OMB APPROVAL
OMB Number: 3235-0570
Expires: January 31, 2017
Estimated average burden hours per response: 20.6
UNITED STATES
SECURITIES AND EXCHANGE COMMISSION
Washington, D.C. 20549
FORM N-CSR
CERTIFIED SHAREHOLDER REPORT OF
REGISTERED MANAGEMENT INVESTMENT COMPANIES
Investment Company Act file number: 811-8319
Voya Partners, Inc.
(Exact name of registrant as specified in charter)
| 7337 E. Doubletree Ranch Rd., Scottsdale, AZ | 85258 |
| (Address of principal executive offices) | (Zip code) |
The Corporation Trust Company, 1209 Orange Street, Wilmington, DE 19801
(Name and address of agent for service)
Registrant’s telephone number, including area code: 1-800-992-0180
| Date of fiscal year end: | December 31 |
| | |
| Date of reporting period: | January 1, 2014 to December 31, 2014 |
| ITEM 1. | REPORTS TO STOCKHOLDERS. |
The following is a copy of the report transmitted to stockholders pursuant to Rule 30e-1 under the Act (17 CFR 270.30e-1):

Annual Report
December 31, 2014
Classes ADV, I, S and S2
Voya Partners, Inc.
| | ■ | Voya Aggregate Bond Portfolio (formerly, VY® PIMCO Bond Portfolio) |
| | ■ | Voya Global Bond Portfolio |
| | ■ | VY® American Century Small-Mid Cap Value Portfolio |
| | ■ | VY® Baron Growth Portfolio |
| | ■ | VY® Columbia Contrarian Core Portfolio |
| | ■ | VY® Columbia Small Cap Value II Portfolio |
| | ■ | VY® Invesco Comstock Portfolio |
| | ■ | VY® Invesco Equity and Income Portfolio |
| | ■ | VY® JPMorgan Mid Cap Value Portfolio |
| | ■ | VY® Oppenheimer Global Portfolio |
| | ■ | VY® Pioneer High Yield Portfolio |
| | ■ | VY® T. Rowe Price Diversified Mid Cap Growth Portfolio |
| | ■ | VY® T. Rowe Price Growth Equity Portfolio |
| | ■ | VY® Templeton Foreign Equity Portfolio |
| | | This report is submitted for general information to shareholders of the Voya mutual funds. It is not authorized for distribution to prospective shareholders unless accompanied or preceded by a prospectus which includes details regarding the funds’ investment objectives, risks, charges, expenses and other information. This information should be read carefully. | | |

TABLE OF CONTENTS
PROXY VOTING INFORMATION
A description of the policies and procedures that the Portfolios use to determine how to vote proxies related to portfolio securities is available: (1) without charge, upon request, by calling Shareholder Services toll-free at (800) 992-0180; (2) on the Portfolios’ website at www.voyainvestments.com; and (3) on the U.S. Securities and Exchange Commission’s (“SEC’s”) website at www.sec.gov. Information regarding how the Portfolios voted proxies related to portfolio securities during the most recent 12-month period ended June 30 is available without charge on the Portfolios’ website at www.voyainvestments.com and on the SEC’s website at www.sec.gov.
QUARTERLY PORTFOLIO HOLDINGS
The Portfolios file their complete schedule of portfolio holdings with the SEC for the first and third quarters of each fiscal year on Form N-Q. This report contains a summary portfolio of investments for the Portfolios. The Portfolios’ Forms N-Q are available on the SEC’s website at www.sec.gov. The Portfolios’ Forms N-Q may be reviewed and copied at the SEC’s Public Reference Room in Washington, DC, and information on the operation of the Public Reference Room may be obtained by calling (800) SEC-0330. The Portfolios’ Forms N-Q, as well as a complete portfolio of investments, are available without charge upon request from the Portfolios by calling Shareholder Services toll-free at (800) 992-0180.
PRESIDENT’S LETTER
New Year, Hopeful View
Dear Shareholder,
As 2014 came to a close, U.S. economic growth accelerated, Japan and Europe were struggling and volatility re-emerged in markets around the world. Though periods of volatility may challenge investor resolve over the course of the year, we believe resilience will prevail thanks to continued improvements in global consumer and business spending and ample global liquidity.
Resilience has been a defining characteristic of markets for some time now, as we have seen them shake off such potentially destabilizing events as Europe’s chronic economic malaise, China’s growth slowdown and Japan’s sharp and surprising return to recession. And that’s not to mention the various geopolitical hotspots — Ukraine, the Middle East and elsewhere — that have flared up from time to time. Along the way markets have been fortified by all-time high U.S. corporate earnings; renewed monetary stimulus from central banks in Japan, Europe and China; and plummeting oil prices that have provided a positive supply shock to consumers and businesses. This confluence of events has bolstered markets worldwide and has raised investor confidence that such trends can be sustained into 2015.
Despite our optimism, we — as always — advocate a well-balanced, globally diversified portfolio. We believe such an approach is the best way to potentially benefit from whatever opportunities may arise, while limiting the potential for over-exposure to as-yet-unidentified risks. Also as always, be sure to review your investment strategy and portfolio with your financial advisor to ensure they continue to reflect your goals and needs. Thoroughly discuss any potential portfolio changes with your advisor before taking action.
We appreciate your continued confidence in us, and we look forward to serving your investment needs in the future.
Sincerely,

Shaun Mathews
Executive Vice President
Voya Family of Funds
January 28, 2015
The views expressed in the President’s Letter reflect those of the President as of the date of the letter. Any such views are subject to change at any time based upon market or other conditions and the Voya mutual funds disclaim any responsibility to update such views. These views may not be relied on as investment advice and because investment decisions for a Voya mutual fund are based on numerous factors, may not be relied on as an indication of investment intent on behalf of any Voya mutual fund. Reference to specific company securities should not be construed as recommendations or investment advice.
International investing poses special risks including currency fluctuation, economic and political risks not found in investments that are solely domestic.
Market Perspective: Year Ended December 31, 2014
Global equities, in the form of the MSCI World IndexSM (the “Index”) measured in local currencies, including net reinvested dividends ended 2013 at a record high. Investor sentiment had evidently reconciled itself to the tapering of the U.S. Federal Reserve Board’s (“Fed’s”) $85 billion of monthly Treasury and mortgage-backed securities purchases. The Fed’s December 18 announcement of a reduction in purchases to $75 billion per month with more to come was taken in stride. There was still plenty to worry about however and the Index endured an early slump and wide swings late in 2014 before ending up 9.81% for the year. (The Index returned 4.94% for the one year ended December 31, 2014, measured in U.S. dollars.)
It did not take long for worries about a flagging U.S. economy to resurface. A disappointingly weak employment report on January 10 showed only 74,000 jobs created in December, the lowest in nearly three years. A cold and snowy winter was thought to be depressing hiring and other key statistics like durable goods orders and home sales.
The Index reached its low point on February 3, down almost exactly 5% in 2014. Yet it took only 18 days to erase the loss despite new political turmoil that flared in Eastern Europe as Russia annexed Crimea after the president of Ukraine was deposed.
With the improvement in the season came a pick-up in U.S. economic data. Employment reports were looking better and the unemployment rate fell below 6%. The December bulletin marked the eighth consecutive month in which more than 200,000 jobs were created. National purchasing managers’ activity indices signaled healthy expansion. While the housing market was cooling, the annualized rate of existing home sales exceeded 5 million for five straight months. Consumer confidence touched seven-year high levels. Growth in gross domestic product (“GDP”) was -2.1% (annualized) in the first quarter but bounced back to 5.0% in the third.
Yet concerns remained about the sustainability of the recovery in the U.S. and worldwide. The improving U.S. employment situation was accompanied by labor force participation rates at or near the lowest since 1978. Wage growth was sluggish near 2% annually. The Fed’s monthly Treasury and mortgage-backed securities purchases ended in October.
Outside of the U.S., growth in China was decelerating, which also weighed on global commodity supplying countries. Japan re-entered recession in the third quarter after an April rise in consumption tax. But it was the euro zone that was the most problematic. Growth almost ground to a halt in the second and third quarters. Unemployment seemed stuck at 11.5%, while deflation was perilously close. Markets became increasingly skeptical that the European Central Bank (“ECB”) could attempt U.S., UK and Japan-style quantitative easing with Germany unequivocally opposed. Oil prices had been steadily falling since late June and would halve by year-end. Increased shale oil production notwithstanding, was this also a signal that global economic activity was weaker than anyone had imagined?
Securities prices mirrored investors’ mood swings in the last few months. The Index actually reached a new peak on September 19, but by October 16 fell 8.2%. From there the Index rebounded 12% to December 5, fell 5% to December 16 then rose 4% to end the year 1.3% below its all-time high.
In U.S. fixed income markets, the Barclays Long-Term U.S. Treasury sub-index returned a remarkable 25.07% in 2014; the Barclays Short-Term U.S. Treasury sub-index just 0.09% as the Treasury yield curve flattened. The Barclays U.S. Aggregate Bond Index (“Barclays Aggregate”) added 5.97%, while the Barclays U.S. Corporate Investment Grade Bond sub-index gained 7.46%. Both outperformed the Barclays High Yield Bond — 2% Issuer Constrained Composite Index (not a part of the Barclays Aggregate), which gained only 2.46%, perhaps reflecting growing disillusionment with the risk/reward profile of high yield bonds after strong returns in recent years.
U.S. equities, represented by the S&P 500® Index including dividends, returned 13.69% in the fiscal year, about 1.5% below its all-time high. The utilities sector was the top performer, returning 28.98%; not surprisingly, the only loser was energy, which dropped 7.78% as oil prices sagged. Record operating earnings per share for S&P 500® companies in the second and third quarters were supported by low interest rates, slow wage growth and historically high share buy-back volumes. Operating margins breached 10% for the first time.
In currencies, the dollar advanced against most other currencies over the year. The dollar surged 13.60% against the euro, on the U.S.’s much better growth and interest rate increase prospects, and 13.74% against the yen, on the likelihood of further monetary easing in Japan and an announced partial re-allocation into non-yen securities for the giant Government Pension Investment Fund (“GPIF”). The dollar gained less, 6.29%, on the pound. The UK had a better growth story than the euro zone, which however is the destination for about 40% of the UK’s exports.
In international markets, the MSCI Japan® Index rose 9.48% in 2014, boosted in the case of Japan’s large exporters by the falling yen and in general by the GPIF’s announcement described above. The MSCI Europe ex UK® Index added 6.63%. The poor economic data referred to above and the lingering conflict in Ukraine dampened markets, which were spasmodically supported by the possibility of quantitative easing. The strong health care sector contributed about one third of the total. Despite superior economic results, the MSCI UK® Index was much weaker, edging up 0.50%. UK stock indices are not particularly representative of the UK economy: the largest 14 names account for half of the index and comprise mostly global banking, energy, pharmaceuticals and materials companies. As a group, they held back returns by about 1.80%.
All indices are unmanaged and investors cannot invest directly in an index. Past performance does not guarantee future results. The performance quoted represents past performance. Investment return and principal value of an investment will fluctuate, and shares, when redeemed, may be worth more or less than their original cost. The Portfolios’ performance is subject to change since the period’s end and may be lower or higher than the performance data shown. Please call (800) 262-3862 or log on to www.voyainvestments.com to obtain performance data current to the most recent month end.
Market Perspective reflects the views of Voya Investment Management’s Chief Investment Risk Officer only through the end of the period, and is subject to change based on market and other conditions.
Benchmark Descriptions
| | | Index | | | | Description | | |
| | | Bank of America/Merrill Lynch All Convertibles (Speculative Grade) Index | | | | An unmanaged index that includes about 270 convertible securities and represents the
non-investment-grade convertible market. | | |
| | | Bank of America/Merrill Lynch High Yield Master II Index | | | | A broad-based index consisting of all U.S. dollar-denominated high-yield bonds with a minimum outstanding amount of $100 million and with a maturity of greater than one year period. The quality rating is less than BBB by Standard & Poor’s. | | |
| | | Barclays Global Aggregate Index | | | | Provides a broad-based measure of the global investment-grade fixed-rate debt markets. | | |
| | | Barclays High Yield Bond — 2% Issuer Constrained Composite Index | | | | An unmanaged index that includes all fixed-income securities having a maximum quality rating of Ba1, a minimum amount outstanding of $150 million, and at least one year to maturity. | | |
| | | Barclays Long-Term U.S. Treasury Index | | | | The Index includes all publicly issued, U.S. Treasury securities that have a remaining maturity of 10 or more years, are rated investment grade, and have $250 million or more of outstanding face value. | | |
| | | Barclays Short-Term U.S. Treasury Index | | | | A market capitalization-weighted index that is composed of fixed-rate, non-convertible U.S. Treasury securities that have a remaining maturity of between one and 12 months and have $250 million or more of outstanding face value. | | |
| | | Barclays U.S. Aggregate Bond Index | | | | An unmanaged index of publicly issued investment grade U.S. Government, mortgage-backed, asset-backed and corporate debt securities. | | |
| | | Barclays U.S. Corporate Investment Grade Bond Index | | | | An unmanaged index consisting of publicly issued, fixed rate, nonconvertible, investment grade debt securities. | | |
| | | Barclays U.S. Government/Credit Bond Index | | | | An index made up of the Barclays Government and Credit indices, including securities issued by the U.S. government and its agencies and publicly issued U.S. corporate and foreign debentures and secured notes that meet specified maturity, liquidity and quality requirements. | | |
| | | MSCI All Country World IndexSM | | | | A broad-based unmanaged index comprised of equity securities in countries around the world, including the United States, other developed countries and emerging markets. | | |
| | | MSCI All Country World ex-U.S. IndexSM | | | | A free float-adjusted market capitalization index that is designed to measure equity market performance in the global developed and emerging markets, excluding the U.S. It includes the reinvestment of dividends and distributions net of withholding taxes, but does not reflect fees, brokerage commissions or other expenses of investing. | | |
| | | MSCI EAFE® Index | | | | An unmanaged index that measures the performance of securities listed on exchanges in Europe, Australasia and the Far East. | | |
| | | MSCI Europe ex UK® Index | | | | A free float-adjusted market capitalization index that is designed to measure developed market equity performance in Europe, excluding the UK. | | |
| | | MSCI Japan® Index | | | | A free float-adjusted market capitalization index that is designed to measure developed market equity performance in Japan. | | |
| | | MSCI UK® Index | | | | A free float-adjusted market capitalization index that is designed to measure developed market equity performance in the UK. | | |
| | | MSCI World IndexSM | | | | An unmanaged index that measures the performance of over 1,400 securities listed on exchanges in the U.S., Europe, Canada, Australia, New Zealand and the Far East. | | |
| | | Russell 1000® Index | | | | An unmanaged, comprehensive large-cap index measuring the performance of the largest 1,000 U.S. incorporated companies. | | |
| | | Russell 1000 Growth® Index | | | | Measures the performance of the 1,000 largest companies in the Russell 3000® Index with higher price-to-book ratios and higher forecasted growth. | | |
| | | Russell 1000® Value Index | | | | An unmanaged index that measures the performance of those Russell 1000® securities with lower price-to-book ratios and lower forecasted growth values. | | |
| | | Russell 2000® Growth Index | | | | An unmanaged index that measures the performance of securities of smaller U.S. companies with greater than average growth orientation. | | |
Benchmark Descriptions (continued)
| | | Index | | | | Description | | |
| | | Russell 2000® Value Index | | | | An unmanaged index that measures the performance of those Russell 2000® companies with lower price-to-book ratios and lower than forecasted growth values. | | |
| | | Russell 2500™ Growth Index | | | | Measures the performance of the small- to mid-cap growth segment of the U.S. equity universe. It includes those Russell 2500™ Index companies with higher price-to-book ratios and higher forecasted growth values. | | |
| | | Russell 2500™ Value Index | | | | Measures the performance of those Russell 2500 companies with lower price-to-book ratios and lower forecasted growth values. | | |
| | | Russell Midcap® Growth Index | | | | An unmanaged index that measures the performance of those companies included in the Russell Midcap® Index with relatively higher price-to-book ratios and higher forecasted growth values. | | |
| | | Russell Midcap® Value Index | | | | Measures the performance of those Russell Midcap companies with lower price-to-book ratios and lower forecasted growth values. | | |
| | | S&P 500® Index | | | | An unmanaged index that measures the performance of securities of approximately 500 large-capitalization companies whose securities are traded on major U.S. stock markets. | | |
| | | S&P MidCap 400 Index | | | | A broad-based unmanaged capitalization weighted index of midcapitalization companies. | | |
| | | S&P Small Cap 600/Citigroup Value Index | | | | Measures the performance of those S&P 600 Index companies with lower price-to-book ratios. | | |
| Portfolio Managers’ Report | Voya Aggregate Bond Portfolio |
| | Investment Type Allocation
as of December 31, 2014
(as a percentage of net assets) | |
| | | | | | |
| | Corporate Bonds/Notes | | | 28.1% | |
| | U.S. Treasury Obligations | | | 20.2% | |
| | U.S. Government Agency Obligations | | | 16.1% | |
| | Asset-Backed Securities | | | 12.6% | |
| | Collateralized Mortgage Obligations | | | 10.8% | |
| | Municipal Bonds | | | 4.6% | |
| | Foreign Government Bonds | | | 2.1% | |
| | Preferred Stock | | | 0.6% | |
| | Certificates of Deposit | | | 0.5% | |
| | Assets in Excess of Other Liabilities* | | | 4.4% | |
| | Net Assets | | | 100.0% | |
| | * Includes short-term investments. | |
| | Portfolio holdings are subject to change daily. | |
Voya Aggregate Bond Portfolio(1) (the “Portfolio”) seeks to provide maximum total return, consistent with capital preservation and prudent investment management. The Portfolio is managed by Christine Hurtsellers, CFA, and Matthew Toms, CFA, Portfolio Managers of Voya Investment Management Co. LLC (“Voya IM”) — the Sub-Adviser.(2)
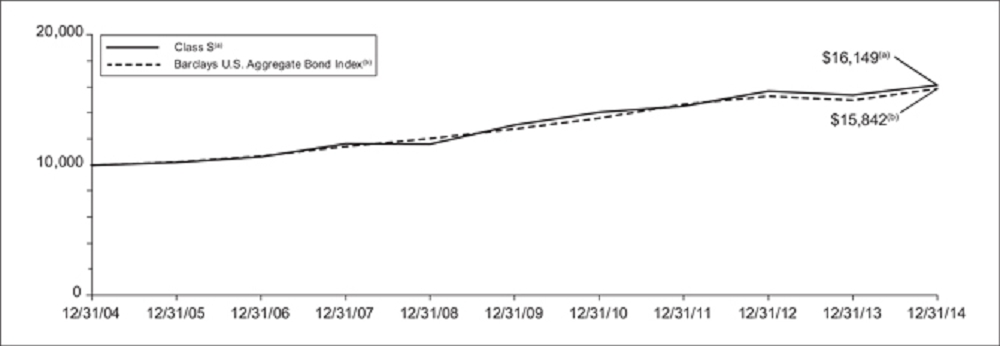
Performance: For the one-year period ended December 31, 2014, the Portfolio’s Class S shares provided a total return of 5.19%, compared to its benchmark the Barclays U.S. Aggregate Bond Index, which returned 5.97% for the same period.
Portfolio Specifics: PIMCO: The Portfolio underperformed the Barclays U.S. Aggregate Bond Index by approximately 88 basis points (0.88%) for the period from January 1, 2014 through December 11, 2014.
Both uncertainty and volatility increased in the first quarter of 2014. Equity markets initially suffered from geopolitical tensions and weather-weakened data before rebounding strongly. Bond markets rallied early in the quarter due to the somewhat uncertain pace of economic expansion and mostly held on to gains as the crisis in Ukraine led a general flight to quality. European economies continued to stabilize but concerns rose in Asia, especially over China’s economic health.
The second quarter of 2014 saw the return of risk appetite and an easing of global political risks. Bond markets rallied as central banks remained accommodative. Global equity markets posted sizeable gains overall as the S&P 500® Index rose to an all-time high and emerging market stocks rebounded on reduced political risks.
The third quarter was marked by geopolitical tension and diverging markets. Most developed market government yields moved lower, while credit markets backed up. Equity markets had modest gains in the U.S., but were flat or slightly negative in many other regions as economic data varied. Given this improvement in the outlook for growth, the U.S. Federal Reserve Board policy rate projections increased modestly and the U.S. dollar surged more than 7.5% versus its major trading partners. Further east, growth concerns developed in China and Japan, and in emerging markets tensions over Ukraine pushed the U.S. and European Union to expand sanctions on Russia.
| | Top Ten Holdings
as of December 31, 2014*
(as a percentage of net assets) | |
| | | | | | |
| | United States Treasury Note, 1.500%,
11/30/19 | | | 11.3% | |
| | United States Treasury Note, 2.250%,
11/15/24 | | | 5.0% | |
| | Freddie Mac, 3.500%, 01/01/45 | | | 4.2% | |
| | Fannie Mae, 4.000%, 12/01/44 | | | 3.5% | |
| | United States Treasury Bond, 3.125%,
08/15/44 | | | 3.3% | |
| | Citibank Credit Card Issuance Trust, 4.850%, 03/10/17 | | | 1.3% | |
| | Accredited Mortgage Loan Trust 2006-1, 0.435%, 04/25/36 | | | 1.1% | |
| | Southern California Public Power Authority, 5.943%, 07/01/40 | | | 0.9% | |
| | Rockies Express Pipeline LLC, 3.900%,
04/15/15 | | | 0.9% | |
| | International Lease Finance Corp., 8.625%, 09/15/15 | | | 0.8% | |
| | * Excludes short-term investments. | |
| | Portfolio holdings are subject to change daily. | |
Evidence of global growth divergence was further borne out in the final quarter of 2014, but the most defining event of the quarter was the sharp decline in oil prices and accompanying market volatility. Growth in the U.S. exceeded expectations and handily outpaced its peers in the developed world, especially Japan and Europe, which continued to struggle. The uneven growth and drop in oil led to bouts of market volatility that dissipated quickly but still managed to leave certain risk sectors bruised.
The following strategies were positive for returns: A defensive position against the euro and the yen, implemented using currency forwards, was positive for performance as these currencies depreciated versus the U.S. dollar. Holdings of non-Agency mortgage backed securities contributed to returns as the sector continued to benefit from limited supply and the ongoing housing recovery. An underweight to investment grade corporate securities was positive for performance as spreads generally widened. Tactical exposure to Italian and Spanish duration contributed to returns for the year as rates fell across the curve in these countries. Exposure to Mexican interest rates, which was partially implemented using interest rates swaps, was positive for performance as rates broadly fell.
The following strategies were negative or neutral for returns: An underweight to the long end of the yield curve, partially implemented through pay fixed interest rate swaps, detracted from returns as long-end rates fell over the year. A focus on the front end of the yield curve also detracted from returns as rates for shorter maturity Treasuries increased. An allocation to U.S. Treasury Inflation-Protected Securities was negative for performance as breakeven inflation levels (the difference between nominal and real yields) fell during the period.
Voya IM: The Portfolio outperformed the Barclays U.S. Aggregate Bond Index by approximately 9 basis points (0.09%) for the period from December 12, 2014 through December 31, 2014.
Current Strategy and Outlook: Going into the New Year, our base case is that the U.S. will maintain a modest pace of growth, while global central banks continue to aggressively fight to improve their own near-term outlooks. We believe the U.S. economy continues to be the bright spot globally with unemployment numbers improving and third quarter gross domestic product surpassing expectations. As oil prices begin to find their footing, we expect better behavior by U.S. spread sectors in 2015. We believe that the contrast in monetary policy between the U.S. and the other major economies is likely to become increasingly stark in 2015. In our view, the ECB appears likely to soon announce a new quantitative easing program that includes euro-denominated corporate or sovereign bonds.
| | (1) | On November 20, 2014, the Board approved a change with respect to the Portfolio’s sub-adviser from Pacific Investment Management Company LLC to Voya IM with related changes to the Portfolio’s name and principal investment strategies. Effective December 12, 2014, the Portfolio’s investment strategies were changed and the Portfolio changed its name from VY® PIMCO Bond Portfolio to Voya Aggregate Bond Portfolio. |
| | (2) | Effective December 12, 2014, Voya IM began managing the Portfolio. Additionally, Mark Kiesel, Scott A. Mather and Mihir Worah were removed as portfolio managers and Christine Hurtsellers and Matthew Toms were added as portfolio managers of the Portfolio. |
Portfolio holdings and characteristics are subject to change and may not be representative of current holdings and characteristics. The outlook for this Portfolio may differ from that presented for other Voya mutual funds. Performance for the different classes of shares will vary based on differences in fees associated with each class.
| Voya Aggregate Bond Portfolio | Portfolio Managers’ Report |
| | Average Annual Total Returns for the Periods Ended December 31, 2014 | |
| | | | 1 Year | | | 5 Year | | | 10 Year | | | Since Inception
of Class S2
February 27, 2009 | | |
| | | | | | | | | | | | | | | |
| | Class ADV | | | 4.85 | % | | | 4.07 | % | | | 4.63 | % | | | — | | |
| | Class I | | | 5.39 | % | | | 4.59 | % | | | 5.16 | % | | | — | | |
| | Class S | | | 5.19 | % | | | 4.34 | % | | | 4.91 | % | | | — | | |
| | Class S2 | | | 5.01 | % | | | 4.18 | % | | | — | | | | 6.29 | % | |
| | Barclays U.S. Aggregate Bond Index | | | 5.97 | % | | | 4.45 | % | | | 4.71 | % | | | 5.06 | % | |
Based on a $10,000 initial investment, the graph and table above illustrate the total return of Voya Aggregate Bond Portfolio against the index indicated. The index is unmanaged and has no cash in its portfolio, imposes no sales charges and incurs no operating expenses. An investor cannot invest directly in an index. The Portfolio’s performance is shown without the imposition of any expenses or charges which are, or may be, imposed under your annuity contract. Total returns would have been lower if such expenses or charges were included.
The performance graph and table do not reflect the deduction of taxes that a shareholder will pay on Portfolio distributions or the redemption of Portfolio shares.
The performance shown may include the effect of fee waivers and/or expense reimbursements by the Investment Adviser and/or other service providers, which have the effect of increasing total return. Had all fees and expenses been considered, the total returns would have been lower.
The performance update illustrates performance for a variable investment option available through a variable
contract. The performance shown indicates past performance and is not a projection or prediction of future results. Actual investment returns and principal value will fluctuate so that shares and/or units, at redemption, may be worth more or less than their original cost. Please log on to www.voyainvestments.com or call (800) 262-3862 to get performance through the most recent month end.
This report contains statements that may be “forward-looking” statements. Actual results may differ materially from those projected in the “forward-looking” statements.
The views expressed in this report reflect those of the portfolio managers, only through the end of the period as stated on the cover. The portfolio managers’ views are subject to change at any time based on market and other conditions.
Portfolio holdings are subject to change daily.
Prior to close of business on December 12, 2014, the Portfolio was advised by a different sub-adviser.
| Portfolio Managers’ Report | Voya Global Bond Portfolio |
| | Geographic Diversification
as of December 31, 2014
(as a percentage of net assets) | |
| | | | | | |
| | United States(1) | | | 91.1% | |
| | Germany | | | 5.3% | |
| | Cayman Islands | | | 5.0% | |
| | Brazil | | | 0.6% | |
| | Russia | | | 0.6% | |
| | France | | | 0.5% | |
| | Netherlands | | | 0.5% | |
| | Australia | | | 0.4% | |
| | United Kingdom | | | 0.4% | |
| | Switzerland | | | 0.3% | |
| | Countries between 0.0%-0.2%^ | | | 1.0% | |
| | Liabilities in Excess of Other Assets* | | | (5.7)% | |
| | Net Assets | | | 100.0% | |
| | * Includes short-term investments. | |
| | ^ Includes 8 countries, which each represents 0.0%-0.2% of net assets. | |
| | (1) Includes 32.1% total investment in Voya Emerging Markets Hard Currency Debt Fund, Voya Emerging Markets Local Currency Debt Fund, Voya Emerging Markets Corporate Debt Fund, and Voya High Yield Bond Fund. | |
| | Portfolio holdings are subject to change daily. | |
Voya Global Bond Portfolio (the “Portfolio”) seeks to maximize total return through a combination of current income and capital appreciation. The Portfolio is managed by Christine Hurtsellers, CFA, and Brian Timberlake, CFA, Portfolio Managers of Voya Investment Management Co. LLC (“Voya IM”) — the Sub-Adviser.*
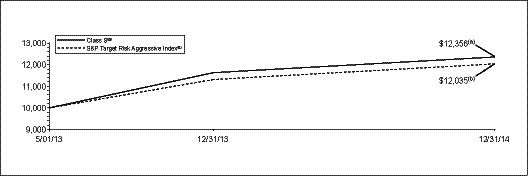
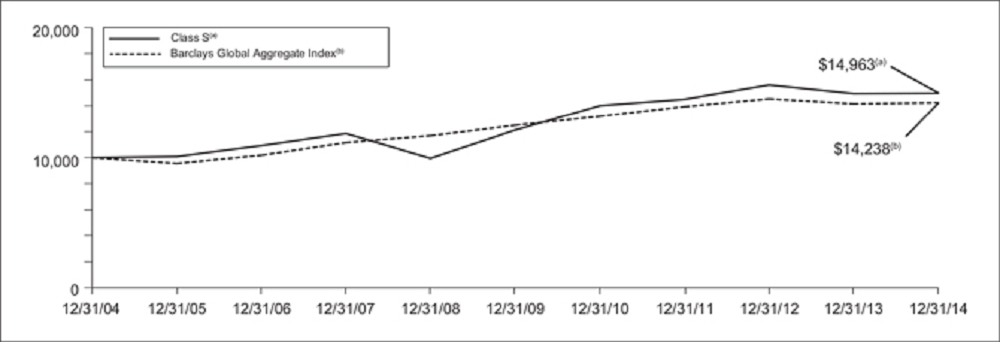
Performance: For the year ended December 31, 2014, the Portfolio’s Class S shares provided a total return of 0.15% compared to the Barclays Global Aggregate Index, which returned 0.59% for the same period.
Portfolio Specifics: A brutal winter obscured an otherwise positive forecast for United States economic growth in the first half of 2014. Meanwhile, in December 2013 the U.S. Federal Reserve Board (the “Fed”) announced it would reduce the scope of its quantitative easing effort by $10 billion per month. However, the Fed continued to reinforce its intention to provide ample liquidity and maintain the federal funds rate at near-zero levels for the foreseeable future, given slack in the labor markets and a benign inflation outlook. Gross domestic product expectations in the U.S. for the second half of the year began to increase after shaking off the chill of winter and the Fed continued its “measured pace” of tapering asset purchases and policy normalization. Elsewhere, conditions outside U.S. borders remained tenuous.
| | Top Ten Holdings
as of December 31, 2014*
(as a percentage of net assets) | |
| | | | | | |
| | Voya Emerging Markets Hard Currency Debt Fund - Class P | | | 11.0% | |
| | Voya Emerging Markets Local Currency Debt Fund - Class P | | | 10.9% | |
| | Voya High Yield Bond Fund - Class P | | | 5.5% | |
| | Bundesrepublik Deutsche Inflation Linked Bond, 0.100%, 04/15/23 | | | 5.2% | |
| | Voya Emerging Markets Corporate Debt Fund - Class P | | | 4.7% | |
| | Fannie Mae, 3.000%, 11/25/42 | | | 2.2% | |
| | Fannie Mae, 3.500%, 07/25/41 | | | 1.5% | |
| | Fannie Mae, 4.000%, 08/25/40 | | | 1.5% | |
| | Fannie Mae, 4.500%, 01/25/39 | | | 1.4% | |
| | United States Treasury Note, 2.250%,
11/ 15/24 | | | 1.3% | |
| | * Excludes short-term investments. | | |
| | Portfolio holdings are subject to change daily. | |
The European Central Bank (“ECB”) grew more accommodative throughout the reporting period by cutting rates and implementing targeted longer-term refinancing operations in the face of a sluggish economy, troubling unemployment levels and persistent deflationary pressures. Tensions between Russia and Ukraine intensified and Iraq descended into internal chaos, while the long-running Israeli/Palestinian conflict flared up. Portugal found itself a source of global panic only two months after it emerged from its international bailout program, as one of its largest lenders missed some debt payments. With the U.S. now leading the charge to unwind its extraordinary accommodation, emerging markets became relatively less attractive. Several central banks were quick to action in defense of their currencies, but the tighter financial conditions necessary to bolster local currencies had a dampening effect on growth. Economic expansion in the emerging markets proved challenging in 2014, particularly in light of weak developed market demand, deflationary fears in Europe, falling commodity prices and China’s economic cooling.
Market concern regarding the end of quantitative easing and the timing of interest rate hikes in the U.S. resulted in heightened volatility in “spread” markets (securities such as corporate bonds or mortgage-backed securities, whose yields are measured by their differences from equivalent-maturity U.S. Treasury securities). Volatility was particularly heightened in the fourth quarter of 2014 in response to the precipitous drop in oil prices. Nonetheless, global interest rates and U.S. dollar-denominated assets were bolstered throughout the period by the expectation of a prolonged period of accommodation from global central banks. For example, the Bank of Japan (“BoJ”) significantly expanded its version of quantitative easing at the end of October and the ECB promised more sizable action in 2015.
| | * | Effective March 1, 2015, Mustafa Chowdhury will be added as a portfolio manager of the Portfolio. |
Portfolio holdings and characteristics are subject to change and may not be representative of current holdings and characteristics. The outlook for this Portfolio may differ from that presented for other Voya mutual funds. Performance for the different classes of shares will vary based on differences in fees associated with each class.
| Voya Global Bond Portfolio | Portfolio Managers’ Report |
The Portfolio maintained a U.S.-centric bias throughout the reporting period. This was expressed through overweights in a variety of spread sectors, most notably U.S. high yield corporate bonds and commercial mortgage-backed securities (“CMBS”), as well as mostly dollar-denominated emerging market (EM) sovereign and corporate bonds. These asset classes were not immune to the volatility that occurred later in the reporting period. The most acute spread widening occurred during the fourth quarter as lower Treasury yields and risks from the energy sector drove credit spreads significantly wider. While supported by strong corporate fundamentals and low default expectations, combined with a supportive technical backdrop (i.e., low new issuance), high yield corporate bond exposures suffered from the fall in oil prices toward the end of the reporting period. CMBS proved fairly resilient, buoyed by strong underlying fundamentals, the housing recovery and a supply/demand balance tilted strongly in favor of sellers. Exposure to EM hard currency sovereign and corporate debt was additive in May, as positions with exposure to Russian and Ukrainian turmoil rebounded from distressed prices. Still, these and other commodity-sensitive exposures suffered from the fall in oil prices later in the period. We were generally positioned, however, in more conservative, lower market-risk issues, avoiding Brazil, South Africa and India. All told, spread sector overweight positioning weighed on relative returns for the reporting period.
The Portfolio was generally overweight the U.S. dollar versus other G10 developed market currencies, including the euro and Japanese yen, with minimal exposure to EM currencies. Being underweight the euro was a detractor earlier in the reporting period. However, this positioning proved beneficial when the euro began to fall versus the dollar in September, as deflation threats in the euro zone pushed the ECB to announce extreme easing measures such as negative interest rates and an asset-backed purchase program. The decision to be underweight the yen also proved beneficial, particularly at the very end of the period in light of the BoJ’s surprise announcement to significantly expand its version of quantitative easing. The decision to be overweight the U.S. dollar relative to underweights in the yen and euro proved to be particularly beneficial during the fourth quarter of 2014, as the euro depreciated more than 4% and the yen more than 8%.
The Portfolio’s interest rate posture detracted from results for the reporting period. Portfolio duration (i.e., interest rate sensitivity) was shorter than the benchmark through the first half of the reporting period, which was followed by an overweight in New Zealand, Australia and the UK during the second half of the year. The Portfolio was short duration in European sovereign and peripheral debt. This detracted from results as the European core and periphery rallied due to easing actions by the ECB. Being overweight in Australia and New Zealand, however, contributed to results. We thought the expectations of rate hikes were too aggressive and were ultimately proven right as the outlook for global economic growth weakened and commodity prices declined. As the reporting period progressed, we moved to a short duration position relative to the benchmark, concentrated in U.S. duration and sought out opportunities to buy protection against significantly higher U.S. rates through option positions. These positions have little impact on the portfolio’s duration, but potentially would work to naturally shorten portfolio duration in the event of a significant interest rate sell-off. Being underweight interest rate risk later in the period (e.g. short U.S. and Canada) detracted from results, as rates rallied to 18-month lows in the U.S. and all-time lows in some other global markets. In particular, lower yields in long-term U.S. Treasuries and in peripheral euro zone sovereigns detracted from returns.
To manage interest rate risk during the period, the Portfolio used government bond futures and interest rate swaps. To manage currency risk, we employed currency forwards, occasionally using currency options to limit risk in adverse scenarios. Occasionally, we used index credit default swaps to manage exposure to spread sectors.
Current Strategy and Outlook: Given the continuing potential for a global economic slowdown and prolonged central bank accommodation, we maintain a bias for U.S. dollar-denominated assets tied to stable corporate fundamentals, the housing recovery and the U.S. consumer. The Portfolio remains overweight a variety of spread sectors, including EM sovereigns, U.S. investment grade corporates and U.S. high yield corporates. Risks to these sectors were highlighted during the fourth quarter, as oil prices plummeted and global growth expectations, particularly in Europe and some emerging markets were revised downward. However, despite low overall yields, we believe spread widening in these sectors leaves valuations compelling for selected holdings. As we still do not anticipate a new default cycle in the near term, particularly in credits most exposed to the U.S. economy, we feel that default-adjusted returns are likely to be attractive in 2015.
The Portfolio remains overweight the U.S. dollar and underweight the euro and Japanese yen. In our view, the yen may have already experienced most of its weakening move, as the BoJ’s surprise announcement of faster bond buying is well past. In the first quarter of 2015, we expect the ECB to announce its own sovereign bond purchase program. As that event approaches, we expect to be increasingly underweight euros versus the U.S. dollar and other currencies, including the British pound and Swiss franc.
The Portfolio is underweight interest rate risk in the U.S., but has closed its underweights in interest rate risk denominated in other currencies. In our opinion, valuations are generally rich in rates, but with new central bank purchase programs being announced, flooding the market with liquidity at a time of economic uncertainty, we see no near-term catalyst for a global rate sell-off. Our underweights are concentrated in the front end of the U.S. curve, where Fed policy may provide a possible cue for a sell-off. We are also positioning in options strategies to gain from less rapid changes in the slope of the U.S. interest rate curve in the near future.
| Portfolio Managers’ Report | Voya Global Bond Portfolio |
| | Average Annual Total Returns for the Periods Ended December 31, 2014 | |
| | | | 1 Year | | | 5 Year | | | 10 Year | | |
| | Class ADV | | | -0.06 | % | | | 4.04 | % | | | 3.85 | % | |
| | Class I | | | 0.42 | % | | | 4.56 | % | | | 4.35 | % | |
| | Class S | | | 0.15 | % | | | 4.30 | % | | | 4.11 | % | |
| | Barclays Global Aggregate Index | | | 0.59 | % | | | 2.65 | % | | | 3.60 | % | |
Based on a $10,000 initial investment, the graph and table above illustrate the total return of Voya Global Bond Portfolio against the index indicated. The index is unmanaged and has no cash in its portfolio, imposes no sales charges and incurs no operating expenses. An investor cannot invest directly in an index. The Portfolio’s performance is shown without the imposition of any expenses or charges which are, or may be, imposed under your annuity contract. Total returns would have been lower if such expenses or charges were included.
The performance graph and table do not reflect the deduction of taxes that a shareholder will pay on Portfolio distributions or the redemption of Portfolio shares.
The performance shown may include the effect of fee waivers and/or expense reimbursements by the Investment Adviser and/or other service providers, which have the effect of increasing total return. Had all fees and expenses been considered, the total returns would have been lower.
The performance update illustrates performance for a variable investment option available through a variable contract. The performance shown indicates past
performance and is not a projection or prediction of future results. Actual investment returns and principal value will fluctuate so that shares and/or units, at redemption, may be worth more or less than their original cost. Please log on to www.voyainvestments.com or call (800) 262-3862 to get performance through the most recent month end.
This report contains statements that may be “forward-looking” statements. Actual results may differ materially from those projected in the “forward-looking” statements.
The views expressed in this report reflect those of the portfolio managers, only through the end of the period as stated on the cover. The portfolio managers’ views are subject to change at any time based on market and other conditions.
Portfolio holdings are subject to change daily.
Prior to January 21, 2011, the Portfolio was advised by a different sub-adviser.
| VY® American Century Small-Mid Cap Value Portfolio | Portfolio Managers’ Report |
| | Sector Diversification
as of December 31, 2014
(as a percentage of net assets) | |
| | | | | | |
| | Financials | | | 28.3% | |
| | Industrials | | | 12.8% | |
| | Information Technology | | | 10.1% | |
| | Utilities | | | 9.9% | |
| | Health Care | | | 9.3% | |
| | Consumer Discretionary | | | 8.6% | |
| | Consumer Staples | | | 5.5% | |
| | Energy | | | 5.4% | |
| | Materials | | | 5.1% | |
| | Exchange-Traded Funds | | | 2.2% | |
| | Telecommunication Services | | | 1.0% | |
| | Assets in Excess of Other Liabilities* | | | 1.8% | |
| | Net Assets | | | 100.0% | |
| | * Includes short-term investments. | |
| | Portfolio holdings are subject to change daily. | |
VY® American Century Small-Mid Cap Value Portfolio (the “Portfolio”) seeks long-term capital growth. Income is a secondary objective. The Portfolio is managed by a team of portfolio managers comprised of Miles Lewis and Jeff John (responsible for the management of the Small Cap Value portion of the Portfolio) and Kevin Toney, Phillip N. Davidson, Michael Liss and Brian Woglom (responsible for the Mid Cap Value portion of the Portfolio) (each a “Sleeve”), Portfolio Managers of American Century Investment Management, Inc. — the Sub-Adviser.*
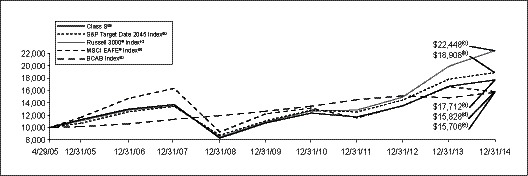
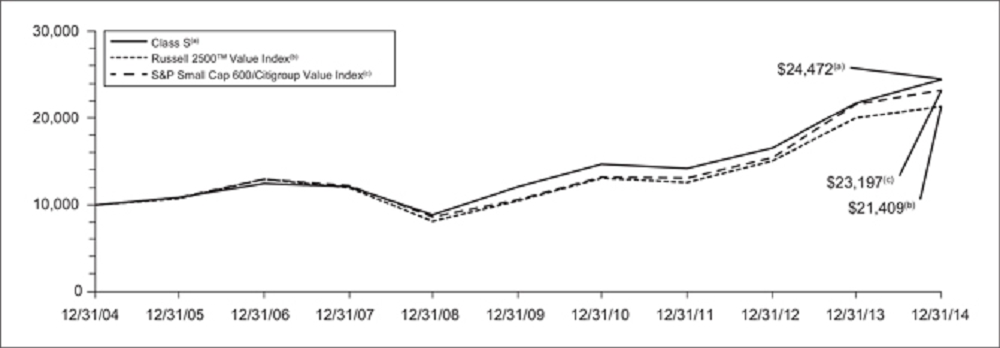
Performance: For the year ended December 31, 2014, the Portfolio’s Class S shares provided a total return 12.47% compared to the Russell 2500TM Value Index and the S&P Small Cap 600/Citigroup Value Index, which returned 7.11% and 7.54%, respectively, for the same period.
Portfolio Specifics: Small Cap Value Sleeve — investments in the materials, energy, and industrials sectors added significantly to performance, while positions in the financials, consumer discretionary, and utilities sectors detracted from returns.
The Small Cap Value Sleeve outperformed its benchmark due to security selection. Sector weightings were detractive on balance.
In materials, the Sleeve benefited from stock selection, particularly in the containers and packaging industry. Berry Plastics benefited from the dramatic drop in crude oil prices during the second half of the year, as the resin it uses in many of its products is a petroleum product that dropped in price. While the consumer discretionary sector detracted, individual names in the sector were among the top contributors. Entravision, the largest Spanish-language broadcaster in the U.S., recovered from previous weakness across the media industry. The company also benefited from news that the federal government is assessing interest among television broadcasters in auctioning off excess broadcast spectrum. If completed, the auction would likely bring in significant capital for the company, and it has indicated it would use the income to deleverage debt. The Portfolio was also helped by its position in Red Robin Gourmet Burgers. The team established the position during the third quarter when the stock dipped as a result of poor marketing execution. The company recovered from the stumble and performed well during the fourth quarter, as restaurants are some of the first places consumers begin spending when discretionary income increases.
Security selection and a significant underweight to the financials sector detracted from relative performance, particularly among real estate investment trusts (“REITs”). BankUnited, which operates in Miami and New York, declined after issuing fourth-quarter guidance that was lower than anticipated. The bank is still experiencing solid growth and the team believes it is a high quality name with attractive valuation. In consumer discretionary, electronics and appliance retailer Conn’s detracted, and the Sleeve exited its position. Watch maker Movado also weighed on relative results as growth in the business segment is slowing. An underweight to the utilities sector further hampered performance.
Mid Cap Value Sleeve – Positions in the information technology, industrials, and energy sectors contributed the most to performance, while positions in the financials and materials sectors detracted from returns.
| | Top Ten Holdings
as of December 31, 2014*
(as a percentage of net assets) | |
| | | | | | |
| | Republic Services, Inc. | | | 2.1% | |
| | Northern Trust Corp. | | | 2.0% | |
| | iShares Russell Midcap Value Index Fund | | | 1.9% | |
| | Laclede Group, Inc. | | | 1.4% | |
| | Sysco Corp. | | | 1.1% | |
| | Koninklijke Philips NV | | | 1.1% | |
| | LifePoint Hospitals, Inc. | | | 1.1% | |
| | Imperial Oil Ltd. | | | 1.1% | |
| | Westar Energy, Inc. | | | 1.1% | |
| | Edison International | | | 1.0% | |
| | * Excludes short-term investments. | |
| | Portfolio holdings are subject to change daily. | |
The Mid Cap Value Sleeve outperformed its benchmark due to security selection. Sector allocations detracted slightly from relative performance.
Security selection among information technology names contributed to relative results. In the information technology sector, Applied Materials enhanced returns. The semiconductor equipment maker saw fundamentals improve across the industry in the wake of technology changes in semiconductor and memory manufacturing. The company continues to focus on improving its margins, market share, and research and development productivity. Additionally, the firm is working toward closing an acquisition that would be highly accretive. In the industrials sector, security selection enhanced relative performance, though some of the gain was offset by a detrimental overweight in the sector. Security selection and an underweight in the machinery segment drove contribution from the sector.
Security selection in the financials sector was the greatest detractor from relative performance. The Portfolio remained significantly underweight in REITs, as the team finds valuations unattractive amid continued low interest rates. In the materials sector, security selection weighed on relative returns, though some of the detraction was offset by the portfolio’s underweight to the sector. Global aluminum fabricator Constellium NV detracted as an acquisition increased its debt burden. Additionally, the company announced its intent to increase capacity over the next three years, which could limit its free cash flow generation.
Current Strategy and Outlook: We continue to be bottom-up investment managers, building our portfolios one stock at a time, a process that results in exposure to market segments based on the attractiveness of individual companies in terms of their valuation and fundamentals. As of December 31, 2014, the Mid Cap Value Sleeve was overweight in industrials, consumer staples, and energy, relative to the benchmark. Fundamental analysis and valuation work have led to smaller relative weightings in financials, consumer discretionary, and materials stocks. The Small Cap Value Sleeve, as of December 31, 2014, maintained an overall underweight in the energy sector, eliminating several oil and gas exploration and production names but retaining, in our opinion, high quality refining companies, which held better than other energy names. The Portfolio is also overweight names that store and transport oil and gas products. The Portfolio is overweight the consumer discretionary sector. The Portfolio is still underweight banks, but has been adding, in our opinion, some high quality names in anticipation of an eventual rise in interest rates and improved earning power. While banks have underperformed recently, the team believes it has seen improving fundamentals and profit growth, while valuations remain attractive.
| | * | Effective December 31, 2014, Benjamin Z. Giele was removed as a portfolio manager and Miles Lewis was added as a portfolio manager of the Portfolio. |
Portfolio holdings and characteristics are subject to change and may not be representative of current holdings and characteristics. The outlook for this Portfolio may differ from that presented for other Voya mutual funds. Performance for the different classes of shares will vary based on differences in fees associated with each class.
| Portfolio Managers’ Report | VY® American Century Small-Mid Cap Value Portfolio |
| | Average Annual Total Returns for the Periods Ended December 31, 2014 | |
| | | | 1 Year | | | 5 Year | | | 10 Year | | | Since Inception
of Class S2
February 27, 2009 | | |
| | Class ADV | | | 12.15 | % | | | 14.95 | % | | | 9.09 | % | | | — | | |
| | Class I | | | 12.76 | % | | | 15.52 | % | | | 9.64 | % | | | — | | |
| | Class S | | | 12.47 | % | | | 15.23 | % | | | 9.36 | % | | | — | | |
| | Class S2 | | | 12.33 | % | | | 15.07 | % | | | — | | | | 23.21 | % | |
| | Russell 2500TM Value Index | | | 7.11 | % | | | 15.48 | % | | | 7.91 | % | | | 23.38 | % | |
| | S&P Small Cap 600/Citigroup Value Index | | | 7.54 | % | | | 16.96 | % | | | 8.78 | % | | | 24.47 | % | |
Based on a $10,000 initial investment, the graph and table above illustrate the total return of VY® American Century Small-Mid Cap Value Portfolio against the indices indicated. An index is unmanaged and has no cash in its portfolio, imposes no sales charges and incurs no operating expenses. An investor cannot invest directly in an index. The Portfolio’s performance is shown without the imposition of any expenses or charges which are, or may be, imposed under your annuity contract. Total returns would have been lower if such expenses or charges were included.
The performance graph and table do not reflect the deduction of taxes that a shareholder will pay on Portfolio distributions or the redemption of Portfolio shares.
The performance shown may include the effect of fee waivers and/or expense reimbursements by the Investment Adviser and/or other service providers, which have the effect of increasing total return. Had all fees and expenses been considered, the total returns would have been lower.
The performance update illustrates performance for a variable investment option available through a variable contract. The performance shown indicates past performance and is not a projection or prediction of future results. Actual investment returns and principal value will fluctuate so that shares and/or units, at redemption, may be worth more or less than their original cost. Please call (800) 262-3862 to get performance through the most recent month end.
This report contains statements that may be “forward-looking” statements. Actual results may differ materially from those projected in the “forward-looking” statements.
The views expressed in this report reflect those of the portfolio managers, only through the end of the period as stated on the cover. The portfolio managers’ views are subject to change at any time based on market and other conditions.
Portfolio holdings are subject to change daily.
| VY® Baron Growth Portfolio | Portfolio Managers’ Report |
| | Sector Diversification
as of December 31, 2014
(as a percentage of net assets) | |
| | | | | | |
| | Consumer Discretionary | | | 27.3% | |
| | Industrials | | | 16.7% | |
| | Financials | | | 15.2% | |
| | Information Technology | | | 14.9% | |
| | Health Care | | | 8.5% | |
| | Consumer Staples | | | 8.3% | |
| | Energy | | | 3.4% | |
| | Materials | | | 2.4% | |
| | Utilities | | | 1.8% | |
| | Telecommunication Services | | | 0.8% | |
| | Assets in Excess of Other Liabilities* | | | 0.7% | |
| | Net Assets | | | 100.0% | |
| | * Includes short-term investments. | |
| | Portfolio holdings are subject to change daily. | |
VY® Baron Growth Portfolio (the “Portfolio”) seeks capital appreciation. The Portfolio is managed by Ronald Baron, Founder, Chief Executive Officer, Chief Investment Officer, Chairman, and Portfolio Manager of BAMCO, Inc. — the Sub-Adviser.
Performance: For the year ended December 31, 2014, the Portfolio’s Class S shares provided a total return of 4.34% compared to the Russell 2000® Growth Index and the Russell 2500TM Growth Index, which returned 5.60% and 7.05%, respectively, for the same period.
Portfolio Specifics: The Portfolio underperformed the Russell 2000® Growth Index. The positive effect of stock selection was more than offset by the negative effect of relative sector weights.
Results for U.S. stock markets were volatile in 2014, as investors rotated among sub-asset classes and sectors in reaction to geopolitical events, the pace of global economic growth, interest rates, and, in the second half of the year, plummeting oil prices. After outperforming by about 1,000 basis points (10%) in 2013, small cap stocks underperformed their large cap counterparts by roughly 800 basis points (8%) in 2014. This cyclical behavior is a well-established pattern. We are confident that stocks of smaller, faster growing companies once again may return to favor, although we cannot predict exactly when, or how, it will happen.
Health care, information technology (“IT”), and consumer staples were the Portfolio’s top contributing sectors in 2014. Health care’s contribution was driven primarily by the strong performance of holdings in health care equipment and health care facilities, including the Portfolio’s fourth largest contributor, U.S. hospital operator Community Health Systems, Inc. The Portfolio’s sole pharmaceuticals investment, Latin American generic drug company CFR Pharmaceuticals S.A., was the third biggest contributor to Portfolio performance. Its stock rose significantly on news that it was being acquired by Abbott Laboratories. IT contributed on gains in holdings in IT consulting & other services and data processing and outsourced services. Several application software companies also performed well in 2014, including SS&C Technologies, Inc., Concur Technologies, Inc., and FactSet Research Systems Inc. In consumer staples, private label food company TreeHouse Foods, Inc. and leading craft brewer Boston Beer Company, Inc. led sector performance. While performance of the Portfolio’s Consumer Discretionary investments was mixed, the sector included the Portfolio’s top two contributors, athletic apparel company Under Armour, Inc. and ski resort operator Vail Resorts, Inc.
| | Top Ten Holdings
as of December 31, 2014
(as a percentage of net assets) | |
| | | | | | |
| | Vail Resorts, Inc. | | | 4.1% | |
| | Under Armour, Inc. | | | 3.2% | |
| | Gartner, Inc. | | | 3.2% | |
| | Choice Hotels International, Inc. | | | 3.1% | |
| | Middleby Corp. | | | 3.0% | |
| | Genesee & Wyoming, Inc. | | | 2.9% | |
| | TreeHouse Foods, Inc. | | | 2.8% | |
| | CoStar Group, Inc. | | | 2.7% | |
| | Dick’s Sporting Goods, Inc. | | | 2.5% | |
| | Caesar Stone Sdot Yam Ltd. | | | 2.4% | |
| | Portfolio holdings are subject to change daily. | |
Energy and industrials detracted from Portfolio performance. Investors fled the energy sector in the second half of the year in reaction to the steep drop in oil prices, which fell by approximately 50%. Oil & gas equipment & services company Core Laboratories NV led the decline in the Portfolio. With mixed performance among its holdings, Industrials lost ground in part due to poor performances by standby generator company Generac Holdings Inc. and industrial machinery company Colfax Corporation. Portfolio performance was also hurt by the sagging stock prices of two consumer discretionary stocks, automotive parts distributor LKQ Corporation and Lumber Liquidators Holdings, Inc., the second and third biggest individual detractors, respectively.
Energy, materials, and utilities contributed the most to relative results. With the Portfolio’s Energy holdings primarily in storage & transportation, which are less sensitive to oil price fluctuations, the sector outperformed its index counterpart. In addition, the outperformance of, and lower exposure to, exploration and production companies helped relative performance. Strong performance of the Portfolio’s only materials holding, CaesarStone Sdot-Yam Ltd., combined with its lower exposure to this underperforming sector, contributed to relative results. The sole utilities investment, ITC Holdings Corp., also outperformed, but this was partly offset by larger exposure to this lagging sector.
Lower exposure to health care and underperformance of industrials and financials detracted the most from relative performance. Gains in health care holdings CFR Pharmaceuticals SA, Community Health Systems, Inc., and IDEXX Laboratories, Inc. were more than offset by lower exposure to biotechnology and pharmaceuticals stocks. Industrials trailed its index counterpart, led by declines in Colfax Corp., Genesee & Wyoming, Inc., and Generac Holdings, Inc. Larger exposure to the lagging asset management & custody banks sub-industry and underperformance of Gaming and Leisure Properties, Inc. detracted the most from relative results of the Portfolio’s financials investments.
Current Strategy and Outlook: Generally positive domestic economic reports over the year support the view that the U.S. economy is accelerating, outpacing much of the rest of the developed world. 2014 was the best year for job creation since 1999, average hourly earnings ticked up, consumer confidence rose, and third quarter GDP of 5% represented the fastest pace of expansion in 11 years. We think the economy will continue to improve in 2015.
We consider the decline in oil prices to be a positive for the U.S. economy and non-energy-related U.S. stocks. While we are not making significant changes to our overall investment approach, we view the low price of oil as an opportunity to explore new and additional investments in companies affected by the price of oil. We are studying companies in energy-intensive industries, such as airlines, cruise lines, and automotive companies, as well as businesses that benefit from increased activity in those industries, such as travel-related businesses. We are also studying consumer discretionary businesses – historically a major focus for us – building on the increase in disposable income produced by lower oil prices and the improving economy.
Portfolio holdings and characteristics are subject to change and may not be representative of current holdings and characteristics. The outlook for this Portfolio may differ from that presented for other Voya mutual funds. Performance for the different classes of shares will vary based on differences in fees associated with each class.
| Portfolio Managers’ Report | VY® Baron Growth Portfolio |

| | Average Annual Total Returns for the Periods Ended December 31, 2014 | |
| | | | 1 Year | | | 5 Year | | | 10 Year | | | Since Inception
of Class S2
February 27, 2009 | | |
| | Class ADV | | | 4.06 | % | | | 17.22 | % | | | 8.58 | % | | | — | | |
| | Class I | | | 4.55 | % | | | 17.80 | % | | | 9.12 | % | | | — | | |
| | Class S | | | 4.34 | % | | | 17.52 | % | | | 8.86 | % | | | — | | |
| | Class S2 | | | 4.17 | % | | | 17.34 | % | | | — | | | | 24.00 | % | |
| | Russell 2000® Growth Index | | | 5.60 | % | | | 16.80 | % | | | 8.54 | % | | | 24.13 | % | |
| | Russell 2500TM Growth Index | | | 7.05 | % | | | 17.27 | % | | | 9.37 | % | | | 24.91 | % | |
Based on a $10,000 initial investment, the graph and table above illustrate the total return of VY® Baron Growth Portfolio against the indices indicated. An index is unmanaged and has no cash in its portfolio, imposes no sales charges and incurs no operating expenses. An investor cannot invest directly in an index. The Portfolio’s performance is shown without the imposition of any expenses or charges which are, or may be, imposed under your annuity contract. Total returns would have been lower if such expenses or charges were included.
The performance graph and table do not reflect the deduction of taxes that a shareholder will pay on Portfolio distributions or the redemption of Portfolio shares.
The performance shown may include the effect of fee waivers and/or expense reimbursements by the Investment Adviser and/or other service providers, which have the effect of increasing total return. Had all fees and expenses been considered, the total returns would have been lower.
The performance update illustrates performance for a variable investment option available through a variable contract. The performance shown indicates past performance and is not a projection or prediction of future results. Actual investment returns and principal value will fluctuate so that shares and/or units, at redemption, may be worth more or less than their original cost. Please call (800) 262-3862 to get performance through the most recent month end.
This report contains statements that may be “forward-looking” statements. Actual results may differ materially from those projected in the “forward-looking” statements.
The views expressed in this report reflect those of the portfolio manager, only through the end of the period as stated on the cover. The portfolio manager’s views are subject to change at any time based on market and other conditions.
Portfolio holdings are subject to change daily.
| VY® Columbia Contrarian Core Portfolio | Portfolio Managers’ Report |
| | Sector Diversification
as of December 31, 2014
(as a percentage of net assets) | |
| | | | | | |
| | Financials | | | 20.2% | |
| | Information Technology | | | 19.1% | |
| | Health Care | | | 15.6% | |
| | Consumer Discretionary | | | 13.2% | |
| | Industrials | | | 11.3% | |
| | Consumer Staples | | | 8.4% | |
| | Energy | | | 6.6% | |
| | Materials | | | 3.2% | |
| | Telecommunication Services | | | 2.4% | |
| | Assets in Excess of Other Liabilities | | | –% | |
| | Net Assets | | | 100.0% | |
| | Portfolio holdings are subject to change daily. | |
VY® Columbia Contrarian Core Portfolio (the “Portfolio”) seeks total return, consisting of long-term capital appreciation and current income. The Portfolio is managed by Guy W. Pope, CFA, Portfolio Manager with Columbia Management Investment Advisers, LLC (“CMIA”) — the Sub-Adviser.
Performance: For the year ended December 31, 2014, the Portfolio’s Class S shares provided a total return of 12.81% compared to the Russell 1000® Index, which returned 13.24% for the same period.
Portfolio Specifics: Stock selection was the primary driver of performance for the period, with stocks in the information technology, health care, and consumer staples sectors leading the way. Stock selection in the industrials, consumer discretionary and financials sectors detracted. An underweight to the utilities sector also detracted from relative performance.
In information technology, software and gaming company Electronic Arts, Inc. (“EA”) continued its strong and steady performance, posting more than 100% gain in the period. The world’s second largest video game publisher has built a diversified array of gaming titles, including its sports series (Madden NFL, FIFA), Sims series, and Battlefield. This year EA has taken market share in the mobile and online gaming segments. The company is extremely cost conscious and is gaining a competitive advantage in these higher profit margin areas.
| | Top Ten Holdings
as of December 31, 2014
(as a percentage of net assets) | |
| | | | | | |
| | Apple, Inc. | | | 4.6% | |
| | JPMorgan Chase & Co. | | | 3.5% | |
| | Citigroup, Inc. | | | 3.5% | |
| | Comcast Corp. – Class A | | | 2.9% | |
| | CVS Caremark Corp. | | | 2.8% | |
| | Honeywell International, Inc. | | | 2.6% | |
| | Berkshire Hathaway, Inc. | | | 2.6% | |
| | Goldman Sachs Group, Inc. | | | 2.5% | |
| | Microsoft Corp. | | | 2.5% | |
| | Blackrock, Inc. | | | 2.4% | |
| | Portfolio holdings are subject to change daily. | |
Apple, Inc. (“Apple”) was once again a top contributor in the portfolio, gaining approximately 40% in the period. Apple reported some of its best earnings in recent memory and focus shifted to possible catalysts for the stock in the months and quarters ahead. There appears to be increased bullishness surrounding Apple’s product launches, which included the highly anticipated iPhone 6, and the iWatch, which Apple will introduce in 2015.
Many of our energy sector names were detractors in the period, especially Halliburton Company, Noble Energy, Inc. and Chevron Corporation. A strengthening U.S. dollar, increasing supply and lower demand driven by fears of a global economic slowdown gripped the energy markets and resulted in a drastic decline in oil prices which left the energy sector down more than 8% for the period.
Current Strategy and Outlook: We expect higher volatility in the short term, and we expect that to continue until there is clarity around a few fundamental factors. In our view, these factors include: the path of the U.S. Federal Reserve Board’s monetary policy, Greece and its position in the Euro, and general earnings growth, which appears to be facing stiffer headwinds in 2015, which marks the 6th year of this maturing earnings and economic cycle. As we have discussed in the past, we believe volatility can create opportunities to pick up good companies at compelling valuations. As such, we will continue to adhere to our process and look for contrarian investments in this environment.
| Portfolio holdings and characteristics are subject to change and may not be representative of current holdings and characteristics. The outlook for this Portfolio may differ from that presented for other Voya mutual funds. Performance for the different classes of shares will vary based on differences in fees associated with each class. |
| Portfolio Managers’ Report | VY® Columbia Contrarian Core Portfolio |

| | Average Annual Total Returns for the Periods Ended December 31, 2014 | |
| | | | 1 Year | | | 5 Year | | | 10 Year | | |
| | Class ADV | | | 12.50 | % | | | 12.47 | % | | | 5.77 | % | |
| | Class I | | | 13.09 | % | | | 13.04 | % | | | 6.30 | % | |
| | Class S | | | 12.81 | % | | | 12.76 | % | | | 6.03 | % | |
| | Russell 1000® Index | | | 13.24 | % | | | 15.64 | % | | | 7.96 | % | |
Based on a $10,000 initial investment, the graph and table above illustrate the total return of VY® Columbia Contrarian Core Portfolio against the index indicated. The index is unmanaged and has no cash in its portfolio, imposes no sales charges and incurs no operating expenses. An investor cannot invest directly in an index. The Portfolio’s performance is shown without the imposition of any expenses or charges which are, or may be, imposed under your annuity contract. Total returns would have been lower if such expenses or charges were included.
The performance graph and table do not reflect the deduction of taxes that a shareholder will pay on Portfolio distributions or the redemption of Portfolio shares.
The performance shown may include the effect of fee waivers and/or expense reimbursements by the Investment Adviser and/or other service providers, which have the effect of increasing total return. Had all fees and expenses been considered, the total returns would have been lower.
The performance update illustrates performance for a variable investment option available through a variable
contract. The performance shown indicates past performance and is not a projection or prediction of future results. Actual investment returns and principal value will fluctuate so that shares and/or units, at redemption, may be worth more or less than their original cost. Please call (800) 262-3862 to get performance through the most recent month end.
This report contains statements that may be “forward-looking” statements. Actual results may differ materially from those projected in the “forward-looking” statements.
The views expressed in this report reflect those of the portfolio manager, only through the end of the period as stated on the cover. The portfolio manager’s views are subject to change at any time based on market and other conditions.
Portfolio holdings are subject to change daily.
Prior to October 31, 2005, the Portfolio was advised by a different sub-adviser. Prior to April 15, 2013, the Portfolio was advised by a different sub-adviser.
| VY® Columbia Small Cap Value II Portfolio | Portfolio Managers’ Report |
| | Sector Diversification
as of December 31, 2014
(as a percentage of net assets) | |
| | | | | | |
| | Financials | | | 35.8% | |
| | Consumer Discretionary | | | 12.7% | |
| | Industrials | | | 11.4% | |
| | Information Technology | | | 10.3% | |
| | Health Care | | | 8.2% | |
| | Materials | | | 7.6% | |
| | Utilities | | | 5.5% | |
| | Energy | | | 4.0% | |
| | Consumer Staples | | | 1.2% | |
| | Assets in Excess of Other Liabilities* | | | 3.3% | |
| | Net Assets | | | 100.0% | |
| | * Includes short-term investments. | |
| | Portfolio holdings are subject to change daily. | |
VY® Columbia Small Cap Value II Portfolio (the “Portfolio”) seeks long-term growth of capital. The Portfolio is managed by Christian K. Stadlinger, CFA, and Jarl Ginsberg, CFA, Portfolio Managers, of Columbia Management Investment Advisors, LLC — the Sub-Adviser.
Performance: For the year ended December 31, 2014, the Portfolio’s Class I shares provided a total return of 4.68% compared to the Russell 2000® Value Index, which returned 4.22% for the same period.
Portfolio Specifics: Despite many challenges, U.S. equity markets generally posted solid performance during 2014. The year began with a harsh winter that brought many parts of the U.S. economy to a near-halt, followed by growing concerns that included slowing global growth, mounting tensions between Russia and Ukraine, and the end of quantitative easing in the U.S. Deflation was an additional threat in many economies worldwide, as was the adverse effects of plunging oil prices. Positive economic data eased much of the anxiety, however, and equity markets charged ahead. By year-end the S&P 500 had hit more than 50 record highs — almost half of which were reached during the fourth quarter.
During 2014, the Portfolio’s relative performance benefited substantially from its strategy of buying undervalued securities where the companies’ fortunes are improving, particularly in the industrials sector. Within the sector, while most industries were strong contributors, the greatest contributions came from two of the Portfolio’s airline holdings. In the beginning of 2014, the stock of American Airlines Group, Inc. reaped the rewards of the long-awaited closure of the merger with US Airways Group that came to fruition. Alaska Air Group, Inc. advanced later in the period on lower gas prices as well as on increased demand for airline seats. The Portfolio also benefited from strong stock selection and continued M&A activity in both industrials and energy.
| | Top Ten Holdings
as of December 31, 2014*
(as a percentage of net assets) | |
| | | | | | |
| | American Assets Trust, Inc. | | | 1.3% | |
| | Amerisafe, Inc. | | | 1.3% | |
| | Western Alliance Bancorp. | | | 1.2% | |
| | Sterling Bancorp/DE | | | 1.2% | |
| | VCA, Inc. | | | 1.2% | |
| | Deluxe Corp. | | | 1.2% | |
| | American Equity Investment Life Holding Co. | | | 1.2% | |
| | Avista Corp. | | | 1.2% | |
| | TreeHouse Foods, Inc. | | | 1.2% | |
| | Integrated Device Technology, Inc. | | | 1.2% | |
| | * Excludes short-term investments. | | |
| | Portfolio holdings are subject to change daily. | |
Stock selection was negative within consumer staples and detracted from the Portfolio’s relative performance. Nu Skin Enterprises, Inc., a personal care company, declined on concerns over sales in China. The continued decline ran contrary to our thesis and we exited the name. In addition, the oil price decline that benefited consumers in many ways hurt energy holdings, most notably Goodrich Petroleum Corporation, Basic Energy Services Inc. and Parsely Energy, Inc. Offsetting these disappointments was our investment in E&P company Athlon Energy. The stock advanced during the period initially as there was more evidence of successful exploration in the Permian Basin. It received another boost later in the period on news that it was being acquired by Canadian based Encana Corp. During the period, we reduced our net exposure to the sector based on overall declining cash flow expectations due to weakness in oil prices.
Current Strategy and Outlook: We continue to believe that our focus on small cap value companies with strong underlying earnings prospects and attractively priced shares have the potential to reward investors. We remain focused on our research of those companies where we believe the valuation gap is likely to shrink in the near term and look for a company’s upward inflection point — we seek out stocks that are both inexpensive and show improving operating performance/metrics. As we do this, three types of opportunities typically come to light: Companies with compressed near term operating fundamentals that the managers believe are poised to expand within a reasonable timeframe; Opportunities in industries that may be out of favor; and “Out-of-the-limelight” companies missed by the Wall Street research community.
Going forward, we believe performance will continue to be driven by our bottom-up stock selection process and this strategy drives sector allocations. At period end, the strategy was overweight versus the Russell 2000® Value Index in materials, health care and consumer discretionary. The Portfolio was underweight financials (driven by real estate investment trusts and specialty finance companies), consumer staples, utilities and industrials.
The Portfolio holdings and characteristics are subject to change and may not be representative of current holdings and characteristics. The outlook for this Portfolio may differ from that presented for other Voya mutual funds. Performance for the different classes of shares will vary based on differences in fees associated with each class.
| Portfolio Managers’ Report | VY® Columbia Small Cap Value II Portfolio |

| | Average Annual Total Returns for the Periods Ended December 31, 2014 | |
| | | | 1 Year | | | 5 Year | | | Since Inception
of Class ADV
December 29, 2006 | | | Since Inception
of Class I
April 28, 2006 | | | Since Inception
of Class S
May 1, 2006 | | | Since Inception
of Class S2
February 27, 2009 | | |
| | Class ADV | | | 4.12 | % | | | 14.98 | % | | | 6.75 | % | | | — | | | | — | | | | — | | |
| | Class I | | | 4.68 | % | | | 15.53 | % | | | — | | | | 6.93 | % | | | — | | | | — | | |
| | Class S | | | 4.33 | % | | | 15.25 | % | | | — | | | | — | | | | 6.71 | % | | | — | | |
| | Class S2 | | | 4.28 | % | | | 15.07 | % | | | — | | | | — | | | | — | | | | 22.56 | % | |
| | Russell 2000® Value Index | | | 4.22 | % | | | 14.26 | % | | | 5.25 | % | | | 5.83 | % | | | 5.87 | % | | | 21.94 | % | |
Based on a $10,000 initial investment, the graph and table above illustrate the total return of VY® Columbia Small Cap Value II Portfolio against the index indicated. The index is unmanaged and has no cash in its portfolio, imposes no sales charges and incurs no operating expenses. An investor cannot invest directly in an index. The Portfolio’s performance is shown without the imposition of any expenses or charges which are, or may be, imposed under your annuity contract. Total returns would have been lower if such expenses or charges were included.
The performance graph and table do not reflect the deduction of taxes that a shareholder will pay on Portfolio distributions or the redemption of Portfolio shares.
The performance shown may include the effect of fee waivers and/or expense reimbursements by the Investment Adviser and/or other service providers, which have the effect of increasing total return. Had all fees and expenses been considered, the total returns would have been lower.
The performance update illustrates performance for a variable investment option available through a variable contract. The performance shown indicates past performance and is not a projection or prediction of future results. Actual investment returns and principal value will fluctuate so that shares and/or units, at redemption, may be worth more or less than their original cost. Please call (800) 262-3862 to get performance through the most recent month end.
This report contains statements that may be “forward-looking” statements. Actual results may differ materially from those projected in the “forward-looking” statements.
The views expressed in this report reflect those of the portfolio managers, only through the end of the period as stated on the cover. The portfolio managers’ views are subject to change at any time based on market and other conditions.
Portfolio holdings are subject to change daily.
| VY® Invesco Comstock Portfolio | Portfolio Managers’ Report |
| | Sector Diversification
as of December 31, 2014
(as a percentage of net assets) | |
| | | | | | |
| | Financials | | | 24.5% | |
| | Consumer Discretionary | | | 16.7% | |
| | Energy | | | 15.0% | |
| | Health Care | | | 12.6% | |
| | Information Technology | | | 12.6% | |
| | Industrials | | | 6.9% | |
| | Consumer Staples | | | 4.6% | |
| | Materials | | | 1.8% | |
| | Telecommunication Services | | | 1.5% | |
| | Utilities | | | 1.0% | |
| | Assets in Excess of Other Liabilities* | | | 2.8% | |
| | Net Assets | | | 100.0% | |
| | * Includes short-term investments. | |
| | Portfolio holdings are subject to change daily. | |
VY® Invesco Comstock Portfolio (the “Portfolio”) seeks capital growth and income. The Portfolio is managed by Kevin Holt, Managing Director, Devin E. Armstrong, CFA, James N. Warwick, and Matthew Seinsheimer, Managers, of Invesco Advisers, Inc. — the Sub-Adviser.*
Performance: For the year ended December 31, 2014, the Portfolio’s Class S shares, provided a total return of 9.13% compared to the Russell 1000® Value Index and the S&P 500® Index, which returned 13.45% and 13.69%, respectively, for the same period.
Portfolio Specifics: Strong stock selection and an underweight in the materials sector enhanced relative Portfolio performance. Notably, Alcoa Inc. had a large positive impact to absolute and relative performance. Also, having no exposure to miners, like Freeport-McMoRan Inc. (not held in Portfolio), boosted Portfolio performance, as margins and earnings were negatively affected by gold and other metals experiencing declines during 2014.
We used currency forward contracts during the reporting period for the purpose of hedging currency exposure of non-US-based companies held in the Portfolio. The use of currency forward contracts had a large positive impact on the Portfolio’s performance relative to the Russell 1000® Value Index for the reporting period.
An overweight to the information technology sector and select stocks boosted performance, as well. Within the hardware and equipment industry, Hewlett-Packard was a clear contributor.
On the negative side, stock selection and an overweight within the energy sector was the largest detractor for the period, with most of the underperformance occurring from mid-September to year-end due to the free-falling price of oil. Notably, within oil services and equipment, Weatherford International was one of the largest detractors on an absolute and relative basis, after being a relative and absolute contributor for the first two quarters of 2014. Also, not owning Exxon Mobile was a large detractor, as it was one of the few energy companies to post positive performance.
| | Top Ten Holdings
as of December 31, 2014*
(as a percentage of net assets) | | |
| | | | | | | |
| | Citigroup, Inc. | | | 4.5% | | |
| | JPMorgan Chase & Co. | | | 3.1% | | |
| | General Electric Co. | | | 2.5% | | |
| | Suncor Energy, Inc. | | | 2.4% | | |
| | Royal Dutch Shell PLC - Class A ADR | | | 2.3% | | |
| | Carnival Corp. | | | 2.2% | | |
| | Bank of America Corp. | | | 2.0% | | |
| | Cisco Systems, Inc. | | | 2.0% | | |
| | Merck & Co., Inc. | | | 2.0% | | |
| | Wells Fargo & Co. | | | 1.9% | | |
| | * Excludes short-term investments. | | | |
| | Portfolio holdings are subject to change daily. | | |
Weak stock selection within consumer discretionary also dampened relative performance. Viacom Inc. within media and General Motors, within automobiles, were the two largest detractors within the sector. General Motors continued to erode investor confidence after the firm announced a recall on ignition switches after a 10-year delay.
Weak stock selection within healthcare also detracted from relative performance, mainly from holdings within the pharmaceutical and biotech industry. Sanofi was a large absolute and relative detractor to performance for the year.
Stock selection and an underweight within financials also hurt relative performance. Not owning any REITs was one of the largest detractors within the sector, as real estate posted strong performance for the year. Also, contributions from holdings such as Allstate Corp. were offset by anemic returns from Citigroup Inc., who disappointed investors as the Federal Reserve failed to pass Citigroup’s plans for returning capital to shareholders and also declined to raise the company’s dividend early in the year.
A material underweight to utilities and cash also detracted from performance.
Current Strategy and Outlook: Although the Portfolio is underweight financials and overweight in energy compared to the benchmark, we have a favorable view of large diversified financials companies and have been taking advantage of weakness in the energy sector to add to the Portfolio’s energy position. The Portfolio’s exposure in each sector has a higher beta than the benchmark. Therefore, we believe the Portfolio should be more sensitive to broad moves within these sectors for the foreseeable future.
| | * | Effective May 1, 2014, Jason Leder was removed as a portfolio manager of the Portfolio. |
Portfolio holdings and characteristics are subject to change and may not be representative of current holdings and characteristics. The outlook for this Portfolio may differ from that presented for other Voya mutual funds. Performance for the different classes of shares will vary based on differences in fees associated with each class.
| Portfolio Managers’ Report | VY® Invesco Comstock Portfolio |

| | Average Annual Total Returns for the Periods Ended December 31, 2014 | |
| | | | 1 Year | | | 5 Year | | | 10 Year | | |
| | Class ADV | | | 8.82 | % | | | 14.24 | % | | | 6.28 | % | |
| | Class I | | | 9.39 | % | | | 14.81 | % | | | 6.81 | % | |
| | Class S | | | 9.13 | % | | | 14.53 | % | | | 6.54 | % | |
| | Russell 1000® Value Index | | | 13.45 | % | | | 15.42 | % | | | 7.30 | % | |
| | S&P 500® Index | | | 13.69 | % | | | 15.45 | % | | | 7.67 | % | |
Based on a $10,000 initial investment, the graph and table above illustrate the total return of VY® Invesco Comstock Portfolio against the indices indicated. An index is unmanaged and has no cash in its portfolio, imposes no sales charges and incurs no operating expenses. An investor cannot invest directly in an index. The Portfolio’s performance is shown without the imposition of any expenses or charges which are, or may be, imposed under your annuity contract. Total returns would have been lower if such expenses or charges were included.
The performance graph and table do not reflect the deduction of taxes that a shareholder will pay on Portfolio distributions or the redemption of Portfolio shares.
The performance shown may include the effect of fee waivers and/or expense reimbursements by the Investment Adviser and/or other service providers, which have the effect of increasing total return. Had all fees and expenses been considered, the total returns would have been lower.
The performance update illustrates performance for a variable investment option available through a variable contract. The performance shown indicates past performance and is not a projection or prediction of future results. Actual investment returns and principal value will fluctuate so that shares and/or units, at redemption, may be worth more or less than their original cost. Please call (800) 262-3862 to get performance through the most recent month end.
This report contains statements that may be “forward-looking” statements. Actual results may differ materially from those projected in the “forward-looking” statements.
The views expressed in this report reflect those of the portfolio managers, only through the end of the period as stated on the cover. The portfolio managers’ views are subject to change at any time based on market and other conditions.
Portfolio holdings are subject to change daily.
| VY® Invesco Equity and Income Portfolio | Portfolio Managers’ Report |
| | Sector Diversification
as of December 31, 2014
(as a percentage of net assets) | |
| | | | | | |
| | Financials | | | 24.3% | |
| | U.S. Treasury Notes | | | 11.9% | |
| | Information Technology | | | 10.0% | |
| | Health Care | | | 8.6% | |
| | Energy | | | 8.4% | |
| | Consumer Discretionary | | | 7.1% | |
| | Industrials | | | 6.2% | |
| | Consumer, Non-cyclical | | | 3.9% | |
| | Consumer Staples | | | 3.9% | |
| | Communications | | | 2.3% | |
| | Technology | | | 2.2% | |
| | Telecommunication Services | | | 1.8% | |
| | Utilities | | | 1.0% | |
| | U.S. Treasury Bonds | | | 0.8% | |
| | Materials | | | 0.7% | |
| | Consumer, Cyclical | | | 0.7% | |
| | Basic Materials | | | 0.5% | |
| | Federal National Mortgage Association | | | 0.2% | |
| | Foreign Government Bonds | | | 0.1% | |
| | Federal Home Loan Mortgage Corporation | | | 0.1% | |
| | Municipal | | | 0.0% | |
| | Assets in Excess of Other Liabilities* | | | 5.3% | |
| | Net Assets | | | 100.0% | |
| | * Includes short-term investments. | |
| | Portfolio holdings are subject to change daily. | |
VY® Invesco Equity and Income Portfolio (the “Portfolio”) seeks total return, consisting of long-term capital appreciation and current income. The Portfolio is managed by Thomas B. Bastian, James O. Roeder, Sergio Marcheli, Mary Jayne Maly and Chuck Burge of Invesco Advisers, Inc. — the Sub-Adviser.
Performance: For the year ended December 31, 2014, the Portfolio’s Class S shares provided a total return of 8.69% compared to the Russell 1000® Value Index, Barclays U.S. Government/Credit Bond Index and the composite index consisting of 60% Russell 1000® Value Index/40% Barclays U.S. Government/Credit Bond Index (“Composite Index”), which returned 13.45%, 6.01% and 10.50%, respectively, for the same period.
Portfolio Specifics: On the positive side, a material underweight to energy stocks, followed by stock selection, versus the Russell 1000® Value was one of the largest contributors to relative performance. Energy stocks sold off beginning in mid-September due to the free-falling price of oil. The Portfolio’s large underweight position in Exxon Mobil Corp. and not owning Chevron Corp. were the largest relative contributors, as the stocks posted negative returns and are large holdings within the benchmark.
We used currency forward contracts during the reporting period for the purpose of hedging currency exposure of non-US-based companies held in the Portfolio. The use of currency forward contracts had a large positive impact on the Portfolio’s performance relative to the Russell 1000® Value Index for the reporting period. This was mainly due to the strength of the US Dollar versus many major foreign currencies.
An underweight to industrials, followed by stock selection, also helped relative performance for the year, as industrials only posted mid-single digit returns. Also, General Dynamics, an aerospace company, assisted relative performance. The company beat profit forecasts and provided positive guidance on demand for its Gulfstream jets. The Portfolio’s underweight position in General Electric compared to the benchmark contributed to relative performance as well.
On the negative side, stock selection and an underweight to consumer staples was a large detractor to relative performance. Notably, Avon Products, within the household and personal products industry, was a large detractor, posting double-digit negative returns for the period. Despite improving earnings, the stock performed poorly, after settling with the Justice Department on bribery charges towards the end of the reporting period.
| | Top Ten Holdings
as of December 31, 2014*
(as a percentage of net assets) | | |
| | | | | | | |
| | United States Treasury Note, 0.625%, 12/31/16 | | | 3.3% | | |
| | Citigroup, Inc. | | | 3.1% | | |
| | JPMorgan Chase & Co. | | | 3.0% | | |
| | United States Treasury Note, 1.625%, 12/31/19 | | | 2.8% | | |
| | United States Treasury Note, 1.000%, 12/15/17 | | | 2.5% | | |
| | United States Treasury Note, 2.500%, 03/31/15 | | | 2.4% | | |
| | General Electric Co. | | | 1.9% | | |
| | Morgan Stanley | | | 1.7% | | |
| | Royal Dutch Shell PLC - Class A | | | 1.7% | | |
| | Bank of America Corp. | | | 1.5% | | |
| | * Excludes short-term investments. | | |
| | Portfolio holdings are subject to change daily. | | |
Stock selection and an underweight to financials dampened performance, as well. Not having any exposure to REITs was the largest detractor within the sector, as real estate posted outsized returns during the year.
Weak stock selection within consumer discretionary also hurt relative performance versus the benchmark.
The Portfolio’s allocation to convertible and high grade bonds posted positive returns; however, it detracted from relative performance versus the Russell 1000® Value index, as bonds generally underperformed equities. The allocation to cash also acted as a large detractor in the strong equity market. The Portfolio is a balanced or moderate allocation Portfolio; therefore, allocations to cash and/or fixed income typically are detractors during a strong equity market. Cash is utilized for investment opportunities and the fixed income allocation potentially provides income and capital preservation during equity market downturns.
Current Strategy and Outlook: Equity markets, although providing investors strong absolute returns, experienced continued volatility during the reporting period, based on political unrest in Eastern Europe, a sluggish Chinese economy and the effects to the global economy from falling oil prices. We believe that market volatility creates opportunities to invest in companies with attractive valuations and strong fundamentals. We believe that ultimately those valuations and fundamentals will be reflected in those companies’ stock prices.
Portfolio holdings and characteristics are subject to change and may not be representative of current holdings and characteristics. The outlook for this Portfolio may differ from that presented for other Voya mutual funds. Performance for the different classes of shares will vary based on differences in fees associated with each class.
| Portfolio Managers’ Report | VY® Invesco Equity and Income Portfolio |
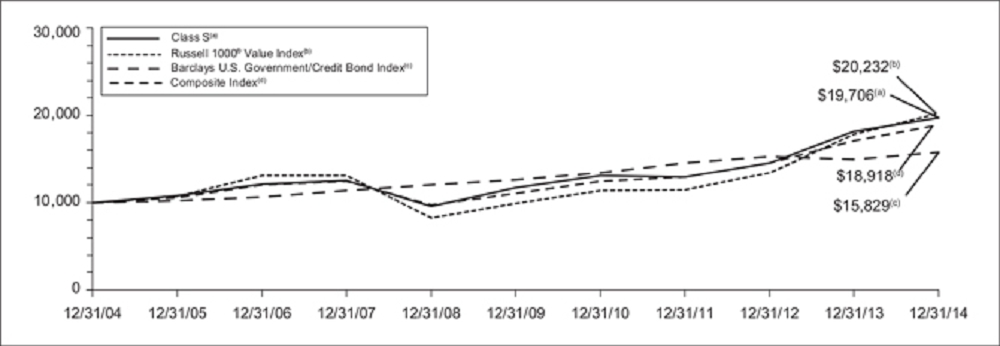
| | Average Annual Total Returns for the Periods Ended December 31, 2014 | |
| | | | 1 Year | | | 5 Year | | | 10 Year | | | Since Inception
of Class S2
February 27, 2009 | | |
| | Class ADV | | | 8.43 | % | | | 10.72 | % | | | 6.76 | % | | | — | | |
| | Class I | | | 8.96 | % | | | 11.28 | % | | | 7.29 | % | | | — | | |
| | Class S | | | 8.69 | % | | | 11.00 | % | | | 7.03 | % | | | — | | |
| | Class S2 | | | 8.54 | % | | | 10.84 | % | | | — | | | | 15.72 | % | |
| | Russell 1000® Value Index | | | 13.45 | % | | | 15.42 | % | | | 7.30 | % | | | 22.05 | % | |
| | Barclays U.S. Government/Credit Bond Index | | | 6.01 | % | | | 4.69 | % | | | 4.70 | % | | | 5.23 | % | |
| | Composite Index | | | 10.50 | % | | | 11.30 | % | | | 6.58 | % | | | 15.35 | % | |
Based on a $10,000 initial investment, the graph and table above illustrate the total return of VY® Invesco Equity and Income Portfolio against the indices indicated. An index is unmanaged and has no cash in its portfolio, imposes no sales charges and incurs no operating expenses. An investor cannot invest directly in an index. The Portfolio’s performance is shown without the imposition of any expenses or charges which are, or may be, imposed under your annuity contract. Total returns would have been lower if such expenses or charges were included.
The performance graph and table do not reflect the deduction of taxes that a shareholder will pay on Portfolio distributions or the redemption of Portfolio shares.
The performance shown may include the effect of fee waivers and/or expense reimbursements by the Investment Adviser and/or other service providers, which have the effect of increasing total return. Had all fees and expenses been considered, the total returns would have been lower.
The performance update illustrates performance for a variable investment option available through a variable contract. The performance shown indicates past performance and is not a projection or prediction of future results. Actual investment returns and principal value will fluctuate so that shares and/or units, at redemption, may be worth more or less than their original cost. Please call (800) 262-3862 to get performance through the most recent month end.
This report contains statements that may be “forward-looking” statements. Actual results may differ materially from those projected in the “forward-looking” statements.
The views expressed in this report reflect those of the portfolio managers, only through the end of the period as stated on the cover. The portfolio managers’ views are subject to change at any time based on market and other conditions.
Portfolio holdings are subject to change daily.
| VY® JPMorgan Mid Cap Value Portfolio | Portfolio Managers’ Report |
| | Sector Diversification
as of December 31, 2014
(as a percentage of net assets) | |
| | | | | | |
| | Financials | | | 30.2% | |
| | Consumer Discretionary | | | 17.6% | |
| | Utilities | | | 10.6% | |
| | Industrials | | | 9.4% | |
| | Information Technology | | | 8.9% | |
| | Health Care | | | 6.6% | |
| | Materials | | | 6.2% | |
| | Consumer Staples | | | 5.7% | |
| | Energy | | | 2.6% | |
| | Assets in Excess of Other Liabilities* | | | 2.2% | |
| | Net Assets | | | 100.0% | |
| | * Includes short-term investments. | |
| | Portfolio holdings are subject to change daily. | |
VY® JPMorgan Mid Cap Value Portfolio (the “Portfolio”) seeks growth from capital appreciation. The Portfolio is managed by Jonathan K.L. Simon, Lawrence Playford and Gloria Fu, Portfolio Managers of J.P. Morgan Investment Management Inc. – the Sub-Adviser.
Performance: For the year ended December 31, 2014, the Portfolio’s Class S shares provided a total return of 14.99% compared to the Russell Midcap® Value Index (the “Index”), which returned 14.75% for the same period.
Portfolio Specifics: The Portfolio outperformed the Index during year. The strategy’s historical performance remains strong with positive alpha in all standard time periods.
The energy sector was the worst-performing sector for the Index for the year. Conversely, the energy sector was actually one of the largest contributors of relative portfolio performance for the year due to our stock selection in lower beta holdings. However, our investments in QEP Resources, Southwestern Energy and EQT were among the top absolute detractors for the year due to the sharp fourth-quarter decline in global energy prices. We believe these companies still hold long-term valuable assets that are currently being mispriced by the overall negative sentiment in the space.
| | Top Ten Holdings
as of December 31, 2014*
(as a percentage of net assets) | | |
| | | | | | | |
| | Kohl’s Corp. | | | 1.6% | | |
| | Loews Corp. | | | 1.6% | | |
| | Expedia, Inc. | | | 1.6% | | |
| | Cigna Corp. | | | 1.6% | | |
| | Gap, Inc. | | | 1.6% | | |
| | Arrow Electronics, Inc. | | | 1.5% | | |
| | Fifth Third Bancorp. | | | 1.5% | | |
| | Jack Henry & Associates, Inc. | | | 1.5% | | |
| | Questar Corp. | | | 1.4% | | |
| | Ameriprise Financial, Inc. | | | 1.4% | | |
| | * Excludes short-term investments. | | |
| | Portfolio holdings are subject to change daily. | | |
The top absolute contributor to performance for the year was our position in Sigma Aldrich Corp. (“Sigma Aldrich”). Shares of Sigma Aldrich spiked in September following the announcement of Merck’s acquisition proposal, which represented a solid premium over the closing share price. This $17 billion transaction will create the third-largest vendor of research supply and bioproduction products in the world. The two businesses are complementary in nature and we believe should realize revenue and cost synergies as well. Shares of Kroger Co. (“Kroger”) rose as the company has positioned itself well for the shift in consumer eating habits. Kroger has been investing in its omni-channel platform, growing its organic food selection and successfully stealing market share from main competitors. We are very impressed with management’s innovative thinking and their strong commitment to returning capital to shareholders through steady dividend raises and aggressive share buybacks. We view Kroger as a top supermarket operator that should continue to gain market share.
Stock selection in financials, historically a strong suit for the portfolio, was a main detractor from performance for the year. This can largely be attributed to what we didn’t own, rather than being penalized for what we did own. Real estate investment trusts (“REITs”) performed particularly well this year despite our view that they were overvalued. Our large underweight in the REIT space detracted most from relative performance. The one notable detractor we did own within the financials sector was Loews. The share price underperformance is largely attributable to the company’s ownership stakes in energy companies Diamond Offshore and Boardwalk Pipeline Partners.
Current Strategy and Outlook: Financials continue to comprise the largest portion of the portfolio. In our view, financials remain an area that will experience both significant earnings-per-share upside as well as multiple expansion as the interest rate and regulatory environments normalize. If the U.S. Federal Reserve Board raises rates in recognition of a strong economy and better unemployment rate, we believe the most positive direct earnings impact to be realized will be by our regional bank holdings. Regional banks may be able to price new loans at higher rates. Additionally, a stronger economy should translate into greater loan demand. In our view, both of these factors should lead to higher net interest margins and net interest income for the regional banks. In our view, a stronger economy should also benefit the consumer discretionary sector, which remains our largest overweight position, especially in the retail sub-segment. We continue to look for companies that have differentiated products and services, are developing effective omni-channel retailing systems and are managed by, in our opinion, strong management teams.
Portfolio holdings and characteristics are subject to change and may not be representative of current holdings and characteristics. The outlook for this Portfolio may differ from that presented for other Voya mutual funds. Performance for the different classes of shares will vary based on differences in fees associated with each class.
| Portfolio Managers’ Report | VY® JPMorgan Mid Cap Value Portfolio |

| | Average Annual Total Returns for the Periods Ended December 31, 2014 | |
| | | | 1 Year | | | 5 Year | | | 10 Year | | | Since Inception
of Class S2
February 27, 2009 | | |
| | Class ADV | | | 14.66 | % | | | 17.55 | % | | | 9.20 | % | | | — | | |
| | Class I | | | 15.27 | % | | | 18.15 | % | | | 9.75 | % | | | — | | |
| | Class S | | | 14.99 | % | | | 17.85 | % | | | 9.48 | % | | | — | | |
| | Class S2 | | | 14.81 | % | | | 17.67 | % | | | — | | | | 23.76 | % | |
| | Russell Midcap® Value Index | | | 14.75 | % | | | 17.43 | % | | | 9.43 | % | | | 25.82 | % | |
Based on a $10,000 initial investment, the graph and table above illustrate the total return of VY® JPMorgan Mid Cap Value Portfolio against the index indicated. The index is unmanaged and has no cash in its portfolio, imposes no sales charges and incurs no operating expenses. An investor cannot invest directly in an index. The Portfolio’s performance is shown without the imposition of any expenses or charges which are, or may be, imposed under your annuity contract. Total returns would have been lower if such expenses or charges were included.
The performance graph and table do not reflect the deduction of taxes that a shareholder will pay on Portfolio distributions or the redemption of Portfolio shares.
The performance shown may include the effect of fee waivers and/or expense reimbursements by the Investment Adviser and/or other service providers, which have the effect of increasing total return. Had all fees and expenses been considered, the total returns would have been lower.
The performance update illustrates performance for a variable investment option available through a variable contract. The performance shown indicates past performance and is not a projection or prediction of future results. Actual investment returns and principal value will fluctuate so that shares and/or units, at redemption, may be worth more or less than their original cost. Please call (800) 262-3862 to get performance through the most recent month end.
This report contains statements that may be “forward-looking” statements. Actual results may differ materially from those projected in the “forward-looking” statements.
The views expressed in this report reflect those of the portfolio managers, only through the end of the period as stated on the cover. The portfolio managers’ views are subject to change at any time based on market and other conditions.
Portfolio holdings are subject to change daily.
| VY® Oppenheimer Global Portfolio | Portfolio Managers’ Report |
| | Geographic Diversification
as of December 31, 2014
(as a percentage of net assets) | |
| | | | | | |
| | United States | | | 44.7% | |
| | Japan | | | 10.5% | |
| | Germany | | | 9.8% | |
| | France | | | 5.2% | |
| | Switzerland | | | 5.2% | |
| | United Kingdom | | | 4.8% | |
| | Sweden | | | 4.2% | |
| | India | | | 3.6% | |
| | Spain | | | 3.4% | |
| | Brazil | | | 3.2% | |
| | Countries between 0.3%-1.7%^ | | | 5.2% | |
| | Assets in Excess of Other Liabilities* | | | 0.2% | |
| | Net Assets | | | 100.0% | |
| | * Includes short-term investments. | |
| | ^ Includes 6 countries, which each represents 0.3%-1.7% of net assets. | |
| | Portfolio holdings are subject to change daily. | |
VY® Oppenheimer Global Portfolio (the “Portfolio”) seeks capital appreciation. The Portfolio is managed by Rajeev Bhaman, Portfolio Manager of OppenheimerFunds, Inc. — the Sub-Adviser.
Performance: For the year ended December 31, 2014, the Portfolio’s Class S shares provided a total return of 2.09% compared to the MSCI All Country World IndexSM, which returned 4.16% for the same period.*
Portfolio Specifics: Top contributors to performance this period included ICICI Bank Ltd. (“ICICI”), Allergan, Inc. (“Allergan”) and Anthem, Inc. (“Anthem”). ICICI is the largest private sector bank in India, a country where about half the banking sector is state-owned. In an environment where the public sector banks are inadequately capitalized for the level of non-performing loans on their books and the government’s ability to continually inject new capital is impaired as a result of its financial position, we believe ICICI has the potential to grow faster with less competition. ICICI’s checking and savings deposits are growing, and its asset quality can improve with GDP growth as can loan growth. Additionally, the election of Narendra Modi as the new Prime Minister of India was greeted with great optimism and boosted Indian equities this reporting period. Allergan is a leading maker of eye care, skin care and aesthetic products, including Botox. Allergan’s stock price jumped after Actavis announced plans to acquire the company. Anthem is a health benefit company that had a strong reporting period. The company also announced plans to acquire Simply Healthcare Holdings toward the end of the year.
| | Top Ten Holdings
as of December 31, 2014
(as a percentage of net assets) | |
| | | | | | |
| | Telefonaktiebolaget LM Ericsson | | | 2.6% | |
| | McGraw-Hill Cos., Inc. | | | 2.5% | |
| | Walt Disney Co. | | | 2.4% | |
| | eBay, Inc. | | | 2.3% | |
| | Citigroup, Inc. | | | 2.1% | |
| | Colgate-Palmolive Co. | | | 2.0% | |
| | Murata Manufacturing Co., Ltd. | | | 1.9% | |
| | Altera Corp. | | | 1.9% | |
| | Aetna, Inc. | | | 1.9% | |
| | Prudential PLC | | | 1.9% | |
| | Portfolio holdings are subject to change daily. | |
| | | | | | | | |
Detractors from performance this period included Airbus Group NV (“Airbus”), Deutsche Bank AG (“Deutsche Bank”), and Technip SA (“Technip”). Airbus has a product refresh coming with the re-engining of both its single aisle A320 and dual aisle A330 products that we believe has the potential to improve profitability over the next several years. The newest Airbus product, the Airbus A350, is expected to be in commercial service by the first quarter of 2015. Concerns about the near-term impact on margins of these developments led to a pullback in Airbus’ shares after a strong run of performance. Continued prosecutorial activism and litigation activity has led to the financial industry paying significant fines for past transgressions. Heightened concerns about the persistence of such fines and their increasing magnitude have led to worries about the adequacy of capital at global investment banks in particular. This, combined with low levels of market activity that detracted from profits, led to Deutsche Bank’s underperformance. Technip’s share price has been buffeted by a number of things in the reporting period, including developments in Russia, where it has a meaningful project underway, concerns about the capital spending plans of the major oil companies, and lower margin guidance for its subsea segment. However, the company has a very substantial backlog of projects, and we do not believe this will change.
Current Strategy and Outlook: At period end, the Portfolio had its largest overweight positions in information technology, health care, consumer discretionary and industrials. The Portfolio had its most significant underweight positions in energy, materials and consumer staples. On a country basis, the Portfolio had its largest overweight positions in Germany, France, Japan and Sweden, with its most significant underweight positions in the United States, Canada, Australia and the United Kingdom. Despite being underweight the United States relative to the Index, the Portfolio had its largest allocation to that country on an absolute basis at period end.
Regardless of whether we are in a fast or a slow growth world, we believe the companies in the Portfolio have the potential to grow above the general rate of the economies in which they operate by virtue of the secular currents driving them and their advantages globally. We have a long-term investment horizon and build the portfolio from the bottom up, focusing on businesses advantaged by long-term trends. We invest in companies that we believe are capable of producing solid and sustainable growth through the business cycle, that have made strong returns on invested capital, and that demonstrate good cash flow generation characteristics.
| | * | Effective May 1, 2014, the Portfolio changed its benchmark from the MSCI World IndexSM to the MSCI ACW IndexSM because the MSCI ACW IndexSM is considered by the Sub-Adviser to be a more appropriate benchmark reflecting the type of securities in which the Portfolio invests. |
Portfolio holdings and characteristics are subject to change and may not be representative of current holdings and characteristics. The outlook for this Portfolio may differ from that presented for other Voya mutual funds. Performance for the different classes of shares will vary based on differences in fees associated with each class.
| Portfolio Managers’ Report | VY® Oppenheimer Global Portfolio |

| | Average Annual Total Returns for the Periods Ended December 31, 2014 | |
| | | | 1 Year | | | 5 Year | | | 10 Year | | | Since Inception
of Class S2
February 27, 2009 | | |
| | Class ADV | | | 1.86 | % | | | 10.49 | % | | | 6.70 | % | | | — | | |
| | Class I | | | 2.32 | % | | | 11.04 | % | | | 7.22 | % | | | — | | |
| | Class S | | | 2.09 | % | | | 10.76 | % | | | 6.95 | % | | | — | | |
| | Class S2 | | | 1.91 | % | | | 10.59 | % | | | — | | | | 18.95 | % | |
| | MSCI All Country World IndexSM | | | 4.16 | % | | | 9.17 | % | | | 6.09 | % | | | 17.25 | % | |
| | MSCI World IndexSM | | | 4.94 | % | | | 10.20 | % | | | 6.03 | % | | | 17.64 | % | |
Based on a $10,000 initial investment, the graph and table above illustrate the total return of VY® Oppenheimer Global Portfolio against the indices indicated. An index is unmanaged and has no cash in its portfolio, imposes no sales charges and incurs no operating expenses. An investor cannot invest directly in an index. The Portfolio’s performance is shown without the imposition of any expenses or charges which are, or may be, imposed under your annuity contract. Total returns would have been lower if such expenses or charges were included.
The performance graph and table do not reflect the deduction of taxes that a shareholder will pay on Portfolio distributions or the redemption of Portfolio shares.
The performance shown may include the effect of fee waivers and/or expense reimbursements by the Investment Adviser and/or other service providers, which have the effect of increasing total return. Had all fees and expenses been considered, the total returns would have been lower.
The performance update illustrates performance for a variable investment option available through a variable contract. The performance shown indicates past performance and is not a projection or prediction of future results. Actual investment returns and principal
value will fluctuate so that shares and/or units, at redemption, may be worth more or less than their original cost. Please call (800) 262-3862 to get performance through the most recent month end.
This report contains statements that may be “forward-looking” statements. Actual results may differ materially from those projected in the “forward-looking” statements.
The views expressed in this report reflect those of the portfolio manager, only through the end of the period as stated on the cover. The portfolio manager’s views are subject to change at any time based on market and other conditions.
Portfolio holdings are subject to change daily.
Prior to November 8, 2004, the Portfolio was advised by a different sub-adviser.
Effective May 1, 2014, the Portfolio changed its benchmark from the MSCI World IndexSM to the MSCI All Country World IndexSM because the MSCI All Country World IndexSM is considered by the Sub-Adviser to be a more appropriate benchmark reflecting the type of securities in which the Portfolio invests.
| VY® Pioneer High Yield Portfolio | Portfolio Managers’ Report |
| | | |
| | Investment Type Allocation | |
| | as of December 31, 2014 | |
| | (as a percentage of net assets) | |
| | | | | | |
| | Corporate Bonds/Notes | | | 82.4% | |
| | Common Stock | | | 7.0% | |
| | Preferred Stock | | | 4.1% | |
| | U.S. Treasury Obligations | | | 1.6% | |
| | Collateralized Mortgage Obligations | | | 0.9% | |
| | Warrants | | | 0.1% | |
| | Assets in Excess of Other Liabilities* | | | 3.9% | |
| | Net Assets | | | 100.0% | |
| | | | | | |
| | * Includes short-term investments. | |
| | | |
| | Portfolio holdings are subject to change daily. | |
VY® Pioneer High Yield Portfolio (the “Portfolio”) seeks to maximize total return through income and capital appreciation. The Portfolio is managed by Andrew Feltus and Tracy Wright, Portfolio Managers, of Pioneer Investment Management, Inc. — the Sub-Adviser.
Performance: For the year ended December 31, 2014, the Portfolio’s Class I shares provided a total return of 0.27% compared to the Bank of America/Merrill Lynch High Yield Master II Index and the Bank of America/Merrill Lynch All Convertibles (Speculative Grade) Index, which returned 2.50% and 6.41%, respectively, for the same period.
Portfolio Specifics: Security selection was the primary detractor to returns, primarily in energy. Energy corporates were hurt badly by the widely unexpected sharp decline in the price of oil. Oil was priced at $101/barrel on June 25 and by year-end had fallen to $53/barrel. The Portfolio has maintained an overweight to the energy sector because the sector has historically been defensive relative to the broader high yield market. This is due to the industry’s asset intensive nature and the financial flexibility issuers maintain throughout the credit cycle. We believe this remains true today despite current oil prices.
Additional factors influencing performance over the course of the year included the underweight to the media industry which hurt returns and our holdings in healthcare and technology which helped returns.
| | | |
| | Top Ten Holdings | |
| | as of December 31, 2014* | |
| | (as a percentage of net assets) | |
| | | |
| | Timberstar Trust, 7.530%, 10/15/36 | | | 0.9% | |
| | Nuance Communications, Inc., 2.750%, 11/01/31 | | | 0.8% | |
| | CHS/Community Health Systems, Inc., 8.000%, 11/15/19 | | | 0.8% | |
| | Alere, Inc. | | | 0.7% | |
| | Ford Motor Co. | | | 0.6% | |
| | Thermo Fisher Scientific, Inc. | | | 0.6% | |
| | Alere, Inc., 3.000%, 05/15/16 | | | 0.6% | |
| | Scientific Games International, Inc.,
10.000%, 12/01/22 | | | 0.6% | |
| | Seagate HDD Cayman, 4.750%, 01/01/25 | | | 0.6% | |
| | ON Semiconductor Corp., 2.625%, 12/15/26 | | | 0.6% | |
| | | | | | |
| | * Excludes short-term investments. | |
| | | |
| | Portfolio holdings are subject to change daily. | |
Securities contributing to performance included the equity and convertible position in Cubist Pharmaceuticals as well as the equity and convertible preferred holdings of Alere Inc. Additionally, the equity holding in Aetna and a convertible bond position in United Airlines helped returns.
Securities detracting from performance included the convertible holding in Theravance, the equity position in Freeport McMoRan, the equity and convertible holdings of General Cable, and the convertible owned in Cobalt International Energy.
We continue to maintain our exposure to convertibles, bank loans and equities, which are less sensitive to rising interest rates. The portfolio managers use these sectors to help manage risk and provide additional sources of diversification and alpha.
Within U.S. High Yield, the higher credit quality BBs significantly outperformed within a market backdrop largely characterized by risk aversion during its second half, returning 5.34%, compared to the single B return of 1.32% and the lowest quality CCC’s return of -2.57%. The Portfolio’s underweight allocation to the CCC segment helped relative returns as a result.
Current Strategy and Outlook: We continue to hold overweights to asset rich industries such as energy and those with strong free cash flows generating capabilities such as technology and healthcare, which we believe offer significant asset value and strong downside protection. High yield spreads have now widened out to levels not seen since July 2013. We believe as a result, the asset class has begun to offer compelling attractive valuations across industries, particularly for those issuers with asset rich balance sheets and ample liquidity. Given our growth outlook, we will maintain our allocation to convertibles and equity.
| Portfolio holdings and characteristics are subject to change and may not be representative of current holdings and characteristics. The outlook for this Portfolio may differ from that presented for other Voya mutual funds. Performance for the different classes of shares will vary based on differences in fees associated with each class. |
| Portfolio Managers’ Report | VY® Pioneer High Yield Portfolio |

| | Average Annual Total Returns for the Periods Ended December 31, 2014 | |
| | | | 1 Year | | | 5 Year | | | Since Inception
of Class I
January 3, 2006 | | | Since Inception
of Class S
January 20, 2006 | | |
| | Class I | | | 0.27 | % | | | 9.11 | % | | | 8.58 | % | | | — | | |
| | Class S | | | 0.10 | % | | | 8.85 | % | | | — | | | | 8.35 | % | |
| | Bank of America/Merrill Lynch High Yield Master II Index | | | 2.50 | % | | | 8.88 | % | | | 8.15 | % | | | 8.11 | % | |
| | Bank of America/Merrill Lynch All Convertibles (Speculative Grade) Index | | | 6.41 | % | | | 11.39 | % | | | 8.35 | % | | | 8.16 | % | |
| | | | | | | | | | | | | | | | | | | |
Based on a $10,000 initial investment, the graph and table above illustrate the total return of VY® Pioneer High Yield Portfolio against the indices indicated. An index is unmanaged and has no cash in its portfolio, imposes no sales charges and incurs no operating expenses. An investor cannot invest directly in an index. The Portfolio’s performance is shown without the imposition of any expenses or charges which are, or may be, imposed under your annuity contract. Total returns would have been lower if such expenses or charges were included.
The performance graph and table do not reflect the deduction of taxes that a shareholder will pay on Portfolio distributions or the redemption of Portfolio shares.
The performance shown may include the effect of fee waivers and/or expense reimbursements by the Investment Adviser and/or other service providers, which have the effect of increasing total return. Had all fees and expenses been considered, the total returns would have been lower.
The performance update illustrates performance for a variable investment option available through a variable contract. The performance shown indicates past performance and is not a projection or prediction of future results. Actual investment returns and principal value will fluctuate so that shares and/or units, at redemption, may be worth more or less than their original cost. Please call (800) 262-3862 to get performance through the most recent month end.
This report contains statements that may be “forward-looking” statements. Actual results may differ materially from those projected in the “forward-looking” statements.
The views expressed in this report reflect those of the portfolio managers, only through the end of the period as stated on the cover. The portfolio managers’ views are subject to change at any time based on market and other conditions.
Portfolio holdings are subject to change daily.
| VY® T. Rowe Price Diversified Mid Cap Growth Portfolio | Portfolio Managers’ Report |
| | | |
| | Sector Diversification | |
| | as of December 31, 2014 | |
| | (as a percentage of net assets) | |
| | | | | | |
| | Consumer Discretionary | | | 21.4% | |
| | Industrials | | | 19.5% | |
| | Information Technology | | | 18.4% | |
| | Health Care | | | 16.6% | |
| | Financials | | | 7.3% | |
| | Materials | | | 5.8% | |
| | Consumer Staples | | | 5.0% | |
| | Energy | | | 4.4% | |
| | Telecommunication Services | | | 1.2% | |
| | Utilities | | | 0.3% | |
| | Assets in Excess of Other Liabilities* | | | 0.1% | |
| | Net Assets | | | 100.0% | |
| | * Includes short-term investments. |
| | Portfolio holdings are subject to change daily. |
VY® T. Rowe Price Diversified Mid Cap Growth Portfolio (the “Portfolio”) seeks long-term capital appreciation. The Portfolio is managed by Donald J. Peters and Donald J. Easley, CFA, Portfolio Managers of T. Rowe Price Associates, Inc. — the Sub-Adviser.
Performance: For the year ended December 31, 2014, the Portfolio’s Class S shares provided a total return of 11.65% compared to the S&P MidCap 400 Index and the Russell Midcap® Growth Index, which returned 9.77% and 11.90%, respectively, for the same period.
Portfolio Specifics: The Portfolio outperformed the Russell Midcap® Growth Index before fees and expenses, but underperformed net of these fees for the period. Consumer discretionary proved to be the greatest contributor to relative results, owing to stock choices that included Hanesbrands and CarMax. Despite a challenging consumer spending environment, Hanesbrands reported strong profits in its activewear lines and cost efficiencies stemming from acquisitions. One of the largest U.S. car retailers, CarMax benefited as many more leased cars came onto the used vehicle market, increasing traffic and sales at the company’s stores. In health care, our strategic overweight was beneficial during a period when the sector led the benchmark.
| | | |
| | Top Ten Holdings | |
| | as of December 31, 2014 | |
| | (as a percentage of net assets) | |
| | | | | | |
| | Sherwin-Williams Co. | | | 1.0% | |
| | Hanesbrands, Inc. | | | 1.0% | |
| | SBA Communications Corp. | | | 1.0% | |
| | Carmax, Inc. | | | 1.0% | |
| | Ross Stores, Inc. | | | 0.9% | |
| | Autozone, Inc. | | | 0.9% | |
| | Sensata Technologies Holdings N.V. | | | 0.9% | |
| | Crown Castle International Corp. | | | 0.9% | |
| | Red Hat, Inc. | | | 0.8% | |
| | AmerisourceBergen Corp. | | | 0.8% | |
| | Portfolio holdings are subject to change daily. | |
In consumer staples, stock choices and an unfavorable underweight both dragged on relative performance. Key detractors included Flowers Foods and Sprouts Farmer’s Market. Flowers Foods, a baking company, experienced renewed competition as Hostess reentered the snack cake market and many competitors began using more aggressive bread promotions. Natural and organic foods retailer Sprouts Farmer’s Market also faced greater competition, in this case stemming from Whole Foods Market.
Industrials and business services was another area of relative weakness, due to stock selection. Copa Holdings and Manpower were among the detrimental holdings here. A Latin American airline offering both passenger and cargo service, Copa Holdings suffered from decreased air traffic demand and was forced to sharply reduce its service in Venezuela in order to avoid exposure to that country’s tumbling currency. Manpower is the world’s largest temp agency, with most of its revenue stemming from Europe. Economic weakness in France, the company’s most significant European market, weighed on shares for the period.
Current Strategy and Outlook: Overall, we remain optimistic about the environment for equities, as we believe valuations still look attractive despite last year’s strong performance. While overall inflation remained tame, we expect that rising wage costs in the U.S. will squeeze record profit margins. Nevertheless, we think the pace of labor cost increases would be manageable, as companies also enjoy modest sales gains. In our opinion, we note that fourth-quarter earnings reports should provide greater clarity on the overall impact on profits of the decline in oil prices, as some firms benefit from increased discretionary spending, particularly on the part of lower-income consumers.
| Portfolio holdings and characteristics are subject to change and may not be representative of current holdings and characteristics. The outlook for this Portfolio may differ from that presented for other Voya mutual funds. Performance for the different classes of shares will vary based on differences in fees associated with each class. |
| Portfolio Managers’ Report | VY® T. Rowe Price Diversified Mid Cap Growth Portfolio |

| | Average Annual Total Returns for the Periods Ended December 31, 2014 | |
| | | | 1 Year | | | 5 Year | | | 10 Year | | | Since Inception
of Class S2
February 27, 2009 | | |
| | Class ADV | | | 11.29 | % | | | 16.20 | % | | | 8.81 | % | | | — | | |
| | Class I | | | 11.82 | % | | | 16.78 | % | | | 9.35 | % | | | — | | |
| | Class S | | | 11.65 | % | | | 16.50 | % | | | 9.08 | % | | | — | | |
| | Class S2 | | | 11.39 | % | | | 16.34 | % | | | — | | | | 23.89 | % | |
| | S&P MidCap 400 Index | | | 9.77 | % | | | 16.54 | % | | | 9.71 | % | | | 24.11 | % | |
| | Russell Midcap® Growth Index | | | 11.90 | % | | | 16.94 | % | | | 9.43 | % | | | 24.71 | % | |
Based on a $10,000 initial investment, the graph and table above illustrate the total return of VY® T. Rowe Price Diversified Mid Cap Growth Portfolio against the indices indicated. An index is unmanaged and has no cash in its portfolio, imposes no sales charges and incurs no operating expenses. An investor cannot invest directly in an index. The Portfolio’s performance is shown without the imposition of any expenses or charges which are, or may be, imposed under your annuity contract. Total returns would have been lower if such expenses or charges were included.
The performance graph and table do not reflect the deduction of taxes that a shareholder will pay on Portfolio distributions or the redemption of Portfolio shares.
The performance shown may include the effect of fee waivers and/or expense reimbursements by the Investment Adviser and/or other service providers, which have the effect of increasing total return. Had all fees and expenses been considered, the total returns would have been lower.
The performance update illustrates performance for a variable investment option available through a variable
contract. The performance shown indicates past performance and is not a projection or prediction of future results. Actual investment returns and principal value will fluctuate so that shares and/or units, at redemption, may be worth more or less than their original cost. Please call (800) 262-3862 to get performance through the most recent month end.
This report contains statements that may be “forward-looking” statements. Actual results may differ materially from those projected in the “forward-looking” statements.
The views expressed in this report reflect those of the portfolio managers, only through the end of the period as stated on the cover. The portfolio managers’ views are subject to change at any time based on market and other conditions.
Portfolio holdings are subject to change daily.
Prior to November 8, 2004, the Portfolio was advised by a different sub-adviser.
| VY® T. Rowe Price Growth Equity Portfolio | Portfolio Managers’ Report |
| | | |
| | Sector Diversification | |
| | as of December 31, 2014 | |
| | (as a percentage of net assets) | |
| | | |
| | Consumer Discretionary | | | 27.0% | |
| | Information Technology | | | 26.9% | |
| | Health Care | | | 18.5% | |
| | Industrials Health Care | | | 13.6% | |
| | Financials | | | 6.6% | |
| | Consumer Staples | | | 2.6% | |
| | Energy | | | 2.2% | |
| | Materials | | | 2.0% | |
| | Telecommunication Services | | | 0.6% | |
| | Assets in Excess of Other Liabilities* | | | —% | |
| | Net Assets | | | 100.0% | |
| | | | | | |
| | * Includes short-term investments. | | | | |
| | Portfolio holdings are subject to change daily. | |
VY® T. Rowe Price Growth Equity Portfolio (the “Portfolio”) seeks long-term growth through investments in stocks.* The Portfolio is managed by Joseph Fath, Portfolio Manager of T. Rowe Price Associates, Inc. — the Sub-Adviser.**
Performance: For the year ended December 31, 2014, the Portfolio’s Class I shares, provided a total return of 8.69% compared to the S&P 500® Index, which returned 13.69% for the same period.
Portfolio Specifics: Stock selection was the reason for relative underperformance by the Portfolio, as sector weighting was positive. Consumer discretionary was the largest relative detractor, primarily due to stock selection but significant overweighting also hurt. Information technology underperformed on stock selection. The portfolio’s lack of utilities stocks also detracted. Health care was the leading relative outperformer, largely due to stock selection but overweighting helped. Energy outperformed due to significant underweighting of the weakest sector in the benchmark. Materials contributed positively to outperformance, due to stock selection.
Consumer discretionary was the largest relative detractor. Amazon.com reported impressive revenue and unit growth but recorded minimal profits due to an ongoing investment cycle. The company is investing heavily in distribution, cloud computing, streaming video content, hardware, and other initiatives. We have maintained our position given the company’s dominant retail presence and continued growth with its cloud-computing platform, Amazon Web Services.
An overweight in Wynn Resorts hurt relative results as concerns of decelerating VIP gambling traffic in Macau casinos weighed on the stock. We maintain a favorable view on the company given the impending completion of its premium Wynn Palace in Macau.
Information technology detracted on stock selection, which more than offset favorable overweighting. Despite strong revenue growth, Google’s profits have disappointed investors. The company has invested heavily in additional data center capacity and acquisitions, while hiring rates have also accelerated.
The portfolio’s lack of utilities stocks led to underperformance, as this was the strongest-performing sector in the benchmark for the period.
| | | |
| | Top Ten Holdings | |
| | as of December 31, 2014 | |
| | (as a percentage of net assets) | |
| | | | | | |
| | Amazon.com, Inc. | | | 3.6% | |
| | Visa, Inc. | | | 3.4% | |
| | Priceline.com, Inc. | | | 3.1% | |
| | Google, Inc. | | | 2.8% | |
| | Google, Inc. – Class A | | | 2.7% | |
| | Mastercard, Inc. | | | 2.3% | |
| | Facebook, Inc. | | | 2.3% | |
| | McKesson Corp. | | | 2.2% | |
| | American Airlines Group, Inc. | | | 2.2% | |
| | Gilead Sciences, Inc. | | | 2.2% | |
| | Portfolio holdings are subject to change daily. | |
Health care was the leading outperformer, on both stock selection and favorable overweighting of the second-strongest-performing sector in the benchmark. Shares of Vertex Pharmaceuticals soared in June on news that the company’s cystic fibrosis treatment met its primary endpoint in phase III trials. The company plans to submit for regulatory approval in both the United States and Europe in the near term.
The energy sector relatively outperformed due to significant underweighting of this worst-performing sector in the benchmark. Stock selection was negative. Shares of Range Resources, a U.S. oil and natural gas producer, declined over the past year and lagged the broader energy sector. Mild summer weather in North America, combined with robust supply, drove down natural gas prices.
Materials was an outperformer due to stock selection. Paint manufacturer and retailer Sherwin-Williams is experiencing strong growth from a combination of commercial demand, home construction, and existing home sales.
Current Strategy and Outlook: U.S. equities rose in 2014 for the sixth consecutive year, as the economy recovered strongly from a first-quarter weather-related contraction. Falling long-term interest rates, solid employment growth, favorable corporate earnings, and expanded stimulus measures by major non-U.S. central banks were also supportive. Sharply falling oil prices was another positive factor for U.S. consumers and oil-importing nations, but they contributed to steep declines in currencies and assets of major oil-producing and -exporting countries. Large-cap stocks reached new highs in December. Large- and mid-cap stocks significantly outpaced small-caps for the year, as measured by various Russell indexes. Value stocks outperformed growth among large- and mid-caps, while growth outpaced value among small-caps.
We expect the equities environment to remain favorable in 2015, barring an exogenous event. In our view, China still poses some risk, and it is possible that the eurozone’s sluggish economy and struggle with deflation will linger for longer than expected. We believe that commodities prices and inflation will remain contained, interest rates will stay low, and the earnings outlook appears promising. We are focused on companies with the ability to grow earnings regardless of macroeconomic conditions.
| * | Effective July 14, 2014, the Portfolio revised its investment objective. |
| ** | Effective January 16, 2014, Joseph Fath replaced Rob Bartolo as the Portfolio Manager of the Portfolio. |
Portfolio holdings and characteristics are subject to change and may not be representative of current holdings and characteristics. The outlook for this Portfolio may differ from that presented for other Voya mutual funds. Performance for the different classes of shares will vary based on differences in fees associated with each class.
| Portfolio Managers’ Report | VY® T. Rowe Price Growth Equity Portfolio |

| | Average Annual Total Returns for the Periods Ended December 31, 2014 | |
| | | | 1 Year | | | 5 Year | | | 10 Year | | | Since Inception
of Class S2
February 27, 2009 | | |
| | Class ADV | | | 8.16 | % | | | 15.20 | % | | | 8.02 | % | | | — | | |
| | Class I | | | 8.69 | % | | | 15.78 | % | | | 8.56 | % | | | — | | |
| | Class S | | | 8.42 | % | | | 15.49 | % | | | 8.29 | % | | | — | | |
| | Class S2 | | | 8.26 | % | | | 15.32 | % | | | — | | | | 21.74 | % | |
| | S&P 500® Index | | | 13.69 | % | | | 15.45 | % | | | 7.67 | % | | | 21.87 | % | |
| | Russell 1000® Growth Index | | | 13.05 | % | | | 15.81 | % | | | 8.49 | % | | | 22.38 | % | |
Based on a $10,000 initial investment, the graph and table above illustrate the total return of VY® T. Rowe Price Growth Equity Portfolio against the indices indicated. An index is unmanaged and has no cash in its portfolio, imposes no sales charges and incurs no operating expenses. An investor cannot invest directly in an index. The Portfolio’s performance is shown without the imposition of any expenses or charges which are, or may be, imposed under your annuity contract. Total returns would have been lower if such expenses or charges were included.
The performance graph and table do not reflect the deduction of taxes that a shareholder will pay on Portfolio distributions or the redemption of Portfolio shares.
The performance shown may include the effect of fee waivers and/or expense reimbursements by the Investment Adviser and/or other service providers, which have the effect of increasing total return. Had all fees and expenses been considered, the total returns would have been lower.
The performance update illustrates performance for a variable investment option available through a variable contract. The performance shown indicates past performance and is not a projection or prediction of future results. Actual investment returns and principal value will fluctuate so that shares and/or units, at redemption, may be worth more or less than their original cost. Please call (800) 262-3862 to get performance through the most recent month end.
This report contains statements that may be “forward-looking” statements. Actual results may differ materially from those projected in the “forward-looking” statements.
The views expressed in this report reflect those of the portfolio manager, only through the end of the period as stated on the cover. The portfolio manager’s views are subject to change at any time based on market and other conditions.
Portfolio holdings are subject to change daily.
| VY® Templeton Foreign Equity Portfolio | Portfolio Managers’ Report |
| | |
| | Geographic Diversification |
| | as of December 31, 2014 |
| | (as a percentage of net assets) |
| | | | | | |
| | United Kingdom | | | 20.0% | |
| | France | | | 11.9% | |
| | Germany | | | 11.6% | |
| | Switzerland | | | 6.9% | |
| | Netherlands | | | 6.4% | |
| | China | | | 6.3% | |
| | Japan | | | 6.2% | |
| | South Korea | | | 5.4% | |
| | Italy | | | 3.1% | |
| | Singapore | | | 3.0% | |
| | Countries between 0.3%-2.9%^ | | | 15.3% | |
| | Assets in Excess of Other Liabilities* | | | 3.9% | |
| | Net Assets | | | 100.0% | |
| | | | | | |
| | * Includes short-term investments. | |
| | ^ Includes 12 countries, which each represents 0.3%-2.9% of net assets. | |
| | Portfolio holdings are subject to change daily. | |
VY® Templeton Foreign Equity Portfolio (the “Portfolio”) seeks long-term capital growth. The Portfolio is managed by Cindy L. Sweeting, CFA, Antonio T. Docal, CFA, and Peter A. Nori, CFA, of Templeton Investment Counsel, LLC — the Sub-Adviser.
Performance: For the year ended December 31, 2014, the Portfolio’s Class I shares provided a total return of -6.59% compared to the MSCI All Country World ex-U.S. IndexSM (“MSCI ACWI ex-U.S.”) and the MSCI EAFE® Index, which returned -3.87% and -4.90%, respectively, for the same period.
Portfolio Specifics: The year 2014 was challenging in international equity markets. In Europe, disinflationary pressures intensified and political discord resurfaced; in Japan, extraordinary monetary policy failed to prevent a triple-dip recession; and in diverse emerging markets, economic growth cooled as commodities and currencies came under pressure. Additionally, the price of oil nearly halved and Russia invaded Ukraine, marring European business confidence and highlighting the risks sometimes associated with emerging markets investing.
Relative underperformance during the year was largely attributable to stock selection and an overweighting in Europe, where the delicate progress made stabilizing the banking system, enacting necessary budget reforms, and preparing for further monetary stimulus failed to meaningfully restore corporate confidence or revive lending activity. Concerns about Europe, along with worries about a slowing China and destabilized Russia, made European equities cheap on nearly all normalized valuation metrics. On the other hand, Asian stocks aided relative performance, buoyed by stock selection in China and Japan. In China, our focus was on finding companies with, in our opinion, balance sheet strength, capital discipline and the ability to sustainably generate strong free cash flow. In Japan, we had yet to see the structural reforms required to deal with challenges caused by debt, demographics and corporate governance.
| | | |
| | Top Ten Holdings | |
| | as of December 31, 2014 | |
| | (as a percentage of net assets) | |
| | | | | | |
| | Sanofi | | | 2.5% | |
| | Roche Holding AG - Genusschein | | | 2.3% | |
| | Samsung Electronics Co., Ltd. GDR | | | 2.3% | |
| | Bayer AG | | | 2.1% | |
| | GlaxoSmithKline PLC | | | 2.1% | |
| | BNP Paribas | | | 1.9% | |
| | Toyota Motor Corp. | | | 1.9% | |
| | Kingfisher PLC | | | 1.8% | |
| | Teva Pharmaceutical Industries Ltd. ADR | | | 1.7% | |
| | HSBC Holdings PLC | | | 1.7% | |
| | Portfolio holdings are subject to change daily. | |
Turning to sectors, overweighted energy stocks comprised several of the Portfolio’s biggest laggards. Energy stocks were historically cheap following a period of sustained pressure on sector fundamentals and, most recently, a major oil price correction. As energy companies improved capital allocation and refocused on shareholder returns, we continued to find what we considered were long-term bargains in the sector. Underweighted consumer staples holdings also detracted, pressured by U.K. grocer Tesco PLC (“Tesco”). Although Tesco’s turnaround has been more difficult than expected, the stock looked cheap to us and we remained positive toward the company’s strategy to recapture market share by improving the quality of its products and offering a stronger, clearer price message. On the other hand, stock selection from even-weighted industrials, underweighted materials and overweighted telecommunications stocks aided performance. Australian airline Qantas Airways Ltd. (“Quantas”) was a major contributor. Qantas shares nearly doubled in the final two months of the year as the price of oil declined and the firm benefited from improving fundamentals in international and domestic markets.
During the period, the U.S. dollar appreciated against most foreign currencies, which also hurt the Portfolio’s performance because investments in securities with non-U.S. currency exposure lost value as the dollar rose.
Current Strategy and Outlook: In recent years, we feel that stocks have traded more on macroeconomic and policy expectations than on business fundamentals. Throughout this challenging period, we have tried to use the market’s distraction to our advantage by focusing on what we determined to be overlooked value. In doing so, we have continued to build differentiated portfolios based on our long-term assumptions about company-level business fundamentals. It has been our experience that price and value eventually do intersect over time. Going into 2015, we remained confident that the Portfolio contained far more value than its prices seemed to reflect.
Portfolio holdings and characteristics are subject to change and may not be representative of current holdings and characteristics. The outlook for this Portfolio may differ from that presented for other Voya mutual funds. Performance for the different classes of shares will vary based on differences in fees associated with each class.
| Portfolio Managers’ Report | VY® Templeton Foreign Equity Portfolio |

| | Average Annual Total Returns for the Periods Ended December 31, 2014 | |
| | | | 1 Year | | | 5 Year | | | Since Inception
of Class ADV
December 20, 2006 | | | Since Inception of
Class I
January 3, 2006 | | | Since Inception
of Class S
January 12, 2006 | | | Since Inception
of Class S2
February 27, 2009 | | |
| | Class ADV | | | -7.01 | % | | | 4.54 | % | | | 1.57 | % | | | — | | | | — | | | | — | | |
| | Class I | | | -6.59 | % | | | 5.06 | % | | | — | | | | 3.95 | % | | | — | | | | — | | |
| | Class S | | | -6.87 | % | | | 4.79 | % | | | — | | | | — | | | | 3.66 | % | | | — | | |
| | Class S2 | | | -6.99 | % | | | 4.66 | % | | | — | | | | — | | | | — | | | | 13.22 | % | |
| | MSCI ACWI ex-U.S. | | | -3.87 | % | | | 4.43 | % | | | 1.46 | % | | | 3.69 | % | | | 3.35 | % | | | 13.80 | % | |
| | MSCI EAFE® Index | | | -4.90 | % | | | 5.33 | % | | | 0.97 | % | | | 3.24 | % | | | 2.92 | % | | | 13.67 | % | |
Based on a $10,000 initial investment, the graph and table above illustrate the total return of VY® Templeton Foreign Equity Portfolio against the indices indicated. An index is unmanaged and has no cash in its portfolio, imposes no sales charges and incurs no operating expenses. An investor cannot invest directly in an index. The Portfolio’s performance is shown without the imposition of any expenses or charges which are, or may be, imposed under your annuity contract. Total returns would have been lower if such expenses or charges were included.
The performance graph and table do not reflect the deduction of taxes that a shareholder will pay on Portfolio distributions or the redemption of Portfolio shares.
The performance shown may include the effect of fee waivers and/or expense reimbursements by the Investment Adviser and/or other service providers, which have the effect of increasing total return. Had all fees and expenses been considered, the total returns would have been lower.
The performance update illustrates performance for a variable investment option available through a variable contract. The performance shown indicates past performance and is not a projection or prediction of future results. Actual investment returns and principal value will fluctuate so that shares and/or units, at redemption, may be worth more or less than their original cost. Please log on to www.voyainvestments.com or call (800) 262-3862 to get performance through the most recent month end.
This report contains statements that may be “forward-looking” statements. Actual results may differ materially from those projected in the “forward-looking” statements.
The views expressed in this report reflect those of the portfolio managers, only through the end of the period as stated on the cover. The portfolio managers’ views are subject to change at any time based on market and other conditions.
Portfolio holdings are subject to change daily.
SHAREHOLDER EXPENSE EXAMPLES (Unaudited)
As a shareholder of a Portfolio, you incur two types of costs: (1) transaction costs, including redemption fees and exchange fees; and (2) ongoing costs, including management fees, distribution and/or service (12b-1) fees, and other Portfolio expenses. These Examples are intended to help you understand your ongoing costs (in dollars) of investing in each class of a Portfolio and to compare these costs with the ongoing costs of investing in other mutual funds.
The Examples are based on an investment of $1,000 invested at the beginning of the period and held for the entire period from July 1, 2014 to December 31, 2014. The Portfolios’ expenses are shown without the imposition of any charges which are, or may be, imposed under your variable annuity contract, variable life insurance policy, qualified pension, or retirement plan. Expenses would have been higher if such charges were included.
Actual Expenses
The left section of the table shown below, “Actual Portfolio Return,” provides information about actual account values and actual expenses. You may use the information in this section, together with the amount you invested, to estimate the expenses that you paid over the period. Simply divide your account value by $1,000 (for example, an $8,600 account value divided by $1,000 = 8.6), then multiply the result by the number in the first section under the heading entitled “Expenses Paid During the Period” to estimate the expenses you paid on your account during this period.
Hypothetical Example for Comparison Purposes
The right section of the table shown below, “Hypothetical (5% return before expenses),” provides information about hypothetical account values and hypothetical expenses based on a Portfolio’s actual expense ratio and an assumed rate of return of 5% per year before expenses, which is not a Portfolio’s actual return. The hypothetical account values and expenses may not be used to estimate the actual ending account balance or expenses you paid for the period. You may use this information to compare the ongoing costs of investing in a Portfolio and other mutual funds. To do so, compare this 5% hypothetical example with the 5% hypothetical examples that appear in the shareholder reports of the other mutual funds.
Please note that the expenses shown in the table are meant to highlight your ongoing costs only and do not reflect any transactional costs, such as redemption fees or exchange fees. Therefore, the hypothetical lines of the table are useful in comparing ongoing costs only, and will not help you determine the relative total costs of owning different mutual funds. In addition, if these transactional costs were included, your costs would have been higher.
| | | Actual Portfolio Return | | | Hypothetical (5% return before expenses) | |
| | | Beginning
Account
Value
July 1,
2014 | | | Ending
Account
Value
December 31,
2014 | | | Annualized
Expense
Ratio | | | Expenses Paid
During the
Period Ended
December 31,
2014* | | | Beginning
Account
Value
July 1,
2014 | | | Ending
Account
Value
December 31,
2014 | | | Annualized
Expense
Ratio | | | Expenses Paid
During the
Period Ended
December 31,
2014* | |
| Voya Aggregate Bond Portfolio | | | | | | | | | | | | | | | | | | | | | | | | | |
| Class ADV | | $ | 1,000.00 | | | $ | 1,016.10 | | | | 1.08 | % | | $ | 5.49 | | | $ | 1,000.00 | | | $ | 1,019.76 | | | | 1.08 | % | | $ | 5.50 | |
| Class I | | | 1,000.00 | | | | 1,018.80 | | | | 0.58 | | | | 2.95 | | | | 1,000.00 | | | | 1,022.28 | | | | 0.58 | | | | 2.96 | |
| Class S | | | 1,000.00 | | | | 1,018.20 | | | | 0.83 | | | | 4.22 | | | | 1,000.00 | | | | 1,021.02 | | | | 0.83 | | | | 4.23 | |
| Class S2 | | | 1,000.00 | | | | 1,016.50 | | | | 0.98 | | | | 4.98 | | | | 1,000.00 | | | | 1,020.27 | | | | 0.98 | | | | 4.99 | |
| Voya Global Bond Portfolio | | | | | | | | | | | | | | | | | | | | | | | | | |
| Class ADV | | $ | 1,000.00 | | | $ | 949.00 | | | | 1.10 | % | | $ | 5.40 | | | $ | 1,000.00 | | | $ | 1,019.66 | | | | 1.10 | % | | $ | 5.60 | |
| Class I | | | 1,000.00 | | | | 951.50 | | | | 0.60 | | | | 2.95 | | | | 1,000.00 | | | | 1,022.18 | | | | 0.60 | | | | 3.06 | |
| Class S | | | 1,000.00 | | | | 949.90 | | | | 0.85 | | | | 4.18 | | | | 1,000.00 | | | | 1,020.92 | | | | 0.85 | | | | 4.33 | |
| VY® American Century Small-Mid Cap Value Portfolio | | | | | | | | | | | | | | | | | |
| Class ADV | | $ | 1,000.00 | | | $ | 1,039.30 | | | | 1.36 | % | | $ | 6.99 | | | $ | 1,000.00 | | | $ | 1,018.35 | | | | 1.36 | % | | $ | 6.92 | |
| Class I | | | 1,000.00 | | | | 1,042.50 | | | | 0.86 | | | | 4.43 | | | | 1,000.00 | | | | 1,020.87 | | | | 0.86 | | | | 4.38 | |
| Class S | | | 1,000.00 | | | | 1,041.00 | | | | 1.11 | | | | 5.71 | | | | 1,000.00 | | | | 1,019.61 | | | | 1.11 | | | | 5.65 | |
| Class S2 | | | 1,000.00 | | | | 1,040.50 | | | | 1.26 | | | | 6.48 | | | | 1,000.00 | | | | 1,018.85 | | | | 1.26 | | | | 6.41 | |
| VY® Baron Growth Portfolio | | | | | | | | | | | | | | | | | |
| Class ADV | | $ | 1,000.00 | | | $ | 1,034.30 | | | | 1.48 | % | | $ | 7.59 | | | $ | 1,000.00 | | | $ | 1,017.74 | | | | 1.48 | % | | $ | 7.53 | |
| Class I | | | 1,000.00 | | | | 1,036.60 | | | | 0.98 | | | | 5.03 | | | | 1,000.00 | | | | 1,020.27 | | | | 0.98 | | | | 4.99 | |
| Class S | | | 1,000.00 | | | | 1,035.60 | | | | 1.23 | | | | 6.31 | | | | 1,000.00 | | | | 1,019.00 | | | | 1.23 | | | | 6.26 | |
| Class S2 | | | 1,000.00 | | | | 1,034.70 | | | | 1.38 | | | | 7.08 | | | | 1,000.00 | | | | 1,018.25 | | | | 1.38 | | | | 7.02 | |
SHAREHOLDER EXPENSE EXAMPLES (Unaudited) (Continued)
| | | Actual Portfolio Return | | | Hypothetical (5% return before expenses) | |
| | | Beginning
Account
Value
July 1,
2014 | | | Ending
Account
Value
December 31,
2014 | | | Annualized
Expense
Ratio | | | Expenses Paid
During the
Period Ended
December 31,
2014* | | | Beginning
Account
Value
July 1,
2014 | | | Ending
Account
Value
December 31,
2014 | | | Annualized
Expense
Ratio | | | Expenses Paid
During the
Period Ended
December 31,
2014* | |
| VY® Columbia Contrarian Core Portfolio | | | | | | | | | | | | | | | | | | | | | |
| Class ADV | | $ | 1,000.00 | | | $ | 1,059.00 | | | | 1.18 | % | | $ | 6.12 | | | $ | 1,000.00 | | | $ | 1,019.26 | | | | 1.18 | % | | $ | 6.01 | |
| Class I | | | 1,000.00 | | | | 1,061.90 | | | | 0.68 | | | | 3.53 | | | | 1,000.00 | | | | 1,021.78 | | | | 0.68 | | | | 3.47 | |
| Class S | | | 1,000.00 | | | | 1,060.90 | | | | 0.93 | | | | 4.83 | | | | 1,000.00 | | | | 1,020.52 | | | | 0.93 | | | | 4.74 | |
| VY® Columbia Small Cap Value II Portfolio | | | | | | | | | | | | | | | | | | | | |
| Class ADV | | $ | 1,000.00 | | | $ | 992.90 | | | | 1.36 | % | | $ | 6.83 | | | $ | 1,000.00 | | | $ | 1,018.35 | | | | 1.36 | % | | $ | 6.92 | |
| Class I | | | 1,000.00 | | | | 995.70 | | | | 0.86 | | | | 4.33 | | | | 1,000.00 | | | | 1,020.87 | | | | 0.86 | | | | 4.38 | |
| Class S | | | 1,000.00 | | | | 994.00 | | | | 1.11 | | | | 5.58 | | | | 1,000.00 | | | | 1,019.61 | | | | 1.11 | | | | 5.65 | |
| Class S2 | | | 1,000.00 | | | | 993.70 | | | | 1.26 | | | | 6.33 | | | | 1,000.00 | | | | 1,018.85 | | | | 1.26 | | | | 6.41 | |
| VY® Invesco Comstock Portfolio | | | | | | | | | | | | | | | | | | |
| Class ADV | | $ | 1,000.00 | | | $ | 1,022.80 | | | | 1.22 | % | | $ | 6.22 | | | $ | 1,000.00 | | | $ | 1,019.06 | | | | 1.22 | % | | $ | 6.21 | |
| Class I | | | 1,000.00 | | | | 1,025.50 | | | | 0.72 | | | | 3.68 | | | | 1,000.00 | | | | 1,021.58 | | | | 0.72 | | | | 3.67 | |
| Class S | | | 1,000.00 | | | | 1,023.70 | | | | 0.97 | | | | 4.95 | | | | 1,000.00 | | | | 1,020.32 | | | | 0.97 | | | | 4.94 | |
| VY® Invesco Equity and Income Portfolio | | | | | | | | | | | | | | | | | | |
| Class ADV | | $ | 1,000.00 | | | $ | 1,024.50 | | | | 1.14 | % | | $ | 5.82 | | | $ | 1,000.00 | | | $ | 1,019.46 | | | | 1.14 | % | | $ | 5.80 | |
| Class I | | | 1,000.00 | | | | 1,026.90 | | | | 0.64 | | | | 3.27 | | | | 1,000.00 | | | | 1,021.98 | | | | 0.64 | | | | 3.26 | |
| Class S | | | 1,000.00 | | | | 1,025.60 | | | | 0.89 | | | | 4.54 | | | | 1,000.00 | | | | 1,020.72 | | | | 0.89 | | | | 4.53 | |
| Class S2 | | | 1,000.00 | | | | 1,025.00 | | | | 1.02 | | | | 5.21 | | | | 1,000.00 | | | | 1,020.06 | | | | 1.02 | | | | 5.19 | |
| VY® JPMorgan Mid Cap Value Portfolio | | | | | | | | | | | | | | | | | | |
| Class ADV | | $ | 1,000.00 | | | $ | 1,062.50 | | | | 1.36 | % | | $ | 7.07 | | | $ | 1,000.00 | | | $ | 1,018.35 | | | | 1.36 | % | | $ | 6.92 | |
| Class I | | | 1,000.00 | | | | 1,065.00 | | | | 0.86 | | | | 4.48 | | | | 1,000.00 | | | | 1,020.87 | | | | 0.86 | | | | 4.38 | |
| Class S | | | 1,000.00 | | | | 1,063.80 | | | | 1.11 | | | | 5.77 | | | | 1,000.00 | | | | 1,019.61 | | | | 1.11 | | | | 5.65 | |
| Class S2 | | | 1,000.00 | | | | 1,062.70 | | | | 1.26 | | | | 6.55 | | | | 1,000.00 | | | | 1,018.85 | | | | 1.26 | | | | 6.41 | |
| VY® Oppenheimer Global Portfolio | | | | | | | | | | | | | | | | | | |
| Class ADV | | $ | 1,000.00 | | | $ | 975.30 | | | | 1.25 | % | | $ | 6.22 | | | $ | 1,000.00 | | | $ | 1,018.90 | | | | 1.25 | % | | $ | 6.36 | |
| Class I | | | 1,000.00 | | | | 977.20 | | | | 0.75 | | | | 3.74 | | | | 1,000.00 | | | | 1,021.42 | | | | 0.75 | | | | 3.82 | |
| Class S | | | 1,000.00 | | | | 976.20 | | | | 1.00 | | | | 4.98 | | | | 1,000.00 | | | | 1,020.16 | | | | 1.00 | | | | 5.09 | |
| Class S2 | | | 1,000.00 | | | | 975.20 | | | | 1.15 | | | | 5.73 | | | | 1,000.00 | | | | 1,019.41 | | | | 1.15 | | | | 5.85 | |
| VY® Pioneer High Yield Portfolio | | | | | | | | | | | | | | | | | | |
| Class I | | $ | 1,000.00 | | | $ | 948.40 | | | | 0.71 | % | | $ | 3.49 | | | $ | 1,000.00 | | | $ | 1,021.63 | | | | 0.71 | % | | $ | 3.62 | |
| Class S | | | 1,000.00 | | | | 947.10 | | | | 0.96 | | | | 4.71 | | | | 1,000.00 | | | | 1,020.37 | | | | 0.96 | | | | 4.89 | |
| VY® T. Rowe Price Diversified Mid Cap Growth Portfolio | | | | | | | | | | | | | | | | | | |
| Class ADV | | $ | 1,000.00 | | | $ | 1,064.90 | | | | 1.27 | % | | $ | 6.61 | | | $ | 1,000.00 | | | $ | 1,018.80 | | | | 1.27 | % | | $ | 6.46 | |
| Class I | | | 1,000.00 | | | | 1,068.00 | | | | 0.77 | | | | 4.01 | | | | 1,000.00 | | | | 1,021.32 | | | | 0.77 | | | | 3.92 | |
| Class S | | | 1,000.00 | | | | 1,067.10 | | | | 1.02 | | | | 5.31 | | | | 1,000.00 | | | | 1,020.06 | | | | 1.02 | | | | 5.19 | |
| Class S2 | | | 1,000.00 | | | | 1,065.80 | | | | 1.17 | | | | 6.09 | | | | 1,000.00 | | | | 1,019.31 | | | | 1.17 | | | | 5.96 | |
| VY® T. Rowe Price Growth Equity Portfolio | | | | | | | | | | | | | | | | | | |
| Class ADV | | $ | 1,000.00 | | | $ | 1,056.70 | | | | 1.23 | % | | $ | 6.38 | | | $ | 1,000.00 | | | $ | 1,019.00 | | | | 1.23 | % | | $ | 6.26 | |
| Class I | | | 1,000.00 | | | | 1,059.30 | | | | 0.73 | | | | 3.79 | | | | 1,000.00 | | | | 1,021.53 | | | | 0.73 | | | | 3.72 | |
| Class S | | | 1,000.00 | | | | 1,058.00 | | | | 0.98 | | | | 5.08 | | | | 1,000.00 | | | | 1,020.27 | | | | 0.98 | | | | 4.99 | |
| Class S2 | | | 1,000.00 | | | | 1,057.20 | | | | 1.13 | | | | 5.86 | | | | 1,000.00 | | | | 1,019.51 | | | | 1.13 | | | | 5.75 | |
| VY® Templeton Foreign Equity Portfolio | | | | | | | | | | | | | | | | | | |
| Class ADV | | $ | 1,000.00 | | | $ | 895.60 | | | | 1.42 | % | | $ | 6.78 | | | $ | 1,000.00 | | | $ | 1,018.05 | | | | 1.42 | % | | $ | 7.22 | |
| Class I | | | 1,000.00 | | | | 897.40 | | | | 0.92 | | | | 4.40 | | | | 1,000.00 | | | | 1,020.57 | | | | 0.92 | | | | 4.69 | |
| Class S | | �� | 1,000.00 | | | | 896.40 | | | | 1.17 | | | | 5.59 | | | | 1,000.00 | | | | 1,019.31 | | | | 1.17 | | | | 5.96 | |
| Class S2 | | | 1,000.00 | | | | 895.80 | | | | 1.32 | | | | 6.31 | | | | 1,000.00 | | | | 1,018.55 | | | | 1.32 | | | | 6.72 | |
_____________
| * | Expenses are equal to each Portfolio’s respective annualized expense ratios multiplied by the average account value over the period, multiplied by 184/365 to reflect the most recent fiscal half-year. |
Report of Independent Registered Public Accounting Firm
The Shareholders and Board of Directors
Voya Partners, Inc.
We have audited the accompanying statements of assets and liabilities, including the summary portfolios of investments, of Voya Aggregate Bond Portfolio (formerly, VY® PIMCO Bond Portfolio), Voya Global Bond Portfolio, VY® American Century Small-Mid Cap Value Portfolio, VY® Baron Growth Portfolio, VY® Columbia Contrarian Core Portfolio, VY® Columbia Small Cap Value II Portfolio, VY® Invesco Comstock Portfolio, VY® Invesco Equity and Income Portfolio, VY® JPMorgan Mid Cap Value Portfolio, VY® Oppenheimer Global Portfolio, VY® Pioneer High Yield Portfolio, VY® T. Rowe Price Diversified Mid Cap Growth Portfolio, VY® T. Rowe Price Growth Equity Portfolio, VY® Templeton Foreign Equity Portfolio, each a series of Voya Partners, Inc., as of December 31, 2014, and the related statements of operations for the year then ended, the statements of changes in net assets for each of the years in the two year period then ended, and the financial highlights for each of the years in the five year period then ended. These financial statements and financial highlights are the responsibility of management. Our responsibility is to express an opinion on these financial statements and financial highlights based on our audits.
We conducted our audits in accordance with the standards of the Public Company Accounting Oversight Board (United States). Those standards require that we plan and perform the audit to obtain reasonable assurance about whether the financial statements and financial highlights are free of material misstatement. An audit includes examining, on a test basis, evidence supporting the amounts and disclosures in the financial statements. Our procedures included confirmation of securities owned as of December 31, 2014, by correspondence with custodian, transfer agent, and brokers, or by other appropriate auditing procedures when replies from brokers were not received. An audit also includes assessing the accounting principles used and significant estimates made by management, as well as evaluating the overall financial statement presentation. We believe that our audits provide a reasonable basis for our opinion.
In our opinion, the financial statements and financial highlights referred to above present fairly, in all material respects, the financial position of the aforementioned funds of Voya Partners, Inc. as of December 31, 2014, the results of their operations for the year then ended, the changes in their net assets for each of the years in the two year period then ended, and the financial highlights for each of the years in the five year period then ended, in conformity with U.S. generally accepted accounting principles.

Boston, Massachusetts
February 24, 2015
Statements of Assets and Liabilities as of December 31, 2014
| | | Voya Aggregate
Bond Portfolio | | | Voya Global Bond
Portfolio | | | VY® American
Century Small-Mid
Cap Value
Portfolio | | | VY® Baron
Growth Portfolio | |
| ASSETS: | | | | | | | | | | | | | | | | |
| Investments in securities at fair value+* | | $ | 739,095,595 | | | $ | 214,669,346 | | | $ | 316,644,696 | | | $ | 1,056,511,901 | |
| Investments in affiliates at fair value** | | | — | | | | 93,820,270 | | | | — | | | | — | |
| Short-term investments at fair value*** | | | 89,576,813 | | | | 7,271,494 | | | | 7,526,485 | | | | 9,894,651 | |
| Total investments at fair value | | $ | 828,672,408 | | | $ | 315,761,110 | | | $ | 324,171,181 | | | $ | 1,066,406,552 | |
| Short-term investments at amortized cost | | | 4,398,266 | | | | — | | | | — | | | | — | |
| Cash | | | 4,787,383 | | | | — | | | | 89,527 | | | | 17 | |
| Cash collateral for futures | | | 350,889 | | | | 1,751,113 | | | | — | | | | — | |
| Cash pledged for centrally cleared swaps (Note 2) | | | — | | | | 3,435,000 | | | | — | | | | — | |
| Cash pledged as collateral for OTC derivatives (Note 2) | | | — | | | | 1,510,000 | | | | — | | | | — | |
| Foreign currencies at value**** | | | — | | | | 70,643 | | | | — | | | | 550 | |
| Foreign cash collateral for futures***** | | | — | | | | 331,425 | | | | — | | | | — | |
| Receivables: | | | | | | | | | | | | | | | | |
| Investment securities sold | | | 9,767,901 | | | | 7,979 | | | | 1,010,757 | | | | 401,217 | |
| Investment securities sold on a delayed-delivery or when-issued basis | | | 109,115,625 | | | | 11,053,325 | | | | — | | | | — | |
| Fund shares sold | | | 203,214 | | | | 323,876 | | | | 180,850 | | | | 8,071 | |
| Dividends | | | 2,443 | | | | 278 | | | | 695,592 | | | | 635,880 | |
| Interest | | | 4,397,936 | | | | 1,716,810 | | | | — | | | | — | |
| Foreign tax reclaims | | | 336 | | | | — | | | | 5,279 | | | | 3,839 | |
| Unrealized appreciation on forward foreign currency contracts | | | 4,236,323 | | | | 5,330,482 | | | | 39,019 | | | | — | |
| Prepaid expenses | | | 7,356 | | | | 2,487 | | | | 2,423 | | | | 8,302 | |
| Reimbursement due from manager | | | 20,000 | | | | 19,978 | | | | 39,116 | | | | — | |
| Other assets | | | 16,703 | | | | 8,681 | | | | 3,631 | | | | 14,423 | |
| Total assets | | | 965,976,783 | | | | 341,323,187 | | | | 326,237,375 | | | | 1,067,478,851 | |
| | | | | | | | | | | | | | | | | |
| LIABILITIES: | | | | | | | | | | | | | | | | |
| Payable for investment securities purchased | | | 10,761,256 | | | | 1,496,628 | | | | 1,168,981 | | | | 469,829 | |
| Payable for investment securities purchased on a delayed-delivery or when-issued basis | | | 169,244,140 | | | | 36,717,262 | | | | — | | | | — | |
| Payable for fund shares redeemed | | | 217,748 | | | | 195,744 | | | | 1,110,271 | | | | 1,806,906 | |
| Payable upon receipt of securities loaned | | | 6,902,927 | | | | 969,494 | | | | 1,065,023 | | | | — | |
| Unrealized depreciation on forward foreign currency contracts | | | 2,570,911 | | | | 8,502,571 | | | | 2,030 | | | | — | |
| Variation margin payable on centrally cleared swaps | | | — | | | | 142,111 | | | | — | | | | — | |
| Cash received as collateral for OTC derivatives (Note 2) | | | 1,880,000 | | | | 570,000 | | | | — | | | | — | |
| Payable for investment management fees | | | 314,256 | | | | 124,907 | | | | 268,997 | | | | 762,787 | |
| Payable for administrative fees | | | 70,395 | | | | 24,981 | | | | 27,198 | | | | 89,884 | |
| Payable for distribution and shareholder service fees | | | 143,754 | | | | 24,856 | | | | 57,591 | | | | 196,046 | |
| Payable to custodian due to bank overdraft | | | — | | | | 48,647 | | | | — | | | | — | |
| Payable to trustees under the deferred compensation plan (Note 6) | | | 16,703 | | | | 8,681 | | | | 3,631 | | | | 14,423 | |
| Payable for trustee fees | | | 5,006 | | | | 1,592 | | | | 1,774 | | | | 5,491 | |
| Other accrued expenses and liabilities | | | 189,552 | | | | 93,539 | | | | 62,217 | | | | 122,633 | |
| Written options, at fair value^ | | | — | | | | 463,831 | | | | — | | | | — | |
| Total liabilities | | | 192,316,648 | | | | 49,384,844 | | | | 3,767,713 | | | | 3,467,999 | |
| NET ASSETS | | $ | 773,660,135 | | | $ | 291,938,343 | | | $ | 322,469,662 | | | $ | 1,064,010,852 | |
| | | | | | | | | | | | | | | | | |
| NET ASSETS WERE COMPRISED OF: | | | | | | | | | | | | | | | | |
| Paid-in capital | | $ | 717,182,060 | | | $ | 303,845,015 | | | $ | 230,082,688 | | | $ | 431,934,999 | |
| Undistributed net investment income | | | 18,031,866 | | | | 2,772,329 | | | | 4,778,941 | | | | 2,927,220 | |
| Accumulated net realized gain (loss) | | | 22,409,729 | | | | (949,584 | ) | | | 54,117,691 | | | | 72,071,191 | |
| Net unrealized appreciation (depreciation) | | | 16,036,480 | | | | (13,729,417 | ) | | | 33,490,342 | | | | 557,077,442 | |
| NET ASSETS | | $ | 773,660,135 | | | $ | 291,938,343 | | | $ | 322,469,662 | | | $ | 1,064,010,852 | |
| | | | | | | | | | | | | | | | | |
| __________________ | | | | | | | | | | | | | | | | |
| + | Including securities loaned at value | | $ | 6,753,454 | | | $ | 917,587 | | | $ | 1,038,449 | | | $ | — | |
| * | Cost of investments in securities | | $ | 724,833,704 | | | $ | 214,338,503 | | | $ | 283,190,285 | | | $ | 499,434,385 | |
| ** | Cost of investments in affiliates | | $ | — | | | $ | 105,300,083 | | | $ | — | | | $ | — | |
| *** | Cost of short-term investments | | $ | 89,577,761 | | | $ | 7,271,494 | | | $ | 7,526,485 | | | $ | 9,894,651 | |
| **** | Cost of foreign currencies | | $ | — | | | $ | 90,762 | | | $ | — | | | $ | 550 | |
| ***** | Cost of foreign cash collateral for futures | | $ | — | | | $ | 331,425 | | | $ | — | | | $ | — | |
| ^ | Premiums received on written options | | $ | — | | | $ | 483,169 | | | $ | — | | | $ | — | |
See Accompanying Notes to Financial Statements
Statements of Assets and Liabilities as of December 31, 2014 (continued)
| | | Voya Aggregate
Bond Portfolio | | | Voya Global Bond
Portfolio | | | VY® American
Century Small-Mid
Cap Value
Portfolio | | | VY® Baron
Growth Portfolio | |
| Class ADV | | | | | | | | | | | | | | | | |
| Net assets | | $ | 172,484,117 | | | $ | 32,874,291 | | | $ | 86,335,218 | | | $ | 111,145,417 | |
| Shares authorized | | | 100,000,000 | | | | 100,000,000 | | | | 100,000,000 | | | | 100,000,000 | |
| Par value | | $ | 0.001 | | | $ | 0.001 | | | $ | 0.001 | | | $ | 0.001 | |
| Shares outstanding | | | 14,814,072 | | | | 3,188,655 | | | | 6,244,979 | | | | 3,662,299 | |
| Net asset value and redemption price per share | | $ | 11.64 | | | $ | 10.31 | | | $ | 13.82 | | | $ | 30.35 | |
| Class I | | | | | | | | | | | | | | | | |
| Net assets | | $ | 274,514,773 | | | $ | 208,023,036 | | | $ | 138,604,728 | | | $ | 251,229,521 | |
| Shares authorized | | | 100,000,000 | | | | 100,000,000 | | | | 100,000,000 | | | | 100,000,000 | |
| Par value | | $ | 0.001 | | | $ | 0.001 | | | $ | 0.001 | | | $ | 0.001 | |
| Shares outstanding | | | 22,946,228 | | | | 19,960,325 | | | | 9,625,124 | | | | 7,774,477 | |
| Net asset value and redemption price per share | | $ | 11.96 | | | $ | 10.42 | | | $ | 14.40 | | | $ | 32.31 | |
| Class S | | | | | | | | | | | | | | | | |
| Net assets | | $ | 324,390,437 | | | $ | 51,041,016 | | | $ | 94,268,175 | | | $ | 694,762,168 | |
| Shares authorized | | | 100,000,000 | | | | 100,000,000 | | | | 100,000,000 | | | | 100,000,000 | |
| Par value | | $ | 0.001 | | | $ | 0.001 | | | $ | 0.001 | | | $ | 0.001 | |
| Shares outstanding | | | 27,382,463 | | | | 4,887,171 | | | | 6,613,939 | | | | 22,134,659 | |
| Net asset value and redemption price per share | | $ | 11.85 | | | $ | 10.44 | | | $ | 14.25 | | | $ | 31.39 | |
| Class S2 | | | | | | | | | | | | | | | | |
| Net assets | | $ | 2,270,808 | | | | n/a | | | $ | 3,261,541 | | | $ | 6,873,746 | |
| Shares authorized | | | 100,000,000 | | | | n/a | | | | 100,000,000 | | | | 100,000,000 | |
| Par value | | $ | 0.001 | | | | n/a | | | $ | 0.001 | | | $ | 0.001 | |
| Shares outstanding | | | 196,278 | | | | n/a | | | | 236,508 | | | | 225,909 | |
| Net asset value and redemption price per share | | $ | 11.57 | | | | n/a | | | $ | 13.79 | | | $ | 30.43 | |
See Accompanying Notes to Financial Statements
Statements of Assets and Liabilities as of December 31, 2014
| | | VY® Columbia
Contrarian Core
Portfolio | | | VY® Columbia
Small Cap Value II
Portfolio | | | VY® Invesco
Comstock
Portfolio | | | VY® Invesco
Equity and
Income Portfolio | |
| ASSETS: | | | | | | | | | | | | | | | | |
| Investments in securities at fair value+* | | $ | 361,322,202 | | | $ | 236,966,767 | | | $ | 552,477,958 | | | $ | 2,045,426,579 | |
| Short-term investments at fair value** | | | — | | | | 7,538,843 | | | | 17,862,798 | | | | 153,684,361 | |
| Total investments at fair value | | $ | 361,322,202 | | | $ | 244,505,610 | | | $ | 570,340,756 | | | $ | 2,199,110,940 | |
| Cash | | | 2,161,082 | | | | — | | | | — | | | | 12 | |
| Foreign currencies at value*** | | | — | | | | — | | | | — | | | | 704,631 | |
| Receivables: | | | | | | | | | | | | | | | | |
| Investment securities sold | | | 4,506,439 | | | | 107,724 | | | | — | | | | 5,053,445 | |
| Fund shares sold | | | 69 | | | | 1,135,699 | | | | 9,075 | | | | 89,523 | |
| Dividends | | | 250,994 | | | | 307,125 | | | | 694,072 | | | | 2,279,318 | |
| Interest | | | 54 | | | | — | | | | — | | | | 3,172,727 | |
| Foreign tax reclaims | | | 179,365 | | | | — | | | | 104,677 | | | | 316,168 | |
| Unrealized appreciation on forward foreign currency contracts | | | — | | | | — | | | | 971,596 | | | | 2,564,060 | |
| Prepaid expenses | | | 2,784 | | | | 1,867 | | | | 4,410 | | | | 16,945 | |
| Reimbursement due from manager | | | 68,458 | | | | — | | | | — | | | | 14,251 | |
| Other assets | | | 7,123 | | | | 4,525 | | | | 12,177 | | | | 23,874 | |
| Total assets | | | 368,498,570 | | | | 246,062,550 | | | | 572,136,763 | | | | 2,213,345,894 | |
| | | | | | | | | | | | | | | | | |
| LIABILITIES: | | | | | | | | | | | | | | | | |
| Payable for investment securities purchased | | | 3,510,389 | | | | 632,997 | | | | — | | | | 5,561,207 | |
| Payable for fund shares redeemed | | | 3,215,486 | | | | 150,444 | | | | 2,727,008 | | | | 3,642,807 | |
| Payable upon receipt of securities loaned | | | — | | | | — | | | | — | | | | 42,968,190 | |
| Unrealized depreciation on forward foreign currency contracts | | | — | | | | — | | | | — | | | | 84,210 | |
| Payable for investment management fees | | | 247,879 | | | | 153,794 | | | | 293,077 | | | | 951,325 | |
| Payable for administrative fees | | | 30,985 | | | | 20,506 | | | | 48,846 | | | | 184,321 | |
| Payable for distribution and shareholder service fees | | | 78,777 | | | | 47,616 | | | | 99,366 | | | | 381,925 | |
| Payable to trustees under the deferred compensation plan (Note 6) | | | 7,123 | | | | 4,525 | | | | 12,177 | | | | 23,874 | |
| Payable for trustee fees | | | 1,789 | | | | 1,097 | | | | 2,809 | | | | 8,204 | |
| Other accrued expenses and liabilities | | | 54,219 | | | | 20,005 | | | | 64,498 | | | | 229,401 | |
| Total liabilities | | | 7,146,647 | | | | 1,030,984 | | | | 3,247,781 | | | | 54,035,464 | |
| NET ASSETS | | $ | 361,351,923 | | | $ | 245,031,566 | | | $ | 568,888,982 | | | $ | 2,159,310,430 | |
| | | | | | | | | | | | | | | | | |
| NET ASSETS WERE COMPRISED OF: | | | | | | | | | | | | | | | | |
| Paid-in capital | | $ | 262,044,533 | | | $ | 210,321,910 | | | $ | 592,537,427 | | | $ | 1,840,082,474 | |
| Undistributed net investment income | | | 2,924,735 | | | | 857,988 | | | | 2,019,041 | | | | 6,410,004 | |
| Accumulated net realized gain (loss) | | | 38,195,684 | | | | (12,648,840 | ) | | | (157,813,533 | ) | | | 152,304,799 | |
| Net unrealized appreciation | | | 58,186,971 | | | | 46,500,508 | | | | 132,146,047 | | | | 160,513,153 | |
| NET ASSETS | | $ | 361,351,923 | | | $ | 245,031,566 | | | $ | 568,888,982 | | | $ | 2,159,310,430 | |
| | | | | | | | | | | | | | | | | |
| ___________________ | | | | | | | | | | | | | | | | |
| + | Including securities loaned at value | | $ | — | | | $ | — | | | $ | — | | | $ | 41,409,560 | |
| * | Cost of investments in securities | | $ | 303,121,911 | | | $ | 190,466,259 | | | $ | 421,296,158 | | | $ | 1,887,355,774 | |
| ** | Cost of short-term investments | | $ | — | | | $ | 7,538,843 | | | $ | 17,862,798 | | | $ | 153,684,361 | |
| *** | Cost of foreign currencies | | $ | — | | | $ | — | | | $ | — | | | $ | 710,448 | |
See Accompanying Notes to Financial Statements
Statements of Assets and Liabilities as of December 31, 2014 (continued)
| | | VY® Columbia
Contrarian Core
Portfolio | | | VY® Columbia
Small Cap Value II
Portfolio | | | VY® Invesco
Comstock
Portfolio | | | VY® Invesco
Equity and
Income Portfolio | |
| Class ADV | | | | | | | | | | | | | | | | |
| Net assets | | $ | 17,942,376 | | | $ | 30,926,642 | | | $ | 41,258,444 | | | $ | 52,407,006 | |
| Shares authorized | | | 100,000,000 | | | | 100,000,000 | | | | 100,000,000 | | | | 100,000,000 | |
| Par value | | $ | 0.001 | | | $ | 0.001 | | | $ | 0.001 | | | $ | 0.001 | |
| Shares outstanding | | | 747,480 | | | | 1,905,626 | | | | 2,512,632 | | | | 1,133,235 | |
| Net asset value and redemption price per share | | $ | 24.00 | | | $ | 16.23 | | | $ | 16.42 | | | $ | 46.25 | |
| Class I | | | | | | | | | | | | | | | | |
| Net assets | | $ | 11,751,021 | | | $ | 49,412,362 | | | $ | 143,633,365 | | | $ | 694,569,226 | |
| Shares authorized | | | 100,000,000 | | | | 100,000,000 | | | | 100,000,000 | | | | 100,000,000 | |
| Par value | | $ | 0.001 | | | $ | 0.001 | | | $ | 0.001 | | | $ | 0.001 | |
| Shares outstanding | | | 473,444 | | | | 2,964,659 | | | | 8,680,117 | | | | 14,799,580 | |
| Net asset value and redemption price per share | | $ | 24.82 | | | $ | 16.67 | | | $ | 16.55 | | | $ | 46.93 | |
| Class S | | | | | | | | | | | | | | | | |
| Net assets | | $ | 331,658,526 | | | $ | 160,725,808 | | | $ | 383,997,173 | | | $ | 889,726,281 | |
| Shares authorized | | | 100,000,000 | | | | 100,000,000 | | | | 100,000,000 | | | | 100,000,000 | |
| Par value | | $ | 0.001 | | | $ | 0.001 | | | $ | 0.001 | | | $ | 0.001 | |
| Shares outstanding | | | 13,566,699 | | | | 9,692,052 | | | | 23,226,848 | | | | 19,096,767 | |
| Net asset value and redemption price per share | | $ | 24.45 | | | $ | 16.58 | | | $ | 16.53 | | | $ | 46.59 | |
| Class S2 | | | | | | | | | | | | | | | | |
| Net assets | | | n/a | | | $ | 3,966,754 | | | | n/a | | | $ | 522,607,917 | |
| Shares authorized | | | n/a | | | | 100,000,000 | | | | n/a | | | | 100,000,000 | |
| Par value | | | n/a | | | $ | 0.001 | | | | n/a | | | $ | 0.001 | |
| Shares outstanding | | | n/a | | | | 244,930 | | | | n/a | | | | 11,353,785 | |
| Net asset value and redemption price per share | | | n/a | | | $ | 16.20 | | | | n/a | | | $ | 46.03 | |
See Accompanying Notes to Financial Statements
Statements of Assets and Liabilities as of December 31, 2014
| | | VY® JPMorgan
Mid Cap Value
Portfolio | | | VY® Oppenheimer
Global Portfolio | | | VY® Pioneer High
Yield Portfolio | | | VY® T. Rowe
Price Diversified
Mid Cap Growth
Portfolio | |
| ASSETS: | | | | | | | | | | | | | | | | |
| Investments in securities at fair value+* | | $ | 706,285,185 | | | $ | 1,638,859,958 | | | $ | 117,217,383 | | | $ | 859,806,429 | |
| Short-term investments at fair value** | | | 16,532,807 | | | | 58,435,520 | | | | 3,166,436 | | | | 24,827,894 | |
| Total investments at fair value | | $ | 722,817,992 | | | $ | 1,697,295,478 | | | $ | 120,383,819 | | | $ | 884,634,323 | |
| Cash | | | 474,886 | | | | 31 | | | | 19,136 | | | | 445,950 | |
| Foreign currencies at value*** | | | — | | | | 645,061 | | | | — | | | | — | |
| Receivables: | | | | | | | | | | | | | | | | |
| Investment securities sold | | | — | | | | 422,819 | | | | 98,723 | | | | 854,723 | |
| Fund shares sold | | | 318,516 | | | | 1,519,968 | | | | 125,453 | | | | 10,750 | |
| Dividends | | | 926,260 | | | | 747,761 | | | | 43,847 | | | | 289,553 | |
| Interest | | | — | | | | — | | | | 1,442,366 | | | | — | |
| Foreign tax reclaims | | | — | | | | 999,626 | | | | — | | | | — | |
| Prepaid expenses | | | 5,428 | | | | 13,392 | | | | 1,016 | | | | 6,519 | |
| Reimbursement due from manager | | | — | | | | — | | | | 4,891 | | | | — | |
| Other assets | | | 7,227 | | | | 38,911 | | | | 3,248 | | | | 17,164 | |
| Total assets | | | 724,550,309 | | | | 1,701,683,047 | | | | 122,122,499 | | | | 886,258,982 | |
| | | | | | | | | | | | | | | | | |
| LIABILITIES: | | | | | | | | | | | | | | | | |
| Payable for fund shares redeemed | | | 1,990,902 | | | | 19,681,273 | | | | 1,693 | | | | 1,239,496 | |
| Payable upon receipt of securities loaned | | | — | | | | 38,615,276 | | | | — | | | | 23,825,925 | |
| Payable for investment management fees | | | 439,282 | | | | 861,762 | | | | 62,027 | | | | 467,627 | |
| Payable for administrative fees | | | 61,048 | | | | 143,625 | | | | 10,338 | | | | 73,066 | |
| Payable for distribution and shareholder service fees | | | 115,297 | | | | 92,251 | | | | 927 | | | | 20,143 | |
| Payable to trustees under the deferred compensation plan (Note 6) | | | 7,227 | | | | 38,911 | | | | 3,248 | | | | 17,164 | |
| Payable for trustee fees | | | 3,563 | | | | 8,859 | | | | 646 | | | | 4,229 | |
| Other accrued expenses and liabilities | | | 70,661 | | | | 283,012 | | | | 14,909 | | | | 95,432 | |
| Total liabilities | | | 2,687,980 | | | | 59,724,969 | | | | 93,788 | | | | 25,743,082 | |
| NET ASSETS | | $ | 721,862,329 | | | $ | 1,641,958,078 | | | $ | 122,028,711 | | | $ | 860,515,900 | |
| | | | | | | | | | | | | | | | | |
| NET ASSETS WERE COMPRISED OF: | | | | | | | | | | | | | | | | |
| Paid-in capital | | $ | 435,873,571 | | | $ | 889,311,275 | | | $ | 132,678,283 | | | $ | 438,617,003 | |
| Undistributed (distributions in excess of) net investment income | | | 236,493 | | | | 23,404,553 | | | | 3,169,121 | | | | (18,084 | ) |
| Accumulated net realized gain (loss) | | | 93,623,334 | | | | 113,746,594 | | | | (13,364,641 | ) | | | 129,796,718 | |
| Net unrealized appreciation (depreciation) | | | 192,128,931 | | | | 615,495,656 | | | | (454,052 | ) | | | 292,120,263 | |
| NET ASSETS | | $ | 721,862,329 | | | $ | 1,641,958,078 | | | $ | 122,028,711 | | | $ | 860,515,900 | |
| | | | | | | | | | | | | | | | | |
| ________________ | | | | | | | | | | | | | | | | |
| + | Including securities loaned at value | | $ | — | | | $ | 36,683,367 | | | $ | — | | | $ | 23,313,781 | |
| * | Cost of investments in securities | | $ | 514,156,254 | | | $ | 1,023,269,196 | | | $ | 117,671,435 | | | $ | 567,686,166 | |
| ** | Cost of short-term investments | | $ | 16,532,807 | | | $ | 58,435,520 | | | $ | 3,166,436 | | | $ | 24,827,894 | |
| *** | Cost of foreign currencies | | $ | — | | | $ | 642,268 | | | $ | — | | | $ | — | |
See Accompanying Notes to Financial Statements
| Statements of Assets and Liabilities as of December 31, 2014 (continued) |
| | | VY® JPMorgan
Mid Cap Value
Portfolio | | | VY® Oppenheimer
Global Portfolio | | | VY® Pioneer High
Yield Portfolio | | | VY® T. Rowe
Price Diversified
Mid Cap Growth
Portfolio | |
| Class ADV | | | | | | | | | | | | | | | | |
| Net assets | | $ | 91,446,484 | | | $ | 101,076,803 | | | | n/a | | | $ | 29,355,605 | |
| Shares authorized | | | 100,000,000 | | | | 100,000,000 | | | | n/a | | | | 100,000,000 | |
| Par value | | $ | 0.001 | | | $ | 0.001 | | | | n/a | | | $ | 0.001 | |
| Shares outstanding | | | 4,069,057 | | | | 5,552,109 | | | | n/a | | | | 2,567,948 | |
| Net asset value and redemption price per share | | $ | 22.47 | | | $ | 18.21 | | | | n/a | | | $ | 11.43 | |
| Class I | | | | | | | | | | | | | | | | |
| Net assets | | $ | 272,496,175 | | | $ | 1,320,670,510 | | | $ | 117,617,179 | | | $ | 796,856,223 | |
| Shares authorized | | | 100,000,000 | | | | 250,000,000 | | | | 100,000,000 | | | | 250,000,000 | |
| Par value | | $ | 0.001 | | | $ | 0.001 | | | $ | 0.001 | | | $ | 0.001 | |
| Shares outstanding | | | 11,923,179 | | | | 70,092,457 | | | | 9,905,462 | | | | 65,666,968 | |
| Net asset value and redemption price per share | | $ | 22.85 | | | $ | 18.84 | | | $ | 11.87 | | | $ | 12.13 | |
| Class S | | | | | | | | | | | | | | | | |
| Net assets | | $ | 352,276,682 | | | $ | 215,383,451 | | | $ | 4,411,532 | | | $ | 30,411,561 | |
| Shares authorized | | | 100,000,000 | | | | 100,000,000 | | | | 100,000,000 | | | | 100,000,000 | |
| Par value | | $ | 0.001 | | | $ | 0.001 | | | $ | 0.001 | | | $ | 0.001 | |
| Shares outstanding | | | 15,516,436 | | | | 11,784,678 | | | | 371,946 | | | | 2,562,298 | |
| Net asset value and redemption price per share | | $ | 22.70 | | | $ | 18.28 | | | $ | 11.86 | | | $ | 11.87 | |
| Class S2 | | | | | | | | | | | | | | | | |
| Net assets | | $ | 5,642,988 | | | $ | 4,827,314 | | | | n/a | | | $ | 3,892,511 | |
| Shares authorized | | | 100,000,000 | | | | 100,000,000 | | | | n/a | | | | 100,000,000 | |
| Par value | | $ | 0.001 | | | $ | 0.001 | | | | n/a | | | $ | 0.001 | |
| Shares outstanding | | | 251,869 | | | | 269,950 | | | | n/a | | | | 340,217 | |
| Net asset value and redemption price per share | | $ | 22.40 | | | $ | 17.88 | | | | n/a | | | $ | 11.44 | |
See Accompanying Notes to Financial Statements
| Statements of Assets and Liabilities as of December 31, 2014 |
| | | VY® T. Rowe Price
Growth Equity Portfolio | | | VY® Templeton Foreign
Equity Portfolio | |
| ASSETS: | | | | | | | | |
| Investments in securities at fair value+* | | $ | 1,574,277,822 | | | $ | 809,751,122 | |
| Short-term investments at fair value** | | | 31,280,170 | | | | 1,052,722 | |
| Total investments at fair value | | $ | 1,605,557,992 | | | $ | 810,803,844 | |
| Cash | | | 2,152,496 | | | | 11,035,346 | |
| Foreign currencies at value*** | | | 30,521 | | | | — | |
| Receivables: | | | | | | | | |
| Investment securities sold | | | 2,845,668 | | | | 4,284,122 | |
| Fund shares sold | | | 222,269 | | | | 16,084,005 | |
| Dividends | | | 588,121 | | | | 1,674,514 | |
| Interest | | | 19 | | | | 23 | |
| Foreign tax reclaims | | | 62,921 | | | | 1,485,780 | |
| Prepaid expenses | | | 12,373 | | | | 6,976 | |
| Reimbursement due from manager | | | — | | | | 7,191 | |
| Other assets | | | 25,281 | | | | 39,575 | |
| Total assets | | | 1,611,497,661 | | | | 845,421,376 | |
| | | | | | | | | |
| LIABILITIES: | | | | | | | | |
| Payable for investment securities purchased | | | 6,403,376 | | | | 1,109 | |
| Payable for fund shares redeemed | | | 17,712,606 | | | | 96,210 | |
| Payable upon receipt of securities loaned | | | 11,554,092 | | | | 1,052,722 | |
| Payable for investment management fees | | | 803,133 | | | | 558,709 | |
| Payable for administrative fees | | | 135,893 | | | | 71,663 | |
| Payable for distribution and shareholder service fees | | | 151,639 | | | | 141,545 | |
| Payable to trustees under the deferred compensation plan (Note 6) | | | 25,281 | | | | 39,575 | |
| Payable for trustee fees | | | 7,921 | | | | 4,740 | |
| Other accrued expenses and liabilities | | | 173,899 | | | | 233,362 | |
| Total liabilities | | | 36,967,840 | | | | 2,199,635 | |
| NET ASSETS | | $ | 1,574,529,821 | | | $ | 843,221,741 | |
| | | | | | | | | |
| NET ASSETS WERE COMPRISED OF: | | | | | | | | |
| Paid-in capital | | $ | 835,811,812 | | | $ | 859,681,633 | |
| Undistributed (distributions in excess of) net investment income | | | (26,371 | ) | | | 30,257,712 | |
| Accumulated net realized gain (loss) | | | 238,168,876 | | | | (185,383,634 | ) |
| Net unrealized appreciation | | | 500,575,504 | | | | 138,666,030 | |
| NET ASSETS | | $ | 1,574,529,821 | | | $ | 843,221,741 | |
| | | | | | | | | |
| _______________ | | | | | | | | |
| + | Including securities loaned at value | | $ | 11,303,310 | | | $ | 971,125 | |
| * | Cost of investments in securities | | $ | 1,073,695,761 | | | $ | 670,931,669 | |
| ** | Cost of short-term investments | | $ | 31,280,170 | | | $ | 1,052,722 | |
| *** | Cost of foreign currencies | | $ | 31,052 | | | $ | — | |
See Accompanying Notes to Financial Statements
| Statements of Assets and Liabilities as of December 31, 2014 (continued) |
| | | VY® T. Rowe Price
Growth Equity Portfolio | | | VY® Templeton Foreign
Equity Portfolio | |
| Class ADV | | | | | | | | |
| Net assets | | $ | 171,971,144 | | | $ | 40,972,938 | |
| Shares authorized | | | 100,000,000 | | | | 100,000,000 | |
| Par value | | $ | 0.001 | | | $ | 0.001 | |
| Shares outstanding | | | 1,987,300 | | | | 3,441,422 | |
| Net asset value and redemption price per share | | $ | 86.54 | | | $ | 11.91 | |
| Class I | | | | | | | | |
| Net assets | | $ | 1,036,976,160 | | | $ | 215,837,791 | |
| Shares authorized | | | 100,000,000 | | | | 100,000,000 | |
| Par value | | $ | 0.001 | | | $ | 0.001 | |
| Shares outstanding | | | 11,503,017 | | | | 17,926,360 | |
| Net asset value and redemption price per share | | $ | 90.15 | | | $ | 12.04 | |
| Class S | | | | | | | | |
| Net assets | | $ | 360,966,242 | | | $ | 584,346,177 | |
| Shares authorized | | | 100,000,000 | | | | 100,000,000 | |
| Par value | | $ | 0.001 | | | $ | 0.001 | |
| Shares outstanding | | | 4,086,656 | | | | 48,890,121 | |
| Net asset value and redemption price per share | | $ | 88.33 | | | $ | 11.95 | |
| Class S2 | | | | | | | | |
| Net assets | | $ | 4,616,275 | | | $ | 2,064,835 | |
| Shares authorized | | | 100,000,000 | | | | 100,000,000 | |
| Par value | | $ | 0.001 | | | $ | 0.001 | |
| Shares outstanding | | | 53,031 | | | | 173,542 | |
| Net asset value and redemption price per share | | $ | 87.05 | | | $ | 11.90 | |
See Accompanying Notes to Financial Statements
| Statements of Operations For the Year ended December 31, 2014 |
| | | Voya Aggregate
Bond Portfolio | | | Voya Global
Bond
Portfolio | | | VY® American
Century Small-Mid
Cap Value
Portfolio | | | VY® Baron
Growth Portfolio | |
| INVESTMENT INCOME: | | | | | | | | | | | | | | | | |
| Dividends, net of foreign taxes withheld* | | $ | 257,443 | | | $ | 12,418 | | | $ | 7,639,520 | | | $ | 16,208,224 | |
| Interest, net of foreign taxes withheld* | | | 18,335,689 | | | | 9,585,278 | | | | — | | | | — | |
| Dividends from affiliated funds | | | — | | | | 4,995,836 | | | | — | | | | — | |
| Securities lending income, net | | | 17,987 | | | | 9,615 | | | | 58,574 | | | | — | |
| Total investment income | | | 18,611,119 | | | | 14,603,147 | | | | 7,698,094 | | | | 16,208,224 | |
| EXPENSES: | | | | | | | | | | | | | | | | |
| Investment management fees | | | 4,405,187 | | | | 1,591,187 | | | | 3,495,577 | | | | 9,309,897 | |
| Distribution and shareholder service fees: | | | | | | | | | | | | | | | | |
| Class ADV | | | 895,245 | | | | 173,022 | | | | 461,989 | | | | 551,681 | |
| Class S | | | 914,723 | | | | 135,589 | | | | 260,822 | | | | 1,810,936 | |
| Class S2 | | | 13,105 | | | | — | | | | 24,267 | | | | 32,399 | |
| Transfer agent fees | | | 1,648 | | | | 491 | | | | 1,099 | | | | 1,449 | |
| Administrative service fees | | | 1,001,169 | | | | 318,235 | | | | 354,793 | | | | 1,098,161 | |
| Shareholder reporting expense | | | 62,615 | | | | 49,690 | | | | 39,555 | | | | 90,570 | |
| Professional fees | | | 93,968 | | | | 32,509 | | | | 39,372 | | | | 94,194 | |
| Custody and accounting expense | | | 201,900 | | | | 74,116 | | | | 125,141 | | | | 124,784 | |
| Trustee fees | | | 30,035 | | | | 9,547 | | | | 10,644 | | | | 32,945 | |
| Information statement costs (Note 6) | | | 20,000 | | | | — | | | | — | | | | — | |
| Miscellaneous expense | | | 33,822 | | | | 9,019 | | | | 16,835 | | | | 38,189 | |
| Interest expense | | | 1,003 | | | | 980 | | | | 933 | | | | 5,874 | |
| Total expenses | | | 7,674,420 | | | | 2,394,385 | | | | 4,831,027 | | | | 13,191,079 | |
| Net waived and reimbursed fees | | | (54,104 | ) | | | (180,814 | ) | | | (1,044,740 | ) | | | (6,480 | ) |
| Brokerage commission recapture | | | — | | | | — | | | | — | | | | (5,251 | ) |
| Net expenses | | | 7,620,316 | | | | 2,213,571 | | | | 3,786,287 | | | | 13,179,348 | |
| Net investment income | | | 10,990,803 | | | | 12,389,576 | | | | 3,911,807 | | | | 3,028,876 | |
| REALIZED AND UNREALIZED GAIN (LOSS): | | | | | | | | | | | | | | | | |
| Net realized gain (loss) on: | | | | | | | | | | | | | | | | |
| Investments | | | (6,781,099 | ) | | | 2,789,941 | | | | 57,927,532 | | | | 73,240,625 | |
| Foreign currency related transactions | | | 16,587,092 | | | | (10,784,275 | ) | | | 824,273 | | | | (78,756 | ) |
| Futures | | | 13,147,604 | | | | 88,616 | | | | (814,399 | ) | | | — | |
| Swaps | | | (602,426 | ) | | | (88,791 | ) | | | — | | | | — | |
| Sale of affiliated underlying funds | | | — | | | | (338,053 | ) | | | — | | | | — | |
| Written options | | | 4,009,518 | | | | 1,119,336 | | | | — | | | | — | |
| Net realized gain (loss) | | | 26,360,689 | | | | (7,213,226 | ) | | | 57,937,406 | | | | 73,161,869 | |
| Net change in unrealized appreciation (depreciation) on: | | | | | | | | | | | | | | | | |
| Investments | | | 14,426,300 | | | | 1,058,201 | | | | (19,276,786 | ) | | | (34,166,347 | ) |
| Affiliated underlying funds | | | — | | | | (2,450,458 | ) | | | — | | | | — | |
| Foreign currency related transactions | | | 3,457,267 | | | | (2,451,925 | ) | | | 103,610 | | | | 30,241 | |
| Futures | | | 2,105,778 | | | | 274,600 | | | | — | | | | — | |
| Swaps | | | (6,732,487 | ) | | | 373,376 | | | | — | | | | — | |
| Written options | | | (293,032 | ) | | | 19,338 | | | | — | | | | — | |
| Sales commitments | | | (8,438 | ) | | | — | | | | — | | | | — | |
| Net change in unrealized appreciation (depreciation) | | | 12,955,388 | | | | (3,176,868 | ) | | | (19,173,176 | ) | | | (34,136,106 | ) |
| Net realized and unrealized gain (loss) | | | 39,316,077 | | | | (10,390,094 | ) | | | 38,764,230 | | | | 39,025,763 | |
| Increase in net assets resulting from operations | | $ | 50,306,880 | | | $ | 1,999,482 | | | $ | 42,676,037 | | | $ | 42,054,639 | |
| _____________ | | | | | | | | | | | | | | | | |
| * Foreign taxes withheld | | $ | 345 | | | $ | — | | | $ | 26,558 | | | $ | 68,178 | |
See Accompanying Notes to Financial Statements
| Statements of Operations For the Year ended December 31, 2014 |
| | | VY® Columbia
Contrarian Core
Portfolio | | | VY® Columbia
Small Cap Value II
Portfolio | | | VY® Invesco
Comstock Portfolio | | | VY® Invesco
Equity and
Income Portfolio | |
| INVESTMENT INCOME: | | | | | | | | | | | | | | | | |
| Dividends, net of foreign taxes withheld* | | $ | 6,245,782 | | | $ | 3,228,152 | | | $ | 13,538,846 | | | $ | 27,895,670 | |
| Interest | | | 417 | | | | — | | | | — | | | | 9,660,063 | |
| Securities lending income, net | | | — | | | | — | | | | 52,980 | | | | 87,175 | |
| Total investment income | | | 6,246,199 | | | | 3,228,152 | | | | 13,591,826 | | | | 37,642,908 | |
| EXPENSES: | | | | | | | | | | | | | | | | |
| Investment management fees | | | 2,863,185 | | | | 1,644,788 | | | | 3,370,788 | | | | 8,717,178 | |
| Distribution and shareholder service fees: | | | | | | | | | | | | | | | | |
| Class ADV | | | 83,756 | | | | 105,121 | | | | 195,615 | | | | 207,810 | |
| Class S | | | 825,027 | | | | 398,649 | | | | 947,088 | | | | 1,404,125 | |
| Class S2 | | | — | | | | 12,678 | | | | — | | | | 2,079,396 | |
| Transfer agent fees | | | 777 | | | | 518 | | | | 1,144 | | | | 1,766 | |
| Administrative service fees | | | 357,895 | | | | 219,303 | | | | 561,791 | | | | 1,640,800 | |
| Shareholder reporting expense | | | 32,963 | | | | 25,908 | | | | 53,982 | | | | 101,406 | |
| Registration fees | | | 365 | | | | — | | | | — | | | | 1,095 | |
| Professional fees | | | 32,911 | | | | 24,720 | | | | 47,893 | | | | 141,606 | |
| Custody and accounting expense | | | 39,520 | | | | 20,160 | | | | 98,425 | | | | 173,651 | |
| Trustee fees | | | 10,737 | | | | 6,579 | | | | 16,854 | | | | 49,224 | |
| Miscellaneous expense | | | 12,914 | | | | 10,223 | | | | 16,012 | | | | 42,701 | |
| Interest expense | | | 173 | | | | — | | | | 295 | | | | — | |
| Total expenses | | | 4,260,223 | | | | 2,468,647 | | | | 5,309,887 | | | | 14,560,758 | |
| Net waived and reimbursed fees | | | (907,855 | ) | | | (61,095 | ) | | | (85,402 | ) | | | (846,439 | ) |
| Brokerage commission recapture | | | (35,678 | ) | | | (37,389 | ) | | | (12,359 | ) | | | (41,757 | ) |
| Net expenses | | | 3,316,690 | | | | 2,370,163 | | | | 5,212,126 | | | | 13,672,562 | |
| Net investment income | | | 2,929,509 | | | | 857,989 | | | | 8,379,700 | | | | 23,970,346 | |
| REALIZED AND UNREALIZED GAIN (LOSS): | | | | | | | | | | | | | | | | |
| Net realized gain (loss) on: | | | | | | | | | | | | | | | | |
| Investments | | | 38,493,938 | | | | 20,004,933 | | | | 57,724,899 | | | | 155,633,827 | |
| Foreign currency related transactions | | | 2,700 | | | | — | | | | 4,421,592 | | | | 9,741,720 | |
| Net realized gain | | | 38,496,638 | | | | 20,004,933 | | | | 62,146,491 | | | | 165,375,547 | |
| Net change in unrealized appreciation (depreciation) on: | | | | | | | | | | | | | | | | |
| Investments | | | 2,100,130 | | | | (13,107,266 | ) | | | (18,887,428 | ) | | | (64,731,173 | ) |
| Foreign currency related transactions | | | (20,539 | ) | | | — | | | | 1,090,062 | | | | 2,842,274 | |
| Net change in unrealized appreciation (depreciation) | | | 2,079,591 | | | | (13,107,266 | ) | | | (17,797,366 | ) | | | (61,888,899 | ) |
| Net realized and unrealized gain | | | 40,576,229 | | | | 6,897,667 | | | | 44,349,125 | | | | 103,486,648 | |
| Increase in net assets resulting from operations | | $ | 43,505,738 | | | $ | 7,755,656 | | | $ | 52,728,825 | | | $ | 127,456,994 | |
| _____________ | | | | | | | | | | | | | | | | |
| * Foreign taxes withheld | | $ | 17,648 | | | $ | 13,418 | | | $ | 271,483 | | | $ | 623,380 | |
See Accompanying Notes to Financial Statements
| Statements of Operations For the Year ended December 31, 2014 |
| | | VY® JPMorgan
Mid Cap Value
Portfolio | | | VY® Oppenheimer
Global Portfolio | | | VY® Pioneer
High Yield
Portfolio | | | VY® T. Rowe
Price Diversified
Mid Cap Growth
Portfolio | |
| INVESTMENT INCOME: | | | | | | | | | | | | | | | | |
| Dividends, net of foreign taxes withheld* | | $ | 13,264,343 | | | $ | 34,904,316 | | | $ | 426,344 | | | $ | 7,987,616 | |
| Interest | | | — | | | | — | | | | 6,614,950 | | | | — | |
| Securities lending income, net | | | 52,494 | | | | 1,699,965 | | | | — | | | | 392,288 | |
| Total investment income | | | 13,316,837 | | | | 36,604,281 | | | | 7,041,294 | | | | 8,379,904 | |
| EXPENSES: | | | | | | | | | | | | | | | | |
| Investment management fees | | | 5,132,160 | | | | 10,630,749 | | | | 776,152 | | | | 5,412,410 | |
| Distribution and shareholder service fees: | | | | | | | | | | | | | | | | |
| Class ADV | | | 420,782 | | | | 520,119 | | | | — | | | | 138,899 | |
| Class S | | | 902,882 | | | | 595,390 | | | | 10,708 | | | | 73,270 | |
| Class S2 | | | 25,949 | | | | 22,717 | | | | — | | | | 12,605 | |
| Transfer agent fees | | | 916 | | | | 1,612 | | | | 671 | | | | 1,162 | |
| Administrative service fees | | | 712,635 | | | | 1,771,770 | | | | 129,357 | | | | 845,683 | |
| Shareholder reporting expense | | | 63,535 | | | | 162,854 | | | | 23,141 | | | | 68,295 | |
| Professional fees | | | 67,220 | | | | 156,957 | | | | 20,151 | | | | 77,398 | |
| Custody and accounting expense | | | 81,918 | | | | 417,699 | | | | 19,916 | | | | 91,295 | |
| Trustee fees | | | 21,379 | | | | 53,154 | | | | 3,880 | | | | 25,371 | |
| Miscellaneous expense | | | 29,504 | | | | 78,286 | | | | 7,128 | | | | 31,030 | |
| Interest expense | | | 67 | | | | 657 | | | | — | | | | 404 | |
| Total expenses | | | 7,458,947 | | | | 14,411,964 | | | | 991,104 | | | | 6,777,822 | |
| Net waived and reimbursed fees | | | (5,190 | ) | | | (4,543 | ) | | | (60,824 | ) | | | (69,941 | ) |
| Brokerage commission recapture | | | (7,768 | ) | | | — | | | | (29 | ) | | | (689 | ) |
| Net expenses | | | 7,445,989 | | | | 14,407,421 | | | | 930,251 | | | | 6,707,192 | |
| Net investment income | | | 5,870,848 | | | | 22,196,860 | | | | 6,111,043 | | | | 1,672,712 | |
| REALIZED AND UNREALIZED GAIN (LOSS): | | | | | | | | | | | | | | | | |
| Net realized gain (loss) on: | | | | | | | | | | | | | | | | |
| Investments | | | 96,022,768 | | | | 128,316,414 | | | | 4,633,438 | | | | 130,307,409 | |
| Foreign currency related transactions | | | — | | | | (259,089 | ) | | | — | | | | — | |
| Net realized gain | | | 96,022,768 | | | | 128,057,325 | | | | 4,633,438 | | | | 130,307,409 | |
| Net change in unrealized appreciation (depreciation) on: | | | | | | | | | | | | | | | | |
| Investments | | | (2,497,019 | ) | | | (109,795,076 | ) | | | (10,312,940 | ) | | | (37,524,909 | ) |
| Foreign currency related transactions | | | — | | | | (92,058 | ) | | | — | | | | — | |
| Unfunded commitments | | | — | | | | — | | | | (9,579 | ) | | | — | |
| Net change in unrealized appreciation (depreciation) | | | (2,497,019 | ) | | | (109,887,134 | ) | | | (10,322,519 | ) | | | (37,524,909 | ) |
| Net realized and unrealized gain (loss) | | | 93,525,749 | | | | 18,170,191 | | | | (5,689,081 | ) | | | 92,782,500 | |
| Increase in net assets resulting from operations | | $ | 99,396,597 | | | $ | 40,367,051 | | | $ | 421,962 | | | $ | 94,455,212 | |
| ____________ | | | | | | | | | | | | | | | | |
| * Foreign taxes withheld | | $ | 6,164 | | | $ | 2,977,334 | | | $ | — | | | $ | 45,729 | |
See Accompanying Notes to Financial Statements
| Statements of Operations For the Year ended December 31, 2014 |
| | | VY® T. Rowe
Price Growth
Equity Portfolio | | | VY® Templeton
Foreign Equity
Portfolio | |
| INVESTMENT INCOME: | | | | | | | | |
| Dividends, net of foreign taxes withheld* | | $ | 11,423,757 | | | $ | 39,345,313 | |
| Interest | | | 159 | | | | 1,853 | |
| Securities lending income, net | | | 139,125 | | | | 895,124 | |
| Total investment income | | | 11,563,041 | | | | 40,242,290 | |
| EXPENSES: | | | | | | | | |
| Investment management fees | | | 9,505,131 | | | | 7,360,584 | |
| Distribution and shareholder service fees: | | | | | | | | |
| Class ADV | | | 837,787 | | | | 225,366 | |
| Class S | | | 898,321 | | | | 1,647,784 | |
| Class S2 | | | 17,739 | | | | 10,598 | |
| Transfer agent fees | | | 1,932 | | | | 1,432 | |
| Administrative service fees | | | 1,584,169 | | | | 948,070 | |
| Shareholder reporting expense | | | 140,141 | | | | 68,600 | |
| Professional fees | | | 134,284 | | | | 106,839 | |
| Custody and accounting expense | | | 197,267 | | | | 319,649 | |
| Trustee fees | | | 47,525 | | | | 28,442 | |
| Miscellaneous expense | | | 54,031 | | | | 63,494 | |
| Interest expense | | | 117 | | | | — | |
| Total expenses | | | 13,418,444 | | | | 10,780,858 | |
| Net waived and reimbursed fees | | | (102,773 | ) | | | (149,096 | ) |
| Brokerage commission recapture | | | (9,715 | ) | | | (24,970 | ) |
| Net expenses | | | 13,305,956 | | | | 10,606,792 | |
| Net investment income (loss) | | | (1,742,915 | ) | | | 29,635,498 | |
| REALIZED AND UNREALIZED GAIN (LOSS): | | | | | | | | |
| Net realized gain (loss) on: | | | | | | | | |
| Investments | | | 242,896,798 | | | | 35,767,937 | |
| Foreign currency related transactions | | | 31,906 | | | | (195,450 | ) |
| Net realized gain | | | 242,928,704 | | | | 35,572,487 | |
| Net change in unrealized appreciation (depreciation) on: | | | | | | | | |
| Investments | | | (112,691,573 | ) | | | (127,956,395 | ) |
| Foreign currency related transactions | | | (7,837 | ) | | | (167,245 | ) |
| Net change in unrealized appreciation (depreciation) | | | (112,699,410 | ) | | | (128,123,640 | ) |
| Net realized and unrealized gain (loss) | | | 130,229,294 | | | | (92,551,153 | ) |
| Increase (decrease) in net assets resulting from operations | | $ | 128,486,379 | | | $ | (62,915,655 | ) |
| ____________ | | | | | | | | |
| * Foreign taxes withheld | | $ | 50,503 | | | $ | 2,897,037 | |
See Accompanying Notes to Financial Statements
| Statements of Changes in Net Assets |
| | | Voya Aggregate Bond Portfolio | | | Voya Global Bond Portfolio | |
| | | Year Ended
December 31, 2014 | | | Year Ended
December 31, 2013 | | | Year Ended
December 31, 2014 | | | Year Ended
December 31, 2013 | |
| FROM OPERATIONS: | | | | | | | | | | | | | | | | |
| Net investment income | | $ | 10,990,803 | | | $ | 14,155,152 | | | $ | 12,389,576 | | | $ | 12,974,270 | |
| Net realized gain (loss) | | | 26,360,689 | | | | 10,677,075 | | | | (7,213,226 | ) | | | (14,219,264 | ) |
| Net change in unrealized appreciation (depreciation) | | | 12,955,388 | | | | (47,816,828 | ) | | | (3,176,868 | ) | | | (15,422,390 | ) |
| Increase (decrease) in net assets resulting from operations | | | 50,306,880 | | | | (22,984,601 | ) | | | 1,999,482 | | | | (16,667,384 | ) |
| FROM DISTRIBUTIONS TO SHAREHOLDERS: | | | | | | | | | | | | | | | | |
| Net investment income: | | | | | | | | | | | | | | | | |
| Class ADV | | | (2,830,532 | ) | | | (6,567,664 | ) | | | (114,685 | ) | | | (600,291 | ) |
| Class I | | | (10,318,216 | ) | | | (15,766,401 | ) | | | (1,849,829 | ) | | | (5,646,889 | ) |
| Class S | | | (6,419,235 | ) | | | (15,055,758 | ) | | | (296,298 | ) | | | (1,081,288 | ) |
| Class S2 | | | (39,767 | ) | | | (128,227 | ) | | | — | | | | — | |
| Net realized gains: | | | | | | | | | | | | | | | | |
| Class ADV | | | (135,805 | ) | | | (1,410,960 | ) | | | — | | | | (940,032 | ) |
| Class I | | | (364,993 | ) | | | (2,972,925 | ) | | | — | | | | (6,967,495 | ) |
| Class S | | | (268,853 | ) | | | (3,086,507 | ) | | | — | | | | (1,541,554 | ) |
| Class S2 | | | (1,978 | ) | | | (26,340 | ) | | | — | | | | — | |
| Total distributions | | | (20,379,379 | ) | | | (45,014,782 | ) | | | (2,260,812 | ) | | | (16,777,549 | ) |
| FROM CAPITAL SHARE TRANSACTIONS: | | | | | | | | | | | | | | | | |
| Net proceeds from sale of shares | | | 206,033,742 | | | | 77,301,188 | | | | 14,678,953 | | | | 17,012,681 | |
| Reinvestment of distributions | | | 20,379,379 | | | | 45,014,782 | | | | 2,260,812 | | | | 16,777,549 | |
| | | | 226,413,121 | | | | 122,315,970 | | | | 16,939,765 | | | | 33,790,230 | |
| Cost of shares redeemed | | | (456,952,093 | ) | | | (381,247,330 | ) | | | (50,787,435 | ) | | | (85,106,669 | ) |
| Net decrease in net assets resulting from capital share transactions | | | (230,538,972 | ) | | | (258,931,360 | ) | | | (33,847,670 | ) | | | (51,316,439 | ) |
| Net decrease in net assets | | | (200,611,471 | ) | | | (326,930,743 | ) | | | (34,109,000 | ) | | | (84,761,372 | ) |
| NET ASSETS: | | | | | | | | | | | | | | | | |
| Beginning of year or period | | | 974,271,606 | | | | 1,301,202,349 | | | | 326,047,343 | | | | 410,808,715 | |
| End of year or period | | $ | 773,660,135 | | | $ | 974,271,606 | | | $ | 291,938,343 | | | $ | 326,047,343 | |
| Undistributed net investment income at end of year or period | | $ | 18,031,866 | | | $ | 21,069,406 | | | $ | 2,772,329 | | | $ | 2,569,982 | |
See Accompanying Notes to Financial Statements
| Statements of Changes in Net Assets |
| | | VY® American Century Small-Mid
Cap Value Portfolio | | | VY® Baron Growth Portfolio | |
| | | Year Ended
December 31, 2014 | | | Year Ended
December 31, 2013 | | | Year Ended
December 31, 2014 | | | Year Ended
December 31, 2013 | |
| FROM OPERATIONS: | | | | | | | | | | | | | | | | |
| Net investment income | | $ | 3,911,807 | | | $ | 3,928,854 | | | $ | 3,028,876 | | | $ | 1,289,244 | |
| Net realized gain | | | 57,937,406 | | | | 48,961,915 | | | | 73,161,869 | | | | 16,009,927 | |
| Net change in unrealized appreciation (depreciation) | | | (19,173,176 | ) | | | 36,040,670 | | | | (34,136,106 | ) | | | 301,703,291 | |
| Increase in net assets resulting from operations | | | 42,676,037 | | | | 88,931,439 | | | | 42,054,639 | | | | 319,002,462 | |
| FROM DISTRIBUTIONS TO SHAREHOLDERS: | | | | | | | | | | | | | | | | |
| Net investment income: | | | | | | | | | | | | | | | | |
| Class ADV | | | (943,984 | ) | | | (846,042 | ) | | | — | | | | (1,036,739 | ) |
| Class I | | | (2,025,981 | ) | | | (1,919,069 | ) | | | (762,616 | ) | | | (3,206,034 | ) |
| Class S | | | (1,186,565 | ) | | | (1,170,027 | ) | | | (535,394 | ) | | | (8,748,816 | ) |
| Class S2 | | | (23,116 | ) | | | (61,758 | ) | | | (9,273 | ) | | | (44,207 | ) |
| Net realized gains: | | | | | | | | | | | | | | | | |
| Class ADV | | | (12,843,745 | ) | | | (2,634,779 | ) | | | (1,793,066 | ) | | | (3,428,414 | ) |
| Class I | | | (19,472,109 | ) | | | (4,706,295 | ) | | | (3,916,469 | ) | | | (8,293,121 | ) |
| Class S | | | (13,873,858 | ) | | | (3,356,449 | ) | | | (11,070,262 | ) | | | (26,022,180 | ) |
| Class S2 | | | (418,876 | ) | | | (175,625 | ) | | | (100,704 | ) | | | (121,178 | ) |
| Total distributions | | | (50,788,234 | ) | | | (14,870,044 | ) | | | (18,187,784 | ) | | | (50,900,689 | ) |
| FROM CAPITAL SHARE TRANSACTIONS: | | | | | | | | | | | | | | | | |
| Net proceeds from sale of shares | | | 43,456,299 | | | | 87,468,119 | | | | 66,706,432 | | | | 198,618,560 | |
| Reinvestment of distributions | | | 50,788,234 | | | | 14,870,044 | | | | 18,187,784 | | | | 50,900,689 | |
| | | | 94,244,533 | | | | 102,338,163 | | | | 84,894,216 | | | | 249,519,249 | |
| Cost of shares redeemed | | | (152,989,535 | ) | | | (47,129,026 | ) | | | (230,556,638 | ) | | | (115,958,521 | ) |
| Net increase (decrease) in net assets resulting from capital share transactions | | | (58,745,002 | ) | | | 55,209,137 | | | | (145,662,422 | ) | | | 133,560,728 | |
| Net increase (decrease) in net assets | | | (66,857,199 | ) | | | 129,270,532 | | | | (121,795,567 | ) | | | 401,662,501 | |
| NET ASSETS: | | | | | | | | | | | | | | | | |
| Beginning of year or period | | | 389,326,861 | | | | 260,056,329 | | | | 1,185,806,419 | | | | 784,143,918 | |
| End of year or period | | $ | 322,469,662 | | | $ | 389,326,861 | | | $ | 1,064,010,852 | | | $ | 1,185,806,419 | |
| Undistributed net investment income at end of year or period | | $ | 4,778,941 | | | $ | 4,163,906 | | | $ | 2,927,220 | | | $ | 730,858 | |
See Accompanying Notes to Financial Statements
| Statements of Changes in Net Assets |
| | | VY® Columbia Contrarian Core Portfolio | | | VY® Columbia Small Cap Value II Portfolio | |
| | | Year Ended
December 31, 2014 | | | Year Ended
December 31, 2013 | | | Year Ended
December 31, 2014 | | | Year Ended
December 31, 2013 | |
| FROM OPERATIONS: | | | | | | | | | | | | | | | | |
| Net investment income | | $ | 2,929,509 | | | $ | 2,794,827 | | | $ | 857,989 | | | $ | 641,838 | |
| Net realized gain | | | 38,496,638 | | | | 108,685,285 | | | | 20,004,933 | | | | 21,846,835 | |
| Net change in unrealized appreciation (depreciation) | | | 2,079,591 | | | | (5,498,114 | ) | | | (13,107,266 | ) | | | 37,616,672 | |
| Increase in net assets resulting from operations | | | 43,505,738 | | | | 105,981,998 | | | | 7,755,656 | | | | 60,105,345 | |
| FROM DISTRIBUTIONS TO SHAREHOLDERS: | | | | | | | | | | | | | | | | |
| Net investment income: | | | | | | | | | | | | | | | | |
| Class ADV | | | (112,210 | ) | | | (154,462 | ) | | | (92,128 | ) | | | (83,440 | ) |
| Class I | | | (105,520 | ) | | | (161,392 | ) | | | (231,900 | ) | | | (186,643 | ) |
| Class S | | | (2,590,384 | ) | | | (4,158,860 | ) | | | (301,525 | ) | | | (1,171,365 | ) |
| Class S2 | | | — | | | | — | | | | (16,920 | ) | | | (5,701 | ) |
| Net realized gains: | | | | | | | | | | | | | | | | |
| Class ADV | | | (2,100,491 | ) | | | — | | | | — | | | | — | |
| Class I | | | (1,350,174 | ) | | | — | | | | — | | | | — | |
| Class S | | | (40,149,084 | ) | | | — | | | | — | | | | — | |
| Total distributions | | | (46,407,863 | ) | | | (4,474,714 | ) | | | (642,473 | ) | | | (1,447,149 | ) |
| FROM CAPITAL SHARE TRANSACTIONS: | | | | | | | | | | | | | | | | |
| Net proceeds from sale of shares | | | 32,189,740 | | | | 19,752,594 | | | | 101,567,544 | | | | 22,350,244 | |
| Reinvestment of distributions | | | 46,407,863 | | | | 4,474,714 | | | | 642,473 | | | | 1,447,149 | |
| | | | 78,597,603 | | | | 24,227,308 | | | | 102,210,017 | | | | 23,797,393 | |
| Cost of shares redeemed | | | (68,347,084 | ) | | | (147,191,999 | ) | | | (62,885,471 | ) | | | (43,062,349 | ) |
| Net increase (decrease) in net assets resulting from capital share transactions | | | 10,250,519 | | | | (122,964,691 | ) | | | 39,324,546 | | | | (19,264,956 | ) |
| Net increase (decrease) in net assets | | | 7,348,394 | | | | (21,457,407 | ) | | | 46,437,729 | | | | 39,393,240 | |
| NET ASSETS: | | | | | | | | | | | | | | | | |
| Beginning of year or period | | | 354,003,529 | | | | 375,460,936 | | | | 198,593,837 | | | | 159,200,597 | |
| End of year or period | | $ | 361,351,923 | | | $ | 354,003,529 | | | $ | 245,031,566 | | | $ | 198,593,837 | |
| Undistributed net investment income at end of year or period | | $ | 2,924,735 | | | $ | 2,800,640 | | | $ | 857,988 | | | $ | 638,457 | |
See Accompanying Notes to Financial Statements
| Statements of Changes in Net Assets |
| | | VY® Invesco Comstock Portfolio | | | VY® Invesco Equity and Income Portfolio | |
| | | Year Ended
December 31, 2014 | | | Year Ended
December 31, 2013 | | | Year Ended
December 31, 2014 | | | Year Ended
December 31, 2013 | |
| FROM OPERATIONS: | | | | | | | | | | | | | | | | |
| Net investment income | | $ | 8,379,700 | | | $ | 4,662,985 | | | $ | 23,970,346 | | | $ | 12,968,470 | |
| Net realized gain | | | 62,146,491 | | | | 22,548,167 | | | | 165,375,547 | | | | 68,789,082 | |
| Net change in unrealized appreciation (depreciation) | | | (17,797,366 | ) | | | 92,683,516 | | | | (61,888,899 | ) | | | 94,077,907 | |
| Increase in net assets resulting from operations | | | 52,728,825 | | | | 119,894,668 | | | | 127,456,994 | | | | 175,835,459 | |
| FROM DISTRIBUTIONS TO SHAREHOLDERS: | | | | | | | | | | | | | | | | |
| Net investment income: | | | | | | | | | | | | | | | | |
| Class ADV | | | (684,628 | ) | | | (190,257 | ) | | | (609,164 | ) | | | (311,510 | ) |
| Class I | | | (3,056,581 | ) | | | (574,039 | ) | | | (10,642,922 | ) | | | (7,442,530 | ) |
| Class S | | | (7,164,868 | ) | | | (2,566,247 | ) | | | (12,476,571 | ) | | | (3,031,362 | ) |
| Class S2 | | | — | | | | — | | | | (6,589,109 | ) | | | (45,616 | ) |
| Net realized gains: | | | | | | | | | | | | | | | | |
| Class ADV | | | — | | | | — | | | | (1,298,506 | ) | | | — | |
| Class I | | | — | | | | — | | | | (17,942,741 | ) | | | — | |
| Class S | | | — | | | | — | | | | (25,536,665 | ) | | | — | |
| Class S2 | | | — | | | | — | | | | (14,282,158 | ) | | | — | |
| Total distributions | | | (10,906,077 | ) | | | (3,330,543 | ) | | | (89,377,836 | ) | | | (10,831,018 | ) |
| FROM CAPITAL SHARE TRANSACTIONS: | | | | | | | | | | | | | | | | |
| Net proceeds from sale of shares | | | 176,901,259 | | | | 87,552,396 | | | | 85,106,952 | | | | 67,764,176 | |
| Proceeds from shares issued in merger (Note 15) | | | — | | | | — | | | | 1,400,213,515 | | | | — | |
| Reinvestment of distributions | | | 10,906,077 | | | | 3,330,543 | | | | 89,377,836 | | | | 10,831,018 | |
| | | | 187,807,336 | | | | 90,882,939 | | | | 1,574,698,303 | | | | 78,595,194 | |
| Cost of shares redeemed | | | (123,556,176 | ) | | | (75,776,067 | ) | | | (323,833,395 | ) | | | (92,990,677 | ) |
| Net increase (decrease) in net assets resulting from capital share transactions | | | 64,251,160 | | | | 15,106,872 | | | | 1,250,864,908 | | | | (14,395,483 | ) |
| Net increase in net assets | | | 106,073,908 | | | | 131,670,997 | | | | 1,288,944,066 | | | | 150,608,958 | |
| NET ASSETS: | | | | | | | | | | | | | | | | |
| Beginning of year or period | | | 462,815,074 | | | | 331,144,077 | | | | 870,366,364 | | | | 719,757,406 | |
| End of year or period | | $ | 568,888,982 | | | $ | 462,815,074 | | | $ | 2,159,310,430 | | | $ | 870,366,364 | |
| Undistributed net investment income at end of year or period | | $ | 2,019,041 | | | $ | 123,826 | | | $ | 6,410,004 | | | $ | 2,692,495 | |
See Accompanying Notes to Financial Statements
| Statements of Changes in Net Assets |
| | | VY® JPMorgan Mid Cap Value Portfolio | | | VY® Oppenheimer Global Portfolio | |
| | | Year Ended
December 31, 2014 | | | Year Ended
December 31, 2013 | | | Year Ended
December 31, 2014 | | | Year Ended
December 31, 2013 | |
| FROM OPERATIONS: | | | | | | | | | | | | | | | | |
| Net investment income | | $ | 5,870,848 | | | $ | 4,342,953 | | | $ | 22,196,860 | | | $ | 19,979,393 | |
| Net realized gain | | | 96,022,768 | | | | 42,136,697 | | | | 128,057,325 | | | | 75,561,729 | |
| Net change in unrealized appreciation (depreciation) | | | (2,497,019 | ) | | | 119,306,493 | | | | (109,887,134 | ) | | | 316,702,862 | |
| Increase in net assets resulting from operations | | | 99,396,597 | | | | 165,786,143 | | | | 40,367,051 | | | | 412,243,984 | |
| FROM DISTRIBUTIONS TO SHAREHOLDERS: | | | | | | | | | | | | | | | | |
| Net investment income: | | | | | | | | | | | | | | | | |
| Class ADV | | | (557,039 | ) | | | (291,149 | ) | | | (828,803 | ) | | | (894,142 | ) |
| Class I | | | (2,825,478 | ) | | | (1,981,813 | ) | | | (16,555,290 | ) | | | (18,995,765 | ) |
| Class S | | | (2,815,938 | ) | | | (2,076,797 | ) | | | (2,294,916 | ) | | | (2,687,717 | ) |
| Class S2 | | | (39,286 | ) | | | (23,629 | ) | | | (44,585 | ) | | | (34,018 | ) |
| Net realized gains: | | | | | | | | | | | | | | | | |
| Class ADV | | | (5,003,963 | ) | | | (2,239,527 | ) | | | (1,471,549 | ) | | | — | |
| Class I | | | (15,175,805 | ) | | | (7,940,923 | ) | | | (19,161,555 | ) | | | — | |
| Class S | | | (20,943,381 | ) | | | (11,816,155 | ) | | | (3,303,767 | ) | | | — | |
| Class S2 | | | (303,318 | ) | | | (125,065 | ) | | | (64,256 | ) | | | — | |
| Total distributions | | | (47,664,208 | ) | | | (26,495,058 | ) | | | (43,724,721 | ) | | | (22,611,642 | ) |
| FROM CAPITAL SHARE TRANSACTIONS: | | | | | | | | | | | | | | | | |
| Net proceeds from sale of shares | | | 56,082,178 | | | | 195,238,623 | | | | 58,362,659 | | | | 83,642,544 | |
| Reinvestment of distributions | | | 47,664,208 | | | | 26,495,058 | | | | 43,724,721 | | | | 22,611,642 | |
| | | | 103,746,386 | | | | 221,733,681 | | | | 102,087,380 | | | | 106,254,186 | |
| Cost of shares redeemed | | | (154,469,981 | ) | | | (105,071,594 | ) | | | (298,181,303 | ) | | | (249,508,943 | ) |
| Net increase (decrease) in net assets resulting from capital share transactions | | | (50,723,595 | ) | | | 116,662,087 | | | | (196,093,923 | ) | | | (143,254,757 | ) |
| Net increase (decrease) in net assets | | | 1,008,794 | | | | 255,953,172 | | | | (199,451,593 | ) | | | 246,377,585 | |
| NET ASSETS: | | | | | | | | | | | | | | | | |
| Beginning of year or period | | | 720,853,535 | | | | 464,900,363 | | | | 1,841,409,671 | | | | 1,595,032,086 | |
| End of year or period | | $ | 721,862,329 | | | $ | 720,853,535 | | | $ | 1,641,958,078 | | | $ | 1,841,409,671 | |
| Undistributed net investment income at end of year or period | | $ | 236,493 | | | $ | 594,109 | | | $ | 23,404,553 | | | $ | 19,684,469 | |
See Accompanying Notes to Financial Statements
| Statements of Changes in Net Assets |
| | | VY® Pioneer High Yield Portfolio | | | VY® T. Rowe Price Diversified Mid
Cap Growth Portfolio | |
| | | Year Ended
December 31, 2014 | | | Year Ended
December 31, 2013 | | | Year Ended
December 31, 2014 | | | Year Ended
December 31, 2013 | |
| FROM OPERATIONS: | | | | | | | | | | | | | | | | |
| Net investment income | | $ | 6,111,043 | | | $ | 5,697,918 | | | $ | 1,672,712 | | | $ | 1,189,577 | |
| Net realized gain | | | 4,633,438 | | | | 6,370,439 | | | | 130,307,409 | | | | 57,251,002 | |
| Net change in unrealized appreciation (depreciation) | | | (10,322,519 | ) | | | 1,367,151 | | | | (37,524,909 | ) | | | 177,187,171 | |
| Increase in net assets resulting from operations | | | 421,962 | | | | 13,435,508 | | | | 94,455,212 | | | | 235,627,750 | |
| FROM DISTRIBUTIONS TO SHAREHOLDERS: | | | | | | | | | | | | | | | | |
| Net investment income: | | | | | | | | | | | | | | | | |
| Class ADV | | | — | | | | — | | | | (7,890 | ) | | | (40,912 | ) |
| Class I | | | (5,902,329 | ) | | | (5,470,673 | ) | | | (2,088,115 | ) | | | (2,130,268 | ) |
| Class S | | | (192,274 | ) | | | (194,214 | ) | | | (11,072 | ) | | | (34,360 | ) |
| Class S2 | | | — | | | | — | | | | (1,180 | ) | | | (1,695 | ) |
| Net realized gains: | | | | | | | | | | | | | | | | |
| Class ADV | | | — | | | | — | | | | (1,976,917 | ) | | | (294,669 | ) |
| Class I | | | — | | | | — | | | | (52,939,583 | ) | | | (8,344,464 | ) |
| Class S | | | — | | | | — | | | | (2,001,564 | ) | | | (247,478 | ) |
| Class S2 | | | — | | | | — | | | | (235,821 | ) | | | (12,207 | ) |
| Total distributions | | | (6,094,603 | ) | | | (5,664,887 | ) | | | (59,262,142 | ) | | | (11,106,053 | ) |
| FROM CAPITAL SHARE TRANSACTIONS: | | | | | | | | | | | | | | | | |
| Net proceeds from sale of shares | | | 27,951,610 | | | | 30,207,910 | | | | 17,929,392 | | | | 23,862,804 | |
| Reinvestment of distributions | | | 6,094,603 | | | | 5,664,887 | | | | 59,262,142 | | | | 11,106,053 | |
| | | | 34,046,213 | | | | 35,872,797 | | | | 77,191,534 | | | | 34,968,857 | |
| Cost of shares redeemed | | | (28,792,935 | ) | | | (30,166,878 | ) | | | (113,441,115 | ) | | | (107,355,802 | ) |
| Net increase (decrease) in net assets resulting from capital share transactions | | | 5,253,278 | | | | 5,705,919 | | | | (36,249,581 | ) | | | (72,386,945 | ) |
| Net increase (decrease) in net assets | | | (419,363 | ) | | | 13,476,540 | | | | (1,056,511 | ) | | | 152,134,752 | |
| NET ASSETS: | | | | | | | | | | | | | | | | |
| Beginning of year or period | | | 122,448,074 | | | | 108,971,534 | | | | 861,572,411 | | | | 709,437,659 | |
| End of year or period | | $ | 122,028,711 | | | $ | 122,448,074 | | | $ | 860,515,900 | | | $ | 861,572,411 | |
| Undistributed (distributions in excess of) net investment income at end of year or period | | $ | 3,169,121 | | | $ | 2,643,998 | | | $ | (18,084 | ) | | $ | 109,583 | |
See Accompanying Notes to Financial Statements
| Statements of Changes in Net Assets |
| | | VY® T. Rowe Price Growth Equity Portfolio | | | VY® Templeton Foreign Equity Portfolio | |
| | | Year Ended
December 31, 2014 | | | Year Ended
December 31, 2013 | | | Year Ended
December 31, 2014 | | | Year Ended
December 31, 2013 | |
| FROM OPERATIONS: | | | | | | | | | | | | | | | | |
| Net investment income (loss) | | $ | (1,742,915 | ) | | $ | (1,741,555 | ) | | $ | 29,635,498 | | | $ | 21,470,579 | |
| Net realized gain | | | 242,928,704 | | | | 167,075,009 | | | | 35,572,487 | | | | 17,748,664 | |
| Net change in unrealized appreciation (depreciation) | | | (112,699,410 | ) | | | 286,456,516 | | | | (128,123,640 | ) | | | 141,212,844 | |
| Increase (decrease) in net assets resulting from operations | | | 128,486,379 | | | | 451,789,970 | | | | (62,915,655 | ) | | | 180,432,087 | |
| FROM DISTRIBUTIONS TO SHAREHOLDERS: | | | | | | | | | | | | | | | | |
| Net investment income: | | | | | | | | | | | | | | | | |
| Class ADV | | | — | | | | (27,617 | ) | | | (910,170 | ) | | | (496,780 | ) |
| Class I | | | — | | | | (186,027 | ) | | | (5,906,833 | ) | | | (3,974,225 | ) |
| Class S | | | — | | | | (53,639 | ) | | | (14,604,147 | ) | | | (8,964,292 | ) |
| Class S2 | | | — | | | | (401 | ) | | | (45,628 | ) | | | (23,884 | ) |
| Net realized gains: | | | | | | | | | | | | | | | | |
| Class ADV | | | (11,953,361 | ) | | | — | | | | — | | | | — | |
| Class I | | | (72,666,041 | ) | | | — | | | | — | | | | — | |
| Class S | | | (24,431,255 | ) | | | — | | | | — | | | | — | |
| Class S2 | | | (256,132 | ) | | | — | | | | — | | | | — | |
| Total distributions | | | (109,306,789 | ) | | | (267,684 | ) | | | (21,466,778 | ) | | | (13,459,181 | ) |
| FROM CAPITAL SHARE TRANSACTIONS: | | | | | | | | | | | | | | | | |
| Net proceeds from sale of shares | | | 152,663,324 | | | | 224,580,393 | | | | 50,603,767 | | | | 78,004,394 | |
| Reinvestment of distributions | | | 109,306,789 | | | | 267,684 | | | | 21,466,778 | | | | 13,459,181 | |
| | | | 261,970,113 | | | | 224,848,077 | | | | 72,070,545 | | | | 91,463,575 | |
| Cost of shares redeemed | | | (311,468,327 | ) | | | (226,784,671 | ) | | | (180,342,792 | ) | | | (285,029,060 | ) |
| Net decrease in net assets resulting from capital share transactions | | | (49,498,214 | ) | | | (1,936,594 | ) | | | (108,272,247 | ) | | | (193,565,485 | ) |
| Net increase (decrease) in net assets | | | (30,318,624 | ) | | | 449,585,692 | | | | (192,654,680 | ) | | | (26,592,579 | ) |
| NET ASSETS: | | | | | | | | | | | | | | | | |
| Beginning of year or period | | | 1,604,848,445 | | | | 1,155,262,753 | | | | 1,035,876,421 | | | | 1,062,469,000 | |
| End of year or period | | $ | 1,574,529,821 | | | $ | 1,604,848,445 | | | $ | 843,221,741 | | | $ | 1,035,876,421 | |
| Undistributed (distributions in excess of) net investment income at end of year or period | | $ | (26,371 | ) | | $ | (23,480 | ) | | $ | 30,257,712 | | | $ | 22,078,375 | |
See Accompanying Notes to Financial Statements
Selected data for a share of beneficial interest outstanding throughout each year or period.
| | | | | | Income (loss) | | | | | | | | | | | | | | | | | | | | | | | | | | | | | | | | | | | | | | | | | | | |
| | | | | | from | | | | | | | | | | | | | | | | | | | | | | | | | | | | | | | | | | | | | | | | | | | |
| | | | | | investment | | | | | | | | | | | | | | | | | | | | | | | | | | | | | | | | | | | | | | | Supplemental | |
| | | | | | operations | | | | | | Less Distributions | | | | | | | | | | | | | | | Ratios to average net assets | | | Data | |
| | | Net asset
value,
beginning
of year
or period | | | Net
investment
income
(loss) | | | Net
realized
and
unrealized
gain
(loss) | | | Total from
investment
operations | | | From net
investment
income | | | From net
realized
gains | | | From
return
of
capital | | | Total
distributions | | | Payment
by
affiliate | | | Net
asset
value,
end
of
year
or
period | | | Total
Return(1) | | | Expenses
before
reductions/
additions(2)
(3)(4) | | | Expenses
net of fee
waivers
and/or
recoupments
if any(2)(3)(4) | | | Expense
net of all
reductions/
additions(2)
(3)(4) | | | Net
investment
income
(loss)(2)(3) | | | Net
assets,
end of
year or
period | | | Portfolio
turnover
rate | |
| Year or | | | | | | | | | | | | | | | | | | | | | | | | | | | | | | | | | | | | | | | | | | | | | | | | | | | |
| period ended | | ($) | | | ($) | | | ($) | | | ($) | | | ($) | | | ($) | | | ($) | | | ($) | | | ($) | | | ($) | | | (%) | | | (%) | | | (%) | | | (%) | | | (%) | | | ($000’s) | | | (%) | |
| Voya Aggregate Bond Portfolio | | | | | | | | | | | | | | | | | | | | | | | | | | | | | | | | | | | | | | | | | | | | | | | | | | | | | | | | | | | | | | | | | | | | |
| Class ADV | | | | | | | | | | | | | | | | | | | | | | | | | | | | | | | | | | | | | | | | | | | | | | | | | | | | | | | | | | | | | | | | | | | | |
| 12-31-14 | | | 11.29 | | | | 0.09 | • | | | 0.46 | | | | 0.55 | | | | 0.19 | | | | 0.01 | | | | — | | | | 0.20 | | | | — | | | | 11.64 | | | | 4.85 | | | | 1.09 | | | | 1.08 | | | | 1.08 | | | | 0.77 | | | | 172,484 | | | | 643 | |
| 12-31-13 | | | 12.00 | | | | 0.11 | | | | (0.36 | ) | | | (0.25 | ) | | | 0.38 | | | | 0.08 | | | | — | | | | 0.46 | | | | — | | | | 11.29 | | | | (2.07 | ) | | | 1.09 | | | | 1.08 | | | | 1.08 | | | | 0.92 | | | | 188,804 | | | | 874 | |
| 12-31-12 | | | 11.48 | | | | 0.21 | • | | | 0.66 | | | | 0.87 | | | | 0.35 | | | | — | | | | — | | | | 0.35 | | | | — | | | | 12.00 | | | | 7.61 | | | | 1.09 | | | | 1.08 | | | | 1.08 | | | | 1.76 | | | | 205,882 | | | | 897 | |
| 12-31-11 | | | 11.89 | | | | 0.28 | • | | | 0.07 | | | | 0.35 | | | | 0.34 | | | | 0.42 | | | | — | | | | 0.76 | | | | — | | | | 11.48 | | | | 2.95 | | | | 1.09 | | | | 1.08 | | | | 1.08 | | | | 2.41 | | | | 161,860 | | | | 783 | |
| 12-31-10 | | | 11.46 | | | | 0.23 | • | | | 0.61 | | | | 0.84 | | | | 0.39 | | | | 0.02 | | | | — | | | | 0.41 | | | | — | | | | 11.89 | | | | 7.30 | | | | 1.09 | | | | 1.08 | | | | 1.08 | | | | 1.96 | | | | 152,733 | | | | 558 | |
| Class I | | | | | | | | | | | | | | | | | | | | | | | | | | | | | | | | | | | | | | | | | | | | | | | | | | | | | | | | | | | | | | | | | | | | |
| 12-31-14 | | | 11.60 | | | | 0.16 | | | | 0.46 | | | | 0.62 | | | | 0.25 | | | | 0.01 | | | | — | | | | 0.26 | | | | — | | | | 11.96 | | | | 5.39 | | | | 0.59 | | | | 0.58 | | | | 0.58 | | | | 1.28 | | | | 274,515 | | | | 643 | |
| 12-31-13 | | | 12.32 | | | | 0.17 | • | | | (0.38 | ) | | | (0.21 | ) | | | 0.43 | | | | 0.08 | | | | — | | | | 0.51 | | | | — | | | | 11.60 | | | | (1.66 | ) | | | 0.59 | | | | 0.58 | | | | 0.58 | | | | 1.44 | | | | 374,305 | | | | 874 | |
| 12-31-12 | | | 11.76 | | | | 0.28 | | | | 0.68 | | | | 0.96 | | | | 0.40 | | | | — | | | | — | | | | 0.40 | | | | — | | | | 12.32 | | | | 8.22 | | | | 0.59 | | | | 0.58 | | | | 0.58 | | | | 2.26 | | | | 550,994 | | | | 897 | |
| 12-31-11 | | | 12.15 | | | | 0.36 | | | | 0.06 | | | | 0.42 | | | | 0.39 | | | | 0.42 | | | | — | | | | 0.81 | | | | — | | | | 11.76 | | | | 3.46 | | | | 0.59 | | | | 0.58 | | | | 0.58 | | | | 2.90 | | | | 523,551 | | | | 783 | |
| 12-31-10 | | | 11.67 | | | | 0.29 | • | | | 0.63 | | | | 0.92 | | | | 0.42 | | | | 0.02 | | | | — | | | | 0.44 | | | | — | | | | 12.15 | | | | 7.84 | | | | 0.59 | | | | 0.58 | | | | 0.58 | | | | 2.43 | | | | 534,495 | | | | 558 | |
| Class S | | | | | | | | | | | | | | | | | | | | | | | | | | | | | | | | | | | | | | | | | | | | | | | | | | | | | | | | | | | | | | | | | | | | |
| 12-31-14 | | | 11.48 | | | | 0.12 | • | | | 0.47 | | | | 0.59 | | | | 0.21 | | | | 0.01 | | | | — | | | | 0.22 | | | | — | | | | 11.85 | | | | 5.19 | | | | 0.84 | | | | 0.83 | | | | 0.83 | | | | 1.03 | | | | 324,390 | | | | 643 | |
| 12-31-13 | | | 12.19 | | | | 0.14 | • | | | (0.37 | ) | | | (0.23 | ) | | | 0.40 | | | | 0.08 | | | | — | | | | 0.48 | | | | — | | | | 11.48 | | | | (1.89 | ) | | | 0.84 | | | | 0.83 | | | | 0.83 | | | | 1.18 | | | | 408,178 | | | | 874 | |
| 12-31-12 | | | 11.65 | | | | 0.23 | | | | 0.68 | | | | 0.91 | | | | 0.37 | | | | — | | | | — | | | | 0.37 | | | | — | | | | 12.19 | | | | 7.88 | | | | 0.84 | | | | 0.83 | | | | 0.83 | | | | 2.01 | | | | 539,300 | | | | 897 | |
| 12-31-11 | | | 12.04 | | | | 0.31 | | | | 0.08 | | | | 0.39 | | | | 0.36 | | | | 0.42 | | | | — | | | | 0.78 | | | | — | | | | 11.65 | | | | 3.25 | | | | 0.84 | | | | 0.83 | | | | 0.83 | | | | 2.65 | | | | 493,803 | | | | 783 | |
| 12-31-10 | | | 11.58 | | | | 0.26 | • | | | 0.62 | | | | 0.88 | | | | 0.40 | | | | 0.02 | | | | — | | | | 0.42 | | | | — | | | | 12.04 | | | | 7.56 | | | | 0.84 | | | | 0.83 | | | | 0.83 | | | | 2.18 | | | | 474,076 | | | | 558 | |
| Class S2 | | | | | | | | | | | | | | | | | | | | | | | | | | | | | | | | | | | | | | | | | | | | | | | | | | | | | | | | | | | | | | | | | | | | |
| 12-31-14 | | | 11.20 | | | | 0.10 | • | | | 0.46 | | | | 0.56 | | | | 0.18 | | | | 0.01 | | | | — | | | | 0.19 | | | | — | | | | 11.57 | | | | 5.01 | | | | 1.09 | | | | 0.98 | | | | 0.98 | | | | 0.88 | | | | 2,271 | | | | 643 | |
| 12-31-13 | | | 11.92 | | | | 0.12 | • | | | (0.37 | ) | | | (0.25 | ) | | | 0.39 | | | | 0.08 | | | | — | | | | 0.47 | | | | — | | | | 11.20 | | | | (2.02 | ) | | | 1.09 | | | | 0.98 | | | | 0.98 | | | | 1.04 | | | | 2,984 | | | | 874 | |
| 12-31-12 | | | 11.42 | | | | 0.22 | • | | | 0.66 | | | | 0.88 | | | | 0.38 | | | | — | | | | — | | | | 0.38 | | | | — | | | | 11.92 | | | | 7.73 | | | | 1.09 | | | | 0.98 | | | | 0.98 | | | | 1.83 | | | | 5,026 | | | | 897 | |
| 12-31-11 | | | 11.85 | | | | 0.30 | • | | | 0.07 | | | | 0.37 | | | | 0.38 | | | | 0.42 | | | | — | | | | 0.80 | | | | — | | | | 11.42 | | | | 3.10 | | | | 1.09 | | | | 0.98 | | | | 0.98 | | | | 2.54 | | | | 1,829 | | | | 783 | |
| 12-31-10 | | | 11.44 | | | | 0.29 | • | | | 0.56 | | | | 0.85 | | | | 0.42 | | | | 0.02 | | | | — | | | | 0.44 | | | | — | | | | 11.85 | | | | 7.38 | | | | 1.09 | | | | 0.98 | | | | 0.98 | | | | 2.42 | | | | 1,003 | | | | 558 | |
| Voya Global Bond Portfolio | | | | | | | | | | | | | | | | | | | | | | | | | | | | | | | | | | | | | | | | | | | | | | | | | | | | | | | | | | | | | | | | | | | | |
| Class ADV | | | | | | | | | | | | | | | | | | | | | | | | | | | | | | | | | | | | | | | | | | | | | | | | | | | | | | | | | | | | | | | | | | | | |
| 12-31-14 | | | 10.35 | | | | 0.37 | • | | | (0.37 | ) | | | 0.00 | * | | | 0.04 | | | | — | | | | — | | | | 0.04 | | | | — | | | | 10.31 | | | | (0.06 | ) | | | 1.16 | | | | 1.10 | | | | 1.10 | | | | 3.49 | | | | 32,874 | | | | 296 | |
| 12-31-13 | | | 11.35 | | | | 0.33 | • | | | (0.85 | ) | | | (0.52 | ) | | | 0.19 | | | | 0.29 | | | | — | | | | 0.48 | | | | — | | | | 10.35 | | | | (4.50 | ) | | | 1.19 | | | | 1.08 | | | | 1.08 | | | | 3.09 | | | | 34,155 | | | | 394 | |
| 12-31-12 | | | 11.22 | | | | 0.41 | • | | | 0.39 | | | | 0.80 | | | | 0.67 | | | | — | | | | — | | | | 0.67 | | | | — | | | | 11.35 | | | | 7.36 | | | | 1.18 | | | | 1.02 | | | | 1.02 | | | | 3.61 | | | | 34,927 | | | | 487 | |
| 12-31-11 | | | 11.67 | | | | 0.44 | • | | | (0.04 | ) | | | 0.40 | | | | 0.85 | | | | — | | | | — | | | | 0.85 | | | | — | | | | 11.22 | | | | 3.26 | | | | 1.16 | | | | 1.02 | | | | 1.02 | | | | 3.73 | | | | 30,299 | | | | 590 | |
| 12-31-10 | | | 10.45 | | | | 0.70 | • | | | 0.88 | | | | 1.58 | | | | 0.36 | | | | — | | | | — | | | | 0.36 | | | | — | | | | 11.67 | | | | 15.22 | | | | 1.04 | | | | 1.02 | | | | 1.02 | | | | 6.27 | | | | 30,887 | | | | 117 | |
| Class I | | | | | | | | | | | | | | | | | | | | | | | | | | | | | | | | | | | | | | | | | | | | | | | | | | | | | | | | | | | | | | | | | | | | |
| 12-31-14 | | | 10.46 | | | | 0.43 | • | | | (0.38 | ) | | | 0.05 | | | | 0.09 | | | | — | | | | — | | | | 0.09 | | | | — | | | | 10.42 | | | | 0.42 | | | | 0.66 | | | | 0.60 | | | | 0.60 | | | | 3.99 | | | | 208,023 | | | | 296 | |
| 12-31-13 | | | 11.46 | | | | 0.40 | • | | | (0.87 | ) | | | (0.47 | ) | | | 0.24 | | | | 0.29 | | | | — | | | | 0.53 | | | | — | | | | 10.46 | | | | (4.00 | ) | | | 0.69 | | | | 0.58 | | | | 0.58 | | | | 3.65 | | | | 237,646 | | | | 394 | |
| 12-31-12 | | | 11.32 | | | | 0.47 | • | | | 0.40 | | | | 0.87 | | | | 0.73 | | | | — | | | | — | | | | 0.73 | | | | — | | | | 11.46 | | | | 7.91 | | | | 0.68 | | | | 0.52 | | | | 0.52 | | | | 4.09 | | | | 309,348 | | | | 487 | |
| 12-31-11 | | | 11.77 | | | | 0.50 | • | | | (0.05 | ) | | | 0.45 | | | | 0.90 | | | | — | | | | — | | | | 0.90 | | | | — | | | | 11.32 | | | | 3.70 | | | | 0.66 | | | | 0.52 | | | | 0.52 | | | | 4.22 | | | | 330,477 | | | | 590 | |
| 12-31-10 | | | 10.48 | | | | 0.75 | | | | 0.90 | | | | 1.65 | | | | 0.36 | | | | — | | | | — | | | | 0.36 | | | | — | | | | 11.77 | | | | 15.86 | | | | 0.54 | | | | 0.52 | | | | 0.52 | | | | 6.82 | | | | 386,383 | | | | 117 | |
| Class S | | | | | | | | | | | | | | | | | | | | | | | | | | | | | | | | | | | | | | | | | | | | | | | | | | | | | | | | | | | | | | | | | | | | |
| 12-31-14 | | | 10.48 | | | | 0.40 | • | | | (0.38 | ) | | | 0.02 | | | | 0.06 | | | | — | | | | — | | | | 0.06 | | | | — | | | | 10.44 | | | | 0.15 | | | | 0.91 | | | | 0.85 | | | | 0.85 | | | | 3.74 | | | | 51,041 | | | | 296 | |
| 12-31-13 | | | 11.48 | | | | 0.37 | • | | | (0.87 | ) | | | (0.50 | ) | | | 0.21 | | | | 0.29 | | | | — | | | | 0.50 | | | | — | | | | 10.48 | | | | (4.28 | ) | | | 0.94 | | | | 0.83 | | | | 0.83 | | | | 3.39 | | | | 54,246 | | | | 394 | |
| 12-31-12 | | | 11.33 | | | | 0.47 | • | | | 0.37 | | | | 0.84 | | | | 0.69 | | | | — | | | | — | | | | 0.69 | | | | — | | | | 11.48 | | | | 7.65 | | | | 0.93 | | | | 0.77 | | | | 0.77 | | | | 4.05 | | | | 66,533 | | | | 487 | |
| 12-31-11 | | | 11.76 | | | | 0.47 | • | | | (0.04 | ) | | | 0.43 | | | | 0.86 | | | | — | | | | — | | | | 0.86 | | | | — | | | | 11.33 | | | | 3.51 | | | | 0.91 | | | | 0.77 | | | | 0.77 | | | | 3.97 | | | | 67,103 | | | | 590 | |
| 12-31-10 | | | 10.50 | | | | 0.74 | • | | | 0.88 | | | | 1.62 | | | | 0.36 | | | | — | | | | — | | | | 0.36 | | | | — | | | | 11.76 | | | | 15.54 | | | | 0.79 | | | | 0.77 | | | | 0.77 | | | | 6.57 | | | | 93,346 | | | | 117 | |
See Accompanying Notes to Financial Statements
| FINANCIAL HIGHLIGHTS (CONTINUED) |
| | | | | | Income (loss) | | | | | | | | | | | | | | | | | | | | | | | | | | | | | | | | | | | | | | | | | | | |
| | | | | | from | | | | | | | | | | | | | | | | | | | | | | | | | | | | | | | | | | | | | | | | | | | |
| | | | | | investment | | | | | | | | | | | | | | | | | | | | | | | | | | | | | | | | | | | | | | | Supplemental | |
| | | | | | operations | | | | | | Less Distributions | | | | | | | | | | | | | | | Ratios to average net assets | | | Data | |
| | | Net asset
value,
beginning
of year
or period | | | Net
investment
income
(loss) | | | Net
realized
and
unrealized
gain
(loss) | | | Total from
investment
operations | | | From net
investment
income | | | From net
realized
gains | | | From
return
of
capital | | | Total
distributions | | | Payment
by
affiliate | | | Net
asset
value,
end
of
year
or
period | | | Total
Return(1) | | | Expenses
before
reductions/
additions(2)
(3)(4) | | | Expenses
net of fee
waivers
and/or
recoupments
if any(2)(3)(4) | | | Expense
net of all
reductions/
additions(2)
(3)(4) | | | Net
investment
income
(loss)(2)(3) | | | Net
assets,
end of
year or
period | | | Portfolio
turnover
rate | |
| Year or | | | | | | | | | | | | | | | | | | | | | | | | | | | | | | | | | | | | | | | | | | | | | | | | | | | |
| period ended | | ($) | | | ($) | | | ($) | | | ($) | | | ($) | | | ($) | | | ($) | | | ($) | | | ($) | | | ($) | | | (%) | | | (%) | | | (%) | | | (%) | | | (%) | | | ($000’s) | | | (%) | |
| VY® American Century Small-Mid Cap Value Portfolio | | | | | | | | | | | | | | | | | | | | | | | | | | | | | | | | | | | | | | | | | | | | | | | | | | | | | | | | | | | | | | | | | | | | |
| Class ADV | | | | | | | | | | | | | | | | | | | | | | | | | | | | | | | | | | | | | | | | | | | | | | | | | | | | | | | | | | | | | | | | | | | | |
| 12-31-14 | | | 14.79 | | | | 0.12 | • | | | 1.49 | | | | 1.61 | | | | 0.18 | | | | 2.40 | | | | — | | | | 2.58 | | | | — | | | | 13.82 | | | | 12.15 | | | | 1.65 | | | | 1.36 | | | | 1.36 | | | | 0.82 | | | | 86,335 | | | | 79 | |
| 12-31-13 | | | 11.76 | | | | 0.12 | • | | | 3.49 | | | | 3.61 | | | | 0.14 | | | | 0.44 | | | | — | | | | 0.58 | | | | — | | | | 14.79 | | | | 31.12 | | | | 1.66 | | | | 1.42 | | | | 1.42 | | | | 0.88 | | | | 95,563 | | | | 84 | |
| 12-31-12 | | | 11.08 | | | | 0.18 | • | | | 1.53 | | | | 1.71 | | | | 0.12 | | | | 0.91 | | | | — | | | | 1.03 | | | �� | — | | | | 11.76 | | | | 16.07 | | | | 1.70 | | | | 1.43 | | | | 1.43 | | | | 1.55 | | | | 56,202 | | | | 95 | |
| 12-31-11 | | | 11.63 | | | | 0.12 | • | | | (0.54 | ) | | | (0.42 | ) | | | 0.13 | | | | 0.00 | * | | | — | | | | 0.13 | | | | — | | | | 11.08 | | | | (3.47 | ) | | | 1.75 | | | | 1.44 | | | | 1.44 | | | | 1.07 | | | | 37,525 | | | | 109 | |
| 12-31-10 | | | 9.65 | | | | 0.15 | • | | | 1.93 | | | | 2.08 | | | | 0.10 | | | | — | | | | — | | | | 0.10 | | | | — | | | | 11.63 | | | | 21.80 | | | | 1.75 | | | | 1.44 | † | | | 1.44 | † | | | 1.47 | † | | | 26,712 | | | | 98 | |
| Class I | | | | | | | | | | | | | | | | | | | | | | | | | | | | | | | | | | | | | | | | | | | | | | | | | | | | | | | | | | | | | | | | | | | | |
| 12-31-14 | | | 15.30 | | | | 0.20 | • | | | 1.55 | | | | 1.75 | | | | 0.25 | | | | 2.40 | | | | — | | | | 2.65 | | | | — | | | | 14.40 | | | | 12.76 | | | | 1.15 | | | | 0.86 | | | | 0.86 | | | | 1.31 | | | | 138,605 | | | | 79 | |
| 12-31-13 | | | 12.12 | | | | 0.19 | • | | | 3.61 | | | | 3.80 | | | | 0.18 | | | | 0.44 | | | | — | | | | 0.62 | | | | — | | | | 15.30 | | | | 31.78 | | | | 1.16 | | | | 0.92 | | | | 0.92 | | | | 1.38 | | | | 171,086 | | | | 84 | |
| 12-31-12 | | | 11.38 | | | | 0.24 | • | | | 1.58 | | | | 1.82 | | | | 0.17 | | | | 0.91 | | | | — | | | | 1.08 | | | | — | | | | 12.12 | | | | 16.59 | | | | 1.20 | | | | 0.93 | | | | 0.93 | | | | 2.05 | | | | 116,175 | | | | 95 | |
| 12-31-11 | | | 11.91 | | | | 0.18 | | | | (0.56 | ) | | | (0.38 | ) | | | 0.15 | | | | 0.00 | * | | | — | | | | 0.15 | | | | — | | | | 11.38 | | | | (2.97 | ) | | | 1.25 | | | | 0.94 | | | | 0.94 | | | | 1.54 | | | | 87,411 | | | | 109 | |
| 12-31-10 | | | 9.86 | | | | 0.20 | • | | | 1.98 | | | | 2.18 | | | | 0.13 | | | | — | | | | — | | | | 0.13 | | | | — | | | | 11.91 | | | | 22.36 | | | | 1.25 | | | | 0.94 | † | | | 0.94 | † | | | 1.92 | † | | | 91,413 | | | | 98 | |
| Class S | | | | | | | | | | | | | | | | | | | | | | | | | | | | | | | | | | | | | | | | | | | | | | | | | | | | | | | | | | | | | | | | | | | | |
| 12-31-14 | | | 15.16 | | | | 0.16 | • | | | 1.54 | | | | 1.70 | | | | 0.21 | | | | 2.40 | | | | — | | | | 2.61 | | | | — | | | | 14.25 | | | | 12.47 | | | | 1.40 | | | | 1.11 | | | | 1.11 | | | | 1.06 | | | | 94,268 | | | | 79 | |
| 12-31-13 | | | 12.03 | | | | 0.15 | • | | | 3.57 | | | | 3.72 | | | | 0.15 | | | | 0.44 | | | | — | | | | 0.59 | | | | — | | | | 15.16 | | | | 31.36 | | | | 1.41 | | | | 1.17 | | | | 1.17 | | | | 1.12 | | | | 116,117 | | | | 84 | |
| 12-31-12 | | | 11.30 | | | | 0.19 | | | | 1.59 | | | | 1.78 | | | | 0.14 | | | | 0.91 | | | | — | | | | 1.05 | | | | — | | | | 12.03 | | | | 16.35 | | | | 1.45 | | | | 1.18 | | | | 1.18 | | | | 1.76 | | | | 84,475 | | | | 95 | |
| 12-31-11 | | | 11.82 | | | | 0.15 | | | | (0.54 | ) | | | (0.39 | ) | | | 0.13 | | | | 0.00 | * | | | — | | | | 0.13 | | | | — | | | | 11.30 | | | | (3.16 | ) | | | 1.50 | | | | 1.19 | | | | 1.19 | | | | 1.28 | | | | 72,824 | | | | 109 | |
| 12-31-10 | | | 9.80 | | | | 0.14 | | | | 1.99 | | | | 2.13 | | | | 0.11 | | | | — | | | | — | | | | 0.11 | | | | — | | | | 11.82 | | | | 22.02 | | | | 1.50 | | | | 1.19 | † | | | 1.19 | † | | | 1.68 | † | | | 75,285 | | | | 98 | |
| Class S2 | | | | | | | | | | | | | | | | | | | | | | | | | | | | | | | | | | | | | | | | | | | | | | | | | | | | | | | | | | | | | | | | | | | | |
| 12-31-14 | | | 14.70 | | | | 0.13 | • | | | 1.49 | | | | 1.62 | | | | 0.13 | | | | 2.40 | | | | — | | | | 2.53 | | | | — | | | | 13.79 | | | | 12.33 | | | | 1.65 | | | | 1.26 | | | | 1.26 | | | | 0.89 | | | | 3,262 | | | | 79 | |
| 12-31-13 | | | 11.70 | | | | 0.13 | • | | | 3.46 | | | | 3.59 | | | | 0.15 | | | | 0.44 | | | | — | | | | 0.59 | | | | — | | | | 14.70 | | | | 31.15 | | | | 1.66 | | | | 1.32 | | | | 1.32 | | | | 0.98 | | | | 6,560 | | | | 84 | |
| 12-31-12 | | | 11.03 | | | | 0.19 | • | | | 1.53 | | | | 1.72 | | | | 0.14 | | | | 0.91 | | | | — | | | | 1.05 | | | | — | | | | 11.70 | | | | 16.24 | | | | 1.70 | | | | 1.33 | | | | 1.33 | | | | 1.68 | | | | 3,205 | | | | 95 | |
| 12-31-11 | | | 11.59 | | | | 0.14 | • | | | (0.55 | ) | | | (0.41 | ) | | | 0.15 | | | | 0.00 | * | | | — | | | | 0.15 | | | | — | | | | 11.03 | | | | (3.33 | ) | | | 1.75 | | | | 1.34 | | | | 1.34 | | | | 1.26 | | | | 1,891 | | | | 109 | |
| 12-31-10 | | | 9.61 | | | | 0.22 | • | | | 1.86 | | | | 2.08 | | | | 0.10 | | | | — | | | | — | | | | 0.10 | | | | — | | | | 11.59 | | | | 21.87 | | | | 1.75 | | | | 1.34 | † | | | 1.34 | † | | | 2.01 | † | | | 326 | | | | 98 | |
| VY® Baron Growth Portfolio | | | | | | | | | | | | | | | | | | | | | | | | | | | | | | | | | | | | | | | | | | | | | | | | | | | | | | | | | | | | | | | | | | | | |
| Class ADV | | | | | | | | | | | | | | | | | | | | | | | | | | | | | | | | | | | | | | | | | | | | | | | | | | | | | | | | | | | | | | | | | | | | |
| 12-31-14 | | | 29.66 | | | | (0.01 | )* | | | 1.17 | | | | 1.16 | | | | — | | | | 0.47 | | | | — | | | | 0.47 | | | | — | | | | 30.35 | | | | 4.06 | | | | 1.48 | | | | 1.48 | | | | 1.48 | | | | (0.04 | ) | | | 111,145 | | | | 10 | |
| 12-31-13 | | | 22.53 | | | | (0.04 | )• | | | 8.55 | | | | 8.51 | | | | 0.32 | | | | 1.06 | | | | — | | | | 1.38 | | | | — | | | | 29.66 | | | | 38.50 | | | | 1.49 | | | | 1.49 | | | | 1.49 | | | | (0.15 | ) | | | 110,486 | | | | 8 | |
| 12-31-12 | | | 18.87 | | | | 0.30 | • | | | 3.36 | | | | 3.66 | | | | — | | | | — | | | | — | | | | — | | | | — | | | | 22.53 | | | | 19.40 | | | | 1.52 | | | | 1.52 | | | | 1.52 | | | | 1.45 | | | | 61,428 | | | | 15 | |
| 12-31-11 | | | 18.52 | | | | (0.19 | ) | | | 0.54 | | | | 0.35 | | | | — | | | | — | | | | — | | | | — | | | | — | | | | 18.87 | | | | 1.89 | | | | 1.58 | | | | 1.58 | | | | 1.58 | | | | (0.98 | ) | | | 54,052 | | | | 14 | |
| 12-31-10 | | | 14.67 | | | | (0.10 | ) | | | 3.95 | | | | 3.85 | | | | — | | | | — | | | | — | | | | — | | | | — | | | | 18.52 | | | | 26.24 | | | | 1.58 | | | | 1.58 | † | | | 1.58 | † | | | (0.65 | )† | | | 51,458 | | | | 19 | |
| Class I | | | | | | | | | | | | | | | | | | | | | | | | | | | | | | | | | | | | | | | | | | | | | | | | | | | | | | | | | | | | | | | | | | | | |
| 12-31-14 | | | 31.49 | | | | 0.14 | | | | 1.24 | | | | 1.38 | | | | 0.09 | | | | 0.47 | | | | — | | | | 0.56 | | | | — | | | | 32.31 | | | | 4.55 | | | | 0.98 | | | | 0.98 | | | | 0.98 | | | | 0.45 | | | | 251,230 | | | | 10 | |
| 12-31-13 | | | 23.80 | | | | 0.10 | • | | | 9.06 | | | | 9.16 | | | | 0.41 | | | | 1.06 | | | | — | | | | 1.47 | | | | — | | | | 31.49 | | | | 39.23 | | | | 0.99 | | | | 0.99 | | | | 0.99 | | | | 0.36 | | | | 270,788 | | | | 8 | |
| 12-31-12 | | | 19.84 | | | | 0.43 | • | | | 3.53 | | | | 3.96 | | | | — | | | | — | | | | — | | | | — | | | | — | | | | 23.80 | | | | 19.96 | | | | 1.02 | | | | 1.02 | | | | 1.02 | | | | 1.95 | | | | 169,708 | | | | 15 | |
| 12-31-11 | | | 19.37 | | | | (0.10 | )• | | | 0.57 | | | | 0.47 | | | | — | | | | — | | | | — | | | | — | | | | — | | | | 19.84 | | | | 2.43 | | | | 1.08 | | | | 1.08 | | | | 1.08 | | | | (0.51 | ) | | | 153,934 | | | | 14 | |
| 12-31-10 | | | 15.27 | | | | (0.03 | ) | | | 4.13 | | | | 4.10 | | | | — | | | | — | | | | — | | | | — | | | | — | | | | 19.37 | | | | 26.85 | | | | 1.08 | | | | 1.08 | † | | | 1.08 | † | | | (0.17 | )† | | | 231,264 | | | | 19 | |
| Class S | | | | | | | | | | | | | | | | | | | | | | | | | | | | | | | | | | | | | | | | | | | | | | | | | | | | | | | | | | | | | | | | | | | | |
| 12-31-14 | | | 30.60 | | | | 0.09 | | | | 1.19 | | | | 1.28 | | | | 0.02 | | | | 0.47 | | | | — | | | | 0.49 | | | | — | | | | 31.39 | | | | 4.34 | | | | 1.23 | | | | 1.23 | | | | 1.23 | | | | 0.26 | | | | 694,762 | | | | 10 | |
| 12-31-13 | | | 23.18 | | | | 0.01 | | | | 8.83 | | | | 8.84 | | | | 0.36 | | | | 1.06 | | | | — | | | | 1.42 | | | | — | | | | 30.60 | | | | 38.85 | | | | 1.24 | | | | 1.24 | | | | 1.24 | | | | 0.09 | | | | 798,221 | | | | 8 | |
| 12-31-12 | | | 19.37 | | | | 0.35 | • | | | 3.46 | | | | 3.81 | | | | — | | | | — | | | | — | | | | — | | | | — | | | | 23.18 | | | | 19.67 | | | | 1.27 | | | | 1.27 | | | | 1.27 | | | | 1.65 | | | | 551,582 | | | | 15 | |
| 12-31-11 | | | 18.95 | | | | (0.14 | )• | | | 0.56 | | | | 0.42 | | | | — | | | | — | | | | — | | | | — | | | | — | | | | 19.37 | | | | 2.22 | | | | 1.33 | | | | 1.31 | | | | 1.31 | | | | (0.72 | ) | | | 526,672 | | | | 14 | |
| 12-31-10 | | | 14.98 | | | | (0.07 | ) | | | 4.04 | | | | 3.97 | | | | — | | | | — | | | | — | | | | — | | | | — | | | | 18.95 | | | | 26.50 | | | | 1.33 | | | | 1.31 | † | | | 1.31 | † | | | (0.41 | )† | | | 560,004 | | | | 19 | |
See Accompanying Notes to Financial Statements
| FINANCIAL HIGHLIGHTS (CONTINUED) |
| | | | | | Income (loss) | | | | | | | | | | | | | | | | | | | | | | | | | | | | | | | | | | | | | | | | | | | |
| | | | | | from | | | | | | | | | | | | | | | | | | | | | | | | | | | | | | | | | | | | | | | | | | | |
| | | | | | investment | | | | | | | | | | | | | | | | | | | | | | | | | | | | | | | | | | | | | | | Supplemental | |
| | | | | | operations | | | | | | Less Distributions | | | | | | | | | | | | | | | Ratios to average net assets | | | Data | |
| | | Net asset
value,
beginning
of year
or period | | | Net
investment
income
(loss) | | | Net
realized
and
unrealized
gain
(loss) | | | Total from
investment
operations | | | From net
investment
income | | | From net
realized
gains | | | From
return of
capital | | | Total
distributions | | | Payment
by
affiliate | | | Net
asset
value,
end
of
year
or
period | | | Total
Return(1) | | | Expenses
before
reductions/
additions(2)(3)(4) | | | Expenses
net of fee
waivers
and/or
recoupments
if any(2)(3)(4) | | | Expense
net of all
reductions/
additions(2)(3)(4) | | | Net
investment
income
(loss) (2)(3) | | | Net
assets,
end of
year or
period | | | Portfolio
turnover rate | |
| Year or | | | | | | | | | | | | | | | | | | | | | | | | | | | | | | | | | | | | | | | | | | | | | | | | | | | |
| period ended | | ($) | | | ($) | | | ($) | | | ($) | | | ($) | | | ($) | | | ($) | | | ($) | | | ($) | | | ($) | | | (%) | | | (%) | | | (%) | | | (%) | | | (%) | | | ($000’s) | | | (%) | |
| VY® Baron Growth Portfolio (continued) | | | | | | | | | | | | | | | | | | | | | | | | | | | | | | | | | | | | | | | | | | | | | | | | | | | | | | | | | | | | | | | | | | | | |
| Class S2 | | | | | | | | | | | | | | | | | | | | | | | | | | | | | | | | | | | | | | | | | | | | | | | | | | | | | | | | | | | | | | | | | | | | |
| 12-31-14 | | | 29.75 | | | | 0.02 | | | | 1.17 | | | | 1.19 | | | | 0.04 | | | | 0.47 | | | | — | | | | 0.51 | | | | — | | | | 30.43 | | | | 4.17 | | | | 1.48 | | | | 1.38 | | | | 1.38 | | | | 0.05 | | | | 6,874 | | | | 10 | |
| 12-31-13 | | | 22.62 | | | | (0.03 | )• | | | 8.61 | | | | 8.58 | | | | 0.39 | | | | 1.06 | | | | — | | | | 1.45 | | | | — | | | | 29.75 | | | | 38.68 | | | | 1.49 | | | | 1.39 | | | | 1.39 | | | | (0.11 | ) | | | 6,312 | | | | 8 | |
| 12-31-12 | | | 18.93 | | | | 0.36 | • | | | 3.33 | | | | 3.69 | | | | — | | | | — | | | | — | | | | — | | | | — | | | | 22.62 | | | | 19.49 | | | | 1.52 | | | | 1.42 | | | | 1.42 | | | | 1.70 | | | | 1,427 | | | | 15 | |
| 12-31-11 | | | 18.55 | | | | (0.13 | )• | | | 0.51 | | | | 0.38 | | | | — | | | | — | | | | — | | | | — | | | | — | | | | 18.93 | | | | 2.05 | | | | 1.58 | | | | 1.48 | | | | 1.48 | | | | (0.68 | ) | | | 339 | | | | 14 | |
| 12-31-10 | | | 14.69 | | | | (0.09 | ) | | | 3.95 | | | | 3.86 | | | | — | | | | — | | | | — | | | | — | | | | — | | | | 18.55 | | | | 26.28 | | | | 1.58 | | | | 1.48 | † | | | 1.48 | † | | | (0.58 | )† | | | 6 | | | | 19 | |
| VY® Columbia Contrarian Core Portfolio | | | | | | | | | | | | | | | | | | | | | | | | | | | | | | | | | | | | | | | | | | | | | | | | | | | | | | | | | | | | | | | | | | | | |
| Class ADV | | | | | | | | | | | | | | | | | | | | | | | | | | | | | | | | | | | | | | | | | | | | | | | | | | | | | | | | | | | | | | | | | | | | |
| 12-31-14 | | | 24.56 | | | | 0.14 | • | | | 2.70 | | | | 2.84 | | | | 0.17 | | | | 3.23 | | | | — | | | | 3.40 | | | | — | | | | 24.00 | | | | 12.50 | | | | 1.44 | | | | 1.18 | | | | 1.17 | | | | 0.56 | | | | 17,942 | | | | 72 | |
| 12-31-13 | | | 18.49 | | | | 0.11 | | | | 6.23 | | | | 6.34 | | | | 0.27 | | | | — | | | | — | | | | 0.27 | | | | — | | | | 24.56 | | | | 34.42 | | | | 1.46 | | | | 1.24 | | | | 1.23 | | | | 0.55 | | | | 15,554 | | | | 128 | |
| 12-31-12 | | | 16.53 | | | | 0.15 | | | | 1.83 | | | | 1.98 | | | | 0.02 | | | | — | | | | — | | | | 0.02 | | | | — | | | | 18.49 | | | | 11.99 | | | | 1.44 | | | | 1.25 | | | | 1.25 | | | | 0.86 | | | | 10,347 | | | | 20 | |
| 12-31-11 | | | 17.57 | | | | 0.05 | • | | | (0.93 | ) | | | (0.88 | ) | | | 0.16 | | | | — | | | | — | | | | 0.16 | | | | — | | | | 16.53 | | | | (4.92 | ) | | | 1.40 | | | | 1.38 | | | | 1.38 | | | | 0.31 | | | | 9,266 | | | | 12 | |
| 12-31-10 | | | 15.77 | | | | 0.05 | • | | | 1.80 | | | | 1.85 | | | | 0.05 | | | | — | | | | — | | | | 0.05 | | | | — | | | | 17.57 | | | | 11.79 | | | | 1.40 | | | | 1.38 | | | | 1.38 | | | | 0.30 | | | | 8,442 | | | | 15 | |
| Class I | | | | | | | | | | | | | | | | | | | | | | | | | | | | | | | | | | | | | | | | | | | | | | | | | | | | | | | | | | | | | | | | | | | | |
| 12-31-14 | | | 25.24 | | | | 0.27 | | | | 2.79 | | | | 3.06 | | | | 0.25 | | | | 3.23 | | | | — | | | | 3.48 | | | | — | | | | 24.82 | | | | 13.09 | | | | 0.94 | | | | 0.68 | | | | 0.67 | | | | 1.07 | | | | 11,751 | | | | 72 | |
| 12-31-13 | | | 18.96 | | | | 0.18 | • | | | 6.45 | | | | 6.63 | | | | 0.35 | | | | — | | | | — | | | | 0.35 | | | | — | | | | 25.24 | | | | 35.18 | | | | 0.96 | | | | 0.74 | | | | 0.72 | | | | 0.87 | | | | 10,991 | | | | 128 | |
| 12-31-12 | | | 16.94 | | | | 0.25 | • | | | 1.87 | | | | 2.12 | | | | 0.10 | | | | — | | | | — | | | | 0.10 | | | | — | | | | 18.96 | | | | 12.56 | | | | 0.94 | | | | 0.75 | | | | 0.75 | | | | 1.37 | | | | 92,694 | | | | 20 | |
| 12-31-11 | | | 17.99 | | | | 0.14 | | | | (0.97 | ) | | | (0.83 | ) | | | 0.22 | | | | — | | | | — | | | | 0.22 | | | | — | | | | 16.94 | | | | (4.52 | ) | | | 0.90 | | | | 0.88 | | | | 0.88 | | | | 0.80 | | | | 109,831 | | | | 12 | |
| 12-31-10 | | | 16.12 | | | | 0.12 | • | | | 1.85 | | | | 1.97 | | | | 0.10 | | | | — | | | | — | | | | 0.10 | | | | — | | | | 17.99 | | | | 12.33 | | | | 0.90 | | | | 0.88 | | | | 0.88 | | | | 0.74 | | | | 143,679 | | | | 15 | |
| Class S | | | | | | | | | | | | | | | | | | | | | | | | | | | | | | | | | | | | | | | | | | | | | | | | | | | | | | | | | | | | | | | | | | | | |
| 12-31-14 | | | 24.93 | | | | 0.21 | | | | 2.75 | | | | 2.96 | | | | 0.21 | | | | 3.23 | | | | — | | | | 3.44 | | | | — | | | | 24.45 | | | | 12.81 | | | | 1.19 | | | | 0.93 | | | | 0.92 | | | | 0.82 | | | | 331,659 | | | | 72 | |
| 12-31-13 | | | 18.75 | | | | 0.18 | • | | | 6.30 | | | | 6.48 | | | | 0.30 | | | | — | | | | — | | | | 0.30 | | | | — | | | | 24.93 | | | | 34.74 | | | | 1.21 | | | | 0.99 | | | | 0.98 | | | | 0.80 | | | | 327,459 | | | | 128 | |
| 12-31-12 | | | 16.75 | | | | 0.20 | • | | | 1.85 | | | | 2.05 | | | | 0.05 | | | | — | | | | — | | | | 0.05 | | | | — | | | | 18.75 | | | | 12.27 | | | | 1.19 | | | | 1.00 | | | | 1.00 | | | | 1.09 | | | | 272,420 | | | | 20 | |
| 12-31-11 | | | 17.76 | | | | 0.09 | • | | | (0.93 | ) | | | (0.84 | ) | | | 0.17 | | | | — | | | | — | | | | 0.17 | | | | — | | | | 16.75 | | | | (4.63 | ) | | | 1.15 | | | | 1.13 | | | | 1.13 | | | | 0.56 | | | | 270,261 | | | | 12 | |
| 12-31-10 | | | 15.93 | | | | 0.09 | | | | 1.81 | | | | 1.90 | | | | 0.07 | | | | — | | | | — | | | | 0.07 | | | | — | | | | 17.76 | | | | 11.99 | | | | 1.15 | | | | 1.13 | | | | 1.13 | | | | 0.51 | | | | 328,415 | | | | 15 | |
| VY® Columbia Small Cap Value II Portfolio | | | | | | | | | | | | | | | | | | | | | | | | | | | | | | | | | | | | | | | | | | | | | | | | | | | | | | | | | | | | | | | | | | | | |
| Class ADV | | | | | | | | | | | | | | | | | | | | | | | | | | | | | | | | | | | | | | | | | | | | | | | | | | | | | | | | | | | | | | | | | | | | |
| 12-31-14 | | | 15.63 | | | | 0.03 | • | | | 0.61 | | | | 0.64 | | | | 0.04 | | | | — | | | | — | | | | 0.04 | | | | — | | | | 16.23 | | | | 4.12 | | | | 1.39 | | | | 1.36 | | | | 1.35 | | | | 0.18 | | | | 30,927 | | | | 52 | |
| 12-31-13 | | | 11.28 | | | | 0.01 | • | | | 4.44 | | | | 4.45 | | | | 0.10 | | | | — | | | | — | | | | 0.10 | | | | — | | | | 15.63 | | | | 39.58 | | | | 1.38 | | | | 1.36 | | | | 1.36 | | | | 0.10 | | | | 12,246 | | | | 39 | |
| 12-31-12 | | | 9.92 | | | | 0.06 | | | | 1.33 | | | | 1.39 | | | | 0.03 | | | | — | | | | — | | | | 0.03 | | | | — | | | | 11.28 | | | | 14.01 | | | | 1.39 | | | | 1.39 | | | | 1.37 | | | | 0.69 | | | | 6,763 | | | | 44 | |
| 12-31-11 | | | 10.29 | | | | (0.01 | ) | | | (0.30 | ) | | | (0.31 | ) | | | 0.06 | | | | — | | | | — | | | | 0.06 | | | | — | | | | 9.92 | | | | (2.96 | ) | | | 1.40 | | | | 1.40 | | | | 1.38 | | | | 0.06 | | | | 4,677 | | | | 36 | |
| 12-31-10 | | | 8.36 | | | | 0.02 | • | | | 2.04 | | | | 2.06 | | | | 0.13 | | | | — | | | | — | | | | 0.13 | | | | — | | | | 10.29 | | | | 24.98 | | | | 1.40 | | | | 1.40 | † | | | 1.37 | † | | | 0.25 | † | | | 2,071 | | | | 62 | |
| Class I | | | | | | | | | | | | | | | | | | | | | | | | | | | | | | | | | | | | | | | | | | | | | | | | | | | | | | | | | | | | | | | | | | | | |
| 12-31-14 | | | 15.99 | | | | 0.11 | • | | | 0.63 | | | | 0.74 | | | | 0.06 | | | | — | | | | — | | | | 0.06 | | | | — | | | | 16.67 | | | | 4.68 | | | | 0.89 | | | | 0.86 | | | | 0.85 | | | | 0.67 | | | | 49,412 | | | | 52 | |
| 12-31-13 | | | 11.51 | | | | 0.08 | • | | | 4.54 | | | | 4.62 | | | | 0.14 | | | | — | | | | — | | | | 0.14 | | | | — | | | | 15.99 | | | | 40.27 | | | | 0.88 | | | | 0.86 | | | | 0.86 | | | | 0.60 | | | | 23,620 | | | | 39 | |
| 12-31-12 | | | 10.10 | | | | 0.12 | • | | | 1.35 | | | | 1.47 | | | | 0.06 | | | | — | | | | — | | | | 0.06 | | | | — | | | | 11.51 | | | | 14.56 | | | | 0.89 | | | | 0.89 | | | | 0.87 | | | | 1.14 | | | | 16,180 | | | | 44 | |
| 12-31-11 | | | 10.44 | | | | 0.03 | • | | | (0.30 | ) | | | (0.27 | ) | | | 0.07 | | | | — | | | | — | | | | 0.07 | | | | — | | | | 10.10 | | | | (2.48 | ) | | | 0.90 | | | | 0.90 | | | | 0.88 | | | | 0.31 | | | | 17,304 | | | | 36 | |
| 12-31-10 | | | 8.46 | | | | 0.06 | | | | 2.06 | | | | 2.12 | | | | 0.14 | | | | — | | | | — | | | | 0.14 | | | | — | | | | 10.44 | | | | 25.48 | | | | 0.90 | | | | 0.90 | † | | | 0.87 | † | | | 0.67 | † | | | 55,866 | | | | 62 | |
| Class S | | | | | | | | | | | | | | | | | | | | | | | | | | | | | | | | | | | | | | | | | | | | | | | | | | | | | | | | | | | | | | | | | | | | |
| 12-31-14 | | | 15.92 | | | | 0.06 | | | | 0.63 | | | | 0.69 | | | | 0.03 | | | | — | | | | — | | | | 0.03 | | | | — | | | | 16.58 | | | | 4.33 | | | | 1.14 | | | | 1.11 | | | | 1.10 | | | | 0.36 | | | | 160,726 | | | | 52 | |
| 12-31-13 | | | 11.46 | | | | 0.05 | • | | | 4.52 | | | | 4.57 | | | | 0.11 | | | | — | | | | — | | | | 0.11 | | | | — | | | | 15.92 | | | | 39.97 | | | | 1.13 | | | | 1.11 | | | | 1.11 | | | | 0.34 | | | | 161,750 | | | | 39 | |
| 12-31-12 | | | 10.06 | | | | 0.10 | • | | | 1.33 | | | | 1.43 | | | | 0.03 | | | | — | | | | — | | | | 0.03 | | | | — | | | | 11.46 | | | | 14.20 | | | | 1.14 | | | | 1.14 | | | | 1.12 | | | | 0.88 | | | | 135,653 | | | | 44 | |
| 12-31-11 | | | 10.39 | | | | 0.03 | | | | (0.32 | ) | | | (0.29 | ) | | | 0.04 | | | | — | | | | — | | | | 0.04 | | | | — | | | | 10.06 | | | | (2.69 | ) | | | 1.15 | | | | 1.15 | | | | 1.13 | | | | 0.21 | | | | 138,626 | | | | 36 | |
| 12-31-10 | | | 8.41 | | | | 0.04 | • | | | 2.06 | | | | 2.10 | | | | 0.12 | | | | — | | | | — | | | | 0.12 | | | | — | | | | 10.39 | | | | 25.28 | | | | 1.15 | | | | 1.15 | † | | | 1.12 | † | | | 0.41 | † | | | 167,293 | | | | 62 | |
See Accompanying Notes to Financial Statements
| FINANCIAL HIGHLIGHTS (CONTINUED) |
| | | | | | Income (loss) | | | | | | | | | | | | | | | | | | | | | | | | | | | | | | | | | | | | | | | | | | | |
| | | | | | from | | | | | | | | | | | | | | | | | | | | | | | | | | | | | | | | | | | | | | | | | | | |
| | | | | | investment | | | | | | | | | | | | | | | | | | | | | | | | | | | | | | | | | | | | | | | Supplemental | |
| | | | | | operations | | | | | | Less Distributions | | | | | | | | | | | | | | | Ratios to average net assets | | | Data | |
| | | Net asset
value,
beginning
of year
or period | | | Net
investment
income
(loss) | | | Net
realized
and
unrealized
gain
(loss) | | | Total from
investment
operations | | | From net
investment
income | | | From net
realized
gains | | | From
return of
capital | | | Total
distributions | | | Payment
by
affiliate | | | Net
asset
value,
end
of
year
or
period | | | Total
Return(1) | | | Expenses
before
reductions/
additions(2)
(3)(4) | | | Expenses
net of fee
waivers
and/or
recoupments
if any(2)(3)(4) | | | Expense
net of all
reductions/
additions(2)
(3)(4) | | | Net
investment
income
(loss) (2)(3) | | | Net
assets,
end of
year or
period | | | Portfolio
turnover
rate | |
| Year or | | | | | | | | | | | | | | | | | | | | | | | | | | | | | | | | | | | | | | | | | | | | | | | | | | | |
| period ended | | ($) | | | ($) | | | ($) | | | ($) | | | ($) | | | ($) | | | ($) | | | ($) | | | ($) | | | ($) | | | (%) | | | (%) | | | (%) | | | (%) | | | (%) | | | ($000’s) | | | (%) | |
| VY® Columbia Small Cap Value II Portfolio (continued) | | | | | | | | | | | | | | | | | | | | | | | | | | | | | | | | | | | | | | | | | | | | | | | | | | | | | | | | | | | | | | | | | | | | |
| Class S2 | | | | | | | | | | | | | | | | | | | | | | | | | | | | | | | | | | | | | | | | | | | | | | | | | | | | | | | | | | | | | | | | | | | | |
| 12-31-14 | | | 15.59 | | | | 0.05 | • | | | 0.61 | | | | 0.66 | | | | 0.05 | | | | — | | | | — | | | | 0.05 | | | | — | | | | 16.20 | | | | 4.28 | | | | 1.39 | | | | 1.26 | | | | 1.25 | | | | 0.30 | | | | 3,967 | | | | 52 | |
| 12-31-13 | | | 11.24 | | | | 0.02 | | | | 4.43 | | | | 4.45 | | | | 0.10 | | | | — | | | | — | | | | 0.10 | | | | — | | | | 15.59 | | | | 39.68 | | | | 1.38 | | | | 1.26 | | | | 1.26 | | | | 0.19 | | | | 978 | | | | 39 | |
| 12-31-12 | | | 9.90 | | | | 0.07 | | | | 1.32 | | | | 1.39 | | | | 0.05 | | | | — | | | | — | | | | 0.05 | | | | — | | | | 11.24 | | | | 14.07 | | | | 1.39 | | | | 1.29 | | | | 1.27 | | | | 0.76 | | | | 604 | | | | 44 | |
| 12-31-11 | | | 10.27 | | | | 0.04 | | | | (0.35 | ) | | | (0.31 | ) | | | 0.06 | | | | — | | | | — | | | | 0.06 | | | | — | | | | 9.90 | | | | (2.88 | ) | | | 1.40 | | | | 1.30 | | | | 1.28 | | | | 0.49 | | | | 436 | | | | 36 | |
| 12-31-10 | | | 8.33 | | | | 0.03 | | | | 2.03 | | | | 2.06 | | | | 0.12 | | | | — | | | | — | | | | 0.12 | | | | — | | | | 10.27 | | | | 25.04 | | | | 1.40 | | | | 1.30 | † | | | 1.27 | † | | | 0.29 | † | | | 6 | | | | 62 | |
| VY® Invesco Comstock Portfolio | | | | | | | | | | | | | | | | | | | | | | | | | | | | | | | | | | | | | | | | | | | | | | | | | | | | | | | | | | | | | | | | | | | | |
| Class ADV | | | | | | | | | | | | | | | | | | | | | | | | | | | | | | | | | | | | | | | | | | | | | | | | | | | | | | | | | | | | | | | | | | | | |
| 12-31-14 | | | 15.34 | | | | 0.19 | | | | 1.17 | | | | 1.36 | | | | 0.28 | | | | — | | | | — | | | | 0.28 | | | | — | | | | 16.42 | | | | 8.82 | | | | 1.24 | | | | 1.22 | | | | 1.22 | | | | 1.20 | | | | 41,258 | | | | 26 | |
| 12-31-13 | | | 11.44 | | | | 0.11 | | | | 3.87 | | | | 3.98 | | | | 0.08 | | | | — | | | | — | | | | 0.08 | | | | — | | | | 15.34 | | | | 34.79 | | | | 1.24 | | | | 1.24 | | | | 1.24 | | | | 0.87 | | | | 36,783 | | | | 15 | |
| 12-31-12 | | | 9.77 | | | | 0.13 | | | | 1.66 | | | | 1.79 | | | | 0.12 | | | | — | | | | — | | | | 0.12 | | | | — | | | | 11.44 | | | | 18.30 | | | | 1.28 | | | | 1.27 | | | | 1.26 | | | | 1.25 | | | | 22,633 | | | | 18 | |
| 12-31-11 | | | 10.13 | | | | 0.11 | | | | (0.35 | ) | | | (0.24 | ) | | | 0.12 | | | | — | | | | — | | | | 0.12 | | | | — | | | | 9.77 | | | | (2.32 | ) | | | 1.35 | | | | 1.31 | | | | 1.31 | | | | 1.09 | | | | 17,338 | | | | 23 | |
| 12-31-10 | | | 8.92 | | | | 0.09 | | | | 1.23 | | | | 1.32 | | | | 0.11 | | | | — | | | | — | | | | 0.11 | | | | — | | | | 10.13 | | | | 14.81 | | | | 1.35 | | | | 1.31 | † | | | 1.31 | † | | | 0.90 | † | | | 17,041 | | | | 23 | |
| Class I | | | | | | | | | | | | | | | | | | | | | | | | | | | | | | | | | | | | | | | | | | | | | | | | | | | | | | | | | | | | | | | | | | | | |
| 12-31-14 | | | 15.45 | | | | 0.28 | | | | 1.17 | | | | 1.45 | | | | 0.35 | | | | — | | | | — | | | | 0.35 | | | | — | | | | 16.55 | | | | 9.39 | | | | 0.74 | | | | 0.72 | | | | 0.72 | | | | 1.70 | | | | 143,633 | | | | 26 | |
| 12-31-13 | | | 11.51 | | | | 0.19 | | | | 3.89 | | | | 4.08 | | | | 0.14 | | | | — | | | | — | | | | 0.14 | | | | — | | | | 15.45 | | | | 35.47 | | | | 0.74 | | | | 0.74 | | | | 0.74 | | | | 1.38 | | | | 58,373 | | | | 15 | |
| 12-31-12 | | | 9.83 | | | | 0.19 | • | | | 1.66 | | | | 1.85 | | | | 0.17 | | | | — | | | | — | | | | 0.17 | | | | — | | | | 11.51 | | | | 18.83 | | | | 0.78 | | | | 0.77 | | | | 0.76 | | | | 1.74 | | | | 48,793 | | | | 18 | |
| 12-31-11 | | | 10.19 | | | | 0.16 | | | | (0.35 | ) | | | (0.19 | ) | | | 0.17 | | | | — | | | | — | | | | 0.17 | | | | — | | | | 9.83 | | | | (1.81 | ) | | | 0.85 | | | | 0.81 | | | | 0.81 | | | | 1.59 | | | | 45,814 | | | | 23 | |
| 12-31-10 | | | 8.97 | | | | 0.14 | | | | 1.23 | | | | 1.37 | | | | 0.15 | | | | — | | | | — | | | | 0.15 | | | | — | | | | 10.19 | | | | 15.38 | | | | 0.85 | | | | 0.81 | † | | | 0.81 | † | | | 1.40 | † | | | 49,022 | | | | 23 | |
| Class S | | | | | | | | | | | | | | | | | | | | | | | | | | | | | | | | | | | | | | | | | | | | | | | | | | | | | | | | | | | | | | | | | | | | |
| 12-31-14 | | | 15.43 | | | | 0.24 | | | | 1.17 | | | | 1.41 | | | | 0.31 | | | | — | | | | — | | | | 0.31 | | | | — | | | | 16.53 | | | | 9.13 | | | | 0.99 | | | | 0.97 | | | | 0.97 | | | | 1.44 | | | | 383,997 | | | | 26 | |
| 12-31-13 | | | 11.51 | | | | 0.15 | | | | 3.88 | | | | 4.03 | | | | 0.11 | | | | — | | | | — | | | | 0.11 | | | | — | | | | 15.43 | | | | 35.00 | | | | 0.99 | | | | 0.99 | | | | 0.99 | | | | 1.13 | | | | 367,659 | | | | 15 | |
| 12-31-12 | | | 9.82 | | | | 0.16 | • | | | 1.67 | | | | 1.83 | | | | 0.14 | | | | — | | | | — | | | | 0.14 | | | | — | | | | 11.51 | | | | 18.66 | | | | 1.03 | | | | 1.02 | | | | 1.01 | | | | 1.49 | | | | 259,717 | | | | 18 | |
| 12-31-11 | | | 10.18 | | | | 0.15 | | | | (0.37 | ) | | | (0.22 | ) | | | 0.14 | | | | — | | | | — | | | | 0.14 | | | | — | | | | 9.82 | | | | (2.09 | ) | | | 1.10 | | | | 1.06 | | | | 1.06 | | | | 1.34 | | | | 238,369 | | | | 23 | |
| 12-31-10 | | | 8.96 | | | | 0.11 | | | | 1.24 | | | | 1.35 | | | | 0.13 | | | | — | | | | — | | | | 0.13 | | | | — | | | | 10.18 | | | | 15.13 | | | | 1.10 | | | | 1.06 | † | | | 1.06 | † | | | 1.15 | † | | | 264,791 | | | | 23 | |
| VY® Invesco Equity and Income Portfolio | | | | | | | | | | | | | | | | | | | | | | | | | | | | | | | | | | | | | | | | | | | | | | | | | | | | | | | | | | | | | | | | | | | | |
| Class ADV | | | | | | | | | | | | | | | | | | | | | | | | | | | | | | | | | | | | | | | | | | | | | | | | | | | | | | | | | | | | | | | | | | | | |
| 12-31-14 | | | 44.34 | | | | 0.61 | • | | | 3.09 | | | | 3.70 | | | | 0.55 | | | | 1.24 | | | | — | | | | 1.79 | | | | — | | | | 46.25 | | | | 8.43 | | | | 1.16 | | | | 1.14 | | | | 1.14 | | | | 1.34 | | | | 52,407 | | | | 157 | |
| 12-31-13 | | | 36.01 | | | | 0.49 | • | | | 8.27 | | | | 8.76 | | | | 0.43 | | | | — | | | | — | | | | 0.43 | | | | — | | | | 44.34 | | | | 24.33 | | | | 1.18 | | | | 1.15 | | | | 1.15 | | | | 1.19 | | | | 32,942 | | | | 37 | |
| 12-31-12 | | | 32.57 | | | | 0.53 | • | | | 3.45 | | | | 3.98 | | | | 0.54 | | | | — | | | | — | | | | 0.54 | | | | — | | | | 36.01 | | | | 12.23 | | | | 1.18 | | | | 1.15 | | | | 1.15 | | | | 1.52 | | | | 19,776 | | | | 27 | |
| 12-31-11 | | | 33.75 | | | | 0.49 | • | | | (1.04 | ) | | | (0.55 | ) | | | 0.63 | | | | — | | | | — | | | | 0.63 | | | | — | | | | 32.57 | | | | (1.58 | ) | | | 1.15 | | | | 1.15 | | | | 1.15 | | | | 1.46 | | | | 22,313 | | | | 20 | |
| 12-31-10 | | | 30.64 | | | | 0.46 | • | | | 3.13 | | | | 3.59 | | | | 0.48 | | | | — | | | | — | | | | 0.48 | | | | — | | | | 33.75 | | | | 11.77 | | | | 1.15 | | | | 1.15 | † | | | 1.15 | † | | | 1.44 | † | | | 14,995 | | | | 38 | |
| Class I | | | | | | | | | | | | | | | | | | | | | | | | | | | | | | | | | | | | | | | | | | | | | | | | | | | | | | | | | | | | | | | | | | | | |
| 12-31-14 | | | 44.92 | | | | 0.87 | • | | | 3.11 | | | | 3.98 | | | | 0.73 | | | | 1.24 | | | | — | | | | 1.97 | | | | — | | | | 46.93 | | | | 8.96 | | | | 0.66 | | | | 0.64 | | | | 0.64 | | | | 1.87 | | | | 694,569 | | | | 157 | |
| 12-31-13 | | | 36.43 | | | | 0.71 | • | | | 8.38 | | | | 9.09 | | | | 0.60 | | | | — | | | | — | | | | 0.60 | | | | — | | | | 44.92 | | | | 24.96 | | | | 0.68 | | | | 0.65 | | | | 0.65 | | | | 1.70 | | | | 561,393 | | | | 37 | |
| 12-31-12 | | | 33.05 | | | | 0.71 | • | | | 3.51 | | | | 4.22 | | | | 0.84 | | | | — | | | | — | | | | 0.84 | | | | — | | | | 36.43 | | | | 12.79 | | | | 0.68 | | | | 0.65 | | | | 0.65 | | | | 2.01 | | | | 499,847 | | | | 27 | |
| 12-31-11 | | | 34.22 | | | | 0.66 | • | | | (1.05 | ) | | | (0.39 | ) | | | 0.78 | | | | — | | | | — | | | | 0.78 | | | | — | | | | 33.05 | | | | (1.08 | ) | | | 0.65 | | | | 0.65 | | | | 0.65 | | | | 1.93 | | | | 530,983 | | | | 20 | |
| 12-31-10 | | | 31.03 | | | | 0.63 | • | | | 3.18 | | | | 3.81 | | | | 0.62 | | | | — | | | | — | | | | 0.62 | | | | — | | | | 34.22 | | | | 12.32 | | | | 0.65 | | | | 0.65 | † | | | 0.65 | † | | | 1.96 | † | | | 594,282 | | | | 38 | |
| Class S | | | | | | | | | | | | | | | | | | | | | | | | | | | | | | | | | | | | | | | | | | | | | | | | | | | | | | | | | | | | | | | | | | | | |
| 12-31-14 | | | 44.65 | | | | 0.64 | • | | | 3.20 | | | | 3.84 | | | | 0.66 | | | | 1.24 | | | | — | | | | 1.90 | | | | — | | | | 46.59 | | | | 8.69 | | | | 0.91 | | | | 0.89 | | | | 0.89 | | | | 1.39 | | | | 889,726 | | | | 157 | |
| 12-31-13 | | | 36.23 | | | | 0.60 | • | | | 8.32 | | | | 8.92 | | | | 0.50 | | | | — | | | | — | | | | 0.50 | | | | — | | | | 44.65 | | | | 24.64 | | | | 0.93 | | | | 0.90 | | | | 0.90 | | | | 1.45 | | | | 271,953 | | | | 37 | |
| 12-31-12 | | | 32.81 | | | | 0.62 | • | | | 3.48 | | | | 4.10 | | | | 0.68 | | | | — | | | | — | | | | 0.68 | | | | — | | | | 36.23 | | | | 12.52 | | | | 0.93 | | | | 0.90 | | | | 0.90 | | | | 1.76 | | | | 198,595 | | | | 27 | |
| 12-31-11 | | | 33.97 | | | | 0.57 | • | | | (1.04 | ) | | | (0.47 | ) | | | 0.69 | | | | — | | | | — | | | | 0.69 | | | | — | | | | 32.81 | | | | (1.33 | ) | | | 0.90 | | | | 0.90 | | | | 0.90 | | | | 1.67 | | | | 205,145 | | | | 20 | |
| 12-31-10 | | | 30.81 | | | | 0.54 | • | | | 3.16 | | | | 3.70 | | | | 0.54 | | | | — | | | | — | | | | 0.54 | | | | — | | | | 33.97 | | | | 12.05 | | | | 0.90 | | | | 0.90 | † | | | 0.90 | † | | | 1.71 | † | | | 240,865 | | | | 38 | |
See Accompanying Notes to Financial Statements
| FINANCIAL HIGHLIGHTS (CONTINUED) |
| | | | | | Income (loss) | | | | | | | | | | | | | | | | | | | | | | | | | | | | | | | | | | | | | | | | | | | |
| | | | | | from | | | | | | | | | | | | | | | | | | | | | | | | | | | | | | | | | | | | | | | | | | | |
| | | | | | investment | | | | | | | | | | | | | | | | | | | | | | | | | | | | | | | | | | | | | | | Supplemental | |
| | | | | | operations | | | | | | Less Distributions | | | | | | | | | | | | | | | Ratios to average net assets | | | Data | |
| | | Net asset
value,
beginning of
year or
period | | | Net
investment
income
(loss) | | | Net
realized
and
unrealized
gain
(loss) | | | Total from
investment
operations | | | From net
investment
income | | | From net
realized
gains | | | From
return of
capital | | | Total
distributions | | | Payment
by
affiliate | | | Net
asset
value,
end
of
year
or
period | | | Total
Return(1) | | | Expenses
before
reductions/
additions(2)
(3)(4) | | | Expenses
net of fee
waivers
and/or
recoupments
if any(2)(3)(4) | | | Expense
net of all
reductions/
additions(2)
(3)(4) | | | Net
investment
income
(loss) (2)(3) | | | Net
assets,
end of
year or
period | | | Portfolio
turnover
rate | |
| Year or | | | | | | | | | | | | | | | | | | | | | | | | | | | | | | | | | | | | | | | | | | | | | | | | | | | |
| period ended | | ($) | | | ($) | | | ($) | | | ($) | | | ($) | | | ($) | | | ($) | | | ($) | | | ($) | | | ($) | | | (%) | | | (%) | | | (%) | | | (%) | | | (%) | | | ($000’s) | | | (%) | |
| VY® Invesco Equity and Income Portfolio (continued) | | | | | | | | | | | | | | | | | | | | | | | | | | | | | | | | | | | | | | | | | | | | | | | | | | | | | | | | | | | | | | | | | | | | |
| Class S2 | | | | | | | | | | | | | | | | | | | | | | | | | | | | | | | | | | | | | | | | | | | | | | | | | | | | | | | | | | | | | | | | | | | | |
| 12-31-14 | | | 44.13 | | | | 0.43 | • | | | 3.29 | | | | 3.72 | | | | 0.58 | | | | 1.24 | | | | — | | | | 1.82 | | | | — | | | | 46.03 | | | | 8.54 | | | | 1.16 | | | | 1.02 | | | | 1.02 | | | | 0.95 | | | | 522,608 | | | | 157 | |
| 12-31-13 | | | 35.87 | | | | 0.54 | • | | | 8.24 | | | | 8.78 | | | | 0.52 | | | | — | | | | — | | | | 0.52 | | | | — | | | | 44.13 | | | | 24.47 | | | | 1.18 | | | | 1.05 | | | | 1.05 | | | | 1.31 | | | | 4,078 | | | | 37 | |
| 12-31-12 | | | 32.52 | | | | 0.56 | • | | | 3.45 | | | | 4.01 | | | | 0.66 | | | | — | | | | — | | | | 0.66 | | | | — | | | | 35.87 | | | | 12.34 | | | | 1.18 | | | | 1.05 | | | | 1.05 | | | | 1.60 | | | | 1,540 | | | | 27 | |
| 12-31-11 | | | 33.70 | | | | 0.52 | • | | | (1.03 | ) | | | (0.51 | ) | | | 0.67 | | | | — | | | | — | | | | 0.67 | | | | — | | | | 32.52 | | | | (1.48 | ) | | | 1.15 | | | | 1.05 | | | | 1.05 | | | | 1.55 | | | | 967 | | | | 20 | |
| 12-31-10 | | | 30.62 | | | | 0.50 | • | | | 3.12 | | | | 3.62 | | | | 0.54 | | | | — | | | | — | | | | 0.54 | | | | — | | | | 33.70 | | | | 11.88 | | | | 1.15 | | | | 1.05 | † | | | 1.05 | † | | | 1.61 | † | | | 843 | | | | 38 | |
| VY® JPMorgan Mid Cap Value Portfolio | | | | | | | | | | | | | | | | | | | | | | | | | | | | | | | | | | | | | | | | | | | | | | | | | | | | | | | | | | | | | | | | | | | | |
| Class ADV | | | | | | | | | | | | | | | | | | | | | | | | | | | | | | | | | | | | | | | | | | | | | | | | | | | | | | | | | | | | | | | | | | | | |
| 12-31-14 | | | 20.96 | | | | 0.11 | | | | 2.84 | | | | 2.95 | | | | 0.14 | | | | 1.30 | | | | — | | | | 1.44 | | | | — | | | | 22.47 | | | | 14.66 | | | | 1.36 | | | | 1.36 | | | | 1.36 | | | | 0.54 | | | | 91,446 | | | | 22 | |
| 12-31-13 | | | 16.57 | | | | 0.06 | | | | 5.07 | | | | 5.13 | | | | 0.08 | | | | 0.66 | | | | — | | | | 0.74 | | | | — | | | | 20.96 | | | | 31.26 | | | | 1.36 | | | | 1.36 | | | | 1.36 | | | | 0.39 | | | | 78,395 | | | | 25 | |
| 12-31-12 | | | 13.91 | | | | 0.09 | | | | 2.65 | | | | 2.74 | | | | 0.08 | | | | — | | | | — | | | | 0.08 | | | | — | | | | 16.57 | | | | 19.69 | | | | 1.43 | | | | 1.43 | | | | 1.43 | | | | 0.64 | | | | 42,637 | | | | 28 | |
| 12-31-11 | | | 13.78 | | | | 0.07 | | | | 0.15 | | | | 0.22 | | | | 0.09 | | | | — | | | | — | | | | 0.09 | | | | — | | | | 13.91 | | | | 1.60 | | | | 1.50 | | | | 1.50 | | | | 1.50 | | | | 0.54 | | | | 30,671 | | | | 36 | |
| 12-31-10 | | | 11.30 | | | | 0.07 | | | | 2.48 | | | | 2.55 | | | | 0.07 | | | | — | | | | — | | | | 0.07 | | | | — | | | | 13.78 | | | | 22.63 | | | | 1.50 | | | | 1.50 | † | | | 1.50 | † | | | 0.69 | † | | | 26,954 | | | | 40 | |
| Class I | | | | | | | | | | | | | | | | | | | | | | | | | | | | | | | | | | | | | | | | | | | | | | | | | | | | | | | | | | | | | | | | | | | | |
| 12-31-14 | | | 21.27 | | | | 0.23 | | | | 2.89 | | | | 3.12 | | | | 0.24 | | | | 1.30 | | | | — | | | | 1.54 | | | | — | | | | 22.85 | | | | 15.27 | | | | 0.86 | | | | 0.86 | | | | 0.86 | | | | 1.02 | | | | 272,496 | | | | 22 | |
| 12-31-13 | | | 16.79 | | | | 0.16 | | | | 5.14 | | | | 5.30 | | | | 0.16 | | | | 0.66 | | | | — | | | | 0.82 | | | | — | | | | 21.27 | | | | 31.89 | | | | 0.86 | | | | 0.86 | | | | 0.86 | | | | 0.88 | | | | 256,705 | | | | 25 | |
| 12-31-12 | | | 14.08 | | | | 0.17 | | | | 2.69 | | | | 2.86 | | | | 0.15 | | | | — | | | | — | | | | 0.15 | | | | — | | | | 16.79 | | | | 20.33 | | | | 0.93 | | | | 0.93 | | | | 0.93 | | | | 1.15 | | | | 171,485 | | | | 28 | |
| 12-31-11 | | | 13.95 | | | | 0.15 | | | | 0.13 | | | | 0.28 | | | | 0.15 | | | | — | | | | — | | | | 0.15 | | | | — | | | | 14.08 | | | | 2.07 | | | | 1.00 | | | | 1.00 | | | | 1.00 | | | | 1.03 | | | | 125,233 | | | | 36 | |
| 12-31-10 | | | 11.42 | | | | 0.14 | | | | 2.52 | | | | 2.66 | | | | 0.13 | | | | — | | | | — | | | | 0.13 | | | | — | | | | 13.95 | | | | 23.30 | | | | 1.00 | | | | 1.00 | † | | | 1.00 | † | | | 1.18 | † | | | 126,864 | | | | 40 | |
| Class S | | | | | | | | | | | | | | | | | | | | | | | | | | | | | | | | | | | | | | | | | | | | | | | | | | | | | | | | | | | | | | | | | | | | |
| 12-31-14 | | | 21.14 | | | | 0.18 | | | | 2.86 | | | | 3.04 | | | | 0.18 | | | | 1.30 | | | | — | | | | 1.48 | | | | — | | | | 22.70 | | | | 14.99 | | | | 1.11 | | | | 1.11 | | | | 1.11 | | | | 0.75 | | | | 352,277 | | | | 22 | |
| 12-31-13 | | | 16.70 | | | | 0.11 | | | | 5.11 | | | | 5.22 | | | | 0.12 | | | | 0.66 | | | | — | | | | 0.78 | | | | — | | | | 21.14 | | | | 31.54 | | | | 1.11 | | | | 1.11 | | | | 1.11 | | | | 0.63 | | | | 380,688 | | | | 25 | |
| 12-31-12 | | | 14.01 | | | | 0.13 | | | | 2.67 | | | | 2.80 | | | | 0.11 | | | | — | | | | — | | | | 0.11 | | | | — | | | | 16.70 | | | | 20.02 | | | | 1.18 | | | | 1.18 | | | | 1.18 | | | | 0.89 | | | | 248,115 | | | | 28 | |
| 12-31-11 | | | 13.88 | | | | 0.11 | | | | 0.14 | | | | 0.25 | | | | 0.12 | | | | — | | | | — | | | | 0.12 | | | | — | | | | 14.01 | | | | 1.82 | | | | 1.25 | | | | 1.25 | | | | 1.25 | | | | 0.78 | | | | 178,083 | | | | 36 | |
| 12-31-10 | | | 11.37 | | | | 0.11 | | | | 2.50 | | | | 2.61 | | | | 0.10 | | | | — | | | | — | | | | 0.10 | | | | — | | | | 13.88 | | | | 22.97 | | | | 1.25 | | | | 1.25 | † | | | 1.25 | † | | | 0.94 | † | | | 172,465 | | | | 40 | |
| Class S2 | | | | | | | | | | | | | | | | | | | | | | | | | | | | | | | | | | | | | | | | | | | | | | | | | | | | | | | | | | | | | | | | | | | | |
| 12-31-14 | | | 20.89 | | | | 0.13 | | | | 2.84 | | | | 2.97 | | | | 0.16 | | | | 1.30 | | | | — | | | | 1.46 | | | | — | | | | 22.40 | | | | 14.81 | | | | 1.36 | | | | 1.26 | | | | 1.26 | | | | 0.63 | | | | 5,643 | | | | 22 | |
| 12-31-13 | | | 16.52 | | | | 0.10 | • | | | 5.03 | | | | 5.13 | | | | 0.10 | | | | 0.66 | | | | — | | | | 0.76 | | | | — | | | | 20.89 | | | | 31.37 | | | | 1.36 | | | | 1.26 | | | | 1.26 | | | | 0.50 | | | | 5,066 | | | | 25 | |
| 12-31-12 | | | 13.88 | | | | 0.14 | • | | | 2.62 | | | | 2.76 | | | | 0.12 | | | | — | | | | — | | | | 0.12 | | | | — | | | | 16.52 | | | | 19.86 | | | | 1.43 | | | | 1.33 | | | | 1.33 | | | | 0.86 | | | | 2,664 | | | | 28 | |
| 12-31-11 | | | 13.79 | | | | 0.13 | • | | | 0.10 | | | | 0.23 | | | | 0.14 | | | | — | | | | — | | | | 0.14 | | | | — | | | | 13.88 | | | | 1.67 | | | | 1.50 | | | | 1.40 | | | | 1.40 | | | | 0.97 | | | | 178 | | | | 36 | |
| 12-31-10 | | | 11.30 | | | | 0.09 | | | | 2.48 | | | | 2.57 | | | | 0.08 | | | | — | | | | — | | | | 0.08 | | | | — | | | | 13.79 | | | | 22.75 | | | | 1.50 | | | | 1.40 | † | | | 1.40 | † | | | 0.76 | † | | | 5 | | | | 40 | |
| VY® Oppenheimer Global Portfolio | | | | | | | | | | | | | | | | | | | | | | | | | | | | | | | | | | | | | | | | | | | | | | | | | | | | | | | | | | | | | | | | | | | | |
| Class ADV | | | | | | | | | | | | | | | | | | | | | | | | | | | | | | | | | | | | | | | | | | | | | | | | | | | | | | | | | | | | | | | | | | | | |
| 12-31-14 | | | 18.28 | | | | 0.15 | | | | 0.19 | | | | 0.34 | | | | 0.15 | | | | 0.26 | | | | — | | | | 0.41 | | | | — | | | | 18.21 | | | | 1.86 | | | | 1.25 | | | | 1.25 | | | | 1.25 | | | | 0.81 | | | | 101,077 | | | | 12 | |
| 12-31-13 | | | 14.60 | | | | 0.12 | • | | | 3.73 | | | | 3.85 | | | | 0.17 | | | | — | | | | — | | | | 0.17 | | | | — | | | | 18.28 | | | | 26.46 | | | | 1.26 | | | | 1.26 | | | | 1.26 | | | | 0.70 | | | | 102,691 | | | | 11 | |
| 12-31-12 | | | 12.15 | | | | 0.14 | | | | 2.42 | | | | 2.56 | | | | 0.11 | | | | — | | | | — | | | | 0.11 | | | | — | | | | 14.60 | | | | 21.18 | | | | 1.22 | | | | 1.22 | | | | 1.22 | | | | 1.00 | | | | 76,791 | | | | 13 | |
| 12-31-11 | | | 13.46 | | | | 0.13 | | | | (1.29 | ) | | | (1.16 | ) | | | 0.15 | | | | — | | | | — | | | | 0.15 | | | | — | | | | 12.15 | | | | (8.60 | ) | | | 1.16 | | | | 1.16 | | | | 1.16 | | | | 0.96 | | | | 65,051 | | | | 12 | |
| 12-31-10 | | | 11.83 | | | | 0.11 | • | | | 1.69 | | | | 1.80 | | | | 0.17 | | | | — | | | | — | | | | 0.17 | | | | — | | | | 13.46 | | | | 15.42 | | | | 1.16 | | | | 1.16 | † | | | 1.16 | † | | | 0.88 | † | | | 71,603 | | | | 15 | |
| Class I | | | | | | | | | | | | | | | | | | | | | | | | | | | | | | | | | | | | | | | | | | | | | | | | | | | | | | | | | | | | | | | | | | | | |
| 12-31-14 | | | 18.89 | | | | 0.25 | • | | | 0.19 | | | | 0.44 | | | | 0.23 | | | | 0.26 | | | | — | | | | 0.49 | | | | — | | | | 18.84 | | | | 2.32 | | | | 0.75 | | | | 0.75 | | | | 0.75 | | | | 1.32 | | | | 1,320,671 | | | | 12 | |
| 12-31-13 | | | 15.06 | | | | 0.21 | • | | | 3.85 | | | | 4.06 | | | | 0.23 | | | | — | | | | — | | | | 0.23 | | | | — | | | | 18.89 | | | | 27.12 | | | | 0.76 | | | | 0.76 | | | | 0.76 | | | | 1.22 | | | | 1,481,760 | | | | 11 | |
| 12-31-12 | | | 12.54 | | | | 0.21 | • | | | 2.49 | | | | 2.70 | | | | 0.18 | | | | — | | | | — | | | | 0.18 | | | | — | | | | 15.06 | | | | 21.70 | | | | 0.72 | | | | 0.72 | | | | 0.72 | | | | 1.52 | | | | 1,324,037 | | | | 13 | |
| 12-31-11 | | | 13.88 | | | | 0.20 | • | | | (1.34 | ) | | | (1.14 | ) | | | 0.20 | | | | — | | | | — | | | | 0.20 | | | | — | | | | 12.54 | | | | (8.13 | ) | | | 0.66 | | | | 0.66 | | | | 0.66 | | | | 1.46 | | | | 1,234,551 | | | | 12 | |
| 12-31-10 | | | 12.17 | | | | 0.18 | • | | | 1.74 | | | | 1.92 | | | | 0.21 | | | | — | | | | — | | | | 0.21 | | | | — | | | | 13.88 | | | | 16.06 | | | | 0.66 | | | | 0.66 | † | | | 0.66 | † | | | 1.40 | † | | | 1,479,319 | | | | 15 | |
See Accompanying Notes to Financial Statements
| FINANCIAL HIGHLIGHTS (CONTINUED) |
| | | | | | Income (loss) | | | | | | | | | | | | | | | | | | | | | | | | | | | | | | | | | | | | | | | | | | | |
| | | | | | from | | | | | | | | | | | | | | | | | | | | | | | | | | | | | | | | | | | | | | | | | | | |
| | | | | | investment | | | | | | | | | | | | | | | | | | | | | | | | | | | | | | | | | | | | | | | Supplemental | |
| | | | | | operations | | | | | | Less Distributions | | | | | | | | | | | | | | | Ratios to average net assets | | | Data | |
| | | Net asset
value,
beginning of
year or
period | | | Net
investment
income
(loss) | | | Net
realized
and
unrealized
gain
(loss) | | | Total from
investment
operations | | | From net
investment
income | | | From net
realized
gains | | | From
return of
capital | | | Total
distributions | | | Payment
by
affiliate | | | Net
asset
value,
end
of
year
or
period | | | Total
Return(1) | | | Expenses
before
reductions/
additions(2)
(3)(4) | | | Expenses
net of fee
waivers
and/or
recoupments
if any(2)(3)(4) | | | Expense
net of all
reductions/
additions(2)
(3)(4) | | | Net
investment
income
(loss) (2)(3) | | | Net
assets,
end of
year or
period | | | Portfolio
turnover
rate | |
| Year or | | | | | | | | | | | | | | | | | | | | | | | | | | | | | | | | | | | | | | | | | | | | | | | | | | | |
| period ended | | ($) | | | ($) | | | ($) | | | ($) | | | ($) | | | ($) | | | ($) | | | ($) | | | ($) | | | ($) | | | (%) | | | (%) | | | (%) | | | (%) | | | (%) | | | ($000’s) | | | (%) | |
| VY® Oppenheimer Global Portfolio (continued) | | | | | | | | | | | | | | | | | | | | | | | | | | | | | | | | | | | | | | | | | | | | | | | | | | | | | | | | | | | | | | | | | | | | |
| Class S | | | | | | | | | | | | | | | | | | | | | | | | | | | | | | | | | | | | | | | | | | | | | | | | | | | | | | | | | | | | | | | | | | | | |
| 12-31-14 | | | 18.34 | | | | 0.20 | • | | | 0.18 | | | | 0.38 | | | | 0.18 | | | | 0.26 | | | | — | | | | 0.44 | | | | — | | | | 18.28 | | | | 2.09 | | | | 1.00 | | | | 1.00 | | | | 1.00 | | | | 1.08 | | | | 215,383 | | | | 12 | |
| 12-31-13 | | | 14.63 | | | | 0.15 | | | | 3.76 | | | | 3.91 | | | | 0.20 | | | | — | | | | — | | | | 0.20 | | | | — | | | | 18.34 | | | | 26.85 | | | | 1.01 | | | | 1.01 | | | | 1.01 | | | | 0.96 | | | | 252,672 | | | | 11 | |
| 12-31-12 | | | 12.19 | | | | 0.17 | • | | | 2.41 | | | | 2.58 | | | | 0.14 | | | | — | | | | — | | | | 0.14 | | | | — | | | | 14.63 | | | | 21.33 | | | | 0.97 | | | | 0.97 | | | | 0.97 | | | | 1.26 | | | | 192,122 | | | | 13 | |
| 12-31-11 | | | 13.50 | | | | 0.16 | | | | (1.30 | ) | | | (1.14 | ) | | | 0.17 | | | | — | | | | — | | | | 0.17 | | | | — | | | | 12.19 | | | | (8.38 | ) | | | 0.91 | | | | 0.91 | | | | 0.91 | | | | 1.20 | | | | 171,755 | | | | 12 | |
| 12-31-10 | | | 11.84 | | | | 0.14 | • | | | 1.70 | | | | 1.84 | | | | 0.18 | | | | — | | | | — | | | | 0.18 | | | | — | | | | 13.50 | | | | 15.80 | | | | 0.91 | | | | 0.91 | † | | | 0.91 | † | | | 1.17 | † | | | 184,961 | | | | 15 | |
| Class S2 | | | | | | | | | | | | | | | | | | | | | | | | | | | | | | | | | | | | | | | | | | | | | | | | | | | | | | | | | | | | | | | | | | | | |
| 12-31-14 | | | 17.98 | | | | 0.16 | • | | | 0.18 | | | | 0.34 | | | | 0.18 | | | | 0.26 | | | | — | | | | 0.44 | | | | — | | | | 17.88 | | | | 1.91 | | | | 1.25 | | | | 1.15 | | | | 1.15 | | | | 0.91 | | | | 4,827 | | | | 12 | |
| 12-31-13 | | | 14.37 | | | | 0.11 | • | | | 3.70 | | | | 3.81 | | | | 0.20 | | | | — | | | | — | | | | 0.20 | | | | — | | | | 17.98 | | | | 26.66 | | | | 1.26 | | | | 1.16 | | | | 1.16 | | | | 0.67 | | | | 4,287 | | | | 11 | |
| 12-31-12 | | | 12.01 | | | | 0.13 | • | | | 2.39 | | | | 2.52 | | | | 0.16 | | | | — | | | | — | | | | 0.16 | | | | — | | | | 14.37 | | | | 21.17 | | | | 1.22 | | | | 1.12 | | | | 1.12 | | | | 1.01 | | | | 2,082 | | | | 13 | |
| 12-31-11 | | | 13.36 | | | | 0.06 | • | | | (1.21 | ) | | | (1.15 | ) | | | 0.20 | | | | — | | | | — | | | | 0.20 | | | | — | | | | 12.01 | | | | (8.52 | ) | | | 1.16 | | | | 1.06 | | | | 1.06 | | | | 0.52 | | | | 755 | | | | 12 | |
| 12-31-10 | | | 11.73 | | | | 0.12 | | | | 1.68 | | | | 1.80 | | | | 0.17 | | | | — | | | | — | | | | 0.17 | | | | — | | | | 13.36 | | | | 15.63 | | | | 1.16 | | | | 1.06 | † | | | 1.06 | † | | | 0.98 | † | | | 5 | | | | 15 | |
| VY® Pioneer High Yield Portfolio | | | | | | | | | | | | | | | | | | | | | | | | | | | | | | | | | | | | | | | | | | | | | | | | | | | | | | | | | | | | | | | | | | | | |
| Class I | | | | | | | | | | | | | | | | | | | | | | | | | | | | | | | | | | | | | | | | | | | | | | | | | | | | | | | | | | | | | | | | | | | | |
| 12-31-14 | | | 12.41 | | | | 0.58 | | | | (0.53 | ) | | | 0.05 | | | | 0.59 | | | | — | | | | — | | | | 0.59 | | | | — | | | | 11.87 | | | | 0.27 | | | | 0.76 | | | | 0.71 | | | | 0.71 | | | | 4.73 | | | | 117,617 | | | | 35 | |
| 12-31-13 | | | 11.60 | | | | 0.60 | • | | | 0.80 | | | | 1.40 | | | | 0.59 | | | | — | | | | — | | | | 0.59 | | | | — | | | | 12.41 | | | | 12.33 | | | | 0.73 | | | | 0.71 | | | | 0.71 | | | | 4.93 | | | | 119,042 | | | | 51 | |
| 12-31-12 | | | 10.55 | | | | 0.63 | • | | | 1.04 | | | | 1.67 | | | | 0.62 | | | | — | | | | — | | | | 0.62 | | | | — | | | | 11.60 | | | | 16.21 | | | | 0.75 | | | | 0.71 | | | | 0.71 | | | | 5.58 | | | | 104,882 | | | | 34 | |
| 12-31-11 | | | 11.24 | | | | 0.63 | | | | (0.70 | ) | | | (0.07 | ) | | | 0.62 | | | | — | | | | — | | | | 0.62 | | | | — | | | | 10.55 | | | | (0.72 | ) | | | 0.77 | | | | 0.71 | | | | 0.71 | | | | 5.64 | | | | 87,529 | | | | 41 | |
| 12-31-10 | | | 10.05 | | | | 0.65 | | | | 1.19 | | | | 1.84 | | | | 0.65 | | | | — | | | | — | | | | 0.65 | | | | — | | | | 11.24 | | | | 19.02 | | | | 0.75 | | | | 0.71 | † | | | 0.71 | † | | | 6.23 | † | | | 98,394 | | | | 41 | |
| Class S | | | | | | | | | | | | | | | | | | | | | | | | | | | | | | | | | | | | | | | | | | | | | | | | | | | | | | | | | | | | | | | | �� | | | | |
| 12-31-14 | | | 12.39 | | | | 0.56 | • | | | (0.53 | ) | | | 0.03 | | | | 0.56 | | | | — | | | | — | | | | 0.56 | | | | — | | | | 11.86 | | | | 0.10 | | | | 1.01 | | | | 0.96 | | | | 0.96 | | | | 4.50 | | | | 4,412 | | | | 35 | |
| 12-31-13 | | | 11.58 | | | | 0.57 | • | | | 0.80 | | | | 1.37 | | | | 0.56 | | | | — | | | | — | | | | 0.56 | | | | — | | | | 12.39 | | | | 12.07 | | | | 0.98 | | | | 0.96 | | | | 0.96 | | | | 4.67 | | | | 3,406 | | | | 51 | |
| 12-31-12 | | | 10.54 | | | | 0.57 | | | | 1.07 | | | | 1.64 | | | | 0.60 | | | | — | | | | — | | | | 0.60 | | | | — | | | | 11.58 | | | | 15.84 | | | | 1.00 | | | | 0.96 | | | | 0.96 | | | | 5.39 | | | | 4,089 | | | | 34 | |
| 12-31-11 | | | 11.23 | | | | 0.60 | • | | | (0.69 | ) | | | (0.09 | ) | | | 0.60 | | | | — | | | | — | | | | 0.60 | | | | — | | | | 10.54 | | | | (0.97 | ) | | | 1.02 | | | | 0.96 | | | | 0.96 | | | | 5.34 | | | | 1,712 | | | | 41 | |
| 12-31-10 | | | 10.04 | | | | 0.62 | • | | | 1.19 | | | | 1.81 | | | | 0.62 | | | | — | | | | — | | | | 0.62 | | | | — | | | | 11.23 | | | | 18.73 | | | | 1.00 | | | | 0.96 | † | | | 0.96 | † | | | 5.97 | † | | | 2,307 | | | | 41 | |
| VY® T. Rowe Price Diversified Mid Cap Growth Portfolio | | | | | | | | | | | | | | | | | | | | | | | | | | | | | | | | | | | | | | | | | | | | | | | | | | | | | | | | | | | | | | | | | | | | |
| Class ADV | | | | | | | | | | | | | | | | | | | | | | | | | | | | | | | | | | | | | | | | | | | | | | | | | | | | | | | | | | | | | | | | | | | | |
| 12-31-14 | | | 11.08 | | | | (0.03 | ) | | | 1.21 | | | | 1.18 | | | | 0.00 | * | | | 0.83 | | | | — | | | | 0.83 | | | | — | | | | 11.43 | | | | 11.29 | | | | 1.28 | | | | 1.27 | | | | 1.27 | | | | (0.28 | ) | | | 29,356 | | | | 27 | |
| 12-31-13 | | | 8.35 | | | | (0.03 | ) | | | 2.90 | | | | 2.87 | | | | 0.02 | | | | 0.12 | | | | — | | | | 0.14 | | | | — | | | | 11.08 | | | | 34.46 | | | | 1.27 | | | | 1.25 | | | | 1.25 | | | | (0.32 | ) | | | 27,222 | | | | 20 | |
| 12-31-12 | | | 7.89 | | | | 0.01 | | | | 1.19 | | | | 1.20 | | | | 0.00 | * | | | 0.74 | | | | — | | | | 0.74 | | | | — | | | | 8.35 | | | | 15.70 | | | | 1.24 | | | | 1.22 | | | | 1.22 | | | | 0.14 | | | | 21,538 | | | | 17 | |
| 12-31-11 | | | 8.25 | | | | (0.03 | ) | | | (0.32 | ) | | | (0.35 | ) | | | 0.01 | | | | — | | | | — | | | | 0.01 | | | | — | | | | 7.89 | | | | (4.23 | ) | | | 1.16 | | | | 1.16 | | | | 1.16 | | | | (0.28 | ) | | | 18,993 | | | | 38 | |
| 12-31-10 | | | 6.46 | | | | (0.01 | ) | | | 1.80 | | | | 1.79 | | | | 0.00 | * | | | — | | | | — | | | | 0.00 | * | | | — | | | | 8.25 | | | | 27.79 | | | | 1.16 | | | | 1.16 | | | | 1.16 | | | | (0.13 | ) | | | 31,927 | | | | 28 | |
| Class I | | | | | | | | | | | | | | | | | | | | | | | | | | | | | | | | | | | | | | | | | | | | | | | | | | | | | | | | | | | | | | | | | | | | |
| 12-31-14 | | | 11.68 | | | | 0.03 | | | | 1.28 | | | | 1.31 | | | | 0.03 | | | | 0.83 | | | | — | | | | 0.86 | | | | — | | | | 12.13 | | | | 11.82 | | | | 0.78 | | | | 0.77 | | | | 0.77 | | | | 0.22 | | | | 796,856 | | | | 27 | |
| 12-31-13 | | | 8.76 | | | | 0.02 | | | | 3.05 | | | | 3.07 | | | | 0.03 | | | | 0.12 | | | | — | | | | 0.15 | | | | — | | | | 11.68 | | | | 35.18 | | | | 0.77 | | | | 0.75 | | | | 0.75 | | | | 0.17 | | | | 804,053 | | | | 20 | |
| 12-31-12 | | | 8.25 | | | | 0.06 | | | | 1.23 | | | | 1.29 | | | | 0.04 | | | | 0.74 | | | | — | | | | 0.78 | | | | — | | | | 8.76 | | | | 16.13 | | | | 0.74 | | | | 0.72 | | | | 0.72 | | | | 0.61 | | | | 668,143 | | | | 17 | |
| 12-31-11 | | | 8.60 | | | | 0.02 | | | | (0.34 | ) | | | (0.32 | ) | | | 0.03 | | | | — | | | | — | | | | 0.03 | | | | — | | | | 8.25 | | | | (3.71 | ) | | | 0.66 | | | | 0.66 | | | | 0.66 | | | | 0.25 | | | | 663,904 | | | | 38 | |
| 12-31-10 | | | 6.71 | | | | 0.03 | | | | 1.88 | | | | 1.91 | | | | 0.02 | | | | — | | | | — | | | | 0.02 | | | | — | | | | 8.60 | | | | 28.51 | | | | 0.66 | | | | 0.66 | | | | 0.66 | | | | 0.37 | | | | 762,608 | | | | 28 | |
| Class S | | | | | | | | | | | | | | | | | | | | | | | | | | | | | | | | | | | | | | | | | | | | | | | | | | | | | | | | | | | | | | | | | | | | |
| 12-31-14 | | | 11.44 | | | | (0.00 | )* | | | 1.26 | | | | 1.26 | | | | 0.00 | * | | | 0.83 | | | | — | | | | 0.83 | | | | — | | | | 11.87 | | | | 11.65 | | | | 1.03 | | | | 1.02 | | | | 1.02 | | | | (0.02 | ) | | | 30,412 | | | | 27 | |
| 12-31-13 | | | 8.60 | | | | (0.00 | )* | | | 2.98 | | | | 2.98 | | | | 0.02 | | | | 0.12 | | | | — | | | | 0.14 | | | | — | | | | 11.44 | | | | 34.74 | | | | 1.02 | | | | 1.00 | | | | 1.00 | | | | (0.06 | ) | | | 29,284 | | | | 20 | |
| 12-31-12 | | | 8.11 | | | | 0.03 | | | | 1.22 | | | | 1.25 | | | | 0.02 | | | | 0.74 | | | | — | | | | 0.76 | | | | — | | | | 8.60 | | | | 15.87 | | | | 0.99 | | | | 0.97 | | | | 0.97 | | | | 0.35 | | | | 18,731 | | | | 17 | |
| 12-31-11 | | | 8.45 | | | | 0.00 | * | | | (0.33 | ) | | | (0.33 | ) | | | 0.01 | | | | — | | | | — | | | | 0.01 | | | | — | | | | 8.11 | | | | (3.89 | ) | | | 0.91 | | | | 0.91 | | | | 0.91 | | | | 0.01 | | | | 21,669 | | | | 38 | |
| 12-31-10 | | | 6.60 | | | | 0.01 | | | | 1.84 | | | | 1.85 | | | | 0.00 | * | | | — | | | | — | | | | 0.00 | * | | | — | | | | 8.45 | | | | 28.12 | | | | 0.91 | | | | 0.91 | | | | 0.91 | | | | 0.12 | | | | 23,701 | | | | 28 | |
See Accompanying Notes to Financial Statements
| FINANCIAL HIGHLIGHTS (CONTINUED) |
| | | | | | Income (loss) | | | | | | | | | | | | | | | | | | | | | | | | | | | | | | | | | | | | | | | | | | | |
| | | | | | from | | | | | | | | | | | | | | | | | | | | | | | | | | | | | | | | | | | | | | | | | | | |
| | | | | | investment | | | | | | | | | | | | | | | | | | | | | | | | | | | | | | | | | | | | | | | Supplemental | |
| | | | | | operations | | | | | | Less Distributions | | | | | | | | | | | | | | | Ratios to average net assets | | | Data | |
| | | Net asset
value,
beginning of
year or
period | | | Net
investment
income
(loss) | | | Net
realized
and
unrealized
gain
(loss) | | | Total from
investment
operations | | | From net
investment
income | | | From net
realized
gains | | | From
return of
capital | | | Total
distributions | | | Payment
by
affiliate | | | Net
asset
value,
end
of
year
or
period | | | Total
Return(1) | | | Expenses
before
reductions/
additions(2)
(3)(4) | | | Expenses
net of fee
waivers
and/or
recoupments
if any(2)(3)(4) | | | Expense
net of all
reductions/
additions(2)
(3)(4) | | | Net
investment
income
(loss) (2)(3) | | | Net
assets,
end of
year or
period | | | Portfolio
turnover
rate | |
| Year or | | | | | | | | | | | | | | | | | | | | | | | | | | | | | | | | | | | | | | | | | | | | | | | | | | | |
| period ended | | ($) | | | ($) | | | ($) | | | ($) | | | ($) | | | ($) | | | ($) | | | ($) | | | ($) | | | ($) | | | (%) | | | (%) | | | (%) | | | (%) | | | (%) | | | ($000’s) | | | (%) | |
| VY® T. Rowe Price Diversified Mid Cap Growth Portfolio (continued) | | | | | | | | | | | | | | | | | | | | | | | | | | | | | | | | | | | | | | | | | | | | | | | | | | | | | | | | | | | | | | | | | | | | |
| Class S2 | | | | | | | | | | | | | | | | | | | | | | | | | | | | | | | | | | | | | | | | | | | | | | | | | | | | | | | | | | | | | | | | | | | | |
| 12-31-14 | | | 11.08 | | | | (0.01 | ) | | | 1.20 | | | | 1.19 | | | | 0.00 | * | | | 0.83 | | | | — | | | | 0.83 | | | | — | | | | 11.44 | | | | 11.39 | | | | 1.28 | | | | 1.17 | | | | 1.17 | | | | (0.13 | ) | | | 3,893 | | | | 27 | |
| 12-31-13 | | | 8.34 | | | | (0.02 | ) | | | 2.90 | | | | 2.88 | | | | 0.02 | | | | 0.12 | | | | — | | | | 0.14 | | | | — | | | | 11.08 | | | | 34.62 | | | | 1.27 | | | | 1.15 | | | | 1.15 | | | | (0.23 | ) | | | 1,013 | | | | 20 | |
| 12-31-12 | | | 7.89 | | | | 0.02 | | | | 1.19 | | | | 1.21 | | | | 0.02 | | | | 0.74 | | | | — | | | | 0.76 | | | | — | | | | 8.34 | | | | 15.73 | | | | 1.24 | | | | 1.12 | | | | 1.12 | | | | 0.29 | | | | 1,025 | | | | 17 | |
| 12-31-11 | | | 8.25 | | | | (0.00 | )* | | | (0.34 | ) | | | (0.34 | ) | | | 0.02 | | | | — | | | | — | | | | 0.02 | | | | — | | | | 7.89 | | | | (4.07 | ) | | | 1.16 | | | | 1.06 | | | | 1.06 | | | | (0.07 | ) | | | 739 | | | | 38 | |
| 12-31-10 | | | 6.45 | | | | (0.00 | )* | | | 1.80 | | | | 1.80 | | | | 0.00 | * | | | — | | | | — | | | | 0.00 | * | | | — | | | | 8.25 | | | | 27.99 | | | | 1.16 | | | | 1.06 | | | | 1.06 | | | | (0.03 | ) | | | 6 | | | | 28 | |
| VY® T. Rowe Price Growth Equity Portfolio | | | | | | | | | | | | | | | | | | | | | | | | | | | | | | | | | | | | | | | | | | | | | | | | | | | | | | | | | | | | | | | | | | | | |
| Class ADV | | | | | | | | | | | | | | | | | | | | | | | | | | | | | | | | | | | | | | | | | | | | | | | | | | | | | | | | | | | | | | | | | | | | |
| 12-31-14 | | | 86.20 | | | | (0.42 | ) | | | 7.08 | | | | 6.66 | | | | — | | | | 6.32 | | | | — | | | | 6.32 | | | | — | | | | 86.54 | | | | 8.16 | | | | 1.24 | | | | 1.23 | | | | 1.23 | | | | (0.50 | ) | | | 171,971 | | | | 35 | |
| 12-31-13 | | | 62.23 | | | | (0.38 | )• | | | 24.36 | | | | 23.98 | | | | 0.01 | | | | — | | | | — | | | | 0.01 | | | | — | | | | 86.20 | | | | 38.54 | | | | 1.24 | | | | 1.23 | | | | 1.23 | | | | (0.53 | ) | | | 164,865 | | | | 41 | |
| 12-31-12 | | | 52.59 | | | | (0.16 | )• | | | 9.80 | | | | 9.64 | | | | — | | | | — | | | | — | | | | — | | | | — | | | | 62.23 | | | | 18.33 | | | | 1.24 | | | | 1.23 | | | | 1.23 | | | | (0.26 | ) | | | 112,773 | | | | 38 | |
| 12-31-11 | | | 53.43 | | | | (0.27 | )• | | | (0.57 | ) | | | (0.84 | ) | | | — | | | | — | | | | — | | | | — | | | | — | | | | 52.59 | | | | (1.57 | ) | | | 1.25 | | | | 1.24 | | | | 1.24 | | | | (0.50 | ) | | | 92,701 | | | | 28 | |
| 12-31-10 | | | 45.97 | | | | (0.21 | ) | | | 7.69 | | | | 7.48 | | | | 0.02 | | | | — | | | | — | | | | 0.02 | | | | — | | | | 53.43 | | | | 16.27 | | | | 1.25 | | | | 1.25 | | | | 1.25 | | | | (0.48 | ) | | | 102,242 | | | | 41 | |
| Class I | | | | | | | | | | | | | | | | | | | | | | | | | | | | | | | | | | | | | | | | | | | | | | | | | | | | | | | | | | | | | | | | | | | | |
| 12-31-14 | | | 89.11 | | | | 0.00 | * | | | 7.36 | | | | 7.36 | | | | — | | | | 6.32 | | | | — | | | | 6.32 | | | | — | | | | 90.15 | | | | 8.69 | | | | 0.74 | | | | 0.73 | | | | 0.73 | | | | 0.00 | * | | | 1,036,976 | | | | 35 | |
| 12-31-13 | | | 64.01 | | | | (0.02 | ) | | | 25.13 | | | | 25.11 | | | | 0.01 | | | | — | | | | — | | | | 0.01 | | | | — | | | | 89.11 | | | | 39.24 | | | | 0.74 | | | | 0.73 | | | | 0.73 | | | | (0.03 | ) | | | 1,069,544 | | | | 41 | |
| 12-31-12 | | | 53.91 | | | | 0.14 | • | | | 10.06 | | | | 10.20 | | | | 0.10 | | | | — | | | | — | | | | 0.10 | | | | — | | | | 64.01 | | | | 18.92 | | | | 0.74 | | | | 0.73 | | | | 0.73 | | | | 0.22 | | | | 801,969 | | | | 38 | |
| 12-31-11 | | | 54.49 | | | | 0.00 | * | | | (0.58 | ) | | | (0.58 | ) | | | — | | | | — | | | | — | | | | — | | | | — | | | | 53.91 | | | | (1.06 | ) | | | 0.75 | | | | 0.74 | | | | 0.74 | | | | 0.00 | * | | | 722,532 | | | | 28 | |
| 12-31-10 | | | 46.65 | | | | 0.01 | | | | 7.85 | | | | 7.86 | | | | 0.02 | | | | — | | | | — | | | | 0.02 | | | | — | | | | 54.49 | | | | 16.86 | | | | 0.75 | | | | 0.75 | | | | 0.75 | | | | 0.02 | | | | 808,032 | | | | 41 | |
| Class S | | | | | | | | | | | | | | | | | | | | | | | | | | | | | | | | | | | | | | | | | | | | | | | | | | | | | | | | | | | | | | | | | | | | |
| 12-31-14 | | | 87.65 | | | | (0.22 | ) | | | 7.22 | | | | 7.00 | | | | — | | | | 6.32 | | | | — | | | | 6.32 | | | | — | | | | 88.33 | | | | 8.42 | | | | 0.99 | | | | 0.98 | | | | 0.98 | | | | (0.25 | ) | | | 360,966 | | | | 35 | |
| 12-31-13 | | | 63.12 | | | | (0.20 | )• | | | 24.74 | | | | 24.54 | | | | 0.01 | | | | — | | | | — | | | | 0.01 | | | | — | | | | 87.65 | | | | 38.89 | | | | 0.99 | | | | 0.98 | | | | 0.98 | | | | (0.28 | ) | | | 367,958 | | | | 41 | |
| 12-31-12 | | | 53.21 | | | | (0.00 | )* | | | 9.91 | | | | 9.91 | | | | — | | | | — | | | | — | | | | — | | | | — | | | | 63.12 | | | | 18.62 | | | | 0.99 | | | | 0.98 | | | | 0.98 | | | | (0.00 | )* | | | 238,987 | | | | 38 | |
| 12-31-11 | | | 53.92 | | | | (0.13 | ) | | | (0.58 | ) | | | (0.71 | ) | | | — | | | | — | | | | — | | | | — | | | | — | | | | 53.21 | | | | (1.32 | ) | | | 1.00 | | | | 0.99 | | | | 0.99 | | | | (0.24 | ) | | | 173,070 | | | | 28 | |
| 12-31-10 | | | 46.27 | | | | (0.11 | ) | | | 7.78 | | | | 7.67 | | | | 0.02 | | | | — | | | | — | | | | 0.02 | | | | — | | | | 53.92 | | | | 16.58 | | | | 1.00 | | | | 1.00 | | | | 1.00 | | | | (0.24 | ) | | | 171,878 | | | | 41 | |
| Class S2 | | | | | | | | | | | | | | | | | | | | | | | | | | | | | | | | | | | | | | | | | | | | | | | | | | | | | | | | | | | | | | | | | | | | |
| 12-31-14 | | | 86.59 | | | | (0.33 | )• | | | 7.11 | | | | 6.78 | | | | — | | | | 6.32 | | | | — | | | | 6.32 | | | | — | | | | 87.05 | | | | 8.26 | | | | 1.24 | | | | 1.13 | | | | 1.13 | | | | (0.38 | ) | | | 4,616 | | | | 35 | |
| 12-31-13 | | | 62.45 | | | | (0.31 | )• | | | 24.46 | | | | 24.15 | | | | 0.01 | | | | — | | | | — | | | | 0.01 | | | | — | | | | 86.59 | | | | 38.68 | | | | 1.24 | | | | 1.13 | | | | 1.13 | | | | (0.43 | ) | | | 2,482 | | | | 41 | |
| 12-31-12 | | | 52.72 | | | | (0.09 | ) | | | 9.82 | | | | 9.73 | | | | — | | | | — | | | | — | | | | — | | | | — | | | | 62.45 | | | | 18.46 | | | | 1.24 | | | | 1.13 | | | | 1.13 | | | | (0.16 | ) | | | 1,534 | | | | 38 | |
| 12-31-11 | | | 53.51 | | | | (0.17 | )• | | | (0.62 | ) | | | (0.79 | ) | | | — | | | | — | | | | — | | | | — | | | | — | | | | 52.72 | | | | (1.48 | ) | | | 1.25 | | | | 1.14 | | | | 1.14 | | | | (0.32 | ) | | | 622 | | | | 28 | |
| 12-31-10 | | | 45.99 | | | | (0.18 | ) | | | 7.72 | | | | 7.54 | | | | 0.02 | | | | — | | | | — | | | | 0.02 | | | | — | | | | 53.51 | | | | 16.39 | | | | 1.25 | | | | 1.15 | | | | 1.15 | | | | (0.37 | ) | | | 5 | | | | 41 | |
| VY® Templeton Foreign Equity Portfolio | | | | | | | | | | | | | | | | | | | | | | | | | | | | | | | | | | | | | | | | | | | | | | | | | | | | | | | | | | | | | | | | | | | | |
| Class ADV | | | | | | | | | | | | | | | | | | | | | | | | | | | | | | | | | | | | | | | | | �� | | | | | | | | | | | | | | | | | | | | | | | | | | | |
| 12-31-14 | | | 13.07 | | | | 0.36 | • | | | (1.26 | ) | | | (0.90 | ) | | | 0.26 | | | | — | | | | — | | | | 0.26 | | | | — | | | | 11.91 | | | | (7.01 | ) | | | 1.44 | | | | 1.42 | | | | 1.42 | | | | 2.81 | | | | 40,973 | | | | 10 | |
| 12-31-13 | | | 11.05 | | | | 0.20 | • | | | 1.96 | | | | 2.16 | | | | 0.14 | | | | — | | | | — | | | | 0.14 | | | | — | | | | 13.07 | | | | 19.68 | | | | 1.44 | | | | 1.42 | | | | 1.42 | | | | 1.64 | | | | 46,583 | | | | 12 | |
| 12-31-12 | | | 9.45 | | | | 0.17 | • | | | 1.55 | | | | 1.72 | | | | 0.12 | | | | — | | | | — | | | | 0.12 | | | | — | | | | 11.05 | | | | 18.32 | | | | 1.46 | | | | 1.44 | | | | 1.44 | | | | 1.71 | | | | 36,360 | | | | 9 | |
| 12-31-11 | | | 10.99 | | | | 0.20 | • | | | (1.57 | ) | | | (1.37 | ) | | | 0.17 | | | | — | | | | — | | | | 0.17 | | | | — | | | | 9.45 | | | | (12.42 | ) | | | 1.48 | | | | 1.48 | | | | 1.48 | | | | 1.94 | | | | 23,120 | | | | 14 | |
| 12-31-10 | | | 10.36 | | | | 0.13 | • | | | 0.70 | | | | 0.83 | | | | 0.20 | | | | — | | | | — | | | | 0.20 | | | | — | | | | 10.99 | | | | 8.25 | | | | 1.46 | | | | 1.46 | | | | 1.46 | | | | 1.33 | | | | 15,178 | | | | 14 | |
| Class I | | | | | | | | | | | | | | | | | | | | | | | | | | | | | | | | | | | | | | | | | | | | | | | | | | | | | | | | | | | | | | | | | | | | |
| 12-31-14 | | | 13.21 | | | | 0.43 | • | | | (1.28 | ) | | | (0.85 | ) | | | 0.32 | | | | — | | | | — | | | | 0.32 | | | | — | | | | 12.04 | | | | (6.59 | ) | | | 0.94 | | | | 0.92 | | | | 0.92 | | | | 3.27 | | | | 215,838 | | | | 10 | |
| 12-31-13 | | | 11.15 | | | | 0.29 | • | | | 1.95 | | | | 2.24 | | | | 0.18 | | | | — | | | | — | | | | 0.18 | | | | — | | | | 13.21 | | | | 20.28 | | | | 0.94 | | | | 0.92 | | | | 0.92 | | | | 2.47 | | | | 277,773 | | | | 12 | |
| 12-31-12 | | | 9.52 | | | | 0.22 | • | | | 1.56 | | | | 1.78 | | | | 0.15 | | | | — | | | | — | | | | 0.15 | | | | — | | | | 11.15 | | | | 18.89 | | | | 0.96 | | | | 0.94 | | | | 0.94 | | | | 2.15 | | | | 375,814 | | | | 9 | |
| 12-31-11 | | | 11.05 | | | | 0.26 | • | | | (1.59 | ) | | | (1.33 | ) | | | 0.20 | | | | — | | | | — | | | | 0.20 | | | | — | | | | 9.52 | | | | (12.00 | ) | | | 0.98 | | | | 0.98 | | | | 0.98 | | | | 2.42 | | | | 289,934 | | | | 14 | |
| 12-31-10 | | | 10.40 | | | | 0.19 | • | | | 0.70 | | | | 0.89 | | | | 0.24 | | | | — | | | | — | | | | 0.24 | | | | — | | | | 11.05 | | | | 8.87 | | | | 0.96 | | | | 0.96 | | | | 0.96 | | | | 1.89 | | | | 401,997 | | | | 14 | |
See Accompanying Notes to Financial Statements
| FINANCIAL HIGHLIGHTS (CONTINUED) |
| | | | | | Income (loss) | | | | | | | | | | | | | | | | | | | | | | | | | | | | | | | | | | | | | | | | | | | |
| | | | | | from | | | | | | | | | | | | | | | | | | | | | | | | | | | | | | | | | | | | | | | | | | | |
| | | | | | investment | | | | | | | | | | | | | | | | | | | | | | | | | | | | | | | | | | | | | | | Supplemental | |
| | | | | | operations | | | | | | Less Distributions | | | | | | | | | | | | | | | Ratios to average net assets | | | Data | |
| | | Net asset
value,
beginning of
year or
period | | | Net
investment
income
(loss) | | | Net
realized
and
unrealized
gain
(loss) | | | Total from
investment
operations | | | From net
investment
income | | | From net
realized
gains | | | From
return of
capital | | | Total
distributions | | | Payment
by
affiliate | | | Net
asset
value,
end
of
year
or
period | | | Total
Return(1) | | | Expenses
before
reductions/
additions(2)
(3)(4) | | | Expenses
net of fee
waivers
and/or
recoupments
if any(2)(3)(4) | | | Expense
net of all
reductions/
additions(2)
(3)(4) | | | Net
investment
income
(loss) (2)(3) | | | Net
assets,
end of
year or
period | | | Portfolio
turnover
rate | |
| Year or | | | | | | | | | | | | | | | | | | | | | | | | | | | | | | | | | | | | | | | | | | | | | | | | | | | |
| period ended | | ($) | | | ($) | | | ($) | | | ($) | | | ($) | | | ($) | | | ($) | | | ($) | | | ($) | | | ($) | | | (%) | | | (%) | | | (%) | | | (%) | | | (%) | | | ($000’s) | | | (%) | |
| VY® Templeton Foreign Equity Portfolio (continued) | | | | | | | | | | | | | | | | | | | | | | | | | | | | | | | | | | | | | | | | | | | | | | | | | | | | | | | | | | | | | | | | | | | | |
| Class S | | | | | | | | | | | | | | | | | | | | | | | | | | | | | | | | | | | | | | | | | | | | | | | | | | | | | | | | | | | | | | | | | | | | |
| 12-31-14 | | | 13.12 | | | | 0.40 | • | | | (1.28 | ) | | | (0.88 | ) | | | 0.29 | | | | — | | | | — | | | | 0.29 | | | | — | | | | 11.95 | | | | (6.87 | ) | | | 1.19 | | | | 1.17 | | | | 1.17 | | | | 3.10 | | | | 584,346 | | | | 10 | |
| 12-31-13 | | | 11.08 | | | | 0.23 | • | | | 1.97 | | | | 2.20 | | | | 0.16 | | | | — | | | | — | | | | 0.16 | | | | — | | | | 13.12 | | | | 20.05 | | | | 1.19 | | | | 1.17 | | | | 1.17 | | | | 1.91 | | | | 709,362 | | | | 12 | |
| 12-31-12 | | | 9.48 | | | | 0.14 | • | | | 1.60 | | | | 1.74 | | | | 0.14 | | | | — | | | | — | | | | 0.14 | | | | — | | | | 11.08 | | | | 18.64 | | | | 1.21 | | | | 1.19 | | | | 1.19 | | | | 1.38 | | | | 648,985 | | | | 9 | |
| 12-31-11 | | | 11.00 | | | | 0.25 | • | | | (1.59 | ) | | | (1.34 | ) | | | 0.18 | | | | — | | | | — | | | | 0.18 | | | | — | | | | 9.48 | | | | (12.21 | ) | | | 1.23 | | | | 1.23 | | | | 1.23 | | | | 2.29 | | | | 204,315 | | | | 14 | |
| 12-31-10 | | | 10.36 | | | | 0.17 | | | | 0.69 | | | | 0.86 | | | | 0.22 | | | | — | | | | — | | | | 0.22 | | | | — | | | | 11.00 | | | | 8.59 | | | | 1.21 | | | | 1.21 | | | | 1.21 | | | | 1.68 | | | | 275,408 | | | | 14 | |
| Class S2 | | | | | | | | | | | | | | | | | | | | | | | | | | | | | | | | | | | | | | | | | | | | | | | | | | | | | | | | | | | | | | | | | | | | |
| 12-31-14 | | | 13.07 | | | | 0.34 | | | | (1.23 | ) | | | (0.89 | ) | | | 0.28 | | | | — | | | | — | | | | 0.28 | | | | — | | | | 11.90 | | | | (6.99 | ) | | | 1.44 | | | | 1.32 | | | | 1.32 | | | | 2.80 | | | | 2,065 | | | | 10 | |
| 12-31-13 | | | 11.04 | | | | 0.21 | • | | | 1.97 | | | | 2.18 | | | | 0.15 | | | | — | | | | — | | | | 0.15 | | | | — | | | | 13.07 | | | | 19.88 | | | | 1.44 | | | | 1.32 | | | | 1.32 | | | | 1.80 | | | | 2,158 | | | | 12 | |
| 12-31-12 | | | 9.45 | | | | 0.17 | | | | 1.55 | | | | 1.72 | | | | 0.13 | | | | — | | | | — | | | | 0.13 | | | | — | | | | 11.04 | | | | 18.40 | | | | 1.46 | | | | 1.34 | | | | 1.34 | | | | 1.89 | | | | 1,310 | | | | 9 | |
| 12-31-11 | | | 11.01 | | | | 0.17 | • | | | (1.53 | ) | | | (1.36 | ) | | | 0.20 | | | | — | | | | — | | | | 0.20 | | | | — | | | | 9.45 | | | | (12.34 | ) | | | 1.48 | | | | 1.38 | | | | 1.38 | | | | 1.67 | | | | 1,013 | | | | 14 | |
| 12-31-10 | | | 10.37 | | | | 0.07 | • | | | 0.78 | | | | 0.85 | | | | 0.21 | | | | — | | | | — | | | | 0.21 | | | | — | | | | 11.01 | | | | 8.53 | | | | 1.46 | | | | 1.36 | | | | 1.36 | | | | 0.69 | | | | 102 | | | | 14 | |
| (1) | Total return is calculated assuming reinvestment of all dividends, capital gain distributions and return of capital distributions, if any, at net asset value and does not reflect the effect of insurance contract charges. Total return for periods less than one year is not annualized. |
| (2) | Annualized for periods less than one year. |
| (3) | Ratios reflect operating expenses of a Portfolio. Expenses before reductions/additions do not reflect amounts reimbursed by an Investment Adviser and/or Distributor or reductions from brokerage service arrangements or other expense offset arrangements and do not represent the amount paid by a Portfolio during periods when reimbursements or reductions occur. Expenses net of fee waivers reflect expenses after reimbursement by an Investment Adviser and/or Distributor but prior to reductions from brokerage service arrangements or other expense offset arrangements. Expenses net of all reductions/additions represent the net expenses paid by a Portfolio. Net investment income (loss) is net of all such additions or reductions. (4) Ratios do not include fees and expenses charged under the variable annuity contract or variable life insurance policy. |
| • | Calculated using average number of shares outstanding throughout the period. |
| * | Amount is less than $0.005 or 0.005% or more than $(0.005) or (0.005)%. |
| † | Impact of waiving the advisory fee for the ING Institutional Prime Money Market Fund holding has less than 0.005% impact on the expense ratio and net investment income or loss ratio. |
See Accompanying Notes to Financial Statements
| NOTES TO FINANCIAL STATEMENTS as of December 31, 2014 |
NOTE 1 — ORGANIZATION
Voya Partners, Inc. (the “Company”) is an open-end management investment company registered under the Investment Company Act of 1940, as amended (the “1940 Act” or “Act”). It was incorporated under the laws of Maryland on May 7, 1997. The Articles of Incorporation permit the Company to offer separate series, each of which has its own investment objective, policies and restrictions. The Company serves as an investment option in underlying variable insurance products offered by Directed Services LLC. The Company currently consists of forty-two active separate investment series. The fourteen series (each, a “Portfolio” and collectively, the “Portfolios”) included in this report are: Voya Aggregate Bond Portfolio (“Aggregate Bond”), Voya Global Bond Portfolio (“Global Bond”), VY® American Century Small-Mid Cap Value Portfolio (“American Century Small-Mid Cap Value”), VY® Baron Growth Portfolio (“Baron Growth”), VY® Columbia Contrarian Core Portfolio (“Columbia Contrarian Core”), VY® Columbia Small Cap Value II Portfolio (“Columbia Small Cap Value II”), VY® Invesco Comstock Portfolio (“Invesco Comstock”), VY® Invesco Equity and Income Portfolio (“Invesco Equity and Income”), VY® JPMorgan Mid Cap Value Portfolio (“JPMorgan Mid Cap Value”), VY® Oppenheimer Global Portfolio (“Oppenheimer Global”), VY® Pioneer High Yield Portfolio (“Pioneer High Yield”), VY® T. Rowe Price Diversified Mid Cap Growth Portfolio (“T. Rowe Price Diversified Mid Cap Growth”), VY® T. Rowe Price Growth Equity Portfolio (“T. Rowe Price Growth Equity”), and VY® Templeton Foreign Equity Portfolio (“Templeton Foreign Equity”), each a diversified series of the Company. The investment objective of the Portfolios is described in the Portfolios’ Prospectus.
Prior to the close of business on December 12, 2014, Aggregate Bond was known as VY® PIMCO Bond Portfolio.
The Company is authorized to offer four classes of shares (Adviser (“Class ADV”), Initial (“Class I”), Service (“Class S”) and Service 2 (“Class S2”)); however, not all Portfolios currently offer all classes. Each class has equal rights as to voting privileges. The classes differ principally in the applicable distribution and shareholder service fees. Generally, shareholders of each class also bear certain expenses that pertain to that particular class. All shareholders bear the common expenses of a portfolio and earn income and realized gains/losses from a portfolio pro rata based on the daily ending net assets of each class, without distinction between share classes. Distributions are determined separately for each class based on income and expenses allocated to each class. Expenses that are specific to a portfolio or a class are charged directly to that portfolio or class. Other operating
expenses shared by several portfolios are generally allocated among those portfolios based on average net assets. Realized gain distributions are allocated to each class pro rata based on the shares outstanding of each class on the date of distribution. Differences in per share dividend rates generally result from differences in separate class expenses, including distribution and shareholder service fees, if applicable.
Directed Services LLC (“DSL” or the “Investment Adviser”), a Delaware limited liability company, serves as the Investment Adviser to the Portfolios. Voya Investment Management Co. LLC (“Voya IM”), a Delaware limited liability company, serves as the sub-adviser to Aggregate Bond and Global Bond. Voya Funds Services, LLC (“VFS” or the “Administrator”), a Delaware limited liability company, serves as the Administrator to the Portfolios. Voya Investments Distributor, LLC (“VID” or the “Distributor”), a Delaware limited liability company, serves as the principal underwriter to the Portfolios.
NOTE 2 — SIGNIFICANT ACCOUNTING POLICIES
The following significant accounting policies are consistently followed by the Portfolios in the preparation of their financial statements. Each Portfolio is considered an investment company under U.S. generally accepted accounting principles (“GAAP”) and follows the accounting and reporting guidance applicable to investment companies.
A. Security Valuation. U.S. GAAP defines fair value as the price the Portfolio(s) would receive to sell an asset or pay to transfer a liability in an orderly transaction between market participants at the measurement date. Investments in equity securities traded on a national securities exchange are valued at the official closing price when available or, for certain markets, the last reported sale price on each valuation day. Securities traded on an exchange for which there has been no sale and securities traded in the over-the-counter-market are valued at the mean between the last reported bid and ask prices on each valuation day. All investments quoted in foreign currencies are valued daily in U.S. dollars on the basis of the foreign currency exchange rates prevailing at that time. Debt securities with more than 60 days to maturity are fair valued using an independent pricing service which takes into consideration such factors as benchmark yields, cash flow assumptions and issuer spreads as well as broker quotes and reported trades for the security as well as securities similar in type, quality, coupon and maturity. Securities for which valuations are not available from an independent pricing service may be valued by brokers which use prices provided by market makers or estimates of fair market value obtained from yield data relating to
| NOTES TO FINANCIAL STATEMENTS as of December 31, 2014 (continued) |
NOTE 2 — SIGNIFICANT ACCOUNTING POLICIES (continued)
investments or securities with similar characteristics. U.S. government obligations are valued by using market quotations or independent pricing services that use prices provided by market-makers or estimates of market values obtained from yield data relating to instruments or securities with similar characteristics. Investments in open-end mutual funds are valued at net asset value (“NAV”). Investments in securities of sufficient credit quality, maturing in 60 days or less, are valued at amortized cost which approximates fair value. The amortized cost method involves valuing a security at its cost and amortizing any discount or premium over the period until maturity.
Securities and assets for which market quotations are not readily available (which may include certain restricted securities, which are subject to limitations as to their sale) are valued at their fair values, as defined by the 1940 Act, and as determined in good faith by or under the supervision of the Portfolios’ Board of Directors (“Board”), in accordance with methods that are specifically authorized by the Board. Securities traded on exchanges, including foreign exchanges, which close earlier than the time that a Portfolio calculates its NAV may also be valued at their fair values, as defined by the Act, and as determined in good faith by or under the supervision of the Board, in accordance with methods that are specifically authorized by the Board. All such fair valuations are made in accordance with valuation procedures of the Portfolios (the “Valuation Procedures”) which have been approved by the Board. The valuation techniques applied in any specific instance are set forth in the Valuation Procedures and may vary from case to case. With respect to a restricted security, for example, consideration is generally given to the cost of the investment, the market value of any unrestricted securities of the same class at the time of valuation, the potential expiration of restrictions on the security, the existence of any registration rights, the costs to the Portfolios related to registration of the security, as well as factors relevant to the issuer itself. Consideration may also be given to the price and extent of any public trading in similar securities of the issuer or comparable companies’ securities. If an event occurs after the time at which the market for foreign securities held by a Portfolio closes but before the time that a Portfolio’s NAV is calculated, such event may cause the closing price on the foreign exchange to not represent a readily available reliable market value quotation for such securities at the time a Portfolio determines its NAV. In such a case, a Portfolio will use the fair value of such securities as determined under a Portfolio’s Valuation Procedures. Events after the close of trading on a foreign market that could require a Portfolio to fair value some or all of its
foreign securities include, among others, securities trading in the U.S. and other markets, corporate announcements, natural and other disasters, and political and other events. Among other elements of analysis in the determination of a security’s fair value, the Board has authorized the use of one or more independent research services to assist with such determinations. An independent research service may use statistical analyses and quantitative models to help determine fair value as of the time a Portfolio calculates its NAV. There can be no assurance that such models accurately reflect the behavior of the applicable markets or the effect of the behavior of such markets on the fair value of securities, or that such markets will continue to behave in a fashion that is consistent with such models. Unlike the closing price of a security on an exchange, fair value determinations employ elements of judgment. Consequently, the fair value assigned to a security may not represent the actual value that a Portfolio could obtain if it were to sell the security at the time of the close of the NYSE. Pursuant to procedures adopted by the Board, a Portfolio is not obligated to use the fair valuations suggested by any research service, and valuation recommendations provided by such research services may be overridden if other events have occurred or if other fair valuations are determined in good faith to be more accurate. Unless an event is such that it causes a Portfolio to determine that the closing prices for one or more securities do not represent readily available reliable market value quotations at the time a Portfolio determines its NAV, events that occur between the time of the close of the foreign market on which they are traded and the close of regular trading on the NYSE will not be reflected in a Portfolio’s NAV.
Each investment asset or liability of the Portfolios is assigned a level at measurement date based on the significance and source of the inputs to its valuation. Quoted prices in active markets for identical securities are classified as “Level 1,” inputs other than quoted prices for an asset or liability that are observable are classified as “Level 2” and unobservable inputs, including the sub-adviser’s judgment about the assumptions that a market participant would use in pricing an asset or liability are classified as “Level 3.” The inputs used for valuing securities are not necessarily an indication of the risks associated with investing in those securities. Short-term securities of sufficient credit quality which are valued at amortized cost, which approximates fair value, are generally considered to be Level 2 securities under applicable accounting rules. A table summarizing the Portfolios’ investments under these levels of classification is included following the Summary Portfolio of Investments.
| NOTES TO FINANCIAL STATEMENTS as of December 31, 2014 (continued) |
NOTE 2 — SIGNIFICANT ACCOUNTING POLICIES (continued)
The Board has adopted methods for valuing securities and other assets in circumstances where market quotes are not readily available, and has delegated the responsibility for applying the valuation methods to the “Pricing Committee” as established by the Portfolios’ Administrator. The Pricing Committee considers all facts it deems relevant that are reasonably available, through either public information or information available to the Investment Adviser or sub-adviser, when determining the fair value of the security. In the event that a security or asset cannot be valued pursuant to one of the valuation methods established by the Board, the fair value of the security or asset will be determined in good faith by the Pricing Committee. When a Portfolio uses these fair valuation methods that use significant unobservable inputs to determine its NAV, securities will be priced by a method that the Pricing Committee believes accurately reflects fair value and are categorized as Level 3 of the fair value hierarchy. The methodologies used for valuing securities are not necessarily an indication of the risks of investing in those securities valued in good faith at fair value nor can it be assured a Portfolio can obtain the fair value assigned to a security if it were to sell the security.
To assess the continuing appropriateness of security valuations, the Pricing Committee may compare prior day prices, prices on comparable securities, and traded prices to the prior or current day prices and the Pricing Committee challenges those prices exceeding certain tolerance levels with the independent pricing service or broker source. For those securities valued in good faith at fair value, the Pricing Committee reviews and affirms the reasonableness of the valuation on a regular basis after considering all relevant information that is reasonably available.
For fair valuations using significant unobservable inputs, U.S. GAAP requires a reconciliation of the beginning to ending balances for reported fair values that presents changes attributable to total realized and unrealized gains or losses, purchases and sales, and transfers in or out of the Level 3 category during the period. The beginning of period timing recognition is used for the transfers between Levels of a Portfolio’s assets and liabilities. A reconciliation of Level 3 investments is presented only when a Portfolio has a significant amount of Level 3 investments.
For the year ended December 31, 2014, there have been no significant changes to the fair valuation methodologies.
B. Security Transactions and Revenue Recognition. Security transactions are accounted for on the trade date. Realized gains and losses are reported on the basis of identified cost of securities sold. Interest income is recorded on an accrual basis. Dividend income is recorded
on the ex-dividend date, or for certain foreign securities, when the information becomes available to the Portfolios. Premium amortization and discount accretion are determined by the effective yield method.
C. Foreign Currency Translation. The books and records of the Portfolios are maintained in U.S. dollars. Any foreign currency amounts are translated into U.S. dollars on the following basis:
| (1) | Market value of investment securities, other assets and liabilities — at the exchange rates prevailing at the end of the day. |
| (2) | Purchases and sales of investment securities, income and expenses — at the rates of exchange prevailing on the respective dates of such transactions. |
Although the net assets and the market values are presented at the foreign exchange rates at the end of the day, the Portfolios do not isolate the portion of the results of operations resulting from changes in foreign exchange rates on investments from the fluctuations arising from changes in market prices of securities held. Such fluctuations are included with the net realized and unrealized gains or losses from investments. For securities, which are subject to foreign withholding tax upon disposition, liabilities are recorded on the Statements of Assets and Liabilities for the estimated tax withholding based on the securities’ current market value. Upon disposition, realized gains or losses on such securities are recorded net of foreign withholding tax.
Reported net realized foreign exchange gains or losses arise from sales of foreign currencies, currency gains or losses realized between the trade and settlement dates on securities transactions, the difference between the amounts of dividends, interest, and foreign withholding tax reclaims recorded on the Portfolios’ books, and the U.S. dollar equivalent of the amounts actually received or paid. Net unrealized foreign exchange gains and losses arise from changes in the value of assets and liabilities other than investments in securities at period end, resulting from changes in the exchange rate. Foreign security and currency transactions may involve certain considerations and risks not typically associated with investing in U.S. companies and U.S. government securities. These risks include, but are not limited to, revaluation of currencies and future adverse political and economic developments, which could cause securities and their markets to be less liquid and prices more volatile than those of comparable U.S. companies and U.S. government securities.
D. Distributions to Shareholders. The Portfolios record distributions to their shareholders on the ex-dividend date. All Portfolios (except Pioneer High Yield) declare and pay dividends annually. Pioneer High Yield declares dividends
| NOTES TO FINANCIAL STATEMENTS as of December 31, 2014 (continued) |
NOTE 2 — SIGNIFICANT ACCOUNTING POLICIES (continued)
on a daily basis and pays dividends monthly. The Portfolios distribute capital gains distributions, if any, annually. The Portfolios may make distributions on a more frequent basis to comply with the distribution requirements of subchapter M of the Internal Revenue Code. The characteristics of income and gains to be distributed are determined in accordance with income tax regulations, which may differ from U.S. GAAP for investment companies.
E. Federal Income Taxes. It is the policy of each Portfolio to comply with the requirements of subchapter M of the Internal Revenue Code that are applicable to regulated investment companies and to distribute substantially all of its net investment income and any net realized capital gains to its shareholders. Therefore, a federal income tax or excise tax provision is not required. Management has considered the sustainability of the Portfolios’ tax positions taken on federal income tax returns for all open tax years in making this determination. No capital gain distributions shall be made until the capital loss carryforwards have been fully utilized or expire.
F. Use of Estimates. Management of the Portfolios has made certain estimates and assumptions relating to the reporting of assets, liabilities, income, and expenses to prepare these financial statements in conformity with U.S. GAAP for investment companies. Actual results could differ from these estimates.
G. Risk Exposures and the Use of Derivative Instruments. The Portfolios’ investment strategies permit the Portfolios to enter into various types of derivatives contracts, including, but not limited to, futures contracts, forward foreign currency exchange contracts, credit default swaps, interest rate swaps, total return swaps, and purchased and written options. In doing so, a Portfolio will employ strategies in differing combinations to permit them to increase or decrease the level of risk, or change the level or types of exposure to market risk factors. This may allow a Portfolio to pursue its objectives more quickly, and efficiently than if it were to make direct purchases or sales of securities capable of affecting a similar response to market factors.
Market Risk Factors. In pursuit of its investment objectives, a Portfolio may seek to use derivatives to increase or decrease its exposure to the following market risk factors:
Credit Risk. Credit risk relates to the ability of the issuer to meet interest and principal payments, or both, as they come due. In general, lower-grade, higher-yield bonds are subject to credit risk to a greater extent than lower-yield, higher-quality bonds.
Equity Risk. Equity risk relates to the change in value of equity securities as they relate to increases or decreases in the general market.
Foreign Exchange Rate Risk. Foreign exchange rate risk relates to the change in U.S. dollar value of a security held that is denominated in a foreign currency. The U.S. dollar value of a foreign currency denominated security will decrease as the U.S dollar appreciates against the currency, while the U.S. dollar value will increase as the U.S dollar depreciates against the currency.
Interest Rate Risk. Interest rate risk refers to the fluctuations in value of fixed-income securities resulting from the inverse relationship between price and yield. For example, an increase in general interest rates will tend to reduce the market value of already issued fixed-income investments, and a decline in general interest rates will tend to increase their value. In addition, debt securities with longer durations, which tend to have higher yields, are subject to potentially greater fluctuations in value from changes in interest rates than obligations with shorter durations.
Risks of Investing in Derivatives. A Portfolio’s use of derivatives can result in losses due to unanticipated changes in the market risk factors and the overall market. In instances where a Portfolio is using derivatives to decrease, or hedge, exposures to market risk factors for securities held by a Portfolio, there are also risks that those derivatives may not perform as expected resulting in losses for the combined or hedged positions.
The use of these strategies involves certain special risks, including a possible imperfect correlation, or even no correlation, between price movements of derivative instruments and price movements of related investments. While some strategies involving derivative instruments can reduce the risk of loss, they can also reduce the opportunity for gain or even result in losses by offsetting favorable price movements in related investments or otherwise, due to the possible inability of a Portfolio to purchase or sell a portfolio security at a time that otherwise would be favorable or the possible need to sell a portfolio security at a disadvantageous time because the Portfolio is required to maintain asset coverage or offsetting positions in connection with transactions in derivative instruments. Additional associated risks from investing in derivatives also exist and potentially could have significant effects on the valuation of the derivative and a Portfolio. Associated risks are not the risks that a Portfolio is attempting to increase or decrease exposure to, per their investment objectives, but are the additional risks from investing in derivatives. Examples of these associated risks are liquidity risk, which is the risk that a Portfolio will not be able to sell the derivative in the open market in a timely
| NOTES TO FINANCIAL STATEMENTS as of December 31, 2014 (continued) |
NOTE 2 — SIGNIFICANT ACCOUNTING POLICIES (continued)
manner, and counterparty credit risk, which is the risk that the counterparty will not fulfill its obligation to a Portfolio. Associated risks can be different for each type of derivative and are discussed by each derivative type in the following notes.
Counterparty Credit Risk and Credit Related Contingent Features. Certain derivative positions are subject to counterparty credit risk, which is the risk that the counterparty will not fulfill its obligation to a Portfolio. Each Portfolio’s derivative counterparties are financial institutions who are subject to market conditions that may weaken their financial position. A Portfolio intends to enter into financial transactions with counterparties that they believe to be creditworthy at the time of the transaction. To reduce this risk, a Portfolio has entered into master netting arrangements, established within each Portfolio’s International Swap and Derivatives Association, Inc. (“ISDA”) Master Agreements (“Master Agreements”). These agreements are with select counterparties and they govern transactions, including certain over-the-counter (“OTC”) derivative and forward foreign currency contracts, entered into by a Portfolio and the counterparty. The Master Agreements maintain provisions for general obligations, representations, agreements, collateral, and events of default or termination. The occurrence of a specified event of termination may give a counterparty the right to terminate all of its contracts and affect settlement of all outstanding transactions under the applicable Master Agreement.
A Portfolio may also enter into collateral agreements with certain counterparties to further mitigate counterparty credit risk on OTC derivative and forward foreign currency contracts. Subject to established minimum levels, collateral is generally determined based on the net aggregate unrealized gain or loss on contracts with a certain counterparty. Collateral pledged to or from a Portfolio is held in a segregated account by a third-party agent and can be in the form of cash or debt securities issued by the U.S. government or related agencies.
As of December 31, 2014, the maximum amount of loss that Aggregate Bond, Global Bond, American Century, Invesco Comstock, and Invesco Equity and Income would incur if the counterparties to its derivative transactions failed to perform would be $4,236,323, $5,332,016, $39,019, $971,596 and $2,564,060, respectively, which represents the gross payments to be received by the Portfolios on open forward foreign currency contracts and purchased OTC options were they to be unwound as of December 31, 2014. To reduce the amount of potential loss to Aggregate Bond and Global Bond, various
counterparties have posted $1,880,000 and $570,000, respectively, in cash collateral open OTC transactions at December 31, 2014.
Each Portfolio has credit related contingent features that if triggered would allow its derivative counterparties to close out and demand payment or additional collateral to cover their exposure from a Portfolio. Credit related contingent features are established between each Portfolio and their derivatives counterparties to reduce the risk that a Portfolio will not fulfill its payment obligations to its counterparties. These triggering features include, but are not limited to, a percentage decrease in a Portfolio’s net assets and or a percentage decrease in a Portfolio’s NAV, which could cause a Portfolio to accelerate payment of any net liability owed to the counterparty. The contingent features are established within each Portfolio’s Master Agreements. There were no credit events during the year ended December 31, 2014, that triggered any credit related contingent features for each respective Portfolio.
As of December 31, 2014, Aggregate Bond, Global Bond, American Century, and Invesco Equity and Income had a liability position of $2,570,911, $8,966,402, $2,030 and $84,210, respectively open forward foreign currency contracts and written OTC options with credit related contingent features.
If a contingent feature would have been triggered as of December 31, 2014, the Portfolios could have been required to pay this amount in cash to its counterparties. As of December 31, 2014, Global Bond had posted $1,510,000 in cash collateral for open OTC derivative transactions with its respective counterparties. There was no collateral posted by any other Portfolio as of December 31, 2014 for open OTC derivative instruments.
H. Forward Foreign Currency Contracts. Certain Portfolios may enter into forward foreign currency contracts primarily to hedge against foreign currency exchange rate risks on their non-U.S. dollar denominated investment securities. When entering into a forward currency contract, a Portfolio agrees to receive or deliver a fixed quantity of foreign currency for an agreed-upon price on an agreed future date. These contracts are valued daily and a Portfolio’s net equity therein, representing unrealized gain or loss on the contracts as measured by the difference between the forward foreign exchange rates at the dates of entry into the contracts and the forward rates at the reporting date, is included in the Statement of Assets and Liabilities. Realized and unrealized gains and losses are included in the Statement of Operations. These instruments involve market and/or credit risk in excess of the amount recognized in the Statement of Assets and Liabilities. Risks arise from the possible inability of counterparties to meet the terms of their contracts and
| NOTES TO FINANCIAL STATEMENTS as of December 31, 2014 (continued) |
NOTE 2 — SIGNIFICANT ACCOUNTING POLICIES (continued)
from movement in currency and securities values and interest rates. Open forward foreign currency contracts are presented following the Summary Portfolio of Investments.
During the year ended December 31, 2014, the following Portfolios had average contract amounts on forward foreign currency contracts to buy and sell as disclosed below:
| | | Buy | | | Sell | |
| Aggregate Bond* | | $ | 57,776,204 | | | $ | 245,476,226 | |
| Global Bond** | | | 378,565,190 | | | | 270,651,319 | |
| American Century Small-Mid Cap Value* | | | 241,721 | | | | 11,138,377 | |
| Invesco Comstock* | | | — | | | | 56,057,222 | |
| Invesco Equity and Income* | | | 2,341,828 | | | | 87,404,035 | |
| Templeton Foreign Equity* | | | 1,068,332 | | | | — | |
| * | For the year ended December 31, 2014, the Portfolios used forward foreign currency contracts primarily to protect their non-U.S. dollar-denominated holdings from adverse currency movements. Please refer to the tables following each respective Summary Portfolio of Investments for open forward foreign currency contracts at December 31, 2014. There were no open forward foreign currency contract for Templeton Foreign Equity at December 31, 2014. |
| ** | For the year ended December 31, 2014, the Portfolio used forward foreign currency contracts primarily to protect their non-U.S. dollar-denominated holdings from adverse currency movements and to gain exposure to currencies for the purposes of risk management or enhanced return. Please refer to the tables following each respective Summary Portfolio of Investments for open forward foreign currency contracts at December 31, 2014. |
I. Futures Contracts. Certain Portfolios may enter into futures contracts involving foreign currency, interest rates, securities and security indices. A futures contract is a commitment to buy or sell a specific amount of a financial instrument at a negotiated price on a stipulated future date. A Portfolio may buy and sell futures contracts. Futures contracts traded on a commodities or futures exchange will be valued at the final settlement price or official closing price on the principal exchange as reported by such principal exchange at its trading session ending at, or most recently prior to, the time when each Portfolio’s assets are valued.
Upon entering into a futures contract, a Portfolio is required to deposit either cash or securities (initial margin) in an amount equal to a certain percentage of the contract value. Subsequent payments (variation margin) are made or received by a Portfolio each day. The variation margin payments are equal to the daily changes in the contract value and are recorded as unrealized gains and losses. Open futures contracts are reported on a table following each Portfolio’s Summary Portfolio of Investments. Securities held in collateralized accounts to cover initial
margin requirements on open futures contracts are footnoted in the Summary Portfolio of Investments. Cash collateral held by the broker to cover initial margin requirements on open futures contracts are noted in the Statements of Assets and Liabilities. The net change in unrealized appreciation and depreciation is reported in the Statements of Operations. Realized gains (losses) are reported in the Statements of Operations at the closing or expiration of futures contracts.
Futures contracts are exposed to the market risk factor of the underlying financial instrument. During the year ended December 31, 2014, Global Bond and Aggregate Bond have purchased and sold futures contracts on various notes and bonds as part of their respective duration strategy. Additional associated risks of entering into futures contracts include the possibility that there may be an illiquid market where each Portfolio is unable to liquidate the contract or enter into an offsetting position and, if used for hedging purposes, the risk that the price of the contract will correlate imperfectly with the prices of each Portfolios’ securities. With futures, there is minimal counterparty credit risk to the Portfolios since futures are exchange traded and the exchange’s clearinghouse, as counterparty to all exchange traded futures, guarantees the futures against default.
During the year ended December 31, 2014, the Portfolios had average notional values on futures contracts purchased and sold as disclosed below
| | | Purchased | | | Sold | |
| Aggregate Bond* | | $ | 849,383,030 | | | $ | 38,329,594 | |
| Global Bond | | | 186,721,143 | | | | 148,186,407 | |
| * | Futures contracts sold in the amount of $38,329,594 represents the outstanding notional value at December 31, 2014. |
J. Securities Lending. Each Portfolio may temporarily loan up to 331∕3% of its total assets to brokers, dealers or other financial institutions in exchange for a negotiated lender’s fee. The borrower is required to fully collateralize the loans with cash or U.S. government securities. Generally, in the event of counterparty default, a Portfolio has the right to use collateral to offset losses incurred. There would be potential loss to a Portfolio in the event a Portfolio is delayed or prevented from exercising its right to dispose of the collateral. The Portfolios bear the risk of loss with respect to the investment of collateral with the following exception: The Bank of New York Mellon (“BNY”) provides the Portfolios indemnification from loss with respect to the investment of collateral provided that the cash collateral is invested solely in overnight repurchase agreements. Engaging in securities lending could have a leveraging effect, which may intensify the credit, market and other risks associated with investing in a Portfolio.
| NOTES TO FINANCIAL STATEMENTS as of December 31, 2014 (continued) |
NOTE 2 — SIGNIFICANT ACCOUNTING POLICIES (continued)
K. Restricted Securities. The Portfolios may invest in restricted securities which include those sold under Rule 144A of the Securities Act of 1933 (“1933 Act”) or securities offered pursuant to Section 4(a)(2) of the 1933 Act, and/or are subject to legal or contractual restrictions on resale and may not be publicly sold without registration under the 1933 Act. Restricted securities are fair valued using market quotations when readily available. In the absence of market quotations, the securities are valued based upon their fair value determined in good faith under procedures approved by the Board.
L. Delayed-Delivery and When-Issued Transactions. Certain Portfolios may purchase or sell securities on a when-issued or forward commitment basis. The price of the underlying securities and date when the securities will be delivered and paid for are fixed at the time the transaction is negotiated. The fair value of such is identified in the Portfolios’ Summary Portfolio of Investments. Losses may arise due to changes in the fair value of the securities or from the inability of counterparties to meet the terms of the contract. In connection with such purchases, the Portfolios are required to hold liquid assets as collateral with the Portfolios’ custodian sufficient to cover the purchase price.
To mitigate counterparty risk, certain Portfolios have entered into Master Securities Forward Transaction Agreements (“MSFTA”) with their respective counterparties that provide for collateral and the right to offset amounts due to or from those counterparties under specified conditions. Subject to minimum transfer amounts, collateral requirements are determined and transfers made based on the net aggregate unrealized gain or loss on all the when-issued or delayed-delivery transactions with a particular counterparty. Cash collateral, if any, is presented on the Statement of Assets and Liabilities as an asset (Cash pledged as collateral for delayed-delivery or when-issued securities) and a liability (Cash received as collateral for delayed-delivery or when-issued securities). At December 31, 2014, there was no collateral posted to or from any Portfolio for delayed-delivery or when-issued transactions.
M. Mortgage Dollar Roll Transactions. Certain Portfolios may engage in dollar roll transactions with respect to mortgage-backed securities issued by Government National Mortgage Association, Federal National Mortgage Association and Federal Home Loan Mortgage Corp. In a dollar roll transaction, a Portfolio sells a mortgage-backed security to a financial institution, such as a bank or broker/dealer, and simultaneously agrees to repurchase a substantially similar (i.e., same type, coupon, and maturity)
security from the institution on a delayed delivery basis at an agreed upon price. The mortgage-backed securities that are repurchased will bear the same interest rate as those sold, but generally will be collateralized by different pools of mortgages with different prepayment histories. The Portfolios account for dollar roll transactions as purchases and sales. For fee based dollar roll transactions, the fee is recorded as income.
N. Options Contracts. Certain Portfolios may purchase put and call options and may write (sell) put options and covered call options on futures, swaps (“swaptions”), securities, commodities or foreign currencies. The Portfolios may engage in option transactions as a hedge against adverse movements in the value of portfolio holdings or to increase market exposure. Option contracts are valued daily and unrealized gains or losses are recorded based upon the last sales price on the principal exchange on which the options are traded. An amount equal to the proceeds of the premium received by the Portfolios upon the writing of a put or call option is included in the Statements of Assets and Liabilities as an asset and equivalent liability which is subsequently marked-to-market until it is exercised or closed, or it expires. The Portfolios will realize a gain or loss upon the expiration or closing of the option contract. When an option is exercised, the proceeds on sales of the underlying security for a written call option, the purchase cost of the security for a written put option, or the cost of the security for a purchased put or call option is adjusted by the amount of premium received or paid. Realized and unrealized gains or losses on option contracts are reflected in the accompanying financial statements. The risk in writing a covered call option is that the Portfolios give up the opportunity for profit if the market price of the security increases and the option is exercised. The risk in writing a put option is that the Portfolios may incur a loss if the market price of the security decreases and the option is exercised. The risk in buying an option is that the Portfolios pay a premium whether or not the option is exercised. Risks may also arise from an illiquid secondary market or from the inability of counterparties to meet the terms of the contract.
During the year ended December 31, 2014, Aggregate Bond had written options on exchange-traded futures contracts on various bonds and notes to generate income. There were no open written options on exchange-traded futures contracts at December 31, 2014.
During the year ended December 31, 2014, Aggregate Bond had purchased and written interest rate swaptions to gain additional exposure to interest rates and to generate income. There were no open purchased or written swaptions at December 31, 2014.
| NOTES TO FINANCIAL STATEMENTS as of December 31, 2014 (continued) |
NOTE 2 — SIGNIFICANT ACCOUNTING POLICIES (continued)
During the year ended December 31, 2014, Aggregate Bond had written credit default swaptions to generate income. There were no open written credit default swaptions at December 31, 2014.
During the year ended December 31, 2014, Aggregate Bond had written foreign currency options to generate income. There were no open written foreign currency options at December 31, 2014.
During the year ended December 31, 2014, Global Bond had purchased and written foreign currency options to gain exposure to currencies and to generate income. Please refer to the Summary Portfolio of Investments for open purchased foreign currency contracts at December 31, 2014. There were no open written foreign currency options at December 31, 2014.
During the year ended December 31, 2014, Global Bond had purchased and written interest rate swaptions to gain additional exposure to interest rates and to generate income. Please refer to the Summary Portfolio of Investments for open purchased interest rate swaptions and the table following for open written interest rate swaptions at December 31, 2014.
Please refer to Note 9 for the volume of both purchased and written option activity during the year ended December 31, 2014.
O. Swap Agreements. Certain Portfolios may enter into swap agreements. A swap is an agreement between two parties pursuant to which each party agrees to make one or more payments to the other at specified future intervals based on the return of an asset (such as a stock, bond or currency) or non-asset reference (such as an interest rate or index). Swap agreements are privately negotiated in the OTC market and may be executed in a multilateral or other trade facility platform, such as a registered commodities exchange (“centrally cleared swaps”).
The swap agreement will specify the “notional” amount of the asset or non-asset reference to which the contract relates. Subsequent changes in fair value, if any, are calculated based upon changes in the performance of the asset or non-asset reference multiplied by the notional value of the contract. A Portfolio may enter into credit default, interest rate, total return and currency swaps to manage its exposure to credit, currency and interest rate risk. All outstanding swap agreements are reported following each Portfolio’s Summary Portfolio of Investments.
Swaps are marked to market daily using quotations primarily from third party pricing services, registered
commodities exchange(s), counterparties or brokers. The fair value of an OTC swap contract is recorded on each Portfolio’s Statements of Assets and Liabilities. Daily changes in the value of centrally cleared swaps, if any, are recorded as variation margin receivable or payable on the Statement of Assets and Liabilities. During the term of the swap, changes in the value of the swap, if any, are recorded as unrealized gains or losses on the Statements of Operations. Upfront payments paid or received on OTC swaps by a Portfolio when entering into the agreements are reported on the Statements of Assets and Liabilities and as a component of the changes in unrealized gains or losses on the Statements of Operations. These upfront payments represent the amounts paid or received when initially entering into the swap agreement to compensate for differences between the stated terms of the swap agreement and the prevailing market conditions. The upfront payments are included as a component in the realized gains or losses on each Portfolio’s Statement of Operations upon termination or maturity of the swap. A Portfolio also records net periodic payments paid or received on the swap contract as a realized gain or loss on the Statements of Operations.
In a centrally cleared swap, immediately following execution of the swap agreement, the swap agreement is novated to a central counterparty (the “CCP”) and the Portfolio’s counterparty on the swap agreement becomes the CCP. The Portfolios are required to interface with the CCP through a broker. Upon entering into a centrally cleared swap, the Portfolios are required to deposit initial margin with the broker in the form of cash or securities in an amount that varies depending on the size and risk profile of the particular swap. Securities deposited as initial margin are footnoted as pledged on the Summary Portfolio of Investments and cash deposited is recorded on the Statements of Assets and Liabilities as cash pledged for centrally cleared swaps. The daily change in valuation of centrally cleared swaps is recorded as a receivable or payable for variation margin in the Statements of Assets and Liabilities. Payments received from (paid to) the counterparty, including at termination, are recorded as realized gain (loss) on the Statements of Operations.
Entering into swap agreements involves the risk that the maximum potential loss of an investment exceeds the current value of the investment as reported on each Portfolio’s Statements of Assets and Liabilities. Other risks involve the possibility that the counterparty to the agreements may default on its obligation to perform, that there will be no liquid market for these investments and that unfavorable changes in the market will have a negative impact on the value of the index or securities underlying the respective swap agreement.
| NOTES TO FINANCIAL STATEMENTS as of December 31, 2014 (continued) |
NOTE 2 — SIGNIFICANT ACCOUNTING POLICIES (continued)
Credit Default Swap Contracts. A credit default swap is a bilateral agreement between counterparties in which the buyer of the protection agrees to make a stream of periodic payments to the seller of protection in exchange for the right to receive a specified return in the event of a default or other credit event for a referenced entity, obligation or index. As a seller of protection on credit default swaps, a Portfolio will generally receive from the buyer a fixed payment stream based on the notional amount of the swap contract. This fixed payment stream will continue until the swap contract expires or a defined credit event occurs.
A Portfolio is subject to credit risk in the normal course of pursuing its investment objectives. As a seller of protection in a credit default swap, a Portfolio may execute these contracts to manage its exposure to the market or certain sectors of the market. Certain Portfolios may also enter into credit default swaps to speculate on changes in an issuer’s credit quality, to take advantage of perceived spread advantages, or to offset an existing short equivalent (i.e. buying protection on an equivalent reference entity).
Certain Portfolios may sell credit default swaps which expose these Portfolios to the risk of loss from credit risk- related events specified in the contract. Although contract specific, credit events are generally defined as bankruptcy, failure to pay, restructuring, obligation acceleration, obligation default or repudiation/moratorium. If a Portfolio is a seller of protection, and a credit event occurs, as defined under the terms of that particular swap agreement, a Portfolio will generally either (i) pay to the buyer an amount equal to the notional amount of the swap and take delivery of the referenced obligation, other deliverable obligations, or underlying securities comprising a referenced index or (ii) pay a net settlement amount in the form of cash or securities equal to the notional amount of the swap less the recovery value of the referenced obligation or underlying securities comprising a referenced index. If a Portfolio is a buyer of protection and a credit event occurs, as defined under the terms of that particular swap agreement, a Portfolio will either (i) receive from the seller of protection an amount equal to the notional amount of the swap and deliver the referenced obligation, other deliverable obligations or underlying securities comprising the referenced index or (ii) receive a net settlement amount in the form of cash or securities equal to the notional amount of the swap less the recovery value of the referenced obligation or underlying securities comprising the referenced index. Recovery values are assumed by market makers considering either industry standard recovery rates or entity specific factors and considerations
until a credit event occurs. If a credit event has occurred, the recovery value is determined by a facilitated auction whereby a minimum number of allowable broker bids, together with a specified valuation method, are used to calculate the settlement value.
Implied credit spreads, represented in absolute terms, utilized in determining the fair value of credit default swap agreements on corporate issues or sovereign issues are disclosed in each Portfolio’s Summary Portfolio of Investments and serve as an indicator of the current status of the payment/performance risk and represent the likelihood or risk of default for the credit derivative. The implied credit spread of a particular referenced entity reflects the cost of buying/selling protection and may include upfront payments required to be made to enter into the agreement. For credit default swaps on asset-backed securities or credit indices, the quoted market prices and resulting fair values serve as the indicator of the current status of the payment/performance risk. Wider credit spreads and increasing fair values, in absolute terms when compared to the notional amount of the swap, represent a deterioration of the referenced entity’s credit soundness and a greater likelihood or risk of default or other credit event occurring as defined under the terms of the agreement.
The maximum amount of future payments (undiscounted) that a Portfolio as seller of protection could be required to make under a credit default swap agreement would be an amount equal to the notional amount of the agreement. Notional amounts of all credit default swap agreements outstanding as of December 31, 2014, for which a Portfolio is seller of protection are disclosed following each Summary Portfolio of Investments. These potential amounts would be partially offset by any recovery values of the respective referenced obligations, upfront payments received upon entering into the agreements, or net amounts received from the settlement of buy protection credit default swap agreements entered into by a Portfolio for the same referenced entity or entities.
For the year ended December 31, 2014, Aggregate Bond had purchased credit protection through credit default swaps to decrease exposure to the credit risk of individual securities. For the year ended December 31, 2014, Aggregate Bond had an average notional amount of $500,000 on credit default swaps to buy protection. There were no open credit default swaps to buy protection at December 31, 2014.
For the year ended December 31, 2014, Aggregate Bond had sold credit protection through credit default swaps to gain exposure to the credit risk of individual securities and credit default indices that are either unavailable or considered to be less attractive in the bond market and to
| NOTES TO FINANCIAL STATEMENTS as of December 31, 2014 (continued) |
NOTE 2 — SIGNIFICANT ACCOUNTING POLICIES (continued)
hedge against anticipated potential credit events. Aggregate Bond had also sold protection on various credit default swap indices to gain additional exposure to the market or certain sectors of the markets. For the year ended December 31, 2014, Aggregate Bond had an average notional amount of $111,547,724 on credit default swaps to sell protection. There were no open credit default swaps to sell protection at December 31, 2014.
Interest Rate Swap Contracts. An interest rate swap involves the agreement between counterparties to exchange periodic payments based on interest rates. One payment will be based on a floating rate of a specified interest rate while the other will be a fixed rate. Risks involve the future fluctuations of interest rates in which a Portfolio may make payments that are greater than what a Portfolio received from the counterparty. Other risks include credit, liquidity and market risk.
For the year ended December 31, 2014, Aggregate Bond and Global Bond had entered into interest rate swaps in which they pay a floating interest rate and receives a fixed interest rate (“Long interest rate swap”) in order to increase exposure to interest rate risk. Average notional amounts on long interest rate swaps were $421,126,155 and $218,857,415, respectively.
For the year ended December 31, 2014, Aggregate Bond and Global Bond had entered into interest rate swaps in which they pay a fixed interest rate and receive a floating interest rate (“Short interest rate swap”) in order to decrease exposure to interest rate risk. Average notional amounts on short interest rate swaps were $62,345,657 and $197,706,626, respectively.
Global Bond and Aggregate Bond entered into interest rate swaps to adjust interest rate and yield curve exposures and to substitute for physical fixed-income securities. Please refer to the tables following the Summary Portfolio of Investments for Global Bond for open centrally cleared interest rate swaps at December 31, 2014. There were no open interest rate swaps for Aggregate Bond at December 31, 2014.
At December 31, 2014, Global Bond had posted $3,435,00 in cash collateral as initial margin for the open centrally cleared interest rate swaps outstanding at December 31, 2014.
P. Structured Products. Global Bond invests in structured products which are specially-designed derivative
investments whose principal payments or interest payments are linked to the performance of underlying foreign currencies, interest rate spreads, stock market indices, prices of individual securities, commodities or other financial instruments or the occurrence of other specific events. The terms and conditions of these products may be ‘structured’ by the purchaser (a Portfolio) and the borrower issuing the note. The market value of these products will increase or decrease based on the performance of the underlying asset or reference. A Portfolio records the net change in the market value of the structured product on the accompanying Statements of Operations as a change in unrealized appreciation or depreciation on investments. A Portfolio records a realized gain or loss on the Statements of Operations upon the sale or maturity of the structured product. Please refer to the Summary Portfolio of Investments for structured products held by Global Bond at December 31, 2014.
Q. Sale Commitments. Sale commitments involve commitments where the unit price and the estimated principal amount are established upon entering into the contract, with the actual principal amount being within a specified range of the estimate. A Portfolio will enter into sale commitments to hedge its portfolio positions or to sell mortgage-backed securities it owns under delayed delivery arrangements. Proceeds of sale commitments are not received until the contractual settlement date. During the time a sale commitment is outstanding, a Portfolio will maintain, in a segregated account, cash or marketable securities in an amount sufficient to meet the purchase price. Unsettled sale commitments are valued at current market value of the underlying securities. If the sale commitment is closed through the acquisition of an offsetting purchase commitment, a Portfolio realizes a gain or loss on the commitment without regard to any unrealized gain or loss on the underlying security. If a Portfolio delivers securities under the commitment, a Portfolio realizes a gain or loss from the sale of the securities, based upon the unit price established at the date the commitment was entered into. There were no open sales commitments at December 31, 2014.
R. Indemnifications. In the normal course of business, the Company may enter into contracts that provide certain indemnifications. The Company’s maximum exposure under these arrangements is dependent on future claims that may be made against the Portfolios and, therefore, cannot be estimated; however, based on experience, management considers the risk of loss from such claims remote.
| NOTES TO FINANCIAL STATEMENTS as of December 31, 2014 (continued) |
NOTE 3 — INVESTMENT TRANSACTIONS
For the year ended December 31, 2014, the cost of purchases and the proceeds from the sales of securities, excluding U.S. government and short-term securities, were as follows:
| | | Purchases | | | Sales | |
| Aggregate Bond | | $ | 539,234,397 | | | $ | 379,652,122 | |
| Global Bond | | | 326,423,200 | | | | 352,360,172 | |
| American Century Small-Mid Cap Value | | | 277,582,931 | | | | 379,787,115 | |
| Baron Growth | | | 110,663,059 | | | | 238,136,889 | |
| Columbia Contrarian Core | | | 256,441,608 | | | | 286,173,432 | |
| Columbia Small Cap Value II | | | 144,398,526 | | | | 111,408,809 | |
| Invesco Comstock | | | 200,907,589 | | | | 141,555,656 | |
| Invesco Equity and Income | | | 821,710,144 | | | | 641,374,387 | |
| JPMorgan Mid Cap Value | | | 156,404,394 | | | | 255,039,978 | |
| Oppenheimer Global | | | 209,403,273 | | | | 428,493,550 | |
| Pioneer High Yield | | | 46,064,949 | | | | 44,090,174 | |
| T. Rowe Price Diversified Mid Cap Growth | | | 231,846,042 | | | | 326,176,871 | |
| T. Rowe Price Growth Equity | | | 552,654,325 | | | | 699,918,336 | |
| Templeton Foreign Equity | | | 94,906,889 | | | | 205,553,075 | |
U.S. government securities not included above were as follows:
| | | Purchases | | | Sales | |
| Aggregate Bond | | $ | 5,864,210,791 | | | $ | 6,448,110,153 | |
| Global Bond | | | 625,370,877 | | | | 601,332,075 | |
| Invesco Equity and Income | | | 1,905,113,346 | | | | 1,747,120,371 | |
| Pioneer High Yield | | | 1,995,642 | | | | – | |
NOTE 4 — INVESTMENT MANAGEMENT AND ADMINISTRATIVE FEES
The Portfolios have entered into an investment management agreement with the Investment Adviser. For its services, each Portfolio pays the Investment Adviser a monthly fee in arrears equal to the following as a percentage of each Portfolio’s average daily net assets during the month:
| Portfolio | | | Fee | |
| Aggregate Bond | | | 0.44% | |
| Global Bond | | | 0.500% on the first $4 billion; | |
| | 0.475% on the next $1 billion; | |
| | 0.450% on the next $1 billion; | |
| | 0.430% on assets over $6 billion | |
| American Century Small-Mid Cap Value(1) | | | 1.00% on the first $250 million; | |
| | 0.95% on the next $250 million; | |
| | 0.90% on assets over $500 million | |
| Baron Growth(2) | | | 0.850% on the first $1 billion; | |
| | 0.825% on the next $1 billion; | |
| | 0.800% on assets over $2 billion | |
| Columbia Contrarian Core | | | 0.80% | |
| Columbia Small Cap Value II | | | 0.75% | |
| Portfolio | | | Fee | |
| Invesco Comstock | | | 0.60% | |
| Invesco Equity and Income(3) | | | 0.55% on the first $750 million; | |
| | 0.53% on the next $250 million; | |
| | 0.51% on assets over $1 billion | |
| JPMorgan Mid Cap Value | | | 0.75% on the first $500 million; | |
| | 0.65% on the next $500 million; | |
| | 0.60% on assets over $1 billion | |
| Oppenheimer Global(4) | | | 0.60% on the first $3 billion; | |
| | 0.58% on the next $1 billion; | |
| | 0.57% on the next $4 billion; | |
| | 0.56% on assets over $8 billion | |
| Pioneer High Yield | | | 0.60% on the first $2 billion; | |
| | 0.50% on the next $1 billion; | |
| | 0.40% on the next $1 billion; | |
| | 0.30% on assets over $4 billion | |
| T. Rowe Price Diversified Mid Cap Growth | | | 0.64% | |
| T. Rowe Price Growth Equity | | | 0.60% | |
| Templeton Foreign Equity | | | 0.80% on the first $500 million; | |
| | | | 0.75% on assets over $500 million | |
_____________
| (1) | Effective January 1, 2014, advisory fee breakpoints were incorporated. |
| (2) | Prior to January 1, 2014, the advisory fee for Baron Growth was 0.85% on the first $2 billion; and 0.80% on assets over $2 billion. |
| (3) | Effective close of business on March 14, 2014, advisory fee breakpoints were incorporated and a 0.01% advisory fee waiver was implemented. |
| (4) | Prior to January 1, 2014, the advisory fee for Oppenheimer Global was 0.60% on the first $4 billion; 0.58% on the next $4 billion; and 0.56% on assets over $8 billion. |
The Adviser has contractually agreed to waive a portion of the advisory fee for Global Bond, American Century Small-Mid Cap Value, Columbia Contrarian Core, Columbia Small Cap Value II, Invesco Comstock and T. Rowe Price Growth Equity. The waiver is calculated as follows:
Waiver = 50% x (former sub-advisory fee rate minus new sub-advisory fee rate)
In addition, the Investment Adviser has agreed to further waive a portion of the advisory fee for T. Rowe Price Growth Equity. The waiver for T. Rowe Price Growth Equity is based on the total savings in excess of $500,000 as a result of the aggregated sub-advisory fee schedule of T. Rowe Price Growth Equity and VY® T. Rowe Price Equity Income Portfolio, which is not included in this report. The aggregated amount of saving is allocated to the two Portfolios pro rata based on each Portfolio’s contribution to the amount saved.
For the year ended December 31, 2014, the Investment Adviser waived $7,332, $576,665, $100,287, $58,560, $85,402, and $99,226 for Global Bond, American Century Small-Mid Cap Value, Columbia Contrarian Core, Columbia Small Cap Value II, Invesco Comstock, and T. Rowe Price Growth Equity, respectively. Termination or modification of these obligations requires approval by the Board.
| NOTES TO FINANCIAL STATEMENTS as of December 31, 2014 (continued) |
NOTE 4 — INVESTMENT MANAGEMENT AND ADMINISTRATIVE FEES (continued)
Effective June 1, 2009, Templeton Foreign Equity may invest its assets in Templeton Smaller Companies Fund. Templeton Foreign Equity’s purchase of shares of Templeton Smaller Companies Fund will result in Templeton Foreign Equity paying a proportionate share of the expenses of Templeton Smaller Companies Fund. The Investment Adviser will waive its management fee in an amount equal to the advisory fee received by the adviser of the Templeton Smaller Companies Fund resulting from the Templeton Foreign Equity’s investment into the Templeton Smaller Companies Fund. There were no such waivers for the year ended December 31, 2014.
The Administrator provides certain administrative and shareholder services necessary for each Portfolio’s operations and is responsible for the supervision of other service providers. For its services, the Administrator is entitled to receive from each Portfolio a fee at an annual rate of 0.10% of each Portfolio’s average daily net assets.
The Company and DSL have entered into portfolio management agreements with each sub-adviser. These sub-advisers provide investment advice for the various Portfolios and are paid by DSL based on the average daily net assets of the respective Portfolios. Subject to such policies as the Board or DSL may determine, the sub-advisers manage each respective Portfolio’s assets in accordance with the Portfolio’s investment objectives, policies, and limitations. The sub-advisers of the Portfolios are as follows (* denotes a related party adviser):
| Portfolio | | | Sub-Adviser | |
| Aggregate Bond(1) | | | Voya Investment Management Co. LLC* | |
| Global Bond | | | Voya Investment Management Co. LLC* | |
| American Century Small-Mid Cap Value | | | American Century Investment Management, Inc. | |
| Baron Growth | | | BAMCO, Inc. | |
| Columbia Contrarian Core & Columbia Small Cap Value II | | | Columbia Management Investment Advisers, LLC | |
| Invesco Comstock & Invesco Equity and Income | | | Invesco Advisers, Inc. | |
| JPMorgan Mid Cap Value | | | J.P. Morgan Investment Management Inc. | |
| Oppenheimer Global | | | OppenheimerFunds, Inc. | |
| Pioneer High Yield | | | Pioneer Investment Management, Inc. | |
| T. Rowe Price Diversified Mid Cap Growth & T. Rowe Price Growth Equity | | | T. Rowe Price Associates, Inc. | |
| Templeton Foreign Equity | | | Templeton Investment Counsel, LLC | |
______________
| (1) | Prior to the close of business on December 12, 2014, Pacific Investment Management Company LLC served as sub-adviser to the Portfolio. |
In placing equity security transactions, each sub-adviser is required to use its best efforts to choose a broker capable of providing brokerage services necessary to obtain the best execution for each transaction. Subject to this requirement, each sub-adviser may allocate equity security transactions through certain designated broker-dealers. Some of these broker-dealers participate in commission recapture programs that have been established for the benefit of the Portfolios. Under these programs, the participating broker-dealers will return to a Portfolio a portion of the brokerage commissions (in the form of a credit to a Portfolio) paid to the broker-dealers to pay certain expenses of a Portfolio. These commission recapture payments benefit the Portfolios and not the sub-advisers. Any amount credited to a Portfolio is reflected as brokerage commission recapture on the accompanying Statements of Operations.
NOTE 5 — DISTRIBUTION AND SERVICE FEES
Class ADV and Class S2 shares of each respective Portfolio have a plan of Distribution pursuant to Rule 12b-1 under the 1940 Act (the “Plan”), whereby the Distributor is reimbursed or compensated by the Portfolios for expenses incurred in the distribution of each Portfolio’s shares. The Distributor may pay, on behalf of each Portfolio, out of its distribution fee, compensation to certain financial institutions for providing distribution assistance. Under the Plan, a Portfolio makes payments at an annual rate of 0.25% of the Portfolio’s average daily net assets attributable to its Class ADV and Class S2 shares, as applicable. The Distributor has contractually agreed to waive a portion of its fee equal to 0.10% of the average daily net assets attributable to the distribution fee paid by Class S2 of the Portfolios, so that the actual fee paid by a Portfolio is an annual rate of 0.15%. Effective close of business on March 14, 2014, the Distributor has agreed to waive an additional 0.02% of the distribution fee for Invesco Equity and Income Class S2 shares. Termination or modification of these obligations requires approval by the Board.
Class ADV, Class S and Class S2 shares are further subject to a shareholder servicing fee payable to Shareholder Organizations pursuant to the Shareholder Servicing Plan adopted for Class ADV, Class S and Class S2 shares which shall not exceed an annual rate of 0.25% of the average daily net assets of each class, respectively. The Distributor has contractually agreed to waive a portion of the servicing fee for Baron Growth so that total net operating expenses do not exceed 1.31% for Class S shares. Termination or modification of this obligation requires approval by the Board.
| NOTES TO FINANCIAL STATEMENTS as of December 31, 2014 (continued) |
NOTE 5 — DISTRIBUTION AND SERVICE FEES (continued)
Fees paid to the Distributor by class during the year ended December 31, 2014 are reflected on the accompanying Statements of Operations.
NOTE 6 — OTHER TRANSACTIONS WITH AFFILIATES AND RELATED PARTIES
For the year ended December 31, 2014, Aggregate Bond incurred $20,000 of information statement costs associated with changes to the Portfolio’s sub-adviser, name, principal investment strategies, and expense structure. The Investment Adviser reimbursed the Portfolio for these costs.
At December 31, 2014, the following direct or indirect, wholly-owned subsidiaries of Voya Financial, Inc. or affiliated investment companies owned more than 5% of the following Portfolios:
Subsidiary/Affiliated
Investment Company | | Portfolio | | Percentage | |
| ReliaStar Life Insurance Company | | Oppenheimer Global | | | 5.36 | % |
| | | Pioneer High Yield | | | 23.99 | |
| | | T. Rowe Price Diversified Mid Cap Growth | | | 13.47 | |
| Security Life of Denver Insurance Company | | Global Bond | | | 5.50 | |
| | | Pioneer High Yield | | | 20.74 | |
| | | T. Rowe Price Diversified Mid Cap Growth | | | 5.55 | |
| Voya Institutional Trust Company | | Aggregate Bond | | | 27.85 | |
| | | Global Bond | | | 18.54 | |
| | | American Century Small-Mid Cap Value | | | 42.90 | |
| | | Baron Growth | | | 15.06 | |
| | | Columbia Small Cap Value II | | | 6.09 | |
| | | Invesco Comstock | | | 8.27 | |
| | | JPMorgan Mid Cap Value | | | 17.98 | |
| | | Oppenheimer Global | | | 9.45 | |
| | | T. Rowe Price Growth Equity | | | 17.97 | |
| Voya Insurance and Annuity Company | | Baron Growth | | | 39.95 | |
| | | Columbia Contrarian Core | | | 82.71 | |
| | | Columbia Small Cap Value II | | | 53.55 | |
| | | Invesco Comstock | | | 48.26 | |
| | | Invesco Equity and Income | | | 62.47 | |
| | | JPMorgan Mid Cap Value | | | 27.55 | |
| | | Oppenheimer Global | | | 9.12 | |
| | | T. Rowe Price Growth Equity | | | 15.61 | |
| | | Templeton Foreign Equity | | | 65.16 | |
| Voya Retirement Insurance and Annuity Company | | Aggregate Bond | | | 68.26 | |
| | | Global Bond | | | 69.55 | |
| | | American Century Small-Mid Cap Value | | | 54.89 | |
| | | Baron Growth | | | 40.15 | |
| | | Columbia Contrarian Core | | | 9.03 | |
Subsidiary/Affiliated
Investment Company | | Portfolio | | Percentage | |
| | | Columbia Small Cap Value II | | | 31.99 | |
| | | Invesco Comstock | | | 21.57 | |
| | | Invesco Equity and Income | | | 32.24 | |
| | | JPMorgan Mid Cap Value | | | 47.64 | |
| | | Oppenheimer Global | | | 74.32 | |
| | | Pioneer High Yield | | | 53.23 | |
| | | T. Rowe Price Diversified Mid Cap Growth | | | 75.20 | |
| | | T. Rowe Price Growth Equity | | | 52.99 | |
| | | Templeton Foreign Equity | | | 24.03 | |
| Voya Solution 2025 Portfolio | | Invesco Comstock | | | 6.22 | |
| Voya Solution 2035 Portfolio | | Invesco Comstock | | | 5.58 | |
Control is defined by the 1940 Act as the beneficial ownership, either directly or through one or more controlled companies, of more than 25% of the voting securities of a company. The 1940 Act defines affiliates as companies that are under common control. Therefore, if certain Portfolios have a common owner that owns over 25% of the outstanding securities of the Portfolios, they may be deemed to be affiliates of each other. Investment activities of these shareholders could have a material impact on the Portfolios.
The Portfolios have adopted a Deferred Compensation Plan (the “Plan”), which allows eligible non-affiliated directors, as described in the Plan, to defer the receipt of all or a portion of the directors’ fees that they are entitled to receive from the Portfolios. For purposes of determining the amount owed to the director under the Plan, the amounts deferred are invested in shares of the funds selected by the director (the “Notional Funds”). The Portfolios purchase shares of the Notional Funds, which are all advised by Voya Investments, in amounts equal to the directors’ deferred fees, resulting in a Portfolio asset equal to the deferred compensation liability. Such assets are included as a component of “Other assets” on the accompanying Statement of Assets and Liabilities. Deferral of directors’ fees under the Plan will not affect net assets of the Portfolio, and will not materially affect the Portfolios’ assets, liabilities or net investment income per share. Amounts will be deferred until distributed in accordance with the Plan.
NOTE 7 — OTHER ACCRUED EXPENSES AND LIABILITIES
At December 31, 2014, the following Portfolio had the below payable included in other accrued expenses and liabilities that exceeded 5% of total liabilities:
| Portfolio | | Accrued Expenses | | Amount | |
| Pioneer High Yield | | Postage | | $ | 5,395 | |
| NOTES TO FINANCIAL STATEMENTS as of December 31, 2014 (continued) |
NOTE 8 — EXPENSE LIMITATION AGREEMENT
The Investment Adviser has entered into a written expense limitation agreement (“Expense Limitation Agreement”) with the following Portfolios, whereby the Investment Adviser has agreed to limit expenses, excluding interest, taxes, brokerage commissions, extraordinary expenses, and acquired fund fees and expenses to the following annual expenses to average daily net assets:
| Portfolio | | Class ADV | | | Class I | | | Class S | | | Class S2 | |
| Aggregate Bond(1) | | | 1.08 | % | | | 0.58 | % | | | 0.83 | % | | | 0.98 | % |
| Global Bond | | | 1.10 | % | | | 0.60 | % | | | 0.85 | % | | | N/A | |
| American Century Small-Mid Cap Value | | | 1.52 | % | | | 1.02 | % | | | 1.27 | % | | | 1.42 | % |
| Baron Growth | | | 1.59 | % | | | 1.09 | % | | | 1.34 | % | | | 1.49 | % |
| Columbia Contrarian Core(2) | | | N/A | | | | N/A | | | | N/A | | | | N/A | |
| Columbia Small Cap Value II | | | 1.65 | % | | | 1.15 | % | | | 1.40 | % | | | 1.55 | % |
| Invesco Comstock(3) | | | N/A | | | | N/A | | | | N/A | | | | N/A | |
| Invesco Equity and Income | | | 1.15 | % | | | 0.65 | % | | | 0.90 | % | | | 1.05 | % |
| JPMorgan Mid Cap Value | | | 1.50 | % | | | 1.00 | % | | | 1.25 | % | | | 1.40 | % |
| Oppenheimer Global | | | 1.30 | % | | | 0.80 | % | | | 1.05 | % | | | 1.20 | % |
| Pioneer High Yield | | | N/A | | | | 0.71 | % | | | 0.96 | % | | | N/A | |
| T. Rowe Price Diversified Mid Cap Growth(4) | | | 1.30 | % | | | 0.80 | % | | | 1.05 | % | | | 1.20 | % |
| T. Rowe Price Growth Equity | | | 1.25 | % | | | 0.75 | % | | | 1.00 | % | | | 1.15 | % |
| Templeton Foreign Equity(5) | | | 1.48 | % | | | 0.98 | % | | | 1.23 | % | | | 1.38 | % |
_____________
| (1) | Effective close of business December 12, 2014, pursuant to a side letter agreement, through May 1, 2017, the Investment Adviser has agreed to waive all or a portion of the advisory fee and/or reimburse expenses so that the expense limits are 1.05%, 0.55%, 0.80%, and 0.95% for Class ADV, Class I, Class S, and Class S2, respectively. Termination or modification of this obligation requires approval by the Board. |
| (2) | Effective January 1, 2014, pursuant to a side letter agreement, through May 1, 2015, the Investment Adviser has agreed to waive all or a portion of the advisory fee and/or reimburse expenses so that the expense limits are 1.21%, 0.71% and 0.96% for Class ADV, Class I, and Class S, respectively. Prior to January 1, 2014, the side letter agreement expense limits were 1.25%, 0.75% and 1.00% for Class ADV, Class I, and Class S, respectively. Termination or modification of this obligation requires approval by the Board. Any fees waived pursuant to the side letter agreement shall not be eligible for recoupment. |
| (3) | Pursuant to a side letter agreement, through May 1, 2015, the Investment Adviser has agreed to waive all or a portion of the |
advisory fee and/or reimburse expenses so that the expense limits are 1.31%, 0.81% and 1.06% for Class ADV, Class I, and Class S, respectively. Termination or modification of this obligation requires approval by the Board. Any fees waived pursuant to the side letter agreement shall not be eligible for recoupment.
| (4) | Prior to May 1, 2014, the expense limits were 1.25%, 0.75%, 1.00% and 1.15% for Class ADV, Class I, Class S and Class S2, respectively. |
| (5) | Pursuant to a side letter agreement, through May 1, 2015, the Investment Adviser has agreed to waive all or a portion of the advisory fee and/or reimburse expenses so that the expense limits are 1.42%, 0.92%, 1.17% and 1.32% for Class ADV, Class I, Class S, and Class S2, respectively. Termination or modification of this obligation requires approval by the Board. Any fees waived pursuant to the side letter agreement shall not be eligible for recoupment. |
The Investment Adviser may, at a later date, recoup from a Portfolio for management fees waived and other expenses, except as otherwise noted above, assumed by the Investment Adviser during the previous 36 months, but only if, after such recoupment, a Portfolio’s expense ratio does not exceed the percentage described above. Waived and reimbursed fees and any recoupment by the Investment Adviser of such waived and reimbursed fees are reflected on the accompanying Statements of Operations. Amounts payable by the Investment Adviser are reflected on the accompanying Statements of Assets and Liabilities.
At December 31, 2014, the amounts of waived and reimbursed fees that are subject to possible recoupment by the Investment Adviser, and the related expiration dates are as follows:
| | | December 31, | | | | |
| Portfolio | | 2015 | | | 2016 | | | 2017 | | | Total | |
| Aggregate Bond | | $ | 76,233 | | | $ | 65,174 | | | $ | 31,483 | | | $ | 172,890 | |
| Global Bond | | | 165,760 | | | | 243,845 | | | | 173,482 | | | | 583,087 | |
| American Century Small-Mid Cap Value | | | 413,790 | | | | 471,719 | | | | 463,222 | | | | 1,348,731 | |
| Invesco Equity and Income | | | 233,707 | | | | 261,856 | | | | 201,217 | | | | 696,780 | |
| Pioneer High Yield | | | 39,164 | | | | 16,528 | | | | 60,824 | | | | 116,516 | |
| T. Rowe Price Diversified Mid Cap Growth | | | 152,848 | | | | 178,875 | | | | 67,420 | | | | 399,143 | |
| Templeton Foreign Equity | | | 9,367 | | | | — | | | | — | | | | 9,367 | |
The Expense Limitation Agreement is contractual through May 1, 2015, except for Aggregate Bond, which is through May 1, 2017 and Invesco Equity and Income, which is through May 1, 2016 and shall renew automatically for one-year terms. Termination or modification of this obligation requires approval by the Board.
| NOTES TO FINANCIAL STATEMENTS as of December 31, 2014 (continued) |
NOTE 9 — PURCHASED AND WRITTEN OPTIONS
Transactions in purchased interest rate swaptions for Aggregate Bond during the year ended December 31, 2014 were as follows:
| | | USD Notional | | | Cost | |
| Balance at 12/31/2013 | | | — | | | $ | — | |
| Options Purchased | | | 4,400,000 | | | | 65,230 | |
| Options Terminated in Closing Sell Transactions | | | (4,400,000 | ) | | | (65,230 | ) |
| Options Exercised | | | — | | | | — | |
| Options Expired | | | — | | | | — | |
| Balance at 12/31/2014 | | | — | | | $ | — | |
Transactions in written options on exchange-traded futures contracts for Aggregate Bond during the year ended December 31, 2014 were as follows:
| | | Number of
Contracts | | | Premiums
Received | |
| Balance at 12/31/2013 | | | 85 | | | $ | 29,865 | |
| Options Written | | | 563 | | | | 194,609 | |
| Options Terminated in Closing Purchase Transactions | | | (52 | ) | | | (42,986 | ) |
| Options Exercised | | | 52 | | | | 42,986 | |
| Options Expired | | | (648 | ) | | | (224,474 | ) |
| Balance at 12/31/2014 | | | — | | | $ | — | |
Transactions in written credit default swaptions for Aggregate Bond during the year ended December 31, 2014 were as follows:
| | | USD
Notional | | | EUR
Notional | | | Premiums
Received | |
| Balance at 12/31/2013 | | | 5,600,000 | | | | 3,000,000 | | | $ | 10,595 | |
| Options Written | | | 11,000,000 | | | | 21,300,000 | | | | 51,242 | |
| Options Terminated in Closing Purchase Transactions | | | (8,900,000 | ) | | | (21,300,000 | ) | | | (50,788 | ) |
| Options Expired | | | (7,700,000 | ) | | | (3,000,000 | ) | | | (11,049 | ) |
| Balance at 12/31/2014 | | | — | | | | — | | | $ | — | |
Transactions in written interest rate swaptions for Aggregate Bond during the year ended December 31, 2014 were as follows:
| | | USD
Notional | | | EUR
Notional | | | Premiums
Received | |
| Balance at 12/31/2013 | | | 324,000,000 | | | | 19,400,000 | | | $ | 1,244,504 | |
| Options Written | | | 516,800,000 | | | | 30,800,000 | | | | 3,147,015 | |
| Options Terminated in Closing Purchase Transactions | | | (203,000,000 | ) | | | (30,800,000 | ) | | | (1,615,050 | ) |
| Options Exercised | | | — | | | | — | | | | — | |
| Options Expired | | | (637,800,000 | ) | | | (19,400,000 | ) | | | (2,776,469 | ) |
| Balance at 12/31/2014 | | | — | | | | — | | | $ | — | |
Transactions in written foreign currency options for Aggregate Bond during the year ended December 31, 2014 were as follows:
| | | USD
Notional | | | AUD
Notional | | | EUR
Notional | | | Premiums
Received | |
| Balance at 12/31/2013 | | | — | | | | — | | | | — | | | $ | — | |
| Options Written | | | 96,900,000 | | | | 22,000,000 | | | | 19,800,000 | | | | 1,067,155 | |
| Options Terminated in Closing Purchase Transactions | | | (82,800,000 | ) | | | (11,200,000 | ) | | | (10,900,000 | ) | | | (909,174 | ) |
| Options Exercised | | | — | | | | — | | | | — | | | | — | |
| Options Expired | | | (14,100,000 | ) | | | (10,800,000 | ) | | | (8,900,000 | ) | | | (157,981 | ) |
| Balance at 12/31/2014 | | | — | | | | — | | | | — | | | $ | — | |
Transactions in purchased foreign currency options for Global Bond during the year ended December 31, 2014 were as follows:
| | | USD
Notional | | | Cost | |
| Balance at 12/31/2013 | | | 13,700,000 | | | $ | 245,975 | |
| Options Purchased | | | 207,920,300 | | | | 1,129,530 | |
| Options Terminated in Closing Sell Transactions | | | (20,723,000 | ) | | | (125,704 | ) |
| Options Exercised | | | — | | | | — | |
| Options Expired | | | (184,253,300 | ) | | | (1,173,239 | ) |
| Balance at 12/31/2014 | | | 16,644,000 | | | $ | 76,562 | |
Transactions in purchased interest rate swaptions for Global Bond during the year ended December 31, 2014 were as follows:
| | | AUD
Notional | | | GBP
Notional | | | USD
Notional | | | Cost | |
| Balance at 12/31/2013 | | | — | | | | — | | | | — | | | $ | — | |
| Options Purchased | | | 5,075,000 | | | | 169,091,000 | | | | 712,347,000 | | | | 3,604,592 | |
| Options Terminated in Closing Sell Transactions | | | (5,075,000 | ) | | | (169,091,000 | ) | | | (509,614,000 | ) | | | (2,344,589 | ) |
| Options Exercised | | | — | | | | — | | | | — | | | | — | |
| Options Expired | | | — | | | | — | | | | (121,260,000 | ) | | | (927,639 | ) |
| Balance at 12/31/2014 | | | — | | | | — | | | | 81,473,000 | | | $ | 332,364 | |
Transactions in written foreign currency options for Global Bond during the year ended December 31, 2014 were as follows:
| NOTES TO FINANCIAL STATEMENTS as of December 31, 2014 (continued) |
NOTE 9 — PURCHASED AND WRITTEN OPTIONS (continued)
| | | USD
Notional | | | Premiums
Received | |
| Balance at 12/31/2013 | | | — | | | $ | — | |
| Options Written | | | 54,053,000 | | | | 380,735 | |
| Options Terminated in Closing Purchase Transactions | | | (6,827,000 | ) | | | (17,409 | ) |
| Options Exercised | | | — | | | | — | |
| Options Expired | | | (47,226,000 | ) | | | (363,326 | ) |
| Balance at 12/31/2014 | | | — | | | $ | — | |
Transactions in written interest rate swaptions for Global Bond Portfolio during the year ended December 31, 2014 were as follows:
| | | GBP
Notional | | | USD
Notional | | | Premiums
Received | |
| Balance at 12/31/2013 | | | — | | | | — | | | $ | —- | |
| Options Written | | | 37,538,000 | | | | 772,918,000 | | | | 2,828,110 | |
| Options Terminated in Closing Purchase Transactions | | | (37,538,000 | ) | | | (476,460,000 | ) | | | (1,258,211 | ) |
| Options Exercised | | | — | | | | — | | | | — | |
| Options Expired | | | — | | | | (130,568,000 | ) | | | (1,086,730 | ) |
| Balance at 12/31/2014 | | | — | | | | 165,890,000 | | | $ | 483,169 | |
NOTE 10 — LINE OF CREDIT
The Portfolios, in addition to certain other funds managed by the Investment Adviser, have entered into an unsecured committed revolving line of credit agreement (the “Credit Agreement”) with BNY for an aggregate amount of $200,000,000. The proceeds may be used only to: (1) temporarily finance the purchase and sale of securities;
or (2) finance the redemption of shares of an investor in the funds. The funds to which the line of credit is available pay a commitment fee equal to 0.07% per annum on the daily unused portion of the committed line amount payable quarterly in arrears. Prior to May 23, 2014, the funds to which the Credit Agreement is available paid a commitment fee equal to 0.08% per annum on the daily unused portion of the committed line amount payable quarterly in arrears.
Borrowings under the Credit Agreement accrue interest at the federal funds rate plus a specified margin. Repayments generally must be made within 60 days after the date of a revolving credit advance.
The following Portfolios utilized the line of credit during the year ended December 31, 2014:
| Portfolio | | Days
Utilized | | Approximate
Average
Daily
Balance For
Days
Utilized | | | Approximate
Weighted
Average
Interest Rate
For Days
Utilized | |
| Aggregate Bond | | 27 | | $ | 1,220,370 | | | | 1.09 | % |
| Global Bond | | 18 | | | 1,244,454 | | | | 1.09 | |
| American Century Small-Mid Cap Value | | 9 | | | 3,340,585 | | | | 1.09 | |
| Baron Growth | | 92 | | | 2,137,935 | | | | 1.09 | |
| Columbia Contrarian Core | | 3 | | | 661,000 | | | | 1.08 | |
| Invesco Comstock | | 1 | | | 9,891,000 | | | | 1.09 | |
| JPMorgan Mid Cap Value | | 1 | | | 2,246,000 | | | | 1.09 | |
| Oppenheimer Global | | 8 | | | 2,748,500 | | | | 1.09 | |
| T. Rowe Price Diversified Mid Cap Growth | | 9 | | | 738,000 | | | | 1.10 | |
NOTE 11 — CAPITAL SHARES
Transactions in capital shares and dollars were as follows:
| | | Shares
sold | | | Shares
issued in
merger | | | Reinvestment
of
distributions | | | Shares
redeemed | | | Net increase
(decrease)
in shares
outstanding | | | Shares sold | | | Proceeds
from shares
issued in
merger | | | Reinvestment
of
distributions | | | Shares
redeemed | | | Net increase
(decrease) | |
Year or period
ended | | # | | | # | | | # | | | # | | | # | | | ($) | | | ($) | | | ($) | | | ($) | | | ($) | |
| Aggregate Bond | | | | | | | | | | | | | | | | | | | | | | | | | | | | |
| Class ADV | | | | | | | | | | | | | | | | | | | | | | | | | | | | | | |
| 12/31/2014 | | | 632,920 | | | | — | | | | 259,068 | | | | (2,806,218 | ) | | | (1,914,230 | ) | | | 7,284,346 | | | | — | | | | 2,966,337 | | | | (32,243,640 | ) | | | (21,992,957 | ) |
| 12/31/2013 | | | 2,868,423 | | | | — | | | | 711,107 | | | | (4,003,882 | ) | | | (424,352 | ) | | | 33,957,710 | | | | — | | | | 7,978,624 | | | | (46,312,355 | ) | | | (4,376,021 | ) |
| Class I | | | | | | | | | | | | | | | | | | | | | | | | | | | | | | | | | | | | | | | | |
| 12/31/2014 | | | 16,246,994 | | | | — | | | | 909,984 | | | | (26,482,029 | ) | | | (9,325,051 | ) | | | 191,001,593 | | | | — | | | | 10,683,209 | | | | (313,636,859 | ) | | | (111,952,057 | ) |
| 12/31/2013 | | | 1,651,231 | | | | — | | | | 1,628,091 | | | | (15,748,966 | ) | | | (12,469,644 | ) | | | 20,132,981 | | | | — | | | | 18,739,326 | | | | (188,464,346 | ) | | | (149,592,039 | ) |
| Class S | | | | | | | | | | | | | | | | | | | | | | | | | | | | | | | | | | | | | | | | |
| 12/31/2014 | | | 608,883 | | | | — | | | | 574,578 | | | | (9,362,669 | ) | | | (8,179,208 | ) | | | 7,122,492 | | | | — | | | | 6,688,087 | | | | (109,606,952 | ) | | | (95,796,373 | ) |
| 12/31/2013 | | | 1,835,526 | | | | — | | | | 1,591,427 | | | | (12,116,759 | ) | | | (8,689,806 | ) | | | 21,991,704 | | | | — | | | | 18,142,265 | | | | (143,306,602 | ) | | | (103,172,633 | ) |
NOTES TO FINANCIAL STATEMENTS as of December 31, 2014 (continued) |
NOTE 11 — CAPITAL SHARES (continued)
| | | Shares
sold | | | Shares
issued in
merger | | | Reinvestment
of
distributions | | | Shares
redeemed | | | Net increase
(decrease)
in shares
outstanding | | | Shares sold | | | Proceeds
from shares
issued in
merger | | | Reinvestment
of
distributions | | | Shares
redeemed | | | Net increase
(decrease) | |
Year or period
ended | | # | | | # | | | # | | | # | | | # | | | ($) | | | ($) | | | ($) | | | ($) | | | ($) | |
| Aggregate Bond (continued) | | | | | | | | | | | | | | | | | | | | | | | | | |
| Class S2 | | | | | | | | | | | | | | | | | | | | | | | | | | | | | | |
| 12/31/2014 | | | 54,679 | | | | — | | | | 3,671 | | | | (128,496 | ) | | | (70,146 | ) | | | 625,311 | | | | — | | | | 41,746 | | | | (1,464,642 | ) | | | (797,585 | ) |
| 12/31/2013 | | | 104,488 | | | | — | | | | 13,887 | | | | (273,579 | ) | | | (155,204 | ) | | | 1,218,793 | | | | — | | | | 154,567 | | | | (3,164,027 | ) | | | (1,790,667 | ) |
| Global Bond | | | | | | | | | | | | | | | | | | | | | | | | | | | | | | | | | | | | | | | | |
| Class ADV | | | | | | | | | | | | | | | | | | | | | | | | | | | | | | | | | | | | | | | | |
| 12/31/2014 | | | 278,699 | | | | — | | | | 10,629 | | | | (400,536 | ) | | | (111,208 | ) | | | 2,975,845 | | | | — | | | | 114,685 | | | | (4,254,237 | ) | | | (1,163,707 | ) |
| 12/31/2013 | | | 470,925 | | | | — | | | | 151,012 | | | | (399,848 | ) | | | 222,089 | | | | 5,104,994 | | | | — | | | | 1,540,323 | | | | (4,268,559 | ) | | | 2,376,758 | |
| Class I | | | | | | | | | | | | | | | | | | | | | | | | | | | | | | | | | | | | | | | | |
| 12/31/2014 | | | 483,622 | | | | — | | | | 169,865 | | | | (3,410,514 | ) | | | (2,757,027 | ) | | | 5,229,242 | | | | — | | | | 1,849,829 | | | | (36,697,829 | ) | | | (29,618,758 | ) |
| 12/31/2013 | | | 560,623 | | | | — | | | | 1,225,888 | | | | (6,060,398 | ) | | | (4,273,887 | ) | | | 6,184,034 | | | | — | | | | 12,614,384 | | | | (65,602,461 | ) | | | (46,804,043 | ) |
| Class S | | | | | | | | | | | | | | | | | | | | | | | | | | | | | | | | | | | | | | | | |
| 12/31/2014 | | | 597,864 | | | | — | | | | 27,133 | | | | (913,455 | ) | | | (288,458 | ) | | | 6,473,866 | | | | — | | | | 296,298 | | | | (9,835,369 | ) | | | (3,065,205 | ) |
| 12/31/2013 | | | 521,691 | | | | — | | | | 254,151 | | | | (1,397,595 | ) | | | (621,753 | ) | | | 5,723,653 | | | | — | | | | 2,622,842 | | | | (15,235,649 | ) | | | (6,889,154 | ) |
| American Century Small-Mid Cap Value | | | | | | | | | | | | | | | | | | | | | | | | | | | | | |
| Class ADV | | | | | | | | | | | | | | | | | | | | | | | | | | | | | | | | | | | | | | | | |
| 12/31/2014 | | | 766,656 | | | | — | | | | 1,070,476 | | | | (2,055,345 | ) | | | (218,213 | ) | | | 11,169,061 | | | | — | | | | 13,787,729 | | | | (31,265,428 | ) | | | (6,308,638 | ) |
| 12/31/2013 | | | 1,908,779 | | | | — | | | | 255,590 | | | | (478,822 | ) | | | 1,685,547 | | | | 25,401,340 | | | | — | | | | 3,480,821 | | | | (6,583,938 | ) | | | 22,298,223 | |
| Class I | | | | | | | | | | | | | | | | | | | | | | | | | | | | | | | | | | | | | | | | |
| 12/31/2014 | | | 1,429,466 | | | | — | | | | 1,605,534 | | | | (4,595,045 | ) | | | (1,560,045 | ) | | | 20,964,408 | | | | — | | | | 21,498,091 | | | | (72,207,900 | ) | | | (29,745,401 | ) |
| 12/31/2013 | | | 2,803,523 | | | | — | | | | 471,256 | | | | (1,671,336 | ) | | | 1,603,443 | | | | 38,492,685 | | | | — | | | | 6,625,364 | | | | (23,199,758 | ) | | | 21,918,291 | |
| Class S | | | | | | | | | | | | | | | | | | | | | | | | | | | | | | | | | | | | | | | | |
| 12/31/2014 | | | 668,630 | | | | — | | | | 1,134,923 | | | | (2,849,694 | ) | | | (1,046,141 | ) | | | 9,811,378 | | | | — | | | | 15,060,423 | | | | (44,122,885 | ) | | | (19,251,084 | ) |
| 12/31/2013 | | | 1,521,362 | | | | — | | | | 324,506 | | | | (1,208,694 | ) | | | 637,174 | | | | 20,912,870 | | | | — | | | | 4,526,476 | | | | (16,697,348 | ) | | | 8,741,998 | |
| Class S2 | | | | | | | | | | | | | | | | | | | | | | | | | | | | | | | | | | | | | | | | |
| 12/31/2014 | | | 107,978 | | | | — | | | | 34,423 | | | | (352,249 | ) | | | (209,848 | ) | | | 1,511,452 | | | | — | | | | 441,991 | | | | (5,393,322 | ) | | | (3,439,879 | ) |
| 12/31/2013 | | | 202,674 | | | | — | | | | 17,533 | | | | (47,839 | ) | | | 172,368 | | | | 2,661,224 | | | | — | | | | 237,383 | | | | (647,982 | ) | | | 2,250,625 | |
| Baron Growth | | | | | | | | | | | | | | | | | | | | | | | | | | | | | | | | | | | | | |
| Class ADV | | | | | | | | | | | | | | | | | | | | | | | | | | | | | | | | | | | | | | | | |
| 12/31/2014 | | | 462,441 | | | | — | | | | 63,969 | | | | (589,391 | ) | | | (62,981 | ) | | | 13,523,075 | | | | — | | | | 1,793,066 | | | | (17,117,076 | ) | | | (1,800,935 | ) |
| 12/31/2013 | | | 1,157,701 | | | | — | | | | 169,006 | | | | (328,106 | ) | | | 998,601 | | | | 30,469,592 | | | | — | | | | 4,465,153 | | | | (8,653,788 | ) | | | 26,280,957 | |
| Class I | | | | | | | | | | | | | | | | | | | | | | | | | | | | | | | | | | | | | | | | |
| 12/31/2014 | | | 955,771 | | | | — | | | | 157,122 | | | | (1,938,401 | ) | | | (825,508 | ) | | | 29,550,969 | | | | — | | | | 4,679,085 | | | | (59,916,474 | ) | | | (25,686,420 | ) |
| 12/31/2013 | | | 2,159,249 | | | | — | | | | 410,831 | | | | (1,099,382 | ) | | | 1,470,698 | | | | 60,122,690 | | | | — | | | | 11,499,155 | | | | (30,290,467 | ) | | | 41,331,378 | |
| Class S | | | | | | | | | | | | | | | | | | | | | | | | | | | | | | | | | | | | | | | | |
| 12/31/2014 | | | 711,655 | | | | — | | | | 400,748 | | | | (5,059,180 | ) | | | (3,946,777 | ) | | | 21,575,656 | | | | — | | | | 11,605,656 | | | | (151,763,902 | ) | | | (118,582,590 | ) |
| 12/31/2013 | | | 3,853,141 | | | | — | | | | 1,276,468 | | | | (2,839,802 | ) | | | 2,289,807 | | | | 103,677,040 | | | | — | | | | 34,770,996 | | | | (76,684,884 | ) | | | 61,763,152 | |
| Class S2 | | | | | | | | | | | | | | | | | | | | | | | | | | | | | | | | | | | | | | | | |
| 12/31/2014 | | | 70,040 | | | | — | | | | 3,915 | | | | (60,211 | ) | | | 13,744 | | | | 2,056,732 | | | | — | | | | 109,977 | | | | (1,759,186 | ) | | | 407,523 | |
| 12/31/2013 | | | 155,404 | | | | — | | | | 6,243 | | | | (12,554 | ) | | | 149,093 | | | | 4,349,238 | | | | — | | | | 165,385 | | | | (329,382 | ) | | | 4,185,241 | |
| Columbia Contrarian Core | | | | | | | | | | | | | | | | | | | | | | | | | | | | | | | | |
| Class ADV | | | | | | | | | | | | | | | | | | | | | | | | | | | | | | | | | | | | | | | | |
| 12/31/2014 | | | 107,457 | | | | — | | | | 98,211 | | | | (91,440 | ) | | | 114,228 | | | | 2,581,671 | | | | — | | | | 2,212,701 | | | | (2,206,659 | ) | | | 2,587,713 | |
| 12/31/2013 | | | 143,979 | | | | — | | | | 6,917 | | | | (77,197 | ) | | | 73,699 | | | | 3,181,643 | | | | — | | | | 154,462 | | | | (1,691,210 | ) | | | 1,644,895 | |
| Class I | | | | | | | | | | | | | | | | | | | | | | | | | | | | | | | | | | | | | | | | |
| 12/31/2014 | | | 44,454 | | | | — | | | | 62,611 | | | | (68,994 | ) | | | 38,071 | | | | 1,097,537 | | | | — | | | | 1,455,694 | | | | (1,712,802 | ) | | | 840,429 | |
| 12/31/2013 | | | 123,522 | | | | — | | | | 7,048 | | | | (4,582,915 | ) | | | (4,452,345 | ) | | | 2,578,326 | | | | — | | | | 161,392 | | | | (96,282,160 | ) | | | (93,542,442 | ) |
| Class S | | | | | | | | | | | | | | | | | | | | | | | | | | | | | | | | | | | | | | | | |
| 12/31/2014 | | | 1,149,239 | | | | — | | | | 1,864,724 | | | | (2,581,735 | ) | | | 432,228 | | | | 28,510,532 | | | | — | | | | 42,739,468 | | | | (64,427,623 | ) | | | 6,822,377 | |
| 12/31/2013 | | | 653,059 | | | | — | | | | 183,614 | | | | (2,231,846 | ) | | | (1,395,173 | ) | | | 13,992,625 | | | | — | | | | 4,158,860 | | | | (49,218,629 | ) | | | (31,067,144 | ) |
| Columbia Small Cap Value II | | | | | | | | | | | | | | | | | | | | | | | | | | | | | | | | | |
| Class ADV | | | | | | | | | | | | | | | | | | | | | | | | | | | | | | | | | | | | | | | | |
| 12/31/2014 | | | 1,725,460 | | | | — | | | | 5,978 | | | | (609,424 | ) | | | 1,122,014 | | | | 27,635,458 | | | | — | | | | 92,128 | | | | (9,469,641 | ) | | | 18,257,945 | |
| 12/31/2013 | | | 489,856 | | | | — | | | | 5,893 | | | | (311,692 | ) | | | 184,057 | | | | 6,598,169 | | | | — | | | | 83,440 | | | | (4,208,893 | ) | | | 2,472,716 | |
| NOTES TO FINANCIAL STATEMENTS as of December 31, 2014 (continued) |
NOTE 11 — CAPITAL SHARES (continued)
| | | Shares
sold | | | Shares
issued in
merger | | | Reinvestment
of
distributions | | | Shares
redeemed | | | Net increase
(decrease)
in shares
outstanding | | | Shares sold | | | Proceeds
from shares
issued in
merger | | | Reinvestment
of
distributions | | | Shares
redeemed | | | Net increase
(decrease) | |
Year or period
ended | | # | | | # | | | # | | | # | | | # | | | ($) | | | ($) | | | ($) | | | ($) | | | ($) | |
| Columbia Small Cap Value II (continued) | | | | | | | | | | | | | | | | | | |
| Class I | | | | | | | | | | | | | | | | | | | | | | | | | | | | | | |
| 12/31/2014 | | | 2,645,302 | | | | — | | | | 14,677 | | | | (1,172,464 | ) | | | 1,487,515 | | | | 43,529,209 | | | | — | | | | 231,900 | | | | (18,594,005 | ) | | | 25,167,104 | |
| 12/31/2013 | | | 525,149 | | | | — | | | | 12,907 | | | | (466,249 | ) | | | 71,807 | | | | 7,387,415 | | | | — | | | | 186,643 | | | | (6,416,300 | ) | | | 1,157,758 | |
| Class S | | | | | | | | | | | | | | | | | | | | | | | | | | | | | | | | | | | | | | | | |
| 12/31/2014 | | | 1,576,282 | | | | — | | | | 19,169 | | | | (2,066,691 | ) | | | (471,240 | ) | | | 25,666,547 | | | | — | | | | 301,525 | | | | (33,043,385 | ) | | | (7,075,313 | ) |
| 12/31/2013 | | | 554,966 | | | | — | | | | 81,288 | | | | (2,307,564 | ) | | | (1,671,310 | ) | | | 8,102,760 | | | | — | | | | 1,171,365 | | | | (32,292,021 | ) | | | (23,017,896 | ) |
| Class S2 | | | | | | | | | | | | | | | | | | | | | | | | | | | | | | | | | | | | | | | | |
| 12/31/2014 | | | 296,541 | | | | — | | | | 1,100 | | | | (115,403 | ) | | | 182,238 | | | | 4,736,330 | | | | — | | | | 16,920 | | | | (1,778,440 | ) | | | 2,974,810 | |
| 12/31/2013 | | | 19,528 | | | | — | | | | 404 | | | | (10,938 | ) | | | 8,994 | | | | 261,900 | | | | — | | | | 5,701 | | | | (145,135 | ) | | | 122,466 | |
| Invesco Comstock | | | | | | | | | | | | | | | | | | | | | | | | | | | | | | | | | |
| Class ADV | | | | | | | | | | | | | | | | | | | | | | | | | | | | | | | | | | | | | | | | |
| 12/31/2014 | | | 348,747 | | | | — | | | | 41,145 | | | | (275,806 | ) | | | 114,086 | | | | 5,511,435 | | | | — | | | | 684,628 | | | | (4,390,054 | ) | | | 1,806,009 | |
| 12/31/2013 | | | 603,933 | | | | — | | | | 12,499 | | | | (196,211 | ) | | | 420,221 | | | | 8,169,712 | | | | — | | | | 190,257 | | | | (2,714,756 | ) | | | 5,645,213 | |
| Class I | | | | | | | | | | | | | | | | | | | | | | | | | | | | | | | | | | | | | | | | |
| 12/31/2014 | | | 7,273,340 | | | | — | | | | 182,269 | | | | (2,554,336 | ) | | | 4,901,273 | | | | 110,787,326 | | | | — | | | | 3,056,581 | | | | (41,490,346 | ) | | | 72,353,561 | |
| 12/31/2013 | | | 786,136 | | | | — | | | | 37,382 | | | | (1,283,129 | ) | | | (459,611 | ) | | | 10,817,877 | | | | — | | | | 574,039 | | | | (17,867,297 | ) | | | (6,475,381 | ) |
| Class S | | | | | | | | | | | | | | | | | | | | | | | | | | | | | | | | | | | | | | | | |
| 12/31/2014 | | | 3,774,314 | | | | — | | | | 427,764 | | | | (4,797,035 | ) | | | (594,957 | ) | | | 60,602,498 | | | | — | | | | 7,164,868 | | | | (77,675,776 | ) | | | (9,908,410 | ) |
| 12/31/2013 | | | 5,107,804 | | | | — | | | | 167,350 | | | | (4,026,287 | ) | | | 1,248,867 | | | | 68,564,807 | | | | — | | | | 2,566,247 | | | | (55,194,014 | ) | | | 15,937,040 | |
| Invesco Equity and Income | | | | | | | | | | | | | | | | | | | | | | | | | | | | | | | | | |
| Class ADV | | | | | | | | | | | | | | | | | | | | | | | | | | | | | | | | | | | | | | | | |
| 12/31/2014 | | | 228,616 | | | | 264,770 | | | | 41,853 | | | | (144,914 | ) | | | 390,325 | | | | 10,439,967 | | | | 12,496,350 | | | | 1,907,670 | | | | (6,612,280 | ) | | | 18,231,707 | |
| 12/31/2013 | | | 324,124 | | | | — | | | | 7,062 | | | | (137,436 | ) | | | 193,750 | | | | 13,389,642 | | | | — | | | | 311,510 | | | | (5,623,667 | ) | | | 8,077,485 | |
| Class I | | | | | | | | | | | | | | | | | | | | | | | | | | | | | | | | | | | | | | | | |
| 12/31/2014 | | | 1,119,580 | | | | 2,472,176 | | | | 616,237 | | | | (1,906,294 | ) | | | 2,301,699 | | | | 52,470,421 | | | | 118,523,109 | | | | 28,585,663 | | | | (88,666,905 | ) | | | 110,912,288 | |
| 12/31/2013 | | | 282,483 | | | | — | | | | 166,447 | | | | (1,671,224 | ) | | | (1,222,294 | ) | | | 11,635,778 | | | | — | | | | 7,442,530 | | | | (69,651,058 | ) | | | (50,572,750 | ) |
| Class S | | | | | | | | | | | | | | | | | | | | | | | | | | | | | | | | | | | | | | | | |
| 12/31/2014 | | | 142,995 | | | | 15,240,652 | | | | 826,865 | | | | (3,204,414 | ) | | | 13,006,098 | | | | 6,516,042 | | | | 725,313,586 | | | | 38,013,236 | | | | (148,168,497 | ) | | | 621,674,367 | |
| 12/31/2013 | | | 955,266 | | | | — | | | | 68,221 | | | | (414,399 | ) | | | 609,088 | | | | 39,807,176 | | | | — | | | | 3,031,362 | | | | (16,907,129 | ) | | | 25,931,409 | |
| Class S2 | | | | | | | | | | | | | | | | | | | | | | | | | | | | | | | | | | | | | | | | |
| 12/31/2014 | | | 344,107 | | | | 12,218,895 | | | | 460,034 | | | | (1,761,679 | ) | | | 11,261,357 | | | | 15,680,522 | | | | 543,880,470 | | | | 20,871,267 | | | | (80,385,713 | ) | | | 500,046,546 | |
| 12/31/2013 | | | 68,351 | | | | — | | | | 1,037 | | | | (19,889 | ) | | | 49,499 | | | | 2,931,580 | | | | — | | | | 45,616 | | | | (808,823 | ) | | | 2,168,373 | |
| JPMorgan Mid Cap Value | | | | | | | | | | | | | | | | | | | | | | | | | | | | | | | | | |
| Class ADV | | | | | | | | | | | | | | | | | | | | | | | | | | | | | | | | | | | | | | | | |
| 12/31/2014 | | | 494,222 | | | | — | | | | 267,177 | | | | (433,406 | ) | | | 327,993 | | | | 10,646,648 | | | | — | | | | 5,561,002 | | | | (9,329,934 | ) | | | 6,877,716 | |
| 12/31/2013 | | | 1,266,772 | | | | — | | | | 128,713 | | | | (227,360 | ) | | | 1,168,125 | | | | 23,875,431 | | | | — | | | | 2,530,676 | | | | (4,436,460 | ) | | | 21,969,647 | |
| Class I | | | | | | | | | | | | | | | | | | | | | | | | | | | | | | | | | | | | | | | | |
| 12/31/2014 | | | 1,251,469 | | | | — | | | | 844,345 | | | | (2,241,033 | ) | | | (145,219 | ) | | | 27,269,524 | | | | — | | | | 18,001,283 | | | | (48,744,453 | ) | | | (3,473,646 | ) |
| 12/31/2013 | | | 3,432,656 | | | | — | | | | 493,740 | | | | (2,070,549 | ) | | | 1,855,847 | | | | 65,792,580 | | | | — | | | | 9,922,736 | | | | (41,373,304 | ) | | | 34,342,012 | |
| Class S | | | | | | | | | | | | | | | | | | | | | | | | | | | | | | | | | | | | | | | | |
| 12/31/2014 | | | 787,608 | | | | — | | | | 1,127,500 | | | | (4,404,972 | ) | | | (2,489,864 | ) | | | 17,177,427 | | | | — | | | | 23,759,319 | | | | (95,277,431 | ) | | | (54,340,685 | ) |
| 12/31/2013 | | | 5,471,300 | | | | — | | | | 698,334 | | | | (3,020,429 | ) | | | 3,149,205 | | | | 103,279,744 | | | | — | | | | 13,892,952 | | | | (58,391,816 | ) | | | 58,780,880 | |
| Class S2 | | | | | | | | | | | | | | | | | | | | | | | | | | | | | | | | | | | | | | | | |
| 12/31/2014 | | | 46,218 | | | | — | | | | 16,485 | | | | (53,315 | ) | | | 9,388 | | | | 988,579 | | | | — | | | | 342,604 | | | | (1,118,163 | ) | | | 213,020 | |
| 12/31/2013 | | | 119,247 | | | | — | | | | 7,558 | | | | (45,552 | ) | | | 81,253 | | | | 2,290,868 | | | | — | | | | 148,694 | | | | (870,014 | ) | | | 1,569,548 | |
| Oppenheimer Global | | | | | | | | | | | | | | | | | | | | | | | | | | | | | | | | | |
| Class ADV | | | | | | | | | | | | | | | | | | | | | | | | | | | | | | | | | | | | | | | | |
| 12/31/2014 | | | 491,367 | | | | — | | | | 126,602 | | | | (682,041 | ) | | | (64,072 | ) | | | 9,014,492 | | | | — | | | | 2,300,353 | | | | (12,504,408 | ) | | | (1,189,563 | ) |
| 12/31/2013 | | | 871,755 | | | | — | | | | 53,832 | | | | (570,239 | ) | | | 355,348 | | | | 14,245,191 | | | | — | | | | 894,142 | | | | (9,190,450 | ) | | | 5,948,883 | |
| Class I | | | | | | | | | | | | | | | | | | | | | | | | | | | | | | | | | | | | | | | | |
| 12/31/2014 | | | 1,639,871 | | | | — | | | | 1,903,883 | | | | (11,877,203 | ) | | | (8,333,449 | ) | | | 31,388,757 | | | | — | | | | 35,716,844 | | | | (225,636,846 | ) | | | (158,531,245 | ) |
| 12/31/2013 | | | 1,668,624 | | | | — | | | | 1,108,918 | | | | (12,272,291 | ) | | | (9,494,749 | ) | | | 27,753,240 | | | | — | | | | 18,995,765 | | | | (207,701,520 | ) | | | (160,952,515 | ) |
| NOTES TO FINANCIAL STATEMENTS as of December 31, 2014 (continued) |
NOTE 11 — CAPITAL SHARES (continued)
| | | Shares
sold | | | Shares
issued in
merger | | | Reinvestment
of
distributions | | | Shares
redeemed | | | Net increase
(decrease)
in shares
outstanding | | | Shares sold | | | Proceeds
from shares
issued in
merger | | | Reinvestment
of
distributions | | | Shares
redeemed | | | Net increase
(decrease) | |
Year or period
ended | | # | | | # | | | # | | | # | | | # | | | ($) | | | ($) | | | ($) | | | ($) | | | ($) | |
| Oppenheimer Global (continued) | | | | | | | | | | | | | | | | | | | | | | |
| Class S | | | | | | | | | | | | | | | | | | | | | | | | | | | | | | |
| 12/31/2014 | | | 914,518 | | | | — | | | | 307,282 | | | | (3,211,814 | ) | | | (1,990,014 | ) | | | 16,783,355 | | | | — | | | | 5,598,683 | | | | (59,323,905 | ) | | | (36,941,867 | ) |
| 12/31/2013 | | | 2,437,447 | | | | — | | | | 161,424 | | | | (1,952,393 | ) | | | 646,478 | | | | 39,723,053 | | | | — | | | | 2,687,717 | | | | (32,219,715 | ) | | | 10,191,055 | |
| Class S2 | | | | | | | | | | | | | | | | | | | | | | | | | | | | | | | | | | | | | | | | |
| 12/31/2014 | | | 65,214 | | | | — | | | | 6,101 | | | | (39,752 | ) | | | 31,563 | | | | 1,176,055 | | | | — | | | | 108,841 | | | | (716,144 | ) | | | 568,752 | |
| 12/31/2013 | | | 116,186 | | | | — | | | | 2,083 | | | | (24,695 | ) | | | 93,574 | | | | 1,921,060 | | | | — | | | | 34,018 | | | | (397,258 | ) | | | 1,557,820 | |
| Pioneer High Yield | | | | | | | | | | | | | | | | | | | | | | | | | | | | | | | | | |
| Class I | | | | | | | | | | | | | | | | | | | | | | | | | | | | | | | | | | | | | | | | |
| 12/31/2014 | | | 2,053,367 | | | | — | | | | 473,025 | | | | (2,214,692 | ) | | | 311,700 | | | | 25,684,022 | | | | — | | | | 5,902,329 | | | | (27,558,304 | ) | | | 4,028,047 | |
| 12/31/2013 | | | 2,356,462 | | | | — | | | | 450,641 | | | | (2,258,105 | ) | | | 548,998 | | | | 28,569,887 | | | | — | | | | 5,470,673 | | | | (27,374,725 | ) | | | 6,665,835 | |
| Class S | | | | | | | | | | | | | | | | | | | | | | | | | | | | | | | | | | | | | | | | |
| 12/31/2014 | | | 180,973 | | | | — | | | | 15,441 | | | | (99,255 | ) | | | 97,159 | | | | 2,267,588 | | | | — | | | | 192,274 | | | | (1,234,631 | ) | | | 1,225,231 | |
| 12/31/2013 | | | 135,486 | | | | — | | | | 16,020 | | | | (229,763 | ) | | | (78,257 | ) | | | 1,638,023 | | | | — | | | | 194,214 | | | | (2,792,153 | ) | | | (959,916 | ) |
| T. Rowe Price Diversified Mid Cap Growth | | | | | | | | | | | | | | | | | | | | | | | | | | | | |
| Class ADV | | | | | | | | | | | | | | | | | | | | | | | | | | | | | | | | | | | | | | | | |
| 12/31/2014 | | | 266,097 | | | | — | | | | 188,491 | | | | (344,239 | ) | | | 110,349 | | | | 2,975,186 | | | | — | | | | 1,984,807 | | | | (3,807,785 | ) | | | 1,152,208 | |
| 12/31/2013 | | | 276,769 | | | | — | | | | 33,424 | | | | (431,730 | ) | | | (121,537 | ) | | | 2,653,031 | | | | — | | | | 335,581 | | | | (4,200,379 | ) | | | (1,211,767 | ) |
| Class I | | | | | | | | | | | | | | | | | | | | | | | | | | | | | | | | | | | | | | | | |
| 12/31/2014 | | | 760,996 | | | | — | | | | 4,906,939 | | | | (8,858,323 | ) | | | (3,190,388 | ) | | | 8,960,731 | | | | — | | | | 55,027,698 | | | | (104,053,966 | ) | | | (40,065,537 | ) |
| 12/31/2013 | | | 1,111,974 | | | | — | | | | 982,896 | | | | (9,469,381 | ) | | | (7,374,511 | ) | | | 11,368,214 | | | | — | | | | 10,474,732 | | | | (97,032,109 | ) | | | (75,189,163 | ) |
| Class S | | | | | | | | | | | | | | | | | | | | | | | | | | | | | | | | | | | | | | | | |
| 12/31/2014 | | | 261,061 | | | | — | | | | 184,114 | | | | (442,140 | ) | | | 3,035 | | | | 2,976,235 | | | | — | | | | 2,012,636 | | | | (5,074,897 | ) | | | (86,026 | ) |
| 12/31/2013 | | | 869,027 | | | | — | | | | 27,204 | | | | (514,567 | ) | | | 381,664 | | | | 9,151,841 | | | | — | | | | 281,838 | | | | (5,176,441 | ) | | | 4,257,238 | |
| Class S2 | | | | | | | | | | | | | | | | | | | | | | | | | | | | | | | | | | | | | | | | |
| 12/31/2014 | | | 271,934 | | | | — | | | | 22,484 | | | | (45,694 | ) | | | 248,724 | | | | 3,017,240 | | | | — | | | | 237,001 | | | | (504,467 | ) | | | 2,749,774 | |
| 12/31/2013 | | | 72,646 | | | | — | | | | 1,386 | | | | (105,474 | ) | | | (31,442 | ) | | | 689,718 | | | | — | | | | 13,902 | | | | (946,873 | ) | | | (243,253 | ) |
| T. Rowe Price Growth Equity | | | | | | | | | | | | | | | | | | | | | | | | | | | | |
| Class ADV | | | | | | | | | | | | | | | | | | | | | | | | | | | | | | | | | | | | | | | | |
| 12/31/2014 | | | 172,357 | | | | — | | | | 146,165 | | | | (243,795 | ) | | | 74,727 | | | | 14,738,836 | | | | — | | | | 11,953,361 | | | | (20,747,055 | ) | | | 5,945,142 | |
| 12/31/2013 | | | 275,713 | | | | — | | | | 372 | | | | (175,607 | ) | | | 100,478 | | | | 19,955,159 | | | | — | | | | 27,617 | | | | (12,666,285 | ) | | | 7,316,491 | |
| Class I | | | | | | | | | | | | | | | | | | | | | | | | | | | | | | | | | | | | | | | | |
| 12/31/2014 | | | 823,913 | | | | — | | | | 854,693 | | | | (2,178,207 | ) | | | (499,601 | ) | | | 72,818,004 | | | | — | | | | 72,666,041 | | | | (193,208,089 | ) | | | (47,724,044 | ) |
| 12/31/2013 | | | 1,553,782 | | | | — | | | | 2,430 | | | | (2,081,757 | ) | | | (525,545 | ) | | | 108,257,942 | | | | — | | | | 186,027 | | | | (154,399,469 | ) | | | (45,955,500 | ) |
| Class S | | | | | | | | | | | | | | | | | | | | | | | | | | | | | | | | | | | | | | | | |
| 12/31/2014 | | | 716,701 | | | | — | | | | 292,976 | | | | (1,121,253 | ) | | | (111,576 | ) | | | 62,320,632 | | | | — | | | | 24,431,255 | | | | (96,554,289 | ) | | | (9,802,402 | ) |
| 12/31/2013 | | | 1,240,461 | | | | — | | | | 712 | | | | (829,185 | ) | | | 411,988 | | | | 95,712,528 | | | | — | | | | 53,639 | | | | (59,365,578 | ) | | | 36,400,589 | |
| Class S2 | | | | | | | | | | | | | | | | | | | | | | | | | | | | | | | | | | | | | | | | |
| 12/31/2014 | | | 32,364 | | | | — | | | | 3,115 | | | | (11,108 | ) | | | 24,371 | | | | 2,785,852 | | | | — | | | | 256,132 | | | | (958,894 | ) | | | 2,083,090 | |
| 12/31/2013 | | | 9,020 | | | | — | | | | 5 | | | | (4,920 | ) | | | 4,105 | | | | 654,764 | | | | — | | | | 401 | | | | (353,339 | ) | | | 301,826 | |
| Templeton Foreign Equity | | | | | | | | | | | | | | | | | | | | | | | | | | | | |
| Class ADV | | | | | | | | | | | | | | | | | | | | | | | | | | | | | | | | | | | | | | | | |
| 12/31/2014 | | | 334,088 | | | | — | | | | 70,556 | | | | (526,520 | ) | | | (121,876 | ) | | | 4,275,954 | | | | — | | | | 910,170 | | | | (6,763,141 | ) | | | (1,577,017 | ) |
| 12/31/2013 | | | 715,336 | | | | — | | | | 41,781 | | | | (485,426 | ) | | | 271,691 | | | | 10,750,088 | | | | — | | | | 496,780 | | | | (5,872,543 | ) | | | 5,374,325 | |
| Class I | | | | | | | | | | | | | | | | | | | | | | | | | | | | | | | | | | | | | | | | |
| 12/31/2014 | | | 788,445 | | | | — | | | | 453,673 | | | | (4,341,392 | ) | | | (3,099,274 | ) | | | 10,318,661 | | | | — | | | | 5,906,833 | | | | (55,741,328 | ) | | | (39,515,834 | ) |
| 12/31/2013 | | | 2,115,894 | | | | — | | | | 331,462 | | | | (15,132,400 | ) | | | (12,685,044 | ) | | | 4,990,888 | | | | — | | | | 3,974,225 | | | | (173,797,876 | ) | | | (164,832,763 | ) |
| Class S | | | | | | | | | | | | | | | | | | | | | | | | | | | | | | | | | | | | | | | | |
| 12/31/2014 | | | 2,840,981 | | | | — | | | | 1,128,605 | | | | (9,157,277 | ) | | | (5,187,691 | ) | | | 35,347,679 | | | | — | | | | 14,604,147 | | | | (117,247,042 | ) | | | (67,295,216 | ) |
| 12/31/2013 | | | 3,651,300 | | | | — | | | | 752,038 | | | | (8,871,748 | ) | | | (4,468,410 | ) | | | 61,349,241 | | | | — | | | | 8,964,292 | | | | (105,021,224 | ) | | | (34,707,691 | ) |
| Class S2 | | | | | | | | | | | | | | | | | | | | | | | | | | | | | | | | | | | | | | | | |
| 12/31/2014 | | | 51,536 | | | | — | | | | 3,540 | | | | (46,725 | ) | | | 8,351 | | | | 661,473 | | | | — | | | | 45,628 | | | | (591,281 | ) | | | 115,820 | |
| 12/31/2013 | | | 72,572 | | | | — | | | | 2,011 | | | | (28,118 | ) | | | 46,465 | | | | 914,177 | | | | — | | | | 23,884 | | | | (337,417 | ) | | | 600,644 | |
| NOTES TO FINANCIAL STATEMENTS as of December 31, 2014 (continued) |
NOTE 12 — SECURITIES LENDING
Under a Master Securities Lending Agreement (the “Agreement”) with BNY, the Portfolios can lend their securities to approved brokers, dealers and other financial institutions. Loans are collateralized by cash and U.S. government securities. The collateral is equal to at least 105% of the market value of non-U.S. securities loaned and 102% of the market value of U.S. securities loaned. The market value of the loaned securities is determined at the close of business of the Portfolios at their last sale price or official closing price on the principal exchange or system on which they are traded and any additional collateral is delivered to the Portfolios on the next business day. The cash collateral received is invested in approved investments as defined in the Agreement with BNY. The Portfolios bear the risk of loss with respect to the investment of collateral with the following exception: BNY provides the Portfolios indemnification from loss with respect to the investment of collateral provided that the cash collateral is invested solely in overnight repurchase agreements.
The cash collateral is invested in overnight repurchase agreements that are collateralized at 102% with securities issued or fully guaranteed by the United States Treasury; United States government or any agency, instrumentality or authority of the United States government. The securities purchased with cash collateral received are reflected in the Summary Portfolio of Investments under Securities Lending Collateral.
Generally, in the event of counterparty default, the Portfolios have the right to use the collateral to offset losses incurred. The Agreement contains certain guarantees by BNY in the event of counterparty default and/or a borrower’s failure to return a loaned security; however, there would be a potential loss to the Portfolios in the event the Portfolios are delayed or prevented from exercising their right to dispose of the collateral. Engaging in securities lending could have a leveraging effect, which may intensify the credit, market and other risks associated with investing in a Portfolio. At December 31, 2014, the following Portfolios had securities on loan with the following market values:
Aggregate Bond
| Counterparty | | Securities
Loaned
at Value | | | Cash
Collateral
Received(1) | | | Net Amount | |
| BNP Prime Brokerage | | $ | 129,652 | | | $ | (129,652 | ) | | $ | — | |
| Barclays Capital Inc. | | | 1,660,920 | | | | (1,660,920 | ) | | | — | |
| Citigroup Global Markets Inc. | | | 481,213 | | | | (481,213 | ) | | | — | |
| Credit Suisse Securities USA | | | 101,949 | | | | (101,949 | ) | | | — | |
| Deutsche Bank Securities | | | 1,654,731 | | | | (1,654,731 | ) | | | — | |
| Counterparty | | Securities
Loaned
at Value | | | Cash
Collateral
Received(1) | | | Net Amount | |
| Goldman Sachs & Company | | | 727,567 | | | | (727,567 | ) | | | — | |
| JPMorgan Clearing Corp. | | | 1 | | | | (1 | ) | | | — | |
| RBC Capital Markets, LLC | | | 1,949,967 | | | | (1,949,967 | ) | | | — | |
| Wells Fargo Securities LLC | | | 47,455 | | | | (47,455 | ) | | | — | |
| Total | | $ | 6,753,454 | | | $ | (6,753,454 | ) | | $ | — | |
| (1) | Collateral with a fair value of $6,902,927 has been received in connection with the above securities lending transactions. Excess collateral received from the individual counterparty is not shown for financial reporting purposes. |
Global Bond
| Counterparty | | Securities
Loaned
at Value | | | Cash
Collateral
Received(1) | | | Net Amount | |
| Deutsche Bank Securities Inc. | | $ | 634,046 | | | $ | (634,046 | ) | | $ | — | |
| Goldman, Sachs & Co. | | | 2,149 | | | | (2,149 | ) | | | — | |
| Nomura International PLC | | | 281,393 | | | | (281,393 | ) | | | — | |
| Total | | $ | 917,587 | | | $ | (917,587 | ) | | $ | — | |
| (1) | Collateral with a fair value of $969,494 has been received in connection with the above securities lending transactions. Excess collateral received from the individual counterparty is not shown for financial reporting purposes. |
American Century Small-Mid Cap Value
| Counterparty | | Securities
Loaned
at Value | | | Cash
Collateral
Received(1) | | | Net Amount | |
| Goldman Sachs & Company | | $ | 229,290 | | | $ | (229,290 | ) | | $ | — | |
| Merrill Lynch | | | 34,275 | | | | (34,275 | ) | | | — | |
| Morgan Stanley & Co. LLC | | | 251,763 | | | | (251,763 | ) | | | — | |
| National Financial Services LLC | | | 149,150 | | | | (149,150 | ) | | | — | |
| RBC Capital Markets, LLC | | | 361,272 | | | | (361,272 | ) | | | — | |
| UBS Securities LLC. | | | 12,698 | | | | (12,698 | ) | | | — | |
| Total | | $ | 1,038,449 | | | $ | (1,038,449 | ) | | $ | — | |
| (1) | Collateral with a fair value of $1,065,023 has been received in connection with the above securities lending transactions. Excess collateral received from the individual counterparty is not shown for financial reporting purposes. |
Invesco Equity and Income
| Counterparty | | Securities
Loaned
at Value | | | Cash
Collateral
Received(1) | | | Net Amount | |
| BNP Prime Brokerage | | $ | 7,333,355 | | | $ | (7,333,355 | ) | | $ | — | |
| Barclays Capital Inc. | | | 574,015 | | | | (574,015 | ) | | | — | |
| Citigroup Global Markets Inc. | | | 6,258,551 | | | | (6,258,551 | ) | | | — | |
| Credit Suisse Securities (USA) LLC | | | 425,859 | | | | (425,859 | ) | | | — | |
| NOTES TO FINANCIAL STATEMENTS as of December 31, 2014 (continued) |
NOTE 12 — SECURITIES LENDING (continued)
| Counterparty | | Securities
Loaned
at Value | | | Cash
Collateral
Received(1) | | | Net Amount | |
| Deutsche Bank Securities | | | 6,644,653 | | | | (6,644,653 | ) | | | — | |
| Goldman, Sachs & Co. | | | 817,179 | | | | (817,179 | ) | | | — | |
| JP Morgan Clearing Corp | | | 5,298,397 | | | | (5,298,397 | ) | | | — | |
| Morgan Stanley & Co. LLC | | | 203,500 | | | | (203,500 | ) | | | — | |
| Nomura Securities International, Inc. | | | 12,430,712 | | | | (12,430,712 | ) | | | — | |
| UBS Securities LLC. | | | 1,423,340 | | | | (1,423,340 | ) | | | — | |
| Total | | $ | 41,409,560 | | | $ | (41,409,560 | ) | | $ | — | |
| (1) | Collateral with a fair value of $42,968,190 has been received in connection with the above securities lending transactions. Excess collateral received from the individual counterparty is not shown for financial reporting purposes. |
Oppenheimer Global
| Counterparty | | Securities
Loaned
at Value | | | Cash
Collateral
Received(1) | | | Net Amount | |
| Barclays Capital Inc. | | $ | 3,263,095 | | | $ | (3,263,095 | ) | | $ | — | |
| Citigroup Global Markets Limited | | | 1,898,194 | | | | (1,898,194 | ) | | | — | |
| Credit Suisse Securities (Europe) Limited | | | 1,552,752 | | | | (1,552,752 | ) | | | — | |
| Credit Suisse Securities (USA) LLC | | | 2,722,761 | | | | (2,722,761 | ) | | | — | |
| Deutsche Bank Securities Inc. | | | 1,499,617 | | | | (1,499,617 | ) | | | — | |
| Goldman Sachs & Company | | | 1,098,624 | | | | (1,098,624 | ) | | | — | |
| Goldman Sachs International | | | 47,926 | | | | (47,926 | ) | | | — | |
| JPMorgan Clearing Corp. | | | 4,613,073 | | | | (4,613,073 | ) | | | — | |
| JPMorgan Securities PLC | | | 935,354 | | | | (935,354 | ) | | | — | |
| Morgan Stanley & Co. LLC | | | 12,896,115 | | | | (12,896,115 | ) | | $ | — | |
| Morgan Stanley Securities Limited | | | 65,832 | | | | (65,832 | ) | | | — | |
| RBC Dominion Securities Inc | | | 241,482 | | | | (241,482 | ) | | | — | |
| SG Americas Securities, LLC | | | 590,105 | | | | (590,105 | ) | | | — | |
| Scotia Capital | | | 174,991 | | | | (174,991 | ) | | | — | |
| UBS Securities LLC. | | | 2,590,665 | | | | (2,590,665 | ) | | | — | |
| Wells Fargo Securities LLC | | | 2,492,780 | | | | (2,492,780 | ) | | | — | |
| Total | | $ | 36,683,367 | | | $ | (36,683,367 | ) | | $ | — | |
| (1) | Collateral with a fair value of $38,615,276 has been received in connection with the above securities lending transactions. Excess collateral received from the individual counterparty is not shown for financial reporting purposes. |
T. Rowe Price Diversified Mid Cap Growth
| Counterparty | | Securities
Loaned
at Value | | | Cash
Collateral
Received(1) | | | Net Amount | |
| Barclays Capital Inc. | | $ | 280,616 | | | $ | (280,616 | ) | | $ | — | |
| Citigroup Global Markets | | | 287,980 | | | | (287,980 | ) | | | — | |
| Credit Suisse Securities USA | | | 262,428 | | | | (262,428 | ) | | | — | |
| Deutsche Bank Securities | | | 3,108,407 | | | | (3,108,407 | ) | | | — | |
| Goldman Sachs & Company | | | 9,208,921 | | | | (9,208,921 | ) | | | — | |
| JPMorgan Clearing Corp. | | | 872,639 | | | | (872,639 | ) | | | — | |
| Merrill Lynch | | | 452,540 | | | | (452,540 | ) | | | — | |
| Morgan Stanley & Co. LLC | | | 5,650,919 | | | | (5,650,919 | ) | | | — | |
| National Financial | | | 232,223 | | | | (232,223 | ) | | | — | |
| Nomura Securities International, Inc. | | | 1,092,473 | | | | (1,092,473 | ) | | | — | |
| RBC Dominion Securities Inc | | | 1,864,636 | | | | (1,864,636 | ) | | | — | |
| Total | | $ | 23,313,781 | | | $ | (23,313,781 | ) | | $ | — | |
| (1) | Collateral with a fair value of $23,825,925 has been received in connection with the above securities lending transactions. Excess collateral received from the individual counterparty is not shown for financial reporting purposes. |
T. Rowe Price Growth Equity
| Counterparty | | Securities
Loaned
at Value | | | Cash
Collateral
Received(1) | | | Net Amount | |
| BMO Capital Markets Corp | | $ | 16,456 | | | $ | (16,456 | ) | | $ | — | |
| BNP Prime Brokerage, Inc. | | | 143,446 | | | | (143,446 | ) | | | — | |
| Barclays Capital Inc. | | | 2,547,183 | | | | (2,547,183 | ) | | | — | |
| Citigroup Global Markets | | | 205,700 | | | | (205,700 | ) | | | — | |
| Deutsche Bank Securities Inc. | | | 635,119 | | | | (635,119 | ) | | | — | |
| Goldman, Sachs & Co. | | | 78,166 | | | | (78,166 | ) | | | — | |
| JPMorgan Clearing Corp. | | | 279,752 | | | | (279,752 | ) | | | — | |
| Merrill Lynch | | | 2,425,571 | | | | (2,425,571 | ) | | | — | |
| Morgan Stanley & Co. LLC | | | 4,154,333 | | | | (4,154,333 | ) | | | — | |
| SG Americas Securities, LLC | | | 817,584 | | | | (817,584 | ) | | | — | |
| Total | | $ | 11,303,310 | | | $ | (11,303,310 | ) | | $ | — | |
| (1) | Collateral with a fair value of $11,554,092 has been received in connection with the above securities lending transactions. Excess collateral received from the individual counterparty is not shown for financial reporting purposes. |
NOTES TO FINANCIAL STATEMENTS as of December 31, 2014 (continued) |
NOTE 12 — SECURITIES LENDING (continued)
Templeton Foreign Equity
| Counterparty | | Securities
Loaned
at Value | | | Cash
Collateral
Received(1) | | | Net Amount | |
| Barclays Capital Inc. | | $ | 971,125 | | | $ | (971,125 | ) | | $ | — | |
| Total | | $ | 971,125 | | | $ | (971,125 | ) | | $ | — | |
| (1) | Collateral with a fair value of $1,052,722 has been received in connection with the above securities lending transactions. Excess collateral received from the individual counterparty is not shown for financial reporting purposes. |
NOTE 13 — UNFUNDED LOAN COMMITMENTS
Certain Portfolios may enter in credit agreements, all or a portion of which may be unfunded. The Portfolios are obligated to fund these loan commitments at the borrower’s discretion. Funded portions of the credit agreements are presented in the Summary Portfolio of Investments. At December 31, 2014, Pioneer High Yield had the following unfunded loan commitments:
| Loan | | Unfunded
Commitments | | | Unrealized
Appreciation
at 12/31/2014* | |
| Kindred Healthcare, Inc., Bridge Loan | | $ | 545,000 | | | | — | |
| * | Unfunded loan commitments are marked to market daily and any unrealized appreciation or depreciation is included in the Portfolio’s Statement of Assets and Liabilities and Statement of Operations. |
NOTE 14 — CONCENTRATION OF INVESTMENT RISKS
All mutual funds involve risk — some more than others — and there is always the chance that you could lose money or not earn as much as you hope. Each Portfolio’s risk profile is largely a factor of the principal securities in which it invests and investment techniques that it uses. For more information regarding the types of securities and investment techniques that may be used by each Portfolio and its corresponding risks, see the Portfolios’ most recent Prospectus and/or the Statement of Additional Information.
Foreign Investments and/or Developing and Emerging Markets. There are certain risks in owning foreign (non-U.S.) securities, including those resulting from: fluctuations in currency exchange rates; devaluation of currencies; political or economic developments and the possible imposition of currency exchange blockages or other foreign governmental laws or restrictions; reduced availability of public information concerning issuers; accounting, auditing and financial reporting standards or other regulatory practices and requirements that are not
uniform when compared to those applicable to domestic companies; settlement and clearance procedures in some countries that may not be reliable and can result in delays in settlement; higher transaction and custody expenses than for domestic securities; and limitations on foreign ownership of equity securities. Also, securities of many foreign companies may be less liquid and the prices more volatile than those of domestic companies. Foreign investment risks may be greater in developing and emerging markets than in developed markets.
NOTE 15 — REORGANIZATIONS
On March 14, 2014, Invesco Equity and Income (“Acquiring Portfolio”) acquired all of the net assets of ING American Funds Asset Allocation Portfolio (“Acquired 1 Portfolio”), an open-end investment company in a tax-free reorganization in exchange for shares of the Acquiring Portfolio, pursuant to a plan of reorganization approved by the shareholders of the Acquired 1 Portfolio on February 27, 2014. The purpose of the transaction was to lower the net expense ratio for shareholders of the Acquired 1 Portfolio. For financial reporting purposes, assets received and shares issued by the Acquiring Portfolio were recorded at fair value; however, the cost basis of the investments received from the Acquired 1 Portfolio were carried forward to align ongoing reporting of the Acquiring Portfolio’s realized and unrealized gains and losses with amounts distributable to shareholders for tax purposes.
Assuming the acquisition had been completed on January 1, 2014, the beginning of the annual reporting period of the Acquiring Portfolio, the Acquiring Portfolio’s pro forma results of operations for the year ended December 31, 2014, are as follows:
| Net investment income | | $ | 23,401,463 | |
| Net realized and unrealized gain on investments | | $ | 100,176,766 | |
| Net increase in net assets resulting from operations | | $ | 123,578,229 | |
Because the combined investment portfolios have been managed as a single integrated portfolio since the acquisition was completed, it is not practicable to separate the amounts of revenue and earnings of the Acquired 1 Portfolio that have been included in the Acquiring Portfolio’s statement of operations since March 14, 2014. Net assets and unrealized appreciation or depreciation as of the reorganization date were as follows:
Total Net
Assets of
Acquired
1 Portfolio
(000s) | | | Total Net
Assets of
Acquiring
Portfolio
(000s) | | | Acquired 1
Portfolio’s
Capital Loss
Carryforwards
(000s) | | | Acquired 1
Portfolios’
Unrealized
Depreciation
(000s) | | | Portfolio’s
Conversion
Ratio | |
| $ | 512,696 | | | $ | 861,963 | | | $ | 0 | | | $ | (8,646 | ) | | | 0.1784 | |
The net assets of the Acquiring Portfolio after the acquisition of Acquired 1 Portfolio were $1,374,658,988.
| NOTES TO FINANCIAL STATEMENTS as of December 31, 2014 (continued) |
NOTE 15 — REORGANIZATIONS (continued)
On July 18, 2014, Invesco Equity and Income (“Acquiring Portfolio”) acquired all of the net assets of VY® MFS Total Return Portfolio (“Acquired 2 Portfolio”), an open-end investment company in a tax-free reorganization in exchange for shares of the Acquiring Portfolio, pursuant to a plan of reorganization approved by the shareholders of the Acquired 2 Portfolio on June 19, 2014. The purpose of the transaction was to lower the gross and net expense ratios for shareholders of the Acquired 2 Portfolio. For financial reporting purposes, assets received and shares issued by the Acquiring Portfolio were recorded at fair value; however, the cost basis of the investments received from the Acquired 2 Portfolio were carried forward to align ongoing reporting of the Acquiring Portfolio’s realized and unrealized gains and losses with amounts distributable to shareholders for tax purposes.
Assuming the acquisition had been completed on January 1, 2014, the beginning of the annual reporting period of the Acquiring Portfolio, the Acquiring Portfolio’s pro forma results of operations for the year ended December 31, 2014, are as follows:
| Net investment income | | $ | 34,212,015 | |
| Net realized and unrealized gain on investments | | $ | 142,409,849 | |
| Net increase in net assets resulting from operations | | $ | 176,621,863 | |
Because the combined investment portfolios have been managed as a single integrated portfolio since the acquisition was completed, it is not practicable to separate the amounts of revenue and earnings of the Acquired 2 Portfolio that have been included in the Acquiring Portfolio’s statement of operations since July 18, 2014. Net assets and unrealized appreciation or depreciation as of the reorganization date were as follows:
Total Net
Assets of
Acquired
2 Portfolio
(000s) | | | Total Net
Assets of
Acquiring
Portfolio
(000s) | | | Acquired 2
Portfolio’s
Capital Loss
Carryforwards
(000s) | | | Acquired 2
Portfolio’s
Unrealized
Appreciation
(000s) | | | Portfolios’
Conversion
Ratio | |
| $ | 887,517 | | | $ | 1,388,200 | | | $ | 0 | | | $ | 35,107 | | | | 0.3501 | |
The net assets of the Acquiring Portfolio after the acquisition of Acquired 2 Portfolio were $2,275,716,892.
NOTE 16 — FEDERAL INCOME TAXES
The amount of distributions from net investment income and net realized capital gains are determined in accordance with federal income tax regulations, which may differ from U.S. GAAP for investment companies. These book/tax differences may be either temporary or permanent. Permanent differences are reclassified within the capital accounts based on their federal tax-basis treatment; temporary differences are not reclassified. Key
differences include the treatment of short-term capital gains, foreign currency transactions, paydowns, income from passive foreign investment companies (PFICs), and wash sale deferrals. Distributions in excess of net investment income and/or net realized capital gains for tax purposes are reported as return of capital.
The following permanent tax differences have been reclassified as of December 31, 2014:
| | | Paid-in
Capital | | | Undistributed
Net Investment
Income | | | Accumulated
Net Realized
Gains/(Losses) | |
| Aggregate Bond | | $ | — | | | $ | 5,579,407 | | | $ | (5,579,407 | ) |
| Global Bond(1) | | | (298,237 | ) | | | (9,926,417 | ) | | | 10,224,654 | |
American Century
Small-Mid Cap Value | | | (870 | ) | | | 882,874 | | | | (882,004 | ) |
| Baron Growth | | | (165 | ) | | | 474,769 | | | | (474,604 | ) |
| Columbia Contrarian Core | | | — | | | | 2,700 | | | | (2,700 | ) |
| Columbia Small Cap Value II | | | — | | | | 4,015 | | | | (4,015 | ) |
| Invesco Comstock | | | — | | | | 4,421,592 | | | | (4,421,592 | ) |
| Invesco Equity and Income | | | — | | | | 9,766,748 | | | | (9,766,748 | ) |
| JPMorgan Mid Cap Value | | | — | | | | 9,277 | | | | (9,277 | ) |
| Oppenheimer Global | | | 44,222 | | | | 1,246,818 | | | | (1,291,040 | ) |
| Pioneer High Yield | | | — | | | | 508,683 | | | | (508,683 | ) |
T. Rowe Price Diversified
Mid Cap Growth | | | — | | | | 307,878 | | | | (307,878 | ) |
| T. Rowe Price Growth Equity | | | — | | | | 1,740,024 | | | | (1,740,024 | ) |
| Templeton Foreign Equity | | | — | | | | 10,617 | | | | (10,617 | ) |
| (1) | Relates to the tax treatment of foreign currency transactions, paydowns and swaps. |
Dividends paid by the Portfolios from net investment income and distributions of net realized short-term capital gains are, for federal income tax purposes, taxable as ordinary income to shareholders.
The tax composition of dividends and distributions to shareholders was as follows:
| | | Year Ended
December 31, 2014 | | | Year Ended
December 31, 2013 | |
| | | Ordinary
Income | | | Long-term
Capital Gains | | | Ordinary
Income | | | Long-term
Capital Gains | |
| Aggregate Bond | | $ | 19,607,750 | | | $ | 771,629 | | | $ | 44,655,399 | | | $ | 359,383 | |
| Global Bond | | | 2,260,812 | | | | — | | | | 16,777,549 | | | | — | |
| American Century Small-Mid Cap Value | | | 27,101,807 | | | | 23,686,427 | | | | 12,281,011 | | | | 2,589,033 | |
| Baron Growth | | | 11,232,376 | | | | 6,955,408 | | | | 13,035,796 | | | | 37,864,893 | |
Columbia Contrarian
Core | | | 2,808,114 | | | | 43,599,749 | | | | 4,474,714 | | | | — | |
Columbia Small Cap
Value II | | | 642,473 | | | | — | | | | 1,447,149 | | | | — | |
| Invesco Comstock | | | 10,906,077 | | | | — | | | | 3,330,543 | | | | — | |
| NOTES TO FINANCIAL STATEMENTS as of December 31, 2014 (continued) |
NOTE 16 — FEDERAL INCOME TAXES (continued)
| | | Year Ended
December 31, 2014 | | | Year Ended
December 31, 2013 | |
| | | Ordinary
Income | | | Long-term
Capital Gains | | | Ordinary
Income | | | Long-term
Capital Gains | |
| Invesco Equity and Income | | | 30,317,766 | | | | 59,060,070 | | | | 10,831,018 | | | | — | |
| JPMorgan Mid Cap Value | | | 10,419,182 | | | | 37,245,026 | | | | 4,373,388 | | | | 22,121,670 | |
| Oppenheimer Global | | | 19,723,594 | | | | 24,001,127 | | | | 22,611,642 | | | | — | |
| Pioneer High Yield | | | 6,094,603 | | | | — | | | | 5,664,887 | | | | — | |
| | | Year Ended
December 31, 2014 | | | Year Ended
December 31, 2013 | |
| | | Ordinary
Income | | | Long-term
Capital Gains | | | Ordinary
Income | | | Long-term
Capital Gains | |
| T. Rowe Price Diversified Mid Cap Growth | | | 3,746,359 | | | | 55,515,783 | | | | 2,207,235 | | | | 8,898,818 | |
| T. Rowe Price Growth Equity | | | — | | | | 109,306,789 | | | | 267,033 | | | | 651 | |
| Templeton Foreign Equity | | | 21,466,778 | | | | — | | | | 13,459,181 | | | | — | |
The tax-basis components of distributable earnings and the capital loss carryforwards which may be used to offset future realized capital gains for federal income tax purposes as of December 31, 2014 are detailed below. The Regulated Investment Company Modernization Act of 2010 (the “Act”) provides an unlimited carryforward period for newly generated capital losses. Under the Act, there may be a greater likelihood that all or a portion of the Portfolios’ pre-enactment capital loss carryforwards may expire without being utilized due to the fact that post-enactment capital losses are required to be utilized before pre-enactment capital loss carryforwards.
| | | Undistributed
Ordinary | | | Undistributed
Long-term | | | Unrealized
Appreciation/ | | | Capital Loss Carryforwards | |
| | | Income | | | Capital Gains | | | (Depreciation) | | | Amount | | | Character | | Expiration | |
| Aggregate Bond | | $ | 36,087,253 | | | $ | 6,486,946 | | | $ | 13,919,673 | | | $ | — | | | — | | | — | |
| Global Bond | | | — | | | | — | | | | (11,193,001 | ) | | | (490,356 | ) | | Long-term | | | None | |
| American Century Small-Mid Cap Value | | | 21,972,497 | | | | 39,581,324 | | | | 30,836,739 | | | | — | | | — | | | — | |
| Baron Growth | | | 2,941,493 | | | | 73,245,152 | | | | 555,903,520 | | | | — | | | — | | | — | |
| Columbia Contrarian Core | | | 15,219,415 | | | | 26,243,631 | | | | 57,851,199 | | | | — | | | — | | | — | |
| Columbia Small Cap Value II | | | 862,207 | | | | — | | | | 46,019,617 | | | | (12,167,949 | ) | | Short-term | | | 2017 | |
| Invesco Comstock | | | 3,003,981 | | | | — | | | | 115,690,133 | | | | (11,420,795 | ) | | Short-term | | | 2016 | |
| | | | | | | | | | | | | | | | (130,908,420 | ) | | Short-term | | | 2017 | |
| | | | | | | | | | | | | | | $ | (142,329,215 | ) | | | | | | |
| Invesco Equity and Income | | | 12,746,205 | | | | 150,834,716 | | | | 155,694,622 | | | | — | | | — | | | — | |
| JPMorgan Mid Cap Value | | | 3,021,939 | | | | 92,148,273 | | | | 190,825,742 | | | | — | | | — | | | — | |
| Oppenheimer Global | | | 23,445,818 | | | | 127,586,377 | | | | 601,655,873 | | | | — | | | — | | | — | |
| Pioneer High Yield | | | 3,196,353 | | | | — | | | | (985,903 | ) | | | (12,856,705 | ) | | Short-term | | | 2017 | |
| T. Rowe Price Diversified Mid Cap Growth | | | 8,013,310 | | | | 121,933,704 | | | | 291,969,967 | | | | — | | | — | | | — | |
| T. Rowe Price Growth Equity | | | 11,502,817 | | | | 228,586,759 | | | | 498,654,804 | | | | — | | | — | | | — | |
| Templeton Foreign Equity | | | 29,657,065 | | | | — | | | | 136,211,938 | | | | (11,132,244 | ) | | Short-term | | | 2015 | |
| | | | | | | | | | | | | | | | (34,963,325 | ) | | Short-term | | | 2016 | |
| | | | | | | | | | | | | | | | (133,709,136 | ) | | Short-term | | | 2017 | |
| | | | | | | | | | | | | | | | (2,482,359 | ) | | Long-term | | | None | |
| | | | | | | | | | | | | | | $ | (182,287,064 | )* | | | | | | |
| * | Utilization of these capital losses is subject to annual limitations under Section 382 of the Internal Revenue Code. Amounts and years of expiration may be adjusted to reflect future gain/loss activity to comply with the limitation rules. |
The Portfolios’ major tax jurisdictions are U.S. federal and Arizona. The earliest tax year that remains subject to examination by these jurisdictions is 2010.
As of December 31, 2014, no provision for income tax is required in the Portfolios’ financial statements as a result of tax positions taken on federal and state income tax returns for open tax years. The Portfolios’ federal and state income and federal excise tax returns for tax years for which the applicable statutes of limitations have not expired are subject to examination by the Internal Revenue Service and state department of revenue.
| NOTES TO FINANCIAL STATEMENTS as of December 31, 2014 (continued) |
NOTE 17 – RESTRUCTURING PLAN
In October 2009, ING Groep N.V. (“ING Groep”) submitted a restructuring plan (the “Restructuring Plan”) to the European Commission in order to receive approval for state aid granted to ING Groep by the Kingdom of the Netherlands in November 2008 and March 2009. To receive approval for this state aid, ING Groep was required to divest its insurance and investment management businesses, including Voya Financial, Inc. (formerly, ING U.S., Inc.), before the end of 2013. In November 2012, the Restructuring Plan was amended to permit ING Groep additional time to complete the divestment. Pursuant to the amended Restructuring Plan, ING Groep was required to divest at least 25% of Voya Financial, Inc. by the end of 2013 and more than 50% by the end of 2014, and is required to divest its remaining interest by the end of 2016 (such divestment, the “Separation Plan”).
In May 2013, Voya Financial, Inc. conducted an initial public offering of its common stock (the “IPO”). In October 2013, March 2014, and September 2014, ING Groep divested additional shares in several secondary offerings of common stock of Voya Financial, Inc. and concurrent share repurchases by Voya Financial, Inc. These transactions reduced ING Groep’s ownership interest in Voya Financial, Inc. to 32%. Voya Financial, Inc. did not receive any proceeds from these offerings.
In November 2014, through an additional secondary offering and the concurrent repurchase of shares by Voya Financial, Inc., ING Groep further reduced its interest in Voya Financial, Inc. below 25% to approximately 19% (the “November 2014 Offering”). The November 2014 Offering was deemed by the Investment Adviser to be a change of control (the “Change of Control”), which resulted in the automatic termination of the existing investment advisory and sub-advisory agreements under which the Investment Adviser and Sub-Adviser provide services to the Portfolios. In anticipation of this termination, and in order to ensure that the existing investment advisory and sub-advisory services could continue uninterrupted, in 2013 the Board approved new advisory and sub-advisory agreements for the Portfolios, as applicable, in connection with the IPO. In addition, in 2013, shareholders of each Portfolio approved new investment advisory and affiliated sub-advisory agreements prompted by the IPO, as well as any future advisory and affiliated sub-advisory agreements prompted by the Separation Plan that are approved by the Board and that have terms not materially different from the current agreements. This meant that shareholders would not have another opportunity to vote on a new agreement with the Investment Adviser or the current affiliated sub-adviser even upon a change of control prompted by the Separation Plan, as long as no single person or group of persons acting together gains “control” (as defined in the 1940 Act) of Voya Financial, Inc.
On November 18, 2014, in response to the Change of Control, the Board, at an in-person meeting, approved new investment advisory and affiliated sub-advisory agreements. At that meeting, the Investment Adviser represented that the agreements approved by the Board were not materially different from the agreements approved by shareholders in 2013 and no single person or group of persons acting together was expected to gain “control” (as defined in the 1940 Act) of Voya Financial, Inc. As a result, shareholders of the Portfolios will not be asked to vote again on these new agreements with the Investment Adviser and affiliated sub-adviser.
NOTE 18 — SUBSEQUENT EVENTS
Subsequent to December 31, 2014, the following Portfolio paid dividends from net investment income of:
| | | Per Share
Amount | | Payable
Date | | Record Date |
| Pioneer High Yield | | | | | | |
| Class I | | $ 0.0507 | | February 2, 2015 | | Daily |
| Class S | | $ 0.0481 | | February 2, 2015 | | Daily |
On November 20, 2014, the Board approved a proposal to reorganize Aggregate Bond (the “Disappearing Portfolio”) with and into Voya Intermediate Bond Portfolio, which is not included in this report (the “Reorganization”) on or about July 17, 2015. The proposed Reorganization is subject to approval by the shareholders of the Disappearing Portfolio at a shareholder meeting scheduled to be held on or about July 10, 2015. The Disappearing Portfolio will notify its shareholders if shareholder approval of its proposed Reorganization is not obtained. If shareholder approval is obtained, and pending Board approval of the revised Reorganization date, it is expected that the Reorganization will take place on or about August 14, 2015.
On November 20, 2014, the Board approved the incorporation of breakpoints to the advisory fee for Columbia Contrarian Core. Effective January 1, 2015, advisory fee breakpoints for the Portfolio are 0.80% on the first $500 million; 0.75% on the next $500 million; and 0.70% thereafter.
Subsequent to the period end, the Board approved amendments to the Portfolios’ Valuation Procedures which changed the valuation methodology for investments in securities of sufficient credit quality, maturing in 60 days or less from amortized cost to a price provided by an independent pricing service.
The Portfolios have evaluated events occurring after the Statements of Assets and Liabilities date (“subsequent events”) to determine whether any subsequent events necessitated adjustment to or disclosure in the financial statements. Other than the above, no such subsequent events were identified.
| Voya Aggregate Bond Portfolio | SUMMARY PORTFOLIO OF INVESTMENTS
as of December 31, 2014 |
Principal
Amount† | | | Value | | | Percentage
of Net
Assets | |
| CORPORATE BONDS/NOTES: 28.1% |
| | | | | | | Basic Materials: 0.9% |
| | 283,000 | | | # | | Braskem Finance Ltd., 7.000%, 05/07/20 | | $ | 305,994 | | | | 0.0 | |
| | 1,800,000 | | | #,L | | CSN Islands XI Corp., 6.875%, 09/21/19 | | | 1,678,500 | | | | 0.2 | |
| | 1,089,000 | | | # | | Georgia-Pacific LLC, 3.600%, 03/01/25 | | | 1,095,914 | | | | 0.2 | |
| | 3,431,000 | | | | | Other Securities | | | 3,685,511 | | | | 0.5 | |
| | | | | | | | | | 6,765,919 | | | | 0.9 | |
| | | | | | | Communications: 4.6% |
| | 1,802,000 | | | # | | Cox Communications, Inc., 3.850%, 02/01/25 | | | 1,822,669 | | | | 0.2 | |
| | 1,209,000 | | | | | Time Warner Cable, Inc., 5.875%, 11/15/40 | | | 1,446,725 | | | | 0.2 | |
| | 2,020,000 | | | | | Time Warner, Inc., 4.050%-5.350%, 12/15/23-12/15/43 | | | 2,210,090 | | | | 0.3 | |
| | 4,700,000 | | | | | Verizon Communications, Inc., 1.991%, 09/14/18 | | | 4,893,565 | | | | 0.6 | |
| | 3,800,000 | | | | | Verizon Communications, Inc., 3.500%, 11/01/24 | | | 3,741,184 | | | | 0.5 | |
| | 6,344,000 | | | | | Verizon Communications, Inc., 2.500%-5.150%, 09/15/16-03/ 15/24 | | | 6,692,803 | | | | 0.9 | |
| | 14,694,000 | | | | | Other Securities(a) | | | 14,902,877 | | | | 1.9 | |
| | | | | | | | | | 35,709,913 | | | | 4.6 | |
| | | | | | | Consumer, Cyclical: 0.8% |
| | 5,718,890 | | | | | Other Securities | | | 5,983,268 | | | | 0.8 | |
| | | | | | | Consumer, Non-cyclical: 3.7% |
| | 1,802,000 | | | # | | Medtronic, Inc., 3.500%, 03/15/25 | | | 1,847,333 | | | | 0.2 | |
| | 1,405,000 | | | # | | Medtronic, Inc., 4.375%, 03/15/35 | | | 1,495,565 | | | | 0.2 | |
| | 692,000 | | | # | | Medtronic, Inc., 4.625%, 03/15/45 | | | 753,273 | | | | 0.1 | |
| | 23,667,000 | | | | | Other Securities | | | 24,510,313 | | | | 3.2 | |
| | | | | | | | | | 28,606,484 | | | | 3.7 | |
| | | | | | | Energy: 2.7% | | | | | | | | |
| | 7,000,000 | | | # | | Rockies Express Pipeline LLC, 3.900%, 04/15/15 | | | 6,982,500 | | | | 0.9 | |
| | 14,046,000 | | | | | Other Securities(a) | | | 14,275,815 | | | | 1.8 | |
| | | | | | | | | | 21,258,315 | | | | 2.7 | |
Principal
Amount† | | | Value | | | Percentage
of Net
Assets | |
| CORPORATE BONDS/NOTES: (continued) |
| | | | | | | Financial: 13.6% | | | | | | | | |
| | 4,000,000 | | | | | Ally Financial, Inc., 4.625%, 06/26/15 | | $ | 4,035,000 | | | | 0.5 | |
| | 3,600,000 | | | | | Ally Financial, Inc., 3.500%-8.300%, 02/12/15-07/18/16 | | | 3,632,820 | | | | 0.5 | |
| | 6,296,000 | | | | | Bank of America Corp., 0.597%-5.000%, 06/20/15-01/21/44 | | | 6,495,366 | | | | 0.8 | |
| | 600,000 | | | # | | Bank of Montreal, 2.850%, 06/09/15 | | | 606,062 | | | | 0.1 | |
| | 500,000 | | | # | | Bank of Nova Scotia, 1.950%, 01/30/17 | | | 507,953 | | | | 0.1 | |
| | 1,200,000 | | | # | | BBVA, 6.500%, 03/10/21 | | | 1,305,480 | | | | 0.2 | |
| | 1,030,000 | | | # | | BPCE SA, 5.150%, 07/21/24 | | | 1,063,380 | | | | 0.1 | |
| | 1,000,000 | | | # | | CIT Group, Inc., 4.750%, 02/15/15 | | | 1,004,242 | | | | 0.1 | |
| | 3,144,000 | | | | | Citigroup, Inc., 4.000%-5.500%, 08/05/24-09/13/25 | | | 3,261,876 | | | | 0.4 | |
| | 1,956,000 | | | # | | Credit Suisse AG, 6.500%, 08/08/23 | | | 2,152,032 | | | | 0.3 | |
| | 1,030,000 | | | # | | Five Corners Funding Trust, 4.419%, 11/15/23 | | | 1,091,144 | | | | 0.2 | |
| | 2,810,000 | | | | | Goldman Sachs Group, Inc., 3.850%, 07/08/24 | | | 2,885,285 | | | | 0.4 | |
| | 1,278,000 | | | | | Goldman Sachs Group, Inc., 0.860%-6.750%, 06/04/17-10/01/37 | | | 1,505,510 | | | | 0.2 | |
| | 4,800,000 | | | # | | ICICI Bank Ltd../Dubai, 4.750%, 11/25/16 | | | 5,020,901 | | | | 0.7 | |
| | 1,800,000 | | | | | ICICI Bank Ltd., 5.500%, 03/25/15 | | | 1,819,028 | | | | 0.2 | |
| | 6,200,000 | | | | | International Lease Finance Corp., 8.625%, 09/15/15 | | | 6,479,000 | | | | 0.8 | |
| | 700,000 | | | # | | International Lease Finance Corp., 6.750%, 09/01/16 | | | 747,250 | | | | 0.1 | |
| | 1,300,000 | | | | | International Lease Finance Corp., 4.875%-5.750%, 04/01/15-05/15/16 | | | 1,320,938 | | | | 0.2 | |
| | 5,474,000 | | | | | JPMorgan Chase & Co., 3.375%-6.125%, 05/01/23-2/29/49 | | | 5,473,498 | | | | 0.7 | |
See Accompanying Notes to Financial Statements
| Voya Aggregate Bond Portfolio | SUMMARY PORTFOLIO OF INVESTMENTS
as of December 31, 2014 (continued) |
Principal
Amount† | | | Value | | | Percentage
of Net
Assets | |
| CORPORATE BONDS/NOTES: (continued) |
| | | | | | | Financial (continued) | | | | | | | | |
| | 3,138,000 | | | | | Morgan Stanley, 3.875%-5.000%, 04/29/24-11/24/25 | | $ | 3,267,743 | | | | 0.4 | |
| | 500,000 | | | # | | National Bank of Canada, 2.200%, 10/19/16 | | | 511,388 | | | | 0.1 | |
| | 1,400,000 | | | # | | Nationwide Building Society, 6.250%, 02/25/20 | | | 1,644,070 | | | | 0.2 | |
| | 4,000,000 | | | # | | Principal Life Global Funding II, 1.200%, 05/19/17 | | | 3,975,516 | | | | 0.5 | |
| | 600,000 | | | # | | Royal Bank of Scotland Group PLC, 6.990%, 10/29/49 | | | 678,000 | | | | 0.1 | |
| | 1,084,000 | | | # | | Scentre Group Trust 1 / Scentre Group Trust 2, 3.500%, 02/12/25 | | | 1,090,544 | | | | 0.1 | |
| | 1,500,000 | | | | | Navient Corp., 6.250%, 01/25/16 | | | 1,563,750 | | | | 0.2 | |
| | 5,700,000 | | | | | Navient Corp., 8.450%, 06/15/18 | | | 6,369,750 | | | | 0.8 | |
| | 400,000 | | | # | | Turkiye Garanti Bankasi AS, 2.731%, 04/20/16 | | | 401,000 | | | | 0.1 | |
| | 4,000,000 | | | | | UBS AG/Stamford CT, 7.625%, 08/17/22 | | | 4,716,408 | | | | 0.6 | |
| | 1,065,000 | | | # | | WEA Finance LLC / Westfield UK & Europe Finance PLC, 3.750%, 09/17/24 | | | 1,082,914 | | | | 0.1 | |
| | 2,522,000 | | | | | Wells Fargo & Co., 4.100%-4.650%, 06/03/26-11/04/44 | | | 2,594,835 | | | | 0.3 | |
| | 25,903,000 | | | | | Other Securities | | | 26,722,415 | | | | 3.5 | |
| | | | | | | | | | 105,025,098 | | | | 13.6 | |
| | | | | | | Industrial: 0.6% | | | | | | | | |
| | 719,000 | | | # | | Keysight Technologies, Inc., 4.550%, 10/30/24 | | | 720,699 | | | | 0.1 | |
| | 3,452,000 | | | | | Other Securities | | | 3,579,298 | | | | 0.5 | |
| | | | | | | | | | 4,299,997 | | | | 0.6 | |
| | | | | | | Technology: 0.2% | | | | | | | | |
| | 1,773,000 | | | | | Other Securities | | | 1,856,756 | | | | 0.2 | |
| | | | | | | Utilities: 1.0% | | | | | | | | |
| | 1,434,000 | | | # | | Berkshire Hathaway Energy Co., 3.500%, 02/01/25 | | | 1,446,164 | | | | 0.2 | |
| | 700,000 | | | # | | Dynegy Finance I, Inc. / Dynegy Finance II, Inc., 6.750%, 11/01/19 | | | 713,125 | | | | 0.1 | |
Principal
Amount† | | | Value | | | Percentage
of Net
Assets | |
| CORPORATE BONDS/NOTES: (continued) | |
| | | | | | | Utilities (continued) | | | | | | | | |
| | 300,000 | | | # | | Dynegy Finance I, Inc. / Dynegy Finance II, Inc., 7.375%, 11/01/22 | | $ | 305,625 | | | | 0.1 | |
| | 200,000 | | | # | | Dynegy Finance I, Inc. / Dynegy Finance II, Inc., 7.625%, 11/01/24 | | | 204,250 | | | | 0.0 | |
| | 4,896,000 | | | | | Other Securities | | | 4,984,689 | | | | 0.6 | |
| | | | | | | | | | 7,653,853 | | | | 1.0 | |
| | | | | | | Total Corporate Bonds/Notes
(Cost $215,774,287) | | | 217,159,603 | | | | 28.1 | |
| | | | | | | | | | | | | | | |
| COLLATERALIZED MORTGAGE OBLIGATIONS: 10.8% |
| | 3,900,000 | | | # | | BAMLL Commercial Mortgage Securities Trust 2014-INLD, 2.764%, 12/15/29 | | | 3,914,582 | | | | 0.5 | |
| | 1,830,000 | | | | | Banc of America Commercial Mortgage Trust 2007-3, 5.547%, 06/10/49 | | | 1,832,604 | | | | 0.2 | |
| | 2,270,000 | | | | | Banc of America Merrill Lynch Commercial Mortgage, Inc. 2005-6 F, 5.152%, 09/10/47 | | | 2,300,502 | | | | 0.3 | |
| | 1,980,000 | | | | | Banc of America Merrill Lynch Commercial Mortgage, Inc., 5.155%, 07/10/45 | | | 1,932,122 | | | | 0.3 | |
| | 162,599 | | | # | | BCAP, LLC Trust, 5.041%, 03/26/37 | | | 160,593 | | | | 0.0 | |
| | 2,599,364 | | | | | Bear Stearns Adjustable Rate Mortgage Trust, 2.515%-5.417%, 09/25/34-02/25/36 | | | 2,584,471 | | | | 0.3 | |
| | 855,955 | | | | | Bear Stearns Alternative-A Trust, 2.554%-2.612%, 05/25/35-11/ 25/36 | | | 682,606 | | | | 0.1 | |
| | 622,557 | | | | | Bear Stearns Structured Products, Inc., 2.337%-2.591%, 01/26/36-12/26/46 | | | 500,701 | | | | 0.1 | |
| | 3,614,000 | | | # | | CGWF Commercial Mortgage Trust 2013-RKWH, 2.461%, 11/15/30 | | | 3,624,518 | | | | 0.5 | |
| | 34,943,203 | | | ^ | | Commercial Mortgage Trust, 1.419%, 10/10/46 | | | 2,969,906 | | | | 0.4 | |
See Accompanying Notes to Financial Statements
| Voya Aggregate Bond Portfolio | SUMMARY PORTFOLIO OF INVESTMENTS
as of December 31, 2014 (continued) |
Principal
Amount† | | | Value | | | Percentage
of Net
Assets | |
| COLLATERALIZED MORTGAGE OBLIGATIONS: (continued) |
| | 23,144,981 | | | ^ | | Commercial Mortgage Trust, 1.440%, 08/10/46 | | $ | 1,693,368 | | | | 0.2 | |
| | 29,017,148 | | | ^ | | Commercial Mortgage Trust, 1.977%, 10/15/45 | | | 3,007,732 | | | | 0.4 | |
| | 6,179,960 | | | | | Countrywide Home Loan Mortgage Pass-through Trust, 0.370%, 04/25/46 | | | 5,441,498 | | | | 0.7 | |
| | 370,821 | | | # | | Countrywide Home Loan Mortgage Pass-through Trust, 0.510%, 06/25/35 | | | 332,374 | | | | 0.0 | |
| | 514,552 | | | | | Countrywide Home Loan Mortgage Pass-through Trust, 0.490%-2.466%, 02/20/35-03/ 25/35 | | | 504,460 | | | | 0.1 | |
| | 3,965,355 | | | | | Credit Suisse Commercial Mortgage Trust Series 2006-C4, 5.460%, 09/15/39 | | | 4,183,228 | | | | 0.5 | |
| | 2,740,000 | | | | | Fannie Mae Connecticut Avenue Securities, 3.070%-5.170%, 07/25/24-11/25/24 | | | 2,682,093 | | | | 0.4 | |
| | 37,548,116 | | | ^ | | GS Mortgage Securities Corp. II, 1.547%, 11/10/46 | | | 2,953,955 | | | | 0.4 | |
| | 2,500,000 | | | | | GS Mortgage Securities Trust, 5.553%, 04/10/38 | | | 2,465,234 | | | | 0.3 | |
| | 40,289,833 | | | ^ | | JP Morgan Chase Commercial Mortgage Securities Corp., 1.757%, 06/15/45 | | | 3,152,422 | | | | 0.4 | |
| | 2,495,000 | | | | | JP Morgan Chase Commercial Mortgage Securities Trust 2004-CIBC10, 5.066%, 01/12/37 | | | 2,512,502 | | | | 0.3 | |
| | 2,500,000 | | | | | JP Morgan Chase Commercial Mortgage Securities Trust 2005-LDP4, 5.040%, 10/15/42 | | | 2,530,827 | | | | 0.3 | |
| | 476,013 | | | | | JPMorgan Mortgage Trust, 2.576%-2.636%, 02/25/35-07/25/35 | | | 485,103 | | | | 0.1 | |
| | 5,752,679 | | | | | MLCC Mortgage Investors, Inc., 2.173%, 11/25/35 | | | 5,695,762 | | | | 0.8 | |
| | 202,027 | | | | | MLCC Mortgage Investors, Inc., 0.420%-1.156%, 10/25/35-11/ 25/35 | | | 192,226 | | | | 0.0 | |
Principal
Amount† | | | Value | | | Percentage
of Net
Assets | |
| COLLATERALIZED MORTGAGE OBLIGATIONS: (continued) |
| | 68,477 | | | # | | Structured Asset Securities Corp., 2.605%, 10/28/35 | | $ | 65,562 | | | | 0.0 | |
| | 3,000,000 | | | | | Wachovia Bank Commercial Mortgage Trust Series 2006-C24, 5.658%, 03/15/45 | | | 3,064,002 | | | | 0.4 | |
| | 2,300,000 | | | | | Wachovia Bank Commercial Mortgage Trust Series 2006-C25, 5.723%, 05/15/43 | | | 2,286,929 | | | | 0.3 | |
| | 2,500,000 | | | | | Wachovia Bank Commercial Mortgage Trust Series, 5.723%, 05/15/43 | | | 2,553,471 | | | | 0.3 | |
| | 75,348 | | | # | | Wachovia Bank Commercial Mortgage Trust, 0.241%, 06/15/20 | | | 75,183 | | | | 0.0 | |
| | 1,250,343 | | | | | Wells Fargo Mortgage Backed Securities 2006-AR10 Trust, 2.610%, 07/25/36 | | | 1,221,773 | | | | 0.1 | |
| | 596,118 | | | | | Wells Fargo Mortgage-Backed Securities Trust, 2.590%-2.616%, 10/25/33-01/ 25/35 | | | 603,722 | | | | 0.1 | |
| | 15,941,111 | | | | | Other Securities | | | 15,619,679 | | | | 2.0 | |
| | | | | | | Total Collateralized Mortgage Obligations (Cost $82,392,528) | | | 83,825,710 | | | | 10.8 | |
| MUNICIPAL BONDS: 4.6% |
| | | | | | | California: 2.3% | | | | | | | | |
| | 3,500,000 | | | | | Los Angeles Department of Airports, 6.582%, 05/15/39 | | | 4,591,300 | | | | 0.6 | |
| | 6,000,000 | | | | | Southern California Public Power Authority, 5.943%, 07/01/40 | | | 7,271,400 | | | | 0.9 | |
| | 4,300,000 | | | | | Other Securities | | | 5,749,460 | | | | 0.8 | |
| | | | | | | | | | 17,612,160 | | | | 2.3 | |
| | | | | | | Illinois: 0.1% | | | | | | | | |
| | 700,000 | | | | | Other Securities | | | 881,972 | | | | 0.1 | |
| | | | | | | Nebraska: 0.1% | | | | | | | | |
| | 500,000 | | | | | Other Securities | | | 587,040 | | | | 0.1 | |
| | | | | | | Nevada: 0.5% | | | | | | | | |
| | 3,300,000 | | | | | City of North Las Vegas NV, 6.572%, 06/01/40 | | | 2,973,135 | | | | 0.4 | |
| | 600,000 | | | | | Other Securities | | | 879,360 | | | | 0.1 | |
| | | | | | | | | | 3,852,495 | | | | 0.5 | |
See Accompanying Notes to Financial Statements
| Voya Aggregate Bond Portfolio | SUMMARY PORTFOLIO OF INVESTMENTS
as of December 31, 2014 (continued) |
Principal
Amount† | | | Value | | | Percentage
of Net
Assets | |
| MUNICIPAL BONDS: (continued) |
| | | | | | | New York: 0.8% | | | | | | | | |
| | 2,000,000 | | | | | New York City Municipal Water Finance Authority, 5.882%, 06/15/44 | | $ | 2,690,120 | | | | 0.4 | |
| | 2,900,000 | | | | | New York City Municipal Water Finance Authority, 6.282%, 06/15/42 | | | 3,415,504 | | | | 0.4 | |
| | 200,000 | | | | | Other Securities | | | 200,490 | | | | 0.0 | |
| | | | | | | | | | 6,306,114 | | | | 0.8 | |
| | | | | | | Texas: 0.8% | | | | | | | | |
| | 2,200,000 | | | | | City of San Antonio TX, 5.808%, 02/01/41 | | | 2,923,954 | | | | 0.4 | |
| | 2,900,000 | | | | | City of San Antonio TX, 6.308%, 02/01/37 | | | 3,366,900 | | | | 0.4 | |
| | | | | | | | | | 6,290,854 | | | | 0.8 | |
| | | | | | | Total Municipal Bonds (Cost $29,081,237) | | | 35,530,635 | | | | 4.6 | |
| CERTIFICATES OF DEPOSIT: 0.5% |
| | | | | | | Financial: 0.5% | | | | | | | | |
| | 3,600,000 | | | | | Credit Suisse/New York NY, 0.645%, 12/07/15 | | | 3,602,722 | | | | 0.5 | |
| | | | | | | Total Certificates of Deposit (Cost $3,600,000) | | | 3,602,722 | | | | 0.5 | |
| FOREIGN GOVERNMENT BONDS: 2.1% |
| | 300,000 | | | # | | Banco Nacional de Desenvolvimento Economico e Social, 3.375%, 09/26/16 | | | 301,770 | | | | 0.0 | |
| | 400,000 | | | # | | Korea Housing Finance Corp., 4.125%, 12/15/15 | | | 411,119 | | | | 0.1 | |
| | 3,400,000 | | | | | Province of Ontario Canada, 1.600%, 09/21/16 | | | 3,447,865 | | | | 0.4 | |
| | 1,900,000 | | | | | Province of Ontario Canada, 1.650%-4.400%, 07/16/18-04/14/20 | | | 1,972,619 | | | | 0.3 | |
| | 2,900,000 | | | # | | State Bank of India/London, 4.500%, 07/27/15 | | | 2,952,699 | | | | 0.4 | |
| | 6,600,000 | | | | | Other Securities | | | 6,850,281 | | | | 0.9 | |
| | | | | | | Total Foreign Government Bonds (Cost $15,629,945) | | | 15,936,353 | | | | 2.1 | |
| U.S. GOVERNMENT AGENCY OBLIGATIONS: 16.1% |
| | | | | | | Federal Home Loan Mortgage Corporation: 5.1%## |
| | 31,573,315 | | | | | 3.500%, due 01/01/45 | | | 32,874,008 | | | | 4.2 | |
| | 6,303,480 | | | | | 0.750%-6.000%, due 10/01/17-10/25/44 | | | 6,964,736 | | | | 0.9 | |
| | | | | | | | | | 39,838,744 | | | | 5.1 | |
Principal
Amount† | | | Value | | | Percentage
of Net
Assets | |
| U.S. GOVERNMENT AGENCY OBLIGATIONS (continued) |
| | | | | | | Federal National Mortgage Association: 10.4%## |
| | 900,000 | | | ^ | | 2.310%, due 08/01/22 | | $ | 893,931 | | | | 0.1 | |
| | 5,165,505 | | | ^ | | 2.790%, due 07/01/22 | | | 5,281,272 | | | | 0.7 | |
| | 3,415,779 | | | | | 3.156%, due 05/01/22 | | | 3,588,157 | | | | 0.5 | |
| | 25,686,436 | | | | | 4.000%, due 12/01/44 | | | 27,455,322 | | | | 3.5 | |
| | 4,045,765 | | | | | 4.500%, due 05/01/39 | | | 4,419,747 | | | | 0.6 | |
| | 35,422,932 | | | | | 0.230%-6.500%, due 12/01/16-10/01/44 | | | 38,540,420 | | | | 5.0 | |
| | | | | | | | | | 80,178,849 | | | | 10.4 | |
| | | | | | | Government National Mortgage Association: 0.6% |
| | 4,346,832 | | | | | 0.561%-5.000%, due 03/16/32-09/15/40 | | | 4,800,865 | | | | 0.6 | |
| | | | | | | Total U.S. Government Agency Obligations (Cost $122,944,777) | | | 124,818,458 | | | | 16.1 | |
| ASSET-BACKED SECURITIES: 12.6% |
| | | | | | | Automobile Asset-Backed Securities: 0.5% |
| | 3,900,000 | | | | | Ally Auto Receivables Trust, 0.680%, 07/17/17 | | | 3,898,247 | | | | 0.5 | |
| | | | | | | Credit Card Asset-Backed Securities: 1.3% |
| | 9,800,000 | | | | | Citibank Credit Card Issuance Trust, 4.850%, 03/10/17 | | | 9,882,795 | | | | 1.3 | |
| | | | | | | Home Equity Asset-Backed Securities: 1.9% |
| | 10,100,000 | | | | | Accredited Mortgage Loan Trust 2006-1, 0.435%, 04/25/36 | | | 8,552,589 | | | | 1.1 | |
| | 6,888,594 | | | | | Other Securities | | | 6,182,917 | | | | 0.8 | |
| | | | | | | | | | 14,735,506 | | | | 1.9 | |
| | | | | | | Other Asset-Backed Securities: 8.9% |
| | 500,000 | | | # | | Apidos Cinco CDO Ltd., 2.483%, 05/14/20 | | | 490,138 | | | | 0.1 | |
| | 427,268 | | | # | | Belhurst CLO Ltd., 0.491%, 01/15/20 | | | 427,252 | | | | 0.1 | |
| | 500,000 | | | # | | Black Diamond CLO 2005-1A C, 1.017%, 06/20/17 | | | 495,500 | | | | 0.1 | |
| | 4,757,289 | | | # | | Callidus Debt Partners Clo Fund VI Ltd., 0.491%, 10/23/21 | | | 4,673,509 | | | | 0.6 | |
| | 1,250,000 | | | # | | Carlyle Veyron CLO Ltd., 0.911%, 07/15/18 | | | 1,240,478 | | | | 0.2 | |
| | 4,200,000 | | | # | | CIFC Funding Ltd, 1.383%, 08/14/24 | | | 4,201,483 | | | | 0.5 | |
| | 3,750,000 | | | # | | ColumbusNova CLO IV Ltd 2007-II, 2.481%, 10/15/21 | | | 3,672,304 | | | | 0.5 | |
See Accompanying Notes to Financial Statements
| Voya Aggregate Bond Portfolio | SUMMARY PORTFOLIO OF INVESTMENTS
as of December 31, 2014 (continued) |
Principal
Amount† | | | Value | | | Percentage
of Net
Assets | |
| ASSET-BACKED SECURITIES: (continued) |
| | | | | | | Other Asset-Backed Securities (continued) |
| | 2,000,000 | | | # | | Denali Capital CLO VI Ltd., 1.931%, 04/21/20 | | $ | 1,990,138 | | | | 0.3 | |
| | 1,000,000 | | | # | | Duane Street CLO III Ltd., 0.990%, 01/11/21 | | | 984,057 | | | | 0.1 | |
| | 500,000 | | | # | | Eaton Vance CDO IX Ltd., 1.731%, 04/20/19 | | | 485,651 | | | | 0.1 | |
| | 2,500,000 | | | # | | Fairway Loan Funding Co., 1.678%, 10/17/18 | | | 2,490,830 | | | | 0.3 | |
| | 1,000,000 | | | # | | Flagship CLO V, 0.597%, 09/20/19 | | | 981,168 | | | | 0.1 | |
| | 1,500,000 | | | # | | Flagship CLO V, 0.947%, 09/20/19 | | | 1,456,867 | | | | 0.2 | |
| | 1,500,000 | | | # | | Flagship CLO V, 1.797%, 09/20/19 | | | 1,428,726 | | | | 0.2 | |
| | 5,000,000 | | | # | | Gallatin CLO III Ltd. 2007-1A A2L, 0.572%, 05/15/21 | | | 4,879,020 | | | | 0.6 | |
| | 5,000,000 | | | # | | Gulf Stream - Compass CLO 2007-I Ltd., 1.133%, 10/28/19 | | | 4,950,000 | | | | 0.6 | |
| | 3,000,000 | | | # | | Hewett’s Island CDO Ltd., 1.036%, 06/09/19 | | | 2,966,640 | | | | 0.4 | |
| | 2,549,402 | | | # | | Hillmark Funding, 0.481%, 05/21/21 | | | 2,520,892 | | | | 0.3 | |
| | 2,000,000 | | | # | | Jersey Street CLO Ltd., 1.781%, 10/20/18 | | | 1,955,050 | | | | 0.2 | |
| | 4,450,000 | | | | | JP Morgan Mortgage Acquisition Trust 2007-CH5, 0.430%, 05/25/37 | | | 3,474,431 | | | | 0.5 | |
| | 48,174 | | | | | JPMorgan Mortgage Acquisition Corp., 0.230%, 03/25/47 | | | 47,153 | | | | 0.0 | |
| | 2,500,000 | | | # | | Madison Park Funding II Ltd., 5.793%, 03/25/20 | | | 2,653,427 | | | | 0.3 | |
| | 2,500,000 | | | # | | Race Point IV CLO Ltd., 0.982%, 08/01/21 | | | 2,441,058 | | | | 0.3 | |
| | 4,357,872 | | | # | | SpringCastle America Funding LLC, 2.700%, 05/25/23 | | | 4,356,952 | | | | 0.6 | |
Principal
Amount† | | | Value | | | Percentage
of Net
Assets | |
| ASSET-BACKED SECURITIES: (continued) |
| | | | | | | Other Asset-Backed Securities (continued) |
| | 2,000,000 | | | # | | Telos CLO 2006-1 Ltd., 1.930%, 10/11/21 | | $ | 1,942,382 | | | | 0.2 | |
| | 1,500,000 | | | # | | Trimaran CLO VI Ltd., 1.782%, 11/01/18 | | | 1,489,151 | | | | 0.2 | |
| | 11,071,547 | | | | | Other Securities | | | 10,189,290 | | | | 1.3 | |
| | | | | | | | | | 68,883,547 | | | | 8.9 | |
| | | | | | | Total Asset-Backed Securities
(Cost $95,736,896) | | | 97,400,095 | | | | 12.6 | |
| U.S. TREASURY OBLIGATIONS: 20.2% |
| | | | | | | U.S. Treasury Bonds: 3.3% |
| | 23,668,000 | | | | | 3.125%, due 08/15/44 | | | 25,485,632 | | | | 3.3 | |
| | | | | | | U.S. Treasury Notes: 16.9% |
| | 4,600,000 | | | | | 0.625%, due 08/31/17 | | | 4,554,897 | | | | 0.6 | |
| | 87,885,000 | | | | | 1.500%, due 11/30/19 | | | 87,315,154 | | | | 11.3 | |
| | 38,873,000 | | | | | 2.250%, due 11/15/24 | | | 39,140,252 | | | | 5.0 | |
| | 200,000 | | | | | 2.375%, due 08/15/24 | | | 203,601 | | | | 0.0 | |
| | | | | | | | | | 131,213,904 | | | | 16.9 | |
| | | | | | | Total U.S. Treasury Obligations
(Cost $157,479,014) | | | 156,699,536 | | | | 20.2 | |
| Shares | | | Value | | | Percentage
of Net
Assets | |
| PREFERRED STOCK: 0.6% |
| | | | | | | Financials: 0.6% | | | | | | | | |
| | 3,400 | | | @ | | Wells Fargo & Co. | | | 4,122,483 | | | | 0.6 | |
| | | | | | | Total Preferred Stock (Cost $2,195,020) | | | 4,122,483 | | | | 0.6 | |
| | | | | | | Total Long-Term Investments
(Cost $724,833,704) | | | 739,095,595 | | | | 95.6 | |
See Accompanying Notes to Financial Statements
| Voya Aggregate Bond Portfolio | SUMMARY PORTFOLIO OF INVESTMENTS
as of December 31, 2014 (continued) |
Principal
Amount† | | | Value | | | Percentage
of Net
Assets | |
| SHORT-TERM INVESTMENTS: 12.1% |
| | | | | | | Commercial Paper: 2.5% |
| | 900,000 | | | | | ENI Finance USA, Inc., 0.480%, 09/24/15 | | $ | 896,823 | | | | 0.1 | |
| | 8,600,000 | | | # | | ENI Finance USA, Inc., 0.609%, 04/10/15 | | | 8,599,707 | | | | 1.1 | |
| | 300,000 | | | # | | ENI Finance USA, Inc., 0.632%, 02/17/15 | | | 300,003 | | | | 0.1 | |
| | 4,100,000 | | | | | ENTERGY DISC 02/03/15, 02/03/15 | | | 4,098,263 | | | | 0.5 | |
| | 5,600,000 | | | # | | Macquarie Bank Ltd, 0.433%, 05/14/15 | | | 5,599,384 | | | | 0.7 | |
| | | | | | | | | | 19,494,180 | | | | 2.5 | |
| | | | | | | Securities Lending Collateralcc: 0.9% |
| | 1,639,557 | | | | | Bank of Nova Scotia, Repurchase Agreement dated 12/31/14, 0.10%, due 01/02/15 (Repurchase Amount $1,639,566, collateralized by various U.S. Government/U.S. Government Agency Obligations, 0.125%-7.125%, Market Value plus accrued interest $1,672,358, due 02/09/15-05/15/40) | | | 1,639,557 | | | | 0.2 | |
| | 1,639,557 | | | | | Cantor Fitzgerald, Repurchase Agreement dated 12/31/14, 0.09%, due 01/02/15 (Repurchase Amount $1,639,565, collateralized by various U.S. Government/U.S. Government Agency Obligations, 0.000%-10.500%, Market Value plus accrued interest $1,672,348, due 01/01/ 15-09/01/49) | | | 1,639,557 | | | | 0.2 | |
| | 344,699 | | | | | Daiwa Capital Markets, Repurchase Agreement dated 12/31/14, 0.12%, due 01/02/15 (Repurchase Amount $344,701, collateralized by various U.S. Government and U.S. Government Agency Obligations, 0.000%-6.500%, Market Value plus accrued interest $351,593, due 06/01/17-03/01/48) | | | 344,699 | | | | 0.1 | |
Principal
Amount† | | | Value | | | Percentage
of Net
Assets | |
| SHORT-TERM INVESTMENTS: (continued) |
| | | | | | | Securities Lending Collateralcc (continued) |
| | 1,639,557 | | | | | Nomura Securities, Repurchase Agreement dated 12/31/14, 0.08%, due 01/02/15 (Repurchase Amount $1,639,564, collateralized by various U.S. Government/U.S. Government Agency Obligations, 0.000%-8.875%, Market Value plus accrued interest $1,672,348, due 01/07/15-10/20/64) | | $ | 1,639,557 | | | | 0.2 | |
| | 1,639,557 | | | | | Royal Bank of Scotland PLC, Repurchase Agreement dated 12/31/14, 0.09%, due 01/02/15 (Repurchase Amount $1,639,565, collateralized by various U.S. Government/U.S. Government Agency Obligations, 0.375%-7.250%, Market Value plus accrued interest $1,672,348, due 11/15/15-07/15/56) | | | 1,639,557 | | | | 0.2 | |
| | | | | | | | | | 6,902,927 | | | | 0.9 | |
| | | | | | | Certificates of Deposit: 0.1% |
| | 700,000 | | | | | Credit Suisse/New York NY, 0.473%, 03/17/15
(Cost $699,972) | | | 699,972 | | | | 0.1 | |
| Shares | | | Value | | | Percentage
of Net
Assets | |
| | | | | | | Mutual Funds: 8.6% |
| | 66,878,000 | | | | | BlackRock Liquidity Funds, TempFund, Institutional Class, 0.030%††
(Cost $66,878,000) | | | 66,878,000 | | | | 8.6 | |
| | | | | | | Total Short-Term Investments
(Cost $93,976,027) | | | 93,975,079 | | | | 12.1 | |
| | | | | | | Total Investments in Securities
(Cost $818,809,731) | | $ | 833,070,674 | | | | 107.7 | |
| | | | | | | Liabilities in Excess of Other Assets | | | (59,410,539 | ) | | | (7.7 | ) |
| | | | | | | Net Assets | | $ | 773,660,135 | | | | 100.0 | |
See Accompanying Notes to Financial Statements
| Voya Aggregate Bond Portfolio | SUMMARY PORTFOLIO OF INVESTMENTS
as of December 31, 2014 (continued) |
“Other Securities” represents issues not identified as the top 50 holdings in terms of market value and issues or issuers not exceeding 1% of net assets individually or in aggregate respectively as of December 31, 2014.
The following footnotes apply to either the individual securities noted or one or more of the securities aggregated and listed as a single line item.
| † | Unless otherwise indicated, principal amount is shown in USD. |
| †† | Rate shown is the 7-day yield as of December 31, 2014. |
| # | Securities with purchases pursuant to Rule 144A or section 4(a)(2), under the Securities Act of 1933 and may not be resold subject to that rule except to qualified institutional buyers. |
| ## | The Federal Housing Finance Agency (“FHFA”) placed the Federal Home Loan Mortgage Corporation and Federal National Mortgage Association into conservatorship with FHFA as the conservator. As such, the FHFA oversees the continuing affairs of these companies. |
| @ | Non-income producing security. |
| cc | Represents securities purchased with cash collateral received for securities on loan. |
| L | Loaned security, a portion or all of the security is on loan at December 31, 2014. |
| ^ | Interest only securities represent the right to receive the monthly interest payments on an underlying pool of mortgage loans. Principal amount shown represents the notional amount on which current interest is calculated. Payments of principal on the pool reduce the value of the interest only security. |
| (a) | This grouping contains securities on loan. |
Cost for federal income tax purposes is $819,143,910.
Net unrealized appreciation consists of:
| Gross Unrealized Appreciation | | $ | 17,392,101 | |
| Gross Unrealized Depreciation | | | (3,465,337 | ) |
| Net Unrealized Appreciation | | $ | 13,926,764 | |
Fair Value Measurements^
The following is a summary of the fair valuations according to the inputs used as of December 31, 2014 in valuing the assets and liabilities:
| | | Quoted Prices
in Active Markets
for Identical
Investments
(Level 1) | | | Significant
Other
Observable
Inputs
(Level 2) | | | Significant
Unobservable
Inputs
(Level 3) | | | Fair Value
at
December 31, 2014 | |
| Asset Table | | | | | | | | | | | | | | | | |
| Investments, at fair value | | | | | | | | | | | | | | | | |
| Preferred Stock | | $ | 4,122,483 | | | $ | — | | | $ | — | | | $ | 4,122,483 | |
| Corporate Bonds/Notes | | | — | | | | 217,159,603 | | | | — | | | | 217,159,603 | |
| Collateralized Mortgage Obligations | | | — | | | | 83,825,710 | | | | — | | | | 83,825,710 | |
| Municipal Bonds | | | — | | | | 35,530,635 | | | | — | | | | 35,530,635 | |
| Short-Term Investments | | | 66,878,000 | | | | 27,097,079 | | | | — | | | | 93,975,079 | |
| U.S. Treasury Obligations | | | — | | | | 156,699,536 | | | | — | | | | 156,699,536 | |
| Asset-Backed Securities | | | — | | | | 97,400,095 | | | | — | | | | 97,400,095 | |
| U.S. Government Agency Obligations | | | — | | | | 124,818,458 | | | | — | | | | 124,818,458 | |
| Foreign Government Bonds | | | — | | | | 15,936,353 | | | | — | | | | 15,936,353 | |
| Certificates of Deposit | | | — | | | | 3,602,722 | | | | — | | | | 3,602,722 | |
| Total Investments, at fair value | | $ | 71,000,483 | | | $ | 762,070,191 | | | $ | — | | | $ | 833,070,674 | |
| Other Financial Instruments+ | | | | | | | | | | | | | | | | |
| Forward Foreign Currency Contracts | | | — | | | | 4,236,323 | | | | — | | | | 4,236,323 | |
| Futures | | | 151,440 | | | | — | | | | — | | | | 151,440 | |
| Total Assets | | $ | 71,151,923 | | | $ | 766,306,514 | | | $ | — | | | $ | 837,458,437 | |
| Liabilities Table | | | | | | | | | | | | | | | | |
| Other Financial Instruments+ | | | | | | | | | | | | | | | | |
| Forward Foreign Currency Contracts | | $ | — | | | $ | (2,570,911 | ) | | $ | — | | | $ | (2,570,911 | ) |
| Futures | | | (41,314 | ) | | | — | | | | — | | | | (41,314 | ) |
| Total Liabilities | | $ | (41,314 | ) | | $ | (2,570,911 | ) | | $ | — | | | $ | (2,612,225 | ) |
| ^ | See Note 2, “Significant Accounting Policies” in the Notes to Financial Statements for additional information. |
| + | Other Financial Instruments are derivatives not reflected in the Portfolio of Investments and may include open forward foreign currency contracts, futures, centrally cleared swaps, OTC swaps and written options. Forward foreign currency contracts, futures and centrally cleared swaps are valued at the unrealized gain (loss) on the instrument. OTC swaps and written options are valued at the fair value of the instrument. |
See Accompanying Notes to Financial Statements
| Voya Aggregate Bond Portfolio | SUMMARY PORTFOLIO OF INVESTMENTS
as of December 31, 2014 (continued) |
At December 31, 2014, the following forward foreign currency contracts were outstanding for Voya Aggregate Bond Portfolio:
| Counterparty | | Currency | | Contract Amount | | | Buy/Sell | | Settlement Date | | In Exchange For | | | Fair Value | | | Unrealized
Appreciation
(Depreciation) | |
| BNP Paribas Bank | | Brazilian Real | | | 3,567,822 | | | Buy | | 01/05/15 | | $ | 1,385,094 | | | $ | 1,341,078 | | | $ | (44,016 | ) |
| Deutsche Bank AG | | EU Euro | | | 3,396,000 | | | Buy | | 01/05/15 | | | 4,211,478 | | | | 4,109,475 | | | | (102,003 | ) |
| Goldman Sachs & Co. | | Japanese Yen | | | 167,700,000 | | | Buy | | 01/05/15 | | | 1,400,674 | | | | 1,400,104 | | | | (570 | ) |
| Goldman Sachs & Co. | | EU Euro | | | 3,525,000 | | | Buy | | 01/05/15 | | | 4,382,836 | | | | 4,265,577 | | | | (117,259 | ) |
| HSBC Bank PLC | | Australian Dollar | | | 10,914,000 | | | Buy | | 01/05/15 | | | 9,155,383 | | | | 8,908,177 | | | | (247,206 | ) |
| UBS AG | | EU Euro | | | 98,939,000 | | | Buy | | 01/05/15 | | | 121,779,167 | | | | 119,725,358 | | | | (2,053,809 | ) |
| UBS AG | | Japanese Yen | | | 3,877,000,000 | | | Buy | | 01/05/15 | | | 32,374,566 | | | | 32,368,518 | | | | (6,048 | ) |
| | | | | | | | | | | | | | | | | | | | | $ | (2,570,911 | ) |
| BNP Paribas Bank | | Brazilian Real | | | 3,567,822 | | | Sell | | 01/05/15 | | $ | 1,373,216 | | | $ | 1,341,078 | | | $ | 32,138 | |
| Deutsche Bank AG | | EU Euro | | | 3,396,000 | | | Sell | | 01/05/15 | | | 4,179,875 | | | | 4,109,475 | | | | 70,400 | |
| Goldman Sachs & Co. | | EU Euro | | | 2,321,000 | | | Sell | | 01/05/15 | | | 2,856,508 | | | | 2,808,625 | | | | 47,883 | |
| Goldman Sachs & Co. | | Japanese Yen | | | 167,700,000 | | | Sell | | 01/05/15 | | | 1,420,188 | | | | 1,400,103 | | | | 20,085 | |
| Goldman Sachs & Co. | | EU Euro | | | 1,204,000 | | | Sell | | 01/05/15 | | | 1,497,588 | | | | 1,456,952 | | | | 40,636 | |
| HSBC Bank PLC | | Australian Dollar | | | 10,914,000 | | | Sell | | 01/05/15 | | | 9,335,583 | | | | 8,908,177 | | | | 427,406 | |
| UBS AG | | EU Euro | | | 98,939,000 | | | Sell | | 01/05/15 | | | 122,902,521 | | | | 119,725,359 | | | | 3,177,162 | |
| UBS AG | | Japanese Yen | | | 3,877,000,000 | | | Sell | | 01/05/15 | | | 32,789,131 | | | | 32,368,518 | | | | 420,613 | |
| | | | | | | | | | | | | | | | | | | | | $ | 4,236,323 | |
At December 31, 2014, the following futures contracts were outstanding for Voya Aggregate Bond Portfolio:
| Contract Description | | Number of
Contracts | | Expiration
Date | | Notional
Value | | | Unrealized
Appreciation/
(Depreciation) | |
| Long Contracts | | | | | | | | | | | | | | |
| U.S. Treasury 2-Year Note | | | 550 | | | 03/31/15 | | $ | 120,226,568 | | | $ | 15,818 | |
| U.S. Treasury 5-Year Note | | | 170 | | | 03/31/15 | | | 20,218,047 | | | | 104,497 | |
| U.S. Treasury Ultra Long Bond | | | 50 | | | 03/20/15 | | | 8,259,375 | | | | 31,125 | |
| | | | | | | | | $ | 148,703,990 | | | $ | 151,440 | |
| Short Contracts | | | | | | | | | | | | | | |
| U.S. Treasury 10-Year Note | | | (186 | ) | | 03/20/15 | | | (23,584,219 | ) | | | (18,747 | ) |
| U.S. Treasury Long Bond | | | (102 | ) | | 03/20/15 | | | (14,745,375 | ) | | | (22,567 | ) |
| | | | | | | | | $ | (38,329,594 | ) | | $ | (41,314 | ) |
A summary of derivative instruments by primary risk exposure is outlined in the following tables.
The fair value of derivative instruments as of December 31, 2014 was as follows:
| Derivatives not accounted for as hedging instruments | | Location on Statement
of Assets and Liabilities | | Fair Value | |
| Asset Derivatives | | | | | | |
| Foreign exchange contracts | | Unrealized appreciation on forward foreign currency contracts | | $ | 4,236,323 | |
| Interest rate contracts | | Net Assets — Unrealized appreciation* | | | 151,440 | |
| Total Asset Derivatives | | | | $ | 4,387,763 | |
| Liability Derivatives | | | | | | |
| Foreign exchange contracts | | Unrealized depreciation on forward foreign currency contracts | | $ | 2,570,911 | |
| Interest rate contracts | | Net Assets — Unrealized depreciation* | | | 41,314 | |
| Total Liability Derivatives | | | | $ | 2,612,225 | |
| * | Includes cumulative appreciation/depreciation of futures contracts as reported in the table following the Summary Portfolio of Investments. |
| ** | Includes cumulative appreciation/depreciation of centrally cleared swaps as reported in the table following the Summary Portfolio of Investments. Only current day’s variation margin receivable/payable is included on the Statement of Assets and Liabilities. |
See Accompanying Notes to Financial Statements
| Voya Aggregate Bond Portfolio | SUMMARY PORTFOLIO OF INVESTMENTS
as of December 31, 2014 (continued) |
The effect of derivative instruments on the Portfolio’s Statement of Operations for the year ended December 31, 2014 was as follows:
Amount of Realized Gain or (Loss) on Derivatives Recognized in Income
Derivatives not accounted for as
hedging instruments | | Investments* | | | Foreign currency
related transactions* | | | Futures | | | Swaps | | | Written options | | | Total | |
| Credit contracts | | $ | — | | | $ | — | | | $ | — | | | $ | 836,707 | | | $ | 32,190 | | | $ | 868,897 | |
| Foreign exchange contracts | | | — | | | | 18,466,935 | | | | — | | | | — | | | | 373,589 | | | | 18,840,524 | |
| Interest rate contracts | | | (48,816 | ) | | | — | | | | 13,147,604 | | | | (1,439,133 | ) | | | 3,603,739 | | | | 15,263,394 | |
| Total | | $ | (48,816 | ) | | $ | 18,466,935 | | | $ | 13,147,604 | | | $ | (602,426 | ) | | $ | 4,009,518 | | | $ | 34,972,815 | |
Change in Unrealized Appreciation or (Depreciation) on Derivatives Recognized in Income
Derivatives not accounted for as
hedging instruments | | Investments* | | | Foreign currency
related transactions* | | | Futures | | | Swaps | | | Written options | | | Total | |
| Credit contracts | | $ | — | | | $ | — | | | $ | — | | | $ | (390,714 | ) | | $ | (2,117 | ) | | $ | (392,831 | ) |
| Foreign exchange contracts | | | — | | | | 3,472,462 | | | | — | | | | — | | | | — | | | | 3,472,462 | |
| Interest rate contracts | | | — | | | | — | | | | 2,105,778 | | | | (6,341,773 | ) | | | (290,915 | ) | | | (4,526,910 | ) |
| Total | | $ | — | | | $ | 3,472,462 | | | $ | 2,105,778 | | | $ | (6,732,487 | ) | | $ | (293,032 | ) | | $ | (1,447,279 | ) |
| * | Amounts recognized for forward foreign currency contracts are included in net realized gain (loss) on foreign currency related transactions and net change in unrealized appreciation or depreciation on foreign currency related transactions. |
The following is a summary by counterparty of the fair value of OTC derivative instruments subject to Master Netting Agreements and collateral pledged (received), if any, at December 31, 2014:
| | | BNP
Paribas Bank | | | Deutsche
Bank AG | | | Goldman
Sachs & Co. | | | HSBC
Bank PLC | | | UBS AG | | | Totals | |
| Assets: | | | | | | | | | | | | | | | | | | | | | | | | |
| Forward foreign currency contracts | | $ | 32,138 | | | $ | 70,400 | | | $ | 108,604 | | | $ | 427,406 | | | $ | 3,597,775 | | | $ | 4,236,323 | |
| Total Assets | | $ | 32,138 | | | $ | 70,400 | | | $ | 108,604 | | | $ | 427,406 | | | $ | 3,597,775 | | | $ | 4,236,323 | |
| Liabilities: | | | | | | | | | | | | | | | | | | | | | | | | |
| Forward foreign currency contracts | | $ | 44,016 | | | $ | 102,003 | | | $ | 117,829 | | | $ | 247,206 | | | $ | 2,059,857 | | | $ | 2,570,911 | |
| Total Liabilities | | $ | 44,016 | | | $ | 102,003 | | | $ | 117,829 | | | $ | 247,206 | | | $ | 2,059,857 | | | $ | 2,570,911 | |
| Net OTC derivative instruments by counterparty, at fair value | | $ | (11,878 | ) | | $ | (31,603 | ) | | $ | (9,225 | ) | | $ | 180,200 | | | $ | 1,537,918 | | | | 1,665,412 | |
| Total collateral pledged by the Portfolio/(Received from counterparty) | | $ | — | | | $ | — | | | $ | — | | | $ | (190,000 | ) | | $ | (1,690,000 | ) | | $ | (1,880,000 | ) |
| Net Exposure(1) | | $ | (11,878 | ) | | $ | (31,603 | ) | | $ | (9,225 | ) | | $ | (9,800 | ) | | $ | (152,082 | ) | | $ | (214,588 | ) |
| (1) | Positive net exposure represents amounts due from each respective counterparty. Negative exposure represents amounts due from the Portfolio. Please refer to Note 2 for additional details regarding counterparty credit risk and credit related contingent features. |
See Accompanying Notes to Financial Statements
| | SUMMARY PORTFOLIO OF INVESTMENTS |
| Voya Global Bond Portfolio | as of December 31, 2014 |
Principal
Amount† | | | Value | | | Percentage
of Net
Assets | |
| CORPORATE BONDS/NOTES: 28.3% |
| | | | | | | Australia: 0.4% | | | | | | | | |
| | 703,000 | | | | | BHP Billiton Finance USA Ltd, 5.000%, 09/30/43 | | $ | 800,065 | | | | 0.3 | |
| | 453,000 | | | # | | Scentre Group Trust 1/ Scentre Group Trust 2, 3.500%, 02/12/25 | | | 455,735 | | | | 0.1 | |
| | | | | | | | | | 1,255,800 | | | | 0.4 | |
| | | | | | | Brazil: 0.4% | | | | | | | | |
| | 350,000 | | | # | | Marfrig Overseas Ltd., 9.500%, 05/04/20 | | | 357,000 | | | | 0.1 | |
| | 200,000 | | | # | | Samarco Mineracao SA, 5.750%, 10/24/23 | | | 191,500 | | | | 0.1 | |
| | 700,000 | | | | | Other Securities | | | 722,400 | | | | 0.2 | |
| | | | | | | | | | 1,270,900 | | | | 0.4 | |
| | | | | | | Canada: 0.1% | | | | | | | | |
| | 402,000 | | | | | Other Securities | | | 392,603 | | | | 0.1 | |
| | | | | | | Cayman Islands: 0.2% |
| | 601,000 | | | # | | Alibaba Group Holding Ltd., 3.600%, 11/28/24 | | | 597,330 | | | | 0.2 | |
| | | | | | | France: 0.5% | | | | | | | | |
| | 287,000 | | | # | | BPCE SA, 5.150%, 07/21/24 | | | 296,301 | | | | 0.1 | |
| | 940,000 | | | # | | Numericable Group SA, 6.000%, 05/15/22 | | | 946,345 | | | | 0.3 | |
| | 294,000 | | | | | Other Securities | | | 298,286 | | | | 0.1 | |
| | | | | | | | | | 1,540,932 | | | | 0.5 | |
| | | | | | | India: 0.2% | | | | | | | | |
| | 600,000 | | | | | Other Securities | | | 596,625 | | | | 0.2 | |
| | | | | | | Italy: 0.1% | | | | | | | | |
| | 286,000 | | | | | Other Securities | | | 296,398 | | | | 0.1 | |
| | | | | | | Luxembourg: 0.2% | | | | | | | | |
| | 555,000 | | | | | Other Securities | | | 591,731 | | | | 0.2 | |
| | | | | | | Mexico: 0.0% | | | | | | | | |
| | MXN1,238,501 | | | | | Other Securities(a) | | | 19,660 | | | | 0.0 | |
| | | | | | | Netherlands: 0.5% |
| | 200,000 | | | # | | Carlson Wagonlit BV, 6.875%, 06/15/19 | | | 210,000 | | | | 0.1 | |
| | 650,000 | | | # | | NXP BV/NXP Funding LLC, 5.750%, 02/15/21 | | | 685,750 | | | | 0.2 | |
| | 551,000 | | | | | Other Securities | | | 593,084 | | | | 0.2 | |
| | | | | | | | | | 1,488,834 | | | | 0.5 | |
| | | | | | | Norway: 0.1% | | | | | | | | |
| | 380,000 | | | | | Other Securities | | | 363,111 | | | | 0.1 | |
| | | | | | | Russia: 0.6% | | | | | | | | |
| | 2,050,000 | | | | | Other Securities(b) | | | 1,730,287 | | | | 0.6 | |
| | | | | | | Sweden: 0.1% | | | | | | | | |
| | 298,000 | | | # | | Nordea Bank AB, 5.500%, 09/29/49 | | | 294,647 | | | | 0.1 | |
Principal
Amount† | | | Value | | | Percentage
of Net
Assets | |
| CORPORATE BONDS/NOTES: (continued) |
| | | | | | | Switzerland: 0.3% | | | | | | | | |
| | 400,000 | | | # | | Credit Suisse AG, 6.500%, 08/08/23 | | $ | 440,088 | | | | 0.2 | |
| | 250,000 | | | | | Other Securities | | | 294,776 | | | | 0.1 | |
| | | | | | | | | | 734,864 | | | | 0.3 | |
| | | | | | | United Kingdom: 0.4% |
| | 265,000 | | | # | | Barclays Bank PLC, 6.050%, 12/04/17 | | | 292,205 | | | | 0.1 | |
| | 200,000 | | | # | | Ineos Finance PLC, 8.375%, 02/15/19 | | | 213,250 | | | | 0.1 | |
| | 602,000 | | | | | Other Securities | | | 596,073 | | | | 0.2 | |
| | | | | | | | | | 1,101,528 | | | | 0.4 | |
| | | | | | | United States: 24.2% |
| | 705,000 | | | | | AES Corp., 7.375%, 07/01/21 | | | 800,175 | | | | 0.3 | |
| | 570,000 | | | # | | Alliance Data Systems Corp., 5.375%, 08/01/22 | | | 564,300 | | | | 0.2 | |
| | 780,000 | | | | | American Tower Corp., 5.000%, 02/15/24 | | | 828,682 | | | | 0.3 | |
| | 638,000 | | | # | | Amsurg Corp., 5.625%, 07/15/22 | | | 657,140 | | | | 0.2 | |
| | 1,050,000 | | | | | Apple Inc., 1.000%, 05/03/18 | | | 1,033,903 | | | | 0.4 | |
| | 490,000 | | | # | | Audatex North America, Inc., 6.000%, 06/15/21 | | | 507,150 | | | | 0.2 | |
| | 1,135,000 | | | | | Bank of America Corp., 3.300%-4.100%, 01/11/23-04/01/24 | | | 1,173,391 | | | | 0.4 | |
| | 1,309,000 | | | | | Barrick North America Finance LLC, 5.750%, 05/01/43 | | | 1,303,336 | | | | 0.4 | |
| | 540,000 | | | # | | Calpine Corp., 6.000%, 01/15/22 | | | 577,800 | | | | 0.2 | |
| | 660,000 | | | # | | Cedar Fair L.P./Canada’s Wonderland Co./ Magnum Management Corp., 5.375%, 06/01/24 | | | 657,525 | | | | 0.2 | |
| | 851,000 | | | | | Citigroup, Inc., 4.000%-5.500%, 08/05/24-09/13/25 | | | 904,006 | | | | 0.3 | |
| | 173,000 | | | # | | CommScope, Inc., 5.000%, 06/15/21 | | | 171,270 | | | | 0.0 | |
| | 215,000 | | | # | | CommScope, Inc., 5.500%, 06/15/24 | | | 212,850 | | | | 0.1 | |
| | 562,000 | | | # | | COX Communications, Inc., 2.950%, 06/30/23 | | | 539,925 | | | | 0.2 | |
| | 985,000 | | | | | Devon Energy Corp., 5.600%, 07/15/41 | | | 1,098,148 | | | | 0.4 | |
See Accompanying Notes to Financial Statements
| | SUMMARY PORTFOLIO OF INVESTMENTS |
| Voya Global Bond Portfolio | as of December 31, 2014 (continued) |
Principal
Amount† | | | Value | | | Percentage
of Net
Assets | |
| CORPORATE BONDS/NOTES: (continued) | | | | |
| | | | | | | United States (continued) | | | |
| | 818,000 | | | | | DIRECTV Holdings LLC/ DIRECTV Financing Co., Inc., 3.500%-5.150%, 03/01/16-03/15/42 | | $ | 843,677 | | | | 0.3 | |
| | 1,026,000 | | | | | Energy Transfer Partners L.P., 4.900%, 02/01/24 | | | 1,077,039 | | | | 0.4 | |
| | 1,276,000 | | | | | Entergy Corp., 5.125%, 09/15/20 | | | 1,391,700 | | | | 0.5 | |
| | 539,000 | | | | | Fifth Third Bancorp., 8.250%, 03/01/38 | | | 814,784 | | | | 0.3 | |
| | 845,000 | | | | | Gannett Co., Inc., 5.125%-6.375%, 07/15/20-10/15/23 | | | 873,525 | | | | 0.3 | |
| | 715,000 | | | | | General Electric Capital Corp., 6.750%, 03/15/32 | | | 979,356 | | | | 0.3 | |
| | 310,000 | | | # | | Georgia-Pacific LLC, 3.163%, 11/15/21 | | | 312,320 | | | | 0.1 | |
| | 960,000 | | | # | | Glencore Funding LLC, 2.500%, 01/15/19 | | | 946,187 | | | | 0.3 | |
| | 916,000 | | | | | Goldman Sachs Group, Inc., 4.800%-5.250%, 07/27/ 21-07/08/44 | | | 1,019,053 | | | | 0.3 | |
| | 605,000 | | | | | Hartford Financial Services Group, Inc., 6.625%, 03/30/40 | | | 817,327 | | | | 0.3 | |
| | 70,000 | | | # | | Hilcorp Energy I L.P./Hilcorp Finance Co., 5.000%, 12/01/24 | | | 61,687 | | | | 0.0 | |
| | 1,165,000 | | | | | Indiana Michigan Power, 7.000%, 03/15/19 | | | 1,378,020 | | | | 0.5 | |
| | 570,000 | | | # | | JBS USA LLC/JBS USA Finance, Inc., 5.875%, 07/15/24 | | | 561,450 | | | | 0.2 | |
| | 302,000 | | | # | | Jersey Central Power & Light Co., 4.700%, 04/01/24 | | | 323,017 | | | | 0.1 | |
| | 1,217,000 | | | | | JPMorgan Chase & Co., 1.625%-6.000%, 05/15/18-12/29/49 | | | 1,206,130 | | | | 0.4 | |
| | 61 | | | # | | Kern River Funding Corp., 4.893%, 04/30/18 | | | 65 | | | | 0.0 | |
| | 375,000 | | | # | | Medtronic, Inc., 3.150%, 03/15/22 | | | 381,582 | | | | 0.1 | |
| | 393,000 | | | # | | Medtronic, Inc., 3.500%, 03/15/25 | | | 402,887 | | | | 0.2 | |
| | 1,577,000 | | | | | Morgan Stanley, 3.750%-4.100%, 02/25/23-04/29/24 | | | 1,612,079 | | | | 0.6 | |
| | 1,048,000 | | | | | Mylan, Inc./PA, 2.600%, 06/24/18 | | | 1,062,664 | | | | 0.4 | |
Principal
Amount† | | | Value | | | Percentage of Net
Assets | |
| CORPORATE BONDS/NOTES: (continued) | | | | |
| | | | | | | United States (continued) | | | |
| | 625,000 | | | # | | Netflix, Inc., 5.750%, 03/01/24 | | $ | 653,125 | | | | 0.2 | |
| | 897,000 | | | | | 21st Century Fox America, Inc., 4.500%-5.400%, 02/15/21-10/01/43 | | | 1,025,015 | | | | 0.3 | |
| | 470,000 | | | # | | Sable International Finance Ltd., 8.750%, 02/01/20 | | | 512,300 | | | | 0.2 | |
| | 225,000 | | | # | | Sanchez Energy Corp., 6.125%, 01/15/23 | | | 189,562 | | | | 0.1 | |
| | 585,000 | | | # | | Sanmina Corp., 4.375%, 06/01/19 | | | 582,075 | | | | 0.2 | |
| | 255,000 | | | # | | Sealed Air Corp., 8.375%, 09/15/21 | | | 286,238 | | | | 0.1 | |
| | 990,000 | | | # | | Sinclair Television Group, Inc., 5.625%, 08/01/24 | | | 962,775 | | | | 0.3 | |
| | 570,000 | | | # | | Steel Dynamics, Inc., 5.125%, 10/01/21 | | | 580,688 | | | | 0.2 | |
| | 340,000 | | | | | Time Warner Cable, Inc., 5.875%, 11/15/40 | | | 406,854 | | | | 0.1 | |
| | 606,000 | | | | | Time Warner, Inc., 6.500%, 11/15/36 | | | 773,413 | | | | 0.3 | |
| | 505,000 | | | # | | Valeant Pharmaceuticals International, 7.250%, 07/15/22 | | | 540,350 | | | | 0.2 | |
| | 1,328,000 | | | | | Verizon Communications, Inc., 5.150%, 09/15/23 | | | 1,467,459 | | | | 0.5 | |
| | 339,000 | | | | | Verizon Communications, Inc., 6.550%, 09/15/43 | | | 434,945 | | | | 0.2 | |
| | 337,000 | | | # | | Verizon Communications, Inc., 5.012%, 08/21/54 | | | 350,173 | | | | 0.1 | |
| | 941,000 | | | | | WellPoint, Inc., 3.500%-5.100%, 08/15/24-01/15/44 | | | 999,078 | | | | 0.3 | |
| | 599,000 | | | | | Wells Fargo & Co., 4.100%, 06/03/26 | | | 613,047 | | | | 0.2 | |
| | 660,000 | | | # | | West Corp., 5.375%, 07/15/22 | | | 633,600 | | | | 0.2 | |
| | 33,554,000 | | | | | Other Securities(b) | | | 32,403,322 | | | | 11.1 | |
| | | | | | | | | | 70,508,169 | | | | 24.2 | |
| | | | | | | Total Corporate Bonds/Notes (Cost $81,541,561) | | | 82,783,419 | | | | 28.3 | |
| COLLATERALIZED MORTGAGE OBLIGATIONS: 12.7% | |
| | | | | | | United States: 12.7% | | | |
| | 619,944 | | | | | Banc of America Alternative Loan Trust 2004-1 4A1, 4.750%, 02/25/19 | | | 625,045 | | | | 0.2 | |
See Accompanying Notes to Financial Statements
| | SUMMARY PORTFOLIO OF INVESTMENTS |
| Voya Global Bond Portfolio | as of December 31, 2014 (continued) |
Principal
Amount† | | | Value | | | Percentage
of Net
Assets | |
| COLLATERALIZED MORTGAGE OBLIGATIONS: (continued) | |
| | | | | | | United States (continued) | | | |
| | 800,000 | | | | | Banc of America Commercial Mortgage Trust 2007-3 AJ, 5.547%, 06/10/49 | | $ | 828,701 | | | | 0.3 | |
| | 700,000 | | | | | Banc of America Commercial Mortgage Trust 2007-3 B, 5.547%, 06/10/49 | | | 714,348 | | | | 0.3 | |
| | 920,000 | | | | | Banc of America Commercial Mortgage Trust 2007-4 AJ, 5.821%, 02/10/51 | | | 956,679 | | | | 0.3 | |
| | 1,243,988 | | | | | Banc of America Funding Corp., 5.500%, 02/25/35 | | | 1,268,444 | | | | 0.4 | |
| | 1,130,000 | | | # | | Banc of America Merrill Lynch Commercial Mortgage, Inc. 2004-4 G, 5.422%, 07/10/42 | | | 1,164,496 | | | | 0.4 | |
| | 550,000 | | | # | | Banc of America Merrill Lynch Commercial Mortgage, Inc. 2005-2 H, 5.268%, 07/10/43 | | | 550,092 | | | | 0.2 | |
| | 440,000 | | | | | Banc of America Merrill Lynch Commercial Mortgage, Inc. 2005-6 C, 5.152%, 09/10/47 | | | 451,249 | | | | 0.2 | |
| | 440,000 | | | # | | Bear Stearns Commercial Mortgage Securities Trust 2004-PWR6, 5.406%, 11/11/41 | | | 484,148 | | | | 0.2 | |
| | 1,030,000 | | | | | Bear Stearns Commercial Mortgage Securities Trust 2005-PWR8, 4.858%, 06/11/41 | | | 1,023,807 | | | | 0.3 | |
| | 500,000 | | | | | Bear Stearns Commercial Mortgage Securities Trust 2005-TOP20, 5.129%, 10/12/42 | | | 509,579 | | | | 0.2 | |
| | 542,693 | | | # | | Beckman Coulter, Inc., 7.498%, 12/15/18 | | | 602,172 | | | | 0.2 | |
| | 660,000 | | | # | | Citigroup Commercial Mortgage Trust 2004-C1, 5.250%, 04/15/40 | | | 667,461 | | | | 0.2 | |
| | 21,185 | | | # | | Citigroup Commercial Mortgage Trust 2004-C1, 5.802%, 04/15/40 | | | 21,458 | | | | 0.0 | |
| | 279,296 | | | | | Citigroup Mortgage Loan Trust, Inc., 2.672%, 05/25/35 | | | 278,923 | | | | 0.1 | |
| | 680,000 | | | # | | Commercial 2004-LNB2 Mortgage Trust, 6.067%, 03/10/39 | | | 759,002 | | | | 0.3 | |
Principal
Amount† | | | Value | | | Percentage of Net
Assets | |
| COLLATERALIZED MORTGAGE OBLIGATIONS: (continued) | |
| | | | | | | United States (continued) | | | | |
| | 4,440,557 | | | ^ | | Commercial Mortgage Pass Through Certificates, 1.211%, 05/10/47 | | $ | 330,945 | | | | 0.1 | |
| | 480,000 | | | # | | Commercial Mortgage Trust 2004-GG1 F, 6.025%, 06/10/36 | | | 490,145 | | | | 0.2 | |
| | 3,000,210 | | | ^ | | Commercial Mortgage Trust, 1.773%, 01/10/46 | | | 252,041 | | | | 0.1 | |
| | 11,258,654 | | | ^ | | Commercial Mortgage Trust, 1.977%, 10/15/45 | | | 1,167,000 | | | | 0.4 | |
| | 4,109,489 | | | ^ | | Commercial Mortgage Trust, 2.118%, 05/15/45 | | | 428,166 | | | | 0.1 | |
| | 240,000 | | | | | Commercial 2007-C9 Mortgage Trust, 5.796%, 12/10/49 | | | 251,984 | | | | 0.1 | |
| | 1,010,000 | | | | | Commercial Mortgage Trust, 5.226%-5.305%, 06/10/ 44-07/15/44 | | | 1,018,783 | | | | 0.3 | |
| | 340,000 | | | | | Credit Suisse Commercial Mortgage Trust Series 2007-C4, 5.898%, 09/15/39 | | | 356,463 | | | | 0.1 | |
| | 540,000 | | | # | | Credit Suisse Commercial Mortgage Trust Series 2008-C1, 5.970%, 02/15/41 | | | 566,632 | | | | 0.2 | |
| | 35,152 | | | # | | Credit Suisse First Boston Mortgage Securities Corp., 5.322%, 08/15/36 | | | 35,190 | | | | 0.0 | |
| | 684,612 | | | # | | Credit Suisse Mortgage Capital Certificates, 2.346%, 07/27/37 | | | 690,468 | | | | 0.3 | |
| | 5,590,555 | | | #,^ | | DBUBS 2011-LC1 Mortgage Trust, 1.374%, 11/10/46 | | | 129,721 | | | | 0.0 | |
| | 84,362 | | | # | | Deutsche Alternative-A Securities, Inc. Alternate Loan Trust, 0.670%, 01/27/37 | | | 118,031 | | | | 0.0 | |
| | 800,000 | | | | | Fannie Mae Connecticut Avenue Securities, 3.070%-5.070%, 07/25/24-11/25/24 | | | 775,043 | | | | 0.3 | |
| | 44,577,912 | | | #,^ | | FREMF Mortgage Trust, 0.100%, 12/25/44 | | | 244,599 | | | | 0.1 | |
| | 520,000 | | | | | GS Mortgage Securities Trust 2006-GG6, 5.553%, 04/10/38 | | | 524,413 | | | | 0.2 | |
| | 300,000 | | | | | GS Mortgage Securities Trust, 5.553%, 04/10/38 | | | 295,828 | | | | 0.1 | |
See Accompanying Notes to Financial Statements
| | SUMMARY PORTFOLIO OF INVESTMENTS |
| Voya Global Bond Portfolio | as of December 31, 2014 (continued) |
Principal
Amount† | | | Value | | | Percentage of Net
Assets | |
| COLLATERALIZED MORTGAGE OBLIGATIONS: (continued) | |
| | | | | | | United States (continued) | | | |
| | 520,000 | | | # | | JP Morgan Chase Commercial Mortgage Securities Corp. Ps Thr Certs Ser 2003-LN1, 5.464%, 10/15/37 | | $ | 518,504 | | | | 0.2 | |
| | 8,605,908 | | | ^ | | JP Morgan Chase Commercial Mortgage Securities Corp., 1.757%, 06/15/45 | | | 673,357 | | | | 0.2 | |
| | 4,534,717 | | | ^ | | JP Morgan Chase Commercial Mortgage Securities Corp., 1.927%, 12/15/47 | | | 423,681 | | | | 0.1 | |
| | 270,000 | | | | | JP Morgan Chase Commercial Mortgage Securities Trust, 5.683%, 06/12/41 | | | 263,113 | | | | 0.1 | |
| | 2,760,000 | | | #,^ | | JP Morgan Chase Commercial Mortgage Securities Trust, 0.359%, 12/15/47 | | | 69,189 | | | | 0.0 | |
| | 231,855 | | | | | JPMorgan Mortgage Trust, 2.531%, 07/25/35 | | | 230,987 | | | | 0.1 | |
| | 273,536 | | | | | LB-UBS Commercial Mortgage Trust 2004-C7, 4.943%, 10/15/36 | | | 273,884 | | | | 0.1 | |
| | 360,000 | | | | | LB-UBS Commercial Mortgage Trust 2005-C3, 4.983%, 07/15/40 | | | 361,980 | | | | 0.1 | |
| | 360,000 | | | # | | LB-UBS Commercial Mortgage Trust 2006-C6, 5.991%, 09/15/39 | | | 369,618 | | | | 0.1 | |
| | 150,000 | | | # | | LB-UBS Commercial Mortgage Trust 2006-C6, 5.991%, 09/15/39 | | | 152,807 | | | | 0.1 | |
| | 150,000 | | | # | | LB-UBS Commercial Mortgage Trust 2006-C6, 5.991%, 09/15/39 | | | 149,203 | | | | 0.0 | |
| | 780,000 | | | | | LB-UBS Commercial Mortgage Trust, 5.853%, 06/15/38 | | | 788,842 | | | | 0.3 | |
| | 260,000 | | | | | LB-UBS Commercial Mortgage Trust, 5.853%, 06/15/38 | | | 257,447 | | | | 0.1 | |
| | 7,619,825 | | | ^ | | Morgan Stanley Bank of America Merrill Lynch Trust, 1.288%, 08/15/47 | | | 600,223 | | | | 0.2 | |
Principal
Amount† | | | Value | | | Percentage of Net
Assets | |
| COLLATERALIZED MORTGAGE OBLIGATIONS: (continued) | |
| | | | | | | United States (continued) | | | |
| | 251,473 | | | | | Morgan Stanley Capital I Trust 2004-IQ7, 5.191%, 06/15/38 | | $ | 251,217 | | | | 0.1 | |
| | 860,000 | | | | | Morgan Stanley Capital I Trust 2005-IQ10, 5.252%, 09/15/42 | | | 832,443 | | | | 0.3 | |
| | 587,405 | | | | | Morgan Stanley Capital I Trust 2007-HQ13, 5.649%, 12/15/44 | | | 586,906 | | | | 0.2 | |
| | 865,000 | | | # | | Morgan Stanley Capital I Trust 2011-C1, 5.251%, 09/15/47 | | | 957,315 | | | | 0.3 | |
| | 570,000 | | | # | | Morgan Stanley Capital I Trust 2011-C1, 5.251%, 09/15/47 | | | 624,301 | | | | 0.2 | |
| | 460,000 | | | # | | Morgan Stanley Capital I Trust 2011-C1, 5.251%, 09/15/47 | | | 496,347 | | | | 0.2 | |
| | 610,000 | | | | | Morgan Stanley Capital I Trust, 5.389%, 11/12/41 | | | 626,825 | | | | 0.2 | |
| | 290,000 | | | # | | Morgan Stanley Reremic Trust, 0.250%, 07/27/49 | | | 252,648 | | | | 0.1 | |
| | 494,506 | | | # | | Morgan Stanley Reremic Trust, 5.246%, 12/17/43 | | | 499,641 | | | | 0.2 | |
| | 680,801 | | | # | | N-Star Real Estate CDO Ltd., 2.020%, 08/25/29 | | | 681,686 | | | | 0.2 | |
| | 670,000 | | | # | | TIAA CMBS I Trust, 5.770%, 06/19/33 | | | 703,060 | | | | 0.2 | |
| | 6,729,840 | | | #,^ | | UBS-Barclays Commercial Mortgage Trust, 2.132%, 08/10/49 | | | 740,826 | | | | 0.3 | |
| | 1,320,000 | | | # | | Wachovia Bank Commercial Mortgage Trust Series 2005-C17 G, 5.396%, 03/15/42 | | | 1,326,269 | | | | 0.4 | |
| | 500,000 | | | | | Wachovia Bank Commercial Mortgage Trust Series 2007-C33 AJ, 5.941%, 02/15/51 | | | 525,012 | | | | 0.2 | |
| | 6,137,511 | | | #,^ | | Wells Fargo Commercial Mortgage Trust 2012-LC5 XA, 2.101%, 10/15/45 | | | 645,036 | | | | 0.2 | |
| | 848,448 | | | | | Wells Fargo Mortgage Backed Securities Trust 2005-AR14 A1, 5.357%, 08/25/35 | | | 856,201 | | | | 0.3 | |
See Accompanying Notes to Financial Statements
| | SUMMARY PORTFOLIO OF INVESTMENTS |
| Voya Global Bond Portfolio | as of December 31, 2014 (continued) |
Principal
Amount† | | | Value | | | Percentage
of Net
Assets | |
| COLLATERALIZED MORTGAGE OBLIGATIONS: (continued) | |
| | | | | | | United States (continued) | | | |
| | 3,021,035 | | | #,^ | | WFRBS Commercial Mortgage Trust 2012-C8 XA, 2.201%, 08/15/45 | | $ | 309,977 | | | | 0.1 | |
| | 473,689 | | | | | Wells Fargo Mortgage-Backed Securities Trust, 2.599%-2.611%, 02/25/34-02/25/35 | | | 478,283 | | | | 0.2 | |
| | 2,118,157 | | | | | Other Securities | | | 2,094,843 | | | | 0.7 | |
| | | | | | | Total Collateralized Mortgage Obligations (Cost $36,524,453) | | | 37,202,727 | | | | 12.7 | |
| STRUCTURED PRODUCTS: 0.1% | | | | | | |
| | | | | | | Mexico: 0.1% | | | | | | | | |
| MXN | 3,258,596 | | | | | Other Securities | | | 204,301 | | | | 0.1 | |
| | | | | | | Russia: 0.0% | | | | | | | | |
| RUB | 6,980,190 | | | | | Morgan Stanley & Co. International PLC - EM Whole Loan SA /Russian Federation Total Return Linked Bonds, Series 007, Cl. VR, 5.000%, 08/22/34 | | | 50,726 | | | | 0.0 | |
| | | | | | | Total Structured Products (Cost $564,247) | | | 255,027 | | | | 0.1 | |
| FOREIGN GOVERNMENT BONDS: 5.6% | | | | | | |
| | | | | | | Brazil: 0.2% | | | | | | | | |
| BRL | 705,000 | | | | | Other Securities | | | 653,288 | | | | 0.2 | |
| | | | | | | Germany: 5.3% | | | | | | | | |
| EUR | 12,020,732 | | | | | Bundesrepublik Deutsche Inflation Linked Bond, 0.100%, 04/15/23 | | | 15,202,355 | | | | 5.2 | |
| EUR | 50,000 | | | | | Bundesrepublik Deutschland, 2.000%-2.500%, 08/15/23-08/15/46 | | | 75,858 | | | | 0.0 | |
| EUR | 170,000 | | | | | Other Securities | | | 205,874 | | | | 0.1 | |
| | | | | | | | | | 15,484,087 | | | | 5.3 | |
| | | | | | | South Africa: 0.1% | | | |
| ZAR | 1,000,000 | | | | | Other Securities | | | 93,039 | | | | 0.1 | |
| | | | | | | Total Foreign Government Bonds (Cost $17,390,085) | | | 16,230,414 | | | | 5.6 | |
| U.S. GOVERNMENT AGENCY OBLIGATIONS: 18.1% | |
| | | | | | | Federal Home Loan Mortgage Corporation: 3.5%## | |
| | 1,102,391 | | | ^ | | 4.000%, due 02/15/43 | | | 217,734 | | | | 0.1 | |
| | 17,577,901 | | | ^ | | 4.000%, due 04/15/43 | | | 3,363,559 | | | | 1.2 | |
| | 3,004,758 | | | ^ | | 5.789%, due 10/15/36 | | | 384,674 | | | | 0.1 | |
| | 7,936,233 | | | ^ | | 5.839%, due 05/15/36 | | | 882,691 | | | | 0.3 | |
| | 6,161,647 | | | ^ | | 5.889%, due 07/15/40 | | | 962,510 | | | | 0.3 | |
| | 164,178 | | | ^ | | 5.989%, due 07/15/35 | | | 28,006 | | | | 0.0 | |
Principal
Amount† | | | Value | | | Percentage
of Net
Assets | |
| U.S. GOVERNMENT AGENCY OBLIGATIONS: (continued) | |
| | | | | | | Federal Home Loan Mortgage Corporation (continued) | |
| | 2,894,555 | | | ^ | | 6.089%, due 11/15/32 | | $ | 528,883 | | | | 0.2 | |
| | 1,713,644 | | | ^ | | 6.439%, due 08/15/28 | | | 169,491 | | | | 0.1 | |
| | 19,810 | | | ^ | | 7.000%, due 03/15/28 | | | 3,955 | | | | 0.0 | |
| | 110,062 | | | ^ | | 7.000%, due 04/15/28 | | | 21,918 | | | | 0.0 | |
| | 176,268 | | | ^ | | 7.489%, due 03/15/29 | | | 38,764 | | | | 0.0 | |
| | 174,271 | | | ^ | | 7.539%, due 03/15/29 | | | 33,451 | | | | 0.0 | |
| | 249,534 | | | ^ | | 8.789%, due 08/15/29 | | | 62,271 | | | | 0.0 | |
| | 3,172,277 | | | | | 0.611%-24.160%, due 05/15/17-08/15/35 | | | 3,461,002 | | | | 1.2 | |
| | | | | | | | | | 10,158,909 | | | | 3.5 | |
| | | | | | | Federal National Mortgage Association: 11.1%## | |
| | 2,550,117 | | | ^ | | 3.000%, due 06/25/33 | | | 395,097 | | | | 0.1 | |
| | 6,440,000 | | | W | | 3.000%, due 11/25/42 | | | 6,498,740 | | | | 2.2 | |
| | 1,161,649 | | | | | 3.000%, due 07/01/43 | | | 1,177,053 | | | | 0.4 | |
| | 1,393,789 | | | ^ | | 3.500%, due 08/25/33 | | | 190,156 | | | | 0.1 | |
| | 4,331,000 | | | W | | 3.500%, due 07/25/41 | | | 4,503,395 | | | | 1.5 | |
| | 823,611 | | | ^ | | 3.500%, due 08/25/43 | | | 164,255 | | | | 0.1 | |
| | 5,170,547 | | | ^ | | 3.881%, due 02/25/37 | | | 155,436 | | | | 0.1 | |
| | 4,194,000 | | | W | | 4.000%, due 08/25/40 | | | 4,476,390 | | | | 1.5 | |
| | 2,612,212 | | | ^ | | 4.000%, due 06/25/42 | | | 444,400 | | | | 0.2 | |
| | 3,724,000 | | | W | | 4.500%, due 01/25/39 | | | 4,042,868 | | | | 1.4 | |
| | 3,489,765 | | | ^ | | 5.000%, due 05/25/18 | | | 192,165 | | | | 0.1 | |
| | 90,857 | | | ^ | | 5.500%, due 07/25/33 | | | 18,537 | | | | 0.0 | |
| | 37,609 | | | ^ | | 5.500%, due 06/01/35 | | | 7,018 | | | | 0.0 | |
| | 3,691,357 | | | ^ | | 5.771%, due 01/25/38 | | | 642,185 | | | | 0.2 | |
| | 6,840,073 | | | ^ | | 5.781%, due 09/25/41 | | | 1,012,860 | | | | 0.4 | |
| | 5,587,635 | | | ^ | | 5.811%, due 11/25/41 | | | 901,128 | | | | 0.3 | |
| | 3,718,099 | | | ^ | | 5.931%, due 01/25/43 | | | 914,925 | | | | 0.3 | |
| | 165,453 | | | ^ | | 6.000%, due 12/01/32 | | | 37,227 | | | | 0.0 | |
| | 69,842 | | | ^ | | 6.000%, due 02/01/33 | | | 13,965 | | | | 0.0 | |
| | 83,128 | | | ^ | | 6.000%, due 03/01/33 | | | 18,945 | | | | 0.0 | |
| | 68,811 | | | ^ | | 6.000%, due 03/01/33 | | | 13,837 | | | | 0.0 | |
| | 38,227 | | | ^ | | 6.000%, due 09/01/35 | | | 6,281 | | | | 0.0 | |
| | 5,608,850 | | | ^ | | 6.281%, due 02/25/42 | | | 1,032,429 | | | | 0.4 | |
| | 173,638 | | | ^ | | 6.371%, due 06/25/37 | | | 26,871 | | | | 0.0 | |
| | 559,425 | | | ^ | | 6.401%, due 06/25/36 | | | 101,773 | | | | 0.0 | |
| | 282,646 | | | ^ | | 6.500%, due 02/01/32 | | | 57,643 | | | | 0.0 | |
| | 31,563 | | | ^ | | 6.581%, due 05/25/35 | | | 5,834 | | | | 0.0 | |
| | 47,123 | | | ^ | | 6.931%, due 06/25/23 | | | 6,065 | | | | 0.0 | |
| | 47,856 | | | ^ | | 7.000%, due 02/01/28 | | | 9,390 | | | | 0.0 | |
| | 59,881 | | | ^ | | 7.000%, due 03/25/33 | | | 16,359 | | | | 0.0 | |
| | 50,496 | | | ^ | | 7.000%, due 04/25/33 | | | 10,538 | | | | 0.0 | |
| | 150,547 | | | ^ | | 7.061%, due 09/25/36 | | | 27,711 | | | | 0.0 | |
| | 270,642 | | | ^ | | 7.381%, due 10/25/33 | | | 46,587 | | | | 0.0 | |
| | 176,989 | | | ^ | | 7.461%, due 03/25/23 | | | 10,349 | | | | 0.0 | |
| | 69,179 | | | ^ | | 7.500%, due 01/01/24 | | | 12,687 | | | | 0.0 | |
See Accompanying Notes to Financial Statements
| | SUMMARY PORTFOLIO OF INVESTMENTS |
| Voya Global Bond Portfolio | as of December 31, 2014 (continued) |
Principal
Amount† | | | Value | | | Percentage
of Net
Assets | |
| U.S. GOVERNMENT AGENCY OBLIGATIONS: (continued) | |
| | | | | | | Federal National Mortgage Association (continued) | |
| | 166,115 | | | ^ | | 7.581%, due 07/25/31 | | $ | 35,011 | | | | 0.0 | |
| | 96,335 | | | ^ | | 7.581%, due 02/25/32 | | | 18,211 | | | | 0.0 | |
| | 55,447 | | | ^ | | 7.781%, due 07/25/32 | | | 12,446 | | | | 0.0 | |
| | 1,990,610 | | | ^ | | 7.838%, due 12/18/32 | | | 400,433 | | | | 0.1 | |
| | 646,509 | | | | | 32.603%, due 11/25/36 | | | 1,116,488 | | | | 0.4 | |
| | 3,314,556 | | | | | 0.570%-27.414%, due 03/25/17-05/25/43 | | | 3,740,038 | | | | 1.3 | |
| | | | | | | | | | 32,513,726 | | | | 11.1 | |
| | | | | | | Government National Mortgage Association: 3.5% | |
| | 2,454,000 | | | | | 3.000%, due 01/15/43 | | | 2,509,713 | | | | 0.9 | |
| | 2,923,242 | | | ^ | | 4.000%, due 04/20/38 | | | 325,543 | | | | 0.1 | |
| | 3,490,000 | | | | | 4.500%, due 06/20/41 | | | 3,813,779 | | | | 1.3 | |
| | 5,936,189 | | | ^ | | 5.685%, due 06/20/40 | | | 954,264 | | | | 0.4 | |
| | 3,172,575 | | | ^ | | 6.539%, due 07/16/41 | | | 647,658 | | | | 0.2 | |
| | 820,360 | | | | | 21.512%, due 03/20/37 | | | 1,240,841 | | | | 0.4 | |
| | 481,037 | | | | | 5.000%-8.000%, due 01/16/30-02/20/35 | | | 552,322 | | | | 0.2 | |
| | | | | | | | | | 10,044,120 | | | | 3.5 | |
| | | | | | | Total U.S. Government Agency Obligations (Cost $51,403,227) | | | 52,716,755 | | | | 18.1 | |
| U.S. TREASURY OBLIGATIONS: 3.4% | | | | | | |
| | | | | | | U.S. Treasury Bonds: 0.6% | | | |
| | 1,450,000 | | | | | 3.125%, due 08/15/44 | | | 1,561,356 | | | | 0.6 | |
| | | | | | | U.S. Treasury Notes: 2.8% | | | |
| | 1,447,000 | | | | | 0.625%, due 12/31/16 | | | 1,445,586 | | | | 0.5 | |
| | 2,957,000 | | | | | 1.000%, due 12/15/17 | | | 2,950,415 | | | | 1.0 | |
| | 3,791,000 | | | | | 2.250%, due 11/15/24 | | | 3,817,063 | | | | 1.3 | |
| | 25,000 | | | | | 1.875%-2.000%, due 01/31/16-11/30/21 | | | 25,046 | | | | 0.0 | |
| | | | | | | | | | 8,238,110 | | | | 2.8 | |
| | | | | | | Total U.S. Treasury Obligations (Cost $9,771,278) | | | 9,799,466 | | | | 3.4 | |
| ASSET-BACKED SECURITIES: 5.3% | | | | | | |
| | | | | | | Cayman Islands: 4.8% | | | |
| | 740,000 | | | # | | Ares XII CLO Ltd., 2.233%, 11/25/20 | | | 747,917 | | | | 0.3 | |
| | 750,000 | | | # | | Belhurst CLO Ltd., 0.931%, 01/15/20 | | | 749,774 | | | | 0.3 | |
| | 950,000 | | | # | | Black Diamond CLO 2005-1A C, 1.017%, 06/20/17 | | | 941,450 | | | | 0.3 | |
| | 1,000,000 | | | # | | Bluemountain CLO III Ltd. 2007-3A C, 0.933%, 03/17/21 | | | 969,776 | | | | 0.3 | |
| | 1,450,000 | | | # | | Castle Garden Funding, 1.984%, 10/27/20 | | | 1,444,529 | | | | 0.5 | |
Principal
Amount† | | | Value | | | Percentage of Net
Assets | |
| ASSET-BACKED SECURITIES: (continued) | |
| | | | | | | Cayman Islands (continued) | | | | |
| | 1,000,000 | | | # | | ColumbusNova CLO IV Ltd 2007-II, 2.481%, 10/15/21 | | $ | 979,281 | | | | 0.3 | |
| | 500,000 | | | # | | ColumbusNova CLO Ltd 2006-II, 3.982%, 04/04/18 | | | 500,001 | | | | 0.2 | |
| | 1,100,000 | | | # | | Eaton Vance CDO IX Ltd., 1.731%, 04/20/19 | | | 1,068,433 | | | | 0.4 | |
| | 400,000 | | | # | | Halcyon Structured Asset Management Long Secured/Short Unsecured, 0.682%, 08/07/21 | | | 392,995 | | | | 0.1 | |
| | 1,300,000 | | | # | | Madison Park Funding Ltd., 1.234%, 07/26/21 | | | 1,272,280 | | | | 0.4 | |
| | 1,550,000 | | | # | | Muir Grove CLO Ltd., 2.234%, 03/25/20 | | | 1,549,420 | | | | 0.5 | |
| | 500,000 | | | # | | Northwoods Capital VIII Ltd., 2.233%, 07/28/22 | | | 497,695 | | | | 0.2 | |
| | 1,000,000 | | | # | | Vitesse CLO Ltd., 2.032%, 08/17/20 | | | 984,260 | | | | 0.3 | |
| | 1,000,000 | | | # | | WhiteHorse III Ltd./Corp 2006-1A A3L, 0.982%, 05/01/18 | | | 998,691 | | | | 0.4 | |
| | 1,000,000 | | | # | | WhiteHorse III Ltd/Corp, 2.082%, 05/01/18 | | | 992,027 | | | | 0.3 | |
| | | | | | | | | | 14,088,529 | | | | 4.8 | |
| | | | | | | United States: 0.5% | | | | | | | | |
| | 180,000 | | | # | | Invitation Homes 2013-SFR1 Trust, 2.900%, 12/17/30 | | | 171,901 | | | | 0.1 | |
| | 280,000 | | | # | | Invitation Homes Trust, 1.162%, 06/17/31 | | | 276,986 | | | | 0.1 | |
| | 280,000 | | | # | | Invitation Homes Trust, 2.254%, 06/17/31 | | | 277,337 | | | | 0.1 | |
| | 820,265 | | | | | Other Securities | | | 722,454 | | | | 0.2 | |
| | | | | | | | | | 1,448,678 | | | | 0.5 | |
| | | | | | | Total Asset-Backed Securities (Cost $15,418,986) | | | 15,537,207 | | | | 5.3 | |
See Accompanying Notes to Financial Statements
| | SUMMARY PORTFOLIO OF INVESTMENTS |
| Voya Global Bond Portfolio | as of December 31, 2014 (continued) |
| Shares | | | Value | | | Percentage
of Net
Assets | |
| COMMON STOCK: 0.1% | | | | | | |
| | | | | | | United States: 0.1% | | | | | | | | |
| | 48,619 | | | | | Other Securities(b) | | $ | 142,797 | | | | 0.1 | |
| | | | | | | Total Common Stock (Cost $1,315,740) | | | 142,797 | | | | 0.1 | |
| MUTUAL FUNDS: 32.1% | | | | | | |
| | | | | | | United States: 32.1% | | | | |
| | 1,408,447 | | | | | Voya Emerging Markets Corporate Debt Fund - Class P | | | 13,690,107 | | | | 4.7 | |
| | 3,420,648 | | | | | Voya Emerging Markets Hard Currency Debt Fund - Class P | | | 32,119,888 | | | | 11.0 | |
| | 4,016,141 | | | | | Voya Emerging Markets Local Currency Debt Fund - Class P | | | 31,847,994 | | | | 10.9 | |
| | 2,010,234 | | | | | Voya High Yield Bond Fund - Class P | | | 16,162,281 | | | | 5.5 | |
| | | | | | | Total Mutual Funds (Cost $105,300,083) | | | 93,820,270 | | | | 32.1 | |
| WARRANTS: –% | | | | | | |
| | | | | | | United States: –% | | | | | | | | |
| | 2,406 | | | | | Other Securities | | | — | | | | — | |
| | | | | | | Total Warrants (Cost $–) | | | — | | | | — | |
# of
Contracts | | | Value | | | Percentage
of Net
Assets | |
| PURCHASED OPTIONS: 0.0% | | | | | | |
| | | | | | | Interest Rate Swaptions: 0.0% | | | | |
| | 73,094,000 | | | @ | | Pay a fixed rate equal to 4.900% and receive a floating rate equal to the 3-month USD-LIBOR-BBA, Exp. 05/29/15 Counterparty: Citigroup, Inc. | | | 1,469 | | | | 0.0 | |
| | 8,379,000 | | | @ | | Pay a fixed rate equal to 5.030% and receive a floating rate equal to the 3-month USD-LIBOR-BBA, Exp. 05/22/15 Counterparty: Citigroup, Inc. | | | 65 | | | | 0.0 | |
| | | | | | | | | | 1,534 | | | | 0.0 | |
| | | | | | | Options on Currencies: –% | | | |
| | 16,644,000 | | | @ | | Put USD vs. Call EUR, Strike 1.307, Exp. 01/05/15 Counterparty: Deutsche Bank AG | | | — | | | | — | |
| | | | | | | Total Purchased Options (Cost $408,926) | | | 1,534 | | | | 0.0 | |
| | | | | | | Total Long-Term Investments (Cost $319,638,586) | | | 308,489,616 | | | | 105.7 | |
Principal
Amount† | | | Value | | | Percentage
of Net
Assets | |
| SHORT-TERM INVESTMENTS: 2.5% | | | | | | | |
| | | | | | | Securities Lending Collateralcc: 0.3% | |
| | 969,494 | | | | | Cantor Fitzgerald, Repurchase Agreement dated 12/31/14, 0.09%, due 01/02/15 (Repurchase Amount $969,499, collateralized by various U.S. Government and U.S. Government Agency Obligations, 0.000%-10.500%, Market Value plus accrued interest $988,884, due 01/01/15- 09/01/49) (Cost $969,494) | | $ | 969,494 | | | | 0.3 | |
| Shares | | | Value | | | Percentage
of Net
Assets | |
| | | | | | | Mutual Funds: 2.2% | | | | |
| | 6,302,000 | | | | | BlackRock Liquidity Funds, TempFund, Institutional Class, 0.030%†† (Cost $6,302,000) | | | 6,302,000 | | | | 2.2 | |
| | | | | | | Total Short-Term Investments (Cost $7,271,494) | | | 7,271,494 | | | | 2.5 | |
| | | | | | | Total Investments in Securities (Cost $326,910,080) | | $ | 315,761,110 | | | | 108.2 | |
| | | | | | | Liabilities in Excess of Other Assets | | | (23,822,767 | ) | | | (8.2 | ) |
| | | | | | | Net Assets | | $ | 291,938,343 | | | | 100.0 | |
“Other Securities” represents issues not identified as the top 50 holdings in terms of market value and issues or issuers not exceeding 1% of net assets individually or inaggregate respectively as of December 31, 2014.
The following footnotes apply to either the individual securities noted or one or more of the securities aggregated and listed as a single line item.
| † | Unless otherwise indicated, principal amount is shown in USD. |
| †† | Rate shown is the 7-day yield as of December 31, 2014. |
| # | Securities with purchases pursuant to Rule 144A or section 4(a)(2), under the Securities Act of 1933 and may not be resold subject to that rule except to qualified institutional buyers. |
| ## | The Federal Housing Finance Agency (“FHFA”) placed the Federal Home Loan Mortgage Corporation and Federal National Mortgage Association into conservatorship with FHFA as the conservator. As such, the FHFA oversees the continuing affairs of these companies. |
| @ | Non-income producing security. |
See Accompanying Notes to Financial Statements
| | SUMMARY PORTFOLIO OF INVESTMENTS |
| Voya Global Bond Portfolio | as of December 31, 2014 (continued) |
| cc | Represents securities purchased with cash collateral received for securities on loan. |
| W | Settlement is on a when-issued or delayed-delivery basis. |
| ^ | Interest only securities represent the right to receive the monthly interest payments on an underlying pool of mortgage loans. Principal amount shown represents the notional amount on which current interest is calculated. Payments of principal on the pool reduce the value of the interest only security. |
| (a) | The grouping contains securities in default. |
| (b) | This grouping contains securities on loan. |
Cost for federal income tax purposes is $327,215,687.
Net unrealized depreciation consists of:
| Gross Unrealized Appreciation | | $ | 5,454,021 | |
| Gross Unrealized Depreciation | | | (16,908,598 | ) |
| Net Unrealized Depreciation | | $ | (11,454,577 | ) |
| Sector Diversification | | Percentage of
Net Assets | |
| Affiliated Investment Companies | | | 32.1 | % |
| Collateralized Mortgage Obligations | | | 12.7 | |
| Federal National Mortgage Association | | | 11.1 | |
| Financial | | | 7.3 | |
| Communications | | | 6.3 | |
| Foreign Government Bonds | | | 5.6 | |
| Other Asset-Backed Securities | | | 5.3 | |
| Consumer, Non-cyclical | | | 3.7 | |
| Federal Home Loan Mortgage Corporation | | | 3.5 | |
| Government National Mortgage Association | | | 3.5 | |
| Basic Materials | | | 3.1 | |
| U.S. Treasury Notes | | | 2.8 | |
| Energy | | | 2.1 | |
| Utilities | | | 2.0 | |
| Consumer, Cyclical | | | 1.7 | |
| Technology | | | 1.1 | |
| Industrial | | | 0.9 | |
| U.S. Treasury Bonds | | | 0.6 | |
| Structured Products | | | 0.1 | |
| Materials | | | 0.1 | |
| Consumer Staples | | | 0.1 | |
| Consumer Discretionary | | | 0.0 | |
| Options on Currencies | | | 0.0 | |
| Interest Rate Swaptions | | | 0.0 | |
| Short-Term Investments | | | 2.5 | |
| Liabilities in Excess of Other Assets | | | (8.2 | ) |
| Net Assets | | | 100.0 | % |
Fair Value Measurements^
The following is a summary of the fair valuations according to the inputs used as of December 31, 2014 in valuing the assets and liabilities:
| | | Quoted Prices
in Active Markets
for Identical
Investments
(Level 1) | | | Significant
Other
Observable
Inputs
(Level 2) | | | Significant
Unobservable
Inputs
(Level 3) | | | Fair Value
at
December 31, 2014 | |
| Asset Table | | | | | | | | | | | | | | | | |
| Investments, at fair value | | | | | | | | | | | | | | | | |
| Common Stock | | | | | | | | | | | | | | | | |
| United States | | $ | 121,256 | | | $ | — | | | $ | 21,541 | | | $ | 142,797 | |
| Total Common Stock | | | 121,256 | | | | — | | | | 21,541 | | | | 142,797 | |
| Mutual Funds | | | 93,820,270 | | | | — | | | | — | | | | 93,820,270 | |
| Warrants | | | — | | | | — | | | | — | | | | — | |
| Purchased Options | | | — | | | | 1,534 | | | | — | | | | 1,534 | |
| Corporate Bonds/Notes | | | — | | | | 82,763,759 | | | | 19,660 | | | | 82,783,419 | |
| Collateralized Mortgage Obligations | | | — | | | | 37,202,727 | | | | — | | | | 37,202,727 | |
| Structured Products | | | — | | | | — | | | | 255,027 | | | | 255,027 | |
| Short-Term Investments | | | 6,302,000 | | | | 969,494 | | | | — | | | | 7,271,494 | |
| U.S. Government Agency Obligations | | | — | | | | 52,716,755 | | | | — | | | | 52,716,755 | |
| Asset-Backed Securities | | | — | | | | 15,537,207 | | | | — | | | | 15,537,207 | |
| U.S. Treasury Obligations | | | — | | | | 9,799,466 | | | | — | | | | 9,799,466 | |
| Foreign Government Bonds | | | — | | | | 16,230,414 | | | | — | | | | 16,230,414 | |
| Total Investments, at fair value | | $ | 100,243,526 | | | $ | 215,221,356 | | | $ | 296,228 | | | $ | 315,761,110 | |
| Other Financial Instruments+ | | | | | | | | | | | | | | | | |
| Centrally Cleared Swaps | | | — | | | | 4,197,935 | | | | — | | | | 4,197,935 | |
| Forward Foreign Currency Contracts | | | — | | | | 5,330,482 | | | | — | | | | 5,330,482 | |
| Futures | | | 1,235,835 | | | | — | | | | — | | | | 1,235,835 | |
| Total Assets | | $ | 101,479,361 | | | $ | 224,749,773 | | | $ | 296,228 | | | $ | 326,525,362 | |
| Liabilities Table | | | | | | | | | | | | | | | | |
See Accompanying Notes to Financial Statements
| | SUMMARY PORTFOLIO OF INVESTMENTS |
| Voya Global Bond Portfolio | as of December 31, 2014 (continued) |
| | | Quoted Prices
in Active Markets
for Identical
Investments
(Level 1) | | | Significant
Other
Observable
Inputs
(Level 2) | | | Significant
Unobservable
Inputs
(Level 3) | | | Fair Value
at
December 31, 2014 | |
| Other Financial Instruments+ | | | | | | | | | | | | | | | | |
| Centrally Cleared Swaps | | $ | — | | | $ | (4,135,817 | ) | | $ | — | | | $ | (4,135,817 | ) |
| Forward Foreign Currency Contracts | | | — | | | | (8,502,571 | ) | | | — | | | | (8,502,571 | ) |
| Futures | | | (704,817 | ) | | | — | | | | — | | | | (704,817 | ) |
| Written Options | | | — | | | | (463,831 | ) | | | — | | | | (463,831 | ) |
| Total Liabilities | | $ | (704,817 | ) | | $ | (13,102,219 | ) | | $ | — | | | $ | (13,807,036 | ) |
| ^ | See Note 2, “Significant Accounting Policies” in the Notes to Financial Statements for additional information. |
| + | Other Financial Instruments are derivatives not reflected in the Portfolio of Investments and may include open forward foreign currency contracts, futures, centrally cleared swaps, OTC swaps and written options. Forward foreign currency contracts, futures and centrally cleared swaps are valued at the unrealized gain (loss) on the instrument. OTC swaps and written options are valued at the fair value of the instrument. |
At December 31, 2014, the following forward foreign currency contracts were outstanding for Voya Global Bond Portfolio:
| Counterparty | | Currency | | Contract Amount | | | Buy/Sell | | Settlement Date | | In Exchange For | | | Fair Value | | | Unrealized
Appreciation
(Depreciation) | |
| Barclays Bank PLC | | EU Euro | | | 2,772,436 | | | Buy | | 02/27/15 | | $ | 3,388,000 | | | $ | 3,356,560 | | | $ | (31,440 | ) |
| Barclays Bank PLC | | Swedish Krona | | | 18,624,278 | | | Buy | | 02/27/15 | | | 2,409,000 | | | | 2,389,550 | | | | (19,450 | ) |
| Barclays Bank PLC | | EU Euro | | | 1,167,152 | | | Buy | | 02/27/15 | | | 1,444,000 | | | | 1,413,059 | | | | (30,941 | ) |
| Barclays Bank PLC | | Singapore Dollar | | | 648,988 | | | Buy | | 02/27/15 | | | 499,872 | | | | 489,397 | | | | (10,475 | ) |
| BNP Paribas Bank | | EU Euro | | | 1,001,947 | | | Buy | | 02/27/15 | | | 1,231,000 | | | | 1,213,047 | | | | (17,953 | ) |
| BNP Paribas Bank | | Swedish Krona | | | 18,455,921 | | | Buy | | 02/27/15 | | | 2,404,000 | | | | 2,367,949 | | | | (36,051 | ) |
| BNP Paribas Bank | | Japanese Yen | | | 868,612,697 | | | Buy | | 02/27/15 | | | 7,397,000 | | | | 7,255,150 | | | | (141,850 | ) |
| Citigroup, Inc. | | New Zealand Dollar | | | 4,086,957 | | | Buy | | 02/27/15 | | | 3,183,000 | | | | 3,170,675 | | | | (12,325 | ) |
| Citigroup, Inc. | | Australian Dollar | | | 1,618,447 | | | Buy | | 02/27/15 | | | 1,308,000 | | | | 1,316,025 | | | | 8,025 | |
| Citigroup, Inc. | | Swedish Krona | | | 9,520,826 | | | Buy | | 02/27/15 | | | 1,261,000 | | | | 1,221,550 | | | | (39,450 | ) |
| Citigroup, Inc. | | Canadian Dollar | | | 1,043,351 | | | Buy | | 02/27/15 | | | 927,059 | | | | 896,951 | | | | (30,108 | ) |
| Citigroup, Inc. | | EU Euro | | | 335,186 | | | Buy | | 02/27/15 | | | 416,774 | | | | 405,806 | | | | (10,968 | ) |
| Citigroup, Inc. | | Canadian Dollar | | | 1,589,722 | | | Buy | | 02/27/15 | | | 1,403,000 | | | | 1,366,657 | | | | (36,343 | ) |
| Citigroup, Inc. | | Australian Dollar | | | 7,117,704 | | | Buy | | 02/27/15 | | | 6,090,000 | | | | 5,787,692 | | | | (302,308 | ) |
| Citigroup, Inc. | | Canadian Dollar | | | 8,612,647 | | | Buy | | 02/27/15 | | | 7,593,119 | | | | 7,404,143 | | | | (188,976 | ) |
| Citigroup, Inc. | | British Pound | | | 13,445,674 | | | Buy | | 02/27/15 | | | 21,008,462 | | | | 20,947,333 | | | | (61,129 | ) |
| Citigroup, Inc. | | British Pound | | | 671,187 | | | Buy | | 02/27/15 | | | 1,049,000 | | | | 1,045,658 | | | | (3,342 | ) |
| Citigroup, Inc. | | Hong Kong Sar Dollar | | | 762,813 | | | Buy | | 02/27/15 | | | 98,368 | | | | 98,366 | | | | (2 | ) |
| Citigroup, Inc. | | Japanese Yen | | | 3,170,184,207 | | | Buy | | 02/27/15 | | | 27,296,700 | | | | 26,479,191 | | | | (817,509 | ) |
| Credit Suisse Group AG | | Australian Dollar | | | 1,098,746 | | | Buy | | 02/27/15 | | | 950,775 | | | | 893,434 | | | | (57,341 | ) |
| Deutsche Bank AG | | New Zealand Dollar | | | 2,459,058 | | | Buy | | 02/27/15 | | | 1,893,000 | | | | 1,907,745 | | | | 14,745 | |
| Deutsche Bank AG | | Czech Koruna | | | 11,259,022 | | | Buy | | 03/20/15 | | | 511,508 | | | | 492,329 | | | | (19,179 | ) |
| Deutsche Bank AG | | EU Euro | | | 1,491,319 | | | Buy | | 02/27/15 | | | 1,872,000 | | | | 1,805,524 | | | | (66,476 | ) |
| Goldman Sachs & Co. | | Swedish Krona | | | 9,172,272 | | | Buy | | 02/27/15 | | | 1,217,000 | | | | 1,176,830 | | | | (40,170 | ) |
| Goldman Sachs & Co. | | Swiss Franc | | | 4,561,846 | | | Buy | | 02/27/15 | | | 4,746,469 | | | | 4,593,091 | | | | (153,378 | ) |
| Goldman Sachs & Co. | | Danish Krone | | | 6,741,468 | | | Buy | | 02/27/15 | | | 1,131,600 | | | | 1,095,947 | | | | (35,653 | ) |
| Goldman Sachs & Co. | | EU Euro | | | 42,961,911 | | | Buy | | 02/27/15 | | | 53,652,291 | | | | 52,013,553 | | | | (1,638,738 | ) |
| Goldman Sachs & Co. | | Norwegian Krone | | | 44,461,579 | | | Buy | | 02/27/15 | | | 6,548,005 | | | | 5,956,187 | | | | (591,818 | ) |
| HSBC Bank PLC | | South Korean Won | | | 3,481,708,496 | | | Buy | | 02/27/15 | | | 3,158,299 | | | | 3,174,674 | | | | 16,375 | |
| JPMorgan Chase & Co. | | EU Euro | | | 3,071,848 | | | Buy | | 02/27/15 | | | 3,737,000 | | | | 3,719,055 | | | | (17,945 | ) |
| JPMorgan Chase & Co. | | Australian Dollar | | | 2,213,186 | | | Buy | | 02/27/15 | | | 1,791,000 | | | | 1,799,631 | | | | 8,631 | |
| JPMorgan Chase & Co. | | Australian Dollar | | | 1,011,191 | | | Buy | | 02/27/15 | | | 821,000 | | | | 822,240 | | | | 1,240 | |
| JPMorgan Chase & Co. | | British Pound | | | 597,476 | | | Buy | | 02/27/15 | | | 935,000 | | | | 930,821 | | | | (4,179 | ) |
| JPMorgan Chase & Co. | | Japanese Yen | | | 868,771,215 | | | Buy | | 02/27/15 | | | 7,397,000 | | | | 7,256,474 | | | | (140,526 | ) |
| JPMorgan Chase & Co. | | Swedish Krona | | | 22,826,201 | | | Buy | | 02/27/15 | | | 2,979,000 | | | | 2,928,669 | | | | (50,331 | ) |
| JPMorgan Chase & Co. | | EU Euro | | | 1,031,014 | | | Buy | | 02/27/15 | | | 1,289,000 | | | | 1,248,239 | | | | (40,761 | ) |
| JPMorgan Chase & Co. | | Swedish Krona | | | 13,234,394 | | | Buy | | 02/27/15 | | | 1,738,000 | | | | 1,698,012 | | | | (39,988 | ) |
| JPMorgan Chase & Co. | | Australian Dollar | | | 1,593,817 | | | Buy | | 02/27/15 | | | 1,303,000 | | | | 1,295,997 | | | | (7,003 | ) |
| JPMorgan Chase & Co. | | EU Euro | | | 1,498,664 | | | Buy | | 02/27/15 | | | 1,855,000 | | | | 1,814,417 | | | | (40,583 | ) |
| JPMorgan Chase & Co. | | British Pound | | | 1,424,802 | | | Buy | | 02/27/15 | | | 2,236,000 | | | | 2,219,732 | | | | (16,268 | ) |
| JPMorgan Chase & Co. | | EU Euro | | | 1,981,095 | | | Buy | | 02/27/15 | | | 2,443,000 | | | | 2,398,492 | | | | (44,508 | ) |
| JPMorgan Chase & Co. | | New Zealand Dollar | | | 1,031,500 | | | Buy | | 02/27/15 | | | 796,000 | | | | 800,241 | | | | 4,241 | |
| JPMorgan Chase & Co. | | EU Euro | | | 6,192,570 | | | Buy | | 02/27/15 | | | 7,662,000 | | | | 7,497,281 | | | | (164,719 | ) |
| JPMorgan Chase & Co. | | British Pound | | | 351,386 | | | Buy | | 02/27/15 | | | 551,000 | | | | 547,432 | | | | (3,568 | ) |
See Accompanying Notes to Financial Statements
| | SUMMARY PORTFOLIO OF INVESTMENTS |
| Voya Global Bond Portfolio | as of December 31, 2014 (continued) |
| Counterparty | | Currency | | Contract Amount | | | Buy/Sell | | Settlement Date | | In Exchange For | | | Fair Value | | | Unrealized
Appreciation
(Depreciation) | |
| JPMorgan Chase & Co. | | Canadian Dollar | | | 6,193,448 | | | Buy | | 02/27/15 | | $ | 5,457,000 | | | $ | 5,324,400 | | | $ | (132,600 | ) |
| JPMorgan Chase & Co. | | EU Euro | | | 1,419,230 | | | Buy | | 02/27/15 | | | 1,777,000 | | | | 1,718,247 | | | | (58,753 | ) |
| JPMorgan Chase & Co. | | New Zealand Dollar | | | 4,190,861 | | | Buy | | 02/27/15 | | | 3,241,000 | | | | 3,251,284 | | | | 10,284 | |
| Morgan Stanley | | New Zealand Dollar | | | 4,004,045 | | | Buy | | 02/27/15 | | | 3,120,000 | | | | 3,106,352 | | | | (13,648 | ) |
| Morgan Stanley | | Swiss Franc | | | 1,357,380 | | | Buy | | 02/27/15 | | | 1,376,000 | | | | 1,366,677 | | | | (9,323 | ) |
| Morgan Stanley | | New Zealand Dollar | | | 1,153,747 | | | Buy | | 02/27/15 | | | 882,000 | | | | 895,080 | | | | 13,080 | |
| Morgan Stanley | | Japanese Yen | | | 868,538,579 | | | Buy | | 02/27/15 | | | 7,397,000 | | | | 7,254,531 | | | | (142,469 | ) |
| Morgan Stanley | | Japanese Yen | | | 868,804,871 | | | Buy | | 02/27/15 | | | 7,397,000 | | | | 7,256,755 | | | | (140,245 | ) |
| Morgan Stanley | | EU Euro | | | 1,882,232 | | | Buy | | 02/27/15 | | | 2,343,000 | | | | 2,278,799 | | | | (64,201 | ) |
| Morgan Stanley | | New Zealand Dollar | | | 3,063,813 | | | Buy | | 02/27/15 | | | 2,332,000 | | | | 2,376,917 | | | | 44,917 | |
| Morgan Stanley | | Swedish Krona | | | 15,765,360 | | | Buy | | 02/27/15 | | | 2,102,000 | | | | 2,022,742 | | | | (79,258 | ) |
| Morgan Stanley | | Swiss Franc | | | 2,125,017 | | | Buy | | 02/27/15 | | | 2,187,000 | | | | 2,139,572 | | | | (47,428 | ) |
| Morgan Stanley | | South African Rand | | | 7,642,188 | | | Buy | | 03/20/15 | | | 648,000 | | | | 652,253 | | | | 4,253 | |
| Morgan Stanley | | Australian Dollar | | | 12,966,230 | | | Buy | | 02/27/15 | | | 10,973,000 | | | | 10,543,364 | | | | (429,636 | ) |
| Morgan Stanley | | Norwegian Krone | | | 62,582,160 | | | Buy | | 02/27/15 | | | 9,012,000 | | | | 8,383,666 | | | | (628,334 | ) |
| Morgan Stanley | | New Zealand Dollar | | | 716,463 | | | Buy | | 02/27/15 | | | 560,000 | | | | 555,834 | | | | (4,166 | ) |
| Morgan Stanley | | Swiss Franc | | | 521,251 | | | Buy | | 02/27/15 | | | 541,000 | | | | 524,821 | | | | (16,179 | ) |
| Morgan Stanley | | British Pound | | | 410,845 | | | Buy | | 02/27/15 | | | 645,000 | | | | 640,066 | | | | (4,934 | ) |
| Morgan Stanley | | Israeli New Shekel | | | 2,615,982 | | | Buy | | 03/20/15 | | | 669,220 | | | | 670,878 | | | | 1,658 | |
| Morgan Stanley | | Mexican Peso | | | 41,274,008 | | | Buy | | 03/20/15 | | | 2,770,161 | | | | 2,784,055 | | | | 13,894 | |
| Morgan Stanley | | New Zealand Dollar | | | 8,244,177 | | | Buy | | 02/27/15 | | | 6,378,000 | | | | 6,395,860 | | | | 17,860 | |
| Morgan Stanley | | Swedish Krona | | | 21,511,247 | | | Buy | | 02/27/15 | | | 2,896,000 | | | | 2,759,956 | | | | (136,044 | ) |
| Morgan Stanley | | Australian Dollar | | | 1,027,570 | | | Buy | | 02/27/15 | | | 881,000 | | | | 835,558 | | | | (45,442 | ) |
| Morgan Stanley | | Swiss Franc | | | 1,024,655 | | | Buy | | 02/27/15 | | | 1,071,000 | | | | 1,031,673 | | | | (39,327 | ) |
| Morgan Stanley | | New Zealand Dollar | | | 2,737,879 | | | Buy | | 02/27/15 | | | 2,132,000 | | | | 2,124,056 | | | | (7,944 | ) |
| Morgan Stanley | | Swedish Krona | | | 20,485,739 | | | Buy | | 02/27/15 | | | 2,772,000 | | | | 2,628,381 | | | | (143,619 | ) |
| Morgan Stanley | | EU Euro | | | 14,368,332 | | | Buy | | 02/27/15 | | | 18,021,000 | | | | 17,395,594 | | | | (625,406 | ) |
| Morgan Stanley | | New Zealand Dollar | | | 1,489,988 | | | Buy | | 02/27/15 | | | 1,170,000 | | | | 1,155,938 | | | | (14,062 | ) |
| Morgan Stanley | | Swedish Krona | | | 7,913,107 | | | Buy | | 02/27/15 | | | 1,071,000 | | | | 1,015,275 | | | | (55,725 | ) |
| Morgan Stanley | | EU Euro | | | 1,420,594 | | | Buy | | 02/27/15 | | | 1,782,000 | | | | 1,719,898 | | | | (62,102 | ) |
| Morgan Stanley | | Japanese Yen | | | 114,827,838 | | | Buy | | 02/27/15 | | | 983,000 | | | | 959,108 | | | | (23,892 | ) |
| Morgan Stanley | | Swedish Krona | | | 9,928,959 | | | Buy | | 02/27/15 | | | 1,336,000 | | | | 1,273,915 | | | | (62,085 | ) |
| | | | | | | | | | | | | | | | | | | | | $ | (7,791,371 | ) |
| | | | | | | | | | | | | | | | | | | | | | | |
| Barclays Bank PLC | | EU Euro | | | 2,780,993 | | | Sell | | 02/27/15 | | $ | 3,388,000 | | | $ | 3,366,920 | | | $ | 21,080 | |
| Barclays Bank PLC | | Norwegian Krone | | | 20,530,814 | | | Sell | | 02/27/15 | | | 3,026,000 | | | | 2,750,360 | | | | 275,640 | |
| Barclays Bank PLC | | New Zealand Dollar | | | 5,599,434 | | | Sell | | 02/27/15 | | | 4,395,550 | | | | 4,344,060 | | | | 51,490 | |
| BNP Paribas Bank | | EU Euro | | | 84,991 | | | Sell | | 02/27/15 | | | 104,000 | | | | 102,898 | | | | 1,102 | |
| BNP Paribas Bank | | Japanese Yen | | | 39,817,531 | | | Sell | | 02/27/15 | | | 335,000 | | | | 332,579 | | | | 2,421 | |
| BNP Paribas Bank | | Japanese Yen | | | 850,646,798 | | | Sell | | 02/27/15 | | | 7,221,000 | | | | 7,105,089 | | | | 115,911 | |
| BNP Paribas Bank | | South African Rand | | | 7,626,960 | | | Sell | | 03/20/15 | | | 648,000 | | | | 650,953 | | | | (2,953 | ) |
| BNP Paribas Bank | | British Pound | | | 1,701,816 | | | Sell | | 02/27/15 | | | 2,679,000 | | | | 2,651,299 | | | | 27,701 | |
| BNP Paribas Bank | | Japanese Yen | | | 1,430,924,369 | | | Sell | | 02/27/15 | | | 12,167,000 | | | | 11,951,899 | | | | 215,101 | |
| Citigroup, Inc. | | Swiss Franc | | | 2,434,481 | | | Sell | | 02/27/15 | | | 2,478,000 | | | | 2,451,156 | | | | 26,844 | |
| Citigroup, Inc. | | New Zealand Dollar | | | 851,819 | | | Sell | | 02/27/15 | | | 658,000 | | | | 660,844 | | | | (2,844 | ) |
| Citigroup, Inc. | | EU Euro | | | 1,943,615 | | | Sell | | 02/27/15 | | | 2,405,000 | | | | 2,353,115 | | | | 51,885 | |
| Citigroup, Inc. | | Canadian Dollar | | | 778,909 | | | Sell | | 02/27/15 | | | 683,000 | | | | 669,614 | | | | 13,386 | |
| Citigroup, Inc. | | Australian Dollar | | | 884,424 | | | Sell | | 02/27/15 | | | 749,000 | | | | 719,161 | | | | 29,839 | |
| Citigroup, Inc. | | EU Euro | | | 2,028,576 | | | Sell | | 02/27/15 | | | 2,532,000 | | | | 2,455,977 | | | | 76,023 | |
| Citigroup, Inc. | | South African Rand | | | 33,881,921 | | | Sell | | 03/20/15 | | | 2,865,690 | | | | 2,891,788 | | | | (26,098 | ) |
| Deutsche Bank AG | | British Pound | | | 1,235,381 | | | Sell | | 02/27/15 | | | 1,927,000 | | | | 1,924,629 | | | | 2,371 | |
| Deutsche Bank AG | | EU Euro | | | 3,194,109 | | | Sell | | 02/27/15 | | | 3,944,000 | | | | 3,867,076 | | | | 76,924 | |
| Deutsche Bank AG | | Polish Zloty | | | 9,521,462 | | | Sell | | 03/20/15 | | | 2,819,503 | | | | 2,679,988 | | | | 139,515 | |
| Deutsche Bank AG | | Hungarian Forint | | | 454,511,665 | | | Sell | | 03/20/15 | | | 1,812,248 | | | | 1,733,765 | | | | 78,483 | |
| Deutsche Bank AG | | EU Euro | | | 760,256 | | | Sell | | 02/27/15 | | | 954,000 | | | | 920,434 | | | | 33,566 | |
| Deutsche Bank AG | | Philippine Peso | | | 29,946,431 | | | Sell | | 02/27/15 | | | 663,559 | | | | 667,457 | | | | (3,898 | ) |
| Deutsche Bank AG | | Indonesian Rupiah | | | 37,295,455,083 | | | Sell | | 02/27/15 | | | 3,007,698 | | | | 2,970,583 | | | | 37,115 | |
| Deutsche Bank AG | | Thai Baht | | | 45,852,799 | | | Sell | | 02/27/15 | | | 1,385,281 | | | | 1,389,794 | | | | (4,513 | ) |
| Goldman Sachs & Co. | | Japanese Yen | | | 851,383,701 | | | Sell | | 02/27/15 | | | 7,221,000 | | | | 7,111,244 | | | | 109,756 | |
| Goldman Sachs & Co. | | Japanese Yen | | | 1,757,884,560 | | | Sell | | 02/27/15 | | | 14,758,000 | | | | 14,682,857 | | | | 75,143 | |
| Goldman Sachs & Co. | | New Zealand Dollar | | | 6,173,336 | | | Sell | | 02/27/15 | | | 4,832,000 | | | | 4,789,294 | | | | 42,706 | |
| Goldman Sachs & Co. | | Canadian Dollar | | | 1,564,724 | | | Sell | | 02/27/15 | | | 1,388,000 | | | | 1,345,166 | | | | 42,834 | |
See Accompanying Notes to Financial Statements
| | SUMMARY PORTFOLIO OF INVESTMENTS |
| Voya Global Bond Portfolio | as of December 31, 2014 (continued) |
| Counterparty | | Currency | | Contract Amount | | | Buy/Sell | | Settlement Date | | In Exchange For | | | Fair Value | | | Unrealized
Appreciation
(Depreciation) | |
| Goldman Sachs & Co. | | New Zealand Dollar | | | 7,687,150 | | | Sell | | 02/27/15 | | $ | 5,975,000 | | | $ | 5,963,716 | | | $ | 11,284 | |
| Goldman Sachs & Co. | | Swedish Krona | | | 17,919,037 | | | Sell | | 02/27/15 | | | 2,418,324 | | | | 2,299,065 | | | | 119,259 | |
| HSBC Bank PLC | | Russian Ruble | | | 101,325,844 | | | Sell | | 03/20/15 | | | 1,499,125 | | | | 1,666,288 | | | | (167,163 | ) |
| HSBC Bank PLC | | Romanian New Leu | | | 2,380,567 | | | Sell | | 03/20/15 | | | 661,268 | | | | 641,383 | | | | 19,885 | |
| HSBC Bank PLC | | Colombian Peso | | | 4,442,236,213 | | | Sell | | 03/20/15 | | | 1,796,367 | | | | 1,861,399 | | | | (65,032 | ) |
| HSBC Bank PLC | | Peruvian Nuevo Sol | | | 2,942,906 | | | Sell | | 03/20/15 | | | 977,060 | | | | 970,598 | | | | 6,462 | |
| HSBC Bank PLC | | Malaysian Ringgit | | | 9,287,250 | | | Sell | | 02/27/15 | | | 2,747,544 | | | | 2,639,065 | | | | 108,479 | |
| Morgan Stanley | | British Pound | | | 380,111 | | | Sell | | 02/27/15 | | | 595,000 | | | | 592,184 | | | | 2,816 | |
| Morgan Stanley | | Swiss Franc | | | 871,465 | | | Sell | | 02/27/15 | | | 894,000 | | | | 877,434 | | | | 16,566 | |
| Morgan Stanley | | EU Euro | | | 1,174,219 | | | Sell | | 02/27/15 | | | 1,444,000 | | | | 1,421,615 | | | | 22,385 | |
| JPMorgan Chase & Co. | | New Zealand Dollar | | | 1,799,647 | | | Sell | | 02/27/15 | | | 1,382,000 | | | | 1,396,172 | | | | (14,172 | ) |
| JPMorgan Chase & Co. | | EU Euro | | | 4,979,111 | | | Sell | | 02/27/15 | | | 6,055,000 | | | | 6,028,160 | | | | 26,840 | |
| JPMorgan Chase & Co. | | Australian Dollar | | | 6,602,622 | | | Sell | | 02/27/15 | | | 5,380,000 | | | | 5,368,858 | | | | 11,142 | |
| JPMorgan Chase & Co. | | New Zealand Dollar | | | 3,403,490 | | | Sell | | 02/27/15 | | | 2,620,000 | | | | 2,640,439 | | | | (20,439 | ) |
| JPMorgan Chase & Co. | | Swiss Franc | | | 1,148,976 | | | Sell | | 02/27/15 | | | 1,182,000 | | | | 1,156,845 | | | | 25,155 | |
| JPMorgan Chase & Co. | | Japanese Yen | | | 850,783,202 | | | Sell | | 02/27/15 | | | 7,221,000 | | | | 7,106,228 | | | | 114,772 | |
| JPMorgan Chase & Co. | | Canadian Dollar | | | 1,053,876 | | | Sell | | 02/27/15 | | | 903,000 | | | | 905,999 | | | | (2,999 | ) |
| JPMorgan Chase & Co. | | New Zealand Dollar | | | 2,397,612 | | | Sell | | 02/27/15 | | | 1,856,000 | | | | 1,860,075 | | | | (4,075 | ) |
| JPMorgan Chase & Co. | | EU Euro | | | 841,280 | | | Sell | | 02/27/15 | | | 1,046,000 | | | | 1,018,530 | | | | 27,470 | |
| JPMorgan Chase & Co. | | Australian Dollar | | | 2,448,956 | | | Sell | | 02/27/15 | | | 2,011,000 | | | | 1,991,345 | | | | 19,655 | |
| JPMorgan Chase & Co. | | New Zealand Dollar | | | 4,208,429 | | | Sell | | 02/27/15 | | | 3,201,000 | | | | 3,264,914 | | | | (63,914 | ) |
| JPMorgan Chase & Co. | | Australian Dollar | | | 924,792 | | | Sell | | 02/27/15 | | | 763,000 | | | | 751,985 | | | | 11,015 | |
| JPMorgan Chase & Co. | | Australian Dollar | | | 5,427,061 | | | Sell | | 02/27/15 | | | 4,522,000 | | | | 4,412,962 | | | | 109,038 | |
| JPMorgan Chase & Co. | | Canadian Dollar | | | 2,060,219 | | | Sell | | 02/27/15 | | | 1,803,000 | | | | 1,771,134 | | | | 31,866 | |
| JPMorgan Chase & Co. | | British Pound | | | 1,563,559 | | | Sell | | 02/27/15 | | | 2,469,000 | | | | 2,435,905 | | | | 33,095 | |
| JPMorgan Chase & Co. | | Australian Dollar | | | 7,144,755 | | | Sell | | 02/27/15 | | | 6,049,000 | | | | 5,809,688 | | | | 239,312 | |
| Morgan Stanley | | Japanese Yen | | | 850,975,931 | | | Sell | | 02/27/15 | | | 7,221,000 | | | | 7,107,838 | | | | 113,162 | |
| Morgan Stanley | | Swiss Franc | | | 1,695,851 | | | Sell | | 02/27/15 | | | 1,766,000 | | | | 1,707,466 | | | | 58,534 | |
| Morgan Stanley | | Swiss Franc | | | 3,440,124 | | | Sell | | 02/27/15 | | | 3,566,000 | | | | 3,463,686 | | | | 102,314 | |
| Morgan Stanley | | Swedish Krona | | | 18,396,577 | | | Sell | | 02/27/15 | | | 2,433,000 | | | | 2,360,335 | | | | 72,665 | |
| Morgan Stanley | | EU Euro | | | 11,911,596 | | | Sell | | 02/27/15 | | | 14,758,000 | | | | 14,421,249 | | | | 336,751 | |
| Morgan Stanley | | Swedish Krona | | | 9,252,598 | | | Sell | | 02/27/15 | | | 1,229,000 | | | | 1,187,136 | | | | 41,864 | |
| Morgan Stanley | | Norwegian Krone | | | 20,817,783 | | | Sell | | 02/27/15 | | | 2,939,000 | | | | 2,788,803 | | | | 150,197 | |
| Morgan Stanley | | Japanese Yen | | | 71,325,138 | | | Sell | | 02/27/15 | | | 596,000 | | | | 595,748 | | | | 252 | |
| Morgan Stanley | | Australian Dollar | | | 2,027,907 | | | Sell | | 02/27/15 | | | 1,703,000 | | | | 1,648,973 | | | | 54,027 | |
| Morgan Stanley | | Swedish Krona | | | 13,722,058 | | | Sell | | 02/27/15 | | | 1,825,000 | | | | 1,760,581 | | | | 64,419 | |
| Morgan Stanley | | EU Euro | | | 10,750,424 | | | Sell | | 02/27/15 | | | 13,424,000 | | | | 13,015,430 | | | | 408,570 | |
| Morgan Stanley | | Swedish Krona | | | 59,430,620 | | | Sell | | 02/27/15 | | | 8,001,000 | | | | 7,625,124 | | | | 375,876 | |
| Morgan Stanley | | Swiss Franc | | | 832,021 | | | Sell | | 02/27/15 | | | 867,000 | | | | 837,720 | | | | 29,280 | |
| Morgan Stanley | | Norwegian Krone | | | 20,656,212 | | | Sell | | 02/27/15 | | | 3,023,000 | | | | 2,767,159 | | | | 255,841 | |
| Morgan Stanley | | Turkish Lira | | | 6,743,695 | | | Sell | | 03/20/15 | | | 2,793,230 | | | | 2,839,773 | | | | (46,543 | ) |
| Morgan Stanley | | Chilean Peso | | | 191,859,055 | | | Sell | | 03/20/15 | | | 306,975 | | | | 313,815 | | | | (6,840 | ) |
| Morgan Stanley | | Brazilian Real | | | 10,343,766 | | | Sell | | 03/20/15 | | | 3,688,274 | | | | 3,808,788 | | | | (120,514 | ) |
| Morgan Stanley | | British Pound | | | 2,821,947 | | | Sell | | 02/27/15 | | | 4,427,000 | | | | 4,396,378 | | | | 30,622 | |
| Morgan Stanley | | Norwegian Krone | | | 42,206,542 | | | Sell | | 02/27/15 | | | 6,184,000 | | | | 5,654,096 | | | | 529,904 | |
| Morgan Stanley | | British Pound | | | 576,562 | | | Sell | | 02/27/15 | | | 903,000 | | | | 898,239 | | | | 4,761 | |
| Morgan Stanley | | British Pound | | | 773,879 | | | Sell | | 02/27/15 | | | 1,209,000 | | | | 1,205,644 | | | | 3,356 | |
| Morgan Stanley | | Swiss Franc | | | 1,150,568 | | | Sell | | 02/27/15 | | | 1,194,000 | | | | 1,158,448 | | | | 35,552 | |
| | | | | | | | | | | | | | | | | | | | | $ | 4,619,282 | |
See Accompanying Notes to Financial Statements
| | SUMMARY PORTFOLIO OF INVESTMENTS |
| Voya Global Bond Portfolio | as of December 31, 2014 (continued) |
At December 31, 2014, the following futures contracts were outstanding for Voya Global Bond Portfolio:
| Contract Description | | Number of
Contracts | | Expiration
Date | | Notional
Value | | | Unrealized
Appreciation/
(Depreciation) | |
| Long Contracts | | | | | | | | | | | | | | |
| 30-year German Government Bond | | | 36 | | | 03/06/15 | | $ | 6,751,225 | | | $ | 335,674 | |
| 90-Day Eurodollar | | | 618 | | | 03/14/16 | | | 152,676,900 | | | | (179,220 | ) |
| 90-Day Eurodollar | | | 243 | | | 12/18/17 | | | 59,292,000 | | | | (116,737 | ) |
| 90-Day Eurodollar | | | 243 | | | 03/19/18 | | | 59,246,438 | | | | (89,708 | ) |
| 90-Day Eurodollar | | | 243 | | | 06/18/18 | | | 59,203,913 | | | | (63,382 | ) |
| 90-Day Eurodollar | | | 243 | | | 09/17/18 | | | 59,167,463 | | | | (35,033 | ) |
| Australia 10-Year Bond | | | 11 | | | 03/16/15 | | | 1,150,793 | | | | 5,385 | |
| Australia 3-Year Bond | | | 43 | | | 03/16/15 | | | 3,906,569 | | | | 14,485 | |
| Canada 10-Year Bond | | | 38 | | | 03/20/15 | | | 4,530,694 | | | | 72,849 | |
| Euro-Bund | | | 74 | | | 03/06/15 | | | 13,957,213 | | | | 264,487 | |
| Euro-Schatz | | | 13 | | | 03/06/15 | | | 1,747,522 | | | | 2,454 | |
| Long Gilt | | | 55 | | | 03/27/15 | | | 10,246,493 | | | | 224,417 | |
| Short Gilt | | | 19 | | | 03/27/15 | | | 3,066,771 | | | | 5,628 | |
| U.S. Treasury 10-Year Note | | | 276 | | | 03/20/15 | | | 34,995,939 | | | | 107,908 | |
| U.S. Treasury 2-Year Note | | | 26 | | | 03/31/15 | | | 5,683,438 | | | | (10,627 | ) |
| U.S. Treasury Ultra Long Bond | | | 21 | | | 03/20/15 | | | 3,468,938 | | | | 126,843 | |
| | | | | | | | | $ | 479,092,309 | | | $ | 665,423 | |
| Short Contracts | | | | | | | | | | | | | | |
| 90-Day Eurodollar | | | (974 | ) | | 03/16/15 | | | (242,806,025 | ) | | | (2,435 | ) |
| 90-Day Eurodollar | | | (309 | ) | | 06/15/15 | | | (76,913,963 | ) | | | 33,990 | |
| 90-Day Eurodollar | | | (309 | ) | | 12/19/16 | | | (75,805,425 | ) | | | 41,715 | |
| U.S. Treasury 5-Year Note | | | (389 | ) | | 03/31/15 | | | (46,263,649 | ) | | | (30,751 | ) |
| U.S. Treasury Long Bond | | | (47 | ) | | 03/20/15 | | | (6,794,438 | ) | | | (176,924 | ) |
| | | | | | | | | $ | (448,583,500 | ) | | $ | (134,405 | ) |
At December 31, 2014, the following centrally cleared interest rate swaps were outstanding for Voya Global Bond Portfolio:
| | | Clearinghouse | | Termination
Date | | Notional
Amount | | Fair
Value | | | Unrealized
Appreciation/
(Depreciation) | |
| Receive a floating rate equal to the 6-month CAD-BA-CDOR and pay a fixed rate equal to 2.130% | | Chicago Mercantile Exchange | | 11/18/18 | | CAD85,345,000 | | $ | (352,427 | ) | | $ | (358,745 | ) |
| Receive a fixed rate equal to 2.960% and pay a floating rate equal to the 6-month CAD-BA-CDOR | | Chicago Mercantile Exchange | | 11/21/44 | | CAD1,000,000 | | | 38,796 | | | | 39,354 | |
| Receive a fixed rate equal to 0.183% and pay a floating rate based on the 6-month EUR-EURIBOR-Reuters | | Chicago Mercantile Exchange | | 10/03/16 | | EUR30,000,000 | | | 6,991 | | | | 6,099 | |
| Receive a fixed rate equal to 0.417% and pay a floating rate based on the 6-month EUR-EURIBOR-Reuters | | Chicago Mercantile Exchange | | 10/03/19 | | EUR7,000,000 | | | 31,296 | | | | 31,562 | |
| Receive a fixed rate equal to 2.899% and pay a floating rate based on the 6-month GBP-LIBOR-BBA | | Chicago Mercantile Exchange | | 08/22/44 | | GBP2,000,000 | | | 477,107 | | | | 484,064 | |
| Receive a fixed rate equal to 0.754% and pay a floating rate based on the 6-month JPY-LIBOR-BBA | | Chicago Mercantile Exchange | | 05/21/24 | | JPY4,729,000,000 | | | 1,004,940 | | | | 1,118,132 | |
See Accompanying Notes to Financial Statements
| | SUMMARY PORTFOLIO OF INVESTMENTS |
| Voya Global Bond Portfolio | as of December 31, 2014 (continued) |
| | | Clearinghouse | | Termination
Date | | Notional
Amount | | Fair
Value | | | Unrealized
Appreciation/
(Depreciation) | |
| Receive a floating rate equal to the 3-month USD-LIBOR-BBA and pay a fixed rate equal to 0.322% | | Chicago Mercantile Exchange | | 08/08/15 | | USD40,000,000 | | $ | (5,310 | ) | | $ | (5,310 | ) |
| Receive a floating rate equal to the 3-month USD-LIBOR-BBA and pay a fixed rate equal to 0.309% | | Chicago Mercantile Exchange | | 08/21/15 | | USD10,000,000 | | | (142 | ) | | | (142 | ) |
| Receive a fixed rate equal to 0.306% and pay a floating rate based on the 3-month USD-LIBOR-BBA | | Chicago Mercantile Exchange | | 08/21/15 | | USD50,000,000 | | | (248 | ) | | | (248 | ) |
| Receive a fixed rate equal to 0.347% and pay a floating rate based on the 3-month USD-LIBOR-BBA | | Chicago Mercantile Exchange | | 10/09/15 | | USD40,100,000 | | | 593 | | | | 593 | |
| Receive a fixed rate equal to 0.704% and pay a floating rate based on the 3-month USD-LIBOR-BBA | | Chicago Mercantile Exchange | | 08/27/16 | | USD21,000,000 | | | (9,107 | ) | | | (9,107 | ) |
| Receive a fixed rate equal to 0.771% and pay a floating rate based on the 3-month USD-LIBOR-BBA | | Chicago Mercantile Exchange | | 10/09/16 | | USD87,000,000 | | | 17,505 | | | | 17,505 | |
| Receive a floating rate equal to the 3-month USD-LIBOR-BBA and pay a fixed rate equal to 1.082% | | Chicago Mercantile Exchange | | 08/21/17 | | USD15,000,000 | | | 30,007 | | | | 30,007 | |
| Receive a floating rate equal to the 3-month USD-LIBOR-BBA and pay a fixed rate equal to 1.143% | | Chicago Mercantile Exchange | | 08/27/17 | | USD40,000,000 | | | 25,685 | | | | 25,685 | |
| Receive a floating rate equal to the 3-month USD-LIBOR-BBA and pay a fixed rate equal to 2.273% | | Chicago Mercantile Exchange | | 12/19/18 | | USD247,721,000 | | | 316,524 | | | | 316,524 | |
| Receive a fixed rate equal to 1.743% and pay a floating rate based on the 3-month USD-LIBOR-BBA | | Chicago Mercantile Exchange | | 08/21/19 | | USD8,100,000 | | | 12,615 | | | | 12,615 | |
| Receive a floating rate equal to the 3-month USD-LIBOR-BBA and pay a fixed rate equal to 1.7440% | | Chicago Mercantile Exchange | | 08/21/19 | | USD32,000,000 | | | (52,000 | ) | | | (52,000 | ) |
| Receive a floating rate equal to the 3-month USD-LIBOR-BBA and pay a fixed rate equal to 1.792% | | Chicago Mercantile Exchange | | 08/27/19 | | USD8,000,000 | | | (29,161 | ) | | | (29,161 | ) |
| Receive a floating rate equal to the 3-month USD-LIBOR-BBA and pay a fixed rate equal to 1.668% | | Chicago Mercantile Exchange | | 10/30/19 | | USD59,452,000 | | | 207,859 | | | | 207,859 | |
| Receive a floating rate equal to the 3-month USD-LIBOR-BBA and pay a fixed rate equal to 2.223% | | Chicago Mercantile Exchange | | 05/15/21 | | USD12,000,000 | | | (182,231 | ) | | | (182,231 | ) |
| Receive a floating rate equal to the 3-month USD-LIBOR-BBA and pay a fixed rate equal to 2.179% | | Chicago Mercantile Exchange | | 07/01/21 | | USD45,000,000 | | | (529,975 | ) | | | (529,975 | ) |
| Receive a floating rate equal to the 3-month USD-LIBOR-BBA and pay a fixed rate equal to 2.557% | | Chicago Mercantile Exchange | | 08/21/24 | | USD300,000 | | | (7,722 | ) | | | (7,722 | ) |
See Accompanying Notes to Financial Statements
| | SUMMARY PORTFOLIO OF INVESTMENTS |
| Voya Global Bond Portfolio | as of December 31, 2014 (continued) |
| | | Clearinghouse | | Termination
Date | | Notional Amount | | Fair Value | | | Unrealized
Appreciation/
(Depreciation) | |
| Receive a floating rate equal to the 3-month USD-LIBOR-BBA and pay a fixed rate equal to 2.507% | | Chicago Mercantile Exchange | | 10/09/24 | | USD8,500,000 | | $ | (177,143 | ) | | $ | (177,143 | ) |
| Receive a fixed rate equal to 2.408% and pay a floating rate based on the 3-month USD-LIBOR-BBA | | Chicago Mercantile Exchange | | 10/30/24 | | USD30,878,000 | | | 364,979 | | | | 364,980 | |
| Receive a fixed rate equal to 3.057% and pay a floating rate equal to the 3-month USD-LIBOR-BBA | | Chicago Mercantile Exchange | | 10/09/44 | | USD1,400,000 | | | 106,391 | | | | 106,391 | |
| Receive a fixed rate equal to 2.000% and pay a floating rate equal to the 3-month USD-LIBOR-BBA | | Chicago Mercantile Exchange | | 11/05/19 | | USD121,260,000 | | | 1,436,565 | | | | 1,436,565 | |
| Receive a floating rate equal to the 3-month USD-LIBOR-BBA and pay a fixed rate equal to 2.760% | | Chicago Mercantile Exchange | | 11/05/24 | | USD64,260,000 | | | (2,784,033 | ) | | | (2,784,033 | ) |
| | | | | | | | | $ | (51,646 | ) | | $ | 62,118 | |
At December 31, 2014, the following over-the-counter written interest rate swaptions were outstanding for Voya Global Bond Portfolio:
| Description | | Counterparty | | Floating Rate
Index/Underlying
Reference Entity | | Pay/
Receive
Floating | | Exercise
Rate | | | Expiration
Date | | Notional
Amount | | Premiums
Received | | | Fair Value | |
| Put OTC Swaption | | Morgan Stanley | | 3-month USD- LIBOR-BBA | | Pay | | | 0.580 | % | | 12/12/16 | | USD82,945,000 | | $ | 241,592 | | | $ | (184,826 | ) |
| Call OTC Swaption | | Morgan Stanley | | 3-month USD- LIBOR-BBA | | Receive | | | 0.580 | % | | 12/12/16 | | USD82,945,000 | | | 241,577 | | | | (279,005 | ) |
| | | | | | | | | | | | | | | Total Written Swaptions | | $ | 483,169 | | | $ | (463,831 | ) |
Transactions with Affiliates
An investment of at least 5% of the voting securities of an issuer, or a company which is under common control results in that issuer becoming an affiliated person as defined by the 1940 Act.
The following table provides transactions during the year ended December 31, 2014, where the following issuers were considered an affiliate:
| Issuer | | Beginning
Market
Value at
12/31/13 | | | Purchases
at Cost | | | Sales
at Cost | | | Change in
Unrealized
Appreciation/
(Depreciation) | | | Ending
Market
Value at
12/31/14 | | | Investment
Income | | | Realized
Gains/
(Losses) | | | Net
Capital
Gain
Distributions | |
| Voya Emerging Markets Corporate Debt Fund - Class P | | $ | 12,900,045 | | | $ | 680,046 | | | $ | — | | | $ | 110,016 | | | $ | 13,690,107 | | | $ | 680,047 | | | $ | — | | | $ | — | |
| Voya Emerging Markets Hard Currency Debt Fund - Class P | | | 40,986,686 | | | | 2,084,625 | | | | (12,338,054 | ) | | | 1,386,631 | | | | 32,119,888 | | | | 2,084,624 | | | | (338,053 | ) | | | — | |
| Voya Emerging Markets Local Currency Debt Fund - Class P | | | 33,646,283 | | | | 1,374,873 | | | | — | | | | (3,173,162 | ) | | | 31,847,994 | | | | 1,374,872 | | | | — | | | | — | |
| Voya High Yield Bond Fund - Class P | | | 6,279,952 | | | | 10,656,272 | | | | — | | | | (773,943 | ) | | | 16,162,281 | | | | 856,293 | | | | — | | | | — | |
| | | $ | 93,812,966 | | | $ | 14,795,816 | | | $ | (12,338,054 | ) | | $ | (2,450,458 | ) | | $ | 93,820,270 | | | $ | 4,995,836 | | | $ | (338,053 | ) | | $ | — | |
See Accompanying Notes to Financial Statements
| | SUMMARY PORTFOLIO OF INVESTMENTS |
| Voya Global Bond Portfolio | as of December 31, 2014 (continued) |
The financial statements for the above mutual fund[s] can be found at www.sec.gov.
A summary of derivative instruments by primary risk exposure is outlined in the following tables.
The fair value of derivative instruments as of December 31, 2014 was as follows:
| Derivatives not accounted for as hedging instruments | | Location on Statement
of Assets and Liabilities | | Fair Value | |
| Asset Derivatives | | | | | | |
| Interest rate contracts | | Investments in securities at value* | | $ | 1,534 | |
| Foreign exchange contracts | | Unrealized appreciation on forward foreign currency contracts | | | 5,330,482 | |
| Interest rate contracts | | Net Assets — Unrealized appreciation** | | | 1,235,835 | |
| Interest rate contracts | | Net Assets — Unrealized appreciation*** | | | 4,197,935 | |
| Total Asset Derivatives | | | | $ | 10,765,786 | |
| Liability Derivatives | | | | | | |
| Foreign exchange contracts | | Unrealized depreciation on forward foreign currency contracts | | $ | 8,502,571 | |
| Interest rate contracts | | Net Assets — Unrealized depreciation** | | | 704,817 | |
| Interest rate contracts | | Net Assets — Unrealized depreciation*** | | | 4,135,817 | |
| Interest rate contracts | | Written options, at fair value | | | 463,831 | |
| Total Liability Derivatives | | | | $ | 13,807,036 | |
| * | Includes purchased options. |
| ** | Includes cumulative appreciation/depreciation of futures contracts as reported in the table following the Summary Portfolio of Investments. |
| *** | Includes cumulative appreciation/depreciation of centrally cleared swaps as reported in the table following the Summary Portfolio of Investments. Only current day’s variation margin receivable/payable is shown on the Statement of Assets and Liabilities. |
The effect of derivative instruments on the Portfolio’s Statement of Operations for the year ended December 31, 2014 was as follows:
Amount of Realized Gain or (Loss) on Derivatives Recognized in Income
Derivatives not accounted for as hedging instruments | | Investments* | | | Foreign currency
related transactions** | | | Futures | | | Swaps | | | Written options | | | Total | |
| Credit Contract | | $ | — | | | $ | — | | | $ | — | | | $ | (59,837 | ) | | $ | — | | | $ | (59,837 | ) |
| Foreign exchange contracts | | | (1,148,750 | ) | | | (11,128,117 | ) | | | — | | | | — | | | | 367,081 | | | | (11,909,786 | ) |
| Interest rate contracts | | | (464,270 | ) | | | — | | | | 88,616 | | | | (28,954 | ) | | | 752,255 | | | | 347,647 | |
| Total | | $ | (1,613,020 | ) | | $ | (11,128,117 | ) | | $ | 88,616 | | | $ | (88,791 | ) | | $ | 1,119,336 | | | $ | (11,621,976 | ) |
Change in Unrealized Appreciation or (Depreciation) on Derivatives Recognized in Income
Derivatives not accounted for as hedging instruments | | Investments* | | | Foreign currency
related transactions** | | | Futures | | | Swaps | | | Written options | | | Total | |
| Credit contracts | | $ | — | | | $ | — | | | $ | — | | | $ | — | | | $ | — | | | $ | — | |
| Foreign exchange contracts | | | (163,371 | ) | | | (2,441,989 | ) | | | — | | | | — | | | | 19,338 | | | | (2,586,022 | ) |
| Interest rate contracts | | | — | | | | — | | | | 274,600 | | | | 373,376 | | | | — | | | | 647,976 | |
| Total | | $ | (163,371 | ) | | $ | (2,441,989 | ) | | $ | 274,600 | | | $ | 373,376 | | | $ | 19,338 | | | $ | (1,938,046 | ) |
| * | Amounts recognized for purchased options are included in net realized gain (loss) on investments and net change in unrealized appreciation or depreciation on investments. |
| ** | Amounts recognized for forward foreign currency contracts are included in net realized gain (loss) on foreign currency related transactions and net change in unrealized appreciation or depreciation on foreign currency related transactions. |
See Accompanying Notes to Financial Statements
| | SUMMARY PORTFOLIO OF INVESTMENTS |
| Voya Global Bond Portfolio | as of December 31, 2014 (continued) |
The following is a summary by counterparty of the fair value of OTC derivative instruments subject to Master Netting Agreements and collateral pledged (received), if any, at December 31, 2014:
| | | Barclays
Bank PLC | | BNP
Paribas
Bank | | Citigroup
Inc. | | Credit
Suisse
Group AG | | Deutsche
Bank AG | | Goldman
Sachs & Co. | | HSBC
Bank PLC | | JPMorgan
Chase & Co. | | Morgan
Stanley | | Totals | |
| Assets: | | | | | | | | | | | | | | | | | | | | | | | | | | | | | | | |
| Purchased options | | $ | — | | $ | — | | $ | 1,534 | | $ | — | | $ | — | | $ | — | | $ | — | | $ | — | | $ | — | | $ | 1,534 | |
| Forward foreign currency contracts | | | 348,210 | | | 362,236 | | | 206,002 | | | — | | | 382,719 | | | 400,982 | | | 151,201 | | | 673,756 | | | 2,805,376 | | | 5,330,482 | |
| Total assets | | $ | 348,210 | | $ | 362,236 | | $ | 207,536 | | $ | — | | $ | 382,719 | | $ | 400,982 | | $ | 151,201 | | $ | 673,756 | | $ | 2,805,376 | | $ | 5,332,016 | |
| Liabilities: | | | | | | | | | | | | | | | | | | | | | | | | | | | | | | | |
| Forward foreign currency contracts | | $ | 92,306 | | $ | 198,807 | | $ | 1,531,402 | | $ | 57,341 | | $ | 94,066 | | $ | 2,459,757 | | $ | 232,195 | | $ | 867,331 | | $ | 2,969,366 | | $ | 8,502,571 | |
| Written options | | | — | | | — | | | — | | | — | | | — | | | — | | | — | | | — | | | 463,831 | | | 463,831 | |
| Total Liabilities | | $ | 92,306 | | $ | 198,807 | | $ | 1,531,402 | | $ | 57,341 | | $ | 94,066 | | $ | 2,459,757 | | $ | 232,195 | | $ | 867,331 | | $ | 3,433,197 | | $ | 8,966,402 | |
| Net OTC derivative instruments by counterparty, at fair value | | $ | 255,904 | | $ | 163,429 | | $ | (1,323,866 | ) | $ | (57,341 | ) | $ | 288,653 | | $ | (2,058,775 | ) | $ | (80,994 | ) | $ | (193,575 | ) | $ | (627,821 | ) | | (3,634,386 | ) |
| Total collateral pledged by the Portfolio/(Received from counterparty) | | $ | (310,000 | ) | $ | (160,000 | ) | $ | 1,000,000 | | $ | — | | $ | (100,000 | ) | $ | — | | $ | — | | $ | — | | $ | 510,000 | | $ | 940,000 | |
| Net Exposure(1) | | $ | (54,096 | ) | $ | 3,429 | | $ | (323,866 | ) | $ | (57,341 | ) | $ | 188,653 | | $ | (2,058,775 | ) | $ | (80,994 | ) | $ | (193,575 | ) | $ | (117,821 | ) | $ | (2,694,386 | ) |
| (1) | Positive net exposure represents amounts due from each respective counterparty. Negative exposure represents amounts due from the Portfolio. Please refer to Note 2 for additional details regarding counterparty credit risk and credit related contingent features. |
See Accompanying Notes to Financial Statements
| VY® American Century Small-Mid Cap Value Portfolio | SUMMARY PORTFOLIO OF INVESTMENTS
as of December 31, 2014 |
| Shares | | | Value | | | Percentage
of Net
Assets | |
| COMMON STOCK: 95.9% | |
| | | | | | | Consumer Discretionary: 8.5% | | | | | | | | |
| | 33,075 | | | | | Lowe’s Cos, Inc. | | $ | 2,275,560 | | | | 0.7 | |
| | 1,138,750 | | | | | Other Securities(a) | | | 25,265,718 | | | | 7.8 | |
| | | | | | | | | | 27,541,278 | | | | 8.5 | |
| | | | | | | Consumer Staples: 5.5% | | | | | | | | |
| | 83,182 | | | | | ConAgra Foods, Inc. | | | 3,017,843 | | | | 1.0 | |
| | 37,323 | | | | | General Mills, Inc. | | | 1,990,436 | | | | 0.6 | |
| | 21,255 | | | | | JM Smucker Co. | | | 2,146,330 | | | | 0.7 | |
| | 92,073 | | | | | Sysco Corp. | | | 3,654,377 | | | | 1.1 | |
| | 159,809 | | | | | Other Securities | | | 6,813,710 | | | | 2.1 | |
| | | | | | | | | | 17,622,696 | | | | 5.5 | |
| | | | | | | Energy: 5.4% | | | | | | | | |
| | 37,220 | | | | | Apache Corp. | | | 2,332,577 | | | | 0.7 | |
| | 34,850 | | | | | Devon Energy Corp. | | | 2,133,168 | | | | 0.7 | |
| | 80,133 | | | | | Imperial Oil Ltd. | | | 3,452,106 | | | | 1.1 | |
| | 360,434 | | | | | Other Securities(a) | | | 9,510,018 | | | | 2.9 | |
| | | | | | | | | | 17,427,869 | | | | 5.4 | |
| | | | | | | Financials: 28.3% | | | | | | | | |
| | 17,183 | | | | | ACE Ltd. | | | 1,973,983 | | | | 0.6 | |
| | 66,227 | | | | | Commerce Bancshares, Inc. | | | 2,880,212 | | | | 0.9 | |
| | 71,660 | | | | | Corrections Corp. of America | | | 2,604,124 | | | | 0.8 | |
| | 47,910 | | | | | HCC Insurance Holdings, Inc. | | | 2,564,143 | | | | 0.8 | |
| | 45,353 | | | | | LPL Financial Holdings, Inc. | | | 2,020,476 | | | | 0.6 | |
| | 23,204 | | | | | M&T Bank Corp. | | | 2,914,887 | | | | 0.9 | |
| | 97,255 | | | | | Northern Trust Corp. | | | 6,554,987 | | | | 2.0 | |
| | 128,723 | | | | | People’s United Financial, Inc. | | | 1,954,015 | | | | 0.6 | |
| | 135,053 | | | | | Piedmont Office Realty Trust, Inc. | | | 2,544,399 | | | | 0.8 | |
| | 31,225 | | | | | PNC Financial Services Group, Inc. | | | 2,848,657 | | | | 0.9 | |
| | 25,108 | | | | | Reinsurance Group of America, Inc. | | | 2,199,963 | | | | 0.7 | |
| | 39,196 | | | | | Westamerica Bancorp. | | | 1,921,388 | | | | 0.6 | |
| | 84,717 | | | | | Weyerhaeuser Co. | | | 3,040,493 | | | | 0.9 | |
| | 2,216,334 | | | | | Other Securities | | | 55,321,717 | | | | 17.2 | |
| | | | | | | | | | 91,343,444 | | | | 28.3 | |
| | | | | | | Health Care: 9.3% | | | | | | | | |
| | 24,251 | | | | | Cardinal Health, Inc. | | | 1,957,783 | | | | 0.6 | |
| | 45,560 | | | | | CareFusion Corp. | | | 2,703,531 | | | | 0.8 | |
| | 48,480 | | | | | LifePoint Hospitals, Inc. | | | 3,486,197 | | | | 1.1 | |
| | 45,589 | | | | | Quest Diagnostics | | | 3,057,198 | | | | 1.0 | |
| | 402,158 | | | | | Other Securities | | | 18,710,424 | | | | 5.8 | |
| | | | | | | | | | 29,915,133 | | | | 9.3 | |
| Shares | | | Value | | | Percentage
of Net
Assets | |
| COMMON STOCK: (continued) | |
| | | | | | | Industrials: 12.8% | | | | | | | | |
| | 76,500 | | | | | ADT Corp. | | $ | 2,771,595 | | | | 0.9 | |
| | 43,973 | | | @ | | Clean Harbors, Inc. | | | 2,112,903 | | | | 0.6 | |
| | 37,160 | | | | | Emerson Electric Co. | | | 2,293,887 | | | | 0.7 | |
| | 121,087 | | | | | Exelis, Inc. | | | 2,122,655 | | | | 0.7 | |
| | 124,318 | | | | | Koninklijke Philips NV | | | 3,603,491 | | | | 1.1 | |
| | 55,959 | | | | | Oshkosh Truck Corp. | | | 2,722,405 | | | | 0.8 | |
| | 166,471 | | | | | Republic Services, Inc. | | | 6,700,458 | | | | 2.1 | |
| | 46,049 | | | | | Tyco International Plc | | | 2,019,709 | | | | 0.6 | |
| | 751,900 | | | | | Other Securities(a) | | | 17,055,538 | | | | 5.3 | |
| | | | | | | | | | 41,402,641 | | | | 12.8 | |
| | | | | | | Information Technology: 10.1% | |
| | 80,520 | | | | | Applied Materials, Inc. | | | 2,006,558 | | | | 0.6 | |
| | 50,808 | | | | | Broadcom Corp. | | | 2,201,511 | | | | 0.7 | |
| | 26,893 | | | | | Lam Research Corp. | | | 2,133,691 | | | | 0.7 | |
| | 44,556 | | | | | Microchip Technology, Inc. | | | 2,009,921 | | | | 0.6 | |
| | 131,192 | | | | | Teradyne, Inc. | | | 2,596,290 | | | | 0.8 | |
| | 28,268 | | | | | Western Digital Corp. | | | 3,129,267 | | | | 1.0 | |
| | 709,175 | | | | | Other Securities | | | 18,492,363 | | | | 5.7 | |
| | | | | | | | | | 32,569,601 | | | | 10.1 | |
| | | | | | | Materials: 5.1% | | | | | | | | |
| | 50,778 | | | | | Bemis Co., Inc. | | | 2,295,673 | | | | 0.7 | |
| | 470,300 | | | | | Other Securities | | | 14,103,283 | | | | 4.4 | |
| | | | | | | | | | 16,398,956 | | | | 5.1 | |
| | | | | | | Telecommunication Services: 1.0% | |
| | 48,541 | | | | | CenturyTel, Inc. | | | 1,921,253 | | | | 0.6 | |
| | 31,846 | | | | | Other Securities | | | 1,238,151 | | | | 0.4 | |
| | | | | | | | | | 3,159,404 | | | | 1.0 | |
| | | | | | | Utilities: 9.9% | | | | | | | | |
| | 41,557 | | | | | Atmos Energy Corp. | | | 2,316,387 | | | | 0.7 | |
| | 50,590 | | | | | Edison International | | | 3,312,633 | | | | 1.0 | |
| | 89,606 | | | | | Great Plains Energy, Inc. | | | 2,545,706 | | | | 0.8 | |
| | 82,053 | | | | | Laclede Group, Inc. | | | 4,365,220 | | | | 1.4 | |
| | 34,408 | | | | | NorthWestern Corp. | | | 1,946,805 | | | | 0.6 | |
| | 39,696 | | | | | Pacific Gas & Electric Co. | | | 2,113,415 | | | | 0.7 | |
| | 83,386 | | | | | Westar Energy, Inc. | | | 3,438,839 | | | | 1.1 | |
| | 91,230 | | | | | Xcel Energy, Inc. | | | 3,276,982 | | | | 1.0 | |
| | 186,678 | | | | | Other Securities | | | 8,491,022 | | | | 2.6 | |
| | | | | | | | | | 31,807,009 | | | | 9.9 | |
| | | | | | | Total Common Stock
(Cost $276,042,624) | | | 309,188,031 | | | | 95.9 | |
See Accompanying Notes to Financial Statements
| VY® American Century Small-Mid Cap Value Portfolio | SUMMARY PORTFOLIO OF INVESTMENTS
as of December 31, 2014 (continued) |
| Shares | | | Value | | | Percentage
of Net
Assets | |
| EXCHANGE-TRADED FUNDS: 2.2% | |
| | 4,500 | | | | | iShares Russell 2000 Value Index Fund | | $ | 457,560 | | | | 0.1 | |
| | 82,900 | | | | | iShares Russell Midcap Value Index Fund | | | 6,115,533 | | | | 1.9 | |
| | 4,700 | | | | | Other Securities | | | 536,082 | | | | 0.2 | |
| | | | | | | Total Exchange-Traded Funds
(Cost $6,804,188) | | | 7,109,175 | | | | 2.2 | |
| PREFERRED STOCK: 0.1% | | | | | | | | |
| | | | | | | Consumer Discretionary: 0.1% | |
| | 11,700 | | | | | Other Securities | | | 347,490 | | | | 0.1 | |
| | | | | | | Total Preferred Stock
(Cost $343,473) | | | 347,490 | | | | 0.1 | |
| | | | | | | Total Long-Term Investments
(Cost $283,190,285) | | | 316,644,696 | | | | 98.2 | |
Principal
Amount† | | | Value | | | Percentage
of Net
Assets | |
| SHORT-TERM INVESTMENTS: 2.3% | |
| | | | | | | Securities Lending Collateralcc: 0.3% | |
| | 65,023 | | | | | Cantor Fitzgerald,
Repurchase Agreement
dated 12/31/14, 0.09%, due
01/02/15 (Repurchase
Amount $65,023,
collateralized by various U.S.
Government and U.S.
Government Agency
Obligations,
0.000%-10.500%, Market
Value plus accrued interest
$66,323, due 01/01/15-
09/01/49) | | | 65,023 | | | | 0.0 | |
| | 1,000,000 | | | | | Millenium Fixed Income Ltd., Repurchase Agreement dated 12/31/14, 0.15%, due
01/02/15 (Repurchase
Amount $1,000,008,
collateralized by various U.S.
Government Securities,
0.625%-3.125%, Market
Value plus accrued interest
$1,020,000, due 09/30/
17-02/15/42) | | | 1,000,000 | | | | 0.3 | |
| | | | | | | | | | 1,065,023 | | | | 0.3 | |
| Shares | | | Value | | | Percentage
of Net
Assets | |
| | | | | | | Mutual Funds: 2.0% | | | | | | | | |
| | 6,461,462 | | | | | BlackRock Liquidity Funds, TempFund, Institutional Class, 0.030%††
(Cost $6,461,462) | | $ | 6,461,462 | | | | 2.0 | |
| | | | | | | Total Short-Term Investments
(Cost $7,526,485) | | | 7,526,485 | | | | 2.3 | |
| | | | | | | Total Investments in Securities
(Cost $290,716,770) | | $ | 324,171,181 | | | | 100.5 | |
| | | | | | | Liabilities in Excess of Other Assets | | | (1,701,519 | ) | | | (0.5 | ) |
| | | | | | | Net Assets | | $ | 322,469,662 | | | | 100.0 | |
“Other Securities” represents issues not identified as the top 50 holdings in terms of market value and issues or issuers not exceeding 1% of net assets individually or in aggregate respectively as of December 31, 2014.
The following footnotes apply to either the individual securities noted or one or more of the securities aggregated and listed as a single line item.
| † | Unless otherwise indicated, principal amount is shown in USD. |
| †† | Rate shown is the 7-day yield as of December 31, 2014. |
| @ | Non-income producing security. |
| cc | Represents securities purchased with cash collateral received for securities on loan. |
| (a) | This grouping contains securities on loan. |
Cost for federal income tax purposes is $293,333,384.
Net unrealized appreciation consists of:
| Gross Unrealized Appreciation | | $ | 38,896,987 | |
| Gross Unrealized Depreciation | | | (8,059,190 | ) |
| Net Unrealized Appreciation | | $ | 30,837,797 | |
See Accompanying Notes to Financial Statements
| VY® American Century Small-Mid Cap Value Portfolio | SUMMARY PORTFOLIO OF INVESTMENTS
as of December 31, 2014 (continued) |
Fair Value Measurements^
The following is a summary of the fair valuations according to the inputs used as of December 31, 2014 in valuing the assets and liabilities:
| | | Quoted Prices
in Active Markets
for Identical
Investments
(Level 1) | | | Significant
Other
Observable
Inputs #
(Level 2) | | | Significant
Unobservable
Inputs
(Level 3) | | | Fair Value
at
December 31, 2014 | |
| Asset Table | | | | | | | | | | | | | | | | |
| Investments, at fair value | | | | | | | | | | | | | | | | |
| Common Stock | | | | | | | | | | | | | | | | |
| Consumer Discretionary | | $ | 27,541,278 | | | $ | — | | | $ | — | | | $ | 27,541,278 | |
| Consumer Staples | | | 17,040,111 | | | | 582,585 | | | | — | | | | 17,622,696 | |
| Energy | | | 17,427,869 | | | | — | | | | — | | | | 17,427,869 | |
| Financials | | | 91,343,444 | | | | — | | | | — | | | | 91,343,444 | |
| Health Care | | | 29,915,133 | | | | — | | | | — | | | | 29,915,133 | |
| Industrials | | | 36,910,090 | | | | 4,492,551 | | | | — | | | | 41,402,641 | |
| Information Technology | | | 32,569,601 | | | | — | | | | — | | | | 32,569,601 | |
| Materials | | | 16,398,956 | | | | — | | | | — | | | | 16,398,956 | |
| Telecommunication Services | | | 3,159,404 | | | | — | | | | — | | | | 3,159,404 | |
| Utilities | | | 31,807,009 | | | | — | | | | — | | | | 31,807,009 | |
| Total Common Stock | | | 304,112,895 | | | | 5,075,136 | | | | — | | | | 309,188,031 | |
| Exchange-Traded Funds | | | 7,109,175 | | | | — | | | | — | | | | 7,109,175 | |
| Preferred Stock | | | 347,490 | | | | — | | | | — | | | | 347,490 | |
| Short-Term Investments | | | 6,461,462 | | | | 1,065,023 | | | | — | | | | 7,526,485 | |
| Total Investments, at fair value | | $ | 318,031,022 | | | $ | 6,140,159 | | | $ | — | | | $ | 324,171,181 | |
| Other Financial Instruments+ | | | | | | | | | | | | | | | | |
| Forward Foreign Currency Contracts | | | — | | | | 39,019 | | | | — | | | | 39,019 | |
| Total Assets | | $ | 318,031,022 | | | $ | 6,179,178 | | | $ | — | | | $ | 324,210,200 | |
| Liabilities Table | | | | | | | | | | | | | | | | |
| Other Financial Instruments+ | | | | | | | | | | | | | | | | |
| Forward Foreign Currency Contracts | | $ | — | | | $ | (2,030 | ) | | $ | — | | | $ | (2,030 | ) |
| Total Liabilities | | $ | — | | | $ | (2,030 | ) | | $ | — | | | $ | (2,030 | ) |
| ^ | See Note 2, “Significant Accounting Policies” in the Notes to Financial Statements for additional information. |
| + | Other Financial Instruments are derivatives not reflected in the Portfolio of Investments and may include open forward foreign currency contracts, futures, centrally cleared swaps, OTC swaps and written options. Forward foreign currency contracts, futures and centrally cleared swaps are valued at the unrealized gain (loss) on the instrument. OTC swaps and written options are valued at the fair value of the instrument. |
| # | The earlier close of the foreign markets gives rise to the possibility that significant events, including broad market moves, may have occurred in the interim and may materially affect the value of those securities. To account for this, the Portfolio may frequently value many of its foreign equity securities using fair value prices based on third party vendor modeling tools to the extent available. Accordingly, a portion of the Portfolio’s investments are categorized as Level 2 investments. |
At December 31, 2014, the following forward foreign currency contracts were outstanding for VY® American Century Small-Mid Cap Value Portfolio:
| Counterparty | | Currency | | Contract Amount | | | Buy/Sell | | Settlement Date | | In Exchange For | | | Fair Value | | | Unrealized
Appreciation
(Depreciation) | |
| Credit Suisse Group AG | | British Pound | | | 11,677 | | | Sell | | 01/30/15 | | $ | 18,147 | | | $ | 18,195 | | | $ | (48 | ) |
| Credit Suisse Group AG | | British Pound | | | 477,401 | | | Sell | | 01/30/15 | | | 744,847 | | | | 743,918 | | | | 929 | |
| JPMorgan Chase & Co. | | Canadian Dollar | | | 125,537 | | | Sell | | 01/30/15 | | | 108,000 | | | | 107,988 | | | | 12 | |
| JPMorgan Chase & Co. | | Canadian Dollar | | | 4,610,978 | | | Sell | | 01/30/15 | | | 3,964,386 | | | | 3,966,368 | | | | (1,982 | ) |
| UBS AG | | EU Euro | | | 79,351 | | | Sell | | 01/30/15 | | | 96,494 | | | | 96,048 | | | | 446 | |
| UBS AG | | EU Euro | | | 2,910,911 | | | Sell | | 01/30/15 | | | 3,561,063 | | | | 3,523,431 | | | | 37,632 | |
| | | | | | | | | | | | | | | | | | | | | $ | 36,989 | |
See Accompanying Notes to Financial Statements
| VY® American Century Small-Mid Cap Value Portfolio | SUMMARY PORTFOLIO OF INVESTMENTS
as of December 31, 2014 (continued) |
A summary of derivative instruments by primary risk exposure is outlined in the following tables.
The fair value of derivative instruments as of December 31, 2014 was as follows:
| Derivatives not accounted for as hedging instruments | | Location on Statement
of Assets and Liabilities | | Fair Value | |
| Asset Derivatives | | | | | | |
| Foreign exchange contracts | | Unrealized appreciation on forward foreign currency contracts | | $ | 39,019 | |
| Total Asset Derivatives | | | | $ | 39,019 | |
| Liability Derivatives | | | | | | |
| Foreign exchange contracts | | Unrealized depreciation on forward foreign currency contracts | | $ | 2,030 | |
| Total Liability Derivatives | | | | $ | 2,030 | |
The effect of derivative instruments on the Portfolio’s Statement of Operations for the year ended December 31, 2014 was as follows:
Amount of Realized Gain or (Loss) on Derivatives Recognized in Income
| Derivatives not accounted for as hedging instruments | | Foreign currency
related transactions* | |
| Foreign exchange contracts | | $ | 784,852 | |
| Total | | $ | 784,852 | |
Change in Unrealized Appreciation or (Depreciation) on Derivatives Recognized in Income
| Derivatives not accounted for as hedging instruments | | Foreign currency
related transactions* | |
| Foreign exchange contracts | | $ | 104,656 | |
| Total | | $ | 104,656 | |
| * | Amounts recognized for forward foreign currency contracts are included in net realized gain (loss) on foreign currency related transactions and net change in unrealized appreciation or depreciation on foreign currency related transactions. |
The following is a summary by counterparty of the fair value of OTC derivative instruments subject to Master Netting Agreements and collateral pledged (received), if any, at December 31, 2014:
| | | Credit Suisse
Group AG | | | JPMorgan
Chase & Co. | | | UBS AG | | | Totals | |
| Assets: | | | | | | | | | | | | | | | | |
| Forward foreign currency contracts | | $ | 929 | | | $ | 12 | | | $ | 38,078 | | | $ | 39,019 | |
| Total Assets | | | 929 | | | | 12 | | | | 38,078 | | | | 39,019 | |
| Total asset derivative instruments subject to master netting agreements(1) | | $ | — | | | $ | — | | | $ | — | | | $ | — | |
| Liabilities: | | | | | | | | | | | | | | | | |
| Forward foreign currency contracts | | $ | 48 | | | $ | 1,982 | | | $ | — | | | $ | 2,030 | |
| Total Liabilities | | | 48 | | | | 1,982 | | | | — | | | | 2,030 | |
| Total liability derivative instruments subject to master netting agreements(1) | | $ | — | | | $ | — | | | $ | — | | | $ | — | |
| (1) | At December 31, 2014, the Portfolio had not entered into any master netting agreements with its derivative counterparties as disclosed above. As such, the Portfolio did not have any amounts subject to offset. Please refer to Note 2 for additional details regarding counterparty credit risk and credit related contingent features. |
See Accompanying Notes to Financial Statements
| VY® Baron Growth Portfolio | SUMMARY PORTFOLIO OF INVESTMENTS
as of December 31, 2014 |
| Shares | | | Value | | | Percentage
of Net
Assets | |
| COMMON STOCK: 99.3% | |
| | | | | | | Consumer Discretionary: 27.3% | |
| | 3,100,000 | | | @ | | AO World PLC | | $ | 13,538,341 | | | | 1.3 | |
| | 429,000 | | | | | Bright Horizons Family Solutions, Inc. | | | 20,167,290 | | | | 1.9 | |
| | 590,000 | | | | | Choice Hotels International, Inc. | | | 33,051,800 | | | | 3.1 | |
| | 230,000 | | | | | DeVry, Inc. | | | 10,918,100 | | | | 1.0 | |
| | 525,000 | | | | | Dick’s Sporting Goods, Inc. | | | 26,066,250 | | | | 2.5 | |
| | 420,000 | | | | | Interval Leisure Group, Inc. | | | 8,773,800 | | | | 0.8 | |
| | 375,000 | | | @ | | LKQ Corp. | | | 10,545,000 | | | | 1.0 | |
| | 149,000 | | | | | Lumber Liquidators | | | 9,880,190 | | | | 0.9 | |
| | 761,383 | | | @ | | Manchester United PLC - Class A | | | 12,105,990 | | | | 1.1 | |
| | 160,000 | | | | | Marriott Vacations Worldwide Corp. | | | 11,926,400 | | | | 1.1 | |
| | 163,000 | | | | | Morningstar, Inc. | | | 10,547,730 | | | | 1.0 | |
| | 66,700 | | | @ | | Panera Bread Co. | | | 11,659,160 | | | | 1.1 | |
| | 593,691 | | | @ | | Pinnacle Entertainment, Inc. | | | 13,209,625 | | | | 1.3 | |
| | 505,000 | | | | | Under Armour, Inc. | | | 34,289,500 | | | | 3.2 | |
| | 475,000 | | | | | Vail Resorts, Inc. | | | 43,286,750 | | | | 4.1 | |
| | 870,524 | | | | | Other Securities | | | 20,400,193 | | | | 1.9 | |
| | | | | | | | | | 290,366,119 | | | | 27.3 | |
| | | | | | | Consumer Staples: 8.3% | |
| | 63,294 | | | | | Boston Beer Co., Inc. | | | 18,326,145 | | | | 1.7 | |
| | 203,500 | | | | | Church & Dwight Co., Inc. | | | 16,037,835 | | | | 1.5 | |
| | 350,000 | | | | | TreeHouse Foods, Inc. | | | 29,935,500 | | | | 2.8 | |
| | 317,641 | | | @ | | United Natural Foods, Inc. | | | 24,561,590 | | | | 2.3 | |
| | | | | | | | | | 88,861,070 | | | | 8.3 | |
| | | | | | | Energy: 3.4% | | | | | | | | |
| | 200,000 | | | | | Targa Resources Corp. | | | 21,210,000 | | | | 2.0 | |
| | 193,293 | | | | | Other Securities | | | 14,689,477 | | | | 1.4 | |
| | | | | | | | | | 35,899,477 | | | | 3.4 | |
| | | | | | | Financials: 15.2% | | | | | | | | |
| | 195,000 | | | @ | | Arch Capital Group Ltd. | | | 11,524,500 | | | | 1.1 | |
| | 272,255 | | | | | Artisan Partners Asset Management, Inc. | | | 13,757,045 | | | | 1.3 | |
| | 347,500 | | | | | Carlyle Group L.P. | | | 9,556,250 | | | | 0.9 | |
| | 425,000 | | | | | Cohen & Steers, Inc. | | | 17,884,000 | | | | 1.7 | |
| | 478,000 | | | | | Douglas Emmett, Inc. | | | 13,575,200 | | | | 1.3 | |
| | 297,229 | | | | | Financial Engines, Inc. | | | 10,863,720 | | | | 1.0 | |
| | 504,411 | | | | | Gaming and Leisure Properties, Inc. | | | 14,799,419 | | | | 1.4 | |
| | 208,000 | | | | | MSCI, Inc. - Class A | | | 9,867,520 | | | | 0.9 | |
| Shares | | | Value | | | Percentage
of Net
Assets | |
| COMMON STOCK: (continued) | |
| | | | | | | Financials (continued) | | | | | | | | |
| | 390,000 | | | | | Primerica, Inc. | | $ | 21,161,400 | | | | 2.0 | |
| | 629,700 | | | | | Other Securities | | | 38,276,766 | | | | 3.6 | |
| | | | | | | | | | 161,265,820 | | | | 15.2 | |
| | | | | | | Health Care: 8.5% | | | | | | | | |
| | 105,000 | | | | | Bio-Techne Corp. | | | 9,702,000 | | | | 0.9 | |
| | 430,000 | | | @ | | Community Health Systems, Inc. | | | 23,185,600 | | | | 2.2 | |
| | 122,200 | | | @ | | Idexx Laboratories, Inc. | | | 18,118,594 | | | | 1.7 | |
| | 73,000 | | | | | Mettler Toledo International, Inc. | | | 22,079,580 | | | | 2.1 | |
| | 301,595 | | | | | Other Securities | | | 17,664,945 | | | | 1.6 | |
| | | | | | | | | | 90,750,719 | | | | 8.5 | |
| | | | | | | Industrials: 16.7% | | | | | | | | |
| | 350,000 | | | | | Air Lease Corp. | | | 12,008,500 | | | | 1.1 | |
| | 305,000 | | | | | Colfax Corp. | | | 15,728,850 | | | | 1.5 | |
| | 355,000 | | | @ | | Copart, Inc. | | | 12,953,950 | | | | 1.2 | |
| | 157,000 | | | | | CoStar Group, Inc. | | | 28,829,910 | | | | 2.7 | |
| | 372,500 | | | | | Generac Holdings, Inc. | | | 17,418,100 | | | | 1.6 | |
| | 340,000 | | | @ | | Genesee & Wyoming, Inc. | | | 30,572,800 | | | | 2.9 | |
| | 318,000 | | | @ | | Middleby Corp. | | | 31,513,800 | | | | 3.0 | |
| | 520,712 | | | | | Other Securities | | | 28,174,371 | | | | 2.7 | |
| | | | | | | | | | 177,200,281 | | | | 16.7 | |
| | | | | | | Information Technology: 14.9% | |
| | 239,000 | | | @ | | Ansys, Inc. | | | 19,598,000 | | | | 1.8 | |
| | 287,819 | | | | | Benefitfocus, Inc. | | | 9,451,976 | | | | 0.9 | |
| | 506,500 | | | | | Booz Allen Hamilton Holding Corp. | | | 13,437,445 | | | | 1.3 | |
| | 85,000 | | | | | Factset Research Systems, Inc. | | | 11,963,750 | | | | 1.1 | |
| | 400,200 | | | @ | | Gartner, Inc. | | | 33,700,842 | | | | 3.2 | |
| | 400,000 | | | | | MAXIMUS, Inc. | | | 21,936,000 | | | | 2.1 | |
| | 385,000 | | | | | SS&C Technologies Holdings, Inc. | | | 22,518,650 | | | | 2.1 | |
| | 854,000 | | | | | Other Securities | | | 25,749,070 | | | | 2.4 | |
| | | | | | | | | | 158,355,733 | | | | 14.9 | |
| | | | | | | Materials: 2.4% | | | | | | | | |
| | 425,000 | | | | | Caesar Stone Sdot Yam Ltd. | | | 25,423,500 | | | | 2.4 | |
| | | | | | | Telecommunication Services: 0.8% | |
| | 921,311 | | | | | Iridium Communications, Inc. | | | 8,982,782 | | | | 0.8 | |
| | | | | | | Utilities: 1.8% | | | | | | | | |
| | 480,000 | | | | | ITC Holdings Corp. | | | 19,406,400 | | | | 1.8 | |
| | | | | | | Total Common Stock
(Cost $499,434,385) | | | 1,056,511,901 | | | | 99.3 | |
See Accompanying Notes to Financial Statements
| VY® Baron Growth Portfolio | SUMMARY PORTFOLIO OF INVESTMENTS
as of December 31, 2014 (continued) |
| Shares | | | Value | | | Percentage
of Net
Assets | |
| SHORT-TERM INVESTMENTS: 0.9% | |
| | | | | | | Mutual Funds: 0.9% | |
| | 9,894,651 | | | | | BlackRock Liquidity Funds, TempFund, Institutional Class, 0.030%††
(Cost $9,894,651) | | $ | 9,894,651 | | | | 0.9 | |
| | | | | | | Total Short-Term Investments
(Cost $9,894,651) | | | 9,894,651 | | | | 0.9 | |
| | | | | | | Total Investments in Securities
(Cost $509,329,036) | | $ | 1,066,406,552 | | | | 100.2 | |
| | | | | | | Liabilities in Excess of Other Assets | | | (2,395,700 | ) | | | (0.2 | ) |
| | | | | | | Net Assets | | $ | 1,064,010,852 | | | | 100.0 | |
“Other Securities” represents issues not identified as the top 50 holdings in terms of market value and issues or issuers not exceeding 1% of net assets individually or in aggregate respectively as of December 31, 2014.
The following footnotes apply to either the individual securities noted or one or more of the securities aggregated and listed as a single line item.
| †† | Rate shown is the 7-day yield as of December 31, 2014. |
| @ | Non-income producing security. |
Cost for federal income tax purposes is $510,502,998.
Net unrealized appreciation consists of:
| Gross Unrealized Appreciation | | $ | 562,139,277 | |
| Gross Unrealized Depreciation | | | (6,235,723 | ) |
| Net Unrealized Appreciation | | $ | 555,903,554 | |
Fair Value Measurements^
The following is a summary of the fair valuations according to the inputs used as of December 31, 2014 in valuing the assets and liabilities:
| | | Quoted Prices
in Active Markets
for Identical
Investments
(Level 1) | | | Significant
Other
Observable
Inputs
(Level 2) | | | Significant
Unobservable
Inputs
(Level 3) | | | Fair Value
at
December 31, 2014 | |
| Asset Table | | | | | | | | | | | | | | | | |
| Investments, at fair value | | | | | | | | | | | | | | | | |
| Common Stock* | | $ | 1,056,511,901 | | | $ | — | | | $ | — | | | $ | 1,056,511,901 | |
| Short-Term Investments | | | 9,894,651 | | | | — | | | | — | | | | 9,894,651 | |
| Total Investments, at fair value | | $ | 1,066,406,552 | | | $ | — | | | $ | — | | | $ | 1,066,406,552 | |
| ^ | See Note 2, “Significant Accounting Policies” in the Notes to Financial Statements for additional information. |
| * | For further breakdown of Common Stock by sector, please refer to the Summary Portfolio of Investments. |
See Accompanying Notes to Financial Statements
| VY® COLUMBIA CONTRARIAN CORE PORTFOLIO | SUMMARY PORTFOLIO OF INVESTMENTS
as of December 31, 2014 |
| Shares | | | Value | | | Percentage
of Net
Assets | |
| COMMON STOCK: 100.0% | |
| | | | | | | Consumer Discretionary: 13.2% | |
| | 82,135 | | | | | CBS Corp. - Class B | | $ | 4,545,351 | | | | 1.3 | |
| | 183,112 | | | | | Comcast Corp. - Class A | | | 10,622,327 | | | | 2.9 | |
| | 68,128 | | | | | Delphi Automotive PLC | | | 4,954,268 | | | | 1.4 | |
| | 89,791 | | | | | Discovery Communications, Inc. - Class A | | | 3,093,300 | | | | 0.9 | |
| | 76,149 | | | | | Lowe’s Cos, Inc. | | | 5,239,051 | | | | 1.4 | |
| | 3,115 | | | @ | | Priceline.com, Inc. | | | 3,551,754 | | | | 1.0 | |
| | 329,478 | | | | | Other Securities | | | 15,698,808 | | | | 4.3 | |
| | | | | | | | | | 47,704,859 | | | | 13.2 | |
| | | | | | | Consumer Staples: 8.4% | | |
| | 104,156 | | | | | CVS Caremark Corp. | | | 10,031,264 | | | | 2.8 | |
| | 32,015 | | | | | Diageo PLC ADR | | | 3,652,591 | | | | 1.0 | |
| | 66,098 | | | | | PepsiCo, Inc. | | | 6,250,227 | | | | 1.7 | |
| | 63,817 | | | | | Procter & Gamble Co. | | | 5,813,091 | | | | 1.6 | |
| | 42,587 | | | | | Walgreens Boots Alliance, Inc. | | | 3,245,130 | | | | 0.9 | |
| | 110,010 | | | | | Other Securities | | | 1,436,994 | | | | 0.4 | |
| | | | | | | | | | 30,429,297 | | | | 8.4 | |
| | | | | | | Energy: 6.6% | | | | | | | | |
| | 77,651 | | | | | Chevron Corp. | | | 8,710,889 | | | | 2.4 | |
| | 123,072 | | | | | Halliburton Co. | | | 4,840,422 | | | | 1.3 | |
| | 41,630 | | | | | Schlumberger Ltd. | | | 3,555,618 | | | | 1.0 | |
| | 162,859 | | | | | Other Securities | | | 6,738,114 | | | | 1.9 | |
| | | | | | | | | | 23,845,043 | | | | 6.6 | |
| | | | | | | Financials: 20.2% | | | | | | | | |
| | 54,538 | | | | | Aon PLC | | | 5,171,839 | | | | 1.4 | |
| | 490,468 | | | | | Bank of America Corp. | | | 8,774,473 | | | | 2.4 | |
| | 61,172 | | | @ | | Berkshire Hathaway, Inc. | | | 9,184,976 | | | | 2.6 | |
| | 24,549 | | | | | Blackrock, Inc. | | | 8,777,740 | | | | 2.4 | |
| | 229,456 | | | | | Citigroup, Inc. | | | 12,415,864 | | | | 3.5 | |
| | 46,104 | | | | | Goldman Sachs Group, Inc. | | | 8,936,338 | | | | 2.5 | |
| | 203,288 | | | | | JPMorgan Chase & Co. | | | 12,721,763 | | | | 3.5 | |
| | 117,845 | | | | | Wells Fargo & Co. | | | 6,460,263 | | | | 1.8 | |
| | 16,445 | | | | | Other Securities | | | 459,473 | | | | 0.1 | |
| | | | | | | | | | 72,902,729 | | | | 20.2 | |
| | | | | | | Health Care: 15.6% | | | | | | | | |
| | 141,710 | | | | | Abbott Laboratories | | | 6,379,784 | | | | 1.8 | |
| | 45,970 | | | | | Cardinal Health, Inc. | | | 3,711,158 | | | | 1.0 | |
| | 50,979 | | | | | Celgene Corp. | | | 5,702,511 | | | | 1.6 | |
| | 36,133 | | | | | Cigna Corp. | | | 3,718,447 | | | | 1.0 | |
| | 76,389 | | | | | Covidien PLC | | | 7,813,067 | | | | 2.2 | |
| Shares | | | Value | | | Percentage
of Net
Assets | |
| COMMON STOCK: (continued) | |
| | | | | | | Health Care (continued) | | |
| | 56,334 | | | | | Johnson & Johnson | | $ | 5,890,846 | | | | 1.6 | |
| | 118,300 | | | | | Medtronic, Inc. | | | 8,541,260 | | | | 2.4 | |
| | 35,441 | | | | | Perrigo Co. PLC | | | 5,924,318 | | | | 1.6 | |
| | 44,520 | | | | | St. Jude Medical, Inc. | | | 2,895,136 | | | | 0.8 | |
| | 28,239 | | | @ | | Vertex Pharmaceuticals, Inc. | | | 3,354,793 | | | | 0.9 | |
| | 64,447 | | | | | Other Securities | | | 2,527,951 | | | | 0.7 | |
| | | | | | | | | | 56,459,271 | | | | 15.6 | |
| | | | | | | Industrials: 11.3% | | | | | | | | |
| | 85,444 | | | | | Eaton Corp. PLC | | | 5,806,774 | | | | 1.6 | |
| | 16,431 | | | | | FedEx Corp. | | | 2,853,407 | | | | 0.8 | |
| | 173,355 | | | | | General Electric Co. | | | 4,380,681 | | | | 1.2 | |
| | 93,527 | | | | | Honeywell International, Inc. | | | 9,345,218 | | | | 2.6 | |
| | 96,032 | | | | | Tyco International Plc | | | 4,211,963 | | | | 1.2 | |
| | 42,515 | | | | | United Technologies Corp. | | | 4,889,225 | | | | 1.3 | |
| | 91,967 | | | | | Other Securities | | | 9,252,443 | | | | 2.6 | |
| | | | | | | | | | 40,739,711 | | | | 11.3 | |
| | | | | | | Information Technology: 19.1% | | |
| | 151,841 | | | | | Apple, Inc. | | | 16,760,210 | | | | 4.6 | |
| | 76,407 | | | | | Broadcom Corp. | | | 3,310,715 | | | | 0.9 | |
| | 104,764 | | | @ | | Electronic Arts, Inc. | | | 4,925,480 | | | | 1.4 | |
| | 136,949 | | | | | EMC Corp. | | | 4,072,863 | | | | 1.1 | |
| | 15,971 | | | | | Google, Inc. | | | 8,407,135 | | | | 2.3 | |
| | 7,993 | | | | | Google, Inc. - Class A | | | 4,241,565 | | | | 1.2 | |
| | 48,656 | | | | | Intuit, Inc. | | | 4,485,597 | | | | 1.2 | |
| | 80,590 | | | | | Mastercard, Inc. | | | 6,943,634 | | | | 1.9 | |
| | 191,475 | | | | | Microsoft Corp. | | | 8,894,014 | | | | 2.5 | |
| | 39,358 | | | | | Qualcomm, Inc. | | | 2,925,480 | | | | 0.8 | |
| | 84,717 | | | | | Other Securities | | | 4,210,200 | | | | 1.2 | |
| | | | | | | | | | 69,176,893 | | | | 19.1 | |
| | | | | | | Materials: 3.2% | | | | | | | | |
| | 48,040 | | | | | LyondellBasell Industries
NV - Class A | | | 3,813,896 | | | | 1.1 | |
| | 38,865 | | | | | Monsanto Co. | | | 4,643,201 | | | | 1.3 | |
| | 87,324 | | | | | Other Securities | | | 2,996,414 | | | | 0.8 | |
| | | | | | | | | | 11,453,511 | | | | 3.2 | |
| | | | | | | Telecommunication Services: 2.4% | |
| | 184,072 | | | | | Verizon Communications, Inc. | | | 8,610,888 | | | | 2.4 | |
| | | | | | | Total Common Stock
(Cost $303,121,911) | | | 361,322,202 | | | | 100.0 | |
See Accompanying Notes to Financial Statements
| VY® COLUMBIA CONTRARIAN CORE PORTFOLIO | SUMMARY PORTFOLIO OF INVESTMENTS
as of December 31, 2014 (continued) |
Principal
Amount† | | | Value | | | Percentage
of Net
Assets | |
| CORPORATE BONDS/NOTES: –% | |
| | | | | | | Materials: –% | | | | | | | | |
| | 649,000 | | | | | Other Securities | | $ | — | | | | — | |
| | | | | | | Total Corporate Bonds/Notes
(Cost $–) | | | — | | | | — | |
| | | | | | | Total Investments in Securities
(Cost $303,121,911) | | $ | 361,322,202 | | | | 100.0 | |
| | | | | | | Assets in Excess of Other Liabilities | | | 29,721 | | | | — | |
| | | | | | | Net Assets | | $ | 361,351,923 | | | | 100.0 | |
“Other Securities” represents issues not identified as the top 50 holdings in terms of market value and issues or issuers not exceeding 1% of net assets individually or in aggregate respectively as of December 31, 2014.
The following footnotes apply to either the individual securities noted or one or more of the securities aggregated and listed as a single line item.
| † | Unless otherwise indicated, principal amount is shown in USD. |
| @ | Non-income producing security. |
| ADR | American Depositary Receipt |
Cost for federal income tax purposes is $303,457,683.
Net unrealized appreciation consists of:
| Gross Unrealized Appreciation | | $ | 61,689,919 | |
| Gross Unrealized Depreciation | | | (3,825,400 | ) |
| Net Unrealized Appreciation | | $ | 57,864,519 | |
Fair Value Measurements^
The following is a summary of the fair valuations according to the inputs used as of December 31, 2014 in valuing the assets and liabilities:
| | | Quoted Prices
in Active Markets
for Identical
Investments
(Level 1) | | | Significant
Other
Observable
Inputs
(Level 2) | | | Significant
Unobservable
Inputs
(Level 3) | | | Fair Value
at
December 31, 2014 | |
| Asset Table | | | | | | | | | | | | | | | | |
| Investments, at fair value | | | | | | | | | | | | | | | | |
| Common Stock* | | $ | 361,322,202 | | | $ | — | | | $ | — | | | $ | 361,322,202 | |
| Corporate Bonds/Notes | | | — | | | | — | | | | — | | | | — | |
| Total Investments, at fair value | | $ | 361,322,202 | | | $ | — | | | $ | — | | | $ | 361,322,202 | |
| ^ | See Note 2, “Significant Accounting Policies” in the Notes to Financial Statements for additional information. |
| * | For further breakdown of Common Stock by sector, please refer to the Summary Portfolio of Investments. |
See Accompanying Notes to Financial Statements
| VY® Columbia Small Cap Value II Portfolio | SUMMARY PORTFOLIO OF INVESTMENTS
as of December 31, 2014 |
| Shares | | | Value | | | Percentage
of Net
Assets | |
| COMMON STOCK: 96.7% | |
| | | | | | | Consumer Discretionary: 12.7% | |
| | 103,000 | | | @ | | American Axle & Manufacturing Holdings, Inc. | | $ | 2,326,770 | | | | 0.9 | |
| | 90,000 | | | | | Del Frisco’s Restaurant Group, Inc. | | | 2,136,600 | | | | 0.9 | |
| | 38,000 | | | @ | | Helen of Troy Ltd. | | | 2,472,280 | | | | 1.0 | |
| | 124,300 | | | @ | | Nord Anglia Education, Inc. | | | 2,371,644 | | | | 1.0 | |
| | 97,000 | | | | | Sonic Corp. | | | 2,641,310 | | | | 1.1 | |
| | 45,000 | | | @ | | Tenneco, Inc. | | | 2,547,450 | | | | 1.0 | |
| | 867,357 | | | | | Other Securities | | | 16,674,423 | | | | 6.8 | |
| | | | | | | | | | 31,170,477 | | | | 12.7 | |
| | | | | | | Consumer Staples: 1.2% | |
| | 34,000 | | | | | TreeHouse Foods, Inc. | | | 2,908,020 | | | | 1.2 | |
| | | | | | | Energy: 4.0% | | | | | | | | |
| | 371,220 | | | | | Other Securities | | | 9,858,100 | | | | 4.0 | |
| | | | | | | Financials: 35.8% | | | | | | | | |
| | 82,500 | | | | | American Assets Trust, Inc. | | | 3,284,325 | | | | 1.3 | |
| | 100,000 | | | | | American Equity Investment Life Holding Co. | | | 2,919,000 | | | | 1.2 | |
| | 72,300 | | | | | Amerisafe, Inc. | | | 3,062,628 | | | | 1.3 | |
| | 43,093 | | | | | Amtrust Financial Services, Inc. | | | 2,423,981 | | | | 1.0 | |
| | 45,777 | | | | | Argo Group International Holdings Ltd. | | | 2,539,250 | | | | 1.0 | |
| | 143,200 | | | | | CNO Financial Group, Inc. | | | 2,465,904 | | | | 1.0 | |
| | 71,100 | | | | | Community Bank System, Inc. | | | 2,711,043 | | | | 1.1 | |
| | 115,000 | | | | | CubeSmart | | | 2,538,050 | | | | 1.0 | |
| | 120,000 | | | | | EverBank Financial Corp. | | | 2,287,200 | | | | 0.9 | |
| | 49,000 | | | | | Highwoods Properties, Inc. | | | 2,169,720 | | | | 0.9 | |
| | 65,000 | | | | | Independent Bank Corp. | | | 2,782,650 | | | | 1.1 | |
| | 36,800 | | | | | Kilroy Realty Corp. | | | 2,541,776 | | | | 1.0 | |
| | 62,000 | | | | | LaSalle Hotel Properties | | | 2,509,140 | | | | 1.0 | |
| | 80,200 | | | | | PrivateBancorp, Inc. | | | 2,678,680 | | | | 1.1 | |
| | 91,000 | | | | | Renasant Corp. | | | 2,632,630 | | | | 1.1 | |
| | 70,000 | | | | | RLJ Lodging Trust | | | 2,347,100 | | | | 1.0 | |
| | 83,000 | | | | | Sandy Spring Bancorp, Inc. | | | 2,164,640 | | | | 0.9 | |
| | 205,000 | | | | | Sterling Bancorp/DE | | | 2,947,900 | | | | 1.2 | |
| | 117,000 | | | | | Symetra Financial Corp. | | | 2,696,850 | | | | 1.1 | |
| | 139,000 | | | | | Umpqua Holdings Corp. | | | 2,364,390 | | | | 1.0 | |
| | 98,000 | | | | | Union Bankshares Corp. | | | 2,359,840 | | | | 1.0 | |
| | 107,000 | | | | | Western Alliance Bancorp. | | | 2,974,600 | | | | 1.2 | |
| | 47,000 | | | | | Wintrust Financial Corp. | | | 2,197,720 | | | | 0.9 | |
| | 1,543,902 | | | | | Other Securities | | | 28,108,073 | | | | 11.5 | |
| | | | | | | | | | 87,707,090 | | | | 35.8 | |
| Shares | | | Value | | | Percentage
of Net
Assets | |
| COMMON STOCK: (continued) | |
| | | | | | | Health Care: 8.2% | | | | | | | | |
| | 96,000 | | | | | Catalent, Inc. | | $ | 2,676,480 | | | | 1.1 | |
| | 121,370 | | | @ | | Healthways, Inc. | | | 2,412,836 | | | | 1.0 | |
| | 32,000 | | | | | LifePoint Hospitals, Inc. | | | 2,301,120 | | | | 0.9 | |
| | 60,000 | | | @ | | VCA, Inc. | | | 2,926,200 | | | | 1.2 | |
| | 438,200 | | | | | Other Securities | | | 9,669,508 | | | | 4.0 | |
| | | | | | | | | | 19,986,144 | | | | 8.2 | |
| | | | | | | Industrials: 11.4% | | | | | | | | |
| | 42,000 | | | | | Alaska Air Group, Inc. | | | 2,509,920 | | | | 1.0 | |
| | 47,000 | | | | | Deluxe Corp. | | | 2,925,750 | | | | 1.2 | |
| | 84,400 | | | | | Heartland Express, Inc. | | | 2,279,644 | | | | 0.9 | |
| | 151,000 | | | @ | | Navigant Consulting, Inc. | | | 2,320,870 | | | | 1.0 | |
| | 91,000 | | | | | Swift Transportation Co. | | | 2,605,330 | | | | 1.1 | |
| | 699,632 | | | | | Other Securities | | | 15,307,293 | | | | 6.2 | |
| | | | | | | | | | 27,948,807 | | | | 11.4 | |
| | | | | | | Information Technology: 10.3% | |
| | 140,000 | | | | | Endurance International Group Holdings, Inc. | | | 2,580,200 | | | | 1.1 | |
| | 145,000 | | | @ | | Integrated Device Technology, Inc. | | | 2,842,000 | | | | 1.2 | |
| | 175,900 | | | @ | | Kulicke & Soffa Industries, Inc. | | | 2,543,514 | | | | 1.0 | |
| | 105,500 | | | | | Mentor Graphics Corp. | | | 2,312,560 | | | | 0.9 | |
| | 26,400 | | | @ | | Rogers Corp. | | | 2,150,016 | | | | 0.9 | |
| | 796,684 | | | | | Other Securities | | | 12,864,350 | | | | 5.2 | |
| | | | | | | | | | 25,292,640 | | | | 10.3 | |
| | | | | | | Materials: 7.6% | | | | | | | | |
| | 32,300 | | | @ | | Clearwater Paper Corp. | | | 2,214,165 | | | | 0.9 | |
| | 46,500 | | | | | Neenah Paper, Inc. | | | 2,802,555 | | | | 1.1 | |
| | 624,193 | | | | | Other Securities | | | 13,706,007 | | | | 5.6 | |
| | | | | | | | | | 18,722,727 | | | | 7.6 | |
| | | | | | | Utilities: 5.5% | | | | | | | | |
| | 82,500 | | | | | Avista Corp. | | | 2,916,375 | | | | 1.2 | |
| | 46,000 | | | | | New Jersey Resources Corp. | | | 2,815,200 | | | | 1.2 | |
| | 36,200 | | | | | Southwest Gas Corp. | | | 2,237,522 | | | | 0.9 | |
| | 63,200 | | | | | UIL Holdings Corp. | | | 2,751,728 | | | | 1.1 | |
| | 53,178 | | | | | Other Securities | | | 2,651,937 | | | | 1.1 | |
| | | | | | | | | | 13,372,762 | | | | 5.5 | |
| | | | | | | Total Common Stock
(Cost $190,466,259) | | | 236,966,767 | | | | 96.7 | |
See Accompanying Notes to Financial Statements
| VY® Columbia Small Cap Value II Portfolio | SUMMARY PORTFOLIO OF INVESTMENTS
as of December 31, 2014 (continued) |
| Shares | | | Value | | | Percentage
of Net
Assets | |
| SHORT-TERM INVESTMENTS: 3.1% | |
| | | | | | | Mutual Funds: 3.1% | | | | | | | | |
| | 7,538,843 | | | | | BlackRock Liquidity Funds, TempFund, Institutional Class, 0.030%††
(Cost $7,538,843) | | $ | 7,538,843 | | | | 3.1 | |
| | | | | | | Total Short-Term Investments
(Cost $7,538,843) | | | 7,538,843 | | | | 3.1 | |
| | | | | | | Total Investments in Securities
(Cost $198,005,102) | | $ | 244,505,610 | | | | 99.8 | |
| | | | | | | Assets in Excess of Other Liabilities | | | 525,956 | | | | 0.2 | |
| | | | | | | Net Assets | | $ | 245,031,566 | | | | 100.0 | |
“Other Securities” represents issues not identified as the top 50 holdings in terms of market value and issues or issuers not exceeding 1% of net assets individually or in aggregate respectively as of December 31, 2014.
The following footnotes apply to either the individual securities noted or one or more of the securities aggregated and listed as a single line item.
| †† | Rate shown is the 7-day yield as of December 31, 2014. |
| @ | Non-income producing security. |
Cost for federal income tax purposes is $198,485,993.
Net unrealized appreciation consists of:
| Gross Unrealized Appreciation | | $ | 51,224,217 | |
| Gross Unrealized Depreciation | | | (5,204,600 | ) |
| Net Unrealized Appreciation | | $ | 46,019,617 | |
Fair Value Measurements^
The following is a summary of the fair valuations according to the inputs used as of December 31, 2014 in valuing the assets and liabilities:
| | | Quoted Prices
in Active Markets
for Identical
Investments
(Level 1) | | | Significant
Other
Observable
Inputs
(Level 2) | | | Significant
Unobservable
Inputs
(Level 3) | | | Fair Value
at
December 31, 2014 | |
| Asset Table | | | | | | | | | | | | | | | | |
| Investments, at fair value | | | | | | | | | | | | | | | | |
| Common Stock* | | $ | 236,966,767 | | | $ | — | | | $ | — | | | $ | 236,966,767 | |
| Short-Term Investments | | | 7,538,843 | | | | — | | | | — | | | | 7,538,843 | |
| Total Investments, at fair value | | $ | 244,505,610 | | | $ | — | | | $ | — | | | $ | 244,505,610 | |
| ^ | See Note 2, “Significant Accounting Policies” in the Notes to Financial Statements for additional information. |
| * | For further breakdown of Common Stock by sector, please refer to the Summary Portfolio of Investments. |
See Accompanying Notes to Financial Statements
| VY® Invesco Comstock Portfolio | SUMMARY PORTFOLIO OF INVESTMENTS
as of December 31, 2014 |
| Shares | | | Value | | | Percentage
of Net
Assets | |
| COMMON STOCK: 97.2% | |
| | | | | | | Consumer Discretionary: 16.7% | |
| | 274,561 | | | | | Carnival Corp. | | $ | 12,445,850 | | | | 2.2 | |
| | 144,512 | | | | | Comcast Corp. - Class A | | | 8,383,141 | | | | 1.5 | |
| | 287,235 | | | | | General Motors Co. | | | 10,027,374 | | | | 1.8 | |
| | 210,772 | | | | | Johnson Controls, Inc. | | | 10,188,718 | | | | 1.8 | |
| | 135,638 | | | | | Kohl’s Corp. | | | 8,279,344 | | | | 1.5 | |
| | 81,076 | | | | | Target Corp. | | | 6,154,479 | | | | 1.1 | |
| | 48,852 | | | | | Time Warner Cable, Inc. | | | 7,428,435 | | | | 1.3 | |
| | 44,966 | | | | | Time Warner, Inc. | | | 3,840,996 | | | | 0.7 | |
| | 216,850 | | | | | Twenty-First Century Fox, Inc. Class B | | | 7,999,596 | | | | 1.4 | |
| | 138,231 | | | | | Viacom - Class B | | | 10,401,883 | | | | 1.8 | |
| | 178,475 | | | | | Other Securities | | | 9,413,735 | | | | 1.6 | |
| | | | | | | | | | 94,563,551 | | | | 16.7 | |
| | | | | | | Consumer Staples: 4.6% | |
| | 260,835 | | | | | ConAgra Foods, Inc. | | | 9,463,094 | | | | 1.7 | |
| | 312,486 | | | | | Other Securities | | | 16,783,286 | | | | 2.9 | |
| | | | | | | | | | 26,246,380 | | | | 4.6 | |
| | | | | | | Energy: 15.0% | | | | | | | | |
| | 262,310 | | | | | BP PLC ADR | | | 9,999,257 | | | | 1.7 | |
| | 59,037 | | | | | Chevron Corp. | | | 6,622,771 | | | | 1.2 | |
| | 96,050 | | | | | Devon Energy Corp. | | | 5,879,220 | | | | 1.0 | |
| | 128,398 | | | | | Halliburton Co. | | | 5,049,893 | | | | 0.9 | |
| | 136,278 | | | | | Murphy Oil Corp. | | | 6,884,765 | | | | 1.2 | |
| | 68,637 | | | | | Occidental Petroleum Corp. | | | 5,532,829 | | | | 1.0 | |
| | 192,305 | | | | | Royal Dutch Shell PLC - Class A ADR | | | 12,874,820 | | | | 2.3 | |
| | 427,439 | | | | | Suncor Energy, Inc. | | | 13,584,011 | | | | 2.4 | |
| | 885,319 | | | @ | | Weatherford International PLC | | | 10,136,903 | | | | 1.8 | |
| | 493,070 | | | | | Other Securities | | | 8,743,076 | | | | 1.5 | |
| | | | | | | | | | 85,307,545 | | | | 15.0 | |
| | | | | | | Financials: 24.5% | | | | | | | | |
| | 116,336 | | | | | Allstate Corp. | | | 8,172,604 | | | | 1.4 | |
| | 634,797 | | | | | Bank of America Corp. | | | 11,356,518 | | | | 2.0 | |
| | 208,991 | | | | | Bank of New York Mellon Corp. | | | 8,478,765 | | | | 1.5 | |
| | 473,345 | | | | | Citigroup, Inc. | | | 25,612,698 | | | | 4.5 | |
| | 316,562 | | | | | Fifth Third Bancorp. | | | 6,449,951 | | | | 1.1 | |
| | 29,279 | | | | | Goldman Sachs Group, Inc. | | | 5,675,149 | | | | 1.0 | |
| | 284,716 | | | | | JPMorgan Chase & Co. | | | 17,817,527 | | | | 3.1 | |
| | 156,883 | | | | | Metlife, Inc. | | | 8,485,801 | | | | 1.5 | |
| Shares | | | Value | | | Percentage
of Net
Assets | |
| COMMON STOCK: (continued) | |
| | | | | | | Financials (continued) | | | | | | | | |
| | 259,192 | | | | | Morgan Stanley | | $ | 10,056,650 | | | | 1.8 | |
| | 98,009 | | | | | PNC Financial Services Group, Inc. | | | 8,941,361 | | | | 1.6 | |
| | 127,993 | | | | | State Street Corp. | | | 10,047,450 | | | | 1.8 | |
| | 202,557 | | | | | Wells Fargo & Co. | | | 11,104,175 | | | | 1.9 | |
| | 131,254 | | | | | Other Securities | | | 7,193,440 | | | | 1.3 | |
| | | | | | | | | | 139,392,089 | | | | 24.5 | |
| | | | | | | Health Care: 12.6% | | | | | | | | |
| | 52,861 | | | | | Anthem, Inc. | | | 6,643,042 | | | | 1.2 | |
| | 85,274 | | | | | Bristol-Myers Squibb Co. | | | 5,033,724 | | | | 0.9 | |
| | 196,473 | | | | | Merck & Co., Inc. | | | 11,157,702 | | | | 2.0 | |
| | 100,893 | | | | | Novartis AG | | | 9,357,168 | | | | 1.6 | |
| | 280,768 | | | | | Pfizer, Inc. | | | 8,745,923 | | | | 1.5 | |
| | 156,661 | | | | | Sanofi-Aventis SA ADR | | | 7,145,308 | | | | 1.2 | |
| | 402,550 | | | | | Other Securities | | | 23,709,731 | | | | 4.2 | |
| | | | | | | | | | 71,792,598 | | | | 12.6 | |
| | | | | | | Industrials: 6.9% | | | | | | | | |
| | 87,149 | | | | | Emerson Electric Co. | | | 5,379,708 | | | | 1.0 | |
| | 572,769 | | | | | General Electric Co. | | | 14,473,872 | | | | 2.5 | |
| | 120,469 | | | | | Ingersoll-Rand PLC - Class A | | | 7,636,530 | | | | 1.3 | |
| | 178,579 | | | | | Textron, Inc. | | | 7,519,962 | | | | 1.3 | |
| | 43,559 | | | | | Other Securities | | | 4,352,415 | | | | 0.8 | |
| | | | | | | | | | 39,362,487 | | | | 6.9 | |
| | | | | | | Information Technology: 12.6% | |
| | 405,960 | | | | | Cisco Systems, Inc. | | | 11,291,777 | | | | 2.0 | |
| | 82,084 | | | @ | | Citrix Systems, Inc. | | | 5,236,959 | | | | 0.9 | |
| | 222,978 | | | | | Corning, Inc. | | | 5,112,886 | | | | 0.9 | |
| | 174,412 | | | @ | | eBay, Inc. | | | 9,788,001 | | | | 1.7 | |
| | 218,334 | | | | | Hewlett-Packard Co. | | | 8,761,743 | | | | 1.5 | |
| | 173,874 | | | | | Intel Corp. | | | 6,309,888 | | | | 1.1 | |
| | 228,155 | | | | | Microsoft Corp. | | | 10,597,800 | | | | 1.9 | |
| | 336,318 | | | | | Symantec Corp. | | | 8,628,238 | | | | 1.5 | |
| | 110,929 | | | | | Other Securities | | | 6,009,720 | | | | 1.1 | |
| | | | | | | | | | 71,737,012 | | | | 12.6 | |
| | | | | | | Materials: 1.8% | | | | | | | | |
| | 100,207 | | | | | International Paper Co. | | | 5,369,091 | | | | 1.0 | |
| | 298,446 | | | | | Other Securities | | | 4,712,462 | | | | 0.8 | |
| | | | | | | | | | 10,081,553 | | | | 1.8 | |
See Accompanying Notes to Financial Statements
| VY® Invesco Comstock Portfolio | SUMMARY PORTFOLIO OF INVESTMENTS
as of December 31, 2014 (continued) |
| Shares | | | Value | | | Percentage
of Net
Assets | |
| COMMON STOCK: (continued) | |
| | | | | | | Telecommunication Services: 1.5% | |
| | 242,293 | | | | | Other Securities | | $ | 8,321,937 | | | | 1.5 | |
| | | | | | | Utilities: 1.0% | | | | | | | | |
| | 126,508 | | | | | Other Securities | | | 5,672,806 | | | | 1.0 | |
| | | | | | | Total Common Stock
(Cost $421,296,158) | | | 552,477,958 | | | | 97.2 | |
| SHORT-TERM INVESTMENTS: 3.1% | | | | | | | | |
| | | | | | | Mutual Funds: 3.1% | |
| | 17,862,798 | | | | | BlackRock Liquidity Funds, TempFund, Institutional Class, 0.030%††
(Cost $17,862,798) | | | 17,862,798 | | | | 3.1 | |
| | | | | | | Total Short-Term Investments
(Cost $17,862,798) | | | 17,862,798 | | | | 3.1 | |
| | | | | | | Total Investments in Securities
(Cost $439,158,956) | | $ | 570,340,756 | | | | 100.3 | |
| | | | | | | Liabilities in Excess of Other Assets | | | (1,451,774 | ) | | | (0.3 | ) |
| | | | | | | Net Assets | | $ | 568,888,982 | | | | 100.0 | |
“Other Securities” represents issues not identified as the top 50 holdings in terms of market value and issues or issuers not exceeding 1% of net assets individually or in aggregate respectively as of December 31, 2014.
The following footnotes apply to either the individual securities noted or one or more of the securities aggregated and listed as a single line item.
| †† | Rate shown is the 7-day yield as of December 31, 2014. |
| @ | Non-income producing security. |
| ADR | American Depositary Receipt |
Cost for federal income tax purposes is $454,643,274.
Net unrealized appreciation consists of:
| Gross Unrealized Appreciation | | $ | 139,436,593 | |
| Gross Unrealized Depreciation | | | (23,739,111 | ) |
| Net Unrealized Appreciation | | $ | 115,697,482 | |
Fair Value Measurements^
The following is a summary of the fair valuations according to the inputs used as of December 31, 2014 in valuing the assets and liabilities:
| | | Quoted Prices
in Active Markets
for Identical
Investments
(Level 1) | | | Significant
Other
Observable
Inputs#
(Level 2) | | | Significant
Unobservable
Inputs
(Level 3) | | | Fair Value
at
December 31, 2014 | |
| Asset table | | | | | | | | | | | | | | | | |
| Investments, at fair value | | | | | | | | | | | | | | | | |
| Common Stock | | | | | | | | | | | | | | | | |
| Consumer Discretionary | | $ | 94,563,551 | | | $ | — | | | $ | — | | | $ | 94,563,551 | |
| Consumer Staples | | | 26,246,380 | | | | — | | | | — | | | | 26,246,380 | |
| Energy | | | 85,307,545 | | | | — | | | | — | | | | 85,307,545 | |
| Financials | | | 139,392,089 | | | | — | | | | — | | | | 139,392,089 | |
| Health Care | | | 62,435,430 | | | | 9,357,168 | | | | — | | | | 71,792,598 | |
| Industrials | | | 39,362,487 | | | | — | | | | — | | | | 39,362,487 | |
| Information Technology | | | 71,737,012 | | | | — | | | | — | | | | 71,737,012 | |
| Materials | | | 10,081,553 | | | | — | | | | — | | | | 10,081,553 | |
| Telecommunication Services | | | 4,896,369 | | | | 3,425,568 | | | | — | | | | 8,321,937 | |
| Utilities | | | 5,672,806 | | | | — | | | | — | | | | 5,672,806 | |
| Total Common Stock | | | 539,695,222 | | | | 12,782,736 | | | | — | | | | 552,477,958 | |
| Short-Term Investments | | | 17,862,798 | | | | — | | | | — | | | | 17,862,798 | |
| Total Investments, at fair value | | $ | 557,558,020 | | | $ | 12,782,736 | | | $ | — | | | $ | 570,340,756 | |
| Other Financial Instruments+ | | | | | | | | | | | | | | | | |
| Forward Foreign Currency Contracts | | | — | | | | 971,596 | | | | — | | | | 971,596 | |
| Total Assets | | $ | 557,558,020 | | | $ | 13,754,332 | | | $ | — | | | $ | 571,312,352 | |
See Accompanying Notes to Financial Statements
| VY® Invesco Comstock Portfolio | SUMMARY PORTFOLIO OF INVESTMENTS
as of December 31, 2014 (continued) |
| ^ | See Note 2, “Significant Accounting Policies” in the Notes to Financial Statements for additional information. |
| + | Other Financial Instruments are derivatives not reflected in the Portfolio of Investments and may include open forward foreign currency contracts, futures, centrally cleared swaps, OTC swaps and written options. Forward foreign currency contracts, futures and centrally cleared swaps are valued at the unrealized gain (loss) on the instrument. OTC swaps and written options are valued at the fair value of the instrument. |
| # | The earlier close of the foreign markets gives rise to the possibility that significant events, including broad market moves, may have occurred in the interim and may materially affect the value of those securities. To account for this, the Portfolio may frequently value many of its foreign equity securities using fair value prices based on third party vendor modeling tools to the extent available. Accordingly, a portion of the Portfolio’s investments are categorized as Level 2 investments. |
At December 31, 2014, the following forward foreign currency contracts were outstanding for VY® Invesco Comstock Portfolio:
| Counterparty | | Currency | | Contract Amount | | | Buy/Sell | | Settlement Date | | In Exchange For | | | Fair Value | | | Unrealized
Appreciation
(Depreciation) | |
| Barclays Bank PLC | | British Pound | | | 1,632,243 | | | Sell | | 01/16/15 | | $ | 2,563,201 | | | $ | 2,543,742 | | | $ | 19,459 | |
| Barclays Bank PLC | | Canadian Dollar | | | 2,934,644 | | | Sell | | 01/16/15 | | | 2,543,658 | | | | 2,525,165 | | | | 18,493 | |
| Barclays Bank PLC | | Swiss Franc | | | 3,019,869 | | | Sell | | 01/16/15 | | | 3,113,684 | | | | 3,038,199 | | | | 75,485 | |
| CIBC World Markets | | EU Euro | | | 4,495,673 | | | Sell | | 01/16/15 | | | 5,570,588 | | | | 5,440,832 | | | | 129,756 | |
| CIBC World Markets | | Canadian Dollar | | | 2,934,644 | | | Sell | | 01/16/15 | | | 2,544,232 | | | | 2,525,166 | | | | 19,066 | |
| CIBC World Markets | | Swiss Franc | | | 3,019,869 | | | Sell | | 01/16/15 | | | 3,114,423 | | | | 3,038,200 | | | | 76,223 | |
| CIBC World Markets | | British Pound | | | 1,632,242 | | | Sell | | 01/16/15 | | | 2,563,004 | | | | 2,543,741 | | | | 19,263 | |
| Deutsche Bank AG | | British Pound | | | 1,632,242 | | | Sell | | 01/16/15 | | | 2,563,033 | | | | 2,543,741 | | | | 19,292 | |
| Deutsche Bank AG | | Canadian Dollar | | | 2,934,644 | | | Sell | | 01/16/15 | | | 2,542,849 | | | | 2,525,165 | | | | 17,684 | |
| Deutsche Bank AG | | EU Euro | | | 4,495,673 | | | Sell | | 01/16/15 | | | 5,570,045 | | | | 5,440,833 | | | | 129,212 | |
| Deutsche Bank AG | | Swiss Franc | | | 3,019,869 | | | Sell | | 01/16/15 | | | 3,113,697 | | | | 3,038,200 | | | | 75,497 | |
| Goldman Sachs & Co. | | Canadian Dollar | | | 2,934,644 | | | Sell | | 01/16/15 | | | 2,542,490 | | | | 2,525,165 | | | | 17,325 | |
| Goldman Sachs & Co. | | Swiss Franc | | | 3,019,868 | | | Sell | | 01/16/15 | | | 3,113,876 | | | | 3,038,199 | | | | 75,677 | |
| Goldman Sachs & Co. | | British Pound | | | 1,632,242 | | | Sell | | 01/16/15 | | | 2,562,930 | | | | 2,543,741 | | | | 19,189 | |
| Goldman Sachs & Co. | | EU Euro | | | 4,495,673 | | | Sell | | 01/16/15 | | | 5,571,622 | | | | 5,440,832 | | | | 130,790 | |
| Royal Bank of Canada | | EU Euro | | | 4,495,673 | | | Sell | | 01/16/15 | | | 5,570,018 | | | | 5,440,833 | | | | 129,185 | |
| | | | | | | | | | | | | | | | | | | | | $ | 971,596 | |
A summary of derivative instruments by primary risk exposure is outlined in the following tables.
The fair value of derivative instruments as of December 31, 2014 was as follows:
| Derivatives not accounted for as hedging instruments | | Location on Statement
of Assets and Liabilities | | Fair Value | |
| Asset Derivatives | | | | | | |
| Foreign exchange contracts | | Unrealized appreciation on forward foreign currency contracts | | $ | 971,596 | |
| Total Asset Derivatives | | | | $ | 971,596 | |
The effect of derivative instruments on the Portfolio’s Statement of Operations for the year ended December 31, 2014 was as follows:
Amount of Realized Gain or (Loss) on Derivatives Recognized in Income
| Derivatives not accounted for as hedging instruments | | Foreign currency
related transactions* | |
| Foreign exchange contracts | | $ | 4,427,625 | |
| Total | | $ | 4,427,625 | |
See Accompanying Notes to Financial Statements
| VY® Invesco Comstock Portfolio | SUMMARY PORTFOLIO OF INVESTMENTS
as of December 31, 2014 (continued) |
Change in Unrealized Appreciation or (Depreciation) on Derivatives Recognized in Income
| Derivatives not accounted for as hedging instruments | | Foreign currency
related transactions* | |
| Foreign exchange contracts | | $ | 1,098,635 | |
| Total | | $ | 1,098,635 | |
| * | Amounts recognized for forward foreign currency contracts are included in net realized gain (loss) on foreign currency related transactions and net change in unrealized appreciation or depreciation on foreign currency related transactions. |
The following is a summary by counterparty of the fair value of OTC derivative instruments subject to Master Netting Agreements and collateral pledged (received), if any, at December 31, 2014:
| | | Barclays
Bank PLC | | | CIBC
World Markets | | | Deutsche
Bank AG | | | Goldman
Sachs & Co. | | | Royal Bank
of Canada | | | Totals | |
| Assets: | | | | | | | | | | | | | | | | | | | | | | | | |
| Forward foreign currency contracts | | $ | 113,437 | | | $ | 244,308 | | | $ | 241,685 | | | $ | 242,981 | | | $ | 129,185 | | | $ | 971,596 | |
| Total Assets | | $ | 113,437 | | | $ | 244,308 | | | $ | 241,685 | | | $ | 242,981 | | | $ | 129,185 | | | $ | 971,596 | |
| Net OTC derivative instruments by counterparty, at fair value | | $ | 113,437 | | | $ | 244,308 | | | $ | 241,685 | | | $ | 242,981 | | | $ | 129,185 | | | | 971,596 | |
| Total collateral pledged by the Portfolio/(Received from counterparty) | | $ | — | | | $ | — | | | $ | — | | | $ | — | | | $ | — | | | $ | — | |
| Net Exposure(1) | | $ | 113,437 | | | $ | 244,308 | | | $ | 241,685 | | | $ | 242,981 | | | $ | 129,185 | | | $ | 971,596 | |
| (1) | Positive net exposure represents amounts due from each respective counterparty. Negative exposure represents amounts due from the Portfolio. Please refer to Note 2 for additional details regarding counterparty credit risk and credit related contingent features. |
See Accompanying Notes to Financial Statements
| VY® Invesco Equity and Income Portfolio | SUMMARY PORTFOLIO OF INVESTMENTS
as of December 31, 2014 |
| Shares | | | Value | | | Percentage
of Net
Assets | |
| COMMON STOCK: 64.6% | |
| | | | | | | Consumer Discretionary: 7.1% | |
| | 514,311 | | | | | Carnival Corp. | | $ | 23,313,718 | | | | 1.1 | |
| | 419,142 | | | | | Comcast Corp. - Class A | | | 24,314,427 | | | | 1.1 | |
| | 483,038 | | | | | General Motors Co. | | | 16,862,857 | | | | 0.8 | |
| | 340,023 | | | | | Target Corp. | | | 25,811,146 | | | | 1.2 | |
| | 111,218 | | | | | Time Warner Cable, Inc. | | | 16,911,809 | | | | 0.8 | |
| | 118,872 | | | | | Time Warner, Inc. | | | 10,154,046 | | | | 0.5 | |
| | 299,873 | | | | | Viacom - Class B | | | 22,565,443 | | | | 1.0 | |
| | 312,328 | | | | | Other Securities(a) | | | 12,600,115 | | | | 0.6 | |
| | | | | | | | | | 152,533,561 | | | | 7.1 | |
| | | | | | | Consumer Staples: 3.9% | |
| | 333,519 | | | | | Archer-Daniels-Midland Co. | | | 17,342,988 | | | | 0.8 | |
| | 468,838 | | | | | Mondelez International, Inc. | | | 17,030,540 | | | | 0.8 | |
| | 179,953 | | | | | Philip Morris International, Inc. | | | 14,657,172 | | | | 0.7 | |
| | 202,276 | | | | | Procter & Gamble Co. | | | 18,425,321 | | | | 0.9 | |
| | 340,531 | | | | | Other Securities | | | 15,734,601 | | | | 0.7 | |
| | | | | | | | | | 83,190,622 | | | | 3.9 | |
| | | | | | | Energy: 6.8% | | | | | | | | |
| | 260,773 | | | | | Apache Corp. | | | 16,342,644 | | | | 0.8 | |
| | 290,830 | | | | | Baker Hughes, Inc. | | | 16,306,838 | | | | 0.7 | |
| | 1,085,992 | | | | | Royal Dutch Shell PLC - Class A | | | 36,242,764 | | | | 1.7 | |
| | 342,983 | | | | | Total S.A. | | | 17,571,757 | | | | 0.8 | |
| | 1,178,055 | | | | | Other Securities(a) | | | 61,272,242 | | | | 2.8 | |
| | | | | | | | | | 147,736,245 | | | | 6.8 | |
| | | | | | | Financials: 19.3% | | | | | | | | |
| | 155,667 | | | | | Aon PLC | | | 14,761,902 | | | | 0.7 | |
| | 1,857,246 | | | | | Bank of America Corp. | | | 33,226,131 | | | | 1.5 | |
| | 609,788 | | | | | Charles Schwab Corp. | | | 18,409,500 | | | | 0.9 | |
| | 1,222,868 | | | | | Citigroup, Inc. | | | 66,169,387 | | | | 3.1 | |
| | 82,708 | | | | | Goldman Sachs Group, Inc. | | | 16,031,292 | | | | 0.7 | |
| | 1,025,181 | | | | | JPMorgan Chase & Co. | | | 64,155,827 | | | | 3.0 | |
| | 349,617 | | | | | Marsh & McLennan Cos., Inc. | | | 20,012,077 | | | | 0.9 | |
| | 958,429 | | | | | Morgan Stanley | | | 37,187,045 | | | | 1.7 | |
| | 282,461 | | | | | PNC Financial Services Group, Inc. | | | 25,768,917 | | | | 1.2 | |
| | 285,415 | | | | | State Street Corp. | | | 22,405,077 | | | | 1.0 | |
| | 2,795,184 | | | | | Other Securities | | | 99,746,789 | | | | 4.6 | |
| | | | | | | | | | 417,873,944 | | | | 19.3 | |
| Shares | | | Value | | | Percentage
of Net
Assets | |
| COMMON STOCK: (continued) | |
| | | | | | | Health Care: 8.6% | | | | | | | | |
| | 126,698 | | | | | Amgen, Inc. | | $ | 20,181,724 | | | | 0.9 | |
| | 121,698 | | | | | Anthem, Inc. | | | 15,293,788 | | | | 0.7 | |
| | 287,587 | | | | | Eli Lilly & Co. | | | 19,840,627 | | | | 0.9 | |
| | 380,964 | | | | | Merck & Co., Inc. | | | 21,634,946 | | | | 1.0 | |
| | 10,948 | | | | | Novartis AG ADR | | | 1,014,442 | | | | 0.1 | |
| | 220,926 | | | | | Novartis AG | | | 20,489,445 | | | | 1.0 | |
| | 346,036 | | | | | Teva Pharmaceutical Industries Ltd. ADR | | | 19,900,530 | | | | 0.9 | |
| | 169,918 | | | | | UnitedHealth Group, Inc. | | | 17,177,011 | | | | 0.8 | |
| | 869,391 | | | | | Other Securities | | | 50,618,634 | | | | 2.3 | |
| | | | | | | | | | 186,151,147 | | | | 8.6 | |
| | | | | | | Industrials: 5.5% | | | | | | | | |
| | 186,864 | | | | | Caterpillar, Inc. | | | 17,103,662 | | | | 0.8 | |
| | 107,540 | | | | | General Dynamics Corp. | | | 14,799,655 | | | | 0.7 | |
| | 1,652,852 | | | | | General Electric Co. | | | 41,767,570 | | | | 1.9 | |
| | 275,737 | | | | | Ingersoll-Rand PLC - Class A | | | 17,478,968 | | | | 0.8 | |
| | 354,098 | | | | | Tyco International Plc | | | 15,530,738 | | | | 0.7 | |
| | 319,438 | | | | | Other Securities | | | 11,573,239 | | | | 0.6 | |
| | | | | | | | | | 118,253,832 | | | | 5.5 | |
| | | | | | | Information Technology: 10.0% | |
| | 219,577 | | | @ | | Adobe Systems, Inc. | | | 15,963,248 | | | | 0.7 | |
| | 368,656 | | | @ | | Amdocs Ltd. | | | 17,199,646 | | | | 0.8 | |
| | 1,041,308 | | | | | Applied Materials, Inc. | | | 25,949,395 | | | | 1.2 | |
| | 718,929 | | | | | Cisco Systems, Inc. | | | 19,997,010 | | | | 0.9 | |
| | 166,131 | | | @ | | Citrix Systems, Inc. | | | 10,599,158 | | | | 0.5 | |
| | 816,255 | | | | | Corning, Inc. | | | 18,716,727 | | | | 0.9 | |
| | 409,259 | | | @ | | eBay, Inc. | | | 22,967,615 | | | | 1.1 | |
| | 537,479 | | | | | Intel Corp. | | | 19,505,113 | | | | 0.9 | |
| | 377,493 | | | | | Microsoft Corp. | | | 17,534,550 | | | | 0.8 | |
| | 783,661 | | | | | Symantec Corp. | | | 20,104,823 | | | | 0.9 | |
| | 641,788 | | | | | Other Securities | | | 27,228,245 | | | | 1.3 | |
| | | | | | | | | | 215,765,530 | | | | 10.0 | |
| | | | | | | Materials: 0.7% | | | | | | | | |
| | 522,744 | | | | | Other Securities | | | 15,642,984 | | | | 0.7 | |
| | | | | | | Telecommunication Services: 1.8% | |
| | 251,911 | | | | | Verizon Communications, Inc. | | | 11,784,397 | | | | 0.6 | |
| | 3,998,513 | | | | | Other Securities | | | 26,138,491 | | | | 1.2 | |
| | | | | | | | | | 37,922,888 | | | | 1.8 | |
See Accompanying Notes to Financial Statements
| VY® Invesco Equity and Income Portfolio | SUMMARY PORTFOLIO OF INVESTMENTS
as of December 31, 2014 (continued) |
| Shares | | | Value | | | Percentage
of Net
Assets | |
| COMMON STOCK: (continued) | |
| | | | | | | Utilities: 0.9% | | | | | | | | |
| | 454,337 | | | | | Other Securities | | $ | 20,518,857 | | | | 0.9 | |
| | | | | | | Total Common Stock
(Cost $1,261,318,662) | | | 1,395,589,610 | | | | 64.6 | |
| PREFERRED STOCK: 1.0% | | | | | | | | |
| | | | | | | Energy: 0.4% | | | | | | | | |
| | 140,612 | | | | | Other Securities | | | 8,526,712 | | | | 0.4 | |
| | | | | | | Financials: 0.6% | | | | | | | | |
| | 172,055 | | | | | Other Securities | | | 12,810,900 | | | | 0.6 | |
| | | | | | | Total Preferred Stock
(Cost $17,570,141) | | | 21,337,612 | | | | 1.0 | |
Principal
Amount† | | | Value | | | Percentage
of Net
Assets | |
| CORPORATE BONDS/NOTES: 16.0% | |
| | | | | | | Basic Materials: 0.5% | |
| | 1,095,000 | | | # | | Glencore Funding LLC, 3.125%, 04/29/19 | | | 1,099,982 | | | | 0.1 | |
| | 535,000 | | | # | | Gold Fields Orogen Holding BVI Ltd., 4.875%, 10/07/20 | | | 452,075 | | | | 0.0 | |
| | 770,000 | | | # | | Montell Finance Co. BV, 8.100%, 03/15/27 | | | 1,034,022 | | | | 0.1 | |
| | 320,000 | | | # | | Xstrata Finance Canada Ltd., 2.050%, 10/23/15 | | | 322,143 | | | | 0.0 | |
| | 320,000 | | | # | | Xstrata Finance Canada Ltd., 2.700%, 10/25/17 | | | 323,988 | | | | 0.0 | |
| | 6,904,000 | | | | | Other Securities | | | 7,216,778 | | | | 0.3 | |
| | | | | | | | | | 10,448,988 | | | | 0.5 | |
| | | | | | | Communications: 2.3% | |
| | 340,000 | | | # | | Cox Communications, Inc., 4.700%, 12/15/42 | | | 341,016 | | | | 0.0 | |
| | 1,210,000 | | | # | | Cox Communications, Inc., 8.375%, 03/01/39 | | | 1,735,803 | | | | 0.1 | |
| | 345,000 | | | # | | Crown Castle Towers, LLC, 3.214%, 08/15/35 | | | 349,237 | | | | 0.0 | |
| | 435,000 | | | # | | Crown Castle Towers, LLC, 6.113%, 01/15/40 | | | 500,841 | | | | 0.0 | |
| | 1,010,000 | | | # | | Tencent Holdings Ltd., 3.375%, 05/02/19 | | | 1,027,629 | | | | 0.0 | |
| | 160,000 | | | | | Time Warner, Inc., 5.875%, 11/15/16 | | | 173,559 | | | | 0.0 | |
| | 2,790,000 | | | | | Time Warner Cable, Inc., 5.000%-5.875%, 02/01/20-11/15/40 | | | 3,119,570 | | | | 0.2 | |
Principal
Amount† | | | Value | | | Percentage
of Net
Assets | |
| CORPORATE BONDS/NOTES: (continued) | |
| | | | | | | Communications (continued) | |
| | 467,000 | | | # | | Verizon Communications, Inc., 5.012%, 08/21/54 | | $ | 485,254 | | | | 0.0 | |
| | 2,850,000 | | | | | Verizon Communications, Inc., 4.400%-6.400%, 09/15/23-02/15/38 | | | 3,295,168 | | | | 0.2 | |
| | 36,168,000 | | | | | Other Securities(a) | | | 39,004,595 | | | | 1.8 | |
| | | | | | | | | | 50,032,672 | | | | 2.3 | |
| | | | | | | Consumer, Cyclical: 0.7% | |
| | 645,000 | | | | | Target Corp., 2.900%, 01/15/22 | | | 653,662 | | | | 0.0 | |
| | 1,659,356 | | | # | | Virgin Australia 2013-1A Trust, 5.000%, 04/23/25 | | | 1,709,136 | | | | 0.1 | |
| | 11,883,890 | | | | | Other Securities | | | 12,133,872 | | | | 0.6 | |
| | | | | | | | | | 14,496,670 | | | | 0.7 | |
| | | | | | | Consumer, Non-cyclical: 3.9% | |
| | 981,000 | | | # | | Bayer US Finance LLC, 3.000%, 10/08/21 | | | 990,480 | | | | 0.1 | |
| | 965,000 | | | # | | ERAC USA Finance LLC, 2.350%, 10/15/19 | | | 958,883 | | | | 0.0 | |
| | 415,000 | | | # | | FBG Finance Ltd., 5.125%, 06/15/15 | | | 423,294 | | | | 0.0 | |
| | 785,000 | | | # | | Grupo Bimbo SAB de CV, 3.875%, 06/27/24 | | | 790,048 | | | | 0.0 | |
| | 2,410,000 | | | # | | Jazz Investments I Ltd., 1.875%, 08/15/21 | | | 2,738,362 | | | | 0.1 | |
| | 1,371,000 | | | # | | Live Nation Entertainment, Inc., 2.500%, 05/15/19 | | | 1,451,546 | | | | 0.1 | |
| | 1,733,000 | | | # | | Medtronic, Inc., 3.150%, 03/15/22 | | | 1,763,420 | | | | 0.1 | |
| | 615,000 | | | # | | Medtronic, Inc., 4.375%, 03/15/35 | | | 654,642 | | | | 0.0 | |
| | 1,976,000 | | | | | Philip Morris International, Inc., 3.250%-4.875%, 11/15/23-11/15/43 | | | 2,090,168 | | | | 0.1 | |
| | 10,007,000 | | | | | WellPoint, Inc., 1.250%-2.750%, 09/10/15-10/15/42 | | | 15,332,600 | | | | 0.7 | |
| | 49,341,000 | | | | | Other Securities(a) | | | 58,086,166 | | | | 2.7 | |
| | | | | | | | | | 85,279,609 | | | | 3.9 | |
| | | | | | | Energy: 1.2% | | | | | | | | |
| | 460,000 | | | # | | Enable Midstream Partners L.P., 2.400%, 05/15/19 | | | 447,856 | | | | 0.0 | |
| | 27,660,000 | | | | | Other Securities(a) | | | 24,608,366 | | | | 1.2 | |
| | | | | | | | | | 25,056,222 | | | | 1.2 | |
See Accompanying Notes to Financial Statements
| VY® Invesco Equity and Income Portfolio | SUMMARY PORTFOLIO OF INVESTMENTS
as of December 31, 2014 (continued) |
Principal
Amount† | | | Value | | | Percentage
of Net
Assets | |
| CORPORATE BONDS/NOTES: (continued) | |
| | | | | | | Financial: 4.3% | | | | | | | | |
| | 440,000 | | | # | | Apollo Management Holdings L.P., 4.000%, 05/30/24 | | $ | 448,674 | | | | 0.0 | |
| | 500,000 | | | #,L | | Banco Inbursa SA Institucion de Banca Multiple, 4.125%, 06/06/24 | | | 491,250 | | | | 0.0 | |
| | 725,000 | | | # | | BBVA Bancomer SA/Texas, 4.375%, 04/10/24 | | | 730,438 | | | | 0.0 | |
| | 515,000 | | | | | Charles Schwab Corp., 4.450%, 07/22/20 | | | 566,376 | | | | 0.0 | |
| | 970,000 | | | | | Citigroup, Inc., 2.650%, 03/02/15 | | | 972,921 | | | | 0.1 | |
| | 472,000 | | | # | | Credit Suisse AG, 6.500%, 08/08/23 | | | 519,304 | | | | 0.0 | |
| | 830,000 | | | # | | Dexus Diversified Trust/Dexus Office Trust, 5.600%, 03/15/21 | | | 943,597 | | | | 0.1 | |
| | 1,540,000 | | | # | | Farmers Exchange Capital III, 5.454%, 10/15/54 | | | 1,586,200 | | | | 0.1 | |
| | 350,000 | | | | | Goldman Sachs Group, Inc./The, 2.625%, 01/31/19 | | | 352,340 | | | | 0.0 | |
| | 4,011,000 | | | # | | Goldman Sachs Group, Inc., 1.000%, 03/15/17 | | | 5,556,117 | | | | 0.3 | |
| | 4,179,000 | | | # | | Goldman Sachs Group, Inc., 1.000%, 09/28/20 | | | 4,705,011 | | | | 0.2 | |
| | 1,420,000 | | | | | Goldman Sachs Group, Inc., 5.250%-6.750%, 04/01/18-10/01/37 | | | 1,644,142 | | | | 0.1 | |
| | 465,000 | | | # | | HBOS PLC, 6.750%, 05/21/18 | | | 519,403 | | | | 0.0 | |
| | 4,110,000 | | | | | JPMorgan Chase & Co., 3.875%-6.750%, 09/10/24-12/29/49 | | | 4,120,960 | | | | 0.2 | |
| | 230,000 | | | # | | KKR Group Finance Co. III LLC, 5.125%, 06/01/44 | | | 248,973 | | | | 0.0 | |
| | 2,000,000 | | | # | | Liberty Mutual Group, Inc., 4.850%, 08/01/44 | | | 2,040,970 | | | | 0.1 | |
| | 510,000 | | | # | | Macquarie Bank Ltd., 5.000%, 02/22/17 | | | 544,274 | | | | 0.0 | |
| | 3,020,000 | | | # | | Mizuho Financial Group Cayman 3 Ltd., 4.600%, 03/27/24 | | | 3,135,113 | | | | 0.2 | |
| | 5,000,000 | | | | | Morgan Stanley, 2.375%-6.375%, 07/24/15-07/24/42 | | | 5,205,934 | | | | 0.3 | |
| | 205,000 | | | # | | National Australia Bank Ltd., 3.750%, 03/02/15 | | | 206,028 | | | | 0.0 | |
| | 330,000 | | | # | | Nationwide Building Society, 6.250%, 02/25/20 | | | 387,531 | | | | 0.0 | |
Principal
Amount† | | | Value | | | Percentage
of Net
Assets | |
| CORPORATE BONDS/NOTES: (continued) | |
| | | | | | | Financial (continued) | |
| | 1,515,000 | | | # | | Nationwide Financial Services, Inc., 5.300%, 11/18/44 | | $ | 1,604,388 | | | | 0.1 | |
| | 225,000 | | | # | | Pacific LifeCorp, 6.000%, 02/10/20 | | | 256,323 | | | | 0.0 | |
| | 2,200,000 | | | # | | Santander US Debt S.A. Unipersonal, 3.724%, 01/20/15 | | | 2,203,238 | | | | 0.1 | |
| | 805,000 | | | # | | Societe Generale SA, 5.000%, 01/17/24 | | | 810,872 | | | | 0.0 | |
| | 315,000 | | | # | | Standard Chartered PLC, 3.850%, 04/27/15 | | | 318,197 | | | | 0.0 | |
| | 440,000 | | | # | | Standard Chartered PLC, 5.700%, 03/26/44 | | | 459,607 | | | | 0.0 | |
| | 47,462,000 | | | | | Other Securities | | | 51,531,957 | | | | 2.4 | |
| | | | | | | | | | 92,110,138 | | | | 4.3 | |
| | | | | | | Financials: 0.1% | | | | | | | | |
| | 2,815,000 | | | | | Other Securities | | | 2,859,232 | | | | 0.1 | |
| | | | | | | Industrial: 0.7% | | | | | | | | |
| | 425,000 | | | # | | BAA Funding Ltd.,2.500%, 06/25/17 | | | 425,310 | | | | 0.0 | |
| | 510,000 | | | # | | Penske Truck Leasing Co. Lp/PTL Finance Corp., 2.500%, 03/15/16 | | | 517,266 | | | | 0.0 | |
| | 3,599,000 | | | # | | UTi Worldwide, Inc., 4.500%, 03/01/19 | | | 3,992,641 | | | | 0.2 | |
| | 10,352,000 | | | | | Other Securities | | | 10,979,657 | | | | 0.5 | |
| | | | | | | | | | 15,914,874 | | | | 0.7 | |
| | | | | | | Technology: 2.2% | | | | | | | | |
| | 7,292,000 | | | #,L | | Citrix Systems, Inc., 0.500%, 04/15/19 | | | 7,688,502 | | | | 0.3 | |
| | 540,000 | | | # | | Seagate HDD Cayman,
4.750%, 01/01/25 | | | 558,278 | | | | 0.0 | |
| | 1,146,000 | | | # | | Seagate HDD Cayman,
5.750%, 12/01/34 | | | 1,212,194 | | | | 0.1 | |
| | 30,950,000 | | | | | Other Securities(a) | | | 38,162,367 | | | | 1.8 | |
| | | | | | | | | | 47,621,341 | | | | 2.2 | |
| | | | | | | Utilities: 0.1% | | | | | | | | |
| | 1,474,000 | | | | | Other Securities | | | 1,535,893 | | | | 0.1 | |
| | | | | | | Total Corporate Bonds/Notes
(Cost $327,658,962) | | | 345,355,639 | | | | 16.0 | |
| See Accompanying Notes to Financial Statements |
| VY® Invesco Equity and Income Portfolio | SUMMARY PORTFOLIO OF INVESTMENTS
as of December 31, 2014 (continued) |
Principal
Amount† | | | Value | | | Percentage
of Net
Assets | |
| MUNICIPAL BONDS: 0.0% | |
| | | | | | | Georgia: 0.0% | | | | | | | | |
| | 500,000 | | | | | Other Securities | | $ | 660,690 | | | | 0.0 | |
| | | | | | | Total Municipal Bonds
(Cost $503,997) | | | 660,690 | | | | 0.0 | |
| U.S. TREASURY OBLIGATIONS: 12.7% | | | | | |
| | | | | | | U.S. Treasury Bonds: 0.8% | |
| | 15,312,900 | | | | | 3.125%, due 08/15/44 | | | 16,488,885 | | | | 0.8 | |
| | | | | | | U.S. Treasury Notes: 11.9% | |
| | 71,028,000 | | | | | 0.625%, due 12/31/16 | | | 70,958,606 | | | | 3.3 | |
| | 55,005,000 | | | | | 1.000%, due 12/15/17 | | | 54,882,504 | | | | 2.5 | |
| | 61,015,200 | | | | | 1.625%, due 12/31/19 | | | 60,929,412 | | | | 2.8 | |
| | 16,409,700 | | | | | 2.250%, due 11/15/24 | | | 16,522,517 | | | | 0.8 | |
| | 52,000,000 | | | | | 2.500%, due 03/31/15 | | | 52,306,696 | | | | 2.4 | |
| | 1,350,000 | | | | | 0.625%-2.625%, due 01/31/15-11/15/20 | | | 1,357,580 | | | | 0.1 | |
| | | | | | | | | | 256,957,315 | | | | 11.9 | |
| | | | | | | Total U.S. Treasury
Obligations
(Cost $272,032,492) | | | 273,446,200 | | | | 12.7 | |
| | | | | | | | | | | | | | | |
| FOREIGN GOVERNMENT BONDS: 0.1% | | | |
| | 150,000 | | | # | | Electricite de France SA, 4.600%, 01/27/20 | | | 165,335 | | | | 0.0 | |
| | 620,000 | | | # | | Electricite de France SA, 4.875%, 01/22/44 | | | 690,891 | | | | 0.1 | |
| | 640,000 | | | # | | Electricite de France SA, 5.625%, 12/29/49 | | | 674,560 | | | | 0.0 | |
| | 1,180,000 | | | | | Other Securities | | | 1,261,533 | | | | 0.0 | |
| | | | | | | Total Foreign Government Bonds
(Cost $2,569,105) | | | 2,792,319 | | | | 0.1 | |
| | | | | | | | | | | | | | | |
| U.S. GOVERNMENT AGENCY OBLIGATIONS: 0.3% |
| | | | | | | Federal Home Loan Mortgage Corporation: 0.1%## | |
| | 2,400,000 | | | | | Other Securities | | | 2,684,424 | | | | 0.1 | |
| | | | | | | Federal National Mortgage Association: 0.2%## | |
| | 3,045,000 | | | | | Other Securities | | | 3,560,085 | | | | 0.2 | |
| | | | | | | Total U.S. Government Agency Obligations
(Cost $5,702,415) | | | 6,244,509 | | | | 0.3 | |
| | | | | | | Total Long-Term
Investments
(Cost $1,887,355,774) | | | 2,045,426,579 | | | | 94.7 | |
Principal
Amount† | | | Value | | | Percentage
of Net
Assets | |
| SHORT-TERM INVESTMENTS: 7.1% | |
| | | | | | | Securities Lending Collateralcc: 2.0% | |
| | 2,147,514 | | | | | Barclays Bank PLC, Repurchase Agreement dated 12/31/14, 0.05%, due 01/02/15 (Repurchase Amount $2,147,520, collateralized by various U.S. Government Securities, 1.500%-2.125%, Market Value plus accrued interest $2,190,465, due 08/31/18-06/30/21) | | $ | 2,147,514 | | | | 0.1 | |
| | 10,205,169 | | | | | Citigroup, Inc., Repurchase
Agreement dated 12/31/14,
0.08%, due 01/02/15
(Repurchase Amount
$10,205,214, collateralized by
various U.S. Government/U.S.
Government Agency
Obligations, 1.375%-8.000%,
Market Value plus accrued
interest $10,409,272, due
12/15/17-07/15/51) | | | 10,205,169 | | | | 0.5 | |
| | 10,205,169 | | | | | HSBC Securities USA, Repurchase Agreement dated 12/31/14, 0.06%, due 01/02/15 (Repurchase Amount $10,205,203, collateralized by various U.S. Government/U.S. Government Agency Obligations, 0.000%-9.375%, Market Value plus accrued interest $10,409,296, due 01/15/15-07/15/32) | | $ | 10,205,169 | | | | 0.4 | |
| | 10,205,169 | | | | | JPMorgan Chase & Co., Repurchase Agreement dated 12/31/14, 0.10%, due 01/02/15 (Repurchase Amount $10,205,225, collateralized by various U.S. Government Agency Obligations, 2.500%-8.000%, Market Value plus accrued interest $10,409,285, due 08/01/16-01/01/45) | | | 10,205,169 | | | | 0.5 | |
| See Accompanying Notes to Financial Statements |
| VY® Invesco Equity and Income Portfolio | SUMMARY PORTFOLIO OF INVESTMENTS
as of December 31, 2014 (continued) |
Principal
Amount† | | | Value | | | Percentage
of Net
Assets | |
| SHORT-TERM INVESTMENTS: (continued) | |
| | | | | | | Securities Lending Collateralcc (continued) | |
| | 10,205,169 | | | | | Mizuho Securities USA Inc., Repurchase Agreement dated 12/31/14, 0.08%, due 01/02/15 (Repurchase Amount $10,205,214, collateralized by various U.S. Government/U.S. Government Agency Obligations, 0.000%-7.500%, Market Value plus accrued interest $10,409,273, due 01/31/16-12/20/44) | | $ | 10,205,169 | | | | 0.5 | |
| | | | | | | | | | 42,968,190 | | | | 2.0 | |
| Shares | | | Value | | | Percentage
of Net
Assets | |
| | | | | | | Mutual Funds: 5.1% | | | | | | | | |
| | 110,716,171 | | | | | BlackRock Liquidity Funds, TempFund, Institutional Class, 0.030%††
(Cost $110,716,171) | | | 110,716,171 | | | | 5.1 | |
| | | | | | | Total Short-Term Investments
(Cost $153,684,361) | | $ | 153,684,361 | | | | 7.1 | |
| | | | | | | Total Investments in Securities
(Cost $2,041,040,135) | | | 2,199,110,940 | | | | 101.8 | |
| | | | | | | Liabilities in Excess of Other Assets | | | (39,800,510 | ) | | | (1.8 | ) |
| | | | | | | Net Assets | | $ | 2,159,310,430 | | | | 100.0 | |
“Other Securities” represents issues not identified as the top 50 holdings in terms of market value and issues or issuers not exceeding 1% of net assets individually or in aggregate respectively as of December 31, 2014.
The following footnotes apply to either the individual securities noted or one or more of the securities aggregated and listed as a single line item.
| † | Unless otherwise indicated, principal amount is shown in USD. |
| †† | Rate shown is the 7-day yield as of December 31, 2014. |
| # | Securities with purchases pursuant to Rule 144A or section 4(a)(2), under the Securities Act of 1933 and may not be resold subject to that rule except to qualified institutional buyers. |
| ## | The Federal Housing Finance Agency (“FHFA”) placed the Federal Home Loan Mortgage Corporation and Federal National Mortgage Association into conservatorship with FHFA as the conservator. As such, the FHFA oversees the continuing affairs of these companies. |
| @ | Non-income producing security. |
| ADR | American Depositary Receipt |
| cc | Represents securities purchased with cash collateral received for securities on loan. |
| L | Loaned security, a portion or all of the security is on loan at December 31, 2014. |
| (a) | This grouping contains securities on loan. |
Cost for federal income tax purposes is $2,043,378,816.
Net unrealized appreciation consists of:
| Gross Unrealized Appreciation | | $ | 200,171,897 | |
| Gross Unrealized Depreciation | | | (44,439,773 | ) |
| Net Unrealized Appreciation | | $ | 155,732,124 | |
Fair Value Measurements^
The following is a summary of the fair valuations according to the inputs used as of December 31, 2014 in valuing the assets and liabilities:
| | | Quoted Prices
in Active Markets
for Identical
Investments
(Level 1) | | | Significant
Other
Observable
Inputs#
(Level 2) | | | Significant
Unobservable
Inputs
(Level 3) | | | Fair Value
at
December 31, 2014 | |
| Asset Table | | | | | | | | | | | | | | | | |
| Investments, at fair value | | | | | | | | | | | | | | | | |
| Common Stock | | | | | | | | | | | | | | | | |
| Consumer Discretionary | | $ | 152,533,561 | | | $ | — | | | $ | — | | | $ | 152,533,561 | |
| Consumer Staples | | | 83,190,622 | | | | — | | | | — | | | | 83,190,622 | |
| Energy | | | 93,921,724 | | | | 53,814,521 | | | | — | | | | 147,736,245 | |
| Financials | | | 417,873,944 | | | | — | | | | — | | | | 417,873,944 | |
| Health Care | | | 152,216,667 | | | | 33,934,480 | | | | — | | | | 186,151,147 | |
| Industrials | | | 118,253,832 | | | | — | | | | — | | | | 118,253,832 | |
See Accompanying Notes to Financial Statements
| VY® Invesco Equity and Income Portfolio | SUMMARY PORTFOLIO OF INVESTMENTS
as of December 31, 2014 (continued) |
| | | Quoted Prices
in Active Markets
for Identical
Investments
(Level 1) | | | Significant
Other
Observable
Inputs#
(Level 2) | | | Significant
Unobservable
Inputs
(Level 3) | | | Fair Value
at
December 31, 2014 | |
| Information Technology | | $ | 215,765,530 | | | $ | — | | | $ | — | | | $ | 215,765,530 | |
| Materials | | | 15,642,984 | | | | — | | | | — | | | | 15,642,984 | |
| Telecommunication Services | | | 25,858,473 | | | | 12,064,415 | | | | — | | | | 37,922,888 | |
| Utilities | | | 20,518,857 | | | | — | | | | — | | | | 20,518,857 | |
| Total Common Stock | | | 1,295,776,194 | | | | 99,813,416 | | | | — | | | | 1,395,589,610 | |
| Preferred Stock | | | 1,209,750 | | | | 20,127,862 | | | | — | | | | 21,337,612 | |
| Corporate Bonds/Notes | | | — | | | | 345,355,639 | | | | — | | | | 345,355,639 | |
| Municipal Bonds | | | — | | | | 660,690 | | | | — | | | | 660,690 | |
| Short-Term Investments | | | 110,716,171 | | | | 42,968,190 | | | | — | | | | 153,684,361 | |
| U.S. Treasury Obligations | | | — | | | | 273,446,200 | | | | — | | | | 273,446,200 | |
| Foreign Government Bonds | | | — | | | | 2,792,319 | | | | — | | | | 2,792,319 | |
| U.S. Government Agency Obligations | | | — | | | | 6,244,509 | | | | — | | | | 6,244,509 | |
| Total Investments, at fair value | | $ | 1,407,702,115 | | | $ | 791,408,825 | | | $ | — | | | $ | 2,199,110,940 | |
| Other Financial Instruments+ | | | | | | | | | | | | | | | | |
| Forward Foreign Currency Contracts | | | — | | | | 2,564,060 | | | | — | | | | 2,564,060 | |
| Total Assets | | $ | 1,407,702,115 | | | $ | 793,972,885 | | | $ | — | | | $ | 2,201,675,000 | |
| Liabilities Table | | | | | | | | | | | | | | | | |
| Other Financial Instruments+ | | | | | | | | | | | | | | | | |
| Forward Foreign Currency Contracts | | $ | — | | | $ | (84,210 | ) | | $ | — | | | $ | (84,210 | ) |
| Total Liabilities | | $ | — | | | $ | (84,210 | ) | | $ | — | | | $ | (84,210 | ) |
| ^ | See Note 2, “Significant Accounting Policies” in the Notes to Financial Statements for additional information. |
| + | Other Financial Instruments are derivatives not reflected in the Portfolio of Investments and may include open forward foreign currency contracts, futures, centrally cleared swaps, OTC swaps and written options. Forward foreign currency contracts, futures and centrally cleared swaps are valued at the unrealized gain (loss) on the instrument. OTC swaps and written options are valued at the fair value of the instrument. |
| # | The earlier close of the foreign markets gives rise to the possibility that significant events, including broad market moves, may have occurred in the interim and may materially affect the value of those securities. To account for this, the Portfolio may frequently value many of its foreign equity securities using fair value prices based on third party vendor modeling tools to the extent available. Accordingly, a portion of the Portfolio’s investments are categorized as Level 2 investments. |
At December 31, 2014, the following forward foreign currency contracts were outstanding for VY® Invesco Equity and Income Portfolio:
| Counterparty | | Currency | | Contract Amount | | | Buy/Sell | | Settlement Date | | In Exchange For | | | Fair Value | | | Unrealized
Appreciation
(Depreciation) | |
| The Bank of New York | | Israeli New Shekel | | | 29,126,970 | | | Sell | | 01/09/15 | | $ | 7,428,076 | | | $ | 7,467,452 | | | $ | (39,376 | ) |
| The Bank of New York | | Canadian Dollar | | | 11,408,627 | | | Sell | | 01/09/15 | | | 10,015,386 | | | | 9,818,268 | | | | 197,118 | |
| The Bank of New York | | EU Euro | | | 17,676,769 | | | Sell | | 01/09/15 | | | 22,056,365 | | | | 21,391,460 | | | | 664,905 | |
| The Bank of New York | | Swiss Franc | | | 8,203,823 | | | Sell | | 01/09/15 | | | 8,516,727 | | | | 8,252,651 | | | | 264,076 | |
| The Bank of New York | | British Pound | | | 11,445,506 | | | Sell | | 01/09/15 | | | 17,991,305 | | | | 17,838,032 | | | | 153,273 | |
| State Street Bank | | Israeli New Shekel | | | 29,229,482 | | | Sell | | 01/09/15 | | | 7,448,900 | | | | 7,493,734 | | | | (44,834 | ) |
| State Street Bank | | British Pound | | | 11,451,427 | | | Sell | | 01/09/15 | | | 18,005,422 | | | | 17,847,261 | | | | 158,161 | |
| State Street Bank | | Canadian Dollar | | | 11,440,608 | | | Sell | | 01/09/15 | | | 10,043,462 | | | | 9,845,791 | | | | 197,671 | |
| State Street Bank | | EU Euro | | | 17,701,167 | | | Sell | | 01/09/15 | | | 22,087,074 | | | | 21,420,986 | | | | 666,088 | |
| State Street Bank | | Swiss Franc | | | 8,220,978 | | | Sell | | 01/09/15 | | | 8,532,677 | | | | 8,269,909 | | | | 262,768 | |
| | | | | | | | | | | | | | | | | | | | | $ | 2,479,850 | |
See Accompanying Notes to Financial Statements
| VY® Invesco Equity and Income Portfolio | SUMMARY PORTFOLIO OF INVESTMENTS
as of December 31, 2014 (continued) |
A summary of derivative instruments by primary risk exposure is outlined in the following tables.
The fair value of derivative instruments as of December 31, 2014 was as follows:
| Derivatives not accounted for as hedging instruments | | Location on Statement
of Assets and Liabilities | | Fair Value | |
| Asset Derivatives | | | | | | |
| Foreign exchange contracts | | Unrealized appreciation on forward foreign currency contracts | | $ | 2,564,060 | |
| Total Asset Derivatives | | | | $ | 2,564,060 | |
| Liability Derivatives | | | | | | |
| Foreign exchange contracts | | Unrealized depreciation on forward foreign currency contracts | | $ | 84,210 | |
| Total Liability Derivatives | | | | $ | 84,210 | |
The effect of derivative instruments on the Portfolio’s Statement of Operations for the year ended December 31, 2014 was as follows:
Amount of Realized Gain or (Loss) on Derivatives Recognized in Income
| Derivatives not accounted for as hedging instruments | | Foreign currency
related transactions* | |
| Foreign exchange contracts | | $ | 11,740,547 | |
| Total | | $ | 11,740,547 | |
Change in Unrealized Appreciation or (Depreciation) on Derivatives Recognized in Income
| Derivatives not accounted for as hedging instruments | | Foreign currency
related transactions* | |
| Foreign exchange contracts | | $ | 2,882,169 | |
| Total | | $ | 2,882,169 | |
| * | Amounts recognized for forward foreign currency contracts are included in net realized gain (loss) on foreign currency related transactions and net change in unrealized appreciation or depreciation on foreign currency related transactions. |
The following is a summary by counterparty of the fair value of OTC derivative instruments subject to Master Netting Agreements and collateral pledged (received), if any, at December 31, 2014:
| | | State
Street Bank | | | The Bank
of New York | | | Totals | |
| Assets: | | | | | | | | | |
| Forward foreign currency contracts | | $ | 1,284,688 | | | $ | 1,279,372 | | | $ | 2,564,060 | |
| Total Assets | | $ | 1,284,688 | | | $ | 1,279,372 | | | $ | 2,564,060 | |
| Liabilities: | | | | | | | | | | | | |
| Forward foreign currency contracts | | $ | 44,834 | | | $ | 39,376 | | | $ | 84,210 | |
| Total Liabilities | | $ | 44,834 | | | $ | 39,376 | | | $ | 84,210 | |
| Net OTC derivative instruments by counterparty, at fair value | | $ | 1,239,854 | | | $ | 1,239,996 | | | | 2,479,850 | |
| Total collateral pledged by the Portfolio/(Received from counterparty) | | $ | — | | | $ | — | | | $ | — | |
| Net Exposure(1) | | $ | 1,239,854 | | | $ | 1,239,996 | | | $ | 2,479,850 | |
| (1) | Positive net exposure represents amounts due from each respective counterparty. Negative exposure represents amounts due from the Portfolio. Please refer to Note 2 for additional details regarding counterparty credit risk and credit related contingent features. |
See Accompanying Notes to Financial Statements
| VY® JPMorgan Mid Cap Value Portfolio | SUMMARY PORTFOLIO OF INVESTMENTS
as of December 31, 2014 |
| Shares | | | Value | | | Percentage
of Net
Assets | |
| COMMON STOCK: 97.8% | |
| | | | | | | Consumer Discretionary: 17.6% | |
| | 11,890 | | | @ | | Autozone, Inc. | | $ | 7,361,218 | | | | 1.0 | |
| | 176,450 | | | | | Best Buy Co., Inc. | | | 6,878,021 | | | | 1.0 | |
| | 102,450 | | | @ | | Dish Network Corp. - Class A | | | 7,467,580 | | | | 1.0 | |
| | 136,690 | | | | | Expedia, Inc. | | | 11,667,858 | | | | 1.6 | |
| | 214,990 | | | | | Gannett Co., Inc. | | | 6,864,631 | | | | 1.0 | |
| | 266,790 | | | | | Gap, Inc. | | | 11,234,527 | | | | 1.6 | |
| | 175,665 | | | @ | | Jarden Corp. | | | 8,410,840 | | | | 1.2 | |
| | 193,180 | | | | | Kohl’s Corp. | | | 11,791,707 | | | | 1.6 | |
| | 61,760 | | | @ | | Mohawk Industries, Inc. | | | 9,595,034 | | | | 1.3 | |
| | 68,340 | | | | | Tiffany & Co. | | | 7,302,812 | | | | 1.0 | |
| | 713,496 | | | | | Other Securities | | | 38,413,300 | | | | 5.3 | |
| | | | | | | | | | 126,987,528 | | | | 17.6 | |
| | | | | | | Consumer Staples: 5.7% | |
| | 149,180 | | | | | Kroger Co. | | | 9,578,848 | | | | 1.3 | |
| | 928,620 | | | @ | | Rite Aid Corp. | | | 6,983,222 | | | | 1.0 | |
| | 256,473 | | | | | Other Securities | | | 24,785,321 | | | | 3.4 | |
| | | | | | | | | | 41,347,391 | | | | 5.7 | |
| | | | | | | Energy: 2.6% | | | | | | | | |
| | 253,390 | | | @ | | Southwestern Energy Co. | | | 6,915,013 | | | | 1.0 | |
| | 375,180 | | | | | Other Securities | | | 11,738,879 | | | | 1.6 | |
| | | | | | | | | | 18,653,892 | | | | 2.6 | |
| | | | | | | Financials: 30.2% | | | | | | | | |
| | 74,650 | | | | | Ameriprise Financial, Inc. | | | 9,872,463 | | | | 1.4 | |
| | 47,490 | | | | | AvalonBay Communities, Inc. | | | 7,759,391 | | | | 1.1 | |
| | 525,320 | | | | | Fifth Third Bancorp. | | | 10,703,395 | | | | 1.5 | |
| | 192,780 | | | | | Hartford Financial Services Group, Inc. | | | 8,036,998 | | | | 1.1 | |
| | 177,310 | | | | | Invesco Ltd. | | | 7,007,291 | | | | 1.0 | |
| | 301,670 | | | | | Kimco Realty Corp. | | | 7,583,984 | | | | 1.1 | |
| | 280,170 | | | | | Loews Corp. | | | 11,772,743 | | | | 1.6 | |
| | 75,451 | | | | | M&T Bank Corp. | | | 9,478,155 | | | | 1.3 | |
| | 165,550 | | | | | Marsh & McLennan Cos., Inc. | | | 9,476,082 | | | | 1.3 | |
| | 215,000 | | | | | SunTrust Bank | | | 9,008,500 | | | | 1.2 | |
| | 104,620 | | | | | T. Rowe Price Group, Inc. | | | 8,982,673 | | | | 1.2 | |
| | 73,706 | | | | | Vornado Realty Trust | | | 8,675,933 | | | | 1.2 | |
| | 196,880 | | | | | Weyerhaeuser Co. | | | 7,066,023 | | | | 1.0 | |
| | 200,390 | | | | | XL Group PLC | | | 6,887,404 | | | | 1.0 | |
| Shares | | | Value | | | Percentage
of Net
Assets | |
| COMMON STOCK: (continued) | |
| | | | | | | Financials (continued) | | | | | | | | |
| | 2,833,176 | | | | | Other Securities | | $ | 95,396,159 | | | | 13.2 | |
| | | | | | | | | | 217,707,194 | | | | 30.2 | |
| | | | | | | Health Care: 6.6% | | | | | | | | |
| | 97,300 | | | | | AmerisourceBergen Corp. | | | 8,772,568 | | | | 1.2 | |
| | 141,180 | | | | | CareFusion Corp. | | | 8,377,621 | | | | 1.1 | |
| | 110,330 | | | | | Cigna Corp. | | | 11,354,061 | | | | 1.6 | |
| | 60,770 | | | | | Humana, Inc. | | | 8,728,395 | | | | 1.2 | |
| | 205,960 | | | | | Other Securities | | | 10,786,648 | | | | 1.5 | |
| | | | | | | | | | 48,019,293 | | | | 6.6 | |
| | | | | | | Industrials: 9.4% | | | | | | | | |
| | 93,810 | | | | | Carlisle Cos., Inc. | | | 8,465,414 | | | | 1.2 | |
| | 110,970 | | | | | Equifax, Inc. | | | 8,974,144 | | | | 1.2 | |
| | 103,520 | | | | | IDEX Corp. | | | 8,057,997 | | | | 1.1 | |
| | 52,001 | | | | | Snap-On, Inc. | | | 7,110,617 | | | | 1.0 | |
| | 608,949 | | | | | Other Securities | | | 35,010,153 | | | | 4.9 | |
| | | | | | | | | | 67,618,325 | | | | 9.4 | |
| | | | | | | Information Technology: 8.9% | |
| | 138,660 | | | | | Amphenol Corp. | | | 7,461,295 | | | | 1.0 | |
| | 161,770 | | | | | Analog Devices, Inc. | | | 8,981,471 | | | | 1.2 | |
| | 188,090 | | | @ | | Arrow Electronics, Inc. | | | 10,888,530 | | | | 1.5 | |
| | 170,976 | | | | | Jack Henry & Associates, Inc. | | | 10,624,449 | | | | 1.5 | |
| | 191,490 | | | @ | | Synopsys, Inc. | | | 8,324,070 | | | | 1.2 | |
| | 189,160 | | | | | Xilinx, Inc. | | | 8,188,736 | | | | 1.1 | |
| | 299,936 | | | | | Other Securities | | | 10,023,195 | | | | 1.4 | |
| | | | | | | | | | 64,491,746 | | | | 8.9 | |
| | | | | | | Materials: 6.2% | | | | | | | | |
| | 79,030 | | | | | Airgas, Inc. | | | 9,102,675 | | | | 1.2 | |
| | 117,150 | | | | | Ball Corp. | | | 7,986,116 | | | | 1.1 | |
| | 129,995 | | | | | Silgan Holdings, Inc. | | | 6,967,732 | | | | 1.0 | |
| | 243,538 | | | | | Other Securities | | | 20,973,772 | | | | 2.9 | |
| | | | | | | | | | 45,030,295 | | | | 6.2 | |
| | | | | | | Utilities: 10.6% | | | | | | | | |
| | 218,150 | | | | | CMS Energy Corp. | | | 7,580,713 | | | | 1.1 | |
| | 104,250 | | | | | Edison International | | | 6,826,290 | | | | 0.9 | |
| | 144,670 | | | | | Energen Corp. | | | 9,224,159 | | | | 1.3 | |
| | 400,350 | | | | | Questar Corp. | | | 10,120,848 | | | | 1.4 | |
| | 84,950 | | | | | Sempra Energy | | | 9,460,032 | | | | 1.3 | |
| | 164,460 | | | | | Westar Energy, Inc. | | | 6,782,330 | | | | 0.9 | |
See Accompanying Notes to Financial Statements
| VY® JPMorgan Mid Cap Value Portfolio | SUMMARY PORTFOLIO OF INVESTMENTS
as of December 31, 2014 (continued) |
| Shares | | | Value | | | Percentage
of Net
Assets | |
| COMMON STOCK: (continued) | |
| | | | | | | Utilities (continued) | | | | | | | | |
| | 703,220 | | | | | Other Securities | | $ | 26,435,149 | | | | 3.7 | |
| | | | | | | | | | 76,429,521 | | | | 10.6 | |
| | | | | | | Total Common Stock
(Cost $514,156,254) | | | 706,285,185 | | | | 97.8 | |
| SHORT-TERM INVESTMENTS: 2.3% | | | | | | | | |
| | | | | | | Mutual Funds: 2.3% | | | | | | | | |
| | 16,532,807 | | | | | BlackRock Liquidity Funds, TempFund, Institutional Class, 0.030%††
(Cost $16,532,807) | | | 16,532,807 | | | | 2.3 | |
| | | | | | | Total Short-Term Investments
(Cost $16,532,807) | | | 16,532,807 | | | | 2.3 | |
| | | | | | | Total Investments in Securities
(Cost $530,689,061) | | $ | 722,817,992 | | | | 100.1 | |
| | | | | | | Liabilities in Excess
of Other Assets | | | (955,663 | ) | | | (0.1 | ) |
| | | | | | | Net Assets | | $ | 721,862,329 | | | | 100.0 | |
“Other Securities” represents issues not identified as the top 50 holdings in terms of market value and issues or issuers not exceeding 1% of net assets individually or in aggregate respectively as of December 31, 2014.
The following footnotes apply to either the individual securities noted or one or more of the securities aggregated and listed as a single line item.
| †† | Rate shown is the 7-day yield as of December 31, 2014. |
| @ | Non-income producing security. |
Cost for federal income tax purposes is $531,992,250.
Net unrealized appreciation consists of:
| Gross Unrealized Appreciation | | $ | 198,297,528 | |
| Gross Unrealized Depreciation | | | (7,471,786 | ) |
| Net Unrealized Appreciation | | $ | 190,825,742 | |
Fair Value Measurements^
The following is a summary of the fair valuations according to the inputs used as of December 31, 2014 in valuing the assets and liabilities:
| | | Quoted Prices
in Active Markets
for Identical
Investments
(Level 1) | | | Significant
Other
Observable
Inputs
(Level 2) | | | Significant
Unobservable
Inputs
(Level 3) | | | Fair Value
at
December 31, 2014 | |
| Asset Table | | | | | | | | | | | | | | | | |
| Investments, at fair value | | | | | | | | | | | | | | | | |
| Common Stock* | | $ | 706,285,185 | | | $ | — | | | $ | — | | | $ | 706,285,185 | |
| Short-Term Investments | | | 16,532,807 | | | | — | | | | — | | | | 16,532,807 | |
| Total Investments, at fair value | | $ | 722,817,992 | | | $ | — | | | $ | — | | | $ | 722,817,992 | |
| ^ | See Note 2, “Significant Accounting Policies” in the Notes to Financial Statements for additional information. |
| * | For further breakdown of Common Stock by sector, please refer to the Summary Portfolio of Investments. |
See Accompanying Notes to Financial Statements
| VY® Oppenheimer Global Portfolio | SUMMARY PORTFOLIO OF INVESTMENTS
as of December 31, 2014 |
| Shares | | | Value | | | Percentage
of Net
Assets | |
| COMMON STOCK: 97.9% | |
| | | | | | | Brazil: 3.2% | | | | | | | | |
| | 6,099,409 | | | | | Other Securities(a) | | $ | 52,348,867 | | | | 3.2 | |
| | | | | | | China: 0.6% | | | | | | | | |
| | 331,763 | | | | | Other Securities(a) | | | 10,359,556 | | | | 0.6 | |
| | | | | | | Denmark: 0.4% | | | | | | | | |
| | 156,855 | | | | | Other Securities(a) | | | 6,876,720 | | | | 0.4 | |
| | | | | | | France: 5.2% | | | | | | | | |
| | 174,688 | | | | | LVMH Moet Hennessy
Louis Vuitton S.A. | | | 27,670,950 | | | | 1.7 | |
| | 137,100 | | | | | Kering | | | 26,346,651 | | | | 1.6 | |
| | 274,024 | | | | | Technip S.A. | | | 16,322,974 | | | | 1.0 | |
| | 291,491 | | | | | Other Securities | | | 14,876,688 | | | | 0.9 | |
| | | | | | | | | | 85,217,263 | | | | 5.2 | |
| | | | | | | Germany: 8.0% | | | | | | | | |
| | 169,003 | | | | | Allianz AG | | | 27,991,401 | | | | 1.7 | |
| | 192,375 | | | | | Bayer AG | | | 26,222,408 | | | | 1.6 | |
| | 90,241 | | | | | Linde AG | | | 16,622,654 | | | | 1.0 | |
| | 422,021 | | | | | SAP SE | | | 29,469,118 | | | | 1.8 | |
| | 162,582 | | | | | Siemens AG | | | 18,242,374 | | | | 1.1 | |
| | 428,878 | | | | | Other Securities | | | 12,842,511 | | | | 0.8 | |
| | | | | | | | | | 131,390,466 | | | | 8.0 | |
| | | | | | | India: 3.5% | | | | | | | | |
| | 7,354,907 | | | | | DLF Ltd. | | | 15,794,623 | | | | 0.9 | |
| | 2,508,650 | | | | | ICICI Bank Ltd. ADR | | | 28,974,908 | | | | 1.8 | |
| | 2,129,457 | | | | | Other Securities | | | 12,791,427 | | | | 0.8 | |
| | | | | | | | | | 57,560,958 | | | | 3.5 | |
| | | | | | | Italy: 1.5% | | | | | | | | |
| | 828,500 | | | | | Other Securities(a) | | | 23,690,068 | | | | 1.5 | |
| | | | | | | Japan: 10.5% | | | | | | | | |
| | 1,274,700 | | | | | Dai-ichi Life Insurance Co., Ltd. | | | 19,349,757 | | | | 1.2 | |
| | 426,000 | | | | | KDDI Corp. | | | 26,763,045 | | | | 1.6 | |
| | 57,251 | | | | | Keyence Corp. | | | 25,510,747 | | | | 1.6 | |
| | 375,800 | | | | | Kyocera Corp. | | | 17,196,465 | | | | 1.1 | |
| | 292,900 | | | | | Murata Manufacturing Co., Ltd. | | | 31,961,543 | | | | 1.9 | |
| | 342,300 | | | | | Nidec Corp. | | | 22,107,670 | | | | 1.3 | |
| | 677,900 | | | | | Other Securities(a) | | | 29,544,109 | | | | 1.8 | |
| | | | | | | | | | 172,433,336 | | | | 10.5 | |
| | | | | | | Mexico: 0.7% | | | | | | | | |
| | 136,982 | | | | | Other Securities | | | 12,058,525 | | | | 0.7 | |
| Shares | | | Value | | | Percentage
of Net
Assets | |
| COMMON STOCK: (continued) | |
| | | | | | | Netherlands: 1.7% | | | | | | | | |
| | 567,943 | | | | | Airbus Group NV | | $ | 28,078,034 | | | | 1.7 | |
| | | | | | | Russia: 0.3% | | | | | | | | |
| | 5,014,709 | | | | | Other Securities | | | 5,095,539 | | | | 0.3 | |
| | | | | | | Spain: 3.4% | | | | | | | | |
| | 1,938,016 | | | | | Banco Bilbao Vizcaya
Argentaria S.A. | | | 18,303,460 | | | | 1.1 | |
| | 940,613 | | | | | Inditex SA | | | 26,831,425 | | | | 1.7 | |
| | 548,683 | | | | | Other Securities | | | 10,271,830 | | | | 0.6 | |
| | | | | | | | | | 55,406,715 | | | | 3.4 | |
| | | | | | | Sweden: 4.2% | | | | | | | | |
| | 493,269 | | | | | Assa Abloy AB | | | 26,052,743 | | | | 1.6 | |
| | 3,517,462 | | | | | Telefonaktiebolaget LM Ericsson | | | 42,589,802 | | | | 2.6 | |
| | | | | | �� | | | | 68,642,545 | | | | 4.2 | |
| | | | | | | Switzerland: 5.2% | | | | | | | | |
| | 768,530 | | | | | Credit Suisse Group | | | 19,306,434 | | | | 1.2 | |
| | 226,818 | | | | | Nestle S.A. | | | 16,535,262 | | | | 1.0 | |
| | 71,875 | | | | | Roche Holding AG -
Genusschein | | | 19,473,972 | | | | 1.2 | |
| | 1,716,343 | | | @ | | UBS Group AG | | | 29,503,422 | | | | 1.8 | |
| | | | | | | | | | 84,819,090 | | | | 5.2 | |
| | | | | | | United Kingdom: 4.8% | | | | | | | | |
| | 1,325,086 | | | | | Prudential PLC | | | 30,635,363 | | | | 1.9 | |
| | 690,695 | | | | | Unilever PLC | | | 28,061,737 | | | | 1.7 | |
| | 5,740,461 | | | | | Other Securities(a) | | | 20,149,346 | | | | 1.2 | |
| | | | | | | | | | 78,846,446 | | | | 4.8 | |
| | | | | | | United States: 44.7% | | | | | | | | |
| | 153,680 | | | | | 3M Co. | | | 25,252,698 | | | | 1.5 | |
| | 412,063 | | | @ | | Adobe Systems, Inc. | | | 29,956,980 | | | | 1.8 | |
| | 345,530 | | | | | Aetna, Inc. | | | 30,693,430 | | | | 1.9 | |
| | 73,840 | | | | | Allergan, Inc. | | | 15,697,645 | | | | 1.0 | |
| | 838,330 | | | | | Altera Corp. | | | 30,967,910 | | | | 1.9 | |
| | 241,990 | | | | | Anthem, Inc. | | | 30,410,883 | | | | 1.8 | |
| | 43,290 | | | @ | | Biogen Idec, Inc. | | | 14,694,790 | | | | 0.9 | |
| | 645,400 | | | | | Citigroup, Inc. | | | 34,922,594 | | | | 2.1 | |
| | 486,240 | | | | | Colgate-Palmolive Co. | | | 33,642,946 | | | | 2.0 | |
| | 664,460 | | | @ | | eBay, Inc. | | | 37,289,495 | | | | 2.3 | |
| | 330,140 | | | | | Facebook, Inc. | | | 25,757,523 | | | | 1.6 | |
| | 220,270 | | | @ | | Gilead Sciences, Inc. | | | 20,762,650 | | | | 1.3 | |
| | 136,200 | | | | | Goldman Sachs Group, Inc. | | | 26,399,646 | | | | 1.6 | |
See Accompanying Notes to Financial Statements
| VY® Oppenheimer Global Portfolio | SUMMARY PORTFOLIO OF INVESTMENTS
as of December 31, 2014 (continued) |
| Shares | | | Value | | | Percentage
of Net
Assets | |
| COMMON STOCK: (continued) | |
| | | | | | | United States (continued) | |
| | 43,130 | | | | | Google, Inc. | | $ | 22,703,632 | | | | 1.4 | |
| | 43,130 | | | | | Google, Inc. - Class A | | | 22,887,366 | | | | 1.4 | |
| | 326,640 | | | | | Intuit, Inc. | | | 30,112,942 | | | | 1.8 | |
| | 869,590 | | | | | Maxim Integrated Products | | | 27,713,833 | | | | 1.7 | |
| | 461,070 | | | | | McGraw-Hill Cos., Inc. | | | 41,026,009 | | | | 2.5 | |
| | 252,280 | | | | | Tiffany & Co. | | | 26,958,641 | | | | 1.6 | |
| | 190,060 | | | | | United Parcel Service, Inc. - Class B | | | 21,128,970 | | | | 1.3 | |
| | 187,120 | | | @ | | Vertex Pharmaceuticals, Inc. | | | 22,229,856 | | | | 1.3 | |
| | 412,860 | | | | | Walt Disney Co. | | | 38,887,283 | | | | 2.4 | |
| | 170,960 | | | | | Zimmer Holdings, Inc. | | | 19,390,283 | | | | 1.2 | |
| | 2,593,211 | | | | | Other Securities(a) | | | 105,104,383 | | | | 6.4 | |
| | | | | | | | | | 734,592,388 | | | | 44.7 | |
| | | | | | | Total Common Stock
(Cost $1,009,174,928) | | | 1,607,416,516 | | | | 97.9 | |
| PREFERRED STOCK: 1.9% | | | | | | | | |
| | | | | | | Germany: 1.8% | | | | | | | | |
| | 370,294 | | | | | Bayerische Motoren
Werke AG | | | 30,253,005 | | | | 1.8 | |
| | | | | | | India: 0.1% | | | | | | | | |
| | 50,809,899 | | | | | Other Securities | | | 700,299 | | | | 0.1 | |
| | | | | | | Total Preferred Stock
(Cost $13,618,275) | | | 30,953,304 | | | | 1.9 | |
| RIGHTS: 0.0% | | | | | | | | |
| | | | | | | Italy: 0.0% | | | | | | | | |
| | 364,738 | | | | | Other Securities | | | 1,456 | | | | 0.0 | |
| | | | | | | Spain: 0.0% | | | | | | | | |
| | 2,486,699 | | | | | Other Securities | | | 488,682 | | | | 0.0 | |
| | | | | | | Total Rights
(Cost $475,993) | | | 490,138 | | | | 0.0 | |
| | | | | | | Total Long-Term
Investments
(Cost $1,023,269,196) | | | 1,638,859,958 | | | | 99.8 | |
Principal
Amount† | | | Value | | | Percentage
of Net
Assets | |
| SHORT-TERM INVESTMENTS: 3.6% | |
| | | | | | | Securities Lending Collateralcc: 2.4% | |
| | 9,171,152 | | | | | Cantor Fitzgerald, Repurchase Agreement dated 12/31/14, 0.09%, due 01/02/15 (Repurchase Amount $9,171,197, collateralized by various U.S. Government/U.S. Government Agency Obligations, 0.000%-10.500%, Market Value plus accrued interest $9,354,575, due 01/01/15-09/01/49) | | $ | 9,171,152 | | | | 0.6 | |
| | 1,930,668 | | | | | Daiwa Capital Markets, Repurchase Agreement dated 12/31/14, 0.12%, due 01/02/15 (Repurchase Amount $1,930,681, collateralized by various U.S. Government/U.S. Government Agency Obligations, 0.000%-6.500%, Market Value plus accrued interest $1,969,281, due 06/01/17-03/01/48) | | | 1,930,668 | | | | 0.1 | |
| | 9,171,152 | | | | | Nomura Securities, Repurchase Agreement dated 12/31/14, 0.08%, due 01/02/15 (Repurchase Amount $9,171,192, collateralized by various U.S. Government/U.S. Government Agency Obligations, 0.000%-8.875%, Market Value plus accrued interest $9,354,575, due 01/07/15-10/20/64) | | | 9,171,152 | | | | 0.6 | |
| | 9,171,152 | | | | | Royal Bank of Scotland PLC, Repurchase Agreement dated 12/31/14, 0.09%, due 01/02/15 (Repurchase Amount $9,171,197, collateralized by various U.S. Government/U.S. Government Agency Obligations, 0.375%-7.250%, Market Value plus accrued interest $9,354,576, due 11/15/15-07/15/56) | | | 9,171,152 | | | | 0.6 | |
See Accompanying Notes to Financial Statements
| VY® Oppenheimer Global Portfolio | SUMMARY PORTFOLIO OF INVESTMENTS
as of December 31, 2014 (continued) |
Principal
Amount† | | | Value | | | Percentage
of Net
Assets | |
| SHORT-TERM INVESTMENTS: (continued) |
| | | | | | | Securities Lending Collateralcc (continued) |
| | 9,171,152 | | | | | State of Wisconsin Investment Board, Repurchase Agreement dated 12/31/14, 0.15%, due 01/02/15 (Repurchase Amount $9,171,227, collateralized by various U.S. Government Securities, 0.125%-2.500%, Market Value plus accrued interest $9,355,494, due 04/15/16-02/15/42) | | $ | 9,171,152 | | | | 0.5 | |
| | | | | | | | | | 38,615,276 | | | | 2.4 | |
| Shares | | | Value | | | Percentage
of Net
Assets | |
| | | | | | | Mutual Funds: 1.2% |
| | 19,820,244 | | | | | BlackRock Liquidity Funds, TempFund, Institutional Class, 0.030%†† (Cost $19,820,244) | | | 19,820,244 | | | | 1.2 | |
| | | | | | | Total Short-Term Investments (Cost $58,435,520) | | | 58,435,520 | | | | 3.6 | |
| | | | | | | Total Investments in Securities (Cost $1,081,704,716) | | $ | 1,697,295,478 | | | | 103.4 | |
| | | | | | | Liabilities in Excess of Other Assets | | | (55,337,400 | ) | | | (3.4 | ) |
| | | | | | | Net Assets | | $ | 1,641,958,078 | | | | 100.0 | |
“Other Securities” represents issues not identified as the top 50 holdings in terms of market value and issues or issuers not exceeding 1% of net assets individually or in aggregate respectively as of December 31, 2014.
The following footnotes apply to either the individual securities noted or one or more of the securities aggregated and listed as a single line item.
| † | Unless otherwise indicated, principal amount is shown in USD. |
| †† | Rate shown is the 7-day yield as of December 31, 2014. |
| @ | Non-income producing security. |
| ADR | American Depositary Receipt |
| cc | Represents securities purchased with cash collateral received for securities on loan. |
| (a) | This grouping contains securities on loan. |
Cost for federal income tax purposes is $1,095,544,499.
Net unrealized appreciation consists of:
| Gross Unrealized Appreciation | | $ | 651,431,785 | |
| Gross Unrealized Depreciation | | | (49,680,806 | ) |
| Net Unrealized Appreciation | | $ | 601,750,979 | |
| Sector Diversification | | Percentage of
Net Assets | |
| Information Technology | | | 23.3 | % |
| Financials | | | 20.0 | |
| Health Care | | | 17.0 | |
| Consumer Discretionary | | | 16.7 | |
| Industrials | | | 11.6 | |
| Consumer Staples | | | 6.0 | |
| Materials | | | 2.0 | |
| Telecommunication Services | | | 1.6 | |
| Energy | | | 1.6 | |
| Short-Term Investments | | | 3.6 | |
| Liabilities in Excess of Other Assets | | | (3.4 | ) |
| Net Assets | | | 100.0 | % |
See Accompanying Notes to Financial Statements
| VY® Oppenheimer Global Portfolio | SUMMARY PORTFOLIO OF INVESTMENTS
as of December 31, 2014 (continued) |
Fair Value Measurements^
The following is a summary of the fair valuations according to the inputs used as of December 31, 2014 in valuing the assets and liabilities:(1)
| | | Quoted Prices
in Active Markets
for Identical
Investments
(Level 1) | | | Significant
Other
Observable
Inputs#
(Level 2) | | | Significant
Unobservable
Inputs
(Level 3) | | | Fair Value
at
December 31, 2014 | |
| Asset Table | | | | | | | | | | | | | | | | |
| Investments, at fair value | | | | | | | | | | | | | | | | |
| Common Stock | | | | | | | | | | | | | | | | |
| Brazil | | $ | 52,348,867 | | | $ | — | | | $ | — | | | $ | 52,348,867 | |
| China | | | 10,359,556 | | | | — | | | | — | | | | 10,359,556 | |
| Denmark | | | — | | | | 6,876,720 | | | | — | | | | 6,876,720 | |
| France | | | — | | | | 85,217,263 | | | | — | | | | 85,217,263 | |
| Germany | | | — | | | | 131,390,466 | | | | — | | | | 131,390,466 | |
| India | | | 28,974,908 | | | | 28,586,050 | | | | — | | | | 57,560,958 | |
| Italy | | | — | | | | 23,690,068 | | | | — | | | | 23,690,068 | |
| Japan | | | — | | | | 172,433,336 | | | | — | | | | 172,433,336 | |
| Mexico | | | 12,058,525 | | | | — | | | | — | | | | 12,058,525 | |
| Netherlands | | | — | | | | 28,078,034 | | | | — | | | | 28,078,034 | |
| Russia | | | — | | | | 5,095,539 | | | | — | | | | 5,095,539 | |
| Spain | | | — | | | | 55,406,715 | | | | — | | | | 55,406,715 | |
| Sweden | | | — | | | | 68,642,545 | | | | — | | | | 68,642,545 | |
| Switzerland | | | 29,503,422 | | | | 55,315,668 | | | | — | | | | 84,819,090 | |
| United Kingdom | | | 2,641,325 | | | | 76,205,121 | | | | — | | | | 78,846,446 | |
| United States | | | 734,592,388 | | | | — | | | | — | | | | 734,592,388 | |
| Total Common Stock | | | 870,478,991 | | | | 736,937,525 | | | | — | | | | 1,607,416,516 | |
| Preferred Stock | | | 700,299 | | | | 30,253,005 | | | | — | | | | 30,953,304 | |
| Rights | | | 488,682 | | | | 1,456 | | | | — | | | | 490,138 | |
| Short-Term Investments | | | 19,820,244 | | | | 38,615,276 | | | | — | | | | 58,435,520 | |
| Total Investments, at fair value | | $ | 891,488,216 | | | $ | 805,807,262 | | | $ | — | | | $ | 1,697,295,478 | |
| (1) | For the year ended December 31, 2014, as a result of the fair value pricing procedures for international equities utilized by the Portfolio, certain securities have transferred in and out of Level 1 and Level 2 measurements during the year. The Portfolio’s policy is to recognize transfers between levels at the beginning of the reporting period. At December 31, 2014, securities valued at $16,560,269 and $14,470,614 were transferred from Level 1 to Level 2 and Level 2 to Level 1, respectively, within the fair value hierarchy. |
| ^ | See Note 2, “Significant Accounting Policies” in the Notes to Financial Statements for additional information. |
| # | The earlier close of the foreign markets gives rise to the possibility that significant events, including broad market moves, may have occurred in the interim and may materially affect the value of those securities. To account for this, the Portfolio may frequently value many of its foreign equity securities using fair value prices based on third party vendor modeling tools to the extent available. Accordingly, a portion of the Portfolio’s investments are categorized as Level 2 investments. |
See Accompanying Notes to Financial Statements
| VY® Pioneer High Yield Portfolio | SUMMARY PORTFOLIO OF INVESTMENTS
as of December 31, 2014 |
Principal
Amount† | | | Value | | | Percentage
of Net
Assets | |
| CORPORATE BONDS/NOTES: 82.4% |
| | | | | | | Basic Materials: 3.7% |
| | 360,000 | | | # | | Cascades, Inc., 5.500%, 07/15/22 | | $ | 359,550 | | | | 0.3 | |
| | 350,000 | | | # | | Eldorado Gold Corp., 6.125%, 12/15/20 | | | 341,250 | | | | 0.3 | |
| | 370,000 | | | # | | IAMGOLD Corp., 6.750%, 10/01/20 | | | 280,534 | | | | 0.2 | |
| | 200,000 | | | # | | INEOS Group Holdings SA, 5.875%, 02/15/19 | | | 190,000 | | | | 0.1 | |
| | 450,000 | | | # | | Mercer International, Inc., 7.000%, 12/01/19 | | | 455,625 | | | | 0.4 | |
| | 350,000 | | | #,± | | Midwest Vanadium Pty Ltd., 11.500%, 02/15/18 | | | 26,250 | | | | 0.0 | |
| | 80,000 | | | # | | Prince Mineral Holding Corp., 12.500%, 12/15/19 | | | 82,000 | | | | 0.1 | |
| | 240,000 | | | # | | Steel Dynamics, Inc., 5.125%, 10/01/21 | | | 244,500 | | | | 0.2 | |
| | 120,000 | | | # | | Unifrax I LLC / Unifrax Holding Co., 7.500%, 02/15/19 | | | 118,800 | | | | 0.1 | |
| | 240,000 | | | # | | WR Grace & Co-Conn, 5.125%, 10/01/21 | | | 246,600 | | | | 0.2 | |
| | 135,000 | | | # | | WR Grace & Co-Conn, 5.625%, 10/01/24 | | | 141,244 | | | | 0.1 | |
| | 2,104,000 | | | | | Other Securities | | | 2,051,969 | | | | 1.7 | |
| | | | | | | | | | 4,538,322 | | | | 3.7 | |
| | | | | | | Communications: 11.8% |
| | 550,000 | | | | | CCO Holdings LLC / CCO Holdings Capital Corp., 6.500%, 04/30/21 | | | 579,562 | | | | 0.5 | |
| | 580,000 | | | | | CenturyLink, Inc., 6.450%, 06/15/21 | | | 624,950 | | | | 0.5 | |
| | 120,000 | | | # | | CommScope, Inc., 5.000%, 06/15/21 | | | 118,800 | | | | 0.1 | |
| | 115,000 | | | # | | CommScope, Inc., 5.500%, 06/15/24 | | | 113,850 | | | | 0.1 | |
| | 330,000 | | | # | | DigitalGlobe, Inc., 5.250%, 02/01/21 | | | 315,150 | | | | 0.3 | |
| | 595,000 | | | | | Equinix, Inc., 5.375%, 01/01/22-04/01/23 | | | 601,735 | | | | 0.5 | |
| | 555,000 | | | | | Frontier Communications Corp., 8.750%, 04/15/22 | | | 622,987 | | | | 0.5 | |
| | 445,000 | | | | | Frontier Communications Corp., 8.500%-9.250%, 04/15/20-07/01/21 | | | 506,150 | | | | 0.4 | |
| | 270,000 | | | # | | MDC Partners, Inc., 6.750%, 04/01/20 | | | 279,113 | | | | 0.2 | |
Principal
Amount† | | | Value | | | Percentage
of Net
Assets | |
| CORPORATE BONDS/NOTES: (continued) |
| | | | | | | Communications (continued) |
| | 85,000 | | | # | | MPL 2 Acquisition Canco, Inc., 9.875%, 08/15/18 | | $ | 91,534 | | | | 0.1 | |
| | 200,000 | | | # | | Numericable Group SA, 6.000%, 05/15/22 | | | 201,350 | | | | 0.2 | |
| | 170,000 | | | # | | Sirius XM Radio, Inc., 4.625%, 05/15/23 | | | 159,800 | | | | 0.1 | |
| | 245,000 | | | # | | Taylor Morrison Communities, Inc. / Monarch Communities, Inc., 5.625%, 03/01/24 | | | 237,650 | | | | 0.2 | |
| | 680,000 | | | | | T-Mobile USA, Inc., 6.125%-6.633%, 04/28/20-01/15/24 | | | 702,363 | | | | 0.6 | |
| | 220,000 | | | # | | Townsquare Radio LLC / Townsquare Radio, Inc., 9.000%, 04/01/19 | | | 235,400 | | | | 0.2 | |
| | 155,000 | | | # | | Twitter, Inc., 0.250%, 09/15/19 | | | 135,431 | | | | 0.1 | |
| | 58,909 | | | | | Univision Communications, Inc., 4.000%, 03/01/20 | | | 57,693 | | | | 0.0 | |
| | 665,000 | | | # | | Univision Communications, Inc., 6.875%, 05/15/19 | | | 694,094 | | | | 0.6 | |
| | 315,000 | | | | | WebMD Health Corp., 1.500%, 12/01/20 | | | 315,984 | | | | 0.3 | |
| | 635,000 | | | | | WebMD Health Corp., 2.500%, 01/31/18 | | | 636,588 | | | | 0.5 | |
| | 1,285,000 | | | | | Windstream Corp., 6.375%-7.750%, 10/15/20-08/01/23 | | | 1,274,113 | | | | 1.0 | |
| | 5,842,598 | | | | | Other Securities | | | 5,856,173 | | | | 4.8 | |
| | | | | | | | | | 14,360,470 | | | | 11.8 | |
| | | | | | | Consumer, Cyclical: 9.9% |
| | 335,000 | | | # | | Asbury Automotive Group, Inc., 6.000%, 12/15/24 | | | 341,700 | | | | 0.3 | |
| | 440,000 | | | # | | Brookfield Residential Properties, Inc., 6.500%, 12/15/20 | | | 462,000 | | | | 0.4 | |
| | 345,000 | | | # | | Global Partners L.P./GLP Finance Corp., 6.250%, 07/15/22 | | | 336,375 | | | | 0.3 | |
| | 490,000 | | | # | | Jarden Corp., 1.125%, 03/15/34 | | | 551,556 | | | | 0.4 | |
| | 355,000 | | | # | | JLL/Delta Dutch Newco BV, 7.500%, 02/01/22 | | | 361,656 | | | | 0.3 | |
| | 650,000 | | | | | KB Home, 1.375%, 02/01/19 | | | 647,563 | | | | 0.5 | |
| | 645,000 | | | | | KB Home, 7.000%-7.500%, 12/15/21-09/15/22 | | | 682,675 | | | | 0.6 | |
See Accompanying Notes to Financial Statements
| VY® Pioneer High Yield Portfolio | SUMMARY PORTFOLIO OF INVESTMENTS
as of December 31, 2014 (continued) |
Principal
Amount† | | | Value | | | Percentage
of Net
Assets | |
| CORPORATE BONDS/NOTES: (continued) |
| | | | | | | Consumer, Cyclical (continued) |
| | 104,000 | | | # | | Lennar Corp., 2.750%, 12/15/20 | | $ | 210,340 | | | | 0.1 | |
| | 715,000 | | | | | Lennar Corp., 4.500%-4.750%, 06/15/19-11/15/22 | | | 709,275 | | | | 0.6 | |
| | 580,000 | | | | | Navistar International Corp., 8.250%, 11/01/21 | | | 574,200 | | | | 0.5 | |
| | 300,000 | | | # | | NCL Corp. Ltd., 5.250%, 11/15/19 | | | 303,750 | | | | 0.2 | |
| | 200,000 | | | # | | Nexteer Automotive Group Ltd., 5.875%, 11/15/21 | | | 201,000 | | | | 0.2 | |
| | 150,000 | | | | | Scientific Games International, Inc., 6.250%, 09/01/20 | | | 105,750 | | | | 0.1 | |
| | 800,000 | | | # | | Scientific Games International, Inc., 10.000%, 12/01/22 | | | 737,000 | | | | 0.6 | |
| | 145,000 | | | # | | Stackpole International Intermediate Co. SA / Stackpole International Power Meta, 7.750%, 10/15/21 | | | 145,725 | | | | 0.1 | |
| | 245,000 | | | # | | Viking Cruises Ltd., 8.500%, 10/15/22 | | | 266,438 | | | | 0.2 | |
| | 475,000 | | | # | | WMG Acquisition Corp., 6.750%, 04/15/22 | | | 434,625 | | | | 0.3 | |
| | 4,816,692 | | | | | Other Securities | | | 5,075,193 | | | | 4.2 | |
| | | | | | | | | | 12,146,821 | | | | 9.9 | |
| | | | | | | Consumer, Non-cyclical: 14.6% |
| | 710,000 | | | | | Alere, Inc., 3.000%, 05/15/16 | | | 741,950 | | | | 0.6 | |
| | 570,000 | | | | | Alliance One International, Inc., 9.875%, 07/15/21 | | | 511,575 | | | | 0.4 | |
| | 210,000 | | | # | | Amsurg Corp., 5.625%, 07/15/22 | | | 216,300 | | | | 0.2 | |
| | 140,000 | | | # | | ARIAD Pharmaceuticals, Inc., 3.625%, 06/15/19 | | | 143,675 | | | | 0.1 | |
| | 175,000 | | | # | | Ashtead Capital, Inc., 5.625%, 10/01/24 | | | 180,250 | | | | 0.1 | |
| | 215,000 | | | # | | C&S Group Enterprises LLC, 5.375%, 07/15/22 | | | 213,925 | | | | 0.2 | |
| | 490,000 | | | | | Cardtronics, Inc., 1.000%, 12/01/20 | | | 487,244 | | | | 0.4 | |
| | 120,000 | | | # | | Carriage Services, Inc., 2.750%, 03/15/21 | | | 130,426 | | | | 0.1 | |
| | 225,000 | | | # | | Cenveo Corp., 6.000%, 08/01/19 | | | 204,750 | | | | 0.2 | |
| | 870,000 | | | | | CHS/Community Health Systems, Inc., 8.000%, 11/15/19 | | | 930,900 | | | | 0.8 | |
| | 265,000 | | | # | | Cott Beverages, Inc., 5.375%, 07/01/22 | | | 243,800 | | | | 0.2 | |
Principal
Amount† | | | Value | | | Percentage
of Net
Assets | |
| CORPORATE BONDS/NOTES: (continued) |
| | | | | | | Consumer, Non-cyclical (continued) |
| | 200,000 | | | # | | Dole Food Co., Inc., 7.250%, 05/01/19 | | $ | 199,750 | | | | 0.2 | |
| | 140,000 | | | # | | Endo Finance LLC, 5.375%, 01/15/23 | | | 137,550 | | | | 0.1 | |
| | 315,000 | | | # | | Endo Finance LLC, 5.750%, 01/15/22 | | | 315,787 | | | | 0.3 | |
| | 250,000 | | | # | | FAGE Dairy Industry SA / FAGE USA Dairy Industry, Inc., 9.875%, 02/01/20 | | | 262,500 | | | | 0.2 | |
| | 250,000 | | | #,& | | Igloo Holdings Corp., 8.250%, 12/15/17 | | | 250,625 | | | | 0.2 | |
| | 200,000 | | | # | | Jazz Investments I Ltd., 1.875%, 08/15/21 | | | 227,250 | | | | 0.2 | |
| | 240,000 | | | # | | Kindred Escrow Corp. II, 8.000%, 01/15/20 | | | 256,200 | | | | 0.2 | |
| | 255,000 | | | # | | Kindred Healthcare, Inc., 6.375%, 04/15/22 | | | 244,163 | | | | 0.2 | |
| | 75,000 | | | # | | Live Nation Entertainment, Inc., 5.375%, 06/15/22 | | | 75,375 | | | | 0.1 | |
| | 300,000 | | | # | | Live Nation Entertainment, Inc., 7.000%, 09/01/20 | | | 318,000 | | | | 0.2 | |
| | 400,000 | | | # | | Multi-Color Corp., 6.125%, 12/01/22 | | | 401,000 | | | | 0.3 | |
| | 328,000 | | | # | | Physio-Control International, Inc., 9.875%, 01/15/19 | | | 349,320 | | | | 0.3 | |
| | 550,000 | | | | | Post Holdings, Inc., 7.375%, 02/15/22 | | | 551,375 | | | | 0.4 | |
| | 100,000 | | | # | | Post Holdings, Inc., 6.750%, 12/01/21 | | | 97,250 | | | | 0.1 | |
| | 935,000 | | | | | Reynolds Group Issuer, Inc., 5.750%-9.875%, 05/15/18-02/15/21 | | | 970,650 | | | | 0.8 | |
| | 165,000 | | | # | | Safway Group Holding LLC / Safway Finance Corp., 7.000%, 05/15/18 | | | 157,575 | | | | 0.1 | |
| | 275,000 | | | | | Salix Pharmaceuticals Ltd., 1.500%, 03/15/19 | | | 502,734 | | | | 0.4 | |
| | 465,000 | | | # | | Sothebys, 5.250%, 10/01/22 | | | 441,750 | | | | 0.3 | |
| | 255,000 | | | # | | Southern States Cooperative, Inc., 10.000%, 08/15/21 | | | 219,300 | | | | 0.2 | |
| | 8,028,511 | | | | | Other Securities | | | 7,892,010 | | | | 6.5 | |
| | | | | | | | | | 17,874,959 | | | | 14.6 | |
| | | | | | | Energy: 14.0% | | | | | | | | |
| | 160,000 | | | # | | Alpha Natural Resources, Inc., 7.500%, 08/01/20 | | | 101,200 | | | | 0.1 | |
See Accompanying Notes to Financial Statements
| VY® Pioneer High Yield Portfolio | SUMMARY PORTFOLIO OF INVESTMENTS
as of December 31, 2014 (continued) |
Principal
Amount† | | | Value | | | Percentage
of Net
Assets | |
| CORPORATE BONDS/NOTES: (continued) |
| | | | | | | Energy (continued) | | | | | | | | |
| | 95,000 | | | # | | American Energy-Permian Basin LLC / AEPB Finance Corp., 7.375%, 11/01/21 | | $ | 70,300 | | | | 0.1 | |
| | 125,000 | | | # | | Calfrac Holdings L.P., 7.500%, 12/01/20 | | | 106,250 | | | | 0.1 | |
| | 350,000 | | | # | | Calumet Specialty Products Partners L.P./Calumet Finance Corp., 6.500%, 04/15/21 | | | 314,125 | | | | 0.2 | |
| | 760,000 | | | | | Chesapeake Energy Corp., 2.250%-5.375%, 06/15/21-12/15/38 | | | 732,950 | | | | 0.6 | |
| | 210,000 | | | # | | ContourGlobal Power Holdings SA, 7.125%, 06/01/19 | | | 211,050 | | | | 0.2 | |
| | 590,000 | | | | | Denbury Resources, Inc., 4.625%-5.500%, 05/01/22-07/15/23 | | | 529,025 | | | | 0.4 | |
| | 245,000 | | | # | | Drill Rigs Holdings, Inc., 6.500%, 10/01/17 | | | 204,575 | | | | 0.2 | |
| | 285,000 | | | # | | Energy & Exploration Partners, Inc., 8.000%, 07/01/19 | | | 102,600 | | | | 0.1 | |
| | 275,000 | | | | | EP Energy, LLC, 7.750%, 09/01/22 | | | 258,500 | | | | 0.2 | |
| | 500,000 | | | | | EP Energy, LLC, 9.375%, 05/01/20 | | | 507,500 | | | | 0.4 | |
| | 225,000 | | | # | | Gibson Energy, Inc., 6.750%, 07/15/21 | | | 225,562 | | | | 0.2 | |
| | 620,000 | | | | | Halcon Resources Corp., 8.875%-9.750%, 07/15/20-02/15/22 | | | 466,587 | | | | 0.4 | |
| | 90,000 | | | # | | Hiland Partners L.P. / Hiland Partners Finance Corp., 5.500%, 05/15/22 | | | 79,425 | | | | 0.1 | |
| | 170,000 | | | # | | Hiland Partners L.P. / Hiland Partners Finance Corp., 7.250%, 10/01/20 | | | 162,350 | | | | 0.1 | |
| | 275,000 | | | # | | Jupiter Resources, Inc., 8.500%, 10/01/22 | | | 208,312 | | | | 0.2 | |
| | 340,000 | | | # | | Memorial Production Partners L.P. / Memorial Production Finance Corp., 6.875%, 08/01/22 | | | 260,100 | | | | 0.2 | |
| | 150,000 | | | # | | Murray Energy Corp., 8.625%, 06/15/21 | | | 144,000 | | | | 0.1 | |
| | 210,000 | | | # | | Rice Energy, Inc., 6.250%, 05/01/22 | | | 196,350 | | | | 0.2 | |
| | 585,000 | | | | | Rosetta Resources, Inc., 5.625%, 05/01/21 | | | 538,259 | | | | 0.4 | |
Principal
Amount† | | | Value | | | Percentage
of Net
Assets | |
| CORPORATE BONDS/NOTES: (continued) |
| | | | | | | Energy (continued) |
| | 240,000 | | | | | Rosetta Resources, Inc., 5.875%, 06/01/22 | | $ | 218,400 | | | | 0.2 | |
| | 560,000 | | | | | Sanchez Energy Corp., 7.750%, 06/15/21 | | | 523,600 | | | | 0.4 | |
| | 400,000 | | | # | | Sanjel Corp., 7.500%, 06/19/19 | | | 306,000 | | | | 0.2 | |
| | 360,000 | | | # | | SolarCity Corp., 1.625%, 11/01/19 | | | 327,150 | | | | 0.3 | |
| | 155,000 | | | # | | Talos Production LLC, 9.750%, 02/15/18 | | | 141,825 | | | | 0.1 | |
| | 165,000 | | | # | | Ultra Petroleum Corp., 5.750%, 12/15/18 | | | 153,038 | | | | 0.1 | |
| | 12,344,198 | | | | | Other Securities | | | 9,979,248 | | | | 8.2 | |
| | | | | | | | | | 17,068,281 | | | | 14.0 | |
| | | | | | | Financial: 7.6% | | | | | | | | |
| | 205,000 | | | #,& | | AAF Holdings LLC/AAF Finance Co., 12.000%, 07/01/19 | | | 199,875 | | | | 0.2 | |
| | 300,000 | | | # | | Ausdrill Finance Pty Ltd., 6.875%, 11/01/19 | | | 247,500 | | | | 0.2 | |
| | 250,000 | | | # | | Embarcadero Reinsurance Ltd., 5.015%, 02/07/17 | | | 250,875 | | | | 0.2 | |
| | 300,000 | | | # | | Fidelity & Guaranty Life Holdings, Inc., 6.375%, 04/01/21 | | | 316,500 | | | | 0.3 | |
| | 645,000 | | | | | Forest City Enterprises, Inc., 3.625%-4.250%, 08/15/18-08/15/20 | | | 716,125 | | | | 0.6 | |
| | 250,000 | | | # | | Galileo Re Ltd., 7.415%, 01/09/19 | | | 258,412 | | | | 0.2 | |
| | 480,000 | | | | | Geo Group, Inc./The, 5.875%, 10/15/24 | | | 488,400 | | | | 0.4 | |
| | 250,000 | | | # | | Kilimanjaro Re Ltd., 4.515%, 04/30/18 | | | 253,337 | | | | 0.2 | |
| | 575,000 | | | | | Nationstar Mortgage LLC / Nationstar Capital Corp., 6.500%, 07/01/21 | | | 526,125 | | | | 0.4 | |
| | 320,000 | | | | | Nationstar Mortgage LLC / Nationstar Capital Corp., 6.500%, 08/01/18-06/01/22 | | | 297,600 | | | | 0.3 | |
| | 275,000 | | | # | | Ocwen Financial Corp., 6.625%, 05/15/19 | | | 253,000 | | | | 0.2 | |
| | 665,000 | | | # | | Outerwall, Inc., 5.875%, 06/15/21 | | | 623,438 | | | | 0.5 | |
| | 250,000 | | | # | | Queen Street VII Re Ltd., 8.615%, 04/08/16 | | | 260,531 | | | | 0.2 | |
| | 125,000 | | | # | | Rayonier AM Products, Inc., 5.500%, 06/01/24 | | | 103,281 | | | | 0.1 | |
See Accompanying Notes to Financial Statements
| VY® Pioneer High Yield Portfolio | SUMMARY PORTFOLIO OF INVESTMENTS
as of December 31, 2014 (continued) |
Principal
Amount† | | | Value | | | Percentage
of Net
Assets | |
| CORPORATE BONDS/NOTES: (continued) |
| | | | | | | Financial (continued) |
| | 250,000 | | | # | | Residential Reinsurance 2012 Ltd., 5.765%, 12/06/18 | | $ | 260,787 | | | | 0.2 | |
| | 250,000 | | | # | | Residential Reinsurance 2012 Ltd., 12.765%, 12/06/18 | | | 273,538 | | | | 0.2 | |
| | 250,000 | | | # | | Sanders Re Ltd., 4.015%, 05/05/17 | | | 250,338 | | | | 0.2 | |
| | 210,000 | | | # | | TMX Finance LLC / TitleMax Finance Corp., 8.500%, 09/15/18 | | | 177,450 | | | | 0.1 | |
| | 250,000 | | | # | | Ursa Re Ltd., 3.515%, 12/07/17 | | | 250,688 | | | | 0.2 | |
| | 525,000 | | | # | | USB Realty Corp., 1.378%, 12/29/49 | | | 475,125 | | | | 0.4 | |
| | 2,722,591 | | | | | Other Securities | | | 2,746,546 | | | | 2.3 | |
| | | | | | | | | | 9,229,471 | | | | 7.6 | |
| | | | | | | Industrial: 11.1% | | | | | | | | |
| | 105,000 | | | # | | AECOM Technology Corp., 5.750%, 10/15/22 | | | 107,625 | | | | 0.1 | |
| | 105,000 | | | # | | AECOM Technology Corp., 5.875%, 10/15/24 | | | 107,625 | | | | 0.1 | |
| | 150,000 | | | # | | Aguila 3 SA, 7.875%, 01/31/18 | | | 145,500 | | | | 0.1 | |
| | 205,000 | | | #,& | | American Energy - Utica LLC, 3.500%, 03/01/21 | | | 150,675 | | | | 0.1 | |
| | 345,000 | | | # | | Amsted Industries, Inc., 5.000%, 03/15/22 | | | 340,256 | | | | 0.3 | |
| | 365,345 | | | #,& | | Ardagh Finance Holdings SA, 8.625%, 06/15/19 | | | 361,692 | | | | 0.3 | |
| | 35,294 | | | # | | Ardagh Packaging Finance PLC, 7.000%, 11/15/20 | | | 35,823 | | | | 0.0 | |
| | 250,000 | | | # | | Aviation Capital Group Corp., 6.750%, 04/06/21 | | | 284,375 | | | | 0.2 | |
| | 350,000 | | | # | | BC Mountain LLC / BC Mountain Finance, Inc., 7.000%, 02/01/21 | | | 301,000 | | | | 0.3 | |
| | 85,000 | | | # | | Belden, Inc., 5.250%, 07/15/24 | | | 82,025 | | | | 0.1 | |
| | 195,000 | | | # | | Belden, Inc., 5.500%, 09/01/22 | | | 194,512 | | | | 0.1 | |
| | 50,000 | | | # | | Beverage Packaging Holdings Luxembourg II SA / Beverage Packaging Holdings II Is, 6.000%, 06/15/17 | | | 48,875 | | | | 0.0 | |
| | 225,000 | | | # | | BioScrip, Inc., 8.875%, 02/15/21 | | | 203,344 | | | | 0.2 | |
| | 200,000 | | | # | | Bombardier, Inc., 4.750%, 04/15/19 | | | 201,000 | | | | 0.2 | |
| | 400,000 | | | # | | Bombardier, Inc., 6.000%, 10/15/22 | | | 404,500 | | | | 0.3 | |
| | 165,000 | | | # | | Bombardier, Inc., 6.125%, 01/15/23 | | | 168,712 | | | | 0.1 | |
Principal
Amount† | | | Value | | | Percentage
of Net
Assets | |
| CORPORATE BONDS/NOTES: (continued) |
| | | | | | | Industrial (continued) |
| | 135,000 | | | # | | Building Materials Corp. of America, 6.750%, 05/01/21 | | $ | 143,100 | | | | 0.1 | |
| | 305,000 | | | # | | Cleaver-Brooks, Inc., 8.750%, 12/15/19 | | | 322,537 | | | | 0.3 | |
| | 640,000 | | | | | Crown Cork & Seal Co., Inc., 7.375%, 12/15/26 | | | 710,400 | | | | 0.6 | |
| | 586,000 | | | # | | Emergent Biosolutions, Inc., 2.875%, 01/15/21 | | | 660,349 | | | | 0.5 | |
| | 300,000 | | | # | | Exopack Holding Corp., 10.000%, 06/01/18 | | | 318,750 | | | | 0.3 | |
| | 270,000 | | | # | | Florida East Coast Holdings Corp., 6.750%, 05/01/19 | | | 267,975 | | | | 0.2 | |
| | 744,000 | | | | | General Cable Corp., 4.500%, 11/15/29 | | | 539,865 | | | | 0.5 | |
| | 505,000 | | | | | Griffon Corp., 5.250%, 03/01/22 | | | 478,488 | | | | 0.4 | |
| | 175,000 | | | # | | Intrepid Aviation Group Holdings LLC / Intrepid Finance Co., 6.875%, 02/15/19 | | | 170,188 | | | | 0.1 | |
| | 310,000 | | | # | | JB Poindexter & Co., Inc., 9.000%, 04/01/22 | | | 336,350 | | | | 0.3 | |
| | 150,000 | | | # | | JMC Steel Group, 8.250%, 03/15/18 | | | 143,063 | | | | 0.1 | |
| | 190,000 | | | # | | Liberty Tire Recycling, 11.000%, 10/01/16 | | | 159,125 | | | | 0.1 | |
| | 190,000 | | | # | | Mcron Finance Sub, LLC / Mcron Finance Corp., 8.375%, 05/15/19 | | | 202,350 | | | | 0.2 | |
| | 220,000 | | | # | | Moog, Inc., 5.250%, 12/01/22 | | | 223,300 | | | | 0.2 | |
| | 575,000 | | | # | | NANA Development Corp., 9.500%, 03/15/19 | | | 520,375 | | | | 0.4 | |
| | 265,000 | | | # | | Packaging Dynamics Corp., 8.750%, 02/01/16 | | | 266,325 | | | | 0.2 | |
| | 400,000 | | | # | | Rentech Nitrogen Partners L.P. / Rentech Nitrogen Finance Corp., 6.500%, 04/15/21 | | | 358,000 | | | | 0.3 | |
| | 400,000 | | | # | | Rexel SA, 5.250%, 06/15/20 | | | 405,000 | | | | 0.3 | |
| | 190,000 | | | # | | SunPower Corp., 0.875%, 06/01/21 | | | 171,950 | | | | 0.1 | |
| | 200,000 | | | # | | Syncreon Group BV / Syncreon Global Finance US, Inc., 8.625%, 11/01/21 | | | 189,000 | | | | 0.2 | |
| | 550,000 | | | # | | Viasystems, Inc., 7.875%, 05/01/19 | | | 583,000 | | | | 0.5 | |
| | 100,000 | | | # | | Videotron Ltd., 5.375%, 06/15/24 | | | 102,250 | | | | 0.1 | |
See Accompanying Notes to Financial Statements
| VY® Pioneer High Yield Portfolio | SUMMARY PORTFOLIO OF INVESTMENTS
as of December 31, 2014 (continued) |
Principal
Amount† | | | Value | | | Percentage
of Net
Assets | |
| CORPORATE BONDS/NOTES: (continued) |
| | | | | | | Industrial (continued) |
| | 545,000 | | | # | | Vishay Intertechnology, Inc., 2.250%, 05/15/41 | | $ | 493,906 | | | | 0.4 | |
| | 2,629,388 | | | | | Other Securities | | | 2,633,042 | | | | 2.2 | |
| | | | | | | | | | 13,536,227 | | | | 11.1 | |
| | | | | | | Materials: 0.7% | | | | | | | | |
| | 610,000 | | | | | Exterran Partners L.P. / EXLP Finance Corp., 6.000%, 04/01/21 | | | 536,800 | | | | 0.5 | |
| | 325,000 | | | # | | Exterran Partners L.P. / EXLP Finance Corp., 6.000%, 10/01/22 | | | 279,500 | | | | 0.2 | |
| | | | | | | | | | 816,300 | | | | 0.7 | |
| | | | | | | Technology: 7.3% | | | | | | | | |
| | 210,000 | | | # | | ACI Worldwide, Inc., 6.375%, 08/15/20 | | | 220,237 | | | | 0.2 | |
| | 200,000 | | | # | | Activision Blizzard, Inc., 5.625%, 09/15/21 | | | 210,500 | | | | 0.2 | |
| | 125,000 | | | # | | Activision Blizzard, Inc., 6.125%, 09/15/23 | | | 135,000 | | | | 0.1 | |
| | 635,000 | | | | | Advanced Micro Devices, Inc., 6.750%-7.500%, 03/01/19-07/ 01/24 | | | 576,875 | | | | 0.5 | |
| | 260,000 | | | #,Z | | Akamai Technologies, Inc., 1.000%, 02/15/19 | | | 271,051 | | | | 0.2 | |
| | 150,000 | | | # | | Audatex North America, Inc., 6.000%, 06/15/21 | | | 155,250 | | | | 0.1 | |
| | 115,000 | | | # | | Cepheid, Inc., 1.250%, 02/01/21 | | | 126,859 | | | | 0.1 | |
| | 160,000 | | | # | | Citrix Systems, Inc., 0.500%, 04/15/19 | | | 168,700 | | | | 0.1 | |
| | 375,000 | | | # | | Entegris, Inc., 6.000%, 04/01/22 | | | 381,563 | | | | 0.3 | |
| | 75,000 | | | # | | First Data Corp., 7.375%, 06/15/19 | | | 79,125 | | | | 0.1 | |
| | 510,000 | | | | | j2 Global, Inc., 8.000%, 08/01/20 | | | 551,438 | | | | 0.5 | |
| | 450,000 | | | | | Mentor Graphics Corp., 4.000%, 04/01/31 | | | 541,125 | | | | 0.4 | |
| | 250,000 | | | # | | MSCI, Inc., 5.250%, 11/15/24 | | | 259,375 | | | | 0.2 | |
| | 1,020,000 | | | | | Nuance Communications, Inc., 2.750%, 11/01/31 | | | 1,021,913 | | | | 0.8 | |
| | 606,000 | | | | | ON Semiconductor Corp., 2.625%, 12/15/26 | | | 722,655 | | | | 0.6 | |
| | 595,000 | | | | | Seagate HDD Cayman, 4.750%, 06/01/23 | | | 619,065 | | | | 0.5 | |
| | 700,000 | | | # | | Seagate HDD Cayman, 4.750%, 01/01/25 | | | 723,693 | | | | 0.6 | |
Principal
Amount† | | | Value | | | Percentage
of Net
Assets | |
| CORPORATE BONDS/NOTES: (continued) |
| | | | | | | Technology (continued) |
| | 2,140,357 | | | | | Other Securities | | $ | 2,148,042 | | | | 1.8 | |
| | | | | | | | | | 8,912,466 | | | | 7.3 | |
| | | | | | | Telecommunication Services: —% |
| | 1,445,000 | | | | | Other Securities | | | — | | | | — | |
| | | | | | | Utilities: 1.7% | | | | | | | | |
| | 505,000 | | | | | AES Corp., 4.875%, 05/15/23 | | | 503,738 | | | | 0.4 | |
| | 100,000 | | | | | AES Corp., 5.500%, 03/15/24 | | | 101,980 | | | | 0.1 | |
| | 550,000 | | | # | | NRG Energy, Inc., 6.250%, 05/01/24 | | | 562,375 | | | | 0.4 | |
| | 425,000 | | | | | NRG Energy, Inc., 6.250%-7.625%, 01/15/18-07/15/22 | | | 456,625 | | | | 0.4 | |
| | 440,000 | | | # | | RJS Power Holdings LLC, 5.125%, 07/15/19 | | | 436,700 | | | | 0.4 | |
| | 438 | | | | | Other Securities | | | 470 | | | | 0.0 | |
| | | | | | | | | | 2,061,888 | | | | 1.7 | |
| | | | | | | Total Corporate Bonds/Notes (Cost $103,216,828) | | | 100,545,205 | | | | 82.4 | |
| | | | | | | | | | | | | | | |
| COLLATERALIZED MORTGAGE OBLIGATIONS: 0.9% |
| | 1,000,000 | | | # | | Timberstar Trust, 7.530%, 10/15/36 | | | 1,045,647 | | | | 0.9 | |
| | | | | | | Total Collateralized Mortgage Obligations (Cost $1,008,075) | | | 1,045,647 | | | | 0.9 | |
| U.S. TREASURY OBLIGATIONS: 1.6% |
| | | | | | | U.S. Treasury Notes: 1.6% |
| | 665,000 | | | | | 0.075%, due 01/31/16 | | | 664,854 | | | | 0.5 | |
| | 665,000 | | | | | 0.099%, due 04/30/16 | | | 665,023 | | | | 0.5 | |
| | 665,000 | | | | | 0.100%, due 07/31/16 | | | 665,037 | | | | 0.6 | |
| | | | | | | Total U.S. Treasury Obligations (Cost $1,995,518) | | | 1,994,914 | | | | 1.6 | |
See Accompanying Notes to Financial Statements
| VY® Pioneer High Yield Portfolio | SUMMARY PORTFOLIO OF INVESTMENTS
as of December 31, 2014 (continued) |
| Shares | | | Value | | | Percentage
of Net
Assets | |
| COMMON STOCK: 7.0% |
| | | | | | | Consumer Discretionary: 1.0% |
| | 50,408 | | | | | Ford Motor Co. | | $ | 781,324 | | | | 0.6 | |
| | 12,269 | | | | | Other Securities | | | 513,444 | | | | 0.4 | |
| | | | | | | | | | 1,294,768 | | | | 1.0 | |
| | | | | | | Energy: 0.4% | | | | | | | | |
| | 10,370 | | | | | Other Securities | | | 506,598 | | | | 0.4 | |
| | | | | | | Financials: 0.5% | | | | | | | | |
| | 29,978 | | | @ | | Forest City Enterprises, Inc. | | | 638,531 | | | | 0.5 | |
| | 1,476 | | | # | | Perseus Holding Corp | | | — | | | | — | |
| | | | | | | | | | 638,531 | | | | 0.5 | |
| | | | | | | Health Care: 2.1% | | | | | | | | |
| | 6,438 | | | | | Aetna, Inc. | | | 571,888 | | | | 0.5 | |
| | 5,400 | | | | | Cigna Corp. | | | 555,714 | | | | 0.5 | |
| | 6,148 | | | | | Thermo Fisher Scientific, Inc. | | | 770,283 | | | | 0.6 | |
| | 19,694 | | | | | Other Securities | | | 642,858 | | | | 0.5 | |
| | | | | | | | | | 2,540,743 | | | | 2.1 | |
| | | | | | | Industrials: 1.0% | | | | | | | | |
| | 66,798 | | | | | Other Securities | | | 1,178,461 | | | | 1.0 | |
| | | | | | | Information Technology: 0.7% | | | | | | | | |
| | 23,403 | | | | | Other Securities | | | 819,098 | | | | 0.7 | |
| | | | | | | Materials: 1.1% | | | | | | | | |
| | 98,900 | | | | | Other Securities | | | 1,366,445 | | | | 1.1 | |
| | | | | | | Telecommunication Services: 0.2% | | | | | | | | |
| | 28,800 | | | | | Other Securities | | | 237,312 | | | | 0.2 | |
| | | | | | | Total Common Stock
(Cost $5,695,583) | | | 8,581,956 | | | | 7.0 | |
| | | | | | | | | | | | | | | |
| PREFERRED STOCK: 4.1% |
| | | | | | | Consumer Discretionary: 0.5% |
| | 7,900 | | | | | Sealy Corp. | | | 626,075 | | | | 0.5 | |
| | | | | | | Consumer Staples: 0.2% | | | | | | | | |
| | 2,600 | | | # | | Post Holdings, Inc. | | | 219,213 | | | | 0.2 | |
| | | | | | | Energy: 0.6% | | | | | | | | |
| | 285 | | | | | Halcon Resources Corp. | | | 114,000 | | | | 0.1 | |
| | 1,400 | | | # | | Penn Virginia Corp. | | | 92,225 | | | | 0.1 | |
| | 20,689 | | | | | Other Securities | | | 553,144 | | | | 0.4 | |
| | | | | | | | | | 759,369 | | | | 0.6 | |
| | | | | | | Financials: 1.6% | | | | | | | | |
| | 325 | | | #,P | | Ally Financial, Inc. | | | 326,493 | | | | 0.3 | |
| | 26,000 | | | P | | Citigroup, Inc. | | | 705,120 | | | | 0.6 | |
| | 775 | | | # | | Perseus Holding Corp. | | | — | | | | — | |
| | 30,630 | | | | | Other Securities | | | 930,978 | | | | 0.7 | |
| | | | | | | | | | 1,962,591 | | | | 1.6 | |
| | | | | | | Health Care: 0.7% | | | | | | | | |
| | 2,811 | | | | | Alere, Inc. | | | 885,465 | | | | 0.7 | |
| Shares | | | Value | | | Percentage
of Net
Assets | |
| PREFERRED STOCK (continued) |
| | | | | | | Industrials: 0.2% | | | | | | | | |
| | 267 | | | | | Other Securities | | $ | 206,948 | | | | 0.2 | |
| | | | | | | Utilities: 0.3% | | | | | | | | |
| | 12,000 | | | | | Other Securities | | | 298,800 | | | | 0.3 | |
| | | | | | | Total Preferred Stock
(Cost $5,492,388) | | | 4,958,461 | | | | 4.1 | |
| | | | | | | | | | | | | | | |
| WARRANTS: 0.1% |
| | | | | | | Energy: —% | | | | | | | | |
| | 75 | | | #,@ | | Green Field Energy Services,
Inc. | | | — | | | | — | |
| | | | | | | Industrials: 0.1% | | | | | | | | |
| | 3,612,760 | | | | | Other Securities | | | 91,200 | | | | 0.1 | |
| | | | | | | Total Warrants
(Cost $263,043) | | | 91,200 | | | | 0.1 | |
| | | | | | | Total Long-Term Investments
(Cost $117,671,435) | | | 117,217,383 | | | | 96.1 | |
| | | | | | | | | | | | | | | |
| SHORT-TERM INVESTMENTS: 2.6% |
| | | | | | | Mutual Funds: 2.6% |
| | 3,166,436 | | | | | BlackRock Liquidity Funds,
TempFund, Institutional Class,
0.030%††
(Cost $3,166,436) | | $ | 3,166,436 | | | | 2.6 | |
| | | | | | | Total Short-Term Investments
(Cost $3,166,436) | | | 3,166,436 | | | | 2.6 | |
| | | | | | | Total Investments in Securities
(Cost $120,837,871) | | $ | 120,383,819 | | | | 98.7 | |
| | | | | | | Assets in Excess of Other Liabilities | | | 1,644,892 | | | | 1.3 | |
| | | | | | | Net Assets | | $ | 122,028,711 | | | | 100.0 | |
“Other Securities” represents issues not identified as the top 50 holdings in terms of market value and issues or issuers not exceeding 1% of net assets individually or in aggregate respectively as of December 31, 2014.
The following footnotes apply to either the individual securities noted or one or more of the securities aggregated and listed as a single line item.
| † | Unless otherwise indicated, principal amount is shown in USD. |
| †† | Rate shown is the 7-day yield as of December 31, 2014. |
| # | Securities with purchases pursuant to Rule 144A or section 4(a)(2), under the Securities Act of 1933 and may not be resold subject to that rule except to qualified institutional buyers. |
| @ | Non-income producing security. |
| P | Preferred Stock may be called prior to convertible date. |
See Accompanying Notes to Financial Statements
| VY® Pioneer High Yield Portfolio | SUMMARY PORTFOLIO OF INVESTMENTS
as of December 31, 2014 (continued) |
| Z | Indicates Zero Coupon Bond; rate shown reflects current effective yield. |
Cost for federal income tax purposes is $121,369,722.
Net unrealized depreciation consists of:
| Gross Unrealized Appreciation | | $ | 6,984,912 | |
| Gross Unrealized Depreciation | | | (7,970,815 | ) |
| Net Unrealized Depreciation | | $ | (985,903 | ) |
Fair Value Measurements^
The following is a summary of the fair valuations according to the inputs used as of December 31, 2014 in valuing the assets and liabilities:
| | | Quoted Prices
in Active Markets
for Identical
Investments
(Level 1) | | | Significant
Other
Observable
Inputs#
(Level 2) | | | Significant
Unobservable
Inputs
(Level 3) | | | Fair Value
at
December 31, 2014 | |
| Asset Table | | | | | | | | | | | | | | | | |
| Investments, at fair value | | | | | | | | | | | | | | | | |
| Common Stock | | | | | | | | | | | | | | | | |
| Consumer Discretionary | | $ | 1,212,049 | | | $ | 82,719 | | | $ | — | | | $ | 1,294,768 | |
| Energy | | | 506,598 | | | | — | | | | — | | | | 506,598 | |
| Financials | | | 638,531 | | | | — | | | | — | | | | 638,531 | |
| Health Care | | | 2,540,743 | | | | — | | | | — | | | | 2,540,743 | |
| Industrials | | | 1,082,865 | | | | — | | | | 95,596 | | | | 1,178,461 | |
| Information Technology | | | 819,098 | | | | — | | | | — | | | | 819,098 | |
| Materials | | | 1,366,445 | | | | — | | | | — | | | | 1,366,445 | |
| Telecommunication Services | | | 237,312 | | | | — | | | | — | | | | 237,312 | |
| Total Common Stock | | | 8,403,641 | | | | 82,719 | | | | 95,596 | | | | 8,581,956 | |
| Preferred Stock | | | 2,291,423 | | | | 2,460,090 | | | | 206,948 | | | | 4,958,461 | |
| Warrants | | | — | | | | 91,200 | | | | — | | | | 91,200 | |
| Corporate Bonds/Notes | | | — | | | | 100,545,205 | | | | — | | | | 100,545,205 | |
| Collateralized Mortgage Obligations | | | — | | | | 1,045,647 | | | | — | | | | 1,045,647 | |
| U.S. Treasury Obligations | | | — | | | | 1,994,914 | | | | — | | | | 1,994,914 | |
| Short-Term Investments | | | 3,166,436 | | | | — | | | | — | | | | 3,166,436 | |
| Total Investments, at fair value | | $ | 13,861,500 | | | $ | 106,219,775 | | | $ | 302,544 | | | $ | 120,383,819 | |
| ^ | See Note 2, “Significant Accounting Policies” in the Notes to Financial Statements for additional information. |
| # | The earlier close of the foreign markets gives rise to the possibility that significant events, including broad market moves, may have occurred in the interim and may materially affect the value of those securities. To account for this, the Portfolio may frequently value many of its foreign equity securities using fair value prices based on third party vendor modeling tools to the extent available. Accordingly, a portion of the Portfolio’s investments are categorized as Level 2 investments. |
See Accompanying Notes to Financial Statements
| VY® T. Rowe Price Diversified Mid Cap Growth Portfolio | SUMMARY PORTFOLIO OF INVESTMENTS
as of December 31, 2014 |
| Shares | | | Value | | | Percentage
of Net
Assets | |
| COMMON STOCK: 99.0% |
| | | | | | | Consumer Discretionary: 21.4% |
| | 12,300 | | | @ | | Autozone, Inc. | | $ | 7,615,053 | | | | 0.9 | |
| | 124,000 | | | @ | | Carmax, Inc. | | | 8,255,920 | | | | 1.0 | |
| | 8,400 | | | | | Chipotle Mexican Grill, Inc. | | | 5,749,884 | | | | 0.7 | |
| | 151,800 | | | | | Discovery Communications, Inc.
- Class C | | | 5,118,696 | | | | 0.6 | |
| | 89,000 | | | @ | | Dollar Tree, Inc. | | | 6,263,820 | | | | 0.7 | |
| | 74,300 | | | | | Hanesbrands, Inc. | | | 8,293,366 | | | | 1.0 | |
| | 55,300 | | | | | L Brands, Inc. | | | 4,786,215 | | | | 0.6 | |
| | 57,512 | | | | | Marriott International, Inc. | | | 4,487,661 | | | | 0.5 | |
| | 52,400 | | | | | McGraw-Hill Cos., Inc. | | | 4,662,552 | | | | 0.5 | |
| | 15,292 | | | @ | | NetFlix, Inc. | | | 5,223,900 | | | | 0.6 | |
| | 31,800 | | | @ | | O'Reilly Automotive, Inc. | | | 6,125,316 | | | | 0.7 | |
| | 84,900 | | | | | Ross Stores, Inc. | | | 8,002,674 | | | | 0.9 | |
| | 55,200 | | | | | Starwood Hotels & Resorts
Worldwide, Inc. | | | 4,475,064 | | | | 0.5 | |
| | 48,400 | | | | | Tiffany & Co. | | | 5,172,024 | | | | 0.6 | |
| | 71,200 | | | | | Tractor Supply Co. | | | 5,611,984 | | | | 0.6 | |
| | 33,300 | | | | | Wynn Resorts Ltd. | | | 4,953,708 | | | | 0.6 | |
| | 2,210,104 | | | | | Other Securities(a) | | | 89,271,131 | | | | 10.4 | |
| | | | | | | | | | 184,068,968 | | | | 21.4 | |
| | | | | | | Consumer Staples: 5.0% |
| | 1,182,750 | | | | | Other Securities(a) | | | 42,979,454 | | | | 5.0 | |
| | | | | | | Energy: 4.4% | | | | | | | | |
| | 65,900 | | | | | EQT Corp. | | | 4,988,630 | | | | 0.6 | |
| | 94,900 | | | | | Range Resources Corp. | | | 5,072,405 | | | | 0.6 | |
| | 580,490 | | | | | Other Securities | | | 28,134,396 | | | | 3.2 | |
| | | | | | | | | | 38,195,431 | | | | 4.4 | |
| | | | | | | Financials: 7.2% | | | | | | | | |
| | 72,633 | | | | | CBOE Holdings, Inc. | | | 4,606,385 | | | | 0.5 | |
| | 94,600 | | | | | Crown Castle International
Corp. | | | 7,445,020 | | | | 0.9 | |
| | 1,050,797 | | | | | Other Securities | | | 49,465,617 | | | | 5.8 | |
| | | | | | | | | | 61,517,022 | | | | 7.2 | |
| | | | | | | Health Care: 16.6% | | | | | | | | |
| | 71,200 | | | | | AmerisourceBergen Corp. | | | 6,419,392 | | | | 0.8 | |
| | 183,184 | | | | | Catalent, Inc. | | | 5,107,170 | | | | 0.6 | |
| | 31,400 | | | @ | | Idexx Laboratories, Inc. | | | 4,655,678 | | | | 0.6 | |
| | 70,000 | | | @ | | Incyte Corp., Ltd. | | | 5,117,700 | | | | 0.6 | |
| | 10,200 | | | @ | | Intuitive Surgical, Inc. | | | 5,395,188 | | | | 0.6 | |
| | 15,100 | | | | | Mettler Toledo International, Inc. | | | 4,567,146 | | | | 0.5 | |
| Shares | | | Value | | | Percentage
of Net
Assets | |
| COMMON STOCK: (continued) |
| | | | | | | Health Care (continued) |
| | 47,700 | | | @ | | Vertex Pharmaceuticals, Inc. | | $ | 5,666,760 | | | | 0.7 | |
| | 123,950 | | | | | Zoetis, Inc. | | | 5,333,569 | | | | 0.6 | |
| | 1,529,500 | | | | | Other Securities(a) | | | 100,110,335 | | | | 11.6 | |
| | | | | | | | | | 142,372,938 | | | | 16.6 | |
| | | | | | | Industrials: 19.5% | | | | | | | | |
| | 43,100 | | | | | Kansas City Southern | | | 5,259,493 | | | | 0.6 | |
| | 47,000 | | | | | Pall Corp. | | | 4,756,870 | | | | 0.5 | |
| | 38,300 | | | | | Roper Industries, Inc. | | | 5,988,205 | | | | 0.7 | |
| | 143,200 | | | @ | | Sensata Technologies Holdings N.V. | | | 7,505,112 | | | | 0.9 | |
| | 139,800 | | | | | Southwest Airlines Co. | | | 5,916,336 | | | | 0.7 | |
| | 82,100 | | | | | Verisk Analytics, Inc. | | | 5,258,505 | | | | 0.6 | |
| | 18,100 | | | | | WW Grainger, Inc. | | | 4,613,509 | | | | 0.5 | |
| | 2,213,262 | | | | | Other Securities(a) | | | 128,708,888 | | | | 15.0 | |
| | | | | | | | | | 168,006,918 | | | | 19.5 | |
| | | | | | | Information Technology: 17.6% |
| | 170,400 | | | | | Altera Corp. | | | 6,294,576 | | | | 0.7 | |
| | 88,000 | | | | | Amphenol Corp. | | | 4,735,280 | | | | 0.5 | |
| | 107,100 | | | | | ARM Holdings PLC ADR | | | 4,958,730 | | | | 0.6 | |
| | 94,900 | | | | | Fidelity National Information
Services, Inc. | | | 5,902,780 | | | | 0.7 | |
| | 65,200 | | | @ | | Fiserv, Inc. | | | 4,627,244 | | | | 0.5 | |
| | 58,500 | | | @ | | Gartner, Inc. | | | 4,926,285 | | | | 0.6 | |
| | 53,800 | | | | | Intuit, Inc. | | | 4,959,822 | | | | 0.6 | |
| | 24,500 | | | | | LinkedIn Corp. | | | 5,627,895 | | | | 0.7 | |
| | 96,700 | | | @ | | Red Hat, Inc. | | | 6,685,838 | | | | 0.8 | |
| | 80,700 | | | | | ServiceNow, Inc. | | | 5,475,495 | | | | 0.6 | |
| | 78,500 | | | @ | | VeriSign, Inc. | | | 4,474,500 | | | | 0.5 | |
| | 1,683,137 | | | | | Other Securities(a) | | | 92,836,011 | | | | 10.8 | |
| | | | | | | | | | 151,504,456 | | | | 17.6 | |
| | | | | | | Materials: 5.8% | | | | | | | | |
| | 74,000 | | | | | Ball Corp. | | | 5,044,580 | | | | 0.6 | |
| | 87,000 | | | | | Celanese Corp. | | | 5,216,520 | | | | 0.6 | |
| | 33,300 | | | | | Sherwin-Williams Co. | | | 8,759,232 | | | | 1.0 | |
| | 719,682 | | | | | Other Securities | | | 31,185,403 | | | | 3.6 | |
| | | | | | | | | | 50,205,735 | | | | 5.8 | |
| | | | | | | Telecommunication Services: 1.2% |
| | 74,650 | | | | | SBA Communications Corp. | | | 8,268,234 | | | | 1.0 | |
| | 72,700 | | | | | Other Securities | | | 1,958,538 | | | | 0.2 | |
| | | | | | | | | | 10,226,772 | | | | 1.2 | |
See Accompanying Notes to Financial Statements
| VY® T. Rowe Price Diversified Mid Cap Growth Portfolio | SUMMARY PORTFOLIO OF INVESTMENTS
as of December 31, 2014 (continued) |
| Shares | | | Value | | | Percentage
of Net
Assets | |
| COMMON STOCK: (continued) | |
| | | | | | | Utilities: 0.3% | | | | | | | | |
| | 59,600 | | | | | Other Securities | | $ | 2,528,232 | | | | 0.3 | |
| | | | | | | Total Common Stock
(Cost $561,069,916) | | | 851,605,926 | | | | 99.0 | |
| PREFERRED STOCK: 0.9% | | |
| | | | | | | Financials: 0.1% | | | | | | | | |
| | 79,278 | | | | | Other Securities | | | 1,320,073 | | | | 0.1 | |
| | | | | | | Information Technology: 0.8% | |
| | 277,133 | | | | | Other Securities | | | 6,880,430 | | | | 0.8 | |
| | | | | | | Total Preferred Stock
(Cost $6,616,250) | | | 8,200,503 | | | | 0.9 | |
| | | | | | | Total Long-Term Investments
(Cost $567,686,166) | | | 859,806,429 | | | | 99.9 | |
Principal
Amount† | | | Value | | | Percentage
of Net
Assets | |
| SHORT-TERM INVESTMENTS: 2.9% | | | | | | | |
| | | | | | | Securities Lending Collateralcc: 2.8% | |
| | 5,658,671 | | | | | Cantor Fitzgerald, Repurchase Agreement dated 12/31/14, 0.09%, due 01/02/15 (Repurchase Amount $5,658,699, collateralized by various U.S. Government/U.S. Government Agency Obligations, 0.000%-10.500%, Market Value plus accrued interest $5,771,845, due 01/01/15-09/01/49) | | | 5,658,671 | | | | 0.7 | |
| | 1,191,241 | | | | | Daiwa Capital Markets, Repurchase Agreement dated 12/31/14, 0.12%, due 01/02/15 (Repurchase Amount $1,191,249, collateralized by various U.S. Government/U.S. Government Agency Obligations, 0.000%-6.500%, Market Value plus accrued interest $1,215,066, due 06/01/17-03/01/48) | | | 1,191,241 | | | | 0.1 | |
| | 5,658,671 | | | | | Nomura Securities, Repurchase Agreement dated 12/31/14, 0.08%, due 01/02/15 (Repurchase Amount $5,658,696, collateralized by various U.S. Government/U.S. Government Agency Obligations, 0.000%-8.875%, Market Value plus accrued interest $5,771,844, due 01/07/15-10/20/64) | | | 5,658,671 | | | | 0.7 | |
Principal
Amount† | | | Value | | | Percentage
of Net
Assets | |
| SHORT-TERM INVESTMENTS: (continued) | |
| | | | | | | Securities Lending Collateralcc (continued) |
| | 5,658,671 | | | | | Royal Bank of Scotland PLC, Repurchase Agreement dated 12/31/14, 0.09%, due 01/02/15 (Repurchase Amount $5,658,699, collateralized by various U.S. Government/U.S. Government Agency Obligations, 0.375%-7.250%, Market Value plus accrued interest $5,771,845, due 11/15/15-07/15/56) | | $ | 5,658,671 | | | | 0.7 | |
| | 5,658,671 | | | | | State of Wisconsin Investment Board, Repurchase Agreement dated 12/31/14, 0.15%, due 01/02/15 (Repurchase Amount $5,658,718, collateralized by various U.S. Government Securities, 0.125%-2.500%, Market Value plus accrued interest $5,772,412, due 04/15/16-02/15/42) | | | 5,658,671 | | | | 0.6 | |
| | | | | | | | | | 23,825,925 | | | | 2.8 | |
| Shares | | | Value | | | Percentage
of Net
Assets | |
| | | | | | | Mutual Funds: 0.1% | | | | |
| | 1,001,969 | | | | | T. Rowe Price Reserve Investment Fund, 0.070%††
(Cost $1,001,969) | | $ | 1,001,969 | | | | 0.1 | |
| | | | | | | Total Short-Term Investments
(Cost $24,827,894) | | | 24,827,894 | | | | 2.9 | |
| | | | | | | Total Investments in Securities
(Cost $592,514,060) | | $ | 884,634,323 | | | | 102.8 | |
| | | | | | | Liabilities in Excess of Other Assets | | | (24,118,423 | ) | | | (2.8 | ) |
| | | | | | | Net Assets | | $ | 860,515,900 | | | | 100.0 | |
“Other Securities” represents issues not identified as the top 50 holdings in terms of market value and issues or issuers not exceeding 1% of net assets individually or in aggregate respectively as of December 31, 2014.
The following footnotes apply to either the individual securities noted or one or more of the securities aggregated and listed as a single line item.
| † | Unless otherwise indicated, principal amount is shown in USD. |
| †† | Rate shown is the 7-day yield as of December 31, 2014. |
| @ | Non-income producing security. |
| ADR | American Depositary Receipt |
| cc | Represents securities purchased with cash collateral received for securities on loan. |
See Accompanying Notes to Financial Statements
| VY® T. Rowe Price Diversified Mid Cap Growth Portfolio | SUMMARY PORTFOLIO OF INVESTMENTS
as of December 31, 2014 (continued) |
| (a) | This grouping contains securities on loan. |
Cost for federal income tax purposes is $592,664,356.
Net unrealized appreciation consists of:
| Gross Unrealized Appreciation | | $ | 308,597,763 | |
| Gross Unrealized Depreciation | | | (16,627,796 | ) |
| Net Unrealized Appreciation | | $ | 291,969,967 | |
Fair Value Measurements^
The following is a summary of the fair valuations according to the inputs used as of December 31, 2014 in valuing the assets and liabilities:
| | | Quoted Prices
in Active Markets
for Identical
Investments
(Level 1) | | | Significant
Other
Observable
Inputs
(Level 2) | | | Significant
Unobservable
Inputs
(Level 3) | | | Fair Value
at
December 31, 2014 | |
| Asset Table | | | | | | | | | | | | | | | | |
| Investments, at fair value | | | | | | | | | | | | | | | | |
| Common Stock | | | | | | | | | | | | | | | | |
| Consumer Discretionary | | $ | 184,068,968 | | | $ | — | | | $ | — | | | $ | 184,068,968 | |
| Consumer Staples | | | 42,979,454 | | | | — | | | | — | | | | 42,979,454 | |
| Energy | | | 38,195,431 | | | | — | | | | — | | | | 38,195,431 | |
| Financials | | | 61,368,277 | | | | — | | | | 148,745 | | | | 61,517,022 | |
| Health Care | | | 142,372,938 | | | | — | | | | — | | | | 142,372,938 | |
| Industrials | | | 168,006,918 | | | | — | | | | — | | | | 168,006,918 | |
| Information Technology | | | 150,071,118 | | | | — | | | | 1,433,338 | | | | 151,504,456 | |
| Materials | | | 50,205,735 | | | | — | | | | — | | | | 50,205,735 | |
| Telecommunication Services | | | 10,226,772 | | | | — | | | | — | | | | 10,226,772 | |
| Utilities | | | 2,528,232 | | | | — | | | | — | | | | 2,528,232 | |
| Total Common Stock | | | 850,023,843 | | | | — | | | | 1,582,083 | | | | 851,605,926 | |
| Preferred Stock | | | — | | | | — | | | | 8,200,503 | | | | 8,200,503 | |
| Short-Term Investments | | | 1,001,969 | | | | 23,825,925 | | | | — | | | | 24,827,894 | |
| Total Investments, at fair value | | $ | 851,025,812 | | | $ | 23,825,925 | | | $ | 9,782,586 | | | $ | 884,634,323 | |
| ^ | See Note 2, “Significant Accounting Policies” in the Notes to Financial Statements for additional information. |
The following table presents additional information about valuation techniques and inputs used for investments that are measured at fair value and categorized within Level 3 at December 31, 2014.
Investments,
at fair value | | Fair Value at
December 31,
2014 | | | Valuation Technique(s) | | Unobservable Inputs | | Range | | | Impact to
Valuation from
an Increase
in Input |
| Common Stock | | $ | 1,060,960 | | | Market comparable | | Enterprise Value to Sales in Multiple/Price to Free Cash Flow | | | 8x−30 | x | | Increase |
| | | | 521,123 | | | Recent Comparable Transaction Price | | Discount Factor* | | | 0.00 | % | | Decrease |
| | | $ | 1,582,083 | | | | | | | | | | | |
| | | | | | | | | | | | | | | |
| Preferred Stock | | $ | 7,279,041 | | | Recent Comparable Transaction Price | | Discount Factor* | | | 0.00 | % | | Decrease |
| | | | 921,462 | | | Market comparable | | Enterprise Value to Sales in Multiple/Price to Free Cash Flow | | | 8x−30 | x | | Increase |
| | | $ | 8,200,503 | | | | | | | | | | | |
| * | No quantitative unobservable inputs were significant to the fair valuation determination at December 31, 2014. |
See Accompanying Notes to Financial Statements
VY® T. Rowe Price Diversified
Mid Cap Growth Portfolio | SUMMARY PORTFOLIO OF INVESTMENTS
as of December 31, 2014 (continued) |
The following is a reconciliation of the fair valuations using significant unobservable inputs (Level 3) for the Portfolios’s assets and liabilities during the year ended December 31, 2014:
Asset Table
Investments, at
fair value | | Beginning
Balance
12/31/2013 | | Purchases | | Sales | | Accrued
Discounts/
(Premiums) | | Total
Realized
Gain/(Loss) | | Total Unrealized
Appreciation/
(Depreciation) | | Transfers
into Level 3 | | Transfers
Out of
Level 3 | | Ending
Balance
12/31/2014 | |
| Common Stock | | $ | 2,036,263 | | $ | 1,042,185 | | $ | (1,748,115 | ) | $ | — | | $ | (97,584 | ) | $ | 349,334 | | $ | — | | $ | — | | $ | 1,582,083 | |
| Preferred Stock | | | 1,399,096 | | | 5,321,054 | | | — | | | — | | | | | | 1,480,353 | | | — | | | — | | | 8,200,503 | |
| Total Investments, at value | | $ | 3,435,359 | | $ | 6,363,239 | | $ | (1,748,115 | ) | $ | — | | $ | (97,584 | ) | $ | 1,829,687 | | $ | — | | $ | — | | $ | 9,782,586 | |
As of December 31, 2014 total change in unrealized gain (loss) on Level 3 securities still held at year end and included in the change in net assets was $1,829,687.
See Accompanying Notes to Financial Statements
| VY® T. Rowe Price Growth Equity Portfolio | SUMMARY PORTFOLIO OF INVESTMENTS
as of December 31, 2014 |
| Shares | | | Value | | | Percentage
of Net
Assets | |
| COMMON STOCK: 99.5% | | | |
| | | | | | | Consumer Discretionary: 27.0% | | |
| | 182,400 | | | @ | | Amazon.com, Inc. | | $ | 56,607,840 | | | | 3.6 | |
| | 31,700 | | | @ | | Autozone, Inc. | | | 19,625,787 | | | | 1.3 | |
| | 232,300 | | | @ | | Carmax, Inc. | | | 15,466,534 | | | | 1.0 | |
| | 174,400 | | | | | Delphi Automotive PLC | | | 12,682,368 | | | | 0.8 | |
| | 114,200 | | | | | Hanesbrands, Inc. | | | 12,747,004 | | | | 0.8 | |
| | 170,700 | | | | | Home Depot, Inc. | | | 17,918,379 | | | | 1.1 | |
| | 232,900 | | | | | Las Vegas Sands Corp. | | | 13,545,464 | | | | 0.9 | |
| | 356,600 | | | | | Lowe’s Cos, Inc. | | | 24,534,080 | | | | 1.6 | |
| | 756,160 | | | @ | | MGM Resorts International | | | 16,166,701 | | | | 1.0 | |
| | 38,300 | | | @ | | NetFlix, Inc. | | | 13,083,663 | | | | 0.8 | |
| | 42,659 | | | @ | | Priceline.com, Inc. | | | 48,640,218 | | | | 3.1 | |
| | 224,500 | | | | | Starbucks Corp. | | | 18,420,225 | | | | 1.2 | |
| | 63,900 L | | | | | Tesla Motors, Inc. | | | 14,211,999 | | | | 0.9 | |
| | 223,000 | | | | | Tractor Supply Co. | | | 17,576,860 | | | | 1.1 | |
| | 580,200 | | | @ | | Vipshop Holdings Ltd. ADR | | | 11,337,108 | | | | 0.7 | |
| | 218,800 | | | | | Walt Disney Co. | | | 20,608,772 | | | | 1.3 | |
| | 150,760 | | | | | Wynn Resorts Ltd. | | | 22,427,058 | | | | 1.4 | |
| | 3,467,000 | | | | | Other Securities(a) | | | 68,760,328 | | | | 4.4 | |
| | | | | | | | | | 424,360,388 | | | | 27.0 | |
| | | | | | | Consumer Staples: 2.6% | | | | |
| | 184,800 | | | | | CVS Caremark Corp. | | | 17,798,088 | | | | 1.1 | |
| | 264,300 | | | | | Other Securities | | | 23,921,895 | | | | 1.5 | |
| | | | | | | | | | 41,719,983 | | | | 2.6 | |
| | | | | | | Energy: 2.2% | | | | | | | | |
| | 475,581 | | | | | Other Securities | | | 34,692,500 | | | | 2.2 | |
| | | | | | | Financials: 6.6% | | | | | | | | |
| | 242,000 | | | | | American Tower Corp. | | | 23,921,700 | | | | 1.5 | |
| | 312,812 | | | | | Crown Castle International
Corp. | | | 24,618,304 | | | | 1.6 | |
| | 418,600 | | | | | Morgan Stanley | | | 16,241,680 | | | | 1.0 | |
| | 470,900 | | | | | Other Securities | | | 38,409,255 | | | | 2.5 | |
| | | | | | | | | | 103,190,939 | | | | 6.6 | |
| | | | | | | Health Care: 18.5% | | | | |
| | 71,100 | | | @ | | Actavis PLC | | | 18,301,851 | | | | 1.1 | |
| | 117,600 | | | @ | | Alexion Pharmaceuticals, Inc. | | | 21,759,528 | | | | 1.4 | |
| | 87,000 | | | | | Allergan, Inc. | | | 18,495,330 | | | | 1.2 | |
| | 97,600 | | | @ | | Biogen Idec, Inc. | | | 33,130,320 | | | | 2.1 | |
| | 197,416 | | | | | Celgene Corp. | | | 22,082,954 | | | | 1.4 | |
| | 362,600 | | | @ | | Gilead Sciences, Inc. | | | 34,178,676 | | | | 2.2 | |
| | 40,600 | | | @ | | Intuitive Surgical, Inc. | | | 21,474,964 | | | | 1.4 | |
| | 166,700 | | | | | McKesson Corp. | | | 34,603,586 | | | | 2.2 | |
| Shares | | | Value | | | Percentage
of Net
Assets | |
| COMMON STOCK: (continued) | | | | | |
| | | | | | | Health Care (continued) | | | | |
| | 31,700 | | | | | Regeneron Pharmaceuticals, Inc. | | $ | 13,004,925 | | | | 0.8 | |
| | 127,800 | | | | | UnitedHealth Group, Inc. | | | 12,919,302 | | | | 0.8 | |
| | 165,200 | | | @ | | Valeant Pharmaceuticals
International | | | 23,641,772 | | | | 1.5 | |
| | 96,000 | | | @ | | Vertex Pharmaceuticals, Inc. | | | 11,404,800 | | | | 0.7 | |
| | 250,600 | | | | | Other Securities | | | 26,674,119 | | | | 1.7 | |
| | | | | | | | | | 291,672,127 | | | | 18.5 | |
| | | | | | | Industrials: 13.6% | | | | |
| | 642,500 | | | | | American Airlines Group, Inc. | | | 34,457,275 | | | | 2.2 | |
| | 187,200 | | | | | Boeing Co. | | | 24,332,256 | | | | 1.5 | |
| | 384,400 | | | | | Danaher Corp. | | | 32,946,924 | | | | 2.1 | |
| | 114,000 | | | | | Precision Castparts Corp. | | | 27,460,320 | | | | 1.7 | |
| | 106,700 | | | | | Roper Industries, Inc. | | | 16,682,545 | | | | 1.1 | |
| | 228,740 | | | @ | | United Continental Holdings,
Inc. | | | 15,300,419 | | | | 1.0 | |
| | 136,500 | | | | | Wabtec Corp. | | | 11,860,485 | | | | 0.7 | |
| | 603,300 | | | | | Other Securities | | | 51,697,280 | | | | 3.3 | |
| | | | | | | | | | 214,737,504 | | | | 13.6 | |
| | | | | | | Information Technology: 26.4% | | |
| | 224,992 | | | @ | | Alibaba Group Holding Ltd.
ADR | | | 23,385,668 | | | | 1.5 | |
| | 292,100 | | | | | Apple, Inc. | | | 32,241,998 | | | | 2.0 | |
| | 128,500 | | | @ | | Baidu.com ADR | | | 29,294,145 | | | | 1.9 | |
| | 456,400 | | | | | Facebook, Inc. | | | 35,608,328 | | | | 2.3 | |
| | 82,550 | | | | | Google, Inc. | | | 43,454,320 | | | | 2.8 | |
| | 80,550 | | | | | Google, Inc. - Class A | | | 42,744,663 | | | | 2.7 | |
| | 56,600 | | | | | LinkedIn Corp. | | | 13,001,586 | | | | 0.8 | |
| | 416,800 | | | | | Mastercard, Inc. | | | 35,911,488 | | | | 2.3 | |
| | 347,864 | | | @ | | Salesforce.com, Inc. | | | 20,631,814 | | | | 1.3 | |
| | 202,900 | | | | | Visa, Inc. | | | 53,200,380 | | | | 3.4 | |
| | 1,769,553 | | | | | Other Securities(a) | | | 85,674,354 | | | | 5.4 | |
| | | | | | | | | | 415,148,744 | | | | 26.4 | |
| | | | | | | Materials: 2.0% | | | | |
| | 68,700 | | | | | Sherwin-Williams Co. | | | 18,070,848 | | | | 1.1 | |
| | 124,100 | | | | | Other Securities | | | 14,165,316 | | | | 0.9 | |
| | | | | | | | | | 32,236,164 | | | | 2.0 | |
| | | | | | | Telecommunication Services: 0.6% | |
| | 157,700 | | | | | Other Securities | | | 9,386,823 | | | | 0.6 | |
| | | | | | | Total Common Stock
(Cost $1,066,563,111) | | | 1,567,145,172 | | | | 99.5 | |
See Accompanying Notes to Financial Statements
| VY® T. Rowe Price Growth Equity Portfolio | SUMMARY PORTFOLIO OF INVESTMENTS
as of December 31, 2014 (continued) |
| Shares | | | Value | | | Percentage
of Net
Assets | |
| PREFERRED STOCK: 0.5% | | | | | | | | |
| | | | | | | Information Technology: 0.5% | | |
| | 219,140 | | | | | Other Securities | | $ | 7,132,650 | | | | 0.5 | |
| | | | | | | Total Preferred Stock
(Cost $7,132,650) | | | 7,132,650 | | | | 0.5 | |
| | | | | | | Total Long-Term Investments
(Cost $1,073,695,761) | | | 1,574,277,822 | | | | 100.0 | |
Principal
Amount† | | | Value | | | Percentage
of Net
Assets | |
| SHORT-TERM INVESTMENTS: 2.0% | | | | | | | |
| | | | | | | Securities Lending Collateralcc: 0.7% | |
| | 2,744,104 | | | | | Cantor Fitzgerald, Repurchase Agreement dated 12/31/14, 0.09%, due 01/02/15 (Repurchase Amount $2,744,118, collateralized by various U.S. Government/U.S. Government Agency Obligations, 0.000%-10.500%, Market Value plus accrued interest $2,798,986, due 01/01/15-09/01/49) | | | 2,744,104 | | | | 0.2 | |
| | 577,676 | | | | | Daiwa Capital Markets,
Repurchase Agreement dated 12/31/14, 0.12%, due 01/02/15 (Repurchase Amount $577,680, collateralized by various U.S. Government and U.S. Government Agency Obligations, 0.000%-6.500%, Market Value plus accrued interest $589,230, due 06/01/17-03/01/48) | | | 577,676 | | | | 0.0 | |
| | 2,744,104 | | | | | Nomura Securities, Repurchase Agreement dated 12/31/14, 0.08%, due 01/02/15 (Repurchase Amount $2,744,116, collateralized by various U.S. Government/U.S. Government Agency Obligations, 0.000%-8.875%, Market Value plus accrued interest $2,798,986, due 01/07/15-10/20/64) | | | 2,744,104 | | | | 0.2 | |
Principal
Amount† | | | Value | | | Percentage
of Net
Assets | |
| SHORT-TERM INVESTMENTS: (continued) | | |
| | | | | | | Securities Lending Collateralcc (continued) | |
| | 2,744,104 | | | | | Royal Bank of Scotland PLC, Repurchase Agreement dated 12/31/14, 0.09%, due 01/02/15 (Repurchase Amount $2,744,118, collateralized by various U.S. Government/U.S. Government Agency Obligations, 0.375%-7.250%, Market Value plus accrued interest $2,798,986, due 11/15/15-07/15/56) | | $ | 2,744,104 | | | | 0.2 | |
| | 2,744,104 | | | | | State of Wisconsin Investment Board, Repurchase Agreement dated 12/31/14, 0.15%, due 01/02/15 (Repurchase Amount $2,744,127, collateralized by various U.S. Government Securities, 0.125%-2.500%, Market Value plus accrued interest $2,799,261, due 04/15/16-02/15/42) | | | 2,744,104 | | | | 0.1 | |
| | | | | | | | | | 11,554,092 | | | | 0.7 | |
| Shares | | | Value | | | Percentage
of Net
Assets | |
| | | | | | | Affiliated Investment Companies: 1.3% | |
| | 19,726,078 | | | | | T. Rowe Price Reserve Investment Fund,0.070%††
(Cost $19,726,078) | | $ | 19,726,078 | | | | 1.3 | |
| | | | | | | Total Short-Term Investments
(Cost $31,280,170) | | | 31,280,170 | | | | 2.0 | |
| | | | | | | Total Investments in Securities
(Cost $1,104,975,931) | | $ | 1,605,557,992 | | | | 102.0 | |
| | | | | | | Liabilities in Excess of Other Assets | | | (31,028,171 | ) | | | (2.0 | ) |
| | | | | | | Net Assets | | $ | 1,574,529,821 | | | | 100.0 | |
“Other Securities” represents issues not identified as the top 50 holdings in terms of market value and issues or issuers not exceeding 1% of net assets individually or in aggregate respectively as of December 31, 2014.
See Accompanying Notes to Financial Statements
| VY® T. Rowe Price Growth Equity Portfolio | SUMMARY PORTFOLIO OF INVESTMENTS
as of December 31, 2014 (continued) |
The following footnotes apply to either the individual securities noted or one or more of the securities aggregated and listed as a single line item.
| † | Unless otherwise indicated, principal amount is shown in USD. |
| †† | Rate shown is the 7-day yield as of December 31, 2014. |
| @ | Non-income producing security. |
| ADR | American Depositary Receipt |
| cc | Represents securities purchased with cash collateral received for securities on loan. |
| L | Loaned security, a portion or all of the security is on loan at December 31, 2014. |
| (a) | This grouping contains securities on loan. |
| Cost for federal income tax purposes is $1,106,896,631. |
| |
| Net unrealized appreciation consists of: |
| Gross Unrealized Appreciation | | $ | 525,273,551 | |
| Gross Unrealized Depreciation | | | (26,612,190 | ) |
| Net Unrealized Appreciation | | $ | 498,661,361 | |
Fair Value Measurements^
The following is a summary of the fair valuations according to the inputs used as of December 31, 2014 in valuing the assets and liabilities:
| | | Quoted Prices
in Active Markets
for Identical
Investments
(Level 1) | | | Significant
Other
Observable
Inputs#
(Level 2) | | | Significant
Unobservable
Inputs
(Level 3) | | | Fair Value
at
December 31, 2014 | |
| Asset Table | | | | | | | | | | | | | | | | |
| Investments, at fair value | | | | | | | | | | | | | | | | |
| Common Stock | | | | | | | | | | | | | | | | |
| Consumer Discretionary | | $ | 417,244,030 | | | $ | 7,116,358 | | | $ | — | | | $ | 424,360,388 | |
| Consumer Staples | | | 41,719,983 | | | | — | | | | — | | | | 41,719,983 | |
| Energy | | | 34,692,500 | | | | — | | | | — | | | | 34,692,500 | |
| Financials | | | 103,190,939 | | | | — | | | | — | | | | 103,190,939 | |
| Health Care | | | 291,672,127 | | | | — | | | | — | | | | 291,672,127 | |
| Industrials | | | 214,737,504 | | | | — | | | | — | | | | 214,737,504 | |
| Information Technology | | | 400,293,244 | | | | 14,833,530 | | | | 21,970 | | | | 415,148,744 | |
| Materials | | | 32,236,164 | | | | — | | | | — | | | | 32,236,164 | |
| Telecommunication Services | | | — | | | | 9,386,823 | | | | — | | | | 9,386,823 | |
| Total Common Stock | | | 1,535,786,491 | | | | 31,336,711 | | | | 21,970 | | | | 1,567,145,172 | |
| Preferred Stock | | | — | | | | — | | | | 7,132,650 | | | | 7,132,650 | |
| Short-Term Investments | | | 19,726,078 | | | | 11,554,092 | | | | — | | | | 31,280,170 | |
| Total Investments, at fair value | | $ | 1,555,512,569 | | | $ | 42,890,803 | | | $ | 7,154,620 | | | $ | 1,605,557,992 | |
| ^ | See Note 2, “Significant Accounting Policies” in the Notes to Financial Statements for additional information. |
| # | The earlier close of the foreign markets gives rise to the possibility that significant events, including broad market moves, may have occurred in the interim and may materially affect the value of those securities. To account for this, the Portfolio may frequently value many of its foreign equity securities using fair value prices based on third party vendor modeling tools to the extent available. Accordingly, a portion of the Portfolio’s investments are categorized as Level 2 investments. |
See Accompanying Notes to Financial Statements
| VY® Templeton Foreign Equity Portfolio | SUMMARY PORTFOLIO OF INVESTMENTS
as of December 31, 2014 |
| Shares | | | Value | | | Percentage
of Net
Assets | |
| COMMON STOCK: 96.1% | | | | | | | | |
| | | | | | | Australia: 0.5% | | | | | | | | |
| | 2,282,732 | | | | | Other Securities | | $ | 4,433,782 | | | | 0.5 | |
| | | | | | | Brazil: 0.3% | | | | | | | | |
| | 345,617 | | | | | Other Securities | | | 2,523,004 | | | | 0.3 | |
| | | | | | | Canada: 1.0% | | | | | | | | |
| | 1,054,600 | | | | | Talisman Energy, Inc. - TSX | | | 8,260,337 | | | | 1.0 | |
| | | | | | | China: 6.3% | | | | | | | | |
| | 3,073,000 | | | | | China Life Insurance Co., Ltd. | | | 12,040,455 | | | | 1.4 | |
| | 774,500 | | | | | China Mobile Ltd. | | | 9,071,522 | | | | 1.1 | |
| | 21,246,000 | | | | | China Telecom Corp., Ltd. | | | 12,322,412 | | | | 1.5 | |
| | 11,231,600 | | | | | Other Securities | | | 19,266,172 | | | | 2.3 | |
| | | | | | | | | | 52,700,561 | | | | 6.3 | |
| | | | | | | France: 11.9% | | | | | | | | |
| | 546,136 | | | | | AXA S.A. | | | 12,584,665 | | | | 1.5 | |
| | 273,888 | | | | | BNP Paribas | | | 16,168,767 | | | | 1.9 | |
| | 191,520 | | | | | Cie de Saint-Gobain | | | 8,112,971 | | | | 0.9 | |
| | 140,074 | | | | | Cie Generale des
Etablissements Michelin | | | 12,644,051 | | | | 1.5 | |
| | 638,860 | | | | | Credit Agricole SA | | | 8,246,761 | | | | 1.0 | |
| | 228,121 | | | | | Sanofi | | | 20,797,953 | | | | 2.5 | |
| | 216,094 | | | | | Total S.A. | | | 11,070,961 | | | | 1.3 | |
| | 369,792 | | | | | Other Securities | | | 10,888,988 | | | | 1.3 | |
| | | | | | | | | | 100,515,117 | | | | 11.9 | |
| | | | | | | Germany: 11.6% | | | | | | | | |
| | 129,781 | | | | | Bayer AG | | | 17,690,294 | | | | 2.1 | |
| | 129,840 | | | | | Deutsche Boerse AG | | | 9,226,701 | | | | 1.1 | |
| | 156,915 | | | | | HeidelbergCement AG | | | 11,075,077 | | | | 1.3 | |
| | 789,795 | | | | | Infineon Technologies AG | | | 8,357,520 | | | | 1.0 | |
| | 147,358 | | | | | Merck KGaA | | | 13,867,660 | | | | 1.6 | |
| | 95,240 | | | | | Siemens AG | | | 10,686,323 | | | | 1.3 | |
| | 723,937 | | | | | Other Securities | | | 26,563,502 | | | | 3.2 | |
| | | | | | | | | | 97,467,077 | | | | 11.6 | |
| | | | | | | Hong Kong: 2.9% | | | | | | | | |
| | 710,000 | | | | | Hutchison Whampoa Ltd. | | | 8,116,413 | | | | 0.9 | |
| | 8,367,900 | | | | | Other Securities | | | 16,677,129 | | | | 2.0 | |
| | | | | | | | | | 24,793,542 | | | | 2.9 | |
| | | | | | | India: 1.9% | | | | | | | | |
| | 496,486 | | | | | Housing Development
Finance Corp. | | | 8,903,164 | | | | 1.0 | |
| | 629,295 | | | | | Other Securities | | | 7,268,357 | | | | 0.9 | |
| | | | | | | | | | 16,171,521 | | | | 1.9 | |
| Shares | | | Value | | | Percentage
of Net
Assets | |
| COMMON STOCK: (continued) | | | | | | | |
| | | | | | | Israel: 1.7% | | | | | | | | |
| | 253,929 | | | | | Teva Pharmaceutical
Industries Ltd. ADR | | $ | 14,603,457 | | | | 1.7 | |
| | | | | | | Italy: 3.1% | | | | | | | | |
| | 680,187 | | | | | ENI S.p.A. | | | 11,914,522 | | | | 1.4 | |
| | 1,493,810 | | | | | UniCredit SpA | | | 9,568,793 | | | | 1.1 | |
| | 1,637,488 | | | | | Other Securities | | | 4,750,205 | | | | 0.6 | |
| | | | | | | | | | 26,233,520 | | | | 3.1 | |
| | | | | | | Japan: 6.2% | | | | | | | | |
| | 822,200 | | | | | Itochu Corp. | | | 8,777,066 | | | | 1.0 | |
| | 1,282,100 | | | | | Nissan Motor Co., Ltd. | | | 11,182,181 | | | | 1.3 | |
| | 240,400 | | | | | Suntory Beverage & Food
Ltd. | | | 8,305,649 | | | | 1.0 | |
| | 255,200 | | | | | Toyota Motor Corp. | | | 15,903,399 | | | | 1.9 | |
| | 462,100 | | | | | Other Securities(a) | | | 8,353,521 | | | | 1.0 | |
| | | | | | | | | | 52,521,816 | | | | 6.2 | |
| | | | | | | Netherlands: 6.4% | | | | | | | | |
| | 192,108 | | | | | Akzo Nobel NV | | | 13,291,996 | | | | 1.6 | |
| | 360,976 | | | | | Royal Dutch Shell PLC -
Class B | | | 12,472,128 | | | | 1.5 | |
| | 1,321,130 | | | | | TNT Express NV | | | 8,807,215 | | | | 1.0 | |
| | 863,210 | | | | | Other Securities | | | 18,948,734 | | | | 2.3 | |
| | | | | | | | | | 53,520,073 | | | | 6.4 | |
| | | | | | | Norway: 1.9% | | | | | | | | |
| | 627,793 | | | | | Telenor ASA | | | 12,699,382 | | | | 1.5 | |
| | 166,074 | | | | | Other Securities | | | 2,924,038 | | | | 0.4 | |
| | | | | | | | | | 15,623,420 | | | | 1.9 | |
| | | | | | | Portugal: 0.7% | | | | | | | | |
| | 564,750 | | | | | Other Securities | | | 5,735,055 | | | | 0.7 | |
| | | | | | | Russia: 0.6% | | | | | | | | |
| | 392,715 | | | | | Other Securities | | | 5,427,361 | | | | 0.6 | |
| | | | | | | Singapore: 3.0% | | | | | | | | |
| | 886,582 | | | | | DBS Group Holdings Ltd. | | | 13,725,466 | | | | 1.6 | |
| | 3,902,000 | | | | | Singapore
Telecommunications Ltd. | | | 11,453,561 | | | | 1.4 | |
| | | | | | | | | | 25,179,027 | | | | 3.0 | |
| | | | | | | South Korea: 5.4% | | | | | | | | |
| | 247,680 | | | | | KB Financial Group, Inc.
ADR | | | 8,079,322 | | | | 1.0 | |
| | 58,716 | | | | | POSCO ADR | | | 3,746,668 | | | | 0.5 | |
| | 17,817 | | | | | POSCO | | | 4,488,010 | | | | 0.5 | |
See Accompanying Notes to Financial Statements
VY® Templeton Foreign
Equity Portfolio | SUMMARY PORTFOLIO OF INVESTMENTS
as of December 31, 2014 (continued) |
| Shares | | | Value | | | Percentage
of Net
Assets | |
| COMMON STOCK: (continued) | | | | | | | | |
| | | | | | | South Korea (continued) | |
| | 32,501 | | | | | Samsung Electronics Co., Ltd. GDR | | $ | 19,508,645 | | | | 2.3 | |
| | 191,406 | | | | | Other Securities | | | 9,278,392 | | | | 1.1 | |
| | | | | | | | | | 45,101,037 | | | | 5.4 | |
| | | | | | | Spain: 2.0% | | | | | | | | |
| | 948,067 | | | | | Telefonica S.A. | | | 13,611,930 | | | | 1.6 | |
| | 178,256 | | | | | Other Securities | | | 3,337,109 | | | | 0.4 | |
| | | | | | | | | | 16,949,039 | | | | 2.0 | |
| | | | | | | Sweden: 1.3% | | | | | | | | |
| | 647,330 | | | | | Other Securities | | | 10,851,877 | | | | 1.3 | |
| | | | | | | Switzerland: 6.9% | | | | | | | | |
| | 553,081 | | | | | Credit Suisse Group | | | 13,894,086 | | | | 1.7 | |
| | 140,377 | | | | | Novartis AG | | | 13,019,051 | | | | 1.5 | |
| | 72,606 | | | | | Roche Holding AG -
Genusschein | | | 19,672,031 | | | | 2.3 | |
| | 142,055 | | | | | Swiss Re Ltd. | | | 11,900,192 | | | | 1.4 | |
| | | | | | | | | | 58,485,360 | | | | 6.9 | |
| | | | | | | Taiwan: 0.5% | | | | | | | | |
| | 995,251 | | | | | Other Securities | | | 4,384,550 | | | | 0.5 | |
| | | | | | | United Kingdom: 20.0% | |
| | 1,446,095 | | | | | Aviva PLC | | | 10,865,085 | | | | 1.3 | |
| | 1,403,493 | | | | | BAE Systems PLC | | | 10,264,040 | | | | 1.2 | |
| | 1,295,484 | | | | | BP PLC | | | 8,223,198 | | | | 1.0 | |
| | 609,930 | | | | | British Sky Broadcasting PLC | | | 8,512,398 | | | | 1.0 | |
| | 559,944 | | | | | CRH PLC - London | | | 13,426,799 | | | | 1.6 | |
| | 821,996 | | | | | GlaxoSmithKline PLC | | | 17,634,804 | | | | 2.1 | |
| | 1,466,000 | | | | | HSBC Holdings PLC | | | 13,940,139 | | | | 1.7 | |
| | 1,075,618 | | | @ | | International Consolidated Airlines Group SA | | | 8,097,338 | | | | 1.0 | |
| | 2,809,874 | | | | | Kingfisher PLC | | | 14,853,416 | | | | 1.8 | |
| | 8,722,507 | | | @ | | Lloyds TSB Group PLC | | | 10,259,958 | | | | 1.2 | |
| | 1,730,630 | | | | | Marks & Spencer Group PLC | | | 12,814,298 | | | | 1.5 | |
| | 2,762,541 | | | | | Vodafone Group PLC | | | 9,471,744 | | | | 1.1 | |
| | 5,706,294 | | | | | Other Securities | | | 29,808,798 | | | | 3.5 | |
| | | | | | | | | | 168,172,015 | | | | 20.0 | |
| | | | | | | Total Common Stock
(Cost $670,838,611) | | | 809,652,548 | | | | 96.1 | |
| Shares | | | Value | | | Percentage
of Net
Assets | |
| RIGHTS: 0.0% | | | | | | | | |
| | | | | | | Spain: 0.0% | | | | | | | | |
| | 178,256 | | | | | Other Securities | | $ | 98,574 | | | | 0.0 | |
| | | | | | | Total Rights
(Cost $93,058) | | | 98,574 | | | | 0.0 | |
| | | | | | | Total Long-Term Investments
(Cost $670,931,669) | | | 809,751,122 | | | | 96.1 | |
Principal
Amount† | | | Value | | | Percentage
of Net
Assets | |
| SHORT-TERM INVESTMENTS: 0.1% | | | | | | | |
| | | | | | | Securities Lending Collateralcc: 0.1% | |
| | 1,000,000 | | | | | Cantor Fitzgerald, Repurchase Agreement dated 12/31/14, 0.09%, due 01/02/15 (Repurchase Amount $1,000,005, collateralized by various U.S. Government/U.S. Government Agency Obligations, 0.000%-10.500%, Market Value plus accrued interest $1,020,000, due 01/01/15-09/01/49) | | | 1,000,000 | | | | 0.1 | |
| | 52,722 | | | | | Nomura Securities, Repurchase Agreement dated 12/31/14, 0.08%, due 01/02/15 (Repurchase Amount $52,722, collateralized by various U.S. Government and U.S. Government Agency Obligations, 0.000%-8.875%, Market Value plus accrued interest $53,777, due 01/07/15-10/20/64) | | | 52,722 | | | | 0.0 | |
| | | | | | | | | | 1,052,722 | | | | 0.1 | |
| | | | | | | Total Short-Term Investments
(Cost $1,052,722) | | | 1,052,722 | | | | 0.1 | |
| | | | | | | Total Investments in Securities
(Cost $671,984,391) | | $ | 810,803,844 | | | | 96.2 | |
| | | | | | | Assets in Excess of Other Liabilities | | | 32,417,897 | | | | 3.8 | |
| | | | | | | Net Assets | | $ | 843,221,741 | | | | 100.0 | |
“Other Securities” represents issues not identified as the top 50 holdings in terms of market value and issues or issuers not exceeding 1% of net assets individually or in aggregate respectively as of December 31, 2014.
See Accompanying Notes to Financial Statements
| VY® Templeton Foreign Equity Portfolio | SUMMARY PORTFOLIO OF INVESTMENTS
as of December 31, 2014 (continued) |
The following footnotes apply to either the individual securities noted or one or more of the securities aggregated and listed as a single line item.
| † | Unless otherwise indicated, principal amount is shown in USD. |
| @ | Non-income producing security. |
| ADR | American Depositary Receipt |
| GDR | Global Depositary Receipt |
| cc | Represents securities purchased with cash collateral received for securities on loan. |
| (a) | This grouping contains securities on loan. |
Cost for federal income tax purposes is $674,432,707.
Net unrealized appreciation consists of:
| Gross Unrealized Appreciation | | $ | 200,394,087 | |
| Gross Unrealized Depreciation | | | (64,022,950 | ) |
| Net Unrealized Appreciation | | $ | 136,371,137 | |
| Sector Diversification | | Percentage of
Net Assets | |
| Financials | | | 24.7 | % |
| Health Care | | | 15.0 | |
| Industrials | | | 11.2 | |
| Energy | | | 10.4 | |
| Consumer Discretionary | | | 10.0 | |
| Telecommunication Services | | | 8.7 | |
| Materials | | | 6.7 | |
| Information Technology | | | 5.3 | |
| Consumer Staples | | | 3.1 | |
| Utilities | | | 1.0 | |
| Short-Term Investments | | | 0.1 | |
| Assets in Excess of Other Liabilities | | | 3.8 | |
| Net Assets | | | 100.0 | % |
Fair Value Measurements^
The following is a summary of the fair valuations according to the inputs used as of December 31, 2014 in valuing the assets and liabilities:
| | | Quoted Prices
in Active Markets
for Identical
Investments
(Level 1) | | | Significant
Other
Observable
Inputs#
(Level 2) | | | Significant
Unobservable
Inputs
(Level 3) | | | Fair Value
at
December 31, 2014 | |
| Asset Table | | | | | | | | | | | | | | | | |
| Investments, at fair value | | | | | | | | | | | | | | | | |
| Common Stock | | | | | | | | | | | | | | | | |
| Australia | | $ | — | | | $ | 4,433,782 | | | $ | — | | | $ | 4,433,782 | |
| Brazil | | | 2,523,004 | | | | — | | | | — | | | | 2,523,004 | |
| Canada | | | 8,260,337 | | | | — | | | | — | | | | 8,260,337 | |
| China | | | 5,744,077 | | | | 46,956,484 | | | | — | | | | 52,700,561 | |
| France | | | — | | | | 100,515,117 | | | | — | | | | 100,515,117 | |
| Germany | | | — | | | | 97,467,077 | | | | — | | | | 97,467,077 | |
| Hong Kong | | | 3,818,848 | | | | 20,974,694 | | | | — | | | | 24,793,542 | |
| India | | | 7,268,357 | | | | 8,903,164 | | | | — | | | | 16,171,521 | |
| Israel | | | 14,603,457 | | | | — | | | | — | | | | 14,603,457 | |
| Italy | | | — | | | | 26,233,520 | | | | — | | | | 26,233,520 | |
| Japan | | | — | | | | 52,521,816 | | | | — | | | | 52,521,816 | |
| Netherlands | | | — | | | | 53,520,073 | | | | — | | | | 53,520,073 | |
| Norway | | | — | | | | 15,623,420 | | | | — | | | | 15,623,420 | |
| Portugal | | | — | | | | 5,735,055 | | | | — | | | | 5,735,055 | |
| Russia | | | 5,427,361 | | | | — | | | | — | | | | 5,427,361 | |
| Singapore | | | — | | | | 25,179,027 | | | | — | | | | 25,179,027 | |
| South Korea | | | 11,825,990 | | | | 33,275,047 | | | | — | | | | 45,101,037 | |
| Spain | | | — | | | | 16,949,039 | | | | — | | | | 16,949,039 | |
| Sweden | | | — | | | | 10,851,877 | | | | — | | | | 10,851,877 | |
| Switzerland | | | — | | | | 58,485,360 | | | | — | | | | 58,485,360 | |
| Taiwan | | | — | | | | 4,384,550 | | | | — | | | | 4,384,550 | |
| United Kingdom | | | — | | | | 168,172,015 | | | | — | | | | 168,172,015 | |
| Total Common Stock | | | 59,471,431 | | | | 750,181,117 | | | | — | | | | 809,652,548 | |
| Rights | | | 98,574 | | | | — | | | | — | | | | 98,574 | |
| Short-Term Investments | | | — | | | | 1,052,722 | | | | — | | | | 1,052,722 | |
| Total Investments, at fair value | | $ | 59,570,005 | | | $ | 751,233,839 | | | $ | — | | | $ | 810,803,844 | |
See Accompanying Notes to Financial Statements
| VY® Templeton Foreign Equity Portfolio | SUMMARY PORTFOLIO OF INVESTMENTS
as of December 31, 2014 (continued) |
| ^ | See Note 2, “Significant Accounting Policies” in the Notes to Financial Statements for additional information. |
| # | The earlier close of the foreign markets gives rise to the possibility that significant events, including broad market moves, may have occurred in the interim and may materially affect the value of those securities. To account for this, the Portfolio may frequently value many of its foreign equity securities using fair value prices based on third party vendor modeling tools to the extent available. Accordingly, a portion of the Portfolio’s investments are categorized as Level 2 investments. |
The effect of derivative instruments on the Portfolio’s Statement of Operations for the year ended December 31, 2014 was as follows:
Amount of Realized Gain or (Loss) on Derivatives Recognized in Income
| Derivatives not accounted for as hedging instruments | | Foreign currency
related transactions* | |
| Foreign exchange contracts | | $ | 5,310 | |
| Total | | $ | 5,310 | |
Change in Unrealized Appreciation or (Depreciation) on Derivatives Recognized in Income
| Derivatives not accounted for as hedging instruments | | Foreign currency
related transactions* | |
| Foreign exchange contracts | | $ | 5,679 | |
| Total | | $ | 5,679 | |
| * | Amounts recognized for forward foreign currency contracts are included in net realized gain (loss) on foreign currency related transactions and net change in unrealized appreciation or depreciation on foreign currency related transactions. |
See Accompanying Notes to Financial Statements
| Tax Information (Unaudited) |
Dividends and distributions paid during the year ended December 31, 2014 were as follows:
| Portfolio Name | | Type | | Per Share
Amount | |
| Voya Aggregate Bond Portfolio | | | | | | |
| Class ADV | | NII | | $ | 0.1855 | |
| Class I | | NII | | $ | 0.2516 | |
| Class S | | NII | | $ | 0.2125 | |
| Class S2 | | NII | | $ | 0.1789 | |
| All Classes | | LTCG | | $ | 0.0089 | |
| | | | | | | |
| Voya Global Bond Portfolio | | | | | | |
| Class ADV | | NII | | $ | 0.0352 | |
| Class I | | NII | | $ | 0.0882 | |
| Class S | | NII | | $ | 0.0587 | |
| | | | | | | |
| VY® American Century Small-Mid Cap Value Portfolio | | | | | | |
| Class ADV | | NII | | $ | 0.1766 | |
| Class I | | NII | | $ | 0.2500 | |
| Class S | | NII | | $ | 0.2055 | |
| Class S2 | | NII | | $ | 0.1326 | |
| All Classes | | STCG | | $ | 1.1817 | |
| All Classes | | LTCG | | $ | 1.2211 | |
| | | | | | | |
| VY® Baron Growth Portfolio | | | | | | |
| Class ADV | | NII | | $ | — | |
| Class I | | NII | | $ | 0.0922 | |
| Class S | | NII | | $ | 0.0229 | |
| Class S2 | | NII | | $ | 0.0436 | |
| All Classes | | STCG | | $ | 0.2784 | |
| All Classes | | LTCG | | $ | 0.1951 | |
| | | | | | | |
| VY® Columbia Contrarian Core Portfolio | | | | | | |
| Class ADV | | NII | | $ | 0.1728 | |
| Class I | | NII | | $ | 0.2528 | |
| Class S | | NII | | $ | 0.2087 | |
| All Classes | | LTCG | | $ | 3.2347 | |
| | | | | | | |
| VY® Columbia Small Cap Value II Portfolio | | | | | | |
| Class ADV | | NII | | $ | 0.0421 | |
| Class I | | NII | | $ | 0.0644 | |
| Class S | | NII | | $ | 0.0286 | |
| Class S2 | | NII | | $ | 0.0543 | |
| | | | | | | |
| VY® Invesco Comstock Portfolio | | | | | | |
| Class ADV | | NII | | $ | 0.2762 | |
| Class I | | NII | | $ | 0.3547 | |
| Class S | | NII | | $ | 0.3134 | |
| Portfolio Name | | Type | | Per Share
Amount | |
| VY® Invesco Equity and Income Portfolio | | | | | | |
| Class ADV | | NII | | $ | 0.5459 | |
| Class I | | NII | | $ | 0.7281 | |
| Class S | | NII | | $ | 0.6559 | |
| Class S2 | | NII | | $ | 0.5835 | |
| All Classes | | LTCG | | $ | 1.2429 | |
| | | | | | | |
| VY® JPMorgan Mid Cap Value Portfolio | | | | | | |
| Class ADV | | NII | | $ | 0.1375 | |
| Class I | | NII | | $ | 0.2395 | |
| Class S | | NII | | $ | 0.1814 | |
| Class S2 | | NII | | $ | 0.1577 | |
| All Classes | | STCG | | $ | 0.1315 | |
| All Classes | | LTCG | | $ | 1.1713 | |
| | | | | | | |
| VY® Oppenheimer Global Portfolio | | | | | | |
| Class ADV | | NII | | $ | 0.1470 | |
| Class I | | NII | | $ | 0.2255 | |
| Class S | | NII | | $ | 0.1813 | |
| Class S2 | | NII | | $ | 0.1811 | |
| All Classes | | LTCG | | $ | 0.2610 | |
| | | | | | | |
| VY® Pioneer High Yield Portfolio | | | | | | |
| Class I | | NII | | $ | 0.5901 | |
| Class S | | NII | | $ | 0.5583 | |
| | | | | | | |
| VY® T. Rowe Price Diversified Mid Cap Growth Portfolio | | | | | | |
| Class ADV | | NII | | $ | 0.0033 | |
| Class I | | NII | | $ | 0.0319 | |
| Class S | | NII | | $ | 0.0045 | |
| Class S2 | | NII | | $ | 0.0040 | |
| All Classes | | STCG | | $ | 0.0237 | |
| All Classes | | LTCG | | $ | 0.8032 | |
| | | | | | | |
| VY® T. Rowe Price Growth Equity Portfolio | | | | | | |
| All Classes | | LTCG | | $ | 6.3213 | |
| | | | | | | |
| VY® Templeton Foreign Equity Portfolio | | | | | | |
| Class ADV | | NII | | $ | 0.2635 | |
| Class I | | NII | | $ | 0.3236 | |
| Class S | | NII | | $ | 0.2907 | |
| Class S2 | | NII | | $ | 0.2774 | |
NII - Net investment income
STCG - Short-term capital gain
LTCG - Long-term capital gain
See Accompanying Notes to Financial Statements
| Tax Information (Unaudited) (continued) |
Of the ordinary distributions made during the year ended December 31, 2014, the following percentages qualify for the dividends received deduction (DRD) available to corporate shareholders:
| Voya Aggregate Bond Portfolio | | | 1.49 | % |
| VY® American Century Small-Mid Cap Value Portfolio | | | 22.81 | % |
| VY® Baron Growth Portfolio | | | 96.57 | % |
| VY® Columbia Contrarian Core Portfolio | | | 99.97 | % |
| VY® Columbia Small Cap Value II Portfolio | | | 100.00 | % |
| VY® Invesco Comstock Portfolio | | | 64.60 | % |
| VY® Invesco Equity and Income Portfolio | | | 49.86 | % |
| VY® JPMorgan Mid Cap Value Portfolio | | | 100.00 | % |
| VY® Oppenheimer Global Portfolio | | | 41.19 | % |
| VY® Pioneer High Yield Portfolio | | | 5.53 | % |
| VY® T. Rowe Price Diversified Mid Cap Growth Portfolio | | | 89.05 | % |
Pursuant to Section 853 of the Internal Revenue Code, the Portfolios designate the following amounts as foreign taxes paid for the year ended December 31, 2014. Foreign taxes paid for purposes of Section 853 may be less than actual foreign taxes paid for financial statement purposes.
| | | Creditable Foreign
Taxes Paid | | | Per Share
Amount | | | Portion of Ordinary Income
Distribution Derived from
Foreign Sourced Income* | |
| VY® Oppenheimer Global Portfolio | | $ | 709,491 | | | $ | 0.0080 | | | | 71.87 | % |
| VY® Templeton Foreign Equity Portfolio | | $ | 1,030,587 | | | $ | 0.0149 | | | | 97.78 | % |
| * | None of the Portfolios listed above derived any income from ineligible foreign sources as defined under Section 901(j) of the Internal Revenue Code. |
Foreign taxes paid or withheld should be included in taxable income with an offsetting deduction from gross income or as a credit for taxes paid to foreign governments. Shareholders are strongly advised to consult their own tax advisors regarding the appropriate treatment of foreign taxes paid.
Above figures may differ from those cited elsewhere in this report due to differences in the calculation of income and gains under U.S. generally accepted accounting principles (book) purposes and Internal Revenue Service (tax) purposes.
Shareholders are strongly advised to consult their own tax advisers with respect to the tax consequences of their investments in the Portfolios. In January, shareholders, excluding corporate shareholders, receive an IRS 1099-DIV regarding the federal tax status of the dividends and distributions they received in the calendar year.
See Accompanying Notes to Financial Statements
| DIRECTOR AND OFFICER INFORMATION (Unaudited) |
The business and affairs of the Company are managed under the direction of the Company’s Board. A Director, who is not an interested person of the Company, as defined in the 1940 Act, is an independent director (“Independent Director”). The Directors and Officers of the Company are listed below. The Statement of Additional Information includes additional information about directors of the Company and is available, without charge, upon request at (800) 992-0180.
| Name, Address and Age | | Position(s)
Held with the
Company | | Term of Office and
Length of Time
Served(1) | | Principal
Occupation(s) -
During the Past 5 Years | | Number of
Portfolios in
Fund
Complex
Overseen by
Director(2) | | Other Board Positions
Held by Director |
| Independent Directors*: | | | | | | | | | | |
| | | | | | | | | | | |
Colleen D. Baldwin
7337 East Doubletree Ranch Rd.
Suite 100
Scottsdale, Arizona 85258
Age: 54 | | Director | | November 2007 - Present | | President, Glantuam Partners, LLC, a business consulting firm (January 2009 - Present). | | 158 | | DSM/Dentaquest, Boston, MA (February 2014 - Present). |
| | | | | | | | | | | |
John V. Boyer
7337 East Doubletree Ranch Rd.
Suite 100
Scottsdale, Arizona 85258
Age: 61 | | Chairperson/
Director | | November 1997 - Present | | President and Chief Executive Officer, Bechtler Arts Foundation, an arts and education foundation (January 2008 - Present). | | 158 | | None. |
| | | | | | | | | | | |
Patricia W. Chadwick
7337 East Doubletree Ranch Rd.
Suite 100
Scottsdale, Arizona 85258
Age: 66 | | Director | | January 2006 - Present | | Consultant and President, Ravengate Partners LLC, a consulting firm that provides advice regarding financial markets and the global economy (January 2000 - Present). | | 158 | | Wisconsin Energy Corporation (June 2006 - Present) and The Royce Funds (35 funds) (December 2009 - Present). |
| | | | | | | | | | | |
Albert E. DePrince, Jr.
7337 E. Doubletree Ranch Rd.
Suite 100
Scottsdale, Arizona 85258
Age: 73 | | Director | | May 2013 - Present | | Retired. Formerly, Professor of Economics and Finance, Middle Tennessee State University (August 1991 - July 2014); Dr. DePrince continued to hold a position with the university under a post-retirement contract through the end of 2014. | | 158 | | None. |
| | | | | | | | | | | |
Peter S. Drotch
7337 East Doubletree Ranch Rd.
Suite 100
Scottsdale, Arizona 85258
Age: 73 | | Director | | November 2007 - Present | | Retired. | | 158 | | First Marblehead Corporation (September 2003 - Present). |
| | | | | | | | | | | |
Russell H. Jones
7337 E. Doubletree Ranch Rd.
Suite 100
Scottsdale, Arizona 85258
Age: 70 | | Director | | May 2013 - Present | | Retired. | | 158 | | None. |
| | | | | | | | | | | |
Patrick W. Kenny
7337 East Doubletree Ranch Rd.
Suite 100
Scottsdale, Arizona 85258
Age: 72 | | Director | | March 2002 - Present | | Retired. | | 158 | | Assured Guaranty Ltd. (April 2004 - Present). |
| DIRECTOR AND OFFICER INFORMATION (Unaudited) (continued) |
| Name, Address and Age | | Position(s)
Held with the
Company | | Term of Office and
Length of Time
Served(1) | | Principal
Occupation(s) -
During the Past 5 Years | | Number of
Portfolios in
Fund
Complex
Overseen by
Director(2) | | Other Board Positions
Held by Director |
Joseph E. Obermeyer
7337 E. Doubletree Ranch Rd.
Suite 100
Scottsdale, Arizona 85258
Age: 57 | | Director | | May 2013 - Present | | President, Obermeyer & Associates, Inc., a provider of financial and economic consulting services (November 1999 - Present). | | 158 | | None. |
| | | | | | | | | | | |
Sheryl K. Pressler
7337 East Doubletree Ranch Rd.
Suite 100
Scottsdale, Arizona 85258
Age: 64 | | Director | | January 2006 - Present | | Consultant (May 2001 - Present). | | 158 | | None. |
| | | | | | | | | | | |
Roger B. Vincent
7337 East Doubletree Ranch Rd.
Suite 100
Scottsdale, Arizona 85258
Age: 69 | | Director | | January 2005 - Present | | Retired. Formerly, President, Springwell Corporation, a corporate finance firm (March 1989 - August 2011). | | 158 | | UGI Corporation (February 2006 - Present) and UGI Utilities, Inc. (February 2006 - Present). |
| | | | | | | | | | | |
| Director who is an “Interested Person”: | | | | |
| | | | | | | | | | | |
Shaun P. Mathews(3)
7337 East Doubletree Ranch Rd.
Suite 100
Scottsdale, Arizona 85258
Age: 59 | | Director | | November 2007 - Present | | President and Chief Executive Officer, Voya Investments, LLC (November 2006 - Present). | | 158 | | Voya Capital Corporation, LLC and Voya Investments Distributor, LLC (December 2005 - Present); Voya Funds Services, LLC, Voya Investments, LLC and Voya Investment Management, LLC (March 2006 - Present); and Voya Investment Trust Co. (April 2009 - Present). |
| (1) | Directors serve until their successors are duly elected and qualified. The tenure of each Director who is not an “interested person” as defined in the 1940 Act, of the Portfolio (as defined below, “Independent Director”) is subject to the Board’s retirement policy which states that each duly elected or appointed Independent Director shall retire from and cease to be a member of the Board of Directors at the close of business on December 31 of the calendar year in which the Independent Director attains the age of 75. A majority vote of the Board’s other Independent Directors may extend the retirement date of an Independent Director if the retirement would trigger a requirement to hold a meeting of shareholders of the Company under applicable law, whether for purposes of appointing a successor to the Independent Director or otherwise comply under applicable law, in which case the extension would apply until such time as the shareholder meeting can be held or is no longer required (as determined by a vote of a majority of the other Independent Directors). |
| (2) | For the purposes of this table, “Fund Complex” means the Voya family of funds including the following investment companies: Voya Asia Pacific High Dividend Equity Income Fund; Voya Balanced Portfolio, Inc.; Voya Emerging Markets High Dividend Equity Fund; Voya Equity Trust; Voya Funds Trust; Voya Global Advantage and Premium Opportunity Fund; Voya Global Equity Dividend and Premium Opportunity Fund; Voya Infrastructure, Industrials and Materials Fund; Voya Intermediate Bond Portfolio; Voya International High Dividend Equity Income Fund; Voya Investors Trust; Voya Money Market Portfolio; Voya Mutual Funds; Voya Natural Resources Equity Income Fund; Voya Partners, Inc.; Voya Prime Rate Trust; Voya Senior Income Fund; Voya Separate Portfolios Trust; Voya Series Fund, Inc.; Voya Strategic Allocation Portfolios, Inc.; Voya Variable Funds; Voya Variable Insurance Trust; Voya Variable Portfolios, Inc.; and Voya Variable Products Trust. The number of funds in the Voya family of funds is as of January 31, 2015. |
| (3) | Mr. Mathews is deemed to be an “Interested Person” of the Company as defined in the 1940 Act, because of his current affiliation with any of the Voya funds, Voya Financial, Inc., or any of Voya Financial, Inc.’s affiliates. |
| * | Effective on December 31, 2014, J. Michael Earley retired as a Director. |
| DIRECTOR AND OFFICER INFORMATION (Unaudited) (continued) |
| Name, Address and Age | | Position(s) Held
With the Company | | Term of Office and
Length of Time Served(1) | | Principal Occupation(s) -
During the Past 5 Years |
Shaun P. Mathews
7337 East Doubletree Ranch Rd.
Suite 100
Scottsdale, Arizona 85258
Age: 59 | | President and Chief Executive Officer | | November 2006 - Present | | President and Chief Executive Officer, Voya Investments, LLC (November 2006 - Present). |
| | | | | | | |
Michael J. Roland
7337 East Doubletree Ranch Rd.
Suite 100
Scottsdale, Arizona 85258
Age: 56 | | Executive Vice President | | January 2005 - Present | | Managing Director and Chief Operating Officer, Voya Investments, LLC and Voya Funds Services, LLC (April 2012 - Present). Formerly, Chief Compliance Officer, Directed Services LLC and Voya Investments, LLC (March 2011 - December 2013); Executive Vice President and Chief Operating Officer, Voya Investments, LLC and Voya Funds Services, LLC (January 2007 - April 2012) and Chief Compliance Officer, Voya Family of Funds (March 2011 - February 2012). |
| | | | | | | |
Stanley D. Vyner
230 Park Avenue
New York, New York 10169
Age: 64 | | Executive Vice President
Chief Investment Risk Officer | | January 2005 – Present September 2009 - Present | | Executive Vice President, Voya Investments, LLC (July 2000 - Present) and Chief Investment Risk Officer, Voya Investments, LLC (January 2003 - Present). |
| | | | | | | |
Kevin M. Gleason
7337 East Doubletree Ranch Rd.
Suite 100
Scottsdale, Arizona 85258
Age: 48 | | Chief Compliance Officer | | February 2012 - Present | | Senior Vice President and Chief Compliance Officer, Voya Investments, LLC (February 2012 - Present). Formerly, Assistant General Counsel and Assistant Secretary, The Northwestern Mutual Life Insurance Company (June 2004 - January 2012). |
| | | | | | | |
Todd Modic
7337 East Doubletree Ranch Rd.
Suite 100
Scottsdale, Arizona 85258
Age: 47 | | Senior Vice President, Chief/Principal Financial Officer and Assistant Secretary | | March 2005 - Present | | Senior Vice President, Voya Funds Services, LLC (March 2005 - Present). |
| | | | | | | |
Kimberly A. Anderson
7337 East Doubletree Ranch Rd.
Suite 100
Scottsdale, Arizona 85258
Age: 50 | | Senior Vice President | | January 2005 - Present | | Senior Vice President, Voya Investments, LLC (October 2003 - Present). |
| | | | | | | |
Julius A. Drelick, III
7337 East Doubletree Ranch Rd.
Suite 100
Scottsdale, Arizona 85258
Age: 48 | | Senior Vice President | | July 2012 - Present | | Senior Vice President - Head of Fund Compliance, Voya Funds Services, LLC (June 2012 - Present); Chief Compliance Officer of Directed Services LLC and Voya Investments, LLC (January 2014 - Present). Formerly, Vice President - Platform Product Management & Project Management, Voya Investments, LLC (April 2007 - June 2012). |
| | | | | | | |
Robert Terris
7337 East Doubletree Ranch Rd.
Suite 100
Scottsdale, Arizona 85258
Age: 44 | | Senior Vice President | | May 2006 - Present | | Senior Vice President, Head of Division Operations, Voya Funds Services, LLC (January 2006 - Present). |
| | | | | | | |
Fred Bedoya
7337 East Doubletree Ranch Rd.
Suite 100
Scottsdale, Arizona 85258
Age: 42 | | Vice President and Treasurer | | September 2012 - Present | | Vice President, Voya Funds Services, LLC (March 2012 - Present). Formerly, Assistant Vice President - Director, Voya Funds Services, LLC (March 2003 - March 2012). |
| | | | | | | |
Maria M. Anderson
7337 East Doubletree Ranch Rd.
Suite 100
Scottsdale, Arizona 85258
Age: 56 | | Vice President | | January 2005 - Present | | Vice President, Voya Funds Services, LLC (September 2004 - Present). |
| DIRECTOR AND OFFICER INFORMATION (Unaudited) (continued) |
| Name, Address and Age | | Position(s) Held
With the Company | | Term of Office and
Length of Time Served(1) | | Principal Occupation(s) -
During the Past 5 Years |
Lauren D. Bensinger
7337 East Doubletree Ranch Rd.
Suite 100
Scottsdale, Arizona 85258
Age: 61 | | Vice President | | January 2005 - Present | | Vice President, Voya Investments, LLC and Voya Funds Services, LLC (February 1996 - Present); Vice President, Voya Investments, LLC (October 2004 - Present); Vice President and Money Laundering Reporting Officer, Voya Investments Distributor, LLC (April 2010 - Present); Anti-Money Laundering Compliance Officer, Voya Financial, Inc. (January 2013 - Present); and Money Laundering Reporting Officer, Voya Investment Management Trust Co. (October 2012 - Present). Formerly, Chief Compliance Officer, Voya Investments Distributor, LLC (August 1995 - April 2010). |
| | | | | | | |
Sara M. Donaldson
7337 East Doubletree Ranch Rd.
Suite 100
Scottsdale, Arizona 85258
Age: 55 | | Vice President | | September 2014 - Present | | Vice President, Voya Funds Services, LLC (April 2014 - Present). Formerly, Director, Compliance, AXA Rosenberg Global Services, LLC (September 1997 - March 2014). |
| | | | | | | |
Robyn L. Ichilov
7337 East Doubletree Ranch Rd.
Suite 100
Scottsdale, Arizona 85258
Age: 47 | | Vice President | | January 2005 - Present | | Vice President, Voya Funds Services, LLC (November 1995 - Present) and Voya Investments, LLC (August 1997 - Present). Formerly, Treasurer, Voya Family of Funds (November 1999 - February 2012). |
| | | | | | | |
Jason Kadavy
7337 East Doubletree Ranch Rd.
Suite 100
Scottsdale, Arizona 85258
Age: 38 | | Vice President | | September 2012 - Present | | Vice President, Voya Funds Services, LLC (July 2007 - Present). |
| | | | | | | |
Kimberly K. Springer
7337 East Doubletree Ranch Rd.
Suite 100
Scottsdale, Arizona 85258
Age: 57 | | Vice President | | March 2006 - Present | | Vice President - Mutual Fund Product Development, Voya Investments, LLC (July 2012 - Present); Vice President, Voya Investment Management - Voya Family of Funds (March 2010 - Present) and Vice President, Voya Funds Services, LLC (March 2006 - Present). Formerly Managing Paralegal, Registration Statements (June 2003 - July 2012). |
| | | | | | | |
Craig Wheeler
7337 East Doubletree Ranch Rd.
Suite 100
Scottsdale, Arizona 85258
Age: 45 | | Vice President | | May 2008 - Present | | Vice President - Director of Tax, Voya Funds Services, LLC (March 2013 - Present). Formerly, Assistant Vice President - Director of Tax, Voya Funds Services, LLC (March 2008 -
March 2013). |
| | | | | | | |
Huey P. Falgout, Jr.
7337 East Doubletree Ranch Rd.
Suite 100
Scottsdale, Arizona 85258
Age: 51 | | Secretary | | August 2003 - Present | | Senior Vice President and Chief Counsel, Voya Investment Management - Mutual Fund Legal Department (March 2010 - Present). Formerly, Chief Counsel, ING Americas, U.S. Legal Services (October 2003 - March 2010). |
| | | | | | | |
Paul A. Caldarelli
7337 East Doubletree Ranch Rd.
Suite 100
Scottsdale, Arizona 85258
Age: 63 | | Assistant Secretary | | June 2010 - Present | | Vice President and Senior Counsel, Voya Investment Management - Mutual Fund Legal Department (March 2010 -Present). Formerly, Senior Counsel, ING Americas, U.S. Legal Services (April 2008 - March 2010). |
| | | | | | | |
Theresa K. Kelety
7337 East Doubletree Ranch Rd.
Suite 100
Scottsdale, Arizona 85258
Age: 52 | | Assistant Secretary | | August 2003 - Present | | Vice President and Senior Counsel, Voya Investment Management - Mutual Fund Legal Department (March 2010 - Present). Formerly, Senior Counsel, ING Americas, U.S. Legal Services (April 2008 - March 2010). |
| (1) | The Officers hold office until the next annual meeting of the Board of Directors and until their successors shall have been elected and qualified. |
| ADVISORY CONTRACT APPROVAL DISCUSSION (Unaudited) |
BOARD CONSIDERATION AND APPROVAL OF INVESTMENT ADVISORY AND SUB-ADVISORY CONTRACTS
Section 15(c) of the Investment Company Act of 1940, as amended (the “1940 Act”), provides that, after an initial period, the Board of Directors (the “Board”) of Voya Partners, Inc. (the “Company”), including a majority of Board members who have no direct or indirect interest in the advisory and sub-advisory contracts of Voya Aggregate Bond Portfolio (formerly, VY® PIMCO Bond Portfolio), Voya Global Bond Portfolio, VY® American Century Small-Mid Cap Value Portfolio, VY® Baron Growth Portfolio, VY® Columbia Contrarian Core Portfolio, VY® Columbia Small Cap Value II Portfolio, VY® Invesco Comstock Portfolio, VY® Invesco Equity and Income Portfolio, VY® JPMorgan Mid Cap Value Portfolio, VY® Oppenheimer Global Portfolio, VY® Pioneer High Yield Portfolio, VY® T. Rowe Price Diversified Mid Cap Growth Portfolio, VY® T. Rowe Price Growth Equity Portfolio and VY® Templeton Foreign Equity Portfolio (collectively, the “Portfolios”), each a series of the Company, and who are not “interested persons” of the Portfolios, as such term is defined under the 1940 Act (the “Independent Directors”), must annually review and approve the Portfolios’ existing investment advisory and sub-advisory contracts. Thus, at a meeting held on September 12, 2014, the Board, including a majority of the Independent Directors, considered whether to renew and approve the amended and restated investment advisory contract (the “Advisory Contract”) between Directed Services LLC (“Adviser”) and the Portfolios, as well as the amended and restated sub-advisory contracts (“Sub-Advisory Contracts”) with the sub-advisers to the Portfolios (the “Sub-Advisers”).
The Independent Directors also held separate meetings on August 14 and September 10, 2014, to consider the renewal of the Advisory Contract and Sub-Advisory Contracts. As a result, subsequent references herein to factors considered and determinations made by the Board include, as applicable, factors considered and determinations made on those earlier dates by the Independent Directors.
At its September 12, 2014 meeting, the Board voted to renew the Advisory and Sub-Advisory Contracts for the Portfolios. In reaching these decisions, the Board took into account information furnished to it throughout the year at meetings of the Board and the Board’s committees, as well as information prepared specifically in connection with the annual renewal or approval process. Determinations by the Independent Directors also took into account various factors that they believed, in light of the legal advice furnished to them by K&L Gates LLP (“K&L Gates”), their independent legal counsel, and their own business judgment, to be relevant. Further, while the Board
considered at the same meeting the advisory contracts and sub-advisory contracts that were subject to renewal for the investment companies in the Voya family of funds (“Voya funds”), the Board considered each Voya fund’s advisory and sub-advisory relationships separately.
Provided below is a general overview of the Board’s contract approval process that it followed, as well as a discussion of certain specific factors that the Board considered at its renewal meetings. While the Board gave its attention to information furnished at the request of the Independent Directors that was most relevant to its considerations, discussed below are some of the primary factors relevant to the Board’s consideration as to whether to renew the Advisory and Sub-Advisory Contracts for the one-year period ending September 30, 2015. Each Board member may have accorded different weight to the various factors in reaching his or her conclusions with respect to each Portfolio’s advisory and sub-advisory arrangements.
Overview of the Contract Renewal and Approval Process
The Board followed a structured process (the “Contract Review Process”) pursuant to which it requested and considered relevant information when it decided whether to approve and renew the Advisory Contract and Sub-Advisory Contracts. Among other actions, the Independent Directors previously retained an independent consultant with experience in the mutual fund industry to assist them in working with personnel employed by the Adviser or its affiliates who administer the Portfolios (“Management”) to: identify the types of information presented to the Board to inform its deliberations with respect to advisory and sub-advisory relationships and to help evaluate that information; evaluate industry best practices in regard to the consideration of investment advisory and sub-advisory contracts; establish a specific format in which certain requested information was provided to the Board; and determine the process for the Board’s review of such information.
The Board has established (among other committees) three Investment Review Committees (each, an “IRC”) and a Contracts Committee. Among other matters, the Contracts Committee provides oversight with respect to the contracts renewal and approval process, and each Portfolio is assigned to an IRC, which provides oversight regarding, among other matters, the investment performance of the Adviser and Sub-Advisers, as well as the oversight by the Adviser of the performance of the Sub-Advisers. The IRCs may apply a heightened level of scrutiny in cases where performance was below a Portfolio’s relevant benchmark, and/or a selected peer
| ADVISORY CONTRACT APPROVAL DISCUSSION (Unaudited) (continued) |
group of investment companies (“Selected Peer Group”), and/or Lipper Inc. (“Lipper”) category median, and/or Morningstar, Inc. (“Morningstar”) category median, as applicable.
The type and format of the information provided to the Board or to legal counsel for the Independent Directors in connection with the Contract Review Process has been codified in a 15(c) methodology guide for the Voya funds (“15(c) Methodology Guide”). This 15(c) Methodology Guide was developed under the direction of the Independent Directors and sets out a blueprint pursuant to which they request certain information that they deem important to facilitate an informed review in connection with initial and annual approvals of advisory and sub-advisory contracts.
Management provided certain of the information requested by the 15(c) Methodology Guide in Fund Analysis and Comparison Tables (“FACT sheets”). The Independent Directors periodically have retained, including most recently in 2014, an independent firm to test and verify the accuracy of certain FACT sheet data for a representative sample of the Voya funds. In addition, the Contracts Committee has routinely employed an independent consultant to assist in its review and analysis of, among other matters, the 15(c) Methodology Guide, the content and format of the FACT sheets, and Selected Peer Groups to be used by the Portfolios for certain comparison purposes during the renewal process.
Set forth below is a discussion of many of the Board’s primary considerations and conclusions in connection with its decision to approve the Portfolios’ Advisory and Sub-Advisory Contracts through September 30, 2015.
Nature, Extent and Quality of Service
The Independent Directors received and evaluated such information as they deemed necessary regarding the nature, extent and quality of services provided to the Portfolios by the Adviser and Sub-Advisers. This included information regarding the Adviser and Sub-Advisers provided throughout the year at regular meetings of the Board and its committees, as well as information furnished in connection with the contract renewal meetings.
The materials requested by the Independent Directors and provided to the Board, K&L Gates and/or independent consultants that assisted the Independent Directors prior to the September 12, 2014 Board meeting included, among other information, the following items for each Portfolio: (1) FACT sheets that provided information regarding the performance and expenses of the Portfolio and other similarly managed funds in its Selected Peer Group, information regarding the Portfolio’s investment portfolio,
objective and strategies and information regarding net asset flows into and out of the Portfolio; (2) reports providing risk and attribution analyses of the Portfolio; (3) the 15(c) Methodology Guide, which describes how the FACT sheets were prepared, including the manner in which each Portfolio’s benchmark and Selected Peer Group were selected and how profitability was determined; (4) responses from the Adviser and Sub-Adviser to the Portfolio to a series of questions posed by K&L Gates on behalf of the Independent Directors; (5) copies of the forms of Advisory and Sub-Advisory Contracts; (6) copies of the Forms ADV for the Adviser and Sub-Adviser; (7) financial statements for the Adviser and Sub-Advisers (or the parent company of certain unaffiliated Sub-Advisers); (8) a draft narrative summary addressing key factors the Board customarily considers in evaluating the advisory and sub-advisory contracts for the Voya funds (including the Portfolio’s Advisory Contract and Sub-Advisory Contract); (9) independent analyses of Portfolio performance by the Company’s Chief Investment Risk Officer; (10) a report by the Company’s Chief Compliance Officer (“CCO”); and (11) other information relevant to the Board’s evaluations.
The Board was advised that pursuant to an agreement with the European Commission, ING Groep, N.V. (“ING Groep”) is required to divest its entire interest in Voya Financial, Inc. (formerly known as ING U.S. Inc.), its U.S.-based insurance, retirement services and investment management operations, which include the Adviser and a Sub-Adviser affiliated with the Adviser, Voya Investment Management Co. LLC (“Voya IM”), by the end of 2016 (such divestment, the “Separation Plan”). Voya Financial, Inc. is and was, at the time of the September Board meeting, a minority owned subsidiary of ING Groep and a parent company of the Adviser and Voya IM. The Board further noted that the Separation Plan may result in the Adviser’s and Voya IM’s loss of access to the services and resources of ING Groep, which could adversely affect their businesses and profitability. The Board was advised that the Separation Plan contemplates one or more public offerings and each may be deemed to be a change of control.
The Board was advised that Voya Financial, Inc. had conducted an initial public offering of Voya Financial, Inc. common stock in May 2013 and ING Groep had divested additional shares through three other public offerings since May 2013, reducing its ownership interest in Voya Financial, Inc. to below 50%. The Board was advised that none of these public offerings was deemed to be a change of control. The Board recognized that if any future public offering is deemed to be a change of control, the investment advisory and sub-advisory agreements for the Voya funds would terminate and trigger a need for new
| ADVISORY CONTRACT APPROVAL DISCUSSION (Unaudited) (continued) |
agreements, which would require the approval of the Board and, potentially, shareholders of the Portfolios. The Board also was advised that there could be no assurance that the Separation Plan will be carried out completely. The Board considered the potential effects of the Separation Plan on the Portfolios, the Adviser and Voya IM, including the Adviser’s and Voya IM’s ability during and after the separation to perform the same level of service to the Portfolios as the Adviser and Voya IM then provided. The Board was advised that neither the Adviser nor Voya IM anticipated that the Separation Plan would have a material adverse impact on the Portfolios or their operations and administration.
The Board was advised that, in connection with the Separation Plan, Voya Financial, Inc. underwent a rebranding effort (the “Rebranding”) whereby Voya Financial, Inc. and several of its affiliates effected name changes. The Voya funds’ names, as well as the Adviser’s and Voya IM’s names, were also changed in connection with the Rebranding. The Rebranding resulted in amended and restated forms of advisory and sub-advisory contracts being presented to and approved by the Board at its September 12, 2014 meeting. The Board was advised that the Advisory and Sub-Advisory Contracts have the same terms as the then-current advisory and sub-advisory contracts, except for the effective date and certain immaterial changes made to certain provisions related to the Rebranding.
For each Portfolio, a specific class of shares was used for purposes of certain comparisons between the Portfolio and its Selected Peer Group. The specified class of a Portfolio was chosen based on the 15(c) Methodology Guide and was compared to an analogous class of shares for each fund in its Selected Peer Group. The mutual funds included in each Portfolio’s Selected Peer Group were selected based upon criteria designed to represent the Portfolio share class being compared to the Selected Peer Group.
In arriving at its conclusions with respect to the Advisory Contract, the Board was mindful of the “manager-of-managers” platform of the Voya funds that has been developed by the Adviser. The Board recognized that the Adviser is responsible for monitoring the investment program, performance, and developments and ongoing operations of the Sub-Advisers under this manager-of-managers arrangement. The Board also considered the techniques and resources that the Adviser has developed to provide ongoing oversight of the nature, extent and quality of the services the Sub-Advisers provide to the applicable Portfolios and the Sub-Advisers’ compliance with applicable laws and regulations. The Board was advised that to assist in the selection and
monitoring of the Sub-Advisers, the Adviser has developed an oversight process formulated by its Manager Research & Selection Group (“MR&S”), which analyzes both qualitative (such as in-person meetings and telephonic meetings with the Sub-Advisers and research on sub-advisers) and quantitative information (such as performance data, portfolio data and attribution analysis) about the Sub-Advisers and the funds that they manage. The Board recognized that MR&S also typically provides in-person reports to the IRCs at their meetings prior to any Sub-Adviser’s presentation. In addition, the Board noted that MR&S prepares periodic due diligence reports regarding the Sub-Advisers based on on-site visits and information and analysis which team members use to attempt to gain and maintain an in-depth understanding of each Sub-Adviser’s investment process and to try to identify issues that may be relevant to a Sub-Adviser’s services to a Portfolio and/or its performance. The Board also noted that MR&S provides written reports on these due diligence analyses to the pertinent IRC. The Board was advised of the resources that Management has committed to its services as a manager-of-managers, including resources for reporting to the Board and the IRCs to assist them with their assessment of the investment performance of the Portfolios on an on-going basis throughout the year. This includes the appointment of a Chief Investment Risk Officer and his staff, who report directly to the Board and who have developed attribution analyses and other metrics used by the IRCs to analyze the key factors underlying investment performance for the Voya funds.
The Board also considered the techniques that the Adviser has developed to screen and perform due diligence on new sub-advisers if and when the Adviser recommends to the Board a new sub-adviser to manage a Voya fund. The Board considered that, for new non-Voya-affiliated sub-advisers, MR&S is responsible for: identifying qualified candidates; analyzing their investment processes, personnel and resources; conducting due diligence on the candidates; and selecting a firm to propose as a new sub-adviser, as well as preparing written materials and reports to the committees and the Board as part of the process of considering the approval of any new sub-adviser for a Voya fund.
The Board also considered that in the course of monitoring performance of the Sub-Advisers, MR&S has developed, based on guidance from the IRCs, a methodology for comparing performance of each Portfolio to a Selected Peer Group, to each Portfolio’s Morningstar category median, to its Lipper category median and to its primary benchmark. The Board also recognized that MR&S provides the IRCs with regular updates on the Portfolios and alerts the IRCs to potential issues as they arise. The
| ADVISORY CONTRACT APPROVAL DISCUSSION (Unaudited) (continued) |
Board considered that MR&S also prepares Fund Dispersion Reports that seek to monitor any dispersion between the funds managed by non-Voya-affiliated sub-advisers and their similarly managed retail counterparts and assists the Board in carrying out its general oversight duties. The Board also was advised that the Adviser regularly monitors performance, personnel, compliance and other issues that may arise on a day-to-day basis regarding the Sub-Advisers and considered that, if issues are identified either through formal or informal processes, they are brought before the IRCs and the Board for consideration and action and the Adviser consistently makes its resources available to the Board and the IRCs to assist with addressing any issues that arise.
The Board considered that the Portfolios also benefit from the services of the Adviser’s Investment Risk Management Department (the “IRMD”), under the leadership of the Chief Investment Risk Officer, the costs of which are shared by the Portfolios and the Adviser. The Board considered that the IRMD regularly presents written materials and reports to the IRCs that focus on the investment risks of the Portfolios. The Board also considered that the IRMD provides the IRCs with analyses that are developed to assist the IRCs in identifying trends in Portfolio performance and other areas over consecutive periods. The Board considered that the services provided by the IRMD are meant to provide an additional perspective for the benefit of the IRCs, which may vary from the perspective of MR&S.
The Board also considered the techniques used by the Adviser to monitor the performance of the Sub-Advisers and the proactive approach that the Adviser, working in cooperation with the IRCs, has taken to advocate or recommend, when it believed appropriate, changes designed to assist in improving a Voya fund’s performance.
In considering the Portfolios’ Advisory Contract, the Board also considered the extent of benefits provided to the Portfolios’ shareholders, beyond advisory services, from being part of the Voya funds. This includes, in most cases, the right to exchange or transfer investments, without a sales charge, between the same class of shares of such funds or among Voya funds available on a product platform, and the wide range of Voya funds available for exchange or transfer. The Board also took into account the Adviser’s ongoing efforts to reduce the expenses of the Voya funds through renegotiated arrangements with the Voya funds’ service providers. In addition, the Board considered the efforts of the Adviser and the expenses that it incurred in recent years to help make the Voya funds more balanced and efficient by the launch of new investment products and the combinations of similar funds.
Further, the Board received periodic reports showing that the investment policies and restrictions for each Portfolio were consistently complied with and other periodic reports covering matters such as compliance by Adviser and Sub-Adviser personnel with codes of ethics. The Board considered reports from the Company’s CCO and/or the Adviser’s CCO evaluating whether the regulatory compliance systems and procedures of the Adviser and each Sub-Adviser are reasonably designed to ensure compliance with the federal securities laws, including those related to, among others, late trading and market timing, best execution, fair value pricing, proxy voting and trade allocation practices. The Board also took into account the Company’s CCO’s annual and periodic reports and recommendations with respect to service provider compliance programs. In this regard, the Board also considered the policies and procedures developed by the Company’s CCO in consultation with the Board’s Compliance Committee that guide the Company’s CCO’s compliance oversight function.
The Board requested and, as applicable, considered information regarding the level of staffing, quality and experience of each Portfolio’s portfolio management team, the respective resources and reputations of the Adviser and Sub-Advisers, and the ability of the Adviser and the Sub-Advisers to attract and retain qualified investment advisory personnel, the adequacy of the resources committed to the Portfolios (and other relevant funds in the Voya funds) by the Adviser and Sub-Advisers, whether those resources are commensurate with the needs of the Portfolios and are sufficient to sustain appropriate levels of performance and compliance needs, and the Board considered the financial stability of the Adviser and the Sub-Advisers.
Based on their deliberations and the materials presented to them, the Board concluded that the advisory and related services provided by the Adviser and each Sub-Adviser are appropriate in light of the Portfolios’ operations, the competitive landscape of the investment company business, and investor needs, and that the nature, extent and quality of the overall services provided by the Adviser and each Sub-Adviser were appropriate.
Portfolio Performance
In assessing advisory and sub-advisory relationships, the Board placed emphasis on the investment returns of each Portfolio. The Board considered the performance reports and analyses from MR&S and IRMD and discussions with portfolio managers at Board and committee meetings during the year. The Board also paid particular attention in assessing performance information provided in the FACT sheets furnished in connection with the renewal and
| ADVISORY CONTRACT APPROVAL DISCUSSION (Unaudited) (continued) |
approval process. The FACT sheets prepared for each Portfolio included its investment performance compared to the Portfolio’s Morningstar category median, Lipper category median, Selected Peer Group and primary benchmark. The FACT sheet performance data was as of March 31, 2014.
The Board also considered at its September 12, 2014 meeting certain additional data regarding performance and Portfolio asset levels for various additional periods ending after March 31, 2014. The Board’s findings specific to each Portfolio’s performance are discussed under “Portfolio-by-Portfolio Analysis” below.
Economies of Scale
When evaluating the reasonableness of advisory fee rates, the Board also considered whether economies of scale likely will be realized by the Adviser and Sub-Advisers as a Portfolio grows larger and the extent to which any such economies are reflected in contractual fee rates. In this regard, the Board noted any breakpoints in advisory fee rate schedules that will result in a lower advisory fee rate when a Portfolio achieves sufficient asset levels to receive a breakpoint discount. In the case of sub-advisory fees, the Board considered that breakpoints would inure to the benefit of the Adviser, except to the extent that there are corresponding advisory fee rate breakpoints or waivers. The Board also considered that some of the Portfolios that do not have advisory fee breakpoints do have fee waiver and/or expense reimbursement arrangements. In this connection, the Board considered the extent to which economies of scale could be realized through such fee waivers, expense reimbursements or other expense reductions. In evaluating fee rate breakpoint arrangements and economies of scale, the Independent Directors also considered prior periodic management reports, industry information on this topic, fee rates at projected levels of growth versus peers and the Portfolios’ investment performance.
Information Regarding Services to Other Clients
��
The Board requested and, as applicable, considered information regarding the nature of services and fee rates offered by the Adviser and Sub-Advisers to other clients, including other registered investment companies and relevant institutional accounts. When fee rates offered to other clients differed materially from those charged to a Portfolio, the Board considered any underlying rationale provided by the Adviser or, in certain circumstances, the Sub-Advisers for these differences. For non-Voya-affiliated Sub-Advisers, the Board did not view this information as being a key factor in its deliberations because of the arm’s-length nature of negotiations between the Adviser and non-Voya-affiliated Sub-Advisers with respect to
sub-advisory fee rates. The Board also noted that the fee rates charged to the Portfolios and other institutional clients of the Adviser or Sub-Advisers (including other investment companies) may differ materially due to, among other reasons: differences in services; different regulatory requirements associated with registered investment companies, such as the Portfolios, as compared to non-registered investment company clients; market differences in fee rates that existed when a Portfolio first was organized; differences in the original sponsors of the Portfolios that now are managed by the Adviser; investment capacity constraints that existed when certain contracts were first agreed upon or that might exist at present; and different pricing structures that are necessary to be competitive in different marketing channels.
Fee Rates and Profitability
The Board reviewed and considered the contractual investment advisory fee rate, combined with the administrative fee rate, payable by each Portfolio to the Adviser and to the Adviser’s affiliated company that serves as the administrator to each Portfolio. The Board also considered the contractual sub-advisory fee rate payable by the Adviser to each Sub-Adviser for sub-advisory services for the relevant Portfolio, including the portion of the contractual advisory fees that are paid to the Sub-Adviser, as compared to the portion retained by the Adviser. In addition, the Board considered fee waivers and expense limitations applicable to the fees payable by the Portfolios, including the Adviser’s agreement to extend each such fee waiver and expense limitation agreement for an additional period of at least one year, and not to terminate such agreement in future years without prior approval of the Board.
The Board requested information regarding and, as applicable, considered: (1) the fee rate structure of each Portfolio as it relates to the services provided under the contracts; and (2) the potential fall-out benefits to the Adviser and the Sub-Advisers and their respective affiliates from their association with the Portfolios. For each Portfolio, the Board separately determined that the fees payable to the Adviser and the fee rate payable to the Sub-Adviser are reasonable for the services that each performs, which were considered in light of the nature, extent and quality of the services that each has performed and is expected to perform.
For each Portfolio, the Board considered information on revenues, costs and profits realized by the Adviser and, as applicable, Voya IM, which was prepared by Management in accordance with the allocation methodology (including related assumptions) specified in the 15(c) Methodology Guide. In analyzing the profitability of the Adviser in
| ADVISORY CONTRACT APPROVAL DISCUSSION (Unaudited) (continued) |
connection with its services to a Portfolio, the Board took into account the sub-advisory fee rate payable by the Adviser to each Sub-Adviser. In addition, the Board considered information that it requested and that was provided by Management with respect to the profitability of service providers affiliated with the Adviser. The Board also considered the profitability of the Adviser and its affiliated companies attributable to managing and operating each Portfolio both with and without the profitability of the distributor of the Portfolios and both before and after giving effect to any expenses incurred by the Adviser or any affiliated company in making revenue sharing or other payments to third parties, including affiliated insurance companies, for distribution and administrative services. The Board did not request profitability data from the Sub-Advisers that were not affiliated with the Adviser because the Board did not view this data as relevant to its deliberations, given the arm’s-length nature of the relationship between the Adviser and these non-Voya-affiliated Sub-Advisers with respect to the negotiation of sub-advisory fee rates. In this regard, the Board also considered that the Adviser (and not a Portfolio) pays the sub-advisory fees earned by a non-Voya- affiliated Sub-Adviser. In addition, the Board considered that many of the Voya funds’ sub-advisers traditionally have not accounted for their profits on an account-by-account basis.
Although the 15(c) Methodology Guide establishes certain standards for profit calculation, the Board recognized that profitability analysis on a Portfolio-by-Portfolio basis is not an exact science and there is no uniform methodology within the asset management industry for determining profitability for this purpose. In this context, the Board realized that Management’s calculations regarding its costs incurred in establishing the infrastructure necessary for the Portfolios’ operations may not be fully reflected in the expenses allocated to each Portfolio in determining profitability, and that the information presented may not portray all of the costs borne by the Adviser and Management or capture their entrepreneurial risk associated with offering and managing a mutual fund complex in the current regulatory and market environment. In addition, the Board recognized that the use of different reasonable methodologies for purposes of calculating profit data can give rise to dramatically different profit and loss results.
In making its determinations, the Board based its conclusions as to the reasonableness of the advisory and sub-advisory fees of the Adviser and each Sub-Adviser primarily on the factors described for each Portfolio below. At the request of the Board, the Adviser has from time to time agreed to implement remedial actions regarding certain Voya funds. These remedial actions have included,
among others: reductions in fee rates or adjustments to expense limitation and waiver arrangements; changes in sub-advisers or portfolio managers; and strategy modifications.
Portfolio-by-Portfolio Analysis
The following paragraphs outline certain of the specific factors that the Board considered, and the conclusions reached, at its September 12, 2014 meeting in relation to approving each Portfolio’s Advisory and Sub-Advisory Contracts. These specific factors are in addition to those considerations discussed above. In each case, the Portfolio’s performance was compared to its Morningstar category median and average, as well as its primary benchmark, a broad-based securities market index that appears in the Portfolio’s prospectus. With respect to Morningstar quintile rankings, the first quintile represents the highest (best) performance and the fifth quintile represents the lowest performance. Each Portfolio’s management fee rate and expense ratio were compared to the fees and expense ratios of the funds in its Selected Peer Group.
Voya Aggregate Bond Portfolio (formerly, VY® PIMCO Bond Portfolio)
In considering whether to approve the renewal of the Advisory and Sub-Advisory Contracts for Voya Aggregate Bond Portfolio (formerly, VY® PIMCO Bond Portfolio), the Board considered that, based on performance data for the periods ended March 31, 2014: (1) the Portfolio underperformed its Morningstar category median for all periods presented, with the exception of the ten-year period, during which it outperformed; (2) the Portfolio underperformed its primary benchmark for all periods presented, with the exception of the five-year and ten-year periods, during which it outperformed; and (3) the Portfolio is ranked in the second quintile of its Morningstar category for the ten-year period, the third quintile for the five-year period, the fourth quintile for the one-year and three-year periods, and the fifth (lowest) quintile for the most recent calendar quarter and year-to-date periods.
In analyzing this performance data, the Board took into account: (1) Management’s analysis regarding the negative effect that credit sector allocation and the Sub-Adviser’s determination to have no exposure to longer-dated bonds had on the Portfolio’s performance; (2) Management’s confidence in the Sub-Adviser’s ability to execute the Portfolio’s investment strategy; and (3) that Management would continue to monitor, and the Board or its IRC would periodically review, the Portfolio’s performance.
In considering the fees payable under the Advisory and Sub-Advisory Contracts for the Portfolio, the Board took
| ADVISORY CONTRACT APPROVAL DISCUSSION (Unaudited) (continued) |
into account the factors described above and also considered: (1) the fairness of the compensation under an Advisory Contract with a level fee rate that does not include breakpoints; and (2) the pricing structure (including the expense ratio to be borne by shareholders) of the Portfolio, as compared to its Selected Peer Group, including that: (a) the management fee rate (inclusive of a 0.10% administration fee) for the Portfolio is above the median and the average management fees of the funds in its Selected Peer Group; and (b) the expense ratio for the Portfolio is above the median and the average expense ratios of the funds in its Selected Peer Group.
In analyzing this fee data, the Board took into account Management’s representations regarding the competitiveness of the Portfolio’s management fee rate and expense ratio.
After its deliberation, the Board reached the following conclusions: (1) the Portfolio’s management fee rate is reasonable in the context of all factors considered by the Board; (2) the Portfolio’s expense ratio is reasonable in the context of all factors considered by the Board; (3) taking into account that Management would continue to monitor, and the Board or its IRC would periodically review the Portfolio’s performance, the Portfolio’s investment performance is reasonable in the context of all factors considered by the Board; and (4) the sub-advisory fee rate payable by the Adviser to the Sub-Adviser is reasonable in the context of all factors considered by the Board. Based on these conclusions and other factors, the Board voted to renew the Advisory and Sub-Advisory Contracts for the Portfolio for the year ending September 30, 2015. During this renewal process, different Board members may have given different weight to different individual factors and related conclusions.
Voya Global Bond Portfolio
In considering whether to approve the renewal of the Advisory and Sub-Advisory Contracts for Voya Global Bond Portfolio, the Board considered that, based on performance data for the periods ended March 31, 2014: (1) the Portfolio outperformed its Morningstar category median for all periods presented, with the exception of the one-year and three-year periods, during which it underperformed; (2) the Portfolio outperformed its primary benchmark for all periods presented, with the exception of the one-year and three-year periods, during which it underperformed; and (3) the Portfolio is ranked in the first (highest) quintile of its Morningstar category for the five-year period, the second quintile for the most recent calendar quarter and year-to-date periods, the third quintile for the one-year period, and the fourth quintile for the three-year period.
In analyzing this performance data, the Board took into account: (1) Management’s analysis regarding the effect that security selection, currency allocation and sector allocation had on the Portfolio’s performance; (2) Management’s representations regarding the strength of the Portfolio’s performance during certain periods; (3) that the Portfolio’s portfolio management team was modified in the second quarter of 2013 and since then the Portfolio’s performance improved; and (4) that Management will continue to monitor, and the Board or its IRC would periodically review, the Portfolio’s performance.
In considering the fees payable under the Advisory and Sub-Advisory Contracts for the Portfolio, the Board took into account the factors described above and also considered: (1) the fairness of the compensation under an Advisory Contract with a breakpoint fee schedule where the asset level necessary to achieve a breakpoint discount had not yet been reached by the Portfolio; and (2) the pricing structure (including the expense ratio to be borne by shareholders) of the Portfolio, as compared to its Selected Peer Group, including that: (a) the management fee rate (inclusive of a 0.10% administration fee) for the Portfolio is below the median and the average management fees of the funds in its Selected Peer Group; and (b) the expense ratio for the Portfolio is below the median and the average expense ratios of the funds in its Selected Peer Group.
After its deliberation, the Board reached the following conclusions: (1) the Portfolio’s management fee rate is reasonable in the context of all factors considered by the Board; (2) the Portfolio’s expense ratio is reasonable in the context of all factors considered by the Board; (3) taking into account that Management will continue to monitor, and the Board or its IRC would periodically review, the Portfolio’s performance, the Portfolio’s performance is reasonable in the context of all factors considered by the Board; and (4) the sub-advisory fee rate payable by the Adviser to the Sub-Adviser is reasonable in the context of all factors considered by the Board. Based on these conclusions and other factors, the Board voted to renew the Advisory and Sub-Advisory Contracts for the Portfolio for the year ending September 30, 2015. During this renewal process, different Board members may have given different weight to different individual factors and related conclusions.
VY® American Century Small-Mid Cap Value Portfolio
In considering whether to approve the renewal of the Advisory and Sub-Advisory Contracts for VY® American Century Small-Mid Cap Value Portfolio, the Board considered that, based on performance data for the periods ended March 31, 2014: (1) the Portfolio outperformed its Morningstar category median for the
| ADVISORY CONTRACT APPROVAL DISCUSSION (Unaudited) (continued) |
three-year, five-year, and ten-year periods, but underperformed for the most recent calendar quarter, year-to-date, and one-year periods; (2) the Portfolio underperformed its primary benchmark for all periods presented, with the exception of the ten-year period, during which it outperformed; and (3) the Portfolio is ranked in the first (highest) quintile of its Morningstar category for the ten-year period, the third quintile for the most recent calendar quarter, year-to-date, three-year, and five-year periods, and the fourth quintile for the one-year period.
In analyzing this performance data, the Board took into account Management’s representations regarding the competitiveness of the Portfolio’s performance during certain periods.
In considering the fees payable under the Advisory and Sub-Advisory Contracts for the Portfolio, the Board took into account the factors described above and also considered: (1) the economies of scale benefits to the Portfolio and its shareholders from breakpoint discounts applicable to the Portfolio’s advisory fee rate, which result in lower fees at higher asset levels; and (2) the pricing structure (including the expense ratio to be borne by shareholders) of the Portfolio, as compared to its Selected Peer Group, including that: (a) the management fee rate (inclusive of a 0.10% administration fee) for the Portfolio is above the median and the average management fees of the funds in its Selected Peer Group; and (b) the expense ratio for the Portfolio is above the median and the average expense ratios of the funds in its Selected Peer Group.
In analyzing this fee data, the Board took into account: (1) Management’s representations regarding the competitiveness of the Portfolio’s management fee rate and expense ratio; and (2) Management’s discussions of fee waivers and expense limits, which lower the Portfolio’s effective management fee rate.
After its deliberation, the Board reached the following conclusions: (1) the Portfolio’s management fee rate is reasonable in the context of all factors considered by the Board; (2) the Portfolio’s expense ratio is reasonable in the context of all factors considered by the Board; (3) the Portfolio’s performance is reasonable in the context of all factors considered by the Board; and (4) the sub-advisory fee rate payable by the Adviser to the Sub-Adviser is reasonable in the context of all factors considered by the Board. Based on these conclusions and other factors, the Board voted to renew the Advisory and Sub-Advisory Contracts for the Portfolio for the year ending September 30, 2015. During this renewal process, different Board members may have given different weight to different individual factors and related conclusions.
VY® Baron Growth Portfolio
In considering whether to approve the renewal of the Advisory and Sub-Advisory Contracts for VY® Baron Growth Portfolio, the Board considered that, based on performance data for the periods ended March 31, 2014: (1) the Portfolio outperformed its Morningstar category median for the three-year, five-year, and ten-year periods, but underperformed for the most recent calendar quarter, year-to-date, and one-year periods; (2) the Portfolio outperformed its primary benchmark for the three-year, five-year, and ten-year periods, but underperformed for the most recent calendar quarter, year-to-date, and one-year periods; and (3) the Portfolio is ranked in the first (highest) quintile of its Morningstar category for the three-year and ten-year periods, the second quintile for the five-year period, and the fourth quintile for the most recent calendar quarter, year-to-date and one-year periods.
In considering the fees payable under the Advisory and Sub-Advisory Contracts for the Portfolio, the Board took into account the factors described above and also considered: (1) the economies of scale benefits to the Portfolio and its shareholders from breakpoint discounts applicable to the Portfolio’s advisory fee rate, which result in lower fees at higher asset levels; and (2) the pricing structure (including the expense ratio to be borne by shareholders) of the Portfolio, as compared to its Selected Peer Group, including that: (a) the management fee rate (inclusive of a 0.10% administration fee) for the Portfolio is above the median and the average management fees of the funds in its Selected Peer Group; and (b) the expense ratio for the Portfolio is above the median and the average expense ratios of the funds in its Selected Peer Group.
In analyzing this fee data, the Board took into account: (1) that effective January 2014, the Portfolio’s advisory fee breakpoint schedule was amended as part of the 2013 15(c) Annual Contract Review process; and (2) Management’s representations regarding the competitiveness of the Portfolio’s management fee rate and expense ratio.
After its deliberation, the Board reached the following conclusions: (1) the Portfolio’s management fee rate is reasonable in the context of all factors considered by the Board; (2) the Portfolio’s expense ratio is reasonable in the context of all factors considered by the Board; (3) the Portfolio’s performance is reasonable in the context of all factors considered by the Board; and (4) the sub-advisory fee rate payable by the Adviser to the Sub-Adviser is reasonable in the context of all factors considered by the Board. Based on these conclusions and other factors, the Board voted to renew the Advisory and Sub-Advisory Contracts for the Portfolio for the year ending
| ADVISORY CONTRACT APPROVAL DISCUSSION (Unaudited) (continued) |
September 30, 2015. During this renewal process, different Board members may have given different weight to different individual factors and related conclusions.
VY® Columbia Contrarian Core Portfolio
In considering whether to approve the renewal of the Advisory and Sub-Advisory Contracts for VY® Columbia Contrarian Core Portfolio, the Board considered that, based on performance data for the periods ended March 31, 2014: (1) the Portfolio underperformed its Morningstar category median for all periods presented, with the exception of the one-year period, during which it outperformed; (2) the Portfolio underperformed its primary benchmark for all periods presented, with the exception of the one-year period, during which it outperformed; and (3) the Portfolio is ranked in the second quintile of its Morningstar category for the one-year period, the third quintile for the five-year period, the fourth quintile for the most recent calendar quarter, year-to-date, and three-year periods, and the fifth (lowest) quintile for the ten-year period.
In analyzing this performance data, the Board took into account: (1) Management’s analysis regarding the negative effect that the Portfolio’s growth bias sector weightings and stock selection had on the Portfolio’s performance; (2) that the Portfolio’s Sub-Adviser was changed in May 2013, and therefore it was reasonable to permit additional time to assess the Portfolio’s performance; (3) Management’s confidence in the Sub-Adviser’s ability to execute the Portfolio’s investment strategy; and (4) that Management would continue to monitor, and the Board or its IRC would periodically review, the Portfolio’s performance.
In considering the fees payable under the Advisory and Sub-Advisory Contracts for the Portfolio, the Board took into account the factors described above and also considered: (1) the fairness of the compensation under an Advisory Contract with a level fee rate that does not include breakpoints; and (2) the pricing structure (including the expense ratio to be borne by shareholders) of the Portfolio, as compared to its Selected Peer Group, including that: (a) the management fee rate (inclusive of a 0.10% administration fee) for the Portfolio is above the median and the average management fees of the funds in its Selected Peer Group; and (b) the expense ratio for the Portfolio is below the median and above the average expense ratios of the funds in its Selected Peer Group.
In analyzing this fee data, the Board took into account: (1) Management’s representations regarding fee waivers and expense limitations, which lower the Portfolio’s effective management fee rate; (2) that, as directed by the Board during the 2013 annual 15(c) process, lower
expense limits were implemented for the Portfolio in January 2014; (3) that, at the Board’s direction during the 2014 annual 15(c) renewal process, advisory fee breakpoints would be implemented on behalf of the Portfolio, effective January 1, 2015; and (4) Management’s representations regarding the competitiveness of the Portfolio’s management fee.
After its deliberation, the Board reached the following conclusions: (1) the Portfolio’s management fee rate is reasonable in the context of all factors considered by the Board; (2) the Portfolio’s expense ratio is reasonable in the context of all factors considered by the Board; (3) taking into account that the Portfolio’s Sub-Adviser was changed in May 2013, it was reasonable to permit the Portfolio to establish a longer performance record for purposes of evaluating investment performance; and (4) the sub-advisory fee rate payable by the Adviser to the Sub-Adviser is reasonable in the context of all factors considered by the Board. Based on these conclusions and other factors, the Board voted to renew the Advisory and Sub-Advisory Contracts for the Portfolio for the year ending September 30, 2015. During this renewal process, different Board members may have given different weight to different individual factors and related conclusions.
VY® Columbia Small Cap Value II Portfolio
In considering whether to approve the renewal of the Advisory and Sub-Advisory Contracts for VY® Columbia Small Cap Value II Portfolio, the Board considered that, based on performance data for the periods ended March 31, 2014: (1) the Portfolio outperformed its Morningstar category median for all periods presented; (2) the Portfolio outperformed its primary benchmark for all periods presented; and (3) the Portfolio is ranked in the second quintile of its Morningstar category for the most recent calendar quarter, year-to-date, one-year, and three-year periods, and the third quintile for the five-year period.
In considering the fees payable under the Advisory and Sub-Advisory Contracts for the Portfolio, the Board took into account the factors described above and also considered: (1) the fairness of the compensation under an Advisory Contract with a level fee rate that does not include breakpoints; and (2) the pricing structure (including the expense ratio to be borne by shareholders) of the Portfolio, as compared to its Selected Peer Group, including that: (a) the management fee rate (inclusive of a 0.10% administration fee) for the Portfolio is equal to the median and above the average management fees of the funds in its Selected Peer Group; and (b) the expense ratio for the Portfolio is below the median and the average expense ratios of the funds in its Selected Peer Group.
| ADVISORY CONTRACT APPROVAL DISCUSSION (Unaudited) (continued) |
After its deliberation, the Board reached the following conclusions: (1) the Portfolio’s management fee rate is reasonable in the context of all factors considered by the Board; (2) the Portfolio’s expense ratio is reasonable in the context of all factors considered by the Board; (3) the Portfolio’s performance is reasonable in the context of all factors considered by the Board; and (4) the sub-advisory fee rate payable by the Adviser to the Sub-Adviser is reasonable in the context of all factors considered by the Board. Based on these conclusions and other factors, the Board voted to renew the Advisory and Sub-Advisory Contracts for the Portfolio for the year ending September 30, 2015. During this renewal process, different Board members may have given different weight to different individual factors and related conclusions.
VY® Invesco Comstock Portfolio
In considering whether to approve the renewal of the Advisory and Sub-Advisory Contracts for VY® Invesco Comstock Portfolio, the Board considered that, based on performance data for the periods ended March 31, 2014: (1) the Portfolio outperformed its Morningstar category median for all periods presented, with the exception of the most recent calendar quarter and year-to-date periods, during which it underperformed; (2) the Portfolio outperformed its primary benchmark for the one-year, three-year, and five-year periods, but underperformed for the most recent calendar quarter, year-to-date, and ten-year periods; and (3) the Portfolio is ranked in the first (highest) quintile of its Morningstar category for the one-year, three-year, and five-year periods, the second quintile for the ten-year period, and the fourth quintile for the most recent calendar quarter and year-to-date periods.
In considering the fees payable under the Advisory and Sub-Advisory Contracts for the Portfolio, the Board took into account the factors described above and also considered: (1) the fairness of the compensation under an Advisory Contract with a level fee rate that does not include breakpoints; and (2) the pricing structure (including the expense ratio to be borne by shareholders) of the Portfolio, as compared to its Selected Peer Group, including that: (a) the management fee rate (inclusive of a 0.10% administration fee) for the Portfolio is below the median and above the average management fees of the funds in its Selected Peer Group; and (b) the expense ratio for the Portfolio is below the median and the average expense ratios of the funds in its Selected Peer Group.
After its deliberation, the Board reached the following conclusions: (1) the Portfolio’s management fee rate is reasonable in the context of all factors considered by the Board; (2) the Portfolio’s expense ratio is reasonable in the context of all factors considered by the Board; (3) the
Portfolio’s performance is reasonable in the context of all factors considered by the Board; and (4) the sub-advisory fee rate payable by the Adviser to the Sub-Adviser is reasonable in the context of all factors considered by the Board. Based on these conclusions and other factors, the Board voted to renew the Advisory and Sub-Advisory Contracts for the Portfolio for the year ending September 30, 2015. During this renewal process, different Board members may have given different weight to different individual factors and related conclusions.
VY® Invesco Equity and Income Portfolio
In considering whether to approve the renewal of the Advisory and Sub-Advisory Contracts for VY® Invesco Equity and Income Portfolio, the Board considered that, based on performance data for the periods ended March 31, 2014: (1) the Portfolio outperformed its Morningstar category median for all periods presented, with the exception of the five-year period, during which it underperformed; (2) the Portfolio underperformed its primary benchmark for all periods presented, with the exception of the ten-year period, during which the Portfolio’s performance equaled the median; and (3) the Portfolio is ranked in the first (highest) quintile of its Morningstar category for the most recent quarter, year-to-date, three-year, and ten-year periods, the second quintile for the one-year period, and the third quintile for the five-year period.
In considering the fees payable under the Advisory and Sub-Advisory Contracts for the Portfolio, the Board took into account the factors described above and also considered: (1) the economies of scale benefits to the Portfolio and its shareholders from breakpoint discounts applicable to the Portfolio’s advisory fee rate, which result in lower fees at higher asset levels; and (2) the pricing structure (including the expense ratio to be borne by shareholders) of the Portfolio, as compared to its Selected Peer Group, including that: (a) the management fee rate (inclusive of a 0.10% administration fee) for the Portfolio is above the median and the average management fees of the funds in its Selected Peer Group; and (b) the expense ratio for the Portfolio is below the median and the average expense ratios of the funds in its Selected Peer Group.
In analyzing this fee data, the Board took into account Management’s representations regarding competitiveness of the Portfolio’s management fee.
After its deliberation, the Board reached the following conclusions: (1) the Portfolio’s management fee rate is reasonable in the context of all factors considered by the Board; (2) the Portfolio’s expense ratio is reasonable in the context of all factors considered by the Board; (3) the Portfolio’s performance is reasonable in the context of all
| ADVISORY CONTRACT APPROVAL DISCUSSION (Unaudited) (continued) |
factors considered by the Board; and (4) the sub-advisory fee rate payable by the Adviser to the Sub-Adviser is reasonable in the context of all factors considered by the Board. Based on these conclusions and other factors, the Board voted to renew the Advisory and Sub-Advisory Contracts for the Portfolio for the year ending September 30, 2015. During this renewal process, different Board members may have given different weight to different individual factors and related conclusions.
VY® JPMorgan Mid Cap Value Portfolio
In considering whether to approve the renewal of the Advisory and Sub-Advisory Contracts for VY® JPMorgan Mid Cap Value Portfolio, the Board considered that, based on performance data for the periods ended March 31, 2014: (1) the Portfolio outperformed its Morningstar category median for all periods presented, with the exception of the one-year period, during which it underperformed; (2) the Portfolio underperformed its primary benchmark for all periods presented, with the exception of the three-year period, during which it outperformed; and (3) the Portfolio is ranked in the first (highest) quintile of its Morningstar Category for the three-year and ten-year periods, the second quintile for the five-year period, the third quintile for the most recent calendar quarter and year-to-date periods, and the fourth quintile for the one-year period.
In considering the fees payable under the Advisory and Sub-Advisory Contracts for the Portfolio, the Board took into account the factors described above and also considered: (1) the economies of scale benefits to the Portfolio and its shareholders from breakpoint discounts applicable to the Portfolio’s advisory fee rate, which result in a lower fee rate at higher asset levels; and (2) the pricing structure (including the expense ratio to be borne by shareholders) of the Portfolio, as compared to its Selected Peer Group, including that: (a) the management fee rate (inclusive of a 0.10% administration fee) for the Portfolio is above the median and the average management fees of the funds in its Selected Peer Group; and (b) the expense ratio for the Portfolio is above the median and the average expense ratios of the funds in its Selected Peer Group.
In analyzing this fee data, the Board took into account that: (1) Management’s discussion regarding advisory fee breakpoints that had been put into place, which lowers the effective management fee rate payable by the Portfolio; and (2) Management’s representations regarding the competitiveness of the Portfolio’s management fee rate and expense ratio.
After its deliberation, the Board reached the following conclusions: (1) the Portfolio’s management fee rate is reasonable in the context of all factors considered by the
Board; (2) the Portfolio’s expense ratio is reasonable in the context of all factors considered by the Board; (3) the Portfolio’s performance is reasonable in the context of all factors considered by the Board; and (4) the sub-advisory fee rate payable by the Adviser to the Sub-Adviser is reasonable in the context of all factors considered by the Board. Based on these conclusions and other factors, the Board voted to renew the Advisory and Sub-Advisory Contracts for the Portfolio for the year ending September 30, 2015. During this renewal process, different Board members may have given different weight to different individual factors and related conclusions.
VY® Oppenheimer Global Portfolio
In considering whether to approve the renewal of the Advisory and Sub-Advisory Contracts for VY® Oppenheimer Global Portfolio, the Board considered that, based on performance data for the periods ended March 31, 2014: (1) the Portfolio outperformed its Morningstar category median for all periods presented, with the exception of the most recent calendar quarter and year-to-date periods, during which it underperformed; (2) the Portfolio outperformed its primary benchmark for all periods presented, with the exception of the most recent calendar quarter and year-to-date periods, during which it underperformed; and (3) the Portfolio is ranked in the first (highest) quintile of its Morningstar category for the five-year period, the second quintile for the one-year, three-year, and ten-year periods, and the fourth quintile for the most recent calendar quarter and year-to-date periods.
In considering the fees payable under the Advisory and Sub-Advisory Contracts for the Portfolio, the Board took into account the factors described above and also considered: (1) the fairness of the compensation under an Advisory Contract with a breakpoint fee schedule where the asset level necessary to achieve a breakpoint discount had not yet been reached by the Portfolio; and (2) the pricing structure (including the expense ratio to be borne by shareholders) of the Portfolio, as compared to its Selected Peer Group, including that: (a) the management fee rate (inclusive of a 0.10% administration fee) for the Portfolio is below the median and the average management fees of the funds in its Selected Peer Group; and (b) the expense ratio for the Portfolio is below the median and the average expense ratios of the funds in its Selected Peer Group.
After its deliberation, the Board reached the following conclusions: (1) the Portfolio’s management fee rate is reasonable in the context of all factors considered by the Board; (2) the Portfolio’s expense ratio is reasonable in the context of all factors considered by the Board; (3) the Portfolio’s performance is reasonable in the context of all
| ADVISORY CONTRACT APPROVAL DISCUSSION (Unaudited) (continued) |
factors considered by the Board; and (4) the sub-advisory fee rate payable by the Adviser to the Sub-Adviser is reasonable in the context of all factors considered by the Board. Based on these conclusions and other factors, the Board voted to renew the Advisory and Sub-Advisory Contracts for the Portfolio for the year ending September 30, 2015. During this renewal process, different Board members may have given different weight to different individual factors and related conclusions.
VY® Pioneer High Yield Portfolio
In considering whether to approve the renewal of the Advisory and Sub-Advisory Contracts for VY® Pioneer High Yield Portfolio, the Board considered that, based on performance data for the periods ended March 31, 2014: (1) the Portfolio outperformed its Morningstar category median for all periods presented; (2) the Portfolio underperformed its primary benchmark for the most recent calendar quarter, year-to-date, and three-year periods, but outperformed for the one-year and five-year periods; and (3) the Portfolio is ranked in the first (highest) quintile of its Morningstar category for the one-year and five-year periods, the second quintile for the most recent calendar quarter and year-to-date periods, and the third quintile for the three-year period.
In considering the fees payable under the Advisory and Sub-Advisory Contracts for the Portfolio, the Board took into account the factors described above and also considered: (1) the fairness of the compensation under an Advisory Contract with a breakpoint fee schedule where the asset level necessary to achieve a breakpoint discount had not yet been reached by the Portfolio; and (2) the pricing structure (including the expense ratio to be borne by shareholders) of the Portfolio, as compared to its Selected Peer Group, including that: (a) the management fee rate (inclusive of a 0.10% administration fee) for the Portfolio is above the median and the average management fees of the funds in its Selected Peer Group; and (b) the expense ratio for the Portfolio is below the median and the average expense ratios of the funds in its Selected Peer Group.
In analyzing this fee data, the Board took into account Management’s representations regarding the competitiveness of the Portfolio’s management fee rate.
After its deliberation, the Board reached the following conclusions: (1) the Portfolio’s management fee rate is reasonable in the context of all factors considered by the Board; (2) the Portfolio’s expense ratio is reasonable in the context of all factors considered by the Board; (3) the Portfolio’s performance is reasonable in the context of all factors considered by the Board; and (4) the sub-advisory fee rate payable by the Adviser to the Sub-Adviser is
reasonable in the context of all factors considered by the Board. Based on these conclusions and other factors, the Board voted to renew the Advisory and Sub-Advisory Contracts for the Portfolio for the year ending September 30, 2015. During this renewal process, different Board members may have given different weight to different individual factors and related conclusions.
VY® T. Rowe Price Diversified Mid Cap Growth Portfolio
In considering whether to approve the renewal of the Advisory and Sub-Advisory Contracts for VY® T. Rowe Price Diversified Mid Cap Growth Portfolio, the Board considered that, based on performance data for the periods ended March 31, 2014: (1) the Portfolio outperformed its Morningstar category median for all periods presented, with the exception of the ten-year period, during which it underperformed; (2) the Portfolio underperformed its primary benchmark for all periods presented, with the exception of the one-year period, during which it outperformed; and (3) the Portfolio is ranked in the first (highest) quintile of its Morningstar category for the five-year period, the second quintile for the most recent calendar quarter, year-to-date, and three-year periods, and the third quintile for the one-year and ten-year periods.
In considering the fees payable under the Advisory and Sub-Advisory Contracts for the Portfolio, the Board took into account the factors described above and also considered: (1) the fairness of the compensation under an Advisory Contract with a level fee rate that does not include breakpoints; and (2) the pricing structure (including the expense ratio to be borne by shareholders) of the Portfolio, as compared to its Selected Peer Group, including that: (a) the management fee rate (inclusive of a 0.10% administration fee) for the Portfolio is below the median and above the average management fees of the funds in its Selected Peer Group; and (b) the expense ratio for the Portfolio is below the median and the average expense ratios of the funds in its Selected Peer Group.
After its deliberation, the Board reached the following conclusions: (1) the Portfolio’s management fee rate is reasonable in the context of all factors considered by the Board; (2) the Portfolio’s expense ratio is reasonable in the context of all factors considered by the Board; (3) the Portfolio’s performance is reasonable in the context of all factors considered by the Board; and (4) the sub-advisory fee rate payable by the Adviser to the Sub-Adviser is reasonable in the context of all factors considered by the Board. Based on these conclusions and other factors, the Board voted to renew the Advisory and Sub-Advisory Contracts for the Portfolio for the year ending September 30, 2015. During this renewal process, different
| ADVISORY CONTRACT APPROVAL DISCUSSION (Unaudited) (continued) |
Board members may have given different weight to different individual factors and related conclusions.
VY® T. Rowe Price Growth Equity Portfolio
In considering whether to approve the renewal of the Advisory and Sub-Advisory Contracts for VY® T. Rowe Price Growth Equity Portfolio, the Board considered that, based on performance data for the periods ended March 31, 2014: (1) the Portfolio outperformed its Morningstar category median for all periods presented, with the exception of the most recent calendar quarter and year-to-date periods, during which it underperformed; (2) the Portfolio outperformed its primary benchmark for all periods presented, with the exception of the most recent calendar quarter and year-to-date periods, during which it underperformed; and (3) the Portfolio is ranked in the first (highest) quintile of its Morningstar category for the one-year, three-year, and five-year periods, the second quintile for the ten-year period, and the fifth (lowest) quintile for the most recent calendar quarter and year-to-date periods.
In considering the fees payable under the Advisory and Sub-Advisory Contracts for the Portfolio, the Board took into account the factors described above and also considered: (1) the fairness of the compensation under an Advisory Contract with a level fee rate that does not include breakpoints; and (2) the pricing structure (including the expense ratio to be borne by shareholders) of the Portfolio, as compared to its Selected Peer Group, including that: (a) the management fee rate (inclusive of a 0.10% administration fee) for the Portfolio is above the median and the average management fees of the funds in its Selected Peer Group; and (b) the expense ratio for the Portfolio is below the median and equal to the average expense ratios of the funds in its Selected Peer Group.
In analyzing this fee data, the Board took into account Management’s representations regarding the competitiveness of the Portfolio’s management fee.
After its deliberation, the Board reached the following conclusions: (1) the Portfolio’s management fee rate is reasonable in the context of all factors considered by the Board; (2) the Portfolio’s expense ratio is reasonable in the context of all factors considered by the Board; (3) the Portfolio’s performance is reasonable in the context of all factors considered by the Board; and (4) the sub-advisory fee rate payable by the Adviser to the Sub-Adviser is reasonable in the context of all factors considered by the Board. Based on these conclusions and other factors, the Board voted to renew the Advisory and Sub-Advisory Contracts for the Portfolio for the year ending September 30, 2015. During this renewal process, different Board members may have given different weight to different individual factors and related conclusions.
VY® Templeton Foreign Equity Portfolio
In considering whether to approve the renewal of the Advisory and Sub-Advisory Contracts for VY® Templeton Foreign Equity Portfolio, the Board considered that, based on performance data for the periods ended March 31, 2014: (1) the Portfolio outperformed its Morningstar category median for all periods presented; (2) the Portfolio outperformed its primary benchmark for all periods presented; and (3) the Portfolio is ranked in the second quintile of its Morningstar Category for all periods presented.
In considering the fees payable under the Advisory and Sub-Advisory Contracts for the Portfolio, the Board took into account the factors described above and also considered: (1) the economies of scale benefits to the Portfolio and its shareholders from breakpoint discounts applicable to the Portfolio’s advisory fee rate, which result in lower fees at higher asset levels; and (2) the pricing structure (including the expense ratio to be borne by shareholders) of the Portfolio, as compared to its Selected Peer Group, including that: (a) the management fee rate (inclusive of a 0.10% administration fee) for the Portfolio is above the median and the average management fees of the funds in its Selected Peer Group; and (b) the expense ratio for the Portfolio is above the median and the average expense ratios of the funds in its Selected Peer Group.
In analyzing this fee data, the Board took into account Management’s representations with respect to the competitiveness of the Portfolio’s management fee rate and expense ratio.
After its deliberation, the Board reached the following conclusions: (1) the Portfolio’s management fee rate is reasonable in the context of all factors considered by the Board; (2) the Portfolio’s expense ratio is reasonable in the context of all factors considered by the Board; (3) the Portfolio’s performance is reasonable in the context of all factors considered by the Board; and (4) the sub-advisory fee rate payable by the Adviser to the Sub-Adviser is reasonable in the context of all factors considered by the Board. Based on these conclusions and other factors, the Board voted to renew the Advisory and Sub-Advisory Contracts for the Portfolio for the year ending September 30, 2015. During this renewal process, different Board members may have given different weight to different individual factors and related conclusions.
BOARD CONSIDERATION AND APPROVAL OF NEW SUB-ADVISORY CONTRACT
At a meeting of the Board held on November 20, 2014, the Board, including a majority of the Independent Directors, determined: (1) to approve the merger (the “Reorganization”) of Voya Aggregate Bond Portfolio
| ADVISORY CONTRACT APPROVAL DISCUSSION (Unaudited) (continued) |
(formerly, VY® PIMCO Bond Portfolio) into Voya Intermediate Bond Portfolio; (2) to appoint Voya IM as the sub-adviser to the Portfolio in advance of the Reorganization; (3) to approve a new sub-advisory agreement (the “New Sub-Advisory Agreement”) with Voya IM under which Voya IM would serve as sub-adviser to the Portfolio, replacing its former sub-adviser, Pacific Investment Management Company LLC (“PIMCO”); and (4) that the appointment of Voya IM was in the best interests of the Portfolio and its shareholders and did not involve a conflict of interest from which the Adviser or Voya IM derives an inappropriate advantage.
In determining whether to approve the New Sub-Advisory Agreement with Voya IM with respect to the Portfolio, the Board received and evaluated such information as it deemed necessary for an informed determination of whether the New Sub-Advisory Agreement should be approved for the Portfolio. The materials provided to the Board to inform its consideration of whether to approve the New Sub-Advisory Agreement included the following: (1) Voya IM’s presentation before the Joint Investment Review Committee at its November 19, 2014 meeting; (2) a written presentation and related materials provided to the Board in advance of its November 20, 2014 meeting discussing: (a) the Adviser’s rationale for recommending that Voya IM be appointed as the sub-adviser to the Portfolio, including the Adviser’s views of the investment program that Voya IM would employ in managing the Portfolio’s assets and its views of recent personnel changes within PIMCO, (b) the performance of Voya IM in managing Voya Intermediate Bond Portfolio, the Voya fund into which the Portfolio would be merged if the Reorganization is approved by shareholders (with such performance being compared against a relevant benchmark index and the Morningstar US Intermediate-Term Bond Category), (c) Voya IM’s investment philosophy and the firm’s overall investment process; and (d) information on the net revenue benefits to the Adviser and its affiliates; (3) Fund Fees and Expenses Tables that show, among other things, that there would be no net expense ratio impact to the Portfolio’s shareholders from the sub-adviser change from PIMCO to Voya IM; (4) Voya IM’s responses to inquiries from K&L Gates, counsel to the Independent Directors; (5) supporting documentation, including a copy of the form of the New Sub-Advisory Agreement; (6) Management’s representations that it would defray the costs associated with the generation and mailing of the Information Statement discussing the sub-advisory arrangements under the New Sub-Advisory Agreement; (7) Management’s undertaking to lower the Portfolio’s expense limits, commencing with Voya IM’s appointment
as sub-adviser to the Portfolio, to align them with Voya Intermediate Bond Portfolio’s expense limits; and (8) other information relevant to the Board’s evaluation.
In reaching its decision to engage Voya IM as the sub-adviser to the Portfolio, the Board, including a majority of the Independent Directors, considered a number of factors including, but not limited to, the following: (1) the Adviser’s view with respect to the reputation of Voya IM in managing other funds in the Voya funds complex, including Voya Intermediate Bond Portfolio; (2) the strength and reputation of Voya IM in the industry and Voya IM’s long-term performance track record, size and reputation in the industry as compared to those of PIMCO; (3) the nature and quality of the services to be provided by Voya IM under the New Sub-Advisory Agreement; (4) the personnel, operations, financial condition, and investment management capabilities, methodologies, and resources of Voya IM and its fit among the stable of managers in the Voya funds line-up; (5) the fairness of the compensation under the New Sub-Advisory Agreement in light of the services to be provided by Voya IM; (6) the sub-advisory fee rate payable by the Adviser to Voya IM; (7) Voya IM’s operations and compliance programs, including the policies and procedures intended to assure compliance with the Federal securities laws; (8) the appropriateness of the selection of Voya IM in light of the Portfolio’s investment objective, as proposed to be amended in connection with the sub-adviser change, and investor base; and (9) Voya IM’s Code of Ethics, which had previously been approved by the Board, and related procedures for complying with that Code.
After its deliberation, the Board reached the following conclusions: (1) Voya IM should be appointed to serve as the sub-adviser to the Portfolio under the New Sub-Advisory Agreement; (2) the sub-advisory fee rate payable by the Adviser to Voya IM is reasonable in the context of all factors considered by the Board; and (3) Voya IM maintains appropriate compliance programs, with this conclusion based upon, among other things, a representation from the Portfolio’s Chief Compliance Officer that Voya IM’s compliance policies and procedures are reasonably designed to assure compliance with the Federal securities laws, which had been previously provided to the Board in connection with the Board’s oversight of other Voya funds managed by Voya IM. Based on these conclusions and other factors, the Board voted to approve the New Sub-Advisory Agreement for the Portfolio. During their deliberations, different Board members may have given different weight to different individual factors and related conclusions.
| ADVISORY CONTRACT APPROVAL DISCUSSION (Unaudited) (continued) |
APPROVAL OF INVESTMENT ADVISORY AND SUB-ADVISORY CONTRACTS IN CONNECTION WITH A CHANGE OF CONTROL EVENT
Section 15(c) of the 1940 Act, provides that, when the Portfolios enter into new investment advisory contracts with the Adviser, and the Adviser enters into new sub-advisory contracts between the Adviser and the Sub-Advisers, the Board, including a majority of the Independent Directors, must approve the new arrangements. Discussed below are certain factors that the Board considered at a meeting held on November 18, 2014 in determining whether to approve new advisory and sub-advisory arrangements for the Portfolios in connection with a Change of Control Event, as such term is defined below, pursuant to the Separation Plan.
At the November 18, 2014 meeting, the Board noted that pursuant to an agreement with the European Commission, ING Groep, N.V. (as defined above, “ING Groep”), the former parent company of the Adviser and Voya IM, is required to divest its entire interest in Voya Financial, Inc. (formerly, ING U.S., Inc.), its U.S.-based insurance, retirement services, and investment management operations, which include the Adviser and Voya IM, by the end of 2016 (as defined above, the “Separation Plan”). Voya Financial, Inc. previously was a wholly owned, indirect subsidiary of ING Groep and is a parent company of the Adviser and Voya IM.
Each of the Portfolios is subject to the 1940 Act, which provides that any investment advisory agreement, including any sub-advisory agreement, must terminate automatically upon its “assignment.” As used in the 1940 Act, the term assignment includes any transfer of a controlling block of outstanding voting securities of an adviser or the parent company of an adviser. Such a transfer is referred to herein as a “Change of Control Event.” ING Groep’s base case to achieve the Separation Plan was through an initial public offering of Voya Financial, Inc. (the “IPO”) followed by the divestment of ING Groep’s remaining ownership interest over time through one or more additional public offerings of Voya Financial, Inc. stock, or, possibly, through one or more privately negotiated sales of the stock. The Board recognized that the Separation Plan contemplated several public offerings and each may have been deemed to be a Change of Control Event, triggering the necessity for new agreements, which would require the approval of the Board. The Board concluded that approval by shareholders of the new agreements that would become effective in the event of one or more Change of Control Events would permit the Portfolios to benefit from the continuation of services by the Adviser, the Sub-Advisers, and their respective affiliates throughout the Separation Plan without the need for multiple shareholder meetings.
The Board was informed by the Adviser and its counsel that the Adviser obtained regulatory assurances from the staff of the U.S. Securities and Exchange Commission in March 2013 that they would not object to approval of future agreements by shareholders at a single shareholder meeting. Portfolio shareholders approved the future agreements in May 2013.
The IPO was completed in May 2013. ING Groep divested additional shares in Voya Financial, Inc. through four subsequent public offerings since May 2013, including a secondary common stock offering that closed on November 18, 2014 (the “November Transaction”). (In addition, concurrently with the November Transaction, Voya Financial, Inc. repurchased $175 million of its shares directly from ING Groep.) Upon the completion of the November Transaction and the concurrent direct share repurchase, ING Groep’s ownership in Voya Financial, Inc. was reduced from approximately 32.5% to approximately 19%. This was deemed to be a Change of Control Event that resulted in the termination of the Portfolios’ existing advisory and sub-advisory agreements (the “Prior Agreements”) at the close of business on November 18, 2014.
In light of the foregoing, on November 18, 2014 the Board, at an in-person meeting, approved new investment advisory and sub-advisory agreements (the “New Agreements”) for the Portfolios to replace the Prior Agreements upon termination. At that meeting, the Adviser represented that the agreements approved by the Board were not materially different from the agreements approved by shareholders of the Portfolios in 2013 and no single person or group of persons acting together was expected to gain “control” (as defined in the 1940 Act) of Voya Financial, Inc. As a result, shareholders of the Portfolios will not be asked to vote again on these new agreements with the Adviser and affiliated sub-advisers, including Voya IM.
The decision by the Board, including a majority of the Independent Directors, to approve the New Agreements was based on a determination by the Board that it would be in the best interests of the shareholders of the Portfolios for the Adviser and Sub-Advisers to continue providing investment advisory, sub-advisory, and related services for the Portfolios, without interruption, after the Change of Control Event.
Prior to its approval of the New Agreements, the Board reviewed, among other matters, the quality, extent and nature of the services currently being provided by the Adviser and Sub-Advisers under the Prior Agreements and to be provided under the New Agreements. A substantial portion of this review was conducted as part of, and in conjunction with, the Board’s annual reviews of the Prior
| ADVISORY CONTRACT APPROVAL DISCUSSION (Unaudited) (continued) |
Agreements, which were most recently approved for continuation at the in-person meeting of the Board held on September 12, 2014. During the review process that led to its approval of the Prior Agreements on September 12, 2014, the Board was informed by the Adviser that it was likely the Board would be asked in the very near future to consider approval of the New Agreements. The Board further noted that the Change of Control Event would result in the Adviser’s and Voya IM’s loss of access to certain services and resources of ING Groep, which could adversely affect their businesses and profitability.
On September 12, 2014, the Board concluded, in light of all factors it considered, including undertakings by the Adviser relating to certain follow-up actions, to renew the Prior Agreements and that the fee rates set forth in the Prior Agreements were fair and reasonable. Among other factors, the Board considered: (1) the nature, extent and quality of services provided and to be provided under the Prior Agreements; (2) the extent to which economies of scale are reflected in fee rate schedules under the Prior Agreements; (3) the existence of any “fall-out” benefits to the Adviser, Sub-Advisers, and their affiliates; (4) a comparison of fee rates, expense ratios, and investment performance to those of similar funds; and (5) the costs incurred and profits realized by the Adviser, Voya IM, and their affiliates with respect to their services to the Portfolios.
A further description of the process followed by the Board in approving the Prior Agreements on September 12, 2014, including the information reviewed, certain material factors considered and certain related conclusions reached, is set forth above under the section titled “BOARD CONSIDERATION AND APPROVAL OF INVESTMENT ADVISORY AND SUB-ADVISORY CONTRACTS.”
In connection with its approval of the New Agreements, on November 18, 2014 the Board considered its conclusions in connection with its September 12, 2014 approvals of those Prior Agreements that were in effect on that date, including the Board’s assessment of the nature, extent and quality of services being provided and, as applicable, actions taken or to be taken in certain instances to improve the relationship between the costs and the quality of services being provided. Also in connection with its November 18, 2014 approvals of the New Agreements, the Board considered a representation from the Adviser that there were no additional developments not already disclosed to the Board since September 12, 2014 that would be a material consideration to the Board in connection with its consideration of the New Agreements.
In addition, in determining whether to approve the New Agreements, the Board took into account the considerations set out below.
| 1) | The Independent Directors solicited and received ongoing advice regarding the Board’s legal duties when approving the New Agreements from K&L Gates, their independent legal counsel, which law firm has extensive experience regarding such matters. |
| 2) | The Board considered Management’s representations regarding its commitment to maintain appropriate levels of overall staffing, ongoing resources and service quality through the transactions under the Separation Plan and after the Change of Control Event. The Board noted that such services include, but are not limited to, portfolio management services, administrative services, and regulatory compliance services. In this regard, the Board considered representations by the Adviser and its affiliates that their separation from ING Groep, as contemplated by the Separation Plan, will not lead to a reduction in the quality or scope of these and other services provided by those firms to the Portfolios. The Board also considered the importance of the asset management operations to the overall success of Voya Financial, Inc., which provides a strong incentive to Voya Financial, Inc. to provide appropriate resource allocations to support those asset management operations. |
| 3) | The Board considered representations by the Adviser and its affiliates that approval of the New Agreements would be necessary for the Portfolios to continue receiving investment management services from the Adviser and Sub-Advisers following the November 18th Change of Control Event. In addition, the Board considered representations by the Adviser and its affiliates, as well as related supporting documentation, indicating that the New Agreements, including the fees payable thereunder, are substantially similar to and, in any event, are no less favorable to the Portfolios than, the terms of the corresponding Prior Agreements. |
| 4) | The Board considered representations by the Adviser and its affiliates, including senior investment management personnel, as well as related supporting documentation, indicating that: (a) the Adviser and Sub-Advisers can be expected to provide services of the same nature, extent and quality under the New Agreements as were provided under the Prior Agreements; and (b) the November 18th Change of Control Event is not expected to result in any changes to: (i) the management of the Portfolios, including the continuity of the Portfolios’ portfolio managers and other personnel responsible for the management |
| ADVISORY CONTRACT APPROVAL DISCUSSION (Unaudited) (continued) |
| | operations of the Portfolios; or (ii) the investment objective of or the principal investment strategies used to manage any of the Portfolios. |
| 5) | The Board considered actions taken by the Adviser subsequent to the September 12, 2014, approvals of the Prior Agreements with respect to certain Voya funds in response to requests made by the Board in connection with those approvals. |
| 6) | The Board considered the potential benefits to be realized by the Adviser and its affiliates as a result of the New Agreements. |
Based on the foregoing and other relevant considerations, at a meeting of the Board held on November 18, 2014, the
Board, including a majority of the Independent Directors, voted to approve the New Agreements. In this connection, the Board concluded that, in light of all factors considered, the terms of the New Agreements, including fee rates, were fair and reasonable, and the New Agreements should be approved so as to enable a continuation without interruption of the services being provided by the current service providers pursuant to the Prior Agreements. The Board noted that no one factor was determinative of its decisions which, instead, were premised upon the totality of factors considered. The Board also noted that different Board members likely placed emphasis on different factors in reaching their individual conclusions to vote in favor of the New Agreements.
Investment Adviser
Directed Services LLC
1475 Dunwoody Drive
West Chester, Pennsylvania 19380
Administrator
Voya Funds Services, LLC
7337 East Doubletree Ranch Road, Suite 100
Scottsdale, Arizona 85258
Distributor
Voya Investments Distributor, LLC
7337 East Doubletree Ranch Road, Suite 100
Scottsdale, Arizona 85258
Transfer Agent
BNY Mellon Investment Servicing (U.S.) Inc.
301 Bellevue Parkway
Wilmington, Delaware 19809
Independent Registered Public Accounting Firm
KPMG LLP
Two Financial Center
60 South Street
Boston, Massachusetts 02111
Custodian
The Bank of New York Mellon
One Wall Street
New York, New York 10286
Legal Counsel
Dechert LLP
1900 K Street, N.W.
Washington, D.C. 20006
Before investing, carefully consider the investment objectives, risks, charges and expenses of the variable universal life insurance policy or variable annuity contract and the underlying variable investment options. This and other information is contained in the prospectus for the variable universal life policy or variable annuity contract and the underlying variable investment options. Obtain these prospectuses from your agent/registered representative and read them carefully before investing.
RETIREMENT | INVESTMENTS | INSURANCE
voyainvestments.com

VPAR-VPI (1214-022015)

Annual Report
December 31, 2014
Classes ADV, S and S2
Voya Partners, Inc.
| ■ | VY® Fidelity® VIP Contrafund® Portfolio* |
| ■ | VY® Fidelity® VIP Equity-Income Portfolio* |
| ■ | VY® Fidelity® VIP Mid Cap Portfolio* |
| | | This report is submitted for general information to shareholders of the Voya mutual funds. It is not authorized for distribution to prospective shareholders unless accompanied or preceded by a prospectus which includes details regarding the funds’ investment objectives, risks, charges, expenses and other information. This information should be read carefully. | | |
* Fidelity and Contrafund are registered trademarks of FMR LLC. Used with permission.

TABLE OF CONTENTS
PROXY VOTING INFORMATION
A description of the policies and procedures that the Portfolios use to determine how to vote proxies related to portfolio securities is available: (1) without charge, upon request, by calling Shareholder Services toll-free at (800) 992-0180; (2) on the Portfolios’ website at www.voyainvestments.com; and (3) on the U.S. Securities and Exchange Commission’s (“SEC’s”) website at www.sec.gov. Information regarding how the Portfolios voted proxies related to portfolio securities during the most recent 12-month period ended June 30 is available without charge on the Portfolios’ website at www.voyainvestments.com and on the SEC’s website at www.sec.gov.
QUARTERLY PORTFOLIO HOLDINGS
The Portfolios file their complete schedule of portfolio holdings with the SEC for the first and third quarters of each fiscal year on Form N-Q. The Portfolios’ Forms N-Q are available on the SEC’s website at www.sec.gov. The Portfolios’ Forms N-Q may be reviewed and copied at the SEC’s Public Reference Room in Washington, DC, and information on the operation of the Public Reference Room may be obtained by calling (800) SEC-0330. The Portfolios’ Forms N-Q, as well as a complete portfolio of investments, are available without charge upon request from the Portfolios by calling Shareholder Services toll-free at (800) 992-0180.
[This Page Intentionally Left Blank]
PRESIDENT’S LETTER
New Year, Hopeful View
Dear Shareholder,
As 2014 came to a close, U.S. economic growth accelerated, Japan and Europe were struggling and volatility re-emerged in markets around the world. Though periods of volatility may challenge investor resolve over the course of the year, we believe resilience will prevail thanks to continued improvements in global consumer and business spending and ample global liquidity.
Resilience has been a defining characteristic of markets for some time now, as we have seen them shake off such potentially destabilizing events as Europe’s chronic economic malaise, China’s growth slowdown and Japan’s sharp and surprising return to recession. And that’s not to mention the various geopolitical hotspots — Ukraine, the Middle East and elsewhere — that have flared up from time to time. Along the way markets have been fortified by all-time high U.S. corporate earnings; renewed monetary stimulus from central banks in Japan, Europe and China; and plummeting oil prices that have provided a positive supply shock to consumers and businesses. This confluence of events has bolstered markets worldwide and has raised investor confidence that such trends can be sustained into 2015.
Despite our optimism, we — as always — advocate a well-balanced, globally diversified portfolio. We believe such an approach is the best way to potentially benefit from whatever opportunities may arise, while limiting the potential for over-exposure to as-yet-unidentified risks. Also as always, be sure to review your investment strategy and portfolio with your financial advisor to ensure they continue to reflect your goals and needs. Thoroughly discuss any potential portfolio changes with your advisor before taking action.
We appreciate your continued confidence in us, and we look forward to serving your investment needs in the future.
Sincerely,

Shaun Mathews
Executive Vice President
Voya Family of Funds
January 28, 2015
The views expressed in the President’s Letter reflect those of the President as of the date of the letter. Any such views are subject to change at any time based upon market or other conditions and the Voya mutual funds disclaim any responsibility to update such views. These views may not be relied on as investment advice and because investment decisions for a Voya mutual fund are based on numerous factors, may not be relied on as an indication of investment intent on behalf of any Voya mutual fund. Reference to specific company securities should not be construed as recommendations or investment advice.
International investing poses special risks including currency fluctuation, economic and political risks not found in investments that are solely domestic.
Market Perspective: Year Ended December 31, 2014
Global equities, in the form of the MSCI World IndexSM (the “Index”) measured in local currencies, including net reinvested dividends ended 2013 at a record high. Investor sentiment had evidently reconciled itself to the tapering of the U.S. Federal Reserve Board’s (“Fed’s”) $85 billion of monthly Treasury and mortgage-backed securities purchases. The Fed’s December 18 announcement of a reduction in purchases to $75 billion per month with more to come was taken in stride. There was still plenty to worry about however and the Index endured an early slump and wide swings late in 2014 before ending up 9.81% for the year. (The Index returned 4.94% for the one year ended December 31, 2014, measured in U.S. dollars.)
It did not take long for worries about a flagging U.S. economy to resurface. A disappointingly weak employment report on January 10 showed only 74,000 jobs created in December, the lowest in nearly three years. A cold and snowy winter was thought to be depressing hiring and other key statistics like durable goods orders and home sales.
The Index reached its low point on February 3, down almost exactly 5% in 2014. Yet it took only 18 days to erase the loss despite new political turmoil that flared in Eastern Europe as Russia annexed Crimea after the president of Ukraine was deposed.
With the improvement in the season came a pick-up in U.S. economic data. Employment reports were looking better and the unemployment rate fell below 6%. The December bulletin marked the eighth consecutive month in which more than 200,000 jobs were created. National purchasing managers’ activity indices signaled healthy expansion. While the housing market was cooling, the annualized rate of existing home sales exceeded 5 million for five straight months. Consumer confidence touched seven-year high levels. Growth in gross domestic product (“GDP”) was -2.1% (annualized) in the first quarter but bounced back to 5.0% in the third.
Yet concerns remained about the sustainability of the recovery in the U.S. and worldwide. The improving U.S. employment situation was accompanied by labor force participation rates at or near the lowest since 1978. Wage growth was sluggish near 2% annually. The Fed’s monthly Treasury and mortgage-backed securities purchases ended in October.
Outside of the U.S., growth in China was decelerating, which also weighed on global commodity supplying countries. Japan re-entered recession in the third quarter after an April rise in consumption tax. But it was the euro zone that was the most problematic. Growth almost ground to a halt in the second and third quarters. Unemployment seemed stuck at 11.5%, while deflation was perilously close. Markets became increasingly skeptical that the European Central Bank (“ECB”) could attempt U.S., UK and Japan-style quantitative easing with Germany unequivocally opposed. Oil prices had been steadily falling since late June and would halve by year-end. Increased shale oil production notwithstanding, was this also a signal that global economic activity was weaker than anyone had imagined?
Securities prices mirrored investors’ mood swings in the last few months. The Index actually reached a new peak on September 19, but by October 16 fell 8.2%. From there the Index rebounded 12% to December 5, fell 5% to December 16 then rose 4% to end the year 1.3% below its all-time high.
In U.S. fixed income markets, the Barclays Long-Term U.S. Treasury sub-index returned a remarkable 25.07% in 2014; the Barclays Short-Term U.S. Treasury sub-index just 0.09% as the Treasury yield curve flattened. The Barclays U.S. Aggregate Bond Index (“Barclays Aggregate”) added 5.97%, while the Barclays U.S. Corporate Investment Grade Bond sub-index gained 7.46%. Both outperformed the Barclays High Yield Bond — 2% Issuer Constrained Composite Index (not a part of the Barclays Aggregate), which gained only 2.46%, perhaps reflecting growing disillusionment with the risk/reward profile of high yield bonds after strong returns in recent years.
U.S. equities, represented by the S&P 500® Index including dividends, returned 13.69% in the fiscal year, about 1.5% below its all-time high. The utilities sector was the top performer, returning 28.98%; not surprisingly, the only loser was energy, which dropped 7.78% as oil prices sagged. Record operating earnings per share for S&P 500® companies in the second and third quarters were supported by low interest rates, slow wage growth and historically high share buy-back volumes. Operating margins breached 10% for the first time.
In currencies, the dollar advanced against most other currencies over the year. The dollar surged 13.60% against the euro, on the U.S.’s much better growth and interest rate increase prospects, and 13.74% against the yen, on the likelihood of further monetary easing in Japan and an announced partial re-allocation into non-yen securities for the giant Government Pension Investment Fund (“GPIF”). The dollar gained less, 6.29%, on the pound. The UK had a better growth story than the euro zone, which however is the destination for about 40% of the UK’s exports.
In international markets, the MSCI Japan® Index rose 9.48% in 2014, boosted in the case of Japan’s large exporters by the falling yen and in general by the GPIF’s announcement described above. The MSCI Europe ex UK® Index added 6.63%. The poor economic data referred to above and the lingering conflict in Ukraine dampened markets, which were spasmodically supported by the possibility of quantitative easing. The strong health care sector contributed about one third of the total. Despite superior economic results, the MSCI UK® Index was much weaker, edging up 0.50%. UK stock indices are not particularly representative of the UK economy: the largest 14 names account for half of the index and comprise mostly global banking, energy, pharmaceuticals and materials companies. As a group, they held back returns by about 1.80%.
All indices are unmanaged and investors cannot invest directly in an index. Past performance does not guarantee future results. The performance quoted represents past performance. Investment return and principal value of an investment will fluctuate, and shares, when redeemed, may be worth more or less than their original cost. The Portfolios’ performance is subject to change since the period’s end and may be lower or higher than the performance data shown. Please call (800) 262-3862 or log on to www.voyainvestments.com to obtain performance data current to the most recent month end.
Market Perspective reflects the views of Voya Investment Management’s Chief Investment Risk Officer only through the end of the period, and is subject to change based on market and other conditions.
Benchmark Descriptions
| Index | Description |
| Barclays High Yield Bond — 2% Issuer Constrained Composite Index | An unmanaged index that includes all fixed-income securities having a maximum quality rating of Ba1, a minimum amount outstanding of $150 million, and at least one year to maturity. |
| Barclays Long-Term U.S. Treasury Index | The Index includes all publicly issued, U.S. Treasury securities that have a remaining maturity of 10 or more years, are rated investment grade, and have $250 million or more of outstanding face value. |
| Barclays Short-Term U.S. Treasury Index | A market capitalization-weighted index that is composed of fixed-rate, non-convertible U.S. Treasury securities that have a remaining maturity of between one and 12 months and have $250 million or more of outstanding face value. |
| Barclays U.S. Aggregate Bond Index | An unmanaged index of publicly issued investment grade U.S. Government, mortgage-backed, asset-backed and corporate debt securities. |
| Barclays U.S. Corporate Investment Grade Bond Index | An unmanaged index consisting of publicly issued, fixed rate, nonconvertible, investment grade debt securities. |
| MSCI Europe ex UK® Index | A free float-adjusted market capitalization index that is designed to measure developed market equity performance in Europe, excluding the UK. |
| MSCI Japan® Index | A free float-adjusted market capitalization index that is designed to measure developed market equity performance in Japan. |
| MSCI UK® Index | A free float-adjusted market capitalization index that is designed to measure developed market equity performance in the UK. |
| MSCI World IndexSM | An unmanaged index that measures the performance of over 1,400 securities listed on exchanges in the U.S., Europe, Canada, Australia, New Zealand and the Far East. |
| Russell 3000® Value Index | A market capitalization-weighted index of stocks of the 3,000 largest U.S. domiciled companies that exhibit value oriented companies. |
| S&P 500® Index | An unmanaged index that measures the performance of securities of approximately 500 large-capitalization companies whose securities are traded on major U.S. stock markets. |
| S&P MidCap 400 Index | An unmanaged index that measures the performance of the mid-size company segment of the U.S. market. |
| VY® Fidelity® VIP Contrafund® Portfolio | Portfolio Managers’ Report |
VY® Fidelity® VIP Contrafund® Portfolio (the “Portfolio”) seeks long-term capital appreciation by investing all of its assets in the Service Class 2 shares of the Fidelity® VIP Contrafund® Portfolio, a series of Fidelity Variable Insurance Products Fund II, a registered open-end investment company. Please refer to Management’s Discussion of Fund Performance on page 4 of the included Fidelity® Variable Insurance Products: Contrafund® Portfolio Annual Report.

| | Average Annual Total Returns for the Periods Ended December 31, 2014 | |
| | | | 1 Year | | 5 Year | | 10 Year | | |
| | Class ADV | | 11.02% | | 13.43% | | 8.01% | | |
| | Class S | | 11.36% | | 13.72% | | 8.30% | | |
| | S&P 500® Index | | 13.69% | | 15.45% | | 7.67% | | |
| | | | | | | | | | |
Based on a $10,000 initial investment, the graph and table above illustrate the total return of VY® Fidelity® VIP Contrafund® Portfolio against the index indicated. The index is unmanaged, has no cash in its portfolio, imposes no sales charges and incurs no operating expenses. An investor cannot invest directly in the index. The Portfolio’s performance is shown without the imposition of any expenses or charges which are, or may be, imposed under your annuity contract. Total returns would have been lower if such expenses or charges were included.
The performance graph and table do not reflect the deduction of taxes that a shareholder will pay on Portfolio distributions or the redemption of Portfolio shares.
The performance shown may include the effect of fee waivers and/or expense reimbursements by the Investment Adviser and/or other service providers, which have the effect of increasing total return. Had all fees and expenses been considered, the total returns would have been lower.
The performance update illustrates performance for a variable investment option available through a variable contract. The performance shown indicates past performance and is not a projection or prediction of future results. Actual investment returns and principal value will fluctuate so that shares and/or units, at redemption, may be worth more or less than their original cost. Please call (800) 262-3862 to get performance through the most recent month end.
This report contains statements that may be “forward-looking” statements. Actual results may differ materially from those projected in the “forward-looking” statements.
The views expressed in this report reflect those of the portfolio managers, only through the end of the period as stated on the cover. The portfolio managers’ views are subject to change at any time based on market and other conditions.
| Portfolio Managers’ Report | VY® Fidelity® VIP Equity-Income Portfolio |
VY® Fidelity® VIP Equity-Income Portfolio (the “Portfolio”) seeks reasonable income and considers the potential for capital appreciation by investing all of its assets in the Service Class 2 shares of the Fidelity® VIP Equity-Income Portfolio, a series of Fidelity Variable Insurance Products Fund, a registered open-end investment company. Please refer to Management’s Discussion of Fund Performance on page 4 of the included Fidelity® Variable Insurance Products: Equity-Income Portfolio Annual Report.

| | Average Annual Total Returns for the Periods Ended December 31, 2014 | |
| | | | 1 Year | | 5 Year | | 10 Year | | |
| | Class ADV | | 8.00% | | 12.82% | | 5.40% | | |
| | Class S | | 8.23% | | 13.12% | | 5.68% | | |
| | Russell 3000® Value Index | | 12.70% | | 15.34% | | 7.26% | | |
| | | | | | | | | | |
Based on a $10,000 initial investment, the graph and table above illustrate the total return of VY® Fidelity® VIP Equity-Income Portfolio against the index indicated. The index is unmanaged, has no cash in its portfolio, imposes no sales charges and incurs no operating expenses. An investor cannot invest directly in the index. The Portfolio’s performance is shown without the imposition of any expenses or charges which are, or may be, imposed under your annuity contract. Total returns would have been lower if such expenses or charges were included.
The performance graph and table do not reflect the deduction of taxes that a shareholder will pay on Portfolio distributions or the redemption of Portfolio shares.
The performance shown may include the effect of fee waivers and/or expense reimbursements by the Investment Adviser and/or other service providers, which have the effect of increasing total return. Had all fees and expenses been considered, the total returns would have been lower.
The performance update illustrates performance for a variable investment option available through a variable contract. The performance shown indicates past performance and is not a projection or prediction of future results. Actual investment returns and principal value will fluctuate so that shares and/or units, at redemption, may be worth more or less than their original cost. Please call (800) 262-3862 to get performance through the most recent month end.
This report contains statements that may be “forward-looking” statements. Actual results may differ materially from those projected in the “forward-looking” statements.
The views expressed in this report reflect those of the portfolio managers, only through the end of the period as stated on the cover. The portfolio managers’ views are subject to change at any time based on market and other conditions.
| VY® Fidelity® VIP Mid Cap Portfolio | Portfolio Managers’ Report |
VY® Fidelity® VIP Mid Cap Portfolio (the “Portfolio”) seeks long-term growth of capital by investing all of its assets in the Service Class 2 shares of the Fidelity® VIP Mid Cap Portfolio, a series of Fidelity Variable Insurance Products Fund III, a registered open-end investment company. Please refer to Management’s Discussion of Fund Performance on page 4 of the included Fidelity® Variable Insurance Products: Mid Cap Portfolio Annual Report.

| | Average Annual Total Returns for the Periods Ended December 31, 2014 | |
| | | | 1 Year | | 5 Year | | 10 Year | | Since Inception
of Class S2
May 28, 2009 | |
| | Class ADV | | 5.44% | | 12.99% | | 8.75% | | — | | |
| | Class S | | 5.69% | | 13.24% | | 9.01% | | — | | |
| | Class S2 | | 5.54% | | 13.08% | | — | | 15.87% | | |
| | S&P MidCap 400 Index | | 9.77% | | 16.54% | | 9.71% | | 20.09% | | |
Based on a $10,000 initial investment, the graph and table above illustrate the total return of VY® Fidelity® VIP Mid Cap Portfolio against the index indicated. The index is unmanaged, has no cash in its portfolio, imposes no sales charges and incurs no operating expenses. An investor cannot invest directly in the index. The Portfolio’s performance is shown without the imposition of any expenses or charges which are, or may be, imposed under your annuity contract. Total returns would have been lower if such expenses or charges were included.
The performance graph and table do not reflect the deduction of taxes that a shareholder will pay on Portfolio distributions or the redemption of Portfolio shares.
The performance shown may include the effect of fee waivers and/or expense reimbursements by the Investment Adviser and/or other service providers, which have the effect of increasing total return. Had all fees and expenses been considered, the total returns would have been lower.
The performance update illustrates performance for a variable investment option available through a variable contract. The performance shown indicates past performance and is not a projection or prediction of future results. Actual investment returns and principal value will fluctuate so that shares and/or units, at redemption, may be worth more or less than their original cost. Please call (800) 262-3862 to get performance through the most recent month end.
This report contains statements that may be “forward-looking” statements. Actual results may differ materially from those projected in the “forward-looking” statements.
The views expressed in this report reflect those of the portfolio manager, only through the end of the period as stated on the cover. The portfolio manager’s views are subject to change at any time based on market and other conditions.
SHAREHOLDER EXPENSE EXAMPLES (Unaudited)
As a shareholder of a Portfolio, you incur two types of costs: (1) transaction costs, including redemption fees and exchange fees; and (2) ongoing costs, including management fees, distribution and/or service (12b-1) fees, and other Portfolio expenses. These Examples are intended to help you understand your ongoing costs (in dollars) of investing in a Portfolio and to compare these costs with the ongoing costs of investing in other mutual funds.
The Examples are based on an investment of $1,000 invested at the beginning of the period and held for the entire period from July 1, 2014 to December 31, 2014. The Portfolios’ expenses are shown without the imposition of any charges which are, or may be, imposed under your variable annuity contract, variable life insurance policy, qualified pension or retirement plan. Expenses would have been higher if such charges were included.
Actual Expenses
The left section of the table shown below, “Actual Portfolio Return,” provides information about actual account values and actual expenses. You may use the information in this section, together with the amount you invested, to estimate the expenses that you paid over the period. Simply divide your account value by $1,000 (for example, an $8,600 account value divided by $1,000 = 8.6), then multiply the result by the number in the first section under the heading entitled “Expenses Paid During the Period” to estimate the expenses you paid on your account during this period.
Hypothetical Example for Comparison Purposes
The right section of the table shown below, “Hypothetical (5% return before expenses),” provides information about hypothetical account values and hypothetical expenses based on a Portfolio’s actual expense ratio and an assumed rate of return of 5% per year before expenses, which is not a Portfolio’s actual return. The hypothetical account values and expenses may not be used to estimate the actual ending account balance or expenses you paid for the period. You may use this information to compare the ongoing costs of investing in a Portfolio and other mutual funds. To do so, compare this 5% hypothetical example with the 5% hypothetical examples that appear in the shareholder reports of the other mutual funds.
Please note that the expenses shown in the table are meant to highlight your ongoing costs only and do not reflect any transactional costs, such as redemption fees or exchange fees. Therefore, the hypothetical lines of the table are useful in comparing ongoing costs only, and will not help you determine the relative total costs of owning different mutual funds. In addition, if these transactional costs were included, your costs would have been higher.
| | | Actual Portfolio Return | | | Hypothetical (5% return before expenses) | |
| | | Beginning
Account
Value
July 1,
2014 | | | Ending
Account
Value
December 31,
2014 | | | Annualized
Expense
Ratio | | | Expenses Paid
During the
Period Ended
December 31,
2014* | | | Beginning
Account
Value
July 1,
2014 | | | Ending
Account
Value
December 31,
2014 | | | Annualized
Expense
Ratio | | | Expenses Paid
During the
Period Ended
December 31,
2014* | |
| VY®Fidelity® VIP Contrafund® Portfolio | | | | | | | | | | | | | |
| Class ADV | | $ | 1,000.00 | | | $ | 1,045.10 | | | | 1.43 | % | | $ | 7.37 | | | $ | 1,000.00 | | | $ | 1,018.00 | | | | 1.43 | % | | $ | 7.27 | |
| Class S | | | 1,000.00 | | | | 1,045.80 | | | | 1.18 | | | | 6.08 | | | | 1,000.00 | | | | 1,019.26 | | | | 1.18 | | | | 6.01 | |
| VY® Fidelity® VIP Equity-Income Portfolio | | | | | | | | | | | | | | | | | | | | | | |
| Class ADV | | $ | 1,000.00 | | | $ | 1,004.30 | | | | 1.34 | % | | $ | 6.77 | | | $ | 1,000.00 | | | $ | 1,018.45 | | | | 1.34 | % | | $ | 6.82 | |
| Class S | | | 1,000.00 | | | | 1,005.60 | | | | 1.09 | | | | 5.51 | | | | 1,000.00 | | | | 1,019.71 | | | | 1.09 | | | | 5.55 | |
| VY® Fidelity® VIP Mid Cap Portfolio | | | | | | | | | | | | | | | | | | | | | | | |
| Class ADV | | $ | 1,000.00 | | | $ | 1,007.20 | | | | 1.43 | % | | $ | 7.23 | | | $ | 1,000.00 | | | $ | 1,018.00 | | | | 1.43 | % | | $ | 7.27 | |
| Class S | | | 1,000.00 | | | | 1,008.60 | | | | 1.18 | | | | 5.97 | | | | 1,000.00 | | | | 1,019.26 | | | | 1.18 | | | | 6.01 | |
| Class S2 | | | 1,000.00 | | | | 1,007.80 | | | | 1.33 | | | | 6.73 | | | | 1,000.00 | | | | 1,018.50 | | | | 1.33 | | | | 6.77 | |
| * | Expenses are equal to each Portfolio’s respective annualized expense ratios, including the expenses of the master fund, multiplied by the average account value over the period, multiplied by 184/365 to reflect the most recent fiscal half-year. |
Report of Independent Registered Public Accounting Firm
The Shareholders and Board of Directors
Voya Partners, Inc.
We have audited the accompanying statements of assets and liabilities, including the portfolios of investments, of VY® Fidelity® VIP Contrafund® Portfolio, VY® Fidelity® VIP Equity-Income Portfolio, and VY® Fidelity® VIP Mid Cap Portfolio, each a series of Voya Partners, Inc., as of December 31, 2014, and the related statements of operations for the year then ended, the statements of changes in net assets for each of the years in the two-year period then ended, and the financial highlights for each of the years in the five-year period then ended. These financial statements and financial highlights are the responsibility of management. Our responsibility is to express an opinion on these financial statements and financial highlights based on our audits.
We conducted our audits in accordance with the standards of the Public Company Accounting Oversight Board (United States). Those standards require that we plan and perform the audit to obtain reasonable assurance about whether the financial statements and financial highlights are free of material misstatement. An audit includes examining, on a test basis, evidence supporting the amounts and disclosures in the financial statements. Our procedures included confirmation of securities owned as of December 31, 2014, by correspondence with custodian, transfer agent, and brokers, or by other appropriate auditing procedures when replies from brokers were not received. An audit also includes assessing the accounting principles used and significant estimates made by management, as well as evaluating the overall financial statement presentation. We believe that our audits provide a reasonable basis for our opinion.
In our opinion, the financial statements and financial highlights referred to above present fairly, in all material respects, the financial position of the aforementioned funds of Voya Partners, Inc. as of December 31, 2014, the results of their operations for the year then ended, the changes in their net assets for each of the years in the two-year period then ended, and the financial highlights for each of the years in the five-year period then ended, in conformity with U.S. generally accepted accounting principles.

Boston, Massachusetts
February 23, 2015
STATEMENTS OF ASSETS AND LIABILITIES as of December 31, 2014
| | | VY® Fidelity®
VIP Contrafund®
Portfolio | | | VY® Fidelity®
VIP Equity-Income
Portfolio | | | VY® Fidelity®
VIP Mid Cap
Portfolio | |
| ASSETS: | | | | | | | | | | | | |
| Investments in master fund at fair value*(1) | | $ | 306,908,062 | | | $ | 12,996,891 | | | $ | 40,147,409 | |
| Cash | | | 417,697 | | | | 15,398 | | | | 100,382 | |
| Receivables: | | | | | | | | | | | | |
| Investment in master fund sold | | | 1,377,611 | | | | 381,080 | | | | 222,384 | |
| Fund shares sold | | | 229 | | | | 53 | | | | 132 | |
| Prepaid expenses | | | 2,463 | | | | 104 | | | | 315 | |
| Reimbursement due from manager | | | 26,046 | | | | 2,421 | | | | 4,822 | |
| Other assets | | | 6,794 | | | | 588 | | | | 1,082 | |
| Total assets | | | 308,738,902 | | | | 13,396,535 | | | | 40,476,526 | |
| | | | | | | | | | | | | |
| LIABILITIES: | | | | | | | | | | | | |
| Payable for investments in master fund purchased | | | — | | | | — | | | | 78 | |
| Payable for fund shares redeemed | | | 1,377,840 | | | | 381,133 | | | | 222,438 | |
| Payable for investment management fees | | | 7,426 | | | | — | | | | — | |
| Payable for administrative fees | | | 26,331 | | | | 1,139 | | | | 3,426 | |
| Payable for distribution and shareholder service fees | | | 67,249 | | | | 2,905 | | | | 8,673 | |
| Payable for directors fees | | | 1,593 | | | | 70 | | | | 214 | |
| Payable to directors under the deferred compensation plan (Note 6) | | | 6,794 | | | | 588 | | | | 1,082 | |
| Other accrued expenses and liabilities | | | 102,333 | | | | 8,600 | | | | 29,397 | |
| Total liabilities | | | 1,589,566 | | | | 394,435 | | | | 265,308 | |
| NET ASSETS | | $ | 307,149,336 | | | $ | 13,002,100 | | | $ | 40,211,218 | |
| | | | | | | | | | | | | |
| NET ASSETS WERE COMPRISED OF: | | | | | | | | | | | | |
| Paid-in capital | | $ | 278,065,959 | | | $ | 25,076,706 | | | $ | 33,871,069 | |
| Undistributed net investment income | | | 7,357,262 | | | | 458,175 | | | | 467,098 | |
| Accumulated net realized loss | | | (112,805,483 | ) | | | (14,357,542 | ) | | | (1,130,504 | ) |
| Net unrealized appreciation | | | 134,531,598 | | | | 1,824,761 | | | | 7,003,555 | |
| NET ASSETS | | $ | 307,149,336 | | | $ | 13,002,100 | | | $ | 40,211,218 | |
| _______ | | | | | | | | | | | | |
| * Cost of investments in master fund at value | | $ | 172,376,464 | | | $ | 11,172,130 | | | $ | 33,143,854 | |
| | | | | | | | | | | | | |
| Class ADV | | | | | | | | | | | | |
| Net assets | | $ | 6,673,717 | | | $ | 273,131 | | | $ | 514,368 | |
| Shares authorized | | | 100,000,000 | | | | 100,000,000 | | | | 100,000,000 | |
| Par value | | $ | 0.001 | | | $ | 0.001 | | | $ | 0.001 | |
| Shares outstanding | | | 447,348 | | | | 22,314 | | | | 30,932 | |
| Net asset value and redemption price per share | | $ | 14.92 | | | $ | 12.24 | | | $ | 16.63 | |
| | | | | | | | | | | | | |
| Class S | | | | | | | | | | | | |
| Net assets | | $ | 300,475,619 | | | $ | 12,728,969 | | | $ | 39,691,874 | |
| Shares authorized | | | 100,000,000 | | | | 100,000,000 | | | | 100,000,000 | |
| Par value | | $ | 0.001 | | | $ | 0.001 | | | $ | 0.001 | |
| Shares outstanding | | | 19,980,105 | | | | 1,039,794 | | | | 2,350,898 | |
| Net asset value and redemption price per share | | $ | 15.04 | | | $ | 12.24 | | | $ | 16.88 | |
| | | | | | | | | | | | | |
| Class S2 | | | | | | | | | | | | |
| Net assets | | | n/a | | | | n/a | | | $ | 4,976 | |
| Shares authorized | | | n/a | | | | n/a | | | | 100,000,000 | |
| Par value | | | n/a | | | | n/a | | | $ | 0.001 | |
| Shares outstanding | | | n/a | | | | n/a | | | | 302 | |
| Net asset value and redemption price per share | | | n/a | | | | n/a | | | $ | 16.50 | |
| (1) | The master funds for the VY® Fidelity® VIP Contrafund®, VY® Fidelity® VIP Equity-Income and VY® Fidelity® VIP Mid Cap Portfolios are the Fidelity® VIP Contrafund®, Fidelity® VIP Equity-Income and Fidelity® VIP Mid Cap Portfolios, respectively. These financial statements should be read in conjunction with the master Fidelity funds’ financial statements. |
See Accompanying Notes to Financial Statements
STATEMENTS OF OPERATIONS For the Year ended December 31, 2014
| | | VY® Fidelity®
VIP Contrafund®
Portfolio | | | VY® Fidelity®
VIP Equity-Income
Portfolio | | | VY® Fidelity®
VIP Mid Cap
Portfolio | |
| INVESTMENT INCOME: | | | | | | | | | | | | |
| Dividends from master fund(1) | | $ | 2,203,694 | | | $ | 350,818 | | | $ | 7,610 | |
| Total investment income | | | 2,203,694 | | | | 350,818 | | | | 7,610 | |
| | | | | | | | | | | | | |
| EXPENSES: | | | | | | | | | | | | |
| Distribution and shareholder service fees: | | | | | | | | | | | | |
| Class ADV | | | 31,731 | | | | 1,300 | | | | 4,399 | |
| Class S | | | 780,590 | | | | 34,883 | | | | 104,669 | |
| Class S2 | | | — | | | | — | | | | 26 | |
| Transfer agent fees | | | 4,344 | | | | 10 | | | | 839 | |
| Administrative service fees | | | 318,580 | | | | 14,213 | | | | 42,752 | |
| Shareholder reporting expense | | | 29,755 | | | | 2,935 | | | | 10,494 | |
| Registration fees | | | 730 | | | | — | | | | 365 | |
| Professional fees | | | 77,608 | | | | 11,118 | | | | 16,354 | |
| Custody and accounting expense | | | 27,010 | | | | 445 | | | | 1,698 | |
| Directors fees | | | 9,557 | | | | 426 | | | | 1,283 | |
| Miscellaneous expense | | | 14,357 | | | | 4,330 | | | | 5,352 | |
| Total expenses | | | 1,294,262 | | | | 69,660 | | | | 188,231 | |
| Net waived and reimbursed fees | | | (320,070 | ) | | | (26,392 | ) | | | (57,394 | ) |
| Net expenses | | | 974,192 | | | | 43,268 | | | | 130,837 | |
| Net investment income (loss) | | | 1,229,502 | | | | 307,550 | | | | (123,227 | ) |
| | | | | | | | | | | | | |
| REALIZED AND UNREALIZED GAIN (LOSS): | | | | | | | | | | | | |
| Net realized gain (loss) on: | | | | | | | | | | | | |
| Investments | | | 572,383 | | | | 71,962 | | | | 96,425 | |
| Capital gain distributions from affiliated underlying funds | | | 6,135,935 | | | | 192,376 | | | | 1,022,518 | |
| Sale of investments in master fund | | | 25,156,358 | | | | 835,694 | | | | 4,993,768 | |
| Net realized gain | | | 31,864,676 | | | | 1,100,032 | | | | 6,112,711 | |
| Net change in unrealized appreciation (depreciation) on: | | | | | | | | | | | | |
| Master fund | | | 826,231 | | | | (259,623 | ) | | | (3,665,690 | ) |
| Net change in unrealized appreciation (depreciation) | | | 826,231 | | | | (259,623 | ) | | | (3,665,690 | ) |
| Net realized and unrealized gain | | | 32,690,907 | | | | 840,409 | | | | 2,447,021 | |
| Increase in net assets resulting from operations | | $ | 33,920,409 | | | $ | 1,147,959 | | | $ | 2,323,794 | |
| (1) | The master funds for the VY® Fidelity® VIP Contrafund®, VY® Fidelity® VIP Equity-Income and VY® Fidelity® VIP Mid Cap Portfolios are the Fidelity® VIP Contrafund®, Fidelity® VIP Equity-Income and Fidelity® VIP Mid Cap Portfolios, respectively. These financial statements should be read in conjunction with the master Fidelity funds’ financial statements. |
See Accompanying Notes to Financial Statements
STATEMENTS OF CHANGES IN NET ASSETS
| | | VY® Fidelity® VIP
Contrafund® Portfolio | | | VY® Fidelity® VIP
Equity-Income Portfolio | |
| | | Year Ended
December 31,
2014 | | | Year Ended
December 31,
2013 | | | Year Ended
December 31,
2014 | | | Year Ended
December 31,
2013 | |
| FROM OPERATIONS: | | | | | | | | | | | | | | | | |
| Net investment income | | $ | 1,229,502 | | | $ | 1,604,348 | | | $ | 307,550 | | | $ | 274,512 | |
| Net realized gain | | | 31,864,676 | | | | 9,528,487 | | | | 1,100,032 | | | | 4,131,544 | |
| Net change in unrealized appreciation (depreciation) | | | 826,231 | | | | 77,125,662 | | | | (259,623 | ) | | | (266,350 | ) |
| Increase in net assets resulting from operations | | | 33,920,409 | | | | 88,258,497 | | | | 1,147,959 | | | | 4,139,706 | |
| | | | | | | | | | | | | | | | | |
| FROM DISTRIBUTIONS TO SHAREHOLDERS: | | | | | | | | | | | | | | | | |
| Net investment income: | | | | | | | | | | | | | | | | |
| Class ADV | | | (24,081 | ) | | | (39,257 | ) | | | (10,601 | ) | | | (7,667 | ) |
| Class S | | | (1,674,200 | ) | | | (2,537,893 | ) | | | (589,465 | ) | | | (684,537 | ) |
| Total distributions | | | (1,698,281 | ) | | | (2,577,150 | ) | | | (600,066 | ) | | | (692,204 | ) |
| | | | | | | | | | | | | | | | | |
| FROM CAPITAL SHARE TRANSACTIONS: | | | | | | | | | | | | | | | | |
| Net proceeds from sale of shares | | | 9,267,936 | | | | 11,578,833 | | | | 901,113 | | | | 1,746,533 | |
| Reinvestment of distributions | | | 1,698,281 | | | | 2,577,150 | | | | 600,066 | | | | 692,204 | |
| | | | 10,966,217 | | | | 14,155,983 | | | | 1,501,179 | | | | 2,438,737 | |
| Cost of shares redeemed | | | (79,991,121 | ) | | | (70,453,207 | ) | | | (3,600,173 | ) | | | (8,423,884 | ) |
| Net decrease in net assets resulting from capital share transactions | | | (69,024,904 | ) | | | (56,297,224 | ) | | | (2,098,994 | ) | | | (5,985,147 | ) |
| Net increase (decrease) in net assets | | | (36,802,776 | ) | | | 29,384,123 | | | | (1,551,101 | ) | | | (2,537,645 | ) |
| | | | | | | | | | | | | | | | | |
| NET ASSETS: | | | | | | | | | | | | | | | | |
| Beginning of year or period | | | 343,952,112 | | | | 314,567,989 | | | | 14,553,201 | | | | 17,090,846 | |
| End of year or period | | $ | 307,149,336 | | | $ | 343,952,112 | | | $ | 13,002,100 | | | $ | 14,553,201 | |
| Undistributed net investment income at end of year or period | | $ | 7,357,262 | | | $ | 1,690,106 | | | $ | 458,175 | | | $ | 598,484 | |
See Accompanying Notes to Financial Statements
STATEMENTS OF CHANGES IN NET ASSETS
| | | VY® Fidelity® VIP
Mid Cap Portfolio | |
| | | Year Ended
December 31,
2014 | | | Year Ended
December 31,
2013 | |
| FROM OPERATIONS: | | | | | | | | |
| Net investment (loss) | | $ | (123,227 | ) | | $ | (18,944 | ) |
| Net realized gain | | | 6,112,711 | | | | 7,633,256 | |
| Net change in unrealized appreciation (depreciation) | | | (3,665,690 | ) | | | 5,406,391 | |
| Increase in net assets resulting from operations | | | 2,323,794 | | | | 13,020,703 | |
| | | | | | | | | |
| FROM DISTRIBUTIONS TO SHAREHOLDERS: | | | | | | | | |
| Net investment income: | | | | | | | | |
| Class ADV | | | (48,801 | ) | | | — | |
| Class S | | | (2,047,718 | ) | | | (20,382 | ) |
| Class S2 | | | (273 | ) | | | — | |
| Net realized gains: | | | | | | | | |
| Class ADV | | | (74,539 | ) | | | — | |
| Class S | | | (2,906,187 | ) | | | — | |
| Class S2 | | | (393 | ) | | | — | |
| Total distributions | | | (5,077,911 | ) | | | (20,382 | ) |
| | | | | | | | | |
| FROM CAPITAL SHARE TRANSACTIONS: | | | | | | | | |
| Net proceeds from sale of shares | | | 2,088,992 | | | | 3,277,814 | |
| Reinvestment of distributions | | | 5,077,245 | | | | 20,382 | |
| | | | 7,166,237 | | | | 3,298,196 | |
| Cost of shares redeemed | | | (10,462,728 | ) | | | (10,622,118 | ) |
| Net decrease in net assets resulting from capital share transactions | | | (3,296,491 | ) | | | (7,323,922 | ) |
| Net increase (decrease) in net assets | | | (6,050,608 | ) | | | 5,676,399 | |
| | | | | | | | | |
| NET ASSETS: | | | | | | | | |
| Beginning of year or period | | | 46,261,826 | | | | 40,585,427 | |
| End of year or period | | $ | 40,211,218 | | | $ | 46,261,826 | |
| Undistributed net investment income at end of year or period | | $ | 467,098 | | | $ | 2,094,675 | |
See Accompanying Notes to Financial Statements
Financial Highlights
Selected data for a share of beneficial interest outstanding throughout each year or period.
| | | | | | Income (loss)
from
investment
operations | | | | | | Less Distributions | | | | | | | | | | | | Ratios to average
net assets | | | Supplemental
Data | | | Ratios and
Supplemental data
including the master
fund | |
| | | Net asset value,
beginning of year
or period | | | Net
investment income
(loss) | | | Net
realized
and
unrealized gain
(loss) on
master fund | | | Total from
investment
operations | | | From net
investment
income | | | From net
realized
gains from
master fund | | | From
return
of
capital from
master fund | | | Total
distributions | | | Net
asset
value, end
of year or
period | | | Total
Return
(1) | | | Gross
expenses excluding expenses of
the master
fund(2)(3)(4) | | | Net
expenses excluding expenses of the
master
fund(2)(3)(4) | | | Net
investment income
(loss)
excluding
expenses
of the
master fund(2)(4) | | | Net
assets,
end of
year or
period | | | Portfolio turnover rate(5) | | | Expenses including
gross
expenses of the
master
fund(2)(3)(4) | | | Expenses including
expenses net of
voluntary
waivers,
if any,
of the
master
fund(2)(3)(4) | | | Expenses including
expenses
net of all
reductions of the
master
fund(2)(3)(4) | | | Portfolio turnover rate
of the
master fund | |
Year or
period ended | | ($) | | | ($) | | | ($) | | | ($) | | | ($) | | | ($) | | | ($) | | | ($) | | | ($) | | | (%) | | | (%) | | | (%) | | | (%) | | | ($000’s) | | | (%) | | | (%) | | | (%) | | | (%) | | | (%) | |
| VY® Fidelity® VIP Contrafund® Portfolio | | | | | | | | | | | | | | | | | | | | | | | | | | | | | | | | | | | | | | | | | | | | | | | | | | | | | | | | | | | | | | | | | | | | | | | | | | | | |
| Class ADV | | | | | | | | | | | | | | | | | | | | | | | | | | | | | | | | | | | | | | | | | | | | | | | | | | | | | | | | | | | | | | | | | | | | | | | | | | | | |
| 12-31-14 | | | 13.49 | | | | 0.03 | | | | 1.45 | | | | 1.48 | | | | 0.05 | | | | — | | | | — | | | | 0.05 | | | | 14.92 | | | | 11.02 | | | | 0.65 | | | | 0.55 | | | | 0.21 | | | | 6,674 | | | | 5 | | | | 1.53 | | | | 1.43 | | | | 1.43 | | | | 74 | |
| 12-31-13 | | | 10.42 | | | | 0.04 | | | | 3.11 | | | | 3.15 | | | | 0.08 | | | | — | | | | — | | | | 0.08 | | | | 13.49 | | | | 30.31 | | | | 0.65 | | | | 0.55 | | | | 0.29 | | | | 6,336 | | | | 4 | | | | 1.54 | | | | 1.43 | | | | 1.42 | | | | 86 | |
| 12-31-12 | | | 9.05 | | | | 0.07 | | | | 1.33 | | | | 1.40 | | | | 0.03 | | | | — | | | | — | | | | 0.03 | | | | 10.42 | | | | 15.46 | | | | 0.61 | | | | 0.55 | | | | 0.77 | | | | 5,451 | | | | 5 | | | | 1.50 | | | | 1.44 | | | | 1.43 | | | | 87 | |
| 12-31-11 | | | 9.42 | | | | 0.01 | | | | (0.33 | ) | | | (0.32 | ) | | | 0.05 | | | | — | | | | — | | | | 0.05 | | | | 9.05 | | | | (3.31 | ) | | | 0.55 | | | | 0.55 | | | | 0.24 | | | | 4,023 | | | | 8 | | | | 1.45 | | | | 1.44 | | | | 1.43 | | | | 135 | |
| 12-31-10 | | | 8.16 | | | | 0.03 | • | | | 1.29 | | | | 1.32 | | | | 0.06 | | | | — | | | | — | | | | 0.06 | | | | 9.42 | | | | 16.29 | | | | 0.55 | | | | 0.55 | | | | 0.40 | | | | 4,024 | | | | 5 | | | | 1.45 | | | | 1.45 | | | | 1.43 | | | | 117 | |
| Class S | | | | | | | | | | | | | | | | | | | | | | | | | | | | | | | | | | | | | | | | | | | | | | | | | | | | | | | | | | | | | | | | | | | | | | | | | | | | |
| 12-31-14 | | | 13.58 | | | | 0.06 | | | | 1.48 | | | | 1.54 | | | | 0.08 | | | | — | | | | — | | | | 0.08 | | | | 15.04 | | | | 11.36 | | | | 0.40 | | | | 0.30 | | | | 0.39 | | | | 300,476 | | | | 5 | | | | 1.28 | | | | 1.18 | | | | 1.18 | | | | 74 | |
| 12-31-13 | | | 10.49 | | | | 0.06 | • | | | 3.13 | | | | 3.19 | | | | 0.10 | | | | — | | | | — | | | | 0.1 | | | | 13.58 | | | | 30.46 | | | | 0.40 | | | | 0.30 | | | | 0.49 | | | | 337,616 | | | | 4 | | | | 1.29 | | | | 1.18 | | | | 1.17 | | | | 86 | |
| 12-31-12 | | | 9.10 | | | | 0.08 | • | | | 1.36 | | | | 1.44 | | | | 0.05 | | | | — | | | | — | | | | 0.05 | | | | 10.49 | | | | 15.82 | | | | 0.36 | | | | 0.30 | | | | 0.77 | | | | 309,112 | | | | 5 | | | | 1.25 | | | | 1.19 | | | | 1.18 | | | | 87 | |
| 12-31-11 | | | 9.47 | | | | 0.05 | | | | (0.35 | ) | | | (0.30 | ) | | | 0.07 | | | | — | | | | — | | | | 0.07 | | | | 9.10 | | | | (3.10 | ) | | | 0.30 | | | | 0.30 | | | | 0.45 | | | | 311,215 | | | | 8 | | | | 1.20 | | | | 1.19 | | | | 1.18 | | | | 135 | |
| 12-31-10 | | | 8.20 | | | | 0.06 | • | | | 1.29 | | | | 1.35 | | | | 0.08 | | | | — | | | | — | | | | 0.08 | | | | 9.47 | | | | 16.63 | | | | 0.30 | | | | 0.30 | | | | 0.73 | | | | 355,013 | | | | 5 | | | | 1.20 | | | | 1.20 | | | | 1.18 | | | | 117 | |
| VY® Fidelity® VIP Equity-Income Portfolio | | | | | | | | | | | | | | | | | | | | | | | | | | | | | | | | | | | | | | | | | | | | | | | | | | | | | | | | | | | | | | | | | | | | | | | | | | | | |
| Class ADV | | | | | | | | | | | | | | | | | | | | | | | | | | | | | | | | | | | | | | | | | | | | | | | | | | | | | | | | | | | | | | | | | | | | | | | | | | | | |
| 12-31-14 | | | 11.81 | | | | 0.27 | • | | | 0.66 | | | | 0.93 | | | | 0.50 | | | | — | | | | — | | | | 0.50 | | | | 12.24 | | | | 8.00 | | | | 0.74 | | | | 0.55 | | | | 2.20 | | | | 273 | | | | 10 | | | | 1.53 | | | | 1.34 | | | | 1.34 | | | | 40 | |
| 12-31-13 | | | 9.62 | | | | 0.20 | • | | | 2.38 | | | | 2.58 | | | | 0.39 | | | | — | | | | — | | | | 0.39 | | | | 11.81 | | | | 27.03 | | | | 0.68 | | | | 0.55 | | | | 1.81 | | | | 247 | | | | 17 | | | | 1.48 | | | | 1.34 | | | | 1.34 | | | | 32 | |
| 12-31-12 | | | 8.36 | | | | 0.10 | • | | | 1.27 | | | | 1.37 | | | | 0.11 | | | | — | | | | — | | | | 0.11 | | | | 9.62 | | | | 16.47 | | | | 0.69 | | | | 0.55 | | | | 1.08 | | | | 203 | | | | 17 | | | | 1.49 | | | | 1.35 | | | | 1.34 | | | | 48 | |
| 12-31-11 | | | 8.47 | | | | 0.16 | | | | (0.16 | ) | | | 0.00 | * | | | 0.11 | | | | — | | | | — | | | | 0.11 | | | | 8.36 | | | | 0.14 | | | | 0.55 | | | | 0.55 | | | | 1.83 | | | | 454 | | | | 20 | | | | 1.36 | | | | 1.36 | | | | 1.35 | | | | 96 | |
| 12-31-10 | | | 7.55 | | | | 0.08 | | | | 0.97 | | | | 1.05 | | | | 0.13 | | | | — | | | | — | | | | 0.13 | | | | 8.47 | | | | 14.21 | | | | 0.55 | | | | 0.55 | | | | 0.90 | | | | 473 | | | | 8 | | | | 1.36 | | | | 1.35 | | | | 1.35 | | | | 29 | |
| Class S | | | | | | | | | | | | | | | | | | | | | | | | | | | | | | | | | | | | | | | | | | | | | | | | | | | | | | | | | | | | | | | | | | | | | | | | | | | | |
| 12-31-14 | | | 11.80 | | | | 0.26 | | | | 0.70 | | | | 0.96 | | | | 0.52 | | | | — | | | | — | | | | 0.52 | | | | 12.24 | | | | 8.23 | | | | 0.49 | | | | 0.30 | | | | 2.16 | | | | 12,729 | | | | 10 | | | | 1.28 | | | | 1.09 | | | | 1.09 | | | | 40 | |
| 12-31-13 | | | 9.63 | | | | 0.17 | • | | | 2.45 | | | | 2.62 | | | | 0.45 | | | | — | | | | — | | | | 0.45 | | | | 11.80 | | | | 27.46 | | | | 0.43 | | | | 0.30 | | | | 1.59 | | | | 14,306 | | | | 17 | | | | 1.23 | | | | 1.09 | | | | 1.09 | | | | 32 | |
| 12-31-12 | | | 8.43 | | | | 0.22 | • | | | 1.18 | | | | 1.40 | | | | 0.20 | | | | — | | | | — | | | | 0.20 | | | | 9.63 | | | | 16.68 | | | | 0.44 | | | | 0.30 | | | | 2.44 | | | | 16,883 | | | | 17 | | | | 1.24 | | | | 1.10 | | | | 1.09 | | | | 48 | |
| 12-31-11 | | | 8.54 | | | | 0.14 | • | | | (0.13 | ) | | | 0.01 | | | | 0.12 | | | | — | | | | — | | | | 0.12 | | | | 8.43 | | | | 0.33 | | | | 0.30 | | | | 0.30 | | | | 1.66 | | | | 17,687 | | | | 20 | | | | 1.11 | | | | 1.11 | | | | 1.10 | | | | 96 | |
| 12-31-10 | | | 7.59 | | | | 0.08 | • | | | 1.01 | | | | 1.09 | | | | 0.14 | | | | — | | | | — | | | | 0.14 | | | | 8.54 | | | | 14.68 | | | | 0.30 | | | | 0.30 | | | | 1.02 | | | | 23,979 | | | | 8 | | | | 1.11 | | | | 1.10 | | | | 1.10 | | | | 29 | |
| VY® Fidelity® VIP Mid Cap Portfolio | | | | | | | | | | | | | | | | | | | | | | | | | | | | | | | | | | | | | | | | | | | | | | | | | | | | | | | | | | | | | | | | | | | | | | | | | | | | |
| Class ADV | | | | | | | | | | | | | | | | | | | | | | | | | | | | | | | | | | | | | | | | | | | | | | | | | | | | | | | | | | | | | | | | | | | | | | | | | | | | |
| 12-31-14 | | | 17.89 | | | | (0.09 | )• | | | 0.98 | | | | 0.89 | | | | 0.85 | | | | 1.30 | | | | — | | | | 2.15 | | | | 16.63 | | | | 5.44 | | | | 0.69 | | | | 0.55 | | | | (0.54 | ) | | | 514 | | | | 7 | | | | 1.57 | | | | 1.43 | | | | 1.43 | | | | 142 | |
| 12-31-13 | | | 13.24 | | | | (0.05 | )• | | | 4.70 | | | | 4.65 | | | | — | | | | — | | | | — | | | | — | | | | 17.89 | | | | 35.12 | | | | 0.67 | | | | 0.55 | | | | (0.33 | ) | | | 1,118 | | | | 20 | | | | 1.56 | | | | 1.44 | | | | 1.43 | | | | 132 | |
| 12-31-12 | | | 11.62 | | | | (0.04 | ) | | | 1.66 | | | | 1.62 | | | | — | | | | — | | | | — | | | | — | | | | 13.24 | | | | 13.94 | | | | 0.65 | | | | 0.55 | | | | (0.23 | ) | | | 1,609 | | | | 11 | | | | 1.55 | | | | 1.45 | | | | 1.43 | | | | 187 | |
| 12-31-11 | | | 13.10 | | | | (0.07 | )• | | | (1.41 | ) | | | (1.48 | ) | | | — | | | | — | | | | — | | | | — | | | | 11.62 | | | | (11.30 | ) | | | 0.55 | | | | 0.55 | | | | (0.54 | ) | | | 1,783 | | | | 6 | | | | 1.46 | | | | 1.46 | | | | 1.45 | | | | 84 | |
| 12-31-10 | | | 10.28 | | | | (0.04 | ) | | | 2.90 | | | | 2.86 | | | | 0.04 | | | | — | | | | — | | | | 0.04 | | | | 13.10 | | | | 27.88 | | | | 0.55 | | | | 0.55 | | | | (0.41 | ) | | | 3,453 | | | | 13 | | | | 1.46 | | | | 1.46 | | | | 1.45 | | | | 25 | |
See Accompanying Notes to Financial Statements
Financial Highlights (continued)
| | | | | | Income (loss)
from
investment
operations | | | | | | Less Distributions | | | | | | | | | | | | Ratios to average
net assets | | | Supplemental
Data | | | Ratios and
Supplemental data
including the master
fund | |
| | | Net asset
value,
beginning
of year
or period | | | Net
investment
income
(loss) | | | Net
realized
and
unrealized
gain
(loss) on
master fund | | | Total from
investment
operations | | | From net
investment
income | | | From net
realized
gains from
master fund | | | From
return
of
capital
from
master fund | | | Total
distributions | | | Net
asset
value, end
of year or
period | | | Total
Return
(1) | | | Gross
expenses
excluding
expenses of
the master
fund(2)(3)(4) | | | Net
expenses
excluding
expenses
of the
master
fund(2)(3)(4) | | | Net
investment
income
(loss)
excluding
expenses
of the
master fund(2)(4) | | | Net
assets,
end of
year or
period | | | Portfolio
turnover
rate(5) | | | Expenses
including
gross
expenses
of the
master
fund(2)(3)(4) | | | Expenses
including
expenses
net of
voluntary
waivers,
if any,
of the
master
fund(2)(3)(4) | | | Expenses
including
expenses
net of all
reductions
of the
master
fund(2)(3)(4) | | | Portfolio
turnover rate
of the
master fund | |
Year or
period ended | | ($) | | | ($) | | | ($) | | | ($) | | | ($) | | | ($) | | | ($) | | | ($) | | | ($) | | | (%) | | | (%) | | | (%) | | | (%) | | | ($000’s) | | | (%) | | | (%) | | | (%) | | | (%) | | | (%) | |
| VY® Fidelity® VIP Mid Cap Portfolio (continued) | | | | | | | | | | | | | | | | | | | | | | | | | | | | | | | | | | | | | | | | | | | | | | | | | | | | | | | | | | | | | | | | | | | | | | | | | | | | |
| Class S | | | | | | | | | | | | | | | | | | | | | | | | | | | | | | | | | | | | | | | | | | | | | | | | | | | | | | | | | | | | | | | | | | | | | | | | | | | | |
| 12-31-14 | | | 18.15 | | | | (0.05 | )• | | | 1.00 | | | | 0.95 | | | | 0.92 | | | | 1.30 | | | | — | | | | 2.22 | | | | 16.88 | | | | 5.69 | | | | 0.44 | | | | 0.30 | | | | (0.28 | ) | | | 39,692 | | | | 7 | | | | 1.32 | | | | 1.18 | | | | 1.18 | | | | 142 | |
| 12-31-13 | | | 13.41 | | | | (0.01 | ) | | | 4.76 | | | | 4.75 | | | | 0.01 | | | | — | | | | — | | | | 0.01 | | | | 18.15 | | | | 35.41 | | | | 0.42 | | | | 0.30 | | | | (0.04 | ) | | | 45,139 | | | | 20 | | | | 1.31 | | | | 1.19 | | | | 1.18 | | | | 132 | |
| 12-31-12 | | | 11.74 | | | | 0.00 | * | | | 1.67 | | | | 1.67 | | | | — | | | | — | | | | — | | | | — | | | | 13.41 | | | | 14.22 | | | | 0.40 | | | | 0.30 | | | | 0.03 | | | | 38,972 | | | | 11 | | | | 1.30 | | | | 1.20 | | | | 1.18 | | | | 187 | |
| 12-31-11 | | | 13.23 | | | | (0.04 | ) | | | (1.43 | ) | | | (1.47 | ) | | | 0.02 | | | | — | | | | — | | | | 0.02 | | | | 11.74 | | | | (11.11 | ) | | | 0.30 | | | | 0.30 | | | | (0.28 | ) | | | 49,159 | | | | 6 | | | | 1.21 | | | | 1.21 | | | | 1.20 | | | | 84 | |
| 12-31-10 | | | 10.38 | | | | (0.02 | ) | | | 2.93 | | | | 2.91 | | | | 0.06 | | | | — | | | | — | | | | 0.06 | | | | 13.23 | | | | 28.16 | | | | 0.30 | | | | 0.30 | | | | (0.18 | ) | | | 72,007 | | | | 13 | | | | 1.21 | | | | 1.21 | | | | 1.20 | | | | 25 | |
| Class S2 | | | | | | | | | | | | | | | | | | | | | | | | | | | | | | | | | | | | | | | | | | | | | | | | | | | | | | | | | | | | | | | | | | | | | | | | | | | | |
| 12-31-14 | | | 17.80 | | | | (0.07 | )• | | | 0.97 | | | | 0.90 | | | | 0.90 | | | | 1.30 | | | | — | | | | 2.20 | | | | 16.50 | | | | 5.54 | | | | 0.69 | | | | 0.45 | | | | (0.42 | ) | | | 5 | | | | 7 | | | | 1.57 | | | | 1.33 | | | | 1.33 | | | | 142 | |
| 12-31-13 | | | 13.16 | | | | (0.03 | ) | | | 4.67 | | | | 4.64 | | | | — | | | | — | | | | — | | | | — | | | | 17.80 | | | | 35.26 | | | | 0.67 | | | | 0.45 | | | | (0.17 | ) | | | 5 | | | | 20 | | | | 1.56 | | | | 1.34 | | | | 1.33 | | | | 132 | |
| 12-31-12 | | | 11.55 | | | | (0.01 | ) | | | 1.62 | | | | 1.61 | | | | — | | | | — | | | | — | | | | — | | | | 13.16 | | | | 13.94 | | | | 0.65 | | | | 0.45 | | | | (0.05 | ) | | | 4 | | | | 11 | | | | 1.55 | | | | 1.35 | | | | 1.33 | | | | 187 | |
| 12-31-11 | | | 13.02 | | | | (0.05 | ) | | | (1.41 | ) | | | (1.46 | ) | | | 0.01 | | | | — | | | | — | | | | 0.01 | | | | 11.55 | | | | (11.19 | ) | | | 0.55 | | | | 0.45 | | | | (0.43 | ) | | | 3 | | | | 6 | | | | 1.46 | | | | 1.36 | | | | 1.35 | | | | 84 | |
| 12-31-10 | | | 10.23 | | | | (0.04 | ) | | | 2.89 | | | | 2.85 | | | | 0.06 | | | | — | | | | — | | | | 0.06 | | | | 13.02 | | | | 28.02 | | | | 0.55 | | | | 0.45 | | | | (0.33 | ) | | | 4 | | | | 13 | | | | 1.46 | | | | 1.36 | | | | 1.35 | | | | 25 | |
| (1) | Total return is calculated assuming reinvestment of all dividends, capital gain distributions and return of capital distributions, if any, at net asset value and does not reflect the effect of insurance contract charges. Total return for periods less than one year is not annualized. |
| (2) | Annualized for periods less than one year. |
| (3) | Expense ratios do not include fees and expenses charged under the variable annuity contract or variable life insurance policy. |
| (4) | Expense ratios reflect operating expenses of a Portfolio. Expenses before reductions/additions do not reflect amounts reimbursed by the Investment Adviser and/or Distributor or reductions from brokerage commission recapture arrangements or other expense offset arrangements and do not represent the amount paid by a Portfolio during periods when reimbursements or reductions occur. Expenses net of fee waivers reflect expenses after reimbursement by the Investment Adviser and/or Distributor but prior to reductions from brokerage commission recapture arrangements or other expense offset arrangements. Expenses net of all reductions/additions represent the net expenses paid by a Portfolio. Net investment income (loss) is net of all such additions or reductions. |
| (5) | Portfolio turnover rate is calculated based on the Portfolio’s purchases or sales of the master fund. |
| • | Calculated using average number of shares outstanding throughout the period. |
| * | Amount is less than $0.005 or 0.005% or more than $(0.005) or (0.005)%. |
See Accompanying Notes to Financial Statements
NOTES TO FINANCIAL STATEMENTS as of December 31, 2014
NOTE 1 — ORGANIZATION
Voya Partners, Inc. (the “Company”) is an open-end management investment company registered under the Investment Company Act of 1940, as amended (the “1940 Act”). It was incorporated under the laws of Maryland on May 7, 1997. The Articles of Incorporation permit the Company to offer separate series, each of which has its own investment objective, policies and restrictions. The Company serves as investment options in underlying variable insurance products offered by Directed Services LLC. The Company currently consists of forty-two active separate investment series. The three series (each, a “Portfolio” and collectively, the “Portfolios”) included in this report are: VY® Fidelity® VIP Contrafund® Portfolio* (“VY® Fidelity® VIP Contrafund®”); VY® Fidelity® VIP Equity-Income Portfolio (“VY® Fidelity® VIP Equity-Income”) and VY® Fidelity® VIP Mid Cap Portfolio (“VY® Fidelity® VIP Mid Cap”), each a diversified series of the Company.
Each Portfolio in this report operates as a “feeder fund” and seeks to achieve its investment objective by investing all its investable assets in a separate mutual fund (“Master Fund”). Each Master Fund is a registered open-end management investment company that has the same investment objective and substantially similar policies as each corresponding Portfolio. The investment objective of the Portfolios is described in the Portfolios’ Prospectus.
As of December 31, 2014, VY® Fidelity® VIP Contrafund®, VY® Fidelity® VIP Equity-Income, and VY® Fidelity® VIP Mid Cap each held 1.56%, 0.21% and 0.44% of their respective Master Fund. Each Master Fund directly acquires securities and a Portfolio investing in the Master Fund acquires an indirect interest in those securities.
Each Portfolio offers at least two of the following classes of shares: Adviser Class (“Class ADV”), Service Class (“Class S”), and Service 2 Class (“Class S2”). Each share class represents interests in the same portfolio of investments of the particular Portfolio, and shall be identical in all respects, except for the impact of expenses, voting, exchange privileges, and any different shareholder services relating to a class of shares. Shares of the Portfolios may be offered to separate accounts (“Separate Accounts”) of insurance companies as investment options in connection with variable annuity contracts and variable life insurance policies (“Variable Contracts”) and to certain of the Portfolios’ investment advisers and their affiliates. In the future, shares may also be offered to qualified pension and retirement plans (“Qualified Plans”) outside the Separate Account context. Shares of the Portfolios are not currently offered directly to Qualified Plans or custodial accounts.
Directed Services LLC (“DSL” or the “Investment Adviser”), a Delaware limited liability company, serves as the Investment Adviser to the Portfolios. Voya Funds Services, LLC (“VFS” or the “Administrator”), a Delaware limited liability company, serves as the Administrator to the Portfolios. Voya Investments Distributor, LLC (“VID” or the “Distributor”), a Delaware limited liability company, serves as the principal underwriter to the Portfolios.
NOTE 2 — SIGNIFICANT ACCOUNTING POLICIES
The following significant accounting policies are consistently followed by the Portfolios in the preparation of their financial statements. Each Portfolio is considered an investment company under U.S. generally accepted accounting principles (“GAAP”) and follows the accounting and reporting guidance applicable to investment companies.
A. Security Valuation. U.S. GAAP defines fair value as the price the Portfolios would receive to sell an asset or pay to transfer a liability in an orderly transaction between market participants at the measurement date. The valuation of each Portfolio’s investment in its corresponding Master Fund is based on the net asset value (“NAV”) of that Master Fund each business day. Valuation of the investments by the Master Funds is discussed in the Master Funds’ notes to their financial statements, which accompany this report.
Each investment asset or liability of the Portfolios is assigned a level at measurement date based on the significance and source of the inputs to its valuation. Quoted prices in active markets for identical securities are classified as “Level 1,” inputs other than quoted prices for an asset or liability that are observable are classified as “Level 2” and unobservable inputs, including the Investment Adviser’s judgment about the assumptions that a market participant would use in pricing an asset or liability are classified as “Level 3.” The inputs used for valuing securities are not necessarily an indication of the risks associated with investing in those securities. Securities valued at amortized cost are generally considered to be Level 2 securities under applicable accounting rules. A table summarizing the Portfolios’ investments under these levels of classification is included following the Portfolios of Investments.
The Portfolios’ Board of Directors (“Board”) has adopted methods for valuing securities and other assets in circumstances where market quotes are not readily available, and has delegated the responsibility for applying the valuation methods to the “Pricing Committee” as established by the Portfolios’ Administrator. The Pricing
| * | Fidelity and Contrafund are registered trademarks of FMR LLC.
Used with permission. |
NOTES TO FINANCIAL STATEMENTS as of December 31, 2014 (continued)
NOTE 2 — SIGNIFICANT ACCOUNTING POLICIES (continued)
Committee considers all facts it deems relevant that are reasonably available, through either public information or information available to the Investment Adviser, when determining the fair value of the security. In the event that a security or asset cannot be valued pursuant to one of the valuation methods established by the Board, the fair value of the security or asset will be determined in good faith by the Pricing Committee. When a Portfolio uses these fair valuation methods that use significant unobservable inputs to determine its NAV, securities will be priced by a method that the Pricing Committee believes accurately reflects fair value and are categorized as Level 3 of the fair value hierarchy. The methodologies used for valuing securities are not necessarily an indication of the risks of investing in those securities valued in good faith at fair value nor can it be assured a Portfolio can obtain the fair value assigned to a security if it were to sell the security.
To assess the continuing appropriateness of security valuations, the Pricing Committee may compare prior day prices, prices on comparable securities, and traded prices to the prior or current day prices and the Pricing Committee challenges those prices exceeding certain tolerance levels with the independent pricing service or broker source. For those securities valued in good faith at fair value, the Pricing Committee reviews and affirms the reasonableness of the valuation on a regular basis after considering all relevant information that is reasonably available.
For fair valuations using significant unobservable inputs, U.S. GAAP requires a reconciliation of the beginning to ending balances for reported fair values that presents changes attributable to total realized and unrealized gains or losses, purchases and sales, and transfers in or out of the Level 3 category during the period. The beginning of period timing recognition is used for the transfers between Levels of the Portfolio’s assets and liabilities. A reconciliation of Level 3 investments is presented only when the Portfolio has a significant amount of Level 3 investments.
For the year ended December 31, 2014, there have been no significant changes to the fair valuation methodologies.
B. Security Transactions and Revenue Recognition. Security transactions are accounted for on the trade date. Dividend income received from the funds is recognized on the ex-dividend date and is recorded as income distributions in the Statements of Operations. Capital gain distributions received from the funds are recognized on the ex-dividend date and are recorded on the Statements of Operations as such. Costs used in determining realized gains and losses on the sales of investment securities are on the basis of specific identification.
C. Distributions to Shareholders. The Portfolios record distributions to their shareholders on the ex-dividend date. Each Portfolio declares and pays dividends and capital gains, if any, annually. The Portfolios may make distributions on a more frequent basis to comply with the distribution requirements of the Internal Revenue Code. The characteristics of income and gains to be distributed are determined in accordance with income tax regulations, which may differ from U.S. GAAP for investment companies.
D. Federal Income Taxes. It is the policy of each Portfolio to comply with the requirements of subchapter M of the Internal Revenue Code that are applicable to regulated investment companies and to distribute substantially all of its net investment income and any net realized capital gains to its shareholders. Therefore, a federal income tax or excise tax provision is not required. Management has considered the sustainability of the Portfolios’ tax positions taken on federal income tax returns for all open tax years in making this determination. No capital gain distributions shall be made until the capital loss carryforwards have been fully utilized or expire.
E. Use of Estimates. The preparation of financial statements in conformity with U.S. GAAP requires management to make estimates and assumptions that affect the reported amounts of assets and liabilities and disclosure of contingent assets and liabilities at the date of the financial statements and the reported amounts of increases and decreases in net assets from operations during the reporting period. Actual results could differ from those estimates.
F. Indemnifications. In the normal course of business, the Company may enter into contracts that provide certain indemnifications. The Company’s maximum exposure under these arrangements is dependent on future claims that may be made against the Portfolios and, therefore, cannot be estimated; however, based on experience, management considers the risk of loss from such claims remote.
NOTE 3 — INVESTMENTS IN MASTER FUNDS
For the year ended December 31, 2014, the cost of purchases and proceeds from sales of the Master Funds were as follows:
| | | Purchases | | | Sales | |
| VY® Fidelity® VIP Contrafund® | | $ | 15,679,819 | | | $ | 85,338,607 | |
| VY® Fidelity® VIP Equity-Income | | | 1,414,903 | | | | 3,814,032 | |
| VY® Fidelity® VIP Mid Cap | | | 3,016,889 | | | | 11,555,548 | |
NOTES TO FINANCIAL STATEMENTS as of December 31, 2014 (continued)
NOTE 4 — INVESTMENT MANAGEMENT, ADMINISTRATIVE FEES, AND MASTER FUNDS EXPENSES
Fidelity Management & Research Company (“FMR”) serves as investment adviser to each Master Fund. FMR has day-to-day responsibility for choosing investments for each Master Fund. As shareholders of the Master Funds, the Portfolios indirectly pay a portion of the master-level management fee(1).
Each Master Fund, VIP Contrafund® Portfolio, VIP Equity-Income Portfolio and VIP Mid Cap Portfolio, pays FMR a management fee for advisory services at annual rates of 0.55%, 0.45% and 0.55%, of each respective Master Fund’s current average daily net assets. Pursuant to its Investment Management Agreement with the Company, if the respective Portfolio does not invest substantially all of its assets in another investment company, DSL may charge an annual advisory fee at annual rates equal to 0.58%, 0.48% and 0.58% of average daily net assets for VY® Fidelity® VIP Contrafund®, VY® Fidelity® VIP Equity-Income and VY® Fidelity® VIP Mid Cap, respectively. If a Portfolio invests substantially all of its assets in another investment company, DSL does not charge an advisory fee. Each Portfolio anticipates investing substantially all of its assets in another investment company.
The Administrator provides certain administrative and shareholder services necessary for each Portfolio’s operations and is responsible for the supervision of other service providers. For its services, the Administrator is entitled to receive from each Portfolio a fee at an annual rate of 0.10% of each Portfolio’s average daily net assets.
For the year ended December 31, 2014, each Portfolio invested substantially all of its assets in its respective Master Fund.
NOTE 5 — DISTRIBUTION AND SERVICE FEES
The Portfolios have a Shareholder Servicing Plan (“Service Plan”) for the Class ADV, Class S, and Class S2 shares of each respective Portfolio. Under the Service Plan, a Portfolio pays the Distributor a fee calculated at an annual rate of 0.25% of a Portfolio’s average daily net assets attributable to its Class ADV, Class S, and Class S2 shares.
The Portfolios have a plan of distribution pursuant to Rule 12b-1 under the 1940 Act (“Distribution Plan”) for the Class ADV and Class S2 shares of each respective Portfolio. The Distribution Plan provides for a distribution fee, payable to
the Distributor at an annual rate not to exceed 0.25% of a Portfolio’s average daily net assets attributable to its Class ADV and Class S2 shares. The Distributor has contractually agreed to waive a portion of each distribution fee equal to 0.10% of a Portfolio’s average daily net assets attributable to the distribution fee paid by Class S2 shares, so that the actual fee paid is an annual rate of 0.15%. Termination or modification of this obligation requires approval by the Board.
Fidelity Distributors Corporation (“FDC”) distributes Service Class 2 shares of each Master Fund. Service Class 2 of each Master Fund currently pays FDC a 12b-1 (service) fee at an annual rate of 0.25% of its average net assets throughout the month. Shareholders of Class ADV, Class S, and Class S2 shares of each respective Portfolio pay only their proportionate share of the Master Fund 12b-1 plan expenses.
NOTE 6 — OTHER TRANSACTIONS WITH AFFILIATES AND RELATED PARTIES
At December 31, 2014, the following direct or indirect, wholly-owned subsidiary of Voya Financial, Inc. owned more than 5% of the following Portfolios:
| Subsidiary | | Portfolio | | Percentage | |
| Voya Retirement | | VY® Fidelity® VIP Contrafund® | | | 99.34 | % |
| Insurance and Annuity | | VY® Fidelity® VIP Equity-Income | | | 96.82 | |
| Company | | VY® Fidelity® VIP Mid Cap | | | 98.82 | |
Control is defined by the 1940 Act as the beneficial ownership, either directly or through one or more controlled companies, of more than 25% of the voting securities of a company. The 1940 Act defines affiliates as companies that are under common control. Therefore, if certain Portfolios have a common owner that owns over 25% of the outstanding securities of the Portfolios, they may be deemed to be affiliates of each other. Investment activities of these shareholders could have a material impact on the Portfolios.
The Portfolios have adopted a Deferred Compensation Plan (the “Plan”), which allows eligible non-affiliated directors, as described in the Plan, to defer the receipt of all or a portion of the directors’ fees that they are entitled to receive from the Portfolios. For purposes of determining the amount owed to the director under the Plan, the amounts deferred are invested in shares of the funds selected by the director (the “Notional Funds”). The Portfolios purchase shares of the Notional Funds, which are all advised by Voya Investments, in amounts equal to the directors’ deferred fees, resulting in a Portfolio asset
| (1) | Investors in the Portfolios should recognize that an investment in the Portfolios bears not only a proportionate share of the expenses of the Portfolios (including operating costs and management fees, if any), but also indirectly similar expenses of the Master Funds in which each Portfolio invests. Investors also bear their proportionate share of any sales charges incurred by the Portfolios related to the purchase of shares of the mutual fund investments. |
NOTES TO FINANCIAL STATEMENTS as of December 31, 2014 (continued)
NOTE 6 — OTHER TRANSACTIONS WITH AFFILIATES AND RELATED PARTIES (continued)
equal to the deferred compensation liability. Such assets are included as a component of “Other assets” on the accompanying Statement of Assets and Liabilities. Deferral of directors’ fees under the Plan will not affect net assets of the Portfolio, and will not materially affect the Portfolios’ assets, liabilities or net investment income per share. Amounts will be deferred until distributed in accordance with the Plan.
NOTE 7 — OTHER ACCRUED EXPENSES AND LIABILITIES
At December 31, 2014, the following Portfolio had the below payable included in Other Accrued Expenses and Liabilities on the Statements of Assets and Liabilities that exceeded 5% of total liabilities:
| Portfolio | | Accrued Expense | | Amount | |
| VY® Fidelity® VIP Mid Cap | | Shareholder Reporting | | $ | 14,051 | |
NOTE 8 — EXPENSE LIMITATION AGREEMENT
The Investment Adviser has entered into a written expense limitation agreement (“Expense Limitation Agreement”) with each Portfolio whereby the Investment Adviser has agreed to limit expenses for each Portfolio, excluding interest, taxes, brokerage commissions, Master Fund Fees and Expenses, and extraordinary expenses to 0.55%, 0.30% and 0.45% for Class ADV, Class S and Class S2, respectively.
The Investment Adviser may at a later date recoup from a Portfolio for management fees waived and other expenses assumed by the Investment Adviser during the previous 36 months, but only if, after such recoupment, a Portfolio’s expense ratio does not exceed the percentage described above. Waived and reimbursed fees and any recoupment by the Investment Adviser of such waived and reimbursed fees are reflected on the accompanying Statements of Operations. Amounts payable by the Investment Adviser are reflected on the accompanying Statements of Assets and Liabilities.
As of December 31, 2014, the amounts of waived and reimbursed fees subject to possible recoupment by the Investment Adviser, and the related expiration dates are as follows:
| | | December 31, | | | | |
| | | 2015 | | | 2016 | | | 2017 | | | Total | |
| VY® Fidelity® VIP Contrafund® | | $ | 200,502 | | | $ | 316,955 | | | $ | 320,070 | | | $ | 837,527 | |
| VY® Fidelity® VIP Equity-Income | | | 25,407 | | | | 22,012 | | | | 26,392 | | | | 73,811 | |
| VY® Fidelity® VIP Mid Cap | | | 47,670 | | | | 53,428 | | | | 57,390 | | | | 158,488 | |
The expense limitation agreement is contractual through May, 1 2015 and shall renew automatically for one-year terms. Termination or modification of this obligation requires approval by the Board.
NOTE 9 — CAPITAL SHARES
Transactions in capital shares and dollars were as follows:
| | | Shares
sold | | | Shares
issued in
merger | | | Reinvestment
of
distributions | | | Shares
redeemed | | | Net increase
(decrease)
in shares
outstanding | | | Shares
sold | | | Proceeds
from
shares
issued in
merger | | | Reinvestment
of
distributions | | | Shares
redeemed | | | Net
increase
(decrease) | |
Year or
period ended | | # | | | # | | | # | | | # | | | # | | | ($) | | | ($) | | | ($) | | | ($) | | | ($) | |
| VY® Fidelity® VIP Contrafund® |
| Class ADV |
| 12/31/2014 | | | 124,454 | | | | — | | | | 1,713 | | | | (148,588 | ) | | | (22,421 | ) | | | 1,726,506 | | | | — | | | | 24,081 | | | | (2,074,739 | ) | | | (324,152 | ) |
| 12/31/2013 | | | 211,378 | | | | — | | | | 3,213 | | | | (267,770 | ) | | | (53,179 | ) | | | 2,486,799 | | | | — | | | | 39,257 | | | | (3,080,791 | ) | | | (554,735 | ) |
| Class S |
| 12/31/2014 | | | 534,851 | | | | — | | | | 118,234 | | | | (5,525,929 | ) | | | (4,872,844 | ) | | | 7,541,430 | | | | — | | | | 1,674,200 | | | | (77,916,382 | ) | | | (68,700,752 | ) |
| 12/31/2013 | | | 780,561 | | | | — | | | | 206,333 | | | | (5,611,702 | ) | | | (4,624,808 | ) | | | 9,092,034 | | | | — | | | | 2,537,893 | | | | (67,367,347 | ) | | | (55,737,420 | ) |
| Class S2(1) |
| 12/31/2014 | | | — | | | | — | | | | — | | | | — | | | | — | | | | — | | | | — | | | | — | | | | — | | | | — | |
| 12/31/2013 | | | — | | | | — | | | | — | | | | (448 | ) | | | (448 | ) | | | — | | | | — | | | | — | | | | (5,069 | ) | | | (5,069 | ) |
| VY® Fidelity® VIP Equity-Income |
| Class ADV |
| 12/31/2014 | | | 873 | | | | — | | | | 886 | | | | (334 | ) | | | 1,425 | | | | 10,526 | | | | — | | | | 10,601 | | | | (4,108 | ) | | | 17,019 | |
| 12/31/2013 | | | 1,326 | | | | — | | | | 686 | | | | (2,224 | ) | | | (212 | ) | | | 14,285 | | | | — | | | | 7,667 | | | | (23,437 | ) | | | (1,485 | ) |
NOTES TO FINANCIAL STATEMENTS as of December 31, 2014 (continued)
NOTE 9 — CAPITAL SHARES (continued)
| | | Shares
sold | | | Shares
issued in
merger | | | Reinvestment
of
distributions | | | Shares
redeemed | | | Net increase
(decrease)
in shares
outstanding | | | Shares
sold | | | Proceeds
from
shares
issued in
merger | | | Reinvestment
of
distributions | | | Shares
redeemed | | | Net
increase
(decrease) | |
Year or
period ended | | # | | | # | | | # | | | # | | | # | | | ($) | | | ($) | | | ($) | | | ($) | | | ($) | |
| VY® Fidelity® VIP Equity-Income (continued) |
| Class S |
| 12/31/2014 | | | 73,964 | | | | — | | | | 49,327 | | | | (295,821 | ) | | | (172,530 | ) | | | 890,587 | | | | — | | | | 589,465 | | | | (3,596,065 | ) | | | (2,116,013 | ) |
| 12/31/2013 | | | 157,985 | | | | — | | | | 61,448 | | | | (760,157 | ) | | | (540,724 | ) | | | 1,732,248 | | | | — | | | | 684,537 | | | | (8,395,278 | ) | | | (5,978,493 | ) |
| Class S2(1) | | | | | | | | | | | | | | | | | | | | | | | | | | | | |
| 12/31/2014 | | | — | | | | — | | | | — | | | | — | | | | — | | | | — | | | | — | | | | — | | | | — | | | | — | |
| 12/31/2013 | | | — | | | | — | | | | — | | | | (483 | ) | | | (483 | ) | | | — | | | | — | | | | — | | | | (5,169 | ) | | | (5,169 | ) |
| VY® Fidelity® VIP Mid Cap | | | | | | | | | | | | | | | | |
| Class ADV | | | | | | | | | | | | | | | | | | | | | | | | | | | | |
| 12/31/2014 | | | 8,353 | | | | — | | | | 7,675 | | | | (47,582 | ) | | | (31,554 | ) | | | 147,725 | | | | — | | | | 123,340 | | | | (786,244 | ) | | | (515,179 | ) |
| 12/31/2013 | | | 15,053 | | | | — | | | | — | | | | (74,122 | ) | | | (59,069 | ) | | | 236,617 | | | | — | | | | — | | | | (1,086,267 | ) | | | (849,650 | ) |
| Class S | | | | | | | | | | | | | | | | | | | | | | | | | | | | | | | | | | | | | | | | |
| 12/31/2014 | | | 109,232 | | | | — | | | | 303,920 | | | | (549,039 | ) | | | (135,887 | ) | | | 1,941,267 | | | | — | | | | 4,953,905 | | | | (9,676,484 | ) | | | (2,781,312 | ) |
| 12/31/2013 | | | 195,746 | | | | — | | | | 1,254 | | | | (616,848 | ) | | | (419,848 | ) | | | 3,041,197 | | | | — | | | | 20,382 | | | | (9,535,851 | ) | | | (6,474,272 | ) |
| Class S2 | | | | | | | | | | | | | | | | | | | | | | | | | | | | | | | | | | | | | | | | |
| 12/31/2014 | | | — | | | | — | | | | — | | | | — | | | | — | | | | — | | | | — | | | | — | | | | — | | | | — | |
| 12/31/2013 | | | — | | | | — | | | | — | | | | — | | | | — | | | | — | | | | — | | | | — | | | | — | | | | — | |
| (1) | Class S2 liquidated on April 30, 2013. |
NOTE 10 — Federal Income Taxes
The amount of distributions from net investment income and net realized capital gains are determined in accordance with federal income tax regulations, which may differ from U.S. GAAP for investment companies. These book/tax differences may be either temporary or permanent. Permanent differences are reclassified within the capital accounts based on their federal tax-basis treatment; temporary differences are not reclassified. Key differences include the treatment of short-term capital gains, foreign currency transactions, and wash sale deferrals. Distributions in excess of net investment income and/or net realized capital gains for tax purposes are reported as return of capital.
The following permanent tax differences have been reclassified as of December 31, 2014:
| | | Undistributed
Net
Investment
Income | | | Accumulated
Net
Realized
Gains/
(Losses) | |
| VY® Fidelity® VIP Contrafund® | | $ | 6,135,935 | | | $ | (6,135,935 | ) |
| VY® Fidelity® VIP Equity-Income | | | 152,207 | | | | (152,207 | ) |
| VY® Fidelity® VIP Mid Cap | | | 592,442 | | | | (592,442 | ) |
Dividends paid by the Portfolios from net investment income and distributions of net realized short-term capital
gains are, for federal income tax purposes, taxable as ordinary income to shareholders.
The tax composition of dividends and distributions to shareholders was as follows:
| | | Year Ended
December 31, 2014 | | | Year Ended
December 31, 2013 | |
| | | Ordinary
Income | | | Long-term
Capital Gains | | | Ordinary
Income | |
| VY® Fidelity® VIP Contrafund® | | $ | 1,698,281 | | | $ | — | | | $ | 2,577,150 | |
| VY® Fidelity® VIP Equity-Income | | | 600,066 | | | | — | | | | 692,204 | |
| VY® Fidelity® VIP Mid Cap | | | 2,096,792 | | | | 2,981,119 | | | | 20,382 | |
The tax-basis components of distributable earnings and the capital loss carryforwards which may be used to offset future realized capital gains for federal income tax purposes as of December 31, 2014 are detailed below. The Regulated Investment Company Modernization Act of 2010 (the “Act”) provides an unlimited carryforward period for newly generated capital losses. Under the Act, there may be a greater likelihood that all or a portion of the Portfolios’ pre-enactment capital loss carryforwards may expire without being utilized due to the fact that post-enactment capital losses are required to be utilized before pre-enactment capital loss carryforwards.
NOTES TO FINANCIAL STATEMENTS as of December 31, 2014 (continued)
NOTE 10 — Federal Income Taxes (continued)
| | | Undistributed
Ordinary | | | Undistributed
Long-term | | | Unrealized
Appreciation/ | | | Capital Loss Carryforwards | |
| | | Income | | | Capital Gains | | | (Depreciation) | | | Amount | | | Character | | | Expiration | |
| VY® Fidelity® VIP Contrafund® | | $ | 7,364,046 | | | $ | — | | | $ | 83,425,048 | | | $ | (4,241,853 | ) | | | Short-term | | | | 2017 | |
| | | | | | | | | | | | | | | | (57,457,080 | ) | | | Short-term | | | | 2018 | |
| | | | | | | | | | | | | | | $ | (61,698,933 | )* | | | | | | | | |
| VY® Fidelity® VIP Equity-Income | | | 458,792 | | | | — | | | | 146,024 | | | | (4,401,655 | ) | | | Short-term | | | | 2017 | |
| | | | | | | | | | | | | | | | (5,708,489 | ) | | | Short-term | | | | 2018 | |
| | | | | | | | | | | | | | | | (2,568,661 | ) | | | Long-term | | | | None | |
| | | | | | | | | | | | | | | $ | (12,678,805 | ) | | | | | | | | |
| VY® Fidelity® VIP Mid Cap | | | 564,612 | | | | 2,070,084 | | | | 3,706,542 | | | | — | | | | — | | | | — | |
| * | Utilization of these capital losses is subject to annual limitations under Section 382 of the Internal Revenue Code. |
The Portfolios’ major tax jurisdictions are U.S. federal and Arizona. The earliest tax year that remains subject to examination by these jurisdictions is 2010.
As of December 31, 2014, no provision for income tax is required in the Portfolios’ financial statements as a result of tax positions taken on federal and state income tax returns for open tax years. The Portfolios’ federal and state income and federal excise tax returns for tax years for which the applicable statutes of limitations have not expired are subject to examination by the Internal Revenue Service and state department of revenue.
NOTE 11 — CONCENTRATION OF INVESTMENT RISKS
All mutual funds involve risk — some more than others — and there is always the chance that you could lose money or not earn as much as you hope. A Portfolio’s risk profile is largely a factor of the principal securities in which it invests and investment techniques that it uses. For more information regarding the types of securities and investment techniques that may be used by each Portfolio and their corresponding risks, see the Portfolios’ most recent Prospectus and/or the Statement of Additional Information.
The value of your investment in VY® Fidelity® VIP Contrafund®, VY® Fidelity® VIP Equity-Income and VY® Fidelity® VIP Mid Cap changes with the values of the corresponding Master Fund and its investments.
Foreign Securities (All Portfolios). Investments in foreign (non-U.S.) securities may entail risks not present in domestic investments. Since securities in which a Master Fund may invest are denominated in foreign currencies, changes in the relationship of these foreign currencies to the U.S. dollar can significantly affect the value of the investments and earnings of a Master Fund. Foreign investments may also subject a Master Fund to foreign government exchange restrictions, expropriation, taxation or other political, social or economic developments, as well as changes vis-a-vis the U.S. dollar from movements in currency, and changes in security value and interest rate, all of which could affect the market and/or credit risk of a Master Fund’s investments.
NOTE 12 — RESTRUCTURING PLAN
In October 2009, ING Groep N.V. (“ING Groep”) submitted a restructuring plan (the “Restructuring Plan”) to the European Commission in order to receive approval for state aid granted to ING Groep by the Kingdom of the Netherlands in November 2008 and March 2009. To receive approval for this state aid, ING Groep was required to divest its insurance and investment management businesses, including Voya Financial, Inc. (formerly, ING U.S., Inc.), before the end of 2013. In November 2012, the Restructuring Plan was amended to permit ING Groep additional time to complete the divestment. Pursuant to the amended Restructuring Plan, ING Groep was required to divest at least 25% of Voya Financial, Inc. by the end of 2013 and more than 50% by the end of 2014, and is required to divest its remaining interest by the end of 2016 (such divestment, the “Separation Plan”).
In May 2013, Voya Financial, Inc. conducted an initial public offering of its common stock (the “IPO”). In October 2013, March 2014, and September 2014, ING Groep divested additional shares in several secondary offerings of common stock of Voya Financial, Inc. and concurrent share repurchases by Voya Financial, Inc. These transactions reduced ING Groep’s ownership interest in Voya Financial, Inc. to 32%. Voya Financial, Inc. did not receive any proceeds from these offerings.
In November 2014, through an additional secondary offering and the concurrent repurchase of shares by Voya Financial, Inc., ING Groep further reduced its interest in Voya Financial, Inc. below 25% to approximately 19% (the
NOTES TO FINANCIAL STATEMENTS as of December 31, 2014 (continued)
NOTE 12 — RESTRUCTURING PLAN (continued)
“November 2014 Offering”). The November 2014 Offering was deemed by the Investment Adviser to be a change of control (the “Change of Control”), which resulted in the automatic termination of the existing investment advisory and sub-advisory agreements under which the Investment Adviser and Sub-Adviser, if applicable, provide services to the Portfolios. In anticipation of this termination, and in order to ensure that the existing investment advisory and sub-advisory services could continue uninterrupted, in 2013 the Board approved new advisory and sub-advisory agreements for the Portfolios, as applicable, in connection with the IPO. In addition, in 2013, shareholders of each Portfolio approved new investment advisory and affiliated sub-advisory agreements prompted by the IPO, as well as any future advisory and affiliated sub-advisory agreements prompted by the Separation Plan that are approved by the Board and that have terms not materially different from the current agreements. This meant that shareholders would not have another opportunity to vote on a new agreement with the Investment Adviser or the current affiliated sub-adviser even upon a change of control prompted by the Separation Plan, as long as no single person or group of
persons acting together gains “control” (as defined in the 1940 Act) of Voya Financial, Inc.
On November 18, 2014, in response to the Change of Control, the Board, at an in-person meeting, approved new investment advisory and affiliated sub-advisory agreements. At that meeting, the Investment Adviser represented that the agreements approved by the Board were not materially different from the agreements approved by shareholders in 2013 and no single person or group of persons acting together was expected to gain “control” (as defined in the 1940 Act) of Voya Financial, Inc. As a result, shareholders of the Portfolios will not be asked to vote again on this new agreement with the Investment Adviser.
NOTE 13 — SUBSEQUENT EVENTS
The Portfolios have evaluated events occurring after the Statements of Assets and Liabilities date (“subsequent events”), to determine whether any subsequent events necessitated adjustment to or disclosure in the financial statements. No such subsequent events were identified.
| VY® Fidelity® VIP Contrafund® Portfolio | PORTFOLIO OF INVESTMENTS
as of December 31, 2014 |
| Shares | | | Value | | | Percentage
of Net
Assets | |
| Master Fund: 99.9% | | | | | | | | |
| | 8,362,617 | | | | | Fidelity VIP Contrafund Portfolio | | $ | 306,908,062 | | | | 99.9 | |
| | | | | | | Total Investments in Master Fund
(Cost $172,376,464) | | $ | 306,908,062 | | | | 99.9 | |
| | | | | | | Assets in Excess of Other Liabilities | | | 241,274 | | | | 0.1 | |
| | | | | | | Net Assets | | $ | 307,149,336 | | | | 100.0 | |
Cost for federal income tax purposes is $223,483,014.
Net unrealized appreciation consists of:
| Gross Unrealized Appreciation | | $ | 83,425,048 | |
| Gross Unrealized Depreciation | | | — | |
| Net Unrealized Appreciation | | $ | 83,425,048 | |
Fair Value Measurements^
The following is a summary of the fair valuations according to the inputs used as of December 31, 2014 in valuing the assets and liabilities:
| | | Quoted Prices
in Active Markets
for Identical
Investments
(Level 1) | | | Significant
Other
Observable
Inputs
(Level 2) | | | Significant
Unobservable
Inputs
(Level 3) | | | Fair Value
at
December 31, 2014 | |
| Asset Table | | | | | | | | | | | | | | | | |
| Investments, at fair value | | | | | | | | | | | | | | | | |
| Master Fund | | $ | 306,908,062 | | | $ | — | | | $ | — | | | $ | 306,908,062 | |
| Total Investments, at fair value | | $ | 306,908,062 | | | $ | — | | | $ | — | | | $ | 306,908,062 | |
| ^ | See Note 2, “Significant Accounting Policies” in the Notes to Financial Statements for additional information. |
See Accompanying Notes to Financial Statements
| VY® Fidelity® VIP Equity-Income Portfolio | PORTFOLIO OF INVESTMENTS
as of December 31, 2014 |
| Shares | | | Value | | | Percentage
of Net
Assets | |
| Master Fund: 100.0% | | | | | | | | |
| | 544,943 | | | | | Fidelity VIP Equity-Income Portfolio | | $ | 12,996,891 | | | | 100.0 | |
| | | | | | | Total Investments in Master Fund
(Cost $11,172,130) | | $ | 12,996,891 | | | | 100.0 | |
| | | | | | | Assets in Excess of Other Liabilities | | | 5,209 | | | | — | |
| | | | | | | Net Assets | | $ | 13,002,100 | | | | 100.0 | |
Cost for federal income tax purposes is $12,850,867.
Net unrealized appreciation consists of:
| Gross Unrealized Appreciation | | $ | 146,024 | |
| Gross Unrealized Depreciation | | | — | |
| Net Unrealized Appreciation | | $ | 146,024 | |
Fair Value Measurements^
The following is a summary of the fair valuations according to the inputs used as of December 31, 2014 in valuing the assets and liabilities:
| | | Quoted Prices
in Active Markets
for Identical
Investments
(Level 1) | | | Significant
Other
Observable
Inputs
(Level 2) | | | Significant
Unobservable
Inputs
(Level 3) | | | Fair Value
at
December 31, 2014 | |
| Asset Table | | | | | | | | | | | | | | | | |
| Investments, at fair value | | | | | | | | | | | | | | | | |
| Master Fund | | $ | 12,996,891 | | | $ | — | | | $ | — | | | $ | 12,996,891 | |
| Total Investments, at fair value | | $ | 12,996,891 | | | $ | — | | | $ | — | | | $ | 12,996,891 | |
| ^ | See Note 2, “Significant Accounting Policies” in the Notes to Financial Statements for additional information. |
See Accompanying Notes to Financial Statements
| VY® Fidelity® VIP Mid Cap Portfolio | PORTFOLIO OF INVESTMENTS
as of December 31, 2014 |
| Shares | | | Value | | | Percentage
of Net
Assets | |
| Master Fund: 99.8% | | | | | | | | |
| | 1,089,778 | | | | | Fidelity VIP Mid Cap Portfolio | | $ | 40,147,409 | | | | 99.8 | |
| | | | | | | Total Investments in Master Fund
(Cost $33,143,854) | | $ | 40,147,409 | | | | 99.8 | |
| | | | | | | Assets in Excess of Other Liabilities | | | 63,809 | | | | 0.2 | |
| | | | | | | Net Assets | | $ | 40,211,218 | | | | 100.0 | |
Cost for federal income tax purposes is $36,440,867.
Net unrealized appreciation consists of:
| Gross Unrealized Appreciation | | $ | 3,706,542 | |
| Gross Unrealized Depreciation | | | — | |
| Net Unrealized Appreciation | | $ | 3,706,542 | |
Fair Value Measurements^
The following is a summary of the fair valuations according to the inputs used as of December 31, 2014 in valuing the assets and liabilities:
| | | Quoted Prices
in Active Markets
for Identical
Investments
(Level 1) | | | Significant
Other
Observable
Inputs
(Level 2) | | | Significant
Unobservable
Inputs
(Level 3) | | | Fair Value
at
December 31, 2014 | |
| Asset Table | | | | | | | | | | | | | | | | |
| Investments, at fair value | | | | | | | | | | | | | | | | |
| Master Fund | | $ | 40,147,409 | | | $ | — | | | $ | — | | | $ | 40,147,409 | |
| Total Investments, at fair value | | $ | 40,147,409 | | | $ | — | | | $ | — | | | $ | 40,147,409 | |
| ^ | See Note 2, “Significant Accounting Policies” in the Notes to Financial Statements for additional information. |
See Accompanying Notes to Financial Statements
Tax Information (Unaudited)
Dividends and distributions paid during the year ended December 31, 2014 were as follows:
| Portfolio Name | | Type | | Per Share Amount | |
| VY® Fidelity® VIP Contrafund® Portfolio | |
| Class ADV | | NII | | $ | 0.0532 | |
| Class S | | NII | | $ | 0.0778 | |
| VY® Fidelity® VIP Equity-Income Portfolio | |
| Class ADV | | NII | | $ | 0.5032 | |
| Class S | | NII | | $ | 0.5189 | |
| Portfolio Name | | Type | | Per Share Amount | |
| VY® Fidelity® VIP Mid Cap Portfolio | |
| Class ADV | | NII | | $ | 0.8542 | |
| Class S | | NII | | $ | 0.9193 | |
| Class S2 | | NII | | $ | 0.9037 | |
| All Classes | | LTCG | | $ | 1.3047 | |
NII - Net investment income
LTCG - Long-term capital gain
Of the ordinary distributions made during the year ended December 31, 2014, the following percentages qualify for the dividends received deduction (DRD) available to corporate shareholders:
| VY® Fidelity® VIP Contrafund® Portfolio | | | 99.88 | % |
| VY® Fidelity® VIP Equity-Income Portfolio | | | 50.97 | % |
| VY® Fidelity® VIP Mid Cap Portfolio | | | 17.00 | % |
Above figures may differ from those cited elsewhere in this report due to differences in the calculation of income and gains under U.S. generally accepted accounting principles (book) purposes and Internal Revenue Service (tax) purposes.
Shareholders are strongly advised to consult their own tax advisers with respect to the tax consequences of their investments in the Portfolios. In January, shareholders, excluding corporate shareholders, receive an IRS 1099-DIV regarding the federal tax status of the dividends and distributions they received in the calendar year.
DIRECTOR AND OFFICER INFORMATION (Unaudited)
The business and affairs of the Company are managed under the direction of the Company’s Board. A Director, who is not an interested person of the Company, as defined in the 1940 Act, is an independent director (“Independent Director”). The Directors and Officers of the Company are listed below. The Statement of Additional Information includes additional information about directors of the Company and is available, without charge, upon request at (800) 992-0180.
| Name, Address and Age | | Position(s)
Held with the
Company | | Term of Office and
Length of Time
Served(1) | | Principal
Occupation(s) -
During the Past 5 Years | | Number of
Portfolios
in Fund
Complex
Overseen
by Director(2) | | Other Board Positions
Held by Director | |
| Independent Directors*: | | | | | | | | | | | |
Colleen D. Baldwin
7337 East Doubletree Ranch Rd.
Suite 100
Scottsdale, Arizona 85258
Age: 54 | | Director | | November 2007 - Present | | President, Glantuam Partners, LLC, a business consulting firm (January 2009 - Present). | | 158 | | DSM/Dentaquest, Boston, MA (February 2014 - Present). | |
John V. Boyer
7337 East Doubletree Ranch Rd.
Suite 100
Scottsdale, Arizona 85258
Age: 61 | | Chairperson/
Director | | November 1997 - Present | | President and Chief Executive Officer, Bechtler Arts Foundation, an arts and education foundation (January 2008 - Present). | | 158 | | None. | |
Patricia W. Chadwick
7337 East Doubletree Ranch Rd.
Suite 100
Scottsdale, Arizona 85258
Age: 66 | | Director | | January 2006 - Present | | Consultant and President, Ravengate Partners LLC, a consulting firm that provides advice regarding financial markets and the global economy (January 2000 - Present). | | 158 | | Wisconsin Energy Corporation (June 2006 - Present) and The Royce Funds (35 funds) (December 2009 - Present). | |
Albert E. DePrince, Jr.
7337 E. Doubletree Ranch Rd.
Suite 100
Scottsdale, Arizona 85258
Age: 73 | | Director | | May 2013 - Present | | Retired. Formerly, Professor of Economics and Finance, Middle Tennessee State University (August 1991 - July 2014); Dr. DePrince continued to hold a position with the university under a post-retirement contract through the end of 2014. | | 158 | | None. | |
Peter S. Drotch
7337 East Doubletree Ranch Rd.
Suite 100
Scottsdale, Arizona 85258
Age: 73 | | Director | | November 2007 - Present | | Retired. | | 158 | | First Marblehead Corporation (September 2003 - Present). | |
Russell H. Jones
7337 E. Doubletree Ranch Rd.
Suite 100
Scottsdale, Arizona 85258
Age: 70 | | Director | | May 2013 - Present | | Retired. | | 158 | | None. | |
Patrick W. Kenny
7337 East Doubletree Ranch Rd.
Suite 100
Scottsdale, Arizona 85258
Age: 72 | | Director | | March 2002 - Present | | Retired. | | 158 | | Assured Guaranty Ltd.
(April 2004 - Present). | |
DIRECTOR AND OFFICER INFORMATION (Unaudited) (continued)
| Name, Address and Age | | Position(s)
Held with the
Company | | Term of Office and
Length of Time
Served(1) | | Principal
Occupation(s) -
During the Past 5 Years | | Number of
Portfolios
in Fund
Complex
Overseen
by Director(2) | | Other Board Positions
Held by Director | |
Joseph E. Obermeyer
7337 E. Doubletree Ranch Rd.
Suite 100
Scottsdale, Arizona 85258
Age: 57 | | Director | | May 2013 - Present | | President, Obermeyer & Associates, Inc., a provider of financial and economic consulting services (November 1999 - Present). | | 158 | | None. | |
Sheryl K. Pressler
7337 East Doubletree Ranch Rd.
Suite 100
Scottsdale, Arizona 85258
Age: 64 | | Director | | January 2006 - Present | | Consultant (May 2001 - Present). | | 158 | | None. | |
Roger B. Vincent
7337 East Doubletree Ranch Rd.
Suite 100
Scottsdale, Arizona 85258
Age: 69 | | Director | | January 2005 - Present | | Retired. Formerly, President, Springwell Corporation, a corporate finance firm (March 1989 - August 2011). | | 158 | | UGI Corporation (February 2006 - Present) and UGI Utilities, Inc.
(February 2006 - Present). | |
| Director who is an “Interested Person”: |
Shaun P. Mathews(3)
7337 East Doubletree Ranch Rd.
Suite 100
Scottsdale, Arizona 85258
Age: 59 | | Director | | November 2007 - Present | | President and Chief Executive Officer, Voya Investments, LLC (November 2006 - Present). | | 158 | | Voya Capital Corporation, LLC and Voya Investments Distributor, LLC (December 2005 - Present); Voya Funds Services, LLC, Voya Investments, LLC and Voya Investment Management, LLC (March 2006 - Present); and Voya Investment Trust Co. (April 2009 - Present). | |
| (1) | Directors serve until their successors are duly elected and qualified. The tenure of each Director who is not an “interested person” as defined in the 1940 Act, of the Portfolio (as defined below, “Independent Director”) is subject to the Board’s retirement policy which states that each duly elected or appointed Independent Director shall retire from and cease to be a member of the Board of Directors at the close of business on December 31 of the calendar year in which the Independent Director attains the age of 75. A majority vote of the Board’s other Independent Directors may extend the retirement date of an Independent Director if the retirement would trigger a requirement to hold a meeting of shareholders of the Company under applicable law, whether for purposes of appointing a successor to the Independent Director or otherwise comply under applicable law, in which case the extension would apply until such time as the shareholder meeting can be held or is no longer required (as determined by a vote of a majority of the other Independent Directors). |
| (2) | For the purposes of this table, “Fund Complex” means the Voya family of funds including the following investment companies: Voya Asia Pacific High Dividend Equity Income Fund; Voya Balanced Portfolio, Inc.; Voya Emerging Markets High Dividend Equity Fund; Voya Equity Trust; Voya Funds Trust; Voya Global Advantage and Premium Opportunity Fund; Voya Global Equity Dividend and Premium Opportunity Fund; Voya Infrastructure, Industrials and Materials Fund; Voya Intermediate Bond Portfolio; Voya International High Dividend Equity Income Fund; Voya Investors Trust; Voya Money Market Portfolio; Voya Mutual Funds; Voya Natural Resources Equity Income Fund; Voya Partners, Inc.; Voya Prime Rate Trust; Voya Senior Income Fund; Voya Separate Portfolios Trust; Voya Series Fund, Inc.; Voya Strategic Allocation Portfolios, Inc.; Voya Variable Funds; Voya Variable Insurance Trust; Voya Variable Portfolios, Inc.; and Voya Variable Products Trust. The number of funds in the Voya family of funds is as of January 31, 2015. |
| (3) | Mr. Mathews is deemed to be an “Interested Person” of the Company as defined in the 1940 Act, because of his current affiliation with any of the Voya funds, Voya Financial, Inc., or any of Voya Financial, Inc.’s affiliates. |
| * | Effective on December 31, 2014, J. Michael Earley retired as a Director. |
DIRECTOR AND OFFICER INFORMATION (Unaudited) (continued)
| Name, Address and Age | | Position(s) Held
With the Company | | Term of Office and
Length of Time Served(1) | | Principal Occupation(s) -
During the Past 5 Years | |
Shaun P. Mathews
7337 East Doubletree Ranch Rd.
Suite 100
Scottsdale, Arizona 85258
Age: 59 | | President and Chief Executive Officer | | November 2006 - Present | | President and Chief Executive Officer, Voya Investments, LLC (November 2006 - Present). | |
Michael J. Roland
7337 East Doubletree Ranch Rd.
Suite 100
Scottsdale, Arizona 85258
Age: 56 | | Executive Vice President | | January 2005 - Present | | Managing Director and Chief Operating Officer, Voya Investments, LLC and Voya Funds Services, LLC (April 2012 - Present). Formerly, Chief Compliance Officer, Directed Services LLC and Voya Investments, LLC (March 2011 - December 2013); Executive Vice President and Chief Operating Officer, Voya Investments, LLC and Voya Funds Services, LLC (January 2007 - April 2012) and Chief Compliance Officer, Voya Family of Funds (March 2011 - February 2012). | |
Stanley D. Vyner
230 Park Avenue
New York, New York 10169
Age: 64 | | Executive Vice President
Chief Investment Risk Officer | | January 2005 - Present
September 2009 - Present | | Executive Vice President, Voya Investments, LLC (July 2000 - Present) and Chief Investment Risk Officer, Voya Investments, LLC (January 2003 - Present). | |
Kevin M. Gleason
7337 East Doubletree Ranch Rd.
Suite 100
Scottsdale, Arizona 85258
Age: 48 | | Chief Compliance Officer | | February 2012 - Present | | Senior Vice President and Chief Compliance Officer, Voya Investments, LLC (February 2012 - Present). Formerly, Assistant General Counsel and Assistant Secretary, The Northwestern Mutual Life Insurance Company (June 2004 - January 2012). | |
Todd Modic
7337 East Doubletree Ranch Rd.
Suite 100
Scottsdale, Arizona 85258
Age: 47 | | Senior Vice President, Chief/Principal Financial Officer and Assistant Secretary | | March 2005 - Present | | Senior Vice President, Voya Funds Services, LLC (March 2005 - Present). | |
Kimberly A. Anderson
7337 East Doubletree Ranch Rd.
Suite 100
Scottsdale, Arizona 85258
Age: 50 | | Senior Vice President | | January 2005 - Present | | Senior Vice President, Voya Investments, LLC (October 2003 - Present). | |
Julius A. Drelick, III
7337 East Doubletree Ranch Rd.
Suite 100
Scottsdale, Arizona 85258
Age: 48 | | Senior Vice President | | July 2012 - Present | | Senior Vice President - Head of Fund Compliance, Voya Funds Services, LLC (June 2012 - Present); Chief Compliance Officer of Directed Services LLC and Voya Investments, LLC (January 2014 - Present). Formerly, Vice President - Platform Product Management & Project Management, Voya Investments, LLC (April 2007 - June 2012). | |
Robert Terris
7337 East Doubletree Ranch Rd.
Suite 100
Scottsdale, Arizona 85258
Age: 44 | | Senior Vice President | | May 2006 - Present | | Senior Vice President, Head of Division Operations, Voya Funds Services, LLC (January 2006 - Present). | |
Fred Bedoya
7337 East Doubletree Ranch Rd.
Suite 100
Scottsdale, Arizona 85258
Age: 42 | | Vice President and Treasurer | | September 2012 - Present | | Vice President, Voya Funds Services, LLC (March 2012 - Present). Formerly, Assistant Vice President - Director, Voya Funds Services, LLC (March 2003 - March 2012). | |
Maria M. Anderson
7337 East Doubletree Ranch Rd.
Suite 100
Scottsdale, Arizona 85258
Age: 56 | | Vice President | | January 2005 - Present | | Vice President, Voya Funds Services, LLC (September 2004 - Present). | |
DIRECTOR AND OFFICER INFORMATION (Unaudited) (continued)
| Name, Address and Age | | Position(s) Held
With the Company | | Term of Office and
Length of Time Served(1) | | Principal Occupation(s) -
During the Past 5 Years | |
Lauren D. Bensinger
7337 East Doubletree Ranch Rd.
Suite 100
Scottsdale, Arizona 85258
Age: 61 | | Vice President | | January 2005 - Present | | Vice President, Voya Investments, LLC and Voya Funds Services, LLC (February 1996 - Present); Vice President, Voya Investments, LLC (October 2004 - Present); Vice President and Money Laundering Reporting Officer, Voya Investments Distributor, LLC (April 2010 - Present); Anti-Money Laundering Compliance Officer, Voya Financial, Inc. (January 2013 - Present); and Money Laundering Reporting Officer, Voya Investment Management Trust Co. (October 2012 - Present). Formerly, Chief Compliance Officer, Voya Investments Distributor, LLC (August 1995 - April 2010). | |
Sara M. Donaldson
7337 East Doubletree Ranch Rd.
Suite 100
Scottsdale, Arizona 85258
Age: 55 | | Vice President | | September 2014 - Present | | Vice President, Voya Funds Services, LLC (April 2014 - Present). Formerly, Director, Compliance, AXA Rosenberg Global Services, LLC (September 1997 - March 2014). | |
Robyn L. Ichilov
7337 East Doubletree Ranch Rd.
Suite 100
Scottsdale, Arizona 85258
Age: 47 | | Vice President | | January 2005- Present | | Vice President, Voya Funds Services, LLC (November 1995 - Present) and Voya Investments, LLC (August 1997 - Present). Formerly, Treasurer, Voya Family of Funds (November 1999 - February 2012). | |
Jason Kadavy
7337 East Doubletree Ranch Rd.
Suite 100
Scottsdale, Arizona 85258
Age: 38 | | Vice President | | September 2012 - Present | | Vice President, Voya Funds Services, LLC (July 2007 - Present). | |
Kimberly K. Springer
7337 East Doubletree Ranch Rd.
Suite 100
Scottsdale, Arizona 85258
Age: 57 | | Vice President | | March 2006 - Present | | Vice President - Mutual Fund Product Development, Voya Investments, LLC (July 2012 - Present); Vice President, Voya Investment Management - Voya Family of Funds (March 2010 - Present) and Vice President, Voya Funds Services, LLC (March 2006 - Present). Formerly Managing Paralegal, Registration Statements (June 2003 - July 2012). | |
Craig Wheeler
7337 East Doubletree Ranch Rd.
Suite 100
Scottsdale, Arizona 85258
Age: 45 | | Vice President | | May 2008 - Present | | Vice President - Director of Tax, Voya Funds Services, LLC (March 2013 - Present). Formerly, Assistant Vice President - Director of Tax, Voya Funds Services, LLC (March 2008 - March 2013). | |
Huey P. Falgout, Jr.
7337 East Doubletree Ranch Rd.
Suite 100
Scottsdale, Arizona 85258
Age: 51 | | Secretary | | August 2003 - Present | | Senior Vice President and Chief Counsel, Voya Investment Management - Mutual Fund Legal Department (March 2010 - Present). Formerly, Chief Counsel, ING Americas, U.S. Legal Services (October 2003 - March 2010). | |
Paul A. Caldarelli
7337 East Doubletree Ranch Rd.
Suite 100
Scottsdale, Arizona 85258
Age: 63 | | Assistant Secretary | | June 2010 - Present | | Vice President and Senior Counsel, Voya Investment Management - Mutual Fund Legal Department (March 2010 - Present). Formerly, Senior Counsel, ING Americas, U.S. Legal Services (April 2008 - March 2010). | |
Theresa K. Kelety
7337 East Doubletree Ranch Rd.
Suite 100
Scottsdale, Arizona 85258
Age: 52 | | Assistant Secretary | | August 2003 - Present | | Vice President and Senior Counsel, Voya Investment Management - Mutual Fund Legal Department (March 2010 - Present). Formerly, Senior Counsel, ING Americas, U.S. Legal Services (April 2008 - March 2010). | |
| (1) | The Officers hold office until the next annual meeting of the Board of Directors and until their successors shall have been elected and qualified. |
ADVISORY CONTRACT APPROVAL DISCUSSION (Unaudited)
BOARD CONSIDERATION AND APPROVAL OF INVESTMENT ADVISORY CONTRACT
Section 15(c) of the Investment Company Act of 1940, as amended (the “1940 Act”), provides that, after an initial period, the Board of Directors (the “Board”) of Voya Partners, Inc. (the “Company”), including a majority of Board members who have no direct or indirect interest in the advisory contracts of VY® Fidelity VIP Contrafund® Portfolio, VY® Fidelity® VIP Equity-Income Portfolio, and VY® Fidelity® VIP Mid Cap Portfolio (collectively, the “Portfolios”), each a series of the Company, and who are not “interested persons” of the Portfolios, as such term is defined under the 1940 Act (the “Independent Directors”), must annually review and approve the Portfolios’ existing investment advisory contracts. Thus, at a meeting held on September 12, 2014, the Board, including a majority of the Independent Directors, considered whether to renew and approve the amended and restated investment advisory contract (the “Advisory Contract”) between Directed Services LLC (“Adviser”) and the Portfolios.
The Independent Directors also held separate meetings on August 14 and September 10, 2014, to consider the renewal of the Advisory Contract. As a result, subsequent references herein to factors considered and determinations made by the Board include, as applicable, factors considered and determinations made on those earlier dates by the Independent Directors.
At its September 12, 2014 meeting, the Board voted to renew the Advisory Contract for the Portfolios. In reaching these decisions, the Board took into account information furnished to it throughout the year at meetings of the Board and the Board’s committees, as well as information prepared specifically in connection with the annual renewal or approval process. Determinations by the Independent Directors also took into account various factors that they believed, in light of the legal advice furnished to them by K&L Gates LLP (“K&L Gates”), their independent legal counsel, and their own business judgment, to be relevant. Further, while the Board considered at the same meeting the advisory contracts that were subject to renewal for the investment companies in the Voya family of funds (“Voya funds”), the Board considered each Voya fund’s advisory relationship separately.
Provided below is a general overview of the Board’s contract approval process that it followed, as well as a discussion of certain specific factors that the Board considered at its renewal meetings. While the Board gave its attention to information furnished at the request of the Independent Directors that was most relevant to its considerations, discussed below are some of the primary factors relevant to the Board’s consideration as to whether to renew the Advisory Contract for the one-year period
ending September 30, 2015. Each Board member may have accorded different weight to the various factors in reaching his or her conclusions with respect to each Portfolio’s advisory arrangements.
Overview of the Contract Renewal and Approval Process
The Board followed a structured process (the “Contract Review Process”) pursuant to which it requested and considered relevant information when it decided whether to approve and renew the Advisory Contract. Among other actions, the Independent Directors previously retained an independent consultant with experience in the mutual fund industry to assist them in working with personnel employed by the Adviser or its affiliates who administer the Portfolios (“Management”) to: identify the types of information presented to the Board to inform its deliberations with respect to advisory relationships and to help evaluate that information; evaluate industry best practices in regard to the consideration of investment advisory contracts; establish a specific format in which certain requested information was provided to the Board; and determine the process for the Board’s review of such information.
The Board has established (among other committees) three Investment Review Committees (each, an “IRC”) and a Contracts Committee. Among other matters, the Contracts Committee provides oversight with respect to the contracts renewal and approval process, and each Portfolio is assigned to an IRC, which provides oversight regarding, among other matters, the investment performance of the Adviser. The IRCs may apply a heightened level of scrutiny in cases where performance was below a Voya fund’s relevant benchmark, and/or a selected peer group of investment companies (“Selected Peer Group”), and/or Lipper Inc. (“Lipper”) category median, and/or Morningstar, Inc. (“Morningstar”) category median, as applicable.
The type and format of the information provided to the Board or to legal counsel for the Independent Directors in connection with the Contract Review Process has been codified in a 15(c) methodology guide for the Voya funds (“15(c) Methodology Guide”). This 15(c) Methodology Guide was developed under the direction of the Independent Directors and sets out a blueprint pursuant to which they request certain information that they deem important to facilitate an informed review in connection with initial and annual approvals of advisory contracts.
Management provided certain of the information requested by the 15(c) Methodology Guide in Fund Analysis and Comparison Tables (“FACT sheets”). The Independent Directors periodically have retained, including most recently in 2014, an independent firm to test and
ADVISORY CONTRACT APPROVAL DISCUSSION (Unaudited) (continued)
verify the accuracy of certain FACT sheet data for a representative sample of the Voya funds. In addition, the Contracts Committee has routinely employed an independent consultant to assist in its review and analysis of, among other matters, the 15(c) Methodology Guide, the content and format of the FACT sheets, and Selected Peer Group to be used by each Portfolio for certain comparison purposes during the renewal process.
Set forth below is a discussion of many of the Board’s primary considerations and conclusions in connection with its decision to approve each Portfolio’s Advisory Contract through September 30, 2015.
Nature, Extent and Quality of Service
The Independent Directors received and evaluated such information as they deemed necessary regarding the nature, extent and quality of services provided to the Portfolios by the Adviser. This included information regarding the Adviser provided throughout the year at regular meetings of the Board and its committees, as well as information furnished in connection with the contract renewal meetings.
The materials requested by the Independent Directors and provided to the Board, K&L Gates and/or independent consultants that assisted the Independent Directors prior to the September 12, 2014 Board meeting included, among other information, the following items for each Portfolio: (1) FACT sheets that provided information regarding the performance and expenses of the Portfolio and other similarly managed funds in its Selected Peer Group, information regarding the Portfolio’s investment portfolio, objective and strategies, and information regarding net asset flows into and out of the Portfolio; (2) reports providing risk and attribution analyses of the Portfolio; (3) the 15(c) Methodology Guide, which describes how the FACT sheets were prepared, including the manner in which each Portfolio’s benchmark and Selected Peer Group were selected and how profitability was determined; (4) responses from the Adviser to the Portfolios to a series of questions posed by K&L Gates on behalf of the Independent Directors; (5) a copy of the form of Advisory Contract; (6) a copy of the Form ADV for the Adviser; (7) financial statements for the Adviser; (8) a draft narrative summary addressing key factors the Board customarily considers in evaluating the advisory contracts for the Voya funds (including the Portfolios’ Advisory Contract); (9) independent analyses of Portfolio performance by the Company’s Chief Investment Risk Officer; (10) a report by the Company’s Chief Compliance Officer (“CCO”); and (11) other information relevant to the Board’s evaluations.
The Board was advised that pursuant to an agreement with the European Commission, ING Groep, N.V. (“ING Groep”)
is required to divest its entire interest in Voya Financial, Inc. (formerly known as ING U.S., Inc.), its U.S.-based insurance, retirement services and investment management operations, which include the Adviser, by the end of 2016 (such divestment, the “Separation Plan”). Voya Financial, Inc. is and was, at the time of the September Board meeting, a minority owned subsidiary of ING Groep and a parent company of the Adviser. The Board further noted that the Separation Plan may result in the Adviser’s loss of access to the services and resources of ING Groep, which could adversely affect its businesses and profitability. The Board was advised that the Separation Plan contemplates one or more public offerings and each may be deemed to be a change of control.
The Board was advised that Voya Financial, Inc. had conducted an initial public offering of Voya Financial, Inc. common stock in May 2013 and ING Groep had divested additional shares through three other public offerings since May 2013, reducing its ownership interest in Voya Financial, Inc. to below 50%. The Board was advised that none of these public offerings was deemed to be a change of control. The Board recognized that if any future public offering is deemed to be a change of control, the investment advisory agreements for each Voya fund would terminate and trigger a need for new agreements, which would require the approval of the Board and, potentially, shareholders of the Portfolios. The Board also was advised that there could be no assurance that the Separation Plan will be carried out completely. The Board considered the potential effects of the Separation Plan on the Portfolios and the Adviser, including the Adviser’s ability during and after the separation to perform the same level of service to the Portfolios as the Adviser currently provides. The Board was advised that the Adviser did not anticipate that the Separation Plan would have a material adverse impact on the Portfolios or their operations and administration.
The Board was advised that, in connection with the Separation Plan, Voya Financial, Inc. underwent a rebranding effort (the “Rebranding”) whereby Voya Financial, Inc. and several of its affiliates effected name changes. The Voya funds’ names, as well as the Adviser’s name, were also changed in connection with the Rebranding. The Rebranding resulted in amended and restated forms of advisory contracts being presented to and approved by the Board at its September 12, 2014 meeting. The Board was advised that the Advisory Contract has the same terms as the then-current advisory contract, except for the effective date and certain immaterial changes made to certain provisions related to the Rebranding.
Each Portfolio operates as a feeder fund and fully invests in a corresponding master fund advised by Fidelity
ADVISORY CONTRACT APPROVAL DISCUSSION (Unaudited) (continued)
Management and Research Company (“Fidelity”). The Board and/or K&L Gates received responses to a series of questions posed by K&L Gates on behalf of the Directors that related to Fidelity. Each Portfolio has only one class of shares, which was compared to the analogous class of shares for each fund in the Portfolio’s Selected Peer Group. The performance of each of the Portfolios primarily reflects the performance of the Master Fund in which it invests.
The Board considered that the Portfolios also benefit from the services of the Adviser’s Investment Risk Management Department (the “IRMD”), under the leadership of the Chief Investment Risk Officer, the costs of which are shared by the Voya funds and the Adviser. The Board considered that the IRMD regularly presents written materials and reports to the IRCs that focus on the investment risks of the Voya funds. The Board also considered that the IRMD provides the IRCs with analyses that are developed to assist the IRCs in identifying trends in the Voya funds’ (including the Portfolios’) performance and other areas over consecutive periods. The Board considered that the services provided by the IRMD are meant to provide an additional perspective for the benefit of the IRCs, which may vary from the perspective of the Adviser’s Manager Research & Selection Group (“MR&S”).
In considering the Portfolios’ Advisory Contract, the Board also considered the extent of benefits provided to the Portfolios’ shareholders, beyond advisory services, from being part of the Voya funds. This includes, in most cases, the right to exchange or transfer investments, without a sales charge, between the same class of shares of such funds or among Voya funds available on a product platform, and the wide range of Voya funds available for exchange or transfer. The Board also took into account the Adviser’s ongoing efforts to reduce the expenses of the Voya funds through renegotiated arrangements with the Voya funds’ service providers. In addition, the Board considered the efforts of the Adviser and the expenses that it incurred in recent years to help make the Voya funds more balanced and efficient by the launch of new investment products and the combinations of similar funds.
Further, the Board received periodic reports showing that the investment policies and restrictions for each Portfolio were consistently complied with and other periodic reports covering matters such as compliance by Adviser personnel with codes of ethics. The Board considered reports from the Company’s CCO and/or the Adviser’s CCO evaluating whether the regulatory compliance systems and procedures of the Adviser are reasonably designed to ensure compliance with the federal securities laws, including those related to, among others, late trading and market timing, best execution, fair value pricing, proxy
voting and trade allocation practices. The Board also took into account the Company’s CCO’s annual and periodic reports and recommendations with respect to service provider compliance programs. In this regard, the Board also considered the policies and procedures developed by the Company’s CCO in consultation with the Board’s Compliance Committee that guide the Company’s CCO’s compliance oversight function.
The Board requested and considered information regarding the level of the Adviser’s staffing, quality and experience of each Portfolio’s portfolio management team, the resources and reputation of the Adviser, the ability of the Adviser to attract and retain qualified investment advisory personnel, the adequacy of the resources committed to the Portfolios (and other relevant funds in the Voya funds) by the Adviser, whether those resources are commensurate with the needs of the Portfolios and are sufficient to sustain appropriate levels of performance and compliance needs, and the financial stability of the Adviser.
Based on their deliberations and the materials presented to them, the Board concluded that the advisory and related services provided by the Adviser are appropriate in light of the Portfolios’ operations, the competitive landscape of the investment company business, and investor needs, and that the nature, extent and quality of the overall services provided by the Adviser were appropriate.
Portfolio Performance
In assessing advisory relationships, the Board placed emphasis on the investment returns of each Portfolio. The Board considered the performance reports and analyses from MR&S and IRMD and discussions with portfolio managers at Board and committee meetings during the year. The Board also paid particular attention in assessing performance information provided in the FACT sheets furnished in connection with the renewal and approval process. The FACT sheets prepared for each Portfolio included its investment performance compared to the Portfolio’s Morningstar category median, Lipper category median, Selected Peer Group and primary benchmark. The FACT sheet performance data was as of March 31, 2014.
The Board also considered at its September 12, 2014 meeting certain additional data regarding performance and Portfolio asset levels for various additional periods ending after March 31, 2014. The Board’s findings specific to each Portfolio’s performance are discussed under “Portfolio-by-Portfolio Analysis” below.
Economies of Scale
When evaluating the reasonableness of advisory fee rates, the Board also considered whether economies of scale
ADVISORY CONTRACT APPROVAL DISCUSSION (Unaudited) (continued)
likely will be realized by the Adviser as a Portfolio grows larger and the extent to which any such economies are reflected in contractual fee rates. The Board considered that while the Portfolios do not have advisory fee breakpoints, they do have fee waiver and/or expense reimbursement arrangements. In this connection, the Board considered the extent to which economies of scale could be realized through such fee waivers, expense reimbursements or other expense reductions. In evaluating economies of scale, the Independent Directors also considered prior periodic management reports, industry information on this topic, fee rates at projected levels of growth versus peers and the Portfolios’ investment performance based on their investments in underlying funds.
Information Regarding Services to Other Clients
The Board requested and considered information regarding the nature of services and fee rates offered by the Adviser to other clients, including other registered investment companies and relevant institutional accounts. When fee rates offered to other clients differ materially from those charged to a Voya fund, the Board considers any underlying rationale provided by the Adviser for these differences. The Board also noted that the fee rates charged to the Portfolios and other institutional clients of the Adviser (including other investment companies) may differ materially due to, among other reasons: differences in services; different regulatory requirements associated with registered investment companies, such as the Portfolios, as compared to non- registered investment company clients; market differences in fee rates that existed when the Portfolios and other funds in the Voya funds complex first were organized; differences in the original sponsors of the Portfolios that now are managed by the Adviser; investment capacity constraints that existed when certain contracts were first agreed upon or that might exist at present; and different pricing structures that are necessary to be competitive in different marketing channels.
Fee Rates and Profitability
The Board reviewed and considered the contractual investment advisory fee rate, combined with the administrative fee rate, payable by each Portfolio to the Adviser and to the Adviser’s affiliated company that serves as the administrator to each Portfolio. In addition, the Board considered fee waivers and expense limitations applicable to the fees payable by the Portfolios, including the Adviser’s agreement to extend each such fee waiver and expense limitation agreement for an additional period of at least one year, and not to terminate such agreement in future years without prior approval of the Board.
The Board requested information regarding and, as applicable, considered: (1) the fee rate structure of each Portfolio as it relates to the services provided under the contracts; and (2) the potential fall-out benefits to the Adviser and its respective affiliates from its association with the Portfolios. For each Portfolio, the Board separately determined that the fees payable to the Adviser are reasonable for the services that the Adviser performs, which were considered in light of the nature, extent and quality of the services that it has performed and is expected to perform.
For each Portfolio, the Board considered information on revenues, costs and profits realized by the Adviser, which was prepared by Management in accordance with the allocation methodology (including related assumptions) specified in the 15(c) Methodology Guide. In addition, the Board considered information that it requested and that was provided by Management with respect to the profitability of service providers affiliated with the Adviser. The Board also considered the profitability of the Adviser and its affiliated companies attributable to managing and operating each Portfolio both with and without the profitability of the distributor of the Portfolios and both before and after giving effect to any expenses incurred by the Adviser or any affiliated company in making revenue sharing or other payments to third parties, including affiliated insurance companies, for distribution and administrative services.
Although the 15(c) Methodology Guide establishes certain standards for profit calculation, the Board recognized that profitability analysis on a Portfolio-by-Portfolio basis is not an exact science and there is no uniform methodology within the asset management industry for determining profitability for this purpose. In this context, the Board realized that Management’s calculations regarding its costs incurred in establishing the infrastructure necessary for the Portfolios’ operations may not be fully reflected in the expenses allocated to the Portfolios in determining profitability, and that the information presented may not portray all of the costs borne by the Adviser and Management or capture their entrepreneurial risk associated with offering and managing a mutual fund complex in the current regulatory and market environment. In addition, the Board recognized that the use of different reasonable methodologies for purposes of calculating profit data can give rise to dramatically different profit and loss results.
In making its determinations, the Board based its conclusions as to the reasonableness of the advisory fees of the Adviser primarily on the factors described for each Portfolio below. At the request of the Board, the Adviser has from time to time agreed to implement remedial
ADVISORY CONTRACT APPROVAL DISCUSSION (Unaudited) (continued)
actions regarding certain Voya funds. These remedial actions have included, among others: reductions in fee rates or adjustments to expense limitation and waiver arrangements; and strategy modifications.
Portfolio-by-Portfolio Analysis
The following paragraphs outline certain of the specific factors that the Board considered, and the conclusions reached, at its September 12, 2014 meeting in relation to approving the Portfolios’ Advisory Contract. These specific factors are in addition to those considerations discussed above. In each case, the Portfolio’s performance was compared to its Morningstar category median and average, as well as its primary benchmark, a broad-based securities market index that appears in the Portfolio’s prospectus. With respect to Morningstar quintile rankings, the first quintile represents the highest (best) performance and the fifth quintile represents the lowest performance. Each Portfolio’s (except VY® Fidelity® VIP Equity-Income Portfolio) management fee rate and expense ratio were compared to the fees and expense ratios of the funds in its Selected Peer Group.
VY® Fidelity® VIP Contrafund® Portfolio
In considering whether to approve the renewal of the Advisory Contract for VY® Fidelity® VIP Contrafund® Portfolio, the Board considered that, based on performance data for the periods ended March 31, 2014: (1) the Portfolio outperformed its Morningstar category median for all periods presented, with the exception of the three-year period, during which it underperformed; (2) the Portfolio outperformed its primary benchmark for all periods presented, with the exception of the three-year and five-year periods, during which it underperformed; and (3) the Portfolio is ranked in the second quintile of its Morningstar category for the most recent calendar quarter, year-to-date, one-year, and five-year periods, and the fourth quintile for the three-year period.
In analyzing this performance data, the Board took into account: (1) Management’s representations regarding the reasonableness of the Portfolio’s performance during certain periods; (2) Management’s analysis regarding the impact that stock selection, exposure to non-U.S. securities and exposure to volatility had on the Portfolio’s performance; and (3) that Management would continue to monitor, and the Board or its IRC would periodically review, the Portfolio’s performance.
In considering the fees payable under the Advisory Contract for the Portfolio, the Board took into account the factors described above and also considered: (1) the fairness of the compensation under an Advisory Contract: (a) under which no advisory fees are charged when the
Portfolio is fully invested in the Contrafund Master Fund; and (b) advisory fees are charged by the Contrafund Master Fund and indirectly borne by Portfolio shareholders; and (2) the pricing structure (including the expense ratio to be borne by shareholders) of the Portfolio, as compared to its Selected Peer Group, including that: (a) the management fee (inclusive of a 0.10% administration fee) for the Portfolio is below the median and the average management fees of the funds in its Selected Peer Group; and (b) the expense ratio for the Portfolio is below the median and the average expense ratios of the funds in its Selected Peer Group.
After its deliberation, the Board reached the following conclusions: (1) the Portfolio’s management fee rate is reasonable in the context of all factors considered by the Board; (2) the Portfolio’s expense ratio is reasonable in the context of all factors considered by the Board; and (3) the Portfolio’s performance is reasonable in the context of all factors considered by the Board. Based on these conclusions and other factors, the Board voted to renew the Advisory Contract for the Portfolio for the year ending September 30, 2015. During this renewal process, different Board members may have given different weight to different individual factors and related conclusions.
VY® Fidelity® VIP Equity-Income Portfolio
In considering whether to approve the renewal of the Advisory Contract for VY® Fidelity® VIP Equity-Income Portfolio, the Board considered that, based on performance data for the periods ended March 31, 2014: (1) the Portfolio underperformed its Morningstar category median for all periods presented, with the exception of the five-year period, during which it outperformed; (2) the Portfolio underperformed its primary benchmark for all periods presented; and (3) the Portfolio is ranked in the second quintile of it Morningstar category for the five- year period, the third quintile for the most recent calendar quarter and year-to-date period, the fourth quintile for the three-year period, and the fifth (lowest) quintile for the one year period.
In analyzing this performance data, the Board took into account: (1) Management’s representations regarding the reasonableness of the Portfolio’s performance during certain periods; (2) that, in 2011, there were was a change to the portfolio management team managing Fidelity’s VIP Equity-Income Portfolio (the “Equity-Income Master Fund”), the underlying fund in which the Portfolio invests, and Management believes this change will lead to improved longer-term performance; (3) Management’s analysis of the negative effects that an exposure to high-dividend stocks as opposed to low/no-yield stocks had on the Portfolio’s more recent performance; and
ADVISORY CONTRACT APPROVAL DISCUSSION (Unaudited) (continued)
(4) that Management will continue to monitor, and the Board or its IIRC would periodically review, the Portfolio’s performance.
In considering the fees payable under the Advisory Contract for the Portfolio, the Board took into account the factors described above and also considered: (1) the fairness of the compensation under an Advisory Contract: (a) under which no advisory fees are charged when the Portfolio is fully invested in the Equity- Income Master Fund; and (b) advisory fees are charged by the Equity-Income Master Fund and indirectly borne by the Portfolio shareholders; and (2) the pricing structure (including the expense ratio to be borne by shareholders) of the Portfolio.
In analyzing this fee data, the Board noted Management’s representations: (1) that the Portfolio’s Selected Peer Group did not contain funds for fee comparison purposes; and (2) regarding the reasonableness of the Portfolio’s expense ratio and management fee rate.
After its deliberation, the Board reached the following conclusions: (1) the Portfolio’s management fee rate is reasonable in the context of all factors considered by the Board; (2) the Portfolio’s expense ratio is reasonable in the context of all factors considered by the Board; and (3) the Portfolio’s performance is reasonable in the context of all factors considered by the Board. Based on these conclusions and other factors, the Board voted to renew the Advisory Contract for the Portfolio for the year ending September 30, 2015. During this renewal process, different Board members may have given different weight to different individual factors and related conclusions.
VY® Fidelity® VIP Mid Cap Portfolio
In considering whether to approve the renewal of the Advisory Contract for VY® Fidelity® VIP Mid Cap Portfolio, the Board considered that, based on performance data for the periods ended March 31, 2014: (1) the Portfolio underperformed its Morningstar category median for the three-year and five-year periods, but outperformed for the most recent calendar quarter, year-to-date, and one-year periods; (2) the Portfolio underperformed its primary benchmark for all periods presented, with the exception of the one-year period, during which outperformed; and (3) the Portfolio is ranked in the third quintile of its Morningstar category for the most recent calendar quarter, year-to-date, and one-year periods, and the fourth quintile for the three-year and five-year periods.
In analyzing this performance data, the Board took into account: (1) Management’s representations regarding the reasonableness of the Portfolio’s performance during certain periods; (2) Management’s representations that the
Portfolio’s underperformance vis-à-vis Morningstar Mid-Cap Growth peers could be attributed largely to poor performance in 2011 that was, in turn, due primarily to exposure to stocks in non-U.S. companies; (3) Management’s discussion of steps taken by the portfolio management team that manages Fidelity’s VIP Mid Cap Portfolio (the “Mid-Cap Master Fund”), the underlying fund in which the Portfolio invests, to address underperformance; and (4) Management’s confidence in the ability of the Mid-Cap Master Fund’s portfolio management team to execute the Mid-Cap Master Fund’s investment strategy.
In considering the fees payable under the Advisory Contract for the Portfolio, the Board took into account the factors described above and also considered: (1) the fairness of the compensation under an Advisory Contract: (a) under which no advisory fees are charged when the Portfolio is fully invested in the Mid Cap Master Fund; and (b) advisory fees are charged by the Mid Cap Master Fund and indirectly borne by Portfolio shareholders; and (2) the pricing structure (including the expense ratio to be borne by shareholders) of the Portfolio, as compared to its Selected Peer Group, including that: (a) the management fee (inclusive of a 0.10% administration fee) for the Portfolio is above the median and the average management fees of the funds in its Selected Peer Group; and (b) the expense ratio for the Portfolio is below the median and the average expense ratios of the funds in its Selected Peer Group.
After its deliberation, the Board reached the following conclusions: (1) the Portfolio’s management fee rate is reasonable in the context of all factors considered by the Board; (2) the Portfolio’s expense ratio is reasonable in the context of all factors considered by the Board; and (3) the Portfolio’s performance is reasonable in the context of all factors considered by the Board. Based on these conclusions and other factors, the Board voted to renew the Advisory Contract for the Portfolio for the year ending September 30, 2015. During this renewal process, different Board members may have given different weight to different individual factors and related conclusions.
APPROVAL OF INVESTMENT ADVISORY CONTRACT IN CONNECTION WITH A CHANGE OF CONTROL EVENT
Section 15(c) of the 1940 Act, provides that, when the Portfolios enter into new investment advisory contracts with the Adviser, the Board, including a majority of the Independent Directors, must approve the new arrangements. Discussed below are certain factors that the Board considered at a meeting held on November18, 2014 in determining whether to approve new advisory arrangements for the Portfolios in connection with a
ADVISORY CONTRACT APPROVAL DISCUSSION (Unaudited) (continued)
Change of Control Event, as such term is defined below, pursuant to the Separation Plan.
At the November 18, 2014 meeting, the Board noted that pursuant to an agreement with the European Commission, ING Groep, N.V. (as defined above, “ING Groep”), the former parent company of the Adviser, is required to divest its entire interest in Voya Financial, Inc. (formerly, ING U.S., Inc.), its U.S.-based insurance, retirement services, and investment management operations, which include the Adviser, by the end of 2016 (as defined above, the “Separation Plan”). Voya Financial, Inc. previously was a wholly owned, indirect subsidiary of ING Groep and is a parent company of the Adviser.
Each of the Portfolios is subject to the 1940 Act, which provides that any investment advisory agreement must terminate automatically upon its “assignment.” As used in the 1940 Act, the term assignment includes any transfer of a controlling block of outstanding voting securities of an adviser or the parent company of an adviser. Such a transfer is referred to herein as a “Change of Control Event.” ING Groep’s base case to achieve the Separation Plan was through an initial public offering of Voya Financial, Inc. (the “IPO”) followed by the divestment of ING Groep’s remaining ownership interest over time through one or more additional public offerings of Voya Financial, Inc. stock, or, possibly, through one or more privately negotiated sales of the stock. The Board recognized that the Separation Plan contemplated several public offerings and each may have been deemed to be a Change of Control Event, triggering the necessity for new agreements, which would require the approval of the Board. The Board concluded that approval by shareholders of the new agreements that would become effective in the event of one or more Change of Control Events would permit the Portfolios to benefit from the continuation of services by the Adviser and its affiliates throughout the Separation Plan without the need for multiple shareholder meetings. The Board was informed by the Adviser and its counsel that the Adviser obtained regulatory assurances from the staff of the U.S. Securities and Exchange Commission in March 2013 that they would not object to approval of future agreements by shareholders at a single shareholder meeting. Portfolio shareholders approved the future agreements in May 2013.
The IPO was completed in May 2013. ING Groep divested additional shares in Voya Financial, Inc. through four subsequent public offerings since May 2013, including a secondary common stock offering that closed on November 18, 2014 (the “November Transaction”). (In addition, concurrently with the November Transaction, Voya Financial, Inc. repurchased $175 million of its shares
directly from ING Groep.) Upon the completion of the November Transaction and the concurrent direct share repurchase, ING Groep’s ownership in Voya Financial, Inc. was reduced from approximately 32.5% to approximately 19%. This was deemed to be a Change of Control Event that resulted in the termination of the Portfolios’ existing advisory agreement (the “Prior Agreement”) at the close of business on November 18, 2014.
In light of the foregoing, on November 18, 2014 the Board, at an in-person meeting, approved a new investment advisory agreement (the “New Agreement”) for the Portfolios to replace the Prior Agreement upon termination. At that meeting, the Adviser represented that the New Agreement approved by the Board was not materially different from the agreement approved by shareholders of the Portfolios in 2013 and no single person or group of persons acting together was expected to gain “control” (as defined in the 1940 Act) of Voya Financial, Inc. As a result, shareholders of the Portfolios will not be asked to vote again on new agreements with the Adviser.
The decision by the Board, including a majority of the Independent Directors, to approve the New Agreement was based on a determination by the Board that it would be in the best interests of the shareholders of the Portfolios for the Adviser to continue providing investment advisory and related services for the Portfolios, without interruption, after the Change of Control Event.
Prior to its approval of the New Agreement, the Board reviewed, among other matters, the quality, extent and nature of the services currently being provided by the Adviser under the Prior Agreement and to be provided under the New Agreement. A substantial portion of this review was conducted as part of, and in conjunction with, the Board’s annual review of the Prior Agreement, which was most recently approved for continuation at the in-person meeting of the Board held on September 12, 2014. During the review process that led to its approval of the Prior Agreement on September 12, 2014, the Board was informed by the Adviser that it was likely the Board would be asked in the very near future to consider approval of the New Agreement. The Board further noted that the Change of Control Event would result in the Adviser’s loss of access to certain services and resources of ING Groep, which could adversely affect its business and profitability.
On September 12, 2014, the Board concluded, in light of all factors it considered, including undertakings by the Adviser relating to certain follow-up actions, to renew the Prior Agreement and that the fee rates set forth in the Prior Agreement were fair and reasonable. Among other factors, the Board considered: (1) the nature, extent and quality of services provided under the Prior Agreement; (2) the extent to which economies of scale are reflected in fee rate
ADVISORY CONTRACT APPROVAL DISCUSSION (Unaudited) (continued)
schedules under the Prior Agreement; (3) the existence of any “fall-out” benefits to the Adviser and its affiliates; (4) a comparison of fee rates, expense ratios, and investment performance to those of similar funds; and (5) the costs incurred and profits realized by the Adviser and its affiliates with respect to its services to the Portfolios.
A further description of the process followed by the Board in approving the Prior Agreement on September 12, 2014, including the information reviewed, certain material factors considered and certain related conclusions reached, is set forth above under the section titled “BOARD CONSIDERATION AND APPROVAL OF INVESTMENT ADVISORY CONTRACT.”
In connection with its approval of the New Agreement, on November 18, 2014 the Board considered its conclusions in connection with its September 12, 2014 approval of the Prior Agreement that was in effect on that date, including the Board’s assessment of the nature, extent and quality of services being provided and, as applicable, actions taken in certain instances to improve the relationship between the costs and the quality of services being provided. Also in connection with its November 18, 2014 approvals of the New Agreement, the Board considered a representation from the Adviser that there were no additional developments not already disclosed to the Board since September 12, 2014 that would be a material consideration to the Board in connection with its consideration of the New Agreement.
In addition, in determining whether to approve the New Agreement, the Board took into account the considerations set out below.
| 1) | The Independent Directors solicited and received ongoing advice regarding the Board’s legal duties when approving the New Agreement from K&L Gates, their independent legal counsel, which law firm has extensive experience regarding such matters. |
| 2) | The Board considered Management’s representations regarding its commitment to maintain appropriate levels of overall staffing, ongoing resources and service quality through the transactions under the Separation Plan and after the Change of Control Event. The Board noted that such services include, but are not limited to, portfolio management services, administrative services, and regulatory compliance services. In this regard, the Board considered representations by the Adviser and its affiliates that its separation from ING Groep, as contemplated by the Separation Plan, will not lead to a reduction in the quality or scope of these |
and other services provided by those firms to the Portfolios. The Board also considered the importance of the asset management operations to the overall success of Voya Financial, Inc., which provides a strong incentive to Voya Financial, Inc. to provide appropriate resource allocations to support those asset management operations.
| 3) | The Board considered representations by the Adviser and its affiliates that approval of the New Agreement would be necessary for the Portfolios to continue receiving investment management services from the Adviser following the November 18th Change of Control Event. In addition, the Board considered representations by the Adviser and its affiliates, as well as related supporting documentation, indicating that the New Agreement, including the fees payable thereunder, are substantially similar to and, in any event, are no less favorable to the Portfolios than, the terms of the corresponding Prior Agreement. |
| 4) | The Board considered representations by the Adviser and its affiliates, including senior investment management personnel, as well as related supporting documentation, indicating that: (a) the Adviser can be expected to provide services of the same nature, extent and quality under the New Agreement as were provided under the Prior Agreement; and (b) the November 18th Change of Control Event is not expected to result in any changes to: (i) the management of the Portfolios, including the continuity of the Portfolios’ portfolio managers and other personnel responsible for the management operations of the Portfolios; or (ii) the investment objective of or the principal investment strategies used to manage any of the Portfolios. |
| 5) | The Board considered actions taken by the Adviser subsequent to the September 12, 2014 approvals of the Prior Agreement with respect to certain Voya funds in response to requests made by the Board in connection with those approvals. |
| 6) | The Board considered the potential benefits to be realized by the Adviser and its affiliates as a result of the New Agreement. |
Based on the foregoing and other relevant considerations, at a meeting of the Board held on November 18, 2014, the Board, including a majority of the Independent Directors, voted to approve the New Agreement. In this connection, the Board concluded that, in light of all factors considered,
ADVISORY CONTRACT APPROVAL DISCUSSION (Unaudited) (continued)
the terms of the New Agreement, including fee rates, were fair and reasonable, and the New Agreement should be approved so as to enable a continuation without interruption of the services being provided by the current service providers pursuant to the Prior Agreement. The Board noted that no one factor was determinative of its
decisions which, instead, were premised upon the totality of factors considered. The Board also noted that different Board members likely placed emphasis on different factors in reaching their individual conclusions to vote in favor of the New Agreement.
Fidelity® Variable Insurance Products:
Contrafund® Portfolio
Annual Report December 31, 2014 |  |

Contents
How the fund has done over time.
The Portfolio Manager’s review of fund performance and strategy.
An example of shareholder expenses.
A summary of major shifts in the fund’s investments over the past six months.
A complete list of the fund’s investments with their market values.
Statements of assets and liabilities, operations, and changes in net assets, as well as financial highlights.
Notes to the financial statements.
To view a fund’s proxy voting guidelines and proxy voting record for the 12-month period ended June 30, visit http://www.fidelity.com/proxyvotingresults or visit the Securities and Exchange Commission’s (SEC) web site at http://www.sec.gov. You may also call 1-877-208-0098 to request a free copy of the proxy voting guidelines.
Fidelity Variable Insurance Products are separate account options which are purchased through a variable insurance contract.
Standard & Poor’s, S&P and S&P 500 are registered service marks of The McGraw-Hill Companies, Inc. and have been licensed for use by Fidelity Distributors Corporation.
Other third-party marks appearing herein are the property of their respective owners.
All other marks appearing herein are registered or unregistered trademarks or service marks of FMR LLC or an affiliated company. © 2015 FMR LLC. All rights reserved.
This report and the financial statements contained herein are submitted for the general information of the shareholders of the fund. This report is not authorized for distribution to prospective investors in the fund unless preceded or accompanied by an effective prospectus.
A fund files its complete schedule of portfolio holdings with the SEC for the first and third quarters of each fiscal year on Form N-Q. Forms N-Q are available on the SEC’s web site at http://www.sec.gov. A fund’s Forms N-Q may be reviewed and copied at the SEC’s Public Reference Room in Washington, DC. Information regarding the operation of the SEC’s Public Reference Room may be obtained by calling 1-800-SEC-0330. For a complete list of a fund’s portfolio holdings, view the most recent holdings listing, semiannual report, or annual report on Fidelity’s web site at http://www.fidelity.com, http://www.advisor.fidelity.com, or http://www.401k.com, as applicable.
NOT FDIC INSURED • MAY LOSE VALUE • NO BANK GUARANTEE
Neither the fund nor Fidelity Distributors Corporation is a bank.
Performance: The Bottom Line
Average annual total return reflects the change in the value of an investment, assuming reinvestment of the class’ distributions from dividend income and capital gains (the profits earned upon the sale of securities that have grown in value, if any) and assuming a constant rate of performance each year. During periods of reimbursement by Fidelity, a fund’s total return will be greater than it would be had the reimbursement not occurred. Performance numbers are net of all underlying fund operating expenses, but do not include any insurance charges imposed by your insurance company’s separate account. If performance information included the effect of these additional charges, the total returns would have been lower. How a fund did yesterday is no guarantee of how it will do tomorrow.
| Average Annual Total Returns | | | |
| Periods ended December 31, 2014 | Past 1 | Past 5 | Past 10 |
| | year | years | years |
| VIP ContrafundSM Portfolio - Initial Class | 11.94% | 14.35% | 8.89% |
| VIP Contrafund Portfolio - Service Class | 11.82% | 14.23% | 8.78% |
| VIP Contrafund Portfolio - Service Class 2 | 11.65% | 14.06% | 8.61% |
| VIP Contrafund Portfolio - Investor ClassA | 11.85% | 14.25% | 8.78% |
A The initial offering of Investor Class shares took place on July 21,2005. Returns prior to July 21, 2005, are those of Initial Class. Had Investor Class’s transfer agent fee been reflected, returns prior to July 21, 2005, would have been lower.
Let’s say hypothetically that $10,000 was invested in VIP ContrafundSM Portfolio – Initial Class on December 31, 2004. The chart shows how the value of your investment would have changed, and also shows how the S&P 500® Index performed over the same period.

Management's Discussion of Fund Performance
Market Recap: Global stocks and bonds posted gains for 2014 despite tepid returns outside the United States, amid recessionary pressure in parts of Asia, as well as anemic economic growth in Europe. The U.S. stock market closed near an all-time high for the 12 months ending December 31, 2014, supported by low interest rates and strong corporate profits. The large-cap S&P 500® Index returned 13.69%, achieving a double-digit return for the third consecutive year. The Barclays® U.S. Aggregate Bond Index, meanwhile, rose 5.97%, significantly outperforming the global taxable investment-grade bond market. Investment-grade credit did particularly well, returning 7.53%, supported by solid corporate fundamentals and a low default rate. The MSCI EAFE Index, a measure of non-U.S. developed stock markets, returned –4.77% for the year, hampered by late-period deflationary concerns in the eurozone. Meanwhile, The Barclays® Global Aggregate GDP Weighted Index, a measure of worldwide investment-grade bond performance, gained 0.77% in U.S. dollar terms. Turning to emerging-market stocks, The MSCI Emerging Markets Index returned –1.82% for the year, held back by continued concerns that a slowing Chinese economy may dampen earnings for companies that do business there.
Comments from Co-Portfolio Manager Robert Stansky, Head of FMR's Stock Selector Large Cap Group, which manages VIP ContrafundSM Portfolio: For the year, the fund’s share classes trailed the 13.69% gain of the S&P 500®. (For specific portfolio performance results, please refer to the performance section of this report.) Most of the performance shortfall occurred in the fourth quarter. Stock selection in financials cost us the most versus our benchmark. Much smaller negatives were spread out over six other sectors. One explanation for the fund’s disappointing results compared with the index was its slightly smaller average market capitalization. Small-cap stocks considerably lagged their large-cap peers during the year. Additionally, in some groups, such as real estate and utilities, investors favored the most defensive stocks — which we tended to avoid — due to declining interest rates, which supported names that were more yield-sensitive. The fund’s overweighting in Internet search provider Google was our biggest detractor, given the roughly –6% return in these shares. The company reported disappointing third-quarter revenue and earnings, attributed to fewer-than-expected clicks on its paid online advertisements. Computer chipmaker and index component Intel hurt because it returned about 44% and the fund didn’t own it. In the energy sector, performance was hampered by Noble Energy. This North American shale oil producer saw its shares decline 30% during the fourth quarter amid the five-year low in crude oil prices. Whiting Petroleum, which we bought in January, also fared poorly. Conversely, a non-index stake in Netherlands-based NXP Semiconductors was the fund’s top relative contributor. As the leading supplier of chips embedded in security-enabled credit cards, NXP rode a combination of expanding profit margins and debt reduction to robust earnings growth. RF Micro Devices also did well, driven by the early success of Apple’s iPhone® 6, which uses RF Micro’s radio-frequency chips. Whiting Petroleum, NXP Semiconductors and RF Micro Devices were not in the benchmark.
The views expressed above reflect those of the portfolio manager(s) only through the end of the period as stated on the cover of this report and do not necessarily represent the views of Fidelity or any other person in the Fidelity organization. Any such views are subject to change at any time based upon market or other conditions and Fidelity disclaims any responsibility to update such views. These views may not be relied on as investment advice and, because investment decisions for a Fidelity fund are based on numerous factors, may not be relied on as an indication of trading intent on behalf of any Fidelity fund.
Shareholder Expense Example
As a shareholder of the Fund, you incur two types of costs: (1) transaction costs, including redemption fees and (2) ongoing costs, including management fees, distribution and/or service (12b-1) fees and other Fund expenses. This Example is intended to help you understand your ongoing costs (in dollars) of investing in the Fund and to compare these costs with the ongoing costs of investing in other mutual funds.
The Example is based on an investment of $1,000 invested at the beginning of the period and held for the entire period (July 1, 2014 to December 31, 2014).
Actual Expenses
The first line of the accompanying table for each class of the Fund provides information about actual account values and actual expenses. You may use the information in this line, together with the amount you invested, to estimate the expenses that you paid over the period. Simply divide your account value by $1,000.00 (for example, an $8,600 account value divided by $1,000.00 = 8.6), then multiply the result by the number in the first line for a class of the Fund under the heading entitled “Expenses Paid During Period” to estimate the expenses you paid on your account during this period. The estimate of expenses does not include any fees or other expenses of any variable annuity or variable life insurance product. If they were, the estimate of expenses you paid during the period would be higher, and your ending account value would be lower. In addition, the Fund, as a shareholder in the underlying Fidelity Central Funds, will indirectly bear its pro-rata share of the fees and expenses incurred by the underlying Fidelity Central Funds. These fees and expenses are not included in the Fund’s annualized expense ratio used to calculate the expense estimate in the table below.
Hypothetical Example for Comparison Purposes
The second line of the accompanying table for each class of the Fund provides information about hypothetical account values and hypothetical expenses based on a Class’ actual expense ratio and an assumed rate of return of 5% per year before expenses, which is not the Class’ actual return. The hypothetical account values and expenses may not be used to estimate the actual ending account balance or expenses you paid for the period. You may use this information to compare the ongoing costs of investing in the Fund and other funds. To do so, compare this 5% hypothetical example with the 5% hypothetical examples that appear in the shareholder reports of the other funds. The estimate of expenses does not include any fees or other expenses of any variable annuity or variable life insurance product. If they were, the estimate of expenses you paid during the period would be higher, and your ending account value would be lower. In addition, the Fund, as a shareholder in the underlying Fidelity Central Funds, will indirectly bear its pro-rata share of the fees and expenses incurred by the underlying Fidelity Central Funds. These fees and expenses are not included in the Fund’s annualized expense ratio used to calculate the expense estimate in the table below.
Please note that the expenses shown in the table are meant to highlight your ongoing costs only and do not reflect any transaction costs. Therefore, the second line of the table is useful in comparing ongoing costs only, and will not help you determine the relative total costs of owning different funds. In addition, if these transactional costs were included, your costs would have been higher.
| | | Annualized Expense RatioB | | Beginning
Account Value
July 1, 2014 | | | Ending
Account Value
December 31, 2014 | | | Expenses Paid
During Period*
July 1, 2014
to December 31, 2014 | |
| Initial Class | | .63% | | | | | | | | | | | | |
| Actual | | | | $ | 1,000.00 | | | $ | 1,048.90 | | | $ | 3.25 | |
| HypotheticalA | | | | $ | 1,000.00 | | | $ | 1,022.03 | | | $ | 3.21 | |
| Service Class | | .73% | | | | | | | | | | | | |
| Actual | | | | $ | 1,000.00 | | | $ | 1,048.40 | | | $ | 3.77 | |
| HypotheticalA | | | | $ | 1,000.00 | | | $ | 1,021.53 | | | $ | 3.72 | |
| Service Class 2 | | .88% | | | | | | | | | | | | |
| Actual | | | | $ | 1,000.00 | | | $ | 1,047.70 | | | $ | 4.54 | |
| HypotheticalA | | | | $ | 1,000.00 | | | $ | 1,020.77 | | | $ | 4.48 | |
| Service Class 2R | | .88% | | | | | | | | | | | | |
| Actual | | | | $ | 1,000.00 | | | $ | 1,047.60 | | | $ | 4.54 | |
| HypotheticalA | | | | $ | 1,000.00 | | | $ | 1,020.77 | | | $ | 4.48 | |
| Investor Class | | .71% | | | | | | | | | | | | |
| Actual | | | | $ | 1,000.00 | | | $ | 1,048.70 | | | $ | 3.67 | |
| HypotheticalA | | | | $ | 1,000.00 | | | $ | 1,021.63 | | | $ | 3.62 | |
A 5% return per year before expenses
B Annualized expense ratio reflects expenses net of applicable fee waivers.
* Expenses are equal to each Class’ annualized expense ratio, multiplied by the average account value over the period, multiplied by 184/365 (to reflect the one-half year period).
Investment Changes (Unaudited)
| Top Ten Stocks as of December 31, 2014 |
| | | % of fund's
net assets | | % of fund's net assets
6 months ago |
| Apple, Inc. | | | 3.7 | | | 4.1 |
| Google, Inc. Class C | | | 2.1 | | | 1.8 |
| Bank of America Corp. | | | 2.0 | | | 1.1 |
| Citigroup, Inc. | | | 1.9 | | | 0.9 |
| Procter & Gamble Co. | | | 1.8 | | | 1.6 |
| Capital One Financial Corp. | | | 1.7 | | | 1.9 |
| JPMorgan Chase & Co. | | | 1.6 | | | 1.7 |
| Chevron Corp. | | | 1.6 | | | 2.1 |
| QUALCOMM, Inc. | | | 1.4 | | | 0.6 |
| Twenty-First Century Fox, Inc. Class A | | | 1.2 | | | 1.1 |
| | | | 19.0 | | | |
| Market Sectors as of December 31, 2014 |
| | | % of fund's | | % of fund's net assets |
| | | net assets | | 6 months ago |
| Information Technology | | | 18.8 | | | 18.2 |
| Financials | | | 16.3 | | | 15.5 |
| Health Care | | | 14.2 | | | 13.8 |
| Consumer Discretionary | | | 13.2 | | | 12.1 |
| Consumer Staples | | | 9.7 | | | 9.3 |
| Industrials | | | 9.3 | | | 9.8 |
| Energy | | | 8.0 | | | 10.5 |
| Materials | | | 4.1 | | | 4.1 |
| Utilities | | | 3.1 | | | 3.3 |
| Telecommunication Services | | | 1.6 | | | 2.0 |
| Asset Allocation (% of fund’s net assets) | |
| As of December 31, 2014* | | As of June 30, 2014** |
 | |  |
Investments December 31, 2014
Showing Percentage of Net Assets
| | | Shares | | | Value | |
| | | | | | | |
| CONSUMER DISCRETIONARY - 13.2% | | | | | | |
| Diversified Consumer Services - 0.5% | | | | | | |
| H&R Block, Inc. | | | 3,054,594 | | | $ | 102,878,726 | |
| Hotels, Restaurants & Leisure - 4.4% | | | | | | | | |
| ARAMARK Holdings Corp. | | | 691,800 | | | | 21,549,570 | |
| Extended Stay America, Inc. unit | | | 6,137,227 | | | | 118,509,853 | |
| Marriott International, Inc. Class A | | | 839,300 | | | | 65,490,579 | |
| McDonald's Corp. | | | 2,064,184 | | | | 193,414,041 | |
| Panera Bread Co. Class A (a) | | | 822,966 | | | | 143,854,457 | |
| Starbucks Corp. | | | 2,466,000 | | | | 202,335,300 | |
| Wynn Resorts Ltd. | | | 240,700 | | | | 35,806,532 | |
| Yum! Brands, Inc. | | | 1,120,296 | | | | 81,613,564 | |
| | | | | | | | 862,573,896 | |
| Internet & Catalog Retail - 1.1% | | | | | | | | |
| Ctrip.com International Ltd. sponsored ADR (a) | | | 877,034 | | | | 39,905,047 | |
| Liberty Interactive Corp. Series A (a) | | | 5,222,392 | | | | 153,642,773 | |
| Qunar Cayman Islands Ltd. sponsored ADR (a) | | | 215,196 | | | | 6,118,022 | |
| Travelport Worldwide Ltd. (d) | | | 1,163,538 | | | | 20,943,684 | |
| | | | | | | | 220,609,526 | |
| Media - 4.3% | | | | | | | | |
| Comcast Corp. Class A | | | 830,106 | | | | 48,154,449 | |
| DIRECTV (a) | | | 1,847,631 | | | | 160,189,608 | |
| DISH Network Corp. Class A (a) | | | 145,600 | | | | 10,612,784 | |
| DreamWorks Animation SKG, Inc. Class A (a)(d) | | | 2,657,928 | | | | 59,351,532 | |
| Legend Pictures LLC (a)(f)(g) | | | 2,062 | | | | 4,158,188 | |
| Liberty Media Corp. Class C (a) | | | 2,005,200 | | | | 70,242,156 | |
| Manchester United PLC (a)(d) | | | 1,849,700 | | | | 29,410,230 | |
| The Madison Square Garden Co. Class A (a) | | | 2,072,210 | | | | 155,954,525 | |
| Time Warner Cable, Inc. | | | 149,700 | | | | 22,763,382 | |
| Twenty-First Century Fox, Inc. Class A | | | 6,215,107 | | | | 238,691,184 | |
| Viacom, Inc. Class B (non-vtg.) | | | 495,418 | | | | 37,280,205 | |
| Weinstein Co. Holdings LLC Class A-1 (a)(f)(g) | | | 11,499 | | | | 2,092,818 | |
| World Wrestling Entertainment, Inc. Class A (d) | | | 503,000 | | | | 6,207,020 | |
| | | | | | | | 845,108,081 | |
| Multiline Retail - 1.0% | | | | | | | | |
| Dollar General Corp. (a) | | | 2,682,420 | | | | 189,647,094 | |
| Poundland Group PLC | | | 42,785 | | | | 218,859 | |
| | | | | | | | 189,865,953 | |
| Specialty Retail - 0.7% | | | | | | | | |
| TJX Companies, Inc. | | | 2,142,707 | | | | 146,946,846 | |
| | | Shares | | | Value | |
| | | | | | | |
| Textiles, Apparel & Luxury Goods - 1.2% | | | | | | | | |
| lululemon athletica, Inc. (a) | | | 1,115,062 | | | $ | 62,209,309 | |
| NIKE, Inc. Class B | | | 1,844,435 | | | | 177,342,425 | |
| | | | | | | | 239,551,734 | |
| | | | | | | | | |
| TOTAL CONSUMER DISCRETIONARY | | | | | | | 2,607,534,762 | |
| | | | | | | | | |
| CONSUMER STAPLES - 9.6% | | | | | | | | |
| Beverages - 1.7% | | | | | | | | |
| Anheuser-Busch InBev SA NV | | | 258,471 | | | | 29,088,681 | |
| Coca-Cola Icecek Sanayi A/S | | | 325,515 | | | | 7,041,403 | |
| Diageo PLC sponsored ADR | | | 240,942 | | | | 27,489,073 | |
| Embotelladora Andina SA sponsored ADR | | | 369,627 | | | | 6,283,659 | |
| Monster Beverage Corp. (a) | | | 405,800 | | | | 43,968,430 | |
| Pernod Ricard SA | | | 250,679 | | | | 27,985,606 | |
| Remy Cointreau SA | | | 259,145 | | | | 17,359,701 | |
| The Coca-Cola Co. | | | 4,075,306 | | | | 172,059,419 | |
| | | | | | | | 331,275,972 | |
| Food & Staples Retailing - 2.5% | | | | | | | | |
| CVS Health Corp. | | | 1,932,964 | | | | 186,163,763 | |
| Kroger Co. | | | 2,175,182 | | | | 139,668,436 | |
| Sysco Corp. | | | 1,000,096 | | | | 39,693,810 | |
| Wal-Mart Stores, Inc. | | | 927,991 | | | | 79,695,867 | |
| Whole Foods Market, Inc. | | | 892,000 | | | | 44,974,640 | |
| | | | | | | | 490,196,516 | |
| Food Products - 1.1% | | | | | | | | |
| Bunge Ltd. | | | 435,412 | | | | 39,583,305 | |
| Keurig Green Mountain, Inc. | | | 346,419 | | | | 45,864,144 | |
| Mead Johnson Nutrition Co. Class A | | | 713,789 | | | | 71,764,346 | |
| Nestle SA | | | 365,668 | | | | 26,657,568 | |
| The Hershey Co. | | | 384,400 | | | | 39,950,692 | |
| | | | | | | | 223,820,055 | |
| Household Products - 1.8% | | | | | | | | |
| Procter & Gamble Co. | | | 3,933,484 | | | | 358,301,058 | |
| Personal Products - 0.2% | | | | | | | | |
| Estee Lauder Companies, Inc. Class A | | | 347,400 | | | | 26,471,880 | |
| L'Oreal SA | | | 73,300 | | | | 12,355,445 | |
| | | | | | | | 38,827,325 | |
| Tobacco - 2.3% | | | | | | | | |
| Altria Group, Inc. | | | 4,021,854 | | | | 198,156,747 | |
| British American Tobacco PLC sponsored ADR | | | 2,050,779 | | | | 221,114,992 | |
| Philip Morris International, Inc. | | | 190,313 | | | | 15,500,994 | |
| Souza Cruz SA | | | 990,300 | | | | 7,197,576 | |
| | | | | | | | 441,970,309 | |
| | | | | | | | | |
| TOTAL CONSUMER STAPLES | | | | | | | 1,884,391,235 | |
See accompanying notes which are an integral part of the financial statements.
Investments – continued
| Common Stocks – continued |
| | | | Shares | | | | Value | |
| | | | | | | | | |
| ENERGY - 8.0% | | | | | | | | |
| Energy Equipment & Services - 1.1% | | | | | | | | |
| Baker Hughes, Inc. | | | 611,600 | | | $ | 34,292,412 | |
| C&J Energy Services, Inc. (a) | | | 1,124,639 | | | | 14,856,481 | |
| Dril-Quip, Inc. (a) | | | 345,092 | | | | 26,478,909 | |
| FMC Technologies, Inc. (a) | | | 734,829 | | | | 34,419,390 | |
| Halliburton Co. | | | 1,607,882 | | | | 63,237,999 | |
| Independence Contract Drilling, Inc. | | | 1,223,029 | | | | 6,384,211 | |
| Oceaneering International, Inc. | | | 587,162 | | | | 34,530,997 | |
| | | | | | | | 214,200,399 | |
| Oil, Gas & Consumable Fuels - 6.9% | | | | | | | | |
| Anadarko Petroleum Corp. | | | 1,600,352 | | | | 132,029,040 | |
| BG Group PLC | | | 1,907,736 | | | | 25,528,752 | |
| Cabot Oil & Gas Corp. | | | 1,841,335 | | | | 54,521,929 | |
| Chevron Corp. | | | 2,765,000 | | | | 310,177,700 | |
| Cimarex Energy Co. | | | 578,600 | | | | 61,331,600 | |
| EOG Resources, Inc. | | | 912,374 | | | | 84,002,274 | |
| EP Energy Corp. (d) | | | 1,629,389 | | | | 17,010,821 | |
| Exxon Mobil Corp. | | | 2,040,502 | | | | 188,644,410 | |
| Kinder Morgan Holding Co. LLC | | | 2,979,643 | | | | 126,068,695 | |
| Memorial Resource Development Corp. | | | 1,311,400 | | | | 23,644,542 | |
| Noble Energy, Inc. | | | 1,911,000 | | | | 90,638,730 | |
| Parsley Energy, Inc. Class A | | | 850,651 | | | | 13,576,390 | |
| Phillips 66 Co. | | | 1,226,139 | | | | 87,914,166 | |
| Phillips 66 Partners LP | | | 10,859 | | | | 748,511 | |
| Plains GP Holdings LP Class A | | | 250,100 | | | | 6,422,568 | |
| PrairieSky Royalty Ltd. (d) | | | 408,150 | | | | 10,750,034 | |
| Suncor Energy, Inc. | | | 2,288,295 | | | | 72,678,676 | |
| Valero Energy Partners LP | | | 577,600 | | | | 24,981,200 | |
| Whiting Petroleum Corp. (a) | | | 897,786 | | | | 29,626,938 | |
| | | | | | | | 1,360,296,976 | |
| | | | | | | | | |
| TOTAL ENERGY | | | | | | | 1,574,497,375 | |
| | | | | | | | | |
| FINANCIALS - 16.3% | | | | | | | | |
| Banks - 7.5% | | | | | | | | |
| Bank of America Corp. | | | 21,524,614 | | | | 385,075,344 | |
| Citigroup, Inc. | | | 6,893,550 | | | | 373,009,991 | |
| Huntington Bancshares, Inc. | | | 8,146,881 | | | | 85,705,188 | |
| JPMorgan Chase & Co. | | | 5,131,506 | | | | 321,129,645 | |
| Societe Generale Series A | | | 730,198 | | | | 30,916,327 | |
| SunTrust Banks, Inc. | | | 1,152,825 | | | | 48,303,368 | |
| Synovus Financial Corp. | | | 979,123 | | | | 26,524,442 | |
| U.S. Bancorp | | | 4,801,344 | | | | 215,820,413 | |
| | | | | | | | 1,486,484,718 | |
| Capital Markets - 2.2% | | | | | | | | |
| Ameriprise Financial, Inc. | | | 363,743 | | | | 48,105,012 | |
| BlackRock, Inc. Class A | | | 277,213 | | | | 99,120,280 | |
| Carlyle Group LP | | | 214,600 | | | | 5,901,500 | |
| E*TRADE Financial Corp. (a) | | | 1,553,878 | | | | 37,689,311 | |
| | | Shares | | | Value | |
| | | | | | | | | |
| Goldman Sachs Group, Inc. | | | 340,400 | | | $ | 65,979,732 | |
| Invesco Ltd. | | | 579,757 | | | | 22,911,997 | |
| Northern Trust Corp. | | | 471,064 | | | | 31,749,714 | |
| Oaktree Capital Group LLC Class A | | | 331,134 | | | | 17,162,675 | |
| State Street Corp. | | | 948,000 | | | | 74,418,000 | |
| The Blackstone Group LP | | | 754,837 | | | | 25,536,136 | |
| | | | | | | | 428,574,357 | |
| Consumer Finance - 2.3% | | | | | | | | |
| Capital One Financial Corp. | | | 3,962,348 | | | | 327,091,827 | |
| Navient Corp. | | | 2,468,076 | | | | 53,335,122 | |
| SLM Corp. | | | 4,666,176 | | | | 47,548,333 | |
| Springleaf Holdings, Inc. (a) | | | 653,700 | | | | 23,644,329 | |
| | | | | | | | 451,619,611 | |
| Diversified Financial Services - 0.8% | | | | | | | | |
| Berkshire Hathaway, Inc.: | | | | | | | | |
| Class A (a) | | | 47 | | | | 10,622,000 | |
| Class B (a) | | | 610,500 | | | | 91,666,575 | |
| IntercontinentalExchange Group, Inc. | | | 184,209 | | | | 40,395,192 | |
| KBC Ancora (a) | | | 401,778 | | | | 12,975,917 | |
| | | | | | | | 155,659,684 | |
| Insurance - 1.9% | | | | | | | | |
| Direct Line Insurance Group PLC | | | 7,642,000 | | | | 34,696,222 | |
| Fairfax Financial Holdings Ltd. (sub. vtg.) | | | 92,700 | | | | 48,574,545 | |
| Marsh & McLennan Companies, Inc. | | | 1,401,670 | | | | 80,231,591 | |
| MetLife, Inc. | | | 1,510,487 | | | | 81,702,242 | |
| Principal Financial Group, Inc. | | | 402,500 | | | | 20,905,850 | |
| The Chubb Corp. | | | 694,000 | | | | 71,808,180 | |
| The Travelers Companies, Inc. | | | 102,141 | | | | 10,811,625 | |
| Unum Group | | | 627,800 | | | | 21,897,664 | |
| | | | | | | | 370,627,919 | |
| Real Estate Investment Trusts - 1.2% | | | | | | | | |
| Altisource Residential Corp. Class B | | | 2,095,782 | | | | 40,658,171 | |
| American Tower Corp. | | | 83,957 | | | | 8,299,149 | |
| Boston Properties, Inc. | | | 442,500 | | | | 56,945,325 | |
| Digital Realty Trust, Inc. | | | 705,000 | | | | 46,741,500 | |
| Outfront Media, Inc. | | | 420,614 | | | | 11,289,280 | |
| Piedmont Office Realty Trust, Inc. Class A | | | 338,687 | | | | 6,380,863 | |
| Senior Housing Properties Trust (SBI) | | | 538,912 | | | | 11,915,344 | |
| Sun Communities, Inc. | | | 772,269 | | | | 46,691,384 | |
| | | | | | | | 228,921,016 | |
| Real Estate Management & Development - 0.3% | | | | | | | | |
| CBRE Group, Inc. (a) | | | 2,001,689 | | | | 68,557,848 | |
| Thrifts & Mortgage Finance - 0.1% | | | | | | | | |
| Ocwen Financial Corp. (a)(d) | | | 886,300 | | | | 13,383,130 | |
| | | | | | | | | |
| TOTAL FINANCIALS | | | | | | | 3,203,828,283 | |
| | | | | | | | | |
| HEALTH CARE - 14.2% | | | | | | | | |
| Biotechnology - 4.6% | | | | | | | | |
| Actelion Ltd. | | | 168,260 | | | | 19,513,557 | |
| Alexion Pharmaceuticals, Inc. (a) | | | 693,832 | | | | 128,379,735 | |
See accompanying notes which are an integral part of the financial statements.
| Common Stocks – continued | |
| | | Shares | | | Value | |
| | | | | | | |
| HEALTH CARE - continued | | | | | | | | |
| Biotechnology - continued | | | | | | | | |
| Amgen, Inc. | | | 1,150,920 | | | $ | 183,330,047 | |
| Biogen Idec, Inc. (a) | | | 419,931 | | | | 142,545,578 | |
| BioMarin Pharmaceutical, Inc. (a) | | | 405,093 | | | | 36,620,407 | |
| Celgene Corp. (a) | | | 1,337,300 | | | | 149,590,378 | |
| Gilead Sciences, Inc. (a) | | | 1,985,061 | | | | 187,111,850 | |
| Vertex Pharmaceuticals, Inc. (a) | | | 456,200 | | | | 54,196,560 | |
| | | | | | | | 901,288,112 | |
| Health Care Equipment & Supplies - 2.3% | | | | | | | | |
| Boston Scientific Corp. (a) | | | 9,296,949 | | | | 123,184,574 | |
| Covidien PLC | | | 770,090 | | | | 78,764,805 | |
| Edwards Lifesciences Corp. (a) | | | 248,842 | | | | 31,697,494 | |
| Medtronic, Inc. | | | 2,232,900 | | | | 161,215,380 | |
| Quidel Corp. (a)(d) | | | 405,931 | | | | 11,739,525 | |
| The Cooper Companies, Inc. | | | 289,420 | | | | 46,912,088 | |
| | | | | | | | 453,513,866 | |
| Health Care Providers & Services - 2.4% | | | | | | | | |
| Brookdale Senior Living, Inc. (a) | | | 2,278,733 | | | | 83,561,139 | |
| Cigna Corp. | | | 1,006,926 | | | | 103,622,755 | |
| HCA Holdings, Inc. (a) | | | 1,095,114 | | | | 80,370,416 | |
| Henry Schein, Inc. (a) | | | 342,041 | | | | 46,568,882 | |
| McKesson Corp. | | | 779,300 | | | | 161,767,094 | |
| | | | | | | | 475,890,286 | |
| Health Care Technology - 0.0% | | | | | | | | |
| Veeva Systems, Inc. Class A (a)(d) | | | 87,210 | | | | 2,303,216 | |
| Life Sciences Tools & Services - 0.9% | | | | | | | | |
| Agilent Technologies, Inc. | | | 1,422,300 | | | | 58,228,962 | |
| Fluidigm Corp. (a) | | | 312,345 | | | | 10,535,397 | |
| Thermo Fisher Scientific, Inc. | | | 917,413 | | | | 114,942,675 | |
| | | | | | | | 183,707,034 | |
| Pharmaceuticals - 4.0% | | | | | | | | |
| AbbVie, Inc. | | | 871,221 | | | | 57,012,702 | |
| Actavis PLC (a) | | | 754,252 | | | | 194,152,007 | |
| Allergan, Inc. | | | 338,400 | | | | 71,940,456 | |
| Bristol-Myers Squibb Co. | | | 2,971,405 | | | | 175,402,037 | |
| Mallinckrodt PLC (a) | | | 602,466 | | | | 59,662,208 | |
| Merck & Co., Inc. | | | 1,024,805 | | | | 58,198,676 | |
| Roche Holding AG (participation certificate) | | | 152,274 | | | | 41,257,455 | |
| Shire PLC | | | 826,974 | | | | 58,632,493 | |
| Teva Pharmaceutical Industries Ltd. sponsored ADR | | | 1,296,300 | | | | 74,550,213 | |
| | | | | | | | 790,808,247 | |
| | | | | | | | | |
| TOTAL HEALTH CARE | | | | | | | 2,807,510,761 | |
| | | Shares | | | Value | |
| | | | | | | |
| INDUSTRIALS - 9.3% | | | | | | | | |
| Aerospace & Defense - 1.2% | | | | | | | | |
| Meggitt PLC | | | 11,838,373 | | | $ | 95,762,185 | |
| TransDigm Group, Inc. | | | 712,863 | | | | 139,970,650 | |
| | | | | | | | 235,732,835 | |
| Air Freight & Logistics - 0.5% | | | | | | | | |
| FedEx Corp. | | | 526,592 | | | | 91,447,967 | |
| Electrical Equipment - 1.8% | | | | | | | | |
| Acuity Brands, Inc. | | | 388,381 | | | | 54,400,527 | |
| AMETEK, Inc. | | | 4,362,549 | | | | 229,600,954 | |
| Hubbell, Inc. Class B | | | 767,853 | | | | 82,029,736 | |
| | | | | | | | 366,031,217 | |
| Industrial Conglomerates - 2.2% | | | | | | | | |
| Danaher Corp. | | | 2,704,521 | | | | 231,804,495 | |
| Roper Industries, Inc. | | | 1,244,004 | | | | 194,500,025 | |
| | | | | | | | 426,304,520 | |
| Machinery - 1.0% | | | | | | | | |
| Deere & Co. | | | 1,076,200 | | | | 95,211,414 | |
| Pall Corp. | | | 674,300 | | | | 68,245,903 | |
| WABCO Holdings, Inc. (a) | | | 415,300 | | | | 43,515,134 | |
| | | | | | | | 206,972,451 | |
| Professional Services - 0.6% | | | | | | | | |
| Verisk Analytics, Inc. (a) | | | 1,903,628 | | | | 121,927,373 | |
| Road & Rail - 1.6% | | | | | | | | |
| CSX Corp. | | | 3,450,500 | | | | 125,011,615 | |
| J.B. Hunt Transport Services, Inc. | | | 2,243,233 | | | | 188,992,380 | |
| | | | | | | | 314,003,995 | |
| Trading Companies & Distributors - 0.4% | | | | | | | | |
| HD Supply Holdings, Inc. (a) | | | 2,472,897 | | | | 72,925,733 | |
| TOTAL INDUSTRIALS | | | | | | | 1,835,346,091 | |
| | | | | | | | | |
| INFORMATION TECHNOLOGY - 18.8% | | | | | | | | |
| Communications Equipment - 2.2% | | | | | | | | |
| Cisco Systems, Inc. | | | 5,225,039 | | | | 145,334,460 | |
| Juniper Networks, Inc. | | | 326,715 | | | | 7,292,279 | |
| QUALCOMM, Inc. | | | 3,660,035 | | | | 272,050,402 | |
| | | | | | | | 424,677,141 | |
| Electronic Equipment & Components - 0.7% | | | | | | | | |
| Keysight Technologies, Inc. (a) | | | 607,341 | | | | 20,509,906 | |
| Samsung SDI Co. Ltd. | | | 90,320 | | | | 9,490,559 | |
| TE Connectivity Ltd. | | | 1,195,964 | | | | 75,644,723 | |
| Trimble Navigation Ltd. (a) | | | 880,900 | | | | 23,379,086 | |
| | | | | | | | 129,024,274 | |
| Internet Software & Services - 4.9% | | | | | | | | |
| 58.com, Inc. ADR (a) | | | 368,337 | | | | 15,304,402 | |
| Benefitfocus, Inc. (a)(d) | | | 72,441 | | | | 2,378,962 | |
| ChannelAdvisor Corp. (a) | | | 814,795 | | | | 17,583,276 | |
| Cvent, Inc. (a) | | | 1,811,413 | | | | 50,429,738 | |
| Demandware, Inc. (a) | | | 328,160 | | | | 18,882,326 | |
See accompanying notes which are an integral part of the financial statements.
Investments – continued
| Common Stocks – continued |
| | | Shares | | | Value | |
| | | | | | | |
| INFORMATION TECHNOLOGY - continued | | | | | | | | |
| Internet Software & Services - continued | | | | | | | | |
| Endurance International Group Holdings, Inc. (a) | | | 337,674 | | | $ | 6,223,332 | |
| Facebook, Inc. Class A (a) | | | 3,018,876 | | | | 235,532,706 | |
| Five9, Inc. | | | 1,370,000 | | | | 6,137,600 | |
| Google, Inc. Class C(a) | | | 769,484 | | | | 405,056,378 | |
| HomeAway, Inc. (a) | | | 1,116,062 | | | | 33,236,326 | |
| Millennial Media, Inc. (a) | | | 193,883 | | | | 310,213 | |
| Opower, Inc. (d) | | | 1,937,726 | | | | 27,573,841 | |
| Twitter, Inc. (a) | | | 267,500 | | | | 9,595,225 | |
| Wix.com Ltd. (a) | | | 421,665 | | | | 8,854,965 | |
| Yahoo!, Inc. (a) | | | 2,337,758 | | | | 118,080,157 | |
| Zoopla Property Group PLC (d) | | | 4,269,700 | | | | 13,076,592 | |
| | | | | | | | 968,256,039 | |
| IT Services - 0.9% | | | | | | | | |
| Fidelity National Information Services, Inc. | | | 187,600 | | | | 11,668,720 | |
| Lionbridge Technologies, Inc. (a) | | | 796,595 | | | | 4,580,421 | |
| Total System Services, Inc. | | | 1,131,700 | | | | 38,432,532 | |
| Visa, Inc. Class A | | | 499,234 | | | | 130,899,155 | |
| | | | | | | | 185,580,828 | |
| Semiconductors & Semiconductor Equipment - 2.1% | | | | | | | | |
| Marvell Technology Group Ltd. | | | 3,614,500 | | | | 52,410,250 | |
| Micron Technology, Inc. (a) | | | 800,300 | | | | 28,018,503 | |
| NVIDIA Corp. | | | 1,992,200 | | | | 39,943,610 | |
| NXP Semiconductors NV (a) | | | 1,475,270 | | | | 112,710,628 | |
| RF Micro Devices, Inc. (a) | | | 10,702,500 | | | | 177,554,475 | |
| TriQuint Semiconductor, Inc. (a) | | | 272,500 | | | | 7,507,375 | |
| | | | | | | | 418,144,841 | |
| Software - 3.1% | | | | | | | | |
| Activision Blizzard, Inc. | | | 485,200 | | | | 9,776,780 | |
| Adobe Systems, Inc. (a) | | | 1,462,229 | | | | 106,304,048 | |
| Autodesk, Inc. (a) | | | 984,000 | | | | 59,099,040 | |
| CommVault Systems, Inc. (a) | | | 287,252 | | | | 14,848,056 | |
| Covisint Corp. (a) | | | 393,800 | | | | 1,043,570 | |
| Fleetmatics Group PLC (a) | | | 422,700 | | | | 15,001,623 | |
| Imperva, Inc. (a) | | | 1,169,547 | | | | 57,810,708 | |
| Informatica Corp. (a) | | | 460,200 | | | | 17,549,727 | |
| Intuit, Inc. | | | 1,016,102 | | | | 93,674,443 | |
| Oracle Corp. | | | 1,549,593 | | | | 69,685,197 | |
| Qlik Technologies, Inc. (a) | | | 283,059 | | | | 8,743,693 | |
| salesforce.com, Inc. (a) | | | 1,851,857 | | | | 109,833,639 | |
| Xero Ltd. (a)(d) | | | 1,192,730 | | | | 15,025,783 | |
| Xero Ltd. (a) | | | 496,188 | | | | 6,250,881 | |
| Yodlee, inc. (d) | | | 511,243 | | | | 6,237,165 | |
| Zendesk, Inc. | | | 674,333 | | | | 16,433,495 | |
| | | | | | | | 607,317,848 | |
| Technology Hardware, Storage & Peripherals - 4.9% | | | | | | | | |
| Apple, Inc. | | | 6,627,692 | | | | 731,564,645 | |
| Electronics for Imaging, Inc. (a) | | | 778,709 | | | | 33,352,106 | |
| | | Shares | | | Value | |
| | | | | | | |
| Hewlett-Packard Co. | | | 3,362,900 | | | $ | 134,953,177 | |
| Samsung Electronics Co. Ltd. | | | 55,356 | | | | 66,885,524 | |
| | | | | | | | 966,755,452 | |
| | | | | | | | | |
| TOTAL INFORMATION TECHNOLOGY | | | | | | | 3,699,756,423 | |
| | | | | | | | | |
| MATERIALS - 4.1% | | | | | | | | |
| Chemicals - 3.4% | | | | | | | | |
| Airgas, Inc. | | | 1,530,755 | | | | 176,312,361 | |
| Cabot Corp. | | | 268,007 | | | | 11,754,787 | |
| CF Industries Holdings, Inc. | | | 111,400 | | | | 30,360,956 | |
| E.I. du Pont de Nemours & Co. | | | 1,199,600 | | | | 88,698,424 | |
| Eastman Chemical Co. | | | 667,441 | | | | 50,632,074 | |
| Ecolab, Inc. | | | 995,000 | | | | 103,997,400 | |
| FMC Corp. | | | 785,932 | | | | 44,821,702 | |
| LyondellBasell Industries NV Class A | | | 548,124 | | | | 43,515,564 | |
| Methanex Corp. | | | 384,177 | | | | 17,648,069 | |
| Monsanto Co. | | | 648,776 | | | | 77,509,269 | |
| W.R. Grace & Co. (a) | | | 333,922 | | | | 31,852,820 | |
| | | | | | | | 677,103,426 | |
| Construction Materials - 0.1% | | | | | | | | |
| Eagle Materials, Inc. | | | 322,700 | | | | 24,534,881 | |
| Containers & Packaging - 0.4% | | | | | | | | |
| Graphic Packaging Holding Co. (a) | | | 1,556,733 | | | | 21,202,703 | |
| Rock-Tenn Co. Class A | | | 781,296 | | | | 47,643,430 | |
| | | | | | | | 68,846,133 | |
| Metals & Mining - 0.2% | | | | | | | | |
| Nucor Corp. | | | 797,000 | | | | 39,092,850 | |
| | | | | | | | | |
| TOTAL MATERIALS | | | | | | | 809,577,290 | |
| | | | | | | | | |
| TELECOMMUNICATION SERVICES - 1.6% | | | | | | | | |
| Diversified Telecommunication Services - 1.4% | | | | | | | | |
| Cogent Communications Group, Inc. | | | 130,900 | | | | 4,632,551 | |
| inContact, Inc. (a) | | | 1,403,117 | | | | 12,333,398 | |
| Level 3 Communications, Inc. (a) | | | 657,786 | | | | 32,481,473 | |
| Verizon Communications, Inc. | | | 5,082,461 | | | | 237,757,526 | |
| | | | | | | | 287,204,948 | |
| Wireless Telecommunication Services - 0. 2% | | | | | | | | |
| T-Mobile U.S., Inc. (a) | | | 1,240,801 | | | | 33,427,179 | |
| Telephone & Data Systems, Inc. | | | 226,711 | | | | 5,724,453 | |
| | | | | | | | 39,151,632 | |
| | | | | | | | | |
| TOTAL TELECOMMUNICATION SERVICES | | | | | | | 326,356,580 | |
| | | | | | | | | |
| UTILITIES - 3.1% | | | | | | | | |
| Electric Utilities - 1.3% | | | | | | | | |
| Edison International | | | 555,126 | | | | 36,349,650 | |
| Exelon Corp. | | | 1,714,292 | | | | 63,565,947 | |
See accompanying notes which are an integral part of the financial statements.
| Common Stocks – continued |
| | | Shares | | | Value | |
| | | | | | | |
| UTILITIES - continued | | | | | | | | |
| Electric Utilities - continued | | | | | | | | |
| NextEra Energy, Inc. | | | 968,400 | | | $ | 102,931,236 | |
| PPL Corp. | | | 1,503,800 | | | | 54,633,054 | |
| | | | | | | | 257,479,887 | |
| Gas Utilities - 0.2% | | | | | | | | |
| National Fuel Gas Co. | | | 479,975 | | | | 33,372,662 | |
| Independent Power and Renewable Electricity Producers - 0.0% | | | | | | | | |
| NextEra Energy Partners LP | | | 89,500 | | | | 3,020,625 | |
| Independent Power Producers & Renewable Electricity Producers - 0.3% | | | | | | | | |
| Calpine Corp. (a) | | | 271,800 | | | | 6,014,934 | |
| NRG Energy, Inc. | | | 1,395,352 | | | | 37,604,736 | |
| The AES Corp. | | | 919,742 | | | | 12,664,847 | |
| | | | | | | | 56,284,517 | |
| Multi-Utilities - 1.3% | | | | | | | | |
| Dominion Resources, Inc. | | | 1,226,031 | | | | 94,281,784 | |
| NiSource, Inc. | | | 1,099,277 | | | | 46,631,330 | |
| PG&E Corp. | | | 700,034 | | | | 37,269,810 | |
| Sempra Energy | | | 722,050 | | | | 80,407,488 | |
| | | | | | | | 258,590,412 | |
| | | | | | | | | |
| TOTAL UTILITIES | | | | | | | 608,748,103 | |
| | | | | | | | | |
| TOTAL COMMON STOCKS | | | | | | | | |
| (Cost $14,713,889,535) | | | | | | | 19,357,546,903 | |
| Convertible Preferred Stocks - 0.0% | | | | | | | | |
| | | | | | | | | |
| INFORMATION TECHNOLOGY - 0.0% | | | | | | | | |
| Software - 0.0% | | | | | | | | |
| MongoDB, Inc. Series F, 8.00% (a)(g) | | | 299,866 | | | | 3,169,584 | |
| Nonconvertible Preferred Stocks - 0.1% | | | | | | | | |
| | | | | | | | | |
| CONSUMER STAPLES - 0.1% | | | | | | | | |
| Beverages - 0.1% | | | | | | | | |
| Ambev SA sponsored ADR | | | 1,581,050 | | | | 9,834,131 | |
| | | | | | | | | |
| TOTAL PREFERRED STOCKS | | | | | | | | |
| (Cost $11,331,267) | | | | | | | 13,003,715 | |
| U.S. Treasury Obligations – 0.0% |
| | | Principal
Amount | | | | |
| | | | | | | | | |
U.S. Treasury Bills, yield at date of purchase 0.01% to 0.03% 1/2/15 to 2/5/15 (e)
(Cost $7,549,895) | | $ | 7,550,000 | | | | 7,549,909 | |
| Money Market Funds – 2.2% |
| | | Shares | | | Value | |
| | | | | | | |
| Fidelity Cash Central Fund, 0.13% (b) | | | 342,563,532 | | | $ | 342,563,532 | |
| Fidelity Securities Lending Cash Central Fund, 0.13% (b)(c) | | | 82,609,854 | | | | 82,609,854 | |
| | | | | | | | | |
| TOTAL MONEY MARKET FUNDS | | | | | | | | |
| (Cost $425,173,386) | | | | | | | 425,173,386 | |
| | | | | | | | | |
| TOTAL INVESTMENT PORTFOLIO - 100.5% | | | | | | | | |
| (Cost $15,157,944,083) | | | | | | | 19,803,273,913 | |
| | | | | | | | | |
| NET OTHER ASSETS (LIABILITIES) - (0.5)% | | | | | | | (97,458,238 | ) |
| | | | | | | | | |
| NET ASSETS - 100% | | | | | | $ | 19,705,815,675 | |
| | | Expiration
Date | | Underlying
Face Amount
at Value | | | Unrealized
Appreciation/
(Depreciation) | |
| Purchased | | | | | | | | | | |
| | | | | | | | | | | |
| Equity Index Contracts | | | | | | | | | | |
| 722 CME E-mini S&P 500 Index Contracts (United States) | | March 2015 | | $ | 74,091,640 | | | $ | 1,189,010 | |
The face value of futures purchased as a percentage of net assets is 0.4%
Legend
| (b) | Affiliated fund that is generally available only to investment companies and other accounts managed by Fidelity Investments. The rate quoted is the annualized seven-day yield of the fund at period end. A complete unaudited listing of the fund's holdings as of its most recent quarter end is available upon request. In addition, each Fidelity Central Fund's financial statements, which are not covered by the Fund's Report of Independent Registered Public Accounting Firm, are available on the SEC's website or upon request. |
| (c) | Investment made with cash collateral received from securities on loan. |
| (d) | Security or a portion of the security is on loan at period end. |
| (e) | Security or a portion of the security was pledged to cover margin requirements for futures contracts. At period end, the value of securities pledged amounted to $3,504,934. |
| (f) | Investment is owned by an entity that is treated as a corporation for U.S. tax purposes and is owned by the Fund. |
See accompanying notes which are an integral part of the financial statements.
Investment – continued
| (g) | Restricted securities - Investment in securities not registered under the Securities Act of 1933 (excluding 144A issues). At the end of the period, the value of restricted securities (excluding 144A issues) amounted to $9,420,590 or 0.0% of net assets. |
Additional information on each restricted holding is as follows:
| Security | | Acquisition Date | | Acquisition Cost | |
| Legend Pictures LLC | | 9/23/10 | | $ | 1,549,500 | |
| MongoDB, Inc. Series F, 8.00% | | 10/2/13 | | $ | 5,014,998 | |
| Weinstein Co. Holdings LLC Class A-1 | | 10/19/05 | | $ | 11,499,000 | |
Affiliated Central Funds
Information regarding fiscal year to date income earned by the Fund from investments in Fidelity Central Funds is as follows:
| Fund | | Income earned | |
| Fidelity Cash Central Fund | | $ | 326,390 | |
| Fidelity Securities Lending Cash Central Fund | | | 1,712,365 | |
| Total | | $ | 2,038,755 | |
Other Information
The following is a summary of the inputs used, as of December 31, 2014, involving the Fund's assets and liabilities carried at fair value. The inputs or methodology used for valuing securities may not be an indication of the risk associated with investing in those securities. For more information on valuation inputs, and their aggregation into the levels used in the table below, please refer to the Investment Valuation section in the accompanying Notes to Financial Statements.
Valuation Inputs at Reporting Date:
| Description | | Total | | | Level 1 | | | Level 2 | | | Level 3 | |
| Investments in Securities: | | | | | | | | | | | | | | | | |
| Equities: | | | | | | | | | | | | | | | | |
| Consumer Discretionary | | $ | 2,607,534,762 | | | $ | 2,601,283,756 | | | $ | – | | | $ | 6,251,006 | |
| Consumer Staples | | | 1,894,225,366 | | | | 1,838,479,117 | | | | 55,746,249 | | | | – | |
| Energy | | | 1,574,497,375 | | | | 1,548,968,623 | | | | 25,528,752 | | | | – | |
| Financials | | | 3,203,828,283 | | | | 3,203,828,283 | | | | – | | | | – | |
| Health Care | | | 2,807,510,761 | | | | 2,707,620,813 | | | | 99,889,948 | | | | – | |
| Industrials | | | 1,835,346,091 | | | | 1,835,346,091 | | | | – | | | | – | |
| Information Technology | | | 3,702,926,007 | | | | 3,623,380,340 | | | | 76,376,083 | | | | 3,169,584 | |
| Materials | | | 809,577,290 | | | | 809,577,290 | | | | – | | | | – | |
| Telecommunication Services | | | 326,356,580 | | | | 326,356,580 | | | | – | | | | – | |
| Utilities | | | 608,748,103 | | | | 608,748,103 | | | | – | | | | – | |
| U.S. Government and Government Agency Obligations | | | 7,549,909 | | | | – | | | | 7,549,909 | | | | – | |
| Money Market Funds | | | 425,173,386 | | | | 425,173,386 | | | | – | | | | – | |
| Total Investments in Securities: | | $ | 19,803,273,913 | | | $ | 19,528,762,382 | | | $ | 265,090,941 | | | $ | 9,420,590 | |
| | | | | | | | | | | | | | | | | |
| Derivative Instruments: | | | | | | | | | | | | | | | | |
| Assets | | | | | | | | | | | | | | | | |
| Futures Contracts | | $ | 1,189,010 | | | $ | 1,189,010 | | | $ | – | | | $ | – | |
See accompanying notes which are an integral part of the financial statements.
Value of Derivative Instruments
The following table is a summary of the Fund's value of derivative instruments by primary risk exposure as of December 31, 2014. For additional information on derivative instruments, please refer to the Derivative Instruments section in the accompanying Notes to Financial Statements.
| Primary Risk Exposure / | | Value | |
| Derivative Type | | | | | | |
| | | Asset | | | Liability | |
| Equity Risk | | | | | | | | |
| Futures Contracts (a) | | $ | 1,189,010 | | | $ | – | |
| Total Value of Derivatives | | $ | 1,189,010 | | | $ | – | |
(a) Reflects gross cumulative appreciation (depreciation) on futures contracts as presented in the Schedule of Investments. Only the period end receivable or payable for daily variation margin and net unrealized appreciation (depreciation) are presented in the Statement of Assets and Liabilities.
See accompanying notes which are an integral part of the financial statements.
Financial Statements
Statement of Assets and Liabilities |
| December 31, 2014 |
| Assets | | | | | | | | |
| Investment in securities, at value (including securities loaned of $81,008,772) — See accompanying schedule: | | | | | | | | |
| Unaffiliated issuers (cost $14,732,770,697) | | $ | 19,378,100,527 | | | | | |
| Fidelity Central Funds (cost $425,173,386) | | | 425,173,386 | | | | | |
| Total Investments (cost $15,157,944,083) | | | | | | $ | 19,803,273,913 | |
| Receivable for investments sold | | | | | | | 37,707,614 | |
| Receivable for fund shares sold | | | | | | | 4,905,819 | |
| Dividends receivable | | | | | | | 19,805,821 | |
| Distributions receivable from Fidelity Central Funds | | | | | | | 151,883 | |
| Prepaid expenses | | | | | | | 39,291 | |
| Other receivables | | | | | | | 930,402 | |
| Total assets | | | | | | | 19,866,814,743 | |
| | | | | | | | | |
| Liabilities | | | | | | | | |
| Payable to custodian bank | | $ | 1,219,356 | | | | | |
| Payable for investments purchased | | | 44,381,561 | | | | | |
| Payable for fund shares redeemed | | | 18,768,612 | | | | | |
| Accrued management fee | | | 8,997,864 | | | | | |
| Distribution and service plan fees payable | | | 1,965,336 | | | | | |
| Payable for daily variation margin for derivative instruments | | | 877,230 | | | | | |
| Other affiliated payables | | | 1,303,547 | | | | | |
| Other payables and accrued expenses | | | 875,708 | | | | | |
| Collateral on securities loaned, at value | | | 82,609,854 | | | | | |
| Total liabilities | | | | | | | 160,999,068 | |
| | | | | | | | | |
| Net Assets | | | | | | $ | 19,705,815,675 | |
| Net Assets consist of: | | | | | | | | |
| Paid in capital | | | | | | $ | 13,493,088,777 | |
| Undistributed net investment income | | | | | | | 1,449,774 | |
| Accumulated undistributed net realized gain (loss) on investments and foreign currency transactions | | | | | | | 1,564,859,595 | |
| Net unrealized appreciation (depreciation) on investments and assets and liabilities in foreign currencies | | | | | | | 4,646,417,529 | |
| Net Assets | | | | | | $ | 19,705,815,675 | |
| Statement of Assets and Liabilities – continued |
| December 31, 2014 |
| Initial Class: | | | |
| Net Asset Value, offering price and redemption price per share ($8,005,930,053 ÷ 214,296,825 shares) | | $ | 37.36 | |
| | | | | |
| Service Class: | | | | |
| Net Asset Value, offering price and redemption price per share ($1,714,614,580 ÷ 46,055,868 shares) | | $ | 37.23 | |
| | | | | |
| Service Class 2: | | | | |
| Net Asset Value, offering price and redemption price per share ($8,764,265,589 ÷ 238,822,017 shares) | | $ | 36.70 | |
| | | | | |
| Service Class 2R: | | | | |
| Net Asset Value, offering price and redemption price per share ($10,413,030 ÷ 284,244 shares) | | $ | 36.63 | |
| | | | | |
| Investor Class: | | | | |
| Net Asset Value, offering price and redemption price per share ($1,210,592,423 ÷ 32,533,687 shares) | | $ | 37.21 | |
See accompanying notes which are an integral part of the financial statements.
| Statement of Operations |
| Year ended December 31, 2014 |
Year ended December 31, 2014
| Investment Income | | | | | | | | |
| Dividends | | | | | | $ | 310,164,899 | |
| Interest | | | | | | | 39,625 | |
| Income from Fidelity Central Funds | | | | | | | 2,038,755 | |
| Total income | | | | | | | 312,243,279 | |
| | | | | | | | | |
| Expenses | | | | | | | | |
| Management fee | | $ | 104,864,189 | | | | | |
| Transfer agent fees | | | 13,416,903 | | | | | |
| Distribution and service plan fees | | | 22,946,364 | | | | | |
| Accounting and security lending fees | | | 1,674,900 | | | | | |
| Custodian fees and expenses | | | 316,415 | | | | | |
| Independent trustees' compensation | | | 78,716 | | | | | |
| Appreciation in deferred trustee compensation account | | | 49 | | | | | |
| Audit | | | 103,929 | | | | | |
| Legal | | | 77,141 | | | | | |
| Tax expense | | | 585 | | | | | |
| Miscellaneous | | | 143,626 | | | | | |
| Total expenses before reductions | | | 143,622,817 | | | | | |
| Expense reductions | | | (533,316 | ) | | | 143,089,501 | |
| | | | | | | | | |
| Net investment income (loss) | | | | | | | 169,153,778 | |
| Realized and Unrealized Gain (Loss) | | | | | | | | |
| Net realized gain (loss) on: | | | | | | | | |
| Investment securities: | | | | | | | | |
| Unaffiliated issuers | | | 2,170,955,181 | | | | | |
| Foreign currency transactions | | | (279,372 | ) | | | | |
| Futures contracts | | | 16,836,644 | | | | | |
| Total net realized gain (loss) | | | | | | | 2,187,512,453 | |
| Change in net unrealized appreciation (depreciation) on: | | | | | | | | |
| Investment securities | | | (224,164,915 | ) | | | | |
| Assets and liabilities in foreign currencies | | | (101,943 | ) | | | | |
| Futures contracts | | | (3,543,973 | ) | | | | |
| Total change in net unrealized appreciation (depreciation) | | | | | | | (227,810,831 | ) |
| Net gain (loss) | | | | | | | 1,959,701,622 | |
| Net increase (decrease) in net assets resulting from operations | | | | | | $ | 2,128,855,400 | |
| Statement of Changes in Net Assets |
| | | Year ended | | | Year ended | |
| | | December 31, | | | December 31, | |
| | | 2014 | | | 2013 | |
| Increase (Decrease) in Net Assets | | | | | | | | |
| Operations | | | | | | | | |
| Net investment income (loss) | | $ | 169,153,778 | | | $ | 161,442,651 | |
| Net realized gain (loss) | | | 2,187,512,453 | | | | 2,522,120,761 | |
| Change in net unrealized appreciation (depreciation) | | | (227,810,831 | ) | | | 2,047,868,434 | |
| Net increase (decrease) in net assets resulting from operations | | | 2,128,855,400 | | | | 4,731,431,846 | |
| Distributions to shareholders from net investment income | | | (161,948,221 | ) | | | (163,378,711 | ) |
| Distributions to shareholders from net realized gain | | | (388,082,984 | ) | | | (4,947,835 | ) |
| Total distributions | | | (550,031,205 | ) | | | (168,326,546 | ) |
| Share transactions - net increase (decrease) | | | (730,491,919 | ) | | | (1,968,972,139 | ) |
| Redemption fees | | | 13 | | | | 359 | |
| Total increase (decrease) in net assets | | | 848,332,289 | | | | 2,594,133,520 | |
| | | | | | | | | |
| Net Assets | | | | | | | | |
| Beginning of period | | | 18,857,483,386 | | | | 16,263,349,866 | |
| End of period (including undistributed net investment income of $1,449,774 and distributions in excess of net investment income of $633,692, respectively) | | $ | 19,705,815,675 | | | $ | 18,857,483,386 | |
See accompanying notes which are an integral part of the financial statements.
| Financial Highlights – Initial Class |
| Years ended December 31, | | 2014 | | | 2013 | | | 2012 | | | 2011 | | | 2010 | |
| Selected Per-Share Data | | | | | | | | | | | | | | | |
| Net asset value, beginning of period | | $ | 34.35 | | | $ | 26.44 | | | $ | 23.02 | | | $ | 23.88 | | | $ | 20.62 | |
| Income from Investment Operations | | | | | | | | | | | | | | | | | | | | |
| Net investment income (loss)C | | | .36 | | | | .32 | | | | .32 | | | | .25 | | | | .23 | |
| Net realized and unrealized gain (loss) | | | 3.76 | | | | 7.94 | | | | 3.46 | | | | (.86 | ) | | | 3.31 | |
| Total from investment operations | | | 4.12 | | | | 8.26 | | | | 3.78 | | | | (.61 | ) | | | 3.54 | |
| Distributions from net investment income | | | (.36 | ) | | | (.34 | ) | | | (.34 | )F | | | (.25 | ) | | | (.27 | ) |
| Distributions from net realized gain | | | (.75 | ) | | | (.01 | ) | | | (.01 | )F | | | — | | | | (.01 | ) |
| Total distributions | | | (1.11 | ) | | | (.35 | ) | | | (.36 | )I | | | (.25 | ) | | | (.28 | ) |
| Redemption fees added to paid in capitalC,H | | | — | | | | — | | | | — | | | | — | | | | — | |
| Net asset value, end of period | | $ | 37.36 | | | $ | 34.35 | | | $ | 26.44 | | | $ | 23.02 | | | $ | 23.88 | |
| Total ReturnA,B | | | 11.94 | % | | | 31.29 | % | | | 16.42 | % | | | (2.53 | )% | | | 17.22 | % |
| Ratios to Average Net AssetsD,G | | | | | | | | | | | | | | | | | | | | |
| Expenses before reductions | | | .63 | % | | | .64 | % | | | .64 | % | | | .65 | % | | | .65 | % |
| Expenses net of fee waivers, if any | | | .63 | % | | | .63 | % | | | .64 | % | | | .64 | % | | | .65 | % |
| Expenses net of all reductions | | | .63 | % | | | .62 | % | | | .63 | % | | | .63 | % | | | .63 | % |
| Net investment income (loss) | | | 1.01 | % | | | 1.05 | % | | | 1.27 | % | | | 1.03 | % | | | 1.06 | % |
| Supplemental Data | | | | | | | | | | | | | | | | | | | | |
| Net assets, end of period (000 omitted) | | $ | 8,005,930 | | | $ | 7,654,305 | | | $ | 6,440,357 | | | $ | 6,113,440 | | | $ | 7,160,125 | |
| Portfolio turnover rateE | | | 74 | % | | | 86 | % | | | 87 | % | | | 135 | % | | | 117 | % |
| A | Total returns do not reflect charges attributable to your insurance company's separate account. Inclusion of these charges would reduce the total returns shown. |
| B | Total returns would have been lower if certain expenses had not been reduced during the applicable periods shown. |
| C | Calculated based on average shares outstanding during the period. |
| D | Fees and expenses of any underlying Fidelity Central Funds are not included in the Fund's expense ratio. The Fund indirectly bears its proportionate share of the expenses of any underlying Fidelity Central Funds. |
| E | Amount does not include the portfolio activity of any underlying Fidelity Central Funds. |
| F | The amounts shown reflect certain reclassifications related to book to tax differences that were made in the year shown. |
| G | Expense ratios reflect operating expenses of the class. Expenses before reductions do not reflect amounts reimbursed by the investment adviser or reductions from brokerage service arrangements or reductions from other expense offset arrangements and do not represent the amount paid by the class during periods when reimbursements or reductions occur. Expenses net of fee waivers reflect expenses after reimbursement by the investment adviser but prior to reductions from brokerage service arrangements or other expense offset arrangements. Expenses net of all reductions represent the net expenses paid by the class. |
| H | Amount represents less than $.01 per share. |
| I | Total distributions of $.36 per share is comprised of distributions from net investment income of $.342 and distributions from net realized gain of $.013 per share. |
| Financial Highlights – Service Class |
| Years ended December 31, | | 2014 | | | 2013 | | | 2012 | | | 2011 | | | 2010 | |
| Selected Per-Share Data | | | | | | | | | | | | | | | |
| Net asset value, beginning of period | | $ | 34.24 | | | $ | 26.36 | | | $ | 22.95 | | | $ | 23.81 | | | $ | 20.55 | |
| Income from Investment Operations | | | | | | | | | | | | | | | | | | | | |
| Net investment income (loss)C | | | .33 | | | | .29 | | | | .30 | | | | .22 | | | | .20 | |
| Net realized and unrealized gain (loss) | | | 3.73 | | | | 7.91 | | | | 3.44 | | | | (.85 | ) | | | 3.31 | |
| Total from investment operations | | | 4.06 | | | | 8.20 | | | | 3.74 | | | | (.63 | ) | | | 3.51 | |
| Distributions from net investment income | | | (.32 | ) | | | (.31 | ) | | | (.32 | )F | | | (.23 | ) | | | (.24 | ) |
| Distributions from net realized gain | | | (.75 | ) | | | (.01 | ) | | | (.01 | )F | | | — | | | | (.01 | ) |
| Total distributions | | | (1.07 | ) | | | (.32 | ) | | | (.33 | ) | | | (.23 | ) | | | (.25 | ) |
| Redemption fees added to paid in capitalC,H | | | — | | | | — | | | | — | | | | — | | | | — | |
| Net asset value, end of period | | $ | 37.23 | | | $ | 34.24 | | | $ | 26.36 | | | $ | 22.95 | | | $ | 23.81 | |
| Total ReturnA,B | | | 11.82 | % | | | 31.14 | % | | | 16.31 | % | | | (2.64 | )% | | | 17.11 | % |
| Ratios to Average Net AssetsD,G | | | | | | | | | | | | | | | | | | | | |
| Expenses before reductions | | | .73 | % | | | .74 | % | | | .74 | % | | | .75 | % | | | .75 | % |
| Expenses net of fee waivers, if any | | | .73 | % | | | .73 | % | | | .74 | % | | | .74 | % | | | .75 | % |
| Expenses net of all reductions | | | .73 | % | | | .72 | % | | | .73 | % | | | .73 | % | | | .73 | % |
| Net investment income (loss) | | | .91 | % | | | .95 | % | | | 1.16 | % | | | .93 | % | | | .96 | % |
| Supplemental Data | | | | | | | | | | | | | | | | | | | | |
| Net assets, end of period (000 omitted) | | $ | 1,714,615 | | | $ | 1,688,448 | | | $ | 1,374,781 | | | $ | 1,277,101 | | | $ | 1,379,305 | |
| Portfolio turnover rateE | | | 74 | % | | | 86 | % | | | 87 | % | | | 135 | % | | | 117 | % |
| A | Total returns do not reflect charges attributable to your insurance company's separate account. Inclusion of these charges would reduce the total returns shown. |
| B | Total returns would have been lower if certain expenses had not been reduced during the applicable periods shown. |
| C | Calculated based on average shares outstanding during the period. |
| D | Fees and expenses of any underlying Fidelity Central Funds are not included in the Fund's expense ratio. The Fund indirectly bears its proportionate share of the expenses of any underlying Fidelity Central Funds. |
| E | Amount does not include the portfolio activity of any underlying Fidelity Central Funds. |
| F | The amounts shown reflect certain reclassifications related to book to tax differences that were made in the year shown. |
| G | Expense ratios reflect operating expenses of the class. Expenses before reductions do not reflect amounts reimbursed by the investment adviser or reductions from brokerage service arrangements or reductions from other expense offset arrangements and do not represent the amount paid by the class during periods when reimbursements or reductions occur. Expenses net of fee waivers reflect expenses after reimbursement by the investment adviser but prior to reductions from brokerage service arrangements or other expense offset arrangements. Expenses net of all reductions represent the net expenses paid by the class. |
| H | Amount represents less than $.01 per share. |
See accompanying notes which are an integral part of the financial statements.
| Financial Highlights – Service Class 2 |
| Years ended December 31, | | 2014 | | | 2013 | | | 2012 | | | 2011 | | | 2010 | |
| Selected Per-Share Data | | | | | | | | | | | | | | | |
| Net asset value, beginning of period | | $ | 33.77 | | | $ | 26.00 | | | $ | 22.64 | | | $ | 23.49 | | | $ | 20.29 | |
| Income from Investment Operations | | | | | | | | | | | | | | | | | | | | |
| Net investment income (loss)C | | | .27 | | | | .24 | | | | .26 | | | | .18 | | | | .17 | |
| Net realized and unrealized gain (loss) | | | 3.68 | | | | 7.80 | | | | 3.39 | | | | (.84 | ) | | | 3.26 | |
| Total from investment operations | | | 3.95 | | | | 8.04 | | | | 3.65 | | | | (.66 | ) | | | 3.43 | |
| Distributions from net investment income | | | (.27 | ) | | | (.26 | ) | | | (.28 | )F | | | (.19 | ) | | | (.22 | ) |
| Distributions from net realized gain | | | (.75 | ) | | | (.01 | ) | | | (.01 | )F | | | — | | | | (.01 | ) |
| Total distributions | | | (1.02 | ) | | | (.27 | ) | | | (.29 | ) | | | (.19 | ) | | | (.23 | ) |
| Redemption fees added to paid in capitalC,H | | | — | | | | — | | | | — | | | | — | | | | — | |
| Net asset value, end of period | | $ | 36.70 | | | $ | 33.77 | | | $ | 26.00 | | | $ | 22.64 | | | $ | 23.49 | |
| Total ReturnA,B | | | 11.65 | % | | | 30.95 | % | | | 16.14 | % | | | (2.78 | )% | | | 16.93 | % |
| Ratios to Average Net AssetsD,G | | | | | | | | | | | | | | | | | | | | |
| Expenses before reductions | | | .88 | % | | | .89 | % | | | .89 | % | | | .90 | % | | | .90 | % |
| Expenses net of fee waivers, if any | | | .88 | % | | | .88 | % | | | .89 | % | | | .89 | % | | | .90 | % |
| Expenses net of all reductions | | | .88 | % | | | .87 | % | | | .88 | % | | | .88 | % | | | .88 | % |
| Net investment income (loss) | | | .76 | % | | | .80 | % | | | 1.02 | % | | | .78 | % | | | .81 | % |
| Supplemental Data | | | | | | | | | | | | | | | | | | | | |
| Net assets, end of period (000 omitted) | | $ | 8,764,266 | | | $ | 8,472,780 | | | $ | 7,740,640 | | | $ | 6,980,191 | | | $ | 7,627,793 | |
| Portfolio turnover rateE | | | 74 | % | | | 86 | % | | | 87 | % | | | 135 | % | | | 117 | % |
| A | Total returns do not reflect charges attributable to your insurance company's separate account. Inclusion of these charges would reduce the total returns shown. |
| B | Total returns would have been lower if certain expenses had not been reduced during the applicable periods shown. |
| C | Calculated based on average shares outstanding during the period. |
| D | Fees and expenses of any underlying Fidelity Central Funds are not included in the Fund's expense ratio. The Fund indirectly bears its proportionate share of the expenses of any underlying Fidelity Central Funds. |
| E | Amount does not include the portfolio activity of any underlying fidelity Central funds. |
| F | The amounts shown reflect certain reclassifications related to book to tax differences that were made in the year shown. |
| G | Expense ratios reflect operating expenses of the class. Expenses before reductions do not reflect amounts reimbursed by the investment adviser or reductions from brokerage service arrangements or reductions from other expense offset arrangements and do not represent the amount paid by the class during periods when reimbursements or reductions occur. Expenses net of fee waivers reflect expenses after reimbursement by the investment adviser but prior to reductions from brokerage service arrangements or other expense offset arrangements. Expenses net of all reductions represent the net expenses paid by the class. |
| H | Amount represents less than $.01 per share. |
| Financial Highlights – Service Class 2R |
| Years ended December 31, | | 2014 | | | 2013 | | | 2012 | | | 2011 | | | 2010 | |
| Selected Per-Share Data | | | | | | | | | | | | | | | | | | | | |
| Net asset value, beginning of period | | $ | 33.70 | | | $ | 25.96 | | | $ | 22.60 | | | $ | 23.44 | | | $ | 20.24 | |
| Income from Investment Operations | | | | | | | | | | | | | | | | | | | | |
| Net investment income (loss)C | | | .27 | | | | .24 | | | | .26 | | | | .18 | | | | .17 | |
| Net realized and unrealized gain (loss) | | | 3.67 | | | | 7.77 | | | | 3.39 | | | | (.84 | ) | | | 3.25 | |
| Total from investment operations | | | 3.94 | | | | 8.01 | | | | 3.65 | | | | (.66 | ) | | | 3.42 | |
| Distributions from net investment income | | | (.26 | ) | | | (.26 | ) | | | (.27 | )F | | | (.18 | ) | | | (.21 | ) |
| Distributions from net realized gain | | | (.75 | ) | | | (.01 | ) | | | (.01 | )F | | | — | | | | (.01 | ) |
| Total distributions | | | (1.01 | ) | | | (.27 | ) | | | (.29 | )I | | | (.18 | ) | | | (.22 | ) |
| Redemption fees added to paid in capitalC,H | | | — | | | | — | | | | — | | | | — | | | | — | |
| Net asset value, end of period | | $ | 36.63 | | | $ | 33.70 | | | $ | 25.96 | | | $ | 22.60 | | | $ | 23.44 | |
| Total ReturnA, B | | | 11.66 | % | | | 30.90 | % | | | 16.15 | % | | | (2.79 | )% | | | 16.94 | % |
| Ratios to Average Net AssetsD,G | | | | | | | | | | | | | | | | | | | | |
| Expenses before reductions | | | .88 | % | | | .89 | % | | | .89 | % | | | .90 | % | | | .90 | % |
| Expenses net of fee waivers, if any | | | .88 | % | | | .88 | % | | | .89 | % | | | .89 | % | | | .90 | % |
| Expenses net of all reductions | | | .88 | % | | | .87 | % | | | .88 | % | | | .88 | % | | | .88 | % |
| Net investment income (loss) | | | .76 | % | | | .80 | % | | | 1.02 | % | | | .78 | % | | | .81 | % |
| Supplemental Data | | | | | | | | | | | | | | | | | | | | |
| Net assets, end of period (000 omitted) | | $ | 10,413 | | | $ | 10,592 | | | $ | 8,727 | | | $ | 8,042 | | | $ | 10,942 | |
| Portfolio turnover rateE | | | 74 | % | | | 86 | % | | | 87 | % | | | 135 | % | | | 117 | % |
| A | Total returns do not reflect charges attributable to your insurance company's separate account. Inclusion of these charges would reduce the total returns shown. |
| B | Total returns would have been lower if certain expenses had not been reduced during the applicable periods shown. |
| C | Calculated based on average shares outstanding during the period. |
| D | Fees and expenses of any underlying fidelity Central Funds are not included in the Fund's expense ratio. The Fund indirectly bears its proportionate share of the expenses of any underlying Fidelity Central Funds. |
| E | Amount does not include the portfolio activity of any underlying Fidelity Central Funds. |
| F | The amounts shown reflect certain reclassifications related to book to tax differences that were made in the year shown. |
| G | Expense ratios reflect operating expenses of the class. Expenses before reductions do not reflect amounts reimbursed by the investment adviser or reductions from brokerage service arrangements or reductions from other expense offset arrangements and do not represent the amount paid by the class during periods when reimbursements or reductions occur. Expenses net of fee waivers reflect expenses after reimbursement by the investment adviser but prior to reductions from brokerage service arrangements or other expense offset arrangements. Expenses net of all reductions represent the net expenses paid by the class. |
| H | Amount represents less than $.01 per share. |
| I | | Total distributions of $.29 per share is comprised of distributions from net investment income of $.274 and distributions from net realized gain of $.013 per share. |
See accompanying notes which are an integral part of the financial statements.
| Financial Highlights – Investor Class |
| Years ended December 31, | | 2014 | | | 2013 | | | 2012 | | | 2011 | | | 2010 | |
| Selected Per-Share Data | | | | | | | | | | | | | | | |
| Net asset value, beginning of period | | $ | 34.22 | | | $ | 26.35 | | | $ | 22.94 | | | $ | 23.80 | | | $ | 20.56 | |
| Income from Investment Operations | | | | | | | | | | | | | | | | | | | | |
| Net investment income (loss)C | | | .33 | | | | .29 | | | | .30 | | | | .23 | | | | .21 | |
| Net realized and unrealized gain (loss) | | | 3.74 | | | | 7.91 | | | | 3.45 | | | | (.86 | ) | | | 3.30 | |
| Total from investment operations | | | 4.07 | | | | 8.20 | | | | 3.75 | | | | (.63 | ) | | | 3.51 | |
| Distributions from net investment income | | | (.33 | ) | | | (.32 | ) | | | (.32 | )F | | | (.23 | ) | | | (.26 | ) |
| Distributions from net realized gain | | | (.75 | ) | | | (.01 | ) | | | (.01 | )F | | | — | | | | (.01 | ) |
| Total distributions | | | (1.08 | ) | | | (.33 | ) | | | (.34 | )I | | | (.23 | ) | | | (.27 | ) |
| Redemption fees added to paid in capitalC,H | | | — | | | | — | | | | — | | | | — | | | | — | |
| Net asset value, end of period | | $ | 37.21 | | | $ | 34.22 | | | $ | 26.35 | | | $ | 22.94 | | | $ | 23.80 | |
| Total ReturnA,B | | | 11.85 | % | | | 31.15 | % | | | 16.34 | % | | | (2.62 | )% | | | 17.10 | % |
| Ratios to Average Net AssetsD,G | | | | | | | | | | | | | | | | | | | | |
| Expenses before reductions | | | .71 | % | | | .72 | % | | | .73 | % | | | .73 | % | | | .74 | % |
| Expenses net of fee waivers, if any | | | .71 | % | | | .71 | % | | | .73 | % | | | .73 | % | | | .73 | % |
| Expenses net of all reductions | | | .71 | % | | | .71 | % | | | .71 | % | | | .71 | % | | | .72 | % |
| Net investment income (loss) | | | .93 | % | | | .97 | % | | | 1.18 | % | | | .94 | % | | | .98 | % |
| Supplemental Data | | | | | | | | | | | | | | | | | | | | |
| Net assets, end of period (000 omitted) | | $ | 1,210,592 | | | $ | 1,031,358 | | | $ | 698,845 | | | $ | 577,021 | | | $ | 570,841 | |
| Portfolio turnover rateE | | | 74 | % | | | 86 | % | | | 87 | % | | | 135 | % | | | 117 | % |
| A | Total returns do not reflect charges attributable to your insurance company's separate account. Inclusion of these charges would reduce the total returns shown. |
| B | Total returns would have been lower if certain expenses had not been reduced during the applicable periods shown. |
| C | Calculated based on average shares outstanding during the period. |
| D | Fees and expenses of any underlying Fidelity Central Funds are not included in the Fund's expense ratio. The Fund indirectly bears its proportionate share of the expenses of any underlying Fidelity Central Funds. |
| E | Amount does not include the portfolio activity of any underlying Fidelity Central Funds. |
| F | The amounts shown reflect certain reclassifications related to book to tax differences that were made in the year shown. |
| G | Expense ratios reflect operating expenses of the class. Expenses before reductions do not reflect amounts reimbursed by the investment adviser or reductions from brokerage service arrangements or reductions from other expense offset arrangements and do not represent the amount paid by the class during periods when reimbursements or reductions occur. Expenses net of fee waivers reflect expenses after reimbursement by the investment adviser but prior to reductions from brokerage service arrangements or other expense offset arrangements. Expenses net of all reductions represent the net expenses paid by the class. |
| H | Amount represents less than $.01 per share. |
| I | Total distributions of $.34 per share is comprised of distributions from net investment income of $.322 and distributions from net realized gain of $.013 per share. |
See accompanying notes which are an integral part of the financial statements.
Notes to Financial Statements
For the period ended December 31, 2014
1. Organization.
VIP Contrafund Portfolio (the Fund) is a fund of Variable Insurance Products Fund II (the Trust) and is authorized to issue an unlimited number of shares. The Trust is registered under the Investment Company Act of 1940, as amended (the 1940 Act), as an open-end management investment company organized as a Massachusetts business trust. Shares of the Fund may only be purchased by insurance companies for the purpose of funding variable annuity or variable life insurance contracts. The Fund offers the following classes of shares: Initial Class shares, Service Class shares, Service Class 2 shares, Service Class 2R shares and Investor Class shares. All classes have equal rights and voting privileges, except for matters affecting a single class.
Effective after the close of business on or about April 30,2015, shares of Service Class 2R will be converted to shares of Service Class 2. After the effective date, Service Class 2R will be closed to new accounts.
2. Investments in Fidelity Central Funds.
The Fund invests in Fidelity Central Funds, which are open-end investment companies generally available only to other investment companies and accounts managed by the investment adviser and its affiliates. The Fund’s Schedule of Investments lists each of the Fidelity Central Funds held as of period end, if any, as an investment of the Fund, but does not include the underlying holdings of each Fidelity Central Fund. As an Investing Fund, the Fund indirectly bears its proportionate share of the expenses of the underlying Fidelity Central Funds.
The Money Market Central Funds seek preservation of capital and current income and are managed by Fidelity Investments Money Management, Inc. (FIMM), an affiliate of the investment adviser. Annualized expenses of the Money Market Central Funds as of their most recent shareholder report date are less than .01%.
A complete unaudited list of holdings for each Fidelity Central Fund is available upon request or at the Securities and Exchange Commission (the SEC) website at www.sec.gov. In addition, the financial statements of the Fidelity Central Funds, which are not covered by the Fund’s Report of Independent Registered Public Accounting Firm, are available on the SEC website or upon request.
3. Significant Accounting Policies.
The financial statements have been prepared in conformity with accounting principles generally accepted in the United States of America (GAAP), which require management to make certain estimates and assumptions at the date of the financial statements. Actual results could differ from those estimates. Subsequent events, if any, through the date that the financial statements were issued have been evaluated in the preparation of the financial statements. The following summarizes the significant accounting policies of the Fund:
Investment Valuation. Investments are valued as of 4:00 p.m. Eastern time on the last calendar day of the period. In accordance with valuation policies and procedures approved by the Board of Trustees (the Board), the Fund attempts to obtain prices from one or more third party pricing vendors or brokers to value its investments. When current market prices, quotations or currency exchange rates are not readily available or reliable, investments will be fair valued in good faith by the Fidelity Management & Research Company (FMR) Fair Value Committee (the Committee), in accordance with procedures adopted by the Board. Factors used in determining fair value vary by investment type and may include market or investment specific events, changes in interest rates and credit quality. The frequency with which these procedures are used cannot be predicted and they may be utilized to a significant extent. The Committee oversees the Fund’s valuation policies and procedures and is responsible for approving and reporting to the Board all fair value determinations.
The Fund categorizes the inputs to valuation techniques used to value its investments into a disclosure hierarchy consisting of three levels as shown below:
Level 1 – quoted prices in active markets for identical investments
Level 2 – other significant observable inputs (including quoted prices for similar investments, interest rates, prepayment speeds, etc.)
Level 3 – unobservable inputs (including the Fund’s own assumptions based on the best information available)
Valuation techniques used to value the Fund’s investments by major category are as follows:
Equity securities, including restricted securities, for which market quotations are readily available, are valued at the last reported sale price or official closing price as reported by a third party pricing vendor on the primary market or exchange on which they are traded and are categorized as Level 1 in the hierarchy. In the event there were no sales during the day or closing prices are not available, securities are valued at the last quoted bid price or may be valued using the last available price and are generally categorized as Level 2 in the hierarchy. For foreign equity securities, when market or security specific events arise, comparisons to the valuation of American Depositary Receipts (ADRs), futures contracts, Exchange-Traded Funds (ETFs) and certain indexes as well as quoted prices for similar securities may be used and would be categorized as Level 2 in the hierarchy. Utilizing these techniques may result in transfers between Level 1 and Level 2. For equity securities, including restricted securities, where observable inputs are limited, assumptions about market activity and risk are used and these securities may be categorized as Level 3 in the hierarchy.
Notes to Financial Statements – continued
3. Significant Accounting Policies – continued
Investment Valuation – continued
Debt securities, including restricted securities, are valued based on evaluated prices received from third party pricing vendors or from brokers who make markets in such securities. U.S. government and government agency obligations are valued by pricing vendors who utilize matrix pricing which considers yield or price of bonds of comparable quality, coupon, maturity and type or by broker-supplied prices. When independent prices are unavailable or unreliable, debt securities may be valued utilizing pricing methodologies which consider similar factors that would be used by third party pricing vendors. Debt securities are generally categorized as Level 2 in the hierarchy but may be Level 3 depending on the circumstances.
Futures contracts are valued at the settlement price established each day by the board of trade or exchange on which they are traded and are categorized as Level 1 in the hierarchy. Investments in open-end mutual funds, including the Fidelity Central Funds, are valued at their closing net asset value (NAV) each business day and are categorized as Level 1 in the hierarchy.
Changes in valuation techniques may result in transfers in or out of an assigned level within the disclosure hierarchy. The aggregate value of investments by input level, as of December 31, 2014, is included at the end of the Fund’s Schedule of Investments.
Foreign Currency. The Fund may use foreign currency contracts to facilitate transactions in foreign-denominated securities. Gains and losses from these transactions may arise from changes in the value of the foreign currency or if the counterparties do not perform under the contracts’ terms.
Foreign-denominated assets, including investment securities, and liabilities are translated into U.S. dollars at the exchange rates at period end. Purchases and sales of investment securities, income and dividends received and expenses denominated in foreign currencies are translated into U.S. dollars at the exchange rate in effect on the transaction date.
The effects of exchange rate fluctuations on investments are included with the net realized and unrealized gain (loss) on investment securities. Other foreign currency transactions resulting in realized and unrealized gain (loss) are disclosed separately.
Investment Transactions and Income. For financial reporting purposes, the Fund’s investment holdings and NAV include trades executed through the end of the last business day of the period. The NAV per share for processing shareholder transactions is calculated as of the close of business of the New York Stock Exchange (NYSE), normally 4:00 p.m. Eastern time and includes trades executed through the end of the prior business day. Gains and losses on securities sold are determined on the basis of identified cost and may include proceeds received from litigation. Dividend income is recorded on the ex-dividend date, except for certain dividends from foreign securities where the ex-dividend date may have passed, which are recorded as soon as the Fund is informed of the ex-dividend date. Non-cash dividends included in dividend income, if any, are recorded at the fair market value of the securities received. Income and capital gain distributions from Fidelity Central Funds, if any, are recorded on the ex-dividend date. Distributions received on securities that represent a return of capital or capital gain are recorded as a reduction of cost of investments and/or as a realized gain. Subsequent to ex-dividend date the Fund determines the components of these distributions, based upon receipt of tax filings or other correspondence relating to the underlying investment. Interest income is accrued as earned and includes coupon interest and amortization of premium and accretion of discount on debt securities as applicable. Investment income is recorded net of foreign taxes withheld where recovery of such taxes is uncertain.
Class Allocations and Expenses. Investment income, realized and unrealized capital gains and losses, common expenses of the Fund, and certain fund-level expense reductions, if any, are allocated daily on a pro-rata basis to each class based on the relative net assets of each class to the total net assets of the Fund. Each class differs with respect to transfer agent and distribution and service plan fees incurred. Certain expense reductions may also differ by class. For the reporting period, the allocated portion of income and expenses to each class as a percent of its average net assets may vary due to the timing of recording these transactions in relation to fluctuating net assets of the classes. Expenses directly attributable to a fund are charged to that fund. Expenses attributable to more than one fund are allocated among the respective funds on the basis of relative net assets or other appropriate methods. Expense estimates are accrued in the period to which they relate and adjustments are made when actual amounts are known.
Deferred Trustee Compensation. Under a Deferred Compensation Plan (the Plan), independent Trustees may elect to defer receipt of a portion of their annual compensation. Deferred amounts are invested in a cross-section of Fidelity funds, are marked-to-market and remain in the Fund until distributed in accordance with the Plan. The investment of deferred amounts and the offsetting payable to the Trustees are included in the accompanying Statement of Assets and Liabilities.
Income Tax Information and Distributions to Shareholders. Each year, the Fund intends to qualify as a regulated investment company under Subchapter M of the Internal Revenue Code, including distributing substantially all of its taxable income and realized gains. As a result, no provision for U.S. Federal income taxes is required. As of December 31, 2014, the Fund did not have any unrecognized tax benefits in the financial statements; nor is the Fund aware of any tax positions for which it is reasonably possible that the total amounts of unrecognized tax benefits will significantly change in the next twelve months. The Fund files a U.S. federal tax return, in addition to state and local tax returns as required. The Fund’s federal income tax returns are subject to examination by the Internal Revenue Service (IRS) for a period of three fiscal years after they are filed. State and local tax returns may be subject to examination for an additional fiscal year depending on the jurisdiction. Foreign taxes are provided for based on the Fund’s understanding of the tax rules and rates that exist in the foreign markets in which it invests.
3. Significant Accounting Policies – continued
Income Tax Information and Distributions to Shareholders – continued
Distributions are declared and recorded on the ex-dividend date. Income dividends and capital gain distributions are declared separately for each class. Income and capital gain distributions are determined in accordance with income tax regulations, which may differ from GAAP.
Capital accounts within the financial statements are adjusted for permanent book-tax differences. These adjustments have no impact on net assets or the results of operations. Capital accounts are not adjusted for temporary book-tax differences which will reverse in a subsequent period.
Book-tax differences are primarily due to futures contracts, foreign currency transactions, passive foreign investment companies (PFIC), market discount, partnerships, deferred trustees compensation, capital loss carryforwards and losses deferred due to wash sales.
The federal tax cost of investment securities and unrealized appreciation (depreciation) as of period end were as follows:
| Gross unrealized appreciation | | $ | 5,016,381,566 | |
| Gross unrealized depreciation | | | (410,297,889 | ) |
| Net unrealized appreciation (depreciation) on securities | | $ | 4,606,083,677 | |
| | | | | |
| Tax Cost | | $ | 15,197,190,236 | |
The tax-based components of distributable earnings as of period end were as follows:
| Undistributed ordinary income | | $ | 11,682,932 | |
| Undistributed long-term capital gain | | $ | 1,595,790,260 | |
| Net unrealized appreciation (depreciation) on securities and other investments | | $ | 4,605,982,364 | |
The tax character of distributions paid was as follows:
| | | December 31, 2014 | | | December 31, 2013 | |
| Ordinary Income | | $ | 550,031,205 | | | $ | 168,326,546 | |
Trading (Redemption) Fees. Service Class 2R shares held by investors less than 60 days may be subject to a redemption fee equal to 1% of the NAV of shares redeemed. All redemption fees, which reduce the proceeds of the shareholder redemption, are retained by the Fund and accounted for as an addition to paid in capital. In November 2014, the Board of Trustees approved the elimination of these redemption fees effective on or about April 30, 2015.
Restricted Securities. The Fund may invest in securities that are subject to legal or contractual restrictions on resale. These securities generally may be resold in transactions exempt from registration or to the public if the securities are registered. Disposal of these securities may involve timeconsuming negotiations and expense, and prompt sale at an acceptable price may be difficult. Information regarding restricted securities is included at the end of the Fund’s Schedule of Investments.
New Accounting Pronouncement. In June 2014, the Financial Accounting Standards Board issued Accounting Standard Update No. 2014-11, Repurchase-to-Maturity Transactions, Repurchase Financings, and Disclosures. The Update amends the accounting for certain repurchase agreements and expands disclosure requirements for reverse repurchase agreements, securities lending and other similar transactions. The disclosure requirements are effective for annual and interim reporting periods beginning after December 15, 2014. Management is currently evaluating the impact of the Update on the Fund’s financial statements and related disclosures.
4. Derivative Instruments.
Risk Exposures and the Use of Derivative Instruments. The Fund’s investment objective allows the Fund to enter into various types of derivative contracts, including futures contracts. Derivatives are investments whose value is primarily derived from underlying assets, indices or reference rates and may be transacted on an exchange or over-the-counter (OTC). Derivatives may involve a future commitment to buy or sell a specified asset based on specified terms, to exchange future cash flows at periodic intervals based on a notional principal amount, or for one party to make one or more payments upon the occurrence of specified events in exchange for periodic payments from the other party.
The Fund used derivatives to increase returns and to manage exposure to certain risks as defined below. The success of any strategy involving derivatives depends on analysis of numerous economic factors, and if the strategies for investment do not work as intended, the Fund may not achieve its objectives.
Notes to Financial Statements – continued
4. Derivative Instruments – continued
Risk Exposures and the Use of Derivative Instruments – continued
The Fund’s use of derivatives increased or decreased its exposure to the following risk:
| Equity Risk | | Equity risk relates to the fluctuations in the value of financial instruments as a result of changes in market prices (other than those arising from interest rate risk or foreign exchange risk), whether caused by factors specific to an individual investment, its issuer, or all factors affecting all instruments traded in a market or market segment. |
The Fund is also exposed to additional risks from investing in derivatives, such as liquidity risk and counterparty credit risk. Liquidity risk is the risk that the Fund will be unable to close out the derivative in the open market in a timely manner. Counterparty credit risk is the risk that the counterparty will not be able to fulfill its obligation to the Fund. Counterparty credit risk related to exchange-traded futures contracts may be mitigated by the protection provided by the exchange on which they trade.
Investing in derivatives may involve greater risks than investing in the underlying assets directly and, to varying degrees, may involve risk of loss in excess of any initial investment and collateral received and amounts recognized in the Statement of Assets and Liabilities. In addition, there may be the risk that the change in value of the derivative contract does not correspond to the change in value of the underlying instrument.
Futures Contracts. A futures contract is an agreement between two parties to buy or sell a specified underlying instrument for a fixed price at a specified future date. The Fund used futures contracts to manage its exposure to the stock market.
Upon entering into a futures contract, a fund is required to deposit either cash or securities (initial margin) with a clearing broker in an amount equal to a certain percentage of the face value of the contract. Futures contracts are marked-to-market daily and subsequent daily payments (variation margin) are made or received by a fund depending on the daily fluctuations in the value of the futures contracts and are recorded as unrealized appreciation or (depreciation). This receivable and/or payable, if any, is included in daily variation margin for derivative instruments in the Statement of Assets and Liabilities. Realized gain or (loss) is recorded upon the expiration or closing of a futures contract.
Any open futures contracts at period end are presented in the Schedule of Investments under the caption “Futures Contracts.” The underlying face amount at value reflects each contract’s exposure to the underlying instrument or index at period end and is representative of volume of activity during the period. Securities deposited to meet initial margin requirements are identified in the Schedule of Investments.
During the period the Fund recognized net realized gain (loss) of $16,836,644 and a change in net unrealized appreciation (depreciation) of $(3,543,973) related to its investment in futures contracts. These amounts are included in the Statement of Operations.
5. Purchases and Sales of Investments.
Purchases and sales of securities, other than short-term securities, aggregated $13,953,815,966 and $15,057,627,111, respectively.
6. Fees and Other Transactions with Affiliates.
Management Fee. Fidelity Management & Research Company (the investment adviser) and its affiliates provide the Fund with investment management related services for which the Fund pays a monthly management fee. The management fee is the sum of an individual fund fee rate that is based on an annual rate of .30% of the Fund’s average net assets and an annualized group fee rate that averaged .25% during the period. The group fee rate is based upon the average net assets of all the mutual funds advised by the investment adviser, including any mutual funds previously advised by the investment adviser that are currently advised by Fidelity SelectCo, LLC, an affiliate of the investment adviser. The group fee rate decreases as assets under management increase and increases as assets under management decrease. For the reporting period, the total annual management fee rate was .55% of the Fund’s average net assets.
Distribution and Service Plan Fees. In accordance with Rule 12b-1 of the 1940 Act, the Fund has adopted separate 12b-1 Plans for each Service Class of shares. Each Service Class pays Fidelity Distributors Corporation (FDC), an affiliate of the investment adviser, a service fee. For the period, the service fee is based on an annual rate of .10% of Service Class’ average net assets and .25% of Service Class 2’s and Service Class 2R’s average net assets.
For the period, total fees, all of which were re-allowed to insurance companies for the distribution of shares and providing shareholder support services were as follows:
| Service Class | | $ | 1,682,947 | |
| Service Class 2 | | | 21,237,086 | |
| Service Class 2R | | | 26,331 | |
| | | $ | 22,946,364 | |
6. Fees and Other Transactions with Affiliates – continued
Transfer Agent Fees. Fidelity Investments Institutional Operations Company, Inc. (FIIOC), an affiliate of the investment adviser, is the Fund’s transfer, dividend disbursing, and shareholder servicing agent. FIIOC receives an asset-based fee with respect to each class. Each class (with the exception of Investor Class) pays a fee for transfer agent services, typesetting, printing and mailing of shareholder reports, excluding mailing of proxy statements and out of pocket expenses, equal to an annual rate of .07% (.15% for Investor Class) of class-level average net assets. For the period, transfer agent fees for each class, including out of pocket expenses, were as follows:
| Initial Class | | $ | 5,097,639 | |
| Service Class | | | 1,105,772 | |
| Service Class 2 | | | 5,571,265 | |
| Service Class 2R | | | 6,890 | |
| Investor Class | | | 1,635,337 | |
| | | $ | 13,416,903 | |
Accounting and Security Lending Fees. Fidelity Service Company, Inc. (FSC), an affiliate of the investment adviser, maintains the Fund’s accounting records. The accounting fee is based on the level of average net assets for each month. Under a separate contract, FSC administers the security lending program. The security lending fee is based on the number and duration of lending transactions.
Brokerage Commissions. The Fund placed a portion of its portfolio transactions with brokerage firms which are affiliates of the investment adviser. Brokerage commissions are included in net realized gain (loss) and change in net unrealized appreciation (depreciation) in the Statement of Operations. The commissions paid to these affiliated firms were $220,601 for the period.
7. Committed Line of Credit.
The Fund participates with other funds managed by the investment adviser or an affiliate in a $4.25 billion credit facility (the “line of credit”) to be utilized for temporary or emergency purposes to fund shareholder redemptions or for other short-term liquidity purposes. The Fund has agreed to pay commitment fees on its pro-rata portion of the line of credit, which amounted to $30,220 and is reflected in Miscellaneous expenses on the Statement of Operations. During the period, the Fund did not borrow on this line of credit.
8. Security Lending.
The Fund lends portfolio securities through a lending agent from time to time in order to earn additional income. For equity securities, a lending agent is used and may loan securities to certain qualified borrowers, including Fidelity Capital Markets (FCM), a broker-dealer affiliated with the Fund. On the settlement date of the loan, the Fund receives collateral (in the form of U.S. Treasury obligations, letters of credit and/or cash) against the loaned securities and maintains collateral in an amount not less than 100% of the market value of the loaned securities during the period of the loan. The market value of the loaned securities is determined at the close of business of the Fund and any additional required collateral is delivered to the Fund on the next business day. If the borrower defaults on its obligation to return the securities loaned because of insolvency or other reasons, the Fund may apply collateral received from the borrower against the obligation. The Fund may experience delays and costs in recovering the securities loaned. Any cash collateral received is invested in the Fidelity Securities Lending Cash Central Fund. The value of loaned securities and cash collateral at period end are disclosed on the Fund’s Statement of Assets and Liabilities. The value of securities loaned to FCM at period end was $577,738. Security lending income represents the income earned on investing cash collateral, less rebates paid to borrowers and any lending agent fees associated with the loan, plus any premium payments received for lending certain types of securities. Security lending income is presented in the Statement of Operations as a component of income from Fidelity Central Funds. Total security lending income during the period amounted to $1,712,365, including $34,370 from securities loaned to FCM.
9. Expense Reductions.
Commissions paid to certain brokers with whom the investment adviser, or its affiliates, places trades on behalf of the Fund include an amount in addition to trade execution, which may be rebated back to the Fund to offset certain expenses. This amount totaled $533,290 for the period. In addition, through arrangements with the Fund’s custodian, credits realized as a result of uninvested cash balances were used to reduce the Fund’s expenses. During the period, these credits reduced the Fund’s custody expenses by $26.
Notes to Financial Statements – continued
10. Distributions to Shareholders.
Distributions to shareholders of each class were as follows:
| Years ended December 31, | | 2014 | | | 2013 | |
| From net investment income | | | | | | | | |
| Initial Class | | $ | 74,463,277 | | | $ | 74,639,848 | |
| Service Class | | | 14,364,873 | | | | 15,078,586 | |
| Service Class 2 | | | 62,622,769 | | | | 64,224,245 | |
| Service Class 2R | | | 73,371 | | | | 82,385 | |
| Investor Class | | | 10,423,931 | | | | 9,353,647 | |
| Total | | $ | 161,948,221 | | | $ | 163,378,711 | |
| From net realized gain | | | | | | | | |
| Initial Class | | $ | 156,226,874 | | | $ | 1,987,452 | |
| Service Class | | | 33,622,782 | | | | 442,043 | |
| Service Class 2 | | | 174,366,001 | | | | 2,249,098 | |
| Service Class 2R | | | 208,163 | | | | 2,841 | |
| Investor Class | | | 23,659,164 | | | | 266,401 | |
| Total | | $ | 388,082,984 | | | $ | 4,947,835 | |
11. Share Transactions.
Transactions for each class of shares were as follows:
| | | Shares | | | Dollars | |
| Years ended December 31, | | 2014 | | | 2013 | | | 2014 | | | 2013 | |
| Initial Class | | | | | | | | | | | | | | | | |
| Shares sold | | | 10,169,551 | | | | 8,443,448 | | | $ | 365,094,273 | | | $ | 260,463,356 | |
| Reinvestment of distributions | | | 6,099,687 | | | | 2,327,682 | | | | 230,690,151 | | | | 76,627,300 | |
| Shares redeemed | | | (24,801,841 | ) | | | (31,488,580 | ) | | | (891,153,398 | ) | | | (952,835,862 | ) |
| Net increase (decrease) | | | (8,532,603 | ) | | | (20,717,450 | ) | | $ | (295,368,974 | ) | | $ | (615,745,206 | ) |
| Service Class | | | | | | | | | | | | | | | | |
| Shares sold | | | 1,837,138 | | | | 3,357,075 | | | $ | 66,530,853 | | | $ | 99,734,652 | |
| Reinvestment of distributions | | | 1,273,220 | | | | 473,046 | | | | 47,987,655 | | | | 15,520,629 | |
| Shares redeemed | | | (6,372,556 | ) | | | (6,669,302 | ) | | | (228,362,389 | ) | | | (202,333,378 | ) |
| Net increase (decrease) | | | (3,262,198 | ) | | | (2,839,181 | ) | | $ | (113,843,881 | ) | | $ | (87,078,097 | ) |
| Service Class 2 | | | | | | | | | | | | | | | | |
| Shares sold | | | 19,214,314 | | | | 20,920,336 | | | $ | 682,228,630 | | | $ | 626,652,763 | |
| Reinvestment of distributions | | | 6,379,240 | | | | 2,054,182 | | | | 236,988,770 | | | | 66,473,343 | |
| Shares redeemed | | | (37,694,574 | ) | | | (69,773,617 | ) | | | (1,326,668,678 | ) | | | (2,068,437,076 | ) |
| Net increase (decrease) | | | (12,101,020 | ) | | | (46,799,099 | ) | | $ | (407,451,278 | ) | | $ | (1,375,310,970 | ) |
| Service Class 2R | | | | | | | | | | | | | | | | |
| Shares sold | | | 17,673 | | | | 46,981 | | | $ | 616,867 | | | $ | 1,393,336 | |
| Reinvestment of distributions | | | 7,591 | | | | 2,639 | | | | 281,534 | | | | 85,226 | |
| Shares redeemed | | | (55,287 | ) | | | (71,564 | ) | | | (1,946,621 | ) | | | (2,147,878 | ) |
| Net increase (decrease) | | | (30,023 | ) | | | (21,944 | ) | | $ | (1,048,220 | ) | | $ | (669,316 | ) |
| Investor Class | | | | | | | | | | | | | | | | |
| Shares sold | | | 2,779,701 | | | | 4,323,390 | | | $ | 99,365,365 | | | $ | 130,507,518 | |
| Reinvestment of distributions | | | 904,781 | | | | 293,384 | | | | 34,083,095 | | | | 9,620,048 | |
| Shares redeemed | | | (1,288,330 | ) | | | (1,000,682 | ) | | | (46,228,026 | ) | | | (30,296,116 | ) |
| Net increase (decrease) | | | 2,396,152 | | | | 3,616,092 | | | $ | 87,220,434 | | | $ | 109,831,450 | |
12. Other.
The Fund’s organizational documents provide former and current trustees and officers with a limited indemnification against liabilities arising in connection with the performance of their duties to the Fund. In the normal course of business, the Fund may also enter into contracts that provide general indemnifications. The Fund’s maximum exposure under these arrangements is unknown as this would be dependent on future claims that may be made against the Fund. The risk of material loss from such claims is considered remote.
At the end of the period, the investment adviser or its affiliates were the owners of record of 11% of the total outstanding shares of the Fund and two otherwise unaffiliated shareholders were the owners of record of 22% of the total outstanding shares of the Fund.
Report of Independent Registered Public Accounting Firm
To the Trustees of Variable Insurance Products Fund II and Shareholders of VIP Contrafund Portfolio:
We have audited the accompanying statement of assets and liabilities of VIP Contrafund Portfolio (the Fund), a fund of Variable Insurance Products Fund II, including the schedule of investments, as of December 31, 2014, and the related statement of operations for the year then ended, the statement of changes in net assets for each of the two years in the period then ended, and the financial highlights for each of the five years in the period then ended. These financial statements and financial highlights are the responsibility of the Fund’s management. Our responsibility is to express an opinion on these financial statements and financial highlights based on our audits.
We conducted our audits in accordance with the standards of the Public Company Accounting Oversight Board (United States). Those standards require that we plan and perform the audit to obtain reasonable assurance about whether the financial statements and financial highlights are free of material misstatement. The Fund is not required to have, nor were we engaged to perform, an audit of its internal control over financial reporting. Our audits included consideration of internal control over financial reporting as a basis for designing audit procedures that are appropriate in the circumstances, but not for the purpose of expressing an opinion on the effectiveness of the Fund’s internal control over financial reporting. Accordingly, we express no such opinion. An audit also includes examining, on a test basis, evidence supporting the amounts and disclosures in the financial statements, assessing the accounting principles used and significant estimates made by management, as well as evaluating the overall financial statement presentation. Our procedures included confirmation of securities owned as of December 31, 2014, by correspondence with the custodians and brokers; where replies were not received from brokers, we performed other auditing procedures. We believe that our audits provide a reasonable basis for our opinion.
In our opinion, the financial statements and financial highlights referred to above present fairly, in all material respects, the financial position of VIP Contrafund Portfolio as of December 31, 2014, the results of its operations for the year then ended, the changes in its net assets for each of the two years in the period then ended, and the financial highlights for each of the five years in the period then ended, in conformity with accounting principles generally accepted in the United States of America.
DELOITTE & TOUCHE LLP
Boston, Massachusetts
February 13, 2015
Trustees and Officers
The Trustees, Member of the Advisory Board, and officers of the trust and fund, as applicable, are listed below. The Board of Trustees governs the fund and is responsible for protecting the interests of shareholders. The Trustees are experienced executives who meet periodically throughout the year to oversee the fund’s activities, review contractual arrangements with companies that provide services to each fund, oversee management of the risks associated with such activities and contractual arrangements, and review the fund’s performance. Except for James C. Curvey, each of the Trustees oversees 174 funds. Mr. Curvey oversees 407 funds.
The Trustees hold office without limit in time except that (a) any Trustee may resign; (b) any Trustee may be removed by written instrument, signed by at least two-thirds of the number of Trustees prior to such removal; (c) any Trustee who requests to be retired or who has become incapacitated by illness or injury may be retired by written instrument signed by a majority of the other Trustees; and (d) any Trustee may be removed at any special meeting of shareholders by a two-thirds vote of the outstanding voting securities of the trust. Each Trustee who is not an interested person (as defined in the 1940 Act) of the trust and the funds (Independent Trustee), shall retire not later than the last day of the calendar year in which his or her 75th birthday occurs. The Independent Trustees may waive this mandatory retirement age policy with respect to individual Trustees. The officers and Advisory Board Member hold office without limit in time, except that any officer and Advisory Board Member may resign or may be removed by a vote of a majority of the Trustees at any regular meeting or any special meeting of the Trustees. Except as indicated, each individual has held the office shown or other offices in the same company for the past five years.
Experience, Skills, Attributes, and Qualifications of the Fund’s Trustees. The Governance and Nominating Committee has adopted a statement of policy that describes the experience, qualifications, attributes, and skills that are necessary and desirable for potential Independent Trustee candidates (Statement of Policy). The Board believes that each Trustee satisfied at the time he or she was initially elected or appointed a Trustee, and continues to satisfy, the standards contemplated by the Statement of Policy. The Governance and Nominating Committee also engages professional search firms to help identify potential Independent Trustee candidates who have the experience, qualifications, attributes, and skills consistent with the Statement of Policy. From time to time, additional criteria based on the composition and skills of the current Independent Trustees, as well as experience or skills that may be appropriate in light of future changes to board composition, business conditions, and regulatory or other developments, have also been considered by the professional search firms and the Governance and Nominating Committee. In addition, the Board takes into account the Trustees’ commitment and participation in Board and committee meetings, as well as their leadership of standing and ad hoc committees throughout their tenure.
In determining that a particular Trustee was and continues to be qualified to serve as a Trustee, the Board has considered a variety of criteria, none of which, in isolation, was controlling. The Board believes that, collectively, the Trustees have balanced and diverse experience, qualifications, attributes, and skills, which allow the Board to operate effectively in governing the fund and protecting the interests of shareholders. Information about the specific experience, skills, attributes, and qualifications of each Trustee, which in each case led to the Board’s conclusion that the Trustee should serve (or continue to serve) as a trustee of the fund, is provided below.
Board Structure and Oversight Function. James C. Curvey is an interested person (as defined in the 1940 Act) and currently serves as Chairman. The Trustees have determined that an interested Chairman is appropriate and benefits shareholders because an interested Chairman has a personal and professional stake in the quality and continuity of services provided to the fund. Independent Trustees exercise their informed business judgment to appoint an individual of their choosing to serve as Chairman, regardless of whether the Trustee happens to be independent or a member of management. The Independent Trustees have determined that they can act independently and effectively without having an Independent Trustee serve as Chairman and that a key structural component for assuring that they are in a position to do so is for the Independent Trustees to constitute a substantial majority for the Board. The Independent Trustees also regularly meet in executive session. Ned C. Lautenbach serves as Chairman of the Independent Trustees and as such (i) acts as a liaison between the Independent Trustees and management with respect to matters important to the Independent Trustees and (ii) with management prepares agendas for Board meetings.
Fidelity funds are overseen by different Boards of Trustees. The fund’s Board oversees Fidelity’s equity and high income funds and another Board oversees Fidelity’s investment-grade bond, money market, and asset allocation funds. The asset allocation funds may invest in Fidelity funds over-seen by the fund’s Board. The use of separate Boards, each with its own committee structure, allows the Trustees of each group of Fidelity funds to focus on the unique issues of the funds they oversee, including common research, investment, and operational issues. On occasion, the separate Boards establish joint committees to address issues of overlapping consequences for the Fidelity funds overseen by each Board.
The Trustees operate using a system of committees to facilitate the timely and efficient consideration of all matters of importance to the Trustees, the fund, and fund shareholders and to facilitate compliance with legal and regulatory requirements and oversight of the fund’s activities and associated risks. The Board, acting through its committees, has charged FMR and its affiliates with (i) identifying events or circumstances the occurrence of which could have demonstrably adverse effects on the funds’ business and/or reputation; (ii) implementing processes and controls to lessen the possibility that such events or circumstances occur or to mitigate the effects of such events or circumstances if they do occur; and (iii) creating and maintaining a system designed to evaluate continuously business and market conditions in order to facilitate the identification and implementation processes described in (i) and (ii) above. Because the day-to-day operations and activities of the fund is carried out by or through FMR, its affiliates and other service providers, the fund’s exposure to risks is mitigated but not eliminated by the processes overseen by the Trustees. While each of the Board’s committees has responsibility for overseeing different aspects of the fund’s activities, oversight is exercised primarily through the Operations, Audit, and Compliance Committees. In addition, the Independent Trustees have worked with FMR to enhance the Board’s oversight of investment and financial risks, legal and regulatory risks, technology risks, and operational risks, including the development of additional risk reporting to the Board. For example, a working group comprised of Independent Trustees and FMR has worked and continues to work to
review the Fidelity fund’s valuation-related activities, reporting and risk management. Appropriate personnel, including but not limited to the fund’s Chief Compliance Officer (CCO), FMR’s internal auditor, the independent accountants, the fund’s Treasurer and portfolio management personnel, make periodic reports to the Board’s committees, as appropriate, including an annual review of FMR’s risk management program for the Fidelity funds. The responsibilities of each standing committee, including their oversight responsibilities, are described further under “Standing Committees of the Fund’s Trustees.”
The fund’s Statement of Additional Information (SAI) includes more information about the Trustees. To request a free copy, call Fidelity at 1-877-208-0098.
Interested Trustees*:
Correspondence intended for each Trustee who is an interested person may be sent to Fidelity Investments, 245 Summer Street, Boston, Massachusetts 02210.
Name, Year of Birth; Principal Occupations and Other Relevant Experience+
James C. Curvey (1935)
Year of Election or Appointment: 2007
Trustee
Chairman of the Board of Trustees
Mr. Curvey also serves as Trustee of other Fidelity funds. Mr. Curvey is a Director of Fidelity Research & Analysis Co. (2009-present), and Vice Chairman (2007-present) and Director of FMR LLC. In addition, Mr. Curvey serves as an Overseer for the Boston Symphony Orchestra and a member of the board of Artis-Naples, Naples, Florida, and as a Trustee for Brewster Academy, Wolfeboro, New Hampshire. Previously, Mr. Curvey served as a Director of Fidelity Investments Money Management, Inc. (2009-2014), a Director of FMR (2007-2014), and a Director of FMR Co., Inc. (2007-2014).
Charles S. Morrison (1960)
Year of Election or Appointment: 2014
Trustee
Mr. Morrison also serves as Trustee of other funds. He serves as a Director of Fidelity Investments Money Management, Inc. (FIMM) (2014-present), Director of Fidelity SelectCo, LLC (2014-present), President, Asset Management (2014-present), and is an employee of Fidelity Investments. Previously, Mr. Morrison served as Vice President of Fidelity's Fixed Income and Asset Allocation Funds (2012-2014), President, Fixed Income (2011-2014), Vice President of Fidelity's Money Market Funds (2005-2009), President, Money Market Group Leader of FMR (2009), and Senior Vice President, Money Market Group of FMR (2004-2009). Mr. Morrison also served as Vice President of Fidelity's Bond Funds (2002-2005), certain Balanced Funds (2002-2005), and certain Asset Allocation Funds (2002-2007), and as Senior Vice President (2002-2005) of Fidelity's Bond Division.
| * | | Trustees have been determined to be “Interested Trustees” by virtue of, among other things, their affiliation with the trust or various entities under common control with FMR. |
| + | | The information above includes each Trustee’s principal occupation during the last five years and other information relating to the experience, attributes, and skills relevant to each Trustee’s qualifications to serve as a Trustee, which led to the conclusion that each Trustee should serve as a Trustee for the fund. |
Independent Trustees:
Correspondence intended for each Independent Trustee (that is, the Trustees other than the Interested Trustees) may be sent to Fidelity Investments, P.O. Box 55235, Boston, Massachusetts 02205-5235.
Name, Year of Birth; Principal Occupations and Other Relevant Experience+
Dennis J. Dirks (1948)
Year of Election or Appointment: 2005
Trustee
Mr. Dirks also serves as Trustee of other Fidelity funds. Prior to his retirement in May 2003, Mr. Dirks was Chief Operating Officer and a member of the Board of The Depository Trust & Clearing Corporation (DTCC). He also served as President, Chief Operating Officer, and Board member of The Depository Trust Company (DTC) and President and Board member of the National Securities Clearing Corporation (NSCC). In addition, Mr. Dirks served as Chief Executive Officer and Board member of the Government Securities Clearing Corporation, Chief Executive Officer and Board member of the Mortgage-Backed Securities Clearing Corporation, as a Trustee and a member of the Finance Committee of Manhattan College (2005-2008), and as a Trustee and a member of the Finance Committee of AHRC of Nassau County (2006-2008). Mr. Dirks is a member of the Independent Directors Council (IDC) Governing Council (2010-present) and Board of Directors for The Brookville Center for Children's Services, Inc. (2009-present).
Trustees and Officers – continued
Name, Year of Birth; Principal Occupations and Other Relevant Experience+
Alan J. Lacy (1953)
Year of Election or Appointment: 2008
Trustee
Mr. Lacy also serves as Trustee of other Fidelity funds. Mr. Lacy serves as a member of the Board of Directors of Dave & Buster's Entertainment, Inc. (restaurant and entertainment complexes, 2010-present) and Bristol-Myers Squibb Company (global pharmaceuticals, 2008-present). In addition, Mr. Lacy served as Senior Adviser (2007-2014) of Oak Hill Capital Partners, L.P. (private equity) and also served as Chief Executive Officer (2000-2005) and Vice Chairman (2005-2006) of Sears Holdings Corporation and Sears, Roebuck and Co. (retail). Mr. Lacy is a member of the Board of Trustees of The National Parks Conservation Association (2006-present). Previously, Mr. Lacy served as Chairman of the Board of Trustees of the National Parks Conservation Association (2008-2011) and as a member of the Board of Directors for The Western Union Company (global money transfer, 2006-2011), The Hillman Companies, Inc. (hardware wholesalers, 2010-2014), and Earth Fare, Inc. (retail grocer, 2010-2014).
Ned C. Lautenbach (1944)
Year of Election or Appointment: 2000
Trustee
Chairman of the Independent Trustees
Mr. Lautenbach also serves as Trustee of other Fidelity funds. Mr. Lautenbach currently serves as the Lead Director of the Eaton Corporation Board of Directors (diversified industrial, 1997-present). Mr. Lautenbach is Chairman of the Board of Directors of Artis-Naples in Naples, Florida (2012-present), a member of the Council on Foreign Relations (1994-present), and a member of the Board of Governors, State University System of Florida (2013-present. Previously, Mr. Lautenbach was a Partner/Advisory Partner at Clayton, Dubilier & Rice, LLC (private equity investment, 1998-2010), as well as a Director of Sony Corporation (2006-2007).
Joseph Mauriello (1944)
Year of Election or Appointment: 2008
Trustee
Mr. Mauriello also serves as Trustee of other Fidelity funds. Prior to his retirement in January 2006, Mr. Mauriello served in numerous senior management positions including Deputy Chairman and Chief Operating Officer (2004-2005), and Vice Chairman of Financial Services (2002-2004) of KPMG LLP US (professional services, 1965-2005). Mr. Mauriello currently serves as a member of the Board of Directors of XL Group plc. (global insurance and re-insurance, 2006-present). Previously, Mr. Mauriello served as a Director of the Hamilton Funds of the Bank of New York (2006-2007) and of Arcadia Resources Inc. (health care services and products, 2007-2012).
Robert W. Selander (1950)
Year of Election or Appointment: 2011
Trustee
Mr. Selander also serves as Trustee of other Fidelity funds. Mr. Selander serves as a Director of The Western Union Company (global money transfer, 2014-present). Previously, Mr. Selander served as a Member of the Advisory Board of other Fidelity funds (2011), and Executive Vice Chairman (2010), Chief Executive Officer (2009-2010), and President and Chief Executive Officer (1997-2009) of Mastercard, Inc.
Cornelia M. Small (1944)
Year of Election or Appointment: 2005
Trustee
Ms. Small also serves as Trustee of other Fidelity funds. Ms. Small is a member of the Board of Directors (2009-present) and Chair of the Investment Committee (2010-present) of the Teagle Foundation. Ms. Small also serves on the Investment Committee of the Berkshire Taconic Community Foundation (2008-present). Previously, Ms. Small served as Chairperson (2002-2008) and a member of the Investment Committee and Chairperson (2008-2012) and a member of the Board of Trustees of Smith College. In addition, Ms. Small served as Chief Investment Officer, Director of Global Equity Investments, and a member of the Board of Directors of Scudder, Stevens & Clark and Scudder Kemper Investments.
Name, Year of Birth; Principal Occupations and Other Relevant Experience+
William S. Stavropoulos (1939)
Year of Election or Appointment: 2001
Trustee
Vice Chairman of the Independent Trustees
Mr. Stavropoulos also serves as Trustee of other Fidelity funds. Mr. Stavropoulos serves as President and Founder of the Michigan Baseball Foundation, the Great Lakes Loons (2007-present). Mr. Stavropoulos is Chairman Emeritus of the Board of Directors of The Dow Chemical Company, where he previously served in numerous senior management positions, including President, CEO (1995-2000; 2002-2004), Chairman of the Executive Committee (2000-2006), and as a member of the Board of Directors (1990-2006). Currently, Mr. Stavropoulos is Chairman of the Board of Directors of Univar Inc. (global distributor of commodity and specialty chemicals), a Director of Teradata Corporation (data warehousing and technology solutions), and Maersk Inc. (industrial conglomerate), and a member of the Advisory Board for Metalmark Capital LLC (private equity investment, 2005-present). Mr. Stavropoulos is an operating advisor to Clayton, Dubilier & Rice, LLC (private equity investment). In addition, Mr. Stavropoulos is a member of the University of Notre Dame Advisory Council for the College of Science, a Trustee of the Rollin L. Gerstacker Foundation, and a Director of the Naples Philharmonic Center for the Arts. Previously, Mr. Stavropoulos served as a Director of Chemical Financial Corporation (bank holding company, 1993-2012) and Tyco International, Ltd. (multinational manufacturing and services, 2007-2012).
David M. Thomas (1949)
Year of Election or Appointment: 2008
Trustee
Mr. Thomas also serves as Trustee of other Fidelity funds. Mr. Thomas serves as Non-Executive Chairman of the Board of Directors of Fortune Brands Home and Security (home and security products, 2011-present), as a member of the Board of Directors (2004-present) and Presiding Director (2013-present) of Interpublic Group of Companies, Inc. (marketing communication), and as a member of the Board of Trustees of the University of Florida (2013-present). Previously, Mr. Thomas served as Executive Chairman (2005-2006) and Chairman and Chief Executive Officer (2000-2005) of IMS Health, Inc. (pharmaceutical and healthcare information solutions), and a Director of Fortune Brands, Inc. (consumer products, 2000-2011).
| + | The information above includes each Trustee’s principal occupation during the last five years and other information relating to the experience, attributes, and skills relevant to each Trustee’s qualifications to serve as a Trustee, which led to the conclusion that each Trustee should serve as a Trustee for each fund. |
Advisory Board Member and Officers:
Correspondence intended for Peter S. Lynch and each officer may be sent to Fidelity Investments, 245 Summer Street, Boston, Massachusetts 02210. Officers appear below in alphabetical order.
Name, Year of Birth; Principal Occupation
Peter S. Lynch (1944)
Year of Election or Appointment: 2003
Member of the Advisory Board
Mr. Lynch also serves as Member of the Advisory Board of other Fidelity funds. Mr. Lynch is Vice Chairman and a Director of FMR and FMR Co., Inc. In addition, Mr. Lynch serves as a Trustee of Boston College and as the Chairman of the Inner-City Scholarship Fund. Previously, Mr. Lynch served on the Special Olympics International Board of Directors (1997-2006).
Elizabeth Paige Baumann (1968)
Year of Election or Appointment: 2012
Anti-Money Laundering (AML) Officer
Ms. Baumann also serves as AML Officer of other funds. She is Chief AML Officer of FMR LLC (2012-present) and is an employee of Fidelity Investments. Previously, Ms. Baumann served as Vice President and Deputy Anti-Money Laundering Officer (2007-2012).
William C. Coffey (1969)
Year of Election or Appointment: 2009
Assistant Secretary
Mr. Coffey also serves as Assistant Secretary of other funds. He is Senior Vice President and Deputy General Counsel of FMR LLC (2010-present), and is an employee of Fidelity Investments. Previously, Mr. Coffey served as Vice President and Associate General Counsel of FMR LLC (2005-2009).
Trustees and Officers – continued
Name, Year of Birth; Principal Occupation
Timothy M. Cohen (1969)
Year of Election or Appointment: 2014
Vice President of certain Equity Funds]
Mr. Cohen also serves as Vice President of other funds. Mr. Cohen serves as a Director and Chief Compliance Officer of Fidelity Management & Research (U.K.) Inc. (2013-present) and is an employee of Fidelity Investments.
Jonathan Davis (1968)
Year of Election or Appointment: 2010
Assistant Treasurer
Mr. Davis also serves as Assistant Treasurer of other funds. Mr. Davis is an employee of Fidelity Investments. Previously, Mr. Davis served as Vice President and Associate General Counsel of FMR LLC (2003-2010).
Adrien E. Deberghes (1967)
Year of Election or Appointment: 2008
Deputy Treasurer
Mr. Deberghes also serves as an officer of other funds. He is an employee of Fidelity Investments (2008-present). Prior to joining Fidelity Investments, Mr. Deberghes was Senior Vice President of Mutual Fund Administration at State Street Corporation (2007-2008), Senior Director of Mutual Fund Administration at Investors Bank & Trust (2005-2007), and Director of Finance for Dunkin' Brands (2000-2005).
Stephanie J. Dorsey (1969)
Year of Election or Appointment: 2010
Assistant Treasurer
Ms. Dorsey also serves as an officer of other funds. She is an employee of Fidelity Investments (2008-present) and has served in other fund officer roles. Prior to joining Fidelity Investments, Ms. Dorsey served as Treasurer (2004-2008) of the JPMorgan Mutual Funds and Vice President (2004-2008) of JPMorgan Chase Bank.
Howard J. Galligan III (1966)
Year of Election or Appointment: 2014
Chief Financial Officer
Mr. Galligan also serves as Chief Financial Officer of other funds. Mr. Galligan serves as President of Fidelity Pricing and Cash Management Services (FPCMS) (2014-present) and as a Director of Strategic Advisers, Inc. (2008-present). Previously, Mr. Galligan served as Chief Administrative Officer of Asset Management (2011-2014) and Chief Operating Officer and Senior Vice President of Investment Support for Strategic Advisers, Inc. (2003-2011).
Scott C. Goebel (1968)
Year of Election or Appointment: 2008
Secretary and Chief Legal Officer (CLO)
Mr. Goebel serves as Secretary and CLO of other funds. Mr. Goebel also serves as Secretary of Fidelity SelectCo, LLC (2013-present), Fidelity Investments Money Management, Inc. (FIMM) (2010-present) and Fidelity Research and Analysis Company (FRAC) (2010-present); General Counsel, Secretary, and Senior Vice President of FMR (2008-present) and FMR Co., Inc. (2008-present); Chief Legal Officer of Fidelity Management & Research (Hong Kong) Limited (2008-present); and Assistant Secretary of Fidelity Management & Research (Japan) Limited (2008-present) and Fidelity Management & Research (U.K.) Inc. (2008-present). Previously, Mr. Goebel served as Secretary and CLO of other Fidelity funds (2008-2013), Assistant Secretary of FIMM (2008-2010), FRAC (2008-2010), and certain funds (2007-2008); and as Vice President and Secretary of Fidelity Distributors Corporation (FDC) (2005-2007). Mr. Goebel has been employed by FMR LLC or an affiliate since 2001.
Brian B. Hogan (1964)
Year of Election or Appointment: 2009
Vice President
Mr. Hogan also serves as Trustee or Vice President of other funds. Mr. Hogan serves as a Director of Fidelity SelectCo, LLC (2014-present) and President of FMR's Equity Division (2009-present). Previously, Mr. Hogan served as Senior Vice President, Equity Research of FMR (2006-2009) and as a portfolio manager.
Name, Year of Birth; Principal Occupation
Chris Maher (1972)
Year of Election or Appointment: 2013
Assistant Treasurer
Mr. Maher serves as Assistant Treasurer of other funds. Mr. Maher is Vice President of Valuation Oversight and is an employee of Fidelity Investments. Previously, Mr. Maher served as Vice President of Asset Management Compliance (2013), Vice President of FMR's Program Management Group (2010-2013), and Vice President of Valuation Oversight (2008-2010).
Kenneth B. Robins (1969)
Year of Election or Appointment: 2008
President and Treasurer
Mr. Robins also serves as an officer of other funds. Mr. Robins serves as Executive Vice President of Fidelity Investments Money Management, Inc. (FIMM) (2013-present) and is an employee of Fidelity Investments (2004-present). Previously, Mr. Robins served in other fund officer roles.
Stephen Sadoski (1971)
Year of Election or Appointment: 2012
Deputy Treasurer
Mr. Sadoski also serves as Deputy Treasurer of other funds. He is an employee of Fidelity Investments (2012-present) and has served in another fund officer role. Prior to joining Fidelity Investments, Mr. Sadoski served as an assistant chief accountant in the Division of Investment Management of the Securities and Exchange Commission (SEC) (2009-2012) and as a senior manager at Deloitte & Touche LLP (1997-2009).
Stacie M. Smith (1974)
Year of Election or Appointment: 2013
Deputy Treasurer
Ms. Smith also serves as an officer of other funds. She is an employee of Fidelity Investments (2009-present) and has served in other fund officer roles. Prior to joining Fidelity Investments, Ms. Smith served as Senior Audit Manager of Ernst & Young LLP (1996-2009).
Renee Stagnone (1975)
Year of Election or Appointment: 2013
Deputy Treasurer
Ms. Stagnone also serves as Deputy Treasurer of other funds. Ms. Stagnone is an employee of Fidelity Investments.
Linda J. Wondrack (1964)
Year of Election or Appointment: 2014
Chief Compliance Officer
Ms. Wondrack also serves as Chief Compliance Officer of other funds. Ms. Wondrack is Executive Vice President and head of the Ethics Office and Asset Management Compliance for Fidelity Investments (2012-present). Ms. Wondrack also serves as Chief Compliance Officer of Fidelity SelectCo, LLC (2014-present); Chief Compliance Officer of Impresa Management LLC (2013-present); and Chief Compliance Officer of FMR Co., Inc., Fidelity Investments Money Management, Inc., Fidelity Management & Research (Japan) Limited, Fidelity Management & Research (U.K.) Inc., Fidelity Management & Research (Hong Kong), Fidelity Management & Research Company, Pyramis Global Advisors, LLC, and Strategic Advisers, Inc., Ballyrock Investment Advisors LLC, and Northern Neck Investors LLC (2012-present). Previously, Ms. Wondrack served as Senior Vice President and Chief Compliance Officer for Columbia Management Investment Advisers, LLC (2005-2012); Chief Compliance Officer for certain funds within the Columbia Family of Funds (2007-2012); and Senior Vice President of Compliance Risk Management at Bank of America (2005-2010).
Joseph F. Zambello (1957)
Year of Election or Appointment: 2011
Deputy Treasurer
Mr. Zambello also serves as Deputy Treasurer of other funds. Mr. Zambello is an employee of Fidelity Investments. Previously, Mr. Zambello served as Vice President of FMR's Program Management Group (2009-2011) and Vice President of the Transfer Agent Oversight Group (2005-2009).
Distributions (Unaudited)
The Board of Trustees of VIP Contrafund Portfolio voted to pay to shareholders of record at the opening of business on record date, the following distributions per share derived from capital gains realized from sales of portfolio securities, and dividends derived from net investment income:
| | Pay Date | Record Date | Dividends | Capital Gains |
| Initial Class | 02/06/2015 | 02/06/2015 | $0.006 | $3.031 |
| Service Class | 02/06/2015 | 02/06/2015 | $0.004 | $3.031 |
| Service Class 2 | 02/06/2015 | 02/06/2015 | $0.003 | $3.031 |
| Investor Class | 02/06/2015 | 02/06/2015 | $0.005 | $3.031 |
The fund hereby designates as a capital gain dividend with respect to the taxable year ended December 31, 2014 $1,595,790,260, or, if subsequently determined to be different, the net capital gain of such year.
Initial Class designates 45%; Service Class designates 47%; Service Class 2 designates 49%; and Investor Class designates 46% of the dividends distributed during the fiscal year as qualifying for the dividends-received deduction for corporate shareholders.
Board Approval of Investment Advisory Contracts and Management Fees
VIP Contrafund Portfolio
Each year, the Board of Trustees, including the Independent Trustees (together, the Board), votes on the renewal of the management contract with Fidelity Management & Research Company (FMR) and the sub-advisory agreements (together, the Advisory Contracts) for the fund. The Board, assisted by the advice of fund counsel and Independent Trustees’ counsel, requests and considers a broad range of information relevant to the renewal of the Advisory Contracts throughout the year.
The Board meets regularly and, at each of its meetings, covers an extensive agenda of topics and materials and considers factors that are relevant to its annual consideration of the renewal of the fund’s Advisory Contracts, including the services and support provided to the fund and its shareholders. The Board has established various standing committees (Committees), each composed of and chaired by Independent Trustees with varying backgrounds, to which the Board has assigned specific subject matter responsibilities in order to enhance effective decision-making by the Board. The Board, acting directly and through its Committees, requests and receives information concerning the annual consideration of the renewal of the fund’s Advisory Contracts. The Board also meets as needed to consider matters specifically related to the Board’s annual consideration of the renewal of the Advisory Contracts. Members of the Board may also meet with trustees of other Fidelity funds through ad hoc joint committees to discuss certain matters relevant to the Fidelity funds.
At its July 2014 meeting, the Board, including the Independent Trustees, unanimously determined to renew the fund’s Advisory Contracts. In reaching its determination, the Board considered all factors it believed relevant, including (i) the nature, extent, and quality of the services to be provided to the fund and its shareholders (including the investment performance of the fund); (ii) the competitiveness of the fund’s management fee and total expense ratio relative to peer funds; (iii) the total costs of the services to be provided by and the profits to be realized by Fidelity from its relationship with the fund; (iv) the extent to which economies of scale exist and would be realized as the fund grows; and (v) whether fee levels reflect these economies of scale, if any, for the benefit of fund shareholders. In connection with separate internal corporate reorganizations involving Fidelity Management & Research (U.K.) Inc. (FMR U.K.) and Fidelity Management & Research (Japan) Inc. (FMR Japan), the Board approved certain non-material amendments to the fund’s sub-advisory agreements with FMR U.K. and FMR Japan to reflect that, after these reorganizations, FMR Investment Management (UK) Limited and Fidelity Management & Research (Japan) Limited will carry on the business of FMR U.K. and FMR Japan, respectively. The Board noted that no changes to the portfolio managers or to the foreign research or investment advisory services provided to the fund were expected in connection with either reorganization and that the same personnel and resources would continue to be available to the fund at the new entities.
In considering whether to renew the Advisory Contracts for the fund, the Board reached a determination, with the assistance of fund counsel and Independent Trustees’ counsel and through the exercise of its business judgment, that the renewal of the Advisory Contracts was in the best interests of the fund and its shareholders and that the compensation payable under the Advisory Contracts was fair and reasonable. The Board’s decision to renew the Advisory Contracts was not based on any single factor, but rather was based on a comprehensive consideration of all the information provided to the Board at its meetings throughout the year. The Board, in reaching its determination to renew the Advisory Contracts, was aware that shareholders of the fund have a broad range of investment choices available to them, including a wide choice among funds offered by Fidelity’s competitors, and that the fund’s shareholders, who have the opportunity to review and weigh the disclosure provided by the fund in its prospectus and other public disclosures, have chosen to invest in this fund, which is part of the Fidelity family of funds.
Nature, Extent, and Quality of Services Provided. The Board considered Fidelity’s staffing as it relates to the fund, including the backgrounds of investment personnel of FMR and the sub-advisers (together, the Investment Advisers), and also considered the fund’s investment objective, strategies, and related investment philosophy. The Independent Trustees also had discussions with senior management of Fidelity’s investment operations and investment groups. The Board considered the structure of the portfolio manager compensation program and whether this structure provides appropriate incentives to act in the best interests of the fund. Additionally, the Board considered the portfolio managers’ investments, if any, in the funds that they manage.
Resources Dedicated to Investment Management and Support Services. The Board and the Fund Oversight and Research Committees reviewed the general qualifications and capabilities of Fidelity’s investment staff, including its size, education, experience, and resources, as well as Fidelity’s approach to recruiting, training, managing, and compensating investment personnel. The Board noted that Fidelity has continued to increase the resources devoted to non-U.S. offices, including expansion of Fidelity’s global investment organization. The Board also noted that Fidelity’s analysts have extensive resources, tools and capabilities that allow them to conduct sophisticated quantitative and fundamental analysis, as well as credit analysis of issuers, counterparties and guarantors. Further, the Board believes that Fidelity’s investment professionals have sufficient access to global information and data so as to provide competitive investment results over time, and that those professionals also have access to sophisticated tools that permit them to assess portfolio construction and risk and performance attribution characteristics continuously, as well as to transmit new information and research conclusions rapidly around the world. Additionally, in its deliberations, the Board considered Fidelity’s trading and risk management capabilities and resources and global compliance infrastructure, which are an integral part of the investment management process.
Shareholder and Administrative Services. The Board considered (i) the nature, extent, quality, and cost of advisory, administrative, and shareholder services performed by the Investment Advisers and their affiliates under the Advisory Contracts and under separate agreements covering transfer
Board Approval of Investment Advisory Contracts and Management Fees – continued
agency, pricing and bookkeeping, and securities lending services for the fund; (ii) the nature and extent of the supervision of third party service providers, principally custodians and subcustodians; and (iii) the resources devoted to, and the record of compliance with, the fund’s compliance policies and procedures. The Board also reviewed the allocation of fund brokerage, including allocations to brokers affiliated with the Investment Advisers, the use of brokerage commissions to pay fund expenses, and the use of “soft” commission dollars to pay for research services.
The Board noted that the growth of fund assets over time across the complex allows Fidelity to reinvest in the development of services designed to enhance the value or convenience of the Fidelity funds as investment vehicles. These services include 24-hour access to account information and market information through telephone representatives and over the Internet, investor education materials and asset allocation tools, and the expanded availability of Fidelity Investor Centers.
In 2014, the Board formed an ad hoc Committee on Transfer Agency Fees to review the variety of transfer agency fee structures throughout the industry and Fidelity’s competitive positioning with respect to industry participants.
Investment in a Large Fund Family. The Board considered the benefits to shareholders of investing in a Fidelity fund, including the benefits of investing in a fund that is part of a large family of funds offering a variety of investment disciplines and providing a large variety of mutual fund investor services. The Board noted that Fidelity had taken, or had made recommendations that resulted in the Fidelity funds taking, a number of actions over the previous year that benefited particular funds, including (i) continuing to dedicate additional resources to investment research and to the support of the senior management team that oversees asset management; (ii) persisting in efforts to enhance Fidelity’s global research capabilities; (iii) launching new funds and making other enhancements to meet client needs for income-oriented solutions; (iv) reducing fund expenses for certain index funds; (v) continuing to launch dedicated lower cost underlying funds to meet portfolio construction needs related to expanding underlying fund options for Fidelity funds of funds, specifically for the Freedom Fund product lines; (vi) rationalizing product lines and gaining increased efficiencies through fund mergers; (vii) launching sector-based exchange-traded funds and establishing a new Fidelity adviser to manage sector-based funds and products; (viii) continuing to develop and implement technology to improve security and increase efficiency; (ix) modifying the eligibility criteria for certain share classes to increase their marketability to a portion of the defined contribution plan market; (x) waiving redemption fees for certain qualified fund-of-fund and wrap programs and certain retirement plan transactions; and (xi) launching new Institutional Class shares of certain money market funds to attract and retain assets and to fill a gap in the money market fund lineup.
Investment Performance. The Board considered whether the fund has operated in accordance with its investment objective, as well as its record of compliance with its investment restrictions and its performance history. The Board noted that there was a portfolio management change for a sleeve of the fund in April 2013 and June 2013.
The Board took into account discussions with the Investment Advisers about fund investment performance that occur at Board meetings throughout the year. In this regard the Board noted that as part of regularly scheduled fund reviews and other reports to the Board on fund performance, the Board periodically considers annualized return information for the fund, for different time periods, measured against a securities market index (“benchmark index”) and a peer group of funds with similar objectives (“peer group”). In its evaluation of fund investment performance, the Board gave particular attention to information indicating changes in performance of certain Fidelity funds for specific time periods and the Investment Advisers’ explanations for any overperformance or underperformance.
In addition to reviewing absolute and relative fund performance, the Independent Trustees periodically consider the appropriateness of fund performance metrics in evaluating the results achieved. In general, the Independent Trustees believe that fund performance should be evaluated based on net performance (after fees and expenses) of both the highest performing and lowest performing classes, where applicable, compared to appropriate benchmark indices, over appropriate time periods which may include full market cycles, and compared to peer groups, as applicable, over the same periods, taking into account relevant factors including the following: general market conditions; issuer-specific information; tactical opportunities for investment; and fund cash flows and other factors.
The Independent Trustees recognize that shareholders evaluate performance on a net basis over their own holding periods, for which one-, three-, and five-year periods are often used as a proxy. For this reason, the performance information reviewed by the Board also included net cumulative calendar year total return information for the fund and an appropriate benchmark index and peer group for the most recent one-, three-, and five-year periods, as shown below. Returns are shown compared to the 25th percentile (top of box, 75% beaten) and 75th percentile (bottom of box, 25% beaten) of the peer universe.
VIP Contrafund Portfolio

The Board has discussed with FMR the fund’s underperformance (based on the December 31, 2013 data presented herein) and has engaged with FMR to consider what steps might be taken to remediate the fund’s underperformance. The Board noted that the fund’s performance has improved for more recent periods.
Based on its review, the Board concluded that the nature, extent, and quality of services provided to the fund under the Advisory Contracts should benefit the fund’s shareholders.
Competitiveness of Management Fee and Total Expense Ratio. The Board considered the fund’s management fee and total expense ratio compared to “mapped groups” of competitive funds and classes. Fidelity creates “mapped groups” by combining similar Lipper investment objective categories that have comparable investment mandates. Combining Lipper investment objective categories aids the Board’s management fee and total expense ratio comparisons by broadening the competitive group used for comparison and by reducing the number of universes to which various Fidelity funds are compared.
Management Fee. The Board considered two proprietary management fee comparisons for the 12-month periods shown in the chart below. The group of Lipper funds used by the Board for management fee comparisons is referred to below as the “Total Mapped Group.” The Total Mapped Group comparison focuses on a fund’s standing in terms of gross management fees before expense reimbursements or caps relative to the total universe of funds with comparable investment mandates, regardless of whether their management fee structures also are comparable. Funds with comparable investment mandates offer exposure to similar types of securities. Funds with comparable management fee structures have similar management fee contractual arrangements (e.g., flat rate charged for advisory services, all-inclusive fee rate, etc.). “TMG %” represents the percentage of funds in the Total Mapped Group that had management fees that were lower than the fund’s. For example, a hypothetical TMG % of 20% would mean that 80% of the funds in the Total Mapped Group had higher, and 20% had lower, management fees than the fund. The fund’s actual TMG %s are in the chart below. The “Asset-Size Peer Group” (ASPG) comparison focuses on a fund’s standing relative to a subset of non-Fidelity funds within the Total Mapped Group that are similar in size and management fee structure. For example, if a fund is in the first quartile of the ASPG, the fund’s management fee ranks in the least expensive or lowest 25% of funds in the ASPG. The ASPG represents at least 15% of the funds in the Total Mapped Group with comparable asset size and management fee structures, subject to a minimum of 50 funds (or all funds in the Total Mapped Group if fewer than 50). Additional information, such as the ASPG quartile in which the fund’s management fee rate ranked, is also included in the chart and considered by the Board.
Board Approval of Investment Advisory Contracts and Management Fees – continued
VIP Contrafund Portfolio

The Board noted that the fund’s management fee rate ranked below the median of its Total Mapped Group and below the median of its ASPG for 2013.
The Board also noted that, in August 2013, the ad hoc Committee on Management Fees was formed to conduct an in-depth review of the management fee rates of Fidelity’s active equity mutual funds. The Committee focused on the following areas: (i) standard fee structures; (ii) research consumption and trading evolution; (iii) management fee competitiveness/profitability by category; and (iv) factors that drive institutional pricing.
Based on its review, the Board concluded that the fund’s management fee is fair and reasonable in light of the services that the fund receives and the other factors considered.
Total Expense Ratio. In its review of each class’s total expense ratio, the Board considered the fund’s management fee as well as other fund or class expenses, as applicable, such as transfer agent fees, pricing and bookkeeping fees, fund-paid 12b-1 fees, and custodial, legal, and audit fees. The Board also noted the effects of any waivers and reimbursements on fees and expenses. As part of its review, the Board also considered the current and historical total expense ratios of each class of the fund compared to competitive fund median expenses. Each class of the fund is compared to those funds and classes in the Total Mapped Group (used by the Board for management fee comparisons) that have a similar sales load structure.
The Board noted that the total expense ratio of each class ranked below its competitive median for 2013.
Fees Charged to Other Fidelity Clients. The Board also considered Fidelity fee structures and other information with respect to clients of Fidelity, such as other funds advised or subadvised by Fidelity, pension plan clients, and other institutional clients. The Board noted the findings of the 2013 ad hoc joint committee (created with the board of other Fidelity funds), which reviewed and compared Fidelity’s institutional investment advisory business with its business of providing services to the Fidelity funds, including the differences in services provided, fees charged, and costs incurred, as well as competition in their respective marketplaces.
Based on its review of total expense ratios and fees charged to other Fidelity clients, the Board concluded that the total expense ratio of each class of the fund was reasonable in light of the services that the fund and its shareholders receive and the other factors considered.
Costs of the Services and Profitability. The Board considered the revenues earned and the expenses incurred by Fidelity in conducting the business of developing, marketing, distributing, managing, administering and servicing the fund and servicing the fund’s shareholders. The Board also considered the level of Fidelity’s profits in respect of all the Fidelity funds.
On an annual basis, Fidelity presents to the Board Fidelity’s profitability for the fund. Fidelity calculates the profitability for each fund, as well as aggregate profitability for groups of Fidelity funds and all Fidelity funds, using a series of detailed revenue and cost allocation methodologies which originate with the books and records of Fidelity on which Fidelity’s audited financial statements are based. The Audit Committee of the Board reviews any significant changes from the prior year’s methodologies.
PricewaterhouseCoopers LLP (PwC), independent registered public accounting firm and auditor to Fidelity and certain Fidelity funds, has been engaged annually by the Board as part of the Board’s assessment of Fidelity’s profitability analysis. PwC’s engagement includes the review and assessment of the methodologies used by Fidelity in determining the revenues and expenses attributable to Fidelity’s mutual fund business, and completion of agreed-upon procedures in respect of the mathematical accuracy of fund profitability and its conformity to established allocation methodologies.
After considering PwC’s reports issued under the engagement and information provided by Fidelity, the Board concluded that while other allocation methods may also be reasonable, Fidelity’s profitability methodologies are reasonable in all material respects.
The Board also reviewed Fidelity’s non-fund businesses and fall-out benefits related to the mutual fund business as well as cases where Fidelity’s affiliates may benefit from or be related to the fund’s business.
The Board considered the costs of the services provided by and the profits realized by Fidelity in connection with the operation of the fund and was satisfied that the profitability was not excessive in the circumstances.
Economies of Scale. The Board considered whether there have been economies of scale in respect of the management of the Fidelity funds, whether the Fidelity funds (including the fund) have appropriately benefited from any such economies of scale, and whether there is potential for realization of any further economies of scale. The Board considered the extent to which the fund will benefit from economies of scale through increased services to the fund, through waivers or reimbursements, or through fee or expense ratio reductions. The Board also noted that in 2013, it and the boards of other Fidelity funds created an ad hoc committee (the Economies of Scale Committee) to analyze whether Fidelity attains economies of scale in respect of the management and servicing of the Fidelity funds, whether the Fidelity funds have appropriately benefited from such economies of scale, and whether there is potential for realization of any further economies of scale.
The Board recognized that the fund’s management contract incorporates a “group fee” structure, which provides for lower group fee rates as total group assets increase, and for higher group fee rates as total group assets decrease (with “group assets” defined to include fund assets under FMR’s management plus sector fund assets previously under FMR’s management and currently managed by Fidelity SelectCo, LLC). FMR calculates the group fee rates based on a tiered asset “breakpoint” schedule that varies based on asset class. The Board considered that the group fee is designed to deliver the benefits of economies of scale to fund shareholders when total Fidelity fund assets increase, even if assets of any particular fund are unchanged or have declined, because some portion of Fidelity’s costs are attributable to services provided to all Fidelity funds, and all funds benefit if those costs can be allocated among more assets. The Board concluded that, given the group fee structure, fund shareholders will benefit from lower management fees as group assets increase at the fund complex level, regardless of whether Fidelity achieves any such economies of scale.
The Board concluded, taking into account the analysis of the Economies of Scale Committee, that economies of scale, if any, are being appropriately shared between fund shareholders and Fidelity.
Additional Information Requested by the Board. In order to develop fully the factual basis for consideration of the Fidelity funds’ Advisory Contracts, the Board requested and received additional information on certain topics, including: (i) fund performance trends and Fidelity’s long-term strategies for certain funds; (ii) Fidelity’s strategic marketing and product lineup goals; (iii) the methodology with respect to competitive fund data and peer group classifications; (iv) the arrangements with, and performance of, certain sub-advisers on behalf of the Fidelity funds, as well as certain proposed participating affiliate arrangements; (v) the realization of fall-out benefits in certain Fidelity business units; (vi) Fidelity’s group fee structures, including the rationale for the individual fee rates of certain categories of funds and the definition of group assets; (vii) trends regarding industry use of performance fee structures and the performance adjustment methodologies applicable to the Fidelity funds; (viii) additional competitive analysis regarding the total expenses for certain classes; (ix) fund profitability methodology, including Fidelity’s cost allocation methodology, and the impact of certain factors on fund profitability results; and (x) the process by which Fidelity determines sub-advisory fees for funds it advises.
Based on its evaluation of all of the conclusions noted above, and after considering all factors it believed relevant, the Board ultimately concluded that the advisory fee structures are fair and reasonable, and that the fund’s Advisory Contracts should be renewed.
Investment Adviser
Fidelity Management & Research Company
Boston, MA
Investment Sub-Advisers
FMR Co., Inc.
Fidelity Management & Research (U.K.) Inc.
Fidelity Management & Research (Hong Kong) Limited
Fidelity Management & Research (Japan) Limited
General Distributor
Fidelity Distributors Corporation
Smithfield, RI
Transfer and Service Agents
Fidelity Investments Institutional Operations Company, Inc.
Boston, MA
Fidelity Service Company, Inc.
Boston, MA
Custodian
Brown Brothers Harriman & Co.
Boston, MA
Fidelity® Variable Insurance Products:
Equity-lncome Portfolio
Annual Report December 31, 2014 | |
How the fund has done over time.
The Portfolio Manager’s review of fund performance and strategy.
An example of shareholder expenses.
A summary of major shifts in the fund’s investments over the past six months.
A complete list of the fund’s investments with their market values.
Statements of assets and liabilities, operations, and changes in net assets, as well as financial highlights.
Notes to the financial statements.
To view a fund’s proxy voting guidelines and proxy voting record for the 12-month period ended June 30, visit http://www.fidelity.com/proxyvotingresults or visit the Securities and Exchange Commission’s (SEC) web site at http://www.sec.gov. You may also call 1-877-208-0098 to request a free copy of the proxy voting guidelines.
Fidelity Variable Insurance Products are separate account options which are purchased through a variable insurance contract.
Standard & Poor’s, S&P and S&P 500 are registered service marks of The McGraw-Hill Companies, Inc. and have been licensed for use by Fidelity Distributors Corporation.
Other third-party marks appearing herein are the property of their respective owners.
All other marks appearing herein are registered or unregistered trademarks or service marks of FMR LLC or an affiliated company. © 2015 FMR LLC. All rights reserved.
This report and the financial statements contained herein are submitted for the general information of the shareholders of the fund. This report is not authorized for distribution to prospective investors in the fund unless preceded or accompanied by an effective prospectus.
A fund files its complete schedule of portfolio holdings with the SEC for the first and third quarters of each fiscal year on Form N-Q. Forms N-Q are available on the SEC’s web site at http://www.sec.gov. A fund’s Forms N-Q may be reviewed and copied at the SEC’s Public Reference Room in Washington, DC. Information regarding the operation of the SEC’s Public Reference Room may be obtained by calling 1-800-SEC-0330. For a complete list of a fund’s portfolio holdings, view the most recent holdings listing, semiannual report, or annual report on Fidelity’s web site at http://www.fidelity.com, http://www.advisor.fidelity.com, or http://www.401k.com, as applicable.
NOT FDIC INSURED • MAY LOSE VALUE • NO BANK GUARANTEE
Neither the fund nor Fidelity Distributors Corporation is a bank.
Performance: The Bottom Line
Average annual total return reflects the change in the value of an investment, assuming reinvestment of the class’ distributions from dividend income and capital gains (the profits earned upon the sale of securities that have grown in value, if any) and assuming a constant rate of performance each year. During periods of reimbursement by Fidelity, a fund’s total return will be greater than it would be had the reimbursement not occurred. Performance numbers are net of all underlying fund operating expenses, but do not include any insurance charges imposed by your insurance company’s separate account. If performance information included the effect of these additional charges, the total returns would have been lower. How a fund did yesterday is no guarantee of how it will do tomorrow.
| Average Annual Total Returns | | | | | | | | | |
| Periods ended December 31, 2014 | | Past 1 | | | Past 5 | | | Past 10 | |
| | | year | | | years | | | years | |
| VIP Equity-Income PortfolioSM – Initial Class | | | 8.85 | % | | | 13.73 | % | | | 6.26 | % |
| VIP Equity-Income Portfolio – Service Class | | | 8.74 | % | | | 13.62 | % | | | 6.15 | % |
| VIP Equity-Income Portfolio – Service Class 2 | | | 8.57 | % | | | 13.45 | % | | | 5.99 | % |
| VIP Equity-Income Portfolio – Investor ClassA | | | 8.77 | % | | | 13.63 | % | | | 6.16 | % |
A The initial offering of Investor Class shares took place on July 21, 2005. Returns prior to July 21, 2005, are those of Initial Class. Had Investor Class’s transfer agent fee been reflected, returns prior to July 21, 2005, would have been lower.
Let’s say hypothetically that $10,000 was invested in VIP Equity-Income PortfolioSM – Initial Class on December 31, 2004. The chart shows how the value of your investment would have changed, and also shows how the Russell 3000® Value Index performed over the same period.

Management's Discussion of Fund Performance
Market Recap: The U.S. stock market closed near an all-time high for the 12 months ending December 31, 2014, supported by low interest rates and strong corporate profits. The large-cap S&P 500® Index returned 13.69%, achieving a double-digit gain for the third consecutive year. Growth stocks in the index outperformed value-oriented names. The tech-heavy Nasdaq Composite Index® returned 14.75%, while the small-cap Russell 2000® Index returned a relatively lackluster 4.89% amid growth and valuation worries. Utilities (+29%) ended the year as the top-performing sector in the S&P 500®, lifted by fourth-quarter demand for U.S.-focused, dividend-paying stocks. Health care (+25%), a much larger index component, also gained strongly, as did information technology (+20%) and consumer staples (+16%). Conversely, energy (-8%) was by far the biggest laggard, reflecting a sharp drop in crude prices beginning in June, attributed to weaker demand and a U.S. supply boom driven by shale drilling. Volatility was tame for much of the period, although it spiked to a three-year high in October amid growth concerns, Ebola fears, and unrest in Syria, Iraq and Ukraine. Yet stocks still gained for the fourth quarter, bolstered by the relative economic strength of the U.S., which marked a six-year low in its unemployment rate.
Comments from James Morrow, Lead Portfolio Manager of Fidelity VIP Equity-Income Fund: For the year ending December 31, 2014, the fund’s share classes trailed the 12.70% gain of the benchmark Russell 3000® Value Index. (For specific portfolio results, please refer to the performance section of this report.) Compared with the benchmark, the fund was hurt by weak security selection in the information technology and financials sectors, whereas stock picking in consumer staples modestly contributed. During the year, the fund’s exposure to financials grew as I reduced its underweighting, partly reflecting the opportunities I saw among certain banks, as well as alternative asset managers. Meanwhile, I cut back in health care, especially large-cap pharmaceutical firms. As the stocks gained, I saw more risk and thus reduced or eliminated exposure to various drugmakers, including two top relative contributors — Merck and the U.K.’s out-of-index AstraZeneca, the latter of which was liquidated by year end. The biggest negative was a large cash stake in a rising market. In retrospect, I positioned the fund too conservatively. But my approach involves being disciplined about not overpaying for stocks, and I generally had a tough time finding compelling buying opportunities. In information technology, IT consultant IBM hampered results. I think the market was too quick to seize on IBM’s business challenges and too slow to recognize its long-term growth opportunities. I still firmly believe in IBM’s prospects, but in retrospect I held too much of this non-index stock, which plunged in October after the company abandoned its prior earnings forecast. The fund also was hurt by avoiding chipmaker and benchmark component Intel. The stock was up sharply but we did not own it because of my concerns about the company’s business model and relatively high debt. Instead, I preferred a name such as system-on-a-chip maker Broadcom, a top individual contributor that I thought offered a much better risk/reward trade-off. Elsewhere, as the price of oil fell, limited exposure to weak-performing Exxon Mobil proved the fund’s top relative contributor. In the convertible securities and high yield subportfolio, the biggest individual detractor by far was GT Advanced Technologies, a maker of sapphire glass, whose convertible bonds we owned.
The views expressed above reflect those of the portfolio manager(s) only through the end of the period as stated on the cover of this report and do not necessarily represent the views of Fidelity or any other person in the Fidelity organization. Any such views are subject to change at any time based upon market or other conditions and Fidelity disclaims any responsibility to update such views. These views may not be relied on as investment advice and, because investment decisions for a Fidelity fund are based on numerous factors, may not be relied on as an indication of trading intent on behalf of any Fidelity fund.
Shareholder Expense Example
As a shareholder of the Fund, you incur two types of costs: (1) transaction costs, including redemption fees and (2) ongoing costs, including management fees, distribution and/or service (12b-1) fees and other Fund expenses. This Example is intended to help you understand your ongoing costs (in dollars) of investing in the Fund and to compare these costs with the ongoing costs of investing in other mutual funds.
The Example is based on an investment of $1,000 invested at the beginning of the period and held for the entire period (July 1, 2014 to December 31, 2014).
Actual Expenses
The first line of the accompanying table for each class of the Fund provides information about actual account values and actual expenses. You may use the information in this line, together with the amount you invested, to estimate the expenses that you paid over the period. Simply divide your account value by $1,000.00 (for example, an $8,600 account value divided by $1,000.00 = 8.6), then multiply the result by the number in the first line for a class of the Fund under the heading entitled “Expenses Paid During Period” to estimate the expenses you paid on your account during this period. The estimate of expenses does not include any fees or other expenses of any variable annuity or variable life insurance product. If they were, the estimate of expenses you paid during the period would be higher, and your ending account value would be lower. In addition, the Fund, as a shareholder in the underlying Fidelity Central Funds, will indirectly bear its pro-rata share of the fees and expenses incurred by the underlying Fidelity Central Funds. These fees and expenses are not included in the Fund’s annualized expense ratio used to calculate the expense estimate in the table below.
Hypothetical Example for Comparison Purposes
The second line of the accompanying table for each class of the Fund provides information about hypothetical account values and hypothetical expenses based on a Class’ actual expense ratio and an assumed rate of return of 5% per year before expenses, which is not the Class’ actual return. The hypothetical account values and expenses may not be used to estimate the actual ending account balance or expenses you paid for the period. You may use this information to compare the ongoing costs of investing in the Fund and other funds. To do so, compare this 5% hypothetical example with the 5% hypothetical examples that appear in the shareholder reports of the other funds. The estimate of expenses does not include any fees or other expenses of any variable annuity or variable life insurance product. If they were, the estimate of expenses you paid during the period would be higher, and your ending account value would be lower. In addition, the Fund, as a shareholder in the underlying Fidelity Central Funds, will indirectly bear its pro-rata share of the fees and expenses incurred by the underlying Fidelity Central Funds. These fees and expenses are not included in the Fund’s annualized expense ratio used to calculate the expense estimate in the table below.
Please note that the expenses shown in the table are meant to highlight your ongoing costs only and do not reflect any transaction costs. Therefore, the second line of the table is useful in comparing ongoing costs only, and will not help you determine the relative total costs of owning different funds. In addition, if these transactional costs were included, your costs would have been higher.
| | | Annualized
Expense RatioB | | | Beginning
Account Value
July 1, 2014 | | | Ending
Account Value
December 31, 2014 | | | Expenses Paid
During Period*
July 1, 2014
to December 31, 2014 | |
| Initial Class | | | .54% | | | | | | | | | | | | | |
| Actual | | | | | | $ | 1,000.00 | | | $ | 1,009.10 | | | $ | 2.73 | |
| HypotheticalA | | | | | | $ | 1,000.00 | | | $ | 1,022.48 | | | $ | 2.75 | |
| Service Class | | | .64% | | | | | | | | | | | | | |
| Actual | | | | | | $ | 1,000.00 | | | $ | 1,008.60 | | | $ | 3.24 | |
| HypotheticalA | | | | | | $ | 1,000.00 | | | $ | 1,021.98 | | | $ | 3.26 | |
| Service Class 2 | | | .79% | | | | | | | | | | | | | |
| Actual | | | | | | $ | 1,000.00 | | | $ | 1,007.70 | | | $ | 4.00 | |
| HypotheticalA | | | | | | $ | 1,000.00 | | | $ | 1,021.22 | | | $ | 4.02 | |
| Service Class 2R | | | .79% | | | | | | | | | | | | | |
| Actual | | | | | | $ | 1,000.00 | | | $ | 1,008.20 | | | $ | 4.00 | |
| HypotheticalA | | | | | | $ | 1,000.00 | | | $ | 1,021.22 | | | $ | 4.02 | |
| Investor Class | | | .62% | | | | | | | | | | | | | |
| Actual | | | | | | $ | 1,000.00 | | | $ | 1,008.50 | | | $ | 3.14 | |
| HypotheticalA | | | | | | $ | 1,000.00 | | | $ | 1,022.08 | | | $ | 3.16 | |
A 5% return per year before expenses
B Annualized expense ratio reflects expenses net of applicable fee waivers.
* Expenses are equal to each Class’ annualized expense ratio, multiplied by the average account value over the period, multiplied by 184/365 (to reflect the one-half year period).
Investment Changes (Unaudited)
| Top Ten Stocks as of December 31, 2014 |
| | | | | | | |
| | | % of fund's
net assets | | | % of fund's net assets
6 months ago | |
| JPMorgan Chase & Co. | | | 4.2 | | | | 4.0 | |
| Johnson & Johnson | | | 4.0 | | | | 2.1 | |
| General Electric Co. | | | 3.2 | | | | 2.3 | |
| Chevron Corp. | | | 2.8 | | | | 3.1 | |
| Cisco Systems, Inc. | | | 2.6 | | | | 2.5 | |
| Procter & Gamble Co. | | | 2.5 | | | | 2.0 | |
| United Parcel Service, Inc. Class B | | | 2.2 | | | | 1.6 | |
| MetLife, Inc. | | | 2.2 | | | | 2.4 | |
| Wells Fargo & Co. | | | 2.0 | | | | 1.8 | |
| Verizon Communications, Inc. | | | 1.8 | | | | 1.8 | |
| | | | 27.5 | | | | | |
| Top Five Market Sectors as of December 31, 2014 |
| | | % of fund's
net assets | | | % of fund's net assets
6 months ago | |
| Financials | | | 26.1 | | | | 24.3 | |
| Information Technology | | | 11.3 | | | | 12.7 | |
| Industrials | | | 11.1 | | | | 9.5 | |
| Energy | | | 10.7 | | | | 15.5 | |
| Health Care | | | 10.7 | | | | 8.8 | |
| Asset Allocation (% of fund's net assets) |
| As of December 31, 2014* | As of June 30, 2014** |
 | 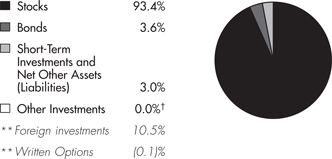 |
Investments December 31, 2014
Showing Percentage of Net Assets
| | | Shares | | | Value | |
| | | | | | | |
| CONSUMER DISCRETIONARY - 8.0% | | | | | | | | |
| Auto Components - 0.3% | | | | | | | | |
| Gentex Corp. | | | 542,757 | | | $ | 19,609,810 | |
| Automobiles - 0.1% | | | | | | | | |
| Ford Motor Co. | | | 378,061 | | | | 5,859,946 | |
| Hotels, Restaurants & Leisure - 2.3% | | | | | | | | |
| Darden Restaurants, Inc. | | | 534,099 | | | | 31,314,224 | |
| Dunkin' Brands Group, Inc. | | | 128,900 | | | | 5,497,585 | |
| McDonald's Corp. | | | 450,600 | | | | 42,221,220 | |
| Starwood Hotels & Resorts Worldwide, Inc. | | | 159,700 | | | | 12,946,879 | |
| Texas Roadhouse, Inc. Class A | | | 540,297 | | | | 18,240,427 | |
| Yum! Brands, Inc. | | | 488,900 | | | | 35,616,365 | |
| | | | | | | | 145,836,700 | |
| Household Durables - 0.2% | | | | | | | | |
| M.D.C. Holdings, Inc. (e) | | | 260,700 | | | | 6,900,729 | |
| Tupperware Brands Corp. | | | 106,400 | | | | 6,703,200 | |
| | | | | | | | 13,603,929 | |
| Leisure Products - 0.3% | | | | | | | | |
| New Academy Holding Co. LLC unit (a)(j)(k) | | | 127,200 | | | | 21,697,776 | |
| Media - 1.8% | | | | | | | | |
| Comcast Corp. Class A | | | 1,661,543 | | | | 96,386,109 | |
| Sinclair Broadcast Group, Inc. Class A | | | 593,604 | | | | 16,241,005 | |
| | | | | | | | 112,627,114 | |
| Multiline Retail - 1.9% | | | | | | | | |
| Kohl's Corp. | | | 501,275 | | | | 30,597,826 | |
| Macy's, Inc. | | | 246,900 | | | | 16,233,675 | |
| Target Corp. | | | 968,060 | | | | 73,485,435 | |
| | | | | | | | 120,316,936 | |
| Specialty Retail - 0.8% | | | | | | | | |
| Foot Locker, Inc. | | | 351,785 | | | | 19,763,281 | |
| GNC Holdings, Inc. | | | 305,900 | | | | 14,365,064 | |
| PetSmart, Inc. | | | 162,600 | | | | 13,218,567 | |
| | | | | | | | 47,346,912 | |
| Textiles, Apparel & Luxury Goods - 0.3% | | | | | | | | |
| Japan Tobacco, Inc. | | | 611,000 | | | | 16,816,423 | |
| | | | | | | | | |
| TOTAL CONSUMER DISCRETIONARY | | | | | | | 503,715,546 | |
| | | | | | | | | |
| CONSUMER STAPLES - 8.5% | | | | | | | | |
| Beverages - 0.8% | | | | | | | | |
| Molson Coors Brewing Co. Class B | | | 433,800 | | | | 32,326,776 | |
| PepsiCo, Inc. | | | 168,057 | | | | 15,891,470 | |
| The Coca-Cola Co. | | | 119,041 | | | | 5,025,911 | |
| | | | | | | | 53,244,157 | |
| Food & Staples Retailing - 2.3% | | | | | | | | |
| CVS Health Corp. | | | 633,700 | | | | 61,031,647 | |
| Tesco PLC | | | 1,564,100 | | | | 4,560,444 | |
| | | Shares | | | Value | |
| | | | | | | |
| Wal-Mart Stores, Inc. | | | 371,378 | | | $ | 31,893,943 | |
| Walgreens Boots Alliance, Inc. (h) | | | 599,107 | | | | 45,651,953 | |
| | | | | | | | 143,137,987 | |
| Food Products - 0.9% | | | | | | | | |
| B&G Foods, Inc. Class A | | | 225,213 | | | | 6,733,869 | |
| Kellogg Co. | | | 762,557 | | | | 49,901,730 | |
| | | | | | | | 56,635,599 | |
| Household Products - 2.5% | | | | | | | | |
| Procter & Gamble Co. | | | 1,734,019 | | | | 157,951,791 | |
| Tobacco - 2.0% | | | | | | | | |
| Lorillard, Inc. | | | 922,215 | | | | 58,044,212 | |
| Philip Morris International, Inc. | | | 427,284 | | | | 34,802,282 | |
| Reynolds American, Inc. | | | 466,800 | | | | 30,001,236 | |
| | | | | | | | 122,847,730 | |
| | | | | | | | | |
| TOTAL CONSUMER STAPLES | | | | | | | 533,817,264 | |
| | | | | | | | | |
| ENERGY - 10.3% | | | | | | | | |
| Energy Equipment & Services - 0.6% | | | | | | | | |
| Ensco PLC Class A | | | 605,376 | | | | 18,131,011 | |
| National Oilwell Varco, Inc. | | | 212,806 | | | | 13,945,177 | |
| Oceaneering International, Inc. | | | 126,800 | | | | 7,457,108 | |
| | | | | | | | 39,533,296 | |
| Oil, Gas & Consumable Fuels - 9.7% | | | | | | | | |
| Access Midstream Partners LP | | | 220,900 | | | | 11,972,780 | |
| Anadarko Petroleum Corp. | | | 332,986 | | | | 27,471,345 | |
| Apache Corp. | | | 571,768 | | | | 35,832,701 | |
| Cameco Corp. (e) | | | 472,100 | | | | 7,741,010 | |
| Chevron Corp. | | | 1,560,580 | | | | 175,065,864 | |
| CONSOL Energy, Inc. | | | 605,735 | | | | 20,479,900 | |
| EV Energy Partners LP | | | 355,311 | | | | 6,846,843 | |
| Exxon Mobil Corp. | | | 508,369 | | | | 46,998,714 | |
| Foresight Energy LP | | | 283,900 | | | | 4,789,393 | |
| HollyFrontier Corp. | | | 152,485 | | | | 5,715,138 | |
| Imperial Oil Ltd. | | | 276,100 | | | | 11,894,306 | |
| Kinder Morgan Holding Co. LLC | | | 660,600 | | | | 27,949,986 | |
| Legacy Reserves LP | | | 935,301 | | | | 10,690,490 | |
| Markwest Energy Partners LP | | | 557,529 | | | | 37,460,374 | |
| Royal Dutch Shell PLC Class A sponsored ADR | | | 375,229 | | | | 25,121,582 | |
| Suncor Energy, Inc. | | | 1,964,800 | | | | 62,404,132 | |
| The Williams Companies, Inc. | | | 1,780,249 | | | | 80,004,390 | |
| Williams Partners LP | | | 246,000 | | | | 11,008,500 | |
| | | | | | | | 609,447,448 | |
| | | | | | | | | |
| TOTAL ENERGY | | | | | | | 648,980,744 | |
| | | | | | | | | |
| FINANCIALS - 25.0% | | | | | | | | |
| Banks - 11.7% | | | | | | | | |
| Bank of America Corp. | | | 2,418,000 | | | | 43,258,020 | |
| CIT Group, Inc. | | | 187,438 | | | | 8,965,160 | |
| Comerica, Inc. | | | 597,248 | | | | 27,975,096 | |
| FirstMerit Corp. | | | 1,072,521 | | | | 20,259,922 | |
See accompanying notes which are an integral part of the financial statements.
Investments – continued
| Common Stocks – continued |
| | | Shares | | | Value | |
| | | | | | | |
| FINANCIALS - continued | | | | | | | | |
| Banks - continued | | | | | | | | |
| JPMorgan Chase & Co. | | | 4,205,564 | | | $ | 263,184,191 | |
| KeyCorp. | | | 678,100 | | | | 9,425,590 | |
| M&T Bank Corp. | | | 514,291 | | | | 64,605,235 | |
| PNC Financial Services Group, Inc. | | | 165,000 | | | | 15,052,950 | |
| Regions Financial Corp. | | | 903,400 | | | | 9,539,904 | |
| Standard Chartered PLC (United Kingdom) | | | 1,067,720 | | | | 16,025,749 | |
| SunTrust Banks, Inc. | | | 1,103,600 | | | | 46,240,840 | |
| TCF Financial Corp. | | | 164,800 | | | | 2,618,672 | |
| U.S. Bancorp | | | 1,714,338 | | | | 77,059,493 | |
| Valley National Bancorp (e) | | | 583,100 | | | | 5,661,901 | |
| Wells Fargo & Co. | | | 2,311,286 | | | | 126,704,699 | |
| | | | | | | | 736,577,422 | |
| Capital Markets - 5.3% | | | | | | | | |
| Apollo Global Management LLC Class A | | | 415,450 | | | | 9,796,311 | |
| Apollo Investment Corp. | | | 2,524,963 | | | | 18,735,225 | |
| Ares Capital Corp. | | | 1,020,795 | | | | 15,929,506 | |
| Ares Management LP | | | 491,400 | | | | 8,422,596 | |
| Ashmore Group PLC | | | 1,111,513 | | | | 4,850,732 | |
| Carlyle Group LP | | | 299,200 | | | | 8,228,000 | |
| Greenhill & Co., Inc. | | | 166,803 | | | | 7,272,611 | |
| KKR & Co. LP | | | 4,306,421 | | | | 99,952,031 | |
| Morgan Stanley | | | 937,175 | | | | 36,362,390 | |
| State Street Corp. | | | 407,602 | | | | 31,996,757 | |
| The Blackstone Group LP | | | 2,749,226 | | | | 93,006,316 | |
| | | | | | | | 334,552,475 | |
| Diversified Financial Services - 0.1% | | | | | | | | |
| TPG Specialty Lending, Inc. | | | 398,000 | | | | 6,694,360 | |
| Insurance - 5.2% | | | | | | | | |
| ACE Ltd. | | | 540,811 | | | | 62,128,368 | |
| Allied World Assurance Co. | | | 331,300 | | | | 12,562,896 | |
| Brasil Insurance Participacoes e Administracao SA | | | 1,341,300 | | | | 1,715,605 | |
| MetLife, Inc. | | | 2,499,370 | | | | 135,190,923 | |
| Prudential Financial, Inc. | | | 344,462 | | | | 31,160,033 | |
| The Chubb Corp. | | | 429,100 | | | | 44,398,977 | |
| The Travelers Companies, Inc. | | | 363,945 | | | | 38,523,578 | |
| | | | | | | | 325,680,380 | |
| Real Estate Investment Trusts - 2.6% | | | | | | | | |
| American Capital Agency Corp. | | | 1,160,048 | | | | 25,323,848 | |
| American Homes 4 Rent (f) | | | 262,132 | | | | 4,464,108 | |
| Annaly Capital Management, Inc. | | | 2,109,809 | | | | 22,807,035 | |
| Coresite Realty Corp. | | | 247,347 | | | | 9,658,900 | |
| Cousins Properties, Inc. | | | 530,000 | | | | 6,052,600 | |
| Duke Realty LP | | | 607,400 | | | | 12,269,480 | |
| First Potomac Realty Trust | | | 1,231,757 | | | | 15,224,517 | |
| Home Properties, Inc. | | | 343,872 | | | | 22,558,003 | |
| Piedmont Office Realty Trust, Inc. Class A | | | 471,324 | | | | 8,879,744 | |
| | | Shares | | | Value | |
| | | | | | | |
| Retail Properties America, Inc. | | | 710,432 | | | $ | 11,857,110 | |
| Sabra Health Care REIT, Inc. | | | 210,900 | | | | 6,405,033 | |
| Two Harbors Investment Corp. | | | 1,131,634 | | | | 11,338,973 | |
| Ventas, Inc. | | | 109,690 | | | | 7,864,773 | |
| | | | | | | | 164,704,124 | |
| Thrifts & Mortgage Finance - 0.1% | | | | | | | | |
| Radian Group, Inc. | | | 359,608 | | | | 6,012,646 | |
| | | | | | | | | |
| TOTAL FINANCIALS | | | | | | | 1,574,221,407 | |
| | | | | | | | | |
| HEALTH CARE - 9.8% | | | | | | | | |
| Biotechnology - 0.3% | | | | | | | | |
| Amgen, Inc. (h) | | | 108,871 | | | | 17,342,062 | |
| Health Care Equipment & Supplies - 1.5% | | | | | | | | |
| Baxter International, Inc. | | | 242,500 | | | | 17,772,825 | |
| Covidien PLC | | | 192,000 | | | | 19,637,760 | |
| DENTSPLY International, Inc. | | | 200,400 | | | | 10,675,308 | |
| Medtronic, Inc. | | | 409,400 | | | | 29,558,680 | |
| Meridian Bioscience, Inc. | | | 629,200 | | | | 10,356,632 | |
| St. Jude Medical, Inc. | | | 105,946 | | | | 6,889,668 | |
| | | | | | | | 94,890,873 | |
| Health Care Providers & Services - 0.7% | | | | | | | | |
| UnitedHealth Group, Inc. | | | 419,423 | | | | 42,399,471 | |
| Pharmaceuticals - 7.3% | | | | | | | | |
| Astellas Pharma, Inc. | | | 1,043,600 | | | | 14,529,108 | |
| GlaxoSmithKline PLC | | | 1,814,600 | | | | 38,929,683 | |
| Johnson & Johnson | | | 2,380,968 | | | | 248,977,824 | |
| Merck & Co., Inc. | | | 581,694 | | | | 33,034,402 | |
| Pfizer, Inc. | | | 3,497,012 | | | | 108,931,924 | |
| Sanofi SA | | | 196,969 | | | | 17,957,757 | |
| | | | | | | | 462,360,698 | |
| | | | | | | | | |
| TOTAL HEALTH CARE | | | | | | | 616,993,104 | |
| | | | | | | | | |
| INDUSTRIALS - 10.8% | | | | | | | | |
| Aerospace & Defense - 1.5% | | | | | | | | |
| The Boeing Co. | | | 197,400 | | | | 25,658,052 | |
| United Technologies Corp. | | | 581,871 | | | | 66,915,165 | |
| | | | | | | | 92,573,217 | |
| Air Freight & Logistics - 2.6% | | | | | | | | |
| C.H. Robinson Worldwide, Inc. | | | 204,028 | | | | 15,279,657 | |
| PostNL NV (a) | | | 3,595,900 | | | | 13,488,778 | |
| United Parcel Service, Inc. Class B | | | 1,237,837 | | | | 137,610,339 | |
| | | | | | | | 166,378,774 | |
| Airlines - 0.2% | | | | | | | | |
| Copa Holdings SA Class A | | | 91,900 | | | | 9,524,516 | |
| Commercial Services & Supplies - 0.6% | | | | | | | | |
| KAR Auction Services, Inc. | | | 522,700 | | | | 18,111,555 | |
| Republic Services, Inc. (h) | | | 522,426 | | | | 21,027,647 | |
| | | | | | | | 39,139,202 | |
See accompanying notes which are an integral part of the financial statements.
| Common Stocks – continued |
| | | Shares | | | Value | |
| | | | | | | |
| INDUSTRIALS - continued | | | | | | | | |
| Electrical Equipment - 0.6% | | | | | | | | |
| Eaton Corp. PLC | | | 383,800 | | | $ | 26,083,048 | |
| Emerson Electric Co. | | | 197,603 | | | | 12,198,033 | |
| | | | | | | | 38,281,081 | |
| Industrial Conglomerates - 3.2% | | | | | | | | |
| General Electric Co. | | | 7,906,776 | | | | 199,804,230 | |
| Machinery - 0.9% | | | | | | | | |
| Cummins, Inc. | | | 69,200 | | | | 9,976,564 | |
| Deere & Co. | | | 277,000 | | | | 24,506,190 | |
| Stanley Black & Decker, Inc. | | | 206,153 | | | | 19,807,180 | |
| | | | | | | | 54,289,934 | |
| Professional Services - 0.3% | | | | | | | | |
| Acacia Research Corp. (e) | | | 571,326 | | | | 9,678,262 | |
| Bureau Veritas SA | | | 272,100 | | | | 6,028,652 | |
| | | | | | | | 15,706,914 | |
| Road & Rail - 0.6% | | | | | | | | |
| Daqin Railway Co. Ltd. (A Shares) | | | 6,426,100 | | | | 10,960,621 | |
| Union Pacific Corp. | | | 233,454 | | | | 27,811,375 | |
| | | | | | | | 38,771,996 | |
| Trading Companies & Distributors - 0.3% | | | | | | | | |
| Watsco, Inc. | | | 202,900 | | | | 21,710,300 | |
| | | | | | | | | |
| TOTAL INDUSTRIALS | | | | | | | 676,180,164 | |
| | | | | | | | | |
| INFORMATION TECHNOLOGY - 10.8% | | | | | | | | |
| Communications Equipment - 3.0% | | | | | | | | |
| Cisco Systems, Inc. | | | 5,830,231 | | | | 162,167,875 | |
| QUALCOMM, Inc. | | | 343,239 | | | | 25,512,955 | |
| | | | | | | | 187,680,830 | |
| Electronic Equipment & Components - 0.5% | | | | | | | | |
| Hitachi Ltd. | | | 1,321,000 | | | | 9,749,992 | |
| TE Connectivity Ltd. | | | 327,361 | | | | 20,705,583 | |
| | | | | | | | 30,455,575 | |
| Internet Software & Services - 0.8% | | | | | | | | |
| Yahoo!, Inc. (a) | | | 959,000 | | | | 48,439,090 | |
| IT Services - 2.4% | | | | | | | | |
| IBM Corp. | | | 601,623 | | | | 96,524,394 | |
| Paychex, Inc. | | | 1,215,769 | | | | 56,132,055 | |
| | | | | | | | 152,656,449 | |
| Semiconductors & Semiconductor Equipment - 1.8% | | | | | | | | |
| Applied Materials, Inc. | | | 2,148,200 | | | | 53,533,144 | |
| Broadcom Corp. Class A | | | 1,034,560 | | | | 44,827,485 | |
| Maxim Integrated Products, Inc. | | | 290,300 | | | | 9,251,861 | |
| Xilinx, Inc. | | | 65,500 | | | | 2,835,495 | |
| | | | | | | | 110,447,985 | |
| | | Shares | | | Value | |
| | | | | | | |
| Software - 1.8% | | | | | | | | |
| CA Technologies, Inc. | | | 608,217 | | | $ | 18,520,208 | |
| Microsoft Corp. | | | 2,078,924 | | | | 96,566,020 | |
| | | | | | | | 115,086,228 | |
| Technology Hardware, Storage & Peripherals - 0.5% | | | | | | | | |
| EMC Corp. | | | 570,964 | | | | 16,980,469 | |
| First Data Holdings, Inc. Class B (k) | | | 6,341,091 | | | | 17,438,000 | |
| | | | | | | | 34,418,469 | |
| | | | | | | | | |
| TOTAL INFORMATION TECHNOLOGY | | | | | | | 679,184,626 | |
| | | | | | | | | |
| MATERIALS - 1.4% | | | | | | | | |
| Chemicals - 0.4% | | | | | | | | |
| Potash Corp. of Saskatchewan, Inc. | | | 444,700 | | | | 15,720,287 | |
| Tronox Ltd. Class A | | | 459,600 | | | | 10,975,248 | |
| | | | | | | | 26,695,535 | |
| Metals & Mining - 1.0% | | | | | | | | |
| Commercial Metals Co. | | | 680,027 | | | | 11,077,640 | |
| Freeport-McMoRan, Inc. | | | 1,512,478 | | | | 35,331,486 | |
| Nucor Corp. | | | 231,700 | | | | 11,364,885 | |
| SunCoke Energy Partners LP | | | 169,017 | | | | 4,585,431 | |
| | | | | | | | 62,359,442 | |
| | | | | | | | | |
| TOTAL MATERIALS | | | | | | | 89,054,977 | |
| | | | | | | | | |
| TELECOMMUNICATION SERVICES - 3.6% | | | | | | | | |
| Diversified Telecommunication Services - 2.9% | | | | | | | | |
| AT&T, Inc. | | | 1,801,693 | | | | 60,518,868 | |
| TDC A/S | | | 420,883 | | | | 3,229,907 | |
| Verizon Communications, Inc. | | | 2,482,959 | | | | 116,152,822 | |
| | | | | | | | 179,901,597 | |
| Wireless Telecommunication Services - 0.7% | | | | | | | | |
| Vodafone Group PLC | | | 12,904,380 | | | | 44,244,306 | |
| | | | | | | | | |
| TOTAL TELECOMMUNICATION SERVICES | | | | | | | 224,145,903 | |
| | | | | | | | | |
| UTILITIES - 4.0% | | | | | | | | |
| Electric Utilities - 3.9% | | | | | | | | |
| American Electric Power Co., Inc. | | | 846,671 | | | | 51,409,863 | |
| Exelon Corp. | | | 1,187,800 | | | | 44,043,624 | |
| Pinnacle West Capital Corp. | | | 108,900 | | | | 7,438,959 | |
| PPL Corp. (h) | | | 1,185,147 | | | | 43,056,391 | |
| Southern Co. (h) | | | 1,529,777 | | | | 75,127,348 | |
| Xcel Energy, Inc. | | | 694,994 | | | | 24,964,184 | |
| | | | | | | | 246,040,369 | |
| Independent Power and Renewable Electricity Producers - 0.1% | | | | | | | | |
| Abengoa Yield PLC | | | 290,700 | | | | 7,941,924 | |
| | | | | | | | | |
| TOTAL UTILITIES | | | | | | | 253,982,293 | |
| | | | | | | | | |
| TOTAL COMMON STOCKS | | | | | | | | |
| (Cost $4,535,048,678) | | | | | | | 5,800,276,028 | |
See accompanying notes which are an integral part of the financial statements.
| | | Shares | | | Value | |
| | | | | | | |
| Convertible Preferred Stocks - 1.1% | | | | | | | | |
| | | | | | | | | |
| FINANCIALS - 0.2% | | | | | | | | |
| Banks - 0.0% | | | | | | | | |
| Wells Fargo & Co. 7.50% | | | 2,500 | | | $ | 3,000,000 | |
| Real Estate Investment Trusts - 0.2% | | | | | | | | |
| Crown Castle International Corp. 4.50% | | | 102,400 | | | | 10,546,176 | |
| | | | | | | | | |
| TOTAL FINANCIALS | | | | | | | 13,546,176 | |
| | | | | | | | | |
| HEALTH CARE - 0.1% | | | | | | | | |
| Health Care Equipment & Supplies - 0.1% | | | | | | | | |
| Alere, Inc. 3.00% | | | 27,580 | | | | 8,687,700 | |
| | | | | | | | | |
| INDUSTRIALS - 0.1% | | | | | | | | |
| Aerospace & Defense - 0.1% | | | | | | | | |
| United Technologies Corp. 7.50% | | | 102,600 | | | | 6,292,458 | |
| | | | | | | | | |
| TELECOMMUNICATION SERVICES - 0.1% | | | | | | | | |
| Wireless Telecommunication Services - 0.1% | | | | | | | | |
| T-Mobile U.S., Inc. Series A 5.50% (a) | | | 119,500 | | | | 6,332,305 | |
| | | | | | | | | |
| UTILITIES - 0.6% | | | | | | | | |
| Electric Utilities - 0.3% | | | | | | | | |
| Exelon Corp. 6.50% | | | 46,500 | | | | 2,441,250 | |
| NextEra Energy, Inc.: | | | | | | | | |
| 5.779% | | | 47,800 | | | | 2,757,582 | |
| Series E, 5.599% | | | 158,600 | | | | 11,010,012 | |
| | | | | | | | 16,208,844 | |
| | | | | | | | | |
| Independent Power Producers & Renewable Electricity Producers - 0.0% | | | | | | | | |
| Dynegy, Inc. 5.375% | | | 25,000 | | | | 2,550,000 | |
| Multi-Utilities - 0.3% | | | | | | | | |
| CenterPoint Energy, Inc. 2.00% ZENS | | | 179,600 | | | | 11,965,850 | |
| Dominion Resources, Inc.: | | | | | | | | |
| 6.375% | | | 75,600 | | | | 3,931,956 | |
| Series B, 6.00% | | | 24,500 | | | | 1,472,940 | |
| | | | | | | | 17,370,746 | |
| | | | | | | | | |
| TOTAL UTILITIES | | | | | | | 36,129,590 | |
| | | | | | | | | |
| TOTAL CONVERTIBLE PREFERRED STOCKS | | | | | | | 70,988,229 | |
| | | | | | | | | |
| Nonconvertible Preferred Stocks - 0.4% | | | | | | | | |
| | | | | | | | | |
| FINANCIALS - 0.4% | | | | | | | | |
| Consumer Finance - 0.4% | | | | | | | | |
| Ally Financial, Inc.: | | | | | | | | |
| 7.00% (f) | | | 18,256 | | | | 18,248,584 | |
| Series A, 8.50% | | | 155,954 | | | | 4,192,044 | |
| | | | | | | | 22,440,628 | |
| TOTAL PREFERRED STOCKS | | | | | | | | |
| (Cost $81,978,925) | | | | | | | 93,428,857 | |
| | | Principal
Amount (d) | | | Value | |
| | | | | | | |
| Convertible Bonds - 2.5% | | | | | | | | |
| | | | | | | | | |
| CONSUMER DISCRETIONARY - 0.3% | | | | | | | | |
| Automobiles - 0.1% | | | | | | | | |
| Volkswagen International Finance NV 5.5% 11/9/15 (f) | | EUR | 6,400,000 | | | $ | 8,607,812 | |
| Diversified Consumer Services - 0.0% | | | | | | | | |
| Carriage Services, Inc. 2.75% 3/15/21 (f) | | | 2,600,000 | | | | 2,821,000 | |
| Household Durables - 0.1% | | | | | | | | |
| Lennar Corp. 3.25% 11/15/21 (f) | | | 1,700,000 | | | | 3,298,000 | |
| Media - 0.1% | | | | | | | | |
| Liberty Media Corp. 3.5% 1/15/31 | | | 7,360,000 | | | | 3,920,672 | |
| | | | | | | | | |
| TOTAL CONSUMER DISCRETIONARY | | | | | | | 18,647,484 | |
| | | | | | | | | |
| CONSUMER STAPLES - 0.2% | | | | | | | | |
| Tobacco - 0.2% | | | | | | | | |
| Vector Group Ltd. 2.5% 1/15/19 (i) | | | 7,303,000 | | | | 10,275,379 | |
| | | | | | | | | |
| ENERGY - 0.4% | | | | | | | | |
| Oil, Gas & Consumable Fuels - 0.4% | | | | | | | | |
| Amyris, Inc. 3% 2/27/17 | | | 1,383,000 | | | | 1,168,690 | |
| Chesapeake Energy Corp. 2.5% 5/15/37 | | | 9,290,000 | | | | 9,022,913 | |
| Clean Energy Fuels Corp. 5.25% 10/1/18 (f) | | | 2,270,000 | | | | 1,574,813 | |
| Scorpio Tankers, Inc. 2.375% 7/1/19 (f) | | | 8,800,000 | | | | 8,387,500 | |
| Ship Finance International Ltd. 3.25% 2/1/18 | | | 6,170,000 | | | | 5,903,080 | |
| | | | | | | | 26,056,996 | |
| FINANCIALS - 0.4% | | | | | | | | |
| Capital Markets - 0.0% | | | | | | | | |
| Ares Capital Corp. 5.75% 2/1/16 | | | 4,130,000 | | | | 4,256,481 | |
| Insurance - 0.2% | | | | | | | | |
| Fidelity National Financial, Inc. 4.25% 8/15/18 | | | 5,620,000 | | | | 10,604,238 | |
See accompanying notes which are an integral part of the financial statements.
| Corporate Bonds – continued |
| | | Principal | | | | |
| | | Amount (d) | | | Value | |
| | | | | | | |
| Convertible Bonds - continued | | | | | | | | |
| | | | | | | | | |
| FINANCIALS - continued | | | | | | | | |
| Thrifts & Mortgage Finance - 0.2% | | | | | | | | |
| MGIC Investment Corp. 9% 4/1/63 (f) | | $ | 10,438,000 | | | $ | 13,409,699 | |
| | | | | | | | | |
| TOTAL FINANCIALS | | | | | | | 28,270,418 | |
| | | | | | | | | |
| HEALTH CARE - 0.6% | | | | | | | | |
| Health Care Providers & Services - 0.5% | | | | | | | | |
| HealthSouth Corp. 2% 12/1/43 | | | 8,098,000 | | | | 9,003,964 | |
| WellPoint, Inc. 2.75% 10/15/42 | | | 13,770,000 | | | | 23,701,613 | |
| | | | | | | | 32,705,577 | |
| Pharmaceuticals - 0.1% | | | | | | | | |
| Jazz Investments I Ltd. 1.875% 8/15/21 (f) | | | 2,580,000 | | | | 2,918,625 | |
| | | | | | | | | |
| TOTAL HEALTH CARE | | | | | | | 35,624,202 | |
| | | | | | | | | |
| INFORMATION TECHNOLOGY - 0.5% | | | | | | | | |
| Communications Equipment - 0.3% | | | | | | | | |
| InterDigital, Inc. 2.5% 3/15/16 | | | 9,150,000 | | | | 10,173,656 | |
| Liberty Interactive LLC 0.75% 3/30/43 | | | 4,970,000 | | | | 7,063,613 | |
| | | | | | | | 17,237,269 | |
| Semiconductors & Semiconductor Equipment - 0.1% | | | | | | | | |
| GT Advanced Technologies, Inc.: | | | | | | | | |
| 3% 10/1/17 | | | 3,920,000 | | | | 1,945,300 | |
| 3% 12/15/20 | | | 5,580,000 | | | | 2,772,563 | |
| Intel Corp. 3.25% 8/1/39 | | | 2,660,000 | | | | 4,625,075 | |
| | | | | | | | 9,342,938 | |
| Software - 0.1% | | | | | | | | |
| TiVo, Inc.: | | | | | | | | |
| 2% 10/1/21 (f) | | | 3,940,000 | | | | 3,767,625 | |
| 4% 3/15/16 (f) | | | 1,720,000 | | | | 2,045,725 | |
| | | | | | | | 5,813,350 | |
| | | | | | | | | |
| TOTAL INFORMATION TECHNOLOGY | | | | | | | 32,393,557 | |
| | | | | | | | | |
| UTILITIES - 0.1% | | | | | | | | |
| Electric Utilities - 0.1% | | | | | | | | |
| NRG Yield, Inc. 3.5% 2/1/19 (f) | | | 6,710,000 | | | | 7,442,397 | |
| | | | | | | | | |
| TOTAL CONVERTIBLE BONDS | | | | | | | 158,710,433 | |
| | | Principal | | | | |
| | | Amount (d) | | | Value | |
| | | | | | | |
| Nonconvertible Bonds - 0.3% | | | | | | | | |
| | | | | | | | | |
| ENERGY - 0.0% | | | | | | | | |
| Oil, Gas & Consumable Fuels - 0.0% | | | | | | | | |
| California Resources Corp. 5% 1/15/20 (f) | | $ | 2,580,000 | | | $ | 2,238,150 | |
| | | | | | | | | |
| FINANCIALS - 0.0% | | | | | | | | |
| Real Estate Management & Development - 0.0% | | | | | | | | |
| CBRE Group, Inc. 5.25% 3/15/25 | | | 335,000 | | | | 341,700 | |
| | | | | | | | | |
| HEALTH CARE - 0.1% | | | | | | | | |
| Health Care Providers & Services - 0.1% | | | | | | | | |
| HCA Holdings, Inc. 4.25% 10/15/19 | | | 7,670,000 | | | | 7,785,050 | |
| | | | | | | | | |
| INDUSTRIALS - 0.1% | | | | | | | | |
| Commercial Services & Supplies - 0.1% | | | | | | | | |
| APX Group, Inc.: | | | | | | | | |
| 8.75% 12/1/20 | | | 4,190,000 | | | | 3,537,931 | |
| 8.75% 12/1/20 (f) | | | 270,000 | | | | 227,981 | |
| | | | | | | | 3,765,912 | |
| | | | | | | | | |
| MATERIALS - 0.1% | | | | | | | | |
| Metals & Mining - 0.1% | | | | | | | | |
| JMC Steel Group, Inc. 8.25% 3/15/18 (f) | | | 4,200,000 | | | | 3,990,000 | |
| Walter Energy, Inc. 8.5% 4/15/21 | | | 5,250,000 | | | | 997,500 | |
| | | | | | | | 4,987,500 | |
| | | | | | | | | |
| TELECOMMUNICATION SERVICES - 0.0% | | | | | | | | |
| Wireless Telecommunication Services - 0.0% | | | | | | | | |
| T-Mobile U.S.A., Inc. 6.5% 1/15/24 | | | 1,380,000 | | | | 1,414,500 | |
| | | | | | | | | |
| TOTAL NONCONVERTIBLE BONDS | | | | | | | 20,532,812 | |
| | | | | | | | | |
| TOTAL CORPORATE BONDS | | | | | | | | |
| (Cost $169,105,566) | | | | | | | 179,243,245 | |
| | | | | | | | | |
| Bank Loan Obligations – 0.2% | |
| | | | | | | | | |
| CONSUMER DISCRETIONARY - 0.0% | | | | | | | | |
| Hotels, Restaurants & Leisure - 0.0% | | | | | | | | |
| Dunkin Brands, Inc. Tranche B 4LN, term loan 3.25% 2/7/21 (i) | | | 475,000 | | | | 461,938 | |
| | | | | | | | | |
| HEALTH CARE - 0.1% | | | | | | | | |
| Health Care Providers & Services - 0.1% | | | | | | | | |
| HCA Holdings, Inc. Tranche B 4LN, term loan 3.0051% 5/1/18 (i) | | | 5,146,970 | | | | 5,095,500 | |
| | | | | | | | | |
| INDUSTRIALS - 0.1% | | | | | | | | |
| Machinery - 0.1% | | | | | | | | |
| Generac Power Systems, Inc. Tranche B, term loan 3.25% 5/31/20 (i) | | | 5,104,688 | | | | 4,926,024 | |
See accompanying notes which are an integral part of the financial statements.
Investments – continued
| Bank Loan Obligations – continued |
| | | Principal
Amount (d) | | | Value | |
| | | | | | | |
| TELECOMMUNICATION SERVICES - 0.0% | | | | | | | | |
| Diversified Telecommunication Services - 0.0% | | | | | | | | |
| Virgin Media Finance PLC Tranche B, term loan 3.5% 6/7/20 (i) | | $ | 1,720,000 | | | $ | 1,689,900 | |
| | | | | | | | | |
| TOTAL BANK LOAN OBLIGATIONS | | | | | | | | |
| (Cost $12,306,649) | | | | | | | 12,173,362 | |
| | | | | | | | | |
| Preferred Securities – 0.1% | |
| | | | | | | | | |
| FINANCIALS - 0.1% | | | | | | | | |
| Diversified Financial Services - 0.1% | | | | | | | | |
Baggot Securities Ltd. 10.24% (f)(g)
(Cost $3,931,535) | | EUR | 2,560,000 | | | | 3,518,902 | |
| Money Market Funds – 3.6% |
| | | | | | | |
| | | Shares | | | Value | |
| | | | | | | |
| Fidelity Cash Central Fund, 0.13% (b) | | | 205,076,895 | | | $ | 205,076,895 | |
| Fidelity Securities Lending Cash Central Fund, 0.13% (b)(c) | | | 23,284,475 | | | | 23,284,475 | |
| | | | | | | | | |
| TOTAL MONEY MARKET FUNDS | | | | | | | | |
| (Cost $228,361,370) | | | | | | | 228,361,370 | |
| | | | | | | | | |
| TOTAL INVESTMENT PORTFOLIO - 100.4% | | | | | | | | |
| (Cost $5,030,732,723) | | | | | | | 6,317,001,764 | |
| | | | | | | | | |
| NET OTHER ASSETS (LIABILITIES) - (0.4)% | | | | | | | (23,682,274 | ) |
| NET ASSETS - 100% | | | | | | $ | 6,293,319,490 | |
| | | Expiration
Date/Exercise
Price | | | Number of
Contracts | | | Premium | | | Value | |
| Call Options | | | | | | | | | | | | | | | | |
| | | | | | | | | | | | | | | | | |
| Amgen, Inc. | | | 1/17/15 - $160.00 | | | | 885 | | | $ | 385,320 | | | $ | (311,963 | ) |
| | | | | | | | | | | | | | | | | |
| PPL Corp. | | | 1/17/15 - $35.00 | | | | 5,734 | | | | 310,725 | | | | (903,105 | ) |
| | | | | | | | | | | | | | | | | |
| Republic Services, Inc. | | | 1/17/15 - $40.00 | | | | 3,669 | | | | 236,902 | | | | (229,313 | ) |
| | | | | | | | | | | | | | | | | |
| Southern Co. | | | 1/17/15 - $48.00 | | | | 4,885 | | | | 250,106 | | | | (705,883 | ) |
| | | | | | | | | | | | | | | | | |
| Walgreen Co. | | | 1/17/15 - $65.00 | | | | 1,913 | | | | 320,900 | | | | (2,156,906 | ) |
| | | | | | | | | | | | | | | | | |
| TOTAL WRITTEN OPTIONS | | | | | | | | | | $ | 1,503,953 | | | | (4,307,170 | ) |
Currency Abbreviations
EUR – European Monetary Unit
Legend
| (a) | Non-income producing |
| | |
| (b) | Affiliated fund that is generally available only to investment companies and other accounts managed by Fidelity Investments. The rate quoted is the annualized seven-day yield of the fund at period end. A complete unaudited listing of the fund's holdings as of its most recent quarter end is available upon request. In addition, each Fidelity Central Fund's financial statements, which are not covered by the Fund's Report of Independent Registered Public Accounting Firm, are available on the SEC's website or upon request. |
| | |
| (c) | Investment made with cash collateral received from securities on loan. |
| | |
| (d) | Amount is stated in United States dollars unless otherwise noted. |
| | |
| (e) | Security or a portion of the security is on loan at period end. |
| | |
| (f) | Security exempt from registration under Rule 144A of the Securities Act of 1933. These securities may be resold in transactions exempt from registration, normally to qualified institutional buyers. At the end of the period, the value of these securities amounted to $86,960,921 or 1.4% of net assets. |
| (g) | Security is perpetual in nature with no stated maturity date. |
| | |
| (h) | Security or a portion of the security is pledged as collateral for call options written. At period end, the value of securities pledged amounted to $88,263,807. |
| | |
| (i) | Coupon rates for floating and adjustable rate securities reflect the rates in effect at period end. |
| | |
| (j) | Investment is owned by an entity that is treated as a U.S. Corporation for tax purposes in which the Fund holds a percentage ownership. |
| | |
| (k) | Restricted securities - Investment in securities not registered under the Securities Act of 1933 (excluding 144A issues). At the end of the period, the value of restricted securities (excluding 144A issues) amounted to $39,135,776 or 0.6% of net assets. |
Additional information on each restricted holding is as follows:
| Security | | Acquisition Date | | | Acquisition Cost | |
| First Data Holdings, Inc. Class B | | 6/26/14 | | $ | 25,364,364 | |
| New Academy Holding Co. LLC unit | | 8/1/11 | | $ | 13,406,880 | |
See accompanying notes which are an integral part of the financial statements.
Affiliated Central Funds
Information regarding fiscal year to date income earned by the Fund from investments in Fidelity Central Funds is as follows:
| Fund | | Income earned | |
| Fidelity Cash Central Fund | | $ | 196,282 | |
| Fidelity Securities Lending Cash Central Fund | | | 534,758 | |
| Total | | $ | 731,040 | |
Other Information
The following is a summary of the inputs used, as of December 31, 2014, involving the Fund's assets and liabilities carried at fair value. The inputs or methodology used for valuing securities may not be an indication of the risk associated with investing in those securities. For more information on valuation inputs, and their aggregation into the levels used in the table below, please refer to the Investment Valuation section in the accompanying Notes to Financial Statements.
| Valuation Inputs at Reporting Date: |
| |
| Description | | Total | | | Level 1 | | | Level 2 | | | Level 3 | |
| Investments in Securities: | | | | | | | | | | | | | | | | |
| Equities: | | | | | | | | | | | | | | | | |
| Consumer Discretionary | | $ | 503,715,546 | | | $ | 465,201,347 | | | $ | 16,816,423 | | | $ | 21,697,776 | |
| Consumer Staples | | | 533,817,264 | | | | 529,256,820 | | | | 4,560,444 | | | | – | |
| Energy | | | 648,980,744 | | | | 648,980,744 | | | | – | | | | – | |
| Financials | | | 1,610,208,211 | | | | 1,591,959,627 | | | | 18,248,584 | | | | – | |
| Health Care | | | 625,680,804 | | | | 554,264,256 | | | | 71,416,548 | | | | – | |
| Industrials | | | 682,472,622 | | | | 671,512,001 | | | | 10,960,621 | | | | – | |
| Information Technology | | | 679,184,626 | | | | 651,996,634 | | | | 9,749,992 | | | | 17,438,000 | |
| Materials | | | 89,054,977 | | | | 89,054,977 | | | | – | | | | – | |
| Telecommunication Services | | | 230,478,208 | | | | 186,233,902 | | | | 44,244,306 | | | | – | |
| Utilities | | | 290,111,883 | | | | 267,136,021 | | | | 22,975,862 | | | | – | |
| Corporate Bonds | | | 179,243,245 | | | | – | | | | 179,243,245 | | | | – | |
| Bank Loan Obligations | | | 12,173,362 | | | | – | | | | 12,173,362 | | | | – | |
| Preferred Securities | | | 3,518,902 | | | | – | | | | 3,518,902 | | | | – | |
| Money Market Funds | | | 228,361,370 | | | | 228,361,370 | | | | – | | | | – | |
| Total Investments in Securities: | | $ | 6,317,001,764 | | | $ | 5,883,957,699 | | | $ | 393,908,289 | | | $ | 39,135,776 | |
| | | | | | | | | | | | | | | | | |
| Derivative Instruments: | | | | | | | | | | | | | | | | |
| Liabilities | | | | | | | | | | | | | | | | |
| Written Options | | $ | (4,307,170 | ) | | $ | (4,307,170 | ) | | $ | – | | | $ | – | |
Value of Derivative Instruments
The following table is a summary of the Fund's value of derivative instruments by primary risk exposure as of December 31, 2014. For additional information on derivative instruments, please refer to the Derivative Instruments section in the accompanying Notes to Financial Statements.
| Primary Risk Exposure / | | Value | |
| Derivative Type | | | | | | |
| | | Asset | | | Liability | |
| Equity Risk | | | | | | | | |
| Written Options (a) | | $ | – | | | $ | (4,307,170 | ) |
| Total Value of Derivatives | | $ | – | | | $ | (4,307,170 | ) |
(a) Gross value is presented in the Statement of Assets and Liabilities in the written options, at value line-item.
See accompanying notes which are an integral part of the financial statements.
Financial Statements
| Statement of Assets and Liabilities |
| | December 31, 2014 | |
| | | | | | | |
| Assets | | | | | | | | |
| Investment in securities, at value (including securities loaned of $22,302,026) — See accompanying schedule: | | | | | | | | |
| Unaffiliated issuers (cost $4,802,371,353) | | $ | 6,088,640,394 | | | | | |
| Fidelity Central Funds (cost $228,361,370) | | | 228,361,370 | | | | | |
| Total Investments (cost $5,030,732,723) | | | | | | $ | 6,317,001,764 | |
| Cash | | | | | | | 163,361 | |
| Receivable for investments sold | | | | | | | 7,729,987 | |
| Receivable for fund shares sold | | | | | | | 817,192 | |
| Dividends receivable | | | | | | | 10,419,062 | |
| Interest receivable | | | | | | | 1,718,969 | |
| Distributions receivable from Fidelity Central Funds | | | | | | | 68,903 | |
| Prepaid expenses | | | | | | | 12,737 | |
| Other receivables | | | | | | | 412,554 | |
| Total assets | | | | | | | 6,338,344,529 | |
| | | | | | | | | |
| Liabilities | | | | | | | | |
| Payable for investments purchased | | $ | 9,258,147 | | | | | |
| Payable for fund shares redeemed | | | 4,473,048 | | | | | |
| Accrued management fee | | | 2,356,180 | | | | | |
| Distribution and service plan fees payable | | | 388,265 | | | | | |
| Written options, at value (premium received $1,503,953) | | | 4,307,170 | | | | | |
| Other affiliated payables | | | 469,630 | | | | | |
| Other payables and accrued expenses | | | 488,124 | | | | | |
| Collateral on securities loaned, at value | | | 23,284,475 | | | | | |
| Total liabilities | | | | | | | 45,025,039 | |
| | | | | | | | | |
| Net Assets | | | | | | $ | 6,293,319,490 | |
| Net Assets consist of: | | | | | | | | |
| Paid in capital | | | | | | $ | 4,508,453,313 | |
| Distributions in excess of net investment income | | | | | | | (3,340,048 | ) |
| Accumulated undistributed net realized gain (loss) on investments and foreign currency transactions | | | | | | | 504,807,677 | |
| Net unrealized appreciation (depreciation) on investments and assets and liabilities in foreign currencies | | | | | | | 1,283,398,548 | |
| Net Assets | | | | | | $ | 6,293,319,490 | |
| Statement of Assets and Liabilities - continued |
| | | December 31, 2014 | |
| | | | | | | |
| Initial Class: | | | | | | | | |
| Net Asset Value, offering price and redemption price per share ($3,817,228,438 ÷ 157,088,042 shares) | | | | | | $ | 24.30 | |
| | | | | | | | | |
| Service Class: | | | | | | | | |
| Net Asset Value, offering price and redemption price per share ($369,023,726 ÷ 15,246,693 shares) | | | | | | $ | 24.20 | |
| | | | | | | | | |
| Service Class 2: | | | | | | | | |
| Net Asset Value, offering price and redemption price per share ($1,702,853,768 ÷ 71,396,433 shares) | | | | | | $ | 23.85 | |
| | | | | | | | | |
| Service Class 2R: | | | | | | | | |
| Net Asset Value, offering price and redemption price per share ($15,440,177 ÷ 651,868 shares) | | | | | | $ | 23.69 | |
| | | | | | | | | |
| Investor Class: | | | | | | | | |
| Net Asset Value, offering price and redemption price per share ($388,773,381 ÷ 16,058,884 shares) | | | | | | $ | 24.21 | |
See accompanying notes which are an integral part of the financial statements.
| | | Year ended December 31, 2014 | |
| | | | | | | |
| Investment Income | | | | | | | | |
| Dividends | | | | | | $ | 191,019,182 | |
| Special dividends | | | | | | | 22,197,225 | |
| Interest | | | | | | | 7,694,732 | |
| Income from Fidelity Central Funds | | | | | | | 731,040 | |
| Total income | | | | | | | 221,642,179 | |
| | | | | | | | | |
| Expenses | | | | | | | | |
| Management fee | | $ | 28,672,666 | | | | | |
| Transfer agent fees | | | 4,500,760 | | | | | |
| Distribution and service plan fees | | | 4,749,969 | | | | | |
| Accounting and security lending fees | | | 1,143,822 | | | | | |
| Custodian fees and expenses | | | 119,987 | | | | | |
| Independent trustees' compensation | | | 27,062 | | | | | |
| Appreciation in deferred trustee compensation account | | | 262 | | | | | |
| Audit | | | 88,428 | | | | | |
| Legal | | | 25,042 | | | | | |
| Miscellaneous | | | 50,931 | | | | | |
| Total expenses before reductions | | | 39,378,929 | | | | | |
| Expense reductions | | | (98,478 | ) | | | 39,280,451 | |
| | | | | | | | | |
| Net investment income (loss) | | | | | | | 182,361,728 | |
| Realized and Unrealized Gain (Loss) | | | | | | | | |
| Net realized gain (loss) on: | | | | | | | | |
| Investment securities: | | | | | | | | |
| Unaffiliated issuers | | | 583,355,277 | | | | | |
| Foreign currency transactions | | | (51,985 | ) | | | | |
| Written options | | | 7,909,899 | | | | | |
| Total net realized gain (loss) | | | | | | | 591,213,191 | |
| Change in net unrealized appreciation (depreciation) on: | | | | | | | | |
| Investment securities | | | (240,076,977 | ) | | | | |
| Assets and liabilities in foreign currencies | | | (143,116 | ) | | | | |
| Written options | | | 466,395 | | | | | |
| Total change in net unrealized appreciation (depreciation) | | | | | | | (239,753,698 | ) |
| Net gain (loss) | | | | | | | 351,459,493 | |
| Net increase (decrease) in net assets resulting from operations | | | | | | $ | 533,821,221 | |
| Statement of Changes in Net Assets |
| | | Year ended | | | Year ended | |
| | | December 31, | | | December 31, | |
| | | 2014 | | | 2013 | |
| Increase (Decrease) in Net Assets | | | | | | | | |
| Operations | | | | | | | | |
| Net investment income (loss) | | $ | 182,361,728 | | | $ | 144,508,656 | |
| Net realized gain (loss) | | | 591,213,191 | | | | 426,826,124 | |
| Change in net unrealized appreciation (depreciation) | | | (239,753,698 | ) | | | 930,403,753 | |
| Net increase (decrease) in net assets resulting from operations | | | 533,821,221 | | | | 1,501,738,533 | |
| Distributions to shareholders from net investment income | | | (173,173,144 | ) | | | (147,533,373 | ) |
| Distributions to shareholders from net realized gain | | | (87,899,582 | ) | | | (403,959,921 | ) |
| Total distributions | | | (261,072,726 | ) | | | (551,493,294 | ) |
| Share transactions - net increase (decrease) | | | (437,948,697 | ) | | | (90,118,096 | ) |
| Redemption fees | | | 7,981 | | | | 144 | |
| Total increase (decrease) in net assets | | | (165,192,221 | ) | | | 860,127,287 | |
| | | | | | �� | | | |
| Net Assets | | | | | | | | |
| Beginning of period | | | 6,458,511,711 | | | | 5,598,384,424 | |
| End of period (including distributions in excess of net investment income of $3,340,048 and distributions in excess of net investment income of $72,000, respectively) | | $ | 6,293,319,490 | | | $ | 6,458,511,711 | |
See accompanying notes which are an integral part of the financial statements.
| Financial Highlights – Initial Class |
| Years ended December 31, | | 2014 | | | 2013 | | | 2012 | | | 2011 | | | 2010 | |
| Selected Per-Share Data | | | | | | | | | | | | | | | | | | | | |
| Net asset value, beginning of period | | $ | 23.29 | | | $ | 19.94 | | | $ | 18.69 | | | $ | 19.02 | | | $ | 16.81 | |
| Income from Investment Operations | | | | | | | | | | | | | | | | | | | | |
| Net investment income (loss)C | | | .71 | F | | | .56 | | | | .59 | | | | .48 | | | | .30 | |
| Net realized and unrealized gain (loss) | | | 1.35 | | | | 4.96 | | | | 2.59 | | | | (.31 | ) | | | 2.24 | |
| Total from investment operations | | | 2.06 | | | | 5.52 | | | | 3.18 | | | | .17 | | | | 2.54 | |
| Distributions from net investment income | | | (.71 | ) | | | (.60 | ) | | | (.63 | )G | | | (.50 | ) | | | (.33 | ) |
| Distributions from net realized gain | | | (.34 | ) | | | (1.57 | ) | | | (1.30 | )G | | | — | | | | — | |
| Total distributions | | | (1.05 | ) | | | (2.17 | ) | | | (1.93 | ) | | | (.50 | ) | | | (.33 | ) |
| Redemption fees added to paid in capitalC,I | | | — | | | | — | | | | — | | | | — | | | | — | |
| Net asset value, end of period | | $ | 24.30 | | | $ | 23.29 | | | $ | 19.94 | | | $ | 18.69 | | | $ | 19.02 | |
| Total ReturnA,B | | | 8.85 | % | | | 28.15 | % | | | 17.31 | % | | | .97 | % | | | 15.15 | % |
| Ratios to Average Net AssetsD,H | | | | | | | | | | | | | | | | | | | | |
| Expenses before reductions | | | .54 | % | | | .55 | % | | | .55 | % | | | .56 | % | | | .56 | % |
| Expenses net of fee waivers, if any | | | .54 | % | | | .54 | % | | | .55 | % | | | .55 | % | | | .55 | % |
| Expenses net of all reductions | | | .54 | % | | | .54 | % | | | .54 | % | | | .54 | % | | | .55 | % |
| Net investment income (loss) | | | 2.94 | %F | | | 2.43 | % | | | 2.94 | % | | | 2.48 | % | | | 1.71 | % |
| Supplemental Data | | | | | | | | | | | | | | | | | | | | |
| Net assets, end of period (000 omitted) | | $ | 3,817,228 | | | $ | 3,947,728 | | | $ | 3,461,083 | | | $ | 3,345,762 | | | $ | 3,798,310 | |
| Portfolio turnover rateE | | | 40 | % | | | 32 | % | | | 48 | % | | | 96 | % | | | 29 | % |
| A | Total returns do not reflect charges attributable to your insurance company's separate account. Inclusion of these charges would reduce the total returns shown. |
| B | Total returns would have been lower if certain expenses had not been reduced during the applicable periods shown. |
| C | Calculated based on average shares outstanding during the period. |
| D | Fees and expenses of any underlying Fidelity Central Funds are not included in the Fund's expense ratio. The Fund indirectly bears its proportionate share of the expenses of any underlying Fidelity Central Funds. |
| E | Amount does not include the portfolio activity of any underlying Fidelity Central Funds. |
| F | Investment income per share reflects a large, non-recurring dividend which amounted to $.08 per share. Excluding this non-recurring dividend, the ratio of net investment income (loss) to average net assets would have been 2.59%. |
| G | The amounts shown reflect certain reclassifications related to book to tax differences that were made in the year shown. |
| H | Expense ratios reflect operating expenses of the class. Expenses before reductions do not reflect amounts reimbursed by the investment adviser or reductions from brokerage service arrangements or reductions from other expense offset arrangements and do not represent the amount paid by the class during periods when reimbursements or reductions occur. Expenses net of fee waivers reflect expenses after reimbursement by the investment adviser but prior to reductions from brokerage service arrangements or other expense offset arrangements. Expenses net of all reductions represent the net expenses paid by the class. |
| I | Amount represents less than $.01 per share. |
| Financial Highlights – Service Class |
| Years ended December 31, | | 2014 | | | 2013 | | | 2012 | | | 2011 | | | 2010 | |
| Selected Per-Share Data | | | | | | | | | | | | | | | | | | | | |
| Net asset value, beginning of period | | $ | 23.20 | | | $ | 19.87 | | | $ | 18.63 | | | $ | 18.96 | | | $ | 16.75 | |
| Income from Investment Operations | | | | | | | | | | | | | | | | | | | | |
| Net investment income (loss)C | | | .69 | F | | | .53 | | | | .57 | | | | .46 | | | | .28 | |
| Net realized and unrealized gain (loss) | | | 1.34 | | | | 4.94 | | | | 2.57 | | | | (.31 | ) | | | 2.24 | |
| Total from investment operations | | | 2.03 | | | | 5.47 | | | | 3.14 | | | | .15 | | | | 2.52 | |
| Distributions from net investment income | | | (.68 | ) | | | (.57 | ) | | | (.60 | )G | | | (.48 | ) | | | (.31 | ) |
| Distributions from net realized gain | | | (.34 | ) | | | (1.57 | ) | | | (1.30 | )G | | | — | | | | — | |
| Total distributions | | | (1.03 | )J | | | (2.14 | ) | | | (1.90 | ) | | | (.48 | ) | | | (.31 | ) |
| Redemption fees added to paid in capitalC,I | | | — | | | | — | | | | — | | | | — | | | | — | |
| Net asset value, end of period | | $ | 24.20 | | | $ | 23.20 | | | $ | 19.87 | | | $ | 18.63 | | | $ | 18.96 | |
| Total ReturnA,B | | | 8.74 | % | | | 28.01 | % | | | 17.19 | % | | | .86 | % | | | 15.09 | % |
| Ratios to Average Net AssetsD,H | | | | | | | | | | | | | | | | | | | | |
| Expenses before reductions | | | .64 | % | | | .65 | % | | | .65 | % | | | .66 | % | | | .66 | % |
| Expenses net of fee waivers, if any | | | .64 | % | | | .64 | % | | | .65 | % | | | .66 | % | | | .65 | % |
| Expenses net of all reductions | | | .64 | % | | | .64 | % | | | .64 | % | | | .64 | % | | | .65 | % |
| Net investment income (loss) | | | 2.84 | %F | | | 2.33 | % | | | 2.84 | % | | | 2.38 | % | | | 1.61 | % |
| Supplemental Data | | | | | | | | | | | | | | | | | | | | |
| Net assets, end of period (000 omitted) | | $ | 369,024 | | | $ | 391,896 | | | $ | 350,493 | | | $ | 347,999 | | | $ | 414,431 | |
| Portfolio turnover rateE | | | 40 | % | | | 32 | % | | | 48 | % | | | 96 | % | | | 29 | % |
| A | Total returns do not reflect charges attributable to your insurance company's separate account. Inclusion of these charges would reduce the total returns shown. |
| B | Total returns would have been lower if certain expenses had not been reduced during the applicable periods shown. |
| C | Calculated based on average shares outstanding during the period. |
| D | Fees and expenses of any underlying Fidelity Central Funds are not included in the Fund's expense ratio. The Fund indirectly bears its proportionate share of the expenses of any underlying Fidelity Central Funds. |
| E | Amount does not include the portfolio activity of any underlying Fidelity Central Funds. |
| F | Investment income per share reflects a large, non-recurring dividend which amounted to $.08 per share. Excluding this non-recurring dividend, the ratio of net investment income (loss) to average net assets would have been 2.49%. |
| G | The amounts shown reflect certain reclassifications related to book to tax differences that were made in the year shown. |
| H | Expense ratios reflect operating expenses of the class. Expenses before reductions do not reflect amounts reimbursed by the investment adviser or reductions from brokerage service arrangements or reductions from other expense offset arrangements and do not represent the amount paid by the class during periods when reimbursements or reductions occur. Expenses net of fee waivers reflect expenses after reimbursement by the investment adviser but prior to reductions from brokerage service arrangements or other expense offset arrangements. Expenses net of all reductions represent the net expenses paid by the class. |
| I | Amount represents less than $.01 per share. |
| J | Total distributions of $1.03 per share is comprised of distributions from net investment income of $.684 and distributions from net realized gain of $.342 per share. |
See accompanying notes which are an integral part of the financial statements.
| Financial Highlights – Service Class 2 |
| Years ended December 31, | | 2014 | | | 2013 | | | 2012 | | | 2011 | | | 2010 | |
| Selected Per-Share Data | | | | | | | | | | | | | | | | | | | | |
| Net asset value, beginning of period | | $ | 22.88 | | | $ | 19.62 | | | $ | 18.41 | | | $ | 18.75 | | | $ | 16.57 | |
| Income from Investment Operations | | | | | | | | | | | | | | | | | | | | |
| Net investment income (loss)C | | | .64 | F | | | .49 | | | | .53 | | | | .42 | | | | .25 | |
| Net realized and unrealized gain (loss) | | | 1.32 | | | | 4.88 | | | | 2.55 | | | | (.31 | ) | | | 2.21 | |
| Total from investment operations | | | 1.96 | | | | 5.37 | | | | 3.08 | | | | .11 | | | | 2.46 | |
| Distributions from net investment income | | | (.65 | ) | | | (.54 | ) | | | (.57 | )G | | | (.45 | ) | | | (.28 | ) |
| Distributions from net realized gain | | | (.34 | ) | | | (1.57 | ) | | | (1.30 | )G | | | - | | | | - | |
| Total distributions | | | (.99 | ) | | | (2.11 | ) | | | (1.87 | ) | | | (.45 | ) | | | (.28 | ) |
| Redemption fees added to paid in capitalC,I | | | — | | | | — | | | | — | | | | — | | | | — | |
| Net asset value, end of period | | $ | 23.85 | | | $ | 22.88 | | | $ | 19.62 | | | $ | 18.41 | | | $ | 18.75 | |
| Tolal ReturnA,B | | | 8.57 | % | | | 27.83 | % | | | 17.05 | % | | | .66 | % | | | 14.92 | % |
| Ratios to Average Net AssetsD,H | | | | | | | | | | | | | | | | | | | | |
| Expenses before reductions | | | .79 | % | | | .80 | % | | | .80 | % | | | .81 | % | | | .81 | % |
| Expenses net of fee waivers, if any | | | .79 | % | | | .79 | % | | | .80 | % | | | .81 | % | | | .80 | % |
| Expenses net of all reductions | | | .79 | % | | | .79 | % | | | .79 | % | | | .80 | % | | | .80 | % |
| Net investment income (loss) | | | 2.69 | %F | | | 2.18 | % | | | 2.69 | % | | | 2.23 | % | | | 1.46 | % |
| Supplemental Data | | | | | | | | | | | | | | | | | | | | |
| Net assets, end of period (000 omitted) | | $ | 1,702,854 | | | $ | 1,755,769 | | | $ | 1,560,856 | | | $ | 1,457,230 | | | $ | 1,619,356 | |
| Portfolio turnover rateE | | | 40 | % | | | 32 | % | | | 48 | % | | | 96 | % | | | 29 | % |
| A | Total returns do not reflect charges attributable to your insurance company's separate account. Inclusion of these charges would reduce the total returns shown. |
| B | Total returns would have been lower if certain expenses had not been reduced during the applicable periods shown. |
| C | Calculated based on average shares outstanding during the period. |
| D | Fees and expenses of any underlying Fidelity Central Funds are not included in the Fund's expense ratio. The Fund indirectly bears its proportionate share of the expenses of any underlying Fidelity Central Funds. |
| E | Amount does not include the portfolio activity of any underlying Fidelity Central Funds. |
| F | Investment income per share reflects a large, non-recurring dividend which amounted to $.08 per share. Excluding this non-recurring dividend, the ratio of net investment income (loss) to average net assets would have been 2.34%. |
| G | The amounts shown reflect certain reclassifications related to book to tax differences that were made in the year shown. |
| H | Expense ratios reflect operating expenses of the class. Expenses before reductions do not reflect amounts reimbursed by the investment adviser or reductions from brokerage service arrangements or reductions from other expense offset arrangements and do not represent the amount paid by the class during periods when reimbursements or reductions occur. Expenses net of fee waivers reflect expenses after reimbursement by the investment adviser but prior to reductions from brokerage service arrangements or other expense offset arrangements. Expenses net of all reductions represent the net expenses paid by the class. |
| I | Amount represents less than $.01 per share. |
| Financial Highlights – Service Class 2R |
| Years ended December 31, | | 2014 | | | 2013 | | | 2012 | | | 2011 | | | 2010 | |
| Selected Per-Share Data | | | | | | | | | | | | | | | | | | | | |
| Net asset value, beginning of period | | $ | 22.74 | | | $ | 19.53 | | | $ | 18.34 | | | $ | 18.66 | | | $ | 16.49 | |
| Income from Investment Operations | | | | | | | | | | | | | | | | | | | | |
| Net investment income (loss)C | | | .64 | F | | | .49 | | | | .53 | | | | .42 | | | | .25 | |
| Net realized and unrealized gain (loss) | | | 1.31 | | | | 4.84 | | | | 2.54 | | | | (.30 | ) | | | 2.20 | |
| Total from investment operations | | | 1.95 | | | | 5.33 | | | | 3.07 | | | | .12 | | | | 2.45 | |
| Distributions from net investment income | | | (.66 | ) | | | (.55 | ) | | | (.58 | )G | | | (.44 | ) | | | (.28 | ) |
| Distributions from net realized gain | | | (.34 | ) | | | (1.57 | ) | | | (1.30 | )G | | | - | | | | - | |
| Total distributions | | | (1.00 | ) | | | (2.12 | ) | | | (1.88 | ) | | | (.44 | ) | | | (.28 | ) |
| Redemption fees added to paid in capitalC,l | | | — | | | | — | | | | — | | | | — | | | | — | |
| Net asset value, end of period | | $ | 23.69 | | | $ | 22.74 | | | $ | 19.53 | | | $ | 18.34 | | | $ | 18.66 | |
| Total ReturnA,B | | | 8.58 | % | | | 27.79 | % | | | 17.05 | % | | | .70 | % | | | 14.90 | % |
| Ratios to Average Net AssetsD,H | | | | | | | | | | | | | | | | | | | | |
| Expenses before reductions | | | .79 | % | | | .79 | % | | | .80 | % | | | .81 | % | | | .81 | % |
| Expenses net of fee waivers, if any | | | .79 | % | | | .79 | % | | | .80 | % | | | .80 | % | | | .80 | % |
| Expenses net of all reductions | | | .79 | % | | | .79 | % | | | .79 | % | | | .79 | % | | | .80 | % |
| Net investment income (loss) | | | 2.69 | %F | | | 2.19 | % | | | 2.69 | % | | | 2.23 | % | | | 1.46 | % |
| Supplemental Data | | | | | | | | | | | | | | | | | | | | |
| Net assets, end of period (000 omitted) | | $ | 15,440 | | | $ | 11,980 | | | $ | 5,640 | | | $ | 3,956 | | | $ | 5,405 | |
| Portfolio turnover rateE | | | 40 | % | | | 32 | % | | | 48 | % | | | 96 | % | | | 29 | % |
| A | Total returns do not reflect charges attributable to your insurance company's separate account. Inclusion of these charges would reduce the total returns shown. |
| B | Total returns would have been lower if certain expenses had not been reduced during the applicable periods shown. |
| C | Calculated based on average shares outstanding during the period. |
| D | Fees and expenses of any underlying Fidelity Central Funds are not included in the Fund's expense ratio. The Fund indirectly bears its proportionate share of the expenses of any underlying Fidelity Central Funds. |
| E | Amount does not include the portfolio activity of any underlying Fidelity Central Funds. |
| F | Investment income per share reflects a large, non-recurring dividend which amounted to $.08 per share. Excluding this non-recurring dividend, the ratio of net investment income (loss) to average net assets would have been 2.34%. |
| G | The amounts shown reflect certain reclassifications related to book to tax differences that were made in the year shown. |
| H | Expense ratios reflect operating expenses of the class. Expenses before reductions do not reflect amounts reimbursed by the investment adviser or reductions from brokerage service arrangements or reductions from other expense offset arrangements and do not represent the amount paid by the class during periods when reimbursements or reductions occur. Expenses net of fee waivers reflect expenses after reimbursement by the investment adviser but prior to reductions from brokerage service arrangements or other expense offset arrangements. Expenses net of all reductions represent the net expenses paid by the class. |
| I | Amount represents less than $.01 per share. |
See accompanying notes which are an integral part of the financial statements.
| Financial Highlights – Investor Class |
| Years ended December 31, | | 2014 | | | 2013 | | | 2012 | | | 2011 | | | 2010 | |
| Selected Per-Share Data | | | | | | | | | | | | | | | | | | | | |
| Net asset value, beginning of period | | $ | 23.21 | | | $ | 19.89 | | | $ | 18.64 | | | $ | 18.97 | | | $ | 16.77 | |
| Income from Investment Operations | | | | | | | | | | | | | | | | | | | | |
| Net investment income (loss)C | | | .69 | F | | | .54 | | | | .57 | | | | .46 | | | | .28 | |
| Net realized and unrealized gain (loss) | | | 1.34 | | | | 4.93 | | | | 2.59 | | | | (.31 | ) | | | 2.23 | |
| Total from investment operations | | | 2.03 | | | | 5.47 | | | | 3.16 | | | | .15 | | | | 2.51 | |
| Distributions from net investment income | | | (.69 | ) | | | (.58 | ) | | | (.61 | )G | | | (.48 | ) | | | (.31 | ) |
| Distributions from net realized gain | | | (.34 | ) | | | (1.57 | ) | | | (1.30 | )G | | | — | | | | — | |
| Total distributions | | | (1.03 | ) | | | (2.15 | ) | | | (1.91 | ) | | | (.48 | ) | | | (.31 | ) |
| Redemption fees added to paid in capitalC,I | | | — | | | | — | | | | — | | | | — | | | | — | |
| Net asset value, end of period | | $ | 24.21 | | | $ | 23.21 | | | $ | 19.89 | | | $ | 18.64 | | | $ | 18.97 | |
| Total ReturnA,B | | | 8.77 | % | | | 27.99 | % | | | 17.27 | % | | | .89 | % | | | 15.04 | % |
| Ratios to Average Net Assets D,H | | | | | | | | | | | | | | | | | | | | |
| Expenses before reductions | | | .62 | % | | | .63 | % | | | .64 | % | | | .64 | % | | | .65 | % |
| Expenses net of fee waivers, if any | | | .62 | % | | | .62 | % | | | .64 | % | | | .64 | % | | | .64 | % |
| Expenses net of all reductions | | | .62 | % | | | .62 | % | | | .63 | % | | | .63 | % | | | .64 | % |
| Net investment income (loss) | | | 2.86 | %F | | | 2.35 | % | | | 2.85 | % | | | 2.39 | % | | | 1.62 | % |
| Supplemental Data | | | | | | | | | | | | | | | | | | | | |
| Net assets, end of period (000 omitted) | | $ | 388,773 | | | $ | 351,139 | | | $ | 220,311 | | | $ | 178,499 | | | $ | 165,946 | |
| Portfolio turnover rateE | | | 40 | % | | | 32 | % | | | 48 | % | | | 96 | % | | | 29 | % |
| A | Total returns do not reflect charges attributable to your insurance company's separate account. Inclusion of these charges would reduce the total returns shown. |
| B | Total returns would have been lower if certain expenses had not been reduced during the applicable periods shown. |
| C | Calculated based on average shares outstanding during the period. |
| D | Fees and expenses of any underlying Fidelity Central Funds are not included in the Fund's expense ratio. The Fund indirectly bears its proportionate share of the expenses of any underlying Fidelity Central Funds. |
| E | Amount does not include the portfolio activity of any underlying Fidelity Central Funds. |
| F | Investment income per share reflects a large, non-recurring dividend which amounted to $.08 per share. Excluding this non-recurring dividend, the ratio of net investment income (loss) to average net assets would have been 2.51%. |
| G | The amounts shown reflect certain reclassifications related to book to tax differences that were made in the year shown. |
| H | Expense ratios reflect operating expenses of the class. Expenses before reductions do not reflect amounts reimbursed by the investment adviser or reductions from brokerage service arrangements or reductions from other expense offset arrangements and do not represent the amount paid by the class during periods when reimbursements or reductions occur. Expenses net of fee waivers reflect expenses after reimbursement by the investment adviser but prior to reductions from brokerage service arrangements or other expense offset arrangements. Expenses net of all reductions represent the net expenses paid by the class. |
| I | Amount represents less than $.01 per share. |
See accompanying notes which are an integral part of the financial statements.
Notes to Financial Statements
For the period ended December 31, 2014
1. Organization.
VIP Equity-Income Portfolio (the Fund) is a fund of Variable Insurance Products Fund (the Trust) and is authorized to issue an unlimited number of shares. The Trust is registered under the Investment Company Act of 1940, as amended (the 1940 Act), as an open-end management investment company organized as a Massachusetts business trust. Shares of the Fund may only be purchased by insurance companies for the purpose of funding variable annuity or variable life insurance contracts. The Fund offers the following classes of shares: Initial Class shares, Service Class shares, Service Class 2 shares, Service Class 2R shares and Investor Class shares. All classes have equal rights and voting privileges, except for matters affecting a single class.
Effective after the close of business on or about April 30, 2015, shares of Service Class 2 R will be converted to shares of Service Class 2. After the effective date, Service Class 2 R will be closed to new accounts.
2. Investments in Fidelity Central Funds.
The Fund invests in Fidelity Central Funds, which are open-end investment companies generally available only to other investment companies and accounts managed by the investment adviser and its affiliates. The Fund’s Schedule of Investments lists each of the Fidelity Central Funds held as of period end, if any, as an investment of the Fund, but does not include the underlying holdings of each Fidelity Central Fund. As an Investing Fund, the Fund indirectly bears its proportionate share of the expenses of the underlying Fidelity Central Funds.
The Money Market Central Funds seek preservation of capital and current income and are managed by Fidelity Investments Money Management, Inc. (FIMM), an affiliate of the investment adviser. Annualized expenses of the Money Market Central Funds as of their most recent shareholder report date are less than .01%.
A complete unaudited list of holdings for each Fidelity Central Fund is available upon request or at the Securities and Exchange Commission (the SEC) website at www.sec.gov. In addition, the financial statements of the Fidelity Central Funds, which are not covered by the Fund’s Report of Independent Registered Public Accounting Firm, are available on the SEC website or upon request.
3. Significant Accounting Policies.
The financial statements have been prepared in conformity with accounting principles generally accepted in the United States of America (GAAP), which require management to make certain estimates and assumptions at the date of the financial statements. Actual results could differ from those estimates. Subsequent events, if any, through the date that the financial statements were issued have been evaluated in the preparation of the financial statements. The following summarizes the significant accounting policies of the Fund:
Investment Valuation. Investments are valued as of 4:00 p.m. Eastern time on the last calendar day of the period. In accordance with valuation policies and procedures approved by the Board of Trustees (the Board), the Fund attempts to obtain prices from one or more third party pricing vendors or brokers to value its investments. When current market prices, quotations or currency exchange rates are not readily available or reliable, investments will be fair valued in good faith by the Fidelity Management & Research Company (FMR) Fair Value Committee (the Committee), in accordance with procedures adopted by the Board. Factors used in determining fair value vary by investment type and may include market or investment specific events, changes in interest rates and credit quality. The frequency with which these procedures are used cannot be predicted and they may be utilized to a significant extent. The Committee oversees the Fund’s valuation policies and procedures and is responsible for approving and reporting to the Board all fair value determinations.
The Fund categorizes the inputs to valuation techniques used to value its investments into a disclosure hierarchy consisting of three levels as shown below:
Level 1 – quoted prices in active markets for identical investments
Level 2 – other significant observable inputs (including quoted prices for similar investments, interest rates, prepayment speeds, etc.)
Level 3 – unobservable inputs (including the Fund’s own assumptions based on the best information available)
Valuation techniques used to value the Fund’s investments by major category are as follows:
Equity securities, including restricted securities, for which market quotations are readily available, are valued at the last reported sale price or official closing price as reported by a third party pricing vendor on the primary market or exchange on which they are traded and are categorized as Level 1 in the hierarchy. In the event there were no sales during the day or closing prices are not available, securities are valued at the last quoted bid price or may be valued using the last available price and are generally categorized as Level 2 in the hierarchy. For foreign equity securities, when market or security specific events arise, comparisons to the valuation of American Depositary Receipts (ADRs), futures contracts, Exchange-Traded Funds (ETFs) and certain indexes as well as quoted prices for similar securities may be used and would be categorized as Level 2 in the hierarchy. Utilizing these techniques may result in transfers between Level 1 and Level 2. For equity securities, including restricted securities, where observable inputs are limited, assumptions about market activity and risk are used and these securities may be categorized as Level 3 in the hierarchy.
Notes to Financial Statements – continued
3. Significant Accounting Policies – continued
Investment Valuation – continued
Debt securities, including restricted securities, are valued based on evaluated prices received from third party pricing vendors or from brokers who make markets in such securities. Corporate bonds, bank loan obligations and preferred securities are valued by pricing vendors who utilize matrix pricing which considers yield or price of bonds of comparable quality, coupon, maturity and type or by broker-supplied prices. When independent prices are unavailable or unreliable, debt securities may be valued utilizing pricing methodologies which consider similar factors that would be used by third party pricing vendors. Debt securities are generally categorized as Level 2 in the hierarchy but may be Level 3 depending on the circumstances.
Exchange-traded options are valued using the last sale price or, in the absence of a sale, the last offering price and are categorized as Level 1 in the hierarchy. Investments in open-end mutual funds, including the Fidelity Central Funds, are valued at their closing net asset value (NAV) each business day and are categorized as Level 1 in the hierarchy.
Changes in valuation techniques may result in transfers in or out of an assigned level within the disclosure hierarchy. The aggregate value of investments by input level, as of December 31, 2014, is included at the end of the Fund’s Schedule of Investments.
Foreign Currency. The Fund may use foreign currency contracts to facilitate transactions in foreign-denominated securities. Gains and losses from these transactions may arise from changes in the value of the foreign currency or if the counterparties do not perform under the contracts’ terms.
Foreign-denominated assets, including investment securities, and liabilities are translated into U.S. dollars at the exchange rates at period end. Purchases and sales of investment securities, income and dividends received and expenses denominated in foreign currencies are translated into U.S. dollars at the exchange rate in effect on the transaction date.
The effects of exchange rate fluctuations on investments are included with the net realized and unrealized gain (loss) on investment securities. Other foreign currency transactions resulting in realized and unrealized gain (loss) are disclosed separately.
Investment Transactions and Income. For financial reporting purposes, the Fund’s investment holdings and NAV include trades executed through the end of the last business day of the period. The NAV per share for processing shareholder transactions is calculated as of the close of business of the New York Stock Exchange (NYSE), normally 4:00 p.m. Eastern time and includes trades executed through the end of the prior business day. Gains and losses on securities sold are determined on the basis of identified cost and may include proceeds received from litigation. Dividend income is recorded on the ex-dividend date, except for certain dividends from foreign securities where the ex-dividend date may have passed, which are recorded as soon as the Fund is informed of the ex-dividend date. Non-cash dividends included in dividend income, if any, are recorded at the fair market value of the securities received. Income and capital gain distributions from Fidelity Central Funds, if any, are recorded on the ex-dividend date. Distributions received on securities that represent a return of capital or capital gain are recorded as a reduction of cost of investments and/or as a realized gain. Subsequent to ex-dividend date the Fund determines the components of these distributions, based upon receipt of tax filings or other correspondence relating to the underlying investment. Large, non-recurring dividends recognized by the Fund are presented separately on the Statement of Operations as “Special Dividends” and the impact of these dividends is presented in the Financial Highlights. Interest income is accrued as earned and includes coupon interest and amortization of premium and accretion of discount on debt securities as applicable. Investment income is recorded net of foreign taxes withheld where recovery of such taxes is uncertain.
Class Allocations and Expenses. Investment income, realized and unrealized capital gains and losses, common expenses of the Fund, and certain fund-level expense reductions, if any, are allocated daily on a pro-rata basis to each class based on the relative net assets of each class to the total net assets of the Fund. Each class differs with respect to transfer agent and distribution and service plan fees incurred. Certain expense reductions may also differ by class. For the reporting period, the allocated portion of income and expenses to each class as a percent of its average net assets may vary due to the timing of recording these transactions in relation to fluctuating net assets of the classes. Expenses directly attributable to a fund are charged to that fund. Expenses attributable to more than one fund are allocated among the respective funds on the basis of relative net assets or other appropriate methods. Expense estimates are accrued in the period to which they relate and adjustments are made when actual amounts are known.
Deferred Trustee Compensation. Under a Deferred Compensation Plan (the Plan), independent Trustees may elect to defer receipt of a portion of their annual compensation. Deferred amounts are invested in a cross-section of Fidelity funds, are marked-to-market and remain in the Fund until distributed in accordance with the Plan. The investment of deferred amounts and the offsetting payable to the Trustees are included in the accompanying Statement of Assets and Liabilities.
Income Tax Information and Distributions to Shareholders. Each year, the Fund intends to qualify as a regulated investment company under Subchapter M of the Internal Revenue Code, including distributing substantially all of its taxable income and realized gains. As a result, no provision for U.S. Federal income taxes is required. As of December 31, 2014, the Fund did not have any unrecognized tax benefits in the financial statements; nor is the Fund aware of any tax positions for which it is reasonably possible that the total amounts of unrecognized tax benefits will significantly change in the next twelve months. The Fund files a U.S. federal tax return, in addition to state and local tax returns as required. The Fund’s federal income tax
3. Significant Accounting Policies - continued
Income Tax Information and Distributions to Shareholders – continued
returns are subject to examination by the Internal Revenue Service (IRS) for a period of three fiscal years after they are filed. State and local tax returns may be subject to examination for an additional fiscal year depending on the jurisdiction. Foreign taxes are provided for based on the Fund’s understanding of the tax rules and rates that exist in the foreign markets in which it invests.
Distributions are declared and recorded on the ex-dividend date. Income dividends and capital gain distributions are declared separately for each class. Income and capital gain distributions are determined in accordance with income tax regulations, which may differ from GAAP.
Capital accounts within the financial statements are adjusted for permanent book-tax differences. These adjustments have no impact on net assets or the results of operations. Capital accounts are not adjusted for temporary book-tax differences which will reverse in a subsequent period.
Book-tax differences are primarily due to foreign currency transactions, market discount, contingent interest, options transactions, certain conversion ratio adjustments, partnerships, deferred trustees compensation, equity-debt classifications and losses deferred due to wash sales.
The federal tax cost of investment securities and unrealized appreciation (depreciation) as of period end were as follows:
| Gross unrealized appreciation | | $ | 1,549,399,787 | |
| Gross unrealized depreciation | | | (284,109,161 | ) |
| Net unrealized appreciation (depreciation) on securities | | $ | 1,265,290,626 | |
| | | | | |
| Tax Cost | | $ | 5,051,711,138 | |
The tax-based components of distributable earnings as of period end were as follows:
| Undistributed tax-exempt income | | $ | 5,765,127 | |
| Undistributed ordinary income | | $ | 525,758,231 | |
| Net unrealized appreciation (depreciation) on securities and other investments | | $ | 1,262,420,133 | |
The tax character of distributions paid was as follows:
| | | December 31, 2014 | | | December 31, 2013 | |
| Ordinary Income | | $ | 242,650,166 | | | $ | 279,000,432 | |
| Long-term Capital Gains | | | 18,422,560 | | | | 272,492,862 | |
| Total | | $ | 261,072,726 | | | $ | 551,493,294 | |
Trading (Redemption) Fees. Service Class 2R shares held by investors less than 60 days may be subject to a redemption fee equal to 1% of the NAV of shares redeemed. All redemption fees, which reduce the proceeds of the shareholder redemption, are retained by the Fund and accounted for as an addition to paid in capital. In November 2014, the Board of Trustees approved the elimination of these redemption fees effective on or about April 30, 2015.
Restricted Securities. The Fund may invest in securities that are subject to legal or contractual restrictions on resale. These securities generally may be resold in transactions exempt from registration or to the public if the securities are registered. Disposal of these securities may involve time-consuming negotiations and expense, and prompt sale at an acceptable price may be difficult. Information regarding restricted securities is included at the end of the Fund’s Schedule of Investments.
Loans and Other Direct Debt Instruments. The Fund invests in direct debt instruments which are interests in amounts owed to lenders by corporate or other borrowers. These instruments may be in the form of loans, trade claims or other receivables and may include standby financing commitments such as revolving credit facilities that obligate the Fund to supply additional cash to the borrower on demand. Loans may be acquired through assignment or participation. The Fund did not have any unfunded loan commitments, which are contractual obligations for future funding, at period end.
New Accounting Pronouncement. In June 2014, the Financial Accounting Standards Board issued Accounting Standard Update No. 2014-11, Repurchase-to-Maturity Transactions, Repurchase Financings, and Disclosures. The Update amends the accounting for certain repurchase agreements and expands disclosure requirements for reverse repurchase agreements, securities lending and other similar transactions. The disclosure requirements are effective for annual and interim reporting periods beginning after December 15, 2014. Management is currently evaluating the impact of the Update on the Fund’s financial statements and related disclosures.
Notes to Financial Statements – continued
4. Derivative Instruments.
Risk Exposures and the Use of Derivative Instruments. The Fund’s investment objective allows the Fund to enter into various types of derivative contracts, including options. Derivatives are investments whose value is primarily derived from underlying assets, indices or reference rates and may be transacted on an exchange or over-the-counter (OTC). Derivatives may involve a future commitment to buy or sell a specified asset based on specified terms, to exchange future cash flows at periodic intervals based on a notional principal amount, or for one party to make one or more payments upon the occurrence of specified events in exchange for periodic payments from the other party.
The Fund used derivatives to increase returns and to manage exposure to certain risks as defined below. The success of any strategy involving derivatives depends on analysis of numerous economic factors, and if the strategies for investment do not work as intended, the Fund may not achieve its objectives.
The Fund’s use of derivatives increased or decreased its exposure to the following risk:
| Equity Risk | Equity risk relates to the fluctuations in the value of financial instruments as a result of changes in market prices (other than those arising from interest rate risk or foreign exchange risk), whether caused by factors specific to an individual investment, its issuer, or all factors affecting all instruments traded in a market or market segment. |
The Fund is also exposed to additional risks from investing in derivatives, such as liquidity risk and counterparty credit risk. Liquidity risk is the risk that the Fund will be unable to close out the derivative in the open market in a timely manner. Counterparty credit risk is the risk that the counterparty will not be able to fulfill its obligation to the Fund. Counterparty credit risk related to exchange-traded options may be mitigated by the protection provided by the exchange on which they trade.
Investing in derivatives may involve greater risks than investing in the underlying assets directly and, to varying degrees, may involve risk of loss in excess of any initial investment and collateral received and amounts recognized in the Statement of Assets and Liabilities. In addition, there may be the risk that the change in value of the derivative contract does not correspond to the change in value of the underlying instrument.
Options. Options give the purchaser the right, but not the obligation, to buy (call) or sell (put) an underlying security or financial instrument at an agreed exercise or strike price between or on certain dates. Options obligate the seller (writer) to buy (put) or sell (call) an underlying instrument at the exercise or strike price or cash settle an underlying derivative instrument if the holder exercises the option on or before the expiration date.
The Fund used exchange-traded written covered call options to manage its exposure to the market. When the Fund writes a covered call option, the Fund holds the underlying instrument which must be delivered to the holder upon the exercise of the option.
Upon entering into a written options contract, the Fund will receive a premium. Premiums received are reflected as a liability on the Statement of Assets and Liabilities. Options are valued daily and any unrealized appreciation (depreciation) is reflected on the Statement of Assets and Liabilities. When a written option is exercised, the premium is added to the proceeds from the sale of the underlying instrument in determining the gain or loss realized on that investment. When an option is closed the Fund will realize a gain or loss depending on whether the proceeds or amount paid for the closing sale transaction are greater or less than the premium received. When an option expires, gains and losses are realized to the extent of premiums received. The net realized gain (loss) on closed and expired written options and the change in net unrealized appreciation (depreciation) on written options are reflected separately on the Statement of Operations.
Writing call options tends to decrease exposure to the underlying instrument and risk of loss is the change in value in excess of the premium received.
Any open options at period end are presented in the Schedule of Investments under the caption “Written Options” and are representative of volume of activity during the period.
During the period, the Fund recognized net realized gain (loss) of $7,909,899 and a change in net unrealized appreciation (depreciation) of $466,395 related to its investment in written options. This amount is included in the Statement of Operations.
The following is a summary of the Fund’s written options activity:
| Written Options | | Number of Contracts | | | Amount of Premiums | |
| Outstanding at beginning of period | | | 31,690 | | | $ | 1,867,358 | |
| Options Opened | | | 194,449 | | | | 16,298,303 | |
| Options Exercised | | | (83,520 | ) | | | (6,793,738 | ) |
| Options Closed | | | (54,157 | ) | | | (4,451,562 | ) |
| Options Expired | | | (71,376 | ) | | | (5,416,408 | ) |
| Outstanding at end of period | | | 17,086 | | | $ | 1,503,953 | |
5. Purchases and Sales of Investments.
Purchases and sales of securities, other than short-term securities, aggregated $2,454,735,699 and $3,007,289,740, respectively.
6. Fees and Other Transactions with Affiliates.
Management Fee. Fidelity Management & Research Company (the investment adviser) and its affiliates provide the Fund with investment management related services for which the Fund pays a monthly management fee. The management fee is the sum of an individual fund fee rate that is based on an annual rate of .20% of the Fund’s average net assets and an annualized group fee rate that averaged ..25% during the period. The group fee rate is based upon the average net assets of all the mutual funds advised by the investment adviser, including any mutual funds previously advised by the investment adviser that are currently advised by Fidelity SelectCo, LLC, an affiliate of the investment adviser. The group fee rate decreases as assets under management increase and increases as assets under management decrease. For the reporting period, the total annual management fee rate was .45% of the Fund’s average net assets.
Distribution and Service Plan Fees. In accordance with Rule 12b-1 of the 1940 Act, the Fund has adopted separate 12b-1 Plans for each Service Class of shares. Each Service Class pays Fidelity Distributors Corporation (FDC), an affiliate of the investment adviser, a service fee. For the period, the service fee is based on an annual rate of .10% of Service Class’ average net assets and ..25% of Service Class 2’s and Service Class 2R’s average net assets.
For the period, total fees, all of which were re-allowed to insurance companies for the distribution of shares and providing shareholder support services were as follows:
| Service Class | | $ | 383,547 | |
| Service Class 2 | | | 4,332,056 | |
| Service Class 2R | | | 34,366 | |
| | | $ | 4,749,969 | |
Transfer Agent Fees. Fidelity Investments Institutional Operations Company, Inc. (FIIOC), an affiliate of the investment adviser, is the Fund’s transfer, dividend disbursing, and shareholder servicing agent. FIIOC receives an asset-based fee with respect to each class. Each class (with the exception of Investor Class) pays a fee for transfer agent services, typesetting, printing and mailing of shareholder reports, excluding mailing of proxy statements and out of pocket expenses, equal to an annual rate of ..07% (.15% for Investor Class) of class-level average net assets. For the period, transfer agent fees for each class, including out of pocket expenses, were as follows:
| Initial Class | | $ | 2,551,492 | |
| Service Class | | | 252,693 | |
| Service Class 2 | | | 1,143,622 | |
| Service Class 2R | | | 8,999 | |
| Investor Class | | | 543,954 | |
| | | $ | 4,500,760 | |
Accounting and Security Lending Fees. Fidelity Service Company, Inc. (FSC), an affiliate of the investment adviser, maintains the Fund’s accounting records. The accounting fee is based on the level of average net assets for each month. Under a separate contract, FSC administers the security lending program. The security lending fee is based on the number and duration of lending transactions.
Brokerage Commissions. The Fund placed a portion of its portfolio transactions with brokerage firms which are affiliates of the investment adviser. Brokerage commissions are included in net realized gain (loss) and change in net unrealized appreciation (depreciation) in the Statement of Operations. The commissions paid to these affiliated firms were $11,501 for the period.
7. Committed Line of Credit.
The Fund participates with other funds managed by the investment adviser or an affiliate in a $4.25 billion credit facility (the “line of credit”) to be utilized for temporary or emergency purposes to fund shareholder redemptions or for other short-term liquidity purposes. The Fund has agreed to pay commitment fees on its pro-rata portion of the line of credit, which amounted to $10,295 and is reflected in Miscellaneous expenses on the Statement of Operations. During the period, the Fund did not borrow on this line of credit.
8. Security Lending.
The Fund lends portfolio securities through a lending agent from time to time in order to earn additional income. For equity securities, a lending agent is used and may loan securities to certain qualified borrowers, including Fidelity Capital Markets (FCM), a broker-dealer affiliated with the Fund. On the settlement date of the loan, the Fund receives collateral (in the form of U.S. Treasury obligations, letters of credit and/or cash) against the loaned securities and maintains collateral in an amount not less than 100% of the market value of the loaned securities during the period of the loan. The
Notes to Financial Statements – continued
8. Security Lending – continued
market value of the loaned securities is determined at the close of business of the Fund and any additional required collateral is delivered to the Fund on the next business day. If the borrower defaults on its obligation to return the securities loaned because of insolvency or other reasons, the Fund may apply collateral received from the borrower against the obligation. The Fund may experience delays and costs in recovering the securities loaned. Any cash collateral received is invested in the Fidelity Securities Lending Cash Central Fund. The value of loaned securities and cash collateral at period end are disclosed on the Fund’s Statement of Assets and Liabilities. Security lending income represents the income earned on investing cash collateral, less rebates paid to borrowers and any lending agent fees associated with the loan, plus any premium payments received for lending certain types of securities. Security lending income is presented in the Statement of Operations as a component of income from Fidelity Central Funds. Total security lending income during the period amounted to $534,758, including $2,587 from securities loaned to FCM.
9. Expense Reductions.
Commissions paid to certain brokers with whom the investment adviser, or its affiliates, places trades on behalf of the Fund include an amount in addition to trade execution, which may be rebated back to the Fund to offset certain expenses. This amount totaled $98,474 for the period. In addition, through arrangements with the Fund’s custodian, credits realized as a result of uninvested cash balances were used to reduce the Fund’s expenses. During the period, these credits reduced the Fund’s custody expenses by $4.
10. Distributions to Shareholders.
Distributions to shareholders of each class were as follows:
| Years ended December 31, | | 2014 | | | 2013 | |
| From net investment income | | | | | | | | |
| Initial Class | | $ | 107,336,069 | | | $ | 92,568,520 | |
| Service Class | | | 10,064,095 | | | | 8,840,014 | |
| Service Class 2 | | | 44,643,796 | | | | 37,705,026 | |
| Service Class 2R | | | 416,261 | | | | 258,073 | |
| Investor Class | | | 10,712,923 | | | | 8,161,740 | |
| Total | | $ | 173,173,144 | | | $ | 147,533,373 | |
| From net realized gain | | | | | | | | |
| Initial Class | | $ | 53,100,552 | | | $ | 245,504,561 | |
| Service Class | | | 5,192,387 | | | | 24,485,710 | |
| Service Class 2 | | | 24,163,154 | | | | 111,276,322 | |
| Service Class 2R | | | 208,074 | | | | 724,327 | |
| Investor Class | | | 5,235,415 | | | | 21,969,001 | |
| Total | | $ | 87,899,582 | | | $ | 403,959,921 | |
11. Share Transactions.
Transactions for each class of shares were as follows:
| | | Shares | | | Dollars | |
| Years ended December 31, | | 2014 | | | 2013 | | | 2014 | | | 2013 | |
| Initial Class | | | | | | | | | | | | | | | | |
| Shares sold | | | 3,745,247 | | | | 5,939,757 | | | $ | 90,278,141 | | | $ | 136,791,018 | |
| Reinvestment of distributions | | | 6,589,354 | | | | 15,117,940 | | | | 160,436,620 | | | | 338,073,081 | |
| Shares redeemed | | | (22,744,482 | ) | | | (25,104,941 | ) | | | (547,118,347 | ) | | | (577,075,155 | ) |
| Net increase (decrease) | | | (12,409,881 | ) | | | (4,047,244 | ) | | $ | (296,403,586 | ) | | $ | (102,211,056 | ) |
| Service Class | | | | | | | | | | | | | | | | |
| Shares sold | | | 560,667 | | | | 522,521 | | | $ | 13,553,192 | | | $ | 11,868,622 | |
| Reinvestment of distributions | | | 629,390 | | | | 1,495,670 | | | | 15,256,482 | | | | 33,325,724 | |
| Shares redeemed | | | (2,833,591 | ) | | | (2,763,995 | ) | | | (68,623,532 | ) | | | (62,879,133 | ) |
| Net increase (decrease) | | | (1,643,534 | ) | | | (745,804 | ) | | $ | (39,813,858 | ) | | $ | (17,684,787 | ) |
| Service Class 2 | | | | | | | | | | | | | | | | |
| Shares sold | | | 4,230,671 | | | | 5,862,575 | | | $ | 100,211,368 | | | $ | 132,392,944 | |
| Reinvestment of distributions | | | 2,879,996 | | | | 6,780,471 | | | | 68,806,950 | | | | 148,981,348 | |
| Shares redeemed | | | (12,454,297 | ) | | | (15,448,401 | ) | | | (296,579,008 | ) | | | (348,570,665 | ) |
| Net increase (decrease) | | | (5,343,630 | ) | | | (2,805,355 | ) | | $ | (127,560,690 | ) | | $ | (67,196,373 | ) |
11. Share Transactions – continued
| | | Shares | | | Dollars | |
| Years ended December 31, | | 2014 | | | 2013 | | | 2014 | | | 2013 | |
| Service Class 2R | | | | | | | | | | | | | | | | |
| Shares sold | | | 205,262 | | | | 253,817 | | | $ | 4,868,639 | | | $ | 5,683,428 | |
| Reinvestment of distributions | | | 26,268 | | | | 44,961 | | | | 624,335 | | | | 982,400 | |
| Shares redeemed | | | (106,535 | ) | | | (60,780 | ) | | | (2,539,192 | ) | | | (1,351,791 | ) |
| Net increase (decrease) | | | 124,995 | | | | 237,998 | | | $ | 2,953,782 | | | $ | 5,314,037 | |
| Investor Class | | | | | | | | | | | | | | | | |
| Shares sold | | | 1,906,050 | | | | 3,800,857 | | | $ | 45,905,466 | | | $ | 86,969,508 | |
| Reinvestment of distributions | | | 656,848 | | | | 1,351,634 | | | | 15,948,338 | | | | 30,130,741 | |
| Shares redeemed | | | (1,632,275 | ) | | | (1,103,166 | ) | | | (38,978,149 | ) | | | (25,440,166 | ) |
| Net increase (decrease) | | | 930,623 | | | | 4,049,325 | | | $ | 22,875,655 | | | $ | 91,660,083 | |
12. Other.
The Fund’s organizational documents provide former and current trustees and officers with a limited indemnification against liabilities arising in connection with the performance of their duties to the Fund. In the normal course of business, the Fund may also enter into contracts that provide general indemnifications. The Fund’s maximum exposure under these arrangements is unknown as this would be dependent on future claims that may be made against the Fund. The risk of material loss from such claims is considered remote.
At the end of the period, the investment adviser or its affiliates were the owners of record of 13% of the total outstanding shares of the Fund and one otherwise unaffiliated shareholder was the owner of record of 18% of the total outstanding shares of the Fund.
Report of Independent Registered Public Accounting Firm
To the Trustees of Variable Insurance Products Fund and the Shareholders of VIP Equity-Income Portfolio:
In our opinion, the accompanying statement of assets and liabilities, including the schedule of investments, and the related statements of operations and of changes in net assets and the financial highlights present fairly, in all material respects, the financial position of VIP Equity-Income Portfolio (a fund of Variable Insurance Products Fund) at December 31, 2014, the results of its operations for the year then ended, the changes in its net assets for each of the two years in the period then ended and the financial highlights for each of the five years in the period then ended, in conformity with accounting principles generally accepted in the United States of America. These financial statements and financial highlights (hereafter referred to as “financial statements”) are the responsibility of the VIP Equity-Income Portfolio’s management. Our responsibility is to express an opinion on these financial statements based on our audits. We conducted our audits of these financial statements in accordance with the standards of the Public Company Accounting Oversight Board (United States). Those standards require that we plan and perform the audit to obtain reasonable assurance about whether the financial statements are free of material misstatement. An audit includes examining, on a test basis, evidence supporting the amounts and disclosures in the financial statements, assessing the accounting principles used and significant estimates made by management, and evaluating the overall financial statement presentation. We believe that our audits, which included confirmation of securities at December 31, 2014 by correspondence with the custodian, agent banks and brokers, provide a reasonable basis for our opinion.
PricewaterhouseCoopers LLP
Boston, Massachusetts
February 19, 2015
Trustees and Officers
The Trustees, Member of the Advisory Board, and officers of the trust and fund, as applicable, are listed below. The Board of Trustees governs the fund and is responsible for protecting the interests of shareholders. The Trustees are experienced executives who meet periodically throughout the year to oversee the fund’s activities, review contractual arrangements with companies that provide services to the fund, oversee management of the risks associated with such activities and contractual arrangements, and review the fund’s performance. Except for James C. Curvey, each of the Trustees oversees 174 funds. Mr. Curvey oversees 407 funds.
The Trustees hold office without limit in time except that (a) any Trustee may resign; (b) any Trustee may be removed by written instrument, signed by at least two-thirds of the number of Trustees prior to such removal; (c) any Trustee who requests to be retired or who has become incapacitated by illness or injury may be retired by written instrument signed by a majority of the other Trustees; and (d) any Trustee may be removed at any special meeting of shareholders by a two-thirds vote of the outstanding voting securities of the trust. Each Trustee who is not an interested person (as defined in the 1940 Act) of the trust and the fund (Independent Trustee), shall retire not later than the last day of the calendar year in which his or her 75th birthday occurs. The Independent Trustees may waive this mandatory retirement age policy with respect to individual Trustees. The officers and Advisory Board Member hold office without limit in time, except that any officer and Advisory Board Member may resign or may be removed by a vote of a majority of the Trustees at any regular meeting or any special meeting of the Trustees. Except as indicated, each individual has held the office shown or other offices in the same company for the past five years.
Experience, Skills, Attributes, and Qualifications of the Fund’s Trustees. The Governance and Nominating Committee has adopted a statement of policy that describes the experience, qualifications, attributes, and skills that are necessary and desirable for potential Independent Trustee candidates (Statement of Policy). The Board believes that each Trustee satisfied at the time he or she was initially elected or appointed a Trustee, and continues to satisfy, the standards contemplated by the Statement of Policy. The Governance and Nominating Committee also engages professional search firms to help identify potential Independent Trustee candidates who have the experience, qualifications, attributes, and skills consistent with the Statement of Policy. From time to time, additional criteria based on the composition and skills of the current Independent Trustees, as well as experience or skills that may be appropriate in light of future changes to board composition, business conditions, and regulatory or other developments, have also been considered by the professional search firms and the Governance and Nominating Committee. In addition, the Board takes into account the Trustees’ commitment and participation in Board and committee meetings, as well as their leadership of standing and ad hoc committees throughout their tenure.
In determining that a particular Trustee was and continues to be qualified to serve as a Trustee, the Board has considered a variety of criteria, none of which, in isolation, was controlling. The Board believes that, collectively, the Trustees have balanced and diverse experience, qualifications, attributes, and skills, which allow the Board to operate effectively in governing the fund and protecting the interests of shareholders. Information about the specific experience, skills, attributes, and qualifications of each Trustee, which in each case led to the Board’s conclusion that the Trustee should serve (or continue to serve) as a trustee of the fund, is provided below.
Board Structure and Oversight Function. James C. Curvey is an interested person (as defined in the 1940 Act) and currently serves as Chairman. The Trustees have determined that an interested Chairman is appropriate and benefits shareholders because an interested Chairman has a personal and professional stake in the quality and continuity of services provided to the fund. Independent Trustees exercise their informed business judgment to appoint an individual of their choosing to serve as Chairman, regardless of whether the Trustee happens to be independent or a member of management. The Independent Trustees have determined that they can act independently and effectively without having an Independent Trustee serve as Chairman and that a key structural component for assuring that they are in a position to do so is for the Independent Trustees to constitute a substantial majority for the Board. The Independent Trustees also regularly meet in executive session. Ned C. Lautenbach serves as Chairman of the Independent Trustees and as such (i) acts as a liaison between the Independent Trustees and management with respect to matters important to the Independent Trustees and (ii) with management prepares agendas for Board meetings.
Fidelity funds are overseen by different Boards of Trustees. The fund’s Board oversees Fidelity’s equity and high income funds and another Board oversees Fidelity’s investment-grade bond, money market, and asset allocation funds. The asset allocation funds may invest in Fidelity funds overseen by the fund’s Board. The use of separate Boards, each with its own committee structure, allows the Trustees of each group of Fidelity funds to focus on the unique issues of the funds they oversee, including common research, investment, and operational issues. On occasion, the separate Boards establish joint committees to address issues of overlapping consequences for the Fidelity funds overseen by each Board.
The Trustees operate using a system of committees to facilitate the timely and efficient consideration of all matters of importance to the Trustees, the fund, and fund shareholders and to facilitate compliance with legal and regulatory requirements and oversight of the fund’s activities and associated risks. The Board, acting through its committees, has charged FMR and its affiliates with (i) identifying events or circumstances the occurrence of which could have demonstrably adverse effects on the fund’s business and/or reputation; (ii) implementing processes and controls to lessen the possibility that such events or circumstances occur or to mitigate the effects of such events or circumstances if they do occur; and (iii) creating and maintaining a system designed to evaluate continuously business and market conditions in order to facilitate the identification and implementation processes described in (i) and (ii) above. Because the day-to-day operations and activities of the fund are carried out by or through FMR, its affiliates and other service providers, the fund’s exposure to risks is mitigated but not eliminated by the processes overseen by the Trustees. While each of the Board’s committees has responsibility for overseeing different aspects of the fund’s activities, oversight is exercised primarily through the Operations, Audit, and Compliance Committees. In addition, the Independent Trustees have worked with FMR to enhance the Board’s oversight of investment and financial risks, legal and regulatory risks, technology risks, and operational risks, including the development of additional risk reporting to the Board. For example, a working group comprised of Independent Trustees and FMR has worked and continues to work to
Trustees and Officers – continued
review the Fidelity funds’ valuation-related activities, reporting and risk management. Appropriate personnel, including but not limited to the fund’s Chief Compliance Officer (CCO), FMR’s internal auditor, the independent accountants, the fund’s Treasurer and portfolio management personnel, make periodic reports to the Board’s committees, as appropriate, including an annual review of FMR’s risk management program for the Fidelity funds. The responsibilities of each standing committee, including their oversight responsibilities, are described further under “Standing Committees of the Fund’s Trustees.”
The fund’s Statement of Additional Information (SAI) includes more information about the Trustees. To request a copy, call Fidelity at 1-877-208-0098.
Interested Trustees*:
Correspondence intended for each Trustee who is an interested person may be sent to Fidelity Investments, 245 Summer Street, Boston, Massachusetts 02210.
Name, Year of Birth; Principal Occupations and Other Relevant Experience+
James C. Curvey (1935)
Year of Election or Appointment: 2007
Trustee
Chairman of the Board of Trustees
Mr. Curvey also serves as Trustee of other Fidelity funds. Mr. Curvey is a Director of Fidelity Research & Analysis Co. (2009-present), and Vice Chairman (2007-present) and Director of FMR LLC. In addition, Mr. Curvey serves as an Overseer for the Boston Symphony Orchestra and a member of the board of Artis-Naples, Naples, Florida, and as a Trustee for Brewster Academy, Wolfeboro, New Hampshire. Previously, Mr. Curvey served as a Director of Fidelity Investments Money Management, Inc. (2009-2014), a Director of FMR (2007-2014), and a Director of FMR Co., Inc. (2007-2014).
Charles S. Morrison (1960)
Year of Election or Appointment: 2014
Trustee
Mr. Morrison also serves as Trustee of other funds. He serves as a Director of Fidelity Investments Money Management, Inc. (FIMM) (2014-present), Director of Fidelity SelectCo, LLC (2014-present), President, Asset Management (2014-present), and is an employee of Fidelity Investments. Previously, Mr. Morrison served as Vice President of Fidelity's Fixed Income and Asset Allocation Funds (2012-2014), President, Fixed Income (2011-2014), Vice President of Fidelity's Money Market Funds (2005-2009), President, Money Market Group Leader of FMR (2009), and Senior Vice President, Money Market Group of FMR (2004-2009). Mr. Morrison also served as Vice President of Fidelity's Bond Funds (2002-2005), certain Balanced Funds (2002-2005), and certain Asset Allocation Funds (2002-2007), and as Senior Vice President (2002-2005) of Fidelity's Bond Division.
| * | Trustees have been determined to be “Interested Trustees” by virtue of, among other things, their affiliation with the trust or various entities under common control with FMR. |
| + | The information above includes each Trustee’s principal occupation during the last five years and other information relating to the experience, attributes, and skills relevant to each Trustee’s qualifications to serve as a Trustee, which led to the conclusion that each Trustee should serve as a Trustee for the fund. |
Independent Trustees:
Correspondence intended for each Independent Trustee (that is, the Trustees other than the Interested Trustees) may be sent to Fidelity Investments, P.O. Box 55235, Boston, Massachusetts 02205-5235.
Name, Year of Birth; Principal Occupations and Other Relevant Experience+
Dennis J. Dirks (1948)
Year of Election or Appointment: 2005
Trustee
Mr. Dirks also serves as Trustee of other Fidelity funds. Prior to his retirement in May 2003, Mr. Dirks was Chief Operating Officer and a member of the Board of The Depository Trust & Clearing Corporation (DTCC). He also served as President, Chief Operating Officer, and Board member of The Depository Trust Company (DTC) and President and Board member of the National Securities Clearing Corporation (NSCC). In addition, Mr. Dirks served as Chief Executive Officer and Board member of the Government Securities Clearing Corporation, Chief Executive Officer and Board member of the Mortgage-Backed Securities Clearing Corporation, as a Trustee and a member of the Finance Committee of Manhattan College (2005-2008), and as a Trustee and a member of the Finance Committee of AHRC of Nassau County (2006-2008). Mr. Dirks is a member of the Independent Directors Council (IDC) Governing Council (2010-present) and Board of Directors for The Brookville Center for Children's Services, Inc. (2009-present).
Name, Year of Birth; Principal Occupations and Other Relevant Experience+
Alan J. Lacy (1953)
Year of Election or Appointment: 2008
Trustee
Mr. Lacy also serves as Trustee of other Fidelity funds. Mr. Lacy serves as a member of the Board of Directors of Dave & Buster's Entertainment, Inc. (restaurant and entertainment complexes, 2010-present) and Bristol-Myers Squibb Company (global pharmaceuticals, 2008-present). In addition, Mr. Lacy served as Senior Adviser (2007-2014) of Oak Hill Capital Partners, L.P. (private equity) and also served as Chief Executive Officer (2000-2005) and Vice Chairman (2005-2006) of Sears Holdings Corporation and Sears, Roebuck and Co. (retail). Mr. Lacy is a member of the Board of Trustees of The National Parks Conservation Association (2006-present). Previously, Mr. Lacy served as Chairman of the Board of Trustees of the National Parks Conservation Association (2008-2011) and as a member of the Board of Directors for The Western Union Company (global money transfer, 2006-2011), The Hillman Companies, Inc. (hardware wholesalers, 2010-2014), and Earth Fare, Inc. (retail grocery, 2010-2014).
Ned C. Lautenbach (1944)
Year of Election or Appointment: 2000
Trustee
Chairman of the Independent Trustees
Mr. Lautenbach also serves as Trustee of other Fidelity funds. Mr. Lautenbach currently serves as the Lead Director of the Eaton Corporation Board of Directors (diversified industrial, 1997-present). Mr. Lautenbach is Chairman of the Board of Directors of Artis-Naples in Naples, Florida (2012-present), a member of the Council on Foreign Relations (1994-present), and a member of the Board of Governors, State University System of Florida (2013-present). Previously, Mr. Lautenbach was a Partner/ Advisory Partner at Clayton, Dubilier & Rice, LLC (private equity investment, 1998-2010), as well as a Director of Sony Corporation (2006-2007).
Joseph Mauriello (1944)
Year of Election or Appointment: 2008
Trustee
Mr. Mauriello also serves as Trustee of other Fidelity funds. Prior to his retirement in January 2006, Mr. Mauriello served in numerous senior management positions including Deputy Chairman and Chief Operating Officer (2004-2005), and Vice Chairman of Financial Services (2002-2004) of KPMG LLP US (professional services, 1965-2005). Mr. Mauriello currently serves as a member of the Board of Directors of XL Group plc. (global insurance and re-insurance, 2006-present). Previously, Mr. Mauriello served as a Director of the Hamilton Funds of the Bank of New York (2006-2007) and of Arcadia Resources Inc. (health care services and products, 2007-2012).
Robert W. Selander (1950)
Year of Election or Appointment: 2011
Trustee
Mr. Selander also serves as Trustee of other Fidelity funds. Mr. Selander serves as a Director of The Western Union Company (global money transfer, 2014-present). Previously, Mr. Selander served as a Member of the Advisory Board of other Fidelity funds (2011), and Executive Vice Chairman (2010), Chief Executive Officer (2009-2010), and President and Chief Executive Officer (1997-2009) of Mastercard, Inc.
Cornelia M. Small (1944)
Year of Election or Appointment: 2005
Trustee
Ms. Small also serves as Trustee of other Fidelity funds. Ms. Small is a member of the Board of Directors (2009-present) and Chair of the Investment Committee (2010-present) of the Teagle Foundation. Ms. Small also serves on the Investment Committee of the Berkshire Taconic Community Foundation (2008-present). Previously, Ms. Small served as Chairperson (2002-2008) and a member of the Investment Committee and Chairperson (2008-2012) and a member of the Board of Trustees of Smith College. In addition, Ms. Small served as Chief Investment Officer, Director of Global Equity Investments, and a member of the Board of Directors of Scudder, Stevens & Clark and Scudder Kemper Investments.
Trustees and Officers – continued
Name, Year of Birth; Principal Occupations and Other Relevant Experience+
William S. Stavropoulos (1939)
Year of Election or Appointment: 2001
Trustee
Vice Chairman of the Independent Trustees
Mr. Stavropoulos also serves as Trustee of other Fidelity funds. Mr. Stavropoulos serves as President and Founder of the Michigan Baseball Foundation, the Great Lakes Loons (2007-present). Mr. Stavropoulos is Chairman Emeritus of the Board of Directors of The Dow Chemical Company, where he previously served in numerous senior management positions, including President, CEO (1995-2000; 2002-2004), Chairman of the Executive Committee (2000-2006), and as a member of the Board of Directors (1990-2006). Currently, Mr. Stavropoulos is Chairman of the Board of Directors of Univar Inc. (global distributor of commodity and specialty chemicals), a Director of Teradata Corporation (data warehousing and technology solutions), and Maersk Inc. (industrial conglomerate), and a member of the Advisory Board for Metalmark Capital LLC (private equity investment, 2005-present). Mr. Stavropoulos is an operating advisor to Clayton, Dubilier & Rice, LLC (private equity investment). In addition, Mr. Stavropoulos is a member of the University of Notre Dame Advisory Council for the College of Science, a Trustee of the Rollin L. Gerstacker Foundation, and a Director of the Naples Philharmonic Center for the Arts. Previously, Mr. Stavropoulos served as a Director of Chemical Financial Corporation (bank holding company, 1993-2012) and Tyco International, Ltd. (multinational manufacturing and services,
2007-2012).
David M. Thomas (1949)
Year of Election or Appointment: 2008
Trustee
Mr. Thomas also serves as Trustee of other Fidelity funds. Mr. Thomas serves as Non-Executive Chairman of the Board of Directors of Fortune Brands Home and Security (home and security products, 2011 -present), as a member of the Board of Directors (2004-present) and Presiding Director (2013-present) of Interpublic Group of Companies, Inc. (marketing communication), and as a member of the Board of Trustees of the University of Florida (2013-present). Previously, Mr. Thomas served as Executive Chairman (2005-2006) and Chairman and Chief Executive Officer (2000-2005) of IMS Health, Inc. (pharmaceutical and healthcare information solutions), and a Director of Fortune Brands, Inc. (consumer products, 2000-2011).
| + | The information above includes each Trustee’s principal occupation during the last five years and other information relating to the experience, attributes, and skills relevant to each Trustee’s qualifications to serve as a Trustee, which led to the conclusion that each Trustee should serve as a Trustee for the fund. |
Advisory Board Member and Officers:
Correspondence intended for each officer and Peter S. Lynch may be sent to Fidelity Investments, 245 Summer Street, Boston, Massachusetts 02210. Officers appear below in alphabetical order.
Name, Year of Birth; Principal Occupation
Peter S. Lynch (1944)
Year of Election or Appointment: 2003
Member of the Advisory Board
Mr. Lynch also serves as Member of the Advisory Board of other Fidelity funds. Mr. Lynch is Vice Chairman and a Director of FMR and FMR Co., Inc. In addition, Mr. Lynch serves as a Trustee of Boston College and as the Chairman of the Inner-City Scholarship Fund. Previously, Mr. Lynch served on the Special Olympics International Board of Directors (1997-2006).
Elizabeth Paige Baumann (1968)
Year of Election or Appointment: 2012
Anti-Money Laundering (AML) Officer
Ms. Baumann also serves as AML Officer of other funds. She is Chief AML Officer of FMR LLC (2012-present) and is an employee of Fidelity Investments. Previously, Ms. Baumann served as Vice President and Deputy Anti-Money Laundering Officer (2007-2012).
William C. Coffey (1969)
Year of Election or Appointment: 2009
Assistant Secretary
Mr. Coffey also serves as Assistant Secretary of other funds. He is Senior Vice President and Deputy General Counsel of FMR LLC (2010-present), and is an employee of Fidelity Investments. Previously, Mr. Coffey served as Vice President and Associate General Counsel of FMR LLC (2005-2009).
Name, year of Birth; Principal Occupation
Jonathan Davis (1968)
Year of Election or Appointment: 2010
Assistant Treasurer
Mr. Davis also serves as Assistant Treasurer of other funds. Mr. Davis is an employee of Fidelity Investments. Previously, Mr. Davis served as Vice President and Associate General Counsel of FMR LLC (2003-2010).
Adrien E. Deberghes (1967)
Year of Election or Appointment: 2008
Deputy Treasurer
Mr. Deberghes also serves as an officer of other funds. He is an employee of Fidelity Investments (2008-present). Prior to joining Fidelity Investments, Mr. Deberghes was Senior Vice President of Mutual Fund Administration at State Street Corporation (2007-2008), Senior Director of Mutual Fund Administration at Investors Bank & Trust (2005-2007), and Director of Finance for Dunkin' Brands (2000-2005).
Stephanie J. Dorsey (1969)
Year of Election or Appointment: 2010
Assistant Treasurer
Ms. Dorsey also serves as an officer of other funds. She is an employee of Fidelity Investments (2008-present) and has served in other fund officer roles. Prior to joining Fidelity Investments, Ms. Dorsey served as Treasurer (2004-2008) of the JPMorgan Mutual Funds and Vice President (2004-2008) of JPMorgan Chase Bank.
Howard J. Galligan III (1966)
Year of Election or Appointment: 2014
Chief Financial Officer
Mr. Galligan also serves as Chief Financial Officer of other funds. Mr. Galligan serves as President of Fidelity Pricing and Cash Management Services (FPCMS) (2014-present) and as a Director of Strategic Advisers, Inc. (2008-present). Previously, Mr. Galligan served as Chief Administrative Officer of Asset Management (2011-2014) and Chief Operating Officer and Senior Vice President of Investment Support for Strategic Advisers, Inc. (2003-2011).
Scott C. Goebel (1968)
Year of Election or Appointment: 2008
Secretary and Chief Legal Officer (CLO)
Mr. Goebel serves as Secretary and CLO of other funds. Mr. Goebel also serves as Secretary of Fidelity SelectCo, LLC (2013-present), Fidelity Investments Money Management, Inc. (FIMM) (2010-present) and Fidelity Research and Analysis Company (FRAC) (2010-present); General Counsel, Secretary, and Senior Vice President of FMR (2008-present) and FMR Co., Inc. (2008-present); Chief Legal Officer of Fidelity Management & Research (Hong Kong) Limited (2008-resent); and Assistant Secretary of Fidelity Management & Research (Japan) Limited (2008-present) and Fidelity Management & Research (U.K.) Inc. (2008-present). Previously, Mr. Goebel served as Secretary and CLO of other Fidelity funds (2008-2013), Assistant Secretary of FIMM (2008-2010), FRAC (2008-2010), and certain funds (2007-2008); and as Vice President and Secretary of Fidelity Distributors Corporation (FDC) (2005-2007). Mr. Goebel has been employed by FMR LLC or an affiliate since 2001.
Brian B. Hogan (1964)
Year of Election or Appointment: 2009
Vice President
Mr. Hogan also serves as Trustee or Vice President of other funds. Mr. Hogan serves as a Director of Fidelity SelectCo, LLC (2014-present) and President of FMR's Equity Division (2009-present). Previously, Mr. Hogan served as Senior Vice President, Equity Research of FMR (2006-2009) and as a portfolio manager.
Chris Maher (1972)
Year of Election or Appointment: 2013
Assistant Treasurer
Mr. Maher serves as Assistant Treasurer of other funds. Mr. Maher is Vice President of Valuation Oversight and is an employee of Fidelity Investments. Previously, Mr. Maher served as Vice President of Asset Management Compliance (2013), Vice President of FMR's Program Management Group (2010-2013), and Vice President of Valuation Oversight (2008-2010).
Melissa M. Reilly (1971)
Year of Election or Appointment: 2014
Vice President of certain Equity Funds
Ms. Reilly also serves as Vice President of other funds. Ms. Reilly is an employee of Fidelity Investments (2004-present).
Trustees and Officers – continued
Name, Year of Birth; Principal Occupation
Kenneth B. Robins (1969)
Year of Election or Appointment: 2008
President and Treasurer
Mr. Robins also serves as an officer of other funds. Mr. Robins serves as Executive Vice President of Fidelity Investments Money Management, Inc. (FIMM) (2013-present) and is an employee of Fidelity Investments (2004-present). Previously, Mr. Robins served in other fund officer roles.
Stephen Sadoski (1971)
Year of Election or Appointment: 2012
Deputy Treasurer
Mr. Sadoski also serves as Deputy Treasurer of other funds. He is an employee of Fidelity Investments (2012-present) and has served in another fund officer role. Prior to joining Fidelity Investments, Mr. Sadoski served as an assistant chief accountant in the Division of Investment Management of the Securities and Exchange Commission (SEC) (2009-2012) and as a senior manager at Deloitte & Touche LLP (1997-2009).
Stacie M. Smith (1974)
Year of Election or Appointment: 2013
Deputy Treasurer
Ms. Smith also serves as an officer of other funds. She is an employee of Fidelity Investments (2009-present) and has served in other fund officer roles. Prior to joining Fidelity Investments, Ms. Smith served as Senior Audit Manager of Ernst & Young LLP (1996-2009).
Renee Stagnone (1975)
Year of Election or Appointment: 2013
Deputy Treasurer
Ms. Stagnone also serves as Deputy Treasurer of other funds. Ms. Stagnone is an employee of Fidelity Investments.
Linda J. Wondrack (1964)
Year of Election or Appointment: 2014
Chief Compliance Officer
Ms. Wondrack also serves as Chief Compliance Officer of other funds. Ms. Wondrack is Executive Vice President and head of the Ethics Office and Asset Management Compliance for Fidelity Investments (2012-present). Ms. Wondrack also serves as Chief Compliance Officer of Fidelity SelectCo, LLC (2014-present); Chief Compliance Officer of Impresa Management LLC (2013- present); and Chief Compliance Officer of FMR Co., Inc., Fidelity Investments Money Management, Inc., Fidelity Management & Research (Japan) Limited, Fidelity Management & Research (U.K.) Inc., Fidelity Management & Research (Hong Kong), Fidelity Management & Research Company, Pyramis Global Advisors, LLC, and Strategic Advisers, Inc., Ballyrock Investment Advisors LLC, and Northern Neck Investors LLC (2012-present). Previously, Ms. Wondrack served as Senior Vice President and Chief Compliance Officer for Columbia Management Investment Advisers, LLC (2005-2012); Chief Compliance Officer for certain funds within the Columbia Family of Funds (2007-2012); and Senior Vice President of Compliance Risk Management at Bank of America (2005-2010).
Joseph F. Zambello (1957)
Year of Election or Appointment: 2011
Deputy Treasurer
Mr. Zambello also serves as Deputy Treasurer of other funds. Mr. Zambello is an employee of Fidelity Investments. Previously, Mr. Zambello served as Vice President of FMR's Program Management Group (2009-2011) and Vice President of the Transfer Agent Oversight Group (2005-2009).
Distributions (Unaudited)
The Board of Trustees of VIP Equity-Income Portfolio voted to pay to shareholders of record at the opening of business on record date, the following distributions per share derived from capital gains realized from sales of portfolio securities, and dividends derived from net investment income:
| | | Pay Date | | Record Date | | Dividends | | | Capital Gains | |
| Initial Class | | 02/06/2015 | | 02/06/2015 | | | $0.020 | | | | $2.053 | |
| Service Class | | 02/06/2015 | | 02/06/2015 | | | $0.019 | | | | $2.053 | |
| Service Class 2 | | 02/06/2015 | | 02/06/2015 | | | $0.018 | | | | $2.053 | |
| Investor Class | | 02/06/2015 | | 02/06/2015 | | | $0.019 | | | | $2.053 | |
The fund hereby designates as a capital gain dividend with respect to the taxable year ended December 31, 2014 $525,758,231, or, if subsequently determined to be different, the net capital gain of such year.
Initial Class designates 10% and 57%; Service Class designates 10% and 58%; Service Class 2 designates 10% and 61%; and Investor Class designates 10% and 58% of the dividends distributed in February and December 2014 respectively, during the fiscal year as qualifying for the dividends-received deduction for corporate shareholders.
Board Approval of Investment Advisory Contracts and Management Fees
VIP Equity-Income Portfolio
Each year, the Board of Trustees, including the Independent Trustees (together, the Board), votes on the renewal of the management contract with Fidelity Management & Research Company (FMR) and the sub-advisory agreements (together, the Advisory Contracts) for the fund. The Board, assisted by the advice of fund counsel and Independent Trustees’ counsel, requests and considers a broad range of information relevant to the renewal of the Advisory Contracts throughout the year.
The Board meets regularly and, at each of its meetings, covers an extensive agenda of topics and materials and considers factors that are relevant to its annual consideration of the renewal of the fund’s Advisory Contracts, including the services and support provided to the fund and its shareholders. The Board has established various standing committees (Committees), each composed of and chaired by Independent Trustees with varying backgrounds, to which the Board has assigned specific subject matter responsibilities in order to enhance effective decision-making by the Board. The Board, acting directly and through its Committees, requests and receives information concerning the annual consideration of the renewal of the fund’s Advisory Contracts. The Board also meets as needed to consider matters specifically related to the Board’s annual consideration of the renewal of the Advisory Contracts. Members of the Board may also meet with trustees of other Fidelity funds through ad hoc joint committees to discuss certain matters relevant to the Fidelity funds.
At its July 2014 meeting, the Board, including the Independent Trustees, unanimously determined to renew the fund’s Advisory Contracts. In reaching its determination, the Board considered all factors it believed relevant, including (i) the nature, extent, and quality of the services to be provided to the fund and its shareholders (including the investment performance of the fund); (ii) the competitiveness of the fund’s management fee and total expense ratio relative to peer funds; (iii) the total costs of the services to be provided by and the profits to be realized by Fidelity from its relationship with the fund; (iv) the extent to which economies of scale exist and would be realized as the fund grows; and (v) whether fee levels reflect these economies of scale, if any, for the benefit of fund shareholders. In connection with separate internal corporate reorganizations involving Fidelity Management & Research (U.K.) Inc. (FMR U.K.) and Fidelity Management & Research (Japan) Inc. (FMR Japan), the Board approved certain non-material amendments to the fund’s sub-advisory agreements with FMR U.K. and FMR Japan to reflect that, after these reorganizations, FMR Investment Management (UK) Limited and Fidelity Management & Research (Japan) Limited will carry on the business of FMR U.K. and FMR Japan, respectively. The Board noted that no changes to the portfolio managers or to the foreign research or investment advisory services provided to the fund were expected in connection with either reorganization and that the same personnel and resources would continue to be available to the fund at the new entities.
In considering whether to renew the Advisory Contracts for the fund, the Board reached a determination, with the assistance of fund counsel and Independent Trustees’ counsel and through the exercise of its business judgment, that the renewal of the Advisory Contracts was in the best interests of the fund and its shareholders and that the compensation payable under the Advisory Contracts was fair and reasonable. The Board’s decision to renew the Advisory Contracts was not based on any single factor, but rather was based on a comprehensive consideration of all the information provided to the Board at its meetings throughout the year. The Board, in reaching its determination to renew the Advisory Contracts, was aware that shareholders of the fund have a broad range of investment choices available to them, including a wide choice among funds offered by Fidelity’s competitors, and that the fund’s shareholders, who have the opportunity to review and weigh the disclosure provided by the fund in its prospectus and other public disclosures, have chosen to invest in this fund, which is part of the Fidelity family of funds.
Nature, Extent, and Quality of Services Provided. The Board considered Fidelity’s staffing as it relates to the fund, including the backgrounds of investment personnel of FMR and the sub-advisers (together, the Investment Advisers), and also considered the fund’s investment objective, strategies, and related investment philosophy. The Independent Trustees also had discussions with senior management of Fidelity’s investment operations and investment groups. The Board considered the structure of the portfolio manager compensation program and whether this structure provides appropriate incentives to act in the best interests of the fund. Additionally, the Board considered the portfolio managers’ investments, if any, in the funds that they manage.
Resources Dedicated to Investment Management and Support Services. The Board and the Fund Oversight and Research Committees reviewed the general qualifications and capabilities of Fidelity’s investment staff, including its size, education, experience, and resources, as well as Fidelity’s approach to recruiting, training, managing, and compensating investment personnel. The Board noted that Fidelity has continued to increase the resources devoted to non-U.S. offices, including expansion of Fidelity’s global investment organization. The Board also noted that Fidelity’s analysts have extensive resources, tools and capabilities that allow them to conduct sophisticated quantitative and fundamental analysis, as well as credit analysis of issuers, counterparties and guarantors. Further, the Board believes that Fidelity’s investment professionals have sufficient access to global information and data so as to provide competitive investment results over time, and that those professionals also have access to sophisticated tools that permit them to assess portfolio construction and risk and performance attribution characteristics continuously, as well as to transmit new information and research conclusions rapidly around the world. Additionally, in its deliberations, the Board considered Fidelity’s trading and risk management capabilities and resources and global compliance infrastructure, which are an integral part of the investment management process.
Shareholder and Administrative Services. The Board considered (i) the nature, extent, quality, and cost of advisory, administrative, and shareholder services performed by the Investment Advisers and their affiliates under the Advisory Contracts and under separate agreements covering transfer
agency, pricing and bookkeeping, and securities lending services for the fund; (ii) the nature and extent of the supervision of third party service providers, principally custodians and subcustodians; and (iii) the resources devoted to, and the record of compliance with, the fund’s compliance policies and procedures. The Board also reviewed the allocation of fund brokerage, including allocations to brokers affiliated with the Investment Advisers, the use of brokerage commissions to pay fund expenses, and the use of “soft” commission dollars to pay for research services.
The Board noted that the growth of fund assets over time across the complex allows Fidelity to reinvest in the development of services designed to enhance the value or convenience of the Fidelity funds as investment vehicles. These services include 24-hour access to account information and market information through telephone representatives and over the Internet, investor education materials and asset allocation tools, and the expanded availability of Fidelity Investor Centers.
In 2014, the Board formed an ad hoc Committee on Transfer Agency Fees to review the variety of transfer agency fee structures throughout the industry and Fidelity’s competitive positioning with respect to industry participants.
Investment in a Large Fund Family. The Board considered the benefits to shareholders of investing in a Fidelity fund, including the benefits of investing in a fund that is part of a large family of funds offering a variety of investment disciplines and providing a large variety of mutual fund investor services. The Board noted that Fidelity had taken, or had made recommendations that resulted in the Fidelity funds taking, a number of actions over the previous year that benefited particular funds, including (i) continuing to dedicate additional resources to investment research and to the support of the senior management team that oversees asset management; (ii) persisting in efforts to enhance Fidelity’s global research capabilities; (iii) launching new funds and making other enhancements to meet client needs for income-oriented solutions; (iv) reducing fund expenses for certain index funds; (v) continuing to launch dedicated lower cost underlying funds to meet portfolio construction needs related to expanding underlying fund options for Fidelity funds of funds, specifically for the Freedom Fund product lines; (vi) rationalizing product lines and gaining increased efficiencies through fund mergers; (vii) launching sector-based exchange-traded funds and establishing a new Fidelity adviser to manage sector-based funds and products; (viii) continuing to develop and implement technology to improve security and increase efficiency; (ix) modifying the eligibility criteria for certain share classes to increase their marketability to a portion of the defined contribution plan market; (x) waiving redemption fees for certain qualified fund-of-fund and wrap programs and certain retirement plan transactions; and (xi) launching new Institutional Class shares of certain money market funds to attract and retain assets and to fill a gap in the money market fund lineup.
Investment Performance. The Board considered whether the fund has operated in accordance with its investment objective, as well as its record of compliance with its investment restrictions and its performance history.
The Board took into account discussions with the Investment Advisers about fund investment performance that occur at Board meetings throughout the year. In this regard the Board noted that as part of regularly scheduled fund reviews and other reports to the Board on fund performance, the Board periodically considers annualized return information for the fund, for different time periods, measured against a securities market index (“benchmark index”) and a peer group of funds with similar objectives (“peer group”). In its evaluation of fund investment performance, the Board gave particular attention to information indicating changes in performance of certain Fidelity funds for specific time periods and the Investment Advisers’ explanations for any overperformance or underperformance.
In addition to reviewing absolute and relative fund performance, the Independent Trustees periodically consider the appropriateness of fund performance metrics in evaluating the results achieved. In general, the Independent Trustees believe that fund performance should be evaluated based on net performance (after fees and expenses) of both the highest performing and lowest performing classes, where applicable, compared to appropriate benchmark indices, over appropriate time periods which may include full market cycles, and compared to peer groups, as applicable, over the same periods, taking into account relevant factors including the following: general market conditions; issuer-specific information; tactical opportunities for investment; and fund cash flows and other factors.
The Independent Trustees recognize that shareholders evaluate performance on a net basis over their own holding periods, for which one-, three-, and five-year periods are often used as a proxy. For this reason, the performance information reviewed by the Board also included net cumulative calendar year total return information for the fund and an appropriate benchmark index and peer group for the most recent one-, three-, and five-year periods, as shown below. Returns are shown compared to the 25th percentile (top of box, 75% beaten) and 75th percentile (bottom of box, 25% beaten) of the peer universe.
Board Approval of Investment Advisory Contracts and Management Fees – continued
VIP Equity-Income Portfolio
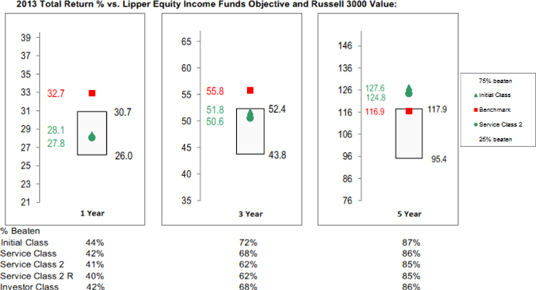
Based on its review, the Board concluded that the nature, extent, and quality of services provided to the fund under the Advisory Contracts should benefit the fund’s shareholders.
Competitiveness of Management Fee and Total Expense Ratio. The Board considered the fund’s management fee and total expense ratio compared to “mapped groups” of competitive funds and classes. Fidelity creates “mapped groups” by combining similar Lipper investment objective categories that have comparable investment mandates. Combining Lipper investment objective categories aids the Board’s management fee and total expense ratio comparisons by broadening the competitive group used for comparison and by reducing the number of universes to which various Fidelity funds are compared.
Management Fee. The Board considered two proprietary management fee comparisons for the 12-month periods shown in the chart below. The group of Lipper funds used by the Board for management fee comparisons is referred to below as the “Total Mapped Group.” The Total Mapped Group is broader than the Lipper peer group used by the Board for performance comparisons because the Total Mapped Group combines several Lipper investment objective categories while the Lipper peer group does not. The Total Mapped Group comparison focuses on a fund’s standing in terms of gross management fees before expense reimbursements or caps relative to the total universe of funds with comparable investment mandates, regardless of whether their management fee structures also are comparable. Funds with comparable investment mandates offer exposure to similar types of securities. Funds with comparable management fee structures have similar management fee contractual arrangements (e.g., flat rate charged for advisory services, all-inclusive fee rate, etc.). “TMG %” represents the percentage of funds in the Total Mapped Group that had management fees that were lower than the fund’s. For example, a hypothetical TMG % of 20% would mean that 80% of the funds in the Total Mapped Group had higher, and 20% had lower, management fees than the fund. The fund’s actual TMG %s are in the chart below. The “Asset-Size Peer Group” (ASPG) comparison focuses on a fund’s standing relative to a subset of non-Fidelity funds within the Total Mapped Group that are similar in size and management fee structure. For example, if a fund is in the first quartile of the ASPG, the fund’s management fee ranks in the least expensive or lowest 25% of funds in the ASPG. The ASPG represents at least 15% of the funds in the Total Mapped Group with comparable asset size and management fee structures, subject to a minimum of 50 funds (or all funds in the Total Mapped Group if fewer than 50). Additional information, such as the ASPG quartile in which the fund’s management fee rate ranked, is also included in the chart and considered by the Board.
VIP Equity-Income Portfolio

The Board noted that the fund’s management fee rate ranked below the median of its Total Mapped Group and below the median of its ASPG for 2013.
The Board also noted that, in August 2013, the ad hoc Committee on Management Fees was formed to conduct an in-depth review of the management fee rates of Fidelity’s active equity mutual funds. The Committee focused on the following areas: (i) standard fee structures; (ii) research consumption and trading evolution; (iii) management fee competitiveness/profitability by category; and (iv) factors that drive institutional pricing.
Based on its review, the Board concluded that the fund’s management fee is fair and reasonable in light of the services that the fund receives and the other factors considered.
Total Expense Ratio. In its review of each class’s total expense ratio, the Board considered the fund’s management fee as well as other fund or class expenses, as applicable, such as transfer agent fees, pricing and bookkeeping fees, fund-paid 12b-1 fees, and custodial, legal, and audit fees. The Board also noted the effects of any waivers and reimbursements on fees and expenses. As part of its review, the Board also considered the current and historical total expense ratios of each class of the fund compared to competitive fund median expenses. Each class of the fund is compared to those funds and classes in the Total Mapped Group (used by the Board for management fee comparisons) that have a similar sales load structure.
The Board noted that the total expense ratio of each class ranked below its competitive median for 2013.
Fees Charged to Other Fidelity Clients. The Board also considered Fidelity fee structures and other information with respect to clients of Fidelity, such as other funds advised or subadvised by Fidelity, pension plan clients, and other institutional clients. The Board noted the findings of the 2013 ad hoc joint committee (created with the board of other Fidelity funds), which reviewed and compared Fidelity’s institutional investment advisory business with its business of providing services to the Fidelity funds, including the differences in services provided, fees charged, and costs incurred, as well as competition in their respective marketplaces.
Based on its review of total expense ratios and fees charged to other Fidelity clients, the Board concluded that the total expense ratio of each class of the fund was reasonable in light of the services that the fund and its shareholders receive and the other factors considered.
Costs of the Services and Profitability. The Board considered the revenues earned and the expenses incurred by Fidelity in conducting the business of developing, marketing, distributing, managing, administering and servicing the fund and servicing the fund’s shareholders. The Board also considered the level of Fidelity’s profits in respect of all the Fidelity funds.
On an annual basis, Fidelity presents to the Board Fidelity’s profitability for the fund. Fidelity calculates the profitability for each fund, as well as aggregate profitability for groups of Fidelity funds and all Fidelity funds, using a series of detailed revenue and cost allocation methodologies which originate with the books and records of Fidelity on which Fidelity’s audited financial statements are based. The Audit Committee of the Board reviews any significant changes from the prior year’s methodologies.
PricewaterhouseCoopers LLP (PwC), independent registered public accounting firm and auditor to Fidelity and certain Fidelity funds, has been engaged annually by the Board as part of the Board’s assessment of Fidelity’s profitability analysis. PwC’s engagement includes the review and assessment of the methodologies used by Fidelity in determining the revenues and expenses attributable to Fidelity’s mutual fund business, and completion of agreed-upon procedures in respect of the mathematical accuracy of fund profitability and its conformity to established allocation methodologies.
Board Approval of Investment Advisory Contracts and Management Fees – continued
After considering PwC’s reports issued under the engagement and information provided by Fidelity, the Board concluded that while other allocation methods may also be reasonable, Fidelity’s profitability methodologies are reasonable in all material respects.
The Board also reviewed Fidelity’s non-fund businesses and fall-out benefits related to the mutual fund business as well as cases where Fidelity’s affiliates may benefit from or be related to the fund’s business.
The Board considered the costs of the services provided by and the profits realized by Fidelity in connection with the operation of the fund and was satisfied that the profitability was not excessive in the circumstances.
Economies of Scale. The Board considered whether there have been economies of scale in respect of the management of the Fidelity funds, whether the Fidelity funds (including the fund) have appropriately benefited from any such economies of scale, and whether there is potential for realization of any further economies of scale. The Board considered the extent to which the fund will benefit from economies of scale through increased services to the fund, through waivers or reimbursements, or through fee or expense ratio reductions. The Board also noted that in 2013, it and the boards of other Fidelity funds created an ad hoc committee (the Economies of Scale Committee) to analyze whether Fidelity attains economies of scale in respect of the management and servicing of the Fidelity funds, whether the Fidelity funds have appropriately benefited from such economies of scale, and whether there is potential for realization of any further economies of scale.
The Board recognized that the fund’s management contract incorporates a “group fee” structure, which provides for lower group fee rates as total group assets increase, and for higher group fee rates as total group assets decrease (with “group assets” defined to include fund assets under FMR’s management plus sector fund assets previously under FMR’s management and currently managed by Fidelity SelectCo, LLC). FMR calculates the group fee rates based on a tiered asset “breakpoint” schedule that varies based on asset class. The Board considered that the group fee is designed to deliver the benefits of economies of scale to fund shareholders when total Fidelity fund assets increase, even if assets of any particular fund are unchanged or have declined, because some portion of Fidelity’s costs are attributable to services provided to all Fidelity funds, and all funds benefit if those costs can be allocated among more assets. The Board concluded that, given the group fee structure, fund shareholders will benefit from lower management fees as group assets increase at the fund complex level, regardless of whether Fidelity achieves any such economies of scale.
The Board concluded, taking into account the analysis of the Economies of Scale Committee, that economies of scale, if any, are being appropriately shared between fund shareholders and Fidelity.
Additional Information Requested by the Board. In order to develop fully the factual basis for consideration of the Fidelity funds’ Advisory Contracts, the Board requested and received additional information on certain topics, including: (i) fund performance trends and Fidelity’s long-term strategies for certain funds; (ii) Fidelity’s strategic marketing and product lineup goals; (iii) the methodology with respect to competitive fund data and peer group classifications; (iv) the arrangements with, and performance of, certain sub-advisers on behalf of the Fidelity funds, as well as certain proposed participating affiliate arrangements; (v) the realization of fall-out benefits in certain Fidelity business units; (vi) Fidelity’s group fee structures, including the rationale for the individual fee rates of certain categories of funds and the definition of group assets; (vii) trends regarding industry use of performance fee structures and the performance adjustment methodologies applicable to the Fidelity funds; (viii) additional competitive analysis regarding the total expenses for certain classes; (ix) fund profitability methodology, including Fidelity’s cost allocation methodology, and the impact of certain factors on fund profitability results; and (x) the process by which Fidelity determines sub-advisory fees for funds it advises.
Based on its evaluation of all of the conclusions noted above, and after considering all factors it believed relevant, the Board ultimately concluded that the advisory fee structures are fair and reasonable, and that the fund’s Advisory Contracts should be renewed.
Investment Adviser
Fidelity Management & Research Company
Boston, MA
Investment Sub-Advisers
FMR Co., Inc.
Fidelity Management & Research (U.K.) Inc.
Fidelity Management & Research (Hong Kong) Limited
Fidelity Management & Research (Japan) Limited
General Distributor
Fidelity Distributors Corporation
Smithfield, RI
Transfer and Service Agents
Fidelity Investments Institutional Operations Company, Inc.
Boston, MA
Fidelity Service Company, Inc.
Boston, MA
Custodian
The Northern Trust Company
Chicago, IL
Fidelity® Variable Insurance Products:
Mid Cap Portfolio
Annual Report December 31, 2014 | |
Contents
How the fund has done over time.
The Portfolio Manager’s review of fund performance and strategy.
An example of shareholder expenses.
A summary of major shifts in the fund’s investments over the past six months.
A complete list of the fund’s investments with their market values.
Statements of assets and liabilities, operations, and changes in net assets, as well as financial highlights.
Notes to the financial statements.
To view a fund’s proxy voting guidelines and proxy voting record for the 12-month period ended June 30, visit http://www.fidelity.com/proxyvotingresults or visit the Securities and Exchange Commission’s (SEC) web site at http://www.sec.gov. You may also call 1-877-208-0098 to request a free copy of the proxy voting guidelines.
Fidelity Variable Insurance Products are separate account options which are purchased through a variable insurance contract.
Standard & Poor’s, S&P and S&P 500 are registered service marks of The McGraw-Hill Companies, Inc. and have been licensed for use by Fidelity Distributors Corporation.
Other third-party marks appearing herein are the property of their respective owners.
All other marks appearing herein are registered or unregistered trademarks or service marks of FMR LLC or an affiliated company. © 2015 FMR LLC. All rights reserved.
This report and the financial statements contained herein are submitted for the general information of the shareholders of the fund. This report is not authorized for distribution to prospective investors in the fund unless preceded or accompanied by an effective prospectus.
A fund files its complete schedule of portfolio holdings with the SEC for the first and third quarters of each fiscal year on Form N-Q. Forms N-Q are available on the SEC’s web site at http://www.sec.gov. A fund’s Forms N-Q may be reviewed and copied at the SEC’s Public Reference Room in Washington, DC. Information regarding the operation of the SEC’s Public Reference Room may be obtained by calling 1-800-SEC-0330. For a complete list of a fund’s portfolio holdings, view the most recent holdings listing, semiannual report, or annual report on Fidelity’s web site at http://www.fidelity.com, http://www.advisor.fidelity.com, or http://www.401k.com, as applicable.
NOT FDIC INSURED • MAY LOSE VALUE • NO BANK GUARANTEE
Neither the fund nor Fidelity Distributors Corporation is a bank.
Performance: The Bottom Line
Average annual total return reflects the change in the value of an investment, assuming reinvestment of the class’ distributions from dividend income and capital gains (the profits earned upon the sale of securities that have grown in value, if any) and assuming a constant rate of performance each year. During periods of reimbursement by Fidelity, a fund’s total return will be greater than it would be had the reimbursement not occurred. Performance numbers are net of all underlying fund operating expenses, but do not include any insurance charges imposed by your insurance company’s separate account. If performance information included the effect of these additional charges, the total returns would have been lower. How a fund did yesterday is no guarantee of how it will do tomorrow.
| Average Annual Total Returns |
| Periods ended December 31, 2014 | | Past 1 | | Past 5 | | Past 10 |
| | | year | | years | | years |
| VIP Mid Cap Portfolio – Initial Class | | 6.29% | | 13.87% | | 9.61% |
| VIP Mid Cap Portfolio – Service Class | | 6.20% | | 13.77% | | 9.51% |
| VIP Mid Cap Portfolio – Service Class 2 | | 6.03% | | 13.60% | | 9.34% |
| VIP Mid Cap Portfolio – Investor ClassA | | 6.20% | | 13.78% | | 9.51% |
A The initial offering of Investor Class shares took place on July 21, 2005. Returns prior to July 21, 2005, are those of Initial Class. Had Investor Class’s transfer agent fee been reflected, returns prior to July 21, 2005, would have been lower.
Let’s say hypothetically that $10,000 was invested in VIP Mid Cap Portfolio - Initial Class on December 31, 2004. The chart shows how the value of your investment would have changed, and also shows how the S&P MidCap 400® Index performed over the same period.

Management's Discussion of Fund Performance
Market Recap: Global stocks and bonds posted gains for 2014 despite tepid returns outside the United States, amid recessionary pressure in parts of Asia, as well as anemic economic growth in Europe. The U.S. stock market closed near an all-time high for the 12 months ending December 31, 2014, supported by low interest rates and strong corporate profits. The large-cap S&P 500® Index returned 13.69%, achieving a double-digit return for the third consecutive year. The Barclays® U.S. Aggregate Bond Index, meanwhile, rose 5.97%, significantly outperforming the global taxable investment-grade bond market. Investment-grade credit did particularly well, returning 7.53%, supported by solid corporate fundamentals and a low default rate. The MSCI EAFE Index, a measure of non-U.S. developed stock markets, returned -4.77% for the year, hampered by late-period deflationary concerns in the eurozone. Meanwhile, The Barclays® Global Aggregate GDP Weighted Index, a measure of worldwide investment-grade bond performance, gained 0.77% in U.S. dollar terms. Turning to emerging-market stocks, The MSCI Emerging Markets Index returned -1.82% for the year, held back by continued concerns that a slowing Chinese economy may dampen earnings for companies that do business there.
Comments from Thomas Allen, Portfolio Manager of VIP Mid Cap Portfolio: For the year, the fund’s share classes trailed the 9.77% gain of the S&P MidCap 400® Index. (For specific portfolio results, please refer to the performance section of this report.) Versus the index, underweighting defensive, yield-sensitive segments of the market such as real estate investment trusts (REITs) and utilities detracted, as did stock selection in the financials, materials and consumer discretionary sectors. Two of the biggest relative detractors were energy stocks Halliburton and Whiting Petroleum. Halliburton, which I bought in June, and Whiting—which I sold — lost ground as oil prices continued their unrelenting sell-off. Performance also suffered due to a stake in Constellium, a Dutch aluminum producer, as well as my decision to sell strong-performing chipmaker Skyworks Solutions. Conversely, stock picking in information technology was a noteworthy positive, led by video-game maker Electronic Arts, the fund’s largest relative contributor. Netherlands-based NXP Semiconductors also bolstered performance, as did two air carriers: Spirit Airlines and Southwest Airlines. None of the stocks I’ve mentioned in this report were part of the index, except for Skyworks Solutions.
The views expressed above reflect those of the portfolio manager(s) only through the end of the period as stated on the cover of this report and do not necessarily represent the views of Fidelity or any other person in the Fidelity organization. Any such views are subject to change at any time based upon market or other conditions and Fidelity disclaims any responsibility to update such views. These views may not be relied on as investment advice and, because investment decisions for a Fidelity fund are based on numerous factors, may not be relied on as an indication of trading intent on behalf of any Fidelity fund.
Shareholder Expense Example
As a shareholder of the Fund, you incur two types of costs: (1) transaction costs and (2) ongoing costs, including management fees, distribution and/or service (12b-1) fees and other Fund expenses. This Example is intended to help you understand your ongoing costs (in dollars) of investing in the Fund and to compare these costs with the ongoing costs of investing in other mutual funds.
The Example is based on an investment of $1,000 invested at the beginning of the period and held for the entire period (July 1, 2014 to December 31, 2014).
Actual Expenses
The first line of the accompanying table for each class of the Fund provides information about actual account values and actual expenses. You may use the information in this line, together with the amount you invested, to estimate the expenses that you paid over the period. Simply divide your account value by $1,000.00 (for example, an $8,600 account value divided by $1,000.00 = 8.6), then multiply the result by the number in the first line for a class of the Fund under the heading entitled “Expenses Paid During Period” to estimate the expenses you paid on your account during this period. The estimate of expenses does not include any fees or other expenses of any variable annuity or variable life insurance product. If they were, the estimate of expenses you paid during the period would be higher, and your ending account value would be lower. In addition, the Fund, as a shareholder in the underlying Fidelity Central Funds, will indirectly bear its pro-rata share of the fees and expenses incurred by the underlying Fidelity Central Funds. These fees and expenses are not included in the Fund’s annualized expense ratio used to calculate the expense estimate in the table below.
Hypothetical Example for Comparison Purposes
The second line of the accompanying table for each class of the Fund provides information about hypothetical account values and hypothetical expenses based on a Class’ actual expense ratio and an assumed rate of return of 5% per year before expenses, which is not the Class’ actual return. The hypothetical account values and expenses may not be used to estimate the actual ending account balance or expenses you paid for the period. You may use this information to compare the ongoing costs of investing in the Fund and other funds. To do so, compare this 5% hypothetical example with the 5% hypothetical examples that appear in the shareholder reports of the other funds. The estimate of expenses does not include any fees or other expenses of any variable annuity or variable life insurance product. If they were, the estimate of expenses you paid during the period would be higher, and your ending account value would be lower. In addition, the Fund, as a shareholder in the underlying Fidelity Central Funds, will indirectly bear its pro-rata share of the fees and expenses incurred by the underlying Fidelity Central Funds. These fees and expenses are not included in the Fund’s annualized expense ratio used to calculate the expense estimate in the table below.
Please note that the expenses shown in the table are meant to highlight your ongoing costs only and do not reflect any transaction costs. Therefore, the second line of the table is useful in comparing ongoing costs only, and will not help you determine the relative total costs of owning different funds.
| | | Annualized
Expense RatioB | | | Beginning
Account Value
July 1, 2014 | | | Ending
Account Value
December 31, 2014 | | | Expenses Paid
During Period*
July 1, 2014
to December 31, 2014 | |
| Initial Class | | | .64% | | | | | | | | | | | | | |
| Actual | | | | | | $ | 1,000.00 | | | $ | 1,011.20 | | | $ | 3.24 | |
| HypotheticalA | | | | | | $ | 1,000.00 | | | $ | 1,021.98 | | | $ | 3.26 | |
| Service Class | | | .74% | | | | | | | | | | | | | |
| Actual | | | | | | $ | 1,000.00 | | | $ | 1,010.80 | | | $ | 3.75 | |
| HypotheticalA | | | | | | $ | 1,000.00 | | | $ | 1,021.48 | | | $ | 3.77 | |
| Service Class 2 | | | .89% | | | | | | | | | | | | | |
| Actual | | | | | | $ | 1,000.00 | | | $ | 1,010.10 | | | $ | 4.51 | |
| HypotheticalA | | | | | | $ | 1,000.00 | | | $ | 1,020.72 | | | $ | 4.53 | |
| Investor Class | | | .72% | | | | | | | | | | | | | |
| Actual | | | | | | $ | 1,000.00 | | | $ | 1,010.70 | | | $ | 3.65 | |
| HypotheticalA | | | | | | $ | 1,000.00 | | | $ | 1,021.58 | | | $ | 3.67 | |
A 5% return per year before expenses
B Annualized expense ratio reflects expenses net of applicable fee waivers.
* Expenses are equal to each Class’ annualized expense ratio, multiplied by the average account value over the period, multiplied by 184/365 (to reflect the one-half year period).
Investment Changes (Unaudited)
Top Ten Stocks as of December 31, 2014
| | | % of fund's
net assets | | % of fund's net assets
6 months ago |
| Spirit Airlines, Inc. | | | 1.2 | | | 1.0 |
| Global Payments, Inc. | | | 1.2 | | | 0.8 |
| Cardinal Health, Inc. | | | 1.2 | | | 0.5 |
| Textron, Inc. | | | 1.2 | | | 0.8 |
| NXP Semiconductors NV | | | 1.2 | | | 1.1 |
| FedEx Corp. | | | 1.1 | | | 0.7 |
| Fidelity National Information Services, Inc. | | | 1.1 | | | 0.9 |
| Steris Corp. | | | 1.0 | | | 0.4 |
| CBRE Group, Inc. | | | 1.0 | | | 0.8 |
| Wyndham Worldwide Corp. | | | 1.0 | | | 0.6 |
| | | | 11.2 | | | |
Top Five Market Sectors as of December 31, 2014
| | | % of fund's
net assets | | % of fund's net assets
6 months ago |
| Information Technology | | | 25.1 | | | 25.8 |
| Industrials | | | 17.2 | | | 19.8 |
| Consumer Discretionary | | | 16.7 | | | 14.4 |
| Financials | | | 15.5 | | | 10.0 |
| Health Care | | | 13.3 | | | 10.9 |
| Asset Allocation (% of fund's net assets) |
| As of December 31, 2014* | As of June 30, 2014** |
 |  |
Investments December 31, 2014
Showing Percentage of Net Assets
| Common Stocks – 100.0% | | | | | | |
| | | Shares | | | Value | |
| | | | | | | |
| CONSUMER DISCRETIONARY - 16.7% | | | | | | | | |
| Auto Components - 1.2% | | | | | | | | |
| Delphi Automotive PLC | | | 221,361 | | | $ | 16,097,372 | |
| Gentex Corp. | | | 1,230,496 | | | | 44,457,820 | |
| Johnson Controls, Inc. | | | 210,454 | | | | 10,173,346 | |
| New Focus Auto Tech Holdings Ltd. (a) | | | 3,095,675 | | | | 218,593 | |
| Tenneco, Inc. (a) | | | 224,176 | | | | 12,690,603 | |
| Visteon Corp. (a) | | | 231,422 | | | | 24,729,755 | |
| | | | | | | | 108,367,489 | |
| Hotels, Restaurants & Leisure - 2.7% | | | | | | | | |
| Brinker International, Inc. | | | 581,767 | | | | 34,143,905 | |
| DineEquity, Inc. | | | 439,100 | | | | 45,508,324 | |
| Jubilant Foodworks Ltd. (a) | | | 75,070 | | | | 1,632,579 | |
| Las Vegas Sands Corp. | | | 432,188 | | | | 25,136,054 | |
| Texas Roadhouse, Inc. Class A | | | 1,209,900 | | | | 40,846,224 | |
| The Cheesecake Factory, Inc. | | | 117,331 | | | | 5,902,923 | |
| Wyndham Worldwide Corp. | | | 1,056,700 | | | | 90,622,592 | |
| | | | | | | | 243,792,601 | |
| Household Durables - 3.4% | | | | | | | | |
| Harman International Industries, Inc. | | | 136,605 | | | | 14,577,120 | |
| Jarden Corp. (a) | | | 1,472,750 | | | | 70,515,270 | |
| Lennar Corp. Class A | | | 1,521,100 | | | | 68,160,491 | |
| NVR, Inc. (a) | | | 51,467 | | | | 65,637,409 | |
| PulteGroup, Inc. | | | 2,528,300 | | | | 54,257,318 | |
| Whirlpool Corp. | | | 161,799 | | | | 31,346,938 | |
| | | | | | | | 304,494,546 | |
| Leisure Products - 1.1% | | | | | | | | |
| Brunswick Corp. | | | 510,200 | | | | 26,152,852 | |
| Polaris Industries, Inc. | | | 488,119 | | | | 73,823,118 | |
| | | | | | | | 99,975,970 | |
| Media - 0.9% | | | | | | | | |
| Interpublic Group of Companies, Inc. | | | 2,225,885 | | | | 46,231,631 | |
| Naspers Ltd. Class N | | | 62,400 | | | | 8,173,023 | |
| Time Warner Cable, Inc. | | | 173,900 | | | | 26,443,234 | |
| | | | | | | | 80,847,888 | |
| Multiline Retail - 0.9% | | | | | | | | |
| Dollar Tree, Inc. (a) | | | 1,159,600 | | | | 81,612,648 | |
| Specialty Retail - 2.7% | | | | | | | | |
| AutoZone, Inc. (a) | | | 38,200 | | | | 23,650,002 | |
| Dick's Sporting Goods, Inc. | | | 535,500 | | | | 26,587,575 | |
| Foot Locker, Inc. | | | 798,587 | | | | 44,864,618 | |
| GNC Holdings, Inc. | | | 518,700 | | | | 24,358,152 | |
| L Brands, Inc. | | | 131,500 | | | | 11,381,325 | |
| Signet Jewelers Ltd. | | | 376,943 | | | | 49,594,391 | |
| TJX Companies, Inc. | | | 594,200 | | | | 40,750,236 | |
| Urban Outfitters, Inc. (a) | | | 424,900 | | | | 14,926,737 | |
| Williams-Sonoma, Inc. | | | 157,900 | | | | 11,949,872 | |
| | | | | | | | 248,062,908 | |
| Textiles, Apparel & Luxury Goods - 3.8% | | | | | | | | |
| Deckers Outdoor Corp. (a)(d) | | | 631,100 | | | | 57,455,344 | |
| G-III Apparel Group Ltd. (a) | | | 884,683 | | | | 89,361,830 | |
| | | | | | | |
| | | Shares | | | Value | |
| | | | | | | |
| Hanesbrands, Inc. | | | 763,400 | | | $ | 85,210,708 | |
| Page Industries Ltd. | | | 21,178 | | | | 3,938,348 | |
| PVH Corp. | | | 318,700 | | | | 40,847,779 | |
| Ralph Lauren Corp. | | | 261,800 | | | | 48,474,888 | |
| VF Corp. | | | 212,776 | | | | 15,936,922 | |
| | | | | | | | 341,225,819 | |
| | | | | | | | | |
| TOTAL CONSUMER DISCRETIONARY | | | | | | | 1,508,379,869 | |
| | | | | | | | | |
| CONSUMER STAPLES - 3.4% | | | | | | | | |
| Beverages - 0.7% | | | | | | | | |
| C&C Group PLC | | | 1,417,668 | | | | 6,209,926 | |
| Dr. Pepper Snapple Group, Inc. | | | 805,825 | | | | 57,761,536 | |
| | | | | | | | 63,971,462 | |
| Food & Staples Retailing - 1.4% | | | | | | | | |
| CVS Health Corp. | | | 699,747 | | | | 67,392,634 | |
| Kroger Co. | | | 849,400 | | | | 54,539,974 | |
| | | | | | | | 121,932,608 | |
| Food Products - 1.3% | | | | | | | | |
| Archer Daniels Midland Co. | | | 546,354 | | | | 28,410,408 | |
| Britannia Industries Ltd. (a) | | | 16,320 | | | | 474,462 | |
| Bunge Ltd. | | | 630,988 | | | | 57,363,119 | |
| Ingredion, Inc. | | | 127,005 | | | | 10,775,104 | |
| Keurig Green Mountain, Inc. | | | 182,399 | | | | 24,148,716 | |
| | | | | | | | 121,171,809 | |
| | | | | | | | | |
| TOTAL CONSUMER STAPLES | | | | | | | 307,075,879 | |
| | | | | | | | | |
| ENERGY - 3.5% | | | | | | | | |
| Energy Equipment & Services - 1.3% | | | | | | | | |
| Baker Hughes, Inc. | | | 276,781 | | | | 15,519,111 | |
| Dril-Quip, Inc. (a) | | | 476,300 | | | | 36,546,499 | |
| Halliburton Co. | | | 809,600 | | | | 31,841,568 | |
| Oceaneering International, Inc. | | | 604,400 | | | �� | 35,544,764 | |
| | | | | | | | 119,451,942 | |
| Oil, Gas & Consumable Fuels - 2.2% | | | | | | | | |
| Apache Corp. | | | 365,696 | | | | 22,918,168 | |
| Chesapeake Energy Corp. | | | 841,200 | | | | 16,462,284 | |
| Cimarex Energy Co. | | | 338,852 | | | | 35,918,312 | |
| Emerald Oil, Inc. warrants 2/4/16 (a) | | | 129,809 | | | | 1 | |
| Energen Corp. | | | 54,903 | | | | 3,500,615 | |
| EOG Resources, Inc. | | | 121,900 | | | | 11,223,333 | |
| GasLog Ltd. | | | 323,300 | | | | 6,579,155 | |
| Newfield Exploration Co. (a) | | | 687,800 | | | | 18,653,136 | |
| Phillips 66 Co. | | | 236,685 | | | | 16,970,315 | |
| Suncor Energy, Inc. | | | 1,799,000 | | | | 57,138,148 | |
| Teekay Tankers Ltd. | | | 85,400 | | | | 432,124 | |
| Western Refining, Inc. | | | 148,200 | | | | 5,598,996 | |
| | | | | | | | 195,394,587 | |
| | | | | | | | | |
| TOTAL ENERGY | | | | | | | 314,846,529 | |
See accompanying notes which are an integral part of the financial statements.
Investments – continued
| Common Stocks – continued | | | | | | |
| | | Shares | | | Value | |
| | | | | | | |
| FINANCIALS - 15.4% | | | | | | | | |
| Banks - 3.1% | | | | | | | | |
| Boston Private Financial Holdings, Inc. | | | 1,793,716 | | | $ | 24,161,355 | |
| CIT Group, Inc. | | | 47,300 | | | | 2,262,359 | |
| Comerica, Inc. | | | 426,229 | | | | 19,964,566 | |
| Commerce Bancshares, Inc. | | | 673,680 | | | | 29,298,343 | |
| First Citizen Bancshares, Inc. | | | 44,300 | | | | 11,198,597 | |
| First Commonwealth Financial Corp. | | | 1,579,600 | | | | 14,563,912 | |
| First Republic Bank | | | 43,200 | | | | 2,251,584 | |
| Huntington Bancshares, Inc. | | | 4,655,816 | | | | 48,979,184 | |
| Investors Bancorp, Inc. | | | 2,106,700 | | | | 23,647,708 | |
| Lakeland Financial Corp. | | | 528,346 | | | | 22,967,201 | |
| M&T Bank Corp. | | | 86,300 | | | | 10,841,006 | |
| PacWest Bancorp | | | 124,193 | | | | 5,645,814 | |
| Prosperity Bancshares, Inc. | | | 41,100 | | | | 2,275,296 | |
| Regions Financial Corp. | | | 205,400 | | | | 2,169,024 | |
| SunTrust Banks, Inc. | | | 910,465 | | | | 38,148,484 | |
| UMB Financial Corp. | | | 375,700 | | | | 21,373,573 | |
| | | | | | | | 279,748,006 | |
| Capital Markets - 3.2% | | | | | | | | |
| Ameriprise Financial, Inc. | | | 566,713 | | | | 74,947,794 | |
| E*TRADE Financial Corp. (a) | | | 156,600 | | | | 3,798,333 | |
| Invesco Ltd. | | | 1,276,000 | | | | 50,427,520 | |
| Lazard Ltd. Class A | | | 963,745 | | | | 48,216,162 | |
| Raymond James Financial, Inc. | | | 718,595 | | | | 41,168,308 | |
| The Blackstone Group LP | | | 1,349,535 | | | | 45,654,769 | |
| Virtus Investment Partners, Inc. | | | 118,900 | | | | 20,271,261 | |
| | | | | | | | 284,484,147 | |
| Consumer Finance - 1.4% | | | | | | | | |
| American Express Co. | | | 271,289 | | | | 25,240,729 | |
| Capital One Financial Corp. | | | 268,600 | | | | 22,172,930 | |
| SLM Corp. | | | 6,635,600 | | | | 67,616,764 | |
| Springleaf Holdings, Inc. (a) | | | 304,600 | | | | 11,017,382 | |
| | | | | | | | 126,047,805 | |
| Diversified Financial Services - 1.0% | | | | | | | | |
| CRISIL Ltd. | | | 84,555 | | | | 2,551,306 | |
| McGraw Hill Financial, Inc. | | | 824,430 | | | | 73,357,781 | |
| Moody's Corp. | | | 166,800 | | | | 15,981,108 | |
| | | | | | | | 91,890,195 | |
| Insurance - 3.9% | | | | | | | | |
| AFLAC, Inc. | | | 739,600 | | | | 45,182,164 | |
| Bajaj Finserv Ltd. (a) | | | 58,922 | | | | 1,218,035 | |
| Fidelity & Guaranty Life | | | 274,793 | | | | 6,669,226 | |
| First American Financial Corp. | | | 1,147,200 | | | | 38,890,080 | |
| Hilltop Holdings, Inc. (a) | | | 76,100 | | | | 1,518,195 | |
| Hiscox Ltd. | | | 1,969,500 | | | | 22,116,920 | |
| Marsh & McLennan Companies, Inc. | | | 1,288,284 | | | | 73,741,376 | |
| Primerica, Inc. | | | 551,820 | | | | 29,941,753 | |
| Principal Financial Group, Inc. | | | 1,117,800 | | | | 58,058,532 | |
| | | | | | | |
| | | Shares | | | Value | |
| | | | | | | |
| Reinsurance Group of America, Inc. | | | 660,458 | | | $ | 57,869,330 | |
| The Chubb Corp. | | | 184,900 | | | | 19,131,603 | |
| | | | | | | | 354,337,214 | |
| Real Estate Investment Trusts - 0.3% | | | | | | | | |
| Altisource Residential Corp. Class B | | | 349,209 | | | | 6,774,655 | |
| American Realty Capital Properties, Inc. | | | 642,200 | | | | 5,811,910 | |
| Digital Realty Trust, Inc. | | | 110,300 | | | | 7,312,890 | |
| Mid-America Apartment Communities, Inc | | | 120,500 | | | | 8,998,940 | |
| SL Green Realty Corp. | | | 8,300 | | | | 987,866 | |
| | | | | | | | 29,886,261 | |
| Real Estate Management & Development - 2.1% | | | | | | | | |
| CBRE Group, Inc. (a) | | | 2,651,323 | | | | 90,807,813 | |
| Howard Hughes Corp. (a) | | | 92,515 | | | | 12,065,806 | |
| Jones Lang LaSalle, Inc. | | | 569,460 | | | | 85,379,138 | |
| | | | | | | | 188,252,757 | |
| Thrifts & Mortgage Finance - 0.4% | | | | | | | | |
| Beneficial Mutual Bancorp, Inc. (a) | | | 473,100 | | | | 5,804,937 | |
| Housing Development Finance Corp. Ltd. | | | 349,130 | | | | 6,269,414 | |
| Ladder Capital Corp. Class A | | | 1,434,899 | | | | 28,138,369 | |
| | | | | | | | 40,212,720 | |
| | | | | | | | | |
| TOTAL FINANCIALS | | | | | | | 1,394,859,105 | |
| | | | | | | | | |
| HEALTH CARE - 13.3% | | | | | | | | |
| Biotechnology - 0.2% | | | | | | | | |
| United Therapeutics Corp. (a) | | | 122,300 | | | | 15,836,627 | |
| Health Care Equipment & Supplies - 3.5% | | | | | | | | |
| Boston Scientific Corp. (a) | | | 4,688,403 | | | | 62,121,340 | |
| DENTSPLY International, Inc. | | | 899,600 | | | | 47,921,692 | |
| Hologic, Inc. (a) | | | 2,180,424 | | | | 58,304,538 | |
| Steris Corp. | | | 1,406,700 | | | | 91,224,495 | |
| Zimmer Holdings, Inc. | | | 490,300 | | | | 55,609,826 | |
| | | | | | | | 315,181,891 | |
| Health Care Providers & Services - 5.1% | | | | | | | | |
| Cardinal Health, Inc. | | | 1,320,847 | | | | 106,631,978 | |
| Catamaran Corp. (a) | | | 348,700 | | | | 18,044,280 | |
| Community Health Systems, Inc. (a) | | | 609,400 | | | | 32,858,848 | |
| DaVita HealthCare Partners, Inc. (a) | | | 851,100 | | | | 64,462,314 | |
| HCA Holdings, Inc. (a) | | | 867,035 | | | | 63,631,699 | |
| McKesson Corp. | | | 428,250 | | | | 88,896,135 | |
| Molina Healthcare, Inc. (a) | | | 142,700 | | | | 7,638,731 | |
| Omnicare, Inc. | | | 1,056,522 | | | | 77,052,149 | |
| | | | | | | | 459,216,134 | |
| Health Care Technology - 0.5% | | | | | | | | |
| MedAssets, Inc. (a) | | | 2,581,900 | | | | 51,018,344 | |
| Life Sciences Tools & Services - 1.3% | | | | | | | | |
| Agilent Technologies, Inc. | | | 725,906 | | | | 29,718,592 | |
| Bruker Corp. (a) | | | 573,400 | | | | 11,250,108 | |
| Thermo Fisher Scientific, Inc. | | | 604,013 | | | | 75,676,789 | |
| | | | | | | | 116,645,489 | |
See accompanying notes which are an integral part of the financial statements.
| Common Stocks – continued | |
| | | Shares | | | Value | |
| | | | | | | |
| HEALTH CARE - continued | | | | | | | | |
| Pharmaceuticals - 2.7% | | | | | | | | |
| Actavis PLC (a) | | | 251,245 | | | $ | 64,672,975 | |
| Jazz Pharmaceuticals PLC (a) | | | 386,171 | | | | 63,227,778 | |
| Mallinckrodt PLC (a) | | | 489,450 | | | | 48,470,234 | |
| Salix Pharmaceuticals Ltd. (a) | | | 48,270 | | | | 5,548,154 | |
| Teva Pharmaceutical Industries Ltd. sponsored ADR | | | 1,139,156 | | | | 65,512,862 | |
| | | | | | | | 247,432,003 | |
| | | | | | | | | |
| TOTAL HEALTH CARE | | | | | | | 1,205,330,488 | |
| | | | | | | | | |
| INDUSTRIALS - 17.2% | | | | | | | | |
| Aerospace & Defense - 2.6% | | | | | | | | |
| Curtiss-Wright Corp. | | | 987,048 | | | | 69,675,718 | |
| Esterline Technologies Corp. (a) | | | 261,148 | | | | 28,642,713 | |
| Huntington Ingalls Industries, Inc. | | | 238,200 | | | | 26,787,972 | |
| | | | 2,518,581 | | | | 106,057,446 | |
| | | | | | | | 231,163,849 | |
| Air Freight & Logistics - 1.1% | | | | | | | | |
| FedEx Corp. | | | 574,811 | | | | 99,821,678 | |
| Airlines - 1.7% | | | | | | | | |
| Allegiant Travel Co. | | | 38,400 | | | | 5,772,672 | |
| Southwest Airlines Co. | | | 948,800 | | | | 40,153,216 | |
| Spirit Airlines, Inc. (a) | | | 1,470,413 | | | | 111,133,807 | |
| | | | | | | | 157,059,695 | |
| Building Products - 0.3% | | | | | | | | |
| A.O. Smith Corp. | | | 206,400 | | | | 11,643,024 | |
| Apogee Enterprises, Inc. | | | 147,171 | | | | 6,235,635 | |
| Lennox International, Inc. | | | 122,756 | | | | 11,670,413 | |
| | | | | | | | 29,549,072 | |
| Commercial Services & Supplies - 0.7% | | | | | | | | |
| G&K Services, Inc. Class A | | | 201,600 | | | | 14,283,360 | |
| Herman Miller, Inc. | | | 301,500 | | | | 8,873,145 | |
| HNI Corp. | | | 207,677 | | | | 10,603,988 | |
| KAR Auction Services, Inc. | | | 347,282 | | | | 12,033,321 | |
| Republic Services, Inc. | | | 415,813 | | | | 16,736,473 | |
| | | | | | | | 62,530,287 | |
| Construction & Engineering - 1.4% | | | | | | | | |
| EMCOR Group, Inc. | | | 1,130,228 | | | | 50,283,844 | |
| Granite Construction, Inc. | | | 48,536 | | | | 1,845,339 | |
| Jacobs Engineering Group, Inc. (a) | | | 988,955 | | | | 44,196,399 | |
| Quanta Services, Inc. (a) | | | 1,112,821 | | | | 31,592,988 | |
| | | | | | | | 127,918,570 | |
| Electrical Equipment - 0.6% | | | | | | | | |
| AMETEK, Inc. | | | 184,200 | | | | 9,694,446 | |
| Generac Holdings, Inc. (a)(d) | | | 1,015,000 | | | | 47,461,400 | |
| | | | | | | | 57,155,846 | |
| Industrial Conglomerates - 0.5% | | | | | | | | |
| Roper Industries, Inc. | | | 269,936 | | | | 42,204,494 | |
| | | | | | | |
| | | Shares | | | Value | |
| | | | | | | |
| Machinery - 5.0% | | | | | | | | |
| AGCO Corp. | | | 746,700 | | | $ | 33,750,840 | |
| Caterpillar, Inc. | | | 428,765 | | | | 39,244,860 | |
| Cummins, Inc. | | | 337,675 | | | | 48,682,605 | |
| Deere & Co. | | | 254,100 | | | | 22,480,227 | |
| IDEX Corp. | | | 17,400 | | | | 1,354,416 | |
| illinois Tool Works, Inc. | | | 516,467 | | | | 48,909,425 | |
| Ingersoll-Rand PLC | | | 437,645 | | | | 27,742,317 | |
| ITT Corp. | | | 321,735 | | | | 13,017,398 | |
| Manitowoc Co., Inc. | | | 876,579 | | | | 19,372,396 | |
| Mueller Industries, Inc. | | | 662,304 | | | | 22,611,059 | |
| Rexnord Corp. (a) | | | 263,204 | | | | 7,424,985 | |
| Snap-On, Inc. | | | 592,300 | | | | 80,991,102 | |
| Stanley Black & Decker, Inc. | | | 59,800 | | | | 5,745,584 | |
| Valmont Industries, Inc. | | | 160,081 | | | | 20,330,287 | |
| WABCO Holdings, Inc. (a) | | | 82,800 | | | | 8,675,784 | |
| Wabtec Corp. | | | 115,860 | | | | 10,067,075 | |
| Woodward, Inc. | | | 737,407 | | | | 36,302,547 | |
| | | | | | | | 446,702,907 | |
| Professional Services - 0.8% | | | | | | | | |
| Corporate Executive Board Co. | | | 190,700 | | | | 13,831,471 | |
| Dun & Bradstreet Corp. | | | 474,505 | | | | 57,396,125 | |
| | | | | | | | 71,227,596 | |
| Road & Rail - 2.1% | | | | | | | | |
| ArcBest Corp. | | | 527,600 | | | | 24,464,812 | |
| Con-way, Inc. | | | 1,591,565 | | | | 78,273,167 | |
| CSX Corp. | | | 676,900 | | | | 24,524,087 | |
| J.B. Hunt Transport Services, Inc. | | | 40,800 | | | | 3,437,400 | |
| Norfolk Southern Corp. | | | 67,200 | | | | 7,365,792 | |
| Saia, Inc. (a) | | | 884,005 | | | | 48,938,517 | |
| Swift Transporation Co. (a) | | | 229,578 | | | | 6,572,818 | |
| | | | | | | | 193,576,593 | |
| Trading Companies & Distributors - 0.4% | | | | | | | | |
| Air Lease Corp. Class A | | | 511,784 | | | | 17,559,309 | |
| GATX Corp. | | | 170,147 | | | | 9,790,258 | |
| Misumi Group, Inc. | | | 201,300 | | | | 6,637,907 | |
| MRC Global, Inc. (a) | | | 145,300 | | | | 2,201,295 | |
| | | | | | | | 36,188,769 | |
| | | | | | | | | |
| TOTAL INDUSTRIALS | | | | | | | 1,555,099,356 | |
| | | | | | | | | |
| INFORMATION TECHNOLOGY - 25.1% | | | | | | | | |
| Communications Equipment - 1.8% | | | | | | | | |
| Aruba Networks, Inc. (a) | | | 452,400 | | | | 8,224,632 | |
| Brocade Communications Systems, Inc. | | | 862,503 | | | | 10,212,036 | |
| CommScope Holding Co., Inc. (a) | | | 1,694,190 | | | | 38,678,358 | |
| F5 Networks, Inc. (a) | | | 596,854 | | | | 77,868,557 | |
| Juniper Networks, Inc. | | | 353,162 | | | | 7,882,576 | |
| Nokia Corp. sponsored ADR | | | 2,327,700 | | | | 18,295,722 | |
| | | | | | | | 161,161,881 | |
See accompanying notes which are an integral part of the financial statements.
Investments – continued
| Common Stocks – continued | |
| | | Shares | | | Value | |
| | | | | | | |
| INFORMATION TECHNOLOGY - continued | | | | | | | | |
| Electronic Equipment & Components - 3.3% | | | | | | | | |
| Arrow Electronics, Inc. (a) | | | 701,980 | | | $ | 40,637,622 | |
| Avnet, Inc. | | | 889,130 | | | | 38,250,373 | |
| CDW Corp. | | | 2,012,720 | | | | 70,787,362 | |
| Ingram Micro, Inc. Class A(a) | | | 296,224 | | | | 8,187,631 | |
| Jabil Circuit, Inc. | | | 298,200 | | | | 6,509,706 | |
| Keysight Technologies, Inc. (a) | | | 362,953 | | | | 12,256,923 | |
| Methode Electronics, Inc. Class A | | | 768,700 | | | | 28,065,237 | |
| TE Connectivity Ltd. | | | 873,766 | | | | 55,265,700 | |
| Trimble Navigation Ltd. (a) | | | 1,549,900 | | | | 41,134,346 | |
| | | | | | | | 301,094,900 | |
| Internet Software & Services - 0.5% | | | | | | | | |
| Google, Inc. Class C(a) | | | 65,970 | | | | 34,726,608 | |
| Tencent Holdings Ltd | | | 545,300 | | | | 7,889,908 | |
| | | | | | | | 42,616,516 | |
| IT Services - 8.4% | | | | | | | | |
| Alliance Data Systems Corp. (a) | | | 251,490 | | | | 71,938,715 | |
| Blackhawk Network Holdings, Inc. (a) | | | 257,594 | | | | 9,708,718 | |
| Broadridge Financial Solutions, Inc. | | | 344,203 | | | | 15,895,295 | |
| Computer Sciences Corp. | | | 39,127 | | | | 2,466,957 | |
| Euronet Worldwide, Inc. (a) | | | 1,292,277 | | | | 70,946,007 | |
| EVERTEC, Inc. | | | 1,010,593 | | | | 22,364,423 | |
| Fidelity National Information Services, Inc. | | | 1,528,377 | | | | 95,065,049 | |
| Fiserv, Inc. (a) | | | 1,060,714 | | | | 75,278,873 | |
| FleetCor Technologies, Inc. (a) | | | 384,740 | | | | 57,214,685 | |
| Genpact Ltd. (a) | | | 2,931,288 | | | | 55,489,282 | |
| Global Payments, Inc. | | | 1,332,788 | | | | 107,595,975 | |
| Maximus, Inc. | | | 437,900 | | | | 24,014,436 | |
| Total System Services, Inc. | | | 2,314,610 | | | | 78,604,156 | |
| Visa, Inc. Class A | | | 102,500 | | | | 26,875,500 | |
| Xerox Corp. | | | 3,149,749 | | | | 43,655,521 | |
| | | | | | | | 757,113,592 | |
| Semiconductors & Semiconductor Equipment - 6.2% | | | | | | | | |
| Altera Corp. | | | 800,700 | | | | 29,577,858 | |
| Atmel Corp. (a) | | | 6,201,033 | | | | 52,057,672 | |
| Broadcom Corp. Class A | | | 1,313,300 | | | | 56,905,289 | |
| Cypress Semiconductor Corp. (d) | | | 997,700 | | | | 14,247,156 | |
| Fairchild Semiconductor International, Inc. (a) | | | 98,619 | | | | 1,664,689 | |
| Freescale Semiconductor, Inc. (a)(d) | | | 3,353,018 | | | | 84,596,644 | |
| Intersil Corp. Class A | | | 761,181 | | | | 11,014,289 | |
| Microchip Technology, Inc. (d) | | | 246,029 | | | | 11,098,368 | |
| NVIDIA Corp. | | | 2,117,833 | | | | 42,462,552 | |
| NXP Semiconductors NV (a) | | | 1,344,923 | | | | 102,752,117 | |
| PMC-Sierra, Inc. (a) | | | 7,171,450 | | | | 65,690,482 | |
| RF Micro Devices, Inc. (a) | | | 3,270,000 | | | | 54,249,300 | |
| Semtech Corp. (a) | | | 862,210 | | | | 23,771,130 | |
| Xilinx, Inc. | | | 251,700 | | | | 10,896,093 | |
| | | | | | | | 560,983,639 | |
| | | | | | | |
| | | Shares | | | Value | |
| | | | | | | |
| Software - 3.8% | | | | | | | | |
| Activision Blizzard, Inc. | | | 1,350,700 | | | $ | 27,216,605 | |
| Cadence Design Systems, Inc. (a) | | | 3,396,200 | | | | 64,425,914 | |
| Electronic Arts, Inc. (a) | | | 1,682,190 | | | | 79,088,163 | |
| Intuit, Inc. | | | 210,997 | | | | 19,451,813 | |
| Parametric Technology Corp. (a) | | | 950,741 | | | | 34,844,658 | |
| Rovi Corp. (a) | | | 449,797 | | | | 10,160,914 | |
| Synopsys, Inc. (a) | | | 1,036,549 | | | | 45,058,785 | |
| TiVo, Inc. (a) | | | 1,368,000 | | | | 16,197,120 | |
| Verint Systems, Inc. (a) | | | 770,312 | | | | 44,893,783 | |
| | | | | | | | 341,337,755 | |
| Technology Hardware, Storage & Peripherals - 1.1% | | | | | | | | |
| EMC Corp. | | | 1,525,939 | | | | 45,381,426 | |
| Super Micro Computer, Inc. (a) | | | 1,621,409 | | | | 56,554,746 | |
| | | | | | | | 101,936,172 | |
| | | | | | | | | |
| TOTAL INFORMATION TECHNOLOGY | | | | | | | 2,266,244,455 | |
| | | | | | | | | |
| MATERIALS - 4.4% | | | | | | | | |
| Chemicals - 3.1% | | | | | | | | |
| Albemarle Corp. U.S. (d) | | | 550,856 | | | | 33,122,971 | |
| Ashland, Inc. | | | 99,526 | | | | 11,919,234 | |
| Cabot Corp. | | | 258,577 | | | | 11,341,187 | |
| Cytec Industries, Inc. | | | 1,413,366 | | | | 65,255,108 | |
| Eastman Chemical Co. | | | 559,500 | | | | 42,443,670 | |
| Ferro Corp. (a) | | | 1,638,609 | | | | 21,236,373 | |
| Methanex Corp. | | | 253,800 | | | | 11,658,897 | |
| PolyOne Corp. | | | 966,160 | | | | 36,627,126 | |
| Potash Corp. of Saskatchewan, Inc. (d) | | | 622,600 | | | | 22,009,108 | |
| Praxair, Inc. | | | 212,400 | | | | 27,518,544 | |
| | | | | | | | 283,132,218 | |
| Containers & Packaging - 0.1% | | | | | | | | |
| Aptargroup, Inc. | | | 188,330 | | | | 12,587,977 | |
| Metals & Mining - 0.8% | | | | | | | | |
| B2Gold Corp. (a) | | | 6,966,000 | | | | 11,392,150 | |
| Carpenter Technology Corp. | | | 372,900 | | | | 18,365,325 | |
| Constellium NV (a) | | | 1,417,664 | | | | 23,292,220 | |
| New Gold, Inc. (a) | | | 2,548,620 | | | | 10,924,537 | |
| TimkenSteel Corp. | | | 121,100 | | | | 4,484,333 | |
| | | | | | | | 68,458,565 | |
| Paper & Forest Products - 0.4% | | | | | | | | |
| Boise Cascade Co. (a) | | | 849,371 | | | | 31,554,133 | |
| | | | | | | | | |
| TOTAL MATERIALS | | | | | | | 395,732,893 | |
| | | | | | | | | |
| TELECOMMUNICATION SERVICES - 0.2% | | | | | | | | |
| Diversified Telecommunication Services - 0.2% | | | | | | | | |
| Verizon Communications, Inc. | | | 347,608 | | | | 16,261,102 | |
See accompanying notes which are an integral part of the financial statements.
| Common Stocks – continued | | | | | | |
| | | | | | | |
| | | Shares | | | Value | |
| | | | | | | |
| UTILITIES - 0.8% | | | | | | | | |
| Electric Utilities - 0.6% | | | | | | | | |
| Exelon Corp. | | | 999,300 | | | $ | 37,054,044 | |
| OGE Energy Corp. | | | 293,000 | | | | 10,395,640 | |
| | | | | | | | 47,449,684 | |
| Independent Power Producers & Renewable Electricity Producers - 0.1% | | | | | | | | |
| Dynegy, Inc. (a) | | | 328,900 | | | | 9,982,115 | |
| Multi-Utilities - 0.1% | | | | | | | | |
| CMS Energy Corp. | | | 159,419 | | | | 5,539,810 | |
| NiSource, Inc. | | | 130,521 | | | | 5,536,701 | |
| | | | | | | | 11,076,511 | |
| TOTAL UTILITIES | | | | | | | 68,508,310 | |
| | | | | | | | | |
| TOTAL COMMON STOCKS | | | | | | | | |
| (Cost $7,552,507,596) | | | | | | | 9,032,337,986 | |
| Nonconvertible Preferred Stocks – 0.1% | | | |
| | | | | | | |
| FINANCIALS - 0.1% | | | | | | | | |
| Capital Markets - 0.1% | | | | | | | | |
| GMAC Capital Trust I Series 2, 8.125% | | | | | | | | |
| (Cost $8,287,786) | | | 402,766 | | | | 10,624,967 | |
| Money Market Funds – 1.0% | |
| | | | |
| | | Shares | | | Value | |
| | | | | | | |
| Fidelity Cash Central Fund, 0.13% (b) | | | 27 | | | $ | 27 | |
| Fidelity Securities Lending Cash Central Fund, 0.13% (b)(c) | | | 88,389,159 | | | | 88,389,159 | |
| | | | | | | | | |
| TOTAL MONEY MARKET FUNDS | | | | | | | | |
| (Cost $88,389,186) | | | | | | | 88,389,186 | |
| | | | | | | | | |
| TOTAL INVESTMENT PORTFOLIO - 101.1% | | | | | | | | |
| (Cost $7,649,184,568) | | | | | | | 9,131,352,139 | |
| NET OTHER ASSETS (LIABILITIES) - (1.1)% | | | | | | | (98,433,649 | ) |
| NET ASSETS - 100% | | | | | | $ | 9,032,918,490 | |
Legend
| (b) | Affiliated fund that is generally available only to investment companies and other accounts managed by Fidelity Investments. The rate quoted is the annualized seven-day yield of the fund at period end. A complete unaudited listing of the fund's holdings as of its most recent quarter end is available upon request. In addition, each Fidelity Central Fund's financial statements, which are not covered by the Fund's Report of Independent Registered Public Accounting Firm, are available on the SEC's website or upon request. |
| (c) | Investment made with cash collateral received from securities on loan. |
| (d) | Security or a portion of the security is on loan at period end. |
Affiliated Central Funds
Information regarding fiscal year to date income earned by the Fund from investments in Fidelity Central Funds is as follows:
| Fund | | Income earned | |
| Fidelity Cash Central Fund | | $ | 55,284 | |
| Fidelity Securities Lending Cash Central Fund | | | 494,563 | |
| Total | | $ | 549,847 | |
Other Affiliated Issuers
An affiliated company is a company in which the Fund has ownership of at least 5% of the voting securities. Fiscal year to date transactions with companies which are or were affiliates are as follows:
| | | Value, | | | | | | | | | | | | Value, | |
| | | beginning of | | | | | | Sales | | | Dividend | | | end of | |
| Affiliate | | period | | | Purchases | | | Proceeds | | | Income | | | period | |
| Boise Cascade Co. | | $ | 66,304,854 | | | $ | 27,760,364 | | | $ | 58,341,215 | | | $ | – | | | $ | – | |
| G-III Apparel Group Ltd. | | | 84,321,456 | | | | 22,093,054 | | | | 42,882,095 | | | | – | | | | – | |
| Ruth's Hospitality Group, Inc. | | | 27,135,501 | | | | – | | | | 23,494,062 | | | | 54,272 | | | | – | |
| Total | | $ | 177,761,811 | | | $ | 49,853,418 | | | $ | 124,717,372 | | | $ | 54,272 | | | $ | – | |
See accompanying notes which are an integral part of the financial statements.
Investments – continued
Other Information
The following is a summary of the inputs used, as of December 31, 2014, involving the Fund's assets and liabilities carried at fair value. The inputs or methodology used for valuing securities may not be an indication of the risk associated with investing in those securities. For more information on valuation inputs, and their aggregation into the levels used in the table below, please refer to the Investment Valuation section in the accompanying Notes to Financial Statements.
| Valuation Inputs at Reporting Date: |
| Description | | Total | | | Level 1 | | | Level 2 | | | Level 3 | |
| Investments in Securities: | | | | | | | | | | | | | | | | |
| Equities: | | | | | | | | | | | | | | | | |
| Consumer Discretionary | | $ | 1,508,379,869 | | | $ | 1,502,590,349 | | | $ | 5,789,520 | | | $ | – | |
| Consumer Staples | | | 307,075,879 | | | | 306,601,417 | | | | 474,462 | | | | – | |
| Energy | | | 314,846,529 | | | | 314,846,528 | | | | 1 | | | | – | |
| Financials | | | 1,405,484,072 | | | | 1,395,445,317 | | | | 10,038,755 | | | | – | |
| Health Care | | | 1,205,330,488 | | | | 1,205,330,488 | | | | – | | | | – | |
| Industrials | | | 1,555,099,356 | | | | 1,548,461,449 | | | | 6,637,907 | | | | – | |
| Information Technology | | | 2,266,244,455 | | | | 2,258,354,547 | | | | 7,889,908 | | | | – | |
| Materials | | | 395,732,893 | | | | 395,732,893 | | | | – | | | | – | |
| Telecommunication Services | | | 16,261,102 | | | | 16,261,102 | | | | – | | | | – | |
| Utilities | | | 68,508,310 | | | | 68,508,310 | | | | – | | | | – | |
| Money Market Funds | | | 88,389,186 | | | | 88,389,186 | | | | – | | | | – | |
| Total Investments in Securities: | | $ | 9,131,352,139 | | | $ | 9,100,521,586 | | | $ | 30,830,553 | | | $ | – | |
Distribution of investments by country or territory of incorporation, as a percentage of total net assets, is as follows (Unaudited):
| United States of America | | | 88.3 | % |
| Bermuda | | | 4.1 | % |
| Ireland | | | 2.3 | % |
| Netherlands | | | 1.5 | % |
| Canada | | | 1.4 | % |
| Others (Individually Less Than 1%) | | | 2.4 | % |
| | | | 100.0 | % |
See accompanying notes which are an integral part of the financial statements.
Financial Statements
| Statement of Assets and Liabilities | |
| | | | | | December 31, 2014 | |
| | | | | | | |
| Assets | | | | | | | | |
| Investment in securities, at value (including securities loaned of $85,212,682) — See accompanying schedule: | | | | | | | | |
| Unaffiliated issuers (cost $7,560,795,382) | | $ | 9,042,962,953 | | | | | |
| Fidelity Central Funds (cost $88,389,186) | | | 88,389,186 | | | | | |
| Total Investments (cost $7,649,184,568) | | | | | | $ | 9,131,352,139 | |
| Receivable for investments sold | | | | | | | 34,464,965 | |
| Receivable for fund shares sold | | | | | | | 970,770 | |
| Dividends receivable | | | | | | | 5,354,296 | |
| Distributions receivable from Fidelity Central Funds | | | | | | | 40,128 | |
| Prepaid expenses | | | | | | | 18,784 | |
| Other receivables | | | | | | | 224,557 | |
| Total assets | | | | | | | 9,172,425,639 | |
| | | | | | | | | |
| Liabilities | | | | | | | | |
| Payable to custodian bank | | $ | 53,276 | | | | | |
| Payable for investments purchased | | | 23,692,027 | | | | | |
| Payable for fund shares redeemed | | | 15,250,092 | | | | | |
| Accrued management fee | | | 4,121,130 | | | | | |
| Distribution and service plan fees payable | | | 1,387,588 | | | | | |
| Other affiliated payables | | | 633,053 | | | | | |
| Other payables and accrued expenses | | | 5,980,824 | | | | | |
| Collateral on securities loaned, at value | | | 88,389,159 | | | | | |
| Total liabilities | | | | | | | 139,507,149 | |
| | | | | | | | | |
| Net Assets | | | | | | $ | 9,032,918,490 | |
| Net Assets consist of: | | | | | | | | |
| Paid in capital | | | | | | $ | 6,519,698,977 | |
| Distributions in excess of net investment income | | | | | | | (109,829 | ) |
| Accumulated undistributed net realized gain (loss) on investments and foreign currency transactions | | | | | | | 1,031,198,951 | |
| Net unrealized appreciation (depreciation) on investments and assets and liabilities in foreign currencies | | | | | | | 1,482,130,391 | |
| Net Assets | | | | | | $ | 9,032,918,490 | |
| Statement of Assets and Liabilities – continued |
| | | December 31, 2014 | |
| | | | |
| Initial Class: | | | | |
| Net Asset Value, offering price and redemption price per share ($1,476,171,118 ÷ 39,172,071 shares) | | $ | 37.68 | |
| | | | | |
| Service Class: | | | | |
| Net Asset Value, offering price and redemption price per share ($622,227,015 ÷ 16,620,517 shares) | | $ | 37.44 | |
| | | | | |
| Service Class 2: | | | | |
| Net Asset Value, offering price and redemption price per share ($6,431,011,239 ÷ 174,572,374 shares) | | $ | 36.84 | |
| | | | | |
| Investor Class: | | | | |
| Net Asset Value, offering price and redemption price per share ($503,509,118 ÷ 13,414,881 shares) | | $ | 37.53 | |
See accompanying notes which are an integral part of the financial statements.
Financial Statements – continued
| Statement of Operations | | | |
| | | Year ended December 31, 2014 | |
| | | | |
| Investment Income | | | | | | | | |
| Dividends (including $54,272 earned from other affiliated issuers) | | | | | | $ | 87,304,732 | |
| Interest | | | | | | | 9 | |
| Income from Fidelity Central Funds | | | | | | | 549,847 | |
| Total income | | | | | | | 87,854,588 | |
| | | | | | | | | |
| Expenses | | | | | | | | |
| Management fee | | $ | 49,504,505 | | | | | |
| Transfer agent fees | | | 6,309,102 | | | | | |
| Distribution and service plan fees | | | 16,684,820 | | | | | |
| Accounting and security lending fees | | | 1,272,620 | | | | | |
| Custodian fees and expenses | | | 189,940 | | | | | |
| Independent trustees' compensation | | | 36,943 | | | | | |
| Audit | | | 82,636 | | | | | |
| Legal | | | 29,471 | | | | | |
| Interest | | | 6,251 | | | | | |
| Miscellaneous | | | 68,813 | | | | | |
| Total expenses before reductions | | | 74,185,101 | | | | | |
| Expense reductions | | | (678,899 | ) | | | 73,506,202 | |
| | | | | | | | | |
| Net investment income (loss) | | | | | | | 14,348,386 | |
| Realized and Unrealized Gain (Loss) | | | | | | | | |
| Net realized gain (loss) on: | | | | | | | | |
| Investment securities: | | | | | | | | |
| Unaffiliated issuers | | | 1,109,112,380 | | | | | |
| Other affiliated issuers | | | 9,731,752 | | | | | |
| Foreign currency transactions | | | (130,573 | ) | | | | |
| Total net realized gain (loss) | | | | | | | 1,118,713,559 | |
| Change in net unrealized appreciation (depreciation) on: | | | | | | | | |
| Investment securities | | | (608,436,500 | ) | | | | |
| Assets and liabilities in foreign currencies | | | (8,507 | ) | | | | |
| Total change in net unrealized appreciation (depreciation) | | | | | | | (608,445,007 | ) |
| Net gain (loss) | | | | | | | 510,268,552 | |
| Net increase (decrease) in net assets resulting from operations | | | | | | $ | 524,616,938 | |
| Statement of Changes in Net Assets |
| | | Year ended | | | Year ended | |
| | | December 31, | | | December 31, | |
| | | 2014 | | | 2013 | |
| Increase (Decrease) in Net Assets | | | | | | |
| Operations | | | | | | |
| Net investment income (loss) | | $ | 14,348,386 | | | $ | 27,382,008 | |
| Net realized gain (loss) | | | 1,118,713,559 | | | | 1,143,849,518 | |
| Change in net unrealized appreciation (depreciation) | | | (608,445,007 | ) | | | 1,361,094,238 | |
| Net increase (decrease) in net assets resulting from operations | | | 524,616,938 | | | | 2,532,325,764 | |
| Distributions to shareholders from net investment income | | | (6,886,171 | ) | | | (27,253,843 | ) |
| Distributions to shareholders from net realized gain | | | (212,967,306 | ) | | | (1,079,038,023 | ) |
| Total distributions | | | (219,853,477 | ) | | | (1,106,291,866 | ) |
| Share transactions – net increase (decrease) | | | (445,133,654 | ) | | | 356,452,089 | |
| Total increase (decrease) in net assets | | | (140,370,193 | ) | | | 1,782,485,987 | |
| | | | | | | | | |
| Net Assets | | | | | | | | |
| Beginning of period | | | 9,173,288,683 | | | | 7,390,802,696 | |
| End of period (including distributions in excess of net investment income of $109,829 and distributions in excess of net investment income of $109,830, respectively) | | $ | 9,032,918,490 | | | $ | 9,173,288,683 | |
See accompanying notes which are an integral part of the financial statements.
| Financial Highlights – Initial Class |
| Years ended December 31, | | 2014 | | | 2013 | | | 2012 | | | 2011 | | | 2010 | |
| Selected Per-Share Data | | | | | | | | | | | | | | | |
| Net asset value, beginning of period | | $ | 36.39 | | | $ | 30.55 | | | $ | 29.08 | | | $ | 32.69 | | | $ | 25.54 | |
| Income from Investment Operations | | | | | | | | | | | | | | | | | | | | |
| Net investment income (loss)C | | | .13 | | | | .18 | | | | .29 | | | | .08 | | | | .11 | |
| Net realized and unrealized gain (loss) | | | 2.11 | | | | 10.57 | | | | 3.99 | | | | (3.55 | ) | | | 7.24 | |
| Total from investment operations | | | 2.24 | | | | 10.75 | | | | 4.28 | | | | (3.47 | ) | | | 7.35 | |
| Distributions from net investment income | | | (.10 | ) | | | (.19 | ) | | | (.20 | )F | | | (.08 | ) | | | (.11 | ) |
| Distributions from net realized gain | | | (.85 | ) | | | (4.72 | ) | | | (2.61 | )F | | | (.06 | ) | | | (.09 | ) |
| Total distributions | | | (.95 | ) | | | (4.91 | ) | | | (2.81 | ) | | | (.14 | ) | | | (.20 | ) |
| Net asset value, end of period | | $ | 37.68 | | | $ | 36.39 | | | $ | 30.55 | | | $ | 29.08 | | | $ | 32.69 | |
| Total ReturnA,B | | | 6.29 | % | | | 36.23 | % | | | 14.83 | % | | | (10.61 | )% | | | 28.83 | % |
| Ratios to Average Net AssetsD,G | | | | | | | | | | | | | | | | | | | | |
| Expenses before reductions | | | .64 | % | | | .64 | % | | | .65 | % | | | .66 | % | | | .66 | % |
| Expenses net of fee waivers, if any | | | .64 | % | | | .64 | % | | | .65 | % | | | .66 | % | | | .66 | % |
| Expenses net of all reductions | | | .63 | % | | | .63 | % | | | .63 | % | | | .65 | % | | | .66 | % |
| Net investment income (loss) | | | .35 | % | | | .52 | % | | | .90 | % | | | .25 | % | | | .40 | % |
| Supplemental Data | | | | | | | | | | | | | | | | | | | | |
| Net assets, end of period (000 omitted) | | $ | 1,476,171 | | | $ | 1,489,788 | | | $ | 1,217,359 | | | $ | 1,085,843 | | | $ | 1,372,063 | |
| Portfolio turnover rateE | | | 142 | % | | | 132 | % | | | 187 | % | | | 84 | % | | | 25 | % |
| A | Total returns do not reflect charges attributable to your insurance company's separate account. Inclusion of these charges would reduce the total returns shown. |
| B | Total returns would have been lower if certain expenses had not been reduced during the applicable periods shown. |
| C | Calculated based on average shares outstanding during the period. |
| D | Fees and expenses of any underlying Fidelity Central Funds are not included in the Fund's expense ratio. The Fund indirectly bears its proportionate share of the expenses of any underlying Fidelity Central Funds. |
| E | Amount does not include the portfolio activity of any underlying Fidelity Central Funds. |
| F | The amounts shown reflect certain reclassifications related to book to tax differences that were made in the year shown. |
| G | Expense ratios reflect operating expenses of the class. Expenses before reductions do not reflect amounts reimbursed by the investment adviser or reductions from brokerage service arrangements or reductions from other expense offset arrangements and do not represent the amount paid by the class during periods when reimbursements or reductions occur. Expenses net of fee waivers reflect expenses after reimbursement by the investment adviser but prior to reductions from brokerage service arrangements or other expense offset arrangements. Expenses net of all reductions represent the net expenses paid by the class. |
| Financial Highlights – Service Class | | | | | | | | |
| Years ended December 31, | | 2014 | | | 2013 | | | 2012 | | | 2011 | | | 2010 | |
| Selected Per-Share Data | | | | | | | | | | | | | | | | | | | | |
| Net asset value, beginning of period | | $ | 36.16 | | | $ | 30.39 | | | $ | 28.93 | | | $ | 32.52 | | | $ | 25.40 | |
| Income from Investment Operations | | | | | | | | | | | | | | | | | | | | |
| Net investment income (loss)C | | | .09 | | | | .15 | | | | .25 | | | | .05 | | | | .08 | |
| Net realized and unrealized gain (loss) | | | 2.10 | | | | 10.49 | | | | 3.98 | | | | (3.54 | ) | | | 7.21 | |
| Total from investment operations | | | 2.19 | | | | 10.64 | | | | 4.23 | | | | (3.49 | ) | | | 7.29 | |
| Distributions from net investment income | | | (.06 | ) | | | (.15 | ) | | | (.16 | )F | | | (.05 | ) | | | (.08 | ) |
| Distributions from net realized gain | | | (.85 | ) | | | (4.72 | ) | | | (2.61 | )F | | | (.06 | ) | | | (.09 | ) |
| Total distributions | | | (.91 | ) | | | (4.87 | ) | | | (2.77 | ) | | | (.10 | )H | | | (.17 | ) |
| Net asset value, end of period | | $ | 37.44 | | | $ | 36.16 | | | $ | 30.39 | | | $ | 28.93 | | | $ | 32.52 | |
| Total ReturnA, B | | | 6.20 | % | | | 36.06 | % | | | 14.75 | % | | | (10.72 | )% | | | 28.75 | % |
| Ratios to Average Net AssetsD,G | | | | | | | | | | | | | | | | | | | | |
| Expenses before reductions | | | .74 | % | | | .74 | % | | | .75 | % | | | .76 | % | | | .76 | % |
| Expenses net of fee waivers, if any | | | .74 | % | | | .74 | % | | | .75 | % | | | .76 | % | | | .76 | % |
| Expenses net of all reductions | | | .73 | % | | | .73 | % | | | .73 | % | | | .75 | % | | | .75 | % |
| Net investment income (loss) | | | .25 | % | | | .42 | % | | | .80 | % | | | .15 | % | | | .30 | % |
| Supplemental Data | | | | | | | | | | | | | | | | | | | | |
| Net assets, end of period (000 omitted) | | $ | 622,227 | | | $ | 638,612 | | | $ | 525,875 | | | $ | 566,560 | | | $ | 749,636 | |
| Portfolio turnover rateE | | | 142 | % | | | 132 | % | | | 187 | % | | | 84 | % | | | 25 | % |
| A | Total returns do not reflect charges attributable to your insurance company's separate account. Inclusion of these charges would reduce the total returns shown. |
| B | Total returns would have been lower if certain expenses had not been reduced during the applicable periods shown. |
| C | Calculated based on average shares outstanding during the period. |
| D | Fees and expenses of any underlying Fidelity Central Funds are not included in the Fund's expense ratio. The Fund indirectly bears its proportionate share of the expenses of any underlying Fidelity Central Funds. |
| E | Amount does not include the portfolio activity of any underlying Fidelity Central Funds. |
| F | The amounts shown reflect certain reclassifications related to book to tax differences that were made in the year shown. |
| G | Expense ratios reflect operating expenses of the class. Expenses before reductions do not reflect amounts reimbursed by the investment adviser or reductions from brokerage service arrangements or reductions from other expense offset arrangements and do not represent the amount paid by the class during periods when reimbursements or reductions occur. Expenses net of fee waivers reflect expenses after reimbursement by the investment adviser but prior to reductions from brokerage service arrangements or other expense offset arrangements. Expenses net of all reductions represent the net expenses paid by the class. |
| H | Total distributions of $.10 per share is comprised of distributions from net investment income of $.048 and distributions from net realized gain of $.055 per share. |
See accompanying notes which are an integral part of the financial statements.
| Financial Highlights – Service Class 2 | | | | | | | |
| Years ended December 31, | | 2014 | | | 2013 | | | 2012 | | | 2011 | | | 2010 | |
| Selected Per-Share Data | | | | | | | | | | | | | | | |
| Net asset value, beginning of period | | $ | 35.60 | | | $ | 29.98 | | | $ | 28.58 | | | $ | 32.13 | | | $ | 25.10 | |
| Income from Investment Operations | | | | | | | | | | | | | | | | | | | | |
| Net investment income (loss)C | | | .04 | | | | .09 | | | | .20 | | | | — | I | | | .04 | |
| Net realized and unrealized gain (loss) | | | 2.06 | | | | 10.35 | | | | 3.93 | | | | (3.49 | ) | | | 7.12 | |
| Total from investment operations | | | 2.10 | | | | 10.44 | | | | 4.13 | | | | (3.49 | ) | | | 7.16 | |
| Distributions from net investment income | | | (.01 | ) | | | (.10 | ) | | | (.12 | )G | | | (.01 | ) | | | (.04 | ) |
| Distributions from net realized gain | | | (.85 | ) | | | (4.72 | ) | | | (2.61 | )G | | | (.06 | ) | | | (.09 | ) |
| Total distributions | | | (.86 | ) | | | (4.82 | ) | | | (2.73 | ) | | | (.06 | )J | | | (.13 | ) |
| Net asset value, end of period | | $ | 36.84 | | | $ | 35.60 | | | $ | 29.98 | | | $ | 28.58 | | | $ | 32.13 | |
| Total ReturnA,B | | | 6.03 | % | | | 35.87 | % | | | 14.56 | % | | | (10.85 | )% | | | 28.57 | % |
| Ratios to Average Net Assets D,H | | | | | | | | | | | | | | | | | | | | |
| Expenses before reductions | | | .88 | % | | | .89 | % | | | .90 | % | | | .91 | % | | | .91 | % |
| Expenses net of fee waivers, if any | | | .88 | % | | | .89 | % | | | .90 | % | | | .91 | % | | | .91 | % |
| Expenses net of all reductions | | | .88 | % | | | .88 | % | | | .88 | % | | | .90 | % | | | .90 | % |
| Net investment income (loss) | | | .10 | % | | | .27 | % | | | .65 | % | | | — | %F | | | .15 | % |
| Supplemental Data | | | | | | | | | | | | | | | | | | | | |
| Net assets, end of period (000 omitted) | | $ | 6,431,011 | | | $ | 6,574,623 | | | $ | 5,335,565 | | | $ | 4,888,475 | | | $ | 5,507,254 | |
| Portfolio turnover rateE | | | 142 | % | | | 132 | % | | | 187 | % | | | 84 | % | | | 25 | % |
| A | Total returns do not reflect charges attributable to your insurance company's separate account. Inclusion of these charges would reduce the total returns shown. |
| B | Total returns would have been lower if certain expenses had not been reduced during the applicable periods shown. |
| C | Calculated based on average shares outstanding during the period. |
| D | Fees and expenses of any underlying Fidelity Central Funds are not included in the Fund's expense ratio. The Fund indirectly bears its proportionate share of the expenses of any underlying Fidelity Central Funds. |
| E | Amount does not include the portfolio activity of any underlying Fidelity Central Funds. |
| F | Amount represents less than .01%. |
| G | The amounts shown reflect certain reclassifications related to book to tax differences that were made in the year shown. |
| H | Expense ratios reflect operating expenses of the class. Expenses before reductions do not reflect amounts reimbursed by the investment adviser or reductions from brokerage service arrangements or reductions from other expense offset arrangements and do not represent the amount paid by the class during periods when reimbursements or reductions occur. Expenses net of fee waivers reflect expenses after reimbursement by the investment adviser but prior to reductions from brokerage service arrangements or other expense offset arrangements. Expenses net of all reductions represent the net expenses paid by the class. |
| I | Amount represents less than $.01 per share. |
| J | Total distributions of $.06 per share is comprised of distributions from net investment income of $.007 and distributions from net realized gain of $.055 per share. |
| Financial Highlights – Investor Class |
| Years ended December 31, | | 2014 | | | 2013 | | | 2012 | | | 2011 | | | 2010 | |
| Selected Per-Share Data | | | | | | | | | | | | | | | | | | | | |
| Net asset value, beginning of period | | $ | 36.25 | | | $ | 30.46 | | | $ | 29.00 | | | $ | 32.60 | | | $ | 25.47 | |
| Income from Investment Operations | | | | | | | | | | | | | | | | | | | | |
| Net investment income (loss)C | | | .10 | | | | .15 | | | | .26 | | | | .05 | | | | .09 | |
| Net realized and unrealized gain (loss) | | | 2.10 | | | | 10.52 | | | | 3.98 | | | | (3.54 | ) | | | 7.22 | |
| Total from investment operations | | | 2.20 | | | | 10.67 | | | | 4.24 | | | | (3.49 | ) | | | 7.31 | |
| Distributions from net investment income | | | (.07 | ) | | | (.16 | ) | | | (.17 | )F | | | (.06 | ) | | | (.09 | ) |
| Distributions from net realized gain | | | (.85 | ) | | | (4.72 | ) | | | (2.61 | )F | | | (.06 | ) | | | (.09 | ) |
| Total distributions | | | (.92 | ) | | | (4.88 | ) | | | (2.78 | ) | | | (.11 | )H | | | (.18 | ) |
| Net asset value, end of period | | $ | 37.53 | | | $ | 36.25 | | | $ | 30.46 | | | $ | 29.00 | | | $ | 32.60 | |
| Total ReturnA,B | | | 6.20 | % | | | 36.08 | % | | | 14.74 | % | | | (10.70 | )% | | | 28.76 | % |
| Ratios to Average Net AssetsD,G | | | | | | | | | | | | | | | | | | | | |
| Expenses before reductions | | | .72 | % | | | .73 | % | | | .74 | % | | | .74 | % | | | .75 | % |
| Expenses net of fee waivers, if any | | | .72 | % | | | .72 | % | | | .74 | % | | | .74 | % | | | .74 | % |
| Expenses net of all reductions | | | .71 | % | | | .71 | % | | | .72 | % | | | .73 | % | | | .74 | % |
| Net investment income (loss) | | | .27 | % | | | .44 | % | | | .82 | % | | | .17 | % | | | .32 | % |
| Supplemental Data | | | | | | | | | | | | | | | | | | | | |
| Net assets, end of period (000 omitted) | | $ | 503,509 | | | $ | 470,265 | | | $ | 312,004 | | | $ | 314,362 | | | $ | 355,842 | |
| Portfolio turnover rateE | | | 142 | % | | | 132 | % | | | 187 | % | | | 84 | % | | | 25 | % |
| A | Total returns do not reflect charges attributable to your insurance company's separate account. Inclusion of these charges would reduce the total returns shown. |
| B | Total returns would have been lower if certain expenses had not been reduced during the applicable periods shown. |
| C | Calculated based on average shares outstanding during the period. |
| D | Fees and expenses of any underlying Fidelity Central Funds are not included in the Fund's expense ratio. The Fund indirectly bears its proportionate share of the expenses of any underlying Fidelity Central Funds. |
| E | Amount does not include the portfolio activity of any underlying Fidelity Central Funds. |
| F | The amounts shown reflect certain reclassifications related to book to tax differences that were made in the year shown. |
| G | Expense ratios reflect operating expenses of the class. Expenses before reductions do not reflect amounts reimbursed by the investment adviser or reductions from brokerage service arrangements or reductions from other expense offset arrangements and do not represent the amount paid by the class during periods when reimbursements or reductions occur. Expenses net of fee waivers reflect expenses after reimbursement by the investment adviser but prior to reductions from brokerage service arrangements or other expense offset arrangements. Expenses net of all reductions represent the net expenses paid by the class. |
| H | Total distributions of $.11 per share is comprised of distributions from net investment income of $.056 and distributions from net realized gain of $.055 per share. |
See accompanying notes which are an integral part of the financial statements.
Notes to Financial Statements
For the period ended December 31, 2014
1. Organization.
VIP Mid Cap Portfolio (the Fund) is a fund of Variable Insurance Products Fund III (the Trust) and is authorized to issue an unlimited number of shares. The Trust is registered under the Investment Company Act of 1940, as amended (the 1940 Act), as an open-end management investment company organized as a Massachusetts business trust. Shares of the Fund may only be purchased by insurance companies for the purpose of funding variable annuity or variable life insurance contracts. The Fund offers the following classes of shares: Initial Class shares, Service Class shares, Service Class 2 shares and Investor Class shares. All classes have equal rights and voting privileges, except for matters affecting a single class.
2. Investments in Fidelity Central Funds.
The Fund invests in Fidelity Central Funds, which are open-end investment companies generally available only to other investment companies and accounts managed by the investment adviser and its affiliates. The Fund’s Schedule of Investments lists each of the Fidelity Central Funds held as of period end, if any, as an investment of the Fund, but does not include the underlying holdings of each Fidelity Central Fund. As an Investing Fund, the Fund indirectly bears its proportionate share of the expenses of the underlying Fidelity Central Funds.
The Money Market Central Funds seek preservation of capital and current income and are managed by Fidelity Investments Money Management, Inc. (FIMM), an affiliate of the investment adviser. Annualized expenses of the Money Market Central Funds as of their most recent shareholder report date are less than .01%.
A complete unaudited list of holdings for each Fidelity Central Fund is available upon request or at the Securities and Exchange Commission (the SEC) website at www.sec.gov. In addition, the financial statements of the Fidelity Central Funds, which are not covered by the Fund’s Report of Independent Registered Public Accounting Firm, are available on the SEC website or upon request.
3. Significant Accounting Policies.
The financial statements have been prepared in conformity with accounting principles generally accepted in the United States of America (GAAP), which require management to make certain estimates and assumptions at the date of the financial statements. Actual results could differ from those estimates. Subsequent events, if any, through the date that the financial statements were issued have been evaluated in the preparation of the financial statements. The following summarizes the significant accounting policies of the Fund:
Investment Valuation. Investments are valued as of 4:00 p.m. Eastern time on the last calendar day of the period. In accordance with valuation policies and procedures approved by the Board of Trustees (the Board), the Fund attempts to obtain prices from one or more third party pricing vendors or brokers to value its investments. When current market prices, quotations or currency exchange rates are not readily available or reliable, investments will be fair valued in good faith by the Fidelity Management & Research Company (FMR) Fair Value Committee (the Committee), in accordance with procedures adopted by the Board. Factors used in determining fair value vary by investment type and may include market or investment specific events. The frequency with which these procedures are used cannot be predicted and they may be utilized to a significant extent. The Committee oversees the Fund’s valuation policies and procedures and is responsible for approving and reporting to the Board all fair value determinations.
The Fund categorizes the inputs to valuation techniques used to value its investments into a disclosure hierarchy consisting of three levels as shown below:
Level 1 – quoted prices in active markets for identical investments
Level 2 – other significant observable inputs (including quoted prices for similar investments, interest rates, prepayment speeds, etc.)
Level 3 – unobservable inputs (including the Fund’s own assumptions based on the best information available)
Valuation techniques used to value the Fund’s investments by major category are as follows:
Equity securities, including restricted securities, for which market quotations are readily available, are valued at the last reported sale price or official closing price as reported by a third party pricing vendor on the primary market or exchange on which they are traded and are categorized as Level 1 in the hierarchy. In the event there were no sales during the day or closing prices are not available, securities are valued at the last quoted bid price or may be valued using the last available price and are generally categorized as Level 2 in the hierarchy. For foreign equity securities, when market or security specific events arise, comparisons to the valuation of American Depositary Receipts (ADRs), futures contracts, Exchange-Traded Funds (ETFs) and certain indexes as well as quoted prices for similar securities may be used and would be categorized as Level 2 in the hierarchy. Utilizing these techniques may result in transfers between Level 1 and Level 2. For equity securities, including restricted securities, where observable inputs are limited, assumptions about market activity and risk are used and these securities may be categorized as Level 3 in the hierarchy.
Investments in open-end mutual funds, including the Fidelity Central Funds, are valued at their closing net asset value (NAV) each business day and are categorized as Level 1 in the hierarchy.
Notes to Financial Statements – continued
3. Significant Accounting Policies – continued
Investment Valuation – continued
Changes in valuation techniques may result in transfers in or out of an assigned level within the disclosure hierarchy. The aggregate value of investments by input level, as of December 31, 2014, is included at the end of the Fund’s Schedule of Investments.
Foreign Currency. The Fund may use foreign currency contracts to facilitate transactions in foreign-denominated securities. Gains and losses from these transactions may arise from changes in the value of the foreign currency or if the counterparties do not perform under the contracts’ terms.
Foreign-denominated assets, including investment securities, and liabilities are translated into U.S. dollars at the exchange rates at period end. Purchases and sales of investment securities, income and dividends received and expenses denominated in foreign currencies are translated into U.S. dollars at the exchange rate in effect on the transaction date.
The effects of exchange rate fluctuations on investments are included with the net realized and unrealized gain (loss) on investment securities. Other foreign currency transactions resulting in realized and unrealized gain (loss) are disclosed separately.
Investment Transactions and Income. For financial reporting purposes, the Fund’s investment holdings and NAV include trades executed through the end of the last business day of the period. The NAV per share for processing shareholder transactions is calculated as of the close of business of the New York Stock Exchange (NYSE), normally 4:00 p.m. Eastern time and includes trades executed through the end of the prior business day. Gains and losses on securities sold are determined on the basis of identified cost and may include proceeds received from litigation. Dividend income is recorded on the ex-dividend date, except for certain dividends from foreign securities where the ex-dividend date may have passed, which are recorded as soon as the Fund is informed of the ex-dividend date. Non-cash dividends included in dividend income, if any, are recorded at the fair market value of the securities received. Income and capital gain distributions from Fidelity Central Funds, if any, are recorded on the ex-dividend date. Distributions received on securities that represent a return of capital or capital gain are recorded as a reduction of cost of investments and/or as a realized gain. Subsequent to ex-dividend date the Fund determines the components of these distributions, based upon receipt of tax filings or other correspondence relating to the underlying investment. Interest income is accrued as earned and includes coupon interest and amortization of premium and accretion of discount on debt securities as applicable Investment income is recorded net of foreign taxes withheld where recovery of such taxes is uncertain.
Class Allocations and Expenses. Investment income, realized and unrealized capital gains and losses, common expenses of the Fund, and certain fund-level expense reductions, if any, are allocated daily on a pro-rata basis to each class based on the relative net assets of each class to the total net assets of the Fund. Each class differs with respect to transfer agent and distribution and service plan fees incurred. Certain expense reductions may also differ by class. For the reporting period, the allocated portion of income and expenses to each class as a percent of its average net assets may vary due to the timing of recording these transactions in relation to fluctuating net assets of the classes. Expenses directly attributable to a fund are charged to that fund. Expenses attributable to more than one fund are allocated among the respective funds on the basis of relative net assets or other appropriate methods. Expense estimates are accrued in the period to which they relate and adjustments are made when actual amounts are known.
Income Tax Information and Distributions to Shareholders. Each year, the Fund intends to qualify as a regulated investment company under Subchapter M of the Internal Revenue Code, including distributing substantially all of its taxable income and realized gains. As a result, no provision for U.S. Federal income taxes is required. As of December 31, 2014, the Fund did not have any unrecognized tax benefits in the financial statements; nor is the Fund aware of any tax positions for which it is reasonably possible that the total amounts of unrecognized tax benefits will significantly change in the next twelve months. The Fund files a U.S. federal tax return, in addition to state and local tax returns as required. The Fund’s federal income tax returns are subject to examination by the Internal Revenue Service (IRS) for a period of three fiscal years after they are filed. State and local tax returns may be subject to examination for an additional fiscal year depending on the jurisdiction. Foreign taxes are provided for based on the Fund’s understanding of the tax rules and rates that exist in the foreign markets in which it invests.
Distributions are declared and recorded on the ex-dividend date. Income dividends and capital gain distributions are declared separately for each class. Income and capital gain distributions are determined in accordance with income tax regulations, which may differ from GAAP.
Capital accounts within the financial statements are adjusted for permanent book-tax differences. These adjustments have no impact on net assets or the results of operations. Capital accounts are not adjusted for temporary book-tax differences which will reverse in a subsequent period.
Book-tax differences are primarily due to foreign currency transactions, partnerships, passive foreign investment companies (PFIC) and losses deferred due to wash sales.
3. Significant Accounting Policies – continued
Income Tax Information and Distributions to Shareholders – continued
The federal tax cost of investment securities and unrealized appreciation (depreciation) as of period end were as follows:
| Gross unrealized appreciation | | $ | 1,652,928,565 | |
| Gross unrealized depreciation | | | (203,098,895 | ) |
| Net unrealized appreciation (depreciation) on securities | | $ | 1,449,829,670 | |
| | | | | |
| Tax Cost | | $ | 7,681,522,469 | |
| | | | | |
| The tax-based components of distributable earnings as of period end were as follows: | | | | |
| | | | | |
| Undistributed tax-exempt income | | $ | 1,063,536,853 | |
| Undistributed long-term capital gain | | $ | 1,449,792,490 | |
The tax character of distributions paid was as follows:
| | | December 31, 2014 | | | December 31, 2013 | |
| Ordinary Income | | $ | 87,283,265 | | | $ | 447,151,917 | |
| Long-term Capital Gains | | | 132,570,212 | | | | 659,139,949 | |
| Total | | $ | 219,853,477 | | | $ | 1,106,291,866 | |
New Accounting Pronouncement. In June 2014, the Financial Accounting Standards Board issued Accounting Standard Update No. 2014-11, Repurchase-to-Maturity Transactions, Repurchase Financings, and Disclosures. The Update amends the accounting for certain repurchase agreements and expands disclosure requirements for reverse repurchase agreements, securities lending and other similar transactions. The disclosure requirements are effective for annual and interim reporting periods beginning after December 15, 2014. Management is currently evaluating the impact of the Update on the Fund’s financial statements and related disclosures.
4. Purchases and Sales of Investments.
Purchases and sales of securities, other than short-term securities, aggregated $12,702,830,134 and $13,315,297,106, respectively.
5. Fees and Other Transactions with Affiliates.
Management Fee. Fidelity Management & Research Company (the investment adviser) and its affiliates provide the Fund with investment management related services for which the Fund pays a monthly management fee. The management fee is the sum of an individual fund fee rate that is based on an annual rate of .30% of the Fund’s average net assets and an annualized group fee rate that averaged ..25% during the period. The group fee rate is based upon the average net assets of all the mutual funds advised by the investment adviser, including any mutual funds previously advised by the investment adviser that are currently advised by Fidelity SelectCo, LLC, an affiliate of the investment adviser. The group fee rate decreases as assets under management increase and increases as assets under management decrease. For the reporting period, the total annual management fee rate was .55% of the Fund’s average net assets.
Distribution and Service Plan Fees. In accordance with Rule 12b-1 of the 1940 Act, the Fund has adopted separate 12b-1 Plans for each Service Class of shares. Each Service Class pays Fidelity Distributors Corporation (FDC), an affiliate of the investment adviser, a service fee. For the period, the service fee is based on an annual rate of .10% of Service Class’ average net assets and ..25% of Service Class 2’s average net assets.
For the period, total fees, all of which were re-allowed to insurance companies for the distribution of shares and providing shareholder support services were as follows:
| Service Class | | $ | 624,495 | |
| Service Class 2 | | | 16,060,325 | |
| | | $ | 16,684,820 | |
Transfer Agent Fees. Fidelity Investments Institutional Operations Company, Inc. (FIIOC), an affiliate of the investment adviser, is the Fund’s transfer, dividend disbursing, and shareholder servicing agent. FIIOC receives an asset-based fee with respect to each class. Each class (with the exception of Investor Class) pays a fee for transfer agent services, typesetting, printing and mailing of shareholder reports, excluding mailing of proxy
Notes to Financial Statements – continued
5. Fees and Other Transactions with Affiliates – continued
Transfer Agent Fees – continued
statements and out of pocket expenses, equal to an annual rate of .07% (.15% for Investor Class) of class-level average net assets. For the period, transfer agent fees for each class, including out of pocket expenses, were as follows:
| Initial Class | | $ | 964,198 | |
| Service Class | | | 412,055 | |
| Service Class 2 | | | 4,211,709 | |
| Investor Class | | | 721,140 | |
| | | $ | 6,309,102 | |
Accounting and Security Lending Fees. Fidelity Service Company, Inc. (FSC), an affiliate of the investment adviser, maintains the Fund’s accounting records. The accounting fee is based on the level of average net assets for each month. Under a separate contract, FSC administers the security lending program. The security lending fee is based on the number and duration of lending transactions.
Brokerage Commissions. The Fund placed a portion of its portfolio transactions with brokerage firms which are affiliates of the investment adviser. Brokerage commissions are included in net realized gain (loss) and change in net unrealized appreciation (depreciation) in the Statement of Operations. The commissions paid to these affiliated firms were $43,091 for the period.
Interfund Lending Program. Pursuant to an Exemptive Order issued by the SEC, the Fund, along with other registered investment companies having management contracts with Fidelity Management & Research Company (FMR) or other affiliated entities of FMR, may participate in an interfund lending program. This program provides an alternative credit facility allowing the funds to borrow from, or lend money to, other participating affiliated funds. At period end, there were no interfund loans outstanding. The Fund’s activity in this program during the period for which loans were outstanding was as follows:
| | | Average Loan | | | Weighted Average | | | | |
| Borrower or Lender | | Balance | | | Interest Rate | | | Interest Expense | |
| Borrower | | $ | 15,142,476 | | | | .33 | % | | $ | 5,817 | |
Other. During the period, the investment adviser reimbursed the Fund for certain losses in the amount of $40,714.
6. Committed Line of Credit.
The Fund participates with other funds managed by the investment adviser or an affiliate in a $4.25 billion credit facility (the “line of credit”) to be utilized for temporary or emergency purposes to fund shareholder redemptions or for other short-term liquidity purposes. The Fund has agreed to pay commitment fees on its pro-rata portion of the line of credit, which amounted to $14,521 and is reflected in Miscellaneous expenses on the Statement of Operations. During the period, the Fund did not borrow on this line of credit.
7. Security Lending.
The Fund lends portfolio securities through a lending agent from time to time in order to earn additional income. For equity securities, a lending agent is used and may loan securities to certain qualified borrowers, including Fidelity Capital Markets (FCM), a broker-dealer affiliated with the Fund. On the settlement date of the loan, the Fund receives collateral (in the form of U.S. Treasury obligations, letters of credit and/or cash) against the loaned securities and maintains collateral in an amount not less than 100% of the market value of the loaned securities during the period of the loan. The market value of the loaned securities is determined at the close of business of the Fund and any additional required collateral is delivered to the Fund on the next business day. If the borrower defaults on its obligation to return the securities loaned because of insolvency or other reasons, the Fund may apply collateral received from the borrower against the obligation. The Fund may experience delays and costs in recovering the securities loaned. Any cash collateral received is invested in the Fidelity Securities Lending Cash Central Fund. The value of loaned securities and cash collateral at period end are disclosed on the Fund’s Statement of Assets and Liabilities. At period end, there were no security loans outstanding with FCM. Security lending income represents the income earned on investing cash collateral, less rebates paid to borrowers and any lending agent fees associated with the loan, plus any premium payments received for lending certain types of securities. Security lending income is presented in the Statement of Operations as a component of income from Fidelity Central Funds. Total security lending income during the period amounted to $494,563, including $25,008 from securities loaned to FCM.
8. Bank Borrowings.
The Fund is permitted to have bank borrowings for temporary or emergency purposes to fund shareholder redemptions or for other short-term liquidity requirements. The Fund has established borrowing arrangements with certain banks. The interest rate on the borrowings is the bank’s base rate, as revised from time to time. The average loan balance during the period for which loans were outstanding amounted to $3,545,286. The weighted average interest rate was .63%. The interest expense amounted to $434 under the bank borrowing program.
9. Expense Reductions.
Commissions paid to certain brokers with whom the investment adviser, or its affiliates, places trades on behalf of the Fund include an amount in addition to trade execution, which may be rebated back to the Fund to offset certain expenses. This amount totaled $678,736 for the period. In addition, through arrangements with the Fund’s custodian, credits realized as a result of uninvested cash balances were used to reduce the Fund’s expenses. During the period, these credits reduced the Fund’s custody expenses by $163.
10. Distributions to Shareholders.
Distributions to shareholders of each class were as follows:
| Years ended December 31, | | 2014 | | | 2013 | |
| From net investment income | | | | | | |
| Initial Class | | $ | 3,774,917 | | | $ | 6,789,315 | |
| Service Class | | | 990,351 | | | | 2,369,936 | |
| Service Class 2 | | | 1,215,921 | | | | 16,251,142 | |
| Investor Class | | | 904,982 | | | | 1,843,450 | |
| Total | | $ | 6,886,171 | | | $ | 27,253,843 | |
| From net realized gain | | | | | | | | |
| Initial Class | | $ | 34,174,917 | | | $ | 171,844,111 | |
| Service Class | | | 14,603,745 | | | | 74,572,730 | |
| Service Class 2 | | | 153,016,366 | | | | 779,239,197 | |
| Investor Class | | | 11,172,278 | | | | 53,381,985 | |
| Total | | $ | 212,967,306 | | | $ | 1,079,038,023 | |
11. Share Transactions.
Transactions for each class of shares were as follows:
| | | Shares | | | Dollars | |
| Years ended December 31, | | 2014 | | | 2013 | | | 2014 | | | 2013 | |
| Initial Class | | | | | | | | | | | | | | | | |
| Shares sold | | | 3,868,698 | | | | 5,558,226 | | | $ | 141,786,603 | | | $ | 193,708,862 | |
| Reinvestment of distributions | | | 1,054,394 | | | | 5,179,580 | | | | 37,949,834 | | | | 178,633,426 | |
| Shares redeemed | | | (6,692,546 | ) | | | (9,638,376 | ) | | | (244,766,127 | ) | | | (335,902,909 | ) |
| Net increase (decrease) | | | (1,769,454 | ) | | | 1,099,430 | | | $ | (65,029,690 | ) | | $ | 36,439,379 | |
| Service Class | | | | | | | | | | | | | | | | |
| Shares sold | | | 1,246,174 | | | | 1,085,616 | | | $ | 45,087,196 | | | $ | 37,988,284 | |
| Reinvestment of distributions | | | 437,179 | | | | 2,245,047 | | | | 15,594,096 | | | | 76,942,666 | |
| Shares redeemed | | | (2,725,033 | ) | | | (2,974,756 | ) | | | (98,952,997 | ) | | | (103,666,319 | ) |
| Net increase (decrease) | | | (1,041,680 | ) | | | 355,907 | | | $ | (38,271,705 | ) | | $ | 11,264,631 | |
| Service Class 2 | | | | | | | | | | | | | | | | |
| Shares sold | | | 12,121,569 | | | | 10,415,479 | | | $ | 436,064,579 | | | $ | 355,999,897 | |
| Reinvestment of distributions | | | 4,408,382 | | | | 23,570,249 | | | | 154,232,287 | | | | 795,490,339 | |
| Shares redeemed | | | (26,657,188 | ) | | | (27,268,029 | ) | | | (947,962,455 | ) | | | (937,258,266 | ) |
| Net increase (decrease) | | | (10,127,237 | ) | | | 6,717,699 | | | $ | (357,665,589 | ) | | $ | 214,231,970 | |
| Investor Class | | | | | | | | | | | | | | | | |
| Shares sold | | | 1,116,739 | | | | 1,638,297 | | | $ | 40,550,127 | | | $ | 57,671,628 | |
| Reinvestment of distributions | | | 336,975 | | | | 1,606,003 | | | | 12,077,260 | | | | 55,225,435 | |
| Shares redeemed | | | (1,012,211 | ) | | | (515,154 | ) | | | (36,794,057 | ) | | | (18,380,954 | ) |
| Net increase (decrease) | | | 441,503 | | | | 2,729,146 | | | $ | 15,833,330 | | | $ | 94,516,109 | |
Notes to Financial Statements – continued
12. Proposed Reorganization.
The Board of Trustees of the Fund approved an Agreement and Plan of Reorganization (the Agreement) between the Fund and VIP Growth Strategies Portfolio. The Agreement provides for the transfer of all the assets and the assumption of all the liabilities of VIP Growth Strategies Portfolio in exchange for corresponding shares of the Fund equal in value to the net assets of VIP Growth Strategies Portfolio on the day the reorganization is effective. The reorganization provides shareholders of VIP Growth Strategies Portfolio access to a larger portfolio with a similar investment objective.
A meeting of shareholders of VIP Growth Strategies Portfolio is expected to be held during the first quarter of 2015 to vote on the reorganization. If approved by shareholders, the reorganization is expected to become effective on or about April 24, 2015. The reorganization is expected to qualify as a tax-free transaction for federal income tax purposes with no gain or loss recognized by the funds or their shareholders.
13. Other.
The Fund’s organizational documents provide former and current trustees and officers with a limited indemnification against liabilities arising in connection with the performance of their duties to the Fund. In the normal course of business, the Fund may also enter into contracts that provide general indemnifications. The Fund’s maximum exposure under these arrangements is unknown as this would be dependent on future claims that may be made against the Fund. The risk of material loss from such claims is considered remote.
At the end of the period, one otherwise unaffiliated shareholder was the owner of record of 10% of the total outstanding shares of the Fund.
Report of Independent Registered Public Accounting Firm
To the Trustees of Variable Insurance Products Fund III and the Shareholders of VIP Mid Cap Portfolio:
In our opinion, the accompanying statement of assets and liabilities, including the schedule of investments, and the related statements of operations and of changes in net assets and the financial highlights present fairly, in all material respects, the financial position of VIP Mid Cap Portfolio (a fund of Variable Insurance Products Fund III) at December 31, 2014, the results of its operations for the year then ended, the changes in its net assets for each of the two years in the period then ended and the financial highlights for each of the five years in the period then ended, in conformity with accounting principles generally accepted in the United States of America. These financial statements and financial highlights (hereafter referred to as “financial statements”) are the responsibility of the VIP Mid Cap Portfolio’s management. Our responsibility is to express an opinion on these financial statements based on our audits. We conducted our audits of these financial statements in accordance with the standards of the Public Company Accounting Oversight Board (United States). Those standards require that we plan and perform the audit to obtain reasonable assurance about whether the financial statements are free of material misstatement. An audit includes examining, on a test basis, evidence supporting the amounts and disclosures in the financial statements, assessing the accounting principles used and significant estimates made by management, and evaluating the overall financial statement presentation. We believe that our audits, which included confirmation of securities at December 31, 2014 by correspondence with the custodian and brokers, provide a reasonable basis for our opinion.
PricewaterhouseCoopers LLP
Boston, Massachusetts
February 12, 2015
Trustees and Officers
The Trustees, Member of the Advisory Board, and officers of the trust and fund, as applicable, are listed below. The Board of Trustees governs the fund and is responsible for protecting the interests of shareholders. The Trustees are experienced executives who meet periodically throughout the year to oversee the fund’s activities, review contractual arrangements with companies that provide services to the fund, oversee management of the risks associated with such activities and contractual arrangements, and review the fund’s performance. Except for James C. Curvey, each of the Trustees oversees 174 funds. Mr. Curvey oversees 407 funds.
The Trustees hold office without limit in time except that (a) any Trustee may resign; (b) any Trustee may be removed by written instrument, signed by at least two-thirds of the number of Trustees prior to such removal; (c) any Trustee who requests to be retired or who has become incapacitated by illness or injury may be retired by written instrument signed by a majority of the other Trustees; and (d) any Trustee may be removed at any special meeting of shareholders by a two-thirds vote of the outstanding voting securities of the trust. Each Trustee who is not an interested person (as defined in the 1940 Act) of the trust and the fund (Independent Trustee), shall retire not later than the last day of the calendar year in which his or her 75th birthday occurs. The Independent Trustees may waive this mandatory retirement age policy with respect to individual Trustees. The officers and Advisory Board Member hold office without limit in time, except that any officer and Advisory Board Member may resign or may be removed by a vote of a majority of the Trustees at any regular meeting or any special meeting of the Trustees. Except as indicated, each individual has held the office shown or other offices in the same company for the past five years.
Experience, Skills, Attributes, and Qualifications of the Fund’s Trustees. The Governance and Nominating Committee has adopted a statement of policy that describes the experience, qualifications, attributes, and skills that are necessary and desirable for potential Independent Trustee candidates (Statement of Policy). The Board believes that each Trustee satisfied at the time he or she was initially elected or appointed a Trustee, and continues to satisfy, the standards contemplated by the Statement of Policy. The Governance and Nominating Committee also engages professional search firms to help identify potential Independent Trustee candidates who have the experience, qualifications, attributes, and skills consistent with the Statement of Policy. From time to time, additional criteria based on the composition and skills of the current Independent Trustees, as well as experience or skills that may be appropriate in light of future changes to board composition, business conditions, and regulatory or other developments, have also been considered by the professional search firms and the Governance and Nominating Committee. In addition, the Board takes into account the Trustees’ commitment and participation in Board and committee meetings, as well as their leadership of standing and ad hoc committees throughout their tenure.
In determining that a particular Trustee was and continues to be qualified to serve as a Trustee, the Board has considered a variety of criteria, none of which, in isolation, was controlling. The Board believes that, collectively, the Trustees have balanced and diverse experience, qualifications, attributes, and skills, which allow the Board to operate effectively in governing the fund and protecting the interests of shareholders. Information about the specific experience, skills, attributes, and qualifications of each Trustee, which in each case led to the Board’s conclusion that the Trustee should serve (or continue to serve) as a trustee of the fund, is provided below.
Board Structure and Oversight Function. James C. Curvey is an interested person (as defined in the 1940 Act) and currently serves as Chairman. The Trustees have determined that an interested Chairman is appropriate and benefits shareholders because an interested Chairman has a personal and professional stake in the quality and continuity of services provided to the fund. Independent Trustees exercise their informed business judgment to appoint an individual of their choosing to serve as Chairman, regardless of whether the Trustee happens to be independent or a member of management. The Independent Trustees have determined that they can act independently and effectively without having an Independent Trustee serve as Chairman and that a key structural component for assuring that they are in a position to do so is for the Independent Trustees to constitute a substantial majority for the Board. The Independent Trustees also regularly meet in executive session. Ned C. Lautenbach serves as Chairman of the Independent Trustees and as such (i) acts as a liaison between the Independent Trustees and management with respect to matters important to the Independent Trustees and (ii) with management prepares agendas for Board meetings.
Fidelity funds are overseen by different Boards of Trustees. The fund’s Board oversees Fidelity’s equity and high income funds and another Board oversees Fidelity’s investment-grade bond, money market, and asset allocation funds. The asset allocation funds may invest in Fidelity funds over-seen by the fund’s Board. The use of separate Boards, each with its own committee structure, allows the Trustees of each group of Fidelity funds to focus on the unique issues of the funds they oversee, including common research, investment, and operational issues. On occasion, the separate Boards establish joint committees to address issues of overlapping consequences for the Fidelity funds overseen by each Board.
The Trustees operate using a system of committees to facilitate the timely and efficient consideration of all matters of importance to the Trustees, the fund, and fund shareholders and to facilitate compliance with legal and regulatory requirements and oversight of the fund’s activities and associated risks. The Board, acting through its committees, has charged FMR and its affiliates with (i) identifying events or circumstances the occurrence of which could have demonstrably adverse effects on the fund’s business and/or reputation; (ii) implementing processes and controls to lessen the possibility that such events or circumstances occur or to mitigate the effects of such events or circumstances if they do occur; and (iii) creating and maintaining a system designed to evaluate continuously business and market conditions in order to facilitate the identification and implementation processes described in (i) and (ii) above. Because the day-to-day operations and activities of the fund are carried out by or through FMR, its affiliates and other service providers, the fund’s exposure to risks is mitigated but not eliminated by the processes overseen by the Trustees. While each of the Board’s committees has responsibility for overseeing different aspects of the fund’s activities, oversight is exercised primarily through the Operations, Audit, and Compliance Committees. In addition, the Independent Trustees have worked with FMR to enhance the Board’s oversight of investment and financial risks, legal and regulatory risks, technology risks, and operational risks, including the development of additional risk reporting to the Board. For example, a working group comprised of Independent Trustees and FMR has worked and continues to work to
review the Fidelity funds’ valuation-related activities, reporting and risk management. Appropriate personnel, including but not limited to the fund’s Chief Compliance Officer (CCO), FMR’s internal auditor, the independent accountants, the fund’s Treasurer and portfolio management personnel, make periodic reports to the Board’s committees, as appropriate, including an annual review of FMR’s risk management program for the Fidelity funds. The responsibilities of each standing committee, including their oversight responsibilities, are described further under “Standing Committees of the Fund’s Trustees.”
The fund’s Statement of Additional Information (SAI) includes more information about the Trustees. To request a free copy, call Fidelity at 1-877-208-0098.
Interested Trustees*:
Correspondence intended for each Trustee who is an interested person may be sent to Fidelity Investments, 245 Summer Street, Boston, Massachusetts 02210.
Name, Year of Birth; Principal Occupations and Other Relevant Experience+
James C. Curvey (1935)
Year of Election or Appointment: 2007
Trustee
Chairman of the Board of Trustees
Mr. Curvey also serves as Trustee of other Fidelity funds. Mr. Curvey is a Director of Fidelity Research & Analysis Co. (2009-present), and Vice Chairman (2007-present) and Director of FMR LLC. In addition, Mr. Curvey serves as an Overseer for the Boston Symphony Orchestra and a member of the board of Artis-Naples, Naples, Florida, and as a Trustee for Brewster Academy, Wolfeboro, New Hampshire. Previously, Mr. Curvey served as a Director of Fidelity Investments Money Management, Inc. (2009-2014), a Director of FMR (2007-2014), and a Director of FMR Co., Inc. (2007-2014).
Charles S. Morrison (1960)
Year of Election or Appointment: 2014
Trustee
Mr. Morrison also serves as Trustee of other funds. He serves as a Director of Fidelity Investments Money Management, Inc. (FIMM) (2014-present), Director of Fidelity SelectCo, LLC (2014-present), President, Asset Management (2014-present), and is an employee of Fidelity Investments. Previously, Mr. Morrison served as Vice President of Fidelity's Fixed Income and Asset Allocation Funds (2012-2014), President, Fixed Income (2011-2014), Vice President of Fidelity's Money Market Funds (2005-2009), President, Money Market Group Leader of FMR (2009), and Senior Vice President, Money Market Group of FMR (2004-2009). Mr. Morrison also served as Vice President of Fidelity's Bond Funds (2002-2005), certain Balanced Funds (2002-2005), and certain Asset Allocation Funds (2002-2007), and as Senior Vice President (2002-2005) of Fidelity's Bond Division.
| * | Trustees have been determined to be “Interested Trustees” by virtue of, among other things, their affiliation with the trust or various entities under common control with FMR. |
| + | The information above includes each Trustee’s principal occupation during the last five years and other information relating to the experience, attributes, and skills relevant to each Trustee’s qualifications to serve as a Trustee, which led to the conclusion that each Trustee should serve as a Trustee for the fund. |
Independent Trustees:
Correspondence intended for each Independent Trustee (that is, the Trustees other than the Interested Trustees) may be sent to Fidelity Investments, P.O. Box 55235, Boston, Massachusetts 02205-5235.
Name, Year of Birth; Principal Occupations and Other Relevant Experience+
Dennis J. Dirks (1948)
Year of Election or Appointment: 2005
Trustee
Mr. Dirks also serves as Trustee of other Fidelity funds. Prior to his retirement in May 2003, Mr. Dirks was Chief Operating Officer and a member of the Board of The Depository Trust & Clearing Corporation (DTCC). He also served as President, Chief Operating Officer, and Board member of The Depository Trust Company (DTC) and President and Board member of the National Securities Clearing Corporation (NSCC). In addition, Mr. Dirks served as Chief Executive Officer and Board member of the Government Securities Clearing Corporation, Chief Executive Officer and Board member of the Mortgage-Backed Securities Clearing Corporation, as a Trustee and a member of the Finance Committee of Manhattan College (2005-2008), and as a Trustee and a member of the Finance Committee of AHRC of Nassau County (2006-2008). Mr. Dirks is a member of the Independent Directors Council (IDC) Governing Council (2010-present) and Board of Directors for The Brookville Center for Children's Services, Inc. (2009-present).
Trustees and Officers – continued
Name, Year of Birth; Principal Occupations and Other Relevant Experience+
Alan J. Lacy (1953)
Year of Election or Appointment: 2008
Trustee
Mr. Lacy also serves as Trustee of other Fidelity funds. Mr. Lacy serves as a member of the Board of Directors of Dave & Buster's Entertainment, Inc. (restaurant and entertainment complexes, 2010-present) and Bristol-Myers Squibb Company (global pharmaceuticals, 2008-present). In addition, Mr. Lacy served as Senior Adviser (2007-2014) of Oak Hill Capital Partners, L.P. (private equity) and also served as Chief Executive Officer (2000-2005) and Vice Chairman (2005-2006) of Sears Holdings Corporation and Sears, Roebuck and Co. (retail). Mr. Lacy is a member of the Board of Trustees of The National Parks Conservation Association (2006-present). Previously, Mr. Lacy served as Chairman of the Board of Trustees of the National Parks Conservation Association (2008-2011) and as a member of the Board of Directors for The Western Union Company (global money transfer, 2006-2011), The Hillman Companies, Inc. (hardware wholesalers, 2010-2014), and Earth Fare, Inc. (retail grocery, 2010-2014).
Ned C. Lautenbach (1944)
Year of Election or Appointment: 2000
Trustee
Chairman of the Independent Trustees
Mr. Lautenbach also serves as Trustee of other Fidelity funds. Mr. Lautenbach currently serves as the Lead Director of the Eaton Corporation Board of Directors (diversified industrial, 1997-present). Mr. Lautenbach is Chairman of the Board of Directors of Artis-Naples in Naples, Florida (2012-present), a member of the Council on Foreign Relations (1994-present), and a member of the Board of Governors, State University System of Florida (2013-present). Previously, Mr. Lautenbach was a Partner/Advisory Partner at Clayton, Dubilier & Rice, LLC (private equity investment, 1998-2010), as well as a Director of Sony Corporation (2006-2007).
Joseph Mauriello (1944)
Year of Election or Appointment: 2008
Trustee
Mr. Mauriello also serves as Trustee of other Fidelity funds. Prior to his retirement in January 2006, Mr. Mauriello served in numerous senior management positions including Deputy Chairman and Chief Operating Officer (2004-2005), and Vice Chairman of Financial Services (2002-2004) of KPMG LLP US (professional services, 1965-2005). Mr. Mauriello currently serves as a member of the Board of Directors of XL Group plc. (global insurance and re-insurance, 2006-present). Previously, Mr. Mauriello served as a Director of the Hamilton Funds of the Bank of New York (2006-2007) and of Arcadia Resources Inc. (health care services and products, 2007-2012).
Robert W. Selander (1950)
Year of Election or Appointment: 2011
Trustee
Mr. Selander also serves as Trustee of other Fidelity funds. Mr. Selander serves as a Director of The Western Union Company (global money transfer, 2014-present). Previously, Mr. Selander served as a Member of the Advisory Board of other Fidelity funds (2011), and Executive Vice Chairman (2010), Chief Executive Officer (2009-2010), and President and Chief Executive Officer (1997-2009) of Mastercard, Inc.
Cornelia M. Small (1944)
Year of Election or Appointment: 2005
Trustee
Ms. Small also serves as Trustee of other Fidelity funds. Ms. Small is a member of the Board of Directors (2009-present) and Chair of the Investment Committee (2010-present) of the Teagle Foundation. Ms. Small also serves on the Investment Committee of the Berkshire Taconic Community Foundation (2008-present). Previously, Ms. Small served as Chairperson (2002-2008) and a member of the Investment Committee and Chairperson (2008-2012) and a member of the Board of Trustees of Smith College. In addition, Ms. Small served as Chief Investment Officer, Director of Global Equity Investments, and a member of the Board of Directors of Scudder, Stevens & Clark and Scudder Kemper Investments.
Name, Year of Birth; Principal Occupations and Other Relevant Experience+
William S. Stavropoulos (1939)
Year of Election or Appointment: 2002
Trustee
Vice Chairman of the Independent Trustees
Mr. Stavropoulos also serves as Trustee of other Fidelity funds. Mr. Stavropoulos serves as President and Founder of the Michigan Baseball Foundation, the Great Lakes Loons (2007-present). Mr. Stavropoulos is Chairman Emeritus of the Board of Directors of The Dow Chemical Company, where he previously served in numerous senior management positions, including President, CEO (1995-2000; 2002-2004), Chairman of the Executive Committee (2000-2006), and as a member of the Board of Directors (1990-2006). Currently, Mr. Stavropoulos is Chairman of the Board of Directors of Univar Inc. (global distributor of commodity and specialty chemicals), a Director of Teradata Corporation (data warehousing and technology solutions), and Maersk Inc. (industrial conglomerate), and a member of the Advisory Board for Metalmark Capital LLC (private equity investment, 2005-present). Mr. Stavropoulos is an operating advisor to Clayton, Dubilier & Rice, LLC (private equity investment). In addition, Mr. Stavropoulos is a member of the University of Notre Dame Advisory Council for the College of Science, a Trustee of the Rollin L. Gerstacker Foundation, and a Director of the Naples Philharmonic Center for the Arts. Previously, Mr. Stavropoulos served as a Director of Chemical Financial Corporation (bank holding company, 1993-2012) and Tyco International, Ltd. (multinational manufacturing and services, 2007-2012).
David M. Thomas (1949)
Year of Election or Appointment: 2008
Trustee
Mr. Thomas also serves as Trustee of other Fidelity funds. Mr. Thomas serves as Non-Executive Chairman of the Board of Directors of Fortune Brands Home and Security (home and security products, 2011-present), as a member of the Board of Directors (2004-present) and Presiding Director (2013-present) of Interpublic Group of Companies, Inc. (marketing communication), and as a member of the Board of Trustees of the University of Florida (2013-present). Previously, Mr. Thomas served as Executive Chairman (2005-2006) and Chairman and Chief Executive Officer (2000-2005) of IMS Health, Inc. (pharmaceutical and healthcare information solutions), and a Director of Fortune Brands, Inc. (consumer products, 2000-2011).
| + | The information above includes each Trustee’s principal occupation during the last five years and other information relating to the experience, attributes, and skills relevant to each Trustee’s qualifications to serve as a Trustee, which led to the conclusion that each Trustee should serve as a Trustee for the fund. |
Advisory Board Member and Officers:
Correspondence intended for each officer and Peter S. Lynch may be sent to Fidelity Investments, 245 Summer Street, Boston, Massachusetts 02210. Officers appear below in alphabetical order.
Name, Year of Birth; Principal Occupation
Peter S. Lynch (1944)
Year of Election or Appointment: 2003
Member of the Advisory Board
Mr. Lynch also serves as Member of the Advisory Board of other Fidelity funds. Mr. Lynch is Vice Chairman and a Director of FMR and FMR Co., Inc. In addition, Mr. Lynch serves as a Trustee of Boston College and as the Chairman of the Inner-City Scholarship Fund. Previously, Mr. Lynch served on the Special Olympics International Board of Directors (1997-2006).
Elizabeth Paige Baumann (1968)
Year of Election or Appointment: 2012
Anti-Money Laundering (AML) Officer
Ms. Baumann also serves as AML Officer of other funds. She is Chief AML Officer of FMR LLC (2012-present) and is an employee of Fidelity Investments. Previously, Ms. Baumann served as Vice President and Deputy Anti-Money Laundering Officer (2007-2012).
William C. Coffey (1969)
Year of Election or Appointment: 2009
Assistant Secretary
Mr. Coffey also serves as Assistant Secretary of other funds. He is Senior Vice President and Deputy General Counsel of FMR LLC (2010-present), and is an employee of Fidelity Investments. Previously, Mr. Coffey served as Vice President and Associate General Counsel of FMR LLC (2005-2009).
Trustees and Officers – continued
Name, Year of Birth; Principal Occupation
Jonathan Davis (1968)
Year of Election or Appointment: 2010
Assistant Treasurer
Mr. Davis also serves as Assistant Treasurer of other funds. Mr. Davis is an employee of Fidelity Investments. Previously, Mr. Davis served as Vice President and Associate General Counsel of FMR LLC (2003-2010).
Adrien E. Deberghes (1967)
Year of Election or Appointment: 2008
Deputy Treasurer
Mr. Deberghes also serves as an officer of other funds. He is an employee of Fidelity Investments (2008-present). Prior to joining Fidelity Investments, Mr. Deberghes was Senior Vice President of Mutual Fund Administration at State Street Corporation (2007-2008), Senior Director of Mutual Fund Administration at Investors Bank & Trust (2005-2007), and Director of Finance for Dunkin’ Brands (2000-2005).
Stephanie J. Dorsey (1969)
Year of Election or Appointment: 2010
Assistant Treasurer
Ms. Dorsey also serves as an officer of other funds. She is an employee of Fidelity Investments (2008-present) and has served in other fund officer roles. Prior to joining Fidelity Investments, Ms. Dorsey served as Treasurer (2004-2008) of the JPMorgan Mutual Funds and Vice President (2004-2008) of JPMorgan Chase Bank.
Howard J. Galligan III (1966)
Year of Election or Appointment: 2014
Chief Financial Officer
Mr. Galligan also serves as Chief Financial Officer of other funds. Mr. Galligan serves as President of Fidelity Pricing and Cash Management Services (FPCMS) (2014-present) and as a Director of Strategic Advisers, Inc. (2008-present). Previously, Mr. Galligan served as Chief Administrative Officer of Asset Management (2011-2014) and Chief Operating Officer and Senior Vice President of Investment Support for Strategic Advisers, Inc. (2003-2011).
Scott C. Goebel (1968)
Year of Election or Appointment: 2008
Secretary and Chief Legal Officer (CLO)
Mr. Goebel serves as Secretary and CLO of other funds. Mr. Goebel also serves as Secretary of Fidelity SelectCo, LLC (2013-present), Fidelity Investments Money Management, Inc. (FIMM) (2010-present) and Fidelity Research and Analysis Company (FRAC) (2010-present); General Counsel, Secretary, and Senior Vice President of FMR (2008-present) and FMR Co., Inc. (2008-present); Chief Legal Officer of Fidelity Management & Research (Hong Kong) Limited (2008-present); and Assistant Secretary of Fidelity Management & Research (Japan) Limited (2008-present) and Fidelity Management & Research (U.K.) Inc. (2008-present). Previously, Mr. Goebel served as Secretary and CLO of other Fidelity funds (2008-2013), Assistant Secretary of FIMM (2008-2010), FRAC (2008-2010), and certain funds (2007-2008); and as Vice President and Secretary of Fidelity Distributors Corporation (FDC) (2005-2007). Mr. Goebel has been employed by FMR LLC or an affiliate since 2001.
Brian B. Hogan (1964)
Year of Election or Appointment: 2009
Vice President
Mr. Hogan also serves as Trustee or Vice President of other funds. Mr. Hogan serves as a Director of Fidelity SelectCo, LLC (2014-present) and President of FMR's Equity Division (2009-present). Previously, Mr. Hogan served as Senior Vice President, Equity Research of FMR (2006-2009) and as a portfolio manager.
Chris Maher (1972)
Year of Election or Appointment: 2013
Assistant Treasurer
Mr. Maher serves as Assistant Treasurer of other funds. Mr. Maher is Vice President of Valuation Oversight and is an employee of Fidelity Investments. Previously, Mr. Maher served as Vice President of Asset Management Compliance (2013), Vice President of FMR's Program Management Group (2010-2013), and Vice President of Valuation Oversight (2008-2010).
Melissa M. Reilly (1971)
Year of Election or Appointment: 2014
Vice President of certain Equity Funds
Ms. Reilly also serves as Vice President of other funds. Ms. Reilly is an employee of Fidelity Investments (2004-present).
Name, Year of Birth; Principal Occupation
Kenneth B. Robins (1969)
Year of Election or Appointment: 2008
President and Treasurer
Mr. Robins also serves as an officer of other funds. Mr. Robins serves as Executive Vice President of Fidelity Investments Money Management, Inc. (FIMM) (2013-present) and is an employee of Fidelity Investments (2004-present). Previously, Mr. Robins served in other fund officer roles.
Stephen Sadoski (1971)
Year of Election or Appointment: 2012
Deputy Treasurer
Mr. Sadoski also serves as Deputy Treasurer of other funds. He is an employee of Fidelity Investments (2012-present) and has served in another fund officer role. Prior to joining Fidelity Investments, Mr. Sadoski served as an assistant chief accountant in the Division of Investment Management of the Securities and Exchange Commission (SEC) (2009-2012) and as a senior manager at Deloitte & Touche LLP (1997-2009).
Stacie M. Smith (1974)
Year of Election or Appointment: 2013
Deputy Treasurer
Ms. Smith also serves as an officer of other funds. She is an employee of Fidelity Investments (2009-present) and has served in other fund officer roles. Prior to joining Fidelity Investments, Ms. Smith served as Senior Audit Manager of Ernst & Young LLP (1996-2009).
Renee Stagnone (1975)
Year of Election or Appointment: 2013
Deputy Treasurer
Ms. Stagnone also serves as Deputy Treasurer of other funds. Ms. Stagnone is an employee of Fidelity Investments.
Linda J. Wondrack (1964)
Year of Election or Appointment: 2014
Chief Compliance Officer
Ms. Wondrack also serves as Chief Compliance Officer of other funds. Ms. Wondrack is Executive Vice President and head of the Ethics Office and Asset Management Compliance for Fidelity Investments (2012-present). Ms. Wondrack also serves as Chief Compliance Officer of Fidelity SelectCo, LLC (2014-present); Chief Compliance Officer of Impresa Management LLC (2013-present); and Chief Compliance Officer of FMR Co., Inc., Fidelity Investments Money Management, Inc., Fidelity Management & Research (Japan) Limited, Fidelity Management & Research (U.K.) Inc., Fidelity Management & Research (Hong Kong), Fidelity Management & Research Company, Pyramis Global Advisors, LLC, and Strategic Advisers, Inc., Ballyrock Investment Advisors LLC, and Northern Neck Investors LLC (2012-present). Previously, Ms. Wondrack served as Senior Vice President and Chief Compliance Officer for Columbia Management Investment Advisers, LLC (2005-2012); Chief Compliance Officer for certain funds within the Columbia Family of Funds (2007-2012); and Senior Vice President of Compliance Risk Management at Bank of America (2005-2010).
Joseph F. Zambello (1957)
Year of Election or Appointment: 2011
Deputy Treasurer
Mr. Zambello also serves as Deputy Treasurer of other funds. Mr. Zambello is an employee of Fidelity Investments. Previously, Mr. Zambello served as Vice President of FMR's Program Management Group (2009-2011) and Vice President of the Transfer Agent Oversight Group (2005-2009).
Distributions (Unaudited)
The Board of Trustees of VIP Mid Cap Portfolio voted to pay to shareholders of record at the opening of business on record date, the following distributions per share derived from capital gains realized from sales of portfolio securities:
| | | Pay Date | | Record Date | | Capital Gains | |
| Initial Class | | 02/06/15 | | 02/06/15 | | $ | 4.403 | |
| Service Class | | 02/06/15 | | 02/06/15 | | $ | 4.403 | |
| Service Class 2 | | 02/06/15 | | 02/06/15 | | $ | 4.403 | |
| Investor Class | | 02/06/15 | | 02/06/15 | | $ | 4.403 | |
The fund hereby designates as a capital gain dividend with respect to the taxable year ended December 31, 2014 $1,110,302,659, or, if subsequently determined to be different, the net capital gain of such year.
Initial Class designates 1% and 72%; Service Class designates 1% and 80%; Service Class 2 designates 1% and 94%; and Investor Class designates 1% and 78% of the dividends distributed in February and December 2014, respectively during the fiscal year as qualifying for the dividends-received deduction for corporate shareholders.
Board Approval of Investment Advisory Contracts and Management Fees
VIP Mid Cap Portfolio
Each year, the Board of Trustees, including the Independent Trustees (together, the Board), votes on the renewal of the management contract with Fidelity Management & Research Company (FMR) and the sub-advisory agreements (together, the Advisory Contracts) for the fund. The Board, assisted by the advice of fund counsel and Independent Trustees’ counsel, requests and considers a broad range of information relevant to the renewal of the Advisory Contracts throughout the year.
The Board meets regularly and, at each of its meetings, covers an extensive agenda of topics and materials and considers factors that are relevant to its annual consideration of the renewal of the fund’s Advisory Contracts, including the services and support provided to the fund and its shareholders. The Board has established various standing committees (Committees), each composed of and chaired by Independent Trustees with varying backgrounds, to which the Board has assigned specific subject matter responsibilities in order to enhance effective decision-making by the Board. The Board, acting directly and through its Committees, requests and receives information concerning the annual consideration of the renewal of the fund’s Advisory Contracts. The Board also meets as needed to consider matters specifically related to the Board’s annual consideration of the renewal of the Advisory Contracts. Members of the Board may also meet with trustees of other Fidelity funds through ad hoc joint committees to discuss certain matters relevant to the Fidelity funds.
At its July 2014 meeting, the Board, including the Independent Trustees, unanimously determined to renew the fund’s Advisory Contracts. In reaching its determination, the Board considered all factors it believed relevant, including (i) the nature, extent, and quality of the services to be provided to the fund and its shareholders (including the investment performance of the fund); (ii) the competitiveness of the fund’s management fee and total expense ratio relative to peer funds; (iii) the total costs of the services to be provided by and the profits to be realized by Fidelity from its relationship with the fund; (iv) the extent to which economies of scale exist and would be realized as the fund grows; and (v) whether fee levels reflect these economies of scale, if any, for the benefit of fund shareholders. In connection with separate internal corporate reorganizations involving Fidelity Management & Research (U.K.) Inc. (FMR U.K.) and Fidelity Management & Research (Japan) Inc. (FMR Japan), the Board approved certain non-material amendments to the fund’s sub-advisory agreements with FMR U.K. and FMR Japan to reflect that, after these reorganizations, FMR Investment Management (UK) Limited and Fidelity Management & Research (Japan) Limited will carry on the business of FMR U.K. and FMR Japan, respectively. The Board noted that no changes to the portfolio managers or to the foreign research or investment advisory services provided to the fund were expected in connection with either reorganization and that the same personnel and resources would continue to be available to the fund at the new entities.
In considering whether to renew the Advisory Contracts for the fund, the Board reached a determination, with the assistance of fund counsel and Independent Trustees’ counsel and through the exercise of its business judgment, that the renewal of the Advisory Contracts was in the best interests of the fund and its shareholders and that the compensation payable under the Advisory Contracts was fair and reasonable. The Board’s decision to renew the Advisory Contracts was not based on any single factor, but rather was based on a comprehensive consideration of all the information provided to the Board at its meetings throughout the year. The Board, in reaching its determination to renew the Advisory Contracts, was aware that shareholders of the fund have a broad range of investment choices available to them, including a wide choice among funds offered by Fidelity’s competitors, and that the fund’s shareholders, who have the opportunity to review and weigh the disclosure provided by the fund in its prospectus and other public disclosures, have chosen to invest in this fund, which is part of the Fidelity family of funds.
Nature, Extent, and Quality of Services Provided. The Board considered Fidelity’s staffing as it relates to the fund, including the backgrounds of investment personnel of FMR and the sub-advisers (together, the Investment Advisers), and also considered the fund’s investment objective, strategies, and related investment philosophy. The Independent Trustees also had discussions with senior management of Fidelity’s investment operations and investment groups. The Board considered the structure of the portfolio manager compensation program and whether this structure provides appropriate incentives to act in the best interests of the fund. Additionally, the Board considered the portfolio managers’ investments, if any, in the funds that they manage.
Resources Dedicated to Investment Management and Support Services. The Board and the Fund Oversight and Research Committees reviewed the general qualifications and capabilities of Fidelity’s investment staff, including its size, education, experience, and resources, as well as Fidelity’s approach to recruiting, training, managing, and compensating investment personnel. The Board noted that Fidelity has continued to increase the resources devoted to non-U.S. offices, including expansion of Fidelity’s global investment organization. The Board also noted that Fidelity’s analysts have extensive resources, tools and capabilities that allow them to conduct sophisticated quantitative and fundamental analysis, as well as credit analysis of issuers, counterparties and guarantors. Further, the Board believes that Fidelity’s investment professionals have sufficient access to global information and data so as to provide competitive investment results over time, and that those professionals also have access to sophisticated tools that permit them to assess portfolio construction and risk and performance attribution characteristics continuously, as well as to transmit new information and research conclusions rapidly around the world. Additionally, in its deliberations, the Board considered Fidelity’s trading and risk management capabilities and resources and global compliance infrastructure, which are an integral part of the investment management process.
Shareholder and Administrative Services. The Board considered (i) the nature, extent, quality, and cost of advisory, administrative, and shareholder services performed by the Investment Advisers and their affiliates under the Advisory Contracts and under separate agreements covering transfer
Board Approval of Investment Advisory Contracts and Management Fees – continued
agency, pricing and bookkeeping, and securities lending services for the fund; (ii) the nature and extent of the supervision of third party service providers, principally custodians and subcustodians; and (iii) the resources devoted to, and the record of compliance with, the fund’s compliance policies and procedures. The Board also reviewed the allocation of fund brokerage, including allocations to brokers affiliated with the Investment Advisers, the use of brokerage commissions to pay fund expenses, and the use of “soft” commission dollars to pay for research services.
The Board noted that the growth of fund assets over time across the complex allows Fidelity to reinvest in the development of services designed to enhance the value or convenience of the Fidelity funds as investment vehicles. These services include 24-hour access to account information and market information through telephone representatives and over the Internet, investor education materials and asset allocation tools, and the expanded availability of Fidelity Investor Centers.
In 2014, the Board formed an ad hoc Committee on Transfer Agency Fees to review the variety of transfer agency fee structures throughout the industry and Fidelity’s competitive positioning with respect to industry participants.
Investment in a Large Fund Family. The Board considered the benefits to shareholders of investing in a Fidelity fund, including the benefits of investing in a fund that is part of a large family of funds offering a variety of investment disciplines and providing a large variety of mutual fund investor services. The Board noted that Fidelity had taken, or had made recommendations that resulted in the Fidelity funds taking, a number of actions over the previous year that benefited particular funds, including (i) continuing to dedicate additional resources to investment research and to the support of the senior management team that oversees asset management; (ii) persisting in efforts to enhance Fidelity’s global research capabilities; (iii) launching new funds and making other enhancements to meet client needs for income-oriented solutions; (iv) reducing fund expenses for certain index funds; (v) continuing to launch dedicated lower cost underlying funds to meet portfolio construction needs related to expanding underlying fund options for Fidelity funds of funds, specifically for the Freedom Fund product lines; (vi) rationalizing product lines and gaining increased efficiencies through fund mergers; (vii) launching sector-based exchange-traded funds and establishing a new Fidelity adviser to manage sector-based funds and products; (viii) continuing to develop and implement technology to improve security and increase efficiency; (ix) modifying the eligibility criteria for certain share classes to increase their marketability to a portion of the defined contribution plan market; (x) waiving redemption fees for certain qualified fund-of-fund and wrap programs and certain retirement plan transactions; and (xi) launching new Institutional Class shares of certain money market funds to attract and retain assets and to fill a gap in the money market fund lineup.
Investment Performance. The Board considered whether the fund has operated in accordance with its investment objective, as well as its record of compliance with its investment restrictions and its performance history.
The Board took into account discussions with the Investment Advisers about fund investment performance that occur at Board meetings throughout the year. In this regard the Board noted that as part of regularly scheduled fund reviews and other reports to the Board on fund performance, the Board periodically considers annualized return information for the fund, for different time periods, measured against a securities market index (“benchmark index”) and a peer group of funds with similar objectives (“peer group”). In its evaluation of fund investment performance, the Board gave particular attention to information indicating changes in performance of certain Fidelity funds for specific time periods and the Investment Advisers’ explanations for any overperformance or underperformance.
In addition to reviewing absolute and relative fund performance, the Independent Trustees periodically consider the appropriateness of fund performance metrics in evaluating the results achieved. In general, the Independent Trustees believe that fund performance should be evaluated based on net performance (after fees and expenses) of both the highest performing and lowest performing classes, where applicable, compared to appropriate benchmark indices, over appropriate time periods which may include full market cycles, and compared to peer groups, as applicable, over the same periods, taking into account relevant factors including the following: general market conditions; issuer-specific information; tactical opportunities for investment; and fund cash flows and other factors.
The Independent Trustees recognize that shareholders evaluate performance on a net basis over their own holding periods, for which one-, three-, and five-year periods are often used as a proxy. For this reason, the performance information reviewed by the Board also included net cumulative calendar year total return information for the fund and an appropriate benchmark index and peer group for the most recent one-, three-, and five-year periods, as shown below. Returns are shown compared to the 25th percentile (top of box, 75% beaten) and 75th percentile (bottom of box, 25% beaten) of the peer universe.
VIP Mid Cap Portfolio
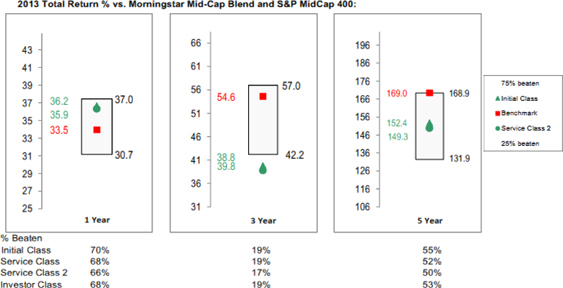
Based on its review, the Board concluded that the nature, extent, and quality of services provided to the fund under the Advisory Contracts should benefit the fund’s shareholders.
Competitiveness of Management Fee and Total Expense Ratio. The Board considered the fund’s management fee and total expense ratio compared to “mapped groups” of competitive funds and classes. Fidelity creates “mapped groups” by combining similar Lipper investment objective categories that have comparable investment mandates. Combining Lipper investment objective categories aids the Board’s management fee and total expense ratio comparisons by broadening the competitive group used for comparison and by reducing the number of universes to which various Fidelity funds are compared.
Management Fee. The Board considered two proprietary management fee comparisons for the 12-month periods shown in the chart below. The group of Lipper funds used by the Board for management fee comparisons is referred to below as the “Total Mapped Group.” The Total Mapped Group comparison focuses on a fund’s standing in terms of gross management fees before expense reimbursements or caps relative to the total universe of funds with comparable investment mandates, regardless of whether their management fee structures also are comparable. Funds with comparable investment mandates offer exposure to similar types of securities. Funds with comparable management fee structures have similar management fee contractual arrangements (e.g., flat rate charged for advisory services, all-inclusive fee rate, etc.). “TMG %” represents the percentage of funds in the Total Mapped Group that had management fees that were lower than the fund’s. For example, a hypothetical TMG % of 20% would mean that 80% of the funds in the Total Mapped Group had higher, and 20% had lower, management fees than the fund. The fund’s actual TMG %s are in the chart below. The “Asset-Size Peer Group” (ASPG) comparison focuses on a fund’s standing relative to a subset of non-Fidelity funds within the Total Mapped Group that are similar in size and management fee structure. For example, if a fund is in the first quartile of the ASPG, the fund’s management fee ranks in the least expensive or lowest 25% of funds in the ASPG. The ASPG represents at least 15% of the funds in the Total Mapped Group with comparable asset size and management fee structures, subject to a minimum of 50 funds (or all funds in the Total Mapped Group if fewer than 50). Additional information, such as the ASPG quartile in which the fund’s management fee rate ranked, is also included in the chart and considered by the Board.
Board Approval of Investment Advisory Contracts and Management Fees – continued
VIP Mid Cap Portfolio
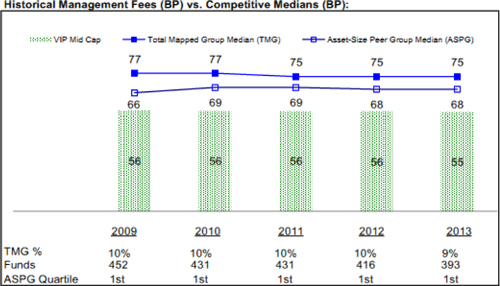
The Board noted that the fund’s management fee rate ranked below the median of its Total Mapped Group and below the median of its ASPG for 2013.
The Board also noted that, in August 2013, the ad hoc Committee on Management Fees was formed to conduct an in-depth review of the management fee rates of Fidelity’s active equity mutual funds. The Committee focused on the following areas: (i) standard fee structures; (ii) research consumption and trading evolution; (iii) management fee competitiveness/profitability by category; and (iv) factors that drive institutional pricing.
Based on its review, the Board concluded that the fund’s management fee is fair and reasonable in light of the services that the fund receives and the other factors considered.
Total Expense Ratio. In its review of each class’s total expense ratio, the Board considered the fund’s management fee as well as other fund or class expenses, as applicable, such as transfer agent fees, pricing and bookkeeping fees, fund-paid 12b-1 fees, and custodial, legal, and audit fees. The Board also noted the effects of any waivers and reimbursements on fees and expenses. As part of its review, the Board also considered the current and historical total expense ratios of each class of the fund compared to competitive fund median expenses. Each class of the fund is compared to those funds and classes in the Total Mapped Group (used by the Board for management fee comparisons) that have a similar sales load structure.
The Board noted that the total expense ratio of each class ranked below its competitive median for 2013.
Fees Charged to Other Fidelity Clients. The Board also considered Fidelity fee structures and other information with respect to clients of Fidelity, such as other funds advised or subadvised by Fidelity, pension plan clients, and other institutional clients. The Board noted the findings of the 2013 ad hoc joint committee (created with the board of other Fidelity funds), which reviewed and compared Fidelity’s institutional investment advisory business with its business of providing services to the Fidelity funds, including the differences in services provided, fees charged, and costs incurred, as well as competition in their respective marketplaces.
Based on its review of total expense ratios and fees charged to other Fidelity clients, the Board concluded that the total expense ratio of each class of the fund was reasonable in light of the services that the fund and its shareholders receive and the other factors considered.
Costs of the Services and Profitability. The Board considered the revenues earned and the expenses incurred by Fidelity in conducting the business of developing, marketing, distributing, managing, administering and servicing the fund and servicing the fund’s shareholders. The Board also considered the level of Fidelity’s profits in respect of all the Fidelity funds.
On an annual basis, Fidelity presents to the Board Fidelity’s profitability for the fund. Fidelity calculates the profitability for each fund, as well as aggregate profitability for groups of Fidelity funds and all Fidelity funds, using a series of detailed revenue and cost allocation methodologies which originate with the books and records of Fidelity on which Fidelity’s audited financial statements are based. The Audit Committee of the Board reviews any significant changes from the prior year’s methodologies.
PricewaterhouseCoopers LLP (PwC), independent registered public accounting firm and auditor to Fidelity and certain Fidelity funds, has been engaged annually by the Board as part of the Board’s assessment of Fidelity’s profitability analysis. PwC’s engagement includes the review and assessment of the methodologies used by Fidelity in determining the revenues and expenses attributable to Fidelity’s mutual fund business, and completion of agreed-upon procedures in respect of the mathematical accuracy of fund profitability and its conformity to established allocation methodologies.
After considering PwC’s reports issued under the engagement and information provided by Fidelity, the Board concluded that while other allocation methods may also be reasonable, Fidelity’s profitability methodologies are reasonable in all material respects.
The Board also reviewed Fidelity’s non-fund businesses and fall-out benefits related to the mutual fund business as well as cases where Fidelity’s affiliates may benefit from or be related to the fund’s business.
The Board considered the costs of the services provided by and the profits realized by Fidelity in connection with the operation of the fund and was satisfied that the profitability was not excessive in the circumstances.
Economies of Scale. The Board considered whether there have been economies of scale in respect of the management of the Fidelity funds, whether the Fidelity funds (including the fund) have appropriately benefited from any such economies of scale, and whether there is potential for realization of any further economies of scale. The Board considered the extent to which the fund will benefit from economies of scale through increased services to the fund, through waivers or reimbursements, or through fee or expense ratio reductions. The Board also noted that in 2013, it and the boards of other Fidelity funds created an ad hoc committee (the Economies of Scale Committee) to analyze whether Fidelity attains economies of scale in respect of the management and servicing of the Fidelity funds, whether the Fidelity funds have appropriately benefited from such economies of scale, and whether there is potential for realization of any further economies of scale.
The Board recognized that the fund’s management contract incorporates a “group fee” structure, which provides for lower group fee rates as total group assets increase, and for higher group fee rates as total group assets decrease (with “group assets” defined to include fund assets under FMR’s management plus sector fund assets previously under FMR’s management and currently managed by Fidelity SelectCo, LLC). FMR calculates the group fee rates based on a tiered asset “breakpoint” schedule that varies based on asset class. The Board considered that the group fee is designed to deliver the benefits of economies of scale to fund shareholders when total Fidelity fund assets increase, even if assets of any particular fund are unchanged or have declined, because some portion of Fidelity’s costs are attributable to services provided to all Fidelity funds, and all funds benefit if those costs can be allocated among more assets. The Board concluded that, given the group fee structure, fund shareholders will benefit from lower management fees as group assets increase at the fund complex level, regardless of whether Fidelity achieves any such economies of scale.
The Board concluded, taking into account the analysis of the Economies of Scale Committee, that economies of scale, if any, are being appropriately shared between fund shareholders and Fidelity.
Additional Information Requested by the Board. In order to develop fully the factual basis for consideration of the Fidelity funds’ Advisory Contracts, the Board requested and received additional information on certain topics, including: (i) fund performance trends and Fidelity’s long-term strategies for certain funds; (ii) Fidelity’s strategic marketing and product lineup goals; (iii) the methodology with respect to competitive fund data and peer group classifications; (iv) the arrangements with, and performance of, certain sub-advisers on behalf of the Fidelity funds, as well as certain proposed participating affiliate arrangements; (v) the realization of fall-out benefits in certain Fidelity business units; (vi) Fidelity’s group fee structures, including the rationale for the individual fee rates of certain categories of funds and the definition of group assets; (vii) trends regarding industry use of performance fee structures and the performance adjustment methodologies applicable to the Fidelity funds; (viii) additional competitive analysis regarding the total expenses for certain classes; (ix) fund profitability methodology, including Fidelity’s cost allocation methodology, and the impact of certain factors on fund profitability results; and (x) the process by which Fidelity determines sub-advisory fees for funds it advises.
Based on its evaluation of all of the conclusions noted above, and after considering all factors it believed relevant, the Board ultimately concluded that the advisory fee structures are fair and reasonable, and that the fund’s Advisory Contracts should be renewed.
Investment Adviser
Fidelity Management & Research Company
Boston, MA
Investment Sub-Advisers
FMR Co., Inc.
Fidelity Management & Research (Hong Kong) Limited
Fidelity Management & Research (Japan) Limited
Fidelity Management & Research (U.K.) Inc.
General Distributor
Fidelity Distributors Corporation
Smithfield, RI
Transfer and Service Agents
Fidelity Investments Institutional Operations Company, Inc.
Boston, MA
Fidelity Service Company, Inc.
Boston, MA
Custodian
Brown Brothers Harriman & Co.
Boston, MA
[This Page Intentionally Left Blank]
Investment Adviser
Directed Services LLC
1475 Dunwoody Drive
West Chester, Pennsylvania 19380
Administrator
Voya Funds Services, LLC
7337 East Doubletree Ranch Road, Suite 100
Scottsdale, Arizona 85258
Distributor
Voya Investments Distributor, LLC
7337 East Doubletree Ranch Road, Suite 100
Scottsdale, Arizona 85258
Transfer Agent
BNY Mellon Investment Servicing (U.S.) Inc.
301 Bellevue Parkway
Wilmington, Delaware 19809
Independent Registered Public Accounting Firm
KPMG LLP
Two Financial Center
60 South Street
Boston, Massachusetts 02111
Custodian
The Bank of New York Mellon
One Wall Street
New York, New York 10286
Legal Counsel
Dechert LLP
1900 K Street, N.W.
Washington, D.C. 20006
Before investing, carefully consider the investment objectives, risks, charges and expenses of the variable universal life insurance policy or variable annuity contract and the underlying variable investment options. This and other information is contained in the prospectus for the variable universal life policy or variable annuity contract and the underlying variable investment options. Obtain these prospectuses from your agent/ registered representative and read them carefully before investing.
| RETIREMENT | INVESTMENTS | INSURANCE |  |
| voyainvestments.com | VPAR-VYFID (1214-021715) |
Annual Report
December 31, 2014
Classes ADV, I, S, S2 and T
Voya Partners, Inc.
| n | | Voya Solution Aggressive Portfolio | | n | | Voya Solution 2025 Portfolio |
| n | | Voya Solution Balanced Portfolio | | n | | Voya Solution 2030 Portfolio |
| n | | Voya Solution Conservative Portfolio | | n | | Voya Solution 2035 Portfolio |
| n | | Voya Solution Income Portfolio | | n | | Voya Solution 2040 Portfolio |
| n | | Voya Solution Moderately Aggressive Portfolio | | n | | Voya Solution 2045 Portfolio |
| n | | Voya Solution Moderately Conservative Portfolio | | n | | Voya Solution 2050 Portfolio |
| n | | Voya Solution 2015 Portfolio | | n | | Voya Solution 2055 Portfolio |
| n | | Voya Solution 2020 Portfolio | | | | |
This report is submitted for general information to shareholders of the Voya mutual funds. It is not authorized for distribution to prospective shareholders unless accompanied or preceded by a prospectus which includes details regarding the funds’ investment objectives, risks, charges, expenses and other information. This information should be read carefully. |
INVESTMENT MANAGEMENT
voyainvestments.com |  |
TABLE OF CONTENTS
| President’s Letter | | | | | 2 | |
| Market Perspective | | | | | 3 | |
| Portfolio Managers’ Reports | | | | | 5 | |
| Shareholder Expense Examples | | | | | 23 | |
| Report of Independent Registered Public Accounting Firm | | | | | 26 | |
| Statements of Assets and Liabilities | | | | | 27 | |
| Statements of Operations | | | | | 35 | |
| Statements of Changes in Net Assets | | | | | 39 | |
| Financial Highlights | | | | | 47 | |
| Notes to Financial Statements | | | | | 56 | |
| Portfolios of Investments | | | | | 69 | |
| Tax Information | | | | | 109 | |
| Director and Officer Information | | | | | 111 | |
| Advisory Contract Approval Discussion | | | | | 115 | |
PROXY VOTING INFORMATION
A description of the policies and procedures that the Portfolios use to determine how to vote proxies related to portfolio securities is available: (1) without charge, upon request, by calling Shareholder Services toll-free at (800) 992-0180; (2) on the Portfolios’ website at www.voyainvestments.com; and (3) on the U.S. Securities and Exchange Commission’s (“SEC’s”) website at www.sec.gov. Information regarding how the Portfolios voted proxies related to portfolio securities during the most recent 12-month period ended June 30 is available without charge on the Portfolios’ website at www.voyainvestments.com and on the SEC’s website at www.sec.gov.
QUARTERLY PORTFOLIO HOLDINGS
The Portfolios file their complete schedule of portfolio holdings with the SEC for the first and third quarters of each fiscal year on Form N-Q. The Portfolios’ Forms N-Q are available on the SEC’s website at www.sec.gov. The Portfolios’ Forms N-Q may be reviewed and copied at the SEC’s Public Reference Room in Washington, DC, and information on the operation of the Public Reference Room may be obtained by calling (800) SEC-0330. The Portfolios’ Forms N-Q, as well as a complete portfolio of investments, are available without charge upon request from the Portfolios by calling Shareholder Services toll-free at (800) 992-0180.
PRESIDENT’S LETTER

New Year, Hopeful View
As 2014 came to a close, U.S. economic growth accelerated, Japan and Europe were struggling and volatility re-emerged in markets around the world. Though periods of volatility may challenge investor resolve over the course of the year, we believe resilience will prevail thanks to continued improvements in global consumer and business spending and ample global liquidity.
Resilience has been a defining characteristic of markets for some time now, as we have seen them shake off such potentially destabilizing events as Europe’s chronic economic malaise, China’s growth slowdown and Japan’s sharp and surprising return to recession. And that’s not to mention the various geopolitical hotspots — Ukraine, the Middle East and elsewhere — that have flared up from time to time. Along the way markets have been fortified by all-time high U.S. corporate earnings; renewed monetary stimulus from central banks in Japan, Europe and China; and plummeting oil prices that have provided a positive supply shock to consumers and businesses. This confluence of events has bolstered markets worldwide and has raised investor confidence that such trends can be sustained into 2015.
Despite our optimism, we — as always — advocate a well-balanced, globally diversified portfolio. We believe such an approach is the best way to potentially benefit from whatever opportunities may arise, while limiting the potential for over-exposure to as-yet-unidentified risks. Also as always, be sure to review your investment strategy and portfolio with your financial advisor to ensure they continue to reflect your goals and needs. Thoroughly discuss any potential portfolio changes with your advisor before taking action.
We appreciate your continued confidence in us, and we look forward to serving your investment needs in the future.
Shaun Mathews
Executive Vice President
Voya Family of Funds
January 28, 2015
The views expressed in the President’s Letter reflect those of the President as of the date of the letter. Any such views are subject to change at any time based upon market or other conditions and the Voya mutual funds disclaim any responsibility to update such views. These views may not be relied on as investment advice and because investment decisions for a Voya mutual fund are based on numerous factors, may not be relied on as an indication of investment intent on behalf of any Voya mutual fund. Reference to specific company securities should not be construed as recommendations or investment advice.
International investing poses special risks including currency fluctuation, economic and political risks not found in investments that are solely domestic.
2
MARKET PERSPECTIVE: YEAR ENDED DECEMBER 31, 2014
Global equities, in the form of the MSCI World IndexSM (the “Index”) measured in local currencies, including net reinvested dividends ended 2013 at a record high. Investor sentiment had evidently reconciled itself to the tapering of the U.S. Federal Reserve Board’s (“Fed’s”) $85 billion of monthly Treasury and mortgage-backed securities purchases. The Fed’s December 18 announcement of a reduction in purchases to $75 billion per month with more to come was taken in stride. There was still plenty to worry about however and the Index endured an early slump and wide swings late in 2014 before ending up 9.81% for the year. (The Index returned 4.94% for the one year ended December 31, 2014, measured in U.S. dollars.)
It did not take long for worries about a flagging U.S. economy to resurface. A disappointingly weak employment report on January 10 showed only 74,000 jobs created in December, the lowest in nearly three years. A cold and snowy winter was thought to be depressing hiring and other key statistics like durable goods orders and home sales.
The Index reached its low point on February 3, down almost exactly 5% in 2014. Yet it took only 18 days to erase the loss despite new political turmoil that flared in Eastern Europe as Russia annexed Crimea after the president of Ukraine was deposed.
With the improvement in the season came a pick-up in U.S. economic data. Employment reports were looking better and the unemployment rate fell below 6%. The December bulletin marked the eighth consecutive month in which more than 200,000 jobs were created. National purchasing managers’ activity indices signaled healthy expansion. While the housing market was cooling, the annualized rate of existing home sales exceeded 5 million for five straight months. Consumer confidence touched seven-year high levels. Growth in gross domestic product (“GDP”) was –2.1% (annualized) in the first quarter but bounced back to 5.0% in the third.
Yet concerns remained about the sustainability of the recovery in the U.S. and worldwide. The improving U.S. employment situation was accompanied by labor force participation rates at or near the lowest since 1978. Wage growth was sluggish near 2% annually. The Fed’s monthly Treasury and mortgage-backed securities purchases ended in October.
Outside of the U.S., growth in China was decelerating, which also weighed on global commodity supplying countries. Japan re-entered recession in the third quarter after an April rise in consumption tax. But it was the euro zone that was the most problematic. Growth almost ground to a halt in the second and third quarters. Unemployment seemed stuck at 11.5%, while deflation was perilously close. Markets became increasingly skeptical that the European Central Bank (“ECB”) could attempt U.S., UK and Japan-style quantitative easing with Germany unequivocally opposed. Oil prices had been steadily falling since late June and would halve by year-end. Increased shale oil production notwithstanding, was this also a signal that global economic activity was weaker than anyone had imagined?
Securities prices mirrored investors’ mood swings in the last few months. The Index actually reached a new peak on September 19, but by October 16 fell 8.2%. From there the Index rebounded 12% to December 5, fell 5% to December 16 then rose 4% to end the year 1.3% below its all-time high.
In U.S. fixed income markets, the Barclays Long-Term U.S. Treasury sub-index returned a remarkable 25.07% in 2014; the Barclays Short-Term U.S. Treasury sub-index just 0.09% as the Treasury yield curve flattened. The Barclays U.S. Aggregate Bond Index (“Barclays Aggregate”) added 5.97%, while the Barclays U.S. Corporate Investment Grade Bond sub-index gained 7.46%. Both outperformed the Barclays High Yield Bond — 2% Issuer Constrained Composite Index (not a part of the Barclays Aggregate), which gained only 2.46%, perhaps reflecting growing disillusionment with the risk/reward profile of high yield bonds after strong returns in recent years.
U.S. equities, represented by the S&P 500® Index including dividends, returned 13.69% in the fiscal year, about 1.5% below its all-time high. The utilities sector was the top performer, returning 28.98%; not surprisingly, the only loser was energy, which dropped 7.78% as oil prices sagged. Record operating earnings per share for S&P 500® companies in the second and third quarters were supported by low interest rates, slow wage growth and historically high share buy-back volumes. Operating margins breached 10% for the first time.
In currencies, the dollar advanced against most other currencies over the year. The dollar surged 13.60% against the euro, on the U.S.’s much better growth and interest rate increase prospects, and 13.74% against the yen, on the likelihood of further monetary easing in Japan and an announced partial re-allocation into non-yen securities for the giant Government Pension Investment Fund (“GPIF”). The dollar gained less, 6.29%, on the pound. The UK had a better growth story than the euro zone, which however is the destination for about 40% of the UK’s exports.
In international markets, the MSCI Japan® Index rose 9.48% in 2014, boosted in the case of Japan’s large exporters by the falling yen and in general by the GPIF’s announcement described above. The MSCI Europe ex UK® Index added 6.63%. The poor economic data referred to above and the lingering conflict in Ukraine dampened markets, which were spasmodically supported by the possibility of quantitative easing. The strong health care sector contributed about one third of the total. Despite superior economic results, the MSCI UK® Index was much weaker, edging up 0.50%. UK stock indices are not particularly representative of the UK economy: the largest 14 names account for half of the index and comprise mostly global banking, energy, pharmaceuticals and materials companies. As a group, they held back returns by about 1.80%.
All indices are unmanaged and investors cannot invest directly in an index. Past performance does not guarantee future results. The performance quoted represents past performance. Investment return and principal value of an investment will fluctuate, and shares, when redeemed, may be worth more or less than their original cost. The Portfolios’ performance is subject to change since the period’s end and may be lower or higher than the performance data shown. Please call (800) 262-3862 or log on to www.voyainvestments.com to obtain performance data current to the most recent month end.
Market Perspective reflects the views of Voya Investment Management’s Chief Investment Risk Officer only through the end of the period, and is subject to change based on market and other conditions.
3
BENCHMARK DESCRIPTIONS
| Index | | | | Description |
|---|
| Barclays High Yield Bond — 2% Issuer Constrained Composite Index | | | | An unmanaged index that includes all fixed-income securities having a maximum quality rating of Ba1, a minimum amount outstanding of $150 million, and at least one year to maturity. |
| Barclays Long-Term U.S. Treasury Index | | | | The Index includes all publicly issued, U.S. Treasury securities that have a remaining maturity of 10 or more years, are rated investment grade, and have $250 million or more of outstanding face value. |
| Barclays Short-Term U.S. Treasury Index | | | | A market capitalization-weighted index that is composed of fixed-rate, non-convertible U.S. Treasury securities that have a remaining maturity of between one and 12 months and have $250 million or more of outstanding face value. |
| Barclays U.S. Aggregate Bond Index | | | | An unmanaged index of publicly issued investment grade U.S. Government, mortgage-backed, asset-backed and corporate debt securities. |
| Barclays U.S. Corporate Investment Grade Bond Index | | | | An unmanaged index consisting of publicly issued, fixed rate, nonconvertible, investment grade debt securities. |
| MSCI EAFE® Index | | | | An unmanaged index that measures the performance of securities listed on exchanges in Europe, Australasia and the Far East. It includes the reinvestment of dividends net of withholding taxes, but does not reflect fees, brokerage commissions or other expenses of investing. |
| MSCI Europe ex UK® Index | | | | A free float-adjusted market capitalization index that is designed to measure developed market equity performance in Europe, excluding the UK. |
| MSCI Japan® Index | | | | A free float-adjusted market capitalization index that is designed to measure developed market equity performance in Japan. |
| MSCI UK® Index | | | | A free float-adjusted market capitalization index that is designed to measure developed market equity performance in the UK. |
MSCI World IndexSM | | | | An unmanaged index that measures the performance of over 1,400 securities listed on exchanges in the U.S., Europe, Canada, Australia, New Zealand and the Far East. |
| Russell 3000® Index | | | | An unmanaged index that measures the performance of the largest 3000 U.S. companies representing approximately 98% of the investable U.S. equity market. |
| S&P 500® Index | | | | An unmanaged index that measures the performance of securities of approximately 500 large-capitalization companies whose securities are traded on major U.S. stock markets. |
| S&P Target Date Retirement Income Index | | | | Seeks to represent asset allocations which target an immediate retirement horizon. |
| S&P Target Risk Aggressive Index | | | | Seeks to emphasize exposure to equity securities, maximizing opportunities for long-term capital accumulation. It may include small allocations in fixed-income securities to enhance portfolio efficiency. |
| S&P Target Risk Conservative Index | | | | Seeks to emphasize exposure to fixed income securities in order to produce a current income stream and avoid excessive volatility of returns. Equity securities are included to protect long-term purchasing power. |
| S&P Target Risk Growth Index | | | | Seeks to measure the performance of an asset allocation strategy targeted to a growth focused risk profile. |
| S&P Target Risk Moderate Index | | | | Seeks to measure the performance of an asset allocation strategy targeted to a moderate risk profile. |
S&P Target Date 2015 Index,
S&P Target Date 2020 Index,
S&P Target Date 2025 Index,
S&P Target Date 2030 Index,
S&P Target Date 2035 Index,
S&P Target Date 2040 Index and
S&P Target Date 2045 Index | | | | Each seeks to represent the market consensus for asset allocations which target an approximate 2015, 2020, 2025, 2030, 2035, 2040, 2045 and beyond 2045 retirement horizon, respectively. |
4
| PORTFOLIO MANAGERS’ REPORT | VOYA SOLUTION PORTFOLIOS |
The Voya Solution Portfolios consist of Voya Solution Aggressive Portfolio, Voya Solution Balanced Portfolio, Voya Solution Conservative Portfolio, Voya Solution Income Portfolio, Voya Solution Moderately Aggressive Portfolio, Voya Solution Moderately Conservative Portfolio, Voya Solution 2015 Portfolio*, Voya Solution 2020 Portfolio, Voya Solution 2025 Portfolio, Voya Solution 2030 Portfolio, Voya Solution 2035 Portfolio, Voya Solution 2040 Portfolio, Voya Solution 2045 Portfolio, Voya Solution 2050 Portfolio and Voya Solution 2055 Portfolio (each a “Portfolio” or collectively, the “Portfolios” or the “Solution Portfolios”). Each Portfolio seeks to achieve its investment objective by investing in a combination of underlying funds which are actively managed funds or passively managed funds (index funds)(1). The Portfolios are managed by Halvard Kvaale, CIMA, Paul Zemsky, CFA, and Frank van Etten, Portfolio Managers of Voya Investment Management Co. LLC (“Voya IM”) the Sub-Adviser (“Sub-Adviser”).
Portfolio Specifics: We began the year with an overweight to high yield corporate bonds and international developed equities, funded by an underweight to core U.S. fixed income and U.S. large-cap core and U.S. large-cap value.
In February, we reduced our underweight to equity in the Voya Solution 2015 Portfolio by increasing its exposure to U.S. large-cap core, funded by a reduction in U.S. core fixed income. In March, due to the geopolitical situation in Russia and Ukraine, we reduced our emerging equity position and moved the proceeds into U.S. large-cap core.
As part of our annual review process, the series glided down, resulting in lower equity allocations for the mid- and near-dated Portfolios at the beginning of May. At the end of May, we moved to an overweight position in U.S. large-cap equity and further underweighted core fixed income, as economic data had improved substantially in the U.S. and, to a lesser extent, internationally. At the end of the second quarter, we took profits on our overweight euro zone trade and moved the funds into U.S. large-cap core equity.
In July, we took profits by selling a portion of our overweight high yield corporate bond position and allocated the proceeds into senior loans. We maintain an overweight to high yield corporate bonds, believing it will continue to outperform core investment grade bonds. At the beginning of August, we reduced our U.S. large-cap core overweight and purchased emerging market equities. This trade was a reversal of a position initiated in the first quarter, where we had turned cautious on emerging markets given geopolitical unrest in Russia and Ukraine. We continued to have concerns about the ability of emerging market companies to increase their profitability longer term and so preserved a slight underweight to the asset class. At the end of August, we sold U.S. small-cap equity and added to our international equity position, based on comments by European Central Bank President Mario Draghi, that suggest increased intervention by the central bank through asset purchase programs and greater openness to fiscal stimulus. We found that U.S. small-cap stocks had unattractive valuations, poor earnings fundamentals, as well as worrying technicals and relative investor flows. At the end of the third quarter, we made a defensive trade by selling U.S. large-cap core equity and purchasing U.S. core fixed income. Rationales for this trade included the possibility of deflation in Europe, slow responses by the global central banks and muted economic global growth outside the United States.
At the end of October, we unwound this position when negative sentiment reached extreme levels on our economic indicators. In November, we increased duration in the mid-dated Portfolios, believing our long-term expectations for interest rate increases had been overly aggressive. In December, we purchased Japan equities, funded by selling U.S. large-cap core. At the time of the trade, we believed Japanese equities to be relatively undervalued and have the potential to rise more than U.S. equities in 2015.
Overall, tactical moves had a negative impact on performance for the year.
Underlying manager performance was mixed for the year before fees and expenses, detracting in the far-dated portfolios, but adding value in the near-dated portfolios. The largest outperformers for the year were Voya Small Company Portfolio, Voya Multi-Manager Large Cap Core Portfolio and Voya Intermediate Bond Fund. The smallest outperformers for the year were VY® T. Rowe Price Growth Equity Portfolio, Voya Multi-Manager Emerging Markets Equity Fund and Voya Large Cap Value Fund.
Certain Solution Portfolios outperformed their respective Standard & Poor’s Target Date or Target Risk indices (“S&P”); others did not, depending on the applicable asset allocations in each case**. The Solution Portfolios tended to hold a higher proportion of domestic stocks within their equity allocations when compared to S&P, which was an advantage as non-US stocks lagged. Within the US equity allocation, the Solution Portfolios benefitted from allocations to subclasses with higher average returns than S&P. This benefit was partially offset by S&P’s fixed income holdings in which there were higher allocations to US core bonds and treasury inflation protected bonds, which outperformed the Solution Portfolios’ allocations to global bonds and bank loans.
Current Strategy and Outlook: Looking ahead, we believe the knock-on effects of collapsing oil prices will vary across industries, regions and asset classes. We believe the U.S. will maintain a modest pace of growth, while global central banks will aggressively fight to improve their own near-term outlooks. In our view, the end of quantitative easing confirms the strength of the U.S. economy, but the uncertain start of interest rate hikes will increase market volatility.
| * | | On November 20, 2014, the Board of Directors approved a proposal to reorganize the Voya Solution 2015 Portfolio with and into the Voya Solution Income Portfolio. |
| ** | | Each Portfolio’s relative performance versus its respective benchmarks can be found on page 6. |
| (1) | | The investment objective of each Portfolio is described in the Portfolios’ prospectuses, each dated May 1, 2014. |
Portfolio holdings and characteristics are subject to change and may not be representative of current holdings and characteristics. The outlook for these Portfolios may differ from that presented for other Voya mutual funds. Performance for the different classes of shares will vary based on differences in fees associated with each class.
5
| VOYA SOLUTION PORTFOLIOS | PORTFOLIO MANAGERS’ REPORT |
Average Annual Total Returns for the Period Ended December 31, 2014
| |
|---|
| | | | 1 Year
|
|---|
| Voya Solution Aggressive Portfolio, Class S | | | | | 6.25 | % |
| S&P Target Risk Aggressive Index | | | | | 6.38 | % |
| Voya Solution Balanced Portfolio, Class S | | | | | 6.34 | % |
| S&P Target Risk Growth Index | | | | | 6.56 | % |
| Voya Solution Conservative Portfolio, Class S | | | | | 4.40 | % |
| S&P Target Risk Conservative Index | | | | | 4.23 | % |
| Voya Solution Income Portfolio, Class S | | | | | 5.76 | % |
| S&P Target Date Retirement Income Index | | | | | 5.13 | % |
| Russell 3000® Index | | | | | 12.56 | % |
| MSCI EAFE® Index | | | | | –4.90 | % |
| Barclays U.S. Aggregate Bond (“BCAB”) Index | | | | | 5.97 | % |
| Voya Solution Moderately Aggressive Portfolio, Class S | | | | | 6.33 | % |
| S&P Target Risk Aggressive Index | | | | | 6.38 | % |
| Voya Solution Moderately Conservative Portfolio, Class S | | | | | 5.58 | % |
| S&P Target Risk Moderate Index | | | | | 4.75 | % |
| Voya Solution 2015 Portfolio, Class S | | | | | 5.77 | % |
| S&P Target Date 2015 Index | | | | | 5.75 | % |
| Russell 3000® Index | | | | | 12.56 | % |
| MSCI EAFE® Index | | | | | –4.90 | % |
| BCAB Index | | | | | 5.97 | % |
| Voya Solution 2020 Portfolio, Class S | | | | | 6.08 | % |
| S&P Target Date 2020 Index | | | | | 5.93 | % |
| Voya Solution 2025 Portfolio, Class S | | | | | 5.58 | % |
| S&P Target Date 2025 Index | | | | | 5.83 | % |
| Russell 3000® Index | | | | | 12.56 | % |
| MSCI EAFE® Index | | | | | –4.90 | % |
| BCAB Index | | | | | 5.97 | % |
| Voya Solution 2030 Portfolio, Class S | | | | | 6.41 | % |
| S&P Target Date 2030 Index | | | | | 5.90 | % |
| Voya Solution 2035 Portfolio, Class S | | | | | 5.68 | % |
| S&P Target Date 2035 Index | | | | | 5.95 | % |
| Russell 3000® Index | | | | | 12.56 | % |
| MSCI EAFE® Index | | | | | –4.90 | % |
| BCAB Index | | | | | 5.97 | % |
| Voya Solution 2040 Portfolio, Class S | | | | | 6.54 | % |
| S&P Target Date 2040 Index | | | | | 5.96 | % |
| Voya Solution 2045 Portfolio, Class S | | | | | 6.10 | % |
| S&P Target Date 2045 Index | | | | | 5.93 | % |
| Russell 3000® Index | | | | | 12.56 | % |
| MSCI EAFE® Index | | | | | –4.90 | % |
| BCAB Index | | | | | 5.97 | % |
| Voya Solution 2050 Portfolio, Class S | | | | | 6.69 | % |
| S&P Target Date 2045 Index | | | | | 5.93 | % |
| Voya Solution 2055 Portfolio, Class S | | | | | 6.25 | % |
| S&P Target Date 2045 Index | | | | | 5.93 | % |
6
| PORTFOLIO MANAGERS’ REPORT | VOYA SOLUTION PORTFOLIOS |
Target Allocations as of December 31, 2014
Asset Class
| | | | 2055 | | 2050 | | 2045 | | 2040 | | 2035 | | 2030 | | 2025 | | 2020 | | 2015 | | Income |
|---|
| US Large Cap | | | | | 48.0 | % | | | 48.0 | % | | | 48.0 | % | | | 46.0 | % | | | 41.0 | % | | | 39.0 | % | | | 32.0 | % | | | 29.0 | % | | | 23.0 | % | | | 23.0 | % |
| US Mid Cap | | | | | 14.0 | % | | | 14.0 | % | | | 14.0 | % | | | 14.0 | % | | | 12.0 | % | | | 12.0 | % | | | 12.0 | % | | | 10.0 | % | | | 8.0 | % | | | 6.0 | % |
| US Small Cap | | | | | 5.0 | % | | | 5.0 | % | | | 5.0 | % | | | 5.0 | % | | | 4.0 | % | | | 4.0 | % | | | 4.0 | % | | | 4.0 | % | | | 0.0 | % | | | 0.0 | % |
| International | | | | | 19.0 | % | | | 19.0 | % | | | 19.0 | % | | | 17.0 | % | | | 17.0 | % | | | 13.0 | % | | | 12.0 | % | | | 10.0 | % | | | 9.0 | % | | | 4.0 | % |
| Emerging Markets | | | | | 7.0 | % | | | 7.0 | % | | | 7.0 | % | | | 7.0 | % | | | 7.0 | % | | | 5.0 | % | | | 4.0 | % | | | 0.0 | % | | | 0.0 | % | | | 0.0 | % |
| Domestic REITs | | | | | 2.0 | % | | | 2.0 | % | | | 2.0 | % | | | 2.0 | % | | | 2.0 | % | | | 2.0 | % | | | 2.0 | % | | | 2.0 | % | | | 2.0 | % | | | 2.0 | % |
| Commodities | | | | | 0.0 | % | | | 0.0 | % | | | 0.0 | % | | | 0.0 | % | | | 0.0 | % | | | 0.0 | % | | | 0.0 | % | | | 0.0 | % | | | 0.0 | % | | | 0.0 | % |
| Core Fixed Income | | | | | 5.0 | % | | | 5.0 | % | | | 5.0 | % | | | 5.0 | % | | | 8.0 | % | | | 12.0 | % | | | 15.0 | % | | | 19.0 | % | | | 29.0 | % | | | 35.0 | % |
| Short Term Bonds | | | | | 0.0 | % | | | 0.0 | % | | | 0.0 | % | | | 0.0 | % | | | 2.0 | % | | | 6.0 | % | | | 6.0 | % | | | 6.0 | % | | | 8.0 | % | | | 8.0 | % |
| High Yield Bonds | | | | | 0.0 | % | | | 0.0 | % | | | 0.0 | % | | | 4.0 | % | | | 4.0 | % | | | 4.0 | % | | | 4.0 | % | | | 4.0 | % | | | 4.0 | % | | | 4.0 | % |
| Floating Rate Bonds | | | | | 0.0 | % | | | 0.0 | % | | | 0.0 | % | | | 0.0 | % | | | 3.0 | % | | | 3.0 | % | | | 3.0 | % | | | 3.0 | % | | | 3.0 | % | | | 3.0 | % |
| Non-US Bonds | | | | | 0.0 | % | | | 0.0 | % | | | 0.0 | % | | | 0.0 | % | | | 0.0 | % | | | 0.0 | % | | | 4.5 | % | | | 4.5 | % | | | 4.5 | % | | | 4.5 | % |
| Emerging Market Bonds | | | | | 0.0 | % | | | 0.0 | % | | | 0.0 | % | | | 0.0 | % | | | 0.0 | % | | | 0.0 | % | | | 1.5 | % | | | 1.5 | % | | | 1.5 | % | | | 1.5 | % |
| TIPS | | | | | 0.0 | % | | | 0.0 | % | | | 0.0 | % | | | 0.0 | % | | | 0.0 | % | | | 0.0 | % | | | 0.0 | % | | | 7.0 | % | | | 8.0 | % | | | 9.0 | % |
| | | | | | 100 | % | | | 100 | % | | | 100 | % | | | 100 | % | | | 100 | % | | | 100 | % | | | 100 | % | | | 100 | % | | | 100 | % | | | 100 | % |
Target Allocations as of December 31, 2014
Asset Class
| | | | Conservative | | Moderately
Conservative | | Balanced | | Moderately
Aggressive | | Aggressive |
|---|
| US Large Cap | | | | | 15.0 | % | | | 20.5 | % | | | 35.0 | % | | | 40.5 | % | | | 48.0 | % |
| US Mid Cap | | | | | 8.0 | % | | | 11.5 | % | | | 13.0 | % | | | 17.5 | % | | | 18.0 | % |
| US Small Cap | | | | | 0.0 | % | | | 2.0 | % | | | 2.0 | % | | | 3.0 | % | | | 4.0 | % |
| International | | | | | 2.0 | % | | | 6.0 | % | | | 8.0 | % | | | 15.0 | % | | | 19.0 | % |
| Emerging Markets | | | | | 0.0 | % | | | 3.0 | % | | | 5.0 | % | | | 7.0 | % | | | 9.0 | % |
| Domestic REITs | | | | | 0.0 | % | | | 2.0 | % | | | 2.0 | % | | | 2.0 | % | | | 2.0 | % |
| Core Fixed Income | | | | | 31.0 | % | | | 31.0 | % | | | 17.0 | % | | | 6.0 | % | | | 0.0 | % |
| Short Term Bonds | | | | | 8.0 | % | | | 5.0 | % | | | 2.0 | % | | | 0.0 | % | | | 0.0 | % |
| High Yield Bonds | | | | | 10.0 | % | | | 6.0 | % | | | 6.0 | % | | | 5.0 | % | | | 0.0 | % |
| Floating Rate Bonds | | | | | 5.0 | % | | | 3.0 | % | | | 3.0 | % | | | 2.0 | % | | | 0.0 | % |
| Non-US Bonds | | | | | 9.0 | % | | | 3.8 | % | | | 3.8 | % | | | 1.5 | % | | | 0.0 | % |
| Emerging Market Bonds | | | | | 3.0 | % | | | 1.2 | % | | | 1.2 | % | | | 0.5 | % | | | 0.0 | % |
| TIPS | | | | | 9.0 | % | | | 5.0 | % | | | 2.0 | % | | | 0.0 | % | | | 0.0 | % |
| | | | | | 100.0 | % | | | 100.0 | % | | | 100.0 | % | | | 100.0 | % | | | 100.0 | % |
As these are target allocations, the actual allocations of each Portfolio’s assets may deviate from the percentages shown. Although the Portfolios expect to be fully invested at all times, they may maintain liquidity reserves to meet redemption requests.
Portfolio holdings are subject to change daily.
7
| VOYA SOLUTION AGGRESSIVE PORTFOLIO | PORTFOLIO MANAGERS’ REPORT |
Average Annual Total Returns for the Periods Ended December 31, 2014
|
|
|---|
| | | | 1 Year
| | Since Inception
of Classes ADV, I, S, and S2
May 1, 2013
|
|---|
| Class ADV | | | | | 6.10 | % | | | 13.00 | % |
| Class I | | | | | 6.56 | % | | | 13.88 | % |
| Class S | | | | | 6.25 | % | | | 13.56 | % |
| Class S2 | | | | | 6.04 | % | | | 13.02 | % |
| S&P Target Risk Aggressive Index | | | | | 6.38 | % | | | 11.77 | % |
Based on a $10,000 initial investment, the graph and table above illustrate the total return of Voya Solution Aggressive Portfolio against the index indicated. The index is unmanaged and has no cash in its portfolio, imposes no sales charges and incurs no operating expenses. An investor cannot invest directly in an index. The Portfolio’s performance is shown without the imposition of any expenses or charges which are, or may be, imposed under your annuity contract. Total returns would have been lower if such expenses or charges were included.
The performance graph and table do not reflect the deduction of taxes that a shareholder will pay on Portfolio distributions or the redemption of Portfolio shares.
The performance shown may include the effect of fee waivers and/ or expense reimbursements by the Investment Adviser and/or other service providers, which have the effect of increasing total return. Had all fees and expenses been considered, the total returns would have been lower.
Performance data represents past performance and is no assurance of future results. Investment return and principal value of an investment in the Portfolio will fluctuate. Shares, when sold, may be worth more or less than their original cost. The Portfolio’s current performance may be lower or higher than the performance data shown. Please log on to www.voyainvestments.com or call (800) 262-3862 to get performance through the most recent month end.
It is important to note that the Portfolio has a limited operating history. Performance over a longer period of time may be more meaningful than short-term performance.
This report contains statements that may be “forward-looking” statements. Actual results may differ materially from those projected in the “forward-looking” statements.
The views expressed in this report reflect those of the portfolio managers, only through the end of the period as stated on the cover. The portfolio managers’ views are subject to change at any time based on market and other conditions.
Portfolio holdings are subject to change daily.
8
| PORTFOLIO MANAGERS’ REPORT | VOYA SOLUTION BALANCED PORTFOLIO |
Average Annual Total Returns for the Periods Ended December 31, 2014
|
|
|---|
| | | | 1 Year
| | 5 Year
| | Since Inception
of Classes ADV, I and S
July 2, 2007
| | Since Inception
of Class S2
April 30, 2010
|
|---|
| Class ADV | | | | | 6.14 | % | | | 8.65 | % | | | 3.05 | % | | | — | |
| Class I | | | | | 6.66 | % | | | 9.27 | % | | | 3.66 | % | | | — | |
| Class S | | | | | 6.34 | % | | | 8.99 | % | | | 3.38 | % | | | — | |
| Class S2 | | | | | 6.22 | % | | | — | | | | — | | | | 8.35 | % |
| S&P Target Risk Growth Index | | | | | 6.56 | % | | | 9.41 | % | | | 4.46 | % | | | 9.12 | % |
Based on a $10,000 initial investment, the graph and table above illustrate the total return of Voya Solution Balanced Portfolio against the index indicated. The index is unmanaged and has no cash in its portfolio, imposes no sales charges and incurs no operating expenses. An investor cannot invest directly in an index. The Portfolio’s performance is shown without the imposition of any expenses or charges which are, or may be, imposed under your annuity contract. Total returns would have been lower if such expenses or charges were included.
The performance graph and table do not reflect the deduction of taxes that a shareholder will pay on Portfolio distributions or the redemption of Portfolio shares.
The performance shown may include the effect of fee waivers and/ or expense reimbursements by the Investment Adviser and/or other service providers, which have the effect of increasing total return. Had all fees and expenses been considered, the total returns would have been lower.
Performance data represents past performance and is no assurance of future results. Investment return and principal value of an investment in the Portfolio will fluctuate. Shares, when sold, may be worth more or less than their original cost. The Portfolio’s current performance may be lower or higher than the performance data shown. Please log on to www.voyainvestments.com or call (800) 262-3862 to get performance through the most recent month end.
This report contains statements that may be “forward-looking” statements. Actual results may differ materially from those projected in the “forward-looking” statements.
The views expressed in this report reflect those of the portfolio managers, only through the end of the period as stated on the cover. The portfolio managers’ views are subject to change at any time based on market and other conditions.
Portfolio holdings are subject to change daily.
9
| VOYA SOLUTION CONSERVATIVE PORTFOLIO | PORTFOLIO MANAGERS’ REPORT |
Average Annual Total Returns for the Periods Ended December 31, 2014
|
|
|---|
| | | | 1 Year
| | Since Inception
of Classes ADV, I, S, and S2
April 30, 2010
|
|---|
| Class ADV | | | | | 4.20 | % | | | 5.29 | % |
| Class I | | | | | 4.63 | % | | | 5.82 | % |
| Class S | | | | | 4.40 | % | | | 5.55 | % |
| Class S2 | | | | | 4.28 | % | | | 5.39 | % |
| S&P Target Risk Conservative Index | | | | | 4.23 | % | | | 5.76 | % |
Based on a $10,000 initial investment, the graph and table above illustrate the total return of Voya Solution Conservative Portfolio against the index indicated. The index is unmanaged and has no cash in its portfolio, imposes no sales charges and incurs no operating expenses. An investor cannot invest directly in an index. The Portfolio’s performance is shown without the imposition of any expenses or charges which are, or may be, imposed under your annuity contract. Total returns would have been lower if such expenses or charges were included.
The performance graph and table do not reflect the deduction of taxes that a shareholder will pay on Portfolio distributions or the redemption of Portfolio shares.
The performance shown may include the effect of fee waivers and/ or expense reimbursements by the Investment Adviser and/or other service providers, which have the effect of increasing total return. Had all fees and expenses been considered, the total returns would have been lower.
Performance data represents past performance and is no assurance of future results. Investment return and principal value of an investment in the Portfolio will fluctuate. Shares, when sold, may be worth more or less than their original cost. The Portfolio’s current performance may be lower or higher than the performance data shown. Please log on to www.voyainvestments.com or call (800) 262-3862 to get performance through the most recent month end.
This report contains statements that may be “forward-looking” statements. Actual results may differ materially from those projected in the “forward-looking” statements.
The views expressed in this report reflect those of the portfolio managers, only through the end of the period as stated on the cover. The portfolio managers’ views are subject to change at any time based on market and other conditions.
Portfolio holdings are subject to change daily.
10
| PORTFOLIO MANAGERS’ REPORT | VOYA SOLUTION INCOME PORTFOLIO |
Average Annual Total Returns for the Periods Ended December 31, 2014
|
|
|---|
| | | | 1 Year
| | 5 Year
| | Since Inception
of Classes ADV, I and S
April 29, 2005
| | Since Inception
of Class S2
May 28, 2009
| | Since Inception
of Class T
August 31, 2005
|
|---|
| Class ADV | | | | | 5.53 | % | | | 6.18 | % | | | 4.46 | % | | | — | | | | — | |
| Class I | | | | | 6.02 | % | | | 6.71 | % | | | 5.00 | % | | | — | | | | — | |
| Class S | | | | | 5.76 | % | | | 6.44 | % | | | 4.73 | % | | | — | | | | — | |
| Class S2 | | | | | 5.61 | % | | | 6.29 | % | | | — | | | | 7.98 | % | | | — | |
| Class T | | | | | 5.22 | % | | | 5.95 | % | | | — | | | | — | | | | 4.11 | % |
| S&P Target Date Retirement Income Index | | | | | 5.13 | % | | | 6.59 | % | | | 5.16 | % | | | 7.94 | % | | | 4.94 | % |
| Russell 3000® Index | | | | | 12.56 | % | | | 15.63 | % | | | 8.72 | % | | | 18.56 | % | | | 8.18 | % |
| MSCI EAFE® Index | | | | | –4.90 | % | | | 5.33 | % | | | 4.86 | % | | | 8.80 | % | | | 4.27 | % |
| BCAB Index | | | | | 5.97 | % | | | 4.45 | % | | | 4.78 | % | | | 4.98 | % | | | 4.73 | % |
Based on a $10,000 initial investment, the graph and table above illustrate the total return of Voya Solution Income Portfolio against the indices indicated. An index is unmanaged and has no cash in its portfolio, imposes no sales charges and incurs no operating expenses. An investor cannot invest directly in an index. The Portfolio’s performance is shown without the imposition of any expenses or charges which are, or may be, imposed under your annuity contract. Total returns would have been lower if such expenses or charges were included.
The performance graph and table do not reflect the deduction of taxes that a shareholder will pay on Portfolio distributions or the redemption of Portfolio shares.
The performance shown may include the effect of fee waivers and/ or expense reimbursements by the Investment Adviser and/or other service providers, which have the effect of increasing total return. Had all fees and expenses been considered, the total returns would have been lower.
Performance data represents past performance and is no assurance of future results. Investment return and principal value of an investment in the Portfolio will fluctuate. Shares, when sold, may be worth more or less than their original cost. The Portfolio’s current performance may be lower or higher than the performance data shown. Please log on to www.voyainvestments.com or call (800) 262-3862 to get performance through the most recent month end.
This report contains statements that may be “forward-looking” statements. Actual results may differ materially from those projected in the “forward-looking” statements.
The views expressed in this report reflect those of the portfolio managers, only through the end of the period as stated on the cover. The portfolio managers’ views are subject to change at any time based on market and other conditions.
Portfolio holdings are subject to change daily.
11
VOYA SOLUTION MODERATELY
AGGRESSIVE PORTFOLIO | PORTFOLIO MANAGERS’ REPORT |
Average Annual Total Returns for the Periods Ended December 31, 2014
|
|
|---|
| | | | 1 Year
| | Since Inception
of Classes ADV, I, S, and S2
April 30, 2010
|
|---|
| Class ADV | | | | | 6.09 | % | | | 9.33 | % |
| Class I | | | | | 6.60 | % | | | 9.91 | % |
| Class S | | | | | 6.33 | % | | | 9.63 | % |
| Class S2 | | | | | 6.17 | % | | | 9.47 | % |
| S&P Target Risk Aggressive Index | | | | | 6.38 | % | | | 11.09 | % |
Based on a $10,000 initial investment, the graph and table above illustrate the total return of Voya Solution Moderately Aggressive Portfolio against the index indicated. The index is unmanaged and has no cash in its portfolio, imposes no sales charges and incurs no operating expenses. An investor cannot invest directly in an index. The Portfolio’s performance is shown without the imposition of any expenses or charges which are, or may be, imposed under your annuity contract. Total returns would have been lower if such expenses or charges were included.
The performance graph and table do not reflect the deduction of taxes that a shareholder will pay on Portfolio distributions or the redemption of Portfolio shares.
The performance shown may include the effect of fee waivers and/ or expense reimbursements by the Investment Adviser and/or other service providers, which have the effect of increasing total return. Had all fees and expenses been considered, the total returns would have been lower.
Performance data represents past performance and is no assurance of future results. Investment return and principal value of an investment in the Portfolio will fluctuate. Shares, when sold, may be worth more or less than their original cost. The Portfolio’s current performance may be lower or higher than the performance data shown. Please log on to www.voyainvestments.com or call (800) 262-3862 to get performance through the most recent month end.
This report contains statements that may be “forward-looking” statements. Actual results may differ materially from those projected in the “forward-looking” statements.
The views expressed in this report reflect those of the portfolio managers, only through the end of the period as stated on the cover. The portfolio managers’ views are subject to change at any time based on market and other conditions.
Portfolio holdings are subject to change daily.
12
| PORTFOLIO MANAGERS’ REPORT | VOYA SOLUTION MODERATELY
CONSERVATIVE PORTFOLIO |
Average Annual Total Returns for the Periods Ended December 31, 2014
|
|
|---|
| | | | 1 Year
| | 5 Year
| | Since Inception
of Classes ADV, I and S
July 2, 2007
| | Since Inception
of Class S2
April 30, 2010
|
|---|
| Class ADV | | | | | 5.20 | % | | | 7.03 | % | | | 3.35 | % | | | — | |
| Class I | | | | | 5.74 | % | | | 7.70 | % | | | 4.03 | % | | | — | |
| Class S | | | | | 5.58 | % | | | 7.42 | % | | | 3.74 | % | | | — | |
| Class S2 | | | | | 5.40 | % | | | — | | | | — | | | | 6.79 | % |
| S&P Target Risk Moderate Index | | | | | 4.75 | % | | | 7.03 | % | | | 4.03 | % | | | 6.86 | % |
Based on a $10,000 initial investment, the graph and table above illustrate the total return of Voya Solution Moderately Conservative Portfolio against the index indicated. The index is unmanaged and has no cash in its portfolio, imposes no sales charges and incurs no operating expenses. An investor cannot invest directly in an index. The Portfolio’s performance is shown without the imposition of any expenses or charges which are, or may be, imposed under your annuity contract. Total returns would have been lower if such expenses or charges were included.
The performance graph and table do not reflect the deduction of taxes that a shareholder will pay on Portfolio distributions or the redemption of Portfolio shares.
The performance shown may include the effect of fee waivers and/ or expense reimbursements by the Investment Adviser and/or other service providers, which have the effect of increasing total return. Had all fees and expenses been considered, the total returns would have been lower.
Performance data represents past performance and is no assurance of future results. Investment return and principal value of an investment in the Portfolio will fluctuate. Shares, when sold, may be worth more or less than their original cost. The Portfolio’s current performance may be lower or higher than the performance data shown. Please log on to www.voyainvestments.com or call (800) 262-3862 to get performance through the most recent month end.
This report contains statements that may be “forward-looking” statements. Actual results may differ materially from those projected in the “forward-looking” statements.
The views expressed in this report reflect those of the portfolio managers, only through the end of the period as stated on the cover. The portfolio managers’ views are subject to change at any time based on market and other conditions.
Portfolio holdings are subject to change daily.
13
| VOYA SOLUTION 2015 PORTFOLIO | PORTFOLIO MANAGERS’ REPORT |
Average Annual Total Returns for the Periods Ended December 31, 2014
|
|
|---|
| | | | 1 Year
| | 5 Year
| | Since Inception
of Classes ADV, I and S
April 29, 2005
| | Since Inception
of Class S2
May 28, 2009
| | Since Inception
of Class T
August 31, 2005
|
|---|
| Class ADV | | | | | 5.43 | % | | | 6.99 | % | | | 4.57 | % | | | — | | | | — | |
| Class I | | | | | 6.04 | % | | | 7.54 | % | | | 5.11 | % | | | — | | | | — | |
| Class S | | | | | 5.77 | % | | | 7.27 | % | | | 4.84 | % | | | — | | | | — | |
| Class S2 | | | | | 5.59 | % | | | 7.10 | % | | | — | | | | 9.45 | % | | | — | |
| Class T | | | | | 5.33 | % | | | 6.79 | % | | | — | | | | — | | | | 4.01 | % |
| S&P Target Date 2015 Index | | | | | 5.75 | % | | | 8.46 | % | | | 6.16 | % | | | 10.52 | % | | | 5.82 | % |
| Russell 3000® Index | | | | | 12.56 | % | | | 15.63 | % | | | 8.72 | % | | | 18.56 | % | | | 8.18 | % |
| MSCI EAFE® Index | | | | | –4.90 | % | | | 5.33 | % | | | 4.86 | % | | | 8.80 | % | | | 4.27 | % |
| BCAB Index | | | | | 5.97 | % | | | 4.45 | % | | | 4.78 | % | | | 4.98 | % | | | 4.73 | % |
Based on a $10,000 initial investment, the graph and table above illustrate the total return of Voya Solution 2015 Portfolio against the indices indicated. An index is unmanaged and has no cash in its portfolio, imposes no sales charges and incurs no operating expenses. An investor cannot invest directly in an index. The Portfolio’s performance is shown without the imposition of any expenses or charges which are, or may be, imposed under your annuity contract. Total returns would have been lower if such expenses or charges were included.
The performance graph and table do not reflect the deduction of taxes that a shareholder will pay on Portfolio distributions or the redemption of Portfolio shares.
The performance shown may include the effect of fee waivers and/ or expense reimbursements by the Investment Adviser and/or other service providers, which have the effect of increasing total return. Had all fees and expenses been considered, the total returns would have been lower.
Performance data represents past performance and is no assurance of future results. Investment return and principal value of an investment in the Portfolio will fluctuate. Shares, when sold, may be worth more or less than their original cost. The Portfolio’s current performance may be lower or higher than the performance data shown. Please log on to www.voyainvestments.com or call (800) 262-3862 to get performance through the most recent month end.
This report contains statements that may be “forward-looking” statements. Actual results may differ materially from those projected in the “forward-looking” statements.
The views expressed in this report reflect those of the portfolio managers, only through the end of the period as stated on the cover. The portfolio managers’ views are subject to change at any time based on market and other conditions.
Portfolio holdings are subject to change daily.
14
| PORTFOLIO MANAGERS’ REPORT | VOYA SOLUTION 2020 PORTFOLIO |
Average Annual Total Returns for the Periods Ended December 31, 2014
|
|
|---|
| | | | 1 Year
| | Since Inception
of Classes ADV, I, S, S2 and T
October 3, 2011
|
|---|
| Class ADV | | | | | 5.97 | % | | | 12.19 | % |
| Class I | | | | | 6.41 | % | | | 12.77 | % |
| Class S | | | | | 6.08 | % | | | 12.42 | % |
| Class S2 | | | | | 5.87 | % | | | 12.32 | % |
| Class T | | | | | 5.72 | % | | | 12.09 | % |
| S&P Target Date 2020 Index | | | | | 5.93 | % | | | 13.05 | % |
Based on a $10,000 initial investment, the graph and table above illustrate the total return of Voya Solution 2020 Portfolio against the index indicated. The index is unmanaged and has no cash in its portfolio, imposes no sales charges and incurs no operating expenses. An investor cannot invest directly in an index. The Portfolio’s performance is shown without the imposition of any expenses or charges which are, or may be, imposed under your annuity contract. Total returns would have been lower if such expenses or charges were included.
The performance graph and table do not reflect the deduction of taxes that a shareholder will pay on Portfolio distributions or the redemption of Portfolio shares.
The performance shown may include the effect of fee waivers and/ or expense reimbursements by the Investment Adviser and/or other service providers, which have the effect of increasing total return. Had all fees and expenses been considered, the total returns would have been lower.
Performance data represents past performance and is no assurance of future results. Investment return and principal value of an investment in the Portfolio will fluctuate. Shares, when sold, may be worth more or less than their original cost. The Portfolio’s current performance may be lower or higher than the performance data shown. Please log on to www.voyainvestments.com or call (800) 262-3862 to get performance through the most recent month end.
This report contains statements that may be “forward-looking” statements. Actual results may differ materially from those projected in the “forward-looking” statements.
The views expressed in this report reflect those of the portfolio managers, only through the end of the period as stated on the cover. The portfolio managers’ views are subject to change at any time based on market and other conditions.
Portfolio holdings are subject to change daily.
15
| VOYA SOLUTION 2025 PORTFOLIO | PORTFOLIO MANAGERS’ REPORT |
Average Annual Total Returns for the Periods Ended December 31, 2014
|
|
|---|
| | | | 1 Year
| | 5 Year
| | Since Inception
of Classes ADV, I and S
April 29, 2005
| | Since Inception
of Class S2
May 28, 2009
| | Since Inception
of Class T
August 31, 2005
|
|---|
| Class ADV | | | | | 5.26 | % | | | 8.69 | % | | | 5.02 | % | | | — | | | | — | |
| Class I | | | | | 5.82 | % | | | 9.23 | % | | | 5.57 | % | | | — | | | | — | |
| Class S | | | | | 5.58 | % | | | 8.97 | % | | | 5.30 | % | | | — | | | | — | |
| Class S2 | | | | | 5.40 | % | | | 8.79 | % | | | — | | | | 11.43 | % | | | — | |
| Class T | | | | | 5.14 | % | | | 8.50 | % | | | — | | | | — | | | | 4.33 | % |
| S&P Target Date 2025 Index | | | | | 5.83 | % | | | 9.82 | % | | | 6.73 | % | | | 12.39 | % | | | 6.30 | % |
| Russell 3000® Index | | | | | 12.56 | % | | | 15.63 | % | | | 8.72 | % | | | 18.56 | % | | | 8.18 | % |
| MSCI EAFE® Index | | | | | –4.90 | % | | | 5.33 | % | | | 4.86 | % | | | 8.80 | % | | | 4.27 | % |
| BCAB Index | | | | | 5.97 | % | | | 4.45 | % | | | 4.78 | % | | | 4.98 | % | | | 4.73 | % |
Based on a $10,000 initial investment, the graph and table above illustrate the total return of Voya Solution 2025 Portfolio against the indices indicated. An index is unmanaged and has no cash in its portfolio, imposes no sales charges and incurs no operating expenses. An investor cannot invest directly in an index. The Portfolio’s performance is shown without the imposition of any expenses or charges which are, or may be, imposed under your annuity contract. Total returns would have been lower if such expenses or charges were included.
The performance graph and table do not reflect the deduction of taxes that a shareholder will pay on Portfolio distributions or the redemption of Portfolio shares.
The performance shown may include the effect of fee waivers and/ or expense reimbursements by the Investment Adviser and/or other service providers, which have the effect of increasing total return. Had all fees and expenses been considered, the total returns would have been lower.
Performance data represents past performance and is no assurance of future results. Investment return and principal value of an investment in the Portfolio will fluctuate. Shares, when sold, may be worth more or less than their original cost. The Portfolio’s current performance may be lower or higher than the performance data shown. Please log on to www.voyainvestments.com or call (800) 262-3862 to get performance through the most recent month end.
This report contains statements that may be “forward-looking” statements. Actual results may differ materially from those projected in the “forward-looking” statements.
The views expressed in this report reflect those of the portfolio managers, only through the end of the period as stated on the cover. The portfolio managers’ views are subject to change at any time based on market and other conditions.
Portfolio holdings are subject to change daily.
16
| PORTFOLIO MANAGERS’ REPORT | VOYA SOLUTION 2030 PORTFOLIO |
Average Annual Total Returns for the Periods Ended December 31, 2014
|
|
|---|
| | | | 1 Year
| | Since Inception
of Classes ADV, I, S, S2 and T
October 3, 2011
|
|---|
| Class ADV | | | | | 6.30 | % | | | 15.22 | % |
| Class I | | | | | 6.94 | % | | | 15.83 | % |
| Class S | | | | | 6.41 | % | | | 15.38 | % |
| Class S2 | | | | | 6.38 | % | | | 15.26 | % |
| Class T | | | | | 6.22 | % | | | 15.16 | % |
| S&P Target Date 2030 Index | | | | | 5.90 | % | | | 15.60 | % |
Based on a $10,000 initial investment, the graph and table above illustrate the total return of Voya Solution 2030 Portfolio against the index indicated. The index is unmanaged and has no cash in its portfolio, imposes no sales charges and incurs no operating expenses. An investor cannot invest directly in an index. The Portfolio’s performance is shown without the imposition of any expenses or charges which are, or may be, imposed under your annuity contract. Total returns would have been lower if such expenses or charges were included.
The performance graph and table do not reflect the deduction of taxes that a shareholder will pay on Portfolio distributions or the redemption of Portfolio shares.
The performance shown may include the effect of fee waivers and/ or expense reimbursements by the Investment Adviser and/or other service providers, which have the effect of increasing total return. Had all fees and expenses been considered, the total returns would have been lower.
Performance data represents past performance and is no assurance of future results. Investment return and principal value of an investment in the Portfolio will fluctuate. Shares, when sold, may be worth more or less than their original cost. The Portfolio’s current performance may be lower or higher than the performance data shown. Please log on to www.voyainvestments.com or call (800) 262-3862 to get performance through the most recent month end.
This report contains statements that may be “forward-looking” statements. Actual results may differ materially from those projected in the “forward-looking” statements.
The views expressed in this report reflect those of the portfolio managers, only through the end of the period as stated on the cover. The portfolio managers’ views are subject to change at any time based on market and other conditions.
Portfolio holdings are subject to change daily.
17
| VOYA SOLUTION 2035 PORTFOLIO | PORTFOLIO MANAGERS’ REPORT |
Average Annual Total Returns for the Periods Ended December 31, 2014
|
|
|---|
| | | | 1 Year
| | 5 Year
| | Since Inception
of Classes ADV, I and S
April 29, 2005
| | Since Inception
of Class S2
May 28, 2009
| | Since Inception
of Class T
August 31, 2005
|
|---|
| Class ADV | | | | | 5.38 | % | | | 9.58 | % | | | 5.51 | % | | | — | | | | — | |
| Class I | | | | | 5.93 | % | | | 10.11 | % | | | 6.05 | % | | | — | | | | — | |
| Class S | | | | | 5.68 | % | | | 9.85 | % | | | 5.78 | % | | | — | | | | — | |
| Class S2 | | | | | 5.50 | % | | | 9.69 | % | | | — | | | | 12.53 | % | | | — | |
| Class T | | | | | 5.26 | % | | | 9.37 | % | | | — | | | | — | | | | 4.76 | % |
| S&P Target Date 2035 Index | | | | | 5.95 | % | | | 10.78 | % | | | 6.98 | % | | | 13.63 | % | | | 6.50 | % |
| Russell 3000® Index | | | | | 12.56 | % | | | 15.63 | % | | | 8.72 | % | | | 18.56 | % | | | 8.18 | % |
| MSCI EAFE® Index | | | | | –4.90 | % | | | 5.33 | % | | | 4.86 | % | | | 8.80 | % | | | 4.27 | % |
| BCAB Index | | | | | 5.97 | % | | | 4.45 | % | | | 4.78 | % | | | 4.98 | % | | | 4.73 | % |
Based on a $10,000 initial investment, the graph and table above illustrate the total return of Voya Solution 2035 Portfolio against the indices indicated. An index is unmanaged and has no cash in its portfolio, imposes no sales charges and incurs no operating expenses. An investor cannot invest directly in an index. The Portfolio’s performance is shown without the imposition of any expenses or charges which are, or may be, imposed under your annuity contract. Total returns would have been lower if such expenses or charges were included.
The performance graph and table do not reflect the deduction of taxes that a shareholder will pay on Portfolio distributions or the redemption of Portfolio shares.
The performance shown may include the effect of fee waivers and/ or expense reimbursements by the Investment Adviser and/or other service providers, which have the effect of increasing total return. Had all fees and expenses been considered, the total returns would have been lower.
Performance data represents past performance and is no assurance of future results. Investment return and principal value of an investment in the Portfolio will fluctuate. Shares, when sold, may be worth more or less than their original cost. The Portfolio’s current performance may be lower or higher than the performance data shown. Please log on to www.voyainvestments.com or call (800) 262-3862 to get performance through the most recent month end.
This report contains statements that may be “forward-looking” statements. Actual results may differ materially from those projected in the “forward-looking” statements.
The views expressed in this report reflect those of the portfolio managers, only through the end of the period as stated on the cover. The portfolio managers’ views are subject to change at any time based on market and other conditions.
Portfolio holdings are subject to change daily.
18
| PORTFOLIO MANAGERS’ REPORT | VOYA SOLUTION 2040 PORTFOLIO |
Average Annual Total Returns for the Periods Ended December 31, 2014
|
|
|---|
| | | | 1 Year
| | Since Inception
of Classes ADV, I, S, S2 and T
October 3, 2011
|
|---|
| Class ADV | | | | | 6.51 | % | | | 17.31 | % |
| Class I | | | | | 7.04 | % | | | 17.93 | % |
| Class S | | | | | 6.54 | % | | | 17.50 | % |
| Class S2 | | | | | 6.66 | % | | | 17.42 | % |
| Class T | | | | | 6.40 | % | | | 17.12 | % |
| S&P Target Date 2040 Index | | | | | 5.96 | % | | | 17.24 | % |
Based on a $10,000 initial investment, the graph and table above illustrate the total return of Voya Solution 2040 Portfolio against the index indicated. The index is unmanaged and has no cash in its portfolio, imposes no sales charges and incurs no operating expenses. An investor cannot invest directly in an index. The Portfolio’s performance is shown without the imposition of any expenses or charges which are, or may be, imposed under your annuity contract. Total returns would have been lower if such expenses or charges were included.
The performance graph and table do not reflect the deduction of taxes that a shareholder will pay on Portfolio distributions or the redemption of Portfolio shares.
The performance shown may include the effect of fee waivers and/ or expense reimbursements by the Investment Adviser and/or other service providers, which have the effect of increasing total return. Had all fees and expenses been considered, the total returns would have been lower.
Performance data represents past performance and is no assurance of future results. Investment return and principal value of an investment in the Portfolio will fluctuate. Shares, when sold, may be worth more or less than their original cost. The Portfolio’s current performance may be lower or higher than the performance data shown. Please log on to www.voyainvestments.com or call (800) 262-3862 to get performance through the most recent month end.
This report contains statements that may be “forward-looking” statements. Actual results may differ materially from those projected in the “forward-looking” statements.
The views expressed in this report reflect those of the portfolio managers, only through the end of the period as stated on the cover. The portfolio managers’ views are subject to change at any time based on market and other conditions.
Portfolio holdings are subject to change daily.
19
| VOYA SOLUTION 2045 PORTFOLIO | PORTFOLIO MANAGERS’ REPORT |
Average Annual Total Returns for the Periods Ended December 31, 2014
|
|
|---|
| | | | 1 Year
| | 5 Year
| | Since Inception
of Classes ADV, I and S
April 29, 2005
| | Since Inception
of Class S2
May 28, 2009
| | Since Inception
of Class T
August 31, 2005
|
|---|
| Class ADV | | | | | 5.84 | % | | | 10.29 | % | | | 5.83 | % | | | — | | | | — | |
| Class I | | | | | 6.34 | % | | | 10.83 | % | | | 6.36 | % | | | — | | | | — | |
| Class S | | | | | 6.10 | % | | | 10.55 | % | | | 6.09 | % | | | — | | | | — | |
| Class S2 | | | | | 5.87 | % | | | 10.38 | % | | | — | | | | 13.30 | % | | | — | |
| Class T | | | | | 5.53 | % | | | 10.05 | % | | | — | | | | — | | | | 4.92 | % |
| S&P Target Date 2045 Index | | | | | 5.93 | % | | | 11.32 | % | | | 6.81 | % | | | 14.25 | % | | | 6.58 | % |
| Russell 3000® Index | | | | | 12.56 | % | | | 15.63 | % | | | 8.72 | % | | | 18.56 | % | | | 8.18 | % |
| MSCI EAFE® Index | | | | | –4.90 | % | | | 5.33 | % | | | 4.86 | % | | | 8.80 | % | | | 4.27 | % |
| BCAB Index | | | | | 5.97 | % | | | 4.45 | % | | | 4.78 | % | | | 4.98 | % | | | 4.73 | % |
Based on a $10,000 initial investment, the graph and table above illustrate the total return of Voya Solution 2045 Portfolio against the indices indicated. An index is unmanaged and has no cash in its portfolio, imposes no sales charges and incurs no operating expenses. An investor cannot invest directly in an index. The Portfolio’s performance is shown without the imposition of any expenses or charges which are, or may be, imposed under your annuity contract. Total returns would have been lower if such expenses or charges were included.
The performance graph and table do not reflect the deduction of taxes that a shareholder will pay on Portfolio distributions or the redemption of Portfolio shares.
The performance shown may include the effect of fee waivers and/ or expense reimbursements by the Investment Adviser and/or other service providers, which have the effect of increasing total return. Had all fees and expenses been considered, the total returns would have been lower.
Performance data represents past performance and is no assurance of future results. Investment return and principal value of an investment in the Portfolio will fluctuate. Shares, when sold, may be worth more or less than their original cost. The Portfolio’s current performance may be lower or higher than the performance data shown. Please log on to www.voyainvestments.com or call (800) 262-3862 to get performance through the most recent month end.
This report contains statements that may be “forward-looking” statements. Actual results may differ materially from those projected in the “forward-looking” statements.
The views expressed in this report reflect those of the portfolio managers, only through the end of the period as stated on the cover. The portfolio managers’ views are subject to change at any time based on market and other conditions.
Portfolio holdings are subject to change daily.
20
| PORTFOLIO MANAGERS’ REPORT | VOYA SOLUTION 2050 PORTFOLIO |
Average Annual Total Returns for the Periods Ended December 31, 2014
|
|
|---|
| | | | 1 Year
| | Since Inception
of Classes ADV, I, S, S2 and T
October 3, 2011
|
|---|
| Class ADV | | | | | 6.49 | % | | | 17.59 | % |
| Class I | | | | | 7.04 | % | | | 18.20 | % |
| Class S | | | | | 6.69 | % | | | 17.78 | % |
| Class S2 | | | | | 6.59 | % | | | 17.63 | % |
| Class T | | | | | 6.30 | % | | | 17.48 | % |
| S&P Target Date 2045 Index | | | | | 5.93 | % | | | 17.77 | % |
Based on a $10,000 initial investment, the graph and table above illustrate the total return of Voya Solution 2050 Portfolio against the index indicated. The index is unmanaged and has no cash in its portfolio, imposes no sales charges and incurs no operating expenses. An investor cannot invest directly in an index. The Portfolio’s performance is shown without the imposition of any expenses or charges which are, or may be, imposed under your annuity contract. Total returns would have been lower if such expenses or charges were included.
The performance graph and table do not reflect the deduction of taxes that a shareholder will pay on Portfolio distributions or the redemption of Portfolio shares.
The performance shown may include the effect of fee waivers and/ or expense reimbursements by the Investment Adviser and/or other service providers, which have the effect of increasing total return. Had all fees and expenses been considered, the total returns would have been lower.
Performance data represents past performance and is no assurance of future results. Investment return and principal value of an investment in the Portfolio will fluctuate. Shares, when sold, may be worth more or less than their original cost. The Portfolio’s current performance may be lower or higher than the performance data shown. Please log on to www.voyainvestments.com or call (800) 262-3862 to get performance through the most recent month end.
This report contains statements that may be “forward-looking” statements. Actual results may differ materially from those projected in the “forward-looking” statements.
The views expressed in this report reflect those of the portfolio managers, only through the end of the period as stated on the cover. The portfolio managers’ views are subject to change at any time based on market and other conditions.
Portfolio holdings are subject to change daily.
21
| VOYA SOLUTION 2055 PORTFOLIO | PORTFOLIO MANAGERS’ REPORT |
Average Annual Total Returns for the Periods Ended December 31, 2014
|
|
|---|
| | | | 1 Year
| | Since Inception
of Classes ADV, I, S, S2 and T
March 8, 2010
|
|---|
| Class ADV | | | | | 6.03 | % | | | 10.42 | % |
| Class I | | | | | 6.56 | % | | | 10.96 | % |
| Class S | | | | | 6.25 | % | | | 10.68 | % |
| Class S2 | | | | | 6.12 | % | | | 10.52 | % |
| Class T | | | | | 6.00 | % | | | 10.22 | % |
| S&P Target Date 2045 Index | | | | | 5.93 | % | | | 11.20 | % |
Based on a $10,000 initial investment, the graph and table above illustrate the total return of Voya Solution 2055 Portfolio against the index indicated. The index is unmanaged and has no cash in its portfolio, imposes no sales charges and incurs no operating expenses. An investor cannot invest directly in an index. The Portfolio’s performance is shown without the imposition of any expenses or charges which are, or may be, imposed under your annuity contract. Total returns would have been lower if such expenses or charges were included.
The performance graph and table do not reflect the deduction of taxes that a shareholder will pay on Portfolio distributions or the redemption of Portfolio shares.
The performance shown may include the effect of fee waivers and/ or expense reimbursements by the Investment Adviser and/or other service providers, which have the effect of increasing total return. Had all fees and expenses been considered, the total returns would have been lower.
Performance data represents past performance and is no assurance of future results. Investment return and principal value of an investment in the Portfolio will fluctuate. Shares, when sold, may be worth more or less than their original cost. The Portfolio’s current performance may be lower or higher than the performance data shown. Please log on to www.voyainvestments.com or call (800) 262-3862 to get performance through the most recent month end.
This report contains statements that may be “forward-looking” statements. Actual results may differ materially from those projected in the “forward-looking” statements.
The views expressed in this report reflect those of the portfolio managers, only through the end of the period as stated on the cover. The portfolio managers’ views are subject to change at any time based on market and other conditions.
Portfolio holdings are subject to change daily.
22
SHAREHOLDER EXPENSE EAMPLES (UNAUDITED)
As a shareholder of a Portfolio, you incur two types of costs: (1) transaction costs, including redemption fees and exchange fees; and (2) ongoing costs including management fees, distribution and/or service (12b-1) fees, and other Portfolio expenses. These Examples are intended to help you understand your ongoing costs (in dollars) of investing in a Portfolio and to compare these costs with the ongoing costs of investing in other mutual funds.
The Examples are based on an investment of $1,000 invested at the beginning of the period and held for the entire period from July 1, 2014 to December 31, 2014. The Portfolios’ expenses are shown without the imposition of any charges which are, or may be, imposed under your variable annuity contract, variable life insurance policy, qualified pension or retirement plan. Expenses would have been higher if such charges were included.
Actual Expenses
The left section of the table shown below, “Actual Portfolio Return,” provides information about actual account values and actual expenses. You may use the information in this section, together with the amount you invested, to estimate the expenses that you paid over the period. Simply divide your account value by $1,000 (for example, an $8,600 account value divided by $1,000 = 8.6), then multiply the result by the number in the first section under the heading entitled “Expenses Paid During the Period” to estimate the expenses you paid on your account during this period.
Hypothetical Example for Comparison Purposes
The right section of the table shown below, “Hypothetical (5% return before expenses),” provides information about hypothetical account values and hypothetical expenses based on a Portfolio’s actual expense ratio and an assumed rate of return of 5% per year before expenses, which is not a Portfolio’s actual return. The hypothetical account values and expenses may not be used to estimate the actual ending account balance or expenses you paid for the period. You may use this information to compare the ongoing costs of investing in a Portfolio and other mutual funds. To do so, compare this 5% hypothetical example with the 5% hypothetical examples that appear in the shareholder reports of the other mutual funds.
Please note that the expenses shown in the table are meant to highlight your ongoing costs only and do not reflect any transactional costs, such as redemption fees or exchange fees. Therefore, the hypothetical lines of the table are useful in comparing ongoing costs only, and will not help you determine the relative total costs of owning different mutual funds. In addition, if these transactional costs were included, your costs would have been higher.
| | | | Actual Portfolio Return
| | Hypothetical (5% return before expenses)
| |
|---|
| | | | Beginning
Account
Value
July 1,
2014
| | Ending
Account
Value
December 31,
2014
| | Annualized
Expense
Ratio*
| | Expenses Paid
During the
Period Ended
December 31,
2014**
| | Beginning
Account
Value
July 1,
2014
| | Ending
Account
Value
December 31,
2014
| | Annualized
Expense
Ratio*
| | Expenses Paid
During the
Period Ended
December 31,
2014**
|
|---|
Voya Solution Aggressive Portfolio |
| Class ADV | | | | $ | 1,000.00 | | | $ | 1,007.80 | | | | 0.65 | % | | $ | 3.29 | | | $ | 1,000.00 | | | $ | 1,021.93 | | | | 0.65 | % | | $ | 3.31 | |
| Class I | | | | | 1,000.00 | | | | 1,010.10 | | | | 0.15 | | | | 0.76 | | | | 1,000.00 | | | | 1,024.45 | | | | 0.15 | | | | 0.77 | |
| Class S | | | | | 1,000.00 | | | | 1,008.70 | | | | 0.40 | | | | 2.03 | | | | 1,000.00 | | | | 1,023.19 | | | | 0.40 | | | | 2.04 | |
| Class S2 | | | | | 1,000.00 | | | | 1,007.30 | | | | 0.55 | | | | 2.78 | | | | 1,000.00 | | | | 1,022.43 | | | | 0.55 | | | | 2.80 | |
Voya Solution Balanced Portfolio |
| Class ADV | | | | $ | 1,000.00 | | | $ | 1,009.40 | | | | 0.64 | % | | $ | 3.24 | | | $ | 1,000.00 | | | $ | 1,021.98 | | | | 0.64 | % | | $ | 3.26 | |
| Class I | | | | | 1,000.00 | | | | 1,011.40 | | | | 0.14 | | | | 0.71 | | | | 1,000.00 | | | | 1,024.50 | | | | 0.14 | | | | 0.71 | |
| Class S | | | | | 1,000.00 | | | | 1,010.20 | | | | 0.39 | | | | 1.98 | | | | 1,000.00 | | | | 1,023.24 | | | | 0.39 | | | | 1.99 | |
| Class S2 | | | | | 1,000.00 | | | | 1,009.70 | | | | 0.54 | | | | 2.74 | | | | 1,000.00 | | | | 1,022.48 | | | | 0.54 | | | | 2.75 | |
| * | | The annualized expense ratios do not include expenses of the underlying funds. |
| ** | | Expenses are equal to each Portfolio’s respective annualized expense ratios multiplied by the average account value over the period, multiplied by 184/365 to reflect the most recent fiscal half-year. |
23
SHAREHOLDER EXPENSE EXAMPLES (UNAUDITED) (CONTINUED)
| | | | Actual Portfolio Return
| | Hypothetical (5% return before expenses)
| |
|---|
| | | | Beginning
Account
Value
July 1,
2014
| | Ending
Account
Value
December 31,
2014
| | Annualized
Expense
Ratio*
| | Expenses Paid
During the
Period Ended
December 31,
2014**
| | Beginning
Account
Value
July 1,
2014
| | Ending
Account
Value
December 31,
2014
| | Annualized
Expense
Ratio*
| | Expenses Paid
During the
Period Ended
December 31,
2014**
|
|---|
Voya Solution Conservative Portfolio |
| Class ADV | | | | $ | 1,000.00 | | | $ | 998.30 | | | | 0.58 | % | | $ | 2.92 | | | $ | 1,000.00 | | | $ | 1,022.28 | | | | 0.58 | % | | $ | 2.96 | |
| Class I | | | | | 1,000.00 | | | | 1,000.50 | | | | 0.08 | | | | 0.40 | | | | 1,000.00 | | | | 1,024.80 | | | | 0.08 | | | | 0.41 | |
| Class S | | | | | 1,000.00 | | | | 999.60 | | | | 0.33 | | | | 1.66 | | | | 1,000.00 | | | | 1,023.54 | | | | 0.33 | | | | 1.68 | |
| Class S2 | | | | | 1,000.00 | | | | 998.30 | | | | 0.48 | | | | 2.42 | | | | 1,000.00 | | | | 1,022.79 | | | | 0.48 | | | | 2.45 | |
Voya Solution Income Portfolio |
| Class ADV | | | | $ | 1,000.00 | | | $ | 1,008.70 | | | | 0.62 | % | | $ | 3.14 | | | $ | 1,000.00 | | | $ | 1,022.08 | | | | 0.62 | % | | $ | 3.16 | |
| Class I | | | | | 1,000.00 | | | | 1,011.00 | | | | 0.12 | | | | 0.61 | | | | 1,000.00 | | | | 1,024.60 | | | | 0.12 | | | | 0.61 | |
| Class S | | | | | 1,000.00 | | | | 1,009.00 | | | | 0.37 | | | | 1.87 | | | | 1,000.00 | | | | 1,023.34 | | | | 0.37 | | | | 1.89 | |
| Class S2 | | | | | 1,000.00 | | | | 1,009.10 | | | | 0.52 | | | | 2.63 | | | | 1,000.00 | | | | 1,022.58 | | | | 0.52 | | | | 2.65 | |
| Class T | | | | | 1,000.00 | | | | 1,007.30 | | | | 0.82 | | | | 4.15 | | | | 1,000.00 | | | | 1,021.07 | | | | 0.82 | | | | 4.18 | |
Voya Solution Moderately Aggressive Portfolio |
| Class ADV | | | | $ | 1,000.00 | | | $ | 1,006.70 | | | | 0.67 | % | | $ | 3.39 | | | $ | 1,000.00 | | | $ | 1,021.83 | | | | 0.67 | % | | $ | 3.41 | |
| Class I | | | | | 1,000.00 | | | | 1,009.50 | | | | 0.17 | | | | 0.86 | | | | 1,000.00 | | | | 1,024.35 | | | | 0.17 | | | | 0.87 | |
| Class S | | | | | 1,000.00 | | | | 1,008.00 | | | | 0.42 | | | | 2.13 | | | | 1,000.00 | | | | 1,023.09 | | | | 0.42 | | | | 2.14 | |
| Class S2 | | | | | 1,000.00 | | | | 1,007.30 | | | | 0.57 | | | | 2.88 | | | | 1,000.00 | | | | 1,022.33 | | | | 0.57 | | | | 2.91 | |
Voya Solution Moderately Conservative Portfolio |
| Class ADV | | | | $ | 1,000.00 | | | $ | 1,004.50 | | | | 0.65 | % | | $ | 3.28 | | | $ | 1,000.00 | | | $ | 1,021.93 | | | | 0.65 | % | | $ | 3.31 | |
| Class I | | | | | 1,000.00 | | | | 1,007.90 | | | | 0.15 | | | | 0.76 | | | | 1,000.00 | | | | 1,024.45 | | | | 0.15 | | | | 0.77 | |
| Class S | | | | | 1,000.00 | | | | 1,006.40 | | | | 0.40 | | | | 2.02 | | | | 1,000.00 | | | | 1,023.19 | | | | 0.40 | | | | 2.04 | |
| Class S2 | | | | | 1,000.00 | | | | 1,006.10 | | | | 0.55 | | | | 2.78 | | | | 1,000.00 | | | | 1,022.43 | | | | 0.55 | | | | 2.80 | |
Voya Solution 2015 Portfolio |
| Class ADV | | | | $ | 1,000.00 | | | $ | 1,007.50 | | | | 0.64 | % | | $ | 3.24 | | | $ | 1,000.00 | | | $ | 1,021.98 | | | | 0.64 | % | | $ | 3.26 | |
| Class I | | | | | 1,000.00 | | | | 1,010.20 | | | | 0.14 | | | | 0.71 | | | | 1,000.00 | | | | 1,024.50 | | | | 0.14 | | | | 0.71 | |
| Class S | | | | | 1,000.00 | | | | 1,008.80 | | | | 0.39 | | | | 1.97 | | | | 1,000.00 | | | | 1,023.24 | | | | 0.39 | | | | 1.99 | |
| Class S2 | | | | | 1,000.00 | | | | 1,007.60 | | | | 0.54 | | | | 2.73 | | | | 1,000.00 | | | | 1,022.48 | | | | 0.54 | | | | 2.75 | |
| Class T | | | | | 1,000.00 | | | | 1,007.10 | | | | 0.84 | | | | 4.25 | | | | 1,000.00 | | | | 1,020.97 | | | | 0.84 | | | | 4.28 | |
Voya Solution 2020 Portfolio |
| Class ADV | | | | $ | 1,000.00 | | | $ | 1,006.80 | | | | 0.63 | % | | $ | 3.19 | | | $ | 1,000.00 | | | $ | 1,022.03 | | | | 0.63 | % | | $ | 3.21 | |
| Class I | | | | | 1,000.00 | | | | 1,008.30 | | | | 0.13 | | | | 0.66 | | | | 1,000.00 | | | | 1,024.55 | | | | 0.13 | | | | 0.66 | |
| Class S | | | | | 1,000.00 | | | | 1,006.00 | | | | 0.38 | | | | 1.92 | | | | 1,000.00 | | | | 1,023.29 | | | | 0.38 | | | | 1.94 | |
| Class S2 | | | | | 1,000.00 | | | | 1,005.30 | | | | 0.53 | | | | 2.68 | | | | 1,000.00 | | | | 1,022.53 | | | | 0.53 | | | | 2.70 | |
| Class T | | | | | 1,000.00 | | | | 1,005.30 | | | | 0.83 | | | | 4.20 | | | | 1,000.00 | | | | 1,021.02 | | | | 0.83 | | | | 4.23 | |
Voya Solution 2025 Portfolio |
| Class ADV | | | | $ | 1,000.00 | | | $ | 1,004.10 | | | | 0.63 | % | | $ | 3.18 | | | $ | 1,000.00 | | | $ | 1,022.03 | | | | 0.63 | % | | $ | 3.21 | |
| Class I | | | | | 1,000.00 | | | | 1,006.80 | | | | 0.13 | | | | 0.66 | | | | 1,000.00 | | | | 1,024.55 | | | | 0.13 | | | | 0.66 | |
| Class S | | | | | 1,000.00 | | | | 1,005.60 | | | | 0.38 | | | | 1.92 | | | | 1,000.00 | | | | 1,023.29 | | | | 0.38 | | | | 1.94 | |
| Class S2 | | | | | 1,000.00 | | | | 1,005.00 | | | | 0.53 | | | | 2.68 | | | | 1,000.00 | | | | 1,022.53 | | | | 0.53 | | | | 2.70 | |
| Class T | | | | | 1,000.00 | | | | 1,003.80 | | | | 0.83 | | | | 4.19 | | | | 1,000.00 | | | | 1,021.02 | | | | 0.83 | | | | 4.23 | |
| * | | The annualized expense ratios do not include expenses of the underlying funds. |
| ** | | Expenses are equal to each Portfolio’s respective annualized expense ratios multiplied by the average account value over the period, multiplied by 184/365 to reflect the most recent fiscal half-year. |
24
SHAREHOLDER EXPENSE EXAMPLES (UNAUDITED) (CONTINUED)
| | | | Actual Portfolio Return
| | Hypothetical (5% return before expenses)
| |
|---|
| | | | Beginning
Account
Value
July 1,
2014
| | Ending
Account
Value
December 31,
2014
| | Annualized
Expense
Ratio*
| | Expenses Paid
During the
Period Ended
December 31,
2014**
| | Beginning
Account
Value
July 1,
2014
| | Ending
Account
Value
December 31,
2014
| | Annualized
Expense
Ratio*
| | Expenses Paid
During the
Period Ended
December 31,
2014**
|
|---|
Voya Solution 2030 Portfolio |
| Class ADV | | | | $ | 1,000.00 | | | $ | 1,008.10 | | | | 0.66 | % | | $ | 3.34 | | | $ | 1,000.00 | | | $ | 1,021.88 | | | | 0.66 | % | | $ | 3.36 | |
| Class I | | | | | 1,000.00 | | | | 1,011.60 | | | | 0.16 | | | | 0.81 | | | | 1,000.00 | | | | 1,024.40 | | | | 0.16 | | | | 0.82 | |
| Class S | | | | | 1,000.00 | | | | 1,008.10 | | | | 0.41 | | | | 2.08 | | | | 1,000.00 | | | | 1,023.14 | | | | 0.41 | | | | 2.09 | |
| Class S2 | | | | | 1,000.00 | | | | 1,008.90 | | | | 0.56 | | | | 2.84 | | | | 1,000.00 | | | | 1,022.38 | | | | 0.56 | | | | 2.85 | |
| Class T | | | | | 1,000.00 | | | | 1,008.90 | | | | 0.86 | | | | 4.35 | | | | 1,000.00 | | | | 1,020.87 | | | | 0.86 | | | | 4.38 | |
Voya Solution 2035 Portfolio |
| Class ADV | | | | $ | 1,000.00 | | | $ | 1,004.20 | | | | 0.66 | % | | $ | 3.33 | | | $ | 1,000.00 | | | $ | 1,021.88 | | | | 0.66 | % | | $ | 3.36 | |
| Class I | | | | | 1,000.00 | | | | 1,006.40 | | | | 0.16 | | | | 0.81 | | | | 1,000.00 | | | | 1,024.40 | | | | 0.16 | | | | 0.82 | |
| Class S | | | | | 1,000.00 | | | | 1,005.60 | | | | 0.41 | | | | 2.07 | | | | 1,000.00 | | | | 1,023.14 | | | | 0.41 | | | | 2.09 | |
| Class S2 | | | | | 1,000.00 | | | | 1,003.90 | | | | 0.56 | | | | 2.83 | | | | 1,000.00 | | | | 1,022.38 | | | | 0.56 | | | | 2.85 | |
| Class T | | | | | 1,000.00 | | | | 1,003.20 | | | | 0.86 | | | | 4.34 | | | | 1,000.00 | | | | 1,020.87 | | | | 0.86 | | | | 4.38 | |
Voya Solution 2040 Portfolio |
| Class ADV | | | | $ | 1,000.00 | | | $ | 1,005.00 | | | | 0.67 | % | | $ | 3.39 | | | $ | 1,000.00 | | | $ | 1,021.83 | | | | 0.67 | % | | $ | 3.41 | |
| Class I | | | | | 1,000.00 | | | | 1,008.40 | | | | 0.17 | | | | 0.86 | | | | 1,000.00 | | | | 1,024.35 | | | | 0.17 | | | | 0.87 | |
| Class S | | | | | 1,000.00 | | | | 1,004.40 | | | | 0.42 | | | | 2.12 | | | | 1,000.00 | | | | 1,023.09 | | | | 0.42 | | | | 2.14 | |
| Class S2 | | | | | 1,000.00 | | | | 1,006.40 | | | | 0.57 | | | | 2.88 | | | | 1,000.00 | | | | 1,022.33 | | | | 0.57 | | | | 2.91 | |
| Class T | | | | | 1,000.00 | | | | 1,005.10 | | | | 0.87 | | | | 4.40 | | | | 1,000.00 | | | | 1,020.82 | | | | 0.87 | | | | 4.43 | |
Voya Solution 2045 Portfolio |
| Class ADV | | | | $ | 1,000.00 | | | $ | 1,005.80 | | | | 0.68 | % | | $ | 3.44 | | | $ | 1,000.00 | | | $ | 1,021.78 | | | | 0.68 | % | | $ | 3.47 | |
| Class I | | | | | 1,000.00 | | | | 1,007.70 | | | | 0.18 | | | | 0.91 | | | | 1,000.00 | | | | 1,024.30 | | | | 0.18 | | | | 0.92 | |
| Class S | | | | | 1,000.00 | | | | 1,006.90 | | | | 0.43 | | | | 2.18 | | | | 1,000.00 | | | | 1,023.04 | | | | 0.43 | | | | 2.19 | |
| Class S2 | | | | | 1,000.00 | | | | 1,005.80 | | | | 0.58 | | | | 2.93 | | | | 1,000.00 | | | | 1,022.28 | | | | 0.58 | | | | 2.96 | |
| Class T | | | | | 1,000.00 | | | | 1,004.20 | | | | 0.88 | | | | 4.45 | | | | 1,000.00 | | | | 1,020.77 | | | | 0.88 | | | | 4.48 | |
Voya Solution 2050 Portfolio |
| Class ADV | | | | $ | 1,000.00 | | | $ | 1,005.20 | | | | 0.68 | % | | $ | 3.44 | | | $ | 1,000.00 | | | $ | 1,021.78 | | | | 0.68 | % | | $ | 3.47 | |
| Class I | | | | | 1,000.00 | | | | 1,008.80 | | | | 0.18 | | | | 0.91 | | | | 1,000.00 | | | | 1,024.30 | | | | 0.18 | | | | 0.92 | |
| Class S | | | | | 1,000.00 | | | | 1,004.80 | | | | 0.43 | | | | 2.17 | | | | 1,000.00 | | | | 1,023.04 | | | | 0.43 | | | | 2.19 | |
| Class S2 | | | | | 1,000.00 | | | | 1,006.20 | | | | 0.58 | | | | 2.93 | | | | 1,000.00 | | | | 1,022.28 | | | | 0.58 | | | | 2.96 | |
| Class T | | | | | 1,000.00 | | | | 1,004.90 | | | | 0.88 | | | | 4.45 | | | | 1,000.00 | | | | 1,020.77 | | | | 0.88 | | | | 4.48 | |
Voya Solution 2055 Portfolio |
| Class ADV | | | | $ | 1,000.00 | | | $ | 1,007.30 | | | | 0.68 | % | | $ | 3.44 | | | $ | 1,000.00 | | | $ | 1,021.78 | | | | 0.68 | % | | $ | 3.47 | |
| Class I | | | | | 1,000.00 | | | | 1,010.40 | | | | 0.18 | | | | 0.91 | | | | 1,000.00 | | | | 1,024.30 | | | | 0.18 | | | | 0.92 | |
| Class S | | | | | 1,000.00 | | | | 1,008.50 | | | | 0.43 | | | | 2.18 | | | | 1,000.00 | | | | 1,023.04 | | | | 0.43 | | | | 2.19 | |
| Class S2 | | | | | 1,000.00 | | | | 1,007.70 | | | | 0.58 | | | | 2.94 | | | | 1,000.00 | | | | 1,022.28 | | | | 0.58 | | | | 2.96 | |
| Class T | | | | | 1,000.00 | | | | 1,007.70 | | | | 0.88 | | | | 4.45 | | | | 1,000.00 | | | | 1,020.77 | | | | 0.88 | | | | 4.48 | |
| * | | The annualized expense ratios do not include expenses of the underlying funds. |
| ** | | Expenses are equal to each Portfolio’s respective annualized expense ratios multiplied by the average account value over the period, multiplied by 184/365 to reflect the most recent fiscal half-year. |
25
REPORT OF INDEPENDENT REGISTERED PUBLIC ACCOUNTING FIRM
The Shareholders and Board of Directors
Voya Partners, Inc.
We have audited the accompanying statements of assets and liabilities, including the portfolios of investments, of Voya Solution Aggressive Portfolio, Voya Solution Balanced Portfolio, Voya Solution Conservative Portfolio, Voya Solution Income Portfolio, Voya Solution Moderately Aggressive Portfolio, Voya Solution Moderately Conservative Portfolio, Voya Solution 2015 Portfolio, Voya Solution 2020 Portfolio, Voya Solution 2025 Portfolio, Voya Solution 2030 Portfolio, Voya Solution 2035 Portfolio, Voya Solution 2040 Portfolio, Voya Solution 2045 Portfolio, Voya Solution 2050 Portfolio, and Voya Solution 2055 Portfolio, each a series of Voya Partners, Inc., as of December 31, 2014, and the related statements of operations for the year then ended, the statements of changes in net assets for each of the years in the two-year period then ended, and the financial highlights for each of the years in the five-year period then ended. These financial statements and financial highlights are the responsibility of management. Our responsibility is to express an opinion on these financial statements and financial highlights based on our audits.
We conducted our audits in accordance with the standards of the Public Company Accounting Oversight Board (United States). Those standards require that we plan and perform the audit to obtain reasonable assurance about whether the financial statements, financial highlights, and portfolios of investments are free of material misstatement. An audit includes examining, on a test basis, evidence supporting the amounts and disclosures in the financial statements and portfolios of investments. Our procedures included confirmation of securities owned as of December 31, 2014, by correspondence with the custodian, transfer agent, and brokers, or by other appropriate auditing procedures when replies from brokers were not received. An audit also includes assessing the accounting principles used and significant estimates made by management, as well as evaluating the overall financial statement presentation. We believe that our audits provide a reasonable basis for our opinion.
In our opinion, the financial statements, financial highlights, and portfolios of investments referred to above present fairly, in all material respects, the financial position of the aforementioned funds of Voya Partners, Inc. as of December 31, 2014, and the results of their operations for the year then ended, the changes in their net assets for each of the years in the two-year period then ended, and the financial highlights for each of the years in the five-year period then ended, in conformity with accounting principles generally accepted in the United States of America.
Boston, Massachusetts
February 24, 2015
26
STATEMENTS OF ASSETS AND LIABILITIES AS OF DECEMBER 31, 2014
| | | | Voya
Solution
Aggressive
Portfolio
| | Voya
Solution
Balanced
Portfolio
| | Voya
Solution
Conservative
Portfolio
| | Voya
Solution
Income
Portfolio
|
|---|
ASSETS: | | | | | | | | | | | | | | | | | | |
| Investments in securities at fair value* | | | | $ | 287,713 | | | $ | 1,570,022 | | | $ | 348,963 | | | $ | 5,086,578 | |
| Investments in affiliated underlying funds at fair value** | | | | | 3,382,601 | | | | 49,464,277 | | | | 17,006,940 | | | | 159,904,934 | |
| Total investments at fair value | | | | $ | 3,670,314 | | | $ | 51,034,299 | | | $ | 17,355,903 | | | $ | 164,991,512 | |
| Cash | | | | | 7,393 | | | | 1,005,489 | | | | 353,840 | | | | 3,367,581 | |
| Cash collateral for futures | | | | | — | | | | 72,711 | | | | 24,237 | | | | 226,212 | |
| Receivables: | | | | | | | | | | | | | | | | | | |
| Investment in affiliated underlying funds sold | | | | | — | | | | — | | | | — | | | | 829,001 | |
| Fund shares sold | | | | | 9,658 | | | | 49,004 | | | | 15,042 | | | | 25,212 | |
| Dividends | | | | | 384 | | | | 5,899 | | | | 21,892 | | | | 19,501 | |
| Prepaid expenses | | | | | 25 | | | | 410 | | | | 137 | | | | 1,358 | |
| Reimbursement due from manager | | | | | — | | | | 5,425 | | | | 3,700 | | | | 18,036 | |
| Other assets | | | | | — | | | | 355 | | | | 114 | | | | 3,607 | |
| Total assets | | | | | 3,687,774 | | | | 52,173,592 | | | | 17,774,865 | | | | 169,482,020 | |
| |
LIABILITIES: | | | | | | | | | | | | | | | | | | |
| Payable for investments in affiliated underlying funds purchased | | | | | 9,658 | | | | 46,813 | | | | 35,908 | | | | — | |
| Payable for fund shares redeemed | | | | | — | | | | 2,192 | | | | — | | | | 854,213 | |
| Payable for foreign cash collateral for futures*** | | | | | — | | | | 26,462 | | | | 8,821 | | | | 82,325 | |
| Payable for investment management fees | | | | | 3,925 | | | | 4,675 | | | | 1,559 | | | | 15,265 | |
| Payable for administrative fees | | | | | 300 | | | | 4,412 | | | | 1,498 | | | | 14,411 | |
| Payable for distribution and shareholder service fees | | | | | 1,200 | | | | 17,053 | | | | 6,189 | | | | 49,402 | |
| Payable to trustees under the deferred compensation plan (Note 6) | | | | | — | | | | 355 | | | | 114 | | | | 3,607 | |
| Payable for trustee fees | | | | | 12 | | | | 259 | | | | 87 | | | | 890 | |
| Other accrued expenses and liabilities | | | | | 8,170 | | | | 12,424 | | | | 5,237 | | | | 24,557 | |
| Total liabilities | | | | | 23,265 | | | | 114,645 | | | | 59,413 | | | | 1,044,670 | |
NET ASSETS | | | | $ | 3,664,509 | | | $ | 52,058,947 | | | $ | 17,715,452 | | | $ | 168,437,350 | |
| |
NET ASSETS WERE COMPRISED OF: | | | | | | | | | | | | | | | | | | |
| Paid-in capital | | | | $ | 3,493,607 | | | $ | 45,286,797 | | | $ | 17,102,924 | | | $ | 159,040,245 | |
| Undistributed net investment income | | | | | 97,431 | | | | 1,408,693 | | | | 431,248 | | | | 4,118,565 | |
| Accumulated net realized gain | | | | | 170,584 | | | | 3,752,710 | | | | 381,913 | | | | 4,301,461 | |
| Net unrealized appreciation (depreciation) | | | | | (97,113 | ) | | | 1,610,747 | | | | (200,633 | ) | | | 977,079 | |
NET ASSETS | | | | $ | 3,664,509 | | | $ | 52,058,947 | | | $ | 17,715,452 | | | $ | 168,437,350 | |
| | | | | | | | | | | | | | | | | | |
| *Cost of investments in securities | | | | $ | 281,492 | | | $ | 1,521,294 | | | $ | 344,196 | | | $ | 4,931,902 | |
| **Cost of investments in affiliated underlying funds | | | | $ | 3,485,935 | | | $ | 47,875,101 | | | $ | 17,203,288 | | | $ | 158,998,044 | |
| ***Cost of payable for foreign cash collateral for futures | | | | $ | — | | | $ | 26,729 | | | $ | 8,910 | | | $ | 83,157 | |
See Accompanying Notes to Financial Statements
27
STATEMENTS OF ASSETS AND LIABILITIES AS OF DECEMBER 31, 2014 (CONTINUED)
| | | | Voya
Solution
Aggressive
Portfolio
| | Voya
Solution
Balanced
Portfolio
| | Voya
Solution
Conservative
Portfolio
| | Voya
Solution
Income
Portfolio
|
|---|
Class ADV | | | | | | | | | | | | | | | | | | |
| Net assets | | | | $ | 2,179,670 | | | $ | 28,236,862 | | | $ | 11,526,768 | | | $ | 84,286,146 | |
| Shares authorized | | | | | 100,000,000 | | | | 100,000,000 | | | | 100,000,000 | | | | 100,000,000 | |
| Par value | | | | $ | 0.001 | | | $ | 0.001 | | | $ | 0.001 | | | $ | 0.001 | |
| Shares outstanding | | | | | 179,754 | | | | 2,672,072 | | | | 1,033,826 | | | | 7,261,655 | |
| Net asset value and redemption price per share | | | | $ | 12.13 | | | $ | 10.57 | | | $ | 11.15 | | | $ | 11.61 | |
| |
Class I | | | | | | | | | | | | | | | | | | |
| Net assets | | | | $ | 12,131 | | | $ | 23,088 | | | $ | 9,576 | | | $ | 23,177,585 | |
| Shares authorized | | | | | 100,000,000 | | | | 100,000,000 | | | | 100,000,000 | | | | 100,000,000 | |
| Par value | | | | $ | 0.001 | | | $ | 0.001 | | | $ | 0.001 | | | $ | 0.001 | |
| Shares outstanding | | | | | 985 | | | | 2,118 | | | | 847 | | | | 1,954,737 | |
| Net asset value and redemption price per share | | | | $ | 12.32 | | | $ | 10.90 | | | $ | 11.30 | | | $ | 11.86 | |
| |
Class S | | | | | | | | | | | | | | | | | | |
| Net assets | | | | $ | 1,394,909 | | | $ | 23,128,215 | | | $ | 5,866,722 | | | $ | 56,601,845 | |
| Shares authorized | | | | | 100,000,000 | | | | 100,000,000 | | | | 100,000,000 | | | | 100,000,000 | |
| Par value | | | | $ | 0.001 | | | $ | 0.001 | | | $ | 0.001 | | | $ | 0.001 | |
| Shares outstanding | | | | | 114,086 | | | | 2,161,073 | | | | 522,736 | | | | 4,811,142 | |
| Net asset value and redemption price per share | | | | $ | 12.23 | | | $ | 10.70 | | | $ | 11.22 | | | $ | 11.76 | |
| |
Class S2 | | | | | | | | | | | | | | | | | | |
| Net assets | | | | $ | 77,799 | | | $ | 670,782 | | | $ | 312,386 | | | $ | 4,280,586 | |
| Shares authorized | | | | | 100,000,000 | | | | 100,000,000 | | | | 100,000,000 | | | | 100,000,000 | |
| Par value | | | | $ | 0.001 | | | $ | 0.001 | | | $ | 0.001 | | | $ | 0.001 | |
| Shares outstanding | | | | | 6,407 | | | | 62,858 | | | | 27,960 | | | | 372,372 | |
| Net asset value and redemption price per share | | | | $ | 12.14 | | | $ | 10.67 | | | $ | 11.17 | | | $ | 11.50 | |
| |
Class T | | | | | | | | | | | | | | | | | | |
| Net assets | | | | | n/a | | | | n/a | | | | n/a | | | $ | 91,188 | |
| Shares authorized | | | | | n/a | | | | n/a | | | | n/a | | | | 100,000,000 | |
| Par value | | | | | n/a | | | | n/a | | | | n/a | | | $ | 0.001 | |
| Shares outstanding | | | | | n/a | | | | n/a | | | | n/a | | | | 7,553 | |
| Net asset value and redemption price per share | | | | | n/a | | | | n/a | | | | n/a | | | $ | 12.07 | |
See Accompanying Notes to Financial Statements
28
STATEMENTS OF ASSETS AND LIABILITIES AS OF DECEMBER 31, 2014
| | | | Voya
Solution
Moderately
Aggressive
Portfolio
| | Voya
Solution
Moderately
Conservative
Portfolio
| | Voya
Solution
2015
Portfolio
| | Voya
Solution
2020
Portfolio
|
|---|
ASSETS: | | | | | | | | | | | | | | | | | | |
| Investments in securities at fair value* | | | | $ | 1,655,402 | | | $ | 1,355,093 | | | $ | 17,510,800 | | | $ | 23,867 | |
| Investments in affiliated underlying funds at fair value** | | | | | 29,889,549 | | | | 42,639,077 | | | | 539,338,659 | | | | 621,258 | |
| Total investments at fair value | | | | $ | 31,544,951 | | | $ | 43,994,170 | | | $ | 556,849,459 | | | $ | 645,125 | |
| Cash | | | | | 640,771 | | | | 879,209 | | | | 11,548,940 | | | | 1,273 | |
| Cash collateral for futures | | | | | 48,474 | | | | 64,632 | | | | 791,742 | | | | — | |
| Receivables: | | | | | | | | | | | | | | | | | | |
| Investment in affiliated underlying funds sold | | | | | — | | | | 43,265 | | | | 8,007,246 | | | | — | |
| Fund shares sold | | | | | 35,149 | | | | 35,365 | | | | 22,831 | | | | — | |
| Dividends | | | | | 3,657 | | | | 5,184 | | | | 66,642 | | | | 37 | |
| Prepaid expenses | | | | | 252 | | | | 359 | | | | 4,678 | | | | 5 | |
| Reimbursement due from manager | | | | | 321 | | | | 4,790 | | | | 46,322 | | | | 1,244 | |
| Other assets | | | | | 189 | | | | 320 | | | | 11,936 | | | | — | |
| Total assets | | | | | 32,273,764 | | | | 45,027,294 | | | | 577,349,796 | | | | 647,684 | |
| |
LIABILITIES: | | | | | | | | | | | | | | | | | | |
| Payable for investments in affiliated underlying funds purchased | | | | | 34,650 | | | | 77,628 | | | | — | | | | — | |
| Payable for fund shares redeemed | | | | | 499 | | | | 1,002 | | | | 8,030,077 | | | | 1 | |
| Payable for foreign cash collateral for futures*** | | | | | 17,641 | | | | 23,521 | | | | 288,138 | | | | — | |
| Payable for investment management fees | | | | | 3,091 | | | | 4,055 | | | | 52,314 | | | | 95 | |
| Payable for administrative fees | | | | | 2,779 | | | | 3,830 | | | | 49,443 | | | | 55 | |
| Payable for distribution and shareholder service fees | | | | | 11,260 | | | | 14,242 | | | | 156,117 | | | | 271 | |
| Payable to trustees under the deferred compensation plan (Note 6) | | | | | 189 | | | | 320 | | | | 11,936 | | | | — | |
| Payable for trustee fees | | | | | 159 | | | | 229 | | | | 3,090 | | | | 2 | |
| Other accrued expenses and liabilities | | | | | 6,995 | | | | 13,546 | | | | 95,196 | | | | 202 | |
| Total liabilities | | | | | 77,263 | | | | 138,373 | | | | 8,686,311 | | | | 626 | |
NET ASSETS | | | | $ | 32,196,501 | | | $ | 44,888,921 | | | $ | 568,663,485 | | | $ | 647,058 | |
| |
NET ASSETS WERE COMPRISED OF: | | | | | | | | | | | | | | | | | | |
| Paid-in capital | | | | $ | 27,326,237 | | | $ | 41,241,521 | | | $ | 517,625,063 | | | $ | 625,389 | |
| Undistributed net investment income | | | | | 916,562 | | | | 1,155,062 | | | | 15,095,750 | | | | 14,270 | |
| Accumulated net realized gain | | | | | 3,054,912 | | | | 2,072,526 | | | | 30,933,099 | | | | 19,569 | |
| Net unrealized appreciation (depreciation) | | | | | 898,790 | | | | 419,812 | | | | 5,009,573 | | | | (12,170 | ) |
NET ASSETS | | | | $ | 32,196,501 | | | $ | 44,888,921 | | | $ | 568,663,485 | | | $ | 647,058 | |
| | | | | | | | | | | | | | | | | | |
| *Cost of investments in securities | | | | $ | 1,516,397 | | | $ | 1,314,000 | | | $ | 16,978,292 | | | $ | 25,468 | |
| **Cost of investments in affiliated underlying funds | | | | $ | 29,111,659 | | | $ | 42,236,219 | | | $ | 534,564,103 | | | $ | 631,828 | |
| ***Cost of payable for foreign cash collateral for futures | | | | $ | 17,819 | | | $ | 23,759 | | | $ | 289,263 | | | $ | — | |
See Accompanying Notes to Financial Statements
29
STATEMENTS OF ASSETS AND LIABILITIES AS OF DECEMBER 31, 2014 (CONTINUED)
| | | | Voya
Solution
Moderately
Aggressive
Portfolio
| | Voya
Solution
Moderately
Conservative
Portfolio
| | Voya
Solution
2015
Portfolio
| | Voya
Solution
2020
Portfolio
|
|---|
Class ADV | | | | | | | | | | | | | | | | | | |
| Net assets | | | | $ | 20,019,613 | | | $ | 21,658,572 | | | $ | 228,791,609 | | | $ | 631,403 | |
| Shares authorized | | | | | 100,000,000 | | | | 100,000,000 | | | | 100,000,000 | | | | 100,000,000 | |
| Par value | | | | $ | 0.001 | | | $ | 0.001 | | | $ | 0.001 | | | $ | 0.001 | |
| Shares outstanding | | | | | 1,536,336 | | | | 2,071,889 | | | | 18,872,261 | | | | 49,076 | |
| Net asset value and redemption price per share | | | | $ | 13.03 | | | $ | 10.45 | | | $ | 12.12 | | | $ | 12.87 | |
| |
Class I | | | | | | | | | | | | | | | | | | |
| Net assets | | | | $ | 56,380 | | | $ | 36,888 | | | $ | 80,808,780 | | | $ | 3,938 | |
| Shares authorized | | | | | 100,000,000 | | | | 100,000,000 | | | | 100,000,000 | | | | 100,000,000 | |
| Par value | | | | $ | 0.001 | | | $ | 0.001 | | | $ | 0.001 | | | $ | 0.001 | |
| Shares outstanding | | | | | 4,260 | | | | 3,394 | | | | 6,533,101 | | | | 302 | |
| Net asset value and redemption price per share | | | | $ | 13.23 | | | $ | 10.87 | | | $ | 12.37 | | | $ | 13.04 | |
| |
Class S | | | | | | | | | | | | | | | | | | |
| Net assets | | | | $ | 11,314,735 | | | $ | 22,345,612 | | | $ | 241,332,879 | | | $ | 3,930 | |
| Shares authorized | | | | | 100,000,000 | | | | 100,000,000 | | | | 100,000,000 | | | | 100,000,000 | |
| Par value | | | | $ | 0.001 | | | $ | 0.001 | | | $ | 0.001 | | | $ | 0.001 | |
| Shares outstanding | | | | | 861,879 | | | | 2,094,667 | | | | 19,667,756 | | | | 302 | |
| Net asset value and redemption price per share | | | | $ | 13.13 | | | $ | 10.67 | | | $ | 12.27 | | | $ | 13.01 | |
| |
Class S2 | | | | | | | | | | | | | | | | | | |
| Net assets | | | | $ | 805,773 | | | $ | 847,849 | | | $ | 16,900,217 | | | $ | 3,900 | |
| Shares authorized | | | | | 100,000,000 | | | | 100,000,000 | | | | 100,000,000 | | | | 100,000,000 | |
| Par value | | | | $ | 0.001 | | | $ | 0.001 | | | $ | 0.001 | | | $ | 0.001 | |
| Shares outstanding | | | | | 61,395 | | | | 80,084 | | | | 1,411,706 | | | | 302 | |
| Net asset value and redemption price per share | | | | $ | 13.12 | | | $ | 10.59 | | | $ | 11.97 | | | $ | 12.91 | |
| |
Class T | | | | | | | | | | | | | | | | | | |
| Net assets | | | | | n/a | | | | n/a | | | $ | 830,000 | | | $ | 3,887 | |
| Shares authorized | | | | | n/a | | | | n/a | | | | 100,000,000 | | | | 100,000,000 | |
| Par value | | | | | n/a | | | | n/a | | | $ | 0.001 | | | $ | 0.001 | |
| Shares outstanding | | | | | n/a | | | | n/a | | | | 67,385 | | | | 302 | |
| Net asset value and redemption price per share | | | | | n/a | | | | n/a | | | $ | 12.32 | | | $ | 12.87 | |
See Accompanying Notes to Financial Statements
30
STATEMENTS OF ASSETS AND LIABILITIES AS OF DECEMBER 31, 2014
| | | | Voya
Solution
2025
Portfolio
| | Voya
Solution
2030
Portfolio
| | Voya
Solution
2035
Portfolio
| | Voya
Solution
2040
Portfolio
|
|---|
ASSETS: | | | | | | | | | | | | | | | | | | |
| Investments in securities at fair value* | | | | $ | 36,829,136 | | | $ | 17,363 | | | $ | 65,648,930 | | | $ | 41,036 | |
| Investments in affiliated underlying funds at fair value** | | | | | 1,093,866,795 | | | | 155,222 | | | | 954,064,135 | | | | 676,185 | |
| Total investments at fair value | | | | $ | 1,130,695,931 | | | $ | 172,585 | | | $ | 1,019,713,065 | | | $ | 717,221 | |
| Cash | | | | | 23,735,444 | | | | 410 | | | | 20,891,259 | | | | 1,434 | |
| Cash collateral for futures | | | | | 1,631,958 | | | | — | | | | 1,462,299 | | | | — | |
| Receivables: | | | | | | | | | | | | | | | | | | |
| Investment in affiliated underlying funds sold | | | | | 32,954,064 | | | | — | | | | 19,331,155 | | | | — | |
| Fund shares sold | | | | | 180,557 | | | | — | | | | 317,981 | | | | — | |
| Dividends | | | | | 68,309 | | | | 20 | | | | 119,509 | | | | 78 | |
| Prepaid expenses | | | | | 9,336 | | | | 2 | | | | 8,301 | | | | 6 | |
| Reimbursement due from manager | | | | | 104,734 | | | | 1,034 | | | | 71,291 | | | | 1,296 | |
| Other assets | | | | | 18,896 | | | | — | | | | 15,800 | | | | — | |
| Total assets | | | | | 1,189,399,229 | | | | 174,051 | | | | 1,061,930,660 | | | | 720,035 | |
| |
LIABILITIES: | | | | | | | | | | | | | | | | | | |
| Payable for fund shares redeemed | | | | | 33,134,620 | | | | — | | | | 19,649,136 | | | | — | |
| Payable for foreign cash collateral for futures*** | | | | | 593,917 | | | | — | | | | 532,173 | | | | — | |
| Payable for investment management fees | | | | | 107,872 | | | | 52 | | | | 101,608 | | | | 119 | |
| Payable for administrative fees | | | | | 101,616 | | | | 16 | | | | 90,710 | | | | 62 | |
| Payable for distribution and shareholder service fees | | | | | 302,279 | | | | 78 | | | | 258,329 | | | | 302 | |
| Payable to trustees under the deferred compensation plan (Note 6) | | | | | 18,896 | | | | — | | | | 15,800 | | | | — | |
| Payable for trustee fees | | | | | 6,149 | | | | 1 | | | | 5,474 | | | | 3 | |
| Other accrued expenses and liabilities | | | | | 175,706 | | | | 246 | | | | 151,027 | | | | 353 | |
| Total liabilities | | | | | 34,441,055 | | | | 393 | | | | 20,804,257 | | | | 839 | |
NET ASSETS | | | | $ | 1,154,958,174 | | | $ | 173,658 | | | $ | 1,041,126,403 | | | $ | 719,196 | |
| |
NET ASSETS WERE COMPRISED OF: | | | | | | | | | | | | | | | | | | |
| Paid-in capital | | | | $ | 975,638,800 | | | $ | 157,109 | | | $ | 850,520,664 | | | $ | 683,755 | |
| Undistributed net investment income | | | | | 33,444,752 | | | | 5,333 | | | | 31,270,051 | | | | 19,490 | |
| Accumulated net realized gain | | | | | 103,529,058 | | | | 14,405 | | | | 109,531,729 | | | | 35,014 | |
| Net unrealized appreciation (depreciation) | | | | | 42,345,564 | | | | (3,189 | ) | | | 49,803,959 | | | | (19,063 | ) |
NET ASSETS | | | | $ | 1,154,958,174 | | | $ | 173,658 | | | $ | 1,041,126,403 | | | $ | 719,196 | |
| | | | | | | | | | | | | | | | | | |
| *Cost of investments in securities | | | | $ | 36,027,650 | | | $ | 17,179 | | | $ | 60,703,288 | | | $ | 41,040 | |
| **Cost of investments in affiliated underlying funds | | | | $ | 1,051,709,521 | | | $ | 158,596 | | | $ | 908,656,370 | | | $ | 695,244 | |
| ***Cost of payable for foreign cash collateral for futures | | | | $ | 596,237 | | | $ | — | | | $ | 534,252 | | | $ | — | |
See Accompanying Notes to Financial Statements
31
STATEMENTS OF ASSETS AND LIABILITIES AS OF DECEMBER 31, 2014 (CONTINUED)
| | | | Voya
Solution
2025
Portfolio
| | Voya
Solution
2030
Portfolio
| | Voya
Solution
2035
Portfolio
| | Voya
Solution
2040
Portfolio
|
|---|
Class ADV | | | | | | | | | | | | | | | | | | |
| Net assets | | | | $ | 435,279,845 | | | $ | 156,626 | | | $ | 361,683,147 | | | $ | 701,097 | |
| Shares authorized | | | | | 100,000,000 | | | | 100,000,000 | | | | 100,000,000 | | | | 100,000,000 | |
| Par value | | | | $ | 0.001 | | | $ | 0.001 | | | $ | 0.001 | | | $ | 0.001 | |
| Shares outstanding | | | | | 33,926,643 | | | | 11,237 | | | | 27,361,010 | | | | 47,080 | |
| Net asset value and redemption price per share | | | | $ | 12.83 | | | $ | 13.94 | | | $ | 13.22 | | | $ | 14.89 | |
| |
Class I | | | | | | | | | | | | | | | | | | |
| Net assets | | | | $ | 197,457,235 | | | $ | 4,290 | | | $ | 214,674,845 | | | $ | 4,559 | |
| Shares authorized | | | | | 100,000,000 | | | | 100,000,000 | | | | 100,000,000 | | | | 100,000,000 | |
| Par value | | | | $ | 0.001 | | | $ | 0.001 | | | $ | 0.001 | | | $ | 0.001 | |
| Shares outstanding | | | | | 15,047,321 | | | | 303 | | | | 15,894,687 | | | | 302 | |
| Net asset value and redemption price per share | | | | $ | 13.12 | | | $ | 14.14 | | | $ | 13.51 | | | $ | 15.08 | |
| |
Class S | | | | | | | | | | | | | | | | | | |
| Net assets | | | | $ | 486,301,960 | | | $ | 4,269 | | | $ | 432,572,652 | | | $ | 4,539 | |
| Shares authorized | | | | | 100,000,000 | | | | 100,000,000 | | | | 100,000,000 | | | | 100,000,000 | |
| Par value | | | | $ | 0.001 | | | $ | 0.001 | | | $ | 0.001 | | | $ | 0.001 | |
| Shares outstanding | | | | | 37,419,022 | | | | 303 | | | | 32,311,592 | | | | 302 | |
| Net asset value and redemption price per share | | | | $ | 13.00 | | | $ | 14.07 | | | $ | 13.39 | | | $ | 15.02 | |
| |
Class S2 | | | | | | | | | | | | | | | | | | |
| Net assets | | | | $ | 35,049,889 | | | $ | 4,236 | | | $ | 31,331,362 | | | $ | 4,513 | |
| Shares authorized | | | | | 100,000,000 | | | | 100,000,000 | | | | 100,000,000 | | | | 100,000,000 | |
| Par value | | | | $ | 0.001 | | | $ | 0.001 | | | $ | 0.001 | | | $ | 0.001 | |
| Shares outstanding | | | | | 2,759,867 | | | | 303 | | | | 2,407,815 | | | | 302 | |
| Net asset value and redemption price per share | | | | $ | 12.70 | | | $ | 13.96 | | | $ | 13.01 | | | $ | 14.93 | |
| |
Class T | | | | | | | | | | | | | | | | | | |
| Net assets | | | | $ | 869,245 | | | $ | 4,237 | | | $ | 864,397 | | | $ | 4,488 | |
| Shares authorized | | | | | 100,000,000 | | | | 100,000,000 | | | | 100,000,000 | | | | 100,000,000 | |
| Par value | | | | $ | 0.001 | | | $ | 0.001 | | | $ | 0.001 | | | $ | 0.001 | |
| Shares outstanding | | | | | 66,523 | | | | 303 | | | | 64,042 | | | | 302 | |
| Net asset value and redemption price per share | | | | $ | 13.07 | | | $ | 13.97 | | | $ | 13.50 | | | $ | 14.85 | |
See Accompanying Notes to Financial Statements
32
STATEMENTS OF ASSETS AND LIABILITIES AS OF DECEMBER 31, 2014
| | | | Voya
Solution
2045
Portfolio
| | Voya
Solution
2050
Portfolio
| | Voya
Solution
2055
Portfolio
|
|---|
ASSETS: | | | | | | | | | | | | | | |
| Investments in securities at fair value* | | | | $ | 33,921,776 | | | $ | 23,237 | | | $ | 4,951,193 | |
| Investments in affiliated underlying funds at fair value** | | | | | 671,889,912 | | | | 348,768 | | | | 102,514,604 | |
| Total investments at fair value | | | | $ | 705,811,688 | | | $ | 372,005 | | | $ | 107,465,797 | |
| Cash | | | | | 14,466,659 | | | | 748 | | | | 2,103,642 | |
| Cash collateral for futures | | | | | 1,017,954 | | | | — | | | | 145,422 | |
| Receivables: | | | | | | | | | | | | | | |
| Investment in affiliated underlying funds sold | | | | | 10,672,270 | | | | — | | | | 1,655,040 | |
| Fund shares sold | | | | | 94,390 | | | | — | | | | 165,314 | |
| Dividends | | | | | 83,402 | | | | 41 | | | | 12,164 | |
| Prepaid expenses | | | | | 5,764 | | | | 3 | | | | 812 | |
| Reimbursement due from manager | | | | | 38,635 | | | | 1,014 | | | | 12,964 | |
| Other assets | | | | | 9,918 | | | | — | | | | 518 | |
| Total assets | | | | | 732,200,680 | | | | 373,811 | | | | 111,561,673 | |
| |
LIABILITIES: | | | | | | | | | | | | | | |
| Payable for fund shares redeemed | | | | | 10,766,660 | | | | — | | | | 1,820,355 | |
| Payable for foreign cash collateral for futures*** | | | | | 370,463 | | | | — | | | | 52,923 | |
| Payable for investment management fees | | | | | 68,533 | | | | 67 | | | | 10,219 | |
| Payable for administrative fees | | | | | 62,838 | | | | 32 | | | | 9,386 | |
| Payable for distribution and shareholder service fees | | | | | 172,961 | | | | 155 | | | | 26,534 | |
| Payable to trustees under the deferred compensation plan (Note 6) | | | | | 9,918 | | | | — | | | | 518 | |
| Payable for trustee fees | | | | | 3,801 | | | | 1 | | | | 505 | |
| Other accrued expenses and liabilities | | | | | 104,167 | | | | 206 | | | | 13,860 | |
| Total liabilities | | | | | 11,559,341 | | | | 461 | | | | 1,934,300 | |
NET ASSETS | | | | $ | 720,641,339 | | | $ | 373,350 | | | $ | 109,627,373 | |
| |
NET ASSETS WERE COMPRISED OF: | | | | | | | | | | | | | | |
| Paid-in capital | | | | $ | 564,118,205 | | | $ | 352,992 | | | $ | 93,863,271 | |
| Undistributed net investment income | | | | | 21,014,258 | | | | 9,823 | | | | 3,067,766 | |
| Accumulated net realized gain | | | | | 98,779,563 | | | | 19,144 | | | | 11,129,728 | |
| Net unrealized appreciation (depreciation) | | | | | 36,729,313 | | | | (8,609 | ) | | | 1,566,608 | |
NET ASSETS | | | | $ | 720,641,339 | | | $ | 373,350 | | | $ | 109,627,373 | |
| | | | | | | | | | | | | | |
| *Cost of investments in securities | | | | $ | 31,008,722 | | | $ | 23,083 | | | $ | 4,531,072 | |
| **Cost of investments in affiliated underlying funds | | | | $ | 637,691,164 | | | $ | 357,531 | | | $ | 101,313,476 | |
| ***Cost of payable for foreign cash collateral for futures | | | | $ | 371,910 | | | $ | — | | | $ | 53,130 | |
See Accompanying Notes to Financial Statements
33
STATEMENTS OF ASSETS AND LIABILITIES AS OF DECEMBER 31, 2014 (CONTINUED)
| | | | Voya
Solution
2045
Portfolio
| | Voya
Solution
2050
Portfolio
| | Voya
Solution
2055
Portfolio
|
|---|
Class ADV | | | | | | | | | | | | | | |
| Net assets | | | | $ | 237,640,662 | | | $ | 355,096 | | | $ | 38,558,216 | |
| Shares authorized | | | | | 100,000,000 | | | | 100,000,000 | | | | 100,000,000 | |
| Par value | | | | $ | 0.001 | | | $ | 0.001 | | | $ | 0.001 | |
| Shares outstanding | | | | | 17,473,223 | | | | 23,753 | | | | 2,701,934 | |
| Net asset value and redemption price per share | | | | $ | 13.60 | | | $ | 14.95 | | | $ | 14.27 | |
| |
Class I | | | | | | | | | | | | | | |
| Net assets | | | | $ | 161,654,001 | | | $ | 4,596 | | | $ | 24,786,614 | |
| Shares authorized | | | | | 100,000,000 | | | | 100,000,000 | | | | 100,000,000 | |
| Par value | | | | $ | 0.001 | | | $ | 0.001 | | | $ | 0.001 | |
| Shares outstanding | | | | | 11,627,521 | | | | 303 | | | | 1,711,152 | |
| Net asset value and redemption price per share | | | | $ | 13.90 | | | $ | 15.15 | | | $ | 14.49 | |
| |
Class S | | | | | | | | | | | | | | |
| Net assets | | | | $ | 301,617,407 | | | $ | 4,579 | | | $ | 43,205,780 | |
| Shares authorized | | | | | 100,000,000 | | | | 100,000,000 | | | | 100,000,000 | |
| Par value | | | | $ | 0.001 | | | $ | 0.001 | | | $ | 0.001 | |
| Shares outstanding | | | | | 21,923,453 | | | | 303 | | | | 3,006,432 | |
| Net asset value and redemption price per share | | | | $ | 13.76 | | | $ | 15.09 | | | $ | 14.37 | |
| |
Class S2 | | | | | | | | | | | | | | |
| Net assets | | | | $ | 19,353,179 | | | $ | 4,542 | | | $ | 3,071,301 | |
| Shares authorized | | | | | 100,000,000 | | | | 100,000,000 | | | | 100,000,000 | |
| Par value | | | | $ | 0.001 | | | $ | 0.001 | | | $ | 0.001 | |
| Shares outstanding | | | | | 1,434,510 | | | | 303 | | | | 214,651 | |
| Net asset value and redemption price per share | | | | $ | 13.49 | | | $ | 14.97 | | | $ | 14.31 | |
| |
Class T | | | | | | | | | | | | | | |
| Net assets | | | | $ | 376,090 | | | $ | 4,537 | | | $ | 5,462 | |
| Shares authorized | | | | | 100,000,000 | | | | 100,000,000 | | | | 100,000,000 | |
| Par value | | | | $ | 0.001 | | | $ | 0.001 | | | $ | 0.001 | |
| Shares outstanding | | | | | 27,303 | | | | 303 | | | | 383 | |
| Net asset value and redemption price per share | | | | $ | 13.77 | | | $ | 14.95 | | | $ | 14.25 | |
See Accompanying Notes to Financial Statements
34
STATEMENTS OF OPERATIONS FOR THE YEAR ENDED DECEMBER 31, 2014
| | | | Voya
Solution
Aggressive
Portfolio
| | Voya
Solution
Balanced
Portfolio
| | Voya
Solution
Conservative
Portfolio
| | Voya
Solution
Income
Portfolio
|
|---|
INVESTMENT INCOME: | | | | | | | | | | | | | | | | | | |
| Dividends from affiliated underlying funds | | | | $ | 34,784 | | | $ | 807,517 | | | $ | 357,012 | | | $ | 3,196,597 | |
| Dividends | | | | | 3,543 | | | | 88,757 | | | | 26,067 | | | | 285,505 | |
| Total investment income | | | | | 38,327 | | | | 896,274 | | | | 383,079 | | | | 3,482,102 | |
| |
EXPENSES: | | | | | | | | | | | | | | | | | | |
| Investment management fees | | | | | 2,715 | | | | 56,463 | | | | 18,878 | | | | 193,615 | |
| Distribution and shareholder service fees: | | | | | | | | | | | | | | | | | | |
| Class ADV | | | | | 6,264 | | | | 137,491 | | | | 56,150 | | | | 450,631 | |
| Class S | | | | | 2,876 | | | | 58,627 | | | | 14,803 | | | | 147,825 | |
| Class S2 | | | | | 188 | | | | 3,795 | | | | 1,611 | | | | 21,538 | |
| Class T | | | | | — | | | | — | | | | — | | | | 1,095 | |
| Transfer agent fees | | | | | 35 | | | | 179 | | | | 276 | | | | 1,849 | |
| Administrative service fees | | | | | 2,446 | | | | 51,715 | | | | 17,478 | | | | 178,170 | |
| Shareholder reporting expense | | | | | 942 | | | | 7,714 | | | | 1,914 | | | | 15,606 | |
| Professional fees | | | | | 7,062 | | | | 13,886 | | | | 7,769 | | | | 27,402 | |
| Custody and accounting expense | | | | | 811 | | | | 4,210 | | | | 1,642 | | | | 14,334 | |
| Trustee fees | | | | | 73 | | | | 1,551 | | | | 524 | | | | 5,345 | |
| Miscellaneous expense | | | | | 4,576 | | | | 8,206 | | | | 6,567 | | | | 9,406 | |
| Interest expense | | | | | — | | | | — | | | | — | | | | 19 | |
| Total expenses | | | | | 27,988 | | | | 343,837 | | | | 127,612 | | | | 1,066,835 | |
| Net waived and reimbursed fees | | | | | (15,006 | ) | | | (71,824 | ) | | | (41,254 | ) | | | (235,219 | ) |
| Net expenses | | | | | 12,982 | | | | 272,013 | | | | 86,358 | | | | 831,616 | |
| Net investment income | | | | | 25,345 | | | | 624,261 | | | | 296,721 | | | | 2,650,486 | |
| |
REALIZED AND UNREALIZED GAIN (LOSS): | | | | | | | | | | | | | | | | | | |
| Net realized gain (loss) on: | | | | | | | | | | | | | | | | | | |
| Investments | | | | | 4,763 | | | | 245,488 | | | | 80,061 | | | | 783,894 | |
| Capital gain distributions from affiliated underlying funds | | | | | 223,765 | | | | 2,830,434 | | | | 465,384 | | | | 5,305,684 | |
| Capital gain distributions from unaffiliated underlying funds | | | | | 5,953 | | | | — | | | | — | | | | — | |
| Sale of affiliated underlying funds | | | | | 8,490 | | | | 1,726,794 | | | | 102,075 | | | | 3,079,118 | |
| Foreign currency related transactions | | | | | — | | | | 768 | | | | 256 | | | | 2,391 | |
| Futures | | | | | — | | | | (73 | ) | | | (24 | ) | | | (229 | ) |
| Net realized gain | | | | | 242,971 | | | | 4,803,411 | | | | 647,752 | | | | 9,170,858 | |
| Net change in unrealized appreciation (depreciation) on: | | | | | | | | | | | | | | | | | | |
| Investments | | | | | 4,482 | | | | (99,176 | ) | | | (35,293 | ) | | | (399,588 | ) |
| Affiliated underlying funds | | | | | (125,842 | ) | | | (2,145,498 | ) | | | (177,350 | ) | | | (1,481,713 | ) |
| Foreign currency related transactions | | | | | — | | | | 267 | | | | 89 | | | | 832 | |
| Futures | | | | | — | | | | (27,424 | ) | | | (9,141 | ) | | | (85,319 | ) |
| Net change in unrealized appreciation (depreciation) | | | | | (121,360 | ) | | | (2,271,831 | ) | | | (221,695 | ) | | | (1,965,788 | ) |
| Net realized and unrealized gain | | | | | 121,611 | | | | 2,531,580 | | | | 426,057 | | | | 7,205,070 | |
Increase in net assets resulting from operations | | | | $ | 146,956 | �� | | $ | 3,155,841 | | | $ | 722,778 | | | $ | 9,855,556 | |
See Accompanying Notes to Financial Statements
35
STATEMENTS OF OPERATIONS FOR THE YEAR ENDED DECEMBER 31, 2014
| | | | Voya
Solution
Moderately
Aggressive
Portfolio
| | Voya
Solution
Moderately
Conservative
Portfolio
| | Voya
Solution
2015
Portfolio
| | Voya
Solution
2020
Portfolio
|
|---|
INVESTMENT INCOME: | | | | | | | | | | | | | | | | | | |
| Dividends from affiliated underlying funds | | | | $ | 425,281 | | | $ | 807,708 | | | $ | 10,519,016 | | | $ | 7,680 | |
| Dividends | | | | | 58,575 | | | | 78,988 | | | | 991,574 | | | | 489 | |
| Total investment income | | | | | 483,856 | | | | 886,696 | | | | 11,510,590 | | | | 8,169 | |
| |
EXPENSES: | | | | | | | | | | | | | | | | | | |
| Investment management fees | | | | | 35,800 | | | | 49,903 | | | | 670,768 | | | | 438 | |
| Distribution and shareholder service fees: | | | | | | | | | | | | | | | | | | |
| Class ADV | | | | | 93,599 | | | | 107,546 | | | | 1,250,423 | | | | 1,824 | |
| Class S | | | | | 31,106 | | | | 58,523 | | | | 635,059 | | | | 11 | |
| Class S2 | | | | | 3,279 | | | | 3,633 | | | | 98,675 | | | | 21 | |
| Class T | | | | | — | | | | — | | | | 10,826 | | | | 29 | |
| Transfer agent fees: | | | | | | | | | | | | | | | | | | |
| Class ADV | | | | | — | | | | — | | | | — | | | | 260 | |
| Class I | | | | | — | | | | — | | | | — | | | | 3 | |
| Class S | | | | | — | | | | — | | | | — | | | | 3 | |
| Transfer agent fees | | | | | 293 | | | | 170 | | | | 814 | | | | 6 | |
| Administrative service fees | | | | | 31,838 | | | | 45,658 | | | | 617,988 | | | | 380 | |
| Shareholder reporting expense | | | | | 3,173 | | | | 7,735 | | | | 30,297 | | | | 131 | |
| Professional fees | | | | | 10,556 | | | | 13,016 | | | | 75,645 | | | | 7,480 | |
| Custody and accounting expense | | | | | 2,675 | | | | 4,071 | | | | 48,692 | | | | 299 | |
| Trustee fees | | | | | 955 | | | | 1,370 | | | | 18,540 | | | | 11 | |
| Miscellaneous expense | | | | | 7,200 | | | | 7,282 | | | | 17,809 | | | | 5,511 | |
| Interest expense | | | | | — | | | | — | | | | 67 | | | | — | |
| Total expenses | | | | | 220,474 | | | | 298,907 | | | | 3,475,603 | | | | 16,407 | |
| Net waived and reimbursed fees | | | | | (38,968 | ) | | | (61,056 | ) | | | (632,933 | ) | | | (14,056 | ) |
| Net expenses | | | | | 181,506 | | | | 237,851 | | | | 2,842,670 | | | | 2,351 | |
| Net investment income | | | | | 302,350 | | | | 648,845 | | | | 8,667,920 | | | | 5,818 | |
| |
REALIZED AND UNREALIZED GAIN (LOSS): | | | | | | | | | | | | | | | | | | |
| Net realized gain (loss) on: | | | | | | | | | | | | | | | | | | |
| Investments | | | | | 156,076 | | | | 224,051 | | | | 2,603,151 | | | | 757 | |
| Capital gain distributions from affiliated underlying funds | | | | | 2,174,669 | | | | 1,846,070 | | | | 23,658,957 | | | | 25,560 | |
| Capital gain distributions from unaffiliated underlying funds | | | | | — | | | | — | | | | — | | | | 1,089 | |
| Sale of affiliated underlying funds | | | | | 1,443,512 | | | | 854,152 | | | | 15,653,379 | | | | 671 | |
| Foreign currency related transactions | | | | | 512 | | | | 683 | | | | 10,153 | | | | — | |
| Futures | | | | | (49 | ) | | | (65 | ) | | | (801 | ) | | | — | |
| Net realized gain | | | | | 3,774,720 | | | | 2,924,891 | | | | 41,924,839 | | | | 28,077 | |
| Net change in unrealized appreciation (depreciation) on: | | | | | | | | | | | | | | | | | | |
| Investments | | | | | 54,533 | | | | (97,318 | ) | | | (1,053,414 | ) | | | (1,658 | ) |
| Affiliated underlying funds | | | | | (2,181,255 | ) | | | (1,073,660 | ) | | | (14,911,653 | ) | | | (11,890 | ) |
| Foreign currency related transactions | | | | | 178 | | | | 238 | | | | 1,126 | | | | — | |
| Futures | | | | | (18,283 | ) | | | (24,377 | ) | | | (298,617 | ) | | | — | |
| Net change in unrealized appreciation (depreciation) | | | | | (2,144,827 | ) | | | (1,195,117 | ) | | | (16,262,558 | ) | | | (13,548 | ) |
| Net realized and unrealized gain | | | | | 1,629,893 | | | | 1,729,774 | | | | 25,662,281 | | | | 14,529 | |
Increase in net assets resulting from operations | | | | $ | 1,932,243 | | | $ | 2,378,619 | | | $ | 34,330,201 | | | $ | 20,347 | |
See Accompanying Notes to Financial Statements
36
STATEMENTS OF OPERATIONS FOR THE YEAR ENDED DECEMBER 31, 2014
| | | | Voya
Solution
2025
Portfolio
| | Voya
Solution
2030
Portfolio
| | Voya
Solution
2035
Portfolio
| | Voya
Solution
2040
Portfolio
|
|---|
INVESTMENT INCOME: | | | | | | | | | | | | | | | | | | |
| Dividends from affiliated underlying funds | | | | $ | 17,512,769 | | | $ | 2,551 | | | $ | 14,506,379 | | | $ | 7,847 | |
| Dividends | | | | | 1,959,495 | | | | 358 | | | | 2,263,348 | | | | 576 | |
| Total investment income | | | | | 19,472,264 | | | | 2,909 | | | | 16,769,727 | | | | 8,423 | |
| |
EXPENSES: | | | | | | | | | | | | | | | | | | |
| Investment management fees | | | | | 1,336,636 | | | | 233 | | | | 1,245,123 | | | | 539 | |
| Distribution and shareholder service fees: | | | | | | | | | | | | | | | | | | |
| Class ADV | | | | | 2,316,884 | | | | 805 | | | | 1,982,958 | | | | 2,160 | |
| Class S | | | | | 1,232,046 | | | | 11 | | | | 1,083,440 | | | | 11 | |
| Class S2 | | | | | 185,620 | | | | 22 | | | | 162,002 | | | | 22 | |
| Class T | | | | | 20,988 | | | | 32 | | | | 15,061 | | | | 33 | |
| Class S2 | | | | | — | | | | — | | | | — | | | | — | |
| Class T | | | | | — | | | | — | | | | — | | | | — | |
| Transfer agent fees | | | | | 1,280 | | | | 271 | | | | 1,436 | | | | 293 | |
| Administrative service fees | | | | | 1,229,823 | | | | 177 | | | | 1,094,829 | | | | 450 | |
| Shareholder reporting expense | | | | | 71,925 | | | | 159 | | | | 63,663 | | | | 15 | |
| Professional fees | | | | | 158,824 | | | | 7,475 | | | | 139,131 | | | | 7,476 | |
| Custody and accounting expense | | | | | 95,641 | | | | 215 | | | | 84,771 | | | | 214 | |
| Trustee fees | | | | | 36,895 | | | | 5 | | | | 32,845 | | | | 13 | |
| Miscellaneous expense | | | | | 34,960 | | | | 5,522 | | | | 34,653 | | | | 5,183 | |
| Interest expense | | | | | 203 | | | | — | | | | 240 | | | | — | |
| Total expenses | | | | | 6,721,725 | | | | 14,927 | | | | 5,940,152 | | | | 16,409 | |
| Net waived and reimbursed fees | | | | | (1,396,601 | ) | | | (13,789 | ) | | | (970,372 | ) | | | (13,442 | ) |
| Net expenses | | | | | 5,325,124 | | | | 1,138 | | | | 4,969,780 | | | | 2,967 | |
| Net investment income | | | | | 14,147,140 | | | | 1,771 | | | | 11,799,947 | | | | 5,456 | |
| |
REALIZED AND UNREALIZED GAIN (LOSS): | | | | | | | | | | | | | | | | | | |
| Net realized gain (loss) on: | | | | | | | | | | | | | | | | | | |
| Investments | | | | | 6,222,229 | | | | 674 | | | | 6,311,985 | | | | 719 | |
| Capital gain distributions from affiliated underlying funds | | | | | 65,947,884 | | | | 13,266 | | | | 70,614,268 | | | | 45,131 | |
| Capital gain distributions from unaffiliated underlying funds | | | | | — | | | | 301 | | | | — | | | | 1,218 | |
| Sale of affiliated underlying funds | | | | | 61,664,142 | | | | 3,759 | | | | 63,006,681 | | | | 1,989 | |
| Foreign currency related transactions | | | | | 20,928 | | | | — | | | | 18,752 | | | | — | |
| Futures | | | | | (1,650 | ) | | | — | | | | (1,479 | ) | | | — | |
| Net realized gain | | | | | 133,853,533 | | | | 18,000 | | | | 139,950,207 | | | | 49,057 | |
| Net change in unrealized appreciation (depreciation) on: | | | | | | | | | | | | | | | | | | |
| Investments | | | | | (2,981,596 | ) | | | 118 | | | | 958,254 | | | | (76 | ) |
| Affiliated underlying funds | | | | | (78,862,045 | ) | | | (5,815 | ) | | | (92,878,700 | ) | | | (22,330 | ) |
| Foreign currency related transactions | | | | | 2,320 | | | | — | | | | 2,079 | | | | — | |
| Futures | | | | | (615,516 | ) | | | — | | | | (551,527 | ) | | | — | |
| Net change in unrealized appreciation (depreciation) | | | | | (82,456,837 | ) | | | (5,697 | ) | | | (92,469,894 | ) | | | (22,406 | ) |
| Net realized and unrealized gain | | | | | 51,396,696 | | | | 12,303 | | | | 47,480,313 | | | | 26,651 | |
Increase in net assets resulting from operations | | | | $ | 65,543,836 | | | $ | 14,074 | | | $ | 59,280,260 | | | $ | 32,107 | |
See Accompanying Notes to Financial Statements
37
STATEMENTS OF OPERATIONS FOR THE YEAR ENDED DECEMBER 31, 2014
| | | | Voya
Solution
2045
Portfolio
| | Voya
Solution
2050
Portfolio
| | Voya
Solution
2055
Portfolio
|
|---|
INVESTMENT INCOME: | | | | | | | | | | | | | | |
| Dividends from affiliated underlying funds | | | | $ | 8,228,256 | | | $ | 3,724 | | | $ | 1,209,235 | |
| Dividends | | | | | 1,197,289 | | | | 329 | | | | 134,062 | |
| Total investment income | | | | | 9,425,545 | | | | 4,053 | | | | 1,343,297 | |
| |
EXPENSES: | | | | | | | | | | | | | | |
| Investment management fees | | | | | 846,729 | | | | 281 | | | | 111,205 | |
| Distribution and shareholder service fees: | | | | | | | | | | | | | | |
| Class ADV | | | | | 1,266,344 | | | | 1,050 | | | | 186,963 | |
| Class S | | | | | 760,762 | | | | 11 | | | | 93,895 | |
| Class S2 | | | | | 97,007 | | | | 22 | | | | 12,824 | |
| Class T | | | | | 7,475 | | | | 33 | | | | 652 | |
| Transfer agent fees | | | | | 1,050 | | | | 286 | | | | 727 | |
| Administrative service fees | | | | | 760,253 | | | | 228 | | | | 101,020 | |
| Shareholder reporting expense | | | | | 34,708 | | | | 38 | | | | 12,710 | |
| Professional fees | | | | | 102,477 | | | | 7,438 | | | | 19,092 | |
| Custody and accounting expense | | | | | 57,289 | | | | 185 | | | | 7,300 | |
| Trustee fees | | | | | 22,808 | | | | 7 | | | | 3,031 | |
| Miscellaneous expense | | | | | 22,828 | | | | 5,171 | | | | 11,752 | |
| Total expenses | | | | | 3,979,730 | | | | 14,750 | | | | 561,171 | |
| Net waived and reimbursed fees | | | | | (493,642 | ) | | | (13,233 | ) | | | (87,199 | ) |
| Net expenses | | | | | 3,486,088 | | | | 1,517 | | | | 473,972 | |
| Net investment income | | | | | 5,939,457 | | | | 2,536 | | | | 869,325 | |
| |
REALIZED AND UNREALIZED GAIN (LOSS): | | | | | | | | | | | | | | |
| | | | | | | | | | | | | | | |
| Net realized gain (loss) on: | | | | | | | | | | | | | | |
| Investments | | | | | 3,824,121 | | | | 180 | | | | 435,654 | |
| Capital gain distributions from affiliated underlying funds | | | | | 53,858,215 | | | | 23,653 | | | | 7,790,400 | |
| Capital gain distributions from unaffiliated underlying funds | | | | | — | | | | 635 | | | | — | |
| Sale of affiliated underlying funds | | | | | 63,251,658 | | | | 1,971 | | | | 5,310,155 | |
| Foreign currency related transactions | | | | | 13,054 | | | | — | | | | 1,865 | |
| Futures | | | | | (1,029 | ) | | | — | | | | (147 | ) |
| Net realized gain | | | | | 120,946,019 | | | | 26,439 | | | | 13,537,927 | |
| Net change in unrealized appreciation (depreciation) on: | | | | | | | | | | | | | | |
| Investments | | | | | 180,130 | | | | 81 | | | | 120,400 | |
| Affiliated underlying funds | | | | | (82,389,720 | ) | | | (12,144 | ) | | | (8,218,596 | ) |
| Foreign currency related transactions | | | | | 1,447 | | | | — | | | | 207 | |
| Futures | | | | | (383,936 | ) | | | — | | | | (54,848 | ) |
| Net change in unrealized appreciation (depreciation) | | | | | (82,592,079 | ) | | | (12,063 | ) | | | (8,152,837 | ) |
| Net realized and unrealized gain | | | | | 38,353,940 | | | | 14,376 | | | | 5,385,090 | |
Increase in net assets resulting from operations | | | | $ | 44,293,397 | | | $ | 16,912 | | | $ | 6,254,415 | |
See Accompanying Notes to Financial Statements
38
STATEMENTS OF CHANGES IN NET ASSETS
| | | | Voya Solution Aggressive Portfolio
| | Voya Solution Balanced Portfolio
| |
|---|
| | | | Year Ended
December 31,
2014
| | May 1, 2013(1) to
December 31,
2013
| | Year Ended
December 31,
2014
| | Year Ended
December 31,
2013
|
|---|
FROM OPERATIONS: | | | | | | | | | | | | | | | | | | |
| Net investment income | | | | $ | 25,345 | | | $ | 6,531 | | | $ | 624,261 | | | $ | 522,074 | |
| Net realized gain | | | | | 242,971 | | | | 21,654 | | | | 4,803,411 | | | | 3,900,604 | |
| Net change in unrealized appreciation (depreciation) | | | | | (121,360 | ) | | | 24,247 | | | | (2,271,831 | ) | | | 2,490,226 | |
| Increase in net assets resulting from operations | | | | | 146,956 | | | | 52,432 | | | | 3,155,841 | | | | 6,912,904 | |
| |
FROM DISTRIBUTIONS TO SHAREHOLDERS: | | | | | | | | | | | | | | | | | | |
| Net investment income: | | | | | | | | | | | | | | | | | | |
| Class ADV | | | | | (7,127 | ) | | | — | | | | (492,698 | ) | | | (517,987 | ) |
| Class I | | | | | (8 | ) | | | — | | | | (26 | ) | | | (25 | ) |
| Class S | | | | | (6,284 | ) | | | — | | | | (459,274 | ) | | | (436,201 | ) |
| Class S2 | | | | | (167 | ) | | | — | | | | (11,001 | ) | | | (19,739 | ) |
| Net realized gains: | | | | | | | | | | | | | | | | | | |
| Class ADV | | | | | (8,033 | ) | | | — | | | | (1,838,481 | ) | | | (622,760 | ) |
| Class I | | | | | (19 | ) | | | — | | | | (75 | ) | | | (24 | ) |
| Class S | | | | | (6,844 | ) | | | — | | | | (1,500,747 | ) | | | (473,507 | ) |
| Class S2 | | | | | (213 | ) | | | — | | | | (44,553 | ) | | | (22,458 | ) |
| Total distributions | | | | | (28,695 | ) | | | — | | | | (4,346,855 | ) | | | (2,092,701 | ) |
| |
FROM CAPITAL SHARE TRANSACTIONS: | | | | | | | | | | | | | | | | | | |
| Net proceeds from sale of shares | | | | | 2,928,113 | | | | 1,099,525 | | | | 6,599,193 | | | | 7,339,855 | |
| Reinvestment of distributions | | | | | 28,695 | | | | — | | | | 4,346,855 | | | | 2,092,652 | |
| | | | | | 2,956,808 | | | | 1,099,525 | | | | 10,946,048 | | | | 9,432,507 | |
| Cost of shares redeemed | | | | | (538,538 | ) | | | (23,979 | ) | | | (9,181,670 | ) | | | (6,383,519 | ) |
| Net increase in net assets resulting from capital share transactions | | | | | 2,418,270 | | | | 1,075,546 | | | | 1,764,378 | | | | 3,048,988 | |
| Net increase in net assets | | | | | 2,536,531 | | | | 1,127,978 | | | | 573,364 | | | | 7,869,191 | |
| |
NET ASSETS: | | | | | | | | | | | | | | | | | | |
| Beginning of year or period | | | | | 1,127,978 | | | | — | | | | 51,485,583 | | | | 43,616,392 | |
| End of year or period | | | | $ | 3,664,509 | | | $ | 1,127,978 | | | $ | 52,058,947 | | | $ | 51,485,583 | |
| Undistributed net investment income at end of year or period | | | | $ | 97,431 | | | $ | 13,582 | | | $ | 1,408,693 | | | $ | 952,974 | |
(1) | | Commencement of operations. |
See Accompanying Notes to Financial Statements
39
STATEMENTS OF CHANGES IN NET ASSETS
| | | | Voya Solution Conservative Portfolio
| | Voya Solution Income Portfolio
| |
|---|
| | | | Year Ended
December 31,
2014
| | Year Ended
December 31,
2013
| | Year Ended
December 31,
2014
| | Year Ended
December 31,
2013
|
|---|
FROM OPERATIONS: | | | | | | | | | | | | | | | | | | |
| Net investment income | | | | $ | 296,721 | | | $ | 264,407 | | | $ | 2,650,486 | | | $ | 2,703,311 | |
| Net realized gain | | | | | 647,752 | | | | 829,665 | | | | 9,170,858 | | | | 12,280,524 | |
| Net change in unrealized (depreciation) | | | | | (221,695 | ) | | | (215,091 | ) | | | (1,965,788 | ) | | | (1,587,252 | ) |
| Increase in net assets resulting from operations | | | | | 722,778 | | | | 878,981 | | | | 9,855,556 | | | | 13,396,583 | |
| |
FROM DISTRIBUTIONS TO SHAREHOLDERS: | | | | | | | | | | | | | | | | | | |
| Net investment income: | | | | | | | | | | | | | | | | | | |
| Class ADV | | | | | (258,110 | ) | | | (271,480 | ) | | | (2,029,424 | ) | | | (3,127,735 | ) |
| Class I | | | | | (98 | ) | | | (101 | ) | | | (696,238 | ) | | | (796,375 | ) |
| Class S | | | | | (148,024 | ) | | | (161,777 | ) | | | (1,510,514 | ) | | | (2,268,465 | ) |
| Class S2 | | | | | (7,699 | ) | | | (7,744 | ) | | | (99,007 | ) | | | (182,935 | ) |
| Class T | | | | | — | | | | — | | | | (2,437 | ) | | | (8,056 | ) |
| Net realized gains: | | | | | | | | | | | | | | | | | | |
| Class ADV | | | | | (454,228 | ) | | | (98,686 | ) | | | — | | | | — | |
| Class I | | | | | (143 | ) | | | (32 | ) | | | — | | | | — | |
| Class S | | | | | (238,082 | ) | | | (54,391 | ) | | | — | | | | — | |
| Class S2 | | | | | (13,060 | ) | | | (2,706 | ) | | | — | | | | — | |
| Total distributions | | | | | (1,119,444 | ) | | | (596,917 | ) | | | (4,337,620 | ) | | | (6,383,566 | ) |
| |
FROM CAPITAL SHARE TRANSACTIONS: | | | | | | | | | | | | | | | | | | |
| Net proceeds from sale of shares | | | | | 2,917,160 | | | | 3,987,489 | | | | 22,799,864 | | | | 27,057,056 | |
| Reinvestment of distributions | | | | | 1,119,445 | | | | 596,786 | | | | 4,337,620 | | | | 6,383,566 | |
| | | | | | 4,036,605 | | | | 4,584,275 | | | | 27,137,484 | | | | 33,440,622 | |
| Cost of shares redeemed | | | | | (3,264,309 | ) | | | (2,654,275 | ) | | | (51,121,212 | ) | | | (65,600,339 | ) |
| Net increase (decrease) in net assets resulting from capital share transactions | | | | | 772,296 | | | | 1,930,000 | | | | (23,983,728 | ) | | | (32,159,717 | ) |
| Net increase (decrease) in net assets | | | | | 375,630 | | | | 2,212,064 | | | | (18,465,792 | ) | | | (25,146,700 | ) |
| |
NET ASSETS: | | | | | | | | | | | | | | | | | | |
| Beginning of year or period | | | | | 17,339,822 | | | | 15,127,758 | | | | 186,903,142 | | | | 212,049,842 | |
| End of year or period | | | | $ | 17,715,452 | | | $ | 17,339,822 | | | $ | 168,437,350 | | | $ | 186,903,142 | |
| Undistributed net investment income at end of year or period | | | | $ | 431,248 | | | $ | 406,670 | | | $ | 4,118,565 | | | $ | 4,295,073 | |
See Accompanying Notes to Financial Statements
40
STATEMENTS OF CHANGES IN NET ASSETS
| | | | Voya Solution Moderately
Aggressive Portfolio
| | Voya SolutionModerately
Conservative Portfolio
| |
|---|
| | | | Year Ended
December 31,
2014
| | Year Ended
December 31,
2013
| | Year Ended
December 31,
2014
| | Year Ended
December 31,
2013
|
|---|
FROM OPERATIONS: | | | | | | | | | | | | | | | | | | |
| Net investment income | | | | $ | 302,350 | | | $ | 226,748 | | | $ | 648,845 | | | $ | 613,395 | |
| Net realized gain | | | | | 3,774,720 | | | | 2,639,644 | | | | 2,924,891 | | | | 3,015,040 | |
| Net change in unrealized appreciation (depreciation) | | | | | (2,144,827 | ) | | | 2,109,556 | | | | (1,195,117 | ) | | | 515,807 | |
| Increase in net assets resulting from operations | | | | | 1,932,243 | | | | 4,975,948 | | | | 2,378,619 | | | | 4,144,242 | |
| |
FROM DISTRIBUTIONS TO SHAREHOLDERS: | | | | | | | | | | | | | | | | | | |
| Net investment income: | | | | | | | | | | | | | | | | | | |
| Class ADV | | | | | (281,227 | ) | | | (263,958 | ) | | | (448,243 | ) | | | (556,451 | ) |
| Class I | | | | | (78 | ) | | | (78 | ) | | | (29 | ) | | | (32 | ) |
| Class S | | | | | (199,025 | ) | | | (190,429 | ) | | | (528,003 | ) | | | (595,229 | ) |
| Class S2 | | | | | (13,714 | ) | | | (2,123 | ) | | | (15,919 | ) | | | (16,779 | ) |
| Net realized gains: | | | | | | | | | | | | | | | | | | |
| Class ADV | | | | | (1,312,300 | ) | | | (445,565 | ) | | | (1,274,824 | ) | | | (603,545 | ) |
| Class I | | | | | (282 | ) | | | (106 | ) | | | (66 | ) | | | (29 | ) |
| Class S | | | | | (818,999 | ) | | | (284,103 | ) | | | (1,329,118 | ) | | | (592,593 | ) |
| Class S2 | | | | | (51,669 | ) | | | (3,195 | ) | | | (42,168 | ) | | | (16,912 | ) |
| Total distributions | | | | | (2,677,294 | ) | | | (1,189,557 | ) | | | (3,638,370 | ) | | | (2,381,570 | ) |
| |
FROM CAPITAL SHARE TRANSACTIONS: | | | | | | | | | | | | | | | | | | |
| Net proceeds from sale of shares | | | | | 7,817,156 | | | | 5,848,555 | | | | 8,005,489 | | | | 8,160,909 | |
| Reinvestment of distributions | | | | | 2,677,295 | | | | 1,189,374 | | | | 3,638,370 | | | | 2,381,509 | |
| | | | | | 10,494,451 | | | | 7,037,929 | | | | 11,643,859 | | | | 10,542,418 | |
| Cost of shares redeemed | | | | | (6,656,733 | ) | | | (4,667,849 | ) | | | (12,099,886 | ) | | | (11,490,640 | ) |
| Net increase (decrease) in net assets resulting from capital share transactions | | | | | 3,837,718 | | | | 2,370,080 | | | | (456,027 | ) | | | (948,222 | ) |
| Net increase (decrease) in net assets | | | | | 3,092,667 | | | | 6,156,471 | | | | (1,715,778 | ) | | | 814,450 | |
| |
NET ASSETS: | | | | | | | | | | | | | | | | | | |
| Beginning of year or period | | | | | 29,103,834 | | | | 22,947,363 | | | | 46,604,699 | | | | 45,790,249 | |
| End of year or period | | | | $ | 32,196,501 | | | $ | 29,103,834 | | | $ | 44,888,921 | | | $ | 46,604,699 | |
| Undistributed net investment income at end of year or period | | | | $ | 916,562 | | | $ | 490,869 | | | $ | 1,155,062 | | | $ | 982,969 | |
See Accompanying Notes to Financial Statements
41
STATEMENTS OF CHANGES IN NET ASSETS
| | | | Voya Solution 2015 Portfolio
| | Voya Solution 2020 Portfolio
| |
|---|
| | | | Year Ended
December 31,
2014
| | Year Ended
December 31,
2013
| | Year Ended
December 31,
2014
| | Year Ended
December 31,
2013
|
|---|
FROM OPERATIONS: | | | | | | | | | | | | | | | | | | |
| Net investment income | | | | $ | 8,667,920 | | | $ | 8,892,103 | | | $ | 5,818 | | | $ | 199 | |
| Net realized gain | | | | | 41,924,839 | | | | 52,888,050 | | | | 28,077 | | | | 1,802 | |
| Net change in unrealized appreciation (depreciation) | | | | | (16,262,558 | ) | | | (7,629 | ) | | | (13,548 | ) | | | 280 | |
| Increase in net assets resulting from operations | | | | | 34,330,201 | | | | 61,772,524 | | | | 20,347 | | | | 2,281 | |
| |
FROM DISTRIBUTIONS TO SHAREHOLDERS: | | | | | | | | | | | | | | | | | | |
| Net investment income: | | | | | | | | | | | | | | | | | | |
| Class ADV | | | | | (5,512,203 | ) | | | (8,577,618 | ) | | | (390 | ) | | | (88 | ) |
| Class I | | | | | (2,540,676 | ) | | | (3,194,885 | ) | | | — | | | | (103 | ) |
| Class S | | | | | (6,403,046 | ) | | | (9,404,098 | ) | | | — | | | | (75 | ) |
| Class S2 | | | | | (431,326 | ) | | | (706,549 | ) | | | — | | | | (92 | ) |
| Class T | | | | | (26,433 | ) | | | (58,040 | ) | | | — | | | | (81 | ) |
| Net realized gains: | | | | | | | | | | | | | | | | | | |
| Class ADV | | | | | (1,531,277 | ) | | | — | | | | (1,614 | ) | | | (241 | ) |
| Class I | | | | | (558,445 | ) | | | — | | | | (11 | ) | | | (240 | ) |
| Class S | | | | | (1,572,429 | ) | | | — | | | | (12 | ) | | | (240 | ) |
| Class S2 | | | | | (116,006 | ) | | | — | | | | (11 | ) | | | (241 | ) |
| Class T | | | | | (9,084 | ) | | | — | | | | (11 | ) | | | (241 | ) |
| Total distributions | | | | | (18,700,925 | ) | | | (21,941,190 | ) | | | (2,049 | ) | | | (1,642 | ) |
| |
FROM CAPITAL SHARE TRANSACTIONS: | | | | | | | | | | | | | | | | | | |
| Net proceeds from sale of shares | | | | | 60,199,484 | | | | 71,944,976 | | | | 612,209 | | | | — | |
| Payment from distribution/payment by affiliate | | | | | — | | | | — | | | | — | | | | 22 | |
| Reinvestment of distributions | | | | | 18,700,925 | | | | 21,941,190 | | | | 2,049 | | | | 6 | |
| | | | | | 78,900,409 | | | | 93,886,166 | | | | 614,258 | | | | 28 | |
| Cost of shares redeemed | | | | | (200,218,289 | ) | | | (203,095,094 | ) | | | (3,935 | ) | | | — | |
| Net increase (decrease) in net assets resulting from capital share transactions | | | | | (121,317,880 | ) | | | (109,208,928 | ) | | | 610,323 | | | | 28 | |
| Net increase (decrease) in net assets | | | | | (105,688,604 | ) | | | (69,377,594 | ) | | | 628,621 | | | | 667 | |
| |
NET ASSETS: | | | | | | | | | | | | | | | | | | |
| Beginning of year or period | | | | | 674,352,089 | | | | 743,729,683 | | | | 18,437 | | | | 17,770 | |
| End of year or period | | | | $ | 568,663,485 | | | $ | 674,352,089 | | | $ | 647,058 | | | $ | 18,437 | |
| Undistributed net investment income at end of year or period | | | | $ | 15,095,750 | | | $ | 14,764,570 | | | $ | 14,270 | | | $ | 384 | |
See Accompanying Notes to Financial Statements
42
STATEMENTS OF CHANGES IN NET ASSETS
| | | | Voya Solution 2025 Portfolio
| | Voya Solution 2030 Portfolio
| |
|---|
| | | | Year Ended
December 31,
2014
| | Year Ended
December 31,
2013
| | Year Ended
December 31,
2014
| | Year Ended
December 31,
2013
|
|---|
FROM OPERATIONS: | | | | | | | | | | | | | | | | | | |
| Net investment income | | | | $ | 14,147,140 | | | $ | 13,341,151 | | | $ | 1,771 | | | $ | 206 | |
| Net realized gain | | | | | 133,853,533 | | | | 126,328,055 | | | | 18,000 | | | | 2,193 | |
| Net change in unrealized appreciation (depreciation) | | | | | (82,456,837 | ) | | | 52,290,517 | | | | (5,697 | ) | | | 908 | |
| Increase in net assets resulting from operations | | | | | 65,543,836 | | | | 191,959,723 | | | | 14,074 | | | | 3,307 | |
| |
FROM DISTRIBUTIONS TO SHAREHOLDERS: | | | | | | | | | | | | | | | | | | |
| Net investment income: | | | | | | | | | | | | | | | | | | |
| Class ADV | | | | | (7,770,543 | ) | | | (9,920,848 | ) | | | (374 | ) | | | (71 | ) |
| Class I | | | | | (5,167,433 | ) | | | (4,821,781 | ) | | | — | | | | (87 | ) |
| Class S | | | | | (9,839,537 | ) | | | (11,844,793 | ) | | | — | | | | (58 | ) |
| Class S2 | | | | | (626,978 | ) | | | (852,034 | ) | | | — | | | | (75 | ) |
| Class T | | | | | (51,109 | ) | | | (49,517 | ) | | | — | | | | (63 | ) |
| Net realized gains: | | | | | | | | | | | | | | | | | | |
| Class ADV | | | | | (22,007,158 | ) | | | — | | | | (1,930 | ) | | | (253 | ) |
| Class I | | | | | (11,058,574 | ) | | | — | | | | (30 | ) | | | (253 | ) |
| Class S | | | | | (23,887,292 | ) | | | — | | | | (31 | ) | | | (253 | ) |
| Class S2 | | | | | (1,695,494 | ) | | | — | | | | (31 | ) | | | (253 | ) |
| Class T | | | | | (153,305 | ) | | | — | | | | (31 | ) | | | (253 | ) |
| Total distributions | | | | | (82,257,423 | ) | | | (27,488,973 | ) | | | (2,427 | ) | | | (1,619 | ) |
| |
FROM CAPITAL SHARE TRANSACTIONS: | | | | | | | | | | | | | | | | | | |
| Net proceeds from sale of shares | | | | | 137,902,204 | | | | 141,374,033 | | | | 267,213 | | | | — | |
| Payment from distribution/payment by affiliate | | | | | — | | | | — | | | | — | | | | 33 | |
| Reinvestment of distributions | | | | | 82,257,423 | | | | 27,488,973 | | | | 2,425 | | | | 6 | |
| | | | | | 220,159,627 | | | | 168,863,006 | | | | 269,638 | | | | 39 | |
| Cost of shares redeemed | | | | | (348,688,179 | ) | | | (277,392,471 | ) | | | (127,607 | ) | | | — | |
| Net increase (decrease) in net assets resulting from capital share transactions | | | | | (128,528,552 | ) | | | (108,529,465 | ) | | | 142,031 | | | | 39 | |
| Net increase (decrease) in net assets | | | | | (145,242,139 | ) | | | 55,941,285 | | | | 153,678 | | | | 1,727 | |
| |
NET ASSETS: | | | | | | | | | | | | | | | | | | |
| Beginning of year or period | | | | | 1,300,200,313 | | | | 1,244,259,028 | | | | 19,980 | | | | 18,253 | |
| End of year or period | | | | $ | 1,154,958,174 | | | $ | 1,300,200,313 | | �� | $ | 173,658 | | | $ | 19,980 | |
| Undistributed net investment income at end of year or period | | | | $ | 33,444,752 | | | $ | 23,171,396 | | | $ | 5,333 | | | $ | 372 | |
See Accompanying Notes to Financial Statements
43
STATEMENTS OF CHANGES IN NET ASSETS
| | | | Voya Solution 2035 Portfolio
| | Voya Solution 2040 Portfolio
| |
|---|
| | | | Year Ended
December 31,
2014
| | Year Ended
December 31,
2013
| | Year Ended
December 31,
2014
| | Year Ended
December 31,
2013
|
|---|
FROM OPERATIONS: | | | | | | | | | | | | | | | | | | |
| Net investment income | | | | $ | 11,799,947 | | | $ | 11,549,368 | | | $ | 5,456 | | | $ | 158 | |
| Net realized gain | | | | | 139,950,207 | | | | 124,368,244 | | | | 49,057 | | | | 2,615 | |
| Net change in unrealized appreciation (depreciation) | | | | | (92,469,894 | ) | | | 71,163,830 | | | | (22,406 | ) | | | 1,267 | |
| Increase in net assets resulting from operations | | | | | 59,280,260 | | | | 207,081,442 | | | | 32,107 | | | | 4,040 | |
| |
FROM DISTRIBUTIONS TO SHAREHOLDERS: | | | | | | | | | | | | | | | | | | |
| Net investment income: | | | | | | | | | | | | | | | | | | |
| Class ADV | | | | | (6,802,252 | ) | | | (6,666,711 | ) | | | (346 | ) | | | (62 | ) |
| Class I | | | | | (5,095,144 | ) | | | (3,752,173 | ) | | | — | | | | (81 | ) |
| Class S | | | | | (8,668,342 | ) | | | (9,003,102 | ) | | | — | | | | (50 | ) |
| Class S2 | | | | | (579,632 | ) | | | (568,093 | ) | | | — | | | | (65 | ) |
| Class T | | | | | (35,193 | ) | | | (33,612 | ) | | | — | | | | (55 | ) |
| Net realized gains: | | | | | | | | | | | | | | | | | | |
| Class ADV | | | | | (32,474,750 | ) | | | — | | | | (2,368 | ) | | | (269 | ) |
| Class I | | | | | (18,565,782 | ) | | | — | | | | (16 | ) | | | (269 | ) |
| Class S | | | | | (35,967,415 | ) | | | — | | | | (16 | ) | | | (269 | ) |
| Class S2 | | | | | (2,623,213 | ) | | | — | | | | (16 | ) | | | (269 | ) |
| Class T | | | | | (193,251 | ) | | | — | | | | (17 | ) | | | (269 | ) |
| Total distributions | | | | | (111,004,974 | ) | | | (20,023,691 | ) | | | (2,779 | ) | | | (1,658 | ) |
| |
FROM CAPITAL SHARE TRANSACTIONS: | | | | | | | | | | | | | | | | | | |
| Net proceeds from sale of shares | | | | | 133,124,882 | | | | 121,265,700 | | | | 802,761 | | | | — | |
| Payment from distribution/payment by affiliate | | | | | — | | | | — | | | | — | | | | 39 | |
| Reinvestment of distributions | | | | | 111,004,974 | | | | 20,023,691 | | | | 2,779 | | | | 6 | |
| | | | | | 244,129,856 | | | | 141,289,391 | | | | 805,540 | | | | 45 | |
| Cost of shares redeemed | | | | | (306,797,936 | ) | | | (248,712,323 | ) | | | (136,869 | ) | | | — | |
| Net increase (decrease) in net assets resulting from capital share transactions | | | | | (62,668,080 | ) | | | (107,422,932 | ) | | | 668,671 | | | | 45 | |
| Net increase (decrease) in net assets | | | | | (114,392,794 | ) | | | 79,634,819 | | | | 697,999 | | | | 2,427 | |
| |
NET ASSETS: | | | | | | | | | | | | | | | | | | |
| Beginning of year or period | | | | | 1,155,519,197 | | | | 1,075,884,378 | | | | 21,197 | | | | 18,770 | |
| End of year or period | | | | $ | 1,041,126,403 | | | $ | 1,155,519,197 | | | $ | 719,196 | | | $ | 21,197 | |
| Undistributed net investment income at end of year or period | | | | $ | 31,270,051 | | | $ | 21,167,122 | | | $ | 19,490 | | | $ | 345 | |
See Accompanying Notes to Financial Statements
44
STATEMENTS OF CHANGES IN NET ASSETS
| | | | Voya Solution 2045 Portfolio
| | Voya Solution 2050 Portfolio
| |
|---|
| | | | Year Ended
December 31,
2014
| | Year Ended
December 31,
2013
| | Year Ended
December 31,
2014
| | Year Ended
December 31,
2013
|
|---|
FROM OPERATIONS: | | | | | | | | | | | | | | | | | | |
| Net investment income | | | | $ | 5,939,457 | | | $ | 5,311,660 | | | $ | 2,536 | | | $ | 130 | |
| Net realized gain | | | | | 120,946,019 | | | | 92,739,197 | | | | 26,439 | | | | 2,711 | |
| Net change in unrealized appreciation (depreciation) | | | | | (82,592,079 | ) | | | 59,897,558 | | | | (12,063 | ) | | | 1,363 | |
| Increase in net assets resulting from operations | | | | | 44,293,397 | | | | 157,948,415 | | | | 16,912 | | | | 4,204 | |
| |
FROM DISTRIBUTIONS TO SHAREHOLDERS: | | | | | | | | | | | | | | | | | | |
| Net investment income: | | | | | | | | | | | | | | | | | | |
| Class ADV | | | | | (3,656,571 | ) | | | (3,425,051 | ) | | | (322 | ) | | | (58 | ) |
| Class I | | | | | (3,392,204 | ) | | | (2,348,659 | ) | | | — | | | | (77 | ) |
| Class S | | | | | (5,059,363 | ) | | | (5,630,912 | ) | | | — | | | | (46 | ) |
| Class S2 | | | | | (283,975 | ) | | | (275,701 | ) | | | — | | | | (62 | ) |
| Class T | | | | | (15,222 | ) | | | (11,246 | ) | | | — | | | | (52 | ) |
| Net realized gains: | | | | | | | | | | | | | | | | | | |
| Class ADV | | | | | (25,471,735 | ) | | | — | | | | (2,393 | ) | | | (265 | ) |
| Class I | | | | | (17,512,336 | ) | | | — | | | | (33 | ) | | | (265 | ) |
| Class S | | | | | (30,526,941 | ) | | | — | | | | (34 | ) | | | (265 | ) |
| Class S2 | | | | | (1,899,842 | ) | | | — | | | | (33 | ) | | | (265 | ) |
| Class T | | | | | (117,244 | ) | | | — | | | | (33 | ) | | | (265 | ) |
| Total distributions | | | | | (87,935,433 | ) | | | (11,691,569 | ) | | | (2,848 | ) | | | (1,620 | ) |
| |
FROM CAPITAL SHARE TRANSACTIONS: | | | | | | | | | | | | | | | | | | |
| Net proceeds from sale of shares | | | | | 114,754,136 | | | | 104,155,321 | | | | 343,577 | | | | — | |
| Payment from distribution/payment by affiliate | | | | | — | | | | — | | | | — | | | | 40 | |
| Reinvestment of distributions | | | | | 87,935,433 | | | | 11,691,569 | | | | 2,848 | | | | 5 | |
| | | | | | 202,689,569 | | | | 115,846,890 | | | | 346,425 | | | | 45 | |
| Cost of shares redeemed | | | | | (234,645,609 | ) | | | (167,082,715 | ) | | | (8,517 | ) | | | — | |
| Net increase (decrease) in net assets resulting from capital share transactions | | | | | (31,956,040 | ) | | | (51,235,825 | ) | | | 337,908 | | | | 45 | |
| Net increase (decrease) in net assets | | | | | (75,598,076 | ) | | | 95,021,021 | | | | 351,972 | | | | 2,629 | |
| |
NET ASSETS: | | | | | | | | | | | | | | | | | | |
| Beginning of year or period | | | | | 796,239,415 | | | | 701,218,394 | | | | 21,378 | | | | 18,749 | |
| End of year or period | | | | $ | 720,641,339 | | | $ | 796,239,415 | | | $ | 373,350 | | | $ | 21,378 | |
| Undistributed net investment income at end of year or period | | | | $ | 21,014,258 | | | $ | 12,397,714 | | | $ | 9,823 | | | $ | 320 | |
See Accompanying Notes to Financial Statements
45
STATEMENTS OF CHANGES IN NET ASSETS
| | | | Voya Solution 2055 Portfolio
| |
|---|
| | | | Year Ended
December 31,
2014
| | Year Ended
December 31,
2013
|
|---|
FROM OPERATIONS: | | | | | | | | | | |
| Net investment income | | | | $ | 869,325 | | | $ | 593,125 | |
| Net realized gain | | | | | 13,537,927 | | | | 6,761,805 | |
| Net change in unrealized appreciation (depreciation) | | | | | (8,152,837 | ) | | | 7,559,346 | |
| Increase in net assets resulting from operations | | | | | 6,254,415 | | | | 14,914,276 | |
| |
FROM DISTRIBUTIONS TO SHAREHOLDERS: | | | | | | | | | | |
| Net investment income: | | | | | | | | | | |
| Class ADV | | | | | (443,228 | ) | | | (292,013 | ) |
| Class I | | | | | (327,350 | ) | | | (151,252 | ) |
| Class S | | | | | (517,436 | ) | | | (364,129 | ) |
| Class S2 | | | | | (32,356 | ) | | | (16,968 | ) |
| Class T | | | | | (569 | ) | | | (325 | ) |
| Net realized gains: | | | | | | | | | | |
| Class ADV | | | | | (2,181,949 | ) | | | (463,722 | ) |
| Class I | | | | | (1,227,740 | ) | | | (186,830 | ) |
| Class S | | | | | (2,218,869 | ) | | | (498,813 | ) |
| Class S2 | | | | | (147,095 | ) | | | (26,087 | ) |
| Class T | | | | | (2,909 | ) | | | (484 | ) |
| Total distributions | | | | | (7,099,501 | ) | | | (2,000,623 | ) |
| |
FROM CAPITAL SHARE TRANSACTIONS: | | | | | | | | | | |
| Net proceeds from sale of shares | | | | | 45,678,343 | | | | 40,881,258 | |
| Reinvestment of distributions | | | | | 7,099,501 | | | | 2,000,514 | |
| | | | | | 52,777,844 | | | | 42,881,772 | |
| Cost of shares redeemed | | | | | (33,424,354 | ) | | | (15,997,423 | ) |
| Net increase in net assets resulting from capital share transactions | | | | | 19,353,490 | | | | 26,884,349 | |
| Net increase in net assets | | | | | 18,508,404 | | | | 39,798,002 | |
| |
NET ASSETS: | | | | | | | | | | |
| Beginning of year or period | | | | | 91,118,969 | | | | 51,320,967 | |
| End of year or period | | | | $ | 109,627,373 | | | $ | 91,118,969 | |
| Undistributed net investment income at end of year or period | | | | $ | 3,067,766 | | | $ | 1,319,569 | |
See Accompanying Notes to Financial Statements
46
FINANCIAL HIGHLIGHTS
Selected data for a share of beneficial interest outstanding throughout each year or period.
| | | Income (loss)
from investment
operations
|
| | | Less distributions
|
| | | | | | | | | Ratios to average
net assets
| | Supplemental
data
| |
|---|
| | | | | | | | | | | | | | | | | | | | | | | | | | | | | | | | |
|---|
| Net
asset
value,
beginning
of
year or
period
|
| Net
investment
income
(loss)
|
| Net
realized
and
unrealized
gain
(loss)
|
| Total
from
investment
operations
|
| From
net
investment
income
|
| From
net
realized
gains
|
| From
return
of
capital
|
| Total
distributions
|
| Payment
by
affiliate
|
| Net
asset
value,
end of
year or
period
|
| Total
Return(1)
|
| Expenses
before
reductions/
additions(2)(3)(4)
|
| Expenses
net
of fee
waivers
and/or
recoupments
if any(2)(3)(4)
|
| Expenses
net
of all
reductions/
additions(2)(3)(4)
|
| Net
investment
income
(loss)(2)(3)
|
| Net
assets,
end of
year or
period
|
| Portfolio
turnover
rate
|
|---|
Year or period ended
| ($)
|
| ($)
|
| ($)
|
| ($)
|
| ($)
|
| ($)
|
| ($)
|
| ($)
|
| ($)
|
| ($)
|
| (%)
|
| (%)
|
| (%)
|
| (%)
|
| (%)
|
| ($000’s)
|
| (%)
|
|---|
Voya Solution Aggressive Portfolio | | | | | | | | | | | | | | | | | | | | | | | | | | | | | | | | | | | | | | | | | | | | | | | | | | | | | | | | | | | | | | | | | | | |
Class ADV | | | | | | | | | | | | | | | | | | | | | | | | | | | | | | | | | | | | | | | | | | | | | | | | | | | | | | | | | | | | | | | | | | | |
| 12-31-14 | | 11.55 | | | | 0.13 | • | | | 0.57 | | | | 0.70 | | | | 0.06 | | | | 0.06 | | | | — | | | | 0.12 | | | | — | | | | 12.13 | | | | 6.10 | | | | 1.26 | | | | 0.65 | | | | 0.65 | | | | 1.12 | | | | 2,180 | | | | 70 | |
05-01-13(5)–12-31-13 | | 10.00 | | | | 0.19 | • | | | 1.36 | | | | 1.55 | | | | — | | | | — | | | | — | | | | — | | | | — | | | | 11.55 | | | | 15.50 | | | | 12.00 | | | | 0.56 | | | | 0.56 | | | | 2.55 | | | | 496 | | | | 35 | |
Class I | | | | | | | | | | | | | | | | | | | | | | | | | | | | | | | | | | | | | | | | | | | | | | | | | | | | | | | | | | | | | | | | | | | |
| 12-31-14 | | 11.65 | | | | 0.24 | • | | | 0.52 | | | | 0.76 | | | | 0.03 | | | | 0.06 | | | | — | | | | 0.09 | | | | — | | | | 12.32 | | | | 6.56 | | | | 0.76 | | | | 0.15 | | | | 0.15 | | | | 2.01 | | | | 12 | | | | 70 | |
05-01-13(5)–12-31-13 | | 10.00 | | | | 0.29 | • | | | 1.36 | | | | 1.65 | | | | — | | | | — | | | | — | | | | — | | | | — | | | | 11.65 | | | | 16.50 | | | | 11.50 | | | | 0.06 | | | | 0.06 | | | | 3.99 | | | | 4 | | | | 35 | |
Class S | | | | | | | | | | | | | | | | | | | | | | | | | | | | | | | | | | | | | | | | | | | | | | | | | | | | | | | | | | | | | | | | | | | |
| 12-31-14 | | 11.63 | | | | 0.11 | • | | | 0.61 | | | | 0.72 | | | | 0.06 | | | | 0.06 | | | | — | | | | 0.12 | | | | — | | | | 12.23 | | | | 6.25 | | | | 1.01 | | | | 0.40 | | | | 0.40 | | | | 0.92 | | | | 1,395 | | | | 70 | |
05-01-13(5)–12-31-13 | | 10.00 | | | | 0.28 | • | | | 1.35 | | | | 1.63 | | | | — | | | | — | | | | — | | | | — | | | | — | | | | 11.63 | | | | 16.30 | | | | 11.75 | | | | 0.31 | | | | 0.31 | | | | 3.73 | | | | 591 | | | | 35 | |
Class S2 | | | | | | | | | | | | | | | | | | | | | | | | | | | | | | | | | | | | | | | | | | | | | | | | | | | | | | | | | | | | | | | | | | | |
| 12-31-14 | | 11.56 | | | | 0.18 | • | | | 0.51 | | | | 0.69 | | | | 0.05 | | | | 0.06 | | | | — | | | | 0.11 | | | | — | | | | 12.14 | | | | 6.04 | | | | 1.26 | | | | 0.55 | | | | 0.55 | | | | 1.54 | | | | 78 | | | | 70 | |
05-01-13(5)–12-31-13 | | 10.00 | | | | 0.23 | • | | | 1.33 | | | | 1.56 | | | | — | | | | — | | | | — | | | | — | | | | — | | | | 11.56 | | | | 15.60 | | | | 12.00 | | | | 0.46 | | | | 0.46 | | | | 3.12 | | | | 38 | | | | 35 | |
Voya Solution Balanced Portfolio | | | | | | | | | | | | | | | | | | | | | | | | | | | | | | | | | | | | | | | | | | | | | | | | | | | | | | | | | | | | | | | | | | | |
Class ADV | | | | | | | | | | | | | | | | | | | | | | | | | | | | | | | | | | | | | | | | | | | | | | | | | | | | | | | | | | | | | | | | | | | |
| 12-31-14 | | 10.88 | | | | 0.12 | | | | 0.52 | | | | 0.64 | | | | 0.20 | | | | 0.75 | | | | — | | | | 0.95 | | | | — | | | | 10.57 | | | | 6.14 | | | | 0.78 | | | | 0.64 | | | | 0.64 | | | | 1.09 | | | | 28,237 | | | | 61 | |
| 12-31-13 | | 9.84 | | | | 0.10 | | | | 1.38 | | | | 1.48 | | | | 0.20 | | | | 0.24 | | | | — | | | | 0.44 | | | | — | | | | 10.88 | | | | 15.39 | | | | 0.78 | | | | 0.63 | | | | 0.63 | | | | 0.97 | | | | 27,369 | | | | 78 | |
| 12-31-12 | | 8.84 | | | | 0.14 | • | | | 1.03 | | | | 1.17 | | | | 0.14 | | | | 0.03 | | | | — | | | | 0.17 | | | | — | | | | 9.84 | | | | 13.35 | | | | 0.71 | | | | 0.62 | | | | 0.62 | | | | 1.44 | | | | 24,244 | | | | 75 | |
| 12-31-11 | | 9.16 | | | | 0.24 | • | | | (0.49 | ) | | | (0.25 | ) | | | 0.03 | | | | 0.04 | | | | — | | | | 0.07 | | | | — | | | | 8.84 | | | | (2.68 | ) | | | 0.62 | | | | 0.62 | | | | 0.62 | | | | 2.63 | | | | 16,050 | | | | 70 | |
| 12-31-10 | | 8.24 | | | | 0.26 | • | | | 0.73 | | | | 0.99 | | | | 0.07 | | | | — | | | | — | | | | 0.07 | | | | — | | | | 9.16 | | | | 12.07 | | | | 0.62 | | | | 0.62 | | | | 0.62 | | | | 2.95 | | | | 4,837 | | | | 43 | |
Class I | | | | | | | | | | | | | | | | | | | | | | | | | | | | | | | | | | | | | | | | | | | | | | | | | | | | | | | | | | | | | | | | | | | |
| 12-31-14 | | 11.19 | | | | 0.27 | • | | | 0.45 | | | | 0.72 | | | | 0.26 | | | | 0.75 | | | | — | | | | 1.01 | | | | — | | | | 10.90 | | | | 6.66 | | | | 0.28 | | | | 0.14 | | | | 0.14 | | | | 2.53 | | | | 23 | | | | 61 | |
| 12-31-13 | | 10.10 | | | | 0.16 | | | | 1.42 | | | | 1.58 | | | | 0.25 | | | | 0.24 | | | | — | | | | 0.49 | | | | — | | | | 11.19 | | | | 15.93 | | | | 0.28 | | | | 0.13 | | | | 0.13 | | | | 1.49 | | | | 1 | | | | 78 | |
| 12-31-12 | | 9.05 | | | | 0.18 | | | | 1.06 | | | | 1.24 | | | | 0.16 | | | | 0.03 | | | | — | | | | 0.19 | | | | — | | | | 10.10 | | | | 13.86 | | | | 0.21 | | | | 0.12 | | | | 0.12 | | | | 1.85 | | | | 1 | | | | 75 | |
| 12-31-11 | | 9.33 | | | | 0.26 | | | | (0.47 | ) | | | (0.21 | ) | | | 0.03 | | | | 0.04 | | | | — | | | | 0.07 | | | | — | | | | 9.05 | | | | (2.17 | ) | | | 0.12 | | | | 0.12 | | | | 0.12 | | | | 2.78 | | | | 1 | | | | 70 | |
| 12-31-10 | | 8.34 | | | | 0.18 | | | | 0.90 | | | | 1.08 | | | | 0.09 | | | | — | | | | — | | | | 0.09 | | | | — | | | | 9.33 | | | | 13.11 | | | | 0.12 | | | | 0.12 | | | | 0.12 | | | | 2.10 | | | | 1 | | | | 43 | |
Class S | | | | | | | | | | | | | | | | | | | | | | | | | | | | | | | | | | | | | | | | | | | | | | | | | | | | | | | | | | | | | | | | | | | |
| 12-31-14 | | 11.01 | | | | 0.16 | | | | 0.51 | | | | 0.67 | | | | 0.23 | | | | 0.75 | | | | — | | | | 0.98 | | | | — | | | | 10.70 | | | | 6.34 | | | | 0.53 | | | | 0.39 | | | | 0.39 | | | | 1.35 | | | | 23,128 | | | | 61 | |
| 12-31-13 | | 9.95 | | | | 0.13 | • | | | 1.39 | | | | 1.52 | | | | 0.22 | | | | 0.24 | | | | — | | | | 0.46 | | | | — | | | | 11.01 | | | | 15.65 | | | | 0.53 | | | | 0.38 | | | | 0.38 | | | | 1.24 | | | | 23,012 | | | | 78 | |
| 12-31-12 | | 8.92 | | | | 0.16 | • | | | 1.05 | | | | 1.21 | | | | 0.15 | | | | 0.03 | | | | — | | | | 0.18 | | | | — | | | | 9.95 | | | | 13.71 | | | | 0.46 | | | | 0.37 | | | | 0.37 | | | | 1.70 | | | | 18,349 | | | | 75 | |
| 12-31-11 | | 9.22 | | | | 0.24 | • | | | (0.47 | ) | | | (0.23 | ) | | | 0.03 | | | | 0.04 | | | | — | | | | 0.07 | | | | — | | | | 8.92 | | | | (2.46 | ) | | | 0.37 | | | | 0.37 | | | | 0.37 | | | | 2.66 | | | | 12,042 | | | | 70 | |
| 12-31-10 | | 8.27 | | | | 0.20 | • | | | 0.84 | | | | 1.04 | | | | 0.09 | | | | — | | | | — | | | | 0.09 | | | | — | | | | 9.22 | | | | 12.74 | | | | 0.37 | | | | 0.37 | | | | 0.37 | | | | 2.28 | | | | 4,729 | | | | 43 | |
Class S2 | | | | | | | | | | | | | | | | | | | | | | | | | | | | | | | | | | | | | | | | | | | | | | | | | | | | | | | | | | | | | | | | | | | |
| 12-31-14 | | 10.95 | | | | 0.12 | • | | | 0.54 | | | | 0.66 | | | | 0.19 | | | | 0.75 | | | | — | | | | 0.94 | | | | — | | | | 10.67 | | | | 6.22 | | | | 0.78 | | | | 0.54 | | | | 0.54 | | | | 1.06 | | | | 671 | | | | 61 | |
| 12-31-13 | | 9.90 | | | | 0.11 | • | | | 1.39 | | | | 1.50 | | | | 0.21 | | | | 0.24 | | | | — | | | | 0.45 | | | | — | | | | 10.95 | | | | 15.51 | | | | 0.78 | | | | 0.53 | | | | 0.53 | | | | 1.06 | | | | 1,103 | | | | 78 | |
| 12-31-12 | | 8.88 | | | | 0.17 | • | | | 1.02 | | | | 1.19 | | | | 0.14 | | | | 0.03 | | | | — | | | | 0.17 | | | | — | | | | 9.90 | | | | 13.54 | | | | 0.71 | | | | 0.52 | | | | 0.52 | | | | 1.75 | | | | 1,022 | | | | 75 | |
| 12-31-11 | | 9.20 | | | | 0.19 | • | | | (0.44 | ) | | | (0.25 | ) | | | 0.03 | | | | 0.04 | | | | — | | | | 0.07 | | | | — | | | | 8.88 | | | | (2.71 | ) | | | 0.62 | | | | 0.52 | | | | 0.52 | | | | 2.04 | | | | 415 | | | | 70 | |
04-30-10(5)–12-31-10 | | 8.68 | | | | 0.12 | • | | | 0.50 | | | | 0.62 | | | | 0.10 | | | | — | | | | — | | | | 0.10 | | | | — | | | | 9.20 | | | | 7.28 | | | | 0.62 | | | | 0.52 | | | | 0.52 | | | | 2.10 | | | | 291 | | | | 43 | |
Voya Solution Conservative Portfolio | | | | | | | | | | | | | | | | | | | | | | | | | | | | | | | | | | | | | | | | | | | | | | | | | | | | | | | | | | | | | | | | | | | |
Class ADV | | | | | | | | | | | | | | | | | | | | | | | | | | | | | | | | | | | | | | | | | | | | | | | | | | | | | | | | | | | | | | | | | | | |
| 12-31-14 | | 11.42 | | | | 0.17 | | | | 0.30 | | | | 0.47 | | | | 0.27 | | | | 0.47 | | | | — | | | | 0.74 | | | | — | | | | 11.15 | | | | 4.20 | | | | 0.81 | | | | 0.58 | | | | 0.58 | | | | 1.62 | | | | 11,527 | | | | 54 | |
| 12-31-13 | | 11.22 | | | | 0.17 | • | | | 0.43 | | | | 0.60 | | | | 0.29 | | | | 0.11 | | | | — | | | | 0.40 | | | | — | | | | 11.42 | | | | 5.40 | | | | 0.85 | | | | 0.60 | | | | 0.60 | | | | 1.50 | | | | 10,870 | | | | 72 | |
| 12-31-12 | | 10.44 | | | | 0.24 | • | | | 0.82 | | | | 1.06 | | | | 0.28 | | | | — | | | | — | | | | 0.28 | | | | — | | | | 11.22 | | | | 10.19 | | | | 0.75 | | | | 0.62 | | | | 0.62 | | | | 2.19 | | | | 9,541 | | | | 69 | |
| 12-31-11 | | 10.50 | | | | 0.39 | • | | | (0.38 | ) | | | 0.01 | | | | 0.04 | | | | 0.03 | | | | — | | | | 0.07 | | | | — | | | | 10.44 | | | | 0.09 | | | | 0.62 | | | | 0.62 | | | | 0.62 | | | | 3.67 | | | | 6,411 | | | | 84 | |
04-30-10(5)–12-31-10 | | 10.00 | | | | 0.36 | • | | | 0.14 | | | | 0.50 | | | | — | | | | — | | | | — | | | | — | | | | — | | | | 10.50 | | | | 5.00 | | | | 0.62 | | | | 0.62 | | | | 0.62 | | | | 5.24 | | | | 1,911 | | | | 51 | |
Class I | | | | | | | | | | | | | | | | | | | | | | | | | | | | | | | | | | | | | | | | | | | | | | | | | | | | | | | | | | | | | | | | | | | |
| 12-31-14 | | 11.57 | | | | 0.25 | • | | | 0.27 | | | | 0.52 | | | | 0.32 | | | | 0.47 | | | | — | | | | 0.79 | | | | — | | | | 11.30 | | | | 4.63 | | | | 0.31 | | | | 0.08 | | | | 0.08 | | | | 2.19 | | | | 10 | | | | 54 | |
| 12-31-13 | | 11.34 | | | | 0.23 | | | | 0.44 | | | | 0.67 | | | | 0.33 | | | | 0.11 | | | | — | | | | 0.44 | | | | — | | | | 11.57 | | | | 6.02 | | | | 0.35 | | | | 0.10 | | | | 0.10 | | | | 1.99 | | | | 3 | | | | 72 | |
| 12-31-12 | | 10.54 | | | | 0.29 | • | | | 0.82 | | | | 1.11 | | | | 0.31 | | | | — | | | | — | | | | 0.31 | | | | — | | | | 11.34 | | | | 10.60 | | | | 0.25 | | | | 0.12 | | | | 0.12 | | | | 2.61 | | | | 3 | | | | 69 | |
| 12-31-11 | | 10.54 | | | | 0.40 | | | | (0.33 | ) | | | 0.07 | | | | 0.04 | | | | 0.03 | | | | — | | | | 0.07 | | | | — | | | | 10.54 | | | | 0.69 | | | | 0.12 | | | | 0.12 | | | | 0.12 | | | | 3.72 | | | | 3 | | | | 84 | |
04-30-10(5)–12-31-10 | | 10.00 | | | | 0.34 | | | | 0.20 | | | | 0.54 | | | | — | | | | — | | | | — | | | | — | | | | — | | | | 10.54 | | | | 5.40 | | | | 0.12 | | | | 0.12 | | | | 0.12 | | | | 5.03 | | | | 3 | | | | 51 | |
See Accompanying Notes to Financial Statements
47
FINANCIAL HIGHLIGHTS (CONTINUED)
Selected data for a share of beneficial interest outstanding throughout each year or period.
| | | Income (loss)
from investment
operations
|
| | | Less distributions
|
| | | | | | | | | Ratios to average
net assets
| | Supplemental
data
| |
|---|
| | | | | | | | | | | | | | | | | | | | | | | | | | | | | | | | |
|---|
| Net
asset
value,
beginning
of
year or
period
|
| Net
investment
income
(loss)
|
| Net
realized
and
unrealized
gain
(loss)
|
| Total
from
investment
operations
|
| From
net
investment
income
|
| From
net
realized
gains
|
| From
return
of
capital
|
| Total
distributions
|
| Payment
by
affiliate
|
| Net
asset
value,
end of
year or
period
|
| Total
Return(1)
|
| Expenses
before
reductions/
additions(2)(3)(4)
|
| Expenses
net
of fee
waivers
and/or
recoupments
if any(2)(3)(4)
|
| Expenses
net
of all
reductions/
additions(2)(3)(4)
|
| Net
investment
income
(loss)(2)(3)
|
| Net
assets,
end of
year or
period
|
| Portfolio
turnover
rate
|
|---|
Year or period ended
| ($)
|
| ($)
|
| ($)
|
| ($)
|
| ($)
|
| ($)
|
| ($)
|
| ($)
|
| ($)
|
| ($)
|
| (%)
|
| (%)
|
| (%)
|
| (%)
|
| (%)
|
| ($000’s)
|
| (%)
|
|---|
Voya Solution Conservative Portfolio (continued) | | | | | | | | | | | | | | | | | | | | | | | | | | | | | | | | | | | | | | | | | | | | | | | | | | | | | | | | | | | | | | | | | | | |
Class S | | | | | | | | | | | | | | | | | | | | | | | | | | | | | | | | | | | | | | | | | | | | | | | | | | | | | | | | | | | | | | | | | | | |
| 12-31-14 | | 11.49 | | | | 0.21 | • | | | 0.29 | | | | 0.50 | | | | 0.30 | | | | 0.47 | | | | — | | | | 0.77 | | | | — | | | | 11.22 | | | | 4.40 | | | | 0.56 | | | | 0.33 | | | | 0.33 | | | | 1.86 | | | | 5,867 | | | | 54 | |
| 12-31-13 | | 11.27 | | | | 0.20 | • | | | 0.44 | | | | 0.64 | | | | 0.31 | | | | 0.11 | | | | — | | | | 0.42 | | | | — | | | | 11.49 | | | | 5.77 | | | | 0.60 | | | | 0.35 | | | | 0.35 | | | | 1.74 | | | | 6,168 | | | | 72 | |
| 12-31-12 | | 10.49 | | | | 0.28 | • | | | 0.80 | | | | 1.08 | | | | 0.30 | | | | — | | | | — | | | | 0.30 | | | | — | | | | 11.27 | | | | 10.34 | | | | 0.50 | | | | 0.37 | | | | 0.37 | | | | 2.51 | | | | 5,285 | | | | 69 | |
| 12-31-11 | | 10.53 | | | | 0.40 | • | | | (0.37 | ) | | | 0.03 | | | | 0.04 | | | | 0.03 | | | | — | | | | 0.07 | | | | — | | | | 10.49 | | | | 0.28 | | | | 0.37 | | | | 0.37 | | | | 0.37 | | | | 3.76 | | | | 2,941 | | | | 84 | |
04-30-10(5)–12-31-10 | | 10.00 | | | | 0.29 | • | | | 0.24 | | | | 0.53 | | | | — | | | | — | | | | — | | | | — | | | | — | | | | 10.53 | | | | 5.30 | | | | 0.37 | | | | 0.37 | | | | 0.37 | | | | 4.23 | | | | 1,098 | | | | 51 | |
Class S2 | | | | | | | | | | | | | | | | | | | | | | | | | | | | | | | | | | | | | | | | | | | | | | | | | | | | | | | | | | | | | | | | | | | |
| 12-31-14 | | 11.44 | | | | 0.18 | | | | 0.30 | | | | 0.48 | | | | 0.28 | | | | 0.47 | | | | — | | | | 0.75 | | | | — | | | | 11.17 | | | | 4.28 | | | | 0.81 | | | | 0.48 | | | | 0.48 | | | | 1.70 | | | | 312 | | | | 54 | |
| 12-31-13 | | 11.23 | | | | 0.18 | • | | | 0.44 | | | | 0.62 | | | | 0.30 | | | | 0.11 | | | | — | | | | 0.41 | | | | — | | | | 11.44 | | | | 5.59 | | | | 0.85 | | | | 0.50 | | | | 0.50 | | | | 1.60 | | | | 298 | | | | 72 | |
| 12-31-12 | | 10.46 | | | | 0.29 | • | | | 0.77 | | | | 1.06 | | | | 0.29 | | | | — | | | | — | | | | 0.29 | | | | — | | | | 11.23 | | | | 10.23 | | | | 0.75 | | | | 0.52 | | | | 0.52 | | | | 2.61 | | | | 298 | | | | 69 | |
| 12-31-11 | | 10.51 | | | | 0.46 | • | | | (0.44 | ) | | | 0.02 | | | | 0.04 | | | | 0.03 | | | | — | | | | 0.07 | | | | — | | | | 10.46 | | | | 0.17 | | | | 0.62 | | | | 0.52 | | | | 0.52 | | | | 4.36 | | | | 122 | | | | 84 | |
04-30-10(5)–12-31-10 | | 10.00 | | | | 0.44 | • | | | 0.07 | | | | 0.51 | | | | — | | | | — | | | | — | | | | — | | | | — | | | | 10.51 | | | | 5.10 | | | | 0.62 | | | | 0.52 | | | | 0.52 | | | | 6.35 | | | | 64 | | | | 51 | |
Voya Solution Income Portfolio | | | | | | | | | | | | | | | | | | | | | | | | | | | | | | | | | | | | | | | | | | | | | | | | | | | | | | | | | | | | | | | | | | | |
Class ADV | | | | | | | | | | | | | | | | | | | | | | | | | | | | | | | | | | | | | | | | | | | | | | | | | | | | | | | | | | | | | | | | | | | |
| 12-31-14 | | 11.26 | | | | 0.15 | • | | | 0.47 | | | | 0.62 | | | | 0.27 | | | | — | | | | — | | | | 0.27 | | | | — | | | | 11.61 | | | | 5.53 | | | | 0.75 | | | | 0.62 | | | | 0.62 | | | | 1.33 | | | | 84,286 | | | | 47 | |
| 12-31-13 | | 10.89 | | | | 0.13 | • | | | 0.59 | | | | 0.72 | | | | 0.35 | | | | — | | | | — | | | | 0.35 | | | | — | | | | 11.26 | | | | 6.68 | | | | 0.74 | | | | 0.63 | | | | 0.63 | | | | 1.19 | | | | 94,068 | | | | 70 | |
| 12-31-12 | | 10.40 | | | | 0.20 | • | | | 0.78 | | | | 0.98 | | | | 0.49 | | | | — | | | | — | | | | 0.49 | | | | — | | | | 10.89 | | | | 9.57 | | | | 0.70 | | | | 0.62 | | | | 0.62 | | | | 1.82 | | | | 111,796 | | | | 71 | |
| 12-31-11 | | 10.83 | | | | 0.34 | • | | | (0.34 | ) | | | 0.00 | * | | | 0.43 | | | | — | | | | — | | | | 0.43 | | | | — | | | | 10.40 | | | | 0.14 | | | | 0.62 | | | | 0.62 | | | | 0.62 | | | | 3.23 | | | | 109,184 | | | | 75 | |
| 12-31-10 | | 10.24 | | | | 0.33 | • | | | 0.60 | | | | 0.93 | | | | 0.34 | | | | — | | | | — | | | | 0.34 | | | | — | | | | 10.83 | | | | 9.26 | | | | 0.62 | | | | 0.62 | | | | 0.62 | | | | 3.11 | | | | 110,352 | | | | 64 | |
Class I | | | | | | | | | | | | | | | | | | | | | | | | | | | | | | | | | | | | | | | | | | | | | | | | | | | | | | | | | | | | | | | | | | | |
| 12-31-14 | | 11.51 | | | | 0.22 | • | | | 0.47 | | | | 0.69 | | | | 0.34 | | | | — | | | | — | | | | 0.34 | | | | — | | | | 11.86 | | | | 6.02 | | | | 0.25 | | | | 0.12 | | | | 0.12 | | | | 1.85 | | | | 23,178 | | | | 47 | |
| 12-31-13 | | 11.12 | | | | 0.19 | • | | | 0.61 | | | | 0.80 | | | | 0.41 | | | | — | | | | — | | | | 0.41 | | | | — | | | | 11.51 | | | | 7.30 | | | | 0.24 | | | | 0.13 | | | | 0.13 | | | | 1.70 | | | | 24,937 | | | | 70 | |
| 12-31-12 | | 10.61 | | | | 0.24 | | | | 0.82 | | | | 1.06 | | | | 0.55 | | | | — | | | | — | | | | 0.55 | | | | — | | | | 11.12 | | | | 10.12 | | | | 0.20 | | | | 0.12 | | | | 0.12 | | | | 2.32 | | | | 25,403 | | | | 71 | |
| 12-31-11 | | 11.05 | | | | 0.40 | • | | | (0.35 | ) | | | 0.05 | | | | 0.49 | | | | — | | | | — | | | | 0.49 | | | | — | | | | 10.61 | | | | 0.54 | | | | 0.12 | | | | 0.12 | | | | 0.12 | | | | 3.63 | | | | 22,837 | | | | 75 | |
| 12-31-10 | | 10.43 | | | | 0.39 | • | | | 0.62 | | | | 1.01 | | | | 0.39 | | | | — | | | | — | | | | 0.39 | | | | — | | | | 11.05 | | | | 9.86 | | | | 0.12 | | | | 0.12 | | | | 0.12 | | | | 3.69 | | | | 24,509 | | | | 64 | |
Class S | | | | | | | | | | | | | | | | | | | | | | | | | | | | | | | | | | | | | | | | | | | | | | | | | | | | | | | | | | | | | | | | | | | |
| 12-31-14 | | 11.41 | | | | 0.19 | • | | | 0.46 | | | | 0.65 | | | | 0.30 | | | | — | | | | — | | | | 0.30 | | | | — | | | | 11.76 | | | | 5.76 | | | | 0.50 | | | | 0.37 | | | | 0.37 | | | | 1.59 | | | | 56,602 | | | | 47 | |
| 12-31-13 | | 11.03 | | | | 0.16 | • | | | 0.60 | | | | 0.76 | | | | 0.38 | | | | — | | | | — | | | | 0.38 | | | | — | | | | 11.41 | | | | 6.97 | | | | 0.49 | | | | 0.38 | | | | 0.38 | | | | 1.46 | | | | 62,431 | | | | 70 | |
| 12-31-12 | | 10.53 | | | | 0.22 | • | | | 0.80 | | | | 1.02 | | | | 0.52 | | | | — | | | | — | | | | 0.52 | | | | — | | | | 11.03 | | | | 9.77 | | | | 0.45 | | | | 0.37 | | | | 0.37 | | | | 2.02 | | | | 68,703 | | | | 71 | |
| 12-31-11 | | 10.96 | | | | 0.37 | • | | | (0.34 | ) | | | 0.03 | | | | 0.46 | | | | — | | | | — | | | | 0.46 | | | | — | | | | 10.53 | | | | 0.35 | | | | 0.37 | | | | 0.37 | | | | 0.37 | | | | 3.39 | | | | 80,716 | | | | 75 | |
| 12-31-10 | | 10.35 | | | | 0.36 | • | | | 0.61 | | | | 0.97 | | | | 0.36 | | | | — | | | | — | | | | 0.36 | | | | — | | | | 10.96 | | | | 9.60 | | | | 0.37 | | | | 0.37 | | | | 0.37 | | | | 3.40 | | | | 93,940 | | | | 64 | |
Class S2 | | | | | | | | | | | | | | | | | | | | | | | | | | | | | | | | | | | | | | | | | | | | | | | | | | | | | | | | | | | | | | | | | | | |
| 12-31-14 | | 11.15 | | | | 0.16 | • | | | 0.46 | | | | 0.62 | | | | 0.27 | | | | — | | | | — | | | | 0.27 | | | | — | | | | 11.50 | | | | 5.61 | | | | 0.75 | | | | 0.52 | | | | 0.52 | | | | 1.42 | | | | 4,281 | | | | 47 | |
| 12-31-13 | | 10.79 | | | | 0.14 | • | | | 0.59 | | | | 0.73 | | | | 0.37 | | | | — | | | | — | | | | 0.37 | | | | — | | | | 11.15 | | | | 6.85 | | | | 0.74 | | | | 0.53 | | | | 0.53 | | | | 1.28 | | | | 5,274 | | | | 70 | |
| 12-31-12 | | 10.32 | | | | 0.21 | • | | | 0.77 | | | | 0.98 | | | | 0.51 | | | | — | | | | — | | | | 0.51 | | | | — | | | | 10.79 | | | | 9.62 | | | | 0.70 | | | | 0.52 | | | | 0.52 | | | | 2.00 | | | | 5,889 | | | | 71 | |
| 12-31-11 | | 10.75 | | | | 0.33 | • | | | (0.32 | ) | | | 0.01 | | | | 0.44 | | | | — | | | | — | | | | 0.44 | | | | — | | | | 10.32 | | | | 0.25 | | | | 0.62 | | | | 0.52 | | | | 0.52 | | | | 3.13 | | | | 4,697 | | | | 75 | |
| 12-31-10 | | 10.20 | | | | 0.43 | • | | | 0.51 | | | | 0.94 | | | | 0.39 | | | | — | | | | — | | | | 0.39 | | | | — | | | | 10.75 | | | | 9.39 | | | | 0.62 | | | | 0.52 | | | | 0.52 | | | | 4.17 | | | | 5,543 | | | | 64 | |
Class T | | | | | | | | | | | | | | | | | | | | | | | | | | | | | | | | | | | | | | | | | | | | | | | | | | | | | | | | | | | | | | | | | | | |
| 12-31-14 | | 11.67 | | | | 0.13 | • | | | 0.48 | | | | 0.61 | | | | 0.21 | | | | — | | | | — | | | | 0.21 | | | | — | | | | 12.07 | | | | 5.22 | | | | 1.00 | | | | 0.82 | | | | 0.82 | | | | 1.05 | | | | 91 | | | | 47 | |
| 12-31-13 | | 11.29 | | | | 0.12 | • | | | 0.61 | | | | 0.73 | | | | 0.35 | | | | — | | | | — | | | | 0.35 | | | | — | | | | 11.67 | | | | 6.55 | | | | 0.99 | | | | 0.83 | | | | 0.83 | | | | 1.00 | | | | 193 | | | | 70 | |
| 12-31-12 | | 10.70 | | | | 0.19 | • | | | 0.80 | | | | 0.99 | | | | 0.40 | | | | — | | | | — | | | | 0.40 | | | | — | | | | 11.29 | | | | 9.29 | | | | 0.95 | | | | 0.82 | | | | 0.82 | | | | 1.69 | | | | 259 | | | | 71 | |
| 12-31-11 | | 11.03 | | | | 0.33 | • | | | (0.34 | ) | | | (0.01 | ) | | | 0.32 | | | | — | | | | — | | | | 0.32 | | | | — | | | | 10.70 | | | | 0.03 | | | | 0.87 | | | | 0.82 | | | | 0.82 | | | | 2.98 | | | | 210 | | | | 75 | |
| 12-31-10 | | 10.42 | | | | 0.30 | • | | | 0.61 | | | | 0.91 | | | | 0.30 | | | | — | | | | — | | | | 0.30 | | | | — | | | | 11.03 | | | | 8.95 | | | | 0.87 | | | | 0.82 | | | | 0.82 | | | | 2.83 | | | | 432 | | | | 64 | |
Voya Solution Moderately Aggressive Portfolio | | | | | | | | | | | | | | | | | | | | | | | | | | | | | | | | | | | | | | | | | | | | | | | | | | | | | | | | | | | | | | | | | | | |
Class ADV | | | | | | | | | | | | | | | | | | | | | | | | | | | | | | | | | | | | | | | | | | | | | | | | | | | | | | | | | | | | | | | | | | | |
| 12-31-14 | | 13.38 | | | | 0.12 | • | | | 0.67 | | | | 0.79 | | | | 0.20 | | | | 0.94 | | | | — | | | | 1.14 | | | | — | | | | 13.03 | | | | 6.09 | | | | 0.78 | | | | 0.67 | | | | 0.67 | | | | 0.89 | | | | 20,020 | | | | 71 | |
| 12-31-13 | | 11.61 | | | | 0.10 | • | | | 2.23 | | | | 2.33 | | | | 0.21 | | | | 0.35 | | | | — | | | | 0.56 | | | | — | | | | 13.38 | | | | 20.42 | | | | 0.80 | | | | 0.63 | | | | 0.63 | | | | 0.78 | | | | 16,945 | | | | 79 | |
| 12-31-12 | | 10.25 | | | | 0.11 | • | | | 1.42 | | | | 1.53 | | | | 0.12 | | | | 0.05 | | | | — | | | | 0.17 | | | | — | | | | 11.61 | | | | 15.07 | | | | 0.73 | | | | 0.62 | | | | 0.62 | | | | 0.98 | | | | 13,603 | | | | 70 | |
| 12-31-11 | | 10.89 | | | | 0.21 | • | | | (0.79 | ) | | | (0.58 | ) | | | 0.02 | | | | 0.04 | | | | — | | | | 0.06 | | | | — | | | | 10.25 | | | | (5.29 | ) | | | 0.62 | | | | 0.62 | | | | 0.62 | | | | 1.96 | | | | 9,527 | | | | 83 | |
04-30-10(5)–12-31-10 | | 10.00 | | | | 0.11 | • | | | 0.78 | | | | 0.89 | | | | — | | | | — | | | | — | | | | — | | | | — | | | | 10.89 | | | | 8.90 | | | | 0.62 | | | | 0.62 | | | | 0.62 | | | | 1.57 | | | | 4,677 | | | | 26 | |
See Accompanying Notes to Financial Statements
48
FINANCIAL HIGHLIGHTS (CONTINUED)
Selected data for a share of beneficial interest outstanding throughout each year or period.
| | | Income (loss)
from investment
operations
|
| | | Less distributions
|
| | | | | | | | | Ratios to average
net assets
| | Supplemental
data
| |
|---|
| | | | | | | | | | | | | | | | | | | | | | | | | | | | | | | | |
|---|
| Net
asset
value,
beginning
of
year or
period
|
| Net
investment
income
(loss)
|
| Net
realized
and
unrealized
gain
(loss)
|
| Total
from
investment
operations
|
| From
net
investment
income
|
| From
net
realized
gains
|
| From
return
of
capital
|
| Total
distributions
|
| Payment
by
affiliate
|
| Net
asset
value,
end of
year or
period
|
| Total
Return(1)
|
| Expenses
before
reductions/
additions(2)(3)(4)
|
| Expenses
net
of fee
waivers
and/or
recoupments
if any(2)(3)(4)
|
| Expenses
net
of all
reductions/
additions(2)(3)(4)
|
| Net
investment
income
(loss)(2)(3)
|
| Net
assets,
end of
year or
period
|
| Portfolio
turnover
rate
|
|---|
Year or period ended
| ($)
|
| ($)
|
| ($)
|
| ($)
|
| ($)
|
| ($)
|
| ($)
|
| ($)
|
| ($)
|
| ($)
|
| (%)
|
| (%)
|
| (%)
|
| (%)
|
| (%)
|
| ($000’s)
|
| (%)
|
|---|
Voya Solution Moderately Aggressive Portfolio (continued) | | | | | | | | | | | | | | | | | | | | | | | | | | | | | | | | | | | | | | | | | | | | | | | | | | | | | | | | | | | | | | | | | | | |
Class I | | | | | | | | | | | | | | | | | | | | | | | | | | | | | | | | | | | | | | | | | | | | | | | | | | | | | | | | | | | | | | | | | | | |
| 12-31-14 | | 13.56 | | | | 0.31 | • | | | 0.56 | | | | 0.87 | | | | 0.26 | | | | 0.94 | | | | — | | | | 1.20 | | | | — | | | | 13.23 | | | | 6.60 | | | | 0.28 | | | | 0.17 | | | | 0.17 | | | | 2.39 | | | | 56 | | | | 71 | |
| 12-31-13 | | 11.74 | | | | 0.15 | | | | 2.28 | | | | 2.43 | | | | 0.26 | | | | 0.35 | | | | — | | | | 0.61 | | | | — | | | | 13.56 | | | | 21.10 | | | | 0.30 | | | | 0.13 | | | | 0.13 | | | | 1.19 | | | | 4 | | | | 79 | |
| 12-31-12 | | 10.34 | | | | 0.16 | | | | 1.44 | | | | 1.60 | | | | 0.15 | | | | 0.05 | | | | — | | | | 0.20 | | | | — | | | | 11.74 | | | | 15.62 | | | | 0.23 | | | | 0.12 | | | | 0.12 | | | | 1.42 | | | | 4 | | | | 70 | |
| 12-31-11 | | 10.94 | | | | 0.23 | • | | | (0.77 | ) | | | (0.54 | ) | | | 0.02 | | | | 0.04 | | | | — | | | | 0.06 | | | | — | | | | 10.34 | | | | (4.84 | ) | | | 0.12 | | | | 0.12 | | | | 0.12 | | | | 2.16 | | | | 3 | | | | 83 | |
04-30-10(5)–12-31-10 | | 10.00 | | | | 0.16 | | | | 0.78 | | | | 0.94 | | | | — | | | | — | | | | — | | | | — | | | | — | | | | 10.94 | | | | 9.40 | | | | 0.12 | | | | 0.12 | | | | 0.12 | | | | 2.50 | | | | 3 | | | | 26 | |
Class S | | | | | | | | | | | | | | | | | | | | | | | | | | | | | | | | | | | | | | | | | | | | | | | | | | | | | | | | | | | | | | | | | | | |
| 12-31-14 | | 13.47 | | | | 0.15 | | | | 0.68 | | | | 0.83 | | | | 0.23 | | | | 0.94 | | | | — | | | | 1.17 | | | | — | | | | 13.13 | | | | 6.33 | | | | 0.53 | | | | 0.42 | | | | 0.42 | | | | 1.04 | | | | 11,315 | | | | 71 | |
| 12-31-13 | | 11.67 | | | | 0.12 | • | | | 2.27 | | | | 2.39 | | | | 0.24 | | | | 0.35 | | | | — | | | | 0.59 | | | | — | | | | 13.47 | | | | 20.84 | | | | 0.55 | | | | 0.38 | | | | 0.38 | | | | 0.96 | | | | 11,871 | | | | 79 | |
| 12-31-12 | | 10.30 | | | | 0.14 | • | | | 1.42 | | | | 1.56 | | | | 0.14 | | | | 0.05 | | | | — | | | | 0.19 | | | | — | | | | 11.67 | | | | 15.28 | | | | 0.48 | | | | 0.37 | | | | 0.37 | | | | 1.29 | | | | 9,256 | | | | 70 | |
| 12-31-11 | | 10.92 | | | | 0.23 | • | | | (0.79 | ) | | | (0.56 | ) | | | 0.02 | | | | 0.04 | | | | — | | | | 0.06 | | | | — | | | | 10.30 | | | | (5.05 | ) | | | 0.37 | | | | 0.37 | | | | 0.37 | | | | 2.20 | | | | 5,379 | | | | 83 | |
04-30-10(5)–12-31-10 | | 10.00 | | | | 0.10 | • | | | 0.82 | | | | 0.92 | | | | — | | | | — | | | | — | | | | — | | | | — | | | | 10.92 | | | | 9.20 | | | | 0.37 | | | | 0.37 | | | | 0.37 | | | | 1.46 | | | | 1,438 | | | | 26 | |
Class S2 | | | | | | | | | | | | | | | | | | | | | | | | | | | | | | | | | | | | | | | | | | | | | | | | | | | | | | | | | | | | | | | | | | | |
| 12-31-14 | | 13.50 | | | | 0.14 | • | | | 0.67 | | | | 0.81 | | | | 0.25 | | | | 0.94 | | | | — | | | | 1.19 | | | | — | | | | 13.12 | | | | 6.17 | | | | 0.78 | | | | 0.57 | | | | 0.57 | | | | 1.08 | | | | 806 | | | | 71 | |
| 12-31-13 | | 11.72 | | | | 0.17 | • | | | 2.19 | | | | 2.36 | | | | 0.23 | | | | 0.35 | | | | — | | | | 0.58 | | | | — | | | | 13.50 | | | | 20.56 | | | | 0.80 | | | | 0.53 | | | | 0.53 | | | | 1.34 | | | | 284 | | | | 79 | |
| 12-31-12 | | 10.30 | | | | 0.14 | • | | | 1.41 | | | | 1.55 | | | | 0.08 | | | | 0.05 | | | | — | | | | 0.13 | | | | — | | | | 11.72 | | | | 15.18 | | | | 0.73 | | | | 0.52 | | | | 0.52 | | | | 1.27 | | | | 84 | | | | 70 | |
| 12-31-11 | | 10.91 | | | | 0.08 | • | | | (0.65 | ) | | | (0.57 | ) | | | — | | | | 0.04 | | | | — | | | | 0.04 | | | | — | | | | 10.30 | | | | (5.18 | ) | | | 0.62 | | | | 0.52 | | | | 0.52 | | | | 0.70 | | | | 37 | | | | 83 | |
04-30-10(5)–12-31-10 | | 10.00 | | | | 0.09 | • | | | 0.82 | | | | 0.91 | | | | — | | | | — | | | | — | | | | — | | | | — | | | | 10.91 | | | | 9.10 | | | | 0.62 | | | | 0.52 | | | | 0.52 | | | | 1.29 | | | | 138 | | | | 26 | |
Voya Solution Moderately Conservative Portfolio | | | | | | | | | | | | | | | | | | | | | | | | | | | | | | | | | | | | | | | | | | | | | | | | | | | | | | | | | | | | | | | | | | | |
Class ADV | | | | | | | | | | | | | | | | | | | | | | | | | | | | | | | | | | | | | | | | | | | | | | | | | | | | | | | | | | | | | | | | | | | |
| 12-31-14 | | 10.80 | | | | 0.15 | | | | 0.39 | | | | 0.54 | | | | 0.23 | | | | 0.66 | | | | — | | | | 0.89 | | | | — | | | | 10.45 | | | | 5.20 | | | | 0.78 | | | | 0.65 | | | | 0.65 | | | | 1.30 | | | | 21,659 | | | | 66 | |
| 12-31-13 | | 10.42 | | | | 0.13 | • | | | 0.81 | | | | 0.94 | | | | 0.27 | | | | 0.29 | | | | — | | | | 0.56 | | | | — | | | | 10.80 | | | | 9.27 | | | | 0.79 | | | | 0.62 | | | | 0.62 | | | | 1.23 | | | | 21,918 | | | | 85 | |
| 12-31-12 | | 9.55 | | | | 0.18 | • | | | 0.94 | | | | 1.12 | | | | 0.19 | | | | 0.06 | | | | — | | | | 0.25 | | | | — | | | | 10.42 | | | | 11.79 | | | | 0.70 | | | | 0.62 | | | | 0.62 | | | | 1.74 | | | | 22,425 | | | | 85 | |
| 12-31-11 | | 9.79 | | | | 0.34 | • | | | (0.44 | ) | | | (0.10 | ) | | | 0.06 | | | | 0.08 | | | | — | | | | 0.14 | | | | — | | | | 9.55 | | | | (0.94 | ) | | | 0.62 | | | | 0.62 | | | | 0.62 | | | | 3.54 | | | | 13,782 | | | | 77 | |
| 12-31-10 | | 9.06 | | | | 0.41 | • | | | 0.51 | | | | 0.92 | | | | 0.14 | | | | 0.05 | | | | — | | | | 0.19 | | | | — | | | | 9.79 | | | | 10.35 | | | | 0.62 | | | | 0.62 | | | | 0.62 | | | | 4.34 | | | | 2,690 | | | | 47 | |
Class I | | | | | | | | | | | | | | | | | | | | | | | | | | | | | | | | | | | | | | | | | | | | | | | | | | | | | | | | | | | | | | | | | | | |
| 12-31-14 | | 11.20 | | | | 0.23 | • | | | 0.39 | | | | 0.62 | | | | 0.29 | | | | 0.66 | | | | — | | | | 0.95 | | | | — | | | | 10.87 | | | | 5.74 | | | | 0.28 | | | | 0.15 | | | | 0.15 | | | | 2.19 | | | | 37 | | | | 66 | |
| 12-31-13 | | 10.79 | | | | 0.18 | | | | 0.84 | | | | 1.02 | | | | 0.32 | | | | 0.29 | | | | — | | | | 0.61 | | | | — | | | | 11.20 | | | | 9.70 | | | | 0.29 | | | | 0.12 | | | | 0.12 | | | | 1.66 | | | | 1 | | | | 85 | |
| 12-31-12 | | 9.86 | | | | 0.23 | | | | 0.97 | | | | 1.20 | | | | 0.21 | | | | 0.06 | | | | — | | | | 0.27 | | | | — | | | | 10.79 | | | | 12.23 | | | | 0.20 | | | | 0.12 | | | | 0.12 | | | | 2.16 | | | | 1 | | | | 85 | |
| 12-31-11 | | 10.04 | | | | 0.34 | | | | (0.38 | ) | | | (0.04 | ) | | | 0.06 | | | | 0.08 | | | | — | | | | 0.14 | | | | — | | | | 9.86 | | | | (0.30 | ) | | | 0.12 | | | | 0.12 | | | | 0.12 | | | | 3.39 | | | | 1 | | | | 77 | |
| 12-31-10 | | 9.17 | | | | 0.26 | | | | 0.79 | | | | 1.05 | | | | 0.13 | | | | 0.05 | | | | — | | | | 0.18 | | | | — | | | | 10.04 | | | | 11.66 | | | | 0.12 | | | | 0.12 | | | | 0.12 | | | | 2.75 | | | | 1 | | | | 47 | |
Class S | | | | | | | | | | | | | | | | | | | | | | | | | | | | | | | | | | | | | | | | | | | | | | | | | | | | | | | | | | | | | | | | | | | |
| 12-31-14 | | 11.00 | | | | 0.17 | • | | | 0.42 | | | | 0.59 | | | | 0.26 | | | | 0.66 | | | | — | | | | 0.92 | | | | — | | | | 10.67 | | | | 5.58 | | | | 0.53 | | | | 0.40 | | | | 0.40 | | | | 1.53 | | | | 22,346 | | | | 66 | |
| 12-31-13 | | 10.60 | | | | 0.16 | | | | 0.82 | | | | 0.98 | | | | 0.29 | | | | 0.29 | | | | — | | | | 0.58 | | | | — | | | | 11.00 | | | | 9.54 | | | | 0.54 | | | | 0.37 | | | | 0.37 | | | | 1.43 | | | | 24,016 | | | | 85 | |
| 12-31-12 | | 9.70 | | | | 0.21 | • | | | 0.95 | | | | 1.16 | | | | 0.20 | | | | 0.06 | | | | — | | | | 0.26 | | | | — | | | | 10.60 | | | | 11.99 | | | | 0.45 | | | | 0.37 | | | | 0.37 | | | | 2.02 | | | | 22,653 | | | | 85 | |
| 12-31-11 | | 9.91 | | | | 0.32 | • | | | (0.40 | ) | | | (0.08 | ) | | | 0.05 | | | | 0.08 | | | | — | | | | 0.13 | | | | — | | | | 9.70 | | | | (0.69 | ) | | | 0.37 | | | | 0.37 | | | | 0.37 | | | | 3.26 | | | | 15,227 | | | | 77 | |
| 12-31-10 | | 9.09 | | | | 0.26 | • | | | 0.74 | | | | 1.00 | | | | 0.13 | | | | 0.05 | | | | — | | | | 0.18 | | | | — | | | | 9.91 | | | | 11.19 | | | | 0.37 | | | | 0.37 | | | | 0.37 | | | | 2.74 | | | | 6,911 | | | | 47 | |
Class S2 | | | | | | | | | | | | | | | | | | | | | | | | | | | | | | | | | | | | | | | | | | | | | | | | | | | | | | | | | | | | | | | | | | | |
| 12-31-14 | | 10.93 | | | | 0.16 | • | | | 0.41 | | | | 0.57 | | | | 0.25 | | | | 0.66 | | | | — | | | | 0.91 | | | | — | | | | 10.59 | | | | 5.40 | | | | 0.78 | | | | 0.55 | | | | 0.55 | | | | 1.43 | | | | 848 | | | | 66 | |
| 12-31-13 | | 10.55 | | | | 0.14 | • | | | 0.82 | | | | 0.96 | | | | 0.29 | | | | 0.29 | | | | — | | | | 0.58 | | | | — | | | | 10.93 | | | | 9.36 | | | | 0.79 | | | | 0.52 | | | | 0.52 | | | | 1.26 | | | | 669 | | | | 85 | |
| 12-31-12 | | 9.67 | | | | 0.23 | • | | | 0.91 | | | | 1.14 | | | | 0.20 | | | | 0.06 | | | | — | | | | 0.26 | | | | — | | | | 10.55 | | | | 11.85 | | | | 0.70 | | | | 0.52 | | | | 0.52 | | | | 2.23 | | | | 712 | | | | 85 | |
| 12-31-11 | | 9.90 | | | | 0.32 | • | | | (0.41 | ) | | | (0.09 | ) | | | 0.06 | | | | 0.08 | | | | — | | | | 0.14 | | | | — | | | | 9.67 | | | | (0.84 | ) | | | 0.62 | | | | 0.52 | | | | 0.52 | | | | 3.21 | | | | 178 | | | | 77 | |
04-30-10(5)–12-31-10 | | 9.51 | | | | 0.21 | • | | | 0.37 | | | | 0.58 | | | | 0.14 | | | | 0.05 | | | | — | | | | 0.19 | | | | — | | | | 9.90 | | | | 6.30 | | | | 0.62 | | | | 0.52 | | | | 0.52 | | | | 3.30 | | | | 32 | | | | 47 | |
Voya Solution 2015 Portfolio | | | | | | | | | | | | | | | | | | | | | | | | | | | | | | | | | | | | | | | | | | | | | | | | | | | | | | | | | | | | | | | | | | | |
Class ADV | | | | | | | | | | | | | | | | | | | | | | | | | | | | | | | | | | | | | | | | | | | | | | | | | | | | | | | | | | | | | | | | | | | |
| 12-31-14 | | 11.84 | | | | 0.15 | • | | | 0.49 | | | | 0.64 | | | | 0.28 | | | | 0.08 | | | | — | | | | 0.36 | | | | — | | | | 12.12 | | | | 5.43 | | | | 0.74 | | | | 0.64 | | | | 0.64 | | | | 1.21 | | | | 228,792 | | | | 47 | |
| 12-31-13 | | 11.20 | | | | 0.12 | • | | | 0.87 | | | | 0.99 | | | | 0.35 | | | | — | | | | — | | | | 0.35 | | | | — | | | | 11.84 | | | | 8.93 | | | | 0.74 | | | | 0.63 | | | | 0.63 | | | | 1.07 | | | | 276,406 | | | | 68 | |
| 12-31-12 | | 10.48 | | | | 0.18 | • | | | 0.98 | | | | 1.16 | | | | 0.44 | | | | — | | | | — | | | | 0.44 | | | | — | | | | 11.20 | | | | 11.14 | | | | 0.70 | | | | 0.62 | | | | 0.62 | | | | 1.62 | | | | 297,552 | | | | 63 | |
| 12-31-11 | | 10.92 | | | | 0.30 | • | | | (0.41 | ) | | | (0.11 | ) | | | 0.33 | | | | — | | | | — | | | | 0.33 | | | | — | | | | 10.48 | | | | (0.90 | ) | | | 0.62 | | | | 0.62 | | | | 0.62 | | | | 2.79 | | | | 312,854 | | | | 74 | |
| 12-31-10 | | 10.07 | | | | 0.27 | | | | 0.80 | | | | 1.07 | | | | 0.22 | | | | — | | | | — | | | | 0.22 | | | | — | | | | 10.92 | | | | 10.82 | | | | 0.62 | | | | 0.62 | | | | 0.62 | | | | 2.54 | | | | 336,038 | | | | 61 | |
See Accompanying Notes to Financial Statements
49
FINANCIAL HIGHLIGHTS (CONTINUED)
Selected data for a share of beneficial interest outstanding throughout each year or period.
| | | Income (loss)
from investment
operations
|
| | | Less distributions
|
| | | | | | | | | Ratios to average
net assets
| | Supplemental
data
| |
|---|
| | | | | | | | | | | | | | | | | | | | | | | | | | | | | | | | |
|---|
| Net
asset
value,
beginning
of
year or
period
|
| Net
investment
income (loss)
|
| Net
realized
and
unrealized
gain
(loss)
|
| Total
from
investment
operations
|
| From
net
investment
income
|
| From
net
realized
gains
|
| From
return
of
capital
|
| Total
distributions
|
| Payment
by
affiliate
|
| Net
asset
value,
end of
year or
period
|
| Total
Return(1)
|
| Expenses
before
reductions/
additions(2)(3)(4)
|
| Expenses
net
of fee
waivers
and/or
recoupments
if any(2)(3)(4)
|
| Expenses
net
of all
reductions/
additions(2)(3)(4)
|
| Net
investment
income
(loss)(2)(3)
|
| Net
assets,
end of
year or
period
|
| Portfolio
turnover
rate
|
|---|
Year or period ended
| ($)
|
| ($)
|
| ($)
|
| ($)
|
| ($)
|
| ($)
|
| ($)
|
| ($)
|
| ($)
|
| ($)
|
| (%)
|
| (%)
|
| (%)
|
| (%)
|
| (%)
|
| ($000’s)
|
| (%)
|
|---|
Voya Solution 2015 Portfolio (continued) | | | | | | | | | | | | | | | | | | | | | | | | | | | | | | | | | | | | | | | | | | | | | | | | | | | | | | | | | | | | | | | | | | | |
Class I | | | | | | | | | | | | | | | | | | | | | | | | | | | | | | | | | | | | | | | | | | | | | | | | | | | | | | | | | | | | | | | | | | | |
| 12-31-14 | | 12.08 | | | | 0.21 | • | | | 0.51 | | | | 0.72 | | | | 0.35 | | | | 0.08 | | | | — | | | | 0.43 | | | | — | | | | 12.37 | | | | 6.04 | | | | 0.24 | | | | 0.14 | | | | 0.14 | | | | 1.74 | | | | 80,809 | | | | 47 | |
| 12-31-13 | | 11.43 | | | | 0.18 | • | | | 0.88 | | | | 1.06 | | | | 0.41 | | | | — | | | | — | | | | 0.41 | | | | — | | | | 12.08 | | | | 9.42 | | | | 0.24 | | | | 0.13 | | | | 0.13 | | | | 1.56 | | | | 94,824 | | | | 68 | |
| 12-31-12 | | 10.69 | | | | 0.25 | • | | | 0.99 | | | | 1.24 | | | | 0.50 | | | | — | | | | — | | | | 0.50 | | | | — | | | | 11.43 | | | | 11.70 | | | | 0.20 | | | | 0.12 | | | | 0.12 | | | | 2.19 | | | | 104,662 | | | | 63 | |
| 12-31-11 | | 11.14 | | | | 0.36 | • | | | (0.43 | ) | | | (0.07 | ) | | | 0.38 | | | | — | | | | — | | | | 0.38 | | | | — | | | | 10.69 | | | | (0.46 | ) | | | 0.12 | | | | 0.12 | | | | 0.12 | | | | 3.38 | | | | 81,565 | | | | 74 | |
| 12-31-10 | | 10.25 | | | | 0.32 | | | | 0.83 | | | | 1.15 | | | | 0.26 | | | | — | | | | — | | | | 0.26 | | | | — | | | | 11.14 | | | | 11.49 | | | | 0.12 | | | | 0.12 | | | | 0.12 | | | | 3.03 | | | | 75,820 | | | | 61 | |
Class S | | | | | | | | | | | | | | | | | | | | | | | | | | | | | | | | | | | | | | | | | | | | | | | | | | | | | | | | | | | | | | | | | | | |
| 12-31-14 | | 11.98 | | | | 0.18 | • | | | 0.51 | | | | 0.69 | | | | 0.32 | | | | 0.08 | | | | — | | | | 0.40 | | | | — | | | | 12.27 | | | | 5.77 | | | | 0.49 | | | | 0.39 | | | | 0.39 | | | | 1.48 | | | | 241,333 | | | | 47 | |
| 12-31-13 | | 11.34 | | | | 0.15 | • | | | 0.87 | | | | 1.02 | | | | 0.38 | | | | — | | | | — | | | | 0.38 | | | | — | | | | 11.98 | | | | 9.10 | | | | 0.49 | | | | 0.38 | | | | 0.38 | | | | 1.31 | | | | 277,984 | | | | 68 | |
| 12-31-12 | | 10.60 | | | | 0.21 | • | | | 0.99 | | | | 1.20 | | | | 0.46 | | | | — | | | | — | | | | 0.46 | | | | — | | | | 11.34 | | | | 11.48 | | | | 0.45 | | | | 0.37 | | | | 0.37 | | | | 1.88 | | | | 312,616 | | | | 63 | |
| 12-31-11 | | 11.05 | | | | 0.33 | • | | | (0.42 | ) | | | (0.09 | ) | | | 0.36 | | | | — | | | | — | | | | 0.36 | | | | — | | | | 10.60 | | | | (0.73 | ) | | | 0.37 | | | | 0.37 | | | | 0.37 | | | | 3.00 | | | | 328,277 | | | | 74 | |
| 12-31-10 | | 10.17 | | | | 0.29 | | | | 0.83 | | | | 1.12 | | | | 0.24 | | | | — | | | | — | | | | 0.24 | | | | — | | | | 11.05 | | | | 11.25 | | | | 0.37 | | | | 0.37 | | | | 0.37 | | | | 2.82 | | | | 380,318 | | | | 61 | |
Class S2 | | | | | | | | | | | | | | | | | | | | | | | | | | | | | | | | | | | | | | | | | | | | | | | | | | | | | | | | | | | | | | | | | | | |
| 12-31-14 | | 11.69 | | | | 0.15 | • | | | 0.50 | | | | 0.65 | | | | 0.29 | | | | 0.08 | | | | — | | | | 0.37 | | | | — | | | | 11.97 | | | | 5.59 | | | | 0.74 | | | | 0.54 | | | | 0.54 | | | | 1.27 | | | | 16,900 | | | | 47 | |
| 12-31-13 | | 11.07 | | | | 0.13 | • | | | 0.85 | | | | 0.98 | | | | 0.36 | | | | — | | | | — | | | | 0.36 | | | | — | | | | 11.69 | | | | 8.98 | | | | 0.74 | | | | 0.53 | | | | 0.53 | | | | 1.14 | | | | 23,461 | | | | 68 | |
| 12-31-12 | | 10.38 | | | | 0.19 | • | | | 0.96 | | | | 1.15 | | | | 0.46 | | | | — | | | | — | | | | 0.46 | | | | — | | | | 11.07 | | | | 11.22 | | | | 0.70 | | | | 0.52 | | | | 0.52 | | | | 1.76 | | | | 26,644 | | | | 63 | |
| 12-31-11 | | 10.84 | | | | 0.32 | • | | | (0.42 | ) | | | (0.10 | ) | | | 0.36 | | | | — | | | | — | | | | 0.36 | | | | — | | | | 10.38 | | | | (0.83 | ) | | | 0.62 | | | | 0.52 | | | | 0.52 | | | | 2.97 | | | | 22,792 | | | | 74 | |
| 12-31-10 | | 10.02 | | | | 0.36 | • | | | 0.72 | | | | 1.08 | | | | 0.26 | | | | — | | | | — | | | | 0.26 | | | | — | | | | 10.84 | | | | 11.05 | | | | 0.62 | | | | 0.52 | | | | 0.52 | | | | 3.54 | | | | 15,289 | | | | 61 | |
Class T | | | | | | | | | | | | | | | | | | | | | | | | | | | | | | | | | | | | | | | | | | | | | | | | | | | | | | | | | | | | | | | | | | | |
| 12-31-14 | | 11.99 | | | | 0.11 | • | | | 0.53 | | | | 0.64 | | | | 0.23 | | | | 0.08 | | | | — | | | | 0.31 | | | | — | | | | 12.32 | | | | 5.33 | | | | 0.99 | | | | 0.84 | | | | 0.84 | | | | 0.88 | | | | 830 | | | | 47 | |
| 12-31-13 | | 11.35 | | | | 0.10 | • | | | 0.86 | | | | 0.96 | | | | 0.32 | | | | — | | | | — | | | | 0.32 | | | | — | | | | 11.99 | | | | 8.59 | | | | 0.99 | | | | 0.83 | | | | 0.83 | | | | 0.83 | | | | 1,677 | | | | 68 | |
| 12-31-12 | | 10.60 | | | | 0.16 | • | | | 0.99 | | | | 1.15 | | | | 0.40 | | | | — | | | | — | | | | 0.40 | | | | — | | | | 11.35 | | | | 10.98 | | | | 0.95 | | | | 0.82 | | | | 0.82 | | | | 1.42 | | | | 2,256 | | | | 63 | |
| 12-31-11 | | 11.04 | | | | 0.28 | • | | | (0.42 | ) | | | (0.14 | ) | | | 0.30 | | | | — | | | | — | | | | 0.30 | | | | — | | | | 10.60 | | | | (1.12 | ) | | | 0.87 | | | | 0.82 | | | | 0.82 | | | | 2.55 | | | | 2,100 | | | | 74 | |
| 12-31-10 | | 10.17 | | | | 0.24 | • | | | 0.83 | | | | 1.07 | | | | 0.20 | | | | — | | | | — | | | | 0.20 | | | | — | | | | 11.04 | | | | 10.65 | | | | 0.87 | | | | 0.82 | | | | 0.82 | | | | 2.30 | | | | 2,529 | | | | 61 | |
Voya Solution 2020 Portfolio | | | | | | | | | | | | | | | | | | | | | | | | | | | | | | | | | | | | | | | | | | | | | | | | | | | | | | | | | | | | | | | | | | | |
Class ADV | | | | | | | | | | | | | | | | | | | | | | | | | | | | | | | | | | | | | | | | | | | | | | | | | | | | | | | | | | | | | | | | | | | |
| 12-31-14 | | 12.19 | | | | 0.20 | • | | | 0.53 | | | | 0.73 | | | | 0.01 | | | | 0.04 | | | | — | | | | 0.05 | | | | — | | | | 12.87 | | | | 5.97 | | | | 4.32 | | | | 0.63 | | | | 0.63 | | | | 1.55 | | | | 631 | | | | 32 | |
| 12-31-13 | | 11.80 | | | | 0.11 | | | | 1.36 | | | | 1.47 | | | | 0.29 | | | | 0.80 | | | | — | | | | 1.09 | | | | 0.01 | | | | 12.19 | | | | 13.01 | (a) | | | 89.79 | | | | 0.63 | | | | 0.63 | | | | 0.87 | | | | 4 | | | | 68 | |
| 12-31-12 | | 10.85 | | | | 0.15 | | | | 1.12 | | | | 1.27 | | | | 0.11 | | | | 0.21 | | | | — | | | | 0.32 | | | | — | | | | 11.80 | | | | 11.76 | | | | 45.86 | | | | 0.62 | | | | 0.62 | | | | 1.28 | | | | 4 | | | | 72 | |
10-03-11(5)–12-31-11 | | 10.00 | | | | 0.08 | | | | 0.77 | | | | 0.85 | | | | — | | | | — | | | | — | | | | — | | | | — | | | | 10.85 | | | | 8.50 | | | | 0.62 | | | | 0.62 | | | | 0.62 | | | | 3.31 | | | | 3 | | | | 15 | |
Class I | | | | | | | | | | | | | | | | | | | | | | | | | | | | | | | | | | | | | | | | | | | | | | | | | | | | | | | | | | | | | | | | | | | |
| 12-31-14 | | 12.29 | | | | 0.19 | | | | 0.60 | | | | 0.79 | | | | — | | | | 0.04 | | | | — | | | | 0.04 | | | | — | | | | 13.04 | | | | 6.41 | | | | 3.82 | | | | 0.13 | | | | 0.13 | | | | 1.52 | | | | 4 | | | | 32 | |
| 12-31-13 | | 11.85 | | | | 0.17 | | | | 1.40 | | | | 1.57 | | | | 0.34 | | | | 0.80 | | | | — | | | | 1.14 | | | | 0.01 | | | | 12.29 | | | | 13.85 | (a) | | | 89.29 | | | | 0.13 | | | | 0.13 | | | | 1.38 | | | | 4 | | | | 68 | |
| 12-31-12 | | 10.86 | | | | 0.21 | | | | 1.12 | | | | 1.33 | | | | 0.13 | | | | 0.21 | | | | — | | | | 0.34 | | | | — | | | | 11.85 | | | | 12.22 | | | | 45.36 | | | | 0.12 | | | | 0.12 | | | | 1.81 | | | | 4 | | | | 72 | |
10-03-11(5)–12-31-11 | | 10.00 | | | | 0.09 | | | | 0.77 | | | | 0.86 | | | | — | | | | — | | | | — | | | | — | | | | — | | | | 10.86 | | | | 8.60 | | | | 0.12 | | | | 0.12 | | | | 0.12 | | | | 3.81 | | | | 3 | | | | 15 | |
Class S | | | | | | | | | | | | | | | | | | | | | | | | | | | | | | | | | | | | | | | | | | | | | | | | | | | | | | | | | | | | | | | | | | | |
| 12-31-14 | | 12.30 | | | | 0.16 | | | | 0.59 | | | | 0.75 | | | | — | | | | 0.04 | | | | — | | | | 0.04 | | | | — | | | | 13.01 | | | | 6.08 | | | | 4.07 | | | | 0.38 | | | | 0.38 | | | | 1.27 | | | | 4 | | | | 32 | |
| 12-31-13 | | 11.81 | | | | 0.14 | | | | 1.39 | | | | 1.53 | | | | 0.25 | | | | 0.80 | | | | — | | | | 1.05 | | | | 0.01 | | | | 12.30 | | | | 13.47 | (a) | | | 89.54 | | | | 0.38 | | | | 0.38 | | | | 1.14 | | | | 4 | | | | 68 | |
| 12-31-12 | | 10.85 | | | | 0.18 | | | | 1.11 | | | | 1.29 | | | | 0.12 | | | | 0.21 | | | | — | | | | 0.33 | | | | — | | | | 11.81 | | | | 11.90 | | | | 45.61 | | | | 0.37 | | | | 0.37 | | | | 1.56 | | | | 4 | | | | 72 | |
10-03-11(5)–12-31-11 | | 10.00 | | | | 0.09 | | | | 0.76 | | | | 0.85 | | | | — | | | | — | | | | — | | | | — | | | | — | | | | 10.85 | | | | 8.50 | | | | 0.37 | | | | 0.37 | | | | 0.37 | | | | 3.55 | | | | 3 | | | | 15 | |
Class S2 | | | | | | | | | | | | | | | | | | | | | | | | | | | | | | | | | | | | | | | | | | | | | | | | | | | | | | | | | | | | | | | | | | | |
| 12-31-14 | | 12.23 | | | | 0.14 | | | | 0.58 | | | | 0.72 | | | | — | | | | 0.04 | | | | — | | | | 0.04 | | | | — | | | | 12.91 | | | | 5.87 | | | | 4.32 | | | | 0.53 | | | | 0.53 | | | | 1.12 | | | | 4 | | | | 32 | |
| 12-31-13 | | 11.81 | | | | 0.12 | | | | 1.40 | | | | 1.52 | | | | 0.31 | | | | 0.80 | | | | — | | | | 1.11 | | | | 0.01 | | | | 12.23 | | | | 13.39 | (a) | | | 89.79 | | | | 0.53 | | | | 0.53 | | | | 0.97 | | | | 4 | | | | 68 | |
| 12-31-12 | | 10.85 | | | | 0.16 | | | | 1.13 | | | | 1.29 | | | | 0.12 | | | | 0.21 | | | | — | | | | 0.33 | | | | — | | | | 11.81 | | | | 11.88 | | | | 45.86 | | | | 0.52 | | | | 0.52 | | | | 1.39 | | | | 4 | | | | 72 | |
10-03-11(5)–12-31-11 | | 10.00 | | | | 0.08 | | | | 0.77 | | | | 0.85 | | | | — | | | | — | | | | — | | | | — | | | | — | | | | 10.85 | | | | 8.50 | | | | 0.62 | | | | 0.52 | | | | 0.52 | | | | 3.42 | | | | 3 | | | | 15 | |
Class T | | | | | | | | | | | | | | | | | | | | | | | | | | | | | | | | | | | | | | | | | | | | | | | | | | | | | | | | | | | | | | | | | | | |
| 12-31-14 | | 12.21 | | | | 0.10 | | | | 0.60 | | | | 0.70 | | | | — | | | | 0.04 | | | | — | | | | 0.04 | | | | — | | | | 12.87 | | | | 5.72 | | | | 4.57 | | | | 0.83 | | | | 0.83 | | | | 0.81 | | | | 4 | | | | 32 | |
| 12-31-13 | | 11.77 | | | | 0.08 | | | | 1.42 | | | | 1.50 | | | | 0.27 | | | | 0.80 | | | | — | | | | 1.07 | | | | 0.01 | | | | 12.21 | | | | 13.28 | (a) | | | 90.04 | | | | 0.83 | | | | 0.83 | | | | 0.67 | | | | 4 | | | | 68 | |
| 12-31-12 | | 10.84 | | | | 0.13 | | | | 1.12 | | | | 1.25 | | | | 0.11 | | | | 0.21 | | | | — | | | | 0.32 | | | | — | | | | 11.77 | | | | 11.53 | | | | 46.11 | | | | 0.82 | | | | 0.82 | | | | 1.11 | | | | 4 | | | | 72 | |
10-03-11(5)–12-31-11 | | 10.00 | | | | 0.08 | | | | 0.76 | | | | 0.84 | | | | — | | | | — | | | | — | | | | — | | | | — | | | | 10.84 | | | | 8.40 | | | | 0.87 | | | | 0.82 | | | | 0.82 | | | | 3.11 | | | | 3 | | | | 15 | |
See Accompanying Notes to Financial Statements
50
FINANCIAL HIGHLIGHTS (CONTINUED)
Selected data for a share of beneficial interest outstanding throughout each year or period.
| | | Income (loss)
from investment
operations
|
| | | Less distributions
|
| | | | | | | | | Ratios to average
net assets
| | Supplemental
data
| |
|---|
| | | | | | | | | | | | | | | | | | | | | | | | | | | | | | | | |
|---|
| Net
asset
value,
beginning
of
year or
period
|
| Net
investment
income
(loss)
|
| Net
realized
and
unrealized
gain
(loss)
|
| Total
from
investment
operations
|
| From
net
investment
income
|
| From
net
realized
gains
|
| From
return
of
capital
|
| Total
distributions
|
| Payment
by
affiliate
|
| Net
asset
value,
end of
year or
period
|
| Total
Return(1)
|
| Expenses
before
reductions/
additions(2)(3)(4)
|
| Expenses
net
of fee
waivers
and/or
recoupments
if any(2)(3)(4)
|
| Expenses
net of
all
reductions/
additions(2)(3)(4)
|
| Net
investment
income
(loss)(2)(3)
|
| Net
assets,
end of
year or
period
|
| Portfolio
turnover
rate
|
|---|
Year or period ended
| ($)
|
| ($)
|
| ($)
|
| ($)
|
| ($)
|
| ($)
|
| ($)
|
| ($)
|
| ($)
|
| ($)
|
| (%)
|
| (%)
|
| (%)
|
| (%)
|
| (%)
|
| ($000’s)
|
| (%)
|
|---|
Voya Solution 2025 Portfolio | | | | | | | | | | | | | | | | | | | | | | | | | | | | | | | | | | | | | | | | | | | | | | | | | | | | | | | | | | | | | | | | | | | |
Class ADV | | | | | | | | | | | | | | | | | | | | | | | | | | | | | | | | | | | | | | | | | | | | | | | | | | | | | | | | | | | | | | | | | | | |
| 12-31-14 | | 13.06 | | | | 0.12 | • | | | 0.54 | | | | 0.66 | | | | 0.23 | | | | 0.66 | | | | — | | | | 0.89 | | | | — | | | | 12.83 | | | | 5.26 | | | | 0.74 | | | | 0.63 | | | | 0.63 | | | | 0.94 | | | | 435,280 | | | | 46 | |
| 12-31-13 | | 11.48 | | | | 0.10 | • | | | 1.73 | | | | 1.83 | | | | 0.25 | | | | — | | | | — | | | | 0.25 | | | | — | | | | 13.06 | | | | 16.05 | | | | 0.74 | | | | 0.62 | | | | 0.62 | | | | 0.85 | | | | 500,390 | | | | 72 | |
| 12-31-12 | | 10.39 | | | | 0.14 | • | | | 1.23 | | | | 1.37 | | | | 0.28 | | | | — | | | | — | | | | 0.28 | | | | — | | | | 11.48 | | | | 13.24 | | | | 0.70 | | | | 0.62 | | | | 0.62 | | | | 1.22 | | | | 494,888 | | | | 65 | |
| 12-31-11 | | 10.98 | | | | 0.22 | | | | (0.60 | ) | | | (0.38 | ) | | | 0.21 | | | | — | | | | — | | | | 0.21 | | | | — | | | | 10.39 | | | | (3.37 | ) | | | 0.62 | | | | 0.62 | | | | 0.62 | | | | 2.01 | | | | 494,505 | | | | 71 | |
| 12-31-10 | | 9.82 | | | | 0.18 | | | | 1.12 | | | | 1.30 | | | | 0.14 | | | | — | | | | — | | | | 0.14 | | | | — | | | | 10.98 | | | | 13.50 | | | | 0.62 | | | | 0.62 | | | | 0.62 | | | | 1.84 | | | | 522,321 | | | | 56 | |
Class I | | | | | | | | | | | | | | | | | | | | | | | | | | | | | | | | | | | | | | | | | | | | | | | | | | | | | | | | | | | | | | | | | | | |
| 12-31-14 | | 13.34 | | | | 0.20 | • | | | 0.55 | | | | 0.75 | | | | 0.31 | | | | 0.66 | | | | — | | | | 0.97 | | | | — | | | | 13.12 | | | | 5.82 | | | | 0.24 | | | | 0.13 | | | | 0.13 | | | | 1.47 | | | | 197,457 | | | | 46 | |
| 12-31-13 | | 11.73 | | | | 0.17 | • | | | 1.75 | | | | 1.92 | | | | 0.31 | | | | — | | | | — | | | | 0.31 | | | | — | | | | 13.34 | | | | 16.54 | | | | 0.24 | | | | 0.12 | | | | 0.12 | | | | 1.39 | | | | 225,551 | | | | 72 | |
| 12-31-12 | | 10.61 | | | | 0.20 | • | | | 1.25 | | | | 1.45 | | | | 0.33 | | | | — | | | | — | | | | 0.33 | | | | — | | | | 11.73 | | | | 13.83 | | | | 0.20 | | | | 0.12 | | | | 0.12 | | | | 1.75 | | | | 191,144 | | | | 65 | |
| 12-31-11 | | 11.21 | | | | 0.28 | • | | | (0.62 | ) | | | (0.34 | ) | | | 0.26 | | | | — | | | | — | | | | 0.26 | | | | — | | | | 10.61 | | | | (2.92 | ) | | | 0.12 | | | | 0.12 | | | | 0.12 | | | | 2.55 | | | | 152,184 | | | | 71 | |
| 12-31-10 | | 10.01 | | | | 0.23 | | | | 1.15 | | | | 1.38 | | | | 0.18 | | | | — | | | | — | | | | 0.18 | | | | — | | | | 11.21 | | | | 14.10 | | | | 0.12 | | | | 0.12 | | | | 0.12 | | | | 2.34 | | | | 126,678 | | | | 56 | |
Class S | | | | | | | | | | | | | | | | | | | | | | | | | | | | | | | | | | | | | | | | | | | | | | | | | | | | | | | | | | | | | | | | | | | |
| 12-31-14 | | 13.22 | | | | 0.16 | • | | | 0.55 | | | | 0.71 | | | | 0.27 | | | | 0.66 | | | | — | | | | 0.93 | | | | — | | | | 13.00 | | | | 5.58 | | | | 0.49 | | | | 0.38 | | | | 0.38 | | | | 1.21 | | | | 486,302 | | | | 46 | |
| 12-31-13 | | 11.62 | | | | 0.14 | • | | | 1.74 | | | | 1.88 | | | | 0.28 | | | | — | | | | — | | | | 0.28 | | | | — | | | | 13.22 | | | | 16.33 | | | | 0.49 | | | | 0.37 | | | | 0.37 | | | | 1.11 | | | | 530,013 | | | | 72 | |
| 12-31-12 | | 10.52 | | | | 0.17 | • | | | 1.23 | | | | 1.40 | | | | 0.30 | | | | — | | | | — | | | | 0.30 | | | | — | | | | 11.62 | | | | 13.44 | | | | 0.45 | | | | 0.37 | | | | 0.37 | | | | 1.48 | | | | 512,357 | | | | 65 | |
| 12-31-11 | | 11.11 | | | | 0.25 | • | | | (0.61 | ) | | | (0.36 | ) | | | 0.23 | | | | — | | | | — | | | | 0.23 | | | | — | | | | 10.52 | | | | (3.10 | ) | | | 0.37 | | | | 0.37 | | | | 0.37 | | | | 2.24 | | | | 503,345 | | | | 71 | |
| 12-31-10 | | 9.93 | | | | 0.21 | | | | 1.13 | | | | 1.34 | | | | 0.16 | | | | — | | | | — | | | | 0.16 | | | | — | | | | 11.11 | | | | 13.79 | | | | 0.37 | | | | 0.37 | | | | 0.37 | | | | 2.11 | | | | 574,267 | | | | 56 | |
Class S2 | | | | | | | | | | | | | | | | | | | | | | | | | | | | | | | | | | | | | | | | | | | | | | | | | | | | | | | | | | | | | | | | | | | |
| 12-31-14 | | 12.93 | | | | 0.13 | • | | | 0.55 | | | | 0.68 | | | | 0.25 | | | | 0.66 | | | | — | | | | 0.91 | | | | — | | | | 12.70 | | | | 5.40 | | | | 0.74 | | | | 0.53 | | | | 0.53 | | | | 1.03 | | | | 35,050 | | | | 46 | |
| 12-31-13 | | 11.38 | | | | 0.11 | • | | | 1.70 | | | | 1.81 | | | | 0.26 | | | | — | | | | — | | | | 0.26 | | | | — | | | | 12.93 | | | | 16.08 | | | | 0.74 | | | | 0.52 | | | | 0.52 | | | | 0.93 | | | | 41,255 | | | | 72 | |
| 12-31-12 | | 10.32 | | | | 0.15 | • | | | 1.21 | | | | 1.36 | | | | 0.30 | | | | — | | | | — | | | | 0.30 | | | | — | | | | 11.38 | | | | 13.33 | | | | 0.70 | | | | 0.52 | | | | 0.52 | | | | 1.40 | | | | 43,134 | | | | 65 | |
| 12-31-11 | | 10.92 | | | | 0.24 | • | | | (0.61 | ) | | | (0.37 | ) | | | 0.23 | | | | — | | | | — | | | | 0.23 | | | | — | | | | 10.32 | | | | (3.23 | ) | | | 0.62 | | | | 0.52 | | | | 0.52 | | | | 2.25 | | | | 32,053 | | | | 71 | |
| 12-31-10 | | 9.80 | | | | 0.26 | • | | | 1.04 | | | | 1.30 | | | | 0.18 | | | | — | | | | — | | | | 0.18 | | | | — | | | | 10.92 | | | | 13.59 | | | | 0.62 | | | | 0.52 | | | | 0.52 | | | | 2.59 | | | | 20,678 | | | | 56 | |
Class T | | | | | | | | | | | | | | | | | | | | | | | | | | | | | | | | | | | | | | | | | | | | | | | | | | | | | | | | | | | | | | | | | | | |
| 12-31-14 | | 13.29 | | | | 0.06 | • | | | 0.60 | | | | 0.66 | | | | 0.22 | | | | 0.66 | | | | — | | | | 0.88 | | | | — | | | | 13.07 | | | | 5.14 | | | | 0.99 | | | | 0.83 | | | | 0.83 | | | | 0.45 | | | | 869 | | | | 46 | |
| 12-31-13 | | 11.68 | | | | 0.08 | • | | | 1.75 | | | | 1.83 | | | | 0.22 | | | | — | | | | — | | | | 0.22 | | | | — | | | | 13.29 | | | | 15.75 | | | | 0.99 | | | | 0.82 | | | | 0.82 | | | | 0.66 | | | | 2,992 | | | | 72 | |
| 12-31-12 | | 10.49 | | | | 0.11 | • | | | 1.24 | | | | 1.35 | | | | 0.16 | | | | — | | | | — | | | | 0.16 | | | | — | | | | 11.68 | | | | 12.95 | | | | 0.95 | | | | 0.82 | | | | 0.82 | | | | 0.93 | | | | 2,737 | | | | 65 | |
| 12-31-11 | | 11.06 | | | | 0.19 | • | | | (0.58 | ) | | | (0.39 | ) | | | 0.18 | | | | — | | | | — | | | | 0.18 | | | | — | | | | 10.49 | | | | (3.44 | ) | | | 0.87 | | | | 0.82 | | | | 0.82 | | | | 1.71 | | | | 3,256 | | | | 71 | |
| 12-31-10 | | 9.89 | | | | 0.16 | | | | 1.14 | | | | 1.30 | | | | 0.13 | | | | — | | | | — | | | | 0.13 | | | | — | | | | 11.06 | | | | 13.28 | | | | 0.87 | | | | 0.82 | | | | 0.82 | | | | 1.65 | | | | 6,215 | | | | 56 | |
Voya Solution 2030 Portfolio | | | | | | | | | | | | | | | | | | | | | | | | | | | | | | | | | | | | | | | | | | | | | | | | | | | | | | | | | | | | | | | | | | | |
Class ADV | | | | | | | | | | | | | | | | | | | | | | | | | | | | | | | | | | | | | | | | | | | | | | | | | | | | | | | | | | | | | | | | | | | |
| 12-31-14 | | 13.23 | | | | 0.14 | • | | | 0.69 | | | | 0.83 | | | | 0.02 | | | | 0.10 | | | | — | | | | 0.12 | | | | — | | | | 13.94 | | | | 6.30 | | | | 8.42 | | | | 0.66 | | | | 0.66 | | | | 0.98 | | | | 157 | | | | 136 | |
| 12-31-13 | | 12.12 | | | | 0.11 | | | | 2.06 | | | | 2.17 | | | | 0.24 | | | | 0.84 | | | | — | | | | 1.08 | | | | 0.02 | | | | 13.23 | | | | 18.66 | (b) | | | 85.63 | | | | 0.64 | | | | 0.64 | | | | 0.86 | | | | 4 | | | | 73 | |
| 12-31-12 | | 11.06 | | | | 0.11 | | | | 1.38 | | | | 1.49 | | | | 0.10 | | | | 0.33 | | | | — | | | | 0.43 | | | | — | | | | 12.12 | | | | 13.48 | | | | 42.34 | | | | 0.62 | | | | 0.62 | | | | 0.96 | | | | 4 | | | | 76 | |
10-03-11(5)–12-31-11 | | 10.00 | | | | 0.07 | | | | 0.99 | | | | 1.06 | | | | — | | | | — | | | | — | | | | — | | | | — | | | | 11.06 | | | | 10.60 | | | | 0.62 | | | | 0.62 | | | | 0.62 | | | | 2.82 | | | | 3 | | | | 11 | |
Class I | | | | | | | | | | | | | | | | | | | | | | | | | | | | | | | | | | | | | | | | | | | | | | | | | | | | | | | | | | | | | | | | | | | |
| 12-31-14 | | 13.32 | | | | 0.20 | | | | 0.72 | | | | 0.92 | | | | — | | | | 0.10 | | | | — | | | | 0.10 | | | | — | | | | 14.14 | | | | 6.94 | | | | 7.92 | | | | 0.16 | | | | 0.16 | | | | 1.50 | | | | 4 | | | | 136 | |
| 12-31-13 | | 12.17 | | | | 0.18 | | | | 2.08 | | | | 2.26 | | | | 0.29 | | | | 0.84 | | | | — | | | | 1.13 | | | | 0.02 | | | | 13.32 | | | | 19.38 | (b) | | | 85.13 | | | | 0.14 | | | | 0.14 | | | | 1.36 | | | | 4 | | | | 73 | |
| 12-31-12 | | 11.07 | | | | 0.18 | | | | 1.37 | | | | 1.55 | | | | 0.12 | | | | 0.33 | | | | — | | | | 0.45 | | | | — | | | | 12.17 | | | | 13.94 | | | | 41.84 | | | | 0.12 | | | | 0.12 | | | | 1.48 | | | | 4 | | | | 76 | |
10-03-11(5)–12-31-11 | | 10.00 | | | | 0.08 | | | | 0.99 | | | | 1.07 | | | | — | | | | — | | | | — | | | | — | | | | — | | | | 11.07 | | | | 10.70 | | | | 0.12 | | | | 0.12 | | | | 0.12 | | | | 3.32 | | | | 3 | | | | 11 | |
Class S | | | | | | | | | | | | | | | | | | | | | | | | | | | | | | | | | | | | | | | | | | | | | | | | | | | | | | | | | | | | | | | | | | | |
| 12-31-14 | | 13.32 | | | | 0.17 | | | | 0.68 | | | | 0.85 | | | | — | | | | 0.10 | | | | — | | | | 0.10 | | | | — | | | | 14.07 | | | | 6.41 | | | | 8.17 | | | | 0.41 | | | | 0.41 | | | | 1.25 | | | | 4 | | | | 136 | |
| 12-31-13 | | 12.13 | | | | 0.14 | | | | 2.06 | | | | 2.20 | | | | 0.19 | | | | 0.84 | | | | — | | | | 1.03 | | | | 0.02 | | | | 13.32 | | | | 18.92 | (b) | | | 85.38 | | | | 0.39 | | | | 0.39 | | | | 1.09 | | | | 4 | | | | 73 | |
| 12-31-12 | | 11.06 | | | | 0.14 | | | | 1.37 | | | | 1.51 | | | | 0.11 | | | | 0.33 | | | | — | | | | 0.44 | | | | — | | | | 12.13 | | | | 13.62 | | | | 42.09 | | | | 0.37 | | | | 0.37 | | | | 1.21 | | | | 4 | | | | 76 | |
10-03-11(5)–12-31-11 | | 10.00 | | | | 0.08 | | | | 0.98 | | | | 1.06 | | | | — | | | | — | | | | — | | | | — | | | | — | | | | 11.06 | | | | 10.60 | | | | 0.37 | | | | 0.37 | | | | 0.37 | | | | 3.10 | | | | 3 | | | | 11 | |
Class S2 | | | | | | | | | | | | | | | | | | | | | | | | | | | | | | | | | | | | | | | | | | | | | | | | | | | | | | | | | | | | | | | | | | | |
| 12-31-14 | | 13.22 | | | | 0.15 | | | | 0.69 | | | | 0.84 | | | | — | | | | 0.10 | | | | — | | | | 0.10 | | | | — | | | | 13.96 | | | | 6.38 | | | | 8.42 | | | | 0.56 | | | | 0.56 | | | | 1.10 | | | | 4 | | | | 136 | |
| 12-31-13 | | 12.13 | | | | 0.12 | | | | 2.04 | | | | 2.16 | | | | 0.25 | | | | 0.84 | | | | — | | | | 1.09 | | | | 0.02 | | | | 13.22 | | | | 18.57 | (b) | | | 85.63 | | | | 0.54 | | | | 0.54 | | | | 0.96 | | | | 4 | | | | 73 | |
| 12-31-12 | | 11.06 | | | | 0.13 | | | | 1.38 | | | | 1.51 | | | | 0.11 | | | | 0.33 | | | | — | | | | 0.44 | | | | — | | | | 12.13 | | | | 13.60 | | | | 42.34 | | | | 0.52 | | | | 0.52 | | | | 1.06 | | | | 4 | | | | 76 | |
10-03-11(5)–12-31-11 | | 10.00 | | | | 0.07 | | | | 0.99 | | | | 1.06 | | | | — | | | | — | | | | — | | | | — | | | | — | | | | 11.06 | | | | 10.60 | | | | 0.62 | | | | 0.52 | | | | 0.52 | | | | 2.93 | | | | 3 | | | | 11 | |
See Accompanying Notes to Financial Statements
51
FINANCIAL HIGHLIGHTS (continued)
Selected data for a share of beneficial interest outstanding throughout each year or period.
| | | Income (loss)
from investment
operations
|
| | | Less distributions
|
| | | | | | | | | Ratios to average
net assets
| | Supplemental
data
| |
|---|
| | | | | | | | | | | | | | | | | | | | | | | | | | | | | | | | |
|---|
| Net
asset
value,
beginning
of
year or
period
|
| Net
investment
income
(loss)
|
| Net
realized
and
unrealized
gain
(loss)
|
| Total
from
investment
operations
|
| From
net
investment
income
|
| From
net
realized
gains
|
| From
return
of
capital
|
| Total
distributions
|
| Payment
by
affiliate
|
| Net
asset
value,
end of
year or
period
|
| Total
Return(1)
|
| Expenses
before
reductions/
additions(2)(3)(4)
|
| Expenses
net of
fee
waivers
and/or
recoupments
if any(2)(3)(4)
|
| Expenses
net
of all
reductions/
additions(2)(3)(4)
|
| Net
investment
income
(loss)(2)(3)
|
| Net
assets,
end of
year or
period
|
| Portfolio
turnover
rate
|
|---|
Year or period ended
| ($)
|
| ($)
|
| ($)
|
| ($)
|
| ($)
|
| ($)
|
| ($)
|
| ($)
|
| ($)
|
| ($)
|
| (%)
|
| (%)
|
| (%)
|
| (%)
|
| (%)
|
| ($000’s)
|
| (%)
|
|---|
Voya Solution 2030 Portfolio (continued) | | | | | | | | | | | | | | | | | | | | | | | | | | | | | | | | | | | | | | | | | | | | | | | | | | | | | | | | | | | | | | | | | | | |
Class T | | | | | | | | | | | | | | | | | | | | | | | | | | | | | | | | | | | | | | | | | | | | | | | | | | | | | | | | | | | | | | | | | | | |
| 12-31-14 | | 13.25 | | | | 0.11 | | | | 0.71 | | | | 0.82 | | | | — | | | | 0.10 | | | | — | | | | 0.10 | | | | — | | | | 13.97 | | | | 6.22 | | | | 8.67 | | | | 0.86 | | | | 0.86 | | | | 0.80 | | | | 4 | | | | 136 | |
| 12-31-13 | | 12.09 | | | | 0.08 | | | | 2.11 | | | | 2.19 | | | | 0.21 | | | | 0.84 | | | | — | | | | 1.05 | | | | 0.02 | | | | 13.25 | | | | 18.89 | (b) | | | 85.88 | | | | 0.84 | | | | 0.84 | | | | 0.66 | | | | 4 | | | | 73 | |
| 12-31-12 | | 11.05 | | | | 0.09 | | | | 1.38 | | | | 1.47 | | | | 0.10 | | | | 0.33 | | | | — | | | | 0.43 | | | | — | | | | 12.09 | | | | 13.25 | | | | 42.59 | | | | 0.82 | | | | 0.82 | | | | 0.74 | | | | 4 | | | | 76 | |
10-03-11(5)–12-31-11 | | 10.00 | | | | 0.07 | | | | 0.98 | | | | 1.05 | | | | — | | | | — | | | | — | | | | — | | | | — | | | | 11.05 | | | | 10.50 | | | | 0.87 | | | | 0.82 | | | | 0.82 | | | | 2.61 | | | | 3 | | | | 11 | |
Voya Solution 2035 Portfolio | | | | | | | | | | | | | | | | | | | | | | | | | | | | | | | | | | | | | | | | | | | | | | | | | | | | | | | | | | | | | | | | | | | |
Class ADV | | | | | | | | | | | | | | | | | | | | | | | | | | | | | | | | | | | | | | | | | | | | | | | | | | | | | | | | | | | | | | | | | | | |
| 12-31-14 | | 13.97 | | | | 0.12 | • | | | 0.61 | | | | 0.73 | | | | 0.26 | | | | 1.22 | | | | — | | | | 1.48 | | | | — | | | | 13.22 | | | | 5.38 | | | | 0.75 | | | | 0.66 | | | | 0.66 | | | | 0.84 | | | | 361,683 | | | | 59 | |
| 12-31-13 | | 11.82 | | | | 0.11 | • | | | 2.25 | | | | 2.36 | | | | 0.21 | | | | — | | | | — | | | | 0.21 | | | | — | | | | 13.97 | | | | 20.09 | | | | 0.74 | | | | 0.63 | | | | 0.63 | | | | 0.82 | | | | 425,221 | | | | 74 | |
| 12-31-12 | | 10.48 | | | | 0.10 | • | | | 1.45 | | | | 1.55 | | | | 0.21 | | | | — | | | | — | | | | 0.21 | | | | — | | | | 11.82 | | | | 14.89 | | | | 0.70 | | | | 0.62 | | | | 0.62 | | | | 0.86 | | | | 411,758 | | | | 58 | |
| 12-31-11 | | 11.19 | | | | 0.17 | | | | (0.73 | ) | | | (0.56 | ) | | | 0.15 | | | | — | | | | — | | | | 0.15 | | | | — | | | | 10.48 | | | | (4.90 | ) | | | 0.62 | | | | 0.62 | | | | 0.62 | | | | 1.54 | | | | 418,753 | | | | 71 | |
| 12-31-10 | | 9.90 | | | | 0.14 | | | | 1.26 | | | | 1.40 | | | | 0.11 | | | | — | | | | — | | | | 0.11 | | | | — | | | | 11.19 | | | | 14.29 | | | | 0.62 | | | | 0.62 | | | | 0.62 | | | | 1.39 | | | | 453,363 | | | | 56 | |
Class I | | | | | | | | | | | | | | | | | | | | | | | | | | | | | | | | | | | | | | | | | | | | | | | | | | | | | | | | | | | | | | | | | | | |
| 12-31-14 | | 14.25 | | | | 0.20 | | | | 0.61 | | | | 0.81 | | | | 0.33 | | | | 1.22 | | | | — | | | | 1.55 | | | | — | | | | 13.51 | | | | 5.93 | | | | 0.25 | | | | 0.16 | | | | 0.16 | | | | 1.40 | | | | 214,675 | | | | 59 | |
| 12-31-13 | | 12.05 | | | | 0.18 | • | | | 2.30 | | | | 2.48 | | | | 0.28 | | | | — | | | | — | | | | 0.28 | | | | — | | | | 14.25 | | | | 20.72 | | | | 0.24 | | | | 0.13 | | | | 0.13 | | | | 1.39 | | | | 208,709 | | | | 74 | |
| 12-31-12 | | 10.69 | | | | 0.16 | • | | | 1.47 | | | | 1.63 | | | | 0.27 | | | | — | | | | — | | | | 0.27 | | | | — | | | | 12.05 | | | | 15.37 | | | | 0.20 | | | | 0.12 | | | | 0.12 | | | | 1.39 | | | | 168,154 | | | | 58 | |
| 12-31-11 | | 11.41 | | | | 0.24 | • | | | (0.76 | ) | | | (0.52 | ) | | | 0.20 | | | | — | | | | — | | | | 0.20 | | | | — | | | | 10.69 | | | | (4.42 | ) | | | 0.12 | | | | 0.12 | | | | 0.12 | | | | 2.10 | | | | 140,503 | | | | 71 | |
| 12-31-10 | | 10.09 | | | | 0.20 | • | | | 1.27 | | | | 1.47 | | | | 0.15 | | | | — | | | | — | | | | 0.15 | | | | — | | | | 11.41 | | | | 14.77 | | | | 0.12 | | | | 0.12 | | | | 0.12 | | | | 1.90 | | | | 115,744 | | | | 56 | |
Class S | | | | | | | | | | | | | | | | | | | | | | | | | | | | | | | | | | | | | | | | | | | | | | | | | | | | | | | | | | | | | | | | | | | |
| 12-31-14 | | 14.13 | | | | 0.16 | • | | | 0.61 | | | | 0.77 | | | | 0.29 | | | | 1.22 | | | | — | | | | 1.51 | | | | — | | | | 13.39 | | | | 5.68 | | | | 0.50 | | | | 0.41 | | | | 0.41 | | | | 1.14 | | | | 432,573 | | | | 59 | |
| 12-31-13 | | 11.96 | | | | 0.14 | • | | | 2.28 | | | | 2.42 | | | | 0.25 | | | | — | | | | — | | | | 0.25 | | | | — | | | | 14.13 | | | | 20.35 | | | | 0.49 | | | | 0.38 | | | | 0.38 | | | | 1.08 | | | | 485,103 | | | | 74 | |
| 12-31-12 | | 10.61 | | | | 0.13 | • | | | 1.46 | | | | 1.59 | | | | 0.24 | | | | — | | | | — | | | | 0.24 | | | | — | | | | 11.96 | | | | 15.09 | | | | 0.45 | | | | 0.37 | | | | 0.37 | | | | 1.15 | | | | 456,581 | | | | 58 | |
| 12-31-11 | | 11.32 | | | | 0.21 | | | | (0.74 | ) | | | (0.53 | ) | | | 0.18 | | | | — | | | | — | | | | 0.18 | | | | — | | | | 10.61 | | | | (4.61 | ) | | | 0.37 | | | | 0.37 | | | | 0.37 | | | | 1.77 | | | | 416,250 | | | | 71 | |
| 12-31-10 | | 10.01 | | | | 0.16 | | | | 1.28 | | | | 1.44 | | | | 0.13 | | | | — | | | | — | | | | 0.13 | | | | — | | | | 11.32 | | | | 14.56 | | | | 0.37 | | | | 0.37 | | | | 0.37 | | | | 1.65 | | | | 477,985 | | | | 56 | |
Class S2 | | | | | | | | | | | | | | | | | | | | | | | | | | | | | | | | | | | | | | | | | | | | | | | | | | | | | | | | | | | | | | | | | | | |
| 12-31-14 | | 13.77 | | | | 0.13 | • | | | 0.60 | | | | 0.73 | | | | 0.27 | | | | 1.22 | | | | — | | | | 1.49 | | | | — | | | | 13.01 | | | | 5.50 | | | | 0.75 | | | | 0.56 | | | | 0.56 | | | | 0.95 | | | | 31,331 | | | | 59 | |
| 12-31-13 | | 11.66 | | | | 0.11 | • | | | 2.22 | | | | 2.33 | | | | 0.22 | | | | — | | | | — | | | | 0.22 | | | | — | | | | 13.77 | | | | 20.17 | | | | 0.74 | | | | 0.53 | | | | 0.53 | | | | 0.88 | | | | 34,588 | | | | 74 | |
| 12-31-12 | | 10.36 | | | | 0.12 | • | | | 1.42 | | | | 1.54 | | | | 0.24 | | | | — | | | | — | | | | 0.24 | | | | — | | | | 11.66 | | | | 14.97 | | | | 0.70 | | | | 0.52 | | | | 0.52 | | | | 1.07 | | | | 36,830 | | | | 58 | |
| 12-31-11 | | 11.08 | | | | 0.19 | • | | | (0.73 | ) | | | (0.54 | ) | | | 0.18 | | | | — | | | | — | | | | 0.18 | | | | — | | | | 10.36 | | | | (4.79 | ) | | | 0.62 | | | | 0.52 | | | | 0.52 | | | | 1.78 | | | | 26,630 | | | | 71 | |
| 12-31-10 | | 9.83 | | | | 0.21 | • | | | 1.19 | | | | 1.40 | | | | 0.15 | | | | — | | | | — | | | | 0.15 | | | | — | | | | 11.08 | | | | 14.44 | | | | 0.62 | | | | 0.52 | | | | 0.52 | | | | 2.08 | | | | 18,369 | | | | 56 | |
Class T | | | | | | | | | | | | | | | | | | | | | | | | | | | | | | | | | | | | | | | | | | | | | | | | | | | | | | | | | | | | | | | | | | | |
| 12-31-14 | | 14.22 | | | | 0.05 | • | | | 0.67 | | | | 0.72 | | | | 0.22 | | | | 1.22 | | | | — | | | | 1.44 | | | | — | | | | 13.50 | | | | 5.26 | | | | 1.00 | | | | 0.86 | | | | 0.86 | | | | 0.32 | | | | 864 | | | | 59 | |
| 12-31-13 | | 12.02 | | | | 0.06 | • | | | 2.31 | | | | 2.37 | | | | 0.17 | | | | — | | | | — | | | | 0.17 | | | | — | | | | 14.22 | | | | 19.85 | | | | 0.99 | | | | 0.83 | | | | 0.83 | | | | 0.48 | | | | 1,898 | | | | 74 | |
| 12-31-12 | | 10.63 | | | | 0.07 | • | | | 1.47 | | | | 1.54 | | | | 0.15 | | | | — | | | | — | | | | 0.15 | | | | — | | | | 12.02 | | | | 14.59 | | | | 0.95 | | | | 0.82 | | | | 0.82 | | | | 0.61 | | | | 2,561 | | | | 58 | |
| 12-31-11 | | 11.33 | | | | 0.15 | • | | | (0.73 | ) | | | (0.58 | ) | | | 0.12 | | | | — | | | | — | | | | 0.12 | | | | — | | | | 10.63 | | | | (5.06 | ) | | | 0.87 | | | | 0.82 | | | | 0.82 | | | | 1.30 | | | | 2,927 | | | | 71 | |
| 12-31-10 | | 10.02 | | | | 0.12 | | | | 1.27 | | | | 1.39 | | | | 0.08 | | | | — | | | | — | | | | 0.08 | | | | — | | | | 11.33 | | | | 14.04 | | | | 0.87 | | | | 0.82 | | | | 0.82 | | | | 1.18 | | | | 3,998 | | | | 56 | |
Voya Solution 2040 Portfolio | | | | | | | | | | | | | | | | | | | | | | | | | | | | | | | | | | | | | | | | | | | | | | | | | | | | | | | | | | | | | | | | | | | |
Class ADV | | | | | | | | | | | | | | | | | | | | | | | | | | | | | | | | | | | | | | | | | | | | | | | | | | | | | | | | | | | | | | | | | | | |
| 12-31-14 | | 14.04 | | | | 0.18 | • | | | 0.73 | | | | 0.91 | | | | 0.01 | | | | 0.05 | | | | — | | | | 0.06 | | | | — | | | | 14.89 | | | | 6.51 | | | | 3.66 | | | | 0.67 | | | | 0.67 | | | | 1.23 | | | | 701 | | | | 80 | |
| 12-31-13 | | 12.45 | | | | 0.08 | | | | 2.58 | | | | 2.66 | | | | 0.21 | | | | 0.89 | | | | — | | | | 1.10 | | | | 0.03 | | | | 14.04 | | | | 22.31 | (c) | | | 84.89 | | | | 0.64 | | | | 0.64 | | | | 0.63 | | | | 4 | | | | 67 | |
| 12-31-12 | | 11.23 | | | | 0.08 | | | | 1.57 | | | | 1.65 | | | | 0.09 | | | | 0.34 | | | | — | | | | 0.43 | | | | — | | | | 12.45 | | | | 14.70 | | | | 44.95 | | | | 0.62 | | | | 0.62 | | | | 0.63 | | | | 4 | | | | 64 | |
10-03-11(5)–12-31-11 | | 10.00 | | | | 0.06 | | | | 1.17 | | | | 1.23 | | | | — | | | | — | | | | — | | | | — | | | | — | | | | 11.23 | | | | 12.30 | | | | 0.62 | | | | 0.62 | | | | 0.62 | | | | 2.25 | | | | 3 | | | | 10 | |
Class I | | | | | | | | | | | | | | | | | | | | | | | | | | | | | | | | | | | | | | | | | | | | | | | | | | | | | | | | | | | | | | | | | | | |
| 12-31-14 | | 14.14 | | | | 0.17 | | | | 0.82 | | | | 0.99 | | | | — | | | | 0.05 | | | | — | | | | 0.05 | | | | — | | | | 15.08 | | | | 7.04 | | | | 3.16 | | | | 0.17 | | | | 0.17 | | | | 1.14 | | | | 5 | | | | 80 | |
| 12-31-13 | | 12.52 | | | | 0.15 | | | | 2.60 | | | | 2.75 | | | | 0.27 | | | | 0.89 | | | | — | | | | 1.16 | | | | 0.03 | | | | 14.14 | | | | 22.99 | (c) | | | 84.39 | | | | 0.14 | | | | 0.14 | | | | 1.11 | | | | 4 | | | | 67 | |
| 12-31-12 | | 11.24 | | | | 0.14 | | | | 1.58 | | | | 1.72 | | | | 0.10 | | | | 0.34 | | | | — | | | | 0.44 | | | | — | | | | 12.52 | | | | 15.34 | | | | 44.45 | | | | 0.12 | | | | 0.12 | | | | 1.16 | | | | 4 | | | | 64 | |
10-03-11(5)–12-31-11 | | 10.00 | | | | 0.07 | | | | 1.17 | | | | 1.24 | | | | — | | | | — | | | | — | | | | — | | | | — | | | | 11.24 | | | | 12.40 | | | | 0.12 | | | | 0.12 | | | | 0.12 | | | | 2.75 | | | | 3 | | | | 10 | |
See Accompanying Notes to Financial Statements
52
FINANCIAL HIGHLIGHTS (CONTINUED)
Selected data for a share of beneficial interest outstanding throughout each year or period.
| | | Income (loss)
from investment
operations
|
| | | Less distributions
|
| | | | | | | | | Ratios to average
net assets
| | Supplemental
data
| |
|---|
| | | | | | | | | | | | | | | | | | | | | | | | | | | | | | | | |
|---|
| Net
asset
value,
beginning
of
year or
period
|
| Net
investment
income
(loss)
|
| Net
realized
and
unrealized
gain
(loss)
|
| Total
from
investment
operations
|
| From
net
investment
income
|
| From
net
realized
gains
|
| From
return
of
capital
|
| Total
distributions
|
| Payment
by
affiliate
|
| Net
asset
value,
end of
year or
period
|
| Total
Return(1)
|
| Expenses
before
reductions/
additions(2)(3)(4)
|
| Expenses
net
of fee
waivers
and/or
recoupments
if any(2)(3)(4)
|
| Expenses
net
of all
reductions/
additions(2)(3)(4)
|
| Net
investment
income
(loss)(2)(3)
|
| Net
assets,
end of
year or
period
|
| Portfolio
turnover
rate
|
|---|
Year or period ended
| ($)
|
| ($)
|
| ($)
|
| ($)
|
| ($)
|
| ($)
|
| ($)
|
| ($)
|
| ($)
|
| ($)
|
| (%)
|
| (%)
|
| (%)
|
| (%)
|
| (%)
|
| ($000’s)
|
| (%)
|
|---|
Voya Solution 2040 Portfolio (continued) | | | | | | | | | | | | | | | | | | | | | | | | | | | | | | | | | | | | | | | | | | | | | | | | | | | | | | | | | | | | | | | | | | | |
Class S | | | | | | | | | | | | | | | | | | | | | | | | | | | | | | | | | | | | | | | | | | | | | | | | | | | | | | | | | | | | | | | | | | | |
| 12-31-14 | | 14.15 | | | | 0.13 | | | | 0.79 | | | | 0.92 | | | | — | | | | 0.05 | | | | — | | | | 0.05 | | | | — | | | | 15.02 | | | | 6.54 | | | | 3.41 | | | | 0.42 | | | | 0.42 | | | | 0.90 | | | | 5 | | | | 80 | |
| 12-31-13 | | 12.48 | | | | 0.11 | | | | 2.59 | | | | 2.70 | | | | 0.17 | | | | 0.89 | | | | — | | | | 1.06 | | | | 0.03 | | | | 14.15 | | | | 22.57 | (c) | | | 84.64 | | | | 0.39 | | | | 0.39 | | | | 0.84 | | | | 4 | | | | 67 | |
| 12-31-12 | | 11.23 | | | | 0.11 | | | | 1.58 | | | | 1.69 | | | | 0.10 | | | | 0.34 | | | | — | | | | 0.44 | | | | — | | | | 12.48 | | | | 15.02 | | | | 44.70 | | | | 0.37 | | | | 0.37 | | | | 0.92 | | | | 4 | | | | 64 | |
10-03-11(5)–12-31-11 | | 10.00 | | | | 0.07 | | | | 1.16 | | | | 1.23 | | | | — | | | | — | | | | — | | | | — | | | | — | | | | 11.23 | | | | 12.30 | | | | 0.37 | | | | 0.37 | | | | 0.37 | | | | 2.57 | | | | 3 | | | | 10 | |
Class S2 | | | | | | | | | | | | | | | | | | | | | | | | | | | | | | | | | | | | | | | | | | | | | | | | | | | | | | | | | | | | | | | | | | | |
| 12-31-14 | | 14.05 | | | | 0.11 | | | | 0.82 | | | | 0.93 | | | | — | | | | 0.05 | | | | — | | | | 0.05 | | | | — | | | | 14.93 | | | | 6.66 | | | | 3.66 | | | | 0.57 | | | | 0.57 | | | | 0.76 | | | | 5 | | | | 80 | |
| 12-31-13 | | 12.47 | | | | 0.10 | | | | 2.56 | | | | 2.66 | | | | 0.22 | | | | 0.89 | | | | — | | | | 1.11 | | | | 0.03 | | | | 14.05 | | | | 22.30 | (c) | | | 84.89 | | | | 0.54 | | | | 0.54 | | | | 0.71 | | | | 4 | | | | 67 | |
| 12-31-12 | | 11.23 | | | | 0.09 | | | | 1.58 | | | | 1.67 | | | | 0.09 | | | | 0.34 | | | | — | | | | 0.43 | | | | — | | | | 12.47 | | | | 14.91 | | | | 44.95 | | | | 0.52 | | | | 0.52 | | | | 0.73 | | | | 4 | | | | 64 | |
10-03-11(5)–12-31-11 | | 10.00 | | | | 0.06 | | | | 1.17 | | | | 1.23 | | | | — | | | | — | | | | — | | | | — | | | | — | | | | 11.23 | | | | 12.30 | | | | 0.62 | | | | 0.52 | | | | 0.52 | | | | 2.36 | | | | 3 | | | | 10 | |
Class T | | | | | | | | | | | | | | | | | | | | | | | | | | | | | | | | | | | | | | | | | | | | | | | | | | | | | | | | | | | | | | | | | | | |
| 12-31-14 | | 14.01 | | | | 0.06 | | | | 0.83 | | | | 0.89 | | | | — | | | | 0.05 | | | | — | | | | 0.05 | | | | — | | | | 14.85 | | | | 6.40 | | | | 3.91 | | | | 0.87 | | | | 0.87 | | | | 0.45 | | | | 4 | | | | 80 | |
| 12-31-13 | | 12.43 | | | | 0.06 | | | | 2.56 | | | | 2.62 | | | | 0.18 | | | | 0.89 | | | | — | | | | 1.07 | | | | 0.03 | | | | 14.01 | | | | 22.06 | (c) | | | 85.14 | | | | 0.84 | | | | 0.84 | | | | 0.41 | | | | 4 | | | | 67 | |
| 12-31-12 | | 11.22 | | | | 0.05 | | | | 1.58 | | | | 1.63 | | | | 0.08 | | | | 0.34 | | | | — | | | | 0.42 | | | | — | | | | 12.43 | | | | 14.56 | | | | 45.20 | | | | 0.82 | | | | 0.82 | | | | 0.43 | | | | 4 | | | | 64 | |
10-03-11(5)–12-31-11 | | 10.00 | | | | 0.05 | | | | 1.17 | | | | 1.22 | | | | — | | | | — | | | | — | | | | — | | | | — | | | | 11.22 | | | | 12.20 | | | | 0.87 | | | | 0.82 | | | | 0.82 | | | | 2.06 | | | | 3 | | | | 10 | |
Voya Solution 2045 Portfolio | | | | | | | | | | | | | | | | | | | | | | | | | | | | | | | | | | | | | | | | | | | | | | | | | | | | | | | | | | | | | | | | | | | |
Class ADV | | | | | | | | | | | | | | | | | | | | | | | | | | | | | | | | | | | | | | | | | | | | | | | | | | | | | | | | | | | | | | | | | | | |
| 12-31-14 | | 14.55 | | | | 0.08 | • | | | 0.73 | | | | 0.81 | | | | 0.22 | | | | 1.54 | | | | — | | | | 1.76 | | | | — | | | | 13.60 | | | | 5.84 | | | | 0.74 | | | | 0.68 | | | | 0.68 | | | | 0.55 | | | | 237,641 | | | | 58 | |
| 12-31-13 | | 11.98 | | | | 0.06 | • | | | 2.69 | | | | 2.75 | | | | 0.18 | | | | — | | | | — | | | | 0.18 | | | | — | | | | 14.55 | | | | 23.09 | | | | 0.74 | | | | 0.63 | | | | 0.63 | | | | 0.49 | | | | 266,469 | | | | 72 | |
| 12-31-12 | | 10.56 | | | | 0.07 | • | | | 1.53 | | | | 1.60 | | | | 0.18 | | | | — | | | | — | | | | 0.18 | | | | — | | | | 11.98 | | | | 15.23 | | | | 0.70 | | | | 0.62 | | | | 0.62 | | | | 0.60 | | | | 239,901 | | | | 50 | |
| 12-31-11 | | 11.29 | | | | 0.14 | • | | | (0.76 | ) | | | (0.62 | ) | | | 0.11 | | | | — | | | | — | | | | 0.11 | | | | — | | | | 10.56 | | | | (5.42 | ) | | | 0.62 | | | | 0.62 | | | | 0.62 | | | | 1.28 | | | | 244,111 | | | | 77 | |
| 12-31-10 | | 9.90 | | | | 0.11 | | | | 1.35 | | | | 1.46 | | | | 0.07 | | | | — | | | | — | | | | 0.07 | | | | — | | | | 11.29 | | | | 14.92 | | | | 0.62 | | | | 0.62 | | | | 0.62 | | | | 1.04 | | | | 262,653 | | | | 40 | |
Class I | | | | | | | | | | | | | | | | | | | | | | | | | | | | | | | | | | | | | | | | | | | | | | | | | | | | | | | | | | | | | | | | | | | |
| 12-31-14 | | 14.84 | | | | 0.15 | | | | 0.75 | | | | 0.90 | | | | 0.30 | | | | 1.54 | | | | — | | | | 1.84 | | | | — | | | | 13.90 | | | | 6.34 | | | | 0.24 | | | | 0.18 | | | | 0.18 | | | | 1.04 | | | | 161,654 | | | | 58 | |
| 12-31-13 | | 12.21 | | | | 0.14 | • | | | 2.74 | | | | 2.88 | | | | 0.25 | | | | — | | | | — | | | | 0.25 | | | | — | | | | 14.84 | | | | 23.74 | | | | 0.24 | | | | 0.13 | | | | 0.13 | | | | 1.07 | | | | 158,048 | | | | 72 | |
| 12-31-12 | | 10.76 | | | | 0.11 | | | | 1.58 | | | | 1.69 | | | | 0.24 | | | | — | | | | — | | | | 0.24 | | | | — | | | | 12.21 | | | | 15.81 | | | | 0.20 | | | | 0.12 | | | | 0.12 | | | | 1.11 | | | | 124,166 | | | | 50 | |
| 12-31-11 | | 11.51 | | | | 0.21 | • | | | (0.80 | ) | | | (0.59 | ) | | | 0.16 | | | | — | | | | — | | | | 0.16 | | | | — | | | | 10.76 | | | | (5.02 | ) | | | 0.12 | | | | 0.12 | | | | 0.12 | | | | 1.86 | | | | 109,358 | | | | 77 | |
| 12-31-10 | | 10.08 | | | | 0.16 | • | | | 1.38 | | | | 1.54 | | | | 0.11 | | | | — | | | | — | | | | 0.11 | | | | — | | | | 11.51 | | | | 15.51 | | | | 0.12 | | | | 0.12 | | | | 0.12 | | | | 1.59 | | | | 88,176 | | | | 40 | |
Class S | | | | | | | | | | | | | | | | | | | | | | | | | | | | | | | | | | | | | | | | | | | | | | | | | | | | | | | | | | | | | | | | | | | |
| 12-31-14 | | 14.70 | | | | 0.12 | • | | | 0.73 | | | | 0.85 | | | | 0.25 | | | | 1.54 | | | | — | | | | 1.79 | | | | — | | | | 13.76 | | | | 6.10 | | | | 0.49 | | | | 0.43 | | | | 0.43 | | | | 0.83 | | | | 301,617 | | | | 58 | |
| 12-31-13 | | 12.10 | | | | 0.10 | • | | | 2.72 | | | | 2.82 | | | | 0.22 | | | | — | | | | — | | | | 0.22 | | | | — | | | | 14.70 | | | | 23.45 | | | | 0.49 | | | | 0.38 | | | | 0.38 | | | | 0.74 | | | | 350,686 | | | | 72 | |
| 12-31-12 | | 10.67 | | | | 0.11 | | | | 1.53 | | | | 1.64 | | | | 0.21 | | | | — | | | | — | | | | 0.21 | | | | — | | | | 12.10 | | | | 15.47 | | | | 0.45 | | | | 0.37 | | | | 0.37 | | | | 0.91 | | | | 313,757 | | | | 50 | |
| 12-31-11 | | 11.40 | | | | 0.18 | • | | | (0.78 | ) | | | (0.60 | ) | | | 0.13 | | | | — | | | | — | | | | 0.13 | | | | — | | | | 10.67 | | | | (5.14 | ) | | | 0.37 | | | | 0.37 | | | | 0.37 | | | | 1.51 | | | | 277,998 | | | | 77 | |
| 12-31-10 | | 10.00 | | | | 0.13 | | | | 1.36 | | | | 1.49 | | | | 0.09 | | | | — | | | | — | | | | 0.09 | | | | — | | | | 11.40 | | | | 15.12 | | | | 0.37 | | | | 0.37 | | | | 0.37 | | | | 1.33 | | | | 319,163 | | | | 40 | |
Class S2 | | | | | | | | | | | | | | | | | | | | | | | | | | | | | | | | | | | | | | | | | | | | | | | | | | | | | | | | | | | | | | | | | | | |
| 12-31-14 | | 14.45 | | | | 0.09 | • | | | 0.72 | | | | 0.81 | | | | 0.23 | | | | 1.54 | | | | — | | | | 1.77 | | | | — | | | | 13.49 | | | | 5.87 | | | | 0.74 | | | | 0.58 | | | | 0.58 | | | | 0.67 | | | | 19,353 | | | | 58 | |
| 12-31-13 | | 11.89 | | | | 0.07 | • | | | 2.68 | | | | 2.75 | | | | 0.19 | | | | — | | | | — | | | | 0.19 | | | | — | | | | 14.45 | | | | 23.26 | | | | 0.74 | | | | 0.53 | | | | 0.53 | | | | 0.52 | | | | 19,968 | | | | 72 | |
| 12-31-12 | | 10.49 | | | | 0.09 | • | | | 1.51 | | | | 1.60 | | | | 0.20 | | | | — | | | | — | | | | 0.20 | | | | — | | | | 11.89 | | | | 15.37 | | | | 0.70 | | | | 0.52 | | | | 0.52 | | | | 0.76 | | | | 22,458 | | | | 50 | |
| 12-31-11 | | 11.24 | | | | 0.16 | • | | | (0.77 | ) | | | (0.61 | ) | | | 0.14 | | | | — | | | | — | | | | 0.14 | | | | — | | | | 10.49 | | | | (5.38 | ) | | | 0.62 | | | | 0.52 | | | | 0.52 | | | | 1.49 | | | | 19,318 | | | | 77 | |
| 12-31-10 | | 9.89 | | | | 0.18 | • | | | 1.28 | | | | 1.46 | | | | 0.11 | | | | — | | | | — | | | | 0.11 | | | | — | | | | 11.24 | | | | 15.00 | | | | 0.62 | | | | 0.52 | | | | 0.52 | | | | 1.74 | | | | 14,341 | | | | 40 | |
Class T | | | | | | | | | | | | | | | | | | | | | | | | | | | | | | | | | | | | | | | | | | | | | | | | | | | | | | | | | | | | | | | | | | | |
| 12-31-14 | | 14.73 | | | | (0.00 | )*• | | | 0.78 | | | | 0.78 | | | | 0.20 | | | | 1.54 | | | | — | | | | 1.74 | | | | — | | | | 13.77 | | | | 5.53 | | | | 0.99 | | | | 0.88 | | | | 0.88 | | | | (0.00 | )* | | | 376 | | | | 58 | |
| 12-31-13 | | 12.10 | | | | 0.04 | • | | | 2.72 | | | | 2.76 | | | | 0.13 | | | | — | | | | — | | | | 0.13 | | | | — | | | | 14.73 | | | | 22.93 | | | | 0.99 | | | | 0.83 | | | | 0.83 | | | | 0.27 | | | | 1,068 | | | | 72 | |
| 12-31-12 | | 10.63 | | | | 0.02 | • | | | 1.57 | | | | 1.59 | | | | 0.12 | | | | — | | | | — | | | | 0.12 | | | | — | | | | 12.10 | | | | 14.98 | | | | 0.95 | | | | 0.82 | | | | 0.82 | | | | 0.21 | | | | 936 | | | | 50 | |
| 12-31-11 | | 11.35 | | | | 0.11 | • | | | (0.75 | ) | | | (0.64 | ) | | | 0.08 | | | | — | | | | — | | | | 0.08 | | | | — | | | | 10.63 | | | | (5.63 | ) | | | 0.87 | | | | 0.82 | | | | 0.82 | | | | 0.98 | | | | 1,367 | | | | 77 | |
| 12-31-10 | | 9.95 | | | | 0.09 | | | | 1.36 | | | | 1.45 | | | | 0.05 | | | | — | | | | — | | | | 0.05 | | | | — | | | | 11.35 | | | | 14.68 | | | | 0.87 | | | | 0.82 | | | | 0.82 | | | | 0.83 | | | | 2,329 | | | | 40 | |
See Accompanying Notes to Financial Statements
53
FINANCIAL HIGHLIGHTS (CONTINUED)
Selected data for a share of beneficial interest outstanding throughout each year or period.
| | | Income (loss)
from investment
operations
|
| | | Less distributions
|
| | | | | | | | | Ratios to average
net assets
| | Supplemental
data
| |
|---|
| | | | | | | | | | | | | | | | | | | | | | | | | | | | | | | | |
|---|
| Net
asset
value,
beginning
of
year or
period
|
| Net
investment
income
(loss)
|
| Net
realized
and
unrealized
gain
(loss)
|
| Total
from
investment
operations
|
| From
net
investment
income
|
| From
net
realized
gains
|
| From
return
of
capital
|
| Total
distributions
|
| Payment
by
affiliate
|
| Net
asset
value,
end of
year or
period
|
| Total
Return(1)
|
| Expenses
before
reductions/
additions(2)(3)(4)
|
| Expenses
net of
fee
waivers
and/or
recoupments
if any(2)(3)(4)
|
| Expenses
net
of all
reductions/
additions(2)(3)(4)
|
| Net
investment
income
(loss)(2)(3)
|
| Net
assets,
end of
year or
period
|
| Portfolio
turnover
rate
|
|---|
Year or period ended
| ($)
|
| ($)
|
| ($)
|
| ($)
|
| ($)
|
| ($)
|
| ($)
|
| ($)
|
| ($)
|
| ($)
|
| (%)
|
| (%)
|
| (%)
|
| (%)
|
| (%)
|
| ($000’s)
|
| (%)
|
|---|
Voya Solution 2050 Portfolio | | | | | | | | | | | | | | | | | | | | | | | | | | | | | | | | | | | | | | | | | | | | | | | | | | | | | | | | | | | | | | | | | | | |
Class ADV | | | | | | | | | | | | | | | | | | | | | | | | | | | | | | | | | | | | | | | | | | | | | | | | | | | | | | | | | | | | | | | | | | | |
| 12-31-14 | | 14.16 | | | | 0.17 | • | | | 0.74 | | | | 0.91 | | | | 0.01 | | | | 0.11 | | | | — | | | | 0.12 | | | | — | | | | 14.95 | | | | 6.49 | | | | 6.49 | | | | 0.68 | | | | 0.68 | | | | 1.15 | | | | 355 | | | | 51 | |
| 12-31-13 | | 12.44 | | | | 0.06 | | | | 2.70 | | | | 2.76 | | | | 0.19 | | | | 0.88 | | | | — | | | | 1.07 | | | | 0.03 | | | | 14.16 | | | | 23.18 | (d) | | | 84.37 | | | | 0.64 | | | | 0.64 | | | | 0.48 | | | | 4 | | | | 65 | |
| 12-31-12 | | 11.23 | | | | 0.07 | | | | 1.59 | | | | 1.66 | | | | 0.09 | | | | 0.36 | | | | — | | | | 0.45 | | | | — | | | | 12.44 | | | | 14.78 | | | | 41.76 | | | | 0.62 | | | | 0.62 | | | | 0.56 | | | | 4 | | | | 59 | |
10-03-11(5)–12-31-11 | | 10.00 | | | | 0.06 | | | | 1.17 | | | | 1.23 | | | | — | | | | — | | | | — | | | | — | | | | — | | | | 11.23 | | | | 12.30 | | | | 0.62 | | | | 0.62 | | | | 0.62 | | | | 2.22 | | | | 3 | | | | 12 | |
Class I | | | | | | | | | | | | | | | | | | | | | | | | | | | | | | | | | | | | | | | | | | | | | | | | | | | | | | | | | | | | | | | | | | | |
| 12-31-14 | | 14.26 | | | | 0.14 | | | | 0.86 | | | | 1.00 | | | | — | | | | 0.11 | | | | — | | | | 0.11 | | | | — | | | | 15.15 | | | | 7.04 | | | | 5.99 | | | | 0.18 | | | | 0.18 | | | | 0.97 | | | | 5 | | | | 51 | |
| 12-31-13 | | 12.51 | | | | 0.13 | | | | 2.73 | | | | 2.86 | | | | 0.26 | | | | 0.88 | | | | — | | | | 1.14 | | | | 0.03 | | | | 14.26 | | | | 23.84 | (d) | | | 84.87 | | | | 0.14 | | | | 0.14 | | | | 0.98 | | | | 4 | | | | 65 | |
| 12-31-12 | | 11.24 | | | | 0.13 | | | | 1.60 | | | | 1.73 | | | | 0.10 | | | | 0.36 | | | | — | | | | 0.46 | | | | — | | | | 12.51 | | | | 15.42 | | | | 41.26 | | | | 0.12 | | | | 0.12 | | | | 1.09 | | | | 4 | | | | 59 | |
10-03-11(5)–12-31-11 | | 10.00 | | | | 0.07 | | | | 1.17 | | | | 1.24 | | | | — | | | | — | | | | — | | | | — | | | | — | | | | 11.24 | | | | 12.40 | | | | 0.12 | | | | 0.12 | | | | 0.12 | | | | 2.73 | | | | 3 | | | | 12 | |
Class S | | | | | | | | | | | | | | | | | | | | | | | | | | | | | | | | | | | | | | | | | | | | | | | | | | | | | | | | | | | | | | | | | | | |
| 12-31-14 | | 14.25 | | | | 0.13 | | | | 0.82 | | | | 0.95 | | | | — | | | | 0.11 | | | | — | | | | 0.11 | | | | — | | | | 15.09 | | | | 6.69 | | | | 6.24 | | | | 0.43 | | | | 0.43 | | | | 0.87 | | | | 5 | | | | 51 | |
| 12-31-13 | | 12.46 | | | | 0.09 | | | | 2.71 | | | | 2.80 | | | | 0.16 | | | | 0.88 | | | | — | | | | 1.04 | | | | 0.03 | | | | 14.25 | | | | 23.37 | (d) | | | 84.12 | | | | 0.39 | | | | 0.39 | | | | 0.66 | | | | 4 | | | | 65 | |
| 12-31-12 | | 11.23 | | | | 0.10 | | | | 1.59 | | | | 1.69 | | | | 0.10 | | | | 0.36 | | | | — | | | | 0.46 | | | | — | | | | 12.46 | | | | 15.01 | | | | 41.51 | | | | 0.37 | | | | 0.37 | | | | 0.84 | | | | 4 | | | | 59 | |
10-03-11(5)–12-31-11 | | 10.00 | | | | 0.06 | | | | 1.17 | | | | 1.23 | | | | — | | | | — | | | | — | | | | — | | | | — | | | | 11.23 | | | | 12.30 | | | | 0.37 | | | | 0.37 | | | | 0.37 | | | | 2.32 | | | | 3 | | | | 12 | |
Class S2 | | | | | | | | | | | | | | | | | | | | | | | | | | | | | | | | | | | | | | | | | | | | | | | | | | | | | | | | | | | | | | | | | | | |
| 12-31-14 | | 14.15 | | | | 0.08 | | | | 0.85 | | | | 0.93 | | | | — | | | | 0.11 | | | | — | | | | 0.11 | | | | — | | | | 14.97 | | | | 6.59 | | | | 6.49 | | | | 0.58 | | | | 0.58 | | | | 0.58 | | | | 5 | | | | 51 | |
| 12-31-13 | | 12.45 | | | | 0.08 | | | | 2.68 | | | | 2.76 | | | | 0.21 | | | | 0.88 | | | | — | | | | 1.09 | | | | 0.03 | | | | 14.15 | | | | 23.09 | (d) | | | 84.37 | | | | 0.54 | | | | 0.54 | | | | 0.58 | | | | 4 | | | | 65 | |
| 12-31-12 | | 11.23 | | | | 0.08 | | | | 1.59 | | | | 1.67 | | | | 0.09 | | | | 0.36 | | | | — | | | | 0.45 | | | | — | | | | 12.45 | | | | 14.90 | | | | 41.76 | | | | 0.52 | | | | 0.52 | | | | 0.66 | | | | 4 | | | | 59 | |
10-03-11(5)–12-31-11 | | 10.00 | | | | 0.06 | | | | 1.17 | | | | 1.23 | | | | — | | | | — | | | | — | | | | — | | | | — | | | | 11.23 | | | | 12.30 | | | | 0.62 | | | | 0.52 | | | | 0.52 | | | | 2.34 | | | | 3 | | | | 12 | |
Class T | | | | | | | | | | | | | | | | | | | | | | | | | | | | | | | | | | | | | | | | | | | | | | | | | | | | | | | | | | | | | | | | | | | |
| 12-31-14 | | 14.17 | | | | 0.04 | | | | 0.85 | | | | 0.89 | | | | — | | | | 0.11 | | | | — | | | | 0.11 | | | | — | | | | 14.95 | | | | 6.30 | | | | 6.74 | | | | 0.88 | | | | 0.88 | | | | 0.28 | | | | 5 | | | | 51 | |
| 12-31-13 | | 12.42 | | | | 0.04 | | | | 2.73 | | | | 2.77 | | | | 0.17 | | | | 0.88 | | | | — | | | | 1.05 | | | | 0.03 | | | | 14.17 | | | | 23.28 | (d) | | | 84.62 | | | | 0.84 | | | | 0.84 | | | | 0.26 | | | | 4 | | | | 65 | |
| 12-31-12 | | 11.22 | | | | 0.04 | | | | 1.60 | | | | 1.64 | | | | 0.08 | | | | 0.36 | | | | — | | | | 0.44 | | | | — | | | | 12.42 | | | | 14.65 | | | | 42.01 | | | | 0.82 | | | | 0.82 | | | | 0.36 | | | | 4 | | | | 59 | |
10-03-11(5)–12-31-11 | | 10.00 | | | | 0.05 | | | | 1.17 | | | | 1.22 | | | | — | | | | — | | | | — | | | | — | | | | — | | | | 11.22 | | | | 12.20 | | | | 0.87 | | | | 0.82 | | | | 0.82 | | | | 2.03 | | | | 3 | | | | 12 | |
Voya Solution 2055 Portfolio | | | | | | | | | | | | | | | | | | | | | | | | | | | | | | | | | | | | | | | | | | | | | | | | | | | | | | | | | | | | | | | | | | | |
Class ADV | | | | | | | | | | | | | | | | | | | | | | | | | | | | | | | | | | | | | | | | | | | | | | | | | | | | | | | | | | | | | | | | | | | |
| 12-31-14 | | 14.46 | | | | 0.09 | • | | | 0.76 | | | | 0.85 | | | | 0.18 | | | | 0.86 | | | | — | | | | 1.04 | | | | — | | | | 14.27 | | | | 6.03 | | | | 0.77 | | | | 0.68 | | | | 0.68 | | | | 0.60 | | | | 38,558 | | | | 72 | |
| 12-31-13 | | 12.05 | | | | 0.08 | • | | | 2.69 | | | | 2.77 | | | | 0.14 | | | | 0.22 | | | | — | | | | 0.36 | | | | — | | | | 14.46 | | | | 23.19 | | | | 0.76 | | | | 0.63 | | | | 0.63 | | | | 0.61 | | | | 34,195 | | | | 73 | |
| 12-31-12 | | 10.66 | | | | 0.09 | • | | | 1.52 | | | | 1.61 | | | | 0.10 | | | | 0.12 | | | | — | | | | 0.22 | | | | — | | | | 12.05 | | | | 15.27 | | | | 0.72 | | | | 0.62 | | | | 0.62 | | | | 0.78 | | | | 19,927 | | | | 55 | |
| 12-31-11 | | 11.34 | | | | 0.17 | • | | | (0.79 | ) | | | (0.62 | ) | | | 0.03 | | | | 0.03 | | | | — | | | | 0.06 | | | | — | | | | 10.66 | | | | (5.45 | ) | | | 0.62 | | | | 0.62 | | | | 0.62 | | | | 1.58 | | | | 11,461 | | | | 81 | |
03-08-10(5)–12-31-10 | | 10.02 | | | | 0.15 | • | | | 1.17 | | | | 1.32 | | | | — | | | | — | | | | — | | | | — | | | | — | | | | 11.34 | | | | 13.17 | | | | 0.62 | | | | 0.62 | | | | 0.62 | | | | 1.72 | | | | 3,923 | | | | 33 | |
Class I | | | | | | | | | | | | | | | | | | | | | | | | | | | | | | | | | | | | | | | | | | | | | | | | | | | | | | | | | | | | | | | | | | | |
| 12-31-14 | | 14.65 | | | | 0.17 | • | | | 0.76 | | | | 0.93 | | | | 0.23 | | | | 0.86 | | | | — | | | | 1.09 | | | | — | | | | 14.49 | | | | 6.56 | | | | 0.27 | | | | 0.18 | | | | 0.18 | | | | 1.15 | | | | 24,787 | | | | 72 | |
| 12-31-13 | | 12.17 | | | | 0.17 | • | | | 2.71 | | | | 2.88 | | | | 0.18 | | | | 0.22 | | | | — | | | | 0.40 | | | | — | | | | 14.65 | | | | 23.89 | | | | 0.26 | | | | 0.13 | | | | 0.13 | | | | 1.24 | | | | 16,948 | | | | 73 | |
| 12-31-12 | | 10.74 | | | | 0.14 | • | | | 1.54 | | | | 1.68 | | | | 0.13 | | | | 0.12 | | | | — | | | | 0.25 | | | | — | | | | 12.17 | | | | 15.80 | | | | 0.22 | | | | 0.12 | | | | 0.12 | | | | 1.21 | | | | 8,034 | | | | 55 | |
| 12-31-11 | | 11.37 | | | | 0.24 | • | | | (0.80 | ) | | | (0.56 | ) | | | 0.04 | | | | 0.03 | | | | — | | | | 0.07 | | | | — | | | | 10.74 | | | | (4.91 | ) | | | 0.12 | | | | 0.12 | | | | 0.12 | | | | 2.16 | | | | 4,746 | | | | 81 | |
03-08-10(5)–12-31-10 | | 10.02 | | | | 0.18 | • | | | 1.17 | | | | 1.35 | | | | — | | | | — | | | | — | | | | — | | | | — | | | | 11.37 | | | | 13.47 | | | | 0.12 | | | | 0.12 | | | | 0.12 | | | | 2.11 | | | | 1,648 | | | | 33 | |
Class S | | | | | | | | | | | | | | | | | | | | | | | | | | | | | | | | | | | | | | | | | | | | | | | | | | | | | | | | | | | | | | | | | | | |
| 12-31-14 | | 14.55 | | | | 0.14 | • | | | 0.74 | | | | 0.88 | | | | 0.20 | | | | 0.86 | | | | — | | | | 1.06 | | | | — | | | | 14.37 | | | | 6.25 | | | | 0.52 | | | | 0.43 | | | | 0.43 | | | | 0.93 | | | | 43,206 | | | | 72 | |
| 12-31-13 | | 12.11 | | | | 0.12 | • | | | 2.70 | | | | 2.82 | | | | 0.16 | | | | 0.22 | | | | — | | | | 0.38 | | | | — | | | | 14.55 | | | | 23.52 | | | | 0.51 | | | | 0.38 | | | | 0.38 | | | | 0.90 | | | | 37,658 | | | | 73 | |
| 12-31-12 | | 10.70 | | | | 0.13 | • | | | 1.52 | | | | 1.65 | | | | 0.12 | | | | 0.12 | | | | — | | | | 0.24 | | | | — | | | | 12.11 | | | | 15.53 | | | | 0.47 | | | | 0.37 | | | | 0.37 | | | | 1.14 | | | | 22,055 | | | | 55 | |
| 12-31-11 | | 11.35 | | | | 0.20 | • | | | (0.78 | ) | | | (0.58 | ) | | | 0.04 | | | | 0.03 | | | | — | | | | 0.07 | | | | — | | | | 10.70 | | | | (5.13 | ) | | | 0.37 | | | | 0.37 | | | | 0.37 | | | | 1.77 | | | | 10,061 | | | | 81 | |
03-08-10(5)–12-31-10 | | 10.02 | | | | 0.15 | • | | | 1.18 | | | | 1.33 | | | | — | | | | — | | | | — | | | | — | | | | — | | | | 11.35 | | | | 13.27 | | | | 0.37 | | | | 0.37 | | | | 0.37 | | | | 1.80 | | | | 4,717 | | | | 33 | |
Class S2 | | | | | | | | | | | | | | | | | | | | | | | | | | | | | | | | | | | | | | | | | | | | | | | | | | | | | | | | | | | | | | | | | | | |
| 12-31-14 | | 14.50 | | | | 0.11 | • | | | 0.75 | | | | 0.86 | | | | 0.19 | | | | 0.86 | | | | — | | | | 1.05 | | | | — | | | | 14.31 | | | | 6.12 | | | | 0.77 | | | | 0.58 | | | | 0.58 | | | | 0.78 | | | | 3,071 | | | | 72 | |
| 12-31-13 | | 12.07 | | | | 0.10 | • | | | 2.69 | | | | 2.79 | | | | 0.14 | | | | 0.22 | | | | — | | | | 0.36 | | | | — | | | | 14.50 | | | | 23.36 | | | | 0.76 | | | | 0.53 | | | | 0.53 | | | | 0.72 | | | | 2,250 | | | | 73 | |
| 12-31-12 | | 10.68 | | | | 0.10 | • | | | 1.52 | | | | 1.62 | | | | 0.11 | | | | 0.12 | | | | — | | | | 0.23 | | | | — | | | | 12.07 | | | | 15.30 | | | | 0.72 | | | | 0.52 | | | | 0.52 | | | | 0.90 | | | | 1,294 | | | | 55 | |
| 12-31-11 | | 11.34 | | | | 0.19 | • | | | (0.79 | ) | | | (0.60 | ) | | | 0.03 | | | | 0.03 | | | | — | | | | 0.06 | | | | — | | | | 10.68 | | | | (5.26 | ) | | | 0.62 | | | | 0.52 | | | | 0.52 | | | | 1.73 | | | | 745 | | | | 81 | |
03-08-10(5)–12-31-10 | | 10.02 | | | | 0.15 | • | | | 1.17 | | | | 1.32 | | | | — | | | | — | | | | — | | | | — | | | | — | | | | 11.34 | | | | 13.17 | | | | 0.62 | | | | 0.52 | | | | 0.52 | | | | 1.73 | | | | 275 | | | | 33 | |
See Accompanying Notes to Financial Statements
54
FINANCIAL HIGHLIGHTS (CONTINUED)
Selected data for a share of beneficial interest outstanding throughout each year or period.
| | | Income (loss)
from investment
operations
|
| | | Less distributions
|
| | | | | | | | | Ratios to average
net assets
| | Supplemental
data
| |
|---|
| | | | | | | | | | | | | | | | | | | | | | | | | | | | | | | | |
|---|
| Net
asset
value,
beginning
of
year or
period
|
| Net
investment
income
(loss)
|
| Net
realized
and
unrealized
gain
(loss)
|
| Total
from
investment
operations
|
| From
net
investment
income
|
| From
net
realized
gains
|
| From
return
of
capital
|
| Total
distributions
|
| Payment
by
affiliate
|
| Net
asset
value,
end of
year or
period
|
| Total
Return(1)
|
| Expenses
before
reductions/
additions(2)(3)(4)
|
| Expenses
net of
fee
waivers
and/or
recoupments
if any(2)(3)(4)
|
| Expenses
net
of all
reductions/
additions(2)(3)(4)
|
| Net
investment
income
(loss)(2)(3)
|
| Net
assets,
end of
year or
period
|
| Portfolio
turnover
rate
|
|---|
Year or period ended
| ($)
|
| ($)
|
| ($)
|
| ($)
|
| ($)
|
| ($)
|
| ($)
|
| ($)
|
| ($)
|
| ($)
|
| (%)
|
| (%)
|
| (%)
|
| (%)
|
| (%)
|
| ($000’s)
|
| (%)
|
|---|
Voya Solution 2055 Portfolio (continued) | | | | | | | | | | | | | | | | | | | | | | | | | | | | | | | | | | | | | | | | | | | | | | | | | | | | | | | | | | | | | | | | | | | |
Class T | | | | | | | | | | | | | | | | | | | | | | | | | | | | | | | | | | | | | | | | | | | | | | | | | | | | | | | | | | | | | | | | | | | |
| 12-31-14 | | 14.44 | | | | (0.06 | )• | | | 0.90 | | | | 0.84 | | | | 0.17 | | | | 0.86 | | | | — | | | | 1.03 | | | | — | | | | 14.25 | | | | 6.00 | | | | 1.02 | | | | 0.88 | | | | 0.88 | | | | (0.40 | ) | | | 5 | | | | 72 | |
| 12-31-13 | | 12.06 | | | | 0.14 | • | | | 2.61 | | | | 2.75 | | | | 0.15 | | | | 0.22 | | | | — | | | | 0.37 | | | | — | | | | 14.44 | | | | 23.00 | | | | 1.01 | | | | 0.83 | | | | 0.83 | | | | 1.02 | | | | 68 | | | | 73 | |
| 12-31-12 | | 10.65 | | | | 0.06 | • | | | 1.52 | | | | 1.58 | | | | 0.05 | | | | 0.12 | | | | — | | | | 0.17 | | | | — | | | | 12.06 | | | | 14.95 | | | | 0.97 | | | | 0.82 | | | | 0.82 | | | | 0.54 | | | | 12 | | | | 55 | |
| 12-31-11 | | 11.31 | | | | 0.11 | | | | (0.74 | ) | | | (0.63 | ) | | | 0.00 | * | | | 0.03 | | | | — | | | | 0.03 | | | | — | | | | 10.65 | | | | (5.56 | ) | | | 0.87 | | | | 0.82 | | | | 0.82 | | | | 0.94 | | | | 7 | | | | 81 | |
03-08-10(5)–12-31-10 | | 10.02 | | | | 0.09 | | | | 1.20 | | | | 1.29 | | | | — | | | | — | | | | — | | | | — | | | | — | | | | 11.31 | | | | 12.87 | | | | 0.87 | | | | 0.82 | | | | 0.82 | | | | 1.08 | | | | 6 | | | | 33 | |
(1) | | Total return is calculated assuming reinvestment of all dividends, capital gain distributions and return of capital distributions, if any, at net asset value and does not reflect the effect of insurance contract charges. Total return for periods less than one year is not annualized. |
(2) | | Annualized for periods less than one year. |
(3) | | Ratios reflect operating expenses of a Portfolio. Expenses before reductions/additions do not reflect amounts reimbursed by an Investment Adviser and/or Distributor or reductions from brokerage service arrangements or other expense offset arrangements and do not represent the amount paid by a Portfolio during periods when reimbursements or reductions occur. Expenses net of fee waivers reflect expenses after reimbursement by an Investment Adviser and/or Distributor but prior to reductions from brokerage service arrangements or other expense offset arrangements. Expenses net of all reductions/additions represent the net expenses paid by a Portfolio. Net investment income (loss) is net of all such additions or reductions. |
(4) | | Ratios do not include expenses of underlying funds and do not include fees and expenses charged under the variable annuity contract or variable life insurance policy. |
(5) | | Commencement of operations. |
(a) | | Excluding a payment by affiliate in the year ended December 31, 2013, Solution 2020 total return would have been 12.88%, 13.71%, 13.33%, 13.25% and 13.15% on Classes ADV, I, S, S2 and T, respectively. |
(b) | | Excluding a payment by affiliate in the year ended December 31, 2013, Solution 2030 total return would have been 18.46%, 19,19%, 18.72%, 18.37% and 18.69% on Classes ADV, I, S, S2 and T, respectively. |
(c) | | Excluding a payment by affiliate in the year ended December 31, 2013, Solution 2040 total return would have been 22.09%, 22.76%, 22.35%, 22.07% and 21.84% on Classes ADV, I, S, S2 and T, respectively. |
(d) | | Excluding a payment by affiliate in the year ended December 31, 2013, Solution 2050 total return would have been 22.95%, 23.61%, 23.14%, 22.86% and 23.05% on Classes ADV, I, S, S2 and T, respectively. |
• | | Calculated using average number of shares outstanding throughout the period. |
| * | | Amount is less than $0.005 or 0.005% or more than $(0.005) or (0.005)%. |
See Accompanying Notes to Financial Statements
55
NOTES TO FINANCIAL STATEMENTS AS OF DECEMBER 31, 2014
NOTE 1 — ORGANIZATION
Voya Partners, Inc. (the “Company”) is an open-end management investment company registered under the Investment Company Act of 1940, as amended (the “1940 Act”). It was incorporated under the laws of Maryland on May 7, 1997. The Articles of Incorporation permit the Company to offer separate series, each of which has its own investment objective, policies and restrictions. The Company serves as investment options in underlying variable insurance products offered by Directed Services LLC. The Company currently consists of forty-two active separate investment series. The fifteen series (each, a “Portfolio” and collectively, the “Portfolios”) included in this report are: Voya Solution Aggressive Portfolio (“Solution Aggressive”), Voya Solution Balanced Portfolio (“Solution Balanced”), Voya Solution Conservative Portfolio (“Solution Conservative”), Voya Solution Income Portfolio (“Solution Income”), Voya Solution Moderately Aggressive Portfolio (“Solution Moderately Aggressive”), Voya Solution Moderately Conservative Portfolio (“Solution Moderately Conservative”), Voya Solution 2015 Portfolio (“Solution 2015”), Voya Solution 2020 Portfolio (“Solution 2020”), Voya Solution 2025 Portfolio (“Solution 2025”), Voya Solution 2030 Portfolio (“Solution 2030”), Voya Solution 2035 Portfolio (“Solution 2035”), Voya Solution 2040 Portfolio (“Solution 2040”), Voya Solution 2045 Portfolio (“Solution 2045”), Voya Solution 2050 Portfolio (“Solution 2050”) and Voya Solution 2055 Portfolio (“Solution 2055”). Each Portfolio is a diversified series of the Company.
Solution 2015, Solution 2020, Solution 2025, Solution 2030, Solution 2035, Solution 2040, Solution 2045, Solution 2050 and Solution 2055 are structured and managed around a specific target retirement or financial goal date (“Target Date”). When these Portfolios reach their respective Target Date, they may be combined with Solution Income, without a vote of shareholders, if approved by the Portfolios’ Board of Directors (the “Board”).
Each Portfolio offers at least four of the following five classes of shares: Adviser Class (“Class ADV”), Initial Class (“Class I”), Service Class (“Class S”), Service 2 Class (“Class S2”) and Class T. Each class has equal rights as to voting privileges. The classes differ principally in the applicable distribution and shareholder service fees. Generally, shareholders of each class also bear certain expenses that pertain to that particular class. All shareholders bear the common expenses of a portfolio and earn income and realized gains/losses from a portfolio pro rata based on the daily ending net assets of each class, without distinction between share classes. Expenses that are specific to a portfolio or a class are charged directly to that portfolio or class. Other operating expenses shared by several portfolios are generally allocated among those portfolios based on average net assets. Distributions are determined separately for each class based on income and expenses allocated to each class. Realized gain distributions are allocated to each class pro rata based on the shares outstanding of each class on the date of distribution. Differences in per share dividend rates generally result from differences in separate class expenses, including distribution and shareholder service fees, if applicable.
Directed Services LLC (“DSL” or the “Investment Adviser”), a Delaware limited liability company, serves as the Investment Adviser to the Portfolios. Voya Investment Management Co. LLC (“Voya IM” or the “Sub-Adviser”), a Delaware limited liability company, serves as the Sub-Adviser to the Portfolios. Voya Funds Services, LLC (“VFS” or the “Administrator”), a Delaware limited liability company, serves as the Administrator to the Portfolios. Voya Investments Distributor, LLC (“VID” or the “Distributor”), a Delaware limited liability company, serves as the principal underwriter to the Portfolios.
Each Portfolio seeks to achieve its investment objective by investing in other investment companies (“Underlying Funds”) and uses asset allocation strategies to determine how much to invest in the Underlying Funds. The investment objective of the Portfolios is described in the Portfolios’ Prospectus.
NOTE 2 — SIGNIFICANT ACCOUNTING POLICIES
The following significant accounting policies are consistently followed by the Portfolios in the preparation of their financial statements. Each Portfolio is considered an investment company under U.S. generally accepted accounting principles (“GAAP”) and follows the accounting and reporting guidance applicable to investment companies.
A. Security Valuation. All investments in Underlying Funds are recorded at their estimated fair value, as described below. U.S. GAAP defines fair value as the price the Portfolios would receive to sell an asset or pay to transfer a liability in an orderly transaction between market participants at the measurement date. The valuations of the Portfolios’ investments in its Underlying Funds are based on the net asset value (“NAV”) of the Underlying Funds each business day.
Each investment asset or liability of the Portfolios is assigned a level at measurement date based on the significance and source of the inputs to its valuation. Quoted prices in active markets for identical securities are classified as “Level 1,” inputs other than quoted prices for
56
NOTES TO FINANCIAL STATEMENTS AS OF DECEMBER 31, 2014 (CONTINUED)
NOTE 2 — SIGNIFICANT ACCOUNTING POLICIES (continued)
an asset or liability that are observable are classified as “Level 2” and unobservable inputs, including the Sub-Adviser’s judgment about the assumptions that a market participant would use in pricing an asset or liability are classified as “Level 3.” The inputs used for valuing securities are not necessarily an indication of the risks associated with investing in those securities. Short-term securities of sufficient credit quality which are valued at amortized cost, which approximates fair value, are generally considered to be Level 2 securities under applicable accounting rules. The Portfolios classify each of their investments in the Underlying Funds as Level 1, without consideration as to the classification level of the specific investments held by the Underlying Funds. A table summarizing each Portfolio’s investments under these levels of classification is included following the Portfolio of Investments.
The Board has adopted methods for valuing securities and other assets in circumstances where market quotes are not readily available, and has delegated the responsibility for applying the valuation methods to the “Pricing Committee” as established by the Portfolio’s Administrator. The Pricing Committee considers all facts it deems relevant that are reasonably available, through either public information or information available to the Investment Adviser or Sub-Adviser, when determining the fair value of the security. In the event that a security or asset cannot be valued pursuant to one of the valuation methods established by the Board, the fair value of the security or asset will be determined in good faith by the Pricing Committee. When a Portfolio uses these fair valuation methods that use significant unobservable inputs to determine its NAV, securities will be priced by a method that the Pricing Committee believes accurately reflects fair value and are categorized as Level 3 of the fair value hierarchy. The methodologies used for valuing securities are not necessarily an indication of the risks of investing in those securities valued in good faith at fair value nor can it be assured a Portfolio can obtain the fair value assigned to a security if it were to sell the security.
To assess the continuing appropriateness of security valuations, the Pricing Committee may compare prior day prices, prices on comparable securities, and traded prices to the prior or current day prices and the Pricing Committee challenges those prices exceeding certain tolerance levels with the independent pricing service or broker source. For those securities valued in good faith at fair value, the Pricing Committee reviews and affirms the reasonableness of the valuation on a regular basis after considering all relevant information that is reasonably available.
For fair valuations using significant unobservable inputs, U.S. GAAP requires a reconciliation of the beginning to ending balances for reported fair values that presents changes attributable to total realized and unrealized gains or losses, purchases and sales, and transfers in or out of the Level 3 category during the period. The beginning of period timing recognition is used for the transfers between Levels of a Portfolio’s assets and liabilities. A reconciliation of Level 3 investments is presented only when a Portfolio had a significant amount of Level 3 investments.
For the year ended December 31, 2014, there have been no significant changes to the fair valuation methodologies.
B. Security Transactions and Revenue Recognition. Security transactions are accounted for on the trade date. Dividend income received from the Underlying Funds is recognized on the ex-dividend date and is recorded as income distributions in the Statements of Operations. Capital gain distributions received from the Underlying Funds are recognized on the ex-dividend date and are recorded on the Statements of Operations as such. Costs used in determining realized gains and losses on the sales of investment securities are on the basis of specific identification.
C. Distributions to Shareholders. The Portfolios record distributions to their shareholders on the ex-dividend date. Each Portfolio declares and pays dividends and capital gains, if any, annually. The Portfolios may make distributions on a more frequent basis to comply with the distribution requirements of the Internal Revenue Code. The characteristics of income and gains to be distributed are determined in accordance with income tax regulations, which may differ from U.S. GAAP for investment companies.
D. Federal Income Taxes. It is the policy of each Portfolio to comply with the requirements of subchapter M of the Internal Revenue Code that are applicable to regulated investment companies and to distribute substantially all of its net investment income and any net realized capital gains to its shareholders. Therefore, a federal income tax or excise tax provision is not required. Management has considered the sustainability of the Portfolios’ tax positions taken on federal income tax returns for all open tax years in making this determination. No capital gain distributions shall be made until the capital loss carryforwards have been fully utilized or expire.
E. Use of Estimates. The preparation of financial statements in conformity with U.S. GAAP requires management to make estimates and assumptions that affect the reported amounts of assets and liabilities and disclosure of contingent assets and liabilities at the date
57
NOTES TO FINANCIAL STATEMENTS AS OF DECEMBER 31, 2014 (CONTINUED)
NOTE 2 — SIGNIFICANT ACCOUNTING POLICIES (continued)
of the financial statements and the reported amounts of increases and decreases in net assets from operations during the reporting period. Actual results could differ from those estimates.
F. Risk Exposures and the Use of Derivative Instruments. Each Portfolio’s investment strategies permit it to enter into various types of derivatives contracts, including, but not limited to, futures contracts. In doing so, a Portfolio will employ strategies in differing combinations to permit it to increase or decrease the level of risk, or change the level or types of exposure to market risk factors. This may allow a Portfolio to pursue its objectives more quickly and efficiently than if it were to make direct purchases or sales of securities capable of affecting a similar response to market factors.
Market Risk Factors. In pursuit of its investment objectives, a Portfolio may seek to use derivatives to increase or decrease its exposure to the following market risk factors:
Equity Risk. Equity risk relates to the change in value of equity securities as they relate to increases or decreases in the general market.
Risks of Investing in Derivatives. Each Portfolio’s use of derivatives can result in losses due to unanticipated changes in the market risk factors and the overall market. In instances where a Portfolio is using derivatives to decrease, or hedge, exposures to market risk factors for securities held by a Portfolio, there are also risks that those derivatives may not perform as expected resulting in losses for the combined or hedged positions.
The use of these strategies involves certain special risks, including a possible imperfect correlation, or even no correlation, between price movements of derivative instruments and price movements of related investments. While some strategies involving derivative instruments can reduce the risk of loss, they can also reduce the opportunity for gain or even result in losses by offsetting favorable price movements in related investments or otherwise, due to the possible inability of a Portfolio to purchase or sell a portfolio security at a time that otherwise would be favorable or the possible need to sell a portfolio security at a disadvantageous time because the Portfolio is required to maintain asset coverage or offsetting positions in connection with transactions in derivative instruments. Additional associated risks from investing in derivatives also exist and potentially could have significant effects on the valuation of the derivative and a Portfolio. Associated risks are not the risks that a Portfolio is attempting to increase or decrease exposure to, per their investment objectives, but are the additional risks from investing in derivatives. Examples of these associated risks are liquidity risk, which is the risk that a Portfolio will not be able to sell the derivative in the open market in a timely manner, and counterparty credit risk, which is the risk that the counterparty will not fulfill its obligation to a Portfolio. Associated risks can be different for each type of derivative and are discussed by each derivative type in the following notes.
G. Futures Contracts. Certain Portfolios may enter into futures contracts involving foreign currency, interest rates, securities and security indices. A futures contract is a commitment to buy or sell a specific amount of a financial instrument at a negotiated price on a stipulated future date. A Portfolio may buy and sell futures contracts. Futures contracts traded on a commodities or futures exchange will be valued at the final settlement price or official closing price on the principal exchange as reported by such principal exchange at its trading session ending at, or most recently prior to, the time when each Portfolio’s assets are valued.
Upon entering into a futures contract, a Portfolio is required to deposit either cash or securities (initial margin) in an amount equal to a certain percentage of the contract value. Subsequent payments (variation margin) are made or received by a Portfolio each day. The variation margin payments are equal to the daily changes in the contract value and are recorded as unrealized gains and losses. Open futures contracts are reported on a table following each Portfolio’s Portfolio of Investments. Securities held in collateralized accounts to cover initial margin requirements on open futures contracts, if any, are footnoted in the Portfolio of Investments. Cash collateral held by the broker to cover initial margin requirements on open futures contracts are noted in the Statements of Assets and Liabilities. The net change in unrealized appreciation and depreciation is reported in the Statements of Operations. Realized gains (losses) are reported in the Statements of Operations at the closing or expiration of futures contracts.
Futures contracts are exposed to the market risk factor of the underlying financial instrument. During year ended December 31, 2014, each Portfolio has purchased futures contracts on various equity indices to “equitize” cash. Futures contracts are purchased to provide immediate market exposure proportionate to the size of the Portfolio’s respective cash flows and residual cash balances in order to decrease potential tracking error if the cash remained uninvested in the market. Additional associated risks of entering into futures contracts include the possibility that there may be an illiquid market where the Portfolios are unable to liquidate the contract or enter into an offsetting position and, if used for hedging purposes, the risk that the price of the contract will correlate imperfectly with the prices
58
NOTES TO FINANCIAL STATEMENTS AS OF DECEMBER 31, 2014 (CONTINUED)
NOTE 2 — SIGNIFICANT ACCOUNTING POLICIES (continued)
of the Portfolios’ securities. With futures, there is minimal counterparty credit risk to the Portfolios since futures are exchange traded and the exchange’s clearinghouse, as counterparty to all exchange traded futures, guarantees the futures against default.
During the final month of the year ended December 31, 2014, the Portfolios had average notional values on futures contracts purchased as disclosed below:
| Solution Balanced | | | | $ | 1,070,775 | |
| Solution Conservative | | | | | 356,925 | |
| Solution Income | | | | | 3,331,300 | |
| Solution Moderately Aggressive | | | | | 713,850 | |
| Solution Moderately Conservative | | | | | 951,800 | |
| Solution 2015 | | | | | 11,659,549 | |
| Solution 2025 | | | | | 24,032,948 | |
| Solution 2035 | | | | | 21,534,473 | |
| Solution 2045 | | | | | 14,990,849 | |
| Solution 2055 | | | | | 2,141,550 | |
H. Offering Costs. Costs incurred with the offering of shares of a Portfolio are deferred and amortized on a twelve month period on a straight-line basis starting at the commencement of operations.
I. Indemnifications. In the normal course of business, the Company may enter into contracts that provide certain indemnifications. The Company’s maximum exposure under these arrangements is dependent on future claims that may be made against the Portfolios and, therefore, cannot be estimated; however, based on experience, management considers the risk of loss from such claims remote.
NOTE 3 — INVESTMENTS IN UNDERLYING FUNDS
For the year ended December 31, 2014, the cost of purchases and the proceeds from sales of the Underlying Funds were as follows:
| | | | Purchases
| | Sales
|
|---|
| Solution Aggressive | | | | $ | 4,139,731 | | | $ | 1,718,300 | |
| Solution Balanced | | | | | 31,375,450 | | | | 34,289,593 | |
| Solution Conservative | | | | | 9,433,513 | | | | 9,779,232 | |
| Solution Income | | | | | 84,164,763 | | | | 112,956,895 | |
| Solution Moderately Aggressive | | | | | 23,184,060 | | | | 22,368,027 | |
| Solution Moderately Conservative | | | | | 29,918,976 | | | | 34,203,850 | |
| Solution 2015 | | | | | 289,973,223 | | | | 431,753,208 | |
| Solution 2020 | | | | | 733,437 | | | | 119,311 | |
| Solution 2025 | | | | | 568,512,522 | | | | 786,982,355 | |
| Solution 2030 | | | | | 375,289 | | | | 234,387 | |
| Solution 2035 | | | | | 651,597,201 | | | | 835,133,418 | |
| Solution 2040 | | | | | 1,024,106 | | | | 353,242 | |
| Solution 2045 | | | | | 443,422,326 | | | | 572,526,707 | |
| Solution 2050 | | | | | 450,301 | | | | 113,122 | |
| Solution 2055 | | | | | 83,695,931 | | | | 72,747,225 | |
NOTE 4 — INVESTMENT MANAGEMENT AND ADMINISTRATIVE SERVICE FEES
The Portfolios have entered into an investment management agreement (“Investment Management Agreement”) with the Investment Adviser. The Investment Management Agreement compensates the Investment Adviser with an annual fee of 0.10% of each Portfolio’s average daily nets assets invested in affiliated Underlying Funds and 0.30% of each Portfolio’s average daily net assets invested in unaffiliated Underlying Funds and/or other investments.
The Investment Adviser has entered into a sub-advisory agreement with Voya IM. Subject to such policies as the Board or the Investment Adviser may determine, Voya IM manages the Portfolios’ assets in accordance with the Portfolios’ investment objectives, policies, and limitations.
The Administrator provides certain administrative and shareholder services necessary for each Portfolio’s operations and is responsible for the supervision of other service providers. For its services, the Administrator is entitled to receive from each Portfolio a fee at an annual rate of 0.10% of each Portfolio’s average daily net assets.
NOTE 5 — DISTRIBUTION AND SERVICE FEES
Classes ADV, S2 and T of the respective Portfolios have a plan of Distribution pursuant to Rule 12b-1 under the 1940 Act (the “12b-1 Plans”), whereby the Distributor is reimbursed or compensated by the Portfolios for expenses incurred in the distribution of each Portfolio’s shares (“Distribution Fees”). The Distributor may pay, on behalf of each Portfolio, out of its distribution fee, compensation to certain financial institutions for providing distribution assistance pursuant to a Distribution Services Agreement. Under the 12b-1 Plans, each Portfolio makes payments to the Distributor at an annual rate of 0.25%, 0.25% and 0.50% of each Portfolio’s average daily net assets attributable to its Class ADV, Class S2 and Class T shares, respectively. The Distributor has contractually agreed to waive a portion of its fee equal to 0.10% of each Portfolio’s average daily net assets attributable to the distribution fee paid by Class S2 shares, so that the actual fee paid is an annual rate of 0.15%. Termination or modification of this obligation requires approval by the Board. The Distributor has contractually agreed to waive a portion of this fee equal to 0.05% of each applicable Portfolio’s average daily net assets attributable to the distribution fee paid by Class T shares, so that the actual fee paid is an annual rate of 0.45%. Termination or modification of this obligation requires approval by the Board.
59
NOTES TO FINANCIAL STATEMENTS AS OF DECEMBER 31, 2014 (CONTINUED)
NOTE 5 — DISTRIBUTION AND SERVICE FEES (continued)
The Company has a Shareholder Servicing Plan (“Service Plan”) for the Classes ADV, S, S2 and T shares of each respective Portfolio. The Service Plan allows the Distributor to enter into shareholder servicing agreements with insurance companies, broker dealers or other financial intermediaries that provide administrative services related to Classes ADV, S, S2 and T shares and their shareholders including Variable Contract owners or Qualified Plan participants with interests in the Portfolios. Under the Service Plan, each Portfolio makes payments to the Distributor which shall not exceed an annual rate of 0.25% of each applicable Portfolio’s average daily net assets attributable to its Classes ADV, S, S2 and T shares.
NOTE 6 — OTHER TRANSACTIONS WITH AFFILIATES AND RELATED PARTIES
At December 31, 2014, the following direct or indirect, wholly-owned subsidiaries of Voya Financial, Inc. more than 5% of the following Portfolios:
Subsidiary
| | | | Portfolio
| | Percentage
|
|---|
| ReliaStar Life Insurance Company | | | | Solution 2030 | | | 9.71 | % |
| Voya Institutional Trust | | | | Solution Aggressive | | | 6.31 | |
| Company | | | | Solution Conservative | | | 5.62 | |
| | | | | Solution Income | | | 33.72 | |
| | | | | Solution 2015 | | | 25.70 | |
| | | | | Solution 2020 | | | 93.07 | |
| | | | | Solution 2025 | | | 25.50 | |
| | | | | Solution 2030 | | | 89.53 | |
| | | | | Solution 2035 | | | 25.59 | |
| | | | | Solution 2040 | | | 94.83 | |
| | | | | Solution 2045 | | | 23.10 | |
| | | | | Solution 2050 | | | 95.13 | |
| | | | | Solution 2055 | | | 19.10 | |
| Voya Retirement | | | | Solution Aggressive | | | 93.59 | |
| Insurance and Annuity | | | | Solution Balanced | | | 96.76 | |
| Company | | | | Solution Conservative | | | 94.36 | |
| | | | | Solution Income | | | 61.24 | |
| | | | | Solution Moderately Aggressive | | | 96.44 | |
| | | | | Solution Moderately Conservative | | | 96.62 | |
| | | | | Solution 2015 | | | 70.92 | |
| | | | | Solution 2025 | | | 72.18 | |
| | | | | Solution 2035 | | | 72.97 | |
| | | | | Solution 2045 | | | 75.97 | |
| | | | | Solution 2055 | | | 80.90 | |
Control is defined by the 1940 Act as the beneficial ownership, either directly or through one or more controlled companies, of more than 25% of the voting securities of a company. The 1940 Act defines affiliates as companies that are under common control. Therefore, if certain Portfolios have a common owner that owns over 25% of the outstanding securities of the Portfolios, they may be deemed to be affiliates of each other. Investment activities of these shareholders could have a material impact on the Portfolios.
The Portfolios have adopted a Deferred Compensation Plan (the “Plan”), which allows eligible non-affiliated directors, as described in the Plan, to defer the receipt of all or a portion of the directors’ fees that they are entitled to receive from the Portfolios. For purposes of determining the amount owed to the director under the Plan, the amounts deferred are invested in shares of the funds selected by the director (the “Notional Funds”). The Portfolios purchase shares of the Notional Funds, which are all advised by Voya Investments, in amounts equal to the directors’ deferred fees, resulting in a Portfolio asset equal to the deferred compensation liability. Such assets are included as a component of “Other assets” on the accompanying Statement of Assets and Liabilities. Deferral of directors’ fees under the Plan will not affect net assets of the Portfolio, and will not materially affect the Portfolios’ assets, liabilities or net investment income per share. Amounts will be deferred until distributed in accordance with the Plan.
For the year ended December 31, 2013, Voya Investments, LLC voluntarily reimbursed Solution 2020, Solution 2030, Solution 2040, and Solution 2050 $22, $33, $39, and $40, respectively, for the foregone investment opportunities attributable to uninvested cash.
NOTE 7 — OTHER ACCRUED EXPENSES AND LIABILITIES
At December 31, 2014, the following Portfolio had the below payables included in Other Accrued Expenses and Liabilities on the Statements of Assets and Liabilities that exceeded 5% of total liabilities:
Portfolio
| | | | Accrued Expense
| | Amount
|
|---|
| Solution Aggressive | | | | Offering Fee | | $ | 5,019 | |
| | | | | Miscellaneous | | | 1,329 | |
NOTE 8 — EXPENSE LIMITATION AGREEMENT
The Investment Adviser has entered into a written expense limitation agreement (“Expense Limitation Agreement”) with each Portfolio whereby the Investment Adviser has agreed to limit expenses, excluding interest, taxes, brokerage commissions, and extraordinary expenses to the levels listed below:
Portfolio(1)
| | | | Class ADV
| | Class I
| | Class S
| | Class S2
| | Class T
|
|---|
| Solution Aggressive | | | | | 1.39 | % | | | 0.89 | % | | | 1.14 | % | | | 1.29 | % | | | N/A | |
| Solution Balanced | | | | | 1.30 | % | | | 0.80 | % | | | 1.05 | % | | | 1.20 | % | | | N/A | |
| Solution Conservative | | | | | 1.16 | % | | | 0.66 | % | | | 0.91 | % | | | 1.06 | % | | | N/A | |
| Solution Income | | | | | 1.18 | % | | | 0.68 | % | | | 0.93 | % | | | 1.08 | % | | | 1.38 | % |
| Solution Moderately Aggressive | | | | | 1.38 | % | | | 0.88 | % | | | 1.13 | % | | | 1.28 | % | | | N/A | |
60
NOTES TO FINANCIAL STATEMENTS AS OF DECEMBER 31, 2014 (CONTINUED)
NOTE 8 — EXPENSE LIMITATION AGREEMENT (continued)
Portfolio(1)
| | | | Class ADV
| | Class I
| | Class S
| | Class S2
| | Class T
|
|---|
| Solution Moderately Conservative | | | | | 1.24 | % | | | 0.74 | % | | | 0.99 | % | | | 1.14 | % | | | N/A | |
| Solution 2015 | | | | | 1.23 | % | | | 0.73 | % | | | 0.98 | % | | | 1.13 | % | | | 1.43 | % |
| Solution 2020 | | | | | 1.26 | % | | | 0.76 | % | | | 1.01 | % | | | 1.16 | % | | | 1.46 | % |
| Solution 2025 | | | | | 1.30 | % | | | 0.80 | % | | | 1.05 | % | | | 1.20 | % | | | 1.50 | % |
| Solution 2030 | | | | | 1.33 | % | | | 0.83 | % | | | 1.08 | % | | | 1.23 | % | | | 1.53 | % |
| Solution 2035 | | | | | 1.37 | % | | | 0.87 | % | | | 1.12 | % | | | 1.27 | % | | | 1.57 | % |
| Solution 2040 | | | | | 1.38 | % | | | 0.88 | % | | | 1.13 | % | | | 1.28 | % | | | 1.58 | % |
| Solution 2045 | | | | | 1.39 | % | | | 0.89 | % | | | 1.14 | % | | | 1.29 | % | | | 1.59 | % |
| Solution 2050 | | | | | 1.39 | % | | | 0.89 | % | | | 1.14 | % | | | 1.29 | % | | | 1.59 | % |
| Solution 2055 | | | | | 1.39 | % | | | 0.89 | % | | | 1.14 | % | | | 1.29 | % | | | 1.59 | % |
(1) | | The operating expense limits take into account the operating expenses incurred at the Underlying Fund level. The amount of fees and expenses of an Underlying Fund borne by each Portfolio will vary based on each Portfolio’s allocation of assets to, and the net expenses of, a particular Underlying Fund. |
The Investment Adviser may at a later date recoup from a Portfolio for management fees waived and other expenses assumed by the Investment Adviser during the previous 36 months, but only if, after such recoupment, a Portfolio’s expense ratio does not exceed the percentage described above. Waived and reimbursed fees and any recoupment by the Investment Adviser of such waived and reimbursed fees are reflected on the accompanying Statements of Operations. Amounts payable by the Investment Adviser are reflected on the accompanying Statements of Assets and Liabilities.
As of December 31, 2014 the amounts of waived and reimbursed fees that are subject to possible recoupment by the Investment Adviser and the related expiration dates are as follows:
| | | | December 31,
| | | |
|---|
| | | | 2015
| | 2016
| | 2017
| | Total
|
|---|
| Solution Aggressive | | | | $ | — | | | $ | 24,058 | | | $ | 14,968 | | | $ | 39,026 | |
| Solution Balanced | | | | | 32,654 | | | | 73,602 | | | | 71,065 | | | | 177,321 | |
| Solution Conservative | | | | | 16,157 | | | | 40,923 | | | | 40,932 | | | | 98,012 | |
| Solution Income | | | | | 168,890 | | | | 235,643 | | | | 230,838 | | | | 635,371 | |
| Solution Moderately Aggressive | | | | | 22,326 | | | | 46,092 | | | | 38,312 | | | | 106,730 | |
| Solution Moderately Conservative | | | | | 33,212 | | | | 76,331 | | | | 60,329 | | | | 169,872 | |
| Solution 2015 | | | | | 585,477 | | | | 780,349 | | | | 612,476 | | | | 1,978,302 | |
| Solution 2020 | | | | | 7,886 | | | | 16,311 | | | | 14,049 | | | | 38,246 | |
| Solution 2025 | | | | | 949,131 | | | | 1,470,250 | | | | 1,358,078 | | | | 3,777,459 | |
| Solution 2030 | | | | $ | 7,463 | | | $ | 16,405 | | | $ | 13,791 | | | $ | 37,659 | |
| Solution 2035 | | | | | 821,484 | | | | 1,223,115 | | | | 936,968 | | | | 2,981,567 | |
| Solution 2040 | | | | | 8,107 | | | | 16,982 | | | | 13,435 | | | | 38,524 | |
| Solution 2045 | | | | | 538,375 | | | | 823,846 | | | | 473,742 | | | | 1,835,963 | |
| Solution 2050 | | | | | 7,517 | | | | 16,935 | | | | 13,226 | | | | 37,678 | |
| Solution 2055 | | | | | 38,939 | | | | 91,227 | | | | 84,591 | | | | 214,757 | |
The expense limitation agreement is contractual through May 1, 2018 for all Portfolios except Solution Aggressive, which is through May 1, 2015 and shall renew automatically for one-year terms. Termination or modification of this obligation requires approval by the Board.
NOTE 9 — LINE OF CREDIT
The Portfolios, in addition to certain other funds managed by the Investment Adviser, have entered into an unsecured committed revolving line of credit agreement (the “Credit Agreement”) with The Bank of New York Mellon for an aggregate amount of $200,000,000. The proceeds may be used only to: (1) temporarily finance the purchase and sale of securities; or (2) finance the redemption of shares of an investor in the funds. The funds to which the line of credit is available pay a commitment fee equal to 0.07% per annum on the daily unused portion of the committed line amount payable quarterly in arrears. Prior to May 23, 2014, the funds to which the Credit Agreement is available paid a commitment fee equal to 0.08% per annum on the daily unused portion of the committed line amount payable quarterly in arrears.
Borrowings under the Credit Agreement accrue interest at the federal funds rate plus a specified margin. Repayments generally must be made within 60 days after the date of a revolving credit advance.
The following Portfolios utilized the line of credit during the year ended December 31, 2014:
Portfolio
| | | | Days
Utilized
| | Approximate
Average
Daily Balance
For Days
Utilized
| | Approximate
Weighted
Average
Interest Rate
For Days
Utilized
|
|---|
| Solution 2015 | | | | | 1 | | | $ | 2,205,000 | | | | 1.09 | % |
| Solution 2025 | | | | | 2 | | | | 3,406,500 | | | | 1.09 | |
| Solution 2035 | | | | | 4 | | | | 2,013,000 | | | | 1.09 | |
| Solution Income | | | | | 1 | | | | 627,000 | | | | 1.09 | |
61
NOTES TO FINANCIAL STATEMENTS AS OF DECEMBER 31, 2014 (CONTINUED)
NOTE 10 — CAPITAL SHARES
Transactions in capital shares and dollars were as follows:
| | | | Shares
sold
| | Reinvestment
of
distributions
| | Shares
redeemed
| | Net
increase
(decrease)
in shares
outstanding
| | Shares
sold
| | Payment from
distribution
settlement
| | Reinvestment
of
distributions
| | Shares
redeemed
| | Net
increase
(decrease)
|
|---|
Year or
period ended
| | | | #
| | #
| | #
| | #
| | ($)
| | ($)
| | ($)
| | ($)
| | ($)
|
|---|
Solution Aggressive |
Class ADV |
| 12/31/2014 | | | | | 154,840 | | | | 1,280 | | | | (19,262 | ) | | | 136,858 | | | | 1,843,267 | | | | — | | | | 15,160 | | | | (228,253 | ) | | | 1,630,174 | |
5/1/2013(1)–12/31/2013 | | | | | 44,925 | | | | — | | | | (2,030 | ) | | | 42,895 | | | | 491,294 | | | | — | | | | — | | | | (21,791 | ) | | | 469,503 | |
Class I |
| 12/31/2014 | | | | | 682 | | | | 2 | | | | —* | | | | 684 | | | | 8,352 | | | | — | | | | 28 | | | | 30 | | | | 8,410 | |
5/1/2013(1)–12/31/2013 | | | | | 301 | | | | — | | | | — | | | | 301 | | | | 3,008 | | | | — | | | | — | | | | — | | | | 3,008 | |
Class S |
| 12/31/2014 | | | | | 85,782 | | | | 1,100 | | | | (23,639 | ) | | | 63,243 | | | | 1,009,337 | | | | — | | | | 13,128 | | | | (281,068 | ) | | | 741,397 | |
5/1/2013(1)–12/31/2013 | | | | | 51,038 | | | | — | | | | (195 | ) | | | 50,843 | | | | 569,036 | | | | — | | | | — | | | | (2,144 | ) | | | 566,892 | |
Class S2 |
| 12/31/2014 | | | | | 5,646 | | | | 32 | | | | (2,531 | ) | | | 3,147 | | | | 67,157 | | | | — | | | | 379 | | | | (29,247 | ) | | | 38,289 | |
5/1/2013(1)–12/31/2013 | | | | | 3,264 | | | | — | | | | (4 | ) | | | 3,260 | | | | 36,187 | | | | — | | | | — | | | | (44 | ) | | | 36,143 | |
Solution Balanced |
Class ADV |
| 12/31/2014 | | | | | 309,124 | | | | 225,452 | | | | (378,551 | ) | | | 156,025 | | | | 3,375,467 | | | | — | | | | 2,331,179 | | | | (4,140,741 | ) | | | 1,565,905 | |
| 12/31/2013 | | | | | 352,259 | | | | 111,292 | | | | (411,704 | ) | | | 51,847 | | | | 3,652,403 | | | | — | | | | 1,140,747 | | | | (4,306,587 | ) | | | 486,563 | |
Class I |
| 12/31/2014 | | | | | 2,118 | | | | 10 | | | | (110 | ) | | | 2,018 | | | | 23,017 | | | | — | | | | 101 | | | | (1,184 | ) | | | 21,934 | |
| 12/31/2013 | | | | | — | | | | — | | | | — | | | | — | | | | — | | | | — | | | | — | | | | — | | | | — | |
Class S |
| 12/31/2014 | | | | | 280,166 | | | | 187,383 | | | | (397,351 | ) | | | 70,198 | | | | 3,067,644 | | | | — | | | | 1,960,021 | | | | (4,431,354 | ) | | | 596,311 | |
| 12/31/2013 | | | | | 336,287 | | | | 87,810 | | | | (178,180 | ) | | | 245,917 | | | | 3,545,077 | | | | — | | | | 909,708 | | | | (1,863,817 | ) | | | 2,590,968 | |
Class S2 |
| 12/31/2014 | | | | | 12,219 | | | | 5,321 | | | | (55,416 | ) | | | (37,876 | ) | | | 133,065 | | | | — | | | | 55,554 | | | | (608,391 | ) | | | (419,772 | ) |
| 12/31/2013 | | | | | 13,687 | | | | 4,089 | | | | (20,322 | ) | | | (2,546 | ) | | | 142,375 | | | | — | | | | 42,197 | | | | (213,115 | ) | | | (28,543 | ) |
Solution Conservative |
Class ADV |
| 12/31/2014 | | | | | 151,604 | | | | 64,290 | | | | (133,750 | ) | | | 82,144 | | | | 1,736,213 | | | | — | | | | 712,338 | | | | (1,537,899 | ) | | | 910,652 | |
| 12/31/2013 | | | | | 212,483 | | | | 33,349 | | | | (144,810 | ) | | | 101,022 | | | | 2,421,270 | | | | — | | | | 370,166 | | | | (1,632,811 | ) | | | 1,158,625 | |
Class I |
| 12/31/2014 | | | | | 525 | | | | 21 | | | | —* | | | | 546 | | | | 5,943 | | | | — | | | | 241 | | | | —* | | | | 6,184 | |
| 12/31/2013 | | | | | — | | | | —* | | | | — | | | | —* | | | | — | | | | — | | | | 1 | | | | — | | | | 1 | |
Class S |
| 12/31/2014 | | | | | 95,898 | | | | 34,659 | | | | (144,688 | ) | | | (14,131 | ) | | | 1,111,927 | | | | — | | | | 386,107 | | | | (1,664,558 | ) | | | (166,524 | ) |
| 12/31/2013 | | | | | 131,519 | | | | 19,370 | | | | (82,815 | ) | | | 68,074 | | | | 1,503,773 | | | | — | | | | 216,169 | | | | (942,369 | ) | | | 777,573 | |
Class S2 |
| 12/31/2014 | | | | | 5,524 | | | | 1,870 | | | | (5,445 | ) | | | 1,949 | | | | 63,077 | | | | — | | | | 20,759 | | | | (61,852 | ) | | | 21,984 | |
| 12/31/2013 | | | | | 5,491 | | | | 940 | | | | (6,966 | ) | | | (535 | ) | | | 62,446 | | | | — | | | | 10,450 | | | | (79,095 | ) | | | (6,199 | ) |
Solution Income |
Class ADV |
| 12/31/2014 | | | | | 663,951 | | | | 177,552 | | | | (1,933,340 | ) | | | (1,091,837 | ) | | | 7,610,632 | | | | — | | | | 2,029,424 | | | | (22,271,265 | ) | | | (12,631,209 | ) |
| 12/31/2013 | | | | | 927,717 | | | | 286,685 | | | | (3,130,484 | ) | | | (1,916,082 | ) | | | 10,300,964 | | | | — | | | | 3,127,735 | | | | (34,812,141 | ) | | | (21,383,442 | ) |
Class I |
| 12/31/2014 | | | | | 675,323 | | | | 59,763 | | | | (947,414 | ) | | | (212,328 | ) | | | 7,947,689 | | | | — | | | | 696,238 | | | | (11,149,334 | ) | | | (2,505,407 | ) |
| 12/31/2013 | | | | | 728,298 | | | | 71,552 | | | | (916,798 | ) | | | (116,948 | ) | | | 8,219,647 | | | | — | | | | 796,375 | | | | (10,420,815 | ) | | | (1,404,793 | ) |
Class S |
| 12/31/2014 | | | | | 523,734 | | | | 130,555 | | | | (1,312,451 | ) | | | (658,162 | ) | | | 6,110,756 | | | | — | | | | 1,510,514 | | | | (15,226,445 | ) | | | (7,605,175 | ) |
| 12/31/2013 | | | | | 595,577 | | | | 205,291 | | | | (1,559,002 | ) | | | (758,134 | ) | | | 6,719,979 | | | | — | | | | 2,268,465 | | | | (17,474,328 | ) | | | (8,485,884 | ) |
Class S2 |
| 12/31/2014 | | | | | 97,794 | | | | 8,746 | | | | (207,263 | ) | | | (100,723 | ) | | | 1,117,962 | | | | — | | | | 99,007 | | | | (2,351,953 | ) | | | (1,134,984 | ) |
| 12/31/2013 | | | | | 158,903 | | | | 16,939 | | | | (248,605 | ) | | | (72,763 | ) | | | 1,732,865 | | | | — | | | | 182,935 | | | | (2,730,082 | ) | | | (814,282 | ) |
Class T |
| 12/31/2014 | | | | | 1,071 | | | | 205 | | | | (10,275 | ) | | | (8,999 | ) | | | 12,825 | | | | — | | | | 2,437 | | | | (122,215 | ) | | | (106,953 | ) |
| 12/31/2013 | | | | | 7,297 | | | | 713 | | | | (14,362 | ) | | | (6,352 | ) | �� | | 83,601 | | | | — | | | | 8,056 | | | | (162,973 | ) | | | (71,316 | ) |
62
NOTES TO FINANCIAL STATEMENTS AS OF DECEMBER 31, 2014 (CONTINUED)
NOTE 10 — CAPITAL SHARES (continued)
| | | | Shares
sold
| | Reinvestment
of
distributions
| | Shares
redeemed
| | Net
increase
(decrease)
in shares
outstanding
| | Shares
sold
| | Payment from
distribution
settlement
| | Reinvestment
of
distributions
| | Shares
redeemed
| | Net
increase
(decrease)
|
|---|
Year or
period ended
| | | | #
| | #
| | #
| | #
| | ($)
| | ($)
| | ($)
| | ($)
| | ($)
|
|---|
Solution Moderately Aggressive |
Class ADV |
| 12/31/2014 | | | | | 356,299 | | | | 125,179 | | | | (211,294 | ) | | | 270,184 | | | | 4,775,780 | | | | — | | | | 1,593,527 | | | | (2,805,589 | ) | | | 3,563,718 | |
| 12/31/2013 | | | | | 252,632 | | | | 57,128 | | | | (215,815 | ) | | | 93,945 | | | | 3,122,569 | | | | — | | | | 709,523 | | | | (2,740,881 | ) | | | 1,091,211 | |
Class I |
| 12/31/2014 | | | | | 4,418 | | | | 28 | | | | (487 | ) | | | 3,959 | | | | 58,536 | | | | — | | | | 360 | | | | (6,395 | ) | | | 52,501 | |
| 12/31/2013 | | | | | — | | | | —* | | | | — | | | | —* | | | | — | | | | — | | | | 1 | | | | — | | | | 1 | |
Class S |
| 12/31/2014 | | | | | 179,296 | | | | 79,409 | | | | (278,237 | ) | | | (19,532 | ) | | | 2,401,872 | | | | — | | | | 1,018,024 | | | | (3,738,911 | ) | | | (319,015 | ) |
| 12/31/2013 | | | | | 204,238 | | | | 38,023 | | | | (153,962 | ) | | | 88,299 | | | | 2,550,378 | | | | — | | | | 474,532 | | | | (1,925,635 | ) | | | 1,099,275 | |
Class S2 |
| 12/31/2014 | | | | | 43,302 | | | | 5,100 | | | | (8,018 | ) | | | 40,384 | | | | 580,968 | | | | — | | | | 65,384 | | | | (105,838 | ) | | | 540,514 | |
| 12/31/2013 | | | | | 13,500 | | | | 425 | | | | (104 | ) | | | 13,821 | | | | 175,608 | | | | — | | | | 5,318 | | | | (1,333 | ) | | | 179,593 | |
Solution Moderately Conservative |
Class ADV |
| 12/31/2014 | | | | | 404,547 | | | | 167,450 | | | | (530,499 | ) | | | 41,498 | | | | 4,358,637 | | | | — | | | | 1,723,067 | | | | (5,705,865 | ) | | | 375,839 | |
| 12/31/2013 | | | | | 425,960 | | | | 111,969 | | | | (660,375 | ) | | | (122,446 | ) | | | 4,517,278 | | | | — | | | | 1,159,996 | | | | (7,018,049 | ) | | | (1,340,775 | ) |
Class I |
| 12/31/2014 | | | | | 3,966 | | | | 9 | | | | (681 | ) | | | 3,294 | | | | 43,084 | | | | — | | | | 95 | | | | (7,291 | ) | | | 35,888 | |
| 12/31/2013 | | | | | — | | | | — | | | | — | | | | — | | | | — | | | | — | | | | — | | | | — | | | | — | |
Class S |
| 12/31/2014 | | | | | 306,420 | | | | 177,037 | | | | (572,181 | ) | | | (88,724 | ) | | | 3,347,877 | | | | — | | | | 1,857,121 | | | | (6,270,232 | ) | | | (1,065,234 | ) |
| 12/31/2013 | | | | | 323,583 | | | | 112,697 | | | | (389,561 | ) | | | 46,719 | | | | 3,514,968 | | | | — | | | | 1,187,823 | | | | (4,240,036 | ) | | | 462,755 | |
Class S2 |
| 12/31/2014 | | | | | 24,148 | | | | 5,580 | | | | (10,878 | ) | | | 18,850 | | | | 255,891 | | | | — | | | | 58,087 | | | | (116,498 | ) | | | 197,480 | |
| 12/31/2013 | | | | | 11,953 | | | | 3,215 | | | | (21,455 | ) | | | (6,287 | ) | | | 128,663 | | | | — | | | | 33,690 | | | | (232,555 | ) | | | (70,202 | ) |
Solution 2015 |
Class ADV |
| 12/31/2014 | | | | | 1,142,819 | | | | 590,401 | | | | (6,212,360 | ) | | | (4,479,140 | ) | | | 13,739,512 | | | | — | | | | 7,043,480 | | | | (74,906,289 | ) | | | (54,123,297 | ) |
| 12/31/2013 | | | | | 2,171,667 | | | | 752,423 | | | | (6,131,935 | ) | | | (3,207,845 | ) | | | 25,137,826 | | | | — | | | | 8,577,618 | | | | (70,791,647 | ) | | | (37,076,203 | ) |
Class I |
| 12/31/2014 | | | | | 2,259,311 | | | | 255,282 | | | | (3,830,740 | ) | | | (1,316,147 | ) | | | 27,758,553 | | | | — | | | | 3,099,121 | | | | (47,259,279 | ) | | | (16,401,605 | ) |
| 12/31/2013 | | | | | 2,037,713 | | | | 275,184 | | | | (3,620,000 | ) | | | (1,307,103 | ) | | | 23,912,360 | | | | — | | | | 3,194,885 | | | | (42,815,574 | ) | | | (15,708,329 | ) |
Class S |
| 12/31/2014 | | | | | 1,252,779 | | | | 661,317 | | | | (5,445,956 | ) | | | (3,531,860 | ) | | | 15,304,402 | | | | — | | | | 7,975,475 | | | | (66,064,692 | ) | | | (42,784,815 | ) |
| 12/31/2013 | | | | | 1,606,865 | | | | 815,620 | | | | (6,795,393 | ) | | | (4,372,908 | ) | | | 18,816,939 | | | | — | | | | 9,404,098 | | | | (79,360,617 | ) | | | (51,139,580 | ) |
Class S2 |
| 12/31/2014 | | | | | 277,471 | | | | 46,503 | | | | (918,979 | ) | | | (595,005 | ) | | | 3,290,772 | | | | — | | | | 547,332 | | | | (10,968,043 | ) | | | (7,129,939 | ) |
| 12/31/2013 | | | | | 340,610 | | | | 62,749 | | | | (803,221 | ) | | | (399,862 | ) | | | 3,865,295 | | | | — | | | | 706,549 | | | | (9,167,886 | ) | | | (4,596,042 | ) |
Class T |
| 12/31/2014 | | | | | 8,644 | | | | 2,928 | | | | (83,992 | ) | | | (72,420 | ) | | | 106,245 | | | | — | | | | 35,517 | | | | (1,019,986 | ) | | | (878,224 | ) |
| 12/31/2013 | | | | | 18,066 | | | | 5,021 | | | | (82,119 | ) | | | (59,032 | ) | | | 212,556 | | | | — | | | | 58,040 | | | | (959,370 | ) | | | (688,774 | ) |
Solution 2020 |
Class ADV |
| 12/31/2014 | | | | | 48,923 | | | | 159 | | | | (307 | ) | | | 48,775 | | | | 612,209 | | | | — | | | | 2,004 | | | | (3,935 | ) | | | 610,278 | |
| 12/31/2013 | | | | | — | | | | —* | | | | — | | | | —* | | | | — | | | | 4 | | | | 1 | | | | — | | | | 5 | |
Class I |
| 12/31/2014 | | | | | — | | | | 1 | | | | — | | | | 1 | | | | — | | | | — | | | | 11 | | | | — | | | | 11 | |
| 12/31/2013 | | | | | — | | | | —* | | | | — | | | | —* | | | | — | | | | 4 | | | | 2 | | | | — | | | | 6 | |
Class S |
| 12/31/2014 | | | | | — | | | | 1 | | | | — | | | | 1 | | | | — | | | | — | | | | 11 | | | | — | | | | 11 | |
| 12/31/2013 | | | | | — | | | | —* | | | | — | | | | —* | | | | — | | | | 5 | | | | 1 | | | | — | | | | 6 | |
Class S2 |
| 12/31/2014 | | | | | — | | | | 1 | | | | — | | | | 1 | | | | — | | | | — | | | | 11 | | | | — | | | | 11 | |
| 12/31/2013 | | | | | — | | | | —* | | | | — | | | | —* | | | | — | | | | 4 | | | | 1 | | | | — | | | | 5 | |
Class T |
| 12/31/2014 | | | | | — | | | | 1 | | | | — | | | | 1 | | | | — | | | | — | | | | 12 | | | | — | | | | 12 | |
| 12/31/2013 | | | | | — | | | | —* | | | | — | | | | —* | | | | — | | | | 5 | | | | 1 | | | | — | | | | 6 | |
63
NOTES TO FINANCIAL STATEMENTS AS OF DECEMBER 31, 2014 (CONTINUED)
NOTE 10 — CAPITAL SHARES (continued)
| | | | Shares
sold
| | Reinvestment
of
distributions
| | Shares
redeemed
| | Net
increase
(decrease)
in shares
outstanding
| | Shares
sold
| | Payment from
distribution
settlement
| | Reinvestment
of
distributions
| | Shares
redeemed
| | Net
increase
(decrease)
|
|---|
Year or
period ended
| | | | #
| | #
| | #
| | #
| | ($)
| | ($)
| | ($)
| | ($)
| | ($)
|
|---|
Solution 2025 |
Class ADV |
| 12/31/2014 | | | | | 2,231,249 | | | | 2,365,187 | | | | (8,995,769 | ) | | | (4,399,333 | ) | | | 29,044,488 | | | | — | | | | 29,777,701 | | | | (118,304,500 | ) | | | (59,482,311 | ) |
| 12/31/2013 | | | | | 3,232,021 | | | | 807,229 | | | | (8,816,697 | ) | | | (4,777,447 | ) | | | 39,595,318 | | | | — | | | | 9,920,848 | | | | (108,594,567 | ) | | | (59,078,401 | ) |
Class I |
| 12/31/2014 | | | | | 5,476,228 | | | | 1,262,725 | | | | (8,596,798 | ) | | | (1,857,845 | ) | | | 73,210,248 | | | | — | | | | 16,226,007 | | | | (114,659,726 | ) | | | (25,223,471 | ) |
| 12/31/2013 | | | | | 4,358,700 | | | | 384,819 | | | | (4,136,505 | ) | | | 607,014 | | | | 54,751,536 | | | | — | | | | 4,821,781 | | | | (51,891,349 | ) | | | 7,681,968 | |
Class S |
| 12/31/2014 | | | | | 2,279,513 | | | | 2,647,318 | | | | (7,601,495 | ) | | | (2,674,664 | ) | | | 30,203,403 | | | | — | | | | 33,726,829 | | | | (99,848,972 | ) | | | (35,918,740 | ) |
| 12/31/2013 | | | | | 3,227,161 | | | | 952,920 | | | | (8,165,989 | ) | | | (3,985,908 | ) | | | 40,157,784 | | | | — | | | | 11,844,793 | | | | (101,767,397 | ) | | | (49,764,820 | ) |
Class S2 |
| 12/31/2014 | | | | | 390,863 | | | | 186,394 | | | | (1,007,792 | ) | | | (430,535 | ) | | | 4,991,097 | | | | — | | | | 2,322,472 | | | | (13,209,698 | ) | | | (5,896,129 | ) |
| 12/31/2013 | | | | | 527,019 | | | | 70,011 | | | | (1,198,054 | ) | | | (601,024 | ) | | | 6,339,632 | | | | — | | | | 852,034 | | | | (14,447,278 | ) | | | (7,255,612 | ) |
Class T |
| 12/31/2014 | | | | | 33,371 | | | | 15,933 | | | | (207,881 | ) | | | (158,577 | ) | | | 452,968 | | | | — | | | | 204,414 | | | | (2,665,283 | ) | | | (2,007,901 | ) |
| 12/31/2013 | | | | | 42,486 | | | | 3,955 | | | | (55,638 | ) | | | (9,197 | ) | | | 529,763 | | | | — | | | | 49,517 | | | | (691,880 | ) | | | (112,600 | ) |
Solution 2030 |
Class ADV |
| 12/31/2014 | | | | | 19,829 | | | | 169 | | | | (9,062 | ) | | | 10,936 | | | | 267,213 | | | | — | | | | 2,303 | | | | (127,607 | ) | | | 141,909 | |
| 12/31/2013 | | | | | — | | | | —* | | | | — | | | | —* | | | | — | | | | 6 | | | | 1 | | | | — | | | | 7 | |
Class I |
| 12/31/2014 | | | | | — | | | | 2 | | | | — | | | | 2 | | | | — | | | | — | | | | 30 | | | | — | | | | 30 | |
| 12/31/2013 | | | | | — | | | | —* | | | | — | | | | —* | | | | — | | | | 6 | | | | 2 | | | | — | | | | 8 | |
Class S |
| 12/31/2014 | | | | | — | | | | 2 | | | | — | | | | 2 | | | | — | | | | — | | | | 31 | | | | — | | | | 31 | |
| 12/31/2013 | | | | | — | | | | —* | | | | — | | | | —* | | | | — | | | | 7 | | | | 1 | | | | — | | | | 8 | |
Class S2 |
| 12/31/2014 | | | | | — | | | | 2 | | | | — | | | | 2 | | | | — | | | | — | | | | 31 | | | | — | | | | 31 | |
| 12/31/2013 | | | | | — | | | | —* | | | | — | | | | —* | | | | — | | | | 7 | | | | 1 | | | | — | | | | 8 | |
Class T |
| 12/31/2014 | | | | | — | | | | 2 | | | | — | | | | 2 | | | | — | | | | — | | | | 30 | | | | — | | | | 30 | |
| 12/31/2013 | | | | | — | | | | —* | | | | — | | | | —* | | | | — | | | | 7 | | | | 1 | | | | — | | | | 8 | |
Solution 2035 |
Class ADV |
| 12/31/2014 | | | | | 1,744,453 | | | | 3,030,633 | | | | (7,862,097 | ) | | | (3,087,011 | ) | | | 24,110,514 | | | | — | | | | 39,277,002 | | | | (108,687,237 | ) | | | (45,299,721 | ) |
| 12/31/2013 | | | | | 2,004,753 | | | | 513,614 | | | | (6,904,983 | ) | | | (4,386,616 | ) | | | 25,600,087 | | | | — | | | | 6,666,711 | | | | (89,299,773 | ) | | | (57,032,975 | ) |
Class I |
| 12/31/2014 | | | | | 5,425,725 | | | | 1,789,783 | | | | (5,971,308 | ) | | | 1,244,200 | | | | 75,880,127 | | | | — | | | | 23,660,926 | | | | (83,373,140 | ) | | | 16,167,913 | |
| 12/31/2013 | | | | | 3,938,288 | | | | 283,826 | | | | (3,521,070 | ) | | | 701,044 | | | | 51,807,591 | | | | — | | | | 3,752,173 | | | | (45,909,900 | ) | | | 9,649,864 | |
Class S |
| 12/31/2014 | | | | | 1,961,410 | | | | 3,404,711 | | | | (7,389,232 | ) | | | (2,023,111 | ) | | | 27,216,748 | | | | — | | | | 44,635,757 | | | | (102,662,482 | ) | | | (30,809,977 | ) |
| 12/31/2013 | | | | | 2,935,185 | | | | 686,212 | | | | (7,463,505 | ) | | | (3,842,108 | ) | | | 38,341,213 | | | | — | | | | 9,003,102 | | | | (98,167,363 | ) | | | (50,823,048 | ) |
Class S2 |
| 12/31/2014 | | | | | 401,603 | | | | 251,203 | | | | (756,733 | ) | | | (103,927 | ) | | | 5,348,909 | | | | — | | | | 3,202,845 | | | | (10,410,085 | ) | | | (1,858,331 | ) |
| 12/31/2013 | | | | | 408,437 | | | | 44,382 | | | | (1,099,623 | ) | | | (646,804 | ) | | | 5,137,234 | | | | — | | | | 568,093 | | | | (13,846,738 | ) | | | (8,141,411 | ) |
Class T |
| 12/31/2014 | | | | | 39,474 | | | | 17,254 | | | | (126,143 | ) | | | (69,415 | ) | | | 568,584 | | | | — | | | | 228,444 | | | | (1,664,992 | ) | | | (867,964 | ) |
| 12/31/2013 | | | | | 29,097 | | | | 2,541 | | | | (111,159 | ) | | | (79,521 | ) | | | 379,575 | | | | — | | | | 33,612 | | | | (1,488,549 | ) | | | (1,075,362 | ) |
Solution 2040 |
Class ADV |
| 12/31/2014 | | | | | 55,828 | | | | 186 | | | | (9,235 | ) | | | 46,779 | | | | 802,761 | | | | — | | | | 2,713 | | | | (136,869 | ) | | | 668,605 | |
| 12/31/2013 | | | | | — | | | | —* | | | | — | | | | —* | | | | — | | | | 7 | | | | 1 | | | | — | | | | 8 | |
Class I |
| 12/31/2014 | | | | | — | | | | 1 | | | | — | | | | 1 | | | | — | | | | — | | | | 17 | | | | — | | | | 17 | |
| 12/31/2013 | | | | | — | | | | —* | | | | — | | | | —* | | | | — | | | | 8 | | | | 2 | | | | — | | | | 10 | |
Class S |
| 12/31/2014 | | | | | — | | | | 1 | | | | — | | | | 1 | | | | — | | | | — | | | | 16 | | | | — | | | | 16 | |
| 12/31/2013 | | | | | — | | | | —* | | | | — | | | | —* | | | | — | | | | 8 | | | | 1 | | | | — | | | | 9 | |
64
NOTES TO FINANCIAL STATEMENTS AS OF DECEMBER 31, 2014 (CONTINUED)
NOTE 10 — CAPITAL SHARES (continued)
| | | | Shares
sold
| | Reinvestment
of
distributions
| | Shares
redeemed
| | Net
increase
(decrease)
in shares
outstanding
| | Shares
sold
| | Payment from
distribution
settlement
| | Reinvestment
of
distributions
| | Shares
redeemed
| | Net
increase
(decrease)
|
|---|
Year or
period ended
| | | | #
| | #
| | #
| | #
| | ($)
| | ($)
| | ($)
| | ($)
| | ($)
|
|---|
Solution 2040 (continued) |
Class S2 |
| 12/31/2014 | | | | | — | | | | 1 | | | | — | | | | 1 | | | | — | | | | — | | | | 16 | | | | — | | | | 16 | |
| 12/31/2013 | | | | | — | | | | —* | | | | — | | | | —* | | | | — | | | | 8 | | | | 1 | | | | — | | | | 9 | |
Class T |
| 12/31/2014 | | | | | — | | | | 1 | | | | — | | | | 1 | | | | — | | | | — | | | | 17 | | | | — | | | | 17 | |
| 12/31/2013 | | | | | — | | | | —* | | | | — | | | | —* | | | | — | | | | 8 | | | | 1 | | | | — | | | | 9 | |
Solution 2045 |
Class ADV |
| 12/31/2014 | | | | | 1,421,478 | | | | 2,191,746 | | | | (4,449,138 | ) | | | (835,914 | ) | | | 20,282,717 | | | | — | | | | 29,128,306 | | | | (63,324,912 | ) | | | (13,913,889 | ) |
| 12/31/2013 | | | | | 1,702,360 | | | | 255,220 | | | | (3,675,388 | ) | | | (1,717,808 | ) | | | 22,306,689 | | | | — | | | | 3,425,051 | | | | (48,938,366 | ) | | | (23,206,626 | ) |
Class I |
| 12/31/2014 | | | | | 4,631,246 | | | | 1,541,633 | | | | (5,193,702 | ) | | | 979,177 | | | | 67,357,973 | | | | — | | | | 20,904,540 | | | | (75,567,806 | ) | | | 12,694,707 | |
| 12/31/2013 | | | | | 3,213,384 | | | | 171,937 | | | | (2,905,251 | ) | | | 480,070 | | | | 43,509,848 | | | | — | | | | 2,348,659 | | | | (38,262,384 | ) | | | 7,596,123 | |
Class S |
| 12/31/2014 | | | | | 1,541,939 | | | | 2,649,762 | | | | (6,124,054 | ) | | | (1,932,353 | ) | | | 22,188,855 | | | | — | | | | 35,586,304 | | | | (88,338,311 | ) | | | (30,563,152 | ) |
| 12/31/2013 | | | | | 2,586,637 | | | | 415,872 | | | | (5,075,113 | ) | | | (2,072,604 | ) | | | 34,565,178 | | | | — | | | | 5,630,912 | | | | (69,154,065 | ) | | | (28,957,975 | ) |
Class S2 |
| 12/31/2014 | | | | | 330,210 | | | | 165,692 | | | | (443,661 | ) | | | 52,241 | | | | 4,621,951 | | | | — | | | | 2,183,817 | | | | (6,389,684 | ) | | | 416,084 | |
| 12/31/2013 | | | | | 271,223 | | | | 20,698 | | | | (798,953 | ) | | | (507,032 | ) | | | 3,527,530 | | | | — | | | | 275,701 | | | | (10,398,224 | ) | | | (6,594,993 | ) |
Class T |
| 12/31/2014 | | | | | 20,235 | | | | 9,827 | | | | (75,284 | ) | | | (45,222 | ) | | | 302,640 | | | | — | | | | 132,466 | | | | (1,024,896 | ) | | | (589,790 | ) |
| 12/31/2013 | | | | | 18,614 | | | | 828 | | | | (24,290 | ) | | | (4,848 | ) | | | 246,076 | | | | — | | | | 11,246 | | | | (329,676 | ) | | | (72,354 | ) |
Solution 2050 |
Class ADV |
| 12/31/2014 | | | | | 23,835 | | | | 186 | | | | (569 | ) | | | 23,452 | | | | 343,577 | | | | — | | | | 2,715 | | | | (8,517 | ) | | | 337,775 | |
| 12/31/2013 | | | | | — | | | | —* | | | | — | | | | —* | | | | — | | | | 8 | | | | 1 | | | | — | | | | 9 | |
Class I |
| 12/31/2014 | | | | | — | | | | 2 | | | | — | | | | 2 | | | | — | | | | — | | | | 33 | | | | — | | | | 33 | |
| 12/31/2013 | | | | | — | | | | —* | | | | — | | | | —* | | | | — | | | | 8 | | | | 1 | | | | — | | | | 9 | |
Class S |
| 12/31/2014 | | | | | — | | | | 2 | | | | — | | | | 2 | | | | — | | | | — | | | | 34 | | | | — | | | | 34 | |
| 12/31/2013 | | | | | — | | | | —* | | | | — | | | | —* | | | | — | | | | 8 | | | | 1 | | | | — | | | | 9 | |
Class S2 |
| 12/31/2014 | | | | | — | | | | 2 | | | | — | | | | 2 | | | | — | | | | — | | | | 33 | | | | — | | | | 33 | |
| 12/31/2013 | | | | �� | — | | | | —* | | | | — | | | | —* | | | | — | | | | 8 | | | | 1 | | | | — | | | | 9 | |
Class T |
| 12/31/2014 | | | | | — | | | | 2 | | | | — | | | | 2 | | | | — | | | | — | | | | 33 | | | | — | | | | 33 | |
| 12/31/2013 | | | | | — | | | | —* | | | | — | | | | —* | | | | — | | | | 8 | | | | 1 | | | | — | | | | 9 | |
Solution 2055 |
Class ADV |
| 12/31/2014 | | | | | 789,420 | | | | 188,455 | | | | (640,060 | ) | | | 337,815 | | | | 11,381,547 | | | | — | | | | 2,625,177 | | | | (9,240,921 | ) | | | 4,765,803 | |
| 12/31/2013 | | | | | 1,002,890 | | | | 56,694 | | | | (349,329 | ) | | | 710,255 | | | | 13,166,347 | | | | — | | | | 755,734 | | | | (4,663,446 | ) | | | 9,258,635 | |
Class I |
| 12/31/2014 | | | | | 1,276,229 | | | | 110,212 | | | | (832,392 | ) | | | 554,049 | | | | 18,577,926 | | | | — | | | | 1,555,089 | | | | (12,432,533 | ) | | | 7,700,482 | |
| 12/31/2013 | | | | | 751,645 | | | | 25,099 | | | | (279,687 | ) | | | 497,057 | | | | 10,096,057 | | | | — | | | | 338,083 | | | | (3,696,402 | ) | | | 6,737,738 | |
Class S |
| 12/31/2014 | | | | | 960,371 | | | | 195,311 | | | | (737,606 | ) | | | 418,076 | | | | 13,967,923 | | | | — | | | | 2,736,305 | | | | (10,611,072 | ) | | | 6,093,156 | |
| 12/31/2013 | | | | | 1,198,793 | | | | 64,398 | | | | (496,546 | ) | | | 766,645 | | | | 16,025,088 | | | | — | | | | 862,941 | | | | (6,682,103 | ) | | | 10,205,926 | |
Class S2 |
| 12/31/2014 | | | | | 110,096 | | | | 12,855 | | | | (63,468 | ) | | | 59,483 | | | | 1,580,844 | | | | — | | | | 179,451 | | | | (907,693 | ) | | | 852,602 | |
| 12/31/2013 | | | | | 116,400 | | | | 3,223 | | | | (71,632 | ) | | | 47,991 | | | | 1,532,819 | | | | — | | | | 43,055 | | | | (944,461 | ) | | | 631,413 | |
Class T |
| 12/31/2014 | | | | | 11,983 | | | | 250 | | | | (16,576 | ) | | | (4,343 | ) | | | 170,103 | | | | — | | | | 3,479 | | | | (232,135 | ) | | | (58,553 | ) |
| 12/31/2013 | | | | | 4,505 | | | | 52 | | | | (815 | ) | | | 3,742 | | | | 60,947 | | | | — | | | | 701 | | | | (11,011 | ) | | | 50,637 | |
| (1) | | Commencement of operations. |
| * | | Share amount is less than 0.500 per share or $0.50. |
65
NOTES TO FINANCIAL STATEMENTS AS OF DECEMBER 31, 2014 (CONTINUED)
NOTE 11 — FEDERAL INCOME TAXES
The amount of distributions from net investment income and net realized capital gains are determined in accordance with federal income tax regulations, which may differ from U.S. GAAP for investment companies. These book/tax differences may be either temporary or permanent. Permanent differences are reclassified within the capital accounts based on their federal tax-basis treatment; temporary differences are not reclassified. Key differences include the treatment of short-term capital gains, foreign currency transactions, and wash sale deferrals. Distributions in excess of net investment income and/or net realized capital gains for tax purposes are reported as return of capital.
The following permanent tax differences have been reclassified as of December 31, 2014(1):
| | | | Undistributed Net
Investment Income
| | Accumulated
Net Realized
Gains/(Losses)
|
|---|
| Solution Aggressive | | | | $ | 72,090 | | | $ | (72,090 | ) |
| Solution Balanced | | | | | 794,457 | | | | (794,457 | ) |
| Solution Conservative | | | | | 141,788 | | | | (141,788 | ) |
| Solution Income | | | | | 1,510,626 | | | | (1,510,626 | ) |
| Solution Moderately Aggressive | | | | | 617,387 | | | | (617,387 | ) |
| Solution Moderately Conservative | | | | | 515,442 | | | | (515,442 | ) |
| Solution 2015 | | | | | 6,576,944 | | | | (6,576,944 | ) |
| Solution 2020 | | | | | 8,458 | | | | (8,458 | ) |
| Solution 2025 | | | | | 19,581,816 | | | | (19,581,816 | ) |
| Solution 2030 | | | | | 3,564 | | | | (3,564 | ) |
| Solution 2035 | | | | | 19,483,545 | | | | (19,483,545 | ) |
| Solution 2040 | | | | | 14,035 | | | | (14,035 | ) |
| Solution 2045 | | | | | 15,084,422 | | | | (15,084,422 | ) |
| Solution 2050 | | | | | 7,289 | | | | (7,289 | ) |
| Solution 2055 | | | | | 2,199,811 | | | | (2,199,811 | ) |
(1) | | Amounts primarily relate to the treatment of short-term capital gains as ordinary income for tax purposes. |
Dividends paid by the Portfolios from net investment income and distributions of net realized short-term capital gains are, for federal income tax purposes, taxable as ordinary income to shareholders.
The tax composition of dividends and distributions to shareholders was as follows:
| | | | Year Ended December 31, 2014
| | Year Ended December 31, 2013
| |
|---|
| | | | Ordinary
Income
| | Long-term
Capital Gains
| | Ordinary
Income
| | Long-term
Capital Gains
|
|---|
| Solution Aggressive | | | | $ | 17,859 | | | $ | 10,836 | | | $ | — | | | $ | — | |
| Solution Balanced | | | | | 1,836,209 | | | | 2,510,646 | | | | 1,424,298 | | | | 668,403 | |
| Solution Conservative | | | | | 651,677 | | | | 467,767 | | | | 507,457 | | | | 89,460 | |
| Solution Income | | | | | 4,337,620 | | | | — | | | | 6,383,566 | | | | — | |
| Solution Moderately Aggressive | | | | | 982,421 | | | | 1,694,873 | | | | 699,936 | | | | 489,621 | |
| Solution Moderately Conservative | | | | | 1,919,034 | | | | 1,719,336 | | | | 1,901,652 | | | | 479,918 | |
| Solution 2015 | | | | | 14,913,684 | | | | 3,787,241 | | | | 21,941,190 | | | | — | |
| Solution 2020 | | | | | 599 | | | | 1,450 | | | | 1,518 | | | | 124 | |
| Solution 2025 | | | | | 23,455,600 | | | | 58,801,823 | | | | 27,488,973 | | | | — | |
| Solution 2030 | | | | | 721 | | | | 1,706 | | | | 1,447 | | | | 172 | |
| Solution 2035 | | | | | 23,445,726 | | | | 87,559,248 | | | | 20,023,691 | | | | — | |
| Solution 2040 | | | | | 701 | | | | 2,078 | | | | 1,444 | | | | 214 | |
| Solution 2045 | | | | | 17,516,559 | | | | 70,418,874 | | | | 11,691,569 | | | | — | |
| Solution 2050 | | | | | 660 | | | | 2,188 | | | | 1,403 | | | | 217 | |
| Solution 2055 | | | | | 2,587,997 | | | | 4,511,504 | | | | 1,183,850 | | | | 816,773 | |
The tax-basis components of distributable earnings as of December 31, 2014 were:
| | | | Undistributed
Ordinary
Income
| | Undistributed
Long-term
Capital Gains
| | Unrealized
Appreciation/
(Depreciation)
|
|---|
| Solution Aggressive | | | | $ | 130,364 | | | $ | 159,230 | | | $ | (118,686 | ) |
| Solution Balanced | | | | | 1,901,143 | | | | 3,609,044 | | | | 1,271,680 | |
| Solution Conservative | | | | | 583,985 | | | | 396,930 | | | | (360,642 | ) |
| Solution Income | | | | | 4,158,256 | | | | 5,617,277 | | | | (338,737 | ) |
66
NOTES TO FINANCIAL STATEMENTS AS OF DECEMBER 31, 2014 (CONTINUED)
NOTE 11 — FEDERAL INCOME TAXES (continued)
| | | | Undistributed
Ordinary
Income
| | Undistributed
Long-term
Capital Gains
| | Unrealized
Appreciation/
(Depreciation)
|
|---|
| Solution Moderately Aggressive | | | | $ | 1,265,775 | | | $ | 2,869,017 | | | $ | 737,985 | |
| Solution Moderately Conservative | | | | | 1,574,841 | | | | 2,119,087 | | | | (38,159 | ) |
| Solution 2015 | | | | | 20,584,530 | | | | 29,768,687 | | | | 819,095 | |
| Solution 2020 | | | | | 15,748 | | | | 18,493 | | | | (12,431 | ) |
| Solution 2025 | | | | | 43,842,076 | | | | 99,600,233 | | | | 36,145,048 | |
| Solution 2030 | | | | | 8,840 | | | | 11,435 | | | | (3,726 | ) |
| Solution 2035 | | | | | 41,924,149 | | | | 105,961,946 | | | | 42,734,835 | |
| Solution 2040 | | | | | 24,128 | | | | 33,990 | | | | (22,676 | ) |
| Solution 2045 | | | | | 30,752,552 | | | | 92,861,101 | | | | 32,918,967 | |
| Solution 2050 | | | | | 10,784 | | | | 19,352 | | | | (9,778 | ) |
| Solution 2055 | | | | | 4,298,030 | | | | 10,297,388 | | | | 1,169,181 | |
At December 31, 2014, the Portfolios did not have any capital loss carryovers for U.S. federal income tax purposes.
The Portfolios’ major tax jurisdictions are U.S. federal and Arizona. The earliest tax year that remains subject to examination by these jurisdictions is 2010.
As of December 31, 2014, no provision for income tax is required in the Portfolios’ financial statements as a result of tax positions taken on federal and state income tax returns for open tax years. The Portfolios’ federal and state income and federal excise tax returns for tax years for which the applicable statutes of limitations have not expired are subject to examination by the Internal Revenue Service and state department of revenue.
NOTE 12 — CONCENTRATION OF INVESTMENT RISK
All mutual funds involve risk — some more than others — and there is always the chance that you could lose money or not earn as much as you hope. Each Portfolio’s risk profile is largely a factor of the principal securities in which it invests and investment techniques that it uses. For more information regarding the types of securities and investment techniques that may be used by each Portfolio and its corresponding risks, see the Portfolios’ most recent Prospectus and/or the Statement of Additional Information.
The Portfolios are also affected by other kinds of risks, depending on the types of securities held or strategies used by an Underlying Fund.
Asset Allocation. Assets will be allocated among Underlying Funds and markets based on judgments by the Investment Adviser or Sub-Adviser. There is a risk that the Portfolios may allocate assets to an Underlying Fund or market that underperforms other funds or asset classes.
Foreign Securities. Investments in foreign (non-U.S.) securities may entail risks not present in domestic investments. Since securities in which an Underlying Fund may invest are denominated in foreign currencies, changes in the relationship of these foreign currencies to the U.S. dollar can significantly affect the value of the investments and earnings of the Underlying Funds. Foreign investments may also subject the Underlying Funds to foreign government exchange restrictions, expropriation, taxation or other political, social or economic developments, as well as changes vis-à-vis the U.S. dollar from movements in currency, and changes in security value and interest rate, all of which could affect the market and/or credit risk of the Underlying Funds’ investments.
NOTE 13 — RESTRUCTURING PLAN
In October 2009, ING Groep N.V. (“ING Groep”) submitted a restructuring plan (the “Restructuring Plan”) to the European Commission in order to receive approval for state aid granted to ING Groep by the Kingdom of the Netherlands in November 2008 and March 2009. To receive approval for this state aid, ING Groep was required to divest its insurance and investment management businesses, including Voya Financial, Inc. (formerly, ING U.S., Inc.), before the end of 2013. In November 2012, the Restructuring Plan was amended to permit ING Groep additional time to complete the divestment. Pursuant to the amended Restructuring Plan, ING Groep was required to divest at least 25% of Voya Financial, Inc. by the end of 2013 and more than 50% by the end of 2014, and is required to divest its remaining interest by the end of 2016 (such divestment, the “Separation Plan”).
In May 2013, Voya Financial, Inc. conducted an initial public offering of its common stock (the “IPO”). In October 2013, March 2014, and September 2014, ING Groep divested additional shares in several secondary offerings of common stock of Voya Financial, Inc. and concurrent share repurchases by Voya Financial, Inc. These transactions reduced ING Groep’s ownership interest in Voya Financial, Inc. to 32%. Voya Financial, Inc. did not receive any proceeds from these offerings.
67
NOTES TO FINANCIAL STATEMENTS AS OF DECEMBER 31, 2014 (CONTINUED)
NOTE 13 — RESTRUCTURING PLAN (continued)
In November 2014, through an additional secondary offering and the concurrent repurchase of shares by Voya Financial, Inc., ING Groep further reduced its interest in Voya Financial, Inc. below 25% to approximately 19% (the “November 2014 Offering”). The November 2014 Offering was deemed by the Investment Adviser to be a change of control (the “Change of Control”), which resulted in the automatic termination of the existing investment advisory and sub-advisory agreements under which the Investment Adviser and Sub-Adviser provide services to the Portfolios. In anticipation of this termination, and in order to ensure that the existing investment advisory and sub-advisory services could continue uninterrupted, in 2013 the Board approved new advisory and sub-advisory agreements for the Portfolios, as applicable, in connection with the IPO. In addition, in 2013, shareholders of each Portfolio approved new investment advisory and affiliated sub-advisory agreements prompted by the IPO, as well as any future advisory and affiliated sub-advisory agreements prompted by the Separation Plan that are approved by the Board and that have terms not materially different from the current agreements. This meant that shareholders would not have another opportunity to vote on a new agreement with the Investment Adviser or the current affiliated sub-adviser even upon a change of control prompted by the Separation Plan, as long as no single person or group of persons acting together gains “control” (as defined in the 1940 Act) of Voya Financial, Inc.
On November 18, 2014, in response to the Change of Control, the Board, at an in-person meeting, approved new investment advisory and affiliated sub-advisory agreements. At that meeting, the Investment Adviser represented that the agreements approved by the Board were not materially different from the agreements approved by shareholders in 2013 and no single person or group of persons acting together was expected to gain “control” (as defined in the 1940 Act) of Voya Financial, Inc. As a result, shareholders of the Portfolios will not be asked to vote again on these new agreements with the Investment Adviser and affiliated sub-adviser.
NOTE 14 — SUBSEQUENT EVENTS
On November 20, 2014, the Board approved a proposal to reorganize Solution 2015 with and into Solution Income (the “Reorganization”) on or about July 17, 2015. Pending Board approval of the revised Reorganization date, it is expected that the Reorganization will take place on or about August 14, 2015.
The Portfolios have evaluated events occurring after the Statements of Assets and Liabilities date (“subsequent events”), to determine whether any subsequent events necessitated adjustment to or disclosure in the financial statements. Other than the above, no such subsequent events were identified.
68
| VOYA SOLUTION AGGRESSIVE PORTFOLIO | PORTFOLIO OF INVESTMENTS
AS OF DECEMBER 31, 2014 |
Shares
|
|
|
|
|
|
|
| Value
|
| Percentage
of Net
Assets
|
|---|
| |
EXCHANGE-TRADED FUNDS: 7.9% |
| 1,503 | | | | | | iShares Russell 1000 Value Index Fund | | $ | 156,913 | | | | 4.3 | |
| 338 | | | | | | SPDR Trust Series 1 | | | 69,459 | | | | 1.9 | |
| 1,246 | | | | | | WisdomTree Japan Hedged Equity Fund | | | 61,341 | | | | 1.7 | |
| |
| | | | | | | Total Exchange-Traded Funds
(Cost $281,492) | | | 287,713 | | | | 7.9 | |
| |
MUTUAL FUNDS: 92.3% |
| | Affiliated Investment Companies: 92.3% |
| 6,626 | | | | | | Voya Emerging Markets Index Portfolio — Class I | | | 70,566 | | | | 1.9 | |
| 29,505 | | | | | | Voya International Core Fund — Class I | | | 271,737 | | | | 7.4 | |
| 7,643 | | | | | | Voya International Index Portfolio — Class I | | | 71,613 | | | | 2.0 | |
| 13,831 | | | | | | Voya Large Cap Growth Portfolio — Class I | | | 277,320 | | | | 7.6 | |
| 21,825 | | | | | | Voya Large Cap Value Fund — Class R6 | | | 288,310 | | | | 7.9 | |
| 9,851 | | | | | | Voya MidCap Opportunities Portfolio — Class I | | | 149,439 | | | | 4.1 | |
| 19,912 | | | | | | Voya Multi-Manager Emerging Markets Equity Fund — Class I | | | 209,270 | | | | 5.7 | |
| 32,263 | | | | | | Voya Multi-Manager International Equity Fund — Class I | | | 340,375 | | | | 9.3 | |
| 19,190 | | | | | | Voya Multi-Manager Large Cap Core Portfolio — Class I | | | 299,936 | | | | 8.2 | |
| |
MUTUAL FUNDS: (continued) |
| | Affiliated Investment Companies: (continued) |
| 26,653 | | | | | | Voya Multi-Manager Mid Cap Value Fund — Class I | | $ | 333,961 | | | | 9.1 | |
| 6,814 | | | | | | Voya RussellTM Mid Cap Growth Index Portfolio — Class I | | | 185,888 | | | | 5.1 | |
| 6,481 | | | | | | Voya Small Company Portfolio — Class I | | | 150,688 | | | | 4.1 | |
| 18,317 | | | | | | Voya U.S. Stock Index Portfolio — Class I | | | 268,895 | | | | 7.3 | |
| 2,194 | | | | | | VY® Clarion Real Estate Portfolio — Class I | | | 77,170 | | | | 2.1 | |
| 6,705 | | | | | | VY® Invesco Comstock Portfolio — Class I | | | 110,975 | | | | 3.0 | |
| 3,067 | | | | @ | | VY® T. Rowe Price Growth Equity Portfolio — Class I | | | 276,458 | | | | 7.5 | |
| |
| | | | | | | Total Mutual Funds | | | | | | | | |
| | | | | | | (Cost $3,485,935) | | | 3,382,601 | | | | 92.3 | |
| |
| | | | | | | Total Investments in Securities
(Cost $3,767,427) | | $ | 3,670,314 | | | | 100.2 | |
| | | | | | | Liabilities in Excess of Other Assets | | | (5,805 | ) | | | (0.2 | ) |
| | | | | | | Net Assets | | $ | 3,664,509 | | | | 100.0 | |
| @ | | Non-income producing security. |
| | Cost for federal income tax purposes is $3,789,000. |
| Net unrealized depreciation consists of: | | | | | | |
| Gross Unrealized Appreciation | | | | $ | 80,919 | |
| Gross Unrealized Depreciation | | | | | (199,605 | ) |
| Net Unrealized Depreciation | | | | $ | (118,686 | ) |
Fair Value Measurementsˆ
The following is a summary of the fair valuations according to the inputs used as of December 31, 2014 in valuing the assets and liabilities:
| | | | Quoted Prices
in Active Markets
for Identical
Investments
(Level 1)
| | Significant
Other
Observable
Inputs
(Level 2)
| | Significant
Unobservable
Inputs
(Level 3)
| | Fair Value
at
December 31, 2014
|
|---|
Asset Table | | | | | | | | | | | | | | | | | | |
Investments, at fair value | | | | | | | | | | | | | | | | | | |
| Exchange-Traded Funds | | | | $ | 287,713 | | | $ | — | | | $ | — | | | $ | 287,713 | |
| Mutual Funds | | | | | 3,382,601 | | | | — | | | | — | | | | 3,382,601 | |
| Total Investments, at fair value | | | | $ | 3,670,314 | | | $ | — | | | $ | — | | | $ | 3,670,314 | |
| ˆ | | See Note 2, “Significant Accounting Policies” in the Notes to Financial Statements for additional information. |
See Accompanying Notes to Financial Statements
69
| VOYA SOLUTION AGGRESSIVE PORTFOLIO | PORTFOLIO OF INVESTMENTS
AS OF DECEMBER 31, 2014 (CONTINUED) |
Transactions with Affiliates
An investment of at least 5% of the voting securities of an issuer, or a company which is under common control results in that issuer becoming an affiliated person as defined by the 1940 Act.
The following table provides transactions during the year ended December 31, 2014, where the following issuers were considered an affiliate:
Issuer
| | | | Beginning
Market
Value at
12/31/13
| | Purchases
at Cost
| | Sales
at Cost
| | Change in
Unrealized
Appreciation/
(Depreciation)
| | Ending
Market
Value at
12/31/14
| | Investment
Income
| | Realized
Gains/
(Losses)
| | Net
Capital Gain
Distributions
|
|---|
| Voya Emerging Markets Index Portfolio — Class I | | | | $ | — | | | $ | 80,867 | | | $ | (4,136 | ) | | $ | (6,165 | ) | | $ | 70,566 | | | $ | — | | | $ | (177 | ) | | $ | — | |
| Voya International Core Fund — Class I | | | | | 61,541 | | | | 292,604 | | | | (34,521 | ) | | | (47,887 | ) | | | 271,737 | | | | 2,316 | | | | 43 | | | | 35,341 | |
| Voya International Index Portfolio — Class I | | | | | 42,128 | | | | 90,419 | | | | (54,911 | ) | | | (6,023 | ) | | | 71,613 | | | | 328 | | | | 756 | | | | — | |
| Voya Large Cap Growth Portfolio — Class I | | | | | 90,697 | | | | 230,454 | | | | (50,998 | ) | | | 7,167 | | | | 277,320 | | | | 961 | | | | 4,555 | | | | 13,904 | |
| Voya Large Cap Value Fund — Class R6 | | | | | 67,179 | | | | 349,745 | | | | (118,430 | ) | | | (10,184 | ) | | | 288,310 | | | | 3,911 | | | | 6,621 | | | | 18,156 | |
| Voya MidCap Opportunities Portfolio — Class I | | | | | 101,625 | | | | 161,603 | | | | (102,886 | ) | | | (10,903 | ) | | | 149,439 | | | | 304 | | | | 509 | | | | 18,941 | |
| Voya Multi-Manager Emerging Markets Equity Fund — Class I | | | | | 66,271 | | | | 226,325 | | | | (67,994 | ) | | | (15,332 | ) | | | 209,270 | | | | 3,159 | | | | (2,033 | ) | | | — | |
| Voya Multi-Manager International Equity Fund — Class I | | | | | 112,636 | | | | 321,440 | | | | (51,165 | ) | | | (42,536 | ) | | | 340,375 | | | | 7,655 | | | | 1,220 | | | | 13,125 | |
| Voya Multi-Manager Large Cap Core Portfolio — Class I | | | | | 146,171 | | | | 269,809 | | | | (123,035 | ) | | | 6,991 | | | | 299,936 | | | | 3,365 | | | | 3,564 | | | | 15,061 | |
| Voya Multi-Manager Mid Cap Value Fund — Class I | | | | | 102,773 | | | | 315,031 | | | | (53,478 | ) | | | (30,365 | ) | | | 333,961 | | | | 3,589 | | | | (1,987 | ) | | | 53,114 | |
Voya RussellTM Mid Cap Growth Index Portfolio — Class I | | | | | — | | | | 197,098 | | | | (25,727 | ) | | | 14,517 | | | | 185,888 | | | | 484 | | | | 1,999 | | | | — | |
| Voya Small Company Portfolio — Class I | | | | | 45,290 | | | | 129,943 | | | | (23,644 | ) | | | (901 | ) | | | 150,688 | | | | 296 | | | | (85 | ) | | | 9,185 | |
| Voya U.S. Bond Index Portfolio — Class I | | | | | — | | | | 100,074 | | | | (100,074 | ) | | | — | | | | — | | | | 449 | | | | 402 | | | | — | |
| Voya U.S. Stock Index Portfolio — Class I | | | | | 33,858 | | | | 583,648 | | | | (352,892 | ) | | | 4,281 | | | | 268,895 | | | | 4,889 | | | | (13,633 | ) | | | 32,150 | |
| VY® Clarion Real Estate Portfolio — Class I | | | | | 22,031 | | | | 58,516 | | | | (13,533 | ) | | | 10,156 | | | | 77,170 | | | | 805 | | | | 1,790 | | | | — | |
| VY® Invesco Comstock Portfolio — Class I | | | | | — | | | | 121,102 | | | | (14,311 | ) | | | 4,184 | | | | 110,975 | | | | 2,273 | | | | 1,229 | | | | — | |
| VY® JPMorgan Emerging Markets Equity Portfolio — Class I | | | | | 21,878 | | | | 10,009 | | | | (32,260 | ) | | | 373 | | | | — | | | | — | | | | (2,019 | ) | | | — | |
| VY® T. Rowe Price Equity Income Portfolio — Class I | | | | | 100,812 | | | | 53,256 | | | | (151,338 | ) | | | (2,730 | ) | | | — | | | | — | | | | 1,350 | | | | — | |
| VY® T. Rowe Price Growth Equity Portfolio — Class I | | | | | 80,451 | | | | 238,196 | | | | (41,704 | ) | | | (485 | ) | | | 276,458 | | | | — | | | | 4,386 | | | | 14,788 | |
| | | | | $ | 1,095,341 | | | $ | 3,830,139 | | | $ | (1,417,037 | ) | | $ | (125,842 | ) | | $ | 3,382,601 | | | $ | 34,784 | | | $ | 8,490 | | | $ | 223,765 | |
The financial statements for the above mutual fund[s] can be found at www.sec.gov.
See Accompanying Notes to Financial Statements
70
| VOYA SOLUTION BALANCED PORTFOLIO | PORTFOLIO OF INVESTMENTS
AS OF DECEMBER 31, 2014 |
Shares
|
|
|
|
|
|
|
| Value
|
| Percentage
of Net
Assets
|
|---|
| |
EXCHANGE-TRADED FUNDS: 3.0% |
| 5,782 | | | | | | iShares iBoxx High Yield Corporate Bond Fund | | $ | 518,067 | | | | 1.0 | |
| 5,119 | | | | | | SPDR Trust Series 1 | | | 1,051,955 | | | | 2.0 | |
| |
| | | | | | | Total Exchange-Traded Funds
(Cost $1,521,294) | | | 1,570,022 | | | | 3.0 | |
| |
MUTUAL FUNDS: 95.0% |
| | Affiliated Investment Companies: 95.0% |
| 93,001 | | | | | | Voya Emerging Markets Index Portfolio — Class I | | | 990,459 | | | | 1.9 | |
| 261,324 | | | | | | Voya Floating Rate Fund — Class I | | | 2,613,239 | | | | 5.0 | |
| 248,315 | | | | | | Voya Global Bond Fund — Class R6 | | | 2,592,404 | | | | 5.0 | |
| 386,628 | | | | | | Voya High Yield Bond Fund — Class I | | | 3,104,619 | | | | 6.0 | |
| 183,199 | | | | | | Voya Intermediate Bond Fund — Class R6 | | | 1,848,477 | | | | 3.5 | |
| 166,050 | | | | | | Voya International Core Fund — Class I | | | 1,529,318 | | | | 2.9 | |
| 161,231 | | | | | | Voya International Index Portfolio — Class I | | | 1,510,736 | | | | 2.9 | |
| 129,832 | | | | | | Voya Large Cap Growth Portfolio — Class I | | | 2,603,140 | | | | 5.0 | |
| 237,502 | | | | | | Voya Large Cap Value Fund — Class R6 | | | 3,137,403 | | | | 6.0 | |
| 112,719 | | | | | | Voya MidCap Opportunities Portfolio — Class I | | | 1,709,949 | | | | 3.3 | |
| 93,127 | | | | | | Voya Multi-Manager Emerging Markets Equity Fund — Class I | | | 978,763 | | | | 1.9 | |
| 143,272 | | | | | | Voya Multi-Manager International Equity Fund — Class I | | | 1,511,523 | | | | 2.9 | |
| 202,773 | | | | | | Voya Multi-Manager Large Cap Core Portfolio — Class I | | | 3,169,348 | | | | 6.1 | |
| 250,093 | | | | | | Voya Multi-Manager Mid Cap Value Fund — Class I | | | 3,133,669 | | | | 6.0 | |
| |
MUTUAL FUNDS: (continued) |
| | Affiliated Investment Companies: (continued) |
| 52,769 | | | | | | Voya RussellTM Mid Cap Growth Index Portfolio — Class I | | $ | 1,439,526 | | | | 2.8 | |
| 105,616 | | | | | | Voya Short Term Bond Fund — Class R6 | | | 1,050,880 | | | | 2.0 | |
| 45,649 | | | | | | Voya Small Company Portfolio — Class I | | | 1,061,344 | | | | 2.0 | |
| 220,788 | | | | | | Voya U.S. Bond Index Portfolio — Class I | | | 2,375,676 | | | | 4.6 | |
| 106,808 | | | | | | Voya U.S. Stock Index Portfolio — Class I | | | 1,567,935 | | | | 3.0 | |
| 109,056 | | | | | | VY® BlackRock Inflation Protected Bond Portfolio — Class I | | | 1,040,399 | | | | 2.0 | |
| 30,979 | | | | | | VY® Clarion Real Estate Portfolio — Class I | | | 1,089,539 | | | | 2.1 | |
| 94,386 | | | | | | VY® Invesco Comstock Portfolio — Class I | | | 1,562,088 | | | | 3.0 | |
| 182,284 | | | | | | VY® T. Rowe Price Capital Appreciation Portfolio — Class I | | | 5,249,773 | | | | 10.1 | |
| 28,775 | | | | @ | | VY® T. Rowe Price Growth Equity Portfolio — Class I | | | 2,594,070 | | | | 5.0 | |
| |
| | | | | | | Total Mutual Funds
(Cost $47,875,101) | | | 49,464,277 | | | | 95.0 | |
| |
| | | | | | | Total Investments in Securities
(Cost $49,396,395) | | $ | 51,034,299 | | | | 98.0 | |
| | | | | | | Assets in Excess of Other Liabilities | | | 1,024,648 | | | | 2.0 | |
| | | | | | | Net Assets | | $ | 52,058,947 | | | | 100.0 | |
| @ | | Non-income producing security. |
| | Cost for federal income tax purposes is $49,735,462. |
| Net unrealized appreciation consists of: | | | | | | |
| Gross Unrealized Appreciation | | | | $ | 2,642,327 | |
| Gross Unrealized Depreciation | | | | | (1,343,490 | ) |
| Net Unrealized Appreciation | | | | $ | 1,298,837 | |
Fair Value Measurementsˆ
The following is a summary of the fair valuations according to the inputs used as of December 31, 2014 in valuing the assets and liabilities:
| | | | Quoted Prices
in Active Markets
for Identical
Investments
(Level 1)
| | Significant
Other
Observable
Inputs
(Level 2)
| | Significant
Unobservable
Inputs
(Level 3)
| | Fair Value
at
December 31, 2014
|
|---|
Asset Table | | | | | | | | | | | | | | | | | | |
Investments, at fair value | | | | | | | | | | | | | | | | | | |
| Exchange-Traded Funds | | | | $ | 1,570,022 | | | $ | — | | | $ | — | | | $ | 1,570,022 | |
| Mutual Funds | | | | | 49,464,277 | | | | — | | | | — | | | | 49,464,277 | |
| Total Investments, at fair value | | | | $ | 51,034,299 | | | $ | — | | | $ | — | | | $ | 51,034,299 | |
Liabilities Table | | | | | | | | | | | | | | | | | | |
Other Financial Instruments+ | | | | | | | | | | | | | | | | | | |
| Futures | | | | $ | (27,424 | ) | | $ | — | | | $ | — | | | $ | (27,424 | ) |
| Total Liabilities | | | | $ | (27,424 | ) | | $ | — | | | $ | — | | | $ | (27,424 | ) |
| ˆ | | See Note 2, “Significant Accounting Policies” in the Notes to Financial Statements for additional information. |
See Accompanying Notes to Financial Statements
71
| VOYA SOLUTION BALANCED PORTFOLIO | PORTFOLIO OF INVESTMENTS
AS OF DECEMBER 31, 2014 (CONTINUED) |
| + | | Other Financial Instruments are derivatives not reflected in the Portfolio of Investments and may include open forward foreign currency contracts, futures, centrally cleared swaps, OTC swaps and written options. Forward foreign currency contracts, futures and centrally cleared swaps are valued at the unrealized gain (loss) on the instrument. OTC swaps and written options are valued at the fair value of the instrument. |
At December 31, 2014, the following futures contracts were outstanding for Voya Solution Balanced Portfolio:
Contract Description
| | | | Number
of Contracts
| | Expiration
Date
| | Notional
Value
| | Unrealized
Appreciation/
(Depreciation)
|
|---|
Long Contracts
| | | | | | | | | | |
|---|
| Tokyo Price Index (TOPIX) | | | | | 9 | | | | 03/12/15 | | | $ | 1,057,564 | | | $ | (27,424 | ) |
| | | | | | | | | | | | | $ | 1,057,564 | | | $ | (27,424 | ) |
Transactions with Affiliates
An investment of at least 5% of the voting securities of an issuer, or a company which is under common control results in that issuer becoming an affiliated person as defined by the 1940 Act.
The following table provides transactions during the year ended December 31, 2014, where the following issuers were considered an affiliate:
Issuer
| | | | Beginning
Market Value
at 12/31/13
| | Purchases
at Cost
| | Sales
at Cost
| | Change in
Unrealized
Appreciation/
(Depreciation)
| | Ending
Market
Value at
12/31/14
| | Investment
Income
| | Realized
Gains/
(Losses)
| | Net
Capital Gain
Distributions
|
|---|
| ING Total Return Bond Portfolio — Class I | | | | $ | 1,000,757 | | | $ | 7,784 | | | $ | (1,057,165 | ) | | $ | 48,624 | | | $ | — | | | $ | — | | | $ | (39,916 | ) | | $ | — | |
| Voya Aggregate Bond Portfolio — Class I | | | | | — | | | | 1,145,552 | | | | (1,145,552 | ) | | | — | | | | — | | | | 21,591 | | | | (909 | ) | | | 764 | |
| Voya Emerging Markets Index Portfolio — Class I | | | | | — | | | | 1,135,096 | | | | (46,511 | ) | | | (98,126 | ) | | | 990,459 | | | | — | | | | (2,840 | ) | | | — | |
| Voya Floating Rate Fund — Class I | | | | | 1,527,047 | | | | 1,429,588 | | | | (284,593 | ) | | | (58,803 | ) | | | 2,613,239 | | | | 73,991 | | | | 7,187 | | | | — | |
| Voya Global Bond Fund — Class R6 | | | | | 2,529,776 | | | | 504,294 | | | | (445,844 | ) | | | 4,178 | | | | 2,592,404 | | | | 18,583 | | | | (13,020 | ) | | | — | |
| Voya High Yield Bond Fund — Class I | | | | | 2,035,511 | | | | 1,880,299 | | | | (680,253 | ) | | | (130,938 | ) | | | 3,104,619 | | | | 152,764 | | | | (6,172 | ) | | | — | |
| Voya High Yield Portfolio — Class I | | | | | 511,023 | | | | 1,023 | | | | (515,140 | ) | | | 3,094 | | | | — | | | | 1,640 | | | | (340 | ) | | | — | |
| Voya Intermediate Bond Fund — Class R6 | | | | | 1,640,281 | | | | 446,704 | | | | (300,283 | ) | | | 61,775 | | | | 1,848,477 | | | | 58,464 | | | | (1,778 | ) | | | — | |
| Voya International Core Fund — Class I | | | | | 1,022,346 | | | | 1,032,017 | | | | (198,148 | ) | | | (326,897 | ) | | | 1,529,318 | | | | 13,575 | | | | 54,255 | | | | 207,113 | |
| Voya International Index Portfolio — Class I | | | | | 1,034,449 | | | | 889,546 | | | | (270,591 | ) | | | (142,668 | ) | | | 1,510,736 | | | | 8,017 | | | | 30,301 | | | | — | |
| Voya Large Cap Growth Portfolio — Class I | | | | | 3,001,615 | | | | 500,851 | | | | (788,730 | ) | | | (110,596 | ) | | | 2,603,140 | | | | 12,865 | | | | 233,400 | | | | 186,093 | |
| Voya Large Cap Value Fund — Class R6 | | | | | 2,833,402 | | | | 863,783 | | | | (482,872 | ) | | | (76,910 | ) | | | 3,137,403 | | | | 57,179 | | | | 118,234 | | | | 210,342 | |
| Voya MidCap Opportunities Portfolio — Class I | | | | | 2,599,020 | | | | 522,841 | | | | (1,045,939 | ) | | | (365,973 | ) | | | 1,709,949 | | | | 7,121 | | | | 228,831 | | | | 255,261 | |
| Voya Multi-Manager Emerging Markets Equity Fund — Class I | | | | | 1,517,703 | | | | 808,429 | | | | (1,235,370 | ) | | | (111,999 | ) | | | 978,763 | | | | 15,413 | | | | 10,084 | | | | — | |
| Voya Multi-Manager International Equity Fund — Class I | | | | | 2,073,292 | | | | 410,420 | | | | (606,973 | ) | | | (365,216 | ) | | | 1,511,523 | | | | 35,414 | | | | 154,031 | | | | 60,710 | |
| Voya Multi-Manager Large Cap Core Portfolio — Class I | | | | | 3,208,683 | | | | 572,736 | | | | (694,598 | ) | | | 82,527 | | | | 3,169,348 | | | | 38,254 | | | | 98,302 | | | | 226,741 | |
| Voya Multi-Manager Mid Cap Value Fund — Class I | | | | | 2,629,455 | | | | 1,643,659 | | | | (904,092 | ) | | | (235,353 | ) | | | 3,133,669 | | | | 35,044 | | | | 82,122 | | | | 518,591 | |
Voya RussellTM Mid Cap Growth Index Portfolio — Class I | | | | | — | | | | 1,660,269 | | | | (387,082 | ) | | | 166,339 | | | | 1,439,526 | | | | 7,195 | | | | 32,972 | | | | — | |
Voya RussellTM Mid Cap Index Portfolio — Class I | | | | | 1,563,597 | | | | 11,676 | | | | (1,383,161 | ) | | | (192,112 | ) | | | — | | | | — | | | | 155,975 | | | | — | |
| Voya Short Term Bond Fund — Class R6 | | | | | 1,013,000 | | | | 212,458 | | | | (168,023 | ) | | | (6,555 | ) | | | 1,050,880 | | | | 18,870 | | | | 224 | | | | — | |
| Voya Small Company Portfolio — Class I | | | | | 1,042,478 | | | | 319,700 | | | | (200,978 | ) | | | (99,856 | ) | | | 1,061,344 | | | | 3,543 | | | | 58,381 | | | | 109,868 | |
| Voya U.S. Bond Index Portfolio — Class I | | | | | 2,811,188 | | | | 2,910,741 | | | | (3,437,131 | ) | | | 90,878 | | | | 2,375,676 | | | | 47,917 | | | | 10,082 | | | | — | |
| Voya U.S. Stock Index Portfolio — Class I | | | | | 1,557,749 | | | | 6,001,847 | | | | (5,955,158 | ) | | | (36,503 | ) | | | 1,567,935 | | | | 36,678 | | | | (254,083 | ) | | | 446,890 | |
| VY® BlackRock Inflation Protected Bond Portfolio — Class I | | | | | 993,188 | | | | 195,558 | | | | (183,122 | ) | | | 34,775 | | | | 1,040,399 | | | | 15,417 | | | | (22,379 | ) | | | — | |
| VY® Clarion Real Estate Portfolio — Class I | | | | | 1,014,048 | | | | 149,850 | | | | (275,707 | ) | | | 201,348 | | | | 1,089,539 | | | | 16,131 | | | | 67,547 | | | | — | |
| VY® Invesco Comstock Portfolio — Class I | | | | | — | | | | 1,695,494 | | | | (250,351 | ) | | | 116,945 | | | | 1,562,088 | | | | 32,651 | | | | 23,184 | | | | 28 | |
| VY® JPMorgan Emerging Markets Equity Portfolio — Class I | | | | | 510,368 | | | | — | | | | (507,357 | ) | | | (3,011 | ) | | | — | | | | — | | | | (27,985 | ) | | | — | |
| VY® T. Rowe Price Capital Appreciation Portfolio — Class I | | | | | 4,117,925 | | | | 2,021,044 | | | | (799,483 | ) | | | (89,713 | ) | | | 5,249,773 | | | | 79,200 | | | | 203,207 | | | | 429,885 | |
See Accompanying Notes to Financial Statements
72
| VOYA SOLUTION BALANCED PORTFOLIO | PORTFOLIO OF INVESTMENTS
AS OF DECEMBER 31, 2014 (CONTINUED) |
Issuer
| | | | Beginning
Market Value
at 12/31/13
| | Purchases
at Cost
| | Sales
at Cost
| | Change in
Unrealized
Appreciation/
(Depreciation)
| | Ending
Market
Value at
12/31/14
| | Investment
Income
| | Realized
Gains/
(Losses)
| | Net
Capital Gain
Distributions
|
|---|
| VY® T. Rowe Price Equity Income Portfolio — Class I | | | | $ | 1,804,098 | | | $ | 18,125 | | | $ | (1,458,029 | ) | | $ | (364,194 | ) | | $ | — | | | $ | — | | | $ | 324,146 | | | $ | — | |
| VY® T. Rowe Price Growth Equity Portfolio — Class I | | | | | 2,250,683 | | | | 967,839 | | | | (483,894 | ) | | | (140,558 | ) | | | 2,594,070 | | | | — | | | | 203,751 | | | | 178,148 | |
| | | | | $ | 47,842,682 | | | $ | 29,959,223 | | | $ | (26,192,130 | ) | | $ | (2,145,498 | ) | | $ | 49,464,277 | | | $ | 807,517 | | | $ | 1,726,794 | | | $ | 2,830,434 | |
The financial statements for the above mutual fund[s] can be found at www.sec.gov.
A summary of derivative instruments by primary risk exposure is outlined in the following tables.
The fair value of derivative instruments as of December 31, 2014 was as follows:
Derivatives not accounted for as
hedging instruments
| | | | Location on Statement of Assets and Liabilities
| | Fair Value
|
|---|
Liability Derivatives
| | | | | | |
|---|
| Equity contracts | | | | Net Assets — Unrealized depreciation* | | $ | 27,424 | |
Total Liability Derivatives | | | | | | $ | 27,424 | |
| * | | Includes cumulative appreciation/depreciation of futures contracts as reported in the table following the Portfolio of Investments. |
The effect of derivative instruments on the Portfolio’s Statement of Operations for the year ended December 31, 2014 was as follows:
| | | | Amount of Realized Gain or (Loss) on
Derivatives Recognized in Income |
|---|
Derivatives not accounted for as
hedging instruments
| | | | Futures
|
|---|
| Equity contracts | | | | $ | (73 | ) |
Total | | | | $ | (73 | ) |
| | | | Change in Unrealized Appreciation or (Depreciation)
on Derivatives Recognized in Income |
|---|
Derivatives not accounted for as
hedging instruments
| | | | Futures
|
|---|
| Equity contracts | | | | $ | (27,424 | ) |
Total | | | | $ | (27,424 | ) |
See Accompanying Notes to Financial Statements
73
| VOYA SOLUTION CONSERVATIVE PORTFOLIO | PORTFOLIO OF INVESTMENTS
AS OF DECEMBER 31, 2014 |
Shares
|
|
|
|
|
|
|
| Value
|
| Percentage
of Net
Assets
|
|---|
| |
EXCHANGE-TRADED FUNDS: 2.0% |
| 1,936 | | | | | | iShares iBoxx High Yield Corporate Bond Fund | | $ | 173,466 | | | | 1.0 | |
| 854 | | | | | | SPDR Trust Series 1 | | | 175,497 | | | | 1.0 | |
| |
| | | | | | | Total Exchange-Traded Funds
(Cost $344,196) | | | 348,963 | | | | 2.0 | |
| |
MUTUAL FUNDS: 96.0% |
| | Affiliated Investment Companies: 96.0% |
| 123,982 | | | | | | Voya Floating Rate Fund — Class I | | | 1,239,823 | | | | 7.0 | |
| 201,996 | | | | | | Voya Global Bond Fund — Class R6 | | | 2,108,839 | | | | 11.9 | |
| 218,853 | | | | | | Voya High Yield Bond Fund — Class I | | | 1,757,391 | | | | 9.9 | |
| 115,310 | | | | | | Voya Intermediate Bond Fund — Class R6 | | | 1,163,478 | | | | 6.6 | |
| 54,628 | | | | | | Voya International Index Portfolio — Class I | | | 511,860 | | | | 2.9 | |
| 13,234 | | | | | | Voya Large Cap Growth Portfolio — Class I | | | 265,344 | | | | 1.5 | |
| 40,285 | | | | | | Voya Large Cap Value Fund — Class R6 | | | 532,164 | | | | 3.0 | |
| 41,122 | | | | | | Voya MidCap Opportunities Portfolio — Class I | | | 623,820 | | | | 3.5 | |
| 49,428 | | | | | | Voya Multi-Manager Mid Cap Value Fund — Class I | | | 619,328 | | | | 3.5 | |
| |
MUTUAL FUNDS: (continued) |
| | Affiliated Investment Companies: (continued) |
| 143,175 | | | | | | Voya Short Term Bond Fund — Class R6 | | $ | 1,424,594 | | | | 8.0 | |
| 291,003 | | | | | | Voya U.S. Bond Index Portfolio — Class I | | | 3,131,187 | | | | 17.7 | |
| 166,349 | | | | | | VY® BlackRock Inflation Protected Bond Portfolio — Class I | | | 1,586,972 | | | | 9.0 | |
| 61,754 | | | | | | VY® T. Rowe Price Capital Appreciation Portfolio — Class I | | | 1,778,512 | | | | 10.0 | |
| 2,924 | | | | @ | | VY® T. Rowe Price Growth Equity Portfolio — Class I | | | 263,628 | | | | 1.5 | |
| |
| | | | | | | Total Mutual Funds
(Cost $17,203,288) | | | 17,006,940 | | | | 96.0 | |
| |
| | | | | | | Total Investments in Securities
(Cost $17,547,484) | | $ | 17,355,903 | | | | 98.0 | |
| | | | | | | Assets in Excess of Other Liabilities | | | 359,549 | | | | 2.0 | |
| | | | | | | Net Assets | | $ | 17,715,452 | | | | 100.0 | |
| @ | | Non-income producing security. |
| | Cost for federal income tax purposes is $17,707,493. |
| Net unrealized depreciation consists of: | | | | | | |
| Gross Unrealized Appreciation | | | | $ | 261,485 | |
| Gross Unrealized Depreciation | | | | | (613,075 | ) |
| Net Unrealized Depreciation | | | | $ | (351,590 | ) |
Fair Value Measurementsˆ
The following is a summary of the fair valuations according to the inputs used as of December 31, 2014 in valuing the assets and liabilities:
| | | | Quoted Prices
in Active Markets
for Identical
Investments
(Level 1)
| | Significant
Other
Observable
Inputs
(Level 2)
| | Significant
Unobservable
Inputs
(Level 3)
| | Fair Value
at
December 31, 2014
|
|---|
Asset Table | | | | | | | | | | | | | | | | | | |
Investments, at fair value | | | | | | | | | | | | | | | | | | |
| Exchange-Traded Funds | | | | $ | 348,963 | | | $ | — | | | $ | — | | | $ | 348,963 | |
| Mutual Funds | | | | | 17,006,940 | | | | — | | | | — | | | | 17,006,940 | |
| Total Investments, at fair value | | | | $ | 17,355,903 | | | $ | — | | | $ | — | | | $ | 17,355,903 | |
Liabilities Table | | | | | | | | | | | | | | | | | | |
Other Financial Instruments+ | | | | | | | | | | | | | | | | | | |
| Futures | | | | $ | (9,141 | ) | | $ | — | | | $ | — | | | $ | (9,141 | ) |
| Total Liabilities | | | | $ | (9,141 | ) | | $ | — | | | $ | — | | | $ | (9,141 | ) |
| ˆ | | See Note 2, “Significant Accounting Policies” in the Notes to Financial Statements for additional information. |
| + | | Other Financial Instruments are derivatives not reflected in the Portfolio of Investments and may include open forward foreign currency contracts, futures, centrally cleared swaps, OTC swaps and written options. Forward foreign currency contracts, futures and centrally cleared swaps are valued at the unrealized gain (loss) on the instrument. OTC swaps and written options are valued at the fair value of the instrument. |
See Accompanying Notes to Financial Statements
74
| VOYA SOLUTION CONSERVATIVE PORTFOLIO | PORTFOLIO OF INVESTMENTS
AS OF DECEMBER 31, 2014 (CONTINUED) |
At December 31, 2014, the following futures contracts were outstanding for Voya Solution Conservative Portfolio:
Contract Description
| | | | Number
of Contracts
| | Expiration
Date
| | Notional
Value
| | Unrealized
Appreciation/
(Depreciation)
|
|---|
Long Contracts
| | | | | | | | | | |
|---|
| Tokyo Price Index (TOPIX) | | | | | 3 | | | | 03/12/15 | | | $ | 352,521 | | | $ | (9,141 | ) |
| | | | | | | | | | | | | $ | 352,521 | | | $ | (9,141 | ) |
Transactions with Affiliates
An investment of at least 5% of the voting securities of an issuer, or a company which is under common control results in that issuer becoming an affiliated person as defined by the 1940 Act.
The following table provides transactions during the year ended December 31, 2014, where the following issuers were considered an affiliate:
Issuer
| | | | Beginning
Market
Value at
12/31/13
| | Purchases
at Cost
| | Sales
at Cost
| | Change in
Unrealized
Appreciation/
(Depreciation)
| | Ending
Market
Value at
12/31/14
| | Investment
Income
| | Realized
Gains/
(Losses)
| | Net Capital
Gain
Distributions
|
|---|
| ING Total Return Bond Portfolio — Class I | | | | $ | 1,022,902 | | | $ | 3,011 | | | $ | (1,073,255 | ) | | $ | 47,342 | | | $ | — | | | $ | — | | | $ | (38,461 | ) | | $ | — | |
| Voya Aggregate Bond Portfolio — Class I | | | | | — | | | | 1,345,627 | | | | (1,345,627 | ) | | | — | | | | — | | | | 25,986 | | | | (1,559 | ) | | | 919 | |
| Voya Floating Rate Fund — Class I | | | | | 867,088 | | | | 561,471 | | | | (163,099 | ) | | | (25,637 | ) | | | 1,239,823 | | | | 37,996 | | | | 739 | | | | — | |
| Voya Global Bond Fund — Class R6 | | | | | 2,068,730 | | | | 389,574 | | | | (341,362 | ) | | | (8,103 | ) | | | 2,108,839 | | | | 14,996 | | | | 116 | | | | — | |
| Voya High Yield Bond Fund — Class I | | | | | 1,394,425 | | | | 780,142 | | | | (348,315 | ) | | | (68,861 | ) | | | 1,757,391 | | | | 91,266 | | | | (4,927 | ) | | | — | |
| Voya High Yield Portfolio — Class I | | | | | 174,616 | | | | 407 | | | | (177,024 | ) | | | 2,001 | | | | — | | | | 556 | | | | (1,066 | ) | | | — | |
| Voya Intermediate Bond Fund — Class R6 | | | | | 1,375,662 | | | | 200,442 | | | | (461,411 | ) | | | 48,785 | | | | 1,163,478 | | | | 37,577 | | | | (7,177 | ) | | | — | |
| Voya International Core Fund — Class I | | | | | 221,793 | | | | 1,631 | | | | (193,350 | ) | | | (30,074 | ) | | | — | | | | — | | | | 24,338 | | | | — | |
| Voya International Index Portfolio — Class I | | | | | 132,071 | | | | 498,873 | | | | (84,523 | ) | | | (34,561 | ) | | | 511,860 | | | | 2,911 | | | | 2,781 | | | | — | |
| Voya Large Cap Growth Portfolio — Class I | | | | | 311,262 | | | | 60,928 | | | | (99,845 | ) | | | (7,001 | ) | | | 265,344 | | | | 1,320 | | | | 18,676 | | | | 19,088 | |
| Voya Large Cap Value Fund — Class R6 | | | | | 263,286 | | | | 374,083 | | | | (86,889 | ) | | | (18,316 | ) | | | 532,164 | | | | 9,691 | | | | 20,182 | | | | 34,835 | |
| Voya MidCap Opportunities Portfolio — Class I | | | | | 619,932 | | | | 274,795 | | | | (188,406 | ) | | | (82,501 | ) | | | 623,820 | | | | 2,705 | | | | 45,285 | | | | 93,344 | |
| Voya Multi-Manager Large Cap Core Portfolio — Class I | | | | | 458,476 | | | | 1,305 | | | | (420,890 | ) | | | (38,891 | ) | | | — | | | | — | | | | 25,488 | | | | — | |
| Voya Multi-Manager Mid Cap Value Fund — Class I | | | | | 627,176 | | | | 276,782 | | | | (225,848 | ) | | | (58,782 | ) | | | 619,328 | | | | 6,819 | | | | 31,281 | | | | 100,903 | |
Voya RussellTM Mid Cap Index Portfolio — Class I | | | | | 177,587 | | | | 502 | | | | (156,288 | ) | | | (21,801 | ) | | | — | | | | — | | | | 17,773 | | | | — | |
| Voya Short Term Bond Fund — Class R6 | | | | | 1,380,489 | | | | 289,116 | | | | (236,162 | ) | | | (8,849 | ) | | | 1,424,594 | | | | 25,544 | | | | 274 | | | | — | |
| Voya U.S. Bond Index Portfolio — Class I | | | | | 2,121,446 | | | | 1,583,707 | | | | (677,746 | ) | | | 103,780 | | | | 3,131,187 | | | | 47,493 | | | | (24,775 | ) | | | — | |
| Voya U.S. Stock Index Portfolio — Class I | | | | | 354,024 | | | | 461,781 | | | | (807,597 | ) | | | (8,208 | ) | | | — | | | | 1,468 | | | | (42,196 | ) | | | 50,932 | |
| VY® BlackRock Inflation Protected Bond Portfolio — Class I | | | | | 1,532,904 | | | | 289,296 | | | | (290,568 | ) | | | 55,340 | | | | 1,586,972 | | | | 23,772 | | | | (35,887 | ) | | | — | |
| VY® T. Rowe Price Capital Appreciation Portfolio — Class I | | | | | 701,543 | | | | 1,413,430 | | | | (358,354 | ) | | | 21,893 | | | | 1,778,512 | | | | 26,912 | | | | 21,362 | | | | 146,986 | |
| VY® T. Rowe Price Equity Income Portfolio — Class I | | | | | 263,440 | | | | 5,182 | | | | (233,492 | ) | | | (35,130 | ) | | | — | | | | — | | | | 36,102 | | | | — | |
| VY® T. Rowe Price Growth Equity Portfolio — Class I | | | | | 225,558 | | | | 91,406 | | | | (43,560 | ) | | | (9,776 | ) | | | 263,628 | | | | — | | | | 13,726 | | | | 18,377 | |
| | | | | $ | 16,294,410 | | | $ | 8,903,491 | | | $ | (8,013,611 | ) | | $ | (177,350 | ) | | $ | 17,006,940 | | | $ | 357,012 | | | $ | 102,075 | | | $ | 465,384 | |
The financial statements for the above mutual fund[s] can be found at www.sec.gov.
A summary of derivative instruments by primary risk exposure is outlined in the following tables.
The fair value of derivative instruments as of December 31, 2014 was as follows:
Derivatives not accounted for as
hedging instruments
| | | | Location on Statement of Assets and Liabilities
| | Fair Value
|
|---|
Liability Derivatives | | | | | | | | |
| Equity contracts | | | | Net Assets — Unrealized depreciation* | | $ | 9,141 | |
Total Liability Derivatives | | | | | | $ | 9,141 | |
| * | | Includes cumulative appreciation/depreciation of futures contracts as reported in the table following the Portfolio of Investments. |
See Accompanying Notes to Financial Statements
75
| VOYA SOLUTION CONSERVATIVE PORTFOLIO | PORTFOLIO OF INVESTMENTS
AS OF DECEMBER 31, 2014 (CONTINUED) |
The effect of derivative instruments on the Portfolio’s Statement of Operations for the year ended December 31, 2014 was as follows:
| | | | Amount of Realized Gain or (Loss) on
Derivatives Recognized in Income |
|---|
Derivatives not accounted for as
hedging instruments
| | | | Futures
|
|---|
| Equity contracts | | | | $ | (24 | ) |
Total | | | | $ | (24 | ) |
| | | | Change in Unrealized Appreciation or (Depreciation)
on Derivatives Recognized in Income |
|---|
Derivatives not accounted for as
hedging instruments
| | | | Futures
|
|---|
Equity contracts | | | | $ | (9,141 | ) |
Total | | | | $ | (9,141 | ) |
See Accompanying Notes to Financial Statements
76
| VOYA SOLUTION INCOME PORTFOLIO | PORTFOLIO OF INVESTMENTS
AS OF DECEMBER 31, 2014 |
Shares
|
|
|
|
|
|
|
| Value
|
| Percentage
of Net
Assets
|
|---|
| |
EXCHANGE-TRADED FUNDS: 3.0% |
| 18,734 | | | | | | iShares iBoxx High Yield Corporate Bond Fund | | $ | 1,678,566 | | | | 1.0 | |
| 16,584 | | | | | | SPDR Trust Series 1 | | | 3,408,012 | | | | 2.0 | |
| |
| | | | | | | Total Exchange-Traded Funds
(Cost $4,931,902) | | | 5,086,578 | | | | 3.0 | |
| |
MUTUAL FUNDS: 95.0% |
| | Affiliated Investment Companies: 95.0% |
| 840,500 | | | | | | Voya Floating Rate Fund — Class I | | | 8,405,003 | | | | 5.0 | |
| 958,338 | | | | | | Voya Global Bond Fund — Class R6 | | | 10,005,050 | | | | 5.9 | |
| 826,702 | | | | | | Voya High Yield Bond Fund — Class I | | | 6,638,416 | | | | 4.0 | |
| 1,683,688 | | | | | | Voya Intermediate Bond Fund — Class R6 | | | 16,988,417 | | | | 10.1 | |
| 518,379 | | | | | | Voya International Index Portfolio — Class I | | | 4,857,208 | | | | 2.9 | |
| 248,574 | | | | | | Voya Large Cap Growth Portfolio — Class I | | | 4,983,918 | | | | 3.0 | |
| 442,586 | | | | | | Voya Large Cap Value Fund — Class R6 | | | 5,846,561 | | | | 3.5 | |
| 334,688 | | | | | | Voya MidCap Opportunities Portfolio — Class I | | | 5,077,224 | | | | 3.0 | |
| 307,099 | | | | | | Voya Multi-Manager International Equity Fund — Class I | | | 3,239,895 | | | | 1.9 | |
| 461,997 | | | | | | Voya Multi-Manager Large Cap Core Portfolio — Class I | | | 7,221,013 | | | | 4.3 | |
| |
MUTUAL FUNDS: (continued) |
| | Affiliated Investment Companies: (continued) |
| 402,176 | | | | | | Voya Multi-Manager Mid Cap Value Fund — Class I | | $ | 5,039,270 | | | | 3.0 | |
| 1,358,853 | | | | | | Voya Short Term Bond Fund — Class R6 | | | 13,520,585 | | | | 8.0 | |
| 2,959,107 | | | | | | Voya U.S. Bond Index Portfolio — Class I | | | 31,839,986 | | | | 18.9 | |
| 1,578,315 | | | | | | VY® BlackRock Inflation Protected Bond Portfolio — Class I | | | 15,057,129 | | | | 8.9 | |
| 99,671 | | | | | | VY® Clarion Real Estate Portfolio — Class I | | | 3,505,431 | | | | 2.1 | |
| 469,039 | | | | | | VY® T. Rowe Price Capital Appreciation Portfolio — Class I | | | 13,508,310 | | | | 8.0 | |
| 46,273 | | | | @ | | VY® T. Rowe Price Growth Equity Portfolio — Class I | | | 4,171,518 | | | | 2.5 | |
| |
| | | | | | | Total Mutual Funds
(Cost $158,998,044) | | | 159,904,934 | | | | 95.0 | |
| |
| | | | | | | Total Investments in Securities
(Cost $163,929,946) | | $ | 164,991,512 | | | | 98.0 | |
| | | | | | | Assets in Excess of Other Liabilities | | | 3,445,838 | | | | 2.0 | |
| | | | | | | Net Assets | | $ | 168,437,350 | | | | 100.0 | |
| @ | | Non-income producing security. |
| | Cost for federal income tax purposes is $165,245,762. |
| Net unrealized depreciation consists of: | | | | | | |
| Gross Unrealized Appreciation | | | | $ | 4,812,419 | |
| Gross Unrealized Depreciation | | | | | (5,066,669 | ) |
| Net Unrealized Depreciation | | | | $ | (254,250 | ) |
Fair Value Measurementsˆ
The following is a summary of the fair valuations according to the inputs used as of December 31, 2014 in valuing the assets and liabilities:
| | | | Quoted Prices
in Active Markets
for Identical
Investments
(Level 1)
| | Significant
Other
Observable
Inputs
(Level 2)
| | Significant
Unobservable
Inputs
(Level 3)
| | Fair Value
at
December 31, 2014
|
|---|
Asset Table | | | | | | | | | | | | | | | | | | |
Investments, at fair value | | | | | | | | | | | | | | | | | | |
| Exchange-Traded Funds | | | | $ | 5,086,578 | | | $ | — | | | $ | — | | | $ | 5,086,578 | |
| Mutual Funds | | | | | 159,904,934 | | | | — | | | | — | | | | 159,904,934 | |
| Total Investments, at fair value | | | | $ | 164,991,512 | | | $ | — | | | $ | — | | | $ | 164,991,512 | |
Liabilities Table | | | | | | | | | | | | | | | | | | |
Other Financial Instruments+ | | | | | | | | | | | | | | | | | | |
| Futures | | | | $ | (85,319 | ) | | $ | — | | | $ | — | | | $ | (85,319 | ) |
| Total Liabilities | | | | $ | (85,319 | ) | | $ | — | | | $ | — | | | $ | (85,319 | ) |
| ˆ | | See Note 2, “Significant Accounting Policies” in the Notes to Financial Statements for additional information. |
| + | | Other Financial Instruments are derivatives not reflected in the Portfolio of Investments and may include open forward foreign currency contracts, futures, centrally cleared swaps, OTC swaps and written options. Forward foreign currency contracts, futures and centrally cleared swaps are valued at the unrealized gain (loss) on the instrument. OTC swaps and written options are valued at the fair value of the instrument. |
See Accompanying Notes to Financial Statements
77
| VOYA SOLUTION INCOME PORTFOLIO | PORTFOLIO OF INVESTMENTS
AS OF DECEMBER 31, 2014 (CONTINUED) |
At December 31, 2014, the following futures contracts were outstanding for Voya Solution Income Portfolio:
Contract Description
| | | | Number
of Contracts
| | Expiration
Date
| | Notional
Value
| | Unrealized
Appreciation/
(Depreciation)
|
|---|
Long Contracts | | | | | | | | | | | | | | | | | | |
| Tokyo Price Index (TOPIX) | | | | | 28 | | | | 03/12/15 | | | $ | 3,290,199 | | | $ | (85,319 | ) |
| | | | | | | | | | | | | $ | 3,290,199 | | | $ | (85,319 | ) |
Transactions with Affiliates
An investment of at least 5% of the voting securities of an issuer, or a company which is under common control results in that issuer becoming an affiliated person as defined by the 1940 Act.
The following table provides transactions during the year ended December 31, 2014, where the following issuers were considered an affiliate:
Issuer
| | | | Beginning
Market
Value at
12/31/13
| | Purchases
at Cost
| | Sales
at Cost
| | Change in
Unrealized
Appreciation/
(Depreciation)
| | Ending
Market
Value at
12/31/14
| | Investment
Income
| | Realized
Gains/
(Losses)
| | Net
Capital Gain
Distributions
|
|---|
| ING Total Return Bond Portfolio — Class I | | | | $ | 12,408,400 | | | $ | 19,274 | | | $ | (12,902,441 | ) | | $ | 474,767 | | | $ | — | | | $ | — | | | $ | (368,152 | ) | | $ | — | |
| Voya Aggregate Bond Portfolio — Class I | | | | | — | | | | 13,333,435 | | | | (13,333,435 | ) | | | — | | | | — | | | | 251,620 | | | | (4,150 | ) | | | 8,901 | |
| Voya Floating Rate Fund — Class I | | | | | 5,602,478 | | | | 4,421,593 | | | | (1,453,701 | ) | | | (165,367 | ) | | | 8,405,003 | | | | 253,102 | | | | (7,407 | ) | | | — | |
| Voya Global Bond Fund — Class R6 | | | | | 11,137,393 | | | | 1,130,017 | | | | (2,330,241 | ) | | | 67,881 | | | | 10,005,050 | | | | 72,740 | | | | (64,918 | ) | | | — | |
| Voya High Yield Bond Fund — Class I | | | | | 3,613,790 | | | | 5,656,403 | | | | (2,334,703 | ) | | | (297,074 | ) | | | 6,638,416 | | | | 317,783 | | | | (22,918 | ) | | | — | |
| Voya High Yield Portfolio — Class I | | | | | 1,878,439 | | | | 2,107 | | | | (1,890,428 | ) | | | 9,882 | | | | — | | | | 5,972 | | | | 140 | | | | — | |
| Voya Intermediate Bond Fund — Class R6 | | | | | 16,201,487 | | | | 4,047,252 | | | | (3,884,571 | ) | | | 624,249 | | | | 16,988,417 | | | | 573,084 | | | | (30,115 | ) | | | — | |
| Voya International Core Fund — Class I | | | | | 2,285,969 | | | | 12,136 | | | | (1,904,755 | ) | | | (393,350 | ) | | | — | | | | — | | | | 333,506 | | | | — | |
| Voya International Index Portfolio — Class I | | | | | 3,318,631 | | | | 3,064,180 | | | | (955,376 | ) | | | (570,227 | ) | | | 4,857,208 | | | | 27,509 | | | | 201,215 | | | | — | |
| Voya Large Cap Growth Portfolio — Class I | | | | | 6,225,930 | | | | 689,232 | | | | (1,711,449 | ) | | | (219,795 | ) | | | 4,983,918 | | | | 26,778 | | | | 467,762 | | | | 387,339 | |
| Voya Large Cap Value Fund — Class R6 | | | | | 2,835,292 | | | | 4,505,664 | | | | (1,241,306 | ) | | | (253,089 | ) | | | 5,846,561 | | | | 113,014 | | | | 285,677 | | | | 396,185 | |
| Voya MidCap Opportunities Portfolio — Class I | | | | | 4,768,930 | | | | 2,983,859 | | | | (1,777,658 | ) | | | (897,907 | ) | | | 5,077,224 | | | | 24,943 | | | | 624,353 | | | | 795,270 | |
| Voya Multi-Manager International Equity Fund — Class I | | | | | — | | | | 4,290,839 | | | | (739,236 | ) | | | (311,708 | ) | | | 3,239,895 | | | | 76,491 | | | | 16,196 | | | | 131,128 | |
| Voya Multi-Manager Large Cap Core Portfolio — Class I | | | | | 11,394,212 | | | | 1,019,870 | | | | (5,047,549 | ) | | | (145,520 | ) | | | 7,221,013 | | | | 88,924 | | | | 469,043 | | | | 557,154 | |
| Voya Multi-Manager Mid Cap Value Fund — Class I | | | | | 4,824,995 | | | | 3,033,551 | | | | (2,272,128 | ) | | | (547,148 | ) | | | 5,039,270 | | | | 56,770 | | | | 401,867 | | | | 840,106 | |
Voya RussellTM Mid Cap Index Portfolio — Class I | | | | | 3,825,236 | | | | 5,711 | | | | (3,356,227 | ) | | | (474,720 | ) | | | — | | | | — | | | | 387,720 | | | | — | |
| Voya Short Term Bond Fund — Class R6 | | | | | 14,865,032 | | | | 1,821,132 | | | | (3,080,041 | ) | | | (85,538 | ) | | | 13,520,585 | | | | 259,244 | | | | 3,606 | | | | — | |
| Voya U.S. Bond Index Portfolio — Class I | | | | | 26,750,606 | | | | 13,878,583 | | | | (10,051,660 | ) | | | 1,262,457 | | | | 31,839,986 | | | | 522,828 | | | | (339,959 | ) | | | — | |
| Voya U.S. Stock Index Portfolio — Class I | | | | | 3,812,793 | | | | 4,996,320 | | | | (8,720,136 | ) | | | (88,977 | ) | | | — | | | | 19,853 | | | | (306,434 | ) | | | 689,006 | |
| VY® BlackRock Inflation Protected Bond Portfolio — Class I | | | | | 16,433,541 | | | | 1,793,771 | | | | (3,845,257 | ) | | | 675,074 | | | | 15,057,129 | | | | 242,218 | | | | (446,689 | ) | | | — | |
| VY® Clarion Real Estate Portfolio — Class I | | | | | 3,719,702 | | | | 314,617 | | | | (1,250,018 | ) | | | 721,130 | | | | 3,505,431 | | | | 55,948 | | | | 208,820 | | | | — | |
| VY® T. Rowe Price Capital Appreciation Portfolio — Class I | | | | | 9,443,666 | | | | 7,434,515 | | | | (3,497,553 | ) | | | 127,682 | | | | 13,508,310 | | | | 207,776 | | | | 203,284 | | | | 1,193,041 | |
| VY® T. Rowe Price Equity Income Portfolio — Class I | | | | | 3,782,588 | | | | 43,708 | | | | (3,086,866 | ) | | | (739,430 | ) | | | — | | | | — | | | | 752,833 | | | | — | |
| VY® T. Rowe Price Growth Equity Portfolio — Class I | | | | | 4,373,696 | | | | 904,488 | | | | (851,681 | ) | | | (254,985 | ) | | | 4,171,518 | | | | — | | | | 313,838 | | | | 307,554 | |
| | | | | $ | 173,502,806 | | | $ | 79,402,257 | | | $ | (91,518,416 | ) | | $ | (1,481,713 | ) | | $ | 159,904,934 | | | $ | 3,196,597 | | | $ | 3,079,118 | | | $ | 5,305,684 | |
The financial statements for the above mutual fund[s] can be found at www.sec.gov.
See Accompanying Notes to Financial Statements
78
| VOYA SOLUTION INCOME PORTFOLIO | PORTFOLIO OF INVESTMENTS
AS OF DECEMBER 31, 2014 (CONTINUED) |
A summary of derivative instruments by primary risk exposure is outlined in the following tables.
The fair value of derivative instruments as of December 31, 2014 was as follows:
Derivatives not accounted for as
hedging instruments
| | | | Location on Statement of Assets and Liabilities
| | Fair Value
|
|---|
Liability Derivatives
| | | | | | |
|---|
| Equity contracts | | | | Net Assets — Unrealized depreciation* | | $ | 85,319 | |
Total Liability Derivatives | | | | | | $ | 85,319 | |
| * | | Includes cumulative appreciation/depreciation of futures contracts as reported in the table following the Portfolio of Investments. |
The effect of derivative instruments on the Portfolio’s Statement of Operations for the year ended December 31, 2014 was as follows:
| | | | Amount of Realized Gain or (Loss) on
Derivatives Recognized in Income |
|---|
Derivatives not accounted for as
hedging instruments
| | | | Futures
|
|---|
| Equity contracts | | | | $ | (229 | ) |
Total | | | | $ | (229 | ) |
| | | | Change in Unrealized Appreciation or (Depreciation)
on Derivatives Recognized in Income |
|---|
Derivatives not accounted for as
hedging instruments
| | | | Futures
|
|---|
| Equity contracts | | | | $ | (85,319 | ) |
Total | | | | $ | (85,319 | ) |
See Accompanying Notes to Financial Statements
79
VOYA SOLUTION MODERATELY
AGGRESSIVE PORTFOLIO | PORTFOLIO OF INVESTMENTS
AS OF DECEMBER 31, 2014 |
Shares
|
|
|
|
|
|
|
| Value
|
| Percentage
of Net
Assets
|
|---|
| |
EXCHANGE-TRADED FUNDS: 5.2% |
| 9,526 | | | | | | iShares Russell 1000 Value Index Fund | | $ | 994,514 | | | | 3.1 | |
| 3,216 | | | | | | SPDR Trust Series 1 | | | 660,888 | | | | 2.1 | |
| |
| | | | | | | Total Exchange-Traded Funds
(Cost $1,516,397) | | | 1,655,402 | | | | 5.2 | |
| |
MUTUAL FUNDS: 92.8% |
| | Affiliated Investment Companies: 92.8% |
| 57,651 | | | | | | Voya Emerging Markets Index Portfolio — Class I | | | 613,979 | | | | 1.9 | |
| 97,358 | | | | | | Voya Floating Rate Fund — Class I | | | 973,576 | | | | 3.0 | |
| 61,674 | | | | | | Voya Global Bond Fund — Class R6 | | | 643,873 | | | | 2.0 | |
| 200,326 | | | | | | Voya High Yield Bond Fund — Class I | | | 1,608,616 | | | | 5.0 | |
| 188,927 | | | | | | Voya International Core Fund — Class I | | | 1,740,018 | | | | 5.4 | |
| 100,030 | | | | | | Voya International Index Portfolio — Class I | | | 937,283 | | | | 2.9 | |
| 96,703 | | | | | | Voya Large Cap Growth Portfolio — Class I | | | 1,938,889 | | | | 6.0 | |
| 121,218 | | | | | | Voya Large Cap Value Fund — Class R6 | | | 1,601,294 | | | | 5.0 | |
| 80,749 | | | | | | Voya MidCap Opportunities Portfolio — Class I | | | 1,224,966 | | | | 3.8 | |
| 115,428 | | | | | | Voya Multi-Manager Emerging Markets Equity Fund — Class I | | | 1,213,144 | | | | 3.8 | |
| 222,212 | | | | | | Voya Multi-Manager International Equity Fund — Class I | | | 2,344,334 | | | | 7.3 | |
| 178,355 | | | | | | Voya Multi-Manager Large Cap Core Portfolio — Class I | | | 2,787,685 | | | | 8.6 | |
| |
MUTUAL FUNDS: (continued) |
| | Affiliated Investment Companies: (continued) |
| 213,452 | | | | | | Voya Multi-Manager Mid Cap Value Fund — Class I | | $ | 2,674,553 | | | | 8.3 | |
| 53,603 | | | | | | Voya RussellTM Mid Cap Growth Index Portfolio — Class I | | | 1,462,299 | | | | 4.5 | |
| 42,519 | | | | | | Voya Small Company Portfolio — Class I | | | 988,576 | | | | 3.1 | |
| 75,853 | | | | | | Voya U.S. Stock Index Portfolio — Class I | | | 1,113,525 | | | | 3.5 | |
| 19,248 | | | | | | VY® Clarion Real Estate Portfolio — Class I | | | 676,956 | | | | 2.1 | |
| 58,583 | | | | | | VY® Invesco Comstock Portfolio — Class I | | | 969,552 | | | | 3.0 | |
| 84,885 | | | | | | VY® T. Rowe Price Capital Appreciation Portfolio — Class I | | | 2,444,693 | | | | 7.6 | |
| 21,428 | | | | @ | | VY® T. Rowe Price Growth Equity Portfolio — Class I | | | 1,931,738 | | | | 6.0 | |
| | | | | | | Total Mutual Funds
(Cost $29,111,659) | | | 29,889,549 | | | | 92.8 | |
| |
| | | | | | | Total Investments in Securities
(Cost $30,628,056) | | $ | 31,544,951 | | | | 98.0 | |
| | | | | | | Assets in Excess of Other Liabilities | | | 651,550 | | | | 2.0 | |
| | | | | | | Net Assets | | $ | 32,196,501 | | | | 100.0 | |
| @ | | Non-income producing security. |
| | Cost for federal income tax purposes is $30,788,861. |
| Net unrealized appreciation consists of: | | | | | | |
| Gross Unrealized Appreciation | | | | $ | 1,654,605 | |
| Gross Unrealized Depreciation | | | | | (898,515 | ) |
| Net Unrealized Appreciation | | | | $ | 756,090 | |
Fair Value Measurementsˆ
The following is a summary of the fair valuations according to the inputs used as of December 31, 2014 in valuing the assets and liabilities:
| | | | Quoted Prices
in Active Markets
for Identical
Investments
(Level 1)
| | Significant
Other
Observable
Inputs
(Level 2)
| | Significant
Unobservable
Inputs
(Level 3)
| | Fair Value
at
December 31, 2014
|
|---|
Asset Table | | | | | | | | | | | | | | | | | | |
Investments, at fair value | | | | | | | | | | | | | | | | | | |
| Exchange-Traded Funds | | | | $ | 1,655,402 | | | $ | — | | | $ | — | | | $ | 1,655,402 | |
| Mutual Funds | | | | | 29,889,549 | | | | — | | | | — | | | | 29,889,549 | |
| Total Investments, at fair value | | | | $ | 31,544,951 | | | $ | — | | | $ | — | | | $ | 31,544,951 | |
Liabilities Table | | | | | | | | | | | | | | | | | | |
Other Financial Instruments+ | | | | | | | | | | | | | | | | | | |
| Futures | | | | $ | (18,283 | ) | | $ | — | | | $ | — | | | $ | (18,283 | ) |
| Total Liabilities | | | | $ | (18,283 | ) | | $ | — | | | $ | — | | | $ | (18,283 | ) |
| ˆ | | See Note 2, “Significant Accounting Policies” in the Notes to Financial Statements for additional information. |
| + | | Other Financial Instruments are derivatives not reflected in the Portfolio of Investments and may include open forward foreign currency contracts, futures, centrally cleared swaps, OTC swaps and written options. Forward foreign currency contracts, futures and centrally cleared swaps are valued at the unrealized gain (loss) on the instrument. OTC swaps and written options are valued at the fair value of the instrument. |
See Accompanying Notes to Financial Statements
80
VOYA SOLUTION MODERATELY
AGGRESSIVE PORTFOLIO | PORTFOLIO OF INVESTMENTS
AS OF DECEMBER 31, 2014 (CONTINUED) |
At December 31, 2014, the following futures contracts were outstanding for Voya Solution Moderately Aggressive Portfolio:
Contract Description
| | | | Number
of Contracts
| | Expiration
Date
| | Notional
Value
| | Unrealized
Appreciation/
(Depreciation)
|
|---|
Long Contracts
| | | | | | | | | | | | | | | | | | |
| Tokyo Price Index (TOPIX) | | | | | 6 | | | | 03/12/15 | | | $ | 705,043 | | | $ | (18,283 | ) |
| | | | | | | | | | | | | $ | 705,043 | | | $ | (18,283 | ) |
Transactions with Affiliates
An investment of at least 5% of the voting securities of an issuer, or a company which is under common control results in that issuer becoming an affiliated person as defined by the 1940 Act.
The following table provides transactions during the year ended December 31, 2014, where the following issuers were considered an affiliate:
Issuer
| | | | Beginning
Market
Value at
12/31/13
| | Purchases
at Cost
| | Sales
at Cost
| | Change in
Unrealized
Appreciation/
(Depreciation)
| | Ending
Market
Value at
12/31/14
| | Investment
Income
| | Realized
Gains/
(Losses)
| | Net
Capital Gain
Distributions
|
|---|
| ING Total Return Bond Portfolio — Class I | | | | $ | 23 | | | $ | — | | | $ | (23 | ) | | $ | — | | | $ | — | | | $ | — | | | $ | — | | | $ | — | |
| Voya Emerging Markets Index Portfolio — Class I | | | | | — | | | | 736,181 | | | | (61,837 | ) | | | (60,365 | ) | | | 613,979 | | | | — | | | | (3,850 | ) | | | — | |
| Voya Floating Rate Fund — Class I | | | | | 572,402 | | | | 579,975 | | | | (158,461 | ) | | | (20,340 | ) | | | 973,576 | | | | 28,914 | | | | 330 | | | | — | |
| Voya Global Bond Fund — Class R6 | | | | | 569,002 | | | | 199,532 | | | | (120,078 | ) | | | (4,583 | ) | | | 643,873 | | | | 4,681 | | | | 387 | | | | — | |
| Voya High Yield Bond Fund — Class I | | | | | 850,366 | | | | 1,307,749 | | | | (478,874 | ) | | | (70,625 | ) | | | 1,608,616 | | | | 77,422 | | | | (5,790 | ) | | | — | |
| Voya High Yield Portfolio — Class I | | | | | 287,326 | | | | 5,227 | | | | (294,210 | ) | | | 1,657 | | | | — | | | | 928 | | | | (94 | ) | | | — | |
| Voya International Core Fund — Class I | | | | | 1,148,642 | | | | 1,243,118 | | | | (268,629 | ) | | | (383,113 | ) | | | 1,740,018 | | | | 15,603 | | | | 65,948 | | | | 238,052 | |
| Voya International Index Portfolio — Class I | | | | | 871,322 | | | | 686,611 | | | | (516,053 | ) | | | (104,597 | ) | | | 937,283 | | | | 5,507 | | | | 25,251 | | | | — | |
| Voya Large Cap Growth Portfolio — Class I | | | | | 2,054,085 | | | | 619,706 | | | | (642,058 | ) | | | (92,844 | ) | | | 1,938,889 | | | | 9,937 | | | | 181,736 | | | | 143,739 | |
| Voya Large Cap Value Fund — Class R6 | | | | | 1,881,978 | | | | 682,427 | | | | (865,068 | ) | | | (98,043 | ) | | | 1,601,294 | | | | 29,761 | | | | 94,908 | | | | 108,978 | |
| Voya MidCap Opportunities Portfolio — Class I | | | | | 2,045,661 | | | | 531,018 | | | | (1,007,399 | ) | | | (344,314 | ) | | | 1,224,966 | | | | 4,856 | | | | 234,707 | | | | 185,025 | |
| Voya Multi-Manager Emerging Markets Equity Fund — Class I | | | | | 1,142,517 | | | | 1,041,818 | | | | (869,571 | ) | | | (101,620 | ) | | | 1,213,144 | | | | 19,308 | | | | 6,717 | | | | — | |
| Voya Multi-Manager International Equity Fund — Class I | | | | | 2,330,562 | | | | 922,389 | | | | (465,142 | ) | | | (443,475 | ) | | | 2,344,334 | | | | 55,494 | | | | 131,228 | | | | 95,133 | |
| Voya Multi-Manager Large Cap Core Portfolio — Class I | | | | | 2,414,708 | | | | 894,902 | | | | (592,276 | ) | | | 70,351 | | | | 2,787,685 | | | | 33,961 | | | | 88,014 | | | | 206,754 | |
| Voya Multi-Manager Mid Cap Value Fund — Class I | | | | | 2,069,929 | | | | 1,586,561 | | | | (753,318 | ) | | | (228,619 | ) | | | 2,674,553 | | | | 30,208 | | | | 75,149 | | | | 447,026 | |
Voya RussellTM Mid Cap Growth Index Portfolio — Class I | | | | | — | | | | 1,682,563 | | | | (381,499 | ) | | | 161,235 | | | | 1,462,299 | | | | 6,987 | | | | 33,578 | | | | — | |
Voya RussellTM Mid Cap Index Portfolio — Class I | | | | | 1,025,573 | | | | 20,661 | | | | (921,158 | ) | | | (125,076 | ) | | | — | | | | — | | | | 101,089 | | | | — | |
| Voya Small Company Portfolio — Class I | | | | | 879,081 | | | | 405,234 | | | | (210,015 | ) | | | (85,724 | ) | | | 988,576 | | | | 3,299 | | | | 47,277 | | | | 102,301 | |
| Voya U.S. Bond Index Portfolio — Class I | | | | | 56,455 | | | | 982,349 | | | | (1,039,353 | ) | | | 549 | | | | — | | | | 4,681 | | | | 4,742 | | | | — | |
| Voya U.S. Stock Index Portfolio — Class I | | | | | 876,093 | | | | 3,953,373 | | | | (3,698,640 | ) | | | (17,301 | ) | | | 1,113,525 | | | | 25,786 | | | | (163,600 | ) | | | 303,626 | |
| VY® Clarion Real Estate Portfolio — Class I | | | | | 569,907 | | | | 173,351 | | | | (186,304 | ) | | | 120,002 | | | | 676,956 | | | | 10,382 | | | | 42,434 | | | | — | |
| VY® Invesco Comstock Portfolio — Class I | | | | | — | | | | 1,102,009 | | | | (198,565 | ) | | | 66,108 | | | | 969,552 | | | | 20,352 | | | | 18,694 | | | | — | |
| VY® JPMorgan Emerging Markets Equity Portfolio — Class I | | | | | 565,557 | | | | 11,806 | | | | (581,669 | ) | | | 4,306 | | | | — | | | | — | | | | (38,908 | ) | | | — | |
| VY® T. Rowe Price Capital Appreciation Portfolio — Class I | | | | | 2,025,635 | | | | 925,283 | | | | (438,520 | ) | | | (67,705 | ) | | | 2,444,693 | | | | 37,214 | | | | 106,497 | | | | 207,514 | |
| VY® T. Rowe Price Equity Income Portfolio — Class I | | | | | 1,303,738 | | | | 42,871 | | | | (1,099,088 | ) | | | (247,521 | ) | | | — | | | | — | | | | 237,394 | | | | — | |
| VY® T. Rowe Price Growth Equity Portfolio — Class I | | | | | 1,489,119 | | | | 942,881 | | | | (390,664 | ) | | | (109,598 | ) | | | 1,931,738 | | | | — | | | | 159,674 | | | | 136,521 | |
| | | | | $ | 27,029,681 | | | $ | 21,279,595 | | | $ | (16,238,472 | ) | | $ | (2,181,255 | ) | | $ | 29,889,549 | | | $ | 425,281 | | | $ | 1,443,512 | | | $ | 2,174,669 | |
The financial statements for the above mutual fund[s] can be found at www.sec.gov.
See Accompanying Notes to Financial Statements
81
VOYA SOLUTION MODERATELY
AGGRESSIVE PORTFOLIO | PORTFOLIO OF INVESTMENTS
AS OF DECEMBER 31, 2014 (CONTINUED) |
A summary of derivative instruments by primary risk exposure is outlined in the following tables.
The fair value of derivative instruments as of December 31, 2014 was as follows:
Derivatives not accounted for as
hedging instruments
| | | | Location on Statement of Assets and Liabilities
| | Fair Value
|
|---|
Liability Derivatives
| | | | | | |
|---|
| Equity contracts | | | | Net Assets — Unrealized depreciation* | | $ | 18,283 | |
Total Liability Derivatives | | | | | | $ | 18,283 | |
| * | | Includes cumulative appreciation/depreciation of futures contracts as reported in the table following the Portfolio of Investments. |
The effect of derivative instruments on the Portfolio’s Statement of Operations for the year ended December 31, 2014 was as follows:
| | | | Amount of Realized Gain or (Loss) on
Derivatives Recognized in Income |
|---|
Derivatives not accounted for as
hedging instruments
| | | | Futures
|
|---|
| Equity contracts | | | | $ | (49 | ) |
Total | | | | $ | (49 | ) |
| | | | Change in Unrealized Appreciation or (Depreciation)
on Derivatives Recognized in Income |
|---|
Derivatives not accounted for as
hedging instruments
| | | | Futures
|
|---|
| Equity contracts | | | | $ | (18,283 | ) |
Total | | | | $ | (18,283 | ) |
See Accompanying Notes to Financial Statements
82
VOYA SOLUTION MODERATELY
CONSERVATIVE PORTFOLIO | PORTFOLIO OF INVESTMENTS
AS OF DECEMBER 31, 2014 |
Shares
|
|
|
|
|
|
|
| Value
|
| Percentage
of Net
Assets
|
|---|
| |
EXCHANGE-TRADED FUNDS: 3.0% |
| 4,991 | | | | | | iShares iBoxx High Yield Corporate Bond Fund | | $ | 447,194 | | | | 1.0 | |
| 4,418 | | | | | | SPDR Trust Series 1 | | | 907,899 | | | | 2.0 | |
| |
| | | | | | | Total Exchange-Traded Funds
(Cost $1,314,000) | | | 1,355,093 | | | | 3.0 | |
| |
MUTUAL FUNDS: 95.0% |
| | Affiliated Investment Companies: 95.0% |
| 79,835 | | | | | | Voya Emerging Markets Index Portfolio — Class I | | | 850,238 | | | | 1.9 | |
| 224,577 | | | | | | Voya Floating Rate Fund — Class I | | | 2,245,771 | | | | 5.0 | |
| 213,422 | | | | | | Voya Global Bond Fund — Class R6 | | | 2,228,129 | | | | 5.0 | |
| 331,903 | | | | | | Voya High Yield Bond Fund — Class I | | | 2,665,179 | | | | 5.9 | |
| 382,471 | | | | | | Voya Intermediate Bond Fund — Class R6 | | | 3,859,131 | | | | 8.6 | |
| 95,093 | | | | | | Voya International Core Fund — Class I | | | 875,804 | | | | 2.0 | |
| 138,478 | | | | | | Voya International Index Portfolio — Class I | | | 1,297,538 | | | | 2.9 | |
| 55,759 | | | | | | Voya Large Cap Growth Portfolio — Class I | | | 1,117,967 | | | | 2.5 | |
| 136,004 | | | | | | Voya Large Cap Value Fund — Class R6 | | | 1,796,615 | | | | 4.0 | |
| 81,935 | | | | | | Voya MidCap Opportunities Portfolio — Class I | | | 1,242,951 | | | | 2.8 | |
| 82,034 | | | | | | Voya Multi-Manager International Equity Fund — Class I | | | 865,463 | | | | 1.9 | |
| 42,668 | | | | | | Voya Multi-Manager Large Cap Core Portfolio — Class I | | | 666,906 | | | | 1.5 | |
| 187,965 | | | | | | Voya Multi-Manager Mid Cap Value Fund — Class I | | | 2,355,197 | | | | 5.2 | |
| |
MUTUAL FUNDS: (continued) |
| | Affiliated Investment Companies: (continued) |
| 41,207 | | | | | | Voya RussellTM Mid Cap Growth Index Portfolio — Class I | | $ | 1,124,125 | | | | 2.5 | |
| 226,968 | | | | | | Voya Short Term Bond Fund — Class R6 | | | 2,258,329 | | | | 5.0 | |
| 39,218 | | | | | | Voya Small Company Portfolio — Class I | | | 911,814 | | | | 2.0 | |
| 653,778 | | | | | | Voya U.S. Bond Index Portfolio — Class I | | | 7,034,655 | | | | 15.7 | |
| 30,420 | | | | | | Voya U.S. Stock Index Portfolio — Class I | | | 446,564 | | | | 1.0 | |
| 234,371 | | | | | | VY® BlackRock Inflation Protected Bond Portfolio — Class I | | | 2,235,897 | | | | 5.0 | |
| 26,622 | | | | | | VY® Clarion Real Estate Portfolio — Class I | | | 936,305 | | | | 2.1 | |
| 156,614 | | | | | | VY® T. Rowe Price Capital Appreciation Portfolio — Class I | | | 4,510,492 | | | | 10.0 | |
| 12,357 | | | | @ | | VY® T. Rowe Price Growth Equity Portfolio — Class I | | | 1,114,007 | | | | 2.5 | |
| |
| | | | | | | Total Mutual Funds
(Cost $42,236,219) | | | 42,639,077 | | | | 95.0 | |
| |
| | | | | | | Total Investments in Securities
(Cost $43,550,219) | | $ | 43,994,170 | | | | 98.0 | |
| | | | | | | Assets in Excess of Other Liabilities | | | 894,751 | | | | 2.0 | |
| | | | | | | Net Assets | | $ | 44,888,921 | | | | 100.0 | |
| @ | | Non-income producing security. |
| | Cost for federal income tax purposes is $44,008,190. |
| Net unrealized depreciation consists of: | | | | | | |
| Gross Unrealized Appreciation | | | | $ | 1,346,683 | |
| Gross Unrealized Depreciation | | | | | (1,360,703 | ) |
| Net Unrealized Depreciation | | | | $ | (14,020 | ) |
Fair Value Measurementsˆ
The following is a summary of the fair valuations according to the inputs used as of December 31, 2014 in valuing the assets and liabilities:
| | | | Quoted Prices
in Active Markets
for Identical
Investments
(Level 1)
| | Significant
Other
Observable
Inputs
(Level 2)
| | Significant
Unobservable
Inputs
(Level 3)
| | Fair Value
at
December 31, 2014
|
|---|
Asset Table | | | | | | | | | | | | | | | | | | |
Investments, at fair value | | | | | | | | | | | | | | | | | | |
| Exchange-Traded Funds | | | | $ | 1,355,093 | | | $ | — | | | $ | — | | | $ | 1,355,093 | |
| Mutual Funds | | | | | 42,639,077 | | | | — | | | | — | | | | 42,639,077 | |
| Total Investments, at fair value | | | | $ | 43,994,170 | | | $ | — | | | $ | — | | | $ | 43,994,170 | |
Liabilities Table | | | | | | | | | | | | | | | | | | |
Other Financial Instruments+ | | | | | | | | | | | | | | | | | | |
| Futures | | | | $ | (24,377 | ) | | $ | — | | | $ | — | | | $ | (24,377 | ) |
| Total Liabilities | | | | $ | (24,377 | ) | | $ | — | | | $ | — | | | $ | (24,377 | ) |
| ˆ | | See Note 2, “Significant Accounting Policies” in the Notes to Financial Statements for additional information. |
See Accompanying Notes to Financial Statements
83
VOYA SOLUTION MODERATELY
CONSERVATIVE PORTFOLIO | PORTFOLIO OF INVESTMENTS
AS OF DECEMBER 31, 2014 (CONTINUED) |
| + | | Other Financial Instruments are derivatives not reflected in the Portfolio of Investments and may include open forward foreign currency contracts, futures, centrally cleared swaps, OTC swaps and written options. Forward foreign currency contracts, futures and centrally cleared swaps are valued at the unrealized gain (loss) on the instrument. OTC swaps and written options are valued at the fair value of the instrument. |
| ˆ | | See Note 2, “Significant Accounting Policies” in the Notes to Financial Statements for additional information. |
At December 31, 2014, the following futures contracts were outstanding for Voya Solution Moderately Conservative Portfolio:
Contract Description
| | | | Number
of Contracts
| | Expiration
Date
| | Notional
Value
| | Unrealized
Appreciation/
(Depreciation)
|
|---|
Long Contracts | | | | | | | | | | | | | | | | | | |
| Tokyo Price Index (TOPIX) | | | | | 8 | | | | 03/12/15 | | | $ | 940,057 | | | $ | (24,377 | ) |
| | | | | | | | | | | | | $ | 940,057 | | | $ | (24,377 | ) |
Transactions with Affiliates
An investment of at least 5% of the voting securities of an issuer, or a company which is under common control results in that issuer becoming an affiliated person as defined by the 1940 Act.
The following table provides transactions during the year ended December 31, 2014, where the following issuers were considered an affiliate:
Issuer
| | | | Beginning
Market
Value at
12/31/13
| | Purchases
at Cost
| | Sales
at Cost
| | Change in
Unrealized
Appreciation/
(Depreciation)
| | Ending
Market
Value at
12/31/14
| | Investment
Income
| | Realized
Gains/
(Losses)
| | Net
Capital Gain
Distributions
|
|---|
| ING Total Return Bond Portfolio — Class I | | | | $ | 2,507,943 | | | $ | 24,874 | | | $ | (2,642,929 | ) | | $ | 110,112 | | | $ | — | | | $ | — | | | $ | (88,398 | ) | | $ | — | |
| Voya Aggregate Bond Portfolio — Class I | | | | | — | | | | 2,596,181 | | | | (2,596,181 | ) | | | — | | | | — | | | | 47,646 | | | | (1,210 | ) | | | 1,685 | |
| Voya Emerging Markets Index Portfolio — Class I | | | | | — | | | | 1,011,599 | | | | (77,465 | ) | | | (83,896 | ) | | | 850,238 | | | | — | | | | (5,060 | ) | | | — | |
| Voya Floating Rate Fund — Class I | | | | | 1,391,965 | | | | 1,290,607 | | | | (379,138 | ) | | | (57,663 | ) | | | 2,245,771 | | | | 65,275 | | | | 11,967 | | | | — | |
| Voya Global Bond Fund — Class R6 | | | | | 2,306,122 | | | | 474,091 | | | | (551,605 | ) | | | (479 | ) | | | 2,228,129 | | | | 16,025 | | | | (3,761 | ) | | | — | |
| Voya High Yield Bond Fund — Class I | | | | | 1,796,115 | | | | 1,849,500 | | | | (870,777 | ) | | | (109,659 | ) | | | 2,665,179 | | | | 134,126 | | | | (11,103 | ) | | | — | |
| Voya High Yield Portfolio — Class I | | | | | 464,809 | | | | 1,026 | | | | (468,809 | ) | | | 2,974 | | | | — | | | | 1,477 | | | | (489 | ) | | | — | |
| Voya Intermediate Bond Fund — Class R6 | | | | | 3,450,232 | | | | 1,239,722 | | | | (965,884 | ) | | | 135,061 | | | | 3,859,131 | | | | 124,848 | | | | (6,177 | ) | | | — | |
| Voya International Core Fund — Class I | | | | | 888,048 | | | | 399,674 | | | | (194,706 | ) | | | (217,212 | ) | | | 875,804 | | | | 7,760 | | | | 52,813 | | | | 118,391 | |
| Voya International Index Portfolio — Class I | | | | | 941,177 | | | | 843,721 | | | | (351,841 | ) | | | (135,519 | ) | | | 1,297,538 | | | | 7,118 | | | | 34,670 | | | | — | |
| Voya Large Cap Growth Portfolio — Class I | | | | | 1,308,048 | | | | 255,324 | | | | (394,451 | ) | | | (50,954 | ) | | | 1,117,967 | | | | 5,658 | | | | 103,594 | | | | 81,837 | |
| Voya Large Cap Value Fund — Class R6 | | | | | 1,055,798 | | | | 1,194,035 | | | | (437,999 | ) | | | (15,219 | ) | | | 1,796,615 | | | | 33,394 | | | | 21,287 | | | | 120,231 | |
| Voya MidCap Opportunities Portfolio — Class I | | | | | 1,894,854 | | | | 441,112 | | | | (806,897 | ) | | | (286,118 | ) | | | 1,242,951 | | | | 5,442 | | | | 183,943 | | | | 189,706 | |
| Voya Multi-Manager Emerging Markets Equity Fund — Class I | | | | | 925,906 | | | | 76,419 | | | | (956,109 | ) | | | (46,216 | ) | | | — | | | | — | | | | (721 | ) | | | — | |
| Voya Multi-Manager International Equity Fund — Class I | | | | | 944,279 | | | | 246,691 | | | | (166,128 | ) | | | (159,379 | ) | | | 865,463 | | | | 20,240 | | | | 46,150 | | | | 34,697 | |
| Voya Multi-Manager Large Cap Core Portfolio — Class I | | | | | 1,367,447 | | | | 209,300 | | | | (854,487 | ) | | | (55,354 | ) | | | 666,906 | | | | 8,136 | | | | 71,685 | | | | 49,857 | |
| Voya Multi-Manager Mid Cap Value Fund — Class I | | | | | 1,917,541 | | | | 1,549,074 | | | | (904,174 | ) | | | (207,244 | ) | | | 2,355,197 | | | | 26,289 | | | | 102,745 | | | | 389,041 | |
Voya RussellTM Mid Cap Growth Index Portfolio — Class I | | | | | — | | | | 1,412,464 | | | | (415,041 | ) | | | 126,702 | | | | 1,124,125 | | | | 5,942 | | | | 31,840 | | | | — | |
Voya RussellTM Mid Cap Index Portfolio — Class I | | | | | 1,662,370 | | | | 15,829 | | | | (1,473,996 | ) | | | (204,203 | ) | | | — | | | | — | | | | 165,982 | | | | — | |
| Voya Short Term Bond Fund — Class R6 | | | | | 2,308,210 | | | | 506,630 | | | | (542,256 | ) | | | (14,255 | ) | | | 2,258,329 | | | | 41,712 | | | | 755 | | | | — | |
| Voya Small Company Portfolio — Class I | | | | | 949,986 | | | | 317,077 | | | | (256,348 | ) | | | (98,901 | ) | | | 911,814 | | | | 3,166 | | | | 57,375 | | | | 98,174 | |
| Voya U.S. Bond Index Portfolio — Class I | | | | | 5,778,685 | | | | 4,629,772 | | | | (3,681,288 | ) | | | 307,486 | | | | 7,034,655 | | | | 121,285 | | | | (97,849 | ) | | | — | |
| Voya U.S. Stock Index Portfolio — Class I | | | | | 1,419,967 | | | | 4,214,095 | | | | (5,147,988 | ) | | | (39,510 | ) | | | 446,564 | | | | 15,640 | | | | (184,859 | ) | | | 305,718 | |
| VY® BlackRock Inflation Protected Bond Portfolio — Class I | | | | | 2,269,701 | | | | 481,015 | | | | (622,103 | ) | | | 107,284 | | | | 2,235,897 | | | | 33,837 | | | | (76,736 | ) | | | — | |
| VY® Clarion Real Estate Portfolio — Class I | | | | | 923,714 | | | | 153,299 | | | | (313,713 | ) | | | 173,005 | | | | 936,305 | | | | 14,188 | | | | 64,535 | | | | — | |
| VY® T. Rowe Price Capital Appreciation Portfolio — Class I | | | | | 2,814,297 | | | | 2,855,657 | | | | (1,109,373 | ) | | | (50,089 | ) | | | 4,510,492 | | | | 68,504 | | | | 155,903 | | | | 378,114 | |
| VY® T. Rowe Price Equity Income Portfolio — Class I | �� | | | | 821,698 | | | | 29,446 | | | | (719,830 | ) | | | (131,314 | ) | | | — | | | | — | | | | 134,423 | | | | — | |
| VY® T. Rowe Price Growth Equity Portfolio — Class I | | | | | 1,086,416 | | | | 382,887 | | | | (282,196 | ) | | | (73,100 | ) | | | 1,114,007 | | | | — | | | | 90,848 | | | | 78,619 | |
| | | | | $ | 43,195,328 | | | $ | 28,701,121 | | | $ | (28,183,712 | ) | | $ | (1,073,660 | ) | | $ | 42,639,077 | | | $ | 807,708 | | | $ | 854,152 | | | $ | 1,846,070 | |
The financial statements for the above mutual fund[s] can be found at www.sec.gov.
See Accompanying Notes to Financial Statements
84
VOYA SOLUTION MODERATELY
CONSERVATIVE PORTFOLIO | PORTFOLIO OF INVESTMENTS
AS OF DECEMBER 31, 2014 (CONTINUED) |
A summary of derivative instruments by primary risk exposure is outlined in the following tables.
The fair value of derivative instruments as of December 31, 2014 was as follows:
Derivatives not accounted for as
hedging instruments
| | | | Location on Statement of Assets and Liabilities
| | Fair Value
|
|---|
Liability Derivatives
| | | | | | |
|---|
| Equity contracts | | | | Net Assets — Unrealized depreciation* | | $ | 24,377 | |
Total Liability Derivatives | | | | | | $ | 24,377 | |
| * | | Includes cumulative appreciation/depreciation of futures contracts as reported in the table following the Portfolio of Investments. |
The effect of derivative instruments on the Portfolio’s Statement of Operations for the year ended December 31, 2014 was as follows:
| | | | Amount of Realized Gain or (Loss) on
Derivatives Recognized in Income |
|---|
Derivatives not accounted for as
hedging instruments
| | | | Futures
|
|---|
| Equity contracts | | | | $ | (65 | ) |
Total | | | | $ | (65 | ) |
| | | | Change in Unrealized Appreciation or (Depreciation)
on Derivatives Recognized in Income |
|---|
Derivatives not accounted for as
hedging instruments
| | | | Futures
|
|---|
| Equity contracts | | | | $ | (24,377 | ) |
Total | | | | $ | (24,377 | ) |
See Accompanying Notes to Financial Statements
85
| VOYA SOLUTION 2015 PORTFOLIO | PORTFOLIO OF INVESTMENTS
AS OF DECEMBER 31, 2014 |
Shares
|
|
|
|
|
|
|
| Value
|
| Percentage
of Net
Assets
|
|---|
| |
EXCHANGE-TRADED FUNDS: 3.1% |
| 64,491 | | | | | | iShares iBoxx High Yield Corporate Bond Fund | | $ | 5,778,394 | | | | 1.0 | |
| 57,092 | | | | | | SPDR Trust Series 1 | | | 11,732,406 | | | | 2.1 | |
| |
| | | | | | | Total Exchange-Traded Funds
(Cost $16,978,292) | | | 17,510,800 | | | | 3.1 | |
| |
MUTUAL FUNDS: 94.8% |
| | Affiliated Investment Companies: 94.8% |
| 2,841,594 | | | | | | Voya Floating Rate Fund — Class I | | | 28,415,939 | | | | 5.0 | |
| 3,239,629 | | | | | | Voya Global Bond Fund — Class R6 | | | 33,821,728 | | | | 5.9 | |
| 2,780,931 | | | | | | Voya High Yield Bond Fund — Class I | | | 22,330,877 | | | | 3.9 | |
| 4,839,650 | | | | | | Voya Intermediate Bond Fund — Class R6 | | | 48,832,064 | | | | 8.6 | |
| 1,804,232 | | | | | | Voya International Core Fund — Class I | | | 16,616,977 | | | | 2.9 | |
| 583,742 | | | | | | Voya International Index Portfolio — Class I | | | 5,469,666 | | | | 1.0 | |
| 846,878 | | | | | | Voya Large Cap Growth Portfolio — Class I | | | 16,979,898 | | | | 3.0 | |
| 1,506,230 | | | | | | Voya Large Cap Value Fund — Class R6 | | | 19,897,301 | | | | 3.5 | |
| 1,320,025 | | | | | | Voya MidCap Opportunities Portfolio — Class I | | | 20,024,784 | | | | 3.5 | |
| 2,074,910 | | | | | | Voya Multi-Manager International Equity Fund — Class I | | | 21,890,296 | | | | 3.9 | |
| 1,543,560 | | | | | | Voya Multi-Manager Large Cap Core Portfolio — Class I | | | 24,125,840 | | | | 4.2 | |
| |
MUTUAL FUNDS: (continued) |
| | Affiliated Investment Companies: (continued) |
| 1,585,903 | | | | | | Voya Multi-Manager Mid Cap Value Fund — Class I | | $ | 19,871,360 | | | | 3.5 | |
| 4,594,728 | | | | | | Voya Short Term Bond Fund — Class R6 | | | 45,717,544 | | | | 8.0 | |
| 7,631,821 | | | | | | Voya U.S. Bond Index Portfolio — Class I | | | 82,118,392 | | | | 14.4 | |
| 1,113,658 | | | | | | Voya U.S. Stock Index Portfolio — Class I | | | 16,348,504 | | | | 2.9 | |
| 4,743,263 | | | | | | VY® BlackRock Inflation Protected Bond Portfolio — Class I | | | 45,250,727 | | | | 8.0 | |
| 337,215 | | | | | | VY® Clarion Real Estate Portfolio — Class I | | | 11,859,838 | | | | 2.1 | |
| 1,585,695 | | | | | | VY® T. Rowe Price Capital Appreciation Portfolio — Class I | | | 45,668,004 | | | | 8.0 | |
| 156,394 | | | | @ | | VY® T. Rowe Price Growth Equity Portfolio — Class I | | | 14,098,920 | | | | 2.5 | |
| |
| | | | | | | Total Mutual Funds
(Cost $534,564,103) | | | 539,338,659 | | | | 94.8 | |
| |
| | | | | | | Total Investments in Securities
(Cost $551,542,395) | | $ | 556,849,459 | | | | 97.9 | |
| | | | | | | Assets in Excess of Other Liabilities | | | 11,814,026 | | | | 2.1 | |
| | | | | | | Net Assets | | $ | 568,663,485 | | | | 100.0 | |
| @ | | Non-income producing security. |
| | Cost for federal income tax purposes is $555,732,873. |
| Net unrealized appreciation consists of: | | | | | | |
| Gross Unrealized Appreciation | | | | $ | 18,073,595 | |
| Gross Unrealized Depreciation | | | | | (16,957,009 | ) |
| Net Unrealized Appreciation | | | | $ | 1,116,586 | |
Fair Value Measurementsˆ
The following is a summary of the fair valuations according to the inputs used as of December 31, 2014 in valuing the assets and liabilities:
| | | | Quoted Prices
in Active Markets
for Identical
Investments
(Level 1)
| | Significant
Other
Observable
Inputs
(Level 2)
| | Significant
Unobservable
Inputs
(Level 3)
| | Fair Value
at
December 31, 2014
|
|---|
Asset Table | | | | | | | | | | | | | | | | | | |
Investments, at fair value | | | | | | | | | | | | | | | | | | |
| Exchange-Traded Funds | | | | $ | 17,510,800 | | | $ | — | | | $ | — | | | $ | 17,510,800 | |
| Mutual Funds | | | | | 539,338,659 | | | | — | | | | — | | | | 539,338,659 | |
| Total Investments, at fair value | | | | $ | 556,849,459 | | | $ | — | | | $ | — | | | $ | 556,849,459 | |
Liabilities Table | | | | | | | | | | | | | | | | | | |
Other Financial Instruments+ | | | | | | | | | | | | | | | | | | |
| Futures | | | | $ | (298,617 | ) | | $ | — | | | $ | — | | | $ | (298,617 | ) |
| Total Liabilities | | | | $ | (298,617 | ) | | $ | — | | | $ | — | | | $ | (298,617 | ) |
| ˆ | | See Note 2, “Significant Accounting Policies” in the Notes to Financial Statements for additional information. |
| + | | Other Financial Instruments are derivatives not reflected in the Portfolio of Investments and may include open forward foreign currency contracts, futures, centrally cleared swaps, OTC swaps and written options. Forward foreign currency contracts, futures and centrally cleared swaps are valued at the unrealized gain (loss) on the instrument. OTC swaps and written options are valued at the fair value of the instrument. |
See Accompanying Notes to Financial Statements
86
| VOYA SOLUTION 2015 PORTFOLIO | PORTFOLIO OF INVESTMENTS
AS OF DECEMBER 31, 2014 (CONTINUED) |
At December 31, 2014, the following futures contracts were outstanding for Voya Solution 2015 Portfolio:
Contract Description
| | | | Number
of Contracts
| | Expiration
Date
| | Notional
Value
| | Unrealized
Appreciation/
(Depreciation)
|
|---|
Long Contracts | | | | | | | | | | | | | | | | | | |
| Tokyo Price Index (TOPIX) | | | | | 98 | | | | 03/12/15 | | | $ | 11,515,695 | | | $ | (298,617 | ) |
| | | | | | | | | | | | | $ | 11,515,695 | | | $ | (298,617 | ) |
Transactions with Affiliates
An investment of at least 5% of the voting securities of an issuer, or a company which is under common control results in that issuer becoming an affiliated person as defined by the 1940 Act.
The following table provides transactions during the year ended December 31, 2014, where the following issuers were considered an affiliate:
Issuer
| | | | Beginning
Market
Value at
12/31/13
| | Purchases
at Cost
| | Sales
at Cost
| | Change in
Unrealized
Appreciation/
(Depreciation)
| | Ending
Market
Value at
12/31/14
| | Investment
Income
| | Realized
Gains/
(Losses)
| | Net
Capital Gain
Distributions
|
|---|
| ING Total Return Bond Portfolio — Class I | | | | $ | 34,681,064 | | | $ | 20,738 | | | $ | (36,196,798 | ) | | $ | 1,494,996 | | | $ | — | | | $ | — | | | $ | (1,199,776 | ) | | $ | — | |
| Voya Aggregate Bond Portfolio — Class I | | | | | — | | | | 30,042,276 | | | | (30,042,276 | ) | | | — | | | | — | | | | 547,898 | | | | 4,906 | | | | 19,381 | |
| Voya Floating Rate Fund — Class I | | | | | 20,164,386 | | | | 15,032,861 | | | | (6,150,499 | ) | | | (630,809 | ) | | | 28,415,939 | | | | 878,229 | | | | 37,038 | | | | — | |
| Voya Global Bond Fund — Class R6 | | | | | 40,085,503 | | | | 3,992,718 | | | | (10,570,463 | ) | | | 313,970 | | | | 33,821,728 | | | | 251,181 | | | | (274,369 | ) | | | — | |
| Voya High Yield Bond Fund — Class I | | | | | 12,977,980 | | | | 20,668,393 | | | | (10,274,867 | ) | | | (1,040,629 | ) | | | 22,330,877 | | | | 1,097,612 | | | | (53,205 | ) | | | — | |
| Voya High Yield Portfolio — Class I | | | | | 6,748,373 | | | | 3,950 | | | | (6,787,420 | ) | | | 35,097 | | | | — | | | | 21,321 | | | | 663 | | | | — | |
| Voya Intermediate Bond Fund — Class R6 | | | | | 44,982,715 | | | | 16,203,909 | | | | (14,186,620 | ) | | | 1,832,060 | | | | 48,832,064 | | | | 1,677,715 | | | | (111,559 | ) | | | — | |
| Voya International Core Fund — Class I | | | | | 13,522,611 | | | | 11,573,899 | | | | (4,245,176 | ) | | | (4,234,357 | ) | | | 16,616,977 | | | | 150,724 | | | | 1,189,329 | | | | 2,299,527 | |
| Voya International Index Portfolio — Class I | | | | | 20,477,195 | | | | 6,906,466 | | | | (19,461,876 | ) | | | (2,452,119 | ) | | | 5,469,666 | | | | — | | | | 1,965,779 | | | | — | |
| Voya Large Cap Growth Portfolio — Class I | | | | | 22,410,114 | | | | 2,314,824 | | | | (6,722,700 | ) | | | (1,022,340 | ) | | | 16,979,898 | | | | 91,991 | | | | 1,888,936 | | | | 1,330,608 | |
| Voya Large Cap Value Fund — Class R6 | | | | | 10,205,385 | | | | 15,502,969 | | | | (4,859,328 | ) | | | (951,725 | ) | | | 19,897,301 | | | | 389,889 | | | | 1,065,850 | | | | 1,362,325 | |
| Voya MidCap Opportunities Portfolio — Class I | | | | | 27,465,077 | | | | 7,568,253 | | | | (10,451,823 | ) | | | (4,556,723 | ) | | | 20,024,784 | | | | 110,352 | | | | 3,203,941 | | | | 3,206,037 | |
| Voya Multi-Manager International Equity Fund — Class I | | | | | 27,385,278 | | | | 4,209,881 | | | | (5,493,328 | ) | | | (4,211,535 | ) | | | 21,890,296 | | | | 524,207 | | | | 1,269,307 | | | | 898,640 | |
| Voya Multi-Manager Large Cap Core Portfolio — Class I | | | | | 36,911,632 | | | | 3,147,245 | | | | (15,688,954 | ) | | | (244,083 | ) | | | 24,125,840 | | | | 300,523 | | | | 1,456,313 | | | | 1,891,513 | |
| Voya Multi-Manager Mid Cap Value Fund — Class I | | | | | 27,788,556 | | | | 7,513,325 | | | | (12,572,600 | ) | | | (2,857,921 | ) | | | 19,871,360 | | | | 226,961 | | | | 2,246,890 | | | | 3,358,657 | |
Voya RussellTM Mid Cap Index Portfolio — Class I | | | | | 6,884,519 | | | | 3,950 | | | | (6,052,308 | ) | | | (836,161 | ) | | | — | | | | — | | | | 681,372 | | | | — | |
| Voya Short Term Bond Fund — Class R6 | | | | | 46,813,984 | | | | 12,395,613 | | | | (13,194,524 | ) | | | (297,529 | ) | | | 45,717,544 | | | | 892,671 | | | | 11,948 | | | | — | |
| Voya U.S. Bond Index Portfolio — Class I | | | | | 83,532,718 | | | | 49,445,485 | | | | (55,432,172 | ) | | | 4,572,361 | | | | 82,118,392 | | | | 1,329,122 | | | | (1,994,052 | ) | | | — | |
| Voya U.S. Stock Index Portfolio — Class I | | | | | 13,724,034 | | | | 37,841,817 | | | | (34,435,755 | ) | | | (781,592 | ) | | | 16,348,504 | | | | 378,509 | | | | (170,959 | ) | | | 4,142,418 | |
| VY® BlackRock Inflation Protected Bond Portfolio — Class I | | | | | 52,447,032 | | | | 5,234,599 | | | | (14,690,845 | ) | | | 2,259,941 | | | | 45,250,727 | | | | 747,343 | | | | (1,514,686 | ) | | | — | |
| VY® Clarion Real Estate Portfolio — Class I | | | | | 13,388,117 | | | | 900,639 | | | | (4,641,014 | ) | | | 2,212,096 | | | | 11,859,838 | | | | 192,239 | | | | 993,426 | | | | — | |
| VY® T. Rowe Price Capital Appreciation Portfolio — Class I | | | | | 40,789,755 | | | | 19,220,090 | | | | (14,622,928 | ) | | | 281,087 | | | | 45,668,004 | | | | 710,529 | | | | 839,970 | | | | 4,098,567 | |
| VY® T. Rowe Price Equity Income Portfolio — Class I | | | | | 13,615,205 | | | | 119,183 | | | | (11,184,637 | ) | | | (2,549,751 | ) | | | — | | | | — | | | | 2,589,979 | | | | — | |
| VY® T. Rowe Price Growth Equity Portfolio — Class I | | | | | 15,743,390 | | | | 3,584,411 | | | | (3,982,894 | ) | | | (1,245,987 | ) | | | 14,098,920 | | | | — | | | | 1,526,338 | | | | 1,051,284 | |
| | | | | $ | 632,744,623 | | | $ | 273,447,494 | | | $ | (351,941,805 | ) | | $ | (14,911,653 | ) | | $ | 539,338,659 | | | $ | 10,519,016 | | | $ | 15,653,379 | | | $ | 23,658,957 | |
The financial statements for the above mutual fund[s] can be found at www.sec.gov.
See Accompanying Notes to Financial Statements
87
| VOYA SOLUTION 2015 PORTFOLIO | PORTFOLIO OF INVESTMENTS
AS OF DECEMBER 31, 2014 (CONTINUED) |
A summary of derivative instruments by primary risk exposure is outlined in the following tables.
The fair value of derivative instruments as of December 31, 2014 was as follows:
Derivatives not accounted for as
hedging instruments
| | | | Location on Statement of Assets and Liabilities
| | Fair Value
|
|---|
Liability Derivatives
| | | | | | |
|---|
| Equity contracts | | | | Net Assets — Unrealized depreciation* | | $ | 298,617 | |
Total Liability Derivatives | | | | | | $ | 298,617 | |
| * | | Includes cumulative appreciation/depreciation of futures contracts as reported in the table following the Portfolio of Investments. |
The effect of derivative instruments on the Portfolio’s Statement of Operations for the year ended December 31, 2014 was as follows:
| | | | Amount of Realized Gain or (Loss) on
Derivatives Recognized in Income |
|---|
Derivatives not accounted for as
hedging instruments
| | | | Futures
|
|---|
| Equity contracts | | | | $ | (801 | ) |
Total | | | | $ | (801 | ) |
| | | | Change in Unrealized Appreciation or (Depreciation)
on Derivatives Recognized in Income |
|---|
Derivatives not accounted for as
hedging instruments
| | | | Futures
|
|---|
| Equity contracts | | | | $ | (298,617 | ) |
Total | | | | $ | (298,617 | ) |
See Accompanying Notes to Financial Statements
88
| VOYA SOLUTION 2020 PORTFOLIO | PORTFOLIO OF INVESTMENTS
AS OF DECEMBER 31, 2014 |
Shares
|
|
|
|
|
|
|
| Value
|
| Percentage
of Net
Assets
|
|---|
| |
EXCHANGE-TRADED FUNDS: 3.7% |
| 70 | | | | | | iShares iBoxx High Yield Corporate Bond Fund | | $ | 6,272 | | | | 1.0 | |
| 31 | | | | | | SPDR Trust Series 1 | | | 6,371 | | | | 1.0 | |
| 228 | | | | | | WisdomTree Japan Hedged Equity Fund | | | 11,224 | | | | 1.7 | |
| |
| | | | | | | Total Exchange-Traded Funds
(Cost $25,468) | | | 23,867 | | | | 3.7 | |
| |
MUTUAL FUNDS: 96.0% |
| | Affiliated Investment Companies: 96.0% |
| 3,238 | | | | | | Voya Floating Rate Fund — Class I | | | 32,382 | | | | 5.0 | |
| 3,693 | | | | | | Voya Global Bond Fund — Class R6 | | | 38,552 | | | | 6.0 | |
| 3,212 | | | | | | Voya High Yield Bond Fund — Class I | | | 25,793 | | | | 4.0 | |
| 2,918 | | | | | | Voya Intermediate Bond Fund — Class R6 | | | 29,447 | | | | 4.5 | |
| 2,401 | | | | | | Voya International Core Fund — Class I | | | 22,113 | | | | 3.4 | |
| 1,998 | | | | | | Voya International Index Portfolio — Class I | | | 18,725 | | | | 2.9 | |
| 1,774 | | | | | | Voya Large Cap Growth Portfolio — Class I | | | 35,565 | | | | 5.5 | |
| 1,723 | | | | | | Voya Large Cap Value Fund — Class R6 | | | 22,757 | | | | 3.5 | |
| 1,290 | | | | | | Voya MidCap Opportunities Portfolio — Class I | | | 19,563 | | | | 3.0 | |
| 2,664 | | | | | | Voya Multi-Manager International Equity Fund — Class I | | | 28,103 | | | | 4.3 | |
| 2,094 | | | | | | Voya Multi-Manager Large Cap Core Portfolio — Class I | | | 32,728 | | | | 5.1 | |
| 2,583 | | | | | | Voya Multi-Manager Mid Cap Value Fund — Class I | | | 32,371 | | | | 5.0 | |
| |
MUTUAL FUNDS: (continued) |
| | Affiliated Investment Companies: (continued) |
| 476 | | | | | | Voya RussellTM Mid Cap Growth Index Portfolio — Class I | | $ | 12,976 | | | | 2.0 | |
| 3,926 | | | | | | Voya Short Term Bond Fund — Class R6 | | | 39,064 | | | | 6.0 | |
| 849 | | | | | | Voya Small Company Portfolio — Class I | | | 19,731 | | | | 3.0 | |
| 4,559 | | | | | | Voya U.S. Bond Index Portfolio — Class I | | | 49,059 | | | | 7.6 | |
| 4,730 | | | | | | VY® BlackRock Inflation Protected Bond Portfolio — Class I | | | 45,126 | | | | 7.0 | |
| 384 | | | | | | VY® Clarion Real Estate Portfolio — Class I | | | 13,494 | | | | 2.1 | |
| 1,170 | | | | | | VY® Invesco Comstock Portfolio — Class I | | | 19,362 | | | | 3.0 | |
| 2,259 | | | | | | VY® T. Rowe Price Capital Appreciation Portfolio — Class I | | | 65,055 | | | | 10.1 | |
| 214 | | | | @ | | VY® T. Rowe Price Growth Equity Portfolio — Class I | | | 19,292 | | | | 3.0 | |
| |
| | | | | | | Total Mutual Funds
(Cost $631,828) | | | 621,258 | | | | 96.0 | |
| |
| | | | | | | Total Investments in Securities
(Cost $657,296) | | $ | 645,125 | | | | 99.7 | |
| | | | | | | Assets in Excess of Other Liabilities | | | 1,933 | | | | 0.3 | |
| | | | | | | Net Assets | | $ | 647,058 | | | | 100.0 | |
| @ | | Non-income producing security. |
| | Cost for federal income tax purposes is $657,557. |
| Net unrealized depreciation consists of: | | | | | | |
| Gross Unrealized Appreciation | | | | $ | 9,642 | |
| Gross Unrealized Depreciation | | | | | (22,074 | ) |
| Net Unrealized Depreciation | | | | $ | (12,432 | ) |
Fair Value Measurementsˆ
The following is a summary of the fair valuations according to the inputs used as of December 31, 2014 in valuing the assets and liabilities:
| | | | Quoted Prices
in Active Markets
for Identical
Investments
(Level 1)
| | Significant
Other
Observable
Inputs
(Level 2)
| | Significant
Unobservable
Inputs
(Level 3)
| | Fair Value
at
December 31, 2014
|
|---|
Asset Table | | | | | | | | | | | | | | | | | | |
Investments, at fair value | | | | | | | | | | | | | | | | | | |
| Exchange-Traded Funds | | | | $ | 23,867 | | | $ | — | | | $ | — | | | $ | 23,867 | |
| Mutual Funds | | | | | 621,258 | | | | — | | | | — | | | | 621,258 | |
| Total Investments, at fair value | | | | $ | 645,125 | | | $ | — | | | $ | — | | | $ | 645,125 | |
| ˆ | | See Note 2, “Significant Accounting Policies” in the Notes to Financial Statements for additional information. |
See Accompanying Notes to Financial Statements
89
| VOYA SOLUTION 2020 PORTFOLIO | PORTFOLIO OF INVESTMENTS
AS OF DECEMBER 31, 2014 (CONTINUED) |
Transactions with Affiliates
An investment of at least 5% of the voting securities of an issuer, or a company which is under common control results in that issuer becoming an affiliated person as defined by the 1940 Act.
The following table provides transactions during the year ended December 31, 2014, where the following issuers were considered an affiliate:
Issuer
| | | | Beginning
Market
Value at
12/31/13
| | Purchases
at Cost
| | Sales
at Cost
| | Change in
Unrealized
Appreciation/
(Depreciation)
| | Ending
Market
Value at
12/31/14
| | Investment
Income
| | Realized
Gains/
(Losses)
| | Net
Capital Gain
Distributions
|
|---|
| ING Total Return Bond Portfolio — Class I | | | | $ | 443 | | | $ | — | | | $ | (460 | ) | | $ | 17 | | | $ | — | | | $ | — | | | $ | (14 | ) | | $ | — | |
| Voya Aggregate Bond Portfolio — Class I | | | | | — | | | | 6,225 | | | | (6,225 | ) | | | — | | | | — | | | | 119 | | | | (107 | ) | | | 4 | |
| Voya Floating Rate Fund — Class I | | | | | 541 | | | | 32,881 | | | | (457 | ) | | | (583 | ) | | | 32,382 | | | | 624 | | | | 9 | | | | — | |
| Voya Global Bond Fund — Class R6 | | | | | 1,075 | | | | 39,494 | | | | (349 | ) | | | (1,668 | ) | | | 38,552 | | | | 269 | | | | (8 | ) | | | — | |
| Voya High Yield Bond Fund — Class I | | | | | 362 | | | | 28,150 | | | | (1,350 | ) | | | (1,369 | ) | | | 25,793 | | | | 799 | | | | (32 | ) | | | — | |
| Voya High Yield Portfolio — Class I | | | | | 161 | | | | — | | | | (161 | ) | | | — | | | | — | | | | 1 | | | | — | | | | — | |
| Voya Intermediate Bond Fund — Class R6 | | | | | 760 | | | | 29,171 | | | | (599 | ) | | | 115 | | | | 29,447 | | | | 547 | | | | — | | | | — | |
| Voya International Core Fund — Class I | | | | | 349 | | | | 26,063 | | | | (156 | ) | | | (4,143 | ) | | | 22,113 | | | | 195 | | | | 42 | | | | 2,976 | |
| Voya International Index Portfolio — Class I | | | | | 549 | | | | 20,141 | | | | (415 | ) | | | (1,550 | ) | | | 18,725 | | | | 3 | | | | 44 | | | | — | |
| Voya Large Cap Growth Portfolio — Class I | | | | | 878 | | | | 36,093 | | | | (2,821 | ) | | | 1,415 | | | | 35,565 | | | | 154 | | | | 262 | | | | 2,228 | |
| Voya Large Cap Value Fund — Class R6 | | | | | 593 | | | | 23,314 | | | | (914 | ) | | | (236 | ) | | | 22,757 | | | | 331 | | | | 97 | | | | 1,512 | |
| Voya MidCap Opportunities Portfolio — Class I | | | | | 828 | | | | 21,114 | | | | (1,521 | ) | | | (858 | ) | | | 19,563 | | | | 5 | | | | 191 | | | | 2,778 | |
| Voya Multi-Manager International Equity Fund — Class I | | | | | 734 | | | | 31,435 | | | | (187 | ) | | | (3,879 | ) | | | 28,103 | | | | 654 | | | | 62 | | | | 1,122 | |
| Voya Multi-Manager Large Cap Core Portfolio — Class I | | | | | 1,063 | | | | 32,844 | | | | (2,338 | ) | | | 1,159 | | | | 32,728 | | | | 387 | | | | 166 | | | | 2,057 | |
| Voya Multi-Manager Mid Cap Value Fund — Class I | | | | | 838 | | | | 36,715 | | | | (1,530 | ) | | | (3,652 | ) | | | 32,371 | | | | 360 | | | | 233 | | | | 5,324 | |
Voya RussellTM Mid Cap Growth Index Portfolio — Class I | | | | | — | | | | 12,514 | | | | (760 | ) | | | 1,222 | | | | 12,976 | | | | 2 | | | | 73 | | | | — | |
Voya RussellTM Mid Cap Index Portfolio — Class I | | | | | 185 | | | | — | | | | (163 | ) | | | (22 | ) | | | — | | | | — | | | | 18 | | | | — | |
| Voya Short Term Bond Fund — Class R6 | | | | | 1,076 | | | | 39,007 | | | | (698 | ) | | | (321 | ) | | | 39,064 | | | | 431 | | | | (2 | ) | | | — | |
| Voya Small Company Portfolio — Class I | | | | | 738 | | | | 24,559 | | | | (7,082 | ) | | | 1,516 | | | | 19,731 | | | | 3 | | | | 525 | | | | 77 | |
| Voya U.S. Bond Index Portfolio — Class I | | | | | 1,147 | | | | 47,978 | | | | (424 | ) | | | 358 | | | | 49,059 | | | | 624 | | | | (8 | ) | | | — | |
| Voya U.S. Stock Index Portfolio — Class I | | | | | 368 | | | | 20,309 | | | | (20,668 | ) | | | (9 | ) | | | — | | | | 47 | | | | (1,526 | ) | | | 1,621 | |
| VY® BlackRock Inflation Protected Bond Portfolio — Class I | | | | | 1,232 | | | | 45,548 | | | | (465 | ) | | | (1,189 | ) | | | 45,126 | | | | 580 | | | | (66 | ) | | | — | |
| VY® Clarion Real Estate Portfolio — Class I | | | | | 359 | | | | 12,640 | | | | (804 | ) | | | 1,299 | | | | 13,494 | | | | 176 | | | | 130 | | | | — | |
| VY® Invesco Comstock Portfolio — Class I | | | | | — | | | | 19,181 | | | | (616 | ) | | | 797 | | | | 19,362 | | | | 406 | | | | 53 | | | | — | |
| VY® T. Rowe Price Capital Appreciation Portfolio — Class I | | | | | 1,276 | | | | 67,061 | | | | (2,386 | ) | | | (896 | ) | | | 65,055 | | | | 963 | | | | 137 | | | | 4,679 | |
| VY® T. Rowe Price Equity Income Portfolio — Class I | | | | | 593 | | | | — | | | | (437 | ) | | | (156 | ) | | | — | | | | — | | | | 144 | | | | — | |
| VY® T. Rowe Price Growth Equity Portfolio — Class I | | | | | 703 | | | | 19,421 | | | | (1,575 | ) | | | 743 | | | | 19,292 | | | | — | | | | 248 | | | | 1,182 | |
| | | | | $ | 16,851 | | | $ | 671,858 | | | $ | (55,561 | ) | | $ | (11,890 | ) | | $ | 621,258 | | | $ | 7,680 | | | $ | 671 | | | $ | 25,560 | |
The financial statements for the above mutual fund[s] can be found at www.sec.gov.
See Accompanying Notes to Financial Statements
90
| VOYA SOLUTION 2025 PORTFOLIO | PORTFOLIO OF INVESTMENTS
AS OF DECEMBER 31, 2014 |
Shares
|
|
|
|
|
|
|
| Value
|
| Percentage
of Net
Assets
|
|---|
| |
EXCHANGE-TRADED FUNDS: 3.2% |
| 101,468 | | | | | | iShares Barclays 20+ Year Treasury Bond Fund | | $ | 12,776,851 | | | | 1.1 | |
| 132,946 | | | | | | iShares iBoxx High Yield Corporate Bond Fund | | | 11,911,962 | | | | 1.0 | |
| 59,077 | | | | | | SPDR Trust Series 1 | | | 12,140,323 | | | | 1.1 | |
| | | | | | | Total Exchange-Traded Funds
(Cost $36,027,650) | | | 36,829,136 | | | | 3.2 | |
| |
MUTUAL FUNDS: 94.7% |
| | Affiliated Investment Companies: 94.7% |
| 2,057,829 | | | | | | Voya Emerging Markets Index Portfolio — Class I | | | 21,915,882 | | | | 1.9 | |
| 5,796,967 | | | | | | Voya Floating Rate Fund — Class I | | | 57,969,673 | | | | 5.0 | |
| 6,608,374 | | | | | | Voya Global Bond Fund — Class R6 | | | 68,991,426 | | | | 6.0 | |
| 5,656,593 | | | | | | Voya High Yield Bond Fund — Class I | | | 45,422,442 | | | | 3.9 | |
| 3,485,063 | | | | | | Voya Intermediate Bond Fund — Class R6 | | | 35,164,284 | | | | 3.0 | |
| 5,519,188 | | | | | | Voya International Core Fund — Class I | | | 50,831,723 | | | | 4.4 | |
| 4,761,031 | | | | | | Voya International Index Portfolio — Class I | | | 44,610,862 | | | | 3.9 | |
| 3,415,050 | | | | | | Voya Large Cap Growth Portfolio — Class I | | | 68,471,758 | | | | 5.9 | |
| 3,889,925 | | | | | | Voya Large Cap Value Fund — Class R6 | | | 51,385,914 | | | | 4.5 | |
| 2,308,262 | | | | | | Voya MidCap Opportunities Portfolio — Class I | | | 35,016,338 | | | | 3.0 | |
| 1,029,867 | | | | | | Voya Multi-Manager Emerging Markets Equity Fund — Class I | | | 10,823,904 | | | | 0.9 | |
| 5,817,319 | | | | | | Voya Multi-Manager International Equity Fund — Class I | | | 61,372,711 | | | | 5.3 | |
| 4,498,863 | | | | | | Voya Multi-Manager Large Cap Core Portfolio — Class I | | | 70,317,236 | | | | 6.1 | |
| |
MUTUAL FUNDS: (continued) |
| | Affiliated Investment Companies: (continued) |
| 5,545,972 | | | | | | Voya Multi-Manager Mid Cap Value Fund — Class I | | $ | 69,491,025 | | | | 6.0 | |
| 1,276,774 | | | | | | Voya RussellTM Mid Cap Growth Index Portfolio — Class I | | | 34,830,387 | | | | 3.0 | |
| 5,806,772 | | | | | | Voya Short Term Bond Fund — Class R6 | | | 57,777,383 | | | | 5.0 | |
| 1,519,503 | | | | | | Voya Small Company Portfolio — Class I | | | 35,328,434 | | | | 3.1 | |
| 5,444,587 | | | | | | Voya U.S. Bond Index Portfolio — Class I | | | 58,583,753 | | | | 5.1 | |
| 688,236 | | | | | | VY® Clarion Real Estate Portfolio — Class I | | | 24,205,245 | | | | 2.1 | |
| 2,092,778 | | | | | | VY® Invesco Comstock Portfolio — Class I | | | 34,635,481 | | | | 3.0 | |
| 4,043,705 | | | | | | VY® T. Rowe Price Capital Appreciation Portfolio — Class I | | | 116,458,700 | | | | 10.1 | |
| 446,614 | | | | @ | | VY® T. Rowe Price Growth Equity Portfolio — Class I | | | 40,262,234 | | | | 3.5 | |
| |
| | | | | | | Total Mutual Funds
(Cost $1,051,709,521) | | | 1,093,866,795 | | | | 94.7 | |
| |
| | | | | | | Total Investments in Securities
(Cost $1,087,737,171) | | $ | 1,130,695,931 | | | | 97.9 | |
| | | | | | | Assets in Excess of Other Liabilities | | | 24,262,243 | | | | 2.1 | |
| | | | | | | Net Assets | | $ | 1,154,958,174 | | | | 100.0 | |
| @ | | Non-income producing security. |
| | Cost for federal income tax purposes is $1,093,937,687. |
| Net unrealized appreciation consists of: | | | | | | |
| Gross Unrealized Appreciation | | | | $ | 64,101,285 | |
| Gross Unrealized Depreciation | | | | | (27,343,041 | ) |
| Net Unrealized Appreciation | | | | $ | 36,758,244 | |
Fair Value Measurementsˆ
The following is a summary of the fair valuations according to the inputs used as of December 31, 2014 in valuing the assets and liabilities:
| | | | Quoted Prices
in Active Markets
for Identical
Investments
(Level 1)
| | Significant
Other
Observable
Inputs
(Level 2)
| | Significant
Unobservable
Inputs
(Level 3)
| | Fair Value
at
December 31, 2014
|
|---|
Asset Table | | | | | | | | | | | | | | | | | | |
Investments, at fair value | | | | | | | | | | | | | | | | | | |
| Exchange-Traded Funds | | | | $ | 36,829,136 | | | $ | — | | | $ | — | | | $ | 36,829,136 | |
| Mutual Funds | | | | | 1,093,866,795 | | | | — | | | | — | | | | 1,093,866,795 | |
| Total Investments, at fair value | | | | $ | 1,130,695,931 | | | $ | — | | | $ | — | | | $ | 1,130,695,931 | |
Liabilities Table | | | | | | | | | | | | | | | | | | |
Other Financial Instruments+ | | | | | | | | | | | | | | | | | | |
| Futures | | | | $ | (615,516 | ) | | $ | — | | | $ | — | | | $ | (615,516 | ) |
| Total Liabilities | | | | $ | (615,516 | ) | | $ | — | | | $ | — | | | $ | (615,516 | ) |
| ˆ | | See Note 2, “Significant Accounting Policies” in the Notes to Financial Statements for additional information. |
See Accompanying Notes to Financial Statements
91
| VOYA SOLUTION 2025 PORTFOLIO | PORTFOLIO OF INVESTMENTS
AS OF DECEMBER 31, 2014 (CONTINUED) |
| + | | Other Financial Instruments are derivatives not reflected in the Portfolio of Investments and may include open forward foreign currency contracts, futures, centrally cleared swaps, OTC swaps and written options. Forward foreign currency contracts, futures and centrally cleared swaps are valued at the unrealized gain (loss) on the instrument. OTC swaps and written options are valued at the fair value of the instrument. |
| ˆ | | See Note 2, “Significant Accounting Policies” in the Notes to Financial Statements for additional information. |
At December 31, 2014, the following futures contracts were outstanding for Voya Solution 2025 Portfolio:
Contract Description
| | | | Number
of Contracts
| | Expiration
Date
| | Notional
Value
| | Unrealized
Appreciation/
(Depreciation)
|
|---|
Long Contracts | | | | | | | | | | | | | | | | | | |
| Tokyo Price Index (TOPIX) | | | | | 202 | | | | 03/12/15 | | | $ | 23,736,433 | | | $ | (615,516 | ) |
| | | | | | | | | | | | | $ | 23,736,433 | | | $ | (615,516 | ) |
Transactions with Affiliates
An investment of at least 5% of the voting securities of an issuer, or a company which is under common control results in that issuer becoming an affiliated person as defined by the 1940 Act.
The following table provides transactions during the year ended December 31, 2014, where the following issuers were considered an affiliate:
Issuer
| | | | Beginning
Market
Value at
12/31/13
| | Purchases
at Cost
| | Sales
at Cost
| | Change in
Unrealized
Appreciation/
(Depreciation)
| | Ending
Market
Value at
12/31/14
| | Investment
Income
| | Realized
Gains/
(Losses)
| | Net
Capital Gain
Distributions
|
|---|
| ING Total Return Bond Portfolio — Class I | | | | $ | 15,790,208 | | | $ | 18,952 | | | $ | (16,580,559 | ) | | $ | 771,399 | | | $ | — | | | $ | — | | | $ | (636,616 | ) | | $ | — | |
| Voya Aggregate Bond Portfolio — Class I | | | | | — | | | | 20,542,208 | | | | (20,542,208 | ) | | | — | | | | — | | | | 383,718 | | | | (6,793 | ) | | | 13,574 | |
| Voya Emerging Markets Index Portfolio — Class I | | | | | — | | | | 26,322,204 | | | | (2,202,428 | ) | | | (2,203,894 | ) | | | 21,915,882 | | | | — | | | | (156,489 | ) | | | — | |
| Voya Floating Rate Fund — Class I | | | | | 38,553,588 | | | | 31,530,737 | | | | (10,839,050 | ) | | | (1,275,602 | ) | | | 57,969,673 | | | | 1,754,751 | | | | 66,223 | | | | — | |
| Voya Global Bond Fund — Class R6 | | | | | 76,646,181 | | | | 8,975,441 | | | | (17,241,424 | ) | | | 611,228 | | | | 68,991,426 | | | | 514,492 | | | | (687,774 | ) | | | — | |
| Voya High Yield Bond Fund — Class I | | | | | 25,468,582 | | | | 39,124,960 | | | | (17,149,187 | ) | | | (2,021,913 | ) | | | 45,422,442 | | | | 2,197,151 | | | | (236,208 | ) | | | — | |
| Voya High Yield Portfolio — Class I | | | | | 12,901,691 | | | | 15,161 | | | | (12,987,800 | ) | | | 70,948 | | | | — | | | | 40,836 | | | | (2,437 | ) | | | — | |
| Voya Intermediate Bond Fund — Class R6 | | | | | 38,227,236 | | | | 4,456,147 | | | | (8,911,643 | ) | | | 1,392,544 | | | | 35,164,284 | | | | 1,201,340 | | | | (117,316 | ) | | | — | |
| Voya International Core Fund — Class I | | | | | 32,688,455 | | | | 40,152,712 | | | | (9,913,694 | ) | | | (12,095,750 | ) | | | 50,831,723 | | | | 465,782 | | | | 2,871,486 | | | | 7,106,215 | |
| Voya International Index Portfolio — Class I | | | | | 45,683,098 | | | | 20,166,205 | | | | (15,321,988 | ) | | | (5,916,453 | ) | | | 44,610,862 | | | | 284,479 | | | | 2,213,516 | | | | — | |
| Voya Large Cap Growth Portfolio — Class I | | | | | 72,507,035 | | | | 15,513,552 | | | | (17,442,818 | ) | | | (2,106,011 | ) | | | 68,471,758 | | | | 370,594 | | | | 5,982,791 | | | | 5,360,490 | |
| Voya Large Cap Value Fund — Class R6 | | | | | 58,541,832 | | | | 8,140,883 | | | | (14,526,635 | ) | | | (770,166 | ) | | | 51,385,914 | | | | 1,010,985 | | | | 1,437,163 | | | | 3,589,769 | |
| Voya MidCap Opportunities Portfolio — Class I | | | | | 72,202,139 | | | | 14,462,744 | | | | (38,938,411 | ) | | | (12,710,134 | ) | | | 35,016,338 | | | | 147,922 | | | | 9,008,956 | | | | 5,523,714 | |
| Voya Multi-Manager Emerging Markets Equity Fund — Class I | | | | | 25,668,674 | | | | 15,691,473 | | | | (28,864,455 | ) | | | (1,671,788 | ) | | | 10,823,904 | | | | 176,191 | | | | 216,213 | | | | — | |
| Voya Multi-Manager International Equity Fund — Class I | | | | | 78,544,436 | | | | 13,071,320 | | | | (18,013,463 | ) | | | (12,229,582 | ) | | | 61,372,711 | | | | 1,484,910 | | | | 3,737,458 | | | | 2,545,559 | |
| Voya Multi-Manager Large Cap Core Portfolio — Class I | | | | | 81,032,682 | | | | 10,038,897 | | | | (22,031,868 | ) | | | 1,277,525 | | | | 70,317,236 | | | | 882,232 | | | | 2,837,050 | | | | 5,442,808 | |
| Voya Multi-Manager Mid Cap Value Fund — Class I | | | | | 73,046,954 | | | | 22,358,605 | | | | (17,321,870 | ) | | | (8,592,664 | ) | | | 69,491,025 | | | | 801,585 | | | | 4,495,839 | | | | 11,862,149 | |
Voya RussellTM Mid Cap Growth Index Portfolio — Class I | | | | | — | | | | 38,379,206 | | | | (7,671,432 | ) | | | 4,122,613 | | | | 34,830,387 | | | | 169,533 | | | | 669,141 | | | | — | |
Voya RussellTM Mid Cap Index Portfolio — Class I | | | | | 13,162,641 | | | | 15,161 | | | | (11,586,837 | ) | | | (1,590,965 | ) | | | — | | | | — | | | | 1,292,989 | | | | — | |
| Voya Short Term Bond Fund — Class R6 | | | | | 76,724,407 | | | | 9,082,611 | | | | (27,645,560 | ) | | | (384,075 | ) | | | 57,777,383 | | | | 1,317,355 | | | | (3,401 | ) | | | — | |
| Voya Small Company Portfolio — Class I | | | | | 52,656,518 | | | | 10,537,075 | | | | (17,622,287 | ) | | | (10,242,872 | ) | | | 35,328,434 | | | | 169,937 | | | | 7,349,079 | | | | 5,269,703 | |
| Voya U.S. Bond Index Portfolio — Class I | | | | | 57,680,289 | | | | 22,869,865 | | | | (24,683,502 | ) | | | 2,717,101 | | | | 58,583,753 | | | | 1,007,641 | | | | (855,522 | ) | | | — | |
| Voya U.S. Stock Index Portfolio — Class I | | | | | 26,240,776 | | | | 60,182,306 | | | | (85,803,627 | ) | | | (619,455 | ) | | | — | | | | 171,729 | | | | (4,458,001 | ) | | | 5,959,808 | |
| VY® Clarion Real Estate Portfolio — Class I | | | | | 25,601,502 | | | | 2,046,343 | | | | (7,813,883 | ) | | | 4,371,283 | | | | 24,205,245 | | | | 387,168 | | | | 2,031,497 | | | | — | |
| VY® Invesco Comstock Portfolio — Class I | | | | | — | | | | 39,837,721 | | | | (7,858,720 | ) | | | 2,656,480 | | | | 34,635,481 | | | | 746,782 | | | | 710,144 | | | | — | |
| VY® JPMorgan Emerging Markets Equity Portfolio — Class I | | | | | 12,707,246 | | | | 15,161 | | | | (12,648,677 | ) | | | (73,730 | ) | | | — | | | | — | | | | (683,356 | ) | | | — | |
| VY® T. Rowe Price Capital Appreciation Portfolio — Class I | | | | | 103,987,386 | | | | 42,851,802 | | | | (23,423,416 | ) | | | (6,957,072 | ) | | | 116,458,700 | | | | 1,825,656 | | | | 9,578,159 | | | | 10,319,480 | |
See Accompanying Notes to Financial Statements
92
| VOYA SOLUTION 2025 PORTFOLIO | PORTFOLIO OF INVESTMENTS
AS OF DECEMBER 31, 2014 (CONTINUED) |
Issuer
| | | | Beginning
Market
Value at
12/31/13
| | Purchases
at Cost
| | Sales
at Cost
| | Change in
Unrealized
Appreciation/
(Depreciation)
| | Ending
Market
Value at
12/31/14
| | Investment
Income
| | Realized
Gains/
(Losses)
| | Net
Capital Gain
Distributions
|
|---|
| VY® T. Rowe Price Equity Income Portfolio — Class I | | | | $ | 39,051,003 | | | $ | 89,489 | | | $ | (30,086,166 | ) | | $ | (9,054,326 | ) | | $ | — | | | $ | — | | | $ | 8,258,630 | | | $ | — | |
| VY® T. Rowe Price Growth Equity Portfolio — Class I | | | | | 53,500,839 | | | | 6,806,607 | | | | (13,708,498 | ) | | | (6,336,714 | ) | | | 40,262,234 | | | | — | | | | 6,751,721 | | | | 2,954,615 | |
| | | | | $ | 1,208,815,398 | | | $ | 523,295,548 | | | $ | (559,382,106 | ) | | $ | (78,862,045 | ) | | $ | 1,093,866,795 | | | $ | 17,512,769 | | | $ | 61,664,142 | | | $ | 65,947,884 | |
The financial statements for the above mutual fund[s] can be found at www.sec.gov.
A summary of derivative instruments by primary risk exposure is outlined in the following tables.
The fair value of derivative instruments as of December 31, 2014 was as follows:
Derivatives not accounted for as
hedging instruments
| | | | Location on Statement of Assets and Liabilities
| | Fair Value
|
|---|
Liability Derivatives
| | | | | | |
|---|
| Equity contracts | | | | Net Assets — Unrealized depreciation* | | $ | 615,516 | |
Total Liability Derivatives | | | | | | $ | 615,516 | |
| * | | Includes cumulative appreciation/depreciation of futures contracts as reported in the table following the Portfolio of Investments. |
The effect of derivative instruments on the Portfolio’s Statement of Operations for the year ended December 31, 2014 was as follows:
| | | | Amount of Realized Gain or (Loss) on
Derivatives Recognized in Income |
|---|
Derivatives not accounted for as
hedging instruments
| | | | Futures
|
|---|
| Equity contracts | | | | $ | (1,650 | ) |
Total | | | | $ | (1,650 | ) |
| | | | Change in Unrealized Appreciation or (Depreciation)
on Derivatives Recognized in Income |
|---|
Derivatives not accounted for as
hedging instruments
| | | | Futures
|
|---|
| Equity contracts | | | | $ | (615,516 | ) |
Total | | | | $ | (615,516 | ) |
See Accompanying Notes to Financial Statements
93
| VOYA SOLUTION 2030 PORTFOLIO | PORTFOLIO OF INVESTMENTS
AS OF DECEMBER 31, 2014 |
Shares
|
|
|
|
|
|
|
| Value
|
| Percentage
of Net
Assets
|
|---|
| |
EXCHANGE-TRADED FUNDS: 10.0% |
| 29 | | | | | | iShares Barclays 20+ Year Treasury Bond Fund | | $ | 3,652 | | | | 2.1 | |
| 20 | | | | | | iShares iBoxx High Yield Corporate Bond Fund | | | 1,792 | | | | 1.0 | |
| 51 | | | | | | iShares Russell 1000 Value Index Fund | | | 5,324 | | | | 3.1 | |
| 17 | | | | | | SPDR Trust Series 1 | | | 3,494 | | | | 2.0 | |
| 63 | | | | | | WisdomTree Japan Hedged Equity Fund | | | 3,101 | | | | 1.8 | |
| |
| | | | | | | Total Exchange-Traded Funds
(Cost $17,179) | | | 17,363 | | | | 10.0 | |
| |
MUTUAL FUNDS: 89.4% |
| | Affiliated Investment Companies: 89.4% |
| 304 | | | | | | Voya Emerging Markets Index Portfolio — Class I | | | 3,240 | | | | 1.9 | |
| 870 | | | | | | Voya Floating Rate Fund — Class I | | | 8,700 | | | | 5.0 | |
| 871 | | | | | | Voya High Yield Bond Fund — Class I | | | 6,995 | | | | 4.0 | |
| 523 | | | | | | Voya Intermediate Bond Fund — Class R6 | | | 5,276 | | | | 3.0 | |
| 921 | | | | | | Voya International Core Fund — Class I | | | 8,480 | | | | 4.9 | |
| 712 | | | | | | Voya International Index Portfolio — Class I | | | 6,669 | | | | 3.8 | |
| 569 | | | | | | Voya Large Cap Growth Portfolio — Class I | | | 11,410 | | | | 6.6 | |
| 591 | | | | | | Voya Large Cap Value Fund — Class R6 | | | 7,803 | | | | 4.5 | |
| 346 | | | | | | Voya MidCap Opportunities Portfolio — Class I | | | 5,254 | | | | 3.0 | |
| 304 | | | | | | Voya Multi-Manager Emerging Markets Equity Fund — Class I | | | 3,197 | | | | 1.8 | |
| 948 | | | | | | Voya Multi-Manager International Equity Fund — Class I | | | 10,004 | | | | 5.8 | |
| |
MUTUAL FUNDS: (continued) |
| | Affiliated Investment Companies: (continued) |
| 787 | | | | | | Voya Multi-Manager Large Cap Core Portfolio — Class I | | $ | 12,300 | | | | 7.1 | |
| 827 | | | | | | Voya Multi-Manager Mid Cap Value Fund — Class I | | | 10,367 | | | | 6.0 | |
| 191 | | | | | | Voya RussellTM Mid Cap Growth Index Portfolio — Class I | | | 5,217 | | | | 3.0 | |
| 706 | | | | | | Voya Short Term Bond Fund — Class R6 | | | 7,024 | | | | 4.1 | |
| 227 | | | | | | Voya Small Company Portfolio — Class I | | | 5,277 | | | | 3.0 | |
| 121 | | | | | | Voya U.S. Stock Index Portfolio — Class I | | | 1,770 | | | | 1.0 | |
| 104 | | | | | | VY® Clarion Real Estate Portfolio — Class I | | | 3,665 | | | | 2.1 | |
| 313 | | | | | | VY® Invesco Comstock Portfolio — Class I | | | 5,184 | | | | 3.0 | |
| 608 | | | | | | VY® T. Rowe Price Capital Appreciation Portfolio — Class I | | | 17,502 | | | | 10.1 | |
| 110 | | | | @ | | VY® T. Rowe Price Growth Equity Portfolio — Class I | | | 9,888 | | | | 5.7 | |
| |
| | | | | | | Total Mutual Funds
(Cost $158,596) | | | 155,222 | | | | 89.4 | |
| |
| | | | | | | Total Investments in Securities
(Cost $175,775) | | $ | 172,585 | | | | 99.4 | |
| | | | | | | Assets in Excess of Other Liabilities | | | 1,073 | | | | 0.6 | |
| | | | | | | Net Assets | | $ | 173,658 | | | | 100.0 | |
| @ | | Non-income producing security. |
| | Cost for federal income tax purposes is $176,312. |
| Net unrealized depreciation consists of: | | | | | | |
| Gross Unrealized Appreciation | | | | $ | 3,695 | |
| Gross Unrealized Depreciation | | | | | (7,422 | ) |
| Net Unrealized Depreciation | | | | $ | (3,727 | ) |
Fair Value Measurementsˆ
The following is a summary of the fair valuations according to the inputs used as of December 31, 2014 in valuing the assets and liabilities:
| | | | Quoted Prices
in Active Markets
for Identical
Investments
(Level 1)
| | Significant
Other
Observable
Inputs
(Level 2)
| | Significant
Unobservable
Inputs
(Level 3)
| | Fair Value
at
December 31, 2014
|
|---|
Asset Table | | | | | | | | | | | | | | | | | | |
Investments, at fair value | | | | | | | | | | | | | | | | | | |
| Exchange-Traded Funds | | | | $ | 17,363 | | | $ | — | | | $ | — | | | $ | 17,363 | |
| Mutual Funds | | | | | 155,222 | | | | — | | | | — | | | | 155,222 | |
| Total Investments, at fair value | | | | $ | 172,585 | | | $ | — | | | $ | — | | | $ | 172,585 | |
| ˆ | | See Note 2, “Significant Accounting Policies” in the Notes to Financial Statements for additional information. |
See Accompanying Notes to Financial Statements
94
| VOYA SOLUTION 2030 PORTFOLIO | PORTFOLIO OF INVESTMENTS
AS OF DECEMBER 31, 2014 (CONTINUED) |
Transactions with Affiliates
An investment of at least 5% of the voting securities of an issuer, or a company which is under common control results in that issuer becoming an affiliated person as defined by the 1940 Act.
The following table provides transactions during the year ended December 31, 2014, where the following issuers were considered an affiliate:
Issuer
| | | | Beginning
Market
Value at
12/31/13
| | Purchases
at Cost
| | Sales
at Cost
| | Change in
Unrealized
Appreciation/
(Depreciation)
| | Ending
Market
Value at
12/31/14
| | Investment
Income
| | Realized
Gains/
(Losses)
| | Net
Capital Gain
Distributions
|
|---|
| ING Total Return Bond Portfolio — Class I | | | | $ | 143 | | | $ | — | | | $ | (151 | ) | | $ | 8 | | | $ | — | | | $ | — | | | $ | (6 | ) | | $ | — | |
| Voya Aggregate Bond Portfolio — Class I | | | | | — | | | | — | | | | — | | | | — | | | | — | | | | — | | | | — | | | | — | |
| Voya Emerging Markets Index Portfolio — Class I | | | | | — | | | | 6,290 | | | | (2,744 | ) | | | (306 | ) | | | 3,240 | | | | — | | | | (177 | ) | | | — | |
| Voya Floating Rate Fund — Class I | | | | | 582 | | | | 14,868 | | | | (6,586 | ) | | | (164 | ) | | | 8,700 | | | | 285 | | | | (52 | ) | | | — | |
| Voya High Yield Bond Fund — Class I | | | | | 391 | | | | 13,738 | | | | (6,817 | ) | | | (317 | ) | | | 6,995 | | | | 368 | | | | (280 | ) | | | — | |
| Voya High Yield Portfolio — Class I | | | | | 195 | | | | — | | | | (196 | ) | | | 1 | | | | — | | | | 1 | | | | — | | | | — | |
| Voya Intermediate Bond Fund — Class R6 | | | | | 385 | | | | 11,534 | | | | (6,666 | ) | | | 23 | | | | 5,276 | | | | 175 | | | | 21 | | | | — | |
| Voya International Core Fund — Class I | | | | | 698 | | | | 15,882 | | | | (6,380 | ) | | | (1,720 | ) | | | 8,480 | | | | 75 | | | | 58 | | | | 1,141 | |
| Voya International Index Portfolio — Class I | | | | | 690 | | | | 12,060 | | | | (5,499 | ) | | | (582 | ) | | | 6,669 | | | | 5 | | | | (167 | ) | | | — | |
| Voya Large Cap Growth Portfolio — Class I | | | | | 1,444 | | | | 19,382 | | | | (9,635 | ) | | | 219 | | | | 11,410 | | | | 94 | | | | 773 | | | | 1,360 | |
| Voya Large Cap Value Fund — Class R6 | | | | | 1,190 | | | | 17,190 | | | | (10,129 | ) | | | (448 | ) | | | 7,803 | | | | 175 | | | | 872 | | | | 516 | |
| Voya MidCap Opportunities Portfolio — Class I | | | | | 1,091 | | | | 9,353 | | | | (4,816 | ) | | | (374 | ) | | | 5,254 | | | | 3 | | | | 58 | | | | 1,298 | |
| Voya Multi-Manager Emerging Markets Equity Fund — Class I | | | | | 582 | | | | 5,948 | | | | (3,014 | ) | | | (319 | ) | | | 3,197 | | | | 50 | | | | (40 | ) | | | — | |
| Voya Multi-Manager International Equity Fund — Class I | | | | | 1,187 | | | | 18,213 | | | | (7,827 | ) | | | (1,569 | ) | | | 10,004 | | | | 234 | | | | (84 | ) | | | 399 | |
| Voya Multi-Manager Large Cap Core Portfolio — Class I | | | | | 829 | | | | 23,126 | | | | (11,957 | ) | | | 302 | | | | 12,300 | | | | 166 | | | | 672 | | | | 1,432 | |
| Voya Multi-Manager Mid Cap Value Fund — Class I | | | | | 1,104 | | | | 18,108 | | | | (7,609 | ) | | | (1,236 | ) | | | 10,367 | | | | 115 | | | | 720 | | | | 1,705 | |
Voya RussellTM Mid Cap Growth Index Portfolio — Class I | | | | | — | | | | 8,515 | | | | (3,803 | ) | | | 505 | | | | 5,217 | | | | 3 | | | | 439 | | | | — | |
Voya RussellTM Mid Cap Index Portfolio — Class I | | | | | 199 | | | | — | | | | (175 | ) | | | (24 | ) | | | — | | | | — | | | | 19 | | | | — | |
| Voya Short Term Bond Fund — Class R6 | | | | | 1,159 | | | | 19,125 | | | | (13,215 | ) | | | (45 | ) | | | 7,024 | | | | 186 | | | | (76 | ) | | | — | |
| Voya Small Company Portfolio — Class I | | | | | 796 | | | | 10,975 | | | | (6,692 | ) | | | 198 | | | | 5,277 | | | | 3 | | | | 651 | | | | 85 | |
| Voya U.S. Bond Index Portfolio — Class I | | | | | 584 | | | | 11,092 | | | | (11,681 | ) | | | 5 | | | | — | | | | 42 | | | | 53 | | | | — | |
| Voya U.S. Stock Index Portfolio — Class I | | | | | 793 | | | | 32,070 | | | | (31,029 | ) | | | (64 | ) | | | 1,770 | | | | 81 | | | | (1,488 | ) | | | 1,882 | |
| VY® Clarion Real Estate Portfolio — Class I | | | | | 397 | | | | 5,561 | | | | (2,633 | ) | | | 340 | | | | 3,665 | | | | 87 | | | | 304 | | | | — | |
| VY® Invesco Comstock Portfolio — Class I | | | | | — | | | | 8,697 | | | | (3,736 | ) | | | 223 | | | | 5,184 | | | | 109 | | | | 312 | | | | — | |
| VY® JPMorgan Emerging Markets Equity Portfolio — Class I | | | | | 192 | | | | — | | | | (191 | ) | | | (1 | ) | | | — | | | | — | | | | (10 | ) | | | — | |
| VY® T. Rowe Price Capital Appreciation Portfolio — Class I | | | | | 1,571 | | | | 29,770 | | | | (13,424 | ) | | | (415 | ) | | | 17,502 | | | | 294 | | | | 214 | | | | 2,327 | |
| VY® T. Rowe Price Equity Income Portfolio — Class I | | | | | 885 | | | | 4 | | | | (655 | ) | | | (234 | ) | | | — | | | | — | | | | 228 | | | | — | |
| VY® T. Rowe Price Growth Equity Portfolio — Class I | | | | | 1,061 | | | | 16,416 | | | | (7,768 | ) | | | 179 | | | | 9,888 | | | | — | | | | 745 | | | | 1,121 | |
| | | | | $ | 18,148 | | | $ | 327,917 | | | $ | (185,028 | ) | | $ | (5,815 | ) | | $ | 155,222 | | | $ | 2,551 | | | $ | 3,759 | | | $ | 13,266 | |
The financial statements for the above mutual fund[s] can be found at www.sec.gov.
See Accompanying Notes to Financial Statements
95
| VOYA SOLUTION 2035 PORTFOLIO | PORTFOLIO OF INVESTMENTS
AS OF DECEMBER 31, 2014 |
Shares
|
|
|
|
|
|
|
| Value
|
| Percentage
of Net
Assets
|
|---|
| |
EXCHANGE-TRADED FUNDS: 6.3% |
| 90,733 | | | | | | iShares Barclays 20+ Year Treasury Bond Fund | | $ | 11,425,099 | | | | 1.1 | |
| 312,039 | | | | | | iShares Russell 1000 Value Index Fund | | | 32,576,872 | | | | 3.1 | |
| 105,338 | | | | | | SPDR Trust Series 1 | | | 21,646,959 | | | | 2.1 | |
| |
| | | | | | | Total Exchange-Traded Funds
(Cost $60,703,288) | | | 65,648,930 | | | | 6.3 | |
| |
MUTUAL FUNDS: 91.6% |
| | Affiliated Investment Companies: 91.6% |
| 1,864,443 | | | | | | Voya Emerging Markets Index Portfolio — Class I | | | 19,856,322 | | | | 1.9 | |
| 5,248,713 | | | | | | Voya Floating Rate Fund — Class I | | | 52,487,129 | | | | 5.0 | |
| 5,183,906 | | | | | | Voya High Yield Bond Fund — Class I | | | 41,626,763 | | | | 4.0 | |
| 7,497,640 | | | | | | Voya International Core Fund — Class I | | | 69,053,265 | | | | 6.6 | |
| 4,312,432 | | | | | | Voya International Index Portfolio — Class I | | | 40,407,486 | | | | 3.9 | |
| 3,649,699 | | | | | | Voya Large Cap Growth Portfolio — Class I | | | 73,176,466 | | | | 7.0 | |
| 3,890,084 | | | | | | Voya Large Cap Value Fund — Class R6 | | | 51,388,012 | | | | 4.9 | |
| 2,089,759 | | | | | | Voya MidCap Opportunities Portfolio — Class I | | | 31,701,643 | | | | 3.1 | |
| 3,732,869 | | | | | | Voya Multi-Manager Emerging Markets Equity Fund — Class I | | | 39,232,448 | | | | 3.8 | |
| 7,903,751 | | | | | | Voya Multi-Manager International Equity Fund — Class I | | | 83,384,571 | | | | 8.0 | |
| 4,072,731 | | | | | | Voya Multi-Manager Large Cap Core Portfolio — Class I | | | 63,656,782 | | | | 6.1 | |
| |
MUTUAL FUNDS: (continued) |
| | Affiliated Investment Companies: (continued) |
| 5,021,491 | | | | | | Voya Multi-Manager Mid Cap Value Fund — Class I | | $ | 62,919,285 | | | | 6.1 | |
| 1,155,988 | | | | | | Voya RussellTM Mid Cap Growth Index Portfolio — Class I | | | 31,535,355 | | | | 3.0 | |
| 1,026,422 | | | | | | Voya Short Term Bond Fund — Class R6 | | | 10,212,894 | | | | 1.0 | |
| 1,375,562 | | | | | | Voya Small Company Portfolio — Class I | | | 31,981,805 | | | | 3.1 | |
| 2,060,119 | | | | | | Voya U.S. Stock Index Portfolio — Class I | | | 30,242,542 | | | | 2.9 | |
| 622,841 | | | | | | VY® Clarion Real Estate Portfolio — Class I | | | 21,905,320 | | | | 2.1 | |
| 1,894,887 | | | | | | VY® Invesco Comstock Portfolio — Class I | | | 31,360,379 | | | | 3.0 | |
| 3,661,014 | | | | | | VY® T. Rowe Price Capital Appreciation Portfolio — Class I | | | 105,437,209 | | | | 10.1 | |
| 693,272 | | | | @ | | VY® T. Rowe Price Growth Equity Portfolio — Class I | | | 62,498,459 | | | | 6.0 | |
| |
| | | | | | | Total Mutual Funds
(Cost $908,656,370) | | | 954,064,135 | | | | 91.6 | |
| |
| | | | | | | Total Investments in Securities
(Cost $969,359,658) | | $ | 1,019,713,065 | | | | 97.9 | |
| | | | | | | Assets in Excess of Other Liabilities | | | 21,413,338 | | | | 2.1 | |
| | | | | | | Net Assets | | $ | 1,041,126,403 | | | | 100.0 | |
| @ | | Non-income producing security. |
| | Cost for federal income tax purposes is $976,428,782. |
| Net unrealized appreciation consists of: | | | | | | |
| Gross Unrealized Appreciation | | | | $ | 67,182,471 | |
| Gross Unrealized Depreciation | | | | | (23,898,188 | ) |
| Net Unrealized Appreciation | | | | $ | 43,284,283 | |
Fair Value Measurementsˆ
The following is a summary of the fair valuations according to the inputs used as of December 31, 2014 in valuing the assets and liabilities:
| | | | Quoted Prices
in Active Markets
for Identical
Investments
(Level 1)
| | Significant
Other
Observable
Inputs
(Level 2)
| | Significant
Unobservable
Inputs
(Level 3)
| | Fair Value
at
December 31, 2014
|
|---|
Asset Table | | | | | | | | | | | | | | | | | | |
Investments, at fair value | | | | | | | | | | | | | | | | | | |
| Exchange-Traded Funds | | | | $ | 65,648,930 | | | $ | — | | | $ | — | | | $ | 65,648,930 | |
| Mutual Funds | | | | | 954,064,135 | | | | — | | | | — | | | | 954,064,135 | |
| Total Investments, at fair value | | | | $ | 1,019,713,065 | | | $ | — | | | $ | — | | | $ | 1,019,713,065 | |
Liabilities Table | | | | | | | | | | | | | | | | | | |
Other Financial Instruments+ | | | | | | | | | | | | | | | | | | |
| Futures | | | | $ | (551,527 | ) | | $ | — | | | $ | — | | | $ | (551,527 | ) |
| Total Liabilities | | | | $ | (551,527 | ) | | $ | — | | | $ | — | | | $ | (551,527 | ) |
| ˆ | | See Note 2, “Significant Accounting Policies” in the Notes to Financial Statements for additional information. |
See Accompanying Notes to Financial Statements
96
| VOYA SOLUTION 2035 PORTFOLIO | PORTFOLIO OF INVESTMENTS
AS OF DECEMBER 31, 2014 (CONTINUED) |
| + | | Other Financial Instruments are derivatives not reflected in the Portfolio of Investments and may include open forward foreign currency contracts, futures, centrally cleared swaps, OTC swaps and written options. Forward foreign currency contracts, futures and centrally cleared swaps are valued at the unrealized gain (loss) on the instrument. OTC swaps and written options are valued at the fair value of the instrument. |
At December 31, 2014, the following futures contracts were outstanding for Voya Solution 2035 Portfolio:
Contract Description
| | | | Number
of Contracts
| | Expiration
Date
| | Notional
Value
| | Unrealized
Appreciation/
(Depreciation)
|
|---|
Long Contracts | | | | | | | | | | | | | | | | | | |
| Tokyo Price Index (TOPIX) | | | | | 181 | | | | 03/12/15 | | | $ | 21,268,784 | | | $ | (551,527 | ) |
| | | | | | | | | | | | | $ | 21,268,784 | | | $ | (551,527 | ) |
Transactions with Affiliates
An investment of at least 5% of the voting securities of an issuer, or a company which is under common control results in that issuer becoming an affiliated person as defined by the 1940 Act.
The following table provides transactions during the year ended December 31, 2014, where the following issuers were considered an affiliate:
Issuer
| | | | Beginning
Market
Value at
12/31/13
| | Purchases
at Cost
| | Sales
at Cost
| | Change in
Unrealized
Appreciation/
(Depreciation)
| | Ending
Market
Value at
12/31/14
| | Investment
Income
| | Realized
Gains/
(Losses)
| | Net
Capital Gain
Distributions
|
|---|
| Voya Emerging Markets Index Portfolio — Class I | | | | $ | — | | | $ | 23,718,196 | | | $ | (1,869,330 | ) | | $ | (1,992,544 | ) | | $ | 19,856,322 | | | $ | — | | | $ | (123,851 | ) | | $ | — | |
| Voya Floating Rate Fund — Class I | | | | | 34,113,339 | | | | 29,469,756 | | | | (9,943,576 | ) | | | (1,152,390 | ) | | | 52,487,129 | | | | 1,597,225 | | | | 35,358 | | | | — | |
| Voya High Yield Bond Fund — Class I | | | | | 22,160,445 | | | | 34,507,340 | | | | (13,184,118 | ) | | | (1,856,904 | ) | | | 41,626,763 | | | | 1,970,635 | | | | (171,529 | ) | | | — | |
| Voya High Yield Portfolio — Class I | | | | | 11,415,890 | | | | 17,599 | | | | (11,493,402 | ) | | | 59,913 | | | | — | | | | 35,914 | | | | 323 | | | | — | |
| Voya Intermediate Bond Fund — Class R6 | | | | | 3,675,709 | | | | 8,504,959 | | | | (12,217,838 | ) | | | 37,170 | | | | — | | | | 127,784 | | | | 242,753 | | | | — | |
| Voya International Core Fund — Class I | | | | | 69,312,161 | | | | 30,171,467 | | | | (16,007,367 | ) | | | (14,422,996 | ) | | | 69,053,265 | | | | 625,268 | | | | 1,264,531 | | | | 9,539,414 | |
| Voya International Index Portfolio — Class I | | | | | 57,744,457 | | | | 19,193,515 | | | | (30,264,739 | ) | | | (6,265,747 | ) | | | 40,407,486 | | | | 251,479 | | | | 2,406,346 | | | | — | |
| Voya Large Cap Growth Portfolio — Class I | | | | | 87,490,072 | | | | 10,157,730 | | | | (20,506,822 | ) | | | (3,964,514 | ) | | | 73,176,466 | | | | 386,882 | | | | 7,554,979 | | | | 5,596,101 | |
| Voya Large Cap Value Fund — Class R6 | | | | | 71,944,167 | | | | 10,350,565 | | | | (26,784,428 | ) | | | (4,122,292 | ) | | | 51,388,012 | | | | 1,001,169 | | | | 4,123,882 | | | | 3,551,815 | |
| Voya MidCap Opportunities Portfolio — Class I | | | | | 63,888,802 | | | | 7,565,608 | | | | (28,205,251 | ) | | | (11,547,516 | ) | | | 31,701,643 | | | | 131,371 | | | | 8,210,680 | | | | 4,954,910 | |
| Voya Multi-Manager Emerging Markets Equity Fund — Class I | | | | | 45,423,619 | | | | 30,610,904 | | | | (32,985,073 | ) | | | (3,817,002 | ) | | | 39,232,448 | | | | 630,732 | | | | 650,099 | | | | — | |
| Voya Multi-Manager International Equity Fund — Class I | | | | | 69,498,680 | | | | 42,723,525 | | | | (15,407,257 | ) | | | (13,430,377 | ) | | | 83,384,571 | | | | 1,993,340 | | | | 3,192,886 | | | | 3,417,154 | |
| Voya Multi-Manager Large Cap Core Portfolio — Class I | | | | | 59,558,526 | | | | 18,801,412 | | | | (16,663,196 | ) | | | 1,960,040 | | | | 63,656,782 | | | | 791,095 | | | | 2,048,194 | | | | 4,870,263 | |
| Voya Multi-Manager Mid Cap Value Fund — Class I | | | | | 64,637,952 | | | | 20,106,843 | | | | (12,719,729 | ) | | | (9,105,781 | ) | | | 62,919,285 | | | | 717,383 | | | | 5,346,624 | | | | 10,616,093 | |
Voya RussellTM Mid Cap Growth Index Portfolio — Class I | | | | | — | | | | 33,901,094 | | | | (6,088,919 | ) | | | 3,723,180 | | | | 31,535,355 | | | | 151,188 | | | | 508,224 | | | | — | |
Voya RussellTM Mid Cap Index Portfolio — Class I | | | | | 11,647,216 | | | | 20,666 | | | | (10,256,327 | ) | | | (1,411,555 | ) | | | — | | | | — | | | | 1,148,749 | | | | — | |
| Voya Short Term Bond Fund — Class R6 | | | | | 22,628,967 | | | | 2,950,121 | | | | (15,286,667 | ) | | | (79,527 | ) | | | 10,212,894 | | | | 373,466 | | | | (7,097 | ) | | | — | |
| Voya Small Company Portfolio — Class I | | | | | 46,593,568 | | | | 9,679,633 | | | | (19,046,553 | ) | | | (5,244,843 | ) | | | 31,981,805 | | | | 151,931 | | | | 2,629,032 | | | | 4,711,260 | |
| Voya U.S. Bond Index Portfolio — Class I | | | | | 17,092,135 | | | | 32,698,227 | | | | (49,938,495 | ) | | | 148,133 | | | | — | | | | 156,705 | | | | 233,540 | | | | — | |
| Voya U.S. Stock Index Portfolio — Class I | | | | | 46,439,143 | | | | 125,538,794 | | | | (140,357,452 | ) | | | (1,377,943 | ) | | | 30,242,542 | | | | 759,215 | | | | (5,268,248 | ) | | | 9,599,367 | |
| VY® Clarion Real Estate Portfolio — Class I | | | | | 22,652,115 | | | | 1,900,515 | | | | (5,560,822 | ) | | | 2,913,512 | | | | 21,905,320 | | | | 346,452 | | | | 2,770,941 | | | | — | |
| VY® Invesco Comstock Portfolio — Class I | | | | | — | | | | 35,911,079 | | | | (6,917,588 | ) | | | 2,366,888 | | | | 31,360,379 | | | | 669,987 | | | | 627,647 | | | | — | |
| VY® JPMorgan Emerging Markets Equity Portfolio — Class I | | | | | 22,484,607 | | | | 41,332 | | | | (22,462,513 | ) | | | (63,426 | ) | | | — | | | | — | | | | (1,269,895 | ) | | | — | |
| VY® T. Rowe Price Capital Appreciation Portfolio — Class I | | | | | 92,012,545 | | | | 38,526,210 | | | | (21,825,670 | ) | | | (3,275,876 | ) | | | 105,437,209 | | | | 1,637,158 | | | | 5,526,342 | | | | 9,234,108 | |
| VY® T. Rowe Price Equity Income Portfolio — Class I | | | | | 54,709,908 | | | | 308,621 | | | | (40,818,166 | ) | | | (14,200,363 | ) | | | — | | | | — | | | | 13,672,598 | | | | — | |
| VY® T. Rowe Price Growth Equity Portfolio — Class I | | | | | 65,098,149 | | | | 13,668,218 | | | | (9,511,968 | ) | | | (6,755,940 | ) | | | 62,498,459 | | | | — | | | | 7,653,573 | | | | 4,523,783 | |
| | | | | $ | 1,062,222,172 | | | $ | 581,043,929 | | | $ | (596,323,266 | ) | | $ | (92,878,700 | ) | | $ | 954,064,135 | | | $ | 14,506,379 | | | $ | 63,006,681 | | | $ | 70,614,268 | |
The financial statements for the above mutual fund[s] can be found at www.sec.gov.
See Accompanying Notes to Financial Statements
97
| VOYA SOLUTION 2035 PORTFOLIO | PORTFOLIO OF INVESTMENTS
AS OF DECEMBER 31, 2014 (CONTINUED) |
A summary of derivative instruments by primary risk exposure is outlined in the following tables.
The fair value of derivative instruments as of December 31, 2014 was as follows:
Derivatives not accounted for as
hedging instruments
| | | | Location on Statement of Assets and Liabilities
| | Fair Value
|
|---|
Liability Derivatives
| | | | | | |
|---|
| Equity contracts | �� | | | Net Assets — Unrealized depreciation* | | $ | 551,527 | |
Total Liability Derivatives | | | | | | $ | 551,527 | |
| * | | Includes cumulative appreciation/depreciation of futures contracts as reported in the table following the Portfolio of Investments. |
The effect of derivative instruments on the Portfolio’s Statement of Operations for the year ended December 31, 2014 was as follows:
| | | | Amount of Realized Gain or (Loss) on
Derivatives Recognized in Income |
|---|
Derivatives not accounted for as
hedging instruments
| | | | Futures
|
|---|
| Equity contracts | | | | $ | (1,479 | ) |
Total | | | | $ | (1,479 | ) |
| | | | Change in Unrealized Appreciation or (Depreciation)
on Derivatives Recognized in Income |
|---|
Derivatives not accounted for as
hedging instruments
| | | | Futures
|
|---|
Equity contracts | | | | $ | (551,527 | ) |
Total | | | | $ | (551,527 | ) |
See Accompanying Notes to Financial Statements
98
| VOYA SOLUTION 2040 PORTFOLIO | PORTFOLIO OF INVESTMENTS
AS OF DECEMBER 31, 2014 |
Shares
|
|
|
|
|
|
|
| Value
|
| Percentage
of Net
Assets
|
|---|
| |
EXCHANGE-TRADED FUNDS: 5.7% |
| 137 | | | | | | iShares Russell 1000 Value Index Fund | | $ | 14,303 | | | | 2.0 | |
| 69 | | | | | | SPDR Trust Series 1 | | | 14,179 | | | | 2.0 | |
| 255 | | | | | | WisdomTree Japan Hedged Equity Fund | | | 12,554 | | | | 1.7 | |
| |
| | | | | | | Total Exchange-Traded Funds
(Cost $41,040) | | | 41,036 | | | | 5.7 | |
| |
MUTUAL FUNDS: 94.0% |
| | Affiliated Investment Companies: 94.0% |
| 1,291 | | | | | | Voya Emerging Markets Index Portfolio — Class I | | | 13,747 | | | | 1.9 | |
| 1,450 | | | | | | Voya Floating Rate Fund — Class I | | | 14,499 | | | | 2.0 | |
| 3,582 | | | | | | Voya High Yield Bond Fund — Class I | | | 28,763 | | | | 4.0 | |
| 5,183 | | | | | | Voya International Core Fund — Class I | | | 47,731 | | | | 6.6 | |
| 2,982 | | | | | | Voya International Index Portfolio — Class I | | | 27,943 | | | | 3.9 | |
| 2,702 | | | | | | Voya Large Cap Growth Portfolio — Class I | | | 54,166 | | | | 7.5 | |
| 4,131 | | | | | | Voya Large Cap Value Fund — Class R6 | | | 54,564 | | | | 7.6 | |
| 1,443 | | | | | | Voya MidCap Opportunities Portfolio — Class I | | | 21,896 | | | | 3.1 | |
| 2,585 | | | | | | Voya Multi-Manager Emerging Markets Equity Fund — Class I | | | 27,169 | | | | 3.8 | |
| 5,466 | | | | | | Voya Multi-Manager International Equity Fund — Class I | | | 57,663 | | | | 8.0 | |
| 3,164 | | | | | | Voya Multi-Manager Large Cap Core Portfolio — Class I | | | 49,453 | | | | 6.9 | |
| |
MUTUAL FUNDS: (continued) |
| | Affiliated Investment Companies: (continued) |
| 4,048 | | | | | | Voya Multi-Manager Mid Cap Value Fund — Class I | | $ | 50,721 | | | | 7.1 | |
| 1,065 | | | | | | Voya RussellTM Mid Cap Growth Index Portfolio — Class I | | | 29,047 | | | | 4.0 | |
| 1,266 | | | | | | Voya Small Company Portfolio — Class I | | | 29,445 | | | | 4.1 | |
| 2,005 | | | | | | Voya U.S. Stock Index Portfolio — Class I | | | 29,429 | | | | 4.1 | |
| 430 | | | | | | VY® Clarion Real Estate Portfolio — Class I | | | 15,106 | | | | 2.1 | |
| 1,309 | | | | | | VY® Invesco Comstock Portfolio — Class I | | | 21,670 | | | | 3.0 | |
| 1,833 | | | | | | VY® T. Rowe Price Capital Appreciation Portfolio — Class I | | | 52,791 | | | | 7.3 | |
| 559 | | | | @ | | VY® T. Rowe Price Growth Equity Portfolio — Class I | | | 50,382 | | | | 7.0 | |
| |
| | | | | | | Total Mutual Funds
(Cost $695,244) | | | 676,185 | | | | 94.0 | |
| | | | | | | Total Investments in Securities
(Cost $736,284) | | $ | 717,221 | | | | 99.7 | |
| | | | | | | Assets in Excess of Other Liabilities | | | 1,975 | | | | 0.3 | |
| | | | | | | Net Assets | | $ | 719,196 | | | | 100.0 | |
| @ | | Non-income producing security. |
| | Cost for federal income tax purposes is $739,897. |
| Net unrealized depreciation consists of: | | | | | | |
| Gross Unrealized Appreciation | | | | $ | 15,784 | |
| Gross Unrealized Depreciation | | | | | (38,460 | ) |
| Net Unrealized Depreciation | | | | $ | (22,676 | ) |
Fair Value Measurementsˆ
The following is a summary of the fair valuations according to the inputs used as of December 31, 2014 in valuing the assets and liabilities:
| | | | Quoted Prices
in Active Markets
for Identical
Investments
(Level 1)
| | Significant
Other
Observable
Inputs
(Level 2)
| | Significant
Unobservable
Inputs
(Level 3)
| | Fair Value
at
December 31, 2014
|
|---|
Asset Table | | | | | | | | | | | | | | | | | | |
Investments, at fair value | | | | | | | | | | | | | | | | | | |
| Exchange-Traded Funds | | | | $ | 41,036 | | | $ | — | | | $ | — | | | $ | 41,036 | |
| Mutual Funds | | | | | 676,185 | | | | — | | | | — | | | | 676,185 | |
| Total Investments, at fair value | | | | $ | 717,221 | | | $ | — | | | $ | — | | | $ | 717,221 | |
| ˆ | | See Note 2, “Significant Accounting Policies” in the Notes to Financial Statements for additional information. |
See Accompanying Notes to Financial Statements
99
| VOYA SOLUTION 2040 PORTFOLIO | PORTFOLIO OF INVESTMENTS
AS OF DECEMBER 31, 2014 (CONTINUED) |
Transactions with Affiliates
An investment of at least 5% of the voting securities of an issuer, or a company which is under common control results in that issuer becoming an affiliated person as defined by the 1940 Act.
The following table provides transactions during the year ended December 31, 2014, where the following issuers were considered an affiliate:
Issuer
| | | | Beginning
Market
Value at
12/31/13
| | Purchases
at Cost
| | Sales
at Cost
| | Change in
Unrealized
Appreciation/
(Depreciation)
| | Ending
Market
Value at
12/31/14
| | Investment
Income
| | Realized
Gains/
(Losses)
| | Net
Capital Gain
Distributions
|
|---|
| Voya Emerging Markets Index Portfolio — Class I | | | | $ | — | | | $ | 17,218 | | | $ | (2,116 | ) | | $ | (1,355 | ) | | $ | 13,747 | | | $ | — | | | $ | (114 | ) | | $ | — | |
| Voya Floating Rate Fund — Class I | | | | | — | | | | 17,401 | | | | (2,663 | ) | | | (239 | ) | | | 14,499 | | | | 228 | | | | (19 | ) | | | — | |
| Voya High Yield Bond Fund — Class I | | | | | 413 | | | | 35,715 | | | | (5,854 | ) | | | (1,511 | ) | | | 28,763 | | | | 946 | | | | (115 | ) | | | — | |
| Voya High Yield Portfolio — Class I | | | | | 206 | | | | — | | | | (207 | ) | | | 1 | | | | — | | | | 1 | | | | — | | | | — | |
| Voya International Core Fund — Class I | | | | | 1,264 | | | | 64,928 | | | | (9,285 | ) | | | (9,176 | ) | | | 47,731 | | | | 421 | | | | 113 | | | | 6,430 | |
| Voya International Index Portfolio — Class I | | | | | 1,043 | | | | 35,097 | | | | (5,920 | ) | | | (2,277 | ) | | | 27,943 | | | | 5 | | | | (140 | ) | | | — | |
| Voya Large Cap Growth Portfolio — Class I | | | | | 1,790 | | | | 63,721 | | | | (13,328 | ) | | | 1,983 | | | | 54,166 | | | | 253 | | | | 641 | | | | 3,653 | |
| Voya Large Cap Value Fund — Class R6 | | | | | 1,403 | | | | 70,035 | | | | (15,570 | ) | | | (1,304 | ) | | | 54,564 | | | | 848 | | | | 1,014 | | | | 3,633 | |
| Voya MidCap Opportunities Portfolio — Class I | | | | | 1,258 | | | | 27,478 | | | | (5,654 | ) | | | (1,186 | ) | | | 21,896 | | | | 6 | | | | 58 | | | | 3,539 | |
| Voya Multi-Manager Emerging Markets Equity Fund — Class I | | | | | 820 | | | | 35,167 | | | | (6,064 | ) | | | (2,754 | ) | | | 27,169 | | | | 425 | | | | 139 | | | | — | |
| Voya Multi-Manager International Equity Fund — Class I | | | | | 1,255 | | | | 76,004 | | | | (11,609 | ) | | | (7,987 | ) | | | 57,663 | | | | 1,344 | | | | (122 | ) | | | 2,304 | |
| Voya Multi-Manager Large Cap Core Portfolio — Class I | | | | | 1,619 | | | | 57,766 | | | | (11,648 | ) | | | 1,716 | | | | 49,453 | | | | 592 | | | | 281 | | | | 3,338 | |
| Voya Multi-Manager Mid Cap Value Fund — Class I | | | | | 1,273 | | | | 65,775 | | | | (10,340 | ) | | | (5,987 | ) | | | 50,721 | | | | 564 | | | | 736 | | | | 8,350 | |
Voya RussellTM Mid Cap Growth Index Portfolio — Class I | | | | | — | | | | 32,708 | | | | (6,173 | ) | | | 2,512 | | | | 29,047 | | | | 4 | | | | 481 | | | | — | |
Voya RussellTM Mid Cap Index Portfolio — Class I | | | | | 421 | | | | — | | | | (368 | ) | | | (53 | ) | | | — | | | | — | | | | 43 | | | | — | |
| Voya Small Company Portfolio — Class I | | | | | 1,052 | | | | 39,788 | | | | (13,455 | ) | | | 2,060 | | | | 29,445 | | | | 4 | | | | 996 | | | | 111 | |
| Voya U.S. Bond Index Portfolio — Class I | | | | | 304 | | | | 23,503 | | | | (23,810 | ) | | | 3 | | | | — | | | | 112 | | | | 110 | | | | — | |
| Voya U.S. Stock Index Portfolio — Class I | | | | | 839 | | | | 110,843 | | | | (82,421 | ) | | | 168 | | | | 29,429 | | | | 637 | | | | (3,915 | ) | | | 6,498 | |
| VY® Clarion Real Estate Portfolio — Class I | | | | | 409 | | | | 16,686 | | | | (3,395 | ) | | | 1,406 | | | | 15,106 | | | | 211 | | | | 347 | | | | — | |
| VY® Invesco Comstock Portfolio — Class I | | | | | — | | | | 25,264 | | | | (4,306 | ) | | | 712 | | | | 21,670 | | | | 455 | | | | 256 | | | | — | |
| VY® JPMorgan Emerging Markets Equity Portfolio — Class I | | | | | 406 | | | | — | | | | (403 | ) | | | (3 | ) | | | — | | | | — | | | | (22 | ) | | | — | |
| VY® T. Rowe Price Capital Appreciation Portfolio — Class I | | | | | 1,454 | | | | 63,590 | | | | (11,677 | ) | | | (576 | ) | | | 52,791 | | | | 791 | | | | (90 | ) | | | 4,079 | |
| VY® T. Rowe Price Equity Income Portfolio — Class I | | | | | 1,196 | | | | — | | | | (831 | ) | | | (365 | ) | | | — | | | | — | | | | 349 | | | | — | |
| VY® T. Rowe Price Growth Equity Portfolio — Class I | | | | | 1,277 | | | | 59,235 | | | | (12,012 | ) | | | 1,882 | | | | 50,382 | | | | — | | | | 962 | | | | 3,196 | |
| | | | | $ | 19,702 | | | $ | 937,922 | | | $ | (259,109 | ) | | $ | (22,330 | ) | | $ | 676,185 | | | $ | 7,847 | | | $ | 1,989 | | | $ | 45,131 | |
The financial statements for the above mutual fund[s] can be found at www.sec.gov.
See Accompanying Notes to Financial Statements
100
| VOYA SOLUTION 2045 PORTFOLIO | PORTFOLIO OF INVESTMENTS
AS OF DECEMBER 31, 2014 |
Shares
|
|
|
|
|
|
|
| Value
|
| Percentage
of Net
Assets
|
|---|
| |
EXCHANGE-TRADED FUNDS: 4.7% |
| 180,774 | | | | | | iShares Russell 1000 Value Index Fund | | $ | 18,872,806 | | | | 2.6 | |
| 73,231 | | | | | | SPDR Trust Series 1 | | | 15,048,970 | | | | 2.1 | |
| |
| | | | | | | Total Exchange-Traded Funds
(Cost $31,008,722) | | | 33,921,776 | | | | 4.7 | |
| |
MUTUAL FUNDS: 93.2% |
| | Affiliated Investment Companies: 93.2% |
| 1,291,458 | | | | | | Voya Emerging Markets Index Portfolio — Class I | | | 13,754,033 | | | | 1.9 | |
| 1,273,062 | | | | | | Voya Floating Rate Fund — Class I | | | 12,730,621 | | | | 1.8 | |
| 728,889 | | | | | | Voya Intermediate Bond Fund — Class R6 | | | 7,354,485 | | | | 1.0 | |
| 5,771,994 | | | | | | Voya International Core Fund — Class I | | | 53,160,069 | | | | 7.4 | |
| 2,987,808 | | | | | | Voya International Index Portfolio — Class I | | | 27,995,759 | | | | 3.9 | |
| 2,709,229 | | | | | | Voya Large Cap Growth Portfolio — Class I | | | 54,320,049 | | | | 7.5 | |
| 4,076,752 | | | | | | Voya Large Cap Value Fund — Class R6 | | | 53,853,890 | | | | 7.5 | |
| 1,447,795 | | | | | | Voya MidCap Opportunities Portfolio — Class I | | | 21,963,056 | | | | 3.1 | |
| 2,585,744 | | | | | | Voya Multi-Manager Emerging Markets Equity Fund — Class I | | | 27,176,171 | | | | 3.8 | |
| 6,305,561 | | | | | | Voya Multi-Manager International Equity Fund — Class I | | | 66,523,666 | | | | 9.2 | |
| 3,291,911 | | | | | | Voya Multi-Manager Large Cap Core Portfolio — Class I | | | 51,452,573 | | | | 7.1 | |
| |
MUTUAL FUNDS: (continued) |
| | Affiliated Investment Companies: (continued) |
| 4,058,350 | | | | | | Voya Multi-Manager Mid Cap Value Fund — Class I | | $ | 50,851,121 | | | | 7.1 | |
| 1,067,818 | | | | | | Voya RussellTM Mid Cap Growth Index Portfolio — Class I | | | 29,130,073 | | | | 4.0 | |
| 1,270,644 | | | | | | Voya Small Company Portfolio — Class I | | | 29,542,471 | | | | 4.1 | |
| 2,659,648 | | | | | | Voya U.S. Stock Index Portfolio — Class I | | | 39,043,632 | | | | 5.4 | |
| 431,634 | | | | | | VY® Clarion Real Estate Portfolio — Class I | | | 15,180,551 | | | | 2.1 | |
| 1,312,671 | | | | | | VY® Invesco Comstock Portfolio — Class I | | | 21,724,700 | | | | 3.0 | |
| 1,458,581 | | | | | | VY® T. Rowe Price Capital Appreciation Portfolio — Class I | | | 42,007,144 | | | | 5.8 | |
| 600,398 | | | | @ | | VY® T. Rowe Price Growth Equity Portfolio — Class I | | | 54,125,848 | | | | 7.5 | |
| |
| | | | | | | Total Mutual Funds
(Cost $637,691,164) | | | 671,889,912 | | | | 93.2 | |
| |
| | | | | | | Total Investments in Securities
(Cost $668,699,886) | | $ | 705,811,688 | | | | 97.9 | |
| | | | | | | Assets in Excess of Other Liabilities | | | 14,829,651 | | | | 2.1 | |
| | | | | | | Net Assets | | $ | 720,641,339 | | | | 100.0 | |
| @ | | Non-income producing security. |
| | Cost for federal income tax purposes is $672,510,232. |
| Net unrealized appreciation consists of: | | | | | | |
| Gross Unrealized Appreciation | | | | $ | 48,899,818 | |
| Gross Unrealized Depreciation | | | | | (15,598,362 | ) |
| Net Unrealized Appreciation | | | | $ | 33,301,456 | |
Fair Value Measurementsˆ
The following is a summary of the fair valuations according to the inputs used as of December 31, 2014 in valuing the assets and liabilities:
| | | | Quoted Prices
in Active Markets
for Identical
Investments
(Level 1)
| | Significant
Other
Observable
Inputs
(Level 2)
| | Significant
Unobservable
Inputs
(Level 3)
| | Fair Value
at
December 31, 2014
|
|---|
Asset Table | | | | | | | | | | | | | | | | | | |
Investments, at fair value | | | | | | | | | | | | | | | | | | |
| Exchange-Traded Funds | | | | $ | 33,921,776 | | | $ | — | | | $ | — | | | $ | 33,921,776 | |
| Mutual Funds | | | | | 671,889,912 | | | | — | | | | — | | | | 671,889,912 | |
| Total Investments, at fair value | | | | $ | 705,811,688 | | | $ | — | | | $ | — | | | $ | 705,811,688 | |
Liabilities Table | | | | | | | | | | | | | | | | | | |
Other Financial Instruments+ | | | | | | | | | | | | | | | | | | |
| Futures | | | | $ | (383,936 | ) | | $ | — | | | $ | — | | | $ | (383,936 | ) |
| Total Liabilities | | | | $ | (383,936 | ) | | $ | — | | | $ | — | | | $ | (383,936 | ) |
| ˆ | | See Note 2, “Significant Accounting Policies” in the Notes to Financial Statements for additional information. |
| + | | Other Financial Instruments are derivatives not reflected in the Portfolio of Investments and may include open forward foreign currency contracts, futures, centrally cleared swaps, OTC swaps and written options. Forward foreign currency contracts, futures and centrally cleared swaps are valued at the unrealized gain (loss) on the instrument. OTC swaps and written options are valued at the fair value of the instrument. |
See Accompanying Notes to Financial Statements
101
| VOYA SOLUTION 2045 PORTFOLIO | PORTFOLIO OF INVESTMENTS
AS OF DECEMBER 31, 2014 (CONTINUED) |
At December 31, 2014, the following futures contracts were outstanding for Voya Solution 2045 Portfolio:
Contract Description
| | | | Number
of Contracts
| | Expiration
Date
| | Notional
Value
| | Unrealized
Appreciation/
(Depreciation)
|
|---|
Long Contracts | | | | | | | | | | | | | | | | | | |
| Tokyo Price Index (TOPIX) | | | | | 126 | | | | 03/12/15 | | | $ | 14,805,894 | | | $ | (383,936 | ) |
| | | | | | | | | | | | | $ | 14,805,894 | | | $ | (383,936 | ) |
Transactions with Affiliates
An investment of at least 5% of the voting securities of an issuer, or a company which is under common control results in that issuer becoming an affiliated person as defined by the 1940 Act.
The following table provides transactions during the year ended December 31, 2014, where the following issuers were considered an affiliate:
Issuer
| | | | Beginning
Market
Value at
12/31/13
| | Purchases
at Cost
| | Sales
at Cost
| | Change in
Unrealized
Appreciation/
(Depreciation)
| | Ending
Market
Value at
12/31/14
| | Investment
Income
| | Realized
Gains/
(Losses)
| | Net
Capital Gain
Distributions
|
|---|
| Voya Emerging Markets Index Portfolio — Class I | | | | $ | — | | | $ | 16,550,867 | | | $ | (1,422,032 | ) | | $ | (1,374,802 | ) | | $ | 13,754,033 | | | $ | — | | | $ | (99,410 | ) | | $ | — | |
| Voya Floating Rate Fund — Class I | | | | | — | | | | 14,239,938 | | | | (1,275,239 | ) | | | (234,078 | ) | | | 12,730,621 | | | | 213,437 | | | | (16,281 | ) | | | — | |
| Voya High Yield Portfolio — Class I | | | | | 7,794,604 | | | | 39,134 | | | | (7,812,323 | ) | | | (21,415 | ) | | | — | | | | 24,170 | | | | 61,862 | | | | — | |
| Voya Intermediate Bond Fund — Class R6 | | | | | — | | | | 8,463,250 | | | | (1,163,980 | ) | | | 55,215 | | | | 7,354,485 | | | | 100,534 | | | | 4,616 | | | | — | |
| Voya International Core Fund — Class I | | | | | 47,696,813 | | | | 28,982,661 | | | | (9,926,519 | ) | | | (13,592,886 | ) | | | 53,160,069 | | | | 479,064 | | | | 3,654,208 | | | | 7,308,855 | |
| Voya International Index Portfolio — Class I | | | | | 39,684,703 | | | | 13,717,735 | | | | (21,101,844 | ) | | | (4,304,835 | ) | | | 27,995,759 | | | | 176,535 | | | | 1,641,478 | | | | — | |
| Voya Large Cap Growth Portfolio — Class I | | | | | 70,145,584 | | | | 8,232,021 | | | | (19,770,019 | ) | | | (4,287,537 | ) | | | 54,320,049 | | | | 286,189 | | | | 6,807,242 | | | | 4,139,612 | |
| Voya Large Cap Value Fund — Class R6 | | | | | 53,397,181 | | | | 16,751,227 | | | | (13,537,081 | ) | | | (2,757,437 | ) | | | 53,853,890 | | | | 1,038,046 | | | | 3,361,322 | | | | 3,680,698 | |
| Voya MidCap Opportunities Portfolio — Class I | | | | | 47,896,783 | | | | 5,657,220 | | | | (21,168,516 | ) | | | (10,422,431 | ) | | | 21,963,056 | | | | 91,112 | | | | 7,989,082 | | | | 3,445,468 | |
| Voya Multi-Manager Emerging Markets Equity Fund — Class I | | | | | 31,214,624 | | | | 21,569,718 | | | | (23,043,923 | ) | | | (2,564,248 | ) | | | 27,176,171 | | | | 434,730 | | | | 384,736 | | | | — | |
| Voya Multi-Manager International Equity Fund — Class I | | | | | 63,682,766 | | | | 27,242,067 | | | | (13,333,618 | ) | | | (11,067,549 | ) | | | 66,523,666 | | | | 1,582,611 | | | | 2,626,663 | | | | 2,713,047 | |
| Voya Multi-Manager Large Cap Core Portfolio — Class I | | | | | 75,502,273 | | | | 8,012,353 | | | | (31,283,010 | ) | | | (779,043 | ) | | | 51,452,573 | | | | 637,209 | | | | 3,199,367 | | | | 3,922,940 | |
| Voya Multi-Manager Mid Cap Value Fund — Class I | | | | | 48,459,245 | | | | 19,991,067 | | | | (11,160,890 | ) | | | (6,438,301 | ) | | | 50,851,121 | | | | 577,080 | | | | 3,570,056 | | | | 8,539,841 | |
Voya RussellTM Mid Cap Growth Index Portfolio — Class I | | | | | — | | | | 31,695,382 | | | | (5,979,082 | ) | | | 3,413,773 | | | | 29,130,073 | | | | 140,305 | | | | 498,416 | | | | — | |
Voya RussellTM Mid Cap Index Portfolio — Class I | | | | | 16,008,489 | | | | 52,178 | | | | (14,077,107 | ) | | | (1,983,560 | ) | | | — | | | | — | | | | 1,620,522 | | | | — | |
| Voya Small Company Portfolio — Class I | | | | | 40,025,355 | | | | 9,028,473 | | | | (11,431,519 | ) | | | (8,079,838 | ) | | | 29,542,471 | | | | 132,209 | | | | 5,894,287 | | | | 4,099,740 | |
| Voya U.S. Bond Index Portfolio — Class I | | | | | — | | | | 22,751,735 | | | | (22,751,735 | ) | | | — | | | | — | | | | 108,968 | | | | 105,104 | | | | — | |
| Voya U.S. Stock Index Portfolio — Class I | | | | | 31,913,678 | | | | 94,741,697 | | | | (86,780,025 | ) | | | (831,718 | ) | | | 39,043,632 | | | | 856,294 | | | | (1,667,211 | ) | | | 8,468,441 | |
| VY® Clarion Real Estate Portfolio — Class I | | | | | 15,566,720 | | | | 1,450,974 | | | | (4,626,450 | ) | | | 2,789,307 | | | | 15,180,551 | | | | 239,185 | | | | 1,165,698 | | | | — | |
| VY® Invesco Comstock Portfolio — Class I | | | | | — | | | | 25,076,369 | | | | (4,973,072 | ) | | | 1,621,403 | | | | 21,724,700 | | | | 462,498 | | | | 465,113 | | | | — | |
| VY® JPMorgan Emerging Markets Equity Portfolio — Class I | | | | | 15,451,205 | | | | 52,178 | | | | (15,531,451 | ) | | | 28,068 | | | | — | | | | — | | | | (946,371 | ) | | | — | |
| VY® T. Rowe Price Capital Appreciation Portfolio — Class I | | | | | 47,255,210 | | | | 8,498,497 | | | | (11,345,500 | ) | | | (2,401,063 | ) | | | 42,007,144 | | | | 648,080 | | | | 3,258,492 | | | | 3,605,005 | |
| VY® T. Rowe Price Equity Income Portfolio — Class I | | | | | 47,492,448 | | | | 340,622 | | | | (34,903,562 | ) | | | (12,929,508 | ) | | | — | | | | — | | | | 12,250,225 | | | | — | |
| VY® T. Rowe Price Growth Equity Portfolio — Class I | | | | | 50,836,014 | | | | 18,865,667 | | | | (9,348,596 | ) | | | (6,227,237 | ) | | | 54,125,848 | | | | — | | | | 7,422,442 | | | | 3,934,568 | |
| | | | | $ | 750,023,695 | | | $ | 402,003,030 | | | $ | (397,747,093 | ) | | $ | (82,389,720 | ) | | $ | 671,889,912 | | | $ | 8,228,256 | | | $ | 63,251,658 | | | $ | 53,858,215 | |
The financial statements for the above mutual fund[s] can be found at www.sec.gov.
See Accompanying Notes to Financial Statements
102
| VOYA SOLUTION 2045 PORTFOLIO | PORTFOLIO OF INVESTMENTS
AS OF DECEMBER 31, 2014 (CONTINUED) |
A summary of derivative instruments by primary risk exposure is outlined in the following tables.
The fair value of derivative instruments as of December 31, 2014 was as follows:
Derivatives not accounted for as
hedging instruments
| | | | Location on Statement of Assets and Liabilities
| | Fair Value
|
|---|
Liability Derivatives
| | | | | |
|---|
| Equity contracts | | | | Net Assets — Unrealized depreciation* | | $ | 383,936 | |
Total Liability Derivatives | | | | | | $ | 383,936 | |
| * | | Includes cumulative appreciation/depreciation of futures contracts as reported in the table following the Portfolio of Investments. |
The effect of derivative instruments on the Portfolio’s Statement of Operations for the year ended December 31, 2014 was as follows:
| | | | Amount of Realized Gain or (Loss) on
Derivatives Recognized in Income |
|---|
Derivatives not accounted for as
hedging instruments
| | | | Futures
|
|---|
| Equity contracts | | | | $ | (1,029 | ) |
Total | | | | $ | (1,029 | ) |
| | | | Change in Unrealized Appreciation or (Depreciation)
on Derivatives Recognized in Income |
|---|
Derivatives not accounted for as
hedging instruments
| | | | Futures
|
|---|
| Equity contracts | | | | $ | (383,936 | ) |
Total | | | | $ | (383,936 | ) |
See Accompanying Notes to Financial Statements
103
| VOYA SOLUTION 2050 PORTFOLIO | PORTFOLIO OF INVESTMENTS
AS OF DECEMBER 31, 2014 |
Shares
|
|
|
|
|
|
|
| Value
|
| Percentage
of Net
Assets
|
|---|
| |
EXCHANGE-TRADED FUNDS: 6.2% |
| 89 | | | | | | iShares Russell 1000 Value Index Fund | | $ | 9,292 | | | | 2.5 | |
| 36 | | | | | | SPDR Trust Series 1 | | | 7,398 | | | | 2.0 | |
| 133 | | | | | | WisdomTree Japan Hedged Equity Fund | | | 6,547 | | | | 1.7 | |
| |
| | | | | | | Total Exchange-Traded Funds
(Cost $23,083) | | | 23,237 | | | | 6.2 | |
| |
MUTUAL FUNDS: 93.4% |
| | Affiliated Investment Companies: 93.4% |
| 669 | | | | | | Voya Emerging Markets Index Portfolio — Class I | | | 7,130 | | | | 1.9 | |
| 658 | | | | | | Voya Floating Rate Fund — Class I | | | 6,581 | | | | 1.8 | |
| 377 | | | | | | Voya Intermediate Bond Fund — Class R6 | | | 3,800 | | | | 1.0 | |
| 2,987 | | | | | | Voya International Core Fund — Class I | | | 27,511 | | | | 7.4 | |
| 1,547 | | | | | | Voya International Index Portfolio — Class I | | | 14,495 | | | | 3.9 | |
| 1,401 | | | | | | Voya Large Cap Growth Portfolio — Class I | | | 28,097 | | | | 7.5 | |
| 2,145 | | | | | | Voya Large Cap Value Fund — Class R6 | | | 28,335 | | | | 7.6 | |
| 749 | | | | | | Voya MidCap Opportunities Portfolio — Class I | | | 11,358 | | | | 3.0 | |
| 1,341 | | | | | | Voya Multi-Manager Emerging Markets Equity Fund — Class I | | | 14,092 | | | | 3.8 | |
| 3,265 | | | | | | Voya Multi-Manager International Equity Fund — Class I | | | 34,443 | | | | 9.2 | |
| 1,700 | | | | | | Voya Multi-Manager Large Cap Core Portfolio — Class I | | | 26,573 | | | | 7.1 | |
| |
MUTUAL FUNDS: (continued) |
| | Affiliated Investment Companies: (continued) |
| 2,100 | | | | | | Voya Multi-Manager Mid Cap Value Fund — Class I | | $ | 26,309 | | | | 7.1 | |
| 552 | | | | | | Voya RussellTM Mid Cap Growth Index Portfolio — Class I | | | 15,067 | | | | 4.0 | |
| 657 | | | | | | Voya Small Company Portfolio — Class I | | | 15,273 | | | | 4.1 | |
| 1,424 | | | | | | Voya U.S. Stock Index Portfolio — Class I | | | 20,907 | | | | 5.6 | |
| 223 | | | | | | VY® Clarion Real Estate Portfolio — Class I | | | 7,836 | | | | 2.1 | |
| 679 | | | | | | VY® Invesco Comstock Portfolio — Class I | | | 11,240 | | | | 3.0 | |
| 754 | | | | | | VY® T. Rowe Price Capital Appreciation Portfolio — Class I | | | 21,719 | | | | 5.8 | |
| 311 | | | | @ | | VY® T. Rowe Price Growth Equity Portfolio — Class I | | | 28,002 | | | | 7.5 | |
| |
| | | | | | | Total Mutual Funds
(Cost $357,531) | | | 348,768 | | | | 93.4 | |
| |
| | | | | | | Total Investments in Securities
(Cost $380,614) | | $ | 372,005 | | | | 99.6 | |
| | | | | | | Assets in Excess of Other Liabilities | | | 1,345 | | | | 0.4 | |
| | | | | | | Net Assets | | $ | 373,350 | | | | 100.0 | |
| @ | | Non-income producing security. |
| | Cost for federal income tax purposes is $381,783. |
| Net unrealized depreciation consists of: | | | | | | |
| Gross Unrealized Appreciation | | | | $ | 8,923 | |
| Gross Unrealized Depreciation | | | | | (18,701 | ) |
| Net Unrealized Depreciation | | | | $ | (9,778 | ) |
Fair Value Measurementsˆ
The following is a summary of the fair valuations according to the inputs used as of December 31, 2014 in valuing the assets and liabilities:
| | | | Quoted Prices
in Active Markets
for Identical
Investments
(Level 1)
| | Significant
Other
Observable
Inputs
(Level 2)
| | Significant
Unobservable
Inputs
(Level 3)
| | Fair Value
at
December 31, 2014
|
|---|
Asset Table | | | | | | | | | | | | | | | | | | |
Investments, at fair value | | | | | | | | | | | | | | | | | | |
| Exchange-Traded Funds | | | | $ | 23,237 | | | $ | — | | | $ | — | | | $ | 23,237 | |
| Mutual Funds | | | | | 348,768 | | | | — | | | | — | | | | 348,768 | |
| Total Investments, at fair value | | | | $ | 372,005 | | | $ | — | | | $ | — | | | $ | 372,005 | |
| ˆ | | See Note 2, “Significant Accounting Policies” in the Notes to Financial Statements for additional information. |
See Accompanying Notes to Financial Statements
104
| VOYA SOLUTION 2050 PORTFOLIO | PORTFOLIO OF INVESTMENTS
AS OF DECEMBER 31, 2014 (CONTINUED) |
Transactions with Affiliates
An investment of at least 5% of the voting securities of an issuer, or a company which is under common control results in that issuer becoming an affiliated person as defined by the 1940 Act.
The following table provides transactions during the year ended December 31, 2014, where the following issuers were considered an affiliate:
Issuer
| | | | Beginning
Market
Value at
12/31/13
| | Purchases
at Cost
| | Sales
at Cost
| | Change in
Unrealized
Appreciation/
(Depreciation)
| | Ending
Market
Value at
12/31/14
| | Investment
Income
| | Realized
Gains/
(Losses)
| | Net
Capital Gain
Distributions
|
|---|
| Voya Emerging Markets Index Portfolio — Class I | | | | $ | — | | | $ | 7,942 | | | $ | (119 | ) | | $ | (693 | ) | | $ | 7,130 | | | $ | — | | | $ | (11 | ) | | $ | — | |
| Voya Floating Rate Fund — Class I | | | | | — | | | | 6,810 | | | | (112 | ) | | | (117 | ) | | | 6,581 | | | | 101 | | | | (2 | ) | | | — | |
| Voya High Yield Portfolio — Class I | | | | | 207 | | | | — | | | | (207 | ) | | | — | | | | — | | | | 1 | | | | 2 | | | | — | |
| Voya Intermediate Bond Fund — Class R6 | | | | | — | | | | 3,827 | | | | (54 | ) | | | 27 | | | | 3,800 | | | | 45 | | | | — | | | | — | |
| Voya International Core Fund — Class I | | | | | 1,273 | | | | 32,074 | | | | (566 | ) | | | (5,270 | ) | | | 27,511 | | | | 243 | | | | 173 | | | | 3,703 | |
| Voya International Index Portfolio — Class I | | | | | 1,051 | | | | 15,393 | | | | (722 | ) | | | (1,227 | ) | | | 14,495 | | | | 5 | | | | 52 | | | | — | |
| Voya Large Cap Growth Portfolio — Class I | | | | | 1,857 | | | | 27,447 | | | | (2,027 | ) | | | 820 | | | | 28,097 | | | | 126 | | | | 474 | | | | 1,822 | |
| Voya Large Cap Value Fund — Class R6 | | | | | 1,414 | | | | 29,203 | | | | (1,919 | ) | | | (363 | ) | | | 28,335 | | | | 418 | | | | 238 | | | | 1,884 | |
| Voya MidCap Opportunities Portfolio — Class I | | | | | 1,268 | | | | 11,822 | | | | (1,059 | ) | | | (673 | ) | | | 11,358 | | | | 4 | | | | 289 | | | | 1,594 | |
| Voya Multi-Manager Emerging Markets Equity Fund — Class I | | | | | 826 | | | | 15,462 | | | | (899 | ) | | | (1,297 | ) | | | 14,092 | | | | 220 | | | | 32 | | | | — | |
| Voya Multi-Manager International Equity Fund — Class I | | | | | 1,686 | | | | 38,369 | | | | (714 | ) | | | (4,898 | ) | | | 34,443 | | | | 802 | | | | 217 | | | | 1,375 | |
| Voya Multi-Manager Large Cap Core Portfolio — Class I | | | | | 1,999 | | | | 26,067 | | | | (2,315 | ) | | | 822 | | | | 26,573 | | | | 316 | | | | 241 | | | | 1,727 | |
| Voya Multi-Manager Mid Cap Value Fund — Class I | | | | | 1,282 | | | | 29,181 | | | | (1,168 | ) | | | (2,986 | ) | | | 26,309 | | | | 292 | | | | 249 | | | | 4,327 | |
Voya RussellTM Mid Cap Growth Index Portfolio — Class I | | | | | — | | | | 14,369 | | | | (749 | ) | | | 1,447 | | | | 15,067 | | | | 4 | | | | 79 | | | | — | |
Voya RussellTM Mid Cap Index Portfolio — Class I | | | | | 424 | | | | — | | | | (371 | ) | | | (53 | ) | | | — | | | | — | | | | 43 | | | | — | |
| Voya Small Company Portfolio — Class I | | | | | 1,059 | | | | 17,695 | | | | (4,453 | ) | | | 972 | | | | 15,273 | | | | 4 | | | | 490 | | | | 112 | |
| Voya U.S. Bond Index Portfolio — Class I | | | | | — | | | | 10,656 | | | | (10,656 | ) | | | — | | | | — | | | | 50 | | | | 49 | | | | — | |
| Voya U.S. Stock Index Portfolio — Class I | | | | | 845 | | | | 55,246 | | | | (35,280 | ) | | | 96 | | | | 20,907 | | | | 427 | | | | (1,858 | ) | | | 3,727 | |
| VY® Clarion Real Estate Portfolio — Class I | | | | | 412 | | | | 7,180 | | | | (488 | ) | | | 732 | | | | 7,836 | | | | 105 | | | | 119 | | | | — | |
| VY® Invesco Comstock Portfolio — Class I | | | | | — | | | | 11,212 | | | | (444 | ) | | | 472 | | | | 11,240 | | | | 237 | | | | 47 | | | | — | |
| VY® JPMorgan Emerging Markets Equity Portfolio — Class I | | | | | 409 | | | | — | | | | (407 | ) | | | (2 | ) | | | — | | | | — | | | | (22 | ) | | | — | |
| VY® T. Rowe Price Capital Appreciation Portfolio — Class I | | | | | 1,255 | | | | 22,045 | | | | (1,088 | ) | | | (493 | ) | | | 21,719 | | | | 324 | | | | 226 | | | | 1,611 | |
| VY® T. Rowe Price Equity Income Portfolio — Class I | | | | | 1,257 | | | | — | | | | (873 | ) | | | (384 | ) | | | — | | | | — | | | | 366 | | | | — | |
| VY® T. Rowe Price Growth Equity Portfolio — Class I | | | | | 1,340 | | | | 27,457 | | | | (1,719 | ) | | | 924 | | | | 28,002 | | | | — | | | | 478 | | | | 1,771 | |
| | | | | $ | 19,864 | | | $ | 409,457 | | | $ | (68,409 | ) | | $ | (12,144 | ) | | $ | 348,768 | | | $ | 3,724 | | | $ | 1,971 | | | $ | 23,653 | |
The financial statements for the above mutual fund[s] can be found at www.sec.gov.
See Accompanying Notes to Financial Statements
105
| VOYA SOLUTION 2055 PORTFOLIO | PORTFOLIO OF INVESTMENTS
AS OF DECEMBER 31, 2014 |
Shares
|
|
|
|
|
|
|
| Value
|
| Percentage
of Net
Assets
|
|---|
| |
EXCHANGE-TRADED FUNDS: 4.5% |
| 26,391 | | | | | | iShares Russell 1000 Value Index Fund | | $ | 2,755,220 | | | | 2.5 | |
| 10,686 | | | | | | SPDR Trust Series 1 | | | 2,195,973 | | | | 2.0 | |
| |
| | | | | | | Total Exchange-Traded Funds
(Cost $4,531,072) | | | 4,951,193 | | | | 4.5 | |
| |
MUTUAL FUNDS: 93.5% |
| | Affiliated Investment Companies: 93.5% |
| 196,822 | | | | | | Voya Emerging Markets Index Portfolio — Class I | | | 2,096,154 | | | | 1.9 | |
| 83,069 | | | | | | Voya Intermediate Bond Fund — Class R6 | | | 838,169 | | | | 0.8 | |
| 878,228 | | | | | | Voya International Core Fund — Class I | | | 8,088,480 | | | | 7.4 | |
| 454,743 | | | | | | Voya International Index Portfolio — Class I | | | 4,260,940 | | | | 3.9 | |
| 412,125 | | | | | | Voya Large Cap Growth Portfolio — Class I | | | 8,263,096 | | | | 7.5 | |
| 628,963 | | | | | | Voya Large Cap Value Fund — Class R6 | | | 8,308,600 | | | | 7.6 | |
| 220,225 | | | | | | Voya MidCap Opportunities Portfolio — Class I | | | 3,340,820 | | | | 3.1 | |
| 394,116 | | | | | | Voya Multi-Manager Emerging Markets Equity Fund — Class I | | | 4,142,164 | | | | 3.8 | |
| 959,769 | | | | | | Voya Multi-Manager International Equity Fund — Class I | | | 10,125,558 | | | | 9.2 | |
| 500,637 | | | | | | Voya Multi-Manager Large Cap Core Portfolio — Class I | | | 7,824,953 | | | | 7.1 | |
| |
MUTUAL FUNDS: (continued) |
| | Affiliated Investment Companies: (continued) |
| 617,622 | | | | | | Voya Multi-Manager Mid Cap Value Fund — Class I | | $ | 7,738,805 | | | | 7.1 | |
| 162,451 | | | | | | Voya RussellTM Mid Cap Growth Index Portfolio — Class I | | | 4,431,650 | | | | 4.0 | |
| 193,269 | | | | | | Voya Small Company Portfolio — Class I | | | 4,493,510 | | | | 4.1 | |
| 567,291 | | | | | | Voya U.S. Stock Index Portfolio — Class I | | | 8,327,836 | | | | 7.6 | |
| 65,548 | | | | | | VY® Clarion Real Estate Portfolio — Class I | | | 2,305,337 | | | | 2.1 | |
| 199,763 | | | | | | VY® Invesco Comstock Portfolio — Class I | | | 3,306,078 | | | | 3.0 | |
| 221,796 | | | | | | VY® T. Rowe Price Capital Appreciation Portfolio — Class I | | | 6,387,718 | | | | 5.8 | |
| 91,345 | | | | @ | | VY® T. Rowe Price Growth Equity Portfolio — Class I | | | 8,234,736 | | | | 7.5 | |
| |
| | | | | | | Total Mutual Funds
(Cost $101,313,476) | | | 102,514,604 | | | | 93.5 | |
| |
| | | | | | | Total Investments in Securities
(Cost $105,844,548) | | $ | 107,465,797 | | | | 98.0 | |
| | | | | | | Assets in Excess of Other Liabilities | | | 2,161,576 | | | | 2.0 | |
| | | | | | | Net Assets | | $ | 109,627,373 | | | | 100.0 | |
| @ | | Non-income producing security. |
| | Cost for federal income tax purposes is $106,241,975. |
| Net unrealized appreciation consists of: | | | | | | |
| Gross Unrealized Appreciation | | | | $ | 4,656,588 | |
| Gross Unrealized Depreciation | | | | | (3,432,766 | ) |
| Net Unrealized Appreciation | | | | $ | 1,223,822 | |
Fair Value Measurementsˆ
The following is a summary of the fair valuations according to the inputs used as of December 31, 2014 in valuing the assets and liabilities:
| | | | Quoted Prices
in Active Markets
for Identical
Investments
(Level 1)
| | Significant
Other
Observable
Inputs
(Level 2)
| | Significant
Unobservable
Inputs
(Level 3)
| | Fair Value
at
December 31, 2014
|
|---|
Asset Table | | | | | | | | | | | | | | | | | | |
Investments, at fair value | | | | | | | | | | | | | | | | | | |
| Exchange-Traded Funds | | | | $ | 4,951,193 | | | $ | — | | | $ | — | | | $ | 4,951,193 | |
| Mutual Funds | | | | | 102,514,604 | | | | — | | | | — | | | | 102,514,604 | |
| Total Investments, at fair value | | | | $ | 107,465,797 | | | $ | — | | | $ | — | | | $ | 107,465,797 | |
Liabilities Table | | | | | | | | | | | | | | | | | | |
Other Financial Instruments+ | | | | | | | | | | | | | | | | | | |
| Futures | | | | $ | (54,848 | ) | | $ | — | | | $ | — | | | $ | (54,848 | ) |
| Total Liabilities | | | | $ | (54,848 | ) | | $ | — | | | $ | — | | | $ | (54,848 | ) |
| ˆ | | See Note 2, “Significant Accounting Policies” in the Notes to Financial Statements for additional information. |
| + | | Other Financial Instruments are derivatives not reflected in the Portfolio of Investments and may include open forward foreign currency contracts, futures, centrally cleared swaps, OTC swaps and written options. Forward foreign currency contracts, futures and centrally cleared swaps are valued at the unrealized gain (loss) on the instrument. OTC swaps and written options are valued at the fair value of the instrument. |
See Accompanying Notes to Financial Statements
106
| VOYA SOLUTION 2055 PORTFOLIO | PORTFOLIO OF INVESTMENTS
AS OF DECEMBER 31, 2014 (CONTINUED) |
At December 31, 2014, the following futures contracts were outstanding for Voya Solution 2055 Portfolio:
Contract Description
| | | | Number
of Contracts
| | Expiration
Date
| | Notional
Value
| | Unrealized
Appreciation/
(Depreciation)
|
|---|
Long Contracts | | | | | | | | | | | | | | | | | | |
| Tokyo Price Index (TOPIX) | | | | | 18 | | | | 03/12/15 | | | $ | 2,115,128 | | | $ | (54,848 | ) |
| | | | | | | | | | | | | $ | 2,115,128 | | | $ | (54,848 | ) |
Transactions with Affiliates
An investment of at least 5% of the voting securities of an issuer, or a company which is under common control results in that issuer becoming an affiliated person as defined by the 1940 Act.
The following table provides transactions during the year ended December 31, 2014, where the following issuers were considered an affiliate:
Issuer
| | | | Beginning
Market
Value at
12/31/13
| | Purchases
at Cost
| | Sales
at Cost
| | Change in
Unrealized
Appreciation/
(Depreciation)
| | Ending
Market
Value at
12/31/14
| | Investment
Income
| | Realized
Gains/
(Losses)
| | Net
Capital Gain
Distributions
|
|---|
| Voya Emerging Markets Index Portfolio — Class I | | | | $ | — | | | $ | 2,435,593 | | | $ | (137,025 | ) | | $ | (202,414 | ) | | $ | 2,096,154 | | | $ | — | | | $ | (8,741 | ) | | $ | — | |
| Voya High Yield Portfolio — Class I | | | | | 882,174 | | | | 14,283 | | | | (891,838 | ) | | | (4,619 | ) | | | — | | | | 2,805 | | | | 9,324 | | | | — | |
| Voya Intermediate Bond Fund — Class R6 | | | | | — | | | | 914,827 | | | | (80,422 | ) | | | 3,764 | | | | 838,169 | | | | 10,833 | | | | (97 | ) | | | — | |
| Voya International Core Fund — Class I | | | | | 5,601,214 | | | | 5,545,204 | | | | (1,335,454 | ) | | | (1,722,484 | ) | | | 8,088,480 | | | | 72,415 | | | | 240,500 | | | | 1,104,803 | |
| Voya International Index Portfolio — Class I | | | | | 4,541,513 | | | | 2,967,170 | | | | (2,714,998 | ) | | | (532,745 | ) | | | 4,260,940 | | | | 25,105 | | | | 177,104 | | | | — | |
| Voya Large Cap Growth Portfolio — Class I | | | | | 8,022,908 | | | | 3,113,114 | | | | (2,516,710 | ) | | | (356,216 | ) | | | 8,263,096 | | | | 37,987 | | | | 733,249 | | | | 549,461 | |
| Voya Large Cap Value Fund — Class R6 | | | | | 6,109,318 | | | | 4,575,687 | | | | (2,077,087 | ) | | | (299,318 | ) | | | 8,308,600 | | | | 144,556 | | | | 329,390 | | | | 562,928 | |
| Voya MidCap Opportunities Portfolio — Class I | | | | | 5,478,532 | | | | 1,614,596 | | | | (2,786,227 | ) | | | (966,081 | ) | | | 3,340,820 | | | | 11,524 | | | | 652,570 | | | | 485,712 | |
| Voya Multi-Manager Emerging Markets Equity Fund — Class I | | | | | 3,572,267 | | | | 3,740,031 | | | | (2,825,816 | ) | | | (344,318 | ) | | | 4,142,164 | | | | 65,806 | | | | 24,448 | | | | — | |
| Voya Multi-Manager International Equity Fund — Class I | | | | | 7,286,442 | | | | 5,967,061 | | | | (1,515,835 | ) | | | (1,612,110 | ) | | | 10,125,558 | | | | 239,298 | | | | 371,978 | | | | 410,226 | |
| Voya Multi-Manager Large Cap Core Portfolio — Class I | | | | | 8,637,250 | | | | 2,892,862 | | | | (3,691,577 | ) | | | (13,582 | ) | | | 7,824,953 | | | | 94,537 | | | | 378,144 | | | | 520,714 | |
| Voya Multi-Manager Mid Cap Value Fund — Class I | | | | | 5,541,847 | | | | 4,505,572 | | | | (1,604,514 | ) | | | (704,100 | ) | | | 7,738,805 | | | | 87,259 | | | | 159,199 | | | | 1,291,292 | |
Voya RussellTM Mid Cap Growth Index Portfolio — Class I | | | | | — | | | | 4,722,112 | | | | (752,626 | ) | | | 462,164 | | | | 4,431,650 | | | | 18,122 | | | | 62,013 | | | | — | |
Voya RussellTM Mid Cap Index Portfolio — Class I | | | | | 1,830,984 | | | | 31,082 | | | | (1,652,060 | ) | | | (210,006 | ) | | | — | | | | — | | | | 167,737 | | | | — | |
| Voya Small Company Portfolio — Class I | | | | | 4,578,153 | | | | 2,448,638 | | | | (1,892,994 | ) | | | (640,287 | ) | | | 4,493,510 | | | | 17,095 | | | | 413,058 | | | | 530,107 | |
| Voya U.S. Bond Index Portfolio — Class I | | | | | — | | | | 3,261,192 | | | | (3,261,192 | ) | | | — | | | | — | | | | 15,361 | | | | 14,652 | | | | — | |
| Voya U.S. Stock Index Portfolio — Class I | | | | | 3,650,544 | | | | 16,963,327 | | | | (12,152,455 | ) | | | (133,580 | ) | | | 8,327,836 | | | | 168,004 | | | | (266,454 | ) | | | 1,319,591 | |
| VY® Clarion Real Estate Portfolio — Class I | | | | | 1,781,117 | | | | 725,337 | | | | (600,288 | ) | | | 399,171 | | | | 2,305,337 | | | | 31,755 | | | | 117,045 | | | | — | |
| VY® Invesco Comstock Portfolio — Class I | | | | | — | | | | 3,712,442 | | | | (614,212 | ) | | | 207,848 | | | | 3,306,078 | | | | 70,312 | | | | 58,436 | | | | — | |
| VY® JPMorgan Emerging Markets Equity Portfolio — Class I | | | | | 1,768,705 | | | | 31,082 | | | | (1,801,142 | ) | | | 1,355 | | | | — | | | | — | | | | (108,057 | ) | | | — | |
| VY® T. Rowe Price Capital Appreciation Portfolio — Class I | | | | | 5,478,522 | | | | 2,909,809 | | | | (1,759,206 | ) | | | (241,407 | ) | | | 6,387,718 | | | | 96,461 | | | | 357,607 | | | | 483,450 | |
| VY® T. Rowe Price Equity Income Portfolio — Class I | | | | | 5,433,745 | | | | 258,095 | | | | (4,795,627 | ) | | | (896,213 | ) | | | — | | | | — | | | | 822,185 | | | | — | |
| VY® T. Rowe Price Growth Equity Portfolio — Class I | | | | | 5,811,222 | | | | 4,289,528 | | | | (1,452,596 | ) | | | (413,418 | ) | | | 8,234,736 | | | | — | | | | 604,865 | | | | 532,116 | |
| | | | | $ | 86,006,457 | | | $ | 77,638,644 | | | $ | (52,911,901 | ) | | $ | (8,218,596 | ) | | $ | 102,514,604 | | | $ | 1,209,235 | | | $ | 5,310,155 | | | $ | 7,790,400 | |
The financial statements for the above mutual fund[s] can be found at www.sec.gov.
See Accompanying Notes to Financial Statements
107
| VOYA SOLUTION 2055 PORTFOLIO | PORTFOLIO OF INVESTMENTS
AS OF DECEMBER 31, 2014 (CONTINUED) |
A summary of derivative instruments by primary risk exposure is outlined in the following tables.
The fair value of derivative instruments as of December 31, 2014 was as follows:
Derivatives not accounted for as
hedging instruments
| | | | Location on Statement of Assets and Liabilities
| | Fair Value
|
|---|
Liability Derivatives
| | | | | | |
|---|
| Equity contracts | | | | Net Assets — Unrealized depreciation* | | $ | 54,848 | |
Total Liability Derivatives | | | | | | $ | 54,848 | |
| * | | Includes cumulative appreciation/depreciation of futures contracts as reported in the table following the Portfolio of Investments. |
The effect of derivative instruments on the Portfolio’s Statement of Operations for the year ended December 31, 2014 was as follows:
| | | | Amount of Realized Gain or (Loss) on
Derivatives Recognized in Income |
|---|
Derivatives not accounted for as
hedging instruments
| | | | Futures
|
|---|
| Equity contracts | | | | $ | (147 | ) |
Total | | | | $ | (147 | ) |
| | | | Change in Unrealized Appreciation or (Depreciation)
on Derivatives Recognized in Income |
|---|
Derivatives not accounted for as
hedging instruments
| | | | Futures
|
|---|
| Equity contracts | | | | $ | (54,848 | ) |
Total | | | | $ | (54,848 | ) |
See Accompanying Notes to Financial Statements
108
TAX INFORMATION (UNAUDITED)
Dividends and distributions paid during the year ended December 31, 2014 were as follows:
Portfolio Name
| | | | Type
| | Per Share Amount
|
|---|
| Voya Solution Aggressive Portfolio | | | | | | | | | | |
| Class ADV | | | | | NII | | | $ | 0.0574 | |
| Class I | | | | | NII | | | $ | 0.0271 | |
| Class S | | | | | NII | | | $ | 0.0594 | |
| Class S2 | | | | | NII | | | $ | 0.0507 | |
| All Classes | | | | | STCG | | | $ | 0.0183 | |
| All Classes | | | | | LTCG | | | $ | 0.0464 | |
| Voya Solution Balanced Portfolio | | | | | | | | | | |
| Class ADV | | | | | NII | | | $ | 0.2022 | |
| Class I | | | | | NII | | | $ | 0.2566 | |
| Class S | | | | | NII | | | $ | 0.2309 | |
| Class S2 | | | | | NII | | | $ | 0.1863 | |
| All Classes | | | | | STCG | | | $ | 0.1947 | |
| All Classes | | | | | LTCG | | | $ | 0.5598 | |
| Voya Solution Conservative Portfolio | | | | | | | | | | |
| Class ADV | | | | | NII | | | $ | 0.2698 | |
| Class I | | | | | NII | | | $ | 0.3247 | |
| Class S | | | | | NII | | | $ | 0.2952 | |
| Class S2 | | | | | NII | | | $ | 0.2799 | |
| All Classes | | | | | STCG | | | $ | 0.1600 | |
| All Classes | | | | | LTCG | | | $ | 0.3148 | |
| Voya Solution Income Portfolio | | | | | | | | | | |
| Class ADV | | | | | NII | | | $ | 0.2682 | |
| Class I | | | | | NII | | | $ | 0.3365 | |
| Class S | | | | | NII | | | $ | 0.3025 | |
| Class S2 | | | | | NII | | | $ | 0.2716 | |
| Class T | | | | | NII | | | $ | 0.2066 | |
| Voya Solution Moderately Aggressive Portfolio | | | | | | | | | | |
| Class ADV | | | | | NII | | | $ | 0.2008 | |
| Class I | | | | | NII | | | $ | 0.2579 | |
| Class S | | | | | NII | | | $ | 0.2277 | |
| Class S2 | | | | | NII | | | $ | 0.2487 | |
| All Classes | | | | | STCG | | | $ | 0.2096 | |
| All Classes | | | | | LTCG | | | $ | 0.7274 | |
| Voya Solution Moderately Conservative Portfolio | | | | | | | | | | |
| Class ADV | | | | | NII | | | $ | 0.2334 | |
| Class I | | | | | NII | | | $ | 0.2922 | |
| Class S | | | | | NII | | | $ | 0.2637 | |
| Class S2 | | | | | NII | | | $ | 0.2506 | |
| All Classes | | | | | STCG | | | $ | 0.2325 | |
| All Classes | | | | | LTCG | | | $ | 0.4313 | |
| Voya Solution 2015 Portfolio | | | | | | | | | | |
| Class ADV | | | | | NII | | | $ | 0.2797 | |
| Class I | | | | | NII | | | $ | 0.3535 | |
| Class S | | | | | NII | | | $ | 0.3164 | |
| Class S2 | | | | | NII | | | $ | 0.2889 | |
| Class T | | | | | NII | | | $ | 0.2261 | |
| All Classes | | | | | LTCG | | | $ | 0.0777 | |
| Voya Solution 2020 Portfolio | | | | | | | | | | |
| Class ADV | | | | | NII | | | $ | 0.0090 | |
| Class I | | | | | NII | | | $ | — | |
| Class S | | | | | NII | | | $ | — | |
| Class S2 | | | | | NII | | | $ | — | |
| Class T | | | | | NII | | | $ | — | |
| All Classes | | | | | STCG | | | $ | 0.0047 | |
| All Classes | | | | | LTCG | | | $ | 0.0326 | |
| Voya Solution 2025 Portfolio | | | | | | | | | | |
| Class ADV | | | | | NII | | | $ | 0.2347 | |
| Class I | | | | | NII | | | $ | 0.3106 | |
| Class S | | | | | NII | | | $ | 0.2738 | |
| Class S2 | | | | | NII | | | $ | 0.2458 | |
| Class T | | | | | NII | | | $ | 0.2216 | |
| All Classes | | | | | LTCG | | | $ | 0.6647 | |
| Voya Solution 2030 Portfolio | | | | | | | | | | |
| Class ADV | | | | | NII | | | $ | 0.0196 | |
| Class I | | | | | NII | | | $ | — | |
| Class S | | | | | NII | | | $ | — | |
| Class S2 | | | | | NII | | | $ | — | |
| Class T | | | | | NII | | | $ | — | |
| All Classes | | | | | STCG | | | $ | 0.0171 | |
| All Classes | | | | | LTCG | | | $ | 0.0842 | |
| Voya Solution 2035 Portfolio | | | | | | | | | | |
| Class ADV | | | | | NII | | | $ | 0.2550 | |
| Class I | | | | | NII | | | $ | 0.3341 | |
| Class S | | | | | NII | | | $ | 0.2934 | |
| Class S2 | | | | | NII | | | $ | 0.2690 | |
| Class T | | | | | NII | | | $ | 0.2217 | |
| All Classes | | | | | STCG | | | $ | 0.0307 | |
| All Classes | | | | | LTCG | | | $ | 1.1867 | |
| Voya Solution 2040 Portfolio | | | | | | | | | | |
| Class ADV | | | | | NII | | | $ | 0.0080 | |
| Class I | | | | | NII | | | $ | — | |
| Class S | | | | | NII | | | $ | — | |
| Class S2 | | | | | NII | | | $ | — | |
| Class T | | | | | NII | | | $ | — | |
| All Classes | | | | | STCG | | | $ | 0.0080 | |
| All Classes | | | | | LTCG | | | $ | 0.0468 | |
| Voya Solution 2045 Portfolio | | | | | | | | | | |
| Class ADV | | | | | NII | | | $ | 0.2207 | |
| Class I | | | | | NII | | | $ | 0.2978 | |
| Class S | | | | | NII | | | $ | 0.2548 | |
| Class S2 | | | | | NII | | | $ | 0.2298 | |
| Class T | | | | | NII | | | $ | 0.1996 | |
| All Classes | | | | | STCG | | | $ | 0.1040 | |
| All Classes | | | | | LTCG | | | $ | 1.4334 | |
| Voya Solution 2050 Portfolio | | | | | | | | | | |
| Class ADV | | | | | NII | | | $ | 0.0149 | |
| Class I | | | | | NII | | | $ | — | |
| Class S | | | | | NII | | | $ | — | |
| Class S2 | | | | | NII | | | $ | — | |
| Class T | | | | | NII | | | $ | — | |
| All Classes | | | | | STCG | | | $ | 0.0148 | |
| All Classes | | | | | LTCG | | | $ | 0.0959 | |
| Voya Solution 2055 Portfolio | | | | | | | | | | |
| Class ADV | | | | | NII | | | $ | 0.1750 | |
| Class I | | | | | NII | | | $ | 0.2297 | |
| Class S | | | | | NII | | | $ | 0.2009 | |
| Class S2 | | | | | NII | | | $ | 0.1895 | |
| Class T | | | | | NII | | | $ | 0.1686 | |
| All Classes | | | | | STCG | | | $ | 0.1889 | |
| All Classes | | | | | LTCG | | | $ | 0.6726 | |
NII — Net investment income
STCG — Short-term capital gain
LTCG — Long-term capital gain
109
TAX INFORMATION (UNAUDITED) (CONTINUED)
Of the ordinary distributions made during the year ended December 31, 2014, the following percentages qualify for the dividends received deduction (DRD) available to corporate shareholders:
| Voya Solution Aggressive Portfolio | | | | | 13.10 | % |
| Voya Solution Balanced Portfolio | | | | | 7.15 | % |
| Voya Solution Conservative Portfolio | | | | | 3.01 | % |
| Voya Solution Income Portfolio | | | | | 7.05 | % |
| Voya Solution Moderately Aggressive Portfolio | | | | | 9.02 | % |
| Voya Solution Moderately Conservative Portfolio | | | | | 4.44 | % |
| Voya Solution 2015 Portfolio | | | | | 7.26 | % |
| Voya Solution 2020 Portfolio | | | | | 5.86 | % |
| Voya Solution 2025 Portfolio | | | | | 14.48 | % |
| Voya Solution 2030 Portfolio | | | | | 8.11 | % |
| Voya Solution 2035 Portfolio | | | | | 16.12 | % |
| Voya Solution 2040 Portfolio | | | | | 6.81 | % |
| Voya Solution 2045 Portfolio | | | | | 17.16 | % |
| Voya Solution 2050 Portfolio | | | | | 8.95 | % |
| Voya Solution 2055 Portfolio | | | | | 12.09 | % |
The Regulated Investment Company Modernization Act of 2010 allows qualified fund-of-funds to elect to pass through the ability to take foreign tax credits (or deductions) to the extent that foreign taxes are passed through from underlying funds. A qualified fund-of-funds is a regulated investment company that has at least 50% of the value of its total assets invested in other regulated investment companies at the end of each quarter of the taxable year. Pursuant to Section 853 of the Internal Revenue Code, the Portfolios designate the following amounts as foreign taxes paid for the year ended December 31, 2014:
| | | | Creditable
Foreign Taxes
Paid
| | Per Share
Amount
| | Portion of Ordinary Income
Distribution Derived from
Foreign Sourced Income*
|
|---|
| Voya Solution Aggressive Portfolio | | | | $ | 2,673 | | | $ | 0.0089 | | | | 12.64 | % |
| Voya Solution Balanced Portfolio | | | | $ | 15,443 | | | $ | 0.0032 | | | | 4.62 | % |
| Voya Solution Conservative Portfolio | | | | $ | 420 | | | $ | 0.0003 | | | | 0.48 | % |
| Voya Solution Income Portfolio | | | | $ | 19,333 | | | $ | 0.0013 | | | | 2.46 | % |
| Voya Solution Moderately Aggressive Portfolio | | | | $ | 19,153 | | | $ | 0.0078 | | | | 8.90 | % |
| Voya Solution Moderately Conservative Portfolio | | | | $ | 8,361 | | | $ | 0.0020 | | | | 2.79 | % |
| Voya Solution 2015 Portfolio | | | | $ | 135,808 | | | $ | 0.0029 | | | | 4.09 | % |
| Voya Solution 2020 Portfolio | | | | $ | 180 | | | $ | 0.0036 | | | | 6.73 | % |
| Voya Solution 2025 Portfolio | | | | $ | 495,591 | | | $ | 0.0054 | | | | 6.78 | % |
| Voya Solution 2030 Portfolio | | | | $ | 81 | | | $ | 0.0065 | | | | 5.08 | % |
| Voya Solution 2035 Portfolio | | | | $ | 691,105 | | | $ | 0.0087 | | | | 10.11 | % |
| Voya Solution 2040 Portfolio | | | | $ | 466 | | | $ | 0.0097 | | | | 11.20 | % |
| Voya Solution 2045 Portfolio | | | | $ | 526,588 | | | $ | 0.0099 | | | | 10.58 | % |
| Voya Solution 2050 Portfolio | | | | $ | 267 | | | $ | 0.0107 | | | | 14.17 | % |
| Voya Solution 2055 Portfolio | | | | $ | 79,694 | | | $ | 0.0103 | | | | 11.43 | % |
| * | | None of the Portfolios listed above derived any income from ineligible foreign sources as defined under Section 901(j) of the Internal Revenue Code. |
Foreign taxes paid or withheld should be included in taxable income with an offsetting deduction from gross income or as a credit for taxes paid to foreign governments. Shareholders are strongly advised to consult their own tax advisors regarding the appropriate treatment of foreign taxes paid.
Above figures may differ from those cited elsewhere in this report due to differences in the calculation of income and gains under U.S. generally accepted accounting principles (book) purposes and Internal Revenue Service (tax) purposes.
Shareholders are strongly advised to consult their own tax advisers with respect to the tax consequences of their investments in the Portfolios. In January, shareholders, excluding corporate shareholders, receive an IRS 1099-DIV regarding the federal tax status of the dividends and distributions they received in the calendar year.
110
DIRECTOR AND OFFICER INFORMATION (UNAUDITED)
The business and affairs of the Company are managed under the direction of the Company’s Board. A Director, who is not an interested person of the Company, as defined in the 1940 Act, is an independent director (“Independent Director”). The Directors and Officers of the Company are listed below. The Statement of Additional Information includes additional information about directors of the Company and is available, without charge, upon request at (800) 992-0180.
Name, Address and Age
| | | | Position(s)
Held with
the Company
| | Term of Office
and Length of
Time Served(1)
| | Principal Occupation(s) —
During the Past 5 Years
| | Number of
Portfolios in
Fund Complex
Overseen by
Director(2)
| | Other Board Positions
Held by Director
|
|---|
| |
Independent Directors*: | | | | | | | | | | | | |
| |
Colleen D. Baldwin
7337 East Doubletree Ranch Rd.
Suite 100
Scottsdale, Arizona 85258
Age: 54 | | | | Director | | November 2007–Present | | President, Glantuam Partners, LLC, a business consulting firm (January 2009–Present). | | 158 | | DSM/Dentaquest, Boston, MA (February 2014– Present). |
| |
John V. Boyer
7337 East Doubletree Ranch Rd.
Suite 100
Scottsdale, Arizona 85258
Age: 61 | | | | Chairperson/Director | | November 1997–Present | | President and Chief Executive Officer, Bechtler Arts Foundation, an arts and education foundation (January 2008–Present). | | 158 | | None.
|
| |
Patricia W. Chadwick
7337 East Doubletree Ranch Rd.
Suite 100
Scottsdale, Arizona 85258
Age: 66 | | | | Director | | January 2006– Present | | Consultant and President, Ravengate Partners LLC, a consulting firm that provides advice regarding financial markets and the global economy (January 2000–Present). | | 158 | | Wisconsin Energy Corporation (June 2006– Present) and The Royce Funds (35 funds) (December 2009–Present). |
| |
Albert E. DePrince, Jr.
7337 E. Doubletree Ranch Rd.
Suite 100
Scottsdale, Arizona 85258
Age: 73 | | | | Director | | May 2013–Present | | Retired. Formerly, Professor of Economics and Finance, Middle Tennessee State University (August 1991–July 2014); Dr. DePrince continued to hold a position with the university under a post-retirement contract through the end of 2014.
| | 158 | | None.
|
| |
Peter S. Drotch
7337 East Doubletree Ranch Rd.
Suite 100
Scottsdale, Arizona 85258
Age: 73 | | | | Director | | November 2007– Present | | Retired. | | 158 | | First Marblehead Corporation (September 2003–Present). |
| |
Russell H. Jones
7337 E. Doubletree Ranch Rd.
Suite 100
Scottsdale, Arizona 85258
Age: 70 | | | | Director | | May 2013–Present | | Retired. | | 158 | | None.
|
| |
Patrick W. Kenny
7337 East Doubletree Ranch Rd.
Suite 100
Scottsdale, Arizona 85258
Age: 72 | | | | Director | | March 2002–Present | | Retired.
| | 158 | | Assured Guaranty Ltd. (April 2004–Present). |
| |
Joseph E. Obermeyer
7337 E. Doubletree Ranch Rd.
Suite 100
Scottsdale, Arizona 85258
Age: 57 | | | | Director | | May 2013–Present | | President, Obermeyer & Associates, Inc., a provider of financial and economic consulting services (November 1999–Present). | | 158 | | None.
|
| |
Sheryl K. Pressler
7337 East Doubletree Ranch Rd.
Suite 100
Scottsdale, Arizona 85258
Age: 64 | | | | Director | | January 2006– Present | | Consultant (May 2001 — Present). | | 158 | | None.
|
| |
Roger B. Vincent
7337 East Doubletree Ranch Rd.
Suite 100
Scottsdale, Arizona 85258
Age: 69 | | | | Director | | January 2005– Present | | Retired. Formerly, President, Springwell Corporation, a corporate finance firm (March 1989–August 2011). | | 158 | | UGI Corporation (February 2006–Present) and UGI Utilities, Inc. (February 2006–Present). |
111
DIRECTOR AND OFFICER INFORMATION (UNAUDITED) (CONTINUED)
Name, Address and Age
| | | | Position(s)
Held with
the Company
| | Term of Office
and Length of
Time Served(1)
| | Principal Occupation(s) —
During the Past 5 Years
| | Number of
Portfolios in
Fund Complex
Overseen by
Director(2)
| | Other Board Positions
Held by Director
|
|---|
| |
Director who is an “Interested Person”: | | | | | | | | | | | | | | | |
| |
Shaun P. Mathews(3)
7337 East Doubletree Ranch Rd.
Suite 100
Scottsdale, Arizona 85258
Age: 59 | | | | Director
| | November 2007–Present | | President and Chief Executive Officer, Voya Investments, LLC (November 2006–Present). | | 158 | | Voya Capital Corporation, LLC and Voya Investments Distributor, LLC (December 2005–Present); Voya Funds Services, LLC, Voya Investments, LLC and Voya Investment Management, LLC (March 2006–Present); and Voya Investment Trust Co. (April 2009–Present). |
(1) | | Directors serve until their successors are duly elected and qualified. The tenure of each Director who is not an “interested person” as defined in the 1940 Act, of the Portfolio (as defined below, “Independent Director”) is subject to the Board’s retirement policy which states that each duly elected or appointed Independent Director shall retire from and cease to be a member of the Board of Directors at the close of business on December 31 of the calendar year in which the Independent Director attains the age of 75. A majority vote of the Board’s other Independent Directors may extend the retirement date of an Independent Director if the retirement would trigger a requirement to hold a meeting of shareholders of the Company under applicable law, whether for purposes of appointing a successor to the Independent Director or otherwise comply under applicable law, in which case the extension would apply until such time as the shareholder meeting can be held or is no longer required (as determined by a vote of a majority of the other Independent Directors). |
(2) | | For the purposes of this table, “Fund Complex” means the Voya family of funds including the following investment companies: Voya Asia Pacific High Dividend Equity Income Fund; Voya Balanced Portfolio, Inc.; Voya Emerging Markets High Dividend Equity Fund; Voya Equity Trust; Voya Funds Trust; Voya Global Advantage and Premium Opportunity Fund; Voya Global Equity Dividend and Premium Opportunity Fund; Voya Infrastructure, Industrials and Materials Fund; Voya Intermediate Bond Portfolio; Voya International High Dividend Equity Income Fund; Voya Investors Trust; Voya Money Market Portfolio; Voya Mutual Funds; Voya Natural Resources Equity Income Fund; Voya Partners, Inc.; Voya Prime Rate Trust; Voya Senior Income Fund; Voya Separate Portfolios Trust; Voya Series Fund, Inc.; Voya Strategic Allocation Portfolios, Inc.; Voya Variable Funds; Voya Variable Insurance Trust; Voya Variable Portfolios, Inc.; and Voya Variable Products Trust. The number of funds in the Voya family of funds is as of January 31, 2015. |
(3) | | Mr. Mathews is deemed to be an “Interested Person” of the Company as defined in the 1940 Act, because of his current affiliation with any of the Voya funds, Voya Financial, Inc., or any of Voya Financial, Inc.’s affiliates. |
| * | | Effective on December 31, 2014, J. Michael Earley retired as a Director. |
112
DIRECTOR AND OFFICER INFORMATION (UNAUDITED) (CONTINUED)
Name, Address and Age
| | | | Position(s) Held
With the Company
| | Term of Office
and Length of
Time Served(1)
| | Principal Occupation(s) —
During the Past 5 Years
|
|---|
| |
Shaun P. Mathews
7337 East Doubletree Ranch Rd.
Suite 100
Scottsdale, Arizona 85258
Age: 59 | | | | President and Chief Executive Officer | | November 2006–Present | | President and Chief Executive Officer, Voya Investments, LLC (November 2006–Present). |
| |
Michael J. Roland
7337 East Doubletree Ranch Rd.
Suite 100
Scottsdale, Arizona 85258
Age: 56 | | | | Executive Vice President
| | January 2005–Present
| | Managing Director and Chief Operating Officer, Voya Investments, LLC and Voya Funds Services, LLC (April 2012–Present). Formerly, Chief Compliance Officer, Directed Services LLC and Voya Investments, LLC (March 2011–December 2013); Executive Vice President and Chief Operating Officer, Voya Investments, LLC and Voya Funds Services, LLC (January 2007–April 2012) and Chief Compliance Officer, Voya Family of Funds (March 2011–February 2012). |
| |
Stanley D. Vyner
230 Park Avenue
New York, New York 10169
Age: 64 | | | | Executive Vice President
Chief Investment Risk Officer
| | January 2005–Present
September 2009–Present | | Executive Vice President, Voya Investments, LLC (July 2000–Present) and Chief Investment Risk Officer, Voya Investments, LLC (January 2003–Present). |
| |
Kevin M. Gleason
7337 East Doubletree Ranch Rd.
Suite 100
Scottsdale, Arizona 85258
Age: 48 | | | | Chief Compliance Officer | | February 2012–Present | | Senior Vice President and Chief Compliance Officer, Voya Investments, LLC (February 2012–Present). Formerly, Assistant General Counsel and Assistant Secretary, The Northwestern Mutual Life Insurance Company (June 2004–January 2012). |
| |
Todd Modic
7337 East Doubletree Ranch Rd.
Suite 100
Scottsdale, Arizona 85258
Age: 47 | | | | Senior Vice President, Chief/Principal Financial Officer and Assistant Secretary | | March 2005–Present | | Senior Vice President, Voya Funds Services, LLC (March 2005–Present). |
| |
Kimberly A. Anderson
7337 East Doubletree Ranch Rd.
Suite 100
Scottsdale, Arizona 85258
Age: 50 | | | | Senior Vice President | | January 2005–Present | | Senior Vice President, Voya Investments, LLC (October 2003–Present). |
| |
Julius A. Drelick, III
7337 East Doubletree Ranch Rd.
Suite 100
Scottsdale, Arizona 85258
Age: 48 | | | | Senior Vice President | | July 2012–Present | | Senior Vice President — Head of Fund Compliance, Voya Funds Services, LLC (June 2012–Present); Chief Compliance Officer of Directed Services LLC and Voya Investments, LLC (January 2014–Present). Formerly, Vice President — Platform Product Management & Project Management, Voya Investments, LLC (April 2007–June 2012). |
| |
Robert Terris
7337 East Doubletree Ranch Rd.
Suite 100
Scottsdale, Arizona 85258
Age: 44 | | | | Senior Vice President | | May 2006–Present | | Senior Vice President, Head of Division Operations, Voya Funds Services, LLC (January 2006–Present).
|
| |
Fred Bedoya
7337 East Doubletree Ranch Rd.
Suite 100
Scottsdale, Arizona 85258
Age: 42 | | | | Vice President and Treasurer
| | September 2012–Present | | Vice President, Voya Funds Services, LLC (March 2012–Present). Formerly, Assistant Vice President — Director, Voya Funds Services, LLC (March 2003–March 2012). |
| |
Maria M. Anderson
7337 East Doubletree Ranch Rd.
Suite 100
Scottsdale, Arizona 85258
Age: 56 | | | | Vice President | | January 2005–Present | | Vice President, Voya Funds Services, LLC (September 2004–Present). |
113
DIRECTOR AND OFFICER INFORMATION (UNAUDITED) (CONTINUED)
Name, Address and Age
| | | | Position(s) Held
With the Company
| | Term of Office
and Length of
Time Served(1)
| | Principal Occupation(s) —
During the Past 5 Years
|
|---|
| |
Lauren D. Bensinger
7337 East Doubletree Ranch Rd.
Suite 100
Scottsdale, Arizona 85258
Age: 61 | | | | Vice President | | January 2005–Present | | Vice President, Voya Investments, LLC and Voya Funds Services, LLC (February 1996–Present); Vice President, Voya Investments, LLC (October 2004–Present); Vice President and Money Laundering Reporting Officer, Voya Investments Distributor, LLC (April 2010–Present); Anti-Money Laundering Compliance Officer, Voya Financial, Inc. (January 2013–Present); and Money Laundering Reporting Officer, Voya Investment Management Trust Co. (October 2012–Present). Formerly, Chief Compliance Officer, Voya Investments Distributor, LLC (August 1995–April 2010). |
| |
Sara M. Donaldson
7337 East Doubletree Ranch Rd.
Suite 100
Scottsdale, Arizona 85258
Age: 55 | | | | Vice President | | September 2014–Present | | Vice President, Voya Funds Services, LLC (April 2014–Present). Formerly, Director, Compliance, AXA Rosenberg Global Services, LLC (September 1997–March 2014). |
| |
Robyn L. Ichilov
7337 East Doubletree Ranch Rd.
Suite 100
Scottsdale, Arizona 85258
Age: 47 | | | | Vice President | | January 2005–Present | | Vice President, Voya Funds Services, LLC (November 1995–Present) and Voya Investments, LLC (August 1997–Present). Formerly, Treasurer, Voya Family of Funds (November 1999–February 2012). |
| |
Jason Kadavy
7337 East Doubletree Ranch Rd.
Suite 100
Scottsdale, Arizona 85258
Age: 38 | | | | Vice President | | September 2012–Present | | Vice President, Voya Funds Services, LLC (July 2007–Present). |
| |
Kimberly K. Springer
7337 East Doubletree Ranch Rd.
Suite 100
Scottsdale, Arizona 85258
Age: 57 | | | | Vice President | | March 2006–Present | | Vice President — Mutual Fund Product Development, Voya Investments, LLC (July 2012–Present); Vice President, Voya Investment Management — Voya Family of Funds (March 2010–Present) and Vice President, Voya Funds Services, LLC (March 2006–Present). Formerly Managing Paralegal, Registration Statements (June 2003–July 2012). |
| |
Craig Wheeler
7337 East Doubletree Ranch Rd.
Suite 100
Scottsdale, Arizona 85258
Age: 45 | | | | Vice President | | May 2008–Present | | Vice President — Director of Tax, Voya Funds Services, LLC (March 2013–Present). Formerly, Assistant Vice President — Director of Tax, Voya Funds Services, LLC (March 2008–March 2013). |
| |
Huey P. Falgout, Jr.
7337 East Doubletree Ranch Rd.
Suite 100
Scottsdale, Arizona 85258
Age: 51 | | | | Secretary | | August 2003–Present | | Senior Vice President and Chief Counsel, Voya Investment Management — Mutual Fund Legal Department (March 2010–Present). Formerly, Chief Counsel, ING Americas, U.S. Legal Services (October 2003–March 2010). |
| |
Paul A. Caldarelli
7337 East Doubletree Ranch Rd.
Suite 100
Scottsdale, Arizona 85258
Age: 63 | | | | Assistant Secretary | | June 2010–Present | | Vice President and Senior Counsel, Voya Investment Management — Mutual Fund Legal Department (March 2010–Present). Formerly, Senior Counsel, ING Americas, U.S. Legal Services (April 2008–March 2010). |
| |
Theresa K. Kelety
7337 East Doubletree Ranch Rd.
Suite 100
Scottsdale, Arizona 85258
Age: 52 | | | | Assistant Secretary | | August 2003–Present | | Vice President and Senior Counsel, Voya Investment Management — Mutual Fund Legal Department (March 2010–Present). Formerly, Senior Counsel, ING Americas, U.S. Legal Services (April 2008–March 2010). |
(1) | | The Officers hold office until the next annual meeting of the Board of Directors and until their successors shall have been elected and qualified. |
114
ADVISORY CONTRACT APPROVAL DISCUSSION (UNAUDITED)
BOARD CONSIDERATION AND APPROVAL OF INVESTMENT ADVISORY AND SUB-ADVISORY CONTRACTS
Section 15(c) of the Investment Company Act of 1940, as amended (the “1940 Act”), provides that, after an initial period, the Board of Directors (the “Board”) of Voya Partners, Inc. (the “Company”), including a majority of Board members who have no direct or indirect interest in the advisory and sub-advisory contracts of Voya Solution Aggressive Portfolio, Voya Solution Balanced Portfolio, Voya Solution Conservative Portfolio, Voya Solution Income Portfolio, Voya Solution Moderately Aggressive Portfolio, Voya Solution Moderately Conservative Portfolio, Voya Solution 2015 Portfolio, Voya Solution 2020 Portfolio, Voya Solution 2025 Portfolio, Voya Solution 2030 Portfolio, Voya Solution 2035 Portfolio, Voya Solution 2040 Portfolio, Voya Solution 2045 Portfolio, Voya Solution 2050 Portfolio, and Voya Solution 2055 Portfolio (collectively, the “Portfolios”), each a series of the Company, and who are not “interested persons” of the Portfolios, as such term is defined under the 1940 Act (the “Independent Directors”), must annually review and approve the Portfolios’ existing investment advisory and sub-advisory contracts. Thus, at a meeting held on September 12, 2014, the Board, including a majority of the Independent Directors, considered whether to renew and approve the amended and restated investment advisory contract (the “Advisory Contract”) between Directed Services LLC (“Adviser”) and the Portfolios as well as the amended and restated sub-advisory contract (“Sub-Advisory Contract”) with Voya Investment Management Co. LLC, the sub-adviser to each Portfolio (the “Sub-Adviser”).
The Independent Directors also held separate meetings on August 14 and September 10, 2014, to consider the renewal of the Advisory Contract and Sub-Advisory Contract. As a result, subsequent references herein to factors considered and determinations made by the Board include, as applicable, factors considered and determinations made on those earlier dates by the Independent Directors.
At its September 12, 2014 meeting, the Board voted to renew the Advisory and Sub-Advisory Contracts for the Portfolios. In reaching these decisions, the Board took into account information furnished to it throughout the year at meetings of the Board and the Board’s committees, as well as information prepared specifically in connection with the annual renewal or approval process. Determinations by the Independent Directors also took into account various factors that they believed, in light of the legal advice furnished to them by K&L Gates LLP (“K&L Gates”), their independent legal counsel, and their own business judgment, to be relevant. Further, while the Board considered at the same meeting the advisory contracts and sub-advisory contracts that were subject to renewal for the investment companies in the Voya family of funds (“Voya funds”), the Board considered each Voya fund’s advisory and sub-advisory relationships separately.
Provided below is a general overview of the Board’s contract approval process that it followed, as well as a discussion of certain specific factors that the Board considered at its renewal meetings. While the Board gave its attention to information furnished at the request of the Independent Directors that was most relevant to its considerations, discussed below are some of the primary factors relevant to the Board’s consideration as to whether to renew the Advisory and Sub-Advisory Contracts for the one-year period ending September 30, 2015. Each Board member may have accorded different weight to the various factors in reaching his or her conclusions with respect to each Portfolio’s advisory and sub-advisory arrangements.
Overview of the Contract Renewal and Approval Process
The Board followed a structured process (the “Contract Review Process”) pursuant to which it requested and considered relevant information when it decided whether to approve and renew the Advisory Contract and Sub-Advisory Contract. Among other actions, the Independent Directors previously retained an independent consultant with experience in the mutual fund industry to assist them in working with personnel employed by the Adviser or its affiliates who administer the Portfolios (“Management”) to: identify the types of information presented to the Board to inform its deliberations with respect to advisory and sub-advisory relationships and to help evaluate that information; evaluate industry best practices in regard to the consideration of investment advisory and sub-advisory contracts; establish a specific format in which certain requested information was provided to the Board; and determine the process for the Board’s review of such information.
The Board has established (among other committees) three Investment Review Committees (each, an “IRC”) and a Contracts Committee. Among other matters, the Contracts Committee provides oversight with respect to the contracts renewal and approval process, and each Portfolio is assigned to an IRC, which provides oversight regarding, among other matters, the investment performance of the Adviser and Sub-Adviser, as well as the oversight by the Adviser of the performance of the Sub-Adviser. The IRCs may apply a heightened level of scrutiny in cases where performance was below a Voya fund’s relevant benchmark, and/or a selected peer group of investment companies (“Selected Peer Group”), and/or Lipper Inc. (“Lipper”) category median, and/or Morningstar, Inc. (“Morningstar”) category median, as applicable.
115
ADVISORY CONTRACT APPROVAL DISCUSSION (UNAUDITED) (CONTINUED)
The type and format of the information provided to the Board or to legal counsel for the Independent Directors in connection with the Contract Review Process has been codified in a 15(c) methodology guide for the Voya funds (“15(c) Methodology Guide”). This 15(c) Methodology Guide was developed under the direction of the Independent Directors and sets out a blueprint pursuant to which they request certain information that they deem important to facilitate an informed review in connection with initial and annual approvals of advisory and sub-advisory contracts.
Management provided certain of the information requested by the 15(c) Methodology Guide in Fund Analysis and Comparison Tables (“FACT sheets”). The Independent Directors periodically have retained, including most recently in 2014, an independent firm to test and verify the accuracy of certain FACT sheet data for a representative sample of the Voya funds. In addition, the Contracts Committee has routinely employed an independent consultant to assist in its review and analysis of, among other matters, the 15(c) Methodology Guide, the content and format of the FACT sheets, and Selected Peer Group to be used by each Portfolio for certain comparison purposes during the renewal process.
Set forth below is a discussion of many of the Board’s primary considerations and conclusions in connection with its decision to approve each Portfolio’s Advisory and Sub-Advisory Contracts through September 30, 2015.
Nature, Extent and Quality of Service
The Independent Directors received and evaluated such information as they deemed necessary regarding the nature, extent and quality of services provided to the Portfolios by the Adviser and Sub-Adviser. This included information regarding the Adviser and Sub-Adviser provided throughout the year at regular meetings of the Board and its committees, as well as information furnished in connection with the contract renewal meetings.
The materials requested by the Independent Directors and provided to the Board, K&L Gates and/or independent consultants that assisted the Independent Directors prior to the September 12, 2014 Board meeting included, among other information, the following items for each Portfolio: (1) FACT sheets that provided information regarding the performance and expenses of the Portfolio and other similarly managed funds in its Selected Peer Group, information regarding the Portfolio’s investment portfolio, objective and strategies, and information regarding net asset flows into and out of the Portfolio; (2) reports providing risk and attribution analyses of the Portfolio; (3) the 15(c) Methodology Guide, which describes how the FACT sheets were prepared, including the manner in which each Portfolio’s benchmark and Selected Peer Group were selected and how profitability was determined; (4) responses from the Adviser and Sub-Adviser to the Portfolios to a series of questions posed by K&L Gates on behalf of the Independent Directors; (5) copies of the forms of Advisory and Sub-Advisory Contracts; (6) copies of the Forms ADV for the Adviser and Sub-Adviser; (7) financial statements for the Adviser and Sub-Adviser; (8) a draft narrative summary addressing key factors the Board customarily considers in evaluating the advisory and sub-advisory contracts for the Voya funds (including the Portfolios’ Advisory Contract and Sub-Advisory Contract); (9) independent analyses of Portfolio performance by the Company’s Chief Investment Risk Officer; (10) a report by the Company’s Chief Compliance Officer (“CCO”); and (11) other information relevant to the Board’s evaluations.
The Board was advised that pursuant to an agreement with the European Commission, ING Groep, N.V. (“ING Groep”) is required to divest its entire interest in Voya Financial, Inc. (formerly known as ING U.S., Inc.), its U.S.-based insurance, retirement services and investment management operations, which include the Adviser and the Sub-Adviser, by the end of 2016 (such divestment, the “Separation Plan”). Voya Financial, Inc. is and was, at the time of the September Board meeting, a minority owned subsidiary of ING Groep and a parent company of the Adviser and the Sub-Adviser. The Board further noted that the Separation Plan may result in the Adviser’s and Sub-Adviser’s loss of access to the services and resources of ING Groep, which could adversely affect their businesses and profitability. The Board was advised that the Separation Plan contemplates one or more public offerings and each may be deemed to be a change of control.
The Board was advised that Voya Financial, Inc. had conducted an initial public offering of Voya Financial, Inc. common stock in May 2013 and ING Groep had divested additional shares through three other public offerings since May 2013, reducing its ownership interest in Voya Financial, Inc. to below 50%. The Board was advised that none of these public offerings was deemed to be a change of control. The Board recognized that if any future public offering is deemed to be a change of control, the investment advisory and sub-advisory agreements for each Voya fund would terminate and trigger a need for new agreements, which would require the approval of the Board and, potentially, shareholders of the Portfolios. The Board also was advised that there could be no assurance that the Separation Plan will be carried out completely. The Board considered the potential effects of the Separation Plan on the Portfolios and the Adviser and the Sub-Adviser, including the Adviser’s and the Sub-Adviser’s ability during and after the separation to perform the same level of service to the Portfolios as the Adviser and the Sub-Adviser then provided. The Board was advised that neither
116
ADVISORY CONTRACT APPROVAL DISCUSSION (UNAUDITED) (CONTINUED)
the Adviser nor the Sub-Adviser anticipated that the Separation Plan would have a material adverse impact on the Portfolios or their operations and administration.
The Board was advised that, in connection with the Separation Plan, Voya Financial, Inc. underwent a rebranding effort (the “Rebranding”) whereby Voya Financial, Inc. and several of its affiliates effected name changes. The Voya funds’ names, as well as the Adviser’s and the Sub-Adviser’s names, were also changed in connection with the Rebranding. The Rebranding resulted in amended and restated forms of advisory and sub-advisory contracts being presented to and approved by the Board at its September 12, 2014 meeting. The Board was advised that the Advisory and Sub-Advisory Contracts have the same terms as the then-current advisory and sub-advisory contracts, except for the effective date and certain immaterial changes made to certain provisions related to the Rebranding.
For each Portfolio, a specific class of shares was used for purposes of certain comparisons between the Portfolio and its Selected Peer Group. The specified class of a Portfolio was chosen based on the 15(c) Methodology Guide and was compared to an analogous class of shares for each fund in its Selected Peer Group. The mutual funds included in each Portfolio’s Selected Peer Group were selected based upon criteria designed to represent the Portfolio share class being compared to the Selected Peer Group.
The Portfolios invest in a combination of mutual funds (“Underlying Funds”) that, in turn, invest directly in a wide range of portfolio securities (such as stocks and bonds). Because each Portfolio operates as a fund-of-funds, the performance of a Portfolio primarily reflects the performance of the Underlying Funds in which it invests.
In arriving at its conclusions with respect to the Advisory Contract, the Board was mindful of the “manager-of-managers” platform of the Voya funds that has been developed by the Adviser. The Board recognized that the Adviser is responsible for monitoring the investment program, performance, and developments and ongoing operations of the Sub-Adviser under this manager-of-managers arrangement. The Board also considered the techniques and resources that the Adviser has developed to provide ongoing oversight of the nature, extent and quality of the services the Sub-Adviser provides to the Portfolios and the Sub-Adviser’s compliance with applicable laws and regulations. The Board was advised that to assist in the selection and monitoring of the Sub-Adviser, the Adviser has developed an oversight process formulated by its Manager Research & Selection Group (“MR&S”), which analyzes both qualitative (such as in-person meetings and telephonic meetings with the Sub-Adviser and research on sub-advisers) and quantitative information (such as performance data, portfolio data and attribution analysis) about the Sub-Adviser and the funds that it manages. The Board recognized that MR&S also typically provides in-person reports to the IRCs at their meetings prior to any presentations from the Voya funds’ sub-advisers (including the Sub-Adviser). In addition, the Board noted that MR&S prepares periodic due diligence reports regarding the Sub-Adviser based on on-site visits and information and analysis which team members use to attempt to gain and maintain an in-depth understanding of the Sub-Adviser’s investment process and to try to identify issues that may be relevant to the Sub-Adviser’s services to a Portfolio and/or its performance. The Board also noted that MR&S provides written reports on these due diligence analyses to the pertinent IRC. The Board was advised of the resources that Management has committed to its services as a manager-of-managers, including resources for reporting to the Board and the relevant IRC to assist them with their assessment of the investment performance of the Portfolios on an on-going basis throughout the year. This includes the appointment of a Chief Investment Risk Officer and his staff, who report directly to the Board and who have developed attribution analyses and other metrics used by the IRCs to analyze the key factors underlying investment performance for the Voya funds.
The Board also considered the techniques that the Adviser has developed to screen and perform due diligence on new sub-advisers if and when the Adviser recommends to the Board a new sub-adviser to manage a fund in the Voya funds complex. The Board considered that, for new non-Voya-affiliated sub-advisers, MR&S is responsible for: identifying qualified candidates; analyzing their investment processes, personnel and resources; conducting due diligence on the candidates; and selecting a firm to propose as a new sub-adviser, as well as preparing written materials and reports to the committees and the Board as part of the process of considering the approval of any new sub-adviser for a Voya fund.
The Board also considered that in the course of monitoring performance of the Sub-Adviser, MR&S has developed, based on guidance from the IRCs, a methodology for comparing performance of each Portfolio to a Selected Peer Group, to each Portfolio’s Morningstar category median, to its Lipper category median and to its primary benchmark. The Board also recognized that MR&S provides the pertinent IRC with regular updates on the Portfolios and alerts the IRC to potential issues as they arise. The Board also was advised that the Adviser regularly monitors performance, personnel, compliance and other issues that may arise on a day-to-day basis regarding the sub-advisers to the Voya funds, including the Sub-Adviser, and considered that, if issues are identified either through formal or informal processes, they are brought before the IRCs and the Board for consideration
117
ADVISORY CONTRACT APPROVAL DISCUSSION (UNAUDITED) (CONTINUED)
and action and the Adviser consistently makes its resources available to the Board and the IRCs to assist with addressing any issues that arise.
The Board considered that the Portfolios also benefit from the services of the Adviser’s Investment Risk Management Department (the “IRMD”), under the leadership of the Chief Investment Risk Officer, the costs of which are shared by the Voya funds and the Adviser. The Board considered that the IRMD regularly presents written materials and reports to the IRCs that focus on the investment risks of the Voya funds. The Board also considered that the IRMD provides the IRCs with analyses that are developed to assist the IRCs in identifying trends in the Voya funds’ (including the Portfolios’) performance and other areas over consecutive periods. The Board considered that the services provided by the IRMD are meant to provide an additional perspective for the benefit of the IRCs, which may vary from the perspective of MR&S.
The Board also considered the techniques used by the Adviser to monitor the performance of the Sub-Adviser and the proactive approach that the Adviser, working in cooperation with the relevant IRC, has taken to advocate or recommend, when it believed appropriate, changes designed to assist in improving the Portfolios’ performance.
In considering the Portfolios’ Advisory Contract, the Board also considered the extent of benefits provided to the Portfolios’ shareholders, beyond advisory services, from being part of the Voya funds. This includes, in most cases, the right to exchange or transfer investments, without a sales charge, between the same class of shares of such funds or among Voya funds available on a product platform, and the wide range of Voya funds available for exchange or transfer. The Board also took into account the Adviser’s ongoing efforts to reduce the expenses of the Voya funds through renegotiated arrangements with the Voya funds’ service providers. In addition, the Board considered the efforts of the Adviser and the expenses that it incurred in recent years to help make the Voya funds more balanced and efficient by the launch of new investment products and the combinations of similar funds.
Further, the Board received periodic reports showing that the investment policies and restrictions for each Portfolio were consistently complied with and other periodic reports covering matters such as compliance by Adviser and Sub-Adviser personnel with codes of ethics. The Board considered reports from the Company’s CCO and/or the Adviser’s CCO evaluating whether the regulatory compliance systems and procedures of the Adviser and the Sub-Adviser are reasonably designed to ensure compliance with the federal securities laws, including those related to, among others, late trading and market timing, best execution, fair value pricing, proxy voting and trade allocation practices. The Board also took into account the Company’s CCO’s annual and periodic reports and recommendations with respect to service provider compliance programs. In this regard, the Board also considered the policies and procedures developed by the Company’s CCO in consultation with the Board’s Compliance Committee that guide the Company’s CCO’s compliance oversight function.
The Board requested and, as applicable, considered information regarding the level of staffing, quality and experience of each Portfolio’s portfolio management team, the respective resources and reputations of the Adviser and Sub-Adviser, and the ability of the Adviser and the Sub-Adviser to attract and retain qualified investment advisory personnel, the adequacy of the resources committed to the Portfolios (and other relevant funds in the Voya funds) by the Adviser and the Sub-Adviser, whether those resources are commensurate with the needs of the Portfolios and are sufficient to sustain appropriate levels of performance and compliance needs, and the Board considered the financial stability of the Adviser and the Sub-Adviser.
Based on their deliberations and the materials presented to them, the Board concluded that the advisory and related services provided by the Adviser and the Sub-Adviser are appropriate in light of the Portfolios’ operations, the competitive landscape of the investment company business, and investor needs, and that the nature, extent and quality of the overall services provided by the Adviser and the Sub-Adviser were appropriate.
Portfolio Performance
In assessing advisory and sub-advisory relationships, the Board placed emphasis on the investment returns of each Portfolio. The Board considered the performance reports and analyses from MR&S and IRMD and discussions with portfolio managers at Board and committee meetings during the year. The Board also paid particular attention in assessing performance information provided in the FACT sheets furnished in connection with the renewal and approval process. The FACT sheets prepared for each Portfolio included its investment performance compared to the Portfolio’s Morningstar category median, Lipper category median, Selected Peer Group and primary benchmark. The FACT sheet performance data was as of March 31, 2014.
The Board also considered at its September 12, 2014 meeting certain additional data regarding performance and Portfolio asset levels for various additional periods ending after March 31, 2014. The Board’s findings specific to each Portfolio’s performance are discussed under “Portfolio-by-Portfolio Analysis” below.
118
ADVISORY CONTRACT APPROVAL DISCUSSION (UNAUDITED) (CONTINUED)
Economies of Scale
When evaluating the reasonableness of advisory fee rates, the Board also considered whether economies of scale likely will be realized by the Adviser and Sub-Adviser as a Portfolio grows larger and the extent to which any such economies are reflected in contractual fee rates. The Board considered that while the Portfolios do not have advisory fee breakpoints, they do have fee waiver and/or expense reimbursement arrangements. In this connection, the Board considered the extent to which economies of scale could be realized through such fee waivers, expense reimbursements or other expense reductions. In evaluating economies of scale, the Independent Directors also considered prior periodic management reports, industry information on this topic, fee rates at projected levels of growth versus peers and the Portfolios’ investment performance based on their investments in Underlying Funds.
Information Regarding Services to Other Clients
The Board requested and considered information regarding the nature of services and fee rates offered by the Adviser and Sub-Adviser to other clients, including other registered investment companies and relevant institutional accounts. When fee rates offered by a sub-adviser to a Voya fund to its other clients differ materially from those charged to the Voya fund, the Board considers any underlying rationale provided by the Adviser or, in certain circumstances, the sub-adviser for these differences. The Board also noted that the fee rates charged to the Portfolios and other institutional clients of the Adviser or Sub-Adviser (including other investment companies) may differ materially due to, among other reasons: differences in services; different regulatory requirements associated with registered investment companies, such as the Portfolios, as compared to non-registered investment company clients; market differences in fee rates that existed when a Portfolio first was organized; differences in the original sponsors of the Portfolios that now are managed by the Adviser; investment capacity constraints that existed when certain contracts were first agreed upon or that might exist at present; and different pricing structures that are necessary to be competitive in different marketing channels.
Fee Rates and Profitability
The Board reviewed and considered the contractual investment advisory fee rate, combined with the administrative fee rate, payable by each Portfolio to the Adviser and to the Adviser’s affiliated company that serves as the administrator to each Portfolio. The Board also considered the contractual sub-advisory fee rate payable by the Adviser to the Sub-Adviser for sub-advisory services for each Portfolio, including the portion of the contractual advisory fees that are paid to the Sub-Adviser, as compared to the portion retained by the Adviser. In addition, the Board considered fee waivers and expense limitations applicable to the fees payable by the Portfolios, including the Adviser’s agreement to extend each such fee waiver and expense limitation agreement for an additional period of at least one year, and not to terminate such agreement in future years without prior approval of the Board.
The Board requested information regarding and, as applicable, considered: (1) the fee rate structure of each Portfolio as it relates to the services provided under the contracts; and (2) the potential fall-out benefits to the Adviser and the Sub-Adviser and their respective affiliates from their association with the Portfolios. For each Portfolio, the Board separately determined that the fees payable to the Adviser and the fee rate payable to the Sub-Adviser are reasonable for the services that each performs, which were considered in light of the nature, extent and quality of the services that each has performed and is expected to perform.
For each Portfolio, the Board considered information on revenues, costs and profits realized by the Adviser and the Sub-Adviser, which was prepared by Management in accordance with the allocation methodology (including related assumptions) specified in the 15(c) Methodology Guide. In analyzing the profitability of the Adviser in connection with its services to a Portfolio, the Board took into account the sub-advisory fee rate payable by the Adviser to the Sub-Adviser. In addition, the Board considered information that it requested and that was provided by Management with respect to the profitability of service providers affiliated with the Adviser. The Board also considered the profitability of the Adviser and its affiliated companies attributable to managing and operating each Portfolio both with and without the profitability of the distributor of the Portfolios and both before and after giving effect to any expenses incurred by the Adviser or any affiliated company in making revenue sharing or other payments to third parties, including affiliated insurance companies, for distribution and administrative services.
Although the 15(c) Methodology Guide establishes certain standards for profit calculation, the Board recognized that profitability analysis on a Portfolio-by-Portfolio basis is not an exact science and there is no uniform methodology within the asset management industry for determining profitability for this purpose. In this context, the Board realized that Management’s calculations regarding its costs incurred in establishing the infrastructure necessary for the Portfolios’ operations may not be fully reflected in the expenses allocated to the Portfolios in determining profitability, and that the information presented may not portray all of the costs borne by the Adviser and
119
ADVISORY CONTRACT APPROVAL DISCUSSION (UNAUDITED) (CONTINUED)
Management or capture their entrepreneurial risk associated with offering and managing a mutual fund complex in the current regulatory and market environment. In addition, the Board recognized that the use of different reasonable methodologies for purposes of calculating profit data can give rise to dramatically different profit and loss results.
In making its determinations, the Board based its conclusions as to the reasonableness of the advisory and sub-advisory fees of the Adviser and the Sub-Adviser primarily on the factors described for each Portfolio below. At the request of the Board, the Adviser has from time to time agreed to implement remedial actions regarding certain Voya funds. These remedial actions have included, among others: reductions in fee rates or adjustments to expense limitation and waiver arrangements; changes in sub-advisers or portfolio managers; and strategy modifications.
Portfolio-by-Portfolio Analysis
The following paragraphs outline certain of the specific factors that the Board considered, and the conclusions reached, at its September 12, 2014 meeting in relation to approving each Portfolio’s Advisory and Sub-Advisory Contracts. These specific factors are in addition to those considerations discussed above. In each case, the Portfolio’s performance was compared to its Morningstar category median and average, as well as its primary benchmark, a broad-based securities market index that appears in the Portfolio’s prospectus. With respect to Morningstar quintile rankings, the first quintile represents the highest (best) performance and the fifth quintile represents the lowest performance. Each Portfolio’s management fee rate and expense ratio were compared to the fees and expense ratios of the funds in its Selected Peer Group.
Voya Solution Aggressive Portfolio
In considering whether to approve the renewal of the Advisory and Sub-Advisory Contracts for Voya Solution Aggressive Portfolio, the Board considered that, based on performance data for the periods ended March 31, 2014: (1) the Portfolio underperformed its Morningstar category median for all periods presented; (2) the Portfolio underperformed its primary benchmark for all periods presented; and (3) the Portfolio is ranked in the fourth quintile of its Morningstar category all periods presented.
In analyzing this performance data, the Board took into account: (1) that the Portfolio commenced operations in May 2013, and therefore had a limited operating history for the purpose of analyzing its performance; and (2) Management would continue to monitor, and the Board or its IRC would periodically review, the Portfolio’s performance.
In considering the fees payable under the Advisory and Sub-Advisory Contracts for the Portfolio, the Board took into account the factors described above and also considered: (1) the fairness of the compensation under an Advisory Contract with a level fee rate that does not include breakpoints; and (2) the pricing structure (including the expense ratio to be borne by shareholders) of the Portfolio, as compared to its Selected Peer Group, including that: (a) the management fee (inclusive of a 0.10% administration fee) for the Portfolio is above the median and the average management fees of the funds in its Selected Peer Group; and (b) the expense ratio for the Portfolio is above the median and equal to the average expense ratios of the funds in its Selected Peer Group.
In analyzing the fee data, the Board took into account: (1) that the Portfolio indirectly bears the fees payable by the Underlying Funds in which the Portfolio invests; and (2) Management’s representations regarding the competitiveness of the Portfolio’s management fee rate and expense ratio.
After its deliberation, the Board reached the following conclusions: (1) the Portfolio’s management fee rate is reasonable in the context of all factors considered by the Board; (2) the Portfolio’s expense ratio is reasonable in the context of all factors considered by the Board; (3) taking into account that the Portfolio commenced operations in May 2013, and therefore had a limited operating history for the purpose of analyzing the Portfolio’s performance, it is reasonable to permit the Portfolio time to establish a longer performance record for the purposes of evaluation investment performance; and (4) the sub-advisory fee rate payable by the Adviser to the Sub-Adviser is reasonable in the context of all factors considered by the Board. Based on these conclusions and other factors, the Board voted to renew the Advisory and Sub-Advisory Contracts for the Portfolio for the year ending September 30, 2015. During this renewal process, different Board members may have given different weight to different individual factors and related conclusions.
Voya Solution Balanced Portfolio
In considering whether to approve the renewal of the Advisory and Sub-Advisory Contracts for Voya Solution Balanced Portfolio, the Board considered that, based on performance data for the periods ended March 31, 2014: (1) the Portfolio outperformed its Morningstar category median for all periods presented, with the exception of the one-year and three-year periods, during which it underperformed; (2) the Portfolio outperformed its primary benchmark for all periods presented, with the exception of the one-year and three-year periods, during which it underperformed; and (3) the Portfolio is ranked in the second quintile of its Morningstar category for the five-year
120
ADVISORY CONTRACT APPROVAL DISCUSSION (UNAUDITED) (CONTINUED)
period, and the third quintile for the most recent calendar quarter, year-to-date, one-year, and three-year periods.
In analyzing this performance data, the Board took into account Management’s representations regarding the competitiveness of the Portfolio’s performance during certain periods.
In considering the fees payable under the Advisory and Sub-Advisory Contracts for the Portfolio, the Board took into account the factors described above and also considered: (1) the fairness of the compensation under an Advisory Contract with a level fee rate that does not include breakpoints; and (2) the pricing structure (including the expense ratio to be borne by shareholders) of the Portfolio, as compared to its Selected Peer Group, including that: (a) the management fee (inclusive of a 0.10% administration fee) for the Portfolio is above the median and the average management fees of the funds in its Selected Peer Group; and (b) the expense ratio for the Portfolio is below the median and the average expense ratios of the funds in its Selected Peer Group.
In analyzing this fee data, the Board took into account that the Portfolio indirectly bears the fees payable by the Underlying Funds in which the Portfolio invests.
After its deliberation, the Board reached the following conclusions: (1) the Portfolio’s management fee rate is reasonable in the context of all factors considered by the Board; (2) the Portfolio’s expense ratio is reasonable in the context of all factors considered by the Board; (3) the Portfolio’s performance is reasonable in the context of all factors considered by the Board; and (4) the sub-advisory fee rate payable by the Adviser to the Sub-Adviser is reasonable in the context of all factors considered by the Board. Based on these conclusions and other factors, the Board voted to renew the Advisory and Sub-Advisory Contracts for the Portfolio for the year ending September 30, 2015. During this renewal process, different Board members may have given different weight to different individual factors and related conclusions.
Voya Solution Conservative Portfolio
In considering whether to approve the renewal of the Advisory and Sub-Advisory Contracts for Voya Solution Conservative Portfolio, the Board considered that, based on performance data for the periods ended March 31, 2014: (1) the Portfolio outperformed its Morningstar category median for the most recent calendar quarter and year-to-date periods, but underperformed for the one-year and three-year periods; (2) the Portfolio outperformed its primary benchmark for the most recent calendar quarter and year-to-date periods, but underperformed for the one-year and three-year periods; and (3) the Portfolio is ranked in the second quintile of its Morningstar category for the most recent calendar quarter and year-to-date periods, and the third quintile for the one-year and three-year periods.
In analyzing this performance data, the Board took into account Management’s representations regarding the reasonableness of the Portfolio’s performance during certain periods.
In considering the fees payable under the Advisory and Sub-Advisory Contracts for the Portfolio, the Board took into account the factors described above and also considered: (1) the fairness of the compensation under an Advisory Contract with a level fee rate that does not include breakpoints; and (2) the pricing structure (including the expense ratio to be borne by shareholders) of the Portfolio, as compared to its Selected Peer Group, including that: (a) the management fee (inclusive of a 0.10% administration fee) for the Portfolio is above the median and the average management fees of the funds in its Selected Peer Group; and (b) the expense ratio for the Portfolio is below the median and the average expense ratios of the funds in its Selected Peer Group.
In analyzing this fee data, the Board took into account: (1) that the Portfolio indirectly bears the fees payable by the Underlying Funds in which the Portfolio invests; and (2) Management’s representations regarding the competitiveness of the Portfolio’s management fee rate.
After its deliberation, the Board reached the following conclusions: (1) the Portfolio’s management fee rate is reasonable in the context of all factors considered by the Board; (2) the Portfolio’s expense ratio is reasonable in the context of all factors considered by the Board; (3) the Portfolio’s performance is reasonable in the context of all factors considered by the Board; and (4) the sub-advisory fee rate payable by the Adviser to the Sub-Adviser is reasonable in the context of all factors considered by the Board. Based on these conclusions and other factors, the Board voted to renew the Advisory and Sub-Advisory Contracts for the Portfolio for the year ending September 30, 2015. During this renewal process, different Board members may have given different weight to different individual factors and related conclusions.
Voya Solution Income Portfolio
In considering whether to approve the renewal of the Advisory and Sub-Advisory Contracts for Voya Solution Income Portfolio, the Board considered that, based on performance data for the periods ended March 31, 2014: (1) the Portfolio outperformed its Morningstar category median for all periods presented, with the exception of the five-year period, during which it underperformed; (2) the Portfolio outperformed its primary benchmark for all periods presented, with the exception of the one-year and three-year periods, during which it underperformed; and (3) the Portfolio is ranked in the first (highest) quintile of its
121
ADVISORY CONTRACT APPROVAL DISCUSSION (UNAUDITED) (CONTINUED)
Morningstar Category for the most recent calendar quarter and year-to-date periods, and the third quintile for the one-year, three-year, and five-year periods.
In considering the fees payable under the Advisory and Sub-Advisory Contracts for the Portfolio, the Board took into account the factors described above and also considered: (1) the fairness of the compensation under an Advisory Contract with a level fee rate that does not include breakpoints; and (2) the pricing structure (including the expense ratio to be borne by shareholders) of the Portfolio, as compared to its Selected Peer Group, including that: (a) the management fee (inclusive of a 0.10% administration fee) for the Portfolio is above the median and the average management fees of the funds in its Selected Peer Group; and (b) the expense ratio for the Portfolio is below the median and the average expense ratios of the funds in its Selected Peer Group.
In analyzing this fee data, the Board took into account that the Portfolio indirectly bears the fees payable by the Underlying Funds in which the Portfolio invests.
After its deliberation, the Board reached the following conclusions: (1) the Portfolio’s management fee rate is reasonable in the context of all factors considered by the Board; (2) the Portfolio’s expense ratio is reasonable in the context of all factors considered by the Board; (3) the Portfolio’s performance is reasonable in the context of rall factors considered by the Board; and (4) the sub-advisory fee rate payable by the Adviser to the Sub-Adviser is reasonable in the context of all factors considered by the Board. Based on these conclusions and other factors, the Board voted to renew the Advisory and Sub-Advisory Contracts for the Portfolio for the year ending September 30, 2015. During this renewal process, different Board members may have given different weight to different individual factors and related conclusions.
Voya Solution Moderately Aggressive Portfolio
In considering whether to approve the renewal of the Advisory and Sub-Advisory Contracts for Voya Solution Moderately Aggressive Portfolio, the Board considered that, based on performance data for the periods ended March 31, 2014: (1) the Portfolio underperformed its Morningstar category median for all periods presented, with the exception of the one-year period, during which it outperformed; (2) the Portfolio underperformed its primary benchmark for all periods presented; and (3) the Portfolio is ranked in the third quintile of its Morningstar category for all periods presented.
In analyzing this performance data, the Board took into account: (1) Management’s representations regarding the strength of the Portfolio’s performance during certain periods; (2) that the Portfolio’s portfolio management team had been modified in August 2013; and (3) that Management will continue to monitor, and the Board or its IRC would periodically review, the Portfolio’s performance.
In considering the fees payable under the Advisory and Sub-Advisory Contracts for the Portfolio, the Board took into account the factors described above and also considered: (1) the fairness of the compensation under an Advisory Contract with a level fee rate that does not include breakpoints; and (2) the pricing structure (including the expense ratio to be borne by shareholders) of the Portfolio, as compared to its Selected Peer Group, including that: (a) the management fee (inclusive of a 0.10% administration fee) for the Portfolio is above the median and the average management fees of the funds in its Selected Peer Group; and (b) the expense ratio for the Portfolio is below the median and the average expense ratios of the funds in its Selected Peer Group.
In analyzing this fee data, the Board took into account that the Portfolio indirectly bears the fees payable by the Underlying Funds in which the Portfolio invests.
After its deliberation, the Board reached the following conclusions: (1) the Portfolio’s management fee rate is reasonable in the context of all factors considered by the Board; (2) the Portfolio’s expense ratio is reasonable in the context of all factors considered by the Board; (3) the Portfolio’s performance is reasonable in the context of all factors considered by the Board; and (4) the sub-advisory fee rate payable by the Adviser to the Sub-Adviser is reasonable in the context of all factors considered by the Board. Based on these conclusions and other factors, the Board voted to renew the Advisory and Sub-Advisory Contracts for the Portfolio for the year ending September 30, 2015. During this renewal process, different Board members may have given different weight to different individual factors and related conclusions.
Voya Solution Moderately Conservative Portfolio
In considering whether to approve the renewal of the Advisory and Sub-Advisory Contracts for Voya Solution Moderately Conservative Portfolio, the Board considered that, based on performance data for the periods ended March 31, 2014: (1) the Portfolio outperformed its Morningstar category median for all periods presented; (2) the Portfolio outperformed its primary benchmark for all periods presented, with the exception of the one-year and three-year periods, during which it underperformed; and (3) the Portfolio is ranked in the second quintile of its Morningstar category for the one-year, three-year, and five-year periods, and the third quintile for the most recent calendar quarter and year-to-date periods.
In considering the fees payable under the Advisory and Sub-Advisory Contracts for the Portfolio, the Board took into account the factors described above and also considered: (1) the fairness of the compensation
122
ADVISORY CONTRACT APPROVAL DISCUSSION (UNAUDITED) (CONTINUED)
under an Advisory Contract with a level fee rate that does not include breakpoints; and (2) the pricing structure (including the expense ratio to be borne by shareholders) of the Portfolio, as compared to its Selected Peer Group, including that: (a) the management fee (inclusive of a 0.10% administration fee) for the Portfolio is above the median and the average management fees of the funds in its Selected Peer Group; and (b) the expense ratio for the Portfolio is below the median and the average expense ratios of the funds in its Selected Peer Group.
In analyzing the fee data, the Board took into account that the Portfolio indirectly bears the fees payable by the Underlying Funds in which the Portfolio invests.
After its deliberation, the Board reached the following conclusions: (1) the Portfolio’s management fee rate is reasonable in the context of all factors considered by the Board; (2) the Portfolio’s expense ratio is reasonable in the context of all factors considered by the Board; (3) the Portfolio’s performance is reasonable in the context of all factors considered by the Board; and (4) the sub-advisory fee rate payable by the Adviser to the Sub-Adviser is reasonable in the context of all factors considered by the Board. Based on these conclusions and other factors, the Board voted to renew the Advisory and Sub-Advisory Contracts for the Portfolio for the year ending September 30, 2015. During this renewal process, different Board members may have given different weight to different individual factors and related conclusions.
Voya Solution 2015 Portfolio
In considering whether to approve the renewal of the Advisory and Sub-Advisory Contracts for Voya Solution 2015 Portfolio, the Board considered that, based on performance data for the periods ended March 31, 2014: (1) the Portfolio underperformed its Morningstar category median for all periods presented, with the exception of the most recent calendar quarter and year-to-date periods, during which it outperformed; (2) the Portfolio outperformed its primary benchmark for all periods presented, with the exception of the one-year and three-year periods, during which it underperformed; and (3) the Portfolio is ranked in the first (highest) quintile of its Morningstar category for the most recent calendar quarter and year-to-date periods, and the third quintile for the one-year, three-year, and five-year periods.
In analyzing this performance data, the Board took into account: (1) Management’s representations regarding the competitiveness of the Portfolio’s performance during certain periods; and (2) that Management would continue to monitor, and the Board or its IRC would periodically review, the Portfolio’s investment performance.
In considering the fees payable under the Advisory and Sub-Advisory Contracts for the Portfolio, the Board took into account the factors described above and also considered: (1) the fairness of the compensation under an Advisory Contract with a level fee rate that does not include breakpoints; and (2) the pricing structure (including the expense ratio to be borne by shareholders) of the Portfolio, as compared to its Selected Peer Group, including that: (a) the management fee (inclusive of a 0.10% administration fee) for the Portfolio is above the median and the average management fees of the funds in its Selected Peer Group; and (b) the expense ratio for the Portfolio is above the median and the average expense ratios of the funds in its Selected Peer Group.
In analyzing the fee data, the Board took into account: (1) that the Portfolio indirectly bears the fees payable by the Underlying Funds in which the Portfolio invests; and (2) Management’s representations with respect to the competitiveness of the Portfolio’s management fee rate and expense ratio.
After its deliberation, the Board reached the following conclusions: (1) the Portfolio’s management fee rate is reasonable in the context of all factors considered by the Board; (2) the Portfolio’s expense ratio is reasonable in the context of all factors considered by the Board; (3) the Portfolio’s performance is reasonable in the context of all factors considered by the Board; and (4) the sub-advisory fee rate payable by the Adviser to the Sub-Adviser is reasonable in the context of all factors considered by the Board. Based on these conclusions and other factors, the Board voted to renew the Advisory and Sub-Advisory Contracts for the Portfolio for the year ending September 30, 2015. During this renewal process, different Board members may have given different weight to different individual factors and related conclusions.
Voya Solution 2020 Portfolio
In considering whether to approve the renewal of the Advisory and Sub-Advisory Contracts for Voya Solution 2020 Portfolio, the Board considered that, based on performance data for the periods ended March 31, 2014: (1) the Portfolio outperformed its Morningstar category median for all periods presented; (2) the Portfolio outperformed its primary benchmark for all periods presented with the exception of the one-year period, during which it underperformed; and (3) the Portfolio is ranked in the second quintile for all periods presented.
In considering the fees payable under the Advisory and Sub-Advisory Contracts for the Portfolio, the Board took into account the factors described above and also considered: (1) the fairness of the compensation under an Advisory Contract with a level fee rate that does not include breakpoints; and (2) the pricing structure (including the expense ratio to be borne by shareholders) of the Portfolio, as compared to its Selected Peer Group,
123
ADVISORY CONTRACT APPROVAL DISCUSSION (UNAUDITED) (CONTINUED)
including that: (a) the management fee (inclusive of a 0.10% administration fee) for the Portfolio is above the median and the average management fees of the funds in its Selected Peer Group; and (b) the expense ratio for the Portfolio is above the median and the average expense ratios of the funds in its Selected Peer Group.
In analyzing the fee data, the Board took into account: (1) that the Portfolio indirectly bears the fees payable by the Underlying Funds in which the Portfolio invests; and (2) Management’s representations with respect to the competitiveness of the Portfolio’s management fee rate and expense ratio.
After its deliberation, the Board reached the following conclusions: (1) the Portfolio’s management fee rate is reasonable in the context of all factors considered by the Board; (2) the Portfolio’s expense ratio is reasonable in the context of all factors considered by the Board; (3) the Portfolio’s performance is reasonable in the context of all factors considered by the Board; and (4) the sub-advisory fee rate payable by the Adviser to the Sub-Adviser is reasonable in the context of all factors considered by the Board. Based on these conclusions and other factors, the Board voted to renew the Advisory and Sub-Advisory Contracts for the Portfolio for the year ending September 30, 2015. During this renewal process, different Board members may have given different weight to different individual factors and related conclusions.
Voya Solution 2025 Portfolio
In considering whether to approve the renewal of the Advisory and Sub-Advisory Contracts for Voya Solution 2025 Portfolio, the Board considered that, based on performance data for the periods ended March 31, 2014: (1) the Portfolio underperformed its Morningstar category median for the most recent calendar quarter, year-to-date, and three year periods, but outperformed for the one-year and five-year periods; (2) the Portfolio underperformed its primary benchmark for all periods presented, with the exception of the five-year period, during which it outperformed; and (3) the Portfolio is ranked in the second quintile of its Morningstar category for the one-year period, and the third quintile for the most recent calendar quarter, year-to-date, three-year, and five-year periods.
In analyzing this performance data, the Board took into account: (1) Management’s representations regarding the competitiveness of the Portfolio’s performance during certain periods; and (2) that Management would continue to monitor, and the Board or its IRC would periodically review, the Portfolio’s performance.
In considering the fees payable under the Advisory and Sub-Advisory Contracts for the Portfolio, the Board took into account the factors described above and also considered: (1) the fairness of the compensation under an Advisory Contract with a level fee rate that does not include breakpoints; and (2) the pricing structure (including the expense ratio to be borne by shareholders) of the Portfolio, as compared to its Selected Peer Group, including that: (a) the management fee (inclusive of a 0.10% administration fee) for the Portfolio is above the median and the average management fees of the funds in its Selected Peer Group; and (b) the expense ratio for the Portfolio is above the median and the average expense ratios of the funds in its Selected Peer Group.
In analyzing the fee data, the Board took into account: (1) that the Portfolio indirectly bears the fees payable by the Underlying Funds in which the Portfolio invests; and (2) Management’s representations with respect to the competitiveness of the Portfolio’s management fee rate and expense ratio.
After its deliberation, the Board reached the following conclusions: (1) the Portfolio’s management fee rate is reasonable in the context of all factors considered by the Board; (2) the Portfolio’s expense ratio is reasonable in the context of all factors considered by the Board; (3) the Portfolio’s performance is reasonable in the context of all factors considered by the Board; and (4) the sub-advisory fee rate payable by the Adviser to the Sub-Adviser is reasonable in the context of all factors considered by the Board. Based on these conclusions and other factors, the Board voted to renew the Advisory and Sub-Advisory Contracts for the Portfolio for the year ending September 30, 2015. During this renewal process, different Board members may have given different weight to different individual factors and related conclusions.
Voya Solution 2030 Portfolio
In considering whether to approve the renewal of the Advisory and Sub-Advisory Contracts for Voya Solution 2030 Portfolio, the Board considered that, based on performance data for the periods ended March 31, 2014: (1) the Portfolio underperformed its Morningstar category median for the most recent calendar quarter and year-to-date periods, but outperformed for the one-year period; (2) the Portfolio underperformed its primary benchmark for all periods presented; and (3) the Portfolio is ranked in the second quintile for the one-year period, and the fourth quintile for the most recent calendar quarter and year-to-date periods.
In analyzing this performance data, the Board took into account: (1) Management’s representations regarding the competitiveness of the Portfolio’s performance during certain periods; and (2) Management would continue to monitor, and the Board or its IRC would periodically review, the Portfolio’s performance.
In considering the fees payable under the Advisory and Sub-Advisory Contracts for the Portfolio, the Board
124
ADVISORY CONTRACT APPROVAL DISCUSSION (UNAUDITED) (CONTINUED)
took into account the factors described above and also considered: (1) the fairness of the compensation under an Advisory Contract with a level fee rate that does not include breakpoints; and (2) the pricing structure (including the expense ratio to be borne by shareholders) of the Portfolio, as compared to its Selected Peer Group, including that: (a) the management fee (inclusive of a 0.10% administration fee) for the Portfolio is above the median and the average management fees of the funds in its Selected Peer Group; and (b) the expense ratio for the Portfolio is above the median and the average expense ratios of the funds in its Selected Peer Group.
In analyzing the fee data, the Board took into account: (1) that the Portfolio indirectly bears the fees payable by the Underlying Funds in which the Portfolio invests; and (2) Management’s representations with respect to the competitiveness of the Portfolio’s management fee rate and expense ratio.
After its deliberation, the Board reached the following conclusions: (1) the Portfolio’s management fee rate is reasonable in the context of all factors considered by the Board; (2) the Portfolio’s expense ratio is reasonable in the context of all factors considered by the Board; (3) the Portfolio’s performance is reasonable in the context of all factors considered by the Board; and (4) the sub-advisory fee rate payable by the Adviser to the Sub-Adviser is reasonable in the context of all factors considered by the Board. Based on these conclusions and other factors, the Board voted to renew the Advisory and Sub-Advisory Contracts for the Portfolio for the year ending September 30, 2015. During this renewal process, different Board members may have given different weight to different individual factors and related conclusions.
Voya Solution 2035 Portfolio
In considering whether to approve the renewal of the Advisory and Sub-Advisory Contracts for Voya Solution 2035 Portfolio, the Board considered that, based on performance data for the periods ended March 31, 2014: (1) the Portfolio underperformed its Morningstar category median for all periods presented, with the exception of the five-year period, during which it matched the Morningstar category’s performance; (2) the Portfolio underperformed its primary benchmark for all periods presented; and (3) the Portfolio is ranked in the third quintile of its Morningstar category for the one-year and five-year periods, the fourth quintile for the three-year period, and the fifth (lowest) quintile for the most recent calendar quarter and year-to-date periods.
In analyzing this performance data, the Board took into account: (1) Management’s representations regarding the competitiveness of the Portfolio’s performance during certain periods; and (2) that Management would continue to monitor, and the Board or its IRC would periodically review, the Portfolio’s performance.
In considering the fees payable under the Advisory and Sub-Advisory Contracts for the Portfolio, the Board took into account the factors described above and also considered: (1) the fairness of the compensation under an Advisory Contract with a level fee rate that does not include breakpoints; and (2) the pricing structure (including the expense ratio to be borne by shareholders) of the Portfolio, as compared to its Selected Peer Group, including that: (a) the management fee (inclusive of a 0.10% administration fee) for the Portfolio is above the median and the average management fees of the funds in its Selected Peer Group; and (b) the expense ratio for the Portfolio is above the median and the average expense ratios of the funds in its Selected Peer Group.
In analyzing the fee data, the Board took into account: (1) that the Portfolio indirectly bears the fees payable by the Underlying Funds in which the Portfolio invests; and (2) Management’s representations with respect to the competitiveness of the Portfolio’s management fee rate and expense ratio.
After its deliberation, the Board reached the following conclusions: (1) the Portfolio’s management fee rate is reasonable in the context of all factors considered by the Board; (2) the Portfolio’s expense ratio is reasonable in the context of all factors considered by the Board; (3) the Portfolio’s performance is reasonable in the context of all factors considered by the Board; and (4) the sub-advisory fee rate payable by the Adviser to the Sub-Adviser is reasonable in the context of all factors considered by the Board. Based on these conclusions and other factors, the Board voted to renew the Advisory and Sub-Advisory Contracts for the Portfolio for the year ending September 30, 2015. During this renewal process, different Board members may have given different weight to different individual factors and related conclusions.
Voya Solution 2040 Portfolio
In considering whether to approve the renewal of the Advisory and Sub-Advisory Contracts for Voya Solution 2040 Portfolio, the Board considered that, based on performance data for the periods ended March 31, 2014: (1) the Portfolio underperformed its Morningstar category median for the most recent calendar quarter and year-to-date periods, but outperformed for the one-year period; (2) the Portfolio underperformed its primary benchmark for all periods presented; and (3) the Portfolio is ranked in the second quintile of its Morningstar category for the one-year period, and the fourth quintile for the most recent calendar quarter and year-to-date periods.
In analyzing this performance data, the Board took into account: (1) Management’s representations regarding the
125
ADVISORY CONTRACT APPROVAL DISCUSSION (UNAUDITED) (CONTINUED)
competitiveness of the Portfolio’s performance during certain periods; and (2) Management would continue to monitor, and the Board or its IRC would periodically review, the Portfolio’s performance.
In considering the fees payable under the Advisory and Sub-Advisory Contracts for the Portfolio, the Board took into account the factors described above and also considered: (1) the fairness of the compensation under an Advisory Contract with a level fee rate that does not include breakpoints; and (2) the pricing structure (including the expense ratio to be borne by shareholders) of the Portfolio, as compared to its Selected Peer Group, including that: (a) the management fee (inclusive of a 0.10% administration fee) for the Portfolio is above the median and the average management fees of the funds in its Selected Peer Group; and (b) the expense ratio for the Portfolio is above the median and the average expense ratios of the funds in its Selected Peer Group.
In analyzing the fee data, the Board took into account: (1) that the Portfolio indirectly bears the fees payable by the Underlying Funds in which the Portfolio invests; and (2) Management’s representations with respect to the competitiveness of the Portfolio’s management fee rate and expense ratio.
After its deliberation, the Board reached the following conclusions: (1) the Portfolio’s management fee rate is reasonable in the context of all factors considered by the Board; (2) the Portfolio’s expense ratio is reasonable in the context of all factors considered by the Board; (3) the Portfolio’s performance is reasonable in the context of all factors considered by the Board; and (4) the sub-advisory fee rate payable by the Adviser to the Sub-Adviser is reasonable in the context of all factors considered by the Board. Based on these conclusions and other factors, the Board voted to renew the Advisory and Sub-Advisory Contracts for the Portfolio for the year ending September 30, 2015. During this renewal process, different Board members may have given different weight to different individual factors and related conclusions.
Voya Solution 2045 Portfolio
In considering whether to approve the renewal of the Advisory and Sub-Advisory Contracts for Voya Solution 2045 Portfolio, the Board considered that, based on performance data for the periods ended March 31, 2014: (1) the Portfolio underperformed its Morningstar category median for all periods presented, with the exception of the one-year and five-year periods, during which it outperformed; (2) the Portfolio underperformed its primary benchmark for all periods presented, with the exception of the one-year period, during which it outperformed; and (3) the Portfolio is ranked in the second quintile of its Morningstar category for the one-year and five-year periods, the third quintile for the three-year period, and the fifth (lowest) quintile for the most recent calendar quarter and year-to-date periods.
In analyzing this performance data, the Board took into account: (1) Management’s representations regarding the competitiveness of the Portfolio’s performance during certain periods; and (2) that Management would continue to monitor, and the Board or its IRC would periodically review, the Portfolio’s performance.
In considering the fees payable under the Advisory and Sub-Advisory Contracts for the Portfolio, the Board took into account the factors described above and also considered: (1) the fairness of the compensation under an Advisory Contract with a level fee rate that does not include breakpoints; and (2) the pricing structure (including the expense ratio to be borne by shareholders) of the Portfolio, as compared to its Selected Peer Group, including that: (a) the management fee (inclusive of a 0.10% administration fee) for the Portfolio is above the median and the average management fees of the funds in its Selected Peer Group; and (b) the expense ratio for the Portfolio is above the median and the average expense ratios of the funds in its Selected Peer Group.
In analyzing the fee data, the Board took into account: (1) that the Portfolio indirectly bears the fees payable by the Underlying Funds in which the Portfolio invests; and (2) Management’s representations with respect to the competitiveness of the Portfolio’s management fee rate and expense ratio.
After its deliberation, the Board reached the following conclusions: (1) the Portfolio’s management fee rate is reasonable in the context of all factors considered by the Board; (2) the Portfolio’s expense ratio is reasonable in the context of all factors considered by the Board; (3) the Portfolio’s performance is reasonable in the context of all factors considered by the Board; and (4) the sub-advisory fee rate payable by the Adviser to the Sub-Adviser is reasonable in the context of all factors considered by the Board. Based on these conclusions and other factors, the Board voted to renew the Advisory and Sub-Advisory Contracts for the Portfolio for the year ending September 30, 2015. During this renewal process, different Board members may have given different weight to different individual factors and related conclusions.
Voya Solution 2050 Portfolio
In considering whether to approve the renewal of the Advisory and Sub-Advisory Contracts for Voya Solution 2050 Portfolio, the Board considered that, based on performance data for the periods ended March 31, 2014: (1) the Portfolio underperformed its Morningstar category median for the most recent calendar quarter and year-to-date periods, but outperformed for the one-year
126
ADVISORY CONTRACT APPROVAL DISCUSSION (UNAUDITED) (CONTINUED)
period; (2) the Portfolio underperformed its primary benchmark for all periods presented; and (3) the Portfolio is ranked in the third quintile of its Morningstar category for the one-year period, and the fifth (lowest) quintile for the most recent calendar quarter and year-to-date periods.
In analyzing this performance data, the Board took into account: (1) Management’s representations regarding the competitiveness of the Portfolio’s performance during the one-year period; and (2) Management would continue to monitor, and the Board or its IRC would periodically review, the Portfolio’s performance.
In considering the fees payable under the Advisory and Sub-Advisory Contracts for the Portfolio, the Board took into account the factors described above and also considered: (1) the fairness of the compensation under an Advisory Contract with a level fee rate that does not include breakpoints; and (2) the pricing structure (including the expense ratio to be borne by shareholders) of the Portfolio, as compared to its Selected Peer Group, including that: (a) the management fee (inclusive of a 0.10% administration fee) for the Portfolio is above the median and the average management fees of the funds in its Selected Peer Group; and (b) the expense ratio for the Portfolio is above the median and the average expense ratios of the funds in its Selected Peer Group.
In analyzing this fee data, the Board took into account: (1) that the Portfolio indirectly bears the fees payable by the Underlying Funds in which the Portfolio invests; and (2) Management’s representations with respect to the competitiveness of the Portfolio’s management fee rate and expense ratio.
After its deliberation, the Board reached the following conclusions: (1) the Portfolio’s management fee rate is reasonable in the context of all factors considered by the Board; (2) the Portfolio’s expense ratio is reasonable in the context of all factors considered by the Board; (3) the Portfolio’s performance is reasonable in the context of all factors considered by the Board; and (4) the sub-advisory fee rate payable by the Adviser to the Sub-Adviser is reasonable in the context of all factors considered by the Board. Based on these conclusions and other factors, the Board voted to renew the Advisory and Sub-Advisory Contracts for the Portfolio for the year ending September 30, 2015. During this renewal process, different Board members may have given different weight to different individual factors and related conclusions.
Voya Solution 2055 Portfolio
In considering whether to approve the renewal of the Advisory and Sub-Advisory Contracts for Voya Solution 2055 Portfolio, the Board considered that, based on performance data for the periods ended March 31, 2014: (1) the Portfolio underperformed its Morningstar category median for all periods presented, with the exception of the one-year period, during which it outperformed; (2) the Portfolio underperformed its primary benchmark for all periods presented, with the exception of the one-year period, during which it outperformed; and (3) the Portfolio is ranked in the third quintile of its Morningstar category for the one-year and three-year periods, and the fifth (lowest) quintile for the most recent calendar quarter and year-to-date periods.
In analyzing this performance data, the Board took into account: (1) Management’s representations regarding the competitiveness of the Portfolio’s performance during certain periods; and (2) that Management would continue to monitor, and the Board or its IRC would periodically review, the Portfolio’s performance.
In considering the fees payable under the Advisory and Sub-Advisory Contracts for the Portfolio, the Board took into account the factors described above and also considered: (1) the fairness of the compensation under an Advisory Contract with a level fee rate that does not include breakpoints; and (2) the pricing structure (including the expense ratio to be borne by shareholders) of the Portfolio, as compared to its Selected Peer Group, including that: (a) the management fee (inclusive of a 0.10% administration fee) for the Portfolio is above the median and the average management fees of the funds in its Selected Peer Group; and (b) the expense ratio for the Portfolio is above the median and the average expense ratios of the funds in its Selected Peer Group.
In analyzing the fee data, the Board took into account: (1) that the Portfolio indirectly bears the fees payable by the Underlying Funds in which the Portfolio invests; and (2) Management’s representations with respect to the competitiveness of the Portfolio’s management fee rate and expense ratio.
After its deliberation, the Board reached the following conclusions: (1) the Portfolio’s management fee rate is reasonable in the context of all factors considered by the Board; (2) the Portfolio’s expense ratio is reasonable in the context of all factors considered by the Board; (3) the Portfolio’s performance is reasonable in the context of all factors considered by the Board; and (4) the sub-advisory fee rate payable by the Adviser to the Sub-Adviser is reasonable in the context of all factors considered by the Board. Based on these conclusions and other factors, the Board voted to renew the Advisory and Sub-Advisory Contracts for the Portfolio for the year ending September 30, 2015. During this renewal process, different Board members may have given different weight to different individual factors and related conclusions.
127
ADVISORY CONTRACT APPROVAL DISCUSSION (UNAUDITED) (CONTINUED)
APPROVAL OF INVESTMENT ADVISORY AND SUB-ADVISORY CONTRACTS IN CONNECTION WITH A CHANGE OF CONTROL EVENT
Section 15(c) of the 1940 Act, provides that, when the Portfolios enter into new investment advisory contracts with the Adviser, and the Adviser enters into new sub-Advisory contracts between the Adviser and the Sub-Adviser, the Board, including a majority of the Independent Directors, must approve the new arrangements.
Discussed below are certain factors that the Board considered at a meeting held on November 18, 2014 in determining whether to approve new advisory and sub-advisory arrangements for the Portfolios in connection with a Change of Control Event, as such term is defined below, pursuant to the Separation Plan.
At the November 18, 2014 meeting, the Board noted that pursuant to an agreement with the European Commission, ING Groep, N.V. (as defined above, “ING Groep”), the former parent company of the Adviser and the Sub-Adviser, is required to divest its entire interest in Voya Financial, Inc. (formerly, ING U.S., Inc.), its U.S.-based insurance, retirement services, and investment management operations, which include the Adviser and the Sub-Adviser, by the end of 2016 (as defined above, the “Separation Plan”). Voya Financial, Inc. previously was a wholly owned, indirect subsidiary of ING Groep and is a parent company of the Adviser and the Sub-Adviser.
Each of the Portfolios is subject to the 1940 Act, which provides that any investment advisory agreement, including any sub-advisory agreement, must terminate automatically upon its “assignment.” As used in the 1940 Act, the term assignment includes any transfer of a controlling block of outstanding voting securities of an adviser or the parent company of an adviser. Such a transfer is referred to herein as a “Change of Control Event.” ING Groep’s base case to achieve the Separation Plan was through an initial public offering of Voya Financial, Inc. (the “IPO”) followed by the divestment of ING Groep’s remaining ownership interest over time through one or more additional public offerings of Voya Financial, Inc. stock, or, possibly, through one or more privately negotiated sales of the stock. The Board recognized that the Separation Plan contemplated several public offerings and each may have been deemed to be a Change of Control Event, triggering the necessity for new agreements, which would require the approval of the Board. The Board concluded that approval by shareholders of the new agreements that would become effective in the event of one or more Change of Control Events would permit the Portfolios to benefit from the continuation of services by the Adviser, Sub-Adviser, and their affiliates throughout the Separation Plan without the need for multiple shareholder meetings. The Board was informed by the Adviser and its counsel that the Adviser obtained regulatory assurances from the staff of the U.S. Securities and Exchange Commission in March 2013 that they would not object to approval of future agreements by shareholders at a single shareholder meeting. Portfolio shareholders approved the future agreements in May 2013.
The IPO was completed in May 2013. ING Groep divested additional shares in Voya Financial, Inc. through four subsequent public offerings since May 2013, including a secondary common stock offering that closed on November 18, 2014 (the “November Transaction”). (In addition, concurrently with the November Transaction, Voya Financial, Inc. repurchased $175 million of its shares directly from ING Groep.) Upon the completion of the November Transaction and the concurrent direct share repurchase, ING Groep’s ownership in Voya Financial, Inc. was reduced from approximately 32.5% to approximately 19%. This was deemed to be a Change of Control Event that resulted in the termination of the Portfolios’ existing advisory and sub-advisory agreements (the “Prior Agreements”) at the close of business on November 18, 2014.
In light of the foregoing, on November 18, 2014 the Board, at an in-person meeting, approved new investment advisory and affiliated sub-advisory agreements (the “New Agreements”) for the Portfolios to replace the Prior Agreements upon termination. At that meeting, the Adviser represented that the agreements approved by the Board were not materially different from the agreements approved by shareholders of the Portfolios in 2013 and no single person or group of persons acting together was expected to gain “control” (as defined in the 1940 Act) of Voya Financial, Inc. As a result, shareholders of the Portfolios will not be asked to vote again on these new agreements with the Adviser and affiliated sub-advisers, including the Sub-Adviser.
The decision by the Board, including a majority of the Independent Directors, to approve the New Agreements was based on a determination by the Board that it would be in the best interests of the shareholders of the Portfolios for the Adviser and Sub-Adviser to continue providing investment advisory, sub-advisory, and related services for the Portfolios, without interruption, after the Change of Control Event.
Prior to its approval of the New Agreements, the Board reviewed, among other matters, the quality, extent and nature of the services currently being provided by the Adviser and Sub-Adviser under the Prior Agreements and to be provided under the New Agreements. A substantial portion of this review was conducted as part of, and in conjunction with, the Board’s annual reviews of the Prior
128
ADVISORY CONTRACT APPROVAL DISCUSSION (UNAUDITED) (CONTINUED)
Agreements, which were most recently approved for continuation at the in-person meeting of the Board held on September 12, 2014. During the review process that led to its approval of the Prior Agreements on September 12, 2014, the Board was informed by the Adviser that it was likely the Board would be asked in the very near future to consider approval of the New Agreements. The Board further noted that the Change of Control Event would result in the Adviser’s and the Sub-Adviser’s loss of access to certain services and resources of ING Groep, which could adversely affect their businesses and profitability.
On September 12, 2014, the Board concluded, in light of all factors it considered, including undertakings by the Adviser relating to certain follow-up actions, to renew the Prior Agreements and that the fee rates set forth in the Prior Agreements were fair and reasonable. Among other factors, the Board considered: (1) the nature, extent and quality of services provided under the Prior Agreements; (2) the extent to which economies of scale are reflected in fee rate schedules under the Prior Agreements; (3) the existence of any “fall-out” benefits to the Adviser, Sub-Adviser, and their affiliates; (4) a comparison of fee rates, expense ratios, and investment performance to those of similar funds; and (5) the costs incurred and profits realized by the Adviser, the Sub-Adviser, and their affiliates with respect to their services to the Portfolios.
A further description of the process followed by the Board in approving the Prior Agreements on September 12, 2014, including the information reviewed, certain material factors considered and certain related conclusions reached, is set forth above under the section titled “BOARD CONSIDERATION AND APPROVAL OF INVESTMENT ADVISORY AND SUB-ADVISORY CONTRACTS.”
In connection with its approval of the New Agreements, on November 18, 2014 the Board considered its conclusions in connection with its September 12, 2014 approvals of those Prior Agreements that were in effect on that date, including the Board’s assessment of the nature, extent and quality of services being provided and, as applicable, actions taken in certain instances to improve the relationship between the costs and the quality of services being provided. Also in connection with its November 18, 2014 approvals of the New Agreements, the Board considered a representation from the Adviser that there were no additional developments not already disclosed to the Board since September 12, 2014 that would be a material consideration to the Board in connection with its consideration of the New Agreements.
In addition, in determining whether to approve the New Agreements, the Board took into account the considerations set out below.
| 1) | | The Independent Directors solicited and received ongoing advice regarding the Board’s legal duties when approving the New Agreements from K&L Gates, their independent legal counsel, which law firm has extensive experience regarding such matters. |
| 2) | | The Board considered Management’s representations regarding its commitment to maintain appropriate levels of overall staffing, ongoing resources and service quality through the transactions under the Separation Plan and after the Change of Control Event. The Board noted that such services include, but are not limited to, portfolio management services, administrative services, and regulatory compliance services. In this regard, the Board considered representations by the Adviser and its affiliates that their separation from ING Groep, as contemplated by the Separation Plan, will not lead to a reduction in the quality or scope of these and other services provided by those firms to the Portfolios. The Board also considered the importance of the asset management operations to the overall success of Voya Financial, Inc., which provides a strong incentive to Voya Financial, Inc. to provide appropriate resource allocations to support those asset management operations. |
| 3) | | The Board considered representations by the Adviser and its affiliates that approval of the New Agreements would be necessary for the Portfolios to continue receiving investment management services from the Adviser and Sub-Adviser following the November 18th Change of Control Event. In addition, the Board considered representations by the Adviser and its affiliates, as well as related supporting documentation, indicating that the New Agreements, including the fees payable thereunder, are substantially similar to and, in any event, are no less favorable to the Portfolios than, the terms of the corresponding Prior Agreements. |
| 4) | | The Board considered representations by the Adviser and its affiliates, including senior investment management personnel, as well as related supporting documentation, indicating that: (a) the Adviser and Sub-Adviser can be expected to provide services of the same nature, extent and quality under the New Agreements as were provided under the Prior Agreements; and (b) the November 18th Change of Control Event is not expected to result in any changes to: (i) the management of the Portfolios, including the continuity of the Portfolios’ portfolio managers and other personnel responsible for the management operations of the Portfolios; or (ii) the investment objective of or the principal investment strategies used to manage any of the Portfolios. |
129
ADVISORY CONTRACT APPROVAL DISCUSSION (UNAUDITED) (CONTINUED)
| 5) | | The Board considered actions taken by the Adviser subsequent to the September 12, 2014 approvals of the Prior Agreements with respect to certain Voya funds in response to requests made by the Board in connection with those approvals. |
| 6) | | The Board considered the potential benefits to be realized by the Adviser and its affiliates as a result of the New Agreements. |
Based on the foregoing and other relevant considerations, at a meeting of the Board held on November 18, 2014, the Board, including a majority of the Independent Directors, voted to approve the New Agreements. In this connection, the Board concluded that, in light of all factors considered, the terms of the New Agreements, including fee rates, were fair and reasonable, and the New Agreements should be approved so as to enable a continuation without interruption of the services being provided by the current service providers pursuant to the Prior Agreements. The Board noted that no one factor was determinative of its decisions which, instead, were premised upon the totality of factors considered. The Board also noted that different Board members likely placed emphasis on different factors in reaching their individual conclusions to vote in favor of the New Agreements.
130
(THIS PAGE INTENTIONALLY LEFT BLANK)
(THIS PAGE INTENTIONALLY LEFT BLANK)
(THIS PAGE INTENTIONALLY LEFT BLANK)
Investment Adviser
Directed Services LLC
1475 Dunwoody Drive
West Chester, Pennsylvania 19380
Administrator
Voya Funds Services, LLC
7337 East Doubletree Ranch Road, Suite 100
Scottsdale, Arizona 85258
Distributor
Voya Investments Distributor, LLC
7337 East Doubletree Ranch Road, Suite 100
Scottsdale, Arizona 85258
Transfer Agent
BNY Mellon Investment Servicing (U.S.) Inc.
301 Bellevue Parkway
Wilmington, Delaware 19809
Independent Registered Public Accounting Firm
KPMG LLP
Two Financial Center
60 South Street
Boston, Massachusetts 02111
Custodian
The Bank of New York Mellon
One Wall Street
New York, New York 10286
Legal Counsel
Dechert LLP
1900 K Street, N.W.
Washington, D.C. 20006
Before investing, carefully consider the investment objectives, risks, charges and expenses of the variable universal life insurance policy or variable annuity contract and the underlying variable investment options. This and other information is contained in the prospectus for the variable universal life policy or variable annuity contract and the underlying variable investment options. Obtain these prospectuses from your agent/registered representative and read them carefully before investing.
RETIREMENT INVESTMENTS INSURANCE
voyainvestments.com
VPAR-VSOL (1214-021715)

Annual Report
December 31, 2014
Classes ADV, I, S, S2 and T
Voya Partners, Inc.
| ■ | Voya Index Solution Income Portfolio |
| ■ | Voya Index Solution 2015 Portfolio |
| ■ | Voya Index Solution 2020 Portfolio |
| ■ | Voya Index Solution 2025 Portfolio |
| ■ | Voya Index Solution 2030 Portfolio |
| ■ | Voya Index Solution 2035 Portfolio |
| ■ | Voya Index Solution 2040 Portfolio |
| ■ | Voya Index Solution 2045 Portfolio |
| ■ | Voya Index Solution 2050 Portfolio |
| ■ | Voya Index Solution 2055 Portfolio |
| This report is submitted for general information to shareholders of the Voya mutual funds. It is not authorized for distribution to prospective shareholders unless accompanied or preceded by a prospectus which includes details regarding the funds’ investment objectives, risks, charges, expenses and other information. This information should be read carefully. |
| INVESTMENT MANAGEMENT | |
| | |
| voyainvestments.com |  |
TABLE OF CONTENTS
PROXY VOTING INFORMATION
A description of the policies and procedures that the Portfolios use to determine how to vote proxies related to portfolio securities is available: (1) without charge, upon request, by calling Shareholder Services toll-free at (800) 992-0180; (2) on the Portfolios’ website at www.voyainvestments.com; and (3) on the U.S. Securities and Exchange Commission’s (“SEC’s”) website at www.sec.gov. Information regarding how the Portfolios voted proxies related to portfolio securities during the most recent 12-month period ended June 30 is available without charge on the Portfolios’ website at www.voyainvestments.com and on the SEC’s website at www.sec.gov.
QUARTERLY PORTFOLIO HOLDINGS
The Portfolios file their complete schedule of portfolio holdings with the SEC for the first and third quarters of each fiscal year on Form N-Q. The Portfolios’ Forms N-Q are available on the SEC’s website at www.sec.gov. The Portfolios’ Forms N-Q may be reviewed and copied at the SEC’s Public Reference Room in Washington, DC, and information on the operation of the Public Reference Room may be obtained by calling (800) SEC-0330. The Portfolios’ Forms N-Q, as well as a complete portfolio of investments, are available without charge upon request from the Portfolios by calling Shareholder Services toll-free at (800) 992-0180.
[This Page Intentionally Left Blank]
PRESIDENT’S LETTER
New Year, Hopeful View
Dear Shareholder,
As 2014 came to a close, U.S. economic growth accelerated, Japan and Europe were struggling and volatility re-emerged in markets around the world. Though periods of volatility may challenge investor resolve over the course of the year, we believe resilience will prevail thanks to continued improvements in global consumer and business spending and ample global liquidity.
Resilience has been a defining characteristic of markets for some time now, as we have seen them shake off such potentially destabilizing events as Europe’s chronic economic malaise, China’s growth slowdown and Japan’s sharp and surprising return to recession. And that’s not to mention the various geopolitical hotspots — Ukraine, the Middle East and elsewhere — that have flared up from time to time. Along the way markets have been fortified by all-time high U.S. corporate earnings; renewed monetary stimulus from central banks in Japan, Europe and China; and plummeting oil prices that have provided a positive supply shock to consumers and businesses. This confluence of events has bolstered markets worldwide and has raised investor confidence that such trends can be sustained into 2015.
Despite our optimism, we — as always — advocate a well-balanced, globally diversified portfolio. We believe such an approach is the best way to potentially benefit from whatever opportunities may arise, while limiting the potential for over-exposure to as-yet-unidentified risks. Also as always, be sure to review your investment strategy and portfolio with your financial advisor to ensure they continue to reflect your goals and needs. Thoroughly discuss any potential portfolio changes with your advisor before taking action.
We appreciate your continued confidence in us, and we look forward to serving your investment needs in the future.
Sincerely,

Shaun Mathews
Executive Vice President
Voya Family of Funds
January 28, 2015
The views expressed in the President’s Letter reflect those of the President as of the date of the letter. Any such views are subject to change at any time based upon market or other conditions and the Voya mutual funds disclaim any responsibility to update such views. These views may not be relied on as investment advice and because investment decisions for a Voya mutual fund are based on numerous factors, may not be relied on as an indication of investment intent on behalf of any Voya mutual fund. Reference to specific company securities should not be construed as recommendations or investment advice.
International investing poses special risks including currency fluctuation, economic and political risks not found in investments that are solely domestic.
Market Perspective: Year Ended December 31, 2014
Global equities, in the form of the MSCI World IndexSM (the “Index”) measured in local currencies, including net reinvested dividends ended 2013 at a record high. Investor sentiment had evidently reconciled itself to the tapering of the U.S. Federal Reserve Board’s (“Fed’s”) $85 billion of monthly Treasury and mortgage-backed securities purchases. The Fed’s December 18 announcement of a reduction in purchases to $75 billion per month with more to come was taken in stride. There was still plenty to worry about however and the Index endured an early slump and wide swings late in 2014 before ending up 9.81% for the year. (The Index returned 4.94% for the one year ended December 31, 2014, measured in U.S. dollars.)
It did not take long for worries about a flagging U.S. economy to resurface. A disappointingly weak employment report on January 10 showed only 74,000 jobs created in December, the lowest in nearly three years. A cold and snowy winter was thought to be depressing hiring and other key statistics like durable goods orders and home sales.
The Index reached its low point on February 3, down almost exactly 5% in 2014. Yet it took only 18 days to erase the loss despite new political turmoil that flared in Eastern Europe as Russia annexed Crimea after the president of Ukraine was deposed.
With the improvement in the season came a pick-up in U.S. economic data. Employment reports were looking better and the unemployment rate fell below 6%. The December bulletin marked the eighth consecutive month in which more than 200,000 jobs were created. National purchasing managers’ activity indices signaled healthy expansion. While the housing market was cooling, the annualized rate of existing home sales exceeded 5 million for five straight months. Consumer confidence touched seven-year high levels. Growth in gross domestic product (“GDP”) was -2.1% (annualized) in the first quarter but bounced back to 5.0% in the third.
Yet concerns remained about the sustainability of the recovery in the U.S. and worldwide. The improving U.S. employment situation was accompanied by labor force participation rates at or near the lowest since 1978. Wage growth was sluggish near 2% annually. The Fed’s monthly Treasury and mortgage-backed securities purchases ended in October.
Outside of the U.S., growth in China was decelerating, which also weighed on global commodity supplying countries. Japan re-entered recession in the third quarter after an April rise in consumption tax. But it was the euro zone that was the most problematic. Growth almost ground to a halt in the second and third quarters. Unemployment seemed stuck at 11.5%, while deflation was perilously close. Markets became increasingly skeptical that the European Central Bank (“ECB”) could attempt U.S., UK and Japan-style quantitative easing with Germany unequivocally opposed. Oil prices had been steadily falling since late June and would halve by year-end. Increased shale oil production notwithstanding, was this also a signal that global economic activity was weaker than anyone had imagined?
Securities prices mirrored investors’ mood swings in the last few months. The Index actually reached a new peak on September 19, but by October 16 fell 8.2%. From there the Index rebounded 12% to December 5, fell 5% to December 16 then rose 4% to end the year 1.3% below its all-time high.
In U.S. fixed income markets, the Barclays Long-Term U.S. Treasury sub-index returned a remarkable 25.07% in 2014; the
Barclays Short-Term U.S. Treasury sub-index just 0.09% as the Treasury yield curve flattened. The Barclays U.S. Aggregate Bond Index (“Barclays Aggregate”) added 5.97%, while the Barclays U.S. Corporate Investment Grade Bond sub-index gained 7.46%. Both outperformed the Barclays High Yield Bond — 2% Issuer Constrained Composite Index (not a part of the Barclays Aggregate), which gained only 2.46%, perhaps reflecting growing disillusionment with the risk/reward profile of high yield bonds after strong returns in recent years.
U.S. equities, represented by the S&P 500® Index including dividends, returned 13.69% in the fiscal year, about 1.5% below its all-time high. The utilities sector was the top performer, returning 28.98%; not surprisingly, the only loser was energy, which dropped 7.78% as oil prices sagged. Record operating earnings per share for S&P 500® companies in the second and third quarters were supported by low interest rates, slow wage growth and historically high share buy-back volumes. Operating margins breached 10% for the first time.
In currencies, the dollar advanced against most other currencies over the year. The dollar surged 13.60% against the euro, on the U.S.’s much better growth and interest rate increase prospects, and 13.74% against the yen, on the likelihood of further monetary easing in Japan and an announced partial re-allocation into non-yen securities for the giant Government Pension Investment Fund (“GPIF”). The dollar gained less, 6.29%, on the pound. The UK had a better growth story than the euro zone, which however is the destination for about 40% of the UK’s exports.
In international markets, the MSCI Japan® Index rose 9.48% in 2014, boosted in the case of Japan’s large exporters by the falling yen and in general by the GPIF’s announcement described above. The MSCI Europe ex UK® Index added 6.63%. The poor economic data referred to above and the lingering conflict in Ukraine dampened markets, which were spasmodically supported by the possibility of quantitative easing. The strong health care sector contributed about one third of the total. Despite superior economic results, the MSCI UK® Index was much weaker, edging up 0.50%. UK stock indices are not particularly representative of the UK economy: the largest 14 names account for half of the index and comprise mostly global banking, energy, pharmaceuticals and materials companies. As a group, they held back returns by about 1.80%.
All indices are unmanaged and investors cannot invest directly in an index. Past performance does not guarantee future results. The performance quoted represents past performance. Investment return and principal value of an investment will fluctuate, and shares, when redeemed, may be worth more or less than their original cost. The Portfolios’ performance is subject to change since the period’s end and may be lower or higher than the performance data shown. Please call (800) 262-3862 or log on to www.voyainvestments.com to obtain performance data current to the most recent month end.
Market Perspective reflects the views of Voya Investment Management’s Chief Investment Risk Officer only through the end of the period, and is subject to change based on market and other conditions.
Benchmark Descriptions
| Index | Description |
| Barclays High Yield Bond — 2% Issuer Constrained Composite Index | An unmanaged index that includes all fixed-income securities having a maximum quality rating of Ba1, a minimum amount outstanding of $150 million, and at least one year to maturity. |
| Barclays Long-Term U.S. Treasury Index | The Index includes all publicly issued, U.S. Treasury securities that have a remaining maturity of 10 or more years, are rated investment grade, and have $250 million or more of outstanding face value. |
| Barclays Short-Term U.S. Treasury Index | A market capitalization-weighted index that is composed of fixed-rate, non-convertible U.S. Treasury securities that have a remaining maturity of between one and 12 months and have $250 million or more of outstanding face value. |
| Barclays U.S. Aggregate Bond Index | An unmanaged index of publicly issued investment grade U.S. Government, mortgage-backed, asset-backed and corporate debt securities. |
| Barclays U.S. Corporate Investment Grade Bond Index | An unmanaged index consisting of publicly issued, fixed rate, nonconvertible, investment grade debt securities. |
| MSCI Europe ex UK® Index | A free float-adjusted market capitalization index that is designed to measure developed market equity performance in Europe, excluding the UK. |
| MSCI Japan® Index | A free float-adjusted market capitalization index that is designed to measure developed market equity performance in Japan. |
| MSCI UK® Index | A free float-adjusted market capitalization index that is designed to measure developed market equity performance in the UK. |
| MSCI World IndexSM | An unmanaged index that measures the performance of over 1,400 securities listed on exchanges in the U.S., Europe, Canada, Australia, New Zealand and the Far East. |
| S&P 500® Index | An unmanaged index that measures the performance of securities of approximately 500 large-capitalization companies whose securities are traded on major U.S. stock markets. |
| S&P Target Date Retirement Income Index | Seeks to represent asset allocations which target an immediate retirement horizon. |
S&P Target Date 2015 Index,
S&P Target Date 2020 Index,
S&P Target Date 2025 Index,
S&P Target Date 2030 Index,
S&P Target Date 2035 Index,
S&P Target Date 2040 Index and
S&P Target Date 2045 Index | Each seeks to represent the market consensus for asset allocations which target an approximate 2015, 2020, 2025, 2030, 2035, 2040, 2045 and beyond 2045 retirement horizon, respectively. |
| Voya Index Solution Portfolios | Portfolio Managers’ Report |
The Voya Index Solution Portfolios consist of Voya Index Solution Income Portfolio, Voya Index Solution 2015 Portfolio*, Voya Index Solution 2020 Portfolio, Voya Index Solution 2025 Portfolio, Voya Index Solution 2030 Portfolio, Voya Index Solution 2035 Portfolio, Voya Index Solution 2040 Portfolio, Voya Index Solution 2045 Portfolio, Voya Index Solution 2050 Portfolio and Voya Index Solution 2055 Portfolio (each a “Portfolio” or collectively, the “Portfolios” or the “Index Solution Portfolios”). Each Portfolio seeks to achieve its investment objective by investing in a combination of underlying funds which are actively managed funds or passively managed funds (index funds)(1). The Portfolios are managed by Halvard Kvaale, CIMA, Paul Zemsky, CFA, and Frank van Etten, Portfolio Managers of Voya Investment Management Co. LLC (“Voya IM”) — the Sub-Adviser (“Sub-Adviser”).
Portfolio Specifics: We began the year overweight to euro zone equities and high yield corporate bonds, funded by underweights to U.S. large-cap core equity and emerging markets equity and core U.S. fixed income. In February, we moved to an overweight in U.S. large-cap core equity, funded by a further reduction in U.S. core fixed income within the Voya Index Solution 2015 Portfolio. In March, due to the geopolitical situation in Russia and Ukraine, we reduced our emerging market equity position and moved the proceeds into U.S. large-cap core equity.
At the beginning of May, as part of our annual review process, the series glided down, resulting in lower equity allocations for the mid- and near-dated Portfolios. As the second quarter drew to a close, we took profits on our overweight euro zone trade and moved the funds into U.S. large-cap core equity.
In July, we took profits by selling a portion of our overweight high yield corporate bond position and allocated the proceeds into senior loans. At the beginning of August, we reduced our U.S. large-cap core equity overweight and purchased emerging market equities. This trade was a reversal of a position initiated in the first quarter where we had turned cautious on emerging markets given geopolitical unrest in Russia and Ukraine. We continued to have concerns about the ability of emerging market companies to increase their profitability longer term and so preserved a slight underweight to the asset class. At the end of August, we sold U.S. small-cap equity and added to our international equities position, based on comments by European Central Bank President Mario Draghi, that suggest increased intervention by the central bank through asset purchase programs and greater openness to fiscal stimulus. We found that U.S. small-cap stocks had unattractive valuations, poor earnings fundamentals, as well as worrying technicals and relative investor flows. At the end of the third quarter, we made a defensive trade by selling U.S. large-cap core equity and purchasing U.S. core fixed income. Rationales for this trade included the possibility of deflation in Europe, slow responses by the global central banks and muted economic global growth outside the United States.
At the end of October, we unwound this defensive position when negative sentiment reached extreme levels within our economic indicators. In December, we purchased Japan equities, funded by U.S. large-cap core. At the time of the trade, we believed Japanese equities to be relatively undervalued and had the potential to rise more than U.S. equities in 2015. While U.S. growth remains strong, potential for growth in the U.S. equity market is limited by high valuations of companies in the equity markets, both relative to U.S. valuations over the past decade and to valuation of companies in other regions.
Overall, tactical moves had a negative impact on performance for the year.
Certain Index Solution Portfolios outperformed their respective Standard & Poor’s Target Date indices (“S&P”); others did not, depending on the applicable asset allocations in each case**. Index Solution Portfolios tended to hold a higher domestic equity allocation relative to S&P, which was an advantage as non-US stocks lagged. Within US equities, Index Solution Portfolios benefitted from allocations to subclasses with higher average returns than S&P. Within non-US equities, Index Solution Portfolios included higher allocations to emerging markets, which outperformed developed markets. In contrast, our near-dated Portfolios’ performance was negatively impacted by their conservative equity allocation relative to S&P.
Current Strategy and Outlook: Looking ahead, we believe the knock-on effects of collapsing oil prices will vary across industries, regions and asset classes. We believe the U.S. will maintain a modest pace of growth, while global central banks will aggressively fight to improve their own near-term outlooks. In our view, the end of quantitative easing confirms the strength of the U.S. economy, but the uncertain start of interest rate hikes will increase market volatility.
| * | Effective November 20, 2014, the Board of Directors approved a proposal to reorganize the Voya Index Solution 2015 Portfolio with and into the Voya Index Solution Income Portfolio. |
| ** | Each Portfolio’s relative performance versus its respective benchmark can be found on page 5. |
| (1) | The investment objective of each Portfolio is described in the Portfolios’ prospectuses, each dated April 30, 2014. |
Portfolio holdings and characteristics are subject to change and may not be representative of current holdings and characteristics. The outlook for these Portfolios may differ from that presented for other Voya mutual funds. Performance for the different classes of shares will vary based on differences in fees associated with each class.
| Portfolio Managers’ Report | Voya Index Solution Portfolios |
| | Average Annual Total Returns for the Period Ended December 31, 2014 | |
| | | | 1 Year | | |
| | Voya Index Solution Income Portfolio, Class S | | | 5.90 | % | |
| | S&P Target Date Retirement Income Index | | | 5.13 | % | |
| | Voya Index Solution 2015 Portfolio, Class S | | | 5.73 | % | |
| | S&P Target Date 2015 Index | | | 5.75 | % | |
| | Voya Index Solution 2020 Portfolio, Class S | | | 5.54 | % | |
| | S&P Target Date 2020 Index | | | 5.93 | % | |
| | Voya Index Solution 2025 Portfolio, Class S | | | 5.67 | % | |
| | S&P Target Date 2025 Index | | | 5.83 | % | |
| | Voya Index Solution 2030 Portfolio, Class S | | | 5.32 | % | |
| | S&P Target Date 2030 Index | | | 5.90 | % | |
| | Voya Index Solution 2035 Portfolio, Class S | | | 5.90 | % | |
| | S&P Target Date 2035 Index | | | 5.95 | % | |
| | Voya Index Solution 2040 Portfolio, Class S | | | 6.03 | % | |
| | S&P Target Date 2040 Index | | | 5.96 | % | |
| | Voya Index Solution 2045 Portfolio, Class S | | | 6.01 | % | |
| | S&P Target Date 2045 Index | | | 5.93 | % | |
| | Voya Index Solution 2050 Portfolio, Class S | | | 5.93 | % | |
| | S&P Target Date 2045 Index | | | 5.93 | % | |
| | Voya Index Solution 2055 Portfolio, Class S | | | 6.35 | % | |
| | S&P Target Date 2045 Index | | | 5.93 | % | |
| | Target Asset Allocation as of December 31, 2014 | |
| | Asset Class | | 2055 | | | 2050 | | | 2045 | | | 2040 | | | 2035 | | | 2030 | | | 2025 | | | 2020 | | | 2015 | | | Income | | |
| | US Large Cap | | | 43.0 | % | | | 43.0 | % | | | 43.0 | % | | | 43.0 | % | | | 39.0 | % | | | 33.0 | % | | | 30.0 | % | | | 27.0 | % | | | 20.0 | % | | | 20.0 | % | |
| | US Mid Cap | | | 17.0 | % | | | 17.0 | % | | | 17.0 | % | | | 16.0 | % | | | 15.0 | % | | | 14.0 | % | | | 14.0 | % | | | 11.0 | % | | | 8.0 | % | | | 8.0 | % | |
| | US Small Cap | | | 5.0 | % | | | 5.0 | % | | | 5.0 | % | | | 5.0 | % | | | 5.0 | % | | | 4.0 | % | | | 4.0 | % | | | 3.0 | % | | | 2.0 | % | | | — | | |
| | International Large Cap | | | 21.0 | % | | | 21.0 | % | | | 21.0 | % | | | 20.0 | % | | | 19.0 | % | | | 19.0 | % | | | 14.0 | % | | | 11.0 | % | | | 9.0 | % | | | 5.0 | % | |
| | Emerging Markets | | | 9.0 | % | | | 9.0 | % | | | 9.0 | % | | | 7.0 | % | | | 5.0 | % | | | 5.0 | % | | | 4.0 | % | | | 3.0 | % | | | 3.0 | % | | | 2.0 | % | |
| | Core Fixed Income | | | 5.0 | % | | | 5.0 | % | | | 5.0 | % | | | 7.0 | % | | | 11.0 | % | | | 19.0 | % | | | 25.0 | % | | | 36.0 | % | | | 49.0 | % | | | 56.0 | % | |
| | High Yield | | | — | | | | — | | | | — | | | | 2.0 | % | | | 6.0 | % | | | 6.0 | % | | | 9.0 | % | | | 9.0 | % | | | 9.0 | % | | | 9.0 | % | |
| | | | | 100.0 | % | | | 100.0 | % | | | 100.0 | % | | | 100.0 | % | | | 100.0 | % | | | 100.0 | % | | | 100.0 | % | | | 100.0 | % | | | 100.0 | % | | | 100.0 | % | |
As these are target allocations, the actual allocations of each Portfolio’s assets may deviate from the percentages shown. Although the Portfolios expect to be fully invested at all times, they may maintain liquidity reserves to meet redemption requests.
Portfolio holdings are subject to change daily.
| Voya Index Solution Income Portfolio | Portfolio Managers’ Report |

| | Average Annual Total Returns for the Periods Ended December 31, 2014 | |
| | | | 1 Year | | 5 Year | | Since Inception
of Classes ADV, I, S and T
March 10, 2008 | | Since Inception
of Class S2
May 28, 2009 | | |
| | Class ADV | | 5.68% | | 6.23% | | 4.93% | | — | | |
| | Class I | | 6.23% | | 6.79% | | 5.48% | | — | | |
| | Class S | | 5.90% | | 6.49% | | 5.19% | | — | | |
| | Class S2 | | 5.78% | | 6.35% | | — | | 7.52% | | |
| | Class T | | 5.47% | | 6.02% | | 4.71% | | — | | |
| | S&P Target Date Retirement Income Index | | 5.13% | | 6.59% | | 4.97% | | 7.94% | | |
Based on a $10,000 initial investment, the graph and table above illustrate the total return of Voya Index Solution Income Portfolio against the index indicated. The index is unmanaged and has no cash in its portfolio, imposes no sales charges and incurs no operating expenses. An investor cannot invest directly in an index. The Portfolio’s performance is shown without the imposition of any expenses or charges which are, or may be, imposed under your annuity contract. Total returns would have been lower if such expenses or charges were included.
The performance graph and table do not reflect the deduction of taxes that a shareholder will pay on Portfolio distributions or the redemption of Portfolio shares.
The performance shown may include the effect of fee waivers and/or expense reimbursements by the Investment Adviser and/or other service providers, which have the effect of increasing total return. Had all fees and expenses been considered, the total returns would have been lower.
Performance data represents past performance and is no assurance of future results. Investment return and principal value of an investment in the Portfolio will fluctuate. Shares, when sold, may be worth more or less than their original cost. The Portfolio’s current performance may be lower or higher than the performance data shown. Please log on to www.voyainvestments.com or call (800) 262-3862 to get performance through the most recent month end.
This report contains statements that may be “forward-looking” statements. Actual results may differ materially from those projected in the “forward-looking” statements.
The views expressed in this report reflect those of the portfolio managers, only through the end of the period as stated on the cover. The portfolio managers’ views are subject to change at any time based on market and other conditions.
Portfolio holdings are subject to change daily.
| Portfolio Managers’ Report | Voya Index Solution 2015 Portfolio |

| | Average Annual Total Returns for the Periods Ended December 31, 2014 | |
| | | | 1 Year | | 5 Year | | Since Inception
of Classes ADV, I, S and T
March 10, 2008 | | Since Inception
of Class S2
May 28, 2009 | |
| | Class ADV | | 5.45% | | 6.75% | | 4.61% | | — | |
| | Class I | | 6.06% | | 7.27% | | 5.13% | | — | |
| | Class S | | 5.73% | | 7.02% | | 4.87% | | — | |
| | Class S2 | | 5.61% | | 6.86% | | — | | 8.82% | |
| | Class T | | 5.24% | | 6.52% | | 4.38% | | — | |
| | S&P Target Date 2015 Index | | 5.75% | | 8.46% | | 6.06% | | 10.52% | |
Based on a $10,000 initial investment, the graph and table above illustrate the total return of Voya Index Solution 2015 Portfolio against the index indicated. The index is unmanaged and has no cash in its portfolio, imposes no sales charges and incurs no operating expenses. An investor cannot invest directly in an index. The Portfolio’s performance is shown without the imposition of any expenses or charges which are, or may be, imposed under your annuity contract. Total returns would have been lower if such expenses or charges were included.
The performance graph and table do not reflect the deduction of taxes that a shareholder will pay on Portfolio distributions or the redemption of Portfolio shares.
The performance shown may include the effect of fee waivers and/or expense reimbursements by the Investment Adviser and/or other service providers, which have the effect of increasing total return. Had all fees and expenses been considered, the total returns would have been lower.
Performance data represents past performance and is no assurance of future results. Investment return and principal value of an investment in the Portfolio will fluctuate. Shares, when sold, may be worth more or less than their original cost. The Portfolio’s current performance may be lower or higher than the performance data shown. Please log on to www.voyainvestments.com or call (800) 262-3862 to get performance through the most recent month end.
This report contains statements that may be “forward-looking” statements. Actual results may differ materially from those projected in the “forward-looking” statements.
The views expressed in this report reflect those of the portfolio managers, only through the end of the period as stated on the cover. The portfolio managers’ views are subject to change at any time based on market and other conditions.
Portfolio holdings are subject to change daily.
| Voya Index Solution 2020 Portfolio | Portfolio Managers’ Report |

| | Average Annual Total Returns for the Periods Ended December 31, 2014 | |
| | | | 1 Year | | Since Inception
of Classes ADV, I, S, T and S2
October 3, 2011 | |
| | Class ADV | | 5.27% | | 11.64% | |
| | Class I | | 5.86% | | 12.19% | |
| | Class S | | 5.54% | | 11.83% | |
| | Class S2 | | 5.36% | | 11.77% | |
| | Class T | | 5.07% | | 11.40% | |
| | S&P Target Date 2020 Index | | 5.93% | | 13.05% | |
Based on a $10,000 initial investment, the graph and table above illustrate the total return of Voya Index Solution 2020 Portfolio against the index indicated. The index is unmanaged and has no cash in its portfolio, imposes no sales charges and incurs no operating expenses. An investor cannot invest directly in an index. The Portfolio’s performance is shown without the imposition of any expenses or charges which are, or may be, imposed under your annuity contract. Total returns would have been lower if such expenses or charges were included.
The performance graph and table do not reflect the deduction of taxes that a shareholder will pay on Portfolio distributions or the redemption of Portfolio shares.
The performance shown may include the effect of fee waivers and/or expense reimbursements by the Investment Adviser and/or other service providers, which have the effect of increasing total return. Had all fees and expenses been considered, the total returns would have been lower.
Performance data represents past performance and is no assurance of future results. Investment return and principal value of an investment in the Portfolio will fluctuate. Shares, when sold, may be worth more or less than their original cost. The Portfolio’s current performance may be lower or higher than the performance data shown. Please log on to www.voyainvestments.com or call (800) 262-3862 to get performance through the most recent month end.
This report contains statements that may be “forward-looking” statements. Actual results may differ materially from those projected in the “forward-looking” statements.
The views expressed in this report reflect those of the portfolio managers, only through the end of the period as stated on the cover. The portfolio managers’ views are subject to change at any time based on market and other conditions.
Portfolio holdings are subject to change daily.
| Portfolio Managers’ Report | Voya Index Solution 2025 Portfolio |
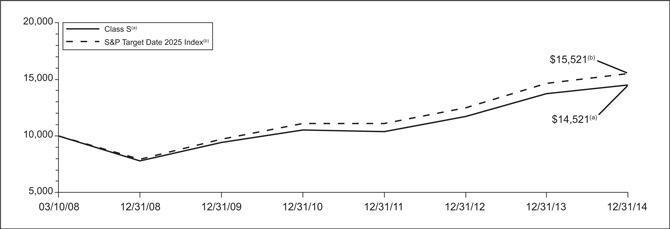
| | Average Annual Total Returns for the Periods Ended December 31, 2014 | |
| | | | 1 Year | | 5 Year | | Since Inception of
Classes ADV, I, S and T
March 10, 2008 | | Since Inception
of Class S2
May 28, 2009 | |
| | Class ADV | | 5.41% | | 8.73% | | 5.37% | | — | |
| | Class I | | 5.95% | | 9.26% | | 5.89% | | — | |
| | Class S | | 5.67% | | 8.99% | | 5.63% | | — | |
| | Class S2 | | 5.52% | | 8.84% | | — | | 11.27% | |
| | Class T | | 5.23% | | 8.49% | | 5.14% | | — | |
| | S&P Target Date 2025 Index | | 5.83% | | 9.82% | | 6.67% | | 12.39% | |
Based on a $10,000 initial investment, the graph and table above illustrate the total return of Voya Index Solution 2025 Portfolio against the index indicated. The index is unmanaged and has no cash in its portfolio, imposes no sales charges and incurs no operating expenses. An investor cannot invest directly in an index. The Portfolio’s performance is shown without the imposition of any expenses or charges which are, or may be, imposed under your annuity contract. Total returns would have been lower if such expenses or charges were included.
The performance graph and table do not reflect the deduction of taxes that a shareholder will pay on Portfolio distributions or the redemption of Portfolio shares.
The performance shown may include the effect of fee waivers and/or expense reimbursements by the Investment Adviser and/or other service providers, which have the effect of increasing total return. Had all fees and expenses been considered, the total returns would have been lower.
Performance data represents past performance and is no assurance of future results. Investment return and principal value of an investment in the Portfolio will fluctuate. Shares, when sold, may be worth more or less than their original cost. The Portfolio’s current performance may be lower or higher than the performance data shown. Please log on to www.voyainvestments.com or call (800) 262-3862 to get performance through the most recent month end.
This report contains statements that may be “forward-looking” statements. Actual results may differ materially from those projected in the “forward-looking” statements.
The views expressed in this report reflect those of the portfolio managers, only through the end of the period as stated on the cover. The portfolio managers’ views are subject to change at any time based on market and other conditions.
Portfolio holdings are subject to change daily.
| Voya Index Solution 2030 Portfolio | Portfolio Managers’ Report |

| | Average Annual Total Returns for the Periods Ended December 31, 2014 | |
| | | | 1 Year | | Since Inception of
Classes ADV, I, S, T and S2
October 3, 2011 | |
| | Class ADV | | 5.00% | | 14.77% | |
| | Class I | | 5.52% | | 15.33% | |
| | Class S | | 5.32% | | 14.97% | |
| | Class S2 | | 5.00% | | 14.86% | |
| | Class T | | 4.75% | | 14.53% | |
| | S&P Target Date 2030 Index | | 5.90% | | 15.60% | |
Based on a $10,000 initial investment, the graph and table above illustrate the total return of Voya Index Solution 2030 Portfolio against the index indicated. The index is unmanaged and has no cash in its portfolio, imposes no sales charges and incurs no operating expenses. An investor cannot invest directly in an index. The Portfolio’s performance is shown without the imposition of any expenses or charges which are, or may be, imposed under your annuity contract. Total returns would have been lower if such expenses or charges were included.
The performance graph and table do not reflect the deduction of taxes that a shareholder will pay on Portfolio distributions or the redemption of Portfolio shares.
The performance shown may include the effect of fee waivers and/or expense reimbursements by the Investment Adviser and/or other service providers, which have the effect of increasing total return. Had all fees and expenses been considered, the total returns would have been lower.
Performance data represents past performance and is no assurance of future results. Investment return and principal value of an investment in the Portfolio will fluctuate. Shares, when sold, may be worth more or less than their original cost. The Portfolio’s current performance may be lower or higher than the performance data shown. Please log on to www.voyainvestments.com or call (800) 262-3862 to get performance through the most recent month end.
This report contains statements that may be “forward-looking” statements. Actual results may differ materially from those projected in the “forward-looking” statements.
The views expressed in this report reflect those of the portfolio managers, only through the end of the period as stated on the cover. The portfolio managers’ views are subject to change at any time based on market and other conditions.
Portfolio holdings are subject to change daily.
| Portfolio Managers’ Report | Voya Index Solution 2035 Portfolio |

| | Average Annual Total Returns for the Period Endeds December 31, 2014 | |
| | | | 1 Year | | 5 Year | | Since Inception
of Classes ADV, I, S and T
March 10, 2008 | | Since Inception
of Class S2
May 28, 2009 | |
| | Class ADV | | 5.65% | | 9.92% | | 5.85% | | — | |
| | Class I | | 6.16% | | 10.45% | | 6.37% | | — | |
| | Class S | | 5.90% | | 10.19% | | 6.11% | | — | |
| | Class S2 | | 5.77% | | 10.03% | | — | | 12.69% | |
| | Class T | | 5.57% | | 9.68% | | 5.62% | | — | |
| | S&P Target Date 2035 Index | | 5.95% | | 10.78% | | 6.93% | | 13.63% | |
Based on a $10,000 initial investment, the graph and table above illustrate the total return of Voya Index Solution 2035 Portfolio against the index indicated. The index is unmanaged and has no cash in its portfolio, imposes no sales charges and incurs no operating expenses. An investor cannot invest directly in an index. The Portfolio’s performance is shown without the imposition of any expenses or charges which are, or may be, imposed under your annuity contract. Total returns would have been lower if such expenses or charges were included.
The performance graph and table do not reflect the deduction of taxes that a shareholder will pay on Portfolio distributions or the redemption of Portfolio shares.
The performance shown may include the effect of fee waivers and/or expense reimbursements by the Investment Adviser and/or other service providers, which have the effect of increasing total return. Had all fees and expenses been considered, the total returns would have been lower.
Performance data represents past performance and is no assurance of future results. Investment return and principal value of an investment in the Portfolio will fluctuate. Shares, when sold, may be worth more or less than their original cost. The Portfolio’s current performance may be lower or higher than the performance data shown. Please log on to www.voyainvestments.com or call (800) 262-3862 to get performance through the most recent month end.
This report contains statements that may be “forward-looking” statements. Actual results may differ materially from those projected in the “forward-looking” statements.
The views expressed in this report reflect those of the portfolio managers, only through the end of the period as stated on the cover. The portfolio managers’ views are subject to change at any time based on market and other conditions.
Portfolio holdings are subject to change daily.
| Voya Index Solution 2040 Portfolio | Portfolio Managers’ Report |

| | Average Annual Total Returns for the Periods Ended December 31, 2014 | |
| | | | 1 Year | | Since Inception of
Classes ADV, I, S, T and S2
October 3, 2011 | |
| | Class ADV | | 5.73% | | 17.25% | |
| | Class I | | 6.21% | | 17.84% | |
| | Class S | | 6.03% | | 17.51% | |
| | Class S2 | | 5.80% | | 17.35% | |
| | Class T | | 5.54% | | 17.05% | |
| | S&P Target Date 2040 Index | | 5.96% | | 17.24% | |
Based on a $10,000 initial investment, the graph and table above illustrate the total return of Voya Index Solution 2040 Portfolio against the index indicated. The index is unmanaged and has no cash in its portfolio, imposes no sales charges and incurs no operating expenses. An investor cannot invest directly in an index. The Portfolio’s performance is shown without the imposition of any expenses or charges which are, or may be, imposed under your annuity contract. Total returns would have been lower if such expenses or charges were included.
The performance graph and table do not reflect the deduction of taxes that a shareholder will pay on Portfolio distributions or the redemption of Portfolio shares.
The performance shown may include the effect of fee waivers and/or expense reimbursements by the Investment Adviser and/or other service providers, which have the effect of increasing total return. Had all fees and expenses been considered, the total returns would have been lower.
Performance data represents past performance and is no assurance of future results. Investment return and principal value of an investment in the Portfolio will fluctuate. Shares, when sold, may be worth more or less than their original cost. The Portfolio’s current performance may be lower or higher than the performance data shown. Please log on to www.voyainvestments.com or call (800) 262-3862 to get performance through the most recent month end.
This report contains statements that may be “forward-looking” statements. Actual results may differ materially from those projected in the “forward-looking” statements.
The views expressed in this report reflect those of the portfolio managers, only through the end of the period as stated on the cover. The portfolio managers’ views are subject to change at any time based on market and other conditions.
Portfolio holdings are subject to change daily.
| Portfolio Managers’ Report | Voya Index Solution 2045 Portfolio |

| | Average Annual Total Returns for the Periods Ended December 31, 2014 | |
| | | | 1 Year | | 5 Year | | Since Inception of
Classes ADV, I, S and T
March 10, 2008 | | Since Inception of
Class S2
May 28, 2009 | |
| | Class ADV | | 5.80% | | 10.46% | | 5.85% | | — | |
| | Class I | | 6.32% | | 11.02% | | 6.38% | | — | |
| | Class S | | 6.01% | | 10.73% | | 6.12% | | — | |
| | Class S2 | | 5.95% | | 10.58% | | — | | 13.53% | |
| | Class T | | 5.76% | | 10.25% | | 5.65% | | — | |
| | S&P Target Date 2045 Index | | 5.93% | | 11.32% | | 7.00% | | 14.25% | |
Based on a $10,000 initial investment, the graph and table above illustrate the total return of Voya Index Solution 2045 Portfolio against the index indicated. The index is unmanaged and has no cash in its portfolio, imposes no sales charges and incurs no operating expenses. An investor cannot invest directly in an index. The Portfolio’s performance is shown without the imposition of any expenses or charges which are, or may be, imposed under your annuity contract. Total returns would have been lower if such expenses or charges were included.
The performance graph and table do not reflect the deduction of taxes that a shareholder will pay on Portfolio distributions or the redemption of Portfolio shares.
The performance shown may include the effect of fee waivers and/or expense reimbursements by the Investment Adviser and/or other service providers, which have the effect of increasing total return. Had all fees and expenses been considered, the total returns would have been lower.
Performance data represents past performance and is no assurance of future results. Investment return and principal value of an investment in the Portfolio will fluctuate. Shares, when sold, may be worth more or less than their original cost. The Portfolio’s current performance may be lower or higher than the performance data shown. Please log on to www.voyainvestments.com or call (800) 262-3862 to get performance through the most recent month end.
This report contains statements that may be “forward-looking” statements. Actual results may differ materially from those projected in the “forward-looking” statements.
The views expressed in this report reflect those of the portfolio managers, only through the end of the period as stated on the cover. The portfolio managers’ views are subject to change at any time based on market and other conditions.
Portfolio holdings are subject to change daily.
| Voya Index Solution 2050 Portfolio | Portfolio Managers’ Report |

| | Average Annual Total Returns for the Periods Ended December 31, 2014 | |
| | | | 1 Year | | Since Inception of
Classes ADV, I, S, T and S2
October 3, 2011 | |
| | Class ADV | | 5.64% | | 17.43% | |
| | Class I | | 6.12% | | 18.02% | |
| | Class S | | 5.93% | | 17.69% | |
| | Class S2 | | 5.71% | | 17.54% | |
| | Class T | | 5.38% | | 17.20% | |
| | S&P Target Date 2045 Index | | 5.93% | | 17.77% | |
Based on a $10,000 initial investment, the graph and table above illustrate the total return of Voya Index Solution 2050 Portfolio against the index indicated. The index is unmanaged and has no cash in its portfolio, imposes no sales charges and incurs no operating expenses. An investor cannot invest directly in an index. The Portfolio’s performance is shown without the imposition of any expenses or charges which are, or may be, imposed under your annuity contract. Total returns would have been lower if such expenses or charges were included.
The performance graph and table do not reflect the deduction of taxes that a shareholder will pay on Portfolio distributions or the redemption of Portfolio shares.
The performance shown may include the effect of fee waivers and/or expense reimbursements by the Investment Adviser and/or other service providers, which have the effect of increasing total return. Had all fees and expenses been considered, the total returns would have been lower.
Performance data represents past performance and is no assurance of future results. Investment return and principal value of an investment in the Portfolio will fluctuate. Shares, when sold, may be worth more or less than their original cost. The Portfolio’s current performance may be lower or higher than the performance data shown. Please log on to www.voyainvestments.com or call (800) 262-3862 to get performance through the most recent month end.
This report contains statements that may be “forward-looking” statements. Actual results may differ materially from those projected in the “forward-looking” statements.
The views expressed in this report reflect those of the portfolio managers, only through the end of the period as stated on the cover. The portfolio managers’ views are subject to change at any time based on market and other conditions.
Portfolio holdings are subject to change daily.
| Portfolio Managers’ Report | Voya Index Solution 2055 Portfolio |

| | Average Annual Total Returns for the Periods Ended December 31, 2014 | |
| | | | 1 Year | | Since Inception
of Classes ADV, I, S, T and S2
March 8, 2010 | |
| | Class ADV | | 6.08% | | 10.59% | |
| | Class I | | 6.61% | | 11.14% | |
| | Class S | | 6.35% | | 10.88% | |
| | Class S2 | | 6.15% | | 10.70% | |
| | Class T | | 5.82% | | 10.36% | |
| | S&P Target Date 2045 Index | | 5.93% | | 11.20% | |
Based on a $10,000 initial investment, the graph and table above illustrate the total return of Voya Index Solution 2055 Portfolio against the index indicated. The index is unmanaged and has no cash in its portfolio, imposes no sales charges and incurs no operating expenses. An investor cannot invest directly in an index. The Portfolio’s performance is shown without the imposition of any expenses or charges which are, or may be, imposed under your annuity contract. Total returns would have been lower if such expenses or charges were included.
The performance graph and table do not reflect the deduction of taxes that a shareholder will pay on Portfolio distributions or the redemption of Portfolio shares.
The performance shown may include the effect of fee waivers and/or expense reimbursements by the Investment Adviser and/or other service providers, which have the effect of increasing total return. Had all fees and expenses been considered, the total returns would have been lower.
Performance data represents past performance and is no assurance of future results. Investment return and principal value of an investment in the Portfolio will fluctuate. Shares, when sold, may be worth more or less than their original cost. The Portfolio’s current performance may be lower or higher than the performance data shown. Please log on to www.voyainvestments.com or call (800) 262-3862 to get performance through the most recent month end.
This report contains statements that may be “forward-looking” statements. Actual results may differ materially from those projected in the “forward-looking” statements.
The views expressed in this report reflect those of the portfolio managers, only through the end of the period as stated on the cover. The portfolio managers’ views are subject to change at any time based on market and other conditions.
Portfolio holdings are subject to change daily.
SHAREHOLDER EXPENSE EXAMPLES (Unaudited)
As a shareholder of a Portfolio, you incur two types of costs: (1) transaction costs, including redemption fees and exchange fees; and (2) ongoing costs including management fees, distribution and/or service (12b-1) fees, and other Portfolio expenses. These Examples are intended to help you understand your ongoing costs (in dollars) of investing in a Portfolio and to compare these costs with the ongoing costs of investing in other mutual funds.
The Examples are based on an investment of $1,000 invested at the beginning of the period and held for the entire period from July 1, 2014 to December 31, 2014. The Portfolios’ expenses are shown without the imposition of any charges which are, or may be, imposed under your variable annuity contract, variable life insurance policy, qualified pension or retirement plan. Expenses would have been higher if such charges were included.
Actual Expenses
The left section of the table shown below, “Actual Portfolio Return,” provides information about actual account values and actual expenses. You may use the information in this section, together with the amount you invested, to estimate the expenses that you paid over the period. Simply divide your account value by $1,000 (for example, an $8,600 account value divided by $1,000 = 8.6), then multiply the result by the number in the first section under the heading entitled “Expenses Paid During the Period” to estimate the expenses you paid on your account during this period.
Hypothetical Example for Comparison Purposes
The right section of the table shown below, “Hypothetical (5% return before expenses),” provides information about hypothetical account values and hypothetical expenses based on a Portfolio’s actual expense ratio and an assumed rate of return of 5% per year before expenses, which is not a Portfolio’s actual return. The hypothetical account values and expenses may not be used to estimate the actual ending account balance or expenses you paid for the period. You may use this information to compare the ongoing costs of investing in a Portfolio and other mutual funds. To do so, compare this 5% hypothetical example with the 5% hypothetical examples that appear in the shareholder reports of the other mutual funds.
Please note that the expenses shown in the table are meant to highlight your ongoing costs only and do not reflect any transactional costs, such as redemption fees or exchange fees. Therefore, the hypothetical lines of the table are useful in comparing ongoing costs only, and will not help you determine the relative total costs of owning different mutual funds. In addition, if these transactional costs were included, your costs would have been higher.
| | | Actual Portfolio Return | | | Hypothetical (5% return before expenses) | |
| | | Beginning
Account
Value
July 1,
2014 | | | Ending
Account
Value
December 31,
2014 | | | Annualized
Expense
Ratio* | | | Expenses Paid
During the
Period Ended
December 31,
2014** | | | Beginning
Account
Value
July 1,
2014 | | | Ending
Account
Value
December 31,
2014 | | | Annualized
Expense
Ratio* | | | Expenses Paid
During the
Period Ended
December 31,
2014** | |
| Voya Index Solution Income Portfolio | | | | | | | | | | | | | | | | |
| Class ADV | | $ | 1,000.00 | | | $ | 1,009.80 | | | | 0.62 | % | | $ | 3.14 | | | $ | 1,000.00 | | | $ | 1,022.08 | | | | 0.62 | % | | $ | 3.16 | |
| Class I | | | 1,000.00 | | | | 1,012.30 | | | | 0.12 | | | | 0.61 | | | | 1,000.00 | | | | 1,024.60 | | | | 0.12 | | | | 0.61 | |
| Class S | | | 1,000.00 | | | | 1,010.50 | | | | 0.37 | | | | 1.87 | | | | 1,000.00 | | | | 1,023.34 | | | | 0.37 | | | | 1.89 | |
| Class S2 | | | 1,000.00 | | | | 1,009.50 | | | | 0.52 | | | | 2.63 | | | | 1,000.00 | | | | 1,022.58 | | | | 0.52 | | | | 2.65 | |
| Class T | | | 1,000.00 | | | | 1,008.00 | | | | 0.82 | | | | 4.15 | | | | 1,000.00 | | | | 1,021.07 | | | | 0.82 | | | | 4.18 | |
| Voya Index Solution 2015 Portfolio | | | | | | | | | | | | |
| Class ADV | | $ | 1,000.00 | | | $ | 1,006.20 | | | | 0.63 | % | | $ | 3.19 | | | $ | 1,000.00 | | | $ | 1,022.03 | | | | 0.63 | % | | $ | 3.21 | |
| Class I | | | 1,000.00 | | | | 1,009.40 | | | | 0.13 | | | | 0.66 | | | | 1,000.00 | | | | 1,024.55 | | | | 0.13 | | | | 0.66 | |
| Class S | | | 1,000.00 | | | | 1,007.60 | | | | 0.38 | | | | 1.92 | | | | 1,000.00 | | | | 1,023.29 | | | | 0.38 | | | | 1.94 | |
| Class S2 | | | 1,000.00 | | | | 1,007.50 | | | | 0.53 | | | | 2.68 | | | | 1,000.00 | | | | 1,022.53 | | | | 0.53 | | | | 2.70 | |
| Class T | | | 1,000.00 | | | | 1,005.40 | | | | 0.83 | | | | 4.20 | | | | 1,000.00 | | | | 1,021.02 | | | | 0.83 | | | | 4.23 | |
| Voya Index Solution 2020 Portfolio | | | | | | | | | | | | |
| Class ADV | | $ | 1,000.00 | | | $ | 1,003.80 | | | | 0.63 | % | | $ | 3.18 | | | $ | 1,000.00 | | | $ | 1,022.03 | | | | 0.63 | % | | $ | 3.21 | |
| Class I | | | 1,000.00 | | | | 1,006.50 | | | | 0.13 | | | | 0.66 | | | | 1,000.00 | | | | 1,024.55 | | | | 0.13 | | | | 0.66 | |
| Class S | | | 1,000.00 | | | | 1,005.10 | | | | 0.38 | | | | 1.92 | | | | 1,000.00 | | | | 1,023.29 | | | | 0.38 | | | | 1.94 | |
| Class S2 | | | 1,000.00 | | | | 1,004.00 | | | | 0.53 | | | | 2.68 | | | | 1,000.00 | | | | 1,022.53 | | | | 0.53 | | | | 2.70 | |
| Class T | | | 1,000.00 | | | | 1,002.50 | | | | 0.83 | | | | 4.19 | | | | 1,000.00 | | | | 1,021.02 | | | | 0.83 | | | | 4.23 | |
SHAREHOLDER EXPENSE EXAMPLES (Unaudited) (continued)
| | | Actual Portfolio Return | | | Hypothetical (5% return before expenses) | |
| | | Beginning
Account
Value
July 1,
2014 | | | Ending
Account
Value
December 31,
2014 | | | Annualized
Expense
Ratio* | | | Expenses Paid
During the
Period Ended
December 31,
2014** | | | Beginning
Account
Value
July 1,
2014 | | | Ending
Account
Value
December 31,
2014 | | | Annualized
Expense
Ratio* | | | Expenses Paid
During the
Period Ended
December 31,
2014** | |
| Voya Index Solution 2025 Portfolio | | | | | | | | | | | | |
| Class ADV | | $ | 1,000.00 | | | $ | 1,000.80 | | | | 0.62 | % | | $ | 3.13 | | | $ | 1,000.00 | | | $ | 1,022.08 | | | | 0.62 | % | | $ | 3.16 | |
| Class I | | | 1,000.00 | | | | 1,003.50 | | | | 0.12 | | | | 0.61 | | | | 1,000.00 | | | | 1,024.60 | | | | 0.12 | | | | 0.61 | |
| Class S | | | 1,000.00 | | | | 1,002.10 | | | | 0.37 | | | | 1.87 | | | | 1,000.00 | | | | 1,023.34 | | | | 0.37 | | | | 1.89 | |
| Class S2 | | | 1,000.00 | | | | 1,001.60 | | | | 0.52 | | | | 2.62 | | | | 1,000.00 | | | | 1,022.58 | | | | 0.52 | | | | 2.65 | |
| Class T | | | 1,000.00 | | | | 1,000.00 | | | | 0.82 | | | | 4.13 | | | | 1,000.00 | | | | 1,021.07 | | | | 0.82 | | | | 4.18 | |
| Voya Index Solution 2030 Portfolio | | | | | | | | | | | | |
| Class ADV | | $ | 1,000.00 | | | $ | 997.10 | | | | 0.63 | % | | $ | 3.17 | | | $ | 1,000.00 | | | $ | 1,022.03 | | | | 0.63 | % | | $ | 3.21 | |
| Class I | | | 1,000.00 | | | | 999.50 | | | | 0.13 | | | | 0.66 | | | | 1,000.00 | | | | 1,024.55 | | | | 0.13 | | | | 0.66 | |
| Class S | | | 1,000.00 | | | | 998.30 | | | | 0.38 | | | | 1.91 | | | | 1,000.00 | | | | 1,023.29 | | | | 0.38 | | | | 1.94 | |
| Class S2 | | | 1,000.00 | | | | 997.10 | | | | 0.53 | | | | 2.67 | | | | 1,000.00 | | | | 1,022.53 | | | | 0.53 | | | | 2.70 | |
| Class T | | | 1,000.00 | | | | 995.30 | | | | 0.83 | | | | 4.17 | | | | 1,000.00 | | | | 1,021.02 | | | | 0.83 | | | | 4.23 | |
| Voya Index Solution 2035 Portfolio | | | | | | | | | | | | |
| Class ADV | | $ | 1,000.00 | | | $ | 999.90 | | | | 0.63 | % | | $ | 3.18 | | | $ | 1,000.00 | | | $ | 1,022.03 | | | | 0.63 | % | | $ | 3.21 | |
| Class I | | | 1,000.00 | | | | 1,002.60 | | | | 0.13 | | | | 0.66 | | | | 1,000.00 | | | | 1,024.55 | | | | 0.13 | | | | 0.66 | |
| Class S | | | 1,000.00 | | | | 1,001.30 | | | | 0.38 | | | | 1.92 | | | | 1,000.00 | | | | 1,023.29 | | | | 0.38 | | | | 1.94 | |
| Class S2 | | | 1,000.00 | | | | 1,000.10 | | | | 0.53 | | | | 2.67 | | | | 1,000.00 | | | | 1,022.53 | | | | 0.53 | | | | 2.70 | |
| Class T | | | 1,000.00 | | | | 999.20 | | | | 0.83 | | | | 4.18 | | | | 1,000.00 | | | | 1,021.02 | | | | 0.83 | | | | 4.23 | |
| Voya Index Solution 2040 Portfolio | | | | | | | | | | | | |
| Class ADV | | $ | 1,000.00 | | | $ | 1,000.70 | | | | 0.63 | % | | $ | 3.18 | | | $ | 1,000.00 | | | $ | 1,022.03 | | | | 0.63 | % | | $ | 3.21 | |
| Class I | | | 1,000.00 | | | | 1,003.10 | | | | 0.13 | | | | 0.66 | | | | 1,000.00 | | | | 1,024.55 | | | | 0.13 | | | | 0.66 | |
| Class S | | | 1,000.00 | | | | 1,001.90 | | | | 0.38 | | | | 1.92 | | | | 1,000.00 | | | | 1,023.29 | | | | 0.38 | | | | 1.94 | |
| Class S2 | | | 1,000.00 | | | | 1,000.80 | | | | 0.53 | | | | 2.67 | | | | 1,000.00 | | | | 1,022.53 | | | | 0.53 | | | | 2.70 | |
| Class T | | | 1,000.00 | | | | 999.50 | | | | 0.83 | | | | 4.18 | | | | 1,000.00 | | | | 1,021.02 | | | | 0.83 | | | | 4.23 | |
| Voya Index Solution 2045 Portfolio | | | | | | | | | | | | |
| Class ADV | | $ | 1,000.00 | | | $ | 999.30 | | | | 0.63 | % | | $ | 3.17 | | | $ | 1,000.00 | | | $ | 1,022.03 | | | | 0.63 | % | | $ | 3.21 | |
| Class I | | | 1,000.00 | | | | 1,001.60 | | | | 0.13 | | | | 0.66 | | | | 1,000.00 | | | | 1,024.55 | | | | 0.13 | | | | 0.66 | |
| Class S | | | 1,000.00 | | | | 1,000.40 | | | | 0.38 | | | | 1.92 | | | | 1,000.00 | | | | 1,023.29 | | | | 0.38 | | | | 1.94 | |
| Class S2 | | | 1,000.00 | | | | 999.90 | | | | 0.53 | | | | 2.67 | | | | 1,000.00 | | | | 1,022.53 | | | | 0.53 | | | | 2.70 | |
| Class T | | | 1,000.00 | | | | 999.00 | | | | 0.83 | | | | 4.18 | | | | 1,000.00 | | | | 1,021.02 | | | | 0.83 | | | | 4.23 | |
| Voya Index Solution 2050 Portfolio | | | | | | | | | | | | |
| Class ADV | | $ | 1,000.00 | | | $ | 999.40 | | | | 0.64 | % | | $ | 3.23 | | | $ | 1,000.00 | | | $ | 1,021.98 | | | | 0.64 | % | | $ | 3.26 | |
| Class I | | | 1,000.00 | | | | 1,001.70 | | | | 0.14 | | | | 0.71 | | | | 1,000.00 | | | | 1,024.50 | | | | 0.14 | | | | 0.71 | |
| Class S | | | 1,000.00 | | | | 1,000.60 | | | | 0.39 | | | | 1.97 | | | | 1,000.00 | | | | 1,023.24 | | | | 0.39 | | | | 1.99 | |
| Class S2 | | | 1,000.00 | | | | 999.50 | | | | 0.54 | | | | 2.72 | | | | 1,000.00 | | | | 1,022.48 | | | | 0.54 | | | | 2.75 | |
| Class T | | | 1,000.00 | | | | 997.50 | | | | 0.84 | | | | 4.23 | | | | 1,000.00 | | | | 1,020.97 | | | | 0.84 | | | | 4.28 | |
| Voya Index Solution 2055 Portfolio | | | | | | | | | | | | |
| Class ADV | | $ | 1,000.00 | | | $ | 1,001.70 | | | | 0.63 | % | | $ | 3.18 | | | $ | 1,000.00 | | | $ | 1,022.03 | | | | 0.63 | % | | $ | 3.21 | |
| Class I | | | 1,000.00 | | | | 1,004.20 | | | | 0.13 | | | | 0.66 | | | | 1,000.00 | | | | 1,024.55 | | | | 0.13 | | | | 0.66 | |
| Class S | | | 1,000.00 | | | | 1,002.70 | | | | 0.38 | | | | 1.92 | | | | 1,000.00 | | | | 1,023.29 | | | | 0.38 | | | | 1.94 | |
| Class S2 | | | 1,000.00 | | | | 1,001.70 | | | | 0.53 | | | | 2.67 | | | | 1,000.00 | | | | 1,022.53 | | | | 0.53 | | | | 2.70 | |
| Class T | | | 1,000.00 | | | | 1,000.50 | | | | 0.83 | | | | 4.19 | | | | 1,000.00 | | | | 1,021.02 | | | | 0.83 | | | | 4.23 | |
| * | The annualized expense ratios do not include expenses of underlying funds. |
| ** | Expenses are equal to each Portfolio’s respective annualized expense ratios multiplied by the average account value over the period, multiplied by 184/365 to reflect the most recent fiscal half-year. |
Report of Independent Registered Public Accounting Firm
The Shareholders and Board of Directors
Voya Partners, Inc.
We have audited the accompanying statements of assets and liabilities, including the portfolios of investments, of Voya Index Solution Income Portfolio, Voya Index Solution 2015 Portfolio, Voya Index Solution 2020 Portfolio, Voya Index Solution 2025 Portfolio, Voya Index Solution 2030 Portfolio, Voya Index Solution 2035 Portfolio, Voya Index Solution 2040 Portfolio, Voya Index Solution 2045 Portfolio, Voya Index Solution 2050 Portfolio, and Voya Index Solution 2055 Portfolio, each a series of Voya Partners, Inc., as of December 31, 2014, and the related statements of operations for the year then ended, the statements of changes in net assets for each of the years in the two-year period then ended, and the financial highlights for each of the years or periods in the five-year period then ended. These financial statements and financial highlights are the responsibility of management. Our responsibility is to express an opinion on these financial statements and financial highlights based on our audits.
We conducted our audits in accordance with the standards of the Public Company Accounting Oversight Board (United States). Those standards require that we plan and perform the audit to obtain reasonable assurance about whether the financial statements and financial highlights are free of material misstatement. An audit includes examining, on a test basis, evidence supporting the amounts and disclosures in the financial statements. Our procedures included confirmation of securities owned as of December 31, 2014, by correspondence with custodian, transfer agent, and brokers, or by other appropriate auditing procedures when replies from brokers were not received. An audit also includes assessing the accounting principles used and significant estimates made by management, as well as evaluating the overall financial statement presentation. We believe that our audits provide a reasonable basis for our opinion.
In our opinion, the financial statements and financial highlights referred to above present fairly, in all material respects, the financial position of the aforementioned funds of Voya Partners, Inc. as of December 31, 2014, the results of its operations for the year then ended, the changes in its net assets for each of the years in the two-year period then ended, and the financial highlights for each of the years or periods in the five-year period then ended, in conformity with U.S. generally accepted accounting principles.

Boston, Massachusetts
February 24, 2015
Statements of Assets and Liabilities as of December 31, 2014
| | | Voya Index
Solution Income
Portfolio | | | Voya Index
Solution 2015
Portfolio | | | Voya Index
Solution 2020
Portfolio | | | Voya Index
Solution 2025
Portfolio | |
| ASSETS: | | | | | | | | | | | | | | | | |
| Investments in securities at fair value* | | $ | 24,368,974 | | | $ | 37,075,969 | | | $ | 2,977 | | | $ | 71,667,072 | |
| Investments in affiliated underlying funds at fair value** | | | 143,611,322 | | | | 224,447,109 | | | | 15,483 | | | | 436,541,893 | |
| Total investments at fair value | | $ | 167,980,296 | | | $ | 261,523,078 | | | $ | 18,460 | | | $ | 508,208,965 | |
| Cash | | | 3,699,458 | | | | 5,538,585 | | | | 52 | | | | 10,761,716 | |
| Cash collateral for futures | | | 242,370 | | | | 363,555 | | | | — | | | | 702,874 | |
| Receivables: | | | | | | | | | | | | | | | | |
| Investment in affiliated underlying funds sold | | | 16,260 | | | | — | | | | — | | | | — | |
| Fund shares sold | | | 40,937 | | | | 152,676 | | | | — | | | | 397,308 | |
| Dividends | | | 62,863 | | | | 95,679 | | | | 7 | | | | 184,928 | |
| Interest | | | 27 | | | | 41 | | | | — | | | | 80 | |
| Prepaid expenses | | | 1,405 | | | | 2,113 | | | | — | | | | 3,994 | |
| Reimbursement due from manager | | | 23,095 | | | | 32,393 | | | | 789 | | | | 68,572 | |
| Other assets | | | 1,880 | | | | 2,348 | | | | — | | | | 3,560 | |
| Total assets | | | 172,068,591 | | | | 267,710,468 | | | | 19,308 | | | | 520,331,997 | |
| | | | | | | | | | | | | | | | | |
| LIABILITIES: | | | | | | | | | | | | | | | | |
| Payable for investments in affiliated underlying funds purchased | | | — | | | | 73,314 | | | | — | | | | 390,949 | |
| Payable for fund shares redeemed | | | 57,196 | | | | 79,363 | | | | — | | | | 6,359 | |
| Payable for foreign cash collateral for futures*** | | | 88,205 | | | | 132,308 | | | | — | | | | 255,796 | |
| Payable for investment management fees | | | 19,535 | | | | 29,920 | | | | 1 | | | | 57,856 | |
| Payable for administrative fees | | | 14,842 | | | | 22,794 | | | | 2 | | | | 44,056 | |
| Payable for distribution and shareholder service fees | | | 44,625 | | | | 77,801 | | | | 6 | | | | 157,338 | |
| Payable to trustees under the deferred compensation plan (Note 6) | | | 1,880 | | | | 2,348 | | | | — | | | | 3,560 | |
| Payable for trustee fees | | | 901 | | | | 1,385 | | | | 1 | | | | 2,569 | |
| Other accrued expenses and liabilities | | | 44,758 | | | | 51,456 | | | | 33 | | | | 103,358 | |
| Total liabilities | | | 271,942 | | | | 470,689 | | | | 43 | | | | 1,021,841 | |
| NET ASSETS | | $ | 171,796,649 | | | $ | 267,239,779 | | | $ | 19,265 | | | $ | 519,310,156 | |
| | | | | | | | | | | | | | | | | |
| NET ASSETS WERE COMPRISED OF: | | | | | | | | | | | | | | | | |
| Paid-in capital | | $ | 156,206,539 | | | $ | 239,456,837 | | | $ | 16,461 | | | $ | 439,760,927 | |
| Undistributed net investment income | | | 3,167,134 | | | | 4,576,398 | | | | 316 | | | | 8,183,908 | |
| Accumulated net realized gain | | | 9,154,870 | | | | 18,111,913 | | | | 1,152 | | | | 40,510,990 | |
| Net unrealized appreciation | | | 3,268,106 | | | | 5,094,631 | | | | 1,336 | | | | 30,854,331 | |
| NET ASSETS | | $ | 171,796,649 | | | $ | 267,239,779 | | | $ | 19,265 | | | $ | 519,310,156 | |
| ____________ | | | | | | | | | | | | | | | | |
| * Cost of investments in securities | | $ | 24,901,602 | | | $ | 37,980,546 | | | $ | 3,086 | | | $ | 73,545,502 | |
| ** Cost of investments in affiliated underlying funds | | $ | 139,719,587 | | | $ | 218,311,398 | | | $ | 14,038 | | | $ | 403,545,227 | |
| *** Cost of payable for foreign cash collateral for futures | | $ | 88,205 | | | $ | 132,308 | | | $ | — | | | $ | 255,796 | |
See Accompanying Notes to Financial Statements
Statements of Assets and Liabilities as of December 31, 2014 (continued)
| | | Voya Index
Solution Income
Portfolio | | | Voya Index
Solution 2015
Portfolio | | | Voya Index
Solution 2020
Portfolio | | | Voya Index
Solution 2025
Portfolio | |
| Class ADV | | | | | | | | | | | | | | | | |
| Net assets | | $ | 37,651,064 | | | $ | 113,993,379 | | | $ | 3,839 | | | $ | 242,980,168 | |
| Shares authorized | | | 100,000,000 | | | | 100,000,000 | | | | 100,000,000 | | | | 100,000,000 | |
| Par value | | $ | 0.001 | | | $ | 0.001 | | | $ | 0.001 | | | $ | 0.001 | |
| Shares outstanding | | | 3,577,022 | | | | 10,722,671 | | | | 325 | | | | 21,142,924 | |
| Net asset value and redemption price per share | | $ | 10.53 | | | $ | 10.63 | | | $ | 11.82 | | | $ | 11.49 | |
| Class I | | | | | | | | | | | | | | | | |
| Net assets | | $ | 5,041,864 | | | $ | 26,627,166 | | | $ | 3,882 | | | $ | 46,808,160 | |
| Shares authorized | | | 100,000,000 | | | | 100,000,000 | | | | 100,000,000 | | | | 100,000,000 | |
| Par value | | $ | 0.001 | | | $ | 0.001 | | | $ | 0.001 | | | $ | 0.001 | |
| Shares outstanding | | | 468,696 | | | | 2,457,129 | | | | 326 | | | | 3,993,512 | |
| Net asset value and redemption price per share | | $ | 10.76 | | | $ | 10.84 | | | $ | 11.91 | | | $ | 11.72 | |
| Class S | | | | | | | | | | | | | | | | |
| Net assets | | $ | 124,504,874 | | | $ | 109,592,938 | | | $ | 3,873 | | | $ | 186,665,520 | |
| Shares authorized | | | 100,000,000 | | | | 100,000,000 | | | | 100,000,000 | | | | 100,000,000 | |
| Par value | | $ | 0.001 | | | $ | 0.001 | | | $ | 0.001 | | | $ | 0.001 | |
| Shares outstanding | | | 11,676,839 | | | | 10,195,745 | | | | 325 | | | | 16,071,528 | |
| Net asset value and redemption price per share | | $ | 10.66 | | | $ | 10.75 | | | $ | 11.91 | | | $ | 11.61 | |
| Class S2 | | | | | | | | | | | | | | | | |
| Net assets | | $ | 4,595,432 | | | $ | 17,022,851 | | | $ | 3,848 | | | $ | 42,852,626 | |
| Shares authorized | | | 100,000,000 | | | | 100,000,000 | | | | 100,000,000 | | | | 100,000,000 | |
| Par value | | $ | 0.001 | | | $ | 0.001 | | | $ | 0.001 | | | $ | 0.001 | |
| Shares outstanding | | | 439,382 | | | | 1,610,687 | | | | 325 | | | | 3,744,635 | |
| Net asset value and redemption price per share | | $ | 10.46 | | | $ | 10.57 | | | $ | 11.84 | | | $ | 11.44 | |
| Class T | | | | | | | | | | | | | | | | |
| Net assets | | $ | 3,415 | | | $ | 3,445 | | | $ | 3,823 | | | $ | 3,682 | |
| Shares authorized | | | 100,000,000 | | | | 100,000,000 | | | | 100,000,000 | | | | 100,000,000 | |
| Par value | | $ | 0.001 | | | $ | 0.001 | | | $ | 0.001 | | | $ | 0.001 | |
| Shares outstanding | | | 322 | | | | 322 | | | | 324 | | | | 319 | |
| Net asset value and redemption price per share | | $ | 10.60 | | | $ | 10.70 | | | $ | 11.79 | | | $ | 11.53 | |
See Accompanying Notes to Financial Statements
Statements of Assets and Liabilities as of December 31, 2014
| | | Voya Index
Solution 2030
Portfolio | | | Voya Index
Solution 2035
Portfolio | | | Voya Index
Solution 2040
Portfolio | | | Voya Index
Solution 2045
Portfolio | |
| ASSETS: | | | | | | | | | | | | | | | | |
| Investments in securities at fair value* | | $ | 2,525 | | | $ | 47,333,681 | | | $ | 1,916 | | | $ | 10,815,845 | |
| Investments in affiliated underlying funds at fair value** | | | 17,604 | | | | 377,231,735 | | | | 20,579 | | | | 253,145,928 | |
| Total investments at fair value | | $ | 20,129 | | | $ | 424,565,416 | | | $ | 22,495 | | | $ | 263,961,773 | |
| Cash | | | 90 | | | | 8,799,246 | | | | 68 | | | | 5,185,277 | |
| Cash collateral for futures | | | — | | | | 589,768 | | | | — | | | | 363,555 | |
| Receivables: | | | | | | | | | | | | | | | | |
| Investment in affiliated underlying funds sold | | | — | | | | — | | | | — | | | | 11,499 | |
| Fund shares sold | | | — | | | | 557,390 | | | | — | | | | 199,244 | |
| Dividends | | | 6 | | | | 124,649 | | | | 5 | | | | 29,924 | |
| Interest | | | — | | | | 65 | | | | — | | | | 38 | |
| Prepaid expenses | | | — | | | | 3,305 | | | | — | | | | 2,040 | |
| Reimbursement due from manager | | | 757 | | | | 50,985 | | | | 715 | | | | 31,092 | |
| Other assets | | | — | | | | 2,753 | | | | — | | | | 1,611 | |
| Total assets | | | 20,982 | | | | 434,693,577 | | | | 23,283 | | | | 269,786,053 | |
| | | | | | | | | | | | | | | | | |
| LIABILITIES: | | | | | | | | | | | | | | | | |
| Payable for investments in affiliated underlying funds purchased | | | — | | | | 279,702 | | | | — | | | | — | |
| Payable for fund shares redeemed | | | — | | | | 277,688 | | | | — | | | | 210,743 | |
| Payable for foreign cash collateral for futures*** | | | — | | | | 214,633 | | | | — | | | | 132,308 | |
| Payable for investment management fees | | | 2 | | | | 46,173 | | | | 2 | | | | 25,463 | |
| Payable for administrative fees | | | 2 | | | | 36,815 | | | | 2 | | | | 22,872 | |
| Payable for distribution and shareholder service fees | | | 7 | | | | 135,474 | | | | 7 | | | | 85,090 | |
| Payable to trustees under the deferred compensation plan (Note 6) | | | — | | | | 2,753 | | | | — | | | | 1,611 | |
| Payable for trustee fees | | | 1 | | | | 2,116 | | | | 1 | | | | 1,302 | |
| Other accrued expenses and liabilities | | | 40 | | | | 72,919 | | | | 57 | | | | 42,389 | |
| Total liabilities | | | 52 | | | | 1,068,273 | | | | 69 | | | | 521,778 | |
| NET ASSETS | | $ | 20,930 | | | $ | 433,625,304 | | | $ | 23,214 | | | $ | 269,264,275 | |
| | | | | | | | | | | | | | | | | |
| NET ASSETS WERE COMPRISED OF: | | | | | | | | | | | | | | | | |
| Paid-in capital | | $ | 16,813 | | | $ | 354,757,355 | | | $ | 17,708 | | | $ | 218,139,338 | |
| Undistributed net investment income | | | 302 | | | | 6,102,320 | | | | 291 | | | | 3,016,491 | |
| Accumulated net realized gain | | | 1,590 | | | | 42,714,055 | | | | 2,091 | | | | 28,512,858 | |
| Net unrealized appreciation | | | 2,225 | | | | 30,051,574 | | | | 3,124 | | | | 19,595,588 | |
| NET ASSETS | | $ | 20,930 | | | $ | 433,625,304 | | | $ | 23,214 | | | $ | 269,264,275 | |
| ____________ | | | | | | | | | | | | | | | | |
| * Cost of investments in securities | | $ | 2,619 | | | $ | 48,342,237 | | | $ | 1,997 | | | $ | 10,610,942 | |
| ** Cost of investments in affiliated underlying funds | | $ | 15,285 | | | $ | 345,950,168 | | | $ | 17,374 | | | $ | 233,618,122 | |
| *** Cost of payable for foreign cash collateral for futures | | $ | — | | | $ | 214,633 | | | $ | — | | | $ | 132,308 | |
See Accompanying Notes to Financial Statements
Statements of Assets and Liabilities as of December 31, 2014 (continued)
| | | Voya Index
Solution 2030
Portfolio | | | Voya Index
Solution 2035
Portfolio | | | Voya Index
Solution 2040
Portfolio | | | Voya Index
Solution 2045
Portfolio | |
| Class ADV | | | | | | | | | | | | | | | | |
| Net assets | | $ | 4,169 | | | $ | 213,541,742 | | | $ | 5,317 | | | $ | 138,234,750 | |
| Shares authorized | | | 100,000,000 | | | | 100,000,000 | | | | 100,000,000 | | | | 100,000,000 | |
| Par value | | $ | 0.001 | | | $ | 0.001 | | | $ | 0.001 | | | $ | 0.001 | |
| Shares outstanding | | | 328 | | | | 18,003,677 | | | | 391 | | | | 11,364,085 | |
| Net asset value and redemption price per share | | $ | 12.70 | | | $ | 11.86 | | | $ | 13.60 | | | $ | 12.16 | |
| Class I | | | | | | | | | | | | | | | | |
| Net assets | | $ | 4,220 | | | $ | 34,037,947 | | | $ | 4,506 | | | $ | 19,837,111 | |
| Shares authorized | | | 100,000,000 | | | | 100,000,000 | | | | 100,000,000 | | | | 100,000,000 | |
| Par value | | $ | 0.001 | | | $ | 0.001 | | | $ | 0.001 | | | $ | 0.001 | |
| Shares outstanding | | | 330 | | | | 2,811,361 | | | | 329 | | | | 1,591,557 | |
| Net asset value and redemption price per share | | $ | 12.79 | | | $ | 12.11 | | | $ | 13.71 | | | $ | 12.46 | |
| Class S | | | | | | | | | | | | | | | | |
| Net assets | | $ | 4,208 | | | $ | 145,942,028 | | | $ | 4,497 | | | $ | 90,709,619 | |
| Shares authorized | | | 100,000,000 | | | | 100,000,000 | | | | 100,000,000 | | | | 100,000,000 | |
| Par value | | $ | 0.001 | | | $ | 0.001 | | | $ | 0.001 | | | $ | 0.001 | |
| Shares outstanding | | | 329 | | | | 12,169,548 | | | | 328 | | | | 7,360,374 | |
| Net asset value and redemption price per share | | $ | 12.79 | | | $ | 11.99 | | | $ | 13.72 | | | $ | 12.32 | |
| Class S2 | | | | | | | | | | | | | | | | |
| Net assets | | $ | 4,178 | | | $ | 40,099,780 | | | $ | 4,461 | | | $ | 20,478,900 | |
| Shares authorized | | | 100,000,000 | | | | 100,000,000 | | | | 100,000,000 | | | | 100,000,000 | |
| Par value | | $ | 0.001 | | | $ | 0.001 | | | $ | 0.001 | | | $ | 0.001 | |
| Shares outstanding | | | 329 | | | | 3,388,743 | | | | 327 | | | | 1,683,915 | |
| Net asset value and redemption price per share | | $ | 12.71 | | | $ | 11.83 | | | $ | 13.62 | | | $ | 12.16 | |
| Class T | | | | | | | | | | | | | | | | |
| Net assets | | $ | 4,155 | | | $ | 3,807 | | | $ | 4,433 | | | $ | 3,895 | |
| Shares authorized | | | 100,000,000 | | | | 100,000,000 | | | | 100,000,000 | | | | 100,000,000 | |
| Par value | | $ | 0.001 | | | $ | 0.001 | | | $ | 0.001 | | | $ | 0.001 | |
| Shares outstanding | | | 328 | | | | 320 | | | | 327 | | | | 319 | |
| Net asset value and redemption price per share | | $ | 12.66 | | | $ | 11.89 | | | $ | 13.56 | | | $ | 12.22 | |
See Accompanying Notes to Financial Statements
Statements of Assets and Liabilities as of December 31, 2014
| | | Voya Index
Solution 2050
Portfolio | | | Voya Index
Solution 2055
Portfolio | |
| ASSETS: | | | | | | | | |
| Investments in securities at fair value* | | $ | 1,237 | | | $ | 1,221,492 | |
| Investments in affiliated underlying funds at fair value** | | | 20,489 | | | | 59,494,676 | |
| Total investments at fair value | | $ | 21,726 | | | $ | 60,716,168 | |
| Cash | | | 53 | | | | 1,170,420 | |
| Cash collateral for futures | | | — | | | | 80,790 | |
| Receivables: | | | | | | | | |
| Fund shares sold | | | — | | | | 215,702 | |
| Dividends | | | — | | | | 6,746 | |
| Interest | | | — | | | | 9 | |
| Prepaid expenses | | | — | | | | 453 | |
| Reimbursement due from manager | | | 683 | | | | 8,046 | |
| Other assets | | | — | | | | 269 | |
| Total assets | | | 22,462 | | | | 62,198,603 | |
| | | | | | | | | |
| LIABILITIES: | | | | | | | | |
| Payable for investments in affiliated underlying funds purchased | | | — | | | | 215,702 | |
| Payable for foreign cash collateral for futures*** | | | — | | | | 29,402 | |
| Payable for investment management fees | | | 2 | | | | 5,582 | |
| Payable for administrative fees | | | 2 | | | | 5,205 | |
| Payable for distribution and shareholder service fees | | | 7 | | | | 19,574 | |
| Payable to trustees under the deferred compensation plan (Note 6) | | | — | | | | 269 | |
| Payable for trustee fees | | | 1 | | | | 275 | |
| Other accrued expenses and liabilities | | | 43 | | | | 11,719 | |
| Total liabilities | | | 55 | | | | 287,728 | |
| NET ASSETS | | $ | 22,407 | | | $ | 61,910,875 | |
| | | | | | | | | |
| NET ASSETS WERE COMPRISED OF: | | | | | | | | |
| Paid-in capital | | $ | 16,797 | | | $ | 52,670,671 | |
| Undistributed net investment income | | | 260 | | | | 652,377 | |
| Accumulated net realized gain | | | 2,132 | | | | 5,632,862 | |
| Net unrealized appreciation | | | 3,218 | | | | 2,954,965 | |
| NET ASSETS | | $ | 22,407 | | | $ | 61,910,875 | |
| ____________ | | | | | | | | |
| * Cost of investments in securities | | $ | 1,282 | | | $ | 1,141,656 | |
| ** Cost of investments in affiliated underlying funds | | $ | 17,226 | | | $ | 56,589,213 | |
| *** Cost of payable for foreign cash collateral for futures | | $ | — | | | $ | 29,402 | |
See Accompanying Notes to Financial Statements
Statements of Assets and Liabilities as of December 31, 2014 (continued)
| | | Voya Index
Solution 2050
Portfolio | | | Voya Index
Solution 2055
Portfolio | |
| Class ADV | | | | | | | | |
| Net assets | | $ | 4,462 | | | $ | 31,810,800 | |
| Shares authorized | | | 100,000,000 | | | | 100,000,000 | |
| Par value | | $ | 0.001 | | | $ | 0.001 | |
| Shares outstanding | | | 326 | | | | 2,165,918 | |
| Net asset value and redemption price per share | | $ | 13.68 | | | $ | 14.69 | |
| Class I | | | | | | | | |
| Net assets | | $ | 4,518 | | | $ | 3,974,129 | |
| Shares authorized | | | 100,000,000 | | | | 100,000,000 | |
| Par value | | $ | 0.001 | | | $ | 0.001 | |
| Shares outstanding | | | 328 | | | | 266,087 | |
| Net asset value and redemption price per share | | $ | 13.79 | | | $ | 14.94 | |
| Class S | | | | | | | | |
| Net assets | | $ | 4,510 | | | $ | 20,758,071 | |
| Shares authorized | | | 100,000,000 | | | | 100,000,000 | |
| Par value | | $ | 0.001 | | | $ | 0.001 | |
| Shares outstanding | | | 327 | | | | 1,401,092 | |
| Net asset value and redemption price per share | | $ | 13.80 | | | $ | 14.82 | |
| Class S2 | | | | | | | | |
| Net assets | | $ | 4,473 | | | $ | 5,363,240 | |
| Shares authorized | | | 100,000,000 | | | | 100,000,000 | |
| Par value | | $ | 0.001 | | | $ | 0.001 | |
| Shares outstanding | | | 326 | | | | 364,357 | |
| Net asset value and redemption price per share | | $ | 13.70 | | | $ | 14.72 | |
| Class T | | | | | | | | |
| Net assets | | $ | 4,444 | | | $ | 4,635 | |
| Shares authorized | | | 100,000,000 | | | | 100,000,000 | |
| Par value | | $ | 0.001 | | | $ | 0.001 | |
| Shares outstanding | | | 326 | | | | 316 | |
| Net asset value and redemption price per share | | $ | 13.63 | | | $ | 14.67 | |
See Accompanying Notes to Financial Statements
STATEMENTS OF OPERATIONS For the Year ended December 31, 2014
| | | Voya Index
Solution Income
Portfolio | | | Voya Index
Solution 2015
Portfolio | | | Voya Index
Solution 2020
Portfolio | | | Voya Index
Solution 2025
Portfolio | |
| INVESTMENT INCOME: | | | | | | | | | | | | | | | | |
| Dividends from affiliated underlying funds | | $ | 2,600,756 | | | $ | 3,829,874 | | | $ | 245 | | | $ | 6,502,101 | |
| Interest | | | 56 | | | | 85 | | | | — | | | | 169 | |
| Dividends | | | 1,184,405 | | | | 1,815,868 | | | | 122 | | | | 3,354,305 | |
| Total investment income | | | 3,785,217 | | | | 5,645,827 | | | | 367 | | | | 9,856,575 | |
| | | | | | | | | | | | | | | | | |
| EXPENSES: | | | | | | | | | | | | | | | | |
| Investment management fees | | | 229,293 | | | | 352,738 | | | | 22 | | | | 652,706 | |
| Distribution and shareholder service fees: | | | | | | | | | | | | | | | | |
| Class ADV | | | 190,126 | | | | 608,054 | | | | 21 | | | | 1,240,455 | |
| Class S | | | 330,969 | | | | 278,281 | | | | 11 | | | | 449,948 | |
| Class S2 | | | 25,125 | | | | 99,686 | | | | 21 | | | | 232,171 | |
| Class T | | | 25 | | | | 25 | | | | 29 | | | | 27 | |
| Transfer agent fees | | | 403 | | | | 442 | | | | 256 | | | | 645 | |
| Administrative service fees | | | 180,086 | | | | 277,009 | | | | 18 | | | | 513,885 | |
| Shareholder reporting expense | | | 16,332 | | | | 16,728 | | | | 126 | | | | 32,024 | |
| Professional fees | | | 40,667 | | | | 56,268 | | | | 7,403 | | | | 102,830 | |
| Custody and accounting expense | | | 14,293 | | | | 23,002 | | | | 49 | | | | 41,330 | |
| Trustee fees | | | 5,403 | | | | 8,310 | | | | — | | | | 15,417 | |
| Miscellaneous expense | | | 14,637 | | | | 16,348 | | | | 5,455 | | | | 19,304 | |
| Total expenses | | | 1,047,359 | | | | 1,736,891 | | | | 13,411 | | | | 3,300,742 | |
| Net waived and reimbursed fees | | | (288,395 | ) | | | (408,413 | ) | | | (13,324 | ) | | | (806,142 | ) |
| Net expenses | | | 758,964 | | | | 1,328,478 | | | | 87 | | | | 2,494,600 | |
| Net investment income | | | 3,026,253 | | | | 4,317,349 | | | | 280 | | | | 7,361,975 | |
| | | | | | | | | | | | | | | | | |
| REALIZED AND UNREALIZED GAIN (LOSS): | | | | | | | | | | | | | | | | |
| Net realized gain (loss) on: | | | | | | | | | | | | | | | | |
| Investments | | | 786,585 | | | | 1,267,910 | | | | 73 | | | | 2,075,183 | |
| Capital gain distributions from affiliated underlying funds | | | 4,258,527 | | | | 7,770,676 | | | | 625 | | | | 20,032,718 | |
| Capital gain distributions from unaffiliated underlying funds | | | — | | | | — | | | | 33 | | | | — | |
| Sale of affiliated underlying funds | | | 5,364,663 | | | | 11,166,318 | | | | 505 | | | | 21,679,702 | |
| Foreign currency related transactions | | | 3,041 | | | | 4,562 | | | | — | | | | 8,819 | |
| Futures | | | (245 | ) | | | (367 | ) | | | — | | | | (710 | ) |
| Net realized gain | | | 10,412,571 | | | | 20,209,099 | | | | 1,236 | | | | 43,795,712 | |
| Net change in unrealized appreciation (depreciation) on: | | | | | | | | | | | | | | | | |
| Investments | | | (1,168,935 | ) | | | (1,868,895 | ) | | | (166 | ) | | | (3,400,959 | ) |
| Affiliated underlying funds | | | (1,889,519 | ) | | | (7,282,196 | ) | | | (358 | ) | | | (19,667,448 | ) |
| Foreign currency related transactions | | | 412 | | | | 618 | | | | — | | | | 1,194 | |
| Futures | | | (91,413 | ) | | | (137,120 | ) | | | — | | | | (265,099 | ) |
| Net change in unrealized appreciation (depreciation) | | | (3,149,455 | ) | | | (9,287,593 | ) | | | (524 | ) | | | (23,332,312 | ) |
| Net realized and unrealized gain | | | 7,263,116 | | | | 10,921,506 | | | | 712 | | | | 20,463,400 | |
| Increase in net assets resulting from operations | | $ | 10,289,369 | | | $ | 15,238,855 | | | $ | 992 | | | $ | 27,825,375 | |
See Accompanying Notes to Financial Statements
STATEMENTS OF OPERATIONS For the Year ended December 31, 2014
| | | Voya Index
Solution 2030
Portfolio | | | Voya Index
Solution 2035
Portfolio | | | Voya Index
Solution 2040
Portfolio | | | Voya Index
Solution 2045
Portfolio | |
| INVESTMENT INCOME: | | | | | | | | | | | | | | | | |
| Dividends from affiliated underlying funds | | $ | 254 | | | $ | 5,312,903 | | | $ | 280 | | | $ | 3,436,126 | |
| Interest | | | — | | | | 146 | | | | — | | | | 77 | |
| Dividends | | | 102 | | | | 2,124,101 | | | | 63 | | | | 368,588 | |
| Total investment income | | | 356 | | | | 7,437,150 | | | | 343 | | | | 3,804,791 | |
| | | | | | | | | | | | | | | | | |
| EXPENSES: | | | | | | | | | | | | | | | | |
| Investment management fees | | | 25 | | | | 515,982 | | | | 26 | | | | 283,892 | |
| Distribution and shareholder service fees: | | | | | | | | | | | | | | | | |
| Class ADV | | | 22 | | | | 1,061,464 | | | | 23 | | | | 676,840 | |
| Class S | | | 11 | | | | 348,655 | | | | 11 | | | | 218,901 | |
| Class S2 | | | 22 | | | | 216,340 | | | | 22 | | | | 104,628 | |
| Class T | | | 31 | | | | 28 | | | | 33 | | | | 29 | |
| Transfer agent fees | | | 257 | | | | 593 | | | | 262 | | | | 469 | |
| Administrative service fees | | | 21 | | | | 423,016 | | | | 22 | | | | 260,286 | |
| Shareholder reporting expense | | | 125 | | | | 14,690 | | | | 136 | | | | 14,820 | |
| Professional fees | | | 7,403 | | | | 86,637 | | | | 7,404 | | | | 54,769 | |
| Custody and accounting expense | | | 69 | | | | 33,662 | | | | 209 | | | | 19,996 | |
| Trustee fees | | | — | | | | 12,691 | | | | 1 | | | | 7,809 | |
| Miscellaneous expense | | | 5,470 | | | | 17,452 | | | | 5,468 | | | | 12,495 | |
| Total expenses | | | 13,456 | | | | 2,731,210 | | | | 13,617 | | | | 1,654,934 | |
| Net waived and reimbursed fees | | | (13,359 | ) | | | (595,406 | ) | | | (13,509 | ) | | | (335,336 | ) |
| Net expenses | | | 97 | | | | 2,135,804 | | | | 108 | | | | 1,319,598 | |
| Net investment income | | | 259 | | | | 5,301,346 | | | | 235 | | | | 2,485,193 | |
| | | | | | | | | | | | | | | | | |
| REALIZED AND UNREALIZED GAIN (LOSS): | | | | | | | | | | | | | | | | |
| Net realized gain (loss) on: | | | | | | | | | | | | | | | | |
| Investments | | | 95 | | | | 1,907,608 | | | | 96 | | | | 1,029,586 | |
| Capital gain distributions from affiliated underlying funds | | | 873 | | | | 21,266,886 | | | | 1,145 | | | | 14,134,535 | |
| Capital gain distributions from unaffiliated underlying funds | | | 33 | | | | — | | | | 38 | | | | — | |
| Sale of affiliated underlying funds | | | 714 | | | | 21,843,105 | | | | 895 | | | | 14,597,373 | |
| Foreign currency related transactions | | | — | | | | 7,400 | | | | — | | | | 4,562 | |
| Futures | | | — | | | | (595 | ) | | | — | | | | 250 | |
| Net realized gain | | | 1,715 | | | | 45,024,404 | | | | 2,174 | | | | 29,766,306 | |
| Net change in unrealized appreciation (depreciation) on: | | | | | | | | | | | | | | | | |
| Investments | | | (161 | ) | | | (2,289,212 | ) | | | (138 | ) | | | (432,400 | ) |
| Affiliated underlying funds | | | (791 | ) | | | (23,764,118 | ) | | | (1,026 | ) | | | (16,643,357 | ) |
| Foreign currency related transactions | | | — | | | | 1,002 | | | | — | | | | — | |
| Futures | | | — | | | | (222,439 | ) | | | — | | | | (137,120 | ) |
| Net change in unrealized appreciation (depreciation) | | | (952 | ) | | | (26,274,767 | ) | | | (1,164 | ) | | | (17,212,877 | ) |
| Net realized and unrealized gain | | | 763 | | | | 18,749,637 | | | | 1,010 | | | | 12,553,429 | |
| Increase in net assets resulting from operations | | $ | 1,022 | | | $ | 24,050,983 | | | $ | 1,245 | | | $ | 15,038,622 | |
See Accompanying Notes to Financial Statements
STATEMENTS OF OPERATIONS For the Year ended December 31, 2014
| | | Voya Index
Solution 2050
Portfolio | | | Voya Index
Solution 2055
Portfolio | |
| INVESTMENT INCOME: | | | | | | | | |
| Dividends from affiliated underlying funds | | $ | 279 | | | $ | 770,243 | |
| Interest | | | — | | | | 16 | |
| Dividends | | | 33 | | | | 51,481 | |
| Total investment income | | | 312 | | | | 821,740 | |
| | | | | | | | | |
| EXPENSES: | | | | | | | | |
| Investment management fees | | | 24 | | | | 58,738 | |
| Distribution and shareholder service fees: | | | | | | | | |
| Class ADV | | | 22 | | | | 142,110 | |
| Class S | | | 11 | | | | 45,009 | |
| Class S2 | | | 22 | | | | 27,628 | |
| Class T | | | 33 | | | | 33 | |
| Transfer agent fees | | | 260 | | | | 465 | |
| Administrative service fees | | | 22 | | | | 55,061 | |
| Shareholder reporting expense | | | 136 | | | | 6,572 | |
| Professional fees | | | 7,404 | | | | 17,028 | |
| Custody and accounting expense | | | 180 | | | | 5,078 | |
| Trustee fees | | | 1 | | | | 1,651 | |
| Miscellaneous expense | | | 5,468 | | | | 7,755 | |
| Total expenses | | | 13,583 | | | | 367,128 | |
| Net waived and reimbursed fees | | | (13,474 | ) | | | (85,912 | ) |
| Net expenses | | | 109 | | | | 281,216 | |
| Net investment income | | | 203 | | | | 540,524 | |
| | | | | | | | | |
| REALIZED AND UNREALIZED GAIN (LOSS): | | | | | | | | |
| Net realized gain (loss) on: | | | | | | | | |
| Investments | | | 90 | | | | 202,582 | |
| Capital gain distributions from affiliated underlying funds | | | 1,156 | | | | 3,101,503 | |
| Capital gain distributions from unaffiliated underlying funds | | | 38 | | | | — | |
| Sale of affiliated underlying funds | | | 912 | | | | 2,626,832 | |
| Foreign currency related transactions | | | — | | | | 1,014 | |
| Futures | | | — | | | | (82 | ) |
| Net realized gain | | | 2,196 | | | | 5,931,849 | |
| Net change in unrealized appreciation (depreciation) on: | | | | | | | | |
| Investments | | | (100 | ) | | | (37,688 | ) |
| Affiliated underlying funds | | | (1,080 | ) | | | (3,223,772 | ) |
| Foreign currency related transactions | | | — | | | | 138 | |
| Futures | | | — | | | | (30,471 | ) |
| Net change in unrealized appreciation (depreciation) | | | (1,180 | ) | | | (3,291,793 | ) |
| Net realized and unrealized gain | | | 1,016 | | | | 2,640,056 | |
| Increase in net assets resulting from operations | | $ | 1,219 | | | $ | 3,180,580 | |
See Accompanying Notes to Financial Statements
STATEMENTS OF CHANGES IN NET ASSETS
| | | Voya Index Solution Income Portfolio | | | Voya Index Solution 2015 Portfolio | |
| | | Year Ended
December 31,
2014 | | | Year Ended
December 31,
2013 | | | Year Ended
December 31,
2014 | | | Year Ended
December 31,
2013 | |
| FROM OPERATIONS: | | | | | | | | | | | | | | | | |
| Net investment income | | $ | 3,026,253 | | | $ | 3,505,728 | | | $ | 4,317,349 | | | $ | 5,233,408 | |
| Net realized gain | | | 10,412,571 | | | | 8,990,898 | | | | 20,209,099 | | | | 13,865,923 | |
| Net change in unrealized appreciation (depreciation) | | | (3,149,455 | ) | | | 1,279,351 | | | | (9,287,593 | ) | | | 6,775,975 | |
| Increase in net assets resulting from operations | | | 10,289,369 | | | | 13,775,977 | | | | 15,238,855 | | | | 25,875,306 | |
| | | | | | | | | | | | | | | | | |
| FROM DISTRIBUTIONS TO SHAREHOLDERS: | | | | | | | | | | | | | | | | |
| Net investment income: | | | | | | | | | | | | | | | | |
| Class ADV | | | (772,494 | ) | | | (926,741 | ) | | | (2,407,258 | ) | | | (2,372,751 | ) |
| Class I | | | (114,554 | ) | | | (260,218 | ) | | | (605,872 | ) | | | (620,470 | ) |
| Class S | | | (2,893,994 | ) | | | (3,917,226 | ) | | | (2,333,692 | ) | | | (2,432,743 | ) |
| Class S2 | | | (105,484 | ) | | | (157,587 | ) | | | (442,287 | ) | | | (462,935 | ) |
| Class T | | | (60 | ) | | | (82 | ) | | | (61 | ) | | | (54 | ) |
| Net realized gains: | | | | | | | | | | | | | | | | |
| Class ADV | | | (1,929,367 | ) | | | (1,180,693 | ) | | | (6,202,267 | ) | | | (3,167,388 | ) |
| Class I | | | (234,690 | ) | | | (288,121 | ) | | | (1,249,158 | ) | | | (693,265 | ) |
| Class S | | | (6,640,745 | ) | | | (4,737,024 | ) | | | (5,406,544 | ) | | | (3,012,270 | ) |
| Class S2 | | | (256,790 | ) | | | (188,602 | ) | | | (1,078,359 | ) | | | (566,053 | ) |
| Class T | | | (170 | ) | | | (115 | ) | | | (170 | ) | | | (85 | ) |
| Total distributions | | | (12,948,348 | ) | | | (11,656,409 | ) | | | (19,725,668 | ) | | | (13,328,014 | ) |
| | | | | | | | | | | | | | | | | |
| FROM CAPITAL SHARE TRANSACTIONS: | | | | | | | | | | | | | | | | |
| Net proceeds from sale of shares | | | 18,242,750 | | | | 23,987,920 | | | | 47,068,158 | | | | 62,878,082 | |
| Reinvestment of distributions | | | 12,948,348 | | | | 11,656,213 | | | | 19,725,668 | | | | 13,327,874 | |
| | | | 31,191,098 | | | | 35,644,133 | | | | 66,793,826 | | | | 76,205,956 | |
| Cost of shares redeemed | | | (40,526,463 | ) | | | (41,796,924 | ) | | | (87,511,026 | ) | | | (64,238,262 | ) |
| Net increase (decrease) in net assets resulting from capital share transactions | | | (9,335,365 | ) | | | (6,152,791 | ) | | | (20,717,200 | ) | | | 11,967,694 | |
| Net increase (decrease) in net assets | | | (11,994,344 | ) | | | (4,033,223 | ) | | | (25,204,013 | ) | | | 24,514,986 | |
| | | | | | | | | | | | | | | | | |
| NET ASSETS: | | | | | | | | | | | | | | | | |
| Beginning of year or period | | | 183,790,993 | | | | 187,824,216 | | | | 292,443,792 | | | | 267,928,806 | |
| End of year or period | | $ | 171,796,649 | | | $ | 183,790,993 | | | $ | 267,239,779 | | | $ | 292,443,792 | |
| Undistributed net investment income at end of year or period | | $ | 3,167,134 | | | $ | 3,885,480 | | | $ | 4,576,398 | | | $ | 5,786,003 | |
See Accompanying Notes to Financial Statements
STATEMENTS OF CHANGES IN NET ASSETS
| | | Voya Index Solution 2020 Portfolio | | | Voya Index Solution 2025 Portfolio | |
| | | Year Ended
December 31,
2014 | | | Year Ended
December 31,
2013 | | | Year Ended
December 31,
2014 | | | Year Ended
December 31,
2013 | |
| FROM OPERATIONS: | | | | | | | | | | | | | | | | |
| Net investment income | | $ | 280 | | | $ | 336 | | | $ | 7,361,975 | | | $ | 8,010,695 | |
| Net realized gain | | | 1,236 | | | | 1,024 | | | | 43,795,712 | | | | 23,695,920 | |
| Net change in unrealized appreciation (depreciation) | | | (524 | ) | | | 896 | | | | (23,332,312 | ) | | | 37,978,133 | |
| Increase in net assets resulting from operations | | | 992 | | | | 2,256 | | | | 27,825,375 | | | | 69,684,748 | |
| | | | | | | | | | | | | | | | | |
| FROM DISTRIBUTIONS TO SHAREHOLDERS: | | | | | | | | | | | | | | | | |
| Net investment income: | | | | | | | | | | | | | | | | |
| Class ADV | | | (70 | ) | | | (80 | ) | | | (4,030,265 | ) | | | (3,089,476 | ) |
| Class I | | | (86 | ) | | | (94 | ) | | | (849,202 | ) | | | (552,641 | ) |
| Class S | | | (78 | ) | | | (66 | ) | | | (3,199,937 | ) | | | (2,446,238 | ) |
| Class S2 | | | (74 | ) | | | (83 | ) | | | (813,600 | ) | | | (655,765 | ) |
| Class T | | | (63 | ) | | | (70 | ) | | | (49 | ) | | | (36 | ) |
| Net realized gains: | | | | | | | | | | | | | | | | |
| Class ADV | | | (204 | ) | | | (162 | ) | | | (11,835,104 | ) | | | (6,103,259 | ) |
| Class I | | | (205 | ) | | | (162 | ) | | | (1,963,736 | ) | | | (880,548 | ) |
| Class S | | | (205 | ) | | | (162 | ) | | | (8,308,066 | ) | | | (4,360,252 | ) |
| Class S2 | | | (205 | ) | | | (162 | ) | | | (2,273,330 | ) | | | (1,203,152 | ) |
| Class T | | | (205 | ) | | | (162 | ) | | | (169 | ) | | | (92 | ) |
| Total distributions | | | (1,395 | ) | | | (1,203 | ) | | | (33,273,458 | ) | | | (19,291,459 | ) |
| | | | | | | | | | | | | | | | | |
| FROM CAPITAL SHARE TRANSACTIONS: | | | | | | | | | | | | | | | | |
| Net proceeds from sale of shares | | | — | | | | — | | | | 99,795,707 | | | | 119,226,787 | |
| Payment from distribution/payment by affiliate | | | — | | | | 22 | | | | — | | | | — | |
| Reinvestment of distributions | | | 1,395 | | | | 4 | | | | 33,273,458 | | | | 19,291,331 | |
| | | | 1,395 | | | | 26 | | | | 133,069,165 | | | | 138,518,118 | |
| Cost of shares redeemed | | | — | | | | — | | | | (110,199,751 | ) | | | (68,633,071 | ) |
| Net increase in net assets resulting from capital share transactions | | | 1,395 | | | | 26 | | | | 22,869,414 | | | | 69,885,047 | |
| Net increase in net assets | | | 992 | | | | 1,079 | | | | 17,421,331 | | | | 120,278,336 | |
| | | | | | | | | | | | | | | | | |
| NET ASSETS: | | | | | | | | | | | | | | | | |
| Beginning of year or period | | | 18,273 | | | | 17,194 | | | | 501,888,825 | | | | 381,610,489 | |
| End of year or period | | $ | 19,265 | | | $ | 18,273 | | | $ | 519,310,156 | | | $ | 501,888,825 | |
| Undistributed net investment income at end of year or period | | $ | 316 | | | $ | 371 | | | $ | 8,183,908 | | | $ | 8,889,270 | |
See Accompanying Notes to Financial Statements
STATEMENTS OF CHANGES IN NET ASSETS
| | | Voya Index Solution 2030 Portfolio | | | Voya Index Solution 2035 Portfolio | |
| | | Year Ended
December 31,
2014 | | | Year Ended
December 31,
2013 | | | Year Ended
December 31,
2014 | | | Year Ended
December 31,
2013 | |
| FROM OPERATIONS: | | | | | | | | | | | | | | | | |
| Net investment income | | $ | 259 | | | $ | 328 | | | $ | 5,301,346 | | | $ | 5,730,459 | |
| Net realized gain | | | 1,715 | | | | 1,342 | | | | 45,024,404 | | | | 21,549,923 | |
| Net change in unrealized appreciation (depreciation) | | | (952 | ) | | | 1,573 | | | | (26,274,767 | ) | | | 41,320,946 | |
| Increase in net assets resulting from operations | | | 1,022 | | | | 3,243 | | | | 24,050,983 | | | | 68,601,328 | |
| | | | | | | | | | | | | | | | | |
| FROM DISTRIBUTIONS TO SHAREHOLDERS: | | | | | | | | | | | | | | | | |
| Net investment income: | | | | | | | | | | | | | | | | |
| Class ADV | | | (66 | ) | | | (81 | ) | | | (2,989,256 | ) | | | (2,010,814 | ) |
| Class I | | | (89 | ) | | | (96 | ) | | | (523,257 | ) | | | (283,976 | ) |
| Class S | | | (77 | ) | | | (68 | ) | | | (2,197,001 | ) | | | (1,501,240 | ) |
| Class S2 | | | (70 | ) | | | (85 | ) | | | (689,228 | ) | | | (466,568 | ) |
| Class T | | | (63 | ) | | | (72 | ) | | | (44 | ) | | | (27 | ) |
| Net realized gains: | | | | | | | | | | | | | | | | |
| Class ADV | | | (275 | ) | | | (165 | ) | | | (10,988,649 | ) | | | (4,866,846 | ) |
| Class I | | | (275 | ) | | | (166 | ) | | | (1,477,868 | ) | | | (528,283 | ) |
| Class S | | | (275 | ) | | | (166 | ) | | | (7,016,371 | ) | | | (3,155,944 | ) |
| Class S2 | | | (275 | ) | | | (165 | ) | | | (2,367,719 | ) | | | (1,026,518 | ) |
| Class T | | | (275 | ) | | | (165 | ) | | | (192 | ) | | | (91 | ) |
| Total distributions | | | (1,740 | ) | | | (1,229 | ) | | | (28,249,585 | ) | | | (13,840,307 | ) |
| | | | | | | | | | | | | | | | | |
| FROM CAPITAL SHARE TRANSACTIONS: | | | | | | | | | | | | | | | | |
| Net proceeds from sale of shares | | | — | | | | — | | | | 92,260,369 | | | | 104,165,460 | |
| Payment from distribution/payment by affiliate | | | — | | | | 30 | | | | — | | | | — | |
| Reinvestment of distributions | | | 1,740 | | | | 4 | | | | 28,249,585 | | | | 13,840,190 | |
| | | | 1,740 | | | | 34 | | | | 120,509,954 | | | | 118,005,650 | |
| Cost of shares redeemed | | | — | | | | — | | | | (88,259,903 | ) | | | (58,115,454 | ) |
| Net increase in net assets resulting from capital share transactions | | | 1,740 | | | | 34 | | | | 32,250,051 | | | | 59,890,196 | |
| Net increase in net assets | | | 1,022 | | | | 2,048 | | | | 28,051,449 | | | | 114,651,217 | |
| | | | | | | | | | | | | | | | | |
| NET ASSETS: | | | | | | | | | | | | | | | | |
| Beginning of year or period | | | 19,908 | | | | 17,860 | | | | 405,573,855 | | | | 290,922,638 | |
| End of year or period | | $ | 20,930 | | | $ | 19,908 | | | $ | 433,625,304 | | | $ | 405,573,855 | |
| Undistributed net investment income at end of year or period | | $ | 302 | | | $ | 363 | | | $ | 6,102,320 | | | $ | 6,396,810 | |
See Accompanying Notes to Financial Statements
STATEMENTS OF CHANGES IN NET ASSETS
| | | Voya Index Solution 2040 Portfolio | | | Voya Index Solution 2045 Portfolio | |
| | | Year Ended
December 31,
2014 | | | Year Ended
December 31,
2013 | | | Year Ended
December 31,
2014 | | | Year Ended
December 31,
2013 | |
| FROM OPERATIONS: | | | | | | | | | | | | | | | | |
| Net investment income | | $ | 235 | | | $ | 286 | | | $ | 2,485,193 | | | $ | 2,830,275 | |
| Net realized gain | | | 2,174 | | | | 1,470 | | | | 29,766,306 | | | | 13,681,016 | |
| Net change in unrealized appreciation (depreciation) | | | (1,164 | ) | | | 2,368 | | | | (17,212,877 | ) | | | 26,929,205 | |
| Increase in net assets resulting from operations | | | 1,245 | | | | 4,124 | | | | 15,038,622 | | | | 43,440,496 | |
| | | | | | | | | | | | | | | | | |
| FROM DISTRIBUTIONS TO SHAREHOLDERS: | | | | | | | | | | | | | | | | |
| Net investment income: | | | | | | | | | | | | | | | | |
| Class ADV | | | (59 | ) | | | (55 | ) | | | (1,590,364 | ) | | | (968,698 | ) |
| Class I | | | (80 | ) | | | (71 | ) | | | (256,041 | ) | | | (138,705 | ) |
| Class S | | | (70 | ) | | | (42 | ) | | | (1,143,217 | ) | | | (757,322 | ) |
| Class S2 | | | (62 | ) | | | (58 | ) | | | (257,702 | ) | | | (170,865 | ) |
| Class T | | | (54 | ) | | | (48 | ) | | | (33 | ) | | | (20 | ) |
| Net realized gains: | | | | | | | | | | | | | | | | |
| Class ADV | | | (290 | ) | | | (189 | ) | | | (7,081,744 | ) | | | (2,875,149 | ) |
| Class I | | | (291 | ) | | | (189 | ) | | | (854,800 | ) | | | (304,199 | ) |
| Class S | | | (291 | ) | | | (189 | ) | | | (4,391,211 | ) | | | (1,914,221 | ) |
| Class S2 | | | (290 | ) | | | (189 | ) | | | (1,092,301 | ) | | | (464,427 | ) |
| Class T | | | (290 | ) | | | (189 | ) | | | (193 | ) | | | (92 | ) |
| Total distributions | | | (1,777 | ) | | | (1,219 | ) | | | (16,667,606 | ) | | | (7,593,698 | ) |
| | | | | | | | | | | | | | | | | |
| FROM CAPITAL SHARE TRANSACTIONS: | | | | | | | | | | | | | | | | |
| Net proceeds from sale of shares | | | 858 | | | | — | | | | 61,543,097 | | | | 69,264,825 | |
| Payment from distribution/payment by affiliate | | | — | | | | 30 | | | | — | | | | — | |
| Reinvestment of distributions | | | 1,777 | | | | 5 | | | | 16,667,606 | | | | 7,593,585 | |
| | | | 2,635 | | | | 35 | | | | 78,210,703 | | | | 76,858,410 | |
| Cost of shares redeemed | | | (3 | ) | | | — | | | | (50,959,586 | ) | | | (37,910,260 | ) |
| Net increase in net assets resulting from capital share transactions | | | 2,632 | | | | 35 | | | | 27,251,117 | | | | 38,948,150 | |
| Net increase in net assets | | | 2,100 | | | | 2,940 | | | | 25,622,133 | | | | 74,794,948 | |
| | | | | | | | | | | | | | | | | |
| NET ASSETS: | | | | | | | | | | | | | | | | |
| Beginning of year or period | | | 21,114 | | | | 18,174 | | | | 243,642,142 | | | | 168,847,194 | |
| End of year or period | | $ | 23,214 | | | $ | 21,114 | | | $ | 269,264,275 | | | $ | 243,642,142 | |
| Undistributed net investment income at end of year or period | | $ | 291 | | | $ | 325 | | | $ | 3,016,491 | | | $ | 3,245,163 | |
See Accompanying Notes to Financial Statements
STATEMENTS OF CHANGES IN NET ASSETS
| | | Voya Index Solution 2050 Portfolio | | | Voya Index Solution 2055 Portfolio | |
| | | Year Ended
December 31,
2014 | | | Year Ended
December 31,
2013 | | | Year Ended
December 31,
2014 | | | Year Ended
December 31,
2013 | |
| FROM OPERATIONS: | | | | | | | | | | | | | | | | |
| Net investment income | | $ | 203 | | | $ | 268 | | | $ | 540,524 | | | $ | 503,779 | |
| Net realized gain | | | 2,196 | | | | 1,449 | | | | 5,931,849 | | | | 2,397,160 | |
| Net change in unrealized appreciation (depreciation) | | | (1,180 | ) | | | 2,467 | | | | (3,291,793 | ) | | | 4,789,221 | |
| Increase in net assets resulting from operations | | | 1,219 | | | | 4,184 | | | | 3,180,580 | | | | 7,690,160 | |
| | | | | | | | | | | | | | | | | |
| FROM DISTRIBUTIONS TO SHAREHOLDERS: | | | | | | | | | | | | | | | | |
| Net investment income: | | | | | | | | | | | | | | | | |
| Class ADV | | | (56 | ) | | | (51 | ) | | | (278,053 | ) | | | (146,323 | ) |
| Class I | | | (77 | ) | | | (68 | ) | | | (41,530 | ) | | | (13,476 | ) |
| Class S | | | (67 | ) | | | (39 | ) | | | (201,219 | ) | | | (96,995 | ) |
| Class S2 | | | (59 | ) | | | (55 | ) | | | (55,145 | ) | | | (35,569 | ) |
| Class T | | | (51 | ) | | | (44 | ) | | | (31 | ) | | | (15 | ) |
| Net realized gains: | | | | | | | | | | | | | | | | |
| Class ADV | | | (282 | ) | | | (157 | ) | | | (1,203,256 | ) | | | (340,888 | ) |
| Class I | | | (282 | ) | | | (157 | ) | | | (134,385 | ) | | | (23,915 | ) |
| Class S | | | (283 | ) | | | (157 | ) | | | (741,487 | ) | | | (199,083 | ) |
| Class S2 | | | (282 | ) | | | (157 | ) | | | (237,458 | ) | | | (81,251 | ) |
| Class T | | | (282 | ) | | | (157 | ) | | | (184 | ) | | | (71 | ) |
| Total distributions | | | (1,721 | ) | | | (1,042 | ) | | | (2,892,748 | ) | | | (937,586 | ) |
| | | | | | | | | | | | | | | | | |
| FROM CAPITAL SHARE TRANSACTIONS: | | | | | | | | | | | | | | | | |
| Net proceeds from sale of shares | | | — | | | | — | | | | 23,259,708 | | | | 20,756,086 | |
| Payment from distribution/payment by affiliate | | | — | | | | 31 | | | | — | | | | — | |
| Reinvestment of distributions | | | 1,721 | | | | 4 | | | | 2,892,748 | | | | 937,501 | |
| | | | 1,721 | | | | 35 | | | | 26,152,456 | | | | 21,693,587 | |
| Cost of shares redeemed | | | — | | | | — | | | | (11,668,378 | ) | | | (8,929,088 | ) |
| Net increase in net assets resulting from capital share transactions | | | 1,721 | | | | 35 | | | | 14,484,078 | | | | 12,764,499 | |
| Net increase in net assets | | | 1,219 | | | | 3,177 | | | | 14,771,910 | | | | 19,517,073 | |
| | | | | | | | | | | | | | | | | |
| NET ASSETS: | | | | | | | | | | | | | | | | |
| Beginning of year or period | | | 21,188 | | | | 18,011 | | | | 47,138,965 | | | | 27,621,892 | |
| End of year or period | | $ | 22,407 | | | $ | 21,188 | | | $ | 61,910,875 | | | $ | 47,138,965 | |
| Undistributed net investment income at end of year or period | | $ | 260 | | | $ | 308 | | | $ | 652,377 | | | $ | 574,922 | |
See Accompanying Notes to Financial Statements
Financial Highlights
Selected data for a share of beneficial interest outstanding throughout each year or period.
| | | | | | Income (loss)
from
investment
operations | | | | | | Less
Distributions | | | | | | | | | | | | | | | Ratios to average net assets | | | Supplemental Data | |
| | | Net asset
value,
beginning
of year
or period | | | Net
investment
income
(loss) | | | Net
realized
and
unrealized
gain
(loss) | | | Total from
investment
operations | | | From net
investment
income | | | From net
realized
gains | | | From
return
of
capital | | | Total
distributions | | | Payment
by
affiliate | | | Net
asset
value,
end
of
year
or
period | | | Total
Return(1) | | | Expenses
before
reductions/
additions(2)(3)(4) | | | Expenses
net of fee
waivers
and/or
recoupments
if any(2)(3)(4) | | | Expense
net of all
reductions/
additions(2)(3)(4) | | | Net
investment
income
(loss)(2)(3) | | | Net
assets,
end of
year or
period | | | Portfolio
turnover
rate | |
Year or
period ended | | ($) | | | ($) | | | ($) | | | ($) | | | ($) | | | ($) | | | ($) | | | ($) | | | ($) | | | ($) | | | (%) | | | (%) | | | (%) | | | (%) | | | (%) | | | ($000’s) | | | (%) | |
| Voya Index Solution Income Portfolio | | | | | | | | | | | | | | | | | | | | | | | | | | | | | | | | | | | | | | | | | | | | | | | | | | | | | | | | | | | | | | | | | | | | |
| Class ADV | | | | | | | | | | | | | | | | | | | | | | | | | | | | | | | | | | | | | | | | | | | | | | | | | | | | | | | | | | | | | | | | | | | | |
| 12-31-14 | | | 10.73 | | | | 0.17 | | | | 0.43 | | | | 0.60 | | | | 0.23 | | | | 0.57 | | | | — | | | | 0.80 | | | | — | | | | 10.53 | | | | 5.68 | | | | 0.78 | | | | 0.62 | | | | 0.62 | | | | 1.50 | | | | 37,651 | | | | 23 | |
| 12-31-13 | | | 10.64 | | | | 0.19 | • | | | 0.58 | | | | 0.77 | | | | 0.30 | | | | 0.38 | | | | — | | | | 0.68 | | | | — | | | | 10.73 | | | | 7.50 | | | | 0.76 | | | | 0.61 | | | | 0.61 | | | | 1.74 | | | | 37,886 | | | | 39 | |
| 12-31-12 | | | 10.42 | | | | 0.19 | • | | | 0.67 | | | | 0.86 | | | | 0.26 | | | | 0.38 | | | | — | | | | 0.64 | | | | — | | | | 10.64 | | | | 8.36 | | | | 0.71 | | | | 0.62 | | | | 0.62 | | | | 1.79 | | | | 31,359 | | | | 45 | |
| 12-31-11 | | | 10.76 | | | | 0.14 | | | | 0.09 | | | | 0.23 | | | | 0.25 | | | | 0.32 | | | | — | | | | 0.57 | | | | — | | | | 10.42 | | | | 2.35 | | | | 0.62 | | | | 0.62 | | | | 0.62 | | | | 1.46 | | | | 25,479 | | | | 78 | |
| 12-31-10 | | | 10.22 | | | | 0.23 | • | | | 0.52 | | | | 0.75 | | | | 0.11 | | | | 0.10 | | | | — | | | | 0.21 | | | | — | | | | 10.76 | | | | 7.37 | | | | 0.62 | | | | 0.62 | | | | 0.62 | | | | 2.24 | | | | 19,550 | | | | 45 | |
| Class I | | | | | | | | | | | | | | | | | | | | | | | | | | | | | | | | | | | | | | | | | | | | | | | | | | | | | | | | | | | | | | | | | | | | |
| 12-31-14 | | | 10.94 | | | | 0.22 | • | | | 0.45 | | | | 0.67 | | | | 0.28 | | | | 0.57 | | | | — | | | | 0.85 | | | | — | | | | 10.76 | | | | 6.23 | | | | 0.28 | | | | 0.12 | | | | 0.12 | | | | 2.00 | | | | 5,042 | | | | 23 | |
| 12-31-13 | | | 10.82 | | | | 0.22 | • | | | 0.63 | | | | 0.85 | | | | 0.35 | | | | 0.38 | | | | — | | | | 0.73 | | | | — | | | | 10.94 | | | | 8.10 | | | | 0.26 | | | | 0.11 | | | | 0.11 | | | | 2.01 | | | | 5,682 | | | | 39 | |
| 12-31-12 | | | 10.59 | | | | 0.27 | • | | | 0.64 | | | | 0.91 | | | | 0.30 | | | | 0.38 | | | | — | | | | 0.68 | | | | — | | | | 10.82 | | | | 8.75 | | | | 0.21 | | | | 0.12 | | | | 0.12 | | | | 2.53 | | | | 10,690 | | | | 45 | |
| 12-31-11 | | | 10.90 | | | | 0.21 | • | | | 0.09 | | | | 0.30 | | | | 0.29 | | | | 0.32 | | | | — | | | | 0.61 | | | | — | | | | 10.59 | | | | 2.99 | | | | 0.12 | | | | 0.12 | | | | 0.12 | | | | 2.01 | | | | 6,699 | | | | 78 | |
| 12-31-10 | | | 10.31 | | | | 0.28 | • | | | 0.53 | | | | 0.81 | | | | 0.12 | | | | 0.10 | | | | — | | | | 0.22 | | | | — | | | | 10.90 | | | | 7.96 | | | | 0.12 | | | | 0.12 | | | | 0.12 | | | | 2.67 | | | | 1,702 | | | | 45 | |
| Class S | | | | | | | | | | | | | | | | | | | | | | | | | | | | | | | | | | | | | | | | | | | | | | | | | | | | | | | | | | | | | | | | | | | | |
| 12-31-14 | | | 10.85 | | | | 0.19 | • | | | 0.44 | | | | 0.63 | | | | 0.25 | | | | 0.57 | | | | — | | | | 0.82 | | | | — | | | | 10.66 | | | | 5.90 | | | | 0.53 | | | | 0.37 | | | | 0.37 | | | | 1.73 | | | | 124,505 | | | | 23 | |
| 12-31-13 | | | 10.74 | | | | 0.21 | • | | | 0.60 | | | | 0.81 | | | | 0.32 | | | | 0.38 | | | | — | | | | 0.70 | | | | — | | | | 10.85 | | | | 7.78 | | | | 0.51 | | | | 0.36 | | | | 0.36 | | | | 1.92 | | | | 134,689 | | | | 39 | |
| 12-31-12 | | | 10.51 | | | | 0.21 | • | | | 0.68 | | | | 0.89 | | | | 0.28 | | | | 0.38 | | | | — | | | | 0.66 | | | | — | | | | 10.74 | | | | 8.52 | | | | 0.46 | | | | 0.37 | | | | 0.37 | | | | 1.97 | | | | 141,443 | | | | 45 | |
| 12-31-11 | | | 10.82 | | | | 0.19 | | | | 0.08 | | | | 0.27 | | | | 0.26 | | | | 0.32 | | | | — | | | | 0.58 | | | | — | | | | 10.51 | | | | 2.73 | | | | 0.37 | | | | 0.37 | | | | 0.37 | | | | 1.64 | | | | 142,821 | | | | 78 | |
| 12-31-10 | | | 10.26 | | | | 0.25 | • | | | 0.52 | | | | 0.77 | | | | 0.11 | | | | 0.10 | | | | — | | | | 0.21 | | | | — | | | | 10.82 | | | | 7.61 | | | | 0.37 | | | | 0.37 | | | | 0.37 | | | | 2.39 | | | | 153,900 | | | | 45 | |
| Class S2 | | | | | | | | | | | | | | | | | | | | | | | | | | | | | | | | | | | | | | | | | | | | | | | | | | | | | | | | | | | | | | | | | | | | |
| 12-31-14 | | | 10.66 | | | | 0.17 | • | | | 0.43 | | | | 0.60 | | | | 0.23 | | | | 0.57 | | | | — | | | | 0.80 | | | | — | | | | 10.46 | | | | 5.78 | | | | 0.78 | | | | 0.52 | | | | 0.52 | | | | 1.56 | | | | 4,595 | | | | 23 | |
| 12-31-13 | | | 10.58 | | | | 0.20 | • | | | 0.58 | | | | 0.78 | | | | 0.32 | | | | 0.38 | | | | — | | | | 0.70 | | | | — | | | | 10.66 | | | | 7.64 | | | | 0.76 | | | | 0.51 | | | | 0.51 | | | | 1.87 | | | | 5,531 | | | | 39 | |
| 12-31-12 | | | 10.39 | | | | 0.22 | • | | | 0.64 | | | | 0.86 | | | | 0.29 | | | | 0.38 | | | | — | | | | 0.67 | | | | — | | | | 10.58 | | | | 8.38 | | | | 0.71 | | | | 0.52 | | | | 0.52 | | | | 2.06 | | | | 4,328 | | | | 45 | |
| 12-31-11 | | | 10.75 | | | | 0.15 | • | | | 0.09 | | | | 0.24 | | | | 0.28 | | | | 0.32 | | | | — | | | | 0.60 | | | | — | | | | 10.39 | | | | 2.52 | | | | 0.62 | | | | 0.52 | | | | 0.52 | | | | 1.46 | | | | 1,763 | | | | 78 | |
| 12-31-10 | | | 10.21 | | | | 0.37 | • | | | 0.39 | | | | 0.76 | | | | 0.12 | | | | 0.10 | | | | — | | | | 0.22 | | | | — | | | | 10.75 | | | | 7.54 | | | | 0.62 | | | | 0.52 | | | | 0.52 | | | | 3.53 | | | | 455 | | | | 45 | |
| Class T | | | | | | | | | | | | | | | | | | | | | | | | | | | | | | | | | | | | | | | | | | | | | | | | | | | | | | | | | | | | | | | | | | | | |
| 12-31-14 | | | 10.79 | | | | 0.13 | | | | 0.45 | | | | 0.58 | | | | 0.20 | | | | 0.57 | | | | — | | | | 0.77 | | | | — | | | | 10.60 | | | | 5.47 | | | | 1.03 | | | | 0.82 | | | | 0.82 | | | | 1.31 | | | | 3 | | | | 23 | |
| 12-31-13 | | | 10.69 | | | | 0.16 | | | | 0.59 | | | | 0.75 | | | | 0.27 | | | | 0.38 | | | | — | | | | 0.65 | | | | — | | | | 10.79 | | | | 7.28 | | | | 1.01 | | | | 0.81 | | | | 0.81 | | | | 1.51 | | | | 3 | | | | 39 | |
| 12-31-12 | | | 10.46 | | | | 0.16 | | | | 0.68 | | | | 0.84 | | | | 0.23 | | | | 0.38 | | | | — | | | | 0.61 | | | | — | | | | 10.69 | | | | 8.09 | | | | 0.96 | | | | 0.82 | | | | 0.82 | | | | 1.53 | | | | 3 | | | | 45 | |
| 12-31-11 | | | 10.78 | | | | 0.13 | | | | 0.08 | | | | 0.21 | | | | 0.21 | | | | 0.32 | | | | — | | | | 0.53 | | | | — | | | | 10.46 | | | | 2.20 | | | | 0.87 | | | | 0.82 | | | | 0.82 | | | | 1.19 | | | | 3 | | | | 78 | |
| 12-31-10 | | | 10.21 | | | | 0.20 | | | | 0.53 | | | | 0.73 | | | | 0.06 | | | | 0.10 | | | | — | | | | 0.16 | | | | — | | | | 10.78 | | | | 7.16 | | | | 0.87 | | | | 0.82 | | | | 0.82 | | | | 1.95 | | | | 3 | | | | 45 | |
| Voya Index Solution 2015 Portfolio | | | | | | | | | | | | | | | | | | | | | | | | | | | | | | | | | | | | | | | | | | | | | | | | | | | | | | | | | | | | | | | | | | | | |
| Class ADV | | | | | | | | | | | | | | | | | | | | | | | | | | | | | | | | | | | | | | | | | | | | | | | | | | | | | | | | | | | | | | | | | | | | |
| 12-31-14 | | | 10.84 | | | | 0.15 | • | | | 0.43 | | | | 0.58 | | | | 0.22 | | | | 0.57 | | | | — | | | | 0.79 | | | | — | | | | 10.63 | | | | 5.45 | | | | 0.77 | | | | 0.63 | | | | 0.63 | | | | 1.39 | | | | 113,993 | | | | 37 | |
| 12-31-13 | | | 10.38 | | | | 0.18 | • | | | 0.77 | | | | 0.95 | | | | 0.21 | | | | 0.28 | | | | — | | | | 0.49 | | | | — | | | | 10.84 | | | | 9.42 | | | | 0.75 | | | | 0.61 | | | | 0.61 | | | | 1.70 | | | | 127,503 | | | | 43 | |
| 12-31-12 | | | 9.90 | | | | 0.18 | • | | | 0.79 | | | | 0.97 | | | | 0.18 | | | | 0.31 | | | | — | | | | 0.49 | | | | — | | | | 10.38 | | | | 9.95 | | | | 0.71 | | | | 0.62 | | | | 0.62 | | | | 1.75 | | | | 111,594 | | | | 46 | |
| 12-31-11 | | | 10.45 | | | | 0.14 | • | | | (0.11 | ) | | | 0.03 | | | | 0.19 | | | | 0.39 | | | | — | | | | 0.58 | | | | — | | | | 9.90 | | | | 0.53 | | | | 0.62 | | | | 0.62 | | | | 0.62 | | | | 1.32 | | | | 71,792 | | | | 90 | |
| 12-31-10 | | | 9.76 | | | | 0.22 | • | | | 0.61 | | | | 0.83 | | | | 0.04 | | | | 0.10 | | | | — | | | | 0.14 | | | | — | | | | 10.45 | | | | 8.68 | | | | 0.62 | | | | 0.62 | | | | 0.62 | | | | 2.25 | | | | 62,077 | | | | 49 | |
See Accompanying Notes to Financial Statements
Financial Highlights (continued)
| | | | | | Income (loss)
from
investment
operations | | | | | | Less
Distributions | | | | | | | | | | | | | | | Ratios to average net assets | | | Supplemental Data | |
| | | Net asset
value,
beginning
of year
or period | | | Net
investment
income
(loss) | | | Net
realized
and
unrealized
gain
(loss) | | | Total from
investment
operations | | | From net
investment
income | | | From net
realized
gains | | | From
return
of
capital | | | Total
distributions | | | Payment
by
affiliate | | | Net
asset
value,
end
of
year
or
period | | | Total
Return(1) | | | Expenses
before
reductions/
additions(2)(3)(4) | | | Expenses
net of fee
waivers
and/or
recoupments
if any(2)(3)(4) | | | Expense
net of all
reductions/
additions(2)(3)(4) | | | Net
investment
income
(loss)(2)(3) | | | Net
assets,
end of
year or
period | | | Portfolio
turnover
rate | |
Year or
period ended | | ($) | | | ($) | | | ($) | | | ($) | | | ($) | | | ($) | | | ($) | | | ($) | | | ($) | | | ($) | | | (%) | | | (%) | | | (%) | | | (%) | | | (%) | | | ($000’s) | | | (%) | |
Voya Index Solution 2015 Portfolio (continued) | | | | | | | | | | | | | | | | | | | | | | | | | | | | | | | | | | | | | | | | | | | | | | | | | | | | | | | | | | | | | | | | | | | | |
| Class I | | | | | | | | | | | | | | | | | | | | | | | | | | | | | | | | | | | | | | | | | | | | | | | | | | | | | | | | | | | | | | | | | | | | |
| 12-31-14 | | | 11.03 | | | | 0.22 | • | | | 0.44 | | | | 0.66 | | | | 0.28 | | | | 0.57 | | | | — | | | | 0.85 | | | | — | | | | 10.84 | | | | 6.06 | | | | 0.27 | | | | 0.13 | | | | 0.13 | | | | 1.97 | | | | 26,627 | | | | 37 | |
| 12-31-13 | | | 10.54 | | | | 0.23 | • | | | 0.79 | | | | 1.02 | | | | 0.25 | | | | 0.28 | | | | — | | | | 0.53 | | | | — | | | | 11.03 | | | | 9.97 | | | | 0.25 | | | | 0.11 | | | | 0.11 | | | | 2.13 | | | | 24,661 | | | | 43 | |
| 12-31-12 | | | 10.03 | | | | 0.26 | • | | | 0.78 | | | | 1.04 | | | | 0.22 | | | | 0.31 | | | | — | | | | 0.53 | | | | — | | | | 10.54 | | | | 10.50 | | | | 0.21 | | | | 0.12 | | | | 0.12 | | | | 2.50 | | | | 28,198 | | | | 46 | |
| 12-31-11 | | | 10.57 | | | | 0.20 | • | | | (0.13 | ) | | | 0.07 | | | | 0.22 | | | | 0.39 | | | | — | | | | 0.61 | | | | — | | | | 10.03 | | | | 1.01 | | | | 0.12 | | | | 0.12 | | | | 0.12 | | | | 1.91 | | | | 15,152 | | | | 90 | |
| 12-31-10 | | | 9.85 | | | | 0.27 | • | | | 0.61 | | | | 0.88 | | | | 0.06 | | | | 0.10 | | | | — | | | | 0.16 | | | | — | | | | 10.57 | | | | 9.11 | | | | 0.12 | | | | 0.12 | | | | 0.12 | | | | 2.72 | | | | 4,813 | | | | 49 | |
| Class S | | | | | | | | | | | | | | | | | | | | | | | | | | | | | | | | | | | | | | | | | | | | | | | | | | | | | | | | | | | | | | | | | | | | |
| 12-31-14 | | | 10.95 | | | | 0.18 | • | | | 0.44 | | | | 0.62 | | | | 0.25 | | | | 0.57 | | | | — | | | | 0.82 | | | | — | | | | 10.75 | | | | 5.73 | | | | 0.52 | | | | 0.38 | | | | 0.38 | | | | 1.67 | | | | 109,593 | | | | 37 | |
| 12-31-13 | | | 10.47 | | | | 0.21 | | | | 0.78 | | | | 0.99 | | | | 0.23 | | | | 0.28 | | | | — | | | | 0.51 | | | | — | | | | 10.95 | | | | 9.69 | | | | 0.50 | | | | 0.36 | | | | 0.36 | | | | 1.93 | | | | 118,482 | | | | 43 | |
| 12-31-12 | | | 9.97 | | | | 0.18 | | | | 0.82 | | | | 1.00 | | | | 0.19 | | | | 0.31 | | | | — | | | | 0.50 | | | | — | | | | 10.47 | | | | 10.19 | | | | 0.46 | | | | 0.37 | | | | 0.37 | | | | 1.89 | | | | 112,364 | | | | 46 | |
| 12-31-11 | | | 10.51 | | | | 0.16 | | | | (0.11 | ) | | | 0.05 | | | | 0.20 | | | | 0.39 | | | | — | | | | 0.59 | | | | — | | | | 9.97 | | | | 0.80 | | | | 0.37 | | | | 0.37 | | | | 0.37 | | | | 1.55 | | | | 98,326 | | | | 90 | |
| 12-31-10 | | | 9.80 | | | | 0.25 | • | | | 0.61 | | | | 0.86 | | | | 0.05 | | | | 0.10 | | | | — | | | | 0.15 | | | | — | | | | 10.51 | | | | 8.97 | | | | 0.37 | | | | 0.37 | | | | 0.37 | | | | 2.50 | | | | 99,941 | | | | 49 | |
| Class S2 | | | | | | | | | | | | | | | | | | | | | | | | | | | | | | | | | | | | | | | | | | | | | | | | | | | | | | | | | | | | | | | | | | | | |
| 12-31-14 | | | 10.78 | | | | 0.16 | • | | | 0.43 | | | | 0.59 | | | | 0.23 | | | | 0.57 | | | | — | | | | 0.80 | | | | — | | | | 10.57 | | | | 5.61 | | | | 0.77 | | | | 0.53 | | | | 0.53 | | | | 1.47 | | | | 17,023 | | | | 37 | |
| 12-31-13 | | | 10.33 | | | | 0.20 | • | | | 0.76 | | | | 0.96 | | | | 0.23 | | | | 0.28 | | | | — | | | | 0.51 | | | | — | | | | 10.78 | | | | 9.56 | | | | 0.75 | | | | 0.51 | | | | 0.51 | | | | 1.88 | | | | 21,794 | | | | 43 | |
| 12-31-12 | | | 9.86 | | | | 0.20 | • | | | 0.77 | | | | 0.97 | | | | 0.19 | | | | 0.31 | | | | — | | | | 0.50 | | | | — | | | | 10.33 | | | | 10.05 | | | | 0.71 | | | | 0.52 | | | | 0.52 | | | | 1.95 | | | | 15,769 | | | | 46 | |
| 12-31-11 | | | 10.43 | | | | 0.13 | • | | | (0.09 | ) | | | 0.04 | | | | 0.22 | | | | 0.39 | | | | — | | | | 0.61 | | | | — | | | | 9.86 | | | | 0.69 | | | | 0.62 | | | | 0.52 | | | | 0.52 | | | | 1.25 | | | | 6,865 | | | | 90 | |
| 12-31-10 | | | 9.76 | | | | 0.25 | • | | | 0.58 | | | | 0.83 | | | | 0.06 | | | | 0.10 | | | | — | | | | 0.16 | | | | — | | | | 10.43 | | | | 8.68 | | | | 0.62 | | | | 0.52 | | | | 0.52 | | | | 2.48 | | | | 2,536 | | | | 49 | |
| Class T | | | | | | | | | | | | | | | | | | | | | | | | | | | | | | | | | | | | | | | | | | | | | | | | | | | | | | | | | | | | | | | | | | | | |
| 12-31-14 | | | 10.91 | | | | 0.13 | | | | 0.43 | | | | 0.56 | | | | 0.20 | | | | 0.57 | | | | — | | | | 0.77 | | | | — | | | | 10.70 | | | | 5.24 | | | | 1.02 | | | | 0.83 | | | | 0.83 | | | | 1.25 | | | | 3 | | | | 37 | |
| 12-31-13 | | | 10.43 | | | | 0.16 | | | | 0.78 | | | | 0.94 | | | | 0.18 | | | | 0.28 | | | | — | | | | 0.46 | | | | — | | | | 10.91 | | | | 9.24 | | | | 1.00 | | | | 0.81 | | | | 0.81 | | | | 1.52 | | | | 3 | | | | 43 | |
| 12-31-12 | | | 9.93 | | | | 0.15 | | | | 0.80 | | | | 0.95 | | | | 0.14 | | | | 0.31 | | | | — | | | | 0.45 | | | | — | | | | 10.43 | | | | 9.74 | | | | 0.96 | | | | 0.82 | | | | 0.82 | | | | 1.45 | | | | 3 | | | | 46 | |
| 12-31-11 | | | 10.46 | | | | 0.11 | | | | (0.10 | ) | | | 0.01 | | | | 0.15 | | | | 0.39 | | | | — | | | | 0.54 | | | | — | | | | 9.93 | | | | 0.38 | | | | 0.87 | | | | 0.82 | | | | 0.82 | | | | 1.10 | | | | 3 | | | | 90 | |
| 12-31-10 | | | 9.76 | | | | 0.20 | | | | 0.60 | | | | 0.80 | | | | 0.00 | * | | | 0.10 | | | | — | | | | 0.10 | | | | — | | | | 10.46 | | | | 8.31 | | | | 0.87 | | | | 0.82 | | | | 0.82 | | | | 2.05 | | | | 3 | | | | 49 | |
| Voya Index Solution 2020 Portfolio | | | | | | | | | | | | | | | | | | | | | | | | | | | | | | | | | | | | | | | | | | | | | | | | | | | | | | | | | | | | | | | | | | | | |
| Class ADV | | | | | | | | | | | | | | | | | | | | | | | | | | | | | | | | | | | | | | | | | | | | | | | | | | | | | | | | | | | | | | | | | | | | |
| 12-31-14 | | | 12.11 | | | | 0.15 | | | | 0.47 | | | | 0.62 | | | | 0.23 | | | | 0.68 | | | | — | | | | 0.91 | | | | — | | | | 11.82 | | | | 5.27 | | | | 71.22 | | | | 0.63 | | | | 0.63 | | | | 1.31 | | | | 4 | | | | 23 | |
| 12-31-13 | | | 11.41 | | | | 0.19 | | | | 1.30 | | | | 1.49 | | | | 0.26 | | | | 0.54 | | | | — | | | | 0.80 | | | | 0.01 | | | | 12.11 | | | | 13.55 | (a) | | | 95.97 | | | | 0.62 | | | | 0.62 | | | | 1.61 | | | | 4 | | | | 36 | |
| 12-31-12 | | | 10.76 | | | | 0.17 | | | | 1.02 | | | | 1.19 | | | | 0.02 | | | | 0.52 | | | | — | | | | 0.54 | | | | — | | | | 11.41 | | | | 11.12 | | | | 58.46 | | | | 0.62 | | | | 0.62 | | | | 1.54 | | | | 3 | | | | 61 | |
| 10-03-11(5) - | | | | | | | | | | | | | | | | | | | | | | | | | | | | | | | | | | | | | | | | | | | | | | | | | | | | | | | | | | | | | | | | | | | | |
| 12-31-11 | | | 10.00 | | | | 0.01 | | | | 0.75 | | | | 0.76 | | | | — | | | | — | | | | — | | | | — | | | | — | | | | 10.76 | | | | 7.60 | | | | 0.62 | | | | 0.62 | | | | 0.62 | | | | 0.42 | | | | 3 | | | | 41 | |
| Class I | | | | | | | | | | | | | | | | | | | | | | | | | | | | | | | | | | | | | | | | | | | | | | | | | | | | | | | | | | | | | | | | | | | | |
| 12-31-14 | | | 12.18 | | | | 0.21 | | | | 0.49 | | | | 0.70 | | | | 0.29 | | | | 0.68 | | | | — | | | | 0.97 | | | | — | | | | 11.91 | | | | 5.86 | | | | 70.72 | | | | 0.13 | | | | 0.13 | | | | 1.82 | | | | 4 | | | | 23 | |
| 12-31-13 | | | 11.47 | | | | 0.25 | | | | 1.30 | | | | 1.55 | | | | 0.31 | | | | 0.54 | | | | — | | | | 0.85 | | | | 0.01 | | | | 12.18 | | | | 14.02 | (a) | | | 95.47 | | | | 0.12 | | | | 0.12 | | | | 2.11 | | | | 4 | | | | 36 | |
| 12-31-12 | | | 10.77 | | | | 0.23 | | | | 1.02 | | | | 1.25 | | | | 0.03 | | | | 0.52 | | | | — | | | | 0.55 | | | | — | | | | 11.47 | | | | 11.69 | | | | 57.96 | | | | 0.12 | | | | 0.12 | | | | 2.04 | | | | 3 | | | | 61 | |
| 10-03-11(5) - | | | | | | | | | | | | | | | | | | | | | | | | | | | | | | | | | | | | | | | | | | | | | | | | | | | | | | | | | | | | | | | | | | | | |
| 12-31-11 | | | 10.00 | | | | 0.02 | | | | 0.75 | | | | 0.77 | | | | — | | | | — | | | | — | | | | — | | | | — | | | | 10.77 | | | | 7.70 | | | | 0.12 | | | | 0.12 | | | | 0.12 | | | | 0.90 | | | | 3 | | | | 41 | |
| Class S | | | | | | | | | | | | | | | | | | | | | | | | | | | | | | | | | | | | | | | | | | | | | | | | | | | | | | | | | | | | | | | | | | | | |
| 12-31-14 | | | 12.19 | | | | 0.18 | | | | 0.48 | | | | 0.66 | | | | 0.26 | | | | 0.68 | | | | — | | | | 0.94 | | | | — | | | | 11.91 | | | | 5.54 | | | | 70.97 | | | | 0.38 | | | | 0.38 | | | | 1.57 | | | | 4 | | | | 23 | |
| 12-31-13 | | | 11.43 | | | | 0.22 | | | | 1.29 | | | | 1.51 | | | | 0.22 | | | | 0.54 | | | | — | | | | 0.76 | | | | 0.01 | | | | 12.19 | | | | 13.63 | (a) | | | 95.72 | | | | 0.37 | | | | 0.37 | | | | 1.86 | | | | 4 | | | | 36 | |
| 12-31-12 | | | 10.76 | | | | 0.20 | | | | 1.01 | | | | 1.21 | | | | 0.02 | | | | 0.52 | | | | — | | | | 0.54 | | | | — | | | | 11.43 | | | | 11.36 | | | | 58.21 | | | | 0.37 | | | | 0.37 | | | | 1.79 | | | | 3 | | | | 61 | |
| 10-03-11(5) - | | | | | | | | | | | | | | | | | | | | | | | | | | | | | | | | | | | | | | | | | | | | | | | | | | | | | | | | | | | | | | | | | | | | |
| 12-31-11 | | | 10.00 | | | | 0.02 | | | | 0.74 | | | | 0.76 | | | | — | | | | — | | | | — | | | | — | | | | — | | | | 10.76 | | | | 7.60 | | | | 0.37 | | | | 0.37 | | | | 0.37 | | | | 0.66 | | | | 3 | | | | 41 | |
See Accompanying Notes to Financial Statements
Financial Highlights (continued)
| | | | | | Income (loss)
from
investment
operations | | | | | | Less
Distributions | | | | | | | | | | | | | | | Ratios to average net assets | | | Supplemental Data | |
| | | Net asset
value,
beginning
of year
or period | | | Net
investment
income
(loss) | | | Net
realized
and
unrealized
gain
(loss) | | | Total from
investment
operations | | | From net
investment
income | | | From net
realized
gains | | | From
return
of
capital | | | Total
distributions | | | Payment
by
affiliate | | | Net
asset
value,
end
of
year
or
period | | | Total
Return(1) | | | Expenses
before
reductions/
additions(2)(3)(4) | | | Expenses
net of fee
waivers
and/or
recoupments
if any(2)(3)(4) | | | Expense
net of all
reductions/
additions(2)(3)(4) | | | Net
investment
income
(loss)(2)(3) | | | Net
assets,
end of
year or
period | | | Portfolio
turnover
rate | |
Year or
period ended | | ($) | | | ($) | | | ($) | | | ($) | | | ($) | | | ($) | | | ($) | | | ($) | | | ($) | | | ($) | | | (%) | | | (%) | | | (%) | | | (%) | | | (%) | | | ($000’s) | | | (%) | |
Voya Index Solution 2020 Portfolio (continued) | | | | | | | | | | | | | | | | | | | | | | | | | | | | | | | | | | | | | | | | | | | | | | | | | | | | | | | | | | | | | | | | | | | | |
| Class S2 | | | | | | | | | | | | | | | | | | | | | | | | | | | | | | | | | | | | | | | | | | | | | | | | | | | | | | | | | | | | | | | | | | | | |
| 12-31-14 | | | 12.13 | | | | 0.16 | | | | 0.48 | | | | 0.64 | | | | 0.25 | | | | 0.68 | | | | — | | | | 0.93 | | | | — | | | | 11.84 | | | | 5.36 | | | | 71.22 | | | | 0.53 | | | | 0.53 | | | | 1.41 | | | | 4 | | | | 23 | |
| 12-31-13 | | | 11.43 | | | | 0.20 | | | | 1.31 | | | | 1.51 | | | | 0.28 | | | | 0.54 | | | | — | | | | 0.82 | | | | 0.01 | | | | 12.13 | | | | 13.64 | (a) | | | 95.97 | | | | 0.52 | | | | 0.52 | | | | 1.71 | | | | 4 | | | | 36 | |
| 12-31-12 | | | 10.76 | | | | 0.21 | | | | 1.00 | | | | 1.21 | | | | 0.02 | | | | 0.52 | | | | — | | | | 0.54 | | | | — | | | | 11.43 | | | | 11.33 | | | | 58.46 | | | | 0.52 | | | | 0.52 | | | | 1.90 | | | | 3 | | | | 61 | |
| 10-03-11(5) - | | | | | | | | | | | | | | | | | | | | | | | | | | | | | | | | | | | | | | | | | | | | | | | | | | | | | | | | | | | | | | | | | | | | |
| 12-31-11 | | | 10.00 | | | | 0.01 | | | | 0.75 | | | | 0.76 | | | | — | | | | — | | | | — | | | | — | | | | — | | | | 10.76 | | | | 7.60 | | | | 0.62 | | | | 0.52 | | | | 0.52 | | | | 0.54 | | | | 3 | | | | 41 | |
| Class T | | | | | | | | | | | | | | | | | | | | | | | | | | | | | | | | | | | | | | | | | | | | | | | | | | | | | | | | | | | | | | | | | | | | |
| 12-31-14 | | | 12.08 | | | | 0.13 | | | | 0.47 | | | | 0.60 | | | | 0.21 | | | | 0.68 | | | | — | | | | 0.89 | | | | — | | | | 11.79 | | | | 5.07 | | | | 71.47 | | | | 0.83 | | | | 0.83 | | | | 1.11 | | | | 4 | | | | 23 | |
| 12-31-13 | | | 11.38 | | | | 0.17 | | | | 1.29 | | | | 1.46 | | | | 0.23 | | | | 0.54 | | | | — | | | | 0.77 | | | | 0.01 | | | | 12.08 | | | | 13.30 | (a) | | | 96.22 | | | | 0.82 | | | | 0.82 | | | | 1.40 | | | | 4 | | | | 36 | |
| 12-31-12 | | | 10.75 | | | | 0.15 | | | | 1.01 | | | | 1.16 | | | | 0.01 | | | | 0.52 | | | | — | | | | 0.53 | | | | — | | | | 11.38 | | | | 10.88 | | | | 58.71 | | | | 0.82 | | | | 0.82 | | | | 1.34 | | | | 3 | | | | 61 | |
| 10-03-11(5) - | | | | | | | | | | | | | | | | | | | | | | | | | | | | | | | | | | | | | | | | | | | | | | | | | | | | | | | | | | | | | | | | | | | | |
| 12-31-11 | | | 10.00 | | | | 0.00 | * | | | 0.75 | | | | 0.75 | | | | — | | | | — | | | | — | | | | — | | | | — | | | | 10.75 | | | | 7.50 | | | | 0.87 | | | | 0.82 | | | | 0.82 | | | | 0.18 | | | | 3 | | | | 41 | |
| Voya Index Solution 2025 Portfolio | | | | | | | | | | | | | | | | | | | | | | | | | | | | | | | | | | | | | | | | | | | | | | | | | | | | | | | | | | | | | | | | | | | | |
| Class ADV | | | | | | | | | | | | | | | | | | | | | | | | | | | | | | | | | | | | | | | | | | | | | | | | | | | | | | | | | | | | | | | | | | | | |
| 12-31-14 | | | 11.63 | | | | 0.15 | | | | 0.46 | | | | 0.61 | | | | 0.19 | | | | 0.56 | | | | — | | | | 0.75 | | | | — | | | | 11.49 | | | | 5.41 | | | | 0.77 | | | | 0.62 | | | | 0.62 | | | | 1.29 | | | | 242,980 | | | | 33 | |
| 12-31-13 | | | 10.38 | | | | 0.18 | • | | | 1.54 | | | | 1.72 | | | | 0.16 | | | | 0.31 | | | | — | | | | 0.47 | | | | — | | | | 11.63 | | | | 16.77 | | | | 0.75 | | | | 0.61 | | | | 0.61 | | | | 1.66 | | | | 245,758 | | | | 40 | |
| 12-31-12 | | | 9.56 | | | | 0.16 | • | | | 1.04 | | | | 1.20 | | | | 0.12 | | | | 0.26 | | | | — | | | | 0.38 | | | | — | | | | 10.38 | | | | 12.74 | | | | 0.71 | | | | 0.62 | | | | 0.62 | | | | 1.63 | | | | 181,218 | | | | 39 | |
| 12-31-11 | | | 10.40 | | | | 0.12 | • | | | (0.34 | ) | | | (0.22 | ) | | | 0.15 | | | | 0.47 | | | | — | | | | 0.62 | | | | — | | | | 9.56 | | | | (1.75 | ) | | | 0.62 | | | | 0.62 | | | | 0.62 | | | | 1.19 | | | | 114,181 | | | | 95 | |
| 12-31-10 | | | 9.36 | | | | 0.20 | • | | | 0.87 | | | | 1.07 | | | | 0.01 | | | | 0.02 | | | | — | | | | 0.03 | | | | — | | | | 10.40 | | | | 11.43 | | | | 0.62 | | | | 0.62 | | | | 0.62 | | | | 2.12 | | | | 96,652 | | | | 48 | |
| Class I | | | | | | | | | | | | | | | | | | | | | | | | | | | | | | | | | | | | | | | | | | | | | | | | | | | | | | | | | | | | | | | | | | | | |
| 12-31-14 | | | 11.84 | | | | 0.22 | • | | | 0.46 | | | | 0.68 | | | | 0.24 | | | | 0.56 | | | | — | | | | 0.80 | | | | — | | | | 11.72 | | | | 5.95 | | | | 0.27 | | | | 0.12 | | | | 0.12 | | | | 1.89 | | | | 46,808 | | | | 33 | |
| 12-31-13 | | | 10.54 | | | | 0.24 | • | | | 1.56 | | | | 1.80 | | | | 0.19 | | | | 0.31 | | | | — | | | | 0.50 | | | | — | | | | 11.84 | | | | 17.38 | | | | 0.25 | | | | 0.11 | | | | 0.11 | | | | 2.13 | | | | 33,098 | | | | 40 | |
| 12-31-12 | | | 9.69 | | | | 0.24 | • | | | 1.02 | | | | 1.26 | | | | 0.15 | | | | 0.26 | | | | — | | | | 0.41 | | | | — | | | | 10.54 | | | | 13.26 | | | | 0.21 | | | | 0.12 | | | | 0.12 | | | | 2.32 | | | | 29,471 | | | | 39 | |
| 12-31-11 | | | 10.52 | | | | 0.16 | • | | | (0.34 | ) | | | (0.18 | ) | | | 0.18 | | | | 0.47 | | | | — | | | | 0.65 | | | | — | | | | 9.69 | | | | (1.24 | ) | | | 0.12 | | | | 0.12 | | | | 0.12 | | | | 1.55 | | | | 15,692 | | | | 95 | |
| 12-31-10 | | | 9.44 | | | | 0.25 | • | | | 0.88 | | | | 1.13 | | | | 0.03 | | | | 0.02 | | | | — | | | | 0.05 | | | | — | | | | 10.52 | | | | 11.96 | | | | 0.12 | | | | 0.12 | | | | 0.12 | | | | 2.63 | | | | 7,248 | | | | 48 | |
| Class S | | | | | | | | | | | | | | | | | | | | | | | | | | | | | | | | | | | | | | | | | | | | | | | | | | | | | | | | | | | | | | | | | | | | |
| 12-31-14 | | | 11.74 | | | | 0.18 | | | | 0.47 | | | | 0.65 | | | | 0.22 | | | | 0.56 | | | | — | | | | 0.78 | | | | — | | | | 11.61 | | | | 5.67 | | | | 0.52 | | | | 0.37 | | | | 0.37 | | | | 1.55 | | | | 186,666 | | | | 33 | |
| 12-31-13 | | | 10.47 | | | | 0.21 | • | | | 1.54 | | | | 1.75 | | | | 0.17 | | | | 0.31 | | | | — | | | | 0.48 | | | | — | | | | 11.74 | | | | 17.00 | | | | 0.50 | | | | 0.36 | | | | 0.36 | | | | 1.88 | | | | 174,380 | | | | 40 | |
| 12-31-12 | | | 9.62 | | | | 0.19 | • | | | 1.05 | | | | 1.24 | | | | 0.13 | | | | 0.26 | | | | — | | | | 0.39 | | | | — | | | | 10.47 | | | | 13.12 | | | | 0.46 | | | | 0.37 | | | | 0.37 | | | | 1.84 | | | | 138,176 | | | | 39 | |
| 12-31-11 | | | 10.46 | | | | 0.14 | • | | | (0.34 | ) | | | (0.20 | ) | | | 0.17 | | | | 0.47 | | | | — | | | | 0.64 | | | | — | | | | 9.62 | | | | (1.55 | ) | | | 0.37 | | | | 0.37 | | | | 0.37 | | | | 1.42 | | | | 98,843 | | | | 95 | |
| 12-31-10 | | | 9.40 | | | | 0.22 | • | | | 0.88 | | | | 1.10 | | | | 0.02 | | | | 0.02 | | | | — | | | | 0.04 | | | | — | | | | 10.46 | | | | 11.72 | | | | 0.37 | | | | 0.37 | | | | 0.37 | | | | 2.31 | | | | 92,770 | | | | 48 | |
| Class S2 | | | | | | | | | | | | | | | | | | | | | | | | | | | | | | | | | | | | | | | | | | | | | | | | | | | | | | | | | | | | | | | | | | | | |
| 12-31-14 | | | 11.58 | | | | 0.16 | • | | | 0.46 | | | | 0.62 | | | | 0.20 | | | | 0.56 | | | | — | | | | 0.76 | | | | — | | | | 11.44 | | | | 5.52 | | | | 0.77 | | | | 0.52 | | | | 0.52 | | | | 1.36 | | | | 42,853 | | | | 33 | |
| 12-31-13 | | | 10.34 | | | | 0.20 | • | | | 1.52 | | | | 1.72 | | | | 0.17 | | | | 0.31 | | | | — | | | | 0.48 | | | | — | | | | 11.58 | | | | 16.87 | | | | 0.75 | | | | 0.51 | | | | 0.51 | | | | 1.80 | | | | 48,649 | | | | 40 | |
| 12-31-12 | | | 9.53 | | | | 0.18 | • | | | 1.03 | | | | 1.21 | | | | 0.14 | | | | 0.26 | | | | — | | | | 0.40 | | | | — | | | | 10.34 | | | | 12.88 | | | | 0.71 | | | | 0.52 | | | | 0.52 | | | | 1.77 | | | | 32,743 | | | | 39 | |
| 12-31-11 | | | 10.40 | | | | 0.09 | • | | | (0.31 | ) | | | (0.22 | ) | | | 0.18 | | | | 0.47 | | | | — | | | | 0.65 | | | | — | | | | 9.53 | | | | (1.70 | ) | | | 0.62 | | | | 0.52 | | | | 0.52 | | | | 0.93 | | | | 13,158 | | | | 95 | |
| 12-31-10 | | | 9.36 | | | | 0.17 | • | | | 0.92 | | | | 1.09 | | | | 0.03 | | | | 0.02 | | | | — | | | | 0.05 | | | | — | | | | 10.40 | | | | 11.63 | | | | 0.62 | | | | 0.52 | | | | 0.52 | | | | 1.76 | | | | 4,796 | | | | 48 | |
| Class T | | | | | | | | | | | | | | | | | | | | | | | | | | | | | | | | | | | | | | | | | | | | | | | | | | | | | | | | | | | | | | | | | | | | |
| 12-31-14 | | | 11.66 | | | | 0.12 | | | | 0.47 | | | | 0.59 | | | | 0.16 | | | | 0.56 | | | | — | | | | 0.72 | | | | — | | | | 11.53 | | | | 5.23 | | | | 1.02 | | | | 0.82 | | | | 0.82 | | | | 1.10 | | | | 4 | | | | 33 | |
| 12-31-13 | | | 10.39 | | | | 0.16 | | | | 1.54 | | | | 1.70 | | | | 0.12 | | | | 0.31 | | | | — | | | | 0.43 | | | | — | | | | 11.66 | | | | 16.58 | | | | 1.00 | | | | 0.81 | | | | 0.81 | | | | 1.42 | | | | 3 | | | | 40 | |
| 12-31-12 | | | 9.55 | | | | 0.14 | | | | 1.04 | | | | 1.18 | | | | 0.08 | | | | 0.26 | | | | — | | | | 0.34 | | | | — | | | | 10.39 | | | | 12.54 | | | | 0.96 | | | | 0.82 | | | | 0.82 | | | | 1.34 | | | | 3 | | | | 39 | |
| 12-31-11 | | | 10.37 | | | | 0.10 | | | | (0.34 | ) | | | (0.24 | ) | | | 0.11 | | | | 0.47 | | | | — | | | | 0.58 | | | | — | | | | 9.55 | | | | (1.93 | ) | | | 0.87 | | | | 0.82 | | | | 0.82 | | | | 0.97 | | | | 3 | | | | 95 | |
| 12-31-10 | | | 9.36 | | | | 0.18 | | | | 0.85 | | | | 1.03 | | | | — | | | | 0.02 | | | | — | | | | 0.02 | | | | — | | | | 10.37 | | | | 10.99 | | | | 0.87 | | | | 0.82 | | | | 0.82 | | | | 1.90 | | | | 3 | | | | 48 | |
See Accompanying Notes to Financial Statements
Financial Highlights (continued)
| | | | | | Income (loss)
from
investment
operations | | | | | | Less
Distributions | | | | | | | | | | | | | | | Ratios to average net assets | | | Supplemental Data | |
| | | Net asset
value,
beginning
of year
or period | | | Net
investment
income
(loss) | | | Net
realized
and
unrealized
gain
(loss) | | | Total from
investment
operations | | | From net
investment
income | | | From net
realized
gains | | | From
return
of
capital | | | Total
distributions | | | Payment
by
affiliate | | | Net
asset
value,
end
of
year
or
period | | | Total
Return(1) | | | Expenses
before
reductions/
additions(2)(3)(4) | | | Expenses
net of fee
waivers
and/or
recoupments
if any(2)(3)(4) | | | Expense
net of all
reductions/
additions(2)(3)(4) | | | Net
investment
income
(loss)(2)(3) | | | Net
assets,
end of
year or
period | | | Portfolio
turnover
rate | |
Year or
period ended | | ($) | | | ($) | | | ($) | | | ($) | | | ($) | | | ($) | | | ($) | | | ($) | | | ($) | | | ($) | | | (%) | | | (%) | | | (%) | | | (%) | | | (%) | | | ($000’s) | | | (%) | |
Voya Index Solution 2030 Portfolio | | | | | | | | | | | | | | | | | | | | | | | | | | | | | | | | | | | | | | | | | | | | | | | | | | | | | | | | | | | | | | | | | | | | |
| Class ADV | | | | | | | | | | | | | | | | | | | | | | | | | | | | | | | | | | | | | | | | | | | | | | | | | | | | | | | | | | | | | | | | | | | | |
| 12-31-14 | | | 13.19 | | | | 0.14 | | | | 0.50 | | | | 0.64 | | | | 0.22 | | | | 0.91 | | | | — | | | | 1.13 | | | | — | | | | 12.70 | | | | 5.00 | | | | 65.69 | | | | 0.63 | | | | 0.63 | | | | 1.10 | | | | 4 | | | | 32 | |
| 12-31-13 | | | 11.85 | | | | 0.19 | • | | | 1.95 | | | | 2.14 | | | | 0.27 | | | | 0.55 | | | | — | | | | 0.82 | | | | 0.02 | | | | 13.19 | | | | 18.71 | (b) | | | 87.48 | | | | 0.61 | | | | 0.61 | | | | 1.48 | | | | 4 | | | | 41 | |
| 12-31-12 | | | 11.00 | | | | 0.20 | | | | 1.33 | | | | 1.53 | | | | 0.01 | | | | 0.67 | | | | — | | | | 0.68 | | | | — | | | | 11.85 | | | | 13.99 | | | | 43.07 | | | | 0.62 | | | | 0.62 | | | | 1.74 | | | | 4 | | | | 51 | |
10-03-11(5) -
12-31-11 | | | 10.00 | | | | (0.00 | )* | | | 1.00 | | | | 1.00 | | | | — | | | | — | | | | — | | | | — | | | | — | | | | 11.00 | | | | 10.00 | | | | 0.62 | | | | 0.62 | | | | 0.62 | | | | (0.00 | )* | | | 3 | | | | 50 | |
| Class I | | | | | | | | | | | | | | | | | | | | | | | | | | | | | | | | | | | | | | | | | | | | | | | | | | | | | | | | | | | | | | | | | | | | |
| 12-31-14 | | | 13.28 | | | | 0.20 | | | | 0.51 | | | | 0.71 | | | | 0.29 | | | | 0.91 | | | | — | | | | 1.20 | | | | — | | | | 12.79 | | | | 5.52 | | | | 65.19 | | | | 0.13 | | | | 0.13 | | | | 1.61 | | | | 4 | | | | 32 | |
| 12-31-13 | | | 11.91 | | | | 0.25 | • | | | 1.97 | | | | 2.22 | | | | 0.32 | | | | 0.55 | | | | — | | | | 0.87 | | | | 0.02 | | | | 13.28 | | | | 19.32 | (b) | | | 86.98 | | | | 0.11 | | | | 0.11 | | | | 1.97 | | | | 4 | | | | 41 | |
| 12-31-12 | | | 11.01 | | | | 0.26 | • | | | 1.33 | | | | 1.59 | | | | 0.02 | | | | 0.67 | | | | — | | | | 0.69 | | | | — | | | | 11.91 | | | | 14.55 | | | | 42.57 | | | | 0.12 | | | | 0.12 | | | | 2.23 | | | | 4 | | | | 51 | |
| 10-03-11(5) - | | | | | | | | | | | | | | | | | | | | | | | | | | | | | | | | | | | | | | | | | | | | | | | | | | | | | | | | | | | | | | | | | | | | |
| 12-31-11 | | | 10.00 | | | | 0.01 | | | | 1.00 | | | | 1.01 | | | | — | | | | — | | | | — | | | | — | | | | — | | | | 11.01 | | | | 10.10 | | | | 0.12 | | | | 0.12 | | | | 0.12 | | | | 0.46 | | | | 3 | | | | 50 | |
| Class S | | | | | | | | | | | | | | | | | | | | | | | | | | | | | | | | | | | | | | | | | | | | | | | | | | | | | | | | | | | | | | | | | | | | |
| 12-31-14 | | | 13.27 | | | | 0.17 | | | | 0.52 | | | | 0.69 | | | | 0.26 | | | | 0.91 | | | | — | | | | 1.17 | | | | — | | | | 12.79 | | | | 5.32 | | | | 65.44 | | | | 0.38 | | | | 0.38 | | | | 1.35 | | | | 4 | | | | 32 | |
| 12-31-13 | | | 11.87 | | | | 0.22 | | | | 1.94 | | | | 2.16 | | | | 0.23 | | | | 0.55 | | | | — | | | | 0.78 | | | | 0.02 | | | | 13.27 | | | | 18.78 | (b) | | | 87.23 | | | | 0.36 | | | | 0.36 | | | | 1.73 | | | | 4 | | | | 41 | |
| 12-31-12 | | | 11.00 | | | | 0.23 | | | | 1.32 | | | | 1.55 | | | | 0.01 | | | | 0.67 | | | | — | | | | 0.68 | | | | — | | | | 11.87 | | | | 14.22 | | | | 42.82 | | | | 0.37 | | | | 0.37 | | | | 2.00 | | | | 4 | | | | 51 | |
| 10-03-11(5) - | | | | | | | | | | | | | | | | | | | | | | | | | | | | | | | | | | | | | | | | | | | | | | | | | | | | | | | | | | | | | | | | | | | | |
| 12-31-11 | | | 10.00 | | | | 0.00 | * | | | 1.00 | | | | 1.00 | | | | — | | | | — | | | | — | | | | — | | | | — | | | | 11.00 | | | | 10.00 | | | | 0.37 | | | | 0.37 | | | | 0.37 | | | | 0.17 | | | | 3 | | | | 50 | |
| Class S2 | | | | | | | | | | | | | | | | | | | | | | | | | | | | | | | | | | | | | | | | | | | | | | | | | | | | | | | | | | | | | | | | | | | | |
| 12-31-14 | | | 13.21 | | | | 0.15 | | | | 0.49 | | | | 0.64 | | | | 0.23 | | | | 0.91 | | | | — | | | | 1.14 | | | | — | | | | 12.71 | | | | 5.00 | | | | 65.69 | | | | 0.53 | | | | 0.53 | | | | 1.20 | | | | 4 | | | | 32 | |
| 12-31-13 | | | 11.87 | | | | 0.20 | | | | 1.95 | | | | 2.15 | | | | 0.28 | | | | 0.55 | | | | — | | | | 0.83 | | | | 0.02 | | | | 13.21 | | | | 18.79 | (b) | | | 87.48 | | | | 0.51 | | | | 0.51 | | | | 1.58 | | | | 4 | | | | 41 | |
| 12-31-12 | | | 11.00 | | | | 0.23 | | | | 1.32 | | | | 1.55 | | | | 0.01 | | | | 0.67 | | | | — | | | | 0.68 | | | | — | | | | 11.87 | | | | 14.20 | | | | 43.07 | | | | 0.52 | | | | 0.52 | | | | 1.97 | | | | 4 | | | | 51 | |
| 10-03-11(5) - | | | | | | | | | | | | | | | | | | | | | | | | | | | | | | | | | | | | | | | | | | | | | | | | | | | | | | | | | | | | | | | | | | | | |
| 12-31-11 | | | 10.00 | | | | 0.00 | * | | | 1.00 | | | | 1.00 | | | | — | | | | — | | | | — | | | | — | | | | — | | | | 11.00 | | | | 10.00 | | | | 0.62 | | | | 0.52 | | | | 0.52 | | | | 0.11 | | | | 3 | | | | 50 | |
| Class T | | | | | | | | | | | | | | | | | | | | | | | | | | | | | | | | | | | | | | | | | | | | | | | | | | | | | | | | | | | | | | | | | | | | |
| 12-31-14 | | | 13.17 | | | | 0.11 | | | | 0.50 | | | | 0.61 | | | | 0.21 | | | | 0.91 | | | | — | | | | 1.12 | | | | — | | | | 12.66 | | | | 4.75 | | | | 65.94 | | | | 0.83 | | | | 0.83 | | | | 0.91 | | | | 4 | | | | 32 | |
| 12-31-13 | | | 11.82 | | | | 0.16 | | | | 1.96 | | | | 2.12 | | | | 0.24 | | | | 0.55 | | | | — | | | | 0.79 | | | | 0.02 | | | | 13.17 | | | | 18.56 | (b) | | | 87.73 | | | | 0.81 | | | | 0.81 | | | | 1.27 | | | | 4 | | | | 41 | |
| 12-31-12 | | | 10.99 | | | | 0.18 | | | | 1.32 | | | | 1.50 | | | | 0.00 | * | | | 0.67 | | | | — | | | | 0.67 | | | | — | | | | 11.82 | | | | 13.75 | | | | 43.32 | | | | 0.82 | | | | 0.82 | | | | 1.52 | | | | 4 | | | | 51 | |
| 10-03-11(5) - | | | | | | | | | | | | | | | | | | | | | | | | | | | | | | | | | | | | | | | | | | | | | | | | | | | | | | | | | | | | | | | | | | | | |
| 12-31-11 | | | 10.00 | | | | (0.01 | ) | | | 1.00 | | | | 0.99 | | | | — | | | | — | | | | — | | | | — | | | | — | | | | 10.99 | | | | 9.90 | | | | 0.87 | | | | 0.82 | | | | 0.82 | | | | (0.29 | ) | | | 3 | | | | 50 | |
| Voya Index Solution 2035 Portfolio | | | | | | | | | | | | | | | | | | | | | | | | | | | | | | | | | | | | | | | | | | | | | | | | | | | | | | | | | | | | | | | | | | | | |
| Class ADV | | | | | | | | | | | | | | | | | | | | | | | | | | | | | | | | | | | | | | | | | | | | | | | | | | | | | | | | | | | | | | | | | | | | |
| 12-31-14 | | | 12.01 | | | | 0.13 | | | | 0.53 | | | | 0.66 | | | | 0.17 | | | | 0.64 | | | | — | | | | 0.81 | | | | — | | | | 11.86 | | | | 5.65 | | | | 0.76 | | | | 0.63 | | | | 0.63 | | | | 1.12 | | | | 213,542 | | | | 44 | |
| 12-31-13 | | | 10.25 | | | | 0.17 | • | | | 2.01 | | | | 2.18 | | | | 0.12 | | | | 0.30 | | | | — | | | | 0.42 | | | | — | | | | 12.01 | | | | 21.67 | | | | 0.75 | | | | 0.62 | | | | 0.62 | | | | 1.51 | | | | 208,246 | | | | 45 | |
| 12-31-12 | | | 9.30 | | | | 0.15 | • | | | 1.21 | | | | 1.36 | | | | 0.09 | | | | 0.32 | | | | — | | | | 0.41 | | | | — | | | | 10.25 | | | | 14.87 | | | | 0.71 | | | | 0.62 | | | | 0.62 | | | | 1.47 | | | | 150,358 | | | | 34 | |
| 12-31-11 | | | 10.27 | | | | 0.11 | • | | | (0.51 | ) | | | (0.40 | ) | | | 0.12 | | | | 0.45 | | | | — | | | | 0.57 | | | | — | | | | 9.30 | | | | (3.46 | ) | | | 0.62 | | | | 0.62 | | | | 0.62 | | | | 1.06 | | | | 94,263 | | | | 100 | |
| 12-31-10 | | | 9.14 | | | | 0.18 | • | | | 0.97 | | | | 1.15 | | | | — | | | | 0.02 | | | | — | | | | 0.02 | | | | — | | | | 10.27 | | | | 12.56 | | | | 0.62 | | | | 0.62 | | | | 0.62 | | | | 1.91 | | | | 77,135 | | | | 45 | |
| Class I | | | | | | | | | | | | | | | | | | | | | | | | | | | | | | | | | | | | | | | | | | | | | | | | | | | | | | | | | | | | | | | | | | | | |
| 12-31-14 | | | 12.24 | | | | 0.21 | • | | | 0.53 | | | | 0.74 | | | | 0.23 | | | | 0.64 | | | | — | | | | 0.87 | | | | — | | | | 12.11 | | | | 6.16 | | | | 0.26 | | | | 0.13 | | | | 0.13 | | | | 1.73 | | | | 34,038 | | | | 44 | |
| 12-31-13 | | | 10.42 | | | | 0.23 | • | | | 2.05 | | | | 2.28 | | | | 0.16 | | | | 0.30 | | | | — | | | | 0.46 | | | | — | | | | 12.24 | | | | 22.29 | | | | 0.25 | | | | 0.12 | | | | 0.12 | | | | 1.99 | | | | 20,257 | | | | 45 | |
| 12-31-12 | | | 9.43 | | | | 0.21 | • | | | 1.23 | | | | 1.44 | | | | 0.13 | | | | 0.32 | | | | — | | | | 0.45 | | | | — | | | | 10.42 | | | | 15.49 | | | | 0.21 | | | | 0.12 | | | | 0.12 | | | | 2.05 | | | | 18,530 | | | | 34 | |
| 12-31-11 | | | 10.40 | | | | 0.14 | • | | | (0.51 | ) | | | (0.37 | ) | | | 0.15 | | | | 0.45 | | | | — | | | | 0.60 | | | | — | | | | 9.43 | | | | (3.06 | ) | | | 0.12 | | | | 0.12 | | | | 0.12 | | | | 1.43 | | | | 11,109 | | | | 100 | |
| 12-31-10 | | | 9.22 | | | | 0.23 | • | | | 0.98 | | | | 1.21 | | | | 0.01 | | | | 0.02 | | | | — | | | | 0.03 | | | | — | | | | 10.40 | | | | 13.10 | | | | 0.12 | | | | 0.12 | | | | 0.12 | | | | 2.40 | | | | 5,521 | | | | 45 | |
See Accompanying Notes to Financial Statements
Financial Highlights (continued)
| | | | | | Income (loss)
from
investment
operations | | | | | | Less
Distributions | | | | | | | | | | | | | | | Ratios to average net assets | | | Supplemental Data | |
| | | Net asset
value,
beginning
of year
or period | | | Net
investment
income
(loss) | | | Net
realized
and
unrealized
gain
(loss) | | | Total from
investment
operations | | | From net
investment
income | | | From net
realized
gains | | | From
return
of
capital | | | Total
distributions | | | Payment
by
affiliate | | | Net
asset
value,
end
of
year
or
period | | | Total
Return(1) | | | Expenses
before
reductions/
additions(2)(3)(4) | | | Expenses
net of fee
waivers
and/or
recoupments
if any(2)(3)(4) | | | Expense
net of all
reductions/
additions(2)(3)(4) | | | Net
investment
income
(loss)(2)(3) | | | Net
assets,
end of
year or
period | | | Portfolio
turnover
rate | |
Year or
period ended | | ($) | | | ($) | | | ($) | | | ($) | | | ($) | | | ($) | | | ($) | | | ($) | | | ($) | | | ($) | | | (%) | | | (%) | | | (%) | | | (%) | | | (%) | | | ($000’s) | | | (%) | |
Voya Index Solution 2035 Portfolio (continued) | | | | | | | | | | | | | | | | | | | | | | | | | | | | | | | | | | | | | | | | | | | | | | | | | | | | | | | | | | | | | | | | | | | | |
| Class S | | | | | | | | | | | | | | | | | | | | | | | | | | | | | | | | | | | | | | | | | | | | | | | | | | | | | | | | | | | | | | | | | | | | |
| 12-31-14 | | | 12.13 | | | | 0.16 | | | | 0.54 | | | | 0.70 | | | | 0.20 | | | | 0.64 | | | | — | | | | 0.84 | | | | — | | | | 11.99 | | | | 5.90 | | | | 0.51 | | | | 0.38 | | | | 0.38 | | | | 1.38 | | | | 145,942 | | | | 44 | |
| 12-31-13 | | | 10.34 | | | | 0.20 | • | | | 2.03 | | | | 2.23 | | | | 0.14 | | | | 0.30 | | | | — | | | | 0.44 | | | | — | | | | 12.13 | | | | 21.97 | | | | 0.50 | | | | 0.37 | | | | 0.37 | | | | 1.76 | | | | 133,001 | | | | 45 | |
| 12-31-12 | | | 9.37 | | | | 0.17 | • | | | 1.23 | | | | 1.40 | | | | 0.11 | | | | 0.32 | | | | — | | | | 0.43 | | | | — | | | | 10.34 | | | | 15.15 | | | | 0.46 | | | | 0.37 | | | | 0.37 | | | | 1.69 | | | | 93,319 | | | | 34 | |
| 12-31-11 | | | 10.34 | | | | 0.13 | • | | | (0.51 | ) | | | (0.38 | ) | | | 0.14 | | | | 0.45 | | | | — | | | | 0.59 | | | | — | | | | 9.37 | | | | (3.26 | ) | | | 0.37 | | | | 0.37 | | | | 0.37 | | | | 1.30 | | | | 64,863 | | | | 100 | |
| 12-31-10 | | | 9.18 | | | | 0.20 | • | | | 0.98 | | | | 1.18 | | | | 0.00 | * | | | 0.02 | | | | — | | | | 0.02 | | | | — | | | | 10.34 | | | | 12.89 | | | | 0.37 | | | | 0.37 | | | | 0.37 | | | | 2.15 | | | | 58,656 | | | | 45 | |
| Class S2 | | | | | | | | | | | | | | | | | | | | | | | | | | | | | | | | | | | | | | | | | | | | | | | | | | | | | | | | | | | | | | | | | | | | |
| 12-31-14 | | | 11.98 | | | | 0.14 | • | | | 0.54 | | | | 0.68 | | | | 0.19 | | | | 0.64 | | | | — | | | | 0.83 | | | | — | | | | 11.83 | | | | 5.77 | | | | 0.76 | | | | 0.53 | | | | 0.53 | | | | 1.17 | | | | 40,100 | | | | 44 | |
| 12-31-13 | | | 10.23 | | | | 0.18 | • | | | 2.01 | | | | 2.19 | | | | 0.14 | | | | 0.30 | | | | — | | | | 0.44 | | | | — | | | | 11.98 | | | | 21.74 | | | | 0.75 | | | | 0.52 | | | | 0.52 | | | | 1.66 | | | | 44,066 | | | | 45 | |
| 12-31-12 | | | 9.29 | | | | 0.16 | • | | | 1.22 | | | | 1.38 | | | | 0.12 | | | | 0.32 | | | | — | | | | 0.44 | | | | — | | | | 10.23 | | | | 15.04 | | | | 0.71 | | | | 0.52 | | | | 0.52 | | | | 1.63 | | | | 28,712 | | | | 34 | |
| 12-31-11 | | | 10.29 | | | | 0.07 | • | | | (0.47 | ) | | | (0.40 | ) | | | 0.15 | | | | 0.45 | | | | — | | | | 0.60 | | | | — | | | | 9.29 | | | | (3.44 | ) | | | 0.62 | | | | 0.52 | | | | 0.52 | | | | 0.71 | | | | 8,819 | | | | 100 | |
| 12-31-10 | | | 9.15 | | | | 0.11 | • | | | 1.06 | | | | 1.17 | | | | 0.01 | | | | 0.02 | | | | — | | | | 0.03 | | | | — | | | | 10.29 | | | | 12.76 | | | | 0.62 | | | | 0.52 | | | | 0.52 | | | | 1.11 | | | | 3,503 | | | | 45 | |
| Class T | | | | | | | | | | | | | | | | | | | | | | | | | | | | | | | | | | | | | | | | | | | | | | | | | | | | | | | | | | | | | | | | | | | | |
| 12-31-14 | | | 12.02 | | | | 0.10 | | | | 0.56 | | | | 0.66 | | | | 0.15 | | | | 0.64 | | | | — | | | | 0.79 | | | | — | | | | 11.89 | | | | 5.57 | | | | 1.01 | | | | 0.83 | | | | 0.83 | | | | 0.92 | | | | 4 | | | | 44 | |
| 12-31-13 | | | 10.25 | | | | 0.14 | | | | 2.02 | | | | 2.16 | | | | 0.09 | | | | 0.30 | | | | — | | | | 0.39 | | | | — | | | | 12.02 | | | | 21.38 | | | | 1.00 | | | | 0.82 | | | | 0.82 | | | | 1.27 | | | | 4 | | | | 45 | |
| 12-31-12 | | | 9.29 | | | | 0.12 | | | | 1.21 | | | | 1.33 | | | | 0.05 | | | | 0.32 | | | | — | | | | 0.37 | | | | — | | | | 10.25 | | | | 14.56 | | | | 0.96 | | | | 0.82 | | | | 0.82 | | | | 1.19 | | | | 3 | | | | 34 | |
| 12-31-11 | | | 10.24 | | | | 0.09 | | | | (0.51 | ) | | | (0.42 | ) | | | 0.08 | | | | 0.45 | | | | — | | | | 0.53 | | | | — | | | | 9.29 | | | | (3.69 | ) | | | 0.87 | | | | 0.82 | | | | 0.82 | | | | 0.88 | | | | 3 | | | | 100 | |
| 12-31-10 | | | 9.14 | | | | 0.17 | | | | 0.95 | | | | 1.12 | | | | — | | | | 0.02 | | | | — | | | | 0.02 | | | | — | | | | 10.24 | | | | 12.23 | | | | 0.87 | | | | 0.82 | | | | 0.82 | | | | 1.82 | | | | 3 | | | | 45 | |
| Voya Index Solution 2040 Portfolio | | | | | | | | | | | | | | | | | | | | | | | | | | | | | | | | | | | | | | | | | | | | | | | | | | | | | | | | | | | | | | | | | | | | |
| Class ADV | | | | | | | | | | | | | | | | | | | | | | | | | | | | | | | | | | | | | | | | | | | | | | | | | | | | | | | | | | | | | | | | | | | | |
| 12-31-14 | | | 13.98 | | | | 0.14 | • | | | 0.64 | | | | 0.78 | | | | 0.20 | | | | 0.96 | | | | — | | | | 1.16 | | | | — | | | | 13.60 | | | | 5.73 | | | | 61.99 | | | | 0.63 | | | | 0.63 | | | | 0.98 | | | | 5 | | | | 32 | |
| 12-31-13 | | | 12.06 | | | | 0.17 | | | | 2.54 | | | | 2.71 | | | | 0.18 | | | | 0.63 | | | | — | | | | 0.81 | | | | 0.02 | | | | 13.98 | | | | 23.19 | (c) | | | 83.06 | | | | 0.61 | | | | 0.61 | | | | 1.29 | | | | 4 | | | | 41 | |
| 12-31-12 | | | 11.18 | | | | 0.14 | | | | 1.53 | | | | 1.67 | | | | — | | | | 0.79 | | | | — | | | | 0.79 | | | | — | | | | 12.06 | | | | 15.03 | | | | 54.52 | | | | 0.62 | | | | 0.62 | | | | 1.14 | | | | 4 | | | | 44 | |
| 10-03-11(5) - | | | | | | | | | | | | | | | | | | | | | | | | | | | | | | | | | | | | | | | | | | | | | | | | | | | | | | | | | | | | | | | | | | | | |
| 12-31-11 | | | 10.00 | | | | (0.01 | ) | | | 1.19 | | | | 1.18 | | | | — | | | | — | | | | — | | | | — | | | | — | | | | 11.18 | | | | 11.80 | | | | 0.62 | | | | 0.62 | | | | 0.62 | | | | (0.32 | ) | | | 3 | | | | 56 | |
| Class I | | | | | | | | | | | | | | | | | | | | | | | | | | | | | | | | | | | | | | | | | | | | | | | | | | | | | | | | | | | | | | | | | | | | |
| 12-31-14 | | | 14.09 | | | | 0.19 | | | | 0.66 | | | | 0.85 | | | | 0.27 | | | | 0.96 | | | | — | | | | 1.23 | | | | — | | | | 13.71 | | | | 6.21 | | | | 61.49 | | | | 0.13 | | | | 0.13 | | | | 1.42 | | | | 5 | | | | 32 | |
| 12-31-13 | | | 12.13 | | | | 0.24 | • | | | 2.57 | | | | 2.81 | | | | 0.24 | | | | 0.63 | | | | — | | | | 0.87 | | | | 0.02 | | | | 14.09 | | | | 23.90 | (c) | | | 82.56 | | | | 0.11 | | | | 0.11 | | | | 1.79 | | | | 4 | | | | 41 | |
| 12-31-12 | | | 11.19 | | | | 0.20 | | | | 1.54 | | | | 1.74 | | | | 0.01 | | | | 0.79 | | | | — | | | | 0.80 | | | | — | | | | 12.13 | | | | 15.63 | | | | 54.02 | | | | 0.12 | | | | 0.12 | | | | 1.64 | | | | 4 | | | | 44 | |
| 10-03-11(5) - | | | | | | | | | | | | | | | | | | | | | | | | | | | | | | | | | | | | | | | | | | | | | | | | | | | | | | | | | | | | | | | | | | | | |
| 12-31-11 | | | 10.00 | | | | 0.00 | * | | | 1.19 | | | | 1.19 | | | | — | | | | — | | | | — | | | | — | | | | — | | | | 11.19 | | | | 11.90 | | | | 0.12 | | | | 0.12 | | | | 0.12 | | | | 0.11 | | | | 3 | | | | 56 | |
| Class S | | | | | | | | | | | | | | | | | | | | | | | | | | | | | | | | | | | | | | | | | | | | | | | | | | | | | | | | | | | | | | | | | | | | |
| 12-31-14 | | | 14.09 | | | | 0.16 | | | | 0.66 | | | | 0.82 | | | | 0.23 | | | | 0.96 | | | | — | | | | 1.19 | | | | — | | | | 13.72 | | | | 6.03 | | | | 61.74 | | | | 0.38 | | | | 0.38 | | | | 1.16 | | | | 4 | | | | 32 | |
| 12-31-13 | | | 12.08 | | | | 0.20 | • | | | 2.56 | | | | 2.76 | | | | 0.14 | | | | 0.63 | | | | — | | | | 0.77 | | | | 0.02 | | | | 14.09 | | | | 23.53 | (c) | | | 82.81 | | | | 0.36 | | | | 0.36 | | | | 1.54 | | | | 4 | | | | 41 | |
| 12-31-12 | | | 11.18 | | | | 0.17 | | | | 1.52 | | | | 1.69 | | | | 0.00 | * | | | 0.79 | | | | — | | | | 0.79 | | | | — | | | | 12.08 | | | | 15.23 | | | | 54.27 | | | | 0.37 | | | | 0.37 | | | | 1.39 | | | | 4 | | | | 44 | |
| 10-03-11(5) - | | | | | | | | | | | | | | | | | | | | | | | | | | | | | | | | | | | | | | | | | | | | | | | | | | | | | | | | | | | | | | | | | | | | |
| 12-31-11 | | | 10.00 | | | | (0.00 | )* | | | 1.18 | | | | 1.18 | | | | — | | | | — | | | | — | | | | — | | | | — | | | | 11.18 | | | | 11.80 | | | | 0.37 | | | | 0.37 | | | | 0.37 | | | | (0.18 | ) | | | 3 | | | | 56 | |
| Class S2 | | | | | | | | | | | | | | | | | | | | | | | | | | | | | | | | | | | | | | | | | | | | | | | | | | | | | | | | | | | | | | | | | | | | |
| 12-31-14 | | | 14.00 | | | | 0.13 | | | | 0.66 | | | | 0.79 | | | | 0.21 | | | | 0.96 | | | | — | | | | 1.17 | | | | — | | | | 13.62 | | | | 5.80 | | | | 61.99 | | | | 0.53 | | | | 0.53 | | | | 1.01 | | | | 4 | | | | 32 | |
| 12-31-13 | | | 12.07 | | | | 0.18 | | | | 2.55 | | | | 2.73 | | | | 0.19 | | | | 0.63 | | | | — | | | | 0.82 | | | | 0.02 | | | | 14.00 | | | | 23.36 | (c) | | | 83.06 | | | | 0.51 | | | | 0.51 | | | | 1.38 | | | | 4 | | | | 41 | |
| 12-31-12 | | | 11.18 | | | | 0.15 | | | | 1.53 | | | | 1.68 | | | | 0.00 | * | | | 0.79 | | | | — | | | | 0.79 | | | | — | | | | 12.07 | | | | 15.13 | | | | 54.52 | | | | 0.52 | | | | 0.52 | | | | 1.24 | | | | 4 | | | | 44 | |
| 10-03-11(5) - | | | | | | | | | | | | | | | | | | | | | | | | | | | | | | | | | | | | | | | | | | | | | | | | | | | | | | | | | | | | | | | | | | | | |
| 12-31-11 | | | 10.00 | | | | (0.01 | ) | | | 1.19 | | | | 1.18 | | | | — | | | | — | | | | — | | | | — | | | | — | | | | 11.18 | | | | 11.80 | | | | 0.62 | | | | 0.52 | | | | 0.52 | | | | (0.21 | ) | | | 3 | | | | 56 | |
See Accompanying Notes to Financial Statements
Financial Highlights (continued)
| | | | | | Income (loss)
from
investment
operations | | | | | | Less
Distributions | | | | | | | | | | | | | | | Ratios to average net assets | | | Supplemental Data | |
| | | Net asset
value,
beginning
of year
or period | | | Net
investment
income
(loss) | | | Net
realized
and
unrealized
gain
(loss) | | | Total from
investment
operations | | | From net
investment
income | | | From net
realized
gains | | | From
return
of
capital | | | Total
distributions | | | Payment
by
affiliate | | | Net
asset
value,
end
of
year
or
period | | | Total
Return(1) | | | Expenses
before
reductions/
additions(2)(3)(4) | | | Expenses
net of fee
waivers
and/or
recoupments
if any(2)(3)(4) | | | Expense
net of all
reductions/
additions(2)(3)(4) | | | Net
investment
income
(loss)(2)(3) | | | Net
assets,
end of
year or
period | | | Portfolio
turnover
rate | |
Year or
period ended | | ($) | | | ($) | | | ($) | | | ($) | | | ($) | | | ($) | | | ($) | | | ($) | | | ($) | | | ($) | | | (%) | | | (%) | | | (%) | | | (%) | | | (%) | | | ($000’s) | | | (%) | |
Voya Index Solution 2040 Portfolio (continued) | | | | | | | | | | | | | | | | | | | | | | | | | | | | | | | | | | | | | | | | | | | | | | | | | | | | | | | | | | | | | | | | | | | | |
| Class T | | | | | | | | | | | | | | | | | | | | | | | | | | | | | | | | | | | | | | | | | | | | | | | | | | | | | | | | | | | | | | | | | | | | |
| 12-31-14 | | | 13.95 | | | | 0.09 | | | | 0.66 | | | | 0.75 | | | | 0.18 | | | | 0.96 | | | | — | | | | 1.14 | | | | — | | | | 13.56 | | | | 5.54 | | | | 62.24 | | | | 0.83 | | | | 0.83 | | | | 0.72 | | | | 4 | | | | 32 | |
| 12-31-13 | | | 12.03 | | | | 0.14 | | | | 2.55 | | | | 2.69 | | | | 0.16 | | | | 0.63 | | | | — | | | | 0.79 | | | | 0.02 | | | | 13.95 | | | | 23.02 | (c) | | | 83.31 | | | | 0.81 | | | | 0.81 | | | | 1.09 | | | | 4 | | | | 41 | |
| 12-31-12 | | | 11.17 | | | | 0.11 | | | | 1.54 | | | | 1.65 | | | | — | | | | 0.79 | | | | — | | | | 0.79 | | | | — | | | | 12.03 | | | | 14.85 | | | | 54.77 | | | | 0.82 | | | | 0.82 | | | | 0.94 | | | | 4 | | | | 44 | |
| 10-03-11(5) - | | | | | | | | | | | | | | | | | | | | | | | | | | | | | | | | | | | | | | | | | | | | | | | | | | | | | | | | | | | | | | | | | | | | |
| 12-31-11 | | | 10.00 | | | | (0.02 | ) | | | 1.19 | | | | 1.17 | | | | — | | | | — | | | | — | | | | — | | | | — | | | | 11.17 | | | | 11.70 | | | | 0.87 | | | | 0.82 | | | | 0.82 | | | | (0.57 | ) | | | 3 | | | | 56 | |
| Voya Index Solution 2045 Portfolio | | | | | | | | | | | | | | | | | | | | | | | | | | | | | | | | | | | | | | | | | | | | | | | | | | | | | | | | | | | | | | | | | | | | |
| Class ADV | | | | | | | | | | | | | | | | | | | | | | | | | | | | | | | | | | | | | | | | | | | | | | | | | | | | | | | | | | | | | | | | | | | | |
| 12-31-14 | | | 12.25 | | | | 0.10 | • | | | 0.59 | | | | 0.69 | | | | 0.14 | | | | 0.64 | | | | — | | | | 0.78 | | | | — | | | | 12.16 | | | | 5.80 | | | | 0.75 | | | | 0.63 | | | | 0.63 | | | | 0.83 | | | | 138,235 | | | | 44 | |
| 12-31-13 | | | 10.26 | | | | 0.14 | • | | | 2.26 | | | | 2.40 | | | | 0.10 | | | | 0.31 | | | | — | | | | 0.41 | | | | — | | | | 12.25 | | | | 23.74 | | | | 0.75 | | | | 0.61 | | | | 0.61 | | | | 1.27 | | | | 128,133 | | | | 48 | |
| 12-31-12 | | | 9.18 | | | | 0.12 | • | | | 1.30 | | | | 1.42 | | | | 0.08 | | | | 0.26 | | | | — | | | | 0.34 | | | | — | | | | 10.26 | | | | 15.64 | | | | 0.71 | | | | 0.62 | | | | 0.62 | | | | 1.22 | | | | 86,051 | | | | 28 | |
| 12-31-11 | | | 10.12 | | | | 0.10 | • | | | (0.58 | ) | | | (0.48 | ) | | | 0.09 | | | | 0.37 | | | | — | | | | 0.46 | | | | — | | | | 9.18 | | | | (4.48 | ) | | | 0.62 | | | | 0.62 | | | | 0.62 | | | | 1.01 | | | | 52,209 | | | | 102 | |
| 12-31-10 | | | 8.92 | | | | 0.16 | • | | | 1.06 | | | | 1.22 | | | | — | | | | 0.02 | | | | — | | | | 0.02 | | | | — | | | | 10.12 | | | | 13.73 | | | | 0.62 | | | | 0.62 | | | | 0.62 | | | | 1.71 | | | | 39,799 | | | | 45 | |
| Class I | | | | | | | | | | | | | | | | | | | | | | | | | | | | | | | | | | | | | | | | | | | | | | | | | | | | | | | | | | | | | | | | | | | | |
| 12-31-14 | | | 12.52 | | | | 0.18 | • | | | 0.59 | | | | 0.77 | | | | 0.19 | | | | 0.64 | | | | — | | | | 0.83 | | | | — | | | | 12.46 | | | | 6.32 | | | | 0.25 | | | | 0.13 | | | | 0.13 | | | | 1.42 | | | | 19,837 | | | | 44 | |
| 12-31-13 | | | 10.46 | | | | 0.20 | • | | | 2.31 | | | | 2.51 | | | | 0.14 | | | | 0.31 | | | | — | | | | 0.45 | | | | — | | | | 12.52 | | | | 24.34 | | | | 0.25 | | | | 0.11 | | | | 0.11 | | | | 1.74 | | | | 11,306 | | | | 48 | |
| 12-31-12 | | | 9.34 | | | | 0.17 | • | | | 1.33 | | | | 1.50 | | | | 0.12 | | | | 0.26 | | | | — | | | | 0.38 | | | | — | | | | 10.46 | | | | 16.19 | | | | 0.21 | | | | 0.12 | | | | 0.12 | | | | 1.73 | | | | 14,728 | | | | 28 | |
| 12-31-11 | | | 10.26 | | | | 0.15 | • | | | (0.59 | ) | | | (0.44 | ) | | | 0.11 | | | | 0.37 | | | | — | | | | 0.48 | | | | — | | | | 9.34 | | | | (3.92 | ) | | | 0.12 | | | | 0.12 | | | | 0.12 | | | | 1.50 | | | | 9,152 | | | | 102 | |
| 12-31-10 | | | 9.00 | | | | 0.19 | • | | | 1.09 | | | | 1.28 | | | | — | | | | 0.02 | | | | — | | | | 0.02 | | | | — | | | | 10.26 | | | | 14.28 | | | | 0.12 | | | | 0.12 | | | | 0.12 | | | | 2.03 | | | | 6,553 | | | | 45 | |
| Class S | | | | | | | | | | | | | | | | | | | | | | | | | | | | | | | | | | | | | | | | | | | | | | | | | | | | | | | | | | | | | | | | | | | | |
| 12-31-14 | | | 12.40 | | | | 0.13 | | | | 0.60 | | | | 0.73 | | | | 0.17 | | | | 0.64 | | | | — | | | | 0.81 | | | | — | | | | 12.32 | | | | 6.01 | | | | 0.50 | | | | 0.38 | | | | 0.38 | | | | 1.07 | | | | 90,710 | | | | 44 | |
| 12-31-13 | | | 10.37 | | | | 0.18 | • | | | 2.28 | | | | 2.46 | | | | 0.12 | | | | 0.31 | | | | — | | | | 0.43 | | | | — | | | | 12.40 | | | | 24.07 | | | | 0.50 | | | | 0.36 | | | | 0.36 | | | | 1.53 | | | | 83,716 | | | | 48 | |
| 12-31-12 | | | 9.27 | | | | 0.14 | • | | | 1.32 | | | | 1.46 | | | | 0.10 | | | | 0.26 | | | | — | | | | 0.36 | | | | — | | | | 10.37 | | | | 15.88 | | | | 0.46 | | | | 0.37 | | | | 0.37 | | | | 1.42 | | | | 54,383 | | | | 28 | |
| 12-31-11 | | | 10.19 | | | | 0.13 | • | | | (0.58 | ) | | | (0.45 | ) | | | 0.10 | | | | 0.37 | | | | — | | | | 0.47 | | | | — | | | | 9.27 | | | | (4.09 | ) | | | 0.37 | | | | 0.37 | | | | 0.37 | | | | 1.27 | | | | 38,266 | | | | 102 | |
| 12-31-10 | | | 8.97 | | | | 0.18 | • | | | 1.06 | | | | 1.24 | | | | — | | | | 0.02 | | | | — | | | | 0.02 | | | | — | | | | 10.19 | | | | 13.88 | | | | 0.37 | | | | 0.37 | | | | 0.37 | | | | 1.93 | | | | 29,555 | | | | 45 | |
| Class S2 | | | | | | | | | | | | | | | | | | | | | | | | | | | | | | | | | | | | | | | | | | | | | | | | | | | | | | | | | | | | | | | | | | | | |
| 12-31-14 | | | 12.24 | | | | 0.11 | | | | 0.60 | | | | 0.71 | | | | 0.15 | | | | 0.64 | | | | — | | | | 0.79 | | | | — | | | | 12.16 | | | | 5.95 | | | | 0.75 | | | | 0.53 | | | | 0.53 | | | | 0.90 | | | | 20,479 | | | | 44 | |
| 12-31-13 | | | 10.25 | | | | 0.16 | • | | | 2.25 | | | | 2.41 | | | | 0.11 | | | | 0.31 | | | | — | | | | 0.42 | | | | — | | | | 12.24 | | | | 23.86 | | | | 0.75 | | | | 0.51 | | | | 0.51 | | | | 1.41 | | | | 20,484 | | | | 48 | |
| 12-31-12 | | | 9.19 | | | | 0.13 | • | | | 1.29 | | | | 1.42 | | | | 0.10 | | | | 0.26 | | | | — | | | | 0.36 | | | | — | | | | 10.25 | | | | 15.65 | | | | 0.71 | | | | 0.52 | | | | 0.52 | | | | 1.33 | | | | 13,683 | | | | 28 | |
| 12-31-11 | | | 10.14 | | | | 0.08 | • | | | (0.55 | ) | | | (0.47 | ) | | | 0.11 | | | | 0.37 | | | | — | | | | 0.48 | | | | — | | | | 9.19 | | | | (4.32 | ) | | | 0.62 | | | | 0.52 | | | | 0.52 | | | | 0.87 | | | | 5,408 | | | | 102 | |
| 12-31-10 | | | 8.93 | | | | 0.07 | • | | | 1.16 | | | | 1.23 | | | | — | | | | 0.02 | | | | — | | | | 0.02 | | | | — | | | | 10.14 | | | | 13.83 | | | | 0.62 | | | | 0.52 | | | | 0.52 | | | | 0.71 | | | | 1,684 | | | | 45 | |
| Class T | | | | | | | | | | | | | | | | | | | | | | | | | | | | | | | | | | | | | | | | | | | | | | | | | | | | | | | | | | | | | | | | | | | | |
| 12-31-14 | | | 12.28 | | | | 0.07 | | | | 0.62 | | | | 0.69 | | | | 0.11 | | | | 0.64 | | | | — | | | | 0.75 | | | | — | | | | 12.22 | | | | 5.76 | | | | 1.00 | | | | 0.83 | | | | 0.83 | | | | 0.62 | | | | 4 | | | | 44 | |
| 12-31-13 | | | 10.27 | | | | 0.12 | | | | 2.27 | | | | 2.39 | | | | 0.07 | | | | 0.31 | | | | — | | | | 0.38 | | | | — | | | | 12.28 | | | | 23.52 | | | | 1.00 | | | | 0.81 | | | | 0.81 | | | | 1.02 | | | | 4 | | | | 48 | |
| 12-31-12 | | | 9.18 | | | | 0.09 | | | | 1.30 | | | | 1.39 | | | | 0.04 | | | | 0.26 | | | | — | | | | 0.30 | | | | — | | | | 10.27 | | | | 15.31 | | | | 0.96 | | | | 0.82 | | | | 0.82 | | | | 0.93 | | | | 3 | | | | 28 | |
| 12-31-11 | | | 10.09 | | | | 0.08 | | | | (0.57 | ) | | | (0.49 | ) | | | 0.05 | | | | 0.37 | | | | — | | | | 0.42 | | | | — | | | | 9.18 | | | | (4.61 | ) | | | 0.87 | | | | 0.82 | | | | 0.82 | | | | 0.86 | | | | 3 | | | | 102 | |
| 12-31-10 | | | 8.92 | | | | 0.16 | | | | 1.03 | | | | 1.19 | | | | — | | | | 0.02 | | | | — | | | | 0.02 | | | | — | | | | 10.09 | | | | 13.40 | | | | 0.87 | | | | 0.82 | | | | 0.82 | | | | 1.75 | | | | 3 | | | | 45 | |
| Voya Index Solution 2050 Portfolio | | | | | | | | | | | | | | | | | | | | | | | | | | | | | | | | | | | | | | | | | | | | | | | | | | | | | | | | | | | | | | | | | | | | |
| Class ADV | | | | | | | | | | | | | | | | | | | | | | | | | | | | | | | | | | | | | | | | | | | | | | | | | | | | | | | | | | | | | | | | | | | | |
| 12-31-14 | | | 14.03 | | | | 0.10 | | | | 0.68 | | | | 0.78 | | | | 0.19 | | | | 0.94 | | | | — | | | | 1.13 | | | | — | | | | 13.68 | | | | 5.64 | | | | 62.26 | | | | 0.64 | | | | 0.64 | | | | 0.77 | | | | 4 | | | | 32 | |
| 12-31-13 | | | 11.95 | | | | 0.16 | | | | 2.59 | | | | 2.75 | | | | 0.17 | | | | 0.52 | | | | — | | | | 0.69 | | | | 0.02 | | | | 14.03 | | | | 23.69 | (d) | | | 83.28 | | | | 0.62 | | | | 0.62 | | | | 1.20 | | | | 4 | | | | 39 | |
| 12-31-12 | | | 11.18 | | | | 0.14 | | | | 1.55 | | | | 1.69 | | | | — | | | | 0.92 | | | | — | | | | 0.92 | | | | — | | | | 11.95 | | | | 15.24 | | | | 42.58 | | | | 0.62 | | | | 0.62 | | | | 1.14 | | | | 4 | | | | 43 | |
| 10-03-11(5) - | | | | | | | | | | | | | | | | | | | | | | | | | | | | | | | | | | | | | | | | | | | | | | | | | | | | | | | | | | | | | | | | | | | | |
| 12-31-11 | | | 10.00 | | | | (0.01 | ) | | | 1.19 | | | | 1.18 | | | | — | | | | — | | | | — | | | | — | | | | — | | | | 11.18 | | | | 11.80 | | | | 0.62 | | | | 0.62 | | | | 0.62 | | | | (0.36 | ) | | | 3 | | | | 55 | |
See Accompanying Notes to Financial Statements
Financial Highlights (continued)
| | | | | | Income (loss)
from
investment
operations | | | | | | Less
Distributions | | | | | | | | | | | | | | | Ratios to average net assets | | | Supplemental
Data | |
| | | Net asset
value,
beginning
of year
or period | | | Net
investment
income
(loss) | | | Net
realized
and
unrealized
gain
(loss) | | | Total from
investment
operations | | | From net
investment
income | | | From net
realized
gains | | | From
return
of
capital | | | Total
distributions | | | Payment
by
affiliate | | | Net
asset
value,
end
of
year
or
period | | | Total
Return(1) | | | Expenses
before
reductions/
additions(2)(3)(4) | | | Expenses
net of fee
waivers
and/or
recoupments
if any(2)(3)(4) | | | Expense
net of all
reductions/
additions(2)(3)(4) | | | Net
investment
income
(loss)(2)(3) | | | Net
assets,
end of
year or
period | | | Portfolio
turnover
rate | |
Year or
period ended | | ($) | | | ($) | | | ($) | | | ($) | | | ($) | | | ($) | | | ($) | | | ($) | | | ($) | | | ($) | | | (%) | | | (%) | | | (%) | | | (%) | | | (%) | | | ($000’s) | | | (%) | |
Voya Index Solution 2050 Portfolio (continued) | | | | | | | | | | | | | | | | | | | | | | | | | | | | | | | | | | | | | | | | | | | | | | | | | | | | | | | | | | | | | | | | | | | | |
| Class I | | | | | | | | | | | | | | | | | | | | | | | | | | | | | | | | | | | | | | | | | | | | | | | | | | | | | | | | | | | | | | | | | | | | |
| 12-31-14 | | | 14.14 | | | | 0.18 | | | | 0.67 | | | | 0.85 | | | | 0.26 | | | | 0.94 | | | | — | | | | 1.20 | | | | — | | | | 13.79 | | | | 6.12 | | | | 61.76 | | | | 0.14 | | | | 0.14 | | | | 1.29 | | | | 5 | | | | 32 | |
| 12-31-13 | | | 12.02 | | | | 0.22 | • | | | 2.63 | | | | 2.85 | | | | 0.23 | | | | 0.52 | | | | — | | | | 0.75 | | | | 0.02 | | | | 14.14 | | | | 24.41 | (d) | | | 82.78 | | | | 0.12 | | | | 0.12 | | | | 1.70 | | | | 4 | | | | 39 | |
| 12-31-12 | | | 11.19 | | | | 0.20 | | | | 1.56 | | | | 1.76 | | | | 0.01 | | | | 0.92 | | | | — | | | | 0.93 | | | | — | | | | 12.02 | | | | 15.83 | | | | 42.08 | | | | 0.12 | | | | 0.12 | | | | 1.65 | | | | 4 | | | | 43 | |
| 10-03-11(5) - | | | | | | | | | | | | | | | | | | | | | | | | | | | | | | | | | | | | | | | | | | | | | | | | | | | | | | | | | | | | | | | | | | | | |
| 12-31-11 | | | 10.00 | | | | 0.00 | * | | | 1.19 | | | | 1.19 | | | | — | | | | — | | | | — | | | | — | | | | — | | | | 11.19 | | | | 11.90 | | | | 0.12 | | | | 0.12 | | | | 0.12 | | | | 0.10 | | | | 3 | | | | 55 | |
| Class S | | | | | | | | | | | | | | | | | | | | | | | | | | | | | | | | | | | | | | | | | | | | | | | | | | | | | | | | | | | | | | | | | | | | |
| 12-31-14 | | | 14.14 | | | | 0.14 | | | | 0.68 | | | | 0.82 | | | | 0.22 | | | | 0.94 | | | | — | | | | 1.16 | | | | — | | | | 13.80 | | | | 5.93 | | | | 62.01 | | | | 0.39 | | | | 0.39 | | | | 1.04 | | | | 5 | | | | 32 | |
| 12-31-13 | | | 11.97 | | | | 0.19 | • | | | 2.61 | | | | 2.80 | | | | 0.13 | | | | 0.52 | | | | — | | | | 0.65 | | | | 0.02 | | | | 14.14 | | | | 24.03 | (d) | | | 83.03 | | | | 0.37 | | | | 0.37 | | | | 1.44 | | | | 4 | | | | 39 | |
| 12-31-12 | | | 11.19 | | | | 0.16 | | | | 1.54 | | | | 1.70 | | | | 0.00 | * | | | 0.92 | | | | — | | | | 0.92 | | | | — | | | | 11.97 | | | | 15.33 | | | | 42.33 | | | | 0.37 | | | | 0.37 | | | | 1.35 | | | | 4 | | | | 43 | |
| 10-03-11(5) - | | | | | | | | | | | | | | | | | | | | | | | | | | | | | | | | | | | | | | | | | | | | | | | | | | | | | | | | | | | | | | | | | | | | |
| 12-31-11 | | | 10.00 | | | | (0.01 | ) | | | 1.20 | | | | 1.19 | | | | — | | | | — | | | | — | | | | — | | | | — | | | | 11.19 | | | | 11.90 | | | | 0.37 | | | | 0.37 | | | | 0.37 | | | | (0.21 | ) | | | 3 | | | | 55 | |
| Class S2 | | | | | | | | | | | | | | | | | | | | | | | | | | | | | | | | | | | | | | | | | | | | | | | | | | | | | | | | | | | | | | | | | | | | |
| 12-31-14 | | | 14.05 | | | | 0.12 | | | | 0.67 | | | | 0.79 | | | | 0.20 | | | | 0.94 | | | | — | | | | 1.14 | | | | — | | | | 13.70 | | | | 5.71 | | | | 62.26 | | | | 0.54 | | | | 0.54 | | | | 0.88 | | | | 4 | | | | 32 | |
| 12-31-13 | | | 11.97 | | | | 0.17 | | | | 2.59 | | | | 2.76 | | | | 0.18 | | | | 0.52 | | | | — | | | | 0.70 | | | | 0.02 | | | | 14.05 | | | | 23.76 | (d) | | | 83.28 | | | | 0.52 | | | | 0.52 | | | | 1.30 | | | | 4 | | | | 39 | |
| 12-31-12 | | | 11.19 | | | | 0.15 | | | | 1.55 | | | | 1.70 | | | | 0.00 | * | | | 0.92 | | | | — | | | | 0.92 | | | | — | | | | 11.97 | | | | 15.33 | | | | 42.58 | | | | 0.52 | | | | 0.52 | | | | 1.28 | | | | 4 | | | | 43 | |
| 10-03-11(5) - | | | | | | | | | | | | | | | | | | | | | | | | | | | | | | | | | | | | | | | | | | | | | | | | | | | | | | | | | | | | | | | | | | | | |
| 12-31-11 | | | 10.00 | | | | (0.01 | ) | | | 1.20 | | | | 1.19 | | | | — | | | | — | | | | — | | | | — | | | | — | | | | 11.19 | | | | 11.90 | | | | 0.62 | | | | 0.52 | | | | 0.52 | | | | (0.24 | ) | | | 3 | | | | 55 | |
| Class T | | | | | | | | | | | | | | | | | | | | | | | | | | | | | | | | | | | | | | | | | | | | | | | | | | | | | | | | | | | | | | | | | | | | |
| 12-31-14 | | | 14.00 | | | | 0.08 | | | | 0.66 | | | | 0.74 | | | | 0.17 | | | | 0.94 | | | | — | | | | 1.11 | | | | — | | | | 13.63 | | | | 5.38 | | | | 62.51 | | | | 0.84 | | | | 0.84 | | | | 0.59 | | | | 4 | | | | 32 | |
| 12-31-13 | | | 11.92 | | | | 0.13 | | | | 2.60 | | | | 2.73 | | | | 0.15 | | | | 0.52 | | | | — | | | | 0.67 | | | | 0.02 | | | | 14.00 | | | | 23.53 | (d) | | | 83.53 | | | | 0.82 | | | | 0.82 | | | | 1.00 | | | | 4 | | | | 39 | |
| 12-31-12 | | | 11.18 | | | | 0.11 | | | | 1.55 | | | | 1.66 | | | | — | | | | 0.92 | | | | — | | | | 0.92 | | | | — | | | | 11.92 | | | | 14.96 | | | | 42.83 | | | | 0.82 | | | | 0.82 | | | | 0.96 | | | | 4 | | | | 43 | |
| 10-03-11(5) - | | | | | | | | | | | | | | | | | | | | | | | | | | | | | | | | | | | | | | | | | | | | | | | | | | | | | | | | | | | | | | | | | | | | |
| 12-31-11 | | | 10.00 | | | | (0.02 | ) | | | 1.20 | | | | 1.18 | | | | — | | | | — | | | | — | | | | — | | | | — | | | | 11.18 | | | | 11.80 | | | | 0.87 | | | | 0.82 | | | | 0.82 | | | | (0.62 | ) | | | 3 | | | | 55 | |
| Voya Index Solution 2055 Portfolio | | | | | | | | | | | | | | | | | | | | | | | | | | | | | | | | | | | | | | | | | | | | | | | | | | | | | | | | | | | | | | | | | | | | |
| Class ADV | | | | | | | | | | | | | | | | | | | | | | | | | | | | | | | | | | | | | | | | | | | | | | | | | | | | | | | | | | | | | | | | | | | | |
| 12-31-14 | | | 14.57 | | | | 0.13 | • | | | 0.74 | | | | 0.87 | | | | 0.14 | | | | 0.61 | | | | — | | | | 0.75 | | | | — | | | | 14.69 | | | | 6.08 | | | | 0.78 | | | | 0.63 | | | | 0.63 | | | | 0.88 | | | | 31,811 | | | | 44 | |
| 12-31-13 | | | 12.06 | | | | 0.17 | • | | | 2.67 | | | | 2.84 | | | | 0.10 | | | | 0.23 | | | | — | | | | 0.33 | | | | — | | | | 14.57 | | | | 23.83 | | | | 0.80 | | | | 0.61 | | | | 0.61 | | | | 1.31 | | | | 24,873 | | | | 50 | |
| 12-31-12 | | | 10.57 | | | | 0.15 | • | | | 1.48 | | | | 1.63 | | | | 0.03 | | | | 0.11 | | | | — | | | | 0.14 | | | | — | | | | 12.06 | | | | 15.52 | | | | 0.74 | | | | 0.62 | | | | 0.62 | | | | 1.29 | | | | 13,319 | | | | 28 | |
| 12-31-11 | | | 11.19 | | | | 0.09 | • | | | (0.59 | ) | | | (0.50 | ) | | | 0.00 | * | | | 0.12 | | | | — | | | | 0.12 | | | | — | | | | 10.57 | | | | (4.40 | ) | | | 0.62 | | | | 0.62 | | | | 0.62 | | | | 0.81 | | | | 5,676 | | | | 135 | |
| 03-08-10(5) - | | | | | | | | | | | | | | | | | | | | | | | | | | | | | | | | | | | | | | | | | | | | | | | | | | | | | | | | | | | | | | | | | | | | |
| 12-31-10 | | | 10.00 | | | | (0.00 | )* | | | 1.19 | | | | 1.19 | | | | — | | | | — | | | | — | | | | — | | | | — | | | | 11.19 | | | | 11.90 | | | | 0.62 | | | | 0.62 | | | | 0.62 | | | | (0.06 | ) | | | 2,381 | | | | 80 | |
| Class I | | | | | | | | | | | | | | | | | | | | | | | | | | | | | | | | | | | | | | | | | | | | | | | | | | | | | | | | | | | | | | | | | | | | |
| 12-31-14 | | | 14.78 | | | | 0.22 | • | | | 0.74 | | | | 0.96 | | | | 0.19 | | | | 0.61 | | | | — | | | | 0.80 | | | | — | | | | 14.94 | | | | 6.61 | | | | 0.28 | | | | 0.13 | | | | 0.13 | | | | 1.44 | | | | 3,974 | | | | 44 | |
| 12-31-13 | | | 12.21 | | | | 0.26 | • | | | 2.67 | | | | 2.93 | | | | 0.13 | | | | 0.23 | | | | — | | | | 0.36 | | | | — | | | | 14.78 | | | | 24.32 | | | | 0.30 | | | | 0.11 | | | | 0.11 | | | | 1.89 | | | | 1,782 | | | | 50 | |
| 12-31-12 | | | 10.66 | | | | 0.21 | • | | | 1.50 | | | | 1.71 | | | | 0.05 | | | | 0.11 | | | | — | | | | 0.16 | | | | — | | | | 12.21 | | | | 16.18 | | | | 0.24 | | | | 0.12 | | | | 0.12 | | | | 1.80 | | | | 1,750 | | | | 28 | |
| 12-31-11 | | | 11.24 | | | | 0.10 | • | | | (0.55 | ) | | | (0.45 | ) | | | 0.01 | | | | 0.12 | | | | — | | | | 0.13 | | | | — | | | | 10.66 | | | | (3.93 | ) | | | 0.12 | | | | 0.12 | | | | 0.12 | | | | 0.91 | | | | 618 | | | | 135 | |
| 03-08-10(5) - | | | | | | | | | | | | | | | | | | | | | | | | | | | | | | | | | | | | | | | | | | | | | | | | | | | | | | | | | | | | | | | | | | | | |
| 12-31-10 | | | 10.00 | | | | 0.26 | | | | 0.98 | | | | 1.24 | | | | — | | | | — | | | | — | | | | — | | | | — | | | | 11.24 | | | | 12.40 | | | | 0.12 | | | | 0.12 | | | | 0.12 | | | | 3.32 | | | | 46 | | | | 80 | |
See Accompanying Notes to Financial Statements
Financial Highlights (continued)
| | | | | | Income (loss)
from
investment
operations | | | | | | Less
Distributions | | | | | | | | | | | | | | | Ratios to average net assets | | | Supplemental
Data | |
| | | Net asset
value,
beginning
of year
or period | | | Net
investment
income
(loss) | | | Net
realized
and
unrealized
gain
(loss) | | | Total from
investment
operations | | | From net
investment
income | | | From net
realized
gains | | | From
return
of
capital | | | Total
distributions | | | Payment
by
affiliate | | | Net
asset
value,
end
of
year
or
period | | | Total
Return(1) | | | Expenses
before
reductions/
additions(2)(3)(4) | | | Expenses
net of fee
waivers
and/or
recoupments
if any(2)(3)(4) | | | Expense
net of all
reductions/
additions(2)(3)(4) | | | Net
investment
income
(loss)(2)(3) | | | Net
assets,
end of
year or
period | | | Portfolio
turnover
rate | |
Year or
period ended | | ($) | | | ($) | | | ($) | | | ($) | | | ($) | | | ($) | | | ($) | | | ($) | | | ($) | | | ($) | | | (%) | | | (%) | | | (%) | | | (%) | | | (%) | | | ($000’s) | | | (%) | |
Voya Index Solution 2055 Portfolio (continued) | | | | | | | | | | | | | | | | | | | | | | | | | | | | | | | | | | | | | | | | | | | | | | | | | | | | | | | | | | | | | | | | | | | | |
| Class S | | | | | | | | | | | | | | | | | | | | | | | | | | | | | | | | | | | | | | | | | | | | | | | | | | | | | | | | | | | | | | | | | | | | |
| 12-31-14 | | | 14.68 | | | | 0.16 | • | | | 0.76 | | | | 0.92 | | | | 0.17 | | | | 0.61 | | | | — | | | | 0.78 | | | | — | | | | 14.82 | | | | 6.35 | | | | 0.53 | | | | 0.38 | | | | 0.38 | | | | 1.09 | | | | 20,758 | | | | 44 | |
| 12-31-13 | | | 12.13 | | | | 0.21 | • | | | 2.68 | | | | 2.89 | | | | 0.11 | | | | 0.23 | | | | — | | | | 0.34 | | | | — | | | | 14.68 | | | | 24.15 | | | | 0.55 | | | | 0.36 | | | | 0.36 | | | | 1.57 | | | | 15,267 | | | | 50 | |
| 12-31-12 | | | 10.61 | | | | 0.17 | • | | | 1.50 | | | | 1.67 | | | | 0.04 | | | | 0.11 | | | | — | | | | 0.15 | | | | — | | | | 12.13 | | | | 15.89 | | | | 0.49 | | | | 0.37 | | | | 0.37 | | | | 1.48 | | | | 8,886 | | | | 28 | |
| 12-31-11 | | | 11.21 | | | | 0.12 | • | | | (0.59 | ) | | | (0.47 | ) | | | 0.01 | | | | 0.12 | | | | — | | | | 0.13 | | | | — | | | | 10.61 | | | | (4.17 | ) | | | 0.37 | | | | 0.37 | | | | 0.37 | | | | 1.13 | | | | 3,385 | | | | 135 | |
| 03-08-10(5) - | | | | | | | | | | | | | | | | | | | | | | | | | | | | | | | | | | | | | | | | | | | | | | | | | | | | | | | | | | | | | | | | | | | | |
| 12-31-10 | | | 10.00 | | | | 0.01 | | | | 1.20 | | | | 1.21 | | | | — | | | | — | | | | — | | | | — | | | | — | | | | 11.21 | | | | 12.10 | | | | 0.37 | | | | 0.37 | | | | 0.37 | | | | 0.19 | | | | 1,209 | | | | 80 | |
| Class S2 | | | | | | | | | | | | | | | | | | | | | | | | | | | | | | | | | | | | | | | | | | | | | | | | | | | | | | | | | | | | | | | | | | | | |
| 12-31-14 | | | 14.59 | | | | 0.13 | • | | | 0.75 | | | | 0.88 | | | | 0.14 | | | | 0.61 | | | | — | | | | 0.75 | | | | — | | | | 14.72 | | | | 6.15 | | | | 0.78 | | | | 0.53 | | | | 0.53 | | | | 0.89 | | | | 5,363 | | | | 44 | |
| 12-31-13 | | | 12.07 | | | | 0.18 | • | | | 2.67 | | | | 2.85 | | | | 0.10 | | | | 0.23 | | | | — | | | | 0.33 | | | | — | | | | 14.59 | | | | 23.92 | | | | 0.80 | | | | 0.51 | | | | 0.51 | | | | 1.36 | | | | 5,212 | | | | 50 | |
| 12-31-12 | | | 10.58 | | | | 0.17 | • | | | 1.48 | | | | 1.65 | | | | 0.05 | | | | 0.11 | | | | — | | | | 0.16 | | | | — | | | | 12.07 | | | | 15.69 | | | | 0.74 | | | | 0.52 | | | | 0.52 | | | | 1.44 | | | | 3,663 | | | | 28 | |
| 12-31-11 | | | 11.20 | | | | 0.05 | • | | | (0.54 | ) | | | (0.49 | ) | | | 0.01 | | | | 0.12 | | | | — | | | | 0.13 | | | | — | | | | 10.58 | | | | (4.32 | ) | | | 0.62 | | | | 0.52 | | | | 0.52 | | | | 0.43 | | | | 733 | | | | 135 | |
| 03-08-10(5) - | | | | | | | | | | | | | | | | | | | | | | | | | | | | | | | | | | | | | | | | | | | | | | | | | | | | | | | | | | | | | | | | | | | | |
| 12-31-10 | | | 10.00 | | | | 0.05 | • | | | 1.15 | | | | 1.20 | | | | — | | | | — | | | | — | | | | — | | | | — | | | | 11.20 | | | | 12.00 | | | | 0.62 | | | | 0.52 | | | | 0.52 | | | | 0.54 | | | | 91 | | | | 80 | |
| Class T | | | | | | | | | | | | | | | | | | | | | | | | | | | | | | | | | | | | | | | | | | | | | | | | | | | | | | | | | | | | | | | | | | | | |
| 12-31-14 | | | 14.55 | | | | 0.09 | | | | 0.74 | | | | 0.83 | | | | 0.10 | | | | 0.61 | | | | — | | | | 0.71 | | | | — | | | | 14.67 | | | | 5.82 | | | | 1.03 | | | | 0.83 | | | | 0.83 | | | | 0.62 | | | | 5 | | | | 44 | |
| 12-31-13 | | | 12.02 | | | | 0.14 | | | | 2.67 | | | | 2.81 | | | | 0.05 | | | | 0.23 | | | | — | | | | 0.28 | | | | — | | | | 14.55 | | | | 23.61 | | | | 1.05 | | | | 0.81 | | | | 0.81 | | | | 1.02 | | | | 4 | | | | 50 | |
| 12-31-12 | | | 10.53 | | | | 0.11 | | | | 1.49 | | | | 1.60 | | | | — | | | | 0.11 | | | | — | | | | 0.11 | | | | — | | | | 12.02 | | | | 15.28 | | | | 0.99 | | | | 0.82 | | | | 0.82 | | | | 0.98 | | | | 4 | | | | 28 | |
| 12-31-11 | | | 11.17 | | | | 0.10 | | | | (0.62 | ) | | | (0.52 | ) | | | — | | | | 0.12 | | | | — | | | | 0.12 | | | | — | | | | 10.53 | | | | (4.59 | ) | | | 0.87 | | | | 0.82 | | | | 0.82 | | | | 0.86 | | | | 3 | | | | 135 | |
| 03-08-10(5) - | | | | | | | | | | | | | | | | | | | | | | | | | | | | | | | | | | | | | | | | | | | | | | | | | | | | | | | | | | | | | | | | | | | | |
| 12-31-10 | | | 10.00 | | | | 0.19 | | | | 0.98 | | | | 1.17 | | | | — | | | | — | | | | — | | | | — | | | | — | | | | 11.17 | | | | 11.70 | | | | 0.87 | | | | 0.82 | | | | 0.82 | | | | 2.28 | | | | 3 | | | | 80 | |
| (1) | Total return is calculated assuming reinvestment of all dividends, capital gain distributions and return of capital distributions, if any, at net asset value and does not reflect the effect of insurance contract charges. Total return for periods less than one year is not annualized. |
| (2) | Annualized for periods less than one year. |
| (3) | Ratios reflect operating expenses of a Portfolio. Expenses before reductions/additions do not reflect amounts reimbursed by an Investment Adviser and/or Distributor or reductions from brokerage service arrangements or other expense offset arrangements and do not represent the amount paid by a Portfolio during periods when reimbursements or reductions occur. Expenses net of fee waivers reflect expenses after reimbursement by an Investment Adviser and/or Distributor but prior to reductions from brokerage service arrangements or other expense offset arrangements. Expenses net of all reductions/additions represent the net expenses paid by a Portfolio. Net investment income (loss) is net of all such additions or reductions. |
| (4) | Ratios do not include expenses of underlying funds and do not include fees and expenses charged under the variable annuity contract or variable life insurance policy. |
| (5) | Commencement of operations. |
| (a) | Excluding a payment by affiliate in the year ended December 31, 2013, Index Solution 2020 total return would have been 13.41%, 13.88%, 13.50%, 13.50% and 13.29% on Classes ADV, I, S, S2 and T, respectively. |
| (b) | Excluding a payment by affiliate in the year ended December 31, 2013, Index Solution 2030 total return would have been 18.53%, 19.14%, 18.60%, 18.62% and 18.38% on Classes ADV, I, S, S2 and T, respectively. |
| (c) | Excluding a payment by affiliate in the year ended December 31, 2013, Index Solution 2040 total return would have been 23.01%, 23.72%, 23.35%, 23.18% and 22.85% on Classes ADV, I, S, S2 and T, respectively. |
| (d) | Excluding a payment by affiliate in the year ended December 31, 2013, Index Solution 2050 total return would have been 23.51%, 24.22%, 23.85%, 23.58% and 23.35% on Classes ADV, I, S, S2 and T, respectively. |
| • | Calculated using average number of shares outstanding throughout the period. |
| * | Amount is less than $0.005 or 0.005% or more than $(0.005) or (0.005)%. |
See Accompanying Notes to Financial Statements
NOTES TO FINANCIAL STATEMENTS as of December 31, 2014
NOTE 1 — ORGANIZATION
Voya Partners, Inc. (the “Company”) is an open-end management investment company registered under the Investment Company Act of 1940, as amended (the “1940 Act”). It was incorporated under the laws of Maryland on May 7, 1997. The Articles of Incorporation permit the Company to offer separate series, each of which has its own investment objective, policies and restrictions. The Company serves as investment options in underlying variable insurance products offered by Directed Services LLC. The Company currently consists of forty-two active separate investment series. The ten series (each, a “Portfolio” and collectively, the “Portfolios”) included in this report are: Voya Index Solution Income Portfolio (“Index Solution Income”), Voya Index Solution 2015 Portfolio (“Index Solution 2015”), Voya Index Solution 2020 Portfolio (“Index Solution 2020”), Voya Index Solution 2025 Portfolio (“Index Solution 2025”), Voya Index Solution 2030 Portfolio (“Index Solution 2030”), Voya Index Solution 2035 Portfolio (“Index Solution 2035”), Voya Index Solution 2040 Portfolio (“Index Solution 2040”), Voya Index Solution 2045 Portfolio (“Index Solution 2045”), Voya Index Solution 2050 Portfolio (“Index Solution 2050”) and Voya Index Solution 2055 Portfolio (“Index Solution 2055”), each a diversified series of the Company.
Index Solution 2015, Index Solution 2020, Index Solution 2025, Index Solution 2030, Index Solution 2035, Index Solution 2040, Index Solution 2045, Index Solution 2050 and Index Solution 2055 are structured and managed around a specific target retirement or financial goal date (“Target Date”). When these Portfolios reach their respective Target Date, they may be combined with the Index Solution Income, without a vote of shareholders, if approved by the Portfolios’ Board of Directors (the “Board”).
The Portfolios offer the following five classes of shares: Adviser Class (“Class ADV”), Initial Class (“Class I”), Service Class (“Class S”), Service 2 Class (“Class S2”) and Class T. Each class has equal rights as to voting privileges. The classes differ principally in the applicable distribution and shareholder service fees. Generally, shareholders of each class also bear certain expenses that pertain to that particular class. All shareholders bear the common expenses of a portfolio and earn income and realized gains/losses from a portfolio pro rata based on the daily ending net assets of each class, without distinction between share classes. Expenses that are specific to a portfolio or a class are charged directly to that portfolio or class. Other operating expenses shared by several portfolios are generally allocated among those portfolios based on average net assets. Distributions are determined separately for each class based on income and expenses
allocated to each class. Realized gain distributions are allocated to each class pro rata based on the shares outstanding of each class on the date of distribution. Differences in per share dividend rates generally result from differences in separate class expenses, including distribution and shareholder service fees, if applicable.
Directed Services LLC (“DSL” or the “Investment Adviser”), a Delaware limited liability company, serves as the Investment Adviser to the Portfolios. Voya Investment Management Co. LLC (“Voya IM” or the “Sub-Adviser”), a Delaware limited liability company, serves as the Sub-Adviser to the Portfolios. Voya Funds Services, LLC (“VFS” or the “Administrator”), a Delaware limited liability company, serves as the Administrator to the Portfolios. Voya Investments Distributor, LLC (“VID” or the “Distributor”), a Delaware limited liability company, serves as the principal underwriter to the Portfolios.
Each Portfolio seeks to achieve its investment objective by investing in other investment companies (“Underlying Funds”) and uses asset allocation strategies to determine how much to invest in the Underlying Funds. The investment objective of the Portfolios is described in the Portfolios’ Prospectus.
NOTE 2 — SIGNIFICANT ACCOUNTING POLICIES
The following significant accounting policies are consistently followed by the Portfolios in the preparation of their financial statements. Each Portfolio is considered an investment company under U.S. generally accepted accounting principles (“GAAP”) and follows the accounting and reporting guidance applicable to investment companies.
A. Security Valuation. All investments in Underlying Funds are recorded at their estimated fair value, as described below. U.S. GAAP defines fair value as the price the Portfolios would receive to sell an asset or pay to transfer a liability in an orderly transaction between market participants at the measurement date. The valuations of the Portfolios’ investments in its Underlying Funds are based on the net asset value (“NAV”) of the Underlying Funds each business day.
Each investment asset or liability of the Portfolios is assigned a level at measurement date based on the significance and source of the inputs to its valuation. Quoted prices in active markets for identical securities are classified as “Level 1,” inputs other than quoted prices for an asset or liability that are observable are classified as “Level 2” and unobservable inputs, including the Sub-Adviser’s judgment about the assumptions that a market participant would use in pricing an asset or liability, are classified as “Level 3.” The inputs used for valuing
NOTES TO FINANCIAL STATEMENTS as of December 31, 2014 (continued)
NOTE 2 — SIGNIFICANT ACCOUNTING POLICIES (continued)
securities are not necessarily an indication of the risks associated with investing in those securities. Short-term securities of sufficient credit quality which are valued at amortized cost, which approximates fair value, are generally considered to be Level 2 securities under applicable accounting rules. The Portfolios classify each of their investments in the Underlying Funds as Level 1, without consideration as to the classification level of the specific investments held by the Underlying Funds. A table summarizing each Portfolio’s investments under these levels of classification is included following the Portfolio of Investments.
The Board has adopted methods for valuing securities and other assets in circumstances where market quotes are not readily available, and has delegated the responsibility for applying the valuation methods to the “Pricing Committee” as established by the Portfolios’ Administrator. The Pricing Committee considers all facts it deems relevant that are reasonably available, through either public information or information available to the Investment Adviser or Sub-Adviser, when determining the fair value of the security. In the event that a security or asset cannot be valued pursuant to one of the valuation methods established by the Board, the fair value of the security or asset will be determined in good faith by the Pricing Committee. When a Portfolio uses these fair valuation methods that use significant unobservable inputs to determine its NAV, securities will be priced by a method that the Pricing Committee believes accurately reflects fair value and are categorized as Level 3 of the fair value hierarchy. The methodologies used for valuing securities are not necessarily an indication of the risks of investing in those securities valued in good faith at fair value nor can it be assured a Portfolio can obtain the fair value assigned to a security if it were to sell the security.
To assess the continuing appropriateness of security valuations, the Pricing Committee may compare prior day prices, prices on comparable securities, and traded prices to the prior or current day prices and the Pricing Committee challenges those prices exceeding certain tolerance levels with the independent pricing service or broker source. For those securities valued in good faith at fair value, the Pricing Committee reviews and affirms the reasonableness of the valuation on a regular basis after considering all relevant information that is reasonably available.
For fair valuations using significant unobservable inputs, U.S. GAAP requires a reconciliation of the beginning to ending balances for reported fair values that presents changes attributable to total realized and unrealized gains
or losses, purchases and sales, and transfers in or out of the Level 3 category during the period. The beginning of period timing recognition is used for the transfers between Levels of a Portfolio’s assets and liabilities. A reconciliation of Level 3 investments is presented only when a Portfolio has a significant amount of Level 3 investments.
For the year ended December 31, 2014, there have been no significant changes to the fair valuation methodologies.
B. Security Transactions and Revenue Recognition. Security transactions are accounted for on the trade date. Dividend income received from the Underlying Funds is recognized on the ex-dividend date and is recorded as income distributions in the Statements of Operations. Capital gain distributions received from the Underlying Funds are recognized on the ex-dividend date and are recorded on the Statements of Operations as such. Realized gains and losses are reported on the basis of identified cost of securities sold.
C. Distributions to Shareholders. The Portfolios record distributions to their shareholders on the ex-dividend date. Dividends from net investment income and capital gains, if any, are declared and paid annually. The Portfolios may make distributions on a more frequent basis to comply with the distribution requirements of the Internal Revenue Code. The characteristics of income and gains to be distributed are determined in accordance with income tax regulations, which may differ from U.S. GAAP for investment companies.
D. Federal Income Taxes. It is the policy of each Portfolio to comply with the requirements of subchapter M of the Internal Revenue Code that are applicable to regulated investment companies and to distribute substantially all of its net investment income and any net realized capital gains to its shareholders. Therefore, a federal income tax or excise tax provision is not required. Management has considered the sustainability of the Portfolios’ tax positions taken on federal income tax returns for all open tax years in making this determination. No capital gain distributions shall be made until the capital loss carryforwards have been fully utilized or expire.
E. Use of Estimates. The preparation of financial statements in conformity with U.S. GAAP requires management to make estimates and assumptions that affect the reported amounts of assets and liabilities and disclosure of contingent assets and liabilities at the date of the financial statements and the reported amounts of increases and decreases in net assets from operations during the reporting period. Actual results could differ from those estimates.
NOTES TO FINANCIAL STATEMENTS as of December 31, 2014 (continued)
NOTE 2 — SIGNIFICANT ACCOUNTING POLICIES (continued)
F. Risk Exposures and the Use of Derivative Instruments. Each Portfolio’s investment strategies permit it to enter into various types of derivatives contracts, including, but not limited to, futures contracts. In doing so, a Portfolio will employ strategies in differing combinations to permit it to increase or decrease the level of risk, or change the level or types of exposure to market risk factors. This may allow a Portfolio to pursue its objectives more quickly and efficiently than if it were to make direct purchases or sales of securities capable of affecting a similar response to market factors.
Market Risk Factors. In pursuit of its investment objectives, a Portfolio may seek to use derivatives to increase or decrease its exposure to the following market risk factors:
Equity Risk. Equity risk relates to the change in value of equity securities as they relate to increases or decreases in the general market.
Risks of Investing in Derivatives. Each Portfolio’s use of derivatives can result in losses due to unanticipated changes in the market risk factors and the overall market. In instances where a Portfolio is using derivatives to decrease, or hedge, exposures to market risk factors for securities held by a Portfolio, there are also risks that those derivatives may not perform as expected resulting in losses for the combined or hedged positions.
The use of these strategies involves certain special risks, including a possible imperfect correlation, or even no correlation, between price movements of derivative instruments and price movements of related investments. While some strategies involving derivative instruments can reduce the risk of loss, they can also reduce the opportunity for gain or even result in losses by offsetting favorable price movements in related investments or otherwise, due to the possible inability of a Portfolio to purchase or sell a portfolio security at a time that otherwise would be favorable or the possible need to sell a portfolio security at a disadvantageous time because the Portfolio is required to maintain asset coverage or offsetting positions in connection with transactions in derivative instruments. Additional associated risks from investing in derivatives also exist and potentially could have significant effects on the valuation of the derivative and a Portfolio. Associated risks are not the risks that a Portfolio is attempting to increase or decrease exposure to, per their investment objectives, but are the additional risks from investing in derivatives. Examples of these associated risks are liquidity risk, which is the risk that a Portfolio will not be able to sell the derivative in the open market in a timely manner, and counterparty credit risk, which is the risk that
the counterparty will not fulfill its obligation to a Portfolio. Associated risks can be different for each type of derivative and are discussed by each derivative type in the following notes.
G. Futures Contracts. Certain Portfolios may enter into futures contracts involving foreign currency, interest rates, securities and security indices. A futures contract is a commitment to buy or sell a specific amount of a financial instrument at a negotiated price on a stipulated future date. A Portfolio may buy and sell futures contracts. Futures contracts traded on a commodities or futures exchange will be valued at the final settlement price or official closing price on the principal exchange as reported by such principal exchange at its trading session ending at, or most recently prior to, the time when each Portfolio’s assets are valued.
Upon entering into a futures contract, a Portfolio is required to deposit either cash or securities (initial margin) in an amount equal to a certain percentage of the contract value. Subsequent payments (variation margin) are made or received by a Portfolio each day. The variation margin payments are equal to the daily changes in the contract value and are recorded as unrealized gains and losses. Open futures contracts are reported on a table following each Portfolio’s Portfolio of Investments. Securities held in collateralized accounts to cover initial margin requirements on open futures contracts, if any, are footnoted in the Portfolio of Investments. Cash collateral held by the broker to cover initial margin requirements on open futures contracts are noted in the Statements of Assets and Liabilities. The net change in unrealized appreciation and depreciation is reported in the Statements of Operations. Realized gains (losses) are reported in the Statements of Operations at the closing or expiration of futures contracts.
Futures contracts are exposed to the market risk factor of the underlying financial instrument. During year ended December 31, 2014, each Portfolio has purchased futures contracts on various equity indices to “equitize” cash. Futures contracts are purchased to provide immediate market exposure proportionate to the size of the Portfolio’s respective cash flows and residual cash balances in order to decrease potential tracking error if the cash remained uninvested in the market. Additional associated risks of entering into futures contracts include the possibility that there may be an illiquid market where the Portfolios are unable to liquidate the contract or enter into an offsetting position and, if used for hedging purposes, the risk that the price of the contract will correlate imperfectly with the prices of the Portfolios’ securities. With futures, there is minimal counterparty credit risk to the Portfolios since futures are exchange traded and the exchange’s clearinghouse, as counterparty to all exchange traded futures, guarantees the futures against default.
NOTES TO FINANCIAL STATEMENTS as of December 31, 2014 (continued)
NOTE 2 — SIGNIFICANT ACCOUNTING POLICIES (continued)
During the final month of the year ended December 31, 2014, the Portfolios had average notional values on futures contracts purchased as disclosed below:
| Index Solution Income | | $ | 3,569,250 | |
| Index Solution 2015 | | | 5,353,874 | |
| Index Solution 2025 | | | 10,350,824 | |
| Index Solution 2035 | | | 8,685,174 | |
| Index Solution 2045 | | | 5,353,874 | |
| Index Solution 2055 | | | 1,189,750 | |
H. Indemnifications. In the normal course of business, the Company may enter into contracts that provide certain indemnifications. The Company’s maximum exposure under these arrangements is dependent on future claims that may be made against the Portfolios and, therefore, cannot be estimated; however, based on experience, management considers the risk of loss from such claims remote.
NOTE 3 — INVESTMENTS IN UNDERLYING FUNDS
For the year ended December 31, 2014, the cost of purchases and the proceeds from sales of the Underlying Funds were as follows:
| | | Purchases | | | Sales | |
| Index Solution Income | | $ | 41,317,986 | | | $ | 64,413,038 | |
| Index Solution 2015 | | | 101,564,807 | | | | 143,444,059 | |
| Index Solution 2020 | | | 4,221 | | | | 4,301 | |
| Index Solution 2025 | | | 170,383,997 | | | | 184,632,925 | |
| Index Solution 2030 | | | 6,448 | | | | 6,568 | |
| Index Solution 2035 | | | 185,711,734 | | | | 185,658,854 | |
| Index Solution 2040 | | | 7,512 | | | | 6,794 | |
| Index Solution 2045 | | | 122,016,833 | | | | 114,421,438 | |
| Index Solution 2050 | | | 6,746 | | | | 6,923 | |
| Index Solution 2055 | | | 35,141,421 | | | | 24,231,234 | |
NOTE 4 — INVESTMENT MANAGEMENT AND ADMINISTRATIVE SERVICE FEES
The Portfolios have entered into an investment management agreement (“Investment Management Agreement”) with the Investment Adviser. The Investment Management Agreement compensates the Investment Adviser with an annual fee of 0.10% of each Portfolio’s average daily nets assets invested in affiliated Underlying Funds and 0.30% of each Portfolio’s average daily net assets invested in unaffiliated Underlying Funds and/or other investments.
The Investment Adviser has entered into a sub-advisory agreement with Voya IM. Subject to such policies as the Board or the Investment Adviser may determine, Voya IM manages the Portfolios’ assets in accordance with the Portfolios’ investment objectives, policies, and limitations.
The Administrator provides certain administrative and shareholder services necessary for each Portfolio’s operations and is responsible for the supervision of other service providers. For its services, the Administrator is entitled to receive from each Portfolio a fee at an annual rate of 0.10% of each Portfolio’s average daily net assets.
NOTE 5 — DISTRIBUTION AND SERVICE FEES
Classes ADV, S2 and T of the Portfolios have a plan of Distribution pursuant to Rule 12b-1 under the 1940 Act (the “12b-1 Plans”), whereby the Distributor is reimbursed or compensated by the Portfolios for expenses incurred in the distribution of each Portfolio’s shares (“Distribution Fees”). The Distributor may pay, on behalf of each Portfolio, out of its distribution fee, compensation to certain financial institutions for providing distribution assistance pursuant to a Distribution Services Agreement. Under the 12b-1 Plans each Portfolio makes payments to the Distributor at an annual rate of 0.25%, 0.25% and 0.50% of each Portfolio’s average daily net assets attributable to its Class ADV, Class S2 and Class T shares, respectively. The Distributor has contractually agreed to waive a portion of its fee equal to 0.10% of each Portfolio’s average daily net assets attributable to the distribution fee paid by Class S2 shares, so that the actual fee paid is an annual rate of 0.15%. Termination or modification of this obligation requires approval by the Board. The Distributor has contractually agreed to waive a portion of its fee equal to 0.05% of each Portfolio’s average daily net assets attributable to the distribution fee paid by Class T shares, so that the actual fee paid is an annual rate of 0.45%. Termination or modification of this obligation requires approval by the Board.
The Company has a Shareholder Servicing Plan (“Service Plan”) for the Classes ADV, S, S2 and T shares of each Portfolio. The Service Plan allows the Distributor to enter into shareholder servicing agreements with insurance companies, broker dealers or other financial intermediaries that provide administrative services related to Classes ADV, S, S2 and T shares and their shareholders including Variable Contract owners or Qualified Plan participants with interests in the Portfolios. Under the Service Plan, each Portfolio makes payments to the Distributor which shall not exceed an annual rate of 0.25% of each Portfolio’s average daily net assets attributable to its Classes ADV, S, S2 and T shares.
NOTES TO FINANCIAL STATEMENTS as of December 31, 2014 (continued)
NOTE 6 — OTHER TRANSACTIONS WITH AFFILIATES AND RELATED PARTIES
At December 31, 2014, the following direct or indirect, wholly-owned subsidiaries of Voya Financial, Inc. owned more than 5% of the following Portfolios:
| Subsidiary | | Portfolio | | Percentage | |
| ReliaStar Life Insurance Company | | Index Solution 2020 | | | 99.63 | % |
| | | Index Solution 2030 | | | 99.63 | |
| | | Index Solution 2040 | | | 95.90 | |
| | | Index Solution 2050 | | | 99.62 | |
| Voya Institutional Trust Company | | Index Solution 2015 | | | 30.44 | |
| | | Index Solution 2025 | | | 20.11 | |
| | | Index Solution 2035 | | | 16.77 | |
| | | Index Solution 2045 | | | 13.82 | |
| | | Index Solution 2055 | | | 10.79 | |
| | | Index Solution Income | | | 72.24 | |
| Voya Retirement Insurance and Annuity Company | | Index Solution 2015 | | | 69.50 | |
| | | Index Solution 2025 | | | 79.89 | |
| | | Index Solution 2035 | | | 83.19 | |
| | | Index Solution 2045 | | | 86.18 | |
| | | Index Solution 2055 | | | 89.21 | |
| | | Index Solution Income | | | 27.75 | |
Control is defined by the 1940 Act as the beneficial ownership, either directly or through one or more controlled companies, of more than 25% of the voting securities of a company. The 1940 Act defines affiliates as companies that are under common control. Therefore, if certain Portfolios have a common owner that owns over 25% of the outstanding securities of the Portfolios, they may be deemed to be affiliates of each other. Investment activities of these shareholders could have a material impact on the Portfolios.
The Portfolios have adopted a Deferred Compensation Plan (the “Plan”), which allows eligible non-affiliated directors, as described in the Plan, to defer the receipt of all or a portion of the directors’ fees that they are entitled to receive from the Portfolios. For purposes of determining the amount owed to the director under the Plan, the amounts deferred are invested in shares of the funds selected by the director (the “Notional Funds”). The Portfolios purchase shares of the Notional Funds, which are all advised by Voya Investments, in amounts equal to the directors’ deferred fees, resulting in a Portfolio asset equal to the deferred compensation liability. Such assets are included as a component of “Other assets” on the accompanying Statement of Assets and Liabilities. Deferral of directors’ fees under the Plan will not affect net assets of the Portfolio, and will not materially affect the Portfolios’ assets, liabilities or net investment income per
share. Amounts will be deferred until distributed in accordance with the Plan.
During the year ended December 31, 2013, Voya Investments, LLC voluntarily reimbursed Index Solution 2020, Index Solution 2030, Index Solution 2040, and Index Solution 2050 $22, $24, $30, and $31, respectively, for the foregone investment opportunities attributable to uninvested cash.
NOTE 7 — OTHER ACCRUED EXPENSES AND LIABILITIES
At December 31, 2014, the following Portfolios had the below payables included in Other Accrued Expenses and Liabilities on the Statements of Assets and Liabilities that exceeded 5% of total liabilities:
| Portfolio | | Accrued Expenses | | Amount | |
| Index Solution Income | | Audit | | $ | 23,725 | |
| Index Solution 2015 | | Audit | | | 34,238 | |
| Index Solution 2020 | | Custody | | | 25 | |
| Index Solution 2025 | | Audit | | | 61,292 | |
| Index Solution 2030 | | Custody | | | 33 | |
| Index Solution 2040 | | Custody | | | 48 | |
| Index Solution 2045 | | Audit | | | 30,950 | |
| Index Solution 2050 | | Custody | | | 34 | |
NOTE 8 — EXPENSE LIMITATION AGREEMENT
The Investment Adviser has entered into a written expense limitation agreement (“Expense Limitation Agreement”) with each Portfolio whereby the Investment Adviser has agreed to limit expenses, excluding interest, taxes, brokerage commissions, and extraordinary expenses to the levels listed below:
| Portfolio(1) | | Class ADV | | | Class I | | | Class S | | | Class S2 | | | Class T | |
| Index Solution Income | | | 1.01 | % | | | 0.51 | % | | | 0.76 | % | | | 0.91 | % | | | 1.21 | % |
| Index Solution 2015 | | | 1.02 | % | | | 0.52 | % | | | 0.77 | % | | | 0.92 | % | | | 1.22 | % |
| Index Solution 2020 | | | 1.01 | % | | | 0.51 | % | | | 0.76 | % | | | 0.91 | % | | | 1.21 | % |
| Index Solution 2025 | | | 1.01 | % | | | 0.51 | % | | | 0.76 | % | | | 0.91 | % | | | 1.21 | % |
| Index Solution 2030 | | | 1.01 | % | | | 0.51 | % | | | 0.76 | % | | | 0.91 | % | | | 1.21 | % |
| Index Solution 2035 | | | 1.01 | % | | | 0.51 | % | | | 0.76 | % | | | 0.91 | % | | | 1.21 | % |
| Index Solution 2040 | | | 1.00 | % | | | 0.50 | % | | | 0.75 | % | | | 0.90 | % | | | 1.20 | % |
| Index Solution 2045 | | | 1.01 | % | | | 0.51 | % | | | 0.76 | % | | | 0.91 | % | | | 1.21 | % |
| Index Solution 2050 | | | 1.01 | % | | | 0.51 | % | | | 0.76 | % | | | 0.91 | % | | | 1.21 | % |
| Index Solution 2055 | | | 1.01 | % | | | 0.51 | % | | | 0.76 | % | | | 0.91 | % | | | 1.21 | % |
| (1) | The operating expense limits take into account the operating expenses incurred at the Underlying Fund level. The amount of fees and expenses of an Underlying Fund borne by each Portfolio will vary based on each Portfolio’s allocation of assets to, and the net expenses of, a particular Underlying Fund. |
NOTES TO FINANCIAL STATEMENTS as of December 31, 2014 (continued)
NOTE 8 — EXPENSE LIMITATION AGREEMENT (continued)
The Investment Adviser may at a later date recoup from a Portfolio for management fees waived and other expenses assumed by the Investment Adviser during the previous 36 months, but only if, after such recoupment, a Portfolio’s expense ratio does not exceed the percentage described above. Waived and reimbursed fees and any recoupment by the Investment Adviser of such waived and reimbursed fees are reflected on the accompanying Statements of Operations. Amounts payable by the Investment Adviser are reflected on the accompanying Statements of Assets and Liabilities.
As of December 31, 2014, the amounts of waived and reimbursed fees that are subject to possible recoupment by the Investment Adviser, and the related expiration dates are as follows:
| | | December 31, | | | | |
| | | 2015 | | | 2016 | | | 2017 | | | Total | |
| Index Solution Income | | $ | 158,543 | | | $ | 262,538 | | | $ | 283,370 | | | $ | 704,451 | |
| Index Solution 2015 | | | 195,030 | | | | 389,197 | | | | 388,476 | | | | 972,703 | |
| Index Solution 2020 | | | 9,853 | | | | 17,073 | | | | 13,317 | | | | 40,243 | |
| Index Solution 2025 | | | 266,773 | | | | 623,562 | | | | 759,707 | | | | 1,650,042 | |
| Index Solution 2030 | | | 7,463 | | | | 16,565 | | | | 13,352 | | | | 37,380 | |
| Index Solution 2035 | | | 210,106 | | | | 451,323 | | | | 552,136 | | | | 1,213,565 | |
| Index Solution 2040 | | | 9,691 | | | | 16,327 | | | | 13,502 | | | | 39,520 | |
| Index Solution 2045 | | | 122,508 | | | | 268,695 | | | | 314,407 | | | | 705,610 | |
| Index Solution 2050 | | | 7,517 | | | | 16,307 | | | | 13,467 | | | | 37,291 | |
| Index Solution 2055 | | | 23,576 | | | | 66,067 | | | | 80,383 | | | | 170,026 | |
The expense limitation agreement is contractual through May 1, 2018 and shall renew automatically for one-year terms. Termination or modification of this obligation requires approval by the Board.
NOTE 9 — LINE OF CREDIT
The Portfolios, in addition to certain other funds managed by the Investment Adviser, have entered into an unsecured committed revolving line of credit agreement (the “Credit Agreement”) with The Bank of New York Mellon for an aggregate amount of $200,000,000. The proceeds may be used only to: (1) temporarily finance the purchase and sale of securities; or (2) finance the redemption of shares of an investor in the funds. The funds to which the line of credit is available pay a commitment fee equal to 0.07% per annum on the daily unused portion of the committed line amount payable quarterly in arrears. Prior to May 23, 2014, the funds to which the Credit Agreement is available paid a commitment fee equal to 0.08% per annum on the daily unused portion of the committed line amount payable quarterly in arrears.
Borrowings under the Credit Agreement accrue interest at the federal funds rate plus a specified margin. Repayments generally must be made within 60 days after the date of a revolving credit advance.
The Portfolios did not utilize the line of credit during the year ended December 31, 2014.
NOTE 10 — CAPITAL SHARES
Transactions in capital shares and dollars were as follows:
| | | | Shares
sold | | | | Reinvestment
of
distributions | | | | Shares
redeemed | | | | Net increase
(decrease)
in shares
outstanding | | | | Shares
sold | | | | Payment
from
distribution
settlement | | | | Reinvestment
of
distributions | | | | Shares
redeemed | | | | Net
increase
(decrease) | |
| Year or period ended | | | # | | | | # | | | | # | | | | # | | | | ($) | | | | ($) | | | | ($) | | | | ($) | | | | ($) | |
| Index Solution Income | | | | | | | | | | | | | | | | | | | | | | | | | | | | | | | | | | | | |
| Class ADV | | | | | | | | | | | | | | | | | | | | | | | | | | | | | | | | | | | | |
| 12/31/2014 | | | 960,343 | | | | 261,302 | | | | (1,176,479 | ) | | | 45,166 | | | | 10,358,076 | | | | — | | | | 2,701,861 | | | | (12,697,126 | ) | | | 362,811 | |
| 12/31/2013 | | | 1,559,039 | | | | 203,420 | | | | (1,178,911 | ) | | | 583,548 | | | | 16,751,930 | | | | — | | | | 2,107,434 | | | | (12,633,466 | ) | | | 6,225,898 | |
| Class I | | | | | | | | | | | | | | | | | | | | | | | | | | | | | | | | | | | | |
| 12/31/2014 | | | 275,491 | | | | 33,104 | | | | (359,382 | ) | | | (50,787 | ) | | | 3,018,885 | | | | — | | | | 349,244 | | | | (3,938,992 | ) | | | (570,863 | ) |
| 12/31/2013 | | | 66,121 | | | | 52,025 | | | | (586,470 | ) | | | (468,321 | ) | | | 725,972 | | | | — | | | | 548,339 | | | | (6,327,732 | ) | | | (5,053,421 | ) |
| Class S | | | | | | | | | | | | | | | | | | | | | | | | | | | | | | | | | | | | |
| 12/31/2014 | | | 385,860 | | | | 910,672 | | | | (2,034,823 | ) | | | (738,291 | ) | | | 4,245,797 | | | | — | | | | 9,534,738 | | | | (22,066,112 | ) | | | (8,285,577 | ) |
| 12/31/2013 | | | 402,011 | | | | 826,576 | | | | (1,984,140 | ) | | | (755,553 | ) | | | 4,381,631 | | | | — | | | | 8,654,251 | | | | (21,534,532 | ) | | | (8,498,650 | ) |
| Class S2 | | | | | | | | | | | | | | | | | | | | | | | | | | | | | | | | | | | | |
| 12/31/2014 | | | 58,265 | | | | 35,275 | | | | (173,057 | ) | | | (79,517 | ) | | | 619,992 | | | | — | | | | 362,274 | | | | (1,824,233 | ) | | | (841,967 | ) |
| 12/31/2013 | | | 197,048 | | | | 33,643 | | | | (120,871 | ) | | | 109,820 | | | | 2,128,387 | | | | — | | | | 346,189 | | | | (1,301,194 | ) | | | 1,173,382 | |
NOTES TO FINANCIAL STATEMENTS as of December 31, 2014 (continued)
NOTE 10 — CAPITAL SHARES (continued)
| | | | Shares
sold | | | | Reinvestment
of
distributions | | | | Shares
redeemed | | | | Net increase
(decrease)
in shares
outstanding | | | | Shares
sold | | | | Payment
from
distribution
settlement | | | | Reinvestment
of
distributions | | | | Shares
redeemed | | | | Net
increase
(decrease) | |
| Year or period ended | | | # | | | | # | | | | # | | | | # | | | | ($) | | | | ($) | | | | ($) | | | | ($) | | | | ($) | |
| Index Solution Income (continued) | | | | | | | | | | | | | | | | | | | | | | | | | | | | | | |
| Class T | | | | | | | | | | | | | | | | | | | | | | | | | | | | | | |
| 12/31/2014 | | | — | | | | 22 | | | | — | | | | 22 | | | | — | | | | — | | | | 231 | | | | — | | | | 231 | |
| 12/31/2013 | | | — | | | | — | | | | — | | | | — | | | | — | | | | — | | | | — | | | | — | | | | — | |
| Index Solution 2015 | | | | | | | | | | | | | | | | | | | | | | | | | | | | | | | | | | | | |
| Class ADV | | | | | | | | | | | | | | | | | | | | | | | | | | | | | | | | | | | | |
| 12/31/2014 | | | 1,643,928 | | | | 823,090 | | | | (3,507,576 | ) | | | (1,040,558 | ) | | | 17,904,461 | | | | — | | | | 8,609,525 | | | | (37,933,111 | ) | | | (11,419,125 | ) |
| 12/31/2013 | | | 2,950,116 | | | | 532,705 | | | | (2,472,964 | ) | | | 1,009,857 | | | | 31,417,235 | | | | — | | | | 5,540,139 | | | | (26,345,147 | ) | | | 10,612,227 | |
| Class I | | | | | | | | | | | | | | | | | | | | | | | | | | | | | | | | | | | | |
| 12/31/2014 | | | 1,346,204 | | | | 174,345 | | | | (1,298,578 | ) | | | 221,971 | | | | 14,989,234 | | | | — | | | | 1,855,031 | | | | (14,390,260 | ) | | | 2,454,005 | |
| 12/31/2013 | | | 539,991 | | | | 124,289 | | | | (1,103,769 | ) | | | (439,489 | ) | | | 5,852,138 | | | | — | | | | 1,313,735 | | | | (11,948,345 | ) | | | (4,782,472 | ) |
| Class S | | | | | | | | | | | | | | | | | | | | | | | | | | | | | | | | | | | | |
| 12/31/2014 | | | 946,774 | | | | 732,977 | | | | (2,305,791 | ) | | | (626,040 | ) | | | 10,306,080 | | | | — | | | | 7,740,236 | | | | (25,511,537 | ) | | | (7,465,221 | ) |
| 12/31/2013 | | | 1,466,967 | | | | 518,573 | | | | (1,898,397 | ) | | | 87,143 | | | | 15,785,065 | | | | — | | | | 5,445,012 | | | | (20,381,284 | ) | | | 848,793 | |
| Class S2 | | | | | | | | | | | | | | | | | | | | | | | | | | | | | | | | | | | | |
| 12/31/2014 | | | 357,017 | | | | 146,357 | | | | (913,989 | ) | | | (410,615 | ) | | | 3,868,383 | | | | — | | | | 1,520,645 | | | | (9,676,118 | ) | | | (4,287,090 | ) |
| 12/31/2013 | | | 921,451 | | | | 99,515 | | | | (525,656 | ) | | | 495,310 | | | | 9,823,613 | | | | — | | | | 1,028,988 | | | | (5,563,487 | ) | | | 5,289,144 | |
| Class T | | | | | | | | | | | | | | | | | | | | | | | | | | | | | | | | | | | | |
| 12/31/2014 | | | — | | | | 22 | | | | — | | | | 22 | | | | — | | | | — | | | | 231 | | | | — | | | | 231 | |
| 12/31/2013 | | | — | | | | — | | | | — | | | | — | | | | — | | | | — | | | | — | | | | — | | | | — | |
| Index Solution 2020 | | | | | | | | | | | | | | | | | | | | | | | | | | | | | | | | | | | | |
| Class ADV | | | | | | | | | | | | | | | | | | | | | | | | | | | | | | | | | | | | |
| 12/31/2014 | | | — | | | | 24 | | | | — | | | | 24 | | | | — | | | | — | | | | 275 | | | | — | | | | 275 | |
| 12/31/2013 | | | — | | | | — | * | | | — | | | | — | | | | — | | | | 4 | | | | 1 | | | | — | | | | 5 | |
| Class I | | | | | | | | | | | | | | | | | | | | | | | | | | | | | | | | | | | | |
| 12/31/2014 | | | — | | | | 25 | | | | — | | | | 25 | | | | — | | | | — | | | | 291 | | | | — | | | | 291 | |
| 12/31/2013 | | | — | | | | — | * | | | — | | | | — | | | | — | | | | 5 | | | | 1 | | | | — | | | | 6 | |
| Class S | | | | | | | | | | | | | | | | | | | | | | | | | | | | | | | | | | | | |
| 12/31/2014 | | | — | | | | 24 | | | | — | | | | 24 | | | | — | | | | — | | | | 283 | | | | — | | | | 283 | |
| 12/31/2013 | | | — | | | | — | | | | — | | | | — | | | | — | | | | 5 | | | | — | | | | — | | | | 5 | |
| Class S2 | | | | | | | | | | | | | | | | | | | | | | | | | | | | | | | | | | | | |
| 12/31/2014 | | | — | | | | 24 | | | | — | | | | 24 | | | | — | | | | — | | | | 278 | | | | — | | | | 278 | |
| 12/31/2013 | | | — | | | | — | * | | | — | | | | — | | | | — | | | | 4 | | | | 1 | | | | — | | | | 5 | |
| Class T | | | | | | | | | | | | | | | | | | | | | | | | | | | | | | | | | | | | |
| 12/31/2014 | | | — | | | | 23 | | | | — | | | | 23 | | | | — | | | | — | | | | 268 | | | | — | | | | 268 | |
| 12/31/2013 | | | — | | | | — | * | | | — | | | | — | | | | — | | | | 4 | | | | 1 | | | | — | | | | 5 | |
| Index Solution 2025 | | | | | | | | | | | | | | | | | | | | | | | | | | | | | | | | | | | | |
| Class ADV | | | | | | | | | | | | | | | | | | | | | | | | | | | | | | | | | | | | |
| 12/31/2014 | | | 2,803,677 | | | | 1,404,015 | | | | (4,196,702 | ) | | | 10,990 | | | | 32,950,980 | | | | — | | | | 15,865,368 | | | | (48,971,969 | ) | | | (155,621 | ) |
| 12/31/2013 | | | 5,492,701 | | | | 841,055 | | | | (2,657,057 | ) | | | 3,676,699 | | | | 60,583,359 | | | | — | | | | 9,192,736 | | | | (29,345,294 | ) | | | 40,430,801 | |
| Class I | | | | | | | | | | | | | | | | | | | | | | | | | | | | | | | | | | | | |
| 12/31/2014 | | | 2,381,776 | | | | 244,603 | | | | (1,428,179 | ) | | | 1,198,200 | | | | 28,457,059 | | | | — | | | | 2,812,938 | | | | (16,899,085 | ) | | | 14,370,912 | |
| 12/31/2013 | | | 931,016 | | | | 129,116 | | | | (1,059,651 | ) | | | 481 | | | | 10,423,339 | | | | — | | | | 1,433,188 | | | | (11,948,074 | ) | | | (91,547 | ) |
NOTES TO FINANCIAL STATEMENTS as of December 31, 2014 (continued)
NOTE 10 — CAPITAL SHARES (continued)
| | | | Shares
sold | | | | Reinvestment
of
distributions | | | | Shares
redeemed | | | | Net increase
(decrease)
in shares
outstanding | | | | Shares
sold | | | | Payment
from
distribution
settlement | | | | Reinvestment
of
distributions | | | | Shares
redeemed | | | | Net
increase
(decrease) | |
| Year or period ended | | | # | | | | # | | | | # | | | | # | | | | ($) | | | | ($) | | | | ($) | | | | ($) | | | | ($) | |
| Index Solution 2025 (continued) | | | | | | | | | | | | | | | | | | | | | | | | | | | | | | |
| Class S | | | | | | | | | | | | | | | | | | | | | | | | | | | | | | | | | | | | |
| 12/31/2014 | | | 2,554,614 | | | | 1,008,589 | | | | (2,342,926 | ) | | | 1,220,277 | | | | 29,849,422 | | | | — | | | | 11,508,003 | | | | (27,687,498 | ) | | | 13,669,927 | |
| 12/31/2013 | | | 2,807,816 | | | | 617,649 | | | | (1,774,272 | ) | | | 1,651,193 | | | | 31,256,497 | | | | — | | | | 6,806,490 | | | | (19,869,952 | ) | | | 18,193,035 | |
| Class S2 | | | | | | | | | | | | | | | | | | | | | | | | | | | | | | | | | | | | |
| 12/31/2014 | | | 732,632 | | | | 274,394 | | | | (1,462,988 | ) | | | (455,962 | ) | | | 8,538,246 | | | | — | | | | 3,086,930 | | | | (16,641,199 | ) | | | (5,016,023 | ) |
| 12/31/2013 | | | 1,543,170 | | | | 170,857 | | | | (679,614 | ) | | | 1,034,413 | | | | 16,963,592 | | | | — | | | | 1,858,917 | | | | (7,469,751 | ) | | | 11,352,758 | |
| Class T | | | | | | | | | | | | | | | | | | | | | | | | | | | | | | | | | | | | |
| 12/31/2014 | | | — | | | | 19 | | | | — | | | | 19 | | | | — | | | | — | | | | 219 | | | | — | | | | 219 | |
| 12/31/2013 | | | — | | | | — | | | | — | | | | — | | | | — | | | | — | | | | — | | | | — | | | | — | |
| Index Solution 2030 | | | | | | | | | | | | | | | | | | | | | | | | | | | | | | | | | | | | |
| Class ADV | | | | | | | | | | | | | | | | | | | | | | | | | | | | | | | | | | | | |
| 12/31/2014 | | | — | | | | 27 | | | | — | | | | 27 | | | | — | | | | — | | | | 342 | | | | — | | | | 342 | |
| 12/31/2013 | | | — | | | | — | * | | | — | | | | — | | | | — | | | | 6 | | | | 1 | | | | — | | | | 7 | |
| Class I | | | | | | | | | | | | | | | | | | | | | | | | | | | | | | | | | | | | |
| 12/31/2014 | | | — | | | | 29 | | | | — | | | | 29 | | | | — | | | | — | | | | 363 | | | | — | | | | 363 | |
| 12/31/2013 | | | — | | | | — | * | | | — | | | | — | | | | — | | | | 6 | | | | 1 | | | | — | | | | 7 | |
| Class S | | | | | | | | | | | | | | | | | | | | | | | | | | | | | | | | | | | | |
| 12/31/2014 | | | — | | | | 28 | | | | — | | | | 28 | | | | — | | | | — | | | | 352 | | | | — | | | | 352 | |
| 12/31/2013 | | | — | | | | — | | | | — | | | | — | | | | — | | | | 6 | | | | — | | | | — | | | | 6 | |
| Class S2 | | | | | | | | | | | | | | | | | | | | | | | | | | | | | | | | | | | | |
| 12/31/2014 | | | — | | | | 28 | | | | — | | | | 28 | | | | — | | | | — | | | | 345 | | | | — | | | | 345 | |
| 12/31/2013 | | | — | | | | — | * | | | — | | | | — | | | | — | | | | 6 | | | | 1 | | | | — | | | | 7 | |
| Class T | | | | | | | | | | | | | | | | | | | | | | | | | | | | | | | | | | | | |
| 12/31/2014 | | | — | | | | 27 | | | | — | | | | 27 | | | | — | | | | — | | | | 338 | | | | — | | | | 338 | |
| 12/31/2013 | | | — | | | | — | | | | — | | | | — | | | | — | | | | — | | | | — | | | | — | | | | — | |
| Index Solution 2035 | | | | | | | | | | | | | | | | | | | | | | | | | | | | | | | | | | | | |
| Class ADV | | | | | | | | | | | | | | | | | | | | | | | | | | | | | | | | | | | | |
| 12/31/2014 | | | 2,870,042 | | | | 1,199,820 | | | | (3,405,171 | ) | | | 664,691 | | | | 34,531,485 | | | | — | | | | 13,977,905 | | | | (41,063,964 | ) | | | 7,445,426 | |
| 12/31/2013 | | | 4,397,113 | | | | 617,939 | | | | (2,340,003 | ) | | | 2,675,049 | | | | 49,160,284 | | | | — | | | | 6,877,660 | | | | (26,280,246 | ) | | | 29,757,698 | |
| Class I | | �� | | | | | | | | | | | | | | | | | | | | | | | | | | | | | | | | | | |
| 12/31/2014 | | | 1,645,774 | | | | 168,587 | | | | (658,627 | ) | | | 1,155,734 | | | | 20,190,708 | | | | — | | | | 2,001,125 | | | | (8,068,263 | ) | | | 14,123,570 | |
| 12/31/2013 | | | 693,359 | | | | 71,755 | | | | (887,583 | ) | | | (122,469 | ) | | | 7,883,395 | | | | — | | | | 812,260 | | | | (9,987,750 | ) | | | (1,292,095 | ) |
| Class S | | | | | | | | | | | | | | | | | | | | | | | | | | | | | | | | | | | | |
| 12/31/2014 | | | 2,487,915 | | | | 782,784 | | | | (2,065,642 | ) | | | 1,205,057 | | | | 29,847,400 | | | | — | | | | 9,213,372 | | | | (25,343,630 | ) | | | 13,717,142 | |
| 12/31/2013 | | | 2,755,296 | | | | 414,709 | | | | (1,227,526 | ) | | | (1,942,479 | ) | | | 31,012,156 | | | | — | | | | 4,657,184 | | | | (13,966,270 | ) | | | 21,703,070 | |
| Class S2 | | | | | | | | | | | | | | | | | | | | | | | | | | | | | | | | | | | | |
| 12/31/2014 | | | 634,379 | | | | 263,076 | | | | (1,185,849 | ) | | | (288,394 | ) | | | 7,690,776 | | | | — | | | | 3,056,947 | | | | (13,784,046 | ) | | | (3,036,323 | ) |
| 12/31/2013 | | | 1,448,845 | | | | 134,391 | | | | (711,888 | ) | | | 871,348 | | | | 16,109,625 | | | | — | | | | 1,493,086 | | | | (7,881,188 | ) | | | 9,721,523 | |
| Class T | | | | | | | | | | | | | | | | | | | | | | | | | | | | | | | | | | | | |
| 12/31/2014 | | | — | | | | 20 | | | | — | | | | 20 | | | | — | | | | — | | | | 236 | | | | — | | | | 236 | |
| 12/31/2013 | | | — | | | | — | | | | — | | | | — | | | | — | | | | — | | | | — | | | | — | | | | — | |
NOTES TO FINANCIAL STATEMENTS as of December 31, 2014 (continued)
NOTE 10 — CAPITAL SHARES (continued)
| | | | Shares
sold | | | | Reinvestment
of
distributions | | | | Shares
redeemed | | | | Net increase
(decrease)
in shares
outstanding | | | | Shares
sold | | | | Payment
from
distribution
settlement | | | | Reinvestment
of
distributions | | | | Shares
redeemed | | | | Net
increase
(decrease) | |
| Year or period ended | | | # | | | | # | | | | # | | | | # | | | | ($) | | | | ($) | | | | ($) | | | | ($) | | | | ($) | |
| Index Solution 2040 | | | | | | | | | | | | | | | | | | | | | | | | | | | | | | | | | | | | |
| Class ADV | | | | | | | | | | | | | | | | | | | | | | | | | | | | | | | | | | | | |
| 12/31/2014 | | | 64 | | | | 26 | | | | — | * | | | 90 | | | | 858 | | | | — | | | | 349 | | | | (3 | ) | | | 1,204 | |
| 12/31/2013 | | | — | | | | — | * | | | — | | | | — | | | | — | | | | 6 | | | | 1 | | | | — | | | | 7 | |
| Class I | | | | | | | | | | | | | | | | | | | | | | | | | | | | | | | | | | | | |
| 12/31/2014 | | | — | | | | 28 | | | | — | | | | 28 | | | | — | | | | — | | | | 371 | | | | — | | | | 371 | |
| 12/31/2013 | | | — | | | | — | * | | | — | | | | — | | | | — | | | | 6 | | | | 1 | | | | — | | | | 7 | |
| Class S | | | | | | | | | | | | | | | | | | | | | | | | | | | | | | | | | | | | |
| 12/31/2014 | | | — | | | | 27 | | | | — | | | | 27 | | | | — | | | | — | | | | 360 | | | | — | | | | 360 | |
| 12/31/2013 | | | — | | | | — | * | | | — | | | | — | | | | — | | | | 6 | | | | 1 | | | | — | | | | 7 | |
| Class S2 | | | | | | | | | | | | | | | | | | | | | | | | | | | | | | | | | | | | |
| 12/31/2014 | | | — | | | | 26 | | | | — | | | | 26 | | | | — | | | | — | | | | 353 | | | | — | | | | 353 | |
| 12/31/2013 | | | — | | | | — | * | | | — | | | | — | | | | — | | | | 6 | | | | 1 | | | | — | | | | 7 | |
| Class T | | | | | | | | | | | | | | | | | | | | | | | | | | | | | | | | | | | | |
| 12/31/2014 | | | — | | | | 26 | | | | — | | | | 26 | | | | — | | | | — | | | | 344 | | | | — | | | | 344 | |
| 12/31/2013 | | | — | | | | — | * | | | — | | | | — | | | | — | | | | 6 | | | | 1 | | | | — | | | | 7 | |
| Index Solution 2045 | | | | | | | | | | | | | | | | | | | | | | | | | | | | | | | | | | | | |
| Class ADV | | | | | | | | | | | | | | | | | | | | | | | | | | | | | | | | | | | | |
| 12/31/2014 | | | 2,181,890 | | | | 725,093 | | | | (2,000,961 | ) | | | 906,022 | | | | 26,901,772 | | | | — | | | | 8,672,107 | | | | (24,478,375 | ) | | | 11,095,504 | |
| 12/31/2013 | | | 2,919,161 | | | | 341,069 | | | | (1,189,386 | ) | | | 2,070,844 | | | | 33,028,985 | | | | — | | | | 3,843,848 | | | | (13,511,372 | ) | | | 23,361,461 | |
| Class I | | | | | | | | | | | | | | | | | | | | | | | | | | | | | | | | | | | | |
| 12/31/2014 | | | 975,805 | | | | 90,829 | | | | (378,117 | ) | | | 688,517 | | | | 12,285,409 | | | | — | | | | 1,110,842 | | | | (4,731,449 | ) | | | 8,664,802 | |
| 12/31/2013 | | | 513,530 | | | | 38,513 | | | | (1,057,268 | ) | | | (505,225 | ) | | | 5,901,670 | | | | — | | | | 442,903 | | | | (11,746,788 | ) | | | (5,402,215 | ) |
| Class S | | | | | | | | | | | | | | | | | | | | | | | | | | | | | | | | | | | | |
| 12/31/2014 | | | 1,414,398 | | | | 457,391 | | | | (1,265,130 | ) | | | 606,659 | | | | 17,550,350 | | | | — | | | | 5,534,428 | | | | (15,794,362 | ) | | | 7,290,416 | |
| 12/31/2013 | | | 2,049,516 | | | | 234,552 | | | | (776,640 | ) | | | 11,507,428 | | | | 23,346,405 | | | | — | | | | 2,671,542 | | | | (8,855,406 | ) | | | 17,162,541 | |
| Class S2 | | | | | | | | | | | | | | | | | | | | | | | | | | | | | | | | | | | | |
| 12/31/2014 | | | 390,464 | | | | 112,971 | | | | (492,469 | ) | | | 10,966 | | | | 4,805,566 | | | | — | | | | 1,350,003 | | | | (5,955,400 | ) | | | 200,169 | |
| 12/31/2013 | | | 622,071 | | | | 56,420 | | | | (340,144 | ) | | | 338,347 | | | | 6,987,765 | | | | — | | | | 635,292 | | | | 3,796,694 | | | | 3,826,363 | |
| Class T | | | | | | | | | | | | | | | | | | | | | | | | | | | | | | | | | | | | |
| 12/31/2014 | | | — | | | | 19 | | | | — | | | | 19 | | | | — | | | | — | | | | 226 | | | | — | | | | 226 | |
| 12/31/2013 | | | — | | | | — | | | | — | | | | — | | | | — | | | | — | | | | — | | | | — | | | | — | |
| Index Solution 2050 | | | | | | | | | | | | | | | | | | | | | | | | | | | | | | | | | | | | |
| Class ADV | | | | | | | | | | | | | | | | | | | | | | | | | | | | | | | | | | | | |
| 12/31/2014 | | | — | | | | 25 | | | | — | | | | 25 | | | | — | | | | — | | | | 338 | | | | — | | | | 338 | |
| 12/31/2013 | | | — | | | | — | * | | | — | | | | — | | | | — | | | | 6 | | | | 1 | | | | — | | | | 7 | |
| Class I | | | | | | | | | | | | | | | | | | | | | | | | | | | | | | | | | | | | |
| 12/31/2014 | | | — | | | | 27 | | | | — | | | | 27 | | | | — | | | | — | | | | 359 | | | | — | | | | 359 | |
| 12/31/2013 | | | — | | | | — | * | | | — | | | | — | | | | — | | | | 7 | | | | 1 | | | | — | | | | 8 | |
| Class S | | | | | | | | | | | | | | | | | | | | | | | | | | | | | | | | | | | | |
| 12/31/2014 | | | — | | | | 26 | | | | — | | | | 26 | | | | — | | | | — | | | | 349 | | | | — | | | | 349 | |
| 12/31/2013 | | | — | | | | — | | | | — | | | | — | | | | — | | | | 6 | | | | — | | | | — | | | | 6 | |
| Class S2 | | | | | | | | | | | | | | | | | | | | | | | | | | | | | | | | | | | | |
| 12/31/2014 | | | — | | | | 25 | | | | — | | | | 25 | | | | — | | | | — | | | | 342 | | | | — | | | | 342 | |
| 12/31/2013 | | | — | | | | — | * | | | — | | | | — | | | | — | | | | 6 | | | | 1 | | | | — | | | | 7 | |
NOTES TO FINANCIAL STATEMENTS as of December 31, 2014 (continued)
NOTE 10 — CAPITAL SHARES (continued)
| | | | Shares
sold | | | | Reinvestment
of
distributions | | | | Shares
redeemed | | | | Net increase
(decrease)
in shares
outstanding | | | | Shares
sold | | | | Payment
from
distribution
settlement | | | | Reinvestment
of
distributions | | | | Shares
redeemed | | | | Net
increase
(decrease) | |
| Year or period ended | | | # | | | | # | | | | # | | | | # | | | | ($) | | | | ($) | | | | ($) | | | | ($) | | | | ($) | |
| Index Solution 2050 (continued) | | | | | | | | | | | | | | | | | | | | | | | | | | | | | | |
| Class T | | | | | | | | | | | | | | | | | | | | | | | | | | | | | | | | | | | | |
| 12/31/2014 | | | — | | | | 25 | | | | — | | | | 25 | | | | — | | | | — | | | | 333 | | | | — | | | | 333 | |
| 12/31/2013 | | | — | | | | — | * | | | — | | | | — | | | | — | | | | 6 | | | | 1 | | | | — | | | | 7 | |
| Index Solution 2055 | | | | | | | | | | | | | | | | | | | | | | | | | | | | | | | | | | | | |
| Class ADV | | | | | | | | | | | | | | | | | | | | | | | | | | | | | | | | | | | | |
| 12/31/2014 | | | 722,460 | | | | 102,726 | | | | (365,872 | ) | | | 459,314 | | | | 10,668,614 | | | | — | | | | 1,481,309 | | | | (5,352,497 | ) | | | 6,797,426 | |
| 12/31/2013 | | | 789,686 | | | | 36,332 | | | | (223,512 | ) | | | 602,506 | | | | 10,565,940 | | | | — | | | | 487,211 | | | | (3,014,898 | ) | | | 8,038,253 | |
| Class I | | | | | | | | | | | | | | | | | | | | | | | | | | | | | | | | | | | | |
| 12/31/2014 | | | 183,611 | | | | 12,024 | | | | (50,103 | ) | | | 145,532 | | | | 2,747,158 | | | | — | | | | 175,914 | | | | (736,098 | ) | | | 2,186,974 | |
| 12/31/2013 | | | 97,888 | | | | 2,755 | | | | (123,419 | ) | | | (22,776 | ) | | | 1,321,269 | | | | — | | | | 37,392 | | | | 1,570,479 | | | | (211,818 | ) |
| Class S | | | | | | | | | | | | | | | | | | | | | | | | | | | | | | | | | | | | |
| 12/31/2014 | | | 540,460 | | | | 64,880 | | | | (243,976 | ) | | | 361,364 | | | | 8,028,381 | | | | — | | | | 942,707 | | | | (3,632,274 | ) | | | 5,338,814 | |
| 12/31/2013 | | | 513,925 | | | | 21,932 | | | | (228,504 | ) | | | 307,353 | | | | 6,908,013 | | | | — | | | | 296,078 | | | | (2,989,611 | ) | | | 4,214,480 | |
| Class S2 | | | | | | | | | | | | | | | | | | | | | | | | | | | | | | | | | | | | |
| 12/31/2014 | | | 123,109 | | | | 20,263 | | | | (136,203 | ) | | | 7,169 | | | | 1,815,555 | | | | — | | | | 292,603 | | | | (1,947,509 | ) | | | 160,649 | |
| 12/31/2013 | | | 145,956 | | | | 8,705 | | | | (101,000 | ) | | | 53,661 | | | | 1,960,864 | | | | — | | | | 116,820 | | | | (1,354,100 | ) | | | 723,584 | |
| Class T | | | | | | | | | | | | | | | | | | | | | | | | | | | | | | | | | | | | |
| 12/31/2014 | | | — | | | | 15 | | | | — | | | | 15 | | | | — | | | | — | | | | 215 | | | | — | | | | 215 | |
| 12/31/2013 | | | — | | | | — | | | | — | | | | — | | | | — | | | | — | | | | — | | | | — | | | | — | |
* Share amount is less than 0.500.
NOTE 11 — FEDERAL INCOME TAXES
The amount of distributions from net investment income and net realized capital gains are determined in accordance with federal income tax regulations, which may differ from U.S. GAAP for investment companies. These book/tax differences may be either temporary or permanent. Permanent differences are reclassified within the capital accounts based on their federal tax-basis treatment; temporary differences are not reclassified. Key differences include the treatment of short-term capital gains, foreign currency transactions, and wash sale deferrals. Distributions in excess of net investment income and/or net realized capital gains for tax purposes are reported as return of capital.
The following permanent tax differences have been reclassified as of December 31, 2014:
| | | Undistributed
Net Investment
Income | | | Accumulated
Net Realized
Gains/(Losses) | |
| Index Solution Income | | $ | 141,987 | | | $ | (141,987 | ) |
| Index Solution 2015 | | | 262,216 | | | | (262,216 | ) |
| Index Solution 2020 | | | 36 | | | | (36 | ) |
| Index Solution 2025 | | | 825,716 | | | | (825,716 | ) |
| | | Undistributed
Net Investment
Income | | | Accumulated
Net Realized
Gains/(Losses) | |
| Index Solution 2030 | | | 45 | | | | (45 | ) |
| Index Solution 2035 | | | 802,950 | | | | (802,950 | ) |
| Index Solution 2040 | | | 56 | | | | (56 | ) |
| Index Solution 2045 | | | 533,492 | | | | (533,492 | ) |
| Index Solution 2050 | | | 59 | | | | (59 | ) |
| Index Solution 2055 | | | 112,909 | | | | (112,909 | ) |
Dividends paid by the Portfolios from net investment income and distributions of net realized short-term capital gains are, for federal income tax purposes, taxable as ordinary income to shareholders.
The tax composition of dividends and distributions to shareholders was as follows:
| | | Year Ended
December 31, 2014 | | | Year Ended
December 31, 2013 | |
| | | Ordinary
Income | | | Long-term
Capital
Gains | | | Ordinary
Income | | | Long-term
Capital
Gains | |
| Index Solution Income | | $ | 3,886,586 | | | $ | 9,061,762 | | | $ | 7,693,821 | | | $ | 3,962,588 | |
| Index Solution 2015 | | | 5,958,588 | | | | 13,767,080 | | | | 9,377,815 | | | | 3,950,199 | |
| Index Solution 2020 | | | 371 | | | | 1,024 | | | | 930 | | | | 273 | |
| Index Solution 2025 | | | 8,893,053 | | | | 24,380,405 | | | | 11,572,247 | | | | 7,719,212 | |
NOTES TO FINANCIAL STATEMENTS as of December 31, 2014 (continued)
NOTE 11 — FEDERAL INCOME TAXES (continued)
| | | Year Ended
December 31, 2014 | | | Year Ended
December 31, 2013 | |
| | | Ordinary
Income | | | Long-term
Capital
Gains | | | Ordinary
Income | | | Long-term
Capital
Gains | |
| Index Solution 2030 | | | 365 | | | | 1,375 | | | | 914 | | | | 315 | |
| Index Solution 2035 | | | 6,463,656 | | | | 21,785,929 | | | | 7,975,838 | | | | 5,864,469 | |
| Index Solution 2040 | | | 325 | | | | 1,452 | | | | 850 | | | | 369 | |
| Index Solution 2045 | | | 3,247,357 | | | | 13,420,249 | | | | 3,911,872 | | | | 3,681,826 | |
| Index Solution 2050 | | | 309 | | | | 1,412 | | | | 874 | | | | 168 | |
| Index Solution 2055 | | | 575,978 | | | | 2,316,770 | | | | 558,051 | | | | 379,535 | |
The tax-basis components of distributable earnings as of December 31, 2014 were:
| | | Undistributed
Ordinary
Income | | | Undistributed
Long-term
Capital Gains | | | Unrealized
Appreciation/
(Depreciation) | |
| Index Solution Income | | $ | 3,807,504 | | | $ | 9,605,318 | | | $ | 2,178,994 | |
| Index Solution 2015 | | | 5,378,216 | | | | 19,824,595 | | | | 2,582,298 | |
| Index Solution 2020 | | | 379 | | | | 1,147 | | | | 1,278 | |
| Index Solution 2025 | | | 9,301,296 | | | | 42,755,319 | | | | 27,495,940 | |
| Index Solution 2030 | | | 389 | | | | 1,603 | | | | 2,125 | |
| Index Solution 2035 | | | 7,445,839 | | | | 42,432,918 | | | | 28,991,768 | |
| Index Solution 2040 | | | 389 | | | | 2,013 | | | | 3,104 | |
| Index Solution 2045 | | | 4,000,506 | | | | 28,270,686 | | | | 18,855,260 | |
| Index Solution 2050 | | | 362 | | | | 2,038 | | | | 3,210 | |
| Index Solution 2055 | | | 881,923 | | | | 5,565,470 | | | | 2,793,068 | |
At December 31, 2014, the Portfolios did not have any capital loss carryovers for U.S. federal income tax purposes.
The Portfolios’ major tax jurisdictions are U.S. federal and Arizona. The earliest tax year that remains subject to examination by these jurisdictions is 2010.
As of December 31, 2014, no provision for income tax is required in the Portfolios’ financial statements as a result of tax positions taken on federal and state income tax returns for open tax years. The Portfolios’ federal and state income and federal excise tax returns for tax years for which the applicable statutes of limitations have not expired are subject to examination by the Internal Revenue Service and state department of revenue.
NOTE 12 — CONCENTRATION OF INVESTMENT RISK
All mutual funds involve risk — some more than others — and there is always the chance that you could lose money or not earn as much as you hope. A Portfolio’s risk profile is largely a factor of the principal securities in which it invests and investment techniques that it uses. For more information regarding the types of securities and investment techniques that may be used by the Portfolios
and their corresponding risks, see the Portfolios’ most recent Prospectus and/or the Statement of Additional Information.
The Portfolios are also affected by other kinds of risks, depending on the types of securities held or strategies used by an Underlying Fund.
Asset Allocation. Assets will be allocated among Underlying Funds and markets based on judgments by the Investment Adviser or Sub-Adviser. There is a risk that the Portfolios may allocate assets to an Underlying Fund or market that underperforms other funds or asset classes.
Foreign Securities. Investments in foreign (non-U.S.) securities may entail risks not present in domestic investments. Since securities in which an Underlying Fund may invest are denominated in foreign currencies, changes in the relationship of these foreign currencies to the U.S. dollar can significantly affect the value of the investments and earnings of the Underlying Funds. Foreign investments may also subject the Underlying Funds to foreign government exchange restrictions, expropriation, taxation or other political, social or economic developments, as well as changes vis-à-vis the U.S. dollar from movements in currency, and changes in security value and interest rate, all of which could affect the market and/or credit risk of the Underlying Funds’ investments.
NOTE 13 — RESTRUCTURING PLAN
In October 2009, ING Groep N.V. (“ING Groep”) submitted a restructuring plan (the “Restructuring Plan”) to the European Commission in order to receive approval for state aid granted to ING Groep by the Kingdom of the Netherlands in November 2008 and March 2009. To receive approval for this state aid, ING Groep was required to divest its insurance and investment management businesses, including Voya Financial, Inc. (formerly, ING U.S., Inc.), before the end of 2013. In November 2012, the Restructuring Plan was amended to permit ING Groep additional time to complete the divestment. Pursuant to the amended Restructuring Plan, ING Groep was required to divest at least 25% of Voya Financial, Inc. by the end of 2013 and more than 50% by the end of 2014, and is required to divest its remaining interest by the end of 2016 (such divestment, the “Separation Plan”).
In May 2013, Voya Financial, Inc. conducted an initial public offering of its common stock (the “IPO”). In October 2013, March 2014, and September 2014, ING Groep divested additional shares in several secondary offerings of common stock of Voya Financial, Inc. and concurrent share repurchases by Voya Financial, Inc. These transactions reduced ING Groep’s ownership interest in Voya Financial, Inc. to 32%. Voya Financial, Inc. did not receive any proceeds from these offerings.
NOTES TO FINANCIAL STATEMENTS as of December 31, 2014 (continued)
NOTE 13 — RESTRUCTURING PLAN (continued)
In November 2014, through an additional secondary offering and the concurrent repurchase of shares by Voya Financial, Inc., ING Groep further reduced its interest in Voya Financial, Inc. below 25% to approximately 19% (the “November 2014 Offering”). The November 2014 Offering was deemed by the Investment Adviser to be a change of control (the “Change of Control”), which resulted in the automatic termination of the existing investment advisory and sub-advisory agreements under which the Investment Adviser and Sub-Adviser provide services to the Portfolios. In anticipation of this termination, and in order to ensure that the existing investment advisory and sub-advisory services could continue uninterrupted, in 2013 the Board approved new advisory and sub-advisory agreements for the Portfolios, as applicable, in connection with the IPO. In addition, in 2013, shareholders of each Portfolio approved new investment advisory and affiliated sub-advisory agreements prompted by the IPO, as well as any future advisory and affiliated sub-advisory agreements prompted by the Separation Plan that are approved by the Board and that have terms not materially different from the current agreements. This meant that shareholders would not have another opportunity to vote on a new agreement with the Investment Adviser or the current affiliated sub-adviser even upon a change of control prompted by the Separation Plan, as long as no single person or group of persons acting together gains “control” (as defined in the 1940 Act) of Voya Financial, Inc.
On November 18, 2014, in response to the Change of Control, the Board, at an in-person meeting, approved new investment advisory and affiliated sub-advisory agreements. At that meeting, the Investment Adviser represented that the agreements approved by the Board were not materially different from the agreements approved by shareholders in 2013 and no single person or group of persons acting together was expected to gain “control” (as defined in the 1940 Act) of Voya Financial, Inc. As a result, shareholders of the Portfolios will not be asked to vote again on these new agreements with the Investment Adviser and affiliated sub-adviser.
NOTE 14 — SUBSEQUENT EVENTS
On November 20, 2014, the Board approved a proposal to reorganize Index Solution 2015 with and into Index Solution Income (the “Reorganization”) on or about July 17, 2015. Pending Board approval of the revised Reorganization date, it is expected that the Reorganization will take place on or about August 14, 2015.
The Portfolios have evaluated events occurring after the Statements of Assets and Liabilities date (“subsequent events”), to determine whether any subsequent events necessitated adjustment to or disclosure in the financial statements. Other than the above, no such subsequent events were identified.
| | PORTFOLIO OF INVESTMENTS |
| Voya Index Solution Income Portfolio | as of December 31, 2014 |
| Shares | | Value | | Percentage
of Net
Assets |
| EXCHANGE-TRADED FUNDS: 14.2% | | | | | | | | |
| | 92,213 | | | | | iShares iBoxx High Yield Corporate Bond Fund | | $ | 8,262,285 | | | | 4.8 | |
| | 146,644 | | | | | PowerShares Senior Loan
Portfolio | | | 3,523,855 | | | | 2.0 | |
| | 234,424 | | | | | SPDR Barclays Capital High
Yield Bond ETF | | | 9,051,111 | | | | 5.3 | |
| | 17,186 | | | | | SPDR Trust Series 1 | | | 3,531,723 | | | | 2.1 | |
| | | | | | | Total Exchange-Traded Funds
(Cost $24,901,602) | | | 24,368,974 | | | | 14.2 | |
| MUTUAL FUNDS: 83.6% | | | | | | | | |
| | | | | | | Affiliated Investment Companies: 83.6% | |
| | 152,135 | | | | | Voya Emerging Markets Index
Portfolio - Class I | | | 1,620,242 | | | | 0.9 | |
| | 1,056,250 | | | | | Voya International Index Portfolio - Class I | | | 9,897,061 | | | | 5.8 | |
| | 796,224 | | | | | Voya Russell™ Mid Cap Index
Portfolio - Class I | | | 13,758,745 | | | | 8.0 | |
| | 8,465,920 | | | | | Voya U.S. Bond Index
Portfolio - Class I | | | 91,093,301 | | | | 53.0 | |
| Shares | | Value | | Percentage
of Net
Assets |
| MUTUAL FUNDS: (continued) | | | | | | | | |
| | | | | | | Affiliated Investment Companies (continued) | |
| | 1,855,720 | | | | | Voya U.S. Stock Index Portfolio - Class I | | $ | 27,241,973 | | | | 15.9 | |
| | | | | | | Total Mutual Funds
(Cost $139,719,587) | | | 143,611,322 | | | | 83.6 | |
| | | | | | | Total Investments in Securities
(Cost $164,621,189) | | $ | 167,980,296 | | | | 97.8 | |
| | | | | | | Assets in Excess of Other Liabilities | | | 3,816,353 | | | | 2.2 | |
| | | | | | | Net Assets | | $ | 171,796,649 | | | | 100.0 | |
Cost for federal income tax purposes is $165,710,301.
Net unrealized appreciation consists of:
| Gross Unrealized Appreciation | | $ | 5,286,127 | |
| Gross Unrealized Depreciation | | | (3,016,132 | ) |
| Net Unrealized Appreciation | | $ | 2,269,995 | |
Fair Value Measurements^
The following is a summary of the fair valuations according to the inputs used as of December 31, 2014 in valuing the assets and liabilities:
| | | Quoted Prices
in Active Markets
for Identical
Investments
(Level 1) | | Significant
Other
Observable
Inputs
(Level 2) | | Significant
Unobservable
Inputs
(Level 3) | | Fair Value
at
December 31, 2014 |
| Asset Table | | | | | | | | | | | | | | | | |
| Investments, at fair value | | | | | | | | | | | | | | | | |
| Exchange-Traded Funds | | $ | 24,368,974 | | | $ | — | | | $ | — | | | $ | 24,368,974 | |
| Mutual Funds | | | 143,611,322 | | | | — | | | | — | | | | 143,611,322 | |
| Total Investments, at fair value | | $ | 167,980,296 | | | $ | — | | | $ | — | | | $ | 167,980,296 | |
| Liabilities Table | | | | | | | | | | | | | | | | |
| Other Financial Instruments+ | | | | | | | | | | | | | | | | |
| Futures | | $ | (91,413 | ) | | $ | — | | | $ | — | | | $ | (91,413 | ) |
| Total Liabilities | | $ | (91,413 | ) | | $ | — | | | $ | — | | | $ | (91,413 | ) |
| ^ | See Note 2, “Significant Accounting Policies” in the Notes to Financial Statements for additional information. |
| + | Other Financial Instruments are derivatives not reflected in the Portfolio of Investments and may include open forward foreign currency contracts, futures, centrally cleared swaps, OTC swaps and written options. Forward foreign currency contracts, futures and centrally cleared swaps are valued at the unrealized gain (loss) on the instrument. OTC swaps and written options are valued at the fair value of the instrument. |
See Accompanying Notes to Financial Statements
| | PORTFOLIO OF INVESTMENTS |
| Voya Index Solution Income Portfolio | as of December 31, 2014 (continued) |
At December 31, 2014, the following futures contracts were outstanding for Voya Index Solution Income Portfolio:
| Contract Description | | Number of
Contracts | | Expiration
Date | | Notional
Value | | Unrealized
Appreciation/
(Depreciation) |
| Long Contracts | | | | | | | | | | | | | | |
| Tokyo Price Index (TOPIX) | | | 30 | | | 03/12/15 | | $ | 3,525,213 | | | $ | (91,413 | ) |
| | | | | | | | | $ | 3,525,213 | | | $ | (91,413 | ) |
Transactions with Affiliates
An investment of at least 5% of the voting securities of an issuer, or a company which is under common control results in that issuer becoming an affiliated person as defined by the 1940 Act.
The following table provides transactions during the year ended December 31, 2014, where the following issuers were considered an affiliate:
| Issuer | | Beginning
Market
Value
at 12/31/13 | | Purchases
at Cost | | Sales
at Cost | | Change in
Unrealized
Appreciation/
(Depreciation) | | Ending
Market
Value
at 12/31/14 | | Investment
Income | | Realized
Gains/
(Losses) | | Net Capital
Gain
Distributions |
| Voya Emerging Markets Index Portfolio - Class I | | $ | 1,835,206 | | | $ | 2,070,383 | | | $ | (2,150,479 | ) | | $ | (134,868 | ) | | $ | 1,620,242 | | | $ | — | | | $ | (112,927 | ) | | $ | — | |
| Voya International Index Portfolio - Class I | | | 9,169,645 | | | | 3,680,947 | | | | (1,669,922 | ) | | | (1,283,609 | ) | | | 9,897,061 | | | | 72,013 | | | | 548,864 | | | | — | |
| Voya Russell™ Mid Cap Index Portfolio - Class I | | | 14,675,623 | | | | 1,827,997 | | | | (2,492,099 | ) | | | (252,776 | ) | | | 13,758,745 | | | | 155,713 | | | | 1,384,609 | | | | 456,174 | |
| Voya U.S. Bond Index Portfolio - Class I | | | 97,063,105 | | | | 13,243,068 | | | | (23,030,707 | ) | | | 3,817,835 | | | | 91,093,301 | | | | 1,846,699 | | | | (362,805 | ) | | | — | |
| Voya U.S. Stock Index Portfolio - Class I | | | 35,342,202 | | | | 12,588,862 | | | | (16,652,990 | ) | | | (4,036,101 | ) | | | 27,241,973 | | | | 526,331 | | | | 3,906,922 | | | | 3,802,353 | |
| | | $ | 158,085,781 | | | $ | 33,411,257 | | | $ | (45,996,197 | ) | | $ | (1,889,519 | ) | | $ | 143,611,322 | | | $ | 2,600,756 | | | $ | 5,364,663 | | | $ | 4,258,527 | |
The financial statements for the above mutual fund[s] can be found at www.sec.gov.
A summary of derivative instruments by primary risk exposure is outlined in the following tables.
The fair value of derivative instruments as of December 31, 2014 was as follows:
| Derivatives not accounted for as hedging instruments | | Location on Statement
of Assets and Liabilities | | Fair Value |
| Liability Derivatives | | | | | | |
| Equity contracts | | Net Assets — Unrealized depreciation* | | $ | 91,413 | |
| Total Liability Derivatives | | | | $ | 91,413 | |
| * | Includes cumulative appreciation/depreciation of futures contracts as reported in the table following the Portfolio of Investments. |
The effect of derivative instruments on the Portfolio’s Statement of Operations for the year ended December 31, 2014 was as follows:
Amount of Realized Gain or (Loss) on Derivatives Recognized in Income
| Derivatives not accounted for as hedging instruments | | Futures |
| Equity contracts | | $ | (245 | ) |
| Total | | $ | (245 | ) |
Change in Unrealized Appreciation or (Depreciation) on Derivatives Recognized in Income
| Derivatives not accounted for as hedging instruments | | Futures |
| Equity contracts | | $ | (91,413 | ) |
| Total | | $ | (91,413 | ) |
See Accompanying Notes to Financial Statements
| | PORTFOLIO OF INVESTMENTS |
| Voya Index Solution 2015 Portfolio | as of December 31, 2014 |
| Shares | | Value | | Percentage
of Net
Assets |
| EXCHANGE-TRADED FUNDS: 13.9% | | | | | | | | |
| | 140,306 | | | | | iShares iBoxx High Yield Corporate Bond Fund | | $ | 12,571,418 | | | | 4.7 | |
| | 222,771 | | | | | PowerShares Senior Loan Portfolio | | | 5,353,187 | | | | 2.0 | |
| | 356,812 | | | | | SPDR Barclays Capital High Yield Bond ETF | | | 13,776,511 | | | | 5.2 | |
| | 26,155 | | | | | SPDR Trust Series 1 | | | 5,374,853 | | | | 2.0 | |
| | | | | | | Total Exchange-Traded Funds
(Cost $37,980,546) | | | 37,075,969 | | | | 13.9 | |
| MUTUAL FUNDS: 84.0% | | | | | | | | |
| | | | | | | Affiliated Investment Companies: 84.0% | |
| | 475,235 | | | | | Voya Emerging Markets Index Portfolio - Class I | | | 5,061,252 | | | | 1.9 | |
| | 2,197,279 | | | | | Voya International Index Portfolio - Class I | | | 20,588,504 | | | | 7.7 | |
| | 1,241,839 | | | | | Voya Russell™ Mid Cap Index Portfolio - Class I | | | 21,458,970 | | | | 8.0 | |
| | 165,161 | | | | | Voya Russell™ Small Cap Index Portfolio - Class I | | | 2,725,150 | | | | 1.0 | |
| Shares | | Value | | Percentage
of Net
Assets |
| MUTUAL FUNDS: (continued) | | | | | | | | |
| | | | | | | Affiliated Investment Companies (continued) | |
| | 11,509,021 | | | | | Voya U.S. Bond Index Portfolio - Class I | | $ | 123,837,065 | | | | 46.4 | |
| | 3,458,867 | | | | | Voya U.S. Stock Index Portfolio - Class I | | | 50,776,168 | | | | 19.0 | |
| | | | | | | Total Mutual Funds
(Cost $218,311,398) | | | 224,447,109 | | | | 84.0 | |
| | | | | | | Total Investments in Securities
(Cost $256,291,944) | | $ | 261,523,078 | | | | 97.9 | |
| | | | | | | Assets in Excess of Other Liabilities | | | 5,716,701 | | | | 2.1 | |
| | | | | | | Net Assets | | $ | 267,239,779 | | | | 100.0 | |
Cost for federal income tax purposes is $258,804,277.
Net unrealized appreciation consists of:
| Gross Unrealized Appreciation | | $ | 7,185,029 | |
| Gross Unrealized Depreciation | | | (4,466,228 | ) |
| Net Unrealized Appreciation | | $ | 2,718,801 | |
Fair Value Measurements^
The following is a summary of the fair valuations according to the inputs used as of December 31, 2014 in valuing the assets and liabilities:
| | | Quoted Prices
in Active Markets
for Identical
Investments
(Level 1) | | Significant
Other
Observable
Inputs
(Level 2) | | Significant
Unobservable
Inputs
(Level 3) | | Fair Value
at
December 31, 2014 |
| Asset Table | | | | | | | | | | | | | | | | |
| Investments, at fair value | | | | | | | | | | | | | | | | |
| Exchange-Traded Funds | | $ | 37,075,969 | | | $ | — | | | $ | — | | | $ | 37,075,969 | |
| Mutual Funds | | | 224,447,109 | | | | — | | | | — | | | | 224,447,109 | |
| Total Investments, at fair value | | $ | 261,523,078 | | | $ | — | | | $ | — | | | $ | 261,523,078 | |
| Liabilities Table | | | | | | | | | | | | | | | | |
| Other Financial Instruments+ | | | | | | | | | | | | | | | | |
| Futures | | $ | (137,120 | ) | | $ | — | | | $ | — | | | $ | (137,120 | ) |
| Total Liabilities | | $ | (137,120 | ) | | $ | — | | | $ | — | | | $ | (137,120 | ) |
| ^ | See Note 2, “Significant Accounting Policies” in the Notes to Financial Statements for additional information. |
| + | Other Financial Instruments are derivatives not reflected in the Portfolio of Investments and may include open forward foreign currency contracts, futures, centrally cleared swaps, OTC swaps and written options. Forward foreign currency contracts, futures and centrally cleared swaps are valued at the unrealized gain (loss) on the instrument. OTC swaps and written options are valued at the fair value of the instrument. |
See Accompanying Notes to Financial Statements
| | PORTFOLIO OF INVESTMENTS |
| Voya Index Solution 2015 Portfolio | as of December 31, 2014 (continued) |
At December 31, 2014, the following futures contracts were outstanding for Voya Index Solution 2015 Portfolio:
| Contract Description | | Number of
Contracts | | Expiration
Date | | Notional
Value | | Unrealized
Appreciation/
(Depreciation) |
| Long Contracts | | | | | | | | | | | | |
| Tokyo Price Index (TOPIX) | | 45 | | 03/12/15 | | $ | 5,287,819 | | | $ | (137,120 | ) |
| | | | | | | $ | 5,287,819 | | | $ | (137,120 | ) |
Transactions with Affiliates
An investment of at least 5% of the voting securities of an issuer, or a company which is under common control results in that issuer becoming an affiliated person as defined by the 1940 Act.
The following table provides transactions during the year ended December 31, 2014, where the following issuers were considered an affiliate:
| Issuer | | Beginning
Market
Value
at 12/31/13 | | Purchases
at Cost | | Sales
at Cost | | Change in
Unrealized
Appreciation/
(Depreciation) | | Ending
Market
Value
at 12/31/14 | | Investment
Income | | Realized
Gains/
(Losses) | | Net Capital
Gain
Distributions |
| Voya Emerging Markets Index Portfolio - Class I | | $ | 5,840,291 | | | $ | 6,489,168 | | | $ | (6,856,668 | ) | | $ | (411,539 | ) | | $ | 5,061,252 | | | $ | — | | | $ | (344,443 | ) | | $ | — | |
| Voya International Index Portfolio - Class I | | | 26,225,484 | | | | 8,423,210 | | | | (9,364,416 | ) | | | (4,695,774 | ) | | | 20,588,504 | | | | 155,416 | | | | 3,372,810 | | | | — | |
| Voya Russell™ Mid Cap Index Portfolio - Class I | | | 23,350,594 | | | | 3,954,708 | | | | (4,935,414 | ) | | | (910,918 | ) | | | 21,458,970 | | | | 244,444 | | | | 2,642,439 | | | | 716,119 | |
| Voya Russell™ Small Cap Index Portfolio - Class I | | | 5,817,704 | | | | 907,980 | | | | (2,759,847 | ) | | | (1,240,687 | ) | | | 2,725,150 | | | | 29,701 | | | | 1,113,140 | | | | 172,788 | |
| Voya U.S. Bond Index Portfolio - Class I | | | 133,775,727 | | | | 34,430,856 | | | | (51,177,211 | ) | | | 6,807,693 | | | | 123,837,065 | | | | 2,424,402 | | | | (2,245,370 | ) | | | — | |
| Voya U.S. Stock Index Portfolio - Class I | | | 56,243,508 | | | | 34,829,584 | | | | (33,465,953 | ) | | | (6,830,971 | ) | | | 50,776,168 | | | | 975,911 | | | | 6,627,742 | | | | 6,881,769 | |
| | | $ | 251,253,308 | | | $ | 89,035,506 | | | $ | (108,559,509 | ) | | $ | (7,282,196 | ) | | $ | 224,447,109 | | | $ | 3,829,874 | | | $ | 11,166,318 | | | $ | 7,770,676 | |
The financial statements for the above mutual fund[s] can be found at www.sec.gov.
A summary of derivative instruments by primary risk exposure is outlined in the following tables.
The fair value of derivative instruments as of December 31, 2014 was as follows:
| Derivatives not accounted for as hedging instruments | | Location on Statement
of Assets and Liabilities | | Fair Value |
| Liability Derivatives | | | | | | |
| Equity contracts | | Net Assets — Unrealized depreciation* | | $ | 137,120 | |
| Total Liability Derivatives | | | | $ | 137,120 | |
| * | | Includes cumulative appreciation/depreciation of futures contracts as reported in the table following the Portfolio of Investments. |
The effect of derivative instruments on the Portfolio’s Statement of Operations for the year ended December 31, 2014 was as follows:
Amount of Realized Gain or (Loss) on Derivatives Recognized in Income
| Derivatives not accounted for as hedging instruments | | Futures | |
| Equity contracts | | $ | (367 | ) |
| Total | | $ | (367 | ) |
Change in Unrealized Appreciation or (Depreciation) on Derivatives Recognized in Income
| Derivatives not accounted for as hedging instruments | | Futures | |
| Equity contracts | | $ | (137,120 | ) |
| Total | | $ | (137,120 | ) |
See Accompanying Notes to Financial Statements
| | PORTFOLIO OF INVESTMENTS |
| Voya Index Solution 2020 Portfolio | as of December 31, 2014 |
| Shares | | Value | | Percentage
of Net
Assets |
| EXCHANGE-TRADED FUNDS: 15.4% | | | | | | | | |
| | 10 | | | | | iShares iBoxx High Yield Corporate Bond Fund | | $ | 896 | | | | 4.6 | |
| | 15 | | | | | PowerShares Senior Loan Portfolio | | | 360 | | | | 1.9 | |
| | 25 | | | | | SPDR Barclays Capital High Yield Bond ETF | | | 965 | | | | 5.0 | |
| | 2 | | | | | SPDR Trust Series 1 | | | 411 | | | | 2.1 | |
| | 7 | | | | | WisdomTree Japan Hedged Equity Fund | | | 345 | | | | 1.8 | |
| | | | | | | Total Exchange-Traded Funds
(Cost $3,086) | | | 2,977 | | | | 15.4 | |
| MUTUAL FUNDS: 80.4% | | | | | | | | |
| | | | | | | Affiliated Investment Companies: 80.4% | |
| | 32 | | | | | Voya Emerging Markets Index Portfolio - Class I | | | 338 | | | | 1.8 | |
| | 229 | | | | | Voya International Index Portfolio - Class I | | | 2,147 | | | | 11.1 | |
| | 119 | | | | | Voya Russell™ Mid Cap Index Portfolio - Class I | | | 2,051 | | | | 10.7 | |
| | 22 | | | | | Voya Russell™ Small Cap Index Portfolio - Class I | | | 363 | | | | 1.9 | |
| Shares | | Value | | Percentage
of Net
Assets |
| MUTUAL FUNDS: (continued) | | |
| | | | | | | Affiliated Investment Companies (continued) | |
| | 571 | | | | | Voya U.S. Bond Index Portfolio - Class I | | $ | 6,148 | | | | 31.9 | |
| | 302 | | | | | Voya U.S. Stock Index Portfolio - Class I | | | 4,436 | | | | 23.0 | |
| | | | | | | Total Mutual Funds
(Cost $14,038) | | | 15,483 | | | | 80.4 | |
| | | | | | | Total Investments in Securities
(Cost $17,124) | | $ | 18,460 | | | | 95.8 | |
| | | | | | | Assets in Excess of Other Liabilities | | | 805 | | | | 4.2 | |
| | | | | | | Net Assets | | $ | 19,265 | | | | 100.0 | |
Cost for federal income tax purposes is $17,182.
Net unrealized appreciation consists of:
| Gross Unrealized Appreciation | | $ | 1,581 | |
| Gross Unrealized Depreciation | | | (303 | ) |
| Net Unrealized Appreciation | | $ | 1,278 | |
Fair Value Measurements^
The following is a summary of the fair valuations according to the inputs used as of December 31, 2014 in valuing the assets and liabilities:
| | | Quoted Prices
in Active Markets
for Identical
Investments
(Level 1) | | Significant
Other
Observable
Inputs
(Level 2) | | Significant
Unobservable
Inputs
(Level 3) | | Fair Value
at
December 31, 2014 |
| Asset Table | | | | | | | | | | | | | | | | |
| Investments, at fair value | | | | | | | | | | | | | | | | |
| Exchange-Traded Funds | | $ | 2,977 | | | $ | — | | | $ | — | | | $ | 2,977 | |
| Mutual Funds | | | 15,483 | | | | — | | | | — | | | | 15,483 | |
| Total Investments, at fair value | | $ | 18,460 | | | $ | — | | | $ | — | | | $ | 18,460 | |
| ^ | | See Note 2, “Significant Accounting Policies” in the Notes to Financial Statements for additional information. |
See Accompanying Notes to Financial Statements
| | PORTFOLIO OF INVESTMENTS |
| Voya Index Solution 2020 Portfolio | as of December 31, 2014 (continued) |
Transactions with Affiliates
An investment of at least 5% of the voting securities of an issuer, or a company which is under common control results in that issuer becoming an affiliated person as defined by the 1940 Act.
The following table provides transactions during the year ended December 31, 2014, where the following issuers were considered an affiliate:
| Issuer | | Beginning
Market
Value
at 12/31/13 | | Purchases
at Cost | | Sales
at Cost | | Change in
Unrealized
Appreciation/
(Depreciation) | | Ending
Market
Value
at 12/31/14 | | Investment
Income | | Realized
Gains/
(Losses) | | Net Capital
Gain
Distributions |
| Voya Emerging Markets Index Portfolio - Class I | | $ | 356 | | | $ | 411 | | | $ | (402 | ) | | $ | (27 | ) | | $ | 338 | | | $ | — | | | $ | (22 | ) | | $ | — | |
| Voya International Index Portfolio - Class I | | | 1,958 | | | | 418 | | | | (54 | ) | | | (175 | ) | | | 2,147 | | | | 16 | | | | 25 | | | | — | |
| Voya Russell™ Mid Cap Index Portfolio - Class I | | | 1,957 | | | | 98 | | | | (93 | ) | | | 89 | | | | 2,051 | | | | 21 | | | | 70 | | | | 62 | |
| Voya Russell™ Small Cap Index Portfolio - Class I | | | 532 | | | | 82 | | | | (142 | ) | | | (109 | ) | | | 363 | | | | 5 | | | | 94 | | | | 31 | |
| Voya U.S. Bond Index Portfolio - Class I | | | 5,863 | | | | 520 | | | | (466 | ) | | | 231 | | | | 6,148 | | | | 119 | | | | (18 | ) | | | — | |
| Voya U.S. Stock Index Portfolio - Class I | | | 4,691 | | | | 1,419 | | | | (1,307 | ) | | | (367 | ) | | | 4,436 | | | | 84 | | | | 356 | | | | 532 | |
| | | $ | 15,357 | | | $ | 2,948 | | | $ | (2,464 | ) | | $ | (358 | ) | | $ | 15,483 | | | $ | 245 | | | $ | 505 | | | $ | 625 | |
The financial statements for the above mutual fund[s] can be found at www.sec.gov.
See Accompanying Notes to Financial Statements
| | PORTFOLIO OF INVESTMENTS |
| Voya Index Solution 2025 Portfolio | as of December 31, 2014 |
| Shares | | Value | | Percentage
of Net
Assets |
| EXCHANGE-TRADED FUNDS: 13.8% | | | | | | | | |
| | 271,242 | | | | | iShares iBoxx High Yield
Corporate Bond Fund | | $ | 24,303,283 | | | | 4.7 | |
| | 430,635 | | | | | PowerShares Senior Loan
Portfolio | | | 10,348,159 | | | | 2.0 | |
| | 689,645 | | | | | SPDR Barclays Capital High
Yield Bond ETF | | | 26,627,194 | | | | 5.1 | |
| | 50,552 | | | | | SPDR Trust Series 1 | | | 10,388,436 | | | | 2.0 | |
| | | | | | | Total Exchange-Traded Funds
(Cost $73,545,502) | | | 71,667,072 | | | | 13.8 | |
| MUTUAL FUNDS: 84.1% | | | | | | | | |
| | | | | | | Affiliated Investment Companies: 84.1% | | | | | | | | |
| | 1,392,482 | | | | | Voya Emerging Markets Index
Portfolio - Class I | | | 14,829,930 | | | | 2.9 | |
| | 8,045,064 | | | | | Voya International Index
Portfolio - Class I | | | 75,382,254 | | | | 14.5 | |
| | 4,242,774 | | | | | Voya Russell™ Mid Cap Index
Portfolio - Class I | | | 73,315,139 | | | | 14.1 | |
| | 967,300 | | | | | Voya Russell™ Small Cap
Index Portfolio - Class I | | | 15,960,453 | | | | 3.1 | |
| Shares | | Value | | Percentage
of Net
Assets |
| MUTUAL FUNDS: (continued) | | | | | | | | |
| | | | | | | Affiliated Investment Companies (continued) | | | | | | | | |
| | 10,773,084 | | | | | Voya U.S. Bond Index
Portfolio - Class I | | $ | 115,918,387 | | | | 22.3 | |
| | 9,614,151 | | | | | Voya U.S. Stock Index
Portfolio - Class I | | | 141,135,730 | | | | 27.2 | |
| | | | | | | Total Mutual Funds
(Cost $403,545,227) | | | 436,541,893 | | | | 84.1 | |
| | | | | | | Total Investments in
Securities
(Cost $477,090,729) | | $ | 508,208,965 | | | | 97.9 | |
| | | | | | | Assets in Excess of Other
Liabilities | | | 11,101,191 | | | | 2.1 | |
| | | | | | | Net Assets | | $ | 519,310,156 | | | | 100.0 | |
Cost for federal income tax purposes is $480,449,120.
Net unrealized appreciation consists of:
| Gross Unrealized Appreciation | | $ | 34,775,300 | |
| Gross Unrealized Depreciation | | | (7,015,455 | ) |
| Net Unrealized Appreciation | | $ | 27,759,845 | |
Fair Value Measurements^
The following is a summary of the fair valuations according to the inputs used as of December 31, 2014 in valuing the assets and liabilities:
| | | Quoted Prices
in Active Markets
for Identical
Investments
(Level 1) | | Significant
Other
Observable
Inputs
(Level 2) | | Significant
Unobservable
Inputs
(Level 3) | | Fair Value
at
December 31, 2014 |
| Asset Table | | | | | | | | | | | | | | | | |
| Investments, at fair value | | | | | | | | | | | | | | | | |
| Exchange-Traded Funds | | $ | 71,667,072 | | | $ | — | | | $ | — | | | $ | 71,667,072 | |
| Mutual Funds | | | 436,541,893 | | | | — | | | | — | | | | 436,541,893 | |
| Total Investments, at fair value | | $ | 508,208,965 | | | $ | — | | | $ | — | | | $ | 508,208,965 | |
| Liabilities Table | | | | | | | | | | | | | | | | |
| Other Financial Instruments+ | | | | | | | | | | | | | | | | |
| Futures | | $ | (265,099 | ) | | $ | — | | | $ | — | | | $ | (265,099 | ) |
| Total Liabilities | | $ | (265,099 | ) | | $ | — | | | $ | — | | | $ | (265,099 | ) |
| ^ | See Note 2, “Significant Accounting Policies” in the Notes to Financial Statements for additional information. |
| + | Other Financial Instruments are derivatives not reflected in the Portfolio of Investments and may include open forward foreign currency contracts, futures, centrally cleared swaps, OTC swaps and written options. Forward foreign currency contracts, futures and centrally cleared swaps are valued at the unrealized gain (loss) on the instrument. OTC swaps and written options are valued at the fair value of the instrument. |
See Accompanying Notes to Financial Statements
| | PORTFOLIO OF INVESTMENTS |
| Voya Index Solution 2025 Portfolio | as of December 31, 2014 (continued) |
At December 31, 2014, the following futures contracts were outstanding for Voya Index Solution 2025 Portfolio:
| Contract Description | | Number of
Contracts | | Expiration
Date | | Notional
Value | | Unrealized
Appreciation/
(Depreciation) |
| Long Contracts | | | | | | | | | | | | |
| Tokyo Price Index (TOPIX) | | 87 | | 03/12/15 | | $ | 10,223,117 | | | $ | (265,099 | ) |
| | | | | | | $ | 10,223,117 | | | $ | (265,099 | ) |
Transactions with Affiliates
An investment of at least 5% of the voting securities of an issuer, or a company which is under common control results in that issuer becoming an affiliated person as defined by the 1940 Act.
The following table provides transactions during the year ended December 31, 2014, where the following issuers were considered an affiliate:
| Issuer | | Beginning
Market
Value
at 12/31/13 | | Purchases
at Cost | | Sales
at Cost | | Change in
Unrealized
Appreciation/
(Depreciation) | | Ending
Market
Value
at 12/31/14 | | Investment
Income | | Realized
Gains/
(Losses) | | Net Capital
Gain
Distributions |
| Voya Emerging Markets Index Portfolio - Class I | | $ | 15,010,951 | | | $ | 13,433,954 | | | $ | (12,725,113 | ) | | $ | (889,862 | ) | | $ | 14,829,930 | | | $ | 74,767 | | | $ | (736,926 | ) | | $ | — | |
| Voya International Index Portfolio - Class I | | | 69,962,502 | | | | 23,259,798 | | | | (9,024,541 | ) | | | (8,815,505 | ) | | | 75,382,254 | | | | 580,579 | | | | 3,582,177 | | | | — | |
| Voya Russell™ Mid Cap Index Portfolio - Class I | | | 70,020,151 | | | | 12,242,077 | | | | (10,693,482 | ) | | | 1,746,393 | | | | 73,315,139 | | | | 777,299 | | | | 3,846,851 | | | | 2,277,158 | |
| Voya Russell™ Small Cap Index Portfolio - Class I | | | 19,938,359 | | | | 5,571,846 | | | | (6,799,676 | ) | | | (2,750,076 | ) | | | 15,960,453 | | | | 206,847 | | | | 2,183,422 | | | | 1,203,342 | |
| Voya U.S. Bond Index Portfolio - Class I | | | 109,409,518 | | | | 29,740,364 | | | | (28,376,233 | ) | | | 5,144,738 | | | | 115,918,387 | | | | 2,229,503 | | | | (1,122,002 | ) | | | — | |
| Voya U.S. Stock Index Portfolio - Class I | | | 147,051,772 | | | | 59,478,374 | | | | (51,291,280 | ) | | | (14,103,136 | ) | | | 141,135,730 | | | | 2,633,106 | | | | 13,926,180 | | | | 16,552,218 | |
| | | $ | 431,393,253 | | | $ | 143,726,413 | | | $ | (118,910,325 | ) | | $ | (19,667,448 | ) | | $ | 436,541,893 | | | $ | 6,502,101 | | | $ | 21,679,702 | | | $ | 20,032,718 | |
The financial statements for the above mutual fund[s] can be found at www.sec.gov.
A summary of derivative instruments by primary risk exposure is outlined in the following tables.
The fair value of derivative instruments as of December 31, 2014 was as follows:
| Derivatives not accounted for as hedging instruments | | Location on Statement
of Assets and Liabilities | | Fair Value |
| Liability Derivatives | | | | | | |
| Equity contracts | | Net Assets — Unrealized depreciation* | | $ | 265,099 | |
| Total Liability Derivatives | | | | $ | 265,099 | |
| * | | Includes cumulative appreciation/depreciation of futures contracts as reported in the table following the Portfolio of Investments. |
The effect of derivative instruments on the Portfolio’s Statement of Operations for the year ended December 31, 2014 was as follows:
Amount of Realized Gain or (Loss) on Derivatives Recognized in Income
| Derivatives not accounted for as hedging instruments | | Futures | |
| Equity contracts | | $ | (710 | ) |
| Total | | $ | (710 | ) |
Change in Unrealized Appreciation or (Depreciation) on Derivatives Recognized in Income
| Derivatives not accounted for as hedging instruments | | Futures | |
| Equity contracts | | $ | (265,099 | ) |
| Total | | $ | (265,099 | ) |
See Accompanying Notes to Financial Statements
| | PORTFOLIO OF INVESTMENTS |
| Voya Index Solution 2030 Portfolio | as of December 31, 2014 |
| Shares | | Value | | Percentage
of Net
Assets |
| EXCHANGE-TRADED FUNDS: 12.1% | | | | | | | | |
| | 7 | | | | | iShares iBoxx High Yield
Corporate Bond Fund | | $ | 627 | | | | 3.0 | |
| | 17 | | | | | PowerShares Senior Loan
Portfolio | | | 408 | | | | 2.0 | |
| | 19 | | | | | SPDR Barclays Capital High Yield Bond ETF | | | 734 | | | | 3.5 | |
| | 2 | | | | | SPDR Trust Series 1 | | | 411 | | | | 2.0 | |
| | 7 | | | | | WisdomTree Japan Hedged
Equity Fund | | | 345 | | | | 1.6 | |
| | | | | | | Total Exchange-Traded Funds
(Cost $2,619) | | | 2,525 | | | | 12.1 | |
| MUTUAL FUNDS: 84.1% | | | | | | | | |
| | | | | | | Affiliated Investment Companies: 84.1% | | | | | | | | |
| | 73 | | | | | Voya Emerging Markets Index
Portfolio - Class I | | | 772 | | | | 3.7 | |
| | 419 | | | | | Voya International Index
Portfolio - Class I | | | 3,927 | | | | 18.7 | |
| | 166 | | | | | Voya Russell™ Mid Cap Index
Portfolio - Class I | | | 2,864 | | | | 13.7 | |
| | 38 | | | | | Voya Russell™ Small Cap
Index Portfolio - Class I | | | 624 | | | | 3.0 | |
| | 268 | | | | | Voya U.S. Bond Index
Portfolio - Class I | | | 2,882 | | | | 13.8 | |
| Shares | | Value | | Percentage
of Net
Assets |
| MUTUAL FUNDS: (continued) |
| | | | | | | Affiliated Investment Companies (continued) | | | | | | | | |
| | 445 | | | | | Voya U.S. Stock Index
Portfolio - Class I | | $ | 6,535 | | | | 31.2 | |
| | | | | | | Total Mutual Funds
(Cost $15,285) | | | 17,604 | | | | 84.1 | |
| | | | | | | Total Investments in
Securities
(Cost $17,904) | | $ | 20,129 | | | | 96.2 | |
| | | | | | | Assets in Excess of Other
Liabilities | | | 801 | | | | 3.8 | |
| | | | | | | Net Assets | | $ | 20,930 | | | | 100.0 | |
Cost for federal income tax purposes is $18,004.
Net unrealized appreciation consists of:
| Gross Unrealized Appreciation | | $ | 2,404 | |
| Gross Unrealized Depreciation | | | (279 | ) |
| Net Unrealized Appreciation | | $ | 2,125 | |
Fair Value Measurements^
The following is a summary of the fair valuations according to the inputs used as of December 31, 2014 in valuing the assets and liabilities:
| | | Quoted Prices
in Active Markets
for Identical
Investments
(Level 1) | | Significant
Other
Observable
Inputs
(Level 2) | | Significant
Unobservable
Inputs
(Level 3) | | Fair Value
at
December 31, 2014 |
| Asset Table | | | | | | | | | | | | | | | | |
| Investments, at fair value | | | | | | | | | | | | | | | | |
| Exchange-Traded Funds | | $ | 2,525 | | | $ | — | | | $ | — | | | $ | 2,525 | |
| Mutual Funds | | | 17,604 | | | | — | | | | — | | | | 17,604 | |
| Total Investments, at fair value | | $ | 20,129 | | | $ | — | | | $ | — | | | $ | 20,129 | |
| ^ | | See Note 2, “Significant Accounting Policies” in the Notes to Financial Statements for additional information. |
See Accompanying Notes to Financial Statements
| | PORTFOLIO OF INVESTMENTS |
| Voya Index Solution 2030 Portfolio | as of December 31, 2014 (continued) |
Transactions with Affiliates
An investment of at least 5% of the voting securities of an issuer, or a company which is under common control results in that issuer becoming an affiliated person as defined by the 1940 Act.
The following table provides transactions during the year ended December 31, 2014, where the following issuers were considered an affiliate:
| Issuer | | Beginning
Market
Value at
12/31/13 | | | Purchases
at Cost | | | Sales
at Cost | | | Change in
Unrealized
Appreciation/
(Depreciation) | | | Ending
Market
Value
at 12/31/14 | | | Investment
Income | | | Realized
Gains/
(Losses) | | | Net Capital
Gain
Distributions | |
| Voya Emerging Markets Index Portfolio - Class I | | $ | 778 | | | $ | 500 | | | $ | (459 | ) | | $ | (47 | ) | | $ | 772 | | | $ | 6 | | | $ | (25 | ) | | $ | — | |
| Voya International Index Portfolio - Class I | | | 3,695 | | | | 611 | | | | (71 | ) | | | (308 | ) | | | 3,927 | | | | 30 | | | | 32 | | | | — | |
| Voya Russell™ Mid Cap Index Portfolio - Class I | | | 2,722 | | | | 120 | | | | (112 | ) | | | 134 | | | | 2,864 | | | | 29 | | | | 85 | | | | 86 | |
| Voya Russell™ Small Cap Index Portfolio - Class I | | | 775 | | | | 112 | | | | (147 | ) | | | (116 | ) | | | 624 | | | | 8 | | | | 97 | | | | 45 | |
| Voya U.S. Bond Index Portfolio - Class I | | | 3,106 | | | | 840 | | | | (1,211 | ) | | | 147 | | | | 2,882 | | | | 60 | | | | (32 | ) | | | — | |
| Voya U.S. Stock Index Portfolio - Class I | | | 6,110 | | | | 2,865 | | | | (1,839 | ) | | | (601 | ) | | | 6,535 | | | | 121 | | | | 557 | | | | 742 | |
| | | $ | 17,186 | | | $ | 5,048 | | | $ | (3,839 | ) | | $ | (791 | ) | | $ | 17,604 | | | $ | 254 | | | $ | 714 | | | $ | 873 | |
The financial statements for the above mutual fund[s] can be found at www.sec.gov.
See Accompanying Notes to Financial Statements
| | PORTFOLIO OF INVESTMENTS |
| Voya Index Solution 2035 Portfolio | as of December 31, 2014 |
| Shares | | | Value | | | Percentage
of Net
Assets | |
| EXCHANGE-TRADED FUNDS: 10.9% | | | | | | | | |
| | 155,796 | | | iShares iBoxx High Yield Corporate Bond Fund | | $ | 13,959,322 | | | | 3.2 | |
| | 361,510 | | | PowerShares Senior Loan Portfolio | | | 8,687,085 | | | | 2.0 | |
| | 413,532 | | | SPDR Barclays Capital High Yield Bond ETF | | | 15,966,471 | | | | 3.7 | |
| | 42,437 | | | SPDR Trust Series 1 | | | 8,720,803 | | | | 2.0 | |
| | | | | Total Exchange-Traded Funds
(Cost $48,342,237) | | | 47,333,681 | | | | 10.9 | |
| MUTUAL FUNDS: 87.0% | | | | | | | | |
| | | | | Affiliated Investment Companies: 87.0% | | | | | | | | |
| | 1,555,547 | | | Voya Emerging Markets Index Portfolio - Class I | | | 16,566,575 | | | | 3.8 | |
| | 8,987,680 | | | Voya International Index Portfolio - Class I | | | 84,214,562 | | | | 19.4 | |
| | 3,808,765 | | | Voya Russell™ Mid Cap Index Portfolio - Class I | | | 65,815,463 | | | | 15.2 | |
| | 1,080,612 | | | Voya Russell™ Small Cap Index Portfolio - Class I | | | 17,830,097 | | | | 4.1 | |
| Shares | | | Value | | | Percentage
of Net
Assets | |
| MUTUAL FUNDS: (continued) | | |
| | | | | Affiliated Investment Companies (continued) | | | | | | | | |
| | 2,455,905 | | | Voya U.S. Bond Index Portfolio - Class I | | $ | 26,425,533 | | | | 6.1 | |
| | 11,333,754 | | | Voya U.S. Stock Index Portfolio - Class I | | | 166,379,505 | | | | 38.4 | |
| | | | | Total Mutual Funds (Cost $345,950,168) | | | 377,231,735 | | | | 87.0 | |
| | | | | Total Investments in Securities (Cost $394,292,405) | | $ | 424,565,416 | | | | 97.9 | |
| | | | | Assets in Excess of Other Liabilities | | | 9,059,888 | | | | 2.1 | |
| | | | | Net Assets | | $ | 433,625,304 | | | | 100.0 | |
Cost for federal income tax purposes is $395,352,211.
Net unrealized appreciation consists of:
| Gross Unrealized Appreciation | | $ | 32,918,837 | |
| Gross Unrealized Depreciation | | | (3,705,632 | ) |
| Net Unrealized Appreciation | | $ | 29,213,205 | |
Fair Value Measurements^
The following is a summary of the fair valuations according to the inputs used as of December 31, 2014 in valuing the assets and liabilities:
| | | Quoted Prices
in Active Markets
for Identical
Investments
(Level 1) | | | Significant
Other
Observable
Inputs
(Level 2) | | | Significant
Unobservable
Inputs
(Level 3) | | | Fair Value
at
December 31, 2014 | |
| Asset Table | | | | | | | | | | | | | | | | |
| Investments, at fair value | | | | | | | | | | | | | | | | |
| Exchange-Traded Funds | | $ | 47,333,681 | | | $ | — | | | $ | — | | | $ | 47,333,681 | |
| Mutual Funds | | | 377,231,735 | | | | — | | | | — | | | | 377,231,735 | |
| Total Investments, at fair value | | $ | 424,565,416 | | | $ | — | | | $ | — | | | $ | 424,565,416 | |
| Liabilities Table | | | | | | | | | | | | | | | | |
| Other Financial Instruments+ | | | | | | | | | | | | | | | | |
| Futures | | $ | (222,439 | ) | | $ | — | | | $ | — | | | $ | (222,439 | ) |
| Total Liabilities | | $ | (222,439 | ) | | $ | — | | | $ | — | | | $ | (222,439 | ) |
| ^ | See Note 2, “Significant Accounting Policies” in the Notes to Financial Statements for additional information. |
| + | Other Financial Instruments are derivatives not reflected in the Portfolio of Investments and may include open forward foreign currency contracts, futures, centrally cleared swaps, OTC swaps and written options. Forward foreign currency contracts, futures and centrally cleared swaps are valued at the unrealized gain (loss) on the instrument. OTC swaps and written options are valued at the fair value of the instrument. |
See Accompanying Notes to Financial Statements
| | PORTFOLIO OF INVESTMENTS |
| Voya Index Solution 2035 Portfolio | as of December 31, 2014 (continued) |
At December 31, 2014, the following futures contracts were outstanding for Voya Index Solution 2035 Portfolio:
| Contract Description | | Number of
Contracts | | | Expiration
Date | | | Notional
Value | | | Unrealized
Appreciation/
(Depreciation) | |
| Long Contracts | | | | | | | | | | | | | | | | |
| Tokyo Price Index (TOPIX) | | | 73 | | | | 03/12/15 | | | $ | 8,578,018 | | | $ | (222,439 | ) |
| | | | | | | | | | | $ | 8,578,018 | | | $ | (222,439 | ) |
Transactions with Affiliates
An investment of at least 5% of the voting securities of an issuer, or a company which is under common control results in that issuer becoming an affiliated person as defined by the 1940 Act.
The following table provides transactions during the year ended December 31, 2014, where the following issuers were considered an affiliate:
| Issuer | | Beginning
Market
Value
at 12/31/13 | | | Purchases
at Cost | | | Sales
at Cost | | | Change in
Unrealized
Appreciation/
(Depreciation) | | | Ending
Market
Value
at 12/31/14 | | | Investment
Income | | | Realized
Gains/
(Losses) | | | Net Capital
Gain
Distributions | |
| Voya Emerging Markets Index Portfolio - Class I | | $ | 16,154,731 | | | $ | 12,253,766 | | | $ | (10,976,769 | ) | | $ | (865,153 | ) | | $ | 16,566,575 | | | $ | 122,491 | | | $ | (663,207 | ) | | $ | — | |
| Voya International Index Portfolio - Class I | | | 76,644,552 | | | | 24,885,827 | | | | (9,459,370 | ) | | | (7,856,447 | ) | | | 84,214,562 | | | | 638,638 | | | | 2,074,467 | | | | — | |
| Voya Russell™ Mid Cap Index Portfolio - Class I | | | 60,555,032 | | | | 11,121,606 | | | | (8,122,149 | ) | | | 2,260,974 | | | | 65,815,463 | | | | 676,186 | | | | 2,756,747 | | | | 1,980,940 | |
| Voya Russell™ Small Cap Index Portfolio - Class I | | | 20,117,600 | | | | 5,866,585 | | | | (5,785,920 | ) | | | (2,368,168 | ) | | | 17,830,097 | | | | 209,902 | | | | 1,879,780 | | | | 1,221,113 | |
| Voya U.S. Bond Index Portfolio - Class I | | | 32,006,685 | | | | 23,887,115 | | | | (30,397,637 | ) | | | 929,370 | | | | 26,425,533 | | | | 609,181 | | | | 300,702 | | | | — | |
| Voya U.S. Stock Index Portfolio - Class I | | | 151,416,783 | | | | 86,138,316 | | | | (55,310,900 | ) | | | (15,864,694 | ) | | | 166,379,505 | | | | 3,056,505 | | | | 15,494,616 | | | | 18,064,833 | |
| | | $ | 356,895,383 | | | $ | 164,153,215 | | | $ | (120,052,745 | ) | | $ | (23,764,118 | ) | | $ | 377,231,735 | | | $ | 5,312,903 | | | $ | 21,843,105 | | | $ | 21,266,886 | |
The financial statements for the above mutual fund[s] can be found at www.sec.gov.
A summary of derivative instruments by primary risk exposure is outlined in the following tables.
The fair value of derivative instruments as of December 31, 2014 was as follows:
| Derivatives not accounted for as hedging instruments | | Location on Statement
of Assets and Liabilities | | Fair Value | |
| Liability Derivatives | | | | | | |
| Equity contracts | | Net Assets — Unrealized depreciation* | | $ | 222,439 | |
| Total Liability Derivatives | | | | $ | 222,439 | |
| * | Includes cumulative appreciation/depreciation of futures contracts as reported in the table following the Portfolio of Investments. |
The effect of derivative instruments on the Portfolio’s Statement of Operations for the year ended December 31, 2014 was as follows:
Amount of Realized Gain or (Loss) on Derivatives Recognized in Income
| Derivatives not accounted for as hedging instruments | | Futures | |
| Equity contracts | | $ | (595 | ) |
| Total | | $ | (595 | ) |
Change in Unrealized Appreciation or (Depreciation) on Derivatives Recognized in Income
| Derivatives not accounted for as hedging instruments | | Futures | |
| Equity contracts | | $ | (222,439 | ) |
| Total | | $ | (222,439 | ) |
See Accompanying Notes to Financial Statements
| | PORTFOLIO OF INVESTMENTS |
| Voya Index Solution 2040 Portfolio | as of December 31, 2014 |
| Shares | | | Value | | | Percentage
of Net
Assets | |
| EXCHANGE-TRADED FUNDS: 8.3% | | | | | | | | |
| | 3 | | | iShares iBoxx High Yield Corporate Bond Fund | | $ | 269 | | | | 1.1 | |
| | 19 | | | PowerShares Senior Loan Portfolio | | | 456 | | | | 2.0 | |
| | 10 | | | SPDR Barclays Capital High Yield Bond ETF | | | 386 | | | | 1.7 | |
| | 2 | | | SPDR Trust Series 1 | | | 411 | | | | 1.8 | |
| | 8 | | | WisdomTree Japan Hedged Equity Fund | | | 394 | | | | 1.7 | |
| | | | | Total Exchange-Traded Funds (Cost $1,997) | | | 1,916 | | | | 8.3 | |
| | | | | | | | | | | | | |
| MUTUAL FUNDS: 88.6% | | | | | | | | |
| | | | | Affiliated Investment Companies: 88.6% | | | | | | | | |
| | 103 | | | Voya Emerging Markets Index Portfolio - Class I | | | 1,097 | | | | 4.7 | |
| | 491 | | | Voya International Index Portfolio - Class I | | | 4,603 | | | | 19.8 | |
| | 213 | | | Voya Russell™ Mid Cap Index Portfolio - Class I | | | 3,675 | | | | 15.8 | |
| | 57 | | | Voya Russell™ Small Cap Index Portfolio - Class I | | | 939 | | | | 4.0 | |
| | 85 | | | Voya U.S. Bond Index Portfolio - Class I | | $ | 919 | | | | 4.0 | |
| Shares | | | Value | | | Percentage
of Net
Assets | |
| MUTUAL FUNDS: (continued) | | | | | | | | |
| | | | | Affiliated Investment Companies (continued) | | | | | | | | |
| | 637 | | | Voya U.S. Stock Index Portfolio - Class I | | | 9,346 | | | | 40.3 | |
| | | | | Total Mutual Funds (Cost $17,374) | | | 20,579 | | | | 88.6 | |
| | | | | Total Investments in Securities (Cost $19,371) | | $ | 22,495 | | | | 96.9 | |
| | | | | Assets in Excess of Other Liabilities | | | 719 | | | | 3.1 | |
| | | | | Net Assets | | $ | 23,214 | | | | 100.0 | |
Cost for federal income tax purposes is $19,391.
Net unrealized appreciation consists of:
| Gross Unrealized Appreciation | | $ | 3,313 | |
| Gross Unrealized Depreciation | | | (209 | ) |
| Net Unrealized Appreciation | | $ | 3,104 | |
Fair Value Measurements^
The following is a summary of the fair valuations according to the inputs used as of December 31, 2014 in valuing the assets and liabilities:
| | | Quoted Prices
in Active Markets
for Identical
Investments
(Level 1) | | | Significant
Other
Observable
Inputs
(Level 2) | | | Significant
Unobservable
Inputs
(Level 3) | | | Fair Value
at
December 31, 2014 | |
| Asset Table | | | | | | | | | | | | | | | | |
| Investments, at fair value | | | | | | | | | | | | | | | | |
| Exchange-Traded Funds | | $ | 1,916 | | | $ | — | | | $ | — | | | $ | 1,916 | |
| Mutual Funds | | | 20,579 | | | | — | | | | — | | | | 20,579 | |
| Total Investments, at fair value | | $ | 22,495 | | | $ | — | | | $ | — | | | $ | 22,495 | |
| ^ | See Note 2, “Significant Accounting Policies” in the Notes to Financial Statements for additional information. |
See Accompanying Notes to Financial Statements
| | PORTFOLIO OF INVESTMENTS |
| Voya Index Solution 2040 Portfolio | as of December 31, 2014 (continued) |
Transactions with Affiliates
An investment of at least 5% of the voting securities of an issuer, or a company which is under common control results in that issuer becoming an affiliated person as defined by the 1940 Act.
The following table provides transactions during the year ended December 31, 2014, where the following issuers were considered an affiliate:
| Issuer | | Beginning
Market
Value
at 12/31/13 | | | Purchases
at Cost | | | Sales
at Cost | | | Change in
Unrealized
Appreciation/
(Depreciation) | | | Ending
Market
Value
at 12/31/14 | | | Investment
Income | | | Realized
Gains/
(Losses) | | | Net Capital
Gain
Distributions | |
| Voya Emerging Markets Index Portfolio - Class I | | $ | 1,035 | | | $ | 611 | | | $ | (470 | ) | | $ | (79 | ) | | $ | 1,097 | | | $ | 9 | | | $ | (13 | ) | | $ | — | |
| Voya International Index Portfolio - Class I | | | 4,138 | | | | 882 | | | | (64 | ) | | | (353 | ) | | | 4,603 | | | | 33 | | | | 29 | | | | — | |
| Voya Russell™ Mid Cap Index Portfolio - Class I | | | 3,309 | | | | 285 | | | | (111 | ) | | | 192 | | | | 3,675 | | | | 36 | | | | 83 | | | | 104 | |
| Voya Russell™ Small Cap Index Portfolio - Class I | | | 1,031 | | | | 210 | | | | (169 | ) | | | (133 | ) | | | 939 | | | | 10 | | | | 111 | | | | 60 | |
| Voya U.S. Bond Index Portfolio - Class I | | | 826 | | | | 781 | | | | (705 | ) | | | 17 | | | | 919 | | | | 20 | | | | 16 | | | | — | |
| Voya U.S. Stock Index Portfolio - Class I | | | 8,805 | | | | 3,168 | | | | (1,957 | ) | | | (670 | ) | | | 9,346 | | | | 172 | | | | 669 | | | | 981 | |
| | | $ | 19,144 | | | $ | 5,937 | | | $ | (3,476 | ) | | $ | (1,026 | ) | | $ | 20,579 | | | $ | 280 | | | $ | 895 | | | $ | 1,145 | |
The financial statements for the above mutual fund[s] can be found at www.sec.gov.
See Accompanying Notes to Financial Statements
| | PORTFOLIO OF INVESTMENTS |
| Voya Index Solution 2045 Portfolio | as of December 31, 2014 |
| Shares | | | Value | | | Percentage
of Net
Assets | |
| EXCHANGE-TRADED FUNDS: 4.0% | | |
| | 224,612 | | | PowerShares Senior Loan Portfolio | | $ | 5,397,426 | | | | 2.0 | |
| | 26,367 | | | SPDR Trust Series 1 | | | 5,418,419 | | | | 2.0 | |
| | | | | Total Exchange-Traded Funds
(Cost $10,610,942) | | | 10,815,845 | | | | 4.0 | |
| MUTUAL FUNDS: 94.0% | | |
| | | | | Affiliated Investment Companies: 94.0% | | | | | | | | |
| | 1,694,069 | | | Voya Emerging Markets Index Portfolio - Class I | | | 18,041,836 | | | | 6.7 | |
| | 6,152,104 | | | Voya International Index Portfolio - Class I | | | 57,645,216 | | | | 21.4 | |
| | 2,686,213 | | | Voya Russell™ Mid Cap Index Portfolio - Class I | | | 46,417,767 | | | | 17.2 | |
| | 672,462 | | | Voya Russell™ Small Cap Index Portfolio - Class I | | | 11,095,631 | | | | 4.1 | |
| | 765,926 | | | Voya U.S. Bond Index Portfolio - Class I | | | 8,241,369 | | | | 3.1 | |
| Shares | | | Value | | | Percentage
of Net
Assets | |
| MUTUAL FUNDS: (continued) | | | | | | | | |
| | | | | Affiliated Investment Companies (continued) | | | | | | | | |
| | 7,609,272 | | | Voya U.S. Stock Index Portfolio - Class I | | $ | 111,704,109 | | | | 41.5 | |
| | | | | Total Mutual Funds (Cost $233,618,122) | | | 253,145,928 | | | | 94.0 | |
| | | | | Total Investments in Securities (Cost $244,229,064) | | $ | 263,961,773 | | | | 98.0 | |
| | | | | Assets in Excess of Other Liabilities | | | 5,302,502 | | | | 2.0 | |
| | | | | Net Assets | | $ | 269,264,275 | | | | 100.0 | |
Cost for federal income tax purposes is $244,969,392.
Net unrealized appreciation consists of:
| Gross Unrealized Appreciation | | $ | 20,971,874 | |
| Gross Unrealized Depreciation | | | (1,979,493 | ) |
| Net Unrealized Appreciation | | $ | 18,992,381 | |
Fair Value Measurements^
The following is a summary of the fair valuations according to the inputs used as of December 31, 2014 in valuing the assets and liabilities:
| | | Quoted Prices
in Active Markets
for Identical
Investments
(Level 1) | | | Significant
Other
Observable
Inputs
(Level 2) | | | Significant
Unobservable
Inputs
(Level 3) | | | Fair Value
at
December 31, 2014 | |
| Asset Table | | | | | | | | | | | | | | | | |
| Investments, at fair value | | | | | | | | | | | | | | | | |
| Exchange-Traded Funds | | $ | 10,815,845 | | | $ | — | | | $ | — | | | $ | 10,815,845 | |
| Mutual Funds | | | 253,145,928 | | | | — | | | | — | | | | 253,145,928 | |
| Total Investments, at fair value | | $ | 263,961,773 | | | $ | — | | | $ | — | | | $ | 263,961,773 | |
| Liabilities Table | | | | | | | | | | | | | | | | |
| Other Financial Instruments+ | | | | | | | | | | | | | | | | |
| Futures | | $ | (137,120 | ) | | $ | — | | | $ | — | | | $ | (137,120 | ) |
| Total Liabilities | | $ | (137,120 | ) | | $ | — | | | $ | — | | | $ | (137,120 | ) |
| ^ | See Note 2, “Significant Accounting Policies” in the Notes to Financial Statements for additional information. |
| + | Other Financial Instruments are derivatives not reflected in the Portfolio of Investments and may include open forward foreign currency contracts, futures, centrally cleared swaps, OTC swaps and written options. Forward foreign currency contracts, futures and centrally cleared swaps are valued at the unrealized gain (loss) on the instrument. OTC swaps and written options are valued at the fair value of the instrument. |
See Accompanying Notes to Financial Statements
| | PORTFOLIO OF INVESTMENTS |
| Voya Index Solution 2045 Portfolio | as of December 31, 2014 (continued) |
At December 31, 2014, the following futures contracts were outstanding for Voya Index Solution 2045 Portfolio:
| Contract Description | | Number of
Contracts | | | Expiration
Date | | | Notional
Value | | | Unrealized
Appreciation/
(Depreciation) | |
| Long Contracts | | | | | | | | | | | | | | | | |
| Tokyo Price Index (TOPIX) | | | 45 | | | | 03/12/15 | | | $ | 5,287,819 | | | $ | (137,120 | ) |
| | | | | | | | | | | $ | 5,287,819 | | | $ | (137,120 | ) |
Transactions with Affiliates
An investment of at least 5% of the voting securities of an issuer, or a company which is under common control results in that issuer becoming an affiliated person as defined by the 1940 Act.
The following table provides transactions during the year ended December 31, 2014, where the following issuers were considered an affiliate:
| Issuer | | Beginning
Market
Value
at 12/31/13 | | | Purchases
at Cost | | | Sales
at Cost | | | Change in
Unrealized
Appreciation/
(Depreciation) | | | Ending
Market
Value
at 12/31/14 | | | Investment
Income | | | Realized
Gains/
(Losses) | | | Net Capital
Gain
Distributions | |
Voya Emerging Markets Index
Portfolio - Class I | | $ | 16,970,071 | | | $ | 10,075,488 | | | $ | (7,938,213 | ) | | $ | (1,065,510 | ) | | $ | 18,041,836 | | | $ | 188,258 | | | $ | (226,937 | ) | | $ | — | |
| Voya International Index Portfolio - Class I | | | 50,883,347 | | | | 18,837,338 | | | | (6,504,629 | ) | | | (5,570,840 | ) | | | 57,645,216 | | | | 431,672 | | | | 1,547,539 | | | | — | |
| Voya Russell™ Mid Cap Index Portfolio - Class I | | | 41,196,783 | | | | 9,614,998 | | | | (5,743,509 | ) | | | 1,349,495 | | | | 46,417,767 | | | | 467,785 | | | | 2,112,647 | | | | 1,370,411 | |
| Voya Russell™ Small Cap Index Portfolio - Class I | | | 12,076,515 | | | | 4,081,697 | | | | (3,668,990 | ) | | | (1,393,591 | ) | | | 11,095,631 | | | | 127,949 | | | | 1,094,340 | | | | 744,348 | |
| Voya U.S. Bond Index Portfolio - Class I | | | 4,817,615 | | | | 13,151,241 | | | | (9,822,367 | ) | | | 94,880 | | | | 8,241,369 | | | | 167,552 | | | | 148,253 | | | | — | |
| Voya U.S. Stock Index Portfolio - Class I | | | 103,165,732 | | | | 54,708,877 | | | | (36,112,709 | ) | | | (10,057,791 | ) | | | 111,704,109 | | | | 2,052,910 | | | | 9,921,531 | | | | 12,019,776 | |
| | | $ | 229,110,063 | | | $ | 110,469,639 | | | $ | (69,790,417 | ) | | $ | (16,643,357 | ) | | $ | 253,145,928 | | | $ | 3,436,126 | | | $ | 14,597,373 | | | $ | 14,134,535 | |
The financial statements for the above mutual fund[s] can be found at www.sec.gov.
A summary of derivative instruments by primary risk exposure is outlined in the following tables.
The fair value of derivative instruments as of December 31, 2014 was as follows:
| Derivatives not accounted for as hedging instruments | | Location on Statement
of Assets and Liabilities | | Fair Value | |
| Liability Derivatives | | | | | | |
| Equity contracts | | Net Assets — Unrealized depreciation* | | $ | 137,120 | |
| Total Liability Derivatives | | | | $ | 137,120 | |
| * | Includes cumulative appreciation/depreciation of futures contracts as reported in the table following the Portfolio of Investments. |
The effect of derivative instruments on the Portfolio’s Statement of Operations for the year ended December 31, 2014 was as follows:
Amount of Realized Gain or (Loss) on Derivatives Recognized in Income
| Derivatives not accounted for as hedging instruments | | Futures | |
| Equity contracts | | $ | 250 | |
| Total | | $ | 250 | |
Change in Unrealized Appreciation or (Depreciation) on Derivatives Recognized in Income
| Derivatives not accounted for as hedging instruments | | Futures | |
| Equity contracts | | $ | (137,120 | ) |
| Total | | $ | (137,120 | ) |
See Accompanying Notes to Financial Statements
| | PORTFOLIO OF INVESTMENTS |
| Voya Index Solution 2050 Portfolio | as of December 31, 2014 |
| Shares | | | Value | | | Percentage
of Net
Assets | |
| EXCHANGE-TRADED FUNDS: 5.5% | | | | | | | | |
| | 18 | | | PowerShares Senior Loan Portfolio | | $ | 432 | | | | 1.9 | |
| | 2 | | | SPDR Trust Series 1 | | | 411 | | | | 1.8 | |
| | 8 | | | WisdomTree Japan Hedged Equity Fund | | | 394 | | | | 1.8 | |
| | | | | Total Exchange-Traded Funds (Cost $1,282) | | | 1,237 | | | | 5.5 | |
| MUTUAL FUNDS: 91.5% | | | | | | | | |
| | | | | Affiliated Investment Companies: 91.5% | | | | | | | | |
| | 138 | | | Voya Emerging Markets Index Portfolio - Class I | | | 1,468 | | | | 6.6 | |
| | 497 | | | Voya International Index Portfolio - Class I | | | 4,660 | | | | 20.8 | |
| | 218 | | | Voya Russell™ Mid Cap Index Portfolio - Class I | | | 3,762 | | | | 16.8 | |
| | 55 | | | Voya Russell™ Small Cap Index Portfolio - Class I | | | 902 | | | | 4.0 | |
| | 62 | | | Voya U.S. Bond Index Portfolio - Class I | | | 666 | | | | 3.0 | |
| Shares | | | Value | | | Percentage
of Net
Assets | |
| MUTUAL FUNDS: (continued) | |
| | | | | Affiliated Investment Companies (continued) | | | | | | | | |
| | 615 | | | Voya U.S. Stock Index Portfolio - Class I | | $ | 9,031 | | | | 40.3 | |
| | | | | Total Mutual Funds (Cost $17,226) | | | 20,489 | | | | 91.5 | |
| | | | | Total Investments in Securities (Cost $18,508) | | $ | 21,726 | | | | 97.0 | |
| | | | | Assets in Excess of Other Liabilities | | | 681 | | | | 3.0 | |
| | | | | Net Assets | | $ | 22,407 | | | | 100.0 | |
Cost for federal income tax purposes is $18,516.
Net unrealized appreciation consists of:
| Gross Unrealized Appreciation | | $ | 3,389 | |
| Gross Unrealized Depreciation | | | (179 | ) |
| Net Unrealized Appreciation | | $ | 3,210 | |
Fair Value Measurements^
The following is a summary of the fair valuations according to the inputs used as of December 31, 2014 in valuing the assets and liabilities:
| | | Quoted Prices
in Active Markets
for Identical
Investments
(Level 1) | | | Significant
Other
Observable
Inputs
(Level 2) | | | Significant
Unobservable
Inputs
(Level 3) | | | Fair Value
at
December 31, 2014 | |
| Asset Table | | | | | | | | | | | | | | | | |
| Investments, at fair value | | | | | | | | | | | | | | | | |
| Exchange-Traded Funds | | $ | 1,237 | | | $ | — | | | $ | — | | | $ | 1,237 | |
| Mutual Funds | | | 20,489 | | | | — | | | | — | | | | 20,489 | |
| Total Investments, at fair value | | $ | 21,726 | | | $ | — | | | $ | — | | | $ | 21,726 | |
| ^ | See Note 2, “Significant Accounting Policies” in the Notes to Financial Statements for additional information. |
See Accompanying Notes to Financial Statements
| | PORTFOLIO OF INVESTMENTS |
| Voya Index Solution 2050 Portfolio | as of December 31, 2014 (continued) |
Transactions with Affiliates
An investment of at least 5% of the voting securities of an issuer, or a company which is under common control results in that issuer becoming an affiliated person as defined by the 1940 Act.
The following table provides transactions during the year ended December 31, 2014, where the following issuers were considered an affiliate:
| Issuer | | Beginning
Market
Value
at 12/31/13 | | | Purchases
at Cost | | | Sales at
Cost | | | Change in
Unrealized
Appreciation/
(Depreciation) | | | Ending
Market
Value
at 12/31/14 | | | Investment
Income | | | Realized
Gains/
(Losses) | | | Net Capital
Gain
Distributions | |
| Voya Emerging Markets Index Portfolio - Class I | | $ | 1,454 | | | $ | 622 | | | $ | (512 | ) | | $ | (96 | ) | | $ | 1,468 | | | $ | 15 | | | $ | (10 | ) | | $ | — | |
| Voya International Index Portfolio - Class I | | | 4,362 | | | | 722 | | | | (67 | ) | | | (357 | ) | | | 4,660 | | | | 35 | | | | 29 | | | | — | |
| Voya Russell™ Mid Cap Index Portfolio - Class I | | | 3,530 | | | | 178 | | | | (133 | ) | | | 187 | | | | 3,762 | | | | 38 | | | | 98 | | | | 111 | |
| Voya Russell™ Small Cap Index Portfolio - Class I | | | 1,035 | | | | 163 | | | | (163 | ) | | | (133 | ) | | | 902 | | | | 10 | | | | 108 | | | | 60 | |
| Voya U.S. Bond Index Portfolio - Class I | | | 415 | | | | 914 | | | | (671 | ) | | | 8 | | | | 666 | | | | 13 | | | | 11 | | | | — | |
| Voya U.S. Stock Index Portfolio - Class I | | | 8,839 | | | | 2,867 | | | | (1,986 | ) | | | (689 | ) | | | 9,031 | | | | 168 | | | | 676 | | | | 985 | |
| | | $ | 19,635 | | | $ | 5,466 | | | $ | (3,532 | ) | | $ | (1,080 | ) | | $ | 20,489 | | | $ | 279 | | | $ | 912 | | | $ | 1,156 | |
The financial statements for the above mutual fund[s] can be found at www.sec.gov.
See Accompanying Notes to Financial Statements
| | PORTFOLIO OF INVESTMENTS |
| Voya Index Solution 2055 Portfolio | as of December 31, 2014 |
| Shares | | | Value | | | Percentage
of Net
Assets | |
| EXCHANGE-TRADED FUNDS: 2.0% | | | | | | | | |
| | 5,944 | | | SPDR Trust Series 1 | | $ | 1,221,492 | | | | 2.0 | |
| | | | | Total Exchange-Traded Funds (Cost $1,141,656) | | | 1,221,492 | | | | 2.0 | |
| MUTUAL FUNDS: 96.1% | | | | | | | | |
| | | | | Affiliated Investment Companies: 96.1% | | | | | | | | |
| | 389,733 | | | Voya Emerging Markets Index Portfolio - Class I | | | 4,150,660 | | | | 6.7 | |
| | 1,414,618 | | | Voya International Index Portfolio - Class I | | | 13,254,966 | | | | 21.4 | |
| | 617,449 | | | Voya Russell™ Mid Cap Index Portfolio - Class I | | | 10,669,525 | | | | 17.2 | |
| | 154,558 | | | Voya Russell™ Small Cap Index Portfolio - Class I | | | 2,550,214 | | | | 4.1 | |
| | 175,994 | | | Voya U.S. Bond Index Portfolio - Class I | | | 1,893,699 | | | | 3.1 | |
| Shares | | | Value | | | Percentage
of Net
Assets | |
| MUTUAL FUNDS: (continued) | | | | | | | | |
| | | | | Affiliated Investment Companies (continued) | |
| | 1,837,576 | | | Voya U.S. Stock Index Portfolio - Class I | | $ | 26,975,612 | | | | 43.6 | |
| | | | | Total Mutual Funds (Cost $56,589,213) | | | 59,494,676 | | | | 96.1 | |
| | | | | Total Investments in Securities (Cost $57,730,869) | | $ | 60,716,168 | | | | 98.1 | |
| | | | | Assets in Excess of Other Liabilities | | | 1,194,707 | | | | 1.9 | |
| | | | | Net Assets | | $ | 61,910,875 | | | | 100.0 | |
Cost for federal income tax purposes is $57,892,766.
Net unrealized appreciation consists of:
| Gross Unrealized Appreciation | | $ | 3,217,898 | |
| Gross Unrealized Depreciation | | | (394,496 | ) |
| Net Unrealized Appreciation | | $ | 2,823,402 | |
Fair Value Measurements^
The following is a summary of the fair valuations according to the inputs used as of December 31, 2014 in valuing the assets and liabilities:
| | | Quoted Prices
in Active Markets
for Identical
Investments
(Level 1) | | | Significant
Other
Observable
Inputs
(Level 2) | | | Significant
Unobservable
Inputs
(Level 3) | | | Fair Value
at
December 31, 2014 | |
| Asset Table | | | | | | | | | | | | | | | | |
| Investments, at fair value | | | | | | | | | | | | | | | | |
| Exchange-Traded Funds | | $ | 1,221,492 | | | $ | — | | | $ | — | | | $ | 1,221,492 | |
| Mutual Funds | | | 59,494,676 | | | | — | | | | — | | | | 59,494,676 | |
| Total Investments, at fair value | | $ | 60,716,168 | | | $ | — | | | $ | — | | | $ | 60,716,168 | |
| Liabilities Table | | | | | | | | | | | | | | | | |
| Other Financial Instruments+ | | | | | | | | | | | | | | | | |
| Futures | | $ | (30,471 | ) | | $ | — | | | $ | — | | | $ | (30,471 | ) |
| Total Liabilities | | $ | (30,471 | ) | | $ | — | | | $ | — | | | $ | (30,471 | ) |
| ^ | See Note 2, “Significant Accounting Policies” in the Notes to Financial Statements for additional information. |
| + | Other Financial Instruments are derivatives not reflected in the Portfolio of Investments and may include open forward foreign currency contracts, futures, centrally cleared swaps, OTC swaps and written options. Forward foreign currency contracts, futures and centrally cleared swaps are valued at the unrealized gain (loss) on the instrument. OTC swaps and written options are valued at the fair value of the instrument. |
See Accompanying Notes to Financial Statements
| | PORTFOLIO OF INVESTMENTS |
| Voya Index Solution 2055 Portfolio | as of December 31, 2014 (continued) |
At December 31, 2014, the following futures contracts were outstanding for Voya Index Solution 2055 Portfolio:
| Contract Description | | Number of
Contracts | | | Expiration
Date | | | Notional
Value | | | Unrealized
Appreciation/
(Depreciation) | |
| Long Contracts | | | | | | | | | | | | | | | | |
| Tokyo Price Index (TOPIX) | | | 10 | | | | 03/12/15 | | | $ | 1,175,071 | | | $ | (30,471 | ) |
| | | | | | | | | | | $ | 1,175,071 | | | $ | (30,471 | ) |
Transactions with Affiliates
An investment of at least 5% of the voting securities of an issuer, or a company which is under common control results in that issuer becoming an affiliated person as defined by the 1940 Act.
The following table provides transactions during the year ended December 31, 2014, where the following issuers were considered an affiliate:
| Issuer | | Beginning
Market Value
at 12/31/13 | | | Purchases
at Cost | | | Sales
at Cost | | | Change in
Unrealized
Appreciation/
(Depreciation) | | | Ending
Market
Value
at 12/31/14 | | | Investment
Income | | | Realized
Gains/
(Losses) | | | Net Capital
Gain
Distributions | |
| Voya Emerging Markets Index Portfolio - Class I | | $ | 3,282,921 | | | $ | 2,665,922 | | | $ | (1,572,173 | ) | | $ | (226,010 | ) | | $ | 4,150,660 | | | $ | 38,585 | | | $ | (68,178 | ) | | $ | — | |
| Voya International Index Portfolio - Class I | | | 9,856,281 | | | | 5,870,315 | | | | (1,231,697 | ) | | | (1,239,933 | ) | | | 13,254,966 | | | | 88,832 | | | | 308,600 | | | | — | |
| Voya Russell™ Mid Cap Index Portfolio - Class I | | | 7,969,434 | | | | 3,461,167 | | | | (1,109,144 | ) | | | 348,068 | | | | 10,669,525 | | | | 95,940 | | | | 388,715 | | | | 281,063 | |
| Voya Russell™ Small Cap Index Portfolio - Class I | | | 2,336,248 | | | | 1,253,475 | | | | (758,061 | ) | | | (281,448 | ) | | | 2,550,214 | | | | 26,252 | | | | 229,955 | | | | 152,722 | |
| Voya U.S. Bond Index Portfolio - Class I | | | 945,243 | | | | 3,626,564 | | | | (2,698,574 | ) | | | 20,466 | | | | 1,893,699 | | | | 33,870 | | | | 35,439 | | | | — | |
| Voya U.S. Stock Index Portfolio - Class I | | | 19,953,489 | | | | 16,801,029 | | | | (7,933,991 | ) | | | (1,844,915 | ) | | | 26,975,612 | | | | 486,764 | | | | 1,732,301 | | | | 2,667,718 | |
| | | $ | 44,343,616 | | | $ | 33,678,472 | | | $ | (15,303,640 | ) | | $ | (3,223,772 | ) | | $ | 59,494,676 | | | $ | 770,243 | | | $ | 2,626,832 | | | $ | 3,101,503 | |
The financial statements for the above mutual fund[s] can be found at www.sec.gov.
A summary of derivative instruments by primary risk exposure is outlined in the following tables.
The fair value of derivative instruments as of December 31, 2014 was as follows:
| Derivatives not accounted for as hedging instruments | | | Location on Statement
of Assets and Liabilities | | | Fair Value | |
| Liability Derivatives | | | |
| Equity contracts | | | Net Assets — Unrealized depreciation* | | | | $ | 30,471 | | |
| Total Liability Derivatives | | | | | | | $ | 30,471 | | |
| * | Includes cumulative appreciation/depreciation of futures contracts as reported in the table following the Portfolio of Investments. |
The effect of derivative instruments on the Portfolio’s Statement of Operations for the year ended December 31, 2014 was as follows:
Amount of Realized Gain or (Loss) on Derivatives Recognized in Income
| Derivatives not accounted for as hedging instruments | | Futures | |
| Equity contracts | | $ | (82 | ) |
| Total | | $ | (82 | ) |
Change in Unrealized Appreciation or (Depreciation) on Derivatives Recognized in Income
| Derivatives not accounted for as hedging instruments | | Futures | |
| Equity contracts | | $ | (30,471 | ) |
| Total | | $ | (30,471 | ) |
See Accompanying Notes to Financial Statements
TAX INFORMATION (Unaudited)
Dividends and distributions paid during the year ended December 31, 2014 were as follows:
| Portfolio Name | | Type | | Per Share Amount | |
| Voya Index Solution Income Portfolio | | | | | | |
| Class ADV | | NII | | $ | 0.2273 | |
| Class I | | NII | | $ | 0.2771 | |
| Class S | | NII | | $ | 0.2474 | |
| Class S2 | | NII | | $ | 0.2332 | |
| Class T | | NII | | $ | 0.2000 | |
| All Classes | | LTCG | | $ | 0.5677 | |
| Voya Index Solution 2015 Portfolio | | | | | | |
| Class ADV | | NII | | $ | 0.2203 | |
| Class I | | NII | | $ | 0.2753 | |
| Class S | | NII | | $ | 0.2450 | |
| Class S2 | | NII | | $ | 0.2328 | |
| Class T | | NII | | $ | 0.2021 | |
| All Classes | | STCG | | $ | 0.0069 | |
| All Classes | | LTCG | | $ | 0.5607 | |
| Voya Index Solution 2020 Portfolio | | | | | | |
| Class ADV | | NII | | $ | 0.2336 | |
| Class I | | NII | | $ | 0.2856 | |
| Class S | | NII | | $ | 0.2592 | |
| Class S2 | | NII | | $ | 0.2450 | |
| Class T | | NII | | $ | 0.2087 | |
| All Classes | | LTCG | | $ | 0.6795 | |
| Voya Index Solution 2025 Portfolio | | | | | | |
| Class ADV | | NII | | $ | 0.1923 | |
| Class I | | NII | | $ | 0.2442 | |
| Class S | | NII | | $ | 0.2175 | |
| Class S2 | | NII | | $ | 0.2021 | |
| Class T | | NII | | $ | 0.1636 | |
| All Classes | | LTCG | | $ | 0.5647 | |
| Voya Index Solution 2030 Portfolio | | | | | | |
| Class ADV | | NII | | $ | 0.2203 | |
| Class I | | NII | | $ | 0.2905 | |
| Class S | | NII | | $ | 0.2551 | |
| Class S2 | | NII | | $ | 0.2319 | |
| Class T | | NII | | $ | 0.2078 | |
| All Classes | | LTCG | | $ | 0.9139 | |
| Portfolio Name | | Type | | Per Share Amount | |
| Voya Index Solution 2035 Portfolio | | | | | | |
| Class ADV | | NII | | $ | 0.1741 | |
| Class I | | NII | | $ | 0.2266 | |
| Class S | | NII | | $ | 0.2004 | |
| Class S2 | | NII | | $ | 0.1863 | |
| Class T | | NII | | $ | 0.1456 | |
| All Classes | | STCG | | $ | 0.0019 | |
| All Classes | | LTCG | | $ | 0.6381 | |
| Voya Index Solution 2040 Portfolio | | | | | | |
| Class ADV | | NII | | $ | 0.1957 | |
| Class I | | NII | | $ | 0.2665 | |
| Class S | | NII | | $ | 0.2315 | |
| Class S2 | | NII | | $ | 0.2067 | |
| Class T | | NII | | $ | 0.1789 | |
| All Classes | | LTCG | | $ | 0.9644 | |
| Voya Index Solution 2045 Portfolio | | | | | | |
| Class ADV | | NII | | $ | 0.1444 | |
| Class I | | NII | | $ | 0.1926 | |
| Class S | | NII | | $ | 0.1674 | |
| Class S2 | | NII | | $ | 0.1517 | |
| Class T | | NII | | $ | 0.1106 | |
| All Classes | | LTCG | | $ | 0.6430 | |
| Voya Index Solution 2050 Portfolio | | | | | | |
| Class ADV | | NII | | $ | 0.1850 | |
| Class I | | NII | | $ | 0.2558 | |
| Class S | | NII | | $ | 0.2205 | |
| Class S2 | | NII | | $ | 0.1961 | |
| Class T | | NII | | $ | 0.1687 | |
| All Classes | | LTCG | | $ | 0.9378 | |
| Voya Index Solution 2055 Portfolio | | | | | | |
| Class ADV | | NII | | $ | 0.1411 | |
| Class I | | NII | | $ | 0.1887 | |
| Class S | | NII | | $ | 0.1657 | |
| Class S2 | | NII | | $ | 0.1418 | |
| Class T | | NII | | $ | 0.1038 | |
| All Classes | | LTCG | | $ | 0.6106 | |
NII - Net investment income
STCG - Short-term capital gain
LTCG - Long-term capital gain
| TAX INFORMATION (Unaudited) (continued) |
Of the ordinary distributions made during the year ended December 31, 2014, the following percentages qualify for the dividends received deduction (DRD) available to corporate shareholders:
| Voya Index Solution Income Portfolio | | | 22.92 | % |
| Voya Index Solution 2015 Portfolio | | | 25.31 | % |
| Voya Index Solution 2020 Portfolio | | | 33.60 | % |
| Voya Index Solution 2025 Portfolio | | | 42.47 | % |
| Voya Index Solution 2030 Portfolio | | | 43.87 | % |
| Voya Index Solution 2035 Portfolio | | | 56.28 | % |
| Voya Index Solution 2040 Portfolio | | | 66.54 | % |
| Voya Index Solution 2045 Portfolio | | | 72.57 | % |
| Voya Index Solution 2050 Portfolio | | | 70.24 | % |
| Voya Index Solution 2055 Portfolio | | | 73.15 | % |
The Regulated Investment Company Modernization Act of 2010 allows qualified fund-of-funds to elect to pass through the ability to take foreign tax credits (or deductions) to the extent that foreign taxes are passed through from underlying funds. A qualified fund-of-funds is a regulated investment company that has at least 50% of the value of its total assets invested in other regulated investment companies at the end of each quarter of the taxable year. Pursuant to Section 853 of the Internal Revenue Code, the Portfolios designate the following amounts as foreign taxes paid for the year ended December 31, 2014:
| | | Creditable
Foreign Taxes
Paid | | | Per Share
Amount | | | Portion of Ordinary Income
Distribution Derived from
Foreign Sourced Income* | |
| Voya Index Solution Income Portfolio | | $ | 8,134 | | | $ | 0.0005 | | | | 1.69% | |
| Voya Index Solution 2015 Portfolio | | $ | 16,914 | | | $ | 0.0007 | | | | 2.48% | |
| Voya Index Solution 2020 Portfolio | | $ | 2 | | | $ | 0.0012 | | | | 3.60% | |
| Voya Index Solution 2025 Portfolio | | $ | 94,875 | | | $ | 0.0021 | | | | 6.10% | |
| Voya Index Solution 2030 Portfolio | | $ | 5 | | | $ | 0.0030 | | | | 7.92% | |
| Voya Index Solution 2035 Portfolio | | $ | 106,001 | | | $ | 0.0029 | | | | 8.66% | |
| Voya Index Solution 2040 Portfolio | | $ | 6 | | | $ | 0.0035 | | | | 9.31% | |
| Voya Index Solution 2045 Portfolio | | $ | 87,525 | | | $ | 0.0040 | | | | 12.68% | |
| Voya Index Solution 2050 Portfolio | | $ | 7 | | | $ | 0.0043 | | | | 11.62% | |
| Voya Index Solution 2055 Portfolio | | $ | 20,057 | | | $ | 0.0048 | | | | 12.08% | |
| * | None of the Portfolios listed above derived any income from ineligible foreign sources as defined under Section901(j) of the Internal Revenue Code. |
Foreign taxes paid or withheld should be included in taxable income with an offsetting deduction from gross income or as a credit for taxes paid to foreign governments. Shareholders are strongly advised to consult their own tax advisors regarding the appropriate treatment of foreign taxes paid.
Above figures may differ from those cited elsewhere in this report due to differences in the calculation of income and gains under U.S. generally accepted accounting principles (book) purposes and Internal Revenue Service (tax) purposes.
Shareholders are strongly advised to consult their own tax advisers with respect to the tax consequences of their investments in the Portfolios. In January, shareholders, excluding corporate shareholders, receive an IRS 1099-DIV regarding the federal tax status of the dividends and distributions they received in the calendar year.
| DIRECTOR AND OFFICER INFORMATION (Unaudited) |
The business and affairs of the Company are managed under the direction of the Company’s Board. A Director, who is not an interested person of the Company, as defined in the 1940 Act, is an independent director (“Independent Director”). The Directors and Officers of the Company are listed below. The Statement of Additional Information includes additional information about directors of the Company and is available, without charge, upon request at (800) 992-0180.
| Name, Address and Age | | Position(s)
Held with the
Company | | Term of Office and
Length of Time
Served(1) | | Principal
Occupation(s) -
During the Past 5 Years | | Number of
Portfolios
in Fund
Complex
Overseen by
Director(2) | | Other Board Positions
Held by Director |
| Independent Directors*: | | | | | | | | | | |
Colleen D. Baldwin
7337 East Doubletree Ranch Rd.
Suite 100
Scottsdale, Arizona 85258
Age: 54 | | Director | | November 2007 - Present | | President, Glantuam Partners, LLC, a business consulting firm (January 2009 - Present). | | 158 | | DSM/Dentaquest, Boston, MA (February 2014 - Present). |
John V. Boyer
7337 East Doubletree Ranch Rd.
Suite 100
Scottsdale, Arizona 85258
Age: 61 | | Chairperson/Director | | November 1997 - Present | | President and Chief Executive Officer, Bechtler Arts Foundation, an arts and education foundation (January 2008 - Present). | | 158 | | None. |
Patricia W. Chadwick
7337 East Doubletree Ranch Rd.
Suite 100
Scottsdale, Arizona 85258
Age: 66 | | Director | | January 2006 - Present | | Consultant and President, Ravengate Partners LLC, a consulting firm that provides advice regarding financial markets and the global economy (January 2000 - Present). | | 158 | | Wisconsin Energy Corporation (June 2006 - Present) and The Royce Funds (35 funds) (December 2009 - Present). |
Albert E. DePrince, Jr.
7337 E. Doubletree Ranch Rd.
Suite 100
Scottsdale, Arizona 85258
Age: 73 | | Director | | May 2013 - Present | | Retired. Formerly, Professor of Economics and Finance, Middle Tennessee State University (August 1991 - July 2014); Dr. DePrince continued to hold a position with the university under a post-retirement contract through the end of 2014. | | 158 | | None. |
Peter S. Drotch
7337 East Doubletree Ranch Rd.
Suite 100
Scottsdale, Arizona 85258
Age: 73 | | Director | | November 2007 - Present | | Retired. | | 158 | | First Marblehead Corporation (September 2003 - Present). |
Russell H. Jones
7337 E. Doubletree Ranch Rd.
Suite 100
Scottsdale, Arizona 85258
Age: 70 | | Director | | May 2013 - Present | | Retired. | | 158 | | None. |
Patrick W. Kenny
7337 East Doubletree Ranch Rd.
Suite 100
Scottsdale, Arizona 85258
Age: 72 | | Director | | March 2002 - Present | | Retired. | | 158 | | Assured Guaranty Ltd. (April 2004 - Present). |
| DIRECTOR AND OFFICER INFORMATION (Unaudited) (continued) |
| Name, Address and Age | | Position(s) Held with the Company | | Term of Office and Length of Time Served(1) | | Principal Occupation(s) - During the Past 5 Years | | Number of Portfolios in Fund Complex Overseen by Director(2) | | Other Board Positions Held by Director |
Joseph E. Obermeyer
7337 E. Doubletree Ranch Rd.
Suite 100
Scottsdale, Arizona 85258
Age: 57 | | Director | | May 2013 - Present | | President, Obermeyer & Associates, Inc., a provider of financial and economic consulting services (November 1999 - Present). | | 158 | | None. |
Sheryl K. Pressler
7337 East Doubletree Ranch Rd.
Suite 100
Scottsdale, Arizona 85258
Age: 64 | | Director | | January 2006 - Present | | Consultant (May 2001 - Present). | | 158 | | None. |
Roger B. Vincent
7337 East Doubletree Ranch Rd.
Suite 100
Scottsdale, Arizona 85258
Age: 69 | | Director | | January 2005 - Present | | Retired. Formerly, President, Springwell Corporation, a corporate finance firm (March 1989 - August 2011). | | 158 | | UGI Corporation (February 2006 - Present) and UGI Utilities, Inc. (February 2006 - Present). |
| Director who is an “Interested Person”: |
Shaun P. Mathews(3)
7337 East Doubletree Ranch Rd.
Suite 100
Scottsdale, Arizona 85258
Age: 59 | | Director | | November 2007 - Present | | President and Chief Executive Officer, Voya Investments, LLC (November 2006 - Present). | | 158 | | Voya Capital Corporation, LLC and Voya Investments Distributor, LLC (December 2005 - Present); Voya Funds Services, LLC, Voya Investments, LLC and Voya Investment Management, LLC (March 2006 - Present); and Voya Investment Trust Co. (April 2009 - Present). |
| (1) | Directors serve until their successors are duly elected and qualified. The tenure of each Director who is not an “interested person” as defined in the 1940 Act, of the Portfolio (as defined below, “Independent Director”) is subject to the Board’s retirement policy which states that each duly elected or appointed Independent Director shall retire from and cease to be a member of the Board of Directors at the close of business on December 31 of the calendar year in which the Independent Director attains the age of 75. A majority vote of the Board’s other Independent Directors may extend the retirement date of an Independent Director if the retirement would trigger a requirement to hold a meeting of shareholders of the Company under applicable law, whether for purposes of appointing a successor to the Independent Director or otherwise comply under applicable law, in which case the extension would apply until such time as the shareholder meeting can be held or is no longer required (as determined by a vote of a majority of the other Independent Directors). |
| (2) | For the purposes of this table, “Fund Complex” means the Voya family of funds including the following investment companies: Voya Asia Pacific High Dividend Equity Income Fund; Voya Balanced Portfolio, Inc.; Voya Emerging Markets High Dividend Equity Fund; Voya Equity Trust; Voya Funds Trust; Voya Global Advantage and Premium Opportunity Fund; Voya Global Equity Dividend and Premium Opportunity Fund; Voya Infrastructure, Industrials and Materials Fund; Voya Intermediate Bond Portfolio; Voya International High Dividend Equity Income Fund; Voya Investors Trust; Voya Money Market Portfolio; Voya Mutual Funds; Voya Natural Resources Equity Income Fund; Voya Partners, Inc.; Voya Prime Rate Trust; Voya Senior Income Fund; Voya Separate Portfolios Trust; Voya Series Fund, Inc.; Voya Strategic Allocation Portfolios, Inc.; Voya Variable Funds; Voya Variable Insurance Trust; Voya Variable Portfolios, Inc.; and Voya Variable Products Trust. The number of funds in the Voya family of funds is as of January 31, 2015. |
| (3) | Mr. Mathews is deemed to be an “Interested Person” of the Company as defined in the 1940 Act, because of his current affiliation with any of the Voya funds, Voya Financial, Inc., or any of Voya Financial, Inc.’s affiliates. |
| * | Effective on December 31, 2014, J. Michael Earley retired as a Director. |
| DIRECTOR AND OFFICER INFORMATION (Unaudited) (continued) |
| Name, Address and Age | | Position(s) Held
With the Company | | Term of Office and
Length of Time Served(1) | | Principal Occupation(s) -
During the Past 5 Years |
Shaun P. Mathews
7337 East Doubletree Ranch Rd.
Suite 100
Scottsdale, Arizona 85258
Age: 59 | | President and Chief Executive Officer | | November 2006 - Present | | President and Chief Executive Officer, Voya Investments, LLC (November 2006 - Present). |
| | | | | | | |
Michael J. Roland
7337 East Doubletree Ranch Rd.
Suite 100
Scottsdale, Arizona 85258
Age: 56 | | Executive Vice President | | January 2005 - Present | | Managing Director and Chief Operating Officer, Voya Investments, LLC and Voya Funds Services, LLC (April 2012 - Present). Formerly, Chief Compliance Officer, Directed Services LLC and Voya Investments, LLC (March 2011 - December 2013); Executive Vice President and Chief Operating Officer, Voya Investments, LLC and Voya Funds Services, LLC (January 2007 - April 2012) and Chief Compliance Officer, Voya Family of Funds (March 2011 - February 2012). |
Stanley D. Vyner
230 Park Avenue
New York, New York 10169
Age: 64 | | Executive Vice President
Chief Investment Risk Officer | | January 2005 - Present
September 2009 - Present | | Executive Vice President, Voya Investments, LLC (July 2000 - Present) and Chief Investment Risk Officer, Voya Investments, LLC (January 2003 - Present). |
| | | | | | | |
Kevin M. Gleason
7337 East Doubletree Ranch Rd.
Suite 100
Scottsdale, Arizona 85258
Age: 48 | | Chief Compliance Officer | | February 2012 - Present | | Senior Vice President and Chief Compliance Officer, Voya Investments, LLC (February 2012 - Present). Formerly, Assistant General Counsel and Assistant Secretary, The Northwestern Mutual Life Insurance Company (June 2004 - January 2012). |
| | | | | | | |
Todd Modic
7337 East Doubletree Ranch Rd.
Suite 100
Scottsdale, Arizona 85258
Age: 47 | | Senior Vice President,
Chief/Principal Financial Officer and
Assistant Secretary | | March 2005 - Present | | Senior Vice President, Voya Funds Services, LLC (March 2005 - Present). |
| | | | | | | |
Kimberly A. Anderson
7337 East Doubletree Ranch Rd.
Suite 100
Scottsdale, Arizona 85258
Age: 50 | | Senior Vice President | | January 2005 - Present | | Senior Vice President, Voya Investments, LLC (October 2003 - Present). |
| | | | | | | |
Julius A. Drelick, III
7337 East Doubletree Ranch Rd.
Suite 100
Scottsdale, Arizona 85258
Age: 48 | | Senior Vice President | | July 2012 - Present | | Senior Vice President - Head of Fund Compliance, Voya Funds Services, LLC (June 2012 - Present); Chief Compliance Officer of Directed Services LLC and Voya Investments, LLC (January 2014 - Present). Formerly, Vice President - Platform Product Management & Project Management, Voya Investments, LLC (April 2007 - June 2012). |
| | | | | | | |
Robert Terris
7337 East Doubletree Ranch Rd.
Suite 100
Scottsdale, Arizona 85258
Age: 44 | | Senior Vice President | | May 2006 - Present | | Senior Vice President, Head of Division Operations, Voya Funds Services, LLC (January 2006 - Present). |
| | | | | | | |
Fred Bedoya
7337 East Doubletree Ranch Rd.
Suite 100
Scottsdale, Arizona 85258
Age: 42 | | Vice President and Treasurer | | September 2012 - Present | | Vice President, Voya Funds Services, LLC (March 2012 - Present). Formerly, Assistant Vice President - Director, Voya Funds Services, LLC (March 2003 - March 2012). |
| | | | | | | |
Maria M. Anderson
7337 East Doubletree Ranch Rd.
Suite 100
Scottsdale, Arizona 85258
Age: 56 | | Vice President | | January 2005 - Present | | Vice President, Voya Funds Services, LLC (September 2004 - Present). |
DIRECTOR AND OFFICER INFORMATION (Unaudited) (continued)
| Name, Address and Age | | Position(s) Held With the Company | | Term of Office and Length of Time Served(1) | | Principal Occupation(s) -
During the Past 5 Years |
Lauren D. Bensinger
7337 East Doubletree Ranch Rd.
Suite 100
Scottsdale, Arizona 85258
Age: 61 | | Vice President | | January 2005 - Present | | Vice President, Voya Investments, LLC and Voya Funds Services, LLC (February 1996 - Present); Vice President, Voya Investments, LLC (October 2004 - Present); Vice President and Money Laundering Reporting Officer, Voya Investments Distributor, LLC (April 2010 - Present); Anti-Money Laundering Compliance Officer, Voya Financial, Inc. (January 2013 - Present); and Money Laundering Reporting Officer, Voya Investment Management Trust Co. (October 2012 - Present). Formerly, Chief Compliance Officer, Voya Investments Distributor, LLC (August 1995 - April 2010). |
Sara M. Donaldson
7337 East Doubletree Ranch Rd.
Suite 100
Scottsdale, Arizona 85258
Age: 55 | | Vice President | | September 2014 - Present | | Vice President, Voya Funds Services, LLC (April 2014 - Present). Formerly, Director, Compliance, AXA Rosenberg Global Services, LLC (September 1997 - March 2014). |
Robyn L. Ichilov
7337 East Doubletree Ranch Rd.
Suite 100
Scottsdale, Arizona 85258
Age: 47 | | Vice President | | January 2005- Present | | Vice President, Voya Funds Services, LLC (November 1995 - Present) and Voya Investments, LLC (August 1997 - Present). Formerly, Treasurer, Voya Family of Funds (November 1999 - February 2012). |
Jason Kadavy
7337 East Doubletree Ranch Rd.
Suite 100
Scottsdale, Arizona 85258
Age: 38 | | Vice President | | September 2012 - Present | | Vice President, Voya Funds Services, LLC (July 2007 - Present). |
Kimberly K. Springer
7337 East Doubletree Ranch Rd.
Suite 100
Scottsdale, Arizona 85258
Age: 57 | | Vice President | | March 2006 - Present | | Vice President - Mutual Fund Product Development, Voya Investments, LLC (July 2012 - Present); Vice President, Voya Investment Management - Voya Family of Funds (March 2010 - Present) and Vice President, Voya Funds Services, LLC (March 2006 - Present). Formerly Managing Paralegal, Registration Statements (June 2003 - July 2012). |
Craig Wheeler
7337 East Doubletree Ranch Rd.
Suite 100
Scottsdale, Arizona 85258
Age: 45 | | Vice President | | May 2008 - Present | | Vice President - Director of Tax, Voya Funds Services, LLC (March 2013 - Present). Formerly, Assistant Vice President - Director of Tax, Voya Funds Services, LLC (March 2008 - March 2013). |
Huey P. Falgout, Jr.
7337 East Doubletree Ranch Rd.
Suite 100
Scottsdale, Arizona 85258
Age: 51 | | Secretary | | August 2003 - Present | | Senior Vice President and Chief Counsel, Voya Investment Management - Mutual Fund Legal Department (March 2010 - Present). Formerly, Chief Counsel, ING Americas, U.S. Legal Services (October 2003 - March 2010). |
Paul A. Caldarelli
7337 East Doubletree Ranch Rd.
Suite 100
Scottsdale, Arizona 85258
Age: 63 | | Assistant Secretary | | June 2010 - Present | | Vice President and Senior Counsel, Voya Investment Management - Mutual Fund Legal Department (March 2010 -Present). Formerly, Senior Counsel, ING Americas, U.S. Legal Services (April 2008 - March 2010). |
Theresa K. Kelety
7337 East Doubletree Ranch Rd.
Suite 100
Scottsdale, Arizona 85258
Age: 52 | | Assistant Secretary | | August 2003 - Present | | Vice President and Senior Counsel, Voya Investment Management - Mutual Fund Legal Department (March 2010 - Present). Formerly, Senior Counsel, ING Americas, U.S. Legal Services (April 2008 - March 2010). |
| (1) | The Officers hold office until the next annual meeting of the Board of Directors and until their successors shall have been elected and qualified. |
ADVISORY CONTRACT APPROVAL DISCUSSION (Unaudited)
BOARD CONSIDERATION AND APPROVAL OF INVESTMENT ADVISORY AND SUB-ADVISORY CONTRACTS
Section 15(c) of the Investment Company Act of 1940, as amended (the “1940 Act”), provides that, after an initial period, the Board of Directors (the “Board”) of Voya Partners, Inc. (the “Company”), including a majority of Board members who have no direct or indirect interest in the advisory and sub-advisory contracts of Voya Index Solution Income Portfolio, Voya Index Solution 2015 Portfolio, Voya Index Solution 2020 Portfolio, Voya Index Solution 2025 Portfolio, Voya Index Solution 2030 Portfolio, Voya Index Solution 2035 Portfolio, Voya Index Solution 2040 Portfolio, Voya Index Solution 2045 Portfolio, Voya Index Solution 2050 Portfolio, and Voya Index Solution 2055 Portfolio (collectively, the “Portfolios”), each a series of the Company, and who are not “interested persons” of the Portfolios, as such term is defined under the 1940 Act (the “Independent Directors”), must annually review and approve the Portfolios’ existing investment advisory and sub-advisory contracts. Thus, at a meeting held on September 12, 2014, the Board, including a majority of the Independent Directors, considered whether to renew and approve the amended and restated investment advisory contract (the “Advisory Contract”) between Directed Services LLC (“Adviser”) and the Portfolios as well as the amended and restated sub-advisory contract (“Sub-Advisory Contract”) with Voya Investment Management Co. LLC, the sub-adviser to each Portfolio (the “Sub-Adviser”).
The Independent Directors also held separate meetings on August 14 and September 10, 2014, to consider the renewal of the Advisory Contract and Sub-Advisory Contract. As a result, subsequent references herein to factors considered and determinations made by the Board include, as applicable, factors considered and determinations made on those earlier dates by the Independent Directors.
At its September 12, 2014 meeting, the Board voted to renew the Advisory and Sub-Advisory Contracts for the Portfolios. In reaching these decisions, the Board took into account information furnished to it throughout the year at meetings of the Board and the Board’s committees, as well as information prepared specifically in connection with the annual renewal or approval process. Determinations by the Independent Directors also took into account various factors that they believed, in light of the legal advice furnished to them by K&L Gates LLP (“K&L Gates”), their independent legal counsel, and their own business judgment, to be relevant. Further, while the Board considered at the same meeting the advisory contracts and sub-advisory contracts that were subject to renewal for the investment companies in the Voya family of funds
(“Voya funds”), the Board considered each Voya fund’s advisory and sub-advisory relationships separately.
Provided below is a general overview of the Board’s contract approval process that it followed, as well as a discussion of certain specific factors that the Board considered at its renewal meetings. While the Board gave its attention to information furnished at the request of the Independent Directors that was most relevant to its considerations, discussed below are some of the primary factors relevant to the Board’s consideration as to whether to renew the Advisory and Sub-Advisory Contracts for the one-year period ending September 30, 2015. Each Board member may have accorded different weight to the various factors in reaching his or her conclusions with respect to each Portfolio’s advisory and sub-advisory arrangements.
Overview of the Contract Renewal and Approval Process
The Board followed a structured process (the “Contract Review Process”) pursuant to which it requested and considered relevant information when it decided whether to approve and renew the Advisory Contract and Sub-Advisory Contract. Among other actions, the Independent Directors previously retained an independent consultant with experience in the mutual fund industry to assist them in working with personnel employed by the Adviser or its affiliates who administer the Portfolios (“Management”) to: identify the types of information presented to the Board to inform its deliberations with respect to advisory and sub-advisory relationships and to help evaluate that information; evaluate industry best practices in regard to the consideration of investment advisory and sub-advisory contracts; establish a specific format in which certain requested information was provided to the Board; and determine the process for the Board’s review of such information.
The Board has established (among other committees) three Investment Review Committees (each, an “IRC”) and a Contracts Committee. Among other matters, the Contracts Committee provides oversight with respect to the contracts renewal and approval process, and each Portfolio is assigned to an IRC, which provides oversight regarding, among other matters, the investment performance of the Adviser and Sub-Adviser, as well as the oversight by the Adviser of the performance of the Sub-Adviser. The IRCs may apply a heightened level of scrutiny in cases where performance was below a Voya fund’s relevant benchmark, and/or a selected peer group of investment companies (“Selected Peer Group”), and/or Lipper Inc. (“Lipper”) category median, and/or Morningstar, Inc. (“Morningstar”) category median, as applicable.
The type and format of the information provided to the Board or to legal counsel for the Independent Directors in
ADVISORY CONTRACT APPROVAL DISCUSSION (Unaudited) (continued)
connection with the Contract Review Process has been codified in a 15(c) methodology guide for the Voya funds (“15(c) Methodology Guide”). This 15(c) Methodology Guide was developed under the direction of the Independent Directors and sets out a blueprint pursuant to which they request certain information that they deem important to facilitate an informed review in connection with initial and annual approvals of advisory and sub-advisory contracts.
Management provided certain of the information requested by the 15(c) Methodology Guide in Fund Analysis and Comparison Tables (“FACT sheets”). The Independent Directors periodically have retained, including most recently in 2014, an independent firm to test and verify the accuracy of certain FACT sheet data for a representative sample of the Voya funds. In addition, the Contracts Committee has routinely employed an independent consultant to assist in its review and analysis of, among other matters, the 15(c) Methodology Guide, the content and format of the FACT sheets, and Selected Peer Group to be used by each Portfolio for certain comparison purposes during the renewal process.
Set forth below is a discussion of many of the Board’s primary considerations and conclusions in connection with its decision to approve each Portfolio’s Advisory and Sub-Advisory Contracts through September 30, 2015.
Nature, Extent and Quality of Service
The Independent Directors received and evaluated such information as they deemed necessary regarding the nature, extent and quality of services provided to the Portfolios by the Adviser and Sub-Adviser. This included information regarding the Adviser and Sub-Adviser provided throughout the year at regular meetings of the Board and its committees, as well as information furnished in connection with the contract renewal meetings.
The materials requested by the Independent Directors and provided to the Board, K&L Gates and/or independent consultants that assisted the Independent Directors prior to the September 12, 2014 Board meeting included, among other information, the following items for each Portfolio: (1) FACT sheets that provided information regarding the performance and expenses of the Portfolio and other similarly managed funds in its Selected Peer Group, information regarding the Portfolio’s investment portfolio, objective and strategies, and information regarding net asset flows into and out of the Portfolio; (2) reports providing risk and attribution analyses of the Portfolio; (3) the 15(c) Methodology Guide, which describes how the FACT sheets were prepared, including the manner in which each Portfolio’s benchmark and Selected Peer Group were selected and how profitability was determined;
(4) responses from the Adviser and Sub-Adviser to the Portfolios to a series of questions posed by K&L Gates on behalf of the Independent Directors; (5) copies of the forms of Advisory and Sub-Advisory Contracts; (6) copies of the Forms ADV for the Adviser and Sub-Adviser; (7) financial statements for the Adviser and Sub-Adviser; (8) a draft narrative summary addressing key factors the Board customarily considers in evaluating the advisory and sub-advisory contracts for the Voya funds (including the Portfolios’ Advisory Contract and Sub-Advisory Contract); (9) independent analyses of Portfolio performance by the Company’s Chief Investment Risk Officer; (10) a report by the Company’s Chief Compliance Officer (“CCO”); and (11) other information relevant to the Board’s evaluations.
The Board was advised that pursuant to an agreement with the European Commission, ING Groep, N.V. (“ING Groep”) is required to divest its entire interest in Voya Financial, Inc. (formerly known as ING U.S., Inc.), its U.S.-based insurance, retirement services and investment management operations, which include the Adviser and the Sub-Adviser, by the end of 2016 (such divestment, the “Separation Plan”). Voya Financial, Inc. is and was, at the time of the September Board meeting, a minority owned subsidiary of ING Groep and a parent company of the Adviser and the Sub-Adviser. The Board further noted that the Separation Plan may result in the Adviser’s and Sub-Adviser’s loss of access to the services and resources of ING Groep, which could adversely affect their businesses and profitability. The Board was advised that the Separation Plan contemplates one or more public offerings and each may be deemed to be a change of control.
The Board was advised that Voya Financial, Inc. had conducted an initial public offering of Voya Financial, Inc. common stock in May 2013 and ING Groep had divested additional shares through three other public offerings since May 2013, reducing its ownership interest in Voya Financial, Inc. to below 50%. The Board was advised that none of these public offerings was deemed to be a change of control. The Board recognized that if any future public offering is deemed to be a change of control, the investment advisory and sub-advisory agreements for each Voya fund would terminate and trigger a need for new agreements, which would require the approval of the Board and, potentially, shareholders of the Portfolios. The Board also was advised that there could be no assurance that the Separation Plan will be carried out completely. The Board considered the potential effects of the Separation Plan on the Portfolios and the Adviser and the Sub-Adviser, including the Adviser’s and the Sub-Adviser’s ability during and after the separation to perform the same level of service to the Portfolios as the Adviser and the Sub-Adviser then provided. The Board was advised that
ADVISORY CONTRACT APPROVAL DISCUSSION (Unaudited) (continued)
neither the Adviser nor the Sub-Adviser anticipated that the Separation Plan would have a material adverse impact on the Portfolios or their operations and administration.
The Board was advised that, in connection with the Separation Plan, Voya Financial, Inc. underwent a rebranding effort (the “Rebranding”) whereby Voya Financial, Inc. and several of its affiliates effected name changes. The Voya funds’ names, as well as the Adviser’s and the Sub-Adviser’s names, were also changed in connection with the Rebranding. The Rebranding resulted in amended and restated forms of advisory and sub-advisory contracts being presented to and approved by the Board at its September 12, 2014 meeting. The Board was advised that the Advisory and Sub-Advisory Contracts have the same terms as the then-current advisory and sub-advisory contracts, except for the effective date and certain immaterial changes made to certain provisions related to the Rebranding.
For each Portfolio, a specific class of shares was used for purposes of certain comparisons between the Portfolio and its Selected Peer Group. The specified class of a Portfolio was chosen based on the 15(c) Methodology Guide and was compared to an analogous class of shares for each fund in its Selected Peer Group. The mutual funds included in each Portfolio’s Selected Peer Group were selected based upon criteria designed to represent the Portfolio share class being compared to the Selected Peer Group.
The Portfolios invest in a combination of mutual funds (“Underlying Funds”) that, in turn, invest directly in a wide range of portfolio securities (such as stocks and bonds). Because each Portfolio operates as a fund-of-funds, the performance of a Portfolio primarily reflects the performance of the Underlying Funds in which it invests.
In arriving at its conclusions with respect to the Advisory Contract, the Board was mindful of the “manager-of-managers” platform of the Voya funds that has been developed by the Adviser. The Board recognized that the Adviser is responsible for monitoring the investment program, performance, and developments and ongoing operations of the Sub-Adviser under this manager-of-managers arrangement. The Board also considered the techniques and resources that the Adviser has developed to provide ongoing oversight of the nature, extent and quality of the services the Sub-Adviser provides to the Portfolios and the Sub-Adviser’s compliance with applicable laws and regulations. The Board was advised that to assist in the selection and monitoring of the Sub-Adviser, the Adviser has developed an oversight process formulated by its Manager Research & Selection Group (“MR&S”), which analyzes both qualitative (such as in-person meetings and telephonic meetings with the
Sub-Adviser and research on sub-advisers) and quantitative information (such as performance data, portfolio data and attribution analysis) about the Sub-Adviser and the funds that it manages. The Board recognized that MR&S also typically provides in-person reports to the IRCs at their meetings prior to any presentations from the Voya funds’ sub-advisers (including the Sub-Adviser). In addition, the Board noted that MR&S prepares periodic due diligence reports regarding the Sub-Adviser based on on-site visits and information and analysis which team members use to attempt to gain and maintain an in-depth understanding of the Sub-Adviser’s investment process and to try to identify issues that may be relevant to the Sub-Adviser’s services to a Portfolio and/or its performance. The Board also noted that MR&S provides written reports on these due diligence analyses to the pertinent IRC. The Board was advised of the resources that Management has committed to its services as a manager-of-managers, including resources for reporting to the Board and the relevant IRC to assist them with their assessment of the investment performance of the Portfolios on an on-going basis throughout the year. This includes the appointment of a Chief Investment Risk Officer and his staff, who report directly to the Board and who have developed attribution analyses and other metrics used by the IRCs to analyze the key factors underlying investment performance for the Voya funds.
The Board also considered the techniques that the Adviser has developed to screen and perform due diligence on new sub-advisers if and when the Adviser recommends to the Board a new sub-adviser to manage a fund in the Voya funds complex. The Board considered that, for new non-Voya-affiliated sub-advisers, MR&S is responsible for: identifying qualified candidates; analyzing their investment processes, personnel and resources; conducting due diligence on the candidates; and selecting a firm to propose as a new sub-adviser, as well as preparing written materials and reports to the committees and the Board as part of the process of considering the approval of any new sub-adviser for a Voya fund.
The Board also considered that in the course of monitoring performance of the Sub-Adviser, MR&S has developed, based on guidance from the IRCs, a methodology for comparing performance of each Portfolio to a Selected Peer Group, to each Portfolio’s Morningstar category median, to its Lipper category median and to its primary benchmark. The Board also recognized that MR&S provides the pertinent IRC with regular updates on the Portfolios and alerts the IRC to potential issues as they arise. The Board also was advised that the Adviser regularly monitors performance, personnel, compliance and other issues that may arise on a day-to-day basis regarding the sub-advisers to the Voya funds, including the
ADVISORY CONTRACT APPROVAL DISCUSSION (Unaudited) (continued)
Sub-Adviser, and considered that, if issues are identified either through formal or informal processes, they are brought before the IRCs and the Board for consideration and action and the Adviser consistently makes its resources available to the Board and the IRCs to assist with addressing any issues that arise.
The Board considered that the Portfolios also benefit from the services of the Adviser’s Investment Risk Management Department (the “IRMD”), under the leadership of the Chief Investment Risk Officer, the costs of which are shared by the Voya funds and the Adviser. The Board considered that the IRMD regularly presents written materials and reports to the IRCs that focus on the investment risks of the Voya funds. The Board also considered that the IRMD provides the IRCs with analyses that are developed to assist the IRCs in identifying trends in the Voya funds’ (including the Portfolios’) performance and other areas over consecutive periods. The Board considered that the services provided by the IRMD are meant to provide an additional perspective for the benefit of the IRCs, which may vary from the perspective of MR&S.
The Board also considered the techniques used by the Adviser to monitor the performance of the Sub-Adviser and the proactive approach that the Adviser, working in cooperation with the relevant IRC, has taken to advocate or recommend, when it believed appropriate, changes designed to assist in improving the Portfolios’ performance.
In considering the Portfolios’ Advisory Contract, the Board also considered the extent of benefits provided to the Portfolios’ shareholders, beyond advisory services, from being part of the Voya funds. This includes, in most cases, the right to exchange or transfer investments, without a sales charge, between the same class of shares of such funds or among Voya funds available on a product platform, and the wide range of Voya funds available for exchange or transfer. The Board also took into account the Adviser’s ongoing efforts to reduce the expenses of the Voya funds through renegotiated arrangements with the Voya funds’ service providers. In addition, the Board considered the efforts of the Adviser and the expenses that it incurred in recent years to help make the Voya funds more balanced and efficient by the launch of new investment products and the combinations of similar funds.
Further, the Board received periodic reports showing that the investment policies and restrictions for each Portfolio were consistently complied with and other periodic reports covering matters such as compliance by Adviser and Sub-Adviser personnel with codes of ethics. The Board considered reports from the Company’s CCO and/or the Adviser’s CCO evaluating whether the regulatory compliance systems and procedures of the Adviser and the Sub-Adviser are reasonably designed to ensure
compliance with the federal securities laws, including those related to, among others, late trading and market timing, best execution, fair value pricing, proxy voting and trade allocation practices. The Board also took into account the Company’s CCO’s annual and periodic reports and recommendations with respect to service provider compliance programs. In this regard, the Board also considered the policies and procedures developed by the Company’s CCO in consultation with the Board’s Compliance Committee that guide the Company’s CCO’s compliance oversight function.
The Board requested and, as applicable, considered information regarding the level of staffing, quality and experience of each Portfolio’s portfolio management team, the respective resources and reputations of the Adviser and Sub-Adviser, and the ability of the Adviser and the Sub-Adviser to attract and retain qualified investment advisory personnel, the adequacy of the resources committed to the Portfolios (and other relevant funds in the Voya funds) by the Adviser and the Sub-Adviser, whether those resources are commensurate with the needs of the Portfolios and are sufficient to sustain appropriate levels of performance and compliance needs, and the Board considered the financial stability of the Adviser and the Sub-Adviser.
Based on their deliberations and the materials presented to them, the Board concluded that the advisory and related services provided by the Adviser and the Sub-Adviser are appropriate in light of the Portfolios’ operations, the competitive landscape of the investment company business, and investor needs, and that the nature, extent and quality of the overall services provided by the Adviser and the Sub-Adviser were appropriate.
Portfolio Performance
In assessing advisory and sub-advisory relationships, the Board placed emphasis on the investment returns of each Portfolio. The Board considered the performance reports and analyses from MR&S and IRMD and discussions with portfolio managers at Board and committee meetings during the year. The Board also paid particular attention in assessing performance information provided in the FACT sheets furnished in connection with the renewal and approval process. The FACT sheets prepared for each Portfolio included its investment performance compared to the Portfolio’s Morningstar category median, Lipper category median, Selected Peer Group and primary benchmark. The FACT sheet performance data was as of March 31, 2014.
The Board also considered at its September 12, 2014 meeting certain additional data regarding performance and Portfolio asset levels for various additional periods ending
ADVISORY CONTRACT APPROVAL DISCUSSION (Unaudited) (continued)
after March 31, 2014. The Board’s findings specific to each Portfolio’s performance are discussed under “Portfolio-by-Portfolio Analysis” below.
Economies of Scale
When evaluating the reasonableness of advisory fee rates, the Board also considered whether economies of scale likely will be realized by the Adviser and Sub-Adviser as a Portfolio grows larger and the extent to which any such economies are reflected in contractual fee rates. The Board considered that while the Portfolios do not have advisory fee breakpoints, they do have fee waiver and/or expense reimbursement arrangements. In this connection, the Board considered the extent to which economies of scale could be realized through such fee waivers, expense reimbursements or other expense reductions. In evaluating economies of scale, the Independent Directors also considered prior periodic management reports, industry information on this topic, fee rates at projected levels of growth versus peers and the Portfolios’ investment performance based on their investments in Underlying Funds.
Information Regarding Services to Other Clients
The Board requested and considered information regarding the nature of services and fee rates offered by the Adviser and Sub-Adviser to other clients, including other registered investment companies and relevant institutional accounts. When fee rates offered by a sub-adviser to a Voya fund to its other clients differ materially from those charged to the Voya fund, the Board considers any underlying rationale provided by the Adviser or, in certain circumstances, the sub-adviser for these differences. The Board also noted that the fee rates charged to the Portfolios and other institutional clients of the Adviser or Sub-Adviser (including other investment companies) may differ materially due to, among other reasons: differences in services; different regulatory requirements associated with registered investment companies, such as the Portfolios, as compared to non-registered investment company clients; market differences in fee rates that existed when a Portfolio first was organized; differences in the original sponsors of the Portfolios that now are managed by the Adviser; investment capacity constraints that existed when certain contracts were first agreed upon or that might exist at present; and different pricing structures that are necessary to be competitive in different marketing channels.
Fee Rates and Profitability
The Board reviewed and considered the contractual investment advisory fee rate, combined with the administrative fee rate, payable by each Portfolio to the
Adviser and to the Adviser’s affiliated company that serves as the administrator to each Portfolio. The Board also considered the contractual sub-advisory fee rate payable by the Adviser to the Sub-Adviser for sub-advisory services for each Portfolio, including the portion of the contractual advisory fees that are paid to the Sub-Adviser, as compared to the portion retained by the Adviser. In addition, the Board considered fee waivers and expense limitations applicable to the fees payable by the Portfolios, including the Adviser’s agreement to extend each such fee waiver and expense limitation agreement for an additional period of at least one year, and not to terminate such agreement in future years without prior approval of the Board.
The Board requested information regarding and, as applicable, considered: (1) the fee rate structure of each Portfolio as it relates to the services provided under the contracts; and (2) the potential fall-out benefits to the Adviser and the Sub-Adviser and their respective affiliates from their association with the Portfolios. For each Portfolio, the Board separately determined that the fees payable to the Adviser and the fee rate payable to the Sub-Adviser are reasonable for the services that each performs, which were considered in light of the nature, extent and quality of the services that each has performed and is expected to perform.
For each Portfolio, the Board considered information on revenues, costs and profits realized by the Adviser and the Sub-Adviser, which was prepared by Management in accordance with the allocation methodology (including related assumptions) specified in the 15(c) Methodology Guide. In analyzing the profitability of the Adviser in connection with its services to a Portfolio, the Board took into account the sub-advisory fee rate payable by the Adviser to the Sub-Adviser. In addition, the Board considered information that it requested and that was provided by Management with respect to the profitability of service providers affiliated with the Adviser. The Board also considered the profitability of the Adviser and its affiliated companies attributable to managing and operating each Portfolio both with and without the profitability of the distributor of the Portfolios and both before and after giving effect to any expenses incurred by the Adviser or any affiliated company in making revenue sharing or other payments to third parties, including affiliated insurance companies, for distribution and administrative services.
Although the 15(c) Methodology Guide establishes certain standards for profit calculation, the Board recognized that profitability analysis on a Portfolio-by-Portfolio basis is not an exact science and there is no uniform methodology within the asset management industry for determining profitability for this purpose. In this context, the Board
ADVISORY CONTRACT APPROVAL DISCUSSION (Unaudited) (continued)
realized that Management’s calculations regarding its costs incurred in establishing the infrastructure necessary for the Portfolios’ operations may not be fully reflected in the expenses allocated to the Portfolios in determining profitability, and that the information presented may not portray all of the costs borne by the Adviser and Management or capture their entrepreneurial risk associated with offering and managing a mutual fund complex in the current regulatory and market environment. In addition, the Board recognized that the use of different reasonable methodologies for purposes of calculating profit data can give rise to dramatically different profit and loss results.
In making its determinations, the Board based its conclusions as to the reasonableness of the advisory and sub-advisory fees of the Adviser and the Sub-Adviser primarily on the factors described for each Portfolio below. At the request of the Board, the Adviser has from time to time agreed to implement remedial actions regarding certain Voya funds. These remedial actions have included, among others: reductions in fee rates or adjustments to expense limitation and waiver arrangements; changes in sub-advisers or portfolio managers; and strategy modifications.
Portfolio-by-Portfolio Analysis
The following paragraphs outline certain of the specific factors that the Board considered, and the conclusions reached, at its September 12, 2014 meeting in relation to approving each Portfolio’s Advisory and Sub-Advisory Contracts. These specific factors are in addition to those considerations discussed above. In each case, the Portfolio’s performance was compared to its Morningstar category median and average, as well as its primary benchmark, a broad-based securities market index that appears in the Portfolio’s prospectus. With respect to Morningstar quintile rankings, the first quintile represents the highest (best) performance and the fifth quintile represents the lowest performance. Each Portfolio’s management fee rate and expense ratio were compared to the fees and expense ratios of the funds in its Selected Peer Group.
Voya Index Solution Income Portfolio
In considering whether to approve the renewal of the Advisory and Sub-Advisory Contracts for Voya Index Solution Income Portfolio, the Board considered that, based on performance data for the periods ended March 31, 2014: (1) the Portfolio outperformed its Morningstar category median for all periods presented, with the exception of the five-year period, during which it underperformed; (2) the Portfolio outperformed its primary benchmark for all periods presented, with the exception of
the one-year and five-year periods, during which it underperformed; and (3) the Portfolio is ranked in the first (highest) quintile of its Morningstar category for the most recent calendar quarter and year-to-date periods, the second quintile for the one-year and three-year periods, and the fourth quintile for the five-year period.
In considering the fees payable under the Advisory and Sub-Advisory Contracts the Portfolio, the Board took into account the factors described above and also considered: (1) the fairness of the compensation under an Advisory Contract with a level fee rate that does not include breakpoints; and (2) the pricing structure (including the expense ratio to be borne by shareholders) of the Portfolio, as compared to its Selected Peer Group, including that: (a) the management fee (inclusive of a 0.10% administration fee) for the Portfolio is above the median and the average management fees of the funds in its Selected Peer Group; and (b) the expense ratio for the Portfolio is below the median and the average expense ratios of the funds in its Selected Peer Group.
In analyzing this fee data, the Board took into account: (1) that the Portfolio indirectly bears the fees payable by the Underlying Funds in which the Portfolio invests; and (2) Management’s representations with respect to the competitiveness of the Portfolio’s management fee rate.
After its deliberation, the Board reached the following conclusions: (1) the Portfolio’s management fee rate is reasonable in the context of all factors considered by the Board; (2) the Portfolio’s expense ratio is reasonable in the context of all factors considered by the Board; (3) the Portfolio’s performance is reasonable in the context of all factors considered by the Board; and (4) the sub-advisory fee rate payable by the Adviser to the Sub-Adviser is reasonable in the context of all factors considered by the Board. Based on these conclusions and other factors, the Board voted to renew the Advisory and Sub-Advisory Contracts for the Portfolio for the year ending September 30, 2015. During this renewal process, different Board members may have given different weight to different individual factors and related conclusions.
Voya Index Solution 2015 Portfolio
In considering whether to approve the renewal of the Advisory and Sub-Advisory Contracts for Voya Index Solution 2015 Portfolio, the Board considered that, based on performance data for the periods ended March 31, 2014: (1) the Portfolio outperformed its Morningstar category median for all periods presented, with the exception of the one-year and five-year periods, during which it underperformed; (2) the Portfolio underperformed its primary benchmark for all periods presented, with the exception of the most recent calendar quarter and
ADVISORY CONTRACT APPROVAL DISCUSSION (Unaudited) (continued)
year-to-date periods, during which it outperformed; and (3) the Portfolio is ranked in the first (highest) quintile of its Morningstar category for the most recent calendar quarter and year-to-date periods, the second quintile for the three-year period, the third quintile for the one-year period, and the fourth quintile for the five-year period.
In analyzing this performance data, the Board took into account Management’s representations regarding the competitiveness of the Portfolio’s performance during certain periods.
In considering the fees payable under the Advisory and Sub-Advisory Contracts for the Portfolio, the Board took into account the factors described above and also considered: (1) the fairness of the compensation under an Advisory Contract with a level fee rate that does not include breakpoints; and (2) the pricing structure (including the expense ratio to be borne by shareholders) of the Portfolio, as compared to its Selected Peer Group, including that: (a) the management fee (inclusive of a 0.10% administration fee) for the Portfolio is above the median and the average management fees of the funds in its Selected Peer Group; and (b) the expense ratio for the Portfolio is below the median and the average expense ratios of the funds in its Selected Peer Group.
In analyzing this fee data, the Board took into account: (1) that the Portfolio indirectly bears the fees payable by the Underlying Funds in which the Portfolio invests; and (2) Management’s view that fee waivers reduce the Portfolio’s net effective management fee rate.
After its deliberation, the Board reached the following conclusions: (1) the Portfolio’s management fee rate is reasonable in the context of all factors considered by the Board; (2) the Portfolio’s expense ratio is reasonable in the context of all factors considered by the Board; (3) the Portfolio’s performance is reasonable in the context of all factors considered by the Board; and (4) the sub-advisory fee rate payable by the Adviser to the Sub-Adviser is reasonable in the context of all factors considered by the Board. Based on these conclusions and other factors, the Board voted to renew the Advisory and Sub-Advisory Contracts for the Portfolio for the year ending September 30, 2015. During this renewal process, different Board members may have given different weight to different individual factors and related conclusions.
Voya Index Solution 2020 Portfolio
In considering whether to approve the renewal of the Advisory and Sub-Advisory Contracts for Voya Index Solution 2020 Portfolio, the Board considered that, based on performance data for the periods ended March 31, 2014: (1) the Portfolio outperformed its Morningstar
category median for all periods presented; (2) the Portfolio outperformed its primary benchmark for all periods presented, with the exception of the one-year period, during which it underperformed; and (3) the Portfolio is ranked in the first (highest) quintile of its Morningstar category for the most recent calendar quarter and year-to-date periods, and the second quintile for the one-year period.
In considering the fees payable under the Advisory and Sub-Advisory Contracts for the Portfolio, the Board took into account the factors described above and also considered: (1) the fairness of the compensation under an Advisory Contract with a level fee rate that does not include breakpoints; and (2) the pricing structure (including the expense ratio to be borne by shareholders) of the Portfolio, as compared to its Selected Peer Group, including that: (a) the management fee (inclusive of a 0.10% administration fee) for the Portfolio is above the median and the average management fees of the funds in its Selected Peer Group; and (b) the expense ratio for the Portfolio is below the median and the average expense ratios of the funds in its Selected Peer Group.
In analyzing this fee data, the Board took into account: (1) Management’s representations that the Portfolio’s management fee is being waived and its expense ratio is competitive; and (2) that the Portfolio indirectly bears the fees payable by the Underlying Funds in which the Portfolio invests.
After its deliberation, the Board reached the following conclusions: (1) the Portfolio’s management fee rate is reasonable in the context of all factors considered by the Board; (2) the Portfolio’s expense ratio is reasonable in the context of all factors considered by the Board; (3) the Portfolio’s performance is reasonable in the context of all factors considered by the Board; and (4) the sub-advisory fee rate payable by the Adviser to the Sub-Adviser is reasonable in the context of all factors considered by the Board. Based on these conclusions and other factors, the Board voted to renew the Advisory and Sub-Advisory Contracts for the Portfolio for the year ending September 30, 2015. During this renewal process, different Board members may have given different weight to different individual factors and related conclusions.
Voya Index Solution 2025 Portfolio
In considering whether to approve the renewal of the Advisory and Sub-Advisory Contracts for Voya Index Solution 2025 Portfolio, the Board considered that, based on performance data for the periods ended March 31, 2014: (1) the Portfolio outperformed its Morningstar category median for all periods presented, with the exception of the five-year period, during which it
ADVISORY CONTRACT APPROVAL DISCUSSION (Unaudited) (continued)
underperformed; (2) the Portfolio outperformed its primary benchmark for all periods presented, with the exception of the three-year and five-year periods, during which it underperformed; and (3) the Portfolio is ranked in the second quintile of its Morningstar category for the most recent calendar quarter, year-to-date, one-year, and three-year periods, and the fourth quintile for the five-year period.
In considering the fees payable under the Advisory and Sub-Advisory Contracts for the Portfolio, the Board took into account the factors described above and also considered: (1) the fairness of the compensation under an Advisory Contract with a level fee rate that does not include breakpoints; and (2) the pricing structure (including the expense ratio to be borne by shareholders) of the Portfolio, as compared to its Selected Peer Group, including that: (a) the management fee (inclusive of 0.10% administration fee) for the Portfolio is above the median and the average management fees of the funds in its Selected Peer Group; and (b) the expense ratio for the Portfolio is below the median and below the average expense ratios of the funds in its Selected Peer Group.
In analyzing this fee data, the Board took into account: (1) that the Portfolio indirectly bears the fees payable by the Underlying Funds in which the Portfolio invests; and (2) Management’s view that fee waivers reduce the Portfolio’s net effective management fee rate.
After its deliberation, the Board reached the following conclusions: (1) the Portfolio’s management fee rate is reasonable in the context of all factors considered by the Board; (2) the Portfolio’s expense ratio is reasonable in the context of all factors considered by the Board; (3) the Portfolio’s performance is reasonable in the context of all factors considered by the Board; and (4) the sub-advisory fee rate payable by the Adviser to the Sub-Adviser is reasonable in the context of all factors considered by the Board. Based on these conclusions and other factors, the Board voted to renew the Advisory and Sub-Advisory Contracts for the Portfolio for the year ending September 30, 2015. During this renewal process, different Board members may have given different weight to different individual factors and related conclusions.
Voya Index Solution 2030 Portfolio
In considering whether to approve the renewal of the Advisory and Sub-Advisory Contracts for Voya Index Solution 2030 Portfolio, the Board considered that, based on performance data for the periods ended March 31, 2014: (1) the Portfolio outperformed its Morningstar category median for all periods presented; (2) the Portfolio underperformed its primary benchmark for all periods
presented; and (3) the Portfolio is ranked in the second quintile of its Morningstar category for all periods presented.
In analyzing this performance data, the Board took into account: (1) Management’s representations regarding the competitiveness of the Portfolio’s performance during certain periods; and (2) Management would continue to monitor, and the Board or its IRC would periodically review, the Portfolio’s performance.
In considering the fees payable under the Advisory and Sub-Advisory Contracts for the Portfolio, the Board took into account the factors described above and also considered: (1) the fairness of the compensation under an Advisory Contract with a level fee rate that does not include breakpoints; and (2) the pricing structure (including the expense ratio to be borne by shareholders) of the Portfolio, as compared to its Selected Peer Group, including that: (a) the management fee (inclusive of a 0.10% administration fee) for the Portfolio is above the median and the average management fees of the funds in its Selected Peer Group; and (b) the expense ratio for the Portfolio is below the median and the average expense ratios of the funds in its Selected Peer Group.
In analyzing this fee data, the Board took into account: (1) that the Portfolio indirectly bears the fees payable by the Underlying Funds in which the Portfolio invests; and (2) Management’s representations with respect to the competitiveness of the Portfolio’s management fee rate.
After its deliberation, the Board reached the following conclusions: (1) the Portfolio’s management fee rate is reasonable in the context of all factors considered by the Board; (2) the Portfolio’s expense ratio is reasonable in the context of all factors considered by the Board; (3) the Portfolio’s performance is reasonable in the context of all factors considered by the Board; and (4) the sub-advisory fee rate payable by the Adviser to the Sub-Adviser is reasonable in the context of all factors considered by the Board. Based on these conclusions and other factors, the Board voted to renew the Advisory and Sub-Advisory Contracts for the Portfolio for the year ending September 30, 2015. During this renewal process, different Board members may have given different weight to different individual factors and related conclusions.
Voya Index Solution 2035 Portfolio
In considering whether to approve the renewal of the Advisory and Sub-Advisory Contracts for Voya Index Solution 2035 Portfolio, the Board considered that, based on performance data for the periods ended March 31, 2014: (1) the Portfolio outperformed its Morningstar category median for all periods presented, with the
ADVISORY CONTRACT APPROVAL DISCUSSION (Unaudited) (continued)
exception of the five-year period, during which it underperformed; (2) the Portfolio outperformed its primary benchmark for the one-year and three-year periods, but underperformed for the most recent calendar quarter, year-to-date, and five-year periods; and (3) the Portfolio is ranked in the second quintile of its Morningstar category for the most recent calendar quarter, year-to-date, one-year, and three-year periods, and the fourth quintile for the five-year period.
In considering the fees payable under the Advisory and Sub-Advisory Contracts for the Portfolio, the Board took into account the factors described above and also considered: (1) the fairness of the compensation under an Advisory Contract with a level fee rate that does not include breakpoints; and (2) the pricing structure (including the expense ratio to be borne by shareholders) of the Portfolio, as compared to its Selected Peer Group, including that: (a) the management fee (inclusive of a 0.10% administration fee) for the Portfolio is above the median and the average management fees of the funds in its Selected Peer Group; and (b) the expense ratio for the Portfolio is below the median and the average expense ratios of the funds in its Selected Peer Group.
In analyzing this fee data, the Board took into account: (1) that the Portfolio indirectly bears the fees payable by the Underlying Funds in which the Portfolio invests; (2) Management’s view that fee waivers reduce the Portfolio’s net effective management fee rate; and (3) Management’s representations with respect to the competitiveness of the Portfolio’s management fee rate.
After its deliberation, the Board reached the following conclusions: (1) the Portfolio’s management fee rate is reasonable in the context of all factors considered by the Board; (2) the Portfolio’s expense ratio is reasonable in the context of all factors considered by the Board; (3) the Portfolio’s performance is reasonable in the context of all factors considered by the Board; and (4) the sub-advisory fee rate payable by the Adviser to the Sub-Adviser is reasonable in the context of all factors considered by the Board. Based on these conclusions and other factors, the Board voted to renew the Advisory and Sub-Advisory Contracts for the Portfolio for the year ending September 30, 2015. During this renewal process, different Board members may have given different weight to different individual factors and related conclusions.
Voya Index Solution 2040 Portfolio
In considering whether to approve the renewal of the Advisory and Sub-Advisory Contracts for Voya Index Solution 2040 Portfolio, the Board considered that, based on performance data for the periods ended March 31, 2014: (1) the Portfolio outperformed its Morningstar
category median for all periods presented; (2) the Portfolio underperformed its primary benchmark for the most recent calendar quarter and year-to-date periods, but outperformed for the one-year period; and (3) the Portfolio is ranked in the second quintile of its Morningstar category for all periods presented.
In considering the fees payable under the Advisory and Sub-Advisory Contracts for the Portfolio, the Board took into account the factors described above and also considered: (1) the fairness of the compensation under an Advisory Contract with a level fee rate that does not include breakpoints; and (2) the pricing structure (including the expense ratio to be borne by shareholders) of the Portfolio, as compared to its Selected Peer Group, including that: (a) the management fee (inclusive of a 0.10% administration fee) for the Portfolio is above the median and the average management fees of the funds in its Selected Peer Group; and (b) the expense ratio for the Portfolio is below the median and the average expense ratios of the funds in its Selected Peer Group.
In analyzing this fee data, the Board took into account: (1) Management’s representations that the Portfolio’s management fee is being waived and its expense ratio is competitive; and (2) that the Portfolio indirectly bears the fees payable by the Underlying Funds in which the Portfolio invests.
After its deliberation, the Board reached the following conclusions: (1) the Portfolio’s management fee rate is reasonable in the context of all factors considered by the Board; (2) the Portfolio’s expense ratio is reasonable in the context of all factors considered by the Board; (3) the Portfolio’s performance is reasonable in the context of all factors considered by the Board; and (4) the sub-advisory fee rate payable by the Adviser to the Sub-Adviser is reasonable in the context of all factors considered by the Board. Based on these conclusions and other factors, the Board voted to renew the Advisory and Sub-Advisory Contracts for the Portfolio for the year ending September 30, 2015. During this renewal process, different Board members may have given different weight to different individual factors and related conclusions.
Voya Index Solution 2045 Portfolio
In considering whether to approve the renewal of the Advisory and Sub-Advisory Contracts for Voya Index Solution 2045 Portfolio, the Board considered that, based on performance data for the periods ended March 31, 2014: (1) the Portfolio outperformed its Morningstar category median for all periods presented; (2) the Portfolio underperformed its primary benchmark for all periods presented, with the exception of the one-year period, during which it outperformed; and (3) the Portfolio is
ADVISORY CONTRACT APPROVAL DISCUSSION (Unaudited) (continued)
ranked in the second quintile of its Morningstar category for the most recent calendar quarter, year-to-date, one-year, and three-year periods, and the third quintile for the five-year period.
In analyzing this performance data, the Board took into account Management’s representations regarding the Portfolio’s favorable performance during certain periods.
In considering the fees payable under the Advisory and Sub-Advisory Contracts for the Portfolio, the Board took into account the factors described above and also considered: (1) the fairness of the compensation under an Advisory Contract with a level fee rate that does not include breakpoints; and (2) the pricing structure (including the expense ratio to be borne by shareholders) of the Portfolio, as compared to its Selected Peer Group, including that: (a) the management fee (inclusive of a 0.10% administration fee) for the Portfolio is above the median and the average management fees of the funds in its Selected Peer Group; and (b) the expense ratio for the Portfolio is below the median and the average expense ratios of the funds in its Selected Peer Group.
In analyzing this fee data, the Board took into account: (1) that the Portfolio indirectly bears the fees payable by the Underlying Funds in which the Portfolio invests; (2) Management’s view that fee waivers reduce the Portfolio’s net effective management fee rate; and (3) Management’s representations with respect to the competitiveness of the Portfolio’s management fee rate.
After its deliberation, the Board reached the following conclusions: (1) the Portfolio’s management fee rate is reasonable in the context of all factors considered by the Board; (2) the Portfolio’s expense ratio is reasonable in the context of all factors considered by the Board; (3) the Portfolio’s performance is reasonable in the context of all factors considered by the Board; and (4) the sub-advisory fee rate payable by the Adviser to the Sub-Adviser is reasonable in the context of all factors considered by the Board. Based on these conclusions and other factors, the Board voted to renew the Advisory and Sub-Advisory Contracts for the Portfolio for the year ending September 30, 2015. During this renewal process, different Board members may have given different weight to different individual factors and related conclusions.
Voya Index Solution 2050 Portfolio
In considering whether to approve the renewal of the Advisory and Sub-Advisory Contracts for Voya Index Solution 2050 Portfolio, the Board considered that, based on performance data for the periods ended March 31, 2014: (1) the Portfolio outperformed its Morningstar category median for all periods presented; (2) the Portfolio
underperformed its primary benchmark for the most recent calendar quarter and year-to-date periods, but outperformed for the one-year period; and (3) the Portfolio is ranked in the second quintile of its Morningstar category for the one-year period, and the third quintile for the most recent calendar quarter and year-to-date periods.
In considering the fees payable under the Advisory and Sub-Advisory Contracts for the Portfolio, the Board took into account the factors described above and also considered: (1) the fairness of the compensation under an Advisory Contract with a level fee rate that does not include breakpoints; and (2) the pricing structure (including the expense ratio to be borne by shareholders) of the Portfolio, as compared to its Selected Peer Group, including that: (a) the management fee (inclusive of a 0.10% administration fee) for the Portfolio is above the median and the average management fees of the funds in its Selected Peer Group; and (b) the expense ratio for the Portfolio is below the median and the average expense ratios of the funds in its Selected Peer Group.
In analyzing this fee data, the Board took into account: (1) Management’s representations that the Portfolio’s management fee is being waived and its expense ratio is competitive; and (2) that the Portfolio indirectly bears the fees payable by the Underlying Funds in which the Portfolio invests.
After its deliberation, the Board reached the following conclusions: (1) the Portfolio’s management fee rate is reasonable in the context of all factors considered by the Board; (2) the Portfolio’s expense ratio is reasonable in the context of all factors considered by the Board; (3) the Portfolio’s performance is reasonable in the context of all factors considered by the Board; and (4) the sub-advisory fee rate payable by the Adviser to the Sub-Adviser is reasonable in the context of all factors considered by the Board. Based on these conclusions and other factors, the Board voted to renew the Advisory and Sub-Advisory Contracts for the Portfolio for the year ending September 30, 2015. During this renewal process, different Board members may have given different weight to different individual factors and related conclusions.
Voya Index Solution 2055 Portfolio
In considering whether to approve the renewal of the Advisory and Sub-Advisory Contracts for Voya Index Solution 2055 Portfolio, the Board considered that, based on performance data for the periods ended March 31, 2014: (1) the Portfolio outperformed its Morningstar category median for all periods presented; (2) the Portfolio underperformed its primary benchmark for all periods presented, with the exception of the one-year period, during which it outperformed; and (3) the Portfolio is
ADVISORY CONTRACT APPROVAL DISCUSSION (Unaudited) (continued)
ranked in the second quintile of its Morningstar category for all periods presented.
In considering the fees payable under the Advisory and Sub-Advisory Contracts for the Portfolio, the Board took into account the factors described above and also considered: (1) the fairness of the compensation under an Advisory Contract with a level fee rate that does not include breakpoints; and (2) the pricing structure (including the expense ratio to be borne by shareholders) of the Portfolio, as compared to its Selected Peer Group, including that: (a) the management fee (inclusive of a 0.10% administration fee) for the Portfolio is above the median and the average management fees of the funds in its Selected Peer Group; and (b) the expense ratio for the Portfolio is below the median and the average expense ratios of the funds in its Selected Peer Group.
In analyzing this fee data, the Board took into account: (1) that the Portfolio indirectly bears the fees payable by the Underlying Funds in which the Portfolio invests; (2) Management’s view that fee waivers reduce the Portfolio’s net effective management fee rate; and (3) Management’s representations with respect to the competitiveness of the Portfolio’s management fee rate.
After its deliberation, the Board reached the following conclusions: (1) the Portfolio’s management fee rate is reasonable in the context of all factors considered by the Board; (2) the Portfolio’s expense ratio is reasonable in the context of all factors considered by the Board; (3) the Portfolio’s performance is reasonable in the context of all factors considered by the Board; and (4) the sub-advisory fee rate payable by the Adviser to the Sub-Adviser is reasonable in the context of all factors considered by the Board. Based on these conclusions and other factors, the Board voted to renew the Advisory and Sub-Advisory Contracts for the Portfolio for the year ending September 30, 2015. During this renewal process, different Board members may have given different weight to different individual factors and related conclusions.
APPROVAL OF INVESTMENT ADVISORY AND SUB-ADVISORY CONTRACTS IN CONNECTION WITH A CHANGE OF CONTROL EVENT
Section 15(c) of the 1940 Act, provides that, when the Portfolios enter into new investment advisory contracts with the Adviser, and the Adviser enters into new sub-advisory contracts between the Adviser and the Sub- Adviser, the Board, including a majority of the Independent Directors, must approve the new arrangements. Discussed below are certain factors that the Board considered at a meeting held on November 18, 2014 in determining whether to approve new advisory and sub-advisory arrangements for the Portfolios in connection
with a Change of Control Event, as such term is defined below, pursuant to the Separation Plan.
At the November 18, 2014 meeting, the Board noted that pursuant to an agreement with the European Commission, ING Groep, N.V. (as defined above, “ING Groep”), the former parent company of the Adviser and the Sub-Adviser, is required to divest its entire interest in Voya Financial, Inc. (formerly, ING U.S., Inc.), its U.S.-based insurance, retirement services, and investment management operations, which include the Adviser and the Sub-Adviser, by the end of 2016 (as defined above, the “Separation Plan”). Voya Financial, Inc. previously was a wholly owned, indirect subsidiary of ING Groep and is a parent company of the Adviser and the Sub-Adviser.
Each of the Portfolios is subject to the 1940 Act, which provides that any investment advisory agreement, including any sub-advisory agreement, must terminate automatically upon its “assignment.” As used in the 1940 Act, the term assignment includes any transfer of a controlling block of outstanding voting securities of an adviser or the parent company of an adviser. Such a transfer is referred to herein as a “Change of Control Event.” ING Groep’s base case to achieve the Separation Plan was through an initial public offering of Voya Financial, Inc. (the “IPO”) followed by the divestment of ING Groep’s remaining ownership interest over time through one or more additional public offerings of Voya Financial, Inc. stock, or, possibly, through one or more privately negotiated sales of the stock. The Board recognized that the Separation Plan contemplated several public offerings and each may have been deemed to be a Change of Control Event, triggering the necessity for new agreements, which would require the approval of the Board. The Board concluded that approval by shareholders of the new agreements that would become effective in the event of one or more Change of Control Events would permit the Portfolios to benefit from the continuation of services by the Adviser, Sub- Adviser, and their affiliates throughout the Separation Plan without the need for multiple shareholder meetings. The Board was informed by the Adviser and its counsel that the Adviser obtained regulatory assurances from the staff of the U.S. Securities and Exchange Commission in March 2013 that they would not object to approval of future agreements by shareholders at a single shareholder meeting. Portfolio shareholders approved the future agreements in May 2013.
The IPO was completed in May 2013. ING Groep divested additional shares in Voya Financial, Inc. through four subsequent public offerings since May 2013, including a secondary common stock offering that closed on November 18, 2014 (the “November Transaction”). (In
ADVISORY CONTRACT APPROVAL DISCUSSION (Unaudited) (continued)
addition, concurrently with the November Transaction, Voya Financial, Inc. repurchased $175 million of its shares directly from ING Groep.) Upon the completion of the November Transaction and the concurrent direct share repurchase, ING Groep’s ownership in Voya Financial, Inc. was reduced from approximately 32.5% to approximately 19%. This was deemed to be a Change of Control Event that resulted in the termination of the Portfolios’ existing advisory and sub-advisory agreements (the “Prior Agreements”) at the close of business on November 18, 2014.
In light of the foregoing, on November 18, 2014 the Board, at an in-person meeting, approved new investment advisory and affiliated sub-advisory agreements (the “New Agreements”) for the Portfolios to replace the Prior Agreements upon termination. At that meeting, the Adviser represented that the agreements approved by the Board were not materially different from the agreements approved by shareholders of the Portfolios in 2013 and no single person or group of persons acting together was expected to gain “control” (as defined in the 1940 Act) of Voya Financial, Inc. As a result, shareholders of the Portfolios will not be asked to vote again on these new agreements with the Adviser and affiliated sub-advisers, including the Sub-Adviser.
The decision by the Board, including a majority of the Independent Directors, to approve the New Agreements was based on a determination by the Board that it would be in the best interests of the shareholders of the Portfolios for the Adviser and Sub-Adviser to continue providing investment advisory, sub-advisory, and related services for the Portfolios, without interruption, after the Change of Control Event.
Prior to its approval of the New Agreements, the Board reviewed, among other matters, the quality, extent and nature of the services currently being provided by the Adviser and Sub-Adviser under the Prior Agreements and to be provided under the New Agreements. A substantial portion of this review was conducted as part of, and in conjunction with, the Board’s annual reviews of the Prior Agreements, which were most recently approved for continuation at the in-person meeting of the Board held on September 12, 2014. During the review process that led to its approval of the Prior Agreements on September 12, 2014, the Board was informed by the Adviser that it was likely the Board would be asked in the very near future to consider approval of the New Agreements. The Board further noted that the Change of Control Event would result in the Adviser’s and the Sub-Adviser’s loss of access to certain services and resources of ING Groep, which could adversely affect their businesses and profitability.
On September 12, 2014, the Board concluded, in light of all factors it considered, including undertakings by the Adviser relating to certain follow-up actions, to renew the Prior Agreements and that the fee rates set forth in the Prior Agreements were fair and reasonable. Among other factors, the Board considered: (1) the nature, extent and quality of services provided under the Prior Agreements; (2) the extent to which economies of scale are reflected in fee rate schedules under the Prior Agreements; (3) the existence of any “fall-out” benefits to the Adviser, Sub-Adviser, and their affiliates; (4) a comparison of fee rates, expense ratios, and investment performance to those of similar funds; and (5) the costs incurred and profits realized by the Adviser, the Sub-Adviser, and their affiliates with respect to their services to the Portfolios.
A further description of the process followed by the Board in approving the Prior Agreements on September 12, 2014, including the information reviewed, certain material factors considered and certain related conclusions reached, is set forth above under the section titled “BOARD CONSIDERATION AND APPROVAL OF INVESTMENT ADVISORY AND SUB-ADVISORY CONTRACTS.”
In connection with its approval of the New Agreements, on November 18, 2014 the Board considered its conclusions in connection with its September 12, 2014 approvals of those Prior Agreements that were in effect on that date, including the Board’s assessment of the nature, extent and quality of services being provided and, as applicable, actions taken in certain instances to improve the relationship between the costs and the quality of services being provided. Also in connection with its November 18, 2014 approvals of the New Agreements, the Board considered a representation from the Adviser that there were no additional developments not already disclosed to the Board since September 12, 2014 that would be a material consideration to the Board in connection with its consideration of the New Agreements.
In addition, in determining whether to approve the New Agreements, the Board took into account the considerations set out below.
| 1) | The Independent Directors solicited and received ongoing advice regarding the Board’s legal duties when approving the New Agreements from K&L Gates, their independent legal counsel, which law firm has extensive experience regarding such matters. |
| 2) | The Board considered Management’s representations regarding its commitment to maintain appropriate levels of overall staffing, ongoing resources and service quality through the transactions under the Separation Plan and |
ADVISORY CONTRACT APPROVAL DISCUSSION (Unaudited) (continued)
after the Change of Control Event. The Board noted that such services include, but are not limited to, portfolio management services, administrative services, and regulatory compliance services. In this regard, the Board considered representations by the Adviser and its affiliates that their separation from ING Groep, as contemplated by the Separation Plan, will not lead to a reduction in the quality or scope of these and other services provided by those firms to the Portfolios. The Board also considered the importance of the asset management operations to the overall success of Voya Financial, Inc., which provides a strong incentive to Voya Financial, Inc. to provide appropriate resource allocations to support those asset management operations.
| 3) | The Board considered representations by the Adviser and its affiliates that approval of the New Agreements would be necessary for the Portfolios to continue receiving investment management services from the Adviser and Sub-Adviser following the November 18th Change of Control Event. In addition, the Board considered representations by the Adviser and its affiliates, as well as related supporting documentation, indicating that the New Agreements, including the fees payable thereunder, are substantially similar to and, in any event, are no less favorable to the Portfolios than, the terms of the corresponding Prior Agreements. |
| 4) | The Board considered representations by the Adviser and its affiliates, including senior investment management personnel, as well as related supporting documentation, indicating that: (a) the Adviser and Sub-Adviser can be expected |
to provide services of the same nature, extent and quality under the New Agreements as were provided under the Prior Agreements; and (b) the November 18th Change of Control Event is not expected to result in any changes to: (i) the management of the Portfolios, including the continuity of the Portfolios’ portfolio managers and other personnel responsible for the management operations of the Portfolios; or (ii) the investment objective of or the principal investment strategies used to manage any of the Portfolios.
| 5) | The Board considered actions taken by the Adviser subsequent to the September 12, 2014 approvals of the Prior Agreements with respect to certain Voya funds in response to requests made by the Board in connection with those approvals. |
| 6) | The Board considered the potential benefits to be realized by the Adviser and its affiliates as a result of the New Agreements. |
Based on the foregoing and other relevant considerations, at a meeting of the Board held on November 18, 2014, the Board, including a majority of the Independent Directors, voted to approve the New Agreements. In this connection, the Board concluded that, in light of all factors considered, the terms of the New Agreements, including fee rates, were fair and reasonable, and the New Agreements should be approved so as to enable a continuation without interruption of the services being provided by the current service providers pursuant to the Prior Agreements. The Board noted that no one factor was determinative of its decisions which, instead, were premised upon the totality of factors considered. The Board also noted that different Board members likely placed emphasis on different factors in reaching their individual conclusions to vote in favor of the New Agreements.
Investment Adviser
Directed Services LLC
1475 Dunwoody Drive
West Chester, Pennsylvania 19380 Administrator
Voya Funds Services, LLC
7337 East Doubletree Ranch Road, Suite 100
Scottsdale, Arizona 85258 Distributor
Voya Investments Distributor, LLC
7337 East Doubletree Ranch Road, Suite 100
Scottsdale, Arizona 85258 Transfer Agent
BNY Mellon Investment Servicing (U.S.) Inc.
301 Bellevue Parkway
Wilmington, Delaware 19809 | | Independent Registered Public Accounting Firm
KPMG LLP
Two Financial Center
60 South Street
Boston, Massachusetts 02111 Custodian
The Bank of New York Mellon
One Wall Street
New York, New York 10286 Legal Counsel
Dechert LLP
1900 K Street, N.W.
Washington, D.C. 20006 |
Before investing, carefully consider the investment objectives, risks, charges and expenses of the variable universal life insurance policy or variable annuity contract and the underlying variable investment options. This and other information is contained in the prospectus for the variable universal life policy or variable annuity contract and the underlying variable investment options. Obtain these prospectuses from your agent/registered representative and read them carefully before investing.
RETIREMENT | INVESTMENTS | INSURANCE voyainvestments.com |  |
VPAR-VINDSOL (1214-021715)
Item 2. Code of Ethics.
As of the end of the period covered by this report, Registrant had adopted a code of ethics, as defined in Item 2 of Form N-CSR, that applies to the Registrant’s principal executive officer and principal financial officer. There were no amendments to the Code during the period covered by the report. The Registrant did not grant any waivers, including implicit waivers, from any provisions of the Code during the period covered by this report. The code of ethics is filed herewith pursuant to Item 10(a)(1), Exhibit 99.CODE ETH.
Item 3. Audit Committee Financial Expert.
The Board of Trustees has determined that J. Michael Earley*, Colleen D. Baldwin, Peter S. Drotch, Patrick W. Kenny, Joseph E. Obermeyer, and Roger B. Vincent are audit committee financial experts, as defined in Item 3 of Form N-CSR. Mr. Earley*, Ms. Baldwin, Mr. Drotch, Mr. Kenny, Mr. Obermeyer and Mr. Vincent are “independent” for purposes of Item 3 of Form N-CSR.
*Effective On December 31, 2014, J. Michael Earley retired as a Director/Trustee.
Item 4. Principal Accountant Fees and Services.
| (a) | Audit Fees: The aggregate fees billed for each of the last two fiscal years for professional services rendered by KPMG LLP (“KPMG”), the principal accountant for the audit of the registrant’s annual financial statements, for services that are normally provided by the accountant in connection with statutory and regulatory filings or engagements for those fiscal years were $896,000 for year ended December 31, 2014 and $887,200 for year ended December 31, 2013. |
| (b) | Audit-Related Fees: The aggregate fees billed in each of the last two fiscal years for assurance and related services by KPMG that are reasonably related to the performance of the audit of the registrant’s financial statements and are not reported under paragraph (a) of this Item were $110,850 for year ended December 31, 2014 and $103,200 for year ended December 31, 2013. |
| (c) | Tax Fees: The aggregate fees billed in each of the last two fiscal years for professional services rendered by KPMG for tax compliance, tax advice, and tax planning were $216,300 in the year ended December 31, 2014 and $199,108 in the year ended December 31, 2013. Such services included review of excise distribution calculations (if applicable), preparation of the Funds’ federal, state and excise tax returns, tax services related to mergers and routine consulting. |
| (d) | All Other Fees: The aggregate fees billed in each of the last two fiscal years for products and services provided by KPMG, other than the services reported in paragraphs (a) through (c) of this Item were $10,944 in the year ended December 31, 2014 and $227 in the year ended December 31, 2013. |
| (e) (1) | Audit Committee Pre-Approval Policies and Procedures |
AUDIT AND NON-AUDIT SERVICES
PRE-APPROVAL POLICY
| I. | Statement of Principles |
Under the Sarbanes-Oxley Act of 2002 (the “Act”), the Audit Committee of the Board of Directors or Trustees (the “Committee”) of the Voya funds (each a “Fund,” collectively, the “Funds”) set out on Exhibit A to this Audit and Non-Audit Services Pre-Approval Policy (“Policy”) is responsible for the oversight of the work of the Funds’ independent auditors. As part of its responsibilities, the Committee must pre-approve the audit and non-audit services performed by the auditors in order to assure that the provision of these services does not impair the auditors’ independence from the Funds. The Committee has adopted, and the Board has ratified, this Policy, which sets out the procedures and conditions under which the services of the independent auditors may be pre-approved.
Under Securities and Exchange Commission (“SEC”) rules promulgated in accordance with the Act, the Funds may establish two different approaches to pre-approving audit and non-audit services. The Committee may approve services without consideration of specific case-by-case services (“general pre-approval”) or it may pre-approve specific services (“specific pre-approval”). The Committee believes that the combination of these approaches contemplated in this Policy results in an effective and efficient method for pre-approving audit and non-audit services to be performed by the Funds’ independent auditors. Under this Policy, services that are not of a type that may receive general pre-approval require specific pre-approval by the Committee. Any proposed services that exceed pre-approved cost levels or budgeted amounts will also require the Committee’s specific pre-approval.
For both types of approval, the Committee considers whether the subject services are consistent with the SEC’s rules on auditor independence and that such services are compatible with maintaining the auditors independence. The Committee also considers whether a particular audit firm is in the best position to provide effective and efficient services to the Funds. Reasons that the auditors are in the best position include the auditors’ familiarity with the Funds’ business, personnel, culture, accounting systems, risk profile, and other factors, and whether the services will enhance the Funds’ ability to manage and control risk or improve audit quality. Such factors will be considered as a whole, with no one factor being determinative.
The appendices attached to this Policy describe the audit, audit-related, tax-related, and other services that have the Committee’s general pre-approval. For any service that has been approved through general pre-approval, the general pre-approval will remain in place for a period 12 months from the date of pre-approval, unless the Committee determines that a different period is appropriate. The Committee will annually review and pre-approve the services that may be provided by the independent auditors without specific pre-approval. The Committee will revise the list of services subject to general pre-approval as appropriate. This Policy does not serve as a delegation to Fund management of the Committee’s duty to pre-approve services performed by the Funds’ independent auditors.
The annual audit services engagement terms and fees are subject to the Committee’s specific pre-approval. Audit services are those services that are normally provided by auditors in connection with statutory and regulatory filings or engagements or those that generally only independent auditors can reasonably provide. They include the Funds’ annual financial statement audit and procedures that the independent auditors must perform in order to form an opinion on the Funds’ financial statements (e.g., information systems and procedural reviews and testing). The Committee will monitor the audit services engagement and approve any changes in terms, conditions or fees deemed by the Committee to be necessary or appropriate.
The Committee may grant general pre-approval to other audit services, such as statutory audits and services associated with SEC registration statements, periodic reports and other documents filed with the SEC or issued in connection with securities offerings.
The Committee has pre-approved the audit services listed on Appendix A. The Committee must specifically approve all audit services not listed on Appendix A.
| III. | Audit-related Services |
Audit-related services are assurance and related services that are reasonably related to the performance of the audit or the review of the Funds’ financial statements or are traditionally performed by the independent auditors. The Committee believes that the provision of audit-related services will not impair the independent auditors’ independence, and therefore may grant pre-approval to audit-related services. Audit-related services include accounting consultations related to accounting, financial reporting or disclosure matters not classified as “audit services;” assistance with understanding and implementing new accounting and financial reporting guidance from rulemaking authorities; agreed-upon or expanded audit procedures relating to accounting and/or billing records required to respond to or comply with financial, accounting or regulatory reporting matters; and assistance with internal control reporting requirements under Form N-SAR or Form N-CSR.
The Committee has pre-approved the audit-related services listed on Appendix B. The Committee must specifically approve all audit-related services not listed on Appendix B.
The Committee believes the independent auditors can provide tax services to the Funds, including tax compliance, tax planning, and tax advice, without compromising the auditors’ independence. Therefore, the Committee may grant general pre-approval with respect to tax services historically provided by the Funds’ independent auditors that do not, in the Committee’s view, impair auditor independence and that are consistent with the SEC’s rules on auditor independence.
The Committee will not grant pre-approval if the independent auditors initially recommends a transaction the sole business purpose of which is tax avoidance and the tax treatment of which may not be supported in the Internal Revenue Code and related regulations. The Committee may consult
outside counsel to determine that tax planning and reporting positions are consistent with this Policy.
The Committee has pre-approved the tax-related services listed on Appendix C. The Committee must specifically approve all tax-related services not listed on Appendix C.
The Committee believes it may grant approval of non-audit services that are permissible services for independent auditors to a Fund. The Committee has determined to grant general pre-approval to other services that it believes are routine and recurring, do not impair auditor independence, and are consistent with SEC rules on auditor independence.
The Committee has pre-approved the non-audit services listed on Appendix D. The Committee must specifically approve all non-audit services not listed on Appendix D.
A list of the SEC’s prohibited non-audit services is attached to this Policy as Appendix E. The SEC’s rules and relevant guidance should be consulted to determine the precise definitions of these impermissible services and the applicability of exceptions to certain of the SEC’s prohibitions.
| VI. | Pre-approval of Fee levels and Budgeted Amounts |
The Committee will annually establish pre-approval fee levels or budgeted amounts for audit, audit-related, tax and non-audit services to be provided to the Funds by the independent auditors. Any proposed services exceeding these levels or amounts require the Committee’s specific pre-approval. The Committee considers fees for audit and non-audit services when deciding whether to pre-approve services. The Committee may determine, for a pre-approval period of 12 months, the appropriate ratio between the total amount of fees for the Fund’s audit, audit-related, and tax services (including fees for services provided to Fund affiliates that are subject to pre-approval), and the total amount of fees for certain permissible non-audit services for the Fund classified as other services (including any such services provided to Fund affiliates that are subject to pre-approval).
Requests or applications for services to be provided by the independent auditors will be submitted to management. If management determines that the services do not fall within those services generally pre-approved by the Committee and set out in the appendices to these procedures, management will submit the services to the Committee or its delagee. Any such submission will include a detailed description of the services to be rendered. Notwithstanding this paragraph, the Committee will, on a quarterly basis, receive from the independent auditors a list of services provided for the previous calendar quarter on a cumulative basis by the auditors during the Pre-Approval Period.
The Committee may delegate pre-approval authority to one or more of the Committee’s members. Any member or members to whom such pre-approval authority is delegated must report any pre-approval decisions, including any pre-approved services, to the Committee at its next scheduled meeting. The Committee will identify any member to whom pre-approval authority is delegated in writing. The member will retain such authority for a period of 12 months from the date of pre-approval unless the Committee determines that a different period is appropriate. The period of delegated authority may be terminated by the Committee or at the option of the member.
| IX. | Additional Requirements |
The Committee will take any measures the Committee deems necessary or appropriate to oversee the work of the independent auditors and to assure the auditors’ independence from the Funds. This may include reviewing a formal written statement from the independent auditors delineating all relationships between the auditors and the Funds, consistent with Independence Standards Board No. 1, and discussing with the auditors their methods and procedures for ensuring independence.
Part of KPMG’s performance of an audit in accordance with standards of the Public Company Accounting Oversight Board (US) includes their responsibility to maintain and monitor auditor independence with respect to the Voya funds. Using a proprietary system called Sentinel, the audit team is able to identify and manage potential conflicts of interest across the member firms of the KPMG International Network and prevent the provision of prohibited services to the Voya entities that would impair KPMG independence with the respect to the Voya funds. In addition to receiving pre-approval from the Voya funds Audit Committee for services provided to the Voya funds and for services for Voya entities in the Investment Company Complex, the audit team has developed a process for periodic notification via email to the Voya funds’ Audit Committee Chairpersons regarding requests to provide services to ING Groep NV and its affiliates from KPMG offices worldwide. Additionally, KPMG provides a quarterly summary of the fees for services that have commenced for ING Groep NV and Affiliates at each Audit Committee Meeting.
Last Approved: May 22, 2014
Appendix A
Pre-Approved Audit Services for the Pre-Approval Period October 1, 2013 through December 31, 2014
| Service |
| | The Fund(s) | Fee Range |
| Statutory audits or financial audits (including tax services associated with audit services) | √ | As presented to Audit Committee1 |
| Services associated with SEC registration statements, periodic reports and other documents filed with the SEC or other documents issued in connection with securities offerings (e.g., consents), and assistance in responding to SEC comment letters. | √ | Not to exceed $9,750 per filing |
| Consultations by Fund management with respect to accounting or disclosure treatment of transactions or events and/or the actual or potential effect of final or proposed rules, standards or interpretations by the SEC, Financial Accounting Standards Board, or other regulatory or standard setting bodies. | √ | Not to exceed $8,000 during the Pre-Approval Period |
| Seed capital audit and related review and issuance of consent on the N-2 registration statement | √ | Not to exceed $13,750 per audit |
| Audit of summary portfolio of investments | √ | Not to exceed $525 per fund |
| 1 | For new Funds launched during the Pre-Approval Period, the fee ranges pre-approved will be the same as those for existing Funds, pro-rated in accordance with inception dates as provided in the auditors’ Proposal or any Engagement Letter covering the period at issue. Fees in the Engagement Letter will be controlling. |
Appendix B
Pre-Approved Audit-Related Services for the Pre-Approval Period October 1, 2013 through December 31, 2014
| Service |
| | The Fund(s) | Fund Affiliates | Fee Range |
| Services related to Fund mergers (Excludes tax services - See Appendix C for tax services associated with Fund mergers) | √ | √ | Not to exceed $10,000 per merger |
| Consultations by Fund management with respect to accounting or disclosure treatment of transactions or events and/or the actual or potential effect of final or proposed rules, standards or interpretations by the SEC, Financial Accounting Standards Board, or other regulatory or standard setting bodies. [Note: Under SEC rules some consultations may be “audit” services and others may be “audit-related” services.] | √ | | Not to exceed $5,000 per occurrence during the Pre-Approval Period |
| Review of the Funds’ semi-annual and quarterly financial statements | √ | | Not to exceed $2,525 per set of financial statements per fund |
| Reports to regulatory or government agencies related to the annual engagement | √ | | Up to $5,000 per occurrence during the Pre-Approval Period |
| Regulatory compliance assistance | √ | √ | Not to exceed $5,000 per quarter |
| Training courses | | √ | Not to exceed $5,000 per course |
| For Prime Rate Trust, agreed upon procedures for quarterly reports to rating agencies | √ | | Not to exceed $9,450 per quarter |
Appendix C
Pre-Approved Tax Services for the Pre-Approval Period October 1, 2013 through December 31, 2014
| Service |
| | The Fund(s) | Fund Affiliates | Fee Range |
| Preparation of federal and state income tax returns and federal excise tax returns for the Funds including assistance and review with excise tax distributions | √ | | As presented to Audit Committee2 |
| Review of IRC Sections 851(b) and 817(h) diversification testing on a real-time basis | √ | | As presented to Audit Committee2 |
| Assistance and advice regarding year-end reporting for 1099’s | √ | | As presented to Audit Committee2 |
| Tax assistance and advice regarding statutory, regulatory or administrative developments | √ | √ | Not to exceed $5,000 for the Funds or for the Funds’ investment adviser during the Pre-Approval Period |
| 2 | For new Funds launched during the Pre-Approval Period, the fee ranges pre-approved will be the same as those for existing Funds, pro-rated in accordance with inception dates as provided in the auditors’ Proposal or any Engagement Letter covering the period at issue. Fees in the Engagement Letter will be controlling. |
Appendix C, continued
| Service |
| | The Fund(s) | Fund Affiliates | Fee Range |
| Tax training courses | | √ | Not to exceed $5,000 per course during the Pre-Approval Period |
| Tax services associated with Fund mergers | √ | √ | Not to exceed $4,000 per fund per merger during the Pre-Approval Period |
| Other tax-related assistance and consultation, including, without limitation, assistance in evaluating derivative financial instruments and international tax issues, qualification and distribution issues, and similar routine tax consultations. | √ | | Not to exceed $120,000 during the Pre-Approval Period |
Appendix D
Pre-Approved Other Services for the Pre-Approval Period October 1, 2013 through December 31, 2014
| Service |
| | The Fund(s) | Fund Affiliates | Fee Range |
| Agreed-upon procedures for Class B share 12b-1 programs | | √ | Not to exceed $60,000 during the Pre-Approval Period |
Security counts performed pursuant to Rule 17f-2 of the 1940 Act (i.e., counts for Funds holding securities with affiliated sub-custodians) Cost to be borne 50% by the Funds and 50% by Voya Investments, LLC. | √ | √ | Not to exceed $5,300 per Fund during the Pre-Approval Period |
| Agreed upon procedures for 15 (c) FACT Books | √ | | Not to exceed $50,000 during the Pre-Approval Period |
Appendix E
Prohibited Non-Audit Services
Dated: October 1, 2013 to December 31, 2014
| · | Bookkeeping or other services related to the accounting records or financial statements of the Funds |
| · | Financial information systems design and implementation |
| · | Appraisal or valuation services, fairness opinions, or contribution-in-kind reports |
| · | Internal audit outsourcing services |
| · | Broker-dealer, investment adviser, or investment banking services |
| · | Expert services unrelated to the audit |
| · | Any other service that the Public Company Accounting Oversight Board determines, by regulation, is impermissible |
EXHIBIT A
VOYA ASIA PACIFIC HIGH DIVIDEND EQUITY INCOME FUND
VOYA BALANCED PORTFOLIO, INC.
VOYA EMERGING MARKETS LOCAL BOND FUND
VOYA EMERGING MARKETS HIGH DIVIDEND EQUITY FUND
VOYA EQUITY TRUST
VOYA FUNDS TRUST
VOYA GLOBAL ADVANTAGE AND PREMIUM OPPORTUNITY FUND
VOYA GLOBAL EQUITY DIVIDEND AND PREMIUM OPPORTUNITY FUND
VOYA GLOBAL STRATEGIC INCOME FUND
VOYA INFRASTRUCTURE, INDUSTRIALS, AND MATERIALS FUND
VOYA INTERMEDIATE BOND PORTFOLIO
VOYA INTERNATIONAL HIGH DIVIDEND EQUITY INCOME FUND
VOYA INVESTORS TRUST
VOYA MONEY MARKET PORTFOLIO
VOYA MUTUAL FUNDS
VOYA PARTNERS, INC.
VOYA PRIME RATE TRUST
VOYA RISK MANAGED NATURAL RESOURCES
VOYA SENIOR INCOME FUND
VOYA SEPARATE PORTFOLIOS TRUST
VOYA SERIES FUND, INC.
VOYA SHORT DURATION HIGH INCOME FUND
VOYA STRATEGIC ALLOCATIONS PORTFOLIOS, INC.
VOYA VARIABLE FUNDS
VOYA VARIABLE INSURANCE TRUST
VOYA VARIABLE PORTFOLIOS INC,
VOYA VARIABLE PRODUCTS TRUST
| (e) (2) | Percentage of services referred to in 4(b) — (4)(d) that were approved by the audit committee |
100% of the services were approved by the audit committee.
| (f) | Percentage of hours expended attributable to work performed by other than full time employees of KPMG if greater than 50%. |
Not applicable.
| (g) | Non-Audit Fees: The following table presents (i) the aggregate non-audit fees (i.e., fees for audit-related, tax, and other services) billed to each Registrant by the independent registered public accounting firm for each Registrant's fiscal years ended December 31, 2014 and December 31, 2013; and (ii) the aggregate non-audit fees billed to the investment adviser, or any of its affiliates that provide ongoing services to the registrant, by the independent registered public accounting firm for the same time periods. |
| Registrant/Investment Adviser | 2014 | 2013 |
| Voya Partners, Inc. | $ 338,094 | $ 302,535 |
| Voya Investments, LLC (1) | $ 184,250 | $ 1,135,567 |
_____________
(1) Each Registrant's investment adviser and any of its affiliates, which are subsidiaries of Voya Financial, Inc.
| (h) | Principal Accountants Independence: The Registrant’s Audit committee has considered whether the provision of non-audit services that were rendered to the registrant’s investment adviser and any entity controlling, controlled by, or under common control with the investment adviser that provides ongoing services to the registrant that were not pre-approved pursuant to Rule 2-01(c)(7)(ii) of Regulation S-X is compatible with maintaining KPMG’s independence. |
Item 5. Audit Committee of Listed Registrants.
Not applicable.
Item 6. Schedule of Investments
Summary Schedule is included as part of the report to shareholders filed under Item 1 of this Form, if applicable.
Report of Independent Registered Public Accounting Firm
The Shareholders and Board of Directors
Voya Partners, Inc.
We have audited the accompanying statements of assets and liabilities, including the summary portfolios of investments, of Voya Aggregate Bond Portfolio (formerly, VY® PIMCO Bond Portfolio), Voya Global Bond Portfolio, VY® American Century Small-Mid Cap Value Portfolio, VY® Baron Growth Portfolio, VY® Columbia Contrarian Core Portfolio, VY® Columbia Small Cap Value II Portfolio, VY® Invesco Comstock Portfolio, VY® Invesco Equity and Income Portfolio, VY® JPMorgan Mid Cap Value Portfolio, VY® Oppenheimer Global Portfolio, VY® Pioneer High Yield Portfolio, VY® T. Rowe Price Diversified Mid Cap Growth Portfolio, VY® T. Rowe Price Growth Equity Portfolio, and VY® Templeton Foreign Equity Portfolio, each a series of Voya Partners, Inc., as of December 31, 2014, and the related statements of operations for the year then ended, the statements of changes in net assets for each of the years in the two-year period then ended (collectively, the "financial statements"), and the financial highlights for each of the years or periods in the five-year period then ended (the financial statements and financial highlights are included in Item 1 of this Form N-CSR), and the portfolios of investments as of December 31, 2014 (included in Item 6 of this Form N-CSR). These financial statements, financial highlights, and portfolios of investments are the responsibility of management. Our responsibility is to express an opinion on these financial statements, financial highlights, and portfolios of investments based on our audits.
We conducted our audits in accordance with the standards of the Public Company Accounting Oversight Board (United States). Those standards require that we plan and perform the audit to obtain reasonable assurance about whether the financial statements, financial highlights, and portfolios of investments are free of material misstatement. An audit includes examining, on a test basis, evidence supporting the amounts and disclosures in the financial statements and portfolios of investments. Our procedures included confirmation of securities owned as of December 31, 2014, by correspondence with the custodian, transfer agent, and brokers, or by other appropriate auditing procedures when replies from brokers were not received. An audit also includes assessing the accounting principles used and significant estimates made by management, as well as evaluating the overall financial statement presentation. We believe that our audits provide a reasonable basis for our opinion.
In our opinion, the financial statements, financial highlights, and portfolios of investments referred to above present fairly, in all material respects, the financial position of the aforementioned funds of Voya Partners, Inc. as of December 31, 2014, and the results of their operations for the year then ended, the changes in their net assets for each of the years in the two-year period then ended, and the financial highlights for each of the years or periods in the five-year period then ended, in conformity with U.S. generally accepted accounting principles.
Boston, Massachusetts
February 24, 2015
| | PORTFOLIO OF INVESTMENTS |
| Voya Aggregate Bond Portfolio | as of December 31, 2014 |
Principal
Amount† | | | | | | | Value | | | Percentage
of Net
Assets | |
| CORPORATE BONDS/NOTES: 28.1% |
| | | | | | | Basic Materials: 0.9% | | | | | | | | |
| | 1,023,000 | | | | | Agrium, Inc., 5.250%, 01/15/45 | | | 1,109,280 | | | | 0.2 | |
| | 988,000 | | | | | BHP Billiton Finance USA Ltd, 5.000%, 09/30/43 | | | 1,124,416 | | | | 0.2 | |
| | 283,000 | | | # | | Braskem Finance Ltd., 7.000%, 05/07/20 | | | 305,994 | | | | 0.0 | |
| | 1,800,000 | | | #,L | | CSN Islands XI Corp., 6.875%, 09/21/19 | | | 1,678,500 | | | | 0.2 | |
| | 718,000 | | | | | Eastman Chemical Co., 3.800%, 03/15/25 | | | 732,417 | | | | 0.1 | |
| | 1,089,000 | | | # | | Georgia-Pacific LLC, 3.600%, 03/01/25 | | | 1,095,914 | | | | 0.1 | |
| | 702,000 | | | | | LYB International Finance BV, 4.000%, 07/15/23 | | | 719,398 | | | | 0.1 | |
| | | | | | | | | | 6,765,919 | | | | 0.9 | |
| | | | | | | | | | | | | | | |
| | | | | | | Communications: 4.6% | | |
| | 716,000 | | | | | Amazon.com, Inc., 4.950%, 12/05/44 | | | 743,114 | | | | 0.1 | |
| | 2,101,000 | | | L | | AT&T, Inc., 3.900%, 03/11/24 | | | 2,163,280 | | | | 0.3 | |
| | 765,000 | | | | | AT&T, Inc., 4.800%, 06/15/44 | | | 782,592 | | | | 0.1 | |
| | 1,437,000 | | | L | | CBS Corp., 3.700%, 08/15/24 | | | 1,435,941 | | | | 0.2 | |
| | 1,802,000 | | | # | | Cox Communications, Inc., 3.850%, 02/01/25 | | | 1,822,669 | | | | 0.2 | |
| | 2,000,000 | | | | | DIRECTV Holdings LLC / DIRECTV Financing Co., Inc., 3.950%, 01/15/25 | | | 2,019,888 | | | | 0.3 | |
| | 1,457,000 | | | | | eBay, Inc., 3.450%, 08/01/24 | | | 1,435,485 | | | | 0.2 | |
| | 1,443,000 | | | L | | Motorola Solutions, Inc., 4.000%, 09/01/24 | | | 1,454,579 | | | | 0.2 | |
| | 1,090,000 | | | | | 21st Century Fox America, Inc., 3.000%, 09/15/22 | | | 1,084,494 | | | | 0.1 | |
| | 800,000 | | | | | Sprint Nextel Corp., 9.125%, 03/01/17 | | | 881,960 | | | | 0.1 | |
| | 1,209,000 | | | | | Time Warner Cable, Inc., 5.875%, 11/15/40 | | | 1,446,726 | | | | 0.2 | |
| | 1,044,000 | | | | | Time Warner, Inc., 4.050%, 12/15/23 | | | 1,097,257 | | | | 0.1 | |
| | 976,000 | | | | | Time Warner, Inc., 5.350%, 12/15/43 | | | 1,112,833 | | | | 0.1 | |
| | 4,700,000 | | | | | Verizon Communications, Inc., 1.991%, 09/14/18 | | | 4,893,565 | | | | 0.6 | |
| | 352,000 | | | | | Verizon Communications, Inc., 2.500%, 09/15/16 | | | 360,049 | | | | 0.0 | |
| | 800,000 | | | | | Verizon Communications, Inc., 3.000%, 11/01/21 | | | 790,194 | | | | 0.1 | |
| | 3,800,000 | | | | | Verizon Communications, Inc., 3.500%, 11/01/24 | | | 3,741,184 | | | | 0.5 | |
| | 1,400,000 | | | | | Verizon Communications, Inc., 3.650%, 09/14/18 | | | 1,480,185 | | | | 0.2 | |
| | 1,853,000 | | | | | Verizon Communications, Inc., 4.150%, 03/15/24 | | | 1,919,752 | | | | 0.3 | |
| | 1,939,000 | | | | | Verizon Communications, Inc., 5.150%, 09/15/23 | | | 2,142,622 | | | | 0.3 | |
| | 2,166,000 | | | | | Viacom, Inc., 3.875%, 04/01/24 | | | 2,178,431 | | | | 0.3 | |
| | 719,000 | | | | | WPP Finance 2010, 3.750%, 09/19/24 | | | 723,113 | | | | 0.1 | |
| | | | | | | | | | 35,709,913 | | | | 4.6 | |
| | | | | | | | | | | | | | | |
| | | | | | | Consumer, Cyclical: 0.8% | | | |
| | 700,000 | | | | | Bed Bath & Beyond, Inc., 5.165%, 08/01/44 | | | 731,841 | | | | 0.1 | |
| | 82,890 | | | | | CVS Pass-Through Trust, 6.943%, 01/10/30 | | | 100,678 | | | | 0.0 | |
| | 684,000 | | | | | Ford Motor Co., 4.750%, 01/15/43 | | | 724,553 | | | | 0.1 | |
| | 697,000 | | | | | Johnson Controls, Inc., 4.625%, 07/02/44 | | | 720,157 | | | | 0.1 | |
| | 676,000 | | | | | Kohl's Corp., 4.750%, 12/15/23 | | | 724,783 | | | | 0.1 | |
| | 722,000 | | | | | Ross Stores, Inc., 3.375%, 09/15/24 | | | 724,123 | | | | 0.1 | |
| | 717,000 | | | | | Walgreens Boots Alliance, Inc., 3.800%, 11/18/24 | | | 732,736 | | | | 0.1 | |
| | 1,440,000 | | | | | Walgreens Boots Alliance, Inc., 4.800%, 11/18/44 | | | 1,524,397 | | | | 0.2 | |
| | | | | | | | | | 5,983,268 | | | | 0.8 | |
| | | | | | | | | | | | | | | |
| | | | | | | Consumer, Non-cyclical: 3.7% | | | |
| | 1,452,000 | | | | | Actavis Funding SCS, 3.850%, 06/15/24 | | | 1,462,226 | | | | 0.2 | |
| | 1,378,000 | | | | | Altria Group, Inc., 4.000%, 01/31/24 | | | 1,439,409 | | | | 0.2 | |
| | 158,000 | | | | | Altria Group, Inc., 5.375%, 01/31/44 | | | 180,555 | | | | 0.0 | |
| | 1,076,000 | | | | | Amgen, Inc., 3.625%, 05/22/24 | | | 1,095,807 | | | | 0.2 | |
| | 1,067,000 | | | | | Becton Dickinson and Co., 3.734%, 12/15/24 | | | 1,100,339 | | | | 0.2 | |
| | 709,000 | | | | | CareFusion Corp., 3.875%, 05/15/24 | | | 733,084 | | | | 0.1 | |
| | 1,076,000 | | | | | Celgene Corp., 3.625%, 05/15/24 | | | 1,100,858 | | | | 0.2 | |
| | 732,000 | | | | | Express Scripts Holding Co., 3.500%, 06/15/24 | | | 730,889 | | | | 0.1 | |
| | 1,059,000 | | | | | Gilead Sciences, Inc., 3.500%, 02/01/25 | | | 1,089,212 | | | | 0.1 | |
| | 1,055,000 | | | | | McKesson Corp., 3.796%, 03/15/24 | | | 1,085,835 | | | | 0.1 | |
| | 1,802,000 | | | # | | Medtronic, Inc., 3.500%, 03/15/25 | | | 1,847,333 | | | | 0.2 | |
| | 1,405,000 | | | # | | Medtronic, Inc., 4.375%, 03/15/35 | | | 1,495,565 | | | | 0.2 | |
| | 692,000 | | | # | | Medtronic, Inc., 4.625%, 03/15/45 | | | 753,273 | | | | 0.1 | |
| | 1,435,000 | | | | | Perrigo Finance plc, 3.900%, 12/15/24 | | | 1,463,011 | | | | 0.2 | |
| | 702,000 | | | | | Pfizer, Inc., 3.400%, 05/15/24 | | | 731,810 | | | | 0.1 | |
| | 1,087,000 | | | | | Philip Morris International, Inc., 3.250%, 11/10/24 | | | 1,091,634 | | | | 0.1 | |
See Accompanying Notes to Financial Statements
| | PORTFOLIO OF INVESTMENTS |
| Voya Aggregate Bond Portfolio | as of December 31, 2014 |
| | 1,441,000 | | | | | Philip Morris International, Inc., 4.250%, 11/10/44 | | | 1,471,552 | | | | 0.2 | |
| | 669,000 | | | | | Reynolds American, Inc., 4.850%, 09/15/23 | | | 721,378 | | | | 0.1 | |
| | 600,000 | | | | | Reynolds American, Inc., 6.750%, 06/15/17 | | | 668,782 | | | | 0.1 | |
| | 725,000 | | | | | St Jude Medical, Inc., 3.250%, 04/15/23 | | | 726,082 | | | | 0.1 | |
| | 684,000 | | | | | St Jude Medical, Inc., 4.750%, 04/15/43 | | | 728,903 | | | | 0.1 | |
| | 1,051,000 | | | | | Synchrony Financial, 4.250%, 08/15/24 | | | 1,079,706 | | | | 0.1 | |
| | 1,760,000 | | | | | Sysco Corp., 3.500%, 10/02/24 | | | 1,817,645 | | | | 0.2 | |
| | 1,389,000 | | | | | Tyson Foods, Inc., 3.950%, 08/15/24 | | | 1,438,643 | | | | 0.2 | |
| | 642,000 | | | | | Tyson Foods, Inc., 5.150%, 08/15/44 | | | 723,936 | | | | 0.1 | |
| | 1,720,000 | | | | | WellPoint, Inc., 4.650%, 08/15/44 | | | 1,829,017 | | | | 0.2 | |
| | | | | | | | | | 28,606,484 | | | | 3.7 | |
| | | | | | | | | | | | | | | |
| | | | | | | Energy: 2.7% | | | | | | | | |
| | 1,453,000 | | | | | ConocoPhillips Co., 3.350%, 11/15/24 | | | 1,471,037 | | | | 0.2 | |
| | 780,000 | | | L | | Diamond Offshore Drilling, Inc., 3.450%, 11/01/23 | | | 725,263 | | | | 0.1 | |
| | 795,000 | | | | | Enbridge, Inc., 3.500%, 06/10/24 | | | 748,256 | | | | 0.1 | |
| | 1,117,000 | | | | | Energy Transfer Partners L.P., 5.150%, 02/01/43 | | | 1,109,484 | | | | 0.1 | |
| | 660,000 | | | | | Energy Transfer Partners L.P., 6.500%, 02/01/42 | | | 761,203 | | | | 0.1 | |
| | 1,670,000 | | | | | Enterprise Products Operating LLC, 5.700%, 02/15/42 | | | 1,938,386 | | | | 0.3 | |
| | 1,115,000 | | | | | Kinder Morgan Energy Partners L.P., 5.400%, 09/01/44 | | | 1,121,380 | | | | 0.1 | |
| | 1,463,000 | | | | | Kinder Morgan, Inc./DE, 4.300%, 06/01/25 | | | 1,470,907 | | | | 0.2 | |
| | 1,232,000 | | | | | Marathon Petroleum Corp., 4.750%, 09/15/44 | | | 1,168,006 | | | | 0.2 | |
| | 1,443,000 | | | | | Phillips 66, 4.875%, 11/15/44 | | | 1,482,788 | | | | 0.2 | |
| | 7,000,000 | | | # | | Rockies Express Pipeline LLC, 3.900%, 04/15/15 | | | 6,982,500 | | | | 0.9 | |
| | 1,030,000 | | | | | Statoil ASA, 2.450%, 01/17/23 | | | 984,221 | | | | 0.1 | |
| | 1,088,000 | | | | | Sunoco Logistics Partners Operations L.P., 4.250%, 04/01/24 | | | 1,102,284 | | | | 0.1 | |
| | 200,000 | | | | | TNK-BP Finance SA, 7.500%, 07/18/16 | | | 192,600 | | | | 0.0 | |
| | | | | | | | | | 21,258,315 | | | | 2.7 | |
| | | | | | | | | | | | | | | |
| | | | | | | Financial: 13.6% | | | | | | | | |
| | 1,045,000 | | | | | American International Group, Inc., 3.375%, 08/15/20 | | | 1,086,932 | | | | 0.1 | |
| | 1,400,000 | | | | | Ally Financial, Inc., 3.500%, 07/18/16 | | | 1,419,250 | | | | 0.2 | |
| | 4,000,000 | | | | | Ally Financial, Inc., 4.625%, 06/26/15 | | | 4,035,000 | | | | 0.5 | |
| | 2,200,000 | | | | | Ally Financial, Inc., 8.300%, 02/12/15 | | | 2,213,570 | | | | 0.3 | |
| | 1,456,000 | | | | | American Tower Corp., 3.450%, 09/15/21 | | | 1,433,570 | | | | 0.2 | |
| | 1,443,000 | | | | | AvalonBay Communities, Inc., 3.500%, 11/15/24 | | | 1,445,495 | | | | 0.2 | |
| | 2,150,000 | | | | | Bank of America Corp., 0.597%, 06/20/15 | | | 2,141,593 | | | | 0.3 | |
| | 1,097,000 | | | | | Bank of America Corp., 4.250%, 10/22/26 | | | 1,096,048 | | | | 0.2 | |
| | 2,080,000 | | | | | Bank of America Corp., 4.000%, 04/01/24 | | | 2,168,256 | | | | 0.3 | |
| | 969,000 | | | | | Bank of America Corp., 5.000%, 01/21/44 | | | 1,089,468 | | | | 0.1 | |
| | 1,700,000 | | | | | Bank of India, 4.750%, 09/30/15 | | | 1,740,621 | | | | 0.2 | |
| | 600,000 | | | # | | Bank of Montreal, 2.850%, 06/09/15 | | | 606,062 | | | | 0.1 | |
| | 500,000 | | | # | | Bank of Nova Scotia, 1.950%, 01/30/17 | | | 507,953 | | | | 0.1 | |
| | 1,200,000 | | | # | | BBVA, 6.500%, 03/10/21 | | | 1,305,480 | | | | 0.2 | |
| | 1,030,000 | | | # | | BPCE SA, 5.150%, 07/21/24 | | | 1,063,380 | | | | 0.1 | |
| | 1,000,000 | | | # | | CIT Group, Inc., 4.750%, 02/15/15 | | | 1,004,242 | | | | 0.1 | |
| | 2,164,000 | | | | | Citigroup, Inc., 4.000%, 08/05/24 | | | 2,175,279 | | | | 0.3 | |
| | 980,000 | | | | | Citigroup, Inc., 5.500%, 09/13/25 | | | 1,086,598 | | | | 0.1 | |
| | 1,823,000 | | | | | Citizens Bank NA/Providence RI, 2.450%, 12/04/19 | | | 1,815,358 | | | | 0.2 | |
| | 1,061,000 | | | | | Comerica, Inc., 3.800%, 07/22/26 | | | 1,070,996 | | | | 0.1 | |
| | 2,100,000 | | | | | Cooperatieve Centrale Raiffeisen-Boerenleenbank BA/Netherlands, 8.375%, 07/29/49 | | | 2,246,941 | | | | 0.3 | |
| | 1,956,000 | | | # | | Credit Suisse AG, 6.500%, 08/08/23 | | | 2,152,032 | | | | 0.3 | |
| | 693,000 | | | | | Discover Bank/Greenwood DE, 4.250%, 03/13/26 | | | 721,566 | | | | 0.1 | |
| | 1,030,000 | | | # | | Five Corners Funding Trust, 4.419%, 11/15/23 | | | 1,091,144 | | | | 0.1 | |
| | 1,000,000 | | | | | Ford Motor Credit Co. LLC, 3.664%, 09/08/24 | | | 1,004,026 | | | | 0.1 | |
| | 2,000,000 | | | | | General Motors Financial Co., Inc., 4.750%, 08/15/17 | | | 2,114,200 | | | | 0.3 | |
| | 400,000 | | | | | Goldman Sachs Group, Inc., 0.860%, 06/04/17 | | | 399,414 | | | | 0.1 | |
| | 2,810,000 | | | | | Goldman Sachs Group, Inc., 3.850%, 07/08/24 | | | 2,885,285 | | | | 0.4 | |
| | 878,000 | | | | | Goldman Sachs Group, Inc., 6.750%, 10/01/37 | | | 1,106,096 | | | | 0.2 | |
| | 712,000 | | | | | HCP, Inc., 3.875%, 08/15/24 | | | 724,676 | | | | 0.1 | |
| | 1,070,000 | | | | | HSBC Holdings PLC, 6.375%, 12/29/49 | | | 1,082,037 | | | | 0.1 | |
| | 4,800,000 | | | # | | ICICI Bank Ltd../Dubai, 4.750%, 11/25/16 | | | 5,020,901 | | | | 0.7 | |
See Accompanying Notes to Financial Statements
| | PORTFOLIO OF INVESTMENTS |
| Voya Aggregate Bond Portfolio | as of December 31, 2014 |
| | 1,800,000 | | | | | ICICI Bank Ltd., 5.500%, 03/25/15 | | | 1,819,028 | | | | 0.2 | |
| | 1,000,000 | | | | | International Lease Finance Corp., 4.875%, 04/01/15 | | | 1,009,125 | | | | 0.1 | |
| | 300,000 | | | | | International Lease Finance Corp., 5.750%, 05/15/16 | | | 311,812 | | | | 0.0 | |
| | 700,000 | | | # | | International Lease Finance Corp., 6.750%, 09/01/16 | | | 747,250 | | | | 0.1 | |
| | 6,200,000 | | | | | International Lease Finance Corp., 8.625%, 09/15/15 | | | 6,479,000 | | | | 0.8 | |
| | 740,000 | | | | | JPMorgan Chase & Co., 3.375%, 05/01/23 | | | 732,882 | | | | 0.1 | |
| | 2,181,000 | | | | | JPMorgan Chase & Co., 3.875%, 09/10/24 | | | 2,185,480 | | | | 0.3 | |
| | 1,464,000 | | | | | JPMorgan Chase & Co., 4.125%, 12/15/26 | | | 1,463,425 | | | | 0.2 | |
| | 1,089,000 | | | | | JPMorgan Chase & Co., 6.125%, 12/29/49 | | | 1,091,712 | | | | 0.1 | |
| | 746,000 | | | | | Kimco Realty Corp., 3.125%, 06/01/23 | | | 732,233 | | | | 0.1 | |
| | 1,800,000 | | | | | Merrill Lynch & Co., Inc., 6.875%, 04/25/18 | | | 2,068,996 | | | | 0.3 | |
| | 2,105,000 | | | | | Morgan Stanley, 3.875%, 04/29/24 | | | 2,164,018 | | | | 0.3 | |
| | 1,033,000 | | | | | Morgan Stanley, 5.000%, 11/24/25 | | | 1,103,725 | | | | 0.2 | |
| | 500,000 | | | # | | National Bank of Canada, 2.200%, 10/19/16 | | | 511,387 | | | | 0.1 | |
| | 1,400,000 | | | # | | Nationwide Building Society, 6.250%, 02/25/20 | | | 1,644,070 | | | | 0.2 | |
| | 4,000,000 | | | # | | Principal Life Global Funding II, 1.200%, 05/19/17 | | | 3,975,516 | | | | 0.5 | |
| | 600,000 | | | # | | Royal Bank of Scotland Group PLC, 6.990%, 10/29/49 | | | 678,000 | | | | 0.1 | |
| | 900,000 | | | | | Sberbank of Russia Via SB Capital SA, 5.499%, 07/07/15 | | | 893,250 | | | | 0.1 | |
| | 1,084,000 | | | # | | Scentre Group Trust 1 / Scentre Group Trust 2, 3.500%, 02/12/25 | | | 1,090,544 | | | | 0.1 | |
| | 1,777,000 | | | | | Simon Property Group L.P., 4.250%, 10/01/44 | | | 1,846,607 | | | | 0.2 | |
| | 1,500,000 | | | | | Navient Corp., 6.250%, 01/25/16 | | | 1,563,750 | | | | 0.2 | |
| | 5,700,000 | | | | | Navient Corp., 8.450%, 06/15/18 | | | 6,369,750 | | | | 0.8 | |
| | 1,000,000 | | | | | Springleaf Finance Corp., 6.900%, 12/15/17 | | | 1,067,500 | | | | 0.1 | |
| | 1,086,000 | | | | | State Street Corp., 3.300%, 12/16/24 | | | 1,104,559 | | | | 0.2 | |
| | 400,000 | | | # | | Turkiye Garanti Bankasi AS, 2.731%, 04/20/16 | | | 401,000 | | | | 0.1 | |
| | 1,075,000 | | | | | UBS AG, 5.125%, 05/15/24 | | | 1,081,977 | | | | 0.1 | |
| | 4,000,000 | | | | | UBS AG/Stamford CT, 7.625%, 08/17/22 | | | 4,716,408 | | | | 0.6 | |
| | 1,416,000 | | | | | US Bancorp/MN, 3.600%, 09/11/24 | | | 1,440,876 | | | | 0.2 | |
| | 1,065,000 | | | # | | WEA Finance LLC / Westfield UK & Europe Finance PLC, 3.750%, 09/17/24 | | | 1,082,914 | | | | 0.1 | |
| | 1,437,000 | | | | | Wells Fargo & Co., 4.100%, 06/03/26 | | | 1,470,698 | | | | 0.2 | |
| | 1,085,000 | | | | | Wells Fargo & Co., 4.650%, 11/04/44 | | | 1,124,137 | | | | 0.2 | |
| | | | | | | | | | 105,025,098 | | | | 13.6 | |
| | | | | | | | | | | | | | | |
| | | | | | | Industrial: 0.6% | | | | | | | | |
| | 678,000 | | | | | Burlington Northern Santa Fe LLC, 4.550%, 09/01/44 | | | 730,724 | | | | 0.1 | |
| | 1,055,000 | | | | | Caterpillar, Inc., 3.400%, 05/15/24 | | | 1,086,388 | | | | 0.2 | |
| | 738,000 | | | | | Eaton Corp., 2.750%, 11/02/22 | | | 726,275 | | | | 0.1 | |
| | 981,000 | | | | | Ingersoll-Rand Global Holding Co. Ltd., 4.250%, 06/15/23 | | | 1,035,911 | | | | 0.1 | |
| | 719,000 | | | # | | Keysight Technologies, Inc., 4.550%, 10/30/24 | | | 720,699 | | | | 0.1 | |
| | | | | | | | | | 4,299,997 | | | | 0.6 | |
| | | | | | | | | | | | | | | |
| | | | | | | Technology: 0.2% | | | | | | | | |
| | 673,000 | | | | | Apple Inc., 4.450%, 05/06/44 | | | 743,513 | | | | 0.1 | |
| | 500,000 | | | | | Apple, Inc., 2.850%, 05/06/21 | | | 511,923 | | | | 0.0 | |
| | 600,000 | | | | | Dell, Inc., 2.300%, 09/10/15 | | | 601,320 | | | | 0.1 | |
| | | | | | | | | | 1,856,756 | | | | 0.2 | |
| | | | | | | | | | | | | | | |
| | | | | | | Utilities: 1.0% | | | | | | | | |
| | 1,434,000 | | | # | | Berkshire Hathaway Energy Co., 3.500%, 02/01/25 | | | 1,446,165 | | | | 0.2 | |
| | 762,000 | | | | | CenterPoint Energy Houston Electric LLC, 3.550%, 08/01/42 | | | 737,141 | | | | 0.1 | |
| | 717,000 | | | | | Dominion Gas Holdings LLC, 3.600%, 12/15/24 | | | 730,885 | | | | 0.1 | |
| | 700,000 | | | # | | Dynegy Finance I, Inc. / Dynegy Finance II, Inc., 6.750%, 11/01/19 | | | 713,125 | | | | 0.1 | |
| | 300,000 | | | # | | Dynegy Finance I, Inc. / Dynegy Finance II, Inc., 7.375%, 11/01/22 | | | 305,625 | | | | 0.0 | |
| | 200,000 | | | # | | Dynegy Finance I, Inc. / Dynegy Finance II, Inc., 7.625%, 11/01/24 | | | 204,250 | | | | 0.0 | |
| | 245,000 | | | | | NextEra Energy Capital Holdings, Inc., 3.625%, 06/15/23 | | | 249,033 | | | | 0.0 | |
| | 1,012,000 | | | | | Oncor Electric Delivery Co. LLC, 4.100%, 06/01/22 | | | 1,088,597 | | | | 0.2 | |
| | 1,070,000 | | | | | Pacific Gas & Electric Co., 3.400%, 08/15/24 | | | 1,085,001 | | | | 0.1 | |
| | 1,090,000 | | | | | PPL Capital Funding, Inc., 3.400%, 06/01/23 | | | 1,094,031 | | | | 0.2 | |
| | | | | | | | | | 7,653,853 | | | | 1.0 | |
| | | | | | | | | | | | | | | |
| | | | | Total Corporate Bonds/Notes | | | | | | | | |
| | | | | (Cost $215,775,235) | | | 217,159,603 | | | | 28.1 | |
See Accompanying Notes to Financial Statements
| | PORTFOLIO OF INVESTMENTS |
| Voya Aggregate Bond Portfolio | as of December 31, 2014 |
| COLLATERALIZED MORTGAGE OBLIGATIONS: 10.8% | |
| | 232,128 | | | | | American Home Mortgage Investment Trust, 2.332%, 02/25/45 | | | 231,878 | | | | 0.0 | |
| | 3,900,000 | | | # | | BAMLL Commercial Mortgage Securities Trust 2014-INLD, 2.764%, 12/15/29 | | | 3,914,582 | | | | 0.5 | |
| | 226,296 | | | | | Banc of America Funding Corp., 2.634%, 05/25/35 | | | 231,009 | | | | 0.0 | |
| | 214,687 | | | | | Banc of America Funding Corp., 2.799%, 01/20/47 | | | 172,253 | | | | 0.0 | |
| | 146,161 | | | | | Banc of America Mortgage Securities, Inc., 2.623%, 07/25/33 | | | 146,823 | | | | 0.0 | |
| | 1,830,000 | | | | | Banc of America Commercial Mortgage Trust 2007-3, 5.547%, 06/10/49 | | | 1,832,604 | | | | 0.2 | |
| | 2,270,000 | | | | | Banc of America Merrill Lynch Commercial Mortgage, Inc. 2005-6 F, 5.152%, 09/10/47 | | | 2,300,502 | | | | 0.3 | |
| | 1,980,000 | | | | | Banc of America Merrill Lynch Commercial Mortgage, Inc., 5.155%, 07/10/45 | | | 1,932,122 | | | | 0.3 | |
| | 162,599 | | | # | | BCAP, LLC Trust, 5.041%, 03/26/37 | | | 160,593 | | | | 0.0 | |
| | 535,986 | | | | | Bear Stearns Adjustable Rate Mortgage Trust, 2.515%, 03/25/35 | | | 542,156 | | | | 0.1 | |
| | 1,163,714 | | | | | Bear Stearns Adjustable Rate Mortgage Trust, 2.580%, 03/25/35 | | | 1,178,473 | | | | 0.2 | |
| | 350,760 | | | | | Bear Stearns Adjustable Rate Mortgage Trust, 2.592%, 11/25/34 | | | 341,268 | | | | 0.1 | |
| | 500,797 | | | | | Bear Stearns Adjustable Rate Mortgage Trust, 2.663%, 09/25/34 | | | 479,150 | | | | 0.1 | |
| | 48,107 | | | | | Bear Stearns Adjustable Rate Mortgage Trust, 5.417%, 02/25/36 | | | 43,425 | | | | 0.0 | |
| | 238,621 | | | | | Bear Stearns Alternative-A Trust, 2.554%, 05/25/35 | | | 229,834 | | | | 0.0 | |
| | 471,073 | | | | | Bear Stearns Alternative-A Trust, 2.590%, 11/25/36 | | | 326,991 | | | | 0.1 | |
| | 146,261 | | | | | Bear Stearns Alternative-A Trust, 2.612%, 09/25/35 | | | 125,780 | | | | 0.0 | |
| | 240,845 | | | | | Bear Stearns Structured Products, Inc., 2.337%, 12/26/46 | | | 188,762 | | | | 0.0 | |
| | 381,712 | | | | | Bear Stearns Structured Products, Inc., 2.591%, 01/26/36 | | | 311,939 | | | | 0.0 | |
| | 3,614,000 | | | # | | CGWF Commercial Mortgage Trust 2013-RKWH, 2.461%, 11/15/30 | | | 3,624,519 | | | | 0.5 | |
| | 56,517 | | | | | CHL Mortgage Pass-Through Trust 2005-2, 0.510%, 03/25/35 | | | 49,110 | | | | 0.0 | |
| | 2,211,363 | | | | | Citicorp Mortgage Securities, Inc., 6.000%, 01/25/37 | | | 2,264,554 | | | | 0.3 | |
| | 290,876 | | | | | Citigroup Mortgage Loan Trust, Inc., 2.556%, 08/25/35 | | | 289,381 | | | | 0.0 | |
| | 34,943,203 | | | ^ | | Commercial Mortgage Trust, 1.419%, 10/10/46 | | | 2,969,907 | | | | 0.4 | |
| | 23,144,981 | | | ^ | | Commercial Mortgage Trust, 1.440%, 08/10/46 | | | 1,693,368 | | | | 0.2 | |
| | 29,017,148 | | | ^ | | Commercial Mortgage Trust, 1.977%, 10/15/45 | | | 3,007,732 | | | | 0.4 | |
| | 254,464 | | | | | Countrywide Home Loan Mortgage Pass-through Trust, 2.418%, 11/25/34 | | | 242,616 | | | | 0.0 | |
| | 6,179,960 | | | | | Countrywide Home Loan Mortgage Pass-through Trust, 0.370%, 04/25/46 | | | 5,441,498 | | | | 0.7 | |
| | 109,011 | | | | | Countrywide Home Loan Mortgage Pass-through Trust, 0.490%, 03/25/35 | | | 104,840 | | | | 0.0 | |
| | 370,821 | | | # | | Countrywide Home Loan Mortgage Pass-through Trust, 0.510%, 06/25/35 | | | 332,374 | | | | 0.1 | |
| | 405,541 | | | | | Countrywide Home Loan Mortgage Pass-through Trust, 2.466%, 02/20/35 | | | 399,620 | | | | 0.1 | |
| | 3,965,355 | | | | | Credit Suisse Commercial Mortgage Trust Series 2006-C4, 5.460%, 09/15/39 | | | 4,183,228 | | | | 0.6 | |
| | 90,493 | | | | | Downey Savings & Loan Association Mortgage Loan Trust, 2.491%, 07/19/44 | | | 90,455 | | | | 0.0 | |
| | 860,000 | | | | | Fannie Mae Connecticut Avenue Securities, 3.070%, 07/25/24 | | | 771,065 | | | | 0.1 | |
| | 1,290,000 | | | | | Fannie Mae Connecticut Avenue Securities, 5.070%, 11/25/24 | | | 1,311,863 | | | | 0.2 | |
| | 590,000 | | | | | Fannie Mae Connecticut Avenue Securities, 5.170%, 11/25/24 | | | 599,165 | | | | 0.1 | |
| | 186,119 | | | | | First Horizon Mortgage Pass-through Trust, 2.612%, 08/25/35 | | | 173,116 | | | | 0.0 | |
| | 1,800,000 | | | | | GCCFC Commercial Mortgage Trust, 6.051%, 12/10/49 | | | 1,887,609 | | | | 0.3 | |
See Accompanying Notes to Financial Statements
| | PORTFOLIO OF INVESTMENTS |
| Voya Aggregate Bond Portfolio | as of December 31, 2014 |
| | 2,781,870 | | | | | Granite Master Issuer PLC, 0.345%, 12/20/54 | | | 2,761,284 | | | | 0.4 | |
| | 148,154 | | | | | Greenpoint Mortgage Pass-through Certificates, 2.786%, 10/25/33 | | | 145,505 | | | | 0.0 | |
| | 37,548,116 | | | ^ | | GS Mortgage Securities Corp. II, 1.547%, 11/10/46 | | | 2,953,955 | | | | 0.4 | |
| | 2,500,000 | | | | | GS Mortgage Securities Trust, 5.553%, 04/10/38 | | | 2,465,234 | | | | 0.3 | |
| | 25,372 | | | | | GSR Mortgage Loan Trust, 2.216%, 06/25/34 | | | 23,787 | | | | 0.0 | |
| | 273,650 | | | | | GSR Mortgage Loan Trust, 2.670%, 09/25/35 | | | 275,417 | | | | 0.0 | |
| | 494 | | | | | GSR Mortgage Loan Trust, 6.000%, 03/25/32 | | | 512 | | | | 0.0 | |
| | 149,760 | | | | | Harborview Mortgage Loan Trust, 0.384%, 05/19/35 | | | 125,431 | | | | 0.0 | |
| | 271,822 | | | | | Harborview Mortgage Loan Trust, 2.603%, 07/19/35 | | | 247,804 | | | | 0.0 | |
| | 149,734 | | | | | Indymac Index Mortgage Loan Trust, 2.525%, 12/25/34 | | | 138,526 | | | | 0.0 | |
| | 40,289,833 | | | ^ | | JP Morgan Chase Commercial Mortgage Securities Corp., 1.757%, 06/15/45 | | | 3,152,422 | | | | 0.4 | |
| | 2,495,000 | | | | | JP Morgan Chase Commercial Mortgage Securities Trust 2004-CIBC10, 5.066%, 01/12/37 | | | 2,512,502 | | | | 0.3 | |
| | 2,500,000 | | | | | JP Morgan Chase Commercial Mortgage Securities Trust 2005-LDP4, 5.040%, 10/15/42 | | | 2,530,827 | | | | 0.3 | |
| | 423,981 | | | | | JPMorgan Mortgage Trust, 2.576%, 07/25/35 | | | 433,959 | | | | 0.1 | |
| | 52,032 | | | | | JPMorgan Mortgage Trust, 2.636%, 02/25/35 | | | 51,144 | | | | 0.0 | |
| | 176,155 | | | | | Merrill Lynch Mortgage Investors Trust, 2.196%, 05/25/33 | | | 171,352 | | | | 0.0 | |
| | 172,586 | | | | | Merrill Lynch Mortgage Investors, Inc., 0.380%, 02/25/36 | | | 159,397 | | | | 0.0 | |
| | 122,379 | | | | | MLCC Mortgage Investors, Inc., 0.420%, 11/25/35 | | | 116,229 | | | | 0.0 | |
| | 79,649 | | | | | MLCC Mortgage Investors, Inc., 1.156%, 10/25/35 | | | 75,997 | | | | 0.0 | |
| | 5,752,679 | | | | | MLCC Mortgage Investors, Inc., 2.173%, 11/25/35 | | | 5,695,762 | | | | 0.7 | |
| | 1,245,256 | | | | | Provident Funding Mortgage Loan Trust, 2.461%, 10/25/35 | | | 1,242,735 | | | | 0.2 | |
| | 19,260 | | | | | Residential Accredit Loans, Inc., 0.570%, 03/25/33 | | | 19,140 | | | | 0.0 | |
| | 11,242 | | | | | Residential Asset Securitization Trust, 0.570%, 05/25/33 | | | 11,202 | | | | 0.0 | |
| | 4,554 | | | | | Residential Funding Mortgage Securities I, 6.500%, 03/25/32 | | | 4,749 | | | | 0.0 | |
| | 96,381 | | | | | Sequoia Mortgage Trust, 0.516%, 07/20/33 | | | 91,181 | | | | 0.0 | |
| | 158,155 | | | | | Sequoia Mortgage Trust, 2.641%, 04/20/35 | | | 157,405 | | | | 0.0 | |
| | 142,658 | | | | | Structured Adjustable Rate Mortgage Loan Trust, 2.514%, 08/25/35 | | | 132,217 | | | | 0.0 | |
| | 297,210 | | | | | Structured Asset Mortgage Investments, Inc., 0.414%, 07/19/35 | | | 286,777 | | | | 0.0 | |
| | 68,477 | | | # | | Structured Asset Securities Corp., 2.605%, 10/28/35 | | | 65,562 | | | | 0.0 | |
| | 1,172,633 | | | | | Thornburg Mortgage Securities Trust, 4.895%, 10/25/46 | | | 1,161,506 | | | | 0.2 | |
| | 3,000,000 | | | | | Wachovia Bank Commercial Mortgage Trust Series 2006-C24, 5.658%, 03/15/45 | | | 3,064,002 | | | | 0.4 | |
| | 2,300,000 | | | | | Wachovia Bank Commercial Mortgage Trust Series 2006-C25, 5.723%, 05/15/43 | | | 2,286,929 | | | | 0.3 | |
| | 2,500,000 | | | | | Wachovia Bank Commercial Mortgage Trust Series, 5.723%, 05/15/43 | | | 2,553,471 | | | | 0.3 | |
| | 75,348 | | | # | | Wachovia Bank Commercial Mortgage Trust, 0.241%, 06/15/20 | | | 75,183 | | | | 0.0 | |
| | 11,454 | | | | | Washington Mutual Mortgage Pass-through Certificates, 1.513%, 08/25/42 | | | 10,581 | | | | 0.0 | |
| | 93,399 | | | | | Washington Mutual Mortgage Pass-through Certificates, 0.480%, 01/25/45 | | | 86,988 | | | | 0.0 | |
| | 93,952 | | | | | Washington Mutual Mortgage Pass-through Certificates, 0.490%, 01/25/45 | | | 88,729 | | | | 0.0 | |
| | 21,571 | | | | | Washington Mutual Mortgage Pass-through Certificates, 1.921%, 02/27/34 | | | 21,210 | | | | 0.0 | |
| | 575,038 | | | | | Washington Mutual Mortgage Pass-through Certificates, 2.163%, 07/25/46 | | | 521,152 | | | | 0.1 | |
| | 624,921 | | | | | Washington Mutual Mortgage Pass-through Certificates, 2.163%, 08/25/46 | | | 567,823 | | | | 0.1 | |
See Accompanying Notes to Financial Statements
| | PORTFOLIO OF INVESTMENTS |
| Voya Aggregate Bond Portfolio | as of December 31, 2014 |
| | 1,514,729 | | | | | Washington Mutual Mortgage Pass-through Certificates, 4.462%, 02/25/37 | | | 1,388,464 | | | | 0.2 | |
| | 1,250,343 | | | | | Wells Fargo Mortgage Backed Securities 2006-AR10 Trust, 2.610%, 07/25/36 | | | 1,221,773 | | | | 0.2 | |
| | 137,512 | | | | | Wells Fargo Mortgage-Backed Securities Trust, 2.590%, 10/25/33 | | | 139,111 | | | | 0.0 | |
| | 272,578 | | | | | Wells Fargo Mortgage-Backed Securities Trust, 2.612%, 12/25/34 | | | 274,843 | | | | 0.0 | |
| | 186,028 | | | | | Wells Fargo Mortgage-Backed Securities Trust, 2.616%, 01/25/35 | | | 189,767 | | | | 0.0 | |
| | | | | | | | | | | | | | | |
| | | | | Total Collateralized Mortgage Obligations | | | | | | | | |
| | | | | (Cost $82,392,528) | | | 83,825,710 | | | | 10.8 | |
| | | | | | | | | | | | | | | |
| MUNICIPAL BONDS: 4.6% | |
| | | | | | | California: 2.3% | | | | | | | | |
| | 1,000,000 | | | | | California Infrastructure & Economic Development Bank, 6.486%, 05/15/49 | | | 1,246,310 | | | | 0.2 | |
| | 1,200,000 | | | | | California State Public Works Board, 7.804%, 03/01/35 | | | 1,637,100 | | | | 0.2 | |
| | 500,000 | | | | | California State University, 6.434%, 11/01/30 | | | 626,855 | | | | 0.1 | |
| | 3,500,000 | | | | | Los Angeles Department of Airports, 6.582%, 05/15/39 | | | 4,591,300 | | | | 0.6 | |
| | 200,000 | | | | | Los Angeles County Public Works Financing Authority, 7.488%, 08/01/33 | | | 265,878 | | | | 0.0 | |
| | 300,000 | | | | | Los Angeles County Public Works Financing Authority, 7.618%, 08/01/40 | | | 436,224 | | | | 0.1 | |
| | 6,000,000 | | | | | Southern California Public Power Authority, 5.943%, 07/01/40 | | | 7,271,400 | | | | 0.9 | |
| | 500,000 | | | | | State of California, 7.500%, 04/01/34 | | | 748,250 | | | | 0.1 | |
| | 100,000 | | | | | State of California, 7.700%, 11/01/30 | | | 126,197 | | | | 0.0 | |
| | 200,000 | | | | | University of California, 6.398%, 05/15/31 | | | 250,326 | | | | 0.0 | |
| | 300,000 | | | | | University of California, 6.548%, 05/15/48 | | | 412,320 | | | | 0.1 | |
| | | | | | | | | | 17,612,160 | | | | 2.3 | |
| | | | | | | | | | | | | | | |
| | | | | | | Illinois: 0.1% | | | | | | | | |
| | 700,000 | | | | | Chicago Transit Authority, 6.899%, 12/01/40 | | | 881,972 | | | | 0.1 | |
| | | | | | | Nebraska: 0.1% | | | | | | | | |
| | 500,000 | | | | | Public Power Generation Agency, 7.242%, 01/01/41 | | | 587,040 | | | | 0.1 | |
| | | | | | | | | | | | | | | |
| | | | | | | Nevada: 0.5% | | | | | | | | |
| | 3,300,000 | | | | | City of North Las Vegas NV, 6.572%, 06/01/40 | | | 2,973,135 | | | | 0.4 | |
| | 600,000 | | | | | County of Clark NV, 6.820%, 07/01/45 | | | 879,360 | | | | 0.1 | |
| | | | | | | | | | 3,852,495 | | | | 0.5 | |
| | | | | | | | | | | | | | | |
| | | | | | | New York: 0.8% | | | | | | | | |
| | 2,000,000 | | | | | New York City Municipal Water Finance Authority, 5.882%, 06/15/44 | | | 2,690,120 | | | | 0.4 | |
| | 2,900,000 | | | | | New York City Municipal Water Finance Authority, 6.282%, 06/15/42 | | | 3,415,504 | | | | 0.4 | |
| | 200,000 | | | | | Tobacco Settlement Financing Corp., 6.250%, 06/01/42 | | | 200,490 | | | | 0.0 | |
| | | | | | | | | | 6,306,114 | | | | 0.8 | |
| | | | | | | | | | | | | | | |
| | | | | | | Texas: 0.8% | | | | | | | | |
| | 2,200,000 | | | | | City of San Antonio TX, 5.808%, 02/01/41 | | | 2,923,954 | | | | 0.4 | |
| | 2,900,000 | | | | | City of San Antonio TX, 6.308%, 02/01/37 | | | 3,366,900 | | | | 0.4 | |
| | | | | | | | | | 6,290,854 | | | | 0.8 | |
| | | | | | | | | | | | | | | |
| | | | | Total Municipal Bonds | | | | | | | | |
| | | | | (Cost $29,081,237) | | | 35,530,635 | | | | 4.6 | |
| | | | | | | | | | | | | | | |
| CERTIFICATES OF DEPOSIT: 0.5% |
| | | | | | | Financial: 0.5% | | | | | | | | |
| | 3,600,000 | | | | | Credit Suisse/New York NY, 0.645%, 12/07/15 | | | 3,602,722 | | | | 0.5 | |
| | | | | | | | | | | | | | | |
| | | | | Total Certificates of Deposit | | | | | | | | |
| | | | | (Cost $3,600,000) | | | 3,602,722 | | | | 0.5 | |
| | | | | | | | | | | | | | | |
| FOREIGN GOVERNMENT BONDS: 2.1% |
| | 300,000 | | | # | | Banco Nacional de Desenvolvimento Economico e Social, 3.375%, 09/26/16 | | | 301,770 | | | | 0.0 | |
| | 600,000 | | | | | Eksportfinans ASA, 5.500%, 05/25/16 | | | 628,410 | | | | 0.1 | |
| | 500,000 | | | | | Eksportfinans ASA, 5.500%, 06/26/17 | | | 534,680 | | | | 0.1 | |
| | 1,800,000 | | | | | Export-Import Bank of Korea, 4.125%, 09/09/15 | | | 1,840,111 | | | | 0.2 | |
| | 2,700,000 | | | | | Korea Development Bank, 4.375%, 08/10/15 | | | 2,758,096 | | | | 0.4 | |
| | 400,000 | | | # | | Korea Housing Finance Corp., 4.125%, 12/15/15 | | | 411,119 | | | | 0.1 | |
| | 500,000 | | | | | Majapahit Holding BV, 7.250%, 06/28/17 | | | 553,250 | | | | 0.1 | |
| | 1,000,000 | | | | | Province of Ontario Canada, 1.650%, 09/27/19 | | | 989,608 | | | | 0.1 | |
See Accompanying Notes to Financial Statements
| | PORTFOLIO OF INVESTMENTS |
| Voya Aggregate Bond Portfolio | as of December 31, 2014 |
| | 3,400,000 | | | | | Province of Ontario Canada, 1.600%, 09/21/16 | | | 3,447,865 | | | | 0.4 | |
| | 300,000 | | | | | Province of Ontario Canada, 3.000%, 07/16/18 | | | 314,504 | | | | 0.0 | |
| | 600,000 | | | | | Province of Ontario Canada, 4.400%, 04/14/20 | | | 668,507 | | | | 0.1 | |
| | 500,000 | | | | | Province of Quebec Canada, 3.500%, 07/29/20 | | | 535,734 | | | | 0.1 | |
| | 2,900,000 | | | # | | State Bank of India/London, 4.500%, 07/27/15 | | | 2,952,699 | | | | 0.4 | |
| | | | | | | | | | | | | | | |
| | | | | Total Foreign Government Bonds | | | | | | | | |
| | | | | (Cost $15,629,945) | | | 15,936,353 | | | | 2.1 | |
| | | | | | | | | | | | | | | |
| U.S. GOVERNMENT AGENCY OBLIGATIONS: 16.1% |
| | | | | | | Federal Home Loan Mortgage Corporation: 5.1%## | |
| | 27,000 | | | | | 0.750%, due 01/12/18 | | | 26,623 | | | | 0.0 | |
| | 165,300 | | | | | 1.315%, due 10/25/44 | | | 166,892 | | | | 0.0 | |
| | 794,922 | | | | | 1.515%, due 07/25/44 | | | 799,767 | | | | 0.1 | |
| | 60,070 | | | | | 1.845%, due 09/01/35 | | | 62,866 | | | | 0.0 | |
| | 195,893 | | | | | 1.875%, due 03/25/24 | | | 205,608 | | | | 0.0 | |
| | 9,031 | | | | | 2.375%, due 04/01/32 | | | 9,582 | | | | 0.0 | |
| | 2,985 | | | | | 3.500%, due 07/15/32 | | | 3,058 | | | | 0.0 | |
| | 31,573,315 | | | | | 3.500%, due 01/01/45 | | | 32,874,008 | | | | 4.3 | |
| | 219,388 | | | | | 4.500%, due 03/01/41 | | | 239,196 | | | | 0.0 | |
| | 22,345 | | | | | 5.500%, due 03/01/23 | | | 24,925 | | | | 0.0 | |
| | 43,459 | | | | | 5.500%, due 05/01/23 | | | 48,477 | | | | 0.0 | |
| | 612 | | | | | 5.500%, due 08/15/30 | | | 648 | | | | 0.0 | |
| | 294,828 | | | | | 5.500%, due 06/01/36 | | | 332,708 | | | | 0.1 | |
| | 508,692 | | | | | 5.500%, due 12/01/37 | | | 571,878 | | | | 0.1 | |
| | 419,423 | | | | | 5.500%, due 04/01/38 | | | 469,420 | | | | 0.1 | |
| | 102,710 | | | | | 5.500%, due 07/01/38 | | | 114,934 | | | | 0.0 | |
| | 528 | | | | | 6.000%, due 10/01/17 | | | 542 | | | | 0.0 | |
| | 7,453 | | | | | 6.000%, due 02/01/22 | | | 8,426 | | | | 0.0 | |
| | 133,650 | | | | | 6.000%, due 03/01/23 | | | 151,127 | | | | 0.0 | |
| | 17,299 | | | | | 6.000%, due 05/01/37 | | | 19,569 | | | | 0.0 | |
| | 202,647 | | | | | 6.000%, due 07/01/37 | | | 229,443 | | | | 0.0 | |
| | 193,544 | | | | | 6.000%, due 08/01/37 | | | 219,074 | | | | 0.0 | |
| | 1,476,209 | | | | | 6.000%, due 09/01/37 | | | 1,668,720 | | | | 0.2 | |
| | 2,600 | | | | | 6.000%, due 10/01/37 | | | 2,968 | | | | 0.0 | |
| | 21,419 | | | | | 6.000%, due 12/01/37 | | | 24,205 | | | | 0.0 | |
| | 275,645 | | | | | 6.000%, due 01/01/38 | | | 311,617 | | | | 0.1 | |
| | 206,479 | | | | | 6.000%, due 02/01/38 | | | 233,221 | | | | 0.0 | |
| | 6,108 | | | | | 6.000%, due 04/01/38 | | | 6,903 | | | | 0.0 | |
| | 35,773 | | | | | 6.000%, due 06/01/38 | | | 40,727 | | | | 0.0 | |
| | 6,023 | | | | | 6.000%, due 07/01/38 | | | 6,812 | | | | 0.0 | |
| | 134,229 | | | | | 6.000%, due 08/01/38 | | | 152,512 | | | | 0.0 | |
| | 210,676 | | | | | 6.000%, due 11/01/38 | | | 239,034 | | | | 0.0 | |
| | 33,429 | | | | | 6.000%, due 05/01/39 | | | 37,803 | | | | 0.0 | |
| | 473,111 | | | | | 6.000%, due 08/01/39 | | | 535,451 | | | | 0.1 | |
| | | | | | | | | | 39,838,744 | | | | 5.1 | |
| | | | | | | | | | | | | | | |
| | | | | | | Federal National Mortgage Association: 10.4%## | |
| | 200,695 | | | | | 0.230%, due 07/25/37 | | | 194,894 | | | | 0.0 | |
| | 54,744 | | | | | 0.290%, due 03/25/34 | | | 54,510 | | | | 0.0 | |
| | 46,564 | | | | | 1.313%, due 10/01/44 | | | 47,686 | | | | 0.0 | |
| | 72,632 | | | | | 1.313%, due 10/01/44 | | | 74,557 | | | | 0.0 | |
| | 442,987 | | | | | 1.504%, due 02/01/33 | | | 463,410 | | | | 0.1 | |
| | 36,732 | | | | | 1.670%, due 04/25/24 | | | 38,128 | | | | 0.0 | |
| | 280,292 | | | | | 1.748%, due 09/01/35 | | | 297,874 | | | | 0.1 | |
| | 2,767 | | | | | 1.750%, due 02/01/20 | | | 2,777 | | | | 0.0 | |
| | 89,733 | | | | | 1.941%, due 08/01/35 | | | 96,185 | | | | 0.0 | |
| | 172,404 | | | | | 2.300%, due 02/01/35 | | | 185,524 | | | | 0.0 | |
| | 900,000 | | | ^ | | 2.310%, due 08/01/22 | | | 893,931 | | | | 0.1 | |
| | 55,184 | | | | | 2.335%, due 04/01/32 | | | 57,282 | | | | 0.0 | |
| | 4,825 | | | | | 2.340%, due 09/01/31 | | | 5,159 | | | | 0.0 | |
| | 131,135 | | | | | 2.435%, due 09/01/34 | | | 140,846 | | | | 0.0 | |
| | 454,742 | | | | | 2.485%, due 11/01/34 | | | 486,732 | | | | 0.1 | |
| | 5,165,505 | | | ^ | | 2.790%, due 07/01/22 | | | 5,281,272 | | | | 0.7 | |
| | 2,695,438 | | | | | 3.010%, due 06/01/22 | | | 2,798,626 | | | | 0.4 | |
| | 3,415,779 | | | | | 3.156%, due 05/01/22 | | | 3,588,157 | | | | 0.5 | |
| | 284,052 | | | | | 3.330%, due 11/01/21 | | | 298,882 | | | | 0.1 | |
| | 39,648 | | | | | 4.000%, due 07/01/18 | | | 41,999 | | | | 0.0 | |
| | 172,714 | | | | | 4.000%, due 08/01/18 | | | 183,145 | | | | 0.0 | |
| | 844,218 | | | | | 4.000%, due 09/01/18 | | | 894,614 | | | | 0.1 | |
| | 163,281 | | | | | 4.000%, due 08/01/19 | | | 173,018 | | | | 0.0 | |
| | 79,378 | | | | | 4.000%, due 03/01/24 | | | 84,332 | | | | 0.0 | |
| | 56,126 | | | | | 4.000%, due 03/01/24 | | | 59,480 | | | | 0.0 | |
| | 57,305 | | | | | 4.000%, due 04/01/24 | | | 60,751 | | | | 0.0 | |
| | 661,873 | | | | | 4.000%, due 04/01/24 | | | 705,068 | | | | 0.1 | |
| | 84,928 | | | | | 4.000%, due 04/01/24 | | | 90,121 | | | | 0.0 | |
| | 84,542 | | | | | 4.000%, due 04/01/24 | | | 89,762 | | | | 0.0 | |
| | 66,483 | | | | | 4.000%, due 04/01/24 | | | 70,575 | | | | 0.0 | |
| | 84,194 | | | | | 4.000%, due 04/01/24 | | | 89,231 | | | | 0.0 | |
| | 591,177 | | | | | 4.000%, due 05/01/24 | | | 629,797 | | | | 0.1 | |
| | 521,968 | | | | | 4.000%, due 05/01/24 | | | 555,998 | | | | 0.1 | |
| | 519,300 | | | | | 4.000%, due 05/01/24 | | | 550,510 | | | | 0.1 | |
| | 63,637 | | | | | 4.000%, due 05/01/24 | | | 67,791 | | | | 0.0 | |
| | 87,445 | | | | | 4.000%, due 05/01/24 | | | 93,205 | | | | 0.0 | |
| | 599,019 | | | | | 4.000%, due 05/01/24 | | | 638,207 | | | | 0.1 | |
| | 79,982 | | | | | 4.000%, due 05/01/24 | | | 85,253 | | | | 0.0 | |
| | 59,404 | | | | | 4.000%, due 05/01/24 | | | 63,258 | | | | 0.0 | |
| | 105,929 | | | | | 4.000%, due 05/01/24 | | | 112,557 | | | | 0.0 | |
| | 581,858 | | | | | 4.000%, due 06/01/24 | | | 618,334 | | | | 0.1 | |
| | 654,635 | | | | | 4.000%, due 06/01/24 | | | 697,854 | | | | 0.1 | |
| | 63,300 | | | | | 4.000%, due 07/01/24 | | | 67,463 | | | | 0.0 | |
| | 33,589 | | | | | 4.000%, due 08/01/24 | | | 35,799 | | | | 0.0 | |
| | 52,540 | | | | | 4.000%, due 09/01/24 | | | 55,988 | | | | 0.0 | |
| | 211,520 | | | | | 4.000%, due 10/01/24 | | | 225,407 | | | | 0.0 | |
| | 42,703 | | | | | 4.000%, due 01/01/25 | | | 45,511 | | | | 0.0 | |
| | 19,930 | | | | | 4.000%, due 02/01/25 | | | 21,241 | | | | 0.0 | |
| | 21,761 | | | | | 4.000%, due 04/01/25 | | | 23,067 | | | | 0.0 | |
| | 14,638 | | | | | 4.000%, due 05/01/25 | | | 15,644 | | | | 0.0 | |
| | 10,936 | | | | | 4.000%, due 06/01/25 | | | 11,594 | | | | 0.0 | |
| | 73,456 | | | | | 4.000%, due 07/01/25 | | | 78,511 | | | | 0.0 | |
| | 26,632 | | | | | 4.000%, due 10/01/25 | | | 28,364 | | | | 0.0 | |
| | 33,130 | | | | | 4.000%, due 11/01/25 | | | 35,392 | | | | 0.0 | |
| | 493,334 | | | | | 4.000%, due 01/01/26 | | | 527,254 | | | | 0.1 | |
| | 280,913 | | | | | 4.000%, due 01/01/26 | | | 301,078 | | | | 0.1 | |
| | 12,733 | | | | | 4.000%, due 02/01/26 | | | 13,653 | | | | 0.0 | |
| | 26,755 | | | | | 4.000%, due 02/01/26 | | | 28,665 | | | | 0.0 | |
| | 159,461 | | | | | 4.000%, due 03/01/26 | | | 169,717 | | | | 0.0 | |
| | 26,499 | | | | | 4.000%, due 04/01/26 | | | 28,265 | | | | 0.0 | |
| | 20,297 | | | | | 4.000%, due 04/01/26 | | | 21,627 | | | | 0.0 | |
| | 91,923 | | | | | 4.000%, due 04/01/26 | | | 98,479 | | | | 0.0 | |
| | 1,603,237 | | | | | 4.000%, due 04/01/26 | | | 1,717,517 | | | | 0.2 | |
| | 77,908 | | | | | 4.000%, due 05/01/26 | | | 83,423 | | | | 0.0 | |
| | 140,287 | | | | | 4.000%, due 06/01/26 | | | 150,261 | | | | 0.0 | |
| | 54,994 | | | | | 4.000%, due 06/01/26 | | | 58,469 | | | | 0.0 | |
| | 57,813 | | | | | 4.000%, due 06/01/26 | | | 61,930 | | | | 0.0 | |
| | 70,156 | | | | | 4.000%, due 07/01/26 | | | 75,153 | | | | 0.0 | |
| | 181,229 | | | | | 4.000%, due 07/01/26 | | | 192,147 | | | | 0.0 | |
| | 43,171 | | | | | 4.000%, due 10/01/31 | | | 46,171 | | | | 0.0 | |
| | 25,686,436 | | | | | 4.000%, due 12/01/44 | | | 27,455,322 | | | | 3.6 | |
| | 35,708 | | | | | 4.371%, due 12/01/36 | | | 38,150 | | | | 0.0 | |
| | 4,294 | | | | | 4.500%, due 12/01/16 | | | 4,512 | | | | 0.0 | |
| | 4,947 | | | | | 4.500%, due 10/01/17 | | | 5,198 | | | | 0.0 | |
| | 607,118 | | | | | 4.500%, due 02/01/18 | | | 637,911 | | | | 0.1 | |
| | 4,937 | | | | | 4.500%, due 02/01/18 | | | 5,188 | | | | 0.0 | |
| | 9,294 | | | | | 4.500%, due 06/01/18 | | | 9,766 | | | | 0.0 | |
| | 28,114 | | | | | 4.500%, due 07/01/18 | | | 29,548 | | | | 0.0 | |
| | 69,997 | | | | | 4.500%, due 10/01/18 | | | 73,580 | | | | 0.0 | |
See Accompanying Notes to Financial Statements
| | PORTFOLIO OF INVESTMENTS |
| Voya Aggregate Bond Portfolio | as of December 31, 2014 |
| | 11,747 | | | | | 4.500%, due 03/01/19 | | | 12,345 | | | | 0.0 | |
| | 30,459 | | | | | 4.500%, due 01/01/20 | | | 32,048 | | | | 0.0 | |
| | 21,346 | | | | | 4.500%, due 03/01/24 | | | 23,057 | | | | 0.0 | |
| | 523,338 | | | | | 4.500%, due 11/01/24 | | | 565,731 | | | | 0.1 | |
| | 13,696 | | | | | 4.500%, due 06/01/25 | | | 14,813 | | | | 0.0 | |
| | 42,317 | | | | | 4.500%, due 07/01/25 | | | 45,521 | | | | 0.0 | |
| | 220,669 | | | | | 4.500%, due 01/01/26 | | | 238,502 | | | | 0.0 | |
| | 141,668 | | | | | 4.500%, due 07/01/26 | | | 153,243 | | | | 0.0 | |
| | 206,812 | | | | | 4.500%, due 02/01/31 | | | 225,913 | | | | 0.0 | |
| | 2,461 | | | | | 4.500%, due 02/01/39 | | | 2,672 | | | | 0.0 | |
| | 453,985 | | | | | 4.500%, due 05/01/39 | | | 493,369 | | | | 0.1 | |
| | 4,045,765 | | | | | 4.500%, due 05/01/39 | | | 4,419,746 | | | | 0.6 | |
| | 663,582 | | | | | 4.500%, due 05/01/40 | | | 721,316 | | | | 0.1 | |
| | 97,831 | | | | | 4.500%, due 12/01/40 | | | 106,710 | | | | 0.0 | |
| | 648,923 | | | | | 4.500%, due 03/01/41 | | | 712,369 | | | | 0.1 | |
| | 1,061,783 | | | | | 4.500%, due 05/01/42 | | | 1,154,201 | | | | 0.2 | |
| | 32,276 | | | | | 4.500%, due 06/01/42 | | | 35,080 | | | | 0.0 | |
| | 5,391 | | | | | 5.000%, due 12/01/23 | | | 5,953 | | | | 0.0 | |
| | 524,529 | | | | | 5.000%, due 09/01/35 | | | 580,565 | | | | 0.1 | |
| | 238,723 | | | | | 5.000%, due 10/01/35 | | | 264,433 | | | | 0.1 | |
| | 333,206 | | | | | 5.000%, due 12/01/35 | | | 368,922 | | | | 0.1 | |
| | 193,173 | | | | | 5.000%, due 04/01/38 | | | 215,785 | | | | 0.0 | |
| | 2,270 | | | | | 5.500%, due 04/01/21 | | | 2,417 | | | | 0.0 | |
| | 26,037 | | | | | 5.500%, due 06/01/22 | | | 28,440 | | | | 0.0 | |
| | 2,107 | | | | | 5.500%, due 11/01/22 | | | 2,227 | | | | 0.0 | |
| | 38,545 | | | | | 5.500%, due 11/01/22 | | | 40,762 | | | | 0.0 | |
| | 2,262 | | | | | 5.500%, due 11/01/22 | | | 2,392 | | | | 0.0 | |
| | 36,774 | | | | | 5.500%, due 05/01/23 | | | 38,868 | | | | 0.0 | |
| | 178,531 | | | | | 5.500%, due 06/01/23 | | | 199,546 | | | | 0.0 | |
| | 27,782 | | | | | 5.500%, due 07/01/23 | | | 30,341 | | | | 0.0 | |
| | 90,635 | | | | | 5.500%, due 07/01/23 | | | 97,286 | | | | 0.0 | |
| | 66,006 | | | | | 5.500%, due 09/01/23 | | | 72,725 | | | | 0.0 | |
| | 95,575 | | | | | 5.500%, due 02/01/24 | | | 106,813 | | | | 0.0 | |
| | 250,763 | | | | | 5.500%, due 07/01/25 | | | 280,348 | | | | 0.1 | |
| | 56,460 | | | | | 5.500%, due 07/01/26 | | | 63,099 | | | | 0.0 | |
| | 25,644 | | | | | 5.500%, due 12/01/27 | | | 28,674 | | | | 0.0 | |
| | 22,574 | | | | | 5.500%, due 04/01/28 | | | 25,267 | | | | 0.0 | |
| | 25,450 | | | | | 5.500%, due 08/01/28 | | | 28,520 | | | | 0.0 | |
| | 28,206 | | | | | 5.500%, due 01/01/29 | | | 31,522 | | | | 0.0 | |
| | 57,392 | | | | | 5.500%, due 09/01/29 | | | 64,255 | | | | 0.0 | |
| | 236,596 | | | | | 5.500%, due 10/01/29 | | | 265,274 | | | | 0.1 | |
| | 212,513 | | | | | 5.500%, due 04/01/33 | | | 239,513 | | | | 0.0 | |
| | 21,745 | | | | | 5.500%, due 11/01/33 | | | 24,474 | | | | 0.0 | |
| | 48,808 | | | | | 5.500%, due 12/01/33 | | | 54,949 | | | | 0.0 | |
| | 222,127 | | | | | 5.500%, due 01/01/34 | | | 250,151 | | | | 0.0 | |
| | 49,437 | | | | | 5.500%, due 06/01/34 | | | 55,566 | | | | 0.0 | |
| | 57,694 | | | | | 5.500%, due 01/01/35 | | | 64,891 | | | | 0.0 | |
| | 35,632 | | | | | 5.500%, due 02/01/35 | | | 40,050 | | | | 0.0 | |
| | 87,045 | | | | | 5.500%, due 06/01/35 | | | 97,451 | | | | 0.0 | |
| | 54,100 | | | | | 5.500%, due 07/01/35 | | | 60,750 | | | | 0.0 | |
| | 15,265 | | | | | 5.500%, due 10/01/35 | | | 17,119 | | | | 0.0 | |
| | 230,368 | | | | | 5.500%, due 11/01/35 | | | 258,485 | | | | 0.0 | |
| | 64,793 | | | | | 5.500%, due 12/01/35 | | | 72,564 | | | | 0.0 | |
| | 543,208 | | | | | 5.500%, due 12/01/35 | | | 609,128 | | | | 0.1 | |
| | 78,157 | | | | | 5.500%, due 01/01/36 | | | 87,400 | | | | 0.0 | |
| | 276,993 | | | | | 5.500%, due 09/01/36 | | | 311,497 | | | | 0.1 | |
| | 549,834 | | | | | 5.500%, due 12/01/36 | | | 615,577 | | | | 0.1 | |
| | 670,781 | | | | | 5.500%, due 12/01/36 | | | 749,656 | | | | 0.1 | |
| | 5,355 | | | | | 5.500%, due 12/01/36 | | | 5,997 | | | | 0.0 | |
| | 12,929 | | | | | 5.500%, due 12/01/36 | | | 14,449 | | | | 0.0 | |
| | 235,075 | | | | | 5.500%, due 02/01/37 | | | 262,837 | | | | 0.1 | |
| | 10,416 | | | | | 5.500%, due 05/01/37 | | | 11,640 | | | | 0.0 | |
| | 81,615 | | | | | 5.500%, due 05/01/37 | | | 91,212 | | | | 0.0 | |
| | 58,151 | | | | | 5.500%, due 08/01/37 | | | 65,293 | | | | 0.0 | |
| | 200,857 | | | | | 5.500%, due 03/01/38 | | | 227,195 | | | | 0.0 | |
| | 43,945 | | | | | 5.500%, due 05/01/38 | | | 49,112 | | | | 0.0 | |
| | 1,578,009 | | | | | 5.500%, due 06/01/38 | | | 1,763,561 | | | | 0.2 | |
| | 48,954 | | | | | 5.500%, due 08/01/38 | | | 54,893 | | | | 0.0 | |
| | 897,959 | | | | | 5.500%, due 11/01/38 | | | 1,003,546 | | | | 0.1 | |
| | 231,760 | | | | | 5.500%, due 01/01/39 | | | 259,041 | | | | 0.0 | |
| | 95,278 | | | | | 5.500%, due 03/01/39 | | | 107,396 | | | | 0.0 | |
| | 450,369 | | | | | 5.500%, due 09/01/41 | | | 503,326 | | | | 0.1 | |
| | 27,111 | | | | | 6.000%, due 06/01/17 | | | 28,222 | | | | 0.0 | |
| | 8,965 | | | | | 6.000%, due 01/01/18 | | | 9,384 | | | | 0.0 | |
| | 3,519 | | | | | 6.000%, due 12/01/18 | | | 3,984 | | | | 0.0 | |
| | 5,758 | | | | | 6.000%, due 05/01/21 | | | 6,520 | | | | 0.0 | |
| | 61,915 | | | | | 6.000%, due 04/01/22 | | | 70,190 | | | | 0.0 | |
| | 141,004 | | | | | 6.000%, due 06/01/22 | | | 159,666 | | | | 0.0 | |
| | 21,757 | | | | | 6.000%, due 01/01/23 | | | 24,641 | | | | 0.0 | |
| | 1,171 | | | | | 6.000%, due 11/01/32 | | | 1,327 | | | | 0.0 | |
| | 464,699 | | | | | 6.000%, due 06/01/35 | | | 526,684 | | | | 0.1 | |
| | 24,209 | | | | | 6.000%, due 07/01/35 | | | 27,510 | | | | 0.0 | |
| | 27,609 | | | | | 6.000%, due 07/01/35 | | | 31,510 | | | | 0.0 | |
| | 19,586 | | | | | 6.000%, due 10/01/35 | | | 22,290 | | | | 0.0 | |
| | 134,360 | | | | | 6.000%, due 02/01/36 | | | 153,029 | | | | 0.0 | |
| | 7,870 | | | | | 6.000%, due 06/01/36 | | | 8,925 | | | | 0.0 | |
| | 12,287 | | | | | 6.000%, due 07/01/36 | | | 13,970 | | | | 0.0 | |
| | 795,159 | | | | | 6.000%, due 08/01/36 | | | 900,658 | | | | 0.1 | |
| | 2,345 | | | | | 6.000%, due 09/01/36 | | | 2,656 | | | | 0.0 | |
| | 313,469 | | | | | 6.000%, due 09/01/36 | | | 355,942 | | | | 0.1 | |
| | 124,341 | | | | | 6.000%, due 10/01/36 | | | 140,797 | | | | 0.0 | |
| | 174,923 | | | | | 6.000%, due 11/01/36 | | | 199,351 | | | | 0.0 | |
| | 44,038 | | | | | 6.000%, due 12/01/36 | | | 49,930 | | | | 0.0 | |
| | 2,692 | | | | | 6.000%, due 01/01/37 | | | 3,049 | | | | 0.0 | |
| | 14,650 | | | | | 6.000%, due 02/01/37 | | | 16,589 | | | | 0.0 | |
| | 71,364 | | | | | 6.000%, due 03/01/37 | | | 81,030 | | | | 0.0 | |
| | 41,450 | | | | | 6.000%, due 03/01/37 | | | 47,058 | | | | 0.0 | |
| | 41,167 | | | | | 6.000%, due 05/01/37 | | | 46,650 | | | | 0.0 | |
| | 49,757 | | | | | 6.000%, due 05/01/37 | | | 56,523 | | | | 0.0 | |
| | 417,127 | | | | | 6.000%, due 05/01/37 | | | 473,068 | | | | 0.1 | |
| | 19,987 | | | | | 6.000%, due 08/01/37 | | | 22,963 | | | | 0.0 | |
| | 240,816 | | | | | 6.000%, due 08/01/37 | | | 273,638 | | | | 0.1 | |
| | 84,791 | | | | | 6.000%, due 08/01/37 | | | 96,123 | | | | 0.0 | |
| | 21,358 | | | | | 6.000%, due 09/01/37 | | | 24,188 | | | | 0.0 | |
| | 107,832 | | | | | 6.000%, due 10/01/37 | | | 122,160 | | | | 0.0 | |
| | 121,738 | | | | | 6.000%, due 10/01/37 | | | 138,347 | | | | 0.0 | |
| | 5,168 | | | | | 6.000%, due 12/01/37 | | | 5,944 | | | | 0.0 | |
| | 5,515 | | | | | 6.000%, due 03/01/38 | | | 6,339 | | | | 0.0 | |
| | 57,635 | | | | | 6.000%, due 06/01/38 | | | 65,386 | | | | 0.0 | |
| | 162,333 | | | | | 6.000%, due 07/01/38 | | | 183,944 | | | | 0.0 | |
| | 4,893 | | | | | 6.000%, due 08/01/38 | | | 5,563 | | | | 0.0 | |
| | 1,736 | | | | | 6.000%, due 08/01/38 | | | 1,966 | | | | 0.0 | |
| | 74,266 | | | | | 6.000%, due 10/01/38 | | | 84,281 | | | | 0.0 | |
| | 73,924 | | | | | 6.000%, due 10/01/38 | | | 83,708 | | | | 0.0 | |
| | 305,879 | | | | | 6.000%, due 10/01/38 | | | 346,361 | | | | 0.1 | |
| | 172,706 | | | | | 6.000%, due 10/01/38 | | | 195,769 | | | | 0.0 | |
| | 329,255 | | | | | 6.000%, due 11/01/38 | | | 372,868 | | | | 0.1 | |
| | 11,737 | | | | | 6.000%, due 12/01/38 | | | 13,315 | | | | 0.0 | |
| | 6,909 | | | | | 6.000%, due 10/01/39 | | | 7,938 | | | | 0.0 | |
| | 101,637 | | | | | 6.000%, due 10/01/39 | | | 115,329 | | | | 0.0 | |
| | 83,063 | | | | | 6.000%, due 04/01/40 | | | 94,294 | | | | 0.0 | |
| | 9,560 | | | | | 6.500%, due 03/01/17 | | | 9,981 | | | | 0.0 | |
| | 6,742 | | | | | 6.500%, due 07/01/29 | | | 7,684 | | | | 0.0 | |
| | 459,230 | | | | | 6.500%, due 06/17/38 | | | 471,561 | | | | 0.1 | |
| | | | | | | | | | 80,178,849 | | | | 10.4 | |
| | | | | | | | | | | | | | | |
| | | | | | | Government National Mortgage Association: 0.6% | |
| | 13,523 | | | | | 0.561%, due 03/16/32 | | | 13,508 | | | | 0.0 | |
| | 97,300 | | | | | 5.000%, due 06/15/37 | | | 107,211 | | | | 0.0 | |
| | 84,645 | | | | | 5.000%, due 03/15/38 | | | 93,914 | | | | 0.0 | |
| | 195,585 | | | | | 5.000%, due 11/15/38 | | | 215,514 | | | | 0.0 | |
| | 146,851 | | | | | 5.000%, due 11/15/38 | | | 161,815 | | | | 0.0 | |
| | 75,908 | | | | | 5.000%, due 12/15/38 | | | 83,642 | | | | 0.0 | |
| | 341,919 | | | | | 5.000%, due 12/15/38 | | | 377,171 | | | | 0.1 | |
| | 1,033,247 | | | | | 5.000%, due 12/15/38 | | | 1,140,065 | | | | 0.2 | |
| | 513,298 | | | | | 5.000%, due 01/15/39 | | | 567,803 | | | | 0.1 | |
| | 176,712 | | | | | 5.000%, due 01/15/39 | | | 194,845 | | | | 0.0 | |
| | 509,363 | | | | | 5.000%, due 02/15/39 | | | 563,784 | | | | 0.1 | |
| | 324,178 | | | | | 5.000%, due 03/15/39 | | | 358,531 | | | | 0.0 | |
See Accompanying Notes to Financial Statements
| | PORTFOLIO OF INVESTMENTS |
| Voya Aggregate Bond Portfolio | as of December 31, 2014 |
| | 379,553 | | | | | 5.000%, due 04/15/39 | | | 420,005 | | | | 0.1 | |
| | 288,707 | | | | | 5.000%, due 09/15/39 | | | 319,528 | | | | 0.0 | |
| | 57,166 | | | | | 5.000%, due 06/15/40 | | | 63,557 | | | | 0.0 | |
| | 108,878 | | | | | 5.000%, due 09/15/40 | | | 119,972 | | | | 0.0 | |
| | | | | | | | | | 4,800,865 | | | | 0.6 | |
| | | | | | | | | | | | | | | |
| | | | | Total U.S. Government Agency Obligations | | | | | | | | |
| | | | | (Cost $122,944,777) | | | 124,818,458 | | | | 16.1 | |
| | | | | | | | | | | | | |
| ASSET-BACKED SECURITIES: 12.6% | | | | | | | |
| | | | | | | Automobile Asset-Backed Securities: 0.5% | |
| | 3,900,000 | | | | | Ally Auto Receivables Trust, 0.680%, 07/17/17 | | | 3,898,247 | | | | 0.5 | |
| | | | | | | | | | | | | | | |
| | | | | | | Credit Card Asset-Backed Securities: 1.3% | |
| | 9,800,000 | | | | | Citibank Credit Card Issuance Trust, 4.850%, 03/10/17 | | | 9,882,795 | | | | 1.3 | |
| | | | | | | | | | | | | | | |
| | | | | | | Home Equity Asset-Backed Securities: 1.9% | |
| | 10,100,000 | | | | | Accredited Mortgage Loan Trust 2006-1, 0.435%, 04/25/36 | | | 8,552,589 | | | | 1.1 | |
| | 2,805,817 | | | | | Citigroup Mortgage Loan Trust 2007-AHL1, 0.310%, 12/25/36 | | | 2,510,421 | | | | 0.3 | |
| | 1,300,000 | | | | | Home Equity Asset Trust 2005-2, 1.265%, 07/25/35 | | | 1,164,296 | | | | 0.1 | |
| | 2,250,000 | | | | | Morgan Stanley ABS Capital I, Inc. Trust 2005-HE4, 0.640%, 07/25/35 | | | 2,084,276 | | | | 0.3 | |
| | 532,777 | | | | | New Century Home Equity Loan Trust 2005-2, 0.660%, 06/25/35 | | | 423,924 | | | | 0.1 | |
| | | | | | | | | | 14,735,506 | | | | 1.9 | |
| | | | | | | | | | | | | | | |
| | | | | | | Other Asset-Backed Securities: 8.9% | |
| | 1,332,536 | | | | | Access Group, Inc., 1.534%, 10/27/25 | | | 1,337,523 | | | | 0.2 | |
| | 500,000 | | | # | | Apidos Cinco CDO Ltd., 2.483%, 05/14/20 | | | 490,138 | | | | 0.1 | |
| | 939,275 | | | | | Argent Securities, Inc. Asset-Backed Pass-Through Certificates Series 2004-W11, 1.295%, 11/25/34 | | | 806,607 | | | | 0.1 | |
| | 427,268 | | | # | | Belhurst CLO Ltd., 0.491%, 01/15/20 | | | 427,252 | | | | 0.1 | |
| | 500,000 | | | # | | Black Diamond CLO 2005-1A C, 1.017%, 06/20/17 | | | 495,500 | | | | 0.1 | |
| | 4,757,289 | | | # | | Callidus Debt Partners Clo Fund VI Ltd., 0.491%, 10/23/21 | | | 4,673,509 | | | | 0.6 | |
| | 1,250,000 | | | # | | Carlyle Veyron CLO Ltd., 0.911%, 07/15/18 | | | 1,240,478 | | | | 0.2 | |
| | 4,200,000 | | | # | | CIFC Funding Ltd, 1.383%, 08/14/24 | | | 4,201,483 | | | | 0.5 | |
| | 3,750,000 | | | # | | ColumbusNova CLO IV Ltd 2007-II, 2.481%, 10/15/21 | | | 3,672,304 | | | | 0.5 | |
| | 834,943 | | | | | Countrywide Asset-Backed Certificates, 0.350%, 08/25/36 | | | 819,472 | | | | 0.1 | |
| | 590,381 | | | | | Countrywide Asset-Backed Certificates, 0.350%, 09/25/36 | | | 578,279 | | | | 0.1 | |
| | 1,242,281 | | | | | Countrywide Asset-Backed Certificates, 2.555%, 01/25/34 | | | 913,698 | | | | 0.1 | |
| | 2,290,619 | | | | | Countrywide Asset-Backed Certificates 2006-26 2A3, 0.340%, 06/25/37 | | | 2,095,795 | | | | 0.3 | |
| | 2,000,000 | | | # | | Denali Capital CLO VI Ltd., 1.931%, 04/21/20 | | | 1,990,138 | | | | 0.3 | |
| | 1,000,000 | | | # | | Duane Street CLO III Ltd., 0.990%, 01/11/21 | | | 984,057 | | | | 0.1 | |
| | 500,000 | | | # | | Eaton Vance CDO IX Ltd., 1.731%, 04/20/19 | | | 485,651 | | | | 0.1 | |
| | 2,500,000 | | | # | | Fairway Loan Funding Co., 1.678%, 10/17/18 | | | 2,490,830 | | | | 0.3 | |
| | 1,000,000 | | | # | | Flagship CLO V, 0.597%, 09/20/19 | | | 981,168 | | | | 0.1 | |
| | 1,500,000 | | | # | | Flagship CLO V, 0.947%, 09/20/19 | | | 1,456,867 | | | | 0.2 | |
| | 1,500,000 | | | # | | Flagship CLO V, 1.797%, 09/20/19 | | | 1,428,726 | | | | 0.2 | |
| | 5,000,000 | | | # | | Gallatin CLO III Ltd. 2007-1A A2L, 0.572%, 05/15/21 | | | 4,879,020 | | | | 0.6 | |
| | 5,000,000 | | | # | | Gulf Stream - Compass CLO 2007-I Ltd., 1.133%, 10/28/19 | | | 4,950,000 | | | | 0.6 | |
| | 3,000,000 | | | # | | Hewett's Island CDO Ltd., 1.036%, 06/09/19 | | | 2,966,640 | | | | 0.4 | |
| | 2,549,402 | | | # | | Hillmark Funding, 0.481%, 05/21/21 | | | 2,520,892 | | | | 0.3 | |
| | 2,000,000 | | | # | | Jersey Street CLO Ltd., 1.781%, 10/20/18 | | | 1,955,050 | | | | 0.2 | |
| | 4,450,000 | | | | | JP Morgan Mortgage Acquisition Trust 2007-CH5, 0.430%, 05/25/37 | | | 3,474,431 | | | | 0.4 | |
| | 48,174 | | | | | JPMorgan Mortgage Acquisition Corp., 0.230%, 03/25/47 | | | 47,153 | | | | 0.0 | |
| | 58,753 | | | | | Long Beach Mortgage Loan Trust, 0.730%, 10/25/34 | | | 55,093 | | | | 0.0 | |
| | 2,500,000 | | | # | | Madison Park Funding II Ltd., 5.793%, 03/25/20 | | | 2,653,427 | | | | 0.3 | |
| | 2,500,000 | | | # | | Race Point IV CLO Ltd., 0.982%, 08/01/21 | | | 2,441,058 | | | | 0.3 | |
| | 1,700,000 | | | | | Specialty Underwriting & Residential Finance Trust Series 2005-BC2, 0.820%, 12/25/35 | | | 1,574,977 | | | | 0.2 | |
| | 4,357,872 | | | # | | SpringCastle America Funding LLC, 2.700%, 05/25/23 | | | 4,356,952 | | | | 0.6 | |
| | 2,000,000 | | | # | | Telos CLO 2006-1 Ltd., 1.930%, 10/11/21 | | | 1,942,382 | | | | 0.2 | |
| | 1,500,000 | | | # | | Trimaran CLO VI Ltd., 1.782%, 11/01/18 | | | 1,489,151 | | | | 0.2 | |
See Accompanying Notes to Financial Statements
| | PORTFOLIO OF INVESTMENTS |
| Voya Aggregate Bond Portfolio | as of December 31, 2014 |
| | 2,082,759 | | | | | Wells Fargo Home Equity Asset-Backed Securities 2006-2 Trust, 0.320%, 01/25/37 | | | 2,007,846 | | | | 0.3 | |
| | | | | | | | | | 68,883,547 | | | | 8.9 | |
| | | | | | | | | | | | | | | |
| | | | | Total Asset-Backed Securities | | | | | | | | |
| | | | | (Cost $95,736,896) | | | 97,400,095 | | | | 12.6 | |
| | | | | | | | | | | | | |
| U.S. TREASURY OBLIGATIONS: 20.3% | | | | | | | |
| | | | | | | U.S. Treasury Bonds: 3.3% | |
| | 23,668,000 | | | | | 3.125%, due 08/15/44 | | | 25,485,632 | | | | 3.3 | |
| | | | | | | | | | | | | | | |
| | | | | | | U.S. Treasury Notes: 17.0% | |
| | 4,600,000 | | | | | 0.625%, due 08/31/17 | | | 4,554,897 | | | | 0.6 | |
| | 87,885,000 | | | | | 1.500%, due 11/30/19 | | | 87,315,154 | | | | 11.3 | |
| | 38,873,000 | | | | | 2.250%, due 11/15/24 | | | 39,140,252 | | | | 5.1 | |
| | 200,000 | | | | | 2.375%, due 08/15/24 | | | 203,601 | | | | 0.0 | |
| | | | | | | | | | 131,213,904 | | | | 17.0 | |
| | | | | | | | | | | | | | | |
| | | | | Total U.S. Treasury Obligations | | | | | | | | |
| | | | | (Cost $157,479,014) | | | 156,699,536 | | | | 20.3 | |
| Shares | | | | | | | Value | | | Percentage
of Net
Assets | |
| PREFERRED STOCK: 0.5% |
| | | | | | | Financials: 0.5% | | | | | | | | |
| | 3,400 | | | @ | | Wells Fargo & Co. | | | 4,122,483 | | | | 0.5 | |
| | | | | | | | | | | | | | | |
| | | | | Total Preferred Stock | | | | | | | | |
| | | | | (Cost $2,195,020) | | | 4,122,483 | | | | 0.5 | |
| | | | | | | | | | | | | | | |
| | | | | Total Long-Term Investments | | | | | | | | |
| | | | | (Cost $724,834,652) | | | 739,095,595 | | | | 95.6 | |
Principal
Amount† | | | | | | | Value | | | Percentage
of Net
Assets | |
| SHORT-TERM INVESTMENTS: 12.1% |
| | | | | | | Commercial Paper: 2.5% | |
| | 900,000 | | | | | ENI Finance USA, Inc., 0.480%, 09/24/15 | | | 896,823 | | | | 0.1 | |
| | 8,600,000 | | | # | | ENI Finance USA, Inc., 0.609%, 04/10/15 | | | 8,599,708 | | | | 1.1 | |
| | 300,000 | | | # | | ENI Finance USA, Inc., 0.632%, 02/17/15 | | | 300,002 | | | | 0.1 | |
| | 4,100,000 | | | | | ENTERGY DISC 02/03/15, 02/03/15 | | | 4,098,263 | | | | 0.5 | |
| | 5,600,000 | | | # | | Macquarie Bank Ltd, 0.433%, 05/14/15 | | | 5,599,384 | | | | 0.7 | |
| | | | | | | | | | 19,494,180 | | | | 2.5 | |
| | | | | | | Securities Lending Collateralcc: 0.9% | |
| | 1,639,557 | | | | | Bank of Nova Scotia, Repurchase Agreement dated 12/31/14, 0.10%, due 01/02/15 (Repurchase Amount $1,639,566, collateralized by various U.S. Government/U.S. Government Agency Obligations, 0.125%-7.125%, Market Value plus accrued interest $1,672,358, due 02/09/15-05/15/40) | | | 1,639,557 | | | | 0.2 | |
| | 1,639,557 | | | | | Cantor Fitzgerald, Repurchase Agreement dated 12/31/14, 0.09%, due 01/02/15 (Repurchase Amount $1,639,565, collateralized by various U.S. Government/U.S. Government Agency Obligations, 0.000%-10.500%, Market Value plus accrued interest $1,672,348, due 01/01/15-09/01/49) | | | 1,639,557 | | | | 0.2 | |
| | 344,699 | | | | | Daiwa Capital Markets, Repurchase Agreement dated 12/31/14, 0.12%, due 01/02/15 (Repurchase Amount $344,701, collateralized by various U.S. Government and U.S. Government Agency Obligations, 0.000%-6.500%, Market Value plus accrued interest $351,593, due 06/01/17-03/01/48) | | | 344,699 | | | | 0.1 | |
| | 1,639,557 | | | | | Nomura Securities, Repurchase Agreement dated 12/31/14, 0.08%, due 01/02/15 (Repurchase Amount $1,639,564, collateralized by various U.S. Government/U.S. Government Agency Obligations, 0.000%-8.875%, Market Value plus accrued interest $1,672,348, due 01/07/15-10/20/64) | | | 1,639,557 | | | | 0.2 | |
See Accompanying Notes to Financial Statements
| | PORTFOLIO OF INVESTMENTS |
| Voya Aggregate Bond Portfolio | as of December 31, 2014 |
| | 1,639,557 | | | | | Royal Bank of Scotland PLC, Repurchase Agreement dated 12/31/14, 0.09%, due 01/02/15 (Repurchase Amount $1,639,565, collateralized by various U.S. Government/U.S. Government Agency Obligations, 0.375%-7.250%, Market Value plus accrued interest $1,672,348, due 11/15/15-07/15/56) | | | 1,639,557 | | | | 0.2 | |
| | | | | | | | | | 6,902,927 | | | | 0.9 | |
| | | | | | | | | | | | | | | |
| | | | | | | Certificates of Deposit: 0.1% | |
| | 700,000 | | | | | Credit Suisse/New York NY, 0.473%, 03/17/15 | | | | | | | | |
| | | | | | | (Cost $699,972) | | | 699,972 | | | | 0.1 | |
| Shares | | | | | | | Value | | | Percentage
of Net
Assets | |
| | | | | | | Mutual Funds: 8.6% | | | |
| | 66,878,000 | | | | | BlackRock Liquidity Funds, TempFund, Institutional Class, 0.030%†† | | | | | | | | |
| | | | | | | (Cost $66,878,000) | | | 66,878,000 | | | | 8.6 | |
| | | | | | | | | | | | | | | |
| | | | | Total Short-Term Investments | | | | | | | | |
| | | | | (Cost $93,975,079) | | | 93,975,079 | | | | 12.1 | |
| | | | | | | | | | | | | |
| | | | | Total Investments in Securities
(Cost $818,809,731) | | $ | 833,070,674 | | | | 107.7 | |
| | | | | Liabilities in Excess of Other Assets | | | (59,410,539 | ) | | | (7.7 | ) |
| | | | | Net Assets | | $ | 773,660,135 | | | | 100.0 | |
| † | Unless otherwise indicated, principal amount is shown in USD. |
| †† | Rate shown is the 7-day yield as of December 31, 2014. |
| # | Securities with purchases pursuant to Rule 144A or section 4(a)(2), under the Securities Act of 1933 and may not be resold subject to that rule except to qualified institutional buyers. |
| ## | The Federal Housing Finance Agency (“FHFA”) placed the Federal Home Loan Mortgage Corporation and Federal National Mortgage Association into conservatorship with FHFA as the conservator. As such, the FHFA oversees the continuing affairs of these companies. |
| @ | Non-income producing security. |
| cc | Represents securities purchased with cash collateral received for securities on loan. |
| L | Loaned security, a portion or all of the security is on loan at December 31, 2014. |
| ^ | Interest only securities represent the right to receive the monthly interest payments on an underlying pool of mortgage loans. Principal amount shown represents the notional amount on which current interest is calculated. Payments of principal on the pool reduce the value of the interest only security. |
See Accompanying Notes to Financial Statements
| | PORTFOLIO OF INVESTMENTS |
| Voya Aggregate Bond Portfolio | as of December 31, 2014 |
Cost for federal income tax purposes is $819,143,910.
Net unrealized appreciation consists of:
| Gross Unrealized Appreciation | | $ | 17,392,101 | |
| Gross Unrealized Depreciation | | | (3,465,337 | ) |
| | | | | |
| Net Unrealized Appreciation | | $ | 13,926,764 | |
See Accompanying Notes to Financial Statements
| Voya Global Bond Portfolio | PORTFOLIO OF INVESTMENTS |
| as of December 31, 2014 |
Principal
Amount† | | | | | | Value | | Percentage
of Net
Assets |
| CORPORATE BONDS/NOTES: 28.4% | | | | | | | | |
| | | | | | | | | Australia: 0.4% | | | | | | | | |
| | 703,000 | | | | | | | BHP Billiton Finance USA Ltd, 5.000%, 09/30/43 | | | 800,065 | | | | 0.3 | |
| | 453,000 | | | | # | | | Scentre Group Trust 1 / Scentre Group Trust 2, 3.500%, 02/12/25 | | | 455,735 | | | | 0.1 | |
| | | | | | | | | | | | 1,255,800 | | | | 0.4 | |
| | | | | | | | | | | | | | | | | |
| | | | | | | | | Brazil: 0.5% | | | | | | | | |
| | 350,000 | | | | # | | | Marfrig Overseas Ltd., 9.500%, 05/04/20 | | | 357,000 | | | | 0.1 | |
| | 200,000 | | | | # | | | Samarco Mineracao SA, 5.750%, 10/24/23 | | | 191,500 | | | | 0.1 | |
| | 700,000 | | | | | | | Suzano Trading Ltd., 5.875%, 01/23/21 | | | 722,400 | | | | 0.3 | |
| | | | | | | | | | | | 1,270,900 | | | | 0.5 | |
| | | | | | | | | | | | | | | | | |
| | | | | | | | | Canada: 0.1% | | | | | | | | |
| | 402,000 | | | | | | | Goldcorp, Inc., 3.700%, 03/15/23 | | | 392,603 | | | | 0.1 | |
| | | | | | | | | | | | | | | | | |
| | | | | | | | | Cayman Islands: 0.2% | | | | | | | | |
| | 601,000 | | | | # | | | Alibaba Group Holding Ltd., 3.600%, 11/28/24 | | | 597,330 | | | | 0.2 | |
| | | | | | | | | | | | | | | | | |
| | | | | | | | | France: 0.5% | | | | | | | | |
| | 294,000 | | | | | | | BPCE SA, 2.500%, 12/10/18 | | | 298,286 | | | | 0.1 | |
| | 287,000 | | | | # | | | BPCE SA, 5.150%, 07/21/24 | | | 296,301 | | | | 0.1 | |
| | 940,000 | | | | # | | | Numericable Group SA, 6.000%, 05/15/22 | | | 946,345 | | | | 0.3 | |
| | | | | | | | | | | | 1,540,932 | | | | 0.5 | |
| | | | | | | | | | | | | | | | | |
| | | | | | | | | India: 0.2% | | | | | | | | |
| | 600,000 | | | | | | | Vedanta Resources PLC, 8.250%, 06/07/21 | | | 596,625 | | | | 0.2 | |
| | | | | | | | | | | | | | | | | |
| | | | | | | | | Italy: 0.1% | | | | | | | | |
| | 286,000 | | | | | | | Intesa Sanpaolo SpA, 3.875%, 01/15/19 | | | 296,398 | | | | 0.1 | |
| | | | | | | | | | | | | | | | | |
| | | | | | | | | Luxembourg: 0.2% | | | | | | | | |
| | 280,000 | | | | | | | Intelsat Jackson Holdings SA, 7.250%, 10/15/20 | | | 296,450 | | | | 0.1 | |
| | 275,000 | | | | | | | Intelsat Jackson Holdings SA, 7.500%, 04/01/21 | | | 295,281 | | | | 0.1 | |
| | | | | | | | | | | | 591,731 | | | | 0.2 | |
| | | | | | | | | | | | | | | | | |
| | | | | | | | | Mexico: 0.0% | | | | | | | | |
| MXN | 1,007,437 | | | | ± | | | Banco Invex S.A., 03/13/34 | | | – | | | | – | |
| MXN | 231,064 | | | | | | | JPMorgan Hipotecaria su Casita, 09/25/35 | | | 19,660 | | | | 0.0 | |
| | | | | | | | | | | | 19,660 | | | | 0.0 | |
| | | | | | | | | | | | | | | | | |
| | | | | | | | | Netherlands: 0.5% | | | | | | | | |
| | 200,000 | | | | # | | | Carlson Wagonlit BV, 6.875%, 06/15/19 | | | 210,000 | | | | 0.1 | |
| | 269,000 | | | | | | | Cooperatieve Centrale Raiffeisen-Boerenleenbank BA/Netherlands, 4.500%, 01/11/21 | | | 296,279 | | | | 0.1 | |
| | 650,000 | | | | # | | | NXP BV / NXP Funding LLC, 5.750%, 02/15/21 | | | 685,750 | | | | 0.2 | |
| | 282,000 | | | | | | | Seagate HDD Cayman, 6.875%, 05/01/20 | | | 296,805 | | | | 0.1 | |
| | | | | | | | | | | | 1,488,834 | | | | 0.5 | |
| | | | | | | | | | | | | | | | | |
| | | | | | | | | Norway: 0.1% | | | | | | | | |
| | 380,000 | | | | | | | Statoil ASA, 2.450%, 01/17/23 | | | 363,111 | | | | 0.1 | |
| | | | | | | | | | | | | | | | | |
| | | | | | | | | Russia: 0.6% | | | | | | | | |
| | 900,000 | | | | L | | | EuroChem Mineral & Chemical Co. OJSC via EuroChem GI Ltd, 5.125%, 12/12/17 | | | 781,200 | | | | 0.3 | |
| | 350,000 | | | | | | | Metalloinvest Finance Ltd., 5.625%, 04/17/20 | | | 267,337 | | | | 0.1 | |
| | 300,000 | | | | | | | Metalloinvest Finance Ltd, 6.500%, 07/21/16 | | | 284,250 | | | | 0.1 | |
| | 500,000 | | | | | | | Mobile Telesystems OJSC via MTS International Funding Ltd., 5.000%, 05/30/23 | | | 397,500 | | | | 0.1 | |
| | | | | | | | | | | | 1,730,287 | | | | 0.6 | |
| | | | | | | | | | | | | | | | | |
| | | | | | | | | Sweden: 0.1% | | | | | | | | |
| | 298,000 | | | | # | | | Nordea Bank AB, 5.500%, 09/29/49 | | | 294,647 | | | | 0.1 | |
| | | | | | | | | | | | | | | | | |
| | | | | | | | | Switzerland: 0.3% | | | | | | | | |
| | 400,000 | | | | # | | | Credit Suisse AG, 6.500%, 08/08/23 | | | 440,088 | | | | 0.2 | |
| | 250,000 | | | | | | | UBS AG/Stamford CT, 7.625%, 08/17/22 | | | 294,776 | | | | 0.1 | |
| | | | | | | | | | | | 734,864 | | | | 0.3 | |
| | | | | | | | | | | | | | | | | |
| | | | | | | | | United Kingdom: 0.4% | | | | | | | | |
| | 265,000 | | | | # | | | Barclays Bank PLC, 6.050%, 12/04/17 | | | 292,205 | | | | 0.1 | |
| | 200,000 | | | | | | | HSBC Holdings PLC, 5.625%, 12/29/49 | | | 200,950 | | | | 0.1 | |
| | 200,000 | | | | # | | | Ineos Finance PLC, 8.375%, 02/15/19 | | | 213,250 | | | | 0.1 | |
| | 402,000 | | | | | | | Vodafone Group PLC, 1.500%, 02/19/18 | | | 395,123 | | | | 0.1 | |
| | | | | | | | | | | | 1,101,528 | | | | 0.4 | |
| | | | | | | | | | | | | | | | | |
| | | | | | | | | United States: 24.2% | | | | | | | | |
| | 705,000 | | | | | | | AES Corp., 7.375%, 07/01/21 | | | 800,175 | | | | 0.3 | |
| | 470,000 | | | | | | | American International Group, Inc., 3.375%, 08/15/20 | | | 488,859 | | | | 0.2 | |
| | 447,000 | | | | | | | Air Lease Corp., 4.250%, 09/15/24 | | | 451,470 | | | | 0.2 | |
| | 80,000 | | | | | | | Albemarle Corp., 3.000%, 12/01/19 | | | 80,103 | | | | 0.0 | |
| | 570,000 | | | | # | | | Alliance Data Systems Corp., 5.375%, 08/01/22 | | | 564,300 | | | | 0.2 | |
| | 400,000 | | | | | | | Alpha Natural Resources, Inc., 6.250%, 06/01/21 | | | 114,000 | | | | 0.0 | |
| | 780,000 | | | | | | | American Tower Corp., 5.000%, 02/15/24 | | | 828,682 | | | | 0.3 | |
See Accompanying Notes to Financial Statements
| Voya Global Bond Portfolio | PORTFOLIO OF INVESTMENTS |
| as of December 31, 2014 |
| | 638,000 | | | # | | Amsurg Corp., 5.625%, 07/15/22 | | | 657,140 | | | | 0.2 | |
| | 1,050,000 | | | | | Apple Inc., 1.000%, 05/03/18 | | | 1,033,903 | | | | 0.4 | |
| | 243,000 | | | | | AT&T, Inc., 2.500%, 08/15/15 | | | 245,684 | | | | 0.1 | |
| | 490,000 | | | # | | Audatex North America, Inc., 6.000%, 06/15/21 | | | 507,150 | | | | 0.2 | |
| | 523,000 | | | | | AvalonBay Communities, Inc., 3.500%, 11/15/24 | | | 523,904 | | | | 0.2 | |
| | 368,000 | | | | | Bank of America Corp., 3.300%, 01/11/23 | | | 368,415 | | | | 0.1 | |
| | 458,000 | | | | | Bank of America Corp., 4.100%, 07/24/23 | | | 482,865 | | | | 0.2 | |
| | 309,000 | | | | | Bank of America Corp., 4.000%, 04/01/24 | | | 322,111 | | | | 0.1 | |
| | 1,309,000 | | | | | Barrick North America Finance LLC, 5.750%, 05/01/43 | | | 1,303,336 | | | | 0.4 | |
| | 374,000 | | | | | BioMed Realty L.P., 4.250%, 07/15/22 | | | 388,263 | | | | 0.1 | |
| | 540,000 | | | # | | Calpine Corp., 6.000%, 01/15/22 | | | 577,800 | | | | 0.2 | |
| | 600,000 | | | | | Case New Holland, Inc., 7.875%, 12/01/17 | | | 663,000 | | | | 0.2 | |
| | 490,000 | | | | | CBRE Services, Inc., 5.250%, 03/15/25 | | | 501,025 | | | | 0.2 | |
| | 628,000 | | | L | | CBS Corp., 3.700%, 08/15/24 | | | 627,537 | | | | 0.2 | |
| | 689,000 | | | | | CCO Holdings LLC / CCO Holdings Capital Corp., 5.125%, 02/15/23 | | | 676,081 | | | | 0.2 | |
| | 115,000 | | | | | CCO Holdings LLC / CCO Holdings Capital Corp., 5.750%, 09/01/23 | | | 116,869 | | | | 0.0 | |
| | 660,000 | | | # | | Cedar Fair L.P. / Canada's Wonderland Co. / Magnum Management Corp., 5.375%, 06/01/24 | | | 657,525 | | | | 0.2 | |
| | 621,000 | | | | | Celgene Corp., 4.000%, 08/15/23 | | | 654,812 | | | | 0.2 | |
| | 515,000 | | | | | CenturyLink, Inc., 5.625%, 04/01/20 | | | 536,244 | | | | 0.2 | |
| | 445,000 | | | | | Chesapeake Energy Corp., 6.625%, 08/15/20 | | | 475,037 | | | | 0.2 | |
| | 180,000 | | | | | Chesapeake Oilfield Operating LLC / Chesapeake Oilfield Finance, Inc., 6.625%, 11/15/19 | | | 137,700 | | | | 0.0 | |
| | 382,000 | | | | | Citigroup, Inc., 4.000%, 08/05/24 | | | 383,991 | | | | 0.1 | |
| | 469,000 | | | | | Citigroup, Inc., 5.500%, 09/13/25 | | | 520,015 | | | | 0.2 | |
| | 758,000 | | | | | Citizens Bank NA/Providence RI, 2.450%, 12/04/19 | | | 754,822 | | | | 0.3 | |
| | 215,000 | | | # | | CommScope, Inc., 5.500%, 06/15/24 | | | 212,850 | | | | 0.1 | |
| | 173,000 | | | # | | CommScope, Inc., 5.000%, 06/15/21 | | | 171,270 | | | | 0.1 | |
| | 262,000 | | | | | ConocoPhillips Co., 3.350%, 11/15/24 | | | 265,252 | | | | 0.1 | |
| | 262,000 | | | | | ConocoPhillips Co., 4.300%, 11/15/44 | | | 275,236 | | | | 0.1 | |
| | 562,000 | | | # | | COX Communications, Inc., 2.950%, 06/30/23 | | | 539,925 | | | | 0.2 | |
| | 985,000 | | | | | | | Devon Energy Corp., 5.600%, 07/15/41 | | | 1,098,148 | | | | 0.4 | |
| | 446,000 | | | | | | | DIRECTV Holdings LLC / DIRECTV Financing Co., Inc., 3.500%, 03/01/16 | | | 457,845 | | | | 0.2 | |
| | 372,000 | | | | | | | DIRECTV Holdings LLC / DIRECTV Financing Co., Inc., 5.150%, 03/15/42 | | | 385,832 | | | | 0.1 | |
| | 442,000 | | | | | | | Discover Bank/Greenwood DE, 7.000%, 04/15/20 | | | 521,503 | | | | 0.2 | |
| | 265,000 | | | | | | | DISH DBS Corp., 4.250%, 04/01/18 | | | 271,294 | | | | 0.1 | |
| | 310,000 | | | | | | | Eastman Chemical Co., 2.700%, 01/15/20 | | | 312,118 | | | | 0.1 | |
| | 260,000 | | | | | | | Eastman Chemical Co., 3.800%, 03/15/25 | | | 265,221 | | | | 0.1 | |
| | 680,000 | | | | | | | Eaton Corp., 4.150%, 11/02/42 | | | 677,679 | | | | 0.2 | |
| | 585,000 | | | | | | | eBay, Inc., 2.600%, 07/15/22 | | | 556,070 | | | | 0.2 | |
| | 1,026,000 | | | | | | | Energy Transfer Partners L.P., 4.900%, 02/01/24 | | | 1,077,039 | | | | 0.4 | |
| | 1,276,000 | | | | | | | Entergy Corp., 5.125%, 09/15/20 | | | 1,391,700 | | | | 0.5 | |
| | 611,000 | | | | | | | Equinix, Inc., 5.375%, 04/01/23 | | | 614,055 | | | | 0.2 | |
| | 539,000 | | | | | | | Fifth Third Bancorp., 8.250%, 03/01/38 | | | 814,784 | | | | 0.3 | |
| | 532,000 | | | | | | | FirstEnergy Corp., 4.250%, 03/15/23 | | | 549,872 | | | | 0.2 | |
| | 390,000 | | | | | | | Freeport-McMoRan, Inc., 4.000%, 11/14/21 | | | 386,987 | | | | 0.1 | |
| | 350,000 | | | | | | | Freeport-McMoRan, Inc., 4.550%, 11/14/24 | | | 340,525 | | | | 0.1 | |
| | 660,000 | | | | | | | Gannett Co., Inc., 5.125%, 07/15/20 | | | 676,500 | | | | 0.2 | |
| | 185,000 | | | | | | | Gannett Co., Inc., 6.375%, 10/15/23 | | | 197,025 | | | | 0.1 | |
| | 478,000 | | | | | | | General Dynamics Corp., 2.250%, 11/15/22 | | | 461,573 | | | | 0.2 | |
| | 715,000 | | | | | | | General Electric Capital Corp., 6.750%, 03/15/32 | | | 979,356 | | | | 0.3 | |
| | 816,000 | | | | | | | Genworth Holdings, Inc., 4.900%, 08/15/23 | | | 661,840 | | | | 0.2 | |
| | 310,000 | | | | # | | | Georgia-Pacific LLC, 3.163%, 11/15/21 | | | 312,320 | | | | 0.1 | |
| | 960,000 | | | | # | | | Glencore Funding LLC, 2.500%, 01/15/19 | | | 946,187 | | | | 0.3 | |
| | 289,000 | | | | | | | Goldman Sachs Group, Inc., 4.800%, 07/08/44 | | | 310,787 | | | | 0.1 | |
| | 627,000 | | | | | | | Goldman Sachs Group, Inc., 5.250%, 07/27/21 | | | 708,267 | | | | 0.2 | |
| | 715,000 | | | | | | | Goodyear Tire & Rubber Co., 8.250%, 08/15/20 | | | 761,475 | | | | 0.3 | |
| | 605,000 | | | | | | | Hartford Financial Services Group, Inc., 6.625%, 03/30/40 | | | 817,327 | | | | 0.3 | |
| | 210,000 | | | | | | | HCA, Inc., 6.375%, 01/15/15 | | | 210,323 | | | | 0.1 | |
| | 721,000 | | | | | | | HCP, Inc., 4.250%, 11/15/23 | | | 759,310 | | | | 0.3 | |
| | 292,000 | | | | | | | Hewlett-Packard Co., 2.600%, 09/15/17 | | | 297,696 | | | | 0.1 | |
| | 70,000 | | | | # | | | Hilcorp Energy I L.P./Hilcorp Finance Co., 5.000%, 12/01/24 | | | 61,687 | | | | 0.0 | |
| | 274,000 | | | | | | | HSBC USA, Inc., 5.000%, 09/27/20 | | | 300,647 | | | | 0.1 | |
See Accompanying Notes to Financial Statements
| Voya Global Bond Portfolio | PORTFOLIO OF INVESTMENTS |
| as of December 31, 2014 |
| | 294,000 | | | | | | | Huntington Bancshares, Inc./OH, 2.600%, 08/02/18 | | | 297,821 | | | | 0.1 | |
| | 1,165,000 | | | | | | | Indiana Michigan Power, 7.000%, 03/15/19 | | | 1,378,020 | | | | 0.5 | |
| | 570,000 | | | | # | | | JBS USA LLC / JBS USA Finance, Inc., 5.875%, 07/15/24 | | | 561,450 | | | | 0.2 | |
| | 810,000 | | | | | | | Jefferson Smurfit Escrow, 10/01/12 | | | – | | | | – | |
| | 245,000 | | | | | | | Jefferson Smurfit Escrow, 06/01/13 | | | – | | | | – | |
| | 302,000 | | | | # | | | Jersey Central Power & Light Co., 4.700%, 04/01/24 | | | 323,017 | | | | 0.1 | |
| | 362,000 | | | | | | | JPMorgan Chase & Co., 1.625%, 05/15/18 | | | 358,342 | | | | 0.1 | |
| | 377,000 | | | | | | | JPMorgan Chase & Co., 3.375%, 05/01/23 | | | 373,374 | | | | 0.1 | |
| | 478,000 | | | | | | | JPMorgan Chase & Co., 6.000%, 12/29/49 | | | 474,415 | | | | 0.2 | |
| | 61 | | | | # | | | Kern River Funding Corp., 4.893%, 04/30/18 | | | 65 | | | | 0.0 | |
| | 222,000 | | | | | | | Kinder Morgan Energy Partners L.P., 4.250%, 09/01/24 | | | 222,874 | | | | 0.1 | |
| | 476,000 | | | | | | | Kohl's Corp., 4.750%, 12/15/23 | | | 510,350 | | | | 0.2 | |
| | 575,000 | | | | | | | Mediacom LLC / Mediacom Capital Corp., 7.250%, 02/15/22 | | | 616,687 | | | | 0.2 | |
| | 375,000 | | | | # | | | Medtronic, Inc., 3.150%, 03/15/22 | | | 381,582 | | | | 0.1 | |
| | 393,000 | | | | # | | | Medtronic, Inc., 3.500%, 03/15/25 | | | 402,887 | | | | 0.1 | |
| | 605,000 | | | | | | | MGM Resorts International, 6.750%, 10/01/20 | | | 636,762 | | | | 0.2 | |
| | 372,000 | | | | | | | Morgan Stanley, 3.750%, 02/25/23 | | | 382,273 | | | | 0.1 | |
| | 587,000 | | | | | | | Morgan Stanley, 3.875%, 04/29/24 | | | 603,458 | | | | 0.2 | |
| | 618,000 | | | | | | | Morgan Stanley, 4.100%, 05/22/23 | | | 626,349 | | | | 0.2 | |
| | 240,000 | | | | | | | MPT Operating Partnership L.P./MPT Finance Corp., 6.375%, 02/15/22 | | | 256,200 | | | | 0.1 | |
| | 1,048,000 | | | | | | | Mylan, Inc./PA, 2.600%, 06/24/18 | | | 1,062,664 | | | | 0.4 | |
| | 325,000 | | | | | | | NCR Corp., 6.375%, 12/15/23 | | | 339,625 | | | | 0.1 | |
| | 625,000 | | | | # | | | Netflix, Inc., 5.750%, 03/01/24 | | | 653,125 | | | | 0.2 | |
| | 490,000 | | | | | | | Newell Rubbermaid, Inc., 2.875%, 12/01/19 | | | 490,741 | | | | 0.2 | |
| | 475,000 | | | | | | | 21st Century Fox America, Inc., 4.500%, 02/15/21 | | | 520,628 | | | | 0.2 | |
| | 422,000 | | | | | | | 21st Century Fox America, Inc., 5.400%, 10/01/43 | | | 504,387 | | | | 0.2 | |
| | 381,000 | | | | | | | NextEra Energy Capital Holdings, Inc., 3.625%, 06/15/23 | | | 387,271 | | | | 0.1 | |
| | 568,000 | | | | | | | Philip Morris International, Inc., 4.250%, 11/10/44 | | | 580,043 | | | | 0.2 | |
| | 390,000 | | | | | | | Phillips 66, 4.875%, 11/15/44 | | | 400,753 | | | | 0.1 | |
| | 640,000 | | | | | | | Pinnacle Entertainment, Inc., 6.375%, 08/01/21 | | | 662,400 | | | | 0.2 | |
| | 490,000 | | | | | | | PolyOne Corp., 5.250%, 03/15/23 | | | 492,122 | | | | 0.2 | |
| | 386,000 | | | | | | | PPL Capital Funding, Inc., 3.400%, 06/01/23 | | | 387,427 | | | | 0.1 | |
| | 562,000 | | | | | | | Prudential Financial, Inc., 4.600%, 05/15/44 | | | 594,736 | | | | 0.2 | |
| | 280,000 | | | | | | | Regency Energy Partners L.P. / Regency Energy Finance Corp., 4.500%, 11/01/23 | | | 258,300 | | | | 0.1 | |
| | 280,000 | | | | | | | Regency Energy Partners L.P. / Regency Energy Finance Corp., 5.500%, 04/15/23 | | | 271,600 | | | | 0.1 | |
| | 682,000 | | | | | | | Reynolds American, Inc., 6.150%, 09/15/43 | | | 793,761 | | | | 0.3 | |
| | 635,000 | | | | | | | RR Donnelley & Sons Co., 6.500%, 11/15/23 | | | 654,050 | | | | 0.2 | |
| | 470,000 | | | | # | | | Sable International Finance Ltd., 8.750%, 02/01/20 | | | 512,300 | | | | 0.2 | |
| | 325,000 | | | | | | | Sabra Health Care L.P. / Sabra Capital Corp., 5.500%, 02/01/21 | | | 338,813 | | | | 0.1 | |
| | 225,000 | | | | # | | | Sanchez Energy Corp., 6.125%, 01/15/23 | | | 189,563 | | | | 0.1 | |
| | 640,000 | | | | | | | SandRidge Energy, Inc., 7.500%, 03/15/21 | | | 412,800 | | | | 0.1 | |
| | 585,000 | | | | # | | | Sanmina Corp., 4.375%, 06/01/19 | | | 582,075 | | | | 0.2 | |
| | 130,000 | | | | | | | Scripps Networks Interactive, Inc., 2.750%, 11/15/19 | | | 130,689 | | | | 0.0 | |
| | 260,000 | | | | | | | Scripps Networks Interactive, Inc., 3.900%, 11/15/24 | | | 265,255 | | | | 0.1 | |
| | 255,000 | | | | # | | | Sealed Air Corp., 8.375%, 09/15/21 | | | 286,238 | | | | 0.1 | |
| | 462,000 | | | | | | | Simon Property Group L.P., 4.250%, 10/01/44 | | | 480,097 | | | | 0.2 | |
| | 990,000 | | | | # | | | Sinclair Television Group, Inc., 5.625%, 08/01/24 | | | 962,775 | | | | 0.3 | |
| | 195,000 | | | | | | | Smithfield Foods, Inc., 7.750%, 07/01/17 | | | 215,963 | | | | 0.1 | |
| | 270,000 | | | | | | | Sprint Corp., 7.125%, 06/15/24 | | | 252,450 | | | | 0.1 | |
| | 270,000 | | | | | | | Sprint Corp., 7.875%, 09/15/23 | | | 267,894 | | | | 0.1 | |
| | 676,000 | | | | | | | St Jude Medical, Inc., 2.500%, 01/15/16 | | | 686,211 | | | | 0.2 | |
| | 570,000 | | | | | | | Starz LLC / Starz Finance Corp., 5.000%, 09/15/19 | | | 577,125 | | | | 0.2 | |
| | 570,000 | | | | # | | | Steel Dynamics, Inc., 5.125%, 10/01/21 | | | 580,688 | | | | 0.2 | |
| | 245,000 | | | | | | | Stone Webster Escrow, 07/01/12 | | | – | | | | – | |
| | 164,000 | | | | | | | Suburban Propane Partners L.P./Suburban Energy Finance Corp., 7.375%, 08/01/21 | | | 172,610 | | | | 0.1 | |
| | 600,000 | | | | | | | Summit Midstream Holdings LLC / Summit Midstream Finance Corp., 5.500%, 08/15/22 | | | 573,000 | | | | 0.2 | |
| | 130,000 | | | | | | | Sunoco Logistics Partners Operations L.P., 4.250%, 04/01/24 | | | 131,707 | | | | 0.0 | |
| | 445,000 | | | | | | | Synchrony Financial, 4.250%, 08/15/24 | | | 457,154 | | | | 0.2 | |
| | 585,000 | | | | | | | Tenet Healthcare Corp., 6.000%, 10/01/20 | | | 629,653 | | | | 0.2 | |
| | 340,000 | | | | | | | Time Warner Cable, Inc., 5.875%, 11/15/40 | | | 406,854 | | | | 0.1 | |
See Accompanying Notes to Financial Statements
| Voya Global Bond Portfolio | PORTFOLIO OF INVESTMENTS |
| as of December 31, 2014 |
| | 606,000 | | | | | | | Time Warner, Inc., 6.500%, 11/15/36 | | | 773,412 | | | | 0.3 | |
| | 520,000 | | | | | | | United Rentals North America, Inc., 7.625%, 04/15/22 | | | 574,340 | | | | 0.2 | |
| | 298,000 | | | | | | | US Bancorp/MN, 3.600%, 09/11/24 | | | 303,235 | | | | 0.1 | |
| | 505,000 | | | | # | | | Valeant Pharmaceuticals International, 7.250%, 07/15/22 | | | 540,350 | | | | 0.2 | |
| | 540,000 | | | | | | | Ventas Realty L.P. / Ventas Capital Corp., 2.700%, 04/01/20 | | | 535,002 | | | | 0.2 | |
| | 337,000 | | | | # | | | Verizon Communications, Inc., 5.012%, 08/21/54 | | | 350,173 | | | | 0.1 | |
| | 1,328,000 | | | | | | | Verizon Communications, Inc., 5.150%, 09/15/23 | | | 1,467,459 | | | | 0.5 | |
| | 339,000 | | | | | | | Verizon Communications, Inc., 6.550%, 09/15/43 | | | 434,945 | | | | 0.1 | |
| | 360,000 | | | | | | | Walgreen Co., 3.100%, 09/15/22 | | | 356,006 | | | | 0.1 | |
| | 260,000 | | | | | | | Walgreens Boots Alliance, Inc., 3.800%, 11/18/24 | | | 265,706 | | | | 0.1 | |
| | 526,000 | | | | | | | WellPoint, Inc., 3.500%, 08/15/24 | | | 530,867 | | | | 0.2 | |
| | 415,000 | | | | | | | WellPoint, Inc., 5.100%, 01/15/44 | | | 468,211 | | | | 0.2 | |
| | 599,000 | | | | | | | Wells Fargo & Co., 4.100%, 06/03/26 | | | 613,047 | | | | 0.2 | |
| | 660,000 | | | | # | | | West Corp., 5.375%, 07/15/22 | | | 633,600 | | | | 0.2 | |
| | | | | | | | | | | | 70,508,169 | | | | 24.2 | |
| | | | | | | | | | | | | | | | | |
| | | | | | | | | Total Corporate Bonds/Notes | | | | | | | | |
| | | | | | | | | (Cost $81,541,561) | | | 82,783,419 | | | | 28.4 | |
| | | | | | | | | | | | | | | | | |
| COLLATERALIZED MORTGAGE OBLIGATIONS: 12.7% | |
| | | | | | | | | United States: 12.7 | | | | | | | | |
| | 619,944 | | | | | | | Banc of America Alternative Loan Trust 2004-1 4A1, 4.750%, 02/25/19 | | | 625,045 | | | | 0.2 | |
| | 800,000 | | | | | | | Banc of America Commercial Mortgage Trust 2007-3 AJ, 5.547%, 06/10/49 | | | 828,701 | | | | 0.3 | |
| | 700,000 | | | | | | | Banc of America Commercial Mortgage Trust 2007-3 B, 5.547%, 06/10/49 | | | 714,348 | | | | 0.2 | |
| | 920,000 | | | | | | | Banc of America Commercial Mortgage Trust 2007-4 AJ, 5.821%, 02/10/51 | | | 956,679 | | | | 0.3 | |
| | 1,243,988 | | | | | | | Banc of America Funding Corp., 5.500%, 02/25/35 | | | 1,268,444 | | | | 0.4 | |
| | 1,130,000 | | | | # | | | Banc of America Merrill Lynch Commercial Mortgage, Inc. 2004-4 G, 5.422%, 07/10/42 | | | 1,164,496 | | | | 0.4 | |
| | 550,000 | | | | # | | | Banc of America Merrill Lynch Commercial Mortgage, Inc. 2005-2 H, 5.268%, 07/10/43 | | | 550,092 | | | | 0.2 | |
| | 440,000 | | | | | | | Banc of America Merrill Lynch Commercial Mortgage, Inc. 2005-6 C, 5.152%, 09/10/47 | | | 451,250 | | | | 0.2 | |
| | 440,000 | | | | # | | | Bear Stearns Commercial Mortgage Securities Trust 2004-PWR6, 5.406%, 11/11/41 | | | 484,148 | | | | 0.2 | |
| | 1,030,000 | | | | | | | Bear Stearns Commercial Mortgage Securities Trust 2005-PWR8, 4.858%, 06/11/41 | | | 1,023,807 | | | | 0.3 | |
| | 500,000 | | | | | | | Bear Stearns Commercial Mortgage Securities Trust 2005-TOP20, 5.129%, 10/12/42 | | | 509,579 | | | | 0.2 | |
| | 542,693 | | | | # | | | Beckman Coulter, Inc., 7.498%, 12/15/18 | | | 602,172 | | | | 0.2 | |
| | 660,000 | | | | # | | | Citigroup Commercial Mortgage Trust 2004-C1, 5.250%, 04/15/40 | | | 667,461 | | | | 0.2 | |
| | 21,185 | | | | # | | | Citigroup Commercial Mortgage Trust 2004-C1, 5.802%, 04/15/40 | | | 21,457 | | | | 0.0 | |
| | 279,296 | | | | | | | Citigroup Mortgage Loan Trust, Inc., 2.672%, 05/25/35 | | | 278,923 | | | | 0.1 | |
| | 680,000 | | | | # | | | Commercial 2004-LNB2 Mortgage Trust, 6.067%, 03/10/39 | | | 759,002 | | | | 0.3 | |
| | 4,440,557 | | | | ^ | | | Commercial Mortgage Pass Through Certificates, 1.211%, 05/10/47 | | | 330,945 | | | | 0.1 | |
| | 480,000 | | | | # | | | Commercial Mortgage Trust 2004-GG1 F, 6.025%, 06/10/36 | | | 490,145 | | | | 0.2 | |
| | 3,000,210 | | | | ^ | | | Commercial Mortgage Trust, 1.773%, 01/10/46 | | | 252,041 | | | | 0.1 | |
| | 11,258,654 | | | | ^ | | | Commercial Mortgage Trust, 1.977%, 10/15/45 | | | 1,167,000 | | | | 0.4 | |
| | 4,109,489 | | | | ^ | | | Commercial Mortgage Trust, 2.118%, 05/15/45 | | | 428,166 | | | | 0.1 | |
| | 380,000 | | | | | | | Commercial Mortgage Trust, 5.226%, 07/15/44 | | | 388,614 | | | | 0.1 | |
| | 630,000 | | | | | | | Commercial Mortgage Trust, 5.305%, 06/10/44 | | | 630,169 | | | | 0.2 | |
| | 240,000 | | | | | | | Commerical 2007-C9 Mortgage Trust, 5.796%, 12/10/49 | | | 251,985 | | | | 0.1 | |
| | 182,367 | | | | | | | Countrywide Home Loan Mortgage Pass-through Trust, 5.500%, 11/25/35 | | | 192,127 | | | | 0.1 | |
| | 209,791 | | | | | | | Countrywide Home Loan Mortgage Pass-through Trust, 5.500%, 09/25/35 | | | 207,055 | | | | 0.1 | |
| | 340,000 | | | | | | | Credit Suisse Commercial Mortgage Trust Series 2007-C4, 5.898%, 09/15/39 | | | 356,464 | | | | 0.1 | |
| | 540,000 | | | | # | | | Credit Suisse Commercial Mortgage Trust Series 2008-C1, 5.970%, 02/15/41 | | | 566,632 | | | | 0.2 | |
| | 35,152 | | | | # | | | Credit Suisse First Boston Mortgage Securities Corp., 5.322%, 08/15/36 | | | 35,190 | | | | 0.0 | |
| | 684,612 | | | | # | | | Credit Suisse Mortgage Capital Certificates, 2.346%, 07/27/37 | | | 690,468 | | | | 0.2 | |
| | 5,590,555 | | | | #,^ | | | DBUBS 2011-LC1 Mortgage Trust, 1.374%, 11/10/46 | | | 129,721 | | | | 0.0 | |
See Accompanying Notes to Financial Statements
| Voya Global Bond Portfolio | PORTFOLIO OF INVESTMENTS |
| as of December 31, 2014 |
| | 84,362 | | | | # | | | Deutsche Alternative-A Securities, Inc. Alternate Loan Trust, 0.670%, 01/27/37 | | | 118,031 | | | | 0.0 | |
| | 320,000 | | | | | | | Fannie Mae Connecticut Avenue Securities, 3.070%, 07/25/24 | | | 286,908 | | | | 0.1 | |
| | 480,000 | | | | | | | Fannie Mae Connecticut Avenue Securities, 5.070%, 11/25/24 | | | 488,135 | | | | 0.2 | |
| | 44,577,912 | | | | #,^ | | | FREMF Mortgage Trust, 0.100%, 12/25/44 | | | 244,599 | | | | 0.1 | |
| | 228,000 | | | | | | | GCCFC Commercial Mortgage Trust, 6.051%, 12/10/49 | | | 239,097 | | | | 0.1 | |
| | 520,000 | | | | | | | GS Mortgage Securities Trust 2006-GG6, 5.553%, 04/10/38 | | | 524,413 | | | | 0.2 | |
| | 300,000 | | | | | | | GS Mortgage Securities Trust, 5.553%, 04/10/38 | | | 295,828 | | | | 0.1 | |
| | 175,855 | | | | | | | GSR Mortgage Loan Trust, 2.655%, 09/25/35 | | | 177,935 | | | | 0.1 | |
| | 520,000 | | | | # | | | JP Morgan Chase Commercial Mortgage Securities Corp. Ps Thr Certs Ser 2003-LN1, 5.464%, 10/15/37 | | | 518,504 | | | | 0.2 | |
| | 8,605,908 | | | | ^ | | | JP Morgan Chase Commercial Mortgage Securities Corp., 1.757%, 06/15/45 | | | 673,357 | | | | 0.2 | |
| | 4,534,717 | | | | ^ | | | JP Morgan Chase Commercial Mortgage Securities Corp., 1.927%, 12/15/47 | | | 423,680 | | | | 0.1 | |
| | 2,760,000 | | | | #,^ | | | JP Morgan Chase Commercial Mortgage Securities Trust, 0.359%, 12/15/47 | | | 69,189 | | | | 0.0 | |
| | 270,000 | | | | | | | JP Morgan Chase Commercial Mortgage Securities Trust, 5.683%, 06/12/41 | | | 263,113 | | | | 0.1 | |
| | 231,855 | | | | | | | JPMorgan Mortgage Trust, 2.531%, 07/25/35 | | | 230,987 | | | | 0.1 | |
| | 273,536 | | | | | | | LB-UBS Commercial Mortgage Trust 2004-C7, 4.943%, 10/15/36 | | | 273,884 | | | | 0.1 | |
| | 360,000 | | | | | | | LB-UBS Commercial Mortgage Trust 2005-C3, 4.983%, 07/15/40 | | | 361,980 | | | | 0.1 | |
| | 150,000 | | | | # | | | LB-UBS Commercial Mortgage Trust 2006-C6, 5.991%, 09/15/39 | | | 152,807 | | | | 0.1 | |
| | 150,000 | | | | # | | | LB-UBS Commercial Mortgage Trust 2006-C6, 5.991%, 09/15/39 | | | 149,203 | | | | 0.1 | |
| | 360,000 | | | | # | | | LB-UBS Commercial Mortgage Trust 2006-C6, 5.991%, 09/15/39 | | | 369,617 | | | | 0.1 | |
| | 780,000 | | | | | | | LB-UBS Commercial Mortgage Trust, 5.853%, 06/15/38 | | | 788,842 | | | | 0.3 | |
| | 260,000 | | | | | | | LB-UBS Commercial Mortgage Trust, 5.853%, 06/15/38 | | | 257,447 | | | | 0.1 | |
| | 253,955 | | | | | | | MASTR Adjustable Rate Mortgages Trust, 2.584%, 04/25/36 | | | 245,315 | | | | 0.1 | |
| | 360,000 | | | | | | | Merrill Lynch Mortgage Investors Trust Series 1998-C1-CTL, 6.750%, 11/15/26 | | | 400,438 | | | | 0.1 | |
| | 7,619,825 | | | | ^ | | | Morgan Stanley Bank of America Merrill Lynch Trust, 1.288%, 08/15/47 | | | 600,223 | | | | 0.2 | |
| | 251,473 | | | | | | | Morgan Stanley Capital I Trust 2004-IQ7, 5.191%, 06/15/38 | | | 251,217 | | | | 0.1 | |
| | 860,000 | | | | | | | Morgan Stanley Capital I Trust 2005-IQ10, 5.252%, 09/15/42 | | | 832,443 | | | | 0.3 | |
| | 587,405 | | | | | | | Morgan Stanley Capital I Trust 2007-HQ13, 5.649%, 12/15/44 | | | 586,905 | | | | 0.2 | |
| | 460,000 | | | | # | | | Morgan Stanley Capital I Trust 2011-C1, 5.251%, 09/15/47 | | | 496,347 | | | | 0.2 | |
| | 865,000 | | | | # | | | Morgan Stanley Capital I Trust 2011-C1, 5.251%, 09/15/47 | | | 957,315 | | | | 0.3 | |
| | 570,000 | | | | # | | | Morgan Stanley Capital I Trust 2011-C1, 5.251%, 09/15/47 | | | 624,301 | | | | 0.2 | |
| | 610,000 | | | | | | | Morgan Stanley Capital I Trust, 5.389%, 11/12/41 | | | 626,825 | | | | 0.2 | |
| | 290,000 | | | | # | | | Morgan Stanley Reremic Trust, 0.250%, 07/27/49 | | | 252,648 | | | | 0.1 | |
| | 494,506 | | | | # | | | Morgan Stanley Reremic Trust, 5.246%, 12/17/43 | | | 499,641 | | | | 0.2 | |
| | 680,801 | | | | # | | | N-Star Real Estate CDO Ltd., 2.020%, 08/25/29 | | | 681,686 | | | | 0.2 | |
| | 8,894 | | | | | | | Residential Accredit Loans, Inc., 3.056%, 04/25/35 | | | 1,332 | | | | 0.0 | |
| | 670,000 | | | | # | | | TIAA CMBS I Trust, 5.770%, 06/19/33 | | | 703,060 | | | | 0.2 | |
| | 6,729,840 | | | | #,^ | | | UBS-Barclays Commercial Mortgage Trust, 2.132%, 08/10/49 | | | 740,826 | | | | 0.3 | |
| | 1,320,000 | | | | # | | | Wachovia Bank Commercial Mortgage Trust Series 2005-C17 G, 5.396%, 03/15/42 | | | 1,326,269 | | | | 0.5 | |
| | 500,000 | | | | | | | Wachovia Bank Commercial Mortgage Trust Series 2007-C33 AJ, 5.941%, 02/15/51 | | | 525,012 | | | | 0.2 | |
| | 699,294 | | | | | | | WaMu Mortgage Pass-Through Certificates Series 2007-HY2 Trust 1A1, 2.195%, 12/25/36 | | | 631,545 | | | | 0.2 | |
| | 6,137,511 | | | | #,^ | | | Wells Fargo Commercial Mortgage Trust 2012-LC5 XA, 2.101%, 10/15/45 | | | 645,036 | | | | 0.2 | |
| | 848,448 | | | | | | | Wells Fargo Mortgage Backed Securities Trust 2005-AR14 A1, 5.357%, 08/25/35 | | | 856,201 | | | | 0.3 | |
| | 125,905 | | | | | | | Wells Fargo Mortgage-Backed Securities Trust, 2.599%, 02/25/34 | | | 127,959 | | | | 0.0 | |
| | 347,784 | | | | | | | Wells Fargo Mortgage-Backed Securities Trust, 2.611%, 02/25/35 | | | 350,324 | | | | 0.1 | |
See Accompanying Notes to Financial Statements
| Voya Global Bond Portfolio | PORTFOLIO OF INVESTMENTS |
| as of December 31, 2014 |
| | 3,021,035 | | | | #,^ | | | WFRBS Commercial Mortgage Trust 2012-C8 XA, 2.201%, 08/15/45 | | | 309,977 | | | | 0.1 | |
| | | | | | | | | | | | | | | | | |
| | | | | | Total Collateralized Mortgage Obligations | | | | | | | | |
| | | | | | (Cost $36,524,453) | | | 37,202,727 | | | | 12.7 | |
| | | | | | | | | | | | | | |
| STRUCTURED PRODUCTS: 0.1% | | | | | | | |
| | | | | | | | | Mexico: 0.1% | | | | | | | | |
| MXN | 97,261 | | | | | | | Reforma BLN-Backed I - Class 2A Asset Backed Variable Funding Notes, 05/22/15 | | | 6,098 | | | | 0.0 | |
| MXN | 170,161 | | | | | | | Reforma BLN-Backed I - Class 2B Asset Backed Variable Funding Notes, 05/22/15 | | | 10,668 | | | | 0.0 | |
| MXN | 2,565,617 | | | | | | | Reforma BLN-Backed I - Class 2C Asset Backed Variable Funding Notes, 05/22/15 | | | 160,854 | | | | 0.1 | |
| MXN | 186,979 | | | | | | | Reforma BLN-Backed I - Class 2D Asset Backed Variable Funding Notes, 05/22/15 | | | 11,723 | | | | 0.0 | |
| MXN | 135,844 | | | | | | | Reforma BLN-Backed I - Class 2E Asset Backed Variable Funding Notes, 05/22/15 | | | 8,517 | | | | 0.0 | |
| MXN | 86,756 | | | | | | | Reforma BLN-Backed I - Class 2F Asset Backed Variable Funding Notes, 05/22/15 | | | 5,439 | | | | 0.0 | |
| MXN | 15,977 | | | | | | | Reforma BLN-Backed I - Class 2G Asset Backed Variable Funding Notes, 05/22/15 | | | 1,002 | | | | 0.0 | |
| | | | | | | | | | | | 204,301 | | | | 0.1 | |
| | | | | | | | | | | | | | | | | |
| | | | | | | | | Russia: 0.0% | | | | | | | | |
| RUB | 6,980,190 | | | | | | | Morgan Stanley & Co. International PLC - EM Whole Loan SA /Russian Federation Total Return Linked Bonds, Series 007, Cl. VR, 5.000%, 08/22/34 | | | 50,726 | | | | 0.0 | |
| | | | | | | | | | | | | | | | | |
| | | | | | Total Structured Products | | | | | | | | |
| | | | | | (Cost $564,247) | | | 255,027 | | | | 0.1 | |
| | | | | | | | | | | | | | | | | |
| FOREIGN GOVERNMENT BONDS: 5.6% |
| | | | | | | | | Brazil: 0.2% | | | | | | | | |
| BRL | 705,000 | | | | | | | Brazil Notas do Tesouro Nacional Series F, 05/15/45 | | | 653,288 | | | | 0.2 | |
| | | | | | | | | | | | | | | | | |
| | | | | | | | | Germany: 5.3% | | | | | | | | |
| EUR | 12,020,732 | | | | | | | Bundesrepublik Deutsche Inflation Linked Bond, 0.100%, 04/15/23 | | | 15,202,355 | | | | 5.2 | |
| EUR | 40,000 | | | | | | | Bundesrepublik Deutschland, 2.500%, 08/15/46 | | | 62,113 | | | | 0.0 | |
| EUR | 10,000 | | | | | | | Bundesrepublik Deutschland, 2.000%, 08/15/23 | | | 13,745 | | | | 0.0 | |
| EUR | 170,000 | | | | Z | | | Bundesschatzanweisungen, 12/11/15 | | | 205,874 | | | | 0.1 | |
| | | | | | | | | | | | 15,484,087 | | | | 5.3 | |
| | | | | | | | | | | | | | | | | |
| | | | | | | | | South Africa: 0.1% | | | | | | | | |
| ZAR | 1,000,000 | | | | | | | Transnet SOC Ltd., 10.800%, 11/06/23 | | | 93,039 | | | | 0.1 | |
| | | | | | | | | | | | | | | | | |
| | | | | | Total Foreign Government Bonds | | | | | | | | |
| | | | | | (Cost $17,390,085) | | | 16,230,414 | | | | 5.6 | |
| | | | | | | | | | | | | | | | | |
| U.S. GOVERNMENT AGENCY OBLIGATIONS: 18.1% | |
| | | | | | | | | Federal Home Loan Mortgage Corporation: 3.5%## | |
| | 52,494 | | | | | | | 0.611%, due 02/15/29 | | | 53,104 | | | | 0.0 | |
| | 18,591 | | | | | | | 0.661%, due 03/15/32 | | | 18,820 | | | | 0.0 | |
| | 74,537 | | | | | | | 0.661%, due 01/15/33 | | | 75,163 | | | | 0.0 | |
| | 26,076 | | | | | | | 1.111%, due 08/15/31 | | | 26,829 | | | | 0.0 | |
| | 15,919 | | | | | | | 1.111%, due 02/15/32 | | | 16,384 | | | | 0.0 | |
| | 15,308 | | | | | | | 1.161%, due 02/15/32 | | | 15,753 | | | | 0.0 | |
| | 15,703 | | | | | | | 1.161%, due 02/15/32 | | | 16,159 | | | | 0.0 | |
| | 22,868 | | | | | | | 1.161%, due 03/15/32 | | | 23,538 | | | | 0.0 | |
| | 1,102,391 | | | | ^ | | | 4.000%, due 02/15/43 | | | 217,734 | | | | 0.1 | |
| | 17,577,901 | | | | ^ | | | 4.000%, due 04/15/43 | | | 3,363,559 | | | | 1.2 | |
| | 7,773 | | | | | | | 5.000%, due 01/01/20 | | | 8,279 | | | | 0.0 | |
| | 35,602 | | | | | | | 5.000%, due 02/01/20 | | | 37,927 | | | | 0.0 | |
| | 241,856 | | | | | | | 5.000%, due 09/15/23 | | | 261,872 | | | | 0.1 | |
| | 860,000 | | | | | | | 5.000%, due 02/15/34 | | | 926,555 | | | | 0.3 | |
| | 845,954 | | | | | | | 5.000%, due 11/15/34 | | | 916,681 | | | | 0.3 | |
| | 22,715 | | | | | | | 5.000%, due 12/01/34 | | | 25,173 | | | | 0.0 | |
| | 19,291 | | | | | | | 5.500%, due 01/01/18 | | | 20,406 | | | | 0.0 | |
| | 3,004,758 | | | | ^ | | | 5.789%, due 10/15/36 | | | 384,674 | | | | 0.2 | |
| | 7,936,233 | | | | ^ | | | 5.839%, due 05/15/36 | | | 882,691 | | | | 0.3 | |
| | 6,161,647 | | | | ^ | | | 5.889%, due 07/15/40 | | | 962,510 | | | | 0.3 | |
| | 164,178 | | | | ^ | | | 5.989%, due 07/15/35 | | | 28,006 | | | | 0.0 | |
| | 14,426 | | | | | | | 6.000%, due 05/15/17 | | | 15,167 | | | | 0.0 | |
| | 63,940 | | | | | | | 6.000%, due 02/01/34 | | | 73,248 | | | | 0.0 | |
| | 2,894,555 | | | | ^ | | | 6.089%, due 11/15/32 | | | 528,883 | | | | 0.2 | |
| | 1,713,644 | | | | ^ | | | 6.439%, due 08/15/28 | | | 169,491 | | | | 0.1 | |
| | 4,436 | | | | | | | 6.500%, due 04/01/18 | | | 4,627 | | | | 0.0 | |
| | 17,508 | | | | | | | 6.500%, due 02/01/22 | | | 19,905 | | | | 0.0 | |
| | 23,398 | | | | | | | 6.500%, due 09/01/22 | | | 26,602 | | | | 0.0 | |
| | 66,724 | | | | | | | 6.500%, due 04/15/28 | | | 74,625 | | | | 0.0 | |
| | 13,382 | | | | | | | 6.500%, due 06/15/31 | | | 14,983 | | | | 0.0 | |
| | 114,827 | | | | | | | 6.500%, due 02/15/32 | | | 127,409 | | | | 0.1 | |
| | 81,811 | | | | | | | 6.500%, due 06/15/32 | | | 91,550 | | | | 0.0 | |
| | 6,165 | | | | | | | 6.500%, due 08/01/32 | | | 7,152 | | | | 0.0 | |
| | 10,063 | | | | | | | 6.500%, due 07/01/34 | | | 11,448 | | | | 0.0 | |
| | 18,563 | | | | | | | 6.500%, due 07/01/34 | | | 21,331 | | | | 0.0 | |
| | 70,805 | | | | | | | 6.750%, due 02/15/24 | | | 78,366 | | | | 0.0 | |
| | 123,368 | | | | | | | 7.000%, due 09/15/26 | | | 138,368 | | | | 0.1 | |
| | 19,810 | | | | ^ | | | 7.000%, due 03/15/28 | | | 3,955 | | | | 0.0 | |
| | 110,062 | | | | ^ | | | 7.000%, due 04/15/28 | | | 21,918 | | | | 0.0 | |
| | 176,268 | | | | ^ | | | 7.489%, due 03/15/29 | | | 38,764 | | | | 0.0 | |
| | 102,599 | | | | | | | 7.500%, due 09/15/22 | | | 114,189 | | | | 0.1 | |
| | 174,271 | | | | ^ | | | 7.539%, due 03/15/29 | | | 33,451 | | | | 0.0 | |
| | 115,862 | | | | | | | 8.000%, due 05/15/35 | | | 130,127 | | | | 0.1 | |
| | 249,534 | | | | ^ | | | 8.789%, due 08/15/29 | | | 62,271 | | | | 0.0 | |
| | 14,935 | | | | | | | 23.794%, due 06/15/34 | | | 17,403 | | | | 0.0 | |
| | 34,775 | | | | | | | 24.160%, due 08/15/35 | | | 51,859 | | | | 0.0 | |
| | | | | | | | | | | | 10,158,909 | | | | 3.5 | |
| | | | | | | | | | | | | | | | | |
| | | | | | | | | Federal National Mortgage Association: 11.1%## | |
| | 9,940 | | | | | | | 0.570%, due 11/25/33 | | | 10,006 | | | | 0.0 | |
| | 10,642 | | | | | | | 0.662%, due 10/18/32 | | | 10,777 | | | | 0.0 | |
| | 37,142 | | | | | | | 1.170%, due 12/25/31 | | | 38,231 | | | | 0.0 | |
| | 5,023 | | | | | | | 1.170%, due 04/25/32 | | | 5,170 | | | | 0.0 | |
| | 16,322 | | | | | | | 1.170%, due 04/25/32 | | | 16,800 | | | | 0.0 | |
| | 48,902 | | | | | | | 1.170%, due 09/25/32 | | | 50,335 | | | | 0.0 | |
| | 48,909 | | | | | | | 1.170%, due 12/25/32 | | | 50,341 | | | | 0.0 | |
See Accompanying Notes to Financial Statements
| Voya Global Bond Portfolio | PORTFOLIO OF INVESTMENTS |
| as of December 31, 2014 |
| | 344,222 | | | | | | | 2.371%, due 10/01/36 | | | 368,471 | | | | 0.1 | |
| | 2,550,117 | | | | ^ | | | 3.000%, due 06/25/33 | | | 395,097 | | | | 0.1 | |
| | 6,440,000 | | | | W | | | 3.000%, due 11/25/42 | | | 6,498,740 | | | | 2.2 | |
| | 1,161,649 | | | | | | | 3.000%, due 07/01/43 | | | 1,177,053 | | | | 0.4 | |
| | 1,393,789 | | | | ^ | | | 3.500%, due 08/25/33 | | | 190,156 | | | | 0.1 | |
| | 4,331,000 | | | | W | | | 3.500%, due 07/25/41 | | | 4,503,395 | | | | 1.6 | |
| | 823,611 | | | | ^ | | | 3.500%, due 08/25/43 | | | 164,255 | | | | 0.1 | |
| | 5,170,547 | | | | ^ | | | 3.881%, due 02/25/37 | | | 155,436 | | | | 0.1 | |
| | 4,194,000 | | | | W | | | 4.000%, due 08/25/40 | | | 4,476,390 | | | | 1.5 | |
| | 2,612,212 | | | | ^ | | | 4.000%, due 06/25/42 | | | 444,400 | | | | 0.2 | |
| | 187,021 | | | | | | | 4.500%, due 08/25/25 | | | 200,382 | | | | 0.1 | |
| | 3,724,000 | | | | W | | | 4.500%, due 01/25/39 | | | 4,042,868 | | | | 1.4 | |
| | 3,489,765 | | | | ^ | | | 5.000%, due 05/25/18 | | | 192,165 | | | | 0.1 | |
| | 433,674 | | | | | | | 5.000%, due 07/25/40 | | | 460,776 | | | | 0.2 | |
| | 145,910 | | | | | | | 5.000%, due 06/01/41 | | | 161,733 | | | | 0.1 | |
| | 20,344 | | | | | | | 5.500%, due 09/01/19 | | | 21,801 | | | | 0.0 | |
| | 24,151 | | | | | | | 5.500%, due 09/01/19 | | | 25,901 | | | | 0.0 | |
| | 58,475 | | | | | | | 5.500%, due 09/01/24 | | | 65,351 | | | | 0.0 | |
| | 90,857 | | | | ^ | | | 5.500%, due 07/25/33 | | | 18,537 | | | | 0.0 | |
| | 37,609 | | | | ^ | | | 5.500%, due 06/01/35 | | | 7,018 | | | | 0.0 | |
| | 3,691,357 | | | | ^ | | | 5.771%, due 01/25/38 | | | 642,185 | | | | 0.2 | |
| | 6,840,073 | | | | ^ | | | 5.781%, due 09/25/41 | | | 1,012,860 | | | | 0.4 | |
| | 5,587,635 | | | | ^ | | | 5.811%, due 11/25/41 | | | 901,128 | | | | 0.3 | |
| | 3,718,099 | | | | ^ | | | 5.931%, due 01/25/43 | | | 914,925 | | | | 0.3 | |
| | 13,479 | | | | | | | 6.000%, due 03/25/17 | | | 14,041 | | | | 0.0 | |
| | 23,185 | | | | | | | 6.000%, due 06/01/17 | | | 24,113 | | | | 0.0 | |
| | 15,109 | | | | | | | 6.000%, due 05/01/21 | | | 16,446 | | | | 0.0 | |
| | 42,056 | | | | | | | 6.000%, due 01/25/32 | | | 45,679 | | | | 0.0 | |
| | 165,453 | | | | ^ | | | 6.000%, due 12/01/32 | | | 37,227 | | | | 0.0 | |
| | 69,842 | | | | ^ | | | 6.000%, due 02/01/33 | | | 13,964 | | | | 0.0 | |
| | 83,128 | | | | ^ | | | 6.000%, due 03/01/33 | | | 18,945 | | | | 0.0 | |
| | 68,811 | | | | ^ | | | 6.000%, due 03/01/33 | | | 13,837 | | | | 0.0 | |
| | 214,298 | | | | | | | 6.000%, due 11/01/34 | | | 244,571 | | | | 0.1 | |
| | 326,963 | | | | | | | 6.000%, due 04/01/35 | | | 373,411 | | | | 0.1 | |
| | 38,227 | | | | ^ | | | 6.000%, due 09/01/35 | | | 6,281 | | | | 0.0 | |
| | 5,608,850 | | | | ^ | | | 6.281%, due 02/25/42 | | | 1,032,429 | | | | 0.4 | |
| | 173,638 | | | | ^ | | | 6.371%, due 06/25/37 | | | 26,871 | | | | 0.0 | |
| | 559,425 | | | | ^ | | | 6.401%, due 06/25/36 | | | 101,773 | | | | 0.0 | |
| | 26,341 | | | | | | | 6.500%, due 04/25/29 | | | 29,180 | | | | 0.0 | |
| | 40,635 | | | | | | | 6.500%, due 11/25/29 | | | 44,754 | | | | 0.0 | |
| | 137,897 | | | | | | | 6.500%, due 12/01/29 | | | 159,358 | | | | 0.1 | |
| | 45,973 | | | | | | | 6.500%, due 10/25/31 | | | 50,370 | | | | 0.0 | |
| | 282,646 | | | | ^ | | | 6.500%, due 02/01/32 | | | 57,643 | | | | 0.0 | |
| | 42,231 | | | | | | | 6.500%, due 04/25/32 | | | 47,427 | | | | 0.0 | |
| | 56,695 | | | | | | | 6.500%, due 01/01/34 | | | 64,976 | | | | 0.0 | |
| | 31,563 | | | | ^ | | | 6.581%, due 05/25/35 | | | 5,834 | | | | 0.0 | |
| | 47,123 | | | | ^ | | | 6.931%, due 06/25/23 | | | 6,065 | | | | 0.0 | |
| | 945 | | | | | | | 7.000%, due 11/01/17 | | | 963 | | | | 0.0 | |
| | 47,856 | | | | ^ | | | 7.000%, due 02/01/28 | | | 9,390 | | | | 0.0 | |
| | 59,881 | | | | ^ | | | 7.000%, due 03/25/33 | | | 16,359 | | | | 0.0 | |
| | 1,295 | | | | | | | 7.000%, due 04/01/33 | | | 1,550 | | | | 0.0 | |
| | 50,496 | | | | ^ | | | 7.000%, due 04/25/33 | | | 10,538 | | | | 0.0 | |
| | 150,547 | | | | ^ | | | 7.061%, due 09/25/36 | | | 27,711 | | | | 0.0 | |
| | 270,642 | | | | ^ | | | 7.381%, due 10/25/33 | | | 46,587 | | | | 0.0 | |
| | 176,989 | | | | ^ | | | 7.461%, due 03/25/23 | | | 10,349 | | | | 0.0 | |
| | 69,179 | | | | ^ | | | 7.500%, due 01/01/24 | | | 12,687 | | | | 0.0 | |
| | 37,351 | | | | | | | 7.500%, due 09/01/32 | | | 44,277 | | | | 0.0 | |
| | 93,943 | | | | | | | 7.500%, due 01/01/33 | | | 110,259 | | | | 0.0 | |
| | 166,115 | | | | ^ | | | 7.581%, due 07/25/31 | | | 35,011 | | | | 0.0 | |
| | 96,335 | | | | ^ | | | 7.581%, due 02/25/32 | | | 18,211 | | | | 0.0 | |
| | 55,447 | | | | ^ | | | 7.781%, due 07/25/32 | | | 12,446 | | | | 0.0 | |
| | 1,990,610 | | | | ^ | | | 7.838%, due 12/18/32 | | | 400,433 | | | | 0.1 | |
| | 477,748 | | | | | | | 8.000%, due 05/25/43 | | | 517,414 | | | | 0.2 | |
| | 125,535 | | | | | | | 23.322%, due 07/25/35 | | | 160,127 | | | | 0.1 | |
| | 101,978 | | | | | | | 23.578%, due 06/25/36 | | | 146,014 | | | | 0.1 | |
| | 34,200 | | | | | | | 23.945%, due 03/25/36 | | | 53,138 | | | | 0.0 | |
| | 66,021 | | | | | | | 27.414%, due 04/25/35 | | | 105,896 | | | | 0.0 | |
| | 646,509 | | | | | | | 32.603%, due 11/25/36 | | | 1,116,488 | | | | 0.4 | |
| | | | | | | | | | | | 32,513,726 | | | | 11.1 | |
| | | | | | | Government National Mortgage Association: 3.5% | |
| | 2,454,000 | | | | | 3.000%, due 01/15/43 | | | 2,509,713 | | | | 0.9 | |
| | 2,923,242 | | | ^ | | 4.000%, due 04/20/38 | | | 325,543 | | | | 0.1 | |
| | 3,490,000 | | | | | 4.500%, due 06/20/41 | | | 3,813,779 | | | | 1.3 | |
| | 87,647 | | | | | 5.000%, due 04/15/34 | | | 97,008 | | | | 0.1 | |
| | 5,936,189 | | | ^ | | 5.685%, due 06/20/40 | | | 954,264 | | | | 0.4 | |
| | 27,265 | | | | | 6.500%, due 02/20/35 | | | 32,042 | | | | 0.0 | |
| | 3,172,575 | | | ^ | | 6.539%, due 07/16/41 | | | 647,658 | | | | 0.2 | |
| | 65,322 | | | | | 8.000%, due 01/16/30 | | | 75,069 | | | | 0.0 | |
| | 300,803 | | | | | 8.000%, due 02/16/30 | | | 348,203 | | | | 0.1 | |
| | 820,360 | | | | | 21.512%, due 03/20/37 | | | 1,240,841 | | | | 0.4 | |
| | | | | | | | | | 10,044,120 | | | | 3.5 | |
| | | | | | | | | | | | | | | |
| | | | | Total U.S. Government Agency Obligations | | | | | | | | |
| | | | | (Cost $51,403,227) | | | 52,716,755 | | | | 18.1 | |
| | | | | | | | | | | | | | | |
| U.S. TREASURY OBLIGATIONS: 3.4% | | | | | | | | |
| | | | | | | U.S. Treasury Bonds: 0.6% | |
| | 1,450,000 | | | | | 3.125%, due 08/15/44 | | | 1,561,356 | | | | 0.6 | |
| | | | | | | | | | | | | | | |
| | | | | | | U.S. Treasury Notes: 2.8% | | | | | | | | |
| | 1,447,000 | | | | | 0.625%, due 12/31/16 | | | 1,445,586 | | | | 0.5 | |
| | 2,957,000 | | | | | 1.000%, due 12/15/17 | | | 2,950,415 | | | | 1.0 | |
| | 17,000 | | | | | 1.875%, due 11/30/21 | | | 16,903 | | | | 0.0 | |
| | 8,000 | | | | | 2.000%, due 01/31/16 | | | 8,143 | | | | 0.0 | |
| | 3,791,000 | | | | | 2.250%, due 11/15/24 | | | 3,817,063 | | | | 1.3 | |
| | | | | | | | | | 8,238,110 | | | | 2.8 | |
| | | | | | | | | | | | | | | |
| | | | | Total U.S. Treasury Obligations | | | | | | | | |
| | | | | (Cost $9,771,278) | | | 9,799,466 | | | | 3.4 | |
| | | | | | | | | | | | | | | |
| ASSET-BACKED SECURITIES: 5.3% | | | | | | | | |
| | | | | | | Cayman Islands: 4.8% | | | | | | | | |
| | 740,000 | | | # | | Ares XII CLO Ltd., 2.233%, 11/25/20 | | | 747,917 | | | | 0.3 | |
| | 750,000 | | | # | | Belhurst CLO Ltd., 0.931%, 01/15/20 | | | 749,774 | | | | 0.3 | |
| | 950,000 | | | # | | Black Diamond CLO 2005-1A C, 1.017%, 06/20/17 | | | 941,450 | | | | 0.3 | |
| | 1,000,000 | | | # | | Bluemountain CLO III Ltd. 2007-3A C, 0.933%, 03/17/21 | | | 969,776 | | | | 0.3 | |
| | 1,450,000 | | | # | | Castle Garden Funding, 1.984%, 10/27/20 | | | 1,444,529 | | | | 0.5 | |
| | 1,000,000 | | | # | | ColumbusNova CLO IV Ltd 2007-II, 2.481%, 10/15/21 | | | 979,281 | | | | 0.3 | |
| | 500,000 | | | # | | ColumbusNova CLO Ltd 2006-II, 3.982%, 04/04/18 | | | 500,001 | | | | 0.2 | |
| | 1,100,000 | | | # | | Eaton Vance CDO IX Ltd., 1.731%, 04/20/19 | | | 1,068,433 | | | | 0.4 | |
| | 400,000 | | | # | | Halcyon Structured Asset Management Long Secured/Short Unsecured, 0.682%, 08/07/21 | | | 392,995 | | | | 0.1 | |
| | 1,300,000 | | | # | | Madison Park Funding Ltd., 1.234%, 07/26/21 | | | 1,272,280 | | | | 0.4 | |
| | 1,550,000 | | | # | | Muir Grove CLO Ltd., 2.234%, 03/25/20 | | | 1,549,420 | | | | 0.5 | |
| | 500,000 | | | # | | Northwoods Capital VIII Ltd., 2.233%, 07/28/22 | | | 497,695 | | | | 0.2 | |
| | 1,000,000 | | | # | | Vitesse CLO Ltd., 2.032%, 08/17/20 | | | 984,260 | | | | 0.3 | |
| | 1,000,000 | | | # | | WhiteHorse III Ltd./Corp 2006-1A A3L, 0.982%, 05/01/18 | | | 998,691 | | | | 0.4 | |
See Accompanying Notes to Financial Statements
| Voya Global Bond Portfolio | PORTFOLIO OF INVESTMENTS |
| as of December 31, 2014 |
| | 1,000,000 | | | | # | | | WhiteHorse III Ltd/Corp, 2.082%, 05/01/18 | | | 992,027 | | | | 0.3 | |
| | | | | | | | | | | | 14,088,529 | | | | 4.8 | |
| | | | | | | | | | | | | | | | | |
| | | | | | | | | United States: 0.5% | | | | |
| | 180,000 | | | | # | | | Invitation Homes 2013-SFR1 Trust, 2.900%, 12/17/30 | | | 171,901 | | | | 0.1 | |
| | 280,000 | | | | # | | | Invitation Homes Trust, 1.162%, 06/17/31 | | | 276,986 | | | | 0.1 | |
| | 280,000 | | | | # | | | Invitation Homes Trust, 2.254%, 06/17/31 | | | 277,337 | | | | 0.1 | |
| | 820,265 | | | | | | | Securitized Asset Backed Receivables LLC Trust 2006-NC2, 0.410%, 03/25/36 | | | 722,454 | | | | 0.2 | |
| | | | | | | | | | | | 1,448,678 | | | | 0.5 | |
| | | | | | | | | | | | | | | | | |
| | | | | | Total Asset-Backed Securities | | | | | | | | |
| | | | | | (Cost $15,418,986) | | | 15,537,207 | | | | 5.3 | |
| Shares | | | | | | | | | | Value | | | | Percentage
of Net
Assets | |
| COMMON STOCK: 0.0% | | | | |
| | | | | | | | | United States: 0.0% | | | | |
| | 43,083 | | | | L | | | American Media, Inc. | | | 21,541 | | | | 0.0 | |
| | 4,988 | | | | | | | Resolute Forest Products | | | 87,839 | | | | 0.0 | |
| | 548 | | | | | | | Rock-Tenn Co. | | | 33,417 | | | | 0.0 | |
| | | | | | | | | | | | | | | | | |
| | | | | | Total Common Stock | | | | | | | | |
| | | | | | (Cost $1,315,740) | | | 142,797 | | | | 0.0 | |
| | | | | | | | | | | | | | | | | |
| MUTUAL FUNDS: 32.1% | | | | | | | | |
| | | | | | | | | United States: 32.1% | | | | | | | | |
| | 1,408,447 | | | | | | | Voya Emerging Markets Corporate Debt Fund - Class P | | | 13,690,107 | | | | 4.7 | |
| | 3,420,648 | | | | | | | Voya Emerging Markets Hard Currency Debt Fund - Class P | | | 32,119,888 | | | | 11.0 | |
| | 4,016,141 | | | | | | | Voya Emerging Markets Local Currency Debt Fund - Class P | | | 31,847,994 | | | | 10.9 | |
| | 2,010,234 | | | | | | | Voya High Yield Bond Fund - Class P | | | 16,162,281 | | | | 5.5 | |
| | | | | | | | | | | | | | | | | |
| | | | | | Total Mutual Funds | | | | | | | | |
| | | | | | (Cost $105,300,083) | | | 93,820,270 | | | | 32.1 | |
| | | | | | | | | | | | | | | | | |
| WARRANTS: –% | | | | | | | | |
| | | | | | | | | United States: –% | | | | | | | | |
| | 2,406 | | | | @ | | | Media News Group | | | – | | | | – | |
| | | | | | | | | | | | | | | | | |
| | | | | | Total Warrants | | | | | | | | |
| | | | | | (Cost $–) | | | – | | | | – | |
# of
Contracts | | | | | | | | Value | | | Percentage
of Net
Assets | |
| PURCHASED OPTIONS: 0.0% | | |
| | | | | | | Interest Rate Swaptions: 0.0% | |
| | 73,094,000 | | | | @ | | | Pay a fixed rate equal to 4.900% and receive a floating rate equal to the 3-month USD-LIBOR-BBA, Exp. 05/29/15 Counterparty: Citigroup, Inc. | | | 1,469 | | | | 0.0 | |
| | 8,379,000 | | | | @ | | | Pay a fixed rate equal to 5.030% and receive a floating rate equal to the 3-month USD-LIBOR-BBA, Exp. 05/22/15 Counterparty: Citigroup, Inc. | | | 65 | | | | 0.0 | |
| | | | | | | | | | | | 1,534 | | | | 0.0 | |
| | | | | | | | | | | | | | | | | |
| | | | | | | | | Options on Currencies: –% | | | | |
| | 16,644,000 | | | | @ | | | Put USD vs. Call EUR, Strike @ 1.307, Exp. 01/05/15 Counterparty: Deutsche Bank AG | | | – | | | | – | |
| | | | | | | | | | | | | | | | | |
| | | | | | Total Purchased Options | | | | | | | | |
| | | | | | (Cost $408,926) | | | 1,534 | | | | 0.0 | |
| | | | | | | | | | | | | | | | | |
| | | | | | Total Long-Term Investments | | | | | | | | |
| | | | | | (Cost $319,638,586) | | | 308,489,616 | | | | 105.7 | |
| | | | | | | | | | | | | | | | | |
Principal
Amount† | | | | | | | | | | Value | | | | Percentage
of Net
Assets | |
| SHORT-TERM INVESTMENTS: 2.5% |
| | | | | | | | | Securities Lending Collateralcc: 0.3% |
| | 969,494 | | | | | | | Cantor Fitzgerald, Repurchase Agreement dated 12/31/14, 0.09%, due 01/02/15 (Repurchase Amount $969,499, collateralized by various U.S. Government and U.S. Government Agency Obligations, 0.000%-10.500%, Market Value plus accrued interest $988,884, due 01/01/15-09/01/49) | | | | | | | | |
| | | | | | | | | (Cost $969,494) | | | 969,494 | | | | 0.3 | |
| | | | | | | | | | | | | | | | | |
| Shares | | | | | | | | | | Value | | | | Percentage
of Net
Assets | |
| | | | | | | | | Mutual Funds: 2.2% | | | | |
| | 6,302,000 | | | | | | | BlackRock Liquidity Funds, TempFund, Institutional Class, 0.030%†† | | | | | | | | |
| | | | | | | | | (Cost $6,302,000) | | | 6,302,000 | | | | 2.2 | |
| | | | | | | | | | | | | | | | | |
| | | | | | Total Short-Term Investments | | | | | | | | |
| | | | | | (Cost $7,271,494) | | | 7,271,494 | | | | 2.5 | |
See Accompanying Notes to Financial Statements
| Voya Global Bond Portfolio | PORTFOLIO OF INVESTMENTS |
| as of December 31, 2014 |
Total Investments in Securities
(Cost $326,910,080) | | $ | 315,761,110 | | | | 108.2 | |
| Liabilities in Excess of Other Assets | | | (23,822,767 | ) | | | (8.2 | ) |
| Net Assets | | $ | 291,938,343 | | | | 100.0 | |
| † | Unless otherwise indicated, principal amount is shown in USD. |
| †† | Rate shown is the 7-day yield as of December 31, 2014. |
| # | Securities with purchases pursuant to Rule 144A or section 4(a)(2), under the Securities Act of 1933 and may not be resold subject to that rule except to qualified institutional buyers. |
| ## | The Federal Housing Finance Agency (“FHFA”) placed the Federal Home Loan Mortgage Corporation and Federal National Mortgage Association into conservatorship with FHFA as the conservator. As such, the FHFA oversees the continuing affairs of these companies. |
| @ | Non-income producing security. |
| cc | Represents securities purchased with cash collateral received for securities on loan. |
| W | Settlement is on a when-issued or delayed-delivery basis. |
| L | Loaned security, a portion or all of the security is on loan at December 31, 2014. |
| ± | Defaulted security |
| ^ | Interest only securities represent the right to receive the monthly interest payments on an underlying pool of mortgage loans. Principal amount shown represents the notional amount on which current interest is calculated. Payments of principal on the pool reduce the value of the interest only security. |
| Z | Indicates Zero Coupon Bond; rate shown reflects current effective yield. |
| BRL | Brazilian Real |
| EUR | EU Euro |
| MXN | Mexican Peso |
| RUB | Russian Ruble |
| ZAR | South African Rand |
| |
Cost for federal income tax purposes is $326,933,991.
Net unrealized appreciation consists of:
| Gross Unrealized Appreciation | | $ | 5,735,717 | |
| Gross Unrealized Depreciation | | | 16,908,598 | |
| | | | | |
| Net Unrealized Appreciation | | $ | 22,644,315 | |
| Sector Diversification | | Percentage
of Net Assets | |
| Affiliated Investment Companies | | | 32.1 | % |
| Collateralized Mortgage Obligations | | | 12.7 | |
| Federal National Mortgage Association | | | 11.1 | |
| Financial | | | 7.4 | |
| Communications | | | 6.2 | |
| Foreign Government Bonds | | | 5.6 | |
| Other Asset-Backed Securities | | | 5.3 | |
| Consumer, Non-cyclical | | | 3.7 | |
| Federal Home Loan Mortgage Corporation | | | 3.5 | |
| Government National Mortgage Association | | | 3.5 | |
| Basic Materials | | | 3.2 | |
| U.S. Treasury Notes | | | 2.8 | |
| Energy | | | 2.1 | |
| Utilities | | | 2.0 | |
| Consumer, Cyclical | | | 1.7 | |
| Technology | | | 1.1 | |
| Industrial | | | 0.9 | |
| U.S. Treasury Bonds | | | 0.6 | |
| Structured Products | | | 0.1 | |
| Consumer Staples | | | 0.1 | |
| Options on Currencies | | | 0.0 | |
| Consumer Discretionary | | | 0.0 | |
| Materials | | | 0.0 | |
| Interest Rate Swaptions | | | 0.0 | |
| Short-Term Investments | | | 2.5 | |
| Liabilities in Excess of Other Assets | | | (8.2 | ) |
| Net Assets | | | 100.0 | % |
See Accompanying Notes to Financial Statements
| VY® American Century | PORTFOLIO OF INVESTMENTS |
| Small-Mid Cap Value Portfolio | as of December 31, 2014 |
| Shares | | | | | | | Value | | | Percentage of Net Assets | |
| COMMON STOCK: 95.9% | �� | | | | | | | |
| | | | | | | Consumer Discretionary: 8.5% | | | | | | | | |
| | 8,465 | | | | | Autoliv, Inc. | | | 898,306 | | | | 0.3 | |
| | 17,596 | | | @ | | Bed Bath & Beyond, Inc. | | | 1,340,287 | | | | 0.4 | |
| | 6,700 | | | | | Boot Barn Holdings, Inc. | | | 121,940 | | | | 0.0 | |
| | 30,760 | | | | | Carnival Corp. | | | 1,394,351 | | | | 0.4 | |
| | 7,700 | | | @ | | Cavco Industries, Inc. | | | 610,379 | | | | 0.2 | |
| | 13,212 | | | | | Century Communities, Inc. | | | 228,303 | | | | 0.1 | |
| | 27,100 | | | | | ClubCorp Holdings, Inc. | | | 485,903 | | | | 0.2 | |
| | 15,610 | | | | | Coach, Inc. | | | 586,312 | | | | 0.2 | |
| | 6,800 | | | | | Cooper Tire & Rubber Co. | | | 235,620 | | | | 0.1 | |
| | 29,100 | | | | | Culp, Inc. | | | 630,888 | | | | 0.2 | |
| | 167,100 | | | | | Cumulus Media, Inc. | | | 706,833 | | | | 0.2 | |
| | 16,200 | | | | | Dana Holding Corp. | | | 352,188 | | | | 0.1 | |
| | 14,500 | | | | | Dave & Buster's Entertainment, Inc. | | | 395,850 | | | | 0.1 | |
| | 18,142 | | | | | Destination Maternity Corp. | | | 289,365 | | | | 0.1 | |
| | 50,334 | | | @ | | Entercom Communications Corp. | | | 612,061 | | | | 0.2 | |
| | 218,000 | | | | | Entravision Communications Corp. | | | 1,412,640 | | | | 0.4 | |
| | 61,948 | | | | | International Game Technology | | | 1,068,603 | | | | 0.3 | |
| | 13,500 | | | @ | | Journal Communications, Inc. | | | 154,305 | | | | 0.1 | |
| | 8,800 | | | @ | | Libbey, Inc. | | | 276,672 | | | | 0.1 | |
| | 33,075 | | | | | Lowe's Cos, Inc. | | | 2,275,560 | | | | 0.7 | |
| | 17,100 | | | | | Malibu Boats, Inc. | | | 329,517 | | | | 0.1 | |
| | 7,100 | | | | | MarineMax, Inc. | | | 142,355 | | | | 0.0 | |
| | 44,201 | | | @ | | Markit Ltd. | | | 1,168,232 | | | | 0.4 | |
| | 49,953 | | | | | Mattel, Inc. | | | 1,545,796 | | | | 0.5 | |
| | 24,400 | | | | | Movado Group, Inc. | | | 692,228 | | | | 0.2 | |
| | 10,900 | | | | | Nexstar Broadcasting Group, Inc. | | | 564,511 | | | | 0.2 | |
| | 20,400 | | | @ | | Office Depot, Inc. | | | 174,930 | | | | 0.1 | |
| | 24,700 | | | L | | Papa Murphy's Holdings, Inc. | | | 287,014 | | | | 0.1 | |
| | 17,400 | | | | | Peak Resorts, Inc. | | | 139,200 | | | | 0.0 | |
| | 13,186 | | | | | Penske Auto Group, Inc. | | | 647,037 | | | | 0.2 | |
| | 6,936 | | | | | Ralph Lauren Corp. | | | 1,284,270 | | | | 0.4 | |
| | 10,300 | | | | | Red Robin Gourmet Burgers, Inc. | | | 792,843 | | | | 0.2 | |
| | 10,200 | | | | | Shutterfly, Inc. | | | 425,289 | | | | 0.1 | |
| | 11,600 | | | | | Sotheby's | | | 500,888 | | | | 0.2 | |
| | 14,800 | | | @ | | Steiner Leisure Ltd. | | | 683,908 | | | | 0.2 | |
| | 20,100 | | | | | Stoneridge, Inc. | | | 258,486 | | | | 0.1 | |
| | 20,800 | | | | | Superior Industries International | | | 411,632 | | | | 0.1 | |
| | 22,412 | | | | | Target Corp. | | | 1,701,295 | | | | 0.5 | |
| | 32,964 | | | @ | | Toll Brothers, Inc. | | | 1,129,676 | | | | 0.4 | |
| | 17,794 | | | | | Tower International, Inc. | | | 454,637 | | | | 0.1 | |
| | 9,937 | | | | | Townsquare Media, Inc. | | | 131,168 | | | | 0.0 | |
| | | | | | | | | | 27,541,278 | | | | 8.5 | |
| | | | | | | Consumer Staples: 5.5% | | | | | | | | |
| | 28,830 | | | | | Campbell Soup Co. | | | 1,268,520 | | | | 0.4 | |
| | 21,300 | | | | | Central Garden & Pet Co. | | | 203,415 | | | | 0.1 | |
| | 83,182 | | | | | ConAgra Foods, Inc. | | | 3,017,843 | | | | 0.9 | |
| | 37,323 | | | | | General Mills, Inc. | | | 1,990,436 | | | | 0.6 | |
| | 8,911 | | | | | Groupe Danone | | | 582,585 | | | | 0.2 | |
| | 21,255 | | | | | JM Smucker Co. | | | 2,146,330 | | | | 0.7 | |
| | 20,310 | | | | | Kellogg Co. | | | 1,329,087 | | | | 0.4 | |
| | 18,529 | | | | | Kraft Foods Group, Inc. | | | 1,161,027 | | | | 0.4 | |
| | 41,329 | | | | | Mondelez International, Inc. | | | 1,501,276 | | | | 0.5 | |
| | 5,500 | | | | | Snyders-Lance, Inc. | | | 168,025 | | | | 0.0 | |
| | 92,073 | | | | | Sysco Corp. | | | 3,654,377 | | | | 1.1 | |
| | 1,800 | | | | | TreeHouse Foods, Inc. | | | 153,954 | | | | 0.0 | |
| | 9,300 | | | | | Village Super Market | | | 254,541 | | | | 0.1 | |
| | 4,000 | | | | | Weis Markets, Inc. | | | 191,280 | | | | 0.1 | |
| | | | | | | | | | 17,622,696 | | | | 5.5 | |
| | | | | | | | | | | | | | | |
| | | | | | | Energy: 5.4% | | | | | | | | |
| | 31,300 | | | L | | Aegean Marine Petroleum Network, Inc. | | | 438,826 | | | | 0.1 | |
| | 17,800 | | | | | Alon USA Energy, Inc. | | | 225,526 | | | | 0.1 | |
| | 21,416 | | | | | Antero Midstream Partners L.P. | | | 588,940 | | | | 0.2 | |
| | 37,220 | | | | | Apache Corp. | | | 2,332,577 | | | | 0.7 | |
| | 42,976 | | | | | Ardmore Shipping Corp. | | | 514,423 | | | | 0.2 | |
| | 32,207 | | | @ | | Cameron International Corp. | | | 1,608,740 | | | | 0.5 | |
| | 5,700 | | | | | Delek US Holdings, Inc. | | | 155,496 | | | | 0.0 | |
| | 34,850 | | | | | Devon Energy Corp. | | | 2,133,168 | | | | 0.7 | |
| | 7,257 | | | | | Forum Energy Technologies, Inc. | | | 150,437 | | | | 0.0 | |
| | 80,133 | | | | | Imperial Oil Ltd. | | | 3,452,106 | | | | 1.1 | |
| | 10,600 | | | @ | | Matrix Service Co. | | | 236,592 | | | | 0.1 | |
| | 20,858 | | | | | Noble Energy, Inc. | | | 989,295 | | | | 0.3 | |
| | 30,500 | | | L | | Nordic American Tankers Ltd. | | | 307,135 | | | | 0.1 | |
| | 25,200 | | | | | Northern Tier Energy L.P. | | | 557,928 | | | | 0.2 | |
| | 20,213 | | | | | Occidental Petroleum Corp. | | | 1,629,370 | | | | 0.5 | |
| | 3,500 | | | | | PDC Energy, Inc. | | | 144,445 | | | | 0.0 | |
| | 49,100 | | | | | Scorpio Tankers, Inc. | | | 426,679 | | | | 0.1 | |
| | 18,290 | | | @ | | Southwestern Energy Co. | | | 499,134 | | | | 0.2 | |
| | 2,200 | | | | | Western Refining, Inc. | | | 83,116 | | | | 0.0 | |
| | 21,317 | | | | | Williams Partners L.P. | | | 953,936 | | | | 0.3 | |
| | | | | | | | | | 17,427,869 | | | | 5.4 | |
| | | | | | | | | | | | | | | |
| | | | | | | Financials: 28.3% | | | | | | | | |
| | 17,183 | | | | | ACE Ltd. | | | 1,973,983 | | | | 0.6 | |
| | 16,702 | | | | | Aflac, Inc. | | | 1,020,325 | | | | 0.3 | |
| | 11,075 | | | | | Allstate Corp. | | | 778,019 | | | | 0.2 | |
| | 2,900 | | | | | American Campus Communities, Inc. | | | 119,944 | | | | 0.0 | |
| | 4,200 | | | | | American Equity Investment Life Holding Co. | | | 122,598 | | | | 0.0 | |
| | 56,235 | | | | | Annaly Capital Management, Inc. | | | 607,900 | | | | 0.2 | |
| | 23,500 | | | | | Apollo Commercial Real Estate Finance, Inc. | | | 384,460 | | | | 0.1 | |
| | 39,500 | | | | | Ares Management L.P. | | | 677,030 | | | | 0.2 | |
See Accompanying Notes to Financial Statements
| VY® American Century | PORTFOLIO OF INVESTMENTS |
| Small-Mid Cap Value Portfolio | as of December 31, 2014 (unaudited) (continued) |
| | 8,800 | | | | | Argo Group International Holdings Ltd. | | | 488,136 | | | | 0.1 | |
| | 39,700 | | | | | Armada Hoffler Properties, Inc. | | | 376,753 | | | | 0.1 | |
| | 14,966 | | | | | Arthur J. Gallagher & Co. | | | 704,599 | | | | 0.2 | |
| | 7,000 | | | | | Aspen Insurance Holdings Ltd. | | | 306,390 | | | | 0.1 | |
| | 16,700 | | | | | Associated Estates Realty Corp. | | | 387,607 | | | | 0.1 | |
| | 25,100 | | | | | Astoria Financial Corp. | | | 335,336 | | | | 0.1 | |
| | 19,600 | | | | | Baldwin & Lyons, Inc. | | | 505,288 | | | | 0.2 | |
| | 24,139 | | | | | Bank of Hawaii Corp. | | | 1,431,684 | | | | 0.4 | |
| | 52,600 | | | | | BankUnited, Inc. | | | 1,523,822 | | | | 0.5 | |
| | 29,235 | | | | | BB&T Corp. | | | 1,136,949 | | | | 0.4 | |
| | 7,800 | | | | | BioMed Realty Trust, Inc. | | | 168,012 | | | | 0.1 | |
| | 8,400 | | | | | Blackstone Mortgage Trust, Inc. | | | 244,776 | | | | 0.1 | |
| | 20,235 | | | | | BOK Financial Corp. | | | 1,214,909 | | | | 0.4 | |
| | 38,031 | | | | | Brown & Brown, Inc. | | | 1,251,600 | | | | 0.4 | |
| | 72,500 | | | | | Campus Crest Communities, Inc. | | | 529,975 | | | | 0.2 | |
| | 32,153 | | | | | Capitol Federal Financial, Inc. | | | 410,915 | | | | 0.1 | |
| | 23,500 | | | | | Capstead Mortgage Corp. | | | 288,580 | | | | 0.1 | |
| | 11,700 | | | | | CBL & Associates Properties, Inc. | | | 227,214 | | | | 0.1 | |
| | 16,300 | | | | | Chatham Lodging Trust | | | 472,211 | | | | 0.1 | |
| | 50,600 | | | | | Chimera Investment Corp. | | | 160,908 | | | | 0.0 | |
| | 13,221 | | | | | Chubb Corp. | | | 1,367,977 | | | | 0.4 | |
| | 19,200 | | | | | CNO Financial Group, Inc. | | | 330,624 | | | | 0.1 | |
| | 10,000 | | | | | Colony Financial, Inc. | | | 238,200 | | | | 0.1 | |
| | 26,590 | | | | | Comerica, Inc. | | | 1,245,476 | | | | 0.4 | |
| | 66,227 | | | | | Commerce Bancshares, Inc. | | | 2,880,212 | | | | 0.9 | |
| | 28,400 | | | | | Compass Diversified Trust | | | 461,500 | | | | 0.1 | |
| | 71,660 | | | | | Corrections Corp. of America | | | 2,604,124 | | | | 0.8 | |
| | 18,286 | | | | | Cullen/Frost Bankers, Inc. | | | 1,291,723 | | | | 0.4 | |
| | 17,100 | | | | | DiamondRock Hospitality Co. | | | 254,277 | | | | 0.1 | |
| | 24,500 | | | | | Dime Community Bancshares | | | 398,860 | | | | 0.1 | |
| | 18,400 | | | @ | | Eagle Bancorp, Inc. | | | 653,568 | | | | 0.2 | |
| | 66,811 | | | | | Empire State Realty Trust, Inc. | | | 1,174,537 | | | | 0.4 | |
| | 10,900 | | | | | Endurance Specialty Holdings Ltd. | | | 652,256 | | | | 0.2 | |
| | 5,500 | | | | | EPR Properties | | | 316,965 | | | | 0.1 | |
| | 27,300 | | | | | Excel Trust, Inc. | | | 365,547 | | | | 0.1 | |
| | 35,500 | | | | | First Horizon National Corp. | | | 482,090 | | | | 0.1 | |
| | 11,800 | | | | | First Industrial Realty Trust, Inc. | | | 242,608 | | | | 0.1 | |
| | 15,500 | | | | | First Interstate Bancsystem, Inc. | | | 431,210 | | | | 0.1 | |
| | 14,600 | | | | | First NBC Bank Holding Co. | | | 513,920 | | | | 0.2 | |
| | 28,800 | | | | | FirstMerit Corp. | | | 544,032 | | | | 0.2 | |
| | 37,000 | | | | | FNB Corp. | | | 492,840 | | | | 0.2 | |
| | 22,303 | | | | | Franklin Resources, Inc. | | | 1,234,917 | | | | 0.4 | |
| | 42,400 | | | | | Fulton Financial Corp. | | | 524,064 | | | | 0.2 | |
| | 2,600 | | | | | Hanover Insurance Group, Inc. | | | 185,432 | | | | 0.1 | |
| | 19,300 | | | | | Hatteras Financial Corp. | | | 355,699 | | | | 0.1 | |
| | 47,910 | | | | | HCC Insurance Holdings, Inc. | | | 2,564,143 | | | | 0.8 | |
| | 8,000 | | | | | Healthcare Realty Trust, Inc. | | | 218,560 | | | | 0.1 | |
| | 9,800 | | | | | Heritage Financial Corp. | | | 171,990 | | | | 0.1 | |
| | 19,800 | | | | | Hersha Hospitality Trust | | | 139,194 | | | | 0.0 | |
| | 6,900 | | | | | Highwoods Properties, Inc. | | | 305,532 | | | | 0.1 | |
| | 30,800 | | | | | Home Bancshares, Inc. | | | 990,528 | | | | 0.3 | |
| | 2,220 | | | | | Infinity Property & Casualty Corp. | | | 171,517 | | | | 0.1 | |
| | 15,519 | | | @ | | James River Group Holdings Ltd. | | | 353,213 | | | | 0.1 | |
| | 10,600 | | | | | Kite Realty Group Trust | | | 304,644 | | | | 0.1 | |
| | 3,100 | | | | | Lakeland Financial Corp. | | | 134,757 | | | | 0.0 | |
| | 10,500 | | | | | LaSalle Hotel Properties | | | 424,935 | | | | 0.1 | |
| | 42,300 | | | | | Lexington Realty Trust | | | 464,454 | | | | 0.1 | |
| | 45,353 | | | | | LPL Financial Holdings, Inc. | | | 2,020,476 | | | | 0.6 | |
| | 23,204 | | | | | M&T Bank Corp. | | | 2,914,887 | | | | 0.9 | |
| | 11,600 | | | | | Mack-Cali Realty Corp. | | | 221,096 | | | | 0.1 | |
| | 10,600 | | | | | MB Financial, Inc. | | | 348,316 | | | | 0.1 | |
| | 28,000 | | | | | Medical Properties Trust, Inc. | | | 385,840 | | | | 0.1 | |
| | 18,414 | | | | | Metlife, Inc. | | | 996,013 | | | | 0.3 | |
| | 52,800 | | | | | MFA Mortgage Investments, Inc. | | | 421,872 | | | | 0.1 | |
| | 16,800 | | | | | New Residential Investment Corp. | | | 214,536 | | | | 0.1 | |
| | 97,255 | | | | | Northern Trust Corp. | | | 6,554,987 | | | | 2.0 | |
| | 44,200 | | | | | OFG Bancorp | | | 735,930 | | | | 0.2 | |
| | 30,800 | | | | | Oritani Financial Corp. | | | 474,320 | | | | 0.1 | |
| | 15,599 | | | | | Outfront Media, Inc. | | | 418,673 | | | | 0.1 | |
| | 27,570 | | | | | Park Sterling Corp. | | | 202,640 | | | | 0.1 | |
| | 13,400 | | | | | Pennsylvania Real Estate Investment Trust | | | 314,364 | | | | 0.1 | |
| | 15,900 | | | | | Pennymac Mortgage Investment Trust | | | 335,331 | | | | 0.1 | |
| | 128,723 | | | | | People's United Financial, Inc. | | | 1,954,015 | | | | 0.6 | |
| | 12,400 | | | | | PHH Corp. | | | 297,104 | | | | 0.1 | |
| | 135,053 | | | | | Piedmont Office Realty Trust, Inc. | | | 2,544,399 | | | | 0.8 | |
| | 2,100 | | | | | Platinum Underwriters Holdings Ltd. | | | 154,182 | | | | 0.0 | |
| | 31,225 | | | | | PNC Financial Services Group, Inc. | | | 2,848,657 | | | | 0.9 | |
| | 10,400 | | | @ | | Popular, Inc. | | | 354,120 | | | | 0.1 | |
| | 7,400 | | | | | PrivateBancorp, Inc. | | | 247,160 | | | | 0.1 | |
| | 3,800 | | | | | Prosperity Bancshares, Inc. | | | 210,368 | | | | 0.1 | |
| | 16,200 | | | | | Radian Group, Inc. | | | 270,864 | | | | 0.1 | |
| | 25,108 | | | | | Reinsurance Group of America, Inc. | | | 2,199,963 | | | | 0.7 | |
| | 11,900 | | | | | Rexford Industrial Realty, Inc. | | | 186,949 | | | | 0.1 | |
| | 5,600 | | | | | RLJ Lodging Trust | | | 187,768 | | | | 0.1 | |
| | 25,400 | | | | | Rouse Properties, Inc. | | | 470,408 | | | | 0.1 | |
| | 7,600 | | | | | Sabra Healthcare REIT, Inc. | | | 230,812 | | | | 0.1 | |
See Accompanying Notes to Financial Statements
| VY® American Century | PORTFOLIO OF INVESTMENTS |
| Small-Mid Cap Value Portfolio | as of December 31, 2014 |
| | 7,400 | | | | | Selective Insurance Group | | | 201,058 | | | | 0.1 | |
| | 20,900 | | | | | ServisFirst Bancshares, Inc. | | | 688,655 | | | | 0.2 | |
| | 15,200 | | | | | Southside Bancshares, Inc. | | | 439,432 | | | | 0.1 | |
| | 20,114 | | | | | State Street Corp. | | | 1,578,949 | | | | 0.5 | |
| | 34,600 | | | | | Summit Hotel Properties, Inc. | | | 430,424 | | | | 0.1 | |
| | 5,200 | | | | | Sun Communities, Inc. | | | 314,392 | | | | 0.1 | |
| | 17,800 | | | | | Sunstone Hotel Investors, Inc. | | | 293,878 | | | | 0.1 | |
| | 34,682 | | | | | SunTrust Bank | | | 1,453,176 | | | | 0.4 | |
| | 8,600 | | | | | Symetra Financial Corp. | | | 198,230 | | | | 0.1 | |
| | 13,500 | | | | | T. Rowe Price Group, Inc. | | | 1,159,110 | | | | 0.4 | |
| | 18,900 | | | | | TCF Financial Corp. | | | 300,321 | | | | 0.1 | |
| | 14,800 | | | | | Texas Capital Bancshares, Inc. | | | 804,084 | | | | 0.2 | |
| | 15,386 | | | | | Torchmark Corp. | | | 833,460 | | | | 0.3 | |
| | 11,345 | | | | | Travelers Cos., Inc. | | | 1,200,868 | | | | 0.4 | |
| | 48,700 | | | | | Two Harbors Investment Corp. | | | 487,974 | | | | 0.1 | |
| | 7,400 | | | | | United Fire Group, Inc. | | | 220,002 | | | | 0.1 | |
| | 50,303 | | | | | UnumProvident Corp. | | | 1,754,569 | | | | 0.5 | |
| | 22,500 | | | | | Urstadt Biddle Properties, Inc. | | | 492,300 | | | | 0.2 | |
| | 4,900 | | | | | Validus Holdings Ltd. | | | 203,644 | | | | 0.1 | |
| | 93,700 | | | | | Valley National Bancorp. | | | 909,827 | | | | 0.3 | |
| | 13,200 | | | | | Washington Real Estate Investment Trust | | | 365,112 | | | | 0.1 | |
| | 39,196 | | | | | Westamerica Bancorp. | | | 1,921,388 | | | | 0.6 | |
| | 84,717 | | | | | Weyerhaeuser Co. | | | 3,040,493 | | | | 0.9 | |
| | | | | | | | | | 91,343,444 | | | | 28.3 | |
| | | | | | | | | | | | | | | |
| | | | | | | Health Care: 9.3% | | | | | | | | |
| | 19,081 | | | | | Agilent Technologies, Inc. | | | 781,176 | | | | 0.2 | |
| | 30,100 | | | | | AMN Healthcare Services, Inc. | | | 589,960 | | | | 0.2 | |
| | 8,118 | | | @ | | Bio-Rad Laboratories, Inc. | | | 978,706 | | | | 0.3 | |
| | 90,366 | | | @ | | Boston Scientific Corp. | | | 1,197,350 | | | | 0.4 | |
| | 24,251 | | | | | Cardinal Health, Inc. | | | 1,957,783 | | | | 0.6 | |
| | 45,560 | | | | | CareFusion Corp. | | | 2,703,531 | | | | 0.8 | |
| | 6,900 | | | | | Catalent, Inc. | | | 192,372 | | | | 0.1 | |
| | 12,132 | | | | | Cigna Corp. | | | 1,248,504 | | | | 0.4 | |
| | 30,100 | | | @ | | Haemonetics Corp. | | | 1,126,342 | | | | 0.3 | |
| | 19,400 | | | @ | | Hanger Orthopedic Group, Inc. | | | 424,860 | | | | 0.1 | |
| | 4,800 | | | | | Healthsouth Corp. | | | 184,608 | | | | 0.1 | |
| | 3,900 | | | | | Hill-Rom Holdings, Inc. | | | 177,918 | | | | 0.0 | |
| | 12,831 | | | | | Hospira, Inc. | | | 785,899 | | | | 0.2 | |
| | 11,856 | | | | | Humana, Inc. | | | 1,702,877 | | | | 0.5 | |
| | 3,900 | | | @ | | Integra LifeSciences Holdings Corp. | | | 211,497 | | | | 0.1 | |
| | 48,480 | | | | | LifePoint Hospitals, Inc. | | | 3,486,197 | | | | 1.1 | |
| | 2,800 | | | | | Magellan Health Services, Inc. | | | 168,084 | | | | 0.0 | |
| | 28,300 | | | | | MedAssets, Inc. | | | 559,208 | | | | 0.2 | |
| | 25,630 | | | | | Medtronic, Inc. | | | 1,850,486 | | | | 0.6 | |
| | 3,200 | | | | | National Healthcare Corp. | | | 201,088 | | | | 0.1 | |
| | 6,600 | | | @ | | Orthofix International NV | | | 198,396 | | | | 0.1 | |
| | 5,700 | | | | | Owens & Minor, Inc. | | | 200,127 | | | | 0.1 | |
| | 26,333 | | | | | Patterson Cos., Inc. | | | 1,266,617 | | | | 0.4 | |
| | 45,589 | | | | | Quest Diagnostics | | | 3,057,198 | | | | 0.9 | |
| | 16,186 | | | | | Stryker Corp. | | | 1,526,825 | | | | 0.5 | |
| | 10,800 | | | | | Utah Medical Products, Inc. | | | 648,540 | | | | 0.2 | |
| | 7,540 | | | @ | | Waters Corp. | | | 849,909 | | | | 0.3 | |
| | 4,100 | | | | | WellCare Health Plans, Inc. | | | 336,446 | | | | 0.1 | |
| | 11,485 | | | | | Zimmer Holdings, Inc. | | | 1,302,629 | | | | 0.4 | |
| | | | | | | | | | 29,915,133 | | | | 9.3 | |
| | | | | | | | | | | | | | | |
| | | | | | | Industrials: 12.8% | | | | | | | | |
| | 10,000 | | | | | AAR Corp. | | | 277,800 | | | | 0.1 | |
| | 76,500 | | | | | ADT Corp. | | | 2,771,595 | | | | 0.9 | |
| | 24,800 | | | | | Albany International Corp. | | | 942,152 | | | | 0.3 | |
| | 15,600 | | | | | American Science & Engineering, Inc. | | | 809,640 | | | | 0.2 | |
| | 4,100 | | | @ | | American Woodmark Corp. | | | 165,804 | | | | 0.0 | |
| | 121,569 | | | | | BAE Systems PLC | | | 889,060 | | | | 0.3 | |
| | 11,500 | | | | | Briggs & Stratton Corp. | | | 234,830 | | | | 0.1 | |
| | 27,600 | | | | | CDI Corp. | | | 488,796 | | | | 0.1 | |
| | 9,300 | | | | | Celadon Group, Inc. | | | 211,017 | | | | 0.1 | |
| | 43,973 | | | @ | | Clean Harbors, Inc. | | | 2,112,903 | | | | 0.7 | |
| | 26,300 | | | | | Continental Building Products, Inc. | | | 466,299 | | | | 0.1 | |
| | 22,600 | | | | | Dynamic Materials Corp. | | | 362,052 | | | | 0.1 | |
| | 37,160 | | | | | Emerson Electric Co. | | | 2,293,887 | | | | 0.7 | |
| | 9,000 | | | | | EnPro Industries, Inc. | | | 564,840 | | | | 0.2 | |
| | 121,087 | | | | | Exelis, Inc. | | | 2,122,655 | | | | 0.7 | |
| | 2,038 | | | L | | Generac Holdings, Inc. | | | 95,297 | | | | 0.0 | |
| | 70,100 | | | | | Global Brass & Copper Holdings, Inc. | | | 922,516 | | | | 0.3 | |
| | 62,800 | | | | | GrafTech International Ltd. | | | 317,768 | | | | 0.1 | |
| | 38,000 | | | @ | | Great Lakes Dredge & Dock Corp. | | | 325,280 | | | | 0.1 | |
| | 46,575 | | | | | Heartland Express, Inc. | | | 1,257,991 | | | | 0.4 | |
| | 4,200 | | | | | Kadant, Inc. | | | 179,298 | | | | 0.1 | |
| | 5,100 | | | | | Kaman Corp. | | | 204,459 | | | | 0.1 | |
| | 8,400 | | | | | Kennametal, Inc. | | | 300,636 | | | | 0.1 | |
| | 7,100 | | | L | | Keyw Holding Corp. | | | 73,698 | | | | 0.0 | |
| | 32,000 | | | | | Kforce, Inc. | | | 772,160 | | | | 0.2 | |
| | 124,318 | | | | | Koninklijke Philips NV | | | 3,603,491 | | | | 1.1 | |
| | 15,100 | | | | | Marten Transport Ltd. | | | 330,086 | | | | 0.1 | |
| | 20,300 | | | | | Multi-Color Corp. | | | 1,125,026 | | | | 0.3 | |
| | 10,600 | | | @ | | NCI Building Systems, Inc. | | | 196,312 | | | | 0.1 | |
| | 11,800 | | | | | Northwest Pipe Co. | | | 355,416 | | | | 0.1 | |
| | 19,100 | | | @ | | On Assignment, Inc. | | | 633,929 | | | | 0.2 | |
| | 55,959 | | | | | Oshkosh Truck Corp. | | | 2,722,405 | | | | 0.8 | |
| | 13,294 | | | | | Pentair PLC | | | 882,987 | | | | 0.3 | |
| | 166,471 | | | | | Republic Services, Inc. | | | 6,700,458 | | | | 2.1 | |
| | 12,700 | | | | | Rexnord Corp. | | | 358,267 | | | | 0.1 | |
| | 25,742 | | | | | Textron, Inc. | | | 1,083,996 | | | | 0.3 | |
| | 46,049 | | | | | Tyco International Plc | | | 2,019,709 | | | | 0.6 | |
| | 4,095 | | | | | Vectrus, Inc. | | | 112,203 | | | | 0.0 | |
| | 11,490 | | | | | Waste Management, Inc. | | | 589,667 | | | | 0.2 | |
| | 48,997 | | | | | Werner Enterprises, Inc. | | | 1,526,256 | | | | 0.5 | |
| | | | | | | | | | 41,402,641 | | | | 12.8 | |
| | | | | | | | | | | | | | | |
| | | | | | | Information Technology: 10.1% | | | | | | | | |
| | 80,520 | | | | | Applied Materials, Inc. | | | 2,006,558 | | | | 0.6 | |
| | 8,100 | | | @ | | AVG Technologies | | | 159,894 | | | | 0.0 | |
See Accompanying Notes to Financial Statements
| VY® American Century | PORTFOLIO OF INVESTMENTS |
| Small-Mid Cap Value Portfolio | as of December 31, 2014 (unaudited) (continued) |
| | 50,808 | | | | | Broadcom Corp. | | | 2,201,511 | | | | 0.7 | |
| | 24,000 | | | | | BroadSoft, Inc. | | | 696,480 | | | | 0.2 | |
| | 14,900 | | | | | CommScope Holding Co., Inc. | | | 340,167 | | | | 0.1 | |
| | 56,800 | | | | | EVERTEC, Inc. | | | 1,256,984 | | | | 0.4 | |
| | 16,200 | | | | | Everyday Health, Inc. | | | 238,950 | | | | 0.1 | |
| | 66,000 | | | @ | | Exar Corp. | | | 673,200 | | | | 0.2 | |
| | 32,600 | | | | | Fairchild Semiconductor International, Inc. | | | 550,288 | | | | 0.2 | |
| | 24,795 | | | | | Fidelity National Information Services, Inc. | | | 1,542,249 | | | | 0.5 | |
| | 16,015 | | | | | Harris Corp. | | | 1,150,197 | | | | 0.4 | |
| | 21,600 | | | | | Ingram Micro, Inc. | | | 597,024 | | | | 0.2 | |
| | 20,093 | | | | | Keysight Technologies, Inc. | | | 678,541 | | | | 0.2 | |
| | 32,300 | | | @ | | Kulicke & Soffa Industries, Inc. | | | 467,058 | | | | 0.1 | |
| | 26,893 | | | | | Lam Research Corp. | | | 2,133,691 | | | | 0.7 | |
| | 47,624 | | | | | Maxim Integrated Products | | | 1,517,777 | | | | 0.5 | |
| | 57,700 | | | | | Mentor Graphics Corp. | | | 1,264,784 | | | | 0.4 | |
| | 44,556 | | | | | Microchip Technology, Inc. | | | 2,009,921 | | | | 0.6 | |
| | 25,400 | | | @ | | MoneyGram International, Inc. | | | 230,886 | | | | 0.1 | |
| | 24,300 | | | | | Nanometrics, Inc. | | | 408,726 | | | | 0.1 | |
| | 4,098 | | | | | Park Electrochemical Corp. | | | 102,163 | | | | 0.0 | |
| | 36,300 | | | @ | | Polycom, Inc. | | | 490,050 | | | | 0.2 | |
| | 36,400 | | | @ | | Riverbed Technolgoy, Inc. | | | 742,924 | | | | 0.2 | |
| | 18,717 | | | | | Sandisk Corp. | | | 1,833,892 | | | | 0.6 | |
| | 17,400 | | | @ | | Semtech Corp. | | | 479,718 | | | | 0.1 | |
| | 64,500 | | | | | Silicon Graphics International Corp. | | | 734,010 | | | | 0.2 | |
| | 700 | | | @ | | SYKES Enterprises, Inc. | | | 16,429 | | | | 0.0 | |
| | 30,337 | | | | | TE Connectivity Ltd. | | | 1,918,815 | | | | 0.6 | |
| | 131,192 | | | | | Teradyne, Inc. | | | 2,596,290 | | | | 0.8 | |
| | 1,896 | | | | | TTM Technologies, Inc. | | | 14,277 | | | | 0.0 | |
| | 10,400 | | | | | VeriFone Holdings, Inc. | | | 386,880 | | | | 0.1 | |
| | 28,268 | | | | | Western Digital Corp. | | | 3,129,267 | | | | 1.0 | |
| | | | | | | | | | 32,569,601 | | | | 10.1 | |
| | | | | | | | | | | | | | | |
| | | | | | | Materials: 5.1% | | | | | | | | |
| | 25,600 | | | @ | | AM Castle & Co. | | | 204,288 | | | | 0.1 | |
| | 50,778 | | | | | Bemis Co., Inc. | | | 2,295,673 | | | | 0.7 | |
| | 50,500 | | | | | Berry Plastics Group, Inc. | | | 1,593,275 | | | | 0.5 | |
| | 24,100 | | | | | Chemtura Corp. | | | 595,993 | | | | 0.2 | |
| | 1,100 | | | @ | | Clearwater Paper Corp. | | | 75,405 | | | | 0.0 | |
| | 9,500 | | | | | Compass Minerals International, Inc. | | | 824,885 | | | | 0.3 | |
| | 58,100 | | | | | Graphic Packaging Holding Co. | | | 791,322 | | | | 0.2 | |
| | 3,852 | | | | | Hawkins, Inc. | | | 166,907 | | | | 0.0 | |
| | 10,900 | | | | | Haynes International, Inc. | | | 528,650 | | | | 0.2 | |
| | 37,833 | | | | | Horsehead Holding Corp. | | | 598,897 | | | | 0.2 | |
| | 15,300 | | | | | Innophos Holdings, Inc. | | | 894,285 | | | | 0.3 | |
| | 17,100 | | | | | KapStone Paper and Packaging Corp. | | | 501,201 | | | | 0.1 | |
| | 23,600 | | | @ | | LSB Industries, Inc. | | | 741,984 | | | | 0.2 | |
| | 39,817 | | | | | Mosaic Co. | | | 1,817,646 | | | | 0.6 | |
| | 52,178 | | | | | Newmont Mining Corp. | | | 986,164 | | | | 0.3 | |
| | 33,506 | | | | | Nucor Corp. | | | 1,643,469 | | | | 0.5 | |
| | 26,814 | | | | | Sonoco Products Co. | | | 1,171,772 | | | | 0.4 | |
| | 40,500 | | | | | Tronox Ltd. - CL A | | | 967,140 | | | | 0.3 | |
| | | | | | | | | | 16,398,956 | | | | 5.1 | |
| | | | | | | | | | | | | | | |
| | | | | | | Telecommunication Services: 1.0% | | | | | | | | |
| | 48,541 | | | | | CenturyTel, Inc. | | | 1,921,253 | | | | 0.6 | |
| | 31,846 | | | | | Rogers Communications, Inc. | | | 1,238,151 | | | | 0.4 | |
| | | | | | | | | | 3,159,404 | | | | 1.0 | |
| | | | | | | | | | | | | | | |
| | | | | | | Utilities: 9.9% | | | | | | | | |
| | 13,500 | | | | | Allete, Inc. | | | 744,390 | | | | 0.2 | |
| | 24,184 | | | | | Ameren Corp. | | | 1,115,608 | | | | 0.3 | |
| | 11,000 | | | | | Artesian Resources Corp. | | | 248,490 | | | | 0.1 | |
| | 41,557 | | | | | Atmos Energy Corp. | | | 2,316,387 | | | | 0.7 | |
| | 12,200 | | | | | Avista Corp. | | | 431,270 | | | | 0.1 | |
| | 4,800 | | | | | Black Hills Corp. | | | 254,592 | | | | 0.1 | |
| | 2,600 | | | | | Cleco Corp. | | | 141,804 | | | | 0.0 | |
| | 17,258 | | | | | Consolidated Edison, Inc. | | | 1,139,200 | | | | 0.4 | |
| | 50,590 | | | | | Edison International | | | 3,312,633 | | | | 1.0 | |
| | 10,700 | | | | | El Paso Electric Co. | | | 428,642 | | | | 0.1 | |
| | 89,606 | | | | | Great Plains Energy, Inc. | | | 2,545,706 | | | | 0.8 | |
| | 82,053 | | | | | Laclede Group, Inc. | | | 4,365,220 | | | | 1.4 | |
| | 18,890 | | | | | Northeast Utilities | | | 1,010,993 | | | | 0.3 | |
| | 34,408 | | | | | NorthWestern Corp. | | | 1,946,805 | | | | 0.6 | |
| | 14,930 | | | | | OGE Energy Corp. | | | 529,716 | | | | 0.2 | |
| | 6,500 | | | | | ONE Gas, Inc. | | | 267,930 | | | | 0.1 | |
| | 39,696 | | | | | Pacific Gas & Electric Co. | | | 2,113,415 | | | | 0.7 | |
| | 12,700 | | | | | Portland General Electric Co. | | | 480,441 | | | | 0.2 | |
| | 7,100 | | | | | Questar Corp. | | | 179,488 | | | | 0.1 | |
| | 4,700 | | | | | South Jersey Industries, Inc. | | | 276,971 | | | | 0.1 | |
| | 22,651 | | | | | Southern Co. | | | 1,112,391 | | | | 0.3 | |
| | 2,965 | | | | | UIL Holdings Corp. | | | 129,096 | | | | 0.0 | |
| | 83,386 | | | | | Westar Energy, Inc. | | | 3,438,839 | | | | 1.1 | |
| | 91,230 | | | | | Xcel Energy, Inc. | | | 3,276,982 | | | | 1.0 | |
| | | | | | | | | | 31,807,009 | | | | 9.9 | |
| | | | | | | | | | | | | | | |
| | | | | Total Common Stock | | | | | | | | |
| | | | | (Cost $276,058,444) | | | 309,188,031 | | | | 95.9 | |
| | | | | | | | | | | | | |
| EXCHANGE-TRADED FUNDS: 2.2% | | | | | | | | |
| | 4,500 | | | | | iShares Russell 2000 Value Index Fund | | | 457,560 | | | | 0.1 | |
| | 82,900 | | | | | iShares Russell Midcap Value Index Fund | | | 6,115,533 | | | | 1.9 | |
| | 4,700 | | | | | iShares S&P SmallCap 600 Index Fund | | | 536,082 | | | | 0.2 | |
| | | | | | | | | | | | | | | |
| | | | | Total Exchange-Traded Funds | | | | | | | | |
| | | | | (Cost $6,804,188) | | | 7,109,175 | | | | 2.2 | |
See Accompanying Notes to Financial Statements
| VY® American Century | PORTFOLIO OF INVESTMENTS |
| Small-Mid Cap Value Portfolio | as of December 31, 2014 |
| PREFERRED STOCK: 0.1% | | | | | | | | |
| | | | | | | Consumer Discretionary: 0.1% | | | | | | | | |
| | 11,700 | | | | | Beazer Homes USA, Inc. | | | 347,490 | | | | 0.1 | |
| | | | | | | | | | | | | | | |
| | | | | Total Preferred Stock | | | | | | | | |
| | | | | (Cost $343,473) | | | 347,490 | | | | 0.1 | |
| | | | | | | | | | | | | |
| | | | | Total Long-Term Investments | | | | | | | | |
| | | | | (Cost $283,206,105) | | | 316,644,696 | | | | 98.2 | |
Principal
Amount† | | | | | | | Value | | | Percentage
of Net
Assets | |
| SHORT-TERM INVESTMENTS: 2.3% | | | | | | | | |
| | | | | | | Securities Lending Collateralcc: 0.3% | |
| | 65,023 | | | | | Cantor Fitzgerald, Repurchase Agreement dated 12/31/14, 0.09%, due 01/02/15 (Repurchase Amount $65,023, collateralized by various U.S. Government and U.S. Government Agency Obligations, 0.000%-10.500%, Market Value plus accrued interest $66,323, due 01/01/15-09/01/49) | | | 65,023 | | | | 0.0 | |
| | 1,000,000 | | | | | Millenium Fixed Income Ltd., Repurchase Agreement dated 12/31/14, 0.15%, due 01/02/15 (Repurchase Amount $1,000,008, collateralized by various U.S. Government Securities, 0.625%-3.125%, Market Value plus accrued interest $1,020,000, due 09/30/17-02/15/42) | | | 1,000,000 | | | | 0.3 | |
| | | | | | | | | | 1,065,023 | | | | 0.3 | |
| Shares | | | | | | | Value | | | Percentage
of Net
Assets | |
| | | | | | Mutual Funds: 2.0% |
| | 6,461,462 | | | | | BlackRock Liquidity Funds, TempFund, Institutional Class, 0.030%†† (Cost $6,461,462) | | | 6,461,462 | | | | 2.0 | |
| | | | | | | | | | | | | | | |
| | | | | Total Short-Term Investments | | | | | | | | |
| | | | | (Cost $7,526,485) | | | 7,526,485 | | | | 2.3 | |
| | | | | | | | | | | | | | | |
| | | | | Total Investments in Securities
(Cost $290,732,590) | | $ | 324,171,181 | | | | 100.5 | |
| | | | | Liabilities in Excess of Other Assets | | | (1,701,519 | ) | | | (0.5 | ) |
| | | | | Net Assets | | $ | 322,469,662 | | | | 100.0 | |
| † | Unless otherwise indicated, principal amount is shown in USD. |
| †† | Rate shown is the 7-day yield as of December 31, 2014. |
| @ | Non-income producing security. |
| cc | Represents securities purchased with cash collateral received for securities on loan. |
| L | Loaned security, a portion or all of the security is on loan at December 31, 2014. |
Cost for federal income tax purposes is $293,349,204.
Net unrealized appreciation consists of:
| Gross Unrealized Appreciation | | $ | 38,881,167 | |
| Gross Unrealized Depreciation | | | (8,059,190 | ) |
| | | | | |
| Net Unrealized Appreciation | | $ | 30,821,977 | |
See Accompanying Notes to Financial Statements
| | PORTFOLIO OF INVESTMENTS |
| VY® Baron Growth Portfolio | as of December 31, 2014 |
| Shares | | | | | | | Value | | | Percentage
of Net
Assets | |
| COMMON STOCK: 99.3% | | | | | | | | |
| | | | | | | Consumer Discretionary: 27.3% | |
| | 3,100,000 | | | @ | | AO World PLC | | | 13,538,342 | | | | 1.3 | |
| | 429,000 | | | | | Bright Horizons Family Solutions, Inc. | | | 20,167,290 | | | | 1.9 | |
| | 138,007 | | | @ | | BRP, Inc./CA | | | 2,875,839 | | | | 0.3 | |
| | 590,000 | | | | | Choice Hotels International, Inc. | | | 33,051,800 | | | | 3.1 | |
| | 18,943 | | | | | ClubCorp Holdings, Inc. | | | 339,648 | | | | 0.0 | |
| | 230,000 | | | | | DeVry, Inc. | | | 10,918,100 | | | | 1.0 | |
| | 13,533 | | | | | Diamond Resorts International, Inc. | | | 377,571 | | | | 0.0 | |
| | 525,000 | | | | | Dick's Sporting Goods, Inc. | | | 26,066,250 | | | | 2.5 | |
| | 420,000 | | | | | Interval Leisure Group, Inc. | | | 8,773,800 | | | | 0.8 | |
| | 375,000 | | | @ | | LKQ Corp. | | | 10,545,000 | | | | 1.0 | |
| | 149,000 | | | | | Lumber Liquidators | | | 9,880,190 | | | | 0.9 | |
| | 761,383 | | | @ | | Manchester United PLC - Class A | | | 12,105,990 | | | | 1.2 | |
| | 160,000 | | | | | Marriott Vacations Worldwide Corp. | | | 11,926,400 | | | | 1.1 | |
| | 163,000 | | | | | Morningstar, Inc. | | | 10,547,730 | | | | 1.0 | |
| | 187,858 | | | @ | | Nord Anglia Education, Inc. | | | 3,584,330 | | | | 0.3 | |
| | 66,700 | | | @ | | Panera Bread Co. | | | 11,659,160 | | | | 1.1 | |
| | 400,380 | | | @ | | Penn National Gaming, Inc. | | | 5,497,217 | | | | 0.5 | |
| | 593,691 | | | @ | | Pinnacle Entertainment, Inc. | | | 13,209,625 | | | | 1.3 | |
| | 111,803 | | | | | Shutterstock, Inc. | | | 7,725,587 | | | | 0.7 | |
| | 505,000 | | | | | Under Armour, Inc. | | | 34,289,500 | | | | 3.2 | |
| | 475,000 | | | | | Vail Resorts, Inc. | | | 43,286,750 | | | | 4.1 | |
| | | | | | | | | | 290,366,119 | | | | 27.3 | |
| | | | | | | | | | | | | | | |
| | | | | | | Consumer Staples: 8.3% | | | | | |
| | 63,294 | | | | | Boston Beer Co., Inc. | | | 18,326,145 | | | | 1.7 | |
| | 203,500 | | | | | Church & Dwight Co., Inc. | | | 16,037,835 | | | | 1.5 | |
| | 350,000 | | | | | TreeHouse Foods, Inc. | | | 29,935,500 | | | | 2.8 | |
| | 317,641 | | | @ | | United Natural Foods, Inc. | | | 24,561,590 | | | | 2.3 | |
| | | | | | | | | | 88,861,070 | | | | 8.3 | |
| | | | | | | | | | | | | | | |
| | | | | | | Energy: 3.4% | | | | | | | | |
| | 52,000 | | | | | Core Laboratories NV | | | 6,257,680 | | | | 0.6 | |
| | 79,300 | | | | | Helmerich & Payne, Inc. | | | 5,346,406 | | | | 0.5 | |
| | 61,993 | | | | | Sunoco L.P. | | | 3,085,391 | | | | 0.3 | |
| | 200,000 | | | | | Targa Resources Corp. | | | 21,210,000 | | | | 2.0 | |
| | | | | | | | | | 35,899,477 | | | | 3.4 | |
| | | | | | | | | | | | | | | |
| | | | | | | Financials: 15.2% | | | | | | | | |
| | 17,700 | | | | | Alexander's, Inc. | | | 7,738,086 | | | | 0.7 | |
| | 82,000 | | | | | Alexandria Real Estate Equities, Inc. | | | 7,276,680 | | | | 0.7 | |
| | 115,000 | | | | | American Assets Trust, Inc. | | | 4,578,150 | | | | 0.4 | |
| | 80,000 | | | | | American Campus Communities, Inc. | | | 3,308,800 | | | | 0.3 | |
| | 195,000 | | | @ | | Arch Capital Group Ltd. | | | 11,524,500 | | | | 1.1 | |
| | 272,255 | | | | | Artisan Partners Asset Management, Inc. | | | 13,757,045 | | | | 1.3 | |
| | 347,500 | | | | | Carlyle Group L.P. | | | 9,556,250 | | | | 0.9 | |
| | 425,000 | | | | | Cohen & Steers, Inc. | | | 17,884,000 | | | | 1.7 | |
| | 478,000 | | | | | Douglas Emmett, Inc. | | | 13,575,200 | | | | 1.3 | |
| | 297,229 | | | | | Financial Engines, Inc. | | | 10,863,720 | | | | 1.0 | |
| | 504,411 | | | | | Gaming and Leisure Properties, Inc. | | | 14,799,419 | | | | 1.4 | |
| | 175,000 | | | | | LaSalle Hotel Properties | | | 7,082,250 | | | | 0.7 | |
| | 208,000 | | | | | MSCI, Inc. - Class A | | | 9,867,520 | | | | 0.9 | |
| | 160,000 | | | | | Oaktree Capital Group, LLC | | | 8,292,800 | | | | 0.8 | |
| | 390,000 | | | | | Primerica, Inc. | | | 21,161,400 | | | | 2.0 | |
| | | | | | | | | | 161,265,820 | | | | 15.2 | |
| | | | | | | | | | | | | | | |
| | | | | | | Health Care: 8.5% | | | | | | | | |
| | 105,000 | | | | | Bio-Techne Corp. | | | 9,702,000 | | | | 0.9 | |
| | 67,000 | | | @ | | Brookdale Senior Living, Inc. | | | 2,456,890 | | | | 0.2 | |
| | 430,000 | | | @ | | Community Health Systems, Inc. | | | 23,185,600 | | | | 2.2 | |
| | 39,000 | | | @ | | Edwards Lifesciences Corp. | | | 4,967,820 | | | | 0.5 | |
| | 122,200 | | | @ | | Idexx Laboratories, Inc. | | | 18,118,594 | | | | 1.7 | |
| | 1,631 | | | | | Juno Therapeutics, Inc. | | | 85,171 | | | | 0.0 | |
| | 73,000 | | | | | Mettler Toledo International, Inc. | | | 22,079,580 | | | | 2.1 | |
| | 47,008 | | | @ | | Neogen Corp. | | | 2,331,127 | | | | 0.2 | |
| | 146,956 | | | | | West Pharmaceutical Services, Inc. | | | 7,823,937 | | | | 0.7 | |
| | | | | | | | | | 90,750,719 | | | | 8.5 | |
| | | | | | | | | | | | | | | |
| | | | | | | Industrials: 16.7% | | | | | | | | |
| | 350,000 | | | | | Air Lease Corp. | | | 12,008,500 | | | | 1.1 | |
| | 205,712 | | | | | Badger Daylighting Ltd | | | 4,683,321 | | | | 0.5 | |
| | 305,000 | | | | | Colfax Corp. | | | 15,728,850 | | | | 1.5 | |
| | 355,000 | | | @ | | Copart, Inc. | | | 12,953,950 | | | | 1.2 | |
| | 157,000 | | | | | CoStar Group, Inc. | | | 28,829,910 | | | | 2.7 | |
| | 372,500 | | | | | Generac Holdings, Inc. | | | 17,418,100 | | | | 1.6 | |
| | 340,000 | | | @ | | Genesee & Wyoming, Inc. | | | 30,572,800 | | | | 2.9 | |
| | 60,000 | | | | | Landstar System, Inc. | | | 4,351,800 | | | | 0.4 | |
| | 318,000 | | | @ | | Middleby Corp. | | | 31,513,800 | | | | 3.0 | |
| | 105,000 | | | | | MSC Industrial Direct Co. | | | 8,531,250 | | | | 0.8 | |
| | 100,000 | | | | | Trex Co., Inc. | | | 4,258,000 | | | | 0.4 | |
| | 50,000 | | | | | Valmont Industries, Inc. | | | 6,350,000 | | | | 0.6 | |
| | | | | | | | | | 177,200,281 | | | | 16.7 | |
| | | | | | | | | | | | | | | |
| | | | | | | Information Technology: 14.9% | | | | | |
| | 265,000 | | | | | Advent Software, Inc. | | | 8,119,600 | | | | 0.8 | |
| | 239,000 | | | @ | | Ansys, Inc. | | | 19,598,000 | | | | 1.8 | |
| | 287,819 | | | | | Benefitfocus, Inc. | | | 9,451,976 | | | | 0.9 | |
| | 506,500 | | | | | Booz Allen Hamilton Holding Corp. | | | 13,437,445 | | | | 1.3 | |
| | 104,000 | | | | | Bottomline Technologies, Inc. | | | 2,629,120 | | | | 0.2 | |
| | 85,000 | | | | | Factset Research Systems, Inc. | | | 11,963,750 | | | | 1.1 | |
| | 400,200 | | | @ | | Gartner, Inc. | | | 33,700,842 | | | | 3.2 | |
| | 165,000 | | | | | Guidewire Software, Inc. | | | 8,353,950 | | | | 0.8 | |
| | 400,000 | | | | | MAXIMUS, Inc. | | | 21,936,000 | | | | 2.1 | |
| | 320,000 | | | | | Pegasystems, Inc. | | | 6,646,400 | | | | 0.6 | |
| | 385,000 | | | | | SS&C Technologies Holdings, Inc. | | | 22,518,650 | | | | 2.1 | |
| | | | | | | | | | 158,355,733 | | | | 14.9 | |
See Accompanying Notes to Financial Statements
| | PORTFOLIO OF INVESTMENTS |
| VY® Baron Growth Portfolio | as of December 31, 2014 (continued) |
| | | | | | | Materials: 2.4% | | | | | | | | |
| | 425,000 | | | | | Caesar Stone Sdot Yam Ltd. | | | 25,423,500 | | | | 2.4 | |
| | | | | | | | | | | | | | | |
| | | | | | | Telecommunication Services: 0.8% | | | | | | | | |
| | 921,311 | | | | | Iridium Communications, Inc. | | | 8,982,782 | | | | 0.8 | |
| | | | | | | | | | | | | | | |
| | | | | | | Utilities: 1.8% | | | | | | | | |
| | 480,000 | | | | | ITC Holdings Corp. | | | 19,406,400 | | | | 1.8 | |
| | | | | | | | | | | | | | | |
| | | | | Total Common Stock | | | | | | | | |
| | | | | (Cost $499,292,436) | | | 1,056,511,901 | | | | 99.3 | |
| | | | | | | | | | | | | | | |
| SHORT-TERM INVESTMENTS: 0.9% | | | | | | | | |
| | | | | | | Mutual Funds: 0.9% | | | | | | | | |
| | 9,894,651 | | | | | BlackRock Liquidity Funds, TempFund, Institutional Class, 0.030%†† | | | | | | | | |
| | | | | | | (Cost $9,894,651) | | | 9,894,651 | | | | 0.9 | |
| | | | | | | | | | | | | | | |
| | | | | Total Short-Term Investments | | | | | | | | |
| | | | | (Cost $9,894,651) | | | 9,894,651 | | | | 0.9 | |
| | | | | | | | | | | | | |
| | | | | Total Investments in Securities
(Cost $509,187,087) | | $ | 1,066,406,552 | | | | 100.2 | |
| | | | | Liabilities in Excess of Other Assets | | | (2,395,700 | ) | | | (0.2 | ) |
| | | | | Net Assets | | $ | 1,064,010,852 | | | | 100.0 | |
| †† | Rate shown is the 7-day yield as of December 31, 2014. |
| @ | Non-income producing security. |
Cost for federal income tax purposes is $510,131,638.
Net unrealized appreciation consists of:
| Gross Unrealized Appreciation | | $ | 562,510,637 | |
| Gross Unrealized Depreciation | | | (6,235,723 | ) |
| | | | | |
| Net Unrealized Appreciation | | $ | 556,274,914 | |
See Accompanying Notes to Financial Statements
| VY® Columbia Contrarian | PORTFOLIO OF INVESTMENTS |
| Core Portfolio | as of December 31, 2014 |
| Shares | | | | | | | Value | | | Percentage of Net Assets | |
| COMMON STOCK: 100.0% | | | | | | | | |
| | | | | | | Consumer Discretionary: 13.2% | |
| | 71,287 | | | | | ARAMARK Holdings Corp. | | | 2,220,590 | | | | 0.6 | |
| | 28,690 | | | | | Cabela's, Inc. | | | 1,512,250 | | | | 0.4 | |
| | 82,135 | | | | | CBS Corp. - Class B | | | 4,545,351 | | | | 1.3 | |
| | 183,112 | | | | | Comcast Corp. – Class A | | | 10,622,327 | | | | 2.9 | |
| | 68,128 | | | | | Delphi Automotive PLC | | | 4,954,268 | | | | 1.4 | |
| | 89,791 | | | | | Discovery Communications, Inc. - Class A | | | 3,093,300 | | | | 0.9 | |
| | 63,049 | | | | | Hilton Worldwide Holdings, Inc. | | | 1,644,948 | | | | 0.5 | |
| | 26,210 | | | | | Las Vegas Sands Corp. | | | 1,524,374 | | | | 0.4 | |
| | 76,149 | | | | | Lowe's Cos, Inc. | | | 5,239,051 | | | | 1.4 | |
| | 27,320 | | | | | McDonald's Corp. | | | 2,559,884 | | | | 0.7 | |
| | 76,983 | | | | | Michaels Cos, Inc. | | | 1,903,790 | | | | 0.5 | |
| | 10,721 | | | @ | | Mohawk Industries, Inc. | | | 1,665,615 | | | | 0.5 | |
| | 3,115 | | | @ | | Priceline.com, Inc. | | | 3,551,754 | | | | 1.0 | |
| | 4,303 | | | | | Ralph Lauren Corp. | | | 796,743 | | | | 0.2 | |
| | 16,878 | | | | | Viacom - Class B | | | 1,270,070 | | | | 0.3 | |
| | 4,037 | | | | | Wynn Resorts Ltd. | | | 600,544 | | | | 0.2 | |
| | | | | | | | | | 47,704,859 | | | | 13.2 | |
| | | | | | | | | | | | | | | |
| | | | | | | Consumer Staples: 8.4% | | | | | | | | |
| | 98,235 | | | | | Avon Products, Inc. | | | 922,427 | | | | 0.3 | |
| | 104,156 | | | | | CVS Caremark Corp. | | | 10,031,264 | | | | 2.8 | |
| | 32,015 | | | | | Diageo PLC ADR | | | 3,652,591 | | | | 1.0 | |
| | 11,775 | | | | | Nu Skin Enterprises, Inc. | | | 514,568 | | | | 0.1 | |
| | 66,098 | | | | | PepsiCo, Inc. | | | 6,250,227 | | | | 1.7 | |
| | 63,817 | | | | | Procter & Gamble Co. | | | 5,813,091 | | | | 1.6 | |
| | 42,587 | | | | | Walgreens Boots Alliance, Inc. | | | 3,245,129 | | | | 0.9 | |
| | | | | | | | | | 30,429,297 | | | | 8.4 | |
| | | | | | | | | | | | | | | |
| | | | | | | Energy: 6.6% | | | | | | | | |
| | 90,147 | | | | | Canadian Natural Resources Ltd. | | | 2,783,739 | | | | 0.8 | |
| | 77,651 | | | | | Chevron Corp. | | | 8,710,889 | | | | 2.4 | |
| | 23,377 | | | | | ConocoPhillips | | | 1,614,416 | | | | 0.4 | |
| | 123,072 | | | | | Halliburton Co. | | | 4,840,422 | | | | 1.3 | |
| | 49,335 | | | | | Noble Energy, Inc. | | | 2,339,959 | | | | 0.7 | |
| | 41,630 | | | | | Schlumberger Ltd. | | | 3,555,618 | | | | 1.0 | |
| | | | | | | | | | 23,845,043 | | | | 6.6 | |
| | | | | | | | | | | | | | | |
| | | | | | | Financials: 20.2% | | | | | | | | |
| | 54,538 | | | | | Aon PLC | | | 5,171,839 | | | | 1.4 | |
| | 490,468 | | | | | Bank of America Corp. | | | 8,774,473 | | | | 2.4 | |
| | 61,172 | | | @ | | Berkshire Hathaway, Inc. – Class B | | | 9,184,976 | | | | 2.6 | |
| | 24,549 | | | | | Blackrock, Inc. | | | 8,777,740 | | | | 2.4 | |
| | 229,456 | | | | | Citigroup, Inc. | | | 12,415,864 | | | | 3.5 | |
| | 46,104 | | | | | Goldman Sachs Group, Inc. | | | 8,936,338 | | | | 2.5 | |
| | 203,288 | | | | | JPMorgan Chase & Co. | | | 12,721,763 | | | | 3.5 | |
| | 16,445 | | | | | Rayonier, Inc. | | | 459,473 | | | | 0.1 | |
| | 117,845 | | | | | Wells Fargo & Co. | | | 6,460,263 | | | | 1.8 | |
| | | | | | | | | | 72,902,729 | | | | 20.2 | |
| | | | | | | | | | | | | | | |
| | | | | | | Health Care: 15.6% | | | | | | | | |
| | 141,710 | | | | | Abbott Laboratories | | | 6,379,784 | | | | 1.8 | |
| | 2,790 | | | @ | | Biogen Idec, Inc. | | | 947,066 | | | | 0.3 | |
| | 45,970 | | | | | Cardinal Health, Inc. | | | 3,711,158 | | | | 1.0 | |
| | 50,979 | | | | | Celgene Corp. | | | 5,702,511 | | | | 1.6 | |
| | 36,133 | | | | | Cigna Corp. | | | 3,718,447 | | | | 1.0 | |
| | 76,389 | | | | | Covidien PLC | | | 7,813,067 | | | | 2.2 | |
| | 61,657 | | | | | IMS Health Holdings, Inc. | | | 1,580,885 | | | | 0.4 | |
| | 56,334 | | | | | Johnson & Johnson | | | 5,890,846 | | | | 1.6 | |
| | 118,300 | | | | | Medtronic, Inc. | | | 8,541,260 | | | | 2.4 | |
| | 35,441 | | | | | Perrigo Co. PLC | | | 5,924,318 | | | | 1.6 | |
| | 44,520 | | | | | St. Jude Medical, Inc. | | | 2,895,136 | | | | 0.8 | |
| | 28,239 | | | @ | | Vertex Pharmaceuticals, Inc. | | | 3,354,793 | | | | 0.9 | |
| | | | | | | | | | 56,459,271 | | | | 15.6 | |
| | | | | | | | | | | | | | | |
| | | | | | | Industrials: 11.3% | | | | | | | | |
| | 21,653 | | | | | Dun & Bradstreet Corp. | | | 2,619,147 | | | | 0.7 | |
| | 85,444 | | | | | Eaton Corp. PLC | | | 5,806,774 | | | | 1.6 | |
| | 16,431 | | | | | FedEx Corp. | | | 2,853,407 | | | | 0.8 | |
| | 41,949 | | | | | Fortune Brands Home & Security, Inc. | | | 1,899,031 | | | | 0.5 | |
| | 173,355 | | | | | General Electric Co. | | | 4,380,681 | | | | 1.2 | |
| | 93,527 | | | | | Honeywell International, Inc. | | | 9,345,218 | | | | 2.6 | |
| | 17,655 | | | | | Kansas City Southern | | | 2,154,440 | | | | 0.6 | |
| | 10,710 | | | | | Precision Castparts Corp. | | | 2,579,825 | | | | 0.7 | |
| | 96,032 | | | | | Tyco International Plc | | | 4,211,963 | | | | 1.2 | |
| | 42,515 | | | | | United Technologies Corp. | | | 4,889,225 | | | | 1.4 | |
| | | | | | | | | | 40,739,711 | | | | 11.3 | |
| | | | | | | | | | | | | | | |
| | | | | | | Information Technology: 19.1% | | | | | |
| | 151,841 | | | | | Apple, Inc. | | | 16,760,210 | | | | 4.6 | |
| | 76,407 | | | | | Broadcom Corp. | | | 3,310,715 | | | | 0.9 | |
| | 104,764 | | | @ | | Electronic Arts, Inc. | | | 4,925,480 | | | | 1.4 | |
| | 136,949 | | | | | EMC Corp. | | | 4,072,863 | | | | 1.1 | |
| | 7,993 | | | | | Google, Inc. – Class A | | | 4,241,565 | | | | 1.2 | |
| | 15,971 | | | | | Google, Inc. - Class C | | | 8,407,134 | | | | 2.3 | |
| | 38,388 | | | | | Hewlett-Packard Co. | | | 1,540,511 | | | | 0.4 | |
| | 48,656 | | | | | Intuit, Inc. | | | 4,485,597 | | | | 1.2 | |
| | 80,590 | | | | | Mastercard, Inc. | | | 6,943,634 | | | | 1.9 | |
| | 191,475 | | | | | Microsoft Corp. | | | 8,894,014 | | | | 2.5 | |
| | 39,358 | | | | | Qualcomm, Inc. | | | 2,925,480 | | | | 0.8 | |
| | 27,358 | | | | | Skyworks Solutions, Inc. | | | 1,989,200 | | | | 0.6 | |
| | 18,971 | | | | | Twitter, Inc. | | | 680,490 | | | | 0.2 | |
| | | | | | | | | | 69,176,893 | | | | 19.1 | |
| | | | | | | | | | | | | | | |
| | | | | | | Materials: 3.2% | | | | | | | | |
| | 47,243 | | | | | Chemtura Corp. | | | 1,168,319 | | | | 0.3 | |
| | 40,081 | | | | | Dow Chemical Co. | | | 1,828,094 | | | | 0.5 | |
| | 48,040 | | | | | LyondellBasell Industries NV - Class A | | | 3,813,896 | | | | 1.1 | |
| | 38,865 | | | | | Monsanto Co. | | | 4,643,202 | | | | 1.3 | |
| | | | | | | | | | 11,453,511 | | | | 3.2 | |
| | | | | | | | | | | |
| | | | | | | Telecommunication Services: 2.4% | |
| | 184,072 | | | | | Verizon Communications, Inc. | | | 8,610,888 | | | | 2.4 | |
| | | | | | | | | | | | | | | |
| | | | | | | Total Common Stock | | | | | | | | |
| | | | | | | (Cost $303,121,911) | | | 361,322,202 | | | | 100.0 | |
See Accompanying Notes to Financial Statements
| VY® Columbia Contrarian | PORTFOLIO OF INVESTMENTS |
| Core Portfolio | as of December 31, 2014 (continued) |
Principal
Amount† | | | | | | | Value | | | Percentage
of Net
Assets | |
| CORPORATE BONDS/NOTES: –% | | | | | | |
| | | | | | | Materials: –% | | | | | | | | |
| | 649,000 | | | | | SINO Forest Corp. Escrow, 5.000%, 08/01/14 | | | – | | | | – | |
| | | | | | | | | | | | | | | |
| | | | | Total Corporate Bonds/Notes | | | | | | | | |
| | | | | (Cost $–) | | | – | | | | – | |
| | | | | | | | | | | | | | | |
| | | | | Total Investments in Securities
(Cost $303,121,911) | | $ | 361,322,202 | | | | 100.0 | |
| | | | | Assets in Excess of Other Liabilities | | | 29,721 | | | | – | |
| | | | | Net Assets | | $ | 361,351,923 | | | | 100.0 | |
| † | Unless otherwise indicated, principal amount is shown in USD. |
| @ | Non-income producing security. |
| ADR | American Depositary Receipt |
Cost for federal income tax purposes is $303,457,683.
Net unrealized appreciation consists of:
| Gross Unrealized Appreciation | | $ | 61,689,919 | |
| Gross Unrealized Depreciation | | | (3,825,400 | ) |
| | | | | |
| Net Unrealized Appreciation | | $ | 57,864,519 | |
See Accompanying Notes to Financial Statements
| VY® Columbia Small Cap Value II Portfolio | PORTFOLIO OF INVESTMENTS
as of December 31, 2014 |
| Shares | | | | | | | Value | | | Percentage
of Net
Assets | |
| COMMON STOCK: 96.7% | | | |
| | | | | | | Consumer Discretionary: 12.7% | |
| | 103,000 | | | @ | | American Axle & Manufacturing Holdings, Inc. | | | 2,326,770 | | | | 1.0 | |
| | 97,000 | | | | | American Eagle Outfitters | | | 1,346,360 | | | | 0.5 | |
| | 61,000 | | | | | Bloomin' Brands, Inc. | | | 1,510,360 | | | | 0.6 | |
| | 89,700 | | | @ | | Christopher & Banks Corp. | | | 512,187 | | | | 0.2 | |
| | 42,000 | | | | | Dave & Buster's Entertainment, Inc. | | | 1,146,600 | | | | 0.5 | |
| | 90,000 | | | | | Del Frisco's Restaurant Group, Inc. | | | 2,136,600 | | | | 0.9 | |
| | 53,700 | | | | | Finish Line | | | 1,305,447 | | | | 0.5 | |
| | 38,000 | | | @ | | Helen of Troy Ltd. | | | 2,472,280 | | | | 1.0 | |
| | 108,600 | | | | | KB Home | | | 1,797,330 | | | | 0.7 | |
| | 124,300 | | | @ | | Nord Anglia Education, Inc. | | | 2,371,644 | | | | 1.0 | |
| | 117,000 | | | @ | | Office Depot, Inc. | | | 1,003,275 | | | | 0.4 | |
| | 18,500 | | | | | Red Robin Gourmet Burgers, Inc. | | | 1,424,038 | | | | 0.6 | |
| | 34,000 | | | | | Skechers USA, Inc. | | | 1,878,500 | | | | 0.8 | |
| | 57,000 | | | | | Sonic Automotive, Inc. | | | 1,541,280 | | | | 0.6 | |
| | 97,000 | | | | | Sonic Corp. | | | 2,641,310 | | | | 1.1 | |
| | 45,000 | | | @ | | Tenneco, Inc. | | | 2,547,450 | | | | 1.0 | |
| | 63,857 | | | | | Tower International, Inc. | | | 1,631,546 | | | | 0.7 | |
| | 125,000 | | | | | Travelcenters of America LLC | | | 1,577,500 | | | | 0.6 | |
| | | | | | | | | | 31,170,477 | | | | 12.7 | |
| | | | | | | | | | | | | | | |
| | | | | | | Consumer Staples: 1.2% | | | | | | | | |
| | 34,000 | | | | | TreeHouse Foods, Inc. | | | 2,908,020 | | | | 1.2 | |
| | | | | | | | | | | | | | | |
| | | | | | | Energy: 4.0% | | | | | | | | |
| | 11,520 | | | | | Aegean Marine Petroleum Network, Inc. | | | 161,510 | | | | 0.1 | |
| | 48,000 | | | | | Delek US Holdings, Inc. | | | 1,309,440 | | | | 0.5 | |
| | 39,000 | | | @ | | Gulfport Energy Corp. | | | 1,627,860 | | | | 0.7 | |
| | 91,700 | | | @ | | Helix Energy Solutions Group, Inc. | | | 1,989,890 | | | | 0.8 | |
| | 93,000 | | | | | Patterson-UTI Energy, Inc. | | | 1,542,870 | | | | 0.6 | |
| | 39,000 | | | | | PDC Energy, Inc. | | | 1,609,530 | | | | 0.6 | |
| | 49,000 | | | @ | | Whiting Petroleum Corp. | | | 1,617,000 | | | | 0.7 | |
| | | | | | | | | | 9,858,100 | | | | 4.0 | |
| | | | | | | | | | | | | | | |
| | | | | | | Financials: 35.8% | | | | | | | | |
| | 82,500 | | | | | American Assets Trust, Inc. | | | 3,284,325 | | | | 1.3 | |
| | 100,000 | | | | | American Equity Investment Life Holding Co. | | | 2,919,000 | | | | 1.2 | |
| | 59,000 | | | | | Ameris Bancorp. | | | 1,512,760 | | | | 0.6 | |
| | 72,300 | | | | | Amerisafe, Inc. | | | 3,062,628 | | | | 1.3 | |
| | 43,093 | | | | | Amtrust Financial Services, Inc. | | | 2,423,982 | | | | 1.0 | |
| | 135,872 | | | | | Apollo Investment Corp. | | | 1,008,170 | | | | 0.4 | |
| | 45,777 | | | | | Argo Group International Holdings Ltd. | | | 2,539,250 | | | | 1.0 | |
| | 116,300 | | | | | Brandywine Realty Trust | | | 1,858,474 | | | | 0.8 | |
| | 59,000 | | | | | Chatham Lodging Trust | | | 1,709,230 | | | | 0.7 | |
| | 143,200 | | | | | CNO Financial Group, Inc. | | | 2,465,904 | | | | 1.0 | |
| | 71,100 | | | | | Community Bank System, Inc. | | | 2,711,043 | | | | 1.1 | |
| | 115,000 | | | | | CubeSmart | | | 2,538,050 | | | | 1.0 | |
| | 120,000 | | | | | EverBank Financial Corp. | | | 2,287,200 | | | | 0.9 | |
| | 69,000 | | | | | First Industrial Realty Trust, Inc. | | | 1,418,640 | | | | 0.6 | |
| | 95,000 | | | | | FirstMerit Corp. | | | 1,794,550 | | | | 0.7 | |
| | 49,000 | | | | | Highwoods Properties, Inc. | | | 2,169,720 | | | | 0.9 | |
| | 95,500 | | | @ | | Hilltop Holdings, Inc. | | | 1,905,225 | | | | 0.8 | |
| | 65,000 | | | | | Independent Bank Corp. | | | 2,782,650 | | | | 1.1 | |
| | 36,800 | | | | | Kilroy Realty Corp. | | | 2,541,776 | | | | 1.0 | |
| | 62,000 | | | | | LaSalle Hotel Properties | | | 2,509,140 | | | | 1.0 | |
| | 156,000 | | | | | Medley Capital Corp. | | | 1,441,440 | | | | 0.6 | |
| | 121,000 | | | @ | | MGIC Investment Corp. | | | 1,127,720 | | | | 0.5 | |
| | 51,000 | | | | | Pennsylvania Real Estate Investment Trust | | | 1,196,460 | | | | 0.5 | |
| | 65,000 | | | | | PHH Corp. | | | 1,557,400 | | | | 0.6 | |
| | 80,200 | | | | | PrivateBancorp, Inc. | | | 2,678,680 | | | | 1.1 | |
| | 35,000 | | | | | Prosperity Bancshares, Inc. | | | 1,937,600 | | | | 0.8 | |
| | 55,530 | | | | | QTS Realty Trust, Inc. | | | 1,879,135 | | | | 0.8 | |
| | 120,600 | | | | | Radian Group, Inc. | | | 2,016,432 | | | | 0.8 | |
| | 91,000 | | | | | Renasant Corp. | | | 2,632,630 | | | | 1.1 | |
| | 70,000 | | | | | RLJ Lodging Trust | | | 2,347,100 | | | | 1.0 | |
| | 83,000 | | | | | Sandy Spring Bancorp, Inc. | | | 2,164,640 | | | | 0.9 | |
| | 205,000 | | | | | Sterling Bancorp/DE | | | 2,947,900 | | | | 1.2 | |
| | 117,000 | | | | | Symetra Financial Corp. | | | 2,696,850 | | | | 1.1 | |
| | 25,000 | | | | | Texas Capital Bancshares, Inc. | | | 1,358,250 | | | | 0.6 | |
| | 43,700 | | | | | The Geo Group, Inc. | | | 1,763,732 | | | | 0.7 | |
| | 37,600 | | | | | TriplePoint Venture Growth BDC Corp. | | | 558,360 | | | | 0.2 | |
| | 139,000 | | | | | Umpqua Holdings Corp. | | | 2,364,390 | | | | 1.0 | |
| | 98,000 | | | | | Union Bankshares Corp. | | | 2,359,840 | | | | 1.0 | |
| | 107,000 | | | | | Western Alliance Bancorp. | | | 2,974,600 | | | | 1.2 | |
| | 203,800 | | | | | Wilshire Bancorp., Inc. | | | 2,064,494 | | | | 0.8 | |
| | 47,000 | | | | | Wintrust Financial Corp. | | | 2,197,720 | | | | 0.9 | |
| | | | | | | | | | 87,707,090 | | | | 35.8 | |
| | | | | | | | | | | | | | | |
| | | | | | | Health Care: 8.2% | | | | | | | | |
| | 96,000 | | | | | Catalent, Inc. | | | 2,676,480 | | | | 1.1 | |
| | 85,000 | | | | | Globus Medical Inc | | | 2,020,450 | | | | 0.8 | |
| | 121,370 | | | @ | | Healthways, Inc. | | | 2,412,836 | | | | 1.0 | |
| | 116,000 | | | | | Kindred Healthcare, Inc. | | | 2,108,880 | | | | 0.9 | |
| | 66,800 | | | | | LHC Group, Inc. | | | 2,082,824 | | | | 0.9 | |
| | 32,000 | | | | | LifePoint Hospitals, Inc. | | | 2,301,120 | | | | 0.9 | |
| | 75,400 | | | | | MedAssets, Inc. | | | 1,489,904 | | | | 0.6 | |
| | 95,000 | | | | | PharMerica Corp. | | | 1,967,450 | | | | 0.8 | |
| | 60,000 | | | @ | | VCA, Inc. | | | 2,926,200 | | | | 1.2 | |
| | | | | | | | | | 19,986,144 | | | | 8.2 | |
| | | | | | | | | | | | | | | |
| | | | | | | Industrials: 11.4% | | | | | | | | |
| | 42,000 | | | | | Alaska Air Group, Inc. | | | 2,509,920 | | | | 1.0 | |
See Accompanying Notes to Financial Statements
| VY® Columbia Small Cap Value II Portfolio | PORTFOLIO OF INVESTMENTS
as of December 31, 2014 (continued) |
| | 47,000 | | | | | Deluxe Corp. | | | 2,925,750 | | | | 1.2 | |
| | 44,000 | | | | | EMCOR Group, Inc. | | | 1,957,560 | | | | 0.8 | |
| | 84,400 | | | | | Heartland Express, Inc. | | | 2,279,644 | | | | 0.9 | |
| | 80,000 | | | @ | | JetBlue Airways Corp. | | | 1,268,800 | | | | 0.5 | |
| | 151,000 | | | @ | | Navigant Consulting, Inc. | | | 2,320,870 | | | | 1.0 | |
| | 106,132 | | | | | Neff Corp. | | | 1,196,108 | | | | 0.5 | |
| | 38,500 | | | @ | | On Assignment, Inc. | | | 1,277,815 | | | | 0.5 | |
| | 74,000 | | | | | Steelcase, Inc. | | | 1,328,300 | | | | 0.5 | |
| | 91,000 | | | | | Swift Transportation Co. | | | 2,605,330 | | | | 1.1 | |
| | 39,400 | | | | | Trinity Industries, Inc. | | | 1,103,594 | | | | 0.5 | |
| | 41,000 | | | @ | | TrueBlue, Inc. | | | 912,250 | | | | 0.4 | |
| | 65,000 | | | @ | | Tutor Perini Corp. | | | 1,564,550 | | | | 0.6 | |
| | 11,600 | | | | | United Rentals, Inc. | | | 1,183,316 | | | | 0.5 | |
| | 35,000 | | | | | United Stationers, Inc. | | | 1,475,600 | | | | 0.6 | |
| | 165,000 | | | @ | | Wabash National Corp. | | | 2,039,400 | | | | 0.8 | |
| | | | | | | | | | 27,948,807 | | | | 11.4 | |
| | | | | | | | | | | | | | | |
| | | | | | | Information Technology: 10.3% | | | | | |
| | 140,000 | | | | | Endurance International Group Holdings, Inc. | | | 2,580,200 | | | | 1.0 | |
| | 115,000 | | | | | Fairchild Semiconductor International, Inc. | | | 1,941,200 | | | | 0.8 | |
| | 37,200 | | | @ | | Insight Enterprises, Inc. | | | 963,108 | | | | 0.4 | |
| | 145,000 | | | @ | | Integrated Device Technology, Inc. | | | 2,842,000 | | | | 1.2 | |
| | 120,600 | | | | | Integrated Silicon Solution, Inc. | | | 1,998,342 | | | | 0.8 | |
| | 154,600 | | | | | IXYS Corp. | | | 1,947,960 | | | | 0.8 | |
| | 175,900 | | | @ | | Kulicke & Soffa Industries, Inc. | | | 2,543,514 | | | | 1.0 | |
| | 105,500 | | | | | Mentor Graphics Corp. | | | 2,312,560 | | | | 0.9 | |
| | 138,300 | | | | | Micrel, Inc. | | | 2,006,733 | | | | 0.8 | |
| | 26,400 | | | @ | | Rogers Corp. | | | 2,150,016 | | | | 0.9 | |
| | 86,084 | | | @ | | Saba Software, Inc. | | | 702,445 | | | | 0.3 | |
| | 97,000 | | | | | SunEdison, Inc. | | | 1,892,470 | | | | 0.8 | |
| | 47,900 | | | @ | | Unisys Corp. | | | 1,412,092 | | | | 0.6 | |
| | | | | | | | | | 25,292,640 | | | | 10.3 | |
| | | | | | | | | | | | | | | |
| | | | | | | Materials: 7.6% | | | | | | | | |
| | 178,000 | | | @ | | AK Steel Holding Corp. | | | 1,057,320 | | | | 0.4 | |
| | 34,900 | | | | | Axiall Corp. | | | 1,482,203 | | | | 0.6 | |
| | 53,000 | | | | | Boise Cascade Co. | | | 1,968,950 | | | | 0.8 | |
| | 25,000 | | | | | Carpenter Technology Corp. | | | 1,231,250 | | | | 0.5 | |
| | 32,300 | | | @ | | Clearwater Paper Corp. | | | 2,214,165 | | | | 0.9 | |
| | 82,000 | | | @ | | Constellium NV - Class A | | | 1,347,260 | | | | 0.6 | |
| | 65,000 | | | | | KapStone Paper and Packaging Corp. | | | 1,905,150 | | | | 0.8 | |
| | 56,900 | | | | | Materion Corp. | | | 2,004,587 | | | | 0.8 | |
| | 46,500 | | | | | Neenah Paper, Inc. | | | 2,802,555 | | | | 1.1 | |
| | 90,393 | | | @ | | Orion Engineered Carbons SA | | | 1,535,777 | | | | 0.6 | |
| | 39,000 | | | | | Worthington Industries | | | 1,173,510 | | | | 0.5 | |
| | | | | | | | | | 18,722,727 | | | | 7.6 | |
| | | | | | | | | | | | | | | |
| | | | | | | Utilities: 5.5% | | | | | | | | |
| | 82,500 | | | | | Avista Corp. | | | 2,916,375 | | | | 1.2 | |
| | 46,000 | | | | | New Jersey Resources Corp. | | | 2,815,200 | | | | 1.2 | |
| | 36,000 | | | | | South Jersey Industries, Inc. | | | 2,121,480 | | | | 0.9 | |
| | 36,200 | | | | | Southwest Gas Corp. | | | 2,237,522 | | | | 0.9 | |
| | 17,178 | | | | | TerraForm Power, Inc. | | | 530,457 | | | | 0.2 | |
| | 63,200 | | | | | UIL Holdings Corp. | | | 2,751,728 | | | | 1.1 | |
| | | | | | | | | | 13,372,762 | | | | 5.5 | |
| | | | | | | | | | | | | | | |
| | | | | Total Common Stock | | | | | | | | |
| | | | | (Cost $190,466,259) | | | 236,966,767 | | | | 96.7 | |
| | | | | | | | | | | | | | | |
| | | | | | | | | | | | | | | |
| SHORT-TERM INVESTMENTS: 3.1% | | | | | |
| | | | | | | Mutual Funds: 3.1% | | | | | | | | |
| | 7,538,843 | | | | | BlackRock Liquidity Funds, TempFund, Institutional Class, 0.030%†† | | | | | | | | |
| | | | | | | (Cost $7,538,843) | | | 7,538,843 | | | | 3.1 | |
| | | | | | | | | | | | | | | |
| | | | | Total Short-Term Investments | | | | | | | | |
| | | | | (Cost $7,538,843) | | | 7,538,843 | | | | 3.1 | |
| | | | | | | | | | | | | | | |
| | | | | Total Investments in Securities
(Cost $198,005,102) | | $ | 244,505,610 | | | | 99.8 | |
| | | | | Assets in Excess of Other Liabilities | | | 525,956 | | | | 0.2 | |
| | | | | Net Assets | | $ | 245,031,566 | | | | 100.0 | |
| †† | Rate shown is the 7-day yield as of December 31, 2014. |
| @ | Non-income producing security. |
Cost for federal income tax purposes is $198,485,993.
Net unrealized appreciation consists of:
| Gross Unrealized Appreciation | | $ | 51,224,217 | |
| Gross Unrealized Depreciation | | | (5,204,600 | ) |
| | | | | |
| Net Unrealized Appreciation | | $ | 46,019,617 | |
See Accompanying Notes to Financial Statements
| PORTFOLIO OF INVESTMENTS |
| VY® Invesco Comstock Portfolio | as of December 31, 2014 |
| Shares | | | | | | | Value | | | Percentage
of Net
Assets | |
| COMMON STOCK: 97.2% |
| | | | | | | Consumer Discretionary: 16.7% | | | | |
| | 274,561 | | | | | Carnival Corp. | | | 12,445,850 | | | | 2.2 | |
| | 47,865 | | | | | CBS Corp. - Class B | | | 2,648,849 | | | | 0.5 | |
| | 144,512 | | | | | Comcast Corp. – Class A | | | 8,383,141 | | | | 1.5 | |
| | 24,638 | | | @ | | Fossil Group, Inc. | | | 2,728,412 | | | | 0.5 | |
| | 287,235 | | | | | General Motors Co. | | | 10,027,374 | | | | 1.8 | |
| | 210,772 | | | | | Johnson Controls, Inc. | | | 10,188,718 | | | | 1.8 | |
| | 135,638 | | | | | Kohl's Corp. | | | 8,279,344 | | | | 1.4 | |
| | 105,972 | | | | | Newell Rubbermaid, Inc. | | | 4,036,473 | | | | 0.7 | |
| | 81,076 | | | | | Target Corp. | | | 6,154,479 | | | | 1.1 | |
| | 48,852 | | | | | Time Warner Cable, Inc. | | | 7,428,435 | | | | 1.3 | |
| | 44,966 | | | | | Time Warner, Inc. | | | 3,840,996 | | | | 0.7 | |
| | 216,850 | | | | | Twenty-First Century Fox, Inc. Class B | | | 7,999,597 | | | | 1.4 | |
| | 138,231 | | | | | Viacom - Class B | | | 10,401,883 | | | | 1.8 | |
| | | | | | | | | | 94,563,551 | | | | 16.7 | |
| | | | | | | | | | | | | | | |
| | | | | | | Consumer Staples: 4.6% | | | | | | | | |
| | 260,835 | | | | | ConAgra Foods, Inc. | | | 9,463,094 | | | | 1.7 | |
| | 48,549 | | | | | CVS Caremark Corp. | | | 4,675,754 | | | | 0.8 | |
| | 112,969 | | | | | Mondelez International, Inc. | | | 4,103,599 | | | | 0.7 | |
| | 105,918 | | | | | Unilever NV ADR | | | 4,135,039 | | | | 0.7 | |
| | 45,050 | | | | | Wal-Mart Stores, Inc. | | | 3,868,894 | | | | 0.7 | |
| | | | | | | | | | 26,246,380 | | | | 4.6 | |
| | | | | | | | | | | | | | | |
| | | | | | | Energy: 15.0% | | | | | | | | |
| | 262,310 | | | | | BP PLC ADR | | | 9,999,257 | | | | 1.8 | |
| | 27,454 | | | | | California Resources Corp. | | | 151,271 | | | | 0.0 | |
| | 59,037 | | | | | Chevron Corp. | | | 6,622,771 | | | | 1.2 | |
| | 96,050 | | | | | Devon Energy Corp. | | | 5,879,220 | | | | 1.0 | |
| | 128,398 | | | | | Halliburton Co. | | | 5,049,893 | | | | 0.9 | |
| | 136,278 | | | | | Murphy Oil Corp. | | | 6,884,765 | | | | 1.2 | |
| | 225,466 | | | | | Noble Corp. PLC | | | 3,735,972 | | | | 0.6 | |
| | 68,637 | | | | | Occidental Petroleum Corp. | | | 5,532,829 | | | | 1.0 | |
| | 240,150 | | | | | QEP Resources, Inc. | | | 4,855,833 | | | | 0.8 | |
| | 192,305 | | | | | Royal Dutch Shell PLC - Class A ADR | | | 12,874,820 | | | | 2.3 | |
| | 427,439 | | | | | Suncor Energy, Inc. | | | 13,584,011 | | | | 2.4 | |
| | 885,319 | | | @ | | Weatherford International PLC | | | 10,136,903 | | | | 1.8 | |
| | | | | | | | | | 85,307,545 | | | | 15.0 | |
| | | | | | | | | | | | | | | |
| | | | | | | Financials: 24.5% | | | | | | | | |
| | 80,147 | | | | | Aflac, Inc. | | | 4,896,180 | | | | 0.9 | |
| | 116,336 | | | | | Allstate Corp. | | | 8,172,604 | | | | 1.4 | |
| | 634,797 | | | | | Bank of America Corp. | | | 11,356,518 | | | | 2.0 | |
| | 208,991 | | | | | Bank of New York Mellon Corp. | | | 8,478,765 | | | | 1.5 | |
| | 473,345 | | | | | Citigroup, Inc. | | | 25,612,698 | | | | 4.5 | |
| | 316,562 | | | | | Fifth Third Bancorp. | | | 6,449,951 | | | | 1.1 | |
| | 29,279 | | | | | Goldman Sachs Group, Inc. | | | 5,675,149 | | | | 1.0 | |
| | 284,716 | | | | | JPMorgan Chase & Co. | | | 17,817,527 | | | | 3.1 | |
| | 156,883 | | | | | Metlife, Inc. | | | 8,485,801 | | | | 1.5 | |
| | 259,192 | | | | | Morgan Stanley | | | 10,056,650 | | | | 1.8 | |
| | 98,009 | | | | | PNC Financial Services Group, Inc. | | | 8,941,361 | | | | 1.6 | |
| | 127,993 | | | | | State Street Corp. | | | 10,047,450 | | | | 1.8 | |
| | 51,107 | | | | | US Bancorp. | | | 2,297,260 | | | | 0.4 | |
| | 202,557 | | | | | Wells Fargo & Co. | | | 11,104,175 | | | | 1.9 | |
| | | | | | | | | | 139,392,089 | | | | 24.5 | |
| | | | | | | | | | | | | | | |
| | | | | | | Health Care: 12.6% | | | | | | | | |
| | 68,412 | | | | | AbbVie, Inc. | | | 4,476,881 | | | | 0.8 | |
| | 52,861 | | | | | Anthem, Inc. | | | 6,643,042 | | | | 1.2 | |
| | 85,274 | | | | | Bristol-Myers Squibb Co. | | | 5,033,724 | | | | 0.9 | |
| | 53,128 | | | @ | | Express Scripts Holding Co. | | | 4,498,348 | | | | 0.8 | |
| | 49,883 | | | | | GlaxoSmithKline PLC ADR | | | 2,132,000 | | | | 0.4 | |
| | 52,919 | | | | | Medtronic, Inc. | | | 3,820,752 | | | | 0.7 | |
| | 196,473 | | | | | Merck & Co., Inc. | | | 11,157,702 | | | | 2.0 | |
| | 100,893 | | | | | Novartis AG | | | 9,357,167 | | | | 1.6 | |
| | 280,768 | | | | | Pfizer, Inc. | | | 8,745,923 | | | | 1.5 | |
| | 137,605 | | | | | Roche Holding AG ADR | | | 4,677,194 | | | | 0.8 | |
| �� | 156,661 | | | | | Sanofi-Aventis SA ADR | | | 7,145,308 | | | | 1.2 | |
| | 40,603 | | | | | UnitedHealth Group, Inc. | | | 4,104,557 | | | | 0.7 | |
| | | | | | | | | | 71,792,598 | | | | 12.6 | |
| | | | | | | | | | | | | | | |
| | | | | | | Industrials: 6.9% | | | | | | | | |
| | 87,149 | | | | | Emerson Electric Co. | | | 5,379,708 | | | | 1.0 | |
| | 572,769 | | | | | General Electric Co. | | | 14,473,872 | | | | 2.5 | |
| | 43,559 | | | | | Honeywell International, Inc. | | | 4,352,415 | | | | 0.8 | |
| | 120,469 | | | | | Ingersoll-Rand PLC - Class A | | | 7,636,530 | | | | 1.3 | |
| | 178,579 | | | | | Textron, Inc. | | | 7,519,962 | | | | 1.3 | |
| | | | | | | | | | 39,362,487 | | | | 6.9 | |
| | | | | | | | | | | | | | | |
| | | | | | | Information Technology: 12.6% | | | |
| | 42,586 | | | @ | | Autodesk, Inc. | | | 2,557,715 | | | | 0.5 | |
| | 405,960 | | | | | Cisco Systems, Inc. | | | 11,291,777 | | | | 2.0 | |
| | 82,084 | | | @ | | Citrix Systems, Inc. | | | 5,236,959 | | | | 0.9 | |
| | 222,978 | | | | | Corning, Inc. | | | 5,112,886 | | | | 0.9 | |
| | 174,412 | | | @ | | eBay, Inc. | | | 9,788,001 | | | | 1.7 | |
| | 218,334 | | | | | Hewlett-Packard Co. | | | 8,761,743 | | | | 1.5 | |
| | 173,874 | | | | | Intel Corp. | | | 6,309,888 | | | | 1.1 | |
| | 228,155 | | | | | Microsoft Corp. | | | 10,597,800 | | | | 1.9 | |
| | 336,318 | | | | | Symantec Corp. | | | 8,628,238 | | | | 1.5 | |
| | 68,343 | | | @ | | Yahoo!, Inc. | | | 3,452,005 | | | | 0.6 | |
| | | | | | | | | | 71,737,012 | | | | 12.6 | |
| | | | | | | | | | | | | | | |
| | | | | | | Materials: 1.8% | | | | | | | | |
| | 298,446 | | | | | Alcoa, Inc. | | | 4,712,462 | | | | 0.8 | |
| | 100,207 | | | | | International Paper Co. | | | 5,369,091 | | | | 1.0 | |
| | | | | | | | | | 10,081,553 | | | | 1.8 | |
| | | | | | | | | | | | | | | |
| | | | | | | Telecommunication Services: 1.5% | |
| | 104,668 | | | | | Verizon Communications, Inc. | | | 4,896,369 | | | | 0.9 | |
| | 137,625 | | | | | Vivendi | | | 3,425,568 | | | | 0.6 | |
| | | | | | | | | | 8,321,937 | | | | 1.5 | |
| | | | | | | | | | | | | | | |
| | | | | | | Utilities: 1.0% | | | | | | | | |
| | 74,560 | | | | | FirstEnergy Corp. | | | 2,907,094 | | | | 0.5 | |
See Accompanying Notes to Financial Statements
| PORTFOLIO OF INVESTMENTS |
| VY® Invesco Comstock Portfolio | as of December 31, 2014 (unaudited) (continued) |
| | 51,948 | | | | | Pacific Gas & Electric Co. | | | 2,765,712 | | | | 0.5 | |
| | | | | | | | | | 5,672,806 | | | | 1.0 | |
| | | | | | | | | | | | | | | |
| | | | | Total Common Stock | | | | | | | | |
| | | | | (Cost $421,296,158) | | | 552,477,958 | | | | 97.2 | |
| | | | | | | | | | | | | | | |
| | | | | | | | | | | | | | | |
| SHORT-TERM INVESTMENTS: 3.1% |
| | | | | | | Mutual Funds: 3.1% | | | | | | | | |
| | 17,862,798 | | | | | BlackRock Liquidity Funds, TempFund, Institutional Class, 0.030%†† | | | | | | | | |
| | | | | | | (Cost $17,862,798) | | | 17,862,798 | | | | 3.1 | |
| | | | | | | | | | | | | | | |
| | | | | Total Short-Term Investments | | | | | | | | |
| | | | | (Cost $17,862,798) | | | 17,862,798 | | | | 3.1 | |
| | | | | | | | | | | | | | | |
| | | | | Total Investments in Securities
(Cost $439,158,956) | | $ | 570,340,756 | | | | 100.3 | |
| | | | | Liabilities in Excess of Other Assets | | | (1,451,774 | ) | | | (0.3 | ) |
| | | | | Net Assets | | $ | 568,888,982 | | | | 100.0 | |
| †† | Rate shown is the 7-day yield as of December 31, 2014. |
| @ | Non-income producing security. |
| ADR | American Depositary Receipt |
Cost for federal income tax purposes is $454,643,274.
Net unrealized appreciation consists of:
| Gross Unrealized Appreciation | | $ | 139,436,593 | |
| Gross Unrealized Depreciation | | | (23,739,111 | ) |
| | | | | |
| Net Unrealized Appreciation | | $ | 115,697,482 | |
See Accompanying Notes to Financial Statements
| | PORTFOLIO OF INVESTMENTS |
| VY® Invesco Equity and Income Portfolio | as of December 31, 2014 |
| Shares | | | | | | | Value | | | Percentage
of Net
Assets | |
| COMMON STOCK: 64.6% |
| | | | | | | Consumer Discretionary: 7.1% | | | | |
| | 514,311 | | | | | Carnival Corp. | | | 23,313,718 | | | | 1.1 | |
| | 419,142 | | | | | Comcast Corp. – Class A | | | 24,314,427 | | | | 1.1 | |
| | 483,038 | | | | | General Motors Co. | | | 16,862,857 | | | | 0.8 | |
| | 340,023 | | | | | Target Corp. | | | 25,811,146 | | | | 1.2 | |
| | 312,328 | | | L | | Thomson Reuters Corp. | | | 12,600,115 | | | | 0.6 | |
| | 111,218 | | | | | Time Warner Cable, Inc. | | | 16,911,809 | | | | 0.8 | |
| | 118,872 | | | | | Time Warner, Inc. | | | 10,154,046 | | | | 0.5 | |
| | 299,873 | | | | | Viacom - Class B | | | 22,565,443 | | | | 1.0 | |
| | | | | | | | | | 152,533,561 | | | | 7.1 | |
| | | | | | | | | | | | | | | |
| | | | | | | Consumer Staples: 3.9% | | | |
| | 333,519 | | | | | Archer-Daniels-Midland Co. | | | 17,342,988 | | | | 0.8 | |
| | 468,838 | | | | | Mondelez International, Inc. | | | 17,030,541 | | | | 0.8 | |
| | 179,953 | | | | | Philip Morris International, Inc. | | | 14,657,172 | | | | 0.7 | |
| | 202,276 | | | | | Procter & Gamble Co. | | | 18,425,321 | | | | 0.9 | |
| | 288,433 | | | | | Unilever NV ADR | | | 11,260,424 | | | | 0.5 | |
| | 52,098 | | | | | Wal-Mart Stores, Inc. | | | 4,474,176 | | | | 0.2 | |
| | | | | | | | | | 83,190,622 | | | | 3.9 | |
| | | | | | | | | | | | | | | |
| | | | | | | Energy: 6.8% | | | | | | | | |
| | 142,272 | | | | | Anadarko Petroleum Corp. | | | 11,737,440 | | | | 0.5 | |
| | 260,773 | | | | | Apache Corp. | | | 16,342,644 | | | | 0.8 | |
| | 290,830 | | | | | Baker Hughes, Inc. | | | 16,306,838 | | | | 0.7 | |
| | 419,311 | | | L | | Canadian Natural Resources Ltd. | | | 12,964,065 | | | | 0.6 | |
| | 295,869 | | | | | Ensco PLC | | | 8,861,277 | | | | 0.4 | |
| | 157,572 | | | | | ExxonMobil Corp. | | | 14,567,531 | | | | 0.7 | |
| | 163,031 | | | | | Occidental Petroleum Corp. | | | 13,141,929 | | | | 0.6 | |
| | 1,085,992 | | | | | Royal Dutch Shell PLC - Class A | | | 36,242,764 | | | | 1.7 | |
| | 342,983 | | | | | Total S.A. | | | 17,571,757 | | | | 0.8 | |
| | | | | | | | | | 147,736,245 | | | | 6.8 | |
| | | | | | | | | | | | | | | |
| | | | | | | Financials: 19.3% | | | | | | | | |
| | 155,667 | | | | | Aon PLC | | | 14,761,902 | | | | 0.7 | |
| | 1,857,246 | | | | | Bank of America Corp. | | | 33,226,131 | | | | 1.5 | |
| | 321,853 | | | | | BB&T Corp. | | | 12,516,863 | | | | 0.6 | |
| | 609,788 | | | | | Charles Schwab Corp. | | | 18,409,500 | | | | 0.8 | |
| | 1,222,868 | | | | | Citigroup, Inc. | | | 66,169,387 | | | | 3.1 | |
| | 419,869 | | | | | Citizens Financial Group, Inc. | | | 10,437,943 | | | | 0.5 | |
| | 127,940 | | | | | CME Group, Inc. | | | 11,341,881 | | | | 0.5 | |
| | 305,873 | | | | | Comerica, Inc. | | | 14,327,091 | | | | 0.7 | |
| | 631,948 | | | | | Fifth Third Bancorp. | | | 12,875,940 | | | | 0.6 | |
| | 219,872 | | | | | First Horizon National Corp. | | | 2,985,862 | | | | 0.1 | |
| | 82,708 | | | | | Goldman Sachs Group, Inc. | | | 16,031,292 | | | | 0.7 | |
| | 1,025,181 | | | | | JPMorgan Chase & Co. | | | 64,155,827 | | | | 3.0 | |
| | 349,617 | | | | | Marsh & McLennan Cos., Inc. | | | 20,012,077 | | | | 0.9 | |
| | 958,429 | | | | | Morgan Stanley | | | 37,187,045 | | | | 1.7 | |
| | 217,524 | | | | | Northern Trust Corp. | | | 14,661,118 | | | | 0.7 | |
| | 282,461 | | | | | PNC Financial Services Group, Inc. | | | 25,768,917 | | | | 1.2 | |
| | 285,415 | | | | | State Street Corp. | | | 22,405,078 | | | | 1.0 | |
| | 269,527 | | | | | Synchrony Financial | | | 8,018,428 | | | | 0.4 | |
| | 280,778 | | | | | Willis Group Holdings PLC | | | 12,581,662 | | | | 0.6 | |
| | | | | | | | | | 417,873,944 | | | | 19.3 | |
| | | | | | | | | | | | | | | |
| | | | | | | Health Care: 8.6% | | | | | | | | |
| | 126,698 | | | | | Amgen, Inc. | | | 20,181,724 | | | | 0.9 | |
| | 121,698 | | | | | Anthem, Inc. | | | 15,293,788 | | | | 0.7 | |
| | 287,587 | | | | | Eli Lilly & Co. | | | 19,840,627 | | | | 0.9 | |
| | 68,754 | | | @ | | Express Scripts Holding Co. | | | 5,821,401 | | | | 0.3 | |
| | 119,019 | | | | | Hospira, Inc. | | | 7,289,914 | | | | 0.3 | |
| | 180,843 | | | | | Medtronic, Inc. | | | 13,056,864 | | | | 0.6 | |
| | 380,964 | | | | | Merck & Co., Inc. | | | 21,634,945 | | | | 1.0 | |
| | 10,948 | | | | | Novartis AG ADR | | | 1,014,442 | | | | 0.1 | |
| | 220,926 | | | | | Novartis AG | | | 20,489,446 | | | | 1.0 | |
| | 353,304 | | | | | Pfizer, Inc. | | | 11,005,420 | | | | 0.5 | |
| | 147,471 | | | | | Sanofi | | | 13,445,035 | | | | 0.6 | |
| | 346,036 | | | | | Teva Pharmaceutical Industries Ltd. ADR | | | 19,900,530 | | | | 0.9 | |
| | 169,918 | | | | | UnitedHealth Group, Inc. | | | 17,177,011 | | | | 0.8 | |
| | | | | | | | | | 186,151,147 | | | | 8.6 | |
| | | | | | | | | | | | | | | |
| | | | | | | Industrials: 5.5% | | | | | | | | |
| | 186,864 | | | | | Caterpillar, Inc. | | | 17,103,662 | | | | 0.8 | |
| | 319,438 | | | | | CSX Corp. | | | 11,573,239 | | | | 0.6 | |
| | 107,540 | | | | | General Dynamics Corp. | | | 14,799,655 | | | | 0.7 | |
| | 1,652,852 | | | | | General Electric Co. | | | 41,767,570 | | | | 1.9 | |
| | 275,737 | | | | | Ingersoll-Rand PLC - Class A | | | 17,478,968 | | | | 0.8 | |
| | 354,098 | | | | | Tyco International Plc | | | 15,530,738 | | | | 0.7 | |
| | | | | | | | | | 118,253,832 | | | | 5.5 | |
| | | | | | | | | | | | | | | |
| | | | | | | Information Technology: 10.0% | | | |
| | 219,577 | | | @ | | Adobe Systems, Inc. | | | 15,963,248 | | | | 0.7 | |
| | 368,656 | | | @ | | Amdocs Ltd. | | | 17,199,646 | | | | 0.8 | |
| | 1,041,308 | | | | | Applied Materials, Inc. | | | 25,949,395 | | | | 1.2 | |
| | 333,049 | | | | | Broadcom Corp. | | | 14,431,013 | | | | 0.7 | |
| | 718,929 | | | | | Cisco Systems, Inc. | | | 19,997,010 | | | | 0.9 | |
| | 166,131 | | | @ | | Citrix Systems, Inc. | | | 10,599,158 | | | | 0.5 | |
| | 816,255 | | | | | Corning, Inc. | | | 18,716,727 | | | | 0.9 | |
| | 409,259 | | | @ | | eBay, Inc. | | | 22,967,615 | | | | 1.1 | |
| | 537,479 | | | | | Intel Corp. | | | 19,505,113 | | | | 0.9 | |
| | 377,493 | | | | | Microsoft Corp. | | | 17,534,550 | | | | 0.8 | |
| | 308,739 | | | | | NetApp, Inc. | | | 12,797,232 | | | | 0.6 | |
| | 783,661 | | | | | Symantec Corp. | | | 20,104,823 | | | | 0.9 | |
| | | | | | | | | | 215,765,530 | | | | 10.0 | |
| | | | | | | | | | | | | | | |
| | | | | | | Materials: 0.7% | | | | | | | | |
| | 154,233 | | | | | Dow Chemical Co. | | | 7,034,567 | | | | 0.3 | |
| | 368,511 | | | | | Freeport-McMoRan, Inc. | | | 8,608,417 | | | | 0.4 | |
| | | | | | | | | | 15,642,984 | | | | 0.7 | |
| | | | | | | | | | | | | | | |
| �� | | | | | | Telecommunication Services: 1.8% | |
| | 229,750 | | | | | Orange SA | | | 3,907,303 | | | | 0.2 | |
| | 1,027,775 | | | | | Koninklijke KPN NV | | | 3,245,053 | | | | 0.2 | |
| | 2,146,418 | | | @ | | Telecom Italia S.p.A. | | | 2,289,133 | | | | 0.1 | |
| | 182,686 | | | | | Telefonica S.A. | | | 2,622,926 | | | | 0.1 | |
See Accompanying Notes to Financial Statements
| | PORTFOLIO OF INVESTMENTS |
| VY® Invesco Equity and Income Portfolio | as of December 31, 2014 (unaudited) (continued) |
| | 251,911 | | | | | Verizon Communications, Inc. | | | 11,784,397 | | | | 0.5 | |
| | 411,884 | | | | | Vodafone Group PLC ADR | | | 14,074,076 | | | | 0.7 | |
| | | | | | | | | | 37,922,888 | | | | 1.8 | |
| | | | | | | | | | | | | | | |
| | | | | | | Utilities: 0.9% | | | | | | | | |
| | 257,547 | | | | | FirstEnergy Corp. | | | 10,041,757 | | | | 0.4 | |
| | 196,790 | | | | | Pacific Gas & Electric Co. | | | 10,477,100 | | | | 0.5 | |
| | | | | | | | | | 20,518,857 | | | | 0.9 | |
| | | | | | | | | | | | | | | |
| | | | | | | Total Common Stock | | | | | | | | |
| | | | | | | (Cost $1,261,318,662) | | | 1,395,589,610 | | | | 64.6 | |
| | | | | | | | | | | | | | | |
| PREFERRED STOCK: 1.0% |
| | | | | | | Energy: 0.4% | | | | | | | | |
| | 140,612 | | | @,P | | El Paso Energy Capital Trust I | | | 8,526,712 | | | | 0.4 | |
| | | | | | | | | | | | | | | |
| | | | | | | Financials: 0.6% | | | | | | | | |
| | 68,900 | | | | | AMG Capital Trust II | | | 4,271,800 | | | | 0.2 | |
| | 56,155 | | | @ | | Keycorp | | | 7,329,350 | | | | 0.3 | |
| | 20,000 | | | P | | State Street Corp. | | | 517,200 | | | | 0.0 | |
| | 27,000 | | | P | | Wells Fargo & Co. | | | 692,550 | | | | 0.1 | |
| | | | | | | | | | 12,810,900 | | | | 0.6 | |
| | | | | | | | | | | | | | | |
| | | | | Total Preferred Stock | | | | | | | | |
| | | | | (Cost $17,570,140) | | | 21,337,612 | | | | 1.0 | |
Principal
Amount† | | | | | | | Value | | | Percentage
of Net
Assets | |
| CORPORATE BONDS/NOTES: 16.0% |
| | | | | | | Basic Materials: 0.5% | | | | | | | | |
| | 570,000 | | | | | ArcelorMittal, 4.250%, 08/05/15 | | | 579,263 | | | | 0.0 | |
| | 80,000 | | | | | ArcelorMittal, 7.250%, 03/01/41 | | | 81,200 | | | | 0.0 | |
| | 460,000 | | | | | ArcelorMittal, 10.350%, 06/01/19 | | | 557,175 | | | | 0.0 | |
| | 350,000 | | | | | Barrick North America Finance, LLC, 5.700%, 05/30/41 | | | 344,786 | | | | 0.0 | |
| | 1,320,000 | | | | | Eastman Chemical Co., 2.700%, 01/15/20 | | | 1,329,020 | | | | 0.1 | |
| | 1,095,000 | | | # | | Glencore Funding LLC, 3.125%, 04/29/19 | | | 1,099,982 | | | | 0.1 | |
| | 535,000 | | | # | | Gold Fields Orogen Holding BVI Ltd., 4.875%, 10/07/20 | | | 452,075 | | | | 0.0 | |
| | 195,000 | | | | �� | International Paper Co., 6.000%, 11/15/41 | | | 229,103 | | | | 0.0 | |
| | 315,000 | | | | | Monsanto Co., 2.125%, 07/15/19 | | | 314,173 | | | | 0.0 | |
| | 215,000 | | | | | Monsanto Co., 3.375%, 07/15/24 | | | 218,889 | | | | 0.0 | |
| | 285,000 | | | | | Monsanto Co., 3.600%, 07/15/42 | | | 260,710 | | | | 0.0 | |
| | 770,000 | | | # | | Montell Finance Co. BV, 8.100%, 03/15/27 | | | 1,034,021 | | | | 0.1 | |
| | 465,000 | | | | | Newmont Mining Corp., 3.500%, 03/15/22 | | | 437,392 | | | | 0.0 | |
| | 150,000 | | | | | Rio Tinto Finance USA Ltd., 7.125%, 07/15/28 | | | 195,852 | | | | 0.0 | |
| | 335,000 | | | | | Rio Tinto Finance USA Ltd., 9.000%, 05/01/19 | | | 424,223 | | | | 0.0 | |
| | 4,000 | | | | | Southern Copper Corp., 5.250%, 11/08/42 | | | 3,593 | | | | 0.0 | |
| | 105,000 | | | | | Southern Copper Corp., 6.750%, 04/16/40 | | | 111,195 | | | | 0.0 | |
| | 835,000 | | | | | Sunoco Logistics Partner, 5.300%, 04/01/44 | | | 844,747 | | | | 0.1 | |
| | 550,000 | | | | | Sunoco Logistics Partner, 5.500%, 02/15/30 | | | 602,367 | | | | 0.1 | |
| | 420,000 | | | | | Vale Overseas Ltd., 5.625%, 09/15/19 | | | 448,988 | | | | 0.0 | |
| | 250,000 | | | | | Vale SA, 5.625%, 09/11/42 | | | 234,103 | | | | 0.0 | |
| | 320,000 | | | # | | Xstrata Finance Canada Ltd., 2.050%, 10/23/15 | | | 322,143 | | | | 0.0 | |
| | 320,000 | | | # | | Xstrata Finance Canada Ltd., 2.700%, 10/25/17 | | | 323,988 | | | | 0.0 | |
| | | | | | | | | | 10,448,988 | | | | 0.5 | |
| | | | | | | | | | | | | | | |
| | | | | | | Communications: 2.3% | | | | | | | | |
| | 1,443,000 | | | | | Amazon.com, Inc., 4.800%, 12/05/34 | | | 1,513,808 | | | | 0.1 | |
| | 225,000 | | | | | America Movil S.A.B de CV, 2.375%, 09/08/16 | | | 228,414 | | | | 0.0 | |
| | 455,000 | | | | | America Movil S.A.B de CV, 4.375%, 07/16/42 | | | 438,165 | | | | 0.0 | |
| | 101,000 | | | | | AT&T, Inc., 5.350%, 09/01/40 | | | 109,758 | | | | 0.0 | |
| | 270,000 | | | | | AT&T, Inc., 6.150%, 09/15/34 | | | 321,630 | | | | 0.0 | |
| | 4,000 | | | | | AT&T, Inc., 8.000%, 11/15/31 | | | 5,910 | | | | 0.0 | |
| | 460,000 | | | | | Baidu, Inc., 3.250%, 08/06/18 | | | 471,011 | | | | 0.0 | |
| | 365,000 | | | | | British Telecommunications PLC, 1.250%, 02/14/17 | | | 363,391 | | | | 0.0 | |
| | 2,421,000 | | | | | Ciena Corp., 4.000%, 12/15/20 | | | 3,012,632 | | | | 0.2 | |
| | 560,000 | | | | | Comcast Corp., 4.250%, 01/15/33 | | | 594,886 | | | | 0.0 | |
| | 3,469,000 | | | | | Comcast Corp., 5.700%, 05/15/18 | | | 3,909,310 | | | | 0.2 | |
| | 135,000 | | | | | Comcast Corp., 6.450%, 03/15/37 | | | 180,200 | | | | 0.0 | |
| | 340,000 | | | # | | Cox Communications, Inc., 4.700%, 12/15/42 | | | 341,016 | | | | 0.0 | |
| | 1,210,000 | | | # | | Cox Communications, Inc., 8.375%, 03/01/39 | | | 1,735,803 | | | | 0.1 | |
| | 345,000 | | | # | | Crown Castle Towers, LLC, 3.214%, 08/15/35 | | | 349,237 | | | | 0.0 | |
| | 435,000 | | | # | | Crown Castle Towers, LLC, 6.113%, 01/15/40 | | | 500,841 | | | | 0.0 | |
| | 2,960,000 | | | | | DIRECTV Holdings LLC / DIRECTV Financing Co., Inc., 5.150%, 03/15/42 | | | 3,070,062 | | | | 0.2 | |
| | 4,490,000 | | | | | Discovery Communications LLC, 3.700%, 06/01/15 | | | 4,541,833 | | | | 0.2 | |
| | 350,000 | | | | | Grupo Televisa SAB, 5.000%, 05/13/45 | | | 355,050 | | | | 0.0 | |
See Accompanying Notes to Financial Statements
| VY® Invesco Equity and Income Portfolio | PORTFOLIO OF INVESTMENTS
as of December 31, 2014 (unaudited) (continued) |
| | 285,000 | | | | | Interpublic Group of Cos., Inc., 2.250%, 11/15/17 | | | 285,757 | | | | 0.0 | |
| | 4,288,000 | | | L | | JDS Uniphase Corp., 0.625%, 08/15/33 | | | 4,550,640 | | | | 0.2 | |
| | 230,000 | | | L | | Juniper Networks, Inc., 4.500%, 03/15/24 | | | 232,598 | | | | 0.0 | |
| | 2,419,000 | | | | | Liberty Interactive LLC, 0.750%, 03/30/43 | | | 3,450,099 | | | | 0.2 | |
| | 9,559,000 | | | | | Liberty Media Corp., 1.375%, 10/15/23 | | | 9,475,359 | | | | 0.5 | |
| | 125,000 | | | | | NBCUniversal Media, LLC, 5.150%, 04/30/20 | | | 142,017 | | | | 0.0 | |
| | 210,000 | | | | | NBCUniversal Media, LLC, 5.950%, 04/01/41 | | | 271,042 | | | | 0.0 | |
| | 415,000 | | | | | Rogers Communications, Inc., 4.500%, 03/15/43 | | | 418,921 | | | | 0.0 | |
| | 370,000 | | | | | Telefonica Emisones SAU, 7.045%, 06/20/36 | | | 488,236 | | | | 0.0 | |
| | 1,010,000 | | | # | | Tencent Holdings Ltd., 3.375%, 05/02/19 | | | 1,027,630 | | | | 0.1 | |
| | 2,345,000 | | | | | Time Warner Cable, Inc., 5.000%, 02/01/20 | | | 2,587,070 | | | | 0.1 | |
| | 445,000 | | | | | Time Warner Cable, Inc., 5.875%, 11/15/40 | | | 532,500 | | | | 0.0 | |
| | 160,000 | | | | | Time Warner, Inc., 5.875%, 11/15/16 | | | 173,559 | | | | 0.0 | |
| | 535,000 | | | | | Verizon Communications, Inc., 4.400%, 11/01/34 | | | 533,527 | | | | 0.0 | |
| | 467,000 | | | # | | Verizon Communications, Inc., 5.012%, 08/21/54 | | | 485,254 | | | | 0.0 | |
| | 745,000 | | | | | Verizon Communications, Inc., 5.150%, 09/15/23 | | | 823,235 | | | | 0.1 | |
| | 280,000 | | | | | Verizon Communications, Inc., 6.400%, 02/15/38 | | | 346,618 | | | | 0.0 | |
| | 1,290,000 | | | | | Verizon Communications, Inc., 6.400%, 09/15/33 | | | 1,591,788 | | | | 0.1 | |
| | 559,000 | | | | | Viacom, Inc., 4.850%, 12/15/34 | | | 573,865 | | | | 0.0 | |
| | | | | | | | | | 50,032,672 | | | | 2.3 | |
| | | | | | | | | | | | | | | |
| | | | | | | Consumer, Cyclical: 0.7% | | | | | | | | |
| | 450,000 | | | | | Advance Auto Parts, Inc., 4.500%, 12/01/23 | | | 477,689 | | | | 0.0 | |
| | 387,000 | | | | | Advance Auto Parts, Inc., 5.750%, 05/01/20 | | | 434,073 | | | | 0.0 | |
| | 755,000 | | | | | American Airlines 2014-1 Class A Pass Through Trust, 3.700%, 10/01/26 | | | 758,775 | | | | 0.0 | |
| | 315,000 | | | | | Cintas Corp. No 2, 2.850%, 06/01/16 | | | 323,142 | | | | 0.0 | |
| | 244,785 | | | | | Continental Airlines 2010-1 Class A Pass Through Trust, 4.750%, 07/15/22 | | | 260,696 | | | | 0.0 | |
| | 370,469 | | | | | Continental Airlines 2012-1 Class A Pass Thru Trusts, 4.150%, 04/11/24 | | | 380,657 | | | | 0.0 | |
| | 620,000 | | | | | CVS Caremark Corp., 3.375%, 08/12/24 | | | 627,265 | | | | 0.0 | |
| | 657,896 | | | | | CVS Pass-Through Trust, 6.036%, 12/10/28 | | | 769,056 | | | | 0.1 | |
| | 172,741 | | | | | Delta Air Lines 2010-1 Class A Pass Through Trust, 6.200%, 01/02/20 | | | 190,015 | | | | 0.0 | |
| | 595,000 | | | | | Dollar General Corp., 3.250%, 04/15/23 | | | 542,559 | | | | 0.0 | |
| | 800,000 | | | | | Ford Motor Co., 4.750%, 01/15/43 | | | 847,430 | | | | 0.1 | |
| | 725,000 | | | | | MDC Holdings, Inc., 6.000%, 01/15/43 | | | 605,375 | | | | 0.0 | |
| | 1,460,000 | | | | | QVC, Inc., 5.450%, 08/15/34 | | | 1,428,857 | | | | 0.1 | |
| | 594,000 | | | | | Ross Stores, Inc., 3.375%, 09/15/24 | | | 595,747 | | | | 0.0 | |
| | 645,000 | | | | | Target Corp., 2.900%, 01/15/22 | | | 653,662 | | | | 0.0 | |
| | 885,000 | | | | | United Airlines 2014-2 Class A Pass Through Trust, 3.750%, 03/03/28 | | | 897,722 | | | | 0.1 | |
| | 1,659,356 | | | # | | Virgin Australia 2013-1A Trust, 5.000%, 04/23/25 | | | 1,709,137 | | | | 0.1 | |
| | 1,000,000 | | | | | Walgreens Boots Alliance, Inc., 3.300%, 11/18/21 | | | 1,008,462 | | | | 0.1 | |
| | 737,000 | | | | | Walgreens Boots Alliance, Inc., 4.500%, 11/18/34 | | | 770,011 | | | | 0.1 | |
| | 50,000 | | | | | Wal-Mart Stores, Inc., 6.500%, 08/15/37 | | | 69,033 | | | | 0.0 | |
| | 375,000 | | | | | Wal-Mart Stores, Inc., 3.300%, 04/22/24 | | | 387,949 | | | | 0.0 | |
| | 135,000 | | | | | Wyndham Worldwide Corp., 2.950%, 03/01/17 | | | 137,943 | | | | 0.0 | |
| | 555,000 | | | | | Wyndham Worldwide Corp., 5.625%, 03/01/21 | | | 621,415 | | | | 0.0 | |
| | | | | | | | | | 14,496,670 | | | | 0.7 | |
| | | | | | | | | | | | | | | |
| | | | | | | Consumer, Non-cyclical: 3.9% | | | | | | | | |
| | 1,250,000 | | | | | AbbVie, Inc., 1.200%, 11/06/15 | | | 1,253,922 | | | | 0.1 | |
| | 985,000 | | | | | Actavis Funding SCS, 4.850%, 06/15/44 | | | 1,003,417 | | | | 0.1 | |
| | 610,000 | | | | | Aetna, Inc., 3.950%, 09/01/20 | | | 644,928 | | | | 0.0 | |
| | 700,000 | | | | | Altria Group, Inc., 4.125%, 09/11/15 | | | 716,110 | | | | 0.0 | |
| | 980,000 | | | | | AmerisourceBergen Corp., 3.400%, 05/15/24 | | | 982,405 | | | | 0.1 | |
| | 255,000 | | | | | Anheuser-Busch InBev Worldwide, Inc., 0.800%, 07/15/15 | | | 255,464 | | | | 0.0 | |
| | 375,000 | | | | | Anheuser-Busch InBev Worldwide, Inc., 3.625%, 04/15/15 | | | 378,344 | | | | 0.0 | |
| | 981,000 | | | # | | Bayer US Finance LLC, 3.000%, 10/08/21 | | | 990,480 | | | | 0.1 | |
| | 507,000 | | | | | Becton Dickinson and Co., 2.675%, 12/15/19 | | | 514,260 | | | | 0.0 | |
See Accompanying Notes to Financial Statements
| VY® Invesco Equity and Income Portfolio | PORTFOLIO OF INVESTMENTS
as of December 31, 2014 (unaudited) (continued) |
| | 3,611,000 | | | L | | BioMarin Pharmaceutical, Inc., 1.500%, 10/15/20 | | | 4,443,787 | | | | 0.2 | |
| | 4,224,000 | | | | | Brookdale Senior Living, Inc., 2.750%, 06/15/18 | | | 5,768,400 | | | | 0.3 | |
| | 240,000 | | | | | Brown-Forman Corp., 2.250%, 01/15/23 | | | 228,505 | | | | 0.0 | |
| | 4,000,000 | | | | | Bunge Ltd Finance Corp., 5.100%, 07/15/15 | | | 4,087,736 | | | | 0.2 | |
| | 715,000 | | | | | CareFusion Corp., 3.875%, 05/15/24 | | | 739,288 | | | | 0.0 | |
| | 435,000 | | | | | CareFusion Corp., 4.875%, 05/15/44 | | | 465,184 | | | | 0.0 | |
| | 1,445,000 | | | | | Celgene Corp., 4.625%, 05/15/44 | | | 1,504,895 | | | | 0.1 | |
| | 325,000 | | | | | Celgene Corp., 4.000%, 08/15/23 | | | 342,696 | | | | 0.0 | |
| | 240,000 | | | | | Corn Products International, Inc., 6.625%, 04/15/37 | | | 304,887 | | | | 0.0 | |
| | 493,000 | | | | | Edwards Lifesciences Corp., 2.875%, 10/15/18 | | | 500,217 | | | | 0.0 | |
| | 965,000 | | | # | | ERAC USA Finance LLC, 2.350%, 10/15/19 | | | 958,883 | | | | 0.1 | |
| | 980,000 | | | | | Express Scripts Holding Co., 2.250%, 06/15/19 | | | 970,524 | | | | 0.1 | |
| | 270,000 | | | | | Express Scripts, Inc., 3.125%, 05/15/16 | | | 277,696 | | | | 0.0 | |
| | 415,000 | | | # | | FBG Finance Ltd., 5.125%, 06/15/15 | | | 423,294 | | | | 0.0 | |
| | 1,400,000 | | | | | General Mills, Inc., 2.200%, 10/21/19 | | | 1,389,808 | | | | 0.1 | |
| | 430,000 | | | | | Gilead Sciences, Inc., 2.050%, 04/01/19 | | | 430,496 | | | | 0.0 | |
| | 80,000 | | | | | GlaxoSmithKline Capital, Inc., 6.375%, 05/15/38 | | | 106,883 | | | | 0.0 | |
| | 785,000 | | | # | | Grupo Bimbo SAB de CV, 3.875%, 06/27/24 | | | 790,048 | | | | 0.0 | |
| | 4,573,000 | | | | | HealthSouth Corp., 2.000%, 12/01/43 | | | 5,107,469 | | | | 0.2 | |
| | 2,410,000 | | | # | | Jazz Investments I Ltd., 1.875%, 08/15/21 | | | 2,738,362 | | | | 0.1 | |
| | 274,000 | | | | | Kraft Foods, Inc., 6.500%, 02/09/40 | | | 366,453 | | | | 0.0 | |
| | 890,000 | | | | | Kroger Co., 3.300%, 01/15/21 | | | 904,377 | | | | 0.1 | |
| | 1,371,000 | | | # | | Live Nation Entertainment, Inc., 2.500%, 05/15/19 | | | 1,451,546 | | | | 0.1 | |
| | 730,000 | | | | | McKesson Corp., 2.284%, 03/15/19 | | | 729,200 | | | | 0.0 | |
| | 210,000 | | | | | Medco Health Solutions, Inc., 2.750%, 09/15/15 | | | 212,816 | | | | 0.0 | |
| | 1,733,000 | | | # | | Medtronic, Inc., 3.150%, 03/15/22 | | | 1,763,419 | | | | 0.1 | |
| | 615,000 | | | # | | Medtronic, Inc., 4.375%, 03/15/35 | | | 654,642 | | | | 0.0 | |
| | 390,000 | | | | | Medtronic, Inc., 4.000%, 04/01/43 | | | 373,382 | | | | 0.0 | |
| | 630,000 | | | | | Moody's Corp., 4.500%, 09/01/22 | | | 676,773 | | | | 0.0 | |
| | 639,000 | | | | | Moodys Corp., 4.875%, 02/15/24 | | | 704,701 | | | | 0.0 | |
| | 2,201,000 | | | | | NuVasive, Inc., 2.750%, 07/01/17 | | | 2,809,026 | | | | 0.1 | |
| | 2,928,000 | | | | | Omnicare, Inc., 3.500%, 02/15/44 | | | 3,513,600 | | | | 0.2 | |
| | 2,627,000 | | | | | Omnicare, Inc., 3.250%, 12/15/35 | | | 3,052,246 | | | | 0.2 | |
| | 780,000 | | | | | PepsiCo, Inc., 3.600%, 03/01/24 | | | 816,398 | | | | 0.0 | |
| | 275,000 | | | | | Perrigo Co. PLC, 2.300%, 11/08/18 | | | 275,035 | | | | 0.0 | |
| | 881,000 | | | | | Philip Morris International, Inc., 3.250%, 11/10/24 | | | 884,756 | | | | 0.0 | |
| | 275,000 | | | | | Philip Morris International, Inc., 3.600%, 11/15/23 | | | 287,552 | | | | 0.0 | |
| | 820,000 | | | | | Philip Morris International, Inc., 4.875%, 11/15/43 | | | 917,860 | | | | 0.1 | |
| | 4,054,000 | | | | | Salix Pharmaceuticals Ltd., 1.500%, 03/15/19 | | | 7,411,219 | | | | 0.4 | |
| | 1,430,000 | | | | | Sysco Corp., 3.500%, 10/02/24 | | | 1,476,837 | | | | 0.1 | |
| | 825,000 | | | | | Tupperware Brands Corp., 4.750%, 06/01/21 | | | 884,299 | | | | 0.0 | |
| | 392,000 | | | | | Tyson Foods, Inc., 3.950%, 08/15/24 | | | 406,010 | | | | 0.0 | |
| | 354,000 | | | | | Tyson Foods, Inc., 4.875%, 08/15/34 | | | 389,564 | | | | 0.0 | |
| | 365,000 | | | | | Tyson Foods, Inc., 5.150%, 08/15/44 | | | 411,583 | | | | 0.0 | |
| | 145,000 | | | | | Ventas Realty L.P., 5.700%, 09/30/43 | | | 174,611 | | | | 0.0 | |
| | 2,690,000 | | | | | WellPoint, Inc., 1.250%, 09/10/15 | | | 2,701,629 | | | | 0.1 | |
| | 7,317,000 | | | | | WellPoint, Inc., 2.750%, 10/15/42 | | | 12,630,971 | | | | 0.6 | |
| | 79,000 | | | | | Zoetis, Inc., 4.700%, 02/01/43 | | | 80,716 | | | | 0.0 | |
| | | | | | | | | | 85,279,609 | | | | 3.9 | |
| | | | | | | | | | | | | | | |
| | | | | | | Energy: 1.2% | | | | | | | | |
| | 655,000 | | | | | BP Capital Markets PLC, 2.237%, 05/10/19 | | | 654,879 | | | | 0.0 | |
| | 360,000 | | | | | Chevron Corp., 1.718%, 06/24/18 | | | 362,148 | | | | 0.0 | |
| | 2,947,000 | | | | | Cobalt International Energy, Inc., 2.625%, 12/01/19 | | | 1,782,935 | | | | 0.1 | |
| | 1,425,000 | | | | | ConocoPhillips Co., 2.875%, 11/15/21 | | | 1,441,389 | | | | 0.1 | |
| | 1,528,000 | | | | | ConocoPhillips Co., 4.150%, 11/15/34 | | | 1,573,085 | | | | 0.1 | |
| | 715,000 | | | | | Devon Energy Corp., 2.250%, 12/15/18 | | | 713,092 | | | | 0.1 | |
| | 680,000 | | | | | Devon Energy Corp., 3.250%, 05/15/22 | | | 669,086 | | | | 0.1 | |
| | 460,000 | | | # | | Enable Midstream Partners L.P., 2.400%, 05/15/19 | | | 447,856 | | | | 0.0 | |
| | 175,000 | | | | | Enterprise Products Operating L.P., 5.250%, 01/31/20 | | | 193,645 | | | | 0.0 | |
| | 300,000 | | | | | Enterprise Products Operating L.P., 6.500%, 01/31/19 | | | 344,159 | | | | 0.0 | |
| See Accompanying Notes to Financial Statements |
| VY® Invesco Equity and Income Portfolio | PORTFOLIO OF INVESTMENTS
as of December 31, 2014 (unaudited) (continued) |
| | 615,000 | | | | | Enterprise Products Operating LLC, 2.550%, 10/15/19 | | | 609,488 | | | | 0.0 | |
| | 1,943,000 | | | | | Helix Energy Solutions Group, Inc., 3.250%, 03/15/32 | | | 2,165,231 | | | | 0.1 | |
| | 250,000 | | | | | Husky Energy, Inc., 3.950%, 04/15/22 | | | 251,264 | | | | 0.0 | |
| | 868,000 | | | | | Kinder Morgan, Inc./DE, 5.300%, 12/01/34 | | | 883,739 | | | | 0.1 | |
| | 2,895,000 | | | | | Marathon Oil Corp., 0.900%, 11/01/15 | | | 2,887,511 | | | | 0.2 | |
| | 570,000 | | | | | Noble Energy, Inc., 5.250%, 11/15/43 | | | 581,022 | | | | 0.0 | |
| | 130,000 | | | | | Noble Holding International Ltd., 2.500%, 03/15/17 | | | 124,435 | | | | 0.0 | |
| | 3,565,000 | | | L | | Peabody Energy Corp., 4.750%, 12/15/66 | | | 1,889,450 | | | | 0.1 | |
| | 445,000 | | | | | Petrobras Global Finance BV, 5.625%, 05/20/43 | | | 365,011 | | | | 0.0 | |
| | 320,000 | | | | | Phillips 66, 1.950%, 03/05/15 | | | 320,831 | | | | 0.0 | |
| | 295,000 | | | | | Plains All American Pipeline L.P. / PAA Finance Corp., 3.650%, 06/01/22 | | | 297,058 | | | | 0.0 | |
| | 605,000 | | | | | Rowan Cos, Inc., 5.850%, 01/15/44 | | | 559,812 | | | | 0.0 | |
| | 510,000 | | | | | Southwestern Energy Co., 4.100%, 03/15/22 | | | 501,281 | | | | 0.0 | |
| | 165,000 | | | | | Spectra Energy Capital, LLC, 7.500%, 09/15/38 | | | 199,753 | | | | 0.0 | |
| | 4,224,000 | | | | | Stone Energy Corp., 1.750%, 03/01/17 | | | 3,693,360 | | | | 0.2 | |
| | 544,000 | | | | | Suncor Energy, Inc., 3.600%, 12/01/24 | | | 539,557 | | | | 0.0 | |
| | 215,000 | | | | | Texas Eastern Transmission LP, 7.000%, 07/15/32 | | | 289,453 | | | | 0.0 | |
| | 591,000 | | | | | Williams Partners L.P., 3.800%, 02/15/15 | | | 592,874 | | | | 0.0 | |
| | 125,000 | | | | | Williams Partners L.P., 5.400%, 03/04/44 | | | 122,818 | | | | 0.0 | |
| | | | | | | | | | 25,056,222 | | | | 1.2 | |
| | | | | | | | | | | | | | | |
| | | | | | | Financial: 4.3% | | | | | | | | |
| | 300,000 | | | | | Aegon NV, 4.625%, 12/01/15 | | | 310,514 | | | | 0.0 | |
| | 1,870,000 | | | | | Air Lease Corp., 4.250%, 09/15/24 | | | 1,888,700 | | | | 0.1 | |
| | 543,000 | | | | | American Express Co., 3.625%, 12/05/24 | | | 548,652 | | | | 0.0 | |
| | 1,200,000 | | | | | American Financial Group, Inc./OH, 9.875%, 06/15/19 | | | 1,544,368 | | | | 0.1 | |
| | 395,000 | | | | | American International Group, Inc., 2.300%, 07/16/19 | | | 395,825 | | | | 0.0 | |
| | 500,000 | | | | | American Tower Corp., 3.400%, 02/15/19 | | | 509,395 | | | | 0.0 | |
| | 1,825,000 | | | | | American Tower Corp., 4.625%, 04/01/15 | | | 1,841,476 | | | | 0.1 | |
| | 440,000 | | | # | | Apollo Management Holdings L.P., 4.000%, 05/30/24 | | | 448,674 | | | | 0.0 | |
| | 500,000 | | | #,L | | Banco Inbursa SA Institucion de Banca Multiple, 4.125%, 06/06/24 | | | 491,250 | | | | 0.0 | |
| | 445,000 | | | | | Bank of America Corp., 1.250%, 01/11/16 | | | 445,963 | | | | 0.0 | |
| | 500,000 | | | | | Bank of America Corp., 5.650%, 05/01/18 | | | 555,911 | | | | 0.0 | |
| | 400,000 | | | | | Bank of America Corp., 5.750%, 12/01/17 | | | 442,290 | | | | 0.0 | |
| | 525,000 | | | | | Barclays Bank PLC, 6.750%, 05/22/19 | | | 618,367 | | | | 0.0 | |
| | 725,000 | | | # | | BBVA Bancomer SA/Texas, 4.375%, 04/10/24 | | | 730,438 | | | | 0.0 | |
| | 260,000 | | | | | Bear Stearns Cos., Inc., 7.250%, 02/01/18 | | | 299,873 | | | | 0.0 | |
| | 860,000 | | | | | BNP Paribas SA, 4.250%, 10/15/24 | | | 870,581 | | | | 0.1 | |
| | 515,000 | | | | | Charles Schwab Corp., 4.450%, 07/22/20 | | | 566,376 | | | | 0.0 | |
| | 365,000 | | | | | Citigroup, Inc., 3.500%, 05/15/23 | | | 355,706 | | | | 0.0 | |
| | 1,930,000 | | | | | Citigroup, Inc., 4.000%, 08/05/24 | | | 1,940,059 | | | | 0.1 | |
| | 260,000 | | | | | Citigroup, Inc., 5.300%, 05/06/44 | | | 285,978 | | | | 0.0 | |
| | 560,000 | | | | | Citigroup, Inc., 6.675%, 09/13/43 | | | 726,748 | | | | 0.0 | |
| | 970,000 | | | | | Citigroup, Inc., 2.650%, 03/02/15 | | | 972,921 | | | | 0.1 | |
| | 325,000 | | | | | CNA Financial Corp., 5.875%, 08/15/20 | | | 371,449 | | | | 0.0 | |
| | 472,000 | | | # | | Credit Suisse AG, 6.500%, 08/08/23 | | | 519,304 | | | | 0.0 | |
| | 590,000 | | | | | Credit Suisse/New York NY, 3.625%, 09/09/24 | | | 600,903 | | | | 0.0 | |
| | 830,000 | | | # | | Dexus Diversified Trust / Dexus Office Trust, 5.600%, 03/15/21 | | | 943,597 | | | | 0.1 | |
| | 340,000 | | | | | Digital Realty Trust L.P., 4.500%, 07/15/15 | | | 343,266 | | | | 0.0 | |
| | 1,540,000 | | | # | | Farmers Exchange Capital III, 5.454%, 10/15/54 | | | 1,586,200 | | | | 0.1 | |
| | 2,835,000 | | | | | Ford Motor Credit Co. LLC, 2.750%, 05/15/15 | | | 2,854,389 | | | | 0.1 | |
| | 340,000 | | | | | Ford Motor Credit Co., LLC, 2.500%, 01/15/16 | | | 343,945 | | | | 0.0 | |
| | 600,000 | | | | | General Electric Capital Corp., 5.250%, 06/29/49 | | | 602,062 | | | | 0.0 | |
| | 700,000 | | | | | General Electric Capital Corp., 6.000%, 08/07/19 | | | 815,051 | | | | 0.1 | |
| | 350,000 | | | | | Goldman Sachs Group, Inc./The, 2.625%, 01/31/19 | | | 352,340 | | | | 0.0 | |
| | 4,011,000 | | | # | | Goldman Sachs Group, Inc., 1.000%, 03/15/17 | | | 5,556,117 | | | | 0.3 | |
| | 4,179,000 | | | # | | Goldman Sachs Group, Inc., 1.000%, 09/28/20 | | | 4,705,011 | | | | 0.2 | |
| | 355,000 | | | | | Goldman Sachs Group, Inc., 5.250%, 07/27/21 | | | 401,012 | | | | 0.0 | |
| See Accompanying Notes to Financial Statements |
| VY® Invesco Equity and Income Portfolio | PORTFOLIO OF INVESTMENTS
as of December 31, 2014 (unaudited) (continued) |
| | 720,000 | | | | | Goldman Sachs Group, Inc., 6.150%, 04/01/18 | | | 808,502 | | | | 0.1 | |
| | 345,000 | | | | | Goldman Sachs Group, Inc., 6.750%, 10/01/37 | | | 434,628 | | | | 0.0 | |
| | 1,000,000 | | | | | Hartford Financial Services Group, Inc./The, 4.000%, 03/30/15 | | | 1,008,002 | | | | 0.1 | |
| | 465,000 | | | # | | HBOS PLC, 6.750%, 05/21/18 | | | 519,403 | | | | 0.0 | |
| | 840,000 | | | | | HCP, Inc., 3.875%, 08/15/24 | | | 854,955 | | | | 0.1 | |
| | 320,000 | | | | | HCP, Inc., 4.200%, 03/01/24 | | | 333,797 | | | | 0.0 | |
| | 200,000 | | | | | HSBC Holdings PLC, 4.250%, 03/14/24 | | | 208,512 | | | | 0.0 | |
| | 3,501,000 | | | | | Jefferies Group, Inc., 3.875%, 11/01/29 | | | 3,630,099 | | | | 0.2 | |
| | 1,305,000 | | | | | JPMorgan Chase & Co., 3.875%, 09/10/24 | | | 1,307,680 | | | | 0.1 | |
| | 665,000 | | | | | JPMorgan Chase & Co., 5.000%, 12/29/49 | | | 653,986 | | | | 0.0 | |
| | 1,825,000 | | | | | JPMorgan Chase & Co., 6.100%, 10/29/49 | | | 1,825,000 | | | | 0.1 | |
| | 315,000 | | | | | JPMorgan Chase & Co., 6.750%, 12/29/49 | | | 334,294 | | | | 0.0 | |
| | 230,000 | | | # | | KKR Group Finance Co. III LLC, 5.125%, 06/01/44 | | | 248,973 | | | | 0.0 | |
| | 2,000,000 | | | # | | Liberty Mutual Group, Inc., 4.850%, 08/01/44 | | | 2,040,970 | | | | 0.1 | |
| | 310,000 | | | | | Lincoln National Corp., 4.000%, 09/01/23 | | | 322,206 | | | | 0.0 | |
| | 375,000 | | | | | Lloyds Bank PLC, 2.300%, 11/27/18 | | | 378,894 | | | | 0.0 | |
| | 510,000 | | | # | | Macquarie Bank Ltd., 5.000%, 02/22/17 | | | 544,274 | | | | 0.0 | |
| | 285,000 | | | | | Markel Corp., 5.000%, 03/30/43 | | | 303,812 | | | | 0.0 | |
| | 275,000 | | | | | Marsh & McLennan Cos, Inc., 4.050%, 10/15/23 | | | 291,078 | | | | 0.0 | |
| | 1,076,000 | | | | | MGIC Investment Corp., 2.000%, 04/01/20 | | | 1,579,703 | | | | 0.1 | |
| | 2,779,000 | | | | | MGIC Investment Corp., 5.000%, 05/01/17 | | | 3,135,059 | | | | 0.2 | |
| | 3,020,000 | | | # | | Mizuho Financial Group Cayman 3 Ltd., 4.600%, 03/27/24 | | | 3,135,113 | | | | 0.2 | |
| | 2,975,000 | | | | | Morgan Stanley, 2.375%, 07/23/19 | | | 2,965,932 | | | | 0.2 | |
| | 790,000 | | | | | Morgan Stanley, 3.450%, 11/02/15 | | | 805,683 | | | | 0.1 | |
| | 675,000 | | | | | Morgan Stanley, 4.000%, 07/24/15 | | | 687,859 | | | | 0.0 | |
| | 560,000 | | | | | Morgan Stanley, 6.375%, 07/24/42 | | | 746,459 | | | | 0.1 | |
| | 205,000 | | | # | | National Australia Bank Ltd., 3.750%, 03/02/15 | | | 206,028 | | | | 0.0 | |
| | 165,000 | | | | | National Rural Utilities Cooperative Finance Corp., 3.050%, 02/15/22 | | | 166,801 | | | | 0.0 | |
| | 330,000 | | | # | | Nationwide Building Society, 6.250%, 02/25/20 | | | 387,531 | | | | 0.0 | |
| | 1,515,000 | | | # | | Nationwide Financial Services, Inc., 5.300%, 11/18/44 | | | 1,604,388 | | | | 0.1 | |
| | 1,293,000 | | | | | Old Republic International Corp., 3.750%, 03/15/18 | | | 1,504,729 | | | | 0.1 | |
| | 225,000 | | | # | | Pacific LifeCorp, 6.000%, 02/10/20 | | | 256,322 | | | | 0.0 | |
| | 400,000 | | | | | Piedmont Operating Partnership L.P., 4.450%, 03/15/24 | | | 411,932 | | | | 0.0 | |
| | 360,000 | | | | | PNC Funding Corp., 5.125%, 02/08/20 | | | 404,979 | | | | 0.0 | |
| | 320,000 | | | | | Prudential Financial, Inc., 4.750%, 09/17/15 | | | 328,451 | | | | 0.0 | |
| | 275,000 | | | | | Prudential Financial, Inc., 5.100%, 08/15/43 | | | 310,975 | | | | 0.0 | |
| | 648,000 | | | | | Radian Group, Inc., 2.250%, 03/01/19 | | | 1,045,305 | | | | 0.1 | |
| | 1,607,000 | | | | | Radian Group, Inc., 3.000%, 11/15/17 | | | 2,463,732 | | | | 0.1 | |
| | 125,000 | | | | | Realty Income Corp., 2.000%, 01/31/18 | | | 125,321 | | | | 0.0 | |
| | 5,000,000 | | | | | Regions Financial Corp., 5.750%, 06/15/15 | | | 5,104,365 | | | | 0.3 | |
| | 525,000 | | | | | Reinsurance Group of America, Inc., 4.700%, 09/15/23 | | | 565,154 | | | | 0.0 | |
| | 2,350,000 | | | | | Santander Holdings USA, Inc./PA, 3.000%, 09/24/15 | | | 2,378,555 | | | | 0.1 | |
| | 2,200,000 | | | # | | Santander US Debt S.A. Unipersonal, 3.724%, 01/20/15 | | | 2,203,238 | | | | 0.1 | |
| | 460,000 | | | | | Senior Housing Properties Trust, 4.300%, 01/15/16 | | | 469,748 | | | | 0.0 | |
| | 805,000 | | | # | | Societe Generale SA, 5.000%, 01/17/24 | | | 810,872 | | | | 0.1 | |
| | 315,000 | | | # | | Standard Chartered PLC, 3.850%, 04/27/15 | | | 318,197 | | | | 0.0 | |
| | 440,000 | | | # | | Standard Chartered PLC, 5.700%, 03/26/44 | | | 459,607 | | | | 0.0 | |
| | 445,000 | | | | | Travelers Cos, Inc./The, 4.600%, 08/01/43 | | | 501,636 | | | | 0.0 | |
| | 110,000 | | | | | UBS AG, 5.750%, 04/25/18 | | | 123,838 | | | | 0.0 | |
| | 500,000 | | | | | US Bank NA/Cincinnati OH, 3.778%, 04/29/20 | | | 504,532 | | | | 0.0 | |
| | 320,000 | | | | | Ventas Realty L.P. / Ventas Capital Corp., 2.700%, 04/01/20 | | | 317,038 | | | | 0.0 | |
| | 170,000 | | | | | Ventas Realty L.P. / Ventas Capital Corp., 4.250%, 03/01/22 | | | 178,889 | | | | 0.0 | |
| | 140,000 | | | | | Wells Fargo & Co., 1.500%, 01/16/18 | | | 139,337 | | | | 0.0 | |
| | 470,000 | | | | | Wells Fargo & Co., 4.100%, 06/03/26 | | | 481,022 | | | | 0.0 | |
| | 2,000,000 | | | | | Wells Fargo & Co., 4.650%, 11/04/44 | | | 2,072,142 | | | | 0.1 | |
| | 350,000 | | | | | WR Berkley Corp., 4.625%, 03/15/22 | | | 375,890 | | | | 0.0 | |
| | | | | | | | | | 92,110,138 | | | | 4.3 | |
| See Accompanying Notes to Financial Statements |
| VY® Invesco Equity and Income Portfolio | PORTFOLIO OF INVESTMENTS
as of December 31, 2014 (unaudited) (continued) |
| | | | | | | Financials: 0.1% | | | | | | | | |
| | 2,815,000 | | | | | American Express Credit Corp., 2.750%, 09/15/15 | | | 2,859,232 | | | | 0.1 | |
| | | | | | | | | | | | | | | |
| | | | | | | Industrial: 0.7% | | | | | | | | |
| | 425,000 | | | # | | BAA Funding Ltd., 2.500%, 06/25/17 | | | 425,310 | | | | 0.0 | |
| | 1,335,000 | | | | | Burlington Northern Santa Fe LLC, 5.150%, 09/01/43 | | | 1,545,484 | | | | 0.1 | |
| | 330,000 | | | | | CSX Corp., 5.500%, 04/15/41 | | | 399,610 | | | | 0.0 | |
| | 1,015,000 | | | | | Deere & Co., 2.600%, 06/08/22 | | | 1,000,205 | | | | 0.1 | |
| | 570,000 | | | | | Eaton Corp., 0.950%, 11/02/15 | | | 570,696 | | | | 0.0 | |
| | 295,000 | | | | | FedEx Corp., 4.900%, 01/15/34 | | | 330,525 | | | | 0.0 | |
| | 605,000 | | | | | FedEx Corp., 5.100%, 01/15/44 | | | 701,385 | | | | 0.0 | |
| | 455,000 | | | | | L-3 Communications Corp., 3.950%, 05/28/24 | | | 459,660 | | | | 0.0 | |
| | 825,000 | | | | | Packaging Corp. of America, 4.500%, 11/01/23 | | | 865,734 | | | | 0.1 | |
| | 510,000 | | | # | | Penske Truck Leasing Co. Lp / PTL Finance Corp., 2.500%, 03/15/16 | | | 517,267 | | | | 0.0 | |
| | 545,000 | | | | | Pentair Finance SA, 5.000%, 05/15/21 | | | 607,035 | | | | 0.0 | |
| | 285,000 | | | | | Precision Castparts Corp., 2.500%, 01/15/23 | | | 274,925 | | | | 0.0 | |
| | 260,000 | | | | | Ryder System, Inc., 3.150%, 03/02/15 | | | 261,004 | | | | 0.0 | |
| | 260,000 | | | | | Union Pacific Corp., 3.250%, 01/15/25 | | | 267,504 | | | | 0.0 | |
| | 157,000 | | | | | Union Pacific Corp., 3.646%, 02/15/24 | | | 166,485 | | | | 0.0 | |
| | 730,000 | | | | | Union Pacific Corp., 4.150%, 01/15/45 | | | 764,071 | | | | 0.1 | |
| | 375,000 | | | | | Union Pacific Corp., 4.850%, 06/15/44 | | | 430,723 | | | | 0.0 | |
| | 225,000 | | | | | United Parcel Service, Inc., 2.450%, 10/01/22 | | | 220,955 | | | | 0.0 | |
| | 3,599,000 | | | # | | UTi Worldwide, Inc., 4.500%, 03/01/19 | | | 3,992,641 | | | | 0.2 | |
| | 550,000 | | | | | Valmont Industries, Inc., 5.000%, 10/01/44 | | | 558,402 | | | | 0.0 | |
| | 1,535,000 | | | | | Valmont Industries, Inc., 5.250%, 10/01/54 | | | 1,555,253 | | | | 0.1 | |
| | | | | | | | | | 15,914,874 | | | | 0.7 | |
| | | | | | | | | | | | | | | |
| | | | | | | Technology: 2.2% | | | | | | | | |
| | 7,292,000 | | | #,L | | Citrix Systems, Inc., 0.500%, 04/15/19 | | | 7,688,503 | | | | 0.4 | |
| | 340,000 | | | | | Computer Sciences Corp., 4.450%, 09/15/22 | | | 348,355 | | | | 0.0 | |
| | 5,367,000 | | | L | | Lam Research Corp., 1.250%, 05/15/18 | | | 7,614,431 | | | | 0.3 | |
| | 4,933,000 | | | | | Micron Technology, Inc., 3.000%, 11/15/43 | | | 6,514,643 | | | | 0.3 | |
| | 3,387,000 | | | | | NetSuite, Inc., 0.250%, 06/01/18 | | | 3,810,375 | | | | 0.2 | |
| | 6,651,000 | | | | | NVIDIA Corp., 1.000%, 12/01/18 | | | 7,677,748 | | | | 0.4 | |
| | 1,005,000 | | | | | Oracle Corp., 4.300%, 07/08/34 | | | 1,078,150 | | | | 0.0 | |
| | 330,000 | | | | | Pitney Bowes, Inc., 4.625%, 03/15/24 | | | 338,408 | | | | 0.0 | |
| | 8,937,000 | | | | | SanDisk Corp., 0.500%, 10/15/20 | | | 10,780,256 | | | | 0.5 | |
| | 540,000 | | | # | | Seagate HDD Cayman, 4.750%, 01/01/25 | | | 558,278 | | | | 0.0 | |
| | 1,146,000 | | | # | | Seagate HDD Cayman, 5.750%, 12/01/34 | | | 1,212,194 | | | | 0.1 | |
| | | | | | | | | | 47,621,341 | | | | 2.2 | |
| | | | | | | | | | | | | | | |
| | | | | | | Utilities: 0.1% | | | | | | | | |
| | 514,000 | | | | | Dominion Resources, Inc./VA, 5.750%, 10/01/54 | | | 537,600 | | | | 0.0 | |
| | 355,000 | | | | | Louisville Gas & Electric Co., 1.625%, 11/15/15 | | | 357,810 | | | | 0.0 | |
| | 605,000 | | | | | Oglethorpe Power Corp., 4.550%, 06/01/44 | | | 640,483 | | | | 0.1 | |
| | | | | | | | | | 1,535,893 | | | | 0.1 | |
| | | | | | | | | | | | | | | |
| | | | | Total Corporate Bonds/Notes | | | | | | | | |
| | | | | (Cost $327,658,962) | | | 345,355,639 | | | | 16.0 | |
| | | | | | | | | | | | | |
| MUNICIPAL BONDS: 0.0% | | |
| | | | | | | Georgia: 0.0% | | | | | | | | |
| | 175,000 | | | | | Municipal Electric Authority of Georgia, 6.637%, 04/01/57 | | | 233,627 | | | | 0.0 | |
| | 325,000 | | | | | Municipal Electric Authority of Georgia, 6.655%, 04/01/57 | | | 427,063 | | | | 0.0 | |
| | | | | | | | | | | | | | | |
| | | | | Total Municipal Bonds | | | | | | | | |
| | | | | (Cost $503,997) | | | 660,690 | | | | 0.0 | |
| | | | | | | | | | | | | | | |
| U.S. TREASURY OBLIGATIONS: 12.7% | | |
| | | | | | | U.S. Treasury Bonds: 0.8% | | | | | | | | |
| | 15,312,900 | | | | | 3.125%, due 08/15/44 | | | 16,488,885 | | | | 0.8 | |
| | | | | | | | | | | | | | | |
| | | | | | | U.S. Treasury Notes: 11.9% | | | | | | | | |
| | 71,028,000 | | | | | 0.625%, due 12/31/16 | | | 70,958,606 | | | | 3.3 | |
| | 310,000 | | | | | 0.625%, due 05/31/17 | | | 308,220 | | | | 0.0 | |
| | 120,000 | | | | | 0.875%, due 04/30/17 | | | 120,141 | | | | 0.0 | |
| | 55,005,000 | | | | | 1.000%, due 12/15/17 | | | 54,882,504 | | | | 2.6 | |
| | 61,015,200 | | | | | 1.625%, due 12/31/19 | | | 60,929,412 | | | | 2.8 | |
| | 740,000 | | | | | 2.250%, due 01/31/15 | | | 741,351 | | | | 0.0 | |
| | 16,409,700 | | | | | 2.250%, due 11/15/24 | | | 16,522,517 | | | | 0.8 | |
| | 52,000,000 | | | | | 2.500%, due 03/31/15 | | | 52,306,696 | | | | 2.4 | |
| | 180,000 | | | | | 2.625%, due 11/15/20 | | | 187,868 | | | | 0.0 | |
| | | | | | | | | | 256,957,315 | | | | 11.9 | |
| | | | | | | | | | | | | | | |
| | | | | Total U.S. Treasury Obligations | | | | | | | | |
| | | | | (Cost $272,032,492) | | | 273,446,200 | | | | 12.7 | |
| | | | | | | | | | | | | | | |
| FOREIGN GOVERNMENT BONDS: 0.1% | | | | | |
| | 150,000 | | | # | | Electricite de France SA, 4.600%, 01/27/20 | | | 165,335 | | | | 0.0 | |
| | 620,000 | | | # | | Electricite de France SA, 4.875%, 01/22/44 | | | 690,891 | | | | 0.0 | |
| | 640,000 | | | # | | Electricite de France SA, 5.625%, 12/29/49 | | | 674,560 | | | | 0.0 | |
| See Accompanying Notes to Financial Statements |
| VY® Invesco Equity and Income Portfolio | PORTFOLIO OF INVESTMENTS
as of December 31, 2014 (unaudited) (continued) |
| | 960,000 | | | | | Brazil Government International Bond, 6.000%, 01/17/17 | | | 1,036,800 | | | | 0.1 | |
| | 220,000 | | | | | Korea Development Bank, 4.375%, 08/10/15 | | | 224,733 | | | | 0.0 | |
| | | | | | | | | | | | | | | |
| | | | | Total Foreign Government Bonds | | | | | | | | |
| | | | | (Cost $2,569,106) | | | 2,792,319 | | | | 0.1 | |
| | | | | | | | | | | | | | | |
| U.S. GOVERNMENT AGENCY OBLIGATIONS: 0.3% | | | | | |
| | | | | | | Federal Home Loan Mortgage Corporation: 0.1%## | |
| | 2,400,000 | | | | | 4.875%, due 06/13/18 | | | 2,684,424 | | | | 0.1 | |
| | | | | | | | | | | | | | | |
| | | | | | | Federal National Mortgage Association: 0.2%## | |
| | 2,130,000 | | | | | 4.375%, due 10/15/15 | | | 2,199,195 | | | | 0.1 | |
| | 915,000 | | | | | 6.625%, due 11/15/30 | | | 1,360,890 | | | | 0.1 | |
| | | | | | | | | | 3,560,085 | | | | 0.2 | |
| | | | | | | | | | | | | | | |
| | | | | Total U.S. Government Agency Obligations | | | | | | | | |
| | | | | (Cost $5,702,415) | | | 6,244,509 | | | | 0.3 | |
| | | | | | | | | | | | | |
| | | | | Total Long-Term Investments | | | | | | | | |
| | | | | (Cost $1,887,355,774) | | | 2,045,426,579 | | | | 94.7 | |
| | | | | | | | | | | | | | | |
| SHORT-TERM INVESTMENTS: 7.1% | | | | | | | | |
| | | | | | | Securities Lending Collateralcc: 2.0% | |
| | 2,147,514 | | | | | Barclays Bank PLC, Repurchase Agreement dated 12/31/14, 0.05%, due 01/02/15 (Repurchase Amount $2,147,520, collateralized by various U.S. Government Securities, 1.500%-2.125%, Market Value plus accrued interest $2,190,465, due 08/31/18-06/30/21) | | | 2,147,514 | | | | 0.1 | |
| | 10,205,169 | | | | | Citigroup, Inc., Repurchase Agreement dated 12/31/14, 0.08%, due 01/02/15 (Repurchase Amount $10,205,214, collateralized by various U.S. Government/U.S. Government Agency Obligations, 1.375%-8.000%, Market Value plus accrued interest $10,409,272, due 12/15/17-07/15/51) | | | 10,205,169 | | | | 0.5 | |
| | 10,205,169 | | | | | HSBC Securities USA, Repurchase Agreement dated 12/31/14, 0.06%, due 01/02/15 (Repurchase Amount $10,205,203, collateralized by various U.S. Government/U.S. Government Agency Obligations, 0.000%-9.375%, Market Value plus accrued interest $10,409,296, due 01/15/15-07/15/32) | | | 10,205,169 | | | | 0.4 | |
| | 10,205,169 | | | | | JPMorgan Chase & Co., Repurchase Agreement dated 12/31/14, 0.10%, due 01/02/15 (Repurchase Amount $10,205,225, collateralized by various U.S. Government Agency Obligations, 2.500%-8.000%, Market Value plus accrued interest $10,409,285, due 08/01/16-01/01/45) | | | 10,205,169 | | | | 0.5 | |
| | 10,205,169 | | | | | Mizuho Securities USA Inc., Repurchase Agreement dated 12/31/14, 0.08%, due 01/02/15 (Repurchase Amount $10,205,214, collateralized by various U.S. Government/U.S. Government Agency Obligations, 0.000%-7.500%, Market Value plus accrued interest $10,409,273, due 01/31/16-12/20/44) | | | 10,205,169 | | | | 0.5 | |
| | | | | | | | | | 42,968,190 | | | | 2.0 | |
| Shares | | | | | | Value | | | Percentage
of Net
Assets | |
| | | | | | | Mutual Funds: 5.1% | | | | | |
| | 110,716,171 | | | | | BlackRock Liquidity Funds, TempFund, Institutional Class, 0.030%†† | | | | | | | | |
| | | | | | | (Cost $110,716,171) | | | 110,716,171 | | | | 5.1 | |
| | | | | | | | | | | | | | | |
| | | | | Total Short-Term Investments | | | | | | | | |
| | | | | (Cost $153,684,361) | | | 153,684,361 | | | | 7.1 | |
| | | | | | | | | | | | | |
| | | | | Total Investments in Securities
(Cost $2,041,040,135) | | $ | 2,199,110,940 | | | | 101.8 | |
| | | | | Liabilities in Excess of Other Assets | | | (39,800,510 | ) | | | (1.8 | ) |
| | | | | Net Assets | | $ | 2,159,310,430 | | | | 100.0 | |
| † | Unless otherwise indicated, principal amount is shown in USD. |
| See Accompanying Notes to Financial Statements |
| VY® Invesco Equity and Income Portfolio | PORTFOLIO OF INVESTMENTS
as of December 31, 2014 (unaudited) (continued) |
| †† | Rate shown is the 7-day yield as of December 31, 2014. |
| # | Securities with purchases pursuant to Rule 144A or section 4(a)(2), under the Securities Act of 1933 and may not be resold subject to that rule except to qualified institutional buyers. |
| ## | The Federal Housing Finance Agency (“FHFA”) placed the Federal Home Loan Mortgage Corporation and Federal National Mortgage Association into conservatorship with FHFA as the conservator. As such, the FHFA oversees the continuing affairs of these companies. |
| @ | Non-income producing security. |
| ADR | American Depositary Receipt |
| P | Preferred Stock may be called prior to convertible date. |
| cc | Represents securities purchased with cash collateral received for securities on loan. |
| L | Loaned security, a portion or all of the security is on loan at December 31, 2014. |
Cost for federal income tax purposes is $2,043,285,333.
Net unrealized appreciation consists of:
| Gross Unrealized Appreciation | | $ | 200,265,380 | |
| Gross Unrealized Depreciation | | | 44,439,773 | |
| | | | | |
| Net Unrealized Appreciation | | $ | 244,705,153 | |
| See Accompanying Notes to Financial Statements |
VY® JPMorgan Mid Cap Value Portfolio | PORTFOLIO OF INVESTMENTS as of December 31, 2014 |
| Shares | | | | | | | Value | | | Percentage of Net Assets | |
| COMMON STOCK: 97.8% | | | | | | | | |
| | | | | | | Consumer Discretionary: 17.6% | | |
| | 11,890 | | | @ | | Autozone, Inc. | | | 7,361,218 | | | | 1.0 | |
| | 75,710 | | | @ | | Bed Bath & Beyond, Inc. | | | 5,766,831 | | | | 0.8 | |
| | 176,450 | | | | | Best Buy Co., Inc. | | | 6,878,021 | | | | 1.0 | |
| | 50,729 | | | | | CBS Corp. - Class B | | | 2,807,343 | | | | 0.4 | |
| | 159,041 | | | | | Clear Channel Outdoor Holdings, Inc. | | | 1,684,244 | | | | 0.2 | |
| | 102,450 | | | @ | | Dish Network Corp. - Class A | | | 7,467,580 | | | | 1.0 | |
| | 136,690 | | | | | Expedia, Inc. | | | 11,667,858 | | | | 1.6 | |
| | 214,990 | | | | | Gannett Co., Inc. | | | 6,864,631 | | | | 1.0 | |
| | 266,790 | | | | | Gap, Inc. | | | 11,234,527 | | | | 1.6 | |
| | 175,665 | | | @ | | Jarden Corp. | | | 8,410,840 | | | | 1.2 | |
| | 193,180 | | | | | Kohl's Corp. | | | 11,791,707 | | | | 1.6 | |
| | 34,566 | | | | | Marriott International, Inc. | | | 2,697,185 | | | | 0.4 | |
| | 61,760 | | | @ | | Mohawk Industries, Inc. | | | 9,595,034 | | | | 1.3 | |
| | 72,900 | | | | | Nordstrom, Inc. | | | 5,787,531 | | | | 0.8 | |
| | 49,270 | | | | | PVH Corp. | | | 6,314,936 | | | | 0.9 | |
| | 80,450 | | | | | Starwood Hotels & Resorts Worldwide, Inc. | | | 6,522,082 | | | | 0.9 | |
| | 68,340 | | | | | Tiffany & Co. | | | 7,302,812 | | | | 1.0 | |
| | 148,340 | | | | | Time, Inc. | | | 3,650,647 | | | | 0.5 | |
| | 42,490 | | | | | VF Corp. | | | 3,182,501 | | | | 0.4 | |
| | | | | | | | | | 126,987,528 | | | | 17.6 | |
| | | | | | | | | | | | | | | |
| | | | | | | Consumer Staples: 5.7% | | | | | | | | |
| | 57,480 | | | @ | | Constellation Brands, Inc. | | | 5,642,812 | | | | 0.8 | |
| | 84,980 | | | | | Dr Pepper Snapple Group, Inc. | | | 6,091,366 | | | | 0.8 | |
| | 48,793 | | | | | Energizer Holdings, Inc. | | | 6,272,828 | | | | 0.9 | |
| | 65,220 | | | | | Hershey Co. | | | 6,778,315 | | | | 0.9 | |
| | 149,180 | | | | | Kroger Co. | | | 9,578,848 | | | | 1.3 | |
| | 928,620 | | | @ | | Rite Aid Corp. | | | 6,983,222 | | | | 1.0 | |
| | | | | | | | | | 41,347,391 | | | | 5.7 | |
| | | | | | | | | | | | | | | |
| | | | | | | Energy: 2.6% | | | | | | | | |
| | 58,550 | | | | | EQT Corp. | | | 4,432,235 | | | | 0.6 | |
| | 140,870 | | | | | PBF Energy, Inc. | | | 3,752,777 | | | | 0.5 | |
| | 175,760 | | | | | QEP Resources, Inc. | | | 3,553,867 | | | | 0.5 | |
| | 253,390 | | | @ | | Southwestern Energy Co. | | | 6,915,013 | | | | 1.0 | |
| | | | | | | | | | 18,653,892 | | | | 2.6 | |
| | | | | | | | | | | | | | | |
| | | | | | | Financials: 30.2% | | | | | | | | |
| | 9,463 | | | @ | | Alleghany Corp. | | | 4,386,100 | | | | 0.6 | |
| | 270,070 | | | | | Ally Financial, Inc. | | | 6,379,053 | | | | 0.9 | |
| | 125,300 | | | | | American Campus Communities, Inc. | | | 5,182,408 | | | | 0.7 | |
| | 74,650 | | | | | Ameriprise Financial, Inc. | | | 9,872,463 | | | | 1.4 | |
| | 47,490 | | | | | AvalonBay Communities, Inc. | | | 7,759,391 | | | | 1.1 | |
| | 29,370 | | | | | Boston Properties, Inc. | | | 3,779,625 | | | | 0.5 | |
| | 182,890 | | | | | Brixmor Property Group, Inc. | | | 4,542,988 | | | | 0.6 | |
| | 56,770 | | | | | Chubb Corp. | | | 5,873,992 | | | | 0.8 | |
| | 150,870 | | | | | Citizens Financial Group, Inc. | | | 3,750,628 | | | | 0.5 | |
| | 69,960 | | | | | City National Corp. | | | 5,653,468 | | | | 0.8 | |
| | 525,320 | | | | | Fifth Third Bancorp. | | | 10,703,395 | | | | 1.5 | |
| | 89,990 | | | | | First Republic Bank | | | 4,690,279 | | | | 0.7 | |
| | 231,040 | | | | | General Growth Properties, Inc. | | | 6,499,155 | | | | 0.9 | |
| | 192,780 | | | | | Hartford Financial Services Group, Inc. | | | 8,036,998 | | | | 1.1 | |
| | 290,580 | | | | | Hudson City Bancorp., Inc. | | | 2,940,670 | | | | 0.4 | |
| | 173,100 | | | | | Huntington Bancshares, Inc. | | | 1,821,012 | | | | 0.3 | |
| | 177,310 | | | | | Invesco Ltd. | | | 7,007,291 | | | | 1.0 | |
| | 301,670 | | | | | Kimco Realty Corp. | | | 7,583,984 | | | | 1.1 | |
| | 78,900 | | | | | Legg Mason, Inc. | | | 4,210,893 | | | | 0.6 | |
| | 280,170 | | | | | Loews Corp. | | | 11,772,743 | | | | 1.6 | |
| | 75,451 | | | | | M&T Bank Corp. | | | 9,478,155 | | | | 1.3 | |
| | 165,550 | | | | | Marsh & McLennan Cos., Inc. | | | 9,476,082 | | | | 1.3 | |
| | 65,190 | | | | | Northern Trust Corp. | | | 4,393,806 | | | | 0.6 | |
| | 212,630 | | | | | Old Republic International Corp. | | | 3,110,777 | | | | 0.4 | |
| | 121,983 | | | | | Outfront Media, Inc. | | | 3,274,020 | | | | 0.5 | |
| | 118,400 | | | | | Progressive Corp. | | | 3,195,616 | | | | 0.4 | |
| | 145,090 | | | | | Rayonier, Inc. | | | 4,053,815 | | | | 0.6 | |
| | 79,130 | | | | | Regency Centers Corp. | | | 5,046,911 | | | | 0.7 | |
| | 215,000 | | | | | SunTrust Bank | | | 9,008,500 | | | | 1.2 | |
| | 104,620 | | | | | T. Rowe Price Group, Inc. | | | 8,982,673 | | | | 1.2 | |
| | 168,590 | | | | | UnumProvident Corp. | | | 5,880,419 | | | | 0.8 | |
| | 73,706 | | | | | Vornado Realty Trust | | | 8,675,933 | | | | 1.2 | |
| | 196,880 | | | | | Weyerhaeuser Co. | | | 7,066,023 | | | | 1.0 | |
| | 90,500 | | | | | WR Berkley Corp. | | | 4,639,030 | | | | 0.6 | |
| | 200,390 | | | | | XL Group PLC | | | 6,887,404 | | | | 1.0 | |
| | 73,360 | | | | | Zions Bancorp. | | | 2,091,494 | | | | 0.3 | |
| | | | | | | | | | 217,707,194 | | | | 30.2 | |
| | | | | | | | | | | | | | | |
| | | | | | | Health Care: 6.6% | | | | | | | | |
| | 97,300 | | | | | AmerisourceBergen Corp. | | | 8,772,568 | | | | 1.2 | |
| | 173,450 | | | @ | | Brookdale Senior Living, Inc. | | | 6,360,412 | | | | 0.9 | |
| | 141,180 | | | | | CareFusion Corp. | | | 8,377,621 | | | | 1.1 | |
| | 110,330 | | | | | Cigna Corp. | | | 11,354,060 | | | | 1.6 | |
| | 32,510 | | | @ | | Henry Schein, Inc. | | | 4,426,237 | | | | 0.6 | |
| | 60,770 | | | | | Humana, Inc. | | | 8,728,395 | | | | 1.2 | |
| | | | | | | | | | 48,019,293 | | | | 6.6 | |
| | | | | | | | | | | | | | | |
| | | | | | | Industrials: 9.4% | | | | | | | | |
| | 126,940 | | | | | Ametek, Inc. | | | 6,680,852 | | | | 0.9 | |
| | 93,810 | | | | | Carlisle Cos., Inc. | | | 8,465,414 | | | | 1.2 | |
| | 110,970 | | | | | Equifax, Inc. | | | 8,974,144 | | | | 1.2 | |
| | 132,370 | | | | | Fortune Brands Home & Security, Inc. | | | 5,992,390 | | | | 0.8 | |
| | 57,990 | | | | | Hubbell, Inc. | | | 6,195,072 | | | | 0.9 | |
| | 103,520 | | | | | IDEX Corp. | | | 8,057,997 | | | | 1.1 | |
| | 76,720 | | | | | MSC Industrial Direct Co. | | | 6,233,500 | | | | 0.9 | |
| | 81,830 | | | | | Regal-Beloit Corp. | | | 6,153,616 | | | | 0.9 | |
| | 133,099 | | | | | Rexnord Corp. | | | 3,754,723 | | | | 0.5 | |
| | 52,001 | | | | | Snap-On, Inc. | | | 7,110,617 | | | | 1.0 | |
| | | | | | | | | | 67,618,325 | | | | 9.4 | |
| | | | | | | | | | | | | | | |
| | | | | | | Information Technology: 8.9% | | | | |
| | 138,660 | | | | | Amphenol Corp. | | | 7,461,295 | | | | 1.0 | |
| | 161,770 | | | | | Analog Devices, Inc. | | | 8,981,471 | | | | 1.2 | |
| | 188,090 | | | @ | | Arrow Electronics, Inc. | | | 10,888,530 | | | | 1.5 | |
See Accompanying Notes to Financial Statements
VY® JPMorgan Mid Cap Value Portfolio | PORTFOLIO OF INVESTMENTS as of December 31, 2014 (continued) |
| | 233,066 | | | | | CommScope Holding Co., Inc. | | | 5,320,897 | | | | 0.7 | |
| | 170,976 | | | | | Jack Henry & Associates, Inc. | | | 10,624,449 | | | | 1.5 | |
| | 66,870 | | | | | KLA-Tencor Corp. | | | 4,702,298 | | | | 0.7 | |
| | 191,490 | | | @ | | Synopsys, Inc. | | | 8,324,070 | | | | 1.2 | |
| | 189,160 | | | | | Xilinx, Inc. | | | 8,188,736 | | | | 1.1 | |
| | | | | | | | | | 64,491,746 | | | | 8.9 | |
| | | | | | | | | | | | | | | |
| | | | | | | Materials: 6.2% | | | | | | | | |
| | 79,030 | | | | | Airgas, Inc. | | | 9,102,675 | | | | 1.2 | |
| | 96,478 | | | | | Albemarle Corp. | | | 5,801,222 | | | | 0.8 | |
| | 117,150 | | | | | Ball Corp. | | | 7,986,116 | | | | 1.1 | |
| | 103,200 | | | | | Rock-Tenn Co. | | | 6,293,136 | | | | 0.9 | |
| | 22,730 | | | | | Sherwin-Williams Co. | | | 5,978,899 | | | | 0.8 | |
| | 21,130 | | | | | Sigma-Aldrich Corp. | | | 2,900,515 | | | | 0.4 | |
| | 129,995 | | | | | Silgan Holdings, Inc. | | | 6,967,732 | | | | 1.0 | |
| | | | | | | | | | 45,030,295 | | | | 6.2 | |
| | | | | | | | | | | | | | | |
| | | | | | | Utilities: 10.6% | | | | | | | | |
| | 275,240 | | | | | CenterPoint Energy, Inc. | | | 6,448,873 | | | | 0.9 | |
| | 218,150 | | | | | CMS Energy Corp. | | | 7,580,713 | | | | 1.1 | |
| | 104,250 | | | | | Edison International | | | 6,826,290 | | | | 0.9 | |
| | 144,670 | | | | | Energen Corp. | | | 9,224,159 | | | | 1.3 | |
| | 68,790 | | | | | National Fuel Gas Co. | | | 4,782,969 | | | | 0.7 | |
| | 70,860 | | | | | NiSource, Inc. | | | 3,005,881 | | | | 0.4 | |
| | 400,350 | | | | | Questar Corp. | | | 10,120,848 | | | | 1.4 | |
| | 84,950 | | | | | Sempra Energy | | | 9,460,032 | | | | 1.3 | |
| | 164,460 | | | | | Westar Energy, Inc. | | | 6,782,330 | | | | 0.9 | |
| | 109,430 | | | | | Wisconsin Energy Corp. | | | 5,771,338 | | | | 0.8 | |
| | 178,900 | | | | | Xcel Energy, Inc. | | | 6,426,088 | | | | 0.9 | |
| | | | | | | | | | 76,429,521 | | | | 10.6 | |
| | | | | | | | | | | | | | | |
| | | | | | | Total Common Stock | | | | | | | | |
| | | | | | | (Cost $514,156,254) | | | 706,285,185 | | | | 97.8 | |
| | | | | | | | | | | | | | | |
| SHORT-TERM INVESTMENTS: 2.3% | | | | | | | | |
| | | | | | | Mutual Funds: 2.3% | | | | | | | | |
| | 16,532,807 | | | | | BlackRock Liquidity Funds, TempFund, Institutional Class, 0.030%†† | | | | | | | | |
| | | | | | | (Cost $16,532,807) | | | 16,532,807 | | | | 2.3 | |
| | | | | | | | | | | | | | | |
| | | | | Total Short-Term Investments | | | | | | | | |
| | | | | (Cost $16,532,807) | | | 16,532,807 | | | | 2.3 | |
| | | | | | | | | | | | | |
| | | | | Total Investments in Securities
(Cost $530,689,061) | | $ | 722,817,992 | | | | 100.1 | |
| | | | | Liabilities in Excess of Other Assets | | | (955,663 | ) | | | (0.1 | ) |
| | | | | Net Assets | | $ | 721,862,329 | | | | 100.0 | |
| †† | Rate shown is the 7-day yield as of December 31, 2014. |
| @ | Non-income producing security. |
Cost for federal income tax purposes is $531,992,250.
Net unrealized appreciation consists of:
| Gross Unrealized Appreciation | | $ | 198,297,528 | |
| Gross Unrealized Depreciation | | | (7,471,786 | ) |
| | | | | |
| Net Unrealized Appreciation | | $ | 190,825,742 | |
See Accompanying Notes to Financial Statements
| VY® Oppenheimer Global Portfolio | PORTFOLIO OF INVESTMENTS as of December 31, 2014 |
| Shares | | | | | | | Value | | | Percentage of Net Assets | |
| COMMON STOCK: 97.9% | | | | | | | | |
| | | | | | | Brazil: 3.2% | | | | | | | | |
| | 1,633,010 | | | | | Ambev SA ADR | | | 10,157,322 | | | | 0.6 | |
| | 2,458,100 | | | | | BM&F Bovespa S.A. | | | 9,108,527 | | | | 0.5 | |
| | 395,440 | | | | | Embraer SA ADR | | | 14,575,918 | | | | 0.9 | |
| | 1,100,189 | | | | | Itau Unibanco Holding S.A. ADR | | | 14,313,459 | | | | 0.9 | |
| | 512,670 | | | L | | Vale SA ADR | | | 4,193,641 | | | | 0.3 | |
| | | | | | | | | | 52,348,867 | | | | 3.2 | |
| | | | | | | | | | | | | | | |
| | | | | | | China: 0.6% | | | | | | | | |
| | 33,200 | | | @ | | Alibaba Group Holding Ltd. ADR | | | 3,450,808 | | | | 0.2 | |
| | 298,563 | | | @,L | | JD.com, Inc. ADR | | | 6,908,748 | | | | 0.4 | |
| | | | | | | | | | 10,359,556 | | | | 0.6 | |
| | | | | | | | | | | | | | | |
| | | | | | | Denmark: 0.4% | | | | | | | | |
| | 156,855 | | | L | | FLSmidth & Co. A/S | | | 6,876,720 | | | | 0.4 | |
| | | | | | | | | | | | | | | |
| | | | | | | France: 5.2% | | | | | | | | |
| | 8,521 | | | | | Hermes International | | | 3,034,313 | | | | 0.2 | |
| | 174,688 | | | | | LVMH Moet Hennessy Louis Vuitton S.A. | | | 27,670,950 | | | | 1.7 | |
| | 137,100 | | | | | Kering | | | 26,346,651 | | | | 1.6 | |
| | 282,970 | | | | | Societe Generale | | | 11,842,375 | | | | 0.7 | |
| | 274,024 | | | | | Technip S.A. | | | 16,322,974 | | | | 1.0 | |
| | | | | | | | | | 85,217,263 | | | | 5.2 | |
| | | | | | | | | | | | | | | |
| | | | | | | Germany: 8.0% | | | | | | | | |
| | 169,003 | | | | | Allianz AG | | | 27,991,401 | | | | 1.7 | |
| | 192,375 | | | | | Bayer AG | | | 26,222,408 | | | | 1.6 | |
| | 428,878 | | | | | Deutsche Bank AG | | | 12,842,511 | | | | 0.8 | |
| | 90,241 | | | | | Linde AG | | | 16,622,654 | | | | 1.0 | |
| | 422,021 | | | | | SAP SE | | | 29,469,118 | | | | 1.8 | |
| | 162,582 | | | | | Siemens AG | | | 18,242,374 | | | | 1.1 | |
| | | | | | | | | | 131,390,466 | | | | 8.0 | |
| | | | | | | | | | | | | | | |
| | | | | | | India: 3.5% | | | | | | | | |
| | 7,354,907 | | | | | DLF Ltd. | | | 15,794,623 | | | | 0.9 | |
| | 2,508,650 | | | | | ICICI Bank Ltd. ADR | | | 28,974,908 | | | | 1.8 | |
| | 2,129,457 | | | | | Zee Telefilms Ltd. | | | 12,791,427 | | | | 0.8 | |
| | | | | | | | | | 57,560,958 | | | | 3.5 | |
| | | | | | | | | | | | | | | |
| | | | | | | Italy: 1.5% | | | | | | | | |
| | 49,700 | | | L | | Brunello Cucinelli SpA | | | 1,110,112 | | | | 0.1 | |
| | 364,738 | | | | | Gtech S.p.A | | | 8,144,200 | | | | 0.5 | |
| | 313,300 | | | | | Prysmian S.p.A. | | | 5,709,519 | | | | 0.4 | |
| | 100,762 | | | L | | Tod's S.p.A. | | | 8,726,237 | | | | 0.5 | |
| | | | | | | | | | 23,690,068 | | | | 1.5 | |
| | | | | | | | | | | | | | | |
| | | | | | | Japan: 10.5% | | | | | | | | |
| | 1,274,700 | | | | | Dai-ichi Life Insurance Co., Ltd. | | | 19,349,757 | | | | 1.2 | |
| | 65,600 | | | | | Fanuc Ltd. | | | 10,816,154 | | | | 0.7 | |
| | 426,000 | | | | | KDDI Corp. | | | 26,763,044 | | | | 1.6 | |
| | 57,251 | | | | | Keyence Corp. | | | 25,510,747 | | | | 1.6 | |
| | 375,800 | | | | | Kyocera Corp. | | | 17,196,465 | | | | 1.0 | |
| | 292,900 | | | | | Murata Manufacturing Co., Ltd. | | | 31,961,543 | | | | 1.9 | |
| | 342,300 | | | | | Nidec Corp. | | | 22,107,670 | | | | 1.3 | |
| | 216,200 | | | L | | Seibu Holdings, Inc. | | | 4,407,862 | | | | 0.3 | |
| | 396,100 | | | | | Sumitomo Mitsui Financial Group, Inc. | | | 14,320,094 | | | | 0.9 | |
| | | | | | | | | | 172,433,336 | | | | 10.5 | |
| | | | | | | | | | | | | | | |
| | | | | | | Mexico: 0.7% | | | | | | | | |
| | 136,982 | | | | | Fomento Economico Mexicano SAB de CV ADR | | | 12,058,525 | | | | 0.7 | |
| | | | | | | | | | | | | | | |
| | | | | | | Netherlands: 1.7% | | | | | | | | |
| | 567,943 | | | | | Airbus Group NV | | | 28,078,034 | | | | 1.7 | |
| | | | | | | | | | | | | | | |
| | | | | | | Russia: 0.3% | | | | | | | | |
| | 5,014,709 | | | | | Alrosa AO | | | 5,095,539 | | | | 0.3 | |
| | | | | | | | | | | | | | | |
| | | | | | | Spain: 3.4% | | | | | | | | |
| | 1,938,016 | | | | | Banco Bilbao Vizcaya Argentaria S.A. | | | 18,303,460 | | | | 1.1 | |
| | 940,613 | | | | | Inditex SA | | | 26,831,425 | | | | 1.7 | |
| | 548,683 | | | | | Repsol YPF S.A. | | | 10,271,830 | | | | 0.6 | |
| | | | | | | | | | 55,406,715 | | | | 3.4 | |
| | | | | | | | | | | | | | | |
| | | | | | | Sweden: 4.2% | | | | | | | | |
| | 493,269 | | | | | Assa Abloy AB | | | 26,052,743 | | | | 1.6 | |
| | 3,517,462 | | | | | Telefonaktiebolaget LM Ericsson | | | 42,589,802 | | | | 2.6 | |
| | | | | | | | | | 68,642,545 | | | | 4.2 | |
| | | | | | | | | | | | | | | |
| | | | | | | Switzerland: 5.2% | | | | | | | | |
| | 768,530 | | | | | Credit Suisse Group | | | 19,306,435 | | | | 1.2 | |
| | 226,818 | | | | | Nestle S.A. | | | 16,535,262 | | | | 1.0 | |
| | 71,875 | | | | | Roche Holding AG - Genusschein | | | 19,473,972 | | | | 1.2 | |
| | 1,716,343 | | | @ | | UBS Group AG | | | 29,503,421 | | | | 1.8 | |
| | | | | | | | | | 84,819,090 | | | | 5.2 | |
| | | | | | | | | | | | | | | |
| | | | | | | United Kingdom: 4.8% | | | | | |
| | 1,725,050 | | | @,L | | Circassia Pharmaceuticals Plc | | | 7,449,409 | | | | 0.4 | |
| | 3,873,541 | | | @,L | | Earthport PLC | | | 2,641,325 | | | | 0.2 | |
| | 1,325,086 | | | | | Prudential PLC | | | 30,635,363 | | | | 1.9 | |
| | 141,870 | | | | | Shire PLC | | | 10,058,612 | | | | 0.6 | |
| | 690,695 | | | | | Unilever PLC | | | 28,061,737 | | | | 1.7 | |
| | | | | | | | | | 78,846,446 | | | | 4.8 | |
| | | | | | | | | | | | | | | |
| | | | | | | United States: 44.7% | | | | | | | | |
| | 153,680 | | | | | 3M Co. | | | 25,252,698 | | | | 1.5 | |
| | 412,063 | | | @ | | Adobe Systems, Inc. | | | 29,956,980 | | | | 1.8 | |
| | 345,530 | | | | | Aetna, Inc. | | | 30,693,430 | | | | 1.9 | |
| | 73,840 | | | | | Allergan, Inc. | | | 15,697,645 | | | | 1.0 | |
| | 838,330 | | | | | Altera Corp. | | | 30,967,910 | | | | 1.9 | |
| | 241,990 | | | | | Anthem, Inc. | | | 30,410,883 | | | | 1.8 | |
| | 43,290 | | | @ | | Biogen Idec, Inc. | | | 14,694,790 | | | | 0.9 | |
| | 128,950 | | | | | BioMarin Pharmaceuticals, Inc. | | | 11,657,080 | | | | 0.7 | |
| | 48,050 | | | | | Bluebird Bio, Inc. | | | 4,407,146 | | | | 0.3 | |
| | 743,000 | | | @,L | | Celldex Therapeutics, Inc. | | | 13,559,750 | | | | 0.8 | |
| | 645,400 | | | | | Citigroup, Inc. | | | 34,922,594 | | | | 2.1 | |
| | 159,790 | | | L | | Clovis Oncology, Inc. | | | 8,948,240 | | | | 0.5 | |
| | 486,240 | | | | | Colgate-Palmolive Co. | | | 33,642,946 | | | | 2.0 | |
| | 664,460 | | | @ | | eBay, Inc. | | | 37,289,495 | | | | 2.3 | |
| | 229,450 | | | | | Emerson Electric Co. | | | 14,163,948 | | | | 0.9 | |
| | 330,140 | | | | | Facebook, Inc. | | | 25,757,523 | | | | 1.6 | |
| | 360,620 | | | | | FNF Group | | | 12,423,359 | | | | 0.8 | |
| | 50,270 | | | | | FNFV Group | | | 791,250 | | | | 0.0 | |
| | 220,270 | | | @ | | Gilead Sciences, Inc. | | | 20,762,650 | | | | 1.3 | |
See Accompanying Notes to Financial Statements
| PORTFOLIO OF INVESTMENTS |
| VY® Oppenheimer Global Portfolio | as of December 31, 2014 (unaudited) (continued) |
| | 136,200 | | | | | Goldman Sachs Group, Inc. | | | 26,399,646 | | | | 1.6 | |
| | 43,130 | | | | | Google, Inc. – Class A | | | 22,887,366 | | | | 1.4 | |
| | 43,130 | | | | | Google, Inc. - Class C | | | 22,703,632 | | | | 1.4 | |
| | 326,640 | | | | | Intuit, Inc. | | | 30,112,942 | | | | 1.8 | |
| | 869,590 | | | | | Maxim Integrated Products | | | 27,713,833 | | | | 1.7 | |
| | 145,450 | | | | | McDonald's Corp. | | | 13,628,665 | | | | 0.8 | |
| | 461,070 | | | | | McGraw-Hill Cos., Inc. | | | 41,026,009 | | | | 2.5 | |
| | 80,060 | | | @ | | Medivation, Inc. | | | 7,974,777 | | | | 0.5 | |
| | 163,320 | | | | | St. Jude Medical, Inc. | | | 10,620,700 | | | | 0.6 | |
| | 100,411 | | | @,L | | Theravance Biopharma, Inc. | | | 1,498,132 | | | | 0.1 | |
| | 383,840 | | | L | | Theravance, Inc. | | | 5,431,336 | | | | 0.3 | |
| | 252,280 | | | | | Tiffany & Co. | | | 26,958,641 | | | | 1.6 | |
| | 190,060 | | | | | United Parcel Service, Inc. - Class B | | | 21,128,970 | | | | 1.3 | |
| | 187,120 | | | @ | | Vertex Pharmaceuticals, Inc. | | | 22,229,856 | | | | 1.4 | |
| | 412,860 | | | | | Walt Disney Co. | | | 38,887,283 | | | | 2.4 | |
| | 170,960 | | | | | Zimmer Holdings, Inc. | | | 19,390,283 | | | | 1.2 | |
| | | | | | | | | | 734,592,388 | | | | 44.7 | |
| | | | | | | | | | | | | | | |
| | | | | Total Common Stock
(Cost $1,009,174,928) | | | 1,607,416,516 | | | | 97.9 | |
| | | | | | | | | | | | | |
| PREFERRED STOCK: 1.9% | | | | | | | | |
| | | | | | | Germany: 1.8% | | | | | | | | |
| | 370,294 | | | | | Bayerische Motoren Werke AG | | | 30,253,005 | | | | 1.8 | |
| | | | | | | | | | | | | | | |
| | | | | | | India: 0.1% | | | | | | | | |
| | 50,809,899 | | | | | Zee Entertainment Enterprises Ltd. | | | 700,299 | | | | 0.1 | |
| | | | | | | | | | | | | | | |
| | | | | Total Preferred Stock | | | | | | | | |
| | | | | (Cost $13,618,275) | | | 30,953,304 | | | | 1.9 | |
| | | | | | | | | | | | | |
| RIGHTS: 0.0% | | | | | | | | |
| | | | | | | Italy: 0.0% | | | | | | | | |
| | 364,738 | | | @ | | GTECH SPA - RTS | | | 1,456 | | | | 0.0 | |
| | | | | | | | | | | | | | | |
| | | | | | | Spain: 0.0% | | | | | | | | |
| | 1,938,016 | | | @ | | Banco Bilbao Vizcaya Argentaria SA | | | 185,263 | | | | 0.0 | |
| | 548,683 | | | @ | | Repsol SA | | | 303,419 | | | | 0.0 | |
| | | | | | | | | | 488,682 | | | | 0.0 | |
| | | | | | | | | | | | | | | |
| | | | | Total Rights | | | | | | | | |
| | | | | (Cost $475,993) | | | 490,138 | | | | 0.0 | |
| | | | | | | | | | | | | |
| | | | | Total Long-Term Investments | | | | | | | | |
| | | | | (Cost $1,023,269,196) | | | 1,638,859,958 | | | | 99.8 | |
Principal Amount† | | | | | | | Value | | | Percentage of Net Assets | |
| SHORT-TERM INVESTMENTS: 3.6% | | | | | | | | |
| | | | | | | Securities Lending Collateralcc: 2.4 % | |
| | 9,171,152 | | | | | Cantor Fitzgerald, Repurchase Agreement dated 12/31/14, 0.09%, due 01/02/15 (Repurchase Amount $9,171,197, collateralized by various U.S. Government/U.S. Government Agency Obligations, 0.000%-10.500%, Market Value plus accrued interest $9,354,575, due 01/01/15-09/01/49) | | | 9,171,152 | | | | 0.6 | |
| | 1,930,668 | | | | | Daiwa Capital Markets, Repurchase Agreement dated 12/31/14, 0.12%, due 01/02/15 (Repurchase Amount $1,930,681, collateralized by various U.S. Government/U.S. Government Agency Obligations, 0.000%-6.500%, Market Value plus accrued interest $1,969,281, due 06/01/17-03/01/48) | | | 1,930,668 | | | | 0.1 | |
| | 9,171,152 | | | | | Nomura Securities, Repurchase Agreement dated 12/31/14, 0.08%, due 01/02/15 (Repurchase Amount $9,171,192, collateralized by various U.S. Government/U.S. Government Agency Obligations, 0.000%-8.875%, Market Value plus accrued interest $9,354,575, due 01/07/15-10/20/64) | | | 9,171,152 | | | | 0.6 | |
| | 9,171,152 | | | | | Royal Bank of Scotland PLC, Repurchase Agreement dated 12/31/14, 0.09%, due 01/02/15 (Repurchase Amount $9,171,197, collateralized by various U.S. Government/U.S. Government Agency Obligations, 0.375%-7.250%, Market Value plus accrued interest $9,354,576, due 11/15/15-07/15/56) | | | 9,171,152 | | | | 0.6 | |
See Accompanying Notes to Financial Statements
| PORTFOLIO OF INVESTMENTS |
| VY® Oppenheimer Global Portfolio | as of December 31, 2014 (unaudited) (continued) |
| | 9,171,152 | | | | | State of Wisconsin Investment Board, Repurchase Agreement dated 12/31/14, 0.15%, due 01/02/15 (Repurchase Amount $9,171,227, collateralized by various U.S. Government Securities, 0.125%-2.500%, Market Value plus accrued interest $9,355,494, due 04/15/16-02/15/42) | | | 9,171,152 | | | | 0.5 | |
| | | | | | | | | | 38,615,276 | | | | 2.4 | |
| Shares | | | | | | | | Value | | | | Percentage
of Net
Assets | |
| | | | | | | Mutual Funds: 1.2% | | | | | | | | |
| | 19,820,244 | | | | | BlackRock Liquidity Funds, TempFund, Institutional Class, 0.030%†† | | | | | | | | |
| | | | | | | (Cost $19,820,244) | | | 19,820,244 | | | | 1.2 | |
| | | | | | | | | | | | | | | |
| | | | | Total Short-Term Investments | | | | | | | | |
| | | | | (Cost $58,435,520) | | | 58,435,520 | | | | 3.6 | |
| | | | | | | | | | | | | |
| | | | | Total Investments in Securities
(Cost $1,081,704,716) | | $ | 1,697,295,478 | | | | 103.4 | |
| | | | | Liabilities in Excess of Other Assets | | | (55,337,400 | ) | | | (3.4 | ) |
| | | | | Net Assets | | $ | 1,641,958,078 | | | | 100.0 | |
| † | Unless otherwise indicated, principal amount is shown in USD. |
| †† | Rate shown is the 7-day yield as of December 31, 2014. |
| @ | Non-income producing security. |
| ADR | American Depositary Receipt |
| cc | Represents securities purchased with cash collateral received for securities on loan. |
| L | Loaned security, a portion or all of the security is on loan at December 31, 2014. |
Cost for federal income tax purposes is $1,096,011,488.
Net unrealized appreciation consists of:
| Gross Unrealized Appreciation | | $ | 650,964,796 | |
| Gross Unrealized Depreciation | | | (49,680,806 | ) |
| | | | | |
| Net Unrealized Appreciation | | $ | 601,283,990 | |
| Sector Diversification | | Percentage
of Net Assets | |
| Information Technology | | | 23.2 | % |
| Financials | | | 19.9 | |
| Health Care | | | 17.1 | |
| Consumer Discretionary | | | 16.7 | |
| Industrials | | | 11.7 | |
| Consumer Staples | | | 6.0 | |
| Materials | | | 2.0 | |
| Telecommunication Services | | | 1.6 | |
| Energy | | | 1.6 | |
| Short-Term Investments | | | 3.6 | |
| Liabilities in Excess of Other Assets | | | (3.4 | ) |
| Net Assets | | | 100.0 | % |
See Accompanying Notes to Financial Statements
| VY® Pioneer High Yield Portfolio | PORTFOLIO OF INVESTMENTS
as of December 31, 2014 |
Principal
Amount† | | | | | | | Value | | | Percentage
of Net
Assets | |
| CORPORATE BONDS/NOTES: 82.4% | | | | |
| | | | | | | Basic Materials: 3.7% | | | | | | | | |
| | 360,000 | | | # | | Cascades, Inc., 5.500%, 07/15/22 | | | 359,550 | | | | 0.3 | |
| | 155,000 | | | | | Chemtura Corp., 5.750%, 07/15/21 | | | 151,900 | | | | 0.1 | |
| | 350,000 | | | # | | Eldorado Gold Corp., 6.125%, 12/15/20 | | | 341,250 | | | | 0.3 | |
| | 220,000 | | | | | Hexion US Finance Corp. / Hexion Nova Scotia Finance ULC, 8.875%, 02/01/18 | | | 196,350 | | | | 0.2 | |
| | 219,000 | | | | | Hexion US Finance Corp. / Hexion Nova Scotia Finance ULC, 9.000%, 11/15/20 | | | 158,775 | | | | 0.1 | |
| | 60,000 | | | | | Hexion US Finance Corp., 6.625%, 04/15/20 | | | 59,100 | | | | 0.0 | |
| | 370,000 | | | # | | IAMGOLD Corp., 6.750%, 10/01/20 | | | 280,534 | | | | 0.2 | |
| | 200,000 | | | # | | INEOS Group Holdings SA, 5.875%, 02/15/19 | | | 190,000 | | | | 0.2 | |
| | 450,000 | | | # | | Mercer International, Inc., 7.000%, 12/01/19 | | | 455,625 | | | | 0.4 | |
| | 350,000 | | | #,± | | Midwest Vanadium Pty Ltd., 11.500%, 02/15/18 | | | 26,250 | | | | 0.0 | |
| | 155,000 | | | | | Millar Western Forest Products Ltd., 8.500%, 04/01/21 | | | 161,200 | | | | 0.1 | |
| | 80,000 | | | # | | Prince Mineral Holding Corp., 12.500%, 12/15/19 | | | 82,000 | | | | 0.1 | |
| | 410,000 | | | | | Resolute Forest Products, Inc., 5.875%, 05/15/23 | | | 391,550 | | | | 0.3 | |
| | 170,000 | | | | | RPM International, Inc., 2.250%, 12/15/20 | | | 199,006 | | | | 0.2 | |
| | 240,000 | | | # | | Steel Dynamics, Inc., 5.125%, 10/01/21 | | | 244,500 | | | | 0.2 | |
| | 410,000 | | | | | Tronox Finance LLC, 6.375%, 08/15/20 | | | 413,075 | | | | 0.3 | |
| | 120,000 | | | # | | Unifrax I LLC / Unifrax Holding Co., 7.500%, 02/15/19 | | | 118,800 | | | | 0.1 | |
| | 240,000 | | | # | | WR Grace & Co-Conn, 5.125%, 10/01/21 | | | 246,600 | | | | 0.2 | |
| | 135,000 | | | # | | WR Grace & Co-Conn, 5.625%, 10/01/24 | | | 141,244 | | | | 0.1 | |
| | 305,000 | | | | | Xerium Technologies, Inc., 8.875%, 06/15/18 | | | 321,013 | | | | 0.3 | |
| | | | | | | | | | 4,538,322 | | | | 3.7 | |
| | | | | | | | | | | | | | | |
| | | | | | | Communications: 11.8% | | | | | | | | |
| | 145,000 | | | | | Cambium Learning Group, Inc., 9.750%, 02/15/17 | | | 143,550 | | | | 0.1 | |
| | 550,000 | | | | | CCO Holdings LLC / CCO Holdings Capital Corp., 6.500%, 04/30/21 | | | 579,562 | | | | 0.5 | |
| | 200,000 | | | | | CCOH Safari LLC, 5.750%, 12/01/24 | | | 202,750 | | | | 0.2 | |
| | 580,000 | | | | | CenturyLink, Inc., 6.450%, 06/15/21 | | | 624,950 | | | | 0.5 | |
| | 250,000 | | | | | Ciena Corp., 0.875%, 06/15/17 | | | 248,906 | | | | 0.2 | |
| | 288,000 | | | | | Cincinnati Bell, Inc., 8.375%, 10/15/20 | | | 303,840 | | | | 0.2 | |
| | 115,000 | | | # | | CommScope, Inc., 5.500%, 06/15/24 | | | 113,850 | | | | 0.1 | |
| | 120,000 | | | # | | CommScope, Inc., 5.000%, 06/15/21 | | | 118,800 | | | | 0.1 | |
| | 330,000 | | | # | | DigitalGlobe, Inc., 5.250%, 02/01/21 | | | 315,150 | | | | 0.2 | |
| | 400,000 | | | | | Equinix, Inc., 5.375%, 01/01/22 | | | 405,760 | | | | 0.3 | |
| | 195,000 | | | | | Equinix, Inc., 5.375%, 04/01/23 | | | 195,975 | | | | 0.2 | |
| | 245,000 | | | | | Finisar Corp., 0.500%, 12/15/33 | | | 232,750 | | | | 0.2 | |
| | 245,000 | | | | | Frontier Communications Corp., 8.500%, 04/15/20 | | | 274,400 | | | | 0.2 | |
| | 555,000 | | | | | Frontier Communications Corp., 8.750%, 04/15/22 | | | 622,987 | | | | 0.5 | |
| | 200,000 | | | | | Frontier Communications Corp., 9.250%, 07/01/21 | | | 231,750 | | | | 0.2 | |
| | 425,000 | | | | | Gannett Co., Inc., 6.375%, 10/15/23 | | | 452,625 | | | | 0.4 | |
| | 250,000 | | | | | Intelsat Jackson Holdings SA, 6.625%, 12/15/22 | | | 258,125 | | | | 0.2 | |
| | 200,000 | | | | | Intelsat Luxembourg SA, 7.750%, 06/01/21 | | | 201,250 | | | | 0.2 | |
| | 150,000 | | | | | Lamar Media Corp., 5.375%, 01/15/24 | | | 155,250 | | | | 0.1 | |
| | 275,000 | | | | | Liberty Media Corp., 1.375%, 10/15/23 | | | 272,594 | | | | 0.2 | |
| | 470,250 | | | | | McGraw-Hill School Educcation, 6.250%, 12/17/19 | | | 470,054 | | | | 0.4 | |
| | 270,000 | | | # | | MDC Partners, Inc., 6.750%, 04/01/20 | | | 279,112 | | | | 0.2 | |
| | 255,000 | | | | | Mediacom Broadband LLC / Mediacom Broadband Corp., 5.500%, 04/15/21 | | | 257,231 | | | | 0.2 | |
| | 85,000 | | | # | | MPL 2 Acquisition Canco, Inc., 9.875%, 08/15/18 | | | 91,534 | | | | 0.1 | |
| | 125,000 | | | | | NeuStar, Inc., 4.500%, 01/15/23 | | | 109,688 | | | | 0.1 | |
| | 200,000 | | | # | | Numericable Group SA, 6.000%, 05/15/22 | | | 201,350 | | | | 0.2 | |
| | 350,000 | | | | | Quebecor Media, Inc., 5.750%, 01/15/23 | | | 359,625 | | | | 0.3 | |
| | 480,000 | | | | | Shutterfly, Inc., 0.250%, 05/15/18 | | | 456,900 | | | | 0.4 | |
| | 170,000 | | | # | | Sirius XM Radio, Inc., 4.625%, 05/15/23 | | | 159,800 | | | | 0.1 | |
| | 400,000 | | | | | Sprint Corp., 7.250%, 09/15/21 | | | 398,500 | | | | 0.3 | |
| See Accompanying Notes to Financial Statements |
| VY® Pioneer High Yield Portfolio | PORTFOLIO OF INVESTMENTS
as of December 31, 2014 (unaudited) (continued) |
| | 245,000 | | | # | | Taylor Morrison Communities, Inc. / Monarch Communities, Inc., 5.625%, 03/01/24 | | | 237,650 | | | | 0.2 | |
| | 60,000 | | | | | T-Mobile USA, Inc., 6.125%, 01/15/22 | | | 61,125 | | | | 0.0 | |
| | 70,000 | | | | | T-Mobile USA, Inc., 6.500%, 01/15/24 | | | 71,925 | | | | 0.1 | |
| | 450,000 | | | | | T-Mobile USA, Inc., 6.542%, 04/28/20 | | | 466,313 | | | | 0.4 | |
| | 100,000 | | | | | T-Mobile USA, Inc., 6.633%, 04/28/21 | | | 103,000 | | | | 0.1 | |
| | 220,000 | | | # | | Townsquare Radio LLC / Townsquare Radio, Inc., 9.000%, 04/01/19 | | | 235,400 | | | | 0.2 | |
| | 155,000 | | | # | | Twitter, Inc., 0.250%, 09/15/19 | | | 135,431 | | | | 0.1 | |
| | 58,909 | | | | | Univision Communications, Inc., 4.000%, 03/01/20 | | | 57,694 | | | | 0.0 | |
| | 665,000 | | | # | | Univision Communications, Inc., 6.875%, 05/15/19 | | | 694,094 | | | | 0.6 | |
| | 340,000 | | | | | VeriSign, Inc., 4.625%, 05/01/23 | | | 334,900 | | | | 0.3 | |
| | 315,000 | | | | | ViaSat, Inc., 6.875%, 06/15/20 | | | 329,175 | | | | 0.3 | |
| | 400,000 | | | | | Virgin Media Investment Holding, 3.500%, 02/15/20 | | | 394,000 | | | | 0.3 | |
| | 315,000 | | | | | WebMD Health Corp., 1.500%, 12/01/20 | | | 315,984 | | | | 0.3 | |
| | 635,000 | | | | | WebMD Health Corp., 2.500%, 01/31/18 | | | 636,588 | | | | 0.5 | |
| | 279,348 | | | | | West Corp., 3.250%, 06/30/18 | | | 274,460 | | | | 0.2 | |
| | 375,000 | | | | | Windstream Corp., 6.375%, 08/01/23 | | | 348,413 | | | | 0.3 | |
| | 360,000 | | | | | Windstream Corp., 7.500%, 06/01/22 | | | 360,450 | | | | 0.3 | |
| | 350,000 | | | | | Windstream Corp., 7.750%, 10/01/21 | | | 358,750 | | | | 0.3 | |
| | 200,000 | | | | | Windstream Corp., 7.750%, 10/15/20 | | | 206,500 | | | | 0.2 | |
| | | | | | | | | | 14,360,470 | | | | 11.8 | |
| | | | | | | | | | | | | | | |
| | | | | | | Consumer, Cyclical: 9.9% | | | | | | | | |
| | 245,000 | | | | | Allegion US Holding Co., Inc., 5.750%, 10/01/21 | | | 260,312 | | | | 0.2 | |
| | 335,000 | | | # | | Asbury Automotive Group, Inc., 6.000%, 12/15/24 | | | 341,700 | | | | 0.3 | |
| | 440,000 | | | # | | Brookfield Residential Properties, Inc., 6.500%, 12/15/20 | | | 462,000 | | | | 0.4 | |
| | 200,000 | | | | | Brown Shoe Co., Inc., 7.125%, 05/15/19 | | | 209,500 | | | | 0.2 | |
| | 360,750 | | | | | Camping World, 5.750%, 02/20/20 | | | 359,397 | | | | 0.3 | |
| | 85,000 | | | | | Continental Airlines, Inc., 4.500%, 01/15/15 | | | 298,084 | | | | 0.2 | |
| | 220,000 | | | | | Dana Holding Corp., 6.000%, 09/15/23 | | | 231,000 | | | | 0.2 | |
| | 285,000 | | | | | DR Horton, Inc., 5.750%, 08/15/23 | | | 302,812 | | | | 0.2 | |
| | 174,775 | | | | | Federal Mogul Corp., 4.750%, 12/27/15 | | | 173,737 | | | | 0.1 | |
| | 100,000 | | | | | Ferrellgas L.P. / Ferrellgas Finance Corp., 6.500%, 05/01/21 | | | 98,000 | | | | 0.1 | |
| | 375,000 | | | | | Ferrellgas L.P. / Ferrellgas Finance Corp., 6.750%, 01/15/22 | | | 368,437 | | | | 0.3 | |
| | 345,000 | | | # | | Global Partners L.P./GLP Finance Corp., 6.250%, 07/15/22 | | | 336,375 | | | | 0.3 | |
| | 105,000 | | | | | Goodyear Tire & Rubber Co., 7.000%, 05/15/22 | | | 113,925 | | | | 0.1 | |
| | 490,000 | | | # | | Jarden Corp., 1.125%, 03/15/34 | | | 551,556 | | | | 0.4 | |
| | 355,000 | | | # | | JLL/Delta Dutch Newco BV, 7.500%, 02/01/22 | | | 361,656 | | | | 0.3 | |
| | 650,000 | | | | | KB Home, 1.375%, 02/01/19 | | | 647,563 | | | | 0.5 | |
| | 400,000 | | | | | KB Home, 7.000%, 12/15/21 | | | 421,750 | | | | 0.3 | |
| | 245,000 | | | | | KB Home, 7.500%, 09/15/22 | | | 260,925 | | | | 0.2 | |
| | 108,338 | | | | | Landrys, Inc., 4.000%, 04/24/18 | | | 107,831 | | | | 0.1 | |
| | 104,000 | | | # | | Lennar Corp., 2.750%, 12/15/20 | | | 210,340 | | | | 0.2 | |
| | 250,000 | | | | | Lennar Corp., 4.500%, 06/15/19 | | | 251,250 | | | | 0.2 | |
| | 465,000 | | | | | Lennar Corp., 4.750%, 11/15/22 | | | 458,025 | | | | 0.4 | |
| | 100,000 | | | | | LKQ Corp., 4.750%, 05/15/23 | | | 96,500 | | | | 0.1 | |
| | 12,772 | | | & | | Mashantucket Western Pequot Tribe, 2.000%, 07/01/36 | | | 160 | | | | 0.0 | |
| | 145,000 | | | | | Meritage Homes Corp., 7.000%, 04/01/22 | | | 154,425 | | | | 0.1 | |
| | 180,000 | | | | | Meritor, Inc., 6.750%, 06/15/21 | | | 189,000 | | | | 0.2 | |
| | 580,000 | | | | | Navistar International Corp., 8.250%, 11/01/21 | | | 574,200 | | | | 0.5 | |
| | 300,000 | | | # | | NCL Corp. Ltd., 5.250%, 11/15/19 | | | 303,750 | | | | 0.2 | |
| | 200,000 | | | # | | Nexteer Automotive Group Ltd., 5.875%, 11/15/21 | | | 201,000 | | | | 0.2 | |
| | 185,000 | | | | | PC Nextco Holdings LLC / PC Nextco Finance, Inc., 8.750%, 08/15/19 | | | 186,850 | | | | 0.2 | |
| | 270,000 | | | | | Regal Entertainment Group, 5.750%, 02/01/25 | | | 249,750 | | | | 0.2 | |
| | 150,000 | | | | | Regal Entertainment Group, 5.750%, 03/15/22 | | | 144,000 | | | | 0.1 | |
| | 330,000 | | | | | Ryland Group, Inc., 0.250%, 06/01/19 | | | 307,106 | | | | 0.2 | |
| | 130,000 | | | | | Ryland Group, Inc., 5.375%, 10/01/22 | | | 126,750 | | | | 0.1 | |
| | 150,000 | | | | | Scientific Games International, Inc., 6.250%, 09/01/20 | | | 105,750 | | | | 0.1 | |
| | 800,000 | | | # | | Scientific Games International, Inc., 10.000%, 12/01/22 | | | 737,000 | | | | 0.6 | |
| See Accompanying Notes to Financial Statements |
| VY® Pioneer High Yield Portfolio | PORTFOLIO OF INVESTMENTS
as of December 31, 2014 (unaudited) (continued) |
| | 145,000 | | | # | | Stackpole International Intermediate Co. SA / Stackpole International Power Meta, 7.750%, 10/15/21 | | | 145,725 | | | | 0.1 | |
| | 235,000 | | | | | Standard Pacific Corp., 1.250%, 08/01/32 | | | 264,669 | | | | 0.2 | |
| | 117,000 | | | | | Star Gas Partners L.P., 8.875%, 12/01/17 | | | 120,510 | | | | 0.1 | |
| | 245,000 | | | | | Tempur Sealy International, Inc., 6.875%, 12/15/20 | | | 261,538 | | | | 0.2 | |
| | 458,057 | | | | | Tower Automotive Holdings - TL B 1L, 4.000%, 04/17/20 | | | 450,900 | | | | 0.4 | |
| | 245,000 | | | # | | Viking Cruises Ltd., 8.500%, 10/15/22 | | | 266,438 | | | | 0.2 | |
| | 475,000 | | | # | | WMG Acquisition Corp., 6.750%, 04/15/22 | | | 434,625 | | | | 0.4 | |
| | | | | | | | | | 12,146,821 | | | | 9.9 | |
| | | | | | | | | | | | | | | |
| | | | | | | Consumer, Non-cyclical: 14.6% | | | | | | | | |
| | 117,228 | | | | | AdvancePierre Foods - TL L, 5.750%, 07/10/17 | | | 116,642 | | | | 0.1 | |
| | 145,000 | | | | | Albany Molecular Research, Inc., 2.250%, 11/15/18 | | | 175,359 | | | | 0.1 | |
| | 710,000 | | | | | Alere, Inc., 3.000%, 05/15/16 | | | 741,950 | | | | 0.6 | |
| | 570,000 | | | | | Alliance One International, Inc., 9.875%, 07/15/21 | | | 511,575 | | | | 0.4 | |
| | 210,000 | | | # | | Amsurg Corp., 5.625%, 07/15/22 | | | 216,300 | | | | 0.2 | |
| | 140,000 | | | # | | ARIAD Pharmaceuticals, Inc., 3.625%, 06/15/19 | | | 143,675 | | | | 0.1 | |
| | 155,000 | | | | | Ascent Capital Group, Inc., 4.000%, 07/15/20 | | | 128,166 | | | | 0.1 | |
| | 175,000 | | | # | | Ashtead Capital, Inc., 5.625%, 10/01/24 | | | 180,250 | | | | 0.1 | |
| | 150,000 | | | | | Aviv Healthcare Properties L.P. / Aviv Healthcare Capital Corp., 7.750%, 02/15/19 | | | 156,862 | | | | 0.1 | |
| | 200,000 | | | | | B&G Foods, Inc., 4.625%, 06/01/21 | | | 195,970 | | | | 0.2 | |
| | 69,612 | | | | | BioScrip, Inc. - TL B DD, 6.500%, 07/31/20 | | | 69,960 | | | | 0.1 | |
| | 119,732 | | | | | BioScrip, Inc. - TL B, 6.500%, 07/31/20 | | | 120,331 | | | | 0.1 | |
| | 115,000 | | | | | BioMarin Pharmaceutical, Inc., 0.750%, 10/15/18 | | | 135,772 | | | | 0.1 | |
| | 115,000 | | | | | BioMarin Pharmaceutical, Inc., 1.500%, 10/15/20 | | | 141,522 | | | | 0.1 | |
| | 215,000 | | | # | | C&S Group Enterprises LLC, 5.375%, 07/15/22 | | | 213,925 | | | | 0.2 | |
| | 490,000 | | | | | Cardtronics, Inc., 1.000%, 12/01/20 | | | 487,244 | | | | 0.4 | |
| | 120,000 | | | # | | Carriage Services, Inc., 2.750%, 03/15/21 | | | 130,426 | | | | 0.1 | |
| | 225,000 | | | # | | Cenveo Corp., 6.000%, 08/01/19 | | | 204,750 | | | | 0.2 | |
| | 139,000 | | | | | Chiquita Brands International, Inc. / Chiquita Brands LLC, 7.875%, 02/01/21 | | | 149,946 | | | | 0.1 | |
| | 70,000 | | | | | CHS/Community Health Systems, Inc., 6.875%, 02/01/22 | | | 74,506 | | | | 0.1 | |
| | 870,000 | | | | | CHS/Community Health Systems, Inc., 8.000%, 11/15/19 | | | 930,900 | | | | 0.8 | |
| | 225,000 | | | | | Constellation Brands, Inc., 3.750%, 05/01/21 | | | 223,312 | | | | 0.2 | |
| | 275,000 | | | | | Constellation Brands, Inc., 4.250%, 05/01/23 | | | 273,625 | | | | 0.2 | |
| | 350,000 | | | | | Corsicanto Ltd., 3.500%, 01/15/32 | | | 222,687 | | | | 0.2 | |
| | 265,000 | | | # | | Cott Beverages, Inc., 5.375%, 07/01/22 | | | 243,800 | | | | 0.2 | |
| | 100,000 | | | | | Cubist Pharmaceuticals, Inc., 1.125%, 09/01/18 | | | 132,812 | | | | 0.1 | |
| | 115,000 | | | | | Cubist Pharmaceuticals, Inc., 1.875%, 09/01/20 | | | 156,687 | | | | 0.1 | |
| | 430,000 | | | | | Del Monte Foods Company, 8.250%, 07/26/21 | | | 369,800 | | | | 0.3 | |
| | 200,000 | | | # | | Dole Food Co., Inc., 7.250%, 05/01/19 | | | 199,750 | | | | 0.2 | |
| | 32,000 | | | | | DynCorp International, Inc., 10.375%, 07/01/17 | | | 27,360 | | | | 0.0 | |
| | 140,000 | | | # | | Endo Finance LLC, 5.375%, 01/15/23 | | | 137,550 | | | | 0.1 | |
| | 315,000 | | | # | | Endo Finance LLC, 5.750%, 01/15/22 | | | 315,787 | | | | 0.3 | |
| | 180,000 | | | | | Endologix, Inc., 2.250%, 12/15/18 | | | 176,737 | | | | 0.1 | |
| | 250,000 | | | # | | FAGE Dairy Industry SA / FAGE USA Dairy Industry, Inc., 9.875%, 02/01/20 | | | 262,500 | | | | 0.2 | |
| | 350,000 | | | | | FTI Consulting, Inc., 6.000%, 11/15/22 | | | 359,625 | | | | 0.3 | |
| | 383,991 | | | | | Gentiva Health Services, Inc. - TL B 1L, 6.500%, 10/18/19 | | | 384,471 | | | | 0.3 | |
| | 73,000 | | | | | Gentiva Health Services, Inc., 11.500%, 09/01/18 | | | 77,763 | | | | 0.1 | |
| | 270,000 | | | | | H&E Equipment Services, Inc., 7.000%, 09/01/22 | | | 279,112 | | | | 0.2 | |
| | 250,000 | | | #,& | | Igloo Holdings Corp., 8.250%, 12/15/17 | | | 250,625 | | | | 0.2 | |
| | 65,000 | | | | | Insulet Corp., 2.000%, 06/15/19 | | | 76,619 | | | | 0.1 | |
| | 300,000 | | | | | Iron Mountain, Inc., 5.750%, 08/15/24 | | | 303,375 | | | | 0.2 | |
| | 200,000 | | | # | | Jazz Investments I Ltd., 1.875%, 08/15/21 | | | 227,250 | | | | 0.2 | |
| | 240,000 | | | # | | Kindred Escrow Corp. II, 8.000%, 01/15/20 | | | 256,200 | | | | 0.2 | |
| | 255,000 | | | # | | Kindred Healthcare, Inc., 6.375%, 04/15/22 | | | 244,163 | | | | 0.2 | |
| | 332,000 | | | | | Lantheus Medical Imaging, Inc., 9.750%, 05/15/17 | | | 319,965 | | | | 0.3 | |
| | 75,000 | | | # | | Live Nation Entertainment, Inc., 5.375%, 06/15/22 | | | 75,375 | | | | 0.1 | |
| | 300,000 | | | # | | Live Nation Entertainment, Inc., 7.000%, 09/01/20 | | | 318,000 | | | | 0.3 | |
| | 181,474 | | | | | Metaldyne LLC, 4.250%, 10/08/21 | | | 180,839 | | | | 0.1 | |
| See Accompanying Notes to Financial Statements |
| VY® Pioneer High Yield Portfolio | PORTFOLIO OF INVESTMENTS
as of December 31, 2014 (unaudited) (continued) |
| | 100,000 | | | | | Monitronics International, Inc., 9.125%, 04/01/20 | | | 94,938 | | | | 0.1 | |
| | 400,000 | | | # | | Multi-Color Corp., 6.125%, 12/01/22 | | | 401,000 | | | | 0.3 | |
| | 106,000 | | | | | NuVasive, Inc., 2.750%, 07/01/17 | | | 135,283 | | | | 0.1 | |
| | 238,000 | | | | | PDL BioPharma, Inc., 4.000%, 02/01/18 | | | 228,778 | | | | 0.2 | |
| | 328,000 | | | # | | Physio-Control International, Inc., 9.875%, 01/15/19 | | | 349,320 | | | | 0.3 | |
| | 100,000 | | | # | | Post Holdings, Inc., 6.750%, 12/01/21 | | | 97,250 | | | | 0.1 | |
| | 550,000 | | | | | Post Holdings, Inc., 7.375%, 02/15/22 | | | 551,375 | | | | 0.4 | |
| | 245,000 | | | | | Quidel Corp., 3.250%, 12/15/20 | | | 274,247 | | | | 0.2 | |
| | 155,000 | | | | | Rent-A-Center, Inc./TX, 4.750%, 05/01/21 | | | 134,075 | | | | 0.1 | |
| | 250,000 | | | | | Revlon Consumer Products Corp., 5.750%, 02/15/21 | | | 251,250 | | | | 0.2 | |
| | 100,000 | | | | | Reynolds Group Issuer, Inc., 5.750%, 10/15/20 | | | 103,000 | | | | 0.1 | |
| | 235,000 | | | | | Reynolds Group Issuer, Inc., 8.250%, 02/15/21 | | | 242,050 | | | | 0.2 | |
| | 335,000 | | | | | Reynolds Group Issuer, Inc., 8.500%, 05/15/18 | | | 343,375 | | | | 0.3 | |
| | 265,000 | | | | | Reynolds Group Issuer, Inc., 9.875%, 08/15/19 | | | 282,225 | | | | 0.2 | |
| | 165,000 | | | # | | Safway Group Holding LLC / Safway Finance Corp., 7.000%, 05/15/18 | | | 157,575 | | | | 0.1 | |
| | 275,000 | | | | | Salix Pharmaceuticals Ltd., 1.500%, 03/15/19 | | | 502,734 | | | | 0.4 | |
| | 465,000 | | | # | | Sothebys, 5.250%, 10/01/22 | | | 441,750 | | | | 0.4 | |
| | 255,000 | | | # | | Southern States Cooperative, Inc., 10.000%, 08/15/21 | | | 219,300 | | | | 0.2 | |
| | 231,475 | | | | | Surgical Care Affiliates, Inc. - TL C-DD 1L, 4.000%, 06/29/18 | | | 229,739 | | | | 0.2 | |
| | 480,000 | | | | | Theravance, Inc., 2.125%, 01/15/23 | | | 373,800 | | | | 0.3 | |
| | 440,000 | | | | | Truven Health Analytics, Inc., 10.625%, 06/01/20 | | | 431,200 | | | | 0.3 | |
| | 100,000 | | | | | United Surgical Partners International, Inc., 9.000%, 04/01/20 | | | 107,875 | | | | 0.1 | |
| | 275,000 | | | | | Universal Hospital Services, Inc., 7.625%, 08/15/20 | | | 237,875 | | | | 0.2 | |
| | 350,000 | | | | | WellCare Health Plans, Inc., 5.750%, 11/15/20 | | | 363,125 | | | | 0.3 | |
| | | | | | | | | | 17,874,959 | | | | 14.6 | |
| | | | | | | | | | | | | | | |
| | | | | | | Energy: 14.0% | | | | | | | | |
| | 160,000 | | | # | | Alpha Natural Resources, Inc., 7.500%, 08/01/20 | | | 101,200 | | | | 0.1 | |
| | 95,000 | | | # | | American Energy-Permian Basin LLC / AEPB Finance Corp., 7.375%, 11/01/21 | | | 70,300 | | | | 0.1 | |
| | 175,000 | | | | | Antero Resources Finance Corp., 6.000%, 12/01/20 | | | 175,437 | | | | 0.1 | |
| | 570,000 | | | | | Approach Resources, Inc., 7.000%, 06/15/21 | | | 424,650 | | | | 0.3 | |
| | 206,000 | | | | | Basic Energy Services, Inc., 7.750%, 10/15/22 | | | 158,620 | | | | 0.1 | |
| | 235,000 | | | | | Berry Petroleum Co., 6.375%, 09/15/22 | | | 179,775 | | | | 0.1 | |
| | 185,000 | | | | | Bonanza Creek Energy, Inc., 5.750%, 02/01/23 | | | 146,612 | | | | 0.1 | |
| | 125,000 | | | # | | Calfrac Holdings L.P., 7.500%, 12/01/20 | | | 106,250 | | | | 0.1 | |
| | 350,000 | | | # | | Calumet Specialty Products Partners L.P./Calumet Finance Corp., 6.500%, 04/15/21 | | | 314,125 | | | | 0.3 | |
| | 100,000 | | | | | Carrizo Oil & Gas, Inc., 7.500%, 09/15/20 | | | 96,500 | | | | 0.1 | |
| | 154,000 | | | | | Carrizo Oil & Gas, Inc., 8.625%, 10/15/18 | | | 154,770 | | | | 0.1 | |
| | 170,000 | | | | | Chaparral Energy, Inc., 8.250%, 09/01/21 | | | 117,300 | | | | 0.1 | |
| | 300,000 | | | | | Chesapeake Energy Corp., 2.250%, 12/15/38 | | | 270,937 | | | | 0.2 | |
| | 460,000 | | | | | Chesapeake Energy Corp., 5.375%, 06/15/21 | | | 462,012 | | | | 0.4 | |
| | 610,000 | | | | | Cobalt International Energy, Inc., 2.625%, 12/01/19 | | | 369,050 | | | | 0.3 | |
| | 335,000 | | | | | Comstock Resources, Inc., 7.750%, 04/01/19 | | | 239,525 | | | | 0.2 | |
| | 225,000 | | | | | Concho Resources, Inc./Midland TX, 6.500%, 01/15/22 | | | 236,250 | | | | 0.2 | |
| | 200,000 | | | | | Concho Resources, Inc., 5.500%, 04/01/23 | | | 201,940 | | | | 0.2 | |
| | 210,000 | | | # | | ContourGlobal Power Holdings SA, 7.125%, 06/01/19 | | | 211,050 | | | | 0.2 | |
| | 115,000 | | | | | Crestwood Midstream Partners L.P. / Crestwood Midstream Finance Corp., 6.000%, 12/15/20 | | | 110,687 | | | | 0.1 | |
| | 290,000 | | | | | Denbury Resources, Inc., 4.625%, 07/15/23 | | | 253,025 | | | | 0.2 | |
| | 300,000 | | | | | Denbury Resources, Inc., 5.500%, 05/01/22 | | | 276,000 | | | | 0.2 | |
| | 245,000 | | | # | | Drill Rigs Holdings, Inc., 6.500%, 10/01/17 | | | 204,575 | | | | 0.2 | |
| | 285,000 | | | # | | Energy & Exploration Partners, Inc., 8.000%, 07/01/19 | | | 102,600 | | | | 0.1 | |
| | 225,000 | | | | | Energy XXI Gulf Coast, Inc., 7.500%, 12/15/21 | | | 122,625 | | | | 0.1 | |
| | 310,000 | | | | | Energy XXI Ltd., 3.000%, 12/15/18 | | | 93,775 | | | | 0.1 | |
| | 275,000 | | | | | EP Energy, LLC, 7.750%, 09/01/22 | | | 258,500 | | | | 0.2 | |
| | 500,000 | | | | | EP Energy, LLC, 9.375%, 05/01/20 | | | 507,500 | | | | 0.4 | |
| | 255,000 | | | | | EPL Oil & Gas, Inc., 8.250%, 02/15/18 | | | 195,075 | | | | 0.2 | |
| | 194,000 | | | | | Fieldwood Energy - TL 2L, 8.375%, 09/30/20 | | | 142,881 | | | | 0.1 | |
| | 280,000 | | | | | Forum Energy Technologies, Inc., 6.250%, 10/01/21 | | | 264,600 | | | | 0.2 | |
| | 21,818 | | | | | FTS International, Inc., 5.750%, 04/09/21 | | | 17,418 | | | | 0.0 | |
| See Accompanying Notes to Financial Statements |
| VY® Pioneer High Yield Portfolio | PORTFOLIO OF INVESTMENTS
as of December 31, 2014 (unaudited) (continued) |
| | 225,000 | | | # | | Gibson Energy, Inc., 6.750%, 07/15/21 | | | 225,562 | | | | 0.2 | |
| | 2,000 | | | | | Green Field Energy Services, Inc. - escrow, 11/15/16 | | | – | | | | – | |
| | 380,000 | | | | | Gulfport Energy Corp., 7.750%, 11/01/20 | | | 373,350 | | | | 0.3 | |
| | 320,000 | | | | | Halcon Resources Corp., 8.875%, 05/15/21 | | | 242,400 | | | | 0.2 | |
| | 185,000 | | | | | Halcon Resources Corp., 9.250%, 02/15/22 | | | 137,362 | | | | 0.1 | |
| | 115,000 | | | | | Halcon Resources Corp., 9.750%, 07/15/20 | | | 86,825 | | | | 0.1 | |
| | 90,000 | | | # | | Hiland Partners L.P. / Hiland Partners Finance Corp., 5.500%, 05/15/22 | | | 79,425 | | | | 0.1 | |
| | 170,000 | | | # | | Hiland Partners L.P. / Hiland Partners Finance Corp., 7.250%, 10/01/20 | | | 162,350 | | | | 0.1 | |
| | 200,000 | | | | | Holly Energy Partners L.P. / Holly Energy Finance Corp., 6.500%, 03/01/20 | | | 199,000 | | | | 0.2 | |
| | 250,380 | | | | | Jonah Energy, 7.500%, 05/12/21 | | | 216,579 | | | | 0.2 | |
| | 275,000 | | | # | | Jupiter Resources, Inc., 8.500%, 10/01/22 | | | 208,313 | | | | 0.2 | |
| | 100,000 | | | | | Kodiak Oil & Gas Corp., 5.500%, 01/15/21 | | | 100,750 | | | | 0.1 | |
| | 175,000 | | | | | Kodiak Oil & Gas Corp., 5.500%, 02/01/22 | | | 176,313 | | | | 0.1 | |
| | 160,000 | | | | | Kodiak Oil & Gas Corp., 8.125%, 12/01/19 | | | 163,600 | | | | 0.1 | |
| | 200,000 | | | | | Legacy Reserves L.P. / Legacy Reserves Finance Corp., 6.625%, 12/01/21 | | | 165,000 | | | | 0.1 | |
| | 525,000 | | | | | Linn Energy LLC / Linn Energy Finance Corp., 6.250%, 11/01/19 | | | 448,875 | | | | 0.4 | |
| | 340,000 | | | # | | Memorial Production Partners L.P. / Memorial Production Finance Corp., 6.875%, 08/01/22 | | | 260,100 | | | | 0.2 | |
| | 200,000 | | | | | Memorial Production Partners L.P. / Memorial Production Finance Corp., 7.625%, 05/01/21 | | | 161,000 | | | | 0.1 | |
| | 250,000 | | | | | Midstates Petroleum Co., Inc. / Midstates Petroleum Co. LLC, 9.250%, 06/01/21 | | | 127,500 | | | | 0.1 | |
| | 205,000 | | | | | Midstates Petroleum Co., Inc. / Midstates Petroleum Co. LLC, 10.750%, 10/01/20 | | | 110,700 | | | | 0.1 | |
| | 250,000 | | | | | Murphy Oil USA, Inc., 6.000%, 08/15/23 | | | 262,500 | | | | 0.2 | |
| | 150,000 | | | # | | Murray Energy Corp., 8.625%, 06/15/21 | | | 144,000 | | | | 0.1 | |
| | 296,000 | | | | | Northern Oil and Gas, Inc., 8.000%, 06/01/20 | | | 225,700 | | | | 0.2 | |
| | 365,000 | | | | | Oasis Petroleum, Inc., 6.875%, 01/15/23 | | | 333,975 | | | | 0.3 | |
| | 195,000 | | | | | Offshore Group Investment Ltd., 7.500%, 11/01/19 | | | 146,250 | | | | 0.1 | |
| | 240,000 | | | | | PDC Energy, Inc., 7.750%, 10/15/22 | | | 229,200 | | | | 0.2 | |
| | 285,000 | | | | | Penn Virginia Corp., 8.500%, 05/01/20 | | | 229,425 | | | | 0.2 | |
| | 275,000 | | | | | Range Resources Corp., 5.000%, 03/15/23 | | | 276,375 | | | | 0.2 | |
| | 210,000 | | | # | | Rice Energy, Inc., 6.250%, 05/01/22 | | | 196,350 | | | | 0.2 | |
| | 585,000 | | | | | Rosetta Resources, Inc., 5.625%, 05/01/21 | | | 538,259 | | | | 0.4 | |
| | 240,000 | | | | | Rosetta Resources, Inc., 5.875%, 06/01/22 | | | 218,400 | | | | 0.2 | |
| | 325,000 | | | | | Sabine Pass Liquefaction LLC, 5.625%, 02/01/21 | | | 320,938 | | | | 0.3 | |
| | 155,000 | | | | | Sabine Pass Liquefaction LLC, 5.750%, 05/15/24 | | | 152,869 | | | | 0.1 | |
| | 270,000 | | | | | Samson Investment Co., 9.750%, 02/15/20 | | | 113,231 | | | | 0.1 | |
| | 560,000 | | | | | Sanchez Energy Corp., 7.750%, 06/15/21 | | | 523,600 | | | | 0.4 | |
| | 175,000 | | | | | SandRidge Energy, Inc., 7.500%, 03/15/21 | | | 112,875 | | | | 0.1 | |
| | 400,000 | | | # | | Sanjel Corp., 7.500%, 06/19/19 | | | 306,000 | | | | 0.3 | |
| | 130,000 | | | | | SEACOR Holdings, Inc., 3.000%, 11/15/28 | | | 119,113 | | | | 0.1 | |
| | 360,000 | | | # | | SolarCity Corp., 1.625%, 11/01/19 | | | 327,150 | | | | 0.3 | |
| | 195,000 | | | | | Stone Energy Corp., 7.500%, 11/15/22 | | | 168,675 | | | | 0.1 | |
| | 250,000 | | | | | Swift Energy Co., 7.875%, 03/01/22 | | | 130,625 | | | | 0.1 | |
| | 175,000 | | | | | Swift Energy Co., 8.875%, 01/15/20 | | | 100,625 | | | | 0.1 | |
| | 155,000 | | | # | | Talos Production LLC, 9.750%, 02/15/18 | | | 141,825 | | | | 0.1 | |
| | 190,000 | | | | | Targa Resources Partners L.P., 6.375%, 08/01/22 | | | 193,325 | | | | 0.2 | |
| | 230,000 | | | | | Targa Resources Partners L.P. / Targa Resources Partners Finance Corp., 4.250%, 11/15/23 | | | 210,450 | | | | 0.2 | |
| | 465,000 | | | | | Templar Energy, 8.500%, 11/25/20 | | | 335,962 | | | | 0.3 | |
| | 300,000 | | | | | Tesoro Corp., 5.375%, 10/01/22 | | | 305,250 | | | | 0.2 | |
| | 165,000 | | | # | | Ultra Petroleum Corp., 5.750%, 12/15/18 | | | 153,038 | | | | 0.1 | |
| | 155,000 | | | | | Unit Corp., 6.625%, 05/15/21 | | | 139,500 | | | | 0.1 | |
| | 210,000 | | | | | Vanguard Natural Resources, LLC, 7.875%, 04/01/20 | | | 182,228 | | | | 0.1 | |
| | | | | | | | | | 17,068,281 | | | | 14.0 | |
| | | | | | | | | | | | | | | |
| | | | | | | Financial: 7.6% | | | | | | | | |
| | 205,000 | | | #,& | | AAF Holdings LLC/AAF Finance Co., 12.000%, 07/01/19 | | | 199,875 | | | | 0.2 | |
| | 242,448 | | | | | Alliant Insurance Services, 4.250%, 12/07/19 | | | 239,341 | | | | 0.2 | |
| | 300,000 | | | # | | Ausdrill Finance Pty Ltd., 6.875%, 11/01/19 | | | 247,500 | | | | 0.2 | |
| | 350,000 | | | | | Bank of America Corp., 6.500%, 10/29/49 | | | 357,140 | | | | 0.3 | |
| See Accompanying Notes to Financial Statements |
| VY® Pioneer High Yield Portfolio | PORTFOLIO OF INVESTMENTS
as of December 31, 2014 (unaudited) (continued) |
| | 350,000 | | | | | Bank of America Corp., 6.250%, 09/29/49 | | | 347,703 | | | | 0.3 | |
| | 315,144 | | | | | Confie Seguros Holding II - TL 1L, 5.750%, 11/08/18 | | | 314,487 | | | | 0.3 | |
| | 400,000 | | | | | DuPont Fabros Technology L.P., 5.875%, 09/15/21 | | | 409,500 | | | | 0.3 | |
| | 115,000 | | | | | E*TRADE Financial Corp., 5.375%, 11/15/22 | | | 117,875 | | | | 0.1 | |
| | 250,000 | | | # | | Embarcadero Reinsurance Ltd., 5.015%, 02/07/17 | | | 250,875 | | | | 0.2 | |
| | 300,000 | | | # | | Fidelity & Guaranty Life Holdings, Inc., 6.375%, 04/01/21 | | | 316,500 | | | | 0.3 | |
| | 400,000 | | | | | Fly Leasing Ltd, 6.375%, 10/15/21 | | | 395,000 | | | | 0.3 | |
| | 280,000 | | | | | Forest City Enterprises, Inc., 3.625%, 08/15/20 | | | 298,200 | | | | 0.2 | |
| | 365,000 | | | | | Forest City Enterprises, Inc., 4.250%, 08/15/18 | | | 417,925 | | | | 0.3 | |
| | 250,000 | | | # | | Galileo Re Ltd., 7.415%, 01/09/19 | | | 258,412 | | | | 0.2 | |
| | 480,000 | | | | | Geo Group, Inc./The, 5.875%, 10/15/24 | | | 488,400 | | | | 0.4 | |
| | 250,000 | | | | | Kennedy-Wilson, Inc., 5.875%, 04/01/24 | | | 251,250 | | | | 0.2 | |
| | 250,000 | | | # | | Kilimanjaro Re Ltd., 4.515%, 04/30/18 | | | 253,337 | | | | 0.2 | |
| | 300,000 | | | | | MPT Operating Partnership L.P. / MPT Finance Corp., 5.500%, 05/01/24 | | | 314,250 | | | | 0.3 | |
| | 220,000 | | | | | Nationstar Mortgage LLC / Nationstar Capital Corp., 6.500%, 06/01/22 | | | 201,850 | | | | 0.2 | |
| | 575,000 | | | | | Nationstar Mortgage LLC / Nationstar Capital Corp., 6.500%, 07/01/21 | | | 526,125 | | | | 0.4 | |
| | 100,000 | | | | | Nationstar Mortgage LLC / Nationstar Capital Corp., 6.500%, 08/01/18 | | | 95,750 | | | | 0.1 | |
| | 275,000 | | | # | | Ocwen Financial Corp., 6.625%, 05/15/19 | | | 253,000 | | | | 0.2 | |
| | 665,000 | | | # | | Outerwall, Inc., 5.875%, 06/15/21 | | | 623,437 | | | | 0.5 | |
| | 250,000 | | | # | | Queen Street VII Re Ltd., 8.615%, 04/08/16 | | | 260,531 | | | | 0.2 | |
| | 125,000 | | | # | | Rayonier AM Products, Inc., 5.500%, 06/01/24 | | | 103,281 | | | | 0.1 | |
| | 250,000 | | | # | | Residential Reinsurance 2012 Ltd., 5.765%, 12/06/18 | | | 260,788 | | | | 0.2 | |
| | 250,000 | | | # | | Residential Reinsurance 2012 Ltd., 12.765%, 12/06/18 | | | 273,538 | | | | 0.2 | |
| | 250,000 | | | # | | Sanders Re Ltd., 4.015%, 05/05/17 | | | 250,338 | | | | 0.2 | |
| | 210,000 | | | # | | TMX Finance LLC / TitleMax Finance Corp., 8.500%, 09/15/18 | | | 177,450 | | | | 0.2 | |
| | 250,000 | | | # | | Ursa Re Ltd., 3.515%, 12/07/17 | | | 250,688 | | | | 0.2 | |
| | 525,000 | | | # | | USB Realty Corp., 1.378%, 12/29/49 | | | 475,125 | | | | 0.4 | |
| | | | | | | | | | 9,229,471 | | | | 7.6 | |
| | | | | | | Industrial: 11.1% | | | | | | | | |
| | 105,000 | | | # | | AECOM Technology Corp., 5.750%, 10/15/22 | | | 107,625 | | | | 0.1 | |
| | 105,000 | | | # | | AECOM Technology Corp., 5.875%, 10/15/24 | | | 107,625 | | | | 0.1 | |
| | 350,000 | | | | | AEP Industries, Inc., 8.250%, 04/15/19 | | | 355,250 | | | | 0.3 | |
| | 150,000 | | | # | | Aguila 3 SA, 7.875%, 01/31/18 | | | 145,500 | | | | 0.1 | |
| | 205,000 | | | #,& | | American Energy - Utica LLC, 3.500%, 03/01/21 | | | 150,675 | | | | 0.1 | |
| | 345,000 | | | # | | Amsted Industries, Inc., 5.000%, 03/15/22 | | | 340,256 | | | | 0.3 | |
| | 365,345 | | | #,& | | Ardagh Finance Holdings SA, 8.625%, 06/15/19 | | | 361,692 | | | | 0.3 | |
| | 35,294 | | | # | | Ardagh Packaging Finance PLC, 7.000%, 11/15/20 | | | 35,824 | | | | 0.0 | |
| | 250,000 | | | # | | Aviation Capital Group Corp., 6.750%, 04/06/21 | | | 284,375 | | | | 0.2 | |
| | 325,000 | | | | | Ball Corp., 4.000%, 11/15/23 | | | 315,250 | | | | 0.3 | |
| | 350,000 | | | # | | BC Mountain LLC / BC Mountain Finance, Inc., 7.000%, 02/01/21 | | | 301,000 | | | | 0.3 | |
| | 85,000 | | | # | | Belden, Inc., 5.250%, 07/15/24 | | | 82,025 | | | | 0.1 | |
| | 195,000 | | | # | | Belden, Inc., 5.500%, 09/01/22 | | | 194,512 | | | | 0.2 | |
| | 50,000 | | | # | | Beverage Packaging Holdings Luxembourg II SA / Beverage Packaging Holdings II Is, 6.000%, 06/15/17 | | | 48,875 | | | | 0.0 | |
| | 225,000 | | | # | | BioScrip, Inc., 8.875%, 02/15/21 | | | 203,344 | | | | 0.2 | |
| | 200,000 | | | # | | Bombardier, Inc., 4.750%, 04/15/19 | | | 201,000 | | | | 0.2 | |
| | 400,000 | | | # | | Bombardier, Inc., 6.000%, 10/15/22 | | | 404,500 | | | | 0.3 | |
| | 165,000 | | | # | | Bombardier, Inc., 6.125%, 01/15/23 | | | 168,712 | | | | 0.1 | |
| | 205,000 | | | | | Bristow Group, Inc., 6.250%, 10/15/22 | | | 205,000 | | | | 0.2 | |
| | 135,000 | | | # | | Building Materials Corp. of America, 6.750%, 05/01/21 | | | 143,100 | | | | 0.1 | |
| | 305,000 | | | # | | Cleaver-Brooks, Inc., 8.750%, 12/15/19 | | | 322,537 | | | | 0.3 | |
| | 640,000 | | | | | Crown Cork & Seal Co., Inc., 7.375%, 12/15/26 | | | 710,400 | | | | 0.6 | |
| | 172,125 | | | | | DAE Aviation Holdings, Inc., 5.000%, 11/02/18 | | | 171,695 | | | | 0.1 | |
| | 78,029 | | | | | DAE Aviation Holdings, Inc., 5.000%, 07/31/14 | | | 77,834 | | | | 0.1 | |
| | 100,000 | | | | | Darling Ingredients, Inc., 5.375%, 01/15/22 | | | 98,875 | | | | 0.1 | |
| | 586,000 | | | # | | Emergent Biosolutions, Inc., 2.875%, 01/15/21 | | | 660,349 | | | | 0.5 | |
| | 300,000 | | | # | | Exopack Holding Corp., 10.000%, 06/01/18 | | | 318,750 | | | | 0.3 | |
| | 125,000 | | | | | Filtration Group, Inc., 8.250%, 11/22/21 | | | 124,844 | | | | 0.1 | |
| | 175,000 | | | | | Flextronics International Ltd., 4.625%, 02/15/20 | | | 178,500 | | | | 0.1 | |
| | 290,000 | | | | | Flextronics International Ltd., 5.000%, 02/15/23 | | | 297,250 | | | | 0.2 | |
| See Accompanying Notes to Financial Statements |
| VY® Pioneer High Yield Portfolio | PORTFOLIO OF INVESTMENTS
as of December 31, 2014 (unaudited) (continued) |
| | 270,000 | | | # | | Florida East Coast Holdings Corp., 6.750%, 05/01/19 | | | 267,975 | | | | 0.2 | |
| | 100,000 | | | | | GCI, Inc., 6.750%, 06/01/21 | | | 98,562 | | | | 0.1 | |
| | 744,000 | | | | | General Cable Corp., 4.500%, 11/15/29 | | | 539,865 | | | | 0.4 | |
| | 100,000 | | | | | Golar LNG Ltd., 3.750%, 03/07/17 | | | 103,000 | | | | 0.1 | |
| | 505,000 | | | | | Griffon Corp., 5.250%, 03/01/22 | | | 478,487 | | | | 0.4 | |
| | 115,000 | | | | | IAC/InterActiveCorp, 4.875%, 11/30/18 | | | 117,588 | | | | 0.1 | |
| | 164,233 | | | | | International Equipment Solution LLC - TL B, 6.750%, 08/16/19 | | | 163,822 | | | | 0.1 | |
| | 175,000 | | | # | | Intrepid Aviation Group Holdings LLC / Intrepid Finance Co., 6.875%, 02/15/19 | | | 170,188 | | | | 0.1 | |
| | 310,000 | | | # | | JB Poindexter & Co., Inc., 9.000%, 04/01/22 | | | 336,350 | | | | 0.3 | |
| | 150,000 | | | # | | JMC Steel Group, 8.250%, 03/15/18 | | | 143,063 | | | | 0.1 | |
| | 190,000 | | | # | | Liberty Tire Recycling, 11.000%, 10/01/16 | | | 159,125 | | | | 0.1 | |
| | 190,000 | | | # | | Mcron Finance Sub, LLC / Mcron Finance Corp., 8.375%, 05/15/19 | | | 202,350 | | | | 0.2 | |
| | 220,000 | | | # | | Moog, Inc., 5.250%, 12/01/22 | | | 223,300 | | | | 0.2 | |
| | 575,000 | | | # | | NANA Development Corp., 9.500%, 03/15/19 | | | 520,375 | | | | 0.4 | |
| | 265,000 | | | # | | Packaging Dynamics Corp., 8.750%, 02/01/16 | | | 266,325 | | | | 0.2 | |
| | 400,000 | | | # | | Rentech Nitrogen Partners L.P. / Rentech Nitrogen Finance Corp., 6.500%, 04/15/21 | | | 358,000 | | | | 0.3 | |
| | 400,000 | | | # | | Rexel SA, 5.250%, 06/15/20 | | | 405,000 | | | | 0.3 | |
| | 205,000 | | | | | RTI International Metals, Inc., 1.625%, 10/15/19 | | | 200,259 | | | | 0.2 | |
| | 190,000 | | | # | | SunPower Corp., 0.875%, 06/01/21 | | | 171,950 | | | | 0.1 | |
| | 200,000 | | | # | | Syncreon Group BV / Syncreon Global Finance US, Inc., 8.625%, 11/01/21 | | | 189,000 | | | | 0.2 | |
| | 125,000 | | | | | Triumph Group, Inc., 5.250%, 06/01/22 | | | 125,313 | | | | 0.1 | |
| | 550,000 | | | # | | Viasystems, Inc., 7.875%, 05/01/19 | | | 583,000 | | | | 0.5 | |
| | 100,000 | | | # | | Videotron Ltd., 5.375%, 06/15/24 | | | 102,250 | | | | 0.1 | |
| | 545,000 | | | # | | Vishay Intertechnology, Inc., 2.250%, 05/15/41 | | | 493,906 | | | | 0.4 | |
| | | | | | | | | | 13,536,227 | | | | 11.1 | |
| | | | | | | | | | | | | | | |
| | | | | | | Materials: 0.7% | | | | | | | | |
| | 325,000 | | | # | | Exterran Partners L.P. / EXLP Finance Corp., 6.000%, 10/01/22 | | | 279,500 | | | | 0.2 | |
| | 610,000 | | | | | Exterran Partners L.P. / EXLP Finance Corp., 6.000%, 04/01/21 | | | 536,800 | | | | 0.5 | |
| | | | | | | | | | 816,300 | | | | 0.7 | |
| | | | | | | Technology: 7.3% | | | | | | | | |
| | 210,000 | | | # | | ACI Worldwide, Inc., 6.375%, 08/15/20 | | | 220,237 | | | | 0.2 | |
| | 200,000 | | | # | | Activision Blizzard, Inc., 5.625%, 09/15/21 | | | 210,500 | | | | 0.2 | |
| | 125,000 | | | # | | Activision Blizzard, Inc., 6.125%, 09/15/23 | | | 135,000 | | | | 0.1 | |
| | 265,000 | | | | | Advanced Micro Devices, Inc., 6.750%, 03/01/19 | | | 250,425 | | | | 0.2 | |
| | 210,000 | | | | | Advanced Micro Devices, Inc., 7.500%, 08/15/22 | | | 190,050 | | | | 0.2 | |
| | 160,000 | | | | | Advanced Micro Devices, Inc., 7.000%, 07/01/24 | | | 136,400 | | | | 0.1 | |
| | 260,000 | | | #,Z | | Akamai Technologies, Inc., 1.000%, 02/15/19 | | | 271,051 | | | | 0.2 | |
| | 150,000 | | | # | | Audatex North America, Inc., 6.000%, 06/15/21 | | | 155,250 | | | | 0.1 | |
| | 460,000 | | | | | Brocade Communications Systems, Inc., 4.625%, 01/15/23 | | | 443,900 | | | | 0.4 | |
| | 115,000 | | | # | | Cepheid, Inc., 1.250%, 02/01/21 | | | 126,859 | | | | 0.1 | |
| | 160,000 | | | # | | Citrix Systems, Inc., 0.500%, 04/15/19 | | | 168,700 | | | | 0.1 | |
| | 190,000 | | | | | Emulex Corp., 1.750%, 11/15/18 | | | 175,156 | | | | 0.2 | |
| | 375,000 | | | # | | Entegris, Inc., 6.000%, 04/01/22 | | | 381,563 | | | | 0.3 | |
| | 74,083 | | | | | Expert Global Solutions, Inc., 8.500%, 04/03/18 | | | 73,743 | | | | 0.1 | |
| | 75,000 | | | # | | First Data Corp., 7.375%, 06/15/19 | | | 79,125 | | | | 0.1 | |
| | 89,000 | | | | | First Data Corp., 12.625%, 01/15/21 | | | 105,910 | | | | 0.1 | |
| | 510,000 | | | | | j2 Global, Inc., 8.000%, 08/01/20 | | | 551,438 | | | | 0.5 | |
| | 145,000 | | | | | KEYW Holding Corp./The, 2.500%, 07/15/19 | | | 131,497 | | | | 0.1 | |
| | 250,000 | | | | | MedAssets, Inc., 8.000%, 11/15/18 | | | 261,250 | | | | 0.2 | |
| | 450,000 | | | | | Mentor Graphics Corp., 4.000%, 04/01/31 | | | 541,125 | | | | 0.4 | |
| | 250,000 | | | # | | MSCI, Inc., 5.250%, 11/15/24 | | | 259,375 | | | | 0.2 | |
| | 265,000 | | | | | NCR Corp., 5.000%, 07/15/22 | | | 259,700 | | | | 0.2 | |
| | 160,000 | | | | | NCR Corp., 6.375%, 12/15/23 | | | 167,200 | | | | 0.1 | |
| | 1,020,000 | | | | | Nuance Communications, Inc., 2.750%, 11/01/31 | | | 1,021,913 | | | | 0.8 | |
| | 606,000 | | | | | ON Semiconductor Corp., 2.625%, 12/15/26 | | | 722,655 | | | | 0.6 | |
| | 700,000 | | | # | | Seagate HDD Cayman, 4.750%, 01/01/25 | | | 723,694 | | | | 0.6 | |
| | 595,000 | | | | | Seagate HDD Cayman, 4.750%, 06/01/23 | | | 619,065 | | | | 0.5 | |
| | 130,000 | | | Z | | ServiceNow, Inc., 11/01/18 | | | 148,525 | | | | 0.1 | |
| | 199,500 | | | | | SkillSoft, 5.750%, 04/28/21 | | | 196,208 | | | | 0.2 | |
| | 130,000 | | | | | Synchronoss Technologies, Inc., 0.750%, 08/15/19 | | | 137,556 | | | | 0.1 | |
| See Accompanying Notes to Financial Statements |
| VY® Pioneer High Yield Portfolio | PORTFOLIO OF INVESTMENTS
as of December 31, 2014 (unaudited) (continued) |
| | 47,774 | | | | | Vertafore, Inc., 4.250%, 07/31/16 | | | 47,396 | | | | 0.0 | |
| | | | | | | | | | 8,912,466 | | | | 7.3 | |
| | | | | | | | | | | | | | | |
| | | | | | | Telecommunication Services: –% | | | | | |
| | 1,445,000 | | | | | Millicom International Cellular S.A. Escrow, 11/15/26 | | | – | | | | – | |
| | | | | | | | | | | | | | | |
| | | | | | | Utilities: 1.7% | | | | | | | | |
| | 505,000 | | | | | AES Corp., 4.875%, 05/15/23 | | | 503,738 | | | | 0.4 | |
| | 100,000 | | | | | AES Corp., 5.500%, 03/15/24 | | | 101,980 | | | | 0.1 | |
| | 438 | | | | | AES Red Oak, LLC, 8.540%, 11/30/19 | | | 470 | | | | 0.0 | |
| | 550,000 | | | # | | NRG Energy, Inc., 6.250%, 05/01/24 | | | 562,375 | | | | 0.5 | |
| | 150,000 | | | | | NRG Energy, Inc., 6.250%, 07/15/22 | | | 154,125 | | | | 0.1 | |
| | 275,000 | | | | | NRG Energy, Inc., 7.625%, 01/15/18 | | | 302,500 | | | | 0.2 | |
| | 440,000 | | | # | | RJS Power Holdings LLC, 5.125%, 07/15/19 | | | 436,700 | | | | 0.4 | |
| | | | | | | | | | 2,061,888 | | | | 1.7 | |
| | | | | | | | | | | | | | | |
| | | | | Total Corporate Bonds/Notes | | | | | | | | |
| | | | | (Cost $103,216,828) | | | 100,545,205 | | | | 82.4 | |
| | | | | | | | | | | | | |
| COLLATERALIZED MORTGAGE OBLIGATIONS: 0.9% | | | | | |
| | 1,000,000 | | | # | | Timberstar Trust, 7.530%, 10/15/36 | | | 1,045,647 | | | | 0.9 | |
| | | | | | | | | | | | | | | |
| | | | | Total Collateralized Mortgage Obligations | | | | | | | | |
| | | | | (Cost $1,008,075) | | | 1,045,647 | | | | 0.9 | |
| | | | | | | | | | | | | | | |
| U.S. TREASURY OBLIGATIONS: 1.6% | | | | | | | | |
| | | | | | | U.S. Treasury Notes: 1.6% | | | | | | | | |
| | 665,000 | | | | | 0.075%, due 01/31/16 | | | 664,854 | | | | 0.5 | |
| | 665,000 | | | | | 0.099%, due 04/30/16 | | | 665,023 | | | | 0.5 | |
| | 665,000 | | | | | 0.100%, due 07/31/16 | | | 665,037 | | | | 0.6 | |
| | | | | | | | | | | | | | | |
| | | | | Total U.S. Treasury Obligations | | | | | | | | |
| | | | | (Cost $1,995,518) | | | 1,994,914 | | | | 1.6 | |
| Shares | | | | | | | Value | | | Percentage
of Net
Assets | |
| COMMON STOCK: 7.0% | |
| | | | | | | Consumer Discretionary: 1.0% | | | | | |
| | 3,636 | | | | | Cengage Learning Holdings II L.P. | | | 82,719 | | | | 0.0 | |
| | 4,891 | | | | | D.R. Horton, Inc. | | | 123,694 | | | | 0.1 | |
| | 50,408 | | | | | Ford Motor Co. | | | 781,324 | | | | 0.6 | |
| | 3,742 | | | | | Starbucks Corp. | | | 307,031 | | | | 0.3 | |
| | | | | | | | | | 1,294,768 | | | | 1.0 | |
| | | | | | | | | | | | | | | |
| | | | | | | Energy: 0.4% | | | | | | | | |
| | 20 | | | | | Green Field Energy Service, Inc. | | | – | | | | – | |
| | 6,900 | | | | | Marathon Oil Corp. | | | 195,201 | | | | 0.2 | |
| | 3,450 | | | | | Marathon Petroleum Corp. | | | 311,397 | | | | 0.2 | |
| | | | | | | | | | 506,598 | | | | 0.4 | |
| | | | | | | Financials: 0.5% | | | | | | | | |
| | 29,978 | | | @ | | Forest City Enterprises, Inc. | | | 638,531 | | | | 0.5 | |
| | 1,476 | | | # | | Perseus Holding Corp. | | | – | | | | – | |
| | | | | | | | | | 638,531 | | | | 0.5 | |
| | | | | | | | | | | | | | | |
| | | | | | | Health Care: 2.1% | | | | | | | | |
| | 6,438 | | | | | Aetna, Inc. | | | 571,887 | | | | 0.5 | |
| | 15,129 | | | | | BioScrip, Inc. | | | 105,752 | | | | 0.1 | |
| | 2,875 | | | @ | | Bio-Rad Laboratories, Inc. | | | 346,610 | | | | 0.3 | |
| | 5,400 | | | | | Cigna Corp. | | | 555,714 | | | | 0.4 | |
| | 6,148 | | | | | Thermo Fisher Scientific, Inc. | | | 770,283 | | | | 0.6 | |
| | 1,690 | | | @ | | Waters Corp. | | | 190,497 | | | | 0.2 | |
| | | | | | | | | | 2,540,743 | | | | 2.1 | |
| | | | | | | | | | | | | | | |
| | | | | | | Industrials: 1.0% | | | | | | | | |
| | 123 | | | | | Ceva Holdings LLC | | | 95,596 | | | | 0.1 | |
| | 19,600 | | | | | Commercial Vehicle Group, Inc. | | | 130,536 | | | | 0.1 | |
| | 15,223 | | | | | General Cable Corp. | | | 226,823 | | | | 0.2 | |
| | 11,246 | | | @ | | Horizon Lines, Inc. | | | 7,097 | | | | 0.0 | |
| | 5,900 | | | | | Joy Global, Inc. | | | 274,468 | | | | 0.2 | |
| | 5,449 | | | | | Kennametal, Inc. | | | 195,020 | | | | 0.2 | |
| | 9,257 | | | | | Orbital Sciences Corp. | | | 248,921 | | | | 0.2 | |
| | | | | | | | | | 1,178,461 | | | | 1.0 | |
| | | | | | | | | | | | | | | |
| | | | | | | Information Technology: 0.7% | | | | | |
| | 5,800 | | | | | EMC Corp. | | | 172,492 | | | | 0.2 | |
| | 105 | | | @ | | Magnachip Semiconductor Corp. | | | 1,364 | | | | 0.0 | |
| | 21 | | | | | Magnachip Semiconductors S.A. | | | – | | | | – | |
| | 13,491 | | | @ | | NCR Corp. | | | 393,128 | | | | 0.3 | |
| | 3,986 | | | | | TE Connectivity Ltd. | | | 252,114 | | | | 0.2 | |
| | | | | | | | | | 819,098 | | | | 0.7 | |
| | | | | | | | | | | | | | | |
| | | | | | | Materials: 1.1% | | | | | | | | |
| | 10,495 | | | | | Axiall Corp. | | | 445,723 | | | | 0.4 | |
| | 16,600 | | | | | Freeport-McMoRan, Inc. | | | 387,776 | | | | 0.3 | |
| | 5,849 | | | | | LyondellBasell Industries NV - Class A | | | 464,352 | | | | 0.4 | |
| | 65,956 | | | @ | | Polymet Mining Corp. | | | 68,594 | | | | 0.0 | |
| | | | | | | | | | 1,366,445 | | | | 1.1 | |
| | | | | | | | | | | | | | | |
| | | | | | | Telecommunication Services: 0.2% | | | | | | | | |
| | 28,800 | | | | | Windstream Holdings, Inc. | | | 237,312 | | | | 0.2 | |
| | | | | | | | | | | | | | | |
| | | | | Total Common Stock | | | | | | | | |
| | | | | (Cost $5,695,583) | | | 8,581,956 | | | | 7.0 | |
| | | | | | | | | | | | | | | |
| PREFERRED STOCK: 4.1% | | | | | | | | |
| | | | | | | Consumer Discretionary: 0.5% | | | | | | | | |
| | 7,900 | | | | | Sealy Corp. | | | 626,075 | | | | 0.5 | |
| | | | | | | | | | | | | | | |
| | | | | | | Consumer Staples: 0.2% | | | | | | | | |
| | 2,600 | | | # | | Post Holdings, Inc. | | | 219,213 | | | | 0.2 | |
| | | | | | | | | | | | | | | |
| | | | | | | Energy: 0.6% | | | | | | | | |
| | 285 | | | | | Halcon Resources Corp. | | | 114,000 | | | | 0.1 | |
| | 6,773 | | | P | | NuStar Logistics L.P. | | | 174,743 | | | | 0.1 | |
| | 1,400 | | | # | | Penn Virginia Corp. | | | 92,225 | | | | 0.1 | |
| | 11,500 | | | @ | | Petroquest Energy, Inc. | | | 276,000 | | | | 0.2 | |
| | 1,016 | | | | | SandRidge Energy, Inc. 7.0% Conv PS | | | 43,688 | | | | 0.0 | |
| See Accompanying Notes to Financial Statements |
| VY® Pioneer High Yield Portfolio | PORTFOLIO OF INVESTMENTS
as of December 31, 2014 (unaudited) (continued) |
| | 1,400 | | | | | SandRidge Energy, Inc. 8.5% Conv PS | | | 58,713 | | | | 0.1 | |
| | | | | | | | | | 759,369 | | | | 0.6 | |
| | | | | | | | | | | | | | | |
| | | | | | | Financials: 1.6% | | | | | | | | |
| | 325 | | | #,P | | Ally Financial, Inc. | | | 326,493 | | | | 0.3 | |
| | 3,000 | | | | | AMG Capital Trust II | | | 186,000 | | | | 0.1 | |
| | 26,000 | | | P | | Citigroup, Inc. | | | 705,120 | | | | 0.6 | |
| | 3,630 | | | P | | Fifth Third Bancorp | | | 99,208 | | | | 0.1 | |
| | 13,000 | | | @,P | | GMAC Capital Trust I | | | 342,940 | | | | 0.3 | |
| | 11,000 | | | P | | Morgan Stanley | | | 302,830 | | | | 0.2 | |
| | 775 | | | # | | Perseus Holding Corp. | | | – | | | | – | |
| | | | | | | | | | 1,962,591 | | | | 1.6 | |
| | | | | | | | | | | | | | | |
| | | | | | | Health Care: 0.7% | | | | | | | | |
| | 2,811 | | | | | Alere, Inc. | | | 885,465 | | | | 0.7 | |
| | | | | | | | | | | | | | | |
| | | | | | | Industrials: 0.2% | | | | | | | | |
| | 267 | | | @ | | Ceva Holdings Series A-2 | | | 206,948 | | | | 0.2 | |
| | | | | | | | | | | | | | | |
| | | | | | | Utilities: 0.3% | | | | | | | | |
| | 12,000 | | | P | | PPL Capital Funding, Inc. | | | 298,800 | | | | 0.3 | |
| | | | | | | | | | | | | | | |
| | | | | Total Preferred Stock | | | | | | | | |
| | | | | (Cost $5,492,388) | | | 4,958,461 | | | | 4.1 | |
| | | | | | | | | | | | | | | |
| WARRANTS: 0.1% | | | | | | | | |
| | | | | | | Energy: –% | | | | | | | | |
| | 75 | | | #,@ | | Green Field Energy Services, Inc. | | | – | | | | – | |
| | | | | | | | | | | | | | | |
| | | | | | | Industrials: 0.1% | | | | | | | | |
| | 3,612,760 | | | @ | | Horizon Lines, Inc. | | | 91,200 | | | | 0.1 | |
| | | | | | | | | | | | | | | |
| | | | | Total Warrants | | | | | | | | |
| | | | | (Cost $263,043) | | | 91,200 | | | | 0.1 | |
| | | | | | | | | | | | | |
| | | | | Total Long-Term Investments | | | | | | | | |
| | | | | (Cost $117,671,435) | | | 117,217,383 | | | | 96.1 | |
| | | | | | | | | | | | | | | |
| SHORT-TERM INVESTMENTS: 2.6% | | | | | | | | |
| | | | | | | Mutual Funds: 2.6% | | | | | | | | |
| | 3,166,436 | | | | | BlackRock Liquidity Funds, TempFund, Institutional Class, 0.030%†† | | | | | | | | |
| | | | | | | (Cost $3,166,436) | | | 3,166,436 | | | | 2.6 | |
| | | | | | | | | | | | | | | |
| | | | | Total Short-Term Investments | | | | | | | | |
| | | | | (Cost $3,166,436) | | | 3,166,436 | | | | 2.6 | |
| | | | | | | | | | | | | |
| | | | | Total Investments in Securities
(Cost $120,837,871) | | $ | 120,383,819 | | | | 98.7 | |
| | | | | Assets in Excess of Other Liabilities | | | 1,644,892 | | | | 1.3 | |
| | | | | Net Assets | | $ | 122,028,711 | | | | 100.0 | |
| † | Unless otherwise indicated, principal amount is shown in USD. |
| †† | Rate shown is the 7-day yield as of December 31, 2014. |
| # | Securities with purchases pursuant to Rule 144A or section 4(a)(2), under the Securities Act of 1933 and may not be resold subject to that rule except to qualified institutional buyers. |
| @ | Non-income producing security. |
| & | Payment-in-kind |
| P | Preferred Stock may be called prior to convertible date. |
| ± | Defaulted security |
| Z | Indicates Zero Coupon Bond; rate shown reflects current effective yield. |
Cost for federal income tax purposes is $121,369,722.
Net unrealized depreciation consists of:
| Gross Unrealized Appreciation | | $ | 6,984,912 | |
| Gross Unrealized Depreciation | | | (7,970,815 | ) |
| | | | | |
| Net Unrealized Depreciation | | $ | (985,903 | ) |
| See Accompanying Notes to Financial Statements |
| VY® T. Rowe Price Diversified | PORTFOLIO OF INVESTMENTS |
| Mid Cap Growth Portfolio | as of December 31, 2014 |
| Shares | | | | | | | Value | | | Percentage
of Net
Assets | |
| COMMON STOCK: 99.0% | | | | | | | | |
| | | | | | | Consumer Discretionary: 21.4% | | |
| | 12,300 | | | @ | | Autozone, Inc. | | | 7,615,053 | | | | 0.9 | |
| | 96,900 | | | | | Bloomin' Brands, Inc. | | | 2,399,244 | | | | 0.3 | |
| | 45,600 | | | | | Brinker International, Inc. | | | 2,676,264 | | | | 0.3 | |
| | 124,000 | | | @ | | Carmax, Inc. | | | 8,255,920 | | | | 1.0 | |
| | 20,000 | | | | | Charter Communications, Inc. | | | 3,332,400 | | | | 0.4 | |
| | 8,400 | | | | | Chipotle Mexican Grill, Inc. | | | 5,749,884 | | | | 0.7 | |
| | 54,700 | | | | | Choice Hotels International, Inc. | | | 3,064,294 | | | | 0.4 | |
| | 47,000 | | | | | Coach, Inc. | | | 1,765,320 | | | | 0.2 | |
| | 137,829 | | | L | | Coupons.com, Inc. | | | 2,446,465 | | | | 0.3 | |
| | 59,300 | | | | | Delphi Automotive PLC | | | 4,312,296 | | | | 0.5 | |
| | 49,100 | | | | | Dick's Sporting Goods, Inc. | | | 2,437,815 | | | | 0.3 | |
| | 151,800 | | | | | Discovery Communications, Inc. - Class C | | | 5,118,696 | | | | 0.6 | |
| | 50,900 | | | | | Dollar General Corp. | | | 3,598,630 | | | | 0.4 | |
| | 89,000 | | | @ | | Dollar Tree, Inc. | | | 6,263,820 | | | | 0.7 | |
| | 69,100 | | | | | Extended Stay America, Inc. | | | 1,334,321 | | | | 0.2 | |
| | 42,500 | | | | | Five Below, Inc. | | | 1,735,275 | | | | 0.2 | |
| | 19,700 | | | @ | | Fossil Group, Inc. | | | 2,181,578 | | | | 0.2 | |
| | 52,900 | | | | | Gentex Corp. | | | 1,911,277 | | | | 0.2 | |
| | 74,300 | | | | | Hanesbrands, Inc. | | | 8,293,366 | | | | 1.0 | |
| | 50,400 | | | | | HomeAway, Inc. | | | 1,500,912 | | | | 0.2 | |
| | 137,100 | | | | | Interpublic Group of Cos., Inc. | | | 2,847,567 | | | | 0.3 | |
| | 95,500 | | | @ | | Kate Spade & Co. | | | 3,056,955 | | | | 0.4 | |
| | 55,300 | | | | | L Brands, Inc. | | | 4,786,215 | | | | 0.6 | |
| | 85,500 | | | | | Liberty Media Corp. - Interactive | | | 2,515,410 | | | | 0.3 | |
| | 12,155 | | | | | Liberty Ventures | | | 458,487 | | | | 0.0 | |
| | 33,100 | | | @,L | | Lululemon Athletica, Inc. | | | 1,846,649 | | | | 0.2 | |
| | 18,400 | | | L | | Lumber Liquidators | | | 1,220,104 | | | | 0.1 | |
| | 87,900 | | | @ | | Markit Ltd. | | | 2,323,197 | | | | 0.3 | |
| | 57,512 | | | | | Marriott International, Inc. | | | 4,487,661 | | | | 0.5 | |
| | 71,500 | | | | | Mattel, Inc. | | | 2,212,567 | | | | 0.3 | |
| | 52,400 | | | | | McGraw-Hill Cos., Inc. | | | 4,662,552 | | | | 0.5 | |
| | 168,800 | | | @ | | MGM Resorts International | | | 3,608,944 | | | | 0.4 | |
| | 70,300 | | | | | Michaels Cos, Inc. | | | 1,738,519 | | | | 0.2 | |
| | 15,292 | | | @ | | NetFlix, Inc. | | | 5,223,900 | | | | 0.6 | |
| | 19,900 | | | @ | | Norwegian Cruise Line Holdings Ltd. | | | 930,524 | | | | 0.1 | |
| | 23,300 | | | | | Omnicom Group, Inc. | | | 1,805,051 | | | | 0.2 | |
| | 31,800 | | | @ | | O'Reilly Automotive, Inc. | | | 6,125,316 | | | | 0.7 | |
| | 49,400 | | | | | Pandora Media, Inc. | | | 880,802 | | | | 0.1 | |
| | 13,000 | | | @ | | Panera Bread Co. | | | 2,272,400 | | | | 0.3 | |
| | 43,000 | | | | | Papa John's International, Inc. | | | 2,399,400 | | | | 0.3 | |
| | 27,800 | | | | | Polaris Industries, Inc. | | | 4,204,472 | | | | 0.5 | |
| | 24,600 | | | | | Restoration Hardware Holdings, Inc. | | | 2,361,846 | | | | 0.3 | |
| | 84,900 | | | | | Ross Stores, Inc. | | | 8,002,674 | | | | 0.9 | |
| | 25,600 | | | | | Royal Caribbean Cruises Ltd. | | | 2,110,208 | | | | 0.2 | |
| | 36,500 | | | | | Sotheby's | | | 1,576,070 | | | | 0.2 | |
| | 55,200 | | | | | Starwood Hotels & Resorts Worldwide, Inc. | | | 4,475,064 | | | | 0.5 | |
| | 48,400 | | | | | Tiffany & Co. | | | 5,172,024 | | | | 0.6 | |
| | 69,600 | | | @ | | Toll Brothers, Inc. | | | 2,385,192 | | | | 0.3 | |
| | 71,200 | | | | | Tractor Supply Co. | | | 5,611,984 | | | | 0.6 | |
| | 25,800 | | | | | TripAdvisor, Inc. | | | 1,926,228 | | | | 0.2 | |
| | 13,400 | | | @ | | Ulta Salon Cosmetics & Fragrance, Inc. | | | 1,713,056 | | | | 0.2 | |
| | 75,000 | | | @ | | Vipshop Holdings Ltd. ADR | | | 1,465,500 | | | | 0.2 | |
| | 37,020 | | | L | | Wayfair, Inc. | | | 734,847 | | | | 0.1 | |
| | 39,800 | | | | | Williams-Sonoma, Inc. | | | 3,012,064 | | | | 0.3 | |
| | 64,300 | | | | | Wolverine World Wide, Inc. | | | 1,894,921 | | | | 0.2 | |
| | 33,300 | | | | | Wynn Resorts Ltd. | | | 4,953,708 | | | | 0.6 | |
| | 45,900 | | | L | | Zulily, Inc. | | | 1,074,060 | | | | 0.1 | |
| | | | | | | | | | 184,068,968 | | | | 21.4 | |
| | | | | | | | | | | | | | | |
| | | | | | | Consumer Staples: 5.0% | | | | |
| | 44,750 | | | | | Brown-Forman Corp. | | | 3,930,840 | | | | 0.5 | |
| | 47,100 | | | | | Church & Dwight Co., Inc. | | | 3,711,951 | | | | 0.4 | |
| | 21,000 | | | | | Clorox Co. | | | 2,188,410 | | | | 0.3 | |
| | 23,700 | | | | | Dr Pepper Snapple Group, Inc. | | | 1,698,816 | | | | 0.2 | |
| | 151,300 | | | | | Flowers Foods, Inc. | | | 2,903,447 | | | | 0.3 | |
| | 41,000 | | | L | | Fresh Market, Inc. | | | 1,689,200 | | | | 0.2 | |
| | 34,900 | | | | | Hershey Co. | | | 3,627,157 | | | | 0.4 | |
| | 21,100 | | | | | JM Smucker Co. | | | 2,130,678 | | | | 0.2 | |
| | 14,700 | | | | | Keurig Green Mountain, Inc. | | | 1,946,207 | | | | 0.2 | |
| | 59,700 | | | | | McCormick & Co., Inc. | | | 4,435,710 | | | | 0.5 | |
| | 34,800 | | | | | Mead Johnson Nutrition Co. | | | 3,498,792 | | | | 0.4 | |
| | 17,900 | | | | | Pricesmart, Inc. | | | 1,632,838 | | | | 0.2 | |
| | 530,000 | | | @ | | Rite Aid Corp. | | | 3,985,600 | | | | 0.5 | |
| | 91,200 | | | | | Sprouts Farmers Market, Inc. | | | 3,098,976 | | | | 0.4 | |
| | 49,600 | | | | | Whole Foods Market, Inc. | | | 2,500,832 | | | | 0.3 | |
| | | | | | | | | | 42,979,454 | | | | 5.0 | |
| | | | | | | | | | | | | | | |
| | | | | | | Energy: 4.4% | | | | | | | | |
| | 25,690 | | | | | Antero Resources Corp. | | | 1,042,500 | | | | 0.1 | |
| | 62,800 | | | | | Cabot Oil & Gas Corp. | | | 1,859,508 | | | | 0.2 | |
| | 30,300 | | | @ | | Cameron International Corp. | | | 1,513,485 | | | | 0.2 | |
| | 21,100 | | | | | Cimarex Energy Co. | | | 2,236,600 | | | | 0.3 | |
| | 33,900 | | | | | Concho Resources, Inc. | | | 3,381,525 | | | | 0.4 | |
| | 22,200 | | | | | Continental Resources, Inc. | | | 851,592 | | | | 0.1 | |
| | 13,900 | | | | | Core Laboratories NV | | | 1,672,726 | | | | 0.2 | |
| | 57,200 | | | | | Diamondback Energy, Inc. | | | 3,419,416 | | | | 0.4 | |
| | 65,900 | | | | | EQT Corp. | | | 4,988,630 | | | | 0.6 | |
| | 72,200 | | | | | Frank's International N.V. | | | 1,200,686 | | | | 0.1 | |
| | 31,900 | | | | | Oceaneering International, Inc. | | | 1,876,039 | | | | 0.2 | |
| | 28,100 | | | | | Pioneer Natural Resources Co. | | | 4,182,685 | | | | 0.5 | |
| | 94,900 | | | | | Range Resources Corp. | | | 5,072,405 | | | | 0.6 | |
| | 57,900 | | | | | Rice Energy, Inc. | | | 1,214,163 | | | | 0.1 | |
See Accompanying Notes to Financial Statements
| VY® T. Rowe Price Diversified | PORTFOLIO OF INVESTMENTS |
| Mid Cap Growth Portfolio | as of December 31, 2014 (unaudited) (continued) |
| | 20,400 | | | | | SM Energy Co. | | | 787,032 | | | | 0.1 | |
| | 27,100 | | | | | Tesoro Corp. | | | 2,014,885 | | | | 0.2 | |
| | 75,800 | | | | | WPX Energy, Inc. | | | 881,554 | | | | 0.1 | |
| | | | | | | | | | 38,195,431 | | | | 4.4 | |
| | | | | | | | | | | | | | | |
| | | | | | | Financials: 7.2% | | | | | | | | |
| | 35,800 | | | | | Artisan Partners Asset Management, Inc. | | | 1,808,974 | | | | 0.2 | |
| | 59,900 | | | | | BankUnited, Inc. | | | 1,735,303 | | | | 0.2 | |
| | 72,633 | | | | | CBOE Holdings, Inc. | | | 4,606,385 | | | | 0.5 | |
| | 94,600 | | | | | Crown Castle International Corp. | | | 7,445,020 | | | | 0.9 | |
| | 172,100 | | | @ | | E*Trade Financial Corp. | | | 4,174,286 | | | | 0.5 | |
| | 17,400 | | | | | Federal Realty Investment Trust | | | 2,322,204 | | | | 0.3 | |
| | 35,400 | | | | | Financial Engines, Inc. | | | 1,293,870 | | | | 0.1 | |
| | 123,400 | | | | | FNF Group | | | 4,251,130 | | | | 0.5 | |
| | 26,464 | | | | | FNFV Group | | | 416,543 | | | | 0.0 | |
| | 31,700 | | | | | HCC Insurance Holdings, Inc. | | | 1,696,584 | | | | 0.2 | |
| | 20,000 | | | | | Intercontinental Exchange, Inc. | | | 4,385,800 | | | | 0.5 | |
| | 42,600 | | | | | Invesco Ltd. | | | 1,683,552 | | | | 0.2 | |
| | 21,400 | | | | | Jones Lang LaSalle, Inc. | | | 3,208,502 | | | | 0.4 | |
| | 70,300 | | | @ | | Lazard Ltd. | | | 3,517,109 | | | | 0.4 | |
| | 59,800 | | | | | LPL Financial Holdings, Inc. | | | 2,664,090 | | | | 0.3 | |
| | 40,700 | | | | | Moody's Corp. | | | 3,899,467 | | | | 0.5 | |
| | 34,300 | | | | | MSCI, Inc. - Class A | | | 1,627,192 | | | | 0.2 | |
| | 25,200 | | | | | Northern Trust Corp. | | | 1,698,480 | | | | 0.2 | |
| | 95,700 | | | | | Progressive Corp. | | | 2,582,943 | | | | 0.3 | |
| | 21,300 | | | @ | | SVB Financial Group | | | 2,472,291 | | | | 0.3 | |
| | 108,400 | | | | | TD Ameritrade Holding Corp. | | | 3,878,552 | | | | 0.5 | |
| | 8,933 | | | | | WeWork Companies, Inc., Classs A | | | 148,745 | | | | 0.0 | |
| | | | | | | | | | 61,517,022 | | | | 7.2 | |
| | | | | | | | | | | | | | | |
| | | | | | | Health Care: 16.6% | | | | | | | | |
| | 79,000 | | | L | | Acadia Pharmaceuticals, Inc. | | | 2,508,250 | | | | 0.3 | |
| | 84,900 | | | | | Agilent Technologies, Inc. | | | 3,475,806 | | | | 0.4 | |
| | 44,500 | | | @ | | Akorn, Inc. | | | 1,610,900 | | | | 0.2 | |
| | 23,400 | | | @ | | Alexion Pharmaceuticals, Inc. | | | 4,329,702 | | | | 0.5 | |
| | 38,200 | | | | | Align Technology, Inc. | | | 2,135,762 | | | | 0.2 | |
| | 68,900 | | | @ | | Alkermes PLC | | | 4,034,784 | | | | 0.5 | |
| | 16,600 | | | | | Alnylam Pharmaceuticals, Inc. | | | 1,610,200 | | | | 0.2 | |
| | 71,200 | | | | | AmerisourceBergen Corp. | | | 6,419,392 | | | | 0.7 | |
| | 9,800 | | | L | | Athenahealth, Inc. | | | 1,427,860 | | | | 0.2 | |
| | 37,100 | | | | | BioMarin Pharmaceuticals, Inc. | | | 3,353,840 | | | | 0.4 | |
| | 10,000 | | | | | Bluebird Bio, Inc. | | | 917,200 | | | | 0.1 | |
| | 67,900 | | | | | Bruker BioSciences Corp. | | | 1,332,198 | | | | 0.2 | |
| | 183,184 | | | | | Catalent, Inc. | | | 5,107,170 | | | | 0.6 | |
| | 35,850 | | | @ | | Catamaran Corp. | | | 1,855,237 | | | | 0.2 | |
| | 48,100 | | | @ | | Cerner Corp. | | | 3,110,146 | | | | 0.4 | |
| | 19,100 | | | | | Cigna Corp. | | | 1,965,581 | | | | 0.2 | |
| | 36,500 | | | @ | | DaVita, Inc. | | | 2,764,510 | | | | 0.3 | |
| | 36,400 | | | | | Dentsply International, Inc. | | | 1,939,028 | | | | 0.2 | |
| | 61,000 | | | | | Endo International PLC | | | 4,399,320 | | | | 0.5 | |
| | 66,700 | | | | | Envision Healthcare Holdings, Inc. | | | 2,313,823 | | | | 0.3 | |
| | 25,300 | | | @ | | Henry Schein, Inc. | | | 3,444,595 | | | | 0.4 | |
| | 36,000 | | | | | Hospira, Inc. | | | 2,205,000 | | | | 0.3 | |
| | 27,300 | | | | | Humana, Inc. | | | 3,921,099 | | | | 0.5 | |
| | 31,400 | | | @ | | Idexx Laboratories, Inc. | | | 4,655,678 | | | | 0.5 | |
| | 70,000 | | | @ | | Incyte Corp., Ltd. | | | 5,117,700 | | | | 0.6 | |
| | 5,850 | | | | | Intercept Pharmaceuticals, Inc. | | | 912,600 | | | | 0.1 | |
| | 10,200 | | | @ | | Intuitive Surgical, Inc. | | | 5,395,188 | | | | 0.6 | |
| | 15,100 | | | | | Jazz Pharmaceuticals PLC | | | 2,472,323 | | | | 0.3 | |
| | 31,700 | | | @ | | Medidata Solutions, Inc. | | | 1,513,675 | | | | 0.2 | |
| | 44,800 | | | @ | | Mednax, Inc. | | | 2,961,728 | | | | 0.3 | |
| | 15,100 | | | | | Mettler Toledo International, Inc. | | | 4,567,146 | | | | 0.5 | |
| | 51,000 | | | @,L | | Myriad Genetics, Inc. | | | 1,737,060 | | | | 0.2 | |
| | 55,900 | | | | | NPS Pharmaceuticals, Inc. | | | 1,999,543 | | | | 0.2 | |
| | 15,700 | | | | | Pacira Pharmaceuticals, Inc./DE | | | 1,391,962 | | | | 0.2 | |
| | 22,600 | | | @ | | Pharmacyclics, Inc. | | | 2,763,076 | | | | 0.3 | |
| | 13,100 | | | L | | Puma Biotechnology, Inc. | | | 2,479,437 | | | | 0.3 | |
| | 28,900 | | | | | Quintiles Transnational Holdings, Inc. | | | 1,701,343 | | | | 0.2 | |
| | 6,900 | | | | | Receptos, Inc. | | | 845,319 | | | | 0.1 | |
| | 6,000 | | | | | Regeneron Pharmaceuticals, Inc. | | | 2,461,500 | | | | 0.3 | |
| | 22,800 | | | @ | | Salix Pharmaceuticals Ltd. | | | 2,620,632 | | | | 0.3 | |
| | 42,100 | | | | | Seattle Genetics, Inc. | | | 1,352,673 | | | | 0.2 | |
| | 35,900 | | | @ | | Sirona Dental Systems, Inc. | | | 3,136,583 | | | | 0.4 | |
| | 37,800 | | | | | Team Health Holdings, Inc. | | | 2,174,634 | | | | 0.2 | |
| | 21,800 | | | | | Teleflex, Inc. | | | 2,503,076 | | | | 0.3 | |
| | 52,500 | | | @ | | Thoratec Corp. | | | 1,704,150 | | | | 0.2 | |
| | 16,000 | | | @ | | United Therapeutics Corp. | | | 2,071,840 | | | | 0.2 | |
| | 18,500 | | | | | Universal Health Services, Inc. | | | 2,058,310 | | | | 0.2 | |
| | 82,600 | | | | | Veeva Systems, Inc. | | | 2,181,466 | | | | 0.3 | |
| | 47,700 | | | @ | | Vertex Pharmaceuticals, Inc. | | | 5,666,760 | | | | 0.7 | |
| | 29,400 | | | | | WellCare Health Plans, Inc. | | | 2,412,564 | | | | 0.3 | |
| | 123,950 | | | | | Zoetis, Inc. | | | 5,333,569 | | | | 0.6 | |
| | | | | | | | | | 142,372,938 | | | | 16.6 | |
| | | | | | | | | | | | | | | |
| | | | | | | Industrials: 19.5% | | | | | | | | |
| | 59,300 | | | | | Alaska Air Group, Inc. | | | 3,543,768 | | | | 0.4 | |
| | 56,362 | | | | | Ametek, Inc. | | | 2,966,332 | | | | 0.3 | |
| | 29,400 | | | @ | | Armstrong World Industries, Inc. | | | 1,502,928 | | | | 0.2 | |
| | 26,900 | | | | | CH Robinson Worldwide, Inc. | | | 2,014,541 | | | | 0.2 | |
| | 29,500 | | | | | Clarcor, Inc. | | | 1,965,880 | | | | 0.2 | |
| | 26,900 | | | @ | | Clean Harbors, Inc. | | | 1,292,545 | | | | 0.2 | |
| | 53,300 | | | | | Colfax Corp. | | | 2,748,681 | | | | 0.3 | |
| | 35,700 | | | | | Copa Holdings S.A. | | | 3,699,948 | | | | 0.4 | |
| | 53,400 | | | @ | | Copart, Inc. | | | 1,948,566 | | | | 0.2 | |
| | 23,600 | | | | | Corporate Executive Board Co. | | | 1,711,708 | | | | 0.2 | |
| | 19,000 | | | | | CoStar Group, Inc. | | | 3,488,970 | | | | 0.4 | |
| | 44,100 | | | @ | | DigitalGlobe, Inc. | | | 1,365,777 | | | | 0.2 | |
| | 73,500 | | | | | Donaldson Co., Inc. | | | 2,839,305 | | | | 0.3 | |
See Accompanying Notes to Financial Statements
| VY® T. Rowe Price Diversified | PORTFOLIO OF INVESTMENTS |
| Mid Cap Growth Portfolio | as of December 31, 2014 (unaudited) (continued) |
| | 44,200 | | | | | Equifax, Inc. | | | 3,574,454 | | | | 0.4 | |
| | 63,000 | | | | | Expeditors International Washington, Inc. | | | 2,810,430 | | | | 0.3 | |
| | 53,300 | | | | | Fastenal Co. | | | 2,534,948 | | | | 0.3 | |
| | 66,900 | | | | | Flowserve Corp. | | | 4,002,627 | | | | 0.5 | |
| | 78,700 | | | | | Fortune Brands Home & Security, Inc. | | | 3,562,749 | | | | 0.4 | |
| | 35,100 | | | | | Generac Holdings, Inc. | | | 1,641,276 | | | | 0.2 | |
| | 25,500 | | | @ | | Genesee & Wyoming, Inc. | | | 2,292,960 | | | | 0.3 | |
| | 44,000 | | | | | Graco, Inc. | | | 3,527,920 | | | | 0.4 | |
| | 64,500 | | | | | Hertz Global Holdings, Inc. | | | 1,608,630 | | | | 0.2 | |
| | 29,500 | | | | | Hubbell, Inc. | | | 3,151,485 | | | | 0.4 | |
| | 24,600 | | | | | IDEX Corp. | | | 1,914,864 | | | | 0.2 | |
| | 31,400 | | | | | IHS, Inc. | | | 3,575,832 | | | | 0.4 | |
| | 30,700 | | | @ | | Jacobs Engineering Group, Inc. | | | 1,371,983 | | | | 0.2 | |
| | 44,300 | | | | | JB Hunt Transport Services, Inc. | | | 3,732,275 | | | | 0.4 | |
| | 43,100 | | | | | Kansas City Southern | | | 5,259,493 | | | | 0.6 | |
| | 69,900 | | | | | KAR Auction Services, Inc. | | | 2,422,035 | | | | 0.3 | |
| | 23,900 | | | | | Landstar System, Inc. | | | 1,733,467 | | | | 0.2 | |
| | 42,400 | | | | | Manpower, Inc. | | | 2,890,408 | | | | 0.3 | |
| | 58,400 | | | | | Nielsen Holdings NV | | | 2,612,232 | | | | 0.3 | |
| | 19,800 | | | | | Nordson Corp. | | | 1,543,608 | | | | 0.2 | |
| | 33,100 | | | | | Paccar, Inc. | | | 2,251,131 | | | | 0.3 | |
| | 47,000 | | | | | Pall Corp. | | | 4,756,870 | | | | 0.6 | |
| | 46,800 | | | @ | | Quanta Services, Inc. | | | 1,328,652 | | | | 0.2 | |
| | 106,200 | | | | | Rexnord Corp. | | | 2,995,902 | | | | 0.3 | |
| | 88,400 | | | L | | Ritchie Brothers Auctioneers, Inc. | | | 2,377,076 | | | | 0.3 | |
| | 47,800 | | | | | Robert Half International, Inc. | | | 2,790,564 | | | | 0.3 | |
| | 38,300 | | | | | Roper Industries, Inc. | | | 5,988,205 | | | | 0.7 | |
| | 143,200 | | | @ | | Sensata Technologies Holdings N.V. | | | 7,505,112 | | | | 0.9 | |
| | 24,500 | | | | | Snap-On, Inc. | | | 3,350,130 | | | | 0.4 | |
| | 139,800 | | | | | Southwest Airlines Co. | | | 5,916,336 | | | | 0.7 | |
| | 39,700 | | | | | Spirit Airlines, Inc. | | | 3,000,526 | | | | 0.3 | |
| | 14,300 | | | @ | | Stericycle, Inc. | | | 1,874,444 | | | | 0.2 | |
| | 45,000 | | | | | Terex Corp. | | | 1,254,600 | | | | 0.1 | |
| | 92,700 | | | | | Textron, Inc. | | | 3,903,597 | | | | 0.5 | |
| | 21,000 | | | | | TransDigm Group, Inc. | | | 4,123,350 | | | | 0.5 | |
| | 66,100 | | | @ | | United Continental Holdings, Inc. | | | 4,421,429 | | | | 0.5 | |
| | 19,200 | | | | | Valmont Industries, Inc. | | | 2,438,400 | | | | 0.3 | |
| | 82,100 | | | | | Verisk Analytics, Inc. | | | 5,258,505 | | | | 0.6 | |
| | 20,300 | | | @ | | WABCO Holdings, Inc. | | | 2,127,034 | | | | 0.2 | |
| | 47,200 | | | | | Wabtec Corp. | | | 4,101,208 | | | | 0.5 | |
| | 36,000 | | | | | Waste Connections, Inc. | | | 1,583,640 | | | | 0.2 | |
| | 18,100 | | | | | WW Grainger, Inc. | | | 4,613,509 | | | | 0.5 | |
| | 83,900 | | | | | Xylem, Inc. | | | 3,194,073 | | | | 0.4 | |
| | | | | | | | | | 168,006,918 | | | | 19.5 | |
| | | | | | | | | | | | | | | |
| | | | | | | Information Technology: 17.6% | | |
| | 46,100 | | | | | Akamai Technologies, Inc. | | | 2,902,456 | | | | 0.3 | |
| | 7,400 | | | | | Alliance Data Systems Corp. | | | 2,116,770 | | | | 0.2 | |
| | 170,400 | | | | | Altera Corp. | | | 6,294,576 | | | | 0.7 | |
| | 88,000 | | | | | Amphenol Corp. | | | 4,735,280 | | | | 0.6 | |
| | 21,800 | | | @ | | Ansys, Inc. | | | 1,787,600 | | | | 0.2 | |
| | 107,100 | | | | | ARM Holdings PLC ADR | | | 4,958,730 | | | | 0.6 | |
| | 6,856 | | | | | Atlassian, Inc. - Class A Restricted | | | 130,264 | | | | 0.0 | |
| | 4,723 | | | | | Atlassian, Inc. - Class A Unrestricted | | | 89,737 | | | | 0.0 | |
| | 12,036 | | | | | Atlassian, Inc. - Series 1 Restricted | | | 228,684 | | | | 0.0 | |
| | 32,225 | | | | | Atlassian, Inc. - Series 2 Restricted | | | 612,275 | | | | 0.1 | |
| | 29,300 | | | @ | | Autodesk, Inc. | | | 1,759,758 | | | | 0.2 | |
| | 24,300 | | | @ | | Check Point Software Technologies | | | 1,909,251 | | | | 0.2 | |
| | 121,400 | | | @ | | CoreLogic, Inc. | | | 3,835,026 | | | | 0.4 | |
| | 35,400 | | | | | DealerTrack Holdings, Inc. | | | 1,568,574 | | | | 0.2 | |
| | 19,495 | | | | | Dropbox, Inc. | | | 372,378 | | | | 0.1 | |
| | 13,306 | | | | | Equinix, Inc. | | | 3,016,869 | | | | 0.4 | |
| | 19,200 | | | @ | | F5 Networks, Inc. | | | 2,504,928 | | | | 0.3 | |
| | 14,000 | | | | | Factset Research Systems, Inc. | | | 1,970,500 | | | | 0.2 | |
| | 22,900 | | | | | FEI Co. | | | 2,069,015 | | | | 0.2 | |
| | 94,900 | | | | | Fidelity National Information Services, Inc. | | | 5,902,780 | | | | 0.7 | |
| | 65,200 | | | @ | | Fiserv, Inc. | | | 4,627,244 | | | | 0.5 | |
| | 58,500 | | | @ | | Gartner, Inc. | | | 4,926,285 | | | | 0.6 | |
| | 88,600 | | | @ | | Genpact Ltd. | | | 1,677,198 | | | | 0.2 | |
| | 36,600 | | | | | Global Payments, Inc. | | | 2,954,718 | | | | 0.3 | |
| | 42,700 | | | | | Guidewire Software, Inc. | | | 2,161,901 | | | | 0.3 | |
| | 53,800 | | | | | Intuit, Inc. | | | 4,959,822 | | | | 0.6 | |
| | 31,300 | | | @,L | | IPG Photonics Corp. | | | 2,344,996 | | | | 0.3 | |
| | 34,950 | | | | | Keysight Technologies, Inc. | | | 1,180,262 | | | | 0.1 | |
| | 27,400 | | | | | KLA-Tencor Corp. | | | 1,926,768 | | | | 0.2 | |
| | 36,800 | | | | | LendingClub Corp. | | | 931,040 | | | | 0.1 | |
| | 68,800 | | | | | Linear Technology Corp. | | | 3,137,280 | | | | 0.4 | |
| | 24,500 | | | | | LinkedIn Corp. | | | 5,627,895 | | | | 0.7 | |
| | 15,300 | | | | | Mercadolibre, Inc. | | | 1,953,351 | | | | 0.2 | |
| | 41,900 | | | | | Microchip Technology, Inc. | | | 1,890,109 | | | | 0.2 | |
| | 51,700 | | | @,L | | Mobileye NV | | | 2,096,952 | | | | 0.2 | |
| | 30,200 | | | | | Motorola Solutions, Inc. | | | 2,025,816 | | | | 0.2 | |
| | 35,000 | | | | | NetSuite, Inc. | | | 3,820,950 | | | | 0.4 | |
| | 17,900 | | | | | Palo Alto Networks, Inc. | | | 2,194,003 | | | | 0.3 | |
| | 41,000 | | | | | Paychex, Inc. | | | 1,892,970 | | | | 0.2 | |
| | 43,400 | | | | | Rackspace Hosting, Inc. | | | 2,031,554 | | | | 0.2 | |
| | 96,700 | | | @ | | Red Hat, Inc. | | | 6,685,838 | | | | 0.8 | |
| | 30,600 | | | | | Sandisk Corp. | | | 2,998,188 | | | | 0.4 | |
| | 80,700 | | | | | ServiceNow, Inc. | | | 5,475,495 | | | | 0.6 | |
| | 55,000 | | | | | Skyworks Solutions, Inc. | | | 3,999,050 | | | | 0.5 | |
| | 26,600 | | | | | Solera Holdings, Inc. | | | 1,361,388 | | | | 0.2 | |
| | 16,400 | | | @,L | | Stratasys Ltd. | | | 1,363,004 | | | | 0.2 | |
| | 29,700 | | | | | Tableau Software, Inc. | | | 2,517,372 | | | | 0.3 | |
| | 100,300 | | | @ | | Trimble Navigation Ltd. | | | 2,661,962 | | | | 0.3 | |
| | 76,400 | | | | | Twitter, Inc. | | | 2,740,468 | | | | 0.3 | |
| | 128,900 | | | | | Vantiv, Inc. | | | 4,372,288 | | | | 0.5 | |
| | 78,500 | | | @ | | VeriSign, Inc. | | | 4,474,500 | | | | 0.5 | |
| | 18,699 | | | | | WEX, Inc. | | | 1,849,705 | | | | 0.2 | |
| | 37,647 | | | | | Workday, Inc. | | | 3,072,372 | | | | 0.4 | |
| | 73,600 | | | | | Xilinx, Inc. | | | 3,186,144 | | | | 0.4 | |
| | 15,300 | | | L | | Zillow, Inc. | | | 1,620,117 | | | | 0.2 | |
| | | | | | | | | | 151,504,456 | | | | 17.6 | |
| | | | | | | | | | | | | | | |
| | | | | | | Materials: 5.8% | | | | | | | | |
| | 37,300 | | | | | Airgas, Inc. | | | 4,296,214 | | | | 0.5 | |
| | 22,800 | | | | | Ashland, Inc. | | | 2,730,528 | | | | 0.3 | |
See Accompanying Notes to Financial Statements
| VY® T. Rowe Price Diversified | PORTFOLIO OF INVESTMENTS |
| Mid Cap Growth Portfolio | as of December 31, 2014 (unaudited) (continued) |
| | 74,000 | | | | | Ball Corp. | | | 5,044,580 | | | | 0.6 | |
| | 27,100 | | | | | Carpenter Technology Corp. | | | 1,334,675 | | | | 0.2 | |
| | 87,000 | | | | | Celanese Corp. | | | 5,216,520 | | | | 0.6 | |
| | 7,900 | | | | | CF Industries Holdings, Inc. | | | 2,153,066 | | | | 0.3 | |
| | 19,300 | | | | | Compass Minerals International, Inc. | | | 1,675,819 | | | | 0.2 | |
| | 23,200 | | | | | Eagle Materials, Inc. | | | 1,763,896 | | | | 0.2 | |
| | 166,700 | | | | | Eldorado Gold Corp. | | | 1,013,536 | | | | 0.1 | |
| | 29,882 | | | | | FMC Corp. | | | 1,704,170 | | | | 0.2 | |
| | 54,900 | | | | | RPM International, Inc. | | | 2,783,979 | | | | 0.3 | |
| | 33,300 | | | | | Sherwin-Williams Co. | | | 8,759,232 | | | | 1.0 | |
| | 74,200 | | | | | Silver Wheaton Corp. | | | 1,508,486 | | | | 0.2 | |
| | 53,000 | | | | | Sociedad Quimica y Minera de Chile SA ADR | | | 1,265,640 | | | | 0.1 | |
| | 103,700 | | | @ | | Stillwater Mining Co | | | 1,528,538 | | | | 0.2 | |
| | 42,100 | | | | | Valspar Corp. | | | 3,640,808 | | | | 0.4 | |
| | 57,600 | | | | | Vulcan Materials Co. | | | 3,786,048 | | | | 0.4 | |
| | | | | | | | | | 50,205,735 | | | | 5.8 | |
| | | | | | | | | | | | | | | |
| | | | | | | Telecommunication Services: 1.2% | |
| | 74,650 | | | | | SBA Communications Corp. | | | 8,268,234 | | | | 1.0 | |
| | 72,700 | | | | | T-Mobile US, Inc. | | | 1,958,538 | | | | 0.2 | |
| | | | | | | | | | 10,226,772 | | | | 1.2 | |
| | | | | | | | | | | | | | | |
| | | | | | | Utilities: 0.3% | | | | | | | | |
| | 59,600 | | | | | NiSource, Inc. | | | 2,528,232 | | | | 0.3 | |
| | | | | | | | | | | | | | | |
| | | | | Total Common Stock | | | | | | | | |
| | | | | (Cost $561,069,916) | | | 851,605,926 | | | | 99.0 | |
| | | | | | | | | | | | | |
| PREFERRED STOCK: 0.9% | | | | | | | | |
| | | | | | | Financials: 0.1% | | | | | | | | |
| | 44,396 | | | @ | | WeWork Companies, Inc. - Series D-1 | | | 739,246 | | | | 0.1 | |
| | 34,882 | | | @ | | WeWork Companies, Inc. - Series D-2 | | | 580,827 | | | | 0.0 | |
| | | | | | | | | | 1,320,073 | | | | 0.1 | |
| | | | | | | | | | | | | | | |
| | | | | | | Information Technology: 0.8% | | |
| | 32,391 | | | @ | | AirBNB, Inc. - Series D | | | 1,318,735 | | | | 0.1 | |
| | 24,667 | | | | | Atlassian, Inc. - Class A Unrestricted | | | 468,673 | | | | 0.1 | |
| | 23,831 | | | | | Atlassian, Inc. - Series A | | | 452,789 | | | | 0.0 | |
| | 24,209 | | | @ | | Dropbox, Inc. - Series A | | | 462,421 | | | | 0.1 | |
| | 118,921 | | | @ | | Dropbox, Inc. - Series A-1 | | | 2,271,534 | | | | 0.3 | |
| | 44,255 | | | @ | | Dropbox, Inc. - Series A | | | 845,324 | | | | 0.1 | |
| | 8,859 | | | | | FLIPKART SERIES G PREF SH | | | 1,060,954 | | | | 0.1 | |
| | | | | | | | | | 6,880,430 | | | | 0.8 | |
| | | | | | | | | | | | | | | |
| | | | | Total Preferred Stock | | | | | | | | |
| | | | | (Cost $6,616,250) | | | 8,200,503 | | | | 0.9 | |
| | | | | | | | | | | | | |
| | | | | Total Long-Term Investments | | | | | | | | |
| | | | | (Cost $567,686,166) | | | 859,806,429 | | | | 99.9 | |
Principal
Amount† | | | | | | | Value | | | Percentage
of Net
Assets | |
| SHORT-TERM INVESTMENTS: 2.9% | | | | | | | | |
| | | | | | | Securities Lending Collateralcc: 2.8% | |
| | 5,658,671 | | | | | Cantor Fitzgerald, Repurchase Agreement dated 12/31/14, 0.09%, due 01/02/15 (Repurchase Amount $5,658,699, collateralized by various U.S. Government/U.S. Government Agency Obligations, 0.000%-10.500%, Market Value plus accrued interest $5,771,845, due 01/01/15-09/01/49) | | | 5,658,671 | | | | 0.7 | |
| | 1,191,241 | | | | | Daiwa Capital Markets, Repurchase Agreement dated 12/31/14, 0.12%, due 01/02/15 (Repurchase Amount $1,191,249, collateralized by various U.S. Government/U.S. Government Agency Obligations, 0.000%-6.500%, Market Value plus accrued interest $1,215,066, due 06/01/17-03/01/48) | | | 1,191,241 | | | | 0.1 | |
| | 5,658,671 | | | | | Nomura Securities, Repurchase Agreement dated 12/31/14, 0.08%, due 01/02/15 (Repurchase Amount $5,658,696, collateralized by various U.S. Government/U.S. Government Agency Obligations, 0.000%-8.875%, Market Value plus accrued interest $5,771,844, due 01/07/15-10/20/64) | | | 5,658,671 | | | | 0.7 | |
| | 5,658,671 | | | | | Royal Bank of Scotland PLC, Repurchase Agreement dated 12/31/14, 0.09%, due 01/02/15 (Repurchase Amount $5,658,699, collateralized by various U.S. Government/U.S. Government Agency Obligations, 0.375%-7.250%, Market Value plus accrued interest $5,771,845, due 11/15/15-07/15/56) | | | 5,658,671 | | | | 0.7 | |
See Accompanying Notes to Financial Statements
| VY® T. Rowe Price Diversified | PORTFOLIO OF INVESTMENTS |
| Mid Cap Growth Portfolio | as of December 31, 2014 (unaudited) (continued) |
| | 5,658,671 | | | | | State of Wisconsin Investment Board, Repurchase Agreement dated 12/31/14, 0.15%, due 01/02/15 (Repurchase Amount $5,658,718, collateralized by various U.S. Government Securities, 0.125%-2.500%, Market Value plus accrued interest $5,772,412, due 04/15/16-02/15/42) | | | 5,658,671 | | | | 0.6 | |
| | | | | | | | | | 23,825,925 | | | | 2.8 | |
| Shares | | | | | | | Value | | | Percentage
of Net
Assets | |
| | | | | | Mutual Funds: 0.1% | | |
| | 1,001,969 | | | | | T. Rowe Price Reserve Investment Fund, 0.070%††
(Cost $1,001,969) | | | 1,001,969 | | | | 0.1 | |
| | | | | | | | | | | | | | | |
| | | | | Total Short-Term Investments(Cost $24,827,894) | | | 24,827,894 | | | | 2.9 | |
| | | | | | | | | | | | | | | |
| | | | | Total Investments in Securities (Cost $592,514,060) | | $ | 884,634,323 | | | | 102.8 | |
| | | | | Liabilities in Excess of Other Assets | | | (24,118,423 | ) | | | (2.8) | |
| | | | | Net Assets | | $ | 860,515,900 | | | | 100.0 | |
| † | Unless otherwise indicated, principal amount is shown in USD. |
| †† | Rate shown is the 7-day yield as of December 31, 2014. |
| @ | Non-income producing security. |
| ADR | American Depositary Receipt |
| cc | Represents securities purchased with cash collateral received for securities on loan. |
| L | Loaned security, a portion or all of the security is on loan at December 31, 2014. |
Cost for federal income tax purposes is $592,664,356.
Net unrealized appreciation consists of:
| Gross Unrealized Appreciation | | $ | 308,597,763 | |
| Gross Unrealized Depreciation | | | (16,627,796 | ) |
| | | | | |
| Net Unrealized Appreciation | | $ | 291,969,967 | |
See Accompanying Notes to Financial Statements
| VY® T. Rowe Price Growth Equity | PORTFOLIO OF INVESTMENTS |
| Portfolio | as of December 31, 2014 |
| Shares | | | | | | | Value | | | Percentage
of Net
Assets | |
| COMMON STOCK: 99.5% | | | | | | | | |
| | | | | | | Consumer Discretionary: 27.0% | | |
| | 182,400 | | | @ | | Amazon.com, Inc. | | | 56,607,840 | | | | 3.6 | |
| | 31,700 | | | @ | | Autozone, Inc. | | | 19,625,787 | | | | 1.2 | |
| | 232,300 | | | @ | | Carmax, Inc. | | | 15,466,534 | | | | 1.0 | |
| | 14,800 | | | | | Chipotle Mexican Grill, Inc. | | | 10,130,748 | | | | 0.6 | |
| | 200,400 | | | @ | | Ctrip.com International Ltd. ADR | | | 9,118,200 | | | | 0.6 | |
| | 174,400 | | | | | Delphi Automotive PLC | | | 12,682,368 | | | | 0.8 | |
| | 114,200 | | | | | Hanesbrands, Inc. | | | 12,747,004 | | | | 0.8 | |
| | 170,700 | | | | | Home Depot, Inc. | | | 17,918,379 | | | | 1.1 | |
| | 232,900 | | | | | Las Vegas Sands Corp. | | | 13,545,464 | | | | 0.9 | |
| | 356,600 | | | | | Lowe's Cos, Inc. | | | 24,534,080 | | | | 1.6 | |
| | 756,160 | | | @ | | MGM Resorts International | | | 16,166,701 | | | | 1.0 | |
| | 74,000 | | | | | Michael Kors Holdings Ltd. | | | 5,557,400 | | | | 0.3 | |
| | 38,300 | | | @ | | NetFlix, Inc. | | | 13,083,663 | | | | 0.8 | |
| | 92,300 | | | | | Nike, Inc. | | | 8,874,645 | | | | 0.6 | |
| | 141,100 | | | | | Pandora Media, Inc. | | | 2,515,813 | | | | 0.2 | |
| | 42,659 | | | @ | �� | Priceline.com, Inc. | | | 48,640,218 | | | | 3.1 | |
| | 70,900 | | | | | Ross Stores, Inc. | | | 6,683,034 | | | | 0.4 | |
| | 224,500 | | | | | Starbucks Corp. | | | 18,420,225 | | | | 1.2 | |
| | 89,800 | | | | | Starwood Hotels & Resorts Worldwide, Inc. | | | 7,280,086 | | | | 0.5 | |
| | 63,900 | | | L | | Tesla Motors, Inc. | | | 14,211,999 | | | | 0.9 | |
| | 223,000 | | | | | Tractor Supply Co. | | | 17,576,860 | | | | 1.1 | |
| | 146,800 | | | | | Twenty-First Century Fox, Inc. - Class A | | | 5,637,854 | | | | 0.4 | |
| | 86,100 | | | | | Under Armour, Inc. | | | 5,846,190 | | | | 0.4 | |
| | 580,200 | | | @ | | Vipshop Holdings Ltd. ADR | | | 11,337,108 | | | | 0.7 | |
| | 218,800 | | | | | Walt Disney Co. | | | 20,608,772 | | | | 1.3 | |
| | 2,550,800 | | | L | | Wynn Macau Ltd. | | | 7,116,358 | | | | 0.5 | |
| | 150,760 | | | | | Wynn Resorts Ltd. | | | 22,427,058 | | | | 1.4 | |
| | | | | | | | | | 424,360,388 | | | | 27.0 | |
| | | | | | | | | | | | | | | |
| | | | | | | Consumer Staples: 2.6% | | | | |
| | 57,700 | | | | | Costco Wholesale Corp. | | | 8,178,975 | | | | 0.5 | |
| | 184,800 | | | | | CVS Caremark Corp. | | | 17,798,088 | | | | 1.1 | |
| | 81,900 | | | | | Estee Lauder Cos., Inc. | | | 6,240,780 | | | | 0.4 | |
| | 124,700 | | | | | Walgreens Boots Alliance, Inc. | | | 9,502,140 | | | | 0.6 | |
| | | | | | | | | | 41,719,983 | | | | 2.6 | |
| | | | | | | | | | | | | | | |
| | | | | | | Energy: 2.2% | | | | | | | | |
| | 99,800 | | | | | Continental Resources, Inc. | | | 3,828,328 | | | | 0.2 | |
| | 34,600 | | | | | EOG Resources, Inc. | | | 3,185,622 | | | | 0.2 | |
| | 122,100 | | | | | EQT Corp. | | | 9,242,970 | | | | 0.6 | |
| | 70,500 | | | | | Pioneer Natural Resources Co. | | | 10,493,925 | | | | 0.7 | |
| | 148,581 | | | | | Range Resources Corp. | | | 7,941,655 | | | | 0.5 | |
| | | | | | | | | | 34,692,500 | | | | 2.2 | |
| | | | | | | | | | | | | | | |
| | | | | | | Financials: 6.6% | | | | | | | | |
| | 242,000 | | | | | American Tower Corp. | | | 23,921,700 | | | | 1.5 | |
| | 21,100 | | | | | Blackrock, Inc. | | | 7,544,516 | | | | 0.5 | |
| | 312,812 | | | | | Crown Castle International Corp. | | | 24,618,304 | | | | 1.6 | |
| | 50,300 | | | | | Intercontinental Exchange, Inc. | | | 11,030,287 | | | | 0.7 | |
| | 19,300 | | | | | Invesco Ltd. | | | 762,736 | | | | 0.1 | |
| | 418,600 | | | | | Morgan Stanley | | | 16,241,680 | | | | 1.0 | |
| | 128,000 | | | | | State Street Corp. | | | 10,048,000 | | | | 0.6 | |
| | 252,200 | | | | | TD Ameritrade Holding Corp. | | | 9,023,716 | | | | 0.6 | |
| | | | | | | | | | 103,190,939 | | | | 6.6 | |
| | | | | | | | | | | | | | | |
| | | | | | | Health Care: 18.5% | | | | | | | | |
| | 71,100 | | | @ | | Actavis PLC | | | 18,301,851 | | | | 1.2 | |
| | 117,600 | | | @ | | Alexion Pharmaceuticals, Inc. | | | 21,759,528 | | | | 1.4 | |
| | 87,000 | | | | | Allergan, Inc. | | | 18,495,330 | | | | 1.2 | |
| | 97,600 | | | @ | | Biogen Idec, Inc. | | | 33,130,320 | | | | 2.1 | |
| | 197,416 | | | | | Celgene Corp. | | | 22,082,954 | | | | 1.4 | |
| | 362,600 | | | @ | | Gilead Sciences, Inc. | | | 34,178,676 | | | | 2.2 | |
| | 71,400 | | | | | Humana, Inc. | | | 10,255,182 | | | | 0.6 | |
| | 111,700 | | | @ | | Incyte Corp., Ltd. | | | 8,166,387 | | | | 0.5 | |
| | 40,600 | | | @ | | Intuitive Surgical, Inc. | | | 21,474,964 | | | | 1.4 | |
| | 166,700 | | | | | McKesson Corp. | | | 34,603,586 | | | | 2.2 | |
| | 67,500 | | | @ | | Pharmacyclics, Inc. | | | 8,252,550 | | | | 0.5 | |
| | 31,700 | | | | | Regeneron Pharmaceuticals, Inc. | | | 13,004,925 | | | | 0.8 | |
| | 127,800 | | | | | UnitedHealth Group, Inc. | | | 12,919,302 | | | | 0.8 | |
| | 165,200 | | | @ | | Valeant Pharmaceuticals International | | | 23,641,772 | | | | 1.5 | |
| | 96,000 | | | @ | | Vertex Pharmaceuticals, Inc. | | | 11,404,800 | | | | 0.7 | |
| | | | | | | | | | 291,672,127 | | | | 18.5 | |
| | | | | | | | | | | | | | | |
| | | | | | | Industrials: 13.6% | | | | | | | | |
| | 642,500 | | | | | American Airlines Group, Inc. | | | 34,457,275 | | | | 2.2 | |
| | 187,200 | | | | | Boeing Co. | | | 24,332,256 | | | | 1.5 | |
| | 384,400 | | | | | Danaher Corp. | | | 32,946,924 | | | | 2.1 | |
| | 64,300 | | | | | FedEx Corp. | | | 11,166,338 | | | | 0.7 | |
| | 75,800 | | | | | Flowserve Corp. | | | 4,535,114 | | | | 0.3 | |
| | 99,100 | | | | | JB Hunt Transport Services, Inc. | | | 8,349,175 | | | | 0.5 | |
| | 89,500 | | | | | Kansas City Southern | | | 10,921,685 | | | | 0.7 | |
| | 114,000 | | | | | Precision Castparts Corp. | | | 27,460,320 | | | | 1.7 | |
| | 106,700 | | | | | Roper Industries, Inc. | | | 16,682,545 | | | | 1.1 | |
| | 208,800 | | | | | Tyco International Plc | | | 9,157,968 | | | | 0.6 | |
| | 228,740 | | | @ | | United Continental Holdings, Inc. | | | 15,300,419 | | | | 1.0 | |
| | 65,800 | | | | | United Technologies Corp. | | | 7,567,000 | | | | 0.5 | |
| | 136,500 | | | | | Wabtec Corp. | | | 11,860,485 | | | | 0.7 | |
| | | | | | | | | | 214,737,504 | | | | 13.6 | |
| | | | | | | | | | | | | | | |
| | | | | | | Information Technology: 26.4% | | | | |
| | 224,992 | | | @ | | Alibaba Group Holding Ltd. ADR | | | 23,385,668 | | | | 1.5 | |
| | 292,100 | | | | | Apple, Inc. | | | 32,241,998 | | | | 2.0 | |
| | 80,700 | | | | | ASML Holding NV-NY REG | | | 8,701,881 | | | | 0.5 | |
| | 128,500 | | | @ | | Baidu.com ADR | | | 29,294,145 | | | | 1.9 | |
| | 456,400 | | | | | Facebook, Inc. | | | 35,608,328 | | | | 2.3 | |
| | 97,800 | | | @ | | Fiserv, Inc. | | | 6,940,866 | | | | 0.4 | |
See Accompanying Notes to Financial Statements
| VY® T. Rowe Price Growth Equity | PORTFOLIO OF INVESTMENTS |
| Portfolio | as of December 31, 2014 (UNAUDITED) (CONTINUED) |
| | 80,550 | | | | | Google, Inc. – Class A | | | 42,744,663 | | | | 2.7 | |
| | 82,550 | | | | | Google, Inc. - Class C | | | 43,454,320 | | | | 2.8 | |
| | 56,600 | | | | | LinkedIn Corp. | | | 13,001,586 | | | | 0.8 | |
| | 84,501 | | | | | LivingSocial.com | | | 21,970 | | | | 0.0 | |
| | 416,800 | | | | | Mastercard, Inc. | | | 35,911,488 | | | | 2.3 | |
| | 95,000 | | | @,L | | Mobileye NV | | | 3,853,200 | | | | 0.2 | |
| | 77,700 | | | | | NetSuite, Inc. | | | 8,482,509 | | | | 0.5 | |
| | 7,652 | | | | | NAVER Corp. | | | 4,900,609 | | | | 0.3 | |
| | 25,600 | | | | | Palo Alto Networks, Inc. | | | 3,137,792 | | | | 0.2 | |
| | 154,400 | | | @ | | Red Hat, Inc. | | | 10,675,216 | | | | 0.7 | |
| | 347,864 | | | @ | | Salesforce.com, Inc. | | | 20,631,814 | | | | 1.3 | |
| | 113,700 | | | | | ServiceNow, Inc. | | | 7,714,545 | | | | 0.5 | |
| | 51,400 | | | @,L | | Stratasys Ltd. | | | 4,271,854 | | | | 0.3 | |
| | 686,500 | | | | | Tencent Holdings Ltd. | | | 9,932,921 | | | | 0.7 | |
| | 154,900 | | | | | Twitter, Inc. | | | 5,556,263 | | | | 0.4 | |
| | 202,900 | | | | | Visa, Inc. | | | 53,200,380 | | | | 3.4 | |
| | 92,100 | | | | | VMware, Inc. | | | 7,600,092 | | | | 0.5 | |
| | 47,600 | | | | | Workday, Inc. | | | 3,884,636 | | | | 0.2 | |
| | | | | | | | | | 415,148,744 | | | | 26.4 | |
| | | | | | | | | | | | | | | |
| | | | | | | Materials: 2.0% | | | | | | | | |
| | 64,100 | | | | | Ashland, Inc. | | | 7,676,616 | | | | 0.5 | |
| | 22,500 | | | | | Ecolab, Inc. | | | 2,351,700 | | | | 0.1 | |
| | 37,500 | | | | | Martin Marietta Materials, Inc. | | | 4,137,000 | | | | 0.3 | |
| | 68,700 | | | | | Sherwin-Williams Co. | | | 18,070,848 | | | | 1.1 | |
| | | | | | | | | | 32,236,164 | | | | 2.0 | |
| | | | | | | | | | | | | | | |
| | | | | | | Telecommunication Services: 0.6% |
| | 157,700 | | | | | Softbank Corp. | | | 9,386,823 | | | | 0.6 | |
| | | | | | | | | | | | | | | |
| | | | | Total Common Stock | | | | | | | | |
| | | | | (Cost $1,066,563,111) | | | 1,567,145,172 | | | | 99.5 | |
| | | | | | | | | | | | | | | |
| PREFERRED STOCK: 0.5% | | | | | | | | |
| | | | | | | Information Technology: 0.5% | | |
| | 59,241 | | | @ | | AirBNB, Inc. - Series D | | | 2,411,880 | | | | 0.2 | |
| | 143,343 | | | @ | | Dropbox, Inc. - Series A | | | 2,738,023 | | | | 0.2 | |
| | 16,556 | | | | | FLIPKART SERIES G PREF SH | | | 1,982,747 | | | | 0.1 | |
| | | | | | | | | | | | | | | |
| | | | | Total Preferred Stock | | | | | | | | |
| | | | | (Cost $7,132,650) | | | 7,132,650 | | | | 0.5 | |
| | | | | | | | | | | | | | | |
| | | | | Total Long-Term Investments | | | | | | | | |
| | | | | (Cost $1,073,695,761) | | | 1,574,277,822 | | | | 100.0 | |
Principal
Amount† | | | | | | | Value | | | Percentage
of Net
Assets | |
| SHORT-TERM INVESTMENTS: 2.0% | | | | |
| | | | | | | Securities Lending Collateralcc: 0.7% | |
| | 2,744,104 | | | | | Cantor Fitzgerald, Repurchase Agreement dated 12/31/14, 0.09%, due 01/02/15 (Repurchase Amount $2,744,118, collateralized by various U.S. Government/U.S. Government Agency Obligations, 0.000%-10.500%, Market Value plus accrued interest $2,798,986, due 01/01/15-09/01/49) | | | 2,744,104 | | | 0.2 | |
| | 577,676 | | | | | Daiwa Capital Markets, Repurchase Agreement dated 12/31/14, 0.12%, due 01/02/15 (Repurchase Amount $577,680, collateralized by various U.S. Government and U.S. Government Agency Obligations, 0.000%-6.500%, Market Value plus accrued interest $589,230, due 06/01/17-03/01/48) | | | 577,676 | | | 0.0 | |
| | 2,744,104 | | | | | Nomura Securities, Repurchase Agreement dated 12/31/14, 0.08%, due 01/02/15 (Repurchase Amount $2,744,116, collateralized by various U.S. Government/U.S. Government Agency Obligations, 0.000%-8.875%, Market Value plus accrued interest $2,798,986, due 01/07/15-10/20/64) | | | 2,744,104 | | | 0.2 | |
| | 2,744,104 | | | | | Royal Bank of Scotland PLC, Repurchase Agreement dated 12/31/14, 0.09%, due 01/02/15 (Repurchase Amount $2,744,118, collateralized by various U.S. Government/U.S. Government Agency Obligations, 0.375%-7.250%, Market Value plus accrued interest $2,798,986, due 11/15/15-07/15/56) | | | 2,744,104 | | | 0.2 | |
See Accompanying Notes to Financial Statements
| VY® T. Rowe Price Growth Equity | PORTFOLIO OF INVESTMENTS |
| Portfolio | as of December 31, 2014 (UNAUDITED) (CONTINUED) |
| | 2,744,104 | | | | | State of Wisconsin Investment Board, Repurchase Agreement dated 12/31/14, 0.15%, due 01/02/15 (Repurchase Amount $2,744,127, collateralized by various U.S. Government Securities, 0.125%-2.500%, Market Value plus accrued interest $2,799,261, due 04/15/16-02/15/42) | | | 2,744,104 | | | 0.1 | |
| | | | | | | | | | 11,554,092 | | | 0.7 | |
| Shares | | | | | | | Value | | | Percentage
of Net
Assets | |
| | | | | | | Affiliated Investment Companies: 1.3% | |
| | 19,726,078 | | | | | T. Rowe Price Reserve Investment Fund, 0.070%†† | | | | | | | | |
| | | | | | | (Cost $19,726,078) | | | 19,726,078 | | | | 1.3 | |
| | | | | | | | | | | | | | | |
| | | | | Total Short-Term
Investments | | | | | | | |
| | | | | (Cost $31,280,170)BS | | 31,280,170 | | | | 2.0 | |
| | | | | | | | | | | | | | | |
| | | | | Total Investments in
Securities
(Cost $1,104,975,931) | $ | 1,605,557,992 | | | | 102.0 | |
| | | | | Liabilities in Excess of
Other Assets | | (31,028,171 | ) | | | (2.0 | ) |
| | | | | Net Assets | $ | 1,574,529,821 | | | | 100.0 | |
| † | Unless otherwise indicated, principal amount is shown in USD. |
| †† | Rate shown is the 7-day yield as of December 31, 2014. |
| @ | Non-income producing security. |
| ADR | American Depositary Receipt |
| cc | Represents securities purchased with cash collateral received for securities on loan. |
| L | Loaned security, a portion or all of the security is on loan at December 31, 2014. |
Cost for federal income tax purposes is $1,106,896,631.
Net unrealized appreciation consists of:
| Gross Unrealized Appreciation | | $ | 525,273,551 | |
| Gross Unrealized Depreciation | | | (26,612,190 | ) |
| | | | | |
| Net Unrealized Appreciation | | $ | 498,661,361 | |
See Accompanying Notes to Financial Statements
| VY® Templeton Foreign Equity | PORTFOLIO OF INVESTMENTS |
| Portfolio | as of December 31, 2014 |
| Shares | | | | | | | Value | | | Percentage
of Net
Assets | |
| COMMON STOCK 96.1% | | | | | | | |
| | | | | | | Australia: 0.5% | | | | | | | | |
| | 2,282,732 | | | @ | | Qantas Airways Ltd. | | | 4,433,782 | | | | 0.5 | |
| | | | | | | | | | | | | | | |
| | | | | | | Brazil: 0.3% | | | | | | | | |
| | 345,617 | | | | | Petroleo Brasileiro SA ADR | | | 2,523,004 | | | | 0.3 | |
| | | | | | | | | | | | | | | |
| | | | | | | Canada: 1.0% | | | | | | | | |
| | 1,054,600 | | | | | Talisman Energy, Inc. - TSX | | | 8,260,337 | | | | 1.0 | |
| | | | | | | | | | | | | | | |
| | | | | | | China: 6.3% | | | | | | | | |
| | 3,073,000 | | | | | China Life Insurance Co., Ltd. | | | 12,040,455 | | | | 1.4 | |
| | 774,500 | | | | | China Mobile Ltd. | | | 9,071,522 | | | | 1.1 | |
| | 1,559,000 | | | | | China Shenhua Energy Co., Ltd. | | | 4,600,472 | | | | 0.5 | |
| | 4,266,600 | | | | | China South Locomotive and Rolling Stock Corp. | | | 5,744,077 | | | | 0.7 | |
| | 21,246,000 | | | | | China Telecom Corp., Ltd. | | | 12,322,412 | | | | 1.5 | |
| | 4,230,000 | | | | | Kunlun Energy Co. Ltd. | | | 3,992,036 | | | | 0.5 | |
| | 1,176,000 | | | | | Weichai Power Co. Ltd. | | | 4,929,587 | | | | 0.6 | |
| | | | | | | | | | 52,700,561 | | | | 6.3 | |
| | | | | | | | | | | | | | | |
| | | | | | | France: 11.9% | | | | | | | | |
| | 546,136 | | | | | AXA S.A. | | | 12,584,665 | | | | 1.5 | |
| | 273,888 | | | | | BNP Paribas | | | 16,168,767 | | | | 1.9 | |
| | 191,520 | | | | | Cie de Saint-Gobain | | | 8,112,971 | | | | 0.9 | |
| | 140,074 | | | | | Cie Generale des Etablissements Michelin | | | 12,644,051 | | | | 1.5 | |
| | 638,860 | | | | | Credit Agricole SA | | | 8,246,761 | | | | 1.0 | |
| | 137,452 | | | | | Gaz de France | | | 3,205,257 | | | | 0.4 | |
| | 228,121 | | | | | Sanofi | | | 20,797,953 | | | | 2.5 | |
| | 54,810 | | | | | Technip S.A. | | | 3,264,904 | | | | 0.4 | |
| | 216,094 | | | | | Total S.A. | | | 11,070,961 | | | | 1.3 | |
| | 177,530 | | | | | Vivendi | | | 4,418,827 | | | | 0.5 | |
| | | | | | | | | | 100,515,117 | | | | 11.9 | |
| | | | | | | | | | | | | | | |
| | | | | | | Germany: 11.6% | | | | | | | | |
| | 129,781 | | | | | Bayer AG | | | 17,690,294 | | | | 2.1 | |
| | 129,840 | | | | | Deutsche Boerse AG | | | 9,226,701 | | | | 1.1 | |
| | 144,348 | | | | | Deutsche Post AG | | | 4,685,823 | | | | 0.6 | |
| | 292,476 | | | | | E.ON AG | | | 4,998,922 | | | | 0.6 | |
| | 156,915 | | | | | HeidelbergCement AG | | | 11,075,077 | | | | 1.3 | |
| | 789,795 | | | | | Infineon Technologies AG | | | 8,357,520 | | | | 1.0 | |
| | 147,358 | | | | | Merck KGaA | | | 13,867,660 | | | | 1.6 | |
| | 193,800 | | | | | Metro AG | | | 5,924,038 | | | | 0.7 | |
| | 34,327 | | | | | Muenchener Rueckversicherungs AG | | | 6,835,812 | | | | 0.8 | |
| | 58,986 | | | | | SAP SE | | | 4,118,907 | | | | 0.5 | |
| | 95,240 | | | | | Siemens AG | | | 10,686,323 | | | | 1.3 | |
| | | | | | | | | | 97,467,077 | | | | 11.6 | |
| | | | | | | | | | | | | | | |
| | | | | | | Hong Kong: 2.9% | | | | | | | | |
| | 1,268,500 | | | | | AIA Group Ltd. | | | 6,996,371 | | | | 0.8 | |
| | 228,400 | | | | | Cheung Kong Holdings Ltd. ADR | | | 3,818,848 | | | | 0.4 | |
| | 710,000 | | | | | Hutchison Whampoa Ltd. | | | 8,116,413 | | | | 1.0 | |
| | 6,871,000 | | | | | Noble Group Ltd. | | | 5,861,910 | | | | 0.7 | |
| | | | | | | | | | 24,793,542 | | | | 2.9 | |
| | | | | | | | | | | | | | | |
| | | | | | | India: 1.9% | | | | | | | | |
| | 496,486 | | | | | Housing Development Finance Corp. | | | 8,903,164 | | | | 1.0 | |
| | 629,295 | | | | | ICICI Bank Ltd. ADR | | | 7,268,357 | | | | 0.9 | |
| | | | | | | | | | 16,171,521 | | | | 1.9 | |
| | | | | | | | | | | | | | | |
| | | | | | | Israel: 1.7% | | | | | | | | |
| | 253,929 | | | | | Teva Pharmaceutical Industries Ltd. ADR | | | 14,603,457 | | | | 1.7 | |
| | | | | | | | | | | | | | | |
| | | | | | | Italy: 3.1% | | | | | | | | |
| | 680,187 | | | | | ENI S.p.A. | | | 11,914,522 | | | | 1.4 | |
| | 1,637,488 | | | | | Intesa Sanpaolo S.p.A. | | | 4,750,205 | | | | 0.6 | |
| | 1,493,810 | | | | | UniCredit SpA | | | 9,568,793 | | | | 1.1 | |
| | | | | | | | | | 26,233,520 | | | | 3.1 | |
| | | | | | | | | | | | | | | |
| | | | | | | Japan: 6.2% | | | | | | | | |
| | 822,200 | | | | | Itochu Corp. | | | 8,777,066 | | | | 1.0 | |
| | 307,800 | | | | | Nikon Corp. | | | 4,089,711 | | | | 0.5 | |
| | 1,282,100 | | | | | Nissan Motor Co., Ltd. | | | 11,182,181 | | | | 1.3 | |
| | 240,400 | | | | | Suntory Beverage & Food Ltd. | | | 8,305,649 | | | | 1.0 | |
| | 255,200 | | | | | Toyota Motor Corp. | | | 15,903,399 | | | | 1.9 | |
| | 154,300 | | | L | | Trend Micro, Inc. | | | 4,263,810 | | | | 0.5 | |
| | | | | | | | | | 52,521,816 | | | | 6.2 | |
| | | | | | | | | | | | | | | |
| | | | | | | Netherlands: 6.4% | | | | | | | | |
| | 192,108 | | | | | Akzo Nobel NV | | | 13,291,996 | | | | 1.6 | |
| | 216,195 | | | | | Koninklijke Philips NV | | | 6,266,645 | | | | 0.7 | |
| | 150,904 | | | @ | | Qiagen NV | | | 3,515,025 | | | | 0.4 | |
| | 360,976 | | | | | Royal Dutch Shell PLC - Class B | | | 12,472,128 | | | | 1.5 | |
| | 374,301 | | | @ | | SBM Offshore NV | | | 4,402,120 | | | | 0.5 | |
| | 1,321,130 | | | | | TNT Express NV | | | 8,807,215 | | | | 1.1 | |
| | 121,810 | | | | | Unilever NV | | | 4,764,944 | | | | 0.6 | |
| | | | | | | | | | 53,520,073 | | | | 6.4 | |
| | | | | | | | | | | | | | | |
| | | | | | | Norway: 1.9% | | | | | | | | |
| | 166,074 | | | | | Statoil ASA | | | 2,924,038 | | | | 0.4 | |
| | 627,793 | | | | | Telenor ASA | | | 12,699,382 | | | | 1.5 | |
| | | | | | | | | | 15,623,420 | | | | 1.9 | |
| | | | | | | | | | | | | | | |
| | | | | | | Portugal: 0.7% | | | | | | | | |
| | 564,750 | | | | | Galp Energia SGPS SA | | | 5,735,055 | | | | 0.7 | |
| | | | | | | | | | | | | | | |
| | | | | | | Russia: 0.6% | | | | | | | | |
| | 392,715 | | | | | MMC Norilsk Nickel ADR | | | 5,427,361 | | | | 0.6 | |
| | | | | | | | | | | | | | | |
| | | | | | | Singapore: 3.0% | | | | | | | | |
| | 886,582 | | | | | DBS Group Holdings Ltd. | | | 13,725,466 | | | | 1.6 | |
| | 3,902,000 | | | | | Singapore Telecommunications Ltd. | | | 11,453,561 | | | | 1.4 | |
| | | | | | | | | | 25,179,027 | | | | 3.0 | |
| | | | | | | | | | | | | | | |
| | | | | | | South Korea: 5.4% | | | | | | | | |
| | 171,216 | | | | | Hana Financial Group, Inc. | | | 4,958,806 | | | | 0.6 | |
| | 20,190 | | | | | Hyundai Mobis | | | 4,319,586 | | | | 0.5 | |
| | 247,680 | | | | | KB Financial Group, Inc. ADR | | | 8,079,321 | | | | 1.0 | |
| | 58,716 | | | | | POSCO ADR | | | 3,746,668 | | | | 0.4 | |
| See Accompanying Notes to Financial Statements |
VY® Templeton Foreign Equity | PORTFOLIO OF INVESTMENTS |
| Portfolio | as of December 31, 2014 (UNAUDITED) (CONTINUED) |
| | 17,817 | | | | | POSCO | | | 4,488,010 | | | 0.6 |
| | 32,501 | | | | | Samsung Electronics Co., Ltd. GDR | | | 19,508,646 | | | 2.3 |
| | | | | | | | | | 45,101,037 | | | 5.4 |
| | | | | | | | | | | | | | |
| | | | | | | Spain: 2.0% | | | | | | | |
| | 178,256 | | | | | Repsol YPF S.A. | | | 3,337,109 | | | 0.4 |
| | 948,067 | | | | | Telefonica S.A. | | | 13,611,930 | | | 1.6 |
| | | | | | | | | | 16,949,039 | | | 2.0 |
| | | | | | | | | | | | | | |
| | | | | | | Sweden: 1.3% | | | | | | | |
| | 364,710 | | | | | Telefonaktiebolaget LM Ericsson | | | 4,415,947 | | | 0.5 |
| | 282,620 | | | | | Getinge AB | | | 6,435,930 | | | 0.8 |
| | | | | | | | | | 10,851,877 | | | 1.3 |
| | | | | | | | | | | | | | |
| | | | | | | Switzerland: 6.9% | | | | | | | |
| | 553,081 | | | | | Credit Suisse Group | | | 13,894,086 | | | 1.7 |
| | 140,377 | | | | | Novartis AG | | | 13,019,051 | | | 1.5 |
| | 72,606 | | | | | Roche Holding AG - Genusschein | | | 19,672,031 | | | 2.3 |
| | 142,055 | | | | | Swiss Re Ltd. | | | 11,900,192 | | | 1.4 |
| | | | | | | | | | 58,485,360 | | | 6.9 |
| | | | | | | | | | | | | | |
| | | | | | | Taiwan: 0.5% | | | | | | | |
| | 995,251 | | | | | Taiwan Semiconductor Manufacturing Co., Ltd. | | | 4,384,550 | | | 0.5 |
| | | | | | | | | | | |
| | | | | | | United Kingdom: 20.0% | | | |
| | 1,446,095 | | | | | Aviva PLC | | | 10,865,085 | | | 1.3 |
| | 1,403,493 | | | | | BAE Systems PLC | | | 10,264,040 | | | 1.2 |
| | 1,914,350 | | | | | Barclays PLC | | | 7,196,691 | | | 0.9 |
| | 1,295,484 | | | | | BP PLC | | | 8,223,198 | | | 1.0 |
| | 609,930 | | | | | British Sky Broadcasting PLC | | | 8,512,398 | | | 1.0 |
| | 559,944 | | | | | CRH PLC - London | | | 13,426,799 | | | 1.6 |
| | 821,996 | | | | | GlaxoSmithKline PLC | | | 17,634,805 | | | 2.1 |
| | 1,466,000 | | | | | HSBC Holdings PLC | | | 13,940,139 | | | 1.6 |
| | 1,075,618 | | | @ | | International Consolidated Airlines Group SA | | | 8,097,338 | | | 1.0 |
| | 2,809,874 | | | | | Kingfisher PLC | | | 14,853,416 | | | 1.8 |
| | 8,722,507 | | | @ | | Lloyds TSB Group PLC | | | 10,259,958 | | | 1.2 |
| | 1,730,630 | | | | | Marks & Spencer Group PLC | | | 12,814,298 | | | 1.5 |
| | 367,550 | | | | | Petrofac Ltd. | | | 4,004,080 | | | 0.5 |
| | 702,723 | | | | | Rexam PLC | | | 4,947,175 | | | 0.6 |
| | 475,511 | | | | | Standard Chartered PLC | | | 7,111,709 | | | 0.8 |
| | 2,246,160 | | | | | Tesco PLC | | | 6,549,142 | | | 0.8 |
| | 2,762,541 | | | | | Vodafone Group PLC | | | 9,471,744 | | | 1.1 |
| | | | | | | | | | 168,172,015 | | | 20.0 |
| | | | | | | | | | | | | | |
| | | | | Total Common Stock | | | | | | |
| | | | | (Cost $670,838,611) | | 809,652,548 | | | 96.1 |
| | | | | | | | | | | | | | |
| | RIGHTS: 0.0% | | | | | | | |
| | | | | | | Spain: 0.0% | | | | | | | |
| | 178,256 | | | @ | | Repsol SA | | | 98,574 | | | 0.0 |
| | | | | | | | | | | |
| | | | | Total Rights | | | | | | |
| | | | | (Cost $93,058) | | 98,574 | | | 0.0 |
| | | | | | | | | | | | | | |
| | | | | Total Long-Term Investments | | | | | | |
| | | | | (Cost $670,931,669) | | 809,751,122 | | | 96.1 |
Principal
Amount† | | | | | | | Value | | | Percentage
of Net
Assets | |
| SHORT-TERM INVESTMENTS: 0.1% | | | | |
| | | | | | | Securities Lending Collateralcc: 0.1% | |
| | 1,000,000 | | | | | Cantor Fitzgerald, Repurchase Agreement dated 12/31/14, 0.09%, due 01/02/15 (Repurchase Amount $1,000,005, collateralized by various U.S. Government/U.S. Government Agency Obligations, 0.000%-10.500%, Market Value plus accrued interest $1,020,000, due 01/01/15-09/01/49) | | | 1,000,000 | | | | 0.1 | |
| | 52,722 | | | | | Nomura Securities, Repurchase Agreement dated 12/31/14, 0.08%, due 01/02/15 (Repurchase Amount $52,722, collateralized by various U.S. Government and U.S. Government Agency Obligations, 0.000%-8.875%, Market Value plus accrued interest $53,777, due 01/07/15-10/20/64) | | | 52,722 | | | | 0.0 | |
| | | | | | |
| | | 1,052,722 | | | | 0.1 | |
| | | | | | | | | | | | | | | |
| | | | | Total Short-Term Investments | | | | | | | | |
| | | | | (Cost $1,052,722) | | | 1,052,722 | | | | 0.1 | |
| | | | | | | | | | | | | |
| | | | | Total Investments in Securities
(Cost $671,984,391) | | $ | 810,803,844 | | | | 96.2 | |
| | | | | Assets in Excess of Other Liabilities | | | 32,417,897 | | | | 3.8 | |
| | | | | Net Assets | | $ | 843,221,741 | | | | 100.0 | |
| † | Unless otherwise indicated, principal amount is shown in USD. |
| @ | Non-income producing security. |
| ADR | American Depositary Receipt |
| GDR | Global Depositary Receipt |
| cc | Represents securities purchased with cash collateral received for securities on loan. |
| L | Loaned security, a portion or all of the security is on loan at December 31, 2014. |
Cost for federal income tax purposes is $674,432,707.
Net unrealized appreciation consists of:
| Gross Unrealized Appreciation | | $ | 200,394,087 | |
| Gross Unrealized Depreciation | | | (64,022,950 | ) |
| | | | | |
| Net Unrealized Appreciation | | $ | 136,371,137 | |
See Accompanying Notes to Financial Statements
VY® Templeton Foreign Equity | PORTFOLIO OF INVESTMENTS |
| Portfolio | as of December 31, 2014 (UNAUDITED) (CONTINUED) |
| Sector Diversification | | | Percentage
of Net Assets | |
| Financials | | | 24.6 | % |
| Health Care | | | 15.0 | |
| Industrials | | | 11.3 | |
| Energy | | | 10.4 | |
| Consumer Discretionary | | | 10.0 | |
| Telecommunication Services | | | 8.7 | |
| Materials | | | 6.7 | |
| Information Technology | | | 5.3 | |
| Consumer Staples | | | 3.1 | |
| Utilities | | | 1.0 | |
| Short-Term Investments | | | 0.1 | |
| Assets in Excess of Other Liabilities | | | 3.8 | |
| Net Assets | | | 100.0 | % |
|
See Accompanying Notes to Financial Statements
Item 7. Disclosure of Proxy Voting Policies and Procedures for Closed-End Management Investment Companies.
Not applicable.
Item 8. Portfolio Managers of Closed-End Management Investment Companies.
Not applicable.
Item 9. Purchases of Equity Securities by Closed-End Management Investment Company and Affiliated Purchasers
Not applicable.
Item 10. Submission of Matters to a Vote of Security Holders.
The Board has a Nominating Committee for the purpose of considering and presenting to the Board candidates it proposes for nomination to fill Independent Trustee vacancies on the Board. The Committee currently consists of all Independent Trustees of the Board (6 individuals). The Nominating Committee operates pursuant to a Charter approved by the Board. The primary purpose of the Nominating Committee is to consider and present to the Board the candidates it proposes for nomination to fill vacancies on the Board. In evaluating candidates, the Nominating Committee may consider a variety of factors, but it has not at this time set any specific minimum qualifications that must be met. Specific qualifications of candidates for Board membership will be based on the needs of the Board at the time of nomination.
The Nominating Committee is willing to consider nominations received from shareholders and shall assess shareholder nominees in the same manner as it reviews its own nominees. A shareholder nominee for director should be submitted in writing to the Fund’s Secretary. Any such shareholder nomination should include at a minimum the following information as to each individual proposed for nomination as trustee: such individual’s written consent to be named in the proxy statement as a nominee (if nominated) and to serve as a trustee (if elected), and all information relating to such individual that is required to be disclosed in the solicitation of proxies for election of trustees, or is otherwise required, in each case under applicable federal securities laws, rules and regulations.
The Secretary shall submit all nominations received in a timely manner to the Nominating Committee. To be timely, any such submission must be delivered to the Fund’s Secretary not earlier than the 90th day prior to such meeting and not later than the close of business on the later of the 60th day prior to such meeting or the 10th day following the day on which public announcement of the date of the meeting is first made, by either disclosure in a press release or in a document publicly filed by the Fund with the Securities and Exchange Commission.
Item 11. Controls and Procedures.
| (a) | Based on our evaluation conducted within 90 days of the filing date, hereof, the design and operation of the registrant’s disclosure controls and procedures are effective to ensure that material information relating to the registrant is made known to the certifying officers by others within the appropriate entities, particularly during the period in which Forms N-CSR are being prepared, and the registrant’s disclosure controls and procedures allow timely preparation and review of the information for the registrant’s Form N-CSR and the officer certifications of such Form N-CSR. |
| (b) | There were no significant changes in the registrant’s internal controls that occurred during the second fiscal quarter of the period covered by this report that has materially affected, or is reasonably likely to materially affect, the registrant’s internal control over financial reporting. |
Item 12. Exhibits.
| (a)(1) | Code of Ethics pursuant to Item 2 of Form N-CSR is filed and attached hereto as EX-99.CODE ETH. |
| (a)(2) | A separate certification for each principal executive officer and principal financial officer of the registrant as required by Rule 30a-2 under the Act (17 CFR 270.30a-2) is attached hereto as EX-99.CERT. |
| (b) | The officer certifications required by Section 906 of the Sarbanes-Oxley Act of 2002 are attached hereto as EX-99.906CERT. |
SIGNATURES
Pursuant to the requirements of the Securities Exchange Act of 1934 and the Investment Company Act of 1940, the registrant has duly caused this report to be signed on its behalf by the undersigned, thereunto duly authorized.
(Registrant): Voya Partners, Inc.
| By | /s/ Shaun P. Mathews | |
| | Shaun P. Mathews | |
| | President and Chief Executive Officer | |
Date: March 6, 2015
Pursuant to the requirements of the Securities Exchange Act of 1934 and the Investment Company Act of 1940, this report has been signed below by the following persons on behalf of the registrant and in the capacities and on the dates indicated.
| By | /s/ Shaun P. Mathews | |
| | Shaun P. Mathews | |
| | President and Chief Executive Officer | |
Date: March 6, 2015
| By | /s/ Todd Modic | |
| | Todd Modic | |
| | Senior Vice President and Chief Financial Officer | |
Date: March 6, 2015