OMB APPROVAL
OMB Number: 3235-0570
Expires: January 31, 2014
Estimated average burden hours per response: 20.6
UNITED STATES
SECURITIES AND EXCHANGE COMMISSION
Washington, D.C. 20549
FORM N-CSR
CERTIFIED SHAREHOLDER REPORT OF
REGISTERED MANAGEMENT INVESTMENT COMPANIES
Investment Company Act file number: 811-8319
ING Partners, Inc.
(Exact name of registrant as specified in charter)
7337 E. Doubletree Ranch Rd., Scottsdale, AZ | | 85258 |
(Address of principal executive offices) | | (Zip code) |
The Corporation Trust Company, 1209 Orange Street, Wilmington, DE 19801
(Name and address of agent for service)
Registrant’s telephone number, including area code: 1-800-992-0180
Date of fiscal year end: | December 31 |
| |
Date of reporting period: | January 1, 2011 to December 31, 2011 |
ITEM 1. REPORTS TO STOCKHOLDERS.
The following is a copy of the report transmitted to stockholders pursuant to Rule 30e-1 under the Act (17 CFR 270.30e-1):

Annual Report
December 31, 2011
Classes ADV, I, S and S2
ING Partners, Inc.
n ING American Century Small-Mid Cap Value Portfolio
n ING Baron Small Cap Growth Portfolio
n ING Columbia Small Cap Value II Portfolio
n ING Davis New York Venture Portfolio
n ING Global Bond Portfolio
n ING Invesco Van Kampen Comstock Portfolio
n ING Invesco Van Kampen Equity and Income Portfolio
n ING JPMorgan Mid Cap Value Portfolio
n ING Oppenheimer Global Portfolio
n ING PIMCO Total Return Portfolio
n ING Pioneer High Yield Portfolio
n ING T. Rowe Price Diversified Mid Cap Growth Portfolio
n ING T. Rowe Price Growth Equity Portfolio
n ING Templeton Foreign Equity Portfolio
n ING Thornburg Value Portfolio
n ING UBS U.S. Large Cap Equity Portfolio
This report is submitted for general information to shareholders of the ING Funds. It is not authorized for distribution to prospective shareholders unless accompanied or preceded by a prospectus which includes details regarding the funds' investment objectives, risks, charges, expenses and other information. This information should be read carefully.
MUTUAL FUNDS

TABLE OF CONTENTS
| President's Letter | | | 1 | | |
|
| Market Perspective | | | 3 | | |
|
| Portfolio Managers' Reports | | | 6 | | |
|
| Shareholder Expense Examples | | | 38 | | |
|
| Report of Independent Registered Public Accounting Firm | | | 41 | | |
|
| Statements of Assets and Liabilities | | | 42 | | |
|
| Statements of Operations | | | 50 | | |
|
| Statements of Changes in Net Assets | | | 54 | | |
|
| Financial Highlights | | | 62 | | |
|
| Notes to Financial Statements | | | 69 | | |
|
| Summary Portfolios of Investments | | | 93 | | |
|
| Tax Information | | | 178 | | |
|
| Director and Officer Information | | | 180 | | |
|
| Shareholder Meeting Information | | | 184 | | |
|
| Advisory Contract Approval Discussion | | | 185 | | |
|
PROXY VOTING INFORMATION
A description of the policies and procedures that the Portfolios use to determine how to vote proxies related to portfolio securities is available: (1) without charge, upon request, by calling Shareholder Services toll-free at (800) 992-0180; (2) on the ING Funds' website at www.inginvestment.com; and (3) on the U.S. Securities and Exchange Commission's ("SEC's") website at www.sec.gov. Information regarding how the Portfolios voted proxies related to portfolio securities during the most recent 12-month period ended June 30 is available without charge on the ING Funds' website at www.inginvestment.com and on the SEC's website at www.sec.gov.
QUARTERLY PORTFOLIO HOLDINGS
The Portfolios file their complete schedule of portfolio holdings with the SEC for the first and third quarters of each fiscal year on Form N-Q. This report contains a summary portfolio of investments for certain Portfolios. The Portfolios' Forms N-Q are available on the SEC's website at www.sec.gov. The Portfolios' Forms N-Q may be reviewed and copied at the SEC's Public Reference Room in Washington, DC, and information on the operation of the Public Reference Room may be obtained by calling (800) SEC-0330. The Portfolios' Forms N-Q, as well as a complete portfolio of investments, are available without charge upon request from the Portfolios by calling Shareholder Services toll-free at (800) 992-0180.
PRESIDENT'S LETTER

Euro zone — continued uncertainty
Dear Shareholder,
Recent months have seen headlines and financial markets continue to focus on the ongoing euro zone debt crisis. Acknowledging that the status quo was untenable, in early December, Europe opted to move closer together rather than be torn apart. All 17 nations that use the euro and nine other European Union members agreed to a new fiscal compact that would invite closer scrutiny of individual country budgets. Ratings agencies were mostly unimpressed by these machinations; ultimately, Standard & Poor's downgraded nine countries in the region, including formerly AAA-rated France.
With the stability of Italy and Spain now in question, the need for an effective policy response has become even more acute. The new governments in both countries will have but a short grace period in which to demonstrate their resolve; both have been forced to pay yields at euro-era highs for newly issued bonds.
Across the Atlantic, the chasm between the two major political parties in the United States is as wide as ever, most recently evidenced by the failure of the Congressional "supercommittee" on deficit reduction. Notwithstanding the ongoing paralysis in Washington, the U.S. economy is showing new signs of momentum.
We expect the global economy to deliver positive, if uninspiring, growth into 2012 despite the euro zone's debt problems. We believe interest rates should remain low in major advanced countries. Markets — and risk assets in general — are likely to remain vulnerable to uncertainty until there is confidence that Europe has adequately addressed its issues.
In times of uncertainty investors historically have turned to sovereign credits, especially U.S. Treasury securities. This spotlights the critical role that governments play in defining the parameters of the financial markets and serving as foundations for generating value within economies. The current trend toward fiscal austerity downplays this important function and may prolong the global economic doldrums.
How should you respond to uncertainty in your own investment program? Don't try to time the markets. Keep your portfolio well diversified, and pay careful attention to the risks you are assuming. Talk to your financial advisor before you make any changes that might detour your portfolio from your long-term goals.
We appreciate your continued confidence in ING Funds, and we look forward to serving your investment needs in the future.
Sincerely,

Shaun Mathews
President and Chief Executive Officer
ING Funds
January 3, 2012
The views expressed in the President's Letter reflect those of the President as of the date of the letter. Any such views are subject to change at any time based upon market or other conditions and ING Funds disclaim any responsibility to update such views. These views may not be relied on as investment advice and because investment decisions for an ING Fund are based on numerous factors, may not be relied on as an indication of investment intent on behalf of any ING Fund. Reference to specific company securities should not be construed as recommendations or investment advice. Consider the fund's investment objectives, risks, and charges and expenses carefully before investing. The prospectus contains this information and other information about the fund.
International investing poses special risks including currency fluctuation, economic and political risks not found in investments that are solely domestic.
1
(THIS PAGE INTENTIONALLY LEFT BLANK)
MARKET PERSPECTIVE: YEAR ENDED DECEMBER 31, 2011
In our semi-annual report we described how investor sentiment was generally positive through April. Many of the developed world's economies including the U.S., seemed to be returning to health, boosted by heavy, ongoing doses of stimulative and monetary medicine. This was despite natural disasters in Japan, the violent uncertainties of the "Arab Spring" in North Africa and the Middle East, not to mention a European sovereign debt crisis.
But the mood darkened in early May 2011. Global equities in the form of the MSCI World IndexSM measured in local currencies, including net reinvested dividends, slid from May through September, losing over 17%, before a remarkable October rally clawed back about half of this. For the whole fiscal year the Index lost 5.49%. (The MSCI World IndexSM returned (5.54)% for the year ended December 31, 2011, measured in U.S. dollars.)
A confluence of factors caused the deterioration in outlook after April. That month the latest unemployment rate was reported at 8.8%, the lowest in 24 months. New private sector jobs, well above 200,000, were added in each of January, February and March. But in May the unemployment rate rebounded to 9.1%. By September the employment report showed zero new jobs created in August. But more upbeat releases in later months revised this up, and by year end the three-month average of jobs created was back to 143,000 from just 35,000 in September.
In the housing market, home prices (based on the S&P/Case-Shiller 20-City Composite Home Price Index) fell every month in the year. Sales were depressed, despite improved affordability and record low mortgage interest rates, by tight credit with many homeowners in negative equity on their properties.
Gross Domestic Product ("GDP") growth had been reported at 3.1% (quarter-over-quarter, annualized) for the fourth quarter of 2010. On July 29, this was scaled down to 2.3%, among other revisions that showed the recession had been deeper and started earlier than previously thought. Worse, growth in the first quarter of 2011 was a barely perceptible 0.4%. When the second quarter's figure was finalized at just 1.3%, the common assessment was that the economy was operating at "stall-speed". There was relief in October when the first estimate of third quarter GDP growth was a much-improved 2.5%, although this was subsequently revised down to 1.8%.
Political deadlock weighed on sentiment throughout. A stopgap agreement to raise the debt ceiling did not stop Standard & Poors from downgrading the country's credit rating. A bipartisan "Debt Super Committee" appointed to negotiate a more lasting set of budget control measures, admitted defeat on November 21.
Other keenly watched figures like retail sales and wages & salaries were stagnant in the months up to October, improved in that month and were mixed thereafter. Purchasing managers' indices indicated expansion but not by much. Taken together, the data were inconclusive as the year ended but the consensus was that the once-feared return to recession now looked unlikely.
The euro zone's sovereign debt crisis continued to move markets. By early August it seemed to be veering out of control. When attention turned from Greece to the much bigger bond markets of Spain and especially Italy, the European Central Bank ("ECB") stepped in, uneasily, to buy their bonds — and some time. The threat to the euro zone banking system, where vast quantities of Italian and Spanish bonds are held, was clear.
Finally, a baby step towards closer fiscal union among euro zone countries was agreed in December, including restrictions on budget deficits with near automatic disciplinary procedures for violators. Bilateral loans of up to €200 billion would be made to the International Monetary Fund, presumably to fund rescue packages for individual nations. But it provided no lender of last resort with unlimited firepower, nor measures to promote growth and liberalize markets. Investors were under no illusions as the year ended that the crisis had been solved.
In U.S. fixed income markets, the Barclays Capital U.S. Aggregate Bond Index of investment grade bonds rose 7.84% in the fiscal year, while the Barclays Capital High Yield Bond — 2% Issuer Constrained Composite Index gained 4.96%. Most notable within the Barclays Capital U.S. Aggregate Bond Index was the remarkable 29.93% return on long-dated Treasuries, reflecting both the overall decline in risk appetite and quantitative easing.
U.S. equities, represented by the S&P 500® Index, including dividends, returned 2.11% for 2011, almost identical to the dividend yield. Sector returns ranged from (17.06)% for financials to 19.91% for utilities. The operating earnings per share of S&P 500® companies made new records in the second and third quarters of 2011, but estimates for future quarters were coming down as December ended.
In currency markets, the euro zone's problems finally took their toll, as the dollar gained 2.34% on the euro in 2011, which dropped sharply after October. The pound was barely changed despite late weakness: the dollar gained 0.10%. But the dollar fell back against the yen by 5.35% despite Bank of Japan intervention as that currency repeatedly breached post-war high levels.
In international markets, the MSCI Japan® Index slumped 18.73% in 2011. The economy contracted for three straight quarters before finally recovering, as it struggled to recover from the earthquake and tsunami of March as well as a strong yen. The MSCI Europe ex UK® Index sank 12.87%, weighed down by the recessionary threat of the sovereign debt crisis. Euro zone growth shrunk to 0.2% in the second and third quarters and unemployment stood at 10.3%, a euro-era high. The MSCI UK® Index slipped just 1.83%. Weak euro zone demand and fiscal austerity at home depressed stocks, within which, however, the well-represented energy, staples and telecoms sectors managed positive average returns.
Parentheses denote a negative number.
Past performance does not guarantee future results. The performance quoted represents past performance. Investment return and principal value of an investment will fluctuate, and shares, when redeemed, may be worth more or less than their original cost. The Portfolios' performance is subject to change since the period's end and may be lower of higher than the performance data shown. Please call (800) 262-3862 or log on to www.inginvestment.com to obtain performance data current to the most recent month end.
Market Perspective reflects the views of ING's Chief Investment Risk Officer only through the end of the period, and is subject to change based on market and other conditions.
3
BENCHMARK DESCRIPTIONS
| Index | | Description | |
| Bank of America/Merrill Lynch All U.S. Convertibles (Speculative Grade) Index | | An unmanaged index that includes about 270 convertible securities and represents the
non-investment-grade convertible market. | |
|
| Bank of America/Merrill Lynch High Yield Master II Index | | A broad-based index consisting of all U.S. dollar-denominated high-yield bonds with a minimum outstanding amount of $100 million and with a maturity of greater than one year period. The quality rating is less than BBB by Standard & Poor's. | |
|
| Barclays Capital Global Aggregate Index | | provides a broad-based measure of the global investment-grade fixed-rate debt markets. | |
|
| Barclays Capital High Yield Bond — 2% Issuer Constrained Composite Index | | An unmanaged index that includes all fixed income securities having a maximum quality rating of Ba1, a minimum amount outstanding of $150 million, and at least one year to maturity. | |
|
| Barclays Capital U.S. Aggregate Bond Index | | An unmanaged index of publicly issued investment grade U.S. Government, mortgage-backed, asset-backed and corporate debt securities. | |
|
| Barclays Capital U.S. Government/Credit Bond Index | | An index made up of the Barclays Capital Government and Credit indices, including securities issued by the U.S. government and its agencies and publicly issued U.S. corporate and foreign debentures and secured notes that meet specified maturity, liquidity and quality requirements. | |
|
| MSCI All Country World ex U.S. IndexSM | | A free float-adjusted market capitalization index that is designed to measure equity market performance in the global developed and emerging markets, excluding the U.S. It includes the reinvestment of dividends and distributions net of withholding taxes, but does not reflect fees, brokerage commissions or other expenses of investing. | |
|
| MSCI All Country World IndexSM | | A broad-based unmanaged index comprised of equity securities in countries around the world, including the United States, other developed countries and emerging markets. | |
|
| MSCI EAFE® Index | | an unmanaged index that measures the performance of securities listed on exchanges in Europe, Australasia and the Far East. | |
|
| MSCI Europe ex UK® Index | | A free float-adjusted market capitalization index that is designed to measure developed market equity performance in Europe, excluding the UK. | |
|
| MSCI Japan® Index | | A free float-adjusted market capitalization index that is designed to measure developed market market equity performance in Japan. | |
|
| MSCI UK® Index | | A free float-adjusted market capitalization index that is designed to measure developed market equity performance in the UK. | |
|
| MSCI World IndexSM | | An unmanaged index that measures the performance of over 1,400 securities listed on exchanges in the U.S., Europe, Canada, Australia, New Zealand and the Far East. | |
|
| Russell 1000® Value Index | | An unmanaged index that measures the performance of those Russell 1000® securities with lower price-to-book ratios and lower forecasted growth values. | |
|
| Russell 1000® Index | | An unmanaged, comprehensive large-cap index measuring the performance of the largest 1,000 U.S. incorporated companies. | |
|
| Russell 2000® Growth Index | | An unmanaged index that measures the performance of securities of smaller U.S. companies with greater than average growth orientation. | |
|
| Russell 2000® Index | | An unmanaged index that measures the performance of securities of small U.S. companies. | |
|
| Russell 2000® Value Index | | An unmanaged index that measures the performance of those Russell 2000® companies with lower price-to-book ratios and lower than forecasted growth values. | |
|
| Russell 2500TM Value Index | | Measures the performance of those Russell 2500 companies with lower price-to-book ratios and lower forecasted growth values. | |
|
| Russell 3000® Growth Index | | An unmanaged index that measures performance of broad growth segment of the U.S. Equity universe. It includes those Russell 3000® companies with higher price-to-book ratios and higher forecasted growth values. | |
|
| Russell Midcap® Growth Index | | An unmanaged index that measures the performance of those companies included in the Russell Midcap® Index with relatively higher price-to-book ratios and higher forecasted growth values. | |
|
| Russell Midcap® Value Index | | Measures the performance of those Russell Midcap companies with lower price-to-book ratios and lower forecasted growth values. | |
|
4
BENCHMARK DESCRIPTIONS (CONTINUED)
| Index | | Description | |
| S&P 500® Index | | An unmanaged index that measures the performance of securities of approximately 500 large-capitalization companies whose securities are traded on major U.S. stock markets. | |
|
| S&P MidCap 400 Index | | A broad-based unmanaged capitalization weighted index of mid-capitalization companies. | |
|
| S&P Small Cap 600/CitigroupValue Index | | Measures the performance of those S&P 600 Index companies with lower price-to-book ratios. | |
|
| S&P/Case-Shiller 20-City Composite Home Price Index | | A composite index of the home price index for the top 20 Metropolitan Statistical Areas in the United States. The index is published monthly by Standard & Poor's. | |
|
| S&P/Citigroup World Government Bond Index | | S&P/Citigroup World Government Bond Index is an unmanaged index of bonds from 14 world government bond markets with maturities of at least one year. | |
|
5
ING AMERICAN CENTURY SMALL-MID CAP VALUE PORTFOLIO
PORTFOLIO MANAGERS' REPORT
ING American Century Small-Mid Cap Value Portfolio (the "Portfolio") seeks long-term capital growth. Income is a secondary objective. The Portfolio is managed by a team of portfolio managers comprised of Benjamin Z. Giele and James Pitman (responsible for the management of the Small Cap Value portion of the Portfolio) and Kevin Toney, Phillip N. Davidson, and Michael Liss (responsible for the Mid Cap Value portion of the Portfolio), Portfolio Managers of American Century Investment Management, Inc. — the Sub-Adviser.
Performance: For the year ended December 31, 2011, the Portfolio's Class S shares provided a total return of (3.16)% compared to the Russell 2500TM Value Index and the S&P Small Cap 600/CitigroupValue Index, which returned (3.36)% and (1.38)%, respectively, for the same period.
Portfolio Specifics: Stocks recorded mixed results in 2011 as some indices eked out small gains and others posted modest losses. Market volatility was high as investors confronted political turmoil in the Middle East; Japan's earthquake, tsunami, and nuclear accident; the European debt crisis; and a political stalemate in the U.S. over the raising of the debt ceiling. Lackluster U.S. growth also dampened investor sentiment, though conditions improved in the final months of the year. Corporate earnings remained solid and employers began to add jobs. Investors generally favored higher-yielding securities. Large cap growth stocks outperformed their value counterparts and small cap value stocks beat their growth counterparts, but mid cap value stocks narrowly outperformed mid cap growth stocks.
Small Cap Value* — The portfolio's return for the year was quite close to that of the Russell 2000® Value Index before deduction of expenses. Investments in the information technology and industrials sectors contributed to relative performance versus the Russell 2000® Value Index. In information technology, the portfolio benefitted from holdings among semiconductor stocks and IT services names. Notable contributors were semiconductor maker National Semiconductor Corp.; Total System Services, Inc., an electronic payment processor; and communications clearinghouse NeuStar, Inc. In industrials, an underweight in commercial services and supplies added value. Stock selection among electrical equipment companies and professional services stocks also enhanced results. A key contributor was Mistras Group, Inc., which provides non-destructive testing and inspection services and software for analyzing energy, industrial and public infrastructure. The energy and financials sectors detracted from performance. In energy, the portfolio was hampered by its investments in the oil, gas and consumable fuels industry. Detractors included independent oil and gas exploration company Penn Virginia Corp.; oil tanker company Overseas Shipholding Group; and coal producer Patriot Coal Corp. In financials, commercial banking was a source of weakness. A notable detractor was regional bank First Horizon National Corp.
Mid Cap Value* — The portfolio outperformed relative to the Russell Mid Cap Value Index. The portfolio benefited from positions in the financials, consumer staples, and energy sectors. In financials, an underweight and effective security selection contributed to relative results. Within the insurance industry, the portfolio benefited from owning TransAtlantic Holdings, Inc., a global reinsurance company. An investment in American Tower Corp. ("American Tower"), which is not represented in the benchmark, was also advantageous. American Tower announced it was planning to convert itself into a real estate investment trust ("REIT") at the end of 2011, attracting more investors to the stock. (The conversion led to American Tower's reclassification from a telecommunications stock to a REIT.) The financials sector was also the source of two top detractors, Northern Trust Corp. and Hudson City Bancorp., Inc. In consumer staples, an overweight added to relative performance as did the portfolio's focus on high-quality names such as Kimberly-Clark Corp. and General Mills, Inc. The energy sector supplied two notable contributors: EQT Corp., a low-cost producer of unconventional tight-shale natural gas, and Imperial Oil Ltd., a Canadian energy company. Detracting from relative performance were positions in the consumer discretionary and utilities sectors. In consumer discretionary, an underweight in the media industry slowed relative performance. The household durables and specialty retailing industries provided key detractors, appliance manufacturer Whirlpool Corp. and office supply retailer Staples. An underweight in utilities dampened relative results. Utilities stocks, which are generally viewed as defensive instruments in difficult economic times, outperformed. The portfolio management team considers many utilities stocks overvalued.
Current Strategy and Outlook: Small Cap Value* — The portfolio management team takes a fundamental, bottom-up approach, evaluating each company individually on its own merits and building the portfolio from the ground up, one stock at a time. As of December 31, 2011, the portfolio was broadly diversified, with overweight positions relative to the benchmark in information technology, industrials and health care and underweights in financials and utilities.
Mid Cap Value* — The portfolio management team takes a fundamental, bottom-up approach, evaluating each company individually on its own merits and building the portfolio from the ground up, one stock at a time. As of December 31, 2011, the portfolio was broadly diversified, with overweight positions relative to the benchmark in industrials and health care, and underweights in financials, utilities, information technology, and consumer discretionary stocks.
Sector Diversification
as of December 31, 2011
(as a percentage of net assets)
| Financials | | | 27.1 | % | |
| Industrials | | | 16.7 | % | |
| Consumer Discretionary | | | 9.6 | % | |
| Utilities | | | 9.4 | % | |
| Health Care | | | 9.0 | % | |
| Information Technology | | | 8.2 | % | |
| Consumer Staples | | | 6.3 | % | |
| Energy | | | 5.8 | % | |
| Materials | | | 4.4 | % | |
| Telecommunications | | | 2.3 | % | |
| Assets in Excess of Other Liabilities* | | | 1.2 | % | |
| Net Assets | | | 100.0 | % | |
* Includes short-term investments.
Portfolio holdings are subject to change daily.
Top Ten Holdings
as of December 31, 2011*
(as a percentage of net assets)
| Republic Services, Inc. | | | 2.0 | % | |
| Northern Trust Corp. | | | 1.6 | % | |
| iShares Russell Midcap Value Index Fund | | | 1.5 | % | |
| HCC Insurance Holdings, Inc. | | | 1.4 | % | |
| Zimmer Holdings, Inc. | | | 1.3 | % | |
| Ralcorp Holdings, Inc. | | | 1.3 | % | |
| Lowe's Cos., Inc. | | | 1.3 | % | |
| Imperial Oil Ltd. | | | 1.3 | % | |
| Bemis Co., Inc. | | | 1.2 | % | |
| Great Plains Energy, Inc. | | | 1.2 | % | |
* Excludes short-term investments.
Portfolio holdings are subject to change daily.
* For purposes of these discussions, "the portfolio" refers to each respectively managed portion of ING American Century Small-Mid Cap Value Portfolio.
Portfolio holdings and characteristics are subject to change and may not be representative of current holdings and characteristics. The outlook for this Portfolio may differ from that presented for other ING Funds. Performance for the different classes of shares will vary based on differences in fees associated with each class.
6
PORTFOLIO MANAGERS' REPORT
ING AMERICAN CENTURY SMALL-MID CAP VALUE PORTFOLIO

| Average Annual Total Returns for the Periods Ended December 31, 2011 | |
| | | 1 Year | | 5 Year | | Since Inception
of Classes ADV, I and S
May 1, 2002 | | Since Inception
of Class S2
February 27, 2009 | |
| Class ADV | | | (3.47 | )% | | | 2.44 | % | | | 6.63 | % | | | — | | |
| Class I | | | (2.97 | )% | | | 2.96 | % | | | 7.17 | % | | | — | | |
| Class S | | | (3.16 | )% | | | 2.71 | % | | | 6.90 | % | | | — | | |
| Class S2 | | | (3.33 | )% | | | — | | | | — | | | | 27.06 | % | |
| Russell 2500TM Value Index | | | (3.36 | )% | | | (0.58 | )% | | | 6.33 | % | | | 27.74 | %(1) | |
| S&P Small Cap 600/Citigroup Value Index | | | (1.38 | )% | | | 0.12 | % | | | 5.61 | % | | | 28.06 | %(1) | |
Based on a $10,000 initial investment, the graph and table above illustrate the total return of ING American Century Small-Mid Cap Value Portfolio against the indices indicated. An index is unmanaged and has no cash in its portfolio, imposes no sales charges and incurs no operating expenses. An investor cannot invest directly in an index. The Portfolio's performance is shown without the imposition of any expenses or charges which are, or may be, imposed under your annuity contract. Total returns would have been lower if such expenses or charges were included.
The performance graph and table do not reflect the deduction of taxes that a shareholder will pay on portfolio distributions or the redemption of portfolio shares.
The performance shown may include the effect of fee waivers and/or expense reimbursements by the Investment Adviser and/or other service providers, which have the effect of increasing total return. Had all fees and expenses been considered, the total returns would have been lower.
The performance update illustrates performance for a variable investment option available through a variable annuity contract. The performance shown indicates past performance and is not a projection or prediction of future results. Actual investment returns and principal value will fluctuate so that shares and/or units, at redemption, may be worth more or less than their original cost. Please call (800) 262-3862 to get performance through the most recent month end.
This report contains statements that may be "forward-looking" statements. Actual results may differ materially from those projected in the "forward-looking" statements.
The views expressed in this report reflect those of the portfolio manager only through the end of the period as stated on the cover. The portfolio manager's views are subject to change at any time based on marked and other conditions.
Portfolio holdings are subject to change daily.
(1) Since inception performance of the indices is shown from March 1, 2009.
7
ING BARON SMALL CAP GROWTH PORTFOLIO
PORTFOLIO MANAGERS' REPORT
ING Baron Small Cap Growth Portfolio (the "Portfolio") seeks capital appreciation. The Portfolio is managed by Ronald Baron, Founder, Chief Executive Officer, Chief Investment Officer, Chairman, and Portfolio Manager of BAMCO, Inc. ("BAMCO") — the Sub-Adviser.
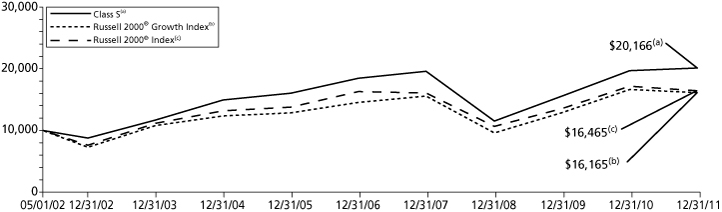
Performance: For the year ended December 31, 2011, the Portfolio's Class S shares provided a total return of 2.22% compared to the Russell 2000® Growth Index and the Russell 2000® Index, which returned (2.91)% and (4.18)%, respectively, for the same period.
Portfolio Specifics: The U.S. stock markets rebounded in the fourth quarter of 2011 following a sharp correction in the third quarter. The markets benefited from generally positive economic data and strong reported business results. We believe the primary reason for the rebound was that a number of economic indicators provided reassurance that a recession was not imminent, as had been feared in the fall. The markets, however, remain dominated by macro concerns. Daily headlines concerning developments in Europe have led to continued volatility.
The two sectors that contributed the most to absolute performance were energy and industrials.
Energy stocks finally showed some life in the fourth quarter. While the near-term macro backdrop is uncertain, over the long-term we believe that global economic growth will generate higher demand in energy. Southern Union Co., one of the nation's leading diversified natural gas companies, was the largest absolute contributor to performance. The company gained for the year as it was subject to a takeover battle between The Williams Companies, Inc. and Energy Transfer Equity, L.P. ("ETE"). ETE emerged as the winner, ultimately paying 33% more than its original offer. We exited our position.
Industrial stocks rallied in the fourth quarter after pulling back sharply in the third quarter. Industrial stock prices are highly sensitive to the macro outlook, yet not always indicative of the fundamentals of each company. For example, Generac Holdings, Inc. a leading manufacturer of standby and portable generators for the residential, industrial, and commercial markets, performed well for the year as the company had strong second half sales driven by severe power outages caused by seasonal storms.
Healthcare performance has been weak due to continued high unemployment and low consumer confidence. For people with health insurance, employers are shifting more of the cost burden to employees, resulting in higher deductibles, co-payments and co-insurance. As a result, people are consuming less healthcare. We believe the winners will be healthcare companies that can reduce costs and enhance efficiency while improving patient outcomes and benefiting from the aging of the population. In our view, examples are Edwards Lifesciences Corp. a leading manufacturer of heart valves used in surgical and transcatheter heart-valve replacement, and Community Health Systems, Inc. ("Community") a leading operator of hospitals, the majority of which are sole providers in mostly rural and suburban U.S. markets. Community's shares dropped sharply after acquisition target Tenet Healthcare accused the company of improper Medicare billing. Hospital stocks, including Community, ended the year trading at historically low multiples due to budget concerns and uncertainty about health care reform. We think Community's stock is oversold, trading at a steep discount to per-bed replacement costs while overlooking the potential for margin improvement from recently acquired facilities.
The individual stock that detracted the most from absolute performance was Anhanguera Educacional Participacoes S/A ("Anhanguera") (consumer discretionary). Anhangerua is the leading private, post-secondary education company in Brazil. We thought that Anhanguera would be the main beneficiary of Brazil's need for skilled workers and an emerging middle class seeking private post-secondary degrees to gain credentials. This year, our investment thesis was overshadowed by multiple headwinds including postponement of government civil service exams that adversely affected enrollment and margin dilution from the largest merger and acquisition in its history. The Portfolio's investments within the energy, industrials, and consumer discretionary sectors were the largest contributors to relative results for the year. Within energy, strength in crude prices coupled with opportunistic acquisitions, led to outperformance of the majority of the energy holdings and translated to positive stock selection effect. The Portfolio's holdings in the oil and gas exploration and production segment also performed well during the year. In industrials, positive stock selection effect was mostly driven by outperformance of Generac Holdings, Inc. and Genesee & Wyoming, Inc. Within consumer discretionary, positive stock selection effect was largely the result of outperformance of Panera Bread Co. and Peet's Coffee & Tea, Inc.
The Portfolio's investments in healthcare and financials were the largest detractors from relative performance. Within healthcare, weakness was mainly attributable to underperformance of the Portfolio's healthcare facilities holdings, led by Community. Within financials, the Portfolio's holdings in consumer and specialized finance were the largest detractors from relative results. Unfavorable stock selection in financials was partially offset by the Fund's larger exposure to the sector, one of the better performing sectors in the benchmark, which positively impacted relative results.
Current Strategy and Outlook: Although there are still U.S. fiscal issues and a somewhat dysfunctional government, we think the U.S. consumer has remained resilient and corporate America has remained strong. We think the balance sheets for the companies we own are mostly solid, and we believe businesses are equipped with ample capital to fund growth opportunities, make acquisitions, or return capital to shareholders. And though there is momentum at present, we think we are in for a period of modest general economic growth. Even in this environment, we believe the businesses in which we have invested can grow earnings and accrete value. We do not believe this growth is reflected in the trading multiples, so we expect multiple expansions in the future when the focus of the markets returns to fundamentals. We believe that current stock market valuations are compelling. U.S. interest rates remain near historically low levels, and the fixed income markets offer limited inflation-adjusted returns. There are important trends occurring in several industries that we believe offer growth opportunities over the next few years independent of normal business cycles. In our search for new companies, we seek businesses with what we believe are visionary leaders that are separating themselves from competitors through efficient operations, strong balance sheets, unique assets or properties and, in many cases, innovative and game changing technology.
Sector Diversification
as of December 31, 2011
(as a percentage of net assets)
| Consumer Discretionary | | | 24.4 | % | |
| Industrials | | | 17.0 | % | |
| Information Technology | | | 14.2 | % | |
| Health Care | | | 12.9 | % | |
| Financials | | | 11.4 | % | |
| Energy | | | 11.0 | % | |
| Consumer Staples | | | 4.6 | % | |
| Utilities | | | 1.6 | % | |
| Telecommunications | | | 0.6 | % | |
| Materials | | | 0.4 | % | |
| Assets in Excess of Other Liabilities* | | | 1.9 | % | |
| Net Assets | | | 100.0 | % | |
* Includes short-term investments.
Portfolio holdings are subject to change daily.
Top Ten Holdings
as of December 31, 2011
(as a percentage of net assets)
| AMERIGROUP Corp. | | | 2.9 | % | |
| Dick's Sporting Goods, Inc. | | | 2.9 | % | |
| Genesee & Wyoming, Inc. | | | 2.9 | % | |
| Choice Hotels International, Inc. | | | 2.8 | % | |
| Vail Resorts, Inc. | | | 2.7 | % | |
| Core Laboratories NV | | | 2.7 | % | |
| Mettler Toledo International, Inc. | | | 2.3 | % | |
| LKQ Corp. | | | 2.3 | % | |
| MSCI, Inc. — Class A | | | 2.2 | % | |
| Panera Bread Co. | | | 2.2 | % | |
Portfolio holdings are subject to change daily.
Portfolio holdings and characteristics are subject to change and may not be representative of current holdings and characteristics. The outlook for this Portfolio may differ from that presented for other ING Funds. Performance for the different classes of shares will vary based on differences in fees associated with each class.
8
PORTFOLIO MANAGERS' REPORT
ING BARON SMALL CAP GROWTH PORTFOLIO
| Average Annual Total Returns for the Periods Ended December 31, 2011 | |
| | | 1 Year | | 5 Year | | Since Inception
of Classes ADV, I and S
May 1, 2002 | | Since Inception
of Class S2
February 27, 2009 | |
| Class ADV | | | 1.89 | % | | | 1.46 | % | | | 7.24 | % | | | — | | |
| Class I | | | 2.43 | % | | | 1.97 | % | | | 7.78 | % | | | — | | |
| Class S | | | 2.22 | % | | | 1.73 | % | | | 7.52 | % | | | — | | |
| Class S2 | | | 2.05 | % | | | — | | | | — | | | | 28.37 | % | |
| Russell 2000® Growth Index | | | (2.91 | )% | | | 2.09 | % | | | 5.09 | % | | | 28.50 | %(1) | |
| Russell 2000® Index | | | (4.18 | )% | | | 0.15 | % | | | 5.29 | % | | | 27.26 | %(1) | |
Based on a $10,000 initial investment, the graph and table above illustrate the total return of ING Baron Small Cap Growth Portfolio against the indices indicated. An index is unmanaged and has no cash in its portfolio, imposes no sales charges and incurs no operating expenses. An investor cannot invest directly in an index. The Portfolio's performance is shown without the imposition of any expenses or charges which are, or may be, imposed under your annuity contract. Total returns would have been lower if such expenses or charges were included.
The performance graph and table do not reflect the deduction of taxes that a shareholder will pay on portfolio distributions or the redemption of portfolio shares.
The performance shown may include the effect of fee waivers and/or expense reimbursements by the Investment Adviser and/or other service providers, which have the effect of increasing total return. Had all fees and expenses been considered, the total returns would have been lower.
The performance update illustrates performance for a variable investment option available through a variable annuity contract. The performance shown indicates past performance and is not a projection or prediction of future results. Actual investment returns and principal value will fluctuate so that shares and/or units, at redemption, may be worth more or less than their original cost. Please call (800) 262-3862 to get performance through the most recent month end.
This report contains statements that may be "forward-looking" statements. Actual results may differ materially from those projected in the "forward-looking" statements.
The views expressed in this report reflect those of the portfolio manager only through the end of the period as stated on the cover. The portfolio manager's views are subject to change at any time based on marked and other conditions.
Portfolio holdings are subject to change daily.
(1) Since inception performance of the index is shown from March 1, 2009.
9
ING COLUMBIA SMALL CAP VALUE II PORTFOLIO
PORTFOLIO MANAGERS' REPORT
ING Columbia Small Cap Value Portfolio II (the "Portfolio") seeks long-term growth of capital. The Portfolio is managed by Christian Stadlinger and Jarl Ginsberg, Portfolio Managers, of Columbia Investment Management Advisors, LLC — the Sub-Adviser.
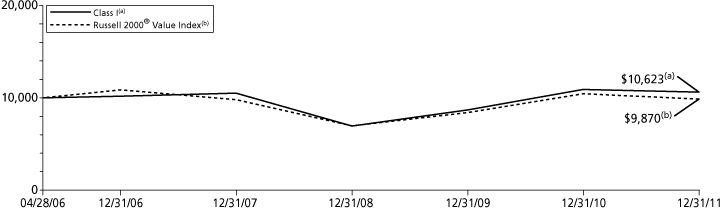
Performance: For the year ended December 31, 2011, the Portfolio's Class I shares provided a total return of (2.48)% compared to the Russell 2000® Value Index, which returned (5.50)% for the same period.
Portfolio Specifics: The year 2011 was marked by volatility and reversals. The year began with several macro issues such as the unrest in the Middle East and North Africa and subsequent regime changes in the region followed by natural disasters and a nuclear crisis in Japan, the ongoing European debt crisis, Standard & Poor's historic downgrade of U.S. sovereign debt, stunted global economic growth and a persistently high unemployment rate in the U.S. On the upside, all this was mitigated by slow underlying improvement in U.S. economic data. Next, while equity markets experienced record highs and lows, in the end equity returns were lackluster. Third quarter indices experienced one of their worst losses in history, while fourth quarter indices posted one of their strongest gains helping to make 2011 a year of reversals.
The small cap market's overall performance in 2011 was negative as the Russell 2000® Value Index posted a (5.50)% return. The Portfolio fared better, outperforming the benchmark.
As a result of the aforementioned volatility, markets were risk averse leading to outperformance by the defensive sectors (utilities, healthcare and consumer staples) and underperformance by the cyclical sectors (information technology, materials and industrials). This was reflected in the Portfolio's sector returns as utilities, consumer staples and healthcare outperformed with double digit performances while materials suffered the most with a double digit loss followed by information technology. The Portfolio was overweight information technology, consumer staples and industrials and underweight financials, utilities and consumer discretionary. However, the impact of sector weights was small. The underweight to utilities and to a much lesser extent, the overweight to information technology, detracted from sector performance.
Stock selection was positive in virtually all of the sectors with materials being the only sector to detract from results. Stock selection drove performance and was most positive in consumer discretionary and industrials, bolstering returns considerably. These were followed by healthcare, energy, consumer staples and information technology.
Stock selection in consumer discretionary was the most positive contributor to returns. Strong performances by Domino's Pizza, Inc. ("Domino's") and specialty retailer GNC Holdings, Inc. ("GNC") benefited returns. Domino's advanced on several fronts during the year as they benefited from better-than-expected results in their domestic and international same store sales, robust international store growth, and generally higher traffic following a well-advertised upgrade of their pizza recipe. Meanwhile, shares of nutritional products company GNC continued to rise as investors became more confident that higher sales and improving merchandising margins may lead to upside. Selection in household durables also benefited returns as the Portfolio avoided many benchmark underperformers.
Stock selection was also positive in industrials led by United Rentals, Inc. The company benefited as economic signs improved and on a trend towards renting rather than owning equipment in an uncertain environment. Stock selection in the healthcare industry was positive driven by the Portfolio's emphasis on managed healthcare companies such as Centene Corp, Wellcare Health Plans and other solid portfolio performers. Late in the year managed healthcare company HealthSpring, Inc. was acquired by a competitor confirming the strategic value of Medicare and Medicaid managed care companies. Stock selection was also positive in the personal products industry within consumer staples as Nu Skin Enterprises, Inc. advanced. Throughout the year, the company's earnings benefited from increased global sales of its new products. Holdings within food products also aided returns. In energy, several holdings in the equipment and services industry were positives for the year.
On the downside, the Portfolio's underweight to utilities, based on high valuation for many of these companies, hampered returns in a strong performing year for that sector.
Current Strategy and Outlook: Our investment process is to focus our research on those companies which we find attractively valued and where we believe the valuation gap is likely to shrink in the near term. We accomplish this by focusing on what we call an "upward inflection point," which essentially means we want stocks that we believe are both inexpensive and are showing improving operating performance metrics. In thinking about the types of situations that are attractive to us, our opportunities typically encompass one or more of the following: 1) "out-of-the-limelight" companies missed by the Wall Street research community; 2) cyclically-driven opportunities in industries that have been out of favor and show signs of resurgence; and, 3) companies with compressed operating margins that we believe are poised to expand within a reasonable timeframe. That said, moving into 2012 the Portfolio begins the year with an overweight to information technology, consumer staples and Industrials. The Portfolio remains underweight the interest rate sensitive sectors of financials (driven by real estate investment trusts and specialty finance companies) and utilities.
Sector Diversification
as of December 31, 2011
(as a percentage of net assets)
| Financials | | | 31.4 | % | |
| Industrials | | | 15.8 | % | |
| Information Technology | | | 14.7 | % | |
| Consumer Discretionary | | | 9.5 | % | |
| Health Care | | | 6.6 | % | |
| Utilities | | | 5.0 | % | |
| Materials | | | 4.8 | % | |
| Energy | | | 4.4 | % | |
| Consumer Staples | | | 4.3 | % | |
| Assets in Excess of Other Liabilities* | | | 3.5 | % | |
| Net Assets | | | 100.0 | % | |
* Includes short-term investments.
Portfolio holdings are subject to change daily.
Top Ten Holdings
as of December 31, 2011*
(as a percentage of net assets)
| South Jersey Industries, Inc. | | | 1.4 | % | |
| New Jersey Resources Corp. | | | 1.4 | % | |
| NeuStar, Inc. | | | 1.3 | % | |
| UIL Holdings Corp. | | | 1.2 | % | |
| Delphi Financial Group | | | 1.2 | % | |
| CubeSmart | | | 1.2 | % | |
| Community Bank System, Inc. | | | 1.2 | % | |
| Domino's Pizza, Inc. | | | 1.2 | % | |
| Independent Bank Corp. | | | 1.2 | % | |
| Helen of Troy Ltd. | | | 1.2 | % | |
* Excludes short-term investments.
Portfolio holdings are subject to change daily.
The Portfolio holdings and characteristics are subject to change and may not be representative of current holdings and characteristics. The outlook for this Portfolio may differ from that presented for other ING Funds. Performance for the different classes of shares will vary based on differences in fees associated with each class.
10
PORTFOLIO MANAGERS' REPORT
ING COLUMBIA SMALL CAP VALUE II PORTFOLIO
| Average Annual Total Returns for the Periods Ended December 31, 2011 | |
| | | 1 Year | | 5 Year | | Since Inception
of Class ADV
December 29, 2006 | | Since Inception
of Class I
April 28, 2006 | | Since Inception
of Class S
May 1, 2006 | | Since Inception
of Class S2
February 27, 2009 | |
| Class ADV | | | (2.96 | )% | | | 0.37 | % | | | 0.37 | % | | | — | | | | — | | | | — | | |
| Class I | | | (2.48 | )% | | | 0.88 | % | | | — | | | | 1.07 | % | | | — | | | | — | | |
| Class S | | | (2.69 | )% | | | 0.63 | % | | | — | | | | — | | | | 0.91 | % | | | — | | |
| Class S2 | | | (2.88 | )% | | | — | | | | — | | | | — | | | | — | | | | 27.01 | % | |
| Russell 2000® Value Index | | | (5.50 | )% | | | (1.87 | )% | | | (1.87 | )%(1) | | | (0.23 | )%(2) | | | (0.23 | )% | | | 25.94 | %(3) | |
Based on a $10,000 initial investment, the graph and table above illustrate the total return of ING Columbia Small Cap Value II Portfolio against the index indicated. An index is unmanaged and has no cash in its portfolio, imposes no sales charges and incurs no operating expenses. An investor cannot invest directly in an index. The Portfolio's performance is shown without the imposition of any expenses or charges which are, or may be, imposed under your annuity contract. Total returns would have been lower if such expenses or charges were included.
The performance graph and table do not reflect the deduction of taxes that a shareholder will pay on portfolio distributions or the redemption of portfolio shares.
The performance shown may include the effect of fee waivers and/or expense reimbursements by the Investment Adviser and/or other service providers, which have the effect of increasing total return. Had all fees and expenses been considered, the total returns would have been lower.
The performance update illustrates performance for a variable investment option available through a variable annuity contract. The performance shown indicates past performance and is not a projection or prediction of future results. Actual investment returns and principal value will fluctuate so that shares and/or units, at redemption, may be worth more or less than their original cost. Please call (800) 262-3862 to get performance through the most recent month end.
This report contains statements that may be "forward-looking" statements. Actual results may differ materially from those projected in the "forward-looking" statements.
The views expressed in this report reflect those of the portfolio manager only through the end of the period as stated on the cover. The portfolio manager's views are subject to change at any time based on marked and other conditions.
Portfolio holdings are subject to change daily.
(1) Since inception performance of the index is shown from January 1, 2007.
(2) Since inception performance of the index is shown from May 1, 2006.
(3) Since inception performance of the index is shown from March 1, 2009.
11
ING DAVIS NEW YORK VENTURE PORTFOLIO
PORTFOLIO MANAGERS' REPORT
ING Davis New York Venture Portfolio (the "Portfolio") seeks long-term growth of capital. The Portfolio is managed by Christopher C. Davis and Kenneth C. Feinberg, Portfolio Managers, with Davis Selected Advisers, L.P. ("Davis Advisers") — the Sub-Adviser.
Performance: For the year ended December 31, 2011, the Portfolio's Class S shares provided a total return of (4.63)% compared to the S&P 500® Index, which returned 2.11% for the same period.
Portfolio Specifics: The sectors within the S&P 500® Index that turned in the strongest performance over the year were utilities, consumer staples, and healthcare. The sectorsthat turned in the weakest performance over the year were financials, materials, and industrials.
Material companies were the most important detractor from performance on an absolute basis and were the second most important detractor from performance relative to the index. The Portfolio's material companies underperformed the corresponding sector within the index and had a higher relative average weighting in this weaker performing sector. Sino-Forest Corp. and Sealed Air Corp. were among the most important detractors from performance.
The Portfolio had more invested in financial companies than in any other sector and they were the second most important detractor from absolute performance. The Portfolio's financial companies outperformed the corresponding sector within the index, but relative performance was harmed by a higher relative average weighting in this weaker performing sector. American Express Co. was among the most important contributors to performance. Bank of New York Mellon Corp. and Wells Fargo & Co. were among the most important detractors from performance.
Energy companies were important detractors from performance on both an absolute basis and relative to the index. The Portfolio's energy companies significantly under-performed the corresponding sector within the Index and had a higher relative average weighting. EOG Resources, Inc. was among the most important contributors to performance. Devon Energy Corp., Canadian Natural Resources Ltd., and Transocean Ltd. were among the most important detractors from performance.
Consumer staple companies made important contributions to performance on both an absolute basis and relative to the index. The Portfolio's consumer staple companies outperformed the corresponding sector within the index and also benefited by having a higher relative average weighting in this stronger performing sector. CVS Caremark Corp., Costco Wholesale Corp., andPhilip Morris International, Inc. were among the most important contributors to performance.
The Portfolio held approximately 17% of its assets in foreign companies (including American depositary receipts) at December 31, 2011. As a whole these companies underperformed the domestic companies held by the Portfolio.
Current Strategy and Outlook: Our long-term focus usually results in low portfolio turnover. We try not to overreact to past short-term performance from individual holdings on either the upside or the downside. The Portfolio's investment strategy is to perform extensive research to buy durable companies at what we believe is a discount to their intrinsic values and to hold them for the long term. We focus deliberately on the future, considering each company's long-term business fundamentals.
As of December 31, 2011, only one company had dropped out of the Portfolio's top 10 holdings from the end of 2010. This is consistent with our low-turnover strategy. Devon Energy Corp. was replaced among the top 10 holdings by Google, Inc.
Sector Diversification
as of December 31, 2011
(as a percentage of net assets)
| Financials | | | 29.8 | % | |
| Consumer Staples | | | 16.9 | % | |
| Energy | | | 12.8 | % | |
| Health Care | | | 9.5 | % | |
| Information Technology | | | 8.0 | % | |
| Consumer Discretionary | | | 7.4 | % | |
| Materials | | | 6.2 | % | |
| Industrials | | | 5.5 | % | |
| Telecommunications | | | 0.4 | % | |
| Assets in Excess of Other Liabilities* | | | 3.5 | % | |
| Net Assets | | | 100.0 | % | |
* Includes short-term investments.
Portfolio holdings are subject to change daily.
Top Ten Holdings
as of December 31, 2011*
(as a percentage of net assets)
| CVS Caremark Corp. | | | 5.0 | % | |
| American Express Co. | | | 5.0 | % | |
| Costco Wholesale Corp. | | | 5.0 | % | |
| Wells Fargo & Co. | | | 4.7 | % | |
| Bank of New York Mellon Corp. | | | 4.2 | % | |
| EOG Resources, Inc. | | | 3.6 | % | |
| Occidental Petroleum Corp. | | | 3.3 | % | |
| Google, Inc. — Class A | | | 3.1 | % | |
| Canadian Natural Resources Ltd. | | | 3.1 | % | |
| Loews Corp. | | | 2.9 | % | |
* Excludes short-term investments.
Portfolio holdings are subject to change daily.
Portfolio holdings and characteristics are subject to change and may not be representative of current holdings and characteristics. The outlook for this Portfolio may differ from that presented for other ING Funds. Performance for the different classes of shares will vary based on differences in fees associated with each class.
12
PORTFOLIO MANAGERS' REPORT
ING DAVIS NEW YORK VENTURE PORTFOLIO

| Average Annual Total Returns for the Periods Ended December 31, 2011 | |
| | | 1 Year | | 5 Year | | 10 Year | |
| Class ADV | | | (4.92 | )% | | | (2.55 | )% | | | 1.68 | % | |
| Class I | | | (4.52 | )% | | | (2.07 | )% | | | 2.18 | % | |
| Class S | | | (4.63 | )% | | | (2.30 | )% | | | 1.93 | % | |
| S&P 500® Index | | | 2.11 | % | | | (0.25 | )% | | | 2.92 | % | |
Based on a $10,000 initial investment, the graph and table above illustrate the total return of ING Davis New York Venture Portfolio against the index indicated. An index is unmanaged and has no cash in its portfolio, imposes no sales charges and incurs no operating expenses. An investor cannot invest directly in an index. The Portfolio's performance is shown without the imposition of any expenses or charges which are, or may be, imposed under your annuity contract. Total returns would have been lower if such expenses or charges were included.
The performance graph and table do not reflect the deduction of taxes that a shareholder will pay on portfolio distributions or the redemption of portfolio shares.
The performance shown may include the effect of fee waivers and/or expense reimbursements by the Investment Adviser and/or other service providers, which have the effect of increasing total return. Had all fees and expenses been considered, the total returns would have been lower.
The performance update illustrates performance for a variable investment option available through a variable annuity contract. The performance shown indicates past performance and is not a projection or prediction of future results. Actual investment returns and principal value will fluctuate so that shares and/or units, at redemption, may be worth more or less than their original cost. Please call (800) 262-3862 to get performance through the most recent month end.
This report contains statements that may be "forward-looking" statements. Actual results may differ materially from those projected in the "forward-looking" statements.
The views expressed in this report reflect those of the portfolio manager only through the end of the period as stated on the cover. The portfolio manager's views are subject to change at any time based on marked and other conditions.
Portfolio holdings are subject to change daily.
Prior to October 31, 2005, the Portfolio was sub-advised by Salomon Brothers Asset Management Inc. Effective October 31, 2005, the Portfolio's principal investment strategies and name changed.
13
ING GLOBAL BOND PORTFOLIO
PORTFOLIO MANAGERS' REPORT
ING Global Bond Portfolio (the "Portfolio") seeks to maximize total return through a combination of current income and capital appreciation. The Portfolio is managed by Christine Hurtsellers, Michael Mata, and Robert Robis, Portfolio Managers of ING Investment Management Co. LLC — the Sub-Adviser.*
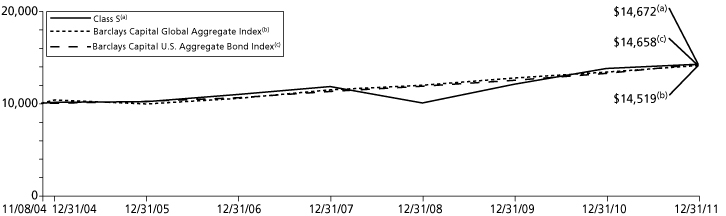
Performance: For the year ended December 31, 2011, the Portfolio's Class S shares provided a total return of 3.51% compared to the Barclays Capital Global Aggregate Index, which returned 5.64% for the same period.
Portfolio Specifics: Volatility reigned supreme in the financial markets for most of the period, prompting a "risk-on/risk-off" mentality — buying risky assets such as stocks, then quickly turning to safer investments such as U.S. Treasury securities when uncertainty reared up. Conflict in the Middle East, natural disasters in Japan, political gridlock in the United States and a deepening sense of crisis in the euro zone pushed and pulled markets around the world. During the latter part of the period interest rates declined across the globe.
The Portfolio lagged its benchmark for the reporting period due to detraction, in aggregate, from security selection. Both investment grade and high yield corporate bond spreads widened in the latter part of the period, in sympathy with global risk aversion stemming from the European sovereign debt problems. We believe fundamentals for these sectors remain sound, but we expect these and other sectors of the market to be subject to downside risk while uncertainties persist around a European solution and Its potential impact on the global economy.
Our interest rate positioning for the period was additive as interest rates ultimately declined. This benefited the Portfolio because we extended duration in a number of key markets where we had forecast softer global economic conditions with expectations of lower inflationary pressures. We continued to actively manage currency allocations seeking to protect against downside risk during the volatile second half of the year. We cut exposures to emerging market currencies that exhibited strong correlations to the downdraft in Europe.
The Portfolio came under severe pressure and underperformed its benchmark in the month of August. Fears of a European credit crisis and global economic slowdown surged, leading many investors to reduce risk by retreating to the relative safety of U.S. government bonds. Despite our decision to reduce credit exposure throughout the summer months due to the deteriorating macro outlook, spread sectors across the board underperformed for the month of August.
Over the summer months and through September, we steadily trimmed risk in the portfolio in response to the headwinds gusting out of the European periphery, and the early warning signs of what might be a more pronounced global economic slowdown. Notable shifts included replacing the Portfolio's emerging market currency overweights with added duration across a number of bond markets to protect the Portfolio from the effects of heightened risk aversion. Towards the end of the period we increased allocations to investment grade credit and high yield, and lowered our exposure to agency mortgage-backed securities (MBS) because of the political headwinds associated with increased prepayment risk due to a broad-based, government-sponsored refinancing wave. We have been avoiding debt of peripheral countries along with corporate credits located throughout the region. We have cautiously increased exposure to the more fundamentally sound emerging markets (EM) in Latin America and Asia, which in our view have far less exposure to the European economy, but whose markets have sold off excessively in sympathy with the euro zone crisis.
Derivative instruments such as currency forwards continue to be important tools for us to manage risk and gain exposure across broad key markets. During the period, derivatives in aggregate added to Portfolio results.
Current Strategy and Outlook: With Europe and Japan likely in or near recession, we are forecasting a more sanguine economic outlook for the global economy. While there are still some bright spots such as Latin America and Asia, our base case is for global interest rates to remain somewhat range-bound for the developed world. This is accentuated by what we would expect to be continued central bank action to help provide stimulus and balance sheet support to offset the pressures of debt-burdened economies. Further, we believe we will see additional interest rate easing by a number of emerging markets central banks this year as inflation considerations continue to abate. Given this outlook and the volatile environment we think likely to persist in 2012, we believe it important to continue to manage risk in the Portfolio, with a focus on quality and liquidity. At the overall Portfolio level we are currently underweight in duration relative to the benchmark. Most of this duration underweight stems from Europe and Japan, where we believe interest rate levels are unattractive given the higher debt burdens. We do favor select duration overweights in emerging markets including Brazil, Mexico, Colombia and South Africa. We continue to like U.S. high yield and investment grade corporate bonds given their attractive valuations and strong fundamentals. We also favor a number of emerging market sovereign and corporate bonds, with preference for Latin American and Asian bonds. We have a modest underweight to residential mortgages. In currencies, we remain underweight the euro based on the significant structural resolution and economic drain eventually facing the euro zone. We remain neutral to a small tactical overweight to the U.S. dollar and Canadian dollar. We favor small overweights to emerging market currencies, particularly in Latin America and Asia. Specific currencies we like include the Brazilian real, the Mexican peso, the Korean won, the Colombian peso and the Indonesian rupiah. These overweights are set against underweights of the euro, the Japanese yen and Australian dollar, the latter of which is partially being used to protect the Portfolio in the event of further economic slowdown. Looking forward into 2012 and beyond, we remain optimistic for investment opportunities in global bonds and currencies given the many forces at play in the global economy.
Country Allocation
as of December 31, 2011
(as a percentage of net assets)
| United States | | | 50.0 | % | |
| Brazil | | | 7.1 | % | |
| Mexico | | | 6.8 | % | |
| South Africa | | | 5.6 | % | |
| France | | | 4.2 | % | |
| Colombia | | | 2.5 | % | |
| Peru | | | 1.9 | % | |
| Canada | | | 0.7 | % | |
| Australia | | | 0.2 | % | |
| Countries between 0.0%-1.6%^ | | | 13.5 | % | |
| Assets in Excess of Other Liabilities* | | | 7.5 | % | |
| Net Assets | | | 100.0 | % | |
* Includes short-term investments.
^ Includes 29 countries, which each represents 0.0%-1.6% of net assets.
Portfolio holdings are subject to change daily.
Top Ten Holdings
as of December 31, 2011*
(as a percentage of net assets)
United States Treasury Note,
0.250%, 11/30/13 | | | 4.3 | % | |
South Africa Government Bond,
7.250%, 01/15/20 | | | 4.0 | % | |
French Treasury Note BTAN,
2.500%, 07/25/16 | | | 2.8 | % | |
United States Treasury Note,
0.375%, 11/15/14 | | | 2.3 | % | |
Brazil Notas do Tesouro Nacional Series F,
10.000%, 01/01/21 | | | 2.2 | % | |
United States Treasury Note,
0.875%, 11/30/16 | | | 2.0 | % | |
Mex Bonos De Desarrollo,
10.000%, 11/20/36 | | | 1.8 | % | |
Citigroup Funding, Inc.,
11.000%, 07/27/20 | | | 1.7 | % | |
Citigroup Funding, Inc.,
11.000%, 07/27/20 | | | 1.7 | % | |
Brazil Notas do Tesouro Nacional Series B,
6.000%, 08/15/16 | | | 1.7 | % | |
* Excludes short-term investments.
Portfolio holdings are subject to change daily.
* Effective January 21, 2011, the Portfolio's name, Sub-Adviser, investment objective and principal investment strategies were changed. Effective July 18, 2011, Robert Robis was added as a portfolio manager to the Portfolio.
Portfolio holdings and characteristics are subject to change and may not be representative of current holdings and characteristics. The outlook for this Portfolio may differ from that presented for other ING Funds. Performance for the different classes of shares will vary based on differences in fees associated with each class.
14
PORTFOLIO MANAGERS' REPORT
ING GLOBAL BOND PORTFOLIO
| Average Annual Total Returns for the Periods Ended December 31, 2011 | |
| | | 1 Year | | 5 Year | | Since Inception
of Classes ADV, I and S
November 8, 2004 | |
| Class ADV | | | 3.26 | % | | | 5.56 | % | | | 5.25 | % | |
| Class I | | | 3.70 | % | | | 6.06 | % | | | 5.76 | % | |
| Class S | | | 3.51 | % | | | 5.81 | % | | | 5.51 | % | |
| Barclays Capital Global Aggregate Index | | | 5.64 | % | | | 6.46 | % | | | 5.34 | %(1) | |
| Barclays Capital U.S. Aggregate Bond Index | | | 7.84 | % | | | 6.50 | % | | | 5.48 | %(1) | |
Based on a $10,000 initial investment, the graph and table above illustrate the total return of ING Global Bond Portfolio against the indices indicated. An index is unmanaged and has no cash in its portfolio, imposes no sales charges and incurs no operating expenses. An investor cannot invest directly in an index. The Portfolio's performance is shown without the imposition of any expenses or charges which are, or may be, imposed under your annuity contract. Total returns would have been lower if such expenses or charges were included.
The performance graph and table do not reflect the deduction of taxes that a shareholder will pay on portfolio distributions or the redemption of portfolio shares.
The performance shown may include the effect of fee waivers and/or expense reimbursements by the Investment Adviser and/or other service providers, which have the effect of increasing total return. Had all fees and expenses been considered, the total returns would have been lower.
The performance update illustrates performance for a variable investment option available through a variable annuity contract. The performance shown indicates past performance and is not a projection or prediction of future results. Actual investment returns and principal value will fluctuate so that shares and/or units, at redemption, may be worth more or less than their original cost. Please log on to www.inginvestment.com or call (800) 262-3862 to get performance through the most recent month end.
This report contains statements that may be "forward-looking" statements. Actual results may differ materially from those projected in the "forward-looking" statements.
The views expressed in this report reflect those of the portfolio manager only through the end of the period as stated on the cover. The portfolio manager's views are subject to change at any time based on marked and other conditions.
Portfolio holdings are subject to change daily.
(1) Since inception performance for the indices is shown from November 1, 2004.
Prior to January 21, 2011, the Portfolio was sub-advised by Oppenheimer Funds, Inc. Effective January 21, 2011, the Portfolio's name and investment strategies changed.
15
ING INVESCO VAN KAMPEN COMSTOCK PORTFOLIO
PORTFOLIO MANAGERS' REPORT
ING Invesco Van Kampen Comstock Portfolio (the "Portfolio") seeks capital growth and income. The Portfolio is managed by Kevin Holt, Managing Director, Jason Leder, Managing Director, Devin E. Armstrong, CFA, Vice President, James N. Warwick, Executive Director, and Matthew Seinsheimer of Invesco Advisers, Inc. — the Sub-Adviser.
Performance: For the year ended December 31, 2011, the Portfolio's Class S shares, provided a total return of (2.09)% compared to the Russell 1000® Value Index and the S&P 500® Index, which returned 0.39% and 2.11%, respectively, for the same period.
Portfolio Specifics: The fiscal year began with equity markets fueled on the second round of "quantitative easing" by the U.S. Federal Reserve and on an upward trend through the first quarter of 2011. However, with the spring came increased volatility due to civil unrest in Egypt and Libya and a devastating earthquake and tsunami in Japan. Although markets stabilized and were generally in positive territory through the summer, major equity indexes sold off precipitously in August as the U.S. received its first ever credit downgrade by Standard and Poor's. Even with the increased volatility, equity markets ended with a slightly positive return.
Results were mixed among the sectors of the Russell 1000® Value Index, with cyclical industries such as financials, materials and information technology posting negative returns, while defensive sectors such as healthcare and consumer staples fared better, posting double digit positive returns.
On the positive side, strong stock selection in the healthcare sector was the largest contributor to Portfolio performance. Specifically, a healthcare service provider and holdings within large pharmaceuticals benefited relative performance. A significant overweight position in the consumer discretionary sector, contributed to relative returns, as did stock selection in telecommunications.
Unfavorable stock selection and a slight underweight position in the energy sector were the largest detractors from Portfolio performance. Specifically, the Portfolio had exposure to oil equipment and services companies, which were the main detractors in this sector due to decreasing profit margins from international drilling efforts that fell through during the economic slow-down in Europe and overseas. Also, stock selection within, and an overweight to, information technology companies dampened performance relative to the index. Finally, stock selection in the financials sector acted as a detractor from relative performance for the period. Notably, exposure to diversified financials detracted from both absolute and relative performance as investors fled bank stocks beginning in the summer of 2011 on concerns of European debt crisis contagion.
Current Strategy and Outlook: Toward the end of the reporting period, at the margins, we reduced positions in media, pharmaceuticals and insurance companies due to rising valuations and used the proceeds to increase exposure to select diversified financial, banking, property and casualty insurance and integrated oil companies as they came under pressure.
We remain overweight in media within the consumer discretionary sector, but continue to pare down holdings as valuations approach what we believe to befair value. The Portfolio is also overweight information technology, and materials. We are materially underweight to financials and utilities, and underweight within industrials.
We believe our contrarian philosophy and deep value approach of buying what we believe are extremely undervalued companies can allow us to capitalize on market volatility and periods of down markets as value is created for new investment opportunities.
Sector Diversification
as of December 31, 2011
(as a percentage of net assets)
| Financials | | | 19.2 | % | |
| Consumer Discretionary | | | 15.6 | % | |
| Health Care | | | 13.4 | % | |
| Energy | | | 11.9 | % | |
| Information Technology | | | 11.0 | % | |
| Consumer Staples | | | 7.7 | % | |
| Industrials | | | 6.1 | % | |
| Materials | | | 4.0 | % | |
| Telecommunications | | | 3.7 | % | |
| Utilities | | | 2.8 | % | |
| Assets in Excess of Other Liabilities* | | | 4.6 | % | |
| Net Assets | | | 100.0 | % | |
* Includes short-term investments.
Portfolio holdings are subject to change daily.
Top Ten Holdings
as of December 31, 2011*
(as a percentage of net assets)
| Comcast Corp. — Class A | | | 3.9 | % | |
| International Paper Co. | | | 3.1 | % | |
| Pfizer, Inc. | | | 2.7 | % | |
| JPMorgan Chase & Co. | | | 2.5 | % | |
| Viacom — Class B | | | 2.5 | % | |
| Microsoft Corp. | | | 2.3 | % | |
| Citigroup, Inc. | | | 2.3 | % | |
| Bristol-Myers Squibb Co. | | | 2.2 | % | |
| Allstate Corp. | | | 2.1 | % | |
| Royal Dutch Shell PLC — Class A ADR | | | 2.1 | % | |
* Excludes short-term investments.
Portfolio holdings are subject to change daily.
Portfolio holdings and characteristics are subject to change and may not be representative of current holdings and characteristics. The outlook for this Portfolio may differ from that presented for other ING Funds. Performance for the different classes of shares will vary based on differences in fees associated with each class.
16
PORTFOLIO MANAGERS' REPORT
ING INVESCO VAN KAMPEN COMSTOCK PORTFOLIO

| Average Annual Total Returns for the Periods Ended December 31, 2011 | |
| | | 1 Year | | 5 Year | | Since Inception
of Classes ADV, I and S
May 1, 2002 | |
| Class ADV | | | (2.32 | )% | | | (2.34 | )% | | | 3.02 | % | |
| Class I | | | (1.81 | )% | | | (1.86 | )% | | | 3.54 | % | |
| Class S | | | (2.09 | )% | | | (2.10 | )% | | | 3.29 | % | |
| Russell 1000® Value Index | | | 0.39 | % | | | (2.64 | )% | | | 3.98 | % | |
| S&P 500® Index | | | 2.11 | % | | | (0.25 | )% | | | 3.66 | % | |
Based on a $10,000 initial investment, the graph and table above illustrate the total return of ING Invesco Van Kampen Comstock Portfolio against the indices indicated. An index is unmanaged and has no cash in its portfolio, imposes no sales charges and incurs no operating expenses. An investor cannot invest directly in an index. The Portfolio's performance is shown without the imposition of any expenses or charges which are, or may be, imposed under your annuity contract. Total returns would have been lower if such expenses or charges were included.
The performance graph and table do not reflect the deduction of taxes that a shareholder will pay on portfolio distributions or the redemption of portfolio shares.
The performance shown may include the effect of fee waivers and/or expense reimbursements by the Investment Adviser and/or other service providers, which have the effect of increasing total return. Had all fees and expenses been considered, the total returns would have been lower.
The performance update illustrates performance for a variable investment option available through a variable annuity contract. The performance shown indicates past performance and is not a projection or prediction of future results. Actual investment returns and principal value will fluctuate so that shares and/or units, at redemption, may be worth more or less than their original cost. Please call (800) 262-3862 to get performance through the most recent month end.
This report contains statements that may be "forward-looking" statements. Actual results may differ materially from those projected in the "forward-looking" statements.
The views expressed in this report reflect those of the portfolio manager only through the end of the period as stated on the cover. The portfolio manager's views are subject to change at any time based on marked and other conditions.
Portfolio holdings are subject to change daily.
17
ING INVESCO VAN KAMPEN EQUITY AND INCOME PORTFOLIO
PORTFOLIO MANAGERS' REPORT
ING Invesco Van Kampen Equity and Income Portfolio (the "Portfolio") seeks total return, consisting of long-term capital appreciation and current income. The Portfolio is managed by Thomas B. Bastian, James O. Roeder, Sergio Marcheli, Mark J. Laskin, Mary Jayne Maly, Chuck Burge and Cynthia Brien of Invesco Advisers, Inc. — the Sub-Adviser.
Performance: For the year ended December 31, 2011, the Portfolio's Class S shares provided a total return of (1.33)% compared to the Russell 1000® Value Index, Barclays Capital U.S. Government/Credit Bond Index and the Composite Index (60% Russell 1000® Value Index/40% Barclays Capital U.S. Government/Credit Bond Index), which returned 0.39%, 8.74% and 4.04%, respectively, for the same period.
Portfolio Specifics: The fiscal year began with equity markets fueled on the second round of "quantitative easing" by the U.S. Federal Reserve and on an upward trend through the first quarter of 2011. However, with the spring came increased volatility due to civil unrest in Egypt and Libya and a devastating earthquake and tsunami in Japan. Although markets stabilized and were generally in positive territory through the summer, major equity indexes sold off precipitously in August as the U.S. received its first ever credit downgrade by Standard and Poor's. Even with the increased volatility, equity markets ended with a slightly positive return.
Results were mixed among the sectors of the Russell 1000® Value Index, with cyclical industries such as financials, materials and information technology posting negative returns, while defensive sectors such as healthcare and consumer staples fared better, posting double digit positive returns.
A material underweight to the financial sector was the largest relative contributor versus the Russell 1000® Value Index style-specific benchmark, as financial stocks were the worst performing sector in the benchmark for the period. In general, we focused on lower risk financial companies with stronger balance sheets and less credit risk given the systemic risk in most financial stocks.
Strong stock selection within telecommunications was also a driver of relative performance versus the benchmark for the period.
Stock selection in the consumer staples was the largest detractor during the review period. Specifically, a holding in a household and products company was the largest detractor within this sector, as this stock is not held in the Russell 1000® Value Index and performed poorly for the year. In addition, stock selection within energy exploration and information technology also negatively impacted relative performance.
Within fixed income, the positive contribution of the investment grade corporate, U.S. Treasury and agency bonds was offset by the allocation to convertible securities. Convertible bonds was a large detractor from relative performance, as convertible bonds became more equity sensitive, i.e. more closely correlated with equities, than bonds, and underperformed the Russell 1000® Value Index over the period.
Currency forward contracts were used during the reporting period for the sole purpose of hedging currency exposure of the U.S. dollar denominated American Depositary Receipts ("ADRs") in the Portfolio. An ADR is a negotiable security that represents the underlying securities of a non-U.S. company that trades in the U.S. financial markets, priced in U.S. dollars.
Current Strategy and Outlook: Our outlook remains cautiously optimistic. The capital markets continue to react strongly to global macro events. Currently, there is not a lot of differentiation being made in regards to valuation and fundamentals. We believe, as we move into the latter stages of the economic and market cycle, the equity markets will begin to react to valuations and fundamentals. Our process emphasizes getting risk/reward in our favor. We are looking for those opportunities where the company is attractively valued, out-of-favor, under-earning, and experiencing a positive catalyst. If we can identify the catalyst, we believe we will have an opportunity to outperform. As the market moves from one in which valuations are separated from fundamentals to one that rewards stock selection, we believe our process may provide the opportunity to do well.
Sector Diversification
as of December 31, 2011
(as a percentage of net assets)
| Financials | | | 18.4 | % | |
| Health Care | | | 13.0 | % | |
| Information Technology | | | 10.5 | % | |
| Energy | | | 9.7 | % | |
| Consumer Discretionary | | | 9.7 | % | |
| Consumer Staples | | | 8.5 | % | |
| Industrials | | | 6.4 | % | |
| U.S. Treasury Bonds | | | 5.6 | % | |
| Telecommunications | | | 3.8 | % | |
| Utilities | | | 3.2 | % | |
| U.S. Treasury Notes | | | 2.1 | % | |
| Materials | | | 1.4 | % | |
| Federal National Mortgage Association | | | 0.5 | % | |
| Federal Home Loan Mortgage Corporation | | | 0.5 | % | |
| Foreign Government Bonds | | | 0.2 | % | |
| Municipal | | | 0.1 | % | |
| Collateralized Mortgage Obligations | | | 0.1 | % | |
| Automobile Asset-Backed Securities | | | 0.0 | % | |
| Assets in Excess of Other Liabilities* | | | 6.3 | % | |
| Net Assets | | | 100.0 | % | |
* Includes short-term investments.
Portfolio holdings are subject to change daily.
Top Ten Holdings
as of December 31, 2011*
(as a percentage of net assets)
| General Electric Co. | | | 2.9 | % | |
| JPMorgan Chase & Co. | | | 2.7 | % | |
United States Treasury Note/Bond,
1.000%, 04/30/12 | | | 2.5 | % | |
| Marsh & McLennan Cos., Inc. | | | 2.1 | % | |
| Pfizer, Inc. | | | 1.9 | % | |
| Anadarko Petroleum Corp. | | | 1.8 | % | |
| Procter & Gamble Co. | | | 1.7 | % | |
| eBay, Inc. | | | 1.6 | % | |
| Royal Dutch Shell PLC — Class A ADR | | | 1.6 | % | |
| Viacom — Class B | | | 1.5 | % | |
* Excludes short-term investments.
Portfolio holdings are subject to change daily.
Portfolio holdings and characteristics are subject to change and may not be representative of current holdings and characteristics. The outlook for this Portfolio may differ from that presented for other ING Funds. Performance for the different classes of shares will vary based on differences in fees associated with each class.
18
PORTFOLIO MANAGERS' REPORT
ING INVESCO VAN KAMPEN EQUITY AND INCOME PORTFOLIO

| Average Annual Total Returns for the Periods Ended December 31, 2011 | |
| | | 1 Year | | 5 Year | | 10 Year | | Since Inception
of Class S2
February 27, 2009 | |
| Class ADV | | | (1.58 | )% | | | 1.08 | % | | | 3.14 | % | | | — | | |
| Class I | | | (1.08 | )% | | | 1.58 | % | | | 3.66 | % | | | — | | |
| Class S | | | (1.33 | )% | | | 1.32 | % | | | 3.40 | % | | | — | | |
| Class S2 | | | (1.48 | )% | | | — | | | | — | | | | 16.55 | % | |
| Russell 1000® Value Index | | | 0.39 | % | | | (2.64 | )% | | | 3.89 | % | | | 23.30 | %(1) | |
| Barclays Capital U.S. Government/Credit Bond Index | | | 8.74 | % | | | 6.55 | % | | | 5.85 | % | | | 7.91 | %(1) | |
| Composite Index | | | 4.04 | % | | | 1.45 | % | | | 5.07 | % | | | 17.40 | %(1) | |
Based on a $10,000 initial investment, the graph and table above illustrate the total return of ING Invesco Van Kampen Equity and Income Portfolio against the indices indicated. An index is unmanaged and has no cash in its portfolio, imposes no sales charges and incurs no operating expenses. An investor cannot invest directly in an index. The Portfolio's performance is shown without the imposition of any expenses or charges which are, or may be, imposed under your annuity contract. Total returns would have been lower if such expenses or charges were included.
The performance graph and table do not reflect the deduction of taxes that a shareholder will pay on portfolio distributions or the redemption of portfolio shares.
The performance shown may include the effect of fee waivers and/or expense reimbursements by the Investment Adviser and/or other service providers, which have the effect of increasing total return. Had all fees and expenses been considered, the total returns would have been lower.
The performance update illustrates performance for a variable investment option available through a variable annuity contract. The performance shown indicates past performance and is not a projection or prediction of future results. Actual investment returns and principal value will fluctuate so that shares and/or units, at redemption, may be worth more or less than their original cost. Please call (800) 262-3862 to get performance through the most recent month end.
This report contains statements that may be "forward-looking" statements. Actual results may differ materially from those projected in the "forward-looking" statements.
The views expressed in this report reflect those of the portfolio manager only through the end of the period as stated on the cover. The portfolio manager's views are subject to change at any time based on marked and other conditions.
Portfolio holdings are subject to change daily.
(1) Since inception performance of the indices is shown from March 1, 2009.
19
ING JPMORGAN MID CAP VALUE PORTFOLIO
PORTFOLIO MANAGERS' REPORT
ING JPMorgan Mid Cap Value Portfolio (the "Portfolio") seeks growth from capital appreciation. The Portfolio is managed by Jonathan K.L. Simon, Lawrence Playford and Gloria Fu, Portfolio Managers of J.P. Morgan Investment Management Inc. — the Sub-Adviser.
Performance: For the year ended December 31, 2011, the Portfolio's Class S shares provided a total return of 1.82% compared to the Russell Midcap® Value Index, which returned (1.38)% for the same period.
Portfolio Specifics: The Portfolio outperformed the Russell Midcap® Value Index during 2011, primarily due to stock selection and an overweight in the consumer discretionary sector, along with stock selection in the materials sector. Stock selection was positive in nine of 10 global industry classification sectors for 2011. An overweight in the telecommunication services sector and an underweight in the utilities sector detracted from results.
The Williams Companies, Inc., ("Williams") an integrated natural gas company, was also a top contributor to performance in the year. Shares rallied on the announcement that Williams will be separated into two publicly traded companies. The restructuring plan calls for the separation of the company's exploration and production business via an initial public offering of up to 20% of its interest. The remaining interest is expected to be distributed to Williams' shareholders via a tax-free spin-off in 2012. After the separation of the exploration and production segment is complete, Williams will be an operator of midstream infrastructure and natural gas pipeline assets. Also helping to propel the stock's advance was the company's announcement that it would increase its quarterly dividend.
A top detractor from performance was Newfield Exploration Co. ("Newfield"), a diversified independent oil and gas company. The stock underperformed during the year as the company announced that second-quarter production would be negatively impacted due to mechanical issues with equipment off the shores of Malaysia. The company also announced an increase in capital spending, which disappointed investors as there was no corresponding increase in production announced in association with the additional spending. We view the decline in production as temporary. Newfield has multiple fields under development that have the potential to drive earnings growth going forward. In our view, some of the more promising projects include development of the Southern Alberta Basin in Montana where all wells to date have successfully uncovered oil deposits and recently purchased acreage in the Uinta Basin in Utah.
Current Strategy and Outlook: Our strategy employs a bottom-up approach to stock selection, constructing the Portfolio based on company fundamentals, quantitative screening and proprietary fundamental analysis. Our aim is to identify what we believe are undervalued companies that have the potential to increase their intrinsic values per share and to purchase these companies at a discount.
While we believe the bout with macroeconomic headwinds most certainly will continue, the portfolio management team's long-term outlook on equities has not changed. We believe valuations look very attractive as price/earnings multiples are compressed and remain well below their long-term averages. We have used this period of increased market weakness as an opportunity to build positions in higher conviction names and reduce holdings that have outperformed. The team has been adding cautiously to names with closer ties to the economy and reducing exposure to the more defensive names, such as TJX Cos., Inc. The team is finding more attractive situations in companies that have a slightly greater sensitivity to the economic cycle and believes that home-related names, such as Sherwin-Williams Co., are at an attractive entry point. Other opportunities can be found in sectors that have experienced economic headwinds, such as in the materials sector. Rock-Tenn Co., a manufacturer of packaging products, has presented a compelling investment opportunity. The Portfolio's largest overweight continues to be in consumer discretionary, particularly retailers, as many names in the space are known for strong brands, recurring revenue business models and lower levels of capital investment, all of which contribute to the sustainable generation of free cash flow. The Portfolio's largest underweight remains in the financials sector where the team is almost exclusively underweight in real estate investment trusts based on their assessment of valuation. Within financials, the Portfolio has a fair amount of exposure to regional banks, like M&T Bank Corp., where the focus is more on small business loans as opposed to commercial real estate.
Sector Diversification
as of December 31, 2011
(as a percentage of net assets)
| Financials | | | 23.4 | % | |
| Consumer Discretionary | | | 18.8 | % | |
| Utilities | | | 13.5 | % | |
| Industrials | | | 8.8 | % | |
| Materials | | | 7.3 | % | |
| Information Technology | | | 6.5 | % | |
| Consumer Staples | | | 6.3 | % | |
| Health Care | | | 6.2 | % | |
| Energy | | | 4.8 | % | |
| Telecommunications | | | 1.4 | % | |
| Assets in Excess of Other Liabilities* | | | 3.0 | % | |
| Net Assets | | | 100.0 | % | |
* Includes short-term investments.
Portfolio holdings are subject to change daily.
Top Ten Holdings
as of December 31, 2011*
(as a percentage of net assets)
| Republic Services, Inc. | | | 2.0 | % | |
| Energen Corp. | | | 1.8 | % | |
| Loews Corp. | | | 1.7 | % | |
| CMS Energy Corp. | | | 1.7 | % | |
| Williams Cos., Inc. | | | 1.6 | % | |
| Ameriprise Financial, Inc. | | | 1.6 | % | |
| Xcel Energy, Inc. | | | 1.6 | % | |
| Ball Corp. | | | 1.5 | % | |
| WR Berkley Corp. | | | 1.4 | % | |
| Oneok, Inc. | | | 1.4 | % | |
* Excludes short-term investments.
Portfolio holdings are subject to change daily.
Portfolio holdings and characteristics are subject to change and may not be representative of current holdings and characteristics. The outlook for this Portfolio may differ from that presented for other ING Funds. Performance for the different classes of shares will vary based on differences in fees associated with each class.
20
PORTFOLIO MANAGERS' REPORT
ING JPMORGAN MID CAP VALUE PORTFOLIO
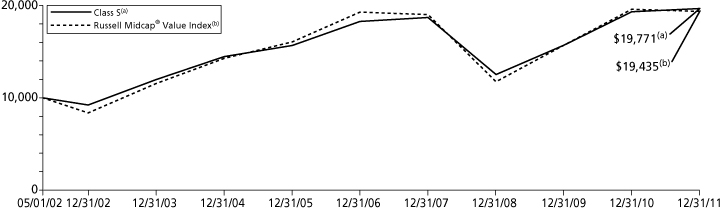
| Average Annual Total Returns for the Periods Ended December 31, 2011 | |
| | | 1 Year | | 5 Year | | Since Inception
of Classes ADV, I and S
May 1, 2002 | | Since Inception
of Class S2
February 27, 2009 | |
| Class ADV | | | 1.60 | % | | | 1.27 | % | | | 7.03 | % | | | — | | |
| Class I | | | 2.07 | % | | | 1.77 | % | | | 7.56 | % | | | — | | |
| Class S | | | 1.82 | % | | | 1.51 | % | | | 7.30 | % | | | — | | |
| Class S2 | | | 1.67 | % | | | — | | | | — | | | | 25.79 | % | |
| Russell Midcap® Value Index | | | (1.38 | )% | | | 0.04 | % | | | 7.11 | % | | | 30.02 | %(1) | |
Based on a $10,000 initial investment, the graph and table above illustrate the total return of ING JPMorgan Mid Cap Value Portfolio against the index indicated. An index is unmanaged and has no cash in its portfolio, imposes no sales charges and incurs no operating expenses. An investor cannot invest directly in an index. The Portfolio's performance is shown without the imposition of any expenses or charges which are, or may be, imposed under your annuity contract. Total returns would have been lower if such expenses or charges were included.
The performance graph and table do not reflect the deduction of taxes that a shareholder will pay on portfolio distributions or the redemption of portfolio shares.
The performance shown may include the effect of fee waivers and/or expense reimbursements by the Investment Adviser and/or other service providers, which have the effect of increasing total return. Had all fees and expenses been considered, the total returns would have been lower.
The performance update illustrates performance for a variable investment option available through a variable annuity contract. The performance shown indicates past performance and is not a projection or prediction of future results. Actual investment returns and principal value will fluctuate so that shares and/or units, at redemption, may be worth more or less than their original cost. Please call (800) 262-3862 to get performance through the most recent month end.
This report contains statements that may be "forward-looking" statements. Actual results may differ materially from those projected in the "forward-looking" statements.
The views expressed in this report reflect those of the portfolio manager only through the end of the period as stated on the cover. The portfolio manager's views are subject to change at any time based on marked and other conditions.
Portfolio holdings are subject to change daily.
(1) Since inception performance of the index is shown from March 1, 2009.
21
ING OPPENHEIMER GLOBAL PORTFOLIO
PORTFOLIO MANAGERS' REPORT
ING Oppenheimer Global Portfolio (the "Portfolio") seeks capital appreciation. The Portfolio is managed by Rajeev Bhaman, Senior Vice President of OppenheimerFunds, Inc. — the Sub-Adviser.
Performance: For the year ended December 31, 2011, the Portfolio's Class S shares provided a total return of (8.38)% compared to the MSCI World® Index and the MSCI All Country World IndexSM, which returned (5.54)% and (7.35)%, respectively, for the same period.
Portfolio Specifics: During the reporting period, Among the top individual contributors to Portfolio performance included leading global fast-food retailer McDonald's Corp. ("McDonald's"), healthcare provider Aetna, Inc,, high-end apparel and accessories retailer Bulgari SpA. ("Bulgari"), aerospace and defense manufacturer European Aeronautic Defence & Space Co. ("EADS"), soft drink distributor and producer Fomento Economico Mexicano S.A.B. de C.V. ("FEMSA") and internet service giant Google, Inc. McDonald's continued to post solid results, as it benefited from the popularity of its McCafe beverage line-up, breakfasts and its premium chicken sandwiches. Managed healthcare firm Aetna, Inc. was a top contributor to Portfolio performance, as fears over the new health care overhaul abated to a degree. During the period, the firm raised its 2011 forecast and reported earnings that beat Wall Street expectations. Bulgari, a leading high-end luxury goods company, was acquired by LVMH Moet Hennessy Louis Vuitton SA ("LVMH") over the first half of the period, which significantly benefited its stock price. We maintained a position in LVMH at period end. EADS, a leading manufacturer of products related to the aerospace and defense industry, continued to display impressive financial results, growing revenues and reducing the costs of goods sold. FEMSA who owns and operates OXXO, the largest convenience store chain in Latin America was also a positive contributor to performance. It controls Coca-Cola FEMSA, one of the largest independent Coca-Cola bottlers in the world. FEMSA also holds a stake in Heineken, with whom it cooperates closely in Latin America beer distribution. FEMSA's profits grew at a healthy rate as modern retail formats continued to gain popularity in Mexico. Towards the end of the period, Coca-Cola FEMSA and Corporacion de los Angeles, SA de CV ("Grupo CIMSA") merged their bottling operations, which also benefited FEMSA's stock price.
Among the top individual detractors from Portfolio performance included Juniper Networks, Inc. ("Juniper Networks"), Infosys, Inc. ("Infosys"), Sony Corp. ("Sony"), investment banking firms Credit Suisse Group AG ("Credit Suisse") and Goldman Sachs Group ("Goldman Sachs"). With a weakening global economy and a gloomy economic outlook, demand for the products of information technology companies was generally soft and revenues were generally lower. The market's pessimistic outlook for information technology companies negatively affected the stock prices of Juniper Networks and Infosys, both of which faced challenges during the period in a more difficult business environment. The weakening economy in India and declining Indian stock market also adversely affected Infosys's business. Similarly, Sony's stock was hurt by weakening demand for television sets and rapidly falling television set prices, in addition to a weak Japanese economy and Japanese stock market. Stocks of the leading investment banking houses generally did not perform well during the period, including the Portfolio's investments in Credit Suisse and Goldman Sachs. These two holdings declined amid market concern over global economic growth and the heightened possibility of a Greek default affecting these banks' balance sheets should a contagion effect spread to Italy, Spain and other countries, potentially threatening the overall health of the euro zone and European banking system. A more difficult and uncertain regulatory environment also resulted in market skittishness about stocks of investment banks.
Current Strategy and Outlook: At period end, the Portfolio had a significant overweight position in the information technology sector and also had overweight positions in the consumer discretionary and industrials sectors. We continue to favor the information technology and consumer discretionary sectors, as we have done consistently in the past. We find that these sectors tend to house companies whose characteristics are generally ones that we seek when identifying companies in which to invest. The Portfolio had significant underweight positions within energy and materials, and also held underweights to all other sectors of the MSCI World® Index. On a country basis, the Portfolio had its largest relative overweight positions in Germany, Sweden, Mexico, Brazil and India, along with substantial relative underweight positions in the U.S., the U.K., Canada and Australia — the Portfolio held no securities in Canada and Australia at period end. While the Portfolio was underweight the U.S. relative to the MSCI World® Index, it had its largest allocation to that country on an absolute basis.
While an uncertain economic environment may continue to create volatile short-term returns in the market, we continue to seek growing businesses with promising competitive positions, regardless of where they're located. We remain focused on uncovering such opportunities by investing in companies that we believe are capable of generating long-term, sustainable and superior growth.
Country Allocation
as of December 31, 2011
(as a percentage of net assets)
| United States | | | 39.1 | % | |
| Germany | | | 9.5 | % | |
| Japan | | | 9.3 | % | |
| Sweden | | | 6.5 | % | |
| France | | | 5.6 | % | |
| Switzerland | | | 5.5 | % | |
| Brazil | | | 4.0 | % | |
| Mexico | | | 3.4 | % | |
| United Kingdom | | | 3.0 | % | |
| Spain | | | 2.7 | % | |
| Countries between 0.2%-2.6%^ | | | 10.1 | % | |
| Assets in Excess of Other Liabilities* | | | 1.3 | % | |
| Net Assets | | | 100.0 | % | |
* Includes short-term investments.
^ Includes 10 countries, which each represents 0.2%-2.6% of net assets.
Portfolio holdings are subject to change daily.
Top Ten Holdings
as of December 31, 2011
(as a percentage of net assets)
| Telefonaktiebolaget LM Ericsson | | | 3.9 | % | |
| eBay, Inc. | | | 3.2 | % | |
| Siemens AG | | | 2.6 | % | |
| McDonald's Corp. | | | 2.2 | % | |
| Altera Corp. | | | 2.2 | % | |
| Intuit, Inc. | | | 2.1 | % | |
| SAP AG | | | 2.0 | % | |
| European Aeronautic Defence and Space Co. NV | | | 1.9 | % | |
| Aetna, Inc. | | | 1.9 | % | |
| WellPoint, Inc. | | | 1.8 | % | |
Portfolio holdings are subject to change daily.
Portfolio holdings and characteristics are subject to change and may not be representative of current holdings and characteristics. The outlook for this Portfolio may differ from that presented for other ING Funds. Performance for the different classes of shares will vary based on differences in fees associated with each class.
22
PORTFOLIO MANAGERS' REPORT
ING OPPENHEIMER GLOBAL PORTFOLIO
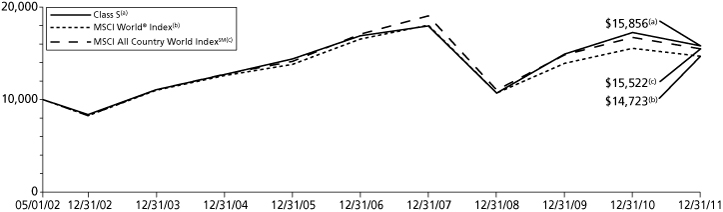
| Average Annual Total Returns for the Periods Ended December 31, 2011 | |
| | | 1 Year | | 5 Year | | Since Inception
of Classes ADV, I and S
May 1, 2002 | | Since Inception
of Class S2
February 27, 2009 | |
| Class ADV | | | (8.60 | )% | | | (1.59 | )% | | | 4.63 | % | | | — | | |
| Class I | | | (8.13 | )% | | | (1.09 | )% | | | 5.26 | % | | | — | | |
| Class S | | | (8.38 | )% | | | (1.32 | )% | | | 4.88 | % | | | — | | |
| Class S2 | | | (8.52 | )% | | | — | | | | — | | | | 22.02 | % | |
| MSCI World® Index | | | (5.54 | )% | | | (2.37 | )% | | | 4.08 | % | | | 19.98 | %(1) | |
| MSCI All Country World IndexSM | | | (7.35 | )% | | | (1.93 | )% | | | 4.65 | % | | | 20.68 | %(1) | |
Based on a $10,000 initial investment, the graph and table above illustrate the total return of ING Oppenheimer Global Portfolio against the indices indicated. An index is unmanaged and has no cash in its portfolio, imposes no sales charges and incurs no operating expenses. An investor cannot invest directly in an index. The Portfolio's performance is shown without the imposition of any expenses or charges which are, or may be, imposed under your annuity contract. Total returns would have been lower if such expenses or charges were included.
The performance graph and table do not reflect the deduction of taxes that a shareholder will pay on portfolio distributions or the redemption of portfolio shares.
The performance shown may include the effect of fee waivers and/or expense reimbursements by the Investment Adviser and/or other service providers, which have the effect of increasing total return. Had all fees and expenses been considered, the total returns would have been lower.
The performance update illustrates performance for a variable investment option available through a variable annuity contract. The performance shown indicates past performance and is not a projection or prediction of future results. Actual investment returns and principal value will fluctuate so that shares and/or units, at redemption, may be worth more or less than their original cost. Please call (800) 262-3862 to get performance through the most recent month end.
This report contains statements that may be "forward-looking" statements. Actual results may differ materially from those projected in the "forward-looking" statements.
The views expressed in this report reflect those of the portfolio manager only through the end of the period as stated on the cover. The portfolio manager's views are subject to change at any time based on marked and other conditions.
Portfolio holdings are subject to change daily.
(1) Since inception performance of the indices is shown from March 1, 2009.
Prior to November 8, 2004, the Portfolio was sub-advised by Massachusetts Financial Services Company. Effective November 8, 2004, the Portfolio's principal investment strategies and name changed.
23
ING PIMCO TOTAL RETURN PORTFOLIO
PORTFOLIO MANAGERS' REPORT
ING PIMCO Total Return Portfolio (the "Portfolio") seeks maximum total return, consistent with preservation of capital and prudent investment management. The Portfolio is managed by William H. Gross, CFA, Managing Director, Co-Chief Investment Officer and Portfolio Manager, of Pacific Investment Management Company LLC — the Sub-Adviser.
Performance: For year ended December 31, 2011, the Fund's Class S shares, provided a total return of 3.25% compared to the Barclays Capital U.S. Aggregate Bond Index, which returned 7.84% for the same period.
Portfolio Specifics: In 2011, the global financial markets consistently made headlines for their persistent volatility resulting from a variety of unpredictable forces on both Main Street and Wall Street. At the start of 2011, most fixed income sectors generated positive returns as global markets struggled to absorb implications of intensified political unrest across the Middle East and North Africa, rising commodity prices and the terrible earthquake and nuclear accidents in Japan. As the first quarter neared its close, a confluence of events prompted a move toward the perceived safety of Treasuries.
With the Federal Reserve's continued participation in the financial markets, Treasury yields continued to fall in the third quarter as the U.S. debt ceiling debate, S&P's downgrade of the U.S. long-term credit rating, and concern about the sovereign debt crisis in Europe sparked a flight to safety and boosted demand for Treasuries.
Following the Federal Reserve's announcement of "Operation Twist", most bonds gained during the fourth quarter, as global financial markets digested improving U.S. economic data and uncertainty surrounding the euro zone sovereign debt crisis. A rebound in U.S. consumption towards the end of the year improved investor risk appetites and helped most fixed income sectors outperform Treasuries.
The following strategies were positive for returns: exposure to non-U.S. developed interest rates, particularly core Europe and implemented via interest rate swaps, where rates fell on fears of a global economic slowdown; exposure to Build America Bonds as they outperformed like duration Treasuries; and, a focus on shorter maturities, implemented via money market futures, as these contracts increased in price.
The following strategies were negative or neutral for returns: an overweight to bonds of financial companies, which lagged the broader corporate market amid fears of a slowdown in global growth and uncertainty surrounding contagion related to European sovereign risk; an underweight to longer maturities, implemented via interest rate swaps, as the 2-30 year portion of the yield curve flattened amid a sharp fall in 30-year yields; an underweight to Treasuries entering into the 3rd quarter detracted from performance and had a significant impact on overall performance for the year; and, a modest holdings of real return bonds, as breakeven inflation levels versus nominal bonds narrowed over the year.
Current Strategy and Outlook: We believe global growth will fall to a real rate of 1.0 to 1.50 percent over the year ahead. We believe growth faces several hurdles that could impose greater uncertainty and volatility on financial markets. As the European sovereign debt crisis continues to unfold and austerity measures are implemented throughout the region, negative effects will continue to influence growth dynamics in the U.S. and other developed markets. With regard to portfolio strategy we plan to maintain an overweight to duration for as long as we view the risk of a disorderly outcome in Europe to be greater than insignificant. We will seek to have a flattening bias with a concentration in the 7 — 15 year portion of the yield curve. This strategy offers greater opportunities for price appreciation relative to the short end of the curve, where rates and volatility remain suppressed by policies of the Federal Reserve.
Investment Type Allocation
as of December 31, 2011
(as a percentage of net assets)
| U.S. Government Agency Obligations | | | 48.0 | % | |
| Corporate Bonds/Notes | | | 29.9 | % | |
| U.S. Treasury Obligations | | | 25.2 | % | |
| Foreign Government Bonds | | | 7.6 | % | |
| Collateralized Mortgage Obligations | | | 5.0 | % | |
| Municipal Bonds | | | 4.2 | % | |
| Preferred Stock | | | 0.8 | % | |
| Asset-Backed Securities | | | 0.2 | % | |
| Purchased Options | | | 0.0 | % | |
| Common Stock | | | 0.0 | % | |
| Liabilities in Excess of Other Assets* | | | (20.9 | )% | |
| Net Assets | | | 100.0 | % | |
* Includes short-term investments.
Portfolio holdings are subject to change daily.
Top Ten Holdings
as of December 31, 2011*
(as a percentage of net assets)
| Fannie Mae, 4.500%, 01/25/39 | | | 8.4 | % | |
| Fannie Mae, 3.500%, 01/25/26 | | | 6.7 | % | |
United States Treasury Note/Bond,
3.625%, 02/15/21 | | | 6.6 | % | |
| Fannie Mae, 3.000%, 10/25/26 | | | 4.5 | % | |
United States Treasury Note/Bond,
1.500%, 08/31/18 | | | 3.4 | % | |
| Fannie Mae, 4.000%, 04/01/41 | | | 3.0 | % | |
United States Treasury Note/Bond,
0.250%, 12/15/14 | | | 2.9 | % | |
| Fannie Mae, 4.500%, 06/01/39 | | | 2.2 | % | |
United States Treasury Note/Bond,
0.875%, 12/31/16 | | | 2.2 | % | |
United States Treasury Note/Bond,
2.625%, 11/15/20 | | | 2.1 | % | |
* Excludes short-term investments.
Portfolio holdings are subject to change daily.
Portfolio holdings and characteristics are subject to change and may not be representative of current holdings and characteristics. The outlook for this Portfolio may differ from that presented for other ING Funds. Performance for the different classes of shares will vary based on differences in fees associated with each class.
24
PORTFOLIO MANAGERS' REPORT
ING PIMCO TOTAL RETURN PORTFOLIO
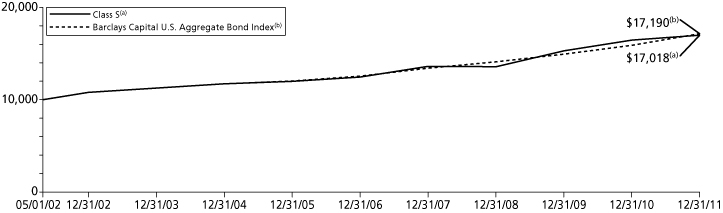
| Average Annual Total Returns for the Periods Ended December 31, 2011 | |
| | | 1 Year | | 5 Year | | Since Inception
of Classes ADV, I and S
May 1, 2002 | | Since Inception
of Class S2
February 27, 2009 | |
| Class ADV | | | 2.95 | % | | | 6.16 | % | | | 5.38 | % | | | — | | |
| Class I | | | 3.46 | % | | | 6.69 | % | | | 5.91 | % | | | — | | |
| Class S | | | 3.25 | % | | | 6.43 | % | | | 5.65 | % | | | — | | |
| Class S2 | | | 3.10 | % | | | — | | | | — | | | | 9.33 | % | |
| Barclays Capital U.S. Aggregate Bond Index | | | 7.84 | % | | | 6.50 | % | | | 5.76 | % | | | 7.66 | %(1) | |
Based on a $10,000 initial investment, the graph and table above illustrate the total return of ING PIMCO Total Return Portfolio against the index indicated. An index is unmanaged and has no cash in its portfolio, imposes no sales charges and incurs no operating expenses. An investor cannot invest directly in an index. The Portfolio's performance is shown without the imposition of any expenses or charges which are, or may be, imposed under your annuity contract. Total returns would have been lower if such expenses or charges were included.
The performance graph and table do not reflect the deduction of taxes that a shareholder will pay on portfolio distributions or the redemption of portfolio shares.
The performance shown may include the effect of fee waivers and/or expense reimbursements by the Investment Adviser and/or other service providers, which have the effect of increasing total return. Had all fees and expenses been considered, the total returns would have been lower.
The performance update illustrates performance for a variable investment option available through a variable annuity contract. The performance shown indicates past performance and is not a projection or prediction of future results. Actual investment returns and principal value will fluctuate so that shares and/or units, at redemption, may be worth more or less than their original cost. Please call (800) 262-3862 to get performance through the most recent month end.
This report contains statements that may be "forward-looking" statements. Actual results may differ materially from those projected in the "forward-looking" statements.
The views expressed in this report reflect those of the portfolio manager only through the end of the period as stated on the cover. The portfolio manager's views are subject to change at any time based on marked and other conditions.
Portfolio holdings are subject to change daily.
(1) Since inception performance of the index is shown from March 1, 2009.
25
ING PIONEER HIGH YIELD PORTFOLIO
PORTFOLIO MANAGERS' REPORT
ING Pioneer High Yield Bond Portfolio (the "Portfolio") seeks to maximize total return through income and capital appreciation. The Portfolio is managed by Andrew Feltus and Tracy Wright, Portfolio Managers, Pioneer Investment Management, Inc. — the Sub-Adviser.
Performance: For the year ended December 31, 2011, the Portfolio's Class I shares provided a total return of (0.72)% compared to the Bank of America/Merrill Lynch High Yield Master II Index and the Bank of America/Merrill Lynch All Convertibles (Speculative Grade) Index, which returned 4.38% and (6.87)%, respectively, for the same period.
Portfolio Specifics: High yield spreads started 2011 at 541 basis points ("bps"). The beginning of the year was positive for the asset class, as spreads narrowed. Heading into the spring and then into summer and fall, spreads widened, as investors' worries over another recession, European debt issues, and ineptitude in Washington caused them to shun risk-related assets. Spreads finished the year at 723 bps, after narrowing through the fourth quarter, but are still above long-term averages of approximately 550-600 bps. On a yield basis, yields were 7.50% at the start of 2011, finishing 2011 at 8.24%. Since yields typically move in the opposite direction of prices, high yield prices fell during 2011, although they've been trending up more recently.
The Portfolio's allocation to convertible bonds and equities were the main drivers of returns. Speculative grade convertible bonds finished in negative territory, while equities barely finished positive for the most part. Both asset classes, however, underperformed the high yield market. From a price appreciation standpoint, high yield was actually negative, but its income component drove returns to the plus side.
At year-end, the Portfolio had approximately 51% in fixed income, 25% in convertibles, 15% in equities, 7% in bank loans and minor positions in preferreds and cash. Within convertibles, consumer non-cyclicals detracted, as did a small allocation to convertible preferred in the financial services sector. Healthcare and telecommunications were positives. The equity allocation subtracted 205 bps from returns. Within equities, industrials and materials hurt, but consumer discretionary and energy helped. Regarding the fixed income allocation, security selection in real estate and telecommunications boosted performance, while selection in basic industry did not. Also subtracting from returns were municipal bonds backed by American Airlines, Inc. after the company announced it was going into bankruptcy. An underweight to banking and financial services helped since these areas lagged the overall index. Concerning bank loans, since this asset class underperformed the high yield market, the Portfolio's 7% allocation was an additional drag.
Current Strategy and Outlook: We believe the economic recovery should continue and thus will benefit commodities, capital goods, and basic materials companies. We have positioned the Portfolio accordingly. The Portfolio is U.S. centric, which allows us to stay clear of many of the debt problems overseas. We believe the greatest risk to our forecast is contagion effects from the European sovereign debt and banking crisis. The European Union must affect a comprehensive solution — recapitalizing the banks, ensuring funding for troubled sovereigns, and achieving a workable fiscal and economic integration — before the crisis can be defused. We continue to deem U.S. high yield, convertible bonds, equities, and bank loans attractive. We believe corporations, particularly in the U.S., have both attractive valuations and strong fundamentals. Revenue growth and tight cost controls may allow U.S. companies to enjoy continued improvement in their earnings and balance sheets, as they have over the past few years. Moreover, the Federal Reserve's commitment to continued low interest rates, coupled with modest economic growth, will continue to support assets such as high yield corporate bonds. High yield spreads remain wide to long-term averages, while projected defaults remain well below long-term averages.
Investment Type Allocation
as of December 31, 2011
(as a percentage of net assets)
| Corporate Bonds/Notes | | | 77.3 | % | |
| Common Stock | | | 14.6 | % | |
| Preferred Stock | | | 2.9 | % | |
| Collateralized Mortgage Obligations | | | 1.1 | % | |
| Municipal Bonds | | | 0.4 | % | |
| Asset-Backed Securities | | | 0.2 | % | |
| Warrants | | | 0.0 | % | |
| Assets in Excess of Other Liabilities* | | | 3.5 | % | |
| Net Assets | | | 100.0 | % | |
* Includes short-term investments.
Portfolio holdings are subject to change daily.
Top Ten Holdings
as of December 31, 2011*
(as a percentage of net assets)
| Wesco International, Inc., 6.000%, 09/15/29 | | | 2.7 | % | |
| Forest City Enterprises, Inc., 6.500%, 02/01/17 | | | 1.7 | % | |
| Nova Chemicals Corp., 7.875%, 09/15/25 | | | 1.6 | % | |
| Forest City Enterprises, Inc. | | | 1.4 | % | |
| Roper Industries, Inc., 01/15/34 | | | 1.3 | % | |
| LyondellBasell Industries NV | | | 1.1 | % | |
| Timberstar Trust, 7.530%, 10/15/36 | | | 1.1 | % | |
| Massey Energy Co., 3.250%, 08/01/15 | | | 1.0 | % | |
| Ford Motor Co., 4.250%, 11/15/16 | | | 1.0 | % | |
| Navistar International Corp., 3.000%, 10/15/14 | | | 1.0 | % | |
* Excludes short-term investments.
Portfolio holdings are subject to change daily.
Portfolio holdings and characteristics are subject to change and may not be representative of current holdings and characteristics. The outlook for this Portfolio may differ from that presented for other ING Funds. Performance for the different classes of shares will vary based on differences in fees associated with each class.
26
PORTFOLIO MANAGERS' REPORT
ING PIONEER HIGH YIELD PORTFOLIO

| Average Annual Total Returns for the Periods Ended December 31, 2011 | |
| | | 1 Year | | 5 Year | | Since Inception
of Class I
January 3, 2006 | | Since Inception
of Class S
January 20, 2006 | |
| Class I | | | (0.72 | )% | | | 8.14 | % | | | 8.17 | % | | | — | | |
| Class S | | | (0.97 | )% | | | 7.87 | % | | | — | | | | 7.97 | % | |
| Bank of America/Merrill Lynch High Yield Master II Index | | | 4.38 | % | | | 7.34 | % | | | 8.06 | %(1) | | | 7.89 | %(2) | |
| Bank of American/Merrill Lynch All Convertible (Speculative Grade) Index | | | (6.87 | )% | | | 2.90 | % | | | 5.22 | %(1) | | | 4.31 | %(2) | |
Based on a $10,000 initial investment, the graph and table above illustrate the total return of ING Pioneer High Yield Portfolio against the indices indicated. An index is unmanaged and has no cash in its portfolio, imposes no sales charges and incurs no operating expenses. An investor cannot invest directly in an index. The Portfolio's performance is shown without the imposition of any expenses or charges which are, or may be, imposed under your annuity contract. Total returns would have been lower if such expenses or charges were included.
The performance graph and table do not reflect the deduction of taxes that a shareholder will pay on portfolio distributions or the redemption of portfolio shares.
The performance shown may include the effect of fee waivers and/or expense reimbursements by the Investment Adviser and/or other service providers, which have the effect of increasing total return. Had all fees and expenses been considered, the total returns would have been lower.
The performance update illustrates performance for a variable investment option available through a variable annuity contract. The performance shown indicates past performance and is not a projection or prediction of future results. Actual investment returns and principal value will fluctuate so that shares and/or units, at redemption, may be worth more or less than their original cost. Please call (800) 262-3862 to get performance through the most recent month end.
This report contains statements that may be "forward-looking" statements. Actual results may differ materially from those projected in the "forward-looking" statements.
The views expressed in this report reflect those of the portfolio manager only through the end of the period as stated on the cover. The portfolio manager's views are subject to change at any time based on marked and other conditions.
Portfolio holdings are subject to change daily.
(1) Since inception performance of the indices is shown from January 1, 2006.
(2) Since inception performance of the indices is shown from February 1, 2006.
27
ING T. ROWE PRICE DIVERSIFIED MID CAP GROWTH PORTFOLIO
PORTFOLIO MANAGERS' REPORT
ING T. Rowe Price Diversified Mid Cap Growth Portfolio (the "Portfolio") seeks long-term capital appreciation. The Portfolio is managed by Donald Peters and Donald Easley, CFA, Portfolio Managers, of T. Rowe Price Associates, Inc. — the Sub-Adviser.
Performance: For the year ended December 31, 2011, the Portfolio's Class S shares provided a total return of (3.89)% compared to the S&P MidCap 400 Index and the Russell Midcap® Growth Index, which returned (1.73)% and (1.65)%, respectively, for the same period.
Portfolio Specifics: Stock choices in materials detracted from relative results, most notably our positioning within the metals and mining industry. Hudbay Minerals, Inc. and Compass Minerals International, Inc. were among the hardest-hit here, as both companies faced major operational setbacks. We increased our holdings in this sector, primarily in the metals and mining area. We believe that higher inflation and growing demand from investors for "hard" assets will boost this area; however, we do not attempt to forecast the direction of commodity prices.
In financials, our stock holdings also underperformed. Jones Lang LaSalle, Inc. was a significant detractor here, as investors are expecting a slowdown in the commercial real estate sector where the firm operates. Green Dot Corp., the leading provider of reloadable prepaid credit cards, hurt as well. While the company is well positioned to tap a growing market, it reported weaker-than-expected new card activation and higher-than-expected marketing costs. Within financials, we are overweight in the insurance industry, where improving pricing leads us to favor underwriters and brokers. Among financial service names, we focus on owners of security and commodity exchanges; among commercial banks, we anchored our holdings with what we believe are strong regional banks.
Consumer discretionary was another area of relative weakness, due to stock selection. Cruise company Royal Caribbean Cruises Ltd. suffered from weak demand, particularly in Europe and North Africa. Sotheby's posted strong results, driven by continued strength among Chinese buyers, but faced increased competition from their primary rival, Christie's. Within this eclectic sector, we are focused on companies with what we believe are good business models, strong cash flow, and other favorable attributes, without any preference for a particular industry.
A boost to relative performance came from industrials and business services, where our stock holdings outperformed. Leading positions included Goodrich Corp., an aviation-focused firm that received a buyout offer at a significant premium, and the freight railroad firm Kansas City Southern. We are currently overweight here, as many of our holdings are world leaders in their respective niches. Our positioning is more cyclical than that of the Russell Midcap® Growth Index, but we favor firms with greater earnings stability.
Current Strategy and Outlook: Equity markets face near-term obstacles, such as elevated unemployment, housing sector weakness and new government regulations, but we believe a double-dip recession seems unlikely. Overall, the environment is consistent with what normally occurs in the wake of major financial crises. Nevertheless, we believe corporations are financially healthy and posting robust profit levels. In our opinion, equity valuations remain reasonable, even after two years of significant gains. Given that Federal Reserve stimulus measures continue to weigh on fixed-income returns, we believe that stocks will provide better long-term returns to investors, even taking into account recent setbacks. Overall, we believe this market environment will reward our investment approach.
Sector Diversification
as of December 31, 2011
(as a percentage of net assets)
| Information Technology | | | 21.2 | % | |
| Consumer Discretionary | | | 20.6 | % | |
| Industrials | | | 15.9 | % | |
| Health Care | | | 12.7 | % | |
| Energy | | | 9.0 | % | |
| Materials | | | 6.8 | % | |
| Financials | | | 6.7 | % | |
| Consumer Staples | | | 4.7 | % | |
| Telecommunications | | | 1.7 | % | |
| Utilities | | | 0.4 | % | |
| Assets in Excess of Other Liabilities* | | | 0.3 | % | |
| Net Assets | | | 100.0 | % | |
* Includes short-term investments.
Portfolio holdings are subject to change daily.
Top Ten Holdings
as of December 31, 2011
(as a percentage of net assets)
| Ross Stores, Inc. | | | 0.9 | % | |
| FMC Technologies, Inc. | | | 0.9 | % | |
| Western Union Co. | | | 0.9 | % | |
| AmerisourceBergen Corp. | | | 0.9 | % | |
| Crown Castle International Corp. | | | 0.9 | % | |
| Nuance Communications, Inc. | | | 0.9 | % | |
| Omnicom Group | | | 0.8 | % | |
| Cameron International Corp. | | | 0.8 | % | |
| Discovery Communications, Inc. — Class C | | | 0.8 | % | |
| Compass Minerals International, Inc. | | | 0.8 | % | |
Portfolio holdings are subject to change daily.
Portfolio holdings and characteristics are subject to change and may not be representative of current holdings and characteristics. The outlook for this Portfolio may differ from that presented for other ING Funds. Performance for the different classes of shares will vary based on differences in fees associated with each class.
28
PORTFOLIO MANAGERS' REPORT
ING T. ROWE PRICE DIVERSIFIED MID CAP GROWTH PORTFOLIO

| Average Annual Total Returns for the Periods Ended December 31, 2011 | |
| | | 1 Year | | 5 Year | | 10 Year | | Since Inception
of Class S2
February 27, 2009 | |
| Class ADV | | | (4.23 | )% | | | 2.61 | % | | | 3.88 | % | | | — | | |
| Class I | | | (3.71 | )% | | | 3.15 | % | | | 4.41 | % | | | — | | |
| Class S | | | (3.89 | )% | | | 2.88 | % | | | 4.14 | % | | | — | | |
| Class S2 | | | (4.07 | )% | | | — | | | | — | | | | 27.90 | % | |
| S&P MidCap 400 Index | | | (1.73 | )% | | | 3.32 | % | | | 7.04 | % | | | 28.63 | %(1) | |
| Russell Midcap® Growth Index | | | (1.65 | )% | | | 2.44 | % | | | 5.29 | % | | | 29.08 | %(1) | |
Based on a $10,000 initial investment, the graph and table above illustrate the total return of ING T. Rowe Price Diversified Mid Cap Growth Portfolio against the indices indicated. An index is unmanaged and has no cash in its portfolio, imposes no sales charges and incurs no operating expenses. An investor cannot invest directly in an index. The Portfolio's performance is shown without the imposition of any expenses or charges which are, or may be, imposed under your annuity contract. Total returns would have been lower if such expenses or charges were included.
The performance graph and table do not reflect the deduction of taxes that a shareholder will pay on portfolio distributions or the redemption of portfolio shares.
The performance shown may include the effect of fee waivers and/or expense reimbursements by the Investment Adviser and/or other service providers, which have the effect of increasing total return. Had all fees and expenses been considered, the total returns would have been lower.
The performance update illustrates performance for a variable investment option available through a variable annuity contract. The performance shown indicates past performance and is not a projection or prediction of future results. Actual investment returns and principal value will fluctuate so that shares and/or units, at redemption, may be worth more or less than their original cost. Please call (800) 262-3862 to get performance through the most recent month end.
This report contains statements that may be "forward-looking" statements. Actual results may differ materially from those projected in the "forward-looking" statements.
The views expressed in this report reflect those of the portfolio manager only through the end of the period as stated on the cover. The portfolio manager's views are subject to change at any time based on marked and other conditions.
Portfolio holdings are subject to change daily.
(1) Since inception performance of the indices is shown from March 1, 2009.
Prior to November 8, 2004, the Portfolio was sub-advised by Fred Alger Management, Inc. Effective November 8, 2004, T. Rowe Price became the sub-adviser and the Portfolio's principal investment strategies and name changed.
29
ING T. ROWE PRICE GROWTH EQUITY PORTFOLIO
PORTFOLIO MANAGERS' REPORT
ING T. Rowe Price Growth Equity Portfolio (the "Portfolio") seeks long-term capital growth, and secondarily, increasing dividend income. The Portfolio is managed by Robert Bartolo, Portfolio Manager of T. Rowe Price Associates, Inc. — the Sub-Adviser.
Performance: For the year ended December 31, 2011, the Portfolio's Class I shares, provided a total return of (1.06)% compared to the S&P 500® Index, which returned 2.11% for the same period.
Portfolio Specifics: Stock selection was the main reason for relative underperformance by the Portfolio, but sector weighting was also negative. Healthcare was the leading relative detractor, largely due to stock selection. Stock selection in consumer discretionary and energy also detracted. Financials was by far the leading outperformer, due to a significant underweight and stock selection. Information technology and telecommunication services also outperformed due to stock selection.
Healthcare was the leading detractor, due to stock selection and an unfavorable underweight against the benchmark. Human Genome Sciences, Inc. reported disappointing sales of Benlysta, its innovative treatment for lupus. The drug was approved by U.S. and European regulators, but the launch has been slower than expected.
Consumer discretionary underperformed on stock selection. A main factor was the overweight in Internet retailer Amazon.com, Inc., whose shares fell sharply in the fourth quarter due to lower than expected operating cash flow and profit margins, despite strong holiday season sales of its Kindle eReader.
Energy contributed negatively to relative performance due to stock selection. Coal companies were hurt by falling prices and concerns about slowing growth in emerging markets. Peabody Energy Corp., the world's largest private-sector coal company, continued to slide amid these concerns. The company successfully completed its acquisition of Australia's MacArthur Coal Ltd. in December. Investors sold shares of Schlumberger Ltd., the global oilfield services and equipment provider, on falling oil prices, as the company generally experiences stronger business demand on higher energy prices.
Financials was the leading outperformer due to stock selection and a significant underweighting of the worst performing sector in the S&P index. American Express Co. benefited from increased consumer spending and improvement in consumer credit. The company released a new line of prepaid-balance cards, aimed at attracting new customers.
Information technology outperformed due to stock selection. MasterCard, Inc. reported impressive transaction volume growth in its global payment network, particularly outside the United States where more consumer spending is shifting to electronic payments. An increase in consumer spending leading into the holiday season also helped to boost the stock price. Apple, Inc., the Portfolio's top overall contributor, continued to report strong growth. The company released an upgraded version of its iPhone and expanded its availability to additional carriers.
Current Strategy and Outlook: Against the backdrop of a volatile year, U.S. stocks ended the fourth quarter on a positive note, as most major indices posted double-digit gains for the period. Investors drove up U.S. stocks despite the Federal Reserve's warning that ongoing turmoil in Europe could pose significant downside risks to the global economy. So far, the U.S. economy has continued to expand at a moderate pace, with noticeable improvements in the labor market, and some stabilization in the housing market, but we believe a recession in Europe could derail U.S. growth in 2012.
We continue to look for slow to moderate economic growth in the U.S., and although expectations have come down, we still believe we will see stronger growth from developing markets. In our opinion, corporate earnings growth continues to be healthy, U.S. economic indicators are improving, and low interest rates are a positive for equities. We believe the high-quality, consistent-growth companies that we seek to purchase are especially attractive and could do well even in a modest economic recovery. However, investors may be hesitant to embrace economic recovery until U.S. policymakers develop a credible plan for dealing with structural deficits, and until worries about potential contagion effects from the European sovereign debt crisis subside.
Sector Diversification
as of December 31, 2011
(as a percentage of net assets)
| Information Technology | | | 35.6 | % | |
| Consumer Discretionary | | | 18.4 | % | |
| Industrials | | | 15.4 | % | |
| Energy | | | 7.6 | % | |
| Health Care | | | 6.0 | % | |
| Telecommunications | | | 4.5 | % | |
| Materials | | | 4.4 | % | |
| Financials | | | 4.1 | % | |
| Consumer Staples | | | 1.9 | % | |
| Assets in Excess of Other Liabilities* | | | 2.1 | % | |
| Net Assets | | | 100.0 | % | |
* Includes short-term investments.
Portfolio holdings are subject to change daily.
Top Ten Holdings
as of December 31, 2011
(as a percentage of net assets)
| Apple, Inc. | | | 9.2 | % | |
| Google, Inc. — Class A | | | 4.8 | % | |
| Amazon.com, Inc. | | | 3.4 | % | |
| Mastercard, Inc. | | | 2.9 | % | |
| Danaher Corp. | | | 2.8 | % | |
| Qualcomm, Inc. | | | 2.8 | % | |
| Praxair, Inc. | | | 2.4 | % | |
| Crown Castle International Corp. | | | 2.3 | % | |
| Priceline.com, Inc. | | | 2.2 | % | |
| American Tower Corp. | | | 2.2 | % | |
Portfolio holdings are subject to change daily.
Portfolio holdings and characteristics are subject to change and may not be representative of current holdings and characteristics. The outlook for this Portfolio may differ from that presented for other ING Funds. Performance for the different classes of shares will vary based on differences in fees associated with each class.
30
PORTFOLIO MANAGERS' REPORT
ING T. ROWE PRICE GROWTH EQUITY PORTFOLIO

| Average Annual Total Returns for the Periods Ended December 31, 2011 | |
| | | 1 Year | | 5 Year | | 10 Year | | Since Inception
of Class S2
February 27, 2009 | |
| Class ADV | | | (1.57 | )% | | | 0.47 | % | | | 2.87 | % | | | — | | |
| Class I | | | (1.06 | )% | | | 0.97 | % | | | 3.39 | % | | | — | | |
| Class S | | | (1.32 | )% | | | 0.72 | % | | | 3.13 | % | | | — | | |
| Class S2 | | | (1.48 | )% | | | — | | | | — | | | | 22.31 | % | |
| S&P 500® Index | | | 2.11 | % | | | (0.25 | )% | | | 2.92 | % | | | 23.44 | %(1) | |
Based on a $10,000 initial investment, the graph and table above illustrate the total return of ING T. Rowe Price Growth Equity Portfolio against the index indicated. An index is unmanaged and has no cash in its portfolio, imposes no sales charges and incurs no operating expenses. An investor cannot invest directly in an index. The Portfolio's performance is shown without the imposition of any expenses or charges which are, or may be, imposed under your annuity contract. Total returns would have been lower if such expenses or charges were included.
The performance graph and table do not reflect the deduction of taxes that a shareholder will pay on portfolio distributions or the redemption of portfolio shares.
The performance shown may include the effect of fee waivers and/or expense reimbursements by the Investment Adviser and/or other service providers, which have the effect of increasing total return. Had all fees and expenses been considered, the total returns would have been lower.
The performance update illustrates performance for a variable investment option available through a variable annuity contract. The performance shown indicates past performance and is not a projection or prediction of future results. Actual investment returns and principal value will fluctuate so that shares and/or units, at redemption, may be worth more or less than their original cost. Please call (800) 262-3862 to get performance through the most recent month end.
This report contains statements that may be "forward-looking" statements. Actual results may differ materially from those projected in the "forward-looking" statements.
The views expressed in this report reflect those of the portfolio manager only through the end of the period as stated on the cover. The portfolio manager's views are subject to change at any time based on marked and other conditions.
Portfolio holdings are subject to change daily.
(1) Since inception performance of the index is shown from March 1, 2009.
31
ING TEMPLETON FOREIGN EQUITY PORTFOLIO
PORTFOLIO MANAGERS' REPORT
ING Templeton Foreign Equity Portfolio (the "Portfolio") seeks long-term capital growth. The Portfolio is managed by Gary P. Motyl, Cindy L. Sweeting, Antonio T. Docal and Peter A. Nori of Templeton Investment Counsel, LLC, — the Sub-Adviser.
Performance: For the year ended December 31, 2011, the Portfolio's Class I shares provided a total return of (12.00)% compared MSCI All Country World ex-U.S. IndexSM ("MSCI ACWI ex-U.S.") and the MSCI EAFE® Index, which returned (13.71)% and (12.14)%, respectively, for the same period.
Portfolio Specifics: International equities, as measured by the MSCI ACWI ex-U.S., declined in 2011, notably in economically sensitive sectors amid sovereign debt concerns and slowing economic growth. The Portfolio's allocations and stock selection among defensive and cyclical sectors benefited relative and absolute results. Among cyclical sectors, an underweighted allocation and stock selection in materials and overweighting and stock selection in energy stocks helped relative performance as most industrial commodities experienced declines. Among materials holdings we avoided what we viewed as expensive metals and mining companies. We invested instead where we believed valuations understated the strategic and technological advantages of leading oil producers like the U.K.'s Royal Dutch Shell PLC, a top portfolio performer in 2011. Stock picking also helped buoy our information technology holdings, led by South Korean semiconductor and consumer electronics firm Samsung Electronics Co., Ltd. An overweighted allocation in telecommunications services, led by the U.K.'s Vodafone Group PLC, and overweighting and stock selection in healthcare, led by European pharmaceuticals firms GlaxoSmithKline PLC (U.K.) and Sanofi-Aventis (France), aided the Portfolio's results. Although we think healthcare strength was partly attributable to the market's defensive rotation, we believe pharmaceuticals valuations at roughly half their long-term average offer further appreciation potential as prices seemingly assigned little or no credit for cost-cutting opportunities, pipeline productivity and global demographics, all potential long-term earnings catalysts.
Our considerable underweighting in the consumer staples sector hampered relative results. We believed consumer staples' valuation premium to the broader market average was unjustified given the potential impact on operating and profit margins from growing competitive pressures and volatile input prices. Among cyclical sectors, the Portfolio's overweighting and stock selection in industrials weighed on results amid a weak global capital spending outlook. Financials also detracted due to stock-specific weakness. Although we remain cautious about our financials exposure given the lack of visibility and political risk surrounding the sector, we believe Europe's debt crisis generated excessive collateral damage, leading to unwarranted downgrades for select fundamentally sound Asian and well-capitalized European financials. During the period, the U.S. dollar appreciated against most foreign currencies, which also hurt the Portfolio's absolute performance because investments in securities with non-U.S. currency exposure lost value as the dollar rose.
From a regional perspective, European holdings outperformed as we identified deep value opportunities that proved relatively resilient. Stock selection in Asia also helped relative returns. Stock selection in Canada hurt Portfolio performance.
Current Strategy and Outlook: Going forward, we believe increasing fiscal consolidation and regulation in developed markets and a potential slowdown in emerging markets following immense stimulus abatement may foster below trend economic growth. Strong business fundamentals may again attract recognition as companies compete for limited demand, potentially benefiting our value philosophy, which has been challenged in macro-driven markets but outperformed over the long term. International equities continue to look attractive to us, as we believe they offer robust average earnings yields and dividend yields. We believe volatility can create compelling opportunities for disciplined, long-term value investors.
Country Allocation
as of December 31, 2011
(as a percentage of net assets)
| United Kingdom | | | 17.0 | % | |
| Germany | | | 10.8 | % | |
| France | | | 8.8 | % | |
| Switzerland | | | 8.2 | % | |
| Netherlands | | | 8.1 | % | |
| China | | | 6.7 | % | |
| South Korea | | | 5.6 | % | |
| Norway | | | 4.4 | % | |
| Hong Kong | | | 3.6 | % | |
| Spain | | | 3.3 | % | |
| Countries between 0.3%-3.2%^ | | | 20.9 | % | |
| Assets in Excess of Other Liabilities | | | 2.6 | % | |
| Net Assets | | | 100.0 | % | |
^ Includes 12 countries, which each represents 0.3%-3.2% of net assets.
Portfolio holdings are subject to change daily.
Top Ten Holdings
as of December 31, 2011
(as a percentage of net assets)
| Samsung Electronics Co., Ltd. GDR | | | 2.9 | % | |
| Royal Dutch Shell PLC — Class B | | | 2.5 | % | |
| China Telecom Corp., Ltd. | | | 2.4 | % | |
| GlaxoSmithKline PLC | | | 2.4 | % | |
| Telenor ASA | | | 2.3 | % | |
| Sanofi-Aventis | | | 2.2 | % | |
| Statoil ASA | | | 2.1 | % | |
| Vodafone Group PLC | | | 2.0 | % | |
| DBS Group Holdings Ltd. | | | 2.0 | % | |
| SAP AG | | | 2.0 | % | |
Portfolio holdings are subject to change daily.
Portfolio holdings and characteristics are subject to change and may not be representative of current holdings and characteristics. The outlook for this Portfolio may differ from that presented for other ING Funds. Performance for the different classes of shares will vary based on differences in fees associated with each class.
32
PORTFOLIO MANAGERS' REPORT
ING TEMPLETON FOREIGN EQUITY PORTFOLIO

| Average Annual Total Returns for the Periods Ended December 31, 2011 | |
| | | 1 Year | | 5 Year | | Since Inception
of Class ADV
December 20, 2006 | | Since Inception
of Class I
January 3, 2006 | | Since Inception
of Class S
January 12, 2006 | | Since Inception
of Class S2
February 27, 2009 | |
| Class ADV | | | (12.42 | )% | | | (3.09 | )% | | | (2.94 | )% | | | — | | | | — | | | | — | | |
| Class I | | | (12.00 | )% | | | (2.72 | )% | | | — | | | | 0.98 | % | | | — | | | | — | | |
| Class S | | | (12.21 | )% | | | (2.97 | )% | | | — | | | | — | | | | 0.69 | % | | | — | | |
| Class S2 | | | (12.34 | )% | | | — | | | | — | | | | — | | | | — | | | | 17.04 | % | |
| MSCI ACWI ex-U.S. | | | (13.71 | )% | | | (2.92 | )% | | | (2.92 | )% | | | 1.48 | % | | | 1.48 | % | | | 19.11 | % | |
| MSCI EAFE® Index | | | (12.14 | )% | | | (4.72 | )% | | | (4.72 | )%(1) | | | (0.13 | )%(2) | | | (0.13 | )%(2) | | | 16.50 | %(3) | |
Based on a $10,000 initial investment, the graph and table above illustrate the total return of ING Templeton Foreign Equity Portfolio against the index indicated. An index is unmanaged and has no cash in its portfolio, imposes no sales charges and incurs no operating expenses. An investor cannot invest directly in an index. The Portfolio's performance is shown without the imposition of any expenses or charges which are, or may be, imposed under your annuity contract. Total returns would have been lower if such expenses or charges were included.
The performance graph and table do not reflect the deduction of taxes that a shareholder will pay on portfolio distributions or the redemption of portfolio shares.
The performance shown may include the effect of fee waivers and/or expense reimbursements by the Investment Adviser and/or other service providers, which have the effect of increasing total return. Had all fees and expenses been considered, the total returns would have been lower.
The performance update illustrates performance for a variable investment option available through a variable annuity contract. The performance shown indicates past performance and is not a projection or prediction of future results. Actual investment returns and principal value will fluctuate so that shares and/or units, at redemption, may be worth more or less than their original cost. Please call (800) 262-3862 to get performance through the most recent month end.
This report contains statements that may be "forward-looking" statements. Actual results may differ materially from those projected in the "forward-looking" statements.
The views expressed in this report reflect those of the portfolio manager only through the end of the period as stated on the cover. The portfolio manager's views are subject to change at any time based on marked and other conditions.
Portfolio holdings are subject to change daily.
(1) Since inception performance for the index is shown from January 1, 2007.
(2) Since inception performance of the index is shown from January 1, 2006.
(3) Since inception performance of the index is shown from March 1, 2009.
33
ING THORNBURG VALUE PORTFOLIO
PORTFOLIO MANAGERS' REPORT
ING Thornburg Value Portfolio (the "Portfolio") seeks long-term capital appreciation and secondarily, current income. The Portfolio is managed by Edward Maran, CFA, Managing Director and Connor Browne, CFA Managing Director, of Thornburg Investment Management, Inc. ("Thornburg") — the Sub-Adviser.
Performance: For the year ended December 31, 2011, the Portfolio's Class I shares provided a total return of (13.11)% compared to the S&P 500® Index, which returned 2.11% for the same period.
Portfolio Specifics: The year was dominated by macroeconomic news related to political unrest in North Africa and the Middle East, uncertainty surrounding the European debt crisis, and continued gridlock in Washington, all of which plagued equity markets. For 2011, the Portfolio underperformed the S&P 500® Index. As bottom up stock pickers, we find "theme-driven" markets more challenging since valuations may be driven by momentum instead of fundamentals for long periods of time with little interruption. At this moment, stocks with exposure to economic cyclicality, financial leverage, or headline risk appear extremely discounted.
Top contributors included Baker Hughes, Inc. ("Baker Hughes"), Dish Network Corp. ("Dish Network"), Life Time Fitness, Inc. ("Life Time Fitness"), Gilead Sciences, Inc. ("Gilead Sciences") and Google, Inc. ("Google"). Baker Hughes benefitted from oil price volatility throughout the year, while Dish Network was helped by strong earnings and the resolution of a significant lawsuit prior to our decision to sell it in the second quarter. Life Time Fitness improved on increased customer additions and retentions despite difficult operating conditions. Gilead Sciences continues to execute, and sentiment for its pipeline products has improved. Google is the global leader in online advertising, which grew 26% year over year in the U.S. in Google's most recent quarter.
The financial sector, the worst relative performing sector, was hit hard this year with concerns over Europe's ongoing sovereign debt crisis. Three of the largest detractors for the year were in this sector: Bank of America Corp., Genworth Financial, Inc. and Hartford Financial Services Group, Inc. We believe there are opportunities in financial stocks related to investors' excessive fear regarding the economy and their surprising willingness to believe that interest rates will stay low indefinitely. The other two largest detractors were United States Steel Corp. ("United States Steel") and MEMC Electronic Materials, Inc. ("MEMC"). We believe that over time United States Steel's competitive position will improve as wage rates and currencies increase in the developing nations that import into the US. Due to a difficult operating environment, MEMC announced a major restructuring during the fourth quarter. It appears that the management has truly shifted course by cutting costs and reducing capital expenditure spending while increasing focus on cash flow generation and profitable businesses. The materials, technology and healthcare sectors also performed poorly.
Current Strategy and Outlook: During 2010-2011, investors sought to reduce risk, and equities are perceived to be risky. This perception is due to the volatility and lack of appreciation of share prices we believe is part of a long cycle that has been going on for over a decade. Investors will probably return to equities when volatility declines, but may be skeptical that it ever will. While understandable, that fear is not justified by history. Over the past century we have had numerous volatility-causing events. Yet, market volatility has always returned to normal within a relatively short time frame after hitting levels similar to what we have recently experienced. In our opinion, the value proposition of equities relative to fixed income is the best that it has been in decades, so when confidence returns we believe the money should flow to stocks. The 6.5% real earnings yield (taking into account inflation) of the S&P 500® Index today looks very attractive relative to real 10 year government yields, which are slightly negative, or real Baa corporate bond yields, which are just over 3%. After a decade of weak returns for equities, individual investor expectations have soured on the future prospects of this investment class. When there is the least enthusiasm for equities — and we think we're close today — we believe there is potential that subsequent returns could be high.
We are contrarian investors. In environments where stock prices are not differentiated by underlying fundamentals, we can struggle. The good news is that these periods do not last forever, and we believe valuation will matter again at some point in the future. We remain optimistic that our approach of buying what we believe are promising companies selling at a discount to their underlying value has the potential to deliver results in the future.
Sector Diversification
as of December 31, 2011
(as a percentage of net assets)
| Information Technology | | | 24.3 | % | |
| Financials | | | 16.0 | % | |
| Health Care | | | 15.5 | % | |
| Consumer Discretionary | | | 14.0 | % | |
| Energy | | | 13.8 | % | |
| Materials | | | 6.4 | % | |
| Telecommunications | | | 5.1 | % | |
| Industrials | | | 1.2 | % | |
| Assets in Excess of Other Liabilities* | | | 3.7 | % | |
| Net Assets | | | 100.0 | % | |
* Includes short-term investments.
Portfolio holdings are subject to change daily.
Top Ten Holdings
as of December 31, 2011*
(as a percentage of net assets)
| Google, Inc. — Class A | | | 4.6 | % | |
| Gilead Sciences, Inc. | | | 4.6 | % | |
| Inpex Holdings, Inc. | | | 4.4 | % | |
| Thermo Fisher Scientific, Inc. | | | 4.3 | % | |
| Hewlett-Packard Co. | | | 4.0 | % | |
| Metlife, Inc. | | | 3.8 | % | |
| ExxonMobil Corp. | | | 3.6 | % | |
| Charles Schwab Corp. | | | 3.6 | % | |
| Staples, Inc. | | | 3.5 | % | |
| United States Steel Corp. | | | 3.5 | % | |
* Excludes short-term investments.
Portfolio holdings are subject to change daily.
Portfolio holdings and characteristics are subject to change and may not be representative of current holdings and characteristics. The outlook for this Portfolio may differ from that presented for other ING Funds. Performance for the different classes of shares will vary based on differences in fees associated with each class.
34
PORTFOLIO MANAGERS' REPORT
ING THORNBURG VALUE PORTFOLIO

| Average Annual Total Returns for the Periods Ended December 31, 2011 | |
| | | 1 Year | | 5 Year | | 10 Year | | Since Inception
of Class S2
March 8, 2010 | |
| Class ADV | | | (13.53 | )% | | | (2.45 | )% | | | 0.32 | % | | | — | | |
| Class I | | | (13.11 | )% | | | (1.97 | )% | | | 0.81 | % | | | — | | |
| Class S | | | (13.30 | )% | | | (2.21 | )% | | | 0.56 | % | | | — | | |
| Class S2 | | | (13.39 | )% | | | — | | | | — | | | | (4.06 | )% | |
| S&P 500® Index | | | 2.11 | % | | | (0.25 | )% | | | 2.92 | % | | | 9.56 | %(1) | |
Based on a $10,000 initial investment, the graph and table above illustrate the total return of ING Thornburg Value Portfolio against the index indicated. An index is unmanaged and has no cash in its portfolio, imposes no sales charges and incurs no operating expenses. An investor cannot invest directly in an index. The Portfolio's performance is shown without the imposition of any expenses or charges which are, or may be, imposed under your annuity contract. Total returns would have been lower if such expenses or charges were included.
The performance graph and table do not reflect the deduction of taxes that a shareholder will pay on portfolio distributions or the redemption of portfolio shares.
The performance shown may include the effect of fee waivers and/or expense reimbursements by the Investment Adviser and/or other service providers, which have the effect of increasing total return. Had all fees and expenses been considered, the total returns would have been lower.
The performance update illustrates performance for a variable investment option available through a variable annuity contract. The performance shown indicates past performance and is not a projection or prediction of future results. Actual investment returns and principal value will fluctuate so that shares and/or units, at redemption, may be worth more or less than their original cost. Please call (800) 262-3862 to get performance through the most recent month end.
This report contains statements that may be "forward-looking" statements. Actual results may differ materially from those projected in the "forward-looking" statements.
The views expressed in this report reflect those of the portfolio manager only through the end of the period as stated on the cover. The portfolio manager's views are subject to change at any time based on marked and other conditions.
Portfolio holdings are subject to change daily.
(1) Since inception performance for the indices is shown from March 1, 2010.
Prior to August 7, 2006, the Portfolio was sub-advised by Massachusetts Financial Services Company and was known as MFS Capital Opportunities Portfolio. Effective August 7, 2006, Thornburg became the sub–adviser and the Portfolio's principal investment strategies changed.
35
ING UBS U.S. LARGE CAP EQUITY PORTFOLIO
PORTFOLIO MANAGERS' REPORT
ING UBS U.S. Large Cap Equity Portfolio (the "Portfolio") seeks long-term growth of capital and future income. The Portfolio is managed by the North American Equities Investment Management Team ("N.A. Equities Team") consisting of Thomas M. Cole, CFA, Head of North American Equities, Research Director and Managing Director, John C. Leonard, CFA and Thomas J. Digenan, CFA, Portfolio Managers for North American Equities of UBS Global Asset Management (Americas) Inc. — the Sub-Adviser.
Performance: For the year ended December 31, 2011, the Portfolio's Class I shares provided a total return of (2.56)% compared to the compared to the S&P 500® Index and the Russell 1000® Index, which returned 2.11% and 1.50%, respectively, for the same period.
Portfolio Specifics: Stock selection was the largest detractor from performance during the year. In particular, holdings in the financials, energy and consumer discretionary sectors detracted the most from performance during the year. Conversely, stock selection in the healthcare, materials and utilities sectors contributed to performance during the year.
In terms of individual stocks, the largest stock detractors from performance during the year were General Motors Co., Citigroup, Inc., Morgan Stanley, Ultra Petroleum Corp. and Carnival Corp. General Motors Co. was the largest detractor over the year. The company has had strong revenue growth, but it has faced competitive headwinds and macro economic uncertainty in North America and in Europe. Recently, the company has been negatively impacted by the news of fires in Volt electric vehicles. We currently maintain our position and believe the company will successfully complete its turnaround.
Conversely, Pharmasset, Inc. ("Pharmasset"), Bank of America (underweight), Alexion Pharmaceuticals, Visa, Inc and National Semiconductor were the largest contributors to performance. Shares of Pharmasset rose sharply higher on news that Gilead, the largest maker of HIV medicines, agreed to buy Pharmasset. Gilead's purchase of Pharmasset shows that Gilead is intent on becoming the leader in hepatitis medicines. Pharmasset has been the strongest stock performer over the fourth quarter and annual period for the portfolio.
Overall, sector positioning was slightly positive to performance during the year. The largest sector contributors were an overweight in healthcare, an underweight in materials and an overweight in consumer discretionary. Conversely, underweights in the telecommunications services and consumer staples, and an overweight in industrials, detracted the most from relative results.
Current Strategy and Outlook: Overall, the U.S. equity market is currently trading at an earnings yield around four times that of U.S. 10-year government bonds. Basically, investors are not pricing in any growth in earnings. As we have stated in earlier writings, we believe this type of environment is where fundamental valuation work bears fruit if an investor is able to weather the current uncertainty. While we believe the market is providing us with excellent price-to-value tradeoffs, we realize that we are still in a market that tests and challenges investors' patience. We remain disciplined in our approach, and also cognizant that we must both practice and preach patience in order to seek to capture the attractive opportunities we are presented with today.
Sector Diversification
as of December 31, 2011
(as a percentage of net assets)
| Information Technology | | | 16.1 | % | |
| Financials | | | 15.8 | % | |
| Consumer Discretionary | | | 15.7 | % | |
| Health Care | | | 14.4 | % | |
| Energy | | | 11.9 | % | |
| Industrials | | | 10.6 | % | |
| Consumer Staples | | | 6.1 | % | |
| Materials | | | 3.9 | % | |
| Utilities | | | 2.7 | % | |
| Assets in Excess of Other Liabilities* | | | 2.8 | % | |
| Net Assets | | | 100.0 | % | |
* Includes short-term investments.
Portfolio holdings are subject to change daily.
Top Ten Holdings
as of December 31, 2011*
(as a percentage of net assets)
| Apple, Inc. | | | 4.1 | % | |
| Wells Fargo & Co. | | | 2.8 | % | |
| Kraft Foods, Inc. | | | 2.5 | % | |
| Comcast Corp. — Class A | | | 2.2 | % | |
| General Dynamics Corp. | | | 2.2 | % | |
| Time Warner, Inc. | | | 2.1 | % | |
| ExxonMobil Corp. | | | 2.1 | % | |
| JPMorgan Chase & Co. | | | 2.1 | % | |
| Adobe Systems, Inc. | | | 2.0 | % | |
| Citigroup, Inc. | | | 2.0 | % | |
* Excludes short-term investments.
Portfolio holdings are subject to change daily.
Portfolio holdings and characteristics are subject to change and may not be representative of current holdings and characteristics. The outlook for this Portfolio may differ from that presented for other ING Funds. Performance for the different classes of shares will vary based on differences in fees associated with each class.
36
PORTFOLIO MANAGERS' REPORT
ING UBS U.S. LARGE CAP EQUITY PORTFOLIO

| Average Annual Total Returns for the Periods Ended December 31, 2011 | |
| | | 1 Year | | 5 Year | | 10 Year | |
| Class ADV | | | (2.92 | )% | | | (2.84 | )% | | | 1.31 | % | |
| Class I | | | (2.56 | )% | | | (2.35 | )% | | | 1.80 | % | |
| Class S | | | (2.71 | )% | | | (2.61 | )% | | | 1.55 | % | |
| S&P 500® Index | | | 2.11 | % | | | (0.25 | )% | | | 2.92 | % | |
| Russell 1000® Index | | | 1.50 | % | | | (0.02 | )% | | | 3.34 | % | |
Based on a $10,000 initial investment, the graph and table above illustrate the total return of ING UBS U.S. Large Cap Equity Portfolio against the indices indicated. An index is unmanaged and has no cash in its portfolio, imposes no sales charges and incurs no operating expenses. An investor cannot invest directly in an index. The Portfolio's performance is shown without the imposition of any expenses or charges which are, or may be, imposed under your annuity contract. Total returns would have been lower if such expenses or charges were included.
The performance graph and table do not reflect the deduction of taxes that a shareholder will pay on portfolio distributions or the redemption of portfolio shares.
The performance shown may include the effect of fee waivers and/or expense reimbursements by the Investment Adviser and/or other service providers, which have the effect of increasing total return. Had all fees and expenses been considered, the total returns would have been lower.
The performance update illustrates performance for a variable investment option available through a variable annuity contract. The performance shown indicates past performance and is not a projection or prediction of future results. Actual investment returns and principal value will fluctuate so that shares and/or units, at redemption, may be worth more or less than their original cost. Please call (800) 262-3862 to get performance through the most recent month end.
This report contains statements that may be "forward-looking" statements. Actual results may differ materially from those projected in the "forward-looking" statements.
The views expressed in this report reflect those of the portfolio manager only through the end of the period as stated on the cover. The portfolio manager's views are subject to change at any time based on marked and other conditions.
Portfolio holdings are subject to change daily.
37
SHAREHOLDER EXPENSE EXAMPLES (UNAUDITED)
As a shareholder of a Portfolio, you incur two types of costs: (1) transaction costs, including redemption fees and exchange fees; and (2) ongoing costs, including management fees, distribution and/or service (12b-1) fees, and other Portfolio expenses. These Examples are intended to help you understand your ongoing costs (in dollars) of investing in the Portfolios and to compare these costs with the ongoing costs of investing in other mutual funds.
The Examples are based on an investment of $1,000 invested at the beginning of the period and held for the entire period from July 1, 2011 to December 31, 2011. The Portfolios' expenses are shown without the imposition of any charges which are, or may be, imposed under your variable annuity contract, variable life insurance policy, qualified pension, or retirement plan. Expenses would have been higher if such charges were included.
Actual Expenses
The left section of the table shown below, "Actual Portfolio Return," provides information about actual account values and actual expenses. You may use the information in this section, together with the amount you invested, to estimate the expenses that you paid over the period. Simply divide your account value by $1,000 (for example, an $8,600 account value divided by $1,000 = 8.6), then multiply the result by the number in the first section under the heading entitled "Expenses Paid During the Period" to estimate the expenses you paid on your account during this period.
Hypothetical Example for Comparison Purposes
The right section of the table shown below, "Hypothetical (5% return before expenses)," provides information about hypothetical account values and hypothetical expenses based on a Portfolio's actual expense ratio and an assumed rate of return of 5% per year before expenses, which is not a Portfolio's actual return. The hypothetical account values and expenses may not be used to estimate the actual ending account balance or expenses you paid for the period. You may use this information to compare the ongoing costs of investing in a Portfolio and other mutual funds. To do so, compare this 5% hypothetical example with the 5% hypothetical examples that appear in the shareholder reports of the other funds.
Please note that the expenses shown in the table are meant to highlight your ongoing costs only and do not reflect any transactional costs, such as redemption fees or exchange fees. Therefore, the hypothetical lines of the table are useful in comparing ongoing costs only, and will not help you determine the relative total costs of owning different mutual funds. In addition, if these transactional costs were included, your costs would have been higher.
| | | Actual Portfolio Return | | Hypothetical (5% return before expenses) | |
ING American Century
Small-Mid Cap Value Portfolio | | Beginning
Account
Value
July 1,
2011 | | Ending
Account
Value
December 31,
2011 | | Annualized
Expense
Ratio | | Expenses Paid
During the
Period Ended
December 31,
2011* | | Beginning
Account
Value
July 1,
2011 | | Ending
Account
Value
December 31,
2011 | | Annualized
Expense
Ratio | | Expenses Paid
During the
Period Ended
December 31,
2011* | |
| Class ADV | | $ | 1,000.00 | | | $ | 937.80 | | | | 1.44 | % | | $ | 7.03 | | | $ | 1,000.00 | | | $ | 1,017.95 | | | | 1.44 | % | | $ | 7.32 | | |
| Class I | | | 1,000.00 | | | | 941.10 | | | | 0.94 | | | | 4.60 | | | | 1,000.00 | | | | 1,020.47 | | | | 0.94 | | | | 4.79 | | |
| Class S | | | 1,000.00 | | | | 939.80 | | | | 1.19 | | | | 5.82 | | | | 1,000.00 | | | | 1,019.21 | | | | 1.19 | | | | 6.06 | | |
| Class S2 | | | 1,000.00 | | | | 938.40 | | | | 1.34 | | | | 6.55 | | | | 1,000.00 | | | | 1,018.45 | | | | 1.34 | | | | 6.82 | | |
| ING Baron Small Cap Growth Portfolio | |
| Class ADV | | $ | 1,000.00 | | | $ | 923.20 | | | | 1.58 | % | | $ | 7.66 | | | $ | 1,000.00 | | | $ | 1,017.24 | | | | 1.58 | % | | $ | 8.03 | | |
| Class I | | | 1,000.00 | | | | 925.40 | | | | 1.08 | | | | 5.24 | | | | 1,000.00 | | | | 1,019.76 | | | | 1.08 | | | | 5.50 | | |
| Class S | | | 1,000.00 | | | | 924.10 | | | | 1.31 | | | | 6.35 | | | | 1,000.00 | | | | 1,018.60 | | | | 1.31 | | | | 6.67 | | |
| Class S2 | | | 1,000.00 | | | | 923.40 | | | | 1.48 | | | | 7.18 | | | | 1,000.00 | | | | 1,017.74 | | | | 1.48 | | | | 7.53 | | |
* Expenses are equal to each Portfolios' respective annualized expense ratios multiplied by the average account value over the period, multiplied by 184/365 to reflect the most recent fiscal half-year.
38
SHAREHOLDER EXPENSE EXAMPLES (UNAUDITED) (CONTINUED)
| | | Actual Portfolio Return | | Hypothetical (5% return before expenses) | |
ING Columbia Small Cap
Value II Portfolio | | Beginning
Account
Value
July 1,
2010 | | Ending
Account
Value
December 31,
2010 | | Annualized
Expense
Ratio | | Expenses Paid
During the
Period Ended
December 31,
2010* | | Beginning
Account
Value
July 1,
2010 | | Ending
Account
Value
December 31,
2010 | | Annualized
Expense
Ratio | | Expenses Paid
During the
Period Ended
December 31,
2010* | |
| Class ADV | | $ | 1,000.00 | | | $ | 902.80 | | | | 1.40 | % | | $ | 6.71 | | | $ | 1,000.00 | | | $ | 1,018.15 | | | | 1.40 | % | | $ | 7.12 | | |
| Class I | | | 1,000.00 | | | | 904.20 | | | | 0.90 | | | | 4.32 | | | | 1,000.00 | | | | 1,020.67 | | | | 0.90 | | | | 4.58 | | |
| Class S | | | 1,000.00 | | | | 904.30 | | | | 1.15 | | | | 5.52 | | | | 1,000.00 | | | | 1,019.41 | | | | 1.15 | | | | 5.85 | | |
| Class S2 | | | 1,000.00 | | | | 902.70 | | | | 1.30 | | | | 6.23 | | | | 1,000.00 | | | | 1,018.65 | | | | 1.30 | | | | 6.61 | | |
| ING Davis New York Venture Portfolio | |
| Class ADV | | $ | 1,000.00 | | | $ | 928.10 | | | | 1.38 | % | | $ | 6.71 | | | $ | 1,000.00 | | | $ | 1,018.25 | | | | 1.38 | % | | $ | 7.02 | | |
| Class I | | | 1,000.00 | | | | 930.00 | | | | 0.88 | | | | 4.28 | | | | 1,000.00 | | | | 1,020.77 | | | | 0.88 | | | | 4.48 | | |
| Class S | | | 1,000.00 | | | | 929.10 | | | | 1.13 | | | | 5.49 | | | | 1,000.00 | | | | 1,019.51 | | | | 1.13 | | | | 5.75 | | |
| ING Global Bond Portfolio | |
| Class ADV | | $ | 1,000.00 | | | $ | 989.30 | | | | 1.02 | % | | $ | 5.11 | | | $ | 1,000.00 | | | $ | 1,020.06 | | | | 1.02 | % | | $ | 5.19 | | |
| Class I | | | 1,000.00 | | | | 991.50 | | | | 0.52 | | | | 2.61 | | | | 1,000.00 | | | | 1,022.58 | | | | 0.52 | | | | 2.65 | | |
| Class S | | | 1,000.00 | | | | 990.50 | | | | 0.77 | | | | 3.86 | | | | 1,000.00 | | | | 1,021.32 | | | | 0.77 | | | | 3.92 | | |
| ING Invesco Van Kampen Comstock Portfolio | |
| Class ADV | | $ | 1,000.00 | | | $ | 925.60 | | | | 1.31 | % | | $ | 6.36 | | | $ | 1,000.00 | | | $ | 1,018.60 | | | | 1.31 | % | | $ | 6.67 | | |
| Class I | | | 1,000.00 | | | | 928.10 | | | | 0.81 | | | | 3.94 | | | | 1,000.00 | | | | 1,021.12 | | | | 0.81 | | | | 4.13 | | |
| Class S | | | 1,000.00 | | | | 927.20 | | | | 1.06 | | | | 5.15 | | | | 1,000.00 | | | | 1,019.86 | | | | 1.06 | | | | 5.40 | | |
| ING Invesco Van Kampen Equity and Income Portfolio | |
| Class ADV | | $ | 1,000.00 | | | $ | 947.40 | | | | 1.15 | % | | $ | 5.64 | | | $ | 1,000.00 | | | $ | 1,019.41 | | | | 1.15 | % | | $ | 5.85 | | |
| Class I | | | 1,000.00 | | | | 949.70 | | | | 0.65 | | | | 3.19 | | | | 1,000.00 | | | | 1,021.93 | | | | 0.65 | | | | 3.31 | | |
| Class S | | | 1,000.00 | | | | 948.40 | | | | 0.90 | | | | 4.42 | | | | 1,000.00 | | | | 1,020.67 | | | | 0.90 | | | | 4.58 | | |
| Class S2 | | | 1,000.00 | | | | 947.80 | | | | 1.05 | | | | 5.15 | | | | 1,000.00 | | | | 1,019.91 | | | | 1.05 | | | | 5.35 | | |
| ING JPMorgan Mid Cap Value Portfolio | |
| Class ADV | | $ | 1,000.00 | | | $ | 951.10 | | | | 1.50 | % | | $ | 7.38 | | | $ | 1,000.00 | | | $ | 1,017.64 | | | | 1.50 | % | | $ | 7.63 | | |
| Class I | | | 1,000.00 | | | | 953.00 | | | | 1.00 | | | | 4.92 | | | | 1,000.00 | | | | 1,020.16 | | | | 1.00 | | | | 5.09 | | |
| Class S | | | 1,000.00 | | | | 952.30 | | | | 1.25 | | | | 6.15 | | | | 1,000.00 | | | | 1,018.90 | | | | 1.25 | | | | 6.36 | | |
| Class S2 | | | 1,000.00 | | | | 951.20 | | | | 1.40 | | | | 6.89 | | | | 1,000.00 | | | | 1,018.15 | | | | 1.40 | | | | 7.12 | | |
| ING Oppenheimer Global Portfolio | |
| Class ADV | | $ | 1,000.00 | | | $ | 850.20 | | | | 1.16 | % | | $ | 5.41 | | | $ | 1,000.00 | | | $ | 1,019.36 | | | | 1.16 | % | | $ | 5.90 | | |
| Class I | | | 1,000.00 | | | | 852.40 | | | | 0.66 | | | | 3.08 | | | | 1,000.00 | | | | 1,021.88 | | | | 0.66 | | | | 3.36 | | |
| Class S | | | 1,000.00 | | | | 851.20 | | | | 0.91 | | | | 4.25 | | | | 1,000.00 | | | | 1,020.62 | | | | 0.91 | | | | 4.63 | | |
| Class S2 | | | 1,000.00 | | | | 850.50 | | | | 1.06 | | | | 4.94 | | | | 1,000.00 | | | | 1,019.86 | | | | 1.06 | | | | 5.40 | | |
* Expenses are equal to each Portfolios' respective annualized expense ratios multiplied by the average account value over the period, multiplied by 184/365 to reflect the most recent fiscal half-year.
39
SHAREHOLDER EXPENSE EXAMPLES (UNAUDITED) (CONTINUED)
| | | Actual Portfolio Return | | Hypothetical (5% return before expenses) | |
ING PIMCO Total Return
Portfolio | | Beginning
Account
Value
July 1,
2010 | | Ending
Account
Value
December 31,
2010 | | Annualized
Expense
Ratio | | Expenses Paid
During the
Period Ended
December 31,
2010* | | Beginning
Account
Value
July 1,
2010 | | Ending
Account
Value
December 31,
2010 | | Annualized
Expense
Ratio | | Expenses Paid
During the
Period Ended
December 31,
2010* | |
| Class ADV | | $ | 1,000.00 | | | $ | 1,004.20 | | | | 1.08 | % | | $ | 5.46 | | | $ | 1,000.00 | | | $ | 1,019.76 | | | | 1.08 | % | | $ | 5.50 | | |
| Class I | | | 1,000.00 | | | | 1,006.40 | | | | 0.58 | | | | 2.93 | | | | 1,000.00 | | | | 1,022.28 | | | | 0.58 | | | | 2.96 | | |
| Class S | | | 1,000.00 | | | | 1,005.80 | | | | 0.83 | | | | 4.20 | | | | 1,000.00 | | | | 1,021.02 | | | | 0.83 | | | | 4.23 | | |
| Class S2 | | | 1,000.00 | | | | 1,004.80 | | | | 0.98 | | | | 4.95 | | | | 1,000.00 | | | | 1,020.27 | | | | 0.98 | | | | 4.99 | | |
| ING Pioneer High Yield Portfolio | |
| Class I | | $ | 1,000.00 | | | $ | 939.80 | | | | 0.71 | % | | $ | 3.47 | | | $ | 1,000.00 | | | $ | 1,021.63 | | | | 0.71 | % | | $ | 3.62 | | |
| Class S | | | 1,000.00 | | | | 938.60 | | | | 0.96 | | | | 4.69 | | | | 1,000.00 | | | | 1,020.37 | | | | 0.96 | | | | 4.89 | | |
| ING T. Rowe Price Diversified Mid Cap Growth Portfolio | |
| Class ADV | | $ | 1,000.00 | | | $ | 883.80 | | | | 1.16 | % | | $ | 5.51 | | | $ | 1,000.00 | | | $ | 1,019.36 | | | | 1.16 | % | | $ | 5.90 | | |
| Class I | | | 1,000.00 | | | | 886.60 | | | | 0.66 | | | | 3.14 | | | | 1,000.00 | | | | 1,021.88 | | | | 0.66 | | | | 3.36 | | |
| Class S | | | 1,000.00 | | | | 885.60 | | | | 0.91 | | | | 4.32 | | | | 1,000.00 | | | | 1,020.62 | | | | 0.91 | | | | 4.63 | | |
| Class S2 | | | 1,000.00 | | | | 884.30 | | | | 1.06 | | | | 5.03 | | | | 1,000.00 | | | | 1,019.86 | | | | 1.06 | | | | 5.40 | | |
| ING T. Rowe Price Growth Equity Portfolio | |
| Class ADV | | $ | 1,000.00 | | | $ | 938.10 | | | | 1.24 | % | | $ | 6.06 | | | $ | 1,000.00 | | | $ | 1,018.95 | | | | 1.24 | % | | $ | 6.31 | | |
| Class I | | | 1,000.00 | | | | 940.50 | | | | 0.74 | | | | 3.62 | | | | 1,000.00 | | | | 1,021.48 | | | | 0.74 | | | | 3.77 | | |
| Class S | | | 1,000.00 | | | | 939.30 | | | | 0.99 | | | | 4.84 | | | | 1,000.00 | | | | 1,020.21 | | | | 0.99 | | | | 5.04 | | |
| Class S2 | | | 1,000.00 | | | | 938.60 | | | | 1.14 | | | | 5.57 | | | | 1,000.00 | | | | 1,019.46 | | | | 1.14 | | | | 5.80 | | |
| ING Templeton Foreign Equity Portfolio | |
| Class ADV | | $ | 1,000.00 | | | $ | 831.90 | | | | 1.48 | % | | $ | 6.83 | | | $ | 1,000.00 | | | $ | 1,017.74 | | | | 1.48 | % | | $ | 7.53 | | |
| Class I | | | 1,000.00 | | | | 834.00 | | | | 0.98 | | | | 4.53 | | | | 1,000.00 | | | | 1,020.27 | | | | 0.98 | | | | 4.99 | | |
| Class S | | | 1,000.00 | | | | 833.20 | | | | 1.23 | | | | 5.68 | | | | 1,000.00 | | | | 1,019.00 | | | | 1.23 | | | | 6.26 | | |
| Class S2 | | | 1,000.00 | | | | 832.80 | | | | 1.38 | | | | 6.38 | | | | 1,000.00 | | | | 1,018.25 | | | | 1.38 | | | | 7.02 | | |
| ING Thornburg Value Portfolio | |
| Class ADV | | $ | 1,000.00 | | | $ | 821.50 | | | | 1.40 | % | | $ | 6.43 | | | $ | 1,000.00 | | | $ | 1,018.15 | | | | 1.40 | % | | $ | 7.12 | | |
| Class I | | | 1,000.00 | | | | 823.10 | | | | 0.90 | | | | 4.14 | | | | 1,000.00 | | | | 1,020.67 | | | | 0.90 | | | | 4.58 | | |
| Class S | | | 1,000.00 | | | | 822.40 | | | | 1.15 | | | | 5.28 | | | | 1,000.00 | | | | 1,019.41 | | | | 1.15 | | | | 5.85 | | |
| Class S2 | | | 1,000.00 | | | | 821.80 | | | | 1.30 | | | | 5.97 | | | | 1,000.00 | | | | 1,018.65 | | | | 1.30 | | | | 6.61 | | |
| ING UBS U.S. Large Cap Equity Portfolio | |
| Class ADV | | $ | 1,000.00 | | | $ | 925.20 | | | | 1.25 | % | | $ | 6.07 | | | $ | 1,000.00 | | | $ | 1,018.90 | | | | 1.25 | % | | $ | 6.36 | | |
| Class I | | | 1,000.00 | | | | 927.30 | | | | 0.75 | | | | 3.64 | | | | 1,000.00 | | | | 1,021.42 | | | | 0.75 | | | | 3.82 | | |
| Class S | | | 1,000.00 | | | | 926.50 | | | | 1.00 | | | | 4.86 | | | | 1,000.00 | | | | 1,020.16 | | | | 1.00 | | | | 5.09 | | |
* Expenses are equal to each Portfolios' respective annualized expense ratios multiplied by the average account value over the period, multiplied by 184/365 to reflect the most recent fiscal half-year.
40
REPORT OF INDEPENDENT REGISTERED PUBLIC ACCOUNTING FIRM
The Shareholders and Board of Trustees
ING Partners, Inc.
We have audited the accompanying statements of assets and liabilities, including the summary portfolios of investments, of ING American Century Small-Mid Cap Value Portfolio, ING Baron Small Cap Growth Portfolio, ING Columbia Small Cap Value II Portfolio, (formerly, Columbia Small Cap Value Portfolio), ING Davis New York Venture Portfolio, ING Global Bond Portfolio, ING Invesco Van Kampen Comstock Portfolio, (formerly, ING Van Kampen Comstock Portfolio), and ING Invesco Van Kampen Equity and Income Portfolio, (formerly, ING Van Kampen Equity and Income Portfolio), ING JPMorgan Mid Cap Value Portfolio, ING Oppenheimer Global Portfolio, ING PIMCO Total Return Portfolio, ING Pioneer High Yield Portfolio, ING T. Rowe Price Diversified Mid Cap Growth Portfolio, ING T. Rowe Price Growth Equity Portfolio, ING Templeton Foreign Equity Portfolio, ING Thornburg Value Portfolio, and ING UBS U.S. Large Cap Equity Portfolio, each a series of ING Partners, Inc., as of December 31, 2011, and the related statements of operations for the year then ended, the statements of changes in net assets for each of the years in the two-year period then ended, and the financial highlights for each of the years or periods in the five-year period then ended. These financial statements and financial highlights are the responsibility of management. Our responsibility is to express an opinion on these financial statements and financial highlights based on our audits.
We conducted our audits in accordance with the standards of the Public Company Accounting Oversight Board (United States). Those standards require that we plan and perform the audit to obtain reasonable assurance about whether the financial statements and financial highlights are free of material misstatement. An audit includes examining, on a test basis, evidence supporting the amounts and disclosures in the financial statements. Our procedures included confirmation of securities owned as of December 31, 2011, by correspondence with the custodian, transfer agent, and brokers, or by other appropriate auditing procedures when replies from brokers were not received. An audit also includes assessing the accounting principles used and significant estimates made by management, as well as evaluating the overall financial statement presentation. We believe that our audits provide a reasonable basis for our opinion.
In our opinion, the financial statements and financial highlights referred to above present fairly, in all material respects, the financial position of the aforementioned portfolios of ING Partners, Inc. as of December 31, 2011, and the results of their operations, the changes in their net assets, and the financial highlights for the periods specified in the first paragraph above, in conformity with U.S. generally accepted accounting principles.

Boston, Massachusetts
February 27, 2012
41
STATEMENTS OF ASSETS AND LIABILITIES AS OF DECEMBER 31, 2011
| | | ING
American Century
Small-Mid Cap Value
Portfolio | | ING
Baron Small
Cap Growth
Portfolio | | ING
Columbia Small
Cap Value II
Portfolio | | ING
Davis
New York
Venture
Portfolio | |
| ASSETS: | |
| Investments in securities at value+* | | $ | 197,239,010 | | | $ | 721,628,880 | | | $ | 155,377,601 | | | $ | 375,894,703 | | |
| Short-term investments at value*** | | | 5,357,404 | | | | 13,695,478 | | | | 5,826,092 | | | | — | | |
| Short-term investments at amortized cost | | | — | | | | — | | | | — | | | | 12,862,904 | | |
| Cash | | | — | | | | — | | | | 30,519 | | | | 194,448 | | |
| Foreign currencies at value***** | | | 126 | | | | 9,114 | | | | — | | | | — | | |
| Receivables: | |
| Investments securities sold | | | 1,391,122 | | | | 843,118 | | | | 257,879 | | | | 821,970 | | |
| Fund shares sold | | | 279,208 | | | | 146,866 | | | | 23,486 | | | | 88,611 | | |
| Dividends | | | 419,193 | | | | 410,032 | | | | 271,636 | | | | 496,248 | | |
| Interest | | | — | | | | — | | | | — | | | | 13,492 | | |
| Foreign tax reclaim | | | — | | | | — | | | | — | | | | 104,464 | | |
Unrealized appreciation on forward foreign
currency contracts | | | 22,220 | | | | — | | | | — | | | | — | | |
| Reimbursement due from manager | | | 38,959 | | | | — | | | | — | | | | — | | |
| Total assets | | | 204,747,242 | | | | 736,733,488 | | | | 161,787,213 | | | | 390,476,840 | | |
| LIABILITIES: | |
| Payable for investment securities purchased | | | 1,775,233 | | | | 360,550 | | | | 357,783 | | | | 1,756 | | |
| Payable for fund shares redeemed | | | 2,125,253 | | | | 571,491 | | | | 193,231 | | | | 767,094 | | |
| Payable upon receipt of securities loaned | | | 948,481 | | | | — | | | | — | | | | — | | |
Unrealized depreciation on forward foreign
currency contracts | | | 6,234 | | | | — | | | | — | | | | — | | |
| Payable to affiliates | | | 241,545 | | | | 804,418 | | | | 146,618 | | | | 350,543 | | |
| Payable for trustee fees | | | — | | | | — | | | | 806 | | | | — | | |
| Other accrued expenses and liabilities | | | — | | | | — | | | | 45,953 | | | | — | | |
| Total liabilities | | | 5,096,746 | | | | 1,736,459 | | | | 744,391 | | | | 1,119,393 | | |
| NET ASSETS | | $ | 199,650,496 | | | $ | 734,997,029 | | | $ | 161,042,822 | | | $ | 389,357,447 | | |
| NET ASSETS WERE COMPRISED OF: | |
| Paid-in capital | | $ | 188,179,467 | | | $ | 531,144,918 | | | $ | 213,459,453 | | | $ | 433,338,223 | | |
Undistributed net investment income/
(accumulated net investment loss) | | | 2,666,219 | | | | (7,023 | ) | | | 426,498 | | | | 1,560,944 | | |
| Accumulated net realized gain (loss) | | | 10,688,808 | | | | (42,589,081 | ) | | | (72,342,654 | ) | | | (77,971,293 | ) | |
| Net unrealized appreciation (depreciation) | | | (1,883,998 | ) | | | 246,448,215 | | | | 19,499,525 | | | | 32,429,573 | | |
| NET ASSETS | | $ | 199,650,496 | | | $ | 734,997,029 | | | $ | 161,042,822 | | | $ | 389,357,447 | | |
| + Including securities loaned at value | | $ | 923,042 | | | $ | — | | | $ | — | | | $ | — | | |
| * Cost of investments in securities | | $ | 199,139,099 | | | $ | 475,180,334 | | | $ | 135,878,076 | | | $ | 343,462,288 | | |
| *** Cost of short-term investments | | $ | 5,357,404 | | | $ | 13,695,478 | | | $ | 5,826,092 | | | $ | — | | |
| ***** Cost of foreign currencies | | $ | 126 | | | $ | 9,114 | | | $ | — | | | $ | — | | |
See Accompanying Notes to Financial Statements
42
STATEMENTS OF ASSETS AND LIABILITIES AS OF DECEMBER 31, 2011 (CONTINUED)
| | | ING
American Century
Small-Mid Cap Value
Portfolio | | ING
Baron Small
Cap Growth
Portfolio | | ING
Columbia Small
Cap Value II
Portfolio | | ING
Davis
New York
Venture
Portfolio | |
| Class ADV: | |
| Net Assets | | $ | 37,524,870 | | | $ | 54,052,085 | | | $ | 4,677,254 | | | $ | 9,265,592 | | |
| Shares authorized | | | 100,000,000 | | | | 100,000,000 | | | | 100,000,000 | | | | 100,000,000 | | |
| Par value | | $ | 0.001 | | | $ | 0.001 | | | $ | 0.001 | | | $ | 0.001 | | |
| Shares outstanding | | | 3,386,112 | | | | 2,864,161 | | | | 471,423 | | | | 560,505 | | |
| Net asset value and redemption price per share | | $ | 11.08 | | | $ | 18.87 | | | $ | 9.92 | | | $ | 16.53 | | |
| Class I: | |
| Net Assets | | $ | 87,410,863 | | | $ | 153,933,963 | | | $ | 17,304,282 | | | $ | 109,831,101 | | |
| Shares authorized | | | 100,000,000 | | | | 100,000,000 | | | | 100,000,000 | | | | 100,000,000 | | |
| Par value | | $ | 0.001 | | | $ | 0.001 | | | $ | 0.001 | | | $ | 0.001 | | |
| Shares outstanding | | | 7,682,754 | | | | 7,758,248 | | | | 1,712,854 | | | | 6,482,034 | | |
| Net asset value and redemption price per share | | $ | 11.38 | | | $ | 19.84 | | | $ | 10.10 | | | $ | 16.94 | | |
| Class S: | |
| Net Assets | | $ | 72,823,702 | | | $ | 526,672,475 | | | $ | 138,625,715 | | | $ | 270,260,754 | | |
| Shares authorized | | | 100,000,000 | | | | 100,000,000 | | | | 100,000,000 | | | | 100,000,000 | | |
| Par value | | $ | 0.001 | | | $ | 0.001 | | | $ | 0.001 | | | $ | 0.001 | | |
| Shares outstanding | | | 6,446,583 | | | | 27,188,107 | | | | 13,786,725 | | | | 16,136,305 | | |
| Net asset value and redemption price per share | | $ | 11.30 | | | $ | 19.37 | | | $ | 10.06 | | | $ | 16.75 | | |
| Class S2: | |
| Net Assets | | $ | 1,891,061 | | | $ | 338,506 | | | $ | 435,571 | | | | n/a | | |
| Shares authorized | | | 100,000,000 | | | | 100,000,000 | | | | 100,000,000 | | | | n/a | | |
| Par value | | $ | 0.001 | | | $ | 0.001 | | | $ | 0.001 | | | | n/a | | |
| Shares outstanding | | | 171,444 | | | | 17,879 | | | | 44,004 | | | | n/a | | |
| Net asset value and redemption price per share | | $ | 11.03 | | | $ | 18.93 | | | $ | 9.90 | | | | n/a | | |
See Accompanying Notes to Financial Statements
43
STATEMENTS OF ASSETS AND LIABILITIES AS OF DECEMBER 31, 2011
| | | ING
Global Bond
Portfolio | | ING
Invesco
Van Kampen
Comstock
Portfolio | | ING
Invesco
Van Kampen
Equity and Income
Portfolio | | ING
JPMorgan
Mid Cap Value
Portfolio | |
| ASSETS: | |
| Investments in securities at value+* | | $ | 397,026,353 | | | $ | 287,823,685 | | | $ | 711,072,735 | | | $ | 324,023,470 | | |
| Short-term investments at value*** | | | 47,808,710 | | | | 7,196,691 | | | | 44,996,916 | | | | 10,315,919 | | |
| Cash | | | 1,184,446 | | | | — | | | | — | | | | — | | |
| Cash collateral for futures | | | 2,692,081 | | | | — | | | | — | | | | — | | |
| Receivable for derivatives collateral (Note 2) | | | 6,491,000 | | | | — | | | | — | | | | — | | |
| Foreign currencies at value***** | | | 15,168,045 | | | | — | | | | 136 | | | | — | | |
| Foreign cash collateral for futures****** | | | 135,003 | | | | — | | | | — | | | | — | | |
| Receivables: | |
| Investments securities sold | | | 917,854 | | | | 1,127,704 | | | | 569,242 | | | | 145,955 | | |
Investment securities sold on a delayed-delivery
or when-issued basis | | | 11,438,201 | | | | — | | | | — | | | | — | | |
| Fund shares sold | | | 125,246 | | | | 6,297,096 | | | | 1,088,416 | | | | 114,304 | | |
| Dividends | | | 11,929 | | | | 653,179 | | | | 1,206,382 | | | | 458,041 | | |
| Interest | | | 4,792,249 | | | | — | | | | 1,613,289 | | | | — | | |
| Foreign tax reclaim | | | 854 | | | | — | | | | 3,210 | | | | — | | |
Unrealized appreciation on forward foreign
currency contracts | | | 4,529,350 | | | | — | | | | 668,565 | | | | — | | |
| Unrealized appreciation on OTC swap agreements | | | 2,046,323 | | | | — | | | | — | | | | — | | |
| Prepaid expenses | | | 1,057 | | | | — | | | | — | | | | — | | |
| Reimbursement due from manager | | | 9,687 | | | | 9,034 | | | | — | | | | — | | |
| Total assets | | | 494,378,388 | | | | 303,107,389 | | | | 761,218,891 | | | | 335,057,689 | | |
| LIABILITIES: | |
| Payable for investment securities purchased | | | 14,089,797 | | | | 1,223,508 | | | | 159,558 | | | | 22,678 | | |
Payable for investment securities purchased on a
delayed-delivery or when-issued basis | | | 11,751,570 | | | | — | | | | — | | | | — | | |
| Payable for fund shares redeemed | | | 1,064,247 | | | | 96,703 | | | | 1,183,648 | | | | 541,700 | | |
| Payable upon receipt of securities loaned | | | 26,834,272 | | | | — | | | | — | | | | — | | |
Unrealized depreciation on forward foreign
currency contracts | | | 5,679,249 | | | | — | | | | — | | | | — | | |
| Unrealized depreciation on OTC swap agreements | | | 5,871,407 | | | | — | | | | — | | | | — | | |
| Payable to affiliates | | | 209,284 | | | | 266,110 | | | | 467,094 | | | | 328,777 | | |
| Payable for trustee fees | | | 2,144 | | | | — | | | | — | | | | — | | |
| Payable for derivatives collateral (Note 2) | | | 530,000 | | | | — | | | | — | | | | — | | |
| Other accrued expenses and liabilities | | | 96,488 | | | | — | | | | — | | | | — | | |
| Written options, at fair value^ | | | 371,097 | | | | — | | | | — | | | | — | | |
| Total liabilities | | | 66,499,555 | | | | 1,586,321 | | | | 1,810,300 | | | | 893,155 | | |
| NET ASSETS | | $ | 427,878,833 | | | $ | 301,521,068 | | | $ | 759,408,591 | | | $ | 334,164,534 | | |
| NET ASSETS WERE COMPRISED OF: | |
| Paid-in capital | | $ | 412,272,748 | | | $ | 534,162,079 | | | $ | 743,097,836 | | | $ | 306,861,504 | | |
| Undistributed net investment income | | | 26,156,280 | | | | 465,455 | | | | 1,939,092 | | | | 212,959 | | |
| Accumulated net realized loss | | | (4,081,848 | ) | | | (264,012,210 | ) | | | (52,789,020 | ) | | | (10,763,930 | ) | |
| Net unrealized appreciation (depreciation) | | | (6,468,347 | ) | | | 30,905,744 | | | | 67,160,683 | | | | 37,854,001 | | |
| NET ASSETS | | $ | 427,878,833 | | | $ | 301,521,068 | | | $ | 759,408,591 | | | $ | 334,164,534 | | |
| + Including securities loaned at value | | $ | 25,946,717 | | | $ | — | | | $ | — | | | $ | — | | |
| * Cost of investments in securities | | $ | 399,720,743 | | | $ | 256,917,941 | | | $ | 644,580,617 | | | $ | 286,169,469 | | |
| *** Cost of short-term investments | | $ | 47,919,938 | | | $ | 7,196,691 | | | $ | 44,996,916 | | | $ | 10,315,919 | | |
| ***** Cost of foreign currencies | | $ | 15,221,846 | | | $ | — | | | $ | 136 | | | $ | — | | |
| ****** Cost of foreign cash collateral for futures | | $ | 133,003 | | | $ | — | | | $ | — | | | $ | — | | |
| ^ Premiums received on written options | | $ | 990,356 | | | $ | — | | | $ | — | | | $ | — | | |
See Accompanying Notes to Financial Statements
44
STATEMENTS OF ASSETS AND LIABILITIES AS OF DECEMBER 31, 2011 (CONTINUED)
| | | ING
Global Bond
Portfolio | | ING
Invesco
Van Kampen
Comstock
Portfolio | | ING
Invesco
Van Kampen
Equity and Income
Portfolio | | ING
JPMorgan
Mid Cap Value
Portfolio | |
| Class ADV: | |
| Net Assets | | $ | 30,299,250 | | | $ | 17,338,449 | | | $ | 22,312,718 | | | $ | 30,670,839 | | |
| Shares authorized | | | 100,000,000 | | | | 100,000,000 | | | | 100,000,000 | | | | 100,000,000 | | |
| Par value | | $ | 0.001 | | | $ | 0.001 | | | $ | 0.001 | | | $ | 0.001 | | |
| Shares outstanding | | | 2,700,445 | | | | 1,773,988 | | | | 685,168 | | | | 2,205,211 | | |
| Net asset value and redemption price per share | | $ | 11.22 | | | $ | 9.77 | | | $ | 32.57 | | | $ | 13.91 | | |
| Class I: | |
| Net Assets | | $ | 330,476,772 | | | $ | 45,813,947 | | | $ | 530,983,343 | | | $ | 125,233,027 | | |
| Shares authorized | | | 100,000,000 | | | | 100,000,000 | | | | 100,000,000 | | | | 100,000,000 | | |
| Par value | | $ | 0.001 | | | $ | 0.001 | | | $ | 0.001 | | | $ | 0.001 | | |
| Shares outstanding | | | 29,185,045 | | | | 4,661,042 | | | | 16,068,433 | | | | 8,892,845 | | |
| Net asset value and redemption price per share | | $ | 11.32 | | | $ | 9.83 | | | $ | 33.05 | | | $ | 14.08 | | |
| Class S: | |
| Net Assets | | $ | 67,102,811 | | | $ | 238,368,672 | | | $ | 205,145,294 | | | $ | 178,082,914 | | |
| Shares authorized | | | 100,000,000 | | | | 100,000,000 | | | | 100,000,000 | | | | 100,000,000 | | |
| Par value | | $ | 0.001 | | | $ | 0.001 | | | $ | 0.001 | | | $ | 0.001 | | |
| Shares outstanding | | | 5,922,340 | | | | 24,263,870 | | | | 6,253,341 | | | | 12,710,712 | | |
| Net asset value and redemption price per share | | $ | 11.33 | | | $ | 9.82 | | | $ | 32.81 | | | $ | 14.01 | | |
| Class S2: | |
| Net Assets | | | n/a | | | | n/a | | | $ | 967,236 | | | $ | 177,754 | | |
| Shares authorized | | | n/a | | | | n/a | | | | 100,000,000 | | | | 100,000,000 | | |
| Par value | | | n/a | | | | n/a | | | $ | 0.001 | | | $ | 0.001 | | |
| Shares outstanding | | | n/a | | | | n/a | | | | 29,746 | | | | 12,804 | | |
| Net asset value and redemption price per share | | | n/a | | | | n/a | | | $ | 32.52 | | | $ | 13.88 | | |
See Accompanying Notes to Financial Statements
45
STATEMENTS OF ASSETS AND LIABILITIES AS OF DECEMBER 31, 2011
| | | ING
Oppenheimer
Global
Portfolio | | ING
PIMCO
Total Return
Portfolio | | ING
Pioneer
High Yield
Portfolio | | ING
T. Rowe Price
Diversified Mid Cap
Growth
Portfolio | |
| ASSETS: | |
| Investments in securities at value+* | | $ | 1,453,324,792 | | | $ | 1,427,623,479 | | | $ | 86,136,378 | | | $ | 703,627,972 | | |
| Short-term investments at value*** | | | 22,821,062 | | | | 53,417,510 | | | | 1,985,452 | | | | 24,354,292 | | |
| Short-term investments at amortized cost | | | — | | | | 2,229,698 | | | | — | | | | — | | |
| Cash | | | — | | | | 5,318,725 | | | | 7,762 | | | | 325,580 | | |
| Receivable for derivatives collateral (Note 2) | | | — | | | | 9,000 | | | | — | | | | — | | |
| Foreign currencies at value***** | | | 2,905,583 | | | | 1,121,723 | | | | — | | | | — | | |
| Receivables: | |
| Investments securities sold | | | 699,256 | | | | 7,757,631 | | | | — | | | | 784,291 | | |
Investment securities sold on a delayed-delivery
or when-issued basis | | | — | | | | 241,803,320 | | | | — | | | | — | | |
| Fund shares sold | | | 190,695 | | | | 1,481,785 | | | | 22,173 | | | | 9,433 | | |
| Dividends | | | 959,392 | | | | 112,421 | | | | 33,679 | | | | 360,146 | | |
| Interest | | | — | | | | 8,782,502 | | | | 1,183,517 | | | | — | | |
| Foreign tax reclaim | | | 985,347 | | | | 4,374 | | | | — | | | | — | | |
Unrealized appreciation on forward foreign
currency contracts | | | — | | | | 6,674,869 | | | | — | | | | — | | |
| Upfront payments paid on OTC swap agreements | | | — | | | | 4,253,946 | | | | — | | | | — | | |
| Unrealized appreciation on OTC swap agreements | | | — | | | | 4,703,873 | | | | — | | | | — | | |
| Variation margin receivable on centrally cleared swaps | | | — | | | | 94,095 | | | | — | | | | — | | |
| Reimbursement due from manager | | | — | | | | — | | | | 5,798 | | | | — | | |
| Total assets | | | 1,481,886,127 | | | | 1,765,388,951 | | | | 89,374,759 | | | | 729,461,714 | | |
| LIABILITIES: | |
| Payable for investment securities purchased | | | — | | | | 15,517,221 | | | | — | | | | — | | |
Payable for investment securities purchased on a
delayed-delivery or when-issued basis | | | — | | | | 507,936,240 | | | | — | | | | — | | |
| Payable for fund shares redeemed | | | 665,475 | | | | 5,840,943 | | | | 34,075 | | | | 202,046 | | |
| Payable upon receipt of securities loaned | | | 8,217,621 | | | | 8,777,862 | | | | — | | | | 23,544,063 | | |
| Sales commitments^^^ | | | — | | | | 25,218,751 | | | | — | | | | — | | |
Unrealized depreciation on forward foreign
currency contracts | | | — | | | | 4,276,214 | | | | — | | | | — | | |
| Upfront payments received on OTC swap agreements | | | — | | | | 1,691,805 | | | | — | | | | — | | |
| Unrealized depreciation on OTC swap agreements | | | — | | | | 4,654,745 | | | | — | | | | — | | |
| Variation margin payable on centrally cleared swaps | | | — | | | | 28,103 | | | | — | | | | — | | |
| Payable to affiliates | | | 890,745 | | | | 756,052 | | | | 52,731 | | | | 410,658 | | |
| Payable for trustee fees | | | — | | | | — | | | | 445 | | | | — | | |
| Payable for derivatives collateral (Note 2) | | | — | | | | 8,686,000 | | | | — | | | | — | | |
| Other accrued expenses and liabilities | | | — | | | | — | | | | 46,012 | | | | — | | |
| Written options, at fair value^ | | | — | | | | 962,120 | | | | — | | | | — | | |
| Total liabilities | | | 9,773,841 | | | | 584,346,056 | | | | 133,263 | | | | 24,156,767 | | |
| NET ASSETS | | $ | 1,472,112,286 | | | $ | 1,181,042,895 | | | $ | 89,241,496 | | | $ | 705,304,947 | | |
| NET ASSETS WERE COMPRISED OF: | |
| Paid-in capital | | $ | 1,385,734,475 | | | $ | 1,142,210,745 | | | $ | 111,088,687 | | | $ | 590,407,140 | | |
| Undistributed net investment income | | | 19,018,027 | | | | 40,615,943 | | | | 511,656 | | | | 162,792 | | |
| Accumulated net realized gain (loss) | | | (76,069,438 | ) | | | (21,049,737 | ) | | | (27,236,735 | ) | | | 59,093,796 | | |
| Net unrealized appreciation | | | 143,429,222 | | | | 19,265,944 | | | | 4,877,888 | | | | 55,641,219 | | |
| NET ASSETS | | $ | 1,472,112,286 | | | $ | 1,181,042,895 | | | $ | 89,241,496 | | | $ | 705,304,947 | | |
| + Including securities loaned at value | | $ | 7,989,278 | | | $ | 8,557,770 | | | $ | — | | | $ | 23,001,827 | | |
| * Cost of investments in securities | | $ | 1,309,918,679 | | | $ | 1,415,055,887 | | | $ | 81,258,490 | | | $ | 647,986,753 | | |
| *** Cost of short-term investments | | $ | 22,821,062 | | | $ | 53,695,064 | | | $ | 1,985,452 | | | $ | 24,354,292 | | |
| ***** Cost of foreign currencies | | $ | 3,008,039 | | | $ | 1,058,224 | | | $ | — | | | $ | — | | |
| ^ Premiums received on written options | | $ | — | | | $ | 4,032,483 | | | $ | — | | | $ | — | | |
| ^^^ Proceeds from sales commitments | | $ | — | | | $ | 25,138,124 | | | $ | — | | | $ | — | | |
See Accompanying Notes to Financial Statements
46
STATEMENTS OF ASSETS AND LIABILITIES AS OF DECEMBER 31, 2011 (CONTINUED)
| | | ING
Oppenheimer
Global
Portfolio | | ING
PIMCO
Total Return
Portfolio | | ING
Pioneer
High Yield
Portfolio | | ING
T. Rowe Price
Diversified Mid Cap
Growth
Portfolio | |
| Class ADV: | |
| Net Assets | | $ | 65,051,438 | | | $ | 161,859,592 | | | | n/a | | | $ | 18,993,031 | | |
| Shares authorized | | | 100,000,000 | | | | 100,000,000 | | | | n/a | | | | 100,000,000 | | |
| Par value | | $ | 0.001 | | | $ | 0.001 | | | | n/a | | | $ | 0.001 | | |
| Shares outstanding | | | 5,352,316 | | | | 14,094,183 | | | | n/a | | | | 2,406,287 | | |
| Net asset value and redemption price per share | | $ | 12.15 | | | $ | 11.48 | | | | n/a | | | $ | 7.89 | | |
| Class I: | |
| Net Assets | | $ | 1,234,550,954 | | | $ | 523,551,070 | | | $ | 87,529,422 | | | $ | 663,903,594 | | |
| Shares authorized | | | 250,000,000 | | | | 100,000,000 | | | | 100,000,000 | | | | 250,000,000 | | |
| Par value | | $ | 0.001 | | | $ | 0.001 | | | $ | 0.001 | | | $ | 0.001 | | |
| Shares outstanding | | | 98,473,078 | | | | 44,500,865 | | | | 8,299,132 | | | | 80,508,618 | | |
| Net asset value and redemption price per share | | $ | 12.54 | | | $ | 11.76 | | | $ | 10.55 | | | $ | 8.25 | | |
| Class S: | |
| Net Assets | | $ | 171,754,785 | | | $ | 493,802,746 | | | $ | 1,712,074 | | | $ | 21,668,932 | | |
| Shares authorized | | | 100,000,000 | | | | 100,000,000 | | | | 100,000,000 | | | | 100,000,000 | | |
| Par value | | $ | 0.001 | | | $ | 0.001 | | | $ | 0.001 | | | $ | 0.001 | | |
| Shares outstanding | | | 14,095,433 | | | | 42,389,540 | | | | 162,476 | | | | 2,673,101 | | |
| Net asset value and redemption price per share | | $ | 12.19 | | | $ | 11.65 | | | $ | 10.54 | | | $ | 8.11 | | |
| Class S2: | |
| Net Assets | | $ | 755,109 | | | $ | 1,829,487 | | | | n/a | | | $ | 739,390 | | |
| Shares authorized | | | 100,000,000 | | | | 100,000,000 | | | | n/a | | | | 100,000,000 | | |
| Par value | | $ | 0.001 | | | $ | 0.001 | | | | n/a | | | $ | 0.001 | | |
| Shares outstanding | | | 62,892 | | | | 160,134 | | | | n/a | | | | 93,759 | | |
| Net asset value and redemption price per share | | $ | 12.01 | | | $ | 11.42 | | | | n/a | | | $ | 7.89 | | |
See Accompanying Notes to Financial Statements
47
STATEMENTS OF ASSETS AND LIABILITIES AS OF DECEMBER 31, 2011
| | | ING
T. Rowe Price
Growth Equity
Portfolio | | ING
Templeton
Foreign Equity
Portfolio | | ING
Thornburg
Value
Portfolio | | ING
UBS U.S.
Large Cap Equity
Portfolio | |
| ASSETS: | |
| Investments in securities at value+* | | $ | 968,062,626 | | | $ | 504,751,571 | | | $ | 211,944,592 | | | $ | 135,982,055 | | |
| Short-term investments at value*** | | | 48,517,154 | | | | — | | | | 15,240,473 | | | | 6,112,699 | | |
| Cash | | | 2,805,410 | | | | 13,360,401 | | | | — | | | | — | | |
| Foreign currencies at value***** | | | — | | | | 78,293 | | | | — | | | | — | | |
| Receivables: | |
| Investments securities sold | | | 260,664 | | | | 76,183 | | | | 2,125,450 | | | | 366,716 | | |
| Fund shares sold | | | 239,063 | | | | 117,649 | | | | 37,815 | | | | 49,439 | | |
| Dividends | | | 647,030 | | | | 1,033,183 | | | | 198,729 | | | | 231,790 | | |
| Interest | | | 23 | | | | 9 | | | | 14,558 | | | | — | | |
| Foreign tax reclaim | | | — | | | | 848,903 | | | | 46,515 | | | | — | | |
| Reimbursement due from manager | | | — | | | | — | | | | — | | | | 11,998 | | |
| Total assets | | | 1,020,531,970 | | | | 520,266,192 | | | | 229,608,132 | | | | 142,754,697 | | |
| LIABILITIES: | |
| Payable for investment securities purchased | | | 425,653 | | | | 413 | | | | 766,675 | | | | 758,497 | | |
| Payable for fund shares redeemed | | | 1,941,376 | | | | 1,208,319 | | | | 1,481,913 | | | | 28,903 | | |
| Payable upon receipt of securities loaned | | | 28,542,859 | | | | — | | | | 7,072,679 | | | | 2,058,668 | | |
| Payable to affiliates | | | 697,757 | | | | 522,188 | | | | 179,665 | | | | 104,897 | | |
| Payable for trustee fees | | | — | | | | 2,598 | | | | — | | | | — | | |
| Other accrued expenses and liabilities | | | — | | | | 151,223 | | | | — | | | | — | | |
| Total liabilities | | | 31,607,645 | | | | 1,884,741 | | | | 9,500,932 | | | | 2,950,965 | | |
| NET ASSETS | | $ | 988,924,325 | | | $ | 518,381,451 | | | $ | 220,107,200 | | | $ | 139,803,732 | | |
| NET ASSETS WERE COMPRISED OF: | |
| Paid-in capital | | $ | 903,618,567 | | | $ | 718,629,056 | | | $ | 305,933,828 | | | $ | 243,279,055 | | |
Undistributed net investment income/
(accumulated net investment loss) | | | (14,799 | ) | | | 14,331,435 | | | | 562,875 | | | | 264,782 | | |
| Accumulated net realized loss | | | (131,943,722 | ) | | | (158,544,310 | ) | | | (61,409,141 | ) | | | (108,962,241 | ) | |
| Net unrealized appreciation (depreciation) | | | 217,264,279 | | | | (56,034,730 | ) | | | (24,980,362 | ) | | | 5,222,136 | | |
| NET ASSETS | | $ | 988,924,325 | | | $ | 518,381,451 | | | $ | 220,107,200 | | | $ | 139,803,732 | | |
| + Including securities loaned at value | | $ | 27,813,940 | | | $ | — | | | $ | 6,919,323 | | | $ | 2,009,449 | | |
| * Cost of investments in securities | | $ | 750,798,347 | | | $ | 560,678,241 | | | $ | 236,924,765 | | | $ | 130,759,919 | | |
| *** Cost of short-term investments | | $ | 48,517,154 | | | $ | — | | | $ | 15,240,473 | | | $ | 6,112,699 | | |
| ***** Cost of foreign currencies | | $ | — | | | $ | 78,392 | | | $ | — | | | $ | — | | |
See Accompanying Notes to Financial Statements
48
STATEMENTS OF ASSETS AND LIABILITIES AS OF DECEMBER 31, 2011 (CONTINUED)
| | | ING
T. Rowe Price
Growth Equity
Portfolio | | ING
Templeton
Foreign Equity
Portfolio | | ING
Thornburg
Value
Portfolio | | ING
UBS U.S.
Large Cap Equity
Portfolio | |
| Class ADV: | |
| Net Assets | | $ | 92,700,799 | | | $ | 23,119,672 | | | $ | 15,435,317 | | | $ | 7,269,665 | | |
| Shares authorized | | | 100,000,000 | | | | 100,000,000 | | | | 100,000,000 | | | | 100,000,000 | | |
| Par value | | $ | 0.001 | | | $ | 0.001 | | | $ | 0.001 | | | $ | 0.001 | | |
| Shares outstanding | | | 1,762,644 | | | | 2,446,137 | | | | 575,338 | | | | 845,372 | | |
| Net asset value and redemption price per share | | $ | 52.59 | | | $ | 9.45 | | | $ | 26.83 | | | $ | 8.60 | | |
| Class I: | |
| Net Assets | | $ | 722,531,785 | | | $ | 289,933,567 | | | $ | 188,868,344 | | | $ | 124,742,503 | | |
| Shares authorized | | | 100,000,000 | | | | 100,000,000 | | | | 100,000,000 | | | | 100,000,000 | | |
| Par value | | $ | 0.001 | | | $ | 0.001 | | | $ | 0.001 | | | $ | 0.001 | | |
| Shares outstanding | | | 13,402,778 | | | | 30,452,313 | | | | 6,854,629 | | | | 14,298,878 | | |
| Net asset value and redemption price per share | | $ | 53.91 | | | $ | 9.52 | | | $ | 27.55 | | | $ | 8.72 | | |
| Class S: | |
| Net Assets | | $ | 173,069,590 | | | $ | 204,315,288 | | | $ | 15,800,817 | | | $ | 7,791,564 | | |
| Shares authorized | | | 100,000,000 | | | | 100,000,000 | | | | 100,000,000 | | | | 100,000,000 | | |
| Par value | | $ | 0.001 | | | $ | 0.001 | | | $ | 0.001 | | | $ | 0.001 | | |
| Shares outstanding | | | 3,252,722 | | | | 21,551,333 | | | | 577,404 | | | | 898,280 | | |
| Net asset value and redemption price per share | | $ | 53.21 | | | $ | 9.48 | | | $ | 27.37 | | | $ | 8.67 | | |
| Class S2: | |
| Net Assets | | $ | 622,151 | | | $ | 1,012,924 | | | $ | 2,722 | | | | n/a | | |
| Shares authorized | | | 100,000,000 | | | | 100,000,000 | | | | 100,000,000 | | | | n/a | | |
| Par value | | $ | 0.001 | | | $ | 0.001 | | | $ | 0.001 | | | | n/a | | |
| Shares outstanding | | | 11,800 | | | | 107,181 | | | | 101 | | | | n/a | | |
| Net asset value and redemption price per share | | $ | 52.72 | | | $ | 9.45 | | | $ | 26.84 | | | | n/a | | |
See Accompanying Notes to Financial Statements
49
STATEMENTS OF OPERATIONS FOR THE YEAR ENDED DECEMBER 31, 2011
| | | ING
American Century
Small-Mid Cap Value
Portfolio | | ING
Baron Small
Cap Growth
Portfolio | | ING
Columbia Small
Cap Value II
Portfolio | | ING
Davis
New York
Venture
Portfolio | |
| INVESTMENT INCOME: | |
| Dividends, net of foreign taxes withheld* | | $ | 4,945,052 | | | $ | 4,856,028 | | | $ | 2,527,587 | | | $ | 7,544,237 | | |
| Interest | | | — | | | | — | | | | — | | | | 46,785 | | |
| Securities lending income, net | | | 44,461 | | | | — | | | | — | | | | — | | |
| Total investment income | | | 4,989,513 | | | | 4,856,028 | | | | 2,527,587 | | | | 7,591,022 | | |
| EXPENSES: | |
| Investment management fees | | | 2,011,349 | | | | 7,034,896 | | | | 1,442,783 | | | | 3,597,429 | | |
| Distribution and service fees: | |
| Class ADV | | | 164,398 | | | | 272,943 | | | | 18,265 | | | | 46,502 | | |
| Class S | | | 188,325 | | | | 1,445,143 | | | | 392,067 | | | | 759,770 | | |
| Class S2 | | | 6,313 | | | | 677 | | | | 623 | | | | — | | |
| Transfer agent fees | | | — | | | | — | | | | 391 | | | | — | | |
| Administrative service fees | | | 502,835 | | | | 1,903,567 | | | | 192,370 | | | | 449,674 | | |
| Shareholder reporting expense | | | — | | | | — | | | | 26,789 | | | | — | | |
| Professional fees | | | — | | | | — | | | | 28,028 | | | | — | | |
| Custody and accounting expense | | | — | | | | — | | | | 19,951 | | | | — | | |
| Trustee fees | | | — | | | | — | | | | 5,931 | | | | — | | |
| Miscellaneous expense | | | 1,221 | | | | 3,375 | | | | 12,061 | | | | 1,793 | | |
| Interest expense | | | 103 | | | | 10,905 | | | | — | | | | 27,127 | | |
| Total expenses | | | 2,874,544 | | | | 10,671,506 | | | | 2,139,259 | | | | 4,882,295 | | |
| Net waived and reimbursed fees | | | (627,577 | ) | | | (115,738 | ) | | | (125 | ) | | | (97,696 | ) | |
| Brokerage commission recapture | | | — | | | | (37,481 | ) | | | (39,269 | ) | | | (19,862 | ) | |
| Net expenses | | | 2,246,967 | | | | 10,518,287 | | | | 2,099,865 | | | | 4,764,737 | | |
| Net investment income (loss) | | | 2,742,546 | | | | (5,662,259 | ) | | | 427,722 | | | | 2,826,285 | | |
| REALIZED AND UNREALIZED GAIN (LOSS): | |
| Net realized gain (loss) on: | |
| Investments | | | 16,541,431 | | | | 72,737,059 | | | | 28,956,772 | | | | 3,955,255 | | |
| Foreign currency related transactions | | | 113,358 | | | | (70,866 | ) | | | — | | | | (25,344 | ) | |
| Net realized gain | | | 16,654,789 | | | | 72,666,193 | | | | 28,956,772 | | | | 3,929,911 | | |
Net change in unrealized appreciation
(depreciation) on: | |
| Investments | | | (25,829,355 | ) | | | (51,788,761 | ) | | | (29,801,308 | ) | | | (30,678,589 | ) | |
| Foreign currency related transactions | | | 31,705 | | | | (1,356 | ) | | | — | | | | (8,335 | ) | |
| Net change in unrealized appreciation (depreciation) | | | (25,797,650 | ) | | | (51,790,117 | ) | | | (29,801,308 | ) | | | (30,686,924 | ) | |
| Net realized and unrealized gain (loss) | | | (9,142,861 | ) | | | 20,876,076 | | | | (844,536 | ) | | | (26,757,013 | ) | |
Increase (decrease) in net assets resulting from
operations | | $ | (6,400,315 | ) | | $ | 15,213,817 | | | $ | (416,814 | ) | | $ | (23,930,728 | ) | |
| * Foreign taxes withheld | | $ | 22,418 | | | $ | 55,815 | | | $ | 5,124 | | | $ | 165,460 | | |
See Accompanying Notes to Financial Statements
50
STATEMENTS OF OPERATIONS FOR THE YEAR ENDED DECEMBER 31, 2011
| | | ING
Global Bond
Portfolio | | ING
Invesco
Van Kampen
Comstock
Portfolio | | ING
Invesco
Van Kampen
Equity and Income
Portfolio | | ING
JPMorgan
Mid Cap Value
Portfolio | |
| INVESTMENT INCOME: | |
| Dividends, net of foreign taxes withheld* | | $ | 64,183 | | | $ | 7,566,067 | | | $ | 13,473,845 | | | $ | 6,838,702 | | |
| Interest, net of foreign taxes withheld* | | | 22,792,070 | | | | — | | | | 7,482,661 | | | | — | | |
| Securities lending income, net | | | 86,448 | | | | 48,732 | | | | — | | | | 14,758 | | |
| Total investment income | | | 22,942,701 | | | | 7,614,799 | | | | 20,956,506 | | | | 6,853,460 | | |
| EXPENSES: | |
| Investment management fees | | | 2,396,671 | | | | 1,908,092 | | | | 4,485,050 | | | | 2,529,574 | | |
| Distribution and service fees: | |
| Class ADV | | | 155,028 | | | | 86,360 | | | | 98,109 | | | | 147,257 | | |
| Class S | | | 202,959 | | | | 634,798 | | | | 558,856 | | | | 447,065 | | |
| Class S2 | | | 1,036 | | | | — | | | | 4,319 | | | | 295 | | |
| Transfer agent fees | | | 802 | | | | — | | | | — | | | | — | | |
| Administrative service fees | | | 460,071 | | | | 795,034 | | | | 815,455 | | | | 843,192 | | |
| Shareholder reporting expense | | | 64,081 | | | | — | | | | — | | | | — | | |
| Professional fees | | | 52,478 | | | | — | | | | — | | | | — | | |
| Custody and accounting expense | | | 166,085 | | | | — | | | | — | | | | — | | |
| Trustee fees | | | 15,943 | | | | — | | | | — | | | | — | | |
| Miscellaneous expense | | | 28,013 | | | | 1,223 | | | | 3,080 | | | | 1,283 | | |
| Interest expense | | | 4,054 | | | | — | | | | — | | | | 132 | | |
| Total expenses | | | 3,547,221 | | | | 3,425,507 | | | | 5,964,869 | | | | 3,968,798 | | |
| Net waived and reimbursed fees | | | (676,322 | ) | | | (128,285 | ) | | | (864 | ) | | | (60 | ) | |
| Brokerage commission recapture | | | — | | | | (14,443 | ) | | | (39,555 | ) | | | — | | |
| Net expenses | | | 2,870,899 | | | | 3,282,779 | | | | 5,924,450 | | | | 3,968,738 | | |
| Net investment income | | | 20,071,802 | | | | 4,332,020 | | | | 15,032,056 | | | | 2,884,722 | | |
| REALIZED AND UNREALIZED GAIN (LOSS): | |
| Net realized gain (loss) on: | |
| Investments | | | 19,448,377 | | | | 24,384,614 | | | | 16,719,753 | | | | 23,695,613 | | |
| Foreign currency related transactions | | | (6,388,761 | ) | | | — | | | | 832,779 | | | | — | | |
| Futures | | | 4,352,138 | | | | — | | | | — | | | | — | | |
| Swaps | | | (6,280,914 | ) | | | — | | | | — | | | | — | | |
| Written options | | | 8,864,850 | | | | — | | | | — | | | | — | | |
| Net realized gain | | | 19,995,690 | | | | 24,384,614 | | | | 17,552,532 | | | | 23,695,613 | | |
Net change in unrealized appreciation
(depreciation) on: | |
| Investments | | | (20,040,756 | ) | | | (34,242,533 | ) | | | (41,977,783 | ) | | | (21,509,493 | ) | |
| Foreign currency related transactions | | | 933,751 | | | | — | | | | 667,341 | | | | — | | |
| Futures | | | 1,919,435 | | | | — | | | | — | | | | — | | |
| Swaps | | | (4,249,928 | ) | | | — | | | | — | | | | — | | |
| Written options | | | 619,259 | | | | — | | | | — | | | | — | | |
| Net change in unrealized appreciation (depreciation) | | | (20,818,239 | ) | | | (34,242,533 | ) | | | (41,310,442 | ) | | | (21,509,493 | ) | |
| Net realized and unrealized gain (loss) | | | (822,549 | ) | | | (9,857,919 | ) | | | (23,757,910 | ) | | | 2,186,120 | | |
Increase (decrease) in net assets resulting from
operations | | $ | 19,249,253 | | | $ | (5,525,899 | ) | | $ | (8,725,854 | ) | | $ | 5,070,842 | | |
| * Foreign taxes withheld | | $ | 5,008 | | | $ | 109,357 | | | $ | 161,433 | | | $ | 11,153 | | |
See Accompanying Notes to Financial Statements
51
STATEMENTS OF OPERATIONS FOR THE YEAR ENDED DECEMBER 31, 2011
| | | ING
Oppenheimer
Global
Portfolio | | ING
PIMCO
Total Return
Portfolio | | ING
Pioneer
High Yield
Portfolio | | ING
T. Rowe Price
Diversified Mid Cap
Growth
Portfolio | |
| INVESTMENT INCOME: | |
| Dividends, net of foreign taxes withheld* | | $ | 33,599,094 | | | $ | 7,487,215 | | | $ | 493,081 | | | $ | 6,632,009 | | |
| Interest, net of foreign taxes withheld* | | | — | | | | 32,918,132 | | | | 5,722,318 | | | | — | | |
| Securities lending income, net | | | 1,819,846 | | | | 51,872 | | | | — | | | | 563,045 | | |
| Total investment income | | | 35,418,940 | | | | 40,457,219 | | | | 6,215,399 | | | | 7,195,054 | | |
| EXPENSES: | |
| Investment management fees | | | 10,018,930 | | | | 5,794,293 | | | | 587,650 | | | | 5,054,131 | | |
| Distribution and service fees: | |
| Class ADV | | | 362,350 | | | | 787,830 | | | | 180 | | | | 128,133 | | |
| Class S | | | 463,164 | | | | 1,191,552 | | | | 4,353 | | | | 59,388 | | |
| Class S2 | | | 1,708 | | | | 6,706 | | | | — | | | | 908 | | |
| Transfer agent fees | | | — | | | | — | | | | 168 | | | | — | | |
| Administrative service fees | | | 1,001,869 | | | | 987,655 | | | | 97,941 | | | | 157,929 | | |
| Shareholder reporting expense | | | — | | | | — | | | | 25,610 | | | | — | | |
| Professional fees | | | 40,138 | | | | — | | | | 16,787 | | | | — | | |
| Custody and accounting expense | | | — | | | | — | | | | 17,845 | | | | — | | |
| Trustee fees | | | — | | | | — | | | | 2,939 | | | | — | | |
| Miscellaneous expense | | | 6,473 | | | | 42,202 | | | | 4,769 | | | | 3,063 | | |
| Interest expense | | | 27 | | | | 778 | | | | 950 | | | | 525 | | |
| Total expenses | | | 11,894,659 | | | | 8,811,016 | | | | 759,192 | | | | 5,404,077 | | |
| Net waived and reimbursed fees | | | (342 | ) | | | (38,377 | ) | | | (57,087 | ) | | | (182 | ) | |
| Brokerage commission recapture | | | — | | | | — | | | | (383 | ) | | | (424 | ) | |
| Net expenses | | | 11,894,317 | | | | 8,772,639 | | | | 701,722 | | | | 5,403,471 | | |
| Net investment income | | | 23,524,623 | | | | 31,684,580 | | | | 5,513,677 | | | | 1,791,583 | | |
| REALIZED AND UNREALIZED GAIN (LOSS): | |
| Net realized gain (loss) on: | |
| Investments (net of Indian capital gains tax withheld)^ | | | 9,935,052 | | | | 4,306,101 | | | | 3,667,772 | | | | 68,463,440 | | |
| Foreign currency related transactions | | | (1,115,353 | ) | | | (1,648,305 | ) | | | — | | | | — | | |
| Futures | | | — | | | | 10,603,380 | | | | — | | | | — | | |
| Swaps | | | — | | | | (17,665,425 | ) | | | — | | | | — | | |
| Written options | | | — | | | | (1,919,008 | ) | | | — | | | | — | | |
| Net realized gain (loss) | | | 8,819,699 | | | | (6,323,257 | ) | | | 3,667,772 | | | | 68,463,440 | | |
Net change in unrealized appreciation
(depreciation) on: | |
| Investments | | | (164,929,973 | ) | | | 8,981,696 | | | | (9,912,305 | ) | | | (96,763,856 | ) | |
| Foreign currency related transactions | | | (141,897 | ) | | | 150,745 | | | | — | | | | — | | |
| Futures | | | — | | | | 3,882,418 | | | | — | | | | — | | |
| Swaps | | | — | | | | (4,862,342 | ) | | | — | | | | — | | |
| Written options | | | — | | | | 4,275,228 | | | | — | | | | — | | |
| Sales commitments | | | — | | | | (80,627 | ) | | | — | | | | — | | |
| Unfunded commitments | | | — | | | | — | | | | (2,603 | ) | | | — | | |
| Net change in unrealized appreciation (depreciation) | | | (165,071,870 | ) | | | 12,347,118 | | | | (9,914,908 | ) | | | (96,763,856 | ) | |
| Net realized and unrealized gain (loss) | | | (156,252,171 | ) | | | 6,023,861 | | | | (6,247,136 | ) | | | (28,300,416 | ) | |
Increase (decrease) in net assets resulting from
operations | | $ | (132,727,548 | ) | | $ | 37,708,441 | | | $ | (733,459 | ) | | $ | (26,508,833 | ) | |
| * Foreign taxes withheld | | $ | 2,984,738 | | | $ | 9,513 | | | $ | 24,201 | | | $ | 58,939 | | |
| ^ Foreign taxes on sale of Indian investments | | $ | 36,916 | | | $ | — | | | $ | — | | | $ | — | | |
See Accompanying Notes to Financial Statements
52
STATEMENTS OF OPERATIONS FOR THE YEAR ENDED DECEMBER 31, 2011
| | | ING
T. Rowe Price
Growth Equity
Portfolio | | ING
Templeton
Foreign Equity
Portfolio | | ING
Thornburg
Value
Portfolio | | ING
UBS U.S.
Large Cap Equity
Portfolio | |
| INVESTMENT INCOME: | |
| Dividends, net of foreign taxes withheld* | | $ | 7,828,679 | | | $ | 21,050,773 | | | $ | 3,042,148 | | | $ | 2,853,126 | | |
| Interest | | | 210 | | | | 4,770 | | | | 204,527 | | | | — | | |
| Securities lending income, net | | | 72,226 | | | | — | | | | 20,461 | | | | 4,073 | | |
| Total investment income | | | 7,901,115 | | | | 21,055,543 | | | | 3,267,136 | | | | 2,857,199 | | |
| EXPENSES: | |
| Investment management fees | | | 6,339,605 | | | | 4,827,048 | | | | 1,850,171 | | | | 1,121,842 | | |
| Distribution and service fees: | |
| Class ADV | | | 504,774 | | | | 99,382 | | | | 86,293 | | | | 40,129 | | |
| Class S | | | 441,178 | | | | 639,504 | | | | 46,302 | | | | 36,323 | | |
| Class S2 | | | 1,691 | | | | 2,947 | | | | 14 | | | | — | | |
| Transfer agent fees | | | — | | | | 728 | | | | — | | | | — | | |
| Administrative service fees | | | 1,584,901 | | | | 610,299 | | | | 711,603 | | | | 240,395 | | |
| Shareholder reporting expense | | | — | | | | 93,691 | | | | — | | | | — | | |
| Professional fees | | | — | | | | 158,441 | | | | — | | | | — | | |
| Custody and accounting expense | | | — | | | | 277,364 | | | | — | | | | — | | |
| Trustee fees | | | — | | | | 18,238 | | | | — | | | | — | | |
| Miscellaneous expense | | | 4,065 | | | | 25,122 | | | | 1,468 | | | | 628 | | |
| Interest expense | | | 571 | | | | 1,347 | | | | 2,412 | | | | 191 | | |
| Total expenses | | | 8,876,785 | | | | 6,754,111 | | | | 2,698,263 | | | | 1,439,508 | | |
| Net waived and reimbursed fees | | | (74,458 | ) | | | (590 | ) | | | (3 | ) | | | (160,740 | ) | |
| Brokerage commission recapture | | | (8,795 | ) | | | (18,258 | ) | | | (24,436 | ) | | | (20,727 | ) | |
| Net expenses | | | 8,793,532 | | | | 6,735,263 | | | | 2,673,824 | | | | 1,258,041 | | |
| Net investment income (loss) | | | (892,417 | ) | | | 14,320,280 | | | | 593,312 | | | | 1,599,158 | | |
| REALIZED AND UNREALIZED GAIN (LOSS): | |
| Net realized gain (loss) on: | |
| Investments | | | 50,961,988 | | | | 10,306,615 | | | | 11,939,708 | | | | 18,659,411 | | |
| Foreign currency related transactions | | | (18,983 | ) | | | 648,376 | | | | (30,271 | ) | | | — | | |
| Net realized gain | | | 50,943,005 | | | | 10,954,991 | | | | 11,909,437 | | | | 18,659,411 | | |
Net change in unrealized appreciation
(depreciation) on: | |
| Investments | | | (62,181,830 | ) | | | (95,928,320 | ) | | | (52,273,594 | ) | | | (23,872,634 | ) | |
| Foreign currency related transactions | | | — | | | | (99,954 | ) | | | (7,241 | ) | | | — | | |
| Net change in unrealized appreciation (depreciation) | | | (62,181,830 | ) | | | (96,028,274 | ) | | | (52,280,835 | ) | | | (23,872,634 | ) | |
| Net realized and unrealized loss | | | (11,238,825 | ) | | | (85,073,283 | ) | | | (40,371,398 | ) | | | (5,213,223 | ) | |
| Decrease in net assets resulting from operations | | $ | (12,131,242 | ) | | $ | (70,753,003 | ) | | $ | (39,778,086 | ) | | $ | (3,614,065 | ) | |
| * Foreign taxes withheld | | $ | 21,817 | | | $ | 2,268,009 | | | $ | 116,921 | | | $ | 2,058 | | |
See Accompanying Notes to Financial Statements
53
STATEMENTS OF CHANGES IN NET ASSETS
| | | ING American Century
Small-Mid Cap Value Portfolio | | ING Baron Small Cap
Growth Portfolio | |
| | | Year
Ended
December 31,
2011 | | Year
Ended
December 31,
2010 | | Year
Ended
December 31,
2011 | | Year
Ended
December 31,
2010 | |
| FROM OPERATIONS: | |
| Net investment income (loss) | | $ | 2,742,546 | | | $ | 2,649,323 | | | $ | (5,662,259 | ) | | $ | (2,608,519 | ) | |
| Net realized gain | | | 16,654,789 | | | | 19,863,324 | | | | 72,666,193 | | | | 41,146,649 | | |
| Net change in unrealized appreciation (depreciation) | | | (25,797,650 | ) | | | 9,412,771 | | | | (51,790,117 | ) | | | 136,692,533 | | |
| Increase (decrease) in net assets resulting from operations | | | (6,400,315 | ) | | | 31,925,418 | | | | 15,213,817 | | | | 175,230,663 | | |
| FROM DISTRIBUTIONS TO SHAREHOLDERS: | |
| Net investment income: | |
| Class ADV | | | (390,632 | ) | | | (174,774 | ) | | | — | | | | — | | |
| Class I | | | (1,186,941 | ) | | | (822,603 | ) | | | — | | | | — | | |
| Class S | | | (807,113 | ) | | | (817,115 | ) | | | — | | | | — | | |
| Class S2 | | | (15,934 | ) | | | (52 | ) | | | — | | | | — | | |
| Net realized gains: | |
| Class ADV | | | (3,367 | ) | | | — | | | | — | | | | — | | |
| Class I | | | (8,467 | ) | | | — | | | | — | | | | — | | |
| Class S | | | (6,958 | ) | | | — | | | | — | | | | — | | |
| Class S2 | | | (115 | ) | | | — | | | | — | | | | — | | |
| Total distributions | | | (2,419,527 | ) | | | (1,814,544 | ) | | | — | | | | — | | |
| FROM CAPITAL SHARE TRANSACTIONS: | |
| Net proceeds from sale of shares | | | 57,291,131 | | | | 77,282,915 | | | | 186,184,673 | | | | 119,161,393 | | |
| Reinvestment of distributions | | | 2,419,527 | | | | 1,814,492 | | | | — | | | | — | | |
| | | | 59,710,658 | | | | 79,097,407 | | | | 186,184,673 | | | | 119,161,393 | | |
| Cost of shares redeemed | | | (44,975,603 | ) | | | (31,239,269 | ) | | | (309,133,062 | ) | | | (138,764,305 | ) | |
Net increase (decrease) in net assets resulting from
capital share transactions | | | 14,735,055 | | | | 47,858,138 | | | | (122,948,389 | ) | | | (19,602,912 | ) | |
| Net increase (decrease) in net assets | | | 5,915,213 | | | | 77,969,012 | | | | (107,734,572 | ) | | | 155,627,751 | | |
| NET ASSETS: | |
| Beginning of year | | | 193,735,283 | | | | 115,766,271 | | | | 842,731,601 | | | | 687,103,850 | | |
| End of year | | $ | 199,650,496 | | | $ | 193,735,283 | | | $ | 734,997,029 | | | $ | 842,731,601 | | |
Undistributed net investment income/(accumulated net
investment loss) at end of year | | $ | 2,666,219 | | | $ | 2,409,521 | | | $ | (7,023 | ) | | $ | — | | |
See Accompanying Notes to Financial Statements
54
STATEMENTS OF CHANGES IN NET ASSETS
| | | ING Columbia Small Cap
Value II Portfolio | | ING Davis New York
Venture Portfolio | |
| | | Year
Ended
December 31,
2011 | | Year
Ended
December 31,
2010 | | Year
Ended
December 31,
2011 | | Year
Ended
December 31,
2010 | |
| FROM OPERATIONS: | |
| Net investment income | | $ | 427,722 | | | $ | 983,106 | | | $ | 2,826,285 | | | $ | 2,747,883 | | |
| Net realized gain | | | 28,956,772 | | | | 27,323,769 | | | | 3,929,911 | | | | 3,186,422 | | |
| Net change in unrealized appreciation (depreciation) | | | (29,801,308 | ) | | | 20,234,096 | | | | (30,686,924 | ) | | | 46,886,662 | | |
| Increase (decrease) in net assets resulting from operations | | | (416,814 | ) | | | 48,540,971 | | | | (23,930,728 | ) | | | 52,820,967 | | |
| FROM DISTRIBUTIONS TO SHAREHOLDERS: | |
| Net investment income: | |
| Class ADV | | | (22,615 | ) | | | (18,339 | ) | | | (90,276 | ) | | | (22,413 | ) | |
| Class I | | | (124,993 | ) | | | (758,673 | ) | | | (1,852,805 | ) | | | (952,452 | ) | |
| Class S | | | (637,489 | ) | | | (1,943,880 | ) | | | (2,923,201 | ) | | | (1,288,733 | ) | |
| Class S2 | | | (210 | ) | | | (67 | ) | | | — | | | | — | | |
| Total distributions | | | (785,307 | ) | | | (2,720,959 | ) | | | (4,866,282 | ) | | | (2,263,598 | ) | |
| FROM CAPITAL SHARE TRANSACTIONS: | |
| Net proceeds from sale of shares | | | 18,765,641 | | | | 18,258,681 | | | | 53,395,247 | | | | 62,825,024 | | |
| Reinvestment of distributions | | | 785,270 | | | | 2,720,892 | | | | 4,866,282 | | | | 2,263,598 | | |
| | | | 19,550,911 | | | | 20,979,573 | | | | 58,261,529 | | | | 65,088,622 | | |
| Cost of shares redeemed | | | (82,542,062 | ) | | | (54,624,055 | ) | | | (120,642,968 | ) | | | (109,181,308 | ) | |
Net decrease in net assets resulting from capital share
transactions | | | (62,991,151 | ) | | | (33,644,482 | ) | | | (62,381,439 | ) | | | (44,092,686 | ) | |
| Net increase (decrease) in net assets | | | (64,193,272 | ) | | | 12,175,530 | | | | (91,178,449 | ) | | | 6,464,683 | | |
| NET ASSETS: | |
| Beginning of year | | | 225,236,094 | | | | 213,060,564 | | | | 480,535,896 | | | | 474,071,213 | | |
| End of year | | $ | 161,042,822 | | | $ | 225,236,094 | | | $ | 389,357,447 | | | $ | 480,535,896 | | |
| Undistributed net investment income at end of year | | $ | 426,498 | | | $ | 784,083 | | | $ | 1,560,944 | | | $ | 4,864,358 | | |
See Accompanying Notes to Financial Statements
55
STATEMENTS OF CHANGES IN NET ASSETS
| | | ING Global Bond Portfolio | | ING Invesco Van Kampen
Comstock Portfolio | |
| | | Year
Ended
December 31,
2011 | | Year
Ended
December 31,
2010 | | Year
Ended
December 31,
2011 | | Year
Ended
December 31,
2010 | |
| FROM OPERATIONS: | |
| Net investment income | | $ | 20,071,802 | | | $ | 32,750,887 | | | $ | 4,332,020 | | | $ | 3,624,274 | | |
| Net realized gain | | | 19,995,690 | | | | 17,729,668 | | | | 24,384,614 | | | | 11,728,931 | | |
| Net change in unrealized appreciation (depreciation) | | | (20,818,239 | ) | | | 19,866,526 | | | | (34,242,533 | ) | | | 27,784,878 | | |
| Increase (decrease) in net assets resulting from operations | | | 19,249,253 | | | | 70,347,081 | | | | (5,525,899 | ) | | | 43,138,083 | | |
| FROM DISTRIBUTIONS TO SHAREHOLDERS: | |
| Net investment income: | |
| Class ADV | | | (2,168,289 | ) | | | (928,779 | ) | | | (212,917 | ) | | | (175,261 | ) | |
| Class I | | | (26,558,914 | ) | | | (10,977,055 | ) | | | (786,737 | ) | | | (741,072 | ) | |
| Class S | | | (5,153,972 | ) | | | (3,226,945 | ) | | | (3,379,115 | ) | | | (3,403,234 | ) | |
| Class S2 | | | (28,534 | ) | | | (100 | ) | | | — | | | | — | | |
| Total distributions | | | (33,909,709 | ) | | | (15,132,879 | ) | | | (4,378,769 | ) | | | (4,319,567 | ) | |
| FROM CAPITAL SHARE TRANSACTIONS: | |
| Net proceeds from sale of shares | | | 34,916,333 | | | | 87,584,205 | | | | 40,914,332 | | | | 41,252,690 | | |
| Reinvestment of distributions | | | 33,909,709 | | | | 15,132,779 | | | | 4,378,769 | | | | 4,319,567 | | |
| | | | 68,826,042 | | | | 102,716,984 | | | | 45,293,101 | | | | 45,572,257 | | |
| Cost of shares redeemed | | | (136,906,420 | ) | | | (99,604,133 | ) | | | (64,720,971 | ) | | | (57,670,926 | ) | |
Net increase (decrease) in net assets resulting from
capital share transactions | | | (68,080,378 | ) | | | 3,112,851 | | | | (19,427,870 | ) | | | (12,098,669 | ) | |
| Net increase (decrease) in net assets | | | (82,740,834 | ) | | | 58,327,053 | | | | (29,332,538 | ) | | | 26,719,847 | | |
| NET ASSETS: | |
| Beginning of year | | | 510,619,667 | | | | 452,292,614 | | | | 330,853,606 | | | | 304,133,759 | | |
| End of year | | $ | 427,878,833 | | | $ | 510,619,667 | | | $ | 301,521,068 | | | $ | 330,853,606 | | |
| Undistributed net investment income at end of year | | $ | 26,156,280 | | | $ | 35,545,997 | | | $ | 465,455 | | | $ | 567,416 | | |
See Accompanying Notes to Financial Statements
56
STATEMENTS OF CHANGES IN NET ASSETS
| | | ING Invesco Van Kampen
Equity and Income Portfolio | | ING JPMorgan Mid Cap
Value Portfolio | |
| | | Year
Ended
December 31,
2011 | | Year
Ended
December 31,
2010 | | Year
Ended
December 31,
2011 | | Year
Ended
December 31,
2010 | |
| FROM OPERATIONS: | |
| Net investment income | | $ | 15,032,056 | | | $ | 15,149,074 | | | $ | 2,884,722 | | | $ | 2,769,288 | | |
| Net realized gain | | | 17,552,532 | | | | 31,235,346 | | | | 23,695,613 | | | | 6,253,583 | | |
| Net change in unrealized appreciation (depreciation) | | | (41,310,442 | ) | | | 47,214,391 | | | | (21,509,493 | ) | | | 48,763,588 | | |
| Increase (decrease) in net assets resulting from operations | | | (8,725,854 | ) | | | 93,598,811 | | | | 5,070,842 | | | | 57,786,459 | | |
| FROM DISTRIBUTIONS TO SHAREHOLDERS: | |
| Net investment income: | |
| Class ADV | | | (399,831 | ) | | | (195,092 | ) | | | (188,965 | ) | | | (141,753 | ) | |
| Class I | | | (12,470,648 | ) | | | (10,643,870 | ) | | | (1,365,727 | ) | | | (1,148,457 | ) | |
| Class S | | | (4,281,171 | ) | | | (3,780,796 | ) | | | (1,478,708 | ) | | | (1,215,265 | ) | |
| Class S2 | | | (18,678 | ) | | | (13,909 | ) | | | (1,504 | ) | | | (31 | ) | |
| Total distributions | | | (17,170,328 | ) | | | (14,633,667 | ) | | | (3,034,904 | ) | | | (2,505,506 | ) | |
| FROM CAPITAL SHARE TRANSACTIONS: | |
| Net proceeds from sale of shares | | | 39,010,332 | | | | 50,386,797 | | | | 87,347,158 | | | | 104,595,538 | | |
| Reinvestment of distributions | | | 17,170,328 | | | | 14,633,667 | | | | 3,034,895 | | | | 2,505,475 | | |
| | | | 56,180,660 | | | | 65,020,464 | | | | 90,382,053 | | | | 107,101,013 | | |
| Cost of shares redeemed | | | (121,860,211 | ) | | | (94,064,905 | ) | | | (84,541,902 | ) | | | (65,975,070 | ) | |
Net increase (decrease) in net assets resulting from
capital share transactions | | | (65,679,551 | ) | | | (29,044,441 | ) | | | 5,840,151 | | | | 41,125,943 | | |
| Net increase (decrease) in net assets | | | (91,575,733 | ) | | | 49,920,703 | | | | 7,876,089 | | | | 96,406,896 | | |
| NET ASSETS: | |
| Beginning of year | | | 850,984,324 | | | | 801,063,621 | | | | 326,288,445 | | | | 229,881,549 | | |
| End of year | | $ | 759,408,591 | | | $ | 850,984,324 | | | $ | 334,164,534 | | | $ | 326,288,445 | | |
| Undistributed net investment income at end of year | | $ | 1,939,092 | | | $ | 3,335,536 | | | $ | 212,959 | | | $ | 522,764 | | |
See Accompanying Notes to Financial Statements
57
STATEMENTS OF CHANGES IN NET ASSETS
| | | ING Oppenheimer Global Portfolio | | ING PIMCO Total Return Portfolio | |
| | | Year
Ended
December 31,
2011 | | Year
Ended
December 31,
2010 | | Year
Ended
December 31,
2011 | | Year
Ended
December 31,
2010 | |
| FROM OPERATIONS: | |
| Net investment income | | $ | 23,524,623 | | | $ | 22,038,254 | | | $ | 31,684,580 | | | $ | 24,225,434 | | |
| Net realized gain (loss) | | | 8,819,699 | | | | 584,686 | | | | (6,323,257 | ) | | | 47,016,105 | | |
| Net change in unrealized appreciation (depreciation) | | | (165,071,870 | ) | | | 220,432,216 | | | | 12,347,118 | | | | 3,008,923 | | |
| Increase (decrease) in net assets resulting from operations | | | (132,727,548 | ) | | | 243,055,156 | | | | 37,708,441 | | | | 74,250,462 | | |
| FROM DISTRIBUTIONS TO SHAREHOLDERS: | |
| Net investment income: | |
| Class ADV | | | (795,043 | ) | | | (845,780 | ) | | | (4,573,905 | ) | | | (4,338,828 | ) | |
| Class I | | | (20,446,960 | ) | | | (22,588,655 | ) | | | (16,506,157 | ) | | | (17,589,023 | ) | |
| Class S | | | (2,368,438 | ) | | | (2,475,668 | ) | | | (14,178,662 | ) | | | (14,499,792 | ) | |
| Class S2 | | | (7,600 | ) | | | (71 | ) | | | (42,942 | ) | | | (11,515 | ) | |
| Net realized gains: | |
| Class ADV | | | — | | | | — | | | | (5,549,282 | ) | | | (180,044 | ) | |
| Class I | | | — | | | | — | | | | (17,584,110 | ) | | | (682,333 | ) | |
| Class S | | | — | | | | — | | | | (16,253,113 | ) | | | (588,861 | ) | |
| Class S2 | | | — | | | | — | | | | (47,092 | ) | | | (447 | ) | |
| Total distributions | | | (23,618,041 | ) | | | (25,910,174 | ) | | | (74,735,263 | ) | | | (37,890,843 | ) | |
| FROM CAPITAL SHARE TRANSACTIONS: | |
| Net proceeds from sale of shares | | | 78,725,639 | | | | 56,805,327 | | | | 154,486,484 | | | | 333,869,537 | | |
| Reinvestment of distributions | | | 23,618,041 | | | | 25,910,103 | | | | 74,735,263 | | | | 37,890,719 | | |
| | | | 102,343,680 | | | | 82,715,430 | | | | 229,221,747 | | | | 371,760,256 | | |
| Cost of shares redeemed | | | (209,774,080 | ) | | | (215,389,499 | ) | | | (173,459,377 | ) | | | (122,062,898 | ) | |
Net increase (decrease) in net assets resulting from
capital share transactions | | | (107,430,400 | ) | | | (132,674,069 | ) | | | 55,762,370 | | | | 249,697,358 | | |
| Net increase (decrease) in net assets | | | (263,775,989 | ) | | | 84,470,913 | | | | 18,735,548 | | | | 286,056,977 | | |
| NET ASSETS: | |
| Beginning of year | | | 1,735,888,275 | | | | 1,651,417,362 | | | | 1,162,307,347 | | | | 876,250,370 | | |
| End of year | | $ | 1,472,112,286 | | | $ | 1,735,888,275 | | | $ | 1,181,042,895 | | | $ | 1,162,307,347 | | |
| Undistributed net investment income at end of year | | $ | 19,018,027 | | | $ | 23,528,229 | | | $ | 40,615,943 | | | $ | 31,290,180 | | |
See Accompanying Notes to Financial Statements
58
STATEMENTS OF CHANGES IN NET ASSETS
| | | ING Pioneer High Yield Portfolio | | ING T. Rowe Price Diversified
Mid Cap Growth Portfolio | |
| | | Year
Ended
December 31,
2011 | | Year
Ended
December 31,
2010 | | Year
Ended
December 31,
2011 | | Year
Ended
December 31,
2010 | |
| FROM OPERATIONS: | |
| Net investment income | | $ | 5,513,677 | | | $ | 5,884,626 | | | $ | 1,791,583 | | | $ | 2,461,464 | | |
| Net realized gain | | | 3,667,772 | | | | 7,168,451 | | | | 68,463,440 | | | | 28,371,337 | | |
| Net change in unrealized appreciation (depreciation) | | | (9,914,908 | ) | | | 3,352,725 | | | | (96,763,856 | ) | | | 153,334,139 | | |
| Increase (decrease) in net assets resulting from operations | | | (733,459 | ) | | | 16,405,802 | | | | (26,508,833 | ) | | | 184,166,940 | | |
| FROM DISTRIBUTIONS TO SHAREHOLDERS: | |
| Net investment income: | |
| Class ADV | | | (1,672 | ) | | | (4,181 | ) | | | (26,206 | ) | | | (16,555 | ) | |
| Class I | | | (5,376,949 | ) | | | (5,723,733 | ) | | | (2,436,752 | ) | | | (1,970,693 | ) | |
| Class S | | | (92,149 | ) | | | (161,579 | ) | | | (27,740 | ) | | | (13,597 | ) | |
| Class S2 | | | — | | | | — | | | | (1,449 | ) | | | (3 | ) | |
| Total distributions | | | (5,470,770 | ) | | | (5,889,493 | ) | | | (2,492,147 | ) | | | (2,000,848 | ) | |
| FROM CAPITAL SHARE TRANSACTIONS: | |
| Net proceeds from sale of shares | | | 25,680,915 | | | | 22,670,528 | | | | 23,884,671 | | | | 27,654,044 | | |
| Reinvestment of distributions | | | 5,470,724 | | | | 5,889,493 | | | | 2,492,139 | | | | 2,000,845 | | |
| | | | 31,151,639 | | | | 28,560,021 | | | | 26,376,810 | | | | 29,654,889 | | |
| Cost of shares redeemed | | | (36,526,307 | ) | | | (33,995,064 | ) | | | (110,313,391 | ) | | | (97,867,239 | ) | |
Net decrease in net assets resulting from capital share
transactions | | | (5,374,668 | ) | | | (5,435,043 | ) | | | (83,936,581 | ) | | | (68,212,350 | ) | |
| Net increase (decrease) in net assets | | | (11,578,897 | ) | | | 5,081,266 | | | | (112,937,561 | ) | | | 113,953,742 | | |
| NET ASSETS: | |
| Beginning of year | | | 100,820,393 | | | | 95,739,127 | | | | 818,242,508 | | | | 704,288,766 | | |
| End of year | | $ | 89,241,496 | | | $ | 100,820,393 | | | $ | 705,304,947 | | | $ | 818,242,508 | | |
| Undistributed net investment income at end of year | | $ | 511,656 | | | $ | 427,328 | | | $ | 162,792 | | | $ | 875,058 | | |
See Accompanying Notes to Financial Statements
59
STATEMENTS OF CHANGES IN NET ASSETS
| | | ING T. Rowe Price
Growth Equity Portfolio | | ING Templeton
Foreign Equity Portfolio | |
| | | Year
Ended
December 31,
2011 | | Year
Ended
December 31,
2010 | | Year
Ended
December 31,
2011 | | Year
Ended
December 31,
2010 | |
| FROM OPERATIONS: | |
| Net investment income (loss) | | $ | (892,417 | ) | | $ | (610,150 | ) | | $ | 14,320,280 | | | $ | 9,893,082 | | |
| Net realized gain | | | 50,943,005 | | | | 39,936,588 | | | | 10,954,991 | | | | 1,666,989 | | |
| Net change in unrealized appreciation (depreciation) | | | (62,181,830 | ) | | | 115,590,481 | | | | (96,028,274 | ) | | | 35,202,313 | | |
| Increase (decrease) in net assets resulting from operations | | | (12,131,242 | ) | | | 154,916,919 | | | | (70,753,003 | ) | | | 46,762,384 | | |
| FROM DISTRIBUTIONS TO SHAREHOLDERS: | |
| Net investment income: | |
| Class ADV | | | — | | | | (31,137 | ) | | | (349,959 | ) | | | (226,608 | ) | |
| Class I | | | — | | | | (274,344 | ) | | | (5,971,695 | ) | | | (7,199,119 | ) | |
| Class S | | | — | | | | (51,974 | ) | | | (4,216,387 | ) | | | (5,422,278 | ) | |
| Class S2 | | | — | | | | (2 | ) | | | (15,463 | ) | | | (102 | ) | |
| Total distributions | | | — | | | | (357,457 | ) | | | (10,553,504 | ) | | | (12,848,107 | ) | |
| FROM CAPITAL SHARE TRANSACTIONS: | |
| Net proceeds from sale of shares | | | 129,084,233 | | | | 113,699,227 | | | | 100,252,733 | | | | 247,561,111 | | |
| Reinvestment of distributions | | | — | | | | 357,455 | | | | 10,553,504 | | | | 12,848,005 | | |
| | | | 129,084,233 | | | | 114,056,682 | | | | 110,806,237 | | | | 260,409,116 | | |
| Cost of shares redeemed | | | (210,186,273 | ) | | | (170,670,840 | ) | | | (203,802,502 | ) | | | (141,150,451 | ) | |
Net increase (decrease) in net assets resulting from
capital share transactions | | | (81,102,040 | ) | | | (56,614,158 | ) | | | (92,996,265 | ) | | | 119,258,665 | | |
| Net increase (decrease) in net assets | | | (93,233,282 | ) | | | 97,945,304 | | | | (174,302,772 | ) | | | 153,172,942 | | |
| NET ASSETS: | |
| Beginning of year | | | 1,082,157,607 | | | | 984,212,303 | | | | 692,684,223 | | | | 539,511,281 | | |
| End of year | | $ | 988,924,325 | | | $ | 1,082,157,607 | | | $ | 518,381,451 | | | $ | 692,684,223 | | |
Undistributed net investment income/(accumulated
net investment loss) at end of year | | $ | (14,799 | ) | | $ | — | | | $ | 14,331,435 | | | $ | 10,551,560 | | |
See Accompanying Notes to Financial Statements
60
STATEMENTS OF CHANGES IN NET ASSETS
| | | ING Thornburg Value Portfolio | | ING UBS U.S. Large Cap
Equity Portfolio | |
| | | Year
Ended
December 31,
2011 | | Year
Ended
December 31,
2010 | | Year
Ended
December 31,
2011 | | Year
Ended
December 31,
2010 | |
| FROM OPERATIONS: | |
| Net investment income | | $ | 593,312 | | | $ | 2,185,001 | | | $ | 1,599,158 | | | $ | 1,450,564 | | |
| Net realized gain | | | 11,909,437 | | | | 31,776,264 | | | | 18,659,411 | | | | 15,780,319 | | |
| Net change in unrealized appreciation (depreciation) | | | (52,280,835 | ) | | | (1,401,372 | ) | | | (23,872,634 | ) | | | 4,176,714 | | |
| Increase (decrease) in net assets resulting from operations | | | (39,778,086 | ) | | | 32,559,893 | | | | (3,614,065 | ) | | | 21,407,597 | | |
| FROM DISTRIBUTIONS TO SHAREHOLDERS: | |
| Net investment income: | |
| Class ADV | | | (74,886 | ) | | | (183,003 | ) | | | (49,176 | ) | | | (39,903 | ) | |
| Class I | | | (1,892,464 | ) | | | (4,222,751 | ) | | | (1,502,666 | ) | | | (1,330,636 | ) | |
| Class S | | | (100,212 | ) | | | (249,052 | ) | | | (70,116 | ) | | | (126,214 | ) | |
| Class S2 | | | (14 | ) | | | (45 | ) | | | — | | | | — | | |
| Total distributions | | | (2,067,576 | ) | | | (4,654,851 | ) | | | (1,621,958 | ) | | | (1,496,753 | ) | |
| FROM CAPITAL SHARE TRANSACTIONS: | |
| Net proceeds from sale of shares | | | 46,975,789 | | | | 96,147,812 | | | | 7,951,981 | | | | 12,183,502 | | |
| Reinvestment of distributions | | | 2,067,562 | | | | 4,654,806 | | | | 1,621,958 | | | | 1,496,753 | | |
| | | | 49,043,351 | | | | 100,802,618 | | | | 9,573,939 | | | | 13,680,255 | | |
| Cost of shares redeemed | | | (81,688,752 | ) | | | (78,733,299 | ) | | | (40,941,746 | ) | | | (39,560,188 | ) | |
Net increase (decrease) in net assets resulting from capital
share transactions | | | (32,645,401 | ) | | | 22,069,319 | | | | (31,367,807 | ) | | | (25,879,933 | ) | |
| Net increase (decrease) in net assets | | | (74,491,063 | ) | | | 49,974,361 | | | | (36,603,830 | ) | | | (5,969,089 | ) | |
| NET ASSETS: | |
| Beginning of year | | | 294,598,263 | | | | 244,623,902 | | | | 176,407,562 | | | | 182,376,651 | | |
| End of year | | $ | 220,107,200 | | | $ | 294,598,263 | | | $ | 139,803,732 | | | $ | 176,407,562 | | |
| Undistributed net investment income at end of year | | $ | 562,875 | | | $ | 2,067,409 | | | $ | 264,782 | | | $ | 280,179 | | |
See Accompanying Notes to Financial Statements
61
FINANCIAL HIGHLIGHTS
Selected data for a share of beneficial interest outstanding throughout each year or period.
| | | | | Income (loss)
from investment
operations | | | | Less distributions | |
| | | Net asset value, beginning of year or period | | Net investment income (loss) | | Net realized and unrealized gain (loss) | | Total from investment operations | | From net investment income | | From net realized gains | | From return of capital | |
| Year or period ended | | ($) | | ($) | | ($) | | ($) | | ($) | | ($) | | ($) | |
| ING American Century Small-Mid Cap Value Portfolio | | | |
| Class ADV | | | |
| | 12-31-11 | | | | 11.63 | | | | 0.12 | • | | | (0.54 | ) | | | (0.42 | ) | | | 0.13 | | | | 0.00 | * | | | — | | |
| | 12-31-10 | | | | 9.65 | | | | 0.15 | • | | | 1.93 | | | | 2.08 | | | | 0.10 | | | | — | | | | — | | |
| | 12-31-09 | | | | 7.23 | | | | 0.14 | | | | 2.39 | | | | 2.53 | | | | 0.11 | | | | — | | | | — | | |
| | 12-31-08 | | | | 11.24 | | | | 0.15 | | | | (2.80 | ) | | | (2.65 | ) | | | 0.05 | | | | 1.31 | | | | — | | |
| | 12-31-07 | | | | 13.35 | | | | 0.08 | • | | | (0.42 | ) | | | (0.34 | ) | | | 0.03 | | | | 1.74 | | | | — | | |
| Class I | | | |
| | 12-31-11 | | | | 11.91 | | | | 0.18 | | | | (0.56 | ) | | | (0.38 | ) | | | 0.15 | | | | 0.00 | * | | | — | | |
| | 12-31-10 | | | | 9.86 | | | | 0.20 | • | | | 1.98 | | | | 2.18 | | | | 0.13 | | | | — | | | | — | | |
| | 12-31-09 | | | | 7.38 | | | | 0.17 | | | | 2.47 | | | | 2.64 | | | | 0.16 | | | | — | | | | — | | |
| | 12-31-08 | | | | 11.46 | | | | 0.20 | • | | | (2.86 | ) | | | (2.66 | ) | | | 0.11 | | | | 1.31 | | | | — | | |
| | 12-31-07 | | | | 13.58 | | | | 0.14 | • | | | (0.43 | ) | | | (0.29 | ) | | | 0.09 | | | | 1.74 | | | | — | | |
| Class S | | | |
| | 12-31-11 | | | | 11.82 | | | | 0.15 | | | | (0.54 | ) | | | (0.39 | ) | | | 0.13 | | | | 0.00 | * | | | — | | |
| | 12-31-10 | | | | 9.80 | | | | 0.14 | | | | 1.99 | | | | 2.13 | | | | 0.11 | | | | — | | | | — | | |
| | 12-31-09 | | | | 7.34 | | | | 0.16 | • | | | 2.44 | | | | 2.60 | | | | 0.14 | | | | — | | | | — | | |
| | 12-31-08 | | | | 11.40 | | | | 0.17 | • | | | (2.84 | ) | | | (2.67 | ) | | | 0.08 | | | | 1.31 | | | | — | | |
| | 12-31-07 | | | | 13.51 | | | | 0.11 | • | | | (0.42 | ) | | | (0.31 | ) | | | 0.06 | | | | 1.74 | | | | — | | |
| Class S2 | | | |
| | 12-31-11 | | | | 11.59 | | | | 0.14 | • | | | (0.55 | ) | | | (0.41 | ) | | | 0.15 | | | | 0.00 | * | | | — | | |
| | 12-31-10 | | | | 9.61 | | | | 0.22 | • | | | 1.86 | | | | 2.08 | | | | 0.10 | | | | — | | | | — | | |
| | 02-27-09 | (5)-12-31-09 | | | 5.84 | | | | 0.14 | • | | | 3.79 | | | | 3.93 | | | | 0.16 | | | | — | | | | — | | |
| ING Baron Small Cap Growth Portfolio | | | |
| Class ADV | | | |
| | 12-31-11 | | | | 18.52 | | | | (0.19 | ) | | | 0.54 | | | | 0.35 | | | | — | | | | — | | | | — | | |
| | 12-31-10 | | | | 14.67 | | | | (0.10 | ) | | | 3.95 | | | | 3.85 | | | | — | | | | — | | | | — | | |
| | 12-31-09 | | | | 10.88 | | | | (0.12 | ) | | | 3.91 | | | | 3.79 | | | | — | | | | — | | | | — | | |
| | 12-31-08 | | | | 19.16 | | | | (0.14 | ) | | | (7.62 | ) | | | (7.76 | ) | | | — | | | | 0.52 | | | | — | | |
| | 12-31-07 | | | | 18.11 | | | | (0.12 | ) | | | 1.17 | | | | 1.05 | | | | — | | | | — | | | | — | | |
| Class I | | | |
| | 12-31-11 | | | | 19.37 | | | | (0.10 | )• | | | 0.57 | | | | 0.47 | | | | — | | | | — | | | | — | | |
| | 12-31-10 | | | | 15.27 | | | | (0.03 | ) | | | 4.13 | | | | 4.10 | | | | — | | | | — | | | | — | | |
| | 12-31-09 | | | | 11.27 | | | | (0.07 | ) | | | 4.07 | | | | 4.00 | | | | — | | | | — | | | | — | | |
| | 12-31-08 | | | | 19.73 | | | | (0.05 | )• | | | (7.89 | ) | | | (7.94 | ) | | | — | | | | 0.52 | | | | — | | |
| | 12-31-07 | | | | 18.55 | | | | (0.02 | ) | | | 1.20 | | | | 1.18 | | | | — | | | | — | | | | — | | |
| Class S | | | |
| | 12-31-11 | | | | 18.95 | | | | (0.14 | )• | | | 0.56 | | | | 0.42 | | | | — | | | | — | | | | — | | |
| | 12-31-10 | | | | 14.98 | | | | (0.07 | ) | | | 4.04 | | | | 3.97 | | | | — | | | | — | | | | — | | |
| | 12-31-09 | | | | 11.08 | | | | (0.09 | ) | | | 3.99 | | | | 3.90 | | | | — | | | | — | | | | — | | |
| | 12-31-08 | | | | 19.45 | | | | (0.08 | )• | | | (7.77 | ) | | | (7.85 | ) | | | — | | | | 0.52 | | | | — | | |
| | 12-31-07 | | | | 18.33 | | | | (0.06 | ) | | | 1.18 | | | | 1.12 | | | | — | | | | — | | | | — | | |
| Class S2 | | | |
| | 12-31-11 | | | | 18.55 | | | | (0.13 | )• | | | 0.51 | | | | 0.38 | | | | — | | | | — | | | | — | | |
| | 12-31-10 | | | | 14.69 | | | | (0.09 | ) | | | 3.95 | | | | 3.86 | | | | — | | | | — | | | | — | | |
| | 02-27-09 | (5)-12-31-09 | | | 9.31 | | | | (0.10 | ) | | | 5.48 | | | | 5.38 | | | | — | | | | — | | | | — | | |
| ING Columbia Small Cap Value II Portfolio | | | |
| Class ADV | | | |
| | 12-31-11 | | | | 10.29 | | | | (0.01 | ) | | | (0.30 | ) | | | (0.31 | ) | | | 0.06 | | | | — | | | | — | | |
| | 12-31-10 | | | | 8.36 | | | | 0.02 | • | | | 2.04 | | | | 2.06 | | | | 0.13 | | | | — | | | | — | | |
| | 12-31-09 | | | | 6.78 | | | | 0.05 | | | | 1.59 | | | | 1.64 | | | | 0.06 | | | | — | | | | — | | |
| | 12-31-08 | | | | 10.41 | | | | 0.09 | • | | | (3.62 | ) | | | (3.53 | ) | | | 0.02 | | | | 0.08 | | | | — | | |
| | 12-31-07 | | | | 10.15 | | | | 0.05 | • | | | 0.23 | | | | 0.28 | | | | 0.02 | | | | — | | | | — | | |
| | | | | Ratios to average net assets | | Supplemental
data | |
| | | Total distributions | | Payment by affiliate | | Net asset value, end of year or period | | Total Return(1) | | Expenses before reductions/additions(2)(3)(4) | | Expenses net of fee waivers and/or recoupments if any(2)(3)(4) | | Expense net of all reductions/additions(2)(3)(4) | | Net investment income (loss)(2)(4) | | Net assets, end of year or period | | Portfolio turnover rate | |
| Year or period ended | | ($) | | ($) | | ($) | | (%) | | (%) | | (%) | | (%) | | (%) | | ($000's) | | (%) | |
| ING American Century Small-Mid Cap Value Portfolio | |
| Class ADV | |
| | 12-31-11 | | | | 0.13 | | | | — | | | | 11.08 | | | | (3.47 | ) | | | 1.75 | | | | 1.44 | | | | 1.44 | | | | 1.07 | | | | 37,525 | | | | 109 | | |
| | 12-31-10 | | | | 0.10 | | | | — | | | | 11.63 | | | | 21.80 | | | | 1.75 | | | | 1.44 | † | | | 1.44 | † | | | 1.47 | † | | | 26,712 | | | | 98 | | |
| | 12-31-09 | | | | 0.11 | | | | — | | | | 9.65 | | | | 35.20 | | | | 1.75 | | | | 1.44 | † | | | 1.44 | † | | | 1.82 | † | | | 10,511 | | | | 135 | | |
| | 12-31-08 | | | | 1.36 | | | | — | | | | 7.23 | | | | (26.69 | ) | | | 1.75 | | | | 1.52 | | | | 1.52 | | | | 1.50 | | | | 7,861 | | | | 191 | | |
| | 12-31-07 | | | | 1.77 | | | | — | | | | 11.24 | | | | (3.17 | ) | | | 1.75 | | | | 1.52 | | | | 1.52 | | | | 0.58 | | | | 12,309 | | | | 146 | | |
| Class I | |
| | 12-31-11 | | | | 0.15 | | | | — | | | | 11.38 | | | | (2.97 | ) | | | 1.25 | | | | 0.94 | | | | 0.94 | | | | 1.54 | | | | 87,411 | | | | 109 | | |
| | 12-31-10 | | | | 0.13 | | | | — | | | | 11.91 | | | | 22.36 | | | | 1.25 | | | | 0.94 | † | | | 0.94 | † | | | 1.92 | † | | | 91,413 | | | | 98 | | |
| | 12-31-09 | | | | 0.16 | | | | — | | | | 9.86 | | | | 36.02 | | | | 1.25 | | | | 0.94 | † | | | 0.94 | † | | | 2.28 | † | | | 51,654 | | | | 135 | | |
| | 12-31-08 | | | | 1.42 | | | | — | | | | 7.38 | | | | (26.37 | ) | | | 1.25 | | | | 1.02 | | | | 1.02 | | | | 2.04 | | | | 35,922 | | | | 191 | | |
| | 12-31-07 | | | | 1.83 | | | | — | | | | 11.46 | | | | (2.70 | ) | | | 1.25 | | | | 1.02 | | | | 1.02 | | | | 1.09 | | | | 47,079 | | | | 146 | | |
| Class S | |
| | 12-31-11 | | | | 0.13 | | | | — | | | | 11.30 | | | | (3.16 | ) | | | 1.50 | | | | 1.19 | | | | 1.19 | | | | 1.28 | | | | 72,824 | | | | 109 | | |
| | 12-31-10 | | | | 0.11 | | | | — | | | | 11.82 | | | | 22.02 | | | | 1.50 | | | | 1.19 | † | | | 1.19 | † | | | 1.68 | † | | | 75,285 | | | | 98 | | |
| | 12-31-09 | | | | 0.14 | | | | — | | | | 9.80 | | | | 35.68 | | | | 1.50 | | | | 1.19 | † | | | 1.19 | † | | | 2.03 | † | | | 53,596 | | | | 135 | | |
| | 12-31-08 | | | | 1.39 | | | | — | | | | 7.34 | | | | (26.56 | ) | | | 1.50 | | | | 1.27 | | | | 1.27 | | | | 1.80 | | | | 31,260 | | | | 191 | | |
| | 12-31-07 | | | | 1.80 | | | | — | | | | 11.40 | | | | (2.90 | ) | | | 1.50 | | | | 1.27 | | | | 1.27 | | | | 0.82 | | | | 40,309 | | | | 146 | | |
| Class S2 | |
| | 12-31-11 | | | | 0.15 | | | | — | | | | 11.03 | | | | (3.33 | ) | | | 1.75 | | | | 1.34 | | | | 1.34 | | | | 1.26 | | | | 1,891 | | | | 109 | | |
| | 12-31-10 | | | | 0.10 | | | | — | | | | 11.59 | | | | 21.87 | | | | 1.75 | | | | 1.34 | † | | | 1.34 | † | | | 2.01 | † | | | 326 | | | | 98 | | |
| | 02-27-09 | (5)-12-31-09 | | | 0.16 | | | | — | | | | 9.61 | | | | 67.61 | | | | 1.75 | | | | 1.34 | † | | | 1.34 | † | | | 2.06 | † | | | 5 | | | | 135 | | |
| ING Baron Small Cap Growth Portfolio | |
| Class ADV | |
| | 12-31-11 | | | | — | | | | — | | | | 18.87 | | | | 1.89 | | | | 1.58 | | | | 1.58 | | | | 1.58 | | | | (0.98 | ) | | | 54,052 | | | | 14 | | |
| | 12-31-10 | | | | — | | | | — | | | | 18.52 | | | | 26.24 | | | | 1.58 | | | | 1.58 | † | | | 1.58 | † | | | (0.65 | )† | | | 51,458 | | | | 19 | | |
| | 12-31-09 | | | | — | | | | — | | | | 14.67 | | | | 34.83 | | | | 1.58 | | | | 1.57 | | | | 1.57 | | | | (1.07 | ) | | | 36,133 | | | | 13 | | |
| | 12-31-08 | | | | 0.52 | | | | — | | | | 10.88 | | | | (41.41 | ) | | | 1.58 | | | | 1.58 | † | | | 1.58 | † | | | (0.80 | )† | | | 23,542 | | | | 30 | | |
| | 12-31-07 | | | | — | | | | — | | | | 19.16 | | | | 5.80 | | | | 1.58 | | | | 1.58 | | | | 1.58 | | | | (0.61 | ) | | | 48,449 | | | | 23 | | |
| Class I | |
| | 12-31-11 | | | | — | | | | — | | | | 19.84 | | | | 2.43 | | | | 1.08 | | | | 1.08 | | | | 1.08 | | | | (0.51 | ) | | | 153,934 | | | | 14 | | |
| | 12-31-10 | | | | — | | | | — | | | | 19.37 | | | | 26.85 | | | | 1.08 | | | | 1.08 | † | | | 1.08 | † | | | (0.17 | )† | | | 231,264 | | | | 19 | | |
| | 12-31-09 | | | | — | | | | — | | | | 15.27 | | | | 35.49 | | | | 1.08 | | | | 1.07 | | | | 1.07 | | | | (0.57 | ) | | | 184,220 | | | | 13 | | |
| | 12-31-08 | | | | 0.52 | | | | — | | | | 11.27 | | | | (41.12 | ) | | | 1.08 | | | | 1.08 | † | | | 1.08 | † | | | (0.29 | )† | | | 131,199 | | | | 30 | | |
| | 12-31-07 | | | | — | | | | — | | | | 19.73 | | | | 6.36 | | | | 1.08 | | | | 1.08 | | | | 1.08 | | | | (0.10 | ) | | | 181,259 | | | | 23 | | |
| Class S | |
| | 12-31-11 | | | | — | | | | — | | | | 19.37 | | | | 2.22 | | | | 1.33 | | | | 1.31 | | | | 1.31 | | | | (0.72 | ) | | | 526,672 | | | | 14 | | |
| | 12-31-10 | | | | — | | | | — | | | | 18.95 | | | | 26.50 | | | | 1.33 | | | | 1.31 | † | | | 1.31 | † | | | (0.41 | )† | | | 560,004 | | | | 19 | | |
| | 12-31-09 | | | | — | | | | — | | | | 14.98 | | | | 35.20 | | | | 1.33 | | | | 1.30 | | | | 1.30 | | | | (0.80 | ) | | | 466,746 | | | | 13 | | |
| | 12-31-08 | | | | 0.52 | | | | — | | | | 11.08 | | | | (41.25 | ) | | | 1.33 | | | | 1.31 | † | | | 1.31 | † | | | (0.52 | )† | | | 291,833 | | | | 30 | | |
| | 12-31-07 | | | | — | | | | — | | | | 19.45 | | | | 6.11 | | | | 1.33 | | | | 1.32 | | | | 1.32 | | | | (0.34 | ) | | | 415,539 | | | | 23 | | |
| Class S2 | |
| | 12-31-11 | | | | — | | | | — | | | | 18.93 | | | | 2.05 | | | | 1.58 | | | | 1.48 | | | | 1.48 | | | | (0.68 | ) | | | 339 | | | | 14 | | |
| | 12-31-10 | | | | — | | | | — | | | | 18.55 | | | | 26.28 | | | | 1.58 | | | | 1.48 | † | | | 1.48 | † | | | (0.58 | )† | | | 6 | | | | 19 | | |
| | 02-27-09 | (5)-12-31-09 | | | — | | | | — | | | | 14.69 | | | | 57.79 | | | | 1.58 | | | | 1.47 | | | | 1.47 | | | | (0.97 | ) | | | 5 | | | | 13 | | |
| ING Columbia Small Cap Value II Portfolio | |
| Class ADV | |
| | 12-31-11 | | | | 0.06 | | | | — | | | | 9.92 | | | | (2.96 | ) | | | 1.40 | | | | 1.40 | | | | 1.38 | | | | 0.06 | | | | 4,677 | | | | 36 | | |
| | 12-31-10 | | | | 0.13 | | | | — | | | | 10.29 | | | | 24.98 | | | | 1.40 | | | | 1.40 | † | | | 1.37 | † | | | 0.25 | † | | | 2,071 | | | | 62 | | |
| | 12-31-09 | | | | 0.06 | | | | — | | | | 8.36 | | | | 24.28 | | | | 1.45 | | | | 1.44 | † | | | 1.44 | † | | | 0.52 | † | | | 534 | | | | 86 | | |
| | 12-31-08 | | | | 0.10 | | | | — | | | | 6.78 | | | | (34.22 | ) | | | 1.41 | | | | 1.41 | † | | | 1.38 | † | | | 1.03 | † | | | 444 | | | | 73 | | |
| | 12-31-07 | | | | 0.02 | | | | — | | | | 10.41 | | | | 2.73 | | | | 1.38 | | | | 1.38 | | | | 1.35 | | | | 0.50 | | | | 330 | | | | 50 | | |
See Accompanying Notes to Financial Statements
62
FINANCIAL HIGHLIGHTS (CONTINUED)
Selected data for a share of beneficial interest outstanding throughout each year or period.
| | | | | Income (loss)
from investment
operations | | | | Less distributions | |
| | | Net asset value, beginning of year or period | | Net investment income (loss) | | Net realized and unrealized gain (loss) | | Total from investment operations | | From net investment income | | From net realized gains | | From return of capital | |
| Year or period ended | | ($) | | ($) | | ($) | | ($) | | ($) | | ($) | | ($) | |
| ING Columbia Small Cap Value II Portfolio (continued) | | | |
| Class I | | | |
| | 12-31-11 | | | | 10.44 | | | | 0.03 | • | | | (0.30 | ) | | | (0.27 | ) | | | 0.07 | | | | — | | | | — | | |
| | 12-31-10 | | | | 8.46 | | | | 0.06 | | | | 2.06 | | | | 2.12 | | | | 0.14 | | | | — | | | | — | | |
| | 12-31-09 | | | | 6.85 | | | | 0.07 | • | | | 1.65 | | | | 1.72 | | | | 0.11 | | | | — | | | | — | | |
| | 12-31-08 | | | | 10.48 | | | | 0.14 | • | | | (3.67 | ) | | | (3.53 | ) | | | 0.02 | | | | 0.08 | | | | — | | |
| | 12-31-07 | | | | 10.17 | | | | 0.10 | • | | | 0.23 | | | | 0.33 | | | | 0.02 | | | | — | | | | — | | |
| Class S | | | |
| | 12-31-11 | | | | 10.39 | | | | 0.03 | | | | (0.32 | ) | | | (0.29 | ) | | | 0.04 | | | | — | | | | — | | |
| | 12-31-10 | | | | 8.41 | | | | 0.04 | • | | | 2.06 | | | | 2.10 | | | | 0.12 | | | | — | | | | — | | |
| | 12-31-09 | | | | 6.82 | | | | 0.06 | | | | 1.62 | | | | 1.68 | | | | 0.09 | | | | — | | | | — | | |
| | 12-31-08 | | | | 10.44 | | | | 0.11 | • | | | (3.64 | ) | | | (3.53 | ) | | | 0.01 | | | | 0.08 | | | | — | | |
| | 12-31-07 | | | | 10.15 | | | | 0.07 | • | | | 0.23 | | | | 0.30 | | | | 0.01 | | | | — | | | | — | | |
| Class S2 | | | |
| | 12-31-11 | | | | 10.27 | | | | 0.04 | | | | (0.35 | ) | | | (0.31 | ) | | | 0.06 | | | | — | | | | — | | |
| | 12-31-10 | | | | 8.33 | | | | 0.03 | | | | 2.03 | | | | 2.06 | | | | 0.12 | | | | — | | | | — | | |
| | 02-27-09 | (5)-12-31-09 | | | 5.20 | | | | 0.04 | • | | | 3.20 | | | | 3.24 | | | | 0.11 | | | | — | | | | — | | |
| ING Davis New York Venture Portfolio | | | |
| Class ADV | | | |
| | 12-31-11 | | | | 17.57 | | | | 0.05 | • | | | (0.93 | ) | | | (0.88 | ) | | | 0.16 | | | | — | | | | — | | |
| | 12-31-10 | | | | 15.77 | | | | 0.05 | • | | | 1.80 | | | | 1.85 | | | | 0.05 | | | | — | | | | — | | |
| | 12-31-09 | | | | 12.02 | | | | 0.04 | • | | | 3.71 | | | | 3.75 | | | | — | | | | — | | | | — | | |
| | 12-31-08 | | | | 20.07 | | | | 0.09 | | | | (7.92 | ) | | | (7.83 | ) | | | 0.04 | | | | 0.18 | | | | — | | |
| | 12-31-07 | | | | 19.39 | | | | 0.19 | • | | | 0.57 | | | | 0.76 | | | | — | | | | 0.08 | | | | — | | |
| Class I | | | |
| | 12-31-11 | | | | 17.99 | | | | 0.14 | | | | (0.97 | ) | | | (0.83 | ) | | | 0.22 | | | | — | | | | — | | |
| | 12-31-10 | | | | 16.12 | | | | 0.12 | • | | | 1.85 | | | | 1.97 | | | | 0.10 | | | | — | | | | — | | |
| | 12-31-09 | | | | 12.32 | | | | 0.10 | • | | | 3.82 | | | | 3.92 | | | | 0.12 | | | | — | | | | — | | |
| | 12-31-08 | | | | 20.60 | | | | 0.15 | • | | | (8.09 | ) | | | (7.94 | ) | | | 0.16 | | | | 0.18 | | | | — | | |
| | 12-31-07 | | | | 19.87 | | | | 0.31 | • | | | 0.57 | | | | 0.88 | | | | 0.07 | | | | 0.08 | | | | — | | |
| Class S | | | |
| | 12-31-11 | | | | 17.76 | | | | 0.09 | • | | | (0.93 | ) | | | (0.84 | ) | | | 0.17 | | | | — | | | | — | | |
| | 12-31-10 | | | | 15.93 | | | | 0.09 | | | | 1.81 | | | | 1.90 | | | | 0.07 | | | | — | | | | — | | |
| | 12-31-09 | | | | 12.18 | | | | 0.06 | | | | 3.78 | | | | 3.84 | | | | 0.09 | | | | — | | | | — | | |
| | 12-31-08 | | | | 20.39 | | | | 0.11 | • | | | (8.02 | ) | | | (7.91 | ) | | | 0.12 | | | | 0.18 | | | | — | | |
| | 12-31-07 | | | | 19.70 | | | | 0.25 | • | | | 0.57 | | | | 0.82 | | | | 0.05 | | | | 0.08 | | | | — | | |
| ING Global Bond Portfolio | | | |
| Class ADV | | | |
| | 12-31-11 | | | | 11.67 | | | | 0.44 | • | | | (0.04 | ) | | | 0.40 | | | | 0.85 | | | | — | | | | — | | |
| | 12-31-10 | | | | 10.45 | | | | 0.70 | • | | | 0.88 | | | | 1.58 | | | | 0.36 | | | | — | | | | — | | |
| | 12-31-09 | | | | 8.84 | | | | 0.40 | | | | 1.51 | | | | 1.91 | | | | 0.30 | | | | — | | | | — | | |
| | 12-31-08 | | | | 11.12 | | | | 0.55 | • | | | (2.28 | ) | | | (1.73 | ) | | | 0.51 | | | | 0.04 | | | | — | | |
| | 12-31-07 | | | | 10.76 | | | | 0.59 | • | | | 0.28 | | | | 0.87 | | | | 0.51 | | | | — | | | | — | | |
| Class I | | | |
| | 12-31-11 | | | | 11.77 | | | | 0.50 | • | | | (0.05 | ) | | | 0.45 | | | | 0.90 | | | | — | | | | — | | |
| | 12-31-10 | | | | 10.48 | | | | 0.75 | | | | 0.90 | | | | 1.65 | | | | 0.36 | | | | — | | | | — | | |
| | 12-31-09 | | | | 8.92 | | | | 0.48 | • | | | 1.49 | | | | 1.97 | | | | 0.41 | | | | — | | | | — | | |
| | 12-31-08 | | | | 11.20 | | | | 0.54 | • | | | (2.22 | ) | | | (1.68 | ) | | | 0.56 | | | | 0.04 | | | | — | | |
| | 12-31-07 | | | | 10.80 | | | | 0.64 | • | | | 0.28 | | | | 0.92 | | | | 0.52 | | | | — | | | | — | | |
| Class S | | | |
| | 12-31-11 | | | | 11.76 | | | | 0.47 | • | | | (0.04 | ) | | | 0.43 | | | | 0.86 | | | | — | | | | — | | |
| | 12-31-10 | | | | 10.50 | | | | 0.74 | • | | | 0.88 | | | | 1.62 | | | | 0.36 | | | | — | | | | — | | |
| | 12-31-09 | | | | 8.92 | | | | 0.49 | • | | | 1.45 | | | | 1.94 | | | | 0.36 | | | | — | | | | — | | |
| | 12-31-08 | | | | 11.21 | | | | 0.48 | • | | | (2.19 | ) | | | (1.71 | ) | | | 0.54 | | | | 0.04 | | | | — | | |
| | 12-31-07 | | | | 10.81 | | | | 0.62 | • | | | 0.27 | | | | 0.89 | | | | 0.49 | | | | — | | | | — | | |
| | | | | Ratios to average net assets | | Supplemental
data | |
| | | Total distributions | | Payment by affiliate | | Net asset value, end of year or period | | Total Return(1) | | Expenses before reductions/additions(2)(3)(4) | | Expenses net of fee waivers and/or recoupments if any(2)(3)(4) | | Expense net of all reductions/additions(2)(3)(4) | | Net investment income (loss)(2)(4) | | Net assets, end of year or period | | Portfolio turnover rate | |
| Year or period ended | | ($) | | ($) | | ($) | | (%) | | (%) | | (%) | | (%) | | (%) | | ($000's) | | (%) | |
| ING Columbia Small Cap Value II Portfolio (continued) | |
| Class I | |
| | 12-31-11 | | | | 0.07 | | | | — | | | | 10.10 | | | | (2.48 | ) | | | 0.90 | | | | 0.90 | | | | 0.88 | | | | 0.31 | | | | 17,304 | | | | 36 | | |
| | 12-31-10 | | | | 0.14 | | | | — | | | | 10.44 | | | | 25.48 | | | | 0.90 | | | | 0.90 | † | | | 0.87 | † | | | 0.67 | † | | | 55,866 | | | | 62 | | |
| | 12-31-09 | | | | 0.11 | | | | — | | | | 8.46 | | | | 25.20 | | | | 0.95 | | | | 0.94 | † | | | 0.94 | † | | | 1.09 | † | | | 46,600 | | | | 86 | | |
| | 12-31-08 | | | | 0.10 | | | | — | | | | 6.85 | | | | (33.93 | ) | | | 0.91 | | | | 0.91 | † | | | 0.88 | † | | | 1.63 | † | | | 225,673 | | | | 73 | | |
| | 12-31-07 | | | | 0.02 | | | | — | | | | 10.48 | | | | 3.21 | | | | 0.88 | | | | 0.88 | | | | 0.85 | | | | 0.94 | | | | 46,922 | | | | 50 | | |
| Class S | |
| | 12-31-11 | | | | 0.04 | | | | — | | | | 10.06 | | | | (2.69 | ) | | | 1.15 | | | | 1.15 | | | | 1.13 | | | | 0.21 | | | | 138,626 | | | | 36 | | |
| | 12-31-10 | | | | 0.12 | | | | — | | | | 10.39 | | | | 25.28 | | | | 1.15 | | | | 1.15 | † | | | 1.12 | † | | | 0.41 | † | | | 167,293 | | | | 62 | | |
| | 12-31-09 | | | | 0.09 | | | | — | | | | 8.41 | | | | 24.72 | | | | 1.20 | | | | 1.19 | † | | | 1.19 | † | | | 0.75 | † | | | 165,922 | | | | 86 | | |
| | 12-31-08 | | | | 0.09 | | | | — | | | | 6.82 | | | | (34.08 | ) | | | 1.16 | | | | 1.16 | † | | | 1.13 | † | | | 1.22 | † | | | 150,309 | | | | 73 | | |
| | 12-31-07 | | | | 0.01 | | | | — | | | | 10.44 | | | | 2.97 | | | | 1.13 | | | | 1.13 | | | | 1.10 | | | | 0.65 | | | | 161,301 | | | | 50 | | |
| Class S2 | |
| | 12-31-11 | | | | 0.06 | | | | — | | | | 9.90 | | | | (2.88 | ) | | | 1.40 | | | | 1.30 | | | | 1.28 | | | | 0.49 | | | | 436 | | | | 36 | | |
| | 12-31-10 | | | | 0.12 | | | | — | | | | 10.27 | | | | 25.04 | | | | 1.40 | | | | 1.30 | † | | | 1.27 | † | | | 0.29 | † | | | 6 | | | | 62 | | |
| | 02-27-09 | (5)-12-31-09 | | | 0.11 | | | | — | | | | 8.33 | | | | 62.42 | | | | 1.45 | | | | 1.34 | † | | | 1.34 | † | | | 0.60 | † | | | 5 | | | | 86 | | |
| ING Davis New York Venture Portfolio | |
| Class ADV | |
| | 12-31-11 | | | | 0.16 | | | | — | | | | 16.53 | | | | (4.92 | ) | | | 1.40 | | | | 1.38 | | | | 1.38 | | | | 0.31 | | | | 9,266 | | | | 12 | | |
| | 12-31-10 | | | | 0.05 | | | | — | | | | 17.57 | | | | 11.79 | | | | 1.40 | | | | 1.38 | | | | 1.38 | | | | 0.30 | | | | 8,442 | | | | 15 | | |
| | 12-31-09 | | | | — | | | | — | | | | 15.77 | | | | 31.20 | | | | 1.40 | | | | 1.39 | | | | 1.39 | | | | 0.31 | | | | 4,844 | | | | 23 | | |
| | 12-31-08 | | | | 0.22 | | | | — | | | | 12.02 | | | | (39.35 | ) | | | 1.40 | | | | 1.40 | | | | 1.40 | | | | 0.41 | | | | 5,662 | | | | 20 | | |
| | 12-31-07 | | | | 0.08 | | | | — | | | | 20.07 | | | | 3.91 | | | | 1.40 | | | | 1.40 | | | | 1.40 | | | | 0.94 | | | | 10,214 | | | | 10 | | |
| Class I | |
| | 12-31-11 | | | | 0.22 | | | | — | | | | 16.94 | | | | (4.52 | ) | | | 0.90 | | | | 0.88 | | | | 0.88 | | | | 0.80 | | | | 109,831 | | | | 12 | | |
| | 12-31-10 | | | | 0.10 | | | | — | | | | 17.99 | | | | 12.33 | | | | 0.90 | | | | 0.88 | | | | 0.88 | | | | 0.74 | | | | 143,679 | | | | 15 | | |
| | 12-31-09 | | | | 0.12 | | | | — | | | | 16.12 | | | | 31.96 | | | | 0.90 | | | | 0.89 | | | | 0.89 | | | | 0.76 | | | | 165,713 | | | | 23 | | |
| | 12-31-08 | | | | 0.34 | | | | — | | | | 12.32 | | | | (39.06 | ) | | | 0.90 | | | | 0.90 | | | | 0.90 | | | | 0.92 | | | | 133,936 | | | | 20 | | |
| | 12-31-07 | | | | 0.15 | | | | — | | | | 20.60 | | | | 4.43 | | | | 0.90 | | | | 0.90 | | | | 0.90 | | | | 1.49 | | | | 101,763 | | | | 10 | | |
| Class S | |
| | 12-31-11 | | | | 0.17 | | | | — | | | | 16.75 | | | | (4.63 | ) | | | 1.15 | | | | 1.13 | | | | 1.13 | | | | 0.56 | | | | 270,261 | | | | 12 | | |
| | 12-31-10 | | | | 0.07 | | | | — | | | | 17.76 | | | | 11.99 | | | | 1.15 | | | | 1.13 | | | | 1.13 | | | | 0.51 | | | | 328,415 | | | | 15 | | |
| | 12-31-09 | | | | 0.09 | | | | — | | | | 15.93 | | | | 31.62 | | | | 1.15 | | | | 1.14 | | | | 1.14 | | | | 0.49 | | | | 303,513 | | | | 23 | | |
| | 12-31-08 | | | | 0.30 | | | | — | | | | 12.18 | | | | (39.22 | ) | | | 1.15 | | | | 1.15 | | | | 1.15 | | | | 0.67 | | | | 213,686 | | | | 20 | | |
| | 12-31-07 | | | | 0.13 | | | | — | | | | 20.39 | | | | 4.16 | | | | 1.15 | | | | 1.15 | | | | 1.15 | | | | 1.23 | | | | 231,511 | | | | 10 | | |
| ING Global Bond Portfolio | |
| Class ADV | |
| | 12-31-11 | | | | 0.85 | | | | — | | | | 11.22 | | | | 3.26 | | | | 1.16 | | | | 1.02 | | | | 1.02 | | | | 3.73 | | | | 30,299 | | | | 590 | | |
| | 12-31-10 | | | | 0.36 | | | | — | | | | 11.67 | | | | 15.22 | | | | 1.04 | | | | 1.02 | | | | 1.02 | | | | 6.27 | | | | 30,887 | | | | 117 | | |
| | 12-31-09 | | | | 0.30 | | | | — | | | | 10.45 | | | | 21.66 | | | | 1.04 | | | | 1.01 | | | | 1.01 | | | | 4.79 | | | | 20,170 | | | | 136 | | |
| | 12-31-08 | | | | 0.55 | | | | — | | | | 8.84 | | | | (16.38 | ) | | | 1.04 | | | | 1.00 | † | | | 1.00 | † | | | 5.19 | † | | | 16,393 | | | | 108 | | |
| | 12-31-07 | | | | 0.51 | | | | — | | | | 11.12 | | | | 8.28 | | | | 1.04 | | | | 1.00 | | | | 1.00 | | | | 5.41 | | | | 20,460 | | | | 104 | | |
| Class I | |
| | 12-31-11 | | | | 0.90 | | | | — | | | | 11.32 | | | | 3.70 | | | | 0.66 | | | | 0.52 | | | | 0.52 | | | | 4.22 | | | | 330,477 | | | | 590 | | |
| | 12-31-10 | | | | 0.36 | | | | — | | | | 11.77 | | | | 15.86 | | | | 0.54 | | | | 0.52 | | | | 0.52 | | | | 6.82 | | | | 386,383 | | | | 117 | | |
| | 12-31-09 | | | | 0.41 | | | | — | | | | 10.48 | | | | 22.14 | | | | 0.54 | | | | 0.53 | | | | 0.53 | | | | 4.99 | | | | 334,527 | | | | 136 | | |
| | 12-31-08 | | | | 0.60 | | | | — | | | | 8.92 | | | | (15.89 | ) | | | 0.54 | | | | 0.54 | † | | | 0.54 | † | | | 5.12 | † | | | 451,197 | | | | 108 | | |
| | 12-31-07 | | | | 0.52 | | | | — | | | | 11.20 | | | | 8.76 | | | | 0.54 | | | | 0.54 | | | | 0.54 | | | | 5.80 | | | | 415,035 | | | | 104 | | |
| Class S | |
| | 12-31-11 | | | | 0.86 | | | | — | | | | 11.33 | | | | 3.51 | | | | 0.91 | | | | 0.77 | | | | 0.77 | | | | 3.97 | | | | 67,103 | | | | 590 | | |
| | 12-31-10 | | | | 0.36 | | | | — | | | | 11.76 | | | | 15.54 | | | | 0.79 | | | | 0.77 | | | | 0.77 | | | | 6.57 | | | | 93,346 | | | | 117 | | |
| | 12-31-09 | | | | 0.36 | | | | — | | | | 10.50 | | | | 21.85 | | | | 0.79 | | | | 0.76 | | | | 0.76 | | | | 5.04 | | | | 97,596 | | | | 136 | | |
| | 12-31-08 | | | | 0.58 | | | | — | | | | 8.92 | | | | (16.10 | ) | | | 0.79 | | | | 0.75 | † | | | 0.75 | † | | | 4.53 | † | | | 88,592 | | | | 108 | | |
| | 12-31-07 | | | | 0.49 | | | | — | | | | 11.21 | | | | 8.50 | | | | 0.79 | | | | 0.75 | | | | 0.75 | | | | 5.61 | | | | 83,977 | | | | 104 | | |
See Accompanying Notes to Financial Statements
63
FINANCIAL HIGHLIGHTS (CONTINUED)
Selected data for a share of beneficial interest outstanding throughout each year or period.
| | | | | Income (loss)
from investment
operations | | | | Less distributions | |
| | | Net asset value, beginning of year or period | | Net investment income (loss) | | Net realized and unrealized gain (loss) | | Total from investment operations | | From net investment income | | From net realized gains | | From return of capital | |
| Year or period ended | | ($) | | ($) | | ($) | | ($) | | ($) | | ($) | | ($) | |
| ING Invesco Van Kampen Comstock Portfolio | | | |
| Class ADV | | | |
| | 12-31-11 | | | | 10.13 | | | | 0.11 | | | | (0.35 | ) | | | (0.24 | ) | | | 0.12 | | | | — | | | | — | | |
| | 12-31-10 | | | | 8.92 | | | | 0.09 | | | | 1.23 | | | | 1.32 | | | | 0.11 | | | | — | | | | — | | |
| | 12-31-09 | | | | 7.09 | | | | 0.09 | | | | 1.91 | | | | 2.00 | | | | 0.17 | | | | — | | | | — | | |
| | 12-31-08 | | | | 12.34 | | | | 0.17 | • | | | (4.47 | ) | | | (4.30 | ) | | | 0.30 | | | | 0.65 | | | | — | | |
| | 12-31-07 | | | | 13.17 | | | | 0.17 | • | | | (0.48 | ) | | | (0.31 | ) | | | 0.16 | | | | 0.36 | | | | — | | |
| Class I | | | |
| | 12-31-11 | | | | 10.19 | | | | 0.16 | | | | (0.35 | ) | | | (0.19 | ) | | | 0.17 | | | | — | | | | — | | |
| | 12-31-10 | | | | 8.97 | | | | 0.14 | | | | 1.23 | | | | 1.37 | | | | 0.15 | | | | — | | | | — | | |
| | 12-31-09 | | | | 7.12 | | | | 0.13 | • | | | 1.93 | | | | 2.06 | | | | 0.21 | | | | — | | | | — | | |
| | 12-31-08 | | | | 12.55 | | | | 0.23 | | | | (4.55 | ) | | | (4.32 | ) | | | 0.46 | | | | 0.65 | | | | — | | |
| | 12-31-07 | | | | 13.37 | | | | 0.24 | | | | (0.49 | ) | | | (0.25 | ) | | | 0.21 | | | | 0.36 | | | | — | | |
| Class S | | | |
| | 12-31-11 | | | | 10.18 | | | | 0.15 | | | | (0.37 | ) | | | (0.22 | ) | | | 0.14 | | | | — | | | | — | | |
| | 12-31-10 | | | | 8.96 | | | | 0.11 | | | | 1.24 | | | | 1.35 | | | | 0.13 | | | | — | | | | — | | |
| | 12-31-09 | | | | 7.12 | | | | 0.11 | | | | 1.92 | | | | 2.03 | | | | 0.19 | | | | — | | | | — | | |
| | 12-31-08 | | | | 12.49 | | | | 0.21 | | | | (4.53 | ) | | | (4.32 | ) | | | 0.40 | | | | 0.65 | | | | — | | |
| | 12-31-07 | | | | 13.30 | | | | 0.21 | | | | (0.49 | ) | | | (0.28 | ) | | | 0.17 | | | | 0.36 | | | | — | | |
| ING Invesco Van Kampen Equity and Income Portfolio | | | |
| Class ADV | | | |
| | 12-31-11 | | | | 33.75 | | | | 0.49 | • | | | (1.04 | ) | | | (0.55 | ) | | | 0.63 | | | | — | | | | — | | |
| | 12-31-10 | | | | 30.64 | | | | 0.46 | • | | | 3.13 | | | | 3.59 | | | | 0.48 | | | | — | | | | — | | |
| | 12-31-09 | | | | 25.44 | | | | 0.44 | • | | | 5.17 | | | | 5.61 | | | | 0.41 | | | | — | | | | — | | |
| | 12-31-08 | | | | 37.09 | | | | 0.71 | • | | | (9.08 | ) | | | (8.37 | ) | | | 1.37 | | | | 1.91 | | | | — | | |
| | 12-31-07 | | | | 37.82 | | | | 0.74 | • | | | 0.41 | | | | 1.15 | | | | 0.78 | | | | 1.10 | | | | — | | |
| Class I | | | |
| | 12-31-11 | | | | 34.22 | | | | 0.66 | • | | | (1.05 | ) | | | (0.39 | ) | | | 0.78 | | | | — | | | | — | | |
| | 12-31-10 | | | | 31.03 | | | | 0.63 | • | | | 3.18 | | | | 3.81 | | | | 0.62 | | | | — | | | | — | | |
| | 12-31-09 | | | | 25.75 | | | | 0.59 | • | | | 5.25 | | | | 5.84 | | | | 0.56 | | | | — | | | | — | | |
| | 12-31-08 | | | | 37.76 | | | | 1.03 | | | | (9.38 | ) | | | (8.35 | ) | | | 1.75 | | | | 1.91 | | | | — | | |
| | 12-31-07 | | | | 38.47 | | | | 0.95 | • | | | 0.41 | | | | 1.36 | | | | 0.97 | | | | 1.10 | | | | — | | |
| Class S | | | |
| | 12-31-11 | | | | 33.97 | | | | 0.57 | • | | | (1.04 | ) | | | (0.47 | ) | | | 0.69 | | | | — | | | | — | | |
| | 12-31-10 | | | | 30.81 | | | | 0.54 | • | | | 3.16 | | | | 3.70 | | | | 0.54 | | | | — | | | | — | | |
| | 12-31-09 | | | | 25.58 | | | | 0.51 | • | | | 5.21 | | | | 5.72 | | | | 0.49 | | | | — | | | | — | | |
| | 12-31-08 | | | | 37.50 | | | | 0.79 | • | | | (9.16 | ) | | | (8.37 | ) | | | 1.64 | | | | 1.91 | | | | — | | |
| | 12-31-07 | | | | 38.24 | | | | 0.83 | • | | | 0.42 | | | | 1.25 | | | | 0.89 | | | | 1.10 | | | | — | | |
| Class S2 | | | |
| | 12-31-11 | | | | 33.70 | | | | 0.52 | • | | | (1.03 | ) | | | (0.51 | ) | | | 0.67 | | | | — | | | | — | | |
| | 12-31-10 | | | | 30.62 | | | | 0.50 | • | | | 3.12 | | | | 3.62 | | | | 0.54 | | | | — | | | | — | | |
| | 02-27-09 | (5)-12-31-09 | | | 22.18 | | | | 0.33 | | | | 8.58 | | | | 8.91 | | | | 0.47 | | | | — | | | | — | | |
| ING JPMorgan Mid Cap Value Portfolio | | | |
| Class ADV | | | |
| | 12-31-11 | | | | 13.78 | | | | 0.07 | | | | 0.15 | | | | 0.22 | | | | 0.09 | | | | — | | | | — | | |
| | 12-31-10 | | | | 11.30 | | | | 0.07 | | | | 2.48 | | | | 2.55 | | | | 0.07 | | | | — | | | | — | | |
| | 12-31-09 | | | | 9.24 | | | | 0.12 | | | | 2.21 | | | | 2.33 | | | | 0.11 | | | | 0.16 | | | | — | | |
| | 12-31-08 | | | | 15.50 | | | | 0.14 | | | | (4.90 | ) | | | (4.76 | ) | | | 0.18 | | | | 1.32 | | | | — | | |
| | 12-31-07 | | | | 16.03 | | | | 0.09 | | | | 0.25 | | | | 0.34 | | | | 0.07 | | | | 0.80 | | | | — | | |
| Class I | | | |
| | 12-31-11 | | | | 13.95 | | | | 0.15 | | | | 0.13 | | | | 0.28 | | | | 0.15 | | | | — | | | | — | | |
| | 12-31-10 | | | | 11.42 | | | | 0.14 | | | | 2.52 | | | | 2.66 | | | | 0.13 | | | | — | | | | — | | |
| | 12-31-09 | | | | 9.33 | | | | 0.17 | | | | 2.23 | | | | 2.40 | | | | 0.15 | | | | 0.16 | | | | — | | |
| | 12-31-08 | | | | 15.77 | | | | 0.22 | | | | (5.00 | ) | | | (4.78 | ) | | | 0.34 | | | | 1.32 | | | | — | | |
| | 12-31-07 | | | | 16.26 | | | | 0.19 | • | | | 0.24 | | | | 0.43 | | | | 0.12 | | | | 0.80 | | | | — | | |
| | | | | Ratios to average net assets | | Supplemental
data | |
| | | Total distributions | | Payment by affiliate | | Net asset value, end of year or period | | Total Return(1) | | Expenses before reductions/additions(2)(3)(4) | | Expenses net of fee waivers and/or recoupments if any(2)(3)(4) | | Expense net of all reductions/additions(2)(3)(4) | | Net investment income (loss)(2)(4) | | Net assets, end of year or period | | Portfolio turnover rate | |
| Year or period ended | | ($) | | ($) | | ($) | | (%) | | (%) | | (%) | | (%) | | (%) | | ($000's) | | (%) | |
| ING Invesco Van Kampen Comstock Portfolio | |
| Class ADV | |
| | 12-31-11 | | | | 0.12 | | | | — | | | | 9.77 | | | | (2.32 | ) | | | 1.35 | | | | 1.31 | | | | 1.31 | | | | 1.09 | | | | 17,338 | | | | 23 | | |
| | 12-31-10 | | | | 0.11 | | | | — | | | | 10.13 | | | | 14.81 | | | | 1.35 | | | | 1.31 | † | | | 1.31 | † | | | 0.90 | † | | | 17,041 | | | | 23 | | |
| | 12-31-09 | | | | 0.17 | | | | — | | | | 8.92 | | | | 28.22 | | | | 1.35 | | | | 1.31 | | | | 1.31 | | | | 1.16 | | | | 16,306 | | | | 27 | | |
| | 12-31-08 | | | | 0.95 | | | | — | | | | 7.09 | | | | (36.64 | ) | | | 1.35 | | | | 1.31 | | | | 1.31 | | | | 1.66 | | | | 13,778 | | | | 47 | | |
| | 12-31-07 | | | | 0.52 | | | | — | | | | 12.34 | | | | (2.51 | ) | | | 1.35 | | | | 1.34 | | | | 1.34 | | | | 1.27 | | | | 40,111 | | | | 26 | | |
| Class I | |
| | 12-31-11 | | | | 0.17 | | | | — | | | | 9.83 | | | | (1.81 | ) | | | 0.85 | | | | 0.81 | | | | 0.81 | | | | 1.59 | | | | 45,814 | | | | 23 | | |
| | 12-31-10 | | | | 0.15 | | | | — | | | | 10.19 | | | | 15.38 | | | | 0.85 | | | | 0.81 | † | | | 0.81 | † | | | 1.40 | † | | | 49,022 | | | | 23 | | |
| | 12-31-09 | | | | 0.21 | | | | — | | | | 8.97 | | | | 28.92 | | | | 0.85 | | | | 0.81 | | | | 0.81 | | | | 1.78 | | | | 50,240 | | | | 27 | | |
| | 12-31-08 | | | | 1.11 | | | | — | | | | 7.12 | | | | (36.36 | ) | | | 0.85 | | | | 0.81 | | | | 0.81 | | | | 2.20 | | | | 357,863 | | | | 47 | | |
| | 12-31-07 | | | | 0.57 | | | | — | | | | 12.55 | | | | (2.04 | ) | | | 0.85 | | | | 0.84 | | | | 0.84 | | | | 1.78 | | | | 608,951 | | | | 26 | | |
| Class S | |
| | 12-31-11 | | | | 0.14 | | | | — | | | | 9.82 | | | | (2.09 | ) | | | 1.10 | | | | 1.06 | | | | 1.06 | | | | 1.34 | | | | 238,369 | | | | 23 | | |
| | 12-31-10 | | | | 0.13 | | | | — | | | | 10.18 | | | | 15.13 | | | | 1.10 | | | | 1.06 | † | | | 1.06 | † | | | 1.15 | † | | | 264,791 | | | | 23 | | |
| | 12-31-09 | | | | 0.19 | | | | — | | | | 8.96 | | | | 28.53 | | | | 1.10 | | | | 1.06 | | | | 1.06 | | | | 1.42 | | | | 237,588 | | | | 27 | | |
| | 12-31-08 | | | | 1.05 | | | | — | | | | 7.12 | | | | (36.48 | ) | | | 1.10 | | | | 1.06 | | | | 1.06 | | | | 1.95 | | | | 197,126 | | | | 47 | | |
| | 12-31-07 | | | | 0.53 | | | | — | | | | 12.49 | | | | (2.28 | ) | | | 1.10 | | | | 1.09 | | | | 1.09 | | | | 1.67 | | | | 342,155 | | | | 26 | | |
| ING Invesco Van Kampen Equity and Income Portfolio | |
| Class ADV | |
| | 12-31-11 | | | | 0.63 | | | | — | | | | 32.57 | | | | (1.58 | ) | | | 1.15 | | | | 1.15 | | | | 1.15 | | | | 1.46 | | | | 22,313 | | | | 20 | | |
| | 12-31-10 | | | | 0.48 | | | | — | | | | 33.75 | | | | 11.77 | | | | 1.15 | | | | 1.15 | † | | | 1.15 | † | | | 1.44 | † | | | 14,995 | | | | 38 | | |
| | 12-31-09 | | | | 0.41 | | | | — | | | | 30.64 | | | | 22.06 | | | | 1.13 | | | | 1.13 | † | | | 1.12 | † | | | 1.66 | † | | | 10,735 | | | | 74 | | |
| | 12-31-08 | | | | 3.28 | | | | — | | | | 25.44 | | | | (23.76 | ) | | | 1.07 | | | | 1.07 | | | | 1.07 | | | | 2.21 | | | | 10,334 | | | | 111 | | |
| | 12-31-07 | | | | 1.88 | | | | — | | | | 37.09 | | | | 3.06 | | | | 1.07 | | | | 1.07 | | | | 1.07 | | | | 1.92 | | | | 14,242 | | | | 89 | | |
| Class I | |
| | 12-31-11 | | | | 0.78 | | | | — | | | | 33.05 | | | | (1.08 | ) | | | 0.65 | | | | 0.65 | | | | 0.65 | | | | 1.93 | | | | 530,983 | | | | 20 | | |
| | 12-31-10 | | | | 0.62 | | | | — | | | | 34.22 | | | | 12.32 | | | | 0.65 | | | | 0.65 | † | | | 0.65 | † | | | 1.96 | † | | | 594,282 | | | | 38 | | |
| | 12-31-09 | | | | 0.56 | | | | — | | | | 31.03 | | | | 22.69 | | | | 0.63 | | | | 0.63 | † | | | 0.62 | † | | | 2.16 | † | | | 572,527 | | | | 74 | | |
| | 12-31-08 | | | | 3.66 | | | | — | | | | 25.75 | | | | (23.38 | ) | | | 0.57 | | | | 0.57 | | | | 0.57 | | | | 2.70 | | | | 516,378 | | | | 111 | | |
| | 12-31-07 | | | | 2.07 | | | | — | | | | 37.76 | | | | 3.56 | | | | 0.57 | | | | 0.57 | | | | 0.57 | | | | 2.42 | | | | 811,810 | | | | 89 | | |
| Class S | |
| | 12-31-11 | | | | 0.69 | | | | — | | | | 32.81 | | | | (1.33 | ) | | | 0.90 | | | | 0.90 | | | | 0.90 | | | | 1.67 | | | | 205,145 | | | | 20 | | |
| | 12-31-10 | | | | 0.54 | | | | — | | | | 33.97 | | | | 12.05 | | | | 0.90 | | | | 0.90 | † | | | 0.90 | † | | | 1.71 | † | | | 240,865 | | | | 38 | | |
| | 12-31-09 | | | | 0.49 | | | | — | | | | 30.81 | | | | 22.37 | | | | 0.88 | | | | 0.88 | † | | | 0.87 | † | | | 1.91 | † | | | 217,798 | | | | 74 | | |
| | 12-31-08 | | | | 3.55 | | | | — | | | | 25.58 | | | | (23.56 | ) | | | 0.82 | | | | 0.82 | | | | 0.82 | | | | 2.49 | | | | 193,142 | | | | 111 | | |
| | 12-31-07 | | | | 1.99 | | | | — | | | | 37.50 | | | | 3.29 | | | | 0.82 | | | | 0.82 | | | | 0.82 | | | | 2.16 | | | | 133,013 | | | | 89 | | |
| Class S2 | |
| | 12-31-11 | | | | 0.67 | | | | — | | | | 32.52 | | | | (1.48 | ) | | | 1.15 | | | | 1.05 | | | | 1.05 | | | | 1.55 | | | | 967 | | | | 20 | | |
| | 12-31-10 | | | | 0.54 | | | | — | | | | 33.70 | | | | 11.88 | | | | 1.15 | | | | 1.05 | † | | | 1.05 | † | | | 1.61 | † | | | 843 | | | | 38 | | |
| | 02-27-09 | (5)-12-31-09 | | | 0.47 | | | | — | | | | 30.62 | | | | 40.18 | | | | 1.13 | | | | 1.03 | † | | | 1.02 | † | | | 1.65 | † | | | 4 | | | | 74 | | |
| ING JPMorgan Mid Cap Value Portfolio | |
| Class ADV | |
| | 12-31-11 | | | | 0.09 | | | | — | | | | 13.91 | | | | 1.60 | | | | 1.50 | | | | 1.50 | | | | 1.50 | | | | 0.54 | | | | 30,671 | | | | 36 | | |
| | 12-31-10 | | | | 0.07 | | | | — | | | | 13.78 | | | | 22.63 | | | | 1.50 | | | | 1.50 | † | | | 1.50 | † | | | 0.69 | † | | | 26,954 | | | | 40 | | |
| | 12-31-09 | | | | 0.27 | | | | — | | | | 11.30 | | | | 25.34 | | | | 1.50 | | | | 1.50 | † | | | 1.50 | † | | | 1.33 | † | | | 16,622 | | | | 40 | | |
| | 12-31-08 | | | | 1.50 | | | | — | | | | 9.24 | | | | (33.17 | ) | | | 1.50 | | | | 1.50 | † | | | 1.50 | † | | | 0.94 | † | | | 13,624 | | | | 58 | | |
| | 12-31-07 | | | | 0.87 | | | | — | | | | 15.50 | | | | 2.06 | | | | 1.50 | | | | 1.50 | | | | 1.50 | | | | 0.64 | | | | 24,824 | | | | 52 | | |
| Class I | |
| | 12-31-11 | | | | 0.15 | | | | — | | | | 14.08 | | | | 2.07 | | | | 1.00 | | | | 1.00 | | | | 1.00 | | | | 1.03 | | | | 125,233 | | | | 36 | | |
| | 12-31-10 | | | | 0.13 | | | | — | | | | 13.95 | | | | 23.30 | | | | 1.00 | | | | 1.00 | † | | | 1.00 | † | | | 1.18 | † | | | 126,864 | | | | 40 | | |
| | 12-31-09 | | | | 0.31 | | | | — | | | | 11.42 | | | | 25.90 | | | | 1.00 | | | | 1.00 | † | | | 1.00 | † | | | 1.83 | † | | | 100,239 | | | | 40 | | |
| | 12-31-08 | | | | 1.66 | | | | — | | | | 9.33 | | | | (32.86 | ) | | | 1.00 | | | | 1.00 | † | | | 1.00 | † | | | 1.46 | † | | | 80,515 | | | | 58 | | |
| | 12-31-07 | | | | 0.92 | | | | — | | | | 15.77 | | | | 2.61 | | | | 1.00 | | | | 1.00 | | | | 1.00 | | | | 1.15 | | | | 145,638 | | | | 52 | | |
See Accompanying Notes to Financial Statements
64
FINANCIAL HIGHLIGHTS (CONTINUED)
Selected data for a share of beneficial interest outstanding throughout each year or period.
| | | | | Income (loss)
from investment
operations | | | | Less distributions | |
| | | Net asset value, beginning of year or period | | Net investment income (loss) | | Net realized and unrealized gain (loss) | | Total from investment operations | | From net investment income | | From net realized gains | | From return of capital | |
| Year or period ended | | ($) | | ($) | | ($) | | ($) | | ($) | | ($) | | ($) | |
| ING JPMorgan Mid Cap Value Portfolio (continued) | | | |
| Class S | | | |
| | 12-31-11 | | | | 13.88 | | | | 0.11 | | | | 0.14 | | | | 0.25 | | | | 0.12 | | | | — | | | | — | | |
| | 12-31-10 | | | | 11.37 | | | | 0.11 | | | | 2.50 | | | | 2.61 | | | | 0.10 | | | | — | | | | — | | |
| | 12-31-09 | | | | 9.29 | | | | 0.15 | | | | 2.22 | | | | 2.37 | | | | 0.13 | | | | 0.16 | | | | — | | |
| | 12-31-08 | | | | 15.67 | | | | 0.16 | • | | | (4.94 | ) | | | (4.78 | ) | | | 0.28 | | | | 1.32 | | | | — | | |
| | 12-31-07 | | | | 16.17 | | | | 0.15 | | | | 0.24 | | | | 0.39 | | | | 0.09 | | | | 0.80 | | | | — | | |
| Class S2 | | | |
| | 12-31-11 | | | | 13.79 | | | | 0.13 | • | | | 0.10 | | | | 0.23 | | | | 0.14 | | | | — | | | | — | | |
| | 12-31-10 | | | | 11.30 | | | | 0.09 | | | | 2.48 | | | | 2.57 | | | | 0.08 | | | | — | | | | — | | |
| | 02-27-09 | (5)-12-31-09 | | | 7.54 | | | | 0.12 | | | | 3.92 | | | | 4.04 | | | | 0.12 | | | | 0.16 | | | | — | | |
| ING Oppenheimer Global Portfolio | | | |
| Class ADV | | | |
| | 12-31-11 | | | | 13.46 | | | | 0.13 | | | | (1.29 | ) | | | (1.16 | ) | | | 0.15 | | | | — | | | | — | | |
| | 12-31-10 | | | | 11.83 | | | | 0.11 | • | | | 1.69 | | | | 1.80 | | | | 0.17 | | | | — | | | | — | | |
| | 12-31-09 | | | | 8.80 | | | | 0.11 | • | | | 3.28 | | | | 3.39 | | | | 0.17 | | | | 0.19 | | | | — | | |
| | 12-31-08 | | | | 16.38 | | | | 0.30 | | | | (6.53 | ) | | | (6.23 | ) | | | 0.23 | | | | 1.12 | | | | — | | |
| | 12-31-07 | | | | 16.22 | | | | 0.17 | • | | | 0.81 | | | | 0.98 | | | | 0.11 | | | | 0.71 | | | | — | | |
| Class I | | | |
| | 12-31-11 | | | | 13.88 | | | | 0.20 | • | | | (1.34 | ) | | | (1.14 | ) | | | 0.20 | | | | — | | | | — | | |
| | 12-31-10 | | | | 12.17 | | | | 0.18 | • | | | 1.74 | | | | 1.92 | | | | 0.21 | | | | — | | | | — | | |
| | 12-31-09 | | | | 9.07 | | | | 0.17 | • | | | 3.38 | | | | 3.55 | | | | 0.26 | | | | 0.19 | | | | — | | |
| | 12-31-08 | | | | 16.87 | | | | 0.32 | | | | (6.67 | ) | | | (6.35 | ) | | | 0.33 | | | | 1.12 | | | | — | | |
| | 12-31-07 | | | | 16.68 | | | | 0.27 | • | | | 0.82 | | | | 1.09 | | | | 0.19 | | | | 0.71 | | | | — | | |
| Class S | | | |
| | 12-31-11 | | | | 13.50 | | | | 0.16 | | | | (1.30 | ) | | | (1.14 | ) | | | 0.17 | | | | — | | | | — | | |
| | 12-31-10 | | | | 11.84 | | | | 0.14 | • | | | 1.70 | | | | 1.84 | | | | 0.18 | | | | — | | | | — | | |
| | 12-31-09 | | | | 8.82 | | | | 0.14 | • | | | 3.30 | | | | 3.44 | | | | 0.23 | | | | 0.19 | | | | — | | |
| | 12-31-08 | | | | 16.46 | | | | 0.23 | • | | | (6.46 | ) | | | (6.23 | ) | | | 0.29 | | | | 1.12 | | | | — | | |
| | 12-31-07 | | | | 16.31 | | | | 0.23 | • | | | 0.80 | | | | 1.03 | | | | 0.17 | | | | 0.71 | | | | — | | |
| Class S2 | | | |
| | 12-31-11 | | | | 13.36 | | | | 0.06 | • | | | (1.21 | ) | | | (1.15 | ) | | | 0.20 | | | | — | | | | — | | |
| | 12-31-10 | | | | 11.73 | | | | 0.12 | | | | 1.68 | | | | 1.80 | | | | 0.17 | | | | — | | | | — | | |
| | 02-27-09 | (5)-12-31-09 | | | 7.35 | | | | 0.12 | • | | | 4.71 | | | | 4.83 | | | | 0.26 | | | | 0.19 | | | | — | | |
| ING PIMCO Total Return Portfolio | | | |
| Class ADV | | | |
| | 12-31-11 | | | | 11.89 | | | | 0.28 | • | | | 0.07 | | | | 0.35 | | | | 0.34 | | | | 0.42 | | | | — | | |
| | 12-31-10 | | | | 11.46 | | | | 0.23 | • | | | 0.61 | | | | 0.84 | | | | 0.39 | | | | 0.02 | | | | — | | |
| | 12-31-09 | | | | 10.91 | | | | 0.35 | • | | | 0.96 | | | | 1.31 | | | | 0.35 | | | | 0.41 | | | | — | | |
| | 12-31-08 | | | | 11.66 | | | | 0.46 | • | | | (0.52 | ) | | | (0.06 | ) | | | 0.52 | | | | 0.17 | | | | — | | |
| | 12-31-07 | | | | 11.03 | | | | 0.44 | • | | | 0.55 | | | | 0.99 | | | | 0.36 | | | | — | | | | — | | |
| Class I | | | |
| | 12-31-11 | | | | 12.15 | | | | 0.36 | | | | 0.06 | | | | 0.42 | | | | 0.39 | | | | 0.42 | | | | — | | |
| | 12-31-10 | | | | 11.67 | | | | 0.29 | • | | | 0.63 | | | | 0.92 | | | | 0.42 | | | | 0.02 | | | | — | | |
| | 12-31-09 | | | | 11.08 | | | | 0.42 | • | | | 0.97 | | | | 1.39 | | | | 0.39 | | | | 0.41 | | | | — | | |
| | 12-31-08 | | | | 11.81 | | | | 0.53 | • | | | (0.54 | ) | | | (0.01 | ) | | | 0.55 | | | | 0.17 | | | | — | | |
| | 12-31-07 | | | | 11.16 | | | | 0.51 | • | | | 0.55 | | | | 1.06 | | | | 0.41 | | | | — | | | | — | | |
| Class S | | | |
| | 12-31-11 | | | | 12.04 | | | | 0.31 | | | | 0.08 | | | | 0.39 | | | | 0.36 | | | | 0.42 | | | | — | | |
| | 12-31-10 | | | | 11.58 | | | | 0.26 | • | | | 0.62 | | | | 0.88 | | | | 0.40 | | | | 0.02 | | | | — | | |
| | 12-31-09 | | | | 11.01 | | | | 0.39 | • | | | 0.96 | | | | 1.35 | | | | 0.37 | | | | 0.41 | | | | — | | |
| | 12-31-08 | | | | 11.75 | | | | 0.49 | • | | | (0.52 | ) | | | (0.03 | ) | | | 0.54 | | | | 0.17 | | | | — | | |
| | 12-31-07 | | | | 11.11 | | | | 0.48 | • | | | 0.55 | | | | 1.03 | | | | 0.39 | | | | — | | | | — | | |
| Class S2 | | | |
| | 12-31-11 | | | | 11.85 | | | | 0.30 | • | | | 0.07 | | | | 0.37 | | | | 0.38 | | | | 0.42 | | | | — | | |
| | 12-31-10 | | | | 11.44 | | | | 0.29 | • | | | 0.56 | | | | 0.85 | | | | 0.42 | | | | 0.02 | | | | — | | |
| | 02-27-09 | (5)-12-31-09 | | | 10.55 | | | | 0.35 | • | | | 1.34 | | | | 1.69 | | | | 0.39 | | | | 0.41 | | | | — | | |
| | | | | Ratios to average net assets | | Supplemental
data | |
| | | Total distributions | | Payment by affiliate | | Net asset value, end of year or period | | Total Return(1) | | Expenses before reductions/additions(2)(3)(4) | | Expenses net of fee waivers and/or recoupments if any(2)(3)(4) | | Expense net of all reductions/additions(2)(3)(4) | | Net investment income (loss)(2)(4) | | Net assets, end of year or period | | Portfolio turnover rate | |
| Year or period ended | | ($) | | ($) | | ($) | | (%) | | (%) | | (%) | | (%) | | (%) | | ($000's) | | (%) | |
| ING JPMorgan Mid Cap Value Portfolio (continued) | |
| Class S | |
| | 12-31-11 | | | | 0.12 | | | | — | | | | 14.01 | | | | 1.82 | | | | 1.25 | | | | 1.25 | | | | 1.25 | | | | 0.78 | | | | 178,083 | | | | 36 | | |
| | 12-31-10 | | | | 0.10 | | | | — | | | | 13.88 | | | | 22.97 | | | | 1.25 | | | | 1.25 | † | | | 1.25 | † | | | 0.94 | † | | | 172,465 | | | | 40 | | |
| | 12-31-09 | | | | 0.29 | | | | — | | | | 11.37 | | | | 25.65 | | | | 1.25 | | | | 1.25 | † | | | 1.25 | † | | | 1.58 | † | | | 113,016 | | | | 40 | | |
| | 12-31-08 | | | | 1.60 | | | | — | | | | 9.29 | | | | (33.04 | ) | | | 1.25 | | | | 1.25 | † | | | 1.25 | † | | | 1.29 | † | | | 78,604 | | | | 58 | | |
| | 12-31-07 | | | | 0.89 | | | | — | | | | 15.67 | | | | 2.34 | | | | 1.25 | | | | 1.25 | | | | 1.25 | | | | 0.89 | | | | 89,851 | | | | 52 | | |
| Class S2 | |
| | 12-31-11 | | | | 0.14 | | | | — | | | | 13.88 | | | | 1.67 | | | | 1.50 | | | | 1.40 | | | | 1.40 | | | | 0.97 | | | | 178 | | | | 36 | | |
| | 12-31-10 | | | | 0.08 | | | | — | | | | 13.79 | | | | 22.75 | | | | 1.50 | | | | 1.40 | † | | | 1.40 | † | | | 0.76 | † | | | 5 | | | | 40 | | |
| | 02-27-09 | (5)-12-31-09 | | | 0.28 | | | | — | | | | 11.30 | | | | 53.76 | | | | 1.50 | | | | 1.40 | † | | | 1.40 | † | | | 1.51 | † | | | 4 | | | | 40 | | |
| ING Oppenheimer Global Portfolio | |
| Class ADV | |
| | 12-31-11 | | | | 0.15 | | | | — | | | | 12.15 | | | | (8.60 | ) | | | 1.16 | | | | 1.16 | | | | 1.16 | | | | 0.96 | | | | 65,051 | | | | 12 | | |
| | 12-31-10 | | | | 0.17 | | | | — | | | | 13.46 | | | | 15.42 | | | | 1.16 | | | | 1.16 | † | | | 1.16 | † | | | 0.88 | † | | | 71,603 | | | | 15 | | |
| | 12-31-09 | | | | 0.36 | | | | — | | | | 11.83 | | | | 39.04 | | | | 1.16 | | | | 1.16 | † | | | 1.16 | † | | | 1.09 | † | | | 54,626 | | | | 12 | | |
| | 12-31-08 | | | | 1.35 | | | | — | | | | 8.80 | | | | (40.65 | ) | | | 1.16 | | | | 1.16 | † | | | 1.16 | † | | | 1.60 | † | | | 40,813 | | | | 12 | | |
| | 12-31-07 | | | | 0.82 | | | | — | | | | 16.38 | | | | 6.04 | | | | 1.16 | | | | 1.15 | | | | 0.15 | | | | 1.08 | | | | 99,669 | | | | 14 | | |
| Class I | |
| | 12-31-11 | | | | 0.20 | | | | — | | | | 12.54 | | | | (8.13 | ) | | | 0.66 | | | | 0.66 | | | | 0.66 | | | | 1.46 | | | | 1,234,551 | | | | 12 | | |
| | 12-31-10 | | | | 0.21 | | | | — | | | | 13.88 | | | | 16.06 | | | | 0.66 | | | | 0.66 | † | | | 0.66 | † | | | 1.40 | † | | | 1,479,319 | | | | 15 | | |
| | 12-31-09 | | | | 0.45 | | | | — | | | | 12.17 | | | | 39.73 | | | | 0.66 | | | | 0.66 | † | | | 0.66 | † | | | 1.63 | † | | | 1,414,460 | | | | 12 | | |
| | 12-31-08 | | | | 1.45 | | | | — | | | | 9.07 | | | | (40.38 | ) | | | 0.66 | | | | 0.66 | † | | | 0.66 | † | | | 2.07 | † | | | 1,124,127 | | | | 12 | | |
| | 12-31-07 | | | | 0.90 | | | | — | | | | 16.87 | | | | 6.57 | | | | 0.66 | | | | 0.66 | | | | 0.66 | | | | 1.57 | | | | 2,289,589 | | | | 14 | | |
| Class S | |
| | 12-31-11 | | | | 0.17 | | | | — | | | | 12.19 | | | | (8.38 | ) | | | 0.91 | | | | 0.91 | | | | 0.91 | | | | 1.20 | | | | 171,755 | | | | 12 | | |
| | 12-31-10 | | | | 0.18 | | | | — | | | | 13.50 | | | | 15.80 | | | | 0.91 | | | | 0.91 | † | | | 0.91 | † | | | 1.17 | † | | | 184,961 | | | | 15 | | |
| | 12-31-09 | | | | 0.42 | | | | — | | | | 11.84 | | | | 39.51 | | | | 0.91 | | | | 0.91 | † | | | 0.91 | † | | | 1.45 | † | | | 182,326 | | | | 12 | | |
| | 12-31-08 | | | | 1.41 | | | | — | | | | 8.82 | | | | (40.55 | ) | | | 0.91 | | | | 0.91 | † | | | 0.91 | † | | | 1.80 | † | | | 157,261 | | | | 12 | | |
| | 12-31-07 | | | | 0.88 | | | | — | | | | 16.46 | | | | 6.35 | | | | 0.91 | | | | 0.91 | | | | 0.91 | | | | 1.37 | | | | 232,651 | | | | 14 | | |
| Class S2 | |
| | 12-31-11 | | | | 0.20 | | | | — | | | | 12.01 | | | | (8.52 | ) | | | 1.16 | | | | 1.06 | | | | 1.06 | | | | 0.52 | | | | 755 | | | | 12 | | |
| | 12-31-10 | | | | 0.17 | | | | — | | | | 13.36 | | | | 15.63 | | | | 1.16 | | | | 1.06 | † | | | 1.06 | † | | | 0.98 | † | | | 5 | | | | 15 | | |
| | 02-27-09 | (5)-12-31-09 | | | 0.45 | | | | — | | | | 11.73 | | | | 66.43 | | | | 1.16 | | | | 1.06 | † | | | 1.06 | † | | | 1.34 | † | | | 5 | | | | 12 | | |
| ING PIMCO Total Return Portfolio | |
| Class ADV | |
| | 12-31-11 | | | | 0.76 | | | | — | | | | 11.48 | | | | 2.95 | | | | 1.09 | | | | 1.08 | | | | 1.08 | | | | 2.41 | | | | 161,860 | | | | 783 | | |
| | 12-31-10 | | | | 0.41 | | | | — | | | | 11.89 | | | | 7.30 | | | | 1.09 | | | | 1.08 | | | | 1.08 | | | | 1.96 | | | | 152,733 | | | | 558 | | |
| | 12-31-09 | | | | 0.76 | | | | — | | | | 11.46 | | | | 12.32 | | | | 1.13 | | | | 1.12 | | | | 1.12 | | | | 3.10 | | | | 93,043 | | | | 737 | | |
| | 12-31-08 | | | | 0.69 | | | | — | | | | 10.91 | | | | (0.54 | ) | | | 1.16 | | | | 1.15 | | | | 1.15 | | | | 4.04 | | | | 44,599 | | | | 872 | | |
| | 12-31-07 | | | | 0.36 | | | | — | | | | 11.66 | | | | 9.25 | | | | 1.21 | (a) | | | 1.21 | (a) | | | 1.21 | (a) | | | 3.98 | (a) | | | 33,445 | | | | 863 | | |
| Class I | |
| | 12-31-11 | | | | 0.81 | | | | — | | | | 11.76 | | | | 3.46 | | | | 0.59 | | | | 0.58 | | | | 0.58 | | | | 2.90 | | | | 523,551 | | | | 783 | | |
| | 12-31-10 | | | | 0.44 | | | | — | | | | 12.15 | | | | 7.84 | | | | 0.59 | | | | 0.58 | | | | 0.58 | | | | 2.43 | | | | 534,495 | | | | 558 | | |
| | 12-31-09 | | | | 0.80 | | | | — | | | | 11.67 | | | | 12.89 | | | | 0.63 | | | | 0.62 | | | | 0.62 | | | | 3.67 | | | | 430,220 | | | | 737 | | |
| | 12-31-08 | | | | 0.72 | | | | — | | | | 11.08 | | | | (0.04 | ) | | | 0.66 | | | | 0.65 | | | | 0.65 | | | | 4.55 | | | | 265,311 | | | | 872 | | |
| | 12-31-07 | | | | 0.41 | | | | — | | | | 11.81 | | | | 9.79 | | | | 0.71 | (a) | | | 0.71 | (a) | | | 0.71 | (a) | | | 4.49 | (a) | | | 320,725 | | | | 863 | | |
| Class S | |
| | 12-31-11 | | | | 0.78 | | | | — | | | | 11.65 | | | | 3.25 | | | | 0.84 | | | | 0.83 | | | | 0.83 | | | | 2.65 | | | | 493,803 | | | | 783 | | |
| | 12-31-10 | | | | 0.42 | | | | — | | | | 12.04 | | | | 7.56 | | | | 0.84 | | | | 0.83 | | | | 0.83 | | | | 2.18 | | | | 474,076 | | | | 558 | | |
| | 12-31-09 | | | | 0.78 | | | | — | | | | 11.58 | | | | 12.62 | | | | 0.88 | | | | 0.87 | | | | 0.87 | | | | 3.42 | | | | 352,984 | | | | 737 | | |
| | 12-31-08 | | | | 0.71 | | | | — | | | | 11.01 | | | | (0.28 | ) | | | 0.91 | | | | 0.90 | | | | 0.90 | | | | 4.30 | | | | 192,259 | | | | 872 | | |
| | 12-31-07 | | | | 0.39 | | | | — | | | | 11.75 | | | | 9.51 | | | | 0.96 | (a) | | | 0.96 | (a) | | | 0.96 | (a) | | | 4.23 | (a) | | | 122,274 | | | | 863 | | |
| Class S2 | |
| | 12-31-11 | | | | 0.80 | | | | — | | | | 11.42 | | | | 3.10 | | | | 1.09 | | | | 0.98 | | | | 0.98 | | | | 2.54 | | | | 1,829 | | | | 783 | | |
| | 12-31-10 | | | | 0.44 | | | | — | | | | 11.85 | | | | 7.38 | | | | 1.09 | | | | 0.98 | | | | 0.98 | | | | 2.42 | | | | 1,003 | | | | 558 | | |
| | 02-27-09 | (5)-12-31-09 | | | 0.80 | | | | — | | | | 11.44 | | | | 16.38 | | | | 1.13 | | | | 1.02 | | | | 1.02 | | | | 3.67 | | | | 3 | | | | 737 | | |
See Accompanying Notes to Financial Statements
65
FINANCIAL HIGHLIGHTS (CONTINUED)
Selected data for a share of beneficial interest outstanding throughout each year or period.
| | | | | Income (loss)
from investment
operations | | | | Less distributions | |
| | | Net asset value, beginning of year or period | | Net investment income (loss) | | Net realized and unrealized gain (loss) | | Total from investment operations | | From net investment income | | From net realized gains | | From return of capital | |
| Year or period ended | | ($) | | ($) | | ($) | | ($) | | ($) | | ($) | | ($) | |
| ING Pioneer High Yield Portfolio | | | |
| Class I | | | |
| | 12-31-11 | | | | 11.24 | | | | 0.63 | | | | (0.70 | ) | | | (0.07 | ) | | | 0.62 | | | | — | | | | — | | |
| | 12-31-10 | | | | 10.05 | | | | 0.65 | | | | 1.19 | | | | 1.84 | | | | 0.65 | | | | — | | | | — | | |
| | 12-31-09 | | | | 6.52 | | | | 0.67 | • | | | 3.49 | | | | 4.16 | | | | 0.63 | | | | — | | | | — | | |
| | 12-31-08 | | | | 10.25 | | | | 0.74 | • | | | (3.54 | ) | | | (2.80 | ) | | | 0.70 | | | | 0.23 | | | | — | | |
| | 12-31-07 | | | | 10.22 | | | | 0.59 | • | | | 0.03 | | | | 0.62 | | | | 0.59 | | | | — | | | | — | | |
| Class S | | | |
| | 12-31-11 | | | | 11.23 | | | | 0.60 | • | | | (0.69 | ) | | | (0.09 | ) | | | 0.60 | | | | — | | | | — | | |
| | 12-31-10 | | | | 10.04 | | | | 0.62 | • | | | 1.19 | | | | 1.81 | | | | 0.62 | | | | — | | | | — | | |
| | 12-31-09 | | | | 6.52 | | | | 0.61 | • | | | 3.52 | | | | 4.13 | | | | 0.61 | | | | — | | | | — | | |
| | 12-31-08 | | | | 10.25 | | | | 0.67 | • | | | (3.49 | ) | | | (2.82 | ) | | | 0.68 | | | | 0.23 | | | | — | | |
| | 12-31-07 | | | | 10.22 | | | | 0.57 | • | | | 0.03 | | | | 0.60 | | | | 0.57 | | | | — | | | | — | | |
| ING T. Rowe Price Diversified Mid Cap Growth Portfolio | | | |
| Class ADV | | | |
| | 12-31-11 | | | | 8.25 | | | | (0.03 | ) | | | (0.32 | ) | | | (0.35 | ) | | | 0.01 | | | | — | | | | — | | |
| | 12-31-10 | | | | 6.46 | | | | (0.01 | ) | | | 1.80 | | | | 1.79 | | | | 0.00 | * | | | — | | | | — | | |
| | 12-31-09 | | | | 4.44 | | | | (0.00 | )* | | | 2.02 | | | | 2.02 | | | | 0.00 | * | | | — | | | | — | | |
| | 12-31-08 | | | | 9.22 | | | | (0.02 | ) | | | (3.48 | ) | | | (3.50 | ) | | | — | | | | 1.28 | | | | — | | |
| | 12-31-07 | | | | 8.99 | | | | (0.03 | ) | | | 1.14 | | | | 1.11 | | | | — | | | | 0.88 | | | | — | | |
| Class I | | | |
| | 12-31-11 | | | | 8.60 | | | | 0.02 | | | | (0.34 | ) | | | (0.32 | ) | | | 0.03 | | | | — | | | | — | | |
| | 12-31-10 | | | | 6.71 | | | | 0.03 | | | | 1.88 | | | | 1.91 | | | | 0.02 | | | | — | | | | — | | |
| | 12-31-09 | | | | 4.60 | | | | 0.03 | | | | 2.10 | | | | 2.13 | | | | 0.02 | | | | — | | | | — | | |
| | 12-31-08 | | | | 9.52 | | | | 0.02 | | | | (3.63 | ) | | | (3.61 | ) | | | 0.03 | | | | 1.28 | | | | — | | |
| | 12-31-07 | | | | 9.22 | | | | 0.02 | | | | 1.18 | | | | 1.20 | | | | 0.02 | | | | 0.88 | | | | — | | |
| Class S | | | |
| | 12-31-11 | | | | 8.45 | | | | 0.00 | * | | | (0.33 | ) | | | (0.33 | ) | | | 0.01 | | | | — | | | | — | | |
| | 12-31-10 | | | | 6.60 | | | | 0.01 | | | | 1.84 | | | | 1.85 | | | | 0.00 | * | | | — | | | | — | | |
| | 12-31-09 | | | | 4.53 | | | | 0.01 | | | | 2.07 | | | | 2.08 | | | | 0.01 | | | | — | | | | — | | |
| | 12-31-08 | | | | 9.37 | | | | (0.00 | )* | | | (3.56 | ) | | | (3.56 | ) | | | 0.00 | * | | | 1.28 | | | | — | | |
| | 12-31-07 | | | | 9.10 | | | | (0.01 | ) | | | 1.16 | | | | 1.15 | | | | — | | | | 0.88 | | | | — | | |
| Class S2 | | | |
| | 12-31-11 | | | | 8.25 | | | | (0.00 | )* | | | (0.34 | ) | | | (0.34 | ) | | | 0.02 | | | | — | | | | — | | |
| | 12-31-10 | | | | 6.45 | | | | (0.00 | )* | | | 1.80 | | | | 1.80 | | | | 0.00 | * | | | — | | | | — | | |
| | 02-27-09 | (5)-12-31-09 | | | 3.94 | | | | 0.01 | | | | 2.51 | | | | 2.52 | | | | 0.01 | | | | — | | | | — | | |
| ING T. Rowe Price Growth Equity Portfolio | | | |
| Class ADV | | | |
| | 12-31-11 | | | | 53.43 | | | | (0.27 | )• | | | (0.57 | ) | | | (0.84 | ) | | | — | | | | — | | | | — | | |
| | 12-31-10 | | | | 45.97 | | | | (0.21 | ) | | | 7.69 | | | | 7.48 | | | | 0.02 | | | | — | | | | — | | |
| | 12-31-09 | | | | 32.31 | | | | (0.10 | ) | | | 13.76 | | | | 13.66 | | | | — | | | | — | | | | — | | |
| | 12-31-08 | | | | 60.78 | | | | (0.04 | )• | | | (24.38 | ) | | | (24.42 | ) | | | 0.08 | | | | 3.92 | | | | 0.05 | | |
| | 12-31-07 | | | | 58.37 | | | | 0.03 | • | | | 5.34 | | | | 5.37 | | | | 0.03 | | | | 2.93 | | | | — | | |
| Class I | | | |
| | 12-31-11 | | | | 54.49 | | | | 0.00 | * | | | (0.58 | ) | | | (0.58 | ) | | | — | | | | — | | | | — | | |
| | 12-31-10 | | | | 46.65 | | | | 0.01 | | | | 7.85 | | | | 7.86 | | | | 0.02 | | | | — | | | | — | | |
| | 12-31-09 | | | | 32.68 | | | | 0.09 | • | | | 13.95 | | | | 14.04 | | | | 0.07 | | | | — | | | | — | | |
| | 12-31-08 | | | | 61.89 | | | | 0.26 | | | | (24.86 | ) | | | (24.60 | ) | | | 0.64 | | | | 3.92 | | | | 0.05 | | |
| | 12-31-07 | | | | 59.36 | | | | 0.32 | | | | 5.45 | | | | 5.77 | | | | 0.31 | | | | 2.93 | | | | — | | |
| Class S | | | |
| | 12-31-11 | | | | 53.92 | | | | (0.13 | ) | | | (0.58 | ) | | | (0.71 | ) | | | — | | | | — | | | | — | | |
| | 12-31-10 | | | | 46.27 | | | | (0.11 | ) | | | 7.78 | | | | 7.67 | | | | 0.02 | | | | — | | | | — | | |
| | 12-31-09 | | | | 32.45 | | | | (0.01 | ) | | | 13.83 | | | | 13.82 | | | | 0.00 | * | | | — | | | | — | | |
| | 12-31-08 | | | | 61.35 | | | | 0.07 | • | | | (24.56 | ) | | | (24.49 | ) | | | 0.44 | | | | 3.92 | | | | 0.05 | | |
| | 12-31-07 | | | | 58.85 | | | | 0.15 | • | | | 5.41 | | | | 5.56 | | | | 0.13 | | | | 2.93 | | | | — | | |
| | | | | Ratios to average net assets | | Supplemental
data | |
| | | Total distributions | | Payment by affiliate | | Net asset value, end of year or period | | Total Return(1) | | Expenses before reductions/additions(2)(3)(4) | | Expenses net of fee waivers and/or recoupments if any(2)(3)(4) | | Expense net of all reductions/additions(2)(3)(4) | | Net investment income (loss)(2)(4) | | Net assets, end of year or period | | Portfolio turnover rate | |
| Year or period ended | | ($) | | ($) | | ($) | | (%) | | (%) | | (%) | | (%) | | (%) | | ($000's) | | (%) | |
| ING Pioneer High Yield Portfolio | |
| Class I | |
| | 12-31-11 | | | | 0.62 | | | | — | | | | 10.55 | | | | (0.72 | ) | | | 0.77 | | | | 0.71 | | | | 0.71 | | | | 5.64 | | | | 87,529 | | | | 41 | | |
| | 12-31-10 | | | | 0.65 | | | | — | | | | 11.24 | | | | 19.02 | | | | 0.75 | | | | 0.71 | † | | | 0.71 | † | | | 6.23 | † | | | 98,394 | | | | 41 | | |
| | 12-31-09 | | | | 0.63 | | | | — | | | | 10.05 | | | | 66.75 | | | | 0.78 | | | | 0.72 | † | | | 0.71 | † | | | 8.88 | † | | | 92,714 | | | | 53 | | |
| | 12-31-08 | | | | 0.93 | | | | — | | | | 6.52 | | | | (29.27 | )(b) | | | 0.74 | | | | 0.73 | † | | | 0.72 | † | | | 8.82 | † | | | 279,168 | | | | 38 | | |
| | 12-31-07 | | | | 0.59 | | | | — | | | | 10.25 | | | | 6.15 | | | | 0.78 | | | | 0.77 | | | | 0.77 | | | | 5.67 | | | | 105,105 | | | | 68 | | |
| Class S | |
| | 12-31-11 | | | | 0.60 | | | | — | | | | 10.54 | | | | (0.97 | ) | | | 1.02 | | | | 0.96 | | | | 0.96 | | | | 5.34 | | | | 1,712 | | | | 41 | | |
| | 12-31-10 | | | | 0.62 | | | | — | | | | 11.23 | | | | 18.73 | | | | 1.00 | | | | 0.96 | † | | | 0.96 | † | | | 5.97 | † | | | 2,307 | | | | 41 | | |
| | 12-31-09 | | | | 0.61 | | | | — | | | | 10.04 | | | | 66.30 | | | | 1.03 | | | | 0.97 | † | | | 0.96 | † | | | 7.50 | † | | | 2,995 | | | | 53 | | |
| | 12-31-08 | | | | 0.91 | | | | — | | | | 6.52 | | | | (29.45 | )(b) | | | 0.99 | | | | 0.98 | † | | | 0.98 | † | | | 7.32 | † | | | 2,170 | | | | 38 | | |
| | 12-31-07 | | | | 0.57 | | | | — | | | | 10.25 | | | | 5.89 | | | | 1.03 | | | | 1.02 | | | | 1.02 | | | | 5.43 | | | | 5,899 | | | | 68 | | |
| ING T. Rowe Price Diversified Mid Cap Growth Portfolio | |
| Class ADV | |
| | 12-31-11 | | | | 0.01 | | | | — | | | | 7.89 | | | | (4.23 | ) | | | 1.16 | | | | 1.16 | | | | 1.16 | | | | (0.28 | ) | | | 18,993 | | | | 38 | | |
| | 12-31-10 | | | | 0.00 | * | | | — | | | | 8.25 | | | | 27.79 | | | | 1.16 | | | | 1.16 | | | | 1.16 | | | | (0.13 | ) | | | 31,927 | | | | 28 | | |
| | 12-31-09 | | | | — | | | | — | | | | 6.46 | | | | 45.55 | | | | 1.16 | | | | 1.16 | | | | 1.16 | | | | (0.01 | ) | | | 24,468 | | | | 27 | | |
| | 12-31-08 | | | | 1.28 | | | | — | | | | 4.44 | | | | (43.35 | ) | | | 1.16 | | | | 1.16 | | | | 1.16 | | | | (0.25 | ) | | | 15,401 | | | | 28 | | |
| | 12-31-07 | | | | 0.88 | | | | — | | | | 9.22 | | | | 12.71 | | | | 1.16 | | | | 1.15 | | | | 1.15 | | | | (0.31 | ) | | | 40,695 | | | | 31 | | |
| Class I | |
| | 12-31-11 | | | | 0.03 | | | | — | | | | 8.25 | | | | (3.71 | ) | | | 0.66 | | | | 0.66 | | | | 0.66 | | | | 0.25 | | | | 663,904 | | | | 38 | | |
| | 12-31-10 | | | | 0.02 | | | | — | | | | 8.60 | | | | 28.51 | | | | 0.66 | | | | 0.66 | | | | 0.66 | | | | 0.37 | | | | 762,608 | | | | 28 | | |
| | 12-31-09 | | | | 0.02 | | | | — | | | | 6.71 | | | | 46.41 | | | | 0.66 | | | | 0.66 | | | | 0.66 | | | | 0.48 | | | | 659,322 | | | | 27 | | |
| | 12-31-08 | | | | 1.31 | | | | — | | | | 4.60 | | | | (43.15 | ) | | | 0.66 | | | | 0.66 | | | | 0.66 | | | | 0.26 | | | | 487,968 | | | | 28 | | |
| | 12-31-07 | | | | 0.90 | | | | — | | | | 9.52 | | | | 13.39 | | | | 0.66 | | | | 0.66 | | | | 0.66 | | | | 0.18 | | | | 995,471 | | | | 31 | | |
| Class S | |
| | 12-31-11 | | | | 0.01 | | | | — | | | | 8.11 | | | | (3.89 | ) | | | 0.91 | | | | 0.91 | | | | 0.91 | | | | 0.01 | | | | 21,669 | | | | 38 | | |
| | 12-31-10 | | | | 0.00 | * | | | — | | | | 8.45 | | | | 28.12 | | | | 0.91 | | | | 0.91 | | | | 0.91 | | | | 0.12 | | | | 23,701 | | | | 28 | | |
| | 12-31-09 | | | | 0.01 | | | | — | | | | 6.60 | | | | 46.00 | | | | 0.91 | | | | 0.91 | | | | 0.91 | | | | 0.25 | | | | 20,494 | | | | 27 | | |
| | 12-31-08 | | | | 1.28 | | | | — | | | | 4.53 | | | | (43.27 | ) | | | 0.91 | | | | 0.91 | | | | 0.91 | | | | 0.03 | | | | 9,009 | | | | 28 | | |
| | 12-31-07 | | | | 0.88 | | | | — | | | | 9.37 | | | | 13.01 | | | | 0.91 | | | | 0.91 | | | | 0.91 | | | | (0.07 | ) | | | 13,319 | | | | 31 | | |
| Class S2 | |
| | 12-31-11 | | | | 0.02 | | | | — | | | | 7.89 | | | | (4.07 | ) | | | 1.16 | | | | 1.06 | | | | 1.06 | | | | (0.07 | ) | | | 739 | | | | 38 | | |
| | 12-31-10 | | | | 0.00 | * | | | — | | | | 8.25 | | | | 27.99 | | | | 1.16 | | | | 1.06 | | | | 1.06 | | | | (0.03 | ) | | | 6 | | | | 28 | | |
| | 02-27-09 | (5)-12-31-09 | | | 0.01 | | | | — | | | | 6.45 | | | | 63.88 | | | | 1.16 | | | | 1.06 | | | | 1.06 | | | | 0.09 | | | | 5 | | | | 27 | | |
| ING T. Rowe Price Growth Equity Portfolio | |
| Class ADV | |
| | 12-31-11 | | | | — | | | | — | | | | 52.59 | | | | (1.57 | ) | | | 1.25 | | | | 1.24 | | | | 1.24 | | | | (0.50 | ) | | | 92,701 | | | | 28 | | |
| | 12-31-10 | | | | 0.02 | | | | — | | | | 53.43 | | | | 16.27 | | | | 1.25 | | | | 1.25 | | | | 1.25 | | | | (0.48 | ) | | | 102,242 | | | | 41 | | |
| | 12-31-09 | | | | — | | | | — | | | | 45.97 | | | | 42.28 | | | | 1.25 | | | | 1.25 | | | | 1.25 | | | | (0.27 | ) | | | 73,747 | | | | 64 | | |
| | 12-31-08 | | | | 4.05 | | | | — | | | | 32.31 | | | | (42.51 | ) | | | 1.25 | | | | 1.24 | | | | 1.24 | | | | (0.09 | ) | | | 49,551 | | | | 54 | | |
| | 12-31-07 | | | | 2.96 | | | | — | | | | 60.78 | | | | 9.36 | | | | 1.25 | | | | 1.24 | | | | 1.24 | | | | 0.05 | | | | 103,588 | | | | 58 | | |
| Class I | |
| | 12-31-11 | | | | — | | | | — | | | | 53.91 | | | | (1.06 | ) | | | 0.75 | | | | 0.74 | | | | 0.74 | | | | 0.00 | * | | | 722,532 | | | | 28 | | |
| | 12-31-10 | | | | 0.02 | | | | — | | | | 54.49 | | | | 16.86 | | | | 0.75 | | | | 0.75 | | | | 0.75 | | | | 0.02 | | | | 808,032 | | | | 41 | | |
| | 12-31-09 | | | | 0.07 | | | | — | | | | 46.65 | | | | 42.96 | | | | 0.75 | | | | 0.75 | | | | 0.75 | | | | 0.24 | | | | 758,453 | | | | 64 | | |
| | 12-31-08 | | | | 4.61 | | | | — | | | | 32.68 | | | | (42.21 | ) | | | 0.75 | | | | 0.74 | | | | 0.74 | | | | 0.42 | | | | 745,790 | | | | 54 | | |
| | 12-31-07 | | | | 3.24 | | | | — | | | | 61.89 | | | | 9.91 | | | | 0.75 | | | | 0.74 | | | | 0.74 | | | | 0.55 | | | | 1,442,336 | | | | 58 | | |
| Class S | |
| | 12-31-11 | | | | — | | | | — | | | | 53.21 | | | | (1.32 | ) | | | 1.00 | | | | 0.99 | | | | 0.99 | | | | (0.24 | ) | | | 173,070 | | | | 28 | | |
| | 12-31-10 | | | | 0.02 | | | | — | | | | 53.92 | | | | 16.58 | | | | 1.00 | | | | 1.00 | | | | 1.00 | | | | (0.24 | ) | | | 171,878 | | | | 41 | | |
| | 12-31-09 | | | | — | | | | — | | | | 46.27 | | | | 42.60 | | | | 1.00 | | | | 1.00 | | | | 1.00 | | | | (0.03 | ) | | | 152,008 | | | | 64 | | |
| | 12-31-08 | | | | 4.41 | | | | — | | | | 32.45 | | | | (42.35 | ) | | | 1.00 | | | | 0.99 | | | | 0.99 | | | | 0.15 | | | | 69,896 | | | | 54 | | |
| | 12-31-07 | | | | 3.06 | | | | — | | | | 61.35 | | | | 9.62 | | | | 1.00 | | | | 0.99 | | | | 0.99 | | | | 0.25 | | | | 101,503 | | | | 58 | | |
See Accompanying Notes to Financial Statements
66
FINANCIAL HIGHLIGHTS (CONTINUED)
Selected data for a share of beneficial interest outstanding throughout each year or period.
| | | | | Income (loss)
from investment
operations | | | | Less distributions | |
| | | Net asset value, beginning of year or period | | Net investment income (loss) | | Net realized and unrealized gain (loss) | | Total from investment operations | | From net investment income | | From net realized gains | | From return of capital | |
| Year or period ended | | ($) | | ($) | | ($) | | ($) | | ($) | | ($) | | ($) | |
| ING T. Rowe Price Growth Equity Portfolio (continued) | | | |
| Class S2 | | | |
| | 12-31-11 | | | | 53.51 | | | | (0.17 | )• | | | (0.62 | ) | | | (0.79 | ) | | | — | | | | — | | | | — | | |
| | 12-31-10 | | | | 45.99 | | | | (0.18 | ) | | | 7.72 | | | | 7.54 | | | | 0.02 | | | | — | | | | — | | |
| | 02-27-09 | (5)-12-31-09 | | | 29.76 | | | | (0.05 | ) | | | 16.28 | | | | 16.23 | | | | — | | | | — | | | | — | | |
| ING Templeton Foreign Equity Portfolio | | | |
| Class ADV | | | |
| | 12-31-11 | | | | 10.99 | | | | 0.20 | • | | | (1.57 | ) | | | (1.37 | ) | | | 0.17 | | | | — | | | | — | | |
| | 12-31-10 | | | | 10.36 | | | | 0.13 | • | | | 0.70 | | | | 0.83 | | | | 0.20 | | | | — | | | | — | | |
| | 12-31-09 | | | | 7.84 | | | | 0.14 | | | | 2.38 | | | | 2.52 | | | | — | | | | — | | | | — | | |
| | 12-31-08 | | | | 13.65 | | | | 0.23 | • | | | (5.81 | ) | | | (5.58 | ) | | | 0.23 | | | | — | | | | — | | |
| | 12-31-07 | | | | 12.03 | | | | 0.18 | • | | | 1.68 | | | | 1.86 | | | | 0.13 | | | | 0.11 | | | | — | | |
| Class I | | | |
| | 12-31-11 | | | | 11.05 | | | | 0.26 | • | | | (1.59 | ) | | | (1.33 | ) | | | 0.20 | | | | — | | | | — | | |
| | 12-31-10 | | | | 10.40 | | | | 0.19 | • | | | 0.70 | | | | 0.89 | | | | 0.24 | | | | — | | | | — | | |
| | 12-31-09 | | | | 7.83 | | | | 0.20 | • | | | 2.37 | | | | 2.57 | | | | — | | | | — | | | | — | | |
| | 12-31-08 | | | | 13.66 | | | | 0.29 | • | | | (5.85 | ) | | | (5.56 | ) | | | 0.27 | | | | — | | | | — | | |
| | 12-31-07 | | | | 12.03 | | | | 0.24 | • | | | 1.63 | | | | 1.87 | | | | 0.13 | | | | 0.11 | | | | — | | |
| Class S | | | |
| | 12-31-11 | | | | 11.00 | | | | 0.25 | • | | | (1.59 | ) | | | (1.34 | ) | | | 0.18 | | | | — | | | | — | | |
| | 12-31-10 | | | | 10.36 | | | | 0.17 | | | | 0.69 | | | | 0.86 | | | | 0.22 | | | | — | | | | — | | |
| | 12-31-09 | | | | 7.81 | | | | 0.14 | | | | 2.41 | | | | 2.55 | | | | — | | | | — | | | | — | | |
| | 12-31-08 | | | | 13.63 | | | | 0.28 | • | | | (5.87 | ) | | | (5.59 | ) | | | 0.23 | | | | — | | | | — | | |
| | 12-31-07 | | | | 12.01 | | | | 0.20 | • | | | 1.63 | | | | 1.83 | | | | 0.10 | | | | 0.11 | | | | — | | |
| Class S2 | | | |
| | 12-31-11 | | | | 11.01 | | | | 0.17 | • | | | (1.53 | ) | | | (1.36 | ) | | | 0.20 | | | | — | | | | — | | |
| | 12-31-10 | | | | 10.37 | | | | 0.07 | • | | | 0.78 | | | | 0.85 | | | | 0.21 | | | | — | | | | — | | |
| | 02-27-09 | (5)-12-31-09 | | | 6.31 | | | | 0.14 | | | | 3.92 | | | | 4.06 | | | | — | | | | — | | | | — | | |
| ING Thornburg Value Portfolio | | | |
| Class ADV | | | |
| | 12-31-11 | | | | 31.18 | | | | (0.07 | )• | | | (4.15 | ) | | | (4.22 | ) | | | 0.13 | | | | — | | | | — | | |
| | 12-31-10 | | | | 28.55 | | | | 0.06 | • | | | 2.98 | | | | 3.04 | | | | 0.41 | | | | — | | | | — | | |
| | 12-31-09 | | | | 19.96 | | | | 0.34 | • | | | 8.42 | | | | 8.76 | | | | 0.17 | | | | — | | | | — | | |
| | 12-31-08 | | | | 33.36 | | | | 0.18 | | | | (13.52 | ) | | | (13.34 | ) | | | 0.06 | | | | — | | | | — | | |
| | 12-31-07 | | | | 31.38 | | | | 0.18 | • | | | 1.93 | | | | 2.11 | | | | 0.13 | | | | — | | | | — | | |
| Class I | | | |
| | 12-31-11 | | | | 31.98 | | | | 0.09 | | | | (4.29 | ) | | | (4.20 | ) | | | 0.23 | | | | — | | | | — | | |
| | 12-31-10 | | | | 29.18 | | | | 0.22 | • | | | 3.03 | | | | 3.25 | | | | 0.45 | | | | — | | | | — | | |
| | 12-31-09 | | | | 20.38 | | | | 0.42 | • | | | 8.67 | | | | 9.09 | | | | 0.29 | | | | — | | | | — | | |
| | 12-31-08 | | | | 34.00 | | | | 0.32 | • | | | (13.79 | ) | | | (13.47 | ) | | | 0.15 | | | | — | | | | — | | |
| | 12-31-07 | | | | 31.85 | | | | 0.28 | | | | 2.02 | | | | 2.30 | | | | 0.15 | | | | — | | | | — | | |
| Class S | | | |
| | 12-31-11 | | | | 31.76 | | | | (0.01 | ) | | | (4.22 | ) | | | (4.23 | ) | | | 0.16 | | | | — | | | | — | | |
| | 12-31-10 | | | | 29.01 | | | | 0.14 | • | | | 3.02 | | | | 3.16 | | | | 0.41 | | | | — | | | | — | | |
| | 12-31-09 | | | | 20.26 | | | | 0.40 | • | | | 8.56 | | | | 8.96 | | | | 0.21 | | | | — | | | | — | | |
| | 12-31-08 | | | | 33.75 | | | | 0.30 | | | | (13.76 | ) | | | (13.46 | ) | | | 0.03 | | | | — | | | | — | | |
| | 12-31-07 | | | | 31.68 | | | | 0.19 | • | | | 2.03 | | | | 2.22 | | | | 0.15 | | | | — | | | | — | | |
| Class S2 | | | |
| | 12-31-11 | | | | 31.16 | | | | (0.02 | ) | | | (4.16 | ) | | | (4.18 | ) | | | 0.14 | | | | — | | | | — | | |
| | 03-08-10 | (5)-12-31-10 | | | 29.58 | | | | 0.03 | • | | | 2.00 | | | | 2.03 | | | | 0.45 | | | | — | | | | — | | |
| ING UBS U.S. Large Cap Equity Portfolio | | | |
| Class ADV | | | |
| | 12-31-11 | | | | 8.92 | | | | 0.05 | | | | (0.31 | ) | | | (0.26 | ) | | | 0.06 | | | | — | | | | — | | |
| | 12-31-10 | | | | 7.95 | | | | 0.03 | | | | 0.98 | | | | 1.01 | | | | 0.04 | | | | — | | | | — | | |
| | 12-31-09 | | | | 6.12 | | | | 0.04 | | | | 1.86 | | | | 1.90 | | | | 0.07 | | | | — | | | | — | | |
| | 12-31-08 | | | | 10.40 | | | | 0.08 | | | | (4.23 | ) | | | (4.15 | ) | | | 0.13 | | | | — | | | | — | | |
| | 12-31-07 | | | | 10.40 | | | | 0.06 | • | | | 0.01 | | | | 0.07 | | | | 0.07 | | | | — | | | | — | | |
| | | | | Ratios to average net assets | | Supplemental
data | |
| | | Total distributions | | Payment by affiliate | | Net asset value, end of year or period | | Total Return(1) | | Expenses before reductions/additions(2)(3)(4) | | Expenses net of fee waivers and/or recoupments if any(2)(3)(4) | | Expense net of all reductions/additions(2)(3)(4) | | Net investment income (loss)(2)(4) | | Net assets, end of year or period | | Portfolio turnover rate | |
| Year or period ended | | ($) | | ($) | | ($) | | (%) | | (%) | | (%) | | (%) | | (%) | | ($000's) | | (%) | |
| ING T. Rowe Price Growth Equity Portfolio (continued) | |
| Class S2 | |
| | 12-31-11 | | | | — | | | | — | | | | 52.72 | | | | (1.48 | ) | | | 1.25 | | | | 1.14 | | | | 1.14 | | | | (0.32 | ) | | | 622 | | | | 28 | | |
| | 12-31-10 | | | | 0.02 | | | | — | | | | 53.51 | | | | 16.39 | | | | 1.25 | | | | 1.15 | | | | 1.15 | | | | (0.37 | ) | | | 5 | | | | 41 | | |
| | 02-27-09 | (5)-12-31-09 | | | — | | | | — | | | | 45.99 | | | | 54.54 | | | | 1.25 | | | | 1.15 | | | | 1.15 | | | | (0.16 | ) | | | 5 | | | | 64 | | |
| ING Templeton Foreign Equity Portfolio | |
| Class ADV | |
| | 12-31-11 | | | | 0.17 | | | | — | | | | 9.45 | | | | (12.42 | ) | | | 1.48 | | | | 1.48 | | | | 1.48 | | | | 1.94 | | | | 23,120 | | | | 14 | | |
| | 12-31-10 | | | | 0.20 | | | | — | | | | 10.99 | | | | 8.25 | | | | 1.46 | | | | 1.46 | | | | 1.46 | | | | 1.33 | | | | 15,178 | | | | 14 | | |
| | 12-31-09 | | | | — | | | | — | | | | 10.36 | | | | 32.14 | | | | 1.47 | | | | 1.47 | | | | 1.47 | | | | 1.63 | | | | 11,334 | | | | 27 | | |
| | 12-31-08 | | | | 0.23 | | | | — | | | | 7.84 | | | | (40.88 | ) | | | 1.46 | | | | 1.47 | | | | 1.47 | | | | 2.22 | | | | 9,418 | | | | 11 | | |
| | 12-31-07 | | | | 0.24 | | | | — | | | | 13.65 | | | | 15.42 | | | | 1.49 | | | | 1.48 | | | | 1.48 | | | | 1.40 | | | | 1 | | | | 20 | | |
| Class I | |
| | 12-31-11 | | | | 0.20 | | | | — | | | | 9.52 | | | | (12.00 | ) | | | 0.98 | | | | 0.98 | | | | 0.98 | | | | 2.42 | | | | 289,934 | | | | 14 | | |
| | 12-31-10 | | | | 0.24 | | | | — | | | | 11.05 | | | | 8.87 | | | | 0.96 | | | | 0.96 | | | | 0.96 | | | | 1.89 | | | | 401,997 | | | | 14 | | |
| | 12-31-09 | | | | — | | | | — | | | | 10.40 | | | | 32.82 | | | | 0.97 | | | | 0.97 | | | | 0.97 | | | | 2.42 | | | | 273,992 | | | | 27 | | |
| | 12-31-08 | | | | 0.27 | | | | — | | | | 7.83 | | | | (40.72 | ) | | | 0.96 | | | | 0.97 | | | | 0.97 | | | | 2.77 | | | | 405,874 | | | | 11 | | |
| | 12-31-07 | | | | 0.24 | | | | — | | | | 13.66 | | | | 15.50 | | | | 0.99 | | | | 0.98 | | | | 0.98 | | | | 1.85 | | | | 46,781 | | | | 20 | | |
| Class S | |
| | 12-31-11 | | | | 0.18 | | | | — | | | | 9.48 | | | | (12.21 | ) | | | 1.23 | | | | 1.23 | | | | 1.23 | | | | 2.29 | | | | 204,315 | | | | 14 | | |
| | 12-31-10 | | | | 0.22 | | | | — | | | | 11.00 | | | | 8.59 | | | | 1.21 | | | | 1.21 | | | | 1.21 | | | | 1.68 | | | | 275,408 | | | | 14 | | |
| | 12-31-09 | | | | — | | | | — | | | | 10.36 | | | | 32.65 | | | | 1.22 | | | | 1.22 | | | | 1.22 | | | | 1.81 | | | | 254,180 | | | | 27 | | |
| | 12-31-08 | | | | 0.23 | | | | — | | | | 7.81 | | | | (40.97 | ) | | | 1.21 | | | | 1.22 | | | | 1.22 | | | | 2.56 | | | | 167,638 | | | | 11 | | |
| | 12-31-07 | | | | 0.21 | | | | — | | | | 13.63 | | | | 15.23 | | | | 1.24 | | | | 1.23 | | | | 1.23 | | | | 1.49 | | | | 131,882 | | | | 20 | | |
| Class S2 | |
| | 12-31-11 | | | | 0.20 | | | | — | | | | 9.45 | | | | (12.34 | ) | | | 1.48 | | | | 1.38 | | | | 1.38 | | | | 1.67 | | | | 1,013 | | | | 14 | | |
| | 12-31-10 | | | | 0.21 | | | | — | | | | 11.01 | | | | 8.53 | | | | 1.46 | | | | 1.36 | | | | 1.36 | | | | 0.69 | | | | 102 | | | | 14 | | |
| | 02-27-09 | (5)-12-31-09 | | | — | | | | — | | | | 10.37 | | | | 64.34 | | | | 1.47 | | | | 1.37 | | | | 1.37 | | | | 1.93 | | | | 2 | | | | 27 | | |
| ING Thornburg Value Portfolio | |
| Class ADV | |
| | 12-31-11 | | | | 0.13 | | | | — | | | | 26.83 | | | | (13.53 | ) | | | 1.40 | | | | 1.40 | | | | 1.39 | | | | (0.23 | ) | | | 15,435 | | | | 77 | | |
| | 12-31-10 | | | | 0.41 | | | | — | | | | 31.18 | | | | 10.86 | | | | 1.40 | | | | 1.40 | † | | | 1.40 | † | | | 0.22 | † | | | 15,361 | | | | 86 | | |
| | 12-31-09 | | | | 0.17 | | | | — | | | | 28.55 | | | | 43.99 | | | | 1.40 | | | | 1.40 | † | | | 1.39 | † | | | 1.40 | † | | | 7,417 | | | | 100 | | |
| | 12-31-08 | | | | 0.06 | | | | — | | | | 19.96 | | | | (40.04 | ) | | | 1.40 | | | | 1.40 | † | | | 1.40 | † | | | 0.53 | † | | | 2,281 | | | | 77 | | |
| | 12-31-07 | | | | 0.13 | | | | — | | | | 33.36 | | | | 6.73 | | | | 1.40 | | | | 1.40 | | | | 1.40 | | | | 0.54 | | | | 4,196 | | | | 88 | | |
| Class I | |
| | 12-31-11 | | | | 0.23 | | | | — | | | | 27.55 | | | | (13.11 | ) | | | 0.90 | | | | 0.90 | | | | 0.89 | | | | 0.25 | | | | 188,868 | | | | 77 | | |
| | 12-31-10 | | | | 0.45 | | | | — | | | | 31.98 | | | | 11.37 | | | | 0.90 | | | | 0.90 | † | | | 0.90 | † | | | 0.76 | † | | | 260,671 | | | | 86 | | |
| | 12-31-09 | | | | 0.29 | | | | — | | | | 29.18 | | | | 44.77 | | | | 0.90 | | | | 0.90 | † | | | 0.89 | † | | | 1.79 | † | | | 222,957 | | | | 100 | | |
| | 12-31-08 | | | | 0.15 | | | | — | | | | 20.38 | | | | (39.75 | ) | | | 0.90 | | | | 0.90 | † | | | 0.90 | † | | | 1.16 | † | | | 256,369 | | | | 77 | | |
| | 12-31-07 | | | | 0.15 | | | | — | | | | 34.00 | | | | 7.24 | | | | 0.90 | | | | 0.90 | | | | 0.90 | | | | 0.92 | | | | 216,408 | | | | 88 | | |
| Class S | |
| | 12-31-11 | | | | 0.16 | | | | — | | | | 27.37 | | | | (13.30 | ) | | | 1.15 | | | | 1.15 | | | | 1.14 | | | | 0.01 | | | | 15,801 | | | | 77 | | |
| | 12-31-10 | | | | 0.41 | | | | — | | | | 31.76 | | | | 11.13 | | | | 1.15 | | | | 1.15 | † | | | 1.15 | † | | | 0.49 | † | | | 18,563 | | | | 86 | | |
| | 12-31-09 | | | | 0.21 | | | | — | | | | 29.01 | | | | 44.36 | | | | 1.15 | | | | 1.15 | † | | | 1.14 | † | | | 1.68 | † | | | 14,251 | | | | 100 | | |
| | 12-31-08 | | | | 0.03 | | | | — | | | | 20.26 | | | | (39.90 | ) | | | 1.15 | | | | 1.15 | † | | | 1.15 | † | | | 0.78 | † | | | 6,604 | | | | 77 | | |
| | 12-31-07 | | | | 0.15 | | | | — | | | | 33.75 | | | | 7.00 | | | | 1.15 | | | | 1.15 | | | | 1.15 | | | | 0.56 | | | | 13,719 | | | | 88 | | |
| Class S2 | |
| | 12-31-11 | | | | 0.14 | | | | — | | | | 26.84 | | | | (13.39 | ) | | | 1.40 | | | | 1.30 | | | | 1.29 | | | | (0.08 | ) | | | 3 | | | | 77 | | |
| | 03-08-10 | (5)-12-31-10 | | | 0.45 | | | | — | | | | 31.16 | | | | 7.09 | | | | 1.40 | | | | 1.30 | † | | | 1.30 | † | | | 0.11 | † | | | 3 | | | | 86 | | |
| ING UBS U.S. Large Cap Equity Portfolio | |
| Class ADV | |
| | 12-31-11 | | | | 0.06 | | | | — | | | | 8.60 | | | | (2.92 | ) | | | 1.35 | | | | 1.25 | | | | 1.24 | | | | 0.55 | | | | 7,270 | | | | 74 | | |
| | 12-31-10 | | | | 0.04 | | | | — | | | | 8.92 | | | | 12.73 | | | | 1.35 | | | | 1.35 | † | | | 1.34 | † | | | 0.39 | † | | | 8,693 | | | | 55 | | |
| | 12-31-09 | | | | 0.07 | | | | — | | | | 7.95 | | | | 31.14 | | | | 1.35 | | | | 1.35 | † | | | 1.31 | † | | | 0.51 | † | | | 7,438 | | | | 73 | | |
| | 12-31-08 | | | | 0.13 | | | | — | | | | 6.12 | | | | (40.07 | ) | | | 1.35 | | | | 1.35 | † | | | 1.33 | † | | | 0.92 | † | | | 6,041 | | | | 65 | | |
| | 12-31-07 | | | | 0.07 | | | | — | | | | 10.40 | | | | 0.65 | | | | 1.35 | | | | 1.35 | | | | 1.34 | | | | 0.52 | | | | 10,494 | | | | 48 | | |
See Accompanying Notes to Financial Statements
67
FINANCIAL HIGHLIGHTS (CONTINUED)
Selected data for a share of beneficial interest outstanding throughout each year or period.
| | | | | Income (loss)
from investment
operations | | | | Less distributions | |
| | | Net asset value, beginning of year or period | | Net investment income (loss) | | Net realized and unrealized gain (loss) | | Total from investment operations | | From net investment income | | From net realized gains | | From return of capital | |
| Year or period ended | | ($) | | ($) | | ($) | | ($) | | ($) | | ($) | | ($) | |
| ING UBS U.S. Large Cap Equity Portfolio (continued) | | | |
| Class I | | | |
| | 12-31-11 | | | | 9.06 | | | | 0.10 | | | | (0.33 | ) | | | (0.23 | ) | | | 0.11 | | | | — | | | | — | | |
| | 12-31-10 | | | | 8.06 | | | | 0.08 | | | | 1.00 | | | | 1.08 | | | | 0.08 | | | | — | | | | — | | |
| | 12-31-09 | | | | 6.20 | | | | 0.12 | | | | 1.85 | | | | 1.97 | | | | 0.11 | | | | — | | | | — | | |
| | 12-31-08 | | | | 10.61 | | | | 0.13 | • | | | (4.32 | ) | | | (4.19 | ) | | | 0.22 | | | | — | | | | — | | |
| | 12-31-07 | | | | 10.56 | | | | 0.11 | | | | 0.02 | | | | 0.13 | | | | 0.08 | | | | — | | | | — | | |
| Class S | | | |
| | 12-31-11 | | | | 8.98 | | | | 0.07 | • | | | (0.32 | ) | | | (0.25 | ) | | | 0.06 | | | | — | | | | — | | |
| | 12-31-10 | | | | 8.00 | | | | 0.06 | | | | 0.98 | | | | 1.04 | | | | 0.06 | | | | — | | | | — | | |
| | 12-31-09 | | | | 6.15 | | | | 0.06 | | | | 1.88 | | | | 1.94 | | | | 0.09 | | | | — | | | | — | | |
| | 12-31-08 | | | | 10.48 | | | | 0.10 | • | | | (4.27 | ) | | | (4.17 | ) | | | 0.16 | | | | — | | | | — | | |
| | 12-31-07 | | | | 10.45 | | | | 0.08 | • | | | 0.02 | | | | 0.10 | | | | 0.07 | | | | — | | | | — | | |
| | | | | Ratios to average net assets | | Supplemental
data | |
| | | Total distributions | | Payment by affiliate | | Net asset value, end of year or period | | Total Return(1) | | Expenses before reductions/additions(2)(3)(4) | | Expenses net of fee waivers and/or recoupments if any(2)(3)(4) | | Expense net of all reductions/additions(2)(3)(4) | | Net investment income (loss)(2)(4) | | Net assets, end of year or period | | Portfolio turnover rate | |
| Year or period ended | | ($) | | ($) | | ($) | | (%) | | (%) | | (%) | | (%) | | (%) | | ($000's) | | (%) | |
| ING UBS U.S. Large Cap Equity Portfolio (continued) | |
| Class I | |
| | 12-31-11 | | | | 0.11 | | | | — | | | | 8.72 | | | | (2.56 | ) | | | 0.85 | | | | 0.75 | | | | 0.74 | | | | 1.05 | | | | 124,743 | | | | 74 | | |
| | 12-31-10 | | | | 0.08 | | | | — | | | | 9.06 | | | | 13.44 | | | | 0.85 | | | | 0.85 | † | | | 0.84 | † | | | 0.89 | † | | | 148,526 | | | | 55 | | |
| | 12-31-09 | | | | 0.11 | | | | — | | | | 8.06 | | | | 31.76 | | | | 0.85 | | | | 0.85 | † | | | 0.81 | † | | | 1.08 | † | | | 155,093 | | | | 73 | | |
| | 12-31-08 | | | | 0.22 | | | | — | | | | 6.20 | | | | (39.76 | ) | | | 0.85 | | | | 0.85 | † | | | 0.83 | † | | | 1.43 | † | | | 235,657 | | | | 65 | | |
| | 12-31-07 | | | | 0.08 | | | | — | | | | 10.61 | | | | 1.18 | | | | 0.85 | | | | 0.85 | | | | 0.84 | | | | 1.02 | | | | 365,084 | | | | 48 | | |
| Class S | |
| | 12-31-11 | | | | 0.06 | | | | — | | | | 8.67 | | | | (2.71 | ) | | | 1.10 | | | | 1.00 | | | | 0.99 | | | | 0.76 | | | | 7,792 | | | | 74 | | |
| | 12-31-10 | | | | 0.06 | | | | — | | | | 8.98 | | | | 13.01 | | | | 1.10 | | | | 1.10 | † | | | 1.09 | † | | | 0.64 | † | | | 19,188 | | | | 55 | | |
| | 12-31-09 | | | | 0.09 | | | | — | | | | 8.00 | | | | 31.56 | | | | 1.10 | | | | 1.10 | † | | | 1.06 | † | | | 0.75 | † | | | 19,846 | | | | 73 | | |
| | 12-31-08 | | | | 0.16 | | | | — | | | | 6.15 | | | | (40.00 | ) | | | 1.10 | | | | 1.10 | † | | | 1.08 | † | | | 1.13 | † | | | 19,357 | | | | 65 | | |
| | 12-31-07 | | | | 0.07 | | | | — | | | | 10.48 | | | | 0.93 | | | | 1.10 | | | | 1.10 | | | | 1.09 | | | | 0.75 | | | | 45,303 | | | | 48 | | |
(1) Total return is calculated assuming reinvestment of all dividends, capital gain distributions and return of capital distributions, if any, at net asset value and does not reflect the effect of insurance contract charges. Total return for periods less than one year is not annualized.
(2) Annualized for periods less than one year.
(3) Expense ratios do not include fees and expenses charged under the variable annuity contract or variable life insurance policy.
(4) Expense ratios reflect operating expenses of a Portfolio. Expenses before reductions/additions do not reflect amounts reimbursed by an Investment Adviser and/or Distributor or reductions from brokerage service arrangements or other expense offset arrangements and do not represent the amount paid by a Portfolio during periods when reimbursements or reductions occur. Expenses net of fee waivers reflect expenses after reimbursement by an Investment Adviser and/or Distributor but prior to reductions from brokerage service arrangements or other expense offset arrangements. Expenses net of all reductions/additions represent the net expenses paid by a Portfolio. Net investment income (loss) is net of all such additions or reductions.
(5) Commencement of operations.
(a) Includes impact of interest expense on inverse floating rate securities.
(b) There was no impact on total return by the affiliate payment.
• Calculated using average number of shares outstanding throughout the period.
* Amount is less than $0.005 or 0.005% or more than $(0.005) or (0.005)%.
† Impact of waiving the advisory fee for the ING Institutional Prime Money Market Fund holding has less than 0.005% impact on the expense ratio and net investment income or loss ratio.
See Accompanying Notes to Financial Statements
68
NOTES TO FINANCIAL STATEMENTS AS OF DECEMBER 31, 2011
NOTE 1 — ORGANIZATION
ING Partners, Inc. (the "Company") is an open-end management investment company registered under the Investment Company Act of 1940, as amended (the "1940 Act" or "Act"). It was incorporated under the laws of Maryland on May 7, 1997. The Articles of Incorporation permit the Company to offer separate series (each, a "Portfolio" and collectively, the "Portfolios"), each of which has its own investment objective, policies and restrictions. The Company serves as an investment option in underlying variable insurance products offered by Directed Services LLC ("DSL" or the "Investment Adviser").
The Company currently consists of forty-three Portfolios of which sixteen diversified Portfolios are included in this report. The Portfolios are: ING American Century Small-Mid Cap Value Portfolio ("American Century Small-Mid Cap Value"), ING Baron Small Cap Growth Portfolio ("Baron Small Cap Growth"), ING Columbia Small Cap Value II Portfolio ("Columbia Small Cap Value II"), ING Davis New York Venture Portfolio ("Davis New York Venture"), ING Global Bond Portfolio ("Global Bond"), ING Invesco Van Kampen Comstock Portfolio ("Invesco Van Kampen Comstock"), ING Invesco Van Kampen Equity and Income Portfolio ("Invesco Van Kampen Equity and Income"), ING JPMorgan Mid Cap Value Portfolio ("JPMorgan Mid Cap Value"), ING Oppenheimer Global Portfolio ("Oppenheimer Global"), ING PIMCO Total Return Portfolio ("PIMCO Total Return"), ING Pioneer High Yield Portfolio ("Pioneer High Yield"), ING T. Rowe Price Diversified Mid Cap Growth Portfolio ("T. Rowe Price Diversified Mid Cap Growth"), ING T. Rowe Price Growth Equity Portfolio ("T. Rowe Price Growth Equity"), ING Templeton Foreign Equity Portfolio ("Templeton Foreign Equity"), ING Thornburg Value Portfolio ("Thornburg Value") and ING UBS U.S. Large Cap Equity Portfolio ("UBS U.S. Large Cap Equity").
The Company is authorized to offer four classes of shares (Adviser ("Class ADV"), Initial ("Class I"), Service ("Class S") and Service 2 ("Class S2")); however, not all Portfolios currently offer all classes. Each class has equal rights as to class and voting privileges. The classes differ principally in the applicable distribution and shareholder service fees. Shareholders of each class also bear certain expenses that pertain to that particular class. All shareholders bear the common expenses of the Portfolios and earn income and realized gains/losses from the Portfolios pro rata based on the average daily net assets of each class, without distinction between share classes. Distributions are determined separately for each class based on income and expenses allocable to each class. Expenses that are specific to a Portfolio or a class are charged directly to that Portfolio or class. Other operating expenses shared by several Portfolios are generally allocated among those Portfolios based on average net assets. Realized gain distributions are allocated to each class pro rata based on the shares outstanding of each class on the date of distribution. Differences in per share dividend rates generally result from differences in separate class expenses, including distribution and shareholder service fees, if applicable.
Directed Services LLC serves as the investment adviser ("DSL" or the "Investment Adviser") to the Portfolios. ING Funds Services, LLC serves as the administrator ("IFS" or the "Administrator") for the Portfolios. ING Investments Distributor, LLC ("IID" or the "Distributor") serves as the principal underwriter to the Portfolios. ING Investment Management Co. LLC ("ING IM") serves as the sub-adviser to Global Bond.
The Investment Adviser, IFS, IID and ING IM are indirect, wholly-owned subsidiaries of ING Groep N.V. ("ING Groep"). ING Groep is a global financial institution of Dutch origin offering banking, investments, life insurance and retirement services.
ING Groep has adopted a formal restructuring plan that was approved by the European Commission in November 2009 under which the ING life insurance businesses, including the retirement services and investment management businesses, which include the Investment Adviser and its affiliates, would be separated from ING Groep by the end of 2013. To achieve this goal, ING Groep announced in November 2010 that it plans to pursue two separate initial public offerings: one a U.S. focused offering that would include U.S. based insurance, retirement services, and investment management operations; and the other a European based offering for European and Asian based insurance and investment management operations. ING Groep recently announced that it will explore options other than an initial public offering for its Asian insurance and investment management businesses. There can be no assurance that the restructuring plan will be carried out through two offerings or at all.
The restructuring plan and the uncertainty about its implementation, whether implemented through the planned public offerings or through other means, in whole or in part, may be disruptive to the businesses of ING entities, including the ING entities that service the Portfolios, and may cause, among other things, interruption or reduction of business and services, diversion of management's attention from day-to-day
69
NOTES TO FINANCIAL STATEMENTS AS OF DECEMBER 31, 2011 (CONTINUED)
NOTE 1 — ORGANIZATION (continued)
operations, and loss of key employees or customers. A failure to complete the offerings or other means of implementation on favorable terms could have a material adverse impact on the operations of the businesses subject to the restructuring plan. The restructuring plan may result in the Investment Adviser's loss of access to services and resources of ING Groep, which could adversely affect their businesses and profitability. In addition, the divestment of ING businesses, including the Investment Adviser, may potentially be deemed a "change of control" of each entity. A change of control would result in the termination of the Portfolios' advisory and sub-advisory agreements, which would trigger the necessity for new agreements that would require approval of the board, and may trigger the need for shareholder approval. Currently, the Investment Adviser does not anticipate that the restructuring will have a material adverse impact on the Portfolios or their operations and administration.
NOTE 2 — SIGNIFICANT ACCOUNTING POLICIES
The following significant accounting policies are consistently followed by the Portfolios in the preparation of their financial statements. Such policies are in conformity with U.S. generally accepted accounting principles ("GAAP") for investment companies.
A. Security Valuation. All investments in securities are recorded at their estimated fair value, as described below. Investments in equity securities traded on a national securities exchange are valued at the last reported sale price. Securities reported by NASDAQ are valued at the NASDAQ official closing prices. Securities traded on an exchange or NASDAQ for which there has been no sale and securities traded in the over-the-counter-market are valued at the mean between the last reported bid and ask prices. All investments quoted in foreign currencies will be valued daily in U.S. dollars on the basis of the foreign currency exchange rates prevailing at that time. Debt securities with more than 60 days to maturity are valued using matrix pricing methods determined by an independent pricing service which takes into consideration such factors as yields, maturities, liquidity, ratings and traded prices in similar or identical securities. Securities for which valuations are not readily available from an independent pricing service may be valued by brokers which use prices provided by market makers or estimates of fair market value obtained from yield data relating to investments or securities with similar characteristics. U.S. government obligations are valued by using market quotations or independent pricing services that use prices provided by market-makers or estimates of market values obtained from yield data relating to instruments or securities with similar characteristics. Investments in open-end mutual funds are valued at net asset value. Investments in securities of sufficient credit quality, maturing in 60 days or less are valued at amortized cost which approximates fair value.
Securities and assets for which market quotations are not readily available (which may include certain restricted securities, which are subject to limitations as to their sale) are valued at their fair values, as defined by the 1940 Act, and as determined in good faith by or under the supervision of the Portfolios' Board of Directors ("Board"), in accordance with methods that are specifically authorized by the Board. Securities traded on exchanges, including foreign exchanges, which close earlier than the time that a Portfolio calculates its NAV may also be valued at their fair values, as defined by the Act, and as determined in good faith by or under the supervision of the Board, in accordance with methods that are specifically authorized by the Board. All such fair valuations are made in accordance with valuation procedures of the Portfolios (the "Valuation Procedures") which have been approved by the Board. The valuation techniques applied in any specific instance are set forth in the Valuation Procedures and may vary from case to case. With respect to a restricted security, for example, consideration is generally given to the cost of the investment, the market value of any unrestricted securities of the same class at the time of valuation, the potential expiration of restrictions on the security, the existence of any registration rights, the costs to the Portfolios related to registration of the security, as well as factors relevant to the issuer itself. Consideration may also be given to the price and extent of any public trading in similar securities of the issuer or comparable companies' securities. If an event occurs after the time at which the market for foreign securities held by a Portfolio closes but before the time that a Portfolio's NAV is calculated, such event may cause the closing price on the foreign exchange to not represent a readily available reliable market value quotation for such securities at the time a Portfolio determines its NAV. In such a case, a Portfolio will use the fair value of such securities as determined under a Portfolio's valuation procedures. Events after the close of trading on a foreign market that could require a Portfolio to fair value some or all of its foreign securities include, among others, securities trading in the U.S. and other markets, corporate announcements, natural and other disasters, and political and other events. Among other elements of analysis in the determination of a
70
NOTES TO FINANCIAL STATEMENTS AS OF DECEMBER 31, 2011 (CONTINUED)
NOTE 2 — SIGNIFICANT ACCOUNTING POLICIES (continued)
security's fair value, the Board has authorized the use of one or more independent research services to assist with such determinations. An independent research service may use statistical analyses and quantitative models to help determine fair value as of the time a Portfolio calculates its NAV. There can be no assurance that such models accurately reflect the behavior of the applicable markets or the effect of the behavior of such markets on the fair value of securities, or that such markets will continue to behave in a fashion that is consistent with such models. Unlike the closing price of a security on an exchange, fair value determinations employ elements of judgment. Consequently, the fair value assigned to a security may not represent the actual value that a Portfolio could obtain if it were to sell the security at the time of the close of the NYSE. Pursuant to procedures adopted by the Board, a Portfolio is not obligated to use the fair valuations suggested by any research service, and valuation recommendations provided by such research services may be overridden if other events have occurred or if other fair valuations are determined in good faith to be more accurate. Unless an event is such that it causes a Portfolio to determine that the closing prices for one or more securities do not represent readily available reliable market value quotations at the time a Portfolio determines its NAV, events that occur between the time of the close of the foreign market on which they are traded and the close of regular trading on the NYSE will not be reflected in a Portfolio's NAV.
Fair value is defined as the price that the Portfolios would receive to sell an asset or pay to transfer a liability in an orderly transaction between market participants at the measurement date. Each investment asset or liability of the Portfolios is assigned a level at measurement date based on the significance and source of the inputs to its valuation. Quoted prices in active markets for identical securities are classified as "Level 1," inputs other than quoted prices for an asset or liability that are observable are classified as "Level 2" and unobservable inputs, including the sub-adviser's judgment about the assumptions that a market participant would use in pricing an asset or liability are classified as "Level 3." The inputs used for valuing securities are not necessarily an indication of the risks associated with investing in those securities. Short-term securities of sufficient credit quality which are valued at amortized costs, which approximates fair value, are generally considered to be Level 2 securities under applicable accounting rules. A table summarizing the Portfolios' investments under these levels of classification is included following the Summary Portfolios of Investments. For the year ended December 31, 2011, there have been no significant changes to the fair valuation methodologies.
B. Security Transactions and Revenue Recognition. Security transactions are accounted for on the trade date. Realized gains and losses are reported on the basis of identified cost of securities sold. Interest income is recorded on an accrual basis. Dividend income is recorded on the ex-dividend date, or for certain foreign securities, when the information becomes available to the Portfolios. Premium amortization and discount accretion are determined by the effective yield method.
C. Foreign Currency Translation. The books and records of the Portfolios are maintained in U.S. dollars. Any foreign currency amounts are translated into U.S. dollars on the following basis:
(1) Market value of investment securities, other assets and liabilities — at the exchange rates prevailing at the end of the day.
(2) Purchases and sales of investment securities, income and expenses — at the rates of exchange prevailing on the respective dates of such transactions.
Although the net assets and the market values are presented at the foreign exchange rates at the end of the day, the Portfolios do not isolate the portion of the results of operations resulting from changes in foreign exchange rates on investments from the fluctuations arising from changes in market prices of securities held. Such fluctuations are included with the net realized and unrealized gains or losses from investments. For securities, which are subject to foreign withholding tax upon disposition, liabilities are recorded on the Statements of Assets and Liabilities for the estimated tax withholding based on the securities' current market value. Upon disposition, realized gains or losses on such securities are recorded net of foreign withholding tax. Reported net realized foreign exchange gains or losses arise from sales of foreign currencies, currency gains or losses realized between the trade and settlement dates on securities transactions, the difference between the amounts of dividends, interest, and foreign withholding taxes recorded on the Portfolios' books, and the U.S. dollar equivalent of the amounts actually received or paid. Net unrealized foreign exchange gains and losses arise from changes in the value of assets and liabilities other than investments in securities at period end, resulting from changes in the exchange rate. Foreign security and currency transactions may involve certain considerations and risks not typically associated with investing in U.S. companies and U.S. government
71
NOTES TO FINANCIAL STATEMENTS AS OF DECEMBER 31, 2011 (CONTINUED)
NOTE 2 — SIGNIFICANT ACCOUNTING POLICIES (continued)
securities. These risks include, but are not limited to, revaluation of currencies and future adverse political and economic developments, which could cause securities and their markets to be less liquid and prices more volatile than those of comparable U.S. companies and U.S. government securities.
D. Distributions to Shareholders. The Portfolios record distributions to their shareholders on the ex-dividend date. Dividends from net investment income and capital gains, if any, are declared and paid at least annually. The Portfolios may make distributions on a more frequent basis to comply with the distribution requirements of subchapter M of the Internal Revenue Code. The characteristics of income and gains to be distributed are determined in accordance with income tax regulations, which may differ from U.S. generally accepted accounting principles for investment companies.
E. Federal Income Taxes. It is the policy of each Portfolio to comply with the requirements of subchapter M of the Internal Revenue Code that are applicable to regulated investment companies and to distribute substantially all of its net investment income and any net realized capital gains to its shareholders. Therefore, a federal income tax or excise tax provision is not required. Management has considered the sustainability of the Portfolios' tax positions taken on federal income tax returns for all open tax years in making this determination. No capital gain distributions shall be made until the capital loss carryforwards have been fully utilized or expire.
F. Use of Estimates. Management of the Portfolios has made certain estimates and assumptions relating to the reporting of assets, liabilities, income, and expenses to prepare these financial statements in conformity with U.S. generally accepted accounting principles for investment companies. Actual results could differ from these estimates.
G. Risk Exposures and the use of Derivative Instruments. The Portfolios' investment strategies permit the Portfolios to enter into various types of derivatives contracts, including, but not limited to, futures contracts, forward foreign currency exchange contracts, credit default swaps, interest rate swaps, total return swaps, and purchased and written options. In doing so, a Portfolio will employ strategies in differing combinations to permit them to increase or decrease the level of risk, or change the level or types of exposure to market risk factors. This may allow a Portfolio to pursue its objectives more quickly, and efficiently than if it were to make direct purchases or sales of securities capable of affecting a similar response to market factors.
Market Risk Factors. In pursuit of its investment objectives, a Portfolio may seek to use derivatives to increase or decrease its exposure to the following market risk factors:
Credit Risk. Credit risk relates to the ability of the issuer to meet interest and principal payments, or both, as they come due. In general, lower-grade, higher-yield bonds are subject to credit risk to a greater extent than lower-yield, higher-quality bonds.
Equity Risk. Equity risk relates to the change in value of equity securities as they relate to increases or decreases in the general market.
Foreign Exchange Rate Risk. Foreign exchange rate risk relates to the change in U.S. dollar value of a security held that is denominated in a foreign currency. The U.S. dollar value of a foreign currency denominated security will decrease as the dollar appreciates against the currency, while the U.S. dollar value will increase as the dollar depreciates against the currency.
Interest Rate Risk. Interest rate risk refers to the fluctuations in value of fixed-income securities resulting from the inverse relationship between price and yield. For example, an increase in general interest rates will tend to reduce the market value of already issued fixed-income investments, and a decline in general interest rates will tend to increase their value. In addition, debt securities with longer durations, which tend to have higher yields, are subject to potentially greater fluctuations in value from changes in interest rates than obligations with shorter durations.
Volatility Risk. Volatility risk refers to the magnitude of the movement, but not the direction of the movement, in a financial instrument's price over a defined time period. Large increases or decreases in a financial instrument's price over a relative time period typically indicate greater volatility risk, while small increases or decreases in its price typically indicate lower volatility risk.
Risks of Investing in Derivatives. A Portfolio's use of derivatives can result in losses due to unanticipated changes in the market risk factors and the overall market. In instances where a Portfolio is using derivatives to decrease, or hedge, exposures to market risk factors for securities held by a Portfolio, there are also risks that those derivatives may not perform as expected resulting in losses for the combined or hedged positions.
72
NOTES TO FINANCIAL STATEMENTS AS OF DECEMBER 31, 2011 (CONTINUED)
NOTE 2 — SIGNIFICANT ACCOUNTING POLICIES (continued)
The use of these strategies involves certain special risks, including a possible imperfect correlation, or even no correlation, between price movements of derivative instruments and price movements of related investments. While some strategies involving derivative instruments can reduce the risk of loss, they can also reduce the opportunity for gain or even result in losses by offsetting favorable price movements in related investments or otherwise, due to the possible inability of a Portfolio to purchase or sell a portfolio security at a time that otherwise would be favorable or the possible need to sell a portfolio security at a disadvantageous time because the Portfolio is required to maintain asset coverage or offsetting positions in connection with transactions in derivative instruments. Additional associated risks from investing in derivatives also exist and potentially could have significant effects on the valuation of the derivative and a Portfolio. Associated risks are not the risks that a Portfolio is attempting to increase or decrease exposure to, per their investment objectives, but are the additional risks from investing in derivatives. Examples of these associated risks are liquidity risk, which is the risk that a Portfolio will not be able to sell the derivative in the open market in a timely manner, and counterparty credit risk, which is the risk that the counterparty will not fulfill its obligation to a Portfolio. Associated risks can be different for each type of derivative and are discussed by each derivative type in the following notes.
Counterparty Credit Risk and Credit Related Contingent Features. Certain derivative positions are subject to counterparty credit risk, which is the risk that the counterparty will not fulfill its obligation to a Portfolio. Each Portfolio's derivative counterparties are financial institutions who are subject to market conditions that may weaken their financial position. A Portfolio intends to enter into financial transactions with counterparties that they believe to be creditworthy at the time of the transaction. To reduce this risk, a Portfolio has entered into master netting arrangements, established within each Portfolio's International Swap and Derivatives Association, Inc. ("ISDA") Master Agreements ("Master Agreements"). These agreements are with select counterparties and they govern transactions, including certain over-the-counter ("OTC") derivative and forward foreign currency contracts, entered into by a Portfolio and the counterparty. The Master Agreements maintain provisions for general obligations, representations, agreements, collateral, and events of default or termination. The occurrence of a specified event of termination may give a counterparty the right to terminate all of its contracts and affect settlement of all outstanding transactions under the applicable Master Agreement.
A Portfolio may also enter into collateral agreements with certain counterparties to further mitigate counterparty risk on OTC derivative and forward foreign currency contracts. Subject to established minimum levels, collateral is generally determined based on the net aggregate unrealized gain or loss on contracts with a certain counterparty. Collateral pledged to or from a Portfolio is held in a segregated account by a third-party agent and can be in the form of cash or debt securities issued by the U.S. government or related agencies.
As of December 31, 2011, the maximum amount of loss that American Century, Global Bond, Invesco Van Kampen Equity and Income and PIMCO Total Return would incur if the counterparties to its derivative transactions failed to perform would be $22,220, $7,641,464, $668,565 and $15,691,671, respectively, which represents the gross payments to be received by the Portfolio's on open swaps, forward foreign currency transactions, and purchased swaptions were they to be unwound as of December 31, 2011. To reduce the amount of potential loss to Global Bond and PIMCO Total Return, various counterparties have posted $530,000 and $8,686,000 in cash collateral for open OTC transactions.
Each Portfolio has credit related contingent features that if triggered would allow its derivative counterparties to close out and demand payment or additional collateral to cover their exposure from a Portfolio. Credit related contingent features are established between each Portfolio and their derivatives counterparties to reduce the risk that a Portfolio will not fulfill its payment obligations to its counterparties. These triggering features include, but are not limited to, a percentage decrease in a Portfolio's net assets and or a percentage decrease in a Portfolio's NAV, which could cause a Portfolio to accelerate payment of any net liability owed to the counterparty. The contingent features are established within each Portfolio's Master Agreements. There were no credit events during the year ended December 31, 2011, that triggered any credit related contingent features for each respective Portfolio.
As of December 31, 2011, American Century Small-Mid Cap Value, Global Bond and PIMCO Total Return had a net liability position of $6,234, $11,921,753 and $11,574,890, respectively open swaps, forward foreign
73
NOTES TO FINANCIAL STATEMENTS AS OF DECEMBER 31, 2011 (CONTINUED)
NOTE 2 — SIGNIFICANT ACCOUNTING POLICIES (continued)
currency contracts and written options with credit related contingent features.
If a contingent feature would have been triggered as of December 31, 2011, the Portfolios could have been required to pay this amount in cash to its counterparties. As of December 31, 2011, Global Bond had posted $6,491,000 in cash collateral for open OTC derivative transactions with its respective counterparties. As of December 31, 2011, PIMCO Total Return has posted $4,564,000 in various U.S. Government Agency Obligations as collateral for open OTC derivatives with its respective counterparties.
H. Forward Foreign Currency Contracts. Certain Portfolios may enter into forward foreign currency contracts primarily to hedge against foreign currency exchange rate risks on their non-U.S. dollar denominated investment securities. When entering into a forward currency contract, a Portfolio agrees to receive or deliver a fixed quantity of foreign currency for an agreed-upon price on an agreed future date. These contracts are valued daily and a Portfolio's net equity therein, representing unrealized gain or loss on the contracts as measured by the difference between the forward foreign exchange rates at the dates of entry into the contracts and the forward rates at the reporting date, is included in the Statement of Assets and Liabilities. Realized and unrealized gains and losses are included in the Statement of Operations. These instruments involve market and/or credit risk in excess of the amount recognized in the Statement of Assets and Liabilities. Risks arise from the possible inability of counterparties to meet the terms of their contracts and from movement in currency and securities values and interest rates. Open forward foreign currency contracts are presented following the Summary Portfolio of Investments.
During the year ended December 31, 2011, the following Portfolios had average contract amounts on forward foreign currency contracts to buy and sell as disclosed below:
| | | Buy | | Sell | |
American Century Small-Mid
Cap Value* | | $ | 16,288 | | | $ | 4,612,066 | | |
| Global Bond** | | | 502,443,602 | | | | 361,546,405 | | |
Invesco Van Kampen Equity and
Income* | | | — | | | | 13,394,692 | | |
| PIMCO Total Return** | | | 149,048,534 | | | | 267,310,955 | | |
| Templeton Foreign Equity* | | | — | | | | 43,822 | | |
* For the year ended December 31, 2011, the Portfolios used forward foreign currency contracts primarily to protect their non- U.S. dollar-denominated holdings from adverse currency movements. Please refer to the table following the Summary Portfolio of Investments for open forward foreign currency contract at December 31, 2011.
** For the year ended December 31, 2011, the Portfolios used forward foreign currency contracts to protect their non-U.S. dollar-denominated holdings from adverse currency movements and to gain exposure to currencies for the purposes of risk management or enhanced return. Please refer to the table following the Summary Portfolio of Investments for open forward foreign currency contract at December 31, 2011.
I. Futures Contracts. Certain Portfolios may enter into futures contracts involving foreign currency, interest rates, securities and security indices. A futures contract is a commitment to buy or sell a specific amount of a financial instrument at a negotiated price on a stipulated future date. A Portfolio may buy and sell futures contracts. Futures contracts traded on a commodities or futures exchange will be valued at the final settlement price or official closing price on the principal exchange as reported by such principal exchange at its trading session ending at, or most recently prior to, the time when each Portfolio's assets are valued.
Upon entering into a futures contract, a Portfolio is required to deposit either cash or securities (initial margin) in an amount equal to a certain percentage of the contract value. Subsequent payments (variation margin) are made or received by a Portfolio each day. The variation margin payments are equal to the daily changes in the contract value and are recorded as unrealized gains and losses. Open futures contracts are reported on a table following each Portfolio's Summary Portfolio of Investments. Securities held in collateralized accounts to cover initial margin requirements on open futures contracts are footnoted in the Summary Portfolio of Investments. Cash collateral held by the broker to cover initial margin requirements on open futures contracts are noted in the Statements of Assets and Liabilities. The net change in unrealized appreciation and depreciation is reported in the Statements of Operations. Realized gains (losses) are reported in the Statements of Operations at the closing or expiration of futures contracts.
As of December 31, 2011, PIMCO Total Return had posted $2,437,000 principal value in U.S. Treasury Notes and Bonds as collateral with their respective broker for open futures contracts which have been segregated on the Summary Portfolio of Investments.
Futures contracts are exposed to the market risk factor of the underlying financial instrument. During the year ended December 31, 2011, Global Bond and PIMCO Total Return have purchased and sold futures contracts on various notes and bonds as part of their respective duration strategy. Additional associated risks of entering into futures contracts include the
74
NOTES TO FINANCIAL STATEMENTS AS OF DECEMBER 31, 2011 (CONTINUED)
NOTE 2 — SIGNIFICANT ACCOUNTING POLICIES (continued)
possibility that there may be an illiquid market where each Portfolio is unable to liquidate the contract or enter into an offsetting position and, if used for hedging purposes, the risk that the price of the contract will correlate imperfectly with the prices of each Portfolios securities. With futures, there is minimal counterparty credit risk to the Portfolios since futures are exchange traded and the exchange's clearinghouse, as counterparty to all exchange traded futures, guarantees the futures against default.
During the year ended December 31, 2011, the Portfolios had average notional values on futures contracts purchased and sold as disclosed below:
| | | Buy | | Sell | |
| Global Bond | | $ | 195,072,654 | | | $ | 123,466,717 | | |
| PIMCO Total Return | | | 1,209,092,742 | | | | 2,701,316 | | |
J. Securities Lending. Each Portfolio may temporarily loan up to 331/3% of its total assets to brokers, dealers or other financial institutions in exchange for a negotiated lender's fee. The borrower is required to fully collateralize the loans with cash or U.S. government securities. Generally, in the event of counterparty default, a Portfolio has the right to use collateral to offset losses incurred. There would be potential loss to a Portfolio in the event a Portfolio is delayed or prevented from exercising its right to dispose of the collateral. The Portfolios bear the risk of loss with respect to the investment of collateral with the following exception: Effective October 1, 2011, BNY provides the Portfolios indemnification from loss with respect to the investment of collateral provided that the cash collateral is invested solely in overnight repurchase agreements. Engaging in securities lending could have a leveraging effect, which may intensify the credit, market and other risks associated with investing in a Portfolio.
K. Restricted Securities. The Portfolios may invest in restricted securities which include those sold under Rule 144A of the Securities Act of 1933 ("1933 Act") or securities offered pursuant to Section 4(2) of the 1933 Act, and/or are subject to legal or contractual restrictions on resale and may not be publicly sold without registration under the 1933 Act. Restricted securities are fair valued using market quotations when readily available. In the absence of market quotations, the securities are valued based upon their fair value determined in good faith under procedures approved by the Board.
L. When-Issued and Delayed-Delivery Transactions. Certain Portfolios may purchase or sell securities on a when-issued or forward commitment basis. The price of the underlying securities and date when the securities will be delivered and paid for are fixed at the time the transaction is negotiated. The market value of such is identified in the Portfolios' Summary Portfolio of Investments. Losses may arise due to changes in the market value of the securities or from the inability of counterparties to meet the terms of the contract. In connection with such purchases, the Portfolios are required to hold liquid assets as collateral with the Portfolios' custodian sufficient to cover the purchase price.
M. Mortgage Dollar Roll Transactions. Certain Portfolios may engage in dollar roll transactions with respect to mortgage-backed securities issued by Government National Mortgage Association, Federal National Mortgage Association and Federal Home Loan Mortgage Corp. In a dollar roll transaction, a Portfolio sells a mortgage-backed security to a financial institution, such as a bank or broker/dealer, and simultaneously agrees to repurchase a substantially similar (i.e., same type, coupon, and maturity) security from the institution on a delayed delivery basis at an agreed upon price. The mortgage-backed securities that are repurchased will bear the same interest rate as those sold, but generally will be collateralized by different pools of mortgages with different prepayment histories. The Portfolios account for dollar roll transactions as purchases and sales. For fee based dollar roll transactions, the fee is recorded as income.
N. Options Contracts. Certain Portfolios may purchase put and call options and may write (sell) put options and covered call options on futures, swaps ("swaptions"), securities, commodities or foreign currencies. The Portfolios may engage in option transactions as a hedge against adverse movements in the value of portfolio holdings or to increase market exposure. Option contracts are valued daily and unrealized gains or losses are recorded based upon the last sales price on the principal exchange on which the options are traded. An amount equal to the proceeds of the premium received by the Portfolios upon the writing of a put or call option is included in the Statements of Assets and Liabilities as an asset and equivalent liability which is subsequently marked-to-market until it is exercised or closed, or it expires. The Portfolios will realize a gain or loss upon the expiration or closing of the option contract. When an option is exercised, the proceeds on sales of the underlying security for a ritten call option, the purchase cost of the security for a written put option, or the cost of the security for a purchased put or call option is adjusted by the amount of premium received or paid. Realized and unrealized gains or losses on option contracts are
75
NOTES TO FINANCIAL STATEMENTS AS OF DECEMBER 31, 2011 (CONTINUED)
NOTE 2 — SIGNIFICANT ACCOUNTING POLICIES (continued)
reflected in the accompanying financial statements. The risk in writing a covered call option is that the Portfolios give up the opportunity for profit if the market price of the security increases and the option is exercised. The risk in writing a put option is that the Portfolios may incur a loss if the market price of the security decreases and the option is exercised. The risk in buying an option is that the Portfolios pay a premium whether or not the option is exercised. Risks may also arise from an illiquid secondary market or from the inability of counterparties to meet the terms of the contract.
During the year ended December 31, 2011, Global Bond had purchased and written foreign currency options to gain exposure to currencies and to generate income. Please refer to the Summary Portfolio of Investments for open purchased foreign currency options and the table following for open written foreign currency options.
During the year ended December 31, 2011, Global Bond had purchased and written options on OTC U.S. Treasuries as part of their duration strategy and to generate income. Please refer to the table following the Summary Portfolio of Investments for open written option on U.S. Treasuries at December 31, 2011.
During the year ended December 31, 2011, PIMCO Total Return had purchased and written options on exchange-traded futures contracts on various bonds and notes as part of their duration strategy and to generate income. Please refer to the Summary Portfolio of Investments for open purchased options on exchange-traded futures contracts and the table following for open written options on exchange-traded futures contracts at December 31, 2011.
During the year ended December 31, 2011, Global Bond and PIMCO Total Return have purchased and written swaptions on interest rates to gain additional exposure to interest rates and to generate income. Please refer to the respective Summary Portfolio of Investments for PIMCO Total Return for open purchased swaptions and the table following for open purchased and written swaptions at December 31, 2011. There were no open interest rate swaptions for Global Bond at December 31, 2011.
During the year ended December 31, 2011, PIMCO Total Return had written inflation floors to generate income. Please refer to the table following the Summary Portfolio of Investments for open written inflation floors at December 31, 2011.
During the year ended December 31, 2011, PIMCO Total Return had written forward volatility options to generate income. There were no open forward volatility options at December 31, 2011.
Please refer to Note 9 for the volume of both purchased and written option activity during the year ended December 31, 2011.
O. Swap Agreements. Certain Portfolios may enter into swap agreements. A swap is an agreement between two parties pursuant to which each party agrees to make one or more payments to the other at specified future intervals based on the return of an asset (such as a stock, bond or currency) or non-asset reference (such as an interest rate or index). Swap agreements are privately negotiated in the OTC market and may be executed in a multilateral or other trade facility platform, such as a registered commodities exchange ("Centrally cleared swaps").
The swap agreement will specify the "notional" amount of the asset or non-asset reference to which the contract relates. Subsequent changes in fair value, if any, are calculated based upon changes in the performance of the asset or non-asset reference multiplied by the notional value of the contract. A Portfolio may enter into credit default, interest rate, total return and currency swaps to manage its exposure to credit, currency and interest rate risk. All outstanding swap agreements are reported following each Portfolio's Summary Portfolio of Investments.
Swaps are marked to market daily using quotations primarily from third party pricing services, registered commodities exchange(s), counterparties or brokers. The fair value of an OTC swap contract is recorded on each Portfolio's Statements of Assets or Liabilities. Daily changes in the value of centrally cleared swaps, if any, are recorded as variation margin receivable or payable on the Statement of Assets and Liabilities. During the term of the swap, changes in the value of the swap, if any, are recorded as unrealized gains or losses on the Statements of Operations. Upfront payments paid or received on OTC swaps by a Portfolio when entering into the agreements are reported on the Statements of Assets and Liabilities and as a component of the changes in unrealized gains or losses on the Statements of Operations. These upfront payments represent the amounts paid or received when initially entering into the swap agreement to compensate for differences between the stated terms of the swap agreement and the prevailing market conditions. The upfront payments are included as a component in the realized gains or losses on each Portfolio's Statement of Operations
76
NOTES TO FINANCIAL STATEMENTS AS OF DECEMBER 31, 2011 (CONTINUED)
NOTE 2 — SIGNIFICANT ACCOUNTING POLICIES (continued)
upon termination or maturity of the swap. A Portfolio also records net periodic payments paid or received on the swap contract as a realized gain or loss on the Statements of Operations.
Entering into swap agreements involves the risk that the maximum potential loss of an investment exceeds the current value of the investment as reported on each Portfolio's Statements of Assets and Liabilities. Other risks involve the possibility that the counterparty to the agreements may default on its obligation to perform, that there will be no liquid market for these investments and that unfavorable changes in the market will have a negative impact on the value of the index or securities underlying the respective swap agreement.
Credit Default Swap Contracts. A credit default swap is a bilateral agreement between counterparties in which the buyer of the protection agrees to make a stream of periodic payments to the seller of protection in exchange for the right to receive a specified return in the event of a default or other credit event for a referenced entity, obligation or index. As a seller of protection on credit default swaps, a Portfolio will generally receive from the buyer a fixed payment stream based on the notional amount of the swap contract. This fixed payment stream will continue until the swap contract expires or a defined credit event occurs.
A Portfolio is subject to credit risk in the normal course of pursuing its investment objectives. As a seller of protection in a credit default swap, a Portfolio may execute these contracts to manage its exposure to the market or certain sectors of the market. Certain Portfolios may also enter into credit default swaps to speculate on changes in an issuer's credit quality, to take advantage of perceived spread advantages, or to offset an existing short equivalent (i.e. buying protection on an equivalent reference entity).
Certain Portfolios may sell credit default swaps which expose these Portfolios to the risk of loss from credit risk- related events specified in the contract. Although contract specific, credit events are generally defined as bankruptcy, failure to pay, restructuring, obligation acceleration, obligation default or repudiation/ moratorium. If a Portfolio is a seller of protection, and a credit event occurs, as defined under the terms of that particular swap agreement, a Portfolio will generally either (i) pay to the buyer an amount equal to the notional amount of the swap and take delivery of the referenced obligation, other deliverable obligations, or underlying securities comprising a referenced index or (ii) pay a net settlement amount in the form of cash or securities equal to the notional amount of the swap less the recovery value of the referenced obligation or underlying securities comprising a referenced index. If a Portfolio is a buyer of protection and a credit event occurs, as defined under the terms of that particular swap agreement, a Portfolio will either (i) receive from the seller of protection an amount equal to the notional amount of the swap and deliver the referenced obligation, other deliverable obligations or underlying securities comprising the referenced index or (ii) receive a net settlement amount in the form of cash or securities equal to the notional amount of the swap less the recovery value of the referenced obligation or underlying securities comprising the referenced index. Recovery values are assumed by market makers considering either industry standard recovery rates or entity specific factors and considerations until a credit event occurs. If a credit event has occurred, the recovery value is determined by a facilitated auction whereby a minimum number of allowable broker bids, together with a specified valuation method, are used to calculate the settlement value.
Implied credit spreads, represented in absolute terms, utilized in determining the fair value of credit default swap agreements on corporate issues or sovereign issues are disclosed in each Portfolio's Summary Portfolio of Investments and serve as an indicator of the current status of the payment/performance risk and represent the likelihood or risk of default for the credit derivative. The implied credit spread of a particular referenced entity reflects the cost of buying/selling protection and may include upfront payments required to be made to enter into the agreement. For credit default swaps on asset-backed securities or credit indices, the quoted market prices and resulting fair values serve as the indicator of the current status of the payment/performance risk. Wider credit spreads and increasing fair values, in absolute terms when compared to the notional amount of the swap, represent a deterioration of the referenced entity's credit soundness and a greater likelihood or risk of default or other credit event occurring as defined under the terms of the agreement.
The maximum amount of future payments (undiscounted) that a Portfolio as seller of protection could be required to make under a credit default swap agreement would be an amount equal to the notional amount of the agreement. Notional amounts of all credit default swap agreements outstanding as of December 31, 2011, for which a Portfolio is seller of protection are disclosed following each Summary
77
NOTES TO FINANCIAL STATEMENTS AS OF DECEMBER 31, 2011 (CONTINUED)
NOTE 2 — SIGNIFICANT ACCOUNTING POLICIES (continued)
Portfolio of Investments. These potential amounts would be partially offset by any recovery values of the respective referenced obligations, upfront payments received upon entering into the agreements, or net amounts received from the settlement of buy protection credit default swap agreements entered into by a Portfolio for the same referenced entity or entities
For the year ended December 31, 2011, Global Bond has purchased credit protection through credit default swaps to decrease exposure to the credit risk of individual securities and to hedge against anticipated potential credit events.
For the year ended December 31, 2011, Global Bond and PIMCO Total Return have sold credit protection through credit default swaps to gain exposure to the credit risk of individual securities and credit default indices that are either unavailable or considered to be less attractive in the bond market and to hedge against anticipated potential credit events.
For the year ended December 31, 2011, Global Bond and PIMCO Total Return had average notional amounts of $2,030,000 on credit default swaps to buy protection and average notional amounts of $9,430,000 and $150,533,060 on credit default swaps to sell protection, respectively.
Interest Rate Swap Contracts. An interest rate swap involves the agreement between counterparties to exchange periodic payments based on interest rates. One payment will be based on a floating rate of a specified interest rate while the other will be a fixed rate. Risks involve the future fluctuations of interest rates in which a Portfolio may make payments that are greater than what a Portfolio received from the counterparty. Other risks include credit, liquidity and market risk.
For the year ended December 31, 2011, Global Bond and PIMCO Total Return had entered into interest rate swaps in which they pay a floating interest rate and receives a fixed interest rate ("Long interest rate swap") in order to increase exposure to interest rate risk. Average notional amounts on long interest rate swaps were $213,832,542 and $159,311,905, respectively.
For the year ended December 31, 2011, Global Bond and PIMCO Total Return had entered into interest rate swaps in which they pay a fixed interest rate and receives a floating interest rate ("Short interest rate swap") in order to decrease exposure to interest rate risk. Average notional amounts on short interest rate swaps were $329,104,135 and $40,400,000, respectively.
Global Bond and PIMCO Total Return enter into interest rate swaps to adjust interest rate and yield curve exposures and to substitute for physical fixed-income securities. Please refer to the tables following each respective Summary Portfolio of Investments for open interest rate swaps at December 31, 2011.
PIMCO Total Return has posted $18,000 in cash collateral and $3,967,000 principal amount in U.S. Treasury Notes which has been segregated in the Summary Portfolio of Investments as initial margin for the open centrally cleared swaps outstanding on December 31, 2011. Please refer to the tables following the Summary Portfolio of Investments for open centrally cleared swaps.
P. Structured Products. Global Bond invests in structured products which are specially-designed derivative investments whose principal payments or interest payments are linked to the performance of underlying foreign currencies, interest rate spreads, stock market indices, prices of individual securities, commodities or other financial instruments or the occurrence of other specific events. The terms and conditions of these products may be 'structured' by the purchaser (a Portfolio) and the borrower issuing the note. The market value of these products will increase or decrease based on the performance of the underlying asset or reference. A Portfolio records the net change in the market value of the structured product on the accompanying Statements of Operations as a change in unrealized appreciation or depreciation on investments. A Portfolio records a realized gain or loss on the Statements of Operations upon the sale or maturity of the structured product. Please refer to the Summary Portfolio of Investments for structured products held by Global Bond at December 31, 2011.
Q. Sale Commitments. Sale commitments involve commitments where the unit price and the estimated principal amount are established upon entering into the contract, with the actual principal amount being within a specified range of the estimate. A Portfolio will enter into sale commitments to hedge its portfolio positions or to sell mortgage-backed securities it owns under delayed delivery arrangements. Proceeds of sale commitments are not received until the contractual settlement date. During the time a sale commitment is outstanding, a Portfolio will maintain, in a segregated account, cash or marketable securities in an amount sufficient to meet the purchase price. Unsettled sale commitments are valued at current market value of the underlying securities. If the sale commitment is closed through the acquisition of an offsetting
78
NOTES TO FINANCIAL STATEMENTS AS OF DECEMBER 31, 2011 (CONTINUED)
NOTE 2 — SIGNIFICANT ACCOUNTING POLICIES (continued)
purchase commitment, a Portfolio realizes a gain or loss on the commitment without regard to any unrealized gain or loss on the underlying security. If a Portfolio delivers securities under the commitment, a Portfolio realizes a gain or loss from the sale of the securities, based upon the unit price established at the date the commitment was entered into. At December 31, 2011, PIMCO Total Return had open sales commitments. Please refer to the table following the Summary Portfolio of Investments for open sales commitments.
R. Indemnifications. In the normal course of business, the Company may enter into contracts that provide certain indemnifications. The Company's maximum exposure under these arrangements is dependent on future claims that may be made against the Portfolios and, therefore, cannot be estimated; however, based on experience, management considers the risk of loss from such claims remote.
NOTE 3 — INVESTMENT TRANSACTIONS
For the year ended December 31, 2011, the cost of purchases and the proceeds from the sales of securities, excluding U.S. government and short-term securities, were as follows:
| | | Purchases | | Sales | |
American Century Small-Mid
Cap Value | | $ | 233,251,166 | | | $ | 217,893,581 | | |
| Baron Small Cap Growth | | | 109,489,498 | | | | 217,158,220 | | |
| Columbia Small Cap Value II | | | 67,844,741 | | | | 136,922,662 | | |
| Davis New York Venture | | | 53,116,009 | | | | 122,317,545 | | |
| Global Bond | | | 766,871,858 | | | | 824,359,292 | | |
| Invesco Van Kampen Comstock | | | 71,436,411 | | | | 98,618,200 | | |
Invesco Van Kampen Equity and
Income | | | 157,799,431 | | | | 240,175,687 | | |
| JPMorgan Mid Cap Value | | | 128,435,823 | | | | 120,152,818 | | |
| Oppenheimer Global | | | 205,323,633 | | | | 315,106,971 | | |
| PIMCO Total Return | | | 237,582,949 | | | | 154,739,645 | | |
| Pioneer High Yield | | | 39,161,964 | | | | 45,512,595 | | |
T. Rowe Price Diversified Mid Cap
Growth | | | 301,067,049 | | | | 385,292,374 | | |
| T. Rowe Price Growth Equity | | | 300,870,191 | | | | 397,127,078 | | |
| Templeton Foreign Equity | | | 86,331,128 | | | | 95,613,337 | | |
| Thornburg Value | | | 215,460,454 | | | | 258,779,269 | | |
| UBS U.S. Large Cap Equity | | | 118,321,335 | | | | 152,410,196 | | |
U.S. government securities not included above were as follows:
| | | Purchases | | Sales | |
| Global Bond | | $ | 1,919,509,441 | | | $ | 1,888,361,689 | | |
Invesco Van Kampen Equity
and Income | | | — | | | | 4,500,000 | | |
| PIMCO Total Return | | | 9,619,834,948 | | | | 9,867,007,968 | | |
NOTE 4 — INVESTMENT ADVISORY AND ADMINISTRATIVE FEES
For its services, each Portfolio pays the Investment Adviser a monthly fee in arrears equal to the following as a percentage of each Portfolio's average daily net assets during the month:
| Portfolio | | Fee | |
| American Century Small-Mid Cap Value | | | 1.00 | % | |
| Baron Small Cap Growth | | 0.85% on the first $2 billion | |
| | | 0.80% on assets over $2 billion | |
| Columbia Small Cap Value II | | | 0.75 | % | |
| Davis New York Venture | | | 0.80 | % | |
| Global Bond(1) | | 0.50% on the first $4 billion | |
| | | 0.475%on the next $1 billion | |
| | | 0.45% on the next $1 billion | |
| | | 0.43% on assets over $6 billion | |
| Invesco Van Kampen Comstock | | | 0.60 | % | |
| Invesco Van Kampen Equity and Income | | | 0.55 | % | |
| JPMorgan Mid Cap Value | | | 0.75 | % | |
| Oppenheimer Global | | 0.60% on the first $4 billion | |
| | | 0.58% on the next $4 billion | |
| | | 0.56% on assets over $8 billion | |
| PIMCO Total Return | | | 0.50 | % | |
| Pioneer High Yield | | 0.60% on the first $2 billion | |
| | | 0.50% on the next $1 billion | |
| | | 0.40% on the next $1 billion | |
| | | 0.30% on assets over $4 billion | |
| T. Rowe Price Diversified Mid Cap Growth | | | 0.64 | % | |
| T. Rowe Price Growth Equity | | | 0.60 | % | |
| Templeton Foreign Equity | | 0.80% on the first $500 million | |
| | | 0.75% on assets over $500 million | |
| Thornburg Value | | | 0.65 | % | |
| UBS U.S. Large Cap Equity | | 0.70% on the first $500 million | |
| | | 0.65% on assets over $500 million | |
(1) Effective January 21, 2011, DSL has contractually agreed to waive a portion of the advisory fee so that the annual advisory fee is 0.40% for the period from January 21, 2011 through May 1, 2012.
DSL has contractually agreed to waive a portion of the advisory fee for American Century Small-Mid Cap Value, Columbia Small Cap Value II, Davis New York Venture, Global Bond, Invesco Van Kampen Comstock, and T. Rowe Price Growth Equity(2). Prior to May 1, 2011, DSL also waived a portion of the advisory fee for PIMCO Total Return. The advisory fee waiver for PIMCO Total Return expired May 1, 2011.
79
NOTES TO FINANCIAL STATEMENTS AS OF DECEMBER 31, 2011 (CONTINUED)
NOTE 4 — INVESTMENT ADVISORY AND ADMINISTRATIVE FEES (continued)
Waiver = 50% x (former sub-advisory fee minus new sub-advisory fee)
In addition, DSL has agreed to further waive a portion of the advisory fee for ING T. Rowe Price Growth Equity(2).
For the year ended December 31, 2011, DSL waived $163,138, $0, $97,696, $102,701, $12,273, $37,036 and $74,119 for American Century Small-Mid Cap Value, Columbia Small Cap Value II, Davis New York Venture, Global Bond, Invesco Van Kampen Comstock, PIMCO Total Return and T. Rowe Price Growth Equity, respectively.
These waivers will continue through at least May 1, 2012. There is no guarantee that the waivers will continue after said dates. The waiver only renews at the election of DSL.
Prior to January 21, 2011, Global Bond did invest its assets in Oppenheimer Master Loan Fund. Global Bond's purchase of shares of Oppenheimer Master Loan Fund resulted in Global Bond paying a proportionate share of the expenses of Oppenheimer Master Loan Fund. DSL waived its management fee in an amount equal to the advisory fee received by the adviser of the Oppenheimer Master Loan Fund resulting from the Global Bond's investment into the Oppenheimer Master Loan Fund. For the year ended December 31, 2011, the Investment Adviser waived $8,773 of such management fees. These fees are not subject to recoupment.
Effective June 1, 2009, Templeton Foreign Equity may invest its assets in Templeton Smaller Companies Fund. Templeton Foreign Equity's purchase of shares of Templeton Smaller Companies Fund will result in Templeton Foreign Equity paying a proportionate share of the expenses of Templeton Smaller Companies Fund. DSL will waive its management fee in an amount equal to the advisory fee received by the adviser of the Templeton Smaller Companies Fund resulting from the Templeton Foreign Equity's investment into the Templeton Smaller Companies Fund. There were no such waivers for the year ended December 31, 2011.
(2) DSL has contractually agreed to waive a portion of the advisory fee for the Portfolio. The waiver for T. Rowe Price Growth Equity is based on the total aggregated savings in excess of $500,000 as a result of the sub-advisory fee schedule effective June 1, 2010 with respect to T. Rowe Price Growth Equity and ING T. Rowe Price Equity Income, which is not in this report, and effective May 1, 2011 with respect to T. Rowe Price Equity Income, pro rata based on each Portfolio's contribution to the amount saved.
The Company and DSL have entered into portfolio management agreements with each sub-adviser. These sub-advisers provide investment advice for the various Portfolios and are paid by DSL based on the average daily net assets of the respective Portfolios. The sub-adviser of each of the Portfolios are as follows (* denotes a related party sub-adviser):
| Portfolio | | Sub-Adviser | |
| American Century Small-Mid Cap Value | | American Century Investment Management, Inc. | |
|
| Baron Small Cap Growth | | BAMCO, Inc. | |
|
| Columbia Small Cap Value II | | Columbia Management Investment Advisers, LLC | |
|
| Davis New York Venture | | Davis Selected Advisers, L.P. | |
|
| Global Bond(1) | | ING Investment Management Co. LLC* | |
|
| Invesco Van Kampen Comstock & Invesco Van Kampen Equity and Income | | Invesco Advisers, Inc. | |
|
| JPMorgan Mid Cap Value | | J.P. Morgan Investment Management Inc. | |
|
| Oppenheimer Global | | OppenheimerFunds, Inc. | |
|
| PIMCO Total Return | | Pacific Investment Management Company LLC | |
|
| Pioneer High Yield | | Pioneer Investment Management, Inc. | |
|
| T. Rowe Price Diversified Mid Cap Growth & T. Rowe Price Growth Equity | | T. Rowe Price Associates, Inc. | |
|
| Templeton Foreign Equity | | Templeton Investment Counsel, LLC | |
|
| Thornburg Value | | Thornburg Investment Management, Inc. | |
|
| UBS U.S. Large Cap Equity | | UBS Global Asset Management (Americas) Inc. | |
|
(1) Prior to January 21, 2011, the Portfolio was managed by a different sub-adviser. In conjunction with the sub-adviser change, the Portfolio changed its name.
Under an Administrative Services Agreement, ING Funds Services, LLC (the "Administrator"), an indirect, wholly-owned subsidiary of ING Groep, acts as administrator and provides certain administrative and shareholder services necessary for the following Portfolios' operations and is responsible for the supervision of other service providers. For its services, the Administrator is entitled to receive from each of the following Portfolios a fee at an annual rate based on the average daily net assets of each Portfolio as follows:
| Portfolio | | Fee | |
| Columbia Small Cap Value II | | | 0.10 | % | |
| Global Bond(1) | | | 0.10 | % | |
| Pioneer High Yield | | | 0.10 | % | |
| Templeton Foreign Equity | | | 0.10 | % | |
(1) Prior to January 21, 2011, the administrative service fee was 0.04%.
80
NOTES TO FINANCIAL STATEMENTS AS OF DECEMBER 31, 2011 (CONTINUED)
NOTE 4 — INVESTMENT ADVISORY AND ADMINISTRATIVE FEES (continued)
In addition to providing all administrative services necessary for the Portfolios' operations, the administrator also assumes all ordinary recurring direct costs of the Portfolios below, such as custodian fees, director's fees, transfer agency fees and accounting fees. As compensation for these services, the Administrator receives a monthly fee from each Portfolio below at an annual rate based on the average daily net assets of each Portfolio as follows:
| Portfolio | | Fee | |
| American Century Small-Mid Cap Value | | 0.25% | |
| Baron Small Cap Growth | | 0.23% | |
| Davis New York Venture | | 0.10% | |
| Invesco Van Kampen Comstock | | 0.25% on the first $1.1 billion | |
| | | 0.20% on assets over $1.1 billion | |
| Invesco Van Kampen Equity and Income | | 0.10% | |
| JPMorgan Mid Cap Value | | 0.25% | |
| Oppenheimer Global | | 0.06% | |
| PIMCO Total Return | | 0.25% on the first $250 million | |
| | | 0.10% on next
$100 million | |
| | | 0.05% on next
$100 million | |
| | | 0.03% on assets over $450 million | |
| T. Rowe Price Diversified Mid Cap Growth | | 0.02% | |
| T. Rowe Price Growth Equity | | 0.15% | |
| Thornburg Value | | 0.25% | |
| UBS U.S. Large Cap Equity | | 0.15% | |
In placing equity security transactions, each sub-adviser is required to use its best efforts to choose a broker capable of providing brokerage services necessary to obtain the best execution for each transaction. Subject to this requirement, each sub-adviser may allocate equity security transactions through certain designated broker-dealers. Some of these broker-dealers participate in commission recapture programs that have been established for the benefit of the Portfolios. Under these programs, the participating broker-dealers will return to a Portfolio a portion of the brokerage commissions (in the form of a credit to a Portfolio) paid to the broker-dealers to pay certain expenses of a Portfolio. These commission recapture payments benefit the Portfolios and not the sub-adviser. Any amount credited to a Portfolio is recognized as brokerage commission recapture in the Statements of Operations.
NOTE 5 — DISTRIBUTION AND SERVICE FEES
The Company has adopted a plan of Distribution pursuant to Rule 12b-1 ("the Plan") for the Class ADV and Class S2 shares of each respective Portfolio. The Plan provides for a distribution fee, payable to the Distributor. The Distributor may pay, on behalf of each Portfolio, out of its distribution fee, compensation to certain financial institutions for providing distribution assistance. Under the Plan, a Portfolio makes payments at an annual rate of 0.25% of the Portfolio's average daily net assets attributable to its Class ADV and Class S2 shares. The Distributor has contractually agreed to waive a portion of its fee equal to 0.10% of the average daily net assets attributable to the distribution fee paid by Class S2 of the Portfolios, so that the actual fee paid by a Portfolio is an annual rate of 0.15%. The expense waiver will continue through at least May 1, 2012.
Class ADV, Class S and Class S2 shares are further subject to a shareholder servicing fee payable to Shareholder Organizations pursuant to the Shareholder Servicing Plan adopted for Class ADV, Class S and Class S2 which shall not exceed an annual rate of 0.25% of the average daily net assets of each class, respectively. The Distributor has contractually agreed to waive all or a portion of the servicing fee for Baron Small Cap Growth so that total net operating expenses do not exceed 1.31% for Class S shares through May 1, 2012.
Fees paid to the Distributor by class during the year ended December 31, 2011 are shown in the accompanying Statements of Operations.
NOTE 6 — OTHER TRANSACTIONS WITH AFFILIATES AND RELATED PARTIES
At December 31, 2011, the Portfolios had the following amounts recorded as payable to affiliates on the accompanying Statements of Assets and Liabilities (See Note 4):
| Portfolio | | Accrued
Investment
Management
Fees | | Accrued
Administrative
Fees | | Accrued
Shareholder
Service and
Distribution
Fees | | Total | |
American Century
Small-Mid Cap Value | | $ | 168,234 | | | $ | 42,058 | | | $ | 31,253 | | | $ | 241,545 | | |
| Baron Small Cap Growth | | | 533,200 | | | | 144,278 | | | | 126,940 | | | | 804,418 | | |
| Columbia Small Cap Value II | | | 101,751 | | | | 13,567 | | | | 31,300 | | | | 146,618 | | |
| Davis New York Venture | | | 256,448 | | | | 32,980 | | | | 61,115 | | | | 350,543 | | |
| Global Bond | | | 145,712 | | | | 36,428 | | | | 27,144 | | | | 209,284 | | |
Invesco Van Kampen
Comstock | | | 148,063 | | | | 62,051 | | | | 55,996 | | | | 266,110 | | |
Invesco Van Kampen Equity
and Income | | | 351,214 | | | | 63,856 | | | | 52,024 | | | | 467,094 | | |
| JPMorgan Mid Cap Value | | | 209,194 | | | | 69,731 | | | | 49,852 | | | | 328,777 | | |
| Oppenheimer Global | | | 751,356 | | | | 75,134 | | | | 64,255 | | | | 890,745 | | |
| PIMCO Total Return | | | 498,584 | | | | 84,315 | | | | 173,153 | | | | 756,052 | | |
| Pioneer High Yield | | | 44,896 | | | | 7,482 | | | | 353 | | | | 52,731 | | |
T. Rowe Price Diversified
Mid Cap Growth | | | 385,662 | | | | 12,051 | | | | 12,945 | | | | 410,658 | | |
| T. Rowe Price Growth Equity | | | 494,877 | | | | 126,429 | | | | 76,451 | | | | 697,757 | | |
| Templeton Foreign Equity | | | 424,479 | | | | 44,209 | | | | 53,500 | | | | 522,188 | | |
| Thornburg Value | | | 122,637 | | | | 47,168 | | | | 9,860 | | | | 179,665 | | |
| UBS U.S. Large Cap Equity | | | 82,494 | | | | 17,677 | | | | 4,726 | | | | 104,897 | | |
81
NOTES TO FINANCIAL STATEMENTS AS OF DECEMBER 31, 2011 (CONTINUED)
NOTE 6 — OTHER TRANSACTIONS WITH AFFILIATES AND RELATED PARTIES (continued)
The Company has adopted a Deferred Compensation Plan (the "Plan"), which allows eligible non-affiliated directors as described in the Plan to defer the receipt of all or a portion of the directors fees payable. Amounts deferred are treated as though invested in various "notional" funds advised by DSL until distribution in accordance with the Plan.
At December 31, 2011, the following indirect, wholly-owned subsidiaries of ING Groep owned more than 5% of the following Portfolios:
| Subsidiary | | Portfolios | | Percentage | |
ING Life Insurance and
Annuity Company | | American Century
Small-Mid Cap Value | | | 68.68 | % | |
| | | Baron Small Cap Growth | | | 38.08 | % | |
| | | Columbia Small Cap Value II | | | 7.45 | % | |
| | | Davis New York Venture | | | 7.20 | % | |
| | | Global Bond | | | 79.20 | % | |
| | | Invesco Van Kampen Comstock | | | 28.46 | % | |
| | | Invesco Van Kampen Equity
and Income | | | 71.72 | % | |
| | | JPMorgan Mid Cap Value | | | 40.84 | % | |
| | | Oppenheimer Global | | | 77.54 | % | |
| | | PIMCO Total Return | | | 77.05 | % | |
| | | Pioneer High Yield | | | 43.96 | % | |
| | | T. Rowe Price Diversified
Mid Cap Growth | | | 76.49 | % | |
| | | T. Rowe Price Growth Equity | | | 58.42 | % | |
| | | Templeton Foreign Equity | | | 32.48 | % | |
| | | Thornburg Value | | | 67.78 | % | |
| | | UBS U.S. Large Cap Equity | | | 80.25 | % | |
| ING National Trust | | American Century
Small-Mid Cap Value | | | 28.86 | % | |
| | | Baron Small Cap Growth | | | 11.16 | % | |
| | | Global Bond | | | 10.93 | % | |
| | | Invesco Van Kampen Comstock | | | 7.93 | % | |
| | | JPMorgan Mid Cap Value | | | 11.45 | % | |
| | | Oppenheimer Global | | | 6.35 | % | |
| | | PIMCO Total Return | | | 18.61 | % | |
| | | T. Rowe Price Growth Equity | | | 15.15 | % | |
| | | Thornburg Value | | | 7.61 | % | |
| | | UBS U.S. Large Cap Equity | | | 5.46 | % | |
| ING Solution 2025 Portfolio | | Davis New York Venture | | | 6.92 | % | |
| | | Templeton Foreign Equity | | | 6.80 | % | |
| | | Thornburg Value | | | 6.70 | % | |
| ING Solution 2035 Portfolio | | Davis New York Venture | | | 6.47 | % | |
| | | Templeton Foreign Equity | | | 7.63 | % | |
| | | Thornburg Value | | | 6.77 | % | |
| ING Solution 2045 Portfolio | | Davis New York Venture | | | 6.29 | % | |
| | | Thornburg Value | | �� | 6.57 | % | |
ING USA Annuity and
Life Insurance Company | | Baron Small Cap Growth | | | 45.85 | % | |
| | | Columbia Small Cap Value II | | | 79.23 | % | |
| | | Davis New York Venture | | | 62.48 | % | |
| | | Invesco Van Kampen Comstock | | | 56.64 | % | |
| | | Invesco Van Kampen Equity
and Income | | | 23.31 | % | |
| | | JPMorgan Mid Cap Value | | | 37.74 | % | |
| | | Oppenheimer Global | | | 8.44 | % | |
| | | T. Rowe Price Growth Equity | | | 10.82 | % | |
| | | Templeton Foreign Equity | | | 36.82 | % | |
| Subsidiary | | Portfolios | | Percentage | |
Reliastar Life Insurance
Company | | Oppenheimer Global | | | 5.07 | % | |
| | | Pioneer High Yield | | | 29.01 | % | |
| | | T. Rowe Price Diversified
Mid Cap Growth | | | 12.99 | % | |
| | | UBS U.S. Large Cap Equity | | | 5.01 | % | |
Security Life of Denver
Insurance Company | | Pioneer High Yield | | | 25.57 | % | |
| | | T. Rowe Price Diversified
Mid Cap Growth | | | 5.34 | % | |
Control is defined by the 1940 Act as the beneficial ownership, either directly or through one or more controlled companies, of more than 25% of the voting securities of a company. The 1940 Act defines affiliates as companies that are under common control. Therefore, because the Portfolios have a common owner that owns over 25% of the outstanding securities of the Portfolios, they may be deemed to be affiliates of each other. Investment activities of these shareholders could have a material impact on the Portfolios.
NOTE 7 — OTHER ACCRUED EXPENSES AND LIABILITIES
At December 31, 2011, the below Portfolio had the following payables included in Other Accrued Expenses and Liabilities on the Statements of Assets and Liabilities that exceed 5% of total liabilities.
| Portfolio | | Accrued Expenses | | Amount | |
| Pioneer High Yield | | Custody | | $ | 8,606 | | |
| | | Postage | | | 16,248 | | |
| | | Professional | | | 18,582 | | |
NOTE 8 — EXPENSE LIMITATION AGREEMENT
The Investment Adviser has entered into a written expense limitation agreement ("Expense Limitation Agreement") with certain of the Portfolios, whereby the Investment Adviser has agreed to limit expenses, excluding interest, taxes, brokerage commissions, extraordinary expenses, and acquired fund fees and expenses to the following annual expenses to average daily net assets:
| Portfolio | | Class ADV | | Class I | | Class S | | Class S2 | |
American Century
Small-MidCap Value | | | 1.52 | % | | | 1.02 | % | | | 1.27 | % | | | 1.42 | % | |
Columbia Small Cap
Value II | | | 1.65 | % | | | 1.15 | % | | | 1.40 | % | | | 1.55 | % | |
| Global Bond(1) | | | 1.04 | % | | | 0.54 | % | | | 0.79 | % | | | N/A | | |
Invesco Van Kampen
Comstock(2) | | | N/A | | | | N/A | | | | N/A | | | | N/A | | |
| Pioneer High Yield | | | N/A | | | | 0.71 | % | | | 0.96 | % | | | N/A | | |
82
NOTES TO FINANCIAL STATEMENTS AS OF DECEMBER 31, 2011 (CONTINUED)
NOTE 8 — EXPENSE LIMITATION AGREEMENT (continued)
| Portfolio | | Class ADV | | Class I | | Class S | | Class S2 | |
| Templeton Foreign Equity | | | 1.48 | % | | | 0.98 | % | | | 1.23 | % | | | 1.38 | % | |
| UBS U.S. Large Cap Equity(3) | | | N/A | | | | N/A | | | | N/A | | | | N/A | | |
(1) Effective January 21, 2011, DSL implemented expense limits for the Portfolio.
(2) Pursuant to a side agreement, the Investment Adviser has agreed to waive all or a portion of the advisory fee so that the expense limits are 1.31%, 0.81%, and 1.06% for Class ADV, Class I, and Class S, respectively. The expense limits will continue until at least May 1, 2012. The amounts waived are not eligible for recoupment.
(3) Pursuant to a side agreement, the Investment Adviser has agreed to waive all or a portion of the advisory fee so that the expense limits are 1.25%, 0.75%, and 1.00% for Class ADV, Class I, and Class S, respectively. The expense limits will continue until at least May 1, 2012. The amounts waived are not eligible for recoupment.
The Expense Limitation Agreement is contractual and shall renew automatically unless DSL provides written notice of the termination of the Expense Limitation Agreement within 90 days of the end of the then current term or upon termination of the Investment Advisory Agreement.
The Investment Adviser may, at a later date, recoup from a Portfolio for management fees waived and other expenses assumed by the Investment Adviser during the previous 36 months, but only if, after such recoupment, the Portfolio's expense ratio does not exceed the percentage described above. Waived and reimbursed fees by, and any recoupment to the Investment Adviser of such waived and reimbursed fees are reflected on the accompanying Statements of Operations for each Portfolio. Amounts payable by the Investment Adviser are reflected on the accompanying Statements of Assets and Liabilities for each Portfolio.
At December 31, 2011, the amounts of waived and reimbursed fees that are subject to possible recoupment by the Investment Adviser, and the related expiration dates are as follows:
| | | December 31, | | | |
| Portfolio | | 2012 | | 2013 | | 2014 | | Total | |
American Century
Small-Mid Cap Value | | $ | 202,907 | | | $ | 344,578 | | | $ | 463,177 | | | $ | 1,010,662 | | |
| Global Bond | | | — | | | | — | | | | 117,411 | | | | 117,411 | | |
| Pioneer High Yield | | | 104,634 | | | | 33,547 | | | | 57,087 | | | | 195,268 | | |
NOTE 9 — PURCHASED AND WRITTEN OPTIONS
Transactions in purchased foreign currency options for Global Bond Portfolio during the year ended December 31, 2011 were as follows:
| | | USD
Notional | | PLN
Notional | | Cost | |
| Balance at 12/31/10 | | | — | | | | 78,720,000 | | | $ | 374,949 | | |
| Options Purchased | | | 1,035,800,000 | | | | — | | | | 10,614,600 | | |
Options Terminated in
Closing Sell
Transactions | | | (193,500,000 | ) | | | — | | | | (2,710,964 | ) | |
| Options Exercised | | | — | | | | — | | | | — | | |
| Options Expired | | | (766,100,000 | ) | | | (78,720,000 | ) | | | (7,127,788 | ) | |
| Balance at 12/31/11 | | | 76,200,000 | | | | — | | | $ | 1,150,797 | | |
Transactions in purchased options on U.S. Treasury futures for Global Bond Portfolio during the year ended December 31, 2011 were as follows:
| | | Number of
Contracts | | Cost | |
| Balance at 12/31/10 | | | — | | | $ | — | | |
| Options Purchased | | | 478 | | | | 375,646 | | |
Options Terminated in
Closing Sell Transactions | | | (159 | ) | | | (225,317 | ) | |
| Options Exercised | | | — | | | | — | | |
| Options Expired | | | (319 | ) | | | (150,329 | ) | |
| Balance at 12/31/11 | | | — | | | $ | — | | |
Transactions in purchased options on U.S. Treasury futures for Global Bond Portfolio during the year ended December 31, 2011 were as follows:
| | | USD
Notional | | Cost | |
| Balance at 12/31/10 | | | — | | | $ | — | | |
| Options Purchased | | | 3,808,000 | | | | 55,930 | | |
Options Terminated in
Closing Sell Transactions | | | (3,808,000 | ) | | | (55,930 | ) | |
| Options Exercised | | | — | | | | — | | |
| Options Expired | | | — | | | | — | | |
| Balance at 12/31/11 | | | — | | | $ | — | | |
Transactions in purchased interest rate swaptions for Global Bond Portfolio during the year ended December 31, 2011 were as follows:
| | | USD
Notional | | Cost | |
| Balance at 12/31/10 | | | — | | | $ | — | | |
| Options Purchased | | | 31,936,000 | | | | 111,776 | | |
Options Terminated in
Closing Sell Transactions | | | (31,936,000 | ) | | | (111,776 | ) | |
| Options Exercised | | | — | | | | — | | |
| Options Expired | | | — | | | | — | | |
| Balance at 12/31/11 | | | — | | | $ | — | | |
83
NOTES TO FINANCIAL STATEMENTS AS OF DECEMBER 31, 2011 (CONTINUED)
NOTE 9 — PURCHASED AND WRITTEN OPTIONS (continued)
Transactions in written interest rate swaptions for Global Bond Portfolio during the year ended December 31, 2011 were as follows:
| | | USD
Notional | | Premiums
Received | |
| Balance at 12/31/10 | | | — | | | $ | — | | |
| Options Written | | | 31,936,000 | | | | 111,776 | | |
Options Terminated in
Closing Purchase Transactions | | | — | | | | — | | |
| Options Exercised | | | — | | | | — | | |
| Options Expired | | | (31,936,000 | ) | | | (111,776 | ) | |
| Balance at 12/31/11 | | | — | | | $ | — | | |
Transactions in written foreign currency options for Global Bond Portfolio during the year ended December 31, 2011 were as follows:
| | | USD
Notional | | Premiums
Received | |
| Balance at 12/31/10 | | | — | | | $ | — | | |
| Options Written | | | 1,010,400,000 | | | | 9,846,149 | | |
Options Terminated in
Closing Purchase Transactions | | | (180,400,000 | ) | | | (1,893,831 | ) | |
| Options Exercised | | | — | | | | — | | |
| Options Expired | | | (753,800,000 | ) | | | (6,963,152 | ) | |
| Balance at 12/31/11 | | | 76,200,000 | | | $ | 989,166 | | |
Transactions in written options on U.S. Treasury futures for Global Bond Portfolio during the year ended December 31, 2011 were as follows:
| | | Number of
Contracts | | Premiums
Received | |
| Balance at 12/31/10 | | | — | | | $ | — | | |
| Options Written | | | 478 | | | | 125,251 | | |
Options Terminated in
Closing Purchase Transactions | | | (159 | ) | | | (91,158 | ) | |
| Options Exercised | | | — | | | | — | | |
| Options Expired | | | (319 | ) | | | (34,093 | ) | |
| Balance at 12/31/11 | | | — | | | $ | — | | |
Transactions in written options on U.S. Treasury futures for Global Bond Portfolio during the year ended December 31, 2011 were as follows:
| | | USD
Notional | | Premiums
Received | |
| Balance at 12/31/10 | | | — | | | $ | — | | |
| Options Written | | | 11,424,000 | | | | 45,220 | | |
Options Terminated in
Closing Purchase Transactions | | | — | | | | — | | |
| Options Exercised | | | — | | | | — | | |
| Options Expired | | | (7,616,000 | ) | | | (44,030 | ) | |
| Balance at 12/31/11 | | | 3,808,000 | | | $ | 1,190 | | |
Transactions in purchased options on exchange traded futures contracts for PIMCO Total Return during the year ended December 31, 2011 were as follows:
| | | Number of
Contracts | | Cost | |
| Balance at 12/31/10 | | | 907 | | | $ | 7,936 | | |
| Options Purchased | | | 6,749 | | | | 56,097 | | |
Options Terminated in
Closing Sell Transactions | | | — | | | | — | | |
| Options Exercised | | | — | | | | — | | |
| Options Expired | | | (4,136 | ) | | | (36,190 | ) | |
| Balance at 12/31/11 | | | 3,520 | | | $ | 27,843 | | |
Transactions in purchased interest rate swaptions for PIMCO Total Return during the year ended December 31, 2011 were as follows:
| | | USD
Notional | | Cost | |
| Balance at 12/31/10 | | | — | | | $ | — | | |
| Options Purchased | | | 10,900,000 | | | | 43,014 | | |
Options Terminated in
Closing Sell Transactions | | | — | | | | — | | |
| Options Exercised | | | — | | | | — | | |
| Options Expired | | | — | | | | — | | |
| Balance at 12/31/11 | | | 10,900,000 | | | $ | 43,014 | | |
Transactions in written options on exchange traded futures contracts for PIMCO Total Return during the year ended December 31, 2011 were as follows:
| | | Number of
Contracts | | Premiums
Received | |
| Balance at 12/31/10 | | | 198 | | | $ | 105,087 | | |
| Options Written | | | 640 | | | | 395,176 | | |
Options Terminated in
Closing Purchase Transactions | | | (99 | ) | | | (40,816 | ) | |
| Options Exercised | | | — | | | | — | | |
| Options Expired | | | (616 | ) | | | (358,881 | ) | |
| Balance at 12/31/11 | | | 123 | | | $ | 100,566 | | |
Transactions in written interest rate swaptions for PIMCO Total Return during the year ended December 31, 2011 were as follows:
| | | USD
Notional | | Premiums
Received | |
| Balance at 12/31/10 | | | 237,700,000 | | | $ | 2,217,657 | | |
| Options Written | | | 556,900,000 | | | | 2,804,487 | | |
Options Terminated in
Closing Purchase Transactions | | | (140,200,000 | ) | | | (347,442 | ) | |
| Options Exercised | | | (14,400,000 | ) | | | (80,980 | ) | |
| Options Expired | | | (169,800,000 | ) | | | (729,045 | ) | |
| Balance at 12/31/11 | | | 470,200,000 | | | $ | 3,864,677 | | |
84
NOTES TO FINANCIAL STATEMENTS AS OF DECEMBER 31, 2011 (CONTINUED)
NOTE 9 — PURCHASED AND WRITTEN OPTIONS (continued)
Transactions in written inflation floor swaps for PIMCO Total Return during the year ended December 31, 2011 were as follows:
| | | USD
Notional | | Premiums
Received | |
| Balance at 12/31/10 | | | 6,800,000 | | | $ | 67,240 | | |
| Options Written | | | — | | | | — | | |
Options Terminated in
Closing Purchase Transactions | | | — | | | | — | | |
| Options Exercised | | | — | | | | — | | |
| Options Expired | | | — | | | | — | | |
| Balance at 12/31/11 | | | 6,800,000 | | | $ | 67,240 | | |
Transactions in written forward volatility swaptions for PIMCO Total Return during the year ended December 31, 2011 were as follows:
| | | USD
Notional | | Premiums
Received | |
| Balance at 12/31/10 | | | 42,200,000 | | | $ | 464,543 | | |
| Options Written | | | — | | | | — | | |
Options Terminated in
Closing Purchase Transactions | | | (18,800,000 | ) | | | (204,472 | ) | |
| Options Exercised | | | (23,400,000 | ) | | | (260,071 | ) | |
| Options Expired | | | — | | | | — | | |
| Balance at 12/31/11 | | | — | | | $ | — | | |
NOTE 10 — CAPITAL SHARES
Transactions in capital shares and dollars were as follows:
| | | Shares sold | | Shares
issued in
merger | | Reinvestment
of
distributions | | Shares
redeemed | | Net increase
(decrease)
in shares
outstanding | | Shares sold | | Proceeds
from shares
issued
in merger | | Reinvestment
of
distributions | | Shares
redeemed | | Net increase
(decrease) | |
| Year or period ended | | # | | # | | # | | # | | # | | ($) | | ($) | | ($) | | ($) | | ($) | |
| American Century Small-Mid Cap Value | | | |
| Class ADV | | | |
| | 12-31-11 | | | | 1,384,511 | | | | — | | | | 40,369 | | | | (336,070 | ) | | | 1,088,810 | | | | 15,960,878 | | | | — | | | | 394,000 | | | | (3,705,769 | ) | | | 12,649,109 | | |
| | 12-31-10 | | | | 1,396,420 | | | | — | | | | 18,111 | | | | (206,217 | ) | | | 1,208,314 | | | | 14,545,558 | | | | — | | | | 174,774 | | | | (2,109,987 | ) | | | 12,610,345 | | |
| Class I | | | |
| | 12-31-11 | | | | 1,878,400 | | | | — | | | | 119,540 | | | | (1,992,277 | ) | | | 5,663 | | | | 22,264,369 | | | | — | | | | 1,195,407 | | | | (23,533,107 | ) | | | (73,331 | ) | |
| | 12-31-10 | | | | 3,266,101 | | | | — | | | | 83,428 | | | | (912,100 | ) | | | 2,437,429 | | | | 34,934,441 | | | | — | | | | 822,603 | | | | (9,663,599 | ) | | | 26,093,445 | | |
| Class S | | | |
| | 12-31-11 | | | | 1,483,814 | | | | — | | | | 81,899 | | | | (1,488,544 | ) | | | 77,169 | | | | 17,214,615 | | | | — | | | | 814,071 | | | | (17,459,968 | ) | | | 568,718 | | |
| | 12-31-10 | | | | 2,640,237 | | | | — | | | | 83,379 | | | | (1,824,382 | ) | | | 899,234 | | | | 27,496,086 | | | | — | | | | 817,115 | | | | (19,455,397 | ) | | | 8,857,804 | | |
| Class S2 | | | |
| | 12-31-11 | | | | 166,365 | | | | — | | | | 1,653 | | | | (24,669 | ) | | | 143,349 | | | | 1,851,269 | | | | — | | | | 16,049 | | | | (276,759 | ) | | | 1,590,559 | | |
| | 12-31-10 | | | | 28,517 | | | | — | | | | — | | | | (936 | ) | | | 27,581 | | | | 306,830 | | | | — | | | | — | | | | (10,286 | ) | | | 296,544 | | |
| Baron Small Cap Growth | | | |
| Class ADV | | | |
| | 12-31-11 | | | | 865,133 | | | | — | | | | — | | | | (780,157 | ) | | | 84,976 | | | | 16,662,019 | | | | — | | | | — | | | | (14,633,728 | ) | | | 2,028,291 | | |
| | 12-31-10 | | | | 901,938 | | | | — | | | | — | | | | (585,808 | ) | | | 316,130 | | | | 14,361,830 | | | | — | | | | — | | | | (9,308,085 | ) | | | 5,053,745 | | |
| Class I | | | |
| | 12-31-11 | | | | 2,257,156 | | | | — | | | | — | | | | (6,438,188 | ) | | | (4,181,032 | ) | | | 46,380,067 | | | | — | | | | — | | | | (130,445,050 | ) | | | (84,064,983 | ) | |
| | 12-31-10 | | | | 1,911,265 | | | | — | | | | — | | | | (2,035,614 | ) | | | (124,349 | ) | | | 32,498,235 | | | | — | | | | — | | | | (33,983,816 | ) | | | (1,485,581 | ) | |
| Class S | | | |
| | 12-31-11 | | | | 6,244,750 | | | | — | | | | — | | | | (8,602,051 | ) | | | (2,357,301 | ) | | | 122,749,474 | | | | — | | | | — | | | | (164,003,239 | ) | | | (41,253,765 | ) | |
| | 12-31-10 | | | | 4,427,284 | | | | — | | | | — | | | | (6,045,466 | ) | | | (1,618,182 | ) | | | 72,301,328 | | | | — | | | | — | | | | (95,472,404 | ) | | | (23,171,076 | ) | |
| Class S2 | | | |
| | 12-31-11 | | | | 20,455 | | | | — | | | | — | | | | (2,898 | ) | | | 17,557 | | | | 393,113 | | | | — | | | | — | | | | (51,045 | ) | | | 342,068 | | |
| | 12-31-10 | | | | — | | | | — | | | | — | | | | — | | | | — | | | | — | | | | — | | | | — | | | | — | | | | — | | |
| Columbia Small Cap Value II | | | |
| Class ADV | | | |
| | 12-31-11 | | | | 391,676 | | | | — | | | | 2,636 | | | | (124,133 | ) | | | 270,179 | | | | 4,082,308 | | | | — | | | | 22,615 | | | | (1,254,145 | ) | | | 2,850,778 | | |
| | 12-31-10 | | | | 166,932 | | | | — | | | | 2,247 | | | | (31,726 | ) | | | 137,453 | | | | 1,507,438 | | | | — | | | | 18,339 | | | | (279,576 | ) | | | 1,246,201 | | |
| Class I | | | |
| | 12-31-11 | | | | 741,745 | | | | — | | | | 14,334 | | | | (4,393,308 | ) | | | (3,637,229 | ) | | | 7,881,740 | | | | — | | | | 124,993 | | | | (50,239,982 | ) | | | (42,233,249 | ) | |
| | 12-31-10 | | | | 1,354,637 | | | | — | | | | 91,738 | | | | (1,607,667 | ) | | | (161,292 | ) | | | 12,127,309 | | | | — | | | | 758,673 | | | | (15,038,488 | ) | | | (2,152,506 | ) | |
| Class S | | | |
| | 12-31-11 | | | | 620,385 | | | | — | | | | 73,444 | | | | (3,013,570 | ) | | | (2,319,741 | ) | | | 6,295,614 | | | | — | | | | 637,489 | | | | (30,925,123 | ) | | | (23,992,020 | ) | |
| | 12-31-10 | | | | 510,795 | | | | — | | | | 236,194 | | | | (4,373,988 | ) | | | (3,626,999 | ) | | | 4,623,934 | | | | — | | | | 1,943,880 | | | | (39,305,991 | ) | | | (32,738,177 | ) | |
| Class S2 | | | |
| | 12-31-11 | | | | 56,389 | | | | — | | | | 20 | | | | (12,982 | ) | | | 43,427 | | | | 505,979 | | | | — | | | | 173 | | | | (122,812 | ) | | | 383,340 | | |
| | 12-31-10 | | | | — | | | | — | | | | — | | | | — | | | | — | | | | — | | | | — | | | | — | | | | — | | | | — | | |
85
NOTES TO FINANCIAL STATEMENTS AS OF DECEMBER 31, 2011 (CONTINUED)
NOTE 10 — CAPITAL SHARES (continued)
| | | Shares sold | | Shares
issued in
merger | | Reinvestment
of
distributions | | Shares
redeemed | | Net increase
(decrease)
in shares
outstanding | | Shares sold | | Proceeds
from shares
issued
in merger | | Reinvestment
of
distributions | | Shares
redeemed | | Net increase
(decrease) | |
| Year or period ended | | # | | # | | # | | # | | # | | ($) | | ($) | | ($) | | ($) | | ($) | |
| Davis New York Venture | | | |
| Class ADV | | | |
| 12-31-11 | | | 137,691 | | | | — | | | | 5,939 | | | | (63,753 | ) | | | 79,877 | | | | 2,439,993 | | | | — | | | | 90,276 | | | | (1,100,454 | ) | | | 1,429,815 | | |
| 12-31-10 | | | 287,594 | | | | — | | | | 1,492 | | | | (115,548 | ) | | | 173,538 | | | | 4,543,915 | | | | — | | | | 22,413 | | | | (1,849,160 | ) | | | 2,717,168 | | |
| Class I | | | |
| 12-31-11 | | | 2,229,641 | | | | — | | | | 119,152 | | | | (3,855,580 | ) | | | (1,506,787 | ) | | | 40,933,909 | | | | — | | | | 1,852,805 | | | | (65,237,491 | ) | | | (22,450,777 | ) | |
| 12-31-10 | | | 1,848,390 | | | | — | | | | 62,049 | | | | (4,203,407 | ) | | | (2,292,968 | ) | | | 30,371,078 | | | | — | | | | 952,452 | | | | (69,593,638 | ) | | | (38,270,108 | ) | |
| Class S | | | |
| 12-31-11 | | | 587,359 | | | | — | | | | 189,941 | | | | (3,128,802 | ) | | | (2,351,502 | ) | | | 10,021,345 | | | | — | | | | 2,923,201 | | | | (54,305,023 | ) | | | (41,360,477 | ) | |
| 12-31-10 | | | 1,735,252 | | | | — | | | | 84,897 | | | | (2,382,997 | ) | | | (562,848 | ) | | | 27,910,031 | | | | — | | | | 1,288,733 | | | | (37,738,510 | ) | | | (8,539,746 | ) | |
| Global Bond | | | |
| Class ADV | | | |
| 12-31-11 | | | 393,581 | | | | — | | | | 189,370 | | | | (528,892 | ) | | | 54,059 | | | | 4,646,579 | | | | — | | | | 2,168,289 | | | | (6,237,771 | ) | | | 577,097 | | |
| 12-31-10 | | | 1,159,875 | | | | — | | | | 82,852 | | | | (527,020 | ) | | | 715,707 | | | | 12,849,351 | | | | — | | | | 928,779 | | | | (6,045,269 | ) | | | 7,732,861 | | |
| Class I | | | |
| 12-31-11 | | | 1,424,917 | | | | — | | | | 2,303,462 | | | | (7,380,903 | ) | | | (3,652,524 | ) | | | 16,811,807 | | | | — | | | | 26,558,914 | | | | (87,408,480 | ) | | | (44,037,759 | ) | |
| 12-31-10 | | | 3,757,899 | | | | — | | | | 973,037 | | | | (3,819,469 | ) | | | 911,467 | | | | 43,279,872 | | | | — | | | | 10,977,055 | | | | (42,984,301 | ) | | | 11,272,626 | | |
| Class S | | | |
| 12-31-11 | | | 1,097,719 | | | | — | | | | 446,232 | | | | (3,559,336 | ) | | | (2,015,385 | ) | | | 13,066,135 | | | | — | | | | 5,153,972 | | | | (42,863,018 | ) | | | (24,642,911 | ) | |
| 12-31-10 | | | 2,754,182 | | | | — | | | | 286,102 | | | | (4,399,165 | ) | | | (1,358,881 | ) | | | 31,451,982 | | | | — | | | | 3,226,945 | | | | (50,574,563 | ) | | | (15,895,636 | ) | |
| Class S2(a) | | | |
| 12-31-11 | | | 32,361 | | | | — | | | | 2,496 | | | | (35,136 | ) | | | (279 | ) | | | 391,812 | | | | — | | | | 28,534 | | | | (397,151 | ) | | | 23,195 | | |
| 03-08-10(1) - 12-31-10 | | | 279 | | | | — | | | | — | | | | — | | | | 279 | | | | 3,000 | | | | — | | | | — | | | | — | | | | 3,000 | | |
| Invesco Van Kampen Comstock | | | |
| Class ADV | | | |
| 12-31-11 | | | 318,466 | | | | — | | | | 22,298 | | | | (249,380 | ) | | | 91,384 | | | | 3,243,285 | | | | — | | | | 212,917 | | | | (2,513,609 | ) | | | 942,593 | | |
| 12-31-10 | | | 306,680 | | | | — | | | | 18,246 | | | | (470,485 | ) | | | (145,559 | ) | | | 2,827,981 | | | | — | | | | 175,261 | | | | (4,267,116 | ) | | | (1,263,874 | ) | |
| Class I | | | |
| 12-31-11 | | | 649,321 | | | | — | | | | 81,532 | | | | (882,920 | ) | | | (152,067 | ) | | | 6,576,039 | | | | — | | | | 786,737 | | | | (9,057,023 | ) | | | (1,694,247 | ) | |
| 12-31-10 | | | 328,721 | | | | — | | | | 75,512 | | | | (1,194,353 | ) | | | (790,120 | ) | | | 3,044,494 | | | | — | | | | 741,072 | | | | (10,998,830 | ) | | | (7,213,264 | ) | |
| Class S | | | |
| 12-31-11 | | | 3,055,659 | | | | — | | | | 351,438 | | | | (5,162,300 | ) | | | (1,755,203 | ) | | | 31,095,008 | | | | — | | | | 3,379,115 | | | | (53,150,339 | ) | | | (18,676,216 | ) | |
| 12-31-10 | | | 3,764,510 | | | | — | | | | 349,684 | | | | (4,609,011 | ) | | | (494,817 | ) | | | 35,380,215 | | | | — | | | | 3,403,234 | | | | (42,404,980 | ) | | | (3,621,531 | ) | |
| Invesco Van Kampen Equity and Income | | | |
| Class ADV | | | |
| 12-31-11 | | | 363,578 | | | | — | | | | 12,516 | | | | (135,215 | ) | | | 240,879 | | | | 12,277,305 | | | | — | | | | 399,831 | | | | (4,514,751 | ) | | | 8,162,385 | | |
| 12-31-10 | | | 189,379 | | | | — | | | | 5,909 | | | | (101,377 | ) | | | 93,911 | | | | 5,985,601 | | | | — | | | | 195,092 | | | | (3,227,620 | ) | | | 2,953,073 | | |
| Class I | | | |
| 12-31-11 | | | 188,797 | | | | — | | | | 383,860 | | | | (1,869,101 | ) | | | (1,296,444 | ) | | | 6,521,649 | | | | — | | | | 12,470,648 | | | | (63,753,963 | ) | | | (44,761,666 | ) | |
| 12-31-10 | | | 501,284 | | | | — | | | | 317,540 | | | | (1,904,712 | ) | | | (1,085,888 | ) | | | 16,008,586 | | | | — | | | | 10,643,886 | | | | (60,580,845 | ) | | | (33,928,373 | ) | |
| Class S | | | |
| 12-31-11 | | | 581,219 | | | | — | | | | 132,974 | | | | (1,550,873 | ) | | | (836,680 | ) | | | 19,910,413 | | | | — | | | | 4,281,171 | | | | (53,418,865 | ) | | | (29,227,281 | ) | |
| 12-31-10 | | | 860,252 | | | | — | | | | 113,975 | | | | (952,848 | ) | | | 21,379 | | | | 27,421,353 | | | | — | | | | 3,780,796 | | | | (30,038,766 | ) | | | 1,163,383 | | |
| Class S2 | | | |
| 12-31-11 | | | 9,237 | | | | — | | | | 584 | | | | (5,087 | ) | | | 4,734 | | | | 300,965 | | | | — | | | | 18,678 | | | | (172,632 | ) | | | 147,011 | | |
| 12-31-10 | | | 31,463 | | | | — | | | | 423 | | | | (7,009 | ) | | | 24,877 | | | | 971,257 | | | | — | | | | 13,893 | | | | (217,674 | ) | | | 767,476 | | |
| JPMorgan Mid Cap Value | | | |
| Class ADV | | | |
| 12-31-11 | | | 530,367 | | | | — | | | | 14,197 | | | | (294,811 | ) | | | 249,753 | | | | 7,470,560 | | | | — | | | | 188,965 | | | | (4,125,845 | ) | | | 3,533,680 | | |
| 12-31-10 | | | 712,397 | | | | — | | | | 10,622 | | | | (238,824 | ) | | | 484,195 | | | | 8,732,450 | | | | — | | | | 141,753 | | | | (2,908,617 | ) | | | 5,965,586 | | |
| Class I | | | |
| 12-31-11 | | | 1,453,977 | | | | — | | | | 99,783 | | | | (1,753,100 | ) | | | (199,340 | ) | | | 20,631,069 | | | | — | | | | 1,365,727 | | | | (24,429,594 | ) | | | (2,432,798 | ) | |
| 12-31-10 | | | 1,560,001 | | | | — | | | | 83,932 | | | | (1,328,171 | ) | | | 315,762 | | | | 19,354,570 | | | | — | | | | 1,148,457 | | | | (16,292,736 | ) | | | 4,210,291 | | |
| Class S | | | |
| 12-31-11 | | | 4,154,359 | | | | — | | | | 109,253 | | | | (3,977,062 | ) | | | 286,550 | | | | 59,038,988 | | | | — | | | | 1,478,708 | | | | (55,942,603 | ) | | | 4,575,093 | | |
| 12-31-10 | | | 6,223,032 | | | | — | | | | 89,791 | | | | (3,829,696 | ) | | | 2,483,127 | | | | 76,508,518 | | | | — | | | | 1,215,265 | | | | (46,773,717 | ) | | | 30,950,066 | | |
(1) Commencement of operations.
(a) Class S2 liquidated on November 1, 2011.
86
NOTES TO FINANCIAL STATEMENTS AS OF DECEMBER 31, 2011 (CONTINUED)
NOTE 10 — CAPITAL SHARES (continued)
| | | Shares sold | | Shares
issued in
merger | | Reinvestment
of
distributions | | Shares
redeemed | | Net increase
(decrease)
in shares
outstanding | | Shares sold | | Proceeds
from shares
issued
in merger | | Reinvestment
of
distributions | | Shares
redeemed | | Net increase
(decrease) | |
| Year or period ended | | # | | # | | # | | # | | # | | ($) | | ($) | | ($) | | ($) | | ($) | |
| JPMorgan Mid Cap Value (continued) | | | |
| Class S2 | | | |
| | 12-31-11 | | | | 15,499 | | | | — | | | | 109 | | | | (3,202 | ) | | | 12,406 | | | | 206,541 | | | | — | | | | 1,495 | | | | (43,860 | ) | | | 164,176 | | |
| | 12-31-10 | | | | — | | | | — | | | | — | | | | — | | | | — | | | | — | | | | — | | | | — | | | | — | | | | — | | |
| Oppenheimer Global | | | |
| Class ADV | | | |
| | 12-31-11 | | | | 908,522 | | | | — | | | | 67,894 | | | | (941,891 | ) | | | 34,525 | | | | 12,411,402 | | | | — | | | | 795,043 | | | | (12,683,281 | ) | | | 523,164 | | |
| | 12-31-10 | | | | 1,685,165 | | | | — | | | | 73,867 | | | | (1,059,767 | ) | | | 699,265 | | | | 20,405,739 | | | | — | | | | 845,780 | | | | (12,891,926 | ) | | | 8,359,593 | | |
| Class I | | | |
| | 12-31-11 | | | | 2,417,329 | | | | — | | | | 1,695,436 | | | | (12,195,658 | ) | | | (8,082,893 | ) | | | 33,146,828 | | | | — | | | | 20,446,960 | | | | (167,848,460 | ) | | | (114,254,672 | ) | |
| | 12-31-10 | | | | 1,763,905 | | | | — | | | | 1,917,543 | | | | (13,327,518 | ) | | | (9,646,070 | ) | | | 22,441,764 | | | | — | | | | 22,588,655 | | | | (165,741,630 | ) | | | (120,711,211 | ) | |
| Class S | | | |
| | 12-31-11 | | | | 2,404,518 | | | | — | | | | 201,913 | | | | (2,216,621 | ) | | | 389,810 | | | | 32,123,465 | | | | — | | | | 2,368,438 | | | | (29,010,819 | ) | | | 5,481,084 | | |
| | 12-31-10 | | | | 1,135,031 | | | | — | | | | 215,839 | | | | (3,047,501 | ) | | | (1,696,631 | ) | | | 13,957,824 | | | | — | | | | 2,475,668 | | | | (36,755,943 | ) | | | (20,322,451 | ) | |
| Class S2 | | | |
| | 12-31-11 | | | | 78,627 | | | | — | | | | 658 | | | | (16,801 | ) | | | 62,484 | | | | 1,043,944 | | | | — | | | | 7,600 | | | | (231,520 | ) | | | 820,024 | | |
| | 12-31-10 | | | | — | | | | — | | | | — | | | | — | | | | — | | | | — | | | | — | | | | — | | | | — | | | | — | | |
| PIMCO Total Return | | | |
| Class ADV | | | |
| | 12-31-11 | | | | 2,664,146 | | | | — | | | | 881,043 | | | | (2,300,154 | ) | | | 1,245,035 | | | | 31,644,886 | | | | — | | | | 10,123,187 | | | | (27,076,320 | ) | | | 14,691,753 | | |
| | 12-31-10 | | | | 6,006,717 | | | | — | | | | 380,376 | | | | (1,654,988 | ) | | | 4,732,105 | | | | 71,281,320 | | | | — | | | | 4,518,872 | | | | (19,699,661 | ) | | | 56,100,531 | | |
| Class I | | | |
| | 12-31-11 | | | | 4,817,362 | | | | — | | | | 2,901,299 | | | | (7,222,953 | ) | | | 495,708 | | | | 58,274,837 | | | | — | | | | 34,090,267 | | | | (87,154,509 | ) | | | 5,210,595 | | |
| | 12-31-10 | | | | 10,278,804 | | | | — | | | | 1,507,538 | | | | (4,639,438 | ) | | | 7,146,904 | | | | 124,111,320 | | | | — | | | | 18,271,355 | | | | (56,505,250 | ) | | | 85,877,425 | | |
| Class S | | | |
| | 12-31-11 | | | | 5,310,291 | | | | — | | | | 2,612,170 | | | | (4,919,222 | ) | | | 3,003,239 | | | | 63,430,711 | | | | — | | | | 30,431,776 | | | | (58,879,225 | ) | | | 34,983,262 | | |
| | 12-31-10 | | | | 11,438,296 | | | | — | | | | 1,255,296 | | | | (3,784,958 | ) | | | 8,908,634 | | | | 137,078,715 | | | | — | | | | 15,088,653 | | | | (45,460,536 | ) | | | 106,706,832 | | |
| Class S2 | | | |
| | 12-31-11 | | | | 97,870 | | | | — | | | | 7,877 | | | | (30,270 | ) | | | 75,477 | | | | 1,136,050 | | | | — | | | | 90,033 | | | | (349,323 | ) | | | 876,760 | | |
| | 12-31-10 | | | | 116,786 | | | | — | | | | 1,000 | | | | (33,413 | ) | | | 84,373 | | | | 1,398,182 | | | | — | | | | 11,839 | | | | (397,451 | ) | | | 1,012,570 | | |
| Pioneer High Yield | | | |
| Class ADV(b) | | | |
| | 12-31-11 | | | | 296 | | | | — | | | | 140 | | | | (11,131 | ) | | | (10,695 | ) | | | 3,400 | | | | — | | | | 1,626 | | | | (129,700 | ) | | | (124,674 | ) | |
| | 12-31-10 | | | | 9,759 | | | | — | | | | 400 | | | | (2,486 | ) | | | 7,673 | | | | 99,278 | | | | — | | | | 4,180 | | | | (25,951 | ) | | | 77,507 | | |
| Class I | | | |
| | 12-31-11 | | | | 2,175,572 | | | | — | | | | 483,160 | | | | (3,114,071 | ) | | | (455,339 | ) | | | 24,399,401 | | | | — | | | | 5,376,948 | | | | (34,466,663 | ) | | | (4,690,314 | ) | |
| | 12-31-10 | | | | 2,088,911 | | | | — | | | | 550,259 | | | | (3,108,077 | ) | | | (468,907 | ) | | | 21,686,531 | | | | — | | | | 5,723,733 | | | | (31,988,737 | ) | | | (4,578,473 | ) | |
| Class S | | | |
| | 12-31-11 | | | | 117,849 | | | | — | | | | 8,217 | | | | (169,054 | ) | | | (42,988 | ) | | | 1,278,114 | | | | — | | | | 92,150 | | | | (1,929,944 | ) | | | (559,680 | ) | |
| | 12-31-10 | | | | 84,561 | | | | — | | | | 15,599 | | | | (192,928 | ) | | | (92,768 | ) | | | 884,719 | | | | — | | | | 161,580 | | | | (1,980,376 | ) | | | (934,077 | ) | |
| T. Rowe Price Diversified Mid Cap Growth | | | |
| Class ADV | | | |
| | 12-31-11 | | | | 963,957 | | | | — | | | | 3,712 | | | | (2,432,166 | ) | | | (1,464,497 | ) | | | 7,959,381 | | | | — | | | | 26,206 | | | | (20,761,093 | ) | | | (12,775,506 | ) | |
| | 12-31-10 | | | | 1,061,333 | | | | — | | | | 2,528 | | | | (981,763 | ) | | | 82,098 | | | | 7,448,938 | | | | — | | | | 16,555 | | | | (6,794,250 | ) | | | 671,243 | | |
| Class I | | | |
| | 12-31-11 | | | | 1,284,148 | | | | — | | | | 308,637 | | | | (9,808,728 | ) | | | (8,215,943 | ) | | | 11,543,100 | | | | — | | | | 2,436,752 | | | | (84,906,288 | ) | | | (70,926,436 | ) | |
| | 12-31-10 | | | | 2,227,521 | | | | — | | | | 240,936 | | | | (12,003,854 | ) | | | (9,535,397 | ) | | | 16,798,421 | | | | — | | | | 1,970,693 | | | | (85,547,112 | ) | | | (66,777,998 | ) | |
| Class S | | | |
| | 12-31-11 | | | | 397,196 | | | | — | | | | 3,831 | | | | (532,877 | ) | | | (131,850 | ) | | | 3,465,098 | | | | — | | | | 27,740 | | | | (4,470,313 | ) | | | (977,475 | ) | |
| | 12-31-10 | | | | 480,466 | | | | — | | | | 1,994 | | | | (782,508 | ) | | | (300,048 | ) | | | 3,406,685 | | | | — | | | | 13,597 | | | | (5,525,877 | ) | | | (2,105,595 | ) | |
| Class S2 | | | |
| | 12-31-11 | | | | 114,818 | | | | — | | | | 187 | | | | (22,007 | ) | | | 92,998 | | | | 917,092 | | | | — | | | | 1,441 | | | | (175,697 | ) | | | 742,836 | | |
| | 12-31-10 | | | | — | | | | — | | | | — | | | | — | | | | — | | | | — | | | | — | | | | — | | | | — | | | | — | | |
| T. Rowe Price Growth Equity | | | |
| Class ADV | | | |
| | 12-31-11 | | | | 252,632 | | | | — | | | | — | | | | (403,679 | ) | | | (151,047 | ) | | | 13,835,357 | | | | — | | | | — | | | | (21,604,429 | ) | | | (7,769,072 | ) | |
| | 12-31-10 | | | | 582,797 | | | | — | | | | 703 | | | | (274,182 | ) | | | 309,318 | | | | 27,415,126 | | | | — | | | | 31,137 | | | | (13,126,887 | ) | | | 14,319,376 | | |
(b) Class ADV liquidated on September 8, 2011.
87
NOTES TO FINANCIAL STATEMENTS AS OF DECEMBER 31, 2011 (CONTINUED)
NOTE 10 — CAPITAL SHARES (continued)
| | | Shares sold | | Shares
issued in
merger | | Reinvestment
of
distributions | | Shares
redeemed | | Net increase
(decrease)
in shares
outstanding | | Shares sold | | Proceeds
from shares
issued
in merger | | Reinvestment
of
distributions | | Shares
redeemed | | Net increase
(decrease) | |
| Year or period ended | | # | | # | | # | | # | | # | | ($) | | ($) | | ($) | | ($) | | ($) | |
| T. Rowe Price Growth Equity (continued) | | | |
| Class I | | | |
| 12-31-11 | | | 1,017,493 | | | | — | | | | — | | | | (2,443,351 | ) | | | (1,425,858 | ) | | | 56,754,920 | | | | — | | | | — | | | | (135,550,221 | ) | | | (78,795,301 | ) | |
| 12-31-10 | | | 954,377 | | | | — | | | | 6,088 | | | | (2,390,396 | ) | | | (1,429,931 | ) | | | 45,470,812 | | | | — | | | | 274,344 | | | | (114,665,943 | ) | | | (68,920,787 | ) | |
| Class S | | | |
| 12-31-11 | | | 1,050,065 | | | | — | | | | — | | | | (985,184 | ) | | | 64,881 | | | | 57,720,809 | | | | — | | | | — | | | | (52,887,743 | ) | | | 4,833,066 | | |
| 12-31-10 | | | 833,938 | | | | — | | | | 1,165 | | | | (932,307 | ) | | | (97,204 | ) | | | 40,813,289 | | | | — | | | | 51,974 | | | | (42,878,010 | ) | | | (2,012,747 | ) | |
| Class S2 | | | |
| 12-31-11 | | | 14,333 | | | | — | | | | — | | | | (2,634 | ) | | | 11,699 | | | | 773,147 | | | | — | | | | — | | | | (143,880 | ) | | | 629,267 | | |
| 12-31-10 | | | — | | | | — | | | | — | | | | — | | | | — | | | | — | | | | — | | | | — | | | | — | | | | — | | |
| Templeton Foreign Equity | | | |
| Class ADV | | | |
| 12-31-11 | | | 1,174,858 | | | | — | | | | 37,072 | | | | (146,664 | ) | | | 1,065,266 | | | | 12,461,321 | | | | — | | | | 349,959 | | | | (1,529,998 | ) | | | 11,281,282 | | |
| 12-31-10 | | | 468,290 | | | | — | | | | 23,458 | | | | (205,465 | ) | | | 286,283 | | | | 4,807,487 | | | | — | | | | 226,608 | | | | (2,049,331 | ) | | | 2,984,764 | | |
| Class I | | | |
| 12-31-11 | | | 4,272,752 | | | | — | | | | 629,262 | | | | (10,824,089 | ) | | | (5,922,075 | ) | | | 45,246,761 | | | | — | | | | 5,971,695 | | | | (122,648,933 | ) | | | (71,430,477 | ) | |
| 12-31-10 | | | 15,810,589 | | | | — | | | | 742,177 | | | | (6,518,153 | ) | | | 10,034,613 | | | | 166,257,143 | | | | — | | | | 7,199,119 | | | | (65,696,451 | ) | | | 107,759,811 | | |
| Class S | | | |
| 12-31-11 | | | 3,726,451 | | | | — | | | | 445,707 | | | | (7,657,107 | ) | | | (3,484,949 | ) | | | 41,442,186 | | | | — | | | | 4,216,387 | | | | (79,554,385 | ) | | | (33,895,812 | ) | |
| 12-31-10 | | | 7,396,784 | | | | — | | | | 561,312 | | | | (7,453,377 | ) | | | 504,719 | | | | 76,185,878 | | | | — | | | | 5,422,278 | | | | (73,171,326 | ) | | | 8,436,830 | | |
| Class S2 | | | |
| 12-31-11 | | | 103,552 | | | | — | | | | 1,638 | | | | (7,244 | ) | | | 97,946 | | | | 1,102,465 | | | | — | | | | 15,463 | | | | (69,186 | ) | | | 1,048,742 | | |
| 12-31-10 | | | 31,345 | | | | — | | | | — | | | | (22,585 | ) | | | 8,760 | | | | 310,603 | | | | — | | | | — | | | | (233,343 | ) | | | 77,260 | | |
| Thornburg Value | | | |
| Class ADV | | | |
| 12-31-11 | | | 184,368 | | | | — | | | | 2,845 | | | | (104,572 | ) | | | 82,641 | | | | 5,884,035 | | | | — | | | | 74,886 | | | | (3,199,971 | ) | | | 2,758,950 | | |
| 12-31-10 | | | 268,869 | | | | — | | | | 6,793 | | | | (42,720 | ) | | | 232,942 | | | | 7,786,475 | | | | — | | | | 183,003 | | | | (1,217,143 | ) | | | 6,752,335 | | |
| Class I | | | |
| 12-31-11 | | | 1,143,371 | | | | — | | | | 70,169 | | | | (2,508,965 | ) | | | (1,295,425 | ) | | | 36,867,095 | | | | — | | | | 1,892,464 | | | | (74,194,668 | ) | | | (35,435,109 | ) | |
| 12-31-10 | | | 2,809,171 | | | | — | | | | 153,054 | | | | (2,453,686 | ) | | | 508,539 | | | | 82,081,301 | | | | — | | | | 4,222,751 | | | | (73,656,449 | ) | | | 12,647,603 | | |
| Class S | | | |
| 12-31-11 | | | 129,142 | | | | — | | | | 3,737 | | | | (139,958 | ) | | | (7,079 | ) | | | 4,224,659 | | | | — | | | | 100,212 | | | | (4,294,113 | ) | | | 30,758 | | |
| 12-31-10 | | | 213,465 | | | | — | | | | 9,083 | | | | (129,274 | ) | | | 93,274 | | | | 6,277,036 | | | | — | | | | 249,052 | | | | (3,859,707 | ) | | | 2,666,381 | | |
| Class S2 | | | |
| 12-31-11 | | | — | | | | — | | | | — | | | | — | | | | — | | | | — | | | | — | | | | — | | | | — | | | | — | | |
| 03-08-10(1) - 12-31-10 | | | 101 | | | | — | | | | — | | | | — | | | | 101 | | | | 3,000 | | | | — | | | | — | | | | — | | | | 3,000 | | |
| UBS U.S. Large Cap Equity | | | |
| Class ADV | | | |
| 12-31-11 | | | 6,318 | | | | — | | | | 5,920 | | | | (140,963 | ) | | | (128,725 | ) | | | 56,813 | | | | — | | | | 49,175 | | | | (1,264,297 | ) | | | (1,158,309 | ) | |
| 12-31-10 | | | 286,682 | | | | — | | | | 4,778 | | | | (253,249 | ) | | | 38,211 | | | | 2,292,505 | | | | — | | | | 39,903 | | | | (2,067,298 | ) | | | 265,110 | | |
| Class I | | | |
| 12-31-11 | | | 703,302 | | | | — | | | | 175,993 | | | | (2,978,206 | ) | | | (2,098,911 | ) | | | 6,556,474 | | | | — | | | | 1,502,667 | | | | (27,326,815 | ) | | | (19,267,674 | ) | |
| 12-31-10 | | | 1,100,320 | | | | — | | | | 151,781 | | | | (4,095,285 | ) | | | (2,843,184 | ) | | | 8,889,048 | | | | — | | | | 1,330,636 | | | | (33,557,910 | ) | | | (23,338,226 | ) | |
| Class S | | | |
| 12-31-11 | | | 149,386 | | | | — | | | | 8,428 | | | | (1,395,325 | ) | | | (1,237,511 | ) | | | 1,338,694 | | | | — | | | | 70,116 | | | | (12,350,634 | ) | | | (10,941,824 | ) | |
| 12-31-10 | | | 123,580 | | | | — | | | | 14,704 | | | | (484,459 | ) | | | (346,175 | ) | | | 1,001,949 | | | | — | | | | 126,214 | | | | (3,934,980 | ) | | | (2,806,817 | ) | |
(1) Commencement of operations.
NOTE 11 — LINE OF CREDIT
The Portfolios, in addition to certain other funds managed by the Investment Advisers, have entered into an unsecured committed revolving line of credit agreement (the "Credit Agreement") with The Bank of New York Mellon for an aggregate amount of $125,000,000. The proceeds may be used to: (1) temporarily finance the purchase and sale of securities; or (2) finance the redemption of shares of an investor in the funds. Effective May 27, 2011, the funds pay a commitment fee equal to 0.08% per annum on the daily unused portion of the committed line amount payable quarterly in arrears. Prior to May 27, 2011, the funds paid a commitment fee equal to 0.15% per annum on the daily unused portion of the committed line amount payable quarterly in arrears.
88
NOTES TO FINANCIAL STATEMENTS AS OF DECEMBER 31, 2011 (CONTINUED)
NOTE 11 — LINE OF CREDIT (continued)
Generally, borrowings under the Credit Agreement accrue interest at the federal funds rate plus a specified margin. Repayments generally must be made within 60 days after the date of a revolving credit advance. The following Portfolios utilized the line of credit during the year ended December 31, 2011:
| Portfolio | | Days
Utilized | | Approximate
Average Daily
Balance For
Days Utilized | | Approximate
Weighted
Average
Interest Rate
For Days
Utilized | |
American Century
Small-Mid Cap Value | | | 6 | | | $ | 494,167 | | | | 1.27 | % | |
| Baron Small Cap Growth | | | 49 | | | | 6,551,122 | | | | 1.24 | | |
| Davis New York Venture | | | 11 | | | | 6,819,545 | | | | 1.25 | | |
| Global Bond | | | 32 | | | | 3,530,156 | | | | 1.31 | | |
| JPMorgan Mid Cap Value | | | 2 | | | | 1,942,500 | | | | 1.24 | | |
| Oppenheimer Global | | | 1 | | | | 725,000 | | | | 1.34 | | |
| PIMCO Total Return | | | 8 | | | | 2,729,375 | | | | 1.30 | | |
| Pioneer High Yield | | | 16 | | | | 1,748,125 | | | | 1.24 | | |
T. Rowe Price Diversified
Mid Cap Growth | | | 15 | | | | 1,006,333 | | | | 1.27 | | |
| T. Rowe Price Growth Equity | | | 7 | | | | 2,272,857 | | | | 1.31 | | |
| Templeton Foreign Equity | | | 6 | | | | 6,113,333 | | | | 1.34 | | |
| Thornburg Value | | | 11 | | | | 6,402,727 | | | | 1.25 | | |
| UBS U.S. Large Cap Equity | | | 4 | | | | 1,391,250 | | | | 1.25 | | |
NOTE 12 — CONCENTRATION OF RISKS
All mutual funds involve risk — some more than others — and there is always the chance that you could lose money or not earn as much as you hope. Each Portfolio's risk profile is largely a factor of the principal securities in which it invests and investment techniques that it uses. For more information regarding the types of securities and investment techniques that may be used by each Portfolio and its corresponding risks, see the Portfolios' most recent Prospectus and/or the Statement of Additional Information.
Foreign Securities. Investments in foreign securities may entail risks not present in domestic investments. Since securities in which a Portfolio may invest are denominated in foreign currencies, changes in the relationship of these foreign currencies to the U.S. dollar can significantly affect the value of the investments and earnings of a Portfolio. Foreign investments may also subject a Portfolio to foreign government exchange restrictions, expropriation, taxation or other political, social or economic developments, as well as changes vis-a-vis the U.S. dollar from movements in currency, and changes in security value and interest rate, all of which could affect the market and/or credit risk of a Portfolio investments.
Emerging Markets Risk. Emerging market countries are generally defined as countries in the initial stage of their industrialization cycles with low per capita income. Investments in emerging market countries present risks in a greater degree than, and in addition to, those presented by investments in foreign issuers in general as these countries may be less politically and economically stable than other countries. A number of emerging market countries restrict, to varying degrees, foreign investment in stocks. Repatriation of investment income, capital and proceeds of sales by foreign investors may require governmental registration and/or approval in some emerging market countries. A number of the currencies of developing countries have experienced significant declines against the U.S. dollar from time to time, and devaluation may occur after investments in those currencies by a Portfolio. Inflation and rapid fluctuations in inflation rates have had, and may continue to have, negative effects on the economies and securities markets of certain emerging market countries.
NOTE 13 — SECURITIES LENDING
Under an agreement with The Bank of New York Mellon ("BNY"), the Portfolios can lend their securities to approved brokers, dealers and other financial institutions. Loans are collateralized by cash and U.S. government securities. The collateral is equal to at least 105% of the market value of non-U.S. securities loaned and 102% of the market value of U.S. securities loaned. The market value of the loaned securities is determined at the close of business of the Portfolios at their last sale price or official closing price on the principal exchange or system on which they are traded and any additional collateral is delivered to the Portfolios on the next business day. The cash collateral received is invested in approved investments as defined in the Securities Lending Agreement with BNY (the "Agreement"). The Portfolios bear the risk of loss with respect to the investment of collateral with the following exception: Effective October 1, 2011, BNY provides the Portfolios indemnification from loss with respect to the investment of collateral provided that the cash collateral is invested solely in overnight repurchase agreements.
Currently, the cash collateral is invested in overnight repurchase agreements that are collateralized at 102% with securities issued or fully guaranteed by the United States Treasury; United States government or any agency, instrumentality or authority of the United States government. The securities purchased with cash collateral received are reflected in the Summary Portfolio of Investments under Securities Lending Collateral.
Prior to October 1, 2011, the cash collateral was invested in the BNY Mellon Overnight Government Fund (formerly, The BNY Institutional Cash Reserves
89
NOTES TO FINANCIAL STATEMENTS AS OF DECEMBER 31, 2011 (CONTINUED)
NOTE 13 — SECURITIES LENDING (continued)
Fund — Series A) and the BNY Institutional Cash Reserves Fund — Series B ("BICR — Series B"), each a series within the BNY Institutional Cash Reserves Trust (collectively, the "BICR Fund"). BNY serves as investment manager, custodian and operational trustee of the BICR Fund. From the beginning of the period covered by this report through October 16, 2011, BICR-Series B held certain defaulted securities issued by Lehman Brothers Holdings, Inc. (the "Lehman Securities"). The Lehman Securities had market values significantly below amortized cost. On May 22, 2009, the Funds agreed to the terms of a capital support agreement (the "Capital Support Agreement") extended by The Bank of New York Mellon Corporation ("BNYC"), an affiliated company of BNY, for the Lehman Securities held by BICR- Series B. Under the terms of the Capital Support Agreement, BNYC agreed to support the value of the Lehman Securities up to 80% of the par value (the remaining 20% of the par value represents a realized loss to the Funds) and subject, in part, to the Funds' continued participation in the BNY securities lending program through September 15, 2011. As of September 15, 2011, the Portfolios had complied with the requirements under the Capital Support Agreement and therefore the Portfolios could exercise their right to sell the Lehman Securities to BNYC at a price equal to 80% of par value. The sale of the Lehman Securities was completed on October 17, 2011.
Generally, in the event of counterparty default, the Portfolios have the right to use the collateral to offset losses incurred. The Agreement contains certain guarantees by BNY in the event of counterparty default and/or a borrower's failure to return a loaned security; however, there would be a potential loss to the Portfolios in the event the Portfolios are delayed or prevented from exercising their right to dispose of the collateral. Engaging in securities lending could have a leveraging effect, which may intensify the credit, market and other risks associated with investing in a Portfolio. At December 31, 2011, the following Portfolios had securities on loan with the following market values:
| Portfolio | | Value of
Securities
Loaned | | Cash
Collateral
Received | |
American Century
Small-Mid Cap Value | | $ | 923,042 | | | $ | 948,481 | | |
| Global Bond | | | 25,946,717 | | | | 26,834,272 | | |
| Oppenheimer Global | | | 7,989,278 | | | | 8,217,621 | | |
| PIMCO Total Return | | | 8,557,770 | | | | 8,777,862 | | |
T. Rowe Price Diversified
Mid Cap Growth | | | 23,001,827 | | | | 23,544,063 | | |
| T. Rowe Price Growth Equity | | | 27,813,940 | | | | 28,542,859 | | |
| Thornburg Value | | | 6,919,323 | | | | 7,072,679 | | |
| UBS U.S. Large Cap Equity | | | 2,009,449 | | | | 2,058,668 | | |
NOTE 14 — FEDERAL INCOME TAXES
The amount of distributions from net investment income and net realized capital gains are determined in accordance with federal income tax regulations, which may differ from U.S. generally accepted accounting principles for investment companies. These book/tax differences may be either temporary or permanent. Permanent differences are reclassified within the capital accounts based on their federal tax-basis treatment; temporary differences are not reclassified. Key differences include the treatment of short-term capital gains, foreign currency transactions, income from passive foreign investment companies (PFICs), and wash sale deferrals. Distributions in excess of net investment income and/or net realized capital gains for tax purposes are reported as return of capital.
The following permanent tax differences have been reclassified as of December 31, 2011:
| | | Paid-in
Capital | | Undistributed
Net Investment
Income | | Accumulated
Net Realized
Gains/
(Losses) | |
American Century
Small-Mid Cap Value | | $ | — | | | $ | (85,228 | ) | | $ | 85,228 | | |
| Baron Small Cap Growth | | | (6,077,594 | ) | | | 5,655,236 | | | | 422,358 | | |
| Davis New York Venture | | | (24,558 | ) | | | (1,263,417 | ) | | | 1,287,975 | | |
| Global Bond | | | — | | | | 4,448,190 | | | | (4,448,190 | ) | |
Invesco Van Kampen
Comstock | | | — | | | | (55,212 | ) | | | 55,212 | | |
Invesco Van Kampen
Equity and Income | | | — | | | | 741,828 | | | | (741,828 | ) | |
| JPMorgan Mid Cap Value | | | — | | | | (159,623 | ) | | | 159,623 | | |
| Oppenheimer Global | | | — | | | | (4,416,784 | ) | | | 4,416,784 | | |
| PIMCO Total Return(1) | | | — | | | | 12,942,849 | | | | (12,942,849 | ) | |
| Pioneer High Yield | | | — | | | | 41,421 | | | | (41,421 | ) | |
T. Rowe Price Diversified
Mid Cap Growth | | | — | | | | (11,702 | ) | | | 11,702 | | |
T. Rowe Price Growth
Equity | | | (896,600 | ) | | | 877,618 | | | | 18,982 | | |
| Templeton Foreign Equity | | | — | | | | 13,099 | | | | (13,099 | ) | |
| Thornburg Value | | | — | | | | (30,270 | ) | | | 30,270 | | |
| UBS U.S. Large Cap Equity | | | — | | | | 7,403 | | | | (7,403 | ) | |
(1) $12,942,849 relates to the tax treatment of swaps, foreign currency transactions and paydowns.
Dividends paid by the Portfolios from net investment income and distributions of net realized short-term capital gains are, for federal income tax purposes, taxable as ordinary income to shareholders.
The tax composition of dividends and distributions to shareholders was as follows:
| | | Year Ended
December 31, 2011 | | Year Ended
December 31, 2010 | |
| | | Ordinary
Income | | Long-term
Capital
Gains | | Ordinary
Income | |
American Century
Small-Mid Cap
Value | | $ | 2,400,620 | | | $ | 18,907 | | | $ | 1,814,544 | | |
Columbia Small Cap
Value II | | | 785,307 | | | | — | | | | 2,720,959 | | |
90
NOTES TO FINANCIAL STATEMENTS AS OF DECEMBER 31, 2011 (CONTINUED)
NOTE 14 — FEDERAL INCOME TAXES (continued)
| | | Year Ended
December 31, 2011 | | Year Ended
December 31, 2010 | |
| | | Ordinary
Income | | Long-term
Capital
Gains | | Ordinary
Income | |
Davis New York
Venture | | $ | 4,866,282 | | | $ | — | | | $ | 2,263,598 | | |
| Global Bond | | | 33,909,709 | | | | — | | | | 15,132,879 | | |
Invesco Van Kampen
Comstock | | | 4,378,769 | | | | — | | | | 4,319,567 | | |
Invesco Van Kampen
Equity and Income | | | 17,170,328 | | | | — | | | | 14,633,667 | | |
JPMorgan Mid Cap
Value | | | 3,034,904 | | | | — | | | | 2,505,506 | | |
| Oppenheimer Global | | | 23,618,041 | | | | — | | | | 25,910,174 | | |
| PIMCO Total Return | | | 60,671,650 | | | | 14,063,613 | | | | 37,890,843 | | |
| | | Year Ended
December 31, 2011 | | Year Ended
December 31, 2010 | |
| | | Ordinary
Income | | Long-term
Capital
Gains | | Ordinary
Income | |
| Pioneer High Yield | | $ | 5,470,770 | | | $ | — | | | $ | 5,889,493 | | |
T. Rowe Price
Diversified Mid
Cap Growth | | | 2,492,147 | | | | — | | | | 2,000,848 | | |
T. Rowe Price Growth
Equity | | | — | | | | — | | | | 357,457 | | |
Templeton Foreign
Equity | | | 10,553,504 | | | | — | | | | 12,848,107 | | |
| Thornburg Value | | | 2,067,576 | | | | — | | | | 4,654,851 | | |
UBS U.S. Large Cap
Equity | | | 1,621,958 | | | | — | | | | 1,496,753 | | |
The tax-basis components of distributable earnings and the expiration dates of the capital loss carryforwards which may be used to offset future realized capital gains for federal income tax purposes as of December 31, 2011 were:
| | | Undistributed
Ordinary Income | | Undistributed
Long-term
Capital Gains | | Unrealized
Appreciation/
(Depreciation) | | Short-term
Capital Loss
Carryforwards | | Expiration | |
| American Century Small-Mid Cap Value | | $ | 11,443,128 | | | $ | 7,889,827 | | | $ | (7,860,532 | ) | | $ | — | | | | — | | |
| Baron Small Cap Growth | | | — | | | | — | | | | 246,841,348 | | | | (27,687,536 | ) | | | 2016 | | |
| | | | | | | | | | (15,294,592 | ) | | | 2017 | | |
| | | | | | | | | | | $ | (42,982,128 | ) | |
| Columbia Small Cap Value II | | | 429,192 | | | | — | | | | 16,795,557 | | | | (69,638,686 | ) | | | 2017 | | |
| Davis New York Venture | | | 1,563,247 | | | | — | | | | 28,605,399 | | | | (16,250,070 | ) | | | 2016 | | |
| | | | | | | | | | (57,895,293 | ) | | | 2017 | | |
| | | | | | | | | | | $ | (74,145,363 | ) | |
| Global Bond | | | 25,670,364 | | | | — | | | | (6,188,502 | ) | | | (3,869,738 | ) | | | 2017 | | |
| Invesco Van Kampen Comstock | | | 474,104 | | | | — | | | | (983,839 | ) | | | (101,214,207 | ) | | | 2016 | | |
| | | | | | | | | | (130,908,420 | ) | | | 2017 | | |
| | | | | | | | | | | $ | (232,122,627 | ) | |
| Invesco Van Kampen Equity and Income | | | 2,619,039 | | | | — | | | | 65,186,158 | | | | (20,091,418 | ) | | | 2016 | | |
| | | | | | | | | | (31,391,642 | ) | | | 2017 | | |
| | | | | | | | | | | $ | (51,483,060 | ) | |
| JPMorgan Mid Cap Value | | | 215,887 | | | | — | | | | 33,088,598 | | | | (5,998,527 | ) | | | 2017 | | |
| Oppenheimer Global | | | 19,043,618 | | | | — | | | | 126,604,165 | | | | (59,145,851 | ) | | | 2017 | | |
| | | | | | | | | | (98,529 | ) | | | 2018 | | |
| | | | | | | | | | | $ | (59,244,380 | ) | |
| PIMCO Total Return | | | 39,101,285 | | | | — | | | | 17,181,178 | | | | (17,442,818 | ) | | | N/A | | |
| Pioneer High Yield | | | 518,181 | | | | — | | | | 4,798,893 | | | | (3,902,477 | ) | | | 2016 | | |
| | | | | | | | | | (23,259,623 | ) | | | 2017 | | |
| | | | | | | | | | | $ | (27,162,100 | ) | |
| T. Rowe Price Diversified Mid Cap Growth | | | 718,603 | | | | 58,844,358 | | | | 55,345,823 | | | | — | | | | — | | |
| T. Rowe Price Growth Equity | | | — | | | | — | | | | 212,764,098 | | | | (19,689,448 | ) | | | 2016 | | |
| | | | | | | | | | (107,754,093 | ) | | | 2017 | | |
| | | | | | | | | | | $ | (127,443,541 | ) | |
| Templeton Foreign Equity | | | 14,340,409 | | | | — | | | | (58,529,547 | ) | | | (22,339,944 | ) | | | 2016 | | |
| | | | | | | | | | (133,709,136 | ) | | | 2017 | | |
| | | | | | | | | | | $ | (156,049,080 | ) | |
| Thornburg Value | | | 566,037 | | | | — | | | | (27,469,426 | ) | | | (32,782,436 | ) | | | 2016 | | |
| | | | | | | | | | (26,137,641 | ) | | | 2017 | | |
| | | | | | | | | | | $ | (58,920,077 | ) | |
| UBS U.S. Large Cap Equity | | | 268,687 | | | | — | | | | 3,880,956 | | | | (22,966,719 | ) | | | 2016 | | |
| | | | | | | | | | (84,654,342 | ) | | | 2017 | | |
| | | | | | | | | | | $ | (107,621,061 | ) | |
* Utilization of these capital losses is subject to annual limitations under Section 382 of the Internal Revenue Code. Amounts and years of expiration may be adjusted to reflect future gain/loss activity to comply with the limitation rules.
91
NOTES TO FINANCIAL STATEMENTS AS OF DECEMBER 31, 2011 (CONTINUED)
NOTE 14 — FEDERAL INCOME TAXES (continued)
The Portfolios' major tax jurisdictions are federal and Arizona. The earliest tax year that remains subject to examination by these jurisdictions is 2007.
As of December 31, 2011, no provisions for income tax would be required in the Portfolios' financial statements as a result of tax positions taken on federal and state income tax returns for open tax years. The Portfolios' federal and state income and federal excise tax returns for tax years for which the applicable statutes of limitations have not expired are subject to examination by the Internal Revenue Service and state department of revenue.
The Regulated Investment Company Modernization Act of 2010 (the "Act") was enacted on December 22, 2010. The Act makes changes to several tax rules impacting the Portfolios. In general, the provisions of the Act are effective for the Portfolios' tax year ended December 31, 2011. Although the Act provides several benefits, including the unlimited carryforward of future capital losses, there may be a greater likelihood that all or a portion of the Portfolios' pre-enactment capital loss carryforwards may expire without being utilized due to the fact that post-enactment capital losses are required to be utilized before pre-enactment capital loss carryforwards.
NOTE 15 — OTHER ACCOUNTING PRONOUNCEMENTS
In May 2011, the Financial Accounting Standards Board ("FASB") issued Accounting Standards Update ("ASU") No. 2011-04 "Amendments to Achieve Common Fair Value Measurement and Disclosure Requirements". ASU No. 2011-04 amends FASB ASC Topic 820, Fair Value Measurements and Disclosures, to establish common requirements for measuring fair value and for disclosing information about fair value measurements in accordance with GAAP and the International Financial Reporting Standards ("IFRSs"). The ASU is effective prospectively for interim and annual periods beginning after December 15, 2011. As of December 31, 2011, management of the Portfolios is currently assessing the potential impact to financial statement disclosure, that may result from adopting this ASU.
NOTE 16 — SUBSEQUENT EVENTS
Dividends: Subsequent to December 31, 2011, the following Portfolio paid dividends from net investment income of:
| | | Per Share
Amount | | Payable Date | | Record Date | |
| Pioneer High Yield | |
| Class I | | $ | 0.0491 | | | February 1, 2012 | | Daily | |
| Class S | | $ | 0.0468 | | | February 1, 2012 | | Daily | |
Effective January 1, 2012, the Board implemented expense limits for Davis New York Venture.
On January 12, 2012, the Board of Trustees of ING Investors Trust also approved a proposal to reorganize ING Artio Foreign Portfolio, which is not included in this report, with and into Templeton Foreign Equity. If shareholder approval of the proposed Reorganization is obtained, it is expected that the Reorganization will take place on or about July 21, 2012.
The Portfolios have evaluated events occurring after the Statements of Assets and Liabilities date (subsequent events) to determine whether any subsequent events necessitated adjustment to or disclosure in the financial statements. Other than the above, no such subsequent events were identified.
92
ING AMERICAN CENTURY SUMMARY PORTFOLIO OF INVESTMENTS
SMALL-MID CAP VALUE PORTFOLIO AS OF DECEMBER 31, 2011
Shares | |
| |
| | Value | | Percentage
of Net
Assets | |
| COMMON STOCK: 95.3% | | | |
| | | | | Consumer Discretionary: 9.5% | |
| | 39,000 | | | | | | | CEC Entertainment, Inc. | | $ | 1,343,550 | | | | 0.7 | | |
| | 100,800 | | | | | | | Lowe's Cos., Inc. | | | 2,558,304 | | | | 1.3 | | |
| | 95,200 | | | | | | | Staples, Inc. | | | 1,322,328 | | | | 0.7 | | |
| | 20,100 | | | | | | | Time Warner Cable, Inc. | | | 1,277,757 | | | | 0.6 | | |
| | 25,900 | | | | | | | Whirlpool Corp. | | | 1,228,955 | | | | 0.6 | | |
| | 755,975 | | | | | | | Other Securities (a) | | | 11,255,676 | | | | 5.6 | | |
| | | | | | | | | | 18,986,570 | | | | 9.5 | | |
| | | | | Consumer Staples: 6.2% | |
| | 40,100 | | | | | | | Dr Pepper Snapple
Group, Inc. | | | 1,583,148 | | | | 0.8 | | |
| | 20,700 | | | | | | | Kellogg Co. | | | 1,046,799 | | | | 0.5 | | |
| | 28,223 | | | | | | | Kimberly-Clark Corp. | | | 2,076,084 | | | | 1.0 | | |
| | 30,397 | | | | @ | | | Ralcorp Holdings, Inc. | | | 2,598,943 | | | | 1.3 | | |
| | 45,200 | | | | | | | Sysco Corp. | | | 1,325,716 | | | | 0.7 | | |
| | 158,315 | | | | | | | Other Securities (a) | | | 3,681,611 | | | | 1.9 | | |
| | | | | | | | | | 12,312,301 | | | | 6.2 | | |
| | | | | Energy: 5.8% | |
| | 57,300 | | | | | | | Imperial Oil Ltd. | | | 2,552,979 | | | | 1.3 | | |
| | 29,300 | | | | | | | Murphy Oil Corp. | | | 1,633,182 | | | | 0.8 | | |
| | 51,000 | | | | @ | | | Ultra Petroleum Corp. | | | 1,511,130 | | | | 0.8 | | |
| | 306,606 | | | | | | | Other Securities (a) | | | 5,844,888 | | | | 2.9 | | |
| | | | | | | | | | 11,542,179 | | | | 5.8 | | |
| | | | | Financials: 23.8% | |
| | 50,400 | | | | | | | Allstate Corp. | | | 1,381,464 | | | | 0.7 | | |
| | 25,200 | | | | | | | AON Corp. | | | 1,179,360 | | | | 0.6 | | |
| | 136,461 | | | | | | | Capitol Federal
Financial, Inc. | | | 1,574,760 | | | | 0.8 | | |
| | 64,036 | | | | | | | Comerica, Inc. | | | 1,652,129 | | | | 0.8 | | |
| | 37,901 | | | | | | | Commerce Bancshares, Inc. | | | 1,444,786 | | | | 0.7 | | |
| | 104,989 | | | | | | | HCC Insurance
Holdings, Inc. | | | 2,887,198 | | | | 1.4 | | |
| | 202,000 | | | | | | | Hudson City Bancorp., Inc. | | | 1,262,500 | | | | 0.6 | | |
| | 57,376 | | | | | | | Marsh & McLennan
Cos., Inc. | | | 1,814,229 | | | | 0.9 | | |
| | 81,305 | | | | | | | Northern Trust Corp. | | | 3,224,556 | | | | 1.6 | | |
| | 92,278 | | | | | | | People's United
Financial, Inc. | | | 1,185,772 | | | | 0.6 | | |
| | 77,468 | | | | | | | Piedmont Office Realty
Trust, Inc. | | | 1,320,055 | | | | 0.7 | | |
| | 1,772,953 | | | | | | | Other Securities (a) | | | 28,678,511 | | | | 14.4 | | |
| | | | | | | | | | 47,605,320 | | | | 23.8 | | |
| | | | | Health Care: 9.0% | |
| | 17,100 | | | | | | | Becton Dickinson & Co. | | | 1,277,712 | | | | 0.6 | | |
| | 66,851 | | | | @ | | | CareFusion Corp. | | | 1,698,684 | | | | 0.9 | | |
| | 49,800 | | | | @ | | | LifePoint Hospitals, Inc. | | | 1,850,070 | | | | 0.9 | | |
| | 44,000 | | | | | | | Patterson Cos., Inc. | | | 1,298,880 | | | | 0.7 | | |
| | 48,700 | | | | | | | Zimmer Holdings, Inc. | | | 2,601,554 | | | | 1.3 | | |
| | 463,286 | | | | | | | Other Securities | | | 9,200,225 | | | | 4.6 | | |
| | | | | | | | | | 17,927,125 | | | | 9.0 | | |
Shares | |
| |
| | Value | | Percentage
of Net
Assets | |
| | | | | Industrials: 16.7% | |
| | 69,334 | | | | | | | Kaydon Corp. | | $ | 2,114,687 | | | | 1.1 | | |
| | 146,212 | | | | | | | Republic Services, Inc. | | | 4,028,140 | | | | 2.0 | | |
| | 91,200 | | | | | | | Koninklijke Philips
Electronics NV | | | 1,913,527 | | | | 0.9 | | |
| | 146,700 | | | | | | | Southwest Airlines Co. | | | 1,255,752 | | | | 0.6 | | |
| | 29,600 | | | | @ | | | Thomas & Betts Corp. | | | 1,616,160 | | | | 0.8 | | |
| | 45,600 | | | | | | | Tyco International Ltd. | | | 2,129,976 | | | | 1.1 | | |
| | 922,473 | | | | | | | Other Securities (a) | | | 20,345,329 | | | | 10.2 | | |
| | | | | | | | | | 33,403,571 | | | | 16.7 | | |
| | | | | Information Technology: 8.2% | |
| | 172,900 | | | | | | | Applied Materials, Inc. | | | 1,851,759 | | | | 0.9 | | |
| | 87,100 | | | | @ | | | Quest Software, Inc. | | | 1,620,060 | | | | 0.8 | | |
| | 117,400 | | | | @ | | | Teradyne, Inc. | | | 1,600,162 | | | | 0.8 | | |
| | 667,719 | | | | | | | Other Securities | | | 11,366,071 | | | | 5.7 | | |
| | | | | | | | | | 16,438,052 | | | | 8.2 | | |
| | | | | Materials: 4.4% | |
| | 76,783 | | | | | | | Bemis Co., Inc. | | | 2,309,632 | | | | 1.2 | | |
| | 19,305 | | | | | | | Minerals
Technologies, Inc. | | | 1,091,312 | | | | 0.5 | | |
| | 22,424 | | | | | | | Newmont Mining Corp. | | | 1,345,664 | | | | 0.7 | | |
| | 229,549 | | | | | | | Other Securities | | | 4,037,602 | | | | 2.0 | | |
| | | | | | | | | | 8,784,210 | | | | 4.4 | | |
| | | | | Telecommunications: 2.3% | |
| | 21,000 | | | | | | | American Tower Corp. | | | 1,260,210 | | | | 0.6 | | |
| | 41,644 | | | | | | | CenturyTel, Inc. | | | 1,549,157 | | | | 0.8 | | |
| | 65,900 | | | | | | | Other Securities | | | 1,747,930 | | | | 0.9 | | |
| | | | | | | | | | 4,557,297 | | | | 2.3 | | |
| | | | | Utilities: 9.4% | |
| | 67,800 | | | | | | | Empire District Electric Co. | | | 1,429,902 | | | | 0.7 | | |
| | 104,900 | | | | | | | Great Plains Energy, Inc. | | | 2,284,722 | | | | 1.2 | | |
| | 117,200 | | | | | | | NV Energy, Inc. | | | 1,916,220 | | | | 1.0 | | |
| | 44,500 | | | | | | | Pacific Gas & Electric Co. | | | 1,834,290 | | | | 0.9 | | |
| | 77,126 | | | | | | | Westar Energy, Inc. | | | 2,219,686 | | | | 1.1 | | |
| | 45,000 | | | | | | | Xcel Energy, Inc. | | | 1,243,800 | | | | 0.6 | | |
| | 221,596 | | | | | | | Other Securities | | | 7,744,854 | | | | 3.9 | | |
| | | | | | | | | | 18,673,474 | | | | 9.4 | | |
| | | | | | | | | Total Common Stock
(Cost $192,455,909) | | | 190,230,099 | | | | 95.3 | | |
| EXCHANGE-TRADED FUNDS: 2.3% | | | |
| | 71,000 | | | | | | | iShares Russell Midcap
Value Index Fund | | | 3,081,400 | | | | 1.5 | | |
| | 20,868 | | | | | | | Other Securities | | | 1,499,893 | | | | 0.8 | | |
| | | | | | | | | Total Exchange-Traded
Funds
(Cost $4,453,285) | | | 4,581,293 | | | | 2.3 | | |
See Accompanying Notes to Financial Statements
93
ING AMERICAN CENTURY SUMMARY PORTFOLIO OF INVESTMENTS
SMALL-MID CAP VALUE PORTFOLIO AS OF DECEMBER 31, 2011 (CONTINUED)
Shares | |
| |
| | Value | | Percentage
of Net
Assets | |
| PREFERRED STOCK: 1.2% | | | |
| | | | | Consumer Discretionary: 0.1% | |
| | 128 | | | # | | LodgeNet Interactive
Corp. | | $ | 110,400 | | | | 0.0 | | |
| | 1,800 | | | | | Other Securities | | | 171,871 | | | | 0.1 | | |
| | | | | | | | | | 282,271 | | | | 0.1 | | |
| | | | | Consumer Staples: 0.1% | |
| | 211 | | | | | Other Securities | | | 224,504 | | | | 0.1 | | |
| | | | | Financials: 1.0% | |
| | 52,528 | | | | | Other Securities | | | 1,920,843 | | | | 1.0 | | |
| | | | | | | Total Preferred Stock
(Cost $2,229,905) | | | 2,427,618 | | | | 1.2 | | |
| | | | | | | Total Long-Term
Investments
(Cost $199,139,099) | | | 197,239,010 | | | | 98.8 | | |
Principal
Amount† | |
| |
| | Value | | Percentage
of Net
Assets | |
| SHORT-TERM INVESTMENTS: 2.7% | | | |
| | | | | Securities Lending Collateralcc(1): 0.5% | |
| | 948,481 | | | | | Merrill Lynch & Co., Inc.,
Repurchase Agreement
dated 12/30/11, 0.05%,
due 01/03/12 (Repurchase
Amount $948,486,
collateralized by various
U.S. Government
Agency Obligations,
0.000%-6.750%,
Market Value plus
accrued interest
$967,451, due
01/03/12-03/01/47)
(Cost $948,481) | | $ | 948,481 | | | | 0.5 | | |
Shares | |
| |
| | Value | | Percentage
of Net
Assets | |
| | | | | Mutual Funds: 2.2% | |
| | 4,408,923 | | | | | BlackRock Liquidity
Funds, TempFund,
Institutional Class
(Cost $4,408,923) | | $ | 4,408,923 | | | | 2.2 | | |
| | | | | | | Total Short-Term
Investments
(Cost $5,357,404) | | | 5,357,404 | | | | 2.7 | | |
| | | | | | | Total Investments in
Securities
(Cost $204,496,503) | | $ | 202,596,414 | | | | 101.5 | | |
| | | | | | | Liabilities in Excess of
Other Assets | | | (2,945,918 | ) | | | (1.5 | ) | |
| | | | | | | Net Assets | | $ | 199,650,496 | | | | 100.0 | | |
"Other Securities" represents issues not identified as the top 50 holdings in terms of market value and issues or issuers not exceeding 1% of net assets individually or in aggregate respectively as of December 31, 2011.
The following footnotes apply to either the individual securities noted or one or more of the securities aggregated and listed as a single line item.
† Unless otherwise indicated, principal amount is shown in USD.
# Securities with purchases pursuant to Rule 144A or section 4(2), under the Securities Act of 1933 and may not be resold subject to that rule except to qualified institutional buyers.
@ Non-income producing security
cc Securities purchased with cash collateral for securities loaned.
(1) Collateral received from brokers for securities lending was invested into these short-term investments.
(a) This grouping contains loaned securities.
Cost for federal income tax purposes is $210,457,051.
| Net unrealized depreciation consists of: | |
| Gross Unrealized Appreciation | | $ | 10,750,915 | | |
| Gross Unrealized Depreciation | | | (18,611,552 | ) | |
| Net Unrealized Depreciation | | $ | (7,860,637 | ) | |
See Accompanying Notes to Financial Statements
94
ING AMERICAN CENTURY SUMMARY PORTFOLIO OF INVESTMENTS
SMALL-MID CAP VALUE PORTFOLIO AS OF DECEMBER 31, 2011 (CONTINUED)
Fair Value Measurements^
The following is a summary of the fair valuations according to the inputs used as of December 31, 2011 in valuing the assets and liabilities:
| | | Quoted Prices
in Active Markets
for Identical Investments
(Level 1) | | Significant Other
Observable
Inputs#
(Level 2) | | Significant
Unobservable
Inputs
(Level 3) | | Fair Value
at
12/31/11 | |
| Asset Table | |
| Investments, at value | |
| Common Stock | |
| Consumer Discretionary | | $ | 18,986,570 | | | $ | — | | | $ | — | | | $ | 18,986,570 | | |
| Consumer Staples | | | 12,312,301 | | | | — | | | | — | | | | 12,312,301 | | |
| Energy | | | 11,542,179 | | | | — | | | | — | | | | 11,542,179 | | |
| Financials | | | 47,605,320 | | | | — | | | | — | | | | 47,605,320 | | |
| Health Care | | | 17,927,125 | | | | — | | | | — | | | | 17,927,125 | | |
| Industrials | | | 31,490,044 | | | | 1,913,527 | | | | — | | | | 33,403,571 | | |
| Information Technology | | | 16,438,052 | | | | — | | | | — | | | | 16,438,052 | | |
| Materials | | | 8,784,210 | | | | — | | | | — | | | | 8,784,210 | | |
| Telecommunications | | | 4,557,297 | | | | — | | | | — | | | | 4,557,297 | | |
| Utilities | | | 18,673,474 | | | | — | | | | — | | | | 18,673,474 | | |
| Total Common Stock | | | 188,316,572 | | | | 1,913,527 | | | | — | | | | 190,230,099 | | |
| Exchange-Traded Funds | | | 4,581,293 | | | | — | | | | — | | | | 4,581,293 | | |
| Preferred Stock | | | 381,558 | | | | 2,046,060 | | | | — | | | | 2,427,618 | | |
| Short-Term Investments | | | 4,408,923 | | | | 948,481 | | | | — | | | | 5,357,404 | | |
| Total Investments, at value | | $ | 197,688,346 | | | $ | 4,908,068 | | | $ | — | | | $ | 202,596,414 | | |
| Other Financial Instruments+ | |
| Forward Foreign Currency Contracts | | | — | | | | 22,220 | | | | — | | | | 22,220 | | |
| Total Assets | | $ | 197,688,346 | | | $ | 4,930,288 | | | $ | — | | | $ | 202,618,634 | | |
| Liabilities Table | |
| Other Financial Instruments+ | |
| Forward Foreign Currency Contracts | | $ | — | | | $ | (6,234 | ) | | $ | — | | | $ | (6,234 | ) | |
| Total Liabilities | | $ | — | | | $ | (6,234 | ) | | $ | — | | | $ | (6,234 | ) | |
The following is a reconciliation of the fair valuations using significant unobservable inputs (Level 3) for the Portfolio's assets and liabilities during the period ended December 31, 2011:
| | | Beginning
Balance
12/31/10 | | Purchases | | Sales | | Accrued
Discounts/
(Premiums) | | Total
Realized
Gain/(Loss) | | Total
Unrealized
Appreciation/
(Depreciation) | | Transfers
Into
Level 3 | | Transfers
Out of
Level 3 | | Ending
Balance
12/31/11 | |
| Asset Table | |
| Investments, at value | |
Short-Term
Investments | | $ | 120,962 | | | $ | — | | | $ | (120,962 | ) | | $ | — | | | $ | (30,240 | ) | | $ | 30,240 | | | $ | — | | | $ | — | | | $ | — | | |
Total Investments,
at value | | $ | 120,962 | | | $ | — | | | $ | (120,962 | ) | | $ | — | | | $ | (30,240 | ) | | $ | 30,240 | | | $ | — | | | $ | — | | | $ | — | | |
As of December 31, 2011, total change in unrealized gain (loss) on Level 3 securities still held at period end and included in the change in net assets was $ 0 .
^ See Note 2, "Significant Accounting Policies" in the Notes to Financial Statements for additional information.
+ Other Financial Instruments are derivatives not reflected in the Portfolio of Investments and may include open forward foreign currency contracts, equity forwards, futures, swaps, and written options. Forward foreign currency contracts, equity forwards and futures are valued at the unrealized gain (loss) on the instrument. Swaps and written options are valued at the fair value of the instrument.
# The earlier close of the foreign markets gives rise to the possibility that significant events, including broad market moves, may have occurred in the interim and may materially affect the value of those securities. To account for this, the Portfolio may frequently value many of its foreign equity securities using fair value prices based on third party vendor modeling tools to the extent available. Accordingly, a significant portion of the Portfolio's investments are categorized as Level 2 investments.
There were no significant transfers between Level 1 and 2 during the year ended December 31, 2011.
Transfers in or out of Level 3 represent either the beginning value (for transfers in), or the ending value (for transfers out) of any security or derivative instrument where a change in the pricing level occurred from the beginning to the end of the period. Transfers are recognized at the end of the reporting period.
See Accompanying Notes to Financial Statements
95
ING AMERICAN CENTURY SUMMARY PORTFOLIO OF INVESTMENTS
SMALL-MID CAP VALUE PORTFOLIO AS OF DECEMBER 31, 2011 (CONTINUED)
At December 31, 2011 , the following forward foreign currency contracts were outstanding for the ING American Century Small-Mid Cap Value Portfolio :
| Counterparty | | Currency | | Contract
Amount | | Buy/Sell | | Settlement
Date | | In
Exchange
For | | Fair Value | | Unrealized
Appreciation
(Depreciation) | |
| UBS Warburg LLC | | EU Euro | | | 48,903 | | | Sell | | 01/31/12 | | $ | 63,553 | | | $ | 63,307 | | | $ | 246 | | |
| UBS Warburg LLC | | Canadian Dollar | | | 2,864,632 | | | Sell | | 01/31/12 | | | 2,803,652 | | | | 2,809,886 | | | | (6,234 | ) | |
| UBS Warburg LLC | | EU Euro | | | 1,658,111 | | | Sell | | 01/31/12 | | | 2,168,444 | | | | 2,146,470 | | | | 21,974 | | |
| | | $ | 15,986 | | |
A summary of derivative instruments by primary risk exposure is outlined in the following tables.
The fair value of derivative instruments as of December 31, 2011 was as follows:
Derivatives not accounted
for as hedging instruments | | Location on Statement of Assets and Liabilities | | Fair Value | |
| Asset Derivatives | |
| Foreign exchange contracts | | Unrealized appreciation on forward foreign currency contracts | | $ | 22,220 | | |
| Total Asset Derivatives | | | | $ | 22,220 | | |
| Liability Derivatives | |
| Foreign exchange contracts | | Unrealized depreciation on forward foreign currency contracts | | $ | 6,234 | | |
| Total Liability Derivatives | | | | $ | 6,234 | | |
The effect of derivative instruments on the Portfolio's Statement of Operations for the year ended December 31, 2011 was as follows:
| | | Amount of Realized Gain or (Loss) on Derivatives Recognized in Income | |
Derivatives not accounted
for as hedging instruments | | Foreign currency related transactions* | |
| Foreign exchange contracts | | $ | 110,545 | | |
| Total | | $ | 110,545 | | |
| | | Change in Unrealized Appreciation or (Depreciation) on Derivatives Recognized in Income | |
Derivatives not accounted
for as hedging instruments | | Foreign currency related transactions* | |
| Foreign exchange contracts | | $ | 31,687 | | |
| Total | | $ | 31,687 | | |
* Amounts recognized for forward foreign currency contracts are included in net realized gain (loss) on foreign currency related transactions and net change in unrealized appreciation or depreciation on foreign currency related transactions.
See Accompanying Notes to Financial Statements
96
ING BARON SUMMARY PORTFOLIO OF INVESTMENTS
SMALL CAP GROWTH PORTFOLIO AS OF DECEMBER 31, 2011
Shares | |
| |
| | Value | | Percentage
of Net
Assets | |
| COMMON STOCK: 98.1% | | | |
| | | | | Consumer Discretionary: 24.4% | |
| | 540,000 | | | | | Choice Hotels
International, Inc. | | $ | 20,547,000 | | | | 2.8 | | |
| | 290,000 | | | | | DeVry, Inc. | | | 11,153,400 | | | | 1.5 | | |
| | 575,000 | | | | | Dick's Sporting
Goods, Inc. | | | 21,206,000 | | | | 2.9 | | |
| | 565,000 | | | @ | | LKQ Corp. | | | 16,995,200 | | | | 2.3 | | |
| | 218,000 | | | | | Morningstar, Inc. | | | 12,960,100 | | | | 1.8 | | |
| | 114,100 | | | @ | | Panera Bread Co. | | | 16,139,445 | | | | 2.2 | | |
| | 200,000 | | | @ | | Peet's Coffee & Tea, Inc. | | | 12,536,000 | | | | 1.7 | | |
| | 405,000 | | | @ | | Penn National
Gaming, Inc. | | | 15,418,350 | | | | 2.1 | | |
| | 190,000 | | | @ | | Under Armour, Inc. | | | 13,640,100 | | | | 1.9 | | |
| | 475,000 | | | | | Vail Resorts, Inc. | | | 20,121,000 | | | | 2.7 | | |
| | 905,300 | | | | | Other Securities | | | 18,407,422 | | | | 2.5 | | |
| | | | | | | | | | 179,124,017 | | | | 24.4 | | |
| | | | | Consumer Staples: 4.6% | |
| | 210,000 | | | | | Church & Dwight
Co., Inc. | | | 9,609,600 | | | | 1.3 | | |
| | 185,000 | | | @ | | TreeHouse Foods, Inc. | | | 12,095,300 | | | | 1.6 | | |
| | 201,737 | | | @ | | United Natural
Foods, Inc. | | | 8,071,498 | | | | 1.1 | | |
| | 467,057 | | | | | Other Securities | | | 4,040,043 | | | | 0.6 | | |
| | | | | | | | | | 33,816,441 | | | | 4.6 | | |
| | | | | Energy: 11.0% | |
| | 110,000 | | | | | CARBO Ceramics, Inc. | | | 13,566,300 | | | | 1.8 | | |
| | 175,000 | | | | | Core Laboratories NV | | | 19,941,250 | | | | 2.7 | | |
| | 140,000 | | | | | Helmerich & Payne, Inc. | | | 8,170,400 | | | | 1.1 | | |
| | 110,000 | | | @ | | SEACOR Holdings, Inc. | | | 9,785,600 | | | | 1.3 | | |
| | 171,000 | | | | | SM Energy Co. | | | 12,500,100 | | | | 1.7 | | |
| | 212,944 | | | | | Targa Resources Corp. | | | 8,664,691 | | | | 1.2 | | |
| | 294,000 | | | | | Other Securities | | | 8,546,890 | | | | 1.2 | | |
| | | | | | | | | | 81,175,231 | | | | 11.0 | | |
| | | | | Financials: 11.4% | |
| | 21,500 | | | | | Alexander's, Inc. | | | 7,955,645 | | | | 1.1 | | |
| | 195,000 | | | @ | | Arch Capital Group Ltd. | | | 7,259,850 | | | | 1.0 | | |
| | 274,479 | | | | | Cohen & Steers, Inc. | | | 7,932,443 | | | | 1.1 | | |
| | 490,500 | | | | | Douglas Emmett, Inc. | | | 8,946,720 | | | | 1.2 | | |
| | 500,000 | | | @ | | MSCI, Inc. - Class A | | | 16,465,000 | | | | 2.2 | | |
| | 320,000 | | | | | Primerica, Inc. | | | 7,436,800 | | | | 1.0 | | |
| | 1,028,649 | | | | | Other Securities | | | 27,819,476 | | | | 3.8 | | |
| | | | | | | | | | 83,815,934 | | | | 11.4 | | |
| | | | | Health Care: 12.9% | |
| | 360,000 | | | @ | | AMERIGROUP Corp. | | | 21,268,800 | | | | 2.9 | | |
| | 490,000 | | | @ | | Community Health
Systems, Inc. | | | 8,550,500 | | | | 1.2 | | |
Shares | |
| |
| | Value | | Percentage
of Net
Assets | |
| | 140,000 | | | @ | | Edwards Lifesciences
Corp. | | $ | 9,898,000 | | | | 1.3 | | |
| | 130,800 | | | @ | | Gen-Probe, Inc. | | | 7,732,896 | | | | 1.1 | | |
| | 136,500 | | | @ | | Idexx Laboratories, Inc. | | | 10,505,040 | | | | 1.4 | | |
| | 117,000 | | | @ | | Mettler Toledo
International, Inc. | | | 17,282,070 | | | | 2.3 | | |
| | 105,000 | | | | | Techne Corp. | | | 7,167,300 | | | | 1.0 | | |
| | 457,228 | | | | | Other Securities | | | 12,416,015 | | | | 1.7 | | |
| | | | | | | | | | 94,820,621 | | | | 12.9 | | |
| | | | | Industrials: 17.0% | |
| | 261,300 | | | @ | | Colfax Corp. | | | 7,441,824 | | | | 1.0 | | |
| | 267,000 | | | @ | | Copart, Inc. | | | 12,786,630 | | | | 1.7 | | |
| | 157,000 | | | @ | | CoStar Group, Inc. | | | 10,476,610 | | | | 1.4 | | |
| | 475,000 | | | @ | | Generac Holdings, Inc. | | | 13,314,250 | | | | 1.8 | | |
| | 350,000 | | | @ | | Genesee & Wyoming, Inc. | | | 21,203,000 | | | | 2.9 | | |
| | 106,000 | | | @ | | Middleby Corp. | | | 9,968,240 | | | | 1.4 | | |
| | 105,000 | | | | | MSC Industrial Direct Co. | | | 7,512,750 | | | | 1.0 | | |
| | 160,000 | | | @ | | Polypore
International, Inc. | | | 7,038,400 | | | | 1.0 | | |
| | 405,000 | | | | | Ritchie Brothers
Auctioneers, Inc. | | | 8,942,400 | | | | 1.2 | | |
| | 335,000 | | | @ | | Tetra Tech, Inc. | | | 7,232,650 | | | | 1.0 | | |
| | 610,000 | | | | | Other Securities | | | 18,929,700 | | | | 2.6 | | |
| | | | | | | | | | 124,846,454 | | | | 17.0 | | |
| | | | | Information Technology: 14.2% | |
| | 250,000 | | | @ | | Ansys, Inc. | | | 14,320,000 | | | | 2.0 | | |
| | 115,000 | | | @ | | Equinix, Inc. | | | 11,661,000 | | | | 1.6 | | |
| | 85,000 | | | | | Factset Research
Systems, Inc. | | | 7,418,800 | | | | 1.0 | | |
| | 405,300 | | | @ | | Gartner, Inc. | | | 14,092,281 | | | | 1.9 | | |
| | 200,000 | | | | | MAXIMUS, Inc. | | | 8,270,000 | | | | 1.1 | | |
| | 238,000 | | | | | Pegasystems, Inc. | | | 6,997,200 | | | | 1.0 | | |
| | 497,500 | | | | | Totvs S.A. | | | 8,871,117 | | | | 1.2 | | |
| | 1,299,639 | | | | | Other Securities | | | 32,568,484 | | | | 4.4 | | |
| | | | | | | | | | 104,198,882 | | | | 14.2 | | |
| | | | | Materials: 0.4% | |
| | 150,000 | | | | | Other Securities | | | 3,394,500 | | | | 0.4 | | |
| | | | | Telecommunications: 0.6% | |
| | 100,000 | | | | | Other Securities | | | 4,296,000 | | | | 0.6 | | |
| | | | | Utilities: 1.6% | |
| | 160,000 | | | | | ITC Holdings Corp. | | | 12,140,800 | | | | 1.6 | | |
| | | | | | | Total Common Stock
(Cost $475,180,334) | | | 721,628,880 | | | | 98.1 | | |
See Accompanying Notes to Financial Statements
97
ING BARON SUMMARY PORTFOLIO OF INVESTMENTS
SMALL CAP GROWTH PORTFOLIO AS OF DECEMBER 31, 2011 (CONTINUED)
| Shares | |
| |
| | Value | | Percentage
of Net
Assets | |
| SHORT-TERM INVESTMENTS: 1.9% | | | |
| | | | | Mutual Funds: 1.9% | |
| | 13,695,478 | | | | | | | BlackRock Liquidity
Funds, TempFund,
Institutional Class
(Cost $13,695,478) | | $ | 13,695,478 | | | | 1.9 | | |
| | | | | | | | | Total Short-Term
Investments
(Cost $13,695,478) | | | 13,695,478 | | | | 1.9 | | |
| | | | | | | | | Total Investments in
Securities
(Cost $488,875,812) | | $ | 735,324,358 | | | | 100.0 | | |
| | | | | | | | | Liabilities in Excess of
Other Assets | | | (327,329 | ) | | | — | | |
| | | | | | | | | Net Assets | | $ | 734,997,029 | | | | 100.0 | | |
"Other Securities" represents issues not identified as the top 50 holdings in terms of market value and issues or issuers not exceeding 1% of net assets individually or in aggregate respectively as of December 31, 2011.
The following footnotes apply to either the individual securities noted or one or more of the securities aggregated and listed as a single line item.
@ Non-income producing security
Cost for federal income tax purposes is $488,482,765.
| Net unrealized appreciation consists of: | |
| Gross Unrealized Appreciation | | $ | 262,066,283 | | |
| Gross Unrealized Depreciation | | | (15,224,690 | ) | |
| Net Unrealized Appreciation | | $ | 246,841,593 | | |
Fair Value Measurements^
The following is a summary of the fair valuations according to the inputs used as of December 31, 2011 in valuing the assets and liabilities:
| | | Quoted Prices
in Active Markets
for Identical Investments
(Level 1) | | Significant Other
Observable
Inputs
(Level 2) | | Significant
Unobservable
Inputs
(Level 3) | | Fair Value
at
12/31/11 | |
| Asset Table | |
| Investments, at value | |
| Common Stock* | | $ | 721,628,880 | | | $ | — | | | $ | — | | | $ | 721,628,880 | | |
| Short-Term Investments | | | 13,695,478 | | | | — | | | | — | | | | 13,695,478 | | |
| Total Investments, at value | | $ | 735,324,358 | | | $ | — | | | $ | — | | | $ | 735,324,358 | | |
^ See Note 2, "Significant Accounting Policies" in the Notes to Financial Statements for additional information.
* For further breakdown of Common Stock by Industry type, please refer to the Portfolio of Investments.
There were no significant transfers between Level 1 and 2 during the year ended December 31, 2011.
See Accompanying Notes to Financial Statements
98
ING COLUMBIA SUMMARY PORTFOLIO OF INVESTMENTS
SMALL CAP VALUE II PORTFOLIO AS OF DECEMBER 31, 2011
Shares | |
| |
| | Value | | Percentage
of Net
Assets | |
| COMMON STOCK: 96.5% | | | |
| | | | | Consumer Discretionary: 9.5% | |
| | 65,000 | | | @ | | Bridgepoint
Education, Inc. | | $ | 1,495,000 | | | | 0.9 | | |
| | 57,000 | | | @ | | Domino's Pizza, Inc. | | | 1,935,150 | | | | 1.2 | | |
| | 26,500 | | | @ | | Genesco, Inc. | | | 1,636,110 | | | | 1.0 | | |
| | 60,000 | | | @ | | GNC Holdings, Inc. | | | 1,737,000 | | | | 1.1 | | |
| | 61,000 | | | @ | | Helen of Troy Ltd. | | | 1,872,700 | | | | 1.2 | | |
| | 451,640 | | | | | Other Securities | | | 6,616,313 | | | | 4.1 | | |
| | | | | | | | | | 15,292,273 | | | | 9.5 | | |
| | | | | Consumer Staples: 4.3% | |
| | 125,000 | | | @ | | Dean Foods Co. | | | 1,400,000 | | | | 0.9 | | |
| | 32,000 | | | | | Nu Skin Enterprises, Inc. | | | 1,554,240 | | | | 1.0 | | |
| | 87,000 | | | | | Other Securities | | | 3,942,510 | | | | 2.4 | | |
| | | | | | | | | | 6,896,750 | | | | 4.3 | | |
| | | | | Energy: 4.4% | |
| | 49,000 | | | @ | | Hornbeck Offshore
Services, Inc. | | | 1,519,980 | | | | 0.9 | | |
| | 120,000 | | | @ | | Key Energy Services, Inc. | | | 1,856,400 | | | | 1.2 | | |
| | 49,000 | | | @ | | Swift Energy Co. | | | 1,456,280 | | | | 0.9 | | |
| | 53,384 | | | | | Other Securities | | | 2,291,709 | | | | 1.4 | | |
| | | | | | | | | | 7,124,369 | | | | 4.4 | | |
| | | | | Financials: 31.4% | |
| | 60,000 | | | | | Alterra Capital
Holdings Ltd. | | | 1,417,800 | | | | 0.9 | | |
| | 76,000 | | | | | American Assets Trust, Inc. | | | 1,558,760 | | | | 1.0 | | |
| | 82,000 | | | | | BioMed Realty Trust, Inc. | | | 1,482,560 | | | | 0.9 | | |
| | 70,000 | | | | | Community Bank
System, Inc. | | | 1,946,000 | | | | 1.2 | | |
| | 185,000 | | | | | CubeSmart | | | 1,968,400 | | | | 1.2 | | |
| | 45,000 | | | | | Delphi Financial Group | | | 1,993,500 | | | | 1.2 | | |
| | 67,500 | | | | | DuPont Fabros
Technology, Inc. | | | 1,634,850 | | | | 1.0 | | |
| | 72,000 | | | | | East-West Bancorp., Inc. | | | 1,422,000 | | | | 0.9 | | |
| | 150,000 | | | | | FNB Corp. | | | 1,696,500 | | | | 1.1 | | |
| | 31,000 | | | | | IBERIABANK Corp. | | | 1,528,300 | | | | 1.0 | | |
| | 70,000 | | | | | Independent Bank Corp. | | | 1,910,300 | | | | 1.2 | | |
| | 68,000 | | | | | LaSalle Hotel Properties | | | 1,646,280 | | | | 1.0 | | |
| | 26,000 | | | | | Mid-America Apartment
Communities, Inc. | | | 1,626,300 | | | | 1.0 | | |
| | 110,000 | | | @ | | National Financial
Partners Corp. | | | 1,487,200 | | | | 0.9 | | |
| | 138,000 | | | | | Northwest Bancshares, Inc. | | | 1,716,720 | | | | 1.1 | | |
| | 41,000 | | | | | Prosperity Bancshares, Inc. | | | 1,654,350 | | | | 1.0 | | |
| | 175,187 | | | | | Sterling Bancorp. | | | 1,513,615 | | | | 0.9 | | |
| | 34,500 | | | @ | | SVB Financial Group | | | 1,645,305 | | | | 1.0 | | |
| | 60,000 | | | @ | | Texas Capital
Bancshares, Inc. | | | 1,836,600 | | | | 1.1 | | |
| | 137,000 | | | | | Umpqua Holdings Corp. | | | 1,697,430 | | | | 1.1 | | |
| | 1,523,449 | | | | | Other Securities | | | 17,262,357 | | | | 10.7 | | |
| | | | | | | | | | 50,645,127 | | | | 31.4 | | |
Shares | |
| |
| | Value | | Percentage
of Net
Assets | |
| | | | | Health Care: 6.6% | |
| | 45,000 | | | @ | | Centene Corp. | | $ | 1,781,550 | | | | 1.1 | | |
| | 29,000 | | | @ | | WellCare Health Plans, Inc. | | | 1,522,500 | | | | 1.0 | | |
| | 563,500 | | | | | Other Securities | | | 7,250,990 | | | | 4.5 | | |
| | | | | | | | | | 10,555,040 | | | | 6.6 | | |
| | | | | Industrials: 15.8% | |
| | 22,000 | | | @ | | Alaska Air Group, Inc. | | | 1,651,980 | | | | 1.0 | | |
| | 70,000 | | | @ | | Beacon Roofing
Supply, Inc. | | | 1,416,100 | | | | 0.9 | | |
| | 74,000 | | | | | Deluxe Corp. | | | 1,684,240 | | | | 1.1 | | |
| | 55,000 | | | | | Textainer Group
Holdings Ltd. | | | 1,601,600 | | | | 1.0 | | |
| | 62,000 | | | @ | | United Rentals, Inc. | | | 1,832,100 | | | | 1.1 | | |
| | 50,000 | | | | | United Stationers, Inc. | | | 1,628,000 | | | | 1.0 | | |
| | 185,000 | | | @ | | Wabash National Corp. | | | 1,450,400 | | | | 0.9 | | |
| | 63,000 | | | | | Werner Enterprises, Inc. | | | 1,518,300 | | | | 0.9 | | |
| | 898,225 | | | | | Other Securities | | | 12,740,045 | | | | 7.9 | | |
| | | | | | | | | | 25,522,765 | | | | 15.8 | | |
| | | | | Information Technology: 14.7% | |
| | 24,000 | | | @ | | Anixter International, Inc. | | | 1,431,360 | | | | 0.9 | | |
| | 67,000 | | | @ | | Cardtronics, Inc. | | | 1,813,020 | | | | 1.1 | | |
| | 86,000 | | | @ | | Cirrus Logic, Inc. | | | 1,363,100 | | | | 0.8 | | |
| | 105,000 | | | @ | | Elster Group SE ADR | | | 1,365,000 | | | | 0.9 | | |
| | 58,965 | | | @ | | NeuStar, Inc. | | | 2,014,834 | | | | 1.3 | | |
| | 1,516,719 | | | | | Other Securities | | | 15,646,385 | | | | 9.7 | | |
| | | | | | | | | | 23,633,699 | | | | 14.7 | | |
| | | | | Materials: 4.8% | |
| | 24,000 | | | | | Schweitzer-Mauduit
International, Inc. | | | 1,595,040 | | | | 1.0 | | |
| | 357,349 | | | | | Other Securities | | | 6,060,738 | | | | 3.8 | | |
| | | | | | | | | | 7,655,778 | | | | 4.8 | | |
| | | | | Utilities: 5.0% | |
| | 61,000 | | | | | Avista Corp. | | | 1,570,750 | | | | 1.0 | | |
| | 45,000 | | | | | New Jersey
Resources Corp. | | | 2,214,000 | | | | 1.4 | | |
| | 39,000 | | | | | South Jersey
Industries, Inc. | | | 2,215,590 | | | | 1.4 | | |
| | 58,000 | | | | | UIL Holdings Corp. | | | 2,051,460 | | | | 1.2 | | |
| | | | | | | | | | 8,051,800 | | | | 5.0 | | |
| | | | | | | Total Common Stock
(Cost $135,878,076) | | | 155,377,601 | | | | 96.5 | | |
See Accompanying Notes to Financial Statements
99
ING COLUMBIA SUMMARY PORTFOLIO OF INVESTMENTS
SMALL CAP VALUE II PORTFOLIO AS OF DECEMBER 31, 2011 (CONTINUED)
Shares | |
| |
| | Value | | Percentage
of Net
Assets | |
| SHORT-TERM INVESTMENTS: 3.6% | | | |
| | | | | Mutual Funds: 3.6% | |
| | 5,826,092 | | | | | | | BlackRock Liquidity
Funds, TempFund,
Institutional Class
(Cost $5,826,092) | | $ | 5,826,092 | | | | 3.6 | | |
| | | | | | | | | Total Short-Term
Investments
(Cost $5,826,092) | | | 5,826,092 | | | | 3.6 | | |
| | | | | | | | | Total Investments in
Securities
(Cost $141,704,168) | | $ | 161,203,693 | | | | 100.1 | | |
| | | | | | | | | Liabilities in Excess of
Other Assets | | | (160,871 | ) | | | (0.1 | ) | |
| | | | | | | | | Net Assets | | $ | 161,042,822 | | | | 100.0 | | |
"Other Securities" represents issues not identified as the top 50 holdings in terms of market value and issues or issuers not exceeding 1% of net assets individually or in aggregate respectively as of December 31, 2011.
The following footnotes apply to either the individual securities noted or one or more of the securities aggregated and listed as a single line item.
@ Non-income producing security
ADR American Depositary Receipt
Cost for federal income tax purposes is $144,408,136.
| Net unrealized appreciation consists of: | |
| Gross Unrealized Appreciation | | $ | 28,578,213 | | |
| Gross Unrealized Depreciation | | | (11,782,656 | ) | |
| Net Unrealized Appreciation | | $ | 16,795,557 | | |
Fair Value Measurements^
The following is a summary of the fair valuations according to the inputs used as of December 31, 2011 in valuing the assets and liabilities:
| | | Quoted Prices
in Active Markets
for Identical Investments
(Level 1) | | Significant Other
Observable
Inputs
(Level 2) | | Significant
Unobservable
Inputs
(Level 3) | | Fair Value
at
12/31/11 | |
| Asset Table | |
| Investments, at value | |
| Common Stock* | | $ | 155,377,601 | | | $ | — | | | $ | — | | | $ | 155,377,601 | | |
| Short-Term Investments | | | 5,826,092 | | | | — | | | | — | | | | 5,826,092 | | |
| Total Investments, at value | | $ | 161,203,693 | | | $ | — | | | $ | — | | | $ | 161,203,693 | | |
^ See Note 2, "Significant Accounting Policies" in the Notes to Financial Statements for additional information.
* For further breakdown of Common Stock by Industry type, please refer to the Portfolio of Investments.
There were no significant transfers between Level 1 and 2 during the year ended December 31, 2011.
See Accompanying Notes to Financial Statements
100
ING DAVIS SUMMARY PORTFOLIO OF INVESTMENTS
NEW YORK VENTURE PORTFOLIO AS OF DECEMBER 31, 2011
Shares | |
| |
| | Value | | Percentage
of Net
Assets | |
| COMMON STOCK: 96.5% | | | |
| | | | | Consumer Discretionary: 7.4% | |
| | 183,300 | | | @ | | Bed Bath & Beyond, Inc. | | $ | 10,625,901 | | | | 2.7 | | |
| | 91,499 | | | @ | | Carmax, Inc. | | | 2,788,890 | | | | 0.7 | | |
| | 53,250 | | | | | Harley-Davidson, Inc. | | | 2,069,827 | | | | 0.6 | | |
| | 153,880 | | | | | Walt Disney Co. | | | 5,770,500 | | | | 1.5 | | |
| | 728,280 | | | | | Other Securities | | | 7,427,650 | | | | 1.9 | | |
| | | | | | | | | | 28,682,768 | | | | 7.4 | | |
| | | | | Consumer Staples: 16.9% | |
| | 138,750 | | | | | Coca-Cola Co. | | | 9,708,337 | | | | 2.5 | | |
| | 231,665 | | | | | Costco Wholesale Corp. | | | 19,302,328 | | | | 5.0 | | |
| | 477,727 | | | | | CVS Caremark Corp. | | | 19,481,707 | | | | 5.0 | | |
| | 47,100 | | | | | Diageo PLC ADR | | | 4,117,482 | | | | 1.1 | | |
| | 102,700 | | | | | Heineken Holding NV | | | 4,197,015 | | | | 1.1 | | |
| | 57,000 | | | | | Kraft Foods, Inc. | | | 2,129,520 | | | | 0.5 | | |
| | 41,902 | | | | | Philip Morris
International, Inc. | | | 3,288,469 | | | | 0.8 | | |
| | 53,840 | | | | | Unilever NV ADR | | | 1,850,481 | | | | 0.5 | | |
| | 45,250 | | | | | Other Securities | | | 1,546,264 | | | | 0.4 | | |
| | | | | | | | | | 65,621,603 | | | | 16.9 | | |
| | | | | Energy: 12.8% | |
| | 324,860 | | | | | Canadian Natural
Resources Ltd. | | | 12,140,018 | | | | 3.1 | | |
| | 72,550 | | | | | Devon Energy Corp. | | | 4,498,100 | | | | 1.2 | | |
| | 144,240 | | | | | EOG Resources, Inc. | | | 14,209,083 | | | | 3.6 | | |
| | 136,000 | | | | | Occidental
Petroleum Corp. | | | 12,743,200 | | | | 3.3 | | |
| | 341,700 | | | @ | | OGX Petroleo e Gas
Participacoes S.A. | | | 2,495,083 | | | | 0.6 | | |
| | 1,378,776 | | | | | Other Securities | | | 3,871,893 | | | | 1.0 | | |
| | | | | | | | | | 49,957,377 | | | | 12.8 | | |
| | | | | Financials: 29.8% | |
| | 38,760 | | | | | ACE Ltd. | | | 2,717,851 | | | | 0.7 | | |
| | 412,620 | | | | | American Express Co. | | | 19,463,286 | | | | 5.0 | | |
| | 47,530 | | | | | Ameriprise
Financial, Inc. | | | 2,359,389 | | | | 0.6 | | |
| | 815,890 | | | | | Bank of New York
Mellon Corp. | | | 16,244,370 | | | | 4.2 | | |
| | 88 | | | @ | | Berkshire Hathaway,
Inc. - Class A | | | 10,098,440 | | | | 2.6 | | |
| | 2,340 | | | | | Fairfax Financial
Holdings Ltd. | | | 1,003,783 | | | | 0.2 | | |
| | 4,480 | | | | | Fairfax Financial
Holdings Ltd. | | | 1,931,776 | | | | 0.5 | | |
| | 565,000 | | | | | Hang Lung Group Ltd. | | | 3,092,064 | | | | 0.8 | | |
| | 133,310 | | | @ | | Julius Baer Group Ltd. | | | 5,192,747 | | | | 1.3 | | |
| | 306,299 | | | | | Loews Corp. | | | 11,532,157 | | | | 2.9 | | |
| | 533,380 | | | | | Progressive Corp. | | | 10,406,244 | | | | 2.7 | | |
| | 90,070 | | | | | Transatlantic
Holdings, Inc. | | | 4,929,531 | | | | 1.3 | | |
Shares | |
| |
| | Value | | Percentage
of Net
Assets | |
| | 663,367 | | | | | Wells Fargo & Co. | | $ | 18,282,395 | | | | 4.7 | | |
| | 323,827 | | | | | Other Securities | | | 8,834,851 | | | | 2.3 | | |
| | | | | | | | | | 116,088,884 | | | | 29.8 | | |
| | | | | Health Care: 9.5% | |
| | 41,200 | | | | | Baxter
International, Inc. | | | 2,038,576 | | | | 0.5 | | |
| | 177,820 | | | @ | | Express Scripts, Inc. | | | 7,946,776 | | | | 2.0 | | |
| | 129,450 | | | | | Johnson & Johnson | | | 8,489,331 | | | | 2.2 | | |
| | 243,915 | | | | | Merck & Co., Inc. | | | 9,195,595 | | | | 2.4 | | |
| | 41,900 | | | | | Roche Holding
AG - Genusschein | | | 7,086,059 | | | | 1.8 | | |
| | 51,758 | | | | | Other Securities | | | 2,411,919 | | | | 0.6 | | |
| | | | | | | | | | 37,168,256 | | | | 9.5 | | |
| | | | | Industrials: 5.5% | |
| | 1,333,196 | | | | | China Merchants
Holdings
International Co., Ltd. | | | 3,856,036 | | | | 1.0 | | |
| | 285,250 | | | | | Iron Mountain, Inc. | | | 8,785,700 | | | | 2.3 | | |
| | 25,157 | | | | | Kuehne & Nagel
International AG | | | 2,817,058 | | | | 0.7 | | |
| | 44,040 | | | | | Lockheed Martin Corp. | | | 3,562,836 | | | | 0.9 | | |
| | 1,057,570 | | | | | Other Securities | | | 2,216,937 | | | | 0.6 | | |
| | | | | | | | | | 21,238,567 | | | | 5.5 | | |
| | | | | Information Technology: 8.0% | |
| | 178,952 | | | | | Activision Blizzard, Inc. | | | 2,204,689 | | | | 0.6 | | |
| | 18,799 | | | @ | | Google, Inc. - Class A | | | 12,142,274 | | | | 3.1 | | |
| | 113,600 | | | | | Hewlett-Packard Co. | | | 2,926,336 | | | | 0.7 | | |
| | 174,870 | | | | | Microsoft Corp. | | | 4,539,625 | | | | 1.2 | | |
| | 201,910 | | | | | Texas Instruments, Inc. | | | 5,877,600 | | | | 1.5 | | |
| | 99,400 | | | | | Other Securities | | | 3,643,402 | | | | 0.9 | | |
| | | | | | | | | | 31,333,926 | | | | 8.0 | | |
| | | | | Materials: 6.2% | |
| | 26,690 | | | | | Air Products &
Chemicals, Inc. | | | 2,273,721 | | | | 0.6 | | |
| | 64,500 | | | | | BHP Billiton PLC | | | 1,885,687 | | | | 0.5 | | |
| | 35,480 | | | | | Ecolab, Inc. | | | 2,051,099 | | | | 0.5 | | |
| | 97,440 | | | | | Monsanto Co. | | | 6,827,621 | | | | 1.8 | | |
| | 70,055 | | | | | Potash Corp. of
Saskatchewan | | | 2,891,870 | | | | 0.7 | | |
| | 24,400 | | | | | Praxair, Inc. | | | 2,608,360 | | | | 0.7 | | |
| | 41,632 | | | | | Rio Tinto PLC | | | 2,033,564 | | | | 0.5 | | |
| | 8,100 | | | #,@,X | | Sino-Forest Corp. | | | 5,568 | | | | 0.0 | | |
| | 533,334 | | | | | Other Securities | | | 3,678,249 | | | | 0.9 | | |
| | | | | | | | | | 24,255,739 | | | | 6.2 | | |
| | | | | Telecommunications: 0.4% | |
| | 60,580 | | | | | Other Securities | | | 1,369,108 | | | | 0.4 | | |
| | | | | | | Total Common Stock
(Cost $342,813,288) | | | 375,716,228 | | | | 96.5 | | |
See Accompanying Notes to Financial Statements
101
ING DAVIS SUMMARY PORTFOLIO OF INVESTMENTS
NEW YORK VENTURE PORTFOLIO AS OF DECEMBER 31, 2011 (CONTINUED)
Principal
Amount† | |
| |
| | Value | | Percentage
of Net
Assets | |
| CORPORATE BONDS/NOTES: 0.0% | | | |
| | | | | Materials: 0.0% | |
| | 649,000 | | | | # | | | Sino-Forest Corp.,
5.000%, 08/01/13 | | $ | 178,475 | | | | 0.0 | | |
| | | | | | | | | Total Corporate
Bonds/Notes
(Cost $649,000) | | | 178,475 | | | | 0.0 | | |
| | | | | | | | | Total Long-Term
Investments
(Cost $343,462,288) | | | 375,894,703 | | | | 96.5 | | |
| SHORT-TERM INVESTMENTS: 3.3% | | | |
| | | | | Commercial Paper: 3.3% | |
| | 12,863,000 | | | | | | | Barclays Fdg. Dis.,
0.090%, 01/03/12
(Cost $12,862,904) | | | 12,862,904 | | | | 3.3 | | |
| | | | | | | | | Total Short-Term
Investments
(Cost $12,862,904) | | | 12,862,904 | | | | 3.3 | | |
| | | | | | | | | Total Investments in
Securities
(Cost $356,325,192) | | $ | 388,757,607 | | | | 99.8 | | |
| | | | | | | | | Assets in Excess of
Other Liabilities | | | 599,840 | | | | 0.2 | | |
| | | | | | | | | Net Assets | | $ | 389,357,447 | | | | 100.0 | | |
"Other Securities" represents issues not identified as the top 50 holdings in terms of market value and issues or issuers not exceeding 1% of net assets individually or in aggregate respectively as of December 31, 2011.
The following footnotes apply to either the individual securities noted or one or more of the securities aggregated and listed as a single line item.
† Unless otherwise indicated, principal amount is shown in USD.
# Securities with purchases pursuant to Rule 144A or section 4(2), under the Securities Act of 1933 and may not be resold subject to that rule except to qualified institutional buyers.
@ Non-income producing security
ADR American Depositary Receipt
X Fair value determined by ING Funds Valuation Committee appointed by the Funds' Board of Directors/Trustees.
Cost for federal income tax purposes is $360,151,122.
| Net unrealized appreciation consists of: | |
| Gross Unrealized Appreciation | | $ | 56,738,912 | | |
| Gross Unrealized Depreciation | | | (28,132,427 | ) | |
| Net Unrealized Appreciation | | $ | 28,606,485 | | |
Fair Value Measurements^
The following is a summary of the fair valuations according to the inputs used as of December 31, 2011 in valuing the assets and liabilities:
| | | Quoted Prices
in Active Markets
for Identical Investments
(Level 1) | | Significant Other
Observable
Inputs#
(Level 2) | | Significant
Unobservable
Inputs
(Level 3) | | Fair Value
at
12/31/11 | |
| Asset Table | |
| Investments, at value | |
| Common Stock | |
| Consumer Discretionary | | $ | 27,258,080 | | | $ | 1,424,688 | | | $ | — | | | $ | 28,682,768 | | |
| Consumer Staples | | | 60,416,805 | | | | 5,204,798 | | | | — | | | | 65,621,603 | | |
| Energy | | | 48,536,650 | | | | 1,420,727 | | | | — | | | | 49,957,377 | | |
| Financials | | | 107,804,073 | | | | 8,284,811 | | | | — | | | | 116,088,884 | | |
| Health Care | | | 30,082,197 | | | | 7,086,059 | | | | — | | | | 37,168,256 | | |
| Industrials | | | 13,969,585 | | | | 7,268,982 | | | | — | | | | 21,238,567 | | |
| Information Technology | | | 31,333,926 | | | | — | | | | — | | | | 31,333,926 | | |
| Materials | | | 20,114,165 | | | | 3,919,251 | | | | 222,323 | | | | 24,255,739 | | |
| Telecommunications | | | 1,369,108 | | | | — | | | | — | | | | 1,369,108 | | |
| Total Common Stock | | | 340,884,589 | | | | 34,609,316 | | | | 222,323 | | | | 375,716,228 | | |
| Corporate Bonds/Notes | | | — | | | | 178,475 | | | | — | | | | 178,475 | | |
| Short-Term Investments | | | — | | | | 12,862,904 | | | | — | | | | 12,862,904 | | |
| Total Investments, at value | | $ | 340,884,589 | | | $ | 47,650,695 | | | $ | 222,323 | | | $ | 388,757,607 | | |
See Accompanying Notes to Financial Statements
102
ING DAVIS SUMMARY PORTFOLIO OF INVESTMENTS
NEW YORK VENTURE PORTFOLIO AS OF DECEMBER 31, 2011 (CONTINUED)
The following is a reconciliation of the fair valuations using significant unobservable inputs (Level 3) for the Portfolio's assets and liabilities during the period ended December 31, 2011:
| | | Beginning
Balance
12/31/10 | | Purchases | | Sales | | Accrued
Discounts/
(Premiums) | | Total
Realized
Gain/(Loss) | | Total
Unrealized
Appreciation/
(Depreciation) | | Transfers
Into
Level 3 | | Transfers
Out of
Level 3 | | Ending
Balance
12/31/11 | |
| Asset Table | |
| Investments, at value | |
| Common Stock | | $ | 55 | | | $ | — | | | $ | — | | | $ | — | | | $ | (50,065 | ) | | $ | 50,010 | | | $ | 222,323 | | | $ | — | | | $ | 222,323 | | |
Total Investments,
at value | | $ | 55 | | | $ | — | | | $ | — | | | $ | — | | | $ | (50,065 | ) | | $ | 50,010 | | | $ | 222,323 | | | $ | — | | | $ | 222,323 | | |
As of December 31, 2011, total change in unrealized gain (loss) on Level 3 securities still held at period end and included in the change in net assets was $0.
^ See Note 2, "Significant Accounting Policies" in the Notes to Financial Statements for additional information.
# The earlier close of the foreign markets gives rise to the possibility that significant events, including broad market moves, may have occurred in the interim and may materially affect the value of those securities. To account for this, the Portfolio may frequently value many of its foreign equity securities using fair value prices based on third party vendor modeling tools to the extent available. Accordingly, a significant portion of the Portfolio's investments are categorized as Level 2 investments.
There were no significant transfers between Level 1 and 2 during the year ended December 31, 2011.
Transfers in or out of Level 3 represent either the beginning value (for transfers in), or the ending value (for transfers out) of any security or derivative instrument where a change in the pricing level occurred from the beginning to the end of the period. Transfers are recognized at the end of the reporting period.
See Accompanying Notes to Financial Statements
103
SUMMARY PORTFOLIO OF INVESTMENTS
ING GLOBAL BOND PORTFOLIO AS OF DECEMBER 31, 2011
Principal
Amount† | |
| |
| | Value | | Percentage
of Net
Assets | |
| CORPORATE BONDS/NOTES: 31.4% | | | |
| | | | | Australia: 0.2% | |
| | 525,000 | | | # | | FMG Resources
August 2006
Pty Ltd,
6.375%,
02/01/16 | | $ | 511,875 | | | | 0.1 | | |
| | 255,000 | | | # | | FMG Resources
August 2006
Pty Ltd.,
7.000%,
11/01/15 | | | 258,825 | | | | 0.1 | | |
| AUD | 195,000 | | | | | Other Securities | | | 210,185 | | | | 0.0 | | |
| | | | | | | | | | 980,885 | | | | 0.2 | | |
| | | | | Bermuda: 0.0% | |
| | 6,845 | | | | | Other Securities | | | 6,623 | | | | 0.0 | | |
| | | | | Brazil: 1.9% | |
| | 1,400,000 | | | # | | Banco do
Brasil SA,
5.875%,
01/26/22 | | | 1,415,400 | | | | 0.3 | | |
| BRL | 3,800,000 | | | # | | Banco
Votorantim SA,
6.250%,
05/16/16 | | | 2,078,413 | | | | 0.5 | | |
| | 300,000 | | | # | | Centrais Eletricas
Brasileiras S.A.,
6.875%,
07/30/19 | | | 342,000 | | | | 0.1 | | |
| | 1,053,140 | | | #,L | | QGOG Atlantic /
Alaskan Rigs
Ltd., 5.250%,
07/30/18 | | | 1,050,507 | | | | 0.2 | | |
| | 3,220,000 | | | | | Other Securities (a) | | | 3,350,981 | | | | 0.8 | | |
| | | | | | | | | | 8,237,301 | | | | 1.9 | | |
| | | | | British Virgin Islands: 0.1% | |
| | 615,000 | | | | | Other Securities | | | 644,048 | | | | 0.1 | | |
| | | | | Canada: 0.4% | |
| | 82,867 | | | #,& | | Ainsworth
Lumber Co.,
Ltd., 11.000%,
07/29/15 | | | 54,278 | | | | 0.0 | | |
| | 900,000 | | | # | | Bombardier, Inc.,
7.750%,
03/15/20 | | | 985,500 | | | | 0.2 | | |
| | 515,000 | | | | | Other Securities | | | 570,362 | | | | 0.2 | | |
| | | | | | | | | | 1,610,140 | | | | 0.4 | | |
| | | | | Cayman Islands: 0.6% | |
| | 1,087,000 | | | # | | IPIC GMTN Ltd.,
5.500%,
03/01/22 | | | 1,092,435 | | | | 0.2 | | |
Principal
Amount† | |
| |
| | Value | | Percentage
of Net
Assets | |
| | 175,000 | | | #,L | | Odebrecht
Finance
Ltd., 7.500%,
09/29/49 | | $ | 171,938 | | | | 0.0 | | |
| | 1,440,000 | | | | | Other Securities | | | 1,523,137 | | | | 0.4 | | |
| | | | | | | | | | 2,787,510 | | | | 0.6 | | |
| | | | | Chile: 0.3% | |
| | 320,000 | | | # | | Empresa Nacional
del Petroleo,
4.750%,
12/06/21 | | | 319,337 | | | | 0.0 | | |
| | 1,135,000 | | | | | Other Securities | | | 1,190,091 | | | | 0.3 | | |
| | | | | | | | | | 1,509,428 | | | | 0.3 | | |
| | | | | China: 0.1% | |
| | 300,000 | | | # | | Mega Advance
Investments
Ltd., 6.375%,
05/12/41 | | | 300,921 | | | | 0.1 | | |
| | | | | Colombia: 2.0% | |
| | 920,000 | | | # | | Banco de Bogota
SA, 5.000%,
01/15/17 | | | 929,277 | | | | 0.2 | | |
| | 492,000 | | | # | | Empresa de
Energia de
Bogota SA,
6.125%,
11/10/21 | | | 496,920 | | | | 0.1 | | |
| | 8,066,000 | | | # | | Citigroup
Funding, Inc.,
11.000%,
07/27/20 | | | 7,188,419 | | | | 1.7 | | |
| | | | | | | | | | 8,614,616 | | | | 2.0 | | |
| | | | | Italy: 0.4% | |
| | 1,589,000 | | | | | Other Securities | | | 1,527,242 | | | | 0.4 | | |
| | | | | Kazakhstan: 0.4% | |
| | 936,000 | | | # | | KazMunaiGaz
Finance Sub BV,
7.000%,
05/05/20 | | | 993,330 | | | | 0.2 | | |
| | 569,000 | | | # | | KazMunaiGaz
Finance Sub BV,
8.375%,
07/02/13 | | | 598,872 | | | | 0.2 | | |
| | 1,500,000 | | | | | Other Securities (b) | | | 153,750 | | | | 0.0 | | |
| | | | | | | | | | 1,745,952 | | | | 0.4 | | |
| | | | | Luxembourg: 0.8% | |
| | 550,000 | | | # | | Gaz Capital for
Gazprom,
6.212%,
11/22/16 | | | 570,625 | | | | 0.1 | | |
See Accompanying Notes to Financial Statements
104
SUMMARY PORTFOLIO OF INVESTMENTS
ING GLOBAL BOND PORTFOLIO AS OF DECEMBER 31, 2011 (CONTINUED)
Principal
Amount† | |
| |
| | Value | | Percentage
of Net
Assets | |
| | | | | Luxembourg (continued) | |
| | 890,000 | | | # | | Gaz Capital for
Gazprom,
9.250%,
04/23/19 | | $ | 1,062,571 | | | | 0.3 | | |
| | 400,000 | | | # | | Gazprom OAO
Via Gaz Capital
SA, 5.999%,
01/23/21 | | | 399,000 | | | | 0.1 | | |
| | 1,140,000 | | | | | Other Securities | | | 1,213,850 | | | | 0.3 | | |
| | | | | | | | | | 3,246,046 | | | | 0.8 | | |
| | | | | Malaysia: 0.1% | |
| | 500,000 | | | # | | Malaysia Sukuk
Global Berhad,
3.928%,
06/04/15 | | | 522,685 | | | | 0.1 | | |
| | | | | Mexico: 2.6% | |
| MXN | 67,000,000 | | | # | | Petroleos
Mexicanos,
7.650%,
11/24/21 | | | 4,777,243 | | | | 1.1 | | |
| | 1,589,000 | | | | | Petroleos
Mexicanos,
6.000%,
03/05/20 | | | 1,772,212 | | | | 0.4 | | |
| | 1,585,000 | | | | | Southern Copper
Corp., 6.750%,
04/16/40 | | | 1,599,241 | | | | 0.4 | | |
| | 11,694,021 | | | | | Other Securities | | | 2,834,305 | | | | 0.7 | | |
| | | | | | | | | | 10,983,001 | | | | 2.6 | | |
| | | | | Netherlands: 0.2% | |
| | 840,000 | | | | | Other Securities | | | 873,922 | | | | 0.2 | | |
| | | | | Philippines: 0.2% | |
| | 660,000 | | | # | | Tiers Trust,
06/15/97 | | | 456,944 | | | | 0.1 | | |
| PHP | 23,800,000 | | | | | Other Securities | | | 605,740 | | | | 0.1 | | |
| | | | | | | | | | 1,062,684 | | | | 0.2 | | |
| | | | | Qatar: 0.1% | |
| | 430,000 | | | # | | Nakilat, Inc.,
6.067%,
12/31/33 | | | 461,175 | | | | 0.1 | | |
| | | | | Russia: 0.3% | |
| | 300,000 | | | # | | Gaz Capital for
Gazprom,
8.125%,
07/31/14 | | | 324,750 | | | | 0.1 | | |
| | 816,000 | | | | | Other Securities | | | 828,310 | | | | 0.2 | | |
| | | | | | | | | | 1,153,060 | | | | 0.3 | | |
Principal
Amount† | |
| |
| | Value | | Percentage
of Net
Assets | |
| | | | | South Africa: 0.2% | |
| | 593,000 | | | # | | Gold Fields
Orogen Holding
BVI Ltd.,
4.875%,
10/07/20 | | $ | 524,306 | | | | 0.1 | | |
| ZAR | 1,000,000 | | | | | Other Securities | | | 137,444 | | | | 0.1 | | |
| | | | | | | | | | 661,750 | | | | 0.2 | | |
| | | | | United Arab Emirates: 0.2% | |
| | 765,000 | | | #,L | | Abu Dhabi
National Energy
Co., 5.875%,
12/13/21 | | | 799,425 | | | | 0.2 | | |
| | | | | United Kingdom: 0.5% | |
| | 520,000 | | | # | | Barclays Bank
PLC, 6.050%,
12/04/17 | | | 472,598 | | | | 0.1 | | |
| | 275,000 | | | # | | Intelsat Jackson
Holdings SA,
7.500%,
04/01/21 | | | 278,781 | | | | 0.1 | | |
| | 463,000 | | | # | | Lloyds TSB Bank
PLC, 6.500%,
09/14/20 | | | 387,906 | | | | 0.1 | | |
| EUR | 740,000 | | | | | Other Securities | | | 994,915 | | | | 0.2 | | |
| | | | | | | | | | 2,134,200 | | | | 0.5 | | |
| | | | | United States: 19.3% | |
| | 48,000 | | | # | | ABI Escrow Corp.,
10.250%,
10/15/18 | | | 53,160 | | | | 0.0 | | |
| | 705,000 | | | # | | AES Corp.,
7.375%,
07/01/21 | | | 763,163 | | | | 0.2 | | |
| | 740,000 | | | # | | AMC Networks,
Inc., 7.750%,
07/15/21 | | | 808,450 | | | | 0.2 | | |
| | 705,000 | | | # | | Arch Coal, Inc.,
7.250%,
06/15/21 | | | 727,912 | | | | 0.2 | | |
| | 2,203,000 | | | | | AT&T, Inc.,
2.500%,
08/15/15 | | | 2,283,506 | | | | 0.5 | | |
| | 530,000 | | | # | | Calpine Corp.,
7.875%,
07/31/20 | | | 573,725 | | | | 0.1 | | |
| | 180,000 | | | # | | Chesapeake
Oilfield
Operating LLC/
Chesapeake
Oilfield Finance,
Inc., 6.625%,
11/15/19 | | | 188,100 | | | | 0.1 | | |
| | 810,000 | | | # | | CIT Group, Inc.,
7.000%,
05/02/17 | | | 810,000 | | | | 0.2 | | |
See Accompanying Notes to Financial Statements
105
SUMMARY PORTFOLIO OF INVESTMENTS
ING GLOBAL BOND PORTFOLIO AS OF DECEMBER 31, 2011 (CONTINUED)
Principal
Amount† | |
| |
| | Value | | Percentage
of Net
Assets | |
| | | | | United States (continued) | |
| | 7,857,000 | | | # | | Citigroup
Funding, Inc.,
11.000%,
07/27/20 | | $ | 7,336,867 | | | | 1.7 | | |
| | 825,000 | | | | | Citigroup, Inc.,
6.010%,
01/15/15 | | | 862,596 | | | | 0.2 | | |
| | 2,017,000 | | | | | Comcast Corp.,
5.700%,
05/15/18 | | | 2,323,598 | | | | 0.6 | | |
| | 500,000 | | | #,L | | Delphi Corp.,
5.875%,
05/15/19 | | | 512,500 | | | | 0.1 | | |
| | 2,079,000 | | | | | General Electric
Capital Corp.,
2.250%,
11/09/15 | | | 2,090,595 | | | | 0.5 | | |
| | 1,270,000 | | | # | | Hyatt Hotels
Corp., 6.875%,
08/15/19 | | | 1,418,910 | | | | 0.3 | | |
| | 1,263,000 | | | #,L | | Hyundai Capital
America,
4.000%,
06/08/17 | | | 1,251,546 | | | | 0.3 | | |
| | 1,760,000 | | | | | Kellogg Co.,
4.000%,
12/15/20 | | | 1,865,535 | | | | 0.5 | | |
| | 92 | | | # | | Kern River
Funding Corp.,
4.893%,
04/30/18 | | | 100 | | | | 0.0 | | |
| | 681,000 | | | | | Morgan Stanley,
4.100%,
01/26/15 | | | 646,956 | | | | 0.1 | | |
| | 380,000 | | | # | | Mylan, Inc./PA,
7.875%,
07/15/20 | | | 421,325 | | | | 0.1 | | |
| | 1,422,000 | | | | | Oracle Corp.,
5.375%,
07/15/40 | | | 1,735,690 | | | | 0.4 | | |
| | 1,075,000 | | | # | | Pacific Life
Insurance Co.,
9.250%,
06/15/39 | | | 1,433,588 | | | | 0.3 | | |
| | 365,000 | | | # | | Reynolds Group
Issuer, Inc.,
9.000%,
04/15/19 | | | 348,575 | | | | 0.1 | | |
| | 480,000 | | | # | | Reynolds Group
Issuer, Inc.,
9.250%,
05/15/18 | | | 462,000 | | | | 0.1 | | |
| | 125,000 | | | # | | RSC Equipment
Rental, Inc.,
10.000%,
07/15/17 | | | 146,250 | | | | 0.0 | | |
Principal
Amount† | |
| |
| | Value | | Percentage
of Net
Assets | |
| | 255,000 | | | # | | Sealed Air Corp.,
8.375%,
09/15/21 | | $ | 283,050 | | | | 0.1 | | |
| | 2,858,000 | | | | | Time Warner
Cable, Inc.,
5.875%,
11/15/40 | | | 3,098,449 | | | | 0.7 | | |
| | 505,000 | | | # | | Valeant
Pharmaceuticals
International,
7.250%,
07/15/22 | | | 492,375 | | | | 0.1 | | |
| | 740,000 | | | # | | XM Satellite
Radio, Inc.,
7.625%,
11/01/18 | | | 780,700 | | | | 0.2 | | |
| | 52,564,426 | | | | | Other
Securities (a),(b) | | | 48,685,138 | | | | 11.4 | | |
| | | | | | | | | | 82,404,359 | | | | 19.3 | | |
| | | | | Venezuela: 0.5% | |
| | 2,689,800 | | | | | Petroleos de
Venezuela SA,
8.500%,
11/02/17 | | | 2,034,834 | | | | 0.5 | | |
| | | | | | | Total Corporate
Bonds/Notes
(Cost
$135,005,290) | | | 134,301,807 | | | | 31.4 | | |
| COLLATERALIZED MORTGAGE OBLIGATIONS: 9.3% | | | |
| | | | | United States: 9.3% | |
| | 1,621,820 | | | | | Banc of America
Alternative
Loan Trust,
4.750%,
02/25/19 | | | 1,658,768 | | | | 0.4 | | |
| | 2,449,626 | | | | | Banc of America
Funding Corp.,
5.500%,
02/25/35 | | | 2,414,343 | | | | 0.6 | | |
| | 1,865,805 | | | | | Credit Suisse
Mortgage
Capital
Certificates,
5.589%,
09/15/40 | | | 1,891,613 | | | | 0.5 | | |
| | 1,411,166 | | | # | | Credit Suisse
Mortgage
Capital
Certificates,
5.358%,
07/27/37 | | | 1,450,220 | | | | 0.3 | | |
| | 3,182,884 | | | | | CW Capital
Cobalt Ltd.,
5.174%-5.736%,
05/15/46-
08/15/48 | | | 3,226,938 | | | | 0.8 | | |
See Accompanying Notes to Financial Statements
106
SUMMARY PORTFOLIO OF INVESTMENTS
ING GLOBAL BOND PORTFOLIO AS OF DECEMBER 31, 2011 (CONTINUED)
Principal
Amount† | |
| |
| | Value | | Percentage
of Net
Assets | |
| | | | | United States (continued) | |
| | 500,000 | | | # | | DBUBS Mortgage
Trust, 5.557%,
11/10/46 | | $ | 413,434 | | | | 0.1 | | |
| | 223,677 | | | # | | Deutsche
Alternative-A
Securities, Inc.
Alternate Loan
Trust, 0.794%,
01/27/37 | | | 101,773 | | | | 0.0 | | |
| | 420,000 | | | # | | JP Morgan Chase
Commercial
Mortgage
Securities Corp.,
5.389%,
07/15/46 | | | 313,583 | | | | 0.1 | | |
| | 3,461,492 | | | | | JP Morgan Chase
Commercial
Mortgage
Securities Corp.,
4.981%-6.288%,
01/15/42-
02/12/51 | | | 3,374,919 | | | | 0.8 | | |
| | 1,791,745 | | | | | JP Morgan
Commercial
Mortgage
Finance Corp.,
8.293%-8.434%,
08/15/32 | | | 1,833,989 | | | | 0.4 | | |
| | 250,000 | | | # | | LB-UBS
Commercial
Mortgage Trust,
5.750%,
01/15/36 | | | 249,050 | | | | 0.1 | | |
| | 3,460,000 | | | | | LB-UBS
Commercial
Mortgage Trust,
5.323%-5.890%,
06/15/38-
09/15/45 | | | 3,102,105 | | | | 0.7 | | |
| | 470,000 | | | | | Morgan Stanley
Capital I,
5.300%,
06/15/40 | | | 359,392 | | | | 0.1 | | |
| | 430,000 | | | | | Morgan Stanley
Capital I,
5.242%,
01/14/42 | | | 410,823 | | | | 0.1 | | |
| | 1,280,000 | | | # | | Morgan Stanley
Capital I,
5.397%,
01/13/41 | | | 1,214,633 | | | | 0.3 | | |
| | 1,780,236 | | | | | Structured Asset
Securities Corp.,
5.000%,
05/25/35 | | | 1,780,638 | | | | 0.4 | | |
| | 1,777,319 | | | | | Wachovia Bank
Commercial
Mortgage Trust,
5.735%,
06/15/49 | | | 1,822,732 | | | | 0.4 | | |
Principal
Amount† | |
| |
| | Value | | Percentage
of Net
Assets | |
| | 618,000 | | | # | | Wachovia Bank
Commercial
Mortgage
Trust, 5.704%,
02/15/35 | | $ | 610,574 | | | | 0.1 | | |
| | 980,000 | | | | | Wachovia Bank
Commercial
Mortgage Trust,
5.368%-5.383%,
12/15/43-
11/15/48 | | | 734,006 | | | | 0.2 | | |
| | 1,792,581 | | | | | Wells Fargo
Mortgage
Backed
Securities Trust,
5.500%,
09/25/37 | | | 1,799,732 | | | | 0.4 | | |
| | 1,957,757 | | | | | Wells Fargo
Mortgage-
Backed
Securities Trust,
5.354%,
08/25/35 | | | 1,882,816 | | | | 0.4 | | |
| | 807,671 | | | | | Wells Fargo
Mortgage-
Backed
Securities Trust,
2.690%-2.719%,
02/25/35-
10/25/35 | | | 713,138 | | | | 0.2 | | |
| | 9,124,750 | | | | | Other Securities | | | 8,384,593 | | | | 1.9 | | |
| | | | | | | Total
Collateralized
Mortgage
Obligations
(Cost
$41,210,438) | | | 39,743,812 | | | | 9.3 | | |
| STRUCTURED PRODUCTS: 0.6% | | | |
| | | | | Brazil: 0.5% | |
| | 1,962,500 | | | # | | Hallertau SPC
2008-2A - Doux
Frangosul S.A.
ARGO Avicola
Credit Linked
Notes, 9.264%,
09/17/13 | | | 1,997,825 | | | | 0.5 | | |
| | | | | Mexico: 0.1% | |
| MXN | 3,258,596 | | | | | Other Securities | | | 226,170 | | | | 0.1 | | |
| | | | | Russia: 0.0% | |
| RUB | 41,451,234 | | | | | Other Securities (b) | | | 162,270 | | | | 0.0 | | |
| | | | | United States: 0.0% | |
| | 188,988 | | | | | Other Securities | | | 57,566 | | | | 0.0 | | |
| | | | | | | Total Structured
Products
(Cost
$4,047,595) | | | 2,443,831 | | | | 0.6 | | |
See Accompanying Notes to Financial Statements
107
SUMMARY PORTFOLIO OF INVESTMENTS
ING GLOBAL BOND PORTFOLIO AS OF DECEMBER 31, 2011 (CONTINUED)
Principal
Amount† | |
| |
| | Value | | Percentage
of Net
Assets | |
| ASSET-BACKED SECURITIES: 0.0% | | | |
| | | | | United States: 0.0% | |
| | 221,000 | | | | | Other Securities | | $ | 221,214 | | | | 0.0 | | |
| | | | | | | Total Asset-
Backed
Securities
(Cost $193,741) | | | 221,214 | | | | 0.0 | | |
| U.S. TREASURY OBLIGATIONS: 10.7% | | | |
| | | | | U.S. Treasury Bonds: 1.1% | |
| | 4,236,000 | | | | | 2.000%,
due 11/15/21 | | | 4,282,994 | | | | 1.0 | | |
| | 267,000 | | | | | 3.750%,
due 08/15/41 | | | 313,308 | | | | 0.1 | | |
| | | | | | | | | | 4,596,302 | | | | 1.1 | | |
| | | | | U.S. Treasury Notes: 9.6% | |
| | 18,113,000 | | | L | | 0.250%,
due 11/30/13 | | | 18,120,082 | | | | 4.3 | | |
| | 9,851,000 | | | L | | 0.375%,
due 11/15/14 | | | 9,860,241 | | | | 2.3 | | |
| | 8,672,000 | | | L | | 0.875%,
due 11/30/16 | | | 8,701,138 | | | | 2.0 | | |
| | 4,298,000 | | | | | 1.375%,
due 11/30/18 | | | 4,313,447 | | | | 1.0 | | |
| | | | | | | | | | 40,994,908 | | | | 9.6 | | |
| | | | | | | Total U.S. Treasury
Obligations
(Cost
$45,445,983) | | | 45,591,210 | | | | 10.7 | | |
| FOREIGN GOVERNMENT BONDS: 29.8% | | | |
| | | | | Argentina: 0.9% | |
| | 98,889 | | | | | Argentina
Government
International
Bond, 04/17/17 | | | 84,550 | | | | 0.0 | | |
| EUR | 1,450,000 | | | | | Argentina
Government
International
Bond, 4.191%,
12/15/35 | | | 193,296 | | | | 0.1 | | |
| | 2,590,000 | | | | | Argentina
Government
International
Bond, 7.000%,
10/03/15 | | | 2,428,125 | | | | 0.6 | | |
| | 3,744,244 | | | L | | Argentina
Government
International
Bond, — %
-8.280%,
12/31/33-
12/15/35 | | | 935,342 | | | | 0.2 | | |
| | | | | | | | | | 3,641,313 | | | | 0.9 | | |
| | | | | Australia: 0.0% | |
| AUD | 190,000 | | | | | Other Securities | | | 213,998 | | | | 0.0 | | |
Principal
Amount† | |
| |
| | Value | | Percentage
of Net
Assets | |
| | | | | Brazil: 4.7% | |
| BRL | 5,953,000 | | | | | Brazil Notas do
Tesouro
Nacional
Series B,
6.000%,
08/15/16 | | $ | 7,041,825 | | | | 1.7 | | |
| BRL | 705,000 | | | | | Brazil Notas do
Tesouro
Nacional
Series F, 6.000%,
05/15/45 | | | 860,184 | | | | 0.2 | | |
| BRL | 18,816,000 | | | | | Brazil Notas do
Tesouro
Nacional
Series F,
10.000%,
01/01/21 | | | 9,403,425 | | | | 2.2 | | |
| BRL | 1,059,000 | | | | | Federal Republic
of Brazil,
10.125%,
05/15/27 | | | 1,757,940 | | | | 0.4 | | |
| | 770,000 | | | | | Other Securities | | | 864,325 | | | | 0.2 | | |
| | | | | | | | | | 19,927,699 | | | | 4.7 | | |
| | | | | Canada: 0.3% | |
| CAD | 1,390,000 | | | | | Other Securities | | | 1,491,450 | | | | 0.3 | | |
| | | | | Colombia: 0.5% | |
| | 2,058,000 | | | | | Colombia
Government
International
Bond, 4.375%,
07/12/21 | | | 2,222,640 | | | | 0.5 | | |
| | | | | France: 4.2% | |
| EUR | 4,510,000 | | | L | | France
Government
Bond OAT,
3.250%,
10/25/21 | | | 5,876,034 | | | | 1.4 | | |
| EUR | 8,978,000 | | | | | French Treasury
Note BTAN,
2.500%,
07/25/16 | | | 11,903,725 | | | | 2.8 | | |
| | | | | | | | | | 17,779,759 | | | | 4.2 | | |
| | | | | Germany: 1.6% | |
| EUR | 480,000 | | | | | Bundesrepublik
Deutschland,
3.250%,
07/04/42 | | | 737,076 | | | | 0.2 | | |
| EUR | 4,700,000 | | | | | Bundesrepublik
Deutschland,
2.000%,
01/04/22 | | | 6,155,519 | | | | 1.4 | | |
| | | | | | | | | | 6,892,595 | | | | 1.6 | | |
See Accompanying Notes to Financial Statements
108
SUMMARY PORTFOLIO OF INVESTMENTS
ING GLOBAL BOND PORTFOLIO AS OF DECEMBER 31, 2011 (CONTINUED)
Principal
Amount† | |
| |
| | Value | | Percentage
of Net
Assets | |
| | | | | Hungary: 0.1% | |
| | 587,000 | | | | | Other Securities (a) | | $ | 531,235 | | | | 0.1 | | |
| | | | | Indonesia: 0.7% | |
| | 2,805,000 | | | # | | Indonesia
Government
International
Bond, 4.875%,
05/05/21 | | | 3,015,375 | | | | 0.7 | | |
| | 159,000 | | | # | | Republic of
Indonesia,
5.875%,
03/13/20 | | | 180,862 | | | | 0.0 | | |
| | | | | | | | | | 3,196,237 | | | | 0.7 | | |
| | | | | Lithuania: 0.2% | |
| | 983,000 | | | # | | Lithuania
Government
International
Bond, 5.125%,
09/14/17 | | | 965,797 | | | | 0.2 | | |
| | | | | Mexico: 4.1% | |
| MXN | 84,910,000 | | | | | Mex Bonos De
Desarrollo,
10.000%,
11/20/36 | | | 7,554,475 | | | | 1.8 | | |
| MXN | 58,100,000 | | | | | Mexican Bonos,
7.750%,
05/29/31 | | | 4,289,367 | | | | 1.0 | | |
| MXN | 56,000,000 | | | | | Mexican Bonos,
8.500%,
11/18/38 | | | 4,351,288 | | | | 1.0 | | |
| | 808,000 | | | | | Other Securities | | | 1,212,000 | | | | 0.3 | | |
| | | | | | | | | | 17,407,130 | | | | 4.1 | | |
| | | | | New Zealand: 0.3% | |
| NZD | 1,275,000 | | | | | Other Securities | | | 1,095,170 | | | | 0.3 | | |
| | | | | Norway: 0.0% | |
| NOK | 415,000 | | | | | Other Securities | | | 77,143 | | | | 0.0 | | |
| | | | | Panama: 0.5% | |
| | 1,599,000 | | | | | Panama
Government
International
Bond,
5.200%-7.125%,
01/30/20-
01/29/26 | | | 1,961,833 | | | | 0.5 | | |
| | | | | Peru: 1.9% | |
| PEN | 13,200,000 | | | # | | Peruvian
Government
International
Bond, 8.200%,
08/12/26 | | | 5,854,701 | | | | 1.4 | | |
Principal
Amount† | |
| |
| | Value | | Percentage
of Net
Assets | |
| | 1,327,000 | | | | | Peruvian
Government
International
Bond, 7.350%,
07/21/25 | | $ | 1,764,910 | | | | 0.4 | | |
| | 363,000 | | | | | Other Securities | | | 458,287 | | | | 0.1 | | |
| | | | | | | | | | 8,077,898 | | | | 1.9 | | |
| | | | | Philippines: 0.8% | |
| | 3,036,000 | | | | | Philippine
Government
International
Bond, 4.000%,
01/15/21 | | | 3,127,080 | | | | 0.7 | | |
| | 279,000 | | | | | Other Securities | | | 334,451 | | | | 0.1 | | |
| | | | | | | | | | 3,461,531 | | | | 0.8 | | |
| | | | | Poland: 0.2% | |
| | 630,000 | | | | | Other Securities | | | 653,029 | | | | 0.2 | | |
| | | | | Russia: 0.8% | |
| | 2,907,053 | | | # | | Russia
Government
Bond, 7.500%,
03/31/30 | | | 3,383,082 | | | | 0.8 | | |
| | | | | South Africa: 5.4% | |
| ZAR | 142,660,103 | | | | | South Africa
Government
Bond, 7.250%,
01/15/20 | | | 17,017,155 | | | | 4.0 | | |
| ZAR | 16,220,000 | | | | | South Africa
Government
Bond, 10.500%,
12/21/26 | | | 2,352,284 | | | | 0.5 | | |
| ZAR | 16,280,000 | | | | | South Africa
Government
Bond, 6.750%-
8.000%,
12/21/18-
03/31/21 | | | 1,973,546 | | | | 0.5 | | |
| | 1,540,000 | | | | | South Africa
Government
International
Bond, 5.500%,
03/09/20 | | | 1,732,500 | | | | 0.4 | | |
| | | | | | | | | | 23,075,485 | | | | 5.4 | | |
| | | | | South Korea: 0.5% | |
| KRW | 2,458,000,000 | | | | | Korea Treasury
Bond, 5.000%,
06/10/20 | | | 2,330,180 | | | | 0.5 | | |
See Accompanying Notes to Financial Statements
109
SUMMARY PORTFOLIO OF INVESTMENTS
ING GLOBAL BOND PORTFOLIO AS OF DECEMBER 31, 2011 (CONTINUED)
Principal
Amount† | |
| |
| | Value | | Percentage
of Net
Assets | |
| | | | | Turkey: 0.8% | |
| | 2,213,000 | | | | | Turkey
Government
International
Bond, 7.500%,
11/07/19 | | $ | 2,522,820 | | | | 0.6 | | |
| | 867,000 | | | | | Turkey
Government
International
Bond, 5.125%-
7.000%,
03/11/19-
03/25/22 | | | 878,202 | | | | 0.2 | | |
| | | | | | | | | | 3,401,022 | | | | 0.8 | | |
| | | | | Ukraine: 0.2% | |
| | 746,000 | | | # | | Ukraine
Government
International
Bond, 6.250%,
06/17/16 | | | 658,345 | | | | 0.2 | | |
| | | | | United Kingdom: 0.2% | |
| GBP | 555,000 | | | | | Other Securities | | | 1,035,737 | | | | 0.2 | | |
| | | | | Uruguay: 0.5% | |
| | 1,610,000 | | | | | Uruguay
Government
International
Bond, 6.875%-
7.625%,
09/28/25-
03/21/36 | | | 2,171,995 | | | | 0.5 | | |
| | | | | Venezuela: 0.4% | |
| | 970,000 | | | # | | Venezuela
Government
International
Bond, 13.625%,
08/15/18 | | | 914,225 | | | | 0.2 | | |
| | 1,367,800 | | | | | Other Securities | | | 986,298 | | | | 0.2 | | |
| | | | | | | | | | 1,900,523 | | | | 0.4 | | |
| | | | | | | Total Foreign
Government
Bonds
(Cost
$129,181,688) | | | 127,552,826 | | | | 29.8 | | |
| U.S. GOVERNMENT AGENCY OBLIGATIONS: 10.4% | | | | | |
| | | | | Federal Home Loan Mortgage
Corporation: 4.0%## | |
| | 3,285,000 | | | | | 1.125%,
due 07/27/12 | | | 3,302,200 | | | | 0.8 | | |
| | 1,937,328 | | | | | 4.500%,
due 02/01/41 | | | 2,091,680 | | | | 0.5 | | |
| | 1,500,000 | | | | | 5.000%,
due 02/16/17 | | | 1,773,369 | | | | 0.4 | | |
Principal
Amount† | |
| |
| | Value | | Percentage
of Net
Assets | |
| | 18,430,796 | | | ^,W | | 0.728%-23.730%,
due 05/15/17-
10/15/40 | | $ | 9,760,366 | | | | 2.3 | | |
| | 8,216 | | | | | Other Securities | | | 8,219 | | | | 0.0 | | |
| | | | | | | | | | 16,935,834 | | | | 4.0 | | |
| | | | | Federal National Mortgage
Association: 5.7%## | |
| | 3,030,000 | | | | | 1.125%,
due 07/30/12 | | | 3,046,710 | | | | 0.7 | | |
| | 2,020,485 | | | | | 5.000%,
due 07/25/40 | | | 2,153,780 | | | | 0.5 | | |
| | 2,000,000 | | | | | 5.375%,
due 06/12/17 | | | 2,420,540 | | | | 0.6 | | |
| | 1,628,787 | | | | | 6.500%,
due 09/01/36 | | | 1,829,644 | | | | 0.4 | | |
| | 31,175,426 | | | ^,W | | 0.694%-26.868%,
due 09/01/14-
02/25/44 | | | 14,624,694 | | | | 3.4 | | |
| | 2,475,417 | | | | | Other Securities (c) | | | 421,172 | | | | 0.1 | | |
| | | | | | | | | | 24,496,540 | | | | 5.7 | | |
| | | | | Government National Mortgage
Association: 0.7% | |
| | 6,976,645 | | | ^ | | 4.000%-8.000%,
due 01/16/30-
07/20/39 | | | 3,228,072 | | | | 0.7 | | |
| | | | | | | Total U.S.
Government
Agency
Obligations
(Cost
$41,793,569) | | | 44,660,446 | | | | 10.4 | | |
Shares | |
| |
| | Value | | Percentage
of Net
Assets | |
| COMMON STOCK: 0.3% | | | | | |
| | | | | Canada: 0.0% | |
| | 182 | | | | | Other Securities | | $ | 2,648 | | | | 0.0 | | |
| | | | | United States: 0.3% | |
| | 58,056 | | | | | Other Securities (a) | | | 1,442,768 | | | | 0.3 | | |
| | | | | | | Total Common
Stock
(Cost
$1,691,642) | | | 1,445,416 | | | | 0.3 | | |
| WARRANTS: —% | | | | | |
| | | | | Consumer Discretionary: —% | |
| | 2,406 | | | | | Other Securities | | | — | | | | — | | |
| | | | | | | Total Warrants
(Cost $—) | | | — | | | | — | | |
See Accompanying Notes to Financial Statements
110
SUMMARY PORTFOLIO OF INVESTMENTS
ING GLOBAL BOND PORTFOLIO AS OF DECEMBER 31, 2011 (CONTINUED)
# of
Contracts | |
| |
| | Value | | Percentage
of Net
Assets | |
| PURCHASED OPTIONS: 0.3% | | | |
| | | | | Options on Currencies: 0.3% | |
| | 10,700,000 | | | @ | | EUR Put vs. USD
Call Currency
Option,
Strike @ 1.310,
Exp. 01/31/12
Counterparty:
Deutsche
Bank AG | | $ | 237,138 | | | | 0.1 | | |
| | 17,100,000 | | | @ | | EUR Put vs. USD
Call Currency
Option,
Strike @ 1.300,
Exp. 01/16/12
Counterparty:
Deutsche
Bank AG | | | 224,368 | | | | 0.0 | | |
| | 26,900,000 | | | @ | | EUR Put vs. USD
Call Currency
Option,
Strike @ 1.300,
Exp. 01/16/12
Counterparty:
Deutsche
Bank AG | | | 352,953 | | | | 0.1 | | |
| | 21,500,000 | | | @ | | JPY Put vs. USD
Call Currency
Option,
Strike @ 79.800,
Exp. 06/01/12
Counterparty:
Deutsche
Bank AG | | | 251,332 | | | | 0.1 | | |
| | | | | | | | | | 1,065,791 | | | | 0.3 | | |
| | | | | | | Total Purchased
Options
(Cost
$1,150,797) | | | 1,065,791 | | | | 0.3 | | |
| | | | | | | Total Long-Term
Investments
(Cost
$399,720,743) | | | 397,026,353 | | | | 92.8 | | |
Principal
Amount† | |
| |
| | Value | | Percentage
of Net
Assets | |
| SHORT-TERM INVESTMENTS: 11.2% | |
| | | | | Securities Lending Collateralcc(1): 6.3% | |
| | 6,373,139 | | | | | | | BNP Paribas Bank,
Repurchase
Agreement
dated 12/30/11,
0.06%,
due 01/03/12
(Repurchase
Amount
$6,373,181,
collateralized
by various U.S.
Government
Agency
Obligations,
5.000%-6.000%,
Market Value
plus accrued
interest
$6,500,602,
due 05/15/24-
04/15/41) | | $ | 6,373,139 | | | | 1.5 | | |
| | 6,373,139 | | | | | | | Cantor Fitzgerald,
Repurchase
Agreement
dated 12/30/11,
0.12%,
due 01/03/12
(Repurchase
Amount
$6,373,223,
collateralized
by various U.S.
Government
Agency
Obligations,
1.437%-6.014%,
Market Value
plus accrued
interest
$6,500,602,
due 06/01/17-
09/01/44) | | | 6,373,139 | | | | 1.5 | | |
See Accompanying Notes to Financial Statements
111
SUMMARY PORTFOLIO OF INVESTMENTS
ING GLOBAL BOND PORTFOLIO AS OF DECEMBER 31, 2011 (CONTINUED)
Principal
Amount† | |
| |
| | Value | | Percentage
of Net
Assets | |
| | | | | Securities Lending
Collateralcc(1) (continued) | |
| | 6,373,139 | | | | | | | Citigroup, Inc.,
Repurchase
Agreement
dated 12/30/11,
0.08%,
due 01/03/12
(Repurchase
Amount
$6,373,195,
collateralized
by various U.S.
Government
and U.S.
Government
Agency
Obligations,
0.000%-5.500%,
Market Value
plus accrued
interest
$6,500,602,
due 01/19/12-
12/20/41) | | $ | 6,373,139 | | | | 1.5 | | |
| | 1,341,716 | | | | | | | Deutsche
Bank AG,
Repurchase
Agreement
dated 12/30/11,
0.10%,
due 01/03/12
(Repurchase
Amount
$1,341,731,
collateralized
by various U.S.
Government
and U.S.
Government
Agency
Obligations,
0.000%-6.500%,
Market Value
plus accrued
interest
$1,368,550,
due 06/28/12-
11/01/41) | | | 1,341,716 | | | | 0.3 | | |
Principal
Amount† | |
| |
| | Value | | Percentage
of Net
Assets | |
| | 6,373,139 | | | | | | | Merrill Lynch &
Co., Inc.,
Repurchase
Agreement
dated 12/30/11,
0.02%,
due 01/03/12
(Repurchase
Amount
$6,373,153,
collateralized
by various U.S.
Government
Securities,
1.875%-4.000%,
Market Value
plus accrued
interest
$6,500,611,
due 02/15/15-
06/30/15) | | $ | 6,373,139 | | | | 1.5 | | |
| | | | | | | | 26,834,272 | | | | 6.3 | | |
| | | | | Foreign Government Bonds: 0.8% | |
| KRW | 1,046,000,000 | | | | | | | Korea Monetary
Stabilization
Bond, 3.280%,
10/02/12 | | | 907,186 | | | | 0.2 | | |
| KRW | 2,784,000,000 | | | | | | | Korea Monetary
Stabilization
Bond, 3.810%,
08/02/12 | | | 2,422,252 | | | | 0.6 | | |
| | | | | | | | 3,329,438 | | | | 0.8 | | |
| Shares | |
| |
| | Value | | Percentage
of Net
Assets | |
| | | | | Mutual Funds: 4.1% | |
| | 17,645,000 | | | | | | | BlackRock
Liquidity Funds,
TempFund,
Institutional
Class
(Cost
$17,645,000) | | $ | 17,645,000 | | | | 4.1 | | |
| | | | | | | | | Total Short-Term
Investments
(Cost
$47,919,938) | | | 47,808,710 | | | | 11.2 | | |
| | | | | | | | | Total Investments
in Securities
(Cost
$447,640,681) | | $ | 444,835,063 | | | | 104.0 | | |
| | | | | | | | | Liabilities in
Excess of Other
Assets | | | (16,956,230 | ) | | | (4.0 | ) | |
| | | | | | | Net Assets | | $ | 427,878,833 | | | | 100.0 | | |
"Other Securities" represents issues not identified as the top 50 holdings in terms of market value and issues or issuers not exceeding 1% of net assets individually or in aggregate respectively as of December 31, 2011.
See Accompanying Notes to Financial Statements
112
SUMMARY PORTFOLIO OF INVESTMENTS
ING GLOBAL BOND PORTFOLIO AS OF DECEMBER 31, 2011 (CONTINUED)
The following footnotes apply to either the individual securities noted or one or more of the securities aggregated and listed as a single line item.
† Unless otherwise indicated, principal amount is shown in USD.
# Securities with purchases pursuant to Rule 144A or section 4(2), under the Securities Act of 1933 and may not be resold subject to that rule except to qualified institutional buyers.
## On September 7, 2008, the Federal Housing Finance Agency placed the Federal National Mortgage Association and the Federal Home Loan Mortgage Corporation into conservatorship and the U.S. Treasury guaranteed the debt issued by those organizations.
@ Non-income producing security
& Payment-in-kind
+ Step-up basis bonds. Interest rates shown reflect current and next coupon rates.
cc Securities purchased with cash collateral for securities loaned.
W Settlement is on a when-issued or delayed-delivery basis.
L Loaned security, a portion or all of the security is on loan at December 31, 2011.
^ Interest only securities represent the right to receive the monthly interest payments on an underlying pool of mortgage loans. Principal amount shown represents the notional amount on which current interest is calculated. Payments of principal on the pool reduce the value of the interest only security.
(1) Collateral received from brokers for securities lending was invested into these short-term investments.
(a) This grouping contains loaned securities.
(b) The grouping contains securities in default.
(c) The grouping contains Interest only securities.
AUD Australian Dollar
BRL Brazilian Real
CAD Canadian Dollar
EUR EU Euro
GBP British Pound
KRW South Korean Won
MXN Mexican Peso
NOK Norwegian Krone
NZD New Zealand Dollar
PEN Peruvian Nuevo Sol
PHP Philippine Peso
RUB Russian Ruble
ZAR South African Rand
Cost for federal income tax purposes is $447,783,505.
| Net unrealized depreciation consists of: | |
| Gross Unrealized Appreciation | | $ | 10,622,030 | | |
| Gross Unrealized Depreciation | | | (13,570,472 | ) | |
| Net Unrealized Depreciation | | $ | (2,948,442 | ) | |
| Sector Diversification | | Percentage of
Net Assets | |
| Automobile Asset-Backed Securities | | | 0.0 | % | |
| Collateralized Mortgage Obligations | | | 9.3 | | |
| Consumer Discretionary | | | 5.2 | | |
| Consumer Staples | | | 1.6 | | |
| Energy | | | 4.8 | | |
| Federal Home Loan Mortgage Corporation | | | 4.0 | | |
| Federal National Mortgage Association | | | 5.7 | | |
| Financials | | | 10.2 | | |
| Foreign Government Bonds | | | 30.6 | | |
| Government National Mortgage Association | | | 0.7 | | |
| Health Care | | | 1.6 | | |
| Industrials | | | 1.3 | | |
| Information Technology | | | 1.1 | | |
| Materials | | | 1.7 | | |
| Options on Currencies | | | 0.3 | | |
| Structured Products | | | 0.6 | | |
| Telecommunications | | | 2.2 | | |
| U.S. Treasury Bonds | | | 1.1 | | |
| U.S. Treasury Notes | | | 9.6 | | |
| Utilities | | | 2.0 | | |
| Short-Term Investments | | | 10.4 | | |
| Liabilities in Excess of Other Assets | | | (4.0 | ) | |
| Net Assets | | | 100.0 | % | |
Fair Value Measurements^
The following is a summary of the fair valuations according to the inputs used as of December 31, 2011 in valuing the assets and liabilities:
| | | Quoted Prices
in Active Markets
for Identical Investments
(Level 1) | | Significant Other
Observable
Inputs
(Level 2) | | Significant
Unobservable
Inputs
(Level 3) | | Fair Value
at
12/31/11 | |
| Asset Table | |
| Investments, at value | |
| Common Stock | |
| Canada | | $ | 2,648 | | | $ | — | | | $ | — | | | $ | 2,648 | | |
| United States | | | 753,440 | | | | — | | | | 689,328 | | | | 1,442,768 | | |
| Total Common Stock | | | 756,088 | | | | — | | | | 689,328 | | | | 1,445,416 | | |
| Warrants | | | — | | | | — | | | | — | | | | — | | |
| Purchased Options | | | — | | | | 1,065,791 | | | | — | | | | 1,065,791 | | |
| Corporate Bonds/Notes | | | — | | | | 119,524,301 | | | | 14,777,506 | | | | 134,301,807 | | |
| Collateralized Mortgage Obligations | | | — | | | | 39,642,039 | | | | 101,773 | | | | 39,743,812 | | |
| Structured Products | | | — | | | | — | | | | 2,443,831 | | | | 2,443,831 | | |
| Short-Term Investments | | | 17,645,000 | | | | 30,163,710 | | | | — | | | | 47,808,710 | | |
| U.S. Treasury Obligations | | | — | | | | 45,591,210 | | | | — | | | | 45,591,210 | | |
| Foreign Government Bonds | | | — | | | | 127,552,826 | | | | — | | | | 127,552,826 | | |
| Asset-Backed Securities | | | — | | | | 221,214 | | | | — | | | | 221,214 | | |
| U.S. Government Agency Obligations | | | — | | | | 44,660,446 | | | | — | | | | 44,660,446 | | |
| Total Investments, at value | | $ | 18,401,088 | | | $ | 408,421,537 | | | $ | 18,012,438 | | | $ | 444,835,063 | | |
See Accompanying Notes to Financial Statements
113
SUMMARY PORTFOLIO OF INVESTMENTS
ING GLOBAL BOND PORTFOLIO AS OF DECEMBER 31, 2011 (CONTINUED)
| | | Quoted Prices
in Active Markets
for Identical Investments
(Level 1) | | Significant Other
Observable
Inputs
(Level 2) | | Significant
Unobservable
Inputs
(Level 3) | | Fair Value
at
12/31/11 | |
| Other Financial Instruments+ | |
| Swaps | | $ | 354,067 | | | $ | 1,692,256 | | | $ | — | | | $ | 2,046,323 | | |
| Futures | | | 1,919,762 | | | | — | | | | — | | | | 1,919,762 | | |
| Forward Foreign Currency Contracts | | | — | | | | 4,529,350 | | | | — | | | | 4,529,350 | | |
| Total Assets | | $ | 20,674,917 | | | $ | 414,643,143 | | | $ | 18,012,438 | | | $ | 453,330,498 | | |
| Liabilities Table | |
| Other Financial Instruments+ | |
| Swaps | | $ | — | | | $ | (5,871,407 | ) | | $ | — | | | $ | (5,871,407 | ) | |
| Futures | | | (1,150,510 | ) | | | — | | | | — | | | | (1,150,510 | ) | |
| Written Options | | | — | | | | (371,097 | ) | | | — | | | | (371,097 | ) | |
| Forward Foreign Currency Contracts | | | — | | | | (5,679,249 | ) | | | — | | | | (5,679,249 | ) | |
| Total Liabilities | | $ | (1,150,510 | ) | | $ | (11,921,753 | ) | | $ | — | | | $ | (13,072,263 | ) | |
The following is a reconciliation of the fair valuations using significant unobservable inputs (Level 3) for the Portfolio's assets and liabilities during the period ended December 31, 2011:
| | | Beginning
Balance
12/31/10 | | Purchases | | Sales | | Accrued
Discounts/
(Premiums) | | Total
Realized
Gain/(Loss) | | Total
Unrealized
Appreciation/
(Depreciation) | | Transfers
Into
Level 3 | | Transfers
Out of
Level 3 | | Ending
Balance
12/31/11 | |
| Asset Table | |
| Investments, at value | |
| Common Stock | | $ | 746,182 | | | $ | 1,236,380 | | | $ | (1,278,378 | ) | | $ | — | | | $ | 526,459 | | | $ | (541,315 | ) | | $ | — | | | $ | — | | | $ | 689,328 | | |
| Preferred Stock | | | 623,500 | | | | — | | | | (554,625 | ) | | | — | | | | (170,375 | ) | | | 101,500 | | | | — | | | | — | | | | — | | |
| Warrants | | | 167,500 | | | | — | | | | — | | | | — | | | | — | | | | — | | | | — | | | | (167,500 | ) | | | — | | |
Corporate
Bonds/Notes | | | 619,259 | | | | 15,924,655 | | | | (96,342 | ) | | | (11,880 | ) | | | (752,974 | ) | | | (737,212 | ) | | | — | | | | (168,000 | ) | | | 14,777,506 | | |
Collateralized
Mortgage
Obligations | | | 67,346 | | | | — | | | | (16,918 | ) | | | 1,570 | | | | 4,136 | | | | 45,639 | | | | — | | | | — | | | | 101,773 | | |
Foreign Government
Bonds | | | 11,787,374 | | | | — | | | | (4,690,231 | ) | | | (15,260 | ) | | | 681,521 | | | | (678,592 | ) | | | — | | | | (7,084,812 | ) | | | — | | |
| Structured Products | | | 5,224,285 | | | | — | | | | (2,615,921 | ) | | | (292,925 | ) | | | (1,594,010 | ) | | | 1,722,402 | | | | — | | | | — | | | | 2,443,831 | | |
Short-Term
Investments | | | 348,512 | | | | — | | | | (348,512 | ) | | | — | | | | (87,128 | ) | | | 87,128 | | | | — | | | | — | | | | — | | |
Total Investments,
at value | | $ | 19,583,958 | | | $ | 17,161,035 | | | $ | (9,600,927 | ) | | $ | (318,495 | ) | | $ | (1,392,371 | ) | | $ | (450 | ) | | $ | — | | | $ | (7,420,312 | ) | | $ | 18,012,438 | | |
| Other Financial Instruments+: | |
| Swaps | | | 392,588 | | | | — | | | | (380,897 | ) | | | 7,585 | | | | 380,897 | | | | (400,173 | ) | | | — | | | | — | | | | — | | |
| Total Assets | | $ | 19,976,546 | | | $ | 17,161,035 | | | $ | (9,981,824 | ) | | $ | (310,910 | ) | | $ | (1,011,474 | ) | | $ | (400,623 | ) | | $ | — | | | $ | (7,420,312 | ) | | $ | 18,012,438 | | |
| Liabilities Table | |
| Other Financial Instruments+: | |
| Swaps, at value | | $ | (209,794 | ) | | $ | — | | | $ | 61,236 | | | $ | (73 | ) | | $ | (61,236 | ) | | $ | 209,867 | | | $ | — | | | $ | — | | | $ | — | | |
| Total Liabilities | | $ | (209,794 | ) | | $ | — | | | $ | 61,236 | | | $ | (73 | ) | | $ | (61,236 | ) | | $ | 209,867 | | | $ | — | | | $ | — | | | $ | — | | |
As of December 31, 2011, total change in unrealized gain (loss) on Level 3 securities still held at period end and included in the change in net assets was $ (2,027,107).
^ See Note 2, "Significant Accounting Policies" in the Notes to Financial Statements for additional information.
+ Other Financial Instruments are derivatives not reflected in the Portfolio of Investments and may include open forward foreign currency contracts, equity forwards, futures, swaps, and written options. Forward foreign currency contracts, equity forwards and futures are valued at the unrealized gain (loss) on the instrument. Swaps and written options are valued at the fair value of the instrument.
There were no significant transfers between Level 1 and 2 during the year ended December 31, 2011.
Transfers in or out of Level 3 represent either the beginning value (for transfers in), or the ending value (for transfers out) of any security or derivative instrument where a change in the pricing level occurred from the beginning to the end of the period. Transfers are recognized at the end of the reporting period.
See Accompanying Notes to Financial Statements
114
SUMMARY PORTFOLIO OF INVESTMENTS
ING GLOBAL BOND PORTFOLIO AS OF DECEMBER 31, 2011 (CONTINUED)
At December 31, 2011 , the following forward foreign currency contracts were outstanding for the ING Global Bond Portfolio:
| Counterparty | | Currency | | Contract
Amount | | Buy/Sell | | Settlement
Date | | In Exchange
For | | Fair
Value | | Unrealized
Appreciation
(Depreciation) | |
| Barclays Bank PLC | | South African Rand | | | 43,618,968 | | | Buy | | 01/27/12 | | $ | 5,420,000 | | | $ | 5,377,334 | | | $ | (42,666 | ) | |
| Citigroup, Inc. | | Swiss Franc | | | 2,381,687 | | | Buy | | 01/13/12 | | | 2,555,036 | | | | 2,536,195 | | | | (18,841 | ) | |
| Citigroup, Inc. | | EU Euro | | | 3,278,135 | | | Buy | | 01/27/12 | | | 4,333,000 | | | | 4,243,508 | | | | (89,492 | ) | |
| Citigroup, Inc. | | EU Euro | | | 3,292,683 | | | Buy | | 01/27/12 | | | 4,316,000 | | | | 4,262,340 | | | | (53,660 | ) | |
| Citigroup, Inc. | | Polish Zloty | | | 24,540,401 | | | Buy | | 01/27/12 | | | 7,144,095 | | | | 7,092,741 | | | | (51,354 | ) | |
| Citigroup, Inc. | | Canadian Dollar | | | 6,570,036 | | | Buy | | 01/27/12 | | | 6,440,000 | | | | 6,445,073 | | | | 5,073 | | |
| Citigroup, Inc. | | Canadian Dollar | | | 11,576,470 | | | Buy | | 01/27/12 | | | 11,208,951 | | | | 11,356,284 | | | | 147,333 | | |
| Citigroup, Inc. | | Japanese Yen | | | 3,852,835,556 | | | Buy | | 01/27/12 | | | 49,495,143 | | | | 50,077,292 | | | | 582,149 | | |
| Credit Suisse First Boston | | Singapore Dollar | | | 9,096,579 | | | Buy | | 01/13/12 | | | 7,000,319 | | | | 7,012,978 | | | | 12,659 | | |
| Credit Suisse First Boston | | Japanese Yen | | | 830,140,809 | | | Buy | | 01/27/12 | | | 10,739,000 | | | | 10,789,768 | | | | 50,768 | | |
| Deutsche Bank AG | | British Pound | | | 1,783,958 | | | Buy | | 01/13/12 | | | 2,792,000 | | | | 2,770,130 | | | | (21,870 | ) | |
| Deutsche Bank AG | | Chilean Peso | | | 3,724,551,600 | | | Buy | | 01/13/12 | | | 7,219,522 | | | | 7,155,087 | | | | (64,435 | ) | |
| Deutsche Bank AG | | British Pound | | | 1,664,174 | | | Buy | | 01/13/12 | | | 2,597,613 | | | | 2,584,130 | | | | (13,483 | ) | |
| Deutsche Bank AG | | EU Euro | | | 2,494,538 | | | Buy | | 01/27/12 | | | 3,254,000 | | | | 3,229,150 | | | | (24,850 | ) | |
| Deutsche Bank AG | | Australian Dollar | | | 1,082,434 | | | Buy | | 01/13/12 | | | 1,098,000 | | | | 1,105,322 | | | | 7,322 | | |
| Deutsche Bank AG | | EU Euro | | | 1,730,846 | | | Buy | | 01/27/12 | | | 2,260,000 | | | | 2,240,560 | | | | (19,440 | ) | |
| Deutsche Bank AG | | Norwegian Krone | | | 5,100,569 | | | Buy | | 01/27/12 | | | 861,000 | | | | 852,016 | | | | (8,984 | ) | |
| Deutsche Bank AG | | EU Euro | | | 3,300,996 | | | Buy | | 01/27/12 | | | 4,316,000 | | | | 4,273,101 | | | | (42,899 | ) | |
| Deutsche Bank AG | | EU Euro | | | 3,268,654 | | | Buy | | 01/27/12 | | | 4,333,000 | | | | 4,231,235 | | | | (101,765 | ) | |
| Deutsche Bank AG | | Israeli New Shekel | | | 15,983,004 | | | Buy | | 01/27/12 | | | 4,236,153 | | | | 4,191,241 | | | | (44,912 | ) | |
| Deutsche Bank AG | | Japanese Yen | | | 118,060,677 | | | Buy | | 01/27/12 | | | 1,517,000 | | | | 1,534,496 | | | | 17,496 | | |
| Deutsche Bank AG | | Swedish Krona | | | 12,718,263 | | | Buy | | 01/27/12 | | | 1,854,850 | | | | 1,845,312 | | | | (9,538 | ) | |
| Deutsche Bank AG | | EU Euro | | | 6,491,697 | | | Buy | | 01/27/12 | | | 8,689,000 | | | | 8,403,426 | | | | (285,574 | ) | |
| Deutsche Bank AG | | Japanese Yen | | | 102,537,263 | | | Buy | | 01/27/12 | | | 1,323,000 | | | | 1,332,730 | | | | 9,730 | | |
| Deutsche Bank AG | | Japanese Yen | | | 317,398,403 | | | Buy | | 01/27/12 | | | 4,089,000 | | | | 4,125,391 | | | | 36,391 | | |
| Deutsche Bank AG | | Mexican Peso | | | 69,257,171 | | | Buy | | 01/27/12 | | | 5,101,667 | | | | 4,950,869 | | | | (150,798 | ) | |
| Deutsche Bank AG | | EU Euro | | | 369,657 | | | Buy | | 01/27/12 | | | 493,000 | | | | 478,517 | | | | (14,483 | ) | |
| Deutsche Bank AG | | Turkish Lira | | | 9,221,664 | | | Buy | | 01/27/12 | | | 4,906,784 | | | | 4,837,021 | | | | (69,763 | ) | |
| HSBC | | British Pound | | | 1,653,912 | | | Buy | | 01/13/12 | | | 2,593,000 | | | | 2,568,194 | | | | (24,806 | ) | |
| HSBC | | Brazilian Real | | | 9,074,509 | | | Buy | | 01/13/12 | | | 4,947,933 | | | | 4,848,774 | | | | (99,159 | ) | |
| HSBC | | South African Rand | | | 52,988,097 | | | Buy | | 01/27/12 | | | 6,437,000 | | | | 6,532,358 | | | | 95,358 | | |
| HSBC | | South African Rand | | | 17,667,589 | | | Buy | | 01/27/12 | | | 2,146,000 | | | | 2,178,056 | | | | 32,056 | | |
| HSBC | | Malaysian Ringgit | | | 28,118,169 | | | Buy | | 01/27/12 | | | 8,843,026 | | | | 8,852,496 | | | | 9,470 | | |
| HSBC | | EU Euro | | | 7,926,846 | | | Buy | | 01/27/12 | | | 10,705,000 | | | | 10,261,210 | | | | (443,790 | ) | |
| HSBC | | Chinese Yuan | | | 46,078,200 | | | Buy | | 03/02/12 | | | 7,245,000 | | | | 7,313,241 | | | | 68,241 | | |
| JPMorgan Chase & Co. | | Canadian Dollar | | | 662,713 | | | Buy | | 01/27/12 | | | 649,000 | | | | 650,108 | | | | 1,108 | | |
| JPMorgan Chase & Co. | | EU Euro | | | 6,074,127 | | | Buy | | 01/27/12 | | | 7,945,000 | | | | 7,862,886 | | | | (82,114 | ) | |
| JPMorgan Chase & Co. | | Japanese Yen | | | 245,887,707 | | | Buy | | 01/27/12 | | | 3,170,000 | | | | 3,195,929 | | | | 25,929 | | |
| JPMorgan Chase & Co. | | Canadian Dollar | | | 2,001,024 | | | Buy | | 01/27/12 | | | 1,961,000 | | | | 1,962,964 | | | | 1,964 | | |
| JPMorgan Chase & Co. | | Canadian Dollar | | | 2,452,416 | | | Buy | | 01/27/12 | | | 2,414,000 | | | | 2,405,771 | | | | (8,229 | ) | |
| JPMorgan Chase & Co. | | Mexican Peso | | | 108,775,364 | | | Buy | | 01/27/12 | | | 7,711,683 | | | | 7,775,839 | | | | 64,156 | | |
| JPMorgan Chase & Co. | | New Zealand Dollar | | | 939,176 | | | Buy | | 01/13/12 | | | 708,000 | | | | 730,342 | | | | 22,342 | | |
| Morgan Stanley | | Indian Rupee | | | 511,751,567 | | | Buy | | 01/13/12 | | | 9,588,750 | | | | 9,608,869 | | | | 20,119 | | |
| Morgan Stanley | | South Korean Won | | | 9,354,153,150 | | | Buy | | 01/13/12 | | | 8,060,451 | | | | 8,111,847 | | | | 51,396 | | |
| Morgan Stanley | | Australian Dollar | | | 4,409,151 | | | Buy | | 01/13/12 | | | 4,380,792 | | | | 4,502,384 | | | | 121,592 | | |
| Morgan Stanley | | Indonesian Rupiah | | | 69,883,802,205 | | | Buy | | 01/27/12 | | | 7,654,305 | | | | 7,684,912 | | | | 30,607 | | |
| Morgan Stanley | | Norwegian Krone | | | 68,629,907 | | | Buy | | 01/27/12 | | | 11,766,388 | | | | 11,464,161 | | | | (302,227 | ) | |
| Morgan Stanley | | Russian Ruble | | | 219,033,185 | | | Buy | | 01/27/12 | | | 6,878,967 | | | | 6,774,650 | | | | (104,317 | ) | |
| Morgan Stanley | | EU Euro | | | 36,384,465 | | | Buy | | 01/27/12 | | | 48,450,281 | | | | 47,099,265 | | | | (1,351,016 | ) | |
| | | | | | | | | | | | | | | $ | (2,131,206 | ) | |
| Barclays Bank PLC | | Norwegian Krone | | | 4,730,972 | | | Sell | | 01/27/12 | | | 787,000 | | | | 790,277 | | | | (3,277 | ) | |
| Barclays Bank PLC | | Mexican Peso | | | 69,968,242 | | | Sell | | 01/27/12 | | | 5,105,000 | | | | 5,001,701 | | | | 103,299 | | |
| Citigroup, Inc. | | Australian Dollar | | | 11,073,014 | | | Sell | | 01/13/12 | | | 10,975,970 | | | | 11,307,155 | | | | (331,185 | ) | |
| Citigroup, Inc. | | Japanese Yen | | | 123,213,304 | | | Sell | | 01/27/12 | | | 1,585,000 | | | | 1,601,467 | | | | (16,467 | ) | |
| Citigroup, Inc. | | Czech Koruna | | | 128,382,582 | | | Sell | | 01/27/12 | | | 6,738,263 | | | | 6,499,287 | | | | 238,976 | | |
| Citigroup, Inc. | | EU Euro | | | 5,093,995 | | | Sell | | 01/27/12 | | | 6,794,035 | | | | 6,594,118 | | | | 199,917 | | |
| Credit Suisse First Boston | | British Pound | | | 5,445,594 | | | Sell | | 01/13/12 | | | 8,453,000 | | | | 8,455,918 | | | | (2,918 | ) | |
| Credit Suisse First Boston | | EU Euro | | | 13,830,602 | | | Sell | | 01/27/12 | | | 18,628,342 | | | | 17,903,554 | | | | 724,788 | | |
| Credit Suisse First Boston | | Mexican Peso | | | 67,000,000 | | | Sell | | 01/27/12 | | | 4,903,684 | | | | 4,789,515 | | | | 114,169 | | |
| Deutsche Bank AG | | New Zealand Dollar | | | 5,683,142 | | | Sell | | 01/13/12 | | | 4,316,000 | | | | 4,419,444 | | | | (103,444 | ) | |
| Deutsche Bank AG | | Australian Dollar | | | 4,317,788 | | | Sell | | 01/13/12 | | | 4,333,000 | | | | 4,409,089 | | | | (76,089 | ) | |
| Deutsche Bank AG | | Hungarian Forint | | | 363,648,690 | | | Sell | | 01/13/12 | | | 1,574,630 | | | | 1,491,832 | | | | 82,798 | | |
| Deutsche Bank AG | | British Pound | | | 995,036 | | | Sell | | 01/13/12 | | | 1,551,000 | | | | 1,545,091 | | | | 5,909 | | |
| Deutsche Bank AG | | Norwegian Krone | | | 22,276,894 | | | Sell | | 01/27/12 | | | 3,724,000 | | | | 3,721,204 | | | | 2,796 | | |
| Deutsche Bank AG | | EU Euro | | | 1,819,772 | | | Sell | | 01/27/12 | | | 2,428,000 | | | | 2,355,674 | | | | 72,326 | | |
| Deutsche Bank AG | | EU Euro | | | 7,956,698 | | | Sell | | 01/27/12 | | | 10,734,000 | | | | 10,299,853 | | | | 434,147 | | |
See Accompanying Notes to Financial Statements
115
SUMMARY PORTFOLIO OF INVESTMENTS
ING GLOBAL BOND PORTFOLIO AS OF DECEMBER 31, 2011 (CONTINUED)
| Counterparty | | Currency | | Contract
Amount | | Buy/Sell | | Settlement
Date | | In Exchange
For | | Fair
Value | | Unrealized
Appreciation
(Depreciation) | |
| Deutsche Bank AG | | Japanese Yen | | | 175,688,421 | | | Sell | | 01/27/12 | | $ | 2,271,000 | | | $ | 2,283,513 | | | $ | (12,513 | ) | |
| Deutsche Bank AG | | EU Euro | | | 1,268,185 | | | Sell | | 01/27/12 | | | 1,704,000 | | | | 1,641,650 | | | | 62,350 | | |
| Deutsche Bank AG | | EU Euro | | | 1,275,744 | | | Sell | | 01/27/12 | | | 1,701,000 | | | | 1,651,435 | | | | 49,565 | | |
| HSBC | | South Korean Won | | | 5,065,267,770 | | | Sell | | 01/13/12 | | | 4,293,000 | | | | 4,392,560 | | | | (99,560 | ) | |
| HSBC | | British Pound | | | 475,196 | | | Sell | | 01/13/12 | | | 737,000 | | | | 737,884 | | | | (884 | ) | |
| HSBC | | Indian Rupee | | | 187,892,520 | | | Sell | | 01/13/12 | | | 3,496,000 | | | | 3,527,951 | | | | (31,951 | ) | |
| HSBC | | Brazilian Real | | | 16,581,588 | | | Sell | | 01/13/12 | | | 9,021,538 | | | | 8,860,024 | | | | 161,514 | | |
| HSBC | | Norwegian Krone | | | 23,667,768 | | | Sell | | 01/27/12 | | | 3,979,000 | | | | 3,953,540 | | | | 25,460 | | |
| HSBC | | South African Rand | | | 26,289,045 | | | Sell | | 01/27/12 | | | 3,151,000 | | | | 3,240,906 | | | | (89,906 | ) | |
| HSBC | | Colombian Peso | | | 13,202,782,565 | | | Sell | | 01/27/12 | | | 6,824,202 | | | | 6,841,009 | | | | (16,807 | ) | |
| HSBC | | Peruvian Nuevo Sol | | | 1,531,939 | | | Sell | | 01/27/12 | | | 565,395 | | | | 566,722 | | | | (1,327 | ) | |
| HSBC | | South African Rand | | | 162,292,776 | | | Sell | | 01/27/12 | | | 19,223,308 | | | | 20,007,409 | | | | (784,101 | ) | |
| JPMorgan Chase & Co. | | New Zealand Dollar | | | 1,845,774 | | | Sell | | 01/13/12 | | | 1,425,000 | | | | 1,435,349 | | | | (10,349 | ) | |
| JPMorgan Chase & Co. | | New Zealand Dollar | | | 1,680,346 | | | Sell | | 01/13/12 | | | 1,267,813 | | | | 1,306,706 | | | | (38,893 | ) | |
| JPMorgan Chase & Co. | | Mexican Peso | | | 63,583,250 | | | Sell | | 01/27/12 | | | 4,641,351 | | | | 4,545,267 | | | | 96,084 | | |
| JPMorgan Chase & Co. | | Turkish Lira | | | 7,943,950 | | | Sell | | 01/27/12 | | | 4,258,000 | | | | 4,166,825 | | | | 91,175 | | |
| JPMorgan Chase & Co. | | South African Rand | | | 35,493,293 | | | Sell | | 01/27/12 | | | 4,301,000 | | | | 4,375,603 | | | | (74,603 | ) | |
| JPMorgan Chase & Co. | | EU Euro | | | 795,305 | | | Sell | | 01/27/12 | | | 1,072,000 | | | | 1,029,513 | | | | 42,487 | | |
| JPMorgan Chase & Co. | | Canadian Dollar | | | 3,173,183 | | | Sell | | 01/27/12 | | | 3,064,000 | | | | 3,112,828 | | | | (48,828 | ) | |
| JPMorgan Chase & Co. | | Japanese Yen | | | 215,646,162 | | | Sell | | 01/27/12 | | | 2,770,000 | | | | 2,802,865 | | | | (32,865 | ) | |
| JPMorgan Chase & Co. | | EU Euro | | | 8,038,519 | | | Sell | | 01/27/12 | | | 10,705,000 | | | | 10,405,769 | | | | 299,231 | | |
| Morgan Stanley | | Taiwan New Dollar | | | 215,467,784 | | | Sell | | 01/13/12 | | | 7,103,880 | | | | 7,118,169 | | | | (14,289 | ) | |
| Morgan Stanley | | Australian Dollar | | | 8,718,057 | | | Sell | | 01/13/12 | | | 8,564,000 | | | | 8,902,402 | | | | (338,402 | ) | |
| Morgan Stanley | | EU Euro | | | 5,850,110 | | | Sell | | 01/27/12 | | | 7,882,000 | | | | 7,572,900 | | | | 309,100 | | |
| UBS Warburg LLC | | New Zealand Dollar | | | 1,116,359 | | | Sell | | 01/13/12 | | | 862,000 | | | | 868,126 | | | | (6,126 | ) | |
| | | | | | | | | | | | | | | $ | 981,307 | | |
ING Global Bond Portfolio Open Futures Contracts on December 31, 2011:
| Contract Description | | Number
of Contracts | | Expiration Date | | Notional
Value | | Unrealized
Appreciation/
(Depreciation) | |
| Long Contracts | |
| 30-year German Government Bond | | | 23 | | | 03/08/12 | | $ | 3,808,477 | | | $ | 247,669 | | |
| Australia 10-Year Bond | | | 25 | | | 03/15/12 | | | 3,040,139 | | | | 27,476 | | |
| Australia 3-Year Bond | | | 30 | | | 03/15/12 | | | 3,324,189 | | | | (5,637 | ) | |
| Canada 10-Year Bond | | | 48 | | | 03/21/12 | | | 6,306,081 | | | | 50,839 | | |
| Euro-Bobl 5-Year | | | 77 | | | 03/08/12 | | | 12,468,090 | | | | 194,187 | | |
| Euro-Bund | | | 47 | | | 03/08/12 | | | 8,457,749 | | | | 262,513 | | |
| Short Gilt | | | 84 | | | 03/28/12 | | | 13,740,403 | | | | 61,571 | | |
| U.S. Treasury 10-Year Note | | | 532 | | | 03/21/12 | | | 69,758,500 | | | | 563,404 | | |
| U.S. Treasury 2-Year Note | | | 149 | | | 03/30/12 | | | 32,861,485 | | | | 5,363 | | |
| U.S. Treasury Ultra Long Bond | | | 104 | | | 03/21/12 | | | 16,659,500 | | | | 506,740 | | |
| | | | | | | $ | 170,424,613 | | | $ | 1,914,125 | | |
| Short Contracts | |
| Euro-Schatz | | | 201 | | | 03/08/12 | | $ | 28,704,252 | | | $ | (70,981 | ) | |
| Long Gilt | | | 3 | | | 03/28/12 | | | 544,866 | | | | (7,947 | ) | |
| Medium Gilt | | | 131 | | | 03/28/12 | | | 23,074,326 | | | | (294,447 | ) | |
| U.S. Treasury 5-Year Note | | | 642 | | | 03/30/12 | | | 79,131,514 | | | | (276,291 | ) | |
| U.S. Treasury Long Bond | | | 258 | | | 03/21/12 | | | 37,361,625 | | | | (495,207 | ) | |
| | | | | | | $ | 168,816,583 | | | $ | (1,144,873 | ) | |
ING Global Bond Portfolio Over-the-Counter Interest Rate Swap Agreements Outstanding on December 31, 2011:
| | | Termination
Date | | Notional
Amount | | Fair
Value | | Upfront Payments
Paid/(Received) | | Unrealized
Appreciation/
(Depreciation) | |
Receive a floating rate based on AUD-BBR-BBSW and
pay a fixed rate equal to 4.118%
Counterparty: UBS Warburg LLC | | 11/02/13 | | AUD | 54,500,000 | | | $ | (265,861 | ) | | $ | — | | | $ | (265,861 | ) | |
Receive a floating rate based on AUD-BBR-BBSW and
pay a fixed rate equal to 3.670%
Counterparty: UBS Warburg LLC | | 11/22/13 | | AUD | 75,000,000 | | | | 264,603 | | | | — | | | | 264,603 | | |
Receive a floating rate based on AUD-BBR-BBSW and
pay a fixed rate equal to 3.940%
Counterparty: UBS Warburg LLC | | 12/07/14 | | AUD | 72,900,000 | | | | 36,637 | | | | — | | | | 36,637 | | |
See Accompanying Notes to Financial Statements
116
SUMMARY PORTFOLIO OF INVESTMENTS
ING GLOBAL BOND PORTFOLIO AS OF DECEMBER 31, 2011 (CONTINUED)
| | | Termination
Date | | Notional
Amount | | Fair
Value | | Upfront Payments
Paid/(Received) | | Unrealized
Appreciation/
(Depreciation) | |
Receive a fixed rate equal to 4.675% and pay a floating
rate based on AUD-BBR-BBSW
Counterparty: UBS Warburg LLC | | 11/22/21 | | AUD | 36,700,000 | | | $ | 167,521 | | | $ | — | | | $ | 167,521 | | |
Receive a fixed rate equal to 9.960% and pay a floating
rate based on Brazil Cetip Interbank
Counterparty: Bank of America | | 01/02/14 | | BRL | 24,000,000 | | | | (75,672 | ) | | | — | | | | (75,672 | ) | |
Receive a fixed rate based on the calcuation of
U.F.(Unidad de Fomento) 135,053 and pay a floating
rate based on the 6-month Tasa Nominal Anual
Promedio (TNA)
Counterparty: Deutsche Bank AG | | 08/03/13 | | CLP | 14,911,612,000 | | | | 354,067 | | | | — | | | | 354,067 | | |
Receive a floating rate based on the 6-month
CLP-CHIBNOM and pay a fixed rate equal to 4.990%
Counterparty: Deutsche Bank AG | | 08/03/13 | | CLP | 14,911,612,000 | | | | (331,942 | ) | | | — | | | | (331,942 | ) | |
Receive a floating rate based on CZK-PRIBOR-PRBO
and pay a fixed rate equal to 1.760%
Counterparty: Bank of America | | 12/05/16 | | CZK | 96,000,000 | | | | (23,676 | ) | | | — | | | | (23,676 | ) | |
Receive a floating rate based on CZK-PRIBOR-PRBO
and pay a fixed rate equal to 1.760%
Counterparty: Deutsche Bank AG | | 12/05/16 | | CZK | 96,000,000 | | | | (23,676 | ) | | | — | | | | (23,676 | ) | |
Receive a floating rate based on CZK-PRIBOR-PRBO
and pay a fixed rate equal to 1.755%
Counterparty: Deutsche Bank AG | | 12/12/16 | | CZK | 194,000,000 | | | | (44,836 | ) | | | — | | | | (44,836 | ) | |
Receive a fixed rate equal to 2.890% and pay a floating
rate based on the 3-month ILS-TELBOR
Counterparty: Morgan Stanley | | 09/10/13 | | ILS | 36,600,000 | | | | 74,261 | | | | — | | | | 74,261 | | |
Receive a floating rate based on the 3-month ILS-TELBOR
and pay a fixed rate equal to 3.470%
Counterparty: Morgan Stanley | | 09/08/16 | | ILS | 30,500,000 | | | | (127,307 | ) | | | — | | | | (127,307 | ) | |
Receive a fixed rate equal to 4.390% and pay a floating
rate based on the 3-month ILS-TELBOR
Counterparty: Morgan Stanley | | 09/09/21 | | ILS | 8,300,000 | | | | 32,745 | | | | — | | | | 32,745 | | |
Receive a fixed rate equal to 7.540% and pay a floating
rate based on INR-MIBOR-OIS-COMPOUND
Counterparty: Citigroup, Inc. | | 03/09/13 | | INR | 1,000,000,000 | | | | (73,457 | ) | | | — | | | | (73,457 | ) | |
Receive a floating rate based on INR-MIBOR-OIS-COMPOUND
and pay a fixed rate equal to 8.100%
Counterparty: Citigroup, Inc. | | 03/09/16 | | INR | 420,000,000 | | | | (266,308 | ) | | | — | | | | (266,308 | ) | |
Receive a floating rate based on the 3-month South
Korean Won and pay fixed rate equal to 3.470%
Counterparty: Bank of America | | 10/05/16 | | KRW | 12,000,000,000 | | | | (50,591 | ) | | | — | | | | (50,591 | ) | |
Receive a floating rate based on the 3-month KRW-CD
and pay a fixed rate equal to 3.775%
Counterparty: Merrill Lynch | | 06/24/13 | | KRW | 27,466,100,000 | | | | (155,503 | ) | | | — | | | | (155,503 | ) | |
Receive a floating rate based on the 3-month KRW-CD
and pay a fixed rate equal to 3.830%
Counterparty: Merrill Lynch | | 06/24/13 | | KRW | 18,400,000,000 | | | | (116,844 | ) | | | — | | | | (116,844 | ) | |
Receive a fixed rate equal to 4.830% and pay a floating
rate based on the 28-day MXN-TIIE-BANXICO
Counterparty: Deutsche Bank AG | | 08/09/13 | | MXN | 129,337,317 | | | | (34,934 | ) | | | — | | | | (34,934 | ) | |
Receive a floating rate based on the 28-day
MXN-TIIE-BANXICO and pay a fixed rate equal to 5.580%
Counterparty: Deutsche Bank AG | | 08/05/16 | | MXN | 113,170,152 | | | | 70,299 | | | | — | | | | 70,299 | | |
Receive a fixed equal to 5.580% and pay a floating rate
based on the 28-day MXN-TIIE-BANXICO
Counterparty: Deutsche Bank AG | | 11/25/16 | | MXN | 135,000,000 | | | | (118,552 | ) | | | — | | | | (118,552 | ) | |
Receive a fixed rate equal to 6.480% and pay a floating
rate based on the 28-day MXN-TIIE-BANXICO
Counterparty: Deutsche Bank AG | | 07/30/21 | | MXN | 32,334,329 | | | | (42,813 | ) | | | — | | | | (42,813 | ) | |
Receive a floating rate based on 28-day
MXN TIIE-BANXICO and pay a fixed rate equal to 6.920%
Counterparty: Goldman Sachs & Co. | | 11/17/21 | | MXN | 80,000,000 | | | | (72,141 | ) | | | — | | | | (72,141 | ) | |
Receive a floating rate based on the 28-day
MXN-TIIE-BANXICO and pay a fixed rate equal to 5.290%
Counterparty: Morgan Stanley | | 09/02/16 | | MXN | 106,000,000 | | | | 168,202 | | | | — | | | | 168,202 | | |
Receive a fixed rate equal to 6.270% and pay a floating
rate based on the 28-day MXN-TIIE-BANXICO
Counterparty: Morgan Stanley | | 08/27/21 | | MXN | 61,000,000 | | | | (157,470 | ) | | | — | | | | (157,470 | ) | |
Receive a floating rate based on 3-month
MYR-KLIBOR-BNM and pay a fixed rate equal to 3.030%
Counterparty: Deutsche Bank AG | | 11/22/13 | | MYR | 75,000,000 | | | | (3,362 | ) | | | — | | | | (3,362 | ) | |
See Accompanying Notes to Financial Statements
117
SUMMARY PORTFOLIO OF INVESTMENTS
ING GLOBAL BOND PORTFOLIO AS OF DECEMBER 31, 2011 (CONTINUED)
| | | Termination
Date | | Notional
Amount | | Fair
Value | | Upfront Payments
Paid/(Received) | | Unrealized
Appreciation/
(Depreciation) | |
Receive a fixed rate equal to 4.940% and pay a floating
rate based on 6-month PLZ-WIBOR-WIBO
Counterparty: Bank of America | | 12/02/13 | | PLN | 77,000,000 | | | $ | 81,669 | | | $ | — | | | $ | 81,669 | | |
Receive a floating rate based on 6-month PLZ-WIBOR-WIBO
and pay a fixed rate equal to 5.095%
Counterparty: Bank of America | | 12/01/16 | | PLN | 33,000,000 | | | | (129,892 | ) | | | — | | | | (129,892 | ) | |
Receive a floating rate based on 6-month PLZ-WIBOR-WIBO
and pay a fixed rate equal to 4.770%
Counterparty: Deutsche Bank AG | | 12/27/13 | | PLN | 33,000,000 | | | | (6,187 | ) | | | — | | | | (6,187 | ) | |
Receive a floating rate based on 6-month PLZ-WIBOR-WIBO
and pay a fixed rate equal to 4.785%
Counterparty: Morgan Stanley | | 12/12/13 | | PLN | 79,000,000 | | | | (20,850 | ) | | | — | | | | (20,850 | ) | |
Receive a floating rate based on 6-month PLZ-WIBOR-WIBO
and pay a fixed rate equal to 4.775%
Counterparty: Morgan Stanley | | 12/27/13 | | PLN | 78,000,000 | | | | (16,782 | ) | | | — | | | | (16,782 | ) | |
Receive a floating rate based on the 3-month
USD-LIBOR-BBA and pay a fixed rate equal to 3.768%
Counterparty: Citigroup, Inc. | | 02/10/21 | | USD | 20,000,000 | | | | (3,114,821 | ) | | | — | | | | (3,114,821 | ) | |
Receive a floating rate based on the 3-month
USD-LIBOR-BBA and pay a fixed rate equal to 0.750%
Counterparty: Credit Suisse First Boston | | 09/19/14 | | USD | 44,000,000 | | | | 68,432 | | | | — | | | | 68,432 | | |
Receive a fixed rate equal to 1.719% and pay a floating
rate based on the 3-month USD-LIBOR-BBA
Counterparty: Credit Suisse First Boston | | 09/19/17 | | USD | 29,300,000 | | | | 330,401 | | | | — | | | | 330,401 | | |
Receive a fixed rate equal to 1.721% and pay a floating
rate based on the 3-month USD-LIBOR-BBA
Counterparty: Credit Suisse First Boston | | 09/19/17 | | USD | 7,900,000 | | | | 90,018 | | | | — | | | | 90,018 | | |
Receive a floating rate based on the 3-month
USD-LIBOR-BBA and pay a fixed rate equal to 2.598%
Counterparty: Credit Suisse First Boston | | 09/19/22 | | USD | 3,100,000 | | | | (106,341 | ) | | | — | | | | (106,341 | ) | |
Receive a floating rate based on the 3-month
USD-LIBOR-BBA and pay a fixed rate equal to 2.585%
Counterparty: Credit Suisse First Boston | | 09/19/22 | | USD | 9,000,000 | | | | (298,512 | ) | | | — | | | | (298,512 | ) | |
Receive a floating rate based on the 3-month
USD-LIBOR-BBA and pay a fixed rate equal to 0.710%
Counterparty: JPMorgan Chase & Co. | | 09/23/14 | | USD | 40,500,000 | | | | 96,772 | | | | — | | | | 96,772 | | |
Receive a fixed rate equal to 1.593% and pay a floating
rate based on the 3-month USD-LIBOR-BBA
Counterparty: JPMorgan Chase & Co. | | 09/23/17 | | USD | 37,200,000 | | | | 183,574 | | | | — | | | | 183,574 | | |
Receive a floating rate based on the 3-month
USD-LIBOR-BBA and pay a fixed rate equal to 2.399%
Counterparty: JPMorgan Chase & Co. | | 09/23/22 | | USD | 12,100,000 | | | | (193,077 | ) | | | — | | | | (193,077 | ) | |
Receive a fixed rate equal to 6.820% and pay a floating
rate based on 3-month ZAR-JIBAR-SAFEX
Counterparty: Morgan Stanley | | 11/16/16 | | ZAR | 85,000,000 | | | | 27,122 | | | | — | | | | 27,122 | | |
| | | | | | | $ | (3,825,084 | ) | | $ | — | | | $ | (3,825,084 | ) | |
ING Global Bond Portfolio Written OTC Options on December 31, 2011
| | | # of
Contracts | |
Counterparty | |
Description | | Exercise
Price | | Expiration
Date | | Premiums
Received | |
Fair Value | |
| Options On Currencies | | | | | | | | | | | | | | | |
| | | | 26,900,000 | | | Deutsche Bank AG | | USD Put vs. EUR Call Currency Option | | | 1.370 | | | USD01/16/12 | | $ | 278,419 | | | $ | (5,947 | ) | |
| | | | 17,100,000 | | | Deutsche Bank AG | | USD Put vs. EUR Call Currency Option | | | 1.380 | | | USD01/16/12 | | | 160,715 | | | | (2,111 | ) | |
| | | | 10,700,000 | | | Deutsche Bank AG | | USD Put vs. EUR Call Currency Option | | | 1.380 | | | USD01/31/12 | | | 147,552 | | | | (7,321 | ) | |
| | | | 21,500,000 | | | Deutsche Bank AG | | USD Put vs. JPY Call Currency Option | | | 75.000 | | | USD06/01/12 | | | 402,480 | | | | (355,703 | ) | |
| Options On Securities | |
| | | | 3,808,000 | | | JPMorgan Chase & Co. | | U.S Treasury 30-Year Bond | | | 93.969 | | | USD01/04/12 | | | 1,190 | | | | (15 | ) | |
| | | Total Written OTC Options | | $ | 990,356 | | | $ | (371,097 | ) | |
See Accompanying Notes to Financial Statements
118
SUMMARY PORTFOLIO OF INVESTMENTS
ING GLOBAL BOND PORTFOLIO AS OF DECEMBER 31, 2011 (CONTINUED)
A summary of derivative instruments by primary risk exposure is outlined in the following tables.
The fair value of derivative instruments as of December 31, 2011 was as follows:
Derivatives not accounted
for as hedging instruments | | Location on Statement of Assets and Liabilities | | Fair Value | |
| Asset Derivatives | |
| Foreign exchange contracts | | Investments in securities at value* | | $ | 1,065,791 | | |
| Foreign exchange contracts | | Unrealized appreciation on forward foreign currency contracts | | | 4,529,350 | | |
| Interest rate contracts | | Unrealized appreciation on swap agreements | | | 2,046,323 | | |
| Interest rate contracts | | Net Assets — Unrealized appreciation** | | | 1,919,762 | | |
| Total Asset Derivatives | | | | $ | 9,561,226 | | |
| Liability Derivatives | |
| Foreign exchange contracts | | Unrealized depreciation on forward foreign currency contracts | | $ | 5,679,249 | | |
| Interest rate contracts | | Unrealized depreciation on swap agreements | | | 5,871,407 | | |
| Interest rate contracts | | Net Assets — Unrealized depreciation** | | | 1,150,510 | | |
| Foreign exchange contracts | | Written options, at fair value | | | 371,082 | | |
| Interest rate contracts | | Written options, at fair value | | | 15 | | |
| Total Liability Derivatives | | | | $ | 13,072,263 | | |
* Includes purchased options.
** Includes cumulative appreciation/depreciation of futures contracts as reported in the table following the Summary Portfolio of Investments.
The effect of derivative instruments on the Portfolio's Statement of Operations for the year ended December 31, 2011 was as follows:
| | | Amount of Realized Gain or (Loss) on Derivatives Recognized in Income | |
Derivatives not
accounted for as
hedging instruments | | Investments* | | Foreign currency
related transactions** | | Futures | | Swaps | | Written
options | | Total | |
| Credit contracts | | $ | — | | | $ | — | | | $ | — | | | $ | (536,764 | ) | | $ | — | | | $ | (536,764 | ) | |
| Equity contracts | | | 157,430 | | | | — | | | | (117,871 | ) | | | — | | | | 4,975 | | | | 44,534 | | |
| Foreign exchange contracts | | | (8,321,086 | ) | | | (3,950,421 | ) | | | — | | | | 352,162 | | | | 8,693,985 | | | | (3,225,360 | ) | |
| Interest rate contracts | | | 239,558 | | | | — | | | | 4,470,009 | | | | (6,096,312 | ) | | | 165,890 | | | | (1,220,855 | ) | |
| Total | | $ | (7,924,098 | ) | | $ | (3,950,421 | ) | | $ | 4,352,138 | | | $ | (6,280,914 | ) | | $ | 8,864,850 | | | $ | (4,938,445 | ) | |
| | | Change in Unrealized Appreciation or (Depreciation) on Derivatives Recognized in Income | |
Derivatives not
accounted for as
hedging instruments | | Investments* | | Foreign currency
related transactions** | | Futures | | Swaps | | Written
options | | Total | |
| Credit contracts | | $ | — | | | $ | — | | | $ | — | | | $ | (246,154 | ) | | $ | — | | | $ | (246,154 | ) | |
| Equity contracts | | | — | | | | — | | | | — | | | | (194,907 | ) | | | — | | | | (194,907 | ) | |
| Foreign exchange contracts | | | 104,678 | | | | 1,083,416 | | | | 111,573 | | | | 4,601 | | | | 618,084 | | | | 1,922,352 | | |
| Interest rate contracts | | | — | | | | — | | | | 1,807,862 | | | | (3,813,468 | ) | | | 1,175 | | | | (2,004,431 | ) | |
| Total | | $ | 104,678 | | | $ | 1,083,416 | | | $ | 1,919,435 | | | $ | (4,249,928 | ) | | $ | 619,259 | | | $ | (523,140 | ) | |
* Amounts recognized for purchased options are included in net realized gain (loss) on investments and net change in unrealized appreciation or depreciation on investments.
** Amounts recognized for forward foreign currency contracts are included in net realized gain (loss) on foreign currency related transactions and net change in unrealized appreciation or depreciation on foreign currency related transactions.
See Accompanying Notes to Financial Statements
119
ING INVESCO SUMMARY PORTFOLIO OF INVESTMENTS
VAN KAMPEN COMSTOCK PORTFOLIO AS OF DECEMBER 31, 2011
Shares | |
| |
| | Value | | Percentage
of Net
Assets | |
| COMMON STOCK: 95.4% | | | |
| | | | Consumer Discretionary: 15.6% | |
| | 492,983 | | | | | Comcast Corp. -
Class A | | $ | 11,688,627 | | | | 3.9 | | |
| | 180,729 | | | @ | | General Motors Co. | | | 3,663,377 | | | | 1.2 | | |
| | 125,298 | | | | | Lowe's Cos., Inc. | | | 3,180,063 | | | | 1.0 | | |
| | 267,941 | | | | | News Corp. - Class B | | | 4,871,167 | | | | 1.6 | | |
| | 81,130 | | | | | Time Warner
Cable, Inc. | | | 5,157,434 | | | | 1.7 | | |
| | 105,082 | | | | | Time Warner, Inc. | | | 3,797,664 | | | | 1.3 | | |
| | 163,477 | | | | | Viacom - Class B | | | 7,423,491 | | | | 2.5 | | |
| | 285,472 | | | | | Other Securities | | | 7,367,932 | | | | 2.4 | | |
| | | | | | | | | | 47,149,755 | | | | 15.6 | | |
| | | | Consumer Staples: 7.7% | |
| | 145,853 | | | | | CVS Caremark Corp. | | | 5,947,885 | | | | 2.0 | | |
| | 139,542 | | | | | Kraft Foods, Inc. | | | 5,213,289 | | | | 1.7 | | |
| | 154,352 | | | | | Unilever NV ADR | | | 5,305,078 | | | | 1.8 | | |
| | 51,266 | | | | | Wal-Mart Stores, Inc. | | | 3,063,656 | | | | 1.0 | | |
| | 92,724 | | | | | Other Securities | | | 3,590,238 | | | | 1.2 | | |
| | | | | | | | | | 23,120,146 | | | | 7.7 | | |
| | | | Energy: 11.9% | |
| | 148,002 | | | | | BP PLC ADR | | | 6,325,605 | | | | 2.1 | | |
| | 58,296 | | | | | Chevron Corp. | | | 6,202,694 | | | | 2.1 | | |
| | 173,602 | | | | | Halliburton Co. | | | 5,991,005 | | | | 2.0 | | |
| | 62,639 | | | | | Murphy Oil Corp. | | | 3,491,498 | | | | 1.2 | | |
| | 87,489 | | | | | Royal Dutch Shell
PLC - Class A ADR | | | 6,394,571 | | | | 2.1 | | |
| | 285,243 | | | @ | | Weatherford
International Ltd. | | | 4,175,958 | | | | 1.4 | | |
| | 125,163 | | | | | Other Securities | | | 3,144,275 | | | | 1.0 | | |
| | | | | | | | | | 35,725,606 | | | | 11.9 | | |
| | | | Financials: 19.2% | |
| | 233,724 | | | | | Allstate Corp. | | | 6,406,375 | | | | 2.1 | | |
| | 468,863 | | | | | Bank of America Corp. | | | 2,606,878 | | | | 0.8 | | |
| | 222,737 | | | | | Bank of New York
Mellon Corp. | | | 4,434,694 | | | | 1.5 | | |
| | 260,720 | | | | | Citigroup, Inc. | | | 6,859,543 | | | | 2.3 | | |
| | 228,276 | | | | | JPMorgan Chase & Co. | | | 7,590,177 | | | | 2.5 | | |
| | 103,045 | | | | | Metlife, Inc. | | | 3,212,943 | | | | 1.1 | | |
| | 78,145 | | | | | PNC Financial Services
Group, Inc. | | | 4,506,622 | | | | 1.5 | | |
| | 65,554 | | | | | Travelers Cos., Inc. | | | 3,878,830 | | | | 1.3 | | |
| | 200,019 | | | | | Wells Fargo & Co. | | | 5,512,524 | | | | 1.8 | | |
| | 533,810 | | | | | Other Securities | | | 12,988,931 | | | | 4.3 | | |
| | | | | | | | | | 57,997,517 | | | | 19.2 | | |
| | | | Health Care: 13.4% | |
| | 186,547 | | | | | | | Bristol-Myers
Squibb Co. | | | 6,573,916 | | | | 2.2 | | |
| | 69,953 | | | | | | | Cardinal Health, Inc. | | | 2,840,791 | | | | 0.9 | | |
Shares | |
| |
| | Value | | Percentage
of Net
Assets | |
| | 74,356 | | | | | GlaxoSmithKline
PLC ADR | | $ | 3,392,864 | | | | 1.1 | | |
| | 157,295 | | | | | Merck & Co., Inc. | | | 5,930,022 | | | | 2.0 | | |
| | 372,963 | | | | | Pfizer, Inc. | | | 8,070,919 | | | | 2.7 | | |
| | 60,473 | | | | | Roche Holding
AG ADR ADR | | | 2,573,126 | | | | 0.8 | | |
| | 111,573 | | | | | UnitedHealth
Group, Inc. | | | 5,654,520 | | | | 1.9 | | |
| | 39,620 | | | | | WellPoint, Inc. | | | 2,624,825 | | | | 0.9 | | |
| | 61,999 | | | | | Other Securities | | | 2,675,252 | | | | 0.9 | | |
| | | | | | | | | | 40,336,235 | | | | 13.4 | | |
| | | | Industrials: 6.1% | |
| | 246,104 | | | | | General Electric Co. | | | 4,407,723 | | | | 1.5 | | |
| | 82,126 | | | | | Honeywell
International, Inc. | | | 4,463,548 | | | | 1.5 | | |
| | 160,787 | | | | | Ingersoll-Rand PLC | | | 4,899,180 | | | | 1.6 | | |
| | 184,044 | | | | | Other Securities | | | 4,681,917 | | | | 1.5 | | |
| | | | | | | | | | 18,452,368 | | | | 6.1 | | |
| | | | Information Technology: 11.0% | |
| | 168,985 | | | | | Cisco Systems, Inc. | | | 3,055,249 | | | | 1.0 | | |
| | 201,398 | | | @ | | Dell, Inc. | | | 2,946,453 | | | | 1.0 | | |
| | 198,489 | | | @ | | eBay, Inc. | | | 6,020,171 | | | | 2.0 | | |
| | 214,591 | | | | | Hewlett-Packard Co. | | | 5,527,864 | | | | 1.8 | | |
| | 269,272 | | | | | Microsoft Corp. | | | 6,990,301 | | | | 2.3 | | |
| | 314,239 | | | @ | | Yahoo!, Inc. | | | 5,068,675 | | | | 1.7 | | |
| | 117,619 | | | | | Other Securities | | | 3,419,549 | | | | 1.2 | | |
| | | | | | | | | | 33,028,262 | | | | 11.0 | | |
| | | | Materials: 4.0% | |
| | 303,506 | | | | | Alcoa, Inc. | | | 2,625,327 | | | | 0.9 | | |
| | 321,793 | | | | | International Paper Co. | | | 9,525,073 | | | | 3.1 | | |
| | | | | | | | | | 12,150,400 | | | | 4.0 | | |
| | | | Telecommunications: 3.7% | |
| | 108,510 | | | | | AT&T, Inc. | | | 3,281,342 | | | | 1.1 | | |
| | 121,548 | | | | | Verizon
Communications, Inc. | | | 4,876,506 | | | | 1.6 | | |
| | 112,117 | | | | | Vodafone Group
PLC ADR | | | 3,142,640 | | | | 1.0 | | |
| | | | | | | | | | 11,300,488 | | | | 3.7 | | |
| | | | Utilities: 2.8% | |
| | 78,810 | | | | | FirstEnergy Corp. | | | 3,491,283 | | | | 1.1 | | |
| | 172,387 | | | | | PPL Corp. | | | 5,071,625 | | | | 1.7 | | |
| | | | | | | | | | 8,562,908 | | | | 2.8 | | |
| | | | | | | Total Common Stock
(Cost $256,917,941) | | | 287,823,685 | | | | 95.4 | | |
See Accompanying Notes to Financial Statements
120
ING INVESCO SUMMARY PORTFOLIO OF INVESTMENTS
VAN KAMPEN COMSTOCK PORTFOLIO AS OF DECEMBER 31, 2011 (CONTINUED)
Shares | |
| |
| | Value | | Percentage
of Net
Assets | |
| SHORT-TERM INVESTMENTS: 2.4% | | | |
| | | | Mutual Funds: 2.4% | |
| | 7,196,691 | | | | | | | BlackRock Liquidity
Funds, TempFund,
Institutional Class
(Cost $7,196,691) | | $ | 7,196,691 | | | | 2.4 | | |
| | | | | | | | | Total Short-Term
Investments
(Cost $7,196,691) | | | 7,196,691 | | | | 2.4 | | |
| | | | | | | | | Total Investments in
Securities
(Cost $264,114,632) | | $ | 295,020,376 | | | | 97.8 | | |
| | | | | | | | | Assets in Excess of
Other Liabilities | | | 6,500,692 | | | | 2.2 | | |
| | | | | | | | | Net Assets | | $ | 301,521,068 | | | | 100.0 | | |
"Other Securities" represents issues not identified as the top 50 holdings in terms of market value and issues or issuers not exceeding 1% of net assets individually or in aggregate respectively as of December 31, 2011.
The following footnotes apply to either the individual securities noted or one or more of the securities aggregated and listed as a single line item.
@ Non-income producing security
ADR American Depositary Receipt
Cost for federal income tax purposes is $296,004,215.
| Net unrealized depreciation consists of: | |
| Gross Unrealized Appreciation | | $ | 54,749,626 | | |
| Gross Unrealized Depreciation | | | (55,733,465 | ) | |
| Net Unrealized Depreciation | | $ | (983,839 | ) | |
Fair Value Measurements^
The following is a summary of the fair valuations according to the inputs used as of December 31, 2011 in valuing the assets and liabilities:
| | | Quoted Prices
in Active Markets
for Identical Investments
(Level 1) | | Significant Other
Observable
Inputs
(Level 2) | | Significant
Unobservable
Inputs
(Level 3) | | Fair Value
at
12/31/11 | |
| Asset Table | |
| Investments, at value | |
| Common Stock* | | $ | 287,823,685 | | | $ | — | | | $ | — | | | $ | 287,823,685 | | |
| Short-Term Investments | | | 7,196,691 | | | | — | | | | — | | | | 7,196,691 | | |
| Total Investments, at value | | $ | 295,020,376 | | | $ | — | | | $ | — | | | $ | 295,020,376 | | |
The following is a reconciliation of the fair valuations using significant unobservable inputs (Level 3) for the Portfolio's assets and liabilities during the period ended December 31, 2011:
| | | Beginning
Balance
12/31/10 | | Purchases | | Sales | | Accrued
Discounts/
(Premiums) | | Total
Realized
Gain/(Loss) | | Total
Unrealized
Appreciation/
(Depreciation) | | Transfers
Into
Level 3 | | Transfers
Out of
Level 3 | | Ending
Balance
12/31/11 | |
| Asset Table | |
| Investments, at value | |
Short-Term
Investments | | $ | 773,276 | | | $ | — | | | $ | (773,276 | ) | | $ | — | | | $ | (193,319 | ) | | $ | 193,319 | | | $ | — | | | $ | — | | | $ | — | | |
Total Investments,
at value | | $ | 773,276 | | | $ | — | | | $ | (773,276 | ) | | $ | — | | | $ | (193,319 | ) | | $ | 193,319 | | | $ | — | | | $ | — | | | $ | — | | |
As of December 31, 2011, total change in unrealized gain (loss) on Level 3 securities still held at period end and included in the change in net assets was $ 0 .
^ See Note 2, "Significant Accounting Policies" in the Notes to Financial Statements for additional information.
* For further breakdown of Common Stock by Industry type, please refer to the Portfolio of Investments.
There were no significant transfers between Level 1 and 2 during the year ended December 31, 2011.
Transfers in or out of Level 3 represent either the beginning value (for transfers in), or the ending value (for transfers out) of any security or derivative instrument where a change in the pricing level occurred from the beginning to the end of the period. Transfers are recognized at the end of the reporting period.
See Accompanying Notes to Financial Statements
121
ING INVESCO VAN KAMPEN SUMMARY PORTFOLIO OF INVESTMENTS
EQUITY AND INCOME PORTFOLIO AS OF DECEMBER 31, 2011
Shares | |
| |
| | Value | | Percentage
of Net
Assets | |
| COMMON STOCK: 62.4% | |
| | | | | Consumer Discretionary: 6.4% | |
| | 444,226 | | | | | Comcast Corp. - Class A | | $ | 10,532,599 | | | | 1.4 | | |
| | 220,808 | | | | | Home Depot, Inc. | | | 9,282,768 | | | | 1.2 | | |
| | 112,520 | | | | | Time Warner Cable, Inc. | | | 7,152,897 | | | | 0.9 | | |
| | 263,807 | | | | | Time Warner, Inc. | | | 9,533,985 | | | | 1.3 | | |
| | 248,654 | | | | | Viacom - Class B | | | 11,291,378 | | | | 1.5 | | |
| | 57,410 | | | | | Other Securities | | | 1,035,676 | | | | 0.1 | | |
| | | | | | | | | | 48,829,303 | | | | 6.4 | | |
| | | | Consumer Staples: 8.0% | |
| | 173,803 | | | | | Archer-Daniels-
Midland Co. | | | 4,970,766 | | | | 0.6 | | |
| | 417,622 | | | | | Avon Products, Inc. | | | 7,295,856 | | | | 1.0 | | |
| | 75,034 | | | | | Coca-Cola Co. | | | 5,250,129 | | | | 0.7 | | |
| | 140,558 | | | | | Kraft Foods, Inc. | | | 5,251,247 | | | | 0.7 | | |
| | 197,654 | | | | | Procter & Gamble Co. | | | 13,185,498 | | | | 1.7 | | |
| | 234,618 | | | | | Sysco Corp. | | | 6,881,346 | | | | 0.9 | | |
| | 221,600 | | | | | Unilever NV ADR | | | 7,616,392 | | | | 1.0 | | |
| | 151,901 | | | | | Walgreen Co. | | | 5,021,847 | | | | 0.7 | | |
| | 76,383 | | | | | Other Securities | | | 5,490,552 | | | | 0.7 | | |
| | | | | | | | | | 60,963,633 | | | | 8.0 | | |
| | | | | Energy: 8.7% | |
| | 181,878 | | | | | Anadarko Petroleum
Corp. | | | 13,882,748 | | | | 1.8 | | |
| | 74,819 | | | | | Devon Energy Corp. | | | 4,638,778 | | | | 0.6 | | |
| | 79,475 | | | | | ExxonMobil Corp. | | | 6,736,301 | | | | 0.9 | | |
| | 137,782 | | | | | Hess Corp. | | | 7,826,017 | | | | 1.0 | | |
| | 55,433 | | | | | Occidental Petroleum
Corp. | | | 5,194,072 | | | | 0.7 | | |
| | 165,044 | | | | | Royal Dutch Shell
PLC - Class A ADR | | | 12,063,066 | | | | 1.6 | | |
| | 137,100 | | | | | Williams Cos., Inc. | | | 4,527,042 | | | | 0.6 | | |
| | 209,730 | | | | | Other Securities | | | 11,484,855 | | | | 1.5 | | |
| | | | | | | | | | 66,352,879 | | | | 8.7 | | |
| | | | | Financials: 11.9% | |
| | 398,765 | | | | | Charles Schwab Corp. | | | 4,490,094 | | | | 0.6 | | |
| | 280,805 | | | | | Citigroup, Inc. | | | 7,387,979 | | | | 1.0 | | |
| | 611,065 | | | | | JPMorgan Chase & Co. | | | 20,317,911 | | | | 2.7 | | |
| | 499,024 | | | | | Marsh & McLennan
Cos., Inc. | | | 15,779,139 | | | | 2.1 | | |
| | 164,845 | | | | | PNC Financial Services
Group, Inc. | | | 9,506,611 | | | | 1.2 | | |
| | 197,034 | | | | | Wells Fargo & Co. | | | 5,430,257 | | | | 0.7 | | |
| | 983,017 | | | | | Other Securities | | | 27,119,621 | | | | 3.6 | | |
| | | | | | | | | | 90,031,612 | | | | 11.9 | | |
| | | | | Health Care: 8.6% | |
| | 283,069 | | | | | | | Bristol-Myers Squibb Co. | | | 9,975,352 | | | | 1.3 | | |
| | 179,527 | | | | | | | Medtronic, Inc. | | | 6,866,908 | | | | 0.9 | | |
| | 258,611 | | | | | | | Merck & Co., Inc. | | | 9,749,635 | | | | 1.3 | | |
Shares | |
| |
| | Value | | Percentage
of Net
Assets | |
| | 672,852 | | | | | Pfizer, Inc. | | $ | 14,560,517 | | | | 1.9 | | |
| | 214,750 | | | | | UnitedHealth
Group, Inc. | | | 10,883,530 | | | | 1.5 | | |
| | 339,265 | | | | | Other Securities | | | 13,021,033 | | | | 1.7 | | |
| | | | | | | | | | 65,056,975 | | | | 8.6 | | |
| | | | | Industrials: 5.6% | |
| | 1,230,642 | | | | | General Electric Co. | | | 22,040,798 | | | | 2.9 | | |
| | 182,714 | | | | | Ingersoll-Rand PLC | | | 5,567,296 | | | | 0.8 | | |
| | 231,911 | | | | | Tyco International Ltd. | | | 10,832,563 | | | | 1.4 | | |
| | 106,357 | | | | | Other Securities | | | 3,702,287 | | | | 0.5 | | |
| | | | | | | | | | 42,142,944 | | | | 5.6 | | |
| | | | | Information Technology: 7.6% | |
| | 177,311 | | | @ | | Amdocs Ltd. | | | 5,058,683 | | | | 0.7 | | |
| | 327,409 | | | @ | | Dell, Inc. | | | 4,789,994 | | | | 0.6 | | |
| | 398,538 | | | @ | | eBay, Inc. | | | 12,087,658 | | | | 1.6 | | |
| | 237,102 | | | | | Hewlett-Packard Co. | | | 6,107,747 | | | | 0.8 | | |
| | 421,114 | | | | | Microsoft Corp. | | | 10,932,119 | | | | 1.4 | | |
| | 266,215 | | | | | Western Union Co. | | | 4,861,086 | | | | 0.6 | | |
| | 1,256,642 | | | | | Other Securities | | | 14,109,435 | | | | 1.9 | | |
| | | | | | | | | | 57,946,722 | | | | 7.6 | | |
| | | | | Materials: 0.7% | |
| | 62,027 | | | | | PPG Industries, Inc. | | | 5,178,634 | | | | 0.7 | | |
| | | | | Telecommunications: 2.2% | |
| | 170,511 | | | | | Verizon
Communications, Inc. | | | 6,840,901 | | | | 0.9 | | |
| | 344,760 | | | | | Vodafone Group
PLC ADR | | | 9,663,623 | | | | 1.3 | | |
| | | | | | | | | | 16,504,524 | | | | 2.2 | | |
| | | | | Utilities: 2.7% | |
| | 204,641 | | | | | American Electric
Power Co., Inc. | | | 8,453,720 | | | | 1.1 | | |
| | 107,325 | | | | | Edison International | | | 4,443,255 | | | | 0.6 | | |
| | 103,477 | | | | | FirstEnergy Corp. | | | 4,584,031 | | | | 0.6 | | |
| | 43,112 | | | | | Other Securities | | | 3,149,331 | | | | 0.4 | | |
| | | | | | | | | | 20,630,337 | | | | 2.7 | | |
| | | | | | | Total Common Stock
(Cost $419,337,327) | | | 473,637,563 | | | | 62.4 | | |
| EXCHANGE-TRADED FUNDS: 0.1% | | | |
| | 66,540 | | | | | Other Securities | | | 1,137,834 | | | | 0.1 | | |
| | | | | | | Total Exchange-Traded
Funds
(Cost $1,125,092) | | | 1,137,834 | | | | 0.1 | | |
| PREFERRED STOCK: 1.7% | | | |
| | | | | Consumer Discretionary: 0.1% | |
| | 7,890 | | | | | Other Securities | | | 458,113 | | | | 0.1 | | |
See Accompanying Notes to Financial Statements
122
ING INVESCO VAN KAMPEN SUMMARY PORTFOLIO OF INVESTMENTS
EQUITY AND INCOME PORTFOLIO AS OF DECEMBER 31, 2011 (CONTINUED)
Shares | |
| |
| | Value | | Percentage
of Net
Assets | |
| | | | | Energy: 0.5% | |
| | 88,000 | | | | | Other Securities | | $ | 4,051,520 | | | | 0.5 | | |
| | | | | Financials: 0.5% | |
| | 35,144 | | | | | Other Securities | | | 3,712,612 | | | | 0.5 | | |
| | | | | Health Care: 0.4% | |
| | 32,051 | | | | | Other Securities | | | 2,816,565 | | | | 0.4 | | |
| | | | | Industrials: 0.2% | |
| | 179,631 | | | # | | Swift Mandatory
Common Exchange
Security Trust | | | 1,583,663 | | | | 0.2 | | |
| | | | | | | Total Preferred Stock
(Cost $11,990,278) | | | 12,622,473 | | | | 1.7 | | |
Principal
Amount† | |
| |
| | Value | | Percentage
of Net
Assets | |
| CORPORATE BONDS/NOTES: 20.4% | | | |
| | | | | Consumer Discretionary: 3.2% | |
| | 60,000 | | | # | | Cox Communications,
Inc., 8.375%, 03/01/39 | | $ | 80,460 | | | | 0.0 | | |
| | 2,575,000 | | | # | | Gaylord Entertainment
Co., 3.750%, 10/01/14 | | | 2,877,562 | | | | 0.4 | | |
| | 555,000 | | | # | | Tupperware Brands
Corp., 4.750%,
06/01/21 | | | 556,942 | | | | 0.1 | | |
| | 19,449,100 | | | | | Other Securities | | | 20,810,609 | | | | 2.7 | | |
| | | | | | | | | | 24,325,573 | | | | 3.2 | | |
| | | | | Consumer Staples: 0.5% | |
| | 66,995 | | | # | | CVS Lease Pass-through,
8.353%, 07/10/31 | | | 82,206 | | | | 0.0 | | |
| | 415,000 | | | # | | FBG Finance Ltd.,
5.125%, 06/15/15 | | | 452,080 | | | | 0.1 | | |
| | 295,000 | | | # | | Grupo Bimbo S.A.B de
CV, 4.875%, 06/30/20 | | | 313,595 | | | | 0.0 | | |
| | 2,508,653 | | | | | Other Securities | | | 2,846,026 | | | | 0.4 | | |
| | | | | | | | | | 3,693,907 | | | | 0.5 | | |
| | | | | Energy: 0.5% | |
| | 735,000 | | | # | | Gold Fields Orogen
Holding BVI Ltd.,
4.875%, 10/07/20 | | | 649,856 | | | | 0.1 | | |
| | 3,000,000 | | | | | Other Securities | | | 3,249,488 | | | | 0.4 | | |
| | | | | | | | | | 3,899,344 | | | | 0.5 | | |
| | | | | Financials: 5.9% | |
| | 290,000 | | | # | | Abbey National Treasury
Services PLC/London,
3.875%, 11/10/14 | | | 272,383 | | | | 0.0 | | |
| | 430,000 | | | # | | BPCE S.A., 2.375%,
10/04/13 | | | 416,652 | | | | 0.1 | | |
Principal
Amount† | |
| |
| | Value | | Percentage
of Net
Assets | |
| | 345,000 | | | | | Citigroup, Inc., 8.500%,
05/22/19 | | $ | 406,553 | | | | 0.1 | | |
| | 385,000 | | | # | | Commonwealth Bank
of Australia, 5.000%,
10/15/19 | | | 408,835 | | | | 0.1 | | |
| | 1,065,000 | | | # | | Dexus Diversified Trust /
Dexus Office Trust,
5.600%, 03/15/21 | | | 1,083,816 | | | | 0.1 | | |
| | 225,000 | | | # | | ERAC USA Finance LLC,
2.750%, 07/01/13 | | | 228,906 | | | | 0.0 | | |
| | 4,950,000 | | | | | General Electric Capital
Corp., 2.625%,
12/28/12 | | | 5,069,914 | | | | 0.7 | | |
| | 4,011,000 | | | # | | Goldman Sachs Group,
Inc., 1.000%, 03/15/17 | | | 3,559,061 | | | | 0.5 | | |
| | 465,000 | | | # | | HBOS PLC, 6.750%,
05/21/18 | | | 373,196 | | | | 0.0 | | |
| | 450,000 | | | # | | HSBC Bank PLC,
4.125%, 08/12/20 | | | 444,681 | | | | 0.1 | | |
| | 170,000 | | | # | | Iberdrola Finance
Ireland Ltd., 3.800%,
09/11/14 | | | 169,855 | | | | 0.0 | | |
| | 1,115,000 | | | | | JPMorgan Chase & Co.,
4.400%-6.000%,
01/15/18-07/22/20 | | | 1,213,241 | | | | 0.2 | | |
| | 165,000 | | | # | | Lloyds TSB Bank PLC,
5.800%, 01/13/20 | | | 156,844 | | | | 0.0 | | |
| | 205,000 | | | # | | National Australia Bank
Ltd., 3.750%, 03/02/15 | | | 211,739 | | | | 0.0 | | |
| | 570,000 | | | # | | Nationwide Building
Society, 6.250%,
02/25/20 | | | 566,256 | | | | 0.1 | | |
| | 290,000 | | | # | | Nordea Bank AB,
4.875%, 01/27/20 | | | 298,207 | | | | 0.0 | | |
| | 225,000 | | | # | | Pacific LifeCorp,
6.000%, 02/10/20 | | | 239,777 | | | | 0.0 | | |
| | 590,000 | | | # | | Cooperatieve Centrale
Raiffeisen-
Boerenleenbank BA/
Netherlands, 4.750%,
01/15/20 | | | 628,346 | | | | 0.1 | | |
| | 200,000 | | | # | | Santander US Debt S.A.
Unipersonal, 3.724%,
01/20/15 | | | 181,755 | | | | 0.0 | | |
| | 775,000 | | | # | | Societe Generale,
2.500%, 01/15/14 | | | 718,065 | | | | 0.1 | | |
| | 100,000 | | | # | | Standard Chartered
Bank, 6.400%,
09/26/17 | | | 103,091 | | | | 0.0 | | |
| | 315,000 | | | # | | Standard Chartered PLC,
3.850%, 04/27/15 | | | 317,330 | | | | 0.0 | | |
| | 300,000 | | | # | | WEA Finance LLC,
7.125%, 04/15/18 | | | 335,630 | | | | 0.0 | | |
| | 570,000 | | | | | Wells Fargo & Co.,
5.625%, 12/11/17 | | | 650,528 | | | | 0.1 | | |
| | 26,845,000 | | | | | Other Securities | | | 26,971,346 | | | | 3.6 | | |
| | | | | | | | | | 45,026,007 | | | | 5.9 | | |
See Accompanying Notes to Financial Statements
123
ING INVESCO VAN KAMPEN SUMMARY PORTFOLIO OF INVESTMENTS
EQUITY AND INCOME PORTFOLIO AS OF DECEMBER 31, 2011 (CONTINUED)
Principal
Amount† | |
| |
| | Value | | Percentage
of Net
Assets | |
| | | | | Health Care: 4.0% | |
| | 5,261,000 | | | | | Gilead Sciences, Inc.,
1.625%, 05/01/16 | | $ | 6,017,269 | | | | 0.8 | | |
| | 22,476,000 | | | | | Other Securities | | | 24,160,287 | | | | 3.2 | | |
| | | | | | | | | | 30,177,556 | | | | 4.0 | | |
| | | | | Industrials: 0.6% | |
| | 285,000 | | | | | General Electric Co.,
5.250%, 12/06/17 | | | 327,619 | | | | 0.0 | | |
| | 5,790,249 | | | | | Other Securities | | | 4,472,709 | | | | 0.6 | | |
| | | | | | | | | | 4,800,328 | | | | 0.6 | | |
| | | | | Information Technology: 2.9% | |
| | 1,927,000 | | | # | | Linear Technology Corp.,
3.000%, 05/01/27 | | | 1,977,584 | | | | 0.3 | | |
| | 1,721,000 | | | # | | Micron Technology, Inc.,
1.500%, 08/01/31 | | | 1,553,202 | | | | 0.2 | | |
| | 1,141,000 | | | # | | Novellus Systems, Inc.,
2.625%, 05/15/41 | | | 1,372,053 | | | | 0.2 | | |
| | 6,649,000 | | | | | SanDisk Corp., 1.000%,
05/15/13 | | | 6,507,709 | | | | 0.8 | | |
| | 1,466,000 | | | # | | Xilinx, Inc., 3.125%,
03/15/37 | | | 1,671,240 | | | | 0.2 | | |
| | 9,145,000 | | | | | Other Securities | | | 8,815,611 | | | | 1.2 | | |
| | | | | | | | | | 21,897,399 | | | | 2.9 | | |
| | | | | Materials: 0.7% | |
| | 300,000 | | | # | | Anglo American Capital
PLC, 9.375%, 04/08/19 | | | 382,149 | | | | 0.1 | | |
| | 4,520,000 | | | | | Other Securities | | | 4,840,168 | | | | 0.6 | | |
| | | | | | | | | | 5,222,317 | | | | 0.7 | | |
| | | | | Telecommunications: 1.6% | |
| | 2,081,000 | | | # | | Ciena Corp., 4.000%,
03/15/15 | | | 2,054,988 | | | | 0.3 | | |
| | 345,000 | | | # | | Crown Castle Towers
LLC, 3.214%, 08/15/15 | | | 349,212 | | | | 0.0 | | |
| | 2,000,000 | | | # | | JDS Uniphase Corp.,
1.000%, 05/15/26 | | | 1,965,332 | | | | 0.3 | | |
| | 6,612,000 | | | | | Other Securities | | | 7,527,888 | | | | 1.0 | | |
| | | | | | | | | | 11,897,420 | | | | 1.6 | | |
| | | | | Utilities: 0.5% | |
| | 150,000 | | | # | | EDF S.A., 4.600%,
01/27/20 | | | 153,518 | | | | 0.0 | | |
| | 425,000 | | | # | | Enel Finance
International S.A.,
5.125%, 10/07/19 | | | 380,144 | | | | 0.1 | | |
| | 550,407 | | | | | Other Securities | | | 3,251,030 | | | | 0.4 | | |
| | | | | | | | | | 3,784,692 | | | | 0.5 | | |
| | | | | | | Total Corporate
Bonds/Notes
(Cost $147,982,490) | | | 154,724,543 | | | | 20.4 | | |
Principal
Amount† | |
| |
| | Value | | Percentage
of Net
Assets | |
| COLLATERALIZED MORTGAGE OBLIGATIONS: 0.1% | | | |
| | 350,000 | | | # | | GE Dealer Floorplan
Master Note
Trust, 1.828%,
10/20/14 | | $ | 353,089 | | | | 0.1 | | |
| | | | | | | Total Collateralized
Mortgage
Obligations
(Cost $350,000) | | | 353,089 | | | | 0.1 | | |
| MUNICIPAL BONDS: 0.1% | | | |
| | | | | California: 0.0% | |
| | 150,000 | | | | | Other Securities | | | 169,005 | | | | 0.0 | | |
| | | | | Georgia: 0.1% | |
| | 500,000 | | | | | Other Securities | | | 516,744 | | | | 0.1 | | |
| | | | | Texas: 0.0% | |
| | 230,000 | | | | | Other Securities | | | 267,754 | | | | 0.0 | | |
| | | | | | | Total Municipal Bonds
(Cost $884,549) | | | 953,503 | | | | 0.1 | | |
| ASSET-BACKED SECURITIES: 0.0% | | | |
| | | | | Automobile Asset-Backed Securities: 0.0% | |
| | 71,679 | | | # | | ARI Fleet Lease Trust,
1.728%, 08/15/18 | | | 71,689 | | | | 0.0 | | |
| | | | | | | Total Asset-Backed
Securities
(Cost $71,679) | | | 71,689 | | | | 0.0 | | |
| U.S. TREASURY OBLIGATIONS: 7.7% | | | |
| | | | | U.S. Treasury Bonds: 5.6% | |
| | 19,000,000 | | | | | 1.000%, due 04/30/12 | | | 19,062,339 | | | | 2.5 | | |
| | 19,156,000 | | | | | 1.750%-6.875%,
due 08/15/12-11/15/40 | | | 21,761,089 | | | | 2.8 | | |
| | 2,000,000 | | | | | Other Securities | | | 2,152,812 | | | | 0.3 | | |
| | | | | | | | | | 42,976,240 | | | | 5.6 | | |
| | | | | U.S. Treasury Notes: 2.1% | |
| | 10,000,000 | | | | | 2.750%, due 10/31/13 | | | 10,455,470 | | | | 1.4 | | |
| | 5,010,000 | | | | | 1.875%-2.375%,
due 04/30/14-11/30/14 | | | 5,258,731 | | | | 0.7 | | |
| | | | | | | | | | 15,714,201 | | | | 2.1 | | |
| | | | | | | Total U.S. Treasury
Obligations
(Cost $54,893,772) | | | 58,690,441 | | | | 7.7 | | |
| U.S. GOVERNMENT AGENCY OBLIGATIONS: 1.0% | | | |
| | | | | Federal Home Loan Mortgage Corporation: 0.5%## | |
| | 2,950,000 | | | | | Other Securities | | | 3,480,901 | | | | 0.5 | | |
| | | | | Federal National Mortgage Association: 0.5%## | |
| | 3,045,000 | | | | | Other Securities | | | 3,766,756 | | | | 0.5 | | |
| | | | | | | Total U.S. Government
Agency Obligations
(Cost $6,435,254) | | | 7,247,657 | | | | 1.0 | | |
See Accompanying Notes to Financial Statements
124
ING INVESCO VAN KAMPEN SUMMARY PORTFOLIO OF INVESTMENTS
EQUITY AND INCOME PORTFOLIO AS OF DECEMBER 31, 2011 (CONTINUED)
Principal
Amount† | |
| |
| | Value | | Percentage
of Net
Assets | |
| FOREIGN GOVERNMENT BONDS: 0.2% | |
| | 1,455,000 | | | | | | | Other Securities | | $ | 1,633,943 | | | | 0.2 | | |
| | | | | Total Foreign
Government Bonds
(Cost $1,510,176) | | | 1,633,943 | | | | 0.2 | | |
| | | | | Total Long-Term
Investments
(Cost $644,580,617) | | | 711,072,735 | | | | 93.7 | | |
Shares | |
| |
| | Value | | Percentage
of Net
Assets | |
| SHORT-TERM INVESTMENTS: 5.9% | |
| | | | | Mutual Funds: 5.9% | |
| | 44,996,916 | | | | | | | BlackRock Liquidity
Funds, TempFund,
Institutional Class
(Cost $44,996,916) | | $ | 44,996,916 | | | | 5.9 | | |
| | | | | Total Short-Term
Investments
(Cost $44,996,916) | | | 44,996,916 | | | | 5.9 | | |
| | | | | Total Investments in
Securities
(Cost $689,577,533) | | $ | 756,069,651 | | | | 99.6 | | |
| | | | | Assets in Excess
of Other Liabilities | | | 3,338,940 | | | | 0.4 | | |
| | | | | Net Assets | | $ | 759,408,591 | | | | 100.0 | | |
"Other Securities" represents issues not identified as the top 50 holdings in terms of market value and issues or issuers not exceeding 1% of net assets individually or inaggregate respectively as of December 31, 2011.
The following footnotes apply to either the individual securities noted or one or more of the securities aggregated and listed as a single line item.
† Unless otherwise indicated, principal amount is shown in USD.
# Securities with purchases pursuant to Rule 144A or section 4(2), under the Securities Act of 1933 and may not be resold subject to that rule except to qualified institutional buyers.
## On September 7, 2008, the Federal Housing Finance Agency placed the Federal National Mortgage Association and the Federal Home Loan Mortgage Corporation into conservatorship and the U.S. Treasury guaranteed the debt issued by those organizations.
@ Non-income producing security
ADR American Depositary Receipt
Cost for federal income tax purposes is $690,883,493.
| Net unrealized appreciation consists of: | |
| Gross Unrealized Appreciation | | $ | 93,350,730 | | |
| Gross Unrealized Depreciation | | | (28,164,572 | ) | |
| Net Unrealized Appreciation | | $ | 65,186,158 | | |
See Accompanying Notes to Financial Statements
125
ING INVESCO VAN KAMPEN SUMMARY PORTFOLIO OF INVESTMENTS
EQUITY AND INCOME PORTFOLIO AS OF DECEMBER 31, 2011 (CONTINUED)
Fair Value Measurements^
The following is a summary of the fair valuations according to the inputs used as of December 31, 2011 in valuing the assets and liabilities:
| | | Quoted Prices
in Active Markets
for Identical Investments
(Level 1) | | Significant Other
Observable
Inputs#
(Level 2) | | Significant
Unobservable
Inputs
(Level 3) | | Fair Value
at
12/31/11 | |
| Asset Table | |
| Investments, at value | |
| Common Stock | | | |
| Consumer Discretionary | | $ | 48,829,303 | | | $ | — | | | $ | — | | | $ | 48,829,303 | | |
| Consumer Staples | | | 60,963,633 | | | | — | | | | — | | | | 60,963,633 | | |
| Energy | | | 66,352,879 | | | | — | | | | — | | | | 66,352,879 | | |
| Financials | | | 90,031,612 | | | | — | | | | — | | | | 90,031,612 | | |
| Health Care | | | 65,056,975 | | | | — | | | | — | | | | 65,056,975 | | |
| Industrials | | | 42,142,944 | | | | — | | | | — | | | | 42,142,944 | | |
| Information Technology | | | 55,879,292 | | | | 2,067,430 | | | | — | | | | 57,946,722 | | |
| Materials | | | 5,178,634 | | | | — | | | | — | | | | 5,178,634 | | |
| Telecommunications | | | 16,504,524 | | | | — | | | | — | | | | 16,504,524 | | |
| Utilities | | | 20,630,337 | | | | — | | | | — | | | | 20,630,337 | | |
| Total Common Stock | | | 471,570,133 | | | | 2,067,430 | | | | — | | | | 473,637,563 | | |
| Exchange-Traded Funds | | | 1,137,834 | | | | — | | | | — | | | | 1,137,834 | | |
| Preferred Stock | | | 3,712,612 | | | | 8,909,861 | | | | — | | | | 12,622,473 | | |
| Corporate Bonds/Notes | | | — | | | | 151,165,482 | | | | 3,559,061 | | | | 154,724,543 | | |
| Collateralized Mortgage Obligations | | | — | | | | 353,089 | | | | — | | | | 353,089 | | |
| Municipal Bonds | | | — | | | | 953,503 | | | | — | | | | 953,503 | | |
| U.S. Treasury Obligations | | | — | | | | 58,690,441 | | | | — | | | | 58,690,441 | | |
| U.S. Government Agency Obligations | | | — | | | | 7,247,657 | | | | — | | | | 7,247,657 | | |
| Short-Term Investments | | | 44,996,916 | | | | — | | | | — | | | | 44,996,916 | | |
| Foreign Government Bonds | | | — | | | | 1,633,943 | | | | — | | | | 1,633,943 | | |
| Asset-Backed Securities | | | — | | | | 71,689 | | | | — | | | | 71,689 | | |
| Total Investments, at value | | $ | 521,417,495 | | | $ | 231,093,095 | | | $ | 3,559,061 | | | $ | 756,069,651 | | |
| Other Financial Instruments+ | |
| Forward Foreign Currency Contracts | | | — | | | | 668,565 | | | | — | | | | 668,565 | | |
| Total Assets | | $ | 521,417,495 | | | $ | 231,761,660 | | | $ | 3,559,061 | | | $ | 756,738,216 | | |
The following is a reconciliation of the fair valuations using significant unobservable inputs (Level 3) for the Portfolio's assets and liabilities during the period ended December 31, 2011:
| | | Beginning
Balance
12/31/10 | | Purchases | | Sales | | Accrued
Discounts/
(Premiums) | | Total
Realized
Gain/(Loss) | | Total
Unrealized
Appreciation/
(Depreciation) | | Transfers
Into
Level 3 | | Transfers
Out of
Level 3 | | Ending
Balance
12/31/11 | |
| Asset Table | |
| Investments, at value | |
Corporate
Bonds/Notes | | $ | 3,981,720 | | | $ | — | | | $ | — | | | $ | — | | | $ | — | | | $ | (422,659 | ) | | $ | — | | | $ | — | | | $ | 3,559,061 | | |
Total Investments,
at value | | $ | 3,981,720 | | | $ | — | | | $ | — | | | $ | — | | | $ | — | | | $ | (422,659 | ) | | $ | — | | | $ | — | | | $ | 3,559,061 | | |
As of December 31, 2011, total change in unrealized gain (loss) on Level 3 securities still held at period end and included in the change in net assets was $(422,659).
^ See Note 2, "Significant Accounting Policies" in the Notes to Financial Statements for additional information.
+ Other Financial Instruments are derivatives not reflected in the Portfolio of Investments and may include open forward foreign currency contracts, equity forwards, futures, swaps, and written options. Forward foreign currency contracts, equity forwards and futures are valued at the unrealized gain (loss) on the instrument. Swaps and written options are valued at the fair value of the instrument.
# The earlier close of the foreign markets gives rise to the possibility that significant events, including broad market moves, may have occurred in the interim and may materially affect the value of those securities. To account for this, the Portfolio may frequently value many of its foreign equity securities using fair value prices based on third party vendor modeling tools to the extent available. Accordingly, a significant portion of the Portfolio's investments are categorized as Level 2 investments.
There were no significant transfers between Level 1 and 2 during the year ended December 31, 2011.
See Accompanying Notes to Financial Statements
126
ING INVESCO VAN KAMPEN SUMMARY PORTFOLIO OF INVESTMENTS
EQUITY AND INCOME PORTFOLIO AS OF DECEMBER 31, 2011 (CONTINUED)
Transfers in or out of Level 3 represent either the beginning value (for transfers in), or the ending value (for transfers out) of any security or derivative instrument where a change in the pricing level occurred from the beginning to the end of the period. Transfers are recognized at the end of the reporting period.
At December 31, 2011 , the following forward foreign currency contracts were outstanding for the ING Invesco Van Kampen Equity and Income Portfolio:
| Counterparty | | Currency | | Contract
Amount | | Buy/Sell | | Settlement
Date | | In
Exchange
For | | Fair Value | | Unrealized
Appreciation
(Depreciation) | |
The Bank of New York
Mellon Corp. | | EU Euro | | | 8,949,044 | | | Sell | | 01/12/12 | | $ | 12,037,538 | | | $ | 11,583,233 | | | $ | 454,305 | | |
| State Street Bank | | EU Euro | | | 3,136,624 | | | Sell | | 01/12/12 | | | 4,219,763 | | | | 4,059,903 | | | | 159,860 | | |
| State Street Bank | | British Pound | | | 4,401,087 | | | Sell | | 01/12/12 | | | 6,888,471 | | | | 6,834,071 | | | | 54,400 | | |
| | | $ | 668,565 | | |
A summary of derivative instruments by primary risk exposure is outlined in the following tables.
The fair value of derivative instruments as of December 31, 2011 was as follows:
Derivatives not accounted
for as hedging instruments | | Location on Statement of Assets and Liabilities | | Fair Value | |
| Asset Derivatives | |
| Foreign exchange contracts | | Unrealized appreciation on forward foreign currency contracts | | $ | 668,565 | | |
| Total Asset Derivatives | | | | $ | 668,565 | | |
The effect of derivative instruments on the Portfolio's Statement of Operations for the year ended December 31, 2011 was as follows:
| | | Amount of Realized Gain or (Loss) on Derivatives Recognized in Income | |
Derivatives not accounted
for as hedging instruments | | Foreign currency related transactions* | |
| Foreign exchange contracts | | $ | 834,114 | | |
| Total | | $ | 834,114 | | |
| | | Change in Unrealized Appreciation or (Depreciation) on Derivatives Recognized in Income | |
Derivatives not accounted
for as hedging instruments | | Foreign currency related transactions* | |
| Foreign exchange contracts | | $ | 668,565 | | |
| Total | | $ | 668,565 | | |
* Amounts recognized for forward foreign currency contracts are included in net realized gain (loss) on foreign currency related transactions and net change in unrealized appreciation or depreciation on foreign currency related transactions.
See Accompanying Notes to Financial Statements
127
ING JPMORGAN SUMMARY PORTFOLIO OF INVESTMENTS
MID CAP VALUE PORTFOLIO AS OF DECEMBER 31, 2011
| Shares | |
| |
| | Value | | Percentage
of Net
Assets | |
| COMMON STOCK: 97.0% | |
| | | | | Consumer Discretionary: 18.8% | |
| | 10,950 | | | @ | | Autozone, Inc. | | $ | 3,558,421 | | | | 1.1 | | |
| | 127,800 | | | | | CBS Corp. - Class B | | | 3,468,492 | | | | 1.0 | | |
| | 77,553 | | | | | Darden
Restaurants, Inc. | | | 3,534,866 | | | | 1.0 | | |
| | 53,700 | | | | | Genuine Parts Co. | | | 3,286,440 | | | | 1.0 | | |
| | 70,600 | | | | | Kohl's Corp. | | | 3,484,110 | | | | 1.0 | | |
| | 139,906 | | | | | Marriott
International, Inc. | | | 4,081,058 | | | | 1.2 | | |
| | 70,400 | | | | | TJX Cos., Inc. | | | 4,544,320 | | | | 1.4 | | |
| | 1,141,426 | | | | | Other Securities | | | 36,956,111 | | | | 11.1 | | |
| | | | | | | | | | 62,913,818 | | | | 18.8 | | |
| | | | | Consumer Staples: 6.3% | |
| | 89,700 | | | | | Beam, Inc. | | | 4,595,331 | | | | 1.4 | | |
| | 45,400 | | | | | JM Smucker Co. | | | 3,548,918 | | | | 1.1 | | |
| | 48,600 | | | @ | | Ralcorp Holdings, Inc. | | | 4,155,300 | | | | 1.2 | | |
| | 143,675 | | | | | Other Securities | | | 8,752,918 | | | | 2.6 | | |
| | | | | | | | | | 21,052,467 | | | | 6.3 | | |
| | | | | Energy: 4.8% | |
| | 66,900 | | | | | Devon Energy Corp. | | | 4,147,800 | | | | 1.2 | | |
| | 161,797 | | | | | Williams Cos., Inc. | | | 5,342,537 | | | | 1.6 | | |
| | 191,500 | | | | | Other Securities | | | 6,565,247 | | | | 2.0 | | |
| | | | | | | | | | 16,055,584 | | | | 4.8 | | |
| | | | | Financials: 23.4% | |
| | 105,700 | | | | | Ameriprise
Financial, Inc. | | | 5,246,948 | | | | 1.6 | | |
| | 273,000 | | | | | Fifth Third Bancorp. | | | 3,472,560 | | | | 1.0 | | |
| | 155,100 | | | | | Loews Corp. | | | 5,839,515 | | | | 1.7 | | |
| | 52,361 | | | | | M&T Bank Corp. | | | 3,997,239 | | | | 1.2 | | |
| | 126,000 | | | | | Marsh & McLennan
Cos., Inc. | | | 3,984,120 | | | | 1.2 | | |
| | 61,600 | | | | | T. Rowe Price
Group, Inc. | | | 3,508,120 | | | | 1.1 | | |
| | 70,700 | | | | | Transatlantic
Holdings, Inc. | | | 3,869,411 | | | | 1.2 | | |
| | 138,300 | | | | | WR Berkley Corp. | | | 4,756,137 | | | | 1.4 | | |
| | 174,100 | | | | | XL Group PLC | | | 3,441,957 | | | | 1.0 | | |
| | 1,931,431 | | | | | Other Securities | | | 40,098,964 | | | | 12.0 | | |
| | | | | | | | | | 78,214,971 | | | | 23.4 | | |
| | | | | Health Care: 6.2% | |
| | 107,380 | | | | | AmerisourceBergen
Corp. | | | 3,993,462 | | | | 1.2 | | |
| | 41,700 | | | | | Humana, Inc. | | | 3,653,337 | | | | 1.1 | | |
| | 174,700 | | | | | Lincare Holdings, Inc. | | | 4,491,537 | | | | 1.4 | | |
| | 222,600 | | | | | Other Securities | | | 8,441,822 | | | | 2.5 | | |
| | | | | | | | | | 20,580,158 | | | | 6.2 | | |
| Shares | |
| |
| | Value | | Percentage
of Net
Assets | |
| | | | | Industrials: 8.8% | |
| | 81,400 | | | | | Ametek, Inc. | | $ | 3,426,940 | | | | 1.0 | | |
| | 77,400 | | | | | Carlisle Cos., Inc. | | | 3,428,820 | | | | 1.0 | | |
| | 64,079 | | | | | Cooper Industries PLC | | | 3,469,878 | | | | 1.0 | | |
| | 65,200 | | | | | Regal-Beloit Corp. | | | 3,323,244 | | | | 1.0 | | |
| | 237,917 | | | | | Republic Services, Inc. | | | 6,554,613 | | | | 2.0 | | |
| | 65,041 | | | | | Snap-On, Inc. | | | 3,292,376 | | | | 1.0 | | |
| | 178,000 | | | | | Other Securities | | | 6,044,901 | | | | 1.8 | | |
| | | | | | | | | | 29,540,772 | | | | 8.8 | | |
| | | | | Information Technology: 6.5% | |
| | 87,100 | | | | | Amphenol Corp. | | | 3,953,469 | | | | 1.2 | | |
| | 94,600 | | | | | Analog Devices, Inc. | | | 3,384,788 | | | | 1.0 | | |
| | 90,700 | | | @ | | Arrow Electronics, Inc. | | | 3,393,087 | | | | 1.0 | | |
| | 117,800 | | | | | Jack Henry &
Associates, Inc. | | | 3,959,258 | | | | 1.2 | | |
| | 127,000 | | | @ | | Synopsys, Inc. | | | 3,454,400 | | | | 1.0 | | |
| | 115,430 | | | @ | | TE Connectivity Ltd. | | | 3,556,398 | | | | 1.1 | | |
| | | | | | | | | | 21,701,400 | | | | 6.5 | | |
| | | | | Materials: 7.3% | |
| | 64,708 | | | | | Albemarle Corp. | | | 3,333,109 | | | | 1.0 | | |
| | 138,000 | | | | | Ball Corp. | | | 4,927,980 | | | | 1.5 | | |
| | 40,300 | | | | | Sherwin-Williams Co. | | | 3,597,581 | | | | 1.1 | | |
| | 54,400 | | | | | Sigma-Aldrich Corp. | | | 3,397,824 | | | | 1.0 | | |
| | 89,200 | | | | | Silgan Holdings, Inc. | | | 3,446,688 | | | | 1.0 | | |
| | 84,820 | | | | | Other Securities | | | 5,634,316 | | | | 1.7 | | |
| | | | | | | | | | 24,337,498 | | | | 7.3 | | |
| | | | | Telecommunications: 1.4% | |
| | 152,887 | | | | | Other Securities | | | 4,490,505 | | | | 1.4 | | |
| | | | | Utilities: 13.5% | |
| | 257,900 | | | | | CMS Energy Corp. | | | 5,694,432 | | | | 1.7 | | |
| | 121,300 | | | | | Energen Corp. | | | 6,065,000 | | | | 1.8 | | |
| | 78,200 | | | | | NSTAR | | | 3,672,272 | | | | 1.1 | | |
| | 200,100 | | | | | NV Energy, Inc. | | | 3,271,635 | | | | 1.0 | | |
| | 53,800 | | | | | Oneok, Inc. | | | 4,663,922 | | | | 1.4 | | |
| | 73,300 | | | | | Sempra Energy | | | 4,031,500 | | | | 1.2 | | |
| | 153,400 | | | | | Westar Energy, Inc. | | | 4,414,852 | | | | 1.3 | | |
| | 122,900 | | | | | Wisconsin Energy Corp. | | | 4,296,584 | | | | 1.3 | | |
| | 187,900 | | | | | Xcel Energy, Inc. | | | 5,193,556 | | | | 1.6 | | |
| | 150,600 | | | | | Other Securities | | | 3,832,544 | | | | 1.1 | | |
| | | | | | | | | | 45,136,297 | | | | 13.5 | | |
| | | | | | | Total Common Stock
(Cost $286,169,469) | | | 324,023,470 | | | | 97.0 | | |
See Accompanying Notes to Financial Statements
128
ING JPMORGAN SUMMARY PORTFOLIO OF INVESTMENTS
MID CAP VALUE PORTFOLIO AS OF DECEMBER 31, 2011 (CONTINUED)
| Shares | |
| |
| | Value | | Percentage
of Net
Assets | |
| SHORT-TERM INVESTMENTS: 3.1% | |
| | | | | Mutual Funds: 3.1% | |
| | 10,315,919 | | | | | | | BlackRock Liquidity
Funds, TempFund,
Institutional Class
(Cost $10,315,919) | | $ | 10,315,919 | | | | 3.1 | | |
| | | | | Total Short-Term
Investments
(Cost $10,315,919) | | | 10,315,919 | | | | 3.1 | | |
| | | | | Total Investments in
Securities
(Cost $296,485,388) | | $ | 334,339,389 | | | | 100.1 | | |
| | | | | Liabilities in Excess
of Other Assets | | | (174,855 | ) | | | (0.1 | ) | |
| | | | | Net Assets | | $ | 334,164,534 | | | | 100.0 | | |
"Other Securities" represents issues not identified as the top 50 holdings in terms of market value and issues or issuers not exceeding 1% of net assets individually or in aggregate respectively as of December 31, 2011.
The following footnotes apply to either the individual securities noted or one or more of the securities aggregated and listed as a single line item.
@ Non-income producing security
Cost for federal income tax purposes is $301,250,791.
| Net unrealized appreciation consists of: | |
| Gross Unrealized Appreciation | | $ | 49,962,245 | | |
| Gross Unrealized Depreciation | | | (16,873,647 | ) | |
| Net Unrealized Appreciation | | $ | 33,088,598 | | |
Fair Value Measurements^
The following is a summary of the fair valuations according to the inputs used as of December 31, 2011 in valuing the assets and liabilities:
| | | Quoted Prices
in Active Markets
for Identical Investments
(Level 1) | | Significant
Other Observable
Inputs
(Level 2) | | Significant
Unobservable
Inputs
(Level 3) | | Fair Value
at
12/31/11 | |
| Asset Table | |
| Investments, at value | |
| Common Stock* | | $ | 324,023,470 | | | $ | — | | | $ | — | | | $ | 324,023,470 | | |
| Short-Term Investments | | | 10,315,919 | | | | — | | | | — | | | | 10,315,919 | | |
| Total Investments, at value | | $ | 334,339,389 | | | $ | — | | | $ | — | | | $ | 334,339,389 | | |
The following is a reconciliation of the fair valuations using significant unobservable inputs (Level 3) for the Portfolio's assets and liabilities during the period ended December 31, 2011:
| | | Beginning
Balance
12/31/10 | | Purchases | | Sales | | Accrued
Discounts/
(Premiums) | | Total
Realized
Gain/(Loss) | | Total
Unrealized
Appreciation/
(Depreciation) | | Transfers
Into
Level 3 | | Transfers
Out of
Level 3 | | Ending
Balance
12/31/11 | |
| Asset Table | |
| Investments, at value | |
Short-Term
Investments | | $ | 452,732 | | | $ | — | | | $ | (452,732 | ) | | $ | — | | | $ | (113,183 | ) | | $ | 113,183 | | | $ | — | | | $ | — | | | $ | — | | |
Total Investments,
at value | | $ | 452,732 | | | $ | — | | | $ | (452,732 | ) | | $ | — | | | $ | (113,183 | ) | | $ | 113,183 | | | $ | — | | | $ | — | | | $ | — | | |
As of December 31, 2011, total change in unrealized gain (loss) on Level 3 securities still held at period end and included in the change in net assets was $ 0 .
^ See Note 2, "Significant Accounting Policies" in the Notes to Financial Statements for additional information.
* For further breakdown of Common Stock by Industry type, please refer to the Portfolio of Investments.
There were no significant transfers between Level 1 and 2 during the year ended December 31, 2011.
Transfers in or out of Level 3 represent either the beginning value (for transfers in), or the ending value (for transfers out) of any security or derivative instrument where a change in the pricing level occurred from the beginning to the end of the period. Transfers are recognized at the end of the reporting period.
See Accompanying Notes to Financial Statements
129
SUMMARY PORTFOLIO OF INVESTMENTS
ING OPPENHEIMER GLOBAL PORTFOLIO AS OF DECEMBER 31, 2011
Shares | |
| |
| | Value | | Percentage
of Net
Assets | |
| COMMON STOCK: 98.7% | | | |
| | | | | Argentina: 0.3% | |
| | 103,180 | | | | | Other Securities | | $ | 3,578,282 | | | | 0.3 | | |
| | | | | Brazil: 4.0% | |
| | 2,730,200 | | | | | BM&F Bovespa S.A. | | | 14,344,436 | | | | 1.0 | | |
| | 537,400 | | | | | Cia de Bebidas das
Americas ADR | | | 19,394,766 | | | | 1.3 | | |
| | 555,480 | | | | | Embraer SA ADR | | | 14,009,206 | | | | 0.9 | | |
| | 967,650 | | | | | Other Securities | | | 11,562,345 | | | | 0.8 | | |
| | | | | | | | | | 59,310,753 | | | | 4.0 | | |
| | | | | Denmark: 0.6% | |
| | 123,462 | | | | | Other Securities | | | 8,693,398 | | | | 0.6 | | |
| | | | | Finland: 0.7% | |
| | 492,816 | | | | | Other Securities | | | 10,495,997 | | | | 0.7 | | |
| | | | | France: 5.6% | |
| | 173,158 | | | L | | LVMH Moet Hennessy
Louis Vuitton S.A. | | | 24,391,785 | | | | 1.7 | | |
| | 259,604 | | | | | Technip S.A. | | | 24,337,802 | | | | 1.6 | | |
| | 339,224 | | | | | Total S.A. | | | 17,309,844 | | | | 1.2 | | |
| | 267,900 | | | | | Other Securities | | | 16,818,394 | | | | 1.1 | | |
| | | | | | | | | | 82,857,825 | | | | 5.6 | | |
| | | | | Germany: 9.5% | |
| | 195,104 | | | | | Allianz AG | | | 18,633,202 | | | | 1.3 | | |
| | 277,612 | | | | | Bayer AG | | | 17,729,214 | | | | 1.2 | | |
| | 481,494 | | | | | Bayerische Motoren
Werke AG | | | 22,732,944 | | | | 1.6 | | |
| | 567,667 | | | | | SAP AG | | | 30,024,771 | | | | 2.0 | | |
| | 403,847 | | | | | Siemens AG | | | 38,638,317 | | | | 2.6 | | |
| | 75,982 | | | | | Other Securities | | | 11,291,846 | | | | 0.8 | | |
| | | | | | | | | | 139,050,294 | | | | 9.5 | | |
| | | | | India: 2.0% | |
| | 348,113 | | | | | Infosys
Technologies Ltd. | | | 18,118,550 | | | | 1.2 | | |
| | 5,844,413 | | | | | Other Securities | | | 10,848,660 | | | | 0.8 | | |
| | | | | | | | | | 28,967,210 | | | | 2.0 | | |
| | | | | Ireland: 0.6% | |
| | 435,880 | | | | | Other Securities | | | 8,617,348 | | | | 0.6 | | |
| | | | | Italy: 1.5% | |
| | 909,026 | | | | | Other Securities (a) | | | 21,849,302 | | | | 1.5 | | |
| | | | | Japan: 9.3% | |
| | 3,005 | | | | | KDDI Corp. | | | 19,299,023 | | | | 1.3 | | |
| | 60,683 | | | | | Keyence Corp. | | | 14,627,015 | | | | 1.0 | | |
Shares | |
| |
| | Value | | Percentage
of Net
Assets | |
| | 337,700 | | | | | | | Murata
Manufacturing
Co., Ltd. | | $ | 17,294,200 | | | | 1.2 | | |
| | 2,160,741 | | | | | | | Other Securities | | | 85,577,477 | | | | 5.8 | | |
| | | | | | | | | | 136,797,715 | | | | 9.3 | | |
| | | | | Mexico: 3.4% | |
| | 3,426,602 | | | | | | | Fomento Economico
Mexicano SA de
CV ADR | | | 23,948,669 | | | | 1.6 | | |
| | 822,734 | | | | | | | Grupo Televisa
SAB ADR | | | 17,326,778 | | | | 1.2 | | |
| | 1,452,967 | | | | | | | Other Securities | | | 9,162,583 | | | | 0.6 | | |
| | | | | | | | | | 50,438,030 | | | | 3.4 | | |
| | | | | Netherlands: 2.6% | |
| | 884,143 | | | | | | | European Aeronautic
Defence and
Space Co. NV | | | 27,531,307 | | | | 1.9 | | |
| | 523,829 | | | | | | | Other Securities | | | 10,990,797 | | | | 0.7 | | |
| | | | | | | | | | 38,522,104 | | | | 2.6 | | |
| | | | | South Korea: 0.6% | |
| | 38,066 | | | | | | | Other Securities | | | 9,204,758 | | | | 0.6 | | |
| | | | | Spain: 2.7% | |
| | 2,099,262 | | | | | | | Banco Bilbao Vizcaya
Argentaria S.A. | | | 18,083,426 | | | | 1.2 | | |
| | 270,871 | | | | | | | Inditex S.A. | | | 22,112,474 | | | | 1.5 | | |
| | | | | | | | | | 40,195,900 | | | | 2.7 | | |
| | | | | Sweden: 6.5% | |
| | 932,753 | | | | | | | Assa Abloy AB | | | 23,324,103 | | | | 1.6 | | |
| | 5,724,696 | | | | | | | Telefonaktiebolaget
LM Ericsson | | | 58,051,930 | | | | 3.9 | | |
| | 787,476 | | | | | | | Investor AB | | | 14,646,059 | | | | 1.0 | | |
| | | | | | | | | | 96,022,092 | | | | 6.5 | | |
| | | | | Switzerland: 5.5% | |
| | 778,875 | | | | | | | Credit Suisse Group | | | 18,255,410 | | | | 1.2 | | |
| | 332,040 | | | | | | | Nestle S.A. | | | 19,066,907 | | | | 1.3 | | |
| | 1,686,609 | | | | | | | UBS AG - Reg | | | 20,007,713 | | | | 1.4 | | |
| | 376,712 | | | | | | | Other Securities | | | 22,916,568 | | | | 1.6 | | |
| | | | | | | | | | 80,246,598 | | | | 5.5 | | |
| | | | | Taiwan: 1.2% | |
| | 7,235,111 | | | | | | | Taiwan Semiconductor
Manufacturing
Co., Ltd. | | | 18,077,646 | | | | 1.2 | | |
| | | | | United Kingdom: 3.0% | |
| | 1,636,216 | | | | | | | Prudential PLC | | | 16,188,875 | | | | 1.1 | | |
| | 711,907 | | | | | | | Unilever PLC | | | 23,872,975 | | | | 1.6 | | |
| | 1,178,830 | | | | | | | Other Securities | | | 4,580,895 | | | | 0.3 | | |
| | | | | | | | | | 44,642,745 | | | | 3.0 | | |
See Accompanying Notes to Financial Statements
130
SUMMARY PORTFOLIO OF INVESTMENTS
ING OPPENHEIMER GLOBAL PORTFOLIO AS OF DECEMBER 31, 2011 (CONTINUED)
Shares | |
| |
| | Value | | Percentage
of Net
Assets | |
| | | | | United States: 39.1% | |
| | 244,950 | | | | | 3M Co. | | $ | 20,019,764 | | | | 1.4 | | |
| | 625,593 | | | @ | | Adobe Systems, Inc. | | | 17,685,514 | | | | 1.2 | | |
| | 646,260 | | | | | Aetna, Inc. | | | 27,265,709 | | | | 1.9 | | |
| | 880,300 | | | | | Altera Corp. | | | 32,659,130 | | | | 2.2 | | |
| | 219,920 | | | | | Amgen, Inc. | | | 14,121,063 | | | | 1.0 | | |
| | 264,790 | | | | | Automatic Data
Processing, Inc. | | | 14,301,308 | | | | 1.0 | | |
| | 693,410 | | | | | Carnival Corp. | | | 22,632,902 | | | | 1.5 | | |
| | 292,420 | | | | | Colgate-Palmolive Co. | | | 27,016,684 | | | | 1.8 | | |
| | 1,528,770 | | | @ | | eBay, Inc. | | | 46,367,594 | | | | 3.2 | | |
| | 161,640 | | | | | Goldman Sachs
Group, Inc. | | | 14,617,105 | | | | 1.0 | | |
| | 31,220 | | | @ | | Google, Inc. - Class A | | | 20,164,998 | | | | 1.4 | | |
| | 595,950 | | | | | Intuit, Inc. | | | 31,341,011 | | | | 2.1 | | |
| | 791,740 | | | @ | | Juniper Networks, Inc. | | | 16,159,413 | | | | 1.1 | | |
| | 902,530 | | | | | Maxim Integrated
Products | | | 23,501,881 | | | | 1.6 | | |
| | 328,160 | | | | | McDonald's Corp. | | | 32,924,293 | | | | 2.2 | | |
| | 396,090 | | | | | McGraw-Hill Cos., Inc. | | | 17,812,167 | | | | 1.2 | | |
| | 880,900 | | | | | Microsoft Corp. | | | 22,868,164 | | | | 1.6 | | |
| | 402,300 | | | | | Tiffany & Co. | | | 26,656,398 | | | | 1.8 | | |
| | 682,060 | | | | | Walt Disney Co. | | | 25,577,250 | | | | 1.7 | | |
| | 410,430 | | | | | WellPoint, Inc. | | | 27,190,988 | | | | 1.8 | | |
| | 336,920 | | | | | Zimmer Holdings, Inc. | | | 17,998,266 | | | | 1.2 | | |
| | 3,297,820 | | | | | Other Securities (a) | | | 76,875,193 | | | | 5.2 | | |
| | | | | | | | 575,756,795 | | | | 39.1 | | |
| | | Total Common Stock | |
(Cost $1,309,918,679) | | | 1,453,324,792 | | | | 98.7 | | |
Principal
Amount† | |
| |
| | Value | | Percentage
of Net
Assets | |
| SHORT-TERM INVESTMENTS: 1.6% | |
| | | | | Securities Lending Collateralcc(1): 0.6% | |
| | 1,951,685 | | | | | | | Citigroup, Inc.,
Repurchase
Agreement dated
12/30/11, 0.08%, due
01/03/12 (Repurchase
Amount $1,951,702,
collateralized by
various U.S.
Government and U.S.
Government Agency
Obligations,
0.000%-5.500%,
Market Value plus
accrued interest
$1,990,719, due
01/19/12-12/20/41) | | $ | 1,951,685 | | | | 0.1 | | |
Principal
Amount† | |
| |
| | Value | | Percentage
of Net
Assets | |
| | 1,951,685 | | | | | | | Deutsche Bank AG,
Repurchase
Agreement
dated 12/30/11,
0.08%, due 01/03/12
(Repurchase
Amount $1,951,702,
collateralized by
various U.S.
Government and
U.S. Government
Agency Obligations,
0.000%-6.500%,
Market Value plus
accrued interest
$1,990,719, due
06/28/12-11/01/41) | | $ | 1,951,685 | | | | 0.1 | | |
| | 1,951,685 | | | | | | | Goldman Sachs & Co.,
Repurchase
Agreement
dated 12/30/11,
0.10%, due 01/03/12
(Repurchase
Amount $1,951,706,
collateralized by
various U.S.
Government Agency
Obligations,
2.163%-6.500%,
Market Value plus
accrued interest
$1,990,719, due
04/01/20-12/01/48) | | | 1,951,685 | | | | 0.2 | | |
| | 1,951,685 | | | | | | | Morgan Stanley,
Repurchase
Agreement dated
12/30/11, 0.08%, due
01/03/12 (Repurchase
Amount $1,951,702,
collateralized by
various U.S.
Government and U.S.
Government Agency
Obligations,
0.000%-6.375%,
Market Value plus
accrued interest
$1,990,719, due
11/15/12-10/01/44) | | | 1,951,685 | | | | 0.2 | | |
| | 410,881 | | | | | | | Royal Bank of Canada,
Repurchase
Agreement dated
12/30/11, 0.01%, due
01/03/12 (Repurchase
Amount $410,881,
collateralized by
various U.S.
Government
Securities,
0.000%-4.250%,
Market Value plus
accrued interest
$419,099, due
08/15/12-11/15/40) | | | 410,881 | | | | 0.0 | | |
| | | | | | | | | | 8,217,621 | | | | 0.6 | | |
See Accompanying Notes to Financial Statements
131
SUMMARY PORTFOLIO OF INVESTMENTS
ING OPPENHEIMER GLOBAL PORTFOLIO AS OF DECEMBER 31, 2011 (CONTINUED)
Shares | |
| |
| | Value | | Percentage
of Net
Assets | |
| | | | | Mutual Funds: 1.0% | |
| | 14,603,441 | | | | | | | BlackRock Liquidity
Funds, TempFund,
Institutional Class
(Cost $14,603,441) | | $ | 14,603,441 | | | | 1.0 | | |
| | | | | | | | | Total Short-Term
Investments
(Cost $22,821,062) | | | 22,821,062 | | | | 1.6 | | |
| | | | | | | Total Investments in
Securities
(Cost $1,332,739,741) | | $ | 1,476,145,854 | | | | 100.3 | | |
| | | | | | | Liabilities in
Excess of Other
Assets | | | (4,033,568 | ) | | | (0.3 | ) | |
| | | | | | | Net Assets | | $ | 1,472,112,286 | | | | 100.0 | | |
"Other Securities" represents issues not identified as the top 50 holdings in terms of market value and issues or issuers not exceeding 1% of net assets individually or in aggregate respectively as of December 31, 2011.
The following footnotes apply to either the individual securities noted or one or more of the securities aggregated and listed as a single line item.
† Unless otherwise indicated, principal amount is shown in USD.
@ Non-income producing security
ADR American Depositary Receipt
cc Securities purchased with cash collateral for securities loaned.
L Loaned security, a portion or all of the security is on loan at December 31, 2011.
(1) Collateral received from brokers for securities lending was invested into these short-term investments.
(a) This grouping contains loaned securities.
Cost for federal income tax purposes is $1,349,564,798.
| Net unrealized appreciation consists of: | |
| Gross Unrealized Appreciation | | $ | 271,258,590 | | |
| Gross Unrealized Depreciation | | | (144,677,534 | ) | |
| Net Unrealized Appreciation | | $ | 126,581,056 | | |
| Sector Diversification | | Percentage of
Net Assets | |
| Consumer Discretionary | | | 17.9 | % | |
| Consumer Staples | | | 9.4 | | |
| Energy | | | 3.9 | | |
| Financials | | | 13.9 | | |
| Health Care | | | 10.3 | | |
| Industrials | | | 12.3 | | |
| Information Technology | | | 28.2 | | |
| Materials | | | 0.8 | | |
| Telecommunications | | | 1.3 | | |
| Utilities | | | 0.7 | | |
| Short-Term Investments | | | 1.6 | | |
| Liabilities in Excess of Other Assets | | | (0.3 | ) | |
| Net Assets | | | 100.0 | % | |
See Accompanying Notes to Financial Statements
132
SUMMARY PORTFOLIO OF INVESTMENTS
ING OPPENHEIMER GLOBAL PORTFOLIO AS OF DECEMBER 31, 2011 (CONTINUED)
Fair Value Measurements^
The following is a summary of the fair valuations according to the inputs used as of December 31, 2011 in valuing the assets and liabilities:
| | | Quoted Prices
in Active Markets
for Identical Investments
(Level 1) | | Significant Other
Observable
Inputs#
(Level 2) | | Significant
Unobservable
Inputs
(Level 3) | | Fair Value
at
12/31/11 | |
| Asset Table | |
| Investments, at value | |
| Common Stock | |
| Argentina | | $ | 3,578,282 | | | $ | — | | | $ | — | | | $ | 3,578,282 | | |
| Brazil | | | 52,756,289 | | | | 6,554,464 | | | | — | | | | 59,310,753 | | |
| Denmark | | | — | | | | 8,693,398 | | | | — | | | | 8,693,398 | | |
| Finland | | | — | | | | 10,495,997 | | | | — | | | | 10,495,997 | | |
| France | | | — | | | | 82,857,825 | | | | — | | | | 82,857,825 | | |
| Germany | | | — | | | | 139,050,294 | | | | — | | | | 139,050,294 | | |
| India | | | — | | | | 28,967,210 | | | | — | | | | 28,967,210 | | |
| Ireland | | | 8,617,348 | | | | — | | | | — | | | | 8,617,348 | | |
| Italy | | | — | | | | 21,849,302 | | | | — | | | | 21,849,302 | | |
| Japan | | | — | | | | 136,797,715 | | | | — | | | | 136,797,715 | | |
| Mexico | | | 50,438,030 | | | | — | | | | — | | | | 50,438,030 | | |
| Netherlands | | | — | | | | 38,522,104 | | | | — | | | | 38,522,104 | | |
| South Korea | | | — | | | | 9,204,758 | | | | — | | | | 9,204,758 | | |
| Spain | | | — | | | | 40,195,900 | | | | — | | | | 40,195,900 | | |
| Sweden | | | — | | | | 96,022,092 | | | | — | | | | 96,022,092 | | |
| Switzerland | | | 11,979,177 | | | | 68,267,421 | | | | — | | | | 80,246,598 | | |
| Taiwan | | | — | | | | 18,077,646 | | | | — | | | | 18,077,646 | | |
| United Kingdom | | | — | | | | 44,642,745 | | | | — | | | | 44,642,745 | | |
| United States | | | 575,756,795 | | | | — | | | | — | | | | 575,756,795 | | |
| Total Common Stock | | | 703,125,921 | | | | 750,198,871 | | | | — | | | | 1,453,324,792 | | |
| Short-Term Investments | | | 14,603,441 | | | | 8,217,621 | | | | — | | | | 22,821,062 | | |
| Total Investments, at value | | $ | 717,729,362 | | | $ | 758,416,492 | | | $ | — | | | $ | 1,476,145,854 | | |
The following is a reconciliation of the fair valuations using significant unobservable inputs (Level 3) for the Portfolio's assets and liabilities during the period ended December 31, 2011:
| | | Beginning
Balance
12/31/10 | | Purchases | | Sales | | Accrued
Discounts/
(Premiums) | | Total
Realized
Gain/(Loss) | | Total
Unrealized
Appreciation/
(Depreciation) | | Transfers
Into
Level 3 | | Transfers
Out of
Level 3 | | Ending
Balance
12/31/11 | |
| Asset Table | |
| Investments, at value | |
Short-Term
Investments | | $ | 3,056,680 | | | $ | — | | | $ | (3,056,680 | ) | | $ | — | | | $ | (764,170 | ) | | $ | 764,170 | | | $ | — | | | $ | — | | | $ | — | | |
Total Investments,
at value | | $ | 3,056,680 | | | $ | — | | | $ | (3,056,680 | ) | | $ | — | | | $ | (764,170 | ) | | $ | 764,170 | | | $ | — | | | $ | — | | | $ | — | | |
As of December 31, 2011, total change in unrealized gain (loss) on Level 3 securities still held at period end and included in the change in net assets was $ 0 .
^ See Note 2, "Significant Accounting Policies" in the Notes to Financial Statements for additional information.
# The earlier close of the foreign markets gives rise to the possibility that significant events, including broad market moves, may have occurred in the interim and may materially affect the value of those securities. To account for this, the Portfolio may frequently value many of its foreign equity securities using fair value prices based on third party vendor modeling tools to the extent available. Accordingly, a significant portion of the Portfolio's investments are categorized as Level 2 investments.
There were no significant transfers between Level 1 and 2 during the year ended December 31, 2011.
Transfers in or out of Level 3 represent either the beginning value (for transfers in), or the ending value (for transfers out) of any security or derivative instrument where a change in the pricing level occurred from the beginning to the end of the period. Transfers are recognized at the end of the reporting period.
See Accompanying Notes to Financial Statements
133
SUMMARY PORTFOLIO OF INVESTMENTS
ING PIMCO TOTAL RETURN PORTFOLIO AS OF DECEMBER 31, 2011
Principal
Amount† | |
| |
| | Value | | Percentage
of Net
Assets | |
| CORPORATE BONDS/NOTES: 29.9% | | | |
| | | | | Consumer Discretionary: 0.2% | |
| | 2,197,074 | | | | | Other Securities | | $ | 2,217,804 | | | | 0.2 | | |
| | | | | Consumer Staples: 0.6% | |
| | 6,000,000 | | | | | Anheuser-Busch
InBev
Worldwide,
Inc., 4.125%-
5.375%,
01/15/15-
01/15/20 | | | 6,760,371 | | | | 0.6 | | |
| | 700,000 | | | | | Other Securities | | | 831,788 | | | | 0.0 | | |
| | | | | | | | | | 7,592,159 | | | | 0.6 | | |
| | | | | Energy: 2.2% | |
| | 6,910,000 | | | Z | | British Transco
International
Finance,
11/04/21 | | | 4,668,589 | | | | 0.4 | | |
| | 200,000 | | | #,L | | ENN Energy
Holdings Ltd.,
6.000%,
05/13/21 | | | 180,852 | | | | 0.0 | | |
| | 300,000 | | | # | | Odebrecht
Drilling Norbe
VIII/IX Ltd.,
6.350%,
06/30/21 | | | 310,500 | | | | 0.0 | | |
| | 3,800,000 | | | | | Petroleos
Mexicanos,
6.000%-8.000%,
05/03/19-
03/05/20 | | | 4,581,140 | | | | 0.4 | | |
| | 15,175,089 | | | | | Other Securities (a) | | | 16,085,626 | | | | 1.4 | | |
| | | | | | | | | | 25,826,707 | | | | 2.2 | | |
| | | | | Financials: 21.7% | |
| EUR | 6,100,000 | | | | | American
General
Finance Corp.,
4.125%,
11/29/13 | | | 6,303,183 | | | | 0.6 | | |
| | 300,000 | | | | | American
General
Finance Corp.,
4.875%,
07/15/12 | | | 288,750 | | | | 0.0 | | |
| CAD | 1,000,000 | | | | | American
International
Group, Inc.,
4.900%,
06/02/14 | | | 975,460 | | | | 0.1 | | |
| | 3,300,000 | | | | | American
International
Group, Inc.,
5.850%,
01/16/18 | | | 3,234,723 | | | | 0.3 | | |
Principal
Amount† | |
| |
| | Value | | Percentage
of Net
Assets | |
| | 800,000 | | | # | | ANZ National
International
Ltd., 6.200%,
07/19/13 | | $ | 849,266 | | | | 0.1 | | |
| | 700,000 | | | # | | Banco
Santander
Brazil SA/
Cayman
Islands, 2.659%,
03/18/14 | | | 667,301 | | | | 0.1 | | |
| | 5,600,000 | | | | | Bank of America
Corp., 0.787%-
6.500%,
08/01/16-
12/01/17 | | | 5,520,623 | | | | 0.5 | | |
| | 300,000 | | | # | | Bank of China
Hong Kong
Ltd., 5.550%,
02/11/20 | | | 311,818 | | | | 0.0 | | |
| | 600,000 | | | # | | Bank of
Montreal,
2.850%,
06/09/15 | | | 622,544 | | | | 0.1 | | |
| | 800,000 | | | #,L | | Bank of Nova
Scotia, 1.650%,
10/29/15 | | | 799,913 | | | | 0.1 | | |
| | 4,100,000 | | | | | Barclays Bank
PLC, 5.450%,
09/12/12 | | | 4,189,425 | | | | 0.4 | | |
| | 700,000 | | | # | | Barclays Bank
PLC, 6.050%,
12/04/17 | | | 636,189 | | | | 0.0 | | |
| | 1,200,000 | | | # | | BBVA Bancomer
SA/Texas,
6.500%,
03/10/21 | | | 1,162,500 | | | | 0.1 | | |
| | 2,200,000 | | | # | | BNP Paribas,
5.186%,
06/29/49 | | | 1,474,000 | | | | 0.1 | | |
| | 300,000 | | | # | | BPCE S.A.,
2.375%,
10/04/13 | | | 290,688 | | | | 0.0 | | |
| | 300,000 | | | # | | CIT Group,
Inc., 5.250%,
04/01/14 | | | 300,375 | | | | 0.0 | | |
| | 7,700,000 | | | | | Citigroup, Inc.,
5.000%,
09/15/14 | | | 7,626,450 | | | | 0.7 | | |
| | 8,400,000 | | | | | Citigroup, Inc.,
5.300%-8.500%,
08/27/12-
05/22/19 | | | 8,680,577 | | | | 0.7 | | |
| | 6,300,000 | | | # | | Commonwealth
Bank of
Australia,
1.000%,
07/12/13 | | | 6,299,899 | | | | 0.5 | | |
| | 1,100,000 | | | # | | Commonwealth
Bank of
Australia,
6.024%,
03/29/49 | | | 1,017,979 | | | | 0.1 | | |
See Accompanying Notes to Financial Statements
134
SUMMARY PORTFOLIO OF INVESTMENTS
ING PIMCO TOTAL RETURN PORTFOLIO AS OF DECEMBER 31, 2011 (CONTINUED)
Principal
Amount† | |
| |
| | Value | | Percentage
of Net
Assets | |
| | | | | Financials (continued) | |
| | 700,000 | | | # | | Corp. Nacional
del Cobre de
Chile -
CODELCO,
7.500%,
01/15/19 | | $ | 894,790 | | | | 0.1 | | |
| | 5,700,000 | | | # | | Credit Agricole
S.A., 8.375%,
12/13/49 | | | 4,303,500 | | | | 0.4 | | |
| | 3,300,000 | | | # | | Dexia Credit
Local, 0.908%,
04/29/14 | | | 2,995,799 | | | | 0.3 | | |
| | 11,900,000 | | | # | | FIH Erhvervsbank
A/S, 0.912%,
06/13/13 | | | 11,893,693 | | | | 1.0 | | |
| EUR | 4,800,000 | | | | | General Electric
Capital Corp.,
5.500%,
09/15/67 | | | 4,907,785 | | | | 0.4 | | |
| | 1,700,000 | | | | | General Electric
Capital Corp.,
5.875%-6.875%,
01/14/38-
01/10/39 | | | 1,915,160 | | | | 0.2 | | |
| EUR | 5,500,000 | | | | | Goldman Sachs
Group, Inc.,
1.884%,
02/04/13 | | | 6,830,898 | | | | 0.6 | | |
| | 6,050,000 | | | | | Goldman Sachs
Group, Inc.,
5.950%-6.750%,
09/01/17-
10/01/37 | | | 5,953,457 | | | | 0.5 | | |
| | 10,900,000 | | | | | HSBC Holdings
PLC, 5.100%,
04/05/21 | | | 11,599,420 | | | | 1.0 | | |
| | 4,800,000 | | | # | | ICICI Bank
Ltd../Dubai,
4.750%,
11/25/16 | | | 4,585,656 | | | | 0.4 | | |
| | 700,000 | | | # | | International
Lease Finance
Corp., 6.750%,
09/01/16 | | | 721,000 | | | | 0.1 | | |
| | 5,800,000 | | | | | International
Lease Finance
Corp., 5.300%-
5.750%,
02/15/12-
05/15/16 | | | 5,791,650 | | | | 0.5 | | |
| | 1,200,000 | | | | | Lloyds TSB Bank
PLC, 4.875%,
01/21/16 | | | 1,170,770 | | | | 0.1 | | |
| | 6,700,000 | | | # | | Lloyds TSB Bank
PLC, 5.800%,
01/13/20 | | | 6,368,819 | | | | 0.5 | | |
| | 3,000,000 | | | # | | Macquarie
Group Ltd.,
7.300%,
08/01/14 | | | 3,125,496 | | | | 0.3 | | |
Principal
Amount† | |
| |
| | Value | | Percentage
of Net
Assets | |
| GBP | 600,000 | | | | | Merrill Lynch &
Co., Inc.,
1.201%,
02/21/12 | | $ | 927,653 | | | | 0.1 | | |
| | 8,000,000 | | | | | Merrill Lynch &
Co., Inc.,
5.450%,
02/05/13 | | | 8,060,936 | | | | 0.7 | | |
| | 3,300,000 | | | L | | Merrill Lynch &
Co., Inc.,
0.757%-
6.875%,
06/05/12-
04/25/18 | | | 3,258,709 | | | | 0.2 | | |
| | 500,000 | | | # | | Monumental
Global
Funding Ltd.,
5.500%,
04/22/13 | | | 520,896 | | | | 0.0 | | |
| | 2,400,000 | | | | | Morgan Stanley,
5.950%-6.250%,
08/28/17-
12/28/17 | | | 2,331,348 | | | | 0.2 | | |
| | 500,000 | | | # | | National Bank of
Canada,
2.200%,
10/19/16 | | | 504,825 | | | | 0.0 | | |
| | 1,400,000 | | | # | | Nationwide
Building Society,
6.250%,
02/25/20 | | | 1,390,803 | | | | 0.1 | | |
| | 4,800,000 | | | | | Nomura
Holdings, Inc.,
6.700%,
03/04/20 | | | 5,060,458 | | | | 0.4 | | |
| | 300,000 | | | # | | Nordea Bank AB,
2.125%,
01/14/14 | | | 294,397 | | | | 0.0 | | |
| CAD | 1,700,000 | | | | | Province of
Ontario
Canada,
4.000%,
06/02/21 | | | 1,833,881 | | | | 0.2 | | |
| CAD | 7,900,000 | | | | | Province of
Ontario
Canada,
4.700%,
06/02/37 | | | 9,407,494 | | | | 0.8 | | |
| | 4,000,000 | | | L | | Province of
Ontario
Canada,
1.600%,
09/21/16 | | | 3,993,100 | | | | 0.3 | | |
| | 600,000 | | | # | | Royal Bank of
Scotland PLC,
6.990%,
10/29/49 | | | 378,750 | | | | 0.0 | | |
| | 1,600,000 | | | # | | Royal Bank of
Scotland PLC,
2.625%,
05/11/12 | | | 1,610,504 | | | | 0.2 | | |
See Accompanying Notes to Financial Statements
135
SUMMARY PORTFOLIO OF INVESTMENTS
ING PIMCO TOTAL RETURN PORTFOLIO AS OF DECEMBER 31, 2011 (CONTINUED)
Principal
Amount† | |
| |
| | Value | | Percentage
of Net
Assets | |
| | | | | Financials (continued) | |
| | 200,000 | | | # | | Royal Bank of
Scotland PLC,
4.875%,
08/25/14 | | $ | 195,839 | | | | 0.0 | | |
| | 6,400,000 | | | # | | Santander US
Debt S.A.
Unipersonal,
1.379%,
03/30/12 | | | 6,389,018 | | | | 0.5 | | |
| EUR | 2,800,000 | | | | | SLM Corp.,
3.125%,
09/17/12 | | | 3,581,529 | | | | 0.3 | | |
| | 8,400,000 | | | | | SLM Corp.,
5.000%,
10/01/13 | | | 8,421,000 | | | | 0.7 | | |
| | 700,000 | | | | | SLM Corp.,
5.375%,
01/15/13 | | | 705,061 | | | | 0.1 | | |
| | 200,000 | | | #,L | | Societe Generale,
5.922%,
12/31/49 | | | 121,860 | | | | 0.0 | | |
| | 2,900,000 | | | # | | State Bank of
India/London,
4.500%,
07/27/15 | | | 2,871,162 | | | | 0.2 | | |
| | 700,000 | | | # | | Temasek
Financial I
Ltd., 4.300%,
10/25/19 | | | 754,900 | | | | 0.1 | | |
| | 300,000 | | | # | | TransCapitalInvest
Ltd. for
OJSC AK
Transneft,
8.700%,
08/07/18 | | | 362,535 | | | | 0.0 | | |
| | 400,000 | | | # | | Turkiye Garanti
Bankasi AS,
2.909%,
04/20/16 | | | 364,000 | | | | 0.0 | | |
| | 400,000 | | | #,L | | Vnesheconombank
Via VEB
Finance Ltd.,
5.450%,
11/22/17 | | | 397,000 | | | | 0.0 | | |
| | 1,200,000 | | | | | Wells Fargo &
Co., 5.625%,
12/11/17 | | | 1,369,532 | | | | 0.1 | | |
| | 3,400,000 | | | # | | Westpac Banking
Corp., 3.585%,
08/14/14 | | | 3,627,576 | | | | 0.3 | | |
| | 146,000 | | | # | | ZFS Finance USA
Trust IV,
5.875%,
05/09/32 | | | 138,700 | | | | 0.0 | | |
| | 80,166,431 | | | | | Other
Securities (a),(b) | | | 63,209,558 | | | | 5.3 | | |
| | | | | | | | | | 256,392,580 | | | | 21.7 | | |
Principal
Amount† | |
| |
| | Value | | Percentage
of Net
Assets | |
| | | | | Health Care: 0.5% | |
| | 5,200,000 | | | | | | | Other Securities | | $ | 5,872,581 | | | | 0.5 | | |
| | | | | Industrials: 0.9% | |
| | 7,100,000 | | | # | | Asciano Finance
Ltd., 5.000%,
04/07/18 | | | 7,128,982 | | | | 0.6 | | |
| | 400,000 | | | # | | Braskem Finance
Ltd., 5.750%,
04/15/21 | | | 401,000 | | | | 0.0 | | |
| | 600,000 | | | # | | C8 Capital SPV
Ltd., 6.640%,
12/31/49 | | | 330,000 | | | | 0.0 | | |
| | 2,000,000 | | | # | | Noble Group Ltd.,
6.750%,
01/29/20 | | | 1,740,000 | | | | 0.2 | | |
| | 400,000 | | | # | | Sydney Air,
5.125%,
02/22/21 | | | 406,451 | | | | 0.1 | | |
| | | | | | | | | | 10,006,433 | | | | 0.9 | | |
| | | | | Information Technology: 0.7% | |
| | 5,700,000 | | | | | International
Business
Machines Corp.,
5.700%,
09/14/17 | | | 6,912,322 | | | | 0.6 | | |
| | 1,300,000 | | | | | Other Securities | | | 1,361,578 | | | | 0.1 | | |
| | | | | | | | | | 8,273,900 | | | | 0.7 | | |
| | | | | Materials: 1.3% | |
| | 3,800,000 | | | #,L | | Braskem Finance
Ltd., 7.000%,
05/07/20 | | | 4,094,500 | | | | 0.4 | | |
| | 3,400,000 | | | # | | CSN Islands
XI Corp.,
6.875%,
09/21/19 | | | 3,609,100 | | | | 0.3 | | |
| | 1,500,000 | | | # | | CSN Resources
S.A.,
6.500%,
07/21/20 | | | 1,575,000 | | | | 0.1 | | |
| | 3,000,000 | | | # | | Gerdau
Holdings, Inc.,
7.000%,
01/20/20 | | | 3,180,000 | | | | 0.3 | | |
| | 300,000 | | | # | | Gerdau
Trade, Inc.,
5.750%,
01/30/21 | | | 299,250 | | | | 0.0 | | |
| | 2,500,000 | | | | | Other Securities | | | 2,778,198 | | | | 0.2 | | |
| | | | | | | | | | 15,536,048 | | | | 1.3 | | |
| | | | | Telecommunications: 0.8% | |
| | 5,516,000 | | | | | AT&T, Inc.,
4.950%-6.300%,
01/15/13-
01/15/38 | | | 6,101,221 | | | | 0.5 | | |
See Accompanying Notes to Financial Statements
136
SUMMARY PORTFOLIO OF INVESTMENTS
ING PIMCO TOTAL RETURN PORTFOLIO AS OF DECEMBER 31, 2011 (CONTINUED)
Principal
Amount† | |
| |
| | Value | | Percentage
of Net
Assets | |
| | | | | Telecommunications (continued) | |
| | 200,000 | | | # | | Qtel
International
Finance Ltd.,
4.750%,
02/16/21 | | $ | 202,500 | | | | 0.0 | | |
| | 2,500,000 | | | | | Other Securities | | | 2,765,845 | | | | 0.3 | | |
| | | | | | | | | | 9,069,566 | | | | 0.8 | | |
| | | | | Utilities: 1.0% | |
| | 200,000 | | | # | | AES Corp.,
7.375%,
07/01/21 | | | 216,500 | | | | 0.0 | | |
| | 6,600,000 | | | # | | Comision
Federal de
Electricidad,
4.875%,
05/26/21 | | | 6,864,000 | | | | 0.6 | | |
| | 600,000 | | | #,L | | EDF S.A.,
5.500%,
01/26/14 | | | 641,156 | | | | 0.0 | | |
| | 600,000 | | | # | | EDF S.A.,
6.500%,
01/26/19 | | | 679,517 | | | | 0.1 | | |
| | 500,000 | | | # | | Electricite de
France SA,
6.950%,
01/26/39 | | | 589,391 | | | | 0.0 | | |
| | 2,100,000 | | | # | | Enel Finance
International
S.A., 6.250%,
09/15/17 | | | 2,007,067 | | | | 0.2 | | |
| | 8,800,000 | | | | | Other Securities | | | 1,035,321 | | | | 0.1 | | |
| | | | | | | | | | 12,032,952 | | | | 1.0 | | |
| | | | | | | Total Corporate
Bonds/Notes
(Cost
$351,715,607) | | | 352,820,730 | | | | 29.9 | | |
| COLLATERALIZED MORTGAGE OBLIGATIONS: 5.0% | | | |
| | 561,153 | | | # | | Banc of
America
Re-Remic
Trust, 1.765%,
02/17/40 | | | 559,035 | | | | 0.0 | | |
| | 200,000 | | | # | | BCAP LLC
Trust,
5.636%,
03/25/37 | | | 147,600 | | | | 0.0 | | |
| | 1,600,000 | | | # | | BCRR Trust,
5.858%,
07/17/40 | | | 1,795,726 | | | | 0.2 | | |
| | 4,149,459 | | | | | Bear Stearns
Adjustable
Rate
Mortgage
Trust, 2.710%-
5.397%,
11/25/34-
02/25/36 | | | 3,790,919 | | | | 0.3 | | |
Principal
Amount† | |
| |
| | Value | | Percentage
of Net
Assets | |
| | 698,617 | | | # | | Countrywide
Home Loan
Mortgage
Pass-through
Trust,
0.634%,
06/25/35 | | $ | 589,108 | | | | 0.0 | | |
| | 466,809 | | | # | | Credit Suisse
Mortgage
Capital
Certificates,
0.448%,
10/15/21 | | | 430,579 | | | | 0.0 | | |
| | 2,385,382 | | | # | | Credit Suisse
Mortgage
Capital
Certificates,
0.508%,
10/15/21 | | | 2,233,138 | | | | 0.2 | | |
| | 2,400,000 | | | | | Credit Suisse
Mortgage
Capital
Certificates,
5.661%-5.695%,
03/15/39-09/15/40 | | | 2,517,261 | | | | 0.2 | | |
| | 6,568,642 | | | | | Granite Master
Issuer PLC,
0.465%,
12/20/54 | | | 6,279,621 | | | | 0.5 | | |
| | 640,353 | | | # | | GS Mortgage
Securities
Corp. II,
1.143%,
03/06/20 | | | 635,128 | | | | 0.1 | | |
| | 3,300,000 | | | # | | Hillmark
Funding,
0.729%,
05/21/21 | | | 3,053,120 | | | | 0.3 | | |
| | 1,700,000 | | | # | | JPMorgan
Chase
Commercial
Mortgage
Securities
Corp.,
4.070%,
11/15/43 | | | 1,795,942 | | | | 0.2 | | |
| | 8,000,000 | | | | | JPMorgan
Chase
Commercial
Mortgage
Securities
Corp.,
5.336%-5.882%,
05/15/47-02/15/51 | | | 8,626,634 | | | | 0.7 | | |
| | 4,800,000 | | | | | Morgan Stanley
Capital I,
5.809%-5.879%,
06/11/49-12/12/49 | | | 5,298,201 | | | | 0.4 | | |
| | 178,816 | | | # | | Structured Asset
Securities
Corp., 2.650%,
10/25/35 | | | 141,419 | | | | 0.0 | | |
See Accompanying Notes to Financial Statements
137
SUMMARY PORTFOLIO OF INVESTMENTS
ING PIMCO TOTAL RETURN PORTFOLIO AS OF DECEMBER 31, 2011 (CONTINUED)
Principal
Amount† | |
| |
| | Value | | Percentage
of Net
Assets | |
| COLLATERALIZED MORTGAGE OBLIGATIONS (continued) | | | |
| | 679,963 | | | # | | Wachovia Bank
Commercial
Mortgage Trust,
0.358%,
06/15/20 | | $ | 608,701 | | | | 0.1 | | |
| | 24,015,189 | | | | | Other Securities | | | 21,163,825 | | | | 1.8 | | |
| | | | | | | Total
Collateralized
Mortgage
Obligations
(Cost
$59,740,379) | | | 59,665,957 | | | | 5.0 | | |
| MUNICIPAL BONDS: 4.2% | | | |
| | | | | California: 2.0% | |
| | 4,000,000 | | | | | Bay Area Toll
Authority,
7.043%,
04/01/50 | | | 5,302,280 | | | | 0.5 | | |
| | 3,500,000 | | | | | Los Angeles
Department
of Airports,
6.582%,
05/15/39 | | | 4,223,870 | | | | 0.4 | | |
| | 450,000 | | | # | | Orange
County
Sanitation
District,
9.250%,
02/01/33 | | | 468,666 | | | | 0.0 | | |
| | 6,000,000 | | | | | Southern
California
Public Power
Authority,
5.943%,
07/01/40 | | | 7,095,780 | | | | 0.6 | | |
| | 5,200,000 | | | | | Other Securities | | | 6,053,400 | | | | 0.5 | | |
| | | | | | | | | | 23,143,996 | | | | 2.0 | | |
| | | | | Illinois: 0.4% | |
| | 3,800,000 | | | | | Other Securities | | | 4,238,579 | | | | 0.4 | | |
| | | | | Nebraska: 0.0% | |
| | 500,000 | | | | | Other Securities | | | 582,700 | | | | 0.0 | | |
| | | | | Nevada: 0.4% | |
| | 3,300,000 | | | | | City of North
Las Vegas NV,
6.572%,
06/01/40 | | | 3,771,702 | | | | 0.3 | | |
| | 600,000 | | | | | Other Securities | | | 762,594 | | | | 0.1 | | |
| | | | | | | | | | 4,534,296 | | | | 0.4 | | |
| | | | | New Jersey: 0.1% | |
| | 600,000 | | | | | Other Securities | | | 600,132 | | | | 0.1 | | |
Principal
Amount† | |
| |
| | Value | | Percentage
of Net
Assets | |
| | | | | New York: 0.8% | |
| | 7,800,000 | | | | | New York City
Municipal
Water Finance
Authority,
5.000%-6.282%,
06/15/42-
06/15/44 | | $ | 9,237,941 | | | | 0.8 | | |
| | 300,000 | | | | | Other Securities | | | 294,718 | | | | 0.0 | | |
| | | | | | | | | | 9,532,659 | | | | 0.8 | | |
| | | | | Ohio: 0.0% | |
| | 400,000 | | | | | Other Securities | | | 296,260 | | | | 0.0 | | |
| | | | | Texas: 0.5% | |
| | 5,100,000 | | | | | City of San
Antonio
TX, 5.808%-
6.308%,
02/01/37-
02/01/41 | | | 5,955,331 | | | | 0.5 | | |
| | 400,000 | | | | | Other Securities | | | 472,060 | | | | 0.0 | | |
| | | | | | | | | | 6,427,391 | | | | 0.5 | | |
| | | | | Wisconsin: 0.0% | |
| | 70,000 | | | | | Other Securities | | | 71,719 | | | | 0.0 | | |
| | | | | | | Total Municipal
Bonds
(Cost
$42,112,168) | | | 49,427,732 | | | | 4.2 | | |
| ASSET-BACKED SECURITIES: 0.2% | | | | | |
| | | | | Home Equity Asset-Backed Securities: 0.1% | |
| | 492,283 | | | | | Other Securities | | | 448,589 | | | | 0.1 | | |
| | | | | Other Asset-Backed Securities: 0.1% | |
| | 1,811,278 | | | | | Other Securities | | | 1,455,785 | | | | 0.1 | | |
| | | | | | | Total Asset-
Backed
Securities
(Cost
$2,293,441) | | | 1,904,374 | | | | 0.2 | | |
| U.S. TREASURY OBLIGATIONS: 25.2% | | | | | |
| | | Securities: 2.8% | | Treasury Inflation Indexed Protected | |
| | 10,454,106 | | | S | | 1.125%, due
01/15/21 | | | 11,665,308 | | | | 1.0 | | |
| | 6,011,163 | | | S | | 2.500%, due
01/15/29 | | | 8,028,191 | | | | 0.7 | | |
| | 9,736,042 | | | | | 1.750%-3.625%,
due 01/15/25-
04/15/28 | | | 12,469,521 | | | | 1.0 | | |
| | 1,406,440 | | | | | Other Securities | | | 1,505,220 | | | | 0.1 | | |
| | | | | | | | | | 33,668,240 | | | | 2.8 | | |
See Accompanying Notes to Financial Statements
138
SUMMARY PORTFOLIO OF INVESTMENTS
ING PIMCO TOTAL RETURN PORTFOLIO AS OF DECEMBER 31, 2011 (CONTINUED)
Principal
Amount† | |
| |
| | Value | | Percentage
of Net
Assets | |
| | | | | U.S. Treasury Bonds: 13.7% | |
| | 23,300,000 | | | | | 2.625%,
due 11/15/20 | | $ | 25,080,260 | | | | 2.1 | | |
| | 66,600,000 | | | S | | 3.625%,
due 02/15/21 | | | 77,308,015 | | | | 6.6 | | |
| | 21,900,000 | | | | | 2.625%,
due 08/15/20 | | | 23,619,501 | | | | 2.0 | | |
| | 9,900,000 | | | | | 3.000%,
due 02/28/17 | | | 10,953,419 | | | | 0.9 | | |
| | 1,500,000 | | | | | 3.375%,
due 11/15/19 | | | 1,710,117 | | | | 0.2 | | |
| | 8,400,000 | | | | | 3.500%,
due 05/15/20 | | | 9,661,310 | | | | 0.8 | | |
| | 10,900,000 | | | | | 3.625%,
due 02/15/20 | | | 12,640,599 | | | | 1.1 | | |
| | 300,000 | | | | | Other Securities | | | 303,328 | | | | 0.0 | | |
| | | | | | | | | | 161,276,549 | | | | 13.7 | | |
| | | | | U.S. Treasury Notes: 8.7% | |
| | 34,500,000 | | | | | 0.250%,
due 12/15/14 | | | 34,397,569 | | | | 2.9 | | |
| | 25,500,000 | | | | | 0.875%,
due 12/31/16 | | | 25,555,794 | | | | 2.2 | | |
| | 40,000,000 | | | S | | 1.500%,
due 08/31/18 | | | 40,600,000 | | | | 3.4 | | |
| | 2,000,000 | | | | | Other Securities | | | 2,007,188 | | | | 0.2 | | |
| | | | | | | | | | 102,560,551 | | | | 8.7 | | |
| | | | | | | Total U.S.
Treasury
Obligations
(Cost
$291,798,336) | | | 297,505,340 | | | | 25.2 | | |
| FOREIGN GOVERNMENT BONDS: 7.6% | | | |
| CAD | 2,600,000 | | | # | | Canada
Housing
Trust
No 1, 3.350%,
12/15/20 | | | 2,761,475 | | | | 0.2 | | |
| CAD | 900,000 | | | # | | Canada
Housing
Trust
No 1, 3.750%,
03/15/20 | | | 984,306 | | | | 0.1 | | |
| CAD | 400,000 | | | # | | Canada
Housing
Trust
No 1, 3.800%,
06/15/21 | | | 439,244 | | | | 0.0 | | |
| | 600,000 | | | # | | Export-Import
Bank of
China,
4.875%,
07/21/15 | | | 648,265 | | | | 0.1 | | |
| EUR | 3,455,028 | | | | | Italy Buoni
Poliennali
Del Tesoro,
2.100%,
09/15/16-
09/15/21 | | | 3,402,461 | | | | 0.3 | | |
Principal
Amount† | |
| |
| | Value | | Percentage
of Net
Assets | |
| JPY | 1,300,000,000 | | | | | Japan Treasury
Bill, 02/06/12 | | $ | 16,888,469 | | | | 1.4 | | |
| JPY | 1,690,000,000 | | | | | Japan Treasury
Bill, 02/13/12 | | | 21,954,358 | | | | 1.9 | | |
| JPY | 1,120,000,000 | | | | | Japan Treasury
Bill, 02/20/12 | | | 14,549,421 | | | | 1.2 | | |
| | 400,000 | | | # | | Korea Housing
Finance Corp.,
4.125%,
12/15/15 | | | 415,117 | | | | 0.0 | | |
| | 1,600,000 | | | | | Province of
Ontario
Canada,
1.375%-3.000%,
01/27/14-
07/16/18 | | | 1,630,402 | | | | 0.1 | | |
| CAD | 4,900,000 | | | | | Province of
Ontario Canada,
3.150%-5.500%,
03/08/17-
06/02/39 | | | 5,422,725 | | | | 0.5 | | |
| | 1,000,000 | | | # | | Societe
Financement
de l'Economie
Francaise,
0.780%,
07/16/12 | | | 1,002,310 | | | | 0.1 | | |
| | 200,000 | | | # | | Societe
Financement
de l'Economie
Francaise,
3.375%,
05/05/14 | | | 205,133 | | | | 0.0 | | |
| EUR | 5,700,000 | | | | | Spain
Government
Bond,
4.650%,
07/30/25 | | | 6,722,112 | | | | 0.6 | | |
| CAD | 12,189,000 | | | | | Other Securities | | | 12,837,599 | | | | 1.1 | | |
| | | | | | | Total Foreign
Government
Bonds
(Cost
$90,773,136) | | | 89,863,397 | | | | 7.6 | | |
| U.S. GOVERNMENT AGENCY OBLIGATIONS: 48.0% | | | | | |
| | | Corporation: 1.6%## | | Federal Home Loan Mortgage | |
| | 7,709,934 | | | | | 4.500%,
due 09/01/41 | | | 8,175,036 | | | | 0.7 | | |
| | 8,110,295 | | | W | | 0.428%-6.000%,
due 05/27/16-
10/25/44 | | | 8,683,733 | | | | 0.7 | | |
| | 2,019,050 | | | | | Other Securities | | | 2,152,041 | | | | 0.2 | | |
| | | | | | | | | | 19,010,810 | | | | 1.6 | | |
| | | Association: 46.4%## | | Federal National Mortgage | |
| | 51,000,000 | | | W | | 3.000%,
due 10/25/26 | | | 52,522,029 | | | | 4.5 | | |
See Accompanying Notes to Financial Statements
139
SUMMARY PORTFOLIO OF INVESTMENTS
ING PIMCO TOTAL RETURN PORTFOLIO AS OF DECEMBER 31, 2011 (CONTINUED)
Principal
Amount† | |
| |
| | Value | | Percentage
of Net
Assets | |
| | | Association (continued) | | Federal National Mortgage | |
| | 9,000,000 | | | W | | 3.500%,
due 09/25/25 | | $ | 9,414,885 | | | | 0.8 | | |
| | 75,700,000 | | | W | | 3.500%,
due 01/25/26 | | | 79,177,469 | | | | 6.7 | | |
| | 34,087,083 | | | | | 4.000%,
due 04/01/41 | | | 35,861,537 | | | | 3.0 | | |
| | 10,874,000 | | | | | 4.500%,
due 01/01/26 | | | 11,605,996 | | | | 1.0 | | |
| | 11,999,994 | | | | | 4.500%,
due 04/01/29 | | | 12,845,377 | | | | 1.1 | | |
| | 12,469,236 | | | | | 4.500%,
due 04/01/29 | | | 13,347,676 | | | | 1.1 | | |
| | 6,623,060 | | | | | 4.500%,
due 01/01/39 | | | 7,055,495 | | | | 0.6 | | |
| | 93,000,000 | | | W | | 4.500%,
due 01/25/39 | | | 98,986,875 | | | | 8.4 | | |
| | 24,805,963 | | | | | 4.500%,
due 06/01/39 | | | 26,425,602 | | | | 2.2 | | |
| | 7,790,490 | | | | | 4.500%,
due 10/01/39 | | | 8,299,149 | | | | 0.7 | | |
| | 7,938,422 | | | | | 4.500%,
due 09/01/40 | | | 8,490,231 | | | | 0.7 | | |
| | 6,864,474 | | | | | 4.500%,
due 10/01/40 | | | 7,312,672 | | | | 0.6 | | |
| | 8,996,082 | | | | | 4.500%,
due 05/01/41 | | | 9,583,457 | | | | 0.8 | | |
| | 7,604,899 | | | | | 4.500%,
due 05/01/41 | | | 8,101,440 | | | | 0.7 | | |
| | 10,000,000 | | | W | | 5.500%,
due 01/25/39 | | | 10,890,627 | | | | 0.9 | | |
| | 6,000,000 | | | W | | 6.000%,
due 01/15/33 | | | 6,607,502 | | | | 0.6 | | |
| | 6,000,000 | | | W | | 6.000%,
due 01/15/39 | | | 6,589,689 | | | | 0.6 | | |
| | 125,810,231 | | | W | | 0.354%-6.500%,
due 06/01/13-
10/01/44 | | | 134,462,071 | | | | 11.4 | | |
| | | | | | | | | | 547,579,779 | | | | 46.4 | | |
| | | Association: 0.0% | | Government National Mortgage | |
| | 22,283 | | | | | Other Securities | | | 22,389 | | | | 0.0 | | |
| | | | | | | Total U.S.
Government
Agency
Obligations
(Cost $558,106,422) | | | 566,612,978 | | | | 48.0 | | |
Shares | |
| |
| | Value | | Percentage
of Net
Assets | |
| COMMON STOCK: —% | | | | | |
| | | | | Consumer Discretionary: —% | |
| | 60,000 | | | | | Other Securities | | $ | — | | | | — | | |
| | | | | | | Total Common Stock
(Cost $0) | | | — | | | | — | | |
Shares | |
| |
| | Value | | Percentage
of Net
Assets | |
| PREFERRED STOCK: 0.8% | | | | | |
| | | | | Financials: 0.8% | |
| | 858,000 | | | | | Citigroup, Inc. | | $ | 6,122,688 | | | | 0.5 | | |
| | 3,400 | | | | | Wells Fargo & Co. | | | 3,619,300 | | | | 0.3 | | |
| | | | | | | Total Preferred
Stock
(Cost $18,445,540) | | | 9,741,988 | | | | 0.8 | | |
# of
Contracts | |
| |
| | Value | | Percentage
of Net
Assets | |
| PURCHASED OPTIONS: 0.0% | | | | | |
| | | Futures Contracts: 0.0% | | Options on Exchange Traded | |
| | 220 | | | @ | | 90-day
Eurodollar
June Futures,
Strike @
93.500,
Exp. 06/18/12 | | $ | 1,375 | | | | 0.0 | | |
| | 3,300 | | | @ | | 90-Day
Eurodollar
September
Futures,
Strike @
93.000,
Exp. 09/17/12 | | | 20,625 | | | | 0.0 | | |
| | | | | | | | | | 22,000 | | | | 0.0 | | |
| | | Rate Swaptions: 0.0% | | Options on Interest | |
| | 10,900,000 | | | @ | | Put OTC
Swaption,
Strike @
1.250%,
Exp. 04/30/12 | | | 58,983 | | | | 0.0 | | |
| | | | | | | Total Purchased
Options
(Cost $70,858) | | | 80,983 | | | | 0.0 | | |
| | | | | | | Total Long-Term
Investments
(Cost
$1,415,055,887) | | | 1,427,623,479 | | | | 120.9 | | |
Principal
Amount† | |
| |
| | Value | | Percentage
of Net
Assets | |
| SHORT-TERM INVESTMENTS: 4.7% | | | | | |
| | | | | U.S. Treasury Bills: 2.5% | |
| | 1,480,000 | | | S | | United States
Treasury Bill,
0.010%,
03/01/12 | | $ | 1,479,970 | | | | 0.1 | | |
| | 1,120,000 | | | S | | United States
Treasury Bill,
0.040%,
04/12/12 | | | 1,119,953 | | | | 0.1 | | |
See Accompanying Notes to Financial Statements
140
SUMMARY PORTFOLIO OF INVESTMENTS
ING PIMCO TOTAL RETURN PORTFOLIO AS OF DECEMBER 31, 2011 (CONTINUED)
Principal
Amount† | |
| |
| | Value | | Percentage
of Net
Assets | |
| | | | | U.S. Treasury Bills (continued) | |
| | 26,700,000 | | | | | United States
Treasury Bill,
0.040%,
06/21/12 | | $ | 26,693,779 | | | | 2.3 | | |
| | 170,000 | | | S | | United States
Treasury Bill,
0.070%,
05/31/12 | | | 169,976 | | | | 0.0 | | |
| | 360,000 | | | S | | United States
Treasury Bill,
0.100%,
02/23/12 | | | 359,996 | | | | 0.0 | | |
| | | | | | | | | | 29,823,674 | | | | 2.5 | | |
| | | | | Securities Lending Collateralcc(1): 0.7% | |
| | 2,084,742 | | | | | BNP Paribas
Bank,
Repurchase
Agreement
dated 12/30/11,
0.06%, due
01/03/12
(Repurchase
Amount
$2,084,756,
collateralized
by various
U.S.
Government
Agency
Obligations,
5.000%-6.000%,
Market
Value
plus accrued
interest
$2,126,437,
due 05/15/24-
04/15/41) | | | 2,084,742 | | | | 0.2 | | |
| | 2,084,742 | | | | | Cantor
Fitzgerald,
Repurchase
Agreement
dated 12/30/11,
0.12%,
due 01/03/12
(Repurchase
Amount
$2,084,769,
collateralized
by various
U.S. Government
Agency
Obligations,
1.437%-6.014%,
Market Value
plus accrued
interest
$2,126,437,
due 06/01/17-
09/01/44) | | | 2,084,742 | | | | 0.2 | | |
Principal
Amount† | |
| |
| | Value | | Percentage
of Net
Assets | |
| | 2,084,742 | | | | | | | Citigroup, Inc.,
Repurchase
Agreement
dated
12/30/11,
0.08%,
due 01/03/12
(Repurchase
Amount
$2,084,760,
collateralized
by various
U.S.
Government
and U.S.
Government
Agency
Obligations,
0.000%-
5.500%,
Market Value
plus accrued
interest
$2,126,437,
due 01/19/12-
12/20/41) | | $ | 2,084,742 | | | | 0.1 | | |
| | 438,894 | | | | | | | Deutsche Bank
AG, Repurchase
Agreement
dated 12/30/11,
0.10%,
due 01/03/12
(Repurchase
Amount
$438,899,
collateralized
by various
U.S.
Government
and U.S.
Government
Agency
Obligations,
0.000%-
6.500%,
Market Value
plus accrued
interest
$447,672,
due 06/28/12-
11/01/41) | | | 438,894 | | | | 0.0 | | |
See Accompanying Notes to Financial Statements
141
SUMMARY PORTFOLIO OF INVESTMENTS
ING PIMCO TOTAL RETURN PORTFOLIO AS OF DECEMBER 31, 2011 (CONTINUED)
Principal
Amount† | |
| |
| | Value | | Percentage
of Net
Assets | |
| | | | | Securities Lending
Collateralcc(1) (continued) | |
| | 2,084,742 | | | | | Merrill Lynch &
Co., Inc.,
Repurchase
Agreement
dated 12/30/11,
0.02%,
due 01/03/12
(Repurchase
Amount
$2,084,747,
collateralized
by various U.S.
Government
Securities,
1.875%-4.000%,
Market Value
plus accrued
interest
$2,126,440,
due 02/15/15-
06/30/15) | | $ | 2,084,742 | | | | 0.2 | | |
| | | | | | | | | | 8,777,862 | | | | 0.7 | | |
| | | | | Foreign Government Bonds: 0.6% | |
| | 1,700,000 | | | # | | Banco
Santander
Chile,
1.659%,
04/20/12 | | | 1,700,692 | | | | 0.2 | | |
| JPY | 30,000,000 | | | Z | | Japan Treasury
Discount Bill,
0.090%,
01/30/12 | | | 389,732 | | | | 0.0 | | |
| JPY | 350,000,000 | | | Z | | Japan Treasury
Discount Bill,
03/29/12 | | | 4,549,045 | | | | 0.4 | | |
| | | | | | | | | | 6,639,469 | | | | 0.6 | | |
Shares | |
| |
| | Value | | Percentage
of Net
Assets | |
| | | | | Foreign Government Securities: 0.4% | |
| JPY | 400,000,000 | | | Z | | Japan
Treasury
Discount
Bill
(Cost
$5,152,005) | | $ | 5,195,733 | | | | 0.4 | | |
Shares | |
| |
| | Value | | Percentage
of Net
Assets | |
| | | | | Financials: 0.5% | |
| | 5,600,000 | | | | | Intesa Sanpaolo
(Cost
$5,596,640 ) | | $ | 5,210,470 | | | | 0.5 | | |
| | | | | Total Short-Term
Investments
(Cost
$55,924,762 ) | | | 55,647,208 | | | | 4.7 | | |
| | | | | Total Investments
in Securities
(Cost
$1,470,980,649) | | $ | 1,483,270,687 | | | | 125.6 | | |
| | | | | Liabilities in
Excess of Other
Assets | | | (302,227,792 | ) | | | (25.6 | ) | |
| | | | | Net Assets | | $ | 1,181,042,895 | | | | 100.0 | | |
"Other Securities" represents issues not identified as the top 50 holdings in terms of market value and issues or issuers not exceeding 1% of net assets individually or in aggregate respectively as of December 31, 2011.
The following footnotes apply to either the individual securities noted or one or more of the securities aggregated and listed as a single line item.
† Unless otherwise indicated, principal amount is shown in USD.
# Securities with purchases pursuant to Rule 144A or section 4(2), under the Securities Act of 1933 and may not be resold subject to that rule except to qualified institutional buyers.
## On September 7, 2008, the Federal Housing Finance Agency placed the Federal National Mortgage Association and the Federal Home Loan Mortgage Corporation into conservatorship and the U.S. Treasury guaranteed the debt issued by those organizations.
@ Non-income producing security
cc Securities purchased with cash collateral for securities loaned.
W Settlement is on a when-issued or delayed-delivery basis.
S All or a portion of this security has been identified by the Fund to cover future collateral requirements for applicable futures, options, swaps, foreign currency contracts and/or when-issued or delayed-delivery securities.
L Loaned security, a portion or all of the security is on loan at December 31, 2011.
Z Indicates Zero Coupon Bond; rate shown reflects current effective yield.
(1) Collateral received from brokers for securities lending was invested into these short-term investments.
(a) This grouping contains loaned securities.
(b) The grouping contains securities in default.
BRL Brazilian Real
CAD Canadian Dollar
DKK Danish Krone
EUR EU Euro
GBP British Pound
JPY Japanese Yen
RUB Russian Ruble
SGD Singapore Dollar
Cost for federal income tax purposes is $1,471,506,768.
| Net unrealized appreciation consists of: | |
| Gross Unrealized Appreciation | | $ | 43,639,655 | | |
| Gross Unrealized Depreciation | | | (31,875,736 | ) | |
| Net Unrealized Appreciation | | $ | 11,763,919 | | |
See Accompanying Notes to Financial Statements
142
SUMMARY PORTFOLIO OF INVESTMENTS
ING PIMCO TOTAL RETURN PORTFOLIO AS OF DECEMBER 31, 2011 (CONTINUED)
Fair Value Measurements^
The following is a summary of the fair valuations according to the inputs used as of December 31, 2011 in valuing the assets and liabilities:
| | | Quoted Prices
in Active Markets
for Identical Investments
(Level 1) | | Significant Other
Observable
Inputs
(Level 2) | | Significant
Unobservable
Inputs
(Level 3) | | Fair Value
at
12/31/11 | |
| Asset Table | |
| Investments, at value | |
| Common Stock | |
| Consumer Discretionary | | $ | — | | | $ | — | | | $ | — | | | $ | — | | |
| Total Common Stock | | | — | | | | — | | | | — | | | | — | | |
| Preferred Stock | | | 3,619,300 | | | | 6,122,688 | | | | — | | | | 9,741,988 | | |
| Purchased Options | | | 22,000 | | | | 58,983 | | | | — | | | | 80,983 | | |
| Corporate Bonds/Notes | | | 977,422 | | | | 350,155,924 | | | | 1,687,384 | | | | 352,820,730 | | |
| Collateralized Mortgage Obligations | | | — | | | | 59,665,957 | | | | — | | | | 59,665,957 | | |
| Municipal Bonds | | | — | | | | 49,427,732 | | | | — | | | | 49,427,732 | | |
| Short-Term Investments | | | — | | | | 55,647,208 | | | | — | | | | 55,647,208 | | |
| U.S. Treasury Obligations | | | — | | | | 297,505,340 | | | | — | | | | 297,505,340 | | |
| U.S. Government Agency Obligations | | | — | | | | 566,612,978 | | | | — | | | | 566,612,978 | | |
| Foreign Government Bonds | | | — | | | | 88,861,087 | | | | 1,002,310 | | | | 89,863,397 | | |
| Asset-Backed Securities | | | — | | | | 1,904,374 | | | | — | | | | 1,904,374 | | |
| Total Investments, at value | | $ | 4,618,722 | | | $ | 1,475,962,271 | | | $ | 2,689,694 | | | $ | 1,483,270,687 | | |
| Other Financial Instruments+ | |
| Futures | | | 2,990,229 | | | | — | | | | — | | | | 2,990,229 | | |
| Swaps | | | 1,224,747 | | | | 7,996,018 | | | | — | | | | 9,220,765 | | |
| Forward Foreign Currency Contracts | | | — | | | | 6,674,869 | | | | — | | | | 6,674,869 | | |
| Total Assets | | $ | 8,833,698 | | | $ | 1,490,633,158 | | | $ | 2,689,694 | | | $ | 1,502,156,550 | | |
| Liabilities Table | |
| Other Financial Instruments+ | |
| Sales Commitments | | $ | — | | | $ | (25,218,751 | ) | | $ | — | | | $ | (25,218,751 | ) | |
| Written Options | | | (9,994 | ) | | | (952,126 | ) | | | — | | | | (962,120 | ) | |
| Swaps | | | (8,732,977 | ) | | | (5,384,749 | ) | | | — | | | | (14,117,726 | ) | |
| Forward Foreign Currency Contracts | | | — | | | | (4,276,214 | ) | | | — | | | | (4,276,214 | ) | |
| Total Liabilities | | $ | (8,742,971 | ) | | $ | (35,831,840 | ) | | $ | — | | | $ | (44,574,811 | ) | |
The following is a reconciliation of the fair valuations using significant unobservable inputs (Level 3) for the Portfolio's assets and liabilities during the period ended December 31, 2011:
| | | Beginning
Balance
12/31/10 | | Purchases | | Sales | | Accrued
Discounts/
(Premiums) | | Total
Realized
Gain/(Loss) | | Total
Unrealized
Appreciation/
(Depreciation) | | Transfers
Into
Level 3 | | Transfers
Out of
Level 3 | | Ending
Balance
12/31/11 | |
| Asset Table | |
| Investments, at value | |
| Common Stock | | $ | — | | | $ | — | | | $ | (6,178 | ) | | $ | — | | | $ | 6,178 | | | $ | — | | | $ | — | | | $ | — | | | $ | — | | |
| Corporate Bonds/Notes | | | 2,395,251 | | | | — | | | | — | | | | (67,639 | ) | | | — | | | | (41,632 | ) | | | — | | | | (598,596 | ) | | | 1,687,384 | | |
Foreign Government
Bonds | | | 1,002,770 | | | | — | | | | — | | | | — | | | | — | | | | (460 | ) | | | — | | | | — | | | | 1,002,310 | | |
| Short-Term Investments | | | 177,187 | | | | — | | | | (177,187 | ) | | | — | | | | (44,297 | ) | | | 44,297 | | | | — | | | | — | | | | — | | |
Total Investments,
at value | | $ | 3,575,208 | | | $ | — | | | $ | (183,365 | ) | | $ | (67,639 | ) | | $ | (38,119 | ) | | $ | 2,205 | | | $ | — | | | $ | (598,596 | ) | | $ | 2,689,694 | | |
As of December 31, 2011, total change in unrealized gain (loss) on Level 3 securities still held at period end and included in the change in net assets was $ (42,092).
^ See Note 2, "Significant Accounting Policies" in the Notes to Financial Statements for additional information.
+ Other Financial Instruments are derivatives not reflected in the Portfolio of Investments and may include open forward foreign currency contracts, equity forwards, futures, swaps, and written options. Forward foreign currency contracts, equity forwards and futures are valued at the unrealized gain (loss) on the instrument. Swaps and written options are valued at the fair value of the instrument.
There were no significant transfers between Level 1 and 2 during the year ended December 31, 2011.
See Accompanying Notes to Financial Statements
143
SUMMARY PORTFOLIO OF INVESTMENTS
ING PIMCO TOTAL RETURN PORTFOLIO AS OF DECEMBER 31, 2011 (CONTINUED)
Transfers in or out of Level 3 represent either the beginning value (for transfers in), or the ending value (for transfers out) of any security or derivative instrument where a change in the pricing level occurred from the beginning to the end of the period. Transfers are recognized at the end of the reporting period.
At December 31, 2011 , the following forward foreign currency contracts were outstanding for the ING PIMCO Total Return Portfolio:
| Counterparty | | Currency | | Contract
Amount | | Buy/Sell | | Settlement
Date | | In Exchange
For | | Fair Value | | Unrealized
Appreciation
(Depreciation) | |
| Barclays Bank PLC | | EU Euro | | | 1,084,000 | | | Buy | | 01/17/12 | | $ | 1,436,371 | | | $ | 1,403,129 | | | $ | (33,242 | ) | |
| Barclays Bank PLC | | EU Euro | | | 975,000 | | | Buy | | 01/17/12 | | | 1,340,006 | | | | 1,262,039 | | | | (77,967 | ) | |
| Barclays Bank PLC | | EU Euro | | | 6,437,000 | | | Buy | | 01/17/12 | | | 8,904,450 | | | | 8,332,046 | | | | (572,404 | ) | |
| Barclays Bank PLC | | Mexican Peso | | | 7,000,000 | | | Buy | | 03/15/12 | | | 504,432 | | | | 498,601 | | | | (5,831 | ) | |
| Barclays Bank PLC | | Mexican Peso | | | 463,710 | | | Buy | | 03/15/12 | | | 33,202 | | | | 33,030 | | | | (172 | ) | |
| Barclays Bank PLC | | Mexican Peso | | | 4,637,096 | | | Buy | | 03/15/12 | | | 330,136 | | | | 330,294 | | | | 158 | | |
| Barclays Bank PLC | | Chinese Yuan | | | 12,550,000 | | | Buy | | 02/13/12 | | | 1,962,900 | | | | 1,992,152 | | | | 29,252 | | |
| Barclays Bank PLC | | Chinese Yuan | | | 21,792,290 | | | Buy | | 06/01/12 | | | 3,419,203 | | | | 3,454,886 | | | | 35,683 | | |
| Barclays Bank PLC | | Chinese Yuan | | | 5,189,653 | | | Buy | | 06/01/12 | | | 814,511 | | | | 822,753 | | | | 8,242 | | |
| Barclays Bank PLC | | Taiwan New Dollar | | | 17,103,035 | | | Buy | | 01/11/12 | | | 596,756 | | | | 564,988 | | | | (31,768 | ) | |
| Barclays Bank PLC | | Chinese Yuan | | | 4,473,000 | | | Buy | | 06/01/12 | | | 700,000 | | | | 709,136 | | | | 9,136 | | |
| Barclays Bank PLC | | Chinese Yuan | | | 11,520,540 | | | Buy | | 06/01/12 | | | 1,800,000 | | | | 1,826,433 | | | | 26,433 | | |
| Citigroup, Inc. | | British Pound | | | 366,000 | | | Buy | | 01/04/12 | | | 568,368 | | | | 568,372 | | | | 4 | | |
| Citigroup, Inc. | | Philippine Peso | | | 170,355,000 | | | Buy | | 03/15/12 | | | 3,907,225 | | | | 3,869,773 | | | | (37,452 | ) | |
| Citigroup, Inc. | | Indonesian Rupiah | | | 12,368,840,000 | | | Buy | | 01/31/12 | | | 1,363,258 | | | | 1,359,595 | | | | (3,663 | ) | |
| Citigroup, Inc. | | Chinese Yuan | | | 3,834,120 | | | Buy | | 06/01/12 | | | 600,000 | | | | 607,850 | | | | 7,850 | | |
| Citigroup, Inc. | | Chinese Yuan | | | 3,202,250 | | | Buy | | 06/01/12 | | | 500,000 | | | | 507,675 | | | | 7,675 | | |
| Credit Suisse First Boston | | EU Euro | | | 1,259,000 | | | Buy | | 01/04/12 | | | 1,681,923 | | | | 1,629,502 | | | | (52,421 | ) | |
| Deutsche Bank AG | | EU Euro | | | 2,065,000 | | | Buy | | 01/17/12 | | | 2,699,079 | | | | 2,672,934 | | | | (26,145 | ) | |
| Deutsche Bank AG | | EU Euro | | | 861,000 | | | Buy | | 01/17/12 | | | 1,218,715 | | | | 1,114,477 | | | | (104,238 | ) | |
| Deutsche Bank AG | | EU Euro | | | 8,851,000 | | | Buy | | 01/17/12 | | | 12,331,213 | | | | 11,456,725 | | | | (874,488 | ) | |
| Deutsche Bank AG | | EU Euro | | | 327,000 | | | Buy | | 01/17/12 | | | 453,389 | | | | 423,269 | | | | (30,120 | ) | |
| Goldman Sachs & Co. | | EU Euro | | | 1,259,000 | | | Buy | | 02/02/12 | | | 1,652,173 | | | | 1,629,841 | | | | (22,332 | ) | |
| HSBC | | Mexican Peso | | | 410,871 | | | Buy | | 03/15/12 | | | 29,222 | | | | 29,266 | | | | 44 | | |
| HSBC | | Chinese Yuan | | | 1,278,500 | | | Buy | | 06/01/12 | | | 200,000 | | | | 202,690 | | | | 2,690 | | |
| HSBC | | Chinese Yuan | | | 1,278,100 | | | Buy | | 06/01/12 | | | 200,000 | | | | 202,626 | | | | 2,626 | | |
| HSBC | | Chinese Yuan | | | 1,278,900 | | | Buy | | 06/01/12 | | | 200,000 | | | | 202,753 | | | | 2,753 | | |
| HSBC | | Chinese Yuan | | | 1,278,600 | | | Buy | | 06/01/12 | | | 200,000 | | | | 202,706 | | | | 2,706 | | |
| HSBC | | Chinese Yuan | | | 4,466,000 | | | Buy | | 06/01/12 | | | 700,000 | | | | 708,027 | | | | 8,027 | | |
| HSBC | | Chinese Yuan | | | 1,276,700 | | | Buy | | 06/01/12 | | | 200,000 | | | | 202,404 | | | | 2,404 | | |
| HSBC | | Chinese Yuan | | | 2,551,000 | | | Buy | | 06/01/12 | | | 400,000 | | | | 404,428 | | | | 4,428 | | |
| HSBC | | Chinese Yuan | | | 3,838,800 | | | Buy | | 06/01/12 | | | 600,000 | | | | 608,592 | | | | 8,592 | | |
| HSBC | | Indonesian Rupiah | | | 28,923,496,000 | | | Buy | | 07/02/12 | | | 3,201,272 | | | | 3,133,051 | | | | (68,221 | ) | |
| JPMorgan Chase & Co. | | EU Euro | | | 550,000 | | | Buy | | 01/17/12 | | | 735,457 | | | | 711,919 | | | | (23,538 | ) | |
| JPMorgan Chase & Co. | | EU Euro | | | 268,000 | | | Buy | | 01/17/12 | | | 359,226 | | | | 346,899 | | | | (12,327 | ) | |
| JPMorgan Chase & Co. | | Brazilian Real | | | 15,939,883 | | | Buy | | 03/02/12 | | | 8,431,570 | | | | 8,428,321 | | | | (3,249 | ) | |
| JPMorgan Chase & Co. | | South African Rand | | | 1,520,050 | | | Buy | | 01/26/12 | | | 208,412 | | | | 187,425 | | | | (20,987 | ) | |
| JPMorgan Chase & Co. | | Malaysian Ringgit | | | 5,727,962 | | | Buy | | 04/23/12 | | | 1,888,547 | | | | 1,798,211 | | | | (90,336 | ) | |
| JPMorgan Chase & Co. | | Chinese Yuan | | | 3,190,000 | | | Buy | | 06/01/12 | | | 500,000 | | | | 505,733 | | | | 5,733 | | |
| JPMorgan Chase & Co. | | Chinese Yuan | | | 2,551,600 | | | Buy | | 06/01/12 | | | 400,000 | | | | 404,523 | | | | 4,523 | | |
| JPMorgan Chase & Co. | | Chinese Yuan | | | 1,283,400 | | | Buy | | 06/01/12 | | | 200,000 | | | | 203,466 | | | | 3,466 | | |
| JPMorgan Chase & Co. | | Chinese Yuan | | | 1,925,100 | | | Buy | | 06/01/12 | | | 300,000 | | | | 305,200 | | | | 5,200 | | |
| JPMorgan Chase & Co. | | Chinese Yuan | | | 1,283,400 | | | Buy | | 06/01/12 | | | 200,000 | | | | 203,466 | | | | 3,466 | | |
| JPMorgan Chase & Co. | | Chinese Yuan | | | 12,810,000 | | | Buy | | 06/01/12 | | | 2,000,000 | | | | 2,030,860 | | | | 30,860 | | |
| JPMorgan Chase & Co. | | Chinese Yuan | | | 2,559,200 | | | Buy | | 06/01/12 | | | 400,000 | | | | 405,728 | | | | 5,728 | | |
| JPMorgan Chase & Co. | | Indian Rupee | | | 183,483,000 | | | Buy | | 07/12/12 | | | 3,947,569 | | | | 3,345,453 | | | | (602,116 | ) | |
| Morgan Stanley | | Brazilian Real | | | 27,657,091 | | | Buy | | 01/04/12 | | | 15,556,044 | | | | 14,812,301 | | | | (743,743 | ) | |
| Morgan Stanley | | Chinese Yuan | | | 4,458,650 | | | Buy | | 06/01/12 | | | 700,000 | | | | 706,861 | | | | 6,861 | | |
| Morgan Stanley | | Philippine Peso | | | 25,991,500 | | | Buy | | 03/15/12 | | | 596,888 | | | | 590,421 | | | | (6,467 | ) | |
| Royal Bank of Scotland | | Chinese Yuan | | | 3,205,500 | | | Buy | | 06/01/12 | | | 500,000 | | | | 508,191 | | | | 8,191 | | |
| Royal Bank of Canada | | British Pound | | | 5,442,000 | | | Buy | | 01/04/12 | | | 8,522,172 | | | | 8,451,046 | | | | (71,126 | ) | |
| Royal Bank of Canada | | EU Euro | | | 444,000 | | | Buy | | 01/17/12 | | | 607,947 | | | | 574,713 | | | | (33,234 | ) | |
| UBS Warburg LLC | | Mexican Peso | | | 2,000,000 | | | Buy | | 03/15/12 | | | 144,430 | | | | 142,457 | | | | (1,973 | ) | |
| | | $ | (3,316,829 | ) | |
| Barclays Bank PLC | | British Pound | | | 1,038,000 | | | Sell | | 01/04/12 | | | 1,627,714 | | | | 1,611,942 | | | | 15,772 | | |
| Barclays Bank PLC | | EU Euro | | | 1,351,000 | | | Sell | | 01/17/12 | | | 1,813,320 | | | | 1,748,733 | | | | 64,587 | | |
| Barclays Bank PLC | | Canadian Dollar | | | 512,000 | | | Sell | | 02/09/12 | | | 501,971 | | | | 502,114 | | | | (143 | ) | |
| Barclays Bank PLC | | Canadian Dollar | | | 4,000 | | | Sell | | 02/09/12 | | | 3,847 | | | | 3,922 | | | | (75 | ) | |
| Barclays Bank PLC | | EU Euro | | | 400,000 | | | Sell | | 01/17/12 | | | 541,326 | | | | 517,760 | | | | 23,566 | | |
| Barclays Bank PLC | | EU Euro | | | 200,000 | | | Sell | | 01/17/12 | | | 270,663 | | | | 258,880 | | | | 11,783 | | |
| Barclays Bank PLC | | Canadian Dollar | | | 304,000 | | | Sell | | 02/09/12 | | | 300,593 | | | | 298,130 | | | | 2,463 | | |
| Barclays Bank PLC | | Canadian Dollar | | | 16,000 | | | Sell | | 02/09/12 | | | 15,570 | | | | 15,691 | | | | (121 | ) | |
| Barclays Bank PLC | | South African Rand | | | 220,050 | | | Sell | | 01/26/12 | | | 27,229 | | | | 27,133 | | | | 96 | | |
| Barclays Bank PLC | | Japanese Yen | | | 479,073,440 | | | Sell | | 02/06/12 | | | 6,310,448 | | | | 6,227,876 | | | | 82,572 | | |
| Barclays Bank PLC | | Indonesian Rupiah | | | 9,565,000,000 | | | Sell | | 01/31/12 | | | 1,065,145 | | | | 1,051,395 | | | | 13,750 | | |
See Accompanying Notes to Financial Statements
144
SUMMARY PORTFOLIO OF INVESTMENTS
ING PIMCO TOTAL RETURN PORTFOLIO AS OF DECEMBER 31, 2011 (CONTINUED)
| Counterparty | | Currency | | Contract
Amount | | Buy/Sell | | Settlement
Date | | In Exchange
For | | Fair Value | | Unrealized
Appreciation
(Depreciation) | |
| Barclays Bank PLC | | Taiwan New Dollar | | | 7,942,035 | | | Sell | | 01/11/12 | | $ | 259,416 | | | $ | 262,360 | | | $ | (2,944 | ) | |
| Barclays Bank PLC | | Philippine Peso | | | 4,800,000 | | | Sell | | 03/15/12 | | | 111,888 | | | | 109,036 | | | | 2,852 | | |
| Barclays Bank PLC | | Philippine Peso | | | 6,218,137 | | | Sell | | 03/15/12 | | | 144,742 | | | | 141,250 | | | | 3,492 | | |
| Barclays Bank PLC | | Philippine Peso | | | 8,100,000 | | | Sell | | 03/15/12 | | | 188,372 | | | | 183,999 | | | | 4,373 | | |
| Barclays Bank PLC | | Philippine Peso | | | 115,187,863 | | | Sell | | 03/15/12 | | | 2,694,768 | | | | 2,616,599 | | | | 78,169 | | |
| Barclays Bank PLC | | Chinese Yuan | | | 640,550 | | | Sell | | 06/01/12 | | | 100,000 | | | | 101,551 | | | | (1,551 | ) | |
| Barclays Bank PLC | | Indian Rupee | | | 84,175,000 | | | Sell | | 07/12/12 | | | 1,631,615 | | | | 1,534,766 | | | | 96,849 | | |
| Barclays Bank PLC | | Indonesian Rupiah | | | 1,914,000,000 | | | Sell | | 07/02/12 | | | 205,255 | | | | 207,329 | | | | (2,074 | ) | |
| Citigroup, Inc. | | EU Euro | | | 743,000 | | | Sell | | 01/17/12 | | | 970,484 | | | | 961,739 | | | | 8,745 | | |
| Citigroup, Inc. | | EU Euro | | | 1,090,000 | | | Sell | | 01/17/12 | | | 1,418,973 | | | | 1,410,895 | | | | 8,078 | | |
| Citigroup, Inc. | | EU Euro | | | 444,000 | | | Sell | | 01/17/12 | | | 578,004 | | | | 574,714 | | | | 3,290 | | |
| Citigroup, Inc. | | EU Euro | | | 800,000 | | | Sell | | 01/17/12 | | | 1,041,448 | | | | 1,035,519 | | | | 5,929 | | |
| Citigroup, Inc. | | EU Euro | | | 282,000 | | | Sell | | 01/17/12 | | | 378,807 | | | | 365,020 | | | | 13,787 | | |
| Citigroup, Inc. | | Canadian Dollar | | | 832,000 | | | Sell | | 02/09/12 | | | 800,077 | | | | 815,934 | | | | (15,857 | ) | |
| Citigroup, Inc. | | Canadian Dollar | | | 729,000 | | | Sell | | 02/09/12 | | | 704,979 | | | | 714,923 | | | | (9,944 | ) | |
| Citigroup, Inc. | | Canadian Dollar | | | 600,000 | | | Sell | | 02/09/12 | | | 586,984 | | | | 588,415 | | | | (1,431 | ) | |
| Citigroup, Inc. | | Canadian Dollar | | | 300,000 | | | Sell | | 02/09/12 | | | 293,492 | | | | 294,207 | | | | (715 | ) | |
| Citigroup, Inc. | | Australian Dollar | | | 100,000 | | | Sell | | 02/23/12 | | | 100,806 | | | | 101,642 | | | | (836 | ) | |
| Citigroup, Inc. | | Australian Dollar | | | 100,000 | | | Sell | | 02/23/12 | | | 100,806 | | | | 101,642 | | | | (836 | ) | |
| Citigroup, Inc. | | Australian Dollar | | | 399,000 | | | Sell | | 02/23/12 | | | 398,790 | | | | 405,550 | | | | (6,760 | ) | |
| Citigroup, Inc. | | Singapore Dollar | | | 2,117,268 | | | Sell | | 02/10/12 | | | 1,657,106 | | | | 1,632,199 | | | | 24,907 | | |
| Citigroup, Inc. | | Australian Dollar | | | 196,000 | | | Sell | | 02/23/12 | | | 193,706 | | | | 199,218 | | | | (5,512 | ) | |
| Citigroup, Inc. | | Japanese Yen | | | 400,000,000 | | | Sell | | 03/26/12 | | | 5,154,706 | | | | 5,205,303 | | | | (50,597 | ) | |
| Citigroup, Inc. | | Japanese Yen | | | 7,394,171 | | | Sell | | 01/30/12 | | | 96,520 | | | | 96,111 | | | | 409 | | |
| Citigroup, Inc. | | Japanese Yen | | | 341,853,119 | | | Sell | | 02/06/12 | | | 4,502,908 | | | | 4,444,034 | | | | 58,874 | | |
| Citigroup, Inc. | | Japanese Yen | | | 421,307,344 | | | Sell | | 02/13/12 | | | 5,397,363 | | | | 5,477,650 | | | | (80,287 | ) | |
| Citigroup, Inc. | | Philippine Peso | | | 2,000,000 | | | Sell | | 03/15/12 | | | 45,075 | | | | 45,431 | | | | (356 | ) | |
| Citigroup, Inc. | | Philippine Peso | | | 3,000,000 | | | Sell | | 03/15/12 | | | 67,492 | | | | 68,148 | | | | (656 | ) | |
| Citigroup, Inc. | | Malaysian Ringgit | | | 5,727,962 | | | Sell | | 04/23/12 | | | 1,850,715 | | | | 1,798,210 | | | | 52,505 | | |
| Credit Suisse First Boston | | Chinese Yuan | | | 1,277,400 | | | Sell | | 06/01/12 | | | 200,000 | | | | 202,515 | | | | (2,515 | ) | |
| Credit Suisse First Boston | | Japanese Yen | | | 350,000,000 | | | Sell | | 03/29/12 | | | 4,504,157 | | | | 4,554,954 | | | | (50,797 | ) | |
| Deutsche Bank AG | | British Pound | | | 100,000 | | | Sell | | 01/04/12 | | | 155,280 | | | | 155,293 | | | | (13 | ) | |
| Deutsche Bank AG | | EU Euro | | | 881,000 | | | Sell | | 01/17/12 | | | 1,154,467 | | | | 1,140,366 | | | | 14,101 | | |
| Deutsche Bank AG | | EU Euro | | | 1,500,000 | | | Sell | | 01/17/12 | | | 2,026,447 | | | | 1,941,598 | | | | 84,849 | | |
| Deutsche Bank AG | | Canadian Dollar | | | 50,000 | | | Sell | | 02/09/12 | | | 48,513 | | | | 49,034 | | | | (521 | ) | |
| Deutsche Bank AG | | EU Euro | | | 500,000 | | | Sell | | 01/17/12 | | | 691,447 | | | | 647,199 | | | | 44,248 | | |
| Deutsche Bank AG | | EU Euro | | | 45,000 | | | Sell | | 01/17/12 | | | 62,230 | | | | 58,248 | | | | 3,982 | | |
| Deutsche Bank AG | | Canadian Dollar | | | 819,000 | | | Sell | | 02/09/12 | | | 787,001 | | | | 803,186 | | | | (16,185 | ) | |
| Deutsche Bank AG | | EU Euro | | | 100,000 | | | Sell | | 01/17/12 | | | 141,546 | | | | 129,439 | | | | 12,107 | | |
| Deutsche Bank AG | | Japanese Yen | | | 7,394,171 | | | Sell | | 01/30/12 | | | 96,569 | | | | 96,111 | | | | 458 | | |
| Deutsche Bank AG | | Indian Rupee | | | 35,644,000 | | | Sell | | 07/12/12 | | | 700,000 | | | | 649,898 | | | | 50,102 | | |
| Goldman Sachs & Co. | | EU Euro | | | 1,259,000 | | | Sell | | 01/04/12 | | | 1,651,808 | | | | 1,629,502 | | | | 22,306 | | |
| Goldman Sachs & Co. | | EU Euro | | | 100,000 | | | Sell | | 01/17/12 | | | 130,815 | | | | 129,439 | | | | 1,376 | | |
| Goldman Sachs & Co. | | EU Euro | | | 499,000 | | | Sell | | 01/17/12 | | | 652,769 | | | | 645,905 | | | | 6,864 | | |
| Goldman Sachs & Co. | | British Pound | | | 4,160,000 | | | Sell | | 01/04/12 | | | 6,508,965 | | | | 6,460,189 | | | | 48,776 | | |
| Goldman Sachs & Co. | | EU Euro | | | 481,000 | | | Sell | | 01/17/12 | | | 644,619 | | | | 622,606 | | | | 22,013 | | |
| Goldman Sachs & Co. | | EU Euro | | | 2,000,000 | | | Sell | | 01/17/12 | | | 2,680,330 | | | | 2,588,798 | | | | 91,532 | | |
| Goldman Sachs & Co. | | Canadian Dollar | | | 309,000 | | | Sell | | 02/09/12 | | | 299,840 | | | | 303,033 | | | | (3,193 | ) | |
| Goldman Sachs & Co. | | Japanese Yen | | | 6,304,391 | | | Sell | | 01/30/12 | | | 82,335 | | | | 81,945 | | | | 390 | | |
| Goldman Sachs & Co. | | Japanese Yen | | | 591,000,000 | | | Sell | | 02/21/12 | | | 7,627,184 | | | | 7,685,076 | | | | (57,892 | ) | |
| Goldman Sachs & Co. | | Philippine Peso | | | 8,570,000 | | | Sell | | 03/15/12 | | | 200,000 | | | | 194,676 | | | | 5,324 | | |
| Goldman Sachs & Co. | | Indonesian Rupiah | | | 176,336,000 | | | Sell | | 07/02/12 | | | 18,951 | | | | 19,101 | | | | (150 | ) | |
| HSBC | | Brazilian Real | | | 445,920 | | | Sell | | 01/04/12 | | | 240,000 | | | | 238,821 | | | | 1,179 | | |
| HSBC | | Brazilian Real | | | 743,000 | | | Sell | | 01/04/12 | | | 400,000 | | | | 397,928 | | | | 2,072 | | |
| HSBC | | Brazilian Real | | | 541,860 | | | Sell | | 01/04/12 | | | 300,000 | | | | 290,204 | | | | 9,796 | | |
| HSBC | | Danish Krone | | | 15,573,000 | | | Sell | | 03/08/12 | | | 2,803,370 | | | | 2,713,509 | | | | 89,861 | | |
| HSBC | | Japanese Yen | | | 561,135,612 | | | Sell | | 02/13/12 | | | 7,178,585 | | | | 7,295,634 | | | | (117,049 | ) | |
| HSBC | | Japanese Yen | | | 280,000,000 | | | Sell | | 02/21/12 | | | 3,615,236 | | | | 3,640,984 | | | | (25,748 | ) | |
| HSBC | | Mexican Peso | | | 2,659,400 | | | Sell | | 03/15/12 | | | 200,000 | | | | 189,426 | | | | 10,574 | | |
| HSBC | | Mexican Peso | | | 2,658,700 | | | Sell | | 03/15/12 | | | 200,000 | | | | 189,376 | | | | 10,624 | | |
| HSBC | | Indonesian Rupiah | | | 8,268,000,000 | | | Sell | | 07/02/12 | | | 885,272 | | | | 895,606 | | | | (10,334 | ) | |
| HSBC | | Indonesian Rupiah | | | 3,965,000,000 | | | Sell | | 07/02/12 | | | 428,649 | | | | 429,497 | | | | (848 | ) | |
| JPMorgan Chase & Co. | | British Pound | | | 100,000 | | | Sell | | 01/04/12 | | | 154,882 | | | | 155,294 | | | | (412 | ) | |
| JPMorgan Chase & Co. | | Brazilian Real | | | 15,939,883 | | | Sell | | 01/04/12 | | | 8,535,413 | | | | 8,536,920 | | | | (1,507 | ) | |
| JPMorgan Chase & Co. | | British Pound | | | 410,000 | | | Sell | | 01/04/12 | | | 641,004 | | | | 636,701 | | | | 4,303 | | |
| JPMorgan Chase & Co. | | EU Euro | | | 543,000 | | | Sell | | 01/17/12 | | | 706,594 | | | | 702,859 | | | | 3,735 | | |
| JPMorgan Chase & Co. | | Canadian Dollar | | | 397,000 | | | Sell | | 02/09/12 | | | 383,542 | | | | 389,335 | | | | (5,793 | ) | |
| JPMorgan Chase & Co. | | EU Euro | | | 1,731,000 | | | Sell | | 01/17/12 | | | 2,339,637 | | | | 2,240,605 | | | | 99,032 | | |
| JPMorgan Chase & Co. | | Canadian Dollar | | | 511,000 | | | Sell | | 02/09/12 | | | 496,792 | | | | 501,133 | | | | (4,341 | ) | |
| JPMorgan Chase & Co. | | Canadian Dollar | | | 710,000 | | | Sell | | 02/09/12 | | | 693,166 | | | | 696,290 | | | | (3,124 | ) | |
See Accompanying Notes to Financial Statements
145
SUMMARY PORTFOLIO OF INVESTMENTS
ING PIMCO TOTAL RETURN PORTFOLIO AS OF DECEMBER 31, 2011 (CONTINUED)
| Counterparty | | Currency | | Contract
Amount | | Buy/Sell | | Settlement
Date | | In Exchange
For | | Fair Value | | Unrealized
Appreciation
(Depreciation) | |
| JPMorgan Chase & Co. | | Canadian Dollar | | | 1,000 | | | Sell | | 02/09/12 | | $ | 980 | | | $ | 981 | | | $ | (1 | ) | |
| JPMorgan Chase & Co. | | Canadian Dollar | | | 712,000 | | | Sell | | 02/09/12 | | | 697,533 | | | | 698,251 | | | | (718 | ) | |
| JPMorgan Chase & Co. | | Canadian Dollar | | | 425,000 | | | Sell | | 02/09/12 | | | 418,975 | | | | 416,793 | | | | 2,182 | | |
| JPMorgan Chase & Co. | | EU Euro | | | 572,000 | | | Sell | | 01/17/12 | | | 779,017 | | | | 740,396 | | | | 38,621 | | |
| JPMorgan Chase & Co. | | Canadian Dollar | | | 260,000 | | | Sell | | 02/09/12 | | | 254,703 | | | | 254,980 | | | | (277 | ) | |
| JPMorgan Chase & Co. | | Canadian Dollar | | | 310,000 | | | Sell | | 02/09/12 | | | 304,860 | | | | 304,014 | | | | 846 | | |
| JPMorgan Chase & Co. | | Canadian Dollar | | | 1,858,000 | | | Sell | | 02/09/12 | | | 1,799,220 | | | | 1,822,123 | | | | (22,903 | ) | |
| JPMorgan Chase & Co. | | Brazilian Real | | | 2,475,900 | | | Sell | | 01/04/12 | | | 1,400,871 | | | | 1,326,017 | | | | 74,854 | | |
| JPMorgan Chase & Co. | | Canadian Dollar | | | 3,000 | | | Sell | | 02/09/12 | | | 2,916 | | | | 2,942 | | | | (26 | ) | |
| JPMorgan Chase & Co. | | South African Rand | | | 600,000 | | | Sell | | 01/26/12 | | | 74,667 | | | | 73,981 | | | | 686 | | |
| JPMorgan Chase & Co. | | South African Rand | | | 700,000 | | | Sell | | 01/26/12 | | | 87,058 | | | | 86,311 | | | | 747 | | |
| JPMorgan Chase & Co. | | EU Euro | | | 68,888,000 | | | Sell | | 01/17/12 | | | 93,665,291 | | | | 89,168,556 | | | | 4,496,735 | | |
| JPMorgan Chase & Co. | | Japanese Yen | | | 7,394,171 | | | Sell | | 01/30/12 | | | 96,517 | | | | 96,110 | | | | 407 | | |
| JPMorgan Chase & Co. | | Japanese Yen | | | 479,073,440 | | | Sell | | 02/06/12 | | | 6,310,240 | | | | 6,227,876 | | | | 82,364 | | |
| JPMorgan Chase & Co. | | Philippine Peso | | | 4,314,500 | | | Sell | | 03/15/12 | | | 100,000 | | | | 98,008 | | | | 1,992 | | |
| JPMorgan Chase & Co. | | Philippine Peso | | | 13,272,000 | | | Sell | | 03/15/12 | | | 300,000 | | | | 301,486 | | | | (1,486 | ) | |
| JPMorgan Chase & Co. | | Philippine Peso | | | 26,532,000 | | | Sell | | 03/15/12 | | | 600,000 | | | | 602,699 | | | | (2,699 | ) | |
| JPMorgan Chase & Co. | | Chinese Yuan | | | 1,277,500 | | | Sell | | 06/01/12 | | | 200,000 | | | | 202,531 | | | | (2,531 | ) | |
| JPMorgan Chase & Co. | | Chinese Yuan | | | 638,250 | | | Sell | | 06/01/12 | | | 100,000 | | | | 101,186 | | | | (1,186 | ) | |
| JPMorgan Chase & Co. | | Philippine Peso | | | 4,352,000 | | | Sell | | 03/15/12 | | | 100,000 | | | | 98,860 | | | | 1,140 | | |
| JPMorgan Chase & Co. | | Indian Rupee | | | 16,500,000 | | | Sell | | 07/12/12 | | | 324,509 | | | | 300,845 | | | | 23,664 | | |
| JPMorgan Chase & Co. | | Indian Rupee | | | 21,719,000 | | | Sell | | 07/12/12 | | | 426,699 | | | | 396,003 | | | | 30,696 | | |
| JPMorgan Chase & Co. | | Indian Rupee | | | 25,445,000 | | | Sell | | 07/12/12 | | | 500,000 | | | | 463,940 | | | | 36,060 | | |
| Morgan Stanley | | Brazilian Real | | | 377,500 | | | Sell | | 01/04/12 | | | 200,000 | | | | 202,178 | | | | (2,178 | ) | |
| Morgan Stanley | | Brazilian Real | | | 674,373 | | | Sell | | 01/04/12 | | | 357,000 | | | | 361,174 | | | | (4,174 | ) | |
| Morgan Stanley | | Brazilian Real | | | 1,756,550 | | | Sell | | 01/04/12 | | | 950,000 | | | | 940,755 | | | | 9,245 | | |
| Morgan Stanley | | Brazilian Real | | | 557,100 | | | Sell | | 01/04/12 | | | 300,000 | | | | 298,366 | | | | 1,634 | | |
| Morgan Stanley | | EU Euro | | | 738,000 | | | Sell | | 01/17/12 | | | 965,887 | | | | 955,266 | | | | 10,621 | | |
| Morgan Stanley | | Canadian Dollar | | | 720,000 | | | Sell | | 02/09/12 | | | 701,139 | | | | 706,097 | | | | (4,958 | ) | |
| Morgan Stanley | | Canadian Dollar | | | 199,000 | | | Sell | | 02/09/12 | | | 193,023 | | | | 195,157 | | | | (2,134 | ) | |
| Morgan Stanley | | Indonesian Rupiah | | | 10,765,000,000 | | | Sell | | 01/31/12 | | | 1,191,873 | | | | 1,183,299 | | | | 8,574 | | |
| Morgan Stanley | | Taiwan New Dollar | | | 6,104,000 | | | Sell | | 01/11/12 | | | 200,000 | | | | 201,642 | | | | (1,642 | ) | |
| Morgan Stanley | | Taiwan New Dollar | | | 3,057,000 | | | Sell | | 01/11/12 | | | 100,000 | | | | 100,986 | | | | (986 | ) | |
| Morgan Stanley | | Mexican Peso | | | 4,011,300 | | | Sell | | 03/15/12 | | | 300,000 | | | | 285,720 | | | | 14,280 | | |
| Royal Bank of Canada | | EU Euro | | | 1,271,000 | | | Sell | | 01/17/12 | | | 1,679,321 | | | | 1,645,181 | | | | 34,140 | | |
| Royal Bank of Canada | | British Pound | | | 5,442,000 | | | Sell | | 02/02/12 | | | 8,520,022 | | | | 8,448,762 | | | | 71,260 | | |
| Royal Bank of Canada | | Canadian Dollar | | | 415,000 | | | Sell | | 02/09/12 | | | 401,842 | | | | 406,987 | | | | (5,145 | ) | |
| Royal Bank of Canada | | Canadian Dollar | | | 622,000 | | | Sell | | 02/09/12 | | | 600,869 | | | | 609,990 | | | | (9,121 | ) | |
| Royal Bank of Canada | | EU Euro | | | 986,000 | | | Sell | | 01/17/12 | | | 1,317,907 | | | | 1,276,277 | | | | 41,630 | | |
| Royal Bank of Canada | | Canadian Dollar | | | 15,688,000 | | | Sell | | 02/09/12 | | | 15,397,526 | | | | 15,385,070 | | | | 12,456 | | |
| UBS Warburg LLC | | Brazilian Real | | | 376,400 | | | Sell | | 01/04/12 | | | 200,000 | | | | 201,588 | | | | (1,588 | ) | |
| UBS Warburg LLC | | Brazilian Real | | | 377,100 | | | Sell | | 01/04/12 | | | 200,000 | | | | 201,963 | | | | (1,963 | ) | |
| UBS Warburg LLC | | Brazilian Real | | | 1,757,025 | | | Sell | | 01/04/12 | | | 950,000 | | | | 941,009 | | | | 8,991 | | |
| UBS Warburg LLC | | Brazilian Real | | | 371,100 | | | Sell | | 01/04/12 | | | 200,000 | | | | 198,750 | | | | 1,250 | | |
| UBS Warburg LLC | | EU Euro | | | 2,378,000 | | | Sell | | 01/17/12 | | | 3,101,369 | | | | 3,078,081 | | | | 23,288 | | |
| UBS Warburg LLC | | EU Euro | | | 696,000 | | | Sell | | 01/17/12 | | | 905,711 | | | | 900,902 | | | | 4,809 | | |
| UBS Warburg LLC | | EU Euro | | | 1,892,000 | | | Sell | | 01/17/12 | | | 2,532,302 | | | | 2,449,003 | | | | 83,299 | | |
| UBS Warburg LLC | | Canadian Dollar | | | 102,000 | | | Sell | | 02/09/12 | | | 99,894 | | | | 100,030 | | | | (136 | ) | |
| UBS Warburg LLC | | Canadian Dollar | | | 11,000 | | | Sell | | 02/09/12 | | | 10,606 | | | | 10,788 | | | | (182 | ) | |
| UBS Warburg LLC | | Canadian Dollar | | | 311,000 | | | Sell | | 02/09/12 | | | 299,847 | | | | 304,994 | | | | (5,147 | ) | |
| UBS Warburg LLC | | EU Euro | | | 861,000 | | | Sell | | 01/17/12 | | | 1,165,316 | | | | 1,114,477 | | | | 50,839 | | |
| UBS Warburg LLC | | Brazilian Real | | | 721,760 | | | Sell | | 01/04/12 | | | 400,000 | | | | 386,553 | | | | 13,447 | | |
| UBS Warburg LLC | | Brazilian Real | | | 541,620 | | | Sell | | 01/04/12 | | | 300,000 | | | | 290,075 | | | | 9,925 | | |
| UBS Warburg LLC | | Indonesian Rupiah | | | 6,639,000,000 | | | Sell | | 01/31/12 | | | 734,809 | | | | 729,765 | | | | 5,044 | | |
| UBS Warburg LLC | | Japanese Yen | | | 1,513,096 | | | Sell | | 01/30/12 | | | 19,764 | | | | 19,667 | | | | 97 | | |
| UBS Warburg LLC | | Japanese Yen | | | 249,000,000 | | | Sell | | 02/21/12 | | | 3,213,857 | | | | 3,237,875 | | | | (24,018 | ) | |
| UBS Warburg LLC | | Mexican Peso | | | 1,329,150 | | | Sell | | 03/15/12 | | | 100,000 | | | | 94,674 | | | | 5,326 | | |
| UBS Warburg LLC | | Mexican Peso | | | 1,329,150 | | | Sell | | 03/15/12 | | | 100,000 | | | | 94,674 | | | | 5,326 | | |
| UBS Warburg LLC | | Mexican Peso | | | 5,346,000 | | | Sell | | 03/15/12 | | | 400,000 | | | | 380,789 | | | | 19,211 | | |
| UBS Warburg LLC | | Chinese Yuan | | | 1,277,400 | | | Sell | | 06/01/12 | | | 200,000 | | | | 202,515 | | | | (2,515 | ) | |
| Westpac | | Japanese Yen | | | 707,557,044 | | | Sell | | 02/13/12 | | | 9,051,516 | | | | 9,199,339 | | | | (147,823 | ) | |
| | | $ | 5,715,484 | | |
See Accompanying Notes to Financial Statements
146
SUMMARY PORTFOLIO OF INVESTMENTS
ING PIMCO TOTAL RETURN PORTFOLIO AS OF DECEMBER 31, 2011 (CONTINUED)
ING PIMCO Total Return Portfolio Open Futures Contracts on December 31, 2011:
| Contract Description | | Number
of Contracts | | Expiration Date | | Notional
Value | | Unrealized
Appreciation/
(Depreciation) | |
| Long Contracts | |
| 90-Day Eurodollar | | | 477 | | | 06/18/12 | | $ | 118,409,288 | | | $ | 7,004 | | |
| 90-Day Eurodollar | | | 976 | | | 03/18/13 | | | 242,170,000 | | | | 854,658 | | |
| 90-Day Eurodollar | | | 667 | | | 06/17/13 | | | 165,474,363 | | | | 713,359 | | |
| 90-Day Eurodollar | | | 231 | | | 09/16/13 | | | 57,293,775 | | | | 330,141 | | |
| 90-Day Eurodollar | | | 73 | | | 12/16/13 | | | 18,095,788 | | | | 22,810 | | |
| 90-Day Eurodollar | | | 160 | | | 03/17/14 | | | 39,628,000 | | | | 282,217 | | |
| 90-Day Eurodollar | | | 53 | | | 06/16/14 | | | 13,108,887 | | | | 5,465 | | |
| 90-Day Eurodollar (NYL) | | | 35 | | | 12/19/12 | | | 8,683,938 | | | | 16,595 | | |
| 90-Day Eurodollar (NYL) | | | 162 | | | 03/18/13 | | | 40,196,250 | | | | 5,687 | | |
| U.S. Treasury 10-Year Note | | | 598 | | | 03/21/12 | | | 78,412,750 | | | | 532,465 | | |
| U.S. Treasury 5-Year Note | | | 587 | | | 03/30/12 | | | 72,352,334 | | | | 219,828 | | |
| | | | | | | $ | 853,825,373 | | | $ | 2,990,229 | | |
ING PIMCO Total Return Portfolio Over-the-Counter Credit Default Swap Agreements Outstanding on December 31, 2011:
Credit Default Swaps on Credit Indices — Sell Protection(1)
| Counterparty | | Reference
Entity/Obligation | | Buy/Sell
Protection | | (Pay)/
Receive
Fixed
Rate (%) | | Termination
Date | | Notional
Amount(2) | | Fair
Value(3) | | Upfront
Payments
Paid/
(Received) | | Unrealized
Appreciation/
(Depreciation) | |
| Barclays Bank PLC | | CDX.EM.13 Index | | Sell | | | 5.000 | | | 06/20/15 | | USD | 7,500,000 | | | $ | 534,357 | | | $ | 680,701 | | | $ | (146,344 | ) | |
| Deutsche Bank AG | | CDX.EM.13 Index | | Sell | | | 5.000 | | | 06/20/15 | | USD | 900,000 | | | | 64,123 | | | | 79,184 | | | | (15,061 | ) | |
Goldman
Sachs & Co. | | CDX.EM.13 Index | | Sell | | | 5.000 | | | 06/20/15 | | USD | 200,000 | | | | 14,250 | | | | 16,761 | | | | (2,511 | ) | |
| HSBC | | CDX.EM.13 Index | | Sell | | | 5.000 | | | 06/20/15 | | USD | 5,600,000 | | | | 398,987 | | | | 466,680 | | | | (67,693 | ) | |
| Morgan Stanley | | CDX.EM.13 Index | | Sell | | | 5.000 | | | 06/20/15 | | USD | 3,000,000 | | | | 213,743 | | | | 245,082 | | | | (31,339 | ) | |
| Barclays Bank PLC | | CDX.EM.14 Index | | Sell | | | 5.000 | | | 12/20/15 | | USD | 5,300,000 | | | | 415,181 | | | | 569,529 | | | | (154,348 | ) | |
| Citigroup, Inc. | | CDX.EM.14 Index | | Sell | | | 5.000 | | | 12/20/15 | | USD | 4,900,000 | | | | 383,846 | | | | 502,579 | | | | (118,733 | ) | |
| Deutsche Bank AG | | CDX.EM.14 Index | | Sell | | | 5.000 | | | 12/20/15 | | USD | 800,000 | | | | 62,669 | | | | 73,914 | | | | (11,245 | ) | |
| HSBC | | CDX.EM.14 Index | | Sell | | | 5.000 | | | 12/20/15 | | USD | 700,000 | | | | 54,835 | | | | 69,338 | | | | (14,503 | ) | |
| Morgan Stanley | | CDX.EM.14 Index | | Sell | | | 5.000 | | | 12/20/15 | | USD | 1,400,000 | | | | 109,670 | | | | 138,144 | | | | (28,474 | ) | |
| UBS Warburg LLC | | CDX.EM.14 Index | | Sell | | | 5.000 | | | 12/20/15 | | USD | 300,000 | | | | 23,501 | | | | 31,671 | | | | (8,170 | ) | |
| Barclays Bank PLC | | CDX.EM.15 Index | | Sell | | | 5.000 | | | 06/20/16 | | USD | 800,000 | | | | 66,816 | | | | 78,902 | | | | (12,086 | ) | |
| Deutsche Bank AG | | CDX.EM.15 Index | | Sell | | | 5.000 | | | 06/20/16 | | USD | 200,000 | | | | 16,704 | | | | 23,071 | | | | (6,367 | ) | |
| Citigroup, Inc. | | CDX.NA.HY.8 Index
(35-100% Tranche) | | Sell | | | 0.401 | | | 06/20/12 | | USD | 948,370 | | | | 1,356 | | | | — | | | | 1,356 | | |
| Deutsche Bank AG | | CDX.NA.IG.10 Index
(30-100% Tranche) | | Sell | | | 0.530 | | | 06/20/13 | | USD | 964,499 | | | | 7,323 | | | | — | | | | 7,323 | | |
| Deutsche Bank AG | | CDX.NA.IG.9 Index
(30-100% Tranche) | | Sell | | | 0.708 | | | 12/20/12 | | USD | 2,893,497 | | | | 20,110 | | | | — | | | | 20,110 | | |
Goldman
Sachs & Co. | | CDX.NA.IG.9 Index
(30-100% Tranche) | |
Sell | | |
0.548 | | |
12/20/17 | | USD | 675,149 | | | | 8,731 | | | | — | | | | 8,731 | | |
| | | | | | | | | | | | | $ | 2,396,202 | | | $ | 2,975,556 | | | $ | (579,354 | ) | |
Credit Default Swaps on Corporate and Sovereign Issues — Sell Protection(1)
| Counterparty | | Reference
Entity/Obligation | | Buy/Sell
Protection | | (Pay)/
Receive
Fixed
Rate (%) | | Termination
Date | | Implied
Credit
Spread at
12/31/11 (%)(4) | | Notional
Amount(2) | | Fair
Value(3) | | Upfront
Payments
Paid/
(Received) | | Unrealized
Appreciation/
(Depreciation) | |
| Citigroup, Inc. | | Federal Republic
of Germany | | Sell | | | 0.250 | | | 12/20/16 | | | 0.989 | | | USD | 600,000 | | | $ | (21,141 | ) | | $ | (22,672 | ) | | $ | 1,531 | | |
Goldman
Sachs & Co. | | Federal Republic
of Germany | | Sell | | | 0.250 | | | 12/20/16 | | | 0.989 | | | USD | 1,100,000 | | | | (38,758 | ) | | | (41,316 | ) | | | 2,558 | | |
Barclays Bank
PLC | | Federative Republic
of Brazil | | Sell | | | 1.000 | | | 06/20/15 | | | 1.306 | | | USD | 500,000 | | | | (5,167 | ) | | | (4,774 | ) | | | (393 | ) | |
Barclays Bank
PLC | | Federative Republic
of Brazil | | Sell | | | 1.000 | | | 06/20/16 | | | 1.476 | | | USD | 2,900,000 | | | | (59,196 | ) | | | (3,657 | ) | | | (55,539 | ) | |
| Citigroup, Inc. | | Federative Republic
of Brazil | | Sell | | | 1.000 | | | 06/20/15 | | | 1.306 | | | USD | 500,000 | | | | (5,167 | ) | | | (9,541 | ) | | | 4,374 | | |
| Citigroup, Inc. | | Federative Republic
of Brazil | | Sell | | | 1.000 | | | 09/20/15 | | | 1.350 | | | USD | 1,000,000 | | | | (12,639 | ) | | | (11,551 | ) | | | (1,088 | ) | |
See Accompanying Notes to Financial Statements
147
SUMMARY PORTFOLIO OF INVESTMENTS
ING PIMCO TOTAL RETURN PORTFOLIO AS OF DECEMBER 31, 2011 (CONTINUED)
| Counterparty | | Reference
Entity/Obligation | | Buy/Sell
Protection | | (Pay)/
Receive
Fixed
Rate (%) | | Termination
Date | | Implied
Credit
Spread at
12/31/11 (%)(4) | | Notional
Amount(2) | | Fair
Value(3) | | Upfront
Payments
Paid/
(Received) | | Unrealized
Appreciation/
(Depreciation) | |
| Citigroup, Inc. | | Federative Republic
of Brazil | | Sell | | | 1.000 | | | 06/20/16 | | | 1.476 | | | USD | 4,800,000 | | | $ | (97,980 | ) | | $ | (10,126 | ) | | $ | (87,854 | ) | |
Deutsche Bank
AG | | Federative Republic
of Brazil | | Sell | | | 1.000 | | | 06/20/16 | | | 1.476 | | | USD | 1,100,000 | | | | (22,454 | ) | | | (2,313 | ) | | | (20,141 | ) | |
Goldman
Sachs & Co. | | Federative Republic
of Brazil | | Sell | | | 1.000 | | | 06/20/15 | | | 1.306 | | | USD | 500,000 | | | | (5,167 | ) | | | (4,458 | ) | | | (709 | ) | |
Goldman
Sachs & Co. | | Federative Republic
of Brazil | | Sell | | | 1.000 | | | 09/20/16 | | | 1.525 | | | USD | 500,000 | | | | (11,827 | ) | | | (2,799 | ) | | | (9,028 | ) | |
| HSBC | | Federative Republic
of Brazil | | Sell | | | 1.000 | | | 06/20/15 | | | 1.306 | | | USD | 800,000 | | | | (8,267 | ) | | | (14,766 | ) | | | 6,499 | | |
| HSBC | | Federative Republic
of Brazil | | Sell | | | 1.000 | | | 06/20/15 | | | 1.306 | | | USD | 1,600,000 | | | | (16,535 | ) | | | (11,738 | ) | | | (4,797 | ) | |
| HSBC | | Federative Republic
of Brazil | | Sell | | | 1.000 | | | 09/20/15 | | | 1.350 | | | USD | 900,000 | | | | (11,375 | ) | | | (6,636 | ) | | | (4,739 | ) | |
| HSBC | | Federative Republic
of Brazil | | Sell | | | 1.000 | | | 03/20/16 | | | 1.422 | | | USD | 600,000 | | | | (10,276 | ) | | | (1,781 | ) | | | (8,495 | ) | |
| HSBC | | Federative Republic
of Brazil | | Sell | | | 1.000 | | | 06/20/16 | | | 1.476 | | | USD | 3,500,000 | | | | (71,444 | ) | | | (4,414 | ) | | | (67,030 | ) | |
UBS Warburg
LLC | | Federative Republic
of Brazil | | Sell | | | 1.000 | | | 09/20/15 | | | 1.350 | | | USD | 500,000 | | | | (6,320 | ) | | | (3,507 | ) | | | (2,813 | ) | |
Barclays Bank
PLC | | General Electric
Capital Corp. | | Sell | | | 0.640 | | | 12/20/12 | | | 1.562 | | | USD | 1,200,000 | | | | (10,748 | ) | | | — | | | | (10,748 | ) | |
BNP Paribas
Bank | | General Electric
Capital Corp. | | Sell | | | 4.700 | | | 12/20/13 | | | 1.936 | | | USD | 600,000 | | | | 31,985 | | | | — | | | | 31,985 | | |
| Citigroup, Inc. | | General Electric
Capital Corp. | | Sell | | | 4.325 | | | 12/20/13 | | | 1.936 | | | USD | 300,000 | | | | 13,823 | | | | — | | | | 13,823 | | |
| Morgan Stanley | | General Electric
Capital Corp. | | Sell | | | 1.000 | | | 12/20/15 | | | 2.342 | | | USD | 1,700,000 | | | | (84,369 | ) | | | (26,257 | ) | | | (58,112 | ) | |
Deutsche Bank
AG | | Government of
France O.A.T. | | Sell | | | 0.250 | | | 03/20/16 | | | 2.031 | | | USD | 900,000 | | | | (63,295 | ) | | | (29,620 | ) | | | (33,675 | ) | |
| Morgan Stanley | | Government of
France O.A.T. | | Sell | | | 0.250 | | | 03/20/16 | | | 2.031 | | | USD | 500,000 | | | | (35,164 | ) | | | (14,000 | ) | | | (21,164 | ) | |
Royal Bank of
Scotland
Group PLC | | Government of
France O.A.T. | | Sell | | | 0.250 | | | 12/20/15 | | | 1.997 | | | USD | 700,000 | | | | (45,712 | ) | | | (10,666 | ) | | | (35,046 | ) | |
Royal Bank of
Scotland
Group PLC | | Government of
France O.A.T. | | Sell | | | 0.250 | | | 03/20/16 | | | 2.031 | | | USD | 500,000 | | | | (35,164 | ) | | | (13,808 | ) | | | (21,356 | ) | |
UBS Warburg
LLC | | Government of
France O.A.T. | | Sell | | | 0.250 | | | 03/20/16 | | | 2.031 | | | USD | 800,000 | | | | (56,262 | ) | | | (26,304 | ) | | | (29,958 | ) | |
Deutsche Bank
AG Japanese
Government | |
20-Year Issue | | Sell | | | 1.000 | | | 03/20/15 | | | 1.080 | | | USD | 1,000,000 | | | | (2,517 | ) | | | 7,379 | | | | (9,896 | ) | |
| Citigroup, Inc. | | Metlife Inc. | | Sell | | | 1.000 | | | 12/20/15 | | | 3.060 | | | USD | 2,900,000 | | | | (216,627 | ) | | | (83,384 | ) | | | (133,243 | ) | |
Deutsche Bank
AG | | Metlife Inc. | | Sell | | | 1.000 | | | 03/20/18 | | | 3.305 | | | USD | 2,500,000 | | | | (301,603 | ) | | | (125,824 | ) | | | (175,779 | ) | |
UBS Warburg
LLC | | Metlife Inc. | | Sell | | | 1.000 | | | 12/20/15 | | | 3.060 | | | USD | 1,600,000 | | | | (119,518 | ) | | | (68,497 | ) | | | (51,021 | ) | |
Barclays Bank
PLC | | Morgan Stanley | | Sell | | | 1.000 | | | 09/20/12 | | | 4.707 | | | USD | 100,000 | | | | (2,641 | ) | | | (1,351 | ) | | | (1,290 | ) | |
Barclays Bank
PLC | | People's Republic
of China | | Sell | | | 1.000 | | | 03/20/16 | | | 1.290 | | | USD | 1,000,000 | | | | (11,732 | ) | | | 9,825 | | | | (21,557 | ) | |
Deutsche Bank
AG | | People's Republic
of China | | Sell | | | 1.000 | | | 03/20/15 | | | 1.087 | | | USD | 5,000,000 | | | | (13,660 | ) | | | 17,927 | | | | (31,587 | ) | |
Deutsche Bank
AG | | People's Republic
of China | | Sell | | | 1.000 | | | 09/20/16 | | | 1.403 | | | USD | 400,000 | | | | (7,235 | ) | | | 1,990 | | | | (9,225 | ) | |
See Accompanying Notes to Financial Statements
148
SUMMARY PORTFOLIO OF INVESTMENTS
ING PIMCO TOTAL RETURN PORTFOLIO AS OF DECEMBER 31, 2011 (CONTINUED)
| Counterparty | | Reference
Entity/Obligation | | Buy/Sell
Protection | | (Pay)/
Receive
Fixed
Rate (%) | | Termination
Date | | Implied
Credit
Spread at
12/31/11 (%)(4) | | Notional
Amount(2) | | Fair
Value(3) | | Upfront
Payments
Paid/
(Received) | | Unrealized
Appreciation/
(Depreciation) | |
Goldman
Sachs & Co. | | People's Republic
of China | | Sell | | | 1.000 | | | 09/20/16 | | | 1.403 | | | USD | 100,000 | | | $ | (1,809 | ) | | $ | 493 | | | $ | (2,302 | ) | |
| Morgan Stanley | | People's Republic
of China | | Sell | | | 1.000 | | | 09/20/16 | | | 1.403 | | | USD | 600,000 | | | | (10,852 | ) | | | 2,815 | | | | (13,667 | ) | |
UBS Warburg
LLC | | People's Republic
of China | | Sell | | | 1.000 | | | 09/20/16 | | | 1.403 | | | USD | 300,000 | | | | (5,426 | ) | | | 1,403 | | | | (6,829 | ) | |
Goldman
Sachs & Co. | | Republic of France | | Sell | | | 0.250 | | | 12/20/16 | | | 2.168 | | | USD | 4,600,000 | | | | (402,241 | ) | | | (328,144 | ) | | | (74,097 | ) | |
| HSBC | | Republic of France | | Sell | | | 0.250 | | | 09/20/16 | | | 2.128 | | | USD | 300,000 | | | | (24,565 | ) | | | (10,494 | ) | | | (14,071 | ) | |
UBS Warburg
LLC | | Republic of France | | Sell | | | 0.250 | | | 09/20/16 | | | 2.128 | | | USD | 100,000 | | | | (8,188 | ) | | | (4,881 | ) | | | (3,307 | ) | |
UBS Warburg
LLC | | Republic of
Indonesia | | Sell | | | 1.000 | | | 09/20/16 | | | 1.997 | | | USD | 300,000 | | | | (13,179 | ) | | | (4,353 | ) | | | (8,826 | ) | |
Barclays Bank
PLC | | Republic of Italy | | Sell | | | 1.000 | | | 03/20/16 | | | 4.859 | | | USD | 800,000 | | | | (109,341 | ) | | | (25,505 | ) | | | (83,836 | ) | |
Goldman
Sachs & Co. | | Republic of Italy | | Sell | | | 1.000 | | | 03/20/16 | | | 4.859 | | | USD | 2,800,000 | | | | (382,694 | ) | | | (77,743 | ) | | | (304,951 | ) | |
Goldman
Sachs & Co. | | Republic of Italy | | Sell | | | 1.000 | | | 03/20/16 | | | 4.859 | | | USD | 200,000 | | | | (27,335 | ) | | | (6,303 | ) | | | (21,032 | ) | |
Goldman
Sachs & Co. | | Republic of Italy | | Sell | | | 1.000 | | | 06/20/16 | | | 4.846 | | | USD | 1,000,000 | | | | (142,762 | ) | | | (16,871 | ) | | | (125,891 | ) | |
Goldman
Sachs & Co. | | Republic of Italy | | Sell | | | 1.000 | | | 06/20/16 | | | 4.846 | | | USD | 16,400,000 | | | | (2,341,304 | ) | | | (267,741 | ) | | | (2,073,563 | ) | |
Deutsche Bank
AG | | Reynolds American
Inc. | | Sell | | | 1.280 | | | 06/20/17 | | | 2.076 | | | USD | 600,000 | | | | (24,067 | ) | | | — | | | | (24,067 | ) | |
| Citigroup, Inc. | | Ruplic of
Kazakhstan | | Sell | | | 1.000 | | | 03/20/16 | | | 2.874 | | | USD | 300,000 | | | | (22,016 | ) | | | (7,118 | ) | | | (14,898 | ) | |
Deutsche Bank
AG | | Ruplic of
Kazakhstan | | Sell | | | 1.000 | | | 03/20/16 | | | 2.874 | | | USD | 300,000 | | | | (22,016 | ) | | | (7,461 | ) | | | (14,555 | ) | |
| HSBC | | Ruplic of
Kazakhstan | | Sell | | | 1.000 | | | 03/20/16 | | | 2.874 | | | USD | 400,000 | | | | (29,355 | ) | | | (9,644 | ) | | | (19,711 | ) | |
Goldman
Sachs & Co. | | Spanish Government
Bond | | Sell | | | 1.000 | | | 03/20/16 | | | 3.724 | | | USD | 300,000 | | | | (30,295 | ) | | | (16,640 | ) | | | (13,655 | ) | |
Goldman
Sachs & Co. | | Spanish Government
Bond | | Sell | | | 1.000 | | | 06/20/16 | | | 3.736 | | | USD | 1,000,000 | | | | (106,475 | ) | | | (51,672 | ) | | | (54,803 | ) | |
| Citigroup, Inc. | | United Kingdom
Gilt | | Sell | | | 1.000 | | | 12/20/16 | | | 0.946 | | | USD | 6,100,000 | | | | 15,798 | | | | 23,040 | | | | (7,242 | ) | |
Goldman
Sachs & Co. | | United Kingdom
Gilt | | Sell | | | 1.000 | | | 06/20/15 | | | 0.703 | | | USD | 4,600,000 | | | | 46,554 | | | | 28,098 | | | | 18,456 | | |
Goldman
Sachs & Co. | | United Kingdom
Gilt | | Sell | | | 1.000 | | | 12/20/15 | | | 0.792 | | | USD | 1,000,000 | | | | 8,059 | | | | 17,801 | | | | (9,742 | ) | |
Goldman
Sachs & Co. | | United Kingdom
Gilt | | Sell | | | 1.000 | | | 12/20/15 | | | 0.792 | | | USD | 800,000 | | | | 6,447 | | | | 14,101 | | | | (7,654 | ) | |
Goldman
Sachs & Co. | | United Kingdom
Gilt | | Sell | | | 1.000 | | | 12/20/16 | | | 0.946 | | | USD | 4,100,000 | | | | 10,618 | | | | 11,604 | | | | (986 | ) | |
| Morgan Stanley | | United Kingdom
Gilt | | Sell | | | 1.000 | | | 06/20/16 | | | 0.872 | | | USD | 400,000 | | | | 2,215 | | | | 6,161 | | | | (3,946 | ) | |
Barclays Bank
PLC | | United Mexican
States | | Sell | | | 1.000 | | | 03/20/15 | | | 1.173 | | | USD | 600,000 | | | | (3,272 | ) | | | (8,480 | ) | | | 5,208 | | |
| Citigroup, Inc. | | United Mexican
States | | Sell | | | 1.000 | | | 03/20/15 | | | 1.173 | | | USD | 600,000 | | | | (3,272 | ) | | | (8,654 | ) | | | 5,382 | | |
| Citigroup, Inc. | | United Mexican
States | | Sell | | | 1.000 | | | 09/20/15 | | | 1.281 | | | USD | 1,000,000 | | | | (10,166 | ) | | | (11,178 | ) | | | 1,012 | | |
| Citigroup, Inc. | | United Mexican
States | | Sell | | | 1.000 | | | 03/20/16 | | | 1.362 | | | USD | 8,000,000 | | | | (117,835 | ) | | | (37,894 | ) | | | (79,941 | ) | |
See Accompanying Notes to Financial Statements
149
SUMMARY PORTFOLIO OF INVESTMENTS
ING PIMCO TOTAL RETURN PORTFOLIO AS OF DECEMBER 31, 2011 (CONTINUED)
| Counterparty | | Reference
Entity/Obligation | | Buy/Sell
Protection | | (Pay)/
Receive
Fixed
Rate (%) | | Termination
Date | | Implied
Credit
Spread at
12/31/11 (%)(4) | | Notional
Amount(2) | | Fair
Value(3) | | Upfront
Payments
Paid/
(Received) | | Unrealized
Appreciation/
(Depreciation) | |
Deutsche Bank
AG | | United Mexican
States | | Sell | | | 1.000 | | | 03/20/15 | | | 1.173 | | | USD | 200,000 | | | $ | (1,091 | ) | | $ | (2,885 | ) | | $ | 1,794 | | |
UBS Warburg
LLC | | United States
Treasury Note | | Sell | | | 0.250 | | | 09/20/15 | | | 0.411 | | | EUR | 5,000,000 | | | | (37,912 | ) | | | (53,004 | ) | | | 15,092 | | |
| | | | | | | | | | | | | | | $ | (5,151,929 | ) | | $ | (1,369,788 | ) | | $ | (3,782,141 | ) | |
(1) If the Portfolio is a seller of protection, and a credit event occurs, as defined under the terms of that particular swap agreement, the Portfolio will generally either 1.) Pay to the buyer an amount equal to the notional amount of the swap and take delivery of the referenced obligation, other deliverable obligations, or underlying securities comprising a referenced index or 2.) Pay a net settlement amount in the form of cash or securities equal to the notional amount of the swap less the recovery value of the referenced obligation or underlying securities comprising a referenced index.
(2) The maximum amount of future payments (undiscounted) that a Portfolio as seller of protection could be required to make or receive as a buyer of credit protection under a credit default swap agreement would be an amount equal to the notional amount of the agreement.
(3) The fair values for credit default swap agreements serve as an indicator of the current status of the payment/performance risk and represent the likelihood or risk of default for the credit derivative. Increasing fair values, in absolute terms, when compared to the notional amount of the agreement, represent a deterioration of the referenced obligation's credit soundness and a greater likelihood or risk of default or other credit event occurring.
(4) Implied credit spreads, represented in absolute terms, utilized in determining the fair value of credit default swap agreements on corporate issues or sovereign issues are disclosed in each Portfolio's Portfolio of Investment and serve as an indicator of the current status of the payment/performance risk and represent the likelihood or risk of default for the credit derivative. The implied credit spread of a particular referenced entity reflects the cost of buying/selling protection and may include upfront payments required to be made to enter into the agreement. For credit default swaps on asset-backed securities or credit indices, the quoted market prices and resulting market values serve as the indicator of the current status of the payment/performance risk. Wider credit spreads and increasing fair values, in absolute terms when compared to the notional amount of the swap, represent a deterioration of the referenced entity's credit soundness and a greater likelihood or risk of default or other credit event occurring as defined under the terms of the agreement.
ING PIMCO Total Return Portfolio Centrally Cleared Interest Rate Swap Agreements Outstanding on December 31, 2011:
| | | Termination
Date | | Notional
Amount | | Fair
Value | | Unrealized
Appreciation/
(Depreciation) | |
Receive a fixed rate equal to 3.650% and pay a floating rate based
on the 6-month EUR-EURIBOR Reuters | | 09/21/21 | | EUR | 1,300,000 | | | $ | 197,277 | | | $ | 37,477 | | |
Receive a fixed rate equal to 2.750% and pay a floating rate based
on the 6-month EUR-EURIBOR Reuters | | 03/21/22 | | EUR | 12,000,000 | | | | 490,548 | | | | 349,899 | | |
Receive a fixed rate equal to 3.000% and pay a floating rate based
on the 6-month EUR-EURIBOR Reuters | | 03/21/22 | | EUR | 5,400,000 | | | | 381,573 | | | | 101,564 | | |
Receive a fixed rate equal to 2.500% and pay a floating rate based
on the 6-month EUR-EURIBOR Reuters | | 03/21/22 | | EUR | 14,000,000 | | | | 155,349 | | | | 597,915 | | |
Receive a floating rate based on the 3-month USD-LIBOR-BBA and
pay a fixed rate equal to 4.250% | | 06/15/41 | | USD | 24,500,000 | | | | (8,732,977 | ) | | | (2,577,239 | ) | |
| | | | | | | $ | (7,508,230 | ) | | $ | (1,490,384 | ) | |
ING PIMCO Total Return Portfolio Over-the-Counter Interest Rate Swap Agreements Outstanding on December 31, 2011:
| | | Termination
Date | | Notional
Amount | | Fair
Value | | Upfront Payments
Paid/(Received) | | Unrealized
Appreciation/
(Depreciation) | |
Receive a fixed rate equal to 4.250% and pay a floating rate
based on AUD-BBR-BBSW
Counterparty: Barclays Bank PLC | | 06/15/17 | | AUD | 300,000 | | | $ | (1,887 | ) | | $ | (292 | ) | | $ | (1,595 | ) | |
Receive a fixed rate equal to 5.000% and pay a floating rate
based on AUD-BBR-BBSW
Counterparty: Citigroup, Inc. | | 06/15/17 | | AUD | 700,000 | | | | 19,457 | | | | 4,966 | | | | 14,491 | | |
Receive a fixed rate equal to 5.000% and pay a floating rate
based on AUD-BBR-BBSW
Counterparty: Deutsche Bank AG | | 06/15/17 | | AUD | 300,000 | | | | 8,341 | | | | 2,224 | | | | 6,117 | | |
Receive a fixed rate equal to 4.250% and pay a floating rate
based on AUD-BBR-BBSW
Counterparty: Deutsche Bank AG | | 06/15/17 | | AUD | 500,000 | | | | (3,145 | ) | | | (271 | ) | | | (2,874 | ) | |
Receive a fixed rate equal to 5.000% and pay a floating rate
based on AUD-BBR-BBSW
Counterparty: Royal Bank of Scotland Group PLC | | 06/15/17 | | AUD | 700,000 | | | | 19,463 | | | | 5,253 | | | | 14,210 | | |
Receive a fixed rate equal to 12.285% and pay a floating rate
based on the Brazil Cetip Interbank Deposit Rate Annualized
Counterparty: Barclays Bank PLC | | 01/02/13 | | BRL | 12,500,000 | | | | 272,597 | | | | 8,716 | | | | 263,881 | | |
See Accompanying Notes to Financial Statements
150
SUMMARY PORTFOLIO OF INVESTMENTS
ING PIMCO TOTAL RETURN PORTFOLIO AS OF DECEMBER 31, 2011 (CONTINUED)
| | | Termination
Date | | Notional
Amount | | Fair
Value | | Upfront Payments
Paid/(Received) | | Unrealized
Appreciation/
(Depreciation) | |
Receive a fixed rate equal to 11.910% and pay a floating rate
based on the Brazil Cetip Interbank Deposit Rate Annualized
Counterparty: Barclays Bank PLC | | 01/02/13 | | BRL | 3,900,000 | | | $ | 62,066 | | | $ | 3,000 | | | $ | 59,066 | | |
Receive a fixed rate equal to 11.990% and pay a floating rate
based on the Brazil Cetip Interbank Deposit Rate Annualized
Counterparty: Barclays Bank PLC | | 01/02/14 | | BRL | 3,200,000 | | | | 61,313 | | | | 7,962 | | | | 53,351 | | |
Receive a fixed rate equal to 11.930% and pay a floating rate
based on the Brazil Cetip Interbank Deposit Rate Annualized
Counterparty: Goldman Sachs & Co. | | 01/02/13 | | BRL | 3,500,000 | | | | 58,696 | | | | (1,599 | ) | | | 60,295 | | |
Receive a fixed rate equal to 11.890% and pay a floating rate
based on the Brazil Cetip Interbank Deposit Rate Annualized
Counterparty: Goldman Sachs & Co. | | 01/02/13 | | BRL | 8,500,000 | | | | 140,792 | | | | 583 | | | | 140,209 | | |
Receive a fixed rate equal to 12.650% and pay a floating rate
based on the Brazil Cetip Interbank Deposit Rate Annualized
Counterparty: Goldman Sachs & Co. | | 01/02/14 | | BRL | 4,200,000 | | | | 126,725 | | | | 16,374 | | | | 110,351 | | |
Receive a fixed rate equal to 11.140% and pay a floating rate
based on the Brazil Cetip Interbank Deposit Rate Annualized
Counterparty: HSBC | | 01/02/12 | | BRL | 2,000,000 | | | | 22,291 | | | | (67 | ) | | | 22,358 | | |
Receive a fixed rate equal to 10.610% and pay a floating rate
based on the Brazil Cetip Interbank Deposit Rate Annualized
Counterparty: HSBC | | 01/02/12 | | BRL | 1,400,000 | | | | 5,790 | | | | — | | | | 5,790 | | |
Receive a fixed rate equal to 10.450% and pay a floating rate
based on Brazil Cetip Interbank
Counterparty: HSBC | | 01/02/13 | | BRL | 6,200,000 | | | | 2,449 | | | | (3,637 | ) | | | 6,086 | | |
Receive a fixed rate equal to 11.890% and pay a floating rate
based on the Brazil Cetip Interbank Deposit Rate Annualized
Counterparty: HSBC | | 01/02/13 | | BRL | 11,200,000 | | | | 185,514 | | | | 5,736 | | | | 179,778 | | |
Receive a fixed rate equal to 12.300% and pay a floating rate
based on the Brazil Cetip Interbank Deposit Rate Annualized
Counterparty: HSBC | | 01/02/13 | | BRL | 5,000,000 | | | | 110,559 | | | | 4,771 | | | | 105,788 | | |
Receive a fixed rate equal to 12.830% and pay a floating rate
based on the Brazil Cetip Interbank Deposit Rate Annualized
Counterparty: HSBC | | 01/02/13 | | BRL | 14,300,000 | | | | 341,085 | | | | — | | | | 341,085 | | |
Receive a fixed rate equal to 11.880% and pay a floating rate
based on the Brazil Cetip Interbank Deposit Rate Annualized
Counterparty: HSBC | | 01/02/13 | | BRL | 5,300,000 | | | | 79,817 | | | | (1,373 | ) | | | 81,190 | | |
Receive a fixed rate equal to 10.990% and pay a floating rate
based on Brazil Cetip Interbank
Counterparty: HSBC | | 01/02/14 | | BRL | 5,600,000 | | | | 19,487 | | | | 7,017 | | | | 12,470 | | |
Receive a fixed rate equal to 10.530% and pay a floating rate
based on Brazil Cetip Interbank
Counterparty: HSBC | | 01/02/14 | | BRL | 8,100,000 | | | | (5,708 | ) | | | (21,278 | ) | | | 15,570 | | |
Receive a fixed rate equal to 11.980% and pay a floating rate
based on the Brazil Cetip Interbank Deposit Rate Annualized
Counterparty: Merrill Lynch | | 01/02/12 | | BRL | 2,100,000 | | | | 44,764 | | | | — | | | | 44,764 | | |
Receive a fixed rate equal to 12.540% and pay a floating rate
based on the Brazil Cetip Interbank Deposit Rate Annualized
Counterparty: Merrill Lynch | | 01/02/12 | | BRL | 2,900,000 | | | | 88,843 | | | | (415 | ) | | | 89,258 | | |
Receive a fixed rate equal to 12.540% and pay a floating rate
based on the Brazil Cetip Interbank Deposit Rate Annualized
Counterparty: HSBC | | 01/02/14 | | BRL | 400,000 | | | | 11,418 | | | | 1,255 | | | | 10,163 | | |
Receive a fixed rate equal to 10.455% and pay a floating rate
based on Brazil Cetip Interbank
Counterparty: Morgan Stanley | | 01/02/13 | | BRL | 4,600,000 | | | | 2,292 | | | | (1,119 | ) | | | 3,411 | | |
Receive a fixed rate equal to 11.980% and pay a floating rate
based on the Brazil Cetip Interbank Deposit Rate Annualized
Counterparty: Morgan Stanley | | 01/02/13 | | BRL | 2,500,000 | | | | 43,706 | | | | 1,291 | | | | 42,415 | | |
Receive a fixed rate equal to 12.590% and pay a floating rate
based on the Brazil Cetip Interbank Deposit Rate Annualized
Counterparty: Morgan Stanley | | 01/02/13 | | BRL | 9,200,000 | | | | 193,316 | | | | 11,588 | | | | 181,728 | | |
Receive a fixed rate equal to 10.580% and pay a floating rate
based on Brazil Cetip Interbank
Counterparty: Morgan Stanley | | 01/02/14 | | BRL | 16,400,000 | | | | (3,319 | ) | | | (28,819 | ) | | | 25,500 | | |
Receive a fixed rate equal to 11.890% and pay a floating rate
based on the Brazil Cetip Interbank Deposit Rate Annualized
Counterparty: Morgan Stanley | | 01/02/14 | | BRL | 3,100,000 | | | | 46,645 | | | | (307 | ) | | | 46,952 | | |
Receive a fixed rate equal to 12.510% and pay a floating rate
based on the Brazil Cetip Interbank Deposit Rate Annualized
Counterparty: Morgan Stanley | | 01/02/14 | | BRL | 1,600,000 | | | | 44,984 | | | | 3,887 | | | | 41,097 | | |
See Accompanying Notes to Financial Statements
151
SUMMARY PORTFOLIO OF INVESTMENTS
ING PIMCO TOTAL RETURN PORTFOLIO AS OF DECEMBER 31, 2011 (CONTINUED)
| | | Termination
Date | | Notional
Amount | | Fair
Value | | Upfront Payments
Paid/(Received) | | Unrealized
Appreciation/
(Depreciation) | |
Receive a fixed rate equal to 11.950% and pay a floating rate
based on the Brazil Cetip Interbank Deposit Rate Annualized
Counterparty: Royal Bank of Scotland Group PLC | | 01/02/13 | | BRL | 3,200,000 | | | $ | 39,523 | | | $ | 1,342 | | | $ | 38,181 | | |
Receive a fixed rate equal to 10.605% and pay a floating rate
based on Brazil Cetip Interbank
Counterparty: UBS Warburg LLC | | 01/02/13 | | BRL | 6,000,000 | | | | 8,838 | | | | — | | | | 8,838 | | |
Receive a fixed rate equal to 12.070% and pay a floating rate
based on the Brazil Cetip Interbank Deposit Rate Annualized
Counterparty: UBS Warburg LLC | | 01/02/13 | | BRL | 2,100,000 | | | | 39,716 | | | | 1,649 | | | | 38,067 | | |
Receive a fixed rate equal to 10.770% and pay a floating rate
based on Brazil Cetip Interbank
Counterparty: UBS Warburg LLC | | 01/02/14 | | BRL | 3,500,000 | | | | 5,629 | | | | (1,465 | ) | | | 7,094 | | |
Receive a fixed rate equal to 12.250% and pay a floating rate
based on the Brazil Cetip Interbank Deposit Rate Annualized
Counterparty: UBS Warburg LLC | | 01/02/14 | | BRL | 2,600,000 | | | | 62,519 | | | | 3,498 | | | | 59,021 | | |
Receive a fixed rate equal to 2.500% and pay a floating rate
based on the 6-month EUR-EURIBOR Reuters
Counterparty: Barclays Bank PLC | | 09/21/18 | | EUR | 900,000 | | | | 34,020 | | | | (14,354 | ) | | | 48,374 | | |
Receive a fixed rate equal to 3.000% and pay a floating rate
based on the 6-month EUR-EURIBOR Reuters
Counterparty: Barclays Bank PLC | | 09/21/21 | | EUR | 2,600,000 | | | | 190,724 | | | | 22,810 | | | | 167,914 | | |
Receive a fixed rate equal to 3.500% and pay a floating rate
based on the 6-month EUR-EURIBOR-Reuters
Counterparty: Barclays Bank PLC | | 09/21/21 | | EUR | 9,500,000 | | | | 1,270,404 | | | | 150,390 | | | | 1,120,014 | | |
Receive a fixed rate equal to 2.500% and pay a floating rate
based on the 6-month EUR-EURIBOR-Reuters
Counterparty: Barclays Bank PLC | | 03/21/22 | | EUR | 2,300,000 | | | | 14,362 | | | | (73,122 | ) | | | 87,484 | | |
Receive a fixed rate equal to 3.000% and pay a floating rate
based on the 6-month EUR-EURIBOR-Reuters
Counterparty: Barclays Bank PLC | | 03/21/22 | | EUR | 3,700,000 | | | | 251,297 | | | | 104,898 | | | | 146,399 | | |
Receive a fixed rate equal to 3.000% and pay a floating rate
based on the 6-month GBP LIBOR
Counterparty: Barclays Bank PLC | | 03/21/22 | | GBP | 700,000 | | | | 66,421 | | | | 12,095 | | | | 54,326 | | |
Receive a fixed rate equal to 3.000% and pay a floating rate
based on the 6-month GBP LIBOR
Counterparty: HSBC | | 03/21/22 | | GBP | 12,800,000 | | | | 1,214,547 | | | | 694,163 | | | | 520,384 | | |
Receive a fixed rate equal to 5.600% and pay a floating rate
based on 28-day MXN TIIE-BANXICO
Counterparty: Barclays Bank PLC | | 09/06/16 | | MXN | 111,000,000 | | | | (69,441 | ) | | | 50,565 | | | | (120,006 | ) | |
Receive a fixed rate equal to 8.860% and pay a floating rate
based on 28-day MXN-TIIE-BANXICO
Counterparty: Citigroup, Inc. | | 09/12/16 | | MXN | 5,700,000 | | | | 54,611 | | | | — | | | | 54,611 | | |
Receive a fixed rate equal to 5.600% and pay a floating rate
based on 28-day MXN TIIE-BANXICO
Counterparty: HSBC | | 09/06/16 | | MXN | 16,100,000 | | | | (10,072 | ) | | | 6,514 | | | | (16,586 | ) | |
Receive a fixed rate equal to 5.600% and pay a floating rate
based on 28-day MXN TIIE-BANXICO
Counterparty: Morgan Stanley | | 09/06/16 | | MXN | 6,000,000 | | | | (3,749 | ) | | | 3,206 | | | | (6,955 | ) | |
Receive a fixed rate equal to 1.000% and pay a floating rate
based on the 3-month USD-LIBOR-BBA
Counterparty: BNP Paribas Bank | | 09/19/14 | | USD | 6,600,000 | | | | 95,869 | | | | (1,991 | ) | | | 97,860 | | |
Receive a fixed rate equal to 1.000% and pay a floating rate
based on the 3-month USD-LIBOR-BBA
Counterparty: Goldman Sachs & Co. | | 09/19/14 | | USD | 3,300,000 | | | | 47,934 | | | | (12,294 | ) | | | 60,228 | | |
Receive a fixed rate equal to 0.500% and pay a floating rate
based on the 3-month USD-LIBOR-BBA
Counterparty: Morgan Stanley | | 09/19/13 | | USD | 16,600,000 | | | | 55,493 | | | | (16,977 | ) | | | 72,470 | | |
| | | | | | | $ | 5,366,996 | | | $ | 956,373 | | | $ | 4,410,623 | | |
See Accompanying Notes to Financial Statements
152
SUMMARY PORTFOLIO OF INVESTMENTS
ING PIMCO TOTAL RETURN PORTFOLIO AS OF DECEMBER 31, 2011 (CONTINUED)
ING PIMCO Total Return Portfolio Written Inflation Floors Outstanding on December 31, 2011:
Inflation Floors
| Counterparty | | Underlying Reference
Entity/Obligation | | Strike
Index | | Floor
Rate | | Termination
Date | | Notional
Amount | | Premiums
Received | | Fair
Value | |
| Citigroup, Inc. | | CPURNSA Index | | | 215.949 | | | | 0.000 | % | | 03/12/20 | | USD | 1,600,000 | | | $ | 13,760 | | | $ | (6,118 | ) | |
| Citigroup, Inc. | | CPURNSA Index | | | 216.687 | | | | 0.000 | % | | 04/07/20 | | USD | 2,000,000 | | | | 17,600 | | | | (7,935 | ) | |
| Citigroup, Inc. | | CPURNSA Index | | | 217.965 | | | | 0.000 | % | | 09/29/20 | | USD | 2,200,000 | | | | 28,380 | | | | (9,265 | ) | |
| Deutsche Bank AG | | CPURNSA Index | | | 215.949 | | | | 0.000 | % | | 03/10/20 | | USD | 1,000,000 | | | | 7,500 | | | | (4,505 | ) | |
| | | | | | | | | | | | | $ | 67,240 | | | $ | (27,823 | ) | |
ING PIMCO Total Return Portfolio Written Options Open on December 31, 2011:
Options on Exchange Traded Futures Contracts
| Description/Name of Issuer | | Exercise
Price | | Expiration
Date | | # of
Contracts | | Premiums
Received | | Value | |
90-Day Eurodollar March Futures
Put Option CME | | USD | 99.00 | | | 03/19/12 | | | 123 | | | $ | 100,566 | | | $ | (9,994 | ) | |
| | | | | | | | | $ | 100,566 | | | $ | (9,994 | ) | |
ING PIMCO Total Return Portfolio Written Swaptions Open on December 31, 2011:
Written Interest Rate Swaptions
| Description | | Counterparty | | Floating Rate
Index/Underlying
Reference Entity | | Pay/Receive
Floating | | Exercise
Rate | | Expiration
Date | | Notional
Amount | | Premiums
Received | | Fair
Value | |
| Put OTC Swaption | | Barclays
Bank PLC | | 3-month USD-LIBOR-BBA | | Pay | | | 3.000 | % | | 06/18/12 | | USD | 21,800,000 | | | $ | 197,358 | | | $ | (743 | ) | |
| Put OTC Swaption | | Citigroup, Inc. | | 3-month USD-LIBOR-BBA | | Pay | | | 0.920 | % | | 11/14/12 | | USD | 6,300,000 | | | | 28,350 | | | | (22,517 | ) | |
| Put OTC Swaption | | Citigroup, Inc. | | 3-month USD-LIBOR-BBA | | Pay | | | 1.700 | % | | 08/13/12 | | USD | 27,600,000 | | | | 476,100 | | | | (181,979 | ) | |
| Put OTC Swaption | | Citigroup, Inc. | | 3-month USD-LIBOR-BBA | | Pay | | | 2.250 | % | | 09/24/12 | | USD | 2,900,000 | | | | 19,756 | | | | (1,174 | ) | |
| Put OTC Swaption | | Citigroup, Inc. | | 3-month USD-LIBOR-BBA | | Pay | | | 3.000 | % | | 06/18/12 | | USD | 16,900,000 | | | | 182,931 | | | | (576 | ) | |
| Put OTC Swaption | | Citigroup, Inc. | | 3-month USD-LIBOR-BBA | | Pay | | | 3.250 | % | | 07/16/12 | | USD | 9,100,000 | | | | 224,982 | | | | (1,456 | ) | |
| Put OTC Swaption | | Deutsche
Bank AG | | 3-month USD-LIBOR-BBA | | Pay | | | 1.000 | % | | 08/13/12 | | USD | 4,700,000 | | | | 48,293 | | | | (24,140 | ) | |
| Put OTC Swaption | | Deutsche
Bank AG | | 3-month USD-LIBOR-BBA | | Pay | | | 1.200 | % | | 07/11/13 | | USD | 12,600,000 | | | | 88,928 | | | | (71,998 | ) | |
| Put OTC Swaption | | Deutsche
Bank AG | | 3-month USD-LIBOR-BBA | | Pay | | | 1.700 | % | | 08/13/12 | | USD | 23,900,000 | | | | 329,612 | | | | (157,583 | ) | |
| Put OTC Swaption | | Deutsche
Bank AG | | 3-month USD-LIBOR-BBA | | Pay | | | 1.750 | % | | 07/11/13 | | USD | 84,400,000 | | | | 396,405 | | | | (115,544 | ) | |
| Put OTC Swaption | | Deutsche
Bank AG | | 3-month USD-LIBOR-BBA | | Pay | | | 2.750 | % | | 06/18/12 | | USD | 11,800,000 | | | | 122,491 | | | | (764 | ) | |
| Put OTC Swaption | | Deutsche
Bank AG | | 3-month USD-LIBOR-BBA | | Pay | | | 3.000 | % | | 06/18/12 | | USD | 13,000,000 | | | | 141,396 | | | | (443 | ) | |
| Put OTC Swaption | | Morgan Stanley | | 3-month USD-LIBOR-BBA | | Pay | | | 0.920 | % | | 11/14/12 | | USD | 43,900,000 | | | | 121,809 | | | | (156,903 | ) | |
| Put OTC Swaption | | Morgan Stanley | | 3-month USD-LIBOR-BBA | | Pay | | | 2.250 | % | | 09/24/12 | | USD | 18,400,000 | | | | 112,916 | | | | (7,447 | ) | |
| Put OTC Swaption | | Morgan Stanley | | 3-month USD-LIBOR-BBA | | Pay | | | 10.000 | % | | 07/10/12 | | USD | 4,900,000 | | | | 29,522 | | | | (1 | ) | |
Put OTC Swaption Royal Bank of
Scotland | |
Group PLC | | 3-month USD-LIBOR-BBA | | Pay | | | 1.700 | % | | 08/13/12 | | USD | 21,600,000 | | | | 299,766 | | | | (142,418 | ) | |
Put OTC Swaption Royal Bank of
Scotland | |
Group PLC | | 3-month USD-LIBOR-BBA | | Pay | | | 1.750 | % | | 11/19/12 | | USD | 19,700,000 | | | | 74,368 | | | | (10,882 | ) | |
Put OTC Swaption Royal Bank of
Scotland | |
Group PLC | | 3-month USD-LIBOR-BBA | | Pay | | | 2.000 | % | | 04/30/12 | | USD | 21,800,000 | | | | 43,600 | | | | (1,210 | ) | |
Put OTC Swaption Royal Bank of
Scotland | |
Group PLC | | 3-month USD-LIBOR-BBA | | Pay | | | 2.250 | % | | 09/24/12 | | USD | 60,000,000 | | | | 470,204 | | | | (24,285 | ) | |
Put OTC Swaption Royal Bank of
Scotland | |
Group PLC | | 3-month USD-LIBOR-BBA | | Pay | | | 2.750 | % | | 06/18/12 | | USD | 10,800,000 | | | | 105,840 | | | | (699 | ) | |
Put OTC Swaption Royal Bank of
Scotland | |
Group PLC | | 3-month USD-LIBOR-BBA | | Pay | | | 3.000 | % | | 06/18/12 | | USD | 31,100,000 | | | | 274,720 | | | | (1,061 | ) | |
Put OTC Swaption Royal Bank of
Scotland | |
Group PLC | | 3-month USD-LIBOR-BBA | | Pay | | | 3.250 | % | | 07/16/12 | | USD | 3,000,000 | | | | 75,330 | | | | (480 | ) | |
| Total Written Swaptions | | | | | | | | | | | | | | $ | 3,864,677 | | | $ | (924,303 | ) | |
See Accompanying Notes to Financial Statements
153
SUMMARY PORTFOLIO OF INVESTMENTS
ING PIMCO TOTAL RETURN PORTFOLIO AS OF DECEMBER 31, 2011 (CONTINUED)
The following sales commitments were held by the ING PIMCO Total Return Portfolio at December 31, 2011:
| Principal Amount | | Description | | Fair Value | |
| $ | (24,000,000 | ) | | Fannie Mae | | $ | (25,218,751 | ) | |
| | | | | Total Sales Commitments
Cost $(25,138,124) | | $ | (25,218,751 | ) | |
A summary of derivative instruments by primary risk exposure is outlined in the following tables.
The fair value of derivative instruments as of December 31, 2011 was as follows:
Derivatives not accounted
for as hedging instruments | | Location on Statement of Assets and Liabilities | | Fair Value | |
| Asset Derivatives | |
| Interest rate contracts | | Investments in securities at value* | | $ | 80,983 | | |
| Foreign exchange contracts | | Unrealized appreciation on forward foreign currency contracts | | | 6,674,869 | | |
| Credit contracts | | Upfront payments paid on swap agreements | | | 3,118,193 | | |
| Interest rate contracts | | Upfront payments paid on swap agreements | | | 1,135,753 | | |
| Credit contracts | | Unrealized appreciation on swap agreements | | | 145,234 | | |
| Interest rate contracts | | Unrealized appreciation on swap agreements | | | 4,558,639 | | |
| Interest rate contracts | | Net Assets — Unrealized appreciation** | | | 1,086,855 | | |
| Interest rate contracts | | Net Assets — Unrealized appreciation*** | | | 2,990,229 | | |
| Total Asset Derivatives | | | | $ | 19,790,755 | | |
| Liability Derivatives | |
| Foreign exchange contracts | | Unrealized depreciation on forward foreign currency contracts | | $ | 4,276,214 | | |
| Credit contracts | | Upfront payments received on swap agreements | | | 1,512,425 | | |
| Interest rate contracts | | Upfront payments received on swap agreements | | | 179,380 | | |
| Credit contracts | | Unrealized depreciation on swap agreements | | | 4,506,729 | | |
| Interest rate contracts | | Unrealized depreciation on swap agreements | | | 148,016 | | |
| Interest rate contracts | | Net Assets — Unrealized depreciation** | | | 2,577,239 | | |
| Interest rate contracts | | Written options, at fair value | | | 962,120 | | |
| Total Liability Derivatives | | | | $ | 14,162,123 | | |
* Includes purchased options.
** Includes cumulative appreciation/depreciation of centrally cleared swaps as reported in the table following the Summary Portfolio of Investments.
*** Includes cumulative appreciation/depreciation of futures contracts as reported in the table following the Summary Portfolio of Investments.
The effect of derivative instruments on the Portfolio's Statement of Operations for the year ended December 31, 2011 was as follows:
| | | Amount of Realized Gain or (Loss) on Derivatives Recognized in Income | |
Derivatives not
accounted for as
hedging instruments | | Investments* | | Foreign currency
related transactions** | | Futures | | Swaps | | Written
options | | Total | |
| Credit contracts | | $ | — | | | $ | — | | | $ | — | | | $ | 3,938,423 | | | $ | 44,768 | | | $ | 3,983,191 | | |
| Foreign exchange contracts | | | — | | | | (2,376,715 | ) | | | — | | | | — | | | | — | | | | (2,376,715 | ) | |
| Interest rate contracts | | | (36,190 | ) | | | — | | | | 10,603,380 | | | | (21,603,848 | ) | | | (1,963,776 | ) | | | (13,000,434 | ) | |
| Total | | $ | (36,190 | ) | | $ | (2,376,715 | ) | | $ | 10,603,380 | | | $ | (17,665,425 | ) | | $ | (1,919,008 | ) | | $ | (11,393,958 | ) | |
| | | Change in Unrealized Appreciation or (Depreciation) on Derivatives Recognized in Income | |
Derivatives not
accounted for as
hedging instruments | | Investments* | | Foreign currency
related transactions** | | Futures | | Swaps | | Written
options | | Total | |
| Credit contracts | | $ | — | | | $ | — | | | $ | — | | | $ | (6,426,645 | ) | | $ | — | | | $ | (6,426,645 | ) | |
| Foreign exchange contracts | | | — | | | | 195,528 | | | | — | | | | — | | | | — | | | | 195,528 | | |
| Interest rate contracts | | | 12,392 | | | | — | | | | 3,882,418 | | | | 1,564,303 | | | | 4,275,228 | | | | 9,734,341 | | |
| Total | | $ | 12,392 | | | $ | 195,528 | | | $ | 3,882,418 | | | $ | (4,862,342 | ) | | $ | 4,275,228 | | | $ | 3,503,224 | | |
* Amounts recognized for purchased options are included in net realized gain (loss) on investments and net change in unrealized appreciation or depreciation on investments.
** Amounts recognized for forward foreign currency contracts are included in net realized gain (loss) on foreign currency related transactions and net change in unrealized appreciation or depreciation on foreign currency related transactions.
See Accompanying Notes to Financial Statements
154
SUMMARY PORTFOLIO OF INVESTMENTS
ING PIONEER HIGH YIELD PORTFOLIO AS OF DECEMBER 31, 2011
Principal
Amount† | |
| |
| | Value | | Percentage
of Net
Assets | |
| CORPORATE BONDS/NOTES: 77.3% | | | |
| | | | | Consumer Discretionary: 10.8% | |
| | 200,000 | | | # | | Allison Transmission, Inc.,
7.125%, 05/15/19 | | $ | 197,000 | | | | 0.2 | | |
| | 545,000 | | | #,+ | | Burger King Capital
Holdings LLC /
Burger King Capital
Finance, Inc.,
04/15/19 | | | 341,988 | | | | 0.4 | | |
| | 550,000 | | | | | CCO Holdings LLC /
CCO Holdings Capital
Corp., 6.500%,
04/30/21 | | | 559,625 | | | | 0.6 | | |
| | 548,625 | | | | | Chrysler Group LLC,
6.000%, 04/28/17 | | | 520,508 | | | | 0.6 | | |
| | 250,000 | | | # | | Chrysler Group LLC/CG
Co-Issuer, Inc., 8.000%,
06/15/19 | | | 230,000 | | | | 0.3 | | |
| | 100,000 | | | # | | Commercial Vehicle
Group, Inc., 7.875%,
04/15/19 | | | 96,750 | | | | 0.1 | | |
| | 622,000 | | | | | Ford Motor Co.,
4.250%, 11/15/16 | | | 894,902 | | | | 1.0 | | |
| | 104,000 | | | # | | Lennar Corp.,
2.750%, 12/15/20 | | | 116,480 | | | | 0.1 | | |
| | 1,010,000 | | | #,± | | Mashantucket
Western Pequot
Tribe, 8.500%,
11/15/15 | | | 50,500 | | | | 0.1 | | |
| | 145,000 | | | # | | MDC Partners, Inc.,
11.000%, 11/01/16 | | | 154,425 | | | | 0.2 | | |
| | 820,000 | | | | | Navistar International
Corp., 3.000%,
10/15/14 | | | 887,650 | | | | 1.0 | | |
| | 577,718 | | | #,& | | Pegasus Solutions, Inc.,
13.000%, 04/15/14 | | | 550,276 | | | | 0.6 | | |
| | 495,000 | | | | | Pierre Foods, Inc.,
7.000%, 07/29/16 | | | 494,072 | | | | 0.6 | | |
| | 175,000 | | | # | | Pittsburgh Glass
Works LLC,
8.500%, 04/15/16 | | | 169,313 | | | | 0.2 | | |
| | 235,000 | | | # | | Reynolds Group
Issuer, Inc. / Reynolds
Group Issuer LLC /
Reynolds Group
Issuer Lu, 8.250%,
02/15/21 | | | 209,150 | | | | 0.2 | | |
| | 105,000 | | | # | | Sally Holdings LLC /
Sally Capital, Inc.,
6.875%, 11/15/19 | | | 110,250 | | | | 0.1 | | |
| | 416,000 | | | # | | Tower Automotive
Holdings USA LLC /
TA Holdings
Finance, Inc.,
10.625%, 09/01/17 | | | 420,160 | | | | 0.5 | | |
| | 480,000 | | | | | Wesco Distribution, Inc.,
7.500%, 10/15/17 | | | 492,600 | | | | 0.5 | | |
| | 3,290,419 | | | | | Other Securities | | | 3,155,138 | | | | 3.5 | | |
| | | | | | | | | | 9,650,787 | | | | 10.8 | | |
Principal
Amount† | |
| |
| | Value | | Percentage
of Net
Assets | |
| | | | | Consumer Staples: 4.6% | |
| | 430,000 | | | | | Alliance One
International, Inc.,
5.500%, 07/15/14 | | $ | 330,563 | | | | 0.4 | | |
| | 825,000 | | | | | Alliance One
International, Inc.,
10.000%, 07/15/16 | | | 746,625 | | | | 0.8 | | |
| | 650,000 | | | | | NCO Group, Inc.,
5.332%, 11/15/13 | | | 609,375 | | | | 0.7 | | |
| | 575,000 | | | | | Pilgrim's Pride Corp.,
7.875%, 12/15/18 | | | 543,375 | | | | 0.6 | | |
| | 620,000 | | | | | Ticketmaster
Entertainment, Inc.,
10.750%, 08/01/16 | | | 663,400 | | | | 0.7 | | |
| | 1,230,114 | | | | | Other Securities | | | 1,207,625 | | | | 1.4 | | |
| | | | | | | | | | 4,100,963 | | | | 4.6 | | |
| | | | | Energy: 9.3% | |
| | 200,000 | | | # | | Arch Coal, Inc.,
7.000%, 06/15/19 | | | 205,000 | | | | 0.2 | | |
| | 475,000 | | | # | | Arch Coal, Inc.,
7.250%, 06/15/21 | | | 490,438 | | | | 0.6 | | |
| | 768,000 | | | | | Chesapeake Energy Corp.,
2.250%-2.500%,
05/15/37-12/15/38 | | | 668,445 | | | | 0.8 | | |
| | 250,000 | | | # | | Coffeyville
Resources LLC /
Coffeyville Finance,
Inc., 9.000%,
04/01/15 | | | 266,250 | | | | 0.3 | | |
| | 500,000 | | | # | | Expro Finance
Luxembourg SCA,
8.500%, 12/15/16 | | | 442,500 | | | | 0.5 | | |
| | 305,000 | | | # | | Goodrich
Petroleum Corp.,
8.875%, 03/15/19 | | | 306,525 | | | | 0.3 | | |
| | 75,000 | | | # | | Green Field Energy
Services, Inc.,
13.000%, 11/15/16 | | | 73,125 | | | | 0.1 | | |
| | 500,000 | | | | | Holly Energy Partners LP,
6.250%, 03/01/15 | | | 506,250 | | | | 0.6 | | |
| | 150,000 | | | # | | James River Coal Co.,
3.125%, 03/15/18 | | | 88,875 | | | | 0.1 | | |
| | 970,000 | | | | | Massey Energy Co.,
3.250%, 08/01/15 | | | 900,887 | | | | 1.0 | | |
| | 300,000 | | | # | | Midwest
Vanadium Pty Ltd.,
11.500%, 02/15/18 | | | 220,500 | | | | 0.2 | | |
| | 500,000 | | | # | | Murray Energy Corp.,
10.250%, 10/15/15 | | | 498,750 | | | | 0.6 | | |
| | 175,000 | | | # | | Peabody Energy Corp.,
6.000%, 11/15/18 | | | 179,375 | | | | 0.2 | | |
| | 785,000 | | | | | Quicksilver Resources, Inc.,
7.125%, 04/01/16 | | | 785,000 | | | | 0.9 | | |
| | 110,000 | | | # | | SM Energy Co.,
6.500%, 11/15/21 | | | 113,850 | | | | 0.1 | | |
| | 2,557,598 | | | | | Other Securities | | | 2,524,248 | | | | 2.8 | | |
| | | | | | | | | | 8,270,018 | | | | 9.3 | | |
See Accompanying Notes to Financial Statements
155
SUMMARY PORTFOLIO OF INVESTMENTS
ING PIONEER HIGH YIELD PORTFOLIO AS OF DECEMBER 31, 2011 (CONTINUED)
Principal
Amount† | |
| |
| | Value | | Percentage
of Net
Assets | |
| | | | | Financials: 8.5% | |
| | 545,000 | | | # | | Alliant Holdings I, Inc.,
11.000%, 05/01/15 | | $ | 564,075 | | | | 0.6 | | |
| | 460,000 | | | #,± | | Buffalo Thunder
Development Authority,
9.375%, 12/15/14 | | | 149,500 | | | | 0.2 | | |
| | 300,000 | | | # | | CEVA Group PLC,
11.500%, 04/01/18 | | | 272,250 | | | | 0.3 | | |
| | 145,000 | | | # | | CEVA Group PLC,
11.625%, 10/01/16 | | | 144,637 | | | | 0.2 | | |
| | 1,645,000 | | | | | Forest City
Enterprises, Inc.,
6.500%, 02/01/17 | | | 1,546,300 | | | | 1.7 | | |
| | 40,000 | | | | | Forest City
Enterprises, Inc.,
7.625%, 06/01/15 | | | 39,500 | | | | 0.1 | | |
| | 365,000 | | | # | | Forest City
Enterprises, Inc.,
4.250%, 08/15/18 | | | 320,287 | | | | 0.4 | | |
| | 150,000 | | | # | | Host Hotels &
Resorts L.P.,
2.500%, 10/15/29 | | | 186,563 | | | | 0.2 | | |
| | 360,000 | | | # | | HUB International
Holdings, Inc.,
10.250%, 06/15/15 | | | 359,100 | | | | 0.4 | | |
| | 1,000,000 | | | # | | Liberty Mutual Group,
Inc., 7.000%,
03/15/37 | | | 850,000 | | | | 0.9 | | |
| | 540,000 | | | | | Offshore Group
Investments Ltd.,
11.500%, 08/01/15 | | | 586,575 | | | | 0.6 | | |
| | 335,000 | | | # | | Reynolds Group
Issuer, Inc.,
9.250%, 05/15/18 | | | 322,438 | | | | 0.4 | | |
| | 525,000 | | | # | | USB Realty Corp.,
6.091%, 12/22/49 | | | 367,500 | | | | 0.4 | | |
| | 110,000 | | | # | | USI Holdings Corp.,
4.332%, 11/15/14 | | | 100,925 | | | | 0.1 | | |
| | 1,852,892 | | | | | Other Securities | | | 1,828,043 | | | | 2.0 | | |
| | | | | | | | | | 7,637,693 | | | | 8.5 | | |
| | | | | Health Care: 7.6% | |
| | 710,000 | | | | | Alere, Inc.,
3.000%, 05/15/16 | | | 676,275 | | | | 0.7 | | |
| | 250,000 | | | | | Cubist Pharmaceuticals,
Inc., 2.250%,
06/15/13 | | | 338,125 | | | | 0.4 | | |
| | 532,000 | | | | | Cubist Pharmaceuticals,
Inc., 2.500%,
11/01/17 | | | 799,330 | | | | 0.9 | | |
| | 878,852 | | | #,& | | Surgical Care
Affiliates, Inc.,
8.875%, 07/15/15 | | | 881,049 | | | | 1.0 | | |
| | 415,000 | | | # | | Tenet Healthcare
Corp., 6.250%,
11/01/18 | | | 423,300 | | | | 0.5 | | |
Principal
Amount† | |
| |
| | Value | | Percentage
of Net
Assets | |
| | 746,000 | | | | | Vertex Pharmaceuticals,
Inc., 3.350%,
10/01/15 | | $ | 786,097 | | | | 0.9 | | |
| | 3,119,979 | | | | | Other Securities | | | 2,908,804 | | | | 3.2 | | |
| | | | | | | | | | 6,812,980 | | | | 7.6 | | |
| | | | | Industrials: 10.3% | |
| | 250,000 | | | # | | ADS Tactical, Inc.,
11.000%, 04/01/18 | | | 248,750 | | | | 0.3 | | |
| | 509,000 | | | + | | General Cable Corp.,
4.500%, 11/15/29 | | | 484,186 | | | | 0.5 | | |
| | 120,000 | | | # | | Greenbrier Cos, Inc.,
3.500%, 04/01/18 | | | 116,850 | | | | 0.1 | | |
| | 190,000 | | | # | | Liberty Tire Recycling,
11.000%, 10/01/16 | | | 190,475 | | | | 0.2 | | |
| | 465,000 | | | | | MasTec, Inc.,
4.000%, 06/15/14 | | | 607,988 | | | | 0.7 | | |
| | 1,065,000 | | | + | | Roper Industries, Inc.,
01/15/34 | | | 1,160,850 | | | | 1.3 | | |
| | 545,000 | | | # | | Vishay Intertechnology,
Inc., 2.250%,
05/15/41 | | | 384,225 | | | | 0.4 | | |
| | 1,166,000 | | | | | Wesco International, Inc.,
6.000%, 09/15/29 | | | 2,365,522 | | | | 2.7 | | |
| | 6,667,853 | | | | | Other Securities | | | 3,623,205 | | | | 4.1 | | |
| | | | | | | | | | 9,182,051 | | | | 10.3 | | |
| | | | | Information Technology: 7.6% | |
| | 316,000 | | | # | | Allen Systems Group, Inc.,
10.500%, 11/15/16 | | | 276,500 | | | | 0.3 | | |
| | 150,000 | | | # | | Emdeon, Inc.,
11.000%, 12/31/19 | | | 157,688 | | | | 0.2 | | |
| | 89,000 | | | # | | First Data Corp.,
8.250%, 01/15/21 | | | 80,100 | | | | 0.1 | | |
| | 625,641 | | | | | Frac Tech
International LLC,
6.250%, 04/19/16 | | | 618,651 | | | | 0.7 | | |
| | 571,000 | | | # | | Lam Research Corp.,
1.250%, 05/15/18 | | | 538,168 | | | | 0.6 | | |
| | 450,000 | | | # | | Mentor Graphics
Corp., 4.000%,
04/01/31 | | | 457,312 | | | | 0.5 | | |
| | 460,000 | | | # | | Novellus Systems, Inc.,
2.625%, 05/15/41 | | | 553,150 | | | | 0.6 | | |
| | 550,000 | | | | | Nuance Communications,
Inc., 2.750%,
08/15/27 | | | 796,125 | | | | 0.9 | | |
| | 200,000 | | | # | | Nuance Communications,
Inc., 2.750%,
11/01/31 | | | 215,750 | | | | 0.2 | | |
| | 556,000 | | | | | ON Semiconductor
Corp., 2.625%,
12/15/26 | | | 616,465 | | | | 0.7 | | |
| | 250,000 | | | # | | Seagate HDD Cayman,
7.000%, 11/01/21 | | | 257,500 | | | | 0.3 | | |
See Accompanying Notes to Financial Statements
156
SUMMARY PORTFOLIO OF INVESTMENTS
ING PIONEER HIGH YIELD PORTFOLIO AS OF DECEMBER 31, 2011 (CONTINUED)
Principal
Amount† | |
| |
| | Value | | Percentage
of Net
Assets | |
| | | | | Information Technology (continued) | |
| | 210,000 | | | # | | Seagate HDD Cayman,
7.750%, 12/15/18 | | $ | 224,437 | | | | 0.3 | | |
| | 150,000 | | | # | | WebMD Health Corp.,
2.250%, 03/31/16 | | | 144,750 | | | | 0.2 | | |
| | 750,000 | | | # | | WebMD Health Corp.,
2.500%, 01/31/18 | | | 702,188 | | | | 0.8 | | |
| | 2,505,000 | | | | | Other Securities | | | 1,110,095 | | | | 1.2 | | |
| | | | | | | | | | 6,748,879 | | | | 7.6 | | |
| | | | | Materials: 8.8% | |
| | 550,000 | | | # | | Algoma Acquisition Corp.,
9.875%, 06/15/15 | | | 475,750 | | | | 0.5 | | |
| | 250,000 | | | # | | APERAM,
7.375%, 04/01/16 | | | 215,000 | | | | 0.2 | | |
| | 150,000 | | | # | | Appleton Papers, Inc.,
10.500%, 06/15/15 | | | 148,687 | | | | 0.2 | | |
| | 317,892 | | | #,& | | ARD Finance SA,
11.125%, 06/01/18 | | | 273,387 | | | | 0.3 | | |
| | 135,000 | | | # | | Building Materials
Corp. of America,
6.750%, 05/01/21 | | | 142,088 | | | | 0.1 | | |
| | 640,000 | | | | | Crown Cork & Seal Co.,
Inc., 7.375%,
12/15/26 | | | 662,400 | | | | 0.7 | | |
| | 400,000 | | | | | Graham
Packaging Co. L.P. /
GPC Capital Corp. I,
8.250%, 01/01/17 | | | 406,500 | | | | 0.4 | | |
| | 225,000 | | | | | Graham
Packaging Co., Inc.,
9.875%, 10/15/14 | | | 229,781 | | | | 0.3 | | |
| | 215,000 | | | # | | Ineos Finance PLC,
9.000%, 05/15/15 | | | 219,300 | | | | 0.2 | | |
| | 235,000 | | | # | | Ineos Group
Holdings PLC,
8.500%, 02/15/16 | | | 188,000 | | | | 0.2 | | |
| | 150,000 | | | # | | JMC Steel Group,
8.250%, 03/15/18 | | | 147,000 | | | | 0.2 | | |
| | 225,000 | | | # | | LyondellBasell
Industries NV,
6.000%, 11/15/21 | | | 234,562 | | | | 0.3 | | |
| | 155,000 | | | # | | Millar Western
Forest Products Ltd.,
8.500%, 04/01/21 | | | 118,575 | | | | 0.1 | | |
| | 1,400,000 | | | | | Nova Chemicals Corp.,
7.875%, 09/15/25 | | | 1,400,000 | | | | 1.6 | | |
| | 325,000 | | | # | | Packaging
Dynamics Corp.,
8.750%, 02/01/16 | | | 326,625 | | | | 0.4 | | |
| | 570,000 | | | | | Texas Industries, Inc.,
9.250%, 08/15/20 | | | 513,000 | | | | 0.6 | | |
| | 253,000 | | | # | | USG Corp.,
8.375%, 10/15/18 | | | 234,025 | | | | 0.3 | | |
| | 2,087,080 | | | | | Other Securities | | | 1,952,862 | | | | 2.2 | | |
| | | | | | | | | | 7,887,542 | | | | 8.8 | | |
Principal
Amount† | |
| |
| | Value | | Percentage
of Net
Assets | |
| | | | | Telecommunications: 7.1% | |
| | 680,000 | | | | | Cincinnati Bell, Inc.,
8.250%-8.375%,
10/15/17-10/15/20 | | $ | 684,500 | | | | 0.8 | | |
| | 600,000 | | | | | Cricket Communications,
Inc., 7.750%,
10/15/20 | | | 526,500 | | | | 0.6 | | |
| | 245,000 | | | | | Frontier Communications
Corp., 8.500%,
04/15/20 | | | 252,044 | | | | 0.3 | | |
| | 555,000 | | | | | Frontier Communications
Corp., 8.750%,
04/15/22 | | | 552,225 | | | | 0.6 | | |
| | 590,000 | | | #,& | | Intelsat Bermuda Ltd.,
11.500%, 02/04/17 | | | 570,825 | | | | 0.6 | | |
| | 50,000 | | | # | | Intelsat Jackson
Holdings SA,
7.250%, 04/01/19 | | | 50,875 | | | | 0.1 | | |
| | 105,000 | | | # | | InterDigital, Inc./PA,
2.500%, 03/15/16 | | | 110,250 | | | | 0.1 | | |
| | 85,000 | | | # | | MPL 2 Acquisition
Canco, Inc.,
9.875%, 08/15/18 | | | 74,800 | | | | 0.1 | | |
| | 700,000 | | | | | PAETEC Holding
Corp., 8.875%,
06/30/17 | | | 759,500 | | | | 0.8 | | |
| | 350,000 | | | | | Windstream Corp.,
7.750%, 10/01/21 | | | 360,500 | | | | 0.4 | | |
| | 460,000 | | | # | | Windstream Corp.,
7.500%, 06/01/22 | | | 460,000 | | | | 0.5 | | |
| | 1,988,753 | | | | | Other Securities | | | 1,923,019 | | | | 2.2 | | |
| | | | | | | | | | 6,325,038 | | | | 7.1 | | |
| | | | | Utilities: 2.7% | |
| | 700,000 | | | # | | Foresight Energy LLC /
Foresight Energy Corp.,
9.625%, 08/15/17 | | | 721,000 | | | | 0.8 | | |
| | 330,000 | | | # | | Intergen NV,
9.000%, 06/30/17 | | | 348,975 | | | | 0.4 | | |
| | 275,000 | | | | | NRG Energy, Inc.,
7.625%, 01/15/18 | | | 276,375 | | | | 0.3 | | |
| | 550,000 | | | # | | NRG Energy, Inc.,
7.625%, 05/15/19 | | | 541,750 | | | | 0.6 | | |
| | 200,000 | | | # | | NRG Energy, Inc.,
7.875%, 05/15/21 | | | 196,000 | | | | 0.3 | | |
| | 100,000 | | | # | | Texas Competitive
Electric
Holdings Co. LLC /
TCEH Finance, Inc.,
11.500%, 10/01/20 | | | 85,375 | | | | 0.1 | | |
| | 375,000 | | | | | Other Securities | | | 208,125 | | | | 0.2 | | |
| | | | | | | | | | 2,377,600 | | | | 2.7 | | |
| | | | | | | Total Corporate
Bonds/Notes
(Cost $66,845,457) | | | 68,993,551 | | | | 77.3 | | |
See Accompanying Notes to Financial Statements
157
SUMMARY PORTFOLIO OF INVESTMENTS
ING PIONEER HIGH YIELD PORTFOLIO AS OF DECEMBER 31, 2011 (CONTINUED)
Principal
Amount† | |
| |
| | Value | | Percentage
of Net
Assets | |
| COLLATERALIZED MORTGAGE OBLIGATIONS: 1.1% | | | |
| | 1,000,000 | | | # | | Timberstar Trust,
7.530%, 10/15/36 | | $ | 927,504 | | | | 1.1 | | |
| | | | | | | Total Collateralized
Mortgage Obligations
(Cost $1,008,473) | | | 927,504 | | | | 1.1 | | |
| MUNICIPAL BONDS: 0.4% | | | |
| | | | | Ohio: 0.4% | |
| | 495,000 | | | | | Other Securities | | | 358,475 | | | | 0.4 | | |
| | | | | | | Total Municipal Bonds
(Cost $379,167) | | | 358,475 | | | | 0.4 | | |
| ASSET-BACKED SECURITIES: 0.2% | | | |
| | | | | Other Asset-Backed Securities: 0.2% | |
| | 150,000 | | | # | | Dominos Pizza
Master Issuer LLC,
5.261%, 04/25/37 | | | 150,766 | | | | 0.2 | | |
| | 120,000 | | | | | Other Securities | | | 41,313 | | | | 0.0 | | |
| | | | | | | Total Asset-Backed
Securities
(Cost $209,010) | | | 192,079 | | | | 0.2 | | |
| Shares | |
| |
| | Value | | Percentage
of Net
Assets | |
| COMMON STOCK: 14.6% | | | |
| | | | | Consumer Discretionary: 1.0% | |
| | 10,709 | | | | | Starbucks Corp. | | $ | 492,721 | | | | 0.5 | | |
| | 32,582 | | | | | Other Securities | | | 444,695 | | | | 0.5 | | |
| | | | | | | | | | 937,416 | | | | 1.0 | | |
| | | | | Consumer Staples: 0.1% | |
| | 35,400 | | | | | Other Securities | | | 96,288 | | | | 0.1 | | |
| | | | | Energy: 0.8% | |
| | 73,681 | | | | | Other Securities | | | 758,645 | | | | 0.8 | | |
| | | | | Financials: 0.2% | |
| | 3,096 | | | | | Other Securities | | | 217,431 | | | | 0.2 | | |
| | | | | Health Care: 3.4% | |
| | 1,400 | | | @ | | Alere, Inc. | | | 32,326 | | | | 0.0 | | |
| | 3,611 | | | | | Alere, Inc. | | | 758,310 | | | | 0.9 | | |
| | 11,045 | | | @ | | Thermo Fisher
Scientific, Inc. | | | 496,694 | | | | 0.6 | | |
| | 29,192 | | | | | Other Securities | | | 1,709,784 | | | | 1.9 | | |
| | | | | | | | | | 2,997,114 | | | | 3.4 | | |
| | | | | Industrials: 3.5% | |
| | 17,548 | | | @ | | BE Aerospace, Inc. | | | 679,283 | | | | 0.8 | | |
| | 112,021 | | | | | Other Securities | | | 2,428,318 | | | | 2.7 | | |
| | | | | | | | | | 3,107,601 | | | | 3.5 | | |
| Shares | |
| |
| | Value | | Percentage
of Net
Assets | |
| | | | | Information Technology: 1.7% | |
| | 95,304 | | | | | Other Securities | | $ | 1,473,919 | | | | 1.7 | | |
| | | | | Materials: 3.2% | |
| | 16,600 | | | | | Freeport-McMoRan
Copper & Gold, Inc. | | | 610,714 | | | | 0.7 | | |
| | 34,947 | | | @ | | Georgia Gulf Corp. | | | 681,117 | | | | 0.8 | | |
| | 31,949 | | | | | LyondellBasell
Industries NV | | | 1,038,023 | | | | 1.1 | | |
| | 106,804 | | | | | Other Securities | | | 555,612 | | | | 0.6 | | |
| | | | | | | | | | 2,885,466 | | | | 3.2 | | |
| | | | | Telecommunications: 0.4% | |
| | 28,800 | | | | | Other Securities | | | 338,112 | | | | 0.4 | | |
| | | | | Utilities: 0.3% | |
| | 10,564 | | | | | Other Securities | | | 233,253 | | | | 0.3 | | |
| | | | | | | Total Common Stock
(Cost $10,165,487) | | | 13,045,245 | | | | 14.6 | | |
| PREFERRED STOCK: 2.9% | | | |
| | | | | Energy: 0.7% | |
| | 12,900 | | | | | Other Securities | | | 599,693 | | | | 0.7 | | |
| | | | | Financials: 1.9% | |
| | 325 | | | #,P | | Ally Financial, Inc. | | | 232,994 | | | | 0.3 | | |
| | 27,580 | | | P | | Forest City
Enterprises, Inc. | | | 1,272,616 | | | | 1.4 | | |
| | 775 | | | #,@ | | Perseus Holding Corp. | | | 28,675 | | | | 0.0 | | |
| | 10,000 | | | | | Other Securities | | | 193,400 | | | | 0.2 | | |
| | | | | | | | | | 1,727,685 | | | | 1.9 | | |
| | | | | Industrials: 0.3% | |
| | 2,200 | | | P | | General Cable Corp. | | | 275,688 | | | | 0.3 | | |
| | | | | | | Total Preferred Stock
(Cost $2,626,653) | | | 2,603,066 | | | | 2.9 | | |
| WARRANTS: 0.0% | | | |
| | | | | Energy: 0.0% | |
| | 75 | | | | | Other Securities | | | 3,450 | | | | 0.0 | | |
| | | | | Industrials: 0.0% | |
| | 74,759 | | | | | Other Securities | | | 13,008 | | | | 0.0 | | |
| | | | | Information Technology: —% | |
| | 840 | | | | | Other Securities | | | — | | | | — | | |
| | | | | | | Total Warrants
(Cost $24,243) | | | 16,458 | | | | 0.0 | | |
| | | | | | | Total Long-Term
Investments
(Cost $81,258,490) | | | 86,136,378 | | | | 96.5 | | |
See Accompanying Notes to Financial Statements
158
SUMMARY PORTFOLIO OF INVESTMENTS
ING PIONEER HIGH YIELD PORTFOLIO AS OF DECEMBER 31, 2011 (CONTINUED)
| Shares | |
| |
| | Value | | Percentage
of Net
Assets | |
| SHORT-TERM INVESTMENTS: 2.2% | |
| | | | | Mutual Funds: 2.2% | |
| | 1,985,452 | | | | | | | BlackRock Liquidity
Funds, TempFund,
Institutional Class
(Cost $1,985,452) | | $ | 1,985,452 | | | | 2.2 | | |
| | | | | Total Short-Term
Investments
(Cost $1,985,452) | | | 1,985,452 | | | | 2.2 | | |
| | | | | Total Investments in
Securities
(Cost $83,243,942) | | $ | 88,121,830 | | | | 98.7 | | |
| | | | | Assets in Excess of
Other Liabilities | | | 1,119,666 | | | | 1.3 | | |
| | | | | Net Assets | | $ | 89,241,496 | | | | 100.0 | | |
"Other Securities" represents issues not identified as the top 50 holdings in terms of market value and issues or issuers not exceeding 1% of net assets individually or in aggregate respectively as of December 31, 2011.
The following footnotes apply to either the individual securities noted or one or more of the securities aggregated and listed as a single line item.
† Unless otherwise indicated, principal amount is shown in USD.
# Securities with purchases pursuant to Rule 144A or section 4(2), under the Securities Act of 1933 and may not be resold subject to that rule except to qualified institutional buyers.
@ Non-income producing security
& Payment-in-kind
+ Step-up basis bonds. Interest rates shown reflect current and next coupon rates.
P Preferred Stock may be called prior to convertible date.
± Defaulted security
Cost for federal income tax purposes is $83,322,937.
| Net unrealized appreciation consists of: | |
| Gross Unrealized Appreciation | | $ | 10,895,933 | | |
| Gross Unrealized Depreciation | | | (6,097,040 | ) | |
| Net Unrealized Appreciation | | $ | 4,798,893 | | |
Fair Value Measurements^
The following is a summary of the fair valuations according to the inputs used as of December 31, 2011 in valuing the assets and liabilities:
| | | Quoted Prices
in Active Markets
for Identical Investments
(Level 1) | | Significant Other
Observable
Inputs#
(Level 2) | | Significant
Unobservable
Inputs
(Level 3) | | Fair Value
at
12/31/11 | |
| Asset Table | |
| Investments, at value | |
| Common Stock | |
| Consumer Discretionary | | $ | 931,143 | | | $ | — | | | $ | 6,273 | | | $ | 937,416 | | |
| Consumer Staples | | | 96,288 | | | | — | | | | — | | | | 96,288 | | |
| Energy | | | 758,645 | | | | — | | | | — | | | | 758,645 | | |
| Financials | | | 217,431 | | | | — | | | | — | | | | 217,431 | | |
| Health Care | | | 2,997,114 | | | | — | | | | — | | | | 2,997,114 | | |
| Industrials | | | 3,107,601 | | | | — | | | | — | | | | 3,107,601 | | |
| Information Technology | | | 1,473,919 | | | | — | | | | — | | | | 1,473,919 | | |
| Materials | | | 2,885,466 | | | | — | | | | — | | | | 2,885,466 | | |
| Telecommunications | | | 338,112 | | | | — | | | | — | | | | 338,112 | | |
| Utilities | | | 233,253 | | | | — | | | | — | | | | 233,253 | | |
| Total Common Stock | | | 13,038,972 | | | | — | | | | 6,273 | | | | 13,045,245 | | |
| Preferred Stock | | | — | | | | 1,301,775 | | | | 1,301,291 | | | | 2,603,066 | | |
| Warrants | | | — | | | | 13,008 | | | | 3,450 | | | | 16,458 | | |
| Corporate Bonds/Notes | | | — | | | | 68,108,977 | | | | 884,574 | | | | 68,993,551 | | |
| Collateralized Mortgage Obligations | | | — | | | | 927,504 | | | | — | | | | 927,504 | | |
| Municipal Bonds | | | — | | | | 358,475 | | | | — | | | | 358,475 | | |
| Short-Term Investments | | | 1,985,452 | | | | — | | | | — | | | | 1,985,452 | | |
| Asset-Backed Securities | | | — | | | | 192,079 | | | | — | | | | 192,079 | | |
| Total Investments, at value | | $ | 15,024,424 | | | $ | 70,901,818 | | | $ | 2,195,588 | | | $ | 88,121,830 | | |
See Accompanying Notes to Financial Statements
159
SUMMARY PORTFOLIO OF INVESTMENTS
ING PIONEER HIGH YIELD PORTFOLIO AS OF DECEMBER 31, 2011 (CONTINUED)
The following is a reconciliation of the fair valuations using significant unobservable inputs (Level 3) for the Portfolio's assets and liabilities during the period ended December 31, 2011:
| | | Beginning
Balance
12/31/10 | | Purchases | | Sales | | Accrued
Discounts/
(Premiums) | | Total
Realized
Gain/(Loss) | | Total
Unrealized
Appreciation/
(Depreciation) | | Transfers
Into
Level 3 | | Transfers
Out of
Level 3 | | Ending
Balance
12/31/11 | |
| Asset Table | |
| Investments, at value | |
| Common Stock | | $ | — | | | $ | — | | | $ | (3 | ) | | $ | — | | | $ | — | | | $ | 6,276 | | | $ | — | | | $ | — | | | $ | 6,273 | | |
| Preferred Stock | | | 1,931,673 | | | | — | | | | (295,102 | ) | | | — | | | | 199,200 | | | | (534,480 | ) | | | — | | | | — | | | | 1,301,291 | | |
| Warrants | | | — | | | | 2,924 | | | | — | | | | — | | | | — | | | | 526 | | | | — | | | | — | | | | 3,450 | | |
Corporate
Bonds/Notes | | | — | | | | 365,267 | | | | — | | | | 3,594 | | | | — | | | | (34,563 | ) | | | 550,276 | | | | — | | | | 884,574 | | |
Total Investments,
at value | | $ | 1,931,673 | | | $ | 368,191 | | | $ | (295,105 | ) | | $ | 3,594 | | | $ | 199,200 | | | $ | (562,241 | ) | | $ | 550,276 | | | $ | — | | | $ | 2,195,588 | | |
As of December 31, 2011, total change in unrealized gain (loss) on Level 3 securities still held at period end and included in the change in net assets was $(562,244).
^ See Note 2, "Significant Accounting Policies" in the Notes to Financial Statements for additional information.
# The earlier close of the foreign markets gives rise to the possibility that significant events, including broad market moves, may have occurred in the interim and may materially affect the value of those securities. To account for this, the Portfolio may frequently value many of its foreign equity securities using fair value prices based on third party vendor modeling tools to the extent available. Accordingly, a significant portion of the Portfolio's investments are categorized as Level 2 investments.
There were no significant transfers between Level 1 and 2 during the year ended December 31, 2011.
Transfers in or out of Level 3 represent either the beginning value (for transfers in), or the ending value (for transfers out) of any security or derivative instrument where a change in the pricing level occurred from the beginning to the end of the period. Transfers are recognized at the end of the reporting period.
See Accompanying Notes to Financial Statements
160
ING T. ROWE PRICE SUMMARY PORTFOLIO OF INVESTMENTS
DIVERSIFIED MID CAP GROWTH PORTFOLIO AS OF DECEMBER 31, 2011
| Shares | |
| |
| | Value | | Percentage
of Net
Assets | |
| COMMON STOCK: 99.6% | | | |
| | | | | Consumer Discretionary: 20.6% | |
| | 95,400 | | | @ | | Bed Bath &
Beyond, Inc. | | $ | 5,530,338 | | | | 0.8 | | |
| | 176,500 | | | @ | | Carmax, Inc. | | | 5,379,720 | | | | 0.8 | | |
| | 153,950 | | | @ | | Discovery
Communications,
Inc. - Class C | | | 5,803,915 | | | | 0.8 | | |
| | 46,650 | | | @ | | Dollar Tree, Inc. | | | 3,877,082 | | | | 0.5 | | |
| | 306,300 | | | @ | | Liberty Media
Corp. - Interactive -
Class A | | | 4,966,654 | | | | 0.7 | | |
| | 184,812 | | | | | Marriott
International, Inc. | | | 5,390,966 | | | | 0.8 | | |
| | 177,900 | | | | | Mattel, Inc. | | | 4,938,504 | | | | 0.7 | | |
| | 110,600 | | | | | McGraw-Hill Cos., Inc. | | | 4,973,682 | | | | 0.7 | | |
| | 176,419 | | | @,X | | Michael Kors
Holdings Ltd. | | | 4,615,017 | | | | 0.6 | | |
| | 133,900 | | | | | Omnicom Group | | | 5,969,262 | | | | 0.8 | | |
| | 61,400 | | | @ | | O'Reilly
Automotive, Inc. | | | 4,908,930 | | | | 0.7 | | |
| | 138,000 | | | | | Ross Stores, Inc. | | | 6,559,140 | | | | 0.9 | | |
| | 149,600 | | | | | Sotheby's | | | 4,268,088 | | | | 0.6 | | |
| | 112,000 | | | | | Starwood
Hotels & Resorts
Worldwide, Inc. | | | 5,372,640 | | | | 0.8 | | |
| | 82,150 | | | | | Tim Hortons, Inc. | | | 3,977,703 | | | | 0.6 | | |
| | 1,954,039 | | | | | Other Securities (a) | | | 69,183,812 | | | | 9.8 | | |
| | | | | | | | | | 145,715,453 | | | | 20.6 | | |
| | | | | Consumer Staples: 4.7% | |
| | 69,100 | | | | | Whole Foods
Market, Inc. | | | 4,807,978 | | | | 0.7 | | |
| | 685,100 | | | | | Other Securities | | | 28,217,048 | | | | 4.0 | | |
| | | | | | | | | | 33,025,026 | | | | 4.7 | | |
| | | | | Energy: 9.0% | |
| | 119,600 | | | @ | | Cameron
International Corp. | | | 5,883,124 | | | | 0.8 | | |
| | 54,100 | | | @ | | Concho Resources, Inc. | | | 5,071,875 | | | | 0.7 | | |
| | 122,600 | | | @ | | FMC Technologies, Inc. | | | 6,403,398 | | | | 0.9 | | |
| | 95,100 | | | | | Oceaneering
International, Inc. | | | 4,386,963 | | | | 0.6 | | |
| | 123,300 | | | | | Peabody Energy Corp. | | | 4,082,463 | | | | 0.6 | | |
| | 85,100 | | | | | Range Resources Corp. | | | 5,271,094 | | | | 0.8 | | |
| | 985,569 | | | | | Other Securities (a) | | | 32,440,423 | | | | 4.6 | | |
| | | | | | | | | | 63,539,340 | | | | 9.0 | | |
| | | | | Financials: 6.7% | |
| | 39,600 | | | @ | | Intercontinental
Exchange, Inc. | | | 4,773,780 | | | | 0.7 | | |
| | 86,600 | | | | | Jones Lang LaSalle, Inc. | | | 5,305,116 | | | | 0.8 | | |
| | 1,628,146 | | | | | Other Securities (a) | | | 37,008,419 | | | | 5.2 | | |
| | | | | | | | | | 47,087,315 | | | | 6.7 | | |
| Shares | |
| |
| | Value | | Percentage
of Net
Assets | |
| | | | | Health Care: 12.7% | |
| | 77,000 | | | @ | | Alexion
Pharmaceuticals, Inc. | | $ | 5,505,500 | | | | 0.8 | | |
| | 170,800 | | | | | AmerisourceBergen
Corp. | | | 6,352,052 | | | | 0.9 | | |
| | 55,600 | | | | | CR Bard, Inc. | | | 4,753,800 | | | | 0.6 | | |
| | 74,900 | | | | | Quest Diagnostics | | | 4,348,694 | | | | 0.6 | | |
| | 1,980,600 | | | | | Other Securities (a) | | | 69,071,698 | | | | 9.8 | | |
| | | | | | | | | | 90,031,744 | | | | 12.7 | | |
| | | | | Industrials: 15.9% | |
| | 72,100 | | | | | CH Robinson
Worldwide, Inc. | | | 5,031,138 | | | | 0.7 | | |
| | 87,300 | | | | | Cooper Industries PLC | | | 4,727,295 | | | | 0.7 | | |
| | 95,700 | | | | | Expeditors
International
Washington, Inc. | | | 3,919,872 | | | | 0.6 | | |
| | 82,900 | | | | | Fluor Corp. | | | 4,165,725 | | | | 0.6 | | |
| | 60,600 | | | | | Joy Global, Inc. | | | 4,543,182 | | | | 0.6 | | |
| | 74,900 | | | @ | | Kansas City Southern | | | 5,093,949 | | | | 0.7 | | |
| | 47,200 | | | | | Roper Industries, Inc. | | | 4,100,264 | | | | 0.6 | | |
| | 22,300 | | | | | WW Grainger, Inc. | | | 4,174,337 | | | | 0.6 | | |
| | 2,287,825 | | | | | Other Securities (a) | | | 76,343,328 | | | | 10.8 | | |
| | | | | | | | | | 112,099,090 | | | | 15.9 | | |
| | | | | Information Technology: 21.1% | |
| | 109,500 | | | | | Altera Corp. | | | 4,062,450 | | | | 0.6 | | |
| | 119,200 | | | | | Analog Devices, Inc. | | | 4,264,976 | | | | 0.6 | | |
| | 142,000 | | | @ | | Autodesk, Inc. | | | 4,306,860 | | | | 0.6 | | |
| | 233,880 | | | @,X | | Groupon, Inc. - Class A | | | 4,583,697 | | | | 0.7 | | |
| | 84,800 | | | | | Intuit, Inc. | | | 4,459,632 | | | | 0.6 | | |
| | 243,500 | | | @ | | Nuance
Communications, Inc. | | | 6,126,460 | | | | 0.9 | | |
| | 107,000 | | | @ | | Red Hat, Inc. | | | 4,418,030 | | | | 0.6 | | |
| | 114,600 | | | @ | | Trimble Navigation Ltd. | | | 4,973,640 | | | | 0.7 | | |
| | 349,400 | | | | | Western Union Co. | | | 6,380,044 | | | | 0.9 | | |
| | 142,700 | | | | | Xilinx, Inc. | | | 4,574,962 | | | | 0.6 | | |
| | 4,367,524 | | | | | Other Securities (a) | | | 100,552,029 | | | | 14.3 | | |
| | | | | | | | | | 148,702,780 | | | | 21.1 | | |
| | | | | Materials: 6.8% | |
| | 63,000 | | | | | Cliffs Natural
Resources, Inc. | | | 3,928,050 | | | | 0.6 | | |
| | 83,600 | | | | | Compass Minerals
International, Inc. | | | 5,755,860 | | | | 0.8 | | |
| | 63,100 | | | | | Sherwin-Williams Co. | | | 5,632,937 | | | | 0.8 | | |
| | 1,208,800 | | | | | Other Securities (a) | | | 32,802,914 | | | | 4.6 | | |
| | | | | | | | | | 48,119,761 | | | | 6.8 | | |
| | | | | Telecommunications: 1.7% | |
| | 140,200 | | | @ | | Crown Castle
International Corp. | | | 6,280,960 | | | | 0.9 | | |
| | 114,950 | | | | @ | | | SBA Communications
Corp. | | | 4,938,252 | | | | 0.7 | | |
See Accompanying Notes to Financial Statements
161
ING T. ROWE PRICE SUMMARY PORTFOLIO OF INVESTMENTS
DIVERSIFIED MID CAP GROWTH PORTFOLIO AS OF DECEMBER 31, 2011 (CONTINUED)
| Shares | |
| |
| | Value | | Percentage
of Net
Assets | |
| | | | | Telecommunications (continued) | |
| | 34,600 | | | | | | | Other Securities | | $ | 736,980 | | | | 0.1 | | |
| | | | | | | | | | 11,956,192 | | | | 1.7 | | |
| | | | | Utilities: 0.4% | |
| | 178,800 | | | | | | | Other Securities | | | 2,919,804 | | | | 0.4 | | |
| | | | | | | Total Common Stock
(Cost $647,555,286) | | | 703,196,505 | | | | 99.6 | | |
| PREFERRED STOCK: 0.1% | | | |
| | | | | Information Technology: 0.1% | |
| | 32,539 | | | | | | | Other Securities | | | 431,467 | | | | 0.1 | | |
| | | | | | | Total Preferred Stock
(Cost $431,467) | | | 431,467 | | | | 0.1 | | |
| | | | | | | Total Long-Term
Investments
(Cost $647,986,753) | | | 703,627,972 | | | | 99.7 | | |
Principal
Amount† | |
| |
| | Value | | Percentage
of Net
Assets | |
| SHORT-TERM INVESTMENTS: 3.5% | | | |
| | | | | Securities Lending Collateralcc(1): 3.4% | |
| | 5,591,715 | | | | | | | Citigroup, Inc.,
Repurchase
Agreement
dated 12/30/11,
0.08%, due 01/03/12
(Repurchase Amount
$5,591,764,
collateralized by
various
U.S. Government and
U.S. Government
Agency Obligations,
0.000%-5.500%,
Market Value plus
accrued interest
$5,703,550, due
01/19/12-12/20/41) | | $ | 5,591,715 | | | | 0.8 | | |
| | 5,591,715 | | | | | | | Deutsche Bank AG,
Repurchase
Agreement
dated 12/30/11, 0.10%,
due 01/03/12
(Repurchase Amount
$5,591,776,
collateralized by
various
U.S. Government and
U.S. Government
Agency Obligations,
0.000%-6.500%,
Market Value plus
accrued interest
$5,703,550, due
06/28/12-11/01/41) | | | 5,591,715 | | | | 0.8 | | |
Principal
Amount† | |
| |
| | Value | | Percentage
of Net
Assets | |
| | 5,591,715 | | | | | | | Goldman Sachs & Co.,
Repurchase
Agreement
dated 12/30/11, 0.10%,
due 01/03/12
(Repurchase Amount
$5,591,776,
collateralized by
various
U.S. Government
Agency Obligations,
2.163%-6.500%,
Market Value plus
accrued interest
$5,703,549, due
04/01/20-12/01/48) | | $ | 5,591,715 | | | | 0.8 | | |
| | 5,591,715 | | | | | | | Morgan Stanley,
Repurchase
Agreement
dated 12/30/11, 0.08%,
due 01/03/12
(Repurchase Amount
$5,591,764,
collateralized by
various
U.S. Government and
U.S. Government
Agency Obligations,
0.000%-6.375%,
Market Value plus
accrued interest
$5,703,549, due
11/15/12-10/01/44) | | | 5,591,715 | | | | 0.8 | | |
| | 1,177,203 | | | | | | | Royal Bank of Canada,
Repurchase
Agreement
dated 12/30/11, 0.01%,
due 01/03/12
(Repurchase Amount
$1,177,204,
collateralized by
various
U.S. Government
Securities,
0.000%-4.250%,
Market Value plus
accrued interest
$1,200,748, due
08/15/12-11/15/40) | | | 1,177,203 | | | | 0.2 | | |
| | | | | | | | | | 23,544,063 | | | | 3.4 | | |
See Accompanying Notes to Financial Statements
162
ING T. ROWE PRICE SUMMARY PORTFOLIO OF INVESTMENTS
DIVERSIFIED MID CAP GROWTH PORTFOLIO AS OF DECEMBER 31, 2011 (CONTINUED)
| Shares | |
| |
| | Value | | Percentage
of Net
Assets | |
| | | | | Mutual Funds: 0.1% | |
| | 810,229 | | | | | | | T. Rowe Price Reserve
Investment Fund
(Cost $810,229) | | $ | 810,229 | | | | 0.1 | | |
| | | | | Total Short-Term
Investments
(Cost $24,354,292) | | | 24,354,292 | | | | 3.5 | | |
| | | | | Total Investments in
Securities
(Cost $672,341,045) | | $ | 727,982,264 | | | | 103.2 | | |
| | | | | Liabilities in Excess of
Other Assets | | | (22,677,317 | ) | | | (3.2 | ) | |
| | | | | Net Assets | | $ | 705,304,947 | | | | 100.0 | | |
"Other Securities" represents issues not identified as the top 50 holdings in terms of market value and issues or issuers not exceeding 1% of net assets individually or in aggregate respectively as of December 31, 2011.
The following footnotes apply to either the individual securities noted or one or more of the securities aggregated and listed as a single line item.
† Unless otherwise indicated, principal amount is shown in USD.
@ Non-income producing security
cc Securities purchased with cash collateral for securities loaned.
L Loaned security, a portion or all of the security is on loan at December 31, 2011.
X Fair value determined by ING Funds Valuation Committee appointed by the Funds' Board of Directors/Trustees.
(1) Collateral received from brokers for securities lending was invested into these short-term investments.
(a) This grouping contains loaned securities.
Cost for federal income tax purposes is $672,636,441.
| Net unrealized appreciation consists of: | |
| Gross Unrealized Appreciation | | $ | 136,852,286 | | |
| Gross Unrealized Depreciation | | | (81,506,463 | ) | |
| Net Unrealized Appreciation | | $ | 55,345,823 | | |
Fair Value Measurements^
The following is a summary of the fair valuations according to the inputs used as of December 31, 2011 in valuing the assets and liabilities:
| | | Quoted Prices
in Active Markets
for Identical Investments
(Level 1) | | Significant Other
Observable
Inputs#
(Level 2) | | Significant
Unobservable
Inputs
(Level 3) | | Fair Value
at
12/31/11 | |
| Asset Table | |
| Investments, at value | |
| Common Stock | |
| Consumer Discretionary | | $ | 142,059,636 | | | $ | 3,655,817 | | | $ | — | | | $ | 145,715,453 | | |
| Consumer Staples | | | 33,025,026 | | | | — | | | | — | | | | 33,025,026 | | |
| Energy | | | 63,539,340 | | | | — | | | | — | | | | 63,539,340 | | |
| Financials | | | 47,087,315 | | | | — | | | | — | | | | 47,087,315 | | |
| Health Care | | | 90,031,744 | | | | — | | | | — | | | | 90,031,744 | | |
| Industrials | | | 112,099,090 | | | | — | | | | — | | | | 112,099,090 | | |
| Information Technology | | | 142,370,967 | | | | — | | | | 6,331,813 | | | | 148,702,780 | | |
| Materials | | | 45,265,711 | | | | 2,854,050 | | | | — | | | | 48,119,761 | | |
| Telecommunications | | | 11,956,192 | | | | — | | | | — | | | | 11,956,192 | | |
| Utilities | | | 2,919,804 | | | | — | | | | — | | | | 2,919,804 | | |
| Total Common Stock | | | 690,354,825 | | | | 6,509,867 | | | | 6,331,813 | | | | 703,196,505 | | |
| Preferred Stock | | | — | | | | 431,467 | | | | — | | | | 431,467 | | |
| Short-Term Investments | | | 810,229 | | | | 23,544,063 | | | | — | | | | 24,354,292 | | |
| Total Investments, at value | | $ | 691,165,054 | | | $ | 30,485,397 | | | $ | 6,331,813 | | | $ | 727,982,264 | | |
See Accompanying Notes to Financial Statements
163
ING T. ROWE PRICE SUMMARY PORTFOLIO OF INVESTMENTS
DIVERSIFIED MID CAP GROWTH PORTFOLIO AS OF DECEMBER 31, 2011 (CONTINUED)
The following is a reconciliation of the fair valuations using significant unobservable inputs (Level 3) for the Portfolio's assets and liabilities during the period ended December 31, 2011:
| | | Beginning
Balance
12/31/10 | | Purchases | | Sales | | Accrued
Discounts/
(Premiums) | | Total
Realized
Gain/(Loss) | | Total
Unrealized
Appreciation/
(Depreciation) | | Transfers
Into
Level 3 | | Transfers
Out of
Level 3 | | Ending
Balance
12/31/11 | |
| Asset Table | |
| Investments, at value | |
| Common Stock | | $ | — | | | $ | 1,748,116 | | | $ | — | | | $ | — | | | $ | — | | | $ | — | | | $ | 4,583,697 | | | $ | — | | | $ | 6,331,813 | | |
Short-Term
Investments | | | 1,907,814 | | | | — | | | | (1,907,814 | ) | | | — | | | | (476,954 | ) | | | 476,954 | | | | — | | | | — | | | | — | | |
Total Investments,
at value | | $ | 1,907,814 | | | $ | 1,748,116 | | | $ | (1,907,814 | ) | | $ | — | | | $ | (476,954 | ) | | $ | 476,954 | | | $ | 4,583,697 | | | $ | — | | | $ | 6,331,813 | | |
As of December 31, 2011, total change in unrealized gain (loss) on Level 3 securities still held at period end and included in the change in net assets was $ 0 .
^ See Note 2, "Significant Accounting Policies" in the Notes to Financial Statements for additional information.
# The earlier close of the foreign markets gives rise to the possibility that significant events, including broad market moves, may have occurred in the interim and may materially affect the value of those securities. To account for this, the Portfolio may frequently value many of its foreign equity securities using fair value prices based on third party vendor modeling tools to the extent available. Accordingly, a significant portion of the Portfolio's investments are categorized as Level 2 investments.
There were no significant transfers between Level 1 and 2 during the year ended December 31, 2011.
Transfers in or out of Level 3 represent either the beginning value (for transfers in), or the ending value (for transfers out) of any security or derivative instrument where a change in the pricing level occurred from the beginning to the end of the period. Transfers are recognized at the end of the reporting period.
See Accompanying Notes to Financial Statements
164
ING T. ROWE PRICE SUMMARY PORTFOLIO OF INVESTMENTS
GROWTH EQUITY PORTFOLIO AS OF DECEMBER 31, 2011
| Shares | |
| |
| | Value | | Percentage
of Net
Assets | |
| COMMON STOCK: 97.9% | | | |
| | | | | Consumer Discretionary: 18.4% | |
| | 194,000 | | | @ | | Amazon.com, Inc. | | $ | 33,581,400 | | | | 3.4 | | |
| | 215,400 | | | @ | | Carmax, Inc. | | | 6,565,392 | | | | 0.7 | | |
| | 26,200 | | | @ | | Chipotle Mexican
Grill, Inc. | | | 8,848,788 | | | | 0.9 | | |
| | 176,800 | | | @ | | Las Vegas Sands Corp. | | | 7,554,664 | | | | 0.8 | | |
| | 278,411 | | | | | Marriott
International, Inc. | | | 8,121,249 | | | | 0.8 | | |
| | 132,000 | | | | | Nike, Inc. | | | 12,720,840 | | | | 1.3 | | |
| | 46,359 | | | @ | | Priceline.com, Inc. | | | 21,682,568 | | | | 2.2 | | |
| | 40,000 | | | | | Ralph Lauren Corp. | | | 5,523,200 | | | | 0.5 | | |
| | 283,800 | | | | | Starbucks Corp. | | | 13,057,638 | | | | 1.3 | | |
| | 133,900 | | | | | Starwood
Hotels & Resorts
Worldwide, Inc. | | | 6,423,183 | | | | 0.6 | | |
| | 212,400 | | | | | Walt Disney Co. | | | 7,965,000 | | | | 0.8 | | |
| | 115,300 | | | | | Yum! Brands, Inc. | | | 6,803,853 | | | | 0.7 | | |
| | 1,894,204 | | | | | Other Securities (a) | | | 43,432,939 | | | | 4.4 | | |
| | | | | | | | | | 182,280,714 | | | | 18.4 | | |
| | | | | Consumer Staples: 1.9% | |
| | 96,400 | | | | | Costco
Wholesale Corp. | | | 8,032,048 | | | | 0.8 | | |
| | 182,900 | | | | | Other Securities | | | 11,035,286 | | | | 1.1 | | |
| | | | | | | | | | 19,067,334 | | | | 1.9 | | |
| | | | | Energy: 7.6% | |
| | 163,200 | | | @ | | Cameron
International Corp. | | | 8,027,808 | | | | 0.8 | | |
| | 103,200 | | | @,L | | Continental
Resources, Inc. | | | 6,884,472 | | | | 0.7 | | |
| | 129,800 | | | | | EOG Resources, Inc. | | | 12,786,598 | | | | 1.3 | | |
| | 229,900 | | | @ | | FMC
Technologies, Inc. | | | 12,007,677 | | | | 1.2 | | |
| | 122,000 | | | | | Occidental
Petroleum Corp. | | | 11,431,400 | | | | 1.2 | | |
| | 199,900 | | | | | Schlumberger Ltd. | | | 13,655,169 | | | | 1.4 | | |
| | 421,800 | | | | | Other Securities | | | 9,925,399 | | | | 1.0 | | |
| | | | | | | | | | 74,718,523 | | | | 7.6 | | |
| | | | | Financials: 4.1% | |
| | 271,900 | | | | | American Express Co. | | | 12,825,523 | | | | 1.3 | | |
| | 107,208 | | | | | Franklin
Resources, Inc. | | | 10,298,400 | | | | 1.0 | | |
| | 53,100 | | | @ | | Intercontinental
Exchange, Inc. | | | 6,401,205 | | | | 0.6 | | |
| | 338,100 | | | @ | | Invesco Ltd. | | | 6,792,429 | | | | 0.7 | | |
| | 199,676 | | | | | Other Securities | | | 4,688,171 | | | | 0.5 | | |
| | | | | | | | | | 41,005,728 | | | | 4.1 | | |
| Shares | |
| |
| | Value | | Percentage
of Net
Assets | |
| | | | | Health Care: 6.0% | |
| | 148,500 | | | @ | | Express Scripts, Inc. | | $ | 6,636,465 | | | | 0.7 | | |
| | 174,700 | | | | | McKesson Corp. | | | 13,610,877 | | | | 1.4 | | |
| | 771,658 | | | | | Other Securities | | | 38,738,815 | | | | 3.9 | | |
| | | | | | | | | | 58,986,157 | | | | 6.0 | | |
| | | | | Industrials: 15.4% | |
| | 116,300 | | | | | Boeing Co. | | | 8,530,605 | | | | 0.9 | | |
| | 601,800 | | | | | Danaher Corp. | | | 28,308,672 | | | | 2.8 | | |
| | 347,900 | | | L | | Fastenal Co. | | | 15,171,919 | | | | 1.5 | | |
| | 187,000 | | | | | FedEx Corp. | | | 15,616,370 | | | | 1.6 | | |
| | 89,700 | | | @ | | Kansas City Southern | | | 6,100,497 | | | | 0.6 | | |
| | 88,800 | | | | | Precision
Castparts Corp. | | | 14,633,352 | | | | 1.5 | | |
| | 111,500 | | | | | Union Pacific Corp. | | | 11,812,310 | | | | 1.2 | | |
| | 119,200 | | | | | United Parcel Service,
Inc. - Class B | | | 8,724,248 | | | | 0.9 | | |
| | 711,600 | | | | | Other Securities | | | 43,417,465 | | | | 4.4 | | |
| | | | | | | | | | 152,315,438 | | | | 15.4 | | |
| | | | | Information Technology: 35.6% | |
| | 199,800 | | | | | Accenture PLC | | | 10,635,354 | | | | 1.1 | | |
| | 224,800 | | | @ | | Apple, Inc. | | | 91,044,000 | | | | 9.2 | | |
| | 181,900 | | | @ | | Baidu.com ADR | | | 21,185,893 | | | | 2.1 | | |
| | 219,800 | | | | | Broadcom Corp. | | | 6,453,328 | | | | 0.6 | | |
| | 496,900 | | | | | Corning, Inc. | | | 6,449,762 | | | | 0.6 | | |
| | 360,100 | | | @ | | eBay, Inc. | | | 10,921,833 | | | | 1.1 | | |
| | 279,291 | | | @,X | | Facebook, Inc. | | | 8,699,105 | | | | 0.9 | | |
| | 74,150 | | | @ | | Google, Inc. - Class A | | | 47,893,485 | | | | 4.8 | | |
| | 252,012 | | | @,X | | Groupon, Inc. - Class A | | | 4,939,057 | | | | 0.5 | | |
| | 371,400 | | | @ | | Juniper Networks, Inc. | | | 7,580,274 | | | | 0.8 | | |
| | 97,711 | | | #,@ | | Mail.ru Group Ltd. GDR | | | 2,536,268 | | | | 0.3 | | |
| | 76,600 | | | | | Mastercard, Inc. | | | 28,558,012 | | | | 2.9 | | |
| | 511,400 | | | | | Qualcomm, Inc. | | | 27,973,580 | | | | 2.8 | | |
| | 348,600 | | | | | Tencent Holdings Ltd. | | | 6,980,147 | | | | 0.7 | | |
| | 143,200 | | | | | Visa, Inc. | | | 14,539,096 | | | | 1.5 | | |
| | 1,895,745 | | | | | Other Securities (a) | | | 55,559,283 | | | | 5.7 | | |
| | | | | | | | | | 351,948,477 | | | | 35.6 | | |
| | | | | Materials: 4.4% | |
| | 194,057 | | | | | BHP Billiton Ltd. | | | 6,849,938 | | | | 0.7 | | |
| | 224,400 | | | | | Praxair, Inc. | | | 23,988,360 | | | | 2.4 | | |
| | 259,000 | | | | | Other Securities | | | 12,156,158 | | | | 1.3 | | |
| | | | | | | | | | 42,994,456 | | | | 4.4 | | |
| | | | | Telecommunications: 4.5% | |
| | 358,100 | | | | | American Tower Corp. | | | 21,489,581 | | | | 2.2 | | |
| | 519,112 | | | @ | | Crown Castle
International Corp. | | | 23,256,218 | | | | 2.3 | | |
| | | | | | | | | | 44,745,799 | | | | 4.5 | | |
| | | | | | | Total Common Stock
(Cost $750,798,347) | | | 968,062,626 | | | | 97.9 | | |
See Accompanying Notes to Financial Statements
165
ING T. ROWE PRICE SUMMARY PORTFOLIO OF INVESTMENTS
GROWTH EQUITY PORTFOLIO AS OF DECEMBER 31, 2011 (CONTINUED)
Principal
Amount† | |
| |
| | Value | | Percentage
of Net
Assets | |
| SHORT-TERM INVESTMENTS: 4.9% | | | |
| | | | | Securities Lending Collateralcc(1): 2.9% | |
| | 6,778,929 | | | | | | | Citigroup, Inc.,
Repurchase
Agreement
dated 12/30/11,
0.08%,
due 01/03/12
(Repurchase
Amount $6,778,988,
collateralized by
various
U.S. Government and
U.S. Government
Agency Obligations,
0.000%-5.500%,
Market Value plus
accrued interest
$6,914,508,
due 01/19/12-
12/20/41) | | $ | 6,778,929 | | | | 0.7 | | |
| | 6,778,929 | | | | | | | Deutsche Bank AG,
Repurchase
Agreement
dated 12/30/11,
0.08%,
due 01/03/12
(Repurchase
Amount $6,778,988,
collateralized by
various
U.S. Government and
U.S. Government
Agency Obligations,
0.000%-6.500%,
Market Value plus
accrued interest
$6,914,508,
due 06/28/12-
11/01/41) | | | 6,778,929 | | | | 0.7 | | |
| | 6,778,929 | | | | | | | Goldman Sachs & Co.,
Repurchase
Agreement
dated 12/30/11,
0.10%,
due 01/03/12
(Repurchase
Amount $6,779,003,
collateralized by
various
U.S. Government
Agency Obligations,
2.163%-6.500%,
Market Value plus
accrued interest
$6,914,508,
due 04/01/20-
12/01/48) | | | 6,778,929 | | | | 0.7 | | |
Principal
Amount† | |
| |
| | Value | | Percentage
of Net
Assets | |
| | 6,778,929 | | | | | | | Morgan Stanley,
Repurchase
Agreement
dated 12/30/11,
0.08%,
due 01/03/12
(Repurchase
Amount $6,778,988,
collateralized by
various
U.S. Government and
U.S. Government
Agency Obligations,
0.000%-6.375%,
Market Value plus
accrued interest
$6,914,508,
due 11/15/12-
10/01/44) | | $ | 6,778,929 | | | | 0.7 | | |
| | 1,427,143 | | | | | | | Royal Bank of Canada,
Repurchase
Agreement
dated 12/30/11,
0.01%,
due 01/03/12
(Repurchase
Amount $1,427,145,
collateralized by
various
U.S. Government
Securities,
0.000%-4.250%,
Market Value plus
accrued interest
$1,455,686,
due 08/15/12-
11/15/40) | | | 1,427,143 | | | | 0.1 | | |
| | | | | | | | | | 28,542,859 | | | | 2.9 | | |
Shares | |
| |
| | Value | | Percentage
of Net
Assets | |
| | | | | Mutual Funds: 2.0% | |
| | 19,974,295 | | | | | | | T. Rowe Price Reserve
Investment Fund
(Cost $19,974,295) | | $ | 19,974,295 | | | | 2.0 | | |
| | | | | | | Total Short-Term
Investments
(Cost $48,517,154) | | | 48,517,154 | | | | 4.9 | | |
| | | | | | | Total Investments in
Securities
(Cost $799,315,501) | | $ | 1,016,579,780 | | | | 102.8 | | |
| | | | | | | Liabilities in Excess
of Other Assets | | | (27,655,455 | ) | | | (2.8 | ) | |
| | | | | | | Net Assets | | $ | 988,924,325 | | | | 100.0 | | |
"Other Securities" represents issues not identified as the top 50 holdings in terms of market value and issues or issuers not exceeding 1% of net assets individually or in aggregate respectively as of December 31, 2011.
See Accompanying Notes to Financial Statements
166
ING T. ROWE PRICE SUMMARY PORTFOLIO OF INVESTMENTS
GROWTH EQUITY PORTFOLIO AS OF DECEMBER 31, 2011 (CONTINUED)
The following footnotes apply to either the individual securities noted or one or more of the securities aggregated and listed as a single line item.
† Unless otherwise indicated, principal amount is shown in USD.
# Securities with purchases pursuant to Rule 144A or section 4(2), under the Securities Act of 1933 and may not be resold subject to that rule except to qualified institutional buyers.
@ Non-income producing security
ADR American Depositary Receipt
GDR Global Depositary Receipt
cc Securities purchased with cash collateral for securities loaned.
L Loaned security, a portion or all of the security is on loan at December 31, 2011.
X Fair value determined by ING Funds Valuation Committee appointed by the Funds' Board of Directors/Trustees.
(1) Collateral received from brokers for securities lending was invested into these short-term investments.
(a) This grouping contains loaned securities.
Cost for federal income tax purposes is $803,815,682.
| Net unrealized appreciation consists of: | |
| Gross Unrealized Appreciation | | $ | 253,297,675 | | |
| Gross Unrealized Depreciation | | | (40,533,577 | ) | |
| Net Unrealized Appreciation | | $ | 212,764,098 | | |
Fair Value Measurements^
The following is a summary of the fair valuations according to the inputs used as of December 31, 2011 in valuing the assets and liabilities:
| | | Quoted Prices
in Active Markets
for Identical Investments
(Level 1) | | Significant Other
Observable
Inputs#
(Level 2) | | Significant
Unobservable
Inputs
(Level 3) | | Fair Value
at
12/31/11 | |
| Asset Table | |
| Investments, at value | |
| Common Stock | |
| Consumer Discretionary | | $ | 173,996,711 | | | $ | 8,284,003 | | | $ | — | | | $ | 182,280,714 | | |
| Consumer Staples | | | 19,067,334 | | | | — | | | | — | | | | 19,067,334 | | |
| Energy | | | 74,718,523 | | | | — | | | | — | | | | 74,718,523 | | |
| Financials | | | 41,005,728 | | | | — | | | | — | | | | 41,005,728 | | |
| Health Care | | | 58,986,157 | | | | — | | | | — | | | | 58,986,157 | | |
| Industrials | | | 152,315,438 | | | | — | | | | — | | | | 152,315,438 | | |
| Information Technology | | | 324,549,539 | | | | 12,067,456 | | | | 15,331,482 | | | | 351,948,477 | | |
| Materials | | | 36,144,518 | | | | 6,849,938 | | | | — | | | | 42,994,456 | | |
| Telecommunications | | | 44,745,799 | | | | — | | | | — | | | | 44,745,799 | | |
| Total Common Stock | | | 925,529,747 | | | | 27,201,397 | | | | 15,331,482 | | | | 968,062,626 | | |
| Short-Term Investments | | | 19,974,295 | | | | 28,542,859 | | | | — | | | | 48,517,154 | | |
| Total Investments, at value | | $ | 945,504,042 | | | $ | 55,744,256 | | | $ | 15,331,482 | | | $ | 1,016,579,780 | | |
See Accompanying Notes to Financial Statements
167
ING T. ROWE PRICE SUMMARY PORTFOLIO OF INVESTMENTS
GROWTH EQUITY PORTFOLIO AS OF DECEMBER 31, 2011 (CONTINUED)
The following is a reconciliation of the fair valuations using significant unobservable inputs (Level 3) for the Portfolio's assets and liabilities during the period ended December 31, 2011:
| | | Beginning
Balance
12/31/10 | | Purchases | | Sales | | Accrued
Discounts/
(Premiums) | | Total
Realized
Gain/(Loss) | | Total
Unrealized
Appreciation/
(Depreciation) | | Transfers
Into
Level 3 | | Transfers
Out of
Level 3 | | Ending
Balance
12/31/11 | |
| Asset Table | |
| Investments, at value | |
| Common Stock | | $ | — | | | $ | 10,153,808 | | | $ | — | | | $ | — | | | $ | — | | | $ | 238,617 | | | $ | 4,939,057 | | | $ | — | | | $ | 15,331,482 | | |
Short-Term
Investments | | | 1,356,580 | | | | — | | | | (1,356,580 | ) | | | — | | | | (339,145 | ) | | | 339,145 | | | | — | | | | — | | | | — | | |
Total Investments,
at value | | $ | 1,356,580 | | | $ | 10,153,808 | | | $ | (1,356,580 | ) | | $ | — | | | $ | (339,145 | ) | | $ | 577,762 | | | $ | 4,939,057 | | | $ | — | | | $ | 15,331,482 | | |
As of December 31, 2011, total change in unrealized gain (loss) on Level 3 securities still held at period end and included in the change in net assets was $ 238,617 .
^ See Note 2, "Significant Accounting Policies" in the Notes to Financial Statements for additional information.
# The earlier close of the foreign markets gives rise to the possibility that significant events, including broad market moves, may have occurred in the interim and may materially affect the value of those securities. To account for this, the Portfolio may frequently value many of its foreign equity securities using fair value prices based on third party vendor modeling tools to the extent available. Accordingly, a significant portion of the Portfolio's investments are categorized as Level 2 investments.
There were no significant transfers between Level 1 and 2 during the year ended December 31, 2011.
Transfers in or out of Level 3 represent either the beginning value (for transfers in), or the ending value (for transfers out) of any security or derivative instrument where a change in the pricing level occurred from the beginning to the end of the period. Transfers are recognized at the end of the reporting period.
See Accompanying Notes to Financial Statements
168
ING TEMPLETON SUMMARY PORTFOLIO OF INVESTMENTS
FOREIGN EQUITY PORTFOLIO AS OF DECEMBER 31, 2011
| Shares | |
| |
| | Value | | Percentage
of Net
Assets | |
| COMMON STOCK: 97.4% | | | |
| | | | | Austria: 0.7% | |
| | 285,860 | | | | | | | Other Securities | | $ | 3,419,836 | | | | 0.7 | | |
| | | | | Bermuda: 0.5% | |
| | 43,930 | | | | | | | Other Securities | | | 2,820,745 | | | | 0.5 | | |
| | | | | Brazil: 1.4% | |
| | 206,834 | | | | | | | Petroleo Brasileiro
SA ADR | | | 5,139,825 | | | | 1.0 | | |
| | 100,920 | | | | | | | Other Securities | | | 2,078,952 | | | | 0.4 | | |
| | | | | | | | | | 7,218,777 | | | | 1.4 | | |
| | | | | Canada: 2.1% | |
| | 596,300 | | | | | | | Talisman Energy, Inc. | | | 7,597,521 | | | | 1.5 | | |
| | 137,400 | | | | | | | Other Securities | | | 3,311,087 | | | | 0.6 | | |
| | | | | | | | | | 10,908,608 | | | | 2.1 | | |
| | | | | China: 6.7% | |
| | 795,000 | | | | | | | China Mobile Ltd. | | | 7,723,892 | | | | 1.5 | | |
| | 22,294,000 | | | | | | | China Telecom
Corp., Ltd. | | | 12,680,540 | | | | 2.4 | | |
| | 13,026,153 | | | | | | | Shanghai Electric
Group Co., Ltd. | | | 6,006,988 | | | | 1.2 | | |
| | 3,820,570 | | | | | | | Other Securities | | | 8,086,783 | | | | 1.6 | | |
| | | | | | | | | | 34,498,203 | | | | 6.7 | | |
| | | | | Denmark: 0.2% | |
| | 119,830 | | | | | | | Other Securities | | | 1,288,783 | | | | 0.2 | | |
| | | | | France: 8.8% | |
| | 476,931 | | | | | | | AXA S.A. | | | 6,164,896 | | | | 1.2 | | |
| | 110,730 | | | | | | | Cie Generale des
Etablissements
Michelin | | | 6,524,332 | | | | 1.3 | | |
| | 446,220 | | | | | | | France Telecom S.A. | | | 6,984,063 | | | | 1.3 | | |
| | 155,898 | | | | | | | Sanofi-Aventis | | | 11,395,758 | | | | 2.2 | | |
| | 172,448 | | | | | | | Total S.A. | | | 8,799,636 | | | | 1.7 | | |
| | 210,226 | | | | | | | Other Securities | | | 5,955,363 | | | | 1.1 | | |
| | | | | | | | | | 45,824,048 | | | | 8.8 | | |
| | | | | Germany: 10.8% | |
| | 393,350 | | | | | | | Deutsche Post AG | | | 6,047,443 | | | | 1.1 | | |
| | 241,782 | | | | | | | E.ON AG | | | 5,210,426 | | | | 1.0 | | |
| | 1,029,094 | | | | | | | Infineon
Technologies AG | | | 7,729,011 | | | | 1.5 | | |
| | 76,740 | | | | | | | Merck KGaA | | | 7,642,074 | | | | 1.5 | | |
| | 46,660 | | | | | | | Muenchener
Rueckversicherungs
AG | | | 5,717,831 | | | | 1.1 | | |
| | 193,706 | | | | | | | SAP AG | | | 10,245,405 | | | | 2.0 | | |
| | 96,313 | | | | | | | Siemens AG | | | 9,214,807 | | | | 1.8 | | |
| | 251,590 | | | | | | | Other Securities | | | 3,979,628 | | | | 0.8 | | |
| | | | | | | | | | 55,786,625 | | | | 10.8 | | |
| Shares | |
| |
| | Value | | Percentage
of Net
Assets | |
| | | | | Hong Kong: 3.6% | |
| | 2,414,500 | | | | | AIA Group Ltd. | | $ | 7,516,151 | | | | 1.5 | | |
| | 1,050,200 | | | | | Other Securities | | | 11,056,527 | | | | 2.1 | | |
| | | | | | | | | | 18,572,678 | | | | 3.6 | | |
| | | | | India: 3.0% | |
| | 799,122 | | | | | Housing Development
Finance Corp. | | | 9,800,446 | | | | 1.9 | | |
| | 218,930 | | | | | ICICI Bank Ltd. ADR | | | 5,786,320 | | | | 1.1 | | |
| | | | | | | | | | 15,586,766 | | | | 3.0 | | |
| | | | | Italy: 2.7% | |
| | 387,065 | | | | | ENI S.p.A. | | | 7,980,346 | | | | 1.5 | | |
| | 2,473,953 | | | | | Other Securities | | | 5,912,954 | | | | 1.2 | | |
| | | | | | | | | | 13,893,300 | | | | 2.7 | | |
| | | | | Japan: 2.8% | |
| | 589,400 | | | | | Itochu Corp. | | | 5,976,198 | | | | 1.2 | | |
| | 1,162,300 | | | | | Mitsubishi UFJ Financial
Group, Inc. | | | 4,920,576 | | | | 0.9 | | |
| | 107,500 | | | | | Other Securities | | | 3,554,715 | | | | 0.7 | | |
| | | | | | | | | | 14,451,489 | | | | 2.8 | | |
| | | | | Netherlands: 8.1% | |
| | 348,450 | | | | | Royal Dutch Shell
PLC - Class B | | | 13,254,197 | | | | 2.5 | | |
| | 357,255 | | | | | Koninklijke Philips
Electronics NV | | | 7,495,800 | | | | 1.4 | | |
| | 272,512 | | | | | SBM Offshore NV | | | 5,586,131 | | | | 1.1 | | |
| | 237,050 | | | | | Unilever NV | | | 8,150,602 | | | | 1.6 | | |
| | 204,010 | | | | | Other Securities | | | 7,747,245 | | | | 1.5 | | |
| | | | | | | | | | 42,233,975 | | | | 8.1 | | |
| | | | | Norway: 4.4% | |
| | 428,280 | | | | | Statoil ASA | | | 10,968,377 | | | | 2.1 | | |
| | 715,540 | | | | | Telenor ASA | | | 11,708,928 | | | | 2.3 | | |
| | | | | | | | | | 22,677,305 | | | | 4.4 | | |
| | | | | Portugal: 0.6% | |
| | 580,950 | | | | | Other Securities | | | 3,345,923 | | | | 0.6 | | |
| | | | | Singapore: 3.2% | |
| | 1,154,500 | | | | | DBS Group
Holdings Ltd. | | | 10,247,668 | | | | 2.0 | | |
| | 2,728,000 | | | | | Singapore
Telecommunications
Ltd. | | | 6,497,412 | | | | 1.2 | | |
| | | | | | | | | | 16,745,080 | | | | 3.2 | | |
| | | | | South Korea: 5.6% | |
| | 105,784 | | | @ | | LG Electronics, Inc. | | | 6,845,887 | | | | 1.3 | | |
| | 32,483 | | | @ | | Samsung Electronics
Co., Ltd. GDR | | | 14,936,904 | | | | 2.9 | | |
| | 153,438 | | | | | Other Securities | | | 7,146,167 | | | | 1.4 | | |
| | | | | | | | | | 28,928,958 | | | | 5.6 | | |
See Accompanying Notes to Financial Statements
169
ING TEMPLETON SUMMARY PORTFOLIO OF INVESTMENTS
FOREIGN EQUITY PORTFOLIO AS OF DECEMBER 31, 2011 (CONTINUED)
| Shares | |
| |
| | Value | | Percentage
of Net
Assets | |
| | | | | Spain: 3.3% | |
| | 531,199 | | | | | | | Telefonica S.A. | | $ | 9,151,560 | | | | 1.8 | | |
| | 621,862 | | | | | | | Other Securities | | | 7,814,663 | | | | 1.5 | | |
| | | | | | | | | | 16,966,223 | | | | 3.3 | | |
| | | | | Sweden: 1.5% | |
| | 744,650 | | | | | | | Telefonaktiebolaget
LM Ericsson | | | 7,551,208 | | | | 1.5 | | |
| | | | | Switzerland: 8.2% | |
| | 153,740 | | | | | | | Nestle S.A. | | | 8,828,292 | | | | 1.7 | | |
| | 92,996 | | | | | | | Novartis AG | | | 5,309,428 | | | | 1.0 | | |
| | 59,950 | | | | | | | Roche Holding AG -
Genusschein | | | 10,138,645 | | | | 2.0 | | |
| | 183,721 | | | | | | | Swiss Re Ltd. | | | 9,340,326 | | | | 1.8 | | |
| | 405,531 | | | | | | | Other Securities | | | 8,731,668 | | | | 1.7 | | |
| | | | | | | | | | 42,348,359 | | | | 8.2 | | |
| | | | | Taiwan: 2.2% | |
| | 195,316 | | | | | | | Taiwan Semiconductor
Manufacturing
Co., Ltd. ADR | | | 2,521,530 | | | | 0.5 | | |
| | 2,305,251 | | | | | | | Taiwan Semiconductor
Manufacturing
Co., Ltd. | | | 5,759,899 | | | | 1.1 | | |
| | 626,784 | | | | | | | Other Securities | | | 3,125,772 | | | | 0.6 | | |
| | | | | | | | | | 11,407,201 | | | | 2.2 | | |
| | | | | United Kingdom: 17.0% | |
| | 1,533,120 | | | | | | | BAE Systems PLC | | | 6,774,532 | | | | 1.3 | | |
| | 931,060 | | | | | | | BP PLC | | | 6,632,159 | | | | 1.3 | | |
| | 544,857 | | | | | | | GlaxoSmithKline PLC | | | 12,414,976 | | | | 2.4 | | |
| | 846,400 | | | | | | | HSBC Holdings PLC | | | 6,447,526 | | | | 1.2 | | |
| | 1,598,725 | | | | | | | Kingfisher PLC | | | 6,212,593 | | | | 1.2 | | |
| | 988,660 | | | | | | | Marks & Spencer
Group PLC | | | 4,774,995 | | | | 0.9 | | |
| | 710,950 | | | | | | | Rolls-Royce
Holdings PLC | | | 8,231,432 | | | | 1.6 | | |
| | 229,268 | | | | | | | Standard Chartered PLC | | | 5,014,631 | | | | 1.0 | | |
| | 1,051,970 | | | | | | | Tesco PLC | | | 6,581,957 | | | | 1.3 | | |
| | 3,777,936 | | | | | | | Vodafone Group PLC | | | 10,533,209 | | | | 2.0 | | |
| | 2,807,060 | | | | | | | Other Securities | | | 14,659,471 | | | | 2.8 | | |
| | | | | | | | | | 88,277,481 | | | | 17.0 | | |
| | | | | | | | | Total Common Stock
(Cost $560,678,241) | | $ | 504,751,571 | | | | 97.4 | | |
| | | | | | | | | Assets in Excess of
Other Liabilities | | | 13,629,880 | | | | 2.6 | | |
| | | | | | | | | Net Assets | | $ | 518,381,451 | | | | 100.0 | | |
"Other Securities" represents issues not identified as the top 50 holdings in terms of market value and issues or issuers not exceeding 1% of net assets individually or in aggregate respectively as of December 31, 2011.
The following footnotes apply to either the individual securities noted or one or more of the securities aggregated and listed as a single line item.
@ Non-income producing security
ADR American Depositary Receipt
Cost for federal income tax purposes is $563,173,471.
| Net unrealized depreciation consists of: | |
| Gross Unrealized Appreciation | | $ | 47,523,439 | | |
| Gross Unrealized Depreciation | | | (105,945,339 | ) | |
| Net Unrealized Depreciation | | $ | (58,421,900 | ) | |
| Sector Diversification | | Percentage of
Net Assets | |
| Consumer Discretionary | | | 5.8 | % | |
| Consumer Staples | | | 4.6 | | |
| Energy | | | 14.1 | | |
| Financials | | | 21.0 | | |
| Health Care | | | 9.9 | | |
| Industrials | | | 13.7 | | |
| Information Technology | | | 10.1 | | |
| Materials | | | 2.7 | | |
| Telecommunications | | | 13.8 | | |
| Utilities | | | 1.7 | | |
| Assets in Excess of Other Liabilities | | | 2.6 | | |
| Net Assets | | | 100.0 | % | |
See Accompanying Notes to Financial Statements
170
ING TEMPLETON SUMMARY PORTFOLIO OF INVESTMENTS
FOREIGN EQUITY PORTFOLIO AS OF DECEMBER 31, 2011 (CONTINUED)
Fair Value Measurements^
The following is a summary of the fair valuations according to the inputs used as of December 31, 2011 in valuing the assets and liabilities:
| | | Quoted Prices
in Active Markets
for Identical Investments
(Level 1) | | Significant Other
Observable
Inputs#
(Level 2) | | Significant
Unobservable
Inputs
(Level 3) | | Fair Value
at
12/31/11 | |
| Asset Table | |
| Investments, at value | |
| Common Stock | |
| Austria | | $ | — | | | $ | 3,419,836 | | | $ | — | | | $ | 3,419,836 | | |
| Bermuda | | | 2,820,745 | | | | — | | | | — | | | | 2,820,745 | | |
| Brazil | | | 7,218,777 | | | | — | | | | — | | | | 7,218,777 | | |
| Canada | | | 10,908,608 | | | | — | | | | — | | | | 10,908,608 | | |
| China | | | — | | | | 34,498,203 | | | | — | | | | 34,498,203 | | |
| Denmark | | | — | | | | 1,288,783 | | | | — | | | | 1,288,783 | | |
| France | | | — | | | | 45,824,048 | | | | — | | | | 45,824,048 | | |
| Germany | | | — | | | | 55,786,625 | | | | — | | | | 55,786,625 | | |
| Hong Kong | | | 3,237,871 | | | | 15,334,807 | | | | — | | | | 18,572,678 | | |
| India | | | 5,786,320 | | | | 9,800,446 | | | | — | | | | 15,586,766 | | |
| Italy | | | — | | | | 13,893,300 | | | | — | | | | 13,893,300 | | |
| Japan | | | — | | | | 14,451,489 | | | | — | | | | 14,451,489 | | |
| Netherlands | | | — | | | | 42,233,975 | | | | — | | | | 42,233,975 | | |
| Norway | | | — | | | | 22,677,305 | | | | — | | | | 22,677,305 | | |
| Portugal | | | 3,345,923 | | | | — | | | | — | | | | 3,345,923 | | |
| Singapore | | | — | | | | 16,745,080 | | | | — | | | | 16,745,080 | | |
| South Korea | | | 7,146,167 | | | | 21,782,791 | | | | — | | | | 28,928,958 | | |
| Spain | | | — | | | | 16,966,223 | | | | — | | | | 16,966,223 | | |
| Sweden | | | — | | | | 7,551,208 | | | | — | | | | 7,551,208 | | |
| Switzerland | | | — | | | | 42,348,359 | | | | — | | | | 42,348,359 | | |
| Taiwan | | | 5,647,302 | | | | 5,759,899 | | | | — | | | | 11,407,201 | | |
| United Kingdom | | | — | | | | 88,277,481 | | | | — | | | | 88,277,481 | | |
| Total Common Stock | | | 46,111,713 | | | | 458,639,858 | | | | — | | | | 504,751,571 | | |
| Total Investments, at value | | $ | 46,111,713 | | | $ | 458,639,858 | | | $ | — | | | $ | 504,751,571 | | |
^ See Note 2, "Significant Accounting Policies" in the Notes to Financial Statements for additional information.
# The earlier close of the foreign markets gives rise to the possibility that significant events, including broad market moves, may have occurred in the interim and may materially affect the value of those securities. To account for this, the Portfolio may frequently value many of its foreign equity securities using fair value prices based on third party vendor modeling tools to the extent available. Accordingly, a significant portion of the Portfolio's investments are categorized as Level 2 investments.
There were no significant transfers between Level 1 and 2 during the year ended December 31, 2011.
See Accompanying Notes to Financial Statements
171
PORTFOLIO OF INVESTMENTS
ING THORNBURG VALUE PORTFOLIO AS OF DECEMBER 31, 2011
| Shares | |
| |
| | Value | | Percentage
of Net
Assets | |
| COMMON STOCK: 95.8% | | | |
| | | | | Consumer Discretionary: 14.0% | |
| | 183,100 | | | | | Best Buy Co., Inc. | | $ | 4,279,047 | | | | 1.9 | | |
| | 349,600 | | | | | Gap, Inc. | | | 6,485,080 | | | | 3.0 | | |
| | 118,096 | | | @ | | Life Time Fitness, Inc. | | | 5,520,988 | | | | 2.5 | | |
| | 934,600 | | | @ | | Office Depot, Inc. | | | 2,009,390 | | | | 0.9 | | |
| | 293,500 | | | @ | | OfficeMax, Inc. | | | 1,332,490 | | | | 0.6 | | |
| | 545,000 | | | @ | | Pulte Homes, Inc. | | | 3,438,950 | | | | 1.6 | | |
| | 559,600 | | | | | Staples, Inc. | | | 7,772,844 | | | | 3.5 | | |
| | | | | | | | | | 30,838,789 | | | | 14.0 | | |
| | | | | Energy: 13.8% | |
| | 63,192 | | | | | Apache Corp. | | | 5,723,931 | | | | 2.6 | | |
| | 312,100 | | | @ | | Bankers Petroleum Ltd. | | | 1,360,220 | | | | 0.6 | | |
| | 94,600 | | | | | ExxonMobil Corp. | | | 8,018,296 | | | | 3.6 | | |
| | 1,540 | | | | | Inpex Holdings, Inc. | | | 9,696,191 | | | | 4.4 | | |
| | 694,042 | | | @ | | SandRidge Energy, Inc. | | | 5,663,383 | | | | 2.6 | | |
| | | | | | | | | | 30,462,021 | | | | 13.8 | | |
| | | | | Financials: 16.0% | |
| | 839,100 | | | | | Bank of America Corp. | | | 4,665,396 | | | | 2.1 | | |
| | 709,200 | | | | | Charles Schwab Corp. | | | 7,985,592 | | | | 3.6 | | |
| | 639,600 | | | @ | | Genworth Financial, Inc. | | | 4,189,380 | | | | 1.9 | | |
| | 331,900 | | | | | Hartford Financial
Services Group, Inc. | | | 5,393,375 | | | | 2.5 | | |
| | 138,935 | | | | | JPMorgan Chase & Co. | | | 4,619,589 | | | | 2.1 | | |
| | 265,600 | | | | | Metlife, Inc. | | | 8,281,408 | | | | 3.8 | | |
| | | | | | | | | | 35,134,740 | | | | 16.0 | | |
| | | | | Health Care: 15.5% | |
| | 194,044 | | | @ | | Alere, Inc. | | | 4,480,476 | | | | 2.0 | | |
| | 206,965 | | | @ | | Community Health
Systems, Inc. | | | 3,611,539 | | | | 1.6 | | |
| | 244,581 | | | @ | | Gilead Sciences, Inc. | | | 10,010,700 | | | | 4.6 | | |
| | 208,777 | | | @ | | Thermo Fisher
Scientific, Inc. | | | 9,388,702 | | | | 4.3 | | |
| | 99,775 | | | @ | | Varian Medical
Systems, Inc. | | | 6,697,896 | | | | 3.0 | | |
| | | | | | | | | | 34,189,313 | | | | 15.5 | | |
| | | | | Industrials: 1.2% | |
| | 128,000 | | | @ | | Oshkosh Truck Corp. | | | 2,736,640 | | | | 1.2 | | |
| | | | | Information Technology: 24.3% | |
| | 232,429 | | | @ | | Amdocs Ltd. | | | 6,631,199 | | | | 3.0 | | |
| | 4,400 | | | @ | | Apple, Inc. | | | 1,782,000 | | | | 0.8 | | |
| | 109,523 | | | | | Corning, Inc. | | | 1,421,609 | | | | 0.6 | | |
| | 345,597 | | | @ | | Dell, Inc. | | | 5,056,084 | | | | 2.3 | | |
| | 15,731 | | | @ | | Google, Inc. - Class A | | | 10,160,653 | | | | 4.6 | | |
| | 338,200 | | | | | Hewlett-Packard Co. | | | 8,712,032 | | | | 4.0 | | |
| | 107,600 | | | @ | | Juniper Networks, Inc. | | | 2,196,116 | | | | 1.0 | | |
| Shares | |
| |
| | Value | | Percentage
of Net
Assets | |
| | 833,202 | | | @ | | MEMC Electronic
Materials, Inc. | | $ | 3,282,816 | | | | 1.5 | | |
| | 169,474 | | | | | Microsoft Corp. | | | 4,399,545 | | | | 2.0 | | |
| | 302,638 | | | @ | | ON Semiconductor Corp. | | | 2,336,365 | | | | 1.1 | | |
| | 458,900 | | | @ | | Yahoo!, Inc. | | | 7,402,057 | | | | 3.4 | | |
| | | | | | | | | | 53,380,476 | | | | 24.3 | | |
| | | | | Materials: 6.4% | |
| | 774,800 | | | | | Tokyo Steel
Manufacturing Co., Ltd. | | | 6,275,958 | | | | 2.9 | | |
| | 290,837 | | | L | | United States Steel Corp. | | | 7,695,547 | | | | 3.5 | | |
| | | | | | | | | | 13,971,505 | | | | 6.4 | | |
| | | | | Telecommunications: 4.6% | |
| | 955 | | | | | KDDI Corp. | | | 6,133,300 | | | | 2.8 | | |
| | 236,002 | | | @ | | Level 3
Communications, Inc. | | | 4,009,674 | | | | 1.8 | | |
| | | | | | | | | | 10,142,974 | | | | 4.6 | | |
| | | | | | | Total Common Stock
(Cost $236,033,765) | | | 210,856,458 | | | | 95.8 | | |
Principal
Amount† | |
| |
| | Value | | Percentage
of Net
Assets | |
| CORPORATE BONDS/NOTES: 0.5% | | | |
| | | | | Telecommunications: 0.5% | |
| | 891,000 | | | | | Level 3
Communications, Inc.,
6.500%, 10/01/16 | | $ | 1,088,134 | | | | 0.5 | | |
| | | | | | | Total Corporate Bonds/
Notes
(Cost $891,000) | | | 1,088,134 | | | | 0.5 | | |
| | | | | | | Total Long-Term
Investments
(Cost $236,924,765) | | | 211,944,592 | | | | 96.3 | | |
| SHORT-TERM INVESTMENTS: 6.9% | | | |
| | | | | Securities Lending Collateralcc(1): 3.2% | |
| | 1,679,761 | | | | | BNP Paribas Bank,
Repurchase Agreement
dated 12/30/11, 0.06%,
due 01/03/12
(Repurchase Amount
$1,679,772,
collateralized by
various U.S.
Government Agency
Obligations,
5.000%-6.000%,
Market Value plus
accrued interest
$1,713,356,
due 05/15/24-04/15/41) | | | 1,679,761 | | | | 0.8 | | |
See Accompanying Notes to Financial Statements
172
PORTFOLIO OF INVESTMENTS
ING THORNBURG VALUE PORTFOLIO AS OF DECEMBER 31, 2011 (CONTINUED)
Principal
Amount† | |
| |
| |
Value | | Percentage
of Net
Assets | |
| | | | | Securities Lending Collateralcc(1) (continued) | |
| | 1,679,761 | | | | | | | Cantor Fitzgerald,
Repurchase Agreement
dated 12/30/11, 0.12%,
due 01/03/12
(Repurchase Amount
$1,679,783,
collateralized by
various U.S.
Government Agency
Obligations,
1.437%-6.014%,
Market Value plus
accrued interest
$1,713,356,
due 06/01/17-09/01/44) | | $ | 1,679,761 | | | | 0.8 | | |
| | 1,679,761 | | | | | | | Citigroup, Inc.,
Repurchase Agreement
dated 12/30/11, 0.08%,
due 01/03/12
(Repurchase Amount
$1,679,776,
collateralized by
various U.S.
Government and
U.S. Government
Agency Obligations,
0.000%-5.500%,
Market Value plus
accrued interest
$1,713,356,
due 01/19/12-12/20/41) | | | 1,679,761 | | | | 0.7 | | |
| | 353,635 | | | | | | | Deutsche Bank AG,
Repurchase Agreement
dated 12/30/11, 0.10%,
due 01/03/12
(Repurchase Amount
$353,639,
collateralized by
various U.S.
Government and
U.S. Government
Agency Obligations,
0.000%-6.500%,
Market Value plus
accrued interest
$360,708,
due 06/28/12-11/01/41) | | | 353,635 | | | | 0.1 | | |
Principal
Amount† | |
| |
| |
Value | | Percentage
of Net
Assets | |
| | 1,679,761 | | | | | | | Merrill Lynch & Co., Inc.,
Repurchase Agreement
dated 12/30/11, 0.02%,
due 01/03/12
(Repurchase Amount
$1,679,765,
collateralized by
various U.S.
Government Securities,
1.875%-4.000%,
Market Value plus
accrued interest
$1,713,359,
due 02/15/15-06/30/15) | | $ | 1,679,761 | | | | 0.8 | | |
| | | | | | | | 7,072,679 | | | | 3.2 | | |
| Shares | |
| |
| |
Value | | Percentage
of Net
Assets | |
| | | | | Mutual Funds: 3.7% | |
| | 8,167,794 | | | | | | | BlackRock Liquidity
Funds, TempFund,
Institutional Class
(Cost $8,167,794) | | $ | 8,167,794 | | | | 3.7 | | |
| | | | | Total Short-Term
Investments
(Cost $15,240,473) | | | 15,240,473 | | | | 6.9 | | |
| | | | | Total Investments in
Securities
(Cost $252,165,238) | | $ | 227,185,065 | | | | 103.2 | | |
| | | | | Liabilities in Excess of
Other Assets | | | (7,077,865 | ) | | | (3.2 | ) | |
| | | | | Net Assets | | $ | 220,107,200 | | | | 100.0 | | |
† Unless otherwise indicated, principal amount is shown in USD.
@ Non-income producing security
cc Securities purchased with cash collateral for securities loaned.
L Loaned security, a portion or all of the security is on loan at December 31, 2011.
(1) Collateral received from brokers for securities lending was invested into these short-term investments.
Cost for federal income tax purposes is $254,654,302.
| Net unrealized depreciation consists of: | |
| Gross Unrealized Appreciation | | $ | 12,690,604 | | |
| Gross Unrealized Depreciation | | | (40,159,841 | ) | |
| Net Unrealized Depreciation | | $ | (27,469,237 | ) | |
See Accompanying Notes to Financial Statements
173
PORTFOLIO OF INVESTMENTS
ING THORNBURG VALUE PORTFOLIO AS OF DECEMBER 31, 2011 (CONTINUED)
Fair Value Measurements^
The following is a summary of the fair valuations according to the inputs used as of December 31, 2011 in valuing the assets and liabilities:
| | | Quoted Prices
in Active Markets
for Identical Investments
(Level 1) | | Significant Other
Observable
Inputs#
(Level 2) | | Significant
Unobservable
Inputs
(Level 3) | | Fair Value
at
12/31/11 | |
| Asset Table | |
| Investments, at value | |
| Common Stock | |
| Consumer Discretionary | | $ | 30,838,789 | | | $ | — | | | $ | — | | | $ | 30,838,789 | | |
| Energy | | | 20,765,830 | | | | 9,696,191 | | | | — | | | | 30,462,021 | | |
| Financials | | | 35,134,740 | | | | — | | | | — | | | | 35,134,740 | | |
| Health Care | | | 34,189,313 | | | | — | | | | — | | | | 34,189,313 | | |
| Industrials | | | 2,736,640 | | | | — | | | | — | | | | 2,736,640 | | |
| Information Technology | | | 53,380,476 | | | | — | | | | — | | | | 53,380,476 | | |
| Materials | | | 7,695,547 | | | | 6,275,958 | | | | — | | | | 13,971,505 | | |
| Telecommunications | | | 4,009,674 | | | | 6,133,300 | | | | — | | | | 10,142,974 | | |
| Total Common Stock | | | 188,751,009 | | | | 22,105,449 | | | | — | | | | 210,856,458 | | |
| Corporate Bonds/Notes | | | — | | | | 1,088,134 | | | | — | | | | 1,088,134 | | |
| Short-Term Investments | | | 8,167,794 | | | | 7,072,679 | | | | — | | | | 15,240,473 | | |
| Total Investments, at value | | $ | 196,918,803 | | | $ | 30,266,262 | | | $ | — | | | $ | 227,185,065 | | |
The following is a reconciliation of the fair valuations using significant unobservable inputs (Level 3) for the Portfolio's assets and liabilities during the period ended December 31, 2011:
| | | Beginning
Balance
12/31/10 | | Purchases | | Sales | | Accrued
Discounts/
(Premiums) | | Total
Realized
Gain/(Loss) | | Total
Unrealized
Appreciation/
(Depreciation) | | Transfers
Into
Level 3 | | Transfers
Out of
Level 3 | | Ending
Balance
12/31/11 | |
| Asset Table | |
| Investments, at value | |
Short-Term
Investments | | $ | 431,842 | | | $ | — | | | $ | (431,842 | ) | | $ | — | | | $ | (107,961 | ) | | $ | 107,961 | | | $ | — | | | $ | — | | | $ | — | | |
Total Investments,
at value | | $ | 431,842 | | | $ | — | | | $ | (431,842 | ) | | $ | — | | | $ | (107,961 | ) | | $ | 107,961 | | | $ | — | | | $ | — | | | $ | — | | |
As of December 31, 2011, total change in unrealized gain (loss) on Level 3 securities still held at period end and included in the change in net assets was $ 0 .
^ See Note 2, "Significant Accounting Policies" in the Notes to Financial Statements for additional information.
# The earlier close of the foreign markets gives rise to the possibility that significant events, including broad market moves, may have occurred in the interim and may materially affect the value of those securities. To account for this, the Portfolio may frequently value many of its foreign equity securities using fair value prices based on third party vendor modeling tools to the extent available. Accordingly, a significant portion of the Portfolio's investments are categorized as Level 2 investments.
There were no significant transfers between Level 1 and 2 during the year ended December 31, 2011.
Transfers in or out of Level 3 represent either the beginning value (for transfers in), or the ending value (for transfers out) of any security or derivative instrument where a change in the pricing level occurred from the beginning to the end of the period. Transfers are recognized at the end of the reporting period.
See Accompanying Notes to Financial Statements
174
ING UBS SUMMARY PORTFOLIO OF INVESTMENTS
U.S. LARGE CAP EQUITY PORTFOLIO AS OF DECEMBER 31, 2011
| Shares | |
| |
| | Value | | Percentage
of Net
Assets | |
| COMMON STOCK: 96.6% | | | |
| | | | | Consumer Discretionary: 15.7% | |
| | 11,300 | | | @ | | Amazon.com, Inc. | | $ | 1,956,030 | | | | 1.4 | | |
| | 60,300 | | | | | Carnival Corp. | | | 1,968,192 | | | | 1.4 | | |
| | 38,300 | | | | | Coach, Inc. | | | 2,337,832 | | | | 1.7 | | |
| | 128,500 | | | | | Comcast Corp. - Class A | | | 3,046,735 | | | | 2.2 | | |
| | 83,300 | | | @ | | General Motors Co. | | | 1,688,491 | | | | 1.2 | | |
| | 90,000 | | | | | International Game
Technology | | | 1,548,000 | | | | 1.1 | | |
| | 40,100 | | | | | Kohl's Corp. | | | 1,978,935 | | | | 1.4 | | |
| | 82,900 | | | | | Time Warner, Inc. | | | 2,996,006 | | | | 2.1 | | |
| | 39,400 | | | | | Viacom - Class B | | | 1,789,154 | | | | 1.3 | | |
| | 80,900 | | | | | Other Securities (a) | | | 2,668,851 | | | | 1.9 | | |
| | | | | | | | | | 21,978,226 | | | | 15.7 | | |
| | | | | Consumer Staples: 6.1% | |
| | 30,300 | | | | | Colgate-Palmolive Co. | | | 2,799,417 | | | | 2.0 | | |
| | 92,700 | | | | | Kraft Foods, Inc. | | | 3,463,272 | | | | 2.5 | | |
| | 90,300 | | | | | Kroger Co. | | | 2,187,066 | | | | 1.6 | | |
| | | | | | | | | | 8,449,755 | | | | 6.1 | | |
| | | | | Energy: 11.9% | |
| | 30,900 | | | | | Baker Hughes, Inc. | | | 1,502,976 | | | | 1.1 | | |
| | 38,200 | | | | | Ensco International
PLC ADR | | | 1,792,344 | | | | 1.3 | | |
| | 21,600 | | | | | EOG Resources, Inc. | | | 2,127,816 | | | | 1.5 | | |
| | 34,700 | | | | | ExxonMobil Corp. | | | 2,941,172 | | | | 2.1 | | |
| | 39,000 | | | | | Hess Corp. | | | 2,215,200 | | | | 1.6 | | |
| | 152,800 | | | @ | | McDermott
International, Inc. | | | 1,758,728 | | | | 1.3 | | |
| | 58,000 | | | | | Noble Corp. | | | 1,752,760 | | | | 1.2 | | |
| | 83,400 | | | | | Other Securities | | | 2,595,378 | | | | 1.8 | | |
| | | | | | | | | | 16,686,374 | | | | 11.9 | | |
| | | | | Financials: 15.2% | |
| | 37,700 | | | | | Aflac, Inc. | | | 1,630,902 | | | | 1.2 | | |
| | 106,679 | | | | | Citigroup, Inc. | | | 2,806,725 | | | | 2.0 | | |
| | 79,700 | | | | | Invesco Ltd. | | | 1,601,173 | | | | 1.1 | | |
| | 87,200 | | | | | JPMorgan Chase & Co. | | | 2,899,400 | | | | 2.1 | | |
| | 55,900 | | | | | Metlife, Inc. | | | 1,742,962 | | | | 1.3 | | |
| | 119,800 | | | | | Morgan Stanley | | | 1,812,574 | | | | 1.3 | | |
| | 79,300 | | | | | US Bancorp. | | | 2,145,065 | | | | 1.5 | | |
| | 140,200 | | | | | Wells Fargo & Co. | | | 3,863,912 | | | | 2.8 | | |
| | 83,400 | | | | | Other Securities | | | 2,697,324 | | | | 1.9 | | |
| | | | | | | | | | 21,200,037 | | | | 15.2 | | |
| | | | | Health Care: 14.4% | |
| | 25,900 | | | @ | | Alexion
Pharmaceuticals, Inc. | | | 1,851,850 | | | | 1.3 | | |
| | 36,300 | | | | | Baxter International, Inc. | | | 1,796,124 | | | | 1.3 | | |
| | 38,800 | | | @ | | Gilead Sciences, Inc. | | | 1,588,084 | | | | 1.1 | | |
| Shares | |
| |
| | Value | | Percentage
of Net
Assets | |
| | 49,700 | | | @ | | Hospira, Inc. | | $ | 1,509,389 | | | | 1.1 | | |
| | 63,000 | | | | | Medtronic, Inc. | | | 2,409,750 | | | | 1.7 | | |
| | 72,873 | | | | | Merck & Co., Inc. | | | 2,747,312 | | | | 2.0 | | |
| | 38,300 | | | | | UnitedHealth Group, Inc. | | | 1,941,044 | | | | 1.4 | | |
| | 222,100 | | | | | Other Securities | | | 6,348,206 | | | | 4.5 | | |
| | | | | | | | | | 20,191,759 | | | | 14.4 | | |
| | | | | Industrials: 10.6% | |
| | 37,500 | | | | | Boeing Co. | | | 2,750,625 | | | | 2.0 | | |
| | 29,800 | | | | | FedEx Corp. | | | 2,488,598 | | | | 1.8 | | |
| | 45,800 | | | | | General Dynamics Corp. | | | 3,041,578 | | | | 2.2 | | |
| | 174,100 | | | @ | | Hertz Global
Holdings, Inc. | | | 2,040,452 | | | | 1.4 | | |
| | 57,400 | | | | | Illinois Tool Works, Inc. | | | 2,681,154 | | | | 1.9 | | |
| | 97,700 | | | | | Textron, Inc. | | | 1,806,473 | | | | 1.3 | | |
| | | | | | | | | | 14,808,880 | | | | 10.6 | | |
| | | | | Information Technology: 16.1% | |
| | 101,400 | | | @ | | Adobe Systems, Inc. | | | 2,866,578 | | | | 2.0 | | |
| | 14,000 | | | @ | | Apple, Inc. | | | 5,670,000 | | | | 4.1 | | |
| | 138,900 | | | | | Cisco Systems, Inc. | | | 2,511,312 | | | | 1.8 | | |
| | 61,300 | | | | | Hewlett-Packard Co. | | | 1,579,088 | | | | 1.1 | | |
| | 150,500 | | | @ | | Symantec Corp. | | | 2,355,325 | | | | 1.7 | | |
| | 21,900 | | | | | Visa, Inc. | | | 2,223,507 | | | | 1.6 | | |
| | 359,400 | | | | | Other Securities | | | 5,321,709 | | | | 3.8 | | |
| | | | | | | | | | 22,527,519 | | | | 16.1 | | |
| | | | | Materials: 3.9% | |
| | 52,800 | | | | | Celanese Corp. | | | 2,337,456 | | | | 1.7 | | |
| | 72,500 | | | | | Dow Chemical Co. | | | 2,085,100 | | | | 1.5 | | |
| | 14,100 | | | | | Other Securities (a) | | | 1,063,281 | | | | 0.7 | | |
| | | | | | | | | | 5,485,837 | | | | 3.9 | | |
| | | | | Utilities: 2.7% | |
| | 42,900 | | | | | Edison International | | | 1,776,060 | | | | 1.3 | | |
| | 31,600 | | | | | NextEra Energy, Inc. | | | 1,923,808 | | | | 1.4 | | |
| | | | | | | | | | 3,699,868 | | | | 2.7 | | |
| | | | | | | Total Common Stock
(Cost $129,808,121) | | | 135,028,255 | | | | 96.6 | | |
| EXCHANGE-TRADED FUNDS: 0.6% | | | |
| | 7,600 | | | | | Other Securities | | | 953,800 | | | | 0.6 | | |
| | | | | | | Total Exchange-Traded
Funds
(Cost $951,798) | | | 953,800 | | | | 0.6 | | |
| | | | | | | Total Long-Term
Investments
(Cost $130,759,919) | | | 135,982,055 | | | | 97.2 | | |
See Accompanying Notes to Financial Statements
175
ING UBS SUMMARY PORTFOLIO OF INVESTMENTS
U.S. LARGE CAP EQUITY PORTFOLIO AS OF DECEMBER 31, 2011 (CONTINUED)
Principal
Amount† | |
| |
| |
Value | | Percentage
of Net
Assets | |
| SHORT-TERM INVESTMENTS: 4.4% | | | |
| | | | | Securities Lending Collateralcc(1): 1.5% | |
| | 58,668 | | | | | | | BNP Paribas Bank,
Repurchase Agreement
dated 12/30/11, 0.06%,
due 01/03/12
(Repurchase Amount
$58,668,
collateralized by
various U.S.
Government Agency
Obligations,
5.000%-6.000%,
Market Value plus
accrued interest $59,841,
due 05/15/24-04/15/41) | | $ | 58,668 | | | | 0.1 | | |
| | 1,000,000 | | | | | | | Cantor Fitzgerald,
Repurchase Agreement
dated 12/30/11, 0.12%,
due 01/03/12
(Repurchase Amount
$1,000,013,
collateralized by
various U.S.
Government Agency
Obligations,
1.437%-6.014%,
Market Value plus
accrued interest
$1,020,000,
due 06/01/17-09/01/44) | | | 1,000,000 | | | | 0.7 | | |
| | 1,000,000 | | | | | | | Citigroup, Inc.,
Repurchase Agreement
dated 12/30/11, 0.08%,
due 01/03/12
(Repurchase Amount
$1,000,009,
collateralized by
various U.S.
Government and U.S.
Government Agency
Obligations,
0.000%-5.500%,
Market Value plus
accrued interest
$1,020,000,
due 01/19/12-12/20/41) | | | 1,000,000 | | | | 0.7 | | |
| | | | | | | | | | 2,058,668 | | | | 1.5 | | |
| Shares | |
| |
| | Value | | Percentage
of Net
Assets | |
| | | | | Mutual Funds: 2.9% | |
| | 4,054,031 | | | | | | | BlackRock Liquidity
Funds, TempFund,
Institutional Class
(Cost $4,054,031) | | $ | 4,054,031 | | | | 2.9 | | |
| | | | | Total Short-Term
Investments
(Cost $6,112,699) | | | 6,112,699 | | | | 4.4 | | |
| | | | | Total Investments in
Securities
(Cost $136,872,618) | | $ | 142,094,754 | | | | 101.6 | | |
| | | | | Liabilities in Excess of
Other Assets | | | (2,291,022 | ) | | | (1.6 | ) | |
| | | | | Net Assets | | $ | 139,803,732 | | | | 100.0 | | |
"Other Securities" represents issues not identified as the top 50 holdings in terms of market value and issues or issuers not exceeding 1% of net assets individually or in aggregate respectively as of December 31, 2011.
The following footnotes apply to either the individual securities noted or one or more of the securities aggregated and listed as a single line item.
† Unless otherwise indicated, principal amount is shown in USD.
@ Non-income producing security
ADR American Depositary Receipt
cc Securities purchased with cash collateral for securities loaned.
(1) Collateral received from brokers for securities lending was invested into these short-term investments.
(a) This grouping contains loaned securities.
Cost for federal income tax purposes is $138,213,798.
| Net unrealized appreciation consists of: | |
| Gross Unrealized Appreciation | | $ | 15,269,528 | | |
| Gross Unrealized Depreciation | | | (11,388,572 | ) | |
| Net Unrealized Appreciation | | $ | 3,880,956 | | |
See Accompanying Notes to Financial Statements
176
ING UBS SUMMARY PORTFOLIO OF INVESTMENTS
U.S. LARGE CAP EQUITY PORTFOLIO AS OF DECEMBER 31, 2011 (CONTINUED)
Fair Value Measurements^
The following is a summary of the fair valuations according to the inputs used as of December 31, 2011 in valuing the assets and liabilities:
| | | Quoted Prices
in Active Markets
for Identical Investments
(Level 1) | | Significant Other
Observable
Inputs
(Level 2) | | Significant
Unobservable
Inputs
(Level 3) | | Fair Value
at
12/31/11 | |
| Asset Table | |
| Investments, at value | |
| Common Stock* | | $ | 135,028,255 | | | $ | — | | | $ | — | | | $ | 135,028,255 | | |
| Exchange-Traded Funds | | | 953,800 | | | | — | | | | — | | | | 953,800 | | |
| Short-Term Investments | | | 4,054,031 | | | | 2,058,668 | | | | — | | | | 6,112,699 | | |
| Total Investments, at value | | $ | 140,036,086 | | | $ | 2,058,668 | | | $ | — | | | $ | 142,094,754 | | |
The following is a reconciliation of the fair valuations using significant unobservable inputs (Level 3) for the Portfolio's assets and liabilities during the period ended December 31, 2011:
| | | Beginning
Balance
12/31/10 | | Purchases | | Sales | | Accrued
Discounts/
(Premiums) | | Total
Realized
Gain/(Loss) | | Total
Unrealized
Appreciation/
(Depreciation) | | Transfers
Into
Level 3 | | Transfers
Out of
Level 3 | | Ending
Balance
12/31/11 | |
| Asset Table | |
| Investments, at value | |
Short-Term
Investments | | $ | 655,000 | | | $ | — | | | $ | (655,000 | ) | | $ | — | | | $ | (163,750 | ) | | $ | 163,750 | | | $ | — | | | $ | — | | | $ | — | | |
Total Investments,
at value | | $ | 655,000 | | | $ | — | | | $ | (655,000 | ) | | $ | — | | | $ | (163,750 | ) | | $ | 163,750 | | | $ | — | | | $ | — | | | $ | — | | |
As of December 31, 2011, total change in unrealized gain (loss) on Level 3 securities still held at period end and included in the change in net assets was $0.
^ See Note 2, "Significant Accounting Policies" in the Notes to Financial Statements for additional information.
* For further breakdown of Common Stock by Industry type, please refer to the Portfolio of Investments.
There were no significant transfers between Level 1 and 2 during the year ended December 31, 2011
Transfers in or out of Level 3 represent either the beginning value (for transfers in), or the ending value (for transfers out) of any security or derivative instrument where a change in the pricing level occurred from the beginning to the end of the period. Transfers are recognized at the end of the reporting period.
See Accompanying Notes to Financial Statements
177
TAX INFORMATION (UNAUDITED)
Dividends and distributions paid during the year ended December 31, 2011 were as follows:
| Portfolio Name | | Type | | Per Share Amount | |
ING American Century Small-Mid
Cap Value Portfolio | |
| Class ADV | | NII | | $ | 0.1276 | | |
| Class I | | NII | | $ | 0.1542 | | |
| Class S | | NII | | $ | 0.1276 | | |
| Class S2 | | NII | | $ | 0.1526 | | |
| All Classes | | LTCG | | $ | 0.0011 | | |
ING Columbia Small Cap
Value II Portfolio | |
| Class ADV | | NII | | $ | 0.0564 | | |
| Class I | | NII | | $ | 0.0702 | | |
| Class S | | NII | | $ | 0.0434 | | |
| Class S2 | | NII | | $ | 0.0643 | | |
ING Davis New York
Venture Portfolio | |
| Class ADV | | NII | | $ | 0.1610 | | |
| Class I | | NII | | $ | 0.2182 | | |
| Class S | | NII | | $ | 0.1727 | | |
| ING Global Bond Portfolio | |
| Class ADV | | NII | | $ | 0.8472 | | |
| Class I | | NII | | $ | 0.9014 | | |
| Class S | | NII | | $ | 0.8591 | | |
ING Invesco Van Kampen
Comstock Portfolio | |
| Class ADV | | NII | | $ | 0.1221 | | |
| Class I | | NII | | $ | 0.1715 | | |
| Class S | | NII | | $ | 0.1442 | | |
ING Invesco Van Kampen
Equity and Income Portfolio | |
| Class ADV | | NII | | $ | 0.6304 | | |
| Class I | | NII | | $ | 0.7827 | | |
| Class S | | NII | | $ | 0.6915 | | |
| Class S2 | | NII | | $ | 0.6651 | | |
ING JPMorgan Mid Cap
Value Portfolio | |
| Class ADV | | NII | | $ | 0.0867 | | |
| Class I | | NII | | $ | 0.1538 | | |
| Class S | | NII | | $ | 0.1181 | | |
| Class S2 | | NII | | $ | 0.1366 | | |
| Portfolio Name | | Type | | Per Share Amount | |
| ING Oppenheimer Global Portfolio | |
| Class ADV | | NII | | $ | 0.1471 | | |
| Class I | | NII | | $ | 0.2038 | | |
| Class S | | NII | | $ | 0.1716 | | |
| Class S2 | | NII | | $ | 0.2032 | | |
| ING PIMCO Total Return Portfolio | |
| Class ADV | | NII | | $ | 0.3442 | | |
| Class I | | NII | | $ | 0.3920 | | |
| Class S | | NII | | $ | 0.3643 | | |
| Class S2 | | NII | | $ | 0.3808 | | |
| All Classes | | STCG | | $ | 0.2686 | | |
| All Classes | | LTCG | | $ | 0.1489 | | |
| ING Pioneer High Yield Portfolio | |
| Class I | | NII | | $ | 0.6249 | | |
| Class S | | NII | | $ | 0.5969 | | |
ING T. Rowe Price Diversified
Mid Cap Growth Portfolio | |
| Class ADV | | NII | | $ | 0.0099 | | |
| Class I | | NII | | $ | 0.0299 | | |
| Class S | | NII | | $ | 0.0099 | | |
| Class S2 | | NII | | $ | 0.0232 | | |
ING Templeton Foreign
Equity Portfolio | |
| Class ADV | | NII | | $ | 0.1745 | | |
| Class I | | NII | | $ | 0.2038 | | |
| Class S | | NII | | $ | 0.1767 | | |
| Class S2 | | NII | | $ | 0.2015 | | |
| ING Thornburg Value Portfolio | |
| Class ADV | | NII | | $ | 0.1298 | | |
| Class I | | NII | | $ | 0.2312 | | |
| Class S | | NII | | $ | 0.1616 | | |
| Class S2 | | NII | | $ | 0.1433 | | |
ING UBS U.S. Large Cap
Equity Portfolio | |
| Class ADV | | NII | | $ | 0.0576 | | |
| Class I | | NII | | $ | 0.1054 | | |
| Class S | | NII | | $ | 0.0647 | | |
NII — Net investment income
STCG — Short-term capital gain
LTCG — Long-term capital gain
Of the ordinary distributions made during the year ended December 31, 2011, the following percentages qualify for the dividends received deduction (DRD) available to corporate shareholders:
| ING American Century Small-Mid Cap Value Portfolio | | | 100.00 | % | |
| ING Columbia Small Cap Value II Portfolio | | | 100.00 | % | |
| ING Davis New York Venture Portfolio | | | 100.00 | % | |
| ING Invesco Van Kampen Comstock Portfolio | | | 100.00 | % | |
| ING Invesco Van Kampen Equity and Income Portfolio | | | 69.87 | % | |
| ING JPMorgan Mid Cap Value Portfolio | | | 100.00 | % | |
| ING Oppenheimer Global Portfolio | | | 31.64 | % | |
| ING PIMCO Total Return Portfolio | | | 6.66 | % | |
| ING Pioneer High Yield Portfolio | | | 9.04 | % | |
| ING T. Rowe Price Diversified Mid Cap Growth Portfolio | | | 100.00 | % | |
| ING Thornburg Value Portfolio | | | 100.00 | % | |
| ING UBS U.S. Large Cap Equity Portfolio | | | 100.00 | % | |
Pursuant to Section 853 of the Internal Revenue Code, the Portfolios designate the following amounts as foreign taxes paid for the year ended December 31, 2011. Foreign taxes paid for purposes of Section 853 may be less than actual foreign taxes paid for financial statement purposes.
| | | Creditable
Foreign
Taxes Paid | | Per Share
Amount | | Portion of Ordinary
Income Distribution
Derived from Foreign
Sourced Income* | |
| ING Oppenheimer Global Portfolio | | $ | 2,974,786 | | | $ | 0.0252 | | | | 79.44 | % | |
| ING Templeton Foreign Equity Portfolio | | $ | 2,161,326 | | | $ | 0.0395 | | | | 98.87 | % | |
* None of the Portfolios listed above derived any income from ineligible foreign sources as defined under Section 901(j) of the Internal Revenue Code.
178
TAX INFORMATION (UNAUDITED) (CONTINUED)
Foreign taxes paid or withheld should be included in taxable income with an offsetting deduction from gross income or as a credit for taxes paid to foreign governments. Shareholders are strongly advised to consult their own tax advisors regarding the appropriate treatment of foreign taxes paid.
Above figures may differ from those cited elsewhere in this report due to differences in the calculation of income and gains under U.S. generally accepted accounting principles (book) purposes and Internal Revenue Service (tax) purposes.
Shareholders are strongly advised to consult their own tax advisers with respect to the tax consequences of their investments in the Portfolios. In January, shareholders, excluding corporate shareholders, receive an IRS 1099-DIV regarding the federal tax status of the dividends and distributions they received in the calendar year.
179
DIRECTOR AND OFFICER INFORMATION (UNAUDITED)
The business and affairs of the Company are managed under the direction of the Company's Board. A Director who is not an interested person of the Company, as defined in the 1940 Act, is an independent director ("Independent Director"). The Directors and Officers of the Company are listed below. The Statement of Additional Information includes additional information about directors of the Company and is available, without charge, upon request at (800) 992-0180.
Name, Address
and Age | | Position(s)
held with the
Company | | Term of
Office and
Length of
Time
Served(1) | | Principal
Occupation(s) -
during the
Past 5 Years | | Number of
Portfolios in
Fund Complex
Overseen
by Director(2) | | Other
Board Positions
held by
Director | |
| Independent Directors: | |
|
Colleen D. Baldwin
7337 East Doubletree Ranch Rd.
Suite 100
Scottsdale, Arizona 85258
Age: 51 | | Director | | November 2007 - Present | | President, Glantuam Partners, LLC, a business consulting firm (January 2009 - Present) and Consultant (January 2005 - Present). | | | 140 | | | None. | |
|
John V. Boyer
7337 East Doubletree Ranch Rd.
Suite 100
Scottsdale, Arizona 85258
Age: 58 | | Director | | November 1997 - Present | | President and Chief Executive Officer, Bechtler Arts Foundation, an arts and education foundation (January 2008 - Present). Formerly, Consultant (July 2007 - February 2008) and President and Chief Executive Officer, Franklin and Eleanor Roosevelt Institute, a public policy foundation (March 2006 - July 2007). | | | 140 | | | None. | |
|
Patricia W. Chadwick
7337 East Doubletree Ranch Rd.
Suite 100
Scottsdale, Arizona 85258
Age: 63 | | Director | | January 2006 - Present | | Consultant and President, Ravengate Partners LLC, a consulting firm that provides advice regarding financial markets and the global economy (January 2000 - Present). | | | 140 | | | Wisconsin Energy Corporation (June 2006 - Present) and The Royce Fund, 35 Funds (December 2009 - Present). | |
|
Peter S. Drotch
7337 East Doubletree Ranch Rd.
Suite 100
Scottsdale, Arizona 85258
Age: 70 | | Director | | November 2007 - Present | | Retired. | | | 140 | | | First Marblehead Corporation (September 2003 - Present). | |
|
J. Michael Earley
7337 East Doubletree Ranch Rd.
Suite 100
Scottsdale, Arizona 85258
Age: 66 | | Director | | January 2005 - Present | | Retired. Formerly, Banking President and Chief Executive Officer, Bankers Trust Company, N.A., Des Moines (June 1992 - December 2008). | | | 140 | | | None. | |
|
Patrick W. Kenny
7337 East Doubletree Ranch Rd.
Suite 100
Scottsdale, Arizona 85258
Age: 69 | | Director | | March 2002 - Present | | Retired. Formerly, President and Chief Executive Officer, International Insurance Society (June 2001 - June 2009).
140 | | | | | | Assured Guaranty Ltd. (April 2004 - Present). | |
|
Sheryl K. Pressler
7337 East Doubletree Ranch Rd.
Suite 100
Scottsdale, Arizona 85258
Age: 61 | | Director | | January 2006 - Present | | Consultant (May 2001 - Present).
140 | | | | | | Stillwater Mining Company (May 2002 - Present). | |
|
Roger B. Vincent
7337 East Doubletree Ranch Rd.
Suite 100
Scottsdale, Arizona 85258
Age: 66 | | Chairperson/Director | | January 2005 - Present | | President, Springwell Corporation, a corporate finance firm (March 1989 - Present). | | | 140 | | | UGI Corporation (February 2006 - Present) and UGI Utilities, Inc. (February 2006 - Present). | |
|
180
DIRECTOR AND OFFICER INFORMATION (UNAUDITED) (CONTINUED)
Name, Address
and Age | | Position(s)
held with the
Company | | Term of
Office and
Length of
Time
Served(1) | | Principal
Occupation(s) -
during the
Past 5 Years | | Number of
Portfolios in
Fund Complex
Overseen
by Director(2) | | Other
Board Positions
held by
Director | |
| Trustees who are "Interested Persons": | |
|
Robert W. Crispin(3)
7337 East Doubletree Ranch Rd.
Suite 100
Scottsdale, Arizona 85258
Age: 65 | | Director | | November 2007 - Present | | Retired. Formerly, Chairman and Chief Executive Officer, ING Investment Management Co. (July 2001 - December 2007). | | | 140 | | | Intact Financial Corporation (December 2004 - Present) and PFM Group (November 2010 - Present). | |
|
Shaun P. Mathews(3)
7337 East Doubletree Ranch Rd.
Suite 100
Scottsdale, Arizona 85258
Age: 56 | | Director | | November 2007 - Present | | President and Chief Executive Officer, ING Investments, LLC (November 2006 - Present). | | | 177 | | | ING Capital Corporation, LLC (December 2005 - Present). | |
|
(1) Directors serve until their successors are duly elected and qualified. The tenure of each Director is subject to the Board's retirement policy which states that each duly elected or appointed Director who is not an "interested person" of the Company, as defined in the 1940 Act, as amended ("Independent Directors"), shall retire from service as a Director at the conclusion of the first regularly scheduled quarterly meeting of the Board that is held after the Director reaches the age of 72. A unanimous vote of the Board may extend the retirement date of a Director for up to one year. An extension may be permitted if the retirement would trigger a requirement to hold a meeting of shareholders of the Company under applicable law, whether for purposes of appointing a successor to the Director or if otherwise necessary under applicable law, in which case the extension would apply until such time as the shareholder meeting can be held or is no longer needed.
(2) Except for Mr. Mathews and for the purposes of this table "ING Fund Complex" means the following investment companies: ING Asia Pacific High Dividend Equity Income Fund; ING Emerging Markets High Dividend Equity Fund; ING Emerging Markets Local Bond Fund; ING Equity Trust; ING Funds Trust; ING Global Equity Dividend and Premium Opportunity Fund; ING Global Advantage and Premium Opportunity Fund; ING Infrastructure, Industrials and Materials Fund; ING International High Dividend Equity Income Fund; ING Investors Trust; ING Mayflower Trust; ING Mutual Funds; ING Partners, Inc.; ING Prime Rate Trust; ING Risk Managed Natural Resources Fund; ING Senior Income Fund; ING Separate Portfolios Trust; ING Variable Insurance Trust; and ING Variable Products Trust. For Mr. Mathews, the ING Fund Complex also includes the following investment companies: ING Balanced Portfolio, Inc.; ING Intermediate Bond Portfolio; ING Money Market Portfolio; ING Series Fund, Inc.; ING Strategic Allocation Portfolios, Inc.; ING Variable Funds; and ING Variable Portfolios, Inc.. Therefore, for the purposes of this table with reference to Mr. Mathews, "Fund Complex" includes these investment companies. The number of funds in the ING Fund Complex is as of January 31, 2012.
(3) Messrs. Crispin and Matthews are deemed "Interested Persons" of the Trust because of their current or prior affiliation with ING Groep, N.V., the parent corporation of the Investment Adviser(s) and the Distributor.
181
DIRECTOR AND OFFICER INFORMATION (UNAUDITED) (CONTINUED)
Name, Address
and Age | | Position(s)
Held With the Company | | Term of Office and
Length of Time Served(1) | | Principal Occupation(s) - During the
Past 5 Years | |
Shaun P. Mathews
7337 East Doubletree Ranch Rd.
Suite 100
Scottsdale, Arizona 85258
Age: 56 | | President and Chief Executive Officer | | November 2006 - Present | | President and Chief Executive Officer, ING Investments, LLC (November 2006 - Present). | |
|
Michael J. Roland
7337 East Doubletree Ranch Rd.
Suite 100
Scottsdale, Arizona 85258
Age: 53 | | Executive Vice President | | January 2005 - Present | | Chief Compliance Officer, Directed Services LLC and ING Investments, LLC (March 2011 - Present) and Executive Vice President and Chief Operating Officer, ING Investments, LLC and ING Funds Services, LLC (January 2007 - Present). Formerly, Chief Compliance Officer, ING Funds (March 2011 - February 2012). | |
|
Stanley D. Vyner
230 Park Avenue
New York, New York 10169
Age: 61 | | Executive Vice President
Chief Investment Risk Officer | | January 2005 - Present
September 2009 - Present | | Executive Vice President, ING Investments, LLC (July 2000 - Present) and Chief Investment Risk Officer, ING Investments, LLC (January 2003 - Present). | |
|
Kevin M. Gleason
7337 East Doubletree Ranch Rd.
Suite 100
Scottsdale, Arizona 85258
Age: 45 | | Chief Compliance Officer | | February 2012 - Present | | Chief Compliance Officer, ING Funds (February 2012 - Present). Formerly, Assistant General Counsel and Assistant Secretary, The Northwestern Mutual Life Insurance Company, (June 2004 - January 2012). | |
|
Kimberly A. Anderson
7337 East Doubletree Ranch Rd.
Suite 100
Scottsdale, Arizona 85258
Age: 47 | | Senior Vice President | | January 2005 - Present | | Senior Vice President, ING Investments, LLC (October 2003 - Present). | |
|
Todd Modic
7337 East Doubletree Ranch Rd.
Suite 100
Scottsdale, Arizona 85258
Age: 44 | | Senior Vice President, Chief/Principal Financial Officer and Assistant Secretary | | March 2005 - Present | | Senior Vice President, ING Funds Services, LLC (March 2005 - Present). | |
|
Robert Terris
7337 East Doubletree Ranch Rd.
Suite 100
Scottsdale, Arizona 85258
Age: 41 | | Senior Vice President | | May 2006 - Present | | Senior Vice President, Head of Division Operations, ING Funds Services, LLC (May 2006 - Present). | |
|
Gregory K. Wilson
7337 East Doubletree Ranch Rd.
Suite 100
Scottsdale, Arizona 85258
Age: 52 | | Senior Vice President | | September 2011 - Present | | Vice President - Fund Compliance, ING Funds Services, LLC (October 2009 - Present). Formerly, Finance Director, ING Funds Services, LLC (September 2006 - October 2009). | |
|
Robyn L. Ichilov
7337 East Doubletree Ranch Rd.
Suite 100
Scottsdale, Arizona 85258
Age: 44 | | Vice President and Treasurer | | January 2005 - Present | | Vice President and Treasurer, ING Funds Services, LLC (November 1995 - Present) and ING Investments, LLC (August 1997 - Present). | |
|
Maria M. Anderson
7337 East Doubletree Ranch Rd.
Suite 100
Scottsdale, Arizona 85258
Age: 53 | | Vice President | | January 2005 - Present | | Vice President, ING Funds Services, LLC (September 2004 - Present). | |
|
Lauren D. Bensinger
7337 East Doubletree Ranch Rd.
Suite 100
Scottsdale, Arizona 85258
Age: 58 | | Vice President | | January 2005 - Present | | Vice President, ING Investments, LLC and ING Funds Services, LLC (February 1996 - Present); Director of Compliance, ING Investments, LLC (October 2004 - Present); and Vice President and Money Laundering Reporting Officer, ING Investments Distributor, LLC (April 2010 - Present). Formerly, Chief Compliance Officer, ING Investments Distributor, LLC (August 1995 - April 2010) | |
|
182
DIRECTOR AND OFFICER INFORMATION (UNAUDITED) (CONTINUED)
Name, Address
and Age | | Position(s)
Held With the Company | | Term of Office and
Length of Time Served(1) | | Principal Occupation(s) - During the
Past 5 Years | |
William Evans
One Orange Way
Windsor, Connecticut 06095
Age: 39 | | Vice President | | September 2007 - Present | | Senior Vice President (March 2010 - Present) and Head of Manager Research and Selection Group, ING Investment Management (April 2007 - Present). Formerly, Vice President, U.S. Mutual Funds and Investment Products (May 2005 - April 2007). | |
|
Denise Lewis
7337 East Doubletree Ranch Rd.
Suite 100
Scottsdale, Arizona 85258
Age: 48 | | Vice President | | January 2007 - Present | | Vice President, ING Funds Services, LLC (December 2006 - Present). | |
|
Kimberly K. Springer
7337 East Doubletree Ranch Rd.
Suite 100
Scottsdale, Arizona 85258
Age: 54 | | Vice President | | March 2006 - Present | | Vice President, ING Investment Management - ING Funds (March 2010 - Present); Vice President, ING Funds Services, LLC (March 2006 - Present) and Managing Paralegal, Registration Statements (June 2003 - Present). | |
|
Craig Wheeler
7337 East Doubletree Ranch Rd.
Suite 100
Scottsdale, Arizona 85258
Age: 42 | | Assistant Vice President | | May 2008 - Present | | Assistant Vice President - Director of Tax, ING Funds Services, LLC (March 2008 - Present). Formerly, Tax Manager, ING Funds Services, LLC (March 2005 - March 2008). | |
|
Huey P. Falgout, Jr.
7337 East Doubletree Ranch Rd.
Suite 100
Scottsdale, Arizona 85258
Age: 48 | | Secretary | | August 2003 - Present | | Senior Vice President and Chief Counsel, ING Investment Management - ING Funds (March 2010 - Present). Formerly, Chief Counsel, ING Americas, U.S. Legal Services (October 2003 - March 2010). | |
|
Paul Caldarelli
7337 East Doubletree Ranch Rd.
Suite 100
Scottsdale, Arizona 85258
Age: 60 | | Assistant Secretary | | June 2010 - Present | | Vice President and Senior Counsel, ING Investment Management - ING Funds (March 2010 - Present). Formerly, Senior Counsel, ING Americas, U.S. Legal Services (April 2008 - March 2010) and Counsel, ING Americas, U.S. Legal Services (May 2005 - April 2008). | |
|
Theresa K. Kelety
7337 East Doubletree Ranch Rd.
Suite 100
Scottsdale, Arizona 85258
Age: 49 | | Assistant Secretary | | August 2003 - Present | | Vice President and Senior Counsel, ING Investment Management - ING Funds (March 2010 - Present). Formerly, Senior Counsel, ING Americas, U.S. Legal Services (April 2008 - March 2010) and Counsel, ING Americas, U.S. Legal Services (April 2003 - April 2008). | |
|
Kathleen Nichols
7337 East Doubletree Ranch Rd.
Suite 100
Scottsdale, Arizona 85258
Age: 36 | | Assistant Secretary | | May 2008 - Present | | Vice President and Counsel, ING Investment Management - ING Funds (March 2010 - Present). Formerly, Counsel, ING Americas, U.S. Legal Services (February 2008 - March 2010) and Associate, Ropes & Gray LLP (September 2005 - February 2008) | |
|
(1) The Officers hold office until the next annual meeting of the Board of Directors and until their successors shall have been elected and qualified.
183
SHAREHOLDER MEETING INFORMATION (UNAUDITED)
A special meeting of shareholders of the ING Global Bond Portfolio (formerly, ING Oppenheimer Global Strategic Income Portfolio) was held June 7, 2011, at the offices of ING Funds, 7337 East Doubletree Ranch Road, Scottsdale, AZ 85258.
Proposal:
1 A new sub-advisory agreement for the Portfolio between Directed Services LLC ("DSL"), the Portfolio's investment adviser and ING Investment Management Co. ("ING IM"), the Portfolio's proposed sub-adviser.
2 A new sub-advisory agreement between DSL and ING Investment Management Asia/Pacific (Hong Kong) Limited.
3 A new sub-advisory agreement between DSL and ING Investment Management Advisors B.V.
| | | Proposal* | | Shares voted for | | Shares voted
against or
withheld | | Shares
abstained | | Broker
non-vote | | Total Shares
Voted | |
| ING Global Bond Portfolio | | | 1 | | | | 22,521,943.449 | | | | 718,193.074 | | | | 921,009.927 | | | | 0 | | | | 24,161,146.450 | | |
| ING Global Bond Portfolio | | | 2 | | | | 22,269,259.898 | | | | 927,808.098 | | | | 964,078.454 | | | | 0 | | | | 24,161,146.450 | | |
| ING Global Bond Portfolio | | | 3 | | | | 22,566,440.404 | | | | 646,332.269 | | | | 948,373.777 | | | | 0 | | | | 24,161,146.450 | | |
* Proposals Passed
184
ADVISORY CONTRACT APPROVAL DISCUSSION (UNAUDITED)
BOARD CONSIDERATION AND RE-APPROVAL OF INVESTMENT ADVISORY AND SUB-ADVISORY CONTRACTS
Section 15(c) of the Investment Company Act of 1940, as amended (the "1940 Act") provides that, after an initial period, the Portfolios' existing investment advisory and sub-advisory contracts will remain in effect only if the Board of Directors (the "Board") of ING Partners, Inc. (the "Company"), including a majority of Board members who have no direct or indirect interest in the advisory and sub-advisory contracts, and who are not "interested persons" of the Portfolios, as such term is defined under the 1940 Act (the "Independent Directors"), annually review and approve them. Thus, at a meeting held on November 17, 2011, the Board, including a majority of the Independent Directors, considered whether to renew the investment advisory contracts (the "Advisory Contracts") between Directed Services LLC (the "Adviser") and the Portfolios and the sub-advisory contracts ("Sub-Advisory Contracts") with the sub-adviser to each Portfolio (each a "Sub-Adviser" and collectively, the "Sub-Advisers").
The Independent Directors also held separate meetings on October 12 and November 15, 2011 to consider the renewal of the Advisory Contracts and Sub-Advisory Contracts. As a result, subsequent references herein to factors considered and determinations made by the Independent Directors include, as applicable, factors considered and determinations made on those earlier dates by the Independent Directors.
At its November 17, 2011 meeting, the Board voted to renew the Advisory and Sub-Advisory Contracts for the Portfolios. In reaching these decisions, the Board took into account information furnished to it throughout the year at regular meetings of the Board and the Board's committees, as well as information prepared specifically in connection with the annual renewal process. Determinations by the Independent Directors also took into account various factors that they believed, in light of the legal advice furnished to them by K&L Gates LLP ("K&L Gates"), their independent legal counsel, and their own business judgment, to be relevant. Further, while the Board considered at the same meeting the advisory contracts and sub-advisory contracts that were subject to renewal for the funds under its jurisdiction, the Directors considered each Portfolio's advisory and sub-advisory relationships separately.
Provided below is an overview of the Board's contract approval process in general, as well as a discussion of certain specific factors that the Board considered at its renewal meeting. While the Board gave its attention to the information furnished at the request of the Independent Directors that was most relevant to its considerations, discussed below are a number of the primary factors relevant to the Board's consideration as to whether to renew the Advisory and Sub-Advisory Contracts for the one-year period ending November 30, 2012. Each Board member may have accorded different weight to the various factors in reaching his or her conclusions with respect to each Portfolio's advisory and sub-advisory arrangements.
Overview of the Contract Renewal and Approval Process
The Board follows a structured process pursuant to which it seeks and considers relevant information when it decides whether to approve new or existing advisory and sub-advisory arrangements for the investment companies in the ING Fund complex under its jurisdiction, including the Portfolios' existing Advisory and Sub-Advisory Contracts. Among other actions, the Independent Directors of the Board: retain the services of independent consultants with experience in the mutual fund industry to assist the Independent Directors in working with the personnel employed by the Adviser or its affiliates who administer the Portfolios ("Management") to identify the types of information presented to the Board to inform its deliberations with respect to advisory and sub-advisory relationships and to help evaluate that information; evaluate industry best practices in regards to the consideration of investment advisory and sub-advisory contracts; established a specific format in which certain requested information is provided to the Board; and determine the process for reviewing such information in connection with advisory and sub-advisory contract renewals and approvals. The result is a process (the "Contract Review Process") employed by the Board and its Independent Directors to review and analyze information in connection with the annual renewal of the ING Funds' advisory and sub-advisory contracts, as well as the review and approval of new advisory and sub-advisory relationships.
Since the Contract Review Process was first implemented, the Board's membership has changed substantially through periodic retirements of some Directors and the appointment and election of new Directors. In addition, the Independent Directors have
185
ADVISORY CONTRACT APPROVAL DISCUSSION (UNAUDITED) (CONTINUED)
reviewed and refined the renewal and approval process at least annually in order to request additional information from Management and address certain unique characteristics related to the introduction of new Portfolios.
The Board has established two Investment Review Committees (each, an "IRC"), which meet independently and, at times, jointly, and a Contracts Committee. Among other matters, the Contracts Committee provides oversight with respect to the contracts renewal and approval process, and each Portfolio is assigned to an IRC which provides oversight regarding, among other matters, the investment performance of the Adviser and Sub-Advisers, as well as the oversight by the Adviser of the performance of the Sub-Advisers. The IRCs may apply a heightened level of scrutiny in cases where performance has lagged a Portfolio's relevant benchmark and/or selected peer group of investment companies ("Selected Peer Groups").
The type and format of the information provided to the Board or to legal counsel for the Independent Directors in connection with the contract approval and renewal process has been codified in the ING Funds' 15(c) Methodology Guide. This Guide was developed under the direction of the Independent Directors and sets out a blueprint pursuant to which the Independent Directors request certain information that they deem important to facilitate an informed review in connection with initial and annual approvals of advisory and sub-advisory contracts.
Management provides certain of the information requested by the 15(c) Methodology Guide in Fund Analysis and Comparison Tables ("FACT sheets") prior to the Independent Directors' review of advisory and sub-advisory arrangements (including the Portfolios' Advisory and Sub-Advisory Contracts). The Independent Directors previously retained an independent firm to verify and test the accuracy of certain FACT sheet data for a representative sample of funds in the ING Fund complex. In addition, the Contracts Committee routinely employs the services of an independent consultant to assist in its review and analysis of, among other matters, the 15(c) Methodology Guide, the content and format of the FACT sheets, and Selected Peer Groups to be used by the Portfolios for certain comparison purposes during the renewal process. As part of an ongoing process, the Contracts Committee recommends or considers recommendations from Management for refinements to the 15(c) Methodology Guide and other aspects of the review process, and the Board's IRCs review benchmarks used to assess the performance of funds in the ING Fund complex.
The Board employed its process for reviewing contracts when considering the renewals of the Portfolios' Advisory and Sub-Advisory Contracts that would be effective through November 30, 2012. Set forth below is a discussion of many of the Board's primary considerations and conclusions resulting from this process.
Nature, Extent and Quality of Service
In determining whether to approve the Advisory and Sub-Advisory Contracts for the Portfolios for the year ended November 30, 2012, the Independent Directors received and evaluated such information as they deemed necessary regarding the nature, extent and quality of services provided to the Portfolios by the Adviser and Sub-Adviser. This included information regarding the Adviser and Sub-Adviser provided throughout the year at regular meetings of the Board and its committees, as well as information furnished in connection with the contract renewal meetings.
The materials requested by the Independent Directors and provided to the Board, K&L Gates and/or independent consultants that assist the Independent Directors prior to the November 17, 2011 Board meeting included, among other information, the following items for each Portfolio: (1) FACT sheets that provided information regarding the performance and expenses of the Portfolio and other similarly managed funds in its Selected Peer Group, as well as information regarding the Portfolio's investment portfolio, objective and strategies; (2) reports providing risk and attribution analyses of the Portfolio; (3) the 15(c) Methodology Guide, which describes how the FACT sheets were prepared, including the manner in which each Portfolio's benchmark and Selected Peer Group were selected and how profitability was determined; (4) responses from the Adviser and Sub-Adviser to a series of questions posed by K&L Gates on behalf of the Independent Directors; (5) copies of the forms of Advisory and Sub-Advisory Contracts; (6) copies of the Forms ADV for the Adviser and Sub-Adviser; (7) financial statements for the Adviser and Sub-Adviser; (8) a draft of a narrative summary addressing key factors the Board customarily considers in evaluating the renewals of the ING Funds' (including the Portfolio's) advisory contracts and sub-advisory contracts, including a written analysis for the Portfolio of how performance, fees and expenses compare to its Selected Peer Group and/or designated benchmark(s);
186
ADVISORY CONTRACT APPROVAL DISCUSSION (UNAUDITED) (CONTINUED)
(9) independent analyses of Portfolio performance by the Company's Chief Investment Risk Officer; (10) for open-end Portfolios, information regarding net asset flows into and out of the Portfolio; and (11) other information relevant to the Board's evaluations.
The Board also noted that ING Groep, N.V. the ultimate parent company of the Adviser, has announced plans for the separation of its U.S.-based insurance, retirement services and investment management operations, which include the Adviser, into an independent, standalone company by the end of 2013. The Board further noted that this separation may result in the Adviser's loss of access to the services and resources of its current ultimate parent company, which could adversely affect its businesses and profitability. The Board recognized that, if the separation plans are deemed to be a change of control, the investment advisory and subadvisory agreements for the Portfolios would terminate and trigger the necessity for new agreements, which would require the approval of the Board and, potentially, the shareholders of a Portfolio. The Board also recognized that there can be no assurance that the separation plan will be carried out. The Board considered the potential effects of the separation on the Portfolios and the Adviser, including its ability prior to, during and after the separation to perform the same level of service to the Portfolios as the Adviser currently provides. In this regard, the Board noted that the Adviser did not currently anticipate that the separation would have a material adverse impact on the Portfolios or their operations and administration.
For each Portfolio, Initial Class ("Class I") shares were used for purposes of certain comparisons between the Portfolios and their Selected Peer Groups. Class I shares generally were selected so that a Portfolio's share class with the longest performance history was compared to the analogous class of shares for each fund in its Selected Peer Group. The mutual funds included in the Portfolios' Selected Peer Groups were selected based upon criteria designed to mirror the Portfolio share class being compared to the Selected Peer Group.
In arriving at its conclusions with respect to the Advisory Contracts, the Board was mindful of the "manager-of-managers" platform of the ING Funds that has been developed by the Adviser. The Board recognized that the Adviser is responsible for monitoring the investment program and performance of the Sub-Advisers under this manager-of-managers arrangement. The Board also considered the techniques and resources that the Adviser has developed to provide ongoing oversight of the nature and quality of the services the Sub-Advisers provide to the applicable Portfolios and the Sub-Advisers' compliance with applicable laws and regulations. The Board noted that to assist in the selection and monitoring of Sub-Advisers, the Adviser has developed an oversight process formulated by its Manager Research & Selection Group ("MRSG"), which analyzes both qualitative (such as in-person meetings and telephonic meetings with Sub-Advisers and research on Sub-Advisers) and quantitative information (such as performance data, portfolio data and attribution analysis) about the Sub-Advisers and the Portfolios that they manage. The Board recognized that the MRSG also typically provides in-person reports to the IRCs at their meetings prior to any Sub-Adviser presentations. In addition, the Board noted that the MRSG prepares periodic due diligence reports regarding the Sub-Advisers based on on-site visits and information and analysis which team members use to attempt to gain and maintain an in-depth understanding of a Sub-Adviser's investment process and to try to identify issues that may be relevant to the Sub-Adviser's services to a Portfolio and/or its performance. The Board also noted that the MRSG provides written reports on these due diligence analyses to the pertinent IRC. The Board noted the resources that the Adviser and Management has committed to its services as a manager-of-managers, including resources for reporting to the Board and the IRCs to assist them with their assessment of the investment performance of the Portfolios on an on-going basis throughout the year. This includes the appointment of a Chief Investment Risk Officer and his staff, who report directly to the Board and who have developed attribution analyses and other metrics used by the IRCs to analyze the key factors underlying investment performance for the funds in the ING Fund complex.
The Board also considered the techniques that the Adviser has developed to screen and perform due diligence on new Sub-Advisers if and when the Adviser recommends to the Board a new sub-adviser to manage a Portfolio in the ING Fund complex. The Board noted that, for new non-ING-affiliated Sub-Advisers, the MSRG is responsible for: identifying qualified candidates; analyzing their investment process, personnel and resources; conducting due diligence on the candidates; and selecting the firm to propose as a new Sub-Adviser, as well as preparing written materials and reports to the Committees and the Board as part of the process of approving any new Sub-Adviser for a Portfolio.
187
ADVISORY CONTRACT APPROVAL DISCUSSION (UNAUDITED) (CONTINUED)
The Board also considered that in the course of monitoring performance of Sub-Advisers, the MRSG has developed, based on guidance from the IRCs, a methodology for comparing performance of each Portfolio to a Selected Peer Group. The Board also recognized that the MRSG provides the IRCs with regular updates on the Portfolios and alerts the IRCs to potential issues as they arise. The Board noted that another service provided by the MSRG is the preparation of the Fund Dispersion Report. This report seeks to monitor any dispersion between Portfolios managed by non-ING-affiliated Sub-Advisers and their similarly managed retail counterparts and again assists the Board in carrying out its general oversight duties. The Board also noted that the Adviser regularly monitors performance, personnel, compliance and myriad other issues that may arise on a day-to-day basis with regards to the Sub-Advisers and noted that, if issues are identified either through formal or informal processes, they are brought before the IRCs and the Board for consideration and action and the Adviser consistently makes its resources available to the Board and the Committees to assist with addressing any issues that arise.
The Board noted that the Portfolios also benefit from the services of the Adviser's Investment Risk Management Department (the "IRMD"), under the leadership of the Chief Investment Risk Officer, the costs of which are shared by the Portfolios and the Adviser. The Board noted that the IRMD regularly presents written materials and reports to the IRCs that focus on the investment risks of the Portfolios. The Board also noted that the IRMD provides the IRCs with analyses that are developed to assist the IRCs in identifying trends in Portfolio performance and other areas over consecutive periods. The Board noted that the services provided by the IRMD are meant to provide an additional perspective for the benefit of the Committees, which may vary from the perspective of the MRSG.
The Board also noted the techniques used by the Adviser to monitor the performance of the Sub-Advisers and the proactive approach that the Adviser, working in cooperation with the IRCs, has taken to advocate or recommend, when it believed appropriate, changes designed to assist in improving the Portfolios' performance.
In considering the Portfolios' Advisory Contracts, the Board also considered the extent of benefits provided to the Portfolios' shareholders, beyond advisory services, from being part of the ING family of funds. This includes, in most cases, the right to exchange or transfer investments, without a sales charge, between the same class of shares of such funds or among ING Funds available on a product platform, and the wide range of ING Funds available for exchange or transfer. The Board also took into account the Adviser's ongoing efforts to reduce the expenses of the ING Funds through renegotiated arrangements with the ING Funds' service providers. In addition, the Board considered the efforts of the Adviser and the expenses that it incurred in recent years to help make the ING Fund complex more balanced and efficient by the launch of new investment products and the combinations of similar funds.
Further, the Board received periodic reports showing that the investment policies and restrictions for each Portfolio were consistently complied with and other periodic reports covering matters such as compliance by Adviser and Sub-Adviser personnel with codes of ethics. The Board considered reports from the Company's Chief Compliance Officer ("CCO") evaluating whether the regulatory compliance systems and procedures of the Adviser and each Sub-Adviser are reasonably designed to assure compliance with the federal securities laws, including those related to, among others, late trading and market timing, best execution, fair value pricing, proxy voting and trade allocation practices. The Board also took into account the CCO's annual and periodic reports and recommendations with respect to service provider compliance programs. In this regard, the Board also considered the policies and procedures developed by the CCO in consultation with the Board's Compliance Committee that guide the CCO's compliance oversight function.
The Board reviewed the level of staffing, quality and experience of each Portfolio's portfolio management team. The Board took into account the respective resources and reputations of the Adviser and Sub-Adviser, and evaluated the ability of the Adviser and the Sub-Adviser to attract and retain qualified investment advisory personnel. The Board also considered the adequacy of the resources committed to the Portfolios (and other relevant funds in the ING Fund complex) by the Adviser and Sub-Adviser, and whether those resources are commensurate with the needs of the Portfolios and are sufficient to sustain appropriate levels of performance and compliance needs. In this regard, the Board considered the financial stability of the Adviser and the Sub-Adviser.
Based on their deliberations and the materials presented to them, the Board concluded that the advisory and related services provided by the Adviser and each Sub-Adviser are appropriate in light of the
188
ADVISORY CONTRACT APPROVAL DISCUSSION (UNAUDITED) (CONTINUED)
Portfolios' operations, the competitive landscape of the investment company business, and investor needs, and that the nature and quality of the overall services provided by the Adviser and the Sub-Adviser were appropriate.
Portfolio Performance
In assessing advisory and sub-advisory relationships, the Board placed emphasis on the investment returns of each Portfolio. While the Board considered the performance reports and discussions with portfolio managers at Board and committee meetings during the year, particular attention in assessing performance was given to the FACT sheets furnished in connection with the renewal process. The FACT sheet prepared for each Portfolio included its investment performance compared to the Portfolio's Morningstar category median and/or Lipper category median, Selected Peer Group and primary benchmark. The FACT sheet performance data was as of June 30, 2011. In addition, the Board also considered at its November 17, 2011 meeting certain additional data regarding performance and Portfolio asset levels as of October 31, 2011. The Board's findings specific to each Portfolio's performance are discussed under "Portfolio-by-Portfolio Analysis" below.
Economies of Scale
When evaluating the reasonableness of advisory fee rates, the Board also considered whether economies of scale likely will be realized by the Adviser and Sub-Adviser as a Portfolio grows larger and the extent to which any such economies are reflected in contractual fee rates. In this regard, the Board noted any breakpoints in advisory fee schedules that will result in a lower advisory fee rate when a Portfolio achieves sufficient asset levels to receive a breakpoint discount. In the case of sub-advisory fees, the Board considered that breakpoints would inure to the benefit of the Adviser, except to the extent that there are corresponding advisory fee breakpoints or waivers. The Board also considered that some of the Portfolios that do not have advisory fee breakpoints do have fee waiver or expense reimbursement arrangements. In this connection, the Board considered the extent to which economies of scale could be realized through such fee waivers, expense reimbursements or other expense reductions. In evaluating fee breakpoint arrangements and economies of scale, the Independent Directors also considered prior periodic management reports, industry information on this topic and the Portfolios' investment performance.
Information Regarding Services to Other Clients
The Board requested and considered information regarding the nature of services and fee rates offered by the Adviser and each Sub-Adviser to other clients, including other registered investment companies and relevant institutional accounts. When fee rates offered to other clients differed materially from those charged to a Portfolio, the Board considered any underlying rationale provided by the Adviser or a Sub-Adviser for these differences. For non-ING-affiliated Sub-Advisers, the Board did not view this information as being a key factor in its deliberations because of the arm's-length nature of negotiations between the Adviser and non-ING-affiliated Sub-Advisers with respect to sub-advisory fee rates. The Board also noted that the fee rates charged to the Portfolios and other institutional clients of the Adviser or a Sub-Adviser (including other investment companies) may differ materially due to, among other reasons: differences in services; different regulatory requirements associated with registered investment companies, such as the Portfolios, as compared to non-registered investment company clients; market differences in fee rates that existed when a Portfolio first was organized; differences in the original sponsors of Portfolios that now are managed by the Adviser; investment capacity constraints that existed when certain contracts were first agreed upon or that might exist at present; and different pricing structures that are necessary to be competitive in different marketing channels.
Fee Rates and Profitability
The Board reviewed and considered each contractual investment advisory fee rate, combined with the administrative fee rate, payable by each Portfolio to the Adviser. The Board also considered the contractual sub-advisory fee rate payable by the Adviser to each Sub-Adviser for sub-advisory services for each Portfolio, including the portion of the contractual advisory fees that are paid to each Sub-Adviser, as compared to the portion retained by the Adviser. In addition, the Board considered fee waivers and expense limitations applicable to the fees payable by the Portfolios.
The Board considered: (1) the fee structure of each Portfolio as it relates to the services provided under the contracts; and (2) the potential fall-out benefits to the Adviser and the Sub-Adviser and their respective affiliates from their association with the Portfolios. For each Portfolio, the Board separately determined that the fees payable to the Adviser and the fees payable to the Sub-Adviser are reasonable for the services that each performs, which were considered in
189
ADVISORY CONTRACT APPROVAL DISCUSSION (UNAUDITED) (CONTINUED)
light of the nature and quality of the services that each has performed and is expected to perform.
For each Portfolio, the Board considered information on revenues, costs and profits realized by the Adviser and each ING-affiliated Sub-Adviser, which was prepared by Management in accordance with the allocation methodology (including related assumptions) specified in the 15(c) Methodology Guide. In analyzing the profitability of the Adviser in connection with its services to a Portfolio, the Board took into account the sub-advisory fee rate payable by the Adviser to each Sub-Adviser. In addition, the Board considered information that it requested and was provided by Management with respect to the profitability of service providers affiliated with the Adviser. The Board did not request profitability data from the Sub-Advisers that were not affiliated with the Adviser because the Board did not view this data as imperative to its deliberations, given the arm's-length nature of the relationship between the Adviser and these non-ING-affiliated Sub-Advisers with respect to the negotiation of sub-advisory fee rates. In this regard, the Board also noted that the Adviser (and not a Portfolio) pays the sub-advisory fees earned by a non-ING-affiliated Sub-Adviser. In addition, the Board noted that many of the Portfolios' Sub-Advisers traditionally have not accounted for their profits on an account-by-account basis.
Although the 15(c) Methodology Guide establishes certain standards for profit calculation, the Board recognized that profitability analysis on a client-by-client basis is not an exact science and there is no uniform methodology within the asset management industry for determining profitability for this purpose. In this context, the Board realized that Management's calculations regarding its costs incurred in establishing the infrastructure necessary for the Portfolios' operations may not be fully reflected in the expenses allocated to each Portfolio in determining profitability, and that the information presented may not portray all of the costs borne by the Adviser and Management or capture their entrepreneurial risk associated with offering and managing a mutual fund complex in the current regulatory and market environment. In addition, the Board recognized that the use of different methodologies for purposes of calculating profit data can give rise to dramatically different profit and loss results.
In making its determinations, the Board based its conclusions as to the reasonableness of the advisory and sub-advisory fees of the Adviser and ING-affiliated Sub-Adviser primarily on the factors described for each Portfolio below. At the request of the Board, the Adviser has from time to time agreed to implement remedial actions regarding certain Portfolios. These remedial actions have included, among others: reductions in fee rates; changes in Sub-Advisers or portfolio managers; and strategy modifications.
Portfolio-by-Portfolio Analysis
The following paragraphs outline certain of the specific factors that the Board considered, and the conclusions reached, at its November 17, 2011 meeting in relation to renewing each Portfolio's current Advisory and Sub-Advisory Contracts. These specific factors are in addition to those considerations discussed above. In each case, the Portfolio's performance was compared to its Morningstar category median and average, as well as its primary benchmark, a broad-based securities market index that appears in the Portfolio's prospectus. With respect to Morningstar quintile rankings, the first quintile represents the highest (best) performance and the fifth quintile represents the lowest performance. Each Portfolio's management fee rate and expense ratio were compared to the fees and expense ratios of the funds in its Selected Peer Group.
ING American Century Small-Mid Cap Value Portfolio
In considering whether to approve the renewal of the Advisory and Sub-Advisory Contracts for ING American Century Small-Mid Cap Value Portfolio, the Board considered that, based on performance data for the periods ended June 30, 2011: (1) the Portfolio outperformed its Morningstar category median for all periods presented, with the exceptions of the year-to-date and one-year periods, during which it underperformed; (2) the Portfolio underperformed its primary benchmark for the most recent calendar quarter, year-to-date, and one-year periods, but outperformed for the three-year and five-year periods; and (3) the Portfolio is ranked in the first (highest) quintile of its Morningstar category for the three-year and five-year periods, the second quintile for the most recent calendar quarter, the fourth quintile for the year-to-date period, and the fifth (lowest) quintile for the one-year period.
In considering the fees payable under the Advisory and Sub-Advisory Contracts for the Portfolio, the Board took into account the factors described above and also considered: (1) the fairness of the compensation under an Advisory Contract with a level fee rate that does not include breakpoints; and (2) the pricing structure (including the expense ratio to be borne by shareholders) of the Portfolio, as compared
190
ADVISORY CONTRACT APPROVAL DISCUSSION (UNAUDITED) (CONTINUED)
to its Selected Peer Group, including that: (a) the management fee for the Portfolio is above the median and the average management fees of the funds in its Selected Peer Group; and (b) the expense ratio for the Portfolio is above the median and the average expense ratios of the funds in its Selected Peer Group.
In analyzing this fee data, the Board took into account: (1) Management's representations with respect to the competitiveness of the Portfolio's expense ratio; (2) that an advisory fee waiver that was put into place at the request of the Board lowers the Portfolio's effective management fee rate; and (3) the Adviser had waived a portion of its advisory fee to meet an expense limitation agreement with respect to the Portfolio.
After its deliberation, the Board reached the following conclusions: (1) the Portfolio's management fee rate is reasonable in the context of all factors considered by the Board; (2) the Portfolio's expense ratio is reasonable in the context of all factors considered by the Board; (3) the Portfolio's performance is reasonable in the context of all factors considered by the Board; and (4) the sub-advisory fee rate payable by the Adviser to the Sub-Adviser is reasonable in the context of all factors considered by the Board. Based on these conclusions and other factors, the Board voted to renew the Advisory and Sub-Advisory Contracts for the Portfolio for the year ending November 30, 2012. During this renewal process, different Board members may have given different weight to different individual factors and related conclusions.
ING Baron Small Cap Growth Portfolio
In considering whether to approve the renewal of the Advisory and Sub-Advisory Contracts for ING Baron Small Cap Growth Portfolio, the Board considered that, based on performance data for the periods ended June 30, 2011: (1) the Portfolio outperformed its Morningstar category median for all periods presented, with the exception of the five-year period, during which it underperformed; (2) the Portfolio outperformed its primary benchmark for all periods presented, with the exception of the one-year and five-year periods, during which it underperformed; and (3) the Portfolio is ranked in the first (highest) quintile of its Morningstar category for the year-to-date and three-year periods, the second quintile for the most recent calendar quarter, the third quintile for the one-year period, and the fourth quintile for the five-year period.
In considering the fees payable under the Advisory and Sub-Advisory Contracts for the Portfolio, the Board took into account the factors described above and also considered: (1) the fairness of the compensation under an Advisory Contract with a breakpoint fee schedule where the asset level necessary to achieve a breakpoint discount had not been reach by the Portfolio; and (2) the pricing structure (including the expense ratio to be borne by shareholders) of the Portfolio, as compared to its Selected Peer Group, including that: (a) the management fee for the Portfolio is above the median and the average management fees of the funds in its Selected Peer Group; and (b) the expense ratio for the Portfolio is above the median and the average expense ratios of the funds in its Selected Peer Group.
In analyzing this fee data, the Board took into account Management's representations with respect to the competitiveness of the Portfolio's expense ratio.
After its deliberation, the Board reached the following conclusions: (1) the Portfolio's management fee rate is reasonable in the context of all factors considered by the Board; (2) the Portfolio's expense ratio is reasonable in the context of all factors considered by the Board; (3) the Portfolio's performance is reasonable in the context of all factors considered by the Board; and (4) the sub-advisory fee rate payable by the Adviser to the Sub-Adviser is reasonable in the context of all factors considered by the Board. Based on these conclusions and other factors, the Board voted to renew the Advisory and Sub-Advisory Contracts for the Portfolio for the year ending November 30, 2012. During this renewal process, different Board members may have given different weight to different individual factors and related conclusions.
ING Columbia Small Cap Value II Portfolio
In considering whether to approve the renewal of the Advisory and Sub-Advisory Contracts for ING Columbia Small Cap Value II Portfolio (formerly, ING Columbia Small Cap Value Portfolio), the Board considered that, based on performance data for the periods ended June 30, 2011: (1) the Portfolio outperformed its Morningstar category median for all periods presented, with the exception of the three-year period, during which it underperformed; (2) the Portfolio outperformed its primary benchmark for all periods presented, with the exception of the three-year period, during which it underperformed; and (3) the Portfolio is ranked in the first (highest) quintile of its Morningstar category for the year-to-date and one-year periods, the second quintile for the five-year period, the third quintile for the most recent calendar quarter, and the fourth quintile for the three-year period.
191
ADVISORY CONTRACT APPROVAL DISCUSSION (UNAUDITED) (CONTINUED)
In considering the fees payable under the Advisory and Sub-Advisory Contracts for the Portfolio, the Board took into account the factors described above and also considered: (1) the fairness of the compensation under an Advisory Contract with a level fee rate that does not include breakpoints; and (2) the pricing structure (including the expense ratio to be borne by shareholders) of the Portfolio, as compared to its Selected Peer Group, including that: (a) the management fee (inclusive of a 0.10% administration fee) for the Portfolio is above the median and the average management fees of the funds in its Selected Peer Group; and (b) the expense ratio for the Portfolio is below the median and the average expense ratios of the funds in its Selected Peer Group.
After its deliberation, the Board reached the following conclusions: (1) the Portfolio's management fee rate is reasonable in the context of all factors considered by the Board; (2) the Portfolio's expense ratio is reasonable in the context of all factors considered by the Board; (3) the Portfolio's performance is reasonable in the context of all factors considered by the Board; and (4) the sub-advisory fee rate payable by the Adviser to the Sub-Adviser is reasonable in the context of all factors considered by the Board. Based on these conclusions and other factors, the Board voted to renew the Advisory and Sub-Advisory Contracts for the Portfolio for the year ending November 30, 2012. During this renewal process, different Board members may have given different weight to different individual factors and related conclusions.
ING Davis New York Venture Portfolio
In considering whether to approve the renewal of the Advisory and Sub-Advisory Contracts for ING Davis New York Venture Portfolio, the Board considered that, based on performance data for the periods ended June 30, 2011: (1) the Portfolio underperformed its Morningstar category median for all periods presented; (2) the Portfolio underperformed its primary benchmark for all periods presented; and (3) the Portfolio is ranked in the fourth quintile of its Morningstar category for the three-year and five-year periods, and the fifth (lowest) quintile for the most recent calendar quarter, year-to-date, and one-year periods.
In analyzing this performance data, the Board took into account: (1) Management's analysis of the negative effect that sector allocation had on the Portfolio's performance; (2) that Management would continue to monitor, and the Board or its IRC would periodically review, the Portfolio's performance; and (3) that, at the request of the board, expense limits for certain classes of the Portfolio would be lowered as a condition of the renewal of the contracts.
In considering the fees payable under the Advisory and Sub-Advisory Contracts for the Portfolio, the Board took into account the factors described above and also considered: (1) the fairness of the compensation under an Advisory Contract with a level fee rate that does not include breakpoints; and (2) the pricing structure (including the expense ratio to be borne by shareholders) of the Portfolio, as compared to its Selected Peer Group, including that: (a) the management fee for the Portfolio is above the median and the average management fees of the funds in its Selected Peer Group; and (b) the expense ratio for the Portfolio is above the median and the average expense ratios of the funds in its Selected Peer Group.
In analyzing this fee data, the Board took into account: (1) Management's representations regarding advisory fee waivers that had been put into place, which lower the effective management fee rate payable by the Portfolio; and (2) Management's representations regarding the competitiveness of the Portfolio's expense ratio.
After its deliberation, the Board reached the following conclusions: (1) the Portfolio's management fee rate is reasonable in the context of all factors considered by the Board; (2) the Portfolio's expense ratio is reasonable in the context of all factors considered by the Board; (3) that Management would continue to monitor, and the Board or its IRC would periodically review, the Portfolio's performance; and (4) the sub-advisory fee rate payable by the Adviser to the Sub-Adviser is reasonable in the context of all factors considered by the Board. Based on these conclusions and other factors, the Board voted to renew the Advisory and Sub-Advisory Contracts for the Portfolio for the year ending November 30, 2012. During this renewal process, different Board members may have given different weight to different individual factors and related conclusions.
ING Global Bond Portfolio
In considering whether to approve the renewal of the Advisory and Sub-Advisory Contracts for ING Global Bond Portfolio (formerly, ING Oppenheimer Global Strategic Income Portfolio), the Board considered that, based on performance data for the periods ended June 30, 2011: (1) the Portfolio outperformed its Morningstar category median for all periods presented, with the exception of the most recent calendar quarter, during which it underperformed;
192
ADVISORY CONTRACT APPROVAL DISCUSSION (UNAUDITED) (CONTINUED)
(2) the Portfolio outperformed its primary benchmark for all periods presented, with the exception of the most recent calendar quarter, during which it underperformed; and (3) the Portfolio is ranked in the second quintile of its Morningstar category for the one-year, three-year, and five-year periods, and the third quintile for the most recent calendar quarter and year-to-date periods.
In considering the fees payable under the Advisory and Sub-Advisory Contracts for the Portfolio, the Board took into account the factors described above and also considered: (1) the fairness of the compensation under an Advisory Contract with a breakpoint fee schedule where the asset level necessary to achieve a breakpoint discount had not been reached by the Portfolio; and (2) the pricing structure (including the expense ratio to be borne by shareholders) of the Portfolio, as compared to its Selected Peer Group, including that: (a) the management fee (inclusive of a 0.10% administration fee) for the Portfolio is below the median and the average management fees of the funds in its Selected Peer Group; and (b) the expense ratio for the Portfolio is below the median and the average expense ratios of the funds in its Selected Peer Group.
After its deliberation, the Board reached the following conclusions: (1) the Portfolio's management fee rate is reasonable in the context of all factors considered by the Board; (2) the Portfolio's expense ratio is reasonable in the context of all factors considered by the Board; (3) the Portfolio's performance is reasonable in the context of all factors considered by the Board; and (4) the sub-advisory fee rate payable by the Adviser to the Sub-Adviser is reasonable in the context of all factors considered by the Board. Based on these conclusions and other factors, the Board voted to renew the Advisory and Sub-Advisory Contracts for the Portfolio for the year ending November 30, 2012. During this renewal process, different Board members may have given different weight to different individual factors and related conclusions.
ING Invesco Van Kampen Comstock Portfolio
In considering whether to approve the renewal of the Advisory and Sub-Advisory Contracts for ING Invesco Van Kampen Comstock Portfolio, the Board considered that, based on performance data for the periods ended June 30, 2011: (1) the Portfolio outperformed its Morningstar category median for all periods presented; (2) the Portfolio outperformed its primary benchmark for all periods presented, with the exception of the year-to-date period, during which underperformed; and (3) the Portfolio is ranked in the first (highest) quintile of its Morningstar category for the three-year period, the second quintile for the one-year period, and the third quintile for the most recent calendar quarter, year-to-date, and five-year periods.
In considering the fees payable under the Advisory and Sub-Advisory Contracts for the Portfolio, the Board took into account the factors described above and also considered: (1) the fairness of the compensation under an Advisory Contract with a level fee rate that does not include breakpoints; and (2) the pricing structure (including the expense ratio to be borne by shareholders) of the Portfolio, as compared to its Selected Peer Group, including that: (a) the management fee for the Portfolio is below the median and the average management fees of the funds in its Selected Peer Group; and (b) the expense ratio for the Portfolio is above the median and the average expense ratios of the funds in its Selected Peer Group.
In analyzing this fee data, the Board took into account Management's representations with respect to the competitiveness of the Portfolio's expense ratio.
After its deliberation, the Board reached the following conclusions: (1) the Portfolio's management fee rate is reasonable in the context of all factors considered by the Board; (2) the Portfolio's expense ratio is reasonable in the context of all factors considered by the Board; (3) the Portfolio's performance is reasonable in the context of all factors considered by the Board; and (4) the sub-advisory fee rate payable by the Adviser to the Sub-Adviser is reasonable in the context of all factors considered by the Board. Based on these conclusions and other factors, the Board voted to renew the Advisory and Sub-Advisory Contracts for the Portfolio for the year ending November 30, 2012. During this renewal process, different Board members may have given different weight to different individual factors and related conclusions.
ING Invesco Van Kampen Equity and Income Portfolio
In considering whether to approve the renewal of the Advisory and Sub-Advisory Contracts for ING Invesco Van Kampen Equity and Income Portfolio, the Board considered that, based on performance data for the periods ended June 30, 2011: (1) the Portfolio outperformed its Morningstar category median for all periods presented, with the exception of the most recent calendar quarter and year-to-date periods, during which it underperformed; (2) the Portfolio outperformed its primary benchmark for all periods presented, with the exception of the year-to-date and
193
ADVISORY CONTRACT APPROVAL DISCUSSION (UNAUDITED) (CONTINUED)
one-year periods, during which it underperformed; and (3) the Portfolio is ranked in the first (highest) quintile of its Morningstar category for the three-year period, the second quintile for the one-year and five-year periods, the third quintile for the year-to-date period, and the fifth (lowest) quintile for the most recent calendar quarter.
In considering the fees payable under the Advisory and Sub-Advisory Contracts for the Portfolio, the Board took into account the factors described above and also considered: (1) the fairness of the compensation under an Advisory Contract with a level fee rate that does not include breakpoints; and (2) the pricing structure (including the expense ratio to be borne by shareholders) of the Portfolio, as compared to its Selected Peer Group, including that: (a) the management fee (inclusive of a 0.10% administration fee) for the Portfolio is below the median and the average management fees of the funds in its Selected Peer Group; and (b) the expense ratio for the Portfolio is below the median and the average expense ratios of the funds in its Selected Peer Group.
After its deliberation, the Board reached the following conclusions: (1) the Portfolio's management fee rate is reasonable in the context of all factors considered by the Board; (2) the Portfolio's expense ratio is reasonable in the context of all factors considered by the Board; (3) the Portfolio's performance is reasonable in the context of all factors considered by the Board; and (4) the sub-advisory fee rate payable by the Adviser to the Sub-Adviser is reasonable in the context of all factors considered by the Board. Based on these conclusions and other factors, the Board voted to renew the Advisory and Sub-Advisory Contracts for the Portfolio for the year ending November 30, 2012. During this renewal process, different Board members may have given different weight to different individual factors and related conclusions.
ING JPMorgan Mid Cap Value Portfolio
In considering whether to approve the renewal of the Advisory and Sub-Advisory Contracts for ING JPMorgan Mid Cap Value Portfolio, the Board considered that, based on performance data for the periods ended June 30, 2011: (1) the Portfolio outperformed its Morningstar category median for all periods presented, with the exception of the one-year period, during which it underperformed; (2) the Portfolio outperformed its primary benchmark for all periods presented, with the exception of the one-year period, during which it underperformed; and (3) the Portfolio is ranked in the first (highest) quintile of its Morningstar category for the most recent calendar quarter, the second quintile for the year-to-date, three-year, and five-year periods, and the fourth quintile for the one-year period.
In considering the fees payable under the Advisory and Sub-Advisory Contracts for the Portfolio, the Board took into account the factors described above and also considered: (1) the fairness of the compensation under an Advisory Contract with a level fee rate that does not include breakpoints; and (2) the pricing structure (including the expense ratio to be borne by shareholders) of the Portfolio, as compared to its Selected Peer Group, including that: (a) the management fee for the Portfolio is equal to the median and the average management fees of the funds in its Selected Peer Group; and (b) the expense ratio for the Portfolio is above the median and the average expense ratios of the funds in its Selected Peer Group.
In analyzing this fee data, the Board took into account Management's representations with respect to the competitiveness of the Portfolio's expense ratio.
After its deliberation, the Board reached the following conclusions: (1) the Portfolio's management fee rate is reasonable in the context of all factors considered by the Board; (2) the Portfolio's expense ratio is reasonable in the context of all factors considered by the Board; (3) the Portfolio's performance is reasonable in the context of all factors considered by the Board; and (4) the sub-advisory fee rate payable by the Adviser to the Sub-Adviser is reasonable in the context of all factors considered by the Board. Based on these conclusions and other factors, the Board voted to renew the Advisory and Sub-Advisory Contracts for the Portfolio for the year ending November 30, 2012. During this renewal process, different Board members may have given different weight to different individual factors and related conclusions.
ING Oppenheimer Global Portfolio
In considering whether to approve the renewal of the Advisory and Sub-Advisory Contracts for ING Oppenheimer Global Portfolio, the Board considered that, based on performance data for the periods ended June 30, 2011: (1) the Portfolio outperformed its Morningstar category median for all periods presented; (2) the Portfolio outperformed its primary benchmark for all periods presented; and (3) the Portfolio is ranked in the first (highest) quintile of its Morningstar category for the year-to-date, one-year, and three-year periods, and the second quintile for the most recent calendar quarter and five-year periods.
194
ADVISORY CONTRACT APPROVAL DISCUSSION (UNAUDITED) (CONTINUED)
In considering the fees payable under the Advisory and Sub-Advisory Contracts for the Portfolio, the Board took into account the factors described above and also considered: (1) the fairness of the compensation under an Advisory Contract with a breakpoint fee schedule where the asset level necessary to achieve a breakpoint discount has not been reached by the Portfolio; and (2) the pricing structure (including the expense ratio to be borne by shareholders) of the Portfolio, as compared to its Selected Peer Group, including that: (a) the management fee for the Portfolio is below the median and the average management fees of the funds in its Selected Peer Group; and (b) the expense ratio for the Portfolio is below the median and the average expense ratios of the funds in its Selected Peer Group.
After its deliberation, the Board reached the following conclusions: (1) the Portfolio's management fee rate is reasonable in the context of all factors considered by the Board; (2) the Portfolio's expense ratio is reasonable in the context of all factors considered by the Board; (3) the Portfolio's performance is reasonable in the context of all factors considered by the Board; and (4) the sub-advisory fee rate payable by the Adviser to the Sub-Adviser is reasonable in the context of all factors considered by the Board. Based on these conclusions and other factors, the Board voted to renew the Advisory and Sub-Advisory Contracts for the Portfolio for the year ending November 30, 2012. During this renewal process, different Board members may have given different weight to different individual factors and related conclusions.
ING PIMCO Total Return Portfolio
In considering whether to approve the renewal of the Advisory and Sub-Advisory Contracts for ING PIMCO Total Return Portfolio, the Board considered that, based on performance data for the periods ended June 30, 2011: (1) the Portfolio outperformed its Morningstar category median for all periods presented, with the exception of the year-to-date period, during which it underperformed; (2) the Portfolio outperformed its primary benchmark for all periods presented, with the exception of the most recent calendar quarter, during which it underperformed; and (3) the Portfolio is ranked in the first (highest) quintile of its Morningstar category for the five-year period, the second quintile for the three-year period, and the third quintile for the most recent calendar quarter, year-to-date, and one-year periods.
In considering the fees payable under the Advisory and Sub-Advisory Contracts for the Portfolio, the Board took into account the factors described above and also considered: (1) the fairness of the compensation under an Advisory Contract with a level fee rate that does not include breakpoints; and (2) the pricing structure (including the expense ratio to be borne by shareholders) of the Portfolio, as compared to its Selected Peer Group, including that: (a) the management fee for the Portfolio is above the median and the average management fees of the funds in its Selected Peer Group; and (b) the expense ratio for the Portfolio is above the median and the average expense ratios of the funds in its Selected Peer Group.
In analyzing this fee data, the Board took into account Management's representations with respect to the competitiveness of the Portfolio's expense ratio.
After its deliberation, the Board reached the following conclusions: (1) the Portfolio's management fee rate is reasonable in the context of all factors considered by the Board; (2) the Portfolio's expense ratio is reasonable in the context of all factors considered by the Board; (3) the Portfolio's performance is reasonable in the context of all factors considered by the Board; and (4) the sub-advisory fee rate payable by the Adviser to the Sub-Adviser is reasonable in the context of all factors considered by the Board. Based on these conclusions and other factors, the Board voted to renew the Advisory and Sub-Advisory Contracts for the Portfolio for the year ending November 30, 2012. During this renewal process, different Board members may have given different weight to different individual factors and related conclusions.
ING Pioneer High Yield Portfolio
In considering whether to approve the renewal of the Advisory and Sub-Advisory Contracts for ING Pioneer High Yield Portfolio, the Board considered that, based on performance data for the periods ended June 30, 2011: (1) the Portfolio outperformed its Morningstar category median for all periods presented, with the exception of the most recent calendar quarter, during which it underperformed; (2) the Portfolio outperformed its primary benchmark for all periods presented, with the exception of the most recent calendar quarter, during which it underperformed; and (3) the Portfolio is ranked in the first (highest) quintile of its Morningstar category for the year-to-date, one-year, three-year, and five-year periods, and the fifth (lowest) quintile for the most recent calendar quarter.
195
ADVISORY CONTRACT APPROVAL DISCUSSION (UNAUDITED) (CONTINUED)
In considering the fees payable under the Advisory and Sub-Advisory Contracts for the Portfolio, the Board took into account the factors described above and also considered: (1) the fairness of the compensation under an Advisory Contract with a breakpoint fee schedule where the asset level necessary to achieve a breakpoint discount had not been reached by the Portfolio; and (2) the pricing structure (including the expense ratio to be borne by shareholders) of the Portfolio, as compared to its Selected Peer Group, including that: (a) the management fee (inclusive of a 0.10% administration fee) for the Portfolio is above the median and the average management fees of the funds in its Selected Peer Group; and (b) the expense ratio for the Portfolio is below the median and the average expense ratios of the funds in its Selected Peer Group.
After its deliberation, the Board reached the following conclusions: (1) the Portfolio's management fee rate is reasonable in the context of all factors considered by the Board; (2) the Portfolio's expense ratio is reasonable in the context of all factors considered by the Board; (3) the Portfolio's performance is reasonable in the context of all factors considered by the Board; and (4) the sub-advisory fee rate payable by the Adviser to the Sub-Adviser is reasonable in the context of all factors considered by the Board. Based on these conclusions and other factors, the Board voted to renew the Advisory and Sub-Advisory Contracts for the Portfolio for the year ending November 30, 2012. During this renewal process, different Board members may have given different weight to different individual factors and related conclusions.
ING T. Rowe Price Diversified Mid Cap Growth Portfolio
In considering whether to approve the renewal of the Advisory and Sub-Advisory Contracts for ING T. Rowe Price Diversified Mid Cap Growth Portfolio, the Board considered that, based on performance data for the periods ended June 30, 2011: (1) the Portfolio outperformed its Morningstar category median for all periods presented; (2) the Portfolio outperformed its primary benchmark for all periods presented, with the exception of the three-year period, during which it underperformed; and (3) the Portfolio is ranked in the second quintile of its Morningstar category for the one-year, three-year, and five-year periods, and the third quintile for the most recent calendar quarter and year-to-date periods.
In considering the fees payable under the Advisory and Sub-Advisory Contracts for the Portfolio, the Board took into account the factors described above and also considered: (1) the fairness of the compensation under an Advisory Contract with a level fee rate that does not include breakpoints; and (2) the pricing structure (including the expense ratio to be borne by shareholders) of the Portfolio, as compared to its Selected Peer Group, including that: (a) the management fee for the Portfolio is below the median and the average management fees of the funds in its Selected Peer Group; and (b) the expense ratio for the Portfolio is below the median and the average expense ratios of the funds in its Selected Peer Group.
After its deliberation, the Board reached the following conclusions: (1) the Portfolio's management fee rate is reasonable in the context of all factors considered by the Board; (2) the Portfolio's expense ratio is reasonable in the context of all factors considered by the Board; (3) the Portfolio's performance is reasonable in the context of all factors considered by the Board; and (4) the sub-advisory fee rate payable by the Adviser to the Sub-Adviser is reasonable in the context of all factors considered by the Board. Based on these conclusions and other factors, the Board voted to renew the Advisory and Sub-Advisory Contracts for the Portfolio for the year ending November 30, 2012. During this renewal process, different Board members may have given different weight to different individual factors and related conclusions.
ING T. Rowe Price Growth Equity Portfolio
In considering whether to approve the renewal of the Advisory and Sub-Advisory Contracts for ING T. Rowe Price Growth Equity Portfolio, the Board considered that, based on performance data for the periods ended June 30, 2011: (1) the Portfolio outperformed its Morningstar category median for all periods presented, with the exception of the most recent calendar quarter and year-to-date periods, during which it underperformed; (2) the Portfolio outperformed its primary benchmark for all periods presented, with the exception of the most recent calendar quarter and year-to-date periods, during which it underperformed; and (3) the Portfolio is ranked in the first (highest) quintile of its Morningstar category for the ten-year period, the second quintile for the three-year and five-year periods, and the third quintile for the most recent quarter, year-to-date, and one-year periods.
196
ADVISORY CONTRACT APPROVAL DISCUSSION (UNAUDITED) (CONTINUED)
In considering the fees payable under the Advisory and Sub-Advisory Contracts for the Portfolio, the Board took into account the factors described above and also considered: (1) the fairness of the compensation under an Advisory Contract with a level fee rate that does not include breakpoints; and (2) the pricing structure (including the expense ratio to be borne by shareholders) of the Portfolio, as compared to its Selected Peer Group, including that: (a) the management fee for the Portfolio is below the median and the average management fees of the funds in its Selected Peer Group; and (b) the expense ratio for the Portfolio is below the median and the average expense ratios of the funds in its Selected Peer Group.
After its deliberation, the Board reached the following conclusions: (1) the Portfolio's management fee rate is reasonable in the context of all factors considered by the Board; (2) the Portfolio's expense ratio is reasonable in the context of all factors considered by the Board; (3) the Portfolio's performance is reasonable in the context of all factors considered by the Board; and (4) the sub-advisory fee rate payable by the Adviser to the Sub-Adviser is reasonable in the context of all factors considered by the Board. Based on these conclusions and other factors, the Board voted to renew the Advisory and Sub-Advisory Contracts for the Portfolio for the year ending November 30, 2012. During this renewal process, different Board members may have given different weight to different individual factors and related conclusions.
ING Templeton Foreign Equity Portfolio
In considering whether to approve the renewal of the Advisory and Sub-Advisory Contracts for ING Templeton Foreign Equity Portfolio, the Board considered that, based on performance data for the periods ended June 30, 2011: (1) the Portfolio outperformed its Morningstar category median for all periods presented, with the exceptions of the most recent calendar quarter and one-year periods, during which it underperformed; (2) the Portfolio outperformed its primary benchmark for all periods presented; and (3) the Portfolio is ranked in the first (highest) quintile of its Morningstar category for the three-year and five-year periods, the third quintile for the year-to-date and one-year periods, and the fourth quintile for the most recent calendar quarter.
In considering the fees payable under the Advisory and Sub-Advisory Contracts for the Portfolio, the Board took into account the factors described above and also considered: (1) the economies of scale benefits to the Portfolio and its shareholders from breakpoint discounts applicable to the Portfolio's advisory fee rate, which result in lower fees at higher asset levels; and (2) the pricing structure (including the expense ratio to be borne by shareholders) of the Portfolio, as compared to its Selected Peer Group, including that: (a) the management fee (inclusive of a 0.10% administration fee) for the Portfolio is equal to the median and above the average management fees of the funds in its Selected Peer Group; and (b) the expense ratio for the Portfolio is below the median and the average expense ratios of the funds in its Selected Peer Group.
After its deliberation, the Board reached the following conclusions: (1) the Portfolio's management fee rate is reasonable in the context of all factors considered by the Board; (2) the Portfolio's expense ratio is reasonable in the context of all factors considered by the Board; (3) the Portfolio's performance is reasonable in the context of all factors considered by the Board; and (4) the sub-advisory fee rate payable by the Adviser to the Sub-Adviser is reasonable in the context of all factors considered by the Board. Based on these conclusions and other factors, the Board voted to renew the Advisory and Sub-Advisory Contracts for the Portfolio for the year ending November 30, 2012. During this renewal process, different Board members may have given different weight to different individual factors and related conclusions.
ING Thornburg Value Portfolio
In considering whether to approve the renewal of the Advisory and Sub-Advisory Contracts for ING Thornburg Value Portfolio, the Board considered that, based on performance data for the periods ended June 30, 2011: (1) the Portfolio outperformed its Morningstar category median for the year-to-date, three-year, and five-year periods, but underperformed most recent calendar quarter, one-year, and ten-year periods; (2) the Portfolio underperformed its primary benchmark for all periods presented, with the exception of the three-year and five-year periods, during which it outperformed; and (3) the Portfolio is ranked in the first (highest) quintile of its Morningstar category for the three-year and five-year periods, the third quintile for the year-to-date period, the fourth quintile for the one-year period, and the fifth (lowest) quintile for the most recent calendar quarter and ten-year periods.
In analyzing this performance data, the Board took into account: (1) Management's analysis regarding the effect that stock selection and the Sub-Adviser's high-conviction strategy had on the Portfolio's performance
197
ADVISORY CONTRACT APPROVAL DISCUSSION (UNAUDITED) (CONTINUED)
during certain periods; (2) Management's representations that it was analyzing the portfolio management team for the Portfolio since a change in its portfolio managers and intended to make recommendations to the Board once Management completes its analysis; and (3) Management's discussion of favorable performance during certain periods.
In considering the fees payable under the Advisory and Sub-Advisory Contracts for the Portfolio, the Board took into account the factors described above and also considered: (1) the fairness of the compensation under an Advisory Contract with a level fee rate that does not include breakpoints; and (2) the pricing structure (including the expense ratio to be borne by shareholders) of the Portfolio, as compared to its Selected Peer Group, including that: (a) the management fee for the Portfolio is below the median and the average management fees of the funds in its Selected Peer Group; and (b) the expense ratio for the Portfolio is above the median and equal to the average expense ratios of the funds in its Selected Peer Group.
After its deliberation, the Board reached the following conclusions: (1) the Portfolio's management fee rate is reasonable in the context of all factors considered by the Board; (2) the Portfolio's expense ratio is reasonable in the context of all factors considered by the Board; (3) the Portfolio's performance is reasonable in the context of all factors considered by the Board; and (4) the sub-advisory fee rate payable by the Adviser to the Sub-Adviser is reasonable in the context of all factors considered by the Board. Based on these conclusions and other factors, the Board voted to renew the Advisory and Sub-Advisory Contracts for the Portfolio for the year ending November 30, 2012. During this renewal process, different Board members may have given different weight to different individual factors and related conclusions.
ING UBS U.S. Large Cap Equity Portfolio
In considering whether to approve the renewal of the Advisory and Sub-Advisory Contracts for ING UBS U.S. Large Cap Equity Portfolio, the Board considered that, based on performance data for the periods ended June 30, 2011: (1) the Portfolio underperformed its Morningstar category median for all periods presented, with the exception of the most recent calendar quarter, during which it outperformed; (2) the Portfolio underperformed its primary benchmark for all periods presented, with the exception of the most recent calendar quarter, during which it outperformed; and (3) the Portfolio is ranked in the first (highest) quintile of its Morningstar category for the most recent calendar quarter, the third quintile for the one-year and three-year periods, and the fourth quintile for the year-to-date, five-year, and ten-year periods.
In analyzing this performance data, the Board took into account: (1) Management's analysis of the negative effect that stock selection and sector allocation had on the Portfolio's performance; and (2) that Management would continue to monitor, and the Board or its IRC would periodically review, the Portfolio's performance.
In considering the fees payable under the Advisory and Sub-Advisory Contracts for the Portfolio, the Board took into account the factors described above and also considered: (1) the fairness of the compensation under an Advisory Contract with a breakpoint fee schedule where the asset level necessary to achieve a breakpoint discount had not been reached by the Portfolio; (2) the pricing structure (including the expense ratio to be borne by shareholders) of the Portfolio, as compared to its Selected Peer Group, including that: (a) the management fee for the Portfolio is above the median and average management fees of the funds in its Selected Peer Group; and (b) the expense ratio for the Portfolio is below the median and equal to the average expense ratios of the funds in its Selected Peer Group.
In analyzing this fee data, the Board took into account Management's representations with respect to the competitiveness of the Portfolio's management fee rate.
After its deliberation, the Board reached the following conclusions: (1) the Portfolio's management fee rate is reasonable in the context of all factors considered by the Board; (2) the Portfolio's expense ratio is reasonable in the context of all factors considered by the Board; (3) that Management would continue to monitor, and the Board or its IRC would periodically review, the Portfolio's performance; and (4) the sub-advisory fee rate payable by the Adviser to the Sub-Adviser is reasonable in the context of all factors considered by the Board. Based on these conclusions and other factors, the Board voted to renew the Advisory and Sub-Advisory Contracts for the Portfolio for the year ending November 30, 2012. During this renewal process, different Board members may have given different weight to different individual factors and related conclusions.
198
Investment Adviser
Directed Services LLC
1475 Dunwoody Drive
West Chester, Pennsylvania 19380
Administrator
ING Funds Services, LLC
7337 East Doubletree Ranch Road, Suite 100
Scottsdale, Arizona 85258
Distributor
ING Investments Distributor, LLC
7337 East Doubletree Ranch Road, Suite 100
Scottsdale, Arizona 85258
Transfer Agent
BNY Mellon Investment Servicing (U.S.) Inc.
301 Bellevue Parkway
Wilmington, Delaware 19809
Independent Registered Public Accounting Firm
KPMG LLP
Two Financial Center
60 South Street
Boston, Massachusetts 02111
Custodian
The Bank of New York Mellon
One Wall Street
New York, New York 10286
Legal Counsel
Dechert LLP
1775 I Street, N.W.
Washington, D.C. 20006
Before investing, carefully consider the investment objectives, risks, charges and expenses of the variable universal life insurance policy or variable annuity contract and the underlying variable investment options. This and other information is contained in the prospectus for the variable universal life policy or variable annuity contract and the underlying variable investment options. Obtain these prospectuses from your agent/ registered representative and read them carefully before investing.
VPAR-UIPI (1211-022412)


Annual Report
December 31, 2011
Classes ADV, S and S2
ING Partners, Inc.
n ING Fidelity® VIP Contrafund® Portfolio*
n ING Fidelity® VIP Equity-Income Portfolio*
n ING Fidelity® VIP Mid Cap Portfolio*
This report is submitted for general information to shareholders of the ING Funds. It is not authorized for distribution to prospective shareholders unless accompanied or preceded by a prospectus which includes details regarding the funds' investment objectives, risks, charges, expenses and other information. This information should be read carefully.
* Fidelity and Contrafund are registered trademarks of FMR Corp.
MUTUAL FUNDS

TABLE OF CONTENTS
| President's Letter | | | 1 | | |
|
| Market Perspective | | | 2 | | |
|
| Portfolio Managers' Reports | | | 4 | | |
|
| Shareholder Expense Examples | | | 7 | | |
|
| Report of Independent Registered Public Accounting Firm | | | 8 | | |
|
| Statements of Assets and Liabilities | | | 9 | | |
|
| Statements of Operations | | | 10 | | |
|
| Statements of Changes in Net Assets | | | 11 | | |
|
| Financial Highlights | | | 13 | | |
|
| Notes to Financial Statements | | | 16 | | |
|
| Portfolios of Investments | | | 23 | | |
|
| Tax Information | | | 26 | | |
|
| Director and Officer Information | | | 27 | | |
|
| Advisory Contract Approval Discussion | | | 31 | | |
|
PROXY VOTING INFORMATION
A description of the policies and procedures that the Portfolios use to determine how to vote proxies related to portfolio securities is available: (1) without charge, upon request, by calling Shareholder Services toll-free at (800) 992-0180; (2) on the ING Funds' website at www.inginvestment.com; and (3) on the U.S. Securities and Exchange Commission's ("SEC's") website at www.sec.gov. Information regarding how the Portfolios voted proxies related to portfolio securities during the most recent 12-month period ended June 30 is available without charge on the ING Funds' website at www.inginvestment.com and on the SEC's website at www.sec.gov.
QUARTERLY PORTFOLIO HOLDINGS
The Portfolios file their complete schedule of portfolio holdings with the SEC for the first and third quarters of each fiscal year on Form N-Q. This report contains a summary portfolio of investments for certain Portfolios. The Portfolios' Forms N-Q are available on the SEC's website at www.sec.gov. The Portfolios' Forms N-Q may be reviewed and copied at the SEC's Public Reference Room in Washington, DC, and information on the operation of the Public Reference Room may be obtained by calling (800) SEC-0330. The Portfolios' Forms N-Q, as well as a complete portfolio of investments, are available without charge upon request from the Portfolios by calling Shareholder Services toll-free at (800) 992-0180.
PRESIDENT'S LETTER

Euro zone — continued uncertainty
Dear Shareholder,
Recent months have seen headlines and financial markets continue to focus on the ongoing euro zone debt crisis. Acknowledging that the status quo was untenable, in early December, Europe opted to move closer together rather than be torn apart. All 17 nations that use the euro and nine other European Union members agreed to a new fiscal compact that would invite closer scrutiny of individual country budgets. Ratings agencies were mostly unimpressed by these machinations; ultimately, Standard & Poor's downgraded nine countries in the region, including formerly AAA-rated France.
With the stability of Italy and Spain now in question, the need for an effective policy response has become even more acute. The new governments in both countries will have but a short grace period in which to demonstrate their resolve; both have been forced to pay yields at euro-era highs for newly issued bonds.
Across the Atlantic, the chasm between the two major political parties in the United States is as wide as ever, most recently evidenced by the failure of the Congressional "supercommittee" on deficit reduction. Notwithstanding the ongoing paralysis in Washington, the U.S. economy is showing new signs of momentum.
We expect the global economy to deliver positive, if uninspiring, growth into 2012 despite the euro zone's debt problems. We believe interest rates should remain low in major advanced countries. Markets — and risk assets in general — are likely to remain vulnerable to uncertainty until there is confidence that Europe has adequately addressed its issues.
In times of uncertainty investors historically have turned to sovereign credits, especially U.S. Treasury securities. This spotlights the critical role that governments play in defining the parameters of the financial markets and serving as foundations for generating value within economies. The current trend toward fiscal austerity downplays this important function and may prolong the global economic doldrums.
How should you respond to uncertainty in your own investment program? Don't try to time the markets. Keep your portfolio well diversified, and pay careful attention to the risks you are assuming. Talk to your financial advisor before you make any changes that might detour your portfolio from your long-term goals.
We appreciate your continued confidence in ING Funds, and we look forward to serving your investment needs in the future.
Sincerely,

Shaun Mathews
President and Chief Executive Officer
ING Funds
January 3, 2012
The views expressed in the President's Letter reflect those of the President as of the date of the letter. Any such views are subject to change at any time based upon market or other conditions and ING Funds disclaims any responsibility to update such views. These views may not be relied on as investment advice and because investment decisions for an ING Fund are based on numerous factors, may not be relied on as an indication of investment intent on behalf of any ING Fund. Reference to specific company securities should not be construed as recommendations or investment advice.
International investing poses special risks including currency fluctuation, economic and political risks not found in investments that are solely domestic.
1
MARKET PERSPECTIVE: YEAR ENDED DECEMBER 31, 2011
In our semi-annual report we described how investor sentiment was generally positive through April. Many of the developed world's economies including the U.S., seemed to be returning to health, boosted by heavy, ongoing doses of stimulative and monetary medicine. This was despite natural disasters in Japan, the violent uncertainties of the "Arab Spring" in North Africa and the Middle East, not to mention a European sovereign debt crisis.
But the mood darkened in early May 2011. Global equities in the form of the MSCI World IndexSM measured in local currencies, including net reinvested dividends, slid from May through September, losing over 17%, before a remarkable October rally clawed back about half of this. For the whole fiscal year the Index lost 5.49%. (The MSCI World IndexSM returned (5.54)% for the year ended December 31, 2011, measured in U.S. dollars.)
A confluence of factors caused the deterioration in outlook after April. That month the latest unemployment rate was reported at 8.8%, the lowest in 24 months. New private sector jobs, well above 200,000, were added in each of January, February and March. But in May the unemployment rate rebounded to 9.1%. By September the employment report showed zero new jobs created in August. But more upbeat releases in later months revised this up, and by year end the three-month average of jobs created was back to 143,000 from just 35,000 in September.
In the housing market, home prices (based on the S&P/Case-Shiller 20-City Composite Home Price Index) fell every month in the year. Sales were depressed, despite improved affordability and record low mortgage interest rates, by tight credit with many homeowners in negative equity on their properties.
Gross Domestic Product ("GDP") growth had been reported at 3.1% (quarter-over-quarter, annualized) for the fourth quarter of 2010. On July 29, this was scaled down to 2.3%, among other revisions that showed the recession had been deeper and started earlier than previously thought. Worse, growth in the first quarter of 2011 was a barely perceptible 0.4%. When the second quarter's figure was finalized at just 1.3%, the common assessment was that the economy was operating at "stall-speed". There was relief in October when the first estimate of third quarter GDP growth was a much-improved 2.5%, although this was subsequently revised down to 1.8%.
Political deadlock weighed on sentiment throughout. A stopgap agreement to raise the debt ceiling did not stop Standard & Poors from downgrading the country's credit rating. A bipartisan "Debt Super Committee" appointed to negotiate a more lasting set of budget control measures, admitted defeat on November 21.
Other keenly watched figures like retail sales and wages & salaries were stagnant in the months up to October, improved in that month and were mixed thereafter. Purchasing managers' indices indicated expansion but not by much. Taken together, the data were inconclusive as the year ended but the consensus was that the once-feared return to recession now looked unlikely.
The euro zone's sovereign debt crisis continued to move markets. By early August it seemed to be veering out of control. When attention turned from Greece to the much bigger bond markets of Spain and especially Italy, the European Central Bank ("ECB") stepped in, uneasily, to buy their bonds — and some time. The threat to the euro zone banking system, where vast quantities of Italian and Spanish bonds are held, was clear.
Finally, a baby step towards closer fiscal union among euro zone countries was agreed in December, including restrictions on budget deficits with near automatic disciplinary procedures for violators. Bilateral loans of up to €200 billion would be made to the International Monetary Fund, presumably to fund rescue packages for individual nations. But it provided no lender of last resort with unlimited firepower, nor measures to promote growth and liberalize markets. Investors were under no illusions as the year ended that the crisis had been solved.
In U.S. fixed income markets, the Barclays Capital U.S. Aggregate Bond Index of investment grade bonds rose 7.84% in the fiscal year, while the Barclays Capital High Yield Bond — 2% Issuer Constrained Composite Index gained 4.96%. Most notable within the Barclays Capital U.S. Aggregate Bond Index was the remarkable 29.93% return on long-dated Treasuries, reflecting both the overall decline in risk appetite and quantitative easing.
U.S. equities, represented by the S&P 500® Index, including dividends, returned 2.11% for 2011, almost identical to the dividend yield. Sector returns ranged from (17.06)% for financials to 19.91% for utilities. The operating earnings per share of S&P 500® companies made new records in the second and third quarters of 2011, but estimates for future quarters were coming down as December ended.
In currency markets, the euro zone's problems finally took their toll, as the dollar gained 2.34% on the euro in 2011, which dropped sharply after October. The pound was barely changed despite late weakness: the dollar gained 0.10%. But the dollar fell back against the yen by 5.35% despite Bank of Japan intervention as that currency repeatedly breached post-war high levels.
In international markets, the MSCI Japan® Index slumped 18.73% in 2011. The economy contracted for three straight quarters before finally recovering, as it struggled to recover from the earthquake and tsunami of March as well as a strong yen. The MSCI Europe ex UK® Index sank 12.87%, weighed down by the recessionary threat of the sovereign debt crisis. Euro zone growth shrunk to 0.2% in the second and third quarters and unemployment stood at 10.3%, a euro-era high. The MSCI UK® Index slipped just 1.83%. Weak euro zone demand and fiscal austerity at home depressed stocks, within which, however, the well-represented energy, staples and telecoms sectors managed positive average returns.
Parentheses denote a negative number.
Past performance does not guarantee future results. The performance quoted represents past performance. Investment return and principal value of an investment will fluctuate, and shares, when redeemed, may be worth more or less than their original cost. The Portfolios' performance is subject to change since the period's end and may be lower of higher than the performance data shown. Please call (800) 262-3862 or log on to www.inginvestment.com to obtain performance data current to the most recent month end.
Market Perspective reflects the views of ING's Chief Investment Risk Officer only through the end of the period, and is subject to change based on market and other conditions.
2
BENCHMARK DESCRIPTIONS
| Index | | Description | |
| MSCI World IndexSM | | An unmanaged index that measures the performance of over 1,400 securities listed on exchanges in the U.S., Europe, Canada, Australia, New Zealand and the Far East. | |
|
| S&P/Case-Shiller 20-City Composite Home Price Index | | A composite index of the home price index for the top 20 Metropolitan Statistical Areas in the United States. The index is published monthly by Standard & Poor's. | |
|
| Barclays Capital U.S. Aggregate Bond Index | | An unmanaged index of publicly issued investment grade U.S. Government, mortgage-backed, asset-backed and corporate debt securities. | |
|
| Barclays Capital High Yield Bond—2% Issuer Constrained Composite Index | | An unmanaged index that includes all fixed income securities having a maximum quality rating of Ba1, a minimum amount outstanding of $150 million, and at least one year to maturity. | |
|
| S&P 500® Index | | An unmanaged index that measures the performance of securities of approximately 500 large-capitalization companies whose securities are traded on major U.S. stock markets. | |
|
| MSCI Japan® Index | | A free float-adjusted market capitalization index that is designed to measure developed market equity performance in Japan. | |
|
| MSCI Europe ex UK® Index | | A free float-adjusted market capitalization index that is designed to measure developed market equity performance in Europe, excluding the UK. | |
|
| MSCI UK® Index | | A free float-adjusted market capitalization index that is designed to measure developed market equity performance in the UK. | |
|
| Russell 3000® Value Index | | A market capitalization-weighted index of stocks of the 3,000 largest U.S. domiciled companies that exhibit value oriented companies. | |
|
| S&P MidCap 400 Index | | An unmanaged index that measures the performance of the mid-size company segment of the U.S. market. | |
|
3
ING FIDELITY® VIP CONTRAFUND® PORTFOLIO
PORTFOLIO MANAGERS' REPORT
ING Fidelity® VIP Contrafund® Portfolio (the "Portfolio") seeks long-term capital appreciation by investing all of its assets in the Service Class 2 shares of the Fidelity® VIP Contrafund® Portfolio, a series of Fidelity Variable Insurance Products Fund II, a registered open-end investment company. Please refer to Management's Discussion of Fund Performance on page 4 of the included Fidelity® Variable Insurance Products: Contrafund® Portfolio Annual Report.
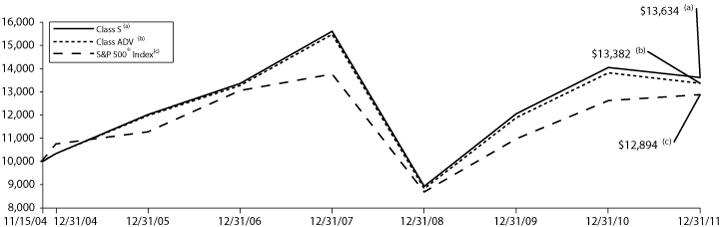
| Average Annual Total Returns for the Periods Ended December 31, 2011 | |
| | | 1 Year | | 5 Year | | Since Inception
of Classes S and ADV
November 15, 2004 | | Since Inception
of Class S2
May 28, 2009 | |
| Class S | | | (3.10 | )% | | | 0.39 | % | | | 4.44 | % | | | — | | |
| Class ADV | | | (3.31 | )% | | | 0.15 | % | | | 4.17 | % | | | — | | |
| Class S2 | | | (3.29 | )% | | | — | | | | — | | | | 14.27 | % | |
| S&P 500® Index | | | 2.11 | % | | | (0.25 | )% | | | 3.63 | %(1) | | | 15.26 | %(2) | |
Based on a $10,000 initial investment, the graph and table above illustrate the total return of ING Fidelity® VIP Contrafund® Portfolio against the index indicated. An index is unmanaged, has no cash in its portfolio, imposes no sales charges and incurs no operating expenses. An investor cannot invest directly in the index. The Portfolio's performance is shown without the imposition of any expenses or charges which are, or may be, imposed under your annuity contract. Total returns would have been lower if such expenses or charges were included.
The performance graph and table do not reflect the deduction of taxes that a shareholder will pay on Portfolio distributions or the redemption of Portfolio Shares.
The performance shown may include the effect of fee waivers and/or expense reimbursements by the Investment Adviser and/or other service providers, which have the effect of increasing total return. Had all fees and expenses been considered, the total returns would have been lower.
The performance update illustrates performance for a variable investment option available through a variable annuity contract. The performance shown indicates past performance and is not a projection or prediction of future results. Actual investment returns and principal value will fluctuate so that shares and/or units, at redemption, may be worth more or less than their original cost. Please call (800) 262-3862 to get performance through the most recent month end.
It is important to note that the Portfolio has a limited operating history. Performance over a longer period of time may be more meaningful than short-term performance.
(1) Since inception performance of the index is shown from November 1, 2004.
(2) Since inception performance of the index is shown from June 1, 2009.
This report contains statements that may be "forward-looking" statements. Actual results may differ materially from those projected in the "forward-looking" statements.
The views expressed in this report reflect those of the portfolio managers, only through the end of the period as stated on the cover. The portfolio managers' views are subject to change at any time based on market and other conditions.
4
PORTFOLIO MANAGERS' REPORT
ING FIDELITY® VIP EQUITY-INCOME PORTFOLIO
ING Fidelity® VIP Equity-Income Portfolio (the "Portfolio") seeks reasonable income by investing all of its assets in the Service Class 2 shares of the Fidelity® VIP Equity-Income Portfolio, a series of Fidelity Variable Insurance Products Fund, a registered open-end investment company. Please refer to Management's Discussion of Fund Performance on page 4 of the included Fidelity® Variable Insurance Products: Equity-Income Portfolio Annual Report.

| Average Annual Total Returns for the Periods Ended December 31, 2011 | |
| | | 1 Year | | 5 Year | | Since Inception
of Classes S and ADV
November 15, 2004 | | Since Inception
of Class S2
May 28, 2009 | |
| Class S | | | 0.33 | % | | | (3.04 | )% | | | 1.48 | % | | | — | | |
| Class ADV | | | 0.14 | % | | | (3.27 | )% | | | 1.18 | % | | | — | | |
| Class S2 | | | 0.08 | % | | | — | | | | — | | | | 14.74 | % | |
| Russell 3000® Value Index | | | (0.10 | )% | | | (2.58 | )% | | | 3.14 | %(1) | | | 14.67 | %(2) | |
Based on a $10,000 initial investment, the graph and table above illustrate the total return of ING Fidelity® VIP Equity-Income Portfolio against the index indicated. An index is unmanaged, has no cash in its portfolio, imposes no sales charges and incurs no operating expenses. An investor cannot invest directly in the index. The Portfolio's performance is shown without the imposition of any expenses or charges which are, or may be, imposed under your annuity contract. Total returns would have been lower if such expenses or charges were included.
The performance graph and table do not reflect the deduction of taxes that a shareholder will pay on Portfolio distributions or the redemption of Portfolio Shares.
The performance shown may include the effect of fee waivers and/or expense reimbursements by the Investment Adviser and/or other service providers, which have the effect of increasing total return. Had all fees and expenses been considered, the total returns would have been lower.
The performance update illustrates performance for a variable investment option available through a variable annuity contract. The performance shown indicates past performance and is not a projection or prediction of future results. Actual investment returns and principal value will fluctuate so that shares and/or units, at redemption, may be worth more or less than their original cost. Please call (800) 262-3862 to get performance through the most recent month end.
It is important to note that the Portfolio has a limited operating history. Performance over a longer period of time may be more meaningful than short-term performance.
(1) Since inception performance of the index is shown from November 1, 2004.
(2) Since inception performance of the index is shown from June 1, 2009.
This report contains statements that may be "forward-looking" statements. Actual results may differ materially from those projected in the "forward-looking" statements.
The views expressed in this report reflect those of the portfolio managers, only through the end of the period as stated on the cover. The portfolio managers' views are subject to change at any time based on market and other conditions.
5
ING FIDELITY® VIP MID CAP PORTFOLIO
PORTFOLIO MANAGERS' REPORT
ING Fidelity® VIP Mid Cap Portfolio (the "Portfolio") seeks long-term growth of capital by investing all of its assets in the Service Class 2 shares of the Fidelity® VIP Mid Cap Portfolio, a series of Fidelity Variable Insurance Products Fund III, a registered open-end investment company. Please refer to Management's Discussion of Fund Performance on page 4 of the included Fidelity® Variable Insurance Products: Mid Cap Portfolio Annual Report.
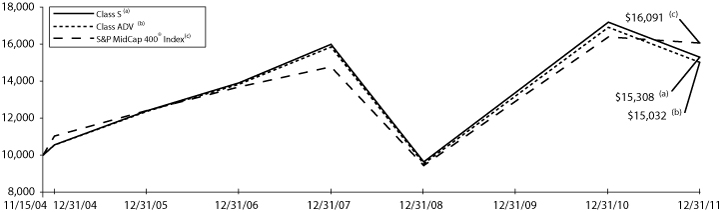
| Average Annual Total Returns for the Periods Ended December 31, 2011 | |
| | | 1 Year | | 5 Year | | Since Inception
of Classes S and ADV
November 15, 2004 | | Since Inception
of Class S2
May 28, 2009 | |
| Class S | | | (11.11 | )% | | | 1.91 | % | | | 6.16 | % | | | — | | |
| Class ADV | | | (11.30 | )% | | | 1.65 | % | | | 5.88 | % | | | — | | |
| Class S2 | | | (11.19 | )% | | | — | | | | — | | | | 13.88 | % | |
| S&P MidCap 400 Index | | | (1.73 | )% | | | 3.32 | % | | | 6.90 | %(1) | | | 19.55 | %(2) | |
Based on a $10,000 initial investment, the graph and table above illustrate the total return of ING Fidelity® VIP Mid Cap Portfolio against the index indicated. An index is unmanaged, has no cash in its portfolio, imposes no sales charges and incurs no operating expenses. An investor cannot invest directly in the index. The Portfolio's performance is shown without the imposition of any expenses or charges which are, or may be, imposed under your annuity contract. Total returns would have been lower if such expenses or charges were included.
The performance graph and table do not reflect the deduction of taxes that a shareholder will pay on Portfolio distributions or the redemption of Portfolio Shares.
The performance shown may include the effect of fee waivers and/or expense reimbursements by the Investment Adviser and/or other service providers, which have the effect of increasing total return. Had all fees and expenses been considered, the total returns would have been lower.
The performance update illustrates performance for a variable investment option available through a variable annuity contract. The performance shown indicates past performance and is not a projection or prediction of future results. Actual investment returns and principal value will fluctuate so that shares and/or units, at redemption, may be worth more or less than their original cost. Please call (800) 262-3862 to get performance through the most recent month end.
It is important to note that the Portfolio has a limited operating history. Performance over a longer period of time may be more meaningful than short-term performance.
(1) Since inception performance of the index is shown from November 1, 2004.
(2) Since inception performance of the index is shown from June 1, 2009.
This report contains statements that may be "forward-looking" statements. Actual results may differ materially from those projected in the "forward-looking" statements.
The views expressed in this report reflect those of the portfolio managers, only through the end of the period as stated on the cover. The portfolio managers' views are subject to change at any time based on market and other conditions.
6
SHAREHOLDER EXPENSE EXAMPLES (UNAUDITED)
As a shareholder of a Portfolio, you incur two types of costs: (1) transaction costs, including redemption fees and exchange fees; and (2) ongoing costs, including management fees, distribution and/or service (12b-1) fees, and other Portfolio expenses. These Examples are intended to help you understand your ongoing costs (in dollars) of investing in a Portfolio and to compare these costs with the ongoing costs of investing in other mutual funds.
The Examples are based on an investment of $1,000 invested at the beginning of the period and held for the entire period from July 1, 2011 to December 31, 2011, unless otherwise indicated. The Portfolios' expenses are shown without the imposition of any charges which are, or may be, imposed under your variable annuity contract, variable life insurance policy, qualified pension or retirement plan. Expenses would have been higher if such charges were included.
Actual Expenses
The left section of the table shown below, "Actual Portfolio Return," provides information about actual account values and actual expenses. You may use the information in this section, together with the amount you invested, to estimate the expenses that you paid over the period. Simply divide your account value by $1,000 (for example, an $8,600 account value divided by $1,000 = 8.6), then multiply the result by the number in the first section under the heading entitled "Expenses Paid During the Period" to estimate the expenses you paid on your account during this period.
Hypothetical Example for Comparison Purposes
The right section of the table shown below, "Hypothetical (5% return before expenses)," provides information about hypothetical account values and hypothetical expenses based on a Portfolio's actual expense ratio and an assumed rate of return of 5% per year before expenses, which is not a Portfolio's actual return. The hypothetical account values and expenses may not be used to estimate the actual ending account balance or expenses you paid for the period. You may use this information to compare the ongoing costs of investing in a Portfolio and other mutual funds. To do so, compare this 5% hypothetical example with the 5% hypothetical examples that appear in the shareholder reports of the other mutual funds.
Please note that the expenses shown in the table are meant to highlight your ongoing costs only and do not reflect any transactional costs, such as redemption fees or exchange fees. Therefore, the hypothetical lines of the table are useful in comparing ongoing costs only, and will not help you determine the relative total costs of owning different funds. In addition, if these transactional costs were included, your costs would have been higher.
| | | Actual Portfolio Return | | Hypothetical (5% return before expenses) | |
ING Fidelity® VIP Contrafund®
Portfolio | | Beginning
Account
Value
July 01,
2011 | | Ending
Account
Value
December 31,
2011 | | Annualized
Expense
Ratio | | Expenses Paid
During the
Period Ended
December 31,
2011* | | Beginning
Account
Value
July 01,
2011 | | Ending
Account
Value
December 31,
2011 | | Annualized
Expense
Ratio | | Expenses Paid
During the
Period Ended
December 31,
2011* | |
| Class ADV | | $ | 1,000.00 | | | $ | 922.80 | | | | 1.44 | % | | $ | 6.98 | | | $ | 1,000.00 | | | $ | 1,017.95 | | | | 1.44 | % | | $ | 7.32 | | |
| Class S | | | 1,000.00 | | | | 924.10 | | | | 1.19 | | | | 5.77 | | | | 1,000.00 | | | | 1,019.21 | | | | 1.19 | | | | 6.06 | | |
| Class S2 | | | 1,000.00 | | | | 922.60 | | | | 1.34 | | | | 6.49 | | | | 1,000.00 | | | | 1,018.45 | | | | 1.34 | | | | 6.82 | | |
| ING Fidelity® VIP Equity-Income Portfolio | |
| Class ADV | | $ | 1,000.00 | | | $ | 944.50 | | | | 1.36 | % | | $ | 6.67 | | | $ | 1,000.00 | | | $ | 1,018.35 | | | | 1.36 | % | | $ | 6.92 | | |
| Class S | | | 1,000.00 | | | | 945.70 | | | | 1.11 | | | | 5.44 | | | | 1,000.00 | | | | 1,019.61 | | | | 1.11 | | | | 5.65 | | |
| Class S2 | | | 1,000.00 | | | | 944.60 | | | | 1.26 | | | | 6.18 | | | | 1,000.00 | | | | 1,018.85 | | | | 1.26 | | | | 6.41 | | |
| ING Fidelity® VIP Mid Cap Portfolio | |
| Class ADV | | $ | 1,000.00 | | | $ | 882.30 | | | | 1.46 | % | | $ | 6.93 | | | $ | 1,000.00 | | | $ | 1,017.85 | | | | 1.46 | % | | $ | 7.43 | | |
| Class S | | | 1,000.00 | | | | 882.90 | | | | 1.21 | | | | 5.74 | | | | 1,000.00 | | | | 1,019.11 | | | | 1.21 | | | | 6.16 | | |
| Class S2 | | | 1,000.00 | | | | 883.30 | | | | 1.36 | | | | 6.46 | | | | 1,000.00 | | | | 1,018.35 | | | | 1.36 | | | | 6.92 | | |
* Expenses are equal to each Portfolio's respective annualized expense ratios, including the expenses of the master fund, multiplied by the average account value over the period, multiplied by 184/365 to reflect the most recent fiscal half-year.
7
REPORT OF INDEPENDENT REGISTERED PUBLIC ACCOUNTING FIRM
The Shareholders and Board of Directors
ING Partners, Inc.
We have audited the accompanying statements of assets and liabilities, including the portfolios of investments, of ING Fidelity® VIP Contrafund® Portfolio, ING Fidelity® VIP Equity-Income Portfolio, and ING Fidelity® VIP Mid Cap Portfolio, each a series of ING Partners, Inc., as of December 31, 2011, and the related statements of operations for the year then ended, the statements of changes in net assets for each of the years in the two-year period then ended, and the financial highlights for each of the years or periods in the five-year period then ended. These financial statements and financial highlights are the responsibility of management. Our responsibility is to express an opinion on these financial statements and financial highlights based on our audits.
We conducted our audits in accordance with the standards of the Public Company Accounting Oversight Board (United States). Those standards require that we plan and perform the audit to obtain reasonable assurance about whether the financial statements and financial highlights are free of material misstatement. An audit includes examining, on a test basis, evidence supporting the amounts and disclosures in the financial statements. Our procedures included confirmation of securities owned as of December 31, 2011, by correspondence with the transfer agent of the master funds. An audit also includes assessing the accounting principles used and significant estimates made by management, as well as evaluating the overall financial statement presentation. We believe that our audits provide a reasonable basis for our opinion.
In our opinion, the financial statements and financial highlights referred to above present fairly, in all material respects, the financial position of the aforementioned portfolios as of December 31, 2011, and the results of their operations, the changes in their net assets, and the financial highlights for the periods specified in the first paragraph above, in conformity with U.S. generally accepted accounting principles.

Boston, Massachusetts
February 21, 2012
8
STATEMENTS OF ASSETS AND LIABILITIES AS OF DECEMBER 31, 2011
| | | ING
Fidelity® VIP
Contrafund®
Portfolio | | ING
Fidelity® VIP
Equity-Income
Portfolio | | ING
Fidelity® VIP
Mid Cap
Portfolio | |
| ASSETS: | |
| Investments in master fund at value*(1) | | $ | 315,278,550 | | | $ | 18,148,880 | | | $ | 50,959,232 | | |
| Cash | | | 45,397 | | | | 974 | | | | 263 | | |
| Receivables: | |
| Investments in master fund sold | | | 1,956,862 | | | | 16,516 | | | | 82,862 | | |
| Fund shares sold | | | 2,724 | | | | 230 | | | | 1,628 | | |
| Total assets | | | 317,283,533 | | | | 18,166,600 | | | | 51,043,985 | | |
| LIABILITIES: | |
| Payable for investments in master fund purchased | | | 923 | | | | — | | | | 598 | | |
| Payable for fund shares redeemed | | | 1,958,663 | | | | 16,745 | | | | 83,892 | | |
| Payable to affiliates | | | 81,338 | | | | 4,713 | | | | 13,691 | | |
| Total liabilities | | | 2,040,924 | | | | 21,458 | | | | 98,181 | | |
| NET ASSETS | | $ | 315,242,609 | | | $ | 18,145,142 | | | $ | 50,945,804 | | |
| NET ASSETS WERE COMPRISED OF: | |
| Paid-in capital | | $ | 450,571,321 | | | $ | 36,625,854 | | | $ | 61,439,179 | | |
| Undistributed (distributions in excess of) net investment income | | | 1,569,865 | | | | 363,271 | | | | (702 | ) | |
| Accumulated net realized loss | | | (142,298,274 | ) | | | (21,583,667 | ) | | | (13,870,975 | ) | |
| Net unrealized appreciation | | | 5,399,697 | | | | 2,739,684 | | | | 3,378,302 | | |
| NET ASSETS | | $ | 315,242,609 | | | $ | 18,145,142 | | | $ | 50,945,804 | | |
| * Cost of investments in master fund at value | | $ | 309,878,853 | | | $ | 15,409,196 | | | $ | 47,580,930 | | |
| Class ADV: | |
| Net Assets | | $ | 4,023,397 | | | $ | 454,380 | | | $ | 1,782,920 | | |
| Shares authorized | | | 100,000,000 | | | | 100,000,000 | | | | 100,000,000 | | |
| Par value | | $ | 0.001 | | | $ | 0.001 | | | $ | 0.001 | | |
| Shares outstanding | | | 444,569 | | | | 54,354 | | | | 153,438 | | |
| Net asset value and redemption price per share | | $ | 9.05 | | | $ | 8.36 | | | $ | 11.62 | | |
| Class S: | |
| Net Assets | | $ | 311,215,198 | | | $ | 17,686,761 | | | $ | 49,159,403 | | |
| Shares authorized | | | 100,000,000 | | | | 100,000,000 | | | | 100,000,000 | | |
| Par value | | $ | 0.001 | | | $ | 0.001 | | | $ | 0.001 | | |
| Shares outstanding | | | 34,202,680 | | | | 2,098,188 | | | | 4,187,823 | | |
| Net asset value and redemption price per share | | $ | 9.10 | | | $ | 8.43 | | | $ | 11.74 | | |
| Class S2: | |
| Net Assets | | $ | 4,014 | | | $ | 4,001 | | | $ | 3,481 | | |
| Shares authorized | | | 100,000,000 | | | | 100,000,000 | | | | 100,000,000 | | |
| Par value | | $ | 0.001 | | | $ | 0.001 | | | $ | 0.001 | | |
| Shares outstanding | | | 448 | | | | 483 | | | | 302 | | |
| Net asset value and redemption price per share | | $ | 8.96 | | | $ | 8.28 | | | $ | 11.55 | | |
(1) The master funds for the ING Fidelity® VIP Contrafund®, ING Fidelity® VIP Equity-Income and ING Fidelity® VIP Mid Cap Portfolios are the Fidelity® VIP Contrafund®, Fidelity® VIP Equity-Income and Fidelity® VIP Mid Cap Portfolios, respectively. These financial statements should be read in conjunction with the master Fidelity funds' financial statements.
See Accompanying Notes to Financial Statements
9
STATEMENTS OF OPERATIONS FOR THE YEAR ENDED DECEMBER 31, 2011
| | | ING
Fidelity® VIP
Contrafund®
Portfolio | | ING
Fidelity® VIP
Equity-Income
Portfolio | | ING
Fidelity® VIP
Mid Cap
Portfolio | |
| INVESTMENT INCOME: | |
| Dividends from master fund(1) | | $ | 2,638,867 | | | $ | 430,154 | | | $ | 12,659 | | |
| Total investment income | | | 2,638,867 | | | | 430,154 | | | | 12,659 | | |
| EXPENSES: | |
| Distribution and service fees: | |
| Class ADV | | | 21,239 | | | | 2,355 | | | | 14,280 | | |
| Class S | | | 868,518 | | | | 53,335 | | | | 160,980 | | |
| Class S2 | | | 22 | | | | 22 | | | | 19 | | |
| Administrative service fees | | | 175,835 | | | | 10,905 | | | | 33,627 | | |
| Miscellaneous expense | | | 284 | | | | 18 | | | | 54 | | |
| Total expenses | | | 1,065,898 | | | | 66,635 | | | | 208,960 | | |
| Net waived and reimbursed fees | | | (4 | ) | | | (4 | ) | | | (4 | ) | |
| Net expenses | | | 1,065,894 | | | | 66,631 | | | | 208,956 | | |
| Net investment income (loss) | | | 1,572,973 | | | | 363,523 | | | | (196,297 | ) | |
| REALIZED AND UNREALIZED GAIN (LOSS): | |
| Net realized gain (loss) on: | |
| Sale of investments in master fund | | | (26,377,613 | ) | | | (1,279,982 | ) | | | (2,828,234 | ) | |
| Capital gain distributions from investments in master fund | | | — | | | | — | | | | 99,465 | | |
| Net realized loss | | | (26,377,613 | ) | | | (1,279,982 | ) | | | (2,728,769 | ) | |
| Net change in unrealized appreciation (depreciation) on: | |
| Investments | | | 13,645,029 | | | | 948,593 | | | | (4,364,254 | ) | |
| Net change in unrealized appreciation (depreciation) | | | 13,645,029 | | | | 948,593 | | | | (4,364,254 | ) | |
| Net realized and unrealized loss | | | (12,732,584 | ) | | | (331,389 | ) | | | (7,093,023 | ) | |
| Increase (decrease) in net assets resulting from operations | | $ | (11,159,611 | ) | | $ | 32,134 | | | $ | (7,289,320 | ) | |
(1) The master funds for the ING Fidelity® VIP Contrafund®, ING Fidelity® VIP Equity-Income and ING Fidelity® VIP Mid Cap Portfolios are the Fidelity® VIP Contrafund®, Fidelity® VIP Equity-Income and Fidelity® VIP Mid Cap Portfolios, respectively. These financial statements should be read in conjunction with the master Fidelity funds' financial statements.
See Accompanying Notes to Financial Statements
10
STATEMENTS OF CHANGES IN NET ASSETS
| | | ING Fidelity® VIP
Contrafund® Portfolio | | ING Fidelity® VIP
Equity-Income Portfolio | |
| | | Year
Ended
December 31,
2011 | | Year
Ended
December 31,
2010 | | Year
Ended
December 31,
2011 | | Year
Ended
December 31,
2010 | |
| FROM OPERATIONS: | |
| Net investment income | | $ | 1,572,973 | | | $ | 2,390,898 | | | $ | 363,523 | | | $ | 305,938 | | |
| Net realized (loss) | | | (26,377,613 | ) | | | (55,820,584 | ) | | | (1,279,982 | ) | | | (8,396,056 | ) | |
| Net change in unrealized appreciation | | | 13,645,029 | | | | 106,791,767 | | | | 948,593 | | | | 11,852,949 | | |
| Increase (decrease) in net assets resulting from operations | | | (11,159,611 | ) | | | 53,362,081 | | | | 32,134 | | | | 3,762,831 | | |
| FROM DISTRIBUTIONS TO SHAREHOLDERS: | |
| Net investment income: | |
| Class ADV | | | (26,874 | ) | | | (26,135 | ) | | | (5,971 | ) | | | (8,551 | ) | |
| Class S | | | (2,518,772 | ) | | | (2,831,482 | ) | | | (300,036 | ) | | | (513,963 | ) | |
| Class S2 | | | (25 | ) | | | (39 | ) | | | (59 | ) | | | (72 | ) | |
| Total distributions | | | (2,545,671 | ) | | | (2,857,656 | ) | | | (306,066 | ) | | | (522,586 | ) | |
| FROM CAPITAL SHARE TRANSACTIONS: | |
| Net proceeds from sale of shares | | | 26,875,043 | | | | 15,683,612 | | | | 4,203,169 | | | | 2,141,736 | | |
| Proceeds from shares issued in merger (Note 8) | | | — | | | | 17,716,925 | | | | — | | | | — | | |
| Reinvestment of distributions | | | 2,545,646 | | | | 2,857,617 | | | | 306,008 | | | | 522,514 | | |
| | | | 29,420,689 | | | | 36,258,154 | | | | 4,509,177 | | | | 2,664,250 | | |
| Cost of shares redeemed | | | (59,513,490 | ) | | | (103,256,389 | ) | | | (10,546,303 | ) | | | (16,006,300 | ) | |
Net decrease in net assets resulting from capital
share transactions | | | (30,092,801 | ) | | | (66,998,235 | ) | | | (6,037,126 | ) | | | (13,342,050 | ) | |
| Net decrease in net assets | | | (43,798,083 | ) | | | (16,493,810 | ) | | | (6,311,058 | ) | | | (10,101,805 | ) | |
| NET ASSETS: | |
| Beginning of year | | | 359,040,692 | | | | 375,534,502 | | | | 24,456,200 | | | | 34,558,005 | | |
| End of year | | $ | 315,242,609 | | | $ | 359,040,692 | | | $ | 18,145,142 | | | $ | 24,456,200 | | |
| Undistributed net investment income at end of year | | $ | 1,569,865 | | | $ | 2,542,563 | | | $ | 363,271 | | | $ | 305,814 | | |
See Accompanying Notes to Financial Statements
11
STATEMENTS OF CHANGES IN NET ASSETS
| | | ING Fidelity® VIP Mid Cap Portfolio | |
| | | Year
Ended
December 31,
2011 | | Year
Ended
December 31,
2010 | |
| FROM OPERATIONS: | |
| Net investment (loss) | | $ | (196,297 | ) | | $ | (129,747 | ) | |
| Net realized (loss) | | | (2,728,769 | ) | | | (2,799,953 | ) | |
| Net change in unrealized appreciation (depreciation) | | | (4,364,254 | ) | | | 20,142,578 | | |
| Increase (decrease) in net assets resulting from operations | | | (7,289,320 | ) | | | 17,212,878 | | |
| FROM DISTRIBUTIONS TO SHAREHOLDERS: | |
| Net investment income: | |
| Class ADV | | | — | | | | (9,077 | ) | |
| Class S | | | (96,372 | ) | | | (346,740 | ) | |
| Class S2 | | | (4 | ) | | | (19 | ) | |
| Total distributions | | | (96,376 | ) | | | (355,836 | ) | |
| FROM CAPITAL SHARE TRANSACTIONS: | |
| Net proceeds from sale of shares | | | 4,370,754 | | | | 8,499,751 | | |
| Reinvestment of distributions | | | 96,372 | | | | 355,817 | | |
| | | | 4,467,126 | | | | 8,855,568 | | |
| Cost of shares redeemed | | | (21,599,008 | ) | | | (16,019,751 | ) | |
| Net decrease in net assets resulting from capital share transactions | | | (17,131,882 | ) | | | (7,164,183 | ) | |
| Net decrease in net assets | | | (24,517,578 | ) | | | (9,692,859 | ) | |
| NET ASSETS: | |
| Beginning of year | | | 75,463,382 | | | | 65,770,523 | | |
| End of year | | $ | 50,945,804 | | | $ | 75,463,382 | | |
| Undistributed (distributions in excess of) net investment income at end of year | | $ | (702 | ) | | $ | 96,074 | | |
See Accompanying Notes to Financial Statements
12
FINANCIAL HIGHLIGHTS (UNAUDITED)
Selected data for a share of beneficial interest outstanding throughout each year or period.
| | | | | Income (loss)
from investment
operations | | | | Less distributions | | | |
| | | Net asset value, beginning of year or period | | Net investment income (loss) | | Net realized and unrealized gain (loss) on master fund | | Total from investment operations | | From net investment income | | From net realized gains from master fund | | From return of capital from master fund | | Total distributions | | Net asset value, end of year or period | | Total Return(1) | |
| | | | | | | | | | | | | | | | | | | | | | |
Year or period
ended | | ($) | | ($) | | ($) | | ($) | | ($) | | ($) | | ($) | | ($) | | ($) | | (%) | |
| ING Fidelity® VIP Contrafund® Portfolio | | | |
| Class ADV | | | |
| 12-31-11 | | | 9.42 | | | | 0.01 | | | | (0.33 | ) | | | (0.32 | ) | | | 0.05 | | | | — | | | | — | | | | 0.05 | | | | 9.05 | | | | (3.31 | ) | |
| 12-31-10 | | | 8.16 | | | | 0.03 | • | | | 1.29 | | | | 1.32 | | | | 0.06 | | | | — | | | | — | | | | 0.06 | | | | 9.42 | | | | 16.29 | | |
| 12-31-09 | | | 6.24 | | | | 0.05 | | | | 2.09 | | | | 2.14 | | | | 0.02 | | | | 0.20 | | | | — | | | | 0.22 | | | | 8.16 | | | | 34.71 | | |
| 12-31-08 | | | 14.62 | | | | 0.05 | • | | | (5.34 | ) | | | (5.29 | ) | | | 0.58 | | | | 2.51 | | | | — | | | | 3.09 | | | | 6.24 | | | | (43.00 | ) | |
| 12-31-07 | | | 13.28 | | | | 0.03 | | | | 2.12 | | | | 2.15 | | | | 0.02 | | | | 0.79 | | | | — | | | | 0.81 | | | | 14.62 | | | | 16.69 | | |
| | | | | | | | | | | | | | — | | | | | | — | | | | | | | | |
| Class S | | | |
| 12-31-11 | | | 9.47 | | | | 0.05 | | | | (0.35 | ) | | | (0.30 | ) | | | 0.07 | | | | — | | | | — | | | | 0.07 | | | | 9.10 | | | | (3.10 | ) | |
| 12-31-10 | | | 8.20 | | | | 0.06 | • | | | 1.29 | | | | 1.35 | | | | 0.08 | | | | — | | | | — | | | | 0.08 | | | | 9.47 | | | | 16.63 | | |
| 12-31-09 | | | 6.28 | | | | 0.06 | | | | 2.12 | | | | 2.18 | | | | 0.06 | | | | 0.20 | | | | — | | | | 0.26 | | | | 8.20 | | | | 35.13 | | |
| 12-31-08 | | | 14.72 | | | | 0.06 | • | | | (5.37 | ) | | | (5.31 | ) | | | 0.62 | | | | 2.51 | | | | — | | | | 3.13 | | | | 6.28 | | | | (42.90 | ) | |
| 12-31-07 | | | 13.37 | | | | 0.09 | | | | 2.11 | | | | 2.20 | | | | 0.06 | | | | 0.79 | | | | — | | | | 0.85 | | | | 14.72 | | | | 16.92 | | |
| | | | | | | | | | | | | | — | | | | | | — | | | | | | | | |
| Class S2 | | | |
| 12-31-11 | | | 9.33 | | | | 0.03 | | | | (0.34 | ) | | | (0.31 | ) | | | 0.06 | | | | — | | | | — | | | | 0.06 | | | | 8.96 | | | | (3.29 | ) | |
| 12-31-10 | | | 8.11 | | | | 0.05 | | | | 1.26 | | | | 1.31 | | | | 0.09 | | | | — | | | | — | | | | 0.09 | | | | 9.33 | | | | 16.32 | | |
05-28-09(6)-
12-31-09 | | | 6.70 | | | | 0.06 | • | | | 1.62 | | | | 1.68 | | | | 0.07 | | | | 0.20 | | | | — | | | | 0.27 | | | | 8.11 | | | | 25.65 | | |
| | | Ratios to average
net assets | | Supplemental data | | Ratios and supplemental
data including the master fund | |
| | | Gross expenses excluding expenses of the master fund(2)(3)(4) | | Net expenses excluding expenses of the master fund(2)(3)(4) | | Net investment income (loss) excluding expenses of the master fund(2)(3)(4) | | Net assets, end of year or period | | Portfolio turnover rate(5) | | Expenses including gross expenses of the master fund(2)(4) | | Expenses including expenses net of voluntary waivers, if any, of the master fund(2)(4) | | Expenses including expenses net of all reductions of the master fund(2)(4) | | Portfolio turnover rate of the master fund | |
| | | | | | | | | | | | | | | | | | | | |
Year or period
ended | | (%) | | (%) | | (%) | | ($000's) | | (%) | | (%) | | (%) | | (%) | | (%) | |
| ING Fidelity® VIP Contrafund® Portfolio | |
| Class ADV | |
| 12-31-11 | | | 0.55 | | | | 0.55 | | | | 0.24 | | | | 4,023 | | | | 8 | | | | 1.45 | | | | 1.44 | | | | 1.43 | | | | 135 | | |
| 12-31-10 | | | 0.55 | | | | 0.55 | | | | 0.40 | | | | 4,024 | | | | 5 | | | | 1.45 | | | | 1.45 | | | | 1.43 | | | | 117 | | |
| 12-31-09 | | | 0.55 | | | | 0.55 | | | | 0.57 | | | | 4,268 | | | | 12 | | | | 1.47 | | | | 1.47 | | | | 1.45 | | | | 145 | | |
| 12-31-08 | | | 0.55 | | | | 0.55 | | | | 0.51 | | | | 3,897 | | | | 8 | | | | 1.46 | | | | 1.46 | | | | 1.45 | | | | 172 | | |
| 12-31-07 | | | 0.55 | | | | 0.55 | | | | 0.24 | | | | 7,741 | | | | 35 | | | | 1.45 | | | | 1.45 | | | | 1.44 | | | | 134 | | |
| | | | | | | | | | | | | | | | | | | | | | |
| Class S | |
| 12-31-11 | | | 0.30 | | | | 0.30 | | | | 0.45 | | | | 311,215 | | | | 8 | | | | 1.20 | | | | 1.19 | | | | 1.18 | | | | 135 | | |
| 12-31-10 | | | 0.30 | | | | 0.30 | | | | 0.73 | | | | 355,013 | | | | 5 | | | | 1.20 | | | | 1.20 | | | | 1.18 | | | | 117 | | |
| 12-31-09 | | | 0.30 | | | | 0.30 | | | | 0.83 | | | | 371,263 | | | | 12 | | | | 1.22 | | | | 1.22 | | | | 1.20 | | | | 145 | | |
| 12-31-08 | | | 0.30 | | | | 0.30 | | | | 0.58 | | | | 290,170 | | | | 8 | | | | 1.21 | | | | 1.21 | | | | 1.20 | | | | 172 | | |
| 12-31-07 | | | 0.30 | | | | 0.30 | | | | 0.63 | | | | 414,723 | | | | 35 | | | | 1.20 | | | | 1.20 | | | | 1.19 | | | | 134 | | |
| | | | | | | | | | | | | | | | | | | | | | |
| Class S2 | |
| 12-31-11 | | | 0.55 | | | | 0.45 | | | | 0.35 | | | | 4 | | | | 8 | | | | 1.45 | | | | 1.34 | | | | 1.33 | | | | 135 | | |
| 12-31-10 | | | 0.55 | | | | 0.45 | | | | 0.59 | | | | 4 | | | | 5 | | | | 1.45 | | | | 1.35 | | | | 1.33 | | | | 117 | | |
05-28-09(6)-
12-31-09 | | | 0.55 | | | | 0.45 | | | | 1.27 | | | | 4 | | | | 12 | | | | 1.47 | | | | 1.37 | | | | 1.35 | | | | 145 | | |
See Accompanying Notes to Financial Statements
13
FINANCIAL HIGHLIGHTS (UNAUDITED) (CONTINUED)
Selected data for a share of beneficial interest outstanding throughout each year or period.
| | | | | Income (loss)
from investment
operations | | | | Less distributions | | | |
| | | Net asset value, beginning of year or period | | Net investment income (loss) | | Net realized and unrealized gain (loss) on master fund | | Total from investment operations | | From net investment income | | From net realized gains from master fund | | From return of capital from master fund | | Total distributions | | Net asset value, end of year or period | | Total Return(1) | |
| | | | | | | | | | | | | | | | | | | | | | |
Year or period
ended | | ($) | | ($) | | ($) | | ($) | | ($) | | ($) | | ($) | | ($) | | ($) | | (%) | |
| ING Fidelity® VIP Equity-Income Portfolio | | | |
| Class ADV | | | |
| 12-31-11 | | | 8.47 | | | | 0.16 | | | | (0.16 | ) | | | 0.00 | * | | | 0.11 | | | | — | | | | — | | | | 0.11 | | | | 8.36 | | | | 0.14 | | |
| 12-31-10 | | | 7.55 | | | | 0.08 | | | | 0.97 | | | | 1.05 | | | | 0.13 | | | | — | | | | — | | | | 0.13 | | | | 8.47 | | | | 14.21 | | |
| 12-31-09 | | | 5.99 | | | | 0.10 | | | | 1.63 | | | | 1.73 | | | | 0.16 | | | | 0.01 | | | | — | | | | 0.17 | | | | 7.55 | | | | 29.15 | | |
| 12-31-08 | | | 11.94 | | | | 0.22 | | | | (4.97 | ) | | | (4.75 | ) | | | 0.18 | | | | 1.02 | | | | — | | | | 1.20 | | | | 5.99 | | | | (43.07 | ) | |
| 12-31-07 | | | 12.83 | | | | 0.13 | • | | | (0.01 | ) | | | 0.12 | | | | 0.21 | | | | 0.80 | | | | — | | | | 1.01 | | | | 11.94 | | | | 0.69 | | |
| | | | | | | | | | | | | | — | | | | | | — | | | | | | | | |
| Class S | | | |
| 12-31-11 | | | 8.54 | | | | 0.14 | • | | | (0.13 | ) | | | 0.01 | | | | 0.12 | | | | — | | | | — | | | | 0.12 | | | | 8.43 | | | | 0.33 | | |
| 12-31-10 | | | 7.59 | | | | 0.08 | • | | | 1.01 | | | | 1.09 | | | | 0.14 | | | | — | | | | — | | | | 0.14 | | | | 8.54 | | | | 14.68 | | |
| 12-31-09 | | | 6.04 | | | | 0.10 | • | | | 1.65 | | | | 1.75 | | | | 0.19 | | | | 0.01 | | | | — | | | | 0.20 | | | | 7.59 | | | | 29.32 | | |
| 12-31-08 | | | 12.06 | | | | 0.20 | • | | | (4.98 | ) | | | (4.78 | ) | | | 0.22 | | | | 1.02 | | | | — | | | | 1.24 | | | | 6.04 | | | | (42.96 | ) | |
| 12-31-07 | | | 12.94 | | | | 0.21 | | | | (0.05 | ) | | | 0.16 | | | | 0.24 | | | | 0.80 | | | | — | | | | 1.04 | | | | 12.06 | | | | 0.97 | | |
| | | | | | | | | | | | | | — | | | | | | — | | | | | | | | |
| Class S2 | | | |
| 12-31-11 | | | 8.41 | | | | 0.16 | | | | (0.17 | ) | | | (0.01 | ) | | | 0.12 | | | | — | | | | — | | | | 0.12 | | | | 8.28 | | | | 0.08 | | |
| 12-31-10 | | | 7.50 | | | | 0.09 | | | | 0.97 | | | | 1.06 | | | | 0.15 | | | | — | | | | — | | | | 0.15 | | | | 8.41 | | | | 14.46 | | |
05-28-09(6)-
12-31-09 | | | 6.21 | | | | 0.11 | • | | | 1.40 | | | | 1.51 | | | | 0.21 | | | | 0.01 | | | | — | | | | 0.22 | | | | 7.50 | | | | 24.73 | | |
| | | Ratios to average
net assets | | Supplemental data | | Ratios and supplemental
data including the master fund | |
| | | Gross expenses excluding expenses of the master fund(2)(3)(4) | | Net expenses excluding expenses of the master fund(2)(3)(4) | | Net investment income (loss) excluding expenses of the master fund(2)(3)(4) | | Net assets, end of year or period | | Portfolio turnover rate(5) | | Expenses including gross expenses of the master fund(2)(4) | | Expenses including expenses net of voluntary waivers, if any, of the master fund(2)(4) | | Expenses including expenses net of all reductions of the master fund(2)(4) | | Portfolio turnover rate of the master fund | |
| | | | | | | | | | | | | | | | | | | | |
Year or period
ended | | (%) | | (%) | | (%) | | ($000's) | | (%) | | (%) | | (%) | | (%) | | (%) | |
| ING Fidelity® VIP Equity-Income Portfolio | |
| Class ADV | |
| 12-31-11 | | | 0.55 | | | | 0.55 | | | | 1.83 | | | | 454 | | | | 20 | | | | 1.36 | | | | 1.36 | | | | 1.35 | | | | 96 | | |
| 12-31-10 | | | 0.55 | | | | 0.55 | | | | 0.90 | | | | 473 | | | | 8 | | | | 1.36 | | | | 1.35 | | | | 1.35 | | | | 29 | | |
| 12-31-09 | | | 0.55 | | | | 0.55 | | | | 1.65 | | | | 510 | | | | 14 | | | | 1.38 | | | | 1.38 | | | | 1.38 | | | | 29 | | |
| 12-31-08 | | | 0.55 | | | | 0.55 | | | | 1.83 | | | | 399 | | | | 23 | | | | 1.37 | | | | 1.37 | | | | 1.37 | | | | 34 | | |
| 12-31-07 | | | 0.55 | | | | 0.55 | | | | 1.01 | | | | 944 | | | | 24 | | | | 1.35 | | | | 1.35 | | | | 1.35 | | | | 20 | | |
| | | | | | | | | | | | | | | | | | | | | | |
| Class S | |
| 12-31-11 | | | 0.30 | | | | 0.30 | | | | 1.66 | | | | 17,687 | | | | 20 | | | | 1.11 | | | | 1.11 | | | | 1.10 | | | | 96 | | |
| 12-31-10 | | | 0.30 | | | | 0.30 | | | | 1.02 | | | | 23,979 | | | | 8 | | | | 1.11 | | | | 1.10 | | | | 1.10 | | | | 29 | | |
| 12-31-09 | | | 0.30 | | | | 0.30 | | | | 1.62 | | | | 34,044 | | | | 14 | | | | 1.13 | | | | 1.13 | | | | 1.13 | | | | 29 | | |
| 12-31-08 | | | 0.30 | | | | 0.30 | | | | 2.14 | | | | 32,759 | | | | 23 | | | | 1.12 | | | | 1.12 | | | | 1.12 | | | | 34 | | |
| 12-31-07 | | | 0.30 | | | | 0.30 | | | | 1.61 | | | | 53,573 | | | | 24 | | | | 1.10 | | | | 1.10 | | | | 1.10 | | | | 20 | | |
| | | | | | | | | | | | | | | | | | | | | | |
| Class S2 | |
| 12-31-11 | | | 0.55 | | | | 0.45 | | | | 1.87 | | | | 4 | | | | 20 | | | | 1.36 | | | | 1.26 | | | | 1.25 | | | | 96 | | |
| 12-31-10 | | | 0.55 | | | | 0.45 | | | | 1.20 | | | | 4 | | | | 8 | | | | 1.36 | | | | 1.25 | | | | 1.25 | | | | 29 | | |
05-28-09(6)-
12-31-09 | | | 0.55 | | | | 0.45 | | | | 2.66 | | | | 4 | | | | 14 | | | | 1.38 | | | | 1.28 | | | | 1.28 | | | | 29 | | |
See Accompanying Notes to Financial Statements
14
FINANCIAL HIGHLIGHTS (UNAUDITED) (CONTINUED)
Selected data for a share of beneficial interest outstanding throughout each year or period.
| | | | | Income (loss)
from investment
operations | | | | Less distributions | | | |
| | | Net asset value, beginning of year or period | | Net investment income (loss) | | Net realized and unrealized gain (loss) on master fund | | Total from investment operations | | From net investment income | | From net realized gains from master fund | | From return of capital from master fund | | Total distributions | | Net asset value, end of year or period | | Total Return(1) | |
| | | | | | | | | | | | | | | | | | | | | | |
Year or period
ended | | ($) | | ($) | | ($) | | ($) | | ($) | | ($) | | ($) | | ($) | | ($) | | (%) | |
| ING Fidelity® VIP Mid Cap Portfolio | | | |
| Class ADV | | | |
| 12-31-11 | | | 13.10 | | | | (0.07 | )• | | | (1.41 | ) | | | (1.48 | ) | | | — | | | | — | | | | — | | | | — | | | | 11.62 | | | | (11.30 | ) | |
| 12-31-10 | | | 10.28 | | | | (0.04 | ) | | | 2.90 | | | | 2.86 | | | | 0.04 | | | | — | | | | — | | | | 0.04 | | | | 13.10 | | | | 27.88 | | |
| 12-31-09 | | | 8.81 | | | | (0.01 | ) | | | 3.24 | | | | 3.23 | | | | 0.47 | | | | 1.29 | | | | — | | | | 1.76 | | | | 10.28 | | | | 38.89 | | |
| 12-31-08 | | | 15.59 | | | | (0.03 | )• | | | (5.91 | ) | | | (5.94 | ) | | | — | | | | 0.84 | | | | — | | | | 0.84 | | | | 8.81 | | | | (39.90 | ) | |
| 12-31-07 | | | 13.84 | | | | (0.01 | ) | | | 2.03 | | | | 2.02 | | | | — | | | | 0.27 | | | | — | | | | 0.27 | | | | 15.59 | | | | 14.64 | | |
| | | | | | | | | | | | | | — | | | | | | — | | | | | | | | |
| Class S | | | |
| 12-31-11 | | | 13.23 | | | | (0.04 | ) | | | (1.43 | ) | | | (1.47 | ) | | | 0.02 | | | | — | | | | — | | | | 0.02 | | | | 11.74 | | | | (11.11 | ) | |
| 12-31-10 | | | 10.38 | | | | (0.02 | ) | | | 2.93 | | | | 2.91 | | | | 0.06 | | | | — | | | | — | | | | 0.06 | | | | 13.23 | | | | 28.16 | | |
| 12-31-09 | | | 8.88 | | | | 0.01 | | | | 3.29 | | | | 3.30 | | | | 0.51 | | | | 1.29 | | | | — | | | | 1.80 | | | | 10.38 | | | | 39.40 | | |
| 12-31-08 | | | 15.72 | | | | (0.01 | )• | | | (5.95 | ) | | | (5.96 | ) | | | 0.04 | | | | 0.84 | | | | — | | | | 0.88 | | | | 8.88 | | | | (39.82 | ) | |
| 12-31-07 | | | 13.92 | | | | 0.03 | • | | | 2.05 | | | | 2.08 | | | | 0.01 | | | | 0.27 | | | | — | | | | 0.28 | | | | 15.72 | | | | 15.00 | | |
| | | | | | | | | | | | | | — | | | | | | — | | | | | | | | |
| Class S2 | | | |
| 12-31-11 | | | 13.02 | | | | (0.05 | ) | | | (1.41 | ) | | | (1.46 | ) | | | 0.01 | | | | — | | | | — | | | | 0.01 | | | | 11.55 | | | | (11.19 | ) | |
| 12-31-10 | | | 10.23 | | | | (0.04 | ) | | | 2.89 | | | | 2.85 | | | | 0.06 | | | | — | | | | — | | | | 0.06 | | | | 13.02 | | | | 28.02 | | |
05-28-09(6)-
12-31-09 | | | 9.95 | | | | 0.01 | • | | | 2.10 | | | | 2.11 | | | | 0.54 | | | | 1.29 | | | | — | | | | 1.83 | | | | 10.23 | | | | 23.22 | | |
| | | Ratios to average
net assets | | Supplemental data | | Ratios and supplemental
data including the master fund | |
| | | Gross expenses excluding expenses of the master fund(2)(3)(4) | | Net expenses excluding expenses of the master fund(2)(3)(4) | | Net investment income (loss) excluding expenses of the master fund(2)(3)(4) | | Net assets, end of year or period | | Portfolio turnover rate(5) | | Expenses including gross expenses of the master fund(2)(4) | | Expenses including expenses net of voluntary waivers, if any, of the master fund(2)(4) | | Expenses including expenses net of all reductions of the master fund(2)(4) | | Portfolio turnover rate of the master fund | |
| | | | | | | | | | | | | | | | | | | | |
Year or period
ended | | (%) | | (%) | | (%) | | ($000's) | | (%) | | (%) | | (%) | | (%) | | (%) | |
| ING Fidelity® VIP Mid Cap Portfolio | |
| Class ADV | |
| 12-31-11 | | | 0.55 | | | | 0.55 | | | | (0.54 | ) | | | 1,783 | | | | 6 | | | | 1.46 | | | | 1.46 | | | | 1.45 | | | | 84 | | |
| 12-31-10 | | | 0.55 | | | | 0.55 | | | | (0.41 | ) | | | 3,453 | | | | 13 | | | | 1.46 | | | | 1.46 | | | | 1.45 | | | | 25 | | |
| 12-31-09 | | | 0.55 | | | | 0.55 | | | | (0.10 | ) | | | 2,613 | | | | 13 | | | | 1.48 | | | | 1.48 | | | | 1.48 | | | | 57 | | |
| 12-31-08 | | | 0.55 | | | | 0.55 | | | | (0.20 | ) | | | 1,953 | | | | 13 | | | | 1.48 | | | | 1.48 | | | | 1.47 | | | | 145 | | |
| 12-31-07 | | | 0.55 | | | | 0.55 | | | | (0.06 | ) | | | 3,315 | | | | 12 | | | | 1.46 | | | | 1.46 | | | | 1.45 | | | | 113 | | |
| | | | | | | | | | | | | | | | | | | | | | |
| Class S | |
| 12-31-11 | | | 0.30 | | | | 0.30 | | | | (0.28 | ) | | | 49,159 | | | | 6 | | | | 1.21 | | | | 1.21 | | | | 1.20 | | | | 84 | | |
| 12-31-10 | | | 0.30 | | | | 0.30 | | | | (0.18 | ) | | | 72,007 | | | | 13 | | | | 1.21 | | | | 1.21 | | | | 1.20 | | | | 25 | | |
| 12-31-09 | | | 0.30 | | | | 0.30 | | | | 0.15 | | | | 63,154 | | | | 13 | | | | 1.23 | | | | 1.23 | | | | 1.23 | | | | 57 | | |
| 12-31-08 | | | 0.30 | | | | 0.30 | | | | (0.06 | ) | | | 49,238 | | | | 13 | | | | 1.23 | | | | 1.23 | | | | 1.22 | | | | 145 | | |
| 12-31-07 | | | 0.30 | | | | 0.30 | | | | 0.20 | | | | 77,608 | | | | 12 | | | | 1.21 | | | | 1.21 | | | | 1.20 | | | | 113 | | |
| | | | | | | | | | | | | | | | | | | | | | |
| Class S2 | |
| 12-31-11 | | | 0.55 | | | | 0.45 | | | | (0.43 | ) | | | 3 | | | | 6 | | | | 1.46 | | | | 1.36 | | | | 1.35 | | | | 84 | | |
| 12-31-10 | | | 0.55 | | | | 0.45 | | | | (0.33 | ) | | | 4 | | | | 13 | | | | 1.46 | | | | 1.36 | | | | 1.35 | | | | 25 | | |
05-28-09(6)-
12-31-09 | | | 0.55 | | | | 0.45 | | | | 0.11 | | | | 3 | | | | 13 | | | | 1.48 | | | | 1.38 | | | | 1.38 | | | | 57 | | |
(1) Total return is calculated assuming reinvestment of all dividends, capital gain distributions and return of capital, if any, at net asset value. Total return for periods less than one year is not annualized. The Portfolio's performance is shown without the imposition of any expenses or charges, which are, or may be, imposed under your annuity contract. Total returns would have been lower if such expenses or charges were included.
(2) Annualized for periods less than one year.
(3) Expense ratios do not include fees and expenses charged under the variable annuity contract or variable life insurance policy.
(4) Expense ratios reflect operating expenses of a Portfolio. Expenses before reductions/additions do not reflect amounts reimbursed by the Investment Adviser and/or Distributor or reductions from brokerage commission recapture arrangements or other expense offset arrangements and do not represent the amount paid by a Portfolio during periods when reimbursements or reductions occur. Expenses net of fee waivers reflect expenses after reimbursement by the Investment Adviser and/or Distributor but prior to reductions from brokerage commission recapture arrangements or other expense offset arrangements. Expenses net of all reductions/ additions represent the net expenses paid by a Portfolio. Net investment income (loss) is net of all such additions or reductions.
(5) Portfolio turnover rate is calculated based on the Portfolio's purchases or sales of the master fund.
(6) Commencement of operations.
• Calculated using average number of shares outstanding throughout the period.
* Amount is less than $0.005 or more than $(0.005).
See Accompanying Notes to Financial Statements
15
NOTES TO FINANCIAL STATEMENTS AS OF DECEMBER 31, 2011
NOTE 1 — ORGANIZATION
ING Partners, Inc. (the "Company") is an open-end management investment company registered under the Investment Company Act of 1940, as amended (the "1940 Act"). It was incorporated under the laws of Maryland on May 7, 1997. The Articles of Incorporation permit the Company to offer separate series ("Portfolios"), each of which has its own investment objective, policies and restrictions. The Portfolios serve as investment options underlying variable insurance products offered by Directed Services LLC ("DSL" or the "Investment Adviser") and its insurance company affiliates. The Company currently consists of forty-three active separate investment series. The three Portfolios included in this report are: ING Fidelity® VIP Contrafund® Portfolio* ("Contrafund"); ING Fidelity® VIP Equity-Income Portfolio* ("Equity-Income") and ING Fidelity® VIP Mid Cap Portfolio* ("Mid Cap") (each, a "Portfolio" and collectively, the "Portfolios").
Each Portfolio in this report operates as a "feeder fund" and seeks to achieve its investment objective by investing all its investable assets in a separate mutual fund ("Master Fund"). Each Master Fund is a registered open-end management investment company that has the same investment objective and substantially similar policies as each corresponding Portfolio. As of December 31, 2011, Contrafund, Equity-Income and Mid Cap Portfolios each held 2.11%, 0.34% and 0.74% of their respective Master Fund. Each Master Fund directly acquires securities and a Portfolio investing in the Master Fund acquires an indirect interest in those securities.
The Portfolios offer three classes of shares, referred to as Adviser Class ("Class ADV"), Service Class ("Class S"), and Service 2 Class ("Class S2"). Each share class represents interests in the same portfolio of investments of the particular Portfolio, and shall be identical in all respects, except for the impact of expenses, voting, exchange privileges, and any different shareholder services relating to a class of shares. Shares of the Portfolios may be offered to separate accounts ("Separate Accounts") of insurance companies as investment options in connection with variable annuity contracts and variable life insurance policies ("Variable Contracts") and to certain of the Portfolios' investment advisers and their affiliates. In the future, shares may also be offered to qualified pension and retirement plans ("Qualified Plans") outside the Separate Account context. Shares of the Portfolios are not currently offered directly to Qualified Plans or custodial accounts.
DSL serves as the investment adviser to the Portfolios. ING Funds Services, LLC serves as the administrator ("IFS" or the "Administrator") for the Portfolios. ING Investments Distributor, LLC ("IID" or the "Distributor") serves as the principal underwriter to the Portfolios.
The Investment Adviser, IFS and IID are indirect, wholly-owned subsidiaries of ING Groep N.V. ("ING Groep"). ING Groep is a global financial institution of Dutch origin offering banking, investments, life insurance and retirement services.
ING Groep has adopted a formal restructuring plan that was approved by the European Commission in November 2009 under which the ING life insurance businesses, including the retirement services and investment management businesses, which include the Investment Adviser and its affiliates, would be separated from ING Groep by the end of 2013. To achieve this goal, ING Groep announced in November 2010 that it plans to pursue two separate initial public offerings: one a U.S. focused offering that would include U.S. based insurance, retirement services, and investment management operations; and the other a European based offering for European and Asian based insurance and investment management operations. ING Groep recently announced that it will explore options other than an initial public offering for its Asian insurance and investment management businesses. There can be no assurance that the restructuring plan will be carried out through two offerings or at all.
The restructuring plan and the uncertainty about its implementation, whether implemented through the planned public offerings or through other means, in whole or in part, may be disruptive to the businesses of ING entities, including the ING entities that service the Portfolios, and may cause, among other things, interruption or reduction of business and services, diversion of management's attention from day-to-day operations, and loss of key employees or customers. A failure to complete the offerings or other means of implementation on favorable terms could have a material adverse impact on the operations of the businesses subject to the restructuring plan. The restructuring plan may result in the Investment Adviser's loss of access to services and resources of ING Groep, which could adversely affect its business and profitability. In addition, the divestment of ING businesses, including the Investment Adviser, may potentially be deemed a "change of control" of each entity. A change of control would result in the termination of the Portfolios' advisory agreement,
* Fidelity and Contrafund are registered trademarks of FMR Corp.
16
NOTES TO FINANCIAL STATEMENTS AS OF DECEMBER 31, 2011 (CONTINUED)
NOTE 1 — ORGANIZATION (continued)
which would trigger the necessity for new agreement that would require approval of the board, and may trigger the need for shareholder approval. Currently, the Investment Adviser does not anticipate that the restructuring will have a material adverse impact on the Portfolios or their operations and administration.
NOTE 2 — SIGNIFICANT ACCOUNTING POLICIES
The following significant accounting policies are consistently followed by the Portfolios in the preparation of their financial statements. Such policies are in conformity with U.S. generally accepted accounting principles ("GAAP") for investment companies.
A. Security Valuation. All investments held by the Master Funds are recorded at their estimated fair value, as described below. The valuation of each Portfolio's investment in its corresponding Master Fund is based on the net asset value of that Master Fund each business day. Valuation of the investments by the Master Funds is discussed in the Master Funds' notes to their financial statements, which accompany this report.
Fair value is defined as the price that the Portfolios would receive to sell an asset or pay to transfer a liability in an orderly transaction between market participants at the measurement date. Each investment asset or liability of the Portfolios is assigned a level at measurement date based on the significance and source of the inputs to its valuation. Quoted prices in active markets for identical securities are classified as "Level 1," inputs other than quoted prices for an asset or liability that are observable are classified as "Level 2" and unobservable inputs, including the adviser's or sub-adviser's judgment about the assumptions that a market participant would use in pricing an asset or liability are classified as "Level 3." The inputs used for valuing securities are not necessarily an indication of the risks associated with investing in those securities. Securities valued at amortized cost are generally considered to be Level 2 securities under applicable accounting rules. A table summarizing the Portfolios' investments under these levels of classification is included following the Portfolios of Investments.
For the year ended December 31, 2011, there have been no significant changes to the fair valuation methodologies.
B. Security Transactions and Revenue Recognition. Security transactions are accounted for on the trade date. Dividend income received from the funds is recognized on the ex-dividend date and is recorded as income distributions in the Statements of Operations. Capital gain distributions received from the funds are recognized on the ex-dividend date and are recorded on the Statements of Operations as such. Costs used in determining realized gains and losses on the sales of investment securities are on the basis of specific identification.
C. Distributions to Shareholders. The Portfolios record distributions to their shareholders on the ex-dividend date. Each Portfolio distributes dividends and capital gains, if any, annually. The Portfolios may make distributions on a more frequent basis to comply with the distribution requirements of the Internal Revenue Code. The characteristics of income and gains to be distributed are determined in accordance with income tax regulations, which may differ from U.S. generally accepted accounting principles for investment companies.
D. Federal Income Taxes. It is the policy of each Portfolio to comply with the requirements of subchapter M of the Internal Revenue Code that are applicable to regulated investment companies and to distribute substantially all of its net investment income and any net realized capital gains to its shareholders. Therefore, a federal income tax or excise tax provision is not required. Management has considered the sustainability of the Portfolios' tax positions taken on federal income tax returns for all open tax years in making this determination. No capital gain distributions shall be made until the capital loss carryforwards have been fully utilized or expire.
E. Use of Estimates. The preparation of financial statements in conformity with U.S. generally accepted accounting principles requires management to make estimates and assumptions that affect the reported amounts of assets and liabilities and disclosure of contingent assets and liabilities at the date of the financial statements and the reported amounts of increases and decreases in net assets from operations during the reporting period. Actual results could differ from those estimates.
F. Indemnifications. In the normal course of business, the Company may enter into contracts that provide certain indemnifications. The Company's maximum
17
NOTES TO FINANCIAL STATEMENTS AS OF DECEMBER 31, 2011 (CONTINUED)
NOTE 2 — SIGNIFICANT ACCOUNTING POLICIES (continued)
exposure under these arrangements is dependent on future claims that may be made against the Portfolios and, therefore, cannot be estimated; however, based on experience, management considers risk of loss from such claims remote.
NOTE 3 — INVESTMENT MANAGEMENT ADMINISTRATIVE FEES, AND MASTER FUNDS EXPENSES
Fidelity Management & Research Company ("FMR") serves as investment adviser to each Master Fund. FMR has day-to-day responsibility for choosing investments for each Master Fund. As shareholders of the Master Funds, the Portfolios indirectly pay a portion of the master-level management fee(1).
Each Master Fund, VIP Contrafund® Portfolio, VIP Equity-Income Portfolio and VIP Mid Cap Portfolio, pays FMR a management fee for advisory services at annual rates of 0.56%, 0.46% and 0.56%, of each respective Master Fund's current average daily net assets. Pursuant to its Investment Management Agreement with the Company, if the respective Portfolio does not invest substantially all of its assets in another investment company, DSL may charge an annual advisory fee at annual rates equal to 0.58%, 0.48% and 0.58% of average daily net assets for Contrafund, Equity-Income and Mid Cap, respectively. If a Portfolio invests substantially all of its assets in another investment company, DSL does not charge an advisory fee. Each Portfolio anticipates investing substantially all of its assets in another investment company.
If a Portfolio invests substantially all of its assets in another investment company, IFS will charge an administration fee of 0.05% of average daily net assets for that Portfolio. Pursuant to its administration agreement with the Portfolios, if the respective Portfolio does not invest substantially all of its assets in another investment company, IFS may receive an annual administration fee equal to 0.15%, 0.15% and 0.17% of average daily net assets for Contrafund, Equity-Income and Mid Cap, respectively.
For the year ended December 31, 2011, each Portfolio invested substantially all of its assets in its respective Master Fund.
(1) Investors in the Portfolios should recognize that an investment in the Portfolios bears not only a proportionate share of the expenses of the Portfolios (including operating costs and management fees, if any), but also indirectly similar expenses of the Master Funds in which each Portfolio invests. Investors also bear their proportionate share of any sales charges incurred by the Portfolios related to the purchase of shares of the mutual fund investments.
NOTE 4 — INVESTMENT IN UNDERLYING PORTFOLIOS
For the year ended December 31, 2011, the cost of purchases and proceeds from sales of the Master Funds were as follows:
| | | Purchases | | Sales | |
| Contrafund | | $ | 28,511,744 | | | $ | 59,534,270 | | |
| Equity-Income | | | 4,497,951 | | | | 10,479,580 | | |
| Mid Cap | | | 4,259,863 | | | | 21,690,865 | | |
NOTE 5 — DISTRIBUTION AND SERVICE FEES
Each Portfolio has adopted a Shareholder Servicing Plan ("Service Plan") for the Class S, Class S2 and Class ADV shares of each Portfolio. Under the Service Plan, a Portfolio makes payments at an annual rate of 0.25% of the Portfolio's average daily net assets attributable to its Class S, Class S2, and Class ADV shares.
Each Portfolio has adopted a Plan of Distribution pursuant to Rule 12b-1 under the 1940 Act ("Distribution Plan") for the Classes ADV and S2 shares of each Portfolio. The Distribution Plan provides for a distribution fee, payable to IID as the Distributor at an annual rate of 0.25% of each Portfolio's average daily net assets attributable to Class ADV and Class S2 shares. The Distributor has contractually agreed to waive a portion of each distribution fee equal to 0.10% of each Portfolio's average daily net assets attributable to the distribution fee paid by Class S2 shares, so that the actual fee paid is an annual rate of 0.15%. The expense waiver will continue through at least May 1, 2012.
NOTE 6 — OTHER TRANSACTIONS WITH AFFILIATES AND RELATED PARTIES
At December 31, 2011, the Portfolios had the following amounts recorded as payable to affiliates on the accompanying Statements of Assets and Liabilities:
| Portfolio | | Accrued
Administrative
Fees | | Accrued
Shareholder
Service and
Distribution
Fees | | Total | |
| Contrafund | | $ | 13,414 | | | $ | 67,924 | | | $ | 81,338 | | |
| Equity-Income | | | 769 | | | | 3,944 | | | | 4,713 | | |
| Mid Cap | | | 2,218 | | | | 11,473 | | | | 13,691 | | |
At December 31, 2011, the following indirect, wholly-owned subsidiary of ING Groep owned more than 5% of the following Portfolios:
| Subsidiary | | Portfolios | | Percentage | |
ING Life Insurance and
Annuity Company | | Contrafund | | | 99.51 | % | |
| | | Equity-Income | | | 98.12 | % | |
| | | Mid Cap | | | 99.17 | % | |
Control is defined by the 1940 Act as the beneficial ownership, either directly or through one or more
18
NOTES TO FINANCIAL STATEMENTS AS OF DECEMBER 31, 2011 (CONTINUED)
NOTE 6 — OTHER TRANSACTIONS WITH AFFILIATES AND RELATED PARTIES (continued)
controlled companies, of more than 25% of the voting securities of a company. The 1940 Act defines affiliates as companies that are under common control. Therefore, because the Portfolios have a common owner that owns over 25% of the outstanding securities of the Portfolios, they may be deemed to be affiliates of each other. Investment activities of these shareholders could have a material impact on the Portfolios.
The Company has adopted a Deferred Compensation Plan (the "Plan"), which allows eligible non-affiliated directors as described in the Plan to defer the receipt of all or a portion of the directors fees payable. Amounts deferred are treated as though invested in various "notional" funds advised by DSL until distribution in accordance with the Plan.
NOTE 7 — CAPITAL SHARES
Transactions in capital shares and dollars were as follows:
| | | Shares sold | | Shares
issued
in merger | | Reinvestment
of
distributions | | Shares
redeemed | | Net increase
(decrease)
in shares
outstanding | | Shares sold | | Proceeds
from shares
issued
in merger | | Reinvestment
of
distributions | | Shares
redeemed | | Net increase
(decrease) | |
| Year or period ended | | # | | # | | # | | # | | # | | ($) | | ($) | | ($) | | ($) | | ($) | |
| Contrafund | | | |
| Class ADV | | | |
| | 12-31-11 | | | | 178,663 | | | | — | | | | 3,273 | | | | (164,564 | ) | | | 17,372 | | | | 1,704,656 | | | | — | | | | 26,874 | | | | (1,533,583 | ) | | | 197,947 | | |
| | 12-31-10 | | | | 52,094 | | | | 2,701 | | | | 3,300 | | | | (153,998 | ) | | | (95,903 | ) | | | 443,515 | | | | 21,192 | | | | 26,135 | | | | (1,280,629 | ) | | | (789,787 | ) | |
| Class S | | | |
| | 12-31-11 | | | | 2,607,763 | | | | — | | | | 305,677 | | | | (6,213,144 | ) | | | (3,299,704 | ) | | | 25,170,387 | | | | — | | | | 2,518,772 | | | | (57,979,907 | ) | | | (30,290,748 | ) | |
| | 12-31-10 | | | | 1,785,342 | | | | 2,245,900 | | | | 356,161 | | | | (12,154,730 | ) | | | (7,767,327 | ) | | | 15,240,097 | | | | 17,692,250 | | | | 2,831,482 | | | | (101,972,277 | ) | | | (66,208,448 | ) | |
| Class S2 | | | |
| | 12-31-11 | | | | — | | | | — | | | | — | | | | — | | | | — | | | | — | | | | — | | | | — | | | | — | | | | — | | |
| | 12-31-10 | | | | — | | | | 448 | | | | — | | | | (448 | ) | | | — | | | | — | | | | 3,483 | | | | — | | | | (3,483 | ) | | | — | | |
| Equity-Income | | | |
| Class ADV | | | |
| | 12-31-11 | | | | 2,507 | | | | — | | | | 799 | | | | (4,784 | ) | | | (1,478 | ) | | | 21,142 | | | | — | | | | 5,971 | | | | (41,049 | ) | | | (13,936 | ) | |
| | 12-31-10 | | | | 8,525 | | | | — | | | | 1,184 | | | | (21,524 | ) | | | (11,815 | ) | | | 66,577 | | | | — | | | | 8,551 | | | | (163,527 | ) | | | (88,399 | ) | |
| Class S | | | |
| | 12-31-11 | | | | 482,632 | | | | — | | | | 39,845 | | | | (1,233,182 | ) | | | (710,705 | ) | | | 4,182,027 | | | | — | | | | 300,037 | | | | (10,505,254 | ) | | | (6,023,190 | ) | |
| | 12-31-10 | | | | 267,791 | | | | — | | | | 70,696 | | | | (2,012,615 | ) | | | (1,674,128 | ) | | | 2,075,159 | | | | — | | | | 513,963 | | | | (15,842,773 | ) | | | (13,253,651 | ) | |
| Class S2 | | | |
| | 12-31-11 | | | | — | | | | — | | | | — | | | | — | | | | — | | | | — | | | | — | | | | — | | | | — | | | | — | | |
| | 12-31-10 | | | | — | | | | — | | | | — | | | | — | | | | — | | | | — | | | | — | | | | — | | | | — | | | | — | | |
| Mid Cap | | | |
| Class ADV | | | |
| | 12-31-11 | | | | 24,938 | | | | — | | | | — | | | | (134,995 | ) | | | (110,057 | ) | | | 324,819 | | | | — | | | | — | | | | (1,702,510 | ) | | | (1,377,691 | ) | |
| | 12-31-10 | | | | 57,905 | | | | — | | | | 827 | | | | (49,373 | ) | | | 9,359 | | | | 691,352 | | | | — | | | | 9,077 | | | | (552,787 | ) | | | 147,642 | | |
| Class S | | | |
| | 12-31-11 | | | | 305,282 | | | | — | | | | 8,559 | | | | (1,568,539 | ) | | | (1,254,698 | ) | | | 4,045,935 | | | | — | | | | 96,372 | | | | (19,896,498 | ) | | | (15,754,191 | ) | |
| | 12-31-10 | | | | 664,061 | | | | — | | | | 31,323 | | | | (1,338,499 | ) | | | (643,115 | ) | | | 7,808,399 | | | | — | | | | 346,740 | | | | (15,466,964 | ) | | | (7,311,825 | ) | |
| Class S2 | | | |
| | 12-31-11 | | | | — | | | | — | | | | — | | | | — | | | | — | | | | — | | | | — | | | | — | | | | — | | | | — | | |
| | 12-31-10 | | | | — | | | | — | | | | — | | | | — | | | | — | | | | — | | | | — | | | | — | | | | — | | | | — | | |
NOTE 8 — REORGANIZATIONS
On August 20, 2010, Contrafund ("Acquiring Portfolio") acquired all of the net assets of ING Fidelity® VIP Growth Portfolio ("Acquired Portfolio"), an open-end investment company in a tax-free reorganization in exchange for shares of the Acquiring Portfolio, pursuant to a plan of reorganization approved by the Acquired Portfolio's shareholders on August 10, 2010. The purposes of the transaction were to combine policies, restrictions, management, and portfolio holdings of the Acquiring and Acquired Funds. For financial reporting purposes, assets received and shares issued by the Acquiring Portfolio were recorded at fair value; however, the cost basis of the investments received from the Acquired Portfolio was carried forward to align ongoing reporting of the Acquiring Portfolio's realized and unrealized gains and losses with amounts distributable to shareholders for tax purposes.
19
NOTES TO FINANCIAL STATEMENTS AS OF DECEMBER 31, 2011 (CONTINUED)
NOTE 8 — REORGANIZATIONS (continued)
Assuming the acquisition had been completed on January 1, 2010, the beginning of the annual reporting period of the Acquiring Portfolio, the Acquiring Portfolio's pro forma results of operations for the period ended December 31, 2010, are as follows:
| Net investment income | | $ | 2,332,990 | | |
| Net realized and unrealized gain on investments | | $ | 50,855,304 | | |
| Net increase in net assets resulting from operations | | $ | 53,188,294 | | |
Because the combined investment Portfolios have been managed as a single integrated Portfolio since the acquisition was completed, it is not practicable to separate the amounts of revenue and earnings of the Acquired Portfolio that have been included in the Acquiring Portfolio's statement of operations since August 20, 2010. Net assets and unrealized appreciation as of the reorganization date were as follows:
Acquiring
Portfolio | | Acquired
Portfolio | | Total Net
Assets of Acquired
Portfolio (000s) | | Total Net
Assets of Acquiring
Portfolio (000s) | | Acquired
Capital Loss
Carryforwards (000s) | | Acquired Portfolio
Unrealized
Appreciation (000s) | | Conversion
Ratio | |
| | | ING | | | | | | | | | | | | | | | | | |
| |
| | | Fidelity® | | | | | | | | | | | | | | | | | |
| |
| | | VIP Growth | | | | | | | | | | | | | | | | | |
| |
| Contrafund | | Portfolio | | $ | 17,717 | | | $ | 288,953 | | | $ | 9,054 | | | $ | (387 | ) | | | 1.119 | | |
The net assets of Contrafund after the acquisition were $306,670,363.
NOTE 9 — FEDERAL INCOME TAXES
The amount of distributions from net investment income and net realized capital gains are determined in accordance with federal income tax regulations, which may differ from U.S. generally accepted accounting principles for investment companies. These book/tax differences may be either temporary or permanent. Permanent differences are reclassified within the capital accounts based on their federal tax-basis treatment; temporary differences are not reclassified. Key differences include the treatment of short-term capital gains, foreign currency transactions, and wash sale deferrals. Distributions in excess of net investment income and/or net realized capital gains for tax purposes are reported as return of capital.
| | | Paid-in
Capital | | Undistributed
Net Investment
Income | | Accumulated
Net Realized
Gains/(Losses) | |
| Mid Cap | | $ | (96,432 | ) | | $ | 195,897 | | | $ | (99,465 | ) | |
Dividends paid by the Portfolios from net investment income and distributions of net realized short-term capital gains are, for federal income tax purposes, taxable as ordinary income to shareholders.
The tax composition of dividends and distributions to shareholders was as follows:
| | | Year Ended
December 31, 2011 | | Year Ended
December 31, 2010 | |
| | | Ordinary
Income | | Ordinary
Income | |
| Contrafund | | $ | 2,545,671 | | | $ | 2,857,656 | | |
| Equity-Income | | | 306,066 | | | | 522,586 | | |
| Mid Cap | | | 96,376 | | | | 355,836 | | |
20
NOTES TO FINANCIAL STATEMENTS AS OF DECEMBER 31, 2011 (CONTINUED)
NOTE 9 — FEDERAL INCOME TAXES (continued)
The tax-basis components of distributable earnings and the expiration dates of the capital loss carryforwards which may be used to offset future realized capital gains for federal income tax purposes as of December 31, 2011 were:
| | | Undistributed
Ordinary | | Unrealized
Appreciation/ | | Capital Loss Carryforwards | |
| | | Income | | (Depreciation) | | Amount | | Character | | Expiration | |
| Contrafund | | $ | 1,573,956 | | | $ | (48,216,037 | ) | | $ | (895,347 | ) | | Short-term | | | 2016 | | |
| | | | | | | | (13,374,108 | ) | | Short-term | | | 2017 | | |
| | | | | | | | (57,457,080 | ) | | Short-term | | | 2018 | | |
| | | | | | | | (16,956,005 | ) | | Long-term | | | N/A | | |
| | | | | | | $ | (88,682,540 | )* | | | | | | | | | |
| Equity-Income | | | 363,705 | | | | (5,537,357 | ) | | | (4,401,655 | ) | | Short-term | | | 2017 | | |
| | | | | | | | (5,708,489 | ) | | Short-term | | | 2018 | | |
| | | | | | | | (3,196,482 | ) | | Long-term | | | N/A | | |
| | | | | | | $ | (13,306,626 | ) | | | | | | | | | |
| Mid Cap | | | — | | | | (4,474,183 | ) | | | (1,491,245 | ) | | Short-term | | | 2017 | | |
| | | | | | | | (2,015,634 | ) | | Short-term | | | 2018 | | |
| | | | | | | | (2,511,611 | ) | | Long-term | | | N/A | | |
| | | | | | | $ | (6,018,490 | ) | | | | | | | | | |
* Utilization of these capital losses is subject to annual limitations under Section 382 of the Internal Revenue Code.
The Portfolios' major tax jurisdictions are federal and Arizona. The earliest tax year that remains subject to examination by these jurisdictions is 2007.
As of December 31, 2011, no provisions for income tax would be required in the Portfolios' financial statements as a result of tax positions taken on federal and state income tax returns for open tax years. The Portfolios' federal and state income and federal excise tax returns for tax years for which the applicable statutes of limitations have not expired are subject to examination by the Internal Revenue Service and state department of revenue.
The Regulated Investment Company Modernization Act of 2010 (the "Act") was enacted on December 22, 2010. The Act makes changes to several tax rules impacting the Portfolios. In general, the provisions of the Act are effective for the Portfolios' tax year ended December 31, 2011. Although the Act provides several benefits, including the unlimited carryforward of future capital losses, there may be a greater likelihood that all or a portion of the Portfolios' pre-enactment capital loss carryforwards may expire without being utilized due to the fact that post-enactment capital losses are required to be utilized before pre-enactment capital loss carryforwards.
NOTE 10 — CONCENTRATION OF INVESTMENT RISKS
All mutual funds involve risk — some more than others — and there is always the chance that you could lose money or not earn as much as you hope. A Portfolio's risk profile is largely a factor of the principal securities in which it invests and investment techniques that it uses. For more information regarding the types of securities and investment techniques that may be used by each Portfolio and their corresponding risks, see the Portfolios' most recent Prospectus and/or the Statement of Additional Information.
The value of your investment in Contrafund, Equity-Income and Mid Cap changes with the values of the corresponding Master Fund and its investments.
Foreign Securities (All Portfolios). Investments in foreign securities may entail risks not present in domestic investments. Since securities in which a Master Fund may invest are denominated in foreign currencies, changes in the relationship of these foreign currencies to the U.S. dollar can significantly affect the value of the investments and earnings of a Master Fund. Foreign investments may also subject a Master Fund to foreign government exchange restrictions, expropriation, taxation or other political, social or economic developments, as well as changes vis-a-vis the U.S. dollar from movements in currency, and changes in security value and interest rate, all of which could affect the market and/or credit risk of a Master Fund's investments.
21
NOTES TO FINANCIAL STATEMENTS AS OF DECEMBER 31, 2011 (CONTINUED)
NOTE 11 — OTHER ACCOUNTING PRONOUNCEMENTS
In May 2011, the Financial Accounting Standards Board ("FASB") issued Accounting Standards Update ("ASU") No. 2011-04 "Amendments to Achieve Common Fair Value Measurement and Disclosure Requirements". ASU No. 2011-04 amends FASB ASC Topic 820, Fair Value Measurements and Disclosures, to establish common requirements for measuring fair value and for disclosing information about fair value measurements in accordance with GAAP and the International Financial Reporting Standards ("IFRSs"). The ASU is effective prospectively for interim and annual periods beginning after December 15, 2011. As of December 31, 2011, management of the Portfolios is currently assessing the potential impact to financial statement disclosure that may result from adopting this ASU.
NOTE 12 — SUBSEQUENT EVENTS
The Portfolios have evaluated events occurring after the Statements of Assets and Liabilities date (subsequent events), to determine whether any subsequent events necessitated adjustment to or disclosure in the financial statements. No such subsequent events were identified.
22
PORTFOLIO OF INVESTMENTS
ING FIDELITY® VIP CONTRAFUND® PORTFOLIO AS OF DECEMBER 31, 2011
| Shares | |
| |
| | Value | | Percent of
Net Assets | |
| MASTER FUND: 100.0% | |
| | 13,925,731 | | | | | | | Fidelity® VIP Contrafund® Portfolio | | $ | 315,278,550 | | | | 100.0 | | |
| | | | | Total Investments in Master Fund
(Cost $309,878,853) | | $ | 315,278,550 | | | | 100.0 | | |
| | | | | Liabilities in Excess of Other Assets | | | (35,941 | ) | | | — | | |
| | | | | Net Assets | | $ | 315,242,609 | | | | 100.0 | | |
Cost for federal income tax purposes is $363,494,587.
Net unrealized appreciation consists of:
| Gross Unrealized Appreciation | | $ | — | | |
| Gross Unrealized Depreciation | | | (48,216,037 | ) | |
| Net Unrealized Depreciation | | $ | (48,216,037 | ) | |
Fair Value Measurements^
The following is a summary of the fair valuations according to the inputs used as of December 31, 2011 in valuing the assets and liabilities:
| | | Quoted Prices
in Active Markets
for Identical Investments
(Level 1) | | Significant Other
Observable
Inputs
(Level 2) | | Significant
Unobservable
Inputs
(Level 3) | | Fair Value
at
12/31/11 | |
| Asset Table | |
| Investments, at value | |
| Master Fund | | $ | 315,278,550 | | | $ | — | | | $ | — | | | $ | 315,278,550 | | |
| Total Investments, at value | | $ | 315,278,550 | | | $ | — | | | $ | — | | | $ | 315,278,550 | | |
^ See Note 2, "Significant Accounting Policies" in the Notes to Financial Statements for additional information.
There were no significant transfers between Level 1 and 2 during the year ending December 31, 2011.
See Accompanying Notes to Financial Statements
23
PORTFOLIO OF INVESTMENTS
ING FIDELITY® VIP EQUITY-INCOME PORTFOLIO AS OF DECEMBER 31, 2011
| Shares | |
| |
| | Value | | Percent of
Net Assets | |
| MASTER FUND: 100.0% | |
| | 985,816 | | | | | | | Fidelity® VIP Equity-Income Portfolio | | $ | 18,148,880 | | | | 100.0 | | |
| | | | | Total Investments in Master Fund
(Cost $15,409,196) | | $ | 18,148,880 | | | | 100.0 | | |
| | | | | Liabilities in Excess of Other Assets | | | (3,738 | ) | | | — | | |
| | | | | Net Assets | | $ | 18,145,142 | | | | 100.0 | | |
Cost for federal income tax purposes is $23,686,237.
Net unrealized appreciation consists of:
| Gross Unrealized Appreciation | | $ | — | | |
| Gross Unrealized Depreciation | | | (5,537,357 | ) | |
| Net Unrealized Depreciation | | $ | (5,537,357 | ) | |
Fair Value Measurements^
The following is a summary of the fair valuations according to the inputs used as of December 31, 2011 in valuing the assets and liabilities:
| | | Quoted Prices
in Active Markets
for Identical Investments
(Level 1) | | Significant Other
Observable
Inputs
(Level 2) | | Significant
Unobservable
Inputs
(Level 3) | | Fair Value
at
12/31/11 | |
| Asset Table | |
| Investments, at value | |
| Master Fund | | $ | 18,148,880 | | | $ | — | | | $ | — | | | $ | 18,148,880 | | |
| Total Investments, at value | | $ | 18,148,880 | | | $ | — | | | $ | — | | | $ | 18,148,880 | | |
^ See Note 2, "Significant Accounting Policies" in the Notes to Financial Statements for additional information.
There were no significant transfers between Level 1 and 2 during the year ending December 31, 2011.
See Accompanying Notes to Financial Statements
24
PORTFOLIO OF INVESTMENTS
ING FIDELITY® VIP MID CAP PORTFOLIO AS OF DECEMBER 31, 2011
| Shares | |
| |
| | Value | | Percent of
Net Assets | |
| MASTER FUND: 100.0% | |
| | 1,783,038 | | | | | | | Fidelity® VIP Mid Cap Portfolio | | $ | 50,959,232 | | | | 100.0 | | |
| | | | | Total Investments in Master Fund
(Cost $47,580,930) | | $ | 50,959,232 | | | | 100.0 | | |
| | | | | Liabilities in Excess of Other Assets | | | (13,428 | ) | | | — | | |
| | | | | Net Assets | | $ | 50,945,804 | | | | 100.0 | | |
Cost for federal income tax purposes is $55,433,415.
Net unrealized appreciation consists of:
| Gross Unrealized Appreciation | | $ | — | | |
| Gross Unrealized Depreciation | | | (4,474,183 | ) | |
| Net Unrealized Depreciation | | $ | (4,474,183 | ) | |
Fair Value Measurements^
The following is a summary of the fair valuations according to the inputs used as of December 31, 2011 in valuing the assets and liabilities:
| | | Quoted Prices
in Active Markets
for Identical Investments
(Level 1) | | Significant Other
Observable
Inputs
(Level 2) | | Significant
Unobservable
Inputs
(Level 3) | | Fair Value
at
12/31/11 | |
| Asset Table | |
| Investments, at value | |
| Master Fund | | $ | 50,959,232 | | | $ | — | | | $ | — | | | $ | 50,959,232 | | |
| Total Investments, at value | | $ | 50,959,232 | | | $ | — | | | $ | — | | | $ | 50,959,232 | | |
^ See Note 2, "Significant Accounting Policies" in the Notes to Financial Statements for additional information.
There were no significant transfers between Level 1 and 2 during the year ending December 31, 2011.
See Accompanying Notes to Financial Statements
25
TAX INFORMATION (UNAUDITED)
Dividends paid during the year ended December 31, 2011 were as follows:
| Portfolio Name | | Type | | Per Share Amount | |
ING Fidelity®
VIP Contrafund® Portfolio | |
| Class ADV | | NII | | $ | 0.0530 | | |
| Class S | | NII | | $ | 0.0692 | | |
| Class S2 | | NII | | $ | 0.0571 | | |
ING Fidelity®
VIP Equity-Income Portfolio | |
| Class ADV | | NII | | $ | 0.1087 | | |
| Class S | | NII | | $ | 0.1231 | | |
| Class S2 | | NII | | $ | 0.1221 | | |
| Portfolio Name | | Type | | Per Share Amount | |
| ING Fidelity® VIP Mid Cap Portfolio | |
| Class ADV | | NII | | $ | — | | |
| Class S | | NII | | $ | 0.0197 | | |
| Class S2 | | NII | | $ | 0.0120 | | |
NII — Net investment income
Of the ordinary distributions made during the year ended December 31, 2011, the following percentages qualify for the dividends received deduction (DRD) available to corporate shareholders:
| ING Fidelity® VIP Contrafund® Portfolio | | | 100.00 | % | |
| ING Fidelity® VIP Equity-Income Portfolio | | | 100.00 | % | |
| ING Fidelity® VIP Mid Cap Portfolio | | | 100.00 | % | |
Above figures may differ from those cited elsewhere in this report due to differences in the calculation of income and gains under U.S. generally accepted accounting principles (book) purposes and Internal Revenue Service (tax) purposes.
Shareholders are strongly advised to consult their own tax advisers with respect to the tax consequences of their investments in the Portfolios. In January, shareholders, excluding corporate shareholders, receive an IRS 1099-DIV regarding the federal tax status of the dividends and distributions they received in the calendar year.
26
DIRECTOR AND OFFICER INFORMATION (UNAUDITED)
The business and affairs of the Company are managed under the direction of the Company's Board. A Director who is not an interested person of the Company, as defined in the 1940 Act, is an independent director ("Independent Director"). The Directors and Officers of the Company are listed below. The Statement of Additional Information includes additional information about directors of the Company and is available, without charge, upon request at (800) 992-0180.
Name, Address
and Age | | Position(s)
held with the
Company | | Term of
Office and
Length of
Time
Served(1) | | Principal
Occupation(s) -
during the
Past 5 Years | | Number of
Portfolios in
Fund Complex
Overseen
by Director(2) | | Other
Board Positions
held by
Director | |
| Independent Directors: | |
|
Colleen D. Baldwin
7337 East Doubletree Ranch Rd.
Suite 100
Scottsdale, Arizona 85258
Age: 51 | | Director | | November 2007 - Present | | President, Glantuam Partners, LLC, a business consulting firm (January 2009 - Present) and Consultant (January 2005 - Present). | | | 140 | | | None. | |
|
John V. Boyer
7337 East Doubletree Ranch Rd.
Suite 100
Scottsdale, Arizona 85258
Age: 58 | | Director | | November 1997 - Present | | President and Chief Executive Officer, Bechtler Arts Foundation, an arts and education foundation (January 2008 - Present). Formerly, Consultant (July 2007 - February 2008) and President and Chief Executive Officer, Franklin and Eleanor Roosevelt Institute, a public policy foundation (March 2006 - July 2007). | | | 140 | | | None. | |
|
Patricia W. Chadwick
7337 East Doubletree Ranch Rd.
Suite 100
Scottsdale, Arizona 85258
Age: 63 | | Director | | January 2006 - Present | | Consultant and President, Ravengate Partners LLC, a consulting firm that provides advice regarding financial markets and the global economy (January 2000 - Present). | | | 140 | | | Wisconsin Energy Corporation (June 2006 - Present) and The Royce Fund, 35 Funds (December 2009 - Present). | |
|
Peter S. Drotch
7337 East Doubletree Ranch Rd.
Suite 100
Scottsdale, Arizona 85258
Age: 70 | | Director | | November 2007 - Present | | Retired. | | | 140 | | | First Marblehead Corporation (September 2003 - Present). | |
|
J. Michael Earley
7337 East Doubletree Ranch Rd.
Suite 100
Scottsdale, Arizona 85258
Age: 66 | | Director | | January 2005 - Present | | Retired. Formerly, Banking President and Chief Executive Officer, Bankers Trust Company, N.A., Des Moines (June 1992 - December 2008). | | | 140 | | | None. | |
|
Patrick W. Kenny
7337 East Doubletree Ranch Rd.
Suite 100
Scottsdale, Arizona 85258
Age: 69 | | Director | | March 2002 - Present | | Retired. Formerly, President and Chief Executive Officer, International Insurance Society (June 2001 - June 2009).
140 | | | | | | Assured Guaranty Ltd. (April 2004 - Present). | |
|
Sheryl K. Pressler
7337 East Doubletree Ranch Rd.
Suite 100
Scottsdale, Arizona 85258
Age: 61 | | Director | | January 2006 - Present | | Consultant (May 2001 - Present).
140 | | | | | | Stillwater Mining Company (May 2002 - Present). | |
|
Roger B. Vincent
7337 East Doubletree Ranch Rd.
Suite 100
Scottsdale, Arizona 85258
Age: 66 | | Chairperson/Director | | January 2005 - Present | | President, Springwell Corporation, a corporate finance firm (March 1989 - Present). | | | 140 | | | UGI Corporation (February 2006 - Present) and UGI Utilities, Inc. (February 2006 - Present). | |
|
27
DIRECTOR AND OFFICER INFORMATION (UNAUDITED) (CONTINUED)
Name, Address
and Age | | Position(s)
held with the
Company | | Term of
Office and
Length of
Time
Served(1) | | Principal
Occupation(s) -
during the
Past 5 Years | | Number of
Portfolios in
Fund Complex
Overseen
by Director(2) | | Other
Board Positions
held by
Director | |
Robert W. Crispin(3)
7337 East Doubletree Ranch Rd.
Suite 100
Scottsdale, Arizona 85258
Age: 65 | | Director | | November 2007 - Present | | Retired. Formerly, Chairman and Chief Executive Officer, ING Investment Management Co. (July 2001 - December 2007). | | | 140 | | | Intact Financial Corporation (December 2004 - Present) and PFM Group (November 2010 - Present). | |
|
Shaun P. Mathews(3)
7337 East Doubletree Ranch Rd.
Suite 100
Scottsdale, Arizona 85258
Age: 56 | | Director | | November 2007 - Present | | President and Chief Executive Officer, ING Investments, LLC (November 2006 - Present). | | | 177 | | | ING Capital Corporation, LLC (December 2005 - Present). | |
|
(1) Directors serve until their successors are duly elected and qualified. The tenure of each Director is subject to the Board's retirement policy which states that each duly elected or appointed Director who is not an "interested person" of the Company, as defined in the 1940 Act, as amended ("Independent Directors"), shall retire from service as a Director at the conclusion of the first regularly scheduled quarterly meeting of the Board that is held after the Director reaches the age of 72. A unanimous vote of the Board may extend the retirement date of a Director for up to one year. An extension may be permitted if the retirement would trigger a requirement to hold a meeting of shareholders of the Company under applicable law, whether for purposes of appointing a successor to the Director or if otherwise necessary under applicable law, in which case the extension would apply until such time as the shareholder meeting can be held or is no longer needed.
(2) Except for Mr. Mathews and for the purposes of this table "ING Fund Complex" means the following investment companies: ING Asia Pacific High Dividend Equity Income Fund; ING Emerging Markets High Dividend Equity Fund; ING Emerging Markets Local Bond Fund; ING Equity Trust; ING Funds Trust; ING Global Equity Dividend and Premium Opportunity Fund; ING Global Advantage and Premium Opportunity Fund; ING Infrastructure, Industrials and Materials Fund; ING International High Dividend Equity Income Fund; ING Investors Trust; ING Mayflower Trust; ING Mutual Funds; ING Partners, Inc.; ING Prime Rate Trust; ING Risk Managed Natural Resources Fund; ING Senior Income Fund; ING Separate Portfolios Trust; ING Variable Insurance Trust; and ING Variable Products Trust. For Mr. Mathews, the ING Fund Complex also includes the following investment companies: ING Balanced Portfolio, Inc.; ING Intermediate Bond Portfolio; ING Money Market Portfolio; ING Series Fund, Inc.; ING Strategic Allocation Portfolios, Inc.; ING Variable Funds; and ING Variable Portfolios, Inc.. Therefore, for the purposes of this table with reference to Mr. Mathews, "Fund Complex" includes these investment companies. The number of funds in the ING Fund Complex is as of January 31, 2012.
(3) Messrs. Crispin and Matthews are deemed "Interested Persons" of the Trust because of their current or prior affiliation with ING Groep, N.V., the parent corporation of the Investment Adviser(s) and the Distributor.
28
DIRECTOR AND OFFICER INFORMATION (UNAUDITED) (CONTINUED)
Name, Address
and Age | | Position(s)
Held With the Company | | Term of Office and
Length of Time Served(1) | | Principal Occupation(s) - During the
Past 5 Years | |
Shaun P. Mathews
7337 East Doubletree Ranch Rd.
Suite 100
Scottsdale, Arizona 85258
Age: 56 | | President and Chief Executive Officer | | November 2006 - Present | | President and Chief Executive Officer, ING Investments, LLC (November 2006 - Present). | |
|
Michael J. Roland
7337 East Doubletree Ranch Rd.
Suite 100
Scottsdale, Arizona 85258
Age: 53 | | Executive Vice President | | January 2005 - Present | | Chief Compliance Officer, Directed Services LLC and ING Investments, LLC (March 2011 - Present) and Executive Vice President and Chief Operating Officer, ING Investments, LLC and ING Funds Services, LLC (January 2007 - Present). Formerly, Chief Compliance Officer, ING Funds (March 2011 - February 2012). | |
|
Stanley D. Vyner
230 Park Avenue
New York, New York 10169
Age: 61 | | Executive Vice President
Chief Investment Risk Officer | | January 2005 - Present
September 2009 - Present | | Executive Vice President, ING Investments, LLC (July 2000 - Present) and Chief Investment Risk Officer, ING Investments, LLC (January 2003 - Present). | |
|
Kevin M. Gleason
7337 East Doubletree Ranch Rd.
Suite 100
Scottsdale, Arizona 85258
Age: 45 | | Chief Compliance Officer | | February 2012 - Present | | Chief Compliance Officer, ING Funds (February 2012 - Present). Formerly, Assistant General Counsel and Assistant Secretary, The Northwestern Mutual Life Insurance Company, (June 2004 - January 2012). | |
|
Kimberly A. Anderson
7337 East Doubletree Ranch Rd.
Suite 100
Scottsdale, Arizona 85258
Age: 47 | | Senior Vice President | | January 2005 - Present | | Senior Vice President, ING Investments, LLC (October 2003 - Present). | |
|
Todd Modic
7337 East Doubletree Ranch Rd.
Suite 100
Scottsdale, Arizona 85258
Age: 44 | | Senior Vice President, Chief/Principal Financial Officer and Assistant Secretary | | March 2005 - Present | | Senior Vice President, ING Funds Services, LLC (March 2005 - Present). | |
|
Robert Terris
7337 East Doubletree Ranch Rd.
Suite 100
Scottsdale, Arizona 85258
Age: 41 | | Senior Vice President | | May 2006 - Present | | Senior Vice President, Head of Division Operations, ING Funds Services, LLC (May 2006 - Present). | |
|
Gregory K. Wilson
7337 East Doubletree Ranch Rd.
Suite 100
Scottsdale, Arizona 85258
Age: 52 | | Senior Vice President | | September 2011 - Present | | Vice President - Fund Compliance, ING Funds Services, LLC (October 2009 - Present). Formerly, Finance Director, ING Funds Services, LLC (September 2006 - October 2009). | |
|
Robyn L. Ichilov
7337 East Doubletree Ranch Rd.
Suite 100
Scottsdale, Arizona 85258
Age: 44 | | Vice President and Treasurer | | January 2005 - Present | | Vice President and Treasurer, ING Funds Services, LLC (November 1995 - Present) and ING Investments, LLC (August 1997 - Present). | |
|
Maria M. Anderson
7337 East Doubletree Ranch Rd.
Suite 100
Scottsdale, Arizona 85258
Age: 53 | | Vice President | | January 2005 - Present | | Vice President, ING Funds Services, LLC (September 2004 - Present). | |
|
Lauren D. Bensinger
7337 East Doubletree Ranch Rd.
Suite 100
Scottsdale, Arizona 85258
Age: 58 | | Vice President | | January 2005 - Present | | Vice President, ING Investments, LLC and ING Funds Services, LLC (February 1996 - Present); Director of Compliance, ING Investments, LLC (October 2004 - Present); and Vice President and Money Laundering Reporting Officer, ING Investments Distributor, LLC (April 2010 - Present). Formerly, Chief Compliance Officer, ING Investments Distributor, LLC (August 1995 - April 2010) | |
|
29
DIRECTOR AND OFFICER INFORMATION (UNAUDITED) (CONTINUED)
Name, Address
and Age | | Position(s)
Held With the Company | | Term of Office and
Length of Time Served(1) | | Principal Occupation(s) - During the
Past 5 Years | |
William Evans
One Orange Way
Windsor, Connecticut 06095
Age: 39 | | Vice President | | September 2007 - Present | | Senior Vice President (March 2010 - Present) and Head of Manager Research and Selection Group, ING Investment Management (April 2007 - Present). Formerly, Vice President, U.S. Mutual Funds and Investment Products (May 2005 - April 2007). | |
|
Denise Lewis
7337 East Doubletree Ranch Rd.
Suite 100
Scottsdale, Arizona 85258
Age: 48 | | Vice President | | January 2007 - Present | | Vice President, ING Funds Services, LLC (December 2006 - Present). | |
|
Kimberly K. Springer
7337 East Doubletree Ranch Rd.
Suite 100
Scottsdale, Arizona 85258
Age: 54 | | Vice President | | March 2006 - Present | | Vice President, ING Investment Management - ING Funds (March 2010 - Present); Vice President, ING Funds Services, LLC (March 2006 - Present) and Managing Paralegal, Registration Statements (June 2003 - Present). | |
|
Craig Wheeler
7337 East Doubletree Ranch Rd.
Suite 100
Scottsdale, Arizona 85258
Age: 42 | | Assistant Vice President | | May 2008 - Present | | Assistant Vice President - Director of Tax, ING Funds Services, LLC (March 2008 - Present). Formerly, Tax Manager, ING Funds Services, LLC (March 2005 - March 2008). | |
|
Huey P. Falgout, Jr.
7337 East Doubletree Ranch Rd.
Suite 100
Scottsdale, Arizona 85258
Age: 48 | | Secretary | | August 2003 - Present | | Senior Vice President and Chief Counsel, ING Investment Management - ING Funds (March 2010 - Present). Formerly, Chief Counsel, ING Americas, U.S. Legal Services (October 2003 - March 2010). | |
|
Paul Caldarelli
7337 East Doubletree Ranch Rd.
Suite 100
Scottsdale, Arizona 85258
Age: 60 | | Assistant Secretary | | June 2010 - Present | | Vice President and Senior Counsel, ING Investment Management - ING Funds (March 2010 - Present). Formerly, Senior Counsel, ING Americas, U.S. Legal Services (April 2008 - March 2010) and Counsel, ING Americas, U.S. Legal Services (May 2005 - April 2008). | |
|
Theresa K. Kelety
7337 East Doubletree Ranch Rd.
Suite 100
Scottsdale, Arizona 85258
Age: 49 | | Assistant Secretary | | August 2003 - Present | | Vice President and Senior Counsel, ING Investment Management - ING Funds (March 2010 - Present). Formerly, Senior Counsel, ING Americas, U.S. Legal Services (April 2008 - March 2010) and Counsel, ING Americas, U.S. Legal Services (April 2003 - April 2008). | |
|
Kathleen Nichols
7337 East Doubletree Ranch Rd.
Suite 100
Scottsdale, Arizona 85258
Age: 36 | | Assistant Secretary | | May 2008 - Present | | Vice President and Counsel, ING Investment Management - ING Funds (March 2010 - Present). Formerly, Counsel, ING Americas, U.S. Legal Services (February 2008 - March 2010) and Associate, Ropes & Gray LLP (September 2005 - February 2008) | |
|
(1) The Officers hold office until the next annual meeting of the Board of Directors and until their successors shall have been elected and qualified.
30
ADVISORY CONTRACT APPROVAL DISCUSSION (UNAUDITED)
BOARD CONSIDERATION AND RE-APPROVAL OF INVESTMENT ADVISORY CONTRACTS
Section 15(c) of the Investment Company Act of 1940, as amended (the "1940 Act") provides that, after an initial period, the Portfolios' existing investment advisory contracts will remain in effect only if the Board of Directors (the "Board") of ING Partners, Inc. (the "Company"), including a majority of Board members who have no direct or indirect interest in the advisory and sub-advisory contracts, and who are not "interested persons" of the Portfolios, as such term is defined under the 1940 Act (the "Independent Directors"), annually review and approve them. Thus, at a meeting held on November 17, 2011, the Board, including a majority of the Independent Directors, considered whether to renew the investment advisory contracts (the "Advisory Contracts") between Directed Services LLC (the "Adviser") and the Portfolios.
The Independent Directors also held separate meetings on October 12 and November 15, 2011 to consider the renewal of the Advisory Contracts. As a result, subsequent references herein to factors considered and determinations made by the Independent Directors include, as applicable, factors considered and determinations made on those earlier dates by the Independent Directors.
At its November 17, 2011 meeting, the Board voted to renew the Advisory Contracts for the Portfolios. In reaching these decisions, the Board took into account information furnished to it throughout the year at regular meetings of the Board and the Board's committees, as well as information prepared specifically in connection with the annual renewal process. Determinations by the Independent Directors also took into account various factors that they believed, in light of the legal advice furnished to them by K&L Gates LLP ("K&L Gates"), their independent legal counsel, and their own business judgment, to be relevant. Further, while the Board considered at the same meeting the advisory contracts that were subject to renewal for the funds under its jurisdiction, the Directors considered each Portfolio's advisory relationship separately.
Provided below is an overview of the Board's contract approval process in general, as well as a discussion of certain specific factors that the Board considered at its renewal meeting. While the Board gave its attention to the information furnished at the request of the Independent Directors that was most relevant to its considerations, discussed below are a number of the primary factors relevant to the Board's consideration as to whether to renew the Advisory Contracts for the one-year period ending November 30, 2012. Each Board member may have accorded different weight to the various factors in reaching his or her conclusions with respect to each Portfolio's advisory arrangement.
Overview of the Contract Renewal and Approval Process
The Board follows a structured process pursuant to which it seeks and considers relevant information when it decides whether to approve new or existing advisory arrangements for the investment companies in the ING Fund complex under its jurisdiction, including the Portfolios' existing Advisory Contract. Among other actions, the Independent Directors of the Board: retain the services of independent consultants with experience in the mutual fund industry to assist the Independent Directors in working with the personnel employed by the Adviser or its affiliates who administer the Portfolios ("Management") to identify the types of information presented to the Board to inform its deliberations with respect to advisory relationships and to help evaluate that information; evaluate industry best practices in regards to the consideration of investment advisory contracts; established a specific format in which certain requested information is provided to the Board; and determine the process for reviewing such information in connection with advisory contract renewals and approvals. The result is a process (the "Contract Review Process") employed by the Board and its Independent Directors to review and analyze information in connection with the annual renewal of the ING Funds' advisory contracts, as well as the review and approval of new advisory relationships.
Since the Contract Review Process was first implemented, the Board's membership has changed substantially through periodic retirements of some Directors and the appointment and election of new Directors. In addition, the Independent Directors have reviewed and refined the renewal and approval process at least annually in order to request additional information from Management and address certain unique characteristics related to the introduction of new Portfolios.
The Board has established two Investment Review Committees (each, an "IRC"), which meet independently and, at times, jointly, and a Contracts Committee. Among other matters, the Contracts Committee provides oversight with respect to the contracts renewal and approval process, and each Portfolio is assigned to an IRC which provides oversight regarding, among other matters, the investment performance of the Adviser. The IRCs may
31
ADVISORY CONTRACT APPROVAL DISCUSSION (UNAUDITED) (CONTINUED)
apply a heightened level of scrutiny in cases where performance has lagged a Portfolio's relevant benchmark and/or selected peer group of investment companies ("Selected Peer Groups").
The type and format of the information provided to the Board or to legal counsel for the Independent Directors in connection with the contract approval and renewal process has been codified in the ING Funds' 15(c) Methodology Guide. This Guide was developed under the direction of the Independent Directors and sets out a blueprint pursuant to which the Independent Directors request certain information that they deem important to facilitate an informed review in connection with initial and annual approvals of advisory contracts.
Management provides certain of the information requested by the 15(c) Methodology Guide in Fund Analysis and Comparison Tables ("FACT sheets") prior to the Independent Directors' review of advisory arrangements (including the Portfolios' Advisory Contracts). The Independent Directors previously retained an independent firm to verify and test the accuracy of certain FACT sheet data for a representative sample of funds in the ING Fund complex. In addition, the Contracts Committee routinely employs the services of an independent consultant to assist in its review and analysis of, among other matters, the 15(c) Methodology Guide, the content and format of the FACT sheets, and Selected Peer Groups to be used by the Portfolios for certain comparison purposes during the renewal process. As part of an ongoing process, the Contracts Committee recommends or considers recommendations from Management for refinements to the 15(c) Methodology Guide and other aspects of the review process, and the Board's IRCs review benchmarks used to assess the performance of funds in the ING Fund complex.
The Board employed its process for reviewing contracts when considering the renewals of the Portfolios' Advisory Contracts that would be effective through November 30, 2012. Set forth below is a discussion of many of the Board's primary considerations and conclusions resulting from this process.
Nature, Extent and Quality of Service
In determining whether to approve the Advisory Contracts for the Portfolios for the year ending November 30, 2012, the Independent Directors received and evaluated such information as they deemed necessary regarding the nature, extent and quality of services provided to the Portfolios by the Adviser. This included information regarding the Adviser provided throughout the year at regular meetings of the Board and its committees, as well as information furnished in connection with the contract renewal meetings.
The materials requested by the Independent Directors and provided to the Board, K&L Gates and/or independent consultants that assist the Independent Directors prior to the November 17, 2011 Board meeting included, among other information, the following items for each Portfolio: (1) FACT sheets that provided information regarding the performance and expenses of the Portfolio and other similarly managed funds in its Selected Peer Group, as well as information regarding the Portfolio's investment portfolio, objective and strategies; (2) reports providing risk and attribution analyses of the Portfolio; (3) the 15(c) Methodology Guide, which describes how the FACT sheets were prepared, including the manner in which each Portfolio's benchmark and Selected Peer Group were selected and how profitability was determined; (4) responses from the Adviser and the investment adviser to the Master Funds in which the Portfolios invest to a series of questions posed by K&L Gates on behalf of the Independent Directors; (5) copies of the forms of Advisory Contracts; (6) copies of the Forms ADV for the Adviser; (7) financial statements for the Adviser; (8) a draft of a narrative summary addressing key factors the Board customarily considers in evaluating the renewals of the ING Funds' (including the Portfolio's) advisory contracts, including a written analysis for the Portfolio of how performance, fees and expenses compare to its Selected Peer Group and/or designated benchmark(s); (9) independent analyses of Portfolio performance by the Company's Chief Investment Risk Officer; (10) for open-end Portfolios, information regarding net asset flows into and out of the Portfolio; and (11) other information relevant to the Board's evaluations.
The Board also noted that ING Groep, N.V. the ultimate parent company of the Adviser, has announced plans for the separation of its U.S.-based insurance, retirement services and investment management operations, which include the Adviser, into an independent, standalone company by the end of 2013. The Board further noted that this separation may result in the Adviser's loss of access to the services and resources of its current ultimate parent company, which could adversely affect its businesses and profitability. The Board recognized that, if the separation plans are deemed to be a change of control,
32
ADVISORY CONTRACT APPROVAL DISCUSSION (UNAUDITED) (CONTINUED)
the investment advisory agreements for the Portfolios would terminate and trigger the necessity for new agreements, which would require the approval of the Board and, potentially, the shareholders of a Portfolio. The Board also recognized that there can be no assurance that the separation plan will be carried out. The Board considered the potential effects of the separation on the Portfolios and the Adviser, including its ability prior to, during and after the separation to perform the same level of service to the Portfolios as the Adviser currently provides. In this regard, the Board noted that the Adviser did not currently anticipate that the separation would have a material adverse impact on the Portfolios or their operations and administration.
Each Portfolio operates as a master-feeder fund and fully invests in a corresponding master fund (each a "Master Fund") advised by Fidelity Management and Research Company ("Fidelity"). The Board and/or K&L Gates received the following items with respect to the Fidelity: (1) responses from the Fidelity to a series of questions posed by K&L Gates on behalf of the Trustees; (2) copies of the Form ADV for Fidelity; (3) financial statements for Fidelity; and (4) other information relevant to the Board's evaluations.
For each Portfolio, Class S shares were used for purposes of certain comparisons. Class S shares generally were selected because it is a Portfolio's share class with the longest performance history. It should be noted that the performance of a Portfolio primarily reflects the performance of the Master Fund in which it invests.
The Board noted that the Portfolios also benefit from the services of the Adviser's Investment Risk Management Department (the "IRMD"), under the leadership of the Chief Investment Risk Officer, the costs of which are shared by the Portfolios and the Adviser. The Board noted that the IRMD regularly presents written materials and reports to the IRCs that focus on the investment risks of the Portfolios. The Board also noted that the IRMD provides the IRCs with analyses that are developed to assist the IRCs in identifying trends in Portfolio performance and other areas over consecutive periods. The Board noted that the services provided by the IRMD are meant to provide an additional perspective for the benefit of the Committees, which may vary from the perspective of the MRSG.
The Board also noted the proactive approach that the Adviser, working in cooperation with the IRCs, has taken to advocate or recommend, when it believed appropriate, changes designed to assist in improving the Portfolios' performance.
In considering the Portfolios' Advisory Contracts, the Board also considered the extent of benefits provided to the Portfolios' shareholders, beyond advisory services, from being part of the ING family of funds. This includes, in most cases, the right to exchange or transfer investments, without a sales charge, between the same class of shares of such funds or among ING Funds available on a product platform, and the wide range of ING Funds available for exchange or transfer. The Board also took into account the Adviser's ongoing efforts to reduce the expenses of the ING Funds through renegotiated arrangements with the ING Funds' service providers. In addition, the Board considered the efforts of the Adviser and the expenses that it incurred in recent years to help make the ING Fund complex more balanced and efficient by the launch of new investment products and the combinations of similar funds.
Further, the Board received periodic reports showing that the investment policies and restrictions for each Portfolio were consistently complied with and other periodic reports covering matters such as compliance by Adviser personnel with codes of ethics. The Board considered reports from the Company's Chief Compliance Officer ("CCO") evaluating whether the regulatory compliance systems and procedures of the Adviser are reasonably designed to assure compliance with the federal securities laws. The Board also took into account the CCO's annual and periodic reports and recommendations with respect to service provider compliance programs. In this regard, the Board also considered the policies and procedures developed by the CCO in consultation with the Board's Compliance Committee that guide the CCO's compliance oversight function.
The Board reviewed the level of staffing, quality and experience of each Portfolio's portfolio management team. The Board took into account the respective resources and reputation of the Adviser, and evaluated the ability of the Adviser to attract and retain qualified investment advisory personnel. The Board also considered the adequacy of the resources committed to the Portfolios (and other relevant funds in the ING Fund complex) by the Adviser, and whether those resources are commensurate with the needs of the Portfolios and are sufficient to sustain appropriate levels of performance and compliance needs. In this regard, the Board considered the financial stability of the Adviser.
33
ADVISORY CONTRACT APPROVAL DISCUSSION (UNAUDITED) (CONTINUED)
Based on their deliberations and the materials presented to them, the Board concluded that the advisory and related services provided by the Adviser are appropriate in light of the Portfolios' operations, the competitive landscape of the investment company business, and investor needs, and that the nature and quality of the overall services provided by the Adviser were appropriate.
Portfolio Performance
In assessing advisory relationships, the Board placed emphasis on the investment returns of each Portfolio. While the Board considered the performance reports and discussions with portfolio managers at Board and committee meetings during the year, particular attention in assessing performance was given to the FACT sheets furnished in connection with the renewal process. The FACT sheet prepared for each Portfolio included its investment performance compared to the Portfolio's Morningstar category median and/or Lipper category median, Selected Peer Group and primary benchmark. The FACT sheet performance data was as of June 30, 2011. In addition, the Board also considered at its November 17, 2011 meeting certain additional data regarding performance and Portfolio asset levels as of October 31, 2011. The Board's findings specific to each Portfolio's performance are discussed under "Portfolio-by-Portfolio Analysis" below.
Economies of Scale
When evaluating the reasonableness of advisory fee rates, the Board also considered whether economies of scale will be realized by the Adviser as a Portfolio grows larger and the extent to which any such economies are reflected in contractual fee rates. In this regard, the Board noted a Portfolio would benefit from waivers to fees payable at the Portfolio level, and considered the extent to which economies of scale could effectively be realized through expense reductions resulting from such waivers or breakpoint discounts. In evaluating fee breakpoint arrangements and economies of scale, the Independent Directors also considered prior periodic management reports and industry information on this topic.
Information Regarding Services to Other Clients
The Board requested and considered information regarding the nature of services and fee rates offered by the Adviser to other clients, including other registered investment companies and relevant institutional accounts. When fee rates offered to other clients differed materially from those charged to a Portfolio, the Board considered any underlying rationale provided by the Adviser for these differences. The Board also noted that the fee rates charged to the Portfolios and other institutional clients of the Adviser (including other investment companies) may differ materially due to, among other reasons: differences in services; different regulatory requirements associated with registered investment companies, such as the Portfolios, as compared to non-registered investment company clients; market differences in fee rates that existed when a Portfolio first was organized; differences in the original sponsors of Portfolios that now are managed by the Adviser; investment capacity constraints that existed when certain contracts were first agreed upon or that might exist at present; and different pricing structures that are necessary to be competitive in different marketing channels.
Fee Rates and Profitability
The Board reviewed and considered each contractual investment advisory fee rate, combined with the administrative fee rate, payable by each Portfolio to the Adviser. In addition, the Board considered fee waivers and expense limitations applicable to the fees payable by the Portfolios.
The Board considered: (1) the fee structure of each Portfolio as it relates to the services provided under the contracts; and (2) the potential fall-out benefits to the Adviser and their respective affiliates from their association with the Portfolios.
For each Portfolio, the Board considered information on revenues, costs and profits realized by the Adviser, which was prepared by Management in accordance with the allocation methodology (including related assumptions) specified in the 15(c) Methodology Guide. In addition, the Board considered information that it requested and was provided by Management with respect to the profitability of service providers affiliated with the Adviser.
Although the 15(c) Methodology Guide establishes certain standards for profit calculation, the Board recognized that profitability analysis on a client-by-client basis is not an exact science and there is no uniform methodology within the asset management industry for determining profitability for this purpose. In this context, the Board realized that Management's calculations regarding its costs incurred in establishing the infrastructure necessary for the Portfolios' operations may not be fully reflected in the expenses allocated to each Portfolio in determining profitability, and that the information presented may not portray all of the costs borne by the Adviser and Management or capture their entrepreneurial risk associated with
34
ADVISORY CONTRACT APPROVAL DISCUSSION (UNAUDITED) (CONTINUED)
offering and managing a mutual fund complex in the current regulatory and market environment. In addition, the Board recognized that the use of different methodologies for purposes of calculating profit data can give rise to dramatically different profit and loss results.
In making its determinations, the Board based its conclusions as to the reasonableness of the advisory fees of the Adviser primarily on the factors described for each Portfolio below. At the request of the Board, the Adviser has from time to time agreed to implement remedial actions regarding certain Portfolios. These remedial actions have included, among others: reductions in fee rates and strategy modifications.
Portfolio-by-Portfolio Analysis
The following paragraphs outline certain of the specific factors that the Board considered, and the conclusions reached, at its November 17, 2011 meeting in relation to renewing each Portfolio's current Advisory Contracts. These specific factors are in addition to those considerations discussed above. In each case, the Portfolio's performance was compared to its Morningstar category median and average, as well as its primary benchmark, a broad-based securities market index that appears in the Portfolio's prospectus. With respect to Morningstar quintile rankings, the first quintile represents the highest (best) performance and the fifth quintile represents the lowest performance. Each Portfolio's management fee and expense ratio were compared to the fees and expense ratios of the funds in its Selected Peer Group.
ING Fidelity® VIP Contrafund® Portfolio
In considering whether to approve the renewal of the Advisory Contract for ING Fidelity VIP Contrafund Portfolio, the Board considered that, based on performance data for the periods ended June 30, 2011: (1) the Portfolio underperformed its Morningstar category median for all periods presented, with the exception of the one-year and five-year periods, during which it outperformed; (2) the Portfolio underperformed its primary benchmark for all periods presented, with the exception of the one-year and five-year periods, during which it outperformed; and (3) the Portfolio is ranked in the second quintile of its Morningstar category for the one-year and five-year periods, the third quintile for the three-year period, and the fourth quintile for the most recent calendar quarter and year-to-date periods.
In analyzing this performance data, the Board took into account: (1) Management's analysis of the effect of the stock selection on the Portfolio's performance; (2) that, in March 2011, the management team for the Master Fund was modified; and (3) Management's representations regarding the reasonableness of the Portfolio's performance during certain periods.
In considering the fees payable under the Advisory Contract for the Portfolio, the Board took into account the factors described above and also considered: (1) the fairness of the compensation under an Advisory Contract: (a) under which no advisory fees are charged when the Portfolio is fully invested in Fidelity's VIP Contrafund Portfolio (the "Contrafund Master Fund"; and (b) advisory fees are charged by the Contrafund Master Fund, and indirectly borne by the Portfolio shareholders; and (2) the pricing structure (including the expense ratio to be borne by shareholders) of the Portfolio, as compared to its Selected Peer Group, including that the expense ratio for the Portfolio is below the median and the average expense ratios of the funds in its Selected Peer Group.
After its deliberation, the Board reached the following conclusions: (1) the Portfolio's management fee rate is reasonable in the context of all factors considered by the Board; (2) the Portfolio's expense ratio is reasonable in the context of all factors considered by the Board; and (3) in March 2011 there was a change to the Master Fund's portfolio management team and it is reasonable to permit the new team to establish a longer performance record for purposes of evaluating performance. Based on these conclusions and other factors, the Board voted to renew the Advisory Contract for the Portfolio for the year ending November 30, 2012. During this renewal process, different Board members may have given different weight to different individual factors and related conclusions.
ING Fidelity® VIP Equity-Income Portfolio
In considering whether to approve the renewal of the Advisory Contract for ING Fidelity VIP Equity-Income Portfolio, the Board considered that, based on performance data for the periods ended June 30, 2011: (1) the Portfolio outperformed its Morningstar category median for all periods presented, with the exception of the three-year and five-year periods, during which it underperformed; (2) the Portfolio outperformed its primary benchmark for all periods presented, with the exception of the three-year and five-year periods, during which it underperformed; and (3) the Portfolio is ranked in the second quintile of its Morningstar category for the year-to-date and one-year periods, the third quintile for the most
35
ADVISORY CONTRACT APPROVAL DISCUSSION (UNAUDITED) (CONTINUED)
recent calendar quarter and three-year periods, and the fourth quintile for the five-year period.
In analyzing this performance data, the Board took into account: (1) Management's analysis of the effect of the Portfolio's 2008 performance data on its performance during certain periods; (2) that Management will continue to monitor, and the Board or its Investment Review Committee will periodically review, the Portfolio's performance; and (3) there was a changed in the Portfolio's portfolio management team in April 2011.
In considering the fees payable under the Advisory Contract for the Portfolio, the Board took into account the factors described above and also considered: (1) the fairness of the compensation under an Advisory Contract: (a) under which no advisory fees are charged when the Portfolio is fully invested in Fidelity's VIP Equity-Income Portfolio (the "Equity-Income Master Fund"; and (b) advisory fees are charged by the Equity-Income Master Fund an indirectly borne by Portfolio shareholders; and (2) the pricing structure (including the expense ratio to be borne by shareholders) of the Portfolio, as compared to its Selected Peer Group, including that the expense ratio for the Portfolio is above the median and the average expense ratios of the funds in its Selected Peer Group.
In analyzing this fee data, the Board took into consideration Management's representations in respect to the competitiveness of the Portfolio's expense ratio.
After its deliberation, the Board reached the following conclusions: (1) the Portfolio's management fee rate is reasonable in the context of all factors considered by the Board; (2) the Portfolio's expense ratio is reasonable in the context of all factors considered by the Board; and (3) the Portfolio's performance is reasonable in the context of all factors considered by the Board. Based on these conclusions and other factors, the Board voted to renew the Advisory Contract for the Portfolio for the year ending November 30, 2012. During this renewal process, different Board members may have given different weight to different individual factors and related conclusions.
ING Fidelity® VIP Mid Cap Portfolio
In considering whether to approve the renewal of the Advisory Contract for ING Fidelity VIP Mid Cap Portfolio, the Board considered that, based on performance data for the periods ended June 30, 2011: (1) the Portfolio underperformed its Morningstar category median for all periods presented; (2) the Portfolio underperformed its primary benchmark for all periods presented; and (3) the Portfolio is ranked in the third quintile of its Morningstar category for the three-year and five-year periods, and the fifth (lowest) quintile for the most recent calendar quarter, year-to-date, and one-year periods.
In analyzing this performance data, the Board took into account: (1) that Management will continue to monitor, and the Board or its IRC will periodically review the Portfolio's investment performance; and (2) Management's confidence in the portfolio manager's ability to execute the Portfolio's investment strategy and management's expectation that the Portfolio's longer-term performance will improve.
In considering the fees payable under the Advisory Contract for the Portfolio, the Board took into account the factors described above and also considered: (1) the fairness of the compensation under an Advisory Contract: (a) under which no advisory fees are charged when the Portfolio is fully invested in Fidelity's VIP Mid Cap Portfolio (the "Mid Cap Master Fund"); and (b) advisory fees are charged by the Mid Cap Master Fund and indirectly borne by Portfolio shareholders; and (2) the pricing structure (including the expense ratio to be borne by shareholders) of the Portfolio.
In analyzing this fee data, the Board took into account Management's representations with respect to the competitiveness of the Portfolio's expense ratio.
After its deliberation, the Board reached the following conclusions: (1) the Portfolio's management fee is reasonable in the context of all factors considered by the Board; (2) the Portfolio's expense ratio is reasonable in the context of all factors considered by the Board; and (3) that Management will continue to monitor, and the Board or its IRC would periodically review, the Portfolio's performance, the Portfolio's performance is reasonable in the context of all factors considered by the Board. Based on these conclusions and other factors, the Board voted to renew the Advisory Contract for the Portfolio for the year ending November 30, 2012. During this renewal process, different Board members may have given different weight to different individual factors and related conclusions.
36
Investment Adviser
Directed Services LLC
1475 Dunwoody Drive
West Chester, Pennsylvania 19380
Administrator
ING Funds Services, LLC
7337 East Doubletree Ranch Road, Suite 100
Scottsdale, Arizona 85258
Distributor
ING Investments Distributor, LLC
7337 East Doubletree Ranch Road, Suite 100
Scottsdale, Arizona 85258
Transfer Agent
BNY Mellon Investment Servicing (U.S.) Inc.
301 Bellevue Parkway
Wilmington, Delaware 19809
Independent Registered Public Accounting Firm
KPMG LLP
Two Financial Center
60 South Street
Boston, Massachusetts 02111
Custodian
The Bank of New York Mellon
One Wall Street
New York, New York 10286
Legal Counsel
Dechert LLP
1775 I Street, N.W.
Washington, D.C. 20006
Before investing, carefully consider the investment objectives, risks, charges and expenses of the variable universal life insurance policy or variable annuity contract and the underlying variable investment options. This and other information is contained in the prospectus for the variable universal life policy or variable annuity contract and the underlying variable investment options. Obtain these prospectuses from your agent/ registered representative and read them carefully before investing.
VPAR-UFID (1211-022112)


Annual Report
December 31, 2011
Classes ADV, I, S, S2 and T
ING Partners, Inc.
| n | ING Solution Aggressive Growth Portfolio |
| n | ING Solution Conservative Portfolio |
| n | ING Solution Growth Portfolio |
| n | ING Solution Income Portfolio |
| n | ING Solution Moderate Portfolio |
| n | ING Solution 2015 Portfolio |
| n | ING Solution 2020 Portfolio |
| n | ING Solution 2025 Portfolio |
| n | ING Solution 2030 Portfolio |
| n | ING Solution 2035 Portfolio |
| n | ING Solution 2040 Portfolio |
| n | ING Solution 2045 Portfolio |
| n | ING Solution 2050 Portfolio |
| n | ING Solution 2055 Portfolio |
This report is submitted for general information to shareholders of the ING Funds. It is not authorized for distribution to prospective shareholders unless accompanied or preceded by a prospectus which includes details regarding the funds’ investment objectives, risks, charges, expenses and other information. This information should be read carefully.
MUTUAL FUNDS 
| |
TABLE OF CONTENTS
PROXY VOTING INFORMATION
A description of the policies and procedures that the Portfolios use to determine how to vote proxies related to portfolio securities is available: (1) without charge, upon request, by calling Shareholder Services toll-free at (800) 992-0180; (2) on the ING Funds’ website at www.inginvestment.com; and (3) on the U.S. Securities and Exchange Commission’s (“SEC’s”) website at www.sec.gov. Information regarding how the Portfolios voted proxies related to portfolio securities during the most recent 12-month period ended June 30 is available without charge on the ING Funds’ website at www.inginvestment.com and on the SEC’s website at www.sec.gov.
QUARTERLY PORTFOLIO HOLDINGS
The Portfolios file their complete schedule of portfolio holdings with the SEC for the first and third quarters of each fiscal year on Form N-Q. The Portfolios’ Forms N-Q are available on the SEC’s website at www.sec.gov. The Portfolios’ Forms N-Q may be reviewed and copied at the SEC’s Public Reference Room in Washington, DC, and information on the operation of the Public Reference Room may be obtained by calling (800) SEC-0330. The Portfolios’ Forms N-Q, as well as a complete portfolio of investments, are available without charge upon request from the Portfolios by calling Shareholder Services toll-free at (800) 992-0180.
PRESIDENT’S LETTER

Euro zone — continued uncertainty
Dear Shareholder,
Recent months have seen headlines and financial markets continue to focus on the ongoing euro zone debt crisis. Acknowledging that the status quo was untenable, in early December, Europe opted to move closer together rather than be torn apart. All 17 nations that use the euro and nine other European Union members agreed to a new fiscal compact that would invite closer scrutiny of individual country budgets. Ratings agencies were mostly unimpressed by these machinations; ultimately, Standard & Poor’s downgraded nine countries in the region, including formerly AAA-rated France.
With the stability of Italy and Spain now in question, the need for an effective policy response has become even more acute. The new governments in both countries will
have but a short grace period in which to demonstrate their resolve; both have been forced to pay yields at euro-era highs for newly issued bonds.
Across the Atlantic, the chasm between the two major political parties in the United States is as wide as ever, most recently evidenced by the failure of the Congressional “supercommittee” on deficit reduction. Notwithstanding the ongoing paralysis in Washington, the U.S. economy is showing new signs of momentum.
We expect the global economy to deliver positive, if uninspiring, growth into 2012 despite the euro zone’s debt problems. We believe interest rates should remain low in major advanced countries. Markets — and risk assets in general — are likely to remain vulnerable to uncertainty until there is confidence that Europe has adequately addressed its issues.
In times of uncertainty investors historically have turned to sovereign credits, especially U.S. Treasury securities. This spotlights the critical role that governments play in defining the parameters of the financial markets and serving as foundations for generating value within economies. The current trend toward fiscal austerity downplays this important function and may prolong the global economic doldrums.
How should you respond to uncertainty in your own investment program? Don’t try to time the markets. Keep your portfolio well diversified, and pay careful attention to the risks you are assuming. Talk to your financial advisor before you make any changes that might detour your portfolio from your long-term goals.
We appreciate your continued confidence in ING Funds, and we look forward to serving your investment needs in the future.
Sincerely,

Shaun Mathews
President and Chief Executive Officer
ING Funds
January 3, 2012
The views expressed in the President’s Letter reflect those of the President as of the date of the letter. Any such
views are subject to change at any time based upon market or other conditions and ING Funds disclaims any
responsibility to update such views. These views may not be relied on as investment advice and because investment
decisions for an ING Fund are based on numerous factors, may not be relied on as an indication of investment intent
on behalf of any ING Fund. Reference to specific company securities should not be construed as recommendations
or investment advice.
International investing poses special risks including currency fluctuation, economic and political risks not found in
investments that are solely domestic.
1
MARKET PERSPECTIVE: YEAR ENDED DECEMBER 31, 2011
In our semi-annual report we described how investor sentiment was generally positive through April. Many of the developed world’s economies including the U.S., seemed to be returning to health, boosted by heavy, ongoing doses of stimulative and monetary medicine. This was despite natural disasters in Japan, the violent uncertainties of the “Arab Spring” in North Africa and the Middle East, not to mention a European sovereign debt crisis.
But the mood darkened in early May 2011. Global equities in the form of the MSCI World IndexSM measured in local currencies, including net reinvested dividends, slid from May through September, losing over 17%, before a remarkable October rally clawed back about half of this. For the whole fiscal year the Index lost 5.49%. (The MSCI World IndexSM returned (5.54%) for the year ended December 31, 2011, measured in U.S. dollars.)
A confluence of factors caused the deterioration in outlook after April. That month the latest unemployment rate was reported at 8.8%, the lowest in 24 months. New private sector jobs, well above 200,000, were added in each of January, February and March. But in May the unemployment rate rebounded to 9.1%. By September the employment report showed zero new jobs created in August. But more upbeat releases in later months revised this up, and by year end the three-month average of jobs created was back to 143,000 from just 35,000 in September.
In the housing market, home prices (based on the S&P/Case-Shiller 20-City Composite Home Price Index) fell every month in the year. Sales were depressed, despite improved affordability and record low mortgage interest rates, by tight credit with many homeowners in negative equity on their properties.
Gross Domestic Product (“GDP”) growth had been reported at 3.1% (quarter-over-quarter, annualized) for the fourth quarter of 2010. On July 29, this was scaled down to 2.3%, among other revisions that showed the recession had been deeper and started earlier than previously thought. Worse, growth in the first quarter of 2011 was a barely perceptible 0.4%. When the second quarter’s figure was finalized at just 1.3%, the common assessment was that the economy was operating at “stall-speed”. There was relief in October when the first estimate of third quarter GDP growth was a much-improved 2.5%, although this was subsequently revised down to 1.8%.
Political deadlock weighed on sentiment throughout. A stopgap agreement to raise the debt ceiling did not stop Standard & Poors from downgrading the country’s credit rating. A bipartisan “Debt Super Committee” appointed to negotiate a more lasting set of budget control measures, admitted defeat on November 21.
Other keenly watched figures like retail sales and wages & salaries were stagnant in the months up to October, improved in that month and were mixed thereafter. Purchasing managers’ indices indicated expansion but not by much. Taken together, the data were inconclusive as the year ended but the consensus was that the once-feared return to recession now looked unlikely.
The euro zone’s sovereign debt crisis continued to move markets. By early August it seemed to be veering out of control. When attention turned from Greece to the much bigger bond markets of Spain and especially Italy, the European Central Bank (“ECB”) stepped in, uneasily, to buy their bonds — and some time. The threat to the euro zone banking system, where vast quantities of Italian and Spanish bonds are held, was clear.
Finally, a baby step towards closer fiscal union among euro zone countries was agreed in December, including restrictions on budget deficits with near automatic disciplinary procedures for violators. Bilateral loans of up to €200 billion would be made to the International Monetary Fund, presumably to fund rescue packages for individual nations. But it provided no lender of last resort with unlimited firepower, nor measures to promote growth and liberalize markets. Investors were under no illusions as the year ended that the crisis had been solved.
In U.S. fixed income markets, the Barclays Capital U.S. Aggregate Bond Index of investment grade bonds rose 7.84% in the fiscal year, while the Barclays Capital High Yield Bond — 2% Issuer Constrained Composite Index gained 4.96%. Most notable within the Barclays Capital U.S. Aggregate Bond Index was the remarkable 29.93% return on long-dated Treasuries, reflecting both the overall decline in risk appetite and quantitative easing.
U.S. equities, represented by the S&P 500® Index, including dividends, returned 2.11% for 2011, almost identical to the dividend yield. Sector returns ranged from (17.06%) for financials to 19.91% for utilities. The operating earnings per share of S&P 500® companies made new records in the second and third quarters of 2011, but estimates for future quarters were coming down as December ended.
In currency markets, the euro zone’s problems finally took their toll, as the dollar gained 2.34% on the euro in 2011, which dropped sharply after October. The pound was barely changed despite late weakness: the dollar gained 0.10%. But the dollar fell back against the yen by 5.35% despite Bank of Japan intervention as that currency repeatedly breached post-war high levels.
In international markets, the MSCI Japan® Index slumped 18.73% in 2011. The economy contracted for three straight quarters before finally recovering, as it struggled to recover from the earthquake and tsunami of March as well as a strong yen. The MSCI Europe ex UK® Index sank 12.87%, weighed down by the recessionary threat of the sovereign debt crisis. Euro zone growth shrunk to 0.2% in the second and third quarters and unemployment stood at 10.3%, a euro-era high. The MSCI UK® Index slipped just 1.83%. Weak euro zone demand and fiscal austerity at home depressed stocks, within which, however, the well-represented energy, staples and telecoms sectors managed positive average returns.
Parentheses denote a negative number.
All indices are unmanaged and investors cannot invest directly in an index. Past performance does not guarantee future results. The performance quoted represents past performance. Investment return and principal value of an investment will fluctuate, and shares, when redeemed, may be worth more or less than their original cost. The Portfolios’ performance is subject to change since the period’s end and may be lower or higher than the performance data shown. Please call (800) 262-3862 or log on to www.inginvestment.com to obtain performance data current to the most recent month end.
Market Perspective reflects the views of ING’s Chief Investment Risk Officer only through the end of the period, and is subject to change based on market and other conditions.
2
BENCHMARK DESCRIPTIONS
| | |
| Index | | Description |
| MSCI World IndexSM | | An unmanaged index that measures the performance of over 1,400 securities listed on exchanges in the U.S., Europe, Canada, Australia, New Zealand and the Far East. |
S&P/Case-Shiller 20-City Composite Home Price Index | | A composite index of the home price index for the top 20 Metropolitan Statistical Areas in the United States. The index is published monthly by Standard & Poor’s. |
| Barclays Capital U.S. Aggregate Bond Index | | An unmanaged index of publicly issued investment grade U.S. Government, mortgage-backed, asset-backed and corporate debt securities. |
| Barclays Capital High Yield Bond — 2% Issuer Constrained Composite Index | | An unmanaged index that includes all fixed income securities having a maximum quality rating of Ba1, a minimum amount outstanding of $150 million, and at least one year to maturity. |
| S&P 500® Index | | An unmanaged index that measures the performance of securities of approximately 500 large-capitalization companies whose securities are traded on major U.S. stock markets. |
| MSCI Japan® Index | | A free float-adjusted market capitalization index that is designed to measure developed market equity performance in Japan. |
| MSCI Europe ex UK® Index | | A free float-adjusted market capitalization index that is designed to measure developed market equity performance in Europe, excluding the UK. |
| MSCI UK® Index | | A free float-adjusted market capitalization index that is designed to measure developed market equity performance in the UK. |
| S&P Target Risk Aggressive Index | | Seeks to emphasize exposure to equity securities, maximizing opportunities for long-term capital accumulation. It may include small allocations in fixed-income securities to enhance portfolio efficiency. |
| S&P Target Risk Conservative Index | | Seeks to emphasize exposure to fixed income in order to produce a current income stream and avoid excessive volatility of returns. Equity securities are included to protect long-term purchasing power. |
| S&P Target Risk Moderate Index | | Seeks to measure the performance of an asset allocation strategy targeted to a moderate risk profile. |
| S&P Target Risk Growth Index | | Seeks to measure the performance of an asset allocation strategy targeted to a growth focused risk profile. |
| S&P Target Date Retirement Income Index | | Seeks to represent asset allocations which target an immediate retirement horizon. |
| Russell 3000® Index | | An unmanaged index that measures the performance of the largest 3000 U.S. companies representing approximately 98% of the investable U.S. equity market. |
| Barclays Capital U.S. Aggregate Bond Index | | An unmanaged index of publicly issued investment grade U.S. Government, mortgage-backed, asset-backed and corporate debt securities. |
| MSCI Europe, Australasia and Far East® Index | | An unmanaged index that measures the performance of securities listed on exchanges in Europe, Australasia and the Far East. It includes the reinvestment of dividends net of withholding taxes, but does not reflect fees, brokerage commissions or other expenses of investing. |
S&P Target Date 2015 Index, S&P Target Date 2020 Index, S&P Target Date 2025 Index, S&P Target Date 2030 Index, S&P Target Date 2035 Index, S&P Target Date 2040 Index and S&P Target Date 2045 Index | | Each seeks to represent the market consensus for asset allocations which target an approximate 2015, 2020, 2025, 2030, 2035, 2040, 2045 and beyond 2045 retirement horizon, respectively. |
3
| | |
| ING SOLUTION PORTFOLIOS | | PORTFOLIO MANAGERS’ REPORT |
The ING Solution Portfolios consist of ING Solution Aggressive Growth Portfolio, ING Solution Conservative Portfolio, ING Solution Growth Portfolio, ING Solution Income Portfolio, ING Solution Moderate Portfolio, ING Solution 2015 Portfolio, ING Solution 2020 Portfolio, ING Solution 2025 Portfolio, ING Solution 2030 Portfolio, ING Solution 2035 Portfolio, ING Solution 2040 Portfolio, ING Solution 2045 Portfolio, ING Solution 2050 Portfolio and ING Solution 2055 Portfolio (each a “Portfolio” or collectively, the “Portfolios” or the “Solution Portfolios”). Each Portfolio seeks to achieve its investment objective by investing in a combination of other ING Funds (“Underlying Funds”) according to target allocations determined by Directed Services LLC (“DSL” or “Investment Adviser”), under the guidance of an Investment Committee(1)(2). ING Investment Management Co. LLC (“Consultant”) is a consultant to the Investment Adviser. Both the Investment Adviser and the Consultant are indirect, wholly-owned subsidiaries of ING Groep.
Portfolio Specifics: The Investment Adviser uses an asset allocation process to determine each Portfolio’s investment mix. This asset allocation process can be found in the Prospectus. Each Portfolio’s approximate target investment allocations (expressed as a percentage of its net assets) among the asset classes in which the Portfolios invest are set out on page 7. As these are target allocations, the actual allocations of the Portfolios’ assets may deviate from the percentages shown.
Assets will be allocated among the Underlying Funds and markets based on judgments made by DSL. The performance of the Portfolios reflects the performance of the Underlying Funds in which each Portfolio invests and the weightings of each Portfolio’s assets in each Underlying Fund. There is a risk that the Portfolios may allocate assets to an Underlying Fund or market that underperforms other asset classes. The Portfolios may be underweighted in assets or a market that is experiencing significant returns (or relative outperformance) or overweighted in assets or a market with significant declines (or relative underperformance).
The Investment Committee allocates each Portfolio’s assets among the Underlying Funds based on advice from the Consultant.
Equity markets bounced back from a difficult third quarter to finish the year strongly, as signs of improvement in the U.S. economy drove investors back into risky assets despite continued pressure from Europe. The S&P 500® Index posted a small positive return for the year, whereas many non-U.S. markets posted losses.
All of our Solution Portfolios underperformed their respective S&P Target Date indices this year. Relative to the Solution Portfolios, S&P had the advantages of less exposure to emerging markets and commodities as well as more exposure to U.S. large cap equities which outperformed U.S. mid and small cap equities. S&P also had the advantages of a higher allocation to treasury inflation protected securities (“TIPS”) which outperformed the Barclays Capital U.S. Aggregate Bond Index.
Relative to our Strategic Benchmarks, our decision to overweight high yield at various points through the year helped performance along with our tactical moves within commodities; however, these moves were offset by our underweight to U.S. large cap equities in October and an overweight to emerging market equities in our far dated portfolios during the second quarter. Overall, tactical moves had a neutral to negative impact on performance results in 2011.
We opened the reporting period with a tactical overweight to high yield bonds offset by an underweight to core and short duration bonds. During the first quarter, we also moved to an underweight to international developed equities in favor of U.S. large cap equities. This tactical position was removed in mid-March, and our tactical exposure to high yield was scaled down.
We overweighted emerging market equities in April, and moved to overweight commodities in May after the asset class experienced a sharp correction. Throughout the remainder of May and into June economic data continued to point to a slowdown in economic activity. We removed our underweight to U.S. large cap equities and lowered our overweight to emerging markets at the end of June.
We became increasingly concerned about European sovereign debt contagion and decided to remove our commodities overweight and take profits at the beginning of August. In mid-August, an unprecedented credit rating downgrade of the U.S. sparked a global sell-off in equities and drove high yield spreads upward more than seven percentage points. We moved to an underweight in equities and commodities and trimmed our exposure to high yield. We were concerned in September that the probability of a sharp upward movement in stock market values had increased, and decided to reduce our underweight to equities and remove the underweight to commodities.
4
| | |
| PORTFOLIO MANAGERS’ REPORT | | ING SOLUTION PORTFOLIOS |
As October progressed, we began to see some of the key risks facing global markets begin to subside; we completely removed the underweight in equities and increased the allocation to high yield bonds.
During the period, we removed as underlying funds ING Artio Foreign Portfolio, ING Baron Small Cap Growth Portfolio, ING Columbia Small Cap Value II Portfolio and ING Pioneer Mid Cap Value Portfolios. We added ING Emerging Markets Equity Fund, ING International Core Fund, ING International Growth Fund and ING Mid Cap Value Fund.
The largest relative contributors and detractors came from underlying funds within alternative asset classes: domestic real estate (ING Clarion Real Estate Portfolio) benefited results and commodities (ING Goldman Sachs Commodity Strategy Portfolio) hurt results. Other contributors included inflation-protected bonds (ING BlackRock Inflation-Protected Bond Portfolio), large cap value (ING Equity Dividend Portfolio), mid cap growth (ING MidCap Opportunities Portfolio) and small cap blend equities (ING Small Company Portfolio). Additional notable contributor was the ING Mid Cap Value Fund.
Among the largest asset class relative detractors were large cap blend (ING Thornburg Value Portfolio and ING Davis N.Y. Venture Value Portfolio and ING Growth and Income Portfolio), large cap growth (ING Marsico Growth Portfolio), foreign large cap growth (ING International Growth Fund), global bonds (ING Global Bond Portfolio) and intermediate bonds (ING PIMCO Total Return Bond Portfolio).
Current Strategy and Outlook: Our central case for 2012 is for modest economic growth in the face of a risky global environment. We believe the U.S. should avoid recession in 2012 and post moderate growth as consumer exuberance will be tempered by continued household balance sheet repair as well as sluggish housing and jobs markets; our current full-year 2012 forecast is for GDP growth of 2.5%, though we may revise this figure upward given recent positive trends in consumption and housing. We believe inflation should remain contained despite a highly accommodative Federal Reserve.
Europe remains a major risk to our forecast, though we believe the region’s policymakers will be able to sidestep disaster. We believe the environment should be supportive of equities as well as most fixed income risk sectors, especially high yield. Markets are likely to remain volatile in 2012.
| (1) | The members of the Investment Committee are: William A. Evans, Paul Zemsky and Heather Hackett. |
| (2) | The investment objective of each Portfolio is described in the Portfolios’ prospectuses, each dated April 30, 2011, except for ING Solution 2020 Portfolio, ING Solution 2030 Portfolio, ING Solution 2040 Portfolio and ING Solution 2050 Portfolio, which are dated September 28, 2011. |
Portfolio holdings and characteristics are subject to change and may not be representative of current holdings and characteristics. The outlook for these Portfolios may differ from that presented for other ING Funds. Performance for the different classes of shares will vary based on differences in fees associated with each class.
5
| | |
| ING SOLUTION PORTFOLIOS | | PORTFOLIO MANAGERS’ REPORT |
| | | | | | | | |
| | | |
| | | Average Annual Total Returns for the Period Ended December 31, 2011 | | | |
| | | | | 1 Year | | | |
| | | ING Solution Aggressive Growth Portfolio, Class S | | | (5.05 | )% | | |
| | | S&P Target Risk Aggressive Index | | | (1.58 | )% | | |
| | | ING Solution Conservative Portfolio, Class S | | | 0.28 | % | | |
| | | S&P Target Risk Conservative Index | | | 4.35 | % | | |
| | | ING Solution Growth Portfolio, Class S | | | (2.46 | )% | | |
| | | S&P Target Risk Growth Index | | | 1.30 | % | | |
| | | ING Solution Income Portfolio, Class S | | | 0.35 | % | | |
| | | S&P Target Date Retirement Income Index | | | 3.98 | % | | |
| | | ING Solution Moderate Portfolio, Class S | | | (0.69 | )% | | |
| | | S&P Target Risk Moderate Index | | | 2.26 | % | | |
| | | ING Solution 2015 Portfolio, Class S | | | (0.73 | )% | | |
| | | S&P Target Date 2015 Index | | | 1.53 | % | | |
| | | ING Solution 2020 Portfolio, Class S | | | 8.50 | %(1) | | |
| | | S&P Target Date 2020 Index | | | 7.13 | %(1) | | |
| | | ING Solution 2025 Portfolio, Class S | | | (3.10 | )% | | |
| | | S&P Target Date 2025 Index | | | (0.28 | )% | | |
| | | ING Solution 2030 Portfolio, Class S | | | 10.60 | %(1) | | |
| | | S&P Target Date 2030 Index | | | 8.45 | %(1) | | |
| | | ING Solution 2035 Portfolio, Class S | | | (4.61 | )% | | |
| | | S&P Target Date 2035 Index | | | (1.71 | )% | | |
| | | ING Solution 2040 Portfolio, Class S | | | 12.30 | %(1) | | |
| | | S&P Target Date 2040 Index | | | 9.22 | %(1) | | |
| | | ING Solution 2045 Portfolio, Class S | | | (5.14 | )% | | |
| | | S&P Target Date 2045 Index | | | (2.56 | )% | | |
| | | ING Solution 2050 Portfolio, Class S | | | 12.30 | %(1) | | |
| | | S&P Target Date 2045 Index | | | 9.33 | %(1) | | |
| | | ING Solution 2055 Portfolio, Class S | | | (5.13 | )% | | |
| | | S&P Target Date 2045 Index | | | (2.56 | )% | | |
| (1) | Return is for the period from inception on October 3, 2011 through December 31, 2011. |
6
| | |
| PORTFOLIO MANAGERS’ REPORT | | ING SOLUTION PORTFOLIOS |
Target Allocations
as of December 31, 2011
(as a percentage of net assets)
| | | | | | | | | | | | | | | | | | | | | | | | | | | | | | | | |
| | | | | | ING
Solution
Aggressive
Portfolio | | | ING
Solution
Conservative
Portfolio | | | ING
Solution
Moderate
Portfolio | | | ING
Solution
Growth
Portfolio | | | ING
Solution
Income
Portfolio | | | ING
Solution
2015
Portfolio | | | ING
Solution
2020
Portfolio | |
U.S. Large Cap Stocks | | | % | | | | 41 | | | | 18 | | | | 24 | | | | 37 | | | | 18 | | | | 20 | | | | 28 | |
U.S. Mid Cap Stocks | | | % | | | | 11 | | | | 5 | | | | 6 | | | | 8 | | | | 5 | | | | 7 | | | | 8 | |
U.S. Small Cap Stocks | | | % | | | | 5 | | | | 0 | | | | 2 | | | | 3 | | | | 0 | | | | 2 | | | | 3 | |
Non-U.S./International Stocks | | | % | | | | 18 | | | | 6 | | | | 9 | | | | 11 | | | | 6 | | | | 9 | | | | 10 | |
Emering Markets Equity | | | % | | | | 7 | | | | 2 | | | | 3 | | | | 4 | | | | 2 | | | | 4 | | | | 4 | |
Domestic Real Estate Investment Trusts (“REITs”) | | | % | | | | 1 | | | | 0 | | | | 1 | | | | 1 | | | | 0 | | | | 1 | | | | 1 | |
Global REITs | | | % | | | | 3 | | | | 2 | | | | 3 | | | | 3 | | | | 2 | | | | 3 | | | | 3 | |
Core Fixed-Income | | | % | | | | 5 | | | | 37 | | | | 30 | | | | 18 | | | | 37 | | | | 28 | | | | 23 | |
High Yield Bonds | | | % | | | | 2 | | | | 3 | | | | 3 | | | | 2 | | | | 3 | | | | 3 | | | | 2 | |
Short-Term Bonds | | | % | | | | 0 | | | | 12 | | | | 8 | | | | 5 | | | | 12 | | | | 9 | | | | 6 | |
Treasury Inflation Protected Securities | | | % | | | | 0 | | | | 5 | | | | 3 | | | | 0 | | | | 5 | | | | 5 | | | | 3 | |
Non-U.S. Bond | | | % | | | | 3 | | | | 3 | | | | 3 | | | | 3 | | | | 3 | | | | 3 | | | | 3 | |
Commodities | | | % | | | | 4 | | | | 2 | | | | 2 | | | | 3 | | | | 2 | | | | 2 | | | | 3 | |
Floating Rate Bonds | | | % | | | | 0 | | | | 5 | | | | 3 | | | | 2 | | | | 5 | | | | 4 | | | | 3 | |
| | | | | | | | | | | | | | | | | | | | | | | | | | | | | | | | |
| | | % | | | | 100 | | | | 100 | | | | 100 | | | | 100 | | | | 100 | | | | 100 | | | | 100 | |
| | | | | | | | | | | | | | | | | | | | | | | | | | | | | | | | |
| | | | | | | | |
| | | | | | ING
Solution
2025
Portfolio | | | ING
Solution
2030
Portfolio | | | ING
Solution
2035
Portfolio | | | ING
Solution
2040
Portfolio | | | ING
Solution
2045
Portfolio | | | ING
Solution
2050
Portfolio | | | ING
Solution
2055
Portfolio | |
U.S. Large Cap Stocks | | | % | | | | 33 | | | | 37 | | | | 40 | | | | 47 | | | | 48 | | | | 48 | | | | 48 | |
U.S. Mid Cap Stocks | | | % | | | | 8 | | | | 9 | | | | 9 | | | | 9 | | | | 9 | | | | 9 | | | | 9 | |
U.S. Small Cap Stocks | | | % | | | | 4 | | | | 4 | | | | 5 | | | | 5 | | | | 5 | | | | 5 | | | | 5 | |
Non-U.S./International Stocks | | | % | | | | 14 | | | | 16 | | | | 18 | | | | 18 | | | | 18 | | | | 18 | | | | 18 | |
Emering Markets Equity | | | % | | | | 4 | | | | 6 | | | | 7 | | | | 7 | | | | 7 | | | | 7 | | | | 7 | |
Domestic Real Estate Investment Trusts (“REITs”) | | | % | | | | 1 | | | | 1 | | | | 2 | | | | 2 | | | | 1 | | | | 1 | | | | 1 | |
Global REITs | | | % | | | | 3 | | | | 3 | | | | 3 | | | | 3 | | | | 4 | | | | 4 | | | | 4 | |
Core Fixed-Income | | | % | | | | 16 | | | | 12 | | | | 8 | | | | 4 | | | | 3 | | | | 3 | | | | 3 | |
High Yield Bonds | | | % | | | | 2 | | | | 2 | | | | 0 | | | | 0 | | | | 0 | | | | 0 | | | | 0 | |
Short-Term Bonds | | | % | | | | 6 | | | | 2 | | | | 0 | | | | 0 | | | | 0 | | | | 0 | | | | 0 | |
Treasury Inflation Protected Securities | | | % | | | | 0 | | | | 0 | | | | 0 | | | | 0 | | | | 0 | | | | 0 | | | | 0 | |
Non-U.S. Bond | | | % | | | | 3 | | | | 2 | | | | 2 | | | | 2 | | | | 2 | | | | 2 | | | | 2 | |
Commodities | | | % | | | | 3 | | | | 3 | | | | 3 | | | | 3 | | | | 3 | | | | 3 | | | | 3 | |
Floating Rate Bonds | | | % | | | | 3 | | | | 3 | | | | 3 | | | | 0 | | | | 0 | | | | 0 | | | | 0 | |
| | | | | | | | | | | | | | | | | | | | | | | | | | | | | | | | |
| | | % | | | | 100 | | | | 100 | | | | 100 | | | | 100 | | | | 100 | | | | 100 | | | | 100 | |
| | | | | | | | | | | | | | | | | | | | | | | | | | | | | | | | |
As these are target allocations, the actual allocations of each Portfolio’s assets may deviate from the percentages shown. Although the Portfolios expect to be fully invested at all times, they may maintain liquidity reserves to meet redemption requests.
Portfolio holdings are subject to change daily.
7
| | |
| ING SOLUTION AGGRESSIVE GROWTH PORTFOLIO | | PORTFOLIO MANAGERS’ REPORT |
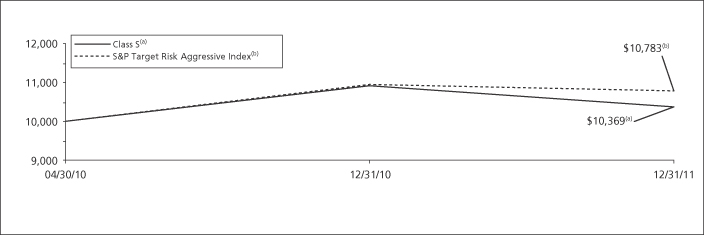
| | | | | | | | | | | | |
| | | |
| | | Average Annual Total Returns for the Periods Ended December 31, 2011 | | | |
| | | | | 1 Year | | | Since Inception
of Classes ADV, I, S, and S2
April 30, 2010 | | | |
| | | Class ADV | | | (5.29 | )% | | | 1.87 | % | | |
| | | Class I | | | (4.84 | )% | | | 2.44 | % | | |
| | | Class S | | | (5.05 | )% | | | 2.19 | % | | |
| | | Class S2 | | | (5.18 | )% | | | 2.05 | % | | |
| | | S&P Target Risk Aggressive Index | | | (1.58 | )% | | | 4.63 | %(1) | | |
Based on a $10,000 initial investment, the graph and table above illustrate the total return of ING Solution Aggressive Growth Portfolio against the indices indicated. An index is unmanaged and has no cash in its portfolio, imposes no sales charges and incurs no operating expenses. An investor cannot invest directly in an index.
The performance graph and table do not reflect the deduction of taxes that a shareholder will pay on Portfolio distributions or the redemption of Portfolio shares.
The performance shown may include the effect of fee waivers and/or expense reimbursements by the Investment Adviser and/or other service providers, which have the effect of increasing total return. Had all fees and expenses been considered, the total returns would have been lower.
Performance data represents past performance and is no assurance of future results. Investment return and principal value of an investment in the Portfolio will fluctuate. Shares, when sold, may be worth more or less than their original cost. The Portfolio’s current
performance may be lower or higher than the performance data shown. Please log on to www.inginvestment.com or call (800) 262-3862 to get performance through the most recent month end.
It is important to note that the Portfolio has a limited operating history. Performance over a longer period of time may be more meaningful than short-term performance.
This report contains statements that may be “forward-looking” statements. Actual results may differ materially from those projected in the “forward-looking” statements.
The views expressed in this report reflect those of the Investment Adviser, only through the end of the period as stated on the cover. The Investment Adviser’s views are subject to change at any time based on market and other conditions.
Portfolio holdings are subject to change daily.
| (1) | | Since inception performance for the indices is shown from May 1, 2010. |
8
| | |
| PORTFOLIO MANAGERS’ REPORT | | ING SOLUTION CONSERVATIVE PORTFOLIO |
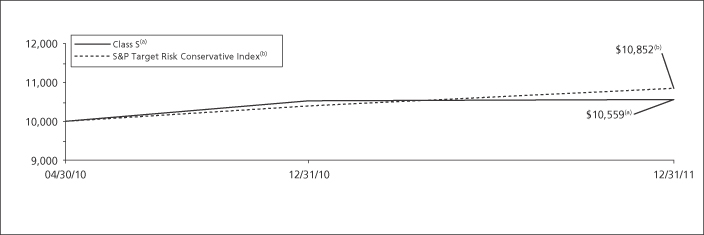
| | | | | | | | | | | | |
| | | |
| | | Average Annual Total Returns for the Periods Ended December 31, 2011 | | | |
| | | | | 1 Year | | | Since Inception
of Classes ADV, I, S, and S2
April 30, 2010 | | | |
| | | Class ADV | | | 0.09 | % | | | 3.01 | % | | |
| | | Class I | | | 0.69 | % | | | 3.62 | % | | |
| | | Class S | | | 0.28 | % | | | 3.31 | % | | |
| | | Class S2 | | | 0.17 | % | | | 3.13 | % | | |
| | | S&P Target Risk Conservative Index | | | 4.35 | % | | | 5.03 | %(1) | | |
Based on a $10,000 initial investment, the graph and table above illustrate the total return of ING Solution Conservative Portfolio against the indices indicated. An index is unmanaged and has no cash in its portfolio, imposes no sales charges and incurs no operating expenses. An investor cannot invest directly in an index.
The performance graph and table do not reflect the deduction of taxes that a shareholder will pay on Portfolio distributions or the redemption of Portfolio shares.
The performance shown may include the effect of fee waivers and/or expense reimbursements by the Investment Adviser and/or other service providers, which have the effect of increasing total return. Had all fees and expenses been considered, the total returns would have been lower.
Performance data represents past performance and is no assurance of future results. Investment return and principal value of an investment in the Portfolio will fluctuate. Shares, when sold, may be worth more or less than their original cost. The Portfolio’s current
performance may be lower or higher than the performance data shown. Please log on to www.inginvestment.com www.ingfunds.com or call (800) 262-3862 to get performance through the most recent month end.
It is important to note that the Portfolio has a limited operating history. Performance over a longer period of time may be more meaningful than short-term performance.
This report contains statements that may be “forward-looking” statements. Actual results may differ materially from those projected in the “forward-looking” statements.
The views expressed in this report reflect those of the Investment Adviser, only through the end of the period as stated on the cover. The Investment Adviser’s views are subject to change at any time based on market and other conditions.
Portfolio holdings are subject to change daily.
| (1) | | Since inception performance for the indices is shown from May 1, 2010. |
9
| | |
| ING SOLUTION GROWTH PORTFOLIO | | PORTFOLIO MANAGERS’ REPORT |
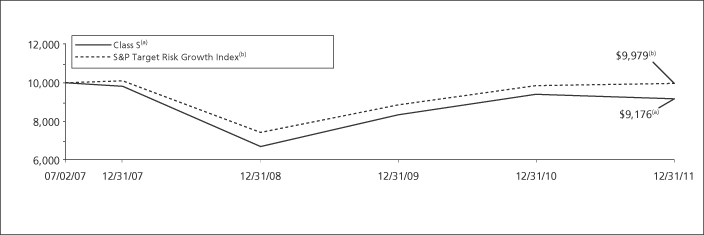
| | | | | | | | | | | | | | | | |
| | | |
| | | Average Annual Total Returns for the Periods Ended December 31, 2011 | | | |
| | | | | 1 Year | | | Since Inception
of Classes ADV, I and S
July 2, 2007 | | | Since Inception
of Class S2
April 30, 2010 | | | |
| | | Class ADV | | | (2.68 | )% | | | (2.26 | )% | | | — | | | |
| | | Class I | | | (2.17 | )% | | | (1.60 | )% | | | — | | | |
| | | Class S | | | (2.46 | )% | | | (1.89 | )% | | | — | | | |
| | | Class S2 | | | (2.71 | )% | | | — | | | | 2.60 | % | | |
| | | S&P Target Risk Growth Index | | | 1.30 | % | | | (0.03 | )%(1) | | | 4.76 | %(2) | | |
Based on a $10,000 initial investment, the graph and table above illustrate the total return of ING Solution Growth Portfolio against the indices indicated. An index is unmanaged and has no cash in its portfolio, imposes no sales charges and incurs no operating expenses. An investor cannot invest directly in an index.
The performance graph and table do not reflect the deduction of taxes that a shareholder will pay on Portfolio distributions or the redemption of Portfolio shares.
The performance shown may include the effect of fee waivers and/or expense reimbursements by the Investment Adviser and/or other service providers, which have the effect of increasing total return. Had all fees and expenses been considered, the total returns would have been lower.
Performance data represents past performance and is no assurance of future results. Investment return and principal value of an investment in the Portfolio will fluctuate. Shares, when sold, may be worth more or less than their original cost. The Portfolio’s current performance may be lower or higher than the performance data
shown. Please log on to www.inginvestment.com or call (800) 262-3862 to get performance through the most recent month end.
It is important to note that the Portfolio has a limited operating history. Performance over a longer period of time may be more meaningful than short-term performance.
This report contains statements that may be “forward-looking” statements. Actual results may differ materially from those projected in the “forward-looking” statements.
The views expressed in this report reflect those of the Investment Adviser, only through the end of the period as stated on the cover. The Investment Adviser’s views are subject to change at any time based on market and other conditions.
Portfolio holdings are subject to change daily.
| (1) | | Since inception performance for the indices is shown from July 1, 2007. |
| (2) | | Since inception performance for the indices is shown from May 1, 2010. |
10
| | |
| PORTFOLIO MANAGERS’ REPORT | | ING SOLUTION INCOME PORTFOLIO |
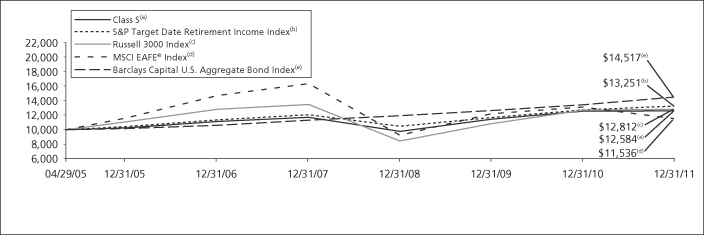
| | | | | | | | | | | | | | | | | | | | | | | | |
| | | |
| | | Average Annual Total Returns for the Periods Ended December 31, 2011 | | | |
| | | | | 1 Year | | | 5 Year | | | Since Inception
of Classes ADV, I and S
April 29, 2005 | | | Since Inception
of Class S2
May 28, 2009 | | | Since Inception
of Class T
August 31, 2005 | | | |
| | | Class ADV | | | 0.14 | % | | | 2.21 | % | | | 3.23 | % | | | — | | | | — | | | |
| | | Class I | | | 0.54 | % | | | 2.73 | % | | | 3.76 | % | | | — | | | | — | | | |
| | | Class S | | | 0.35 | % | | | 2.48 | % | | | 3.50 | % | | | — | | | | — | | | |
| | | Class S2 | | | 0.25 | % | | | — | | | | — | | | | 8.71 | % | | | — | | | |
| | | Class T | | | 0.03 | % | | | 2.01 | % | | | — | | | | — | | | | 2.76 | % | | |
| | | S&P Target Date Retirement Income Index | | | 3.98 | % | | | 3.12 | % | | | 4.32 | %(1) | | | 8.89 | %(2) | | | 3.96 | %(3) | | |
| | | Russell 3000 Index | | | 1.03 | % | | | (0.01 | )% | | | 3.80 | %(1) | | | 15.78 | %(2) | | | 2.79 | %(3) | | |
| | | MSCI EAFE® Index | | | (12.14 | )% | | | (4.72 | )% | | | 2.19 | %(1) | | | 5.53 | %(2) | | | 1.20 | %(3) | | |
| | | Barclays Capital U.S. Aggregate Bond Index | | | 7.84 | % | | | 6.50 | % | | | 5.75 | %(1) | | | 7.35 | %(2) | | | 5.73 | %(3) | | |
Based on a $10,000 initial investment, the graph and table above illustrate the total return of ING Solution Income Portfolio against the indices indicated. An index is unmanaged and has no cash in its portfolio, imposes no sales charges and incurs no operating expenses. An investor cannot invest directly in an index.
The performance graph and table do not reflect the deduction of taxes that a shareholder will pay on Portfolio distributions or the redemption of Portfolio shares.
The performance shown may include the effect of fee waivers and/or expense reimbursements by the Investment Adviser and/or other service providers, which have the effect of increasing total return. Had all fees and expenses been considered, the total returns would have been lower.
Performance data represents past performance and is no assurance of future results. Investment return and principal value of an investment in the Portfolio will fluctuate. Shares, when sold, may be worth more or less than their original cost. The Portfolio’s current performance may be lower or higher than the performance data shown. Please log on to www.inginvestment.com or call (800) 262-3862 to get performance through the most recent month end.
This report contains statements that may be “forward-looking” statements. Actual results may differ materially from those projected in the “forward-looking” statements.
The views expressed in this report reflect those of the Investment Adviser, only through the end of the period as stated on the cover. The Investment Adviser’s views are subject to change at any time based on market and other conditions.
Portfolio holdings are subject to change daily.
| (1) | | Since inception performance for the indices is shown from May 1, 2005. |
| (2) | | Since inception performance for the indices is shown from June 1, 2009. |
| (3) | | Since inception performance for the indices is shown from September 1, 2005. |
11
| | |
| ING SOLUTION MODERATE PORTFOLIO | | PORTFOLIO MANAGERS’ REPORT |
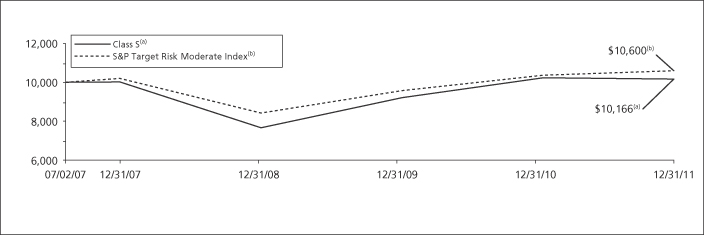
| | | | | | | | | | | | | | | | |
| | | |
| | | Average Annual Total Returns for the Periods Ended December 31, 2011 | | | |
| | | | | 1 Year | | | Since Inception
of Classes ADV, I and S
July 2, 2007 | | | Since Inception
of Class S2
April 30, 2010 | | | |
| | | Class ADV | | | (0.94 | )% | | | (0.09 | )% | | | — | | | |
| | | Class I | | | (0.30 | )% | | | 0.71 | % | | | — | | | |
| | | Class S | | | (0.69 | )% | | | 0.37 | % | | | — | | | |
| | | Class S2 | | | (0.84 | )% | | | — | | | | 3.20 | % | | |
| | | S&P Target Risk Moderate Index | | | 2.26 | % | | | 1.30 | %(1) | | | 4.43 | %(2) | | |
Based on a $10,000 initial investment, the graph and table above illustrate the total return of ING Solution Moderate Portfolio against the indices indicated. An index is unmanaged and has no cash in its portfolio, imposes no sales charges and incurs no operating expenses. An investor cannot invest directly in an index.
The performance graph and table do not reflect the deduction of taxes that a shareholder will pay on Portfolio distributions or the redemption of Portfolio shares.
The performance shown may include the effect of fee waivers and/or expense reimbursements by the Investment Adviser and/or other service providers, which have the effect of increasing total return. Had all fees and expenses been considered, the total returns would have been lower.
Performance data represents past performance and is no assurance of future results. Investment return and principal value of an investment in the Portfolio will fluctuate. Shares, when sold, may be worth more or less than their original cost. The Portfolio’s current performance may be lower or higher than the performance data
shown. Please log on to www.inginvestment.com or call (800) 262-3862 to get performance through the most recent month end.
It is important to note that the Portfolio has a limited operating history. Performance over a longer period of time may be more meaningful than short-term performance.
This report contains statements that may be “forward-looking” statements. Actual results may differ materially from those projected in the “forward-looking” statements.
The views expressed in this report reflect those of the Investment Adviser, only through the end of the period as stated on the cover. The Investment Adviser’s views are subject to change at any time based on market and other conditions.
Portfolio holdings are subject to change daily.
| (1) | | Since inception performance for the indices is shown from July 1, 2007. |
| (2) | | Since inception performance for the indices is shown from May 1, 2010. |
12
| | |
| PORTFOLIO MANAGERS’ REPORT | | ING SOLUTION 2015 PORTFOLIO |
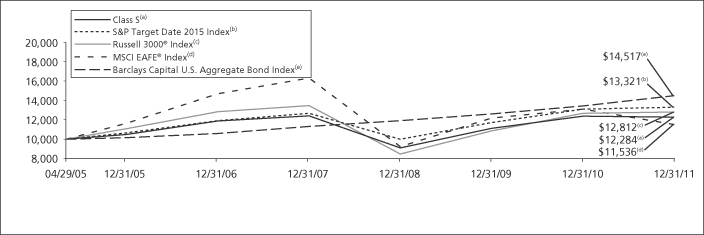
| | | | | | | | | | | | | | | | | | | | | | | | |
| | | |
| | | Average Annual Total Returns for the Periods Ended December 31, 2011 | | | |
| | | | | 1 Year | | | 5 Year | | | Since Inception
of Classes ADV, I and S
April 29, 2005 | | | Since Inception
of Class S2
May 28, 2009 | | | Since Inception
of Class T
August 31, 2005 | | | |
| | | Class ADV | | | (0.90 | )% | | | 0.41 | % | | | 2.86 | % | | | — | | | | — | | | |
| | | Class I | | | (0.46 | )% | | | 0.92 | % | | | 3.39 | % | | | — | | | | — | | | |
| | | Class S | | | (0.73 | )% | | | 0.66 | % | | | 3.13 | % | | | — | | | | — | | | |
| | | Class S2 | | | (0.83 | )% | | | — | | | | — | | | | 10.46 | % | | | — | | | |
| | | Class T | | | (1.12 | )% | | | 0.21 | % | | | — | | | | — | | | | 2.04 | % | | |
| | | S&P Target Date 2015 Index | | | 1.53 | % | | | 2.26 | % | | | 4.41 | %(1) | | | 10.80 | %(2) | | | 3.84 | %(3) | | |
| | | Russell 3000® Index | | | 1.03 | % | | | (0.01 | )% | | | 3.80 | %(1) | | | 15.78 | %(2) | | | 2.79 | %(3) | | |
| | | MSCI EAFE® Index | | | (12.14 | )% | | | (4.72 | )% | | | 2.19 | %(1) | | | 5.53 | %(2) | | | 1.20 | %(3) | | |
| | | Barclays Capital U.S. Aggregate Bond Index | | | 7.84 | % | | | 6.50 | % | | | 5.75 | %(1) | | | 7.35 | %(2) | | | 5.73 | %(3) | | |
Based on a $10,000 initial investment, the graph and table above illustrate the total return of ING Solution 2015 Portfolio against the indices indicated. An index is unmanaged and has no cash in its portfolio, imposes no sales charges and incurs no operating expenses. An investor cannot invest directly in an index.
The performance graph and table do not reflect the deduction of taxes that a shareholder will pay on Portfolio distributions or the redemption of Portfolio shares.
The performance shown may include the effect of fee waivers and/or expense reimbursements by the Investment Adviser and/or other service providers, which have the effect of increasing total return. Had all fees and expenses been considered, the total returns would have been lower.
Performance data represents past performance and is no assurance of future results. Investment return and principal value of an investment in the Portfolio will fluctuate. Shares, when sold, may be worth more or less than their original cost. The Portfolio’s current performance may be lower or higher than the performance data shown. Please log on to www.inginvestment.com or call (800) 262-3862 to get performance through the most recent month end.
This report contains statements that may be “forward-looking” statements. Actual results may differ materially from those projected in the “forward-looking” statements.
The views expressed in this report reflect those of the Investment Adviser, only through the end of the period as stated on the cover. The Investment Adviser’s views are subject to change at any time based on market and other conditions.
Portfolio holdings are subject to change daily.
| (1) | | Since inception performance for the indices is shown from May 1, 2005. |
| (2) | | Since inception performance for the indices is shown from June 1, 2009. |
| (3) | | Since inception performance for the indices is shown from September 1, 2005. |
13
| | |
| ING SOLUTION 2020 PORTFOLIO | | PORTFOLIO MANAGERS’ REPORT |
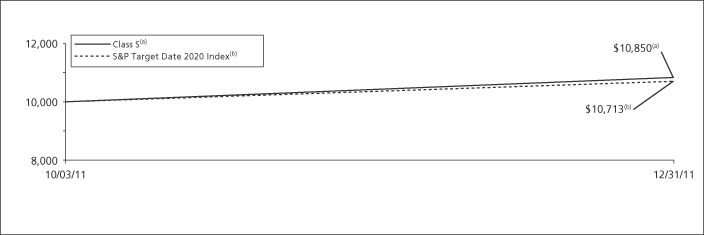
| | | | | | | | |
| | | |
| | | Cumulative Total Returns for the Periods Ended December 31, 2011 | | | |
| | | | | Since Inception
of Classes ADV, I, S, S2 and T
October 3, 2011 | | | |
| | | Class ADV | | | 8.50 | % | | |
| | | Class I | | | 8.60 | % | | |
| | | Class S | | | 8.50 | % | | |
| | | Class S2 | | | 8.50 | % | | |
| | | Class T | | | 8.40 | % | | |
| | | S&P Target Date 2020 Index | | | 7.13 | %(1) | | |
Based on a $10,000 initial investment, the graph and table above illustrate the total return of ING Solution 2020 Portfolio against the indices indicated. An index is unmanaged and has no cash in its portfolio, imposes no sales charges and incurs no operating expenses. An investor cannot invest directly in an index.
The performance graph and table do not reflect the deduction of taxes that a shareholder will pay on Portfolio distributions or the redemption of Portfolio shares.
The performance shown may include the effect of fee waivers and/or expense reimbursements by the Investment Adviser and/or other service providers, which have the effect of increasing total return. Had all fees and expenses been considered, the total returns would have been lower.
Performance data represents past performance and is no assurance of future results. Investment return and principal value of an investment in the Portfolio will fluctuate. Shares, when sold, may be worth more or less than their original cost. The Portfolio’s current performance may be lower or higher than the performance data shown. Please log on to www.inginvestment.com or call (800) 262-3862 to get performance through the most recent month end.
It is important to note that the Portfolio has a limited operating history. Performance over a longer period of time may be more meaningful than short-term performance.
This report contains statements that may be “forward-looking” statements. Actual results may differ materially from those projected in the “forward-looking” statements.
The views expressed in this report reflect those of the Investment Adviser, only through the end of the period as stated on the cover. The Investment Adviser’s views are subject to change at any time based on market and other conditions.
Portfolio holdings are subject to change daily.
| (1) | | Since inception performance for the indices is shown from October 3, 2011. |
14
| | |
| PORTFOLIO MANAGERS’ REPORT | | ING SOLUTION 2025 PORTFOLIO |
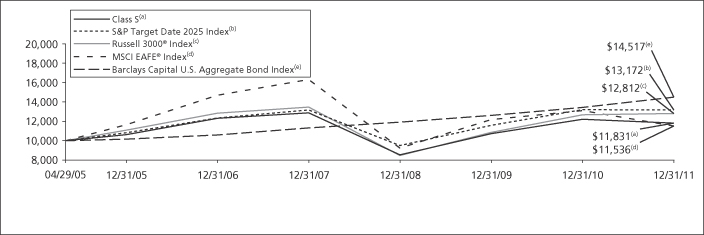
| | | | | | | | | | | | | | | | | | | | | | | | |
| | | |
| | | Average Annual Total Returns for the Periods Ended December 31, 2011 | | | |
| | | | | 1 Year | | | 5 Year | | | Since Inception
of Classes ADV, I and S
April 29, 2005 | | | Since Inception
of Class S2
May 28, 2009 | | | Since Inception
of Class T
August 31, 2005 | | | |
| | | Class ADV | | | (3.37 | )% | | | (1.09 | )% | | | 2.27 | % | | | — | | | | — | | | |
| | | Class I | | | (2.92 | )% | | | (0.59 | )% | | | 2.81 | % | | | — | | | | — | | | |
| | | Class S | | | (3.10 | )% | | | (0.82 | )% | | | 2.54 | % | | | — | | | | — | | | |
| | | Class S2 | | | (3.23 | )% | | | — | | | | — | | | | 11.33 | % | | | — | | | |
| | | Class T | | | (3.44 | )% | | | (1.26 | )% | | | — | | | | — | | | | 1.23 | % | | |
| | | S&P Target Date 2025 Index | | | (0.28 | )% | | | 1.31 | % | | | 4.23 | %(1) | | | 12.05 | %(2) | | | 3.50 | %(3) | | |
| | | Russell 3000® Index | | | 1.03 | % | | | (0.01 | )% | | | 3.80 | %(1) | | | 15.78 | %(2) | | | 2.79 | %(3) | | |
| | | MSCI EAFE® Index | | | (12.14 | )% | | | (4.72 | )% | | | 2.19 | %(1) | | | 5.53 | %(2) | | | 1.20 | %(3) | | |
| | | Barclays Capital U.S. Aggregate Bond Index | | | 7.84 | % | | | 6.50 | % | | | 5.75 | %(1) | | | 7.35 | %(2) | | | 5.73 | %(3) | | |
Based on a $10,000 initial investment, the graph and table above illustrate the total return of ING Solution 2025 Portfolio against the indices indicated. An index is unmanaged and has no cash in its portfolio, imposes no sales charges and incurs no operating expenses. An investor cannot invest directly in an index.
The performance graph and table do not reflect the deduction of taxes that a shareholder will pay on Portfolio distributions or the redemption of Portfolio shares.
The performance shown may include the effect of fee waivers and/or expense reimbursements by the Investment Adviser and/or other service providers, which have the effect of increasing total return. Had all fees and expenses been considered, the total returns would have been lower.
Performance data represents past performance and is no assurance of future results. Investment return and principal value of an investment in the Portfolio will fluctuate. Shares, when sold, may be worth more or less than their original cost. The Portfolio’s current performance may be lower or higher than the performance data shown. Please log on to www.inginvestment.com or call (800) 262-3862 to get performance through the most recent month end.
It is important to note that the Portfolio has a limited operating history. Performance over a longer period of time may be more meaningful than short-term performance.
This report contains statements that may be “forward-looking” statements. Actual results may differ materially from those projected in the “forward-looking” statements.
The views expressed in this report reflect those of the Investment Adviser, only through the end of the period as stated on the cover. The Investment Adviser’s views are subject to change at any time based on market and other conditions.
Portfolio holdings are subject to change daily.
| (1) | | Since inception performance for the indices is shown from May 1, 2005. |
| (2) | | Since inception performance for the indices is shown from June 1, 2009. |
| (3) | | Since inception performance for the indices is shown from September 1, 2005. |
15
| | |
| ING SOLUTION 2030 PORTFOLIO | | PORTFOLIO MANAGERS’ REPORT |
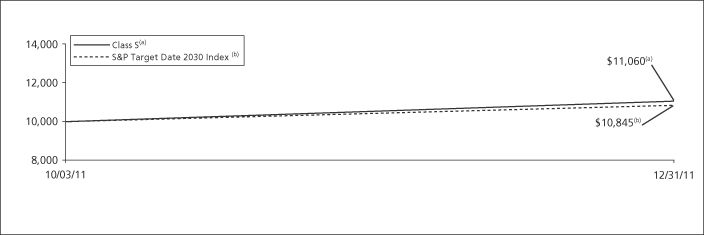
| | | | | | | | |
| | | |
| | | Cumulative Total Returns for the Periods Ended December 31, 2011 | | | |
| | | | | Since Inception
of Classes ADV, I, S, S2 and T
October 3, 2011 | | | |
| | | Class ADV | | | 10.60 | % | | |
| | | Class I | | | 10.70 | % | | |
| | | Class S | | | 10.60 | % | | |
| | | Class S2 | | | 10.60 | % | | |
| | | Class T | | | 10.50 | % | | |
| | | S&P Target Date 2030 Index | | | 8.45 | %(1) | | |
Based on a $10,000 initial investment, the graph and table above illustrate the total return of ING Solution 2030 Portfolio against the indices indicated. An index is unmanaged and has no cash in its portfolio, imposes no sales charges and incurs no operating expenses. An investor cannot invest directly in an index.
The performance graph and table do not reflect the deduction of taxes that a shareholder will pay on Portfolio distributions or the redemption of Portfolio shares.
The performance shown may include the effect of fee waivers and/or expense reimbursements by the Investment Adviser and/or other service providers, which have the effect of increasing total return. Had all fees and expenses been considered, the total returns would have been lower.
Performance data represents past performance and is no assurance of future results. Investment return and principal value of an investment in the Portfolio will fluctuate. Shares, when sold, may be worth more or less than their original cost. The Portfolio’s current performance may be lower or higher than the performance data shown. Please log on to www.inginvestment.com or call (800) 262-3862 to get performance through the most recent month end.
It is important to note that the Portfolio has a limited operating history. Performance over a longer period of time may be more meaningful than short-term performance.
This report contains statements that may be “forward-looking” statements. Actual results may differ materially from those projected in the “forward-looking” statements.
The views expressed in this report reflect those of the Investment Adviser, only through the end of the period as stated on the cover. The Investment Adviser’s views are subject to change at any time based on market and other conditions.
Portfolio holdings are subject to change daily.
| (1) | | Since inception performance for the indices is shown from October 3, 2011. |
16
| | |
| PORTFOLIO MANAGERS’ REPORT | | ING SOLUTION 2035 PORTFOLIO |
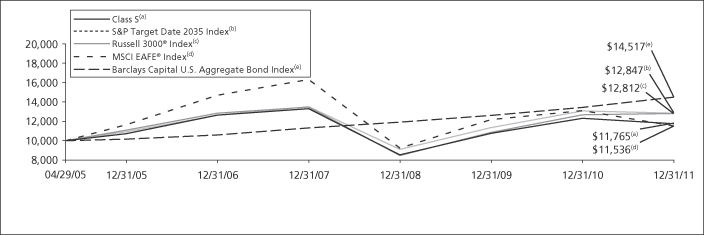
| | | | | | | | | | | | | | | | | | | | | | | | |
| | | |
| | | Average Annual Total Returns for the Periods Ended December 31, 2011 | | | |
| | | | | 1 Year | | | 5 Year | | | Since Inception
of Classes ADV, I and S
April 29, 2005 | | | Since Inception
of Class S2
May 28, 2009 | | | Since Inception
of Class T
August 31, 2005 | | | |
| | | Class ADV | | | (4.90 | )% | | | (1.70 | )% | | | 2.19 | % | | | — | | | | — | | | |
| | | Class I | | | (4.42 | )% | | | (1.19 | )% | | | 2.72 | % | | | — | | | | — | | | |
| | | Class S | | | (4.61 | )% | | | (1.43 | )% | | | 2.47 | % | | | — | | | | — | | | |
| | | Class S2 | | | (4.79 | )% | | | — | | | | — | | | | 11.54 | % | | | — | | | |
| | | Class T | | | (5.06 | )% | | | (1.88 | )% | | | — | | | | — | | | | 1.03 | % | | |
| | | S&P Target Date 2035 Index | | | (1.71 | )% | | | 0.33 | % | | | 3.84 | %(1) | | | 12.60 | %(2) | | | 3.01 | %(3) | | |
| | | Russell 3000® Index | | | 1.03 | % | | | (0.01 | )% | | | 3.80 | %(1) | | | 15.78 | %(2) | | | 2.79 | %(3) | | |
| | | MSCI EAFE® Index | | | (12.14 | )% | | | (4.72 | )% | | | 2.19 | %(1) | | | 5.53 | %(2) | | | 1.20 | %(3) | | |
| | | Barclays Capital U.S. Aggregate Bond Index | | | 7.84 | % | | | 6.50 | % | | | 5.75 | %(1) | | | 7.35 | %(2) | | | 5.73 | %(3) | | |
Based on a $10,000 initial investment, the graph and table above illustrate the total return of ING Solution 2035 Portfolio against the indices indicated. An index is unmanaged and has no cash in its portfolio, imposes no sales charges and incurs no operating expenses. An investor cannot invest directly in an index.
The performance graph and table do not reflect the deduction of taxes that a shareholder will pay on Portfolio distributions or the redemption of Portfolio shares.
The performance shown may include the effect of fee waivers and/or expense reimbursements by the Investment Adviser and/or other service providers, which have the effect of increasing total return. Had all fees and expenses been considered, the total returns would have been lower.
Performance data represents past performance and is no assurance of future results. Investment return and principal value of an investment in the Portfolio will fluctuate. Shares, when sold, may be worth more or less than their original cost. The Portfolio’s current performance may be lower or higher than the performance data shown. Please log on to www.inginvestment.com or call (800) 262-3862 to get performance through the most recent month end.
This report contains statements that may be “forward-looking” statements. Actual results may differ materially from those projected in the “forward-looking” statements.
The views expressed in this report reflect those of the Investment Adviser, only through the end of the period as stated on the cover. The Investment Adviser’s views are subject to change at any time based on market and other conditions.
Portfolio holdings are subject to change daily.
| (1) | | Since inception performance for the indices is shown from May 1, 2005. |
| (2) | | Since inception performance for the indices is shown from June 1, 2009. |
| (3) | | Since inception performance for the indices is shown from September 1, 2005. |
17
| | |
| ING SOLUTION 2040 PORTFOLIO | | PORTFOLIO MANAGERS’ REPORT |
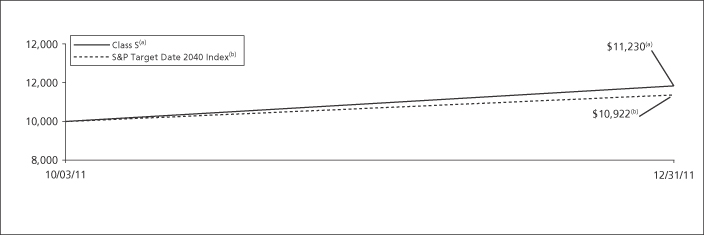
| | | | | | | | |
| | | |
| | | Cumulative Total Returns for the Periods Ended December 31, 2011 | | | |
| | | | | Since Inception
of Classes ADV, I, S, S2 and T
October 3, 2011 | | | |
| | | Class ADV | | | 12.30 | % | | |
| | | Class I | | | 12.40 | % | | |
| | | Class S | | | 12.30 | % | | |
| | | Class S2 | | | 12.30 | % | | |
| | | Class T | | | 12.20 | % | | |
| | | S&P Target Date 2040 Index | | | 9.22 | %(1) | | |
Based on a $10,000 initial investment, the graph and table above illustrate the total return of ING Solution 2040 Portfolio against the indices indicated. An index is unmanaged and has no cash in its portfolio, imposes no sales charges and incurs no operating expenses. An investor cannot invest directly in an index.
The performance graph and table do not reflect the deduction of taxes that a shareholder will pay on Portfolio distributions or the redemption of Portfolio shares.
The performance shown may include the effect of fee waivers and/or expense reimbursements by the Investment Adviser and/or other service providers, which have the effect of increasing total return. Had all fees and expenses been considered, the total returns would have been lower.
Performance data represents past performance and is no assurance of future results. Investment return and principal value of an investment in the Portfolio will fluctuate. Shares, when sold, may be worth more or less than their original cost. The Portfolio’s current performance may be lower or higher than the performance data shown. Please log on to www.inginvestment.com or call (800) 262-3862 to get performance through the most recent month end.
It is important to note that the Portfolio has a limited operating history. Performance over a longer period of time may be more meaningful than short-term performance.
This report contains statements that may be “forward-looking” statements. Actual results may differ materially from those projected in the “forward-looking” statements.
The views expressed in this report reflect those of the Investment Adviser, only through the end of the period as stated on the cover. The Investment Adviser’s views are subject to change at any time based on market and other conditions.
Portfolio holdings are subject to change daily.
| (1) | | Since inception performance for the indices is shown from October 3, 2011. |
18
| | |
| PORTFOLIO MANAGERS’ REPORT | | ING SOLUTION 2045 PORTFOLIO |
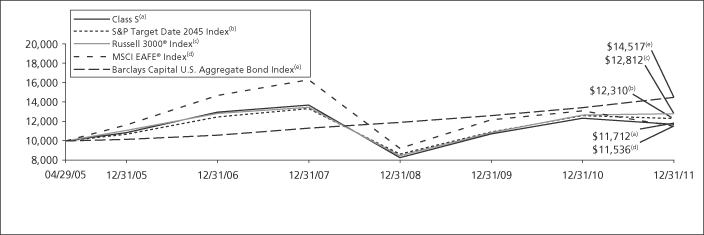
| | | | | | | | | | | | | | | | | | | | | | | | |
| | | |
| | | Average Annual Total Returns for the Periods Ended December 31, 2011 | | | |
| | | | | 1 Year | | | 5 Year | | | Since Inception
of Classes ADV, I and S
April 29, 2005 | | | Since Inception
of Class S2
May 28, 2009 | | | Since Inception
of Class T
August 31, 2005 | | | |
| | | Class ADV | | | (5.42 | )% | | | (2.28 | )% | | | 2.14 | % | | | — | | | | — | | | |
| | | Class I | | | (5.02 | )% | | | (1.82 | )% | | | 2.65 | % | | | — | | | | — | | | |
| | | Class S | | | (5.14 | )% | | | (2.04 | )% | | | 2.39 | % | | | — | | | | — | | | |
| | | Class S2 | | | (5.38 | )% | | | — | | | | — | | | | 11.79 | % | | | — | | | |
| | | Class T | | | (5.63 | )% | | | (2.48 | )% | | | — | | | | — | | | | 0.77 | % | | |
| | | S&P Target Date 2045 Index | | | (2.56 | )% | | | (0.27 | )% | | | 3.22 | %(4) | | | 12.70 | %(2) | | | 2.68 | %(3) | | |
| | | Russell 3000® Index | | | 1.03 | % | | | (0.01 | )% | | | 3.80 | %(1) | | | 15.78 | %(2) | | | 2.79 | %(3) | | |
| | | MSCI EAFE® Index | | | (12.14 | )% | | | (4.72 | )% | | | 2.19 | %(1) | | | 5.53 | %(2) | | | 1.20 | %(3) | | |
| | | Barclays Capital U.S. Aggregate Bond Index | | | 7.84 | % | | | 6.50 | % | | | 5.75 | %(1) | | | 7.35 | %(2) | | | 5.73 | %(3) | | |
Based on a $10,000 initial investment, the graph and table above illustrate the total return of ING Solution 2045 Portfolio against the indices indicated. An index is unmanaged and has no cash in its portfolio, imposes no sales charges and incurs no operating expenses. An investor cannot invest directly in an index.
The performance graph and table do not reflect the deduction of taxes that a shareholder will pay on Portfolio distributions or the redemption of Portfolio shares.
The performance shown may include the effect of fee waivers and/or expense reimbursements by the Investment Adviser and/or other service providers, which have the effect of increasing total return. Had all fees and expenses been considered, the total returns would have been lower.
Performance data represents past performance and is no assurance of future results. Investment return and principal value of an investment in the Portfolio will fluctuate. Shares, when sold, may be worth more or less than their original cost. The Portfolio’s current performance may be lower or higher than the performance data shown. Please log on to www.inginvestment.com or call (800) 262-3862 to get performance through the most recent month end.
This report contains statements that may be “forward-looking” statements. Actual results may differ materially from those projected in the “forward-looking” statements.
The views expressed in this report reflect those of the Investment Adviser, only through the end of the period as stated on the cover. The Investment Adviser’s views are subject to change at any time based on market and other conditions.
Portfolio holdings are subject to change daily.
| (1) | | Since inception performance for the indices is shown from May 1, 2005. |
| (2) | | Since inception performance for the indices is shown from June 1, 2009. |
| (3) | | Since inception performance for the indices is shown from September 1, 2005. |
| (4) | | Since inception performance for the index is shown from June 1, 2005. |
19
| | |
| ING SOLUTION 2050 PORTFOLIO | | PORTFOLIO MANAGERS’ REPORT |

| | | | | | | | |
| | | |
| | | Cumulative Total Returns for the Periods Ended December 31, 2011 | | | |
| | | | | Since Inception
of Classes ADV, I, S, S2 and T
October 3, 2011 | | | |
| | | Class ADV | | | 12.30 | % | | |
| | | Class I | | | 12.40 | % | | |
| | | Class S | | | 12.30 | % | | |
| | | Class S2 | | | 12.30 | % | | |
| | | Class T | | | 12.20 | % | | |
| | | S&P Target Date 2045 Index | | | 9.33 | %(1) | | |
Based on a $10,000 initial investment, the graph and table above illustrate the total return of ING Solution 2050 Portfolio against the indices indicated. An index is unmanaged and has no cash in its portfolio, imposes no sales charges and incurs no operating expenses. An investor cannot invest directly in an index.
The performance graph and table do not reflect the deduction of taxes that a shareholder will pay on Portfolio distributions or the redemption of Portfolio shares.
The performance shown may include the effect of fee waivers and/or expense reimbursements by the Investment Adviser and/or other service providers, which have the effect of increasing total return. Had all fees and expenses been considered, the total returns would have been lower.
Performance data represents past performance and is no assurance of future results. Investment return and principal value of an investment in the Portfolio will fluctuate. Shares, when sold, may be worth more or less than their original cost. The Portfolio’s current performance may be lower or higher than the performance data shown. Please log on to www.inginvestment.com or call (800) 262-3862 to get performance through the most recent month end.
It is important to note that the Portfolio has a limited operating history. Performance over a longer period of time may be more meaningful than short-term performance.
This report contains statements that may be “forward-looking” statements. Actual results may differ materially from those projected in the “forward-looking” statements.
The views expressed in this report reflect those of the Investment Adviser, only through the end of the period as stated on the cover. The Investment Adviser’s views are subject to change at any time based on market and other conditions.
Portfolio holdings are subject to change daily.
| (1) | | Since inception performance for the indices is shown from October 3, 2011. |
20
| | |
| PORTFOLIO MANAGERS’ REPORT | | ING SOLUTION 2055 PORTFOLIO |
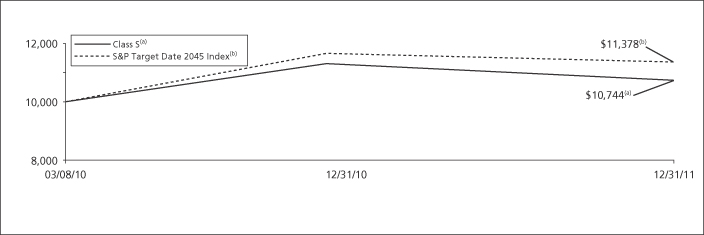
| | | | | | | | | | |
| | | |
| | | Average Annual Total Returns for the Period Ended December 31, 2011 | | | |
| | | | | 1 Year | | Since Inception
of Classes ADV, I, S, S2 and T
March 8, 2010 | | | |
| | | Class ADV | | (5.45)% | | | 3.80 | % | | |
| | | Class I | | (4.91)% | | | 4.28 | % | | |
| | | Class S | | (5.13)% | | | 4.04 | % | | |
| | | Class S2 | | (5.26)% | | | 3.91 | % | | |
| | | Class T | | (5.56)% | | | 3.58 | % | | |
| | | S&P Target Date 2045 Index | | (2.56)% | | | 7.30 | %(1) | | |
Based on a $10,000 initial investment, the graph and table above illustrate the total return of ING Solution 2055 Portfolio against the indices indicated. An index is unmanaged and has no cash in its portfolio, imposes no sales charges and incurs no operating expenses. An investor cannot invest directly in an index.
The performance graph and table do not reflect the deduction of taxes that a shareholder will pay on Portfolio distributions or the redemption of Portfolio shares.
The performance shown may include the effect of fee waivers and/or expense reimbursements by the Investment Adviser and/or other service providers, which have the effect of increasing total return. Had all fees and expenses been considered, the total returns would have been lower.
Performance data represents past performance and is no assurance of future results. Investment return and principal value of an investment in the Portfolio will fluctuate. Shares, when sold, may be worth more or less than their original cost. The Portfolio’s current performance may be lower or higher than the performance data shown. Please log on to www.inginvestment.com or call (800) 262-3862 to get performance through the most recent month end.
It is important to note that the Portfolio has a limited operating history. Performance over a longer period of time may be more meaningful than short-term performance.
This report contains statements that may be “forward-looking” statements. Actual results may differ materially from those projected in the “forward-looking” statements.
The views expressed in this report reflect those of the Investment Adviser, only through the end of the period as stated on the cover. The Investment Adviser’s views are subject to change at any time based on market and other conditions.
Portfolio holdings are subject to change daily.
| (1) | | Since inception performance for the indices is shown from March 1, 2010. |
21
SHAREHOLDER EXPENSE EXAMPLES (UNAUDITED)
As a shareholder of a Portfolio, you incur two types of costs: (1) transaction costs, including redemption and exchange fees; and (2) ongoing costs including management fees, distribution and/or service (12b-1) fees, and other Portfolio expenses. These Examples are intended to help you understand your ongoing costs (in dollars) of investing in a Portfolio and to compare these costs with the ongoing costs of investing in other mutual funds.
The Examples are based on an investment of $1,000 invested at the beginning of the period (except as noted) and held for the entire period from July 1, 2011 to December 31, 2011. The Portfolios’ expenses are shown without the imposition of any charges which are, or may be, imposed under your annuity contract. Expenses would have been higher if such charges were included.
Actual Expenses
The first section of the table shown below, “Actual Portfolio Return,” provides information about actual account values and actual expenses. You may use the information in this section, together with the amount you invested, to estimate the expenses that you paid over the period. Simply divide your account value by $1,000 (for example, an $8,600 account value divided by $1,000 = 8.6), then multiply the result by the number in the first section under the heading entitled “Expenses Paid During the Period” to estimate the expenses you paid on your account during this period.
Hypothetical Example for Comparison Purposes
The second section of the table shown below, “Hypothetical (5% return before expenses),” provides information about hypothetical account values and hypothetical expenses based on a Portfolio’s actual expense ratio and an assumed rate of return of 5% per year before expenses, which is not a Portfolio’s actual return. The hypothetical account values and expenses may not be used to estimate the actual ending account balance or expenses you paid for the period. You may use this information to compare the ongoing costs of investing in a Portfolio and other mutual funds. To do so, compare this 5% hypothetical example with the 5% hypothetical examples that appear in the shareholder reports of the other mutual funds.
Please note that the expenses shown in the table are meant to highlight your ongoing costs only and do not reflect any transactional costs, such as redemption fees or exchange fees. Therefore, the hypothetical lines of the table are useful in comparing ongoing costs only, and will not help you determine the relative total costs of owning different mutual funds. In addition, if these transactional costs were included, your costs would have been higher.
| | | | | | | | | | | | | | | | | | | | | | | | | | | | | | | | |
| | | Actual Portfolio Return | | | Hypothetical (5% return before expenses) | |
| | | Beginning Account Value July 1, 2011 | | | Ending Account Value December 31, 2011 | | | Annualized Expense Ratio* | | | Expenses Paid During the Period Ended December 31, 2011** | | | Beginning Account Value July 1, 2011 | | | Ending Account Value December 31, 2011 | | | Annualized Expense Ratio* | | | Expenses Paid During the Period Ended December 31, 2011** | |
ING Solution Aggressive Growth Portfolio | | | | | | | | | | | | | | | | | | | | | |
Class ADV | | $ | 1,000.00 | | | $ | 907.20 | | | | 0.62 | % | | $ | 2.98 | | | $ | 1,000.00 | | | $ | 1,022.08 | | | | 0.62 | % | | $ | 3.16 | |
Class I | | | 1,000.00 | | | | 909.20 | | | | 0.12 | | | | 0.58 | | | | 1,000.00 | | | | 1,024.60 | | | | 0.12 | | | | 0.61 | |
Class S | | | 1,000.00 | | | | 907.90 | | | | 0.37 | | | | 1.78 | | | | 1,000.00 | | | | 1,023.34 | | | | 0.37 | | | | 1.89 | |
Class S2 | | | 1,000.00 | | | | 907.40 | | | | 0.52 | | | | 2.50 | | | | 1,000.00 | | | | 1,022.58 | | | | 0.52 | | | | 2.65 | |
ING Solution Conservative Portfolio | | | | | | | | | | | | | | | | | | | | | |
Class ADV | | $ | 1,000.00 | | | $ | 969.50 | | | | 0.62 | % | | $ | 3.08 | | | $ | 1,000.00 | | | $ | 1,022.08 | | | | 0.62 | % | | $ | 3.16 | |
Class I | | | 1,000.00 | | | | 972.70 | | | | 0.12 | | | | 0.60 | | | | 1,000.00 | | | | 1,024.60 | | | | 0.12 | | | | 0.61 | |
Class S | | | 1,000.00 | | | | 971.40 | | | | 0.37 | | | | 1.84 | | | | 1,000.00 | | | | 1,023.34 | | | | 0.37 | | | | 1.89 | |
Class S2 | | | 1,000.00 | | | | 970.40 | | | | 0.52 | | | | 2.58 | | | | 1,000.00 | | | | 1,022.58 | | | | 0.52 | | | | 2.65 | |
| * | | Expense ratios do not include expenses of the Underlying Portfolios. |
| ** | | Expenses are equal to each Portfolios’ respective annualized expense ratios multiplied by the average account value over the period, multiplied by 184/365 to reflect the most recent fiscal half-year. |
| (1) | Commencement of operations was October 03, 2011. Expenses paid for the actual Portfolios’ return reflect the 89-day period ended December 31, 2011. |
22
SHAREHOLDER EXPENSE EXAMPLES (UNAUDITED) (CONTINUED)
| | | | | | | | | | | | | | | | | | | | | | | | | | | | | | | | |
| | | Actual Portfolio Return | | | Hypothetical (5% return before expenses) | |
| | | Beginning Account Value July 1, 2011 | | | Ending Account Value December 31, 2011 | | | Annualized Expense Ratio* | | | Expenses Paid During the Period Ended December 31, 2011** | | | Beginning Account Value July 1, 2011 | | | Ending Account Value December 31, 2011 | | | Annualized Expense Ratio* | | | Expenses Paid During the Period Ended December 31, 2011** | |
ING Solution Growth Portfolio | | | | | | | | | | | | | | | | | | | | | |
Class ADV | | $ | 1,000.00 | | | $ | 933.50 | | | | 0.62 | % | | $ | 3.02 | | | $ | 1,000.00 | | | $ | 1,022.08 | | | | 0.62 | % | | $ | 3.16 | |
Class I | | | 1,000.00 | | | | 936.20 | | | | 0.12 | | | | 0.59 | | | | 1,000.00 | | | | 1,024.60 | | | | 0.12 | | | | 0.61 | |
Class S | | | 1,000.00 | | | | 933.90 | | | | 0.37 | | | | 1.80 | | | | 1,000.00 | | | | 1,023.34 | | | | 0.37 | | | | 1.89 | |
Class S2 | | | 1,000.00 | | | | 933.30 | | | | 0.52 | | | | 2.53 | | | | 1,000.00 | | | | 1,022.58 | | | | 0.52 | | | | 2.65 | |
ING Solution Income Portfolio | | | | | | | | | | | | | | | | | | | | | |
Class ADV | | $ | 1,000.00 | | | $ | 970.00 | | | | 0.62 | % | | $ | 3.08 | | | $ | 1,000.00 | | | $ | 1,022.08 | | | | 0.62 | % | | $ | 3.16 | |
Class I | | | 1,000.00 | | | | 972.00 | | | | 0.12 | | | | 0.60 | | | | 1,000.00 | | | | 1,024.60 | | | | 0.12 | | | | 0.61 | |
Class S | | | 1,000.00 | | | | 971.60 | | | | 0.37 | | | | 1.84 | | | | 1,000.00 | | | | 1,023.34 | | | | 0.37 | | | | 1.89 | |
Class S2 | | | 1,000.00 | | | | 970.90 | | | | 0.52 | | | | 2.58 | | | | 1,000.00 | | | | 1,022.58 | | | | 0.52 | | | | 2.65 | |
Class T | | | 1,000.00 | | | | 969.50 | | | | 0.82 | | | | 4.07 | | | | 1,000.00 | | | | 1,021.07 | | | | 0.82 | | | | 4.18 | |
ING Solution Moderate Portfolio | | | | | | | | | | | | | | | | | | | | | |
Class ADV | | $ | 1,000.00 | | | $ | 952.60 | | | | 0.62 | % | | $ | 3.05 | | | $ | 1,000.00 | | | $ | 1,022.08 | | | | 0.62 | % | | $ | 3.16 | |
Class I | | | 1,000.00 | | | | 956.10 | | | | 0.12 | | | | 0.59 | | | | 1,000.00 | | | | 1,024.60 | | | | 0.12 | | | | 0.61 | |
Class S | | | 1,000.00 | | | | 954.60 | | | | 0.37 | | | | 1.82 | | | | 1,000.00 | | | | 1,023.34 | | | | 0.37 | | | | 1.89 | |
Class S2 | | | 1,000.00 | | | | 954.00 | | | | 0.52 | | | | 2.56 | | | | 1,000.00 | | | | 1,022.58 | | | | 0.52 | | | | 2.65 | |
ING Solution 2015 Portfolio | | | | | | | | | | | | | | | | | | | | | |
Class ADV | | $ | 1,000.00 | | | $ | 953.50 | | | | 0.62 | % | | $ | 3.05 | | | $ | 1,000.00 | | | $ | 1,022.08 | | | | 0.62 | % | | $ | 3.16 | |
Class I | | | 1,000.00 | | | | 955.90 | | | | 0.12 | | | | 0.59 | | | | 1,000.00 | | | | 1,024.60 | | | | 0.12 | | | | 0.61 | |
Class S | | | 1,000.00 | | | | 954.60 | | | | 0.37 | | | | 1.82 | | | | 1,000.00 | | | | 1,023.34 | | | | 0.37 | | | | 1.89 | |
Class S2 | | | 1,000.00 | | | | 954.70 | | | | 0.52 | | | | 2.56 | | | | 1,000.00 | | | | 1,022.58 | | | | 0.52 | | | | 2.65 | |
Class T | | | 1,000.00 | | | | 952.50 | | | | 0.82 | | | | 4.04 | | | | 1,000.00 | | | | 1,021.07 | | | | 0.82 | | | | 4.18 | |
ING Solution 2020 Portfolio | | | | | | | | | | | | | | | | | | | | | |
Class ADV(1) | | $ | 1,000.00 | | | $ | 1,085.00 | | | | 0.62 | % | | $ | 3.26 | | | $ | 1,000.00 | | | $ | 1,022.08 | | | | 0.62 | % | | $ | 3.16 | |
Class I(1) | | | 1,000.00 | | | | 1,086.00 | | | | 0.12 | | | | 0.63 | | | | 1,000.00 | | | | 1,024.60 | | | | 0.12 | | | | 0.61 | |
Class S(1) | | | 1,000.00 | | | | 1,085.00 | | | | 0.37 | | | | 1.94 | | | | 1,000.00 | | | | 1,023.34 | | | | 0.37 | | | | 1.89 | |
Class S2(1) | | | 1,000.00 | | | | 1,085.00 | | | | 0.52 | | | | 2.73 | | | | 1,000.00 | | | | 1,022.58 | | | | 0.52 | | | | 2.65 | |
Class T(1) | | | 1,000.00 | | | | 1,084.00 | | | | 0.82 | | | | 4.31 | | | | 1,000.00 | | | | 1,021.07 | | | | 0.82 | | | | 4.18 | |
ING Solution 2025 Portfolio | | | | | | | | | | | | | | | | | | | | | |
Class ADV | | $ | 1,000.00 | | | $ | 926.60 | | | | 0.62 | % | | $ | 3.01 | | | $ | 1,000.00 | | | $ | 1,022.08 | | | | 0.62 | % | | $ | 3.16 | |
Class I | | | 1,000.00 | | | | 928.60 | | | | 0.12 | | | | 0.58 | | | | 1,000.00 | | | | 1,024.60 | | | | 0.12 | | | | 0.61 | |
Class S | | | 1,000.00 | | | | 928.00 | | | | 0.37 | | | | 1.80 | | | | 1,000.00 | | | | 1,023.34 | | | | 0.37 | | | | 1.89 | |
Class S2 | | | 1,000.00 | | | | 927.80 | | | | 0.52 | | | | 2.53 | | | | 1,000.00 | | | | 1,022.58 | | | | 0.52 | | | | 2.65 | |
Class T | | | 1,000.00 | | | | 926.30 | | | | 0.82 | | | | 3.98 | | | | 1,000.00 | | | | 1,021.07 | | | | 0.82 | | | | 4.18 | |
ING Solution 2030 Portfolio | | | | | | | | | | | | | | | | | | | | | |
Class ADV(1) | | $ | 1,000.00 | | | $ | 1,106.00 | | | | 0.62 | % | | $ | 3.29 | | | $ | 1,000.00 | | | $ | 1,022.08 | | | | 0.62 | % | | $ | 3.16 | |
Class I(1) | | | 1,000.00 | | | | 1,107.00 | | | | 0.12 | | | | 0.64 | | | | 1,000.00 | | | | 1,024.60 | | | | 0.12 | | | | 0.61 | |
Class S(1) | | | 1,000.00 | | | | 1,106.00 | | | | 0.37 | | | | 1.96 | | | | 1,000.00 | | | | 1,023.34 | | | | 0.37 | | | | 1.89 | |
Class S2(1) | | | 1,000.00 | | | | 1,106.00 | | | | 0.52 | | | | 2.76 | | | | 1,000.00 | | | | 1,022.58 | | | | 0.52 | | | | 2.65 | |
Class T(1) | | | 1,000.00 | | | | 1,105.00 | | | | 0.82 | | | | 4.35 | | | | 1,000.00 | | | | 1,021.07 | | | | 0.82 | | | | 4.18 | |
| * | | Expense ratios do not include expenses of the Underlying Portfolios. |
| ** | | Expenses are equal to each Portfolios’ respective annualized expense ratios multiplied by the average account value over the period, multiplied by 184/365 to reflect the most recent fiscal half-year. |
| (1) | | Commencement of operations was October 03, 2011. Expenses paid for the actual Portfolios’ return reflect the 89-day period ended December 31, 2011. |
23
SHAREHOLDER EXPENSE EXAMPLES (UNAUDITED) (CONTINUED)
| | | | | | | | | | | | | | | | | | | | | | | | | | | | | | | | |
| | | Actual Portfolio Return | | | Hypothetical (5% return before expenses) | |
| | | Beginning Account Value July 1, 2011 | | | Ending Account Value December 31, 2011 | | | Annualized Expense Ratio* | | | Expenses Paid During the Period Ended December 31, 2011** | | | Beginning Account Value July 1, 2011 | | | Ending Account Value December 31, 2011 | | | Annualized Expense Ratio* | | | Expenses Paid During the Period Ended December 31, 2011** | |
ING Solution 2035 Portfolio | | | | | | | | | | | | | | | | | | | | | |
Class ADV | | $ | 1,000.00 | | | $ | 910.30 | | | | 0.62 | % | | $ | 2.99 | | | $ | 1,000.00 | | | $ | 1,022.08 | | | | 0.62 | % | | $ | 3.16 | |
Class I | | | 1,000.00 | | | | 912.60 | | | | 0.12 | | | | 0.58 | | | | 1,000.00 | | | | 1,024.60 | | | | 0.12 | | | | 0.61 | |
Class S | | | 1,000.00 | | | | 912.00 | | | | 0.37 | | | | 1.78 | | | | 1,000.00 | | | | 1,023.34 | | | | 0.37 | | | | 1.89 | |
Class S2 | | | 1,000.00 | | | | 910.20 | | | | 0.52 | | | | 2.50 | | | | 1,000.00 | | | | 1,022.58 | | | | 0.52 | | | | 2.65 | |
Class T | | | 1,000.00 | | | | 909.20 | | | | 0.82 | | | | 3.95 | | | | 1,000.00 | | | | 1,021.07 | | | | 0.82 | | | | 4.18 | |
ING Solution 2040 Portfolio | | | | | | | | | | | | | | | | | | | | | |
Class ADV(1) | | $ | 1,000.00 | | | $ | 1,123.00 | | | | 0.62 | % | | $ | 3.32 | | | $ | 1,000.00 | | | $ | 1,022.08 | | | | 0.62 | % | | $ | 3.16 | |
Class I(1) | | | 1,000.00 | | | | 1,124.00 | | | | 0.12 | | | | 0.64 | | | | 1,000.00 | | | | 1,024.60 | | | | 0.12 | | | | 0.61 | |
Class S(1) | | | 1,000.00 | | | | 1,123.00 | | | | 0.37 | | | | 1.98 | | | | 1,000.00 | | | | 1,023.34 | | | | 0.37 | | | | 1.89 | |
Class S2(1) | | | 1,000.00 | | | | 1,123.00 | | | | 0.52 | | | | 2.78 | | | | 1,000.00 | | | | 1,022.58 | | | | 0.52 | | | | 2.65 | |
Class T(1) | | | 1,000.00 | | | | 1,122.00 | | | | 0.82 | | | | 4.39 | | | | 1,000.00 | | | | 1,021.07 | | | | 0.82 | | | | 4.18 | |
ING Solution 2045 Portfolio | | | | | | | | | | | | | | | | | | | | | |
Class ADV | | $ | 1,000.00 | | | $ | 904.90 | | | | 0.62 | % | | $ | 2.98 | | | $ | 1,000.00 | | | $ | 1,022.08 | | | | 0.62 | % | | $ | 3.16 | |
Class I | | | 1,000.00 | | | | 906.40 | | | | 0.12 | | | | 0.58 | | | | 1,000.00 | | | | 1,024.60 | | | | 0.12 | | | | 0.61 | |
Class S | | | 1,000.00 | | | | 906.50 | | | | 0.37 | | | | 1.78 | | | | 1,000.00 | | | | 1,023.34 | | | | 0.37 | | | | 1.89 | |
Class S2 | | | 1,000.00 | | | | 905.10 | | | | 0.52 | | | | 2.50 | | | | 1,000.00 | | | | 1,022.58 | | | | 0.52 | | | | 2.65 | |
Class T | | | 1,000.00 | | | | 903.80 | | | | 0.82 | | | | 3.93 | | | | 1,000.00 | | | | 1,021.07 | | | | 0.82 | | | | 4.18 | |
ING Solution 2050 Portfolio | | | | | | | | | | | | | | | | | | | | | |
Class ADV(1) | | $ | 1,000.00 | | | $ | 1,123.00 | | | | 0.62 | % | | $ | 3.32 | | | $ | 1,000.00 | | | $ | 1,022.08 | | | | 0.62 | % | | $ | 3.16 | |
Class I(1) | | | 1,000.00 | | | | 1,124.00 | | | | 0.12 | | | | 0.64 | | | | 1,000.00 | | | | 1,024.60 | | | | 0.12 | | | | 0.61 | |
Class S(1) | | | 1,000.00 | | | | 1,123.00 | | | | 0.37 | | | | 1.98 | | | | 1,000.00 | | | | 1,023.34 | | | | 0.37 | | | | 1.89 | |
Class S2(1) | | | 1,000.00 | | | | 1,123.00 | | | | 0.52 | | | | 2.78 | | | | 1,000.00 | | | | 1,022.58 | | | | 0.52 | | | | 2.65 | |
Class T(1) | | | 1,000.00 | | | | 1,122.00 | | | | 0.82 | | | | 4.39 | | | | 1,000.00 | | | | 1,021.07 | | | | 0.82 | | | | 4.18 | |
ING Solution 2055 Portfolio | | | | | | | | | | | | | | | | | | | | | |
Class ADV | | $ | 1,000.00 | | | $ | 904.80 | | | | 0.62 | % | | $ | 2.98 | | | $ | 1,000.00 | | | $ | 1,022.08 | | | | 0.62 | % | | $ | 3.16 | |
Class I | | | 1,000.00 | | | | 907.10 | | | | 0.12 | | | | 0.58 | | | | 1,000.00 | | | | 1,024.60 | | | | 0.12 | | | | 0.61 | |
Class S | | | 1,000.00 | | | | 906.30 | | | | 0.37 | | | | 1.78 | | | | 1,000.00 | | | | 1,023.34 | | | | 0.37 | | | | 1.89 | |
Class S2 | | | 1,000.00 | | | | 905.90 | | | | 0.52 | | | | 2.50 | | | | 1,000.00 | | | | 1,022.58 | | | | 0.52 | | | | 2.65 | |
Class T | | | 1,000.00 | | | | 904.40 | | | | 0.82 | | | | 3.94 | | | | 1,000.00 | | | | 1,021.07 | | | | 0.82 | | | | 4.18 | |
| * | | Expense ratios do not include expenses of the Underlying Portfolios. |
| ** | | Expenses are equal to each Portfolios’ respective annualized expense ratios multiplied by the average account value over the period, multiplied by 184/365 to reflect the most recent fiscal half-year. |
| (1) | | Commencement of operations was October 03, 2011. Expenses paid for the actual Portfolios’ return reflect the 89-day period ended December 31, 2011. |
24
REPORT OF INDEPENDENT REGISTERED PUBLIC ACCOUNTING FIRM
The Shareholders and Board of Directors
ING Partners, Inc.
We have audited the accompanying statements of assets and liabilities, including the portfolios of investments, of ING Solution Aggressive Growth Portfolio, ING Solution Conservative Portfolio, ING Solution Growth Portfolio, ING Solution Income Portfolio, ING Solution Moderate Portfolio, ING Solution 2015 Portfolio, ING Solution 2020 Portfolio, ING Solution 2025 Portfolio, ING Solution 2030 Portfolio, ING Solution 2035 Portfolio, ING Solution 2040 Portfolio, ING Solution 2045 Portfolio, ING Solution 2050 Portfolio, and ING Solution 2055 Portfolio, each a series of ING Partners, Inc., as of December 31, 2011, and the related statements of operations for the year or period then ended, the statements of changes in net assets for each of the years or periods in the two-year period then ended, and the financial highlights for each of the years or periods in the five-year period then ended. These financial statements and financial highlights are the responsibility of management. Our responsibility is to express an opinion on these financial statements and financial highlights based on our audits.
We conducted our audits in accordance with the standards of the Public Company Accounting Oversight Board (United States). Those standards require that we plan and perform the audit to obtain reasonable assurance about whether the financial statements and financial highlights are free of material misstatement. An audit includes examining, on a test basis, evidence supporting the amounts and disclosures in the financial statements. Our procedures included confirmation of securities owned as of December 31, 2011, by correspondence with the transfer agent of the underlying funds. An audit also includes assessing the accounting principles used and significant estimates made by management, as well as evaluating the overall financial statement presentation. We believe that our audits provide a reasonable basis for our opinion.
In our opinion, the financial statements and financial highlights referred to above present fairly, in all material respects, the financial position of the aforementioned portfolios as of December 31, 2011, and the results of their operations, the changes in their net assets, and the financial highlights for the periods specified in the first paragraph above, in conformity with U.S. generally accepted accounting principles.

Boston, Massachusetts
February 27, 2012
25
STATEMENTS OF ASSETS AND LIABILITIESASOF DECEMBER 31, 2011
| | | | | | | | | | | | | | | | |
| | | ING Solution Aggressive Growth Portfolio | | | ING Solution Conservative Portfolio | | | ING Solution Growth Portfolio | | | ING Solution Income Portfolio | |
ASSETS: | | | | | | | | | | | | | | | | |
Investments in affiliated underlying funds** | | $ | 14,950,609 | | | $ | 9,477,203 | | | $ | 28,519,348 | | | $ | 217,647,202 | |
Cash | | | 1,803 | | | | 3,504 | | | | — | | | | 89,614 | |
Receivables: | | | | | | | | | | | | | | | | |
Investments in affiliated underlying funds sold | | | — | | | | — | | | | — | | | | 966,132 | |
Fund shares sold | | | 377,274 | | | | 475,324 | | | | 1,537,492 | | | | 57,795 | |
Dividends | | | 8,530 | | | | 6,111 | | | | 18,804 | | | | 152,558 | |
| | | | | | | | | | | | | | | | |
Total assets | | | 15,338,216 | | | | 9,962,142 | | | | 30,075,644 | | | | 218,913,301 | |
| | | | | | | | | | | | | | | | |
LIABILITIES: | | | | | | | | | | | | | | | | |
Payable for investments in affiliated underlying funds purchased | | | 385,927 | | | | 463,136 | | | | 1,277,297 | | | | 157,400 | |
Payable for fund shares redeemed | | | — | | | | 18,486 | | | | 279,400 | | | | 1,023,928 | |
Payable to affiliates | | | 6,299 | | | | 4,051 | | | | 11,368 | | | | 87,333 | |
| | | | | | | | | | | | | | | | |
Total liabilities | | | 392,226 | | | | 485,673 | | | | 1,568,065 | | | | 1,268,661 | |
| | | | | | | | | | | | | | | | |
NET ASSETS | | $ | 14,945,990 | | | $ | 9,476,469 | | | $ | 28,507,579 | | | $ | 217,644,640 | |
| | | | | | | | | | | | | | | | |
NET ASSETS WERE COMPRISED OF: | | | | | | | | | | | | | | | | |
Paid-in capital | | $ | 15,347,510 | | | $ | 9,549,183 | | | $ | 28,974,765 | | | $ | 231,249,971 | |
Undistributed net investment income | | | 251,849 | | | | 343,882 | | | | 608,421 | | | | 9,849,403 | |
Accumulated net realized loss | | | (78,342 | ) | | | (148,607 | ) | | | (96,569 | ) | | | (19,339,526 | ) |
Net unrealized depreciation | | | (575,027 | ) | | | (267,989 | ) | | | (979,038 | ) | | | (4,115,208 | ) |
| | | | | | | | | | | | | | | | |
NET ASSETS | | $ | 14,945,990 | | | $ | 9,476,469 | | | $ | 28,507,579 | | | $ | 217,644,640 | |
| | | | | | | | | | | | | | | | |
| | | | | | | | | | | | | | | | |
** Cost of investments in affiliated underlying funds | | $ | 15,525,636 | | | $ | 9,745,192 | | | $ | 29,498,386 | | | $ | 221,762,410 | |
| | | | | | | | | | | | | | | | |
Class ADV | | | | | | | | | | | | | | | | |
Net assets | | $ | 9,526,936 | | | $ | 6,410,719 | | | $ | 16,050,318 | | | $ | 109,184,421 | |
Shares authorized | | | 100,000,000 | | | | 100,000,000 | | | | 100,000,000 | | | | 100,000,000 | |
Par value | | $ | 0.001 | | | $ | 0.001 | | | $ | 0.001 | | | $ | 0.001 | |
Shares outstanding | | | 929,442 | | | | 613,849 | | | | 1,816,374 | | | | 10,498,482 | |
Net asset value and redemption price per share | | $ | 10.25 | | | $ | 10.44 | | | $ | 8.84 | | | $ | 10.40 | |
Class I | | | | | | | | | | | | | | | | |
Net assets | | $ | 3,112 | | | $ | 3,171 | | | $ | 905 | | | $ | 22,837,000 | |
Shares authorized | | | 100,000,000 | | | | 100,000,000 | | | | 100,000,000 | | | | 100,000,000 | |
Par value | | $ | 0.001 | | | $ | 0.001 | | | $ | 0.001 | | | $ | 0.001 | |
Shares outstanding | | | 301 | | | | 301 | | | | 100 | | | | 2,151,445 | |
Net asset value and redemption price per share | | $ | 10.34 | | | $ | 10.54 | | | $ | 9.05 | | | $ | 10.61 | |
Class S | | | | | | | | | | | | | | | | |
Net assets | | $ | 5,379,296 | | | $ | 2,940,891 | | | $ | 12,041,535 | | | $ | 80,715,868 | |
Shares authorized | | | 100,000,000 | | | | 100,000,000 | | | | 100,000,000 | | | | 100,000,000 | |
Par value | | $ | 0.001 | | | $ | 0.001 | | | $ | 0.001 | | | $ | 0.001 | |
Shares outstanding | | | 522,379 | | | | 280,356 | | | | 1,350,091 | | | | 7,666,135 | |
Net asset value and redemption price per share | | $ | 10.30 | | | $ | 10.49 | | | $ | 8.92 | | | $ | 10.53 | |
Class S2 | | | | | | | | | | | | | | | | |
Net assets | | $ | 36,646 | | | $ | 121,688 | | | $ | 414,821 | | | $ | 4,697,112 | |
Shares authorized | | | 100,000,000 | | | | 100,000,000 | | | | 100,000,000 | | | | 100,000,000 | |
Par value | | $ | 0.001 | | | $ | 0.001 | | | $ | 0.001 | | | $ | 0.001 | |
Shares outstanding | | | 3,559 | | | | 11,628 | | | | 46,700 | | | | 455,245 | |
Net asset value and redemption price per share | | $ | 10.30 | | | $ | 10.46 | | | $ | 8.88 | | | $ | 10.32 | |
Class T | | | | | | | | | | | | | | | | |
Net assets | | | n/a | | | | n/a | | | | n/a | | | $ | 210,239 | |
Shares authorized | | | n/a | | | | n/a | | | | n/a | | | | 100,000,000 | |
Par value | | | n/a | | | | n/a | | | | n/a | | | $ | 0.001 | |
Shares outstanding | | | n/a | | | | n/a | | | | n/a | | | | 19,650 | |
Net asset value and redemption price per share | | | n/a | | | | n/a | | | | n/a | | | $ | 10.70 | |
See Accompanying Notes to Financial Statements
26
STATEMENTS OF ASSETS AND LIABILITIESASOF DECEMBER 31, 2011
| | | | | | | | | | | | | | | | |
| | | ING Solution
Moderate Portfolio | | | ING Solution 2015 Portfolio | | | ING Solution 2020 Portfolio | | | ING Solution 2025 Portfolio | |
ASSETS: | | | | | | | | | | | | | | | | |
Investments in affiliated underlying funds** | | $ | 29,189,640 | | | $ | 747,581,618 | | | $ | 16,331 | | | $ | 1,185,816,906 | |
Cash | | | 10,499 | | | | 311,401 | | | | 2 | | | | — | |
Receivables: | | | | | | | | | | | | | | | | |
Investments in affiliated underlying funds sold | | | — | | | | 4,789,671 | | | | — | | | | 11,700,170 | |
Fund shares sold | | | 1,762,386 | | | | 444,577 | | | | — | | | | 574,145 | |
Dividends | | | 16,505 | | | | 595,181 | | | | 12 | | | | 894,151 | |
| | | | | | | | | | | | | | | | |
Total assets | | | 30,979,030 | | | | 753,722,448 | | | | 16,345 | | | | 1,198,985,372 | |
| | | | | | | | | | | | | | | | |
LIABILITIES: | | | | | | | | | | | | | | | | |
Payable for investments in affiliated underlying funds purchased | | | 1,739,843 | | | | 610,784 | | | | 12 | | | | 914,863 | |
Payable for fund shares redeemed | | | 39,549 | | | | 5,234,248 | | | | — | | | | 12,274,315 | |
Payable to affiliates | | | 11,193 | | | | 288,522 | | | | 6 | | | | 453,865 | |
| | | | | | | | | | | | | | | | |
Total liabilities | | | 1,790,585 | | | | 6,133,554 | | | | 18 | | | | 13,643,043 | |
| | | | | | | | | | | | | | | | |
NET ASSETS | | $ | 29,188,445 | | | $ | 747,588,894 | | | $ | 16,327 | | | $ | 1,185,342,329 | |
| | | | | | | | | | | | | | | | |
NET ASSETS WERE COMPRISED OF: | | | | | | | | | | | | | | | | |
Paid-in capital | | $ | 29,164,734 | | | $ | 803,134,936 | | | $ | 15,037 | | | $ | 1,275,864,828 | |
Undistributed net investment income | | | 769,932 | | | | 30,660,310 | | | | 176 | | | | 32,669,695 | |
Accumulated net realized gain (loss) | | | (54,180 | ) | | | (83,088,447 | ) | | | 115 | | | | (161,403,415 | ) |
Net unrealized appreciation (depreciation) | | | (692,041 | ) | | | (3,117,905 | ) | | | 999 | | | | 38,211,221 | |
| | | | | | | | | | | | | | | | |
NET ASSETS | | $ | 29,188,445 | | | $ | 747,588,894 | | | $ | 16,327 | | | $ | 1,185,342,329 | |
| | | | | | | | | | | | | | | | |
| | | | | | | | | | | | | | | | |
** Cost of investments in affiliated underlying funds | | $ | 29,881,681 | | | $ | 750,699,523 | | | $ | 15,332 | | | $ | 1,147,605,685 | |
| | | | | | | | | | | | | | | | |
Class ADV | | | | | | | | | | | | | | | | |
Net assets | | $ | 13,782,146 | | | $ | 312,853,943 | | | $ | 3,265 | | | $ | 494,504,606 | |
Shares authorized | | | 100,000,000 | | | | 100,000,000 | | | | 100,000,000 | | | | 100,000,000 | |
Par value | | $ | 0.001 | | | $ | 0.001 | | | $ | 0.001 | | | $ | 0.001 | |
Shares outstanding | | | 1,442,674 | | | | 29,849,988 | | | | 301 | | | | 47,572,486 | |
Net asset value and redemption price per share | | $ | 9.55 | | | $ | 10.48 | | | $ | 10.85 | | | $ | 10.39 | |
Class I | | | | | | | | | | | | | | | | |
Net assets | | $ | 985 | | | $ | 81,564,846 | | | $ | 3,268 | | | $ | 152,184,011 | |
Shares authorized | | | 100,000,000 | | | | 100,000,000 | | | | 100,000,000 | | | | 100,000,000 | |
Par value | | $ | 0.001 | | | $ | 0.001 | | | $ | 0.001 | | | $ | 0.001 | |
Shares outstanding | | | 100 | | | | 7,631,357 | | | | 301 | | | | 14,339,050 | |
Net asset value and redemption price per share | | $ | 9.86 | | | $ | 10.69 | | | $ | 10.86 | | | $ | 10.61 | |
Class S | | | | | | | | | | | | | | | | |
Net assets | | $ | 15,227,387 | | | $ | 328,277,300 | | | $ | 3,266 | | | $ | 503,344,513 | |
Shares authorized | | | 100,000,000 | | | | 100,000,000 | | | | 100,000,000 | | | | 100,000,000 | |
Par value | | $ | 0.001 | | | $ | 0.001 | | | $ | 0.001 | | | $ | 0.001 | |
Shares outstanding | | | 1,569,665 | | | | 30,965,581 | | | | 301 | | | | 47,849,430 | |
Net asset value and redemption price per share | | $ | 9.70 | | | $ | 10.60 | | | $ | 10.85 | | | $ | 10.52 | |
Class S2 | | | | | | | | | | | | | | | | |
Net assets | | $ | 177,927 | | | $ | 22,792,356 | | | $ | 3,265 | | | $ | 32,053,172 | |
Shares authorized | | | 100,000,000 | | | | 100,000,000 | | | | 100,000,000 | | | | 100,000,000 | |
Par value | | $ | 0.001 | | | $ | 0.001 | | | $ | 0.001 | | | $ | 0.001 | |
Shares outstanding | | | 18,400 | | | | 2,196,508 | | | | 301 | | | | 3,106,643 | |
Net asset value and redemption price per share | | $ | 9.67 | | | $ | 10.38 | | | $ | 10.85 | | | $ | 10.32 | |
Class T | | | | | | | | | | | | | | | | |
Net assets | | | n/a | | | $ | 2,100,449 | | | $ | 3,263 | | | $ | 3,256,027 | |
Shares authorized | | | n/a | | | | 100,000,000 | | | | 100,000,000 | | | | 100,000,000 | |
Par value | | | n/a | | | $ | 0.001 | | | $ | 0.001 | | | $ | 0.001 | |
Shares outstanding | | | n/a | | | | 198,142 | | | | 301 | | | | 310,441 | |
Net asset value and redemption price per share | | | n/a | | | $ | 10.60 | | | $ | 10.84 | | | $ | 10.49 | |
See Accompanying Notes to Financial Statements
27
STATEMENTS OF ASSETS AND LIABILITIESASOF DECEMBER 31, 2011
| | | | | | | | | | | | | | | | |
| | | ING Solution 2030 Portfolio | | | ING Solution 2035 Portfolio | | | ING Solution 2040 Portfolio | | | ING Solution 2045 Portfolio | |
ASSETS: | | | | | | | | | | | | | | | | |
Investments in affiliated underlying funds** | | $ | 16,655 | | | $ | 1,005,401,548 | | | $ | 16,912 | | | $ | 652,390,562 | |
Cash | | | — | | | | 54,888 | | | | — | | | | — | |
Receivables: | | | | | | | | | | | | | | | | |
Investments in affiliated underlying funds sold | | | — | | | | 5,562,383 | | | | — | | | | 2,876,487 | |
Fund shares sold | | | — | | | | 654,315 | | | | — | | | | 530,309 | |
Dividends | | | 6 | | | | 751,364 | | | | 3 | | | | 334,484 | |
| | | | | | | | | | | | | | | | |
Total assets | | | 16,661 | | | | 1,012,424,498 | | | | 16,915 | | | | 656,131,842 | |
| | | | | | | | | | | | | | | | |
LIABILITIES: | | | | | | | | | | | | | | | | |
Payable for investments in affiliated underlying funds purchased | | | 12 | | | | 765,106 | | | | 9 | | | | 336,948 | |
Payable for fund shares redeemed | | | — | | | | 6,216,698 | | | | — | | | | 3,406,796 | |
Payable to affiliates | | | 7 | | | | 380,605 | | | | 7 | | | | 236,512 | |
| | | | | | | | | | | | | | | | |
Total liabilities | | | 19 | | | | 7,362,409 | | | | 16 | | | | 3,980,256 | |
| | | | | | | | | | | | | | | | |
NET ASSETS | | $ | 16,642 | | | $ | 1,005,062,089 | | | $ | 16,899 | | | $ | 652,151,586 | |
| | | | | | | | | | | | | | | | |
NET ASSETS WERE COMPRISED OF: | | | | | | | | | | | | | | | | |
Paid-in capital | | $ | 15,037 | | | $ | 1,075,421,153 | | | $ | 15,037 | | | $ | 683,977,923 | |
Undistributed net investment income | | | 160 | | | | 21,918,040 | | | | 142 | | | | 12,431,489 | |
Accumulated net realized gain (loss) | | | 90 | | | | (111,401,595 | ) | | | 109 | | | | (57,368,003 | ) |
Net unrealized appreciation | | | 1,355 | | | | 19,124,491 | | | | 1,611 | | | | 13,110,177 | |
| | | | | | | | | | | | | | | | |
NET ASSETS | | $ | 16,642 | | | $ | 1,005,062,089 | | | $ | 16,899 | | | $ | 652,151,586 | |
| | | | | | | | | | | | | | | | |
| | | | | | | | | | | | | | | | |
** Cost of investments in affiliated underlying funds | | $ | 15,300 | | | $ | 986,277,057 | | | $ | 15,301 | | | $ | 639,280,385 | |
| | | | | | | | | | | | | | | | |
Class ADV | | | | | | | | | | | | | | | | |
Net assets | | $ | 3,328 | | | $ | 418,752,619 | | | $ | 3,379 | | | $ | 244,111,280 | |
Shares authorized | | | 100,000,000 | | | | 100,000,000 | | | | 100,000,000 | | | | 100,000,000 | |
Par value | | $ | 0.001 | | | $ | 0.001 | | | $ | 0.001 | | | $ | 0.001 | |
Shares outstanding | | | 301 | | | | 39,943,298 | | | | 301 | | | | 23,114,505 | |
Net asset value and redemption price per share | | $ | 11.06 | | | $ | 10.48 | | | $ | 11.23 | | | $ | 10.56 | |
Class I | | | | | | | | | | | | | | | | |
Net assets | | $ | 3,331 | | | $ | 140,502,620 | | | $ | 3,382 | | | $ | 109,358,184 | |
Shares authorized | | | 100,000,000 | | | | 100,000,000 | | | | 100,000,000 | | | | 100,000,000 | |
Par value | | $ | 0.001 | | | $ | 0.001 | | | $ | 0.001 | | | $ | 0.001 | |
Shares outstanding | | | 301 | | | | 13,144,902 | | | | 301 | | | | 10,160,170 | |
Net asset value and redemption price per share | | $ | 11.07 | | | $ | 10.69 | | | $ | 11.24 | | | $ | 10.76 | |
Class S | | | | | | | | | | | | | | | | |
Net assets | | $ | 3,329 | | | $ | 416,249,848 | | | $ | 3,381 | | | $ | 277,997,918 | |
Shares authorized | | | 100,000,000 | | | | 100,000,000 | | | | 100,000,000 | | | | 100,000,000 | |
Par value | | $ | 0.001 | | | $ | 0.001 | | | $ | 0.001 | | | $ | 0.001 | |
Shares outstanding | | | 301 | | | | 39,248,648 | | | | 301 | | | | 26,060,059 | |
Net asset value and redemption price per share | | $ | 11.06 | | | $ | 10.61 | | | $ | 11.23 | | | $ | 10.67 | |
Class S2 | | | | | | | | | | | | | | | | |
Net assets | | $ | 3,328 | | | $ | 26,630,307 | | | $ | 3,380 | | | $ | 19,317,670 | |
Shares authorized | | | 100,000,000 | | | | 100,000,000 | | | | 100,000,000 | | | | 100,000,000 | |
Par value | | $ | 0.001 | | | $ | 0.001 | | | $ | 0.001 | | | $ | 0.001 | |
Shares outstanding | | | 301 | | | | 2,570,239 | | | | 301 | | | | 1,841,102 | |
Net asset value and redemption price per share | | $ | 11.06 | | | $ | 10.36 | | | $ | 11.23 | | | $ | 10.49 | |
Class T | | | | | | | | | | | | | | | | |
Net assets | | $ | 3,326 | | | $ | 2,926,695 | | | $ | 3,377 | | | $ | 1,366,534 | |
Shares authorized | | | 100,000,000 | | | | 100,000,000 | | | | 100,000,000 | | | | 100,000,000 | |
Par value | | $ | 0.001 | | | $ | 0.001 | | | $ | 0.001 | | | $ | 0.001 | |
Shares outstanding | | | 301 | | | | 275,284 | | | | 301 | | | | 128,518 | |
Net asset value and redemption price per share | | $ | 11.05 | | | $ | 10.63 | | | $ | 11.22 | | | $ | 10.63 | |
See Accompanying Notes to Financial Statements
28
STATEMENTS OF ASSETS AND LIABILITIESASOF DECEMBER 31, 2011
| | | | | | | | |
| | | ING Solution 2050 Portfolio | | | ING Solution 2055 Portfolio | |
ASSETS: | | | | | | | | |
Investments in affiliated underlying funds** | | $ | 16,913 | | | $ | 27,029,805 | |
Receivables: | | | | | | | | |
Investments in affiliated underlying funds sold | | | — | | | | 28,843 | |
Fund shares sold | | | — | | | | 109,230 | |
Dividends | | | 2 | | | | 13,834 | |
| | | | | | | | |
Total assets | | | 16,915 | | | | 27,181,712 | |
| | | | | | | | |
LIABILITIES: | | | | | | | | |
Payable for investments in affiliated underlying funds purchased | | | 8 | | | | 13,824 | |
Payable for fund shares redeemed | | | — | | | | 138,034 | |
Payable to affiliates | | | 7 | | | | 9,748 | |
| | | | | | | | |
Total liabilities | | | 15 | | | | 161,606 | |
| | | | | | | | |
NET ASSETS | | $ | 16,900 | | | $ | 27,020,106 | |
| | | | | | | | |
NET ASSETS WERE COMPRISED OF: | | | | | | | | |
Paid-in capital | | $ | 15,037 | | | $ | 27,565,216 | |
Undistributed net investment income | | | 140 | | | | 426,491 | |
Accumulated net realized gain | | | 140 | | | | 168,740 | |
Net unrealized appreciation (depreciation) | | | 1,583 | | | | (1,140,341 | ) |
| | | | | | | | |
NET ASSETS | | $ | 16,900 | | | $ | 27,020,106 | |
| | | | | | | | |
| | | | | | | | |
** Cost of investments in affiliated underlying funds | | $ | 15,330 | | | $ | 28,170,146 | |
| | | | | | | | |
Class ADV | | | | | | | | |
Net assets | | $ | 3,380 | | | $ | 11,461,236 | |
Shares authorized | | | 100,000,000 | | | | 100,000,000 | |
Par value | | $ | 0.001 | | | $ | 0.001 | |
Shares outstanding | | | 301 | | | | 1,074,811 | |
Net asset value and redemption price per share | | $ | 11.23 | | | $ | 10.66 | |
Class I | | | | | | | | |
Net assets | | $ | 3,383 | | | $ | 4,746,395 | |
Shares authorized | | | 100,000,000 | | | | 100,000,000 | |
Par value | | $ | 0.001 | | | $ | 0.001 | |
Shares outstanding | | | 301 | | | | 441,943 | |
Net asset value and redemption price per share | | $ | 11.24 | | | $ | 10.74 | |
Class S | | | | | | | | |
Net assets | | $ | 3,380 | | | $ | 10,060,525 | |
Shares authorized | | | 100,000,000 | | | | 100,000,000 | |
Par value | | $ | 0.001 | | | $ | 0.001 | |
Shares outstanding | | | 301 | | | | 940,303 | |
Net asset value and redemption price per share | | $ | 11.23 | | | $ | 10.70 | |
Class S2 | | | | | | | | |
Net assets | | $ | 3,380 | | | $ | 744,810 | |
Shares authorized | | | 100,000,000 | | | | 100,000,000 | |
Par value | | $ | 0.001 | | | $ | 0.001 | |
Shares outstanding | | | 301 | | | | 69,767 | |
Net asset value and redemption price per share | | $ | 11.23 | | | $ | 10.68 | |
Class T | | | | | | | | |
Net assets | | $ | 3,377 | | | $ | 7,140 | |
Shares authorized | | | 100,000,000 | | | | 100,000,000 | |
Par value | | $ | 0.001 | | | $ | 0.001 | |
Shares outstanding | | | 301 | | | | 671 | |
Net asset value and redemption price per share | | $ | 11.22 | | | $ | 10.65 | |
See Accompanying Notes to Financial Statements
29
STATEMENTS OF OPERATIONSFORTHE YEAR ENDED DECEMBER 31, 2011
| | | | | | | | | | | | | | | | |
| | | ING
Solution
Aggressive Growth Portfolio | | | ING Solution Conservative Portfolio | | | ING
Solution Growth Portfolio | | | ING Solution Income Portfolio | |
INVESTMENT INCOME: | | | | | | | | | | | | | | | | |
Dividends from affiliated underlying funds | | $ | 262,572 | | | $ | 302,454 | | | $ | 585,190 | | | $ | 8,664,992 | |
| | | | | | | | | | | | | | | | |
Total investment income | | | 262,572 | | | | 302,454 | | | | 585,190 | | | | 8,664,992 | |
| | | | | | | | | | | | | | | | |
EXPENSES: | | | | | | | | | | | | | | | | |
Investment management fees | | | 10,249 | | | | 7,115 | | | | 18,601 | | | | 228,096 | |
Distribution and service fees: | | | | | | | | | | | | | | | | |
Class ADV | | | 34,867 | | | | 24,676 | | | | 54,525 | | | | 561,658 | |
Class S | | | 7,931 | | | | 5,162 | | | | 18,129 | | | | 221,018 | |
Class S2 | | | 503 | | | | 560 | | | | 2,219 | | | | 23,327 | |
Class T | | | — | | | | — | | | | — | | | | 2,575 | |
Administrative service fees | | | 2,050 | | | | 1,423 | | | | 3,720 | | | | 45,616 | |
Miscellaneous expense | | | 34 | | | | 25 | | | | 63 | | | | 877 | |
| | | | | | | | | | | | | | | | |
Total expenses | | | 55,634 | | | | 38,961 | | | | 97,257 | | | | 1,083,167 | |
Net waived and reimbursed fees | | | (100 | ) | | | (112 | ) | | | (444 | ) | | | (4,837 | ) |
| | | | | | | | | | | | | | | | |
Net expenses | | | 55,534 | | | | 38,849 | | | | 96,813 | | | | 1,078,330 | |
| | | | | | | | | | | | | | | | |
Net investment income | | | 207,038 | | | | 263,605 | | | | 488,377 | | | | 7,586,662 | |
| | | | | | | | | | | | | | | | |
REALIZED AND UNREALIZED GAIN (LOSS): | | | | | | | | | | | | | | | | |
Net realized gain (loss) on: | | | | | | | | | | | | | | | | |
Sale of affiliated underlying funds | | | (129,740 | ) | | | (178,033 | ) | | | (177,747 | ) | | | 10,270,681 | |
Capital gain distributions from affiliated underlying funds | | | 96,503 | | | | 116,459 | | | | 208,064 | | | | 3,282,795 | |
| | | | | | | | | | | | | | | | |
Net realized gain (loss) | | | (33,237 | ) | | | (61,574 | ) | | | 30,317 | | | | 13,553,476 | |
| | | | | | | | | | | | | | | | |
Net change in unrealized appreciation (depreciation) on: | | | | | | | | | | | | | | | | |
Affiliated underlying funds | | | (853,993 | ) | | | (281,783 | ) | | | (1,384,784 | ) | | | (20,227,049 | ) |
| | | | | | | | | | | | | | | | |
Net change in unrealized appreciation (depreciation) | | | (853,993 | ) | | | (281,783 | ) | | | (1,384,784 | ) | | | (20,227,049 | ) |
| | | | | | | | | | | | | | | | |
Net realized and unrealized loss | | | (887,230 | ) | | | (343,357 | ) | | | (1,354,467 | ) | | | (6,673,573 | ) |
| | | | | | | | | | | | | | | | |
Increase (decrease) in net assets resulting from operations | | $ | (680,192 | ) | | $ | (79,752 | ) | | $ | (866,090 | ) | | $ | 913,089 | |
| | | | | | | | | | | | | | | | |
See Accompanying Notes to Financial Statements
30
STATEMENTS OF OPERATIONSFORTHE YEAR ENDED DECEMBER 31, 2011
| | | | | | | | | | | | | | | | |
| | | ING
Solution Moderate
Portfolio | | | ING Solution
2015 Portfolio | | | ING Solution 2020 Portfolio | | | ING Solution 2025 Portfolio | |
| | | | | | | | | October 3, 2011(1) to December 31, 2011 | | | | |
INVESTMENT INCOME: | | | | | | | | | | | | | | | | |
Dividends from affiliated underlying funds | | $ | 689,513 | | | $ | 26,932,418 | | | $ | 147 | | | $ | 32,873,659 | |
| | | | | | | | | | | | | | | | |
Total investment income | | | 689,513 | | | | 26,932,418 | | | | 147 | | | | 32,873,659 | |
| | | | | | | | | | | | | | | | |
EXPENSES: | | | | | | | | | | | | | | | | |
Investment management fees | | | 17,845 | | | | 792,814 | | | | 4 | | | | 1,252,050 | |
Distribution and service fees: | | | | | | | | | | | | | | | | |
Class ADV | | | 39,535 | | | | 1,659,189 | | | | 3 | | | | 2,640,572 | |
Class S | | | 24,566 | | | | 913,802 | | | | 2 | | | | 1,400,859 | |
Class S2 | | | 552 | | | | 87,875 | | | | 3 | | | | 123,484 | |
Class T | | | — | | | | 19,060 | | | | 6 | | | | 43,086 | |
Administrative service fees | | | 3,568 | | | | 158,551 | | | | 1 | | | | 250,392 | |
Miscellaneous expense | | | 59 | | | | 3,046 | | | | — | | | | 4,787 | |
| | | | | | | | | | | | | | | | |
Total expenses | | | 86,125 | | | | 3,634,337 | | | | 19 | | | | 5,715,230 | |
Net waived and reimbursed fees | | | (111 | ) | | | (18,845 | ) | | | (1 | ) | | | (27,569 | ) |
| | | | | | | | | | | | | | | | |
Net expenses | | | 86,014 | | | | 3,615,492 | | | | 18 | | | | 5,687,661 | |
| | | | | | | | | | | | | | | | |
Net investment income | | | 603,499 | | | | 23,316,926 | | | | 129 | | | | 27,185,998 | |
| | | | | | | | | | | | | | | | |
REALIZED AND UNREALIZED GAIN (LOSS): | | | | | | | | | | | | | | | | |
Net realized gain (loss) on: | | | | | | | | | | | | | | | | |
Sale of affiliated underlying funds | | | (135,711 | ) | | | 56,567,921 | | | | 105 | | | | 65,400,820 | |
Capital gain distributions from affiliated underlying funds | | | 258,938 | | | | 11,328,450 | | | | 44 | | | | 10,337,927 | |
| | | | | | | | | | | | | | | | |
Net realized gain | | | 123,227 | | | | 67,896,371 | | | | 149 | | | | 75,738,747 | |
| | | | | | | | | | | | | | | | |
Net change in unrealized appreciation (depreciation) on: | | | | | | | | | | | | | | | | |
Affiliated underlying funds | | | (1,035,912 | ) | | | (96,100,672 | ) | | | 999 | | | | (141,949,834 | ) |
| | | | | | | | | | | | | | | | |
Net change in unrealized appreciation (depreciation) | | | (1,035,912 | ) | | | (96,100,672 | ) | | | 999 | | | | (141,949,834 | ) |
| | | | | | | | | | | | | | | | |
Net realized and unrealized gain (loss) | | | (912,685 | ) | | | (28,204,301 | ) | | | 1,148 | | | | (66,211,087 | ) |
| | | | | | | | | | | | | | | | |
Increase (decrease) in net assets resulting from operations | | $ | (309,186 | ) | | $ | (4,887,375 | ) | | $ | 1,277 | | | $ | (39,025,089 | ) |
| | | | | | | | | | | | | | | | |
| (1) | | Commencement of operations. |
See Accompanying Notes to Financial Statements
31
STATEMENTS OF OPERATIONSFORTHE YEAR ENDED DECEMBER 31, 2011
| | | | | | | | | | | | | | | | |
| | | ING Solution 2030 Portfolio | | | ING Solution 2035 Portfolio | | | ING Solution 2040 Portfolio | | | ING Solution 2045 Portfolio | |
| | | October 3, 2011(1) to December 31, 2011 | | | | | | October 3, 2011(1) to December 31, 2011 | | | | |
INVESTMENT INCOME: | | | | | | | | | | | | | | | | |
Dividends from affiliated underlying funds | | $ | 131 | | | $ | 22,987,618 | | | $ | 111 | | | $ | 13,041,184 | |
| | | | | | | | | | | | | | | | |
Total investment income | | | 131 | | | | 22,987,618 | | | | 111 | | | | 13,041,184 | |
| | | | | | | | | | | | | | | | |
EXPENSES: | | | | | | | | | | | | | | | | |
Investment management fees | | | 4 | | | | 1,062,937 | | | | 4 | | | | 683,788 | |
Distribution and service fees: | | | | | | | | | | | | | | | | |
Class ADV | | | 4 | | | | 2,256,353 | | | | 4 | | | | 1,309,174 | |
Class S | | | 2 | | | | 1,163,119 | | | | 2 | | | | 758,116 | |
Class S2 | | | 3 | | | | 108,351 | | | | 3 | | | | 80,270 | |
Class T | | | 6 | | | | 27,236 | | | | 6 | | | | 15,847 | |
Administrative service fees | | | 1 | | | | 212,572 | | | | 1 | | | | 136,748 | |
Miscellaneous expense | | | — | | | | 4,068 | | | | — | | | | 2,613 | |
| | | | | | | | | | | | | | | | |
Total expenses | | | 20 | | | | 4,834,636 | | | | 20 | | | | 2,986,556 | |
Net waived and reimbursed fees | | | (1 | ) | | | (23,486 | ) | | | (2 | ) | | | (17,110 | ) |
| | | | | | | | | | | | | | | | |
Net expenses | | | 19 | | | | 4,811,150 | | | | 18 | | | | 2,969,446 | |
| | | | | | | | | | | | | | | | |
Net investment income | | | 112 | | | | 18,176,468 | | | | 93 | | | | 10,071,738 | |
| | | | | | | | | | | | | | | | |
REALIZED AND UNREALIZED GAIN (LOSS): | | | | | | | | | | | | | | | | |
Net realized gain (loss) on: | | | | | | | | | | | | | | | | |
Sale of affiliated underlying funds | | | 82 | | | | 59,378,538 | | | | 104 | | | | 48,822,187 | |
Capital gain distributions from affiliated underlying funds | | | 43 | | | | 8,383,027 | | | | 41 | | | | 5,766,610 | |
| | | | | | | | | | | | | | | | |
Net realized gain | | | 125 | | | | 67,761,565 | | | | 145 | | | | 54,588,797 | |
| | | | | | | | | | | | | | | | |
Net change in unrealized appreciation (depreciation) on: | | | | | | | | | | | | | | | | |
Affiliated underlying funds | | | 1,355 | | | | (135,905,734 | ) | | | 1,611 | | | | (100,288,416 | ) |
| | | | | | | | | | | | | | | | |
Net change in unrealized appreciation (depreciation) | | | 1,355 | | | | (135,905,734 | ) | | | 1,611 | | | | (100,288,416 | ) |
| | | | | | | | | | | | | | | | |
Net realized and unrealized gain (loss) | | | 1,480 | | | | (68,144,169 | ) | | | 1,756 | | | | (45,699,619 | ) |
| | | | | | | | | | | | | | | | |
Increase (decrease) in net assets resulting from operations | | $ | 1,592 | | | $ | (49,967,701 | ) | | $ | 1,849 | | | $ | (35,627,881 | ) |
| | | | | | | | | | | | | | | | |
| (1) | | Commencement of operations. |
See Accompanying Notes to Financial Statements
32
STATEMENTS OF OPERATIONSFORTHE YEAR ENDED DECEMBER 31, 2011
| | | | | | | | |
| | | ING Solution 2050 Portfolio | | | ING
Solution
2055 Portfolio | |
| | | October 3, 2011(1) to December 31, 2011 | | | | |
INVESTMENT INCOME: | | | | | | | | |
Dividends from affiliated underlying funds | | $ | 110 | | | $ | 429,261 | |
| | | | | | | | |
Total investment income | | | 110 | | | | 429,261 | |
| | | | | | | | |
EXPENSES: | | | | | | | | |
Investment management fees | | | 4 | | | | 19,594 | |
Distribution and service fees: | | | | | | | | |
Class ADV | | | 3 | | | | 41,830 | |
Class S | | | 2 | | | | 19,726 | |
Class S2 | | | 4 | | | | 2,549 | |
Class T | | | 6 | | | | 67 | |
Administrative service fees | | | 1 | | | | 3,919 | |
Miscellaneous expense | | | — | | | | 66 | |
| | | | | | | | |
Total expenses | | | 20 | | | | 87,751 | |
Net waived and reimbursed fees | | | (1 | ) | | | (514 | ) |
| | | | | | | | |
Net expenses | | | 19 | | | | 87,237 | |
| | | | | | | | |
Net investment income | | | 91 | | | | 342,024 | |
| | | | | | | | |
REALIZED AND UNREALIZED GAIN (LOSS): | | | | | | | | |
Net realized gain (loss) on: | | | | | | | | |
Sale of affiliated underlying funds | | | 135 | | | | 97,876 | |
Capital gain distributions from affiliated underlying funds | | | 41 | | | | 186,944 | |
| | | | | | | | |
Net realized gain | | | 176 | | | | 284,820 | |
| | | | | | | | |
Net change in unrealized appreciation (depreciation) on: | | | | | | | | |
Affiliated underlying funds | | | 1,583 | | | | (1,996,890 | ) |
| | | | | | | | |
Net change in unrealized appreciation (depreciation) | | | 1,583 | | | | (1,996,890 | ) |
| | | | | | | | |
Net realized and unrealized gain (loss) | | | 1,759 | | | | (1,712,070 | ) |
| | | | | | | | |
Increase (decrease) in net assets resulting from operations | | $ | 1,850 | | | $ | (1,370,046 | ) |
| | | | | | | | |
| (1) | | Commencement of operations. |
See Accompanying Notes to Financial Statements
33
STATEMENTS OF CHANGES IN NET ASSETS
| | | | | | | | | | | | | | | | |
| | | ING Solution Aggressive Growth Portfolio | | | ING Solution Conservative Portfolio | |
| | | Year Ended December 31, 2011 | | | April 30, 2010(1) to December 31, 2010 | | | Year Ended December 31, 2011 | | | April 30, 2010(1) to December 31, 2010 | |
FROM OPERATIONS: | | | | | | | | | | | | | | | | |
Net investment income | | $ | 207,038 | | | $ | 18,488 | | | $ | 263,605 | | | $ | 28,048 | |
Net realized gain (loss) | | | (33,237 | ) | | | 46,215 | | | | (61,574 | ) | | | 15,689 | |
Net change in unrealized appreciation (depreciation) | | | (853,993 | ) | | | 278,966 | | | | (281,783 | ) | | | 13,794 | |
| | | | | | | | | | | | | | | | |
Increase (decrease) in net assets resulting from operations | | | (680,192 | ) | | | 343,669 | | | | (79,752 | ) | | | 57,531 | |
| | | | | | | | | | | | | | | | |
FROM DISTRIBUTIONS TO SHAREHOLDERS: | | | | | | | | | | | | | | | | |
Net investment income: | | | | | | | | | | | | | | | | |
Class ADV | | | (13,230 | ) | | | — | | | | (20,417 | ) | | | — | |
Class I | | | (7 | ) | | | — | | | | (13 | ) | | | — | |
Class S | | | (7,295 | ) | | | — | | | | (8,648 | ) | | | — | |
Class S2 | | | — | | | | — | | | | (410 | ) | | | — | |
Net realized gains: | | | | | | | | | | | | | | | | |
Class ADV | | | (30,198 | ) | | | — | | | | (14,569 | ) | | | — | |
Class I | | | (13 | ) | | | — | | | | (8 | ) | | | — | |
Class S | | | (14,118 | ) | | | — | | | | (6,139 | ) | | | — | |
Class S2 | | | (144 | ) | | | — | | | | (297 | ) | | | — | |
| | | | | | | | | | | | | | | | |
Total distributions | | | (65,005 | ) | | | — | | | | (50,501 | ) | | | — | |
| | | | | | | | | | | | | | | | |
FROM CAPITAL SHARE TRANSACTIONS: | | | | | | | | | | | | | | | | |
Net proceeds from sale of shares | | | 11,387,885 | | | | 6,178,037 | | | | 8,309,839 | | | | 3,386,632 | |
Reinvestment of distributions | | | 64,985 | | | | — | | | | 50,481 | | | | — | |
| | | | | | | | | | | | | | | | |
| | | 11,452,870 | | | | 6,178,037 | | | | 8,360,320 | | | | 3,386,632 | |
Cost of shares redeemed | | | (2,018,897 | ) | | | (264,492 | ) | | | (1,829,377 | ) | | | (368,384 | ) |
| | | | | | | | | | | | | | | | |
Net increase in net assets resulting from capital share transactions | | | 9,433,973 | | | | 5,913,545 | | | | 6,530,943 | | | | 3,018,248 | |
| | | | | | | | | | | | | | | | |
Net increase in net assets | | | 8,688,776 | | | | 6,257,214 | | | | 6,400,690 | | | | 3,075,779 | |
| | | | | | | | | | | | | | | | |
NET ASSETS: | | | | | | | | | | | | | | | | |
Beginning of year or period | | | 6,257,214 | | | | — | | | | 3,075,779 | | | | — | |
| | | | | | | | | | | | | | | | |
End of year or period | | $ | 14,945,990 | | | $ | 6,257,214 | | | $ | 9,476,469 | | | $ | 3,075,779 | |
| | | | | | | | | | | | | | | | |
Undistributed net investment income at end of year or period | | $ | 251,849 | | | $ | 20,519 | | | $ | 343,882 | | | $ | 29,471 | |
| | | | | | | | | | | | | | | | |
| (1) | | Commencement of operations. |
See Accompanying Notes to Financial Statements
34
STATEMENTS OF CHANGES IN NET ASSETS
| | | | | | | | | | | | | | | | |
| | | ING Solution Growth Portfolio | | | ING Solution Income Portfolio | |
| | | Year Ended December 31, 2011 | | | Year Ended December 31, 2010 | | | Year Ended December 31, 2011 | | | Year Ended December 31, 2010 | |
FROM OPERATIONS: | | | | | | | | | | | | | | | | |
Net investment income | | $ | 488,377 | | | $ | 61,519 | | | $ | 7,586,662 | | | $ | 7,463,941 | |
Net realized gain | | | 30,317 | | | | 133,707 | | | | 13,553,476 | | | | 10,561,442 | |
Net change in unrealized appreciation (depreciation) | | | (1,384,784 | ) | | | 338,985 | | | | (20,227,049 | ) | | | 2,468,751 | |
| | | | | | | | | | | | | | | | |
Increase (decrease) in net assets resulting from operations | | | (866,090 | ) | | | 534,211 | | | | 913,089 | | | | 20,494,134 | |
| | | | | | | | | | | | | | | | |
FROM DISTRIBUTIONS TO SHAREHOLDERS: | | | | | | | | | | | | | | | | |
Net investment income: | | | | | | | | | | | | | | | | |
Class ADV | | | (40,462 | ) | | | (7 | ) | | | (4,429,419 | ) | | | (3,340,664 | ) |
Class I | | | (3 | ) | | | (9 | ) | | | (920,437 | ) | | | (778,507 | ) |
Class S | | | (25,988 | ) | | | (10,571 | ) | | | (3,538,958 | ) | | | (3,083,437 | ) |
Class S2 | | | (1,137 | ) | | | (34 | ) | | | (167,535 | ) | | | (186,747 | ) |
Class T | | | — | | | | — | | | | (7,074 | ) | | | (14,106 | ) |
Net realized gains: | | | | | | | | | | | | | | | | |
Class ADV | | | (53,993 | ) | | | — | | | | — | | | | — | |
Class I | | | (4 | ) | | | — | | | | — | | | | — | |
Class S | | | (36,620 | ) | | | — | | | | — | | | | — | |
Class S2 | | | (1,730 | ) | | | — | | | | — | | | | — | |
| | | | | | | | | | | | | | | | |
Total distributions | | | (159,937 | ) | | | (10,621 | ) | | | (9,063,423 | ) | | | (7,403,461 | ) |
| | | | | | | | | | | | | | | | |
FROM CAPITAL SHARE TRANSACTIONS: | | | | | | | | | | | | | | | | |
Net proceeds from sale of shares | | | 21,875,242 | | | | 8,861,777 | | | | 57,588,232 | | | | 59,189,253 | |
Reinvestment of distributions | | | 159,930 | | | | 10,572 | | | | 9,063,423 | | | | 7,403,461 | |
| | | | | | | | | | | | | | | | |
| | | 22,035,172 | | | | 8,872,349 | | | | 66,651,655 | | | | 66,592,714 | |
Cost of shares redeemed | | | (2,360,044 | ) | | | (278,201 | ) | | | (75,632,988 | ) | | | (62,005,929 | ) |
| | | | | | | | | | | | | | | | |
Net increase (decrease) in net assets resulting from capital share transactions | | | 19,675,128 | | | | 8,594,148 | | | | (8,981,333 | ) | | | 4,586,785 | |
| | | | | | | | | | | | | | | | |
Net increase (decrease) in net assets | | | 18,649,101 | | | | 9,117,738 | | | | (17,131,667 | ) | | | 17,677,458 | |
| | | | | | | | | | | | | | | | |
NET ASSETS: | | | | | | | | | | | | | | | | |
Beginning of year or period | | | 9,858,478 | | | | 740,740 | | | | 234,776,307 | | | | 217,098,849 | |
| | | | | | | | | | | | | | | | |
End of year or period | | $ | 28,507,579 | | | $ | 9,858,478 | | | $ | 217,644,640 | | | $ | 234,776,307 | |
| | | | | | | | | | | | | | | | |
Undistributed net investment income at end of year or period | | $ | 608,421 | | | $ | 67,566 | | | $ | 9,849,403 | | | $ | 9,062,920 | |
| | | | | | | | | | | | | | | | |
See Accompanying Notes to Financial Statements
35
STATEMENTS OF CHANGES IN NET ASSETS
| | | | | | | | | | | | | | | | |
| | | ING Solution Moderate Portfolio | | | ING Solution 2015 Portfolio | |
| | | Year Ended December 31, 2011 | | | Year Ended December 31, 2010 | | | Year Ended December 31, 2011 | | | Year Ended December 31, 2010 | |
FROM OPERATIONS: | | | | | | | | | | | | | | | | |
Net investment income | | $ | 603,499 | | | $ | 94,858 | | | $ | 23,316,926 | | | $ | 20,618,784 | |
Net realized gain | | | 123,227 | | | | 190,964 | | | | 67,896,371 | | | | 9,792,538 | |
Net change in unrealized appreciation (depreciation) | | | (1,035,912 | ) | | | 210,078 | | | | (96,100,672 | ) | | | 50,621,705 | |
| | | | | | | | | | | | | | | | |
Increase (decrease) in net assets resulting from operations | | | (309,186 | ) | | | 495,900 | | | | (4,887,375 | ) | | | 81,033,027 | |
| | | | | | | | | | | | | | | | |
FROM DISTRIBUTIONS TO SHAREHOLDERS: | | | | | | | | | | | | | | | | |
Net investment income: | | | | | | | | | | | | | | | | |
Class ADV | | | (54,404 | ) | | | (1,717 | ) | | | (9,822,823 | ) | | | (6,560,701 | ) |
Class I | | | (6 | ) | | | (13 | ) | | | (2,473,021 | ) | | | (1,657,246 | ) |
Class S | | | (52,759 | ) | | | (29,511 | ) | | | (11,411,661 | ) | | | (8,189,236 | ) |
Class S2 | | | (537 | ) | | | (45 | ) | | | (531,537 | ) | | | (346,966 | ) |
Class T | | | — | | | | — | | | | (71,208 | ) | | | (48,315 | ) |
Net realized gains: | | | | | | | | | | | | | | | | |
Class ADV | | | (77,693 | ) | | | (585 | ) | | | — | | | | — | |
Class I | | | (9 | ) | | | (5 | ) | | | — | | | | — | |
Class S | | | (83,020 | ) | | | (10,815 | ) | | | — | | | | — | |
Class S2 | | | (783 | ) | | | (15 | ) | | | — | | | | — | |
| | | | | | | | | | | | | | | | |
Total distributions | | | (269,211 | ) | | | (42,706 | ) | | | (24,310,250 | ) | | | (16,802,464 | ) |
| | | | | | | | | | | | | | | | |
FROM CAPITAL SHARE TRANSACTIONS: | | | | | | | | | | | | | | | | |
Net proceeds from sale of shares | | | 22,239,953 | | | | 7,982,370 | | | | 137,506,278 | | | | 153,395,299 | |
Reinvestment of distributions | | | 269,195 | | | | 42,609 | | | | 24,310,250 | | | | 16,802,464 | |
| | | | | | | | | | | | | | | | |
| | | 22,509,148 | | | | 8,024,979 | | | | 161,816,528 | | | | 170,197,763 | |
Cost of shares redeemed | | | (2,376,917 | ) | | | (374,409 | ) | | | (195,024,320 | ) | | | (148,326,550 | ) |
| | | | | | | | | | | | | | | | |
Net increase (decrease) in net assets resulting from capital share transactions | | | 20,132,231 | | | | 7,650,570 | | | | (33,207,792 | ) | | | 21,871,213 | |
| | | | | | | | | | | | | | | | |
Net increase (decrease) in net assets | | | 19,553,834 | | | | 8,103,764 | | | | (62,405,417 | ) | | | 86,101,776 | |
| | | | | | | | | | | | | | | | |
NET ASSETS: | | | | | | | | | | | | | | | | |
Beginning of year or period | | | 9,634,611 | | | | 1,530,847 | | | | 809,994,311 | | | | 723,892,535 | |
| | | | | | | | | | | | | | | | |
End of year or period | | $ | 29,188,445 | | | $ | 9,634,611 | | | $ | 747,588,894 | | | $ | 809,994,311 | |
| | | | | | | | | | | | | | | | |
Undistributed net investment income at end of year or period | | $ | 769,932 | | | $ | 107,704 | | | $ | 30,660,310 | | | $ | 24,308,661 | |
| | | | | | | | | | | | | | | | |
See Accompanying Notes to Financial Statements
36
STATEMENTS OF CHANGES IN NET ASSETS
| | | | | | | | | | | | | | | | |
| | | ING Solution 2020 Portfolio | | | ING Solution 2025 Portfolio | | | ING Solution 2030 Portfolio | |
| | | October 3, 2011(1) to December 31, 2011 | | | Year Ended December 31, 2011 | | | Year Ended December 31, 2010 | | | October 3, 2011(1) to December 31, 2011 | |
FROM OPERATIONS: | | | | | | | | | | | | | | | | |
Net investment income | | $ | 129 | | | $ | 27,185,998 | | | $ | 22,789,809 | | | $ | 112 | |
Net realized gain (loss) | | | 149 | | | | 75,738,747 | | | | (16,404,444 | ) | | | 125 | |
Net change in unrealized appreciation (depreciation) | | | 999 | | | | (141,949,834 | ) | | | 143,939,861 | | | | 1,355 | |
| | | | | | | | | | | | | | | | |
Increase (decrease) in net assets resulting from operations | | | 1,277 | | | | (39,025,089 | ) | | | 150,325,226 | | | | 1,592 | |
| | | | | | | | | | | | | | | | |
FROM DISTRIBUTIONS TO SHAREHOLDERS: | | | | | | | | | | | | | | | | |
Net investment income: | | | | | | | | | | | | | | | | |
Class ADV | | | — | | | | (10,006,665 | ) | | | (6,781,215 | ) | | | — | |
Class I | | | — | | | | (2,896,280 | ) | | | (1,991,643 | ) | | | — | |
Class S | | | — | | | | (11,679,285 | ) | | | (8,486,689 | ) | | | — | |
Class S2 | | | — | | | | (506,920 | ) | | | (335,207 | ) | | | — | |
Class T | | | — | | | | (90,084 | ) | | | (68,878 | ) | | | — | |
| | | | | | | | | | | | | | | | |
Total distributions | | | — | | | | (25,179,234 | ) | | | (17,663,632 | ) | | | — | |
| | | | | | | | | | | | | | | | |
FROM CAPITAL SHARE TRANSACTIONS: | | | | | | | | | | | | | | | | |
Net proceeds from sale of shares | | | 15,050 | | | | 222,454,400 | | | | 203,590,100 | | | | 15,050 | |
Reinvestment of distributions | | | — | | | | 25,179,234 | | | | 17,663,632 | | | | — | |
| | | | | | | | | | | | | | | | |
| | | 15,050 | | | | 247,633,634 | | | | 221,253,732 | | | | 15,050 | |
Cost of shares redeemed | | | — | | | | (248,245,759 | ) | | | (171,803,895 | ) | | | — | |
| | | | | | | | | | | | | | | | |
Net increase (decrease) in net assets resulting from capital share transactions | | | 15,050 | | | | (612,125 | ) | | | 49,449,837 | | | | 15,050 | |
| | | | | | | | | | | | | | | | |
Net increase (decrease) in net assets | | | 16,327 | | | | (64,816,448 | ) | | | 182,111,431 | | | | 16,642 | |
| | | | | | | | | | | | | | | | |
NET ASSETS: | | | | | | | | | | | | | | | | |
Beginning of year or period | | | — | | | | 1,250,158,777 | | | | 1,068,047,346 | | | | — | |
| | | | | | | | | | | | | | | | |
End of year or period | | $ | 16,327 | | | $ | 1,185,342,329 | | | $ | 1,250,158,777 | | | $ | 16,642 | |
| | | | | | | | | | | | | | | | |
Undistributed net investment income at end of year or period | | $ | 176 | | | $ | 32,669,695 | | | $ | 25,174,969 | | | $ | 160 | |
| | | | | | | | | | | | | | | | |
| (1) | | Commencement of operations. |
See Accompanying Notes to Financial Statements
37
STATEMENTS OF CHANGES IN NET ASSETS
| | | | | | | | | | | | |
| | | ING Solution 2035 Portfolio | | | ING Solution
2040 Portfolio | |
| | | Year Ended December 31, 2011 | | | Year Ended December 31, 2010 | | | October 3, 2011(1) to December 31, 2011 | |
FROM OPERATIONS: | | | | | | | | | | | | |
Net investment income | | $ | 18,176,468 | | | $ | 14,796,621 | | | $ | 93 | |
Net realized gain (loss) | | | 67,761,565 | | | | (16,618,803 | ) | | | 145 | |
Net change in unrealized appreciation (depreciation) | | | (135,905,734 | ) | | | 135,520,456 | | | | 1,611 | |
| | | | | | | | | | | | |
Increase (decrease) in net assets resulting from operations | | | (49,967,701 | ) | | | 133,698,274 | | | | 1,849 | |
| | | | | | | | | | | | |
FROM DISTRIBUTIONS TO SHAREHOLDERS: | | | | | | | | | | | | |
Net investment income: | | | | | | | | | | | | |
Class ADV | | | (6,147,305 | ) | | | (4,272,162 | ) | | | — | |
Class I | | | (2,036,122 | ) | | | (1,325,539 | ) | | | — | |
Class S | | | (7,227,185 | ) | | | (5,254,947 | ) | | | — | |
Class S2 | | | (343,641 | ) | | | (238,633 | ) | | | — | |
Class T | | | (36,630 | ) | | | (29,900 | ) | | | — | |
| | | | | | | | | | | | |
Total distributions | | | (15,790,883 | ) | | | (11,121,181 | ) | | | — | |
| | | | | | | | | | | | |
FROM CAPITAL SHARE TRANSACTIONS: | | | | | | | | | | | | |
Net proceeds from sale of shares | | | 207,546,197 | | | | 181,862,931 | | | | 15,050 | |
Reinvestment of distributions | | | 15,790,882 | | | | 11,121,181 | | | | — | |
| | | | | | | | | | | | |
| | | 223,337,079 | | | | 192,984,112 | | | | 15,050 | |
Cost of shares redeemed | | | (221,976,420 | ) | | | (130,975,091 | ) | | | — | |
| | | | | | | | | | | | |
Net increase in net assets resulting from capital share transactions | | | 1,360,659 | | | | 62,009,021 | | | | 15,050 | |
| | | | | | | | | | | | |
Net increase (decrease) in net assets | | | (64,397,925 | ) | | | 184,586,114 | | | | 16,899 | |
| | | | | | | | | | | | |
NET ASSETS: | | | | | | | | | | | | |
Beginning of year or period | | | 1,069,460,014 | | | | 884,873,900 | | | | — | |
| | | | | | | | | | | | |
End of year or period | | $ | 1,005,062,089 | | | $ | 1,069,460,014 | | | $ | 16,899 | |
| | | | | | | | | | | | |
Undistributed net investment income at end of year or period | | $ | 21,918,040 | | | $ | 15,789,353 | | | $ | 142 | |
| | | | | | | | | | | | |
| (1) | | Commencement of operations. |
See Accompanying Notes to Financial Statements
38
STATEMENTS OF CHANGES IN NET ASSETS
| | | | | | | | | | | | |
| | | ING Solution 2045 Portfolio | | | ING Solution
2050 Portfolio | |
| | | Year Ended December 31, 2011 | | | Year Ended December 31, 2010 | | | October 3, 2011(1) to December 31, 2011 | |
FROM OPERATIONS: | | | | | | | | | | | | |
Net investment income | | $ | 10,071,738 | | | $ | 7,453,829 | | | $ | 91 | |
Net realized gain (loss) | | | 54,588,797 | | | | (23,580,823 | ) | | | 176 | |
Net change in unrealized appreciation (depreciation) | | | (100,288,416 | ) | | | 105,521,003 | | | | 1,583 | |
| | | | | | | | | | | | |
Increase (decrease) in net assets resulting from operations | | | (35,627,881 | ) | | | 89,394,009 | | | | 1,850 | |
| | | | | | | | | | | | |
FROM DISTRIBUTIONS TO SHAREHOLDERS: | | | | | | | | | | | | |
Net investment income: | | | | | | | | | | | | |
Class ADV | | | (2,574,545 | ) | | | (1,692,814 | ) | | | — | |
Class I | | | (1,234,496 | ) | | | (767,598 | ) | | | — | |
Class S | | | (3,677,605 | ) | | | (2,628,850 | ) | | | — | |
Class S2 | | | (193,691 | ) | | | (140,124 | ) | | | — | |
Class T | | | (13,363 | ) | | | (10,767 | ) | | | — | |
| | | | | | | | | | | | |
Total distributions | | | (7,693,700 | ) | | | (5,240,153 | ) | | | — | |
| | | | | | | | | | | | |
FROM CAPITAL SHARE TRANSACTIONS: | | | | | | | | | | | | |
Net proceeds from sale of shares | | | 165,712,855 | | | | 125,521,705 | | | | 15,050 | |
Reinvestment of distributions | | | 7,693,699 | | | | 5,240,153 | | | | — | |
| | | | | | | | | | | | |
| | | 173,406,554 | | | | 130,761,858 | | | | 15,050 | |
Cost of shares redeemed | | | (164,594,721 | ) | | | (80,728,582 | ) | | | — | |
| | | | | | | | | | | | |
Net increase in net assets resulting from capital share transactions | | | 8,811,833 | | | | 50,033,276 | | | | 15,050 | |
| | | | | | | | | | | | |
Net increase (decrease) in net assets | | | (34,509,748 | ) | | | 134,187,132 | | | | 16,900 | |
| | | | | | | | | | | | |
NET ASSETS: | | | | | | | | | | | | |
Beginning of year or period | | | 686,661,334 | | | | 552,474,202 | | | | — | |
| | | | | | | | | | | | |
End of year or period | | $ | 652,151,586 | | | $ | 686,661,334 | | | $ | 16,900 | |
| | | | | | | | | | | | |
Undistributed net investment income at end of year or period | | $ | 12,431,489 | | | $ | 7,691,967 | | | $ | 140 | |
| | | | | | | | | | | | |
| (1) | | Commencement of operations. |
See Accompanying Notes to Financial Statements
39
STATEMENTS OF CHANGES IN NET ASSETS
| | | | | | | | |
| | | ING Solution 2055 Portfolio | |
| | | Year Ended December 31, 2011 | | | March 8, 2010(1) to December 31, 2010 | |
FROM OPERATIONS: | | | | | | | | |
Net investment income | | $ | 342,024 | | | $ | 63,229 | |
Net realized gain | | | 284,820 | | | | 20,515 | |
Net change in unrealized appreciation (depreciation) | | | (1,996,890 | ) | | | 856,549 | |
| | | | | | | | |
Increase (decrease) in net assets resulting from operations | | | (1,370,046 | ) | | | 940,293 | |
| | | | | | | | |
FROM DISTRIBUTIONS TO SHAREHOLDERS: | | | | | | | | |
Net investment income: | | | | | | | | |
Class ADV | | | (26,166 | ) | | | — | |
Class I | | | (10,054 | ) | | | — | |
Class S | | | (29,728 | ) | | | — | |
Class S2 | | | (1,686 | ) | | | — | |
Class T | | | (2 | ) | | | — | |
Net realized gains: | | | | | | | | |
Class ADV | | | (20,674 | ) | | | — | |
Class I | | | (6,202 | ) | | | — | |
Class S | | | (20,458 | ) | | | — | |
Class S2 | | | (1,285 | ) | | | — | |
Class T | | | (19 | ) | | | — | |
| | | | | | | | |
Total distributions | | | (116,274 | ) | | | — | |
| | | | | | | | |
FROM CAPITAL SHARE TRANSACTIONS: | | | | | | | | |
Net proceeds from sale of shares | | | 27,299,170 | | | | 11,460,549 | |
Reinvestment of distributions | | | 116,264 | | | | — | |
| | | | | | | | |
| | | 27,415,434 | | | | 11,460,549 | |
Cost of shares redeemed | | | (9,477,335 | ) | | | (1,832,515 | ) |
| | | | | | | | |
Net increase in net assets resulting from capital share transactions | | | 17,938,099 | | | | 9,628,034 | |
| | | | | | | | |
Net increase in net assets | | | 16,451,779 | | | | 10,568,327 | |
| | | | | | | | |
NET ASSETS: | | | | | | | | |
Beginning of year or period | | | 10,568,327 | | | | — | |
| | | | | | | | |
End of year or period | | $ | 27,020,106 | | | $ | 10,568,327 | |
| | | | | | | | |
Undistributed net investment income at end of year or period | | $ | 426,491 | | | $ | 67,633 | |
| | | | | | | | |
| (1) | | Commencement of operations. |
See Accompanying Notes to Financial Statements
40
FINANCIAL HIGHLIGHTS
Selected data for a share of beneficial interest outstanding throughout each year or period.
| | | | | | | | | | | | | | | | | | | | | | | | | | | | | | | | | | | | | | | | | | | | | | | | | | | | | | | | | | | | | | | | | | | | |
| | | | | | Income (loss)
from
investment
operations | | | | | | Less distributions | | | | | | | | | | | | | | | Ratios to average net assets | | | Supplemental
data | |
| | | | | | | | | | | | | | | | | | | | | | | | | | | | | | | | | | | | | | | | | | | | | | | | | | | | |
| | | Net asset value, beginning of year or period | | | Net investment income (loss) | | | Net realized and unrealized gain (loss) | | | Total from investment operations | | | From net investment income | | | From net realized gains | | | From return of capital | | | Total distributions | | | Payment by affiliate | | | Net asset value, end of year or period | | | Total Return(1) | | | Expenses before reductions/additions(2)(3)(4)(5) | | | Expenses net of fee waivers and/or recoupments if any(2)(3)(4)(5) | | | Expense net of all reductions/additions(2)(3)(4)(5) | | | Net investment income (loss)(2)(4)(5) | | | Net assets, end of year or period | | | Portfolio turnover rate | |
| | | | | | | | | | | | | | | | | | | | | | | | | | | | | | | | | | | | | | | | | | | | | | | | | | | | | | | | | | | | | | | | | | | | |
Year or period ended | | ($) | | | ($) | | | ($) | | | ($) | | | ($) | | | ($) | | | ($) | | | ($) | | | ($) | | | ($) | | | (%) | | | (%) | | | (%) | | | (%) | | | (%) | | | ($000’s) | | | (%) | |
ING Solution Aggressive Growth Portfolio | | | | | | | | | | | | | | | | | | | | | | | | | | | | | | | | | | | | | | | | | | | | | | | | | | | | | | | | | | | | | | | | | | | | |
Class ADV | | | | | | | | | | | | | | | | | | | | | | | | | | | | | | | | | | | | | | | | | | | | | | | | | | | | | | | | | | | | | | | | | | | | |
12-31-11 | | | 10.89 | | | | 0.21 | • | | | (0.79 | ) | | | (0.58 | ) | | | 0.02 | | | | 0.04 | | | | — | | | | 0.06 | | | | — | | | | 10.25 | | | | (5.29 | ) | | | 0.62 | | | | 0.62 | | | | 0.62 | | | | 1.96 | | | | 9,527 | | | | 83 | |
04-30-10(6) - 12-31-10 | | | 10.00 | | | | 0.11 | • | | | 0.78 | | | | 0.89 | | | | — | | | | — | | | | — | | | | — | | | | — | | | | 10.89 | | | | 8.90 | | | | 0.62 | | | | 0.62 | | | | 0.62 | | | | 1.57 | | | | 4,677 | | | | 26 | |
Class I | | | | | | | | | | | | | | | | | | | | | | | | | | | | | | | | | | | | | | | | | | | | | | | | | | | | | | | | | | | | | | | | | | | | |
12-31-11 | | | 10.94 | | | | 0.23 | | | | (0.77 | ) | | | (0.54 | ) | | | 0.02 | | | | 0.04 | | | | — | | | | 0.06 | | | | — | | | | 10.34 | | | | (4.84 | ) | | | 0.12 | | | | 0.12 | | | | 0.12 | | | | 2.16 | | | | 3 | | | | 83 | |
04-30-10(6) - 12-31-10 | | | 10.00 | | | | 0.16 | | | | 0.78 | | | | 0.94 | | | | — | | | | — | | | | — | | | | — | | | | — | | | | 10.94 | | | | 9.40 | | | | 0.12 | | | | 0.12 | | | | 0.12 | | | | 2.50 | | | | 3 | | | | 26 | |
Class S | | | | | | | | | | | | | | | | | | | | | | | | | | | | | | | | | | | | | | | | | | | | | | | | | | | | | | | | | | | | | | | | | | | | |
12-31-11 | | | 10.92 | | | | 0.23 | • | | | (0.79 | ) | | | (0.56 | ) | | | 0.02 | | | | 0.04 | | | | — | | | | 0.06 | | | | — | | | | 10.30 | | | | (5.05 | ) | | | 0.37 | | | | 0.37 | | | | 0.37 | | | | 2.20 | | | | 5,379 | | | | 83 | |
04-30-10(6) - 12-31-10 | | | 10.00 | | | | 0.10 | • | | | 0.82 | | | | 0.92 | | | | — | | | | — | | | | — | | | | — | | | | — | | | | 10.92 | | | | 9.20 | | | | 0.37 | | | | 0.37 | | | | 0.37 | | | | 1.46 | | | | 1,438 | | | | 26 | |
Class S2 | | | | | | | | | | | | | | | | | | | | | | | | | | | | | | | | | | | | | | | | | | | | | | | | | | | | | | | | | | | | | | | | | | | | |
12-31-11 | | | 10.91 | | | | 0.08 | • | | | (0.65 | ) | | | (0.57 | ) | | | — | | | | 0.04 | | | | — | | | | 0.04 | | | | — | | | | 10.30 | | | | (5.18 | ) | | | 0.62 | | | | 0.52 | | | | 0.52 | | | | 0.70 | | | | 37 | | | | 83 | |
04-30-10(6) - 12-31-10 | | | 10.00 | | | | 0.09 | • | | | 0.82 | | | | 0.91 | | | | — | | | | — | | | | — | | | | — | | | | — | | | | 10.91 | | | | 9.10 | | | | 0.62 | | | | 0.52 | | | | 0.52 | | | | 1.29 | | | | 138 | | | | 26 | |
| | | | | | | | | | | | | | | | | |
ING Solution Conservative Portfolio | | | | | | | | | | | | | | | | | | | | | | | | | | | | | | | | | | | | | | | | | | | | | | | | | | | | | | | | | | | | | | | | | | | | |
Class ADV | | | | | | | | | | | | | | | | | | | | | | | | | | | | | | | | | | | | | | | | | | | | | | | | | | | | | | | | | | | | | | | | | | | | |
12-31-11 | | | 10.50 | | | | 0.39 | • | | | (0.38 | ) | | | 0.01 | | | | 0.04 | | | | 0.03 | | | | — | | | | 0.07 | | | | — | | | | 10.44 | | | | 0.09 | | | | 0.62 | | | | 0.62 | | | | 0.62 | | | | 3.67 | | | | 6,411 | | | | 84 | |
04-30-10(6) - 12-31-10 | | | 10.00 | | | | 0.36 | • | | | 0.14 | | | | 0.50 | | | | — | | | | — | | | | — | | | | — | | | | — | | | | 10.50 | | | | 5.00 | | | | 0.62 | | | | 0.62 | | | | 0.62 | | | | 5.24 | | | | 1,911 | | | | 51 | |
Class I | | | | | | | | | | | | | | | | | | | | | | | | | | | | | | | | | | | | | | | | | | | | | | | | | | | | | | | | | | | | | | | | | | | | |
12-31-11 | | | 10.54 | | | | 0.40 | | | | (0.33 | ) | | | 0.07 | | | | 0.04 | | | | 0.03 | | | | — | | | | 0.07 | | | | — | | | | 10.54 | | | | 0.69 | | | | 0.12 | | | | 0.12 | | | | 0.12 | | | | 3.72 | | | | 3 | | | | 84 | |
04-30-10(6) - 12-31-10 | | | 10.00 | | | | 0.34 | | | | 0.20 | | | | 0.54 | | | | — | | | | — | | | | — | | | | — | | | | — | | | | 10.54 | | | | 5.40 | | | | 0.12 | | | | 0.12 | | | | 0.12 | | | | 5.03 | | | | 3 | | | | 51 | |
Class S | | | | | | | | | | | | | | | | | | | | | | | | | | | | | | | | | | | | | | | | | | | | | | | | | | | | | | | | | | | | | | | | | | | | |
12-31-11 | | | 10.53 | | | | 0.40 | • | | | (0.37 | ) | | | 0.03 | | | | 0.04 | | | | 0.03 | | | | — | | | | 0.07 | | | | — | | | | 10.49 | | | | 0.28 | | | | 0.37 | | | | 0.37 | | | | 0.37 | | | | 3.76 | | | | 2,941 | | | | 84 | |
04-30-10(6) - 12-31-10 | | | 10.00 | | | | 0.29 | • | | | 0.24 | | | | 0.53 | | | | — | | | | — | | | | — | | | | — | | | | — | | | | 10.53 | | | | 5.30 | | | | 0.37 | | | | 0.37 | | | | 0.37 | | | | 4.23 | | | | 1,098 | | | | 51 | |
Class S2 | | | | | | | | | | | | | | | | | | | | | | | | | | | | | | | | | | | | | | | | | | | | | | | | | | | | | | | | | | | | | | | | | | | | |
12-31-11 | | | 10.51 | | | | 0.46 | • | | | (0.44 | ) | | | 0.02 | | | | 0.04 | | | | 0.03 | | | | — | | | | 0.07 | | | | — | | | | 10.46 | | | | 0.17 | | | | 0.62 | | | | 0.52 | | | | 0.52 | | | | 4.36 | | | | 122 | | | | 84 | |
04-30-10(6) - 12-31-10 | | | 10.00 | | | | 0.44 | • | | | 0.07 | | | | 0.51 | | | | — | | | | — | | | | — | | | | — | | | | — | | | | 10.51 | | | | 5.10 | | | | 0.62 | | | | 0.52 | | | | 0.52 | | | | 6.35 | | | | 64 | | | | 51 | |
| | | | | | | | | | | | | | | | | |
ING Solution Growth Portfolio | | | | | | | | | | | | | | | | | | | | | | | | | | | | | | | | | | | | | | | | | | | | | | | | | | | | | | | | | | | | | | | | | | | | |
Class ADV | | | | | | | | | | | | | | | | | | | | | | | | | | | | | | | | | | | | | | | | | | | | | | | | | | | | | | | | | | | | | | | | | | | | |
12-31-11 | | | 9.16 | | | | 0.24 | • | | | (0.49 | ) | | | (0.25 | ) | | | 0.03 | | | | 0.04 | | | | — | | | | 0.07 | | | | — | | | | 8.84 | | | | (2.68 | ) | | | 0.62 | | | | 0.62 | | | | 0.62 | | | | 2.63 | | | | 16,050 | | | | 70 | |
12-31-10 | | | 8.24 | | | | 0.26 | • | | | 0.73 | | | | 0.99 | | | | 0.07 | | | | — | | | | — | | | | 0.07 | | | | — | | | | 9.16 | | | | 12.07 | | | | 0.62 | | | | 0.62 | | | | 0.62 | | | | 2.95 | | | | 4,837 | | | | 43 | |
12-31-09 | | | 6.67 | | | | 0.14 | | | | 1.46 | | | | 1.60 | | | | 0.02 | | | | 0.01 | | | | — | | | | 0.03 | | | | — | | | | 8.24 | | | | 24.00 | | | | 0.62 | | | | 0.62 | | | | 0.62 | | | | 1.89 | | | | 1 | | | | 77 | |
12-31-08 | | | 9.81 | | | | 0.14 | • | | | (3.28 | ) | | | (3.14 | ) | | | — | | | | 0.00 | * | | | — | | | | 0.00 | * | | | — | | | | 6.67 | | | | (32.00 | ) | | | 0.62 | | | | 0.62 | | | | 0.62 | | | | 1.59 | | | | 1 | | | | 283 | |
07-02-07(6) - 12-31-07 | | | 10.00 | | | | 0.08 | | | | (0.27 | ) | | | (0.19 | ) | | | — | | | | — | | | | — | | | | — | | | | — | | | | 9.81 | | | | (1.90 | ) | | | 0.62 | | | | 0.62 | | | | 0.62 | | | | 1.58 | | | | 1 | | | | 8 | |
See Accompanying Notes to Financial Statements
41
FINANCIAL HIGHLIGHTS (CONTINUED)
Selected data for a share of beneficial interest outstanding throughout each year or period.
| | | | | | | | | | | | | | | | | | | | | | | | | | | | | | | | | | | | | | | | | | | | | | | | | | | | | | | | | | | | | | | | | | | | |
| | | | | | Income (loss)
from
investment
operations | | | | | | Less distributions | | | | | | | | | | | | | | | Ratios to average net assets | | | Supplemental
data | |
| | | | | | | | | | | | | | | | | | | | | | | | | | | | | | | | | | | | | | | | | | | | | | | | | | | | |
| | | Net asset value, beginning of year or period | | | Net investment income (loss) | | | Net realized and unrealized gain (loss) | | | Total from investment operations | | | From net investment income | | | From net realized gains | | | From return of capital | | | Total distributions | | | Payment by affiliate | | | Net asset value, end of year or period | | | Total Return(1) | | | Expenses before reductions/additions(2)(3)(4)(5) | | | Expenses net of fee waivers and/or recoupments if any(2)(3)(4)(5) | | | Expense net of all reductions/additions(2)(3)(4)(5) | | | Net investment income (loss)(2)(4)(5) | | | Net assets, end of year or period | | | Portfolio turnover rate | |
| | | | | | | | | | | | | | | | | | | | | | | | | | | | | | | | | | | | | | | | | | | | | | | | | | | | | | | | | | | | | | | | | | | | |
Year or period ended | | ($) | | | ($) | | | ($) | | | ($) | | | ($) | | | ($) | | | ($) | | | ($) | | | ($) | | | ($) | | | (%) | | | (%) | | | (%) | | | (%) | | | (%) | | | ($000’s) | | | (%) | |
ING Solution Growth Portfolio (Continued) | | | | | | | | | | | | | | | | | | | | | | | | | | | | | | | | | | | | | | | | | | | | | | | | | | | | | | | | | | | | | | | | | | | | |
Class I | | | | | | | | | | | | | | | | | | | | | | | | | | | | | | | | | | | | | | | | | | | | | | | | | | | | | | | | | | | | | | | | | | | | |
12-31-11 | | | 9.33 | | | | 0.26 | | | | (0.47 | ) | | | (0.21 | ) | | | 0.03 | | | | 0.04 | | | | — | | | | 0.07 | | | | — | | | | 9.05 | | | | (2.17 | ) | | | 0.12 | | | | 0.12 | | | | 0.12 | | | | 2.78 | | | | 1 | | | | 70 | |
12-31-10 | | | 8.34 | | | | 0.18 | | | | 0.90 | | | | 1.08 | | | | 0.09 | | | | — | | | | — | | | | 0.09 | | | | — | | | | 9.33 | | | | 13.11 | | | | 0.12 | | | | 0.12 | | | | 0.12 | | | | 2.10 | | | | 1 | | | | 43 | |
12-31-09 | | | 6.74 | | | | 0.18 | | | | 1.48 | | | | 1.66 | | | | 0.05 | | | | 0.01 | | | | — | | | | 0.06 | | | | — | | | | 8.34 | | | | 24.68 | | | | 0.12 | | | | 0.12 | | | | 0.12 | | | | 2.50 | | | | 1 | | | | 77 | |
12-31-08 | | | 9.85 | | | | 0.19 | • | | | (3.30 | ) | | | (3.11 | ) | | | — | | | | 0.00 | * | | | — | | | | 0.00 | * | | | — | | | | 6.74 | | | | (31.57 | ) | | | 0.12 | | | | 0.12 | | | | 0.12 | | | | 2.19 | | | | 1 | | | | 283 | |
07-02-07(6) - 12-31-07 | | | 10.00 | | | | 0.11 | | | | (0.26 | ) | | | (0.15 | ) | | | — | | | | — | | | | — | | | | — | | | | — | | | | 9.85 | | | | (1.50 | ) | | | 0.12 | | | | 0.12 | | | | 0.12 | | | | 2.28 | | | | 1 | | | | 8 | |
Class S | | | | | | | | | | | | | | | | | | | | | | | | | | | | | | | | | | | | | | | | | | | | | | | | | | | | | | | | | | | | | | | | | | | | |
12-31-11 | | | 9.22 | | | | 0.24 | • | | | (0.47 | ) | | | (0.23 | ) | | | 0.03 | | | | 0.04 | | | | — | | | | 0.07 | | | | — | | | | 8.92 | | | | (2.46 | ) | | | 0.37 | | | | 0.37 | | | | 0.37 | | | | 2.66 | | | | 12,042 | | | | 70 | |
12-31-10 | | | 8.27 | | | | 0.20 | • | | | 0.84 | | | | 1.04 | | | | 0.09 | | | | — | | | | — | | | | 0.09 | | | | — | | | | 9.22 | | | | 12.74 | | | | 0.37 | | | | 0.37 | | | | 0.37 | | | | 2.28 | | | | 4,729 | | | | 43 | |
12-31-09 | | | 6.70 | | | | 0.20 | • | | | 1.44 | | | | 1.64 | | | | 0.06 | | | | 0.01 | | | | — | | | | 0.07 | | | | — | | | | 8.27 | | | | 24.48 | | | | 0.37 | | | | 0.37 | | | | 0.37 | | | | 2.67 | | | | 739 | | | | 77 | |
12-31-08 | | | 9.83 | | | | 0.22 | • | | | (3.35 | ) | | | (3.13 | ) | | | — | | | | 0.00 | * | | | — | | | | 0.00 | * | | | — | | | | 6.70 | | | | (31.81 | ) | | | 0.37 | | | | 0.37 | | | | 0.37 | | | | 3.14 | | | | 173 | | | | 283 | |
07-02-07(6) - 12-31-07 | | | 10.00 | | | | 0.09 | | | | (0.26 | ) | | | (0.17 | ) | | | — | | | | — | | | | — | | | | — | | | | — | | | | 9.83 | | | | (1.70 | ) | | | 0.37 | | | | 0.37 | | | | 0.37 | | | | 1.83 | | | | 1 | | | | 8 | |
Class S2 | | | | | | | | | | | | | | | | | | | | | | | | | | | | | | | | | | | | | | | | | | | | | | | | | | | | | | | | | | | | | | | | | | | | |
12-31-11 | | | 9.20 | | | | 0.19 | • | | | (0.44 | ) | | | (0.25 | ) | | | 0.03 | | | | 0.04 | | | | — | | | | 0.07 | | | | — | | | | 8.88 | | | | (2.71 | ) | | | 0.62 | | | | 0.52 | | | | 0.52 | | | | 2.04 | | | | 415 | | | | 70 | |
04-30-10(6) - 12-31-10 | | | 8.68 | | | | 0.12 | • | | | 0.50 | | | | 0.62 | | | | 0.10 | | | | — | | | | — | | | | 0.10 | | | | — | | | | 9.20 | | | | 7.28 | | | | 0.62 | | | | 0.52 | | | | 0.52 | | | | 2.10 | | | | 291 | | | | 43 | |
| | | | | | | | | | | | | | | | | |
ING Solution Income Portfolio | | | | | | | | | | | | | | | | | | | | | | | | | | | | | | | | | | | | | | | | | | | | | | | | | | | | | | | | | | | | | | | | | | | | |
Class ADV | | | | | | | | | | | | | | | | | | | | | | | | | | | | | | | | | | | | | | | | | | | | | | | | | | | | | | | | | | | | | | | | | | | | |
12-31-11 | | | 10.83 | | | | 0.34 | | | | (0.34 | ) | | | 0.00 | * | | | 0.43 | | | | — | | | | — | | | | 0.43 | | | | — | | | | 10.40 | | | | 0.14 | | | | 0.62 | | | | 0.62 | | | | 0.62 | | | | 3.23 | | | | 109,184 | | | | 75 | |
12-31-10 | | | 10.24 | | | | 0.33 | • | | | 0.60 | | | | 0.93 | | | | 0.34 | | | | — | | | | — | | | | 0.34 | | | | — | | | | 10.83 | | | | 9.26 | | | | 0.62 | | | | 0.62 | | | | 0.62 | | | | 3.11 | | | | 110,352 | | | | 64 | |
12-31-09 | | | 9.27 | | | | 0.31 | • | | | 1.23 | | | | 1.54 | | | | 0.53 | | | | 0.04 | | | | — | | | | 0.57 | | | | — | | | | 10.24 | | | | 16.98 | | | | 0.62 | | | | 0.62 | | | | 0.62 | | | | 3.24 | | | | 107,684 | | | | 70 | |
12-31-08 | | | 11.54 | | | | 0.37 | • | | | (2.27 | ) | | | (1.90 | ) | | | 0.19 | | | | 0.18 | | | | — | | | | 0.37 | | | | — | | | | 9.27 | | | | (16.93 | ) | | | 0.62 | | | | 0.62 | | | | 0.62 | | | | 3.46 | | | | 85,343 | | | | 84 | |
12-31-07 | | | 11.08 | | | | 0.32 | • | | | 0.22 | | | | 0.54 | | | | 0.07 | | | | 0.01 | | | | — | | | | 0.08 | | | | — | | | | 11.54 | | | | 4.91 | | | | 0.62 | | | | 0.62 | | | | 0.62 | | | | 2.80 | | | | 93,760 | | | | 35 | |
Class I | | | | | | | | | | | | | | | | | | | | | | | | | | | | | | | | | | | | | | | | | | | | | | | | | | | | | | | | | | | | | | | | | | | | |
12-31-11 | | | 11.05 | | | | 0.40 | • | | | (0.35 | ) | | | 0.05 | | | | 0.49 | | | | — | | | | — | | | | 0.49 | | | | — | | | | 10.61 | | | | 0.54 | | | | 0.12 | | | | 0.12 | | | | 0.12 | | | | 3.63 | | | | 22,837 | | | | 75 | |
12-31-10 | | | 10.43 | | | | 0.39 | • | | | 0.62 | | | | 1.01 | | | | 0.39 | | | | — | | | | — | | | | 0.39 | | | | — | | | | 11.05 | | | | 9.86 | | | | 0.12 | | | | 0.12 | | | | 0.12 | | | | 3.69 | | | | 2,451 | | | | 64 | |
12-31-09 | | | 9.43 | | | | 0.28 | • | | | 1.34 | | | | 1.62 | | | | 0.58 | | | | 0.04 | | | | — | | | | 0.62 | | | | — | | | | 10.43 | | | | 17.62 | | | | 0.12 | | | | 0.12 | | | | 0.12 | | | | 2.87 | | | | 18,772 | | | | 70 | |
12-31-08 | | | 11.70 | | | | 0.48 | • | | | (2.35 | ) | | | (1.87 | ) | | | 0.22 | | | | 0.18 | | | | — | | | | 0.40 | | | | — | | | | 9.43 | | | | (16.49 | ) | | | 0.12 | | | | 0.12 | | | | 0.12 | | | | 4.41 | | | | 24,417 | | | | 84 | |
12-31-07 | | | 11.18 | | | | 0.37 | • | | | 0.24 | | | | 0.61 | | | | 0.08 | | | | 0.01 | | | | — | | | | 0.09 | | | | — | | | | 11.70 | | | | 5.44 | | | | 0.12 | | | | 0.12 | | | | 0.12 | | | | 3.20 | | | | 18,104 | | | | 35 | |
Class S | | | | | | | | | | | | | | | | | | | | | | | | | | | | | | | | | | | | | | | | | | | | | | | | | | | | | | | | | | | | | | | | | | | | |
12-31-11 | | | 10.96 | | | | 0.37 | • | | | (0.34 | ) | | | 0.03 | | | | 0.46 | | | | — | | | | — | | | | 0.46 | | | | — | | | | 10.53 | | | | 0.35 | | | | 0.37 | | | | 0.37 | | | | 0.37 | | | | 3.39 | | | | 80,716 | | | | 75 | |
12-31-10 | | | 10.35 | | | | 0.36 | • | | | 0.61 | | | | 0.97 | | | | 0.36 | | | | — | | | | — | | | | 0.36 | | | | — | | | | 10.96 | | | | 9.60 | | | | 0.37 | | | | 0.37 | | | | 0.37 | | | | 3.40 | | | | 93,940 | | | | 64 | |
12-31-09 | | | 9.37 | | | | 0.33 | | | | 1.24 | | | | 1.57 | | | | 0.55 | | | | 0.04 | | | | — | | | | 0.59 | | | | — | | | | 10.35 | | | | 17.20 | | | | 0.37 | | | | 0.37 | | | | 0.37 | | | | 3.41 | | | | 90,135 | | | | 70 | |
12-31-08 | | | 11.63 | | | | 0.40 | • | | | (2.29 | ) | | | (1.89 | ) | | | 0.19 | | | | 0.18 | | | | — | | | | 0.37 | | | | — | | | | 9.37 | | | | (16.66 | ) | | | 0.37 | | | | 0.37 | | | | 0.37 | | | | 3.70 | | | | 77,076 | | | | 84 | |
12-31-07 | | | 11.13 | | | | 0.30 | • | | | 0.28 | | | | 0.58 | | | | 0.07 | | | | 0.01 | | | | — | | | | 0.08 | | | | — | | | | 11.63 | | | | 5.23 | | | | 0.37 | | | | 0.37 | | | | 0.37 | | | | 2.61 | | | | 88,723 | | | | 35 | |
See Accompanying Notes to Financial Statements
42
FINANCIAL HIGHLIGHTS (CONTINUED)
Selected data for a share of beneficial interest outstanding throughout each year or period.
| | | | | | | | | | | | | | | | | | | | | | | | | | | | | | | | | | | | | | | | | | | | | | | | | | | | | | | | | | | | | | | | | | | | |
| | | | | | Income (loss)
from
investment
operations | | | | | | Less distributions | | | | | | | | | | | | | | | Ratios to average net assets | | | Supplemental
data | |
| | | | | | | | | | | | | | | | | | | | | | | | | | | | | | | | | | | | | | | | | | | | | | | | | | | | |
| | | Net asset value, beginning of year or period | | | Net investment income (loss) | | | Net realized and unrealized gain (loss) | | | Total from investment operations | | | From net investment income | | | From net realized gains | | | From return of capital | | | Total distributions | | | Payment by affiliate | | | Net asset value, end of year or period | | | Total Return(1) | | | Expenses before reductions/additions(2)(3)(4)(5) | | | Expenses net of fee waivers and/or recoupments if any(2)(3)(4)(5) | | | Expense net of all reductions/additions(2)(3)(4)(5) | | | Net investment income (loss)(2)(4)(5) | | | Net assets, end of year or period | | | Portfolio turnover rate | |
| | | | | | | | | | | | | | | | | | | | | | | | | | | | | | | | | | | | | | | | | | | | | | | | | | | | | | | | | | | | | | | | | | | | |
Year or period ended | | ($) | | | ($) | | | ($) | | | ($) | | | ($) | | | ($) | | | ($) | | | ($) | | | ($) | | | ($) | | | (%) | | | (%) | | | (%) | | | (%) | | | (%) | | | ($000’s) | | | (%) | |
ING Solution Income Portfolio (Continued) | | | | | | | | | | | | | | | | | | | | | | | | | | | | | | | | | | | | | | | | | | | | | | | | | | | | | | | | | | | | | | | | | | | | |
Class S2 | | | | | | | | | | | | | | | | | | | | | | | | | | | | | | | | | | | | | | | | | | | | | | | | | | | | | | | | | | | | | | | | | | | | |
12-31-11 | | | 10.75 | | | | 0.33 | • | | | (0.32 | ) | | | 0.01 | | | | 0.44 | | | | — | | | | — | | | | 0.44 | | | | — | | | | 10.32 | | | | 0.25 | | | | 0.62 | | | | 0.52 | | | | 0.52 | | | | 3.13 | | | | 4,697 | | | | 75 | |
12-31-10 | | | 10.20 | | | | 0.43 | • | | | 0.51 | | | | 0.94 | | | | 0.39 | | | | — | | | | — | | | | 0.39 | | | | — | | | | 10.75 | | | | 9.39 | | | | 0.62 | | | | 0.52 | | | | 0.52 | | | | 4.17 | | | | 5,543 | | | | 64 | |
05-28-09(6) - 12-31-09 | | | 9.59 | | | | 0.31 | • | | | 0.92 | | | | 1.23 | | | | 0.58 | | | | 0.04 | | | | — | | | | 0.62 | | | | — | | | | 10.20 | | | | 13.26 | | | | 0.62 | | | | 0.52 | | | | 0.52 | | | | 5.29 | | | | 3 | | | | 70 | |
Class T | | | | | | | | | | | | | | | | | | | | | | | | | | | | | | | | | | | | | | | | | | | | | | | | | | | | | | | | | | | | | | | | | | | | |
12-31-11 | | | 11.03 | | | | 0.33 | • | | | (0.34 | ) | | | (0.01 | ) | | | 0.32 | | | | — | | | | — | | | | 0.32 | | | | — | | | | 10.70 | | | | 0.03 | | | | 0.87 | | | | 0.82 | | | | 0.82 | | | | 2.98 | | | | 210 | | | | 75 | |
12-31-10 | | | 10.42 | | | | 0.30 | • | | | 0.61 | | | | 0.91 | | | | 0.30 | | | | — | | | | — | | | | 0.30 | | | | — | | | | 11.03 | | | | 8.95 | | | | 0.87 | | | | 0.82 | | | | 0.82 | | | | 2.83 | | | | 432 | | | | 64 | |
12-31-09 | | | 9.34 | | | | 0.28 | • | | | 1.26 | | | | 1.54 | | | | 0.42 | | | | 0.04 | | | | — | | | | 0.46 | | | | — | | | | 10.42 | | | | 16.85 | | | | 0.87 | | | | 0.82 | | | | 0.82 | | | | 2.93 | | | | 505 | | | | 70 | |
12-31-08 | | | 11.54 | | | | 0.31 | • | | | (2.25 | ) | | | (1.94 | ) | | | 0.08 | | | | 0.18 | | | | — | | | | 0.26 | | | | — | | | | 9.34 | | | | (17.14 | ) | | | 0.87 | | | | 0.82 | | | | 0.82 | | | | 2.89 | | | | 623 | | | | 84 | |
12-31-07 | | | 11.03 | | | | 0.20 | | | | 0.32 | | | | 0.52 | | | | — | | | | 0.01 | | | | — | | | | 0.01 | | | | — | | | | 11.54 | | | | 4.72 | | | | 0.87 | | | | 0.82 | | | | 0.82 | | | | 1.75 | | | | 1,636 | | | | 35 | |
| | | | | | | | | | | | | | | | | |
ING Solution Moderate Portfolio | | | | | | | | | | | | | | | | | | | | | | | | | | | | | | | | | | | | | | | | | | | | | | | | | | | | | | | | | | | | | | | | | | | | |
Class ADV | | | | | | | | | | | | | | | | | | | | | | | | | | | | | | | | | | | | | | | | | | | | | | | | | | | | | | | | | | | | | | | | | | | | |
12-31-11 | | | 9.79 | | | | 0.34 | • | | | (0.44 | ) | | | (0.10 | ) | | | 0.06 | | | | 0.08 | | | | — | | | | 0.14 | | | | — | | | | 9.55 | | | | (0.94 | ) | | | 0.62 | | | | 0.62 | | | | 0.62 | | | | 3.54 | | | | 13,782 | | | | 77 | |
12-31-10 | | | 9.06 | | | | 0.41 | • | | | 0.51 | | | | 0.92 | | | | 0.14 | | | | 0.05 | | | | — | | | | 0.19 | | | | — | | | | 9.79 | | | | 10.35 | | | | 0.62 | | | | 0.62 | | | | 0.62 | | | | 4.34 | | | | 2,690 | | | | 47 | |
12-31-09 | | | 7.61 | | | | 0.20 | | | | 1.29 | | | | 1.49 | | | | 0.03 | | | | 0.01 | | | | — | | | | 0.04 | | | | — | | | | 9.06 | | | | 19.69 | | | | 0.62 | | | | 0.62 | | | | 0.62 | | | | 2.47 | | | | 1 | | | | 87 | |
12-31-08 | | | 10.00 | | | | 0.16 | | | | (2.55 | ) | | | (2.39 | ) | | | — | | | | — | | | | — | | | | — | | | | — | | | | 7.61 | | | | (23.88 | ) | | | 0.62 | | | | 0.62 | | | | 0.62 | | | | 1.78 | | | | 1 | | | | 212 | |
07-02-07(6) - 12-31-07 | | | 10.00 | | | | 0.13 | | | | (0.13 | ) | | | 0.00 | | | | — | | | | — | | | | — | | | | — | | | | — | | | | 10.00 | | | | 0.00 | | | | 0.62 | | | | 0.62 | | | | 0.62 | | | | 2.55 | | | | 1 | | | | 7 | |
Class I | | | | | | | | | | | | | | | | | | | | | | | | | | | | | | | | | | | | | | | | | | | | | | | | | | | | | | | | | | | | | | | | | | | | |
12-31-11 | | | 10.04 | | | | 0.34 | | | | (0.38 | ) | | | (0.04 | ) | | | 0.06 | | | | 0.08 | | | | — | | | | 0.14 | | | | — | | | | 9.86 | | | | (0.30 | ) | | | 0.12 | | | | 0.12 | | | | 0.12 | | | | 3.39 | | | | 1 | | | | 77 | |
12-31-10 | | | 9.17 | | | | 0.26 | | | | 0.79 | | | | 1.05 | | | | 0.13 | | | | 0.05 | | | | — | | | | 0.18 | | | | — | | | | 10.04 | | | | 11.66 | | | | 0.12 | | | | 0.12 | | | | 0.12 | | | | 2.75 | | | | 1 | | | | 47 | |
12-31-09 | | | 7.69 | | | | 0.24 | • | | | 1.32 | | | | 1.56 | | | | 0.07 | | | | 0.01 | | | | — | | | | 0.08 | | | | — | | | | 9.17 | | | | 20.46 | | | | 0.12 | | | | 0.12 | | | | 0.12 | | | | 2.93 | | | | 1 | | | | 87 | |
12-31-08 | | | 10.04 | | | | 0.21 | • | | | (2.55 | ) | | | (2.34 | ) | | | 0.01 | | | | — | | | | — | | | | 0.01 | | | | — | | | | 7.69 | | | | (23.32 | ) | | | 0.12 | | | | 0.12 | | | | 0.12 | | | | 2.26 | | | | 1 | | | | 212 | |
07-02-07(6) - 12-31-07 | | | 10.00 | | | | 0.15 | | | | (0.11 | ) | | | 0.04 | | | | — | | | | — | | | | — | | | | — | | | | — | | | | 10.04 | | | | 0.40 | | | | 0.12 | | | | 0.12 | | | | 0.12 | | | | 3.04 | | | | 1 | | | | 7 | |
Class S | | | | | | | | | | | | | | | | | | | | | | | | | | | | | | | | | | | | | | | | | | | | | | | | | | | | | | | | | | | | | | | | | | | | |
12-31-11 | | | 9.91 | | | | 0.32 | • | | | (0.40 | ) | | | (0.08 | ) | | | 0.05 | | | | 0.08 | | | | — | | | | 0.13 | | | | — | | | | 9.70 | | | | (0.69 | ) | | | 0.37 | | | | 0.37 | | | | 0.37 | | | | 3.26 | | | | 15,227 | | | | 77 | |
12-31-10 | | | 9.09 | | | | 0.26 | • | | | 0.74 | | | | 1.00 | | | | 0.13 | | | | 0.05 | | | | — | | | | 0.18 | | | | — | | | | 9.91 | | | | 11.19 | | | | 0.37 | | | | 0.37 | | | | 0.37 | | | | 2.74 | | | | 6,911 | | | | 47 | |
12-31-09 | | | 7.64 | | | | 0.25 | • | | | 1.29 | | | | 1.54 | | | | 0.08 | | | | 0.01 | | | | — | | | | 0.09 | | | | — | | | | 9.09 | | | | 20.31 | | | | 0.37 | | | | 0.37 | | | | 0.37 | | | | 2.98 | | | | 1,529 | | | | 87 | |
12-31-08 | | | 10.02 | | | | 0.46 | • | | | (2.82 | ) | | | (2.36 | ) | | | 0.02 | | | | — | | | | — | | | | 0.02 | | | | — | | | | 7.64 | | | | (23.63 | ) | | | 0.37 | | | | 0.37 | | | | 0.37 | | | | 6.07 | | | | 625 | | | | 212 | |
07-02-07(6) - 12-31-07 | | | 10.00 | | | | 0.14 | | | | (0.12 | ) | | | 0.02 | | | | — | | | | — | | | | — | | | | — | | | | — | | | | 10.02 | | | | 0.20 | | | | 0.37 | | | | 0.37 | | | | 0.37 | | | | 2.79 | | | | 1 | | | | 7 | |
Class S2 | | | | | | | | | | | | | | | | | | | | | | | | | | | | | | | | | | | | | | | | | | | | | | | | | | | | | | | | | | | | | | | | | | | | |
12-31-11 | | | 9.90 | | | | 0.32 | • | | | (0.41 | ) | | | (0.09 | ) | | | 0.06 | | | | 0.08 | | | | — | | | | 0.14 | | | | — | | | | 9.67 | | | | (0.84 | ) | | | 0.62 | | | | 0.52 | | | | 0.52 | | | | 3.21 | | | | 178 | | | | 77 | |
04-30-10(6) - 12-31-10 | | | 9.51 | | | | 0.21 | • | | | 0.37 | | | | 0.58 | | | | 0.14 | | | | 0.05 | | | | — | | | | 0.19 | | | | — | | | | 9.90 | | | | 6.30 | | | | 0.62 | | | | 0.52 | | | | 0.52 | | | | 3.30 | | | | 32 | | | | 47 | |
See Accompanying Notes to Financial Statements
43
FINANCIAL HIGHLIGHTS (CONTINUED)
Selected data for a share of beneficial interest outstanding throughout each year or period.
| | | | | | | | | | | | | | | | | | | | | | | | | | | | | | | | | | | | | | | | | | | | | | | | | | | | | | | | | | | | | | | | | | | | |
| | | | | | Income (loss)
from
investment
operations | | | | | | Less distributions | | | | | | | | | | | | | | | Ratios to average net assets | | | Supplemental
data | |
| | | | | | | | | | | | | | | | | | | | | | | | | | | | | | | | | | | | | | | | | | | | | | | | | | | | |
| | | Net asset value, beginning of year or period | | | Net investment income (loss) | | | Net realized and unrealized gain (loss) | | | Total from investment operations | | | From net investment income | | | From net realized gains | | | From return of capital | | | Total distributions | | | Payment by affiliate | | | Net asset value, end of year or period | | | Total Return(1) | | | Expenses before reductions/additions(2)(3)(4)(5) | | | Expenses net of fee waivers and/or recoupments if any(2)(3)(4)(5) | | | Expense net of all reductions/additions(2)(3)(4)(5) | | | Net investment income (loss)(2)(4)(5) | | | Net assets, end of year or period | | | Portfolio turnover rate | |
| | | | | | | | | | | | | | | | | | | | | | | | | | | | | | | | | | | | | | | | | | | | | | | | | | | | | | | | | | | | | | | | | | | | |
Year or period ended | | ($) | | | ($) | | | ($) | | | ($) | | | ($) | | | ($) | | | ($) | | | ($) | | | ($) | | | ($) | | | (%) | | | (%) | | | (%) | | | (%) | | | (%) | | | ($000’s) | | | (%) | |
ING Solution 2015 Portfolio | | | | | | | | | | | | | | | | | | | | | | | | | | | | | | | | | | | | | | | | | | | | | | | | | | | | | | | | | | | | | | | | | | | | |
Class ADV | | | | | | | | | | | | | | | | | | | | | | | | | | | | | | | | | | | | | | | | | | | | | | | | | | | | | | | | | | | | | | | | | | | | |
12-31-11 | | | 10.92 | | | | 0.30 | • | | | (0.41 | ) | | | (0.11 | ) | | | 0.33 | | | | — | | | | — | | | | 0.33 | | | | — | | | | 10.48 | | | | (0.90 | ) | | | 0.62 | | | | 0.62 | | | | 0.62 | | | | 2.79 | | | | 312,854 | | | | 74 | |
12-31-10 | | | 10.07 | | | | 0.27 | | | | 0.80 | | | | 1.07 | | | | 0.22 | | | | — | | | | — | | | | 0.22 | | | | — | | | | 10.92 | | | | 10.82 | | | | 0.62 | | | | 0.62 | | | | 0.62 | | | | 2.54 | | | | 336,038 | | | | 61 | |
12-31-09 | | | 8.63 | | | | 0.21 | • | | | 1.67 | | | | 1.88 | | | | 0.35 | | | | 0.09 | | | | — | | | | 0.44 | | | | — | | | | 10.07 | | | | 22.16 | | | | 0.62 | | | | 0.62 | | | | 0.62 | | | | 2.32 | | | | 310,244 | | | | 60 | |
12-31-08 | | | 12.26 | | | | 0.28 | • | | | (3.51 | ) | | | (3.23 | ) | | | 0.17 | | | | 0.23 | | | | — | | | | 0.40 | | | | — | | | | 8.63 | | | | (27.05 | ) | | | 0.62 | | | | 0.62 | | | | 0.62 | | | | 2.56 | | | | 231,719 | | | | 59 | |
12-31-07 | | | 11.84 | | | | 0.24 | • | | | 0.27 | | | | 0.51 | | | | 0.07 | | | | 0.02 | | | | — | | | | 0.09 | | | | — | | | | 12.26 | | | | 4.30 | | | | 0.62 | | | | 0.62 | | | | 0.62 | | | | 1.99 | | | | 237,369 | | | | 39 | |
Class I | | | | | | | | | | | | | | | | | | | | | | | | | | | | | | | | | | | | | | | | | | | | | | | | | | | | | | | | | | | | | | | | | | | | |
12-31-11 | | | 11.14 | | | | 0.36 | • | | | (0.43 | ) | | | (0.07 | ) | | | 0.38 | | | | — | | | | — | | | | 0.38 | | | | — | | | | 10.69 | | | | (0.46 | ) | | | 0.12 | | | | 0.12 | | | | 0.12 | | | | 3.38 | | | | 81,565 | | | | 74 | |
12-31-10 | | | 10.25 | | | | 0.32 | | | | 0.83 | | | | 1.15 | | | | 0.26 | | | | — | | | | — | | | | 0.26 | | | | — | | | | 11.14 | | | | 11.49 | | | | 0.12 | | | | 0.12 | | | | 0.12 | | | | 3.03 | | | | 75,820 | | | | 61 | |
12-31-09 | | | 8.78 | | | | 0.25 | | | | 1.70 | | | | 1.95 | | | | 0.39 | | | | 0.09 | | | | — | | | | 0.48 | | | | — | | | | 10.25 | | | | 22.70 | | | | 0.12 | | | | 0.12 | | | | 0.12 | | | | 2.68 | | | | 65,252 | | | | 60 | |
12-31-08 | | | 12.44 | | | | 0.34 | • | | | (3.57 | ) | | | (3.23 | ) | | | 0.20 | | | | 0.23 | | | | — | | | | 0.43 | | | | — | | | | 8.78 | | | | (26.71 | ) | | | 0.12 | | | | 0.12 | | | | 0.12 | | | | 3.10 | | | | 51,793 | | | | 59 | |
12-31-07 | | | 11.95 | | | | 0.30 | • | | | 0.28 | | | | 0.58 | | | | 0.07 | | | | 0.02 | | | | — | | | | 0.09 | | | | — | | | | 12.44 | | | | 4.90 | | | | 0.12 | | | | 0.12 | | | | 0.12 | | | | 2.41 | | | | 41,863 | | | | 39 | |
Class S | | | | | | | | | | | | | | | | | | | | | | | | | | | | | | | | | | | | | | | | | | | | | | | | | | | | | | | | | | | | | | | | | | | | |
12-31-11 | | | 11.05 | | | | 0.33 | • | | | (0.42 | ) | | | (0.09 | ) | | | 0.36 | | | | — | | | | — | | | | 0.36 | | | | — | | | | 10.60 | | | | (0.73 | ) | | | 0.37 | | | | 0.37 | | | | 0.37 | | | | 3.00 | | | | 328,277 | | | | 74 | |
12-31-10 | | | 10.17 | | | | 0.29 | | | | 0.83 | | | | 1.12 | | | | 0.24 | | | | — | | | | — | | | | 0.24 | | | | — | | | | 11.05 | | | | 11.25 | | | | 0.37 | | | | 0.37 | | | | 0.37 | | | | 2.82 | | | | 380,318 | | | | 61 | |
12-31-09 | | | 8.72 | | | | 0.21 | | | | 1.70 | | | | 1.91 | | | | 0.37 | | | | 0.09 | | | | — | | | | 0.46 | | | | — | | | | 10.17 | | | | 22.32 | | | | 0.37 | | | | 0.37 | | | | 0.37 | | | | 2.53 | | | | 345,876 | | | | 60 | |
12-31-08 | | | 12.36 | | | | 0.30 | • | | | (3.53 | ) | | | (3.23 | ) | | | 0.18 | | | | 0.23 | | | | — | | | | 0.41 | | | | — | | | | 8.72 | | | | (26.86 | ) | | | 0.37 | | | | 0.37 | | | | 0.37 | | | | 2.78 | | | | 265,937 | | | | 59 | |
12-31-07 | | | 11.90 | | | | 0.24 | • | | | 0.31 | | | | 0.55 | | | | 0.07 | | | | 0.02 | | | | — | | | | 0.09 | | | | — | | | | 12.36 | | | | 4.60 | | | | 0.37 | | | | 0.37 | | | | 0.37 | | | | 1.96 | | | | 300,704 | | | | 39 | |
Class S2 | | | | | | | | | | | | | | | | | | | | | | | | | | | | | | | | | | | | | | | | | | | | | | | | | | | | | | | | | | | | | | | | | | | | |
12-31-11 | | | 10.84 | | | | 0.32 | • | | | (0.42 | ) | | | (0.10 | ) | | | 0.36 | | | | — | | | | — | | | | 0.36 | | | | — | | | | 10.38 | | | | (0.83 | ) | | | 0.62 | | | | 0.52 | | | | 0.52 | | | | 2.97 | | | | 22,792 | | | | 74 | |
12-31-10 | | | 10.02 | | | | 0.36 | • | | | 0.72 | | | | 1.08 | | | | 0.26 | | | | — | | | | — | | | | 0.26 | | | | — | | | | 10.84 | | | | 11.05 | | | | 0.62 | | | | 0.52 | | | | 0.52 | | | | 3.54 | | | | 15,289 | | | | 61 | |
05-28-09(6) - 12-31-09 | | | 8.97 | | | | 0.21 | • | | | 1.32 | | | | 1.53 | | | | 0.39 | | | | 0.09 | | | | — | | | | 0.48 | | | | — | | | | 10.02 | | | | 17.53 | | | | 0.62 | | | | 0.52 | | | | 0.52 | | | | 3.70 | | | | 3 | | | | 60 | |
Class T | | | | | | | | | | | | | | | | | | | | | | | | | | | | | | | | | | | | | | | | | | | | | | | | | | | | | | | | | | | | | | | | | | | | |
12-31-11 | | | 11.04 | | | | 0.28 | • | | | (0.42 | ) | | | (0.14 | ) | | | 0.30 | | | | — | | | | — | | | | 0.30 | | | | — | | | | 10.60 | | | | (1.12 | ) | | | 0.87 | | | | 0.82 | | | | 0.82 | | | | 2.55 | | | | 2,100 | | | | 74 | |
12-31-10 | | | 10.17 | | | | 0.24 | • | | | 0.83 | | | | 1.07 | | | | 0.20 | | | | — | | | | — | | | | 0.20 | | | | — | | | | 11.04 | | | | 10.65 | | | | 0.87 | | | | 0.82 | | | | 0.82 | | | | 2.30 | | | | 2,529 | | | | 61 | |
12-31-09 | | | 8.70 | | | | 0.18 | • | | | 1.69 | | | | 1.87 | | | | 0.31 | | | | 0.09 | | | | — | | | | 0.40 | | | | — | | | | 10.17 | | | | 21.79 | | | | 0.87 | | | | 0.82 | | | | 0.82 | | | | 1.95 | | | | 2,517 | | | | 60 | |
12-31-08 | | | 12.28 | | | | 0.27 | | | | (3.54 | ) | | | (3.27 | ) | | | 0.08 | | | | 0.23 | | | | — | | | | 0.31 | | | | — | | | | 8.70 | | | | (27.17 | ) | | | 0.87 | | | | 0.82 | | | | 0.82 | | | | 2.27 | | | | 2,615 | | | | 59 | |
12-31-07 | | | 11.81 | | | | 0.17 | | | | 0.32 | | | | 0.49 | | | | — | | | | 0.02 | | | | — | | | | 0.02 | | | | — | | | | 12.28 | | | | 4.15 | | | | 0.87 | | | | 0.82 | | | | 0.82 | | | | 1.38 | | | | 4,220 | | | | 39 | |
| | | | | | | | | | | | | | | | | |
ING Solution 2020 Portfolio | | | | | | | | | | | | | | | | | | | | | | | | | | | | | | | | | | | | | | | | | | | | | | | | | | | | | | | | | | | | | | | | | | | | |
Class ADV | | | | | | | | | | | | | | | | | | | | | | | | | | | | | | | | | | | | | | | | | | | | | | | | | | | | | | | | | | | | | | | | | | | | |
10-03-11(6) - 12-31-11 | | | 10.00 | | | | 0.08 | | | | 0.77 | | | | 0.85 | | | | — | | | | — | | | | — | | | | — | | | | — | | | | 10.85 | | | | 8.50 | | | | 0.62 | | | | 0.62 | | | | 0.62 | | | | 3.31 | | | | 3 | | | | 15 | |
Class I | | | | | | | | | | | | | | | | | | | | | | | | | | | | | | | | | | | | | | | | | | | | | | | | | | | | | | | | | | | | | | | | | | | | |
10-03-11(6) - 12-31-11 | | | 10.00 | | | | 0.09 | | | | 0.77 | | | | 0.86 | | | | — | | | | — | | | | — | | | | — | | | | — | | | | 10.86 | | | | 8.60 | | | | 0.12 | | | | 0.12 | | | | 0.12 | | | | 3.81 | | | | 3 | | | | 15 | |
Class S | | | | | | | | | | | | | | | | | | | | | | | | | | | | | | | | | | | | | | | | | | | | | | | | | | | | | | | | | | | | | | | | | | | | |
10-03-11(6) - 12-31-11 | | | 10.00 | | | | 0.09 | | | | 0.76 | | | | 0.85 | | | | — | | | | — | | | | — | | | | — | | | | — | | | | 10.85 | | | | 8.50 | | | | 0.37 | | | | 0.37 | | | | 0.37 | | | | 3.55 | | | | 3 | | | | 15 | |
See Accompanying Notes to Financial Statements
44
FINANCIAL HIGHLIGHTS (CONTINUED)
Selected data for a share of beneficial interest outstanding throughout each year or period.
| | | | | | | | | | | | | | | | | | | | | | | | | | | | | | | | | | | | | | | | | | | | | | | | | | | | | | | | | | | | | | | | | | | | |
| | | | | | Income (loss)
from
investment
operations | | | | | | Less distributions | | | | | | | | | | | | | | | Ratios to average net assets | | | Supplemental
data | |
| | | | | | | | | | | | | | | | | | | | | | | | | | | | | | | | | | | | | | | | | | | | | | | | | | | | |
| | | Net asset value, beginning of year or period | | | Net investment income (loss) | | | Net realized and unrealized gain (loss) | | | Total from investment operations | | | From net investment income | | | From net realized gains | | | From return of capital | | | Total distributions | | | Payment by affiliate | | | Net asset value, end of year or period | | | Total Return(1) | | | Expenses before reductions/additions(2)(3)(4)(5) | | | Expenses net of fee waivers and/or recoupments if any(2)(3)(4)(5) | | | Expense net of all reductions/additions(2)(3)(4)(5) | | | Net investment income (loss)(2)(4)(5) | | | Net assets, end of year or period | | | Portfolio turnover rate | |
| | | | | | | | | | | | | | | | | | | | | | | | | | | | | | | | | | | | | | | | | | | | | | | | | | | | | | | | | | | | | | | | | | | | |
Year or period ended | | ($) | | | ($) | | | ($) | | | ($) | | | ($) | | | ($) | | | ($) | | | ($) | | | ($) | | | ($) | | | (%) | | | (%) | | | (%) | | | (%) | | | (%) | | | ($000’s) | | | (%) | |
ING Solution 2020 Portfolio (Continued) | | | | | | | | | | | | | | | | | | | | | | | | | | | | | | | | | | | | | | | | | | | | | | | | | | | | | | | | | | | | | | | | | | | | |
Class S2 | | | | | | | | | | | | | | | | | | | | | | | | | | | | | | | | | | | | | | | | | | | | | | | | | | | | | | | | | | | | | | | | | | | | |
10-03-11(6) - 12-31-11 | | | 10.00 | | | | 0.08 | | | | 0.77 | | | | 0.85 | | | | — | | | | — | | | | — | | | | — | | | | — | | | | 10.85 | | | | 8.50 | | | | 0.62 | | | | 0.52 | | | | 0.52 | | | | 3.42 | | | | 3 | | | | 15 | |
Class T | | | | | | | | | | | | | | | | | | | | | | | | | | | | | | | | | | | | | | | | | | | | | | | | | | | | | | | | | | | | | | | | | | | | |
10-03-11(6) - 12-31-11 | | | 10.00 | | | | 0.08 | | | | 0.76 | | | | 0.84 | | | | — | | | | — | | | | — | | | | — | | | | — | | | | 10.84 | | | | 8.40 | | | | 0.87 | | | | 0.82 | | | | 0.82 | | | | 3.11 | | | | 3 | | | | 15 | |
| | | | | | | | | | | | | | | | | |
ING Solution 2025 Portfolio | | | | | | | | | | | | | | | | | | | | | | | | | | | | | | | | | | | | | | | | | | | | | | | | | | | | | | | | | | | | | | | | | | | | |
Class ADV | | | | | | | | | | | | | | | | | | | | | | | | | | | | | | | | | | | | | | | | | | | | | | | | | | | | | | | | | | | | | | | | | | | | |
12-31-11 | | | 10.98 | | | | 0.22 | | | | (0.60 | ) | | | (0.38 | ) | | | 0.21 | | | | — | | | | — | | | | 0.21 | | | | — | | | | 10.39 | | | | (3.37 | ) | | | 0.62 | | | | 0.62 | | | | 0.62 | | | | 2.01 | | | | 494,505 | | | | 71 | |
12-31-10 | | | 9.82 | | | | 0.18 | | | | 1.12 | | | | 1.30 | | | | 0.14 | | | | — | | | | — | | | | 0.14 | | | | — | | | | 10.98 | | | | 13.50 | | | | 0.62 | | | | 0.62 | | | | 0.62 | | | | 1.84 | | | | 522,321 | | | | 56 | |
12-31-09 | | | 8.06 | | | | 0.15 | • | | | 1.88 | | | | 2.03 | | | | 0.26 | | | | 0.01 | | | | — | | | | 0.27 | | | | — | | | | 9.82 | | | | 25.54 | | | | 0.62 | | | | 0.62 | | | | 0.62 | | | | 1.73 | | | | 457,213 | | | | 51 | |
12-31-08 | | | 12.71 | | | | 0.20 | • | | | (4.41 | ) | | | (4.21 | ) | | | 0.13 | | | | 0.31 | | | | — | | | | 0.44 | | | | — | | | | 8.06 | | | | (34.05 | ) | | | 0.62 | | | | 0.62 | | | | 0.62 | | | | 1.87 | | | | 321,460 | | | | 62 | |
12-31-07 | | | 12.28 | | | | 0.15 | • | | | 0.37 | | | | 0.52 | | | | 0.05 | | | | 0.04 | | | | — | | | | 0.09 | | | | — | | | | 12.71 | | | | 4.28 | | | | 0.62 | | | | 0.62 | | | | 0.62 | | | | 1.16 | | | | 345,763 | | | | 39 | |
Class I | | | | | | | | | | | | | | | | | | | | | | | | | | | | | | | | | | | | | | | | | | | | | | | | | | | | | | | | | | | | | | | | | | | | |
12-31-11 | | | 11.21 | | | | 0.28 | • | | | (0.62 | ) | | | (0.34 | ) | | | 0.26 | | | | — | | | | — | | | | 0.26 | | | | — | | | | 10.61 | | | | (2.92 | ) | | | 0.12 | | | | 0.12 | | | | 0.12 | | | | 2.55 | | | | 152,184 | | | | 71 | |
12-31-10 | | | 10.01 | | | | 0.23 | | | | 1.15 | | | | 1.38 | | | | 0.18 | | | | — | | | | — | | | | 0.18 | | | | — | | | | 11.21 | | | | 14.10 | | | | 0.12 | | | | 0.12 | | | | 0.12 | | | | 2.34 | | | | 126,678 | | | | 56 | |
12-31-09 | | | 8.21 | | | | 0.17 | | | | 1.95 | | | | 2.12 | | | | 0.31 | | | | 0.01 | | | | — | | | | 0.32 | | | | — | | | | 10.01 | | | | 26.13 | | | | 0.12 | | | | 0.12 | | | | 0.12 | | | | 2.15 | | | | 102,548 | | | | 51 | |
12-31-08 | | | 12.91 | | | | 0.26 | • | | | (4.49 | ) | | | (4.23 | ) | | | 0.16 | | | | 0.31 | | | | — | | | | 0.47 | | | | — | | | | 8.21 | | | | (33.72 | ) | | | 0.12 | | | | 0.12 | | | | 0.12 | | | | 2.41 | | | | 72,518 | | | | 62 | |
12-31-07 | | | 12.41 | | | | 0.22 | • | | | 0.38 | | | | 0.60 | | | | 0.06 | | | | 0.04 | | | | — | | | | 0.10 | | | | — | | | | 12.91 | | | | 4.84 | | | | 0.12 | | | | 0.12 | | | | 0.12 | | | | 1.74 | | | | 59,212 | | | | 39 | |
Class S | | | | | | | | | | | | | | | | | | | | | | | | | | | | | | | | | | | | | | | | | | | | | | | | | | | | | | | | | | | | | | | | | | | | |
12-31-11 | | | 11.11 | | | | 0.25 | • | | | (0.61 | ) | | | (0.36 | ) | | | 0.23 | | | | — | | | | — | | | | 0.23 | | | | — | | | | 10.52 | | | | (3.10 | ) | | | 0.37 | | | | 0.37 | | | | 0.37 | | | | 2.24 | | | | 503,345 | | | | 71 | |
12-31-10 | | | 9.93 | | | | 0.21 | | | | 1.13 | | | | 1.34 | | | | 0.16 | | | | — | | | | — | | | | 0.16 | | | | — | | | | 11.11 | | | | 13.79 | | | | 0.37 | | | | 0.37 | | | | 0.37 | | | | 2.11 | | | | 574,267 | | | | 56 | |
12-31-09 | | | 8.15 | | | | 0.17 | • | | | 1.90 | | | | 2.07 | | | | 0.28 | | | | 0.01 | | | | — | | | | 0.29 | | | | — | | | | 9.93 | | | | 25.78 | | | | 0.37 | | | | 0.37 | | | | 0.37 | | | | 1.98 | | | | 502,884 | | | | 51 | |
12-31-08 | | | 12.82 | | | | 0.22 | • | | | (4.44 | ) | | | (4.22 | ) | | | 0.14 | | | | 0.31 | | | | — | | | | 0.45 | | | | — | | | | 8.15 | | | | (33.87 | ) | | | 0.37 | | | | 0.37 | | | | 0.37 | | | | 2.06 | | | | 341,919 | | | | 62 | |
12-31-07 | | | 12.34 | | | | 0.15 | • | | | 0.42 | | | | 0.57 | | | | 0.05 | | | | 0.04 | | | | — | | | | 0.09 | | | | — | | | | 12.82 | | | | 4.64 | | | | 0.37 | | | | 0.37 | | | | 0.37 | | | | 1.18 | | | | 446,724 | | | | 39 | |
Class S2 | | | | | | | | | | | | | | | | | | | | | | | | | | | | | | | | | | | | | | | | | | | | | | | | | | | | | | | | | | | | | | | | | | | | |
12-31-11 | | | 10.92 | | | | 0.24 | • | | | (0.61 | ) | | | (0.37 | ) | | | 0.23 | | | | — | | | | — | | | | 0.23 | | | | — | | | | 10.32 | | | | (3.23 | ) | | | 0.62 | | | | 0.52 | | | | 0.52 | | | | 2.25 | | | | 32,053 | | | | 71 | |
12-31-10 | | | 9.80 | | | | 0.26 | • | | | 1.04 | | | | 1.30 | | | | 0.18 | | | | — | | | | — | | | | 0.18 | | | | — | | | | 10.92 | | | | 13.59 | | | | 0.62 | | | | 0.52 | | | | 0.52 | | | | 2.59 | | | | 20,678 | | | | 56 | |
05-28-09(6) - 12-31-09 | | | 8.44 | | | | 0.16 | • | | | 1.52 | | | | 1.68 | | | | 0.31 | | | | 0.01 | | | | — | | | | 0.32 | | | | — | | | | 9.80 | | | | 20.20 | | | | 0.62 | | | | 0.52 | | | | 0.52 | | | | 2.84 | | | | 3 | | | | 51 | |
Class T | | | | | | | | | | | | | | | | | | | | | | | | | | | | | | | | | | | | | | | | | | | | | | | | | | | | | | | | | | | | | | | | | | | | |
12-31-11 | | | 11.06 | | | | 0.19 | • | | | (0.58 | ) | | | (0.39 | ) | | | 0.18 | | | | — | | | | — | | | | 0.18 | | | | — | | | | 10.49 | | | | (3.44 | ) | | | 0.87 | | | | 0.82 | | | | 0.82 | | | | 1.71 | | | | 3,256 | | | | 71 | |
12-31-10 | | | 9.89 | | | | 0.16 | | | | 1.14 | | | | 1.30 | | | | 0.13 | | | | — | | | | — | | | | 0.13 | | | | — | | | | 11.06 | | | | 13.28 | | | | 0.87 | | | | 0.82 | | | | 0.82 | | | | 1.65 | | | | 6,215 | | | | 56 | |
12-31-09 | | | 8.10 | | | | 0.13 | | | | 1.89 | | | | 2.02 | | | | 0.22 | | | | 0.01 | | | | — | | | | 0.23 | | | | — | | | | 9.89 | | | | 25.14 | | | | 0.87 | | | | 0.82 | | | | 0.82 | | | | 1.48 | | | | 5,399 | | | | 51 | |
12-31-08 | | | 12.72 | | | | 0.16 | • | | | (4.41 | ) | | | (4.25 | ) | | | 0.06 | | | | 0.31 | | | | — | | | | 0.37 | | | | — | | | | 8.10 | | | | (34.18 | ) | | | 0.87 | | | | 0.82 | | | | 0.82 | | | | 1.45 | | | | 4,423 | | | | 62 | |
12-31-07 | | | 12.25 | | | | 0.07 | • | | | 0.44 | | | | 0.51 | | | | — | | | | 0.04 | | | | — | | | | 0.04 | | | | — | | | | 12.72 | | | | 4.17 | | | | 0.87 | | | | 0.82 | | | | 0.82 | | | | 0.53 | | | | 7,917 | | | | 39 | |
See Accompanying Notes to Financial Statements
45
FINANCIAL HIGHLIGHTS (CONTINUED)
Selected data for a share of beneficial interest outstanding throughout each year or period.
| | | | | | | | | | | | | | | | | | | | | | | | | | | | | | | | | | | | | | | | | | | | | | | | | | | | | | | | | | | | | | | | | | | | |
| | | | | | Income (loss)
from
investment
operations | | | | | | Less distributions | | | | | | | | | | | | | | | Ratios to average net assets | | | Supplemental
data | |
| | | | | | | | | | | | | | | | | | | | | | | | | | | | | | | | | | | | | | | | | | | | | | | | | | | | |
| | | Net asset value, beginning of year or period | | | Net investment income (loss) | | | Net realized and unrealized gain (loss) | | | Total from investment operations | | | From net investment income | | | From net realized gains | | | From return of capital | | | Total distributions | | | Payment by affiliate | | | Net asset value, end of year or period | | | Total Return(1) | | | Expenses before reductions/additions(2)(3)(4)(5) | | | Expenses net of fee waivers and/or recoupments if any(2)(3)(4)(5) | | | Expense net of all reductions/additions(2)(3)(4)(5) | | | Net investment income (loss)(2)(4)(5) | | | Net assets, end of year or period | | | Portfolio turnover rate | |
| | | | | | | | | | | | | | | | | | | | | | | | | | | | | | | | | | | | | | | | | | | | | | | | | | | | | | | | | | | | | | | | | | | | |
Year or period ended | | ($) | | | ($) | | | ($) | | | ($) | | | ($) | | | ($) | | | ($) | | | ($) | | | ($) | | | ($) | | | (%) | | | (%) | | | (%) | | | (%) | | | (%) | | | ($000’s) | | | (%) | |
ING Solution 2030 Portfolio | | | | | | | | | | | | | | | | | | | | | | | | | | | | | | | | | | | | | | | | | | | | | | | | | | | | | | | | | | | | | | | | | | | | |
Class ADV | | | | | | | | | | | | | | | | | | | | | | | | | | | | | | | | | | | | | | | | | | | | | | | | | | | | | | | | | | | | | | | | | | | | |
10-03-11(6) - 12-31-11 | | | 10.00 | | | | 0.07 | | | | 0.99 | | | | 1.06 | | | | — | | | | — | | | | — | | | | — | | | | — | | | | 11.06 | | | | 10.60 | | | | 0.62 | | | | 0.62 | | | | 0.62 | | | | 2.82 | | | | 3 | | | | 11 | |
Class I | | | | | | | | | | | | | | | | | | | | | | | | | | | | | | | | | | | | | | | | | | | | | | | | | | | | | | | | | | | | | | | | | | | | |
10-03-11(6) - 12-31-11 | | | 10.00 | | | | 0.08 | | | | 0.99 | | | | 1.07 | | | | — | | | | — | | | | — | | | | — | | | | — | | | | 11.07 | | | | 10.70 | | | | 0.12 | | | | 0.12 | | | | 0.12 | | | | 3.32 | | | | 3 | | | | 11 | |
Class S | | | | | | | | | | | | | | | | | | | | | | | | | | | | | | | | | | | | | | | | | | | | | | | | | | | | | | | | | | | | | | | | | | | | |
10-03-11(6) - 12-31-11 | | | 10.00 | | | | 0.08 | | | | 0.98 | | | | 1.06 | | | | — | | | | — | | | | — | | | | — | | | | — | | | | 11.06 | | | | 10.60 | | | | 0.37 | | | | 0.37 | | | | 0.37 | | | | 3.10 | | | | 3 | | | | 11 | |
Class S2 | | | | | | | | | | | | | | | | | | | | | | | | | | | | | | | | | | | | | | | | | | | | | | | | | | | | | | | | | | | | | | | | | | | | |
10-03-11(6) - 12-31-11 | | | 10.00 | | | | 0.07 | | | | 0.99 | | | | 1.06 | | | | — | | | | — | | | | — | | | | — | | | | — | | | | 11.06 | | | | 10.60 | | | | 0.62 | | | | 0.52 | | | | 0.52 | | | | 2.93 | | | | 3 | | | | 11 | |
Class T | | | | | | | | | | | | | | | | | | | | | | | | | | | | | | | | | | | | | | | | | | | | | | | | | | | | | | | | | | | | | | | | | | | | |
10-03-11(6) - 12-31-11 | | | 10.00 | | | | 0.07 | | | | 0.98 | | | | 1.05 | | | | — | | | | — | | | | — | | | | — | | | | — | | | | 11.05 | | | | 10.50 | | | | 0.87 | | | | 0.82 | | | | 0.82 | | | | 2.61 | | | | 3 | | | | 11 | |
| | | | | | | | | | | | | | | | | |
ING Solution 2035 Portfolio | | | | | | | | | | | | | | | | | | | | | | | | | | | | | | | | | | | | | | | | | | | | | | | | | | | | | | | | | | | | | | | | | | | | |
Class ADV | | | | | | | | | | | | | | | | | | | | | | | | | | | | | | | | | | | | | | | | | | | | | | | | | | | | | | | | | | | | | | | | | | | | |
12-31-11 | | | 11.19 | | | | 0.17 | | | | (0.73 | ) | | | (0.56 | ) | | | 0.15 | | | | — | | | | — | | | | 0.15 | | | | — | | | | 10.48 | | | | (4.90 | ) | | | 0.62 | | | | 0.62 | | | | 0.62 | | | | 1.54 | | | | 418,753 | | | | 71 | |
12-31-10 | | | 9.90 | | | | 0.14 | | | | 1.26 | | | | 1.40 | | | | 0.11 | | | | — | | | | — | | | | 0.11 | | | | — | | | | 11.19 | | | | 14.29 | | | | 0.62 | | | | 0.62 | | | | 0.62 | | | | 1.39 | | | | 453,363 | | | | 56 | |
12-31-09 | | | 7.94 | | | | 0.12 | • | | | 2.08 | | | | 2.20 | | | | 0.23 | | | | 0.01 | | | | — | | | | 0.24 | | | | — | | | | 9.90 | | | | 28.00 | | | | 0.62 | | | | 0.62 | | | | 0.62 | | | | 1.35 | | | | 389,542 | | | | 46 | |
12-31-08 | | | 13.19 | | | | 0.15 | • | | | (4.91 | ) | | | (4.76 | ) | | | 0.14 | | | | 0.35 | | | | — | | | | 0.49 | | | | — | | | | 7.94 | | | | (37.18 | ) | | | 0.62 | | | | 0.62 | | | | 0.62 | | | | 1.38 | | | | 252,226 | | | | 62 | |
12-31-07 | | | 12.65 | | | | 0.12 | • | | | 0.51 | | | | 0.63 | | | | 0.05 | | | | 0.04 | | | | — | | | | 0.09 | | | | — | | | | 13.19 | | | | 5.03 | | | | 0.62 | | | | 0.62 | | | | 0.62 | | | | 0.88 | | | | 279,171 | | | | 32 | |
Class I | | | | | | | | | | | | | | | | | | | | | | | | | | | | | | | | | | | | | | | | | | | | | | | | | | | | | | | | | | | | | | | | | | | | |
12-31-11 | | | 11.41 | | | | 0.24 | • | | | (0.76 | ) | | | (0.52 | ) | | | 0.20 | | | | — | | | | — | | | | 0.20 | | | | — | | | | 10.69 | | | | (4.42 | ) | | | 0.12 | | | | 0.12 | | | | 0.12 | | | | 2.10 | | | | 140,503 | | | | 71 | |
12-31-10 | | | 10.09 | | | | 0.20 | • | | | 1.27 | | | | 1.47 | | | | 0.15 | | | | — | | | | — | | | | 0.15 | | | | — | | | | 11.41 | | | | 14.77 | | | | 0.12 | | | | 0.12 | | | | 0.12 | | | | 1.90 | | | | 115,744 | | | | 56 | |
12-31-09 | | | 8.08 | | | | 0.16 | • | | | 2.13 | | | | 2.29 | | | | 0.27 | | | | 0.01 | | | | — | | | | 0.28 | | | | — | | | | 10.09 | | | | 28.68 | | | | 0.12 | | | | 0.12 | | | | 0.12 | | | | 1.82 | | | | 85,142 | | | | 46 | |
12-31-08 | | | 13.38 | | | | 0.21 | • | | | (4.99 | ) | | | (4.78 | ) | | | 0.17 | | | | 0.35 | | | | — | | | | 0.52 | | | | — | | | | 8.08 | | | | (36.85 | ) | | | 0.12 | | | | 0.12 | | | | 0.12 | | | | 1.96 | | | | 50,607 | | | | 62 | |
12-31-07 | | | 12.76 | | | | 0.19 | • | | | 0.53 | | | | 0.72 | | | | 0.06 | | | | 0.04 | | | | — | | | | 0.10 | | | | — | | | | 13.38 | | | | 5.66 | | | | 0.12 | | | | 0.12 | | | | 0.12 | | | | 1.43 | | | | 44,254 | | | | 32 | |
Class S | | | | | | | | | | | | | | | | | | | | | | | | | | | | | | | | | | | | | | | | | | | | | | | | | | | | | | | | | | | | | | | | | | | | |
12-31-11 | | | 11.32 | | | | 0.21 | | | | (0.74 | ) | | | (0.53 | ) | | | 0.18 | | | | — | | | | — | | | | 0.18 | | | | — | | | | 10.61 | | | | (4.61 | ) | | | 0.37 | | | | 0.37 | | | | 0.37 | | | | 1.77 | | | | 416,250 | | | | 71 | |
12-31-10 | | | 10.01 | | | | 0.16 | | | | 1.28 | | | | 1.44 | | | | 0.13 | | | | — | | | | — | | | | 0.13 | | | | — | | | | 11.32 | | | | 14.56 | | | | 0.37 | | | | 0.37 | | | | 0.37 | | | | 1.65 | | | | 477,985 | | | | 56 | |
12-31-09 | | | 8.02 | | | | 0.14 | • | | | 2.11 | | | | 2.25 | | | | 0.25 | | | | 0.01 | | | | — | | | | 0.26 | | | | — | | | | 10.01 | | | | 28.35 | | | | 0.37 | | | | 0.37 | | | | 0.37 | | | | 1.59 | | | | 406,568 | | | | 46 | |
12-31-08 | | | 13.29 | | | | 0.17 | • | | | (4.94 | ) | | | (4.77 | ) | | | 0.15 | | | | 0.35 | | | | — | | | | 0.50 | | | | — | | | | 8.02 | | | | (37.01 | ) | | | 0.37 | | | | 0.37 | | | | 0.37 | | | | 1.59 | | | | 269,288 | | | | 62 | |
12-31-07 | | | 12.71 | | | | 0.12 | • | | | 0.55 | | | | 0.67 | | | | 0.05 | | | | 0.04 | | | | — | | | | 0.09 | | | | — | | | | 13.29 | | | | 5.30 | | | | 0.37 | | | | 0.37 | | | | 0.37 | | | | 0.93 | | | | 347,197 | | | | 32 | |
Class S2 | | | | | | | | | | | | | | | | | | | | | | | | | | | | | | | | | | | | | | | | | | | | | | | | | | | | | | | | | | | | | | | | | | | | |
12-31-11 | | | 11.08 | | | | 0.19 | • | | | (0.73 | ) | | | (0.54 | ) | | | 0.18 | | | | — | | | | — | | | | 0.18 | | | | — | | | | 10.36 | | | | (4.79 | ) | | | 0.62 | | | | 0.52 | | | | 0.52 | | | | 1.78 | | | | 26,630 | | | | 71 | |
12-31-10 | | | 9.83 | | | | 0.21 | • | | | 1.19 | | | | 1.40 | | | | 0.15 | | | | — | | | | — | | | | 0.15 | | | | — | | | | 11.08 | | | | 14.44 | | | | 0.62 | | | | 0.52 | | | | 0.52 | | | | 2.08 | | | | 18,369 | | | | 56 | |
05-28-09(6) - 12-31-09 | | | 8.32 | | | | 0.13 | • | | | 1.66 | | | | 1.79 | | | | 0.27 | | | | 0.01 | | | | — | | | | 0.28 | | | | — | | | | 9.83 | | | | 21.84 | | | | 0.62 | | | | 0.52 | | | | 0.52 | | | | 2.35 | | | | 4 | | | | 46 | |
See Accompanying Notes to Financial Statements
46
FINANCIAL HIGHLIGHTS (CONTINUED)
Selected data for a share of beneficial interest outstanding throughout each year or period.
| | | | | | | | | | | | | | | | | | | | | | | | | | | | | | | | | | | | | | | | | | | | | | | | | | | | | | | | | | | | | | | | | | | | |
| | | | | | Income (loss)
from
investment
operations | | | | | | Less distributions | | | | | | | | | | | | | | | Ratios to average net assets | | | Supplemental
data | |
| | | | | | | | | | | | | | | | | | | | | | | | | | | | | | | | | | | | | | | | | | | | | | | | | | | | |
| | | Net asset value, beginning of year or period | | | Net investment income (loss) | | | Net realized and unrealized gain (loss) | | | Total from investment operations | | | From net investment income | | | From net realized gains | | | From return of capital | | | Total distributions | | | Payment by affiliate | | | Net asset value, end of year or period | | | Total Return(1) | | | Expenses before reductions/additions(2)(3)(4)(5) | | | Expenses net of fee waivers and/or recoupments if any(2)(3)(4)(5) | | | Expense net of all reductions/additions(2)(3)(4)(5) | | | Net investment income (loss)(2)(4)(5) | | | Net assets, end of year or period | | | Portfolio turnover rate | |
| | | | | | | | | | | | | | | | | | | | | | | | | | | | | | | | | | | | | | | | | | | | | | | | | | | | | | | | | | | | | | | | | | | | |
Year or period ended | | ($) | | | ($) | | | ($) | | | ($) | | | ($) | | | ($) | | | ($) | | | ($) | | | ($) | | | ($) | | | (%) | | | (%) | | | (%) | | | (%) | | | (%) | | | ($000’s) | | | (%) | |
ING Solution 2035 Portfolio (Continued) | | | | | | | | | | | | | | | | | | | | | | | | | | | | | | | | | | | | | | | | | | | | | | | | | | | | | | | | | | | | | | | | | | | | |
Class T | | | | | | | | | | | | | | | | | | | | | | | | | | | | | | | | | | | | | | | | | | | | | | | | | | | | | | | | | | | | | | | | | | | | |
12-31-11 | | | 11.33 | | | | 0.15 | • | | | (0.73 | ) | | | (0.58 | ) | | | 0.12 | | | | — | | | | — | | | | 0.12 | | | | — | | | | 10.63 | | | | (5.06 | ) | | | 0.87 | | | | 0.82 | | | | 0.82 | | | | 1.30 | | | | 2,927 | | | | 71 | |
12-31-10 | | | 10.02 | | | | 0.12 | | | | 1.27 | | | | 1.39 | | | | 0.08 | | | | — | | | | — | | | | 0.08 | | | | — | | | | 11.33 | | | | 14.04 | | | | 0.87 | | | | 0.82 | | | | 0.82 | | | | 1.18 | | | | 3,998 | | | | 56 | |
12-31-09 | | | 7.98 | | | | 0.09 | • | | | 2.11 | | | | 2.20 | | | | 0.15 | | | | 0.01 | | | | — | | | | 0.16 | | | | — | | | | 10.02 | | | | 27.73 | | | | 0.87 | | | | 0.82 | | | | 0.82 | | | | 1.10 | | | | 3,618 | | | | 46 | |
12-31-08 | | | 13.18 | | | | 0.09 | • | | | (4.89 | ) | | | (4.80 | ) | | | 0.05 | | | | 0.35 | | | | — | | | | 0.40 | | | | — | | | | 7.98 | | | | (37.30 | ) | | | 0.87 | | | | 0.82 | | | | 0.82 | | | | 0.78 | | | | 2,979 | | | | 62 | |
12-31-07 | | | 12.60 | | | | 0.05 | | | | 0.57 | | | | 0.62 | | | | — | | | | 0.04 | | | | — | | | | 0.04 | | | | — | | | | 13.18 | | | | 4.89 | | | | 0.87 | | | | 0.82 | | | | 0.82 | | | | 0.38 | | | | 8,774 | | | | 32 | |
| | | | | | | | | | | | | | | | | |
ING Solution 2040 Portfolio | | | | | | | | | | | | | | | | | | | | | | | | | | | | | | | | | | | | | | | | | | | | | | | | | | | | | | | | | | | | | | | | | | | | |
Class ADV | | | | | | | | | | | | | | | | | | | | | | | | | | | | | | | | | | | | | | | | | | | | | | | | | | | | | | | | | | | | | | | | | | | | |
10-03-11(6) - 12-31-11 | | | 10.00 | | | | 0.06 | | | | 1.17 | | | | 1.23 | | | | — | | | | — | | | | — | | | | — | | | | — | | | | 11.23 | | | | 12.30 | | | | 0.62 | | | | 0.62 | | | | 0.62 | | | | 2.25 | | | | 3 | | | | 10 | |
Class I | | | | | | | | | | | | | | | | | | | | | | | | | | | | | | | | | | | | | | | | | | | | | | | | | | | | | | | | | | | | | | | | | | | | |
10-03-11(6) - 12-31-11 | | | 10.00 | | | | 0.07 | | | | 1.17 | | | | 1.24 | | | | — | | | | — | | | | — | | | | — | | | | — | | | | 11.24 | | | | 12.40 | | | | 0.12 | | | | 0.12 | | | | 0.12 | | | | 2.75 | | | | 3 | | | | 10 | |
Class S | | | | | | | | | | | | | | | | | | | | | | | | | | | | | | | | | | | | | | | | | | | | | | | | | | | | | | | | | | | | | | | | | | | | |
10-03-11(6) - 12-31-11 | | | 10.00 | | | | 0.07 | | | | 1.16 | | | | 1.23 | | | | — | | | | — | | | | — | | | | — | | | | — | | | | 11.23 | | | | 12.30 | | | | 0.37 | | | | 0.37 | | | | 0.37 | | | | 2.57 | | | | 3 | | | | 10 | |
Class S2 | | | | | | | | | | | | | | | | | | | | | | | | | | | | | | | | | | | | | | | | | | | | | | | | | | | | | | | | | | | | | | | | | | | | |
10-03-11(6) - 12-31-11 | | | 10.00 | | | | 0.06 | | | | 1.17 | | | | 1.23 | | | | — | | | | — | | | | — | | | | — | | | | — | | | | 11.23 | | | | 12.30 | | | | 0.62 | | | | 0.52 | | | | 0.52 | | | | 2.36 | | | | 3 | | | | 10 | |
Class T | | | | | | | | | | | | | | | | | | | | | | | | | | | | | | | | | | | | | | | | | | | | | | | | | | | | | | | | | | | | | | | | | | | | |
10-03-11(6) - 12-31-11 | | | 10.00 | | | | 0.05 | | | | 1.17 | | | | 1.22 | | | | — | | | | — | | | | — | | | | — | | | | — | | | | 11.22 | | | | 12.20 | | | | 0.87 | | | | 0.82 | | | | 0.82 | | | | 2.06 | | | | 3 | | | | 10 | |
| | | | | | | | | | | | | | | | | |
ING Solution 2045 Portfolio | | | | | | | | | | | | | | | | | | | | | | | | | | | | | | | | | | | | | | | | | | | | | | | | | | | | | | | | | | | | | | | | | | | | |
Class ADV | | | | | | | | | | | | | | | | | | | | | | | | | | | | | | | | | | | | | | | | | | | | | | | | | | | | | | | | | | | | | | | | | | | | |
12-31-11 | | | 11.29 | | | | 0.14 | | | | (0.76 | ) | | | (0.62 | ) | | | 0.11 | | | | — | | | | — | | | | 0.11 | | | | — | | | | 10.56 | | | | (5.42 | ) | | | 0.62 | | | | 0.62 | | | | 0.62 | | | | 1.28 | | | | 244,111 | | | | 77 | |
12-31-10 | | | 9.90 | | | | 0.11 | | | | 1.35 | | | | 1.46 | | | | 0.07 | | | | — | | | | — | | | | 0.07 | | | | — | | | | 11.29 | | | | 14.92 | | | | 0.62 | | | | 0.62 | | | | 0.62 | | | | 1.04 | | | | 262,653 | | | | 40 | |
12-31-09 | | | 7.87 | | | | 0.09 | • | | | 2.20 | | | | 2.29 | | | | 0.19 | | | | 0.07 | | | | — | | | | 0.26 | | | | — | | | | 9.90 | | | | 29.50 | | | | 0.62 | | | | 0.62 | | | | 0.62 | | | | 1.07 | | | | 229,164 | | | | 36 | |
12-31-08 | | | 13.66 | | | | 0.12 | • | | | (5.44 | ) | | | (5.32 | ) | | | 0.11 | | | | 0.36 | | | | — | | | | 0.47 | | | | — | | | | 7.87 | | | | (40.02 | ) | | | 0.62 | | | | 0.62 | | | | 0.62 | | | | 1.14 | | | | 136,526 | | | | 57 | |
12-31-07 | | | 13.01 | | | | 0.05 | | | | 0.66 | | | | 0.71 | | | | 0.03 | | | | 0.03 | | | | — | | | | 0.06 | | | | — | | | | 13.66 | | | | 5.51 | | | | 0.62 | | | | 0.62 | | | | 0.62 | | | | 0.33 | | | | 148,649 | | | | 39 | |
Class I | | | | | | | | | | | | | | | | | | | | | | | | | | | | | | | | | | | | | | | | | | | | | | | | | | | | | | | | | | | | | | | | | | | | |
12-31-11 | | | 11.51 | | | | 0.21 | • | | | (0.80 | ) | | | (0.59 | ) | | | 0.16 | | | | — | | | | — | | | | 0.16 | | | | — | | | | 10.76 | | | | (5.02 | ) | | | 0.12 | | | | 0.12 | | | | 0.12 | | | | 1.86 | | | | 109,358 | | | | 77 | |
12-31-10 | | | 10.08 | | | | 0.16 | • | | | 1.38 | | | | 1.54 | | | | 0.11 | | | | — | | | | — | | | | 0.11 | | | | — | | | | 11.51 | | | | 15.51 | | | | 0.12 | | | | 0.12 | | | | 0.12 | | | | 1.59 | | | | 88,176 | | | | 40 | |
12-31-09 | | | 8.00 | | | | 0.13 | • | | | 2.25 | | | | 2.38 | | | | 0.23 | | | | 0.07 | | | | — | | | | 0.30 | | | | — | | | | 10.08 | | | | 30.16 | | | | 0.12 | | | | 0.12 | | | | 0.12 | | | | 1.54 | | | | 61,035 | | | | 36 | |
12-31-08 | | | 13.84 | | | | 0.19 | • | | | (5.53 | ) | | | (5.34 | ) | | | 0.14 | | | | 0.36 | | | | — | | | | 0.50 | | | | — | | | | 8.00 | | | | (39.70 | ) | | | 0.12 | | | | 0.12 | | | | 0.12 | | | | 1.71 | | | | 33,161 | | | | 57 | |
12-31-07 | | | 13.13 | | | | 0.12 | | | | 0.66 | | | | 0.78 | | | | 0.04 | | | | 0.03 | | | | — | | | | 0.07 | | | | — | | | | 13.84 | | | | 5.96 | | | | 0.12 | | | | 0.12 | | | | 0.12 | | | | 0.84 | | | | 28,381 | | | | 39 | |
See Accompanying Notes to Financial Statements
47
FINANCIAL HIGHLIGHTS (CONTINUED)
Selected data for a share of beneficial interest outstanding throughout each year or period.
| | | | | | | | | | | | | | | | | | | | | | | | | | | | | | | | | | | | | | | | | | | | | | | | | | | | | | | | | | | | | | | | | | | | |
| | | | | | Income (loss)
from
investment
operations | | | | | | Less distributions | | | | | | | | | | | | | | | Ratios to average net assets | | | Supplemental
data | |
| | | | | | | | | | | | | | | | | | | | | | | | | | | | | | | | | | | | | | | | | | | | | | | | | | | | |
| | | Net asset value, beginning of year or period | | | Net investment income (loss) | | | Net realized and unrealized gain (loss) | | | Total from investment operations | | | From net investment income | | | From net realized gains | | | From return of capital | | | Total distributions | | | Payment by affiliate | | | Net asset value, end of year or period | | | Total Return(1) | | | Expenses before reductions/additions(2)(3)(4)(5) | | | Expenses net of fee waivers and/or recoupments if any(2)(3)(4)(5) | | | Expense net of all reductions/additions(2)(3)(4)(5) | | | Net investment income (loss)(2)(4)(5) | | | Net assets, end of year or period | | | Portfolio turnover rate | |
| | | | | | | | | | | | | | | | | | | | | | | | | | | | | | | | | | | | | | | | | | | | | | | | | | | | | | | | | | | | | | | | | | | | |
Year or period ended | | ($) | | | ($) | | | ($) | | | ($) | | | ($) | | | ($) | | | ($) | | | ($) | | | ($) | | | ($) | | | (%) | | | (%) | | | (%) | | | (%) | | | (%) | | | ($000’s) | | | (%) | |
ING Solution 2045 Portfolio (Continued) | | | | | | | | | | | | | | | | | | | | | | | | | | | | | | | | | | | | | | | | | | | | | | | | | | | | | | | | | | | | | | | | | | | | |
Class S | | | | | | | | | | | | | | | | | | | | | | | | | | | | | | | | | | | | | | | | | | | | | | | | | | | | | | | | | | | | | | | | | | | | |
12-31-11 | | | 11.40 | | | | 0.18 | | | | (0.78 | ) | | | (0.60 | ) | | | 0.13 | | | | — | | | | — | | | | 0.13 | | | | — | | | | 10.67 | | | | (5.14 | ) | | | 0.37 | | | | 0.37 | | | | 0.37 | | | | 1.51 | | | | 277,998 | | | | 77 | |
12-31-10 | | | 10.00 | | | | 0.13 | | | | 1.36 | | | | 1.49 | | | | 0.09 | | | | — | | | | — | | | | 0.09 | | | | — | | | | 11.40 | | | | 15.12 | | | | 0.37 | | | | 0.37 | | | | 0.37 | | | | 1.33 | | | | 319,163 | | | | 40 | |
12-31-09 | | | 7.94 | | | | 0.11 | • | | | 2.23 | | | | 2.34 | | | | 0.21 | | | | 0.07 | | | | — | | | | 0.28 | | | | — | | | | 10.00 | | | | 29.86 | | | | 0.37 | | | | 0.37 | | | | 0.37 | | | | 1.32 | | | | 260,130 | | | | 36 | |
12-31-08 | | | 13.75 | | | | 0.15 | • | | | (5.48 | ) | | | (5.33 | ) | | | 0.12 | | | | 0.36 | | | | — | | | | 0.48 | | | | — | | | | 7.94 | | | | (39.86 | ) | | | 0.37 | | | | 0.37 | | | | 0.37 | | | | 1.32 | | | | 156,122 | | | | 57 | |
12-31-07 | | | 13.06 | | | | 0.07 | | | | 0.68 | | | | 0.75 | | | | 0.03 | | | | 0.03 | | | | — | | | | 0.06 | | | | — | | | | 13.75 | | | | 5.79 | | | | 0.37 | | | | 0.37 | | | | 0.37 | | | | 0.54 | | | | 199,688 | | | | 39 | |
Class S2 | | | | | | | | | | | | | | | | | | | | | | | | | | | | | | | | | | | | | | | | | | | | | | | | | | | | | | | | | | | | | | | | | | | | |
12-31-11 | | | 11.24 | | | | 0.16 | • | | | (0.77 | ) | | | (0.61 | ) | | | 0.14 | | | | — | | | | — | | | | 0.14 | | | | — | | | | 10.49 | | | | (5.38 | ) | | | 0.62 | | | | 0.52 | | | | 0.52 | | | | 1.49 | | | | 19,318 | | | | 77 | |
12-31-10 | | | 9.89 | | | | 0.18 | • | | | 1.28 | | | | 1.46 | | | | 0.11 | | | | — | | | | — | | | | 0.11 | | | | — | | | | 11.24 | | | | 15.00 | | | | 0.62 | | | | 0.52 | | | | 0.52 | | | | 1.74 | | | | 14,341 | | | | 40 | |
05-28-09(6) - 12-31-09 | | | 8.33 | | | | 0.11 | • | | | 1.75 | | | | 1.86 | | | | 0.23 | | | | 0.07 | | | | — | | | | 0.30 | | | | — | | | | 9.89 | | | | 22.72 | | | | 0.62 | | | | 0.52 | | | | 0.52 | | | | 1.93 | | | | 4 | | | | 36 | |
Class T | | | | | | | | | | | | | | | | | | | | | | | | | | | | | | | | | | | | | | | | | | | | | | | | | | | | | | | | | | | | | | | | | | | | |
12-31-11 | | | 11.35 | | | | 0.11 | • | | | (0.75 | ) | | | (0.64 | ) | | | 0.08 | | | | — | | | | — | | | | 0.08 | | | | — | | | | 10.63 | | | | (5.63 | ) | | | 0.87 | | | | 0.82 | | | | 0.82 | | | | 0.98 | | | | 1,367 | | | | 77 | |
12-31-10 | | | 9.95 | | | | 0.09 | | | | 1.36 | | | | 1.45 | | | | 0.05 | | | | — | | | | — | | | | 0.05 | | | | — | | | | 11.35 | | | | 14.68 | | | | 0.87 | | | | 0.82 | | | | 0.82 | | | | 0.83 | | | | 2,329 | | | | 40 | |
12-31-09 | | | 7.88 | | | | 0.07 | | | | 2.21 | | | | 2.28 | | | | 0.14 | | | | 0.07 | | | | — | | | | 0.21 | | | | — | | | | 9.95 | | | | 29.26 | | | | 0.87 | | | | 0.82 | | | | 0.82 | | | | 0.80 | | | | 2,142 | | | | 36 | |
12-31-08 | | | 13.62 | | | | 0.10 | | | | (5.44 | ) | | | (5.34 | ) | | | 0.04 | | | | 0.36 | | | | — | | | | 0.40 | | | | — | | | | 7.88 | | | | (40.12 | ) | | | 0.87 | | | | 0.82 | | | | 0.82 | | | | 0.73 | | | | 1,712 | | | | 57 | |
12-31-07 | | | 12.97 | | | | 0.01 | | | | 0.67 | | | | 0.68 | | | | — | | | | 0.03 | | | | — | | | | 0.03 | | | | — | | | | 13.62 | | | | 5.27 | | | | 0.87 | | | | 0.82 | | | | 0.82 | | | | 0.06 | | | | 3,306 | | | | 39 | |
| | | | | | | | | | | | | | | | | |
ING Solution 2050 Portfolio | | | | | | | | | | | | | | | | | | | | | | | | | | | | | | | | | | | | | | | | | | | | | | | | | | | | | | | | | | | | | | | | | | | | |
Class ADV | | | | | | | | | | | | | | | | | | | | | | | | | | | | | | | | | | | | | | | | | | | | | | | | | | | | | | | | | | | | | | | | | | | | |
10-03-11(6) - 12-31-11 | | | 10.00 | | | | 0.06 | | | | 1.17 | | | | 1.23 | | | | — | | | | — | | | | — | | | | — | | | | — | | | | 11.23 | | | | 12.30 | | | | 0.62 | | | | 0.62 | | | | 0.62 | | | | 2.22 | | | | 3 | | | | 12 | |
Class I | | | | | | | | | | | | | | | | | | | | | | | | | | | | | | | | | | | | | | | | | | | | | | | | | | | | | | | | | | | | | | | | | | | | |
10-03-11(6) - 12-31-11 | | | 10.00 | | | | 0.07 | | | | 1.17 | | | | 1.24 | | | | — | | | | — | | | | — | | | | — | | | | — | | | | 11.24 | | | | 12.40 | | | | 0.12 | | | | 0.12 | | | | 0.12 | | | | 2.73 | | | | 3 | | | | 12 | |
Class S | | | | | | | | | | | | | | | | | | | | | | | | | | | | | | | | | | | | | | | | | | | | | | | | | | | | | | | | | | | | | | | | | | | | |
10-03-11(6) - 12-31-11 | | | 10.00 | | | | 0.06 | | | | 1.17 | | | | 1.23 | | | | — | | | | — | | | | — | | | | — | | | | — | | | | 11.23 | | | | 12.30 | | | | 0.37 | | | | 0.37 | | | | 0.37 | | | | 2.32 | | | | 3 | | | | 12 | |
Class S2 | | | | | | | | | | | | | | | | | | | | | | | | | | | | | | | | | | | | | | | | | | | | | | | | | | | | | | | | | | | | | | | | | | | | |
10-03-11(6) - 12-31-11 | | | 10.00 | | | | 0.06 | | | | 1.17 | | | | 1.23 | | | | — | | | | — | | | | — | | | | — | | | | — | | | | 11.23 | | | | 12.30 | | | | 0.62 | | | | 0.52 | | | | 0.52 | | | | 2.34 | | | | 3 | | | | 12 | |
Class T | | | | | | | | | | | | | | | | | | | | | | | | | | | | | | | | | | | | | | | | | | | | | | | | | | | | | | | | | | | | | | | | | | | | |
10-03-11(6) - 12-31-11 | | | 10.00 | | | | 0.05 | | | | 1.17 | | | | 1.22 | | | | — | | | | — | | | | — | | | | — | | | | — | | | | 11.22 | | | | 12.20 | | | | 0.87 | | | | 0.82 | | | | 0.82 | | | | 2.03 | | | | 3 | | | | 12 | |
| | | | | | | | | | | | | | | | | |
ING Solution 2055 Portfolio | | | | | | | | | | | | | | | | | | | | | | | | | | | | | | | | | | | | | | | | | | | | | | | | | | | | | | | | | | | | | | | | | | | | |
Class ADV | | | | | | | | | | | | | | | | | | | | | | | | | | | | | | | | | | | | | | | | | | | | | | | | | | | | | | | | | | | | | | | | | | | | |
12-31-11 | | | 11.34 | | | | 0.17 | • | | | (0.79 | ) | | | (0.62 | ) | | | 0.03 | | | | 0.03 | | | | — | | | | 0.06 | | | | — | | | | 10.66 | | | | (5.45 | ) | | | 0.62 | | | | 0.62 | | | | 0.62 | | | | 1.58 | | | | 11,461 | | | | 81 | |
03-08-10(6) - 12-31-10 | | | 10.02 | | | | 0.15 | • | | | 1.17 | | | | 1.32 | | | | — | | | | — | | | | — | | | | — | | | | — | | | | 11.34 | | | | 13.17 | | | | 0.62 | | | | 0.62 | | | | 0.62 | | | | 1.72 | | | | 3,923 | | | | 33 | |
Class I | | | | | | | | | | | | | | | | | | | | | | | | | | | | | | | | | | | | | | | | | | | | | | | | | | | | | | | | | | | | | | | | | | | | |
12-31-11 | | | 11.37 | | | | 0.24 | • | | | (0.80 | ) | | | (0.56 | ) | | | 0.04 | | | | 0.03 | | | | — | | | | 0.07 | | | | — | | | | 10.74 | | | | (4.91 | ) | | | 0.12 | | | | 0.12 | | | | 0.12 | | | | 2.16 | | | | 4,746 | | | | 81 | |
03-08-10(6) - 12-31-10 | | | 10.02 | | | | 0.18 | • | | | 1.17 | | | | 1.35 | | | | — | | | | — | | | | — | | | | — | | | | — | | | | 11.37 | | | | 13.47 | | | | 0.12 | | | | 0.12 | | | | 0.12 | | | | 2.11 | | | | 1,648 | | | | 33 | |
See Accompanying Notes to Financial Statements
48
FINANCIAL HIGHLIGHTS (CONTINUED)
Selected data for a share of beneficial interest outstanding throughout each year or period.
| | | | | | | | | | | | | | | | | | | | | | | | | | | | | | | | | | | | | | | | | | | | | | | | | | | | | | | | | | | | | | | | | | | | |
| | | | | | Income (loss)
from
investment
operations | | | | | | Less distributions | | | | | | | | | | | | | | | Ratios to average net assets | | | Supplemental
data | |
| | | | | | | | | | | | | | | | | | | | | | | | | | | | | | | | | | | | | | | | | | | | | | | | | | | | |
| | | Net asset value, beginning of year or period | | | Net investment income (loss) | | | Net realized and unrealized gain (loss) | | | Total from investment operations | | | From net investment income | | | From net realized gains | | | From return of capital | | | Total distributions | | | Payment by affiliate | | | Net asset value, end of year or period | | | Total Return(1) | | | Expenses before reductions/additions(2)(3)(4)(5) | | | Expenses net of fee waivers and/or recoupments if any(2)(3)(4)(5) | | | Expense net of all reductions/additions(2)(3)(4)(5) | | | Net investment income (loss)(2)(4)(5) | | | Net assets, end of year or period | | | Portfolio turnover rate | |
| | | | | | | | | | | | | | | | | | | | | | | | | | | | | | | | | | | | | | | | | | | | | | | | | | | | | | | | | | | | | | | | | | | | |
Year or period ended | | ($) | | | ($) | | | ($) | | | ($) | | | ($) | | | ($) | | | ($) | | | ($) | | | ($) | | | ($) | | | (%) | | | (%) | | | (%) | | | (%) | | | (%) | | | ($000’s) | | | (%) | |
ING Solution 2055 Portfolio (Continued) | | | | | | | | | | | | | | | | | | | | | | | | | | | | | | | | | | | | | | | | | | | | | | | | | | | | | | | | | | | | | | | | | | | | |
Class S | | | | | | | | | | | | | | | | | | | | | | | | | | | | | | | | | | | | | | | | | | | | | | | | | | | | | | | | | | | | | | | | | | | | |
12-31-11 | | | 11.35 | | | | 0.20 | • | | | (0.78 | ) | | | (0.58 | ) | | | 0.04 | | | | 0.03 | | | | — | | | | 0.07 | | | | — | | | | 10.70 | | | | (5.13 | ) | | | 0.37 | | | | 0.37 | | | | 0.37 | | | | 1.77 | | | | 10,061 | | | | 81 | |
03-08-10(6) - 12-31-10 | | | 10.02 | | | | 0.15 | • | | | 1.18 | | | | 1.33 | | | | — | | | | — | | | | — | | | | — | | | | — | | | | 11.35 | | | | 13.27 | | | | 0.37 | | | | 0.37 | | | | 0.37 | | | | 1.80 | | | | 4,717 | | | | 33 | |
Class S2 | | | | | | | | | | | | | | | | | | | | | | | | | | | | | | | | | | | | | | | | | | | | | | | | | | | | | | | | | | | | | | | | | | | | |
12-31-11 | | | 11.34 | | | | 0.19 | • | | | (0.79 | ) | | | (0.60 | ) | | | 0.03 | | | | 0.03 | | | | — | | | | 0.06 | | | | — | | | | 10.68 | | | | (5.26 | ) | | | 0.62 | | | | 0.52 | | | | 0.52 | | | | 1.73 | | | | 745 | | | | 81 | |
03-08-10(6) - 12-31-10 | | | 10.02 | | | | 0.15 | • | | | 1.17 | | | | 1.32 | | | | — | | | | — | | | | — | | | | — | | | | — | | | | 11.34 | | | | 13.17 | | | | 0.62 | | | | 0.52 | | | | 0.52 | | | | 1.73 | | | | 275 | | | | 33 | |
Class T | | | | | | | | | | | | | | | | | | | | | | | | | | | | | | | | | | | | | | | | | | | | | | | | | | | | | | | | | | | | | | | | | | | | |
12-31-11 | | | 11.31 | | | | 0.11 | | | | (0.74 | ) | | | (0.63 | ) | | | 0.00 | * | | | 0.03 | | | | — | | | | 0.03 | | | | — | | | | 10.65 | | | | (5.56 | ) | | | 0.87 | | | | 0.82 | | | | 0.82 | | | | 0.94 | | | | 7 | | | | 81 | |
03-08-10(6) - 12-31-10 | | | 10.02 | | | | 0.09 | | | | 1.20 | | | | 1.29 | | | | — | | | | — | | | | — | | | | — | | | | — | | | | 11.31 | | | | 12.87 | | | | 0.87 | | | | 0.82 | | | | 0.82 | | | | 1.08 | | | | 6 | | | | 33 | |
| (1) | Total return is calculated assuming reinvestment of all dividends, capital gain distributions and return of capital distributions, if any, at net asset value and does not reflect the effect of insurance contract charges. Total return for periods less than one year is not annualized. |
| (2) | Annualized for periods less than one year. |
| (3) | Expense ratios do not include fees and expenses charged under the variable annuity contract or variable life insurance policy. |
| (4) | Expense ratios reflect operating expenses of a Portfolio. Expenses before reductions/additions do not reflect amounts reimbursed by an Investment Adviser and/or Distributor or reductions from brokerage service arrangements or other expense offset arrangements and do not represent the amount paid by a Portfolio during periods when reimbursements or reductions occur. Expenses net of fee waivers reflect expenses after reimbursement by an Investment Adviser and/or Distributor but prior to reductions from brokerage service arrangements or other expense offset arrangements. Expenses net of all reductions/additions represent the net expenses paid by a Portfolio. Net investment income (loss) is net of all such additions or reductions. |
| (5) | Expense ratios do not include expenses of underlying funds and do not include fees and expenses charged under the variable annuity contract or variable life insurance policy. |
| (6) | Commencement of operations. |
| • | Calculated using average number of shares outstanding throughout the period. |
| * | Amount is less than $0.005 or 0.005% or more than $(0.005) or (0.005)%. |
See Accompanying Notes to Financial Statements
49
NOTES TO FINANCIAL STATEMENTSASOF DECEMBER 31, 2011
NOTE 1 — ORGANIZATION
Organization. ING Partners, Inc. (the “Company”) is an open-end management investment company registered under the Investment Company Act of 1940, as amended (the “1940 Act”). It was incorporated under the laws of Maryland on May 7, 1997. The Articles of Incorporation permit the Company to offer separate series, each of which has its own investment objective, policies and restrictions. The Company currently consists of forty-three active separate investment series. The fourteen Portfolios included in this report are: ING Solution Aggressive Growth Portfolio (“Solution Aggressive Growth”), ING Solution Conservative Portfolio (“Solution Conservative”), ING Solution Growth Portfolio (“Solution Growth”), ING Solution Income Portfolio (“Solution Income”), ING Solution Moderate Portfolio (“Solution Moderate”), ING Solution 2015 Portfolio (“Solution 2015”), ING Solution 2020 Portfolio (“Solution 2020”), ING Solution 2025 Portfolio (“Solution 2025”), ING Solution 2030 Portfolio (“Solution 2030”), ING Solution 2035 Portfolio (“Solution 2035”), ING Solution 2040 Portfolio (“Solution 2040”), ING Solution 2045 Portfolio (“Solution 2045”), ING Solution 2050 Portfolio (“Solution 2050”) and ING Solution 2055 Portfolio (“Solution 2055”) (each, a “Portfolio” and collectively, the “Portfolios”). With the exception of Solution Aggressive Growth, Solution Conservative, Solution Growth, Solution Income and Solution Moderate, each Portfolio is structured and managed around a specific target retirement or financial goal date (“Target Date”). When Solution 2015, 2020, 2025, 2030, 2035, 2040, 2045, 2050 and 2055 Portfolios reach their respective Target Date, they may be combined with the Solution Income Portfolio, without a vote of shareholders, if approved by the Board of Directors (the “Board”). The Portfolios serve as an investment option in underlying variable insurance products offered by Directed Services LLC.
The Portfolios offer at least four of the following five classes: Adviser Class (“Class ADV”), Initial Class (“Class I”), Service Class (“Class S”), Service 2 Class (“Class S2”) and Class T. Each class has equal rights as to class and voting privileges. The classes differ principally in the applicable distribution and shareholder service fees. Shareholders of each class also bear certain expenses that pertain to that particular class. All shareholders bear the common expenses of the Portfolios and earn income and realized gains/losses from the Portfolios pro rata based on the average daily net assets of each class, without distinction between share classes. Expenses that are specific to a Portfolio or a class are charged
directly to that Portfolio or class. Other operating expenses shared by several Portfolios are generally allocated among those Portfolios based on average net assets. Distributions are determined separately for each class based on income and expenses allocable to each class. Realized gain distributions are allocated to each class pro rata based on the shares outstanding of each class on the date of distribution. Differences in per share dividend rates generally result from differences in separate class expenses, including distribution and shareholder service fees, if applicable.
Directed Services LLC serves as the investment adviser (“DSL” or the “Investment Adviser”) to the Portfolios. ING Investment Management Co. LLC serves as the consultant (“IIM” or the “Consultant”) to the Investment Adviser. ING Funds Services, LLC serves as the administrator (“IFS” or the “Administrator”) for the Portfolios. ING Investments Distributor, LLC (“IID” or the “Distributor”) serves as the principal underwriter to the Portfolios.
The Investment Adviser, the Consultant, IFS and IID are indirect, wholly-owned subsidiaries of ING Groep N.V. (“ING Groep”). ING Groep is a global financial institution of Dutch origin offering banking, investments, life insurance and retirement services.
ING Groep has adopted a formal restructuring plan that was approved by the European Commission in November 2009 under which the ING life insurance businesses, including the retirement services and investment management businesses, which include the Investment Adviser and its affiliates, would be separated from ING Groep by the end of 2013. To achieve this goal, ING Groep announced in November 2010 that it plans to pursue two separate initial public offerings: one a U.S. focused offering that would include U.S. based insurance, retirement services, and investment management operations; and the other a European based offering for European and Asian based insurance and investment management operations. ING Groep recently announced that it will explore options other than an initial public offering for its Asian insurance and investment management businesses. There can be no assurance that the restructuring plan will be carried out through two offerings or at all.
The restructuring plan and the uncertainty about its implementation, whether implemented through the planned public offerings or through other means, in whole or in part, may be disruptive to the businesses of ING entities, including the ING entities that service the Portfolios, and may cause, among other things, interruption or reduction of business and services,
50
NOTES TO FINANCIAL STATEMENTSASOF DECEMBER 31, 2011 (CONTINUED)
NOTE 1 — ORGANIZATION (continued)
diversion of management’s attention from day-to-day operations, and loss of key employees or customers. A failure to complete the offerings or other means of implementation on favorable terms could have a material adverse impact on the operations of the businesses subject to the restructuring plan. The restructuring plan may result in the Investment Adviser’s loss of access to services and resources of ING Groep, which could adversely affect their businesses and profitability. In addition, the divestment of ING businesses, including the Investment Adviser, may potentially be deemed a “change of control” of the entity. A change of control would result in the termination of the Portfolios’ advisory agreement, which would trigger the necessity for new agreements that would require approval of the Board, and may trigger the need for shareholder approval. Currently, the Investment Adviser does not anticipate that the restructuring will have a material adverse impact on the Portfolios or their operations and administration.
Each Portfolio seeks to achieve its investment objective by investing in other ING Funds (“Underlying Funds”) and uses asset allocation strategies to determine how much to invest in the Underlying Funds.
NOTE 2 — SIGNIFICANT ACCOUNTING POLICIES
The following significant accounting policies are consistently followed by the Portfolios in the preparation of their financial statements. Such policies are in conformity with U.S. generally accepted accounting principles (“GAAP”) for investment companies.
A. Security Valuation. All investments in securities are recorded at their estimated fair value, as described below. The valuation of each Portfolio’s investments in its Underlying Funds is based on the net asset values of the Underlying Funds each business day.
Fair value is defined as the price that the Portfolios would receive to sell an asset or pay to transfer a liability in an orderly transaction between market participants at the measurement date. Each investment asset or liability of the Portfolios is assigned a level at measurement date based on the significance and source of the inputs to its valuation. Quoted prices in active markets for identical securities are classified as “Level 1,” inputs other than quoted prices for an asset or liability that are observable are classified as “Level 2” and unobservable inputs, including the investment adviser’s judgment about the assumptions that a market participant would use in pricing an asset or
liability are classified as “Level 3.” The inputs used for valuing securities are not necessarily an indication of the risks associated with investing in those securities. Short-term securities of sufficient credit quality which are valued at amortized cost, which approximates fair value, are generally considered to be Level 2 securities under applicable accounting rules. The Portfolios classify each of their investments in the Underlying Funds as Level 1, without consideration as to the classification level of the specific investments held by the Underlying Funds. A table summarizing the Portfolios’ investments under these levels of classification is included following each Portfolio’s Portfolio of Investments. For the year ended December 31, 2011, there have been no significant changes to the fair valuation methodologies.
B. Security Transactions and Revenue Recognition. Security transactions are accounted for on the trade date. Dividend income received from the affiliated funds is recognized on the ex-dividend date and is recorded as income distributions in the Statements of Operations. Capital gain distributions received from the affiliated funds are recognized on the ex-dividend date and are recorded on the Statements of Operations as such. Costs used in determining realized gains and losses on the sales of investment securities are on the basis of specific identification.
C. Distributions to Shareholders. The Portfolios record distributions to their shareholders on the ex-dividend date. Each Portfolio distributes dividends and capital gains, if any, annually. The Portfolios may make distributions on a more frequent basis to comply with the distribution requirements of the Internal Revenue Code. The characteristics of income and gains to be distributed are determined in accordance with income tax regulations, which may differ from U.S. generally accepted accounting principles for investment companies.
D. Federal Income Taxes. It is the policy of each Portfolio to comply with the requirements of subchapter M of the Internal Revenue Code that are applicable to regulated investment companies and to distribute substantially all of its net investment income and any net realized capital gains to its shareholders. Therefore, a federal income tax or excise tax provision is not required. Management has considered the sustainability of the Portfolios’ tax positions taken on federal income tax returns for all open tax years in making this determination. No capital gain distributions shall be made until the capital loss carryforwards have been fully utilized or expire.
51
NOTES TO FINANCIAL STATEMENTSASOF DECEMBER 31, 2011 (CONTINUED)
NOTE 2 — SIGNIFICANT ACCOUNTING POLICIES (continued)
E. Use of Estimates. The preparation of financial statements in conformity with U.S. generally accepted accounting principles requires management to make estimates and assumptions that affect the reported amounts of assets and liabilities and disclosure of contingent assets and liabilities at the date of the financial statements and the reported amounts of increases and decreases in net assets from operations during the reporting period. Actual results could differ from those estimates.
F. Indemnifications. In the normal course of business, the Company may enter into contracts that provide certain indemnifications. The Company’s maximum exposure under these arrangements is dependent on future claims that may be made against the Portfolios and, therefore, cannot be estimated; however, based on experience, management considers the risk of loss from such claims remote.
NOTE 3 — INVESTMENT ADVISER AND ADMINISTRATIVE SERVICE FEES
The Portfolios entered into an investment management agreement with the Investment Adviser. For its services, each Portfolio pays the Investment Adviser a monthly fee in arrears equal to 0.10% of each Portfolio’s average daily net assets.
DSL pays the Consultant a consulting fee of 0.030% of the first $500 million, 0.025% of the next $500 million, 0.020% of the next $1 billion and 0.010% of amounts over $2 billion based on each Portfolio’s average daily net assets.
The Consultant will provide tactical allocation recommendations to the Investment Adviser. The Investment Adviser has set up an Investment Committee made up of a team of professionals to consider, review and implement the recommendations of the Consultant, and will retain discretion over implementation of the Consultant’s recommendations. The Consultant will provide ongoing recommendations to the Investment Committee of the Investment Adviser quarterly or as warranted by market conditions.
Under an Administrative Services Agreement between the Portfolios and IFS, IFS provides all administrative services necessary for the Portfolios’ operations and is responsible for the supervision of the Portfolios’ other service providers. IFS also assumes all ordinary recurring direct costs of the Portfolios, such as custodian fees, director fees, transfer agency fees and accounting fees.
As compensation for these services, IFS receives a monthly fee from each portfolio at an annual rate of 0.02% based on the average daily net assets of each Portfolio.
NOTE 4 — INVESTMENTS IN AFFILIATED UNDERLYING FUNDS
For the year ended December 31, 2011, the cost of purchases and the proceeds from sales of the Underlying Funds were as follows:
| | | | | | | | |
| | | Purchases | | | Sales | |
Solution Aggressive Growth | | $ | 18,168,925 | | | $ | 8,590,985 | |
Solution Conservative | | | 12,687,894 | | | | 5,944,337 | |
Solution Growth | | | 33,170,261 | | | | 13,158,613 | |
Solution Income | | | 171,749,647 | | | | 182,295,617 | |
Solution Moderate | | | 34,445,064 | | | | 13,980,477 | |
Solution 2015 | | | 592,700,570 | | | | 627,210,334 | |
Solution 2020 | | | 17,675 | | | | 2,491 | |
Solution 2025 | | | 900,123,820 | | | | 898,719,890 | |
Solution 2030 | | | 16,980 | | | | 1,805 | |
Solution 2035 | | | 761,379,863 | | | | 757,692,911 | |
Solution 2040 | | | 16,861 | | | | 1,705 | |
Solution 2045 | | | 540,089,417 | | | | 528,912,367 | |
Solution 2050 | | | 17,183 | | | | 2,029 | |
Solution 2055 | | | 34,258,284 | | | | 16,088,226 | |
NOTE 5 — DISTRIBUTION AND SERVICE FEES
Class ADV, Class S2 and Class T of the Portfolios have adopted a plan of Distribution pursuant to Rule 12b-1 under the 1940 Act (the “Rule 12b-1 Plans”), whereby IID is reimbursed or compensated by the Portfolios for expenses incurred in the distribution of each Portfolio’s shares (“Distribution Fees”). The Distributor may pay, on behalf of each Portfolio, out of its distribution fee, compensation to certain financial institutions for providing distribution assistance pursuant to a Distribution Services Agreement. Under the Rule 12b-1 Plans, each Portfolio makes payments to IID at an annual rate of 0.25%, 0.25% and 0.50% of each Portfolio’s average daily net assets attributable to its Class ADV, Class S2 and Class T shares, respectively. The Distributor has contractually agreed to waive a portion of its fee equal to 0.10% of each Portfolio’s average daily net assets attributable to the distribution fee paid by Class S2 shares, so that the actual fee paid is an annual rate of 0.15%. The expense waiver will continue through at least May 1, 2012 for Solution Aggressive Growth, Solution Conservative, Solution Growth, Solution Income, Solution Moderate, Solution 2015, Solution 2025, Solution 2035, Solution 2045 and Solution 2055 and through at least May 1, 2013 for Solution 2020, Solution 2030, Solution 2040 and Solution 2050. The Distributor has contractually agreed
52
NOTES TO FINANCIAL STATEMENTSASOF DECEMBER 31, 2011 (CONTINUED)
NOTE 5 — DISTRIBUTION AND SERVICE FEES (continued)
to waive a portion of this fee equal to 0.05% of each Portfolio’s average daily net assets attributable to the distribution fee paid by Class T shares, so that the actual fee paid is an annual rate of 0.45%. The expense waiver will continue through at least May 1, 2012 for Solution Aggressive Growth, Solution Conservative, Solution Growth, Solution Income, Solution Moderate, Solution 2015, Solution 2025, Solution 2035, Solution 2045 and Solution 2055 and through at least May 1, 2013 for Solution 2020, Solution 2030, Solution 2040 and Solution 2050.
The Company has also adopted a Shareholder Servicing Plan (“Service Plan”) for the Classes ADV, S, S2 and T shares of each Portfolio. The Service Plan allows the Distributor to enter into shareholder servicing agreements with insurance companies, broker dealers or other financial intermediaries that provide administrative services related to Classes ADV, S, S2 and T shares and their shareholders including Variable Contract owners or Qualified Plan participants with interests in the Portfolios. Under the Service Plan, each Portfolio makes payments to IID which shall not exceed an annual rate of 0.25% of each Portfolio’s average daily net assets attributable to its Classes ADV, S, S2 and T shares.
NOTE 6 — OTHER TRANSACTIONS WITH AFFILIATES AND RELATED PARTIES
At December 31, 2011, the Portfolios had the following amounts recorded as payable to affiliates on the accompanying Statements of Assets and Liabilities (see Notes 3 and 5):
| | | | | | | | | | | | | | | | |
Portfolio | | Accrued Investment
Management Fees | | | Accrued Administrative Fees | | | Accrued Shareholder Service and Distribution Fees | | | Total | |
Solution Aggressive Growth | | $ | 1,185 | | | $ | 237 | | | $ | 4,877 | | | $ | 6,299 | |
Solution Conservative | | | 738 | | | | 148 | | | | 3,165 | | | | 4,051 | |
Solution Growth | | | 2,190 | | | | 438 | | | | 8,740 | | | | 11,368 | |
Solution Income | | | 18,488 | | | | 3,697 | | | | 65,148 | | | | 87,333 | |
Solution Moderate | | | 2,258 | | | | 452 | | | | 8,483 | | | | 11,193 | |
Solution 2015 | | | 63,689 | | | | 12,737 | | | | 212,096 | | | | 288,522 | |
Solution 2020 | | | 1 | | | | 0 | | | | 5 | | | | 6 | |
Solution 2025 | | | 101,275 | | | | 20,253 | | | | 332,337 | | | | 453,865 | |
Solution 2030 | | | 2 | | | | 0 | | | | 5 | | | | 7 | |
Solution 2035 | | | 85,498 | | | | 17,098 | | | | 278,009 | | | | 380,605 | |
Solution 2040 | | | 2 | | | | 0 | | | | 5 | | | | 7 | |
Solution 2045 | | | 55,305 | | | | 11,060 | | | | 170,147 | | | | 236,512 | |
Solution 2050 | | | 2 | | | | 0 | | | | 5 | | | | 7 | |
Solution 2055 | | | 2,226 | | | | 445 | | | | 7,077 | | | | 9,748 | |
The Company has adopted a Deferred Compensation Plan (the “Plan”), which allows eligible non-affiliated directors as described in the Plan to defer the receipt of all or a portion of the directors fees payable. Amounts deferred are treated as though invested in various “notional” funds advised by DSL until distribution in accordance with the Plan.
At December 31, 2011, the following indirect, wholly-owned subsidiaries of ING Groep owned more than 5% of the following Portfolios:
ING Life Insurance and Annuity Company — Solution Aggressive Growth (99.72%); Solution Conservative (94.69%); Solution Growth (96.97%); Solution Income (68.69%); Solution Moderate (96.28%); Solution 2015 (77.78%); Solution 2025 (76.91%); Solution 2035 (78.90%); Solution 2045 (81.46%); and Solution 2055 (81.34%).
ING National Trust — Solution Conservative (5.28%); Solution Income (26.82%); Solution 2015 (18.88%); Solution 2025 (20.30%); Solution 2035 (19.24%); Solution 2045 (17.66%); and Solution 2055 (18.65%).
Reliastar Life Insurance Company — Solution 2020 (99.67%); Solution 2030 (99.67%); Solution 2040 (99.67%); Solution 2050 (99.67%).
Control is defined by the 1940 Act as the beneficial ownership, either directly or through one or more controlled companies, of more than 25% of the voting securities of a company. The 1940 Act defines affiliates as companies that are under common control. Therefore, because the Portfolios have a common owner that owns over 25% of the outstanding securities of the Portfolios, they may be deemed to be affiliates of each other. Investment activities of these shareholders could have a material impact on the Portfolios.
53
NOTES TO FINANCIAL STATEMENTSASOF DECEMBER 31, 2011 (CONTINUED)
NOTE 7 — EXPENSE LIMITATION AGREEMENT
The Investment Adviser has agreed to limit expenses, excluding interest, taxes, brokerage commissions and extraordinary expenses to the levels listed below:
| | | | | | | | | | | | | | | | | | | | |
Portfolio(1) | | Class ADV | | | Class I | | | Class S | | | Class S2 | | | Class T | |
Solution Aggressive Growth | | | 0.62 | % | | | 0.12 | % | | | 0.37 | % | | | 0.52 | % | | | N/A | |
Solution Conservative | | | 0.62 | % | | | 0.12 | % | | | 0.37 | % | | | 0.52 | % | | | N/A | |
Solution Growth | | | 0.62 | % | | | 0.12 | % | | | 0.37 | % | | | 0.52 | % | | | N/A | |
Solution Income | | | 0.62 | % | | | 0.12 | % | | | 0.37 | % | | | 0.52 | % | | | 0.82 | % |
Solution Moderate | | | 0.62 | % | | | 0.12 | % | | | 0.37 | % | | | 0.52 | % | | | N/A | |
Solution 2015 | | | 0.62 | % | | | 0.12 | % | | | 0.37 | % | | | 0.52 | % | | | 0.82 | % |
Solution 2020 | | | 0.62 | % | | | 0.12 | % | | | 0.37 | % | | | 0.52 | % | | | 0.82 | % |
Solution 2025 | | | 0.62 | % | | | 0.12 | % | | | 0.37 | % | | | 0.52 | % | | | 0.82 | % |
Solution 2030 | | | 0.62 | % | | | 0.12 | % | | | 0.37 | % | | | 0.52 | % | | | 0.82 | % |
Solution 2035 | | | 0.62 | % | | | 0.12 | % | | | 0.37 | % | | | 0.52 | % | | | 0.82 | % |
Solution 2040 | | | 0.62 | % | | | 0.12 | % | | | 0.37 | % | | | 0.52 | % | | | 0.82 | % |
Solution 2045 | | | 0.62 | % | | | 0.12 | % | | | 0.37 | % | | | 0.52 | % | | | 0.82 | % |
Solution 2050 | | | 0.62 | % | | | 0.12 | % | | | 0.37 | % | | | 0.52 | % | | | 0.82 | % |
Solution 2055 | | | 0.62 | % | | | 0.12 | % | | | 0.37 | % | | | 0.52 | % | | | 0.82 | % |
| (1) | The operating expense limits apply only at the Portfolio level and do not limit the fees payable by the underlying investment companies in which the Portfolios invest. The amount of fees and expenses of an Underlying Fund borne by each Portfolio will vary based on each Portfolio’s allocation of assets to, and the net expenses of, a particular Underlying Fund. |
The Investment Adviser may at a later date recoup from a Portfolio management fees waived and other expenses assumed by the Investment Adviser during the previous 36 months, but only if, after such recoupment, the Portfolio’s expense ratio does not exceed the percentage described above. Waived and reimbursed fees and any recoupment by the Investment Adviser of such waived and reimbursed fees are reflected on the accompanying Statements of Operations for each Portfolio.
As of December 31, 2011, the Portfolios did not have any waived or reimbursed fees subject to recoupment.
Outstanding reimbursement balances due to the Portfolios, if any, under their respective expense limitation agreements are reflected in Reimbursement Due from manager on the accompanying Statements of Assets and Liabilities.
The expense limitation agreement is contractual and shall renew automatically for one-year terms unless the Investment Adviser provides written notice of the termination of the expense limitation agreement within 90 days of the end of the then current term.
NOTE 8 — CAPITAL SHARES
Transactions in capital shares and dollars were as follows:
| | | | | | | | | | | | | | | | | | | | | | | | | | | | | | | | | | | | | | | | | | |
Year or period ended | | Shares
sold | | | Shares
issued in
merger | | | Reinvestment
of
distributions | | | Shares
redeemed | | | Net increase
(decrease) in
shares
outstanding | | | | | Shares
sold | | | Proceeds
from shares
issued in
merger | | | Reinvestment
of
distributions | | | Shares
redeemed | | | Net increase
(decrease) | |
| | # | | | # | | | # | | | # | | | # | | | | | ($) | | | ($) | | | ($) | | | ($) | | | ($) | |
Solution Aggressive Growth | | | | | | | | | | | | | | | | | | | | | | | | | | | |
Class ADV | | | | | | | | | | | | | | | | | | | | | | | | | | | | | | | | | | | | | | | | | | |
12/31/2011 | | | 583,117 | | | | — | | | | 4,514 | | | | (87,695 | ) | | | 499,936 | | | | | | 6,273,930 | | | | — | | | | 43,428 | | | | (930,023 | ) | | | 5,387,335 | |
4/30/2010(1) - 12/31/2010 | | | 448,990 | | | | — | | | | — | | | | (19,484 | ) | | | 429,506 | | | | | | 4,658,208 | | | | — | | | | — | | | | (205,363 | ) | | | 4,452,845 | |
Class I | | | | | | | | | | | | | | | | | | | | | | | | | | | | | | | | | | | | | | | | | | |
12/31/2011 | | | — | | | | — | | | | — | | | | — | | | | — | | | | | | — | | | | — | | | | — | | | | — | | | | — | |
4/30/2010(1) - 12/31/2010 | | | 301 | | | | — | | | | — | | | | — | | | | 301 | | | | | | 3,010 | | | | — | | | | — | | | | — | | | | 3,010 | |
Class S | | | | | | | | | | | | | | | | | | | | | | | | | | | | | | | | | | | | | | | | | | |
12/31/2011 | | | 433,197 | | | | — | | | | 2,219 | | | | (44,789 | ) | | | 390,627 | | | | | | 4,612,710 | | | | — | | | | 21,413 | | | | (481,853 | ) | | | 4,152,270 | |
4/30/2010(1) - 12/31/2010 | | | 137,087 | | | | — | | | | — | | | | (5,334 | ) | | | 131,753 | | | | | | 1,388,032 | | | | — | | | | — | | | | (56,057 | ) | | | 1,331,975 | |
Class S2 | | | | | | | | | | | | | | | | | | | | | | | | | | | | | | | | | | | | | | | | | | |
12/31/2011 | | | 45,591 | | | | — | | | | 15 | | | | (54,719 | ) | | | (9,113 | ) | | | | | 501,245 | | | | — | | | | 144 | | | | (607,021 | ) | | | (105,632 | ) |
4/30/2010(1) - 12/31/2010 | | | 12,972 | | | | — | | | | — | | | | (300 | ) | | | 12,672 | | | | | | 128,787 | | | | — | | | | — | | | | (3,072 | ) | | | 125,715 | |
Solution Conservative | | | | | | | | | | | | | | | | | | | | | | | | | | | |
Class ADV | | | | | | | | | | | | | | | | | | | | | | | | | | | | | | | | | | | | | | | | | | |
12/31/2011 | | | 532,013 | | | | — | | | | 3,447 | | | | (103,503 | ) | | | 431,957 | | | | | | 5,663,951 | | | | — | | | | 34,986 | | | | (1,111,163 | ) | | | 4,587,774 | |
4/30/2010(1) - 12/31/2010 | | | 192,046 | | | | — | | | | — | | | | (10,514 | ) | | | 181,892 | | | | | | 1,990,136 | | | | — | | | | — | | | | (105,598 | ) | | | 1,884,538 | |
54
NOTES TO FINANCIAL STATEMENTSASOF DECEMBER 31, 2011 (CONTINUED)
NOTE 8 — CAPITAL SHARES (continued)
| | | | | | | | | | | | | | | | | | | | | | | | | | | | | | | | | | | | | | | | | | |
Year or period ended | | Shares
sold | | | Shares
issued in
merger | | | Reinvestment
of
distributions | | | Shares
redeemed | | | Net increase
(decrease) in
shares
outstanding | | | | | Shares
sold | | | Proceeds
from shares
issued in
merger | | | Reinvestment
of
distributions | | | Shares
redeemed | | | Net increase
(decrease) | |
| | # | | | # | | | # | | | # | | | # | | | | | ($) | | | ($) | | | ($) | | | ($) | | | ($) | |
Solution Conservative (continued) | | | | | | | | | | | | | | | | | | | | | | | | | | | |
Class I | | | | | | | | | | | | | | | | | | | | | | | | | | | | | | | | | | | | | | | | | | |
12/31/2011 | | | — | | | | — | | | | — | | | | — | | | | — | | | | | | — | | | | — | | | | — | | | | — | | | | — | |
4/30/2010(1) - 12/31/2010 | | | 127,851 | | | | — | | | | — | | | | (23,576 | ) | | | 104,275 | | | | | | 1,313,367 | | | | — | | | | — | | | | (246,410 | ) | | | 1,066,957 | |
Class S | | | | | | | | | | | | | | | | | | | | | | | | | | | | | | | | | | | | | | | | | | |
12/31/2011 | | | 234,758 | | | | — | | | | 1,451 | | | | (60,127 | ) | | | 176,082 | | | | | | 2,504,049 | | | | — | | | | 14,787 | | | | (636,648 | ) | | | 1,882,188 | |
4/30/2010(1) - 12/31/2010 | | | 301 | | | | — | | | | — | | | | — | | | | 301 | | | | | | 3,010 | | | | — | | | | — | | | | — | | | | 3,010 | |
Class S2 | | | | | | | | | | | | | | | | | | | | | | | | | | | | | | | | | | | | | | | | | | |
12/31/2011 | | | 13,048 | | | | — | | | | 69 | | | | (7,609 | ) | | | 5,508 | | | | | | 141,839 | | | | — | | | | 708 | | | | (81,566 | ) | | | 60,981 | |
4/30/2010(1) - 12/31/2010 | | | 7,702 | | | | — | | | | — | | | | (1,582 | ) | | | 6,120 | | | | | | 80,119 | | | | — | | | | — | | | | (16,376 | ) | | | 63,743 | |
Solution Growth | | | | | | | | | | | | | | | | | | | | | | | | | | | |
Class ADV | | | | | | | | | | | | | | | | | | | | | | | | | | | | | | | | | | | | | | | | | | |
12/31/2011 | | | 1,424,159 | | | | — | | | | 11,312 | | | | (147,016 | ) | | | 1,288,455 | | | | | | 13,112,751 | | | | — | | | | 94,455 | | | | (1,344,967 | ) | | | 11,862,239 | |
12/31/2010 | | | 535,887 | | | | — | | | | — | | | | (8,069 | ) | | | 527,818 | | | | | | 4,732,134 | | | | — | | | | — | | | | (72,017 | ) | | | 4,660,117 | |
Class I | | | | | | | | | | | | | | | | | | | | | | | | | | | | | | | | | | | | | | | | | | |
12/31/2011 | | | — | | | | — | | | | — | | | | — | | | | — | | | | | | — | | | | — | | | | — | | | | — | | | | — | |
12/31/2010 | | | 445,258 | | | | — | | | | 1,299 | | | | (23,095 | ) | | | 423,462 | | | | | | 3,854,100 | | | | — | | | | 10,571 | | | | (203,134 | ) | | | 3,661,537 | |
Class S | | | | | | | | | | | | | | | | | | | | | | | | | | | | | | | | | | | | | | | | | | |
12/31/2011 | | | 917,722 | | | | — | | | | 7,436 | | | | (87,911 | ) | | | 837,247 | | | | | | 8,409,723 | | | | — | | | | 62,608 | | | | (798,034 | ) | | | 7,674,297 | |
12/31/2010 | | | — | | | | — | | | | — | | | | — | | | | — | | | | | | — | | | | — | | | | — | | | | — | | | | — | |
Class S2 | | | | | | | | | | | | | | | | | | | | | | | | | | | | | | | | | | | | | | | | | | |
12/31/2011 | | | 37,687 | | | | — | | | | 342 | | | | (23,015 | ) | | | 15,014 | | | | | | 352,768 | | | | — | | | | 2,867 | | | | (217,043 | ) | | | 138,592 | |
4/30/2010(1) - 12/31/2010 | | | 32,036 | | | | — | | | | — | | | | (349 | ) | | | 31,687 | | | | | | 275,544 | | | | — | | | | — | | | | (3,050 | ) | | | 272,494 | |
Solution Income | | | | | | | | | | | | | | | | | | | | | | | | | | | |
Class ADV | | | | | | | | | | | | | | | | | | | | | | | | | | | | | | | | | | | | | | | | | | |
12/31/2011 | | | 2,569,350 | | | | — | | | | 438,123 | | | | (2,697,704 | ) | | | 309,769 | | | | | | 27,823,835 | | | | — | | | | 4,429,419 | | | | (29,122,498 | ) | | | 3,130,756 | |
12/31/2010 | | | 2,157,211 | | | | — | | | | 326,875 | | | | (2,809,720 | ) | | | (325,634 | ) | | | | | 22,580,623 | | | | — | | | | 3,340,664 | | | | (29,675,732 | ) | | | (3,754,445 | ) |
Class I | | | | | | | | | | | | | | | | | | | | | | | | | | | | | | | | | | | | | | | | | | |
12/31/2011 | | | 1,319,341 | | | | — | | | | 89,363 | | | | (1,476,014 | ) | | | (67,310 | ) | | | | | 14,467,537 | | | | — | | | | 920,437 | | | | (16,425,438 | ) | | | (1,037,464 | ) |
12/31/2010 | | | 948,026 | | | | — | | | | 74,784 | | | | (603,409 | ) | | | 419,401 | | | | | | 10,108,136 | | | | — | | | | 778,507 | | | | (6,444,161 | ) | | | 4,442,482 | |
Class S | | | | | | | | | | | | | | | | | | | | | | | | | | | | | | | | | | | | | | | | | | |
12/31/2011 | | | 1,122,253 | | | | — | | | | 345,939 | | | | (2,375,948 | ) | | | (907,756 | ) | | | | | 12,190,210 | | | | — | | | | 3,538,958 | | | | (25,856,621 | ) | | | (10,127,453 | ) |
12/31/2010 | | | 1,669,294 | | | | — | | | | 298,493 | | | | (2,099,800 | ) | | | (132,013 | ) | | | | | 17,651,340 | | | | — | | | | 3,083,437 | | | | (22,248,192 | ) | | | (1,513,415 | ) |
Class S2 | | | | | | | | | | | | | | | | | | | | | | | | | | | | | | | | | | | | | | | | | | |
12/31/2011 | | | 293,348 | | | | — | | | | 16,703 | | | | (370,474 | ) | | | (60,423 | ) | | | | | 3,074,158 | | | | — | | | | 167,535 | | | | (3,972,390 | ) | | | (730,697 | ) |
12/31/2010 | | | 832,047 | | | | — | | | | 18,417 | | | | (335,108 | ) | | | 515,356 | | | | | | 8,809,770 | | | | — | | | | 186,747 | | | | (3,482,971 | ) | | | 5,513,546 | |
Class T | | | | | | | | | | | | | | | | | | | | | | | | | | | | | | | | | | | | | | | | | | |
12/31/2011 | | | 2,943 | | | | — | | | | 680 | | | | (23,138 | ) | | | (19,515 | ) | | | | | 32,492 | | | | — | | | | 7,074 | | | | (256,041 | ) | | | (216,475 | ) |
12/31/2010 | | | 3,699 | | | | — | | | | 1,354 | | | | (14,344 | ) | | | (9,291 | ) | | | | | 39,384 | | | | — | | | | 14,106 | | | | (154,873 | ) | | | (101,383 | ) |
55
NOTES TO FINANCIAL STATEMENTSASOF DECEMBER 31, 2011 (CONTINUED)
NOTE 8 — CAPITAL SHARES (continued)
| | | | | | | | | | | | | | | | | | | | | | | | | | | | | | | | | | | | | | | | | | |
Year or period ended | | Shares
sold | | | Shares
issued in
merger | | | Reinvestment
of
distributions | | | Shares
redeemed | | | Net increase
(decrease) in
shares
outstanding | | | | | Shares
sold | | | Proceeds
from shares
issued in
merger | | | Reinvestment
of
distributions | | | Shares
redeemed | | | Net increase
(decrease) | |
| | # | | | # | | | # | | | # | | | # | | | | | ($) | | | ($) | | | ($) | | | ($) | | | ($) | |
Solution Moderate | | | | | | | | | | | | | | | | | | | | | | | | | | | |
Class ADV | | | | | | | | | | | | | | | | | | | | | | | | | | | | | | | | | | | | | | | | | | |
12/31/2011 | | | 1,268,557 | | | | — | | | | 14,406 | | | | (115,015 | ) | | | 1,167,948 | | | | | | 12,457,626 | | | | — | | | | 132,097 | | | | (1,118,161 | ) | | | 11,471,562 | |
12/31/2010 | | | 294,439 | | | | — | | | | 255 | | | | (20,068 | ) | | | 274,626 | | | | | | 2,811,307 | | | | — | | | | 2,283 | | | | (183,017 | ) | | | 2,630,573 | |
Class I | | | | | | | | | | | | | | | | | | | | | | | | | | | | | | | | | | | | | | | | | | |
12/31/2011 | | | — | | | | — | | | | — | | | | — | | | | — | | | | | | — | | | | — | | | | — | | | | — | | | | — | |
12/31/2010 | | | — | | | | — | | | | — | | | | — | | | | — | | | | | | — | | | | — | | | | — | | | | — | | | | — | |
Class S | | | | | | | | | | | | | | | | | | | | | | | | | | | | | | | | | | | | | | | | | | |
12/31/2011 | | | 979,510 | | | | — | | | | 14,584 | | | | (121,648 | ) | | | 872,446 | | | | | | 9,590,980 | | | | — | | | | 135,778 | | | | (1,213,515 | ) | | | 8,513,243 | |
12/31/2010 | | | 544,371 | | | | — | | | | 4,456 | | | | (19,806 | ) | | | 529,021 | | | | | | 5,134,975 | | | | — | | | | 40,326 | | | | (186,286 | ) | | | 4,989,015 | |
Class S2 | | | | | | | | | | | | | | | | | | | | | | | | | | | | | | | | | | | | | | | | | | |
12/31/2011 | | | 19,468 | | | | — | | | | 142 | | | | (4,442 | ) | | | 15,168 | | | | | | 191,347 | | | | — | | | | 1,320 | | | | (45,241 | ) | | | 147,426 | |
4/30/2010(1) - 12/31/2010 | | | 3,758 | | | | — | | | | — | | | | (526 | ) | | | 3,232 | | | | | | 36,088 | | | | — | | | | — | | | | (5,106 | ) | | | 30,982 | |
Solution 2015 | | | | | | | | | | | | | | | | | | | | | | | | | | | |
Class ADV | | | | | | | | | | | | | | | | | | | | | | | | | | | | | | | | | | | | | | | | | | |
12/31/2011 | | | 4,286,555 | | | | — | | | | 973,520 | | | | (6,170,458 | ) | | | (910,383 | ) | | | | | 46,838,887 | | | | — | | | | 9,822,823 | | | | (67,063,764 | ) | | | (10,402,054 | ) |
12/31/2010 | | | 5,738,694 | | | | — | | | | 656,727 | | | | (6,455,159 | ) | | | (59,738 | ) | | | | | 59,287,791 | | | | — | | | | 6,560,701 | | | | (67,377,039 | ) | | | (1,528,547 | ) |
Class I | | | | | | | | | | | | | | | | | | | | | | | | | | | | | | | | | | | | | | | | | | |
12/31/2011 | | | 3,925,243 | | | | — | | | | 240,801 | | | | (3,343,012 | ) | | | 823,032 | | | | | | 43,630,595 | | | | — | | | | 2,473,021 | | | | (37,981,799 | ) | | | 8,121,817 | |
12/31/2010 | | | 2,642,468 | | | | — | | | | 163,115 | | | | (2,363,588 | ) | | | 441,995 | | | | | | 27,713,388 | | | | — | | | | 1,657,246 | | | | (24,990,082 | ) | | | 4,380,552 | |
Class S | | | | | | | | | | | | | | | | | | | | | | | | | | | | | | | | | | | | | | | | | | |
12/31/2011 | | | 3,199,911 | | | | — | | | | 1,118,790 | | | | (7,782,195 | ) | | | (3,463,494 | ) | | | | | 35,164,929 | | | | — | | | | 11,411,661 | | | | (85,261,679 | ) | | | (38,685,089 | ) |
12/31/2010 | | | 4,576,846 | | | | — | | | | 811,619 | | | | (4,959,273 | ) | | | 429,192 | | | | | | 47,828,398 | | | | — | | | | 8,189,236 | | | | (51,709,693 | ) | | | 4,307,941 | |
Class S2 | | | | | | | | | | | | | | | | | | | | | | | | | | | | | | | | | | | | | | | | | | |
12/31/2011 | | | 1,105,707 | | | | — | | | | 53,207 | | | | (373,212 | ) | | | 785,702 | | | | | | 11,541,217 | | | | — | | | | 531,537 | | | | (3,993,281 | ) | | | 8,079,473 | |
12/31/2010 | | | 1,724,852 | | | | — | | | | 35,047 | | | | (349,427 | ) | | | 1,410,472 | | | | | | 18,130,133 | | | | — | | | | 349,966 | | | | (3,555,076 | ) | | | 14,922,023 | |
Class T | | | | | | | | | | | | | | | | | | | | | | | | | | | | | | | | | | | | | | | | | | |
12/31/2011 | | | 29,955 | | | | — | | | | 6,975 | | | | (67,825 | ) | | | (30,895 | ) | | | | | 330,650 | | | | — | | | | 71,208 | | | | (723,797 | ) | | | (321,939 | ) |
12/31/2010 | | | 41,941 | | | | — | | | | 4,784 | | | | (65,254 | ) | | | (18,529 | ) | | | | | 435,589 | | | | — | | | | 48,315 | | | | (694,660 | ) | | | (210,756 | ) |
Solution 2020 | | | | | | | | | | | | | | | | | | | | | | | | | | | |
Class ADV | | | | | | | | | | | | | | | | | | | | | | | | | | | | | | | | | | | | | | | | | | |
10/3/2011(1) - 12/31/2011 | | | 301 | | | | — | | | | — | | | | — | | | | 301 | | | | | | 3,010 | | | | — | | | | — | | | | — | | | | 3,010 | |
Class I | | | | | | | | | | | | | | | | | | | | | | | | | | | | | | | | | | | | | | | | | | |
10/3/2011(1) - 12/31/2011 | | | 301 | | | | — | | | | — | | | | — | | | | 301 | | | | | | 3,010 | | | | — | | | | — | | | | — | | | | 3,010 | |
Class S | | | | | | | | | | | | | | | | | | | | | | | | | | | | | | | | | | | | | | | | | | |
10/3/2011(1) - 12/31/2011 | | | 301 | | | | — | | | | — | | | | — | | | | 301 | | | | | | 3,010 | | | | — | | | | — | | | | — | | | | 3,010 | |
Class S2 | | | | | | | | | | | | | | | | | | | | | | | | | | | | | | | | | | | | | | | | | | |
10/3/2011(1) - 12/31/2011 | | | 301 | | | | — | | | | — | | | | — | | | | 301 | | | | | | 3,010 | | | | — | | | | — | | | | — | | | | 3,010 | |
56
NOTES TO FINANCIAL STATEMENTSASOF DECEMBER 31, 2011 (CONTINUED)
NOTE 8 — CAPITAL SHARES (continued)
| | | | | | | | | | | | | | | | | | | | | | | | | | | | | | | | | | | | | | | | | | |
Year or period ended | | Shares
sold | | | Shares
issued in
merger | | | Reinvestment
of
distributions | | | Shares
redeemed | | | Net increase
(decrease) in
shares
outstanding | | | | | Shares
sold | | | Proceeds
from shares
issued in
merger | | | Reinvestment
of
distributions | | | Shares
redeemed | | | Net increase
(decrease) | |
| | # | | | # | | | # | | | # | | | # | | | | | ($) | | | ($) | | | ($) | | | ($) | | | ($) | |
Solution 2020 (continued) | | | | | | | | | | | | | | | | | | | | | | | | | | | |
Class T | | | | | | | | | | | | | | | | | | | | | | | | | | | | | | | | | | | | | | | | | | |
10/3/2011(1) - 12/31/2011 | | | 301 | | | | — | | | | — | | | | — | | | | 301 | | | | | | 3,010 | | | | — | | | | — | | | | — | | | | 3,010 | |
Solution 2025 | | | | | | | | | | | | | | | | | | | | | | | | | | | |
Class ADV | | | | | | | | | | | | | | | | | | | | | | | | | | | | | | | | | | | | | | | | | | |
12/31/2011 | | | 6,260,828 | | | | — | | | | 1,016,938 | | | | (7,281,465 | ) | | | (3,699 | ) | | | | | 68,546,664 | | | | — | | | | 10,006,665 | | | | (78,617,916 | ) | | | (64,587 | ) |
12/31/2010 | | | 8,023,508 | | | | — | | | | 708,591 | | | | (7,717,341 | ) | | | 1,014,758 | | | | | | 80,554,293 | | | | — | | | | 6,781,215 | | | | (78,391,571 | ) | | | 8,943,937 | |
Class I | | | | | | | | | | | | | | | | | | | | | | | | | | | | | | | | | | | | | | | | | | |
12/31/2011 | | | 7,248,419 | | | | — | | | | 289,050 | | | | (4,502,712 | ) | | | 3,034,757 | | | | | | 80,293,332 | | | | — | | | | 2,896,280 | | | | (52,224,601 | ) | | | 30,965,011 | |
12/31/2010 | | | 3,413,151 | | | | — | | | | 204,271 | | | | (2,556,890 | ) | | | 1,060,532 | | | | | | 34,946,969 | | | | — | | | | 1,991,643 | | | | (26,411,316 | ) | | | 10,527,296 | |
Class S | | | | | | | | | | | | | | | | | | | | | | | | | | | | | | | | | | | | | | | | | | |
12/31/2011 | | | 5,167,738 | | | | — | | | | 1,174,978 | | | | (10,195,514 | ) | | | (3,852,798 | ) | | | | | 57,215,196 | | | | — | | | | 11,679,285 | | | | (110,373,340 | ) | | | (41,478,859 | ) |
12/31/2010 | | | 6,396,101 | | | | — | | | | 877,631 | | | | (6,222,436 | ) | | | 1,051,296 | | | | | | 65,201,618 | | | | — | | | | 8,486,689 | | | | (63,540,590 | ) | | | 10,147,717 | |
Class S2 | | | | | | | | | | | | | | | | | | | | | | | | | | | | | | | | | | | | | | | | | | |
12/31/2011 | | | 1,418,291 | | | | — | | | | 51,939 | | | | (257,551 | ) | | | 1,212,679 | | | | | | 14,825,010 | | | | — | | | | 506,920 | | | | (2,716,105 | ) | | | 12,615,825 | |
12/31/2010 | | | 2,131,339 | | | | — | | | | 35,248 | | | | (272,978 | ) | | | 1,893,609 | | | | | | 22,010,952 | | | | — | | | | 335,207 | | | | (2,684,054 | ) | | | 19,662,105 | |
Class T | | | | | | | | | | | | | | | | | | | | | | | | | | | | | | | | | | | | | | | | | | |
12/31/2011 | | | 147,996 | | | | — | | | | 9,072 | | | | (408,373 | ) | | | (251,305 | ) | | | | | 1,574,198 | | | | — | | | | 90,084 | | | | (4,313,797 | ) | | | (2,649,515 | ) |
12/31/2010 | | | 85,837 | | | | — | | | | 7,138 | | | | (76,892 | ) | | | 16,083 | | | | | | 876,268 | | | | — | | | | 68,878 | | | | (776,364 | ) | | | 168,782 | |
Solution 2030 | | | | | | | | | | | | | | | | | | | | | | | | | | | |
Class ADV | | | | | | | | | | | | | | | | | | | | | | | | | | | | | | | | | | | | | | | | | | |
10/3/2011(1) - 12/31/2011 | | | 301 | | | | — | | | | — | | | | — | | | | 301 | | | | | | 3,010 | | | | — | | | | — | | | | — | | | | 3,010 | |
Class I | | | | | | | | | | | | | | | | | | | | | | | | | | | | | | | | | | | | | | | | | | |
10/3/2011(1) - 12/31/2011 | | | 301 | | | | — | | | | — | | | | — | | | | 301 | | | | | | 3,010 | | | | — | | | | — | | | | — | | | | 3,010 | |
Class S | | | | | | | | | | | | | | | | | | | | | | | | | | | | | | | | | | | | | | | | | | |
10/3/2011(1) - 12/31/2011 | | | 301 | | | | — | | | | — | | | | — | | | | 301 | | | | | | 3,010 | | | | — | | | | — | | | | — | | | | 3,010 | |
Class S2 | | | | | | | | | | | | | | | | | | | | | | | | | | | | | | | | | | | | | | | | | | |
10/3/2011(1) - 12/31/2011 | | | 301 | | | | — | | | | — | | | | — | | | | 301 | | | | | | 3,010 | | | | — | | | | — | | | | — | | | | 3,010 | |
Class T | | | | | | | | | | | | | | | | | | | | | | | | | | | | | | | | | | | | | | | | | | |
10/3/2011(1) - 12/31/2011 | | | 301 | | | | — | | | | — | | | | — | | | | 301 | | | | | | 3,010 | | | | — | | | | — | | | | — | | | | 3,010 | |
Solution 2035 | | | | | | | | | | | | | | | | | | | | | | | | | | | |
Class ADV | | | | | | | | | | | | | | | | | | | | | | | | | | | | | | | | | | | | | | | | | | |
12/31/2011 | | | 5,005,265 | | | | — | | | | 627,276 | | | | (6,192,834 | ) | | | (560,293 | ) | | | | | 55,667,351 | | | | — | | | | 6,147,305 | | | | (67,772,610 | ) | | | (5,957,954 | ) |
12/31/2010 | | | 6,691,048 | | | | — | | | | 444,092 | | | | (5,960,040 | ) | | | 1,175,100 | | | | | | 67,599,113 | | | | — | | | | 4,272,162 | | | | (61,170,800 | ) | | | 10,700,475 | |
Class I | | | | | | | | | | | | | | | | | | | | | | | | | | | | | | | | | | | | | | | | | | |
12/31/2011 | | | 7,799,008 | | | | — | | | | 204,020 | | | | (5,000,537 | ) | | | 3,002,491 | | | | | | 88,295,875 | | | | — | | | | 2,036,122 | | | | (59,368,376 | ) | | | 30,963,621 | |
12/31/2010 | | | 3,263,052 | | | | — | | | | 135,397 | | | | (1,698,124 | ) | | | 1,700,325 | | | | | | 33,817,013 | | | | — | | | | 1,325,539 | | | | (17,192,641 | ) | | | 17,949,911 | |
57
NOTES TO FINANCIAL STATEMENTSASOF DECEMBER 31, 2011 (CONTINUED)
NOTE 8 — CAPITAL SHARES (continued)
| | | | | | | | | | | | | | | | | | | | | | | | | | | | | | | | | | | | | | | | | | |
Year or period ended | | Shares
sold | | | Shares
issued in
merger | | | Reinvestment
of
distributions | | | Shares
redeemed | | | Net increase
(decrease) in
shares
outstanding | | | | | Shares
sold | | | Proceeds
from shares
issued in
merger | | | Reinvestment
of
distributions | | | Shares
redeemed | | | Net increase
(decrease) | |
| | # | | | # | | | # | | | # | | | # | | | | | ($) | | | ($) | | | ($) | | | ($) | | | ($) | |
Solution 2035 (continued) | | | | | | | | | | | | | | | | | | | | | | | | | | | |
Class S | | | | | | | | | | | | | | | | | | | | | | | | | | | | | | | | | | | | | | | | | | |
12/31/2011 | | | 4,535,165 | | | | — | | | | 729,282 | | | | (8,233,063 | ) | | | (2,968,616 | ) | | | | | 50,931,359 | | | | — | | | | 7,227,185 | | | | (90,604,211 | ) | | | (32,445,667 | ) |
12/31/2010 | | | 5,843,315 | | | | — | | | | 540,632 | | | | (4,774,208 | ) | | | 1,609,739 | | | | | | 59,889,155 | | | | — | | | | 5,254,947 | | | | (48,977,856 | ) | | | 16,166,246 | |
Class S2 | | | | | | | | | | | | | | | | | | | | | | | | | | | | | | | | | | | | | | | | | | |
12/31/2011 | | | 1,146,562 | | | | — | | | | 35,464 | | | | (268,949 | ) | | | 913,077 | | | | | | 12,171,079 | | | | — | | | | 343,641 | | | | (2,864,900 | ) | | | 9,649,820 | |
12/31/2010 | | | 1,941,298 | | | | — | | | | 25,067 | | | | (309,563 | ) | | | 1,656,802 | | | | | | 20,122,579 | | | | — | | | | 238,633 | | | | (3,078,867 | ) | | | 17,282,345 | |
Class T | | | | | | | | | | | | | | | | | | | | | | | | | | | | | | | | | | | | | | | | | | |
12/31/2011 | | | 43,228 | | | | — | | | | 3,681 | | | | (124,450 | ) | | | (77,541 | ) | | | | | 480,533 | | | | — | | | | 36,629 | | | | (1,366,323 | ) | | | (849,161 | ) |
12/31/2010 | | | 42,525 | | | | — | | | | 3,067 | | | | (53,780 | ) | | | (8,188 | ) | | | | | 435,071 | | | | — | | | | 29,900 | | | | (554,927 | ) | | | (89,956 | ) |
Solution 2040 | | | | | | | | | | | | | | | | | | | | | | | | | | | |
Class ADV | | | | | | | | | | | | | | | | | | | | | | | | | | | | | | | | | | | | | | | | | | |
10/3/2011(1) - 12/31/2011 | | | 301 | | | | — | | | | — | | | | — | | | | 301 | | | | | | 3,010 | | | | — | | | | — | | | | — | | | | 3,010 | |
Class I | | | | | | | | | | | | | | | | | | | | | | | | | | | | | | | | | | | | | | | | | | |
10/3/2011(1) - 12/31/2011 | | | 301 | | | | — | | | | — | | | | — | | | | 301 | | | | | | 3,010 | | | | — | | | | — | | | | — | | | | 3,010 | |
Class S | | | | | | | | | | | | | | | | | | | | | | | | | | | | | | | | | | | | | | | | | | |
10/3/2011(1) - 12/31/2011 | | | 301 | | | | — | | | | — | | | | — | | | | 301 | | | | | | 3,010 | | | | — | | | | — | | | | — | | | | 3,010 | |
Class S2 | | | | | | | | | | | | | | | | | | | | | | | | | | | | | | | | | | | | | | | | | | |
10/3/2011(1) - 12/31/2011 | | | 301 | | | | — | | | | — | | | | — | | | | 301 | | | | | | 3,010 | | | | — | | | | — | | | | — | | | | 3,010 | |
Class T | | | | | | | | | | | | | | | | | | | | | | | | | | | | | | | | | | | | | | | | | | |
10/3/2011(1) - 12/31/2011 | | | 301 | | | | — | | | | — | | | | — | | | | 301 | | | | | | 3,010 | | | | — | | | | — | | | | — | | | | 3,010 | |
Solution 2045 | | | | | | | | | | | | | | | | | | | | | | | | | | | |
Class ADV | | | | | | | | | | | | | | | | | | | | | | | | | | | | | | | | | | | | | | | | | | |
12/31/2011 | | | 3,164,971 | | | | — | | | | 261,641 | | | | (3,578,586 | ) | | | (151,974 | ) | | | | | 35,425,518 | | | | — | | | | 2,574,545 | | | | (39,525,672 | ) | | | (1,525,609 | ) |
12/31/2010 | | | 3,732,520 | | | | — | | | | 176,703 | | | | (3,787,757 | ) | | | 121,466 | | | | | | 37,827,956 | | | | — | | | | 1,692,814 | | | | (39,033,768 | ) | | | 487,002 | |
Class I | | | | | | | | | | | | | | | | | | | | | | | | | | | | | | | | | | | | | | | | | | |
12/31/2011 | | | 6,982,323 | | | | — | | | | 123,326 | | | | (4,608,895 | ) | | | 2,496,754 | | | | | | 79,887,475 | | | | — | | | | 1,234,496 | | | | (55,155,388 | ) | | | 25,966,583 | |
12/31/2010 | | | 2,596,391 | | | | — | | | | 78,728 | | | | (1,066,766 | ) | | | 1,608,353 | | | | | | 26,969,936 | | | | — | | | | 767,598 | | | | (11,003,559 | ) | | | 16,733,975 | |
Class S | | | | | | | | | | | | | | | | | | | | | | | | | | | | | | | | | | | | | | | | | | |
12/31/2011 | | | 3,726,034 | | | | — | | | | 370,353 | | | | (6,025,750 | ) | | | (1,929,363 | ) | | | | | 42,201,768 | | | | — | | | | 3,677,605 | | | | (66,730,630 | ) | | | (20,851,257 | ) |
12/31/2010 | | | 4,500,943 | | | | — | | | | 271,856 | | | | (2,804,431 | ) | | | 1,968,368 | | | | | | 45,943,903 | | | | — | | | | 2,628,850 | | | | (28,978,763 | ) | | | 19,593,990 | |
Class S2 | | | | | | | | | | | | | | | | | | | | | | | | | | | | | | | | | | | | | | | | | | |
12/31/2011 | | | 724,338 | | | | — | | | | 19,805 | | | | (179,354 | ) | | | 564,789 | | | | | | 7,816,596 | | | | — | | | | 193,691 | | | | (1,970,290 | ) | | | 6,039,997 | |
12/31/2010 | | | 1,381,646 | | | | — | | | | 14,703 | | | | (120,397 | ) | | | 1,275,952 | | | | | | 14,405,313 | | | | — | | | | 140,124 | | | | (1,224,446 | ) | | | 13,320,991 | |
Class T | | | | | | | | | | | | | | | | | | | | | | | | | | | | | | | | | | | | | | | | | | |
12/31/2011 | | | 33,742 | | | | — | | | | 1,347 | | | | (111,810 | ) | | | (76,721 | ) | | | | | 381,498 | | | | — | | | | 13,362 | | | | (1,212,741 | ) | | | (817,881 | ) |
12/31/2010 | | | 36,668 | | | | — | | | | 1,117 | | | | (47,900 | ) | | | (10,115 | ) | | | | | 374,597 | | | | — | | | | 10,767 | | | | (488,046 | ) | | | (102,682 | ) |
58
NOTES TO FINANCIAL STATEMENTSASOF DECEMBER 31, 2011 (CONTINUED)
NOTE 8 — CAPITAL SHARES (continued)
| | | | | | | | | | | | | | | | | | | | | | | | | | | | | | | | | | | | | | | | | | |
Year or period ended | | Shares
sold | | | Shares
issued in
merger | | | Reinvestment
of
distributions | | | Shares
redeemed | | | Net increase
(decrease) in
shares
outstanding | | | | | Shares
sold | | | Proceeds
from shares
issued in
merger | | | Reinvestment
of
distributions | | | Shares
redeemed | | | Net increase
(decrease) | |
| | # | | | # | | | # | | | # | | | # | | | | | ($) | | | ($) | | | ($) | | | ($) | | | ($) | |
Solution 2050 | | | | | | | | | | | | | | | | | | | | | | | | | | | |
Class ADV | | | | | | | | | | | | | | | | | | | | | | | | | | | | | | | | | | | | | | | | | | |
10/3/2011(1) - 12/31/2011 | | | 301 | | | | — | | | | — | | | | — | | | | 301 | | | | | | 3,010 | | | | — | | | | — | | | | — | | | | 3,010 | |
Class I | | | | | | | | | | | | | | | | | | | | | | | | | | | | | | | | | | | | | | | | | | |
10/3/2011(1) - 12/31/2011 | | | 301 | | | | — | | | | — | | | | — | | | | 301 | | | | | | 3,010 | | | | — | | | | — | | | | — | | | | 3,010 | |
Class S | | | | | | | | | | | | | | | | | | | | | | | | | | | | | | | | | | | | | | | | | | |
10/3/2011(1) - 12/31/2011 | | | 301 | | | | — | | | | — | | | | — | | | | 301 | | | | | | 3,010 | | | | — | | | | — | | | | — | | | | 3,010 | |
Class S2 | | | | | | | | | | | | | | | | | | | | | | | | | | | | | | | | | | | | | | | | | | |
10/3/2011(1) - 12/31/2011 | | | 301 | | | | — | | | | — | | | | — | | | | 301 | | | | | | 3,010 | | | | — | | | | — | | | | — | | | | 3,010 | |
Class T | | | | | | | | | | | | | | | | | | | | | | | | | | | | | | | | | | | | | | | | | | |
10/3/2011(1) - 12/31/2011 | | | 301 | | | | — | | | | — | | | | — | | | | 301 | | | | | | 3,010 | | | | — | | | | — | | | | — | | | | 3,010 | |
Solution 2055 | | | | | | | | | | | | | | | | | | | | | | | | | | | |
Class ADV | | | | | | | | | | | | | | | | | | | | | | | | | | | | | | | | | | | | | | | | | | |
12/31/2011 | | | 1,007,927 | | | | — | | | | 4,713 | | | | (283,793 | ) | | | 728,847 | | | | | | 11,310,580 | | | | — | | | | 46,840 | | | | (3,187,766 | ) | | | 8,169,654 | |
3/8/2010(1) - 12/31/2010 | | | 450,025 | | | | — | | | | — | | | | (104,061 | ) | | | 345,964 | | | | | | 4,616,348 | | | | — | | | | — | | | | (1,093,489 | ) | | | 3,522,859 | |
Class I | | | | | | | | | | | | | | | | | | | | | | | | | | | | | | | | | | | | | | | | | | |
12/31/2011 | | | 600,711 | | | | — | | | | 1,627 | | | | (305,278 | ) | | | 297,060 | | | | | | 6,768,482 | | | | — | | | | 16,256 | | | | (3,528,213 | ) | | | 3,256,525 | |
3/8/2010(1) - 12/31/2010 | | | 439,872 | | | | — | | | | — | | | | (24,465 | ) | | | 415,407 | | | | | | 4,575,358 | | | | — | | | | — | | | | (249,120 | ) | | | 4,326,238 | |
Class S | | | | | | | | | | | | | | | | | | | | | | | | | | | | | | | | | | | | | | | | | | |
12/31/2011 | | | 764,515 | | | | — | | | | 5,039 | | | | (244,657 | ) | | | 524,897 | | | | | | 8,607,232 | | | | — | | | | 50,185 | | | | (2,658,477 | ) | | | 5,998,940 | |
3/8/2010(1) - 12/31/2010 | | | 193,170 | | | | — | | | | — | | | | (48,287 | ) | | | 144,883 | | | | | | 2,014,629 | | | | — | | | | — | | | | (478,069 | ) | | | 1,536,560 | |
Class S2 | | | | | | | | | | | | | | | | | | | | | | | | | | | | | | | | | | | | | | | | | | |
12/31/2011 | | | 53,418 | | | | — | | | | 298 | | | | (8,180 | ) | | | 45,536 | | | | | | 597,651 | | | | — | | | | 2,970 | | | | (88,889 | ) | | | 511,732 | |
3/8/2010(1) - 12/31/2010 | | | 730 | | | | — | | | | — | | | | (213 | ) | | | 517 | | | | | | 7,475 | | | | — | | | | — | | | | (2,055 | ) | | | 5,420 | |
Class T | | | | | | | | | | | | | | | | | | | | | | | | | | | | | | | | | | | | | | | | | | |
12/31/2011 | | | 1,469 | | | | — | | | | 1 | | | | (1,316 | ) | | | 154 | | | | | | 15,225 | | | | — | | | | 13 | | | | (13,990 | ) | | | 1,248 | |
3/8/2010(1) - 12/31/2010 | | | 25,172 | | | | — | | | | — | | | | (941 | ) | | | 24,231 | | | | | | 246,739 | | | | — | | | | — | | | | (9,782 | ) | | | 236,957 | |
| (1) | | Commencement of operations. |
59
NOTES TO FINANCIAL STATEMENTSASOF DECEMBER 31, 2011 (CONTINUED)
NOTE 9 — LINE OF CREDIT
Certain Portfolios, in addition to certain other funds managed by the Investment Adviser, have entered into an unsecured committed revolving line of credit agreement (the “Credit Agreement”) with The Bank of New York Mellon for an aggregate amount of $125,000,000. The proceeds may be used to: (1) temporarily finance the purchase and sale of securities; or (2) finance the redemption of shares of an investor in the funds. Effective May 27, 2011, the funds pay a commitment fee equal to 0.08% per annum on the daily unused portion of the committed line amount payable quarterly in arrears. Prior to May 27, 2011, the funds paid a commitment fee equal to 0.15% per annum on the daily unused portion of the committed line amount payable quarterly in arrears.
Generally, borrowings under the Credit Agreement accrue interest at the federal funds rate plus a specified margin. Repayments generally must be made within 60 days after the date of a revolving credit advance. The Portfolios did not utilize the line of credit during the year ended December 31, 2011.
NOTE 10—FEDERAL INCOME TAXES
The amount of distributions from net investment income and net realized capital gains are determined in accordance with federal income tax regulations, which may differ from U.S. generally accepted accounting principles for investment companies. These book/tax differences may be either temporary or permanent.
Permanent differences are reclassified within the capital accounts based on their federal tax-basis treatment; temporary differences are not reclassified. Key differences include the treatment of short-term capital gains, foreign currency transactions, and wash sale deferrals. Distributions in excess of net investment income and/or net realized capital gains for tax purposes are reported as return of capital.
The following permanent tax differences have been reclassified as of December 31, 2011:
| | | | | | | | | | | | |
| | | Paid-in Capital | | | Undistributed Net Investment Income | | | Accumulated Net Realized Gains / (Losses) | |
Solution Aggressive Growth | | $ | — | | | $ | 44,824 | | | $ | (44,824 | ) |
Solution Conservative | | | — | | | | 80,294 | | | | (80,294 | ) |
Solution Growth | | | — | | | | 120,068 | | | | (120,068 | ) |
Solution Income | | | — | | | | 2,263,244 | | | | (2,263,244 | ) |
Solution Moderate | | | — | | | | 166,435 | | | | (166,435 | ) |
Solution 2015 | | | — | | | | 7,344,973 | | | | (7,344,973 | ) |
Solution 2020 | | | (13 | ) | | | 47 | | | | (34 | ) |
Solution 2025 | | | — | | | | 5,487,962 | | | | (5,487,962 | ) |
Solution 2030 | | | (13 | ) | | | 48 | | | | (35 | ) |
Solution 2035 | | | — | | | | 3,743,102 | | | | (3,743,102 | ) |
Solution 2040 | | | (13 | ) | | | 49 | | | | (36 | ) |
Solution 2045 | | | — | | | | 2,361,484 | | | | (2,361,484 | ) |
Solution 2050 | | | (13 | ) | | | 49 | | | | (36 | ) |
Solution 2055 | | | — | | | | 84,470 | | | | (84,470 | ) |
Dividends paid by the Portfolios from net investment income and distributions of net realized short-term capital gains are, for federal income tax purposes, taxable as ordinary income to shareholders.
The tax composition of dividends and distributions to shareholders was as follows:
| | | | | | | | | | | | | | | | |
| | | Year Ended December 31, 2011 | | | Year Ended December 31, 2010 | |
| | | Ordinary
Income | | | Long-Term
Capital Gains | | | Ordinary
Income | | | Long-Term
Capital Gains | |
Solution Aggressive Growth | | $ | 64,899 | | | $ | 106 | | | $ | — | | | $ | — | |
Solution Conservative | | | 50,494 | | | | 7 | | | | — | | | | — | |
Solution Growth | | | 94,171 | | | | 65,766 | | | | 10,621 | | | | — | |
Solution Income | | | 9,063,423 | | | | — | | | | 7,403,461 | | | | — | |
Solution Moderate | | | 139,078 | | | | 130,133 | | | | 34,691 | | | | 8,015 | |
Solution 2015 | | | 24,310,250 | | | | — | | | | 16,802,464 | | | | — | |
Solution 2025 | | | 25,179,234 | | | | — | | | | 17,663,632 | | | | — | |
Solution 2035 | | | 15,790,883 | | | | — | | | | 11,121,181 | | | | — | |
Solution 2045 | | | 7,693,700 | | | | — | | | | 5,240,153 | | | | — | |
Solution 2055 | | | 115,324 | | | | 950 | | | | — | | | | — | |
60
NOTES TO FINANCIAL STATEMENTSASOF DECEMBER 31, 2011 (CONTINUED)
NOTE 10 — FEDERAL INCOME TAXES (continued)
The tax-basis components of distributable earnings and the expiration dates of the capital loss carryforwards which may be used to offset future realized capital gains for federal income tax purposes as of December 31, 2011 were:
| | | | | | | | | | | | | | | | | | | | |
| | | Undistributed Ordinary Income | | | Undistributed Long-term Capital Gains | | | Unrealized Appreciation/ (Depreciation) | | | Short-term Capital Loss Carryforwards | | | Expiration | |
Solution Aggressive Growth | | $ | 298,820 | | | $ | 54,553 | | | $ | (754,878 | ) | | $ | — | | | | — | |
Solution Conservative | | | 343,893 | | | | — | | | | (368,199 | ) | | | (48,397 | ) | | | N/A | |
Solution Growth | | | 608,463 | | | | 131,387 | | | | (1,206,994 | ) | | | — | | | | — | |
Solution Income | | | 9,851,405 | | | | — | | | | (7,964,213 | ) | | | (15,490,521 | ) | | | 2017 | |
Solution Moderate | | | 802,726 | | | | 200,401 | | | | (979,386 | ) | | | — | | | | — | |
Solution 2015 | | | 30,666,695 | | | | — | | | | (24,186,577 | ) | | | (57,785,966 | ) | | | 2017 | |
| | | | | | | | | | | | | | | (4,233,809 | ) | | | 2018 | |
| | | | | | | | | | | | | | | | | | | | |
| | | | | | | | | | | | | | $ | (62,019,775 | ) | | | | |
| | | | | | | | | | | | | | | | | | | | |
Solution 2020 | | | 284 | | | | 10 | | | | 996 | | | | — | | | | — | |
Solution 2025 | | | 32,678,974 | | | | — | | | | (1,905,165 | ) | | | (94,904,113 | ) | | | 2017 | |
| | | | | | | | | | | | | | | (26,382,916 | ) | | | 2018 | |
| | | | | | | | | | | | | | | | | | | | |
| | | | | | | | | | | | | | $ | (121,287,029 | ) | | | | |
| | | | | | | | | | | | | | | | | | | | |
Solution 2030 | | | 243 | | | | 8 | | | | 1,354 | | | | — | | | | — | |
Solution 2035 | | | 21,925,504 | | | | — | | | | (19,972,331 | ) | | | (45,926,678 | ) | | | 2017 | |
| | | | | | | | | | | | | | | (26,378,095 | ) | | | 2018 | |
| | | | | | | | | | | | | | | | | | | | |
| | | | | | | | | | | | | | $ | (72,304,773 | ) | | | | |
| | | | | | | | | | | | | | | | | | | | |
Solution 2040 | | | 246 | | | | 5 | | | | 1,611 | | | | — | | | | — | |
Solution 2045 | | | 12,435,869 | | | | — | | | | (5,612,036 | ) | | | (10,927,690 | ) | | | 2017 | |
| | | | | | | | | | | | | | | (27,718,100 | ) | | | 2018 | |
| | | | | | | | | | | | | | | | | | | | |
| | | | | | | | | | | | | | $ | (38,645,790 | ) | | | | |
| | | | | | | | | | | | | | | | | | | | |
Solution 2050 | | | 275 | | | | 5 | | | | 1,583 | | | | — | | | | — | |
Solution 2055 | | | 636,196 | | | | 251,440 | | | | (1,432,717 | ) | | | — | | | | — | |
The Portfolios’ major tax jurisdictions are federal and Arizona. The earliest tax year that remains subject to
examination by these jurisdictions is 2007.
As of December 31, 2011, no provisions for income tax would be required in the Portfolios’ financial statements as a result of tax positions taken on federal and state income tax returns for open tax years. The Portfolios’ federal and state income and federal excise tax returns for tax years for which the applicable statutes of limitations have not expired are subject to examination by the Internal Revenue Service and state department of revenue.
The Regulated Investment Company Modernization Act of 2010 (the “Act”) was enacted on December 22, 2010. The Act makes changes to several tax rules impacting the Portfolios. In general, the provisions of the Act are effective for the Portfolios’ tax year ended December 31, 2011. Although the Act provides several benefits, including the unlimited carryforward of future capital losses, there may be a greater likelihood that all or a portion of the Portfolios’ pre-enactment capital loss carryforwards may expire
without being utilized due to the fact that post-enactment capital losses are required to be utilized before pre-enactment capital loss carryforwards.
NOTE 11 — CONCENTRATION OF INVESTMENT RISK
All mutual funds involve risk — some more than others — and there is always the chance that you could lose money or not earn as much as you hope. Each Portfolio’s risk profile is largely a factor of the principal securities in which it invests and investment techniques that it uses. For more information regarding the types of securities and investment techniques that may be used by each Portfolio and its corresponding risks, see the Portfolios’ most recent Prospectus and/or the Statement of Additional Information.
The Portfolios are also affected by other kinds of risks, depending on the types of securities held or strategies used by an Underlying Fund.
Asset Allocation. Assets will be allocated among Underlying Funds and markets based on judgements by the Adviser or Consultant. There is a risk that the
61
NOTES TO FINANCIAL STATEMENTSASOF DECEMBER 31, 2011 (CONTINUED)
NOTE 11 — CONCENTRATION OF INVESTMENT RISK (continued)
Portfolios may allocate assets to as Underlying Fund or market that underperforms other funds or asset classes.
Foreign Securities. Investments in foreign securities may entail risks not present in domestic investments. Since securities in which an Underlying Fund may invest are denominated in foreign currencies, changes in the relationship of these foreign currencies to the U.S. dollar can significantly affect the value of the investments and earnings of the Underlying Funds. Foreign investments may also subject the Underlying Funds to foreign government exchange restrictions, expropriation, taxation or other political, social or economic developments, as well as changes vis-à-vis the U.S. dollar from movements in currency, and changes in security value and interest rate, all of which could affect the market and/or credit risk of the Underlying Funds’ investments.
NOTE 12 — OTHER ACCOUNTING PRONOUNCEMENTS
In May 2011, the Financial Accounting Standards Board (“FASB”) issued Accounting Standards Update (“ASU”)
No. 2011-04 “Amendments to Achieve Common Fair Value Measurement and Disclosure Requirements”. ASU No. 2011-04 amends FASB ASC Topic 820, Fair Value Measurements and Disclosures, to establish common requirements for measuring fair value and for disclosing information about fair value measurements in accordance with GAAP and the International Financial Reporting Standards (“IFRSs”). The ASU is effective prospectively for interim and annual periods beginning after December 15, 2011. As of December 31, 2011, management of the Portfolios is currently assessing the potential impact to financial statement disclosure that may result from adopting this ASU.
NOTE 13 — SUBSEQUENT EVENTS
The Portfolios have evaluated events occurring after the Statements of Assets and Liabilities date (subsequent events) to determine whether any subsequent events necessitated adjustment to or disclosure in the financial statements. No such subsequent events were identified.
62
| | |
ING SOLUTION AGGRESSIVE GROWTH
PORTFOLIO | | PORTFOLIO OF INVESTMENTS ASOF DECEMBER 31, 2011 |
| | | | | | | | | | | | | | |
| Shares | | | | | | | Value | | | Percentage of Net Assets | |
| | | | | | | | | | | | | | |
| |
| | AFFILIATED INVESTMENT COMPANIES: 100.0% | | | | | |
| | 50,383 | | | | | ING Clarion Global Real Estate Portfolio - Class I | | $ | 449,920 | | | | 3.0 | |
| | 6,643 | | | | | ING Clarion Real Estate Portfolio - Class I | | | 157,900 | | | | 1.1 | |
| | 24,457 | | | | | ING Davis New York Venture Portfolio - Class I | | | 414,306 | | | | 2.8 | |
| | 28,803 | | | | | ING Emerging Markets Equity Fund - Class I | | | 292,640 | | | | 2.0 | |
| | 56,882 | | | | | ING Equity Dividend Fund - Class I | | | 579,629 | | | | 3.9 | |
| | 38,921 | | | | | ING Global Bond Fund - Class I | | | 439,413 | | | | 2.9 | |
| | 94,438 | | | | | ING Goldman Sachs Commodity Strategy Portfolio - Class I | | | 564,738 | | | | 3.8 | |
| | 31,748 | | | | | ING Growth and Income Portfolio - Class I | | | 685,440 | | | | 4.6 | |
| | 176,808 | | | | | ING International Core Fund - Class I | | | 1,471,040 | | | | 9.8 | |
| | 68,099 | | | | | ING International Growth Fund - Class I | | | 584,288 | | | | 3.9 | |
| | 40,461 | | | | | ING JPMorgan Emerging Markets Equity Portfolio - Class I | | | 728,696 | | | | 4.9 | |
| | 52,863 | | | | | ING Large Cap Growth Portfolio - Class I | | | 672,416 | | | | 4.5 | |
| | 39,319 | | | | | ING Marsico Growth Portfolio - Class I | | | 667,249 | | | | 4.5 | |
| | 70,501 | | | @ | | ING MidCap Opportunities Portfolio - Class I | | | 819,921 | | | | 5.5 | |
| | 72,254 | | | | | ING MidCap Value Fund - Class I | | | 840,309 | | | | 5.6 | |
| | 75,726 | | | | | ING PIMCO High Yield Portfolio - Class I | | | 751,959 | | | | 5.0 | |
| | | | | | | | | | | | | | |
| Shares | | | | | | | Value | | | Percentage of Net Assets | |
| | | | | | | | | | | | | | |
|
| | AFFILIATED INVESTMENT COMPANIES: (continued) | |
| | 43,158 | | | | | ING Small Company Portfolio - Class I | | $ | 769,069 | | | | 5.1 | |
| | 32,653 | | | | | ING T Rowe Price Capital Appreciation Portfolio - Class I | | | 746,766 | | | | 5.0 | |
| | 90,590 | | | | | ING T. Rowe Price Equity Income Portfolio - Class I | | | 1,035,441 | | | | 6.9 | |
| | 12,446 | | | @ | | ING T. Rowe Price Growth Equity Portfolio - Class I | | | 670,967 | | | | 4.5 | |
| | 61,839 | | | | | ING Templeton Foreign Equity Portfolio - Class I | | | 588,710 | | | | 3.9 | |
| | 9,424 | | | | | ING Thornburg Value Portfolio - Class I | | | 259,637 | | | | 1.7 | |
| | 73,022 | | | | | ING U.S. Stock Index Portfolio - Class I | | | 760,155 | | | | 5.1 | |
| | | | | | | | | | | | | | |
| | | | | | Total Investments in Affiliated Investment Companies
(Cost $15,525,636) | | $ | 14,950,609 | | | | 100.0 | |
| | | | | | Liabilities in Excess of Other Assets | | | (4,619 | ) | | | — | |
| | | | | | | | | | | | | | |
| | | | | | Net Assets | | $ | 14,945,990 | | | | 100.0 | |
| | | | | | | | | | | | | | |
| @ | Non-income producing security |
| | Cost for federal income tax purposes is $15,705,487. |
| | | | |
Net unrealized depreciation consists of: | | | | |
Gross Unrealized Appreciation | | $ | 109,654 | |
Gross Unrealized Depreciation | | | (864,532 | ) |
| | | | |
Net Unrealized depreciation | | $ | (754,878 | ) |
| | | | |
Fair Value Measurements^
The following is a summary of the fair valuations according to the inputs used as of December 31, 2011 in valuing the assets and liabilities:
| | | | | | | | | | | | | | | | |
| | | Quoted Prices in Active Markets for Identical Investments (Level 1) | | | Significant Other Observable Inputs (Level 2) | | | Significant Unobservable Inputs (Level 3) | | | Fair Value at 12/31/2011 | |
Asset Table | | | | | | | | | | | | | | | | |
Investments, at value | | | | | | | | | | | | | | | | |
Affiliated Investment Companies | | $ | 14,950,609 | | | $ | — | | | $ | — | | | $ | 14,950,609 | |
| | | | | | | | | | | | | | | | |
Total Investments, at value | | $ | 14,950,609 | | | $ | — | | | $ | — | | | $ | 14,950,609 | |
| | | | | | | | | | | | | | | | |
| ^ | See Note 2, “Significant Accounting Policies” in the Notes to Financial Statements for additional information. |
| | There were no significant transfers between Level 1 and 2 during the year ending December 31, 2011. |
See Accompanying Notes to Financial Statements
63
| | |
| ING SOLUTION CONSERVATIVE PORTFOLIO | | PORTFOLIO OF INVESTMENTS ASOF DECEMBER 31, 2011 |
| | | | | | | | | | | | | | |
| Shares | | | | | | | Value | | | Percentage of Net Assets | |
| | | | | | | | | | | | | | |
|
| | AFFILIATED INVESTMENT COMPANIES: 100.0% | |
| | 42,472 | | | | | ING BlackRock Inflation Protected Bond Portfolio - Class I | | $ | 463,366 | | | | 4.9 | |
| | 21,480 | | | | | ING Clarion Global Real Estate Portfolio - Class I | | | 191,818 | | | | 2.0 | |
| | 11,378 | | | | | ING Davis New York Venture Portfolio - Class I | | | 192,749 | | | | 2.0 | |
| | 47,594 | | | | | ING Floating Rate Fund - Class I | | | 469,752 | | | | 5.0 | |
| | 41,565 | | | | | ING Global Bond Fund - Class I | | | 469,273 | | | | 4.9 | |
| | 30,257 | | | | | ING Goldman Sachs Commodity Strategy Portfolio - Class I | | | 180,939 | | | | 1.9 | |
| | 17,882 | | | | | ING Growth and Income Portfolio - Class I | | | 386,067 | | | | 4.1 | |
| | 79,746 | | | | | ING Intermediate Bond Portfolio - Class I | | | 988,845 | | | | 10.4 | |
| | 22,623 | | | | | ING International Core Fund - Class I | | | 188,226 | | | | 2.0 | |
| | 21,791 | | | | | ING International Growth Fund - Class I | | | 186,963 | | | | 2.0 | |
| | 10,363 | | | | | ING JPMorgan Emerging Markets Equity Portfolio - Class I | | | 186,636 | | | | 2.0 | |
| | 15,030 | | | | | ING Large Cap Growth Portfolio - Class I | | | 191,179 | | | | 2.0 | |
| | 55,201 | | | | | ING Limited Maturity Bond Portfolio - Class I | | | 557,534 | | | | 5.9 | |
| | 20,501 | | | @ | | ING MidCap Opportunities Portfolio - Class I | | | 238,421 | | | | 2.5 | |
| | | | | | | | | | | | | | |
| Shares | | | | | | | Value | | | Percentage of Net Assets | |
| | | | | | | | | | | | | | |
|
| | AFFILIATED INVESTMENT COMPANIES: (continued) | |
| | 20,998 | | | | | ING MidCap Value Fund - Class I | | $ | 244,210 | | | | 2.6 | |
| | 77,614 | | | | | ING PIMCO High Yield Portfolio - Class I | | | 770,711 | | | | 8.1 | |
| | 142,674 | | | | | ING PIMCO Total Return Bond Portfolio - Class I | | | 1,656,440 | | | | 17.5 | |
| | 30,039 | | | | | ING T. Rowe Price Equity Income Portfolio - Class I | | | 343,348 | | | | 3.6 | |
| | 2,654 | | | @ | | ING T. Rowe Price Growth Equity Portfolio - Class I | | | 143,081 | | | | 1.5 | |
| | 19,781 | | | | | ING Templeton Foreign Equity Portfolio - Class I | | | 188,316 | | | | 2.0 | |
| | 59,248 | | | | | ING U.S. Bond Index Portfolio - Class I | | | 655,877 | | | | 6.9 | |
| | 56,047 | | | | | ING U.S. Stock Index Portfolio - Class I | | | 583,452 | | | | 6.2 | |
| | | | | | | | | | | | | | |
| | | | | | Total Investments in Affiliated Investment Companies
(Cost $9,745,192) | | $ | 9,477,203 | | | | 100.0 | |
| | | | | | Liabilities in Excess of Other Assets | | | (734 | ) | | | — | |
| | | | | | | | | | | | | | |
| | | | | | Net Assets | | $ | 9,476,469 | | | | 100.0 | |
| | | | | | | | | | | | | | |
| @ | Non-income producing security |
| | Cost for federal income tax purposes is $9,845,402. |
| | | | |
Net unrealized depreciation consists of: | | | | |
Gross Unrealized Appreciation | | $ | 63,478 | |
Gross Unrealized Depreciation | | | (431,677 | ) |
| | | | |
Net Unrealized depreciation | | $ | (368,199 | ) |
| | | | |
Fair Value Measurements^
The following is a summary of the fair valuations according to the inputs used as of December 31, 2011 in valuing the assets and liabilities:
| | | | | | | | | | | | | | | | |
| | | Quoted Prices in Active Markets for Identical Investments (Level 1) | | | Significant Other Observable Inputs (Level 2) | | | Significant Unobservable Inputs (Level 3) | | | Fair Value at 12/31/2011 | |
Asset Table | | | | | | | | | | | | | | | | |
Investments, at value | | | | | | | | | | | | | | | | |
Affiliated Investment Companies | | $ | 9,477,203 | | | $ | — | | | $ | — | | | $ | 9,477,203 | |
| | | | | | | | | | | | | | | | |
Total Investments, at value | | $ | 9,477,203 | | | $ | — | | | $ | — | | | $ | 9,477,203 | |
| | | | | | | | | | | | | | | | |
| ^ | See Note 2, “Significant Accounting Policies” in the Notes to Financial Statements for additional information. |
| | There were no significant transfers between Level 1 and 2 during the year ending December 31, 2011. |
See Accompanying Notes to Financial Statements
64
| | |
ING SOLUTION GROWTH PORTFOLIO | | PORTFOLIO OF INVESTMENTS ASOF DECEMBER 31, 2011 |
| | | | | | | | | | | | | | |
| Shares | | | | | | | Value | | | Percentage of Net Assets | |
| | | | | | | | | | | | | | |
| |
| | AFFILIATED INVESTMENT COMPANIES: 100.0% | | | | | |
| | 96,203 | | | | | ING Clarion Global Real Estate Portfolio - Class I | | $ | 859,090 | | | | 3.0 | |
| | 12,664 | | | | | ING Clarion Real Estate Portfolio - Class I | | | 301,015 | | | | 1.1 | |
| | 46,694 | | | | | ING Davis New York Venture Portfolio - Class I | | | 790,991 | | | | 2.8 | |
| | 27,515 | | | | | ING Emerging Markets Equity Fund - Class I | | | 279,548 | | | | 1.0 | |
| | 79,578 | | | | | ING Equity Dividend Fund - Class I | | | 810,898 | | | | 2.8 | |
| | 56,838 | | | | | ING Floating Rate Fund - Class I | | | 560,991 | | | | 2.0 | |
| | 124,090 | | | | | ING Global Bond Fund - Class I | | | 1,400,971 | | | | 4.9 | |
| | 135,610 | | | | | ING Goldman Sachs Commodity Strategy Portfolio - Class I | | | 810,947 | | | | 2.8 | |
| | 60,590 | | | | | ING Growth and Income Portfolio - Class I | | | 1,308,147 | | | | 4.6 | |
| | 90,690 | | | | | ING Intermediate Bond Portfolio - Class I | | | 1,124,556 | | | | 3.9 | |
| | 168,915 | | | | | ING International Core Fund - Class I | | | 1,405,371 | | | | 4.9 | |
| | 97,594 | | | | | ING International Growth Fund - Class I | | | 837,360 | | | | 2.9 | |
| | 46,392 | | | | | ING JPMorgan Emerging Markets Equity Portfolio - Class I | | | 835,514 | | | | 2.9 | |
| | 89,736 | | | | | ING Large Cap Growth Portfolio - Class I | | | 1,141,447 | | | | 4.0 | |
| | 58,411 | | | | | ING Marsico Growth Portfolio - Class I | | | 991,228 | | | | 3.5 | |
| | 97,901 | | | @ | | ING MidCap Opportunities Portfolio - Class I | | | 1,138,589 | | | | 4.0 | |
| | 100,255 | | | | | ING MidCap Value Fund - Class I | | | 1,165,968 | | | | 4.1 | |
| | | | | | | | | | | | | | |
| Shares | | | | | | | Value | | | Percentage of Net Assets | |
| | | | | | | | | | | | | | |
|
| | AFFILIATED INVESTMENT COMPANIES: (continued) | |
| | 202,599 | | | | | ING PIMCO High Yield Portfolio - Class I | | $ | 2,011,805 | | | | 7.1 | |
| | 158,172 | | | | | ING PIMCO Total Return Bond Portfolio - Class I | | | 1,836,374 | | | | 6.4 | |
| | 49,383 | | | | | ING Small Company Portfolio - Class I | | | 880,011 | | | | 3.1 | |
| | 62,384 | | | | | ING T Rowe Price Capital Appreciation Portfolio - Class I | | | 1,426,731 | | | | 5.0 | |
| | 147,247 | | | | | ING T. Rowe Price Equity Income Portfolio - Class I | | | 1,683,032 | | | | 5.9 | |
| | 21,125 | | | @ | | ING T. Rowe Price Growth Equity Portfolio - Class I | | | 1,138,835 | | | | 4.0 | |
| | 88,610 | | | | | ING Templeton Foreign Equity Portfolio - Class I | | | 843,563 | | | | 3.0 | |
| | 17,998 | | | | | ING Thornburg Value Portfolio - Class I | | | 495,849 | | | | 1.7 | |
| | 63,182 | | | | | ING U.S. Bond Index Portfolio - Class I | | | 699,420 | | | | 2.5 | |
| | 167,252 | | | | | ING U.S. Stock Index Portfolio - Class I | | | 1,741,097 | | | | 6.1 | |
| | | | | | | | | | | | | | |
| | | | | | Total Investments in Affiliated Investment Companies (Cost $29,498,386) | | $ | 28,519,348 | | | | 100.0 | |
| | | | | | Liabilities in Excess of Other Assets | | | (11,769 | ) | | | — | |
| | | | | | | | | | | | | | |
| | | | | | Net Assets | | $ | 28,507,579 | | | | 100.0 | |
| | | | | | | | | | | | | | |
| @ | Non-income producing security |
| | Cost for federal income tax purposes is $29,726,342. |
| | | | |
Net unrealized depreciation consists of: | | | | |
Gross Unrealized Appreciation | | $ | 210,100 | |
Gross Unrealized Depreciation | | | (1,417,094 | ) |
| | | | |
Net Unrealized depreciation | | $ | (1,206,994 | ) |
| | | | |
Fair Value Measurements^
The following is a summary of the fair valuations according to the inputs used as of December 31, 2011 in valuing the assets and liabilities:
| | | | | | | | | | | | | | | | |
| | | Quoted Prices in Active Markets for Identical Investments (Level 1) | | | Significant Other Observable Inputs (Level 2) | | | Significant Unobservable Inputs (Level 3) | | | Fair Value at 12/31/2011 | |
Asset Table | | | | | | | | | | | | | | | | |
Investments, at value | | | | | | | | | | | | | | | | |
Affiliated Investment Companies | | $ | 28,519,348 | | | $ | — | | | $ | — | | | $ | 28,519,348 | |
| | | | | | | | | | | | | | | | |
Total Investments, at value | | $ | 28,519,348 | | | $ | — | | | $ | — | | | $ | 28,519,348 | |
| | | | | | | | | | | | | | | | |
| ^ | See Note 2, “Significant Accounting Policies” in the Notes to Financial Statements for additional information. |
| | There were no significant transfers between Level 1 and 2 during the year ending December 31, 2011. |
See Accompanying Notes to Financial Statements
65
| | |
| ING SOLUTION INCOME PORTFOLIO | | PORTFOLIO OF INVESTMENTS ASOF DECEMBER 31, 2011 |
| | | | | | | | | | | | | | |
| Shares | | | | | | | Value | | | Percentage of Net Assets | |
| | | | | | | | | | | | | | |
| |
| | AFFILIATED INVESTMENT COMPANIES: 100.0% | | | | | |
| | 973,131 | | | | | ING BlackRock Inflation Protected Bond Portfolio - Class I | | $ | 10,616,862 | | | | 4.9 | |
| | 494,058 | | | | | ING Clarion Global Real Estate Portfolio - Class I | | | 4,411,940 | | | | 2.0 | |
| | 261,871 | | | | | ING Davis New York Venture Portfolio - Class I | | | 4,436,090 | | | | 2.0 | |
| | 1,091,956 | | | | | ING Floating Rate Fund - Class I | | | 10,777,608 | | | | 5.0 | |
| | 953,506 | | | | | ING Global Bond Fund - Class I | | | 10,765,086 | | | | 4.9 | |
| | 691,780 | | | | | ING Goldman Sachs Commodity Strategy Portfolio - Class I | | | 4,136,845 | | | | 1.9 | |
| | 411,493 | | | | | ING Growth and Income Portfolio - Class I | | | 8,884,132 | | | | 4.1 | |
| | 1,829,538 | | | | | ING Intermediate Bond Portfolio - Class I | | | 22,686,273 | | | | 10.4 | |
| | 519,324 | | | | | ING International Core Fund - Class I | | | 4,320,772 | | | | 2.0 | |
| | 499,957 | | | | | ING International Growth Fund - Class I | | | 4,289,629 | | | | 2.0 | |
| | 237,808 | | | | | ING JPMorgan Emerging Markets Equity Portfolio - Class I | | | 4,282,923 | | | | 2.0 | |
| | 345,600 | | | | | ING Large Cap Growth Portfolio - Class I | | | 4,396,027 | | | | 2.0 | |
| | 1,265,030 | | | | | ING Limited Maturity Bond Portfolio - Class I | | | 12,776,803 | | | | 5.9 | |
| | 471,361 | | | @ | | ING MidCap Opportunities Portfolio - Class I | | | 5,481,928 | | | | 2.5 | |
| | | | | | | | | | | | | | |
| Shares | | | | | | | Value | | | Percentage of Net Assets | |
| | | | | | | | | | | | | | |
|
| | AFFILIATED INVESTMENT COMPANIES: (continued) | |
| | 483,916 | | | | | ING MidCap Value Fund - Class I | | $ | 5,627,937 | | | | 2.6 | |
| | 1,785,193 | | | | | ING PIMCO High Yield Portfolio - Class I | | | 17,726,969 | | | | 8.1 | |
| | 3,275,005 | | | | | ING PIMCO Total Return Bond Portfolio - Class I | | | 38,022,811 | | | | 17.5 | |
| | 692,442 | | | | | ING T. Rowe Price Equity Income Portfolio - Class I | | | 7,914,608 | | | | 3.6 | |
| | 61,030 | | | @ | | ING T. Rowe Price Growth Equity Portfolio - Class I | | | 3,290,148 | | | | 1.5 | |
| | 454,166 | | | | | ING Templeton Foreign Equity Portfolio - Class I | | | 4,323,663 | | | | 2.0 | |
| | 1,358,577 | | | | | ING U.S. Bond Index Portfolio - Class I | | | 15,039,450 | | | | 6.9 | |
| | 1,290,941 | | | | | ING U.S. Stock Index Portfolio - Class I | | | 13,438,698 | | | | 6.2 | |
| | | | | | | | | | | | | | |
| | | | | | Total Investments in Affiliated Investment Companies (Cost $221,762,410) | | $ | 217,647,202 | | | | 100.0 | |
| | | | | | Liabilities in Excess of Other Assets | | | (2,562 | ) | | | — | |
| | | | | | | | | | | | | | |
| | | | | | Net Assets | | $ | 217,644,640 | | | | 100.0 | |
| | | | | | | | | | | | | | |
| @ | Non-income producing security |
| | Cost for federal income tax purposes is $225,611,415. |
| | | | |
Net unrealized depreciation consists of: | |
Gross Unrealized Appreciation | | $ | 2,617,395 | |
Gross Unrealized Depreciation | | | (10,581,608 | ) |
| | | | |
Net Unrealized depreciation | | $ | (7,964,213 | ) |
| | | | |
Fair Value Measurements^
The following is a summary of the fair valuations according to the inputs used as of December 31, 2011 in valuing the assets and liabilities:
| | | | | | | | | | | | | | | | |
| | | Quoted Prices in Active Markets for Identical Investments (Level 1) | | | Significant Other Observable Inputs (Level 2) | | | Significant Unobservable Inputs (Level 3) | | | Fair Value at 12/31/2011 | |
Asset Table | | | | | | | | | | | | | | | | |
Investments, at value | | | | | | | | | | | | | | | | |
Affiliated Investment Companies | | $ | 217,647,202 | | | $ | — | | | $ | — | | | $ | 217,647,202 | |
| | | | | | | | | | | | | | | | |
Total Investments, at value | | $ | 217,647,202 | | | $ | — | | | $ | — | | | $ | 217,647,202 | |
| | | | | | | | | | | | | | | | |
| ^ | See Note 2, “Significant Accounting Policies” in the Notes to Financial Statements for additional information. |
| | There were no significant transfers between Level 1 and 2 during the year ending December 31, 2011. |
See Accompanying Notes to Financial Statements
66
| | |
| ING SOLUTION MODERATE PORTFOLIO | | PORTFOLIO OF INVESTMENTS ASOF DECEMBER 31, 2011 |
| | | | | | | | | | | | | | |
| Shares | | | | | | | Value | | | Percentage of Net Assets | |
| | | | | | | | | | | | | | |
| |
| | AFFILIATED INVESTMENT COMPANIES: 100.0% | | | | | |
| | 78,244 | | | | | ING BlackRock Inflation Protected Bond Portfolio - Class I | | $ | 853,645 | | | | 2.9 | |
| | 98,867 | | | | | ING Clarion Global Real Estate Portfolio - Class I | | | 882,883 | | | | 3.0 | |
| | 13,022 | | | | | ING Clarion Real Estate Portfolio - Class I | | | 309,545 | | | | 1.1 | |
| | 34,907 | | | | | ING Davis New York Venture Portfolio - Class I | | | 591,318 | | | | 2.0 | |
| | 87,670 | | | | | ING Floating Rate Fund - Class I | | | 865,301 | | | | 3.0 | |
| | 127,591 | | | | | ING Global Bond Fund - Class I | | | 1,440,500 | | | | 4.9 | |
| | 92,898 | | | | | ING Goldman Sachs Commodity Strategy Portfolio - Class I | | | 555,532 | | | | 1.9 | |
| | 54,865 | | | | | ING Growth and Income Portfolio - Class I | | | 1,184,528 | | | | 4.1 | |
| | 186,522 | | | | | ING Intermediate Bond Portfolio - Class I | | | 2,312,871 | | | | 7.9 | |
| | 173,523 | | | | | ING International Core Fund - Class I | | | 1,443,714 | | | | 5.0 | |
| | 66,833 | | | | | ING International Growth Fund - Class I | | | 573,427 | | | | 2.0 | |
| | 47,662 | | | | | ING JPMorgan Emerging Markets Equity Portfolio - Class I | | | 858,389 | | | | 2.9 | |
| | 57,641 | | | | | ING Large Cap Growth Portfolio - Class I | | | 733,191 | | | | 2.5 | |
| | 56,504 | | | | | ING Limited Maturity Bond Portfolio - Class I | | | 570,690 | | | | 2.0 | |
| | 34,297 | | | | | ING Marsico Growth Portfolio - Class I | | | 582,014 | | | | 2.0 | |
| | 75,452 | | | @ | | ING MidCap Opportunities Portfolio - Class I | | | 877,502 | | | | 3.0 | |
| | 77,275 | | | | | ING MidCap Value Fund - Class I | | | 898,708 | | | | 3.1 | |
| | | | | | | | | | | | | | |
| Shares | | | | | | | Value | | | Percentage of Net Assets | |
| | | | | | | | | | | | | | |
|
| | AFFILIATED INVESTMENT COMPANIES: (continued) | |
| | 238,152 | | | | | ING PIMCO High Yield Portfolio - Class I | | $ | 2,364,847 | | | | 8.1 | |
| | 325,330 | | | | | ING PIMCO Total Return Bond Portfolio - Class I | | | 3,777,080 | | | | 12.9 | |
| | 33,841 | | | | | ING Small Company Portfolio - Class I | | | 603,047 | | | | 2.1 | |
| | 64,132 | | | | | ING T Rowe Price Capital Appreciation Portfolio - Class I | | | 1,466,701 | | | | 5.0 | |
| | 92,141 | | | | | ING T. Rowe Price Equity Income Portfolio - Class I | | | 1,053,171 | | | | 3.6 | |
| | 10,854 | | | @ | | ING T. Rowe Price Growth Equity Portfolio - Class I | | | 585,156 | | | | 2.0 | |
| | 60,683 | | | | | ING Templeton Foreign Equity Portfolio - Class I | | | 577,698 | | | | 2.0 | |
| | 129,936 | | | | | ING U.S. Bond Index Portfolio - Class I | | | 1,438,396 | | | | 4.9 | |
| | 171,929 | | | | | ING U.S. Stock Index Portfolio - Class I | | | 1,789,786 | | | | 6.1 | |
| | | | | | | | | | | | | | |
| | | | | | Total Investments in Affiliated Investment Companies (Cost $29,881,681) | | $ | 29,189,640 | | | | 100.0 | |
| | | | | | Liabilities in Excess of Other Assets | | | (1,195 | ) | | | — | |
| | | | | | | | | | | | | | |
| | | | | | Net Assets | | $ | 29,188,445 | | | | 100.0 | |
| | | | | | | | | | | | | | |
| @ | Non-income producing security |
| | Cost for federal income tax purposes is $30,169,026. |
| | | | |
Net unrealized depreciation consists of: | | | | |
Gross Unrealized Appreciation | | $ | 185,028 | |
Gross Unrealized Depreciation | | | (1,164,414 | ) |
| | | | |
Net Unrealized depreciation | | $ | (979,386 | ) |
| | | | |
Fair Value Measurements^
The following is a summary of the fair valuations according to the inputs used as of December 31, 2011 in valuing the assets and liabilities:
| | | | | | | | | | | | | | | | |
| | | Quoted Prices in Active Markets for Identical Investments (Level 1) | | | Significant Other Observable Inputs (Level 2) | | | Significant Unobservable Inputs (Level 3) | | | Fair Value at 12/31/2011 | |
Asset Table | | | | | | | | | | | | | | | | |
Investments, at value | | | | | | | | | | | | | | | | |
Affiliated Investment Companies | | $ | 29,189,640 | | | $ | — | | | $ | — | | | $ | 29,189,640 | |
| | | | | | | | | | | | | | | | |
Total Investments, at value | | $ | 29,189,640 | | | $ | — | | | $ | — | | | $ | 29,189,640 | |
| | | | | | | | | | | | | | | | |
| ^ | See Note 2, “Significant Accounting Policies” in the Notes to Financial Statements for additional information. |
| | There were no significant transfers between Level 1 and 2 during the year ending December 31, 2011. |
See Accompanying Notes to Financial Statements
67
| | |
| ING SOLUTION 2015 PORTFOLIO | | PORTFOLIO OF INVESTMENTS ASOF DECEMBER 31, 2011 |
| | | | | | | | | | | | | | |
| Shares | | | | | | | Value | | | Percentage of Net Assets | |
| | | | | | | | | | | | | | |
| |
| | AFFILIATED INVESTMENT COMPANIES: 100.0% | | | | | |
| | 3,329,072 | | | | | ING BlackRock Inflation Protected Bond Portfolio - Class I | | $ | 36,320,174 | | | | 4.9 | |
| | 2,536,560 | | | | | ING Clarion Global Real Estate Portfolio - Class I | | | 22,651,484 | | | | 3.0 | |
| | 335,694 | | | | | ING Clarion Real Estate Portfolio - Class I | | | 7,979,447 | | | | 1.1 | |
| | 896,342 | | | | | ING Davis New York Venture Portfolio - Class I | | | 15,184,030 | | | | 2.0 | |
| | 724,404 | | | | | ING Emerging Markets Equity Fund - Class I | | | 7,359,947 | | | | 1.0 | |
| | 1,340,435 | | | | | ING Equity Dividend Fund - Class I | | | 13,659,031 | | | | 1.8 | |
| | 2,988,931 | | | | | ING Floating Rate Fund - Class I | | | 29,500,748 | | | | 4.0 | |
| | 3,262,278 | | | | | ING Global Bond Fund - Class I | | | 36,831,118 | | | | 4.9 | |
| | 2,366,490 | | | | | ING Goldman Sachs Commodity Strategy Portfolio - Class I | | | 14,151,610 | | | | 1.9 | |
| | 1,408,351 | | | | | ING Growth and Income Portfolio - Class I | | | 30,406,295 | | | | 4.1 | |
| | 4,769,124 | | | | | ING Intermediate Bond Portfolio - Class I | | | 59,137,133 | | | | 7.9 | |
| | 4,443,470 | | | | | ING International Core Fund - Class I | | | 36,969,673 | | | | 4.9 | |
| | 1,711,130 | | | | | ING International Growth Fund - Class I | | | 14,681,496 | | | | 2.0 | |
| | 1,220,802 | | | | | ING JPMorgan Emerging Markets Equity Portfolio - Class I | | | 21,986,647 | | | | 2.9 | |
| | 1,478,627 | | | | | ING Large Cap Growth Portfolio - Class I | | | 18,808,133 | | | | 2.5 | |
| | 1,803,315 | | | | | ING Limited Maturity Bond Portfolio - Class I | | | 18,213,486 | | | | 2.4 | |
| | | | | | | | | | | | | | |
| Shares | | | | | | | Value | | | Percentage of Net Assets | |
| | | | | | | | | | | | | | |
|
| | AFFILIATED INVESTMENT COMPANIES: (continued) | |
| | 2,258,655 | | | @ | | ING MidCap Opportunities Portfolio - Class I | | $ | 26,268,163 | | | | 3.5 | |
| | 2,319,077 | | | | | ING MidCap Value Fund - Class I | | | 26,970,871 | | | | 3.6 | |
| | 6,109,089 | | | | | ING PIMCO High Yield Portfolio - Class I | | | 60,663,253 | | | | 8.1 | |
| | 8,324,098 | | | | | ING PIMCO Total Return Bond Portfolio - Class I | | | 96,642,783 | | | | 12.9 | |
| | 871,421 | | | | | ING Small Company Portfolio - Class I | | | 15,528,724 | | | | 2.1 | |
| | 2,031,710 | | | | | ING T. Rowe Price Equity Income Portfolio - Class I | | | 23,222,448 | | | | 3.1 | |
| | 313,342 | | | @ | | ING T. Rowe Price Growth Equity Portfolio - Class I | | | 16,892,289 | | | | 2.3 | |
| | 1,554,461 | | | | | ING Templeton Foreign Equity Portfolio - Class I | | | 14,798,469 | | | | 2.0 | |
| | 3,320,050 | | | | | ING U.S. Bond Index Portfolio - Class I | | | 36,752,959 | | | | 4.9 | |
| | 4,418,944 | | | | | ING U.S. Stock Index Portfolio - Class I | | | 46,001,207 | | | | 6.2 | |
| | | | | | | | | | | | | | |
| | | | | | Total Investments in Affiliated Investment Companies (Cost $750,699,523) | | $ | 747,581,618 | | | | 100.0 | |
| | | | | | Assets in Excess of Other Liabilities | | | 7,276 | | | | — | |
| | | | | | | | | | | | | | |
| | | | | | Net Assets | | $ | 747,588,894 | | | | 100.0 | |
| | | | | | | | | | | | | | |
| @ | Non-income producing security |
| | Cost for federal income tax purposes is $771,768,195. |
| | | | |
Net unrealized depreciation consists of: | | | | |
Gross Unrealized Appreciation | | $ | 21,885,238 | |
Gross Unrealized Depreciation | | | (46,071,815 | ) |
| | | | |
Net Unrealized depreciation | | $ | (24,186,577 | ) |
| | | | |
See Accompanying Notes to Financial Statements
68
| | |
| ING SOLUTION 2015 PORTFOLIO | | PORTFOLIO OF INVESTMENTS ASOF DECEMBER 31, 2011 (CONTINUED) |
Fair Value Measurements^
The following is a summary of the fair valuations according to the inputs used as of December 31, 2011 in valuing the assets and liabilities:
| | | | | | | | | | | | | | | | |
| | | Quoted Prices in Active Markets for Identical Investments (Level 1) | | | Significant Other Observable Inputs (Level 2) | | | Significant Unobservable Inputs (Level 3) | | | Fair Value at 12/31/2011 | |
Asset Table | | | | | | | | | | | | | | | | |
Investments, at value | | | | | | | | | | | | | | | | |
Affiliated Investment Companies | | $ | 747,581,618 | | | $ | — | | | $ | — | | | $ | 747,581,618 | |
| | | | | | | | | | | | | | | | |
Total Investments, at value | | $ | 747,581,618 | | | $ | — | | | $ | — | | | $ | 747,581,618 | |
| | | | | | | | | | | | | | | | |
| ^ | See Note 2, “Significant Accounting Policies” in the Notes to Financial Statements for additional information. |
| | There were no significant transfers between Level 1 and 2 during the year ending December 31, 2011. |
See Accompanying Notes to Financial Statements
69
| | |
| ING SOLUTION 2020 PORTFOLIO | | PORTFOLIO OF INVESTMENTS ASOF DECEMBER 31, 2011 |
| | | | | | | | | | | | | | |
| Shares | | | | | | | Value | | | Percentage
of Net
Assets | |
| | | | | | | | | | | | | | |
|
| | AFFILIATED INVESTMENT COMPANIES: 100.0% | |
| | 44 | | | | | ING BlackRock Inflation Protected Bond Portfolio - Class I | | $ | 475 | | | | 2.9 | |
| | 55 | | | | | ING Clarion Global Real Estate Portfolio - Class I | | | 494 | | | | 3.0 | |
| | 7 | | | | | ING Clarion Real Estate Portfolio - Class I | | | 174 | | | | 1.1 | |
| | 20 | | | | | ING Davis New York Venture Portfolio - Class I | | | 331 | | | | 2.0 | |
| | 16 | | | | | ING Emerging Markets Equity Fund - Class I | | | 160 | | | | 1.0 | |
| | 33 | | | | | ING Equity Dividend Fund - Class I | | | 340 | | | | 2.1 | |
| | 49 | | | | | ING Floating Rate Fund - Class I | | | 482 | | | | 3.0 | |
| | 71 | | | | | ING Global Bond Fund - Class I | | | 803 | | | | 4.9 | |
| | 77 | | | | | ING Goldman Sachs Commodity Strategy Portfolio - Class I | | | 463 | | | | 2.8 | |
| | 31 | | | | | ING Growth and Income Portfolio - Class I | | | 663 | | | | 4.1 | |
| | 78 | | | | | ING Intermediate Bond Portfolio - Class I | | | 967 | | | | 5.9 | |
| | 116 | | | | | ING International Core Fund - Class I | | | 967 | | | | 5.9 | |
| | 37 | | | | | ING International Growth Fund - Class I | | | 320 | | | | 2.0 | |
| | 27 | | | | | ING JPMorgan Emerging Markets Equity Portfolio - Class I | | | 479 | | | | 2.9 | |
| | 39 | | | | | ING Large Cap Growth Portfolio - Class I | | | 492 | | | | 3.0 | |
| | 16 | | | | | ING Limited Maturity Bond Portfolio - Class I | | | 159 | | | | 1.0 | |
| | 19 | | | | | ING Marsico Growth Portfolio - Class I | | | 325 | | | | 2.0 | |
| | 56 | | | @ | | ING MidCap Opportunities Portfolio - Class I | | | 654 | | | | 4.0 | |
| | | | | | | | | | | | | | |
| Shares | | | | | | | Value | | | Percentage
of Net
Assets | |
| | | | | | | | | | | | | | |
|
| | AFFILIATED INVESTMENT COMPANIES: (continued) | |
| | 58 | | | | | ING MidCap Value Fund - Class I | | $ | 672 | | | | 4.1 | |
| | 117 | | | | | ING PIMCO High Yield Portfolio - Class I | | | 1,157 | | | | 7.1 | |
| | 133 | | | | | ING PIMCO Total Return Bond Portfolio - Class I | | | 1,539 | | | | 9.4 | |
| | 28 | | | | | ING Small Company Portfolio - Class I | | | 508 | | | | 3.1 | |
| | 25 | | | | | ING T Rowe Price Capital Appreciation Portfolio - Class I | | | 574 | | | | 3.5 | |
| | 59 | | | | | ING T. Rowe Price Equity Income Portfolio - Class I | | | 675 | | | | 4.1 | |
| | 9 | | | @ | | ING T. Rowe Price Growth Equity Portfolio - Class I | | | 491 | | | | 3.0 | |
| | 34 | | | | | ING Templeton Foreign Equity Portfolio - Class I | | | 323 | | | | 2.0 | |
| | 58 | | | | | ING U.S. Bond Index Portfolio - Class I | | | 641 | | | | 3.9 | |
| | 96 | | | | | ING U.S. Stock Index Portfolio - Class I | | | 1,003 | | | | 6.2 | |
| | | | | | Total Investments in Affiliated Investment Companies
(Cost $15,332) | | $ | 16,331 | | | | 100.0 | |
| | | | | | Liabilities in Excess of Other Assets | | | (4 | ) | | | — | |
| | | | | | | | | | | | | | |
| | | | | | Net Assets | | $ | 16,327 | | | | 100.0 | |
| | | | | | | | | | | | | | |
| @ | Non-income producing security |
| | Cost for federal income tax purposes is $15,335. |
| | | | |
Net unrealized appreciation consists of: | | | | |
Gross Unrealized Appreciation | | $ | 1,050 | |
Gross Unrealized Depreciation | | | (54 | ) |
| | | | |
Net Unrealized appreciation | | $ | 996 | |
| | | | |
Fair Value Measurements^
The following is a summary of the fair valuations according to the inputs used as of December 31, 2011 in valuing the assets and liabilities:
| | | | | | | | | | | | | | | | |
| | | Quoted Prices
in Active Markets
for Identical Investments
(Level 1) | | | Significant Other
Observable
Inputs (Level 2) | | | Significant
Unobservable
Inputs
(Level 3) | | | Fair Value
at
12/31/2011 | |
Asset Table | | | | | | | | | | | | | | | | |
Investments, at value | | | | | | | | | | | | | | | | |
Affiliated Investment Companies | | $ | 16,331 | | | $ | — | | | $ | — | | | $ | 16,331 | |
| | | | | | | | | | | | | | | | |
Total Investments, at value | | $ | 16,331 | | | $ | — | | | $ | — | | | $ | 16,331 | |
| | | | | | | | | | | | | | | | |
| ^ | See Note 2, “Significant Accounting Policies” in the Notes to Financial Statements for additional information. |
| | There were no significant transfers between Level 1 and 2 during the year ending December 31, 2011. |
See Accompanying Notes to Financial Statements
70
| | |
| ING SOLUTION 2025 PORTFOLIO | | PORTFOLIO OF INVESTMENTS ASOF DECEMBER 31, 2011 |
| | | | | | | | | | | | | | |
| Shares | | | | | | | Value | | | Percentage
of Net
Assets | |
| | | | | | | | | | | | | | |
|
| | AFFILIATED INVESTMENT COMPANIES: 100.0% | |
| | 4,003,366 | | | | | ING Clarion Global Real Estate Portfolio - Class I | | $ | 35,750,060 | | | | 3.0 | |
| | 529,932 | | | | | ING Clarion Real Estate Portfolio - Class I | | | 12,596,477 | | | | 1.1 | |
| | 1,591,553 | | | | | ING Davis New York Venture Portfolio - Class I | | | 26,960,906 | | | | 2.3 | |
| | 1,143,304 | | | | | ING Emerging Markets Equity Fund - Class I | | | 11,615,966 | | | | 1.0 | |
| | 3,022,652 | | | | | ING Equity Dividend Fund - Class I | | | 30,800,825 | | | | 2.6 | |
| | 3,535,584 | | | | | ING Floating Rate Fund - Class I | | | 34,896,210 | | | | 2.9 | |
| | 5,145,034 | | | | | ING Global Bond Fund - Class I | | | 58,087,434 | | | | 4.9 | |
| | 5,598,227 | | | | | ING Goldman Sachs Commodity Strategy Portfolio - Class I | | | 33,477,395 | | | | 2.8 | |
| | 1,965,390 | | | | | ING Growth and Income Portfolio - Class I | | | 42,432,770 | | | | 3.6 | |
| | 2,820,460 | | | | | ING Intermediate Bond Portfolio - Class I | | | 34,973,701 | | | | 2.9 | |
| | 11,220,078 | | | | | ING International Core Fund - Class I | | | 93,351,048 | | | | 7.9 | |
| | 4,050,884 | | | | | ING International Growth Fund - Class I | | | 34,756,586 | | | | 2.9 | |
| | 1,926,606 | | | | | ING JPMorgan Emerging Markets Equity Portfolio - Class I | | | 34,698,167 | | | | 2.9 | |
| | 3,733,695 | | | | | ING Large Cap Growth Portfolio - Class I | | | 47,492,604 | | | | 4.0 | |
| | 2,428,714 | | | | | ING Marsico Growth Portfolio - Class I | | | 41,215,280 | | | | 3.5 | |
| | 4,074,034 | | | @ | | ING MidCap Opportunities Portfolio - Class I | | | 47,381,012 | | | | 4.0 | |
| | 4,183,900 | | | | | ING MidCap Value Fund - Class I | | | 48,658,758 | | | | 4.1 | |
| | 8,432,716 | | | | | ING PIMCO High Yield Portfolio - Class I | | | 83,736,870 | | | | 7.1 | |
| | | | | | | | | | | | | | |
| Shares | | | | | | | Value | | | Percentage
of Net
Assets | |
| | | | | | | | | | | | | | |
|
| | AFFILIATED INVESTMENT COMPANIES: (continued) | |
| | 6,059,389 | | | | | ING PIMCO Total Return Bond Portfolio - Class I | | $ | 70,349,512 | | | | 5.9 | |
| | 2,751,653 | | | | | ING Small Company Portfolio - Class I | | | 49,034,449 | | | | 4.1 | |
| | 2,594,024 | | | | | ING T Rowe Price Capital Appreciation Portfolio - Class I | | | 59,325,330 | | | | 5.0 | |
| | 5,879,410 | | | | | ING T. Rowe Price Equity Income Portfolio - Class I | | | 67,201,661 | | | | 5.7 | |
| | 769,289 | | | @ | | ING T. Rowe Price Growth Equity Portfolio - Class I | | | 41,472,393 | | | | 3.5 | |
| | 3,680,089 | | | | | ING Templeton Foreign Equity Portfolio - Class I | | | 35,034,448 | | | | 3.0 | |
| | 534,516 | | | | | ING Thornburg Value Portfolio - Class I | | | 14,725,927 | | | | 1.2 | |
| | 2,094,327 | | | | | ING U.S. Bond Index Portfolio - Class I | | | 23,184,203 | | | | 2.0 | |
| | 6,974,728 | | | | | ING U.S. Stock Index Portfolio - Class I | | | 72,606,914 | | | | 6.1 | |
| | | | | | Total Investments in Affiliated Investment Companies
(Cost $1,147,605,685) | | $ | 1,185,816,906 | | | | 100.0 | |
| | | | | | Liabilities in Excess of Other Assets | | | (474,577 | ) | | | — | |
| | | | | | | | | | | | | | |
| | | | | | Net Assets | | $ | 1,185,342,329 | | | | 100.0 | |
| | | | | | | | | | | | | | |
| @ | Non-income producing security |
| | Cost for federal income tax purposes is $1,187,722,071. |
| | | | |
Net unrealized depreciation consists of: | | | | |
Gross Unrealized Appreciation | | $ | 82,505,491 | |
Gross Unrealized Depreciation | | | (84,410,656 | ) |
| | | | |
Net Unrealized depreciation | | $ | (1,905,165 | ) |
| | | | |
See Accompanying Notes to Financial Statements
71
| | |
| ING SOLUTION 2025 PORTFOLIO | | PORTFOLIO OF INVESTMENTS ASOF DECEMBER 31, 2011 (CONTINUED) |
Fair Value Measurements^
The following is a summary of the fair valuations according to the inputs used as of December 31, 2011 in valuing the assets and liabilities:
| | | | | | | | | | | | | | | | |
| | | Quoted Prices
in Active Markets
for Identical Investments
(Level 1) | | | Significant Other
Observable
Inputs (Level 2) | | | Significant
Unobservable
Inputs
(Level 3) | | | Fair Value
at
12/31/2011 | |
Asset Table | | | | | | | | | | | | | | | | |
Investments, at value | | | | | | | | | | | | | | | | |
Affiliated Investment Companies | | $ | 1,185,816,906 | | | $ | — | | | $ | — | | | $ | 1,185,816,906 | |
| | | | | | | | | | | | | | | | |
Total Investments, at value | | $ | 1,185,816,906 | | | $ | — | | | $ | — | | | $ | 1,185,816,906 | |
| | | | | | | | | | | | | | | | |
| ^ | See Note 2, “Significant Accounting Policies” in the Notes to Financial Statements for additional information. |
| | There were no significant transfers between Level 1 and 2 during the year ending December 31, 2011. |
See Accompanying Notes to Financial Statements
72
| | |
| ING SOLUTION 2030 PORTFOLIO | | PORTFOLIO OF INVESTMENTS ASOF DECEMBER 31, 2011 |
| | | | | | | | | | | | | | |
| Shares | | | | | | | Value | | | Percentage
of Net
Assets | |
| | | | | | | | | | | | | | |
|
| | AFFILIATED INVESTMENT COMPANIES: 100.1% | |
| | 56 | | | | | ING Clarion Global Real Estate Portfolio - Class I | | $ | 502 | | | | 3.0 | |
| | 7 | | | | | ING Clarion Real Estate Portfolio - Class I | | | 177 | | | | 1.1 | |
| | 27 | | | | | ING Davis New York Venture Portfolio - Class I | | | 462 | | | | 2.8 | |
| | 32 | | | | | ING Emerging Markets Equity Fund - Class I | | | 326 | | | | 2.0 | |
| | 42 | | | | | ING Equity Dividend Fund - Class I | | | 432 | | | | 2.6 | |
| | 50 | | | | | ING Floating Rate Fund - Class I | | | 490 | | | | 2.9 | |
| | 51 | | | | | ING Global Bond Fund - Class I | | | 571 | | | | 3.4 | |
| | 79 | | | | | ING Goldman Sachs Commodity Strategy Portfolio - Class I | | | 470 | | | | 2.8 | |
| | 35 | | | | | ING Growth and Income Portfolio - Class I | | | 766 | | | | 4.6 | |
| | 20 | | | | | ING Intermediate Bond Portfolio - Class I | | | 245 | | | | 1.5 | |
| | 197 | | | | | ING International Core Fund - Class I | | | 1,638 | | | | 9.8 | |
| | 57 | | | | | ING International Growth Fund - Class I | | | 488 | | | | 2.9 | |
| | 36 | | | | | ING JPMorgan Emerging Markets Equity Portfolio - Class I | | | 649 | | | | 3.9 | |
| | 52 | | | | | ING Large Cap Growth Portfolio - Class I | | | 667 | | | | 4.0 | |
| | 34 | | | | | ING Marsico Growth Portfolio - Class I | | | 578 | | | | 3.5 | |
| | 64 | | | @ | | ING MidCap Opportunities Portfolio - Class I | | | 748 | | | | 4.5 | |
| | 66 | | | | | ING MidCap Value Fund - Class I | | | 768 | | | | 4.6 | |
| | | | | | | | | | | | | | |
| Shares | | | | | | | Value | | | Percentage
of Net
Assets | |
| | | | | | | | | | | | | | |
|
| | AFFILIATED INVESTMENT COMPANIES: (continued) | |
| | 118 | | | | | ING PIMCO High Yield Portfolio - Class I | | $ | 1,175 | | | | 7.1 | |
| | 43 | | | | | ING PIMCO Total Return Bond Portfolio - Class I | | | 494 | | | | 3.0 | |
| | 39 | | | | | ING Small Company Portfolio - Class I | | | 688 | | | | 4.1 | |
| | 36 | | | | | ING T Rowe Price Capital Appreciation Portfolio - Class I | | | 833 | | | | 5.0 | |
| | 82 | | | | | ING T. Rowe Price Equity Income Portfolio - Class I | | | 943 | | | | 5.7 | |
| | 11 | | | @ | | ING T. Rowe Price Growth Equity Portfolio - Class I | | | 582 | | | | 3.5 | |
| | 52 | | | | | ING Templeton Foreign Equity Portfolio - Class I | | | 492 | | | | 3.0 | |
| | 11 | | | | | ING Thornburg Value Portfolio - Class I | | | 289 | | | | 1.7 | |
| | 15 | | | | | ING U.S. Bond Index Portfolio - Class I | | | 163 | | | | 1.0 | |
| | 98 | | | | | ING U.S. Stock Index Portfolio - Class I | | | 1,019 | | | | 6.1 | |
| | | | | | Total Investments in Affiliated Investment Companies
(Cost $15,300) | | $ | 16,655 | | | | 100.1 | |
| | | | | | Liabilities in Excess of
Other Assets | | | (13 | ) | | | (0.1 | ) |
| | | | | | | | | | | | | | |
| | | | | | Net Assets | | $ | 16,642 | | | | 100.0 | |
| | | | | | | | | | | | | | |
| @ | Non-income producing security |
| | Cost for federal income tax purposes is $15,301. |
| | | | |
Net unrealized appreciation consists of: | | | | |
Gross Unrealized Appreciation | | $ | 1,380 | |
Gross Unrealized Depreciation | | | (26 | ) |
| | | | |
Net Unrealized appreciation | | $ | 1,354 | |
| | | | |
Fair Value Measurements^
The following is a summary of the fair valuations according to the inputs used as of December 31, 2011 in valuing the assets and liabilities:
| | | | | | | | | | | | | | | | |
| | | Quoted Prices
in Active Markets
for Identical Investments
(Level 1) | | | Significant Other
Observable
Inputs
(Level 2) | | | Significant
Unobservable
Inputs
(Level 3) | | | Fair Value
at
12/31/2011 | |
Asset Table | | | | | | | | | | | | | | | | |
Investments, at value | | | | | | | | | | | | | | | | |
Affiliated Investment Companies | | $ | 16,655 | | | $ | — | | | $ | — | | | $ | 16,655 | |
| | | | | | | | | | | | | | | | |
Total Investments, at value | | $ | 16,655 | | | $ | — | | | $ | — | | | $ | 16,655 | |
| | | | | | | | | | | | | | | | |
| ^ | See Note 2, “Significant Accounting Policies” in the Notes to Financial Statements for additional information. |
| | There were no significant transfers between Level 1 and 2 during the year ending December 31, 2011. |
See Accompanying Notes to Financial Statements
73
| | |
| ING SOLUTION 2035 PORTFOLIO | | PORTFOLIO OF INVESTMENTS AS OF DECEMBER 31, 2011 |
| | | | | | | | | | | | | | |
| Shares | | | | | | | Value | | | Percentage of Net Assets | |
| | | | | | | | | | | | | | |
|
| | AFFILIATED INVESTMENT COMPANIES: 100.0% | |
| | 3,384,845 | | | | | ING Clarion Global Real Estate Portfolio - Class I | | $ | 30,226,669 | | | | 3.0 | |
| | 895,934 | | | | | ING Clarion Real Estate Portfolio - Class I | | | 21,296,359 | | | | 2.1 | |
| | 1,495,121 | | | | | ING Davis New York Venture Portfolio - Class I | | | 25,327,350 | | | | 2.5 | |
| | 1,933,744 | | | | | ING Emerging Markets Equity Fund - Class I | | | 19,646,840 | | | | 2.0 | |
| | 4,088,417 | | | | | ING Equity Dividend Fund - Class I | | | 41,660,969 | | | | 4.1 | |
| | 2,987,810 | | | | | ING Floating Rate Fund - Class I | | | 29,489,686 | | | | 2.9 | |
| | 1,739,165 | | | | | ING Global Bond Fund - Class I | | | 19,635,177 | | | | 1.9 | |
| | 4,732,755 | | | | | ING Goldman Sachs Commodity Strategy Portfolio - Class I | | | 28,301,873 | | | | 2.8 | |
| | 1,898,973 | | | | | ING Growth and Income Portfolio - Class I | | | 40,998,836 | | | | 4.1 | |
| | 11,859,433 | | | | | ING International Core Fund - Class I | | | 98,670,484 | | | | 9.8 | |
| | 4,567,533 | | | | | ING International Growth Fund - Class I | | | 39,189,434 | | | | 3.9 | |
| | 2,715,327 | | | | | ING JPMorgan Emerging Markets Equity Portfolio - Class I | | | 48,903,034 | | | | 4.9 | |
| | 3,945,847 | | | | | ING Large Cap Growth Portfolio - Class I | | | 50,191,176 | | | | 5.0 | |
| | 2,640,306 | | | | | ING Marsico Growth Portfolio - Class I | | | 44,805,995 | | | | 4.5 | |
| | 3,875,338 | | | @ | | ING MidCap Opportunities Portfolio - Class I | | | 45,070,178 | | | | 4.5 | |
| | | | | | | | | | | | | | |
| Shares | | | | | | | Value | | | Percentage of Net Assets | |
| | | | | | | | | | | | | | |
|
| | AFFILIATED INVESTMENT COMPANIES: (continued) | |
| | 3,979,947 | | | | | ING MidCap Value Fund - Class I | | $ | 46,286,788 | | | | 4.6 | |
| | 5,089,999 | | | | | ING PIMCO High Yield Portfolio - Class I | | | 50,543,687 | | | | 5.0 | |
| | 2,908,344 | | | | | ING Small Company Portfolio - Class I | | | 51,826,686 | | | | 5.2 | |
| | 1,753,934 | | | | | ING T Rowe Price Capital Appreciation Portfolio - Class I | | | 40,112,478 | | | | 4.0 | |
| | 6,326,020 | | | | | ING T. Rowe Price Equity Income Portfolio - Class I | | | 72,306,409 | | | | 7.2 | |
| | 836,292 | | | @ | | ING T. Rowe Price Growth Equity Portfolio - Class I | | | 45,084,493 | | | | 4.5 | |
| | 4,149,412 | | | | | ING Templeton Foreign Equity Portfolio - Class I | | | 39,502,401 | | | | 3.9 | |
| | 542,370 | | | | | ING Thornburg Value Portfolio - Class I | | | 14,942,305 | | | | 1.5 | |
| | 5,896,469 | | | | | ING U.S. Stock Index Portfolio - Class I | | | 61,382,241 | | | | 6.1 | |
| | | | | | Total Investments in Affiliated Investment Companies
(Cost $986,277,057) | | $ | 1,005,401,548 | | | | 100.0 | |
| | | | | | Liabilities in Excess of Other Assets | | | (339,459 | ) | | | — | |
| | | | | | | | | | | | | | |
| | | | | | Net Assets | | $ | 1,005,062,089 | | | | 100.0 | |
| | | | | | | | | | | | | | |
| @ | Non-income producing security |
| | Cost for federal income tax purposes is $1,025,373,879. |
| | | | |
Net unrealized depreciation consists of: | | | | |
Gross Unrealized Appreciation | | $ | 66,744,574 | |
Gross Unrealized Depreciation | | | (86,716,905 | ) |
| | | | |
Net Unrealized depreciation | | $ | (19,972,331 | ) |
| | | | |
Fair Value Measurements^
The following is a summary of the fair valuations according to the inputs used as of December 31, 2011 in valuing the assets and liabilities:
| | | | | | | | | | | | | | | | |
| | | Quoted Prices
in Active Markets
for Identical Investments
(Level 1) | | | Significant Other
Observable
Inputs
(Level 2) | | | Significant
Unobservable
Inputs
(Level 3) | | | Fair Value
at
12/31/2011 | |
Asset Table | | | | | | | | | | | | | | | | |
Investments, at value | | | | | | | | | | | | | | | | |
Affiliated Investment Companies | | $ | 1,005,401,548 | | | $ | — | | | $ | — | | | $ | 1,005,401,548 | |
| | | | | | | | | | | | | | | | |
Total Investments, at value | | $ | 1,005,401,548 | | | $ | — | | | $ | — | | | $ | 1,005,401,548 | |
| | | | | | | | | | | | | | | | |
| ^ | See Note 2, “Significant Accounting Policies” in the Notes to Financial Statements for additional information. |
| | There were no significant transfers between Level 1 and 2 during the year ending December 31, 2011. |
See Accompanying Notes to Financial Statements
74
| | |
| ING SOLUTION 2040 PORTFOLIO | | PORTFOLIO OF INVESTMENTS ASOF DECEMBER 31, 2011 |
| | | | | | | | | | | | | | |
| Shares | | | | | | | Value | | | Percentage
of Net
Assets | |
| | | | | | | | | | | | | | |
| |
| | AFFILIATED INVESTMENT COMPANIES: 100.1% | | | | | |
| | 57 | | | | | ING Clarion Global Real Estate Portfolio - Class I | | $ | 508 | | | | 3.0 | |
| | 15 | | | | | ING Clarion Real Estate Portfolio - Class I | | | 358 | | | | 2.1 | |
| | 33 | | | | | ING Davis New York Venture Portfolio - Class I | | | 553 | | | | 3.3 | |
| | 32 | | | | | ING Emerging Markets Equity Fund - Class I | | | 330 | | | | 2.0 | |
| | 86 | | | | | ING Equity Dividend Fund - Class I | | | 875 | | | | 5.2 | |
| | 22 | | | | | ING Global Bond Fund - Class I | | | 248 | | | | 1.5 | |
| | 80 | | | | | ING Goldman Sachs Commodity Strategy Portfolio - Class I | | | 476 | | | | 2.8 | |
| | 44 | | | | | ING Growth and Income Portfolio - Class I | | | 947 | | | | 5.6 | |
| | 199 | | | | | ING International Core Fund - Class I | | | 1,657 | | | | 9.8 | |
| | 77 | | | | | ING International Growth Fund - Class I | | | 658 | | | | 3.9 | |
| | 46 | | | | | ING JPMorgan Emerging Markets Equity Portfolio - Class I | | | 821 | | | | 4.9 | |
| | 66 | | | | | ING Large Cap Growth Portfolio - Class I | | | 843 | | | | 5.0 | |
| | 49 | | | | | ING Marsico Growth Portfolio - Class I | | | 836 | | | | 4.9 | |
| | 65 | | | @ | | ING MidCap Opportunities Portfolio - Class I | | | 757 | | | | 4.5 | |
| | 67 | | | | | ING MidCap Value Fund - Class I | | | 777 | | | | 4.6 | |
| | | | | | | | | | | | | | |
| Shares | | | | | | | Value | | | Percentage
of Net
Assets | |
| | | | | | | | | | | | | | |
|
| | AFFILIATED INVESTMENT COMPANIES: (continued) | |
| | 52 | | | | | ING PIMCO High Yield Portfolio - Class I | | $ | 512 | | | | 3.0 | |
| | 49 | | | | | ING Small Company Portfolio - Class I | | | 870 | | | | 5.1 | |
| | 29 | | | | | ING T Rowe Price Capital Appreciation Portfolio - Class I | | | 674 | | | | 4.0 | |
| | 114 | | | | | ING T. Rowe Price Equity Income Portfolio - Class I | | | 1,301 | | | | 7.7 | |
| | 16 | | | @ | | ING T. Rowe Price Growth Equity Portfolio - Class I | | | 841 | | | | 5.0 | |
| | 70 | | | | | ING Templeton Foreign Equity Portfolio - Class I | | | 663 | | | | 3.9 | |
| | 14 | | | | | ING Thornburg Value Portfolio - Class I | | | 376 | | | | 2.2 | |
| | 99 | | | | | ING U.S. Stock Index Portfolio - Class I | | | 1,031 | | | | 6.1 | |
| | | | | | | | | | | | | | |
| | | | | | Total Investments in Affiliated Investment Companies
(Cost $15,301) | | $ | 16,912 | | | | 100.1 | |
| | | | | | Liabilities in Excess of
Other Assets | | | (13 | ) | | | (0.1 | ) |
| | | | | | | | | | | | | | |
| | | | | | Net Assets | | $ | 16,899 | | | | 100.0 | |
| | | | | | | | | | | | | | |
| @ | Non-income producing security |
| | Cost for federal income tax purposes is the same as for financial statement purposes. |
| | | | |
Net unrealized appreciation consists of: | | | | |
Gross Unrealized Appreciation | | $ | 1,621 | |
Gross Unrealized Depreciation | | | (10 | ) |
| | | | |
Net Unrealized appreciation | | $ | 1,611 | |
| | | | |
Fair Value Measurements^
The following is a summary of the fair valuations according to the inputs used as of December 31, 2011 in valuing the assets and liabilities:
| | | | | | | | | | | | | | | | |
| | | Quoted Prices
in Active Markets
for Identical Investments
(Level 1) | | | Significant Other
Observable
Inputs
(Level 2) | | | Significant
Unobservable
Inputs
(Level 3) | | | Fair Value
at
12/31/2011 | |
Asset Table | | | | | | | | | | | | | | | | |
Investments, at value | | | | | | | | | | | | | | | | |
Affiliated Investment Companies | | $ | 16,912 | | | $ | — | | | $ | — | | | $ | 16,912 | |
| | | | | | | | | | | | | | | | |
Total Investments, at value | | $ | 16,912 | | | $ | — | | | $ | — | | | $ | 16,912 | |
| | | | | | | | | | | | | | | | |
| ^ | See Note 2, “Significant Accounting Policies” in the Notes to Financial Statements for additional information. |
| | There were no significant transfers between Level 1 and 2 during the year ending December 31, 2011. |
See Accompanying Notes to Financial Statements
75
| | |
| ING SOLUTION 2045 PORTFOLIO | | SUMMARY PORTFOLIO OF INVESTMENTS ASOF DECEMBER 31, 2011 |
| | | | | | | | | | | | | | |
| Shares | | | | | | | Value | | | Percentage
of Net
Assets | |
| | | | | | | | | | | | | | |
| |
| | AFFILIATED INVESTMENT COMPANIES: 100.0% | | | | | |
| | 2,925,867 | | | | | ING Clarion Global Real Estate Portfolio - Class I | | $ | 26,127,994 | | | | 4.0 | |
| | 290,372 | | | | | ING Clarion Real Estate Portfolio - Class I | | | 6,902,135 | | | | 1.1 | |
| | 1,453,890 | | | | | ING Davis New York Venture Portfolio - Class I | | | 24,628,893 | | | | 3.8 | |
| | 1,253,674 | | | | | ING Emerging Markets Equity Fund - Class I | | | 12,737,330 | | | | 1.9 | |
| | 3,313,614 | | | | | ING Equity Dividend Fund - Class I | | | 33,765,722 | | | | 5.2 | |
| | 845,688 | | | | | ING Global Bond Fund - Class I | | | 9,547,813 | | | | 1.5 | |
| | 3,068,957 | | | | | ING Goldman Sachs Commodity Strategy Portfolio - Class I | | | 18,352,360 | | | | 2.8 | |
| | 1,846,540 | | | | | ING Growth and Income Portfolio - Class I | | | 39,866,804 | | | | 6.1 | |
| | 7,689,048 | | | | | ING International Core Fund - Class I | | | 63,972,879 | | | | 9.8 | |
| | 2,961,380 | | | | | ING International Growth Fund - Class I | | | 25,408,641 | | | | 3.9 | |
| | 1,760,424 | | | | | ING JPMorgan Emerging Markets Equity Portfolio - Class I | | | 31,705,233 | | | | 4.9 | |
| | 2,558,107 | | | | | ING Large Cap Growth Portfolio - Class I | | | 32,539,122 | | | | 5.0 | |
| | 1,901,972 | | | | | ING Marsico Growth Portfolio - Class I | | | 32,276,464 | | | | 4.9 | |
| | 2,512,376 | | | @ | | ING MidCap Opportunities Portfolio - Class I | | | 29,218,932 | | | | 4.5 | |
| | 2,579,980 | | | | | ING MidCap Value Fund - Class I | | | 30,005,165 | | | | 4.6 | |
| | | | | | | | | | | | | | |
| Shares | | | | | | | Value | | | Percentage
of Net
Assets | |
| | | | | | | | | | | | | | |
|
| | AFFILIATED INVESTMENT COMPANIES: (continued) | |
| | 1,319,891 | | | | | ING PIMCO High Yield Portfolio - Class I | | $ | 13,106,513 | | | | 2.0 | |
| | 1,885,301 | | | | | ING Small Company Portfolio - Class I | | | 33,596,071 | | | | 5.1 | |
| | 1,136,936 | | | | | ING T Rowe Price Capital Appreciation Portfolio - Class I | | | 26,001,724 | | | | 4.0 | |
| | 4,393,692 | | | | | ING T. Rowe Price Equity Income Portfolio - Class I | | | 50,219,896 | | | | 7.7 | |
| | 602,404 | | | @ | | ING T. Rowe Price Growth Equity Portfolio - Class I | | | 32,475,620 | | | | 5.0 | |
| | 2,690,228 | | | | | ING Templeton Foreign Equity Portfolio - Class I | | | 25,610,974 | | | | 3.9 | |
| | 527,432 | | | | | ING Thornburg Value Portfolio - Class I | | | 14,530,764 | | | | 2.2 | |
| | 3,822,624 | | | | | ING U.S. Stock Index Portfolio - Class I | | | 39,793,513 | | | | 6.1 | |
| | | | | | | | | | | | | | |
| | | | | | Total Investments in Affiliated Investment Companies
(Cost $639,280,385) | | $ | 652,390,562 | | | | 100.0 | |
| | | | | | Liabilities in Excess of
Other Assets | | | (238,976 | ) | | | — | |
| | | | | | | | | | | | | | |
| | | | | | Net Assets | | $ | 652,151,586 | | | | 100.0 | |
| | | | | | | | | | | | | | |
| @ | Non-income producing security |
| | Cost for federal income tax purposes is $658,002,598. |
| | | | |
Net unrealized depreciation consists of: | | | | |
Gross Unrealized Appreciation | | $ | 48,392,467 | |
Gross Unrealized Depreciation | | | (54,004,503 | ) |
| | | | |
Net Unrealized depreciation | | $ | (5,612,036 | ) |
| | | | |
See Accompanying Notes to Financial Statements
76
| | |
| ING SOLUTION 2045 PORTFOLIO | | SUMMARY PORTFOLIO OF INVESTMENTS ASOF DECEMBER 31, 2011 (CONTINUED) |
Fair Value Measurements^
The following is a summary of the fair valuations according to the inputs used as of December 31, 2011 in valuing the assets and liabilities:
| | | | | | | | | | | | | | | | |
| | | Quoted Prices
in Active Markets
for Identical Investments
(Level 1) | | | Significant Other
Observable
Inputs
(Level 2) | | | Significant
Unobservable
Inputs
(Level 3) | | | Fair Value
at
12/31/2011 | |
Asset Table | | | | | | | | | | | | | | | | |
Investments, at value | | | | | | | | | | | | | | | | |
Affiliated Investment Companies | | $ | 652,390,562 | | | $ | — | | | $ | — | | | $ | 652,390,562 | |
| | | | | | | | | | | | | | | | |
Total Investments, at value | | $ | 652,390,562 | | | $ | — | | | $ | — | | | $ | 652,390,562 | |
| | | | | | | | | | | | | | | | |
| ^ | See Note 2, “Significant Accounting Policies” in the Notes to Financial Statements for additional information. |
| | There were no significant transfers between Level 1 and 2 during the year ending December 31, 2011. |
See Accompanying Notes to Financial Statements
77
| | |
| ING SOLUTION 2050 PORTFOLIO | | PORTFOLIO OF INVESTMENTS ASOF DECEMBER 31, 2011 |
| | | | | | | | | | | | | | |
| Shares | | | | | | | Value | | | Percentage of Net Assets | |
| | | | | | | | | | | | | | |
| |
| | AFFILIATED INVESTMENT COMPANIES: 100.1% | | | | | |
| | 76 | | | | | ING Clarion Global Real Estate Portfolio - Class I | | $ | 677 | | | | 4.0 | |
| | 8 | | | | | ING Clarion Real Estate Portfolio - Class I | | | 179 | | | | 1.1 | |
| | 38 | | | | | ING Davis New York Venture Portfolio - Class I | | | 638 | | | | 3.8 | |
| | 33 | | | | | ING Emerging Markets Equity Fund - Class I | | | 330 | | | | 1.9 | |
| | 86 | | | | | ING Equity Dividend Fund - Class I | | | 875 | | | | 5.2 | |
| | 22 | | | | | ING Global Bond Fund - Class I | | | 249 | | | | 1.5 | |
| | 80 | | | | | ING Goldman Sachs Commodity Strategy Portfolio - Class I | | | 476 | | | | 2.8 | |
| | 48 | | | | | ING Growth and Income Portfolio - Class I | | | 1,033 | | | | 6.1 | |
| | 199 | | | | | ING International Core Fund - Class I | | | 1,658 | | | | 9.8 | |
| | 77 | | | | | ING International Growth Fund - Class I | | | 659 | | | | 3.9 | |
| | 46 | | | | | ING JPMorgan Emerging Markets Equity Portfolio - Class I | | | 822 | | | | 4.9 | |
| | 66 | | | | | ING Large Cap Growth Portfolio - Class I | | | 843 | | | | 5.0 | |
| | 49 | | | | | ING Marsico Growth Portfolio - Class I | | | 837 | | | | 4.9 | |
| | 65 | | | @ | | ING MidCap Opportunities Portfolio - Class I | | | 757 | | | | 4.5 | |
| | 67 | | | | | ING MidCap Value Fund - Class I | | | 778 | | | | 4.6 | |
| | | | | | | | | | | | | | |
| Shares | | | | | | | Value | | | Percentage of Net Assets | |
| | | | | | | | | | | | | | |
|
| | AFFILIATED INVESTMENT COMPANIES: (continued) | |
| | 34 | | | | | ING PIMCO High Yield Portfolio - Class I | | $ | 341 | | | | 2.0 | |
| | 49 | | | | | ING Small Company Portfolio - Class I | | | 871 | | | | 5.2 | |
| | 29 | | | | | ING T Rowe Price Capital Appreciation Portfolio - Class I | | | 674 | | | | 4.0 | |
| | 114 | | | | | ING T. Rowe Price Equity Income Portfolio - Class I | | | 1,302 | | | | 7.7 | |
| | 16 | | | @ | | ING T. Rowe Price Growth Equity Portfolio - Class I | | | 842 | | | | 5.0 | |
| | 70 | | | | | ING Templeton Foreign Equity Portfolio - Class I | | | 664 | | | | 3.9 | |
| | 14 | | | | | ING Thornburg Value Portfolio - Class I | | | 377 | | | | 2.2 | |
| | 99 | | | | | ING U.S. Stock Index Portfolio - Class I | | | 1,031 | | | | 6.1 | |
| | | | | | | | | | | | | | |
| | | | | | Total Investments in Affiliated Investment Companies (Cost $15,330) | | $ | 16,913 | | | | 100.1 | |
| | | | | | Liabilities in Excess of Other Assets | | | (13 | ) | | | (0.1 | ) |
| | | | | | | | | | | | | | |
| | | | | | Net Assets | | $ | 16,900 | | | | 100.0 | |
| | | | | | | | | | | | | | |
| @ | Non-income producing security |
| | Cost for federal income tax purposes is the same as for financial statement purposes. |
| | | | |
Net unrealized appreciation consists of: | | | | |
Gross Unrealized Appreciation | | $ | 1,592 | |
Gross Unrealized Depreciation | | | (9 | ) |
| | | | |
Net Unrealized appreciation | | $ | 1,583 | |
| | | | |
Fair Value Measurements^
The following is a summary of the fair valuations according to the inputs used as of December 31, 2011 in valuing the assets and liabilities:
| | | | | | | | | | | | | | | | |
| | | Quoted Prices in Active Markets for Identical Investments (Level 1) | | | Significant Other Observable Inputs (Level 2) | | | Significant Unobservable Inputs (Level 3) | | | Fair Value at 12/31/2011 | |
Asset Table | | | | | | | | | | | | | | | | |
Investments, at value | | | | | | | | | | | | | | | | |
Affiliated Investment Companies | | $ | 16,913 | | | $ | — | | | $ | — | | | $ | 16,913 | |
| | | | | | | | | | | | | | | | |
Total Investments, at value | | $ | 16,913 | | | $ | — | | | $ | — | | | $ | 16,913 | |
| | | | | | | | | | | | | | | | |
| ^ | See Note 2, “Significant Accounting Policies” in the Notes to Financial Statements for additional information. |
| | There were no significant transfers between Level 1 and 2 during the year ending December 31, 2011. |
See Accompanying Notes to Financial Statements
78
| | |
| ING SOLUTION 2055 PORTFOLIO | | PORTFOLIO OF INVESTMENTS ASOF DECEMBER 31, 2011 |
| | | | | | | | | | | | | | |
| Shares | | | | | | | Value | | | Percentage of Net Assets | |
| | | | | | | | | | | | | | |
| |
| | AFFILIATED INVESTMENT COMPANIES: 100.0% | | | | | |
| | 121,236 | | | | | ING Clarion Global Real Estate Portfolio - Class I | | $ | 1,082,634 | | | | 4.0 | |
| | 12,011 | | | | | ING Clarion Real Estate Portfolio - Class I | | | 285,512 | | | | 1.1 | |
| | 60,221 | | | | | ING Davis New York Venture Portfolio - Class I | | | 1,020,147 | | | | 3.8 | |
| | 51,972 | | | | | ING Emerging Markets Equity Fund - Class I | | | 528,035 | | | | 1.9 | |
| | 137,126 | | | | | ING Equity Dividend Fund - Class I | | | 1,397,312 | | | | 5.2 | |
| | 35,071 | | | | | ING Global Bond Fund - Class I | | | 395,957 | | | | 1.5 | |
| | 127,482 | | | | | ING Goldman Sachs Commodity Strategy Portfolio - Class I | | | 762,345 | | | | 2.8 | |
| | 76,458 | | | | | ING Growth and Income Portfolio - Class I | | | 1,650,731 | | | | 6.1 | |
| | 318,859 | | | | | ING International Core Fund - Class I | | | 2,652,910 | | | | 9.8 | |
| | 122,815 | | | | | ING International Growth Fund - Class I | | | 1,053,754 | | | | 3.9 | |
| | 72,990 | | | | | ING JPMorgan Emerging Markets Equity Portfolio - Class I | | | 1,314,548 | | | | 4.9 | |
| | 105,992 | | | | | ING Large Cap Growth Portfolio - Class I | | | 1,348,214 | | | | 5.0 | |
| | 78,822 | | | | | ING Marsico Growth Portfolio - Class I | | | 1,337,604 | | | | 4.9 | |
| | 104,101 | | | @ | | ING MidCap Opportunities Portfolio - Class I | | | 1,210,697 | | | | 4.5 | |
| | 106,833 | | | | | ING MidCap Value Fund - Class I | | | 1,242,468 | | | | 4.6 | |
| | 54,664 | | | | | ING PIMCO High Yield Portfolio - Class I | | | 542,810 | | | | 2.0 | |
| | | | | | | | | | | | | | |
| Shares | | | | | | | Value | | | Percentage of Net Assets | |
| | | | | | | | | | | | | | |
|
| | AFFILIATED INVESTMENT COMPANIES: (continued) | |
| | 78,018 | | | | | ING Small Company Portfolio - Class I | | $ | 1,390,290 | | | | 5.1 | |
| | 47,114 | | | | | ING T Rowe Price Capital Appreciation Portfolio - Class I | | | 1,077,498 | | | | 4.0 | |
| | 181,879 | | | | | ING T. Rowe Price Equity Income Portfolio - Class I | | | 2,078,877 | | | | 7.7 | |
| | 24,958 | | | @ | | ING T. Rowe Price Growth Equity Portfolio - Class I | | | 1,345,464 | | | | 5.0 | |
| | 111,553 | | | | | ING Templeton Foreign Equity Portfolio - Class I | | | 1,061,980 | | | | 3.9 | |
| | 21,862 | | | | | ING Thornburg Value Portfolio - Class I | | | 602,310 | | | | 2.2 | |
| | 158,281 | | | | | ING U.S. Stock Index Portfolio - Class I | | | 1,647,708 | | | | 6.1 | |
| | | | | | | | | | | | | | |
| | | | | | Total Investments in Affiliated Investment Companies (Cost $28,170,146) | | $ | 27,029,805 | | | | 100.0 | |
| | | | | | Liabilities in Excess of Other Assets | | | (9,699 | ) | | | — | |
| | | | | | | | | | | | | | |
| | | | | | Net Assets | | $ | 27,020,106 | | | | 100.0 | |
| | | | | | | | | | | | | | |
| @ | Non-income producing security |
| | Cost for federal income tax purposes is $28,462,522. |
| | | | |
Net unrealized depreciation consists of: | | | | |
Gross Unrealized Appreciation | | $ | 232,999 | |
Gross Unrealized Depreciation | | | (1,665,716 | ) |
| | | | |
Net Unrealized depreciation | | $ | (1,432,717 | ) |
| | | | |
Fair Value Measurements^
The following is a summary of the fair valuations according to the inputs used as of December 31, 2011 in valuing the assets and liabilities:
| | | | | | | | | | | | | | | | |
| | | Quoted Prices in Active Markets for Identical Investments (Level 1) | | | Significant Other Observable Inputs (Level 2) | | | Significant Unobservable Inputs (Level 3) | | | Fair Value at 12/31/2011 | |
Asset Table | | | | | | | | | | | | | | | | |
Investments, at value | | | | | | | | | | | | | | | | |
Affiliated Investment Companies | | $ | 27,029,805 | | | $ | — | | | $ | — | | | $ | 27,029,805 | |
| | | | | | | | | | | | | | | | |
Total Investments, at value | | $ | 27,029,805 | | | $ | — | | | $ | — | | | $ | 27,029,805 | |
| | | | | | | | | | | | | | | | |
| ^ | See Note 2, “Significant Accounting Policies” in the Notes to Financial Statements for additional information. |
| | There were no significant transfers between Level 1 and 2 during the year ending December 31, 2011. |
See Accompanying Notes to Financial Statements
79
TAX INFORMATION (UNAUDITED)
Dividends and distributions paid during the year ended December 31, 2011 were as follows:
| | | | | | |
Portfolio Name | | Type | | Per Share Amount | |
| | |
ING Solution Aggressive Growth Portfolio | | | | | | |
Class ADV | | NII | | $ | 0.0184 | |
Class I | | NII | | $ | 0.0241 | |
Class S | | NII | | $ | 0.0217 | |
Class S2 | | NII | | $ | — | |
All Classes | | STCG | | $ | 0.0419 | |
All Classes | | LTCG | | $ | 0.0001 | |
| | |
ING Solution Conservative Portfolio | | | | | | |
Class ADV | | NII | | $ | 0.0393 | |
Class I | | NII | | $ | 0.0423 | |
Class S | | NII | | $ | 0.0395 | |
Class S2 | | NII | | $ | 0.0387 | |
All Classes | | STCG | | $ | 0.0277 | |
All Classes | | LTCG | | $ | 0.0000 | * |
| | |
ING Solution Growth Portfolio | | | | | | |
Class ADV | | NII | | $ | 0.0302 | |
Class I | | NII | | $ | 0.0331 | |
Class S | | NII | | $ | 0.0286 | |
Class S2 | | NII | | $ | 0.0265 | |
All Classes | | STCG | | $ | 0.0116 | |
All Classes | | LTCG | | $ | 0.0287 | |
| | |
ING Solution Income Portfolio | | | | | | |
Class ADV | | NII | | $ | 0.4325 | |
Class I | | NII | | $ | 0.4851 | |
Class S | | NII | | $ | 0.4555 | |
Class S2 | | NII | | $ | 0.4440 | |
Class T | | NII | | $ | 0.3240 | |
ING Solution Moderate Portfolio | | | | | | |
| | |
Class ADV | | NII | | $ | 0.0584 | |
Class I | | NII | | $ | 0.0603 | |
Class S | | NII | | $ | 0.0530 | |
Class S2 | | NII | | $ | 0.0572 | |
All Classes | | STCG | | $ | 0.0162 | |
All Classes | | LTCG | | $ | 0.0672 | |
ING Solution 2015 Portfolio | | | | | | |
| | |
Class ADV | | NII | | $ | 0.3293 | |
Class I | | NII | | $ | 0.3826 | |
Class S | | NII | | $ | 0.3550 | |
Class S2 | | NII | | $ | 0.3561 | |
Class T | | NII | | $ | 0.3046 | |
80
TAX INFORMATION (UNAUDITED) (CONTINUED)
| | | | | | |
Portfolio Name | | Type | | Per Share Amount | |
| | |
ING Solution 2025 Portfolio | | | | | | |
Class ADV | | NII | | $ | 0.2082 | |
Class I | | NII | | $ | 0.2576 | |
Class S | | NII | | $ | 0.2318 | |
Class S2 | | NII | | $ | 0.2337 | |
Class T | | NII | | $ | 0.1797 | |
| | |
ING Solution 2035 Portfolio | | | | | | |
Class ADV | | NII | | $ | 0.1511 | |
Class I | | NII | | $ | 0.2012 | |
Class S | | NII | | $ | 0.1754 | |
Class S2 | | NII | | $ | 0.1775 | |
Class T | | NII | | $ | 0.1181 | |
| | |
ING Solution 2045 Portfolio | | | | | | |
Class ADV | | NII | | $ | 0.1097 | |
Class I | | NII | | $ | 0.1597 | |
Class S | | NII | | $ | 0.1342 | |
Class S2 | | NII | | $ | 0.1352 | |
Class T | | NII | | $ | 0.0751 | |
| | |
ING Solution 2055 Portfolio | | | | | | |
Class ADV | | NII | | $ | 0.0324 | |
Class I | | NII | | $ | 0.0415 | |
Class S | | NII | | $ | 0.0372 | |
Class S2 | | NII | | $ | 0.0336 | |
All Classes | | STCG | | $ | 0.0251 | |
All Classes | | LTCG | | $ | 0.0005 | |
NII - Net investment income
STCG - Short-term capital gain
LTCG - Long-term capital gain
| * | Rounds to $0.0000 per share |
Of the ordinary distributions made during the year ended December 31, 2011, the following percentages qualify for the dividends received deduction (DRD) available to corporate shareholders:
| | | | |
| |
ING Solution Aggressive Growth Portfolio | | | 27.98 | % |
| |
ING Solution Conservative Portfolio | | | 8.05 | % |
| |
ING Solution Growth Portfolio | | | 32.73 | % |
| |
ING Solution Income Portfolio | | | 6.16 | % |
| |
ING Solution Moderate Portfolio | | | 17.27 | % |
| |
ING Solution 2015 Portfolio | | | 14.93 | % |
| |
ING Solution 2025 Portfolio | | | 27.98 | % |
| |
ING Solution 2035 Portfolio | | | 40.07 | % |
| |
ING Solution 2045 Portfolio | | | 53.99 | % |
| |
ING Solution 2055 Portfolio | | | 35.54 | % |
81
TAX INFORMATION (UNAUDITED) (CONTINUED)
The Regulated Investment Company Modernization Act of 2010 allows qualified fund-of-funds to elect to pass through the ability to take foreign tax credits (or deductions) to the extent that foreign taxes are passed through from underlying funds. A qualified fund-of-funds is a regulated investment company that has at least 50% of the value of its total assets invested in other regulated investment companies at the end of each quarter of the taxable year. Pursuant to Section 853 of the Internal Revenue Code, the Portfolios designate the following amounts as foreign taxes paid for the year ended December 31, 2011:
| | | | | | | | | | | | |
| | | Creditable
Foreign Taxes
Paid | | | Per Share
Amount | | | Portion of Ordinary Income
Distribution Derived from
Foreign Sourced Income* | |
ING Solution Aggressive Growth Portfolio | | $ | 6,896 | | | $ | 0.0049 | | | | 19.77 | % |
ING Solution Conservative Portfolio | | $ | 1,760 | | | $ | 0.0020 | | | | 4.45 | % |
ING Solution Growth Portfolio | | $ | 8,642 | | | $ | 0.0028 | | | | 10.74 | % |
ING Solution Income Portfolio | | $ | 43,228 | | | $ | 0.0021 | | | | 4.23 | % |
ING Solution Moderate Portfolio | | $ | 7,211 | | | $ | 0.0025 | | | | 7.33 | % |
ING Solution 2015 Portfolio | | $ | 199,641 | | | $ | 0.0028 | | | | 6.78 | % |
ING Solution 2025 Portfolio | | $ | 437,128 | | | $ | 0.0038 | | | | 11.99 | % |
ING Solution 2035 Portfolio | | $ | 485,040 | | | $ | 0.0051 | | | | 18.43 | % |
ING Solution 2045 Portfolio | | $ | 321,262 | | | $ | 0.0052 | | | | 23.14 | % |
ING Solution 2055 Portfolio | | $ | 13,126 | | | $ | 0.0052 | | | | 23.63 | % |
| * | None of the Portfolios listed above derived any income from ineligible foreign sources as defined under Section 901(j) of the Internal Revenue Code. |
Above figures may differ from those cited elsewhere in this report due to differences in the calculation of income and gains under U.S. generally accepted accounting principles (book) purposes and Internal Revenue Service (tax) purposes.
Shareholders are strongly advised to consult their own tax advisers with respect to the tax consequences of their investments in the Portfolios. In January, shareholders, excluding corporate shareholders, receive an IRS 1099-DIV regarding the federal tax status of the dividends and distributions they received in the calendar year.
82
DIRECTOR AND OFFICER INFORMATION (UNAUDITED)
The business and affairs of the Company are managed under the direction of the Company’s Board. A Director who is not an interested person of the Company, as defined in the 1940 Act, is an independent director (“Independent Director”). The Directors and Officers of the Company are listed below. The Statement of Additional Information includes additional information about directors of the Company and is available, without charge, upon request at (800) 992-0180.
| | | | | | | | | | |
Name, Address and Age | | Position(s) held with the Company | | Term of Office and Length of Time Served(1) | | Principal Occupation(s) during the Past 5 Years | | Number of Portfolios in
Fund Complex
Overseen by Director(2) | | Other Board Positions
held by Director |
Independent Directors: | | | | | | | | | | |
| | | | | |
Colleen D. Baldwin 7337 East Doubletree Ranch Rd. Suite 100 Scottsdale, Arizona 85258 Age: 51 | | Director | | November 2007 -Present | | President, Glantuam Partners, LLC, a business consulting firm (January 2009 - Present) and Consultant (January 2005 - Present). | | 140 | | None. |
| | | | | |
John V. Boyer 7337 East Doubletree Ranch Rd. Suite 100 Scottsdale, Arizona 85258 Age: 58 | | Director | | November 1997 - Present | | President and Chief Executive Officer, Bechtler Arts Foundation, an arts and education foundation (January 2008 - Present). Formerly, Consultant (July 2007 - February 2008) and President and Chief Executive Officer, Franklin and Eleanor Roosevelt Institute, a public policy foundation (March 2006 - July 2007). | | 140 | | None. |
| | | | | |
Patricia W. Chadwick 7337 East Doubletree Ranch Rd. Suite 100 Scottsdale, Arizona 85258 Age: 63 | | Director | | January 2006 - Present | | Consultant and President, Ravengate Partners LLC, a consulting firm that provides advice regarding financial markets and the global economy (January 2000 - Present). | | 140 | | Wisconsin Energy Corporation (June 2006 - Present) and The Royce Fund, 35 Funds (December 2009 - Present). |
| | | | | |
Peter S. Drotch 7337 East Doubletree Ranch Rd. Suite 100 Scottsdale, Arizona 85258 Age: 70 | | Director | | November 2007 - Present | | Retired. | | 140 | | First Marblehead Corporation (September 2003 - Present). |
| | | | | |
J. Michael Earley 7337 East Doubletree Ranch Rd. Suite 100 Scottsdale, Arizona 85258 Age: 66 | | Director | | January 2005 - Present | | Retired. Formerly, Banking President and Chief Executive Officer, Bankers Trust Company, N.A., Des Moines (June 1992 - December 2008). | | 140 | | None. |
| | | | | |
Patrick W. Kenny 7337 East Doubletree Ranch Rd. Suite 100 Scottsdale, Arizona 85258 Age: 69 | | Director | | March 2002 - Present | | Retired. Formerly, President and Chief Executive Officer, International Insurance Society (June 2001 - June 2009). | | 140 | | Assured Guaranty Ltd. (April 2004 - Present). |
| | | | | |
Sheryl K. Pressler 7337 East Doubletree Ranch Rd. Suite 100 Scottsdale, Arizona 85258 Age: 61 | | Director | | January 2006 - Present | | Consultant (May 2001 - Present). | | 140 | | Stillwater Mining Company (May 2002 - Present). |
| | | | | |
Roger B. Vincent 7337 East Doubletree Ranch Rd. Suite 100 Scottsdale, Arizona 85258 Age: 66 | | Chairperson/Director | | January 2005 - Present | | President, Springwell Corporation, a corporate finance firm (March 1989 - Present). | | 140 | | UGI Corporation (February 2006 - Present) and UGI Utilities, Inc. (February 2006 - Present). |
83
DIRECTOR AND OFFICER INFORMATION (UNAUDITED) (CONTINUED)
| | | | | | | | | | |
Name, Address and Age | | Position(s) held with the Company | | Term of Office and Length of Time Served(1) | | Principal Occupation(s) during the Past 5 Years | | Number of Portfolios in
Fund Complex
Overseen by Director(2) | | Other Board Positions
held by Director |
Trustees who are “Interested Persons”: |
| | | | | |
Robert W. Crispin (3) 7337 East Doubletree Ranch Rd. Suite 100 Scottsdale, Arizona 85258 Age: 65 | | Director | | November 2007 - Present | | Retired. Formerly, Chairman and Chief Executive Officer, ING Investment Management Co. (July 2001 - December 2007). | | 140 | | Intact Financial Corporation (December 2004 - Present) and PFM Group (November 2010 - Present). |
| | | | | |
Shaun P. Mathews (3) 7337 East Doubletree Ranch Rd. Suite 100 Scottsdale, Arizona 85258 Age: 56 | | Director | | November 2007 - Present | | President and Chief Executive Officer, ING Investments, LLC (November 2006 - Present). | | 177 | | ING Capital Corporation, LLC (December 2005 - Present). |
| (1) | | Directors serve until their successors are duly elected and qualified. The tenure of each Director is subject to the Board’s retirement policy which states that each duly elected or appointed Director who is not an “interested person” of the Company, as defined in the 1940 Act, as amended (“Independent Directors”), shall retire from service as a Director at the conclusion of the first regularly scheduled quarterly meeting of the Board that is held after the Director reaches the age of 72. A unanimous vote of the Board may extend the retirement date of a Director for up to one year. An extension may be permitted if the retirement would trigger a requirement to hold a meeting of shareholders of the Company under applicable law, whether for purposes of appointing a successor to the Director or if otherwise necessary under applicable law, in which case the extension would apply until such time as the shareholder meeting can be held or is no longer needed. |
| (2) | | Except for Mr. Mathews and for the purposes of this table “ING Fund Complex” means the following investment companies: ING Asia Pacific High Dividend Equity Income Fund; ING Emerging Markets High Dividend Equity Fund; ING Emerging Markets Local Bond Fund; ING Equity Trust; ING Funds Trust; ING Global Equity Dividend and Premium Opportunity Fund; ING Global Advantage and Premium Opportunity Fund; ING Infrastructure, Industrials and Materials Fund; ING International High Dividend Equity Income Fund; ING Investors Trust; ING Mayflower Trust; ING Mutual Funds; ING Partners, Inc.; ING Prime Rate Trust; ING Risk Managed Natural Resources Fund; ING Senior Income Fund; ING Separate Portfolios Trust; ING Variable Insurance Trust; and ING Variable Products Trust. For Mr. Mathews, the ING Fund Complex also includes the following investment companies: ING Balanced Portfolio, Inc.; ING Intermediate Bond Portfolio; ING Money Market Portfolio; ING Series Fund, Inc.; ING Strategic Allocation Portfolios, Inc.; ING Variable Funds; and ING Variable Portfolios, Inc. Therefore, for the purposes of this table with reference to Mr. Mathews, “Fund Complex” includes these investment companies. The number of funds in the ING Fund Complex is as of January 31, 2012. |
| (3) | | Messrs. Crispin and Matthews are deemed “Interested Persons” of the Trust because of their current or prior affiliation with ING Groep, N.V., the parent corporation of the Investment Adviser(s) and the Distributor. |
84
DIRECTOR AND OFFICER INFORMATION (UNAUDITED) (CONTINUED)
| | | | | | |
Name, Address and Age | | Position(s) Held
With the Company | | Term of Office and Length of Time Served(1) | | Principal Occupation(s) during the Past 5 Years |
| | | |
Shaun P. Mathews 7337 East Doubletree Ranch Rd. Suite 100 Scottsdale, Arizona 85258 Age: 56 | | President and Chief Executive Officer | | November 2006 - Present | | President and Chief Executive Officer, ING Investments, LLC (November 2006 - Present). |
| | | |
Michael J. Roland 7337 East Doubletree Ranch Rd. Suite 100 Scottsdale, Arizona 85258 Age: 53 | | Executive Vice President | | January 2005 - Present | | Chief Compliance Officer, Directed Services LLC and ING Investments, LLC (March 2011 - Present) and Executive Vice President and Chief Operating Officer, ING Investments, LLC and ING Funds Services, LLC (January 2007 - Present). Formerly, Chief Compliance Officer, ING Funds (March 2011 - February 2012). |
| | | |
Stanley D. Vyner 230 Park Avenue New York, New York 10169 Age: 61 | | Executive Vice President Chief Investment Risk Officer | | January 2005 - Present September 2009 - Present | | Executive Vice President, ING Investments, LLC (July 2000 - Present) and Chief Investment Risk Officer, ING Investments, LLC (January 2003 - Present). |
| | | |
Kevin M. Gleason 7337 East Doubletree Ranch Rd. Suite 100 Scottsdale, Arizona 85258 Age: 45 | | Chief Compliance Officer | | February 2012 - Present | | Chief Compliance Officer, ING Funds (February 2012 - Present). Formerly, Assistant General Counsel and Assistant Secretary, The Northwestern Mutual Life Insurance Company, (June 2004 - January 2012). |
| | | |
Kimberly A. Anderson 7337 East Doubletree Ranch Rd. Suite 100 Scottsdale, Arizona 85258 Age: 47 | | Senior Vice President | | January 2005 - Present | | Senior Vice President, ING Investments, LLC (October 2003 - Present). |
| | | |
Todd Modic 7337 East Doubletree Ranch Rd. Suite 100 Scottsdale, Arizona 85258 Age: 44 | | Senior Vice President, Chief/Principal Financial Officer and Assistant Secretary | | March 2005 - Present | | Senior Vice President, ING Funds Services, LLC (March 2005 - Present). |
| | | |
Robert Terris 7337 East Doubletree Ranch Rd. Suite 100 Scottsdale, Arizona 85258 Age: 41 | | Senior Vice President | | May 2006 - Present | | Senior Vice President, Head of Division Operations, ING Funds Services, LLC (May 2006 - Present). |
| | | |
Gregory K. Wilson 7337 East Doubletree Ranch Rd. Suite 100 Scottsdale, Arizona 85258 Age: 52 | | Senior Vice President | | September 2011 - Present | | Vice President - Fund Compliance, ING Funds Services, LLC (October 2009 - Present). Formerly, Finance Director, ING Funds Services, LLC (September 2006 - October 2009). |
| | | |
Robyn L. Ichilov 7337 East Doubletree Ranch Rd. Suite 100 Scottsdale, Arizona 85258 Age: 44 | | Vice President and Treasurer | | January 2005 - Present | | Vice President and Treasurer, ING Funds Services, LLC (November 1995 - Present) and ING Investments, LLC (August 1997 - Present). |
| | | |
Maria M. Anderson 7337 East Doubletree Ranch Rd. Suite 100 Scottsdale, Arizona 85258 Age: 53 | | Vice President | | January 2005 - Present | | Vice President, ING Funds Services, LLC (September 2004 - Present). |
| | | |
Lauren D. Bensinger 7337 East Doubletree Ranch Rd. Suite 100 Scottsdale, Arizona 85258 Age: 58 | | Vice President | | January 2005 - Present | | Vice President, ING Investments, LLC and ING Funds Services, LLC (February 1996 - Present); Director of Compliance, ING Investments, LLC (October 2004 - Present); and Vice President and Money Laundering Reporting Officer, ING Investments Distributor, LLC (April 2010 - Present). Formerly, Chief Compliance Officer, ING Investments Distributor, LLC (August 1995 - April 2010) |
85
DIRECTOR AND OFFICER INFORMATION (UNAUDITED) (CONTINUED)
| | | | | | |
Name, Address and Age | | Position(s) Held
With the Company | | Term of Office and Length of Time Served(1) | | Principal Occupation(s) during the Past 5 Years |
| | | |
William Evans One Orange Way Windsor, Connecticut 06095 Age: 39 | | Vice President | | September 2007 - Present | | Senior Vice President (March 2010 - Present) and Head of Manager Research and Selection Group, ING Investment Management (April 2007 - Present). Formerly, Vice President, U.S. Mutual Funds and Investment Products (May 2005 - April 2007). |
| | | |
Denise Lewis 7337 East Doubletree Ranch Rd. Suite 100 Scottsdale, Arizona 85258 Age: 48 | | Vice President | | January 2007 - Present | | Vice President, ING Funds Services, LLC (December 2006 - Present). |
| | | |
Kimberly K. Springer 7337 East Doubletree Ranch Rd. Suite 100 Scottsdale, Arizona 85258 Age: 54 | | Vice President | | March 2006 - Present | | Vice President, ING Investment Management -ING Funds (March 2010 - Present); Vice President, ING Funds Services, LLC (March 2006 - Present) and Managing Paralegal, Registration Statements (June 2003 - Present). |
| | | |
Craig Wheeler 7337 East Doubletree Ranch Rd. Suite 100 Scottsdale, Arizona 85258 Age: 42 | | Assistant Vice President | | May 2008 - Present | | Assistant Vice President - Director of Tax, ING Funds Services, LLC (March 2008 - Present). Formerly, Tax Manager, ING Funds Services, LLC (March 2005 - March 2008). |
| | | |
Huey P. Falgout, Jr. 7337 East Doubletree Ranch Rd. Suite 100 Scottsdale, Arizona 85258 Age: 48 | | Secretary | | August 2003 - Present | | Senior Vice President and Chief Counsel, ING Investment Management - ING Funds (March 2010 - Present). Formerly, Chief Counsel, ING Americas, U.S. Legal Services (October 2003 - March 2010). |
| | | |
Paul Caldarelli 7337 East Doubletree Ranch Rd. Suite 100 Scottsdale, Arizona 85258 Age: 60 | | Assistant Secretary | | June 2010 - Present | | Vice President and Senior Counsel, ING Investment Management - ING Funds (March 2010 - Present). Formerly, Senior Counsel, ING Americas, U.S. Legal Services (April 2008 - March 2010) and Counsel, ING Americas, U.S. Legal Services (May 2005 - April 2008). |
| | | |
Theresa K. Kelety 7337 East Doubletree Ranch Rd. Suite 100 Scottsdale, Arizona 85258 Age: 49 | | Assistant Secretary | | August 2003 - Present | | Vice President and Senior Counsel, ING Investment Management - ING Funds (March 2010 - Present). Formerly, Senior Counsel, ING Americas, U.S. Legal Services (April 2008 - March 2010) and Counsel, ING Americas, U.S. Legal Services (April 2003 - April 2008). |
| | | |
Kathleen Nichols 7337 East Doubletree Ranch Rd. Suite 100 Scottsdale, Arizona 85258 Age: 36 | | Assistant Secretary | | May 2008 - Present | | Vice President and Counsel, ING Investment Management - ING Funds (March 2010 - Present). Formerly, Counsel, ING Americas, U.S. Legal Services (February 2008 - March 2010) and Associate, Ropes & Gray LLP (September 2005 - February 2008) |
| (1) | | The Officers hold office until the next annual meeting of the Board of Directors and until their successors shall have been elected and qualified. |
86
ADVISORY CONTRACT APPROVAL DISCUSSION (UNAUDITED)
BOARD CONSIDERATION AND RE-APPROVAL OF INVESTMENT ADVISORY CONTRACTS
Section 15(c) of the Investment Company Act of 1940, as amended (the “1940 Act”) provides that, after an initial period, the Portfolios’ existing investment advisory contracts will remain in effect only if the Board of Directors (the “Board”) of ING Partners, Inc. (the “Company”), including a majority of Board members who have no direct or indirect interest in the advisory contracts, and who are not “interested persons” of the Portfolios, as such term is defined under the 1940 Act (the “Independent Directors”), annually review and approve them. Thus, at a meeting held on November 17, 2011, the Board, including a majority of the Independent Directors, considered whether to renew the investment advisory contracts (the “Advisory Contracts”) between Directed Services LLC (the “Adviser”) and the Portfolios.
The Independent Directors also held separate meetings on October 12 and November 15, 2011 to consider the renewal of the Advisory Contracts. As a result, subsequent references herein to factors considered and determinations made by the Independent Directors include, as applicable, factors considered and determinations made on those earlier dates by the Independent Directors.
At its November 17, 2011 meeting, the Board voted to renew the Advisory Contracts for the Portfolios. In reaching these decisions, the Board took into account information furnished to it throughout the year at regular meetings of the Board and the Board’s committees, as well as information prepared specifically in connection with the annual renewal process. Determinations by the Independent Directors also took into account various factors that they believed, in light of the legal advice furnished to them by K&L Gates LLP (“K&L Gates”), their independent legal counsel, and their own business judgment, to be relevant. Further, while the advisory contracts for all the Portfolios were considered at the same Board meeting, the Directors considered each Portfolio’s advisory relationship separately.
Provided below is an overview of the Board’s contract approval process in general, as well as a discussion of certain specific factors that the Board considered at its renewal meeting. While the Board gave its attention to the information furnished at the request of the Independent Directors that was most relevant to its considerations, discussed below are a number of the primary factors relevant to the Board’s consideration as
to whether to renew the Advisory Contracts for the one-year period ending November 30, 2012. Each Board member may have accorded different weight to the various factors in reaching his or her conclusions with respect to each Portfolio’s advisory arrangement.
Overview of the Contract Renewal and Approval Process
The Board follows a structured process pursuant to which it seeks and considers relevant information when it decides whether to approve new or existing advisory arrangements for the investment companies in the ING Fund complex under its jurisdiction, including the Portfolios’ existing Advisory Contracts. Among other actions, the Independent Directors of the Board: retain the services of independent consultants with experience in the mutual fund industry to assist the Independent Directors in working with the personnel employed by the Adviser or its affiliates who administer the Portfolios (“Management”) to identify the types of information presented to the Board to inform its deliberations with respect to advisory relationships and to help evaluate that information; evaluate industry best practices in regards to the consideration of investment advisory contracts; established a specific format in which certain requested information is provided to the Board; and determine the process for reviewing such information in connection with advisory contract renewals and approvals. The result is a process (the “Contract Review Process”) employed by the Board and its Independent Directors to review and analyze information in connection with the annual renewal of the ING Funds’ advisory contracts, as well as the review and approval of new advisory relationships.
Since the Contract Review Process was first implemented, the Board’s membership has changed substantially through periodic retirements of some Directors and the appointment and election of new Directors. In addition, the Independent Directors have reviewed and refined the renewal and approval process at least annually in order to request additional information from Management and address certain unique characteristics related to the introduction of new Portfolios.
The Board has established two Investment Review Committees (each, an “IRC”), which meet independently and, at times, jointly, and a Contracts Committee. Among other matters, the Contracts Committee provides oversight with respect to the contracts renewal and approval process, and each Portfolio is assigned to an IRC which provides oversight
87
ADVISORY CONTRACT APPROVAL DISCUSSION (UNAUDITED) (CONTINUED)
regarding, among other matters, the investment performance of the Adviser. The IRCs may apply a heightened level of scrutiny in cases where performance has lagged a Portfolio’s relevant benchmark and/or selected peer group of investment companies (“Selected Peer Groups”).
The type and format of the information provided to the Board or to legal counsel for the Independent Directors in connection with the contract approval and renewal process has been codified in the ING Funds’ 15(c) Methodology Guide. This Guide was developed under the direction of the Independent Directors and sets out a blueprint pursuant to which the Independent Directors request certain information that they deem important to facilitate an informed review in connection with initial and annual approvals of advisory contracts.
Management provides certain of the information requested by the 15(c) Methodology Guide in Fund Analysis and Comparison Tables (“FACT sheets”) prior to the Independent Directors’ review of advisory arrangements (including the Portfolios’ Advisory Contracts). The Independent Directors previously retained an independent firm to verify and test the accuracy of certain FACT sheet data for a representative sample of funds in the ING Fund complex. In addition, the Contracts Committee routinely employs the services of an independent consultant to assist in its review and analysis of, among other matters, the 15(c) Methodology Guide, the content and format of the FACT sheets, and Selected Peer Groups to be used by the Portfolios for certain comparison purposes during the renewal process. As part of an ongoing process, the Contracts Committee recommends or considers recommendations from Management for refinements to the 15(c) Methodology Guide and other aspects of the review process, and the Board’s IRCs review benchmarks used to assess the performance of funds in the ING Fund complex.
The Board employed its process for reviewing contracts when considering the renewals of the Portfolios’ Advisory Contracts that would be effective through November 30, 2012. Set forth below is a discussion of many of the Board’s primary considerations and conclusions resulting from this process.
Nature, Extent and Quality of Service
In determining whether to approve the Advisory Contracts for the Portfolios for the year ended November 30, 2012, the Independent Directors received
and evaluated such information as they deemed necessary regarding the nature, extent and quality of services provided to the Portfolios by the Adviser. This included information regarding the Adviser provided throughout the year at regular meetings of the Board and its committees, as well as information furnished in connection with the contract renewal meetings.
The materials requested by the Independent Directors and provided to the Board, K&L Gates and/or independent consultants that assist the Independent Directors prior to the November 17, 2011 Board meeting included, among other information, the following items for each Portfolio: (1) FACT sheets that provided information regarding the performance and expenses of the Portfolio and other similarly managed funds in its Selected Peer Group, as well as information regarding the Portfolio’s investment portfolio, objective and strategies; (2) reports providing risk and attribution analyses of the Portfolio; (3) the 15(c) Methodology Guide, which describes how the FACT sheets were prepared, including the manner in which each Portfolio’s benchmark and Selected Peer Group were selected and how profitability was determined; (4) responses from the Adviser to a series of questions posed by K&L Gates on behalf of the Independent Directors; (5) copies of the forms of Advisory Contracts; (6) copies of the Forms ADV for the Adviser; (7) financial statements for the Adviser; (8) a draft of a narrative summary addressing key factors the Board customarily considers in evaluating the renewals of the ING Funds’ (including the Portfolio’s) advisory contracts, including a written analysis for the Portfolio of how performance, fees and expenses compare to its Selected Peer Group and/or designated benchmark(s); (9) independent analyses of Portfolio performance by the Company’s Chief Investment Risk Officer; (10) for open-end Portfolios, information regarding net asset flows into and out of the Portfolio; and (11) other information relevant to the Board’s evaluations.
The Board also noted that ING Groep, N.V. the ultimate parent company of the Adviser, has announced plans for the separation of its U.S.-based insurance, retirement services and investment management operations, which include the Adviser, into an independent, standalone company by the end of 2013. The Board further noted that this separation may result in the Adviser’s loss of access to the services and resources of its current ultimate parent company, which could adversely affect its businesses and profitability. The Board recognized that, if the separation plans are deemed to be a change of control, the investment
88
ADVISORY CONTRACT APPROVAL DISCUSSION (UNAUDITED) (CONTINUED)
advisory agreements for the Portfolios would terminate and trigger the necessity for new agreements, which would require the approval of the Board and, potentially, the shareholders of a Portfolio. The Board also recognized that there can be no assurance that the separation plan will be carried out. The Board considered the potential effects of the separation on the Portfolios and the Adviser, including its ability prior to, during and after the separation to perform the same level of service to the Portfolios as the Adviser currently provides. In this regard, the Board noted that the Adviser did not currently anticipate that the separation would have a material adverse impact on the Portfolios or their operations and administration.
For each Portfolio, Class I shares were used for purposes of certain comparisons between the Portfolio and its Selected Peer Group. Class I shares generally were selected so that a Portfolio’s share class with the longest performance history was compared to the analogous class of shares for each fund in its Selected Peer Group. The mutual funds included in the Portfolios’ Selected Peer Groups were selected based upon criteria designed to mirror the Portfolio share class being compared to the Selected Peer Groups. The Portfolios invest in a combination of mutual funds (“Underlying Funds”) that, in turn, invest directly in a wide range of portfolio securities (such as stocks and bonds). It should be noted that the performance of a Portfolio primarily reflects the performance of the Underlying Funds in which it invests.
The Board noted that the Portfolios benefit from the services of the Adviser’s Investment Risk Management Department (the “IRMD”), under the leadership of the Chief Investment Risk Officer, the costs of which are shared by the Portfolios and the Adviser. The Board noted that the IRMD regularly presents written materials and reports to the IRCs that focus on the investment risks of the Portfolios. The Board also noted that the IRMD provides the IRCs with analyses that are developed to assist the IRCs in identifying trends in Portfolio performance and other areas over consecutive periods. The Board noted that the services provided by the IRMD are meant to provide an additional perspective for the benefit of the Committees.
The Board also noted the proactive approach that the Adviser, working in cooperation with the IRCs, has taken to advocate or recommend, when it believed appropriate, changes designed to assist in improving the Portfolios’ performance.
In considering the Portfolios’ Advisory Contracts, the Board also considered the extent of benefits provided
to the Portfolios’ shareholders, beyond advisory services, from being part of the ING family of funds. This includes, in most cases, the right to exchange or transfer investments, without a sales charge, between the same class of shares of such funds or among ING Funds available on a product platform, and the wide range of ING Funds available for exchange or transfer. The Board also took into account the Adviser’s ongoing efforts to reduce the expenses of the ING Funds through renegotiated arrangements with the ING Funds’ service providers. In addition, the Board considered the efforts of the Adviser and the expenses that it incurred in recent years to help make the ING Fund complex more balanced and efficient by the launch of new investment products and the combinations of similar funds.
Further, the Board received periodic reports showing that the investment policies and restrictions for each Portfolio were consistently complied with and other periodic reports covering matters such as compliance by Adviser personnel with codes of ethics. The Board considered reports from the Company’s Chief Compliance Officer (“CCO”) evaluating whether the regulatory compliance systems and procedures of the Adviser are reasonably designed to assure compliance with the federal securities laws, including those related to, among others, late trading and market timing, best execution, fair value pricing, proxy voting and trade allocation practices. The Board also took into account the CCO’s annual and periodic reports and recommendations with respect to service provider compliance programs. In this regard, the Board also considered the policies and procedures developed by the CCO in consultation with the Board’s Compliance Committee that guide the CCO’s compliance oversight function.
The Board reviewed the level of staffing, quality and experience of each Portfolio’s portfolio management team. The Board took into account the respective resources and reputation of the Adviser, and evaluated the ability of the Adviser to attract and retain qualified investment advisory personnel. The Board also considered the adequacy of the resources committed to the Portfolios (and other relevant funds in the ING Fund complex) by the Adviser, and whether those resources are commensurate with the needs of the Portfolios and are sufficient to sustain appropriate levels of performance and compliance needs. In this regard, the Board considered the financial stability of the Adviser.
89
ADVISORY CONTRACT APPROVAL DISCUSSION (UNAUDITED) (CONTINUED)
Based on their deliberations and the materials presented to them, the Board concluded that the advisory and related services provided by the Adviser are appropriate in light of the Portfolios’ operations, the competitive landscape of the investment company business, and investor needs, and that the nature and quality of the overall services provided by the Adviser were appropriate.
Portfolio Performance
In assessing advisory relationships, the Board placed emphasis on the investment returns of each Portfolio. While the Board considered the performance reports and discussions with portfolio managers at Board and committee meetings during the year, particular attention in assessing performance was given to the FACT sheets furnished in connection with the renewal process. The FACT sheet prepared for each Portfolio included its investment performance compared to the Portfolio’s Morningstar category median and/or Lipper category median, Selected Peer Group and primary benchmark. The FACT sheet performance data was as of June 30, 2011. In addition, the Board also considered at its November 17, 2011 meeting certain additional data regarding performance and Portfolio asset levels as of October 31, 2011. The Board’s findings specific to each Portfolio’s performance are discussed under “Portfolio-by-Portfolio Analysis” below.
Economies of Scale
When evaluating the reasonableness of advisory fee rates, the Board also considered whether economies of scale will be realized by the Adviser as a Portfolio grows larger and the extent to which any such economies are reflected in contractual fee rates. In this regard, the Board noted a Portfolio would benefit from waivers to fees payable at the Portfolio level, and considered the extent to which economies of scale could effectively be realized through expense reductions resulting from such waivers or breakpoint discounts. In evaluating fee breakpoint arrangements and economies of scale, the Independent Directors also considered prior periodic management reports, industry information on this topic and the Portfolio’s investment performance based on their investments in Underlying Funds.
Information Regarding Services to Other Clients
The Board requested and considered information regarding the nature of services and fee rates offered by the Adviser to other clients, including other registered investment companies and relevant
institutional accounts. When fee rates offered to other clients differed materially from those charged to a Portfolio, the Board considered any underlying rationale provided by the Adviser for these differences. The Board also noted that the fee rates charged to the Portfolios and other institutional clients of the Adviser (including other investment companies) may differ materially due to, among other reasons: differences in services; different regulatory requirements associated with registered investment companies, such as the Portfolios, as compared to non-registered investment company clients; market differences in fee rates that existed when a Portfolio first was organized; differences in the original sponsors of Portfolios that now are managed by the Adviser; investment capacity constraints that existed when certain contracts were first agreed upon or that might exist at present; and different pricing structures that are necessary to be competitive in different marketing channels.
Fee Rates and Profitability
The Board reviewed and considered each contractual investment advisory fee rate, combined with the administrative fee rate, payable by each Portfolio to the Adviser. In addition, the Board considered fee waivers and expense limitations applicable to the fees payable by the Portfolios.
The Board considered: (1) the fee structure of each Portfolio as it relates to the services provided under the contracts; and (2) the potential fall-out benefits to the Adviser and their respective affiliates from their association with the Portfolios.
For each Portfolio, the Board considered information on revenues, costs and profits realized by the Adviser, which was prepared by Management in accordance with the allocation methodology (including related assumptions) specified in the 15(c) Methodology Guide. In addition, the Board considered information that it requested and was provided by Management with respect to the profitability of service providers affiliated with the Adviser.
Although the 15(c) Methodology Guide establishes certain standards for profit calculation, the Board recognized that profitability analysis on a client-by-client basis is not an exact science and there is no uniform methodology within the asset management industry for determining profitability for this purpose. In this context, the Board realized that Management’s calculations regarding its costs incurred in establishing the infrastructure necessary for the Portfolios’ operations may not be fully reflected in the expenses
90
ADVISORY CONTRACT APPROVAL DISCUSSION (UNAUDITED) (CONTINUED)
allocated to each Portfolio in determining profitability, and that the information presented may not portray all of the costs borne by the Adviser and Management or capture their entrepreneurial risk associated with offering and managing a mutual fund complex in the current regulatory and market environment. In addition, the Board recognized that the use of different methodologies for purposes of calculating profit data can give rise to dramatically different profit and loss results.
In making its determinations, the Board based its conclusions as to the reasonableness of the advisory fees of the Adviser primarily on the factors described for each Portfolio below. At the request of the Board, the Adviser has from time to time agreed to implement remedial actions regarding certain Portfolios. These remedial actions have included, among others: reductions in fee rates and strategy modifications.
Portfolio-by-Portfolio Analysis
The following paragraphs outline certain of the specific factors that the Board considered, and the conclusions reached, at its November 17, 2011 meeting in relation to renewing each Portfolio’s current Advisory Contracts. These specific factors are in addition to those considerations discussed above. In each case, the Portfolio’s performance was compared to its Morningstar category median and average, as well as its primary benchmark, a broad-based securities market index that appears in the Portfolio’s prospectus. With respect to Morningstar quintile rankings, the first quintile represents the highest (best) performance and the fifth quintile represents the lowest performance. Each Portfolio’s management fee and expense ratio were compared to the fees and expense ratios of the funds in its Selected Peer Group.
ING Solution Aggressive Growth Portfolio
In considering whether to approve the renewal of the Advisory Contract for ING Solution Aggressive Growth Portfolio, the Board considered that, based on performance data for the periods ended June 30, 2011: (1) the Portfolio underperformed its Morningstar category median for the most recent calendar quarter and year-to-date periods, but outperformed for the one-year period; (2) the Portfolio underperformed its primary benchmark for all periods presented; and (3) the Portfolio is ranked in the first (highest) quintile of its Morningstar category for the one-year period, and the third quintile for the most recent calendar quarter and year-to-date periods.
In analyzing this performance data, the Board took into account that the Portfolio commenced operations in April 2010 and therefore has a limited operating history for the purpose of analyzing its investment performance.
In considering the fees payable under the Advisory Contract for the Portfolio, the Board took into account the factors described above and also considered: (1) the fairness of the compensation under an Advisory Contract with a level fee rate that does not include breakpoints; and (2) the pricing structure (including the expense ratio to be borne by shareholders) of the Portfolio, as compared to its Selected Peer Group, including that: (a) the management fee for the Portfolio is below the median and average management fees of the funds in its Selected Peer Group; and (b) the expense ratio for the Portfolio is below the median and average expense ratios of the funds in its Selected Peer Group.
In analyzing the fee data, the Board took into account that the Portfolio indirectly bears the fees payable by the Underlying Funds in which the Portfolio invests.
After its deliberation, the Board reached the following conclusions: (1) the Portfolio’s management fee rate is reasonable in the context of all factors considered by the Board; (2) the Portfolio’s expense ratio is reasonable in the context of all factors considered by the Board; and (3) the Portfolio commenced operations in April 2010 and it is reasonable to permit the Portfolio time to establish a longer performance record for the purposes of evaluating performance. Based on these conclusions and other factors, the Board voted to renew the Advisory Contract for the Portfolio for the year ending November 30, 2012. During this renewal process, different Board members may have given different weight to different individual factors and related conclusions.
ING Solution Conservative Portfolio
In considering whether to approve the renewal of the Advisory Contract for ING Solution Conservative Portfolio, the Board considered that, based on performance data for the periods ended June 30, 2011: (1) the Portfolio underperformed its Morningstar category median for all periods presented; (2) the Portfolio underperformed its primary benchmark for the most recent calendar quarter, but outperformed for the year-to-date and one-year periods; and (3) the Portfolio is ranked in the third quintile of its Morningstar category for the year-to-date period, and the fourth quintile for the most recent calendar quarter and one-year periods.
91
ADVISORY CONTRACT APPROVAL DISCUSSION (UNAUDITED) (CONTINUED)
In analyzing this performance data, the Board took into account that the Portfolio commenced operations in April 2010 and therefore has a limited operating history for the purpose of analyzing its investment performance.
In considering the fees payable under the Advisory Contract for the Portfolio, the Board took into account the factors described above and also considered: (1) the fairness of the compensation under an Advisory Contract with a level fee rate that does not include breakpoints; and (2) the pricing structure (including the expense ratio to be borne by shareholders) of the Portfolio, as compared to its Selected Peer Group, including that: (a) the management fee for the Portfolio is equal to the median and below the average management fees of the funds in its Selected Peer Group; and (b) the expense ratio for the Portfolio is below the median and average expense ratios of the funds in its Selected Peer Group.
In analyzing the fee data, the Board took into account that the Portfolio indirectly bears the fees payable by the Underlying Funds in which the Portfolio invests.
After its deliberation, the Board reached the following conclusions: (1) the Portfolio’s management fee rate is reasonable in the context of all factors considered by the Board; (2) the Portfolio’s expense ratio is reasonable in the context of all factors considered by the Board; and (3) the Portfolio commenced operations in April 2010 and it is reasonable to permit the Portfolio time to establish a longer performance record for the purposes of evaluating performance. Based on these conclusions and other factors, the Board voted to renew the Advisory Contract for the Portfolio for the year ending November 30, 2012. During this renewal process, different Board members may have given different weight to different individual factors and related conclusions.
ING Solution Growth Portfolio
In considering whether to approve the renewal of the Advisory Contract for ING Solution Growth Portfolio, the Board considered that, based on performance data for the periods ended June 30, 2011: (1) the Portfolio outperformed its Morningstar category median for the year-to-date and one-year periods, but underperformed for the most recent calendar quarter and three-year periods; (2) the Portfolio underperformed its primary benchmark for the most recent calendar quarter and year-to-date periods, but outperformed for the one-year and three-year periods; and (3) the Portfolio is ranked in
the first (highest) quintile of its Morningstar category for the one-year period, the second quintile for the year-to-date period, and the fourth quintile for the most recent calendar quarter and three-year periods.
In analyzing this performance data, the Board took into account: (1) Management’s analysis regarding the rationale for underperformance, including its analysis regarding the underperformance of certain of the Underlying Funds in which the Portfolio invests; and (2) that Management would continue to monitor, and the Board or its IRC would periodically review, the Portfolio’s investment performance.
In considering the fees payable under the Advisory Contract for the Portfolio, the Board took into account the factors described above and also considered: (1) the fairness of the compensation under an Advisory Contract with a level fee rate that does not include breakpoints; and (2) the pricing structure (including the expense ratio to be borne by shareholders) of the Portfolio, as compared to its Selected Peer Group, including that: (a) the management fee for the Portfolio is equal to the median and below the average management fees of the funds in its Selected Peer Group; and (b) the expense ratio for the Portfolio is below the median and the average expense ratios of the funds in its Selected Peer Group.
In analyzing the fee data, the Board took into account that the Portfolio indirectly bears the fees payable by the Underlying Funds in which the Portfolio invests.
After its deliberation, the Board reached the following conclusions: (1) the Portfolio’s management fee rate is reasonable in the context of all factors considered by the Board; (2) the Portfolio’s expense ratio is reasonable in the context of all factors considered by the Board; and (3) that Management would continue to monitor, and the Board or its IRC would periodically review, the Portfolio’s investment performance. Based on these conclusions and other factors, the Board voted to renew the Advisory Contract for the Portfolio for the year ending November 30, 2012. During this renewal process, different Board members may have given different weight to different individual factors and related conclusions.
ING Solution Income Portfolio
In considering whether to approve the renewal of the Advisory Contract for ING Solution Income Portfolio, the Board considered that, based on performance data for the periods ended June 30, 2011: (1) the Portfolio outperformed its Morningstar category median for the
92
ADVISORY CONTRACT APPROVAL DISCUSSION (UNAUDITED) (CONTINUED)
three-year and five-year periods but underperformed for the most recent calendar quarter, year-to-date, and one-year periods; (2) the Portfolio outperformed its primary benchmark for all periods presented, with the exception of the most recent calendar quarter and year-to-date periods, during which it underperformed; and (3) the Portfolio is ranked in the second quintile of its Morningstar category for the three-year period, and the third quintile for the most recent calendar quarter, year-to-date, one-year, and five-year periods.
In considering the fees payable under the Advisory Contract for the Portfolio, the Board took into account the factors described above and also considered: (1) the fairness of the compensation under an Advisory Contract with a level fee rate that does not include breakpoints; and (2) the pricing structure (including the expense ratio to be borne by shareholders) of the Portfolio, as compared to its Selected Peer Group, including that: (a) the management fee for the Portfolio is below the median and average management fees of the funds in its Selected Peer Group; and (b) the expense ratio for the Portfolio is below the median and average expense ratios of the funds in its Selected Peer Group.
In analyzing the fee data, the Board took into account that the Portfolio indirectly bears the fees payable by the Underlying Funds in which the Portfolio invests.
After its deliberation, the Board reached the following conclusions: (1) the Portfolio’s management fee rate is reasonable in the context of all factors considered by the Board; (2) the Portfolio’s expense ratio is reasonable in the context of all factors considered by the Board; and (3) the Portfolio’s performance is reasonable in the context of all factors considered by the Board. Based on these conclusions and other factors, the Board voted to renew the Advisory Contract for the Portfolio for the year ending November 30, 2012. During this renewal process, different Board members may have given different weight to different individual factors and related conclusions.
ING Solution Moderate Portfolio
In considering whether to approve the renewal of the Advisory Contract for ING Solution Moderate Portfolio, the Board considered that, based on performance data for the periods ended June 30, 2011: (1) the Portfolio outperformed its Morningstar category median for the year-to-date and one-year periods, but underperformed for the most recent calendar quarter and three-year
periods; (2) the Portfolio outperformed its primary benchmark for all periods presented, with the exception of the most recent calendar quarter, during which it underperformed; and (3) the Portfolio is ranked in the first (highest) quintile of its Morningstar category for the one-year period, the second quintile for the year-to-date period, and the fourth quintile for the most recent calendar quarter and three-year periods.
In analyzing this performance data, the Board took into account: (1) Management’s analysis regarding the rationale for underperformance, including its analysis regarding the underperformance of certain of these Underlying Funds in which the Portfolio invests; and (2) that Management would continue to monitor, and the Board or its IRC would periodically review, the Portfolio’s investment performance.
In considering the fees payable under the Advisory Contract for the Portfolio, the Board took into account the factors described above and also considered: (1) the fairness of the compensation under an Advisory Contract with a level fee rate that does not include breakpoints; and (2) the pricing structure (including the expense ratio to be borne by shareholders) of the Portfolio, as compared to its Selected Peer Group, including that: (a) the management fee for the Portfolio is below the median and average management fees of the funds in its Selected Peer Group; and (b) the expense ratio for the Portfolio is equal to the median and below the average expense ratios of the funds in its Selected Peer Group.
After its deliberation, the Board reached the following conclusions: (1) the Portfolio’s management fee rate is reasonable in the context of all factors considered by the Board; (2) the Portfolio’s expense ratio is reasonable in the context of all factors considered by the Board; and (3) that Management would continue to monitor, and the Board or its IRC would periodically review, the Portfolio’s investment performance. Based on these conclusions and other factors, the Board voted to renew the Advisory Contract for the Portfolio for the year ending November 30, 2012. During this renewal process, different Board members may have given different weight to different individual factors and related conclusions.
ING Solution 2015 Portfolio
In considering whether to approve the renewal of the Advisory Contract for ING Solution 2015 Portfolio, the Board considered that, based on performance data for the periods ended June 30, 2011: (1) the Portfolio
93
ADVISORY CONTRACT APPROVAL DISCUSSION (UNAUDITED) (CONTINUED)
underperformed its Morningstar category median for the most recent calendar quarter, year-to-date, and one-year periods, but outperformed for the three-year and five-year periods; (2) the Portfolio underperformed its primary benchmark for all periods presented; and (3) the Portfolio is ranked in the third quintile of its Morningstar category for the most recent calendar quarter, year-to-date, three-year, and five-year periods, and the fourth quintile for the one-year period.
In considering the fees payable under the Advisory Contract for the Portfolio, the Board took into account the factors described above and also considered: (1) the fairness of the compensation under an Advisory Contract with a level fee rate that does not include breakpoints; and (2) the pricing structure (including the expense ratio to be borne by shareholders) of the Portfolio, as compared to its Selected Peer Group, including that: (a) the management fee for the Portfolio is below the median and the average management fees of the funds in its Selected Peer Group; and (b) the expense ratio for the Portfolio is below the median and the average expense ratios of the funds in its Selected Peer Group.
In analyzing the fee data, the Board took into account that the Portfolio indirectly bears the fees payable by the Underlying Funds in which the Portfolio invests.
After its deliberation, the Board reached the following conclusions: (1) the Portfolio’s management fee rate is reasonable in the context of all factors considered by the Board; (2) the Portfolio’s expense ratio is reasonable in the context of all factors considered by the Board; and (3) the Portfolio’s performance is reasonable in the context of all factors considered by the Board. Based on these conclusions and other factors, the Board voted to renew the Advisory Contract for the Portfolio for the year ending November 30, 2012. During this renewal process, different Board members may have given different weight to different individual factors and related conclusions.
ING Solution 2025 Portfolio
In considering whether to approve the renewal of the Advisory Contract for ING Solution 2025 Portfolio, the Board considered that, based on performance data for the periods ended June 30, 2011: (1) the Portfolio outperformed its Morningstar category median for all periods presented, with the exception of the most recent calendar quarter and year-to-date periods, during which it underperformed; (2) the Portfolio
underperformed its primary benchmark for all periods presented, with the exception of the one-year period, during which it outperformed; and (3) the Portfolio is ranked in the second quintile of its Morningstar category for the one-year period, the third quintile for the year-to-date, three-year, and five-year periods, and the fourth quintile for the most recent calendar quarter.
In considering the fees payable under the Advisory Contract for the Portfolio, the Board took into account the factors described above and also considered: (1) the fairness of the compensation under an Advisory Contract with a level fee rate that does not include breakpoints; and (2) the pricing structure (including the expense ratio to be borne by shareholders) of the Portfolio, as compared to its Selected Peer Group, including that: (a) the management fee for the Portfolio is below the median and the average management fees of the funds in its Selected Peer Group; and (b) the expense ratio for the Portfolio is below the median and the average expense ratios of the funds in its Selected Peer Group.
In analyzing the fee data, the Board took into account that the Portfolio indirectly bears the fees payable by the Underlying Funds in which the Portfolio invests.
After its deliberation, the Board reached the following conclusions: (1) the Portfolio’s management fee rate is reasonable in the context of all factors considered by the Board; (2) the Portfolio’s expense ratio is reasonable in the context of all factors considered by the Board; and (3) the Portfolio’s performance is reasonable in the context of all factors considered by the Board. Based on these conclusions and other factors, the Board voted to renew the Advisory Contract for the Portfolio for the year ending November 30, 2012. During this renewal process, different Board members may have given different weight to different individual factors and related conclusions.
ING Solution 2035 Portfolio
In considering whether to approve the renewal of the Advisory Contract for ING Solution 2035 Portfolio, the Board considered that, based on performance data for the periods ended June 30, 2011: (1) the Portfolio outperformed its Morningstar category median for all periods presented, with the exception of the most recent calendar quarter and year-to-date periods, during which it underperformed; (2) the Portfolio underperformed its primary benchmark for all periods
94
ADVISORY CONTRACT APPROVAL DISCUSSION (UNAUDITED) (CONTINUED)
presented, with the exception of the one-year period, during which it outperformed; and (3) the Portfolio is ranked in the second quintile for the one-year and five-year periods, the third quintile for the three-year period, and the fourth quintile for the most recent calendar quarter and year-to-date periods.
In considering the fees payable under the Advisory Contract for the Portfolio, the Board took into account the factors described above and also considered: (1) the fairness of the compensation under an Advisory Contract with a level fee rate that does not include breakpoints; and (2) the pricing structure (including the expense ratio to be borne by shareholders) of the Portfolio, as compared to its Selected Peer Group, including that: (a) the management fee for the Portfolio is below the median and the average management fees of the funds in its Selected Peer Group; and (b) the expense ratio for the Portfolio is below the median and the average expense ratios of the funds in its Selected Peer Group.
In analyzing the fee data, the Board took into account that the Portfolio indirectly bears the fees payable by the Underlying Funds in which the Portfolio invests.
After its deliberation, the Board reached the following conclusions: (1) the Portfolio’s management fee rate is reasonable in the context of all factors considered by the Board; (2) the Portfolio’s expense ratio is reasonable in the context of all factors considered by the Board; and (3) the Portfolio’s performance is reasonable in the context of all factors considered by the Board. Based on these conclusions and other factors, the Board voted to renew the Advisory Contract for the Portfolio for the year ending November 30, 2012. During this renewal process, different Board members may have given different weight to different individual factors and related conclusions.
ING Solution 2045 Portfolio
In considering whether to approve the renewal of the Advisory Contract for ING Solution 2045 Portfolio, the Board considered that, based on performance data for the periods ended June 30, 2011: (1) the Portfolio outperformed its Morningstar category median for the one-year and five-year periods, but underperformed for the most recent calendar quarter, year-to-date, and three year periods; (2) the Portfolio underperformed its primary benchmark for all periods presented, with the exception of the one-year period, during which it outperformed; and (3) the Portfolio is ranked in the second quintile for the one-year and five-year periods,
the third quintile for the most recent calendar quarter and three-year periods, and the fourth quintile for the year-to-date period.
In analyzing this performance data, the Board took into account: (1) Management’s analysis regarding the rationale for underperformance, including its analysis regarding the underperformance of certain of these Underlying Funds in which the Portfolio invests; and (2) that Management would continue to monitor, and the Board or its IRC would periodically review, the Portfolio’s investment performance.
In considering the fees payable under the Advisory Contract for the Portfolio, the Board took into account the factors described above and also considered: (1) the fairness of the compensation under an Advisory Contract with a level fee rate that does not include breakpoints; and (2) the pricing structure (including the expense ratio to be borne by shareholders) of the Portfolio, as compared to its Selected Peer Group, including that: (a) the management fee for the Portfolio is below the median and average management fees of the funds in its Selected Peer Group; and (b) the expense ratio for the Portfolio is below the median and average expense ratios of the funds in its Selected Peer Group.
In analyzing the fee data, the Board took into account that the Portfolio indirectly bears the fees payable by the Underlying Funds in which the Portfolio invests.
After its deliberation, the Board reached the following conclusions: (1) the Portfolio’s management fee rate is reasonable in the context of all factors considered by the Board; (2) the Portfolio’s expense ratio is reasonable in the context of all factors considered by the Board; and (3) that Management would continue to monitor, and the Board or its IRC would periodically review, the Portfolio’s investment performance. Based on these conclusions and other factors, the Board voted to renew the Advisory Contract for the Portfolio for the year ending November 30, 2012. During this renewal process, different Board members may have given different weight to different individual factors and related conclusions.
ING Solution 2055 Portfolio
In considering whether to approve the renewal of the Advisory Contract for ING Solution 2055 Portfolio, the Board considered that, based on performance data for the periods ended June 30, 2011: (1) the Portfolio outperformed its Morningstar category median for the one-year period, but underperformed for the most
95
ADVISORY CONTRACT APPROVAL DISCUSSION (UNAUDITED) (CONTINUED)
recent calendar quarter and year-to-date periods; (2) the Portfolio underperformed its primary benchmark for the most recent calendar quarter and year-to-date periods, but outperformed for the one-year period; and (3) the Portfolio is ranked in the second quintile of its Morningstar category for the one-year period, the third quintile for the most recent calendar quarter, and the fourth quintile for the year-to-date period.
In analyzing this performance data, the Board took into account that the Portfolio commenced operations in March 2010 and therefore has a limited operating history for the purpose of analyzing its investment performance.
In considering the fees payable under the Advisory Contract for the Portfolio, the Board took into account the factors described above and also considered: (1) the fairness of the compensation under an Advisory Contract with a level fee rate that does not include breakpoints; and (2) the pricing structure (including the expense ratio to be borne by shareholders) of the Portfolio, as compared to its Selected Peer Group, including that: (a) the management fee for the Portfolio is equal to the median and below the average management fees of the funds in its Selected Peer Group; and (b) the expense ratio for the Portfolio is below the median and average expense ratios of the funds in its Selected Peer Group.
In analyzing the fee data, the Board took into account that the Portfolio indirectly bears the fees payable by the Underlying Funds in which the Portfolio invests.
After its deliberation, the Board reached the following conclusions: (1) the Portfolio’s management fee rate is reasonable in the context of all factors considered by the Board; (2) the Portfolio’s expense ratio is reasonable in the context of all factors considered by the Board; and (3) the Portfolio commenced operations in March 2010 and it is reasonable to permit the Portfolio time to establish a longer performance record for the purposes of evaluating performance. Based on these conclusions and other factors, the Board voted to renew the Advisory Contract for the Portfolio for the year ending November 30, 2012. During this renewal process, different Board members may have given different weight to different individual factors and related conclusions.
Board Consideration and Approval of New Advisory Contracts for ING Solution Portfolio 2020, ING Solution Portfolio 2030, ING Solution Portfolio 2040, ING Solution Portfolio 2050
At a meeting held on July 15, 2011, the Board considered the initial approval of Advisory and Sub-Advisory Contracts for ING Solution Portfolio 2020, ING Solution Portfolio 2030, ING Solution Portfolio 2040, ING Solution Portfolio 2050 (each a “Portfolio,” and collectively, the “Portfolios”).
In determining whether to approve the Advisory Contract for each Portfolio, the Board received and evaluated such information as it deemed necessary for an informed determination of whether each agreement, and the proposed policies and procedures for the Portfolios, should be approved. The materials provided to the Board in support of the Portfolios and the Portfolios’ advisory arrangements included the following: (1) a memorandum presenting Management’s rationale for requesting the launch of the Portfolios that discusses, among other things, the experience and expertise of Directed Services LLC (“DSL”) in the management of other Funds within the ING Funds complex, including the existing ING Solution Portfolios; (2) information about the Portfolios’ proposed investment objectives and strategies and anticipated portfolio characteristics; (3) FACT sheets for the Portfolios that compare the Portfolios’ proposed fee structures to their comparable Selected Peer Groups and Morningstar/Lipper category medians; (4) supporting documentation, including copies of the form of Advisory Contract for the Portfolios; and (5) other information relevant to the Board’s evaluation. In addition, the Board considered the information provided periodically throughout the year in presentations to the Board by DSL in the context of DSL’s oversight and management of Funds in the ING Funds complex.
At the Board meeting at which the Advisory Contract was considered, the Board considered that the Portfolios would be subject to the standard policies and procedures of ING Partners, Inc. (“IPI”) previously approved by the Board for other series of IPI and approved in accordance with Rule 38a-1 under the Investment Company Act of 1940. The Board also noted that, in managing the Fund, DSL would be subject to procedures adopted pursuant to Rule 206(4)-7 under the Investment Advisers Act of 1940 that had been previously approved by the Board in connection with other Funds in the ING Funds complex.
96
ADVISORY CONTRACT APPROVAL DISCUSSION (UNAUDITED) (CONTINUED)
The Board’s consideration of whether to approve the Advisory Contract with DSL on behalf of the Portfolios took into account several factors including, but not limited to, the following: (1) the nature and quality of the services to be provided by DSL to the Portfolios under the proposed Advisory Contract; (2) DSL’s experience as a manager-of-managers overseeing sub-advisers to other Funds within the ING Funds complex, including similar Funds-of-Funds; (3) DSL’s strength and reputation within the industry; (4) the fairness of the compensation under the proposed Advisory Contract in light of the services to be provided to the Portfolios; (5) the costs for the services to be provided by DSL, including that the proposed advisory fee would not be subject to breakpoint discounts; (6) the pricing structure (including the estimated expense ratio to be borne by shareholders) of the Portfolios, including that: (a) the proposed management fee for each Portfolio is below the median and the average management fees of the funds in the Portfolio’s Selected Peer Group, and (b) the estimated expense ratio for each Portfolio is below the median and average expense ratios of the funds in the Portfolio’s Selected Peer Group; (7) the projected profitability of DSL; (8) the personnel, operations, financial condition, and investment management capabilities, methodologies and resources of DSL, including its management team’s expertise in the management of other Funds, including other Funds-of-Funds and asset allocation products; (9) DSL’s
compliance capabilities, as demonstrated by, among other things, its policies and procedures designed to prevent violations of the Federal securities laws, which had previously been approved by the Board in connection with their oversight of other Funds in the ING Funds complex; (10) the information that had been provided by DSL at regular Board meetings, and in anticipation of the March 2010 meeting, with respect to its capabilities in overseeing similar asset allocation products; and (11) “fall-out benefits” to DSL and its affiliates that were anticipated to arise from DSL’s management of the Portfolios.
After its deliberation, the Board reached the following conclusions: (1) each Portfolio’s proposed management fee rate is reasonable in the context of all factors considered by the Board; (2) the Portfolio’s estimated expense ratio is reasonable in the context of all factors considered by the Board; and (3) DSL maintains an appropriate compliance program, with this conclusion based upon the Board’s previous and ongoing review of the compliance program and the representations of the Fund’s CCO in materials provided to the Board in advance of the May meeting. Based on these conclusions and other factors, the Board voted to approve the Advisory Contract for the Portfolios. During its deliberations, different Board members may have given different weight to different individual factors and related conclusions.
97
Investment Adviser
Directed Services LLC
1475 Dunwoody Drive
West Chester, Pennsylvania 19380
Administrator
ING Funds Services, LLC
7337 East Doubletree Ranch Road, Suite 100
Scottsdale, Arizona 85258
Distributor
ING Investments Distributor, LLC
7337 East Doubletree Ranch Road, Suite 100
Scottsdale, Arizona 85258
Transfer Agent
BNY Mellon Investment Servicing (U.S.) Inc.
301 Bellevue Parkway
Wilmington, Delaware 19809
Independent Registered Public Accounting Firm
KPMG LLP
Two Financial Center
60 South Street
Boston, Massachusetts 02111
Custodian
The Bank of New York Mellon
One Wall Street
New York, New York 10286
Legal Counsel
Dechert LLP
1775 I Street, N.W.
Washington, D.C. 20006
Before investing, carefully consider the investment objectives, risks, charges and expenses of the variable universal life insurance policy or variable annuity contract and the underlying variable investment options. This and other information is contained in the prospectus for the variable universal life policy or variable annuity contract and the underlying variable investment options. Obtain these prospectuses from your agent/ registered representative and read them carefully before investing.
| | | | |
 | | VPAR-USOL | | (1211-022112) |

Annual Report
December 31, 2011
Classes ADV, I, S, S2 and T
ING Partners, Inc.
| n | ING Index Solution Income Portfolio |
| n | ING Index Solution 2015 Portfolio |
| n | ING Index Solution 2020 Portfolio |
| n | ING Index Solution 2025 Portfolio |
| n | ING Index Solution 2030 Portfolio |
| n | ING Index Solution 2035 Portfolio |
| n | ING Index Solution 2040 Portfolio |
| n | ING Index Solution 2045 Portfolio |
| n | ING Index Solution 2050 Portfolio |
| n | ING Index Solution 2055 Portfolio |
This report is submitted for general information to shareholders of the ING Funds. It is not authorized for distribution to prospective shareholders unless accompanied or preceded by a prospectus which includes details regarding the funds’ investment objectives, risks, charges, expenses and other information. This information should be read carefully.
MUTUAL FUNDS 
| |
TABLE OF CONTENTS
PROXY VOTING INFORMATION
A description of the policies and procedures that the Portfolios use to determine how to vote proxies related to portfolio securities is available: (1) without charge, upon request, by calling Shareholder Services toll-free at (800) 992-0180; (2) on the ING Funds’ website at www.inginvestment.com; and (3) on the U.S. Securities and Exchange Commission’s (“SEC’s”) website at www.sec.gov. Information regarding how the Portfolios voted proxies related to portfolio securities during the most recent 12-month period ended June 30 is available without charge on the ING Funds’ website at www.inginvestment.com and on the SEC’s website at www.sec.gov.
QUARTERLY PORTFOLIO HOLDINGS
The Portfolios file their complete schedule of portfolio holdings with the SEC for the first and third quarters of each fiscal year on Form N-Q. The Portfolios’ Forms N-Q are available on the SEC’s website at www.sec.gov. The Portfolios’ Forms N-Q may be reviewed and copied at the SEC’s Public Reference Room in Washington, DC, and information on the operation of the Public Reference Room may be obtained by calling (800) SEC-0330. The Portfolios’ Forms N-Q, as well as a complete portfolio of investments, are available without charge upon request from the Portfolios by calling Shareholder Services toll-free at (800) 992-0180.
PRESIDENT’S LETTER

Euro zone — continued uncertainty
Dear Shareholder,
Recent months have seen headlines and financial markets continue to focus on the ongoing euro zone debt crisis. Acknowledging that the status quo was untenable, in early December, Europe opted to move closer together rather than be torn apart. All 17 nations that use the euro and nine other European Union members agreed to a new fiscal compact that would invite closer scrutiny of individual country budgets. Ratings agencies were mostly unimpressed by these machinations; ultimately, Standard & Poor’s downgraded nine countries in the region, including formerly AAA-rated France.
With the stability of Italy and Spain now in question, the need for an effective policy response has become even more acute. The new governments in both countries will
have but a short grace period in which to demonstrate their resolve; both have been forced to pay yields at euro-era highs for newly issued bonds.
Across the Atlantic, the chasm between the two major political parties in the United States is as wide as ever, most recently evidenced by the failure of the Congressional “supercommittee” on deficit reduction. Notwithstanding the ongoing paralysis in Washington, the U.S. economy is showing new signs of momentum.
We expect the global economy to deliver positive, if uninspiring, growth into 2012 despite the euro zone’s debt problems. We believe interest rates should remain low in major advanced countries. Markets — and risk assets in general — are likely to remain vulnerable to uncertainty until there is confidence that Europe has adequately addressed its issues.
In times of uncertainty investors historically have turned to sovereign credits, especially U.S. Treasury securities. This spotlights the critical role that governments play in defining the parameters of the financial markets and serving as foundations for generating value within economies. The current trend toward fiscal austerity downplays this important function and may prolong the global economic doldrums.
How should you respond to uncertainty in your own investment program? Don’t try to time the markets. Keep your portfolio well diversified, and pay careful attention to the risks you are assuming. Talk to your financial advisor before you make any changes that might detour your portfolio from your long-term goals.
We appreciate your continued confidence in ING Funds, and we look forward to serving your investment needs in the future.
Sincerely,

Shaun Mathews
President and Chief Executive Officer
ING Funds
January 3, 2012
The views expressed in the President’s Letter reflect those of the President as of the date of the letter. Any such
views are subject to change at any time based upon market or other conditions and ING Funds disclaims any
responsibility to update such views. These views may not be relied on as investment advice and because investment
decisions for an ING Fund are based on numerous factors, may not be relied on as an indication of investment intent
on behalf of any ING Fund. Reference to specific company securities should not be construed as recommendations
or investment advice.
International investing poses special risks including currency fluctuation, economic and political risks not found in
investments that are solely domestic.
1
MARKET PERSPECTIVE: YEAR ENDED DECEMBER 31, 2011
In our semi-annual report we described how investor sentiment was generally positive through April. Many of the developed world’s economies including the U.S., seemed to be returning to health, boosted by heavy, ongoing doses of stimulative and monetary medicine. This was despite natural disasters in Japan, the violent uncertainties of the “Arab Spring” in North Africa and the Middle East, not to mention a European sovereign debt crisis.
But the mood darkened in early May 2011. Global equities in the form of the MSCI World IndexSM measured in local currencies, including net reinvested dividends, slid from May through September, losing over 17%, before a remarkable October rally clawed back about half of this. For the whole fiscal year the Index lost 5.49%. (The MSCI World IndexSM returned (5.54%) for the year ended December 31, 2011, measured in U.S. dollars.)
A confluence of factors caused the deterioration in outlook after April. That month the latest unemployment rate was reported at 8.8%, the lowest in 24 months. New private sector jobs, well above 200,000, were added in each of January, February and March. But in May the unemployment rate rebounded to 9.1%. By September the employment report showed zero new jobs created in August. But more upbeat releases in later months revised this up, and by year end the three-month average of jobs created was back to 143,000 from just 35,000 in September.
In the housing market, home prices (based on the S&P/Case-Shiller 20-City Composite Home Price Index) fell every month in the year. Sales were depressed, despite improved affordability and record low mortgage interest rates, by tight credit with many homeowners in negative equity on their properties.
Gross Domestic Product (“GDP”) growth had been reported at 3.1% (quarter-over-quarter, annualized) for the fourth quarter of 2010. On July 29, this was scaled down to 2.3%, among other revisions that showed the recession had been deeper and started earlier than previously thought. Worse, growth in the first quarter of 2011 was a barely perceptible 0.4%. When the second quarter’s figure was finalized at just 1.3%, the common assessment was that the economy was operating at “stall-speed”. There was relief in October when the first estimate of third quarter GDP growth was a much-improved 2.5%, although this was subsequently revised down to 1.8%.
Political deadlock weighed on sentiment throughout. A stopgap agreement to raise the debt ceiling did not stop Standard & Poors from downgrading the country’s credit rating. A bipartisan “Debt Super Committee” appointed to negotiate a more lasting set of budget control measures, admitted defeat on November 21.
Other keenly watched figures like retail sales and wages & salaries were stagnant in the months up to October, improved in that month and were mixed thereafter. Purchasing managers’ indices indicated expansion but not by much. Taken together, the data were inconclusive as the year ended but the consensus was that the once-feared return to recession now looked unlikely.
The euro zone’s sovereign debt crisis continued to move markets. By early August it seemed to be veering out of control. When attention turned from Greece to the much bigger bond markets of Spain and especially Italy, the European Central Bank (“ECB”) stepped in, uneasily, to buy their bonds — and some time. The threat to the euro zone banking system, where vast quantities of Italian and Spanish bonds are held, was clear.
Finally, a baby step towards closer fiscal union among euro zone countries was agreed in December, including restrictions on budget deficits with near automatic disciplinary procedures for violators. Bilateral loans of up to €200 billion would be made to the International Monetary Fund, presumably to fund rescue packages for individual nations. But it provided no lender of last resort with unlimited firepower, nor measures to promote growth and liberalize markets. Investors were under no illusions as the year ended that the crisis had been solved.
In U.S. fixed income markets, the Barclays Capital U.S. Aggregate Bond Index of investment grade bonds rose 7.84% in the fiscal year, while the Barclays Capital High Yield Bond — 2% Issuer Constrained Composite Index gained 4.96%. Most notable within the Barclays Capital U.S. Aggregate Bond Index was the remarkable 29.93% return on long-dated Treasuries, reflecting both the overall decline in risk appetite and quantitative easing.
U.S. equities, represented by the S&P 500® Index, including dividends, returned 2.11% for 2011, almost identical to the dividend yield. Sector returns ranged from (17.06%) for financials to 19.91% for utilities. The operating earnings per share of S&P 500® companies made new records in the second and third quarters of 2011, but estimates for future quarters were coming down as December ended.
In currency markets, the euro zone’s problems finally took their toll, as the dollar gained 2.34% on the euro in 2011, which dropped sharply after October. The pound was barely changed despite late weakness: the dollar gained 0.10%. But the dollar fell back against the yen by 5.35% despite Bank of Japan intervention as that currency repeatedly breached post-war high levels.
In international markets, the MSCI Japan® Index slumped 18.73% in 2011. The economy contracted for three straight quarters before finally recovering, as it struggled to recover from the earthquake and tsunami of March as well as a strong yen. The MSCI Europe ex UK® Index sank 12.87%, weighed down by the recessionary threat of the sovereign debt crisis. Euro zone growth shrunk to 0.2% in the second and third quarters and unemployment stood at 10.3%, a euro-era high. The MSCI UK® Index slipped just 1.83%. Weak euro zone demand and fiscal austerity at home depressed stocks, within which, however, the well-represented energy, staples and telecoms sectors managed positive average returns.
Parentheses denote a negative number.
All indices are unmanaged and investors cannot invest directly in an index. Past performance does not guarantee future results. The performance quoted represents past performance. Investment return and principal value of an investment will fluctuate, and shares, when redeemed, may be worth more or less than their original cost. The Portfolios’ performance is subject to change since the period’s end and may be lower or higher than the performance data shown. Please call (800) 262-3862 or log on to www.inginvestment.com to obtain performance data current to the most recent month end.
Market Perspective reflects the views of ING’s Chief Investment Risk Officer only through the end of the period, and is subject to change based on market and other conditions.
2
BENCHMARK DESCRIPTIONS
| | |
| Index | | Description |
| MSCI World IndexSM | | An unmanaged index that measures the performance of over 1,400 securities listed on exchanges in the U.S., Europe, Canada, Australia, New Zealand and the Far East. |
| S&P/Case-Shiller 20-City Composite Home Price Index | | A composite index of the home price index for the top 20 Metropolitan Statistical Areas in the United States. The index is published monthly by Standard & Poor’s. |
| Barclays Capital U.S. Aggregate Bond Index | | An unmanaged index of publicly issued investment grade U.S. Government, mortgage-backed, asset-backed and corporate debt securities. |
| Barclays Capital High Yield Bond — 2% Issuer Constrained Composite Index | | An unmanaged index that includes all fixed income securities having a maximum quality rating of Ba1, a minimum amount outstanding of $150 million, and at least one year to maturity. |
| S&P 500® Index | | An unmanaged index that measures the performance of securities of approximately 500 large-capitalization companies whose securities are traded on major U.S. stock markets. |
| MSCI Japan® Index | | A free float-adjusted market capitalization index that is designed to measure developed market equity performance in Japan. |
| MSCI Europe ex UK® Index | | A free float-adjusted market capitalization index that is designed to measure developed market equity performance in Europe, excluding the UK. |
| MSCI UK® Index | | A free float-adjusted market capitalization index that is designed to measure developed market equity performance in the UK. |
| S&P Target Date Retirement Income Index | | Seeks to represent asset allocations which target an immediate retirement horizon. |
S&P Target Date 2015 Index, S&P Target Date 2020 Index, S&P Target Date 2025 Index, S&P Target Date 2030 Index, S&P Target Date 2035 Index, S&P Target Date 2040 Index and S&P Target Date 2045 Index | | Each seeks to represent the market consensus for asset allocations which target an approximate 2015, 2020, 2025, 2030, 2035, 2040, 2045 and beyond 2045 retirement horizon, respectively. |
3
| | |
| ING INDEX SOLUTION PORTFOLIOS | | PORTFOLIO MANAGERS’ REPORT |
The ING Index Solution Portfolios consist of ING Index Solution Income Portfolio, ING Index Solution 2015 Portfolio, ING Index Solution 2020 Portfolio, ING Index Solution 2025 Portfolio, ING Index Solution 2030 Portfolio, ING Index Solution 2035 Portfolio, ING Index Solution 2040 Portfolio, ING Index Solution 2045 Portfolio, ING Index Solution 2050 Portfolio and Index Solution 2055 Portfolio (each a “Portfolio” or collectively, the “Portfolios” or the “Index Solution Portfolios”). Each Portfolio seeks to achieve its investment objective by investing in a combination of other ING Funds and other non-affiliated funds (“Underlying Funds”) according to target allocations determined by Directed Services LLC (“DSL” or “Investment Adviser”), under the guidance of an Investment Committee(1)(2). ING Investment Management Co. LLC (“Consultant”) is a consultant to the Investment Adviser. Both the Investment Adviser and the Consultant are indirect, wholly-owned subsidiaries of ING Groep.
Portfolio Specifics: The Investment Adviser uses an asset allocation process to determine each Portfolio’s investment mix. This asset allocation process can be found in the Prospectus. Each Portfolio’s approximate target investment allocations (expressed as a percentage of its net assets) among the asset classes in which the Portfolios invest are set out on page 5. As these are target allocations, the actual allocations of the Portfolios’ assets may deviate from the percentages shown.
Assets will be allocated among the Underlying Funds and markets based on judgments made by DSL. The performance of the Portfolios reflects the performance of the Underlying Funds in which each Portfolio invests and the weightings of each Portfolio’s assets in each Underlying Fund.
There is a risk that the Portfolios may allocate assets to an Underlying Fund or market that underperforms other asset classes. The Portfolios may be underweighted in assets or a market that is experiencing significant returns (or relative outperformance) or overweighted in assets or a market with significant declines (or relative underperformance).
The Investment Committee allocates each Portfolio’s assets among the Underlying Funds based on advice from the Consultant.
Equity markets bounced back from a difficult third quarter to finish the year strongly, as signs of improvement in the U.S. economy drove investors back into risky assets despite continued pressure from Europe. The S&P 500® Index posted a small positive return for the year, whereas many non-U.S. markets posted losses.
All of our Index Solution Portfolios underperformed their respective S&P Target Date indices this year. Relative to the Index Solution Portfolios, S&P had the advantage of more exposure to U.S. large cap equities which outperformed U.S. mid and small cap equities during the year. S&P also had the advantage of more exposure to treasury inflation protected securities (“TIPS”) which outperformed the Barclays Capital Aggregate Bond Index, but had the disadvantage of an allocation to real estate investment trusts (“REITs”) which exhibited negative returns during the year.
Relative to our Strategic Benchmarks, our decision to initiate a tactical position in high yield in the fourth quarter helped performance; however, this decision was offset by our underweight to U.S. large cap equities in October and overweight to emerging market equities during the second quarter.
Overall, tactical moves had a negative impact on performance results in 2011.
We opened the reporting period with a tactical overweight to U.S. large cap equities and a corresponding underweight to core bonds. During the first quarter, we underweighted international developed equities and increased the overweight to U.S. large cap equities. This tactical position was removed in mid-March. In February, we saw a rise in geopolitical risks in Northern Africa and the Middle East, and decided to reduce risk in our equity exposure by removing the overweight to U.S. large cap and underweight to fixed income.
In April, we overweighted emerging market equities, funded by underweights in U.S. large-cap equities and international developed market equities in our far dated portfolios. Through May and into June, data pointed to a slowdown of economic activity. We removed the underweight to U.S. large cap equities and lowered the overweight to emerging markets at the end of June.
In mid-August, an unprecedented credit rating downgrade of the United States sparked a global sell-off in equities. We moved to an underweight in equities. In September, we saw coordinated global policy responses buoy the market, and we expected to see additional large-scale responses from global governments and agencies. With equities down 10% since we moved to an underweight in mid-August, we believed that the probability of a sharp upward movement in stock market values had increased and decided to reduce our underweight to equities. We also neutralized our international developed underweight and emerging markets equity overweight.
As October progressed, we began to see some of the key risks facing global markets continue to subside and decided to completely remove our underweight position in equities and initiated a tactical position to high yield bonds offset by an underweight to core fixed income. Also, we launched five year increments for the ING Index Solution Portfolios, creating 2020, 2030, 2040 and 2050 portfolios.
During December we replaced Vanguard’s and MSCI’s Emerging Market exchanged traded funds (“ETF”) with the ING Emerging Markets Index Portfolio in order to free up the Portfolios’ ETF capacity. We also replaced ING Russell Large Cap Index Portfolio, which tracks the Russell Top 200® Index, with the ING U.S. Stock Index Portfolio, which tracks the S&P 500® Index, to broaden large and mid cap exposure.
We are overweight high yield and underweight core fixed income. We are neutral equity vs. bonds.
Current Strategy and Outlook: Our central case for 2012 is for modest economic growth in the face of a risky global environment. The United States should avoid recession in 2012 and post moderate growth as consumer exuberance will be tempered by continued household balance sheet repair as well as sluggish housing and jobs markets; our current full-year 2012 forecast is for GDP growth of 2.5%, though we may revise this figure upward given recent positive trends in consumption and housing. Inflation should remain contained despite a highly accommodative Federal Reserve.
Europe remains a major risk to our forecast, though we believe the region’s policymakers will be able to sidestep disaster. We believe the environment should be supportive of equities as well as most fixed income risk sectors, especially high yield. Markets are likely to remain volatile in 2012.
| (1) | The members of the Investment Committee are: William A. Evans, Paul Zemsky and Heather Hackett. |
| (2) | The investment objective of each Portfolio is described in the Portfolios’ prospectuses, each dated April 30, 2011, except for ING Index Solution 2020 Portfolio, ING Index Solution 2030 Portfolio, ING Index Solution 2040 Portfolio and ING Index Solution 2050 Portfolio, which are dated September 28, 2011. |
Portfolio holdings and characteristics are subject to change and may not be representative of current holdings and characteristics. The outlook for this Portfolio may differ from that presented for other ING Funds. Performance for the different classes of shares will vary based on differences in fees associated with each class.
4
| | |
| PORTFOLIO MANAGERS’ REPORT | | ING INDEX SOLUTION PORTFOLIOS |
| | | | | | | | |
| | | |
| | | Average Annual Total Returns for the Period Ended December 31, 2011 | | | |
| | | | | 1 Year | | | |
| | | ING Index Solution Income Portfolio, Class S | | | 2.73 | % | | |
| | | S&P Target Date Retirement Income Index | | | 3.98 | % | | |
| | | ING Index Solution 2015 Portfolio, Class S | | | 0.80 | % | | |
| | | S&P Target Date 2015 Index | | | 1.53 | % | | |
| | | ING Index Solution 2020 Portfolio, Class S | | | 7.60 | %(1) | | |
| | | S&P Target Date 2020 Index | | | 7.13 | %(1) | | |
| | | ING Index Solution 2025 Portfolio, Class S | | | (1.55 | )% | | |
| | | S&P Target Date 2025 Index | | | (0.28 | )% | | |
| | | ING Index Solution 2030 Portfolio, Class S | | | 10.00 | %(1) | | |
| | | S&P Target Date 2030 Index | | | 8.45 | %(1) | | |
| | | ING Index Solution 2035 Portfolio, Class S | | | (3.26 | )% | | |
| | | S&P Target Date 2035 Index | | | (1.71 | )% | | |
| | | ING Index Solution 2040 Portfolio, Class S | | | 11.80 | %(1) | | |
| | | S&P Target Date 2040 Index | | | 9.15 | %(1) | | |
| | | ING Index Solution 2045 Portfolio, Class S | | | (4.09 | )% | | |
| | | S&P Target Date 2045 Index | | | (2.56 | )% | | |
| | | ING Index Solution 2050 Portfolio, Class S | | | 11.90 | %(1) | | |
| | | S&P Target Date 2045 Index | | | 9.33 | %(1) | | |
| | | ING Index Solution 2055 Portfolio, Class S | | | (4.17 | )% | | |
| | | S&P Target Date 2045 Index | | | (2.56 | )% | | |
| (1) | Return is for the period from inception on October 3, 2011 through December 31, 2011. |
Target Allocations
as of December 31, 2011
(as a percentage of net assets)
| | | | | | | | | | | | | | | | | | | | | | | | | | | | | | | | | | | | | | | | | | | | |
| | | | | | ING
Index
Solution Income | | | ING
Index Solution 2015 | | | ING
Index
Solution 2020 | | | ING
Index
Solution 2025 | | | ING
Index
Solution 2030 | | | ING
Index Solution 2035 | | | ING
Index
Solution 2040 | | | ING
Index Solution 2045 | | | ING
Index
Solution 2050 | | | ING
Index Solution 2055 | |
US Large Cap Stocks | | | % | | | | 17 | | | | 18 | | | | 23 | | | | 29 | | | | 33 | | | | 39 | | | | 42 | | | | 42 | | | | 42 | | | | 42 | |
US Mid Cap Stocks | | | % | | | | 9 | | | | 11 | | | | 13 | | | | 14 | | | | 16 | | | | 16 | | | | 16 | | | | 16 | | | | 16 | | | | 16 | |
US Small Cap Stocks | | | % | | | | 0 | | | | 2 | | | | 3 | | | | 4 | | | | 4 | | | | 5 | | | | 5 | | | | 5 | | | | 5 | | | | 5 | |
Non US/lntl Stocks | | | % | | | | 6 | | | | 12 | | | | 15 | | | | 17 | | | | 19 | | | | 20 | | | | 24 | | | | 25 | | | | 25 | | | | 25 | |
Core Fl | | | % | | | | 65 | | | | 52 | | | | 40 | | | | 30 | | | | 21 | | | | 13 | | | | 6 | | | | 5 | | | | 5 | | | | 5 | |
Emerging Markets Equity | | | % | | | | 3 | | | | 5 | | | | 6 | | | | 6 | | | | 7 | | | | 7 | | | | 7 | | | | 7 | | | | 7 | | | | 7 | |
As these are target allocations, the actual allocations of each Portfolio’s assets may deviate from the percentages shown. Although the Portfolios expect to be fully invested at all times, they may maintain liquidity reserves to meet redemption requests.
Portfolio holdings are subject to change daily.
5
| | |
| ING INDEX SOLUTION INCOME PORTFOLIO | | PORTFOLIO MANAGERS’ REPORT |
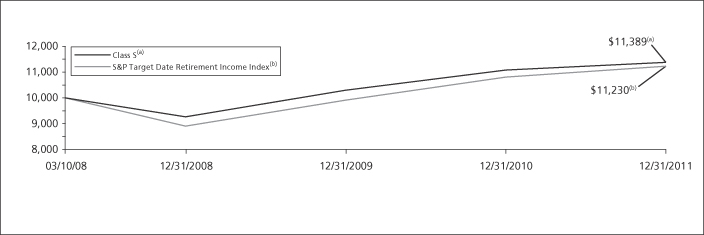
| | | | | | | | | | | | | | | | |
| | | |
| | | Average Annual Total Returns for the Period Ended December 31, 2011 | | | |
| | | | | 1 Year | | | Since Inception
of Classes ADV, I, S and T
March 10, 2008 | | | Since Inception
of Class S2
May 28, 2009 | | | |
| | | Class ADV | | | 2.35 | % | | | 3.19 | % | | | — | | | |
| | | Class I | | | 2.99 | % | | | 3.77 | % | | | — | | | |
| | | Class S | | | 2.73 | % | | | 3.47 | % | | | — | | | |
| | | Class S2 | | | 2.52 | % | | | — | | | | 7.82 | % | | |
| | | Class T | | | 2.20 | % | | | 2.98 | % | | | — | | | |
| | | S&P Target Date Retirement Income Index | | | 3.98 | % | | | 3.09 | %(1) | | | 8.89 | %(2) | | |
Based on a $10,000 initial investment, the graph and table above illustrate the total return of ING Index Solution Income Portfolio against the indices indicated. An index is unmanaged and has no cash in its portfolio, imposes no sales charges and incurs no operating expenses. An investor cannot invest directly in an index.
The performance graph and table do not reflect the deduction of taxes that a shareholder will pay on Portfolio distributions or the redemption of Portfolio shares.
The performance shown may include the effect of fee waivers and/or expense reimbursements by the Investment Adviser and/or other service providers, which have the effect of increasing total return. Had all fees and expenses been considered, the total returns would have been lower.
Performance data represents past performance and is no assurance of future results. Investment return and principal value of an investment in the Portfolio will fluctuate. Shares, when sold, may be worth more or less than their original cost. The Portfolio’s current performance may be lower or higher than the performance data shown. Please log on to www.inginvestment.com or call (800) 992-0180 to get performance through the most recent month end.
It is important to note that the Portfolio has a limited operating history. Performance over a longer period of time may be more meaningful than short-term performance.
This report contains statements that may be “forward-looking” statements. Actual results may differ materially from those projected in the “forward-looking” statements.
The views expressed in this report reflect those of the Investment Adviser, only through the end of the period as stated on the cover. The Investment Adviser’s views are subject to change at any time based on market and other conditions.
Portfolio holdings are subject to change daily.
| (1) | | Since inception performance for the index is shown from March 1, 2008. |
| (2) | | Since inception performance for the index is shown from June 1, 2009. |
6
| | |
| PORTFOLIO MANAGERS’ REPORT | | ING INDEX SOLUTION 2015 PORTFOLIO |
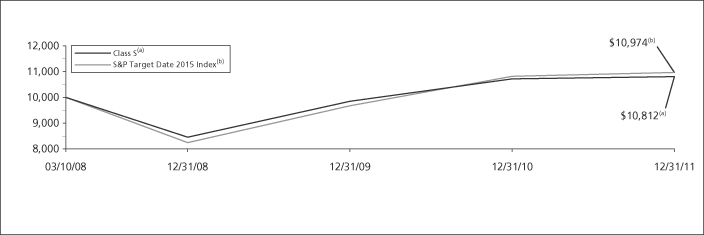
| | | | | | | | | | | | | | | | |
| | | |
| | | Average Annual Total Returns for the Period Ended December 31, 2011 | | | |
| | | | | 1 Year | | | Since Inception
of Classes ADV, I, S and T
March 10, 2008 | | | Since Inception
of Class S2
May 28, 2009 | | | |
| | | Class ADV | | | 0.53 | % | | | 1.81 | % | | | — | | | |
| | | Class I | | | 1.01 | % | | | 2.31 | % | | | — | | | |
| | | Class S | | | 0.80 | % | | | 2.07 | % | | | — | | | |
| | | Class S2 | | | 0.69 | % | | | — | | | | 9.30 | % | | |
| | | Class T | | | 0.38 | % | | | 1.57 | % | | | — | | | |
| | | S&P Target Date 2015 Index | | | 1.53 | % | | | 2.47 | %(1) | | | 10.80 | %(2) | | |
Based on a $10,000 initial investment, the graph and table above illustrate the total return of ING Index Solution 2015 Portfolio against the indices indicated. An index is unmanaged and has no cash in its portfolio, imposes no sales charges and incurs no operating expenses. An investor cannot invest directly in an index.
The performance graph and table do not reflect the deduction of taxes that a shareholder will pay on Portfolio distributions or the redemption of Portfolio shares.
The performance shown may include the effect of fee waivers and/or expense reimbursements by the Investment Adviser and/or other service providers, which have the effect of increasing total return. Had all fees and expenses been considered, the total returns would have been lower.
Performance data represents past performance and is no assurance of future results. Investment return and principal value of an investment in the Portfolio will fluctuate. Shares, when sold, may be worth more or less than their original cost. The Portfolio’s current performance may be lower or higher than the performance data shown. Please log on to www.inginvestment.com or call (800) 992-0180 to get performance through the most recent month end.
It is important to note that the Portfolio has a limited operating history. Performance over a longer period of time may be more meaningful than short-term performance.
This report contains statements that may be “forward-looking” statements. Actual results may differ materially from those projected in the “forward-looking” statements.
The views expressed in this report reflect those of the Investment Adviser, only through the end of the period as stated on the cover. The Investment Adviser’s views are subject to change at any time based on market and other conditions.
Portfolio holdings are subject to change daily.
| (1) | | Since inception performance for the index is shown from March 1, 2008. |
| (2) | | Since inception performance for the index is shown from June 1, 2009. |
7
| | |
| ING INDEX SOLUTION 2020 PORTFOLIO | | PORTFOLIO MANAGERS’ REPORT |
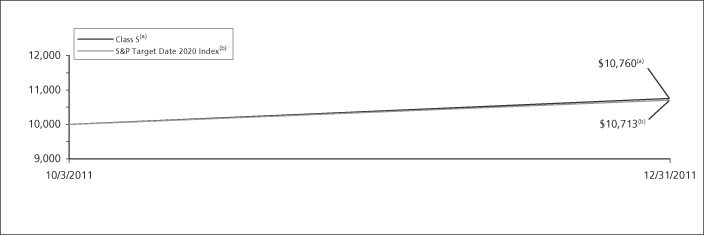
| | | | | | | | |
| | | |
| | | Cumulative Total Returns for the Period Ended December 31, 2011 | | | |
| | | | | Since Inception
of Classes ADV, I, S, T and S2
October 3, 2011 | | | |
| | | Class ADV | | | 7.60 | % | | |
| | | Class I | | | 7.70 | % | | |
| | | Class S | | | 7.60 | % | | |
| | | Class S2 | | | 7.60 | % | | |
| | | Class T | | | 7.50 | % | | |
| | | S&P Target Date 2020 Index | | | 7.13 | % | | |
Based on a $10,000 initial investment, the graph and table above illustrate the total return of ING Index Solution 2020 Portfolio against the indices indicated. An index is unmanaged and has no cash in its portfolio, imposes no sales charges and incurs no operating expenses. An investor cannot invest directly in an index.
The performance graph and table do not reflect the deduction of taxes that a shareholder will pay on Portfolio distributions or the redemption of Portfolio shares.
The performance shown may include the effect of fee waivers and/or expense reimbursements by the Investment Adviser and/or other service providers, which have the effect of increasing total return. Had all fees and expenses been considered, the total returns would have been lower.
Performance data represents past performance and is no assurance of future results. Investment return and principal value of an investment in the Portfolio will fluctuate. Shares, when sold, may be worth more or less than their original cost. The Portfolio’s current performance may be lower or higher than the performance data shown. Please log on to www.inginvestment.com or call (800) 992-0180 to get performance through the most recent month end.
It is important to note that the Portfolio has a limited operating history. Performance over a longer period of time may be more meaningful than short-term performance.
This report contains statements that may be “forward-looking” statements. Actual results may differ materially from those projected in the “forward-looking” statements.
The views expressed in this report reflect those of the Investment Adviser, only through the end of the period as stated on the cover. The Investment Adviser’s views are subject to change at any time based on market and other conditions.
Portfolio holdings are subject to change daily.
8
| | |
| PORTFOLIO MANAGERS’ REPORT | | ING INDEX SOLUTION 2025 PORTFOLIO |
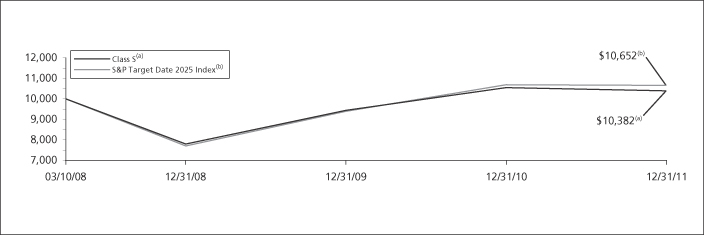
| | | | | | | | | | | | | | | | |
| | | |
| | | Average Annual Total Returns for the Period Ended December 31, 2011 | | | |
| | | | | 1 Year | | | Since Inception
of Classes ADV, I, S and T
March 10, 2008 | | | Since Inception
of Class S2
May 28, 2009 | | | |
| | | Class ADV | | | (1.75 | )% | | | 0.74 | % | | | — | | | |
| | | Class I | | | (1.24 | )% | | | 1.23 | % | | | — | | | |
| | | Class S | | | (1.55 | )% | | | 0.98 | % | | | — | | | |
| | | Class S2 | | | (1.70 | )% | | | — | | | | 10.82 | % | | |
| | | Class T | | | (1.93 | )% | | | 0.49 | % | | | — | | | |
| | | S&P Target Date 2025 Index | | | (0.28 | )% | | | 1.67 | %(1) | | | 12.05 | %(2) | | |
Based on a $10,000 initial investment, the graph and table above illustrate the total return of ING Index Solution 2025 Portfolio against the indices indicated. An index is unmanaged and has no cash in its portfolio, imposes no sales charges and incurs no operating expenses. An investor cannot invest directly in an index.
The performance graph and table do not reflect the deduction of taxes that a shareholder will pay on Portfolio distributions or the redemption of Portfolio shares.
The performance shown may include the effect of fee waivers and/or expense reimbursements by the Investment Adviser and/or other service providers, which have the effect of increasing total return. Had all fees and expenses been considered, the total returns would have been lower.
Performance data represents past performance and is no assurance of future results. Investment return and principal value of an investment in the Portfolio will fluctuate. Shares, when sold, may be worth more or less than their original cost. The Portfolio’s current performance may be lower or higher than the performance data shown. Please log on to www.inginvestment.com or call (800) 992-0180 to get performance through the most recent month end.
It is important to note that the Portfolio has a limited operating history. Performance over a longer period of time may be more meaningful than short-term performance.
This report contains statements that may be “forward-looking” statements. Actual results may differ materially from those projected in the “forward-looking” statements.
The views expressed in this report reflect those of the Investment Adviser, only through the end of the period as stated on the cover. The Investment Adviser’s views are subject to change at any time based on market and other conditions.
Portfolio holdings are subject to change daily.
| (1) | | Since inception performance for the index is shown from March 1, 2008. |
| (2) | | Since inception performance for the index is shown from June 1, 2009. |
9
| | |
| ING INDEX SOLUTION 2030 PORTFOLIO | | PORTFOLIO MANAGERS’ REPORT |
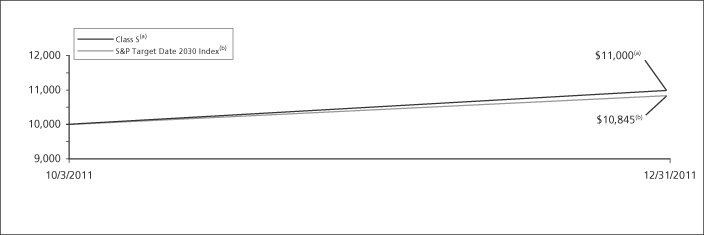
| | | | | | | | |
| | | |
| | | Cumulative Total Returns for the Period Ended December 31, 2011 | | | |
| | | | | Since Inception
of Classes ADV, I, S, T and S2
October 3, 2011 | | | |
| | | Class ADV | | | 10.00 | % | | |
| | | Class I | | | 10.10 | % | | |
| | | Class S | | | 10.00 | % | | |
| | | Class S2 | | | 10.00 | % | | |
| | | Class T | | | 9.90 | % | | |
| | | S&P Target Date 2030 Index | | | 8.45 | % | | |
Based on a $10,000 initial investment, the graph and table above illustrate the total return of ING Index Solution 2030 Portfolio against the indices indicated. An index is unmanaged and has no cash in its portfolio, imposes no sales charges and incurs no operating expenses. An investor cannot invest directly in an index.
The performance graph and table do not reflect the deduction of taxes that a shareholder will pay on Portfolio distributions or the redemption of Portfolio shares.
The performance shown may include the effect of fee waivers and/or expense reimbursements by the Investment Adviser and/or other service providers, which have the effect of increasing total return. Had all fees and expenses been considered, the total returns would have been lower.
Performance data represents past performance and is no assurance of future results. Investment return and principal value of an investment in the Portfolio will fluctuate. Shares, when sold, may be worth more or less than their original cost. The Portfolio’s current performance may be lower or higher than the performance data shown. Please log on to www.inginvestment.com or call (800) 992-0180 to get performance through the most recent month end.
It is important to note that the Portfolio has a limited operating history. Performance over a longer period of time may be more meaningful than short-term performance.
This report contains statements that may be “forward-looking” statements. Actual results may differ materially from those projected in the “forward-looking” statements.
The views expressed in this report reflect those of the Investment Adviser, only through the end of the period as stated on the cover. The Investment Adviser’s views are subject to change at any time based on market and other conditions.
Portfolio holdings are subject to change daily.
10
| | |
| PORTFOLIO MANAGERS’ REPORT | | ING INDEX SOLUTION 2035 PORTFOLIO |
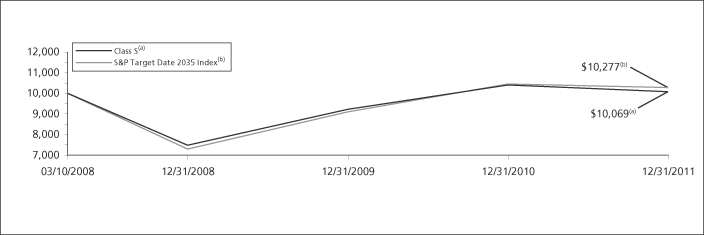
| | | | | | | | | | | | | | | | |
| | | |
| | | Average Annual Total Returns for the Period Ended December 31, 2011 | | | |
| | | | | 1 Year | | | Since Inception
of Classes ADV, I, S and T
March 10, 2008 | | | Since Inception
of Class S2
May 28, 2009 | | | |
| | | Class ADV | | | (3.46 | )% | | | (0.07 | )% | | | — | | | |
| | | Class I | | | (3.06 | )% | | | 0.40 | % | | | — | | | |
| | | Class S | | | (3.26 | )% | | | 0.18 | % | | | — | | | |
| | | Class S2 | | | (3.44 | )% | | | — | | | | 11.19 | % | | |
| | | Class T | | | (3.69 | )% | | | (0.32 | )% | | | — | | | |
| | | S&P Target Date 2035 Index | | | (1.71 | )% | | | 0.72 | %(1) | | | 12.60 | %(2) | | |
Based on a $10,000 initial investment, the graph and table above illustrate the total return of ING Index Solution 2035 Portfolio against the indices indicated. An index is unmanaged and has no cash in its portfolio, imposes no sales charges and incurs no operating expenses. An investor cannot invest directly in an index.
The performance graph and table do not reflect the deduction of taxes that a shareholder will pay on Portfolio distributions or the redemption of Portfolio shares.
The performance shown may include the effect of fee waivers and/or expense reimbursements by the Investment Adviser and/or other service providers, which have the effect of increasing total return. Had all fees and expenses been considered, the total returns would have been lower.
Performance data represents past performance and is no assurance of future results. Investment return and principal value of an investment in the Portfolio will fluctuate. Shares, when sold, may be worth more or less than their original cost. The Portfolio’s current performance may be lower or higher than the performance data shown. Please log on to www.inginvestment.com or call (800) 992-0180 to get performance through the most recent month end.
It is important to note that the Portfolio has a limited operating history. Performance over a longer period of time may be more meaningful than short-term performance.
This report contains statements that may be “forward-looking” statements. Actual results may differ materially from those projected in the “forward-looking” statements.
The views expressed in this report reflect those of the Investment Adviser, only through the end of the period as stated on the cover. The Investment Adviser’s views are subject to change at any time based on market and other conditions.
Portfolio holdings are subject to change daily.
| (1) | | Since inception performance for the index is shown from March 1, 2008. |
| (2) | | Since inception performance for the index is shown from June 1, 2009. |
11
| | |
| ING INDEX SOLUTION 2040 PORTFOLIO | | PORTFOLIO MANAGERS’ REPORT |
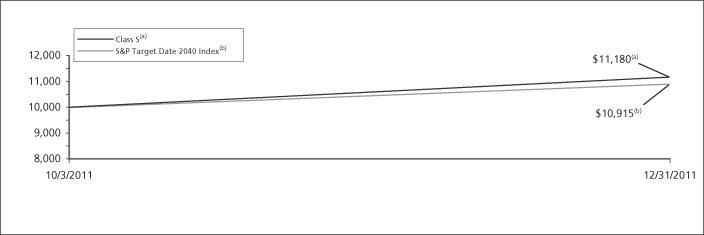
| | | | | | | | |
| | | |
| | | Cumulative Total Returns for the Period Ended December 31, 2011 | | | |
| | | | | Since Inception
of Classes ADV, I, S, T and S2
October 3, 2011 | | | |
| | | Class ADV | | | 11.80 | % | | |
| | | Class I | | | 11.90 | % | | |
| | | Class S | | | 11.80 | % | | |
| | | Class S2 | | | 11.80 | % | | |
| | | Class T | | | 11.70 | % | | |
| | | S&P Target Date 2040 Index | | | 9.15 | % | | |
Based on a $10,000 initial investment, the graph and table above illustrate the total return of ING Index Solution 2040 Portfolio against the indices indicated. An index is unmanaged and has no cash in its portfolio, imposes no sales charges and incurs no operating expenses. An investor cannot invest directly in an index.
The performance graph and table do not reflect the deduction of taxes that a shareholder will pay on Portfolio distributions or the redemption of Portfolio shares.
The performance shown may include the effect of fee waivers and/or expense reimbursements by the Investment Adviser and/or other service providers, which have the effect of increasing total return. Had all fees and expenses been considered, the total returns would have been lower.
Performance data represents past performance and is no assurance of future results. Investment return and principal value of an investment in the Portfolio will fluctuate. Shares, when sold, may be worth more or less than their original cost. The Portfolio’s current performance may be lower or higher than the performance data shown. Please log on to www.inginvestment.com or call (800) 992-0180 to get performance through the most recent month end.
It is important to note that the Portfolio has a limited operating history. Performance over a longer period of time may be more meaningful than short-term performance.
This report contains statements that may be “forward-looking” statements. Actual results may differ materially from those projected in the “forward-looking” statements.
The views expressed in this report reflect those of the Investment Adviser, only through the end of the period as stated on the cover. The Investment Adviser’s views are subject to change at any time based on market and other conditions.
Portfolio holdings are subject to change daily.
12
| | |
| PORTFOLIO MANAGERS’ REPORT | | ING INDEX SOLUTION 2045 PORTFOLIO |
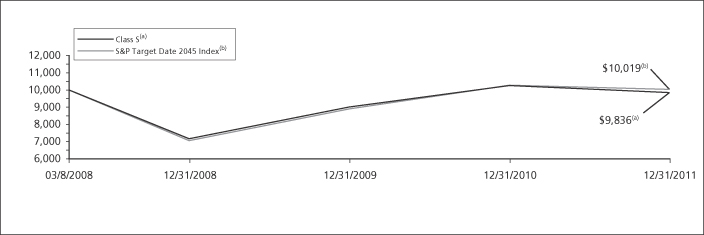
| | | | | | | | | | | | | | | | |
| | | |
| | | Average Annual Total Returns for the Period Ended December 31, 2011 | | | |
| | | | | 1 Year | | | Since Inception
of Classes ADV, I, S and T
March 10, 2008 | | | Since Inception
of Class S2
May 28, 2009 | | | |
| | | Class ADV | | | (4.48 | )% | | | (0.73 | )% | | | — | | | |
| | | Class I | | | (3.92 | )% | | | (0.21 | )% | | | — | | | |
| | | Class S | | | (4.09 | )% | | | (0.44 | )% | | | — | | | |
| | | Class S2 | | | (4.32 | )% | | | — | | | | 11.92 | % | | |
| | | Class T | | | (4.61 | )% | | | (0.93 | )% | | | — | | | |
| | | S&P Target Date 2045 Index | | | (2.56 | )% | | | 0.05 | %(1) | | | 12.70 | %(2) | | |
Based on a $10,000 initial investment, the graph and table above illustrate the total return of ING Index Solution 2045 Portfolio against the indices indicated. An index is unmanaged and has no cash in its portfolio, imposes no sales charges and incurs no operating expenses. An investor cannot invest directly in an index.
The performance graph and table do not reflect the deduction of taxes that a shareholder will pay on Portfolio distributions or the redemption of Portfolio shares.
The performance shown may include the effect of fee waivers and/or expense reimbursements by the Investment Adviser and/or other service providers, which have the effect of increasing total return. Had all fees and expenses been considered, the total returns would have been lower.
Performance data represents past performance and is no assurance of future results. Investment return and principal value of an investment in the Portfolio will fluctuate. Shares, when sold, may be worth more or less than their original cost. The Portfolio’s current performance may be lower or higher than the performance data shown. Please log on to www.inginvestment.com or call (800) 992-0180 to get performance through the most recent month end.
It is important to note that the Portfolio has a limited operating history. Performance over a longer period of time may be more meaningful than short-term performance.
This report contains statements that may be “forward-looking” statements. Actual results may differ materially from those projected in the “forward-looking” statements.
The views expressed in this report reflect those of the Investment Adviser, only through the end of the period as stated on the cover. The Investment Adviser’s views are subject to change at any time based on market and other conditions.
Portfolio holdings are subject to change daily.
| (1) | | Since inception performance for the index is shown from March 1, 2008. |
| (2) | | Since inception performance for the index is shown from June 1, 2009. |
13
| | |
| ING INDEX SOLUTION 2050 PORTFOLIO | | PORTFOLIO MANAGERS’ REPORT |
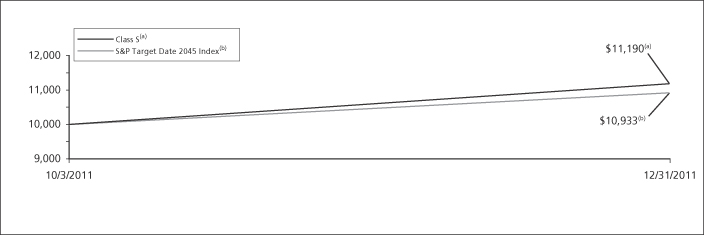
| | | | | | | | |
| | | |
| | | Cumulative Total Returns for the Period Ended December 31, 2011 | | | |
| | | | | Since Inception
of Classes ADV, I, S, T and S2
October 3, 2011 | | | |
| | | Class ADV | | | 11.80 | % | | |
| | | Class I | | | 11.90 | % | | |
| | | Class S | | | 11.90 | % | | |
| | | Class S2 | | | 11.90 | % | | |
| | | Class T | | | 11.80 | % | | |
| | | S&P Target Date 2045 Index | | | 9.33 | % | | |
Based on a $10,000 initial investment, the graph and table above illustrate the total return of ING Index Solution 2050 Portfolio against the indices indicated. An index is unmanaged and has no cash in its portfolio, imposes no sales charges and incurs no operating expenses. An investor cannot invest directly in an index.
The performance graph and table do not reflect the deduction of taxes that a shareholder will pay on Portfolio distributions or the redemption of Portfolio shares.
The performance shown may include the effect of fee waivers and/or expense reimbursements by the Investment Adviser and/or other service providers, which have the effect of increasing total return. Had all fees and expenses been considered, the total returns would have been lower.
Performance data represents past performance and is no assurance of future results. Investment return and principal value of an investment in the Portfolio will fluctuate. Shares, when sold, may be worth more or less than their original cost. The Portfolio’s current performance may be lower or higher than the performance data shown. Please log on to www.inginvestment.com or call (800) 992-0180 to get performance through the most recent month end.
It is important to note that the Portfolio has a limited operating history. Performance over a longer period of time may be more meaningful than short-term performance.
This report contains statements that may be “forward-looking” statements. Actual results may differ materially from those projected in the “forward-looking” statements.
The views expressed in this report reflect those of the Investment Adviser, only through the end of the period as stated on the cover. The Investment Adviser’s views are subject to change at any time based on market and other conditions.
Portfolio holdings are subject to change daily.
14
| | |
| PORTFOLIO MANAGERS’ REPORT | | ING INDEX SOLUTION 2055 PORTFOLIO |
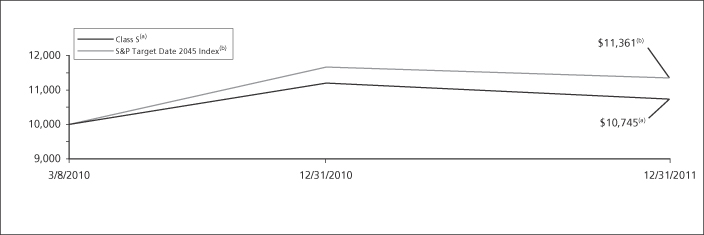
| | | | | | | | | | | | |
| | | |
| | | Average Annual Total Returns for the Period Ended December 31, 2011 | | | |
| | | | | 1 Year | | | Since Inception
of Classes ADV, I, S, T and S2
March 8, 2010 | | | |
| | | Class ADV | | | (4.40 | )% | | | 3.78 | % | | |
| | | Class I | | | (3.93 | )% | | | 4.32 | % | | |
| | | Class S | | | (4.17 | )% | | | 4.02 | % | | |
| | | Class S2 | | | (4.32 | )% | | | 3.88 | % | | |
| | | Class T | | | (4.59 | )% | | | 3.56 | % | | |
| | | S&P Target Date 2045 Index | | | (2.56 | )% | | | 7.30 | %(1) | | |
Based on a $10,000 initial investment, the graph and table above illustrate the total return of ING Index Solution 2055 Portfolio against the indices indicated. An index is unmanaged and has no cash in its portfolio, imposes no sales charges and incurs no operating expenses. An investor cannot invest directly in an index.
The performance graph and table do not reflect the deduction of taxes that a shareholder will pay on Portfolio distributions or the redemption of Portfolio shares.
The performance shown may include the effect of fee waivers and/or expense reimbursements by the Investment Adviser and/or other service providers, which have the effect of increasing total return. Had all fees and expenses been considered, the total returns would have been lower.
Performance data represents past performance and is no assurance of future results. Investment return and principal value of an investment in the Portfolio will fluctuate. Shares, when sold, may be worth more or less than their original cost. The Portfolio’s current performance may be lower or higher than the performance data shown. Please log on to www.inginvestment.com or call (800) 992-0180 to get performance through the most recent month end.
It is important to note that the Portfolio has a limited operating history. Performance over a longer period of time may be more meaningful than short-term performance.
This report contains statements that may be “forward-looking” statements. Actual results may differ materially from those projected in the “forward-looking” statements.
The views expressed in this report reflect those of the Investment Adviser, only through the end of the period as stated on the cover. The Investment Adviser’s views are subject to change at any time based on market and other conditions.
Portfolio holdings are subject to change daily.
| (1) | | Since inception performance for the index is shown from March 1, 2010. |
15
SHAREHOLDER EXPENSE EXAMPLES (UNAUDITED)
As a shareholder of a Portfolio, you incur two types of costs: (1) transaction costs, including redemption and exchange fees; and (2) ongoing costs including management fees, distribution and/or service (12b-1) fees, and other Portfolio expenses. These Examples are intended to help you understand your ongoing costs (in dollars) of investing in a Portfolio and to compare these costs with the ongoing costs of investing in other mutual funds.
The Examples are based on an investment of $1,000 invested at the beginning of the period (except as noted) and held for the entire period from July 1, 2011 to December 31, 2011. The Portfolios’ expenses are shown without the imposition of any charges which are, or may be, imposed under your variable annuity contract, variable life insurance policy, qualified pension or retirement plan. Expenses would have been higher if such charges were included.
Actual Expenses
The left section of the table shown below, “Actual Portfolio Return,” provides information about actual account values and actual expenses. You may use the information in this section, together with the amount you invested, to estimate the expenses that you paid over the period. Simply divide your account value by $1,000 (for example, an $8,600 account value divided by $1,000 = 8.6), then multiply the result by the number in the first section under the heading entitled “Expenses Paid During the Period” to estimate the expenses you paid on your account during this period.
Hypothetical Example for Comparison Purposes
The right section of the table shown below, “Hypothetical (5% return before expenses),” provides information about hypothetical account values and hypothetical expenses based on a Portfolio’s actual expense ratio and an assumed rate of return of 5% per year before expenses, which is not a Portfolio’s actual return. The hypothetical account values and expenses may not be used to estimate the actual ending account balance or expenses you paid for the period. You may use this information to compare the ongoing costs of investing in a Portfolio and other mutual funds. To do so, compare this 5% hypothetical example with the 5% hypothetical examples that appear in the shareholder reports of the other mutual funds.
Please note that the expenses shown in the table are meant to highlight your ongoing costs only and do not reflect any transactional costs, such as redemption fees or exchange fees. Therefore, the hypothetical lines of the table are useful in comparing ongoing costs only, and will not help you determine the relative total costs of owning different mutual funds. In addition, if these transactional costs were included, your costs would have been higher.
| | | | | | | | | | | | | | | | | | | | | | | | | | | | | | | | |
| | | Actual Portfolio Return | | | Hypothetical (5% return before expenses) | |
| | | Beginning
Account
Value
July 1, 2011 | | | Ending
Account Value
December 31, 2011 | | | Annualized Expense Ratio* | | | Expenses Paid
During the
Period Ended
December 31, 2011** | | | Beginning
Account
Value
July 1, 2011 | | | Ending
Account Value
December 31, 2011 | | | Annualized Expense Ratio* | | | Expenses Paid
During the
Period Ended
December 31, 2011** | |
ING Index Solution Income Portfolio | | | | | | | | | | | | | | | | | | | | | |
Class ADV | | $ | 1,000.00 | | | $ | 995.70 | | | | 0.62 | % | | $ | 3.12 | | | $ | 1,000.00 | | | $ | 1,022.08 | | | | 0.62 | % | | $ | 3.16 | |
Class I | | | 1,000.00 | | | | 999.60 | | | | 0.12 | | | | 0.60 | | | | 1,000.00 | | | | 1,024.60 | | | | 0.12 | | | | 0.61 | |
Class S | | | 1,000.00 | | | | 997.80 | | | | 0.37 | | | | 1.86 | | | | 1,000.00 | | | | 1,023.34 | | | | 0.37 | | | | 1.89 | |
Class S2 | | | 1,000.00 | | | | 996.50 | | | | 0.52 | | | | 2.62 | | | | 1,000.00 | | | | 1,022.58 | | | | 0.52 | | | | 2.65 | |
Class T | | | 1,000.00 | | | | 995.20 | | | | 0.82 | | | | 4.12 | | | | 1,000.00 | | | | 1,021.07 | | | | 0.82 | | | | 4.18 | |
ING Index Solution 2015 Portfolio | | | | | | | | | | | | | | | | | | | | | |
Class ADV | | $ | 1,000.00 | | | $ | 971.80 | | | | 0.62 | % | | $ | 3.08 | | | $ | 1,000.00 | | | $ | 1,022.08 | | | | 0.62 | % | | $ | 3.16 | |
Class I | | | 1,000.00 | | | | 974.20 | | | | 0.12 | | | | 0.60 | | | | 1,000.00 | | | | 1,024.60 | | | | 0.12 | | | | 0.61 | |
Class S | | | 1,000.00 | | | | 973.70 | | | | 0.37 | | | | 1.84 | | | | 1,000.00 | | | | 1,023.34 | | | | 0.37 | | | | 1.89 | |
Class S2 | | | 1,000.00 | | | | 972.40 | | | | 0.52 | | | | 2.59 | | | | 1,000.00 | | | | 1,022.58 | | | | 0.52 | | | | 2.65 | |
Class T | | | 1,000.00 | | | | 970.40 | | | | 0.82 | | | | 4.07 | | | | 1,000.00 | | | | 1,021.07 | | | | 0.82 | | | | 4.18 | |
| * | | Expense ratios do not include expenses of the Underlying Portfolios. |
| ** | | Expenses are equal to each Portfolios’ respective annualized expense ratios multiplied by the average account value over the period, multiplied by 184/365 to reflect the most recent fiscal half-year. |
16
SHAREHOLDER EXPENSE EXAMPLES (UNAUDITED) (CONTINUED)
| | | | | | | | | | | | | | | | | | | | | | | | | | | | | | | | |
| | | Actual Portfolio Return | | | Hypothetical (5% return before expenses) | |
| | | Beginning
Account
Value
July 1, 2011 | | | Ending
Account Value
December 31, 2011 | | | Annualized Expense Ratio* | | | Expenses Paid
During the
Period Ended
December 31, 2011** | | | Beginning
Account
Value
July 1, 2011 | | | Ending
Account Value
December 31, 2011 | | | Annualized Expense Ratio* | | | Expenses Paid
During the
Period Ended
December 31, 2011** | |
ING Index Solution 2020 Portfolio | | | | | | | | | | | | | | | | | | | | | |
Class ADV(1) | | $ | 1,000.00 | | | $ | 1,076.00 | | | | 0.62 | % | | $ | 3.24 | | | $ | 1,000.00 | | | $ | 1,022.08 | | | | 0.62 | % | | $ | 3.16 | |
Class I(1) | | | 1,000.00 | | | | 1,077.00 | | | | 0.12 | | | | 0.63 | | | | 1,000.00 | | | | 1,024.60 | | | | 0.12 | | | | 0.61 | |
Class S(1) | | | 1,000.00 | | | | 1,076.00 | | | | 0.37 | | | | 1.94 | | | | 1,000.00 | | | | 1,023.34 | | | | 0.37 | | | | 1.89 | |
Class S2(1) | | | 1,000.00 | | | | 1,076.00 | | | | 0.52 | | | | 2.72 | | | | 1,000.00 | | | | 1,022.58 | | | | 0.52 | | | | 2.65 | |
Class T(1) | | | 1,000.00 | | | | 1,075.00 | | | | 0.82 | | | | 4.29 | | | | 1,000.00 | | | | 1,021.07 | | | | 0.82 | | | | 4.18 | |
ING Index Solution 2025 Portfolio | | | | | | | | | | | | | | | | | | | | | |
Class ADV | | $ | 1,000.00 | | | $ | 939.20 | | | | 0.62 | % | | $ | 3.03 | | | $ | 1,000.00 | | | $ | 1,022.08 | | | | 0.62 | % | | $ | 3.16 | |
Class I | | | 1,000.00 | | | | 941.90 | | | | 0.12 | | | | 0.59 | | | | 1,000.00 | | | | 1,024.60 | | | | 0.12 | | | | 0.61 | |
Class S | | | 1,000.00 | | | | 940.50 | | | | 0.37 | | | | 1.81 | | | | 1,000.00 | | | | 1,023.34 | | | | 0.37 | | | | 1.89 | |
Class S2 | | | 1,000.00 | | | | 939.70 | | | | 0.52 | | | | 2.54 | | | | 1,000.00 | | | | 1,022.58 | | | | 0.52 | | | | 2.65 | |
Class T | | | 1,000.00 | | | | 938.20 | | | | 0.82 | | | | 4.01 | | | | 1,000.00 | | | | 1,021.07 | | | | 0.82 | | | | 4.18 | |
ING Index Solution 2030 Portfolio | | | | | | | | | | | | | | | | | | | | | |
Class ADV(1) | | $ | 1,000.00 | | | $ | 1,100.00 | | | | 0.62 | % | | $ | 3.28 | | | $ | 1,000.00 | | | $ | 1,022.08 | | | | 0.62 | % | | $ | 3.16 | |
Class I(1) | | | 1,000.00 | | | | 1,101.00 | | | | 0.12 | | | | 0.64 | | | | 1,000.00 | | | | 1,024.60 | | | | 0.12 | | | | 0.61 | |
Class S(1) | | | 1,000.00 | | | | 1,100.00 | | | | 0.37 | | | | 1.96 | | | | 1,000.00 | | | | 1,023.34 | | | | 0.37 | | | | 1.89 | |
Class S2(1) | | | 1,000.00 | | | | 1,100.00 | | | | 0.52 | | | | 2.75 | | | | 1,000.00 | | | | 1,022.58 | | | | 0.52 | | | | 2.65 | |
Class T(1) | | | 1,000.00 | | | | 1,099.00 | | | | 0.82 | | | | 4.34 | | | | 1,000.00 | | | | 1,021.07 | | | | 0.82 | | | | 4.18 | |
ING Index Solution 2035 Portfolio | | | | | | | | | | | | | | | | | | | | | |
Class ADV | | $ | 1,000.00 | | | $ | 919.70 | | | | 0.62 | % | | $ | 3.00 | | | $ | 1,000.00 | | | $ | 1,022.08 | | | | 0.62 | % | | $ | 3.16 | |
Class I | | | 1,000.00 | | | | 921.50 | | | | 0.12 | | | | 0.58 | | | | 1,000.00 | | | | 1,024.60 | | | | 0.12 | | | | 0.61 | |
Class S | | | 1,000.00 | | | | 921.10 | | | | 0.37 | | | | 1.79 | | | | 1,000.00 | | | | 1,023.34 | | | | 0.37 | | | | 1.89 | |
Class S2 | | | 1,000.00 | | | | 920.00 | | | | 0.52 | | | | 2.52 | | | | 1,000.00 | | | | 1,022.58 | | | | 0.52 | | | | 2.65 | |
Class T | | | 1,000.00 | | | | 919.10 | | | | 0.82 | | | | 3.97 | | | | 1,000.00 | | | | 1,021.07 | | | | 0.82 | | | | 4.18 | |
ING Index Solution 2040 Portfolio | | | | | | | | | | | | | | | | | | | | | |
Class ADV(1) | | $ | 1,000.00 | | | $ | 1,118.00 | | | | 0.62 | % | | $ | 3.31 | | | $ | 1,000.00 | | | $ | 1,022.08 | | | | 0.62 | % | | $ | 3.16 | |
Class I(1) | | | 1,000.00 | | | | 1,119.00 | | | | 0.12 | | | | 0.64 | | | | 1,000.00 | | | | 1,024.60 | | | | 0.12 | | | | 0.61 | |
Class S(1) | | | 1,000.00 | | | | 1,118.00 | | | | 0.37 | | | | 1.98 | | | | 1,000.00 | | | | 1,023.34 | | | | 0.37 | | | | 1.89 | |
Class S2(1) | | | 1,000.00 | | | | 1,118.00 | | | | 0.52 | | | | 2.78 | | | | 1,000.00 | | | | 1,022.58 | | | | 0.52 | | | | 2.65 | |
Class T(1) | | | 1,000.00 | | | | 1,117.00 | | | | 0.82 | | | | 4.38 | | | | 1,000.00 | | | | 1,021.07 | | | | 0.82 | | | | 4.18 | |
ING Index Solution 2045 Portfolio | | | | | | | | | | | | | | | | | | | | | |
Class ADV | | $ | 1,000.00 | | | $ | 906.00 | | | | 0.62 | % | | $ | 2.98 | | | $ | 1,000.00 | | | $ | 1,022.08 | | | | 0.62 | % | | $ | 3.16 | |
Class I | | | 1,000.00 | | | | 908.60 | | | | 0.12 | | | | 0.58 | | | | 1,000.00 | | | | 1,024.60 | | | | 0.12 | | | | 0.61 | |
Class S | | | 1,000.00 | | | | 907.40 | | | | 0.37 | | | | 1.78 | | | | 1,000.00 | | | | 1,023.34 | | | | 0.37 | | | | 1.89 | |
Class S2 | | | 1,000.00 | | | | 906.80 | | | | 0.52 | | | | 2.50 | | | | 1,000.00 | | | | 1,022.58 | | | | 0.52 | | | | 2.65 | |
Class T | | | 1,000.00 | | | | 904.60 | | | | 0.82 | | | | 3.94 | | | | 1,000.00 | | | | 1,021.07 | | | | 0.82 | | | | 4.18 | |
| * | | Expense ratios do not include expenses of the Underlying Portfolios. |
| ** | | Expenses are equal to each Portfolios’ respective annualized expense ratios multiplied by the average account value over the period, multiplied by 184/365 to reflect the most recent fiscal half-year. |
| (1) | | Commencement of operations was October 03, 2011. Expenses paid for the actual Portfolios’ return reflect the 89-day period ended December 31, 2011. |
17
SHAREHOLDER EXPENSE EXAMPLES (UNAUDITED) (CONTINUED)
| | | | | | | | | | | | | | | | | | | | | | | | | | | | | | | | |
| | | Actual Portfolio Return | | | Hypothetical (5% return before expenses) | |
| | | Beginning
Account
Value
July 1, 2011 | | | Ending
Account Value
December 31, 2011 | | | Annualized Expense Ratio* | | | Expenses Paid
During the
Period Ended
December 31, 2011** | | | Beginning
Account
Value
July 1, 2011 | | | Ending
Account Value
December 31, 2011 | | | Annualized Expense Ratio* | | | Expenses Paid
During the
Period Ended
December 31, 2011** | |
ING Index Solution 2050 Portfolio | | | | | | | | | | | | | | | | | | | | | |
Class ADV(1) | | $ | 1,000.00 | | | $ | 1,118.00 | | | | 0.62 | % | | $ | 3.31 | | | $ | 1,000.00 | | | $ | 1,022.08 | | | | 0.62 | % | | $ | 3.16 | |
Class I(1) | | | 1,000.00 | | | | 1,119.00 | | | | 0.12 | | | | 0.64 | | | | 1,000.00 | | | | 1,024.60 | | | | 0.12 | | | | 0.61 | |
Class S(1) | | | 1,000.00 | | | | 1,119.00 | | | | 0.37 | | | | 1.98 | | | | 1,000.00 | | | | 1,023.34 | | | | 0.37 | | | | 1.89 | |
Class S2(1) | | | 1,000.00 | | | | 1,119.00 | | | | 0.52 | | | | 2.78 | | | | 1,000.00 | | | | 1,022.58 | | | | 0.52 | | | | 2.65 | |
Class T(1) | | | 1,000.00 | | | | 1,118.00 | | | | 0.82 | | | | 4.38 | | | | 1,000.00 | | | | 1,021.07 | | | | 0.82 | | | | 4.18 | |
ING Index Solution 2055 Portfolio | | | | | | | | | | | | | | | | | | | | | |
Class ADV | | $ | 1,000.00 | | | $ | 906.50 | | | | 0.62 | % | | $ | 2.98 | | | $ | 1,000.00 | | | $ | 1,022.08 | | | | 0.62 | % | | $ | 3.16 | |
Class I | | | 1,000.00 | | | | 908.90 | | | | 0.12 | | | | 0.58 | | | | 1,000.00 | | | | 1,024.60 | | | | 0.12 | | | | 0.61 | |
Class S | | | 1,000.00 | | | | 906.60 | | | | 0.37 | | | | 1.78 | | | | 1,000.00 | | | | 1,023.34 | | | | 0.37 | | | | 1.89 | |
Class S2 | | | 1,000.00 | | | | 906.60 | | | | 0.52 | | | | 2.50 | | | | 1,000.00 | | | | 1,022.58 | | | | 0.52 | | | | 2.65 | |
Class T | | | 1,000.00 | | | | 905.40 | | | | 0.82 | | | | 3.94 | | | | 1,000.00 | | | | 1,021.07 | | | | 0.82 | | | | 4.18 | |
| * | | Expense ratios do not include expenses of the Underlying Portfolios. |
| ** | | Expenses are equal to each Portfolios’ respective annualized expense ratios multiplied by the average account value over the period, multiplied by 184/365 to reflect the most recent fiscal half-year. |
| (1) | | Commencement of operations was October 03, 2011. Expenses paid for the actual Portfolios’ return reflect the 89-day period ended December 31, 2011. |
18
REPORT OF INDEPENDENT REGISTERED PUBLIC ACCOUNTING FIRM
The Shareholders and Board of Directors
ING Partners, Inc.
We have audited the accompanying statements of assets and liabilities, including the portfolios of investments, of ING Index Solution Income Portfolio, ING Index Solution 2015 Portfolio, ING Index Solution 2020 Portfolio, Index Solution 2025 Portfolio, Index Solution 2030 Portfolio, ING Index Solution 2035 Portfolio, Index Solution 2040 Portfolio, ING Index Solution 2045 Portfolio, Index Solution 2050 Portfolio, and ING Index Solution 2055 Portfolio, each a series of ING Partners, Inc., as of December 31, 2011, and the related statements of operations for the year or period then ended, the statements of changes in net assets for each of the years or periods in the two year period then ended, and the financial highlights for the years or periods in the four-year period then ended. These financial statements and financial highlights are the responsibility of management. Our responsibility is to express an opinion on these financial statements and financial highlights based on our audits.
We conducted our audits in accordance with the standards of the Public Company Accounting Oversight Board (United States). Those standards require that we plan and perform the audit to obtain reasonable assurance about whether the financial statements and financial highlights are free of material misstatement. An audit includes examining, on a test basis, evidence supporting the amounts and disclosures in the financial statements. Our procedures included confirmation of securities owned as of December 31, 2011, by correspondence with the custodian and transfer agent of the underlying funds. An audit also includes assessing the accounting principles used and significant estimates made by management, as well as evaluating the overall financial statement presentation. We believe that our audits provide a reasonable basis for our opinion.
In our opinion, the financial statements and financial highlights referred to above present fairly, in all material respects, the financial position of the aforementioned portfolios as of December 31, 2011, and the results of their operations, the changes in their net assets, and the financial highlights for the periods specified in the first paragraph above, in conformity with U.S. generally accepted accounting principles.
Boston, Massachusetts
February 27, 2012
19
STATEMENTS OF ASSETS AND LIABILITIESFORTHE YEAR ENDED DECEMBER 31, 2011
| | | | | | | | | | | | | | | | |
| | | ING Index
Solution Income
Portfolio | | | ING Index
Solution 2015
Portfolio | | | ING Index
Solution 2020
Portfolio | | | ING Index
Solution 2025
Portfolio | |
ASSETS: | | | | | | | | | | | | | | | | |
Investments in securities at value* | | $ | 7,047,616 | | | $ | 7,713,416 | | | $ | 615 | | | $ | 9,745,768 | |
Investments in affiliated underlying funds** | | | 169,688,099 | | | | 184,401,807 | | | | 15,568 | | | | 232,109,355 | |
Cash | | | 790,802 | | | | 890,321 | | | | 255 | | | | 1,737,675 | |
Receivables: | | | | | | | | | | | | | | | | |
Investments in affiliated underlying funds sold | | | 343,949 | | | | 2,157,108 | | | | — | | | | 3,956,806 | |
Fund shares sold | | | 278,217 | | | | 540,385 | | | | — | | | | 1,055,476 | |
Dividends | | | 40,488 | | | | 43,443 | | | | 4 | | | | 54,026 | |
Interest | | | 6 | | | | 6 | | | | — | | | | 8 | |
| | | | | | | | | | | | | | | | |
Total assets | | | 178,189,177 | | | | 195,746,486 | | | | 16,442 | | | | 248,659,114 | |
| | | | | | | | | | | | | | | | |
LIABILITIES: | | | | | | | | | | | | | | | | |
Payable for investments in affiliated underlying funds purchased | | | 741,000 | | | | 837,682 | | | | 240 | | | | 1,671,651 | |
Payable for fund shares redeemed | | | 622,166 | | | | 2,697,493 | | | | — | | | | 5,012,282 | |
Payable to affiliates | | | 60,187 | | | | 73,366 | | | | 6 | | | | 97,771 | |
| | | | | | | | | | | | | | | | |
Total liabilities | | | 1,423,353 | | | | 3,608,541 | | | | 246 | | | | 6,781,704 | |
| | | | | | | | | | | | | | | | |
NET ASSETS | | $ | 176,765,824 | | | $ | 192,137,945 | | | $ | 16,196 | | | $ | 241,877,410 | |
| | | | | | | | | | | | | | | | |
NET ASSETS WERE COMPRISED OF: | | | | | | | | | | | | | | | | |
Paid-in capital | | $ | 164,819,697 | | | $ | 182,979,074 | | | $ | 15,037 | | | $ | 231,650,033 | |
Undistributed net investment income | | | 4,534,846 | | | | 4,061,542 | | | | 33 | | | | 3,884,326 | |
Accumulated net realized gain | | | 5,930,068 | | | | 6,453,648 | | | | 581 | | | | 7,762,880 | |
Net unrealized appreciation (depreciation) | | | 1,481,213 | | | | (1,356,319 | ) | | | 545 | | | | (1,419,829 | ) |
| | | | | | | | | | | | | | | | |
NET ASSETS | | $ | 176,765,824 | | | $ | 192,137,945 | | | $ | 16,196 | | | $ | 241,877,410 | |
| | | | | | | | | | | | | | | | |
| | | | | | | | | | | | | | | | |
* Cost of investments in securities | | $ | 6,972,996 | | | $ | 7,632,002 | | | $ | 609 | | | $ | 9,648,647 | |
** Cost of investments in affiliated underlying funds | | $ | 168,281,506 | | | $ | 185,839,540 | | | $ | 15,029 | | | $ | 233,626,305 | |
| | | | | | | | | | | | | | | | |
Class ADV | | | | | | | | | | | | | | | | |
Net assets | | $ | 25,479,191 | | | $ | 71,791,612 | | | $ | 3,238 | | | $ | 114,181,212 | |
Shares authorized | | | 100,000,000 | | | | 100,000,000 | | | | 100,000,000 | | | | 100,000,000 | |
Par value | | $ | 0.001 | | | $ | 0.001 | | | $ | 0.001 | | | $ | 0.001 | |
Shares outstanding | | | 2,444,140 | | | | 7,252,455 | | | | 301 | | | | 11,948,047 | |
Net asset value and redemption price per share | | $ | 10.42 | | | $ | 9.90 | | | $ | 10.76 | | | $ | 9.56 | |
Class I | | | | | | | | | | | | | | | | |
Net assets | | $ | 6,699,490 | | | $ | 15,151,677 | | | $ | 3,242 | | | $ | 15,691,847 | |
Shares authorized | | | 100,000,000 | | | | 100,000,000 | | | | 100,000,000 | | | | 100,000,000 | |
Par value | | $ | 0.001 | | | $ | 0.001 | | | $ | 0.001 | | | $ | 0.001 | |
Shares outstanding | | | 632,922 | | | | 1,510,147 | | | | 301 | | | | 1,619,978 | |
Net asset value and redemption price per share | | $ | 10.59 | | | $ | 10.03 | | | $ | 10.77 | | | $ | 9.69 | |
Class S | | | | | | | | | | | | | | | | |
Net assets | | $ | 142,820,524 | | | $ | 98,326,353 | | | $ | 3,240 | | | $ | 98,843,150 | |
Shares authorized | | | 100,000,000 | | | | 100,000,000 | | | | 100,000,000 | | | | 100,000,000 | |
Par value | | $ | 0.001 | | | $ | 0.001 | | | $ | 0.001 | | | $ | 0.001 | |
Shares outstanding | | | 13,593,234 | | | | 9,866,914 | | | | 301 | | | | 10,272,576 | |
Net asset value and redemption price per share | | $ | 10.51 | | | $ | 9.97 | | | $ | 10.76 | | | $ | 9.62 | |
Class S2 | | | | | | | | | | | | | | | | |
Net assets | | $ | 1,763,481 | | | $ | 6,865,324 | | | $ | 3,239 | | | $ | 13,158,336 | |
Shares authorized | | | 100,000,000 | | | | 100,000,000 | | | | 100,000,000 | | | | 100,000,000 | |
Par value | | $ | 0.001 | | | $ | 0.001 | | | $ | 0.001 | | | $ | 0.001 | |
Shares outstanding | | | 169,727 | | | | 696,021 | | | | 301 | | | | 1,380,805 | |
Net asset value and redemption price per share | | $ | 10.39 | | | $ | 9.86 | | | $ | 10.76 | | | $ | 9.53 | |
Class T | | | | | | | | | | | | | | | | |
Net assets | | $ | 3,138 | | | $ | 2,979 | | | $ | 3,237 | | | $ | 2,865 | |
Shares authorized | | | 100,000,000 | | | | 100,000,000 | | | | 100,000,000 | | | | 100,000,000 | |
Par value | | $ | 0.001 | | | $ | 0.001 | | | $ | 0.001 | | | $ | 0.001 | |
Shares outstanding | | | 300 | | | | 300 | | | | 301 | | | | 300 | |
Net asset value and redemption price per share | | $ | 10.46 | | | $ | 9.93 | | | $ | 10.75 | | | $ | 9.55 | |
See Accompanying Notes to Financial Statements
20
STATEMENTS OF ASSETS AND LIABILITIESFORTHE YEAR ENDED DECEMBER 31, 2011
| | | | | | | | | | | | | | | | |
| | | ING Index
Solution 2030
Portfolio | | | ING Index
Solution 2035
Portfolio | | | ING Index
Solution 2040
Portfolio | | | ING Index
Solution 2045
Portfolio | |
ASSETS: | | | | | | | | | | | | | | | | |
Investments in securities at value* | | $ | 615 | | | $ | 7,207,068 | | | $ | 461 | | | $ | 2,129,861 | |
Investments in affiliated underlying funds** | | | 15,925 | | | | 171,836,344 | | | | 16,355 | | | | 102,923,505 | |
Cash | | | 301 | | | | 1,656,150 | | | | 274 | | | | 945,470 | |
Receivables: | | | | | | | | | | | | | | | | |
Investments in affiliated underlying funds sold | | | — | | | | 2,992,839 | | | | — | | | | 2,381,643 | |
Fund shares sold | | | — | | | | 135,237 | | | | — | | | | 160,660 | |
Dividends | | | 4 | | | | 39,764 | | | | 2 | | | | 11,806 | |
Interest | | | — | | | | 6 | | | | — | | | | 1 | |
| | | | | | | | | | | | | | | | |
Total assets | | | 16,845 | | | | 183,867,408 | | | | 17,092 | | | | 108,552,946 | |
| | | | | | | | | | | | | | | | |
LIABILITIES: | | | | | | | | | | | | | | | | |
Payable for investments in affiliated underlying funds purchased | | | 280 | | | | 1,607,454 | | | | 260 | | | | 930,229 | |
Payable for fund shares redeemed | | | — | | | | 3,128,076 | | | | — | | | | 2,542,303 | |
Payable to affiliates | | | 7 | | | | 74,473 | | | | 7 | | | | 43,050 | |
| | | | | | | | | | | | | | | | |
Total liabilities | | | 287 | | | | 4,810,003 | | | | 267 | | | | 3,515,582 | |
| | | | | | | | | | | | | | | | |
NET ASSETS | | $ | 16,558 | | | $ | 179,057,405 | | | $ | 16,825 | | | $ | 105,037,364 | |
| | | | | | | | | | | | | | | | |
NET ASSETS WERE COMPRISED OF: | | | | | | | | | | | | | | | | |
Paid-in capital | | $ | 15,036 | | | $ | 172,462,907 | | | $ | 15,037 | | | $ | 102,591,275 | |
Undistributed net investment income | | | 17 | | | | 2,425,785 | | | | 4 | | | | 1,283,247 | |
Accumulated net realized gain | | | 806 | | | | 7,281,483 | | | | 994 | | | | 3,268,602 | |
Net unrealized appreciation (depreciation) | | | 699 | | | | (3,112,770 | ) | | | 790 | | | | (2,105,760 | ) |
| | | | | | | | | | | | | | | | |
NET ASSETS | | $ | 16,558 | | | $ | 179,057,405 | | | $ | 16,825 | | | $ | 105,037,364 | |
| | | | | | | | | | | | | | | | |
| | | | | | | | | | | | | | | | |
* Cost of investments in securities | | $ | 608 | | | $ | 7,136,834 | | | $ | 454 | | | $ | 2,080,469 | |
** Cost of investments in affiliated underlying funds | | $ | 15,233 | | | $ | 175,019,348 | | | $ | 15,572 | | | $ | 105,078,657 | |
| | | | | | | | | | | | | | | | |
Class ADV | | | | | | | | | | | | | | | | |
Net assets | | $ | 3,311 | | | $ | 94,262,612 | | | $ | 3,364 | | | $ | 52,208,652 | |
Shares authorized | | | 100,000,000 | | | | 100,000,000 | | | | 100,000,000 | | | | 100,000,000 | |
Par value | | $ | 0.001 | | | $ | 0.001 | | | $ | 0.001 | | | $ | 0.001 | |
Shares outstanding | | | 301 | | | | 10,134,879 | | | | 301 | | | | 5,684,371 | |
Net asset value and redemption price per share | | $ | 11.00 | | | $ | 9.30 | | | $ | 11.18 | | | $ | 9.18 | |
Class I | | | | | | | | | | | | | | | | |
Net assets | | $ | 3,314 | | | $ | 11,109,288 | | | $ | 3,368 | | | $ | 9,152,328 | |
Shares authorized | | | 100,000,000 | | | | 100,000,000 | | | | 100,000,000 | | | | 100,000,000 | |
Par value | | $ | 0.001 | | | $ | 0.001 | | | $ | 0.001 | | | $ | 0.001 | |
Shares outstanding | | | 301 | | | | 1,177,720 | | | | 301 | | | | 979,789 | |
Net asset value and redemption price per share | | $ | 11.01 | | | $ | 9.43 | | | $ | 11.19 | | | $ | 9.34 | |
Class S | | | | | | | | | | | | | | | | |
Net assets | | $ | 3,312 | | | $ | 64,863,371 | | | $ | 3,366 | | | $ | 38,265,560 | |
Shares authorized | | | 100,000,000 | | | | 100,000,000 | | | | 100,000,000 | | | | 100,000,000 | |
Par value | | $ | 0.001 | | | $ | 0.001 | | | $ | 0.001 | | | $ | 0.001 | |
Shares outstanding | | | 301 | | | | 6,922,183 | | | | 301 | | | | 4,129,038 | |
Net asset value and redemption price per share | | $ | 11.00 | | | $ | 9.37 | | | $ | 11.18 | | | $ | 9.27 | |
Class S2 | | | | | | | | | | | | | | | | |
Net assets | | $ | 3,312 | | | $ | 8,819,347 | | | $ | 3,365 | | | $ | 5,408,069 | |
Shares authorized | | | 100,000,000 | | | | 100,000,000 | | | | 100,000,000 | | | | 100,000,000 | |
Par value | | $ | 0.001 | | | $ | 0.001 | | | $ | 0.001 | | | $ | 0.001 | |
Shares outstanding | | | 301 | | | | 948,852 | | | | 301 | | | | 588,554 | |
Net asset value and redemption price per share | | $ | 11.00 | | | $ | 9.29 | | | $ | 11.18 | | | $ | 9.19 | |
Class T | | | | | | | | | | | | | | | | |
Net assets | | $ | 3,309 | | | $ | 2,787 | | | $ | 3,362 | | | $ | 2,755 | |
Shares authorized | | | 100,000,000 | | | | 100,000,000 | | | | 100,000,000 | | | | 100,000,000 | |
Par value | | $ | 0.001 | | | $ | 0.001 | | | $ | 0.001 | | | $ | 0.001 | |
Shares outstanding | | | 301 | | | | 300 | | | | 301 | | | | 300 | |
Net asset value and redemption price per share | | $ | 10.99 | | | $ | 9.29 | | | $ | 11.17 | | | $ | 9.18 | |
See Accompanying Notes to Financial Statements
21
STATEMENTS OF ASSETS AND LIABILITIESFORTHE YEAR ENDED DECEMBER 31, 2011
| | | | | | | | |
| | | ING Index Solution 2050 Portfolio | | | ING Index Solution 2055 Portfolio | |
ASSETS: | | | | | | | | |
Investments in securities at value* | | $ | 308 | | | $ | 205,515 | |
Investments in affiliated underlying funds** | | | 16,515 | | | | 10,214,168 | |
Cash | | | 254 | | | | 113,129 | |
Receivables: | | | | | | | | |
Fund shares sold | | | — | | | | 35,915 | |
Dividends | | | 2 | | | | 1,084 | |
| | | | | | | | |
Total assets | | | 17,079 | | | | 10,569,811 | |
| | | | | | | | |
LIABILITIES: | | | | | | | | |
Payable for investments in affiliated underlying funds purchased | | | 238 | | | | 146,859 | |
Payable for fund shares redeemed | | | — | | | | 3,486 | |
Payable to affiliates | | | 7 | | | | 4,269 | |
| | | | | | | | |
Total liabilities | | | 245 | | | | 154,614 | |
| | | | | | | | |
NET ASSETS | | $ | 16,834 | | | $ | 10,415,197 | |
| | | | | | | | |
NET ASSETS WERE COMPRISED OF: | | | | | | | | |
Paid-in capital | | $ | 15,037 | | | $ | 10,513,109 | |
Undistributed net investment income | | | 3 | | | | 72,582 | |
Accumulated net realized gain | | | 992 | | | | 159,201 | |
Net unrealized appreciation (depreciation) | | | 802 | | | | (329,695 | ) |
| | | | | | | | |
NET ASSETS | | $ | 16,834 | | | $ | 10,415,197 | |
| | | | | | | | |
| | | | | | | | |
* Cost of investments in securities | | $ | 300 | | | $ | 201,394 | |
** Cost of investments in affiliated underlying funds | | $ | 15,721 | | | $ | 10,547,984 | |
| | | | | | | | |
Class ADV | | | | | | | | |
Net assets | | $ | 3,366 | | | $ | 5,675,661 | |
Shares authorized | | | 100,000,000 | | | | 100,000,000 | |
Par value | | $ | 0.001 | | | $ | 0.001 | |
Shares outstanding | | | 301 | | | | 537,116 | |
Net asset value and redemption price per share | | $ | 11.18 | | | $ | 10.57 | |
Class I | | | | | | | | |
Net assets | | $ | 3,370 | | | $ | 617,543 | |
Shares authorized | | | 100,000,000 | | | | 100,000,000 | |
Par value | | $ | 0.001 | | | $ | 0.001 | |
Shares outstanding | | | 301 | | | | 57,938 | |
Net asset value and redemption price per share | | $ | 11.19 | | | $ | 10.66 | |
Class S | | | | | | | | |
Net assets | | $ | 3,367 | | | $ | 3,385,439 | |
Shares authorized | | | 100,000,000 | | | | 100,000,000 | |
Par value | | $ | 0.001 | | | $ | 0.001 | |
Shares outstanding | | | 301 | | | | 318,956 | |
Net asset value and redemption price per share | | $ | 11.19 | | | $ | 10.61 | |
Class S2 | | | | | | | | |
Net assets | | $ | 3,367 | | | $ | 733,386 | |
Shares authorized | | | 100,000,000 | | | | 100,000,000 | |
Par value | | $ | 0.001 | | | $ | 0.001 | |
Shares outstanding | | | 301 | | | | 69,331 | |
Net asset value and redemption price per share | | $ | 11.19 | | | $ | 10.58 | |
Class T | | | | | | | | |
Net assets | | $ | 3,364 | | | $ | 3,168 | |
Shares authorized | | | 100,000,000 | | | | 100,000,000 | |
Par value | | $ | 0.001 | | | $ | 0.001 | |
Shares outstanding | | | 301 | | | | 301 | |
Net asset value and redemption price per share | | $ | 11.18 | | | $ | 10.53 | |
See Accompanying Notes to Financial Statements
22
STATEMENTS OF OPERATIONSFORTHE YEAR ENDED DECEMBER 31, 2011
| | | | | | | | | | | | | | | | |
| | | ING Index Solution Income Portfolio | | | ING Index Solution 2015 Portfolio | | | ING Index Solution 2020 Portfolio | | | ING Index Solution 2025 Portfolio | |
| | | | | | | | | October 3, 2011(1) to December 31, 2011 | | | | |
INVESTMENT INCOME: | | | | | | | | | | | | | | | | |
Interest | | $ | 17 | | | $ | 23 | | | $ | — | | | $ | 30 | |
Dividends from affiliated underlying funds | | | 3,467,030 | | | | 3,358,077 | | | | 30 | | | | 3,776,169 | |
Dividends from underlying funds | | | 119,126 | | | | 143,149 | | | | 8 | | | | 190,112 | |
| | | | | | | | | | | | | | | | |
Total investment income | | | 3,586,173 | | | | 3,501,249 | | | | 38 | | | | 3,966,311 | |
| | | | | | | | | | | | | | | | |
EXPENSES: | | | | | | | | | | | | | | | | |
Investment management fees | | | 177,182 | | | | 181,688 | | | | 4 | | | | 223,376 | |
Distribution and service fees: | | | | | | | | | | | | | | | | |
Class ADV | | | 110,496 | | | | 332,285 | | | | 3 | | | | 524,199 | |
Class S | | | 378,178 | | | | 257,566 | | | | 2 | | | | 246,628 | |
Class S2 | | | 5,854 | | | | 30,657 | | | | 3 | | | | 57,332 | |
Class T | | | 24 | | | | 23 | | | | 6 | | | | 23 | |
Administrative service fees | | | 35,434 | | | | 36,335 | | | | 1 | | | | 44,672 | |
Miscellaneous expense | | | 671 | | | | 677 | | | | — | | | | 827 | |
| | | | | | | | | | | | | | | | |
Total expenses | | | 707,839 | | | | 839,231 | | | | 19 | | | | 1,097,057 | |
Net waived and reimbursed fees | | | (1,172 | ) | | | (6,133 | ) | | | (1 | ) | | | (11,468 | ) |
| | | | | | | | | | | | | | | | |
Net expenses | | | 706,667 | | | | 833,098 | | | | 18 | | | | 1,085,589 | |
| | | | | | | | | | | | | | | | |
Net investment income | | | 2,879,506 | | | | 2,668,151 | | | | 20 | | | | 2,880,722 | |
| | | | | | | | | | | | | | | | |
REALIZED AND UNREALIZED GAIN (LOSS): | | | | | | | | | | | | | | | | |
Net realized gain on: | | | | | | | | | | | | | | | | |
Investments | | | 5,594,651 | | | | 6,469,114 | | | | 581 | | | | 8,093,298 | |
Capital gain distributions from affiliated underlying funds | | | 2,031,490 | | | | 1,699,505 | | | | — | | | | 1,188,677 | |
Capital gain distributions from underlying funds | | | 48,889 | | | | 52,458 | | | | — | | | | 65,237 | |
| | | | | | | | | | | | | | | | |
Net realized gain | | | 7,675,030 | | | | 8,221,077 | | | | 581 | | | | 9,347,212 | |
| | | | | | | | | | | | | | | | |
Net change in unrealized appreciation (depreciation) on: | | | | | | | | | | | | | | | | |
Affiliated underlying funds | | | (5,535,818 | ) | | | (9,276,565 | ) | | | 539 | | | | (16,692,782 | ) |
Underlying funds | | | (371,585 | ) | | | (326,514 | ) | | | 6 | | | | (573,058 | ) |
| | | | | | | | | | | | | | | | |
Net change in unrealized appreciation (depreciation) | | | (5,907,403 | ) | | | (9,603,079 | ) | | | 545 | | | | (16,265,840 | ) |
| | | | | | | | | | | | | | | | |
Net realized and unrealized gain (loss) | | | 1,767,627 | | | | (1,382,002 | ) | | | 1,126 | | | | (6,918,628 | ) |
| | | | | | | | | | | | | | | | |
Increase (decrease) in net assets resulting from operations | | $ | 4,647,133 | | | $ | 1,286,149 | | | $ | 1,146 | | | $ | (4,037,906 | ) |
| | | | | | | | | | | | | | | | |
| (1) | | Commencement of operations. |
See Accompanying Notes to Financial Statements
23
STATEMENTS OF OPERATIONSFORTHE YEAR ENDED DECEMBER 31, 2011
| | | | | | | | | | | | | | | | |
| | | ING Index Solution 2030 Portfolio | | | ING Index Solution 2035 Portfolio | | | ING Index Solution 2040 Portfolio | | | ING Index Solution 2045 Portfolio | |
| | | October 3, 2011(1) to December 31, 2011 | | | | | | October 3, 2011(1) to December 31, 2011 | | | | |
INVESTMENT INCOME: | | | | | | | | | | | | | | | | |
Interest | | $ | — | | | $ | 21 | | | $ | — | | | $ | 9 | |
Dividends from affiliated underlying funds | | | 15 | | | | 2,578,167 | | | | 3 | | | | 1,465,955 | |
Dividends from underlying funds | | | 7 | | | | 140,616 | | | | 6 | | | | 70,773 | |
| | | | | | | | | | | | | | | | |
Total investment income | | | 22 | | | | 2,718,804 | | | | 9 | | | | 1,536,737 | |
| | | | | | | | | | | | | | | | |
EXPENSES: | | | | | | | | | | | | | | | | |
Investment management fees | | | 4 | | | | 164,375 | | | | 4 | | | | 94,705 | |
Distribution and service fees: | | | | | | | | | | | | | | | | |
Class ADV | | | 4 | | | | 435,852 | | | | 4 | | | | 239,772 | |
Class S | | | 2 | | | | 157,461 | | | | 2 | | | | 88,945 | |
Class S2 | | | 3 | | | | 37,399 | | | | 3 | | | | 18,074 | |
Class T | | | 6 | | | | 23 | | | | 6 | | | | 23 | |
Administrative service fees | | | 1 | | | | 32,873 | | | | 1 | | | | 18,940 | |
Miscellaneous expense | | | — | | | | 606 | | | | — | | | | 346 | |
| | | | | | | | | | | | | | | | |
Total expenses | | | 20 | | | | 828,589 | | | | 20 | | | | 460,805 | |
Net waived and reimbursed fees | | | (1 | ) | | | (7,481 | ) | | | (2 | ) | | | (3,616 | ) |
| | | | | | | | | | | | | | | | |
Net expenses | | | 19 | | | | 821,108 | | | | 18 | | | | 457,189 | |
| | | | | | | | | | | | | | | | |
Net investment income (loss) | | | 3 | | | | 1,897,696 | | | | (9 | ) | | | 1,079,548 | |
| | | | | | | | | | | | | | | | |
REALIZED AND UNREALIZED GAIN (LOSS): | | | | | | | | | | | | | | | | |
Net realized gain on: | | | | | | | | | | | | | | | | |
Investments | | | 806 | | | | 7,681,420 | | | | 994 | | | | 3,582,860 | |
Capital gain distributions from affiliated underlying funds | | | — | | | | 599,436 | | | | — | | | | 219,577 | |
Capital gain distributions from underlying funds | | | — | | | | 48,015 | | | | — | | | | 14,257 | |
| | | | | | | | | | | | | | | | |
Net realized gain | | | 806 | | | | 8,328,871 | | | | 994 | | | | 3,816,694 | |
| | | | | | | | | | | | | | | | |
Net change in unrealized appreciation (depreciation) on: | | | | | | | | | | | | | | | | |
Affiliated underlying funds | | | 692 | | | | (15,627,237 | ) | | | 783 | | | | (9,349,639 | ) |
Underlying funds | | | 7 | | | | (558,753 | ) | | | 7 | | | | (274,245 | ) |
| | | | | | | | | | | | | | | | |
Net change in unrealized appreciation (depreciation) | | | 699 | | | | (16,185,990 | ) | | | 790 | | | | (9,623,884 | ) |
| | | | | | | | | | | | | | | | |
Net realized and unrealized gain (loss) | | | 1,505 | | | | (7,857,119 | ) | | | 1,784 | | | | (5,807,190 | ) |
| | | | | | | | | | | | | | | | |
Increase (decrease) in net assets resulting from operations | | $ | 1,508 | | | $ | (5,959,423 | ) | | $ | 1,775 | | | $ | (4,727,642 | ) |
| | | | | | | | | | | | | | | | |
| (1) | | Commencement of operations. |
See Accompanying Notes to Financial Statements
24
STATEMENTS OF OPERATIONSFORTHE YEAR ENDED DECEMBER 31, 2011
| | | | | | | | |
| | | ING Index Solution 2050 Portfolio | | | ING Index Solution 2055 Portfolio | |
| | | October 3, 2011(1) to December 31, 2011 | | | | |
INVESTMENT INCOME: | | | | | | | | |
Dividends from affiliated underlying funds | | $ | 2 | | | $ | 89,294 | |
Dividends from underlying funds | | | 6 | | | | 5,576 | |
| | | | | | | | |
Total investment income | | | 8 | | | | 94,870 | |
| | | | | | | | |
EXPENSES: | | | | | | | | |
Investment management fees | | | 4 | | | | 6,698 | |
Distribution and service fees: | | | | | | | | |
Class ADV | | | 4 | | | | 19,706 | |
Class S | | | 2 | | | | 5,477 | |
Class S2 | | | 3 | | | | 1,494 | |
Class T | | | 6 | | | | 26 | |
Administrative service fees | | | 1 | | | | 1,340 | |
Miscellaneous expense | | | — | | | | 22 | |
| | | | | | | | |
Total expenses | | | 20 | | | | 34,763 | |
Net waived and reimbursed fees | | | (2 | ) | | | (300 | ) |
| | | | | | | | |
Net expenses | | | 18 | | | | 34,463 | |
| | | | | | | | |
Net investment income (loss) | | | (10 | ) | | | 60,407 | |
| | | | | | | | |
REALIZED AND UNREALIZED GAIN (LOSS): | | | | | | | | |
Net realized gain on: | | | | | | | | |
Investments | | | 992 | | | | 193,333 | |
Capital gain distributions from affiliated underlying funds | | | — | | | | 13,129 | |
Capital gain distributions from underlying funds | | | — | | | | 1,322 | |
| | | | | | | | |
Net realized gain | | | 992 | | | | 207,784 | |
| | | | | | | | |
Net change in unrealized appreciation (depreciation) on: | | | | | | | | |
Affiliated underlying funds | | | 794 | | | | (656,639 | ) |
Underlying funds | | | 8 | | | | (14,209 | ) |
| | | | | | | | |
Net change in unrealized appreciation (depreciation) | | | 802 | | | | (670,848 | ) |
| | | | | | | | |
Net realized and unrealized gain (loss) | | | 1,794 | | | | (463,064 | ) |
| | | | | | | | |
Increase (decrease) in net assets resulting from operations | | $ | 1,784 | | | $ | (402,657 | ) |
| | | | | | | | |
| (1) | | Commencement of operations. |
See Accompanying Notes to Financial Statements
25
STATEMENTS OF CHANGES IN NET ASSETS
| | | | | | | | | | | | | | | | |
| | | ING Index Solution Income Portfolio | | | ING Index Solution 2015 Portfolio | |
| | | Year Ended December 31, 2011 | | | Year Ended December 31, 2010 | | | Year Ended December 31, 2011 | | | Year Ended December 31, 2010 | |
FROM OPERATIONS: | | | | | | | | | | | | | | | | |
Net investment income | | $ | 2,879,506 | | | $ | 4,121,110 | | | $ | 2,668,151 | | | $ | 3,402,311 | |
Net realized gain | | | 7,675,030 | | | | 5,101,394 | | | | 8,221,077 | | | | 7,368,948 | |
Net change in unrealized appreciation (depreciation) | | | (5,907,403 | ) | | | 3,532,916 | | | | (9,603,079 | ) | | | 1,769,518 | |
| | | | | | | | | | | | | | | | |
Increase in net assets resulting from operations | | | 4,647,133 | | | | 12,755,420 | | | | 1,286,149 | | | | 12,540,777 | |
| | | | | | | | | | | | | | | | |
FROM DISTRIBUTIONS TO SHAREHOLDERS: | | | | | | | | | | | | | | | | |
Net investment income: | | | | | | | | | | | | | | | | |
Class ADV | | | (480,376 | ) | | | (166,909 | ) | | | (1,185,602 | ) | | | (225,105 | ) |
Class I | | | (53,442 | ) | | | (17,358 | ) | | | (98,742 | ) | | | (25,888 | ) |
Class S | | | (3,551,747 | ) | | | (1,653,227 | ) | | | (1,964,382 | ) | | | (474,216 | ) |
Class S2 | | | (34,295 | ) | | | (742 | ) | | | (154,042 | ) | | | (1,526 | ) |
Class T | | | (64 | ) | | | (17 | ) | | | (45 | ) | | | — | |
Net realized gains: | | | | | | | | | | | | | | | | |
Class ADV | | | (624,974 | ) | | | (155,425 | ) | | | (2,514,217 | ) | | | (536,188 | ) |
Class I | | | (60,001 | ) | | | (14,023 | ) | | | (173,051 | ) | | | (42,896 | ) |
Class S | | | (4,425,938 | ) | | | (1,445,476 | ) | | | (3,818,232 | ) | | | (893,715 | ) |
Class S2 | | | (38,884 | ) | | | (605 | ) | | | (274,735 | ) | | | (2,537 | ) |
Class T | | | (97 | ) | | | (30 | ) | | | (118 | ) | | | (31 | ) |
| | | | | | | | | | | | | | | | |
Total distributions | | | (9,269,818 | ) | | | (3,453,812 | ) | | | (10,183,166 | ) | | | (2,202,102 | ) |
| | | | | | | | | | | | | | | | |
FROM CAPITAL SHARE TRANSACTIONS: | | | | | | | | | | | | | | | | |
Net proceeds from sale of shares | | | 29,381,597 | | | | 27,423,913 | | | | 76,416,530 | | | | 70,184,214 | |
Reinvestment of distributions | | | 9,269,658 | | | | 3,453,766 | | | | 10,183,002 | | | | 2,202,072 | |
| | | | | | | | | | | | | | | | |
| | | 38,651,255 | | | | 30,877,679 | | | | 86,599,532 | | | | 72,386,286 | |
Cost of shares redeemed | | | (32,873,389 | ) | | | (29,104,876 | ) | | | (54,935,336 | ) | | | (22,681,593 | ) |
| | | | | | | | | | | | | | | | |
Net increase in net assets resulting from capital share transactions | | | 5,777,866 | | | | 1,772,803 | | | | 31,664,196 | | | | 49,704,693 | |
| | | | | | | | | | | | | | | | |
Net increase in net assets | | | 1,155,181 | | | | 11,074,411 | | | | 22,767,179 | | | | 60,043,368 | |
| | | | | | | | | | | | | | | | |
NET ASSETS: | | | | | | | | | | | | | | | | |
Beginning of year or period | | | 175,610,643 | | | | 164,536,232 | | | | 169,370,766 | | | | 109,327,398 | |
| | | | | | | | | | | | | | | | |
End of year or period | | $ | 176,765,824 | | | $ | 175,610,643 | | | $ | 192,137,945 | | | $ | 169,370,766 | |
| | | | | | | | | | | | | | | | |
Undistributed net investment income at end of year or period | | $ | 4,534,846 | | | $ | 4,119,914 | | | $ | 4,061,542 | | | $ | 3,401,871 | |
| | | | | | | | | | | | | | | | |
See Accompanying Notes to Financial Statements
26
STATEMENTS OF CHANGES IN NET ASSETS
| | | | | | | | | | | | | | | | |
| | | ING Index Solution 2020 Portfolio | | | ING Index Solution 2025 Portfolio | | | ING Index Solution 2030 Portfolio | |
| | | October 3, 2011(1) to December 31, 2011 | | | Year Ended December 31, 2011 | | | Year Ended December 31, 2010 | | | October 3, 2011(1) to December 31, 2011 | |
FROM OPERATIONS: | | | | | | | | | | | | | | | | |
Net investment income | | $ | 20 | | | $ | 2,880,722 | | | $ | 3,402,806 | | | $ | 3 | |
Net realized gain | | | 581 | | | | 9,347,212 | | | | 10,826,667 | | | | 806 | |
Net change in unrealized appreciation (depreciation) | | | 545 | | | | (16,265,840 | ) | | | 4,542,430 | | | | 699 | |
| | | | | | | | | | | | | | | | |
Increase (decrease) in net assets resulting from operations | | | 1,146 | | | | (4,037,906 | ) | | | 18,771,903 | | | | 1,508 | |
| | | | | | | | | | | | | | | | |
FROM DISTRIBUTIONS TO SHAREHOLDERS: | | | | | | | | | | | | | | | | |
Net investment income: | | | | | | | | | | | | | | | | |
Class ADV | | | — | | | | (1,465,834 | ) | | | (83,801 | ) | | | — | |
Class I | | | — | | | | (120,118 | ) | | | (16,224 | ) | | | — | |
Class S | | | — | | | | (1,575,381 | ) | | | (155,258 | ) | | | — | |
Class S2 | | | — | | | | (241,916 | ) | | | (2,165 | ) | | | — | |
Class T | | | — | | | | (33 | ) | | | — | | | | — | |
Net realized gains: | | | | | | | | | | | | | | | | |
Class ADV | | | — | | | | (4,744,698 | ) | | | (134,739 | ) | | | — | |
Class I | | | — | | | | (309,902 | ) | | | (9,928 | ) | | | — | |
Class S | | | — | | | | (4,522,069 | ) | | | (124,816 | ) | | | — | |
Class S2 | | | — | | | | (640,160 | ) | | | (1,325 | ) | | | — | |
Class T | | | — | | | | (142 | ) | | | (5 | ) | | | — | |
| | | | | | | | | | | | | | | | |
Total distributions | | | — | | | | (13,620,253 | ) | | | (528,261 | ) | | | — | |
| | | | | | | | | | | | | | | | |
FROM CAPITAL SHARE TRANSACTIONS: | | | | | | | | | | | | | | | | |
Net proceeds from sale of shares | | | 15,050 | | | | 92,610,407 | | | | 97,167,450 | | | | 15,050 | |
Reinvestment of distributions | | | — | | | | 13,620,078 | | | | 528,257 | | | | — | |
| | | | | | | | | | | | | | | | |
| | | 15,050 | | | | 106,230,485 | | | | 97,695,707 | | | | 15,050 | |
Cost of shares redeemed | | | — | | | | (48,164,573 | ) | | | (19,863,896 | ) | | | — | |
| | | | | | | | | | | | | | | | |
Net increase in net assets resulting from capital share transactions | | | 15,050 | | | | 58,065,912 | | | | 77,831,811 | | | | 15,050 | |
| | | | | | | | | | | | | | | | |
Net increase in net assets | | | 16,196 | | | | 40,407,753 | | | | 96,075,453 | | | | 16,558 | |
| | | | | | | | | | | | | | | | |
NET ASSETS: | | | | | | | | | | | | | | | | |
Beginning of year or period | | | — | | | | 201,469,657 | | | | 105,394,204 | | | | — | |
| | | | | | | | | | | | | | | | |
End of year or period | | $ | 16,196 | | | $ | 241,877,410 | | | $ | 201,469,657 | | | $ | 16,558 | |
| | | | | | | | | | | | | | | | |
Undistributed net investment income at end of year or period | | $ | 33 | | | $ | 3,884,326 | | | $ | 3,402,421 | | | $ | 17 | |
| | | | | | | | | | | | | | | | |
| (1) | | Commencement of operations. |
See Accompanying Notes to Financial Statements
27
STATEMENTS OF CHANGES IN NET ASSETS
| | | | | | | | | | | | |
| | | ING Index Solution 2035 Portfolio | | | ING Index Solution 2040 Portfolio | |
| | | Year Ended December 31, 2011 | | | Year Ended December 31, 2010 | | | October 3, 2011(1) to December 31, 2011 | |
FROM OPERATIONS: | | | | | | | | | | | | |
Net investment income (loss) | | $ | 1,897,696 | | | $ | 2,107,710 | | | $ | (9 | ) |
Net realized gain | | | 8,328,871 | | | | 7,846,142 | | | | 994 | |
Net change in unrealized appreciation (depreciation) | | | (16,185,990 | ) | | | 4,754,932 | | | | 790 | |
| | | | | | | | | | | | |
Increase (decrease) in net assets resulting from operations | | | (5,959,423 | ) | | | 14,708,784 | | | | 1,775 | |
| | | | | | | | | | | | |
FROM DISTRIBUTIONS TO SHAREHOLDERS: | | | | | | | | | | | | |
Net investment income: | | | | | | | | | | | | |
Class ADV | | | (1,040,556 | ) | | | — | | | | — | |
Class I | | | (81,733 | ) | | | (2,616 | ) | | | — | |
Class S | | | (844,847 | ) | | | (21,917 | ) | | | — | |
Class S2 | | | (140,650 | ) | | | (447 | ) | | | — | |
Class T | | | (25 | ) | | | — | | | | — | |
Net realized gains: | | | | | | | | | | | | |
Class ADV | | | (3,907,060 | ) | | | (104,795 | ) | | | — | |
Class I | | | (239,422 | ) | | | (5,072 | ) | | | — | |
Class S | | | (2,781,469 | ) | | | (75,756 | ) | | | — | |
Class S2 | | | (423,826 | ) | | | (877 | ) | | | — | |
Class T | | | (136 | ) | | | (5 | ) | | | — | |
| | | | | | | | | | | | |
Total distributions | | | (9,459,724 | ) | | | (211,485 | ) | | | — | |
| | | | | | | | | | | | |
FROM CAPITAL SHARE TRANSACTIONS: | | | | | | | | | | | | |
Net proceeds from sale of shares | | | 73,755,852 | | | | 73,849,414 | | | | 15,050 | |
Reinvestment of distributions | | | 9,459,564 | | | | 211,479 | | | | — | |
| | | | | | | | | | | | |
| | | 83,215,416 | | | | 74,060,893 | | | | 15,050 | |
Cost of shares redeemed | | | (33,556,723 | ) | | | (12,271,559 | ) | | | — | |
| | | | | | | | | | | | |
Net increase in net assets resulting from capital share transactions | | | 49,658,693 | | | | 61,789,334 | | | | 15,050 | |
| | | | | | | | | | | | |
Net increase in net assets | | | 34,239,546 | | | | 76,286,633 | | | | 16,825 | |
| | | | | | | | | | | | |
NET ASSETS: | | | | | | | | | | | | |
Beginning of year or period | | | 144,817,859 | | | | 68,531,226 | | | | — | |
| | | | | | | | | | | | |
End of year or period | | $ | 179,057,405 | | | $ | 144,817,859 | | | $ | 16,825 | |
| | | | | | | | | | | | |
Undistributed net investment income at end of year or period | | $ | 2,425,785 | | | $ | 2,107,456 | | | $ | 4 | |
| | | | | | | | | | | | |
| (1) | | Commencement of operations. |
See Accompanying Notes to Financial Statements
28
STATEMENTS OF CHANGES IN NET ASSETS
| | | | | | | | | | | | |
| | | ING Index Solution 2045 Portfolio | | | ING Index Solution 2050 Portfolio | |
| | | Year Ended December 31, 2011 | | | Year Ended December 31, 2010 | | | October 3, 2011(1) to December 31, 2011 | |
FROM OPERATIONS: | | | | | | | | | | | | |
Net investment income (loss) | | $ | 1,079,548 | | | $ | 920,307 | | | $ | (10 | ) |
Net realized gain | | | 3,816,694 | | | | 3,927,127 | | | | 992 | |
Net change in unrealized appreciation (depreciation) | | | (9,623,884 | ) | | | 3,592,551 | | | | 802 | |
| | | | | | | | | | | | |
Increase (decrease) in net assets resulting from operations | | | (4,727,642 | ) | | | 8,439,985 | | | | 1,784 | |
| | | | | | | | | | | | |
FROM DISTRIBUTIONS TO SHAREHOLDERS: | | | | | | | | | | | | |
Net investment income: | | | | | | | | | | | | |
Class ADV | | | (431,721 | ) | | | — | | | | — | |
Class I | | | (78,362 | ) | | | — | | | | — | |
Class S | | | (364,941 | ) | | | — | | | | — | |
Class S2 | | | (45,573 | ) | | | — | | | | — | |
Class T | | | (14 | ) | | | — | | | | — | |
Net realized gains: | | | | | | | | | | | | |
Class ADV | | | (1,826,091 | ) | | | (72,397 | ) | | | — | |
Class I | | | (250,254 | ) | | | (4,239 | ) | | | — | |
Class S | | | (1,326,169 | ) | | | (50,155 | ) | | | — | |
Class S2 | | | (152,036 | ) | | | (605 | ) | | | — | |
Class T | | | (110 | ) | | | (6 | ) | | | — | |
| | | | | | | | | | | | |
Total distributions | | | (4,475,271 | ) | | | (127,402 | ) | | | — | |
| | | | | | | | | | | | |
FROM CAPITAL SHARE TRANSACTIONS: | | | | | | | | | | | | |
Net proceeds from sale of shares | | | 49,044,457 | | | | 44,969,895 | | | | 15,050 | |
Reinvestment of distributions | | | 4,475,148 | | | | 127,396 | | | | — | |
| | | | | | | | | | | | |
| | | 53,519,605 | | | | 45,097,291 | | | | 15,050 | |
Cost of shares redeemed | | | (16,873,766 | ) | | | (7,525,241 | ) | | | — | |
| | | | | | | | | | | | |
Net increase in net assets resulting from capital share transactions | | | 36,645,839 | | | | 37,572,050 | | | | 15,050 | |
| | | | | | | | | | | | |
Net increase in net assets | | | 27,442,926 | | | | 45,884,633 | | | | 16,834 | |
| | | | | | | | | | | | |
NET ASSETS: | | | | | | | | | | | | |
Beginning of year or period | | | 77,594,438 | | | | 31,709,805 | | | | — | |
| | | | | | | | | | | | |
End of year or period | | $ | 105,037,364 | | | $ | 77,594,438 | | | $ | 16,834 | |
| | | | | | | | | | | | |
Undistributed net investment income at end of year or period | | $ | 1,283,247 | | | $ | 920,307 | | | $ | 3 | |
| | | | | | | | | | | | |
| (1) | | Commencement of operations. |
See Accompanying Notes to Financial Statements
29
STATEMENTS OF CHANGES IN NET ASSETS
| | | | | | | | |
| | | ING Index Solution 2055 Portfolio | |
| | | Year Ended December 31, 2011 | | | March 8, 2010(1) to December 31, 2010 | |
FROM OPERATIONS: | | | | | | | | |
Net investment income | | $ | 60,407 | | | $ | 1,463 | |
Net realized gain | | | 207,784 | | | | 43,727 | |
Net change in unrealized appreciation (depreciation) | | | (670,848 | ) | | | 341,153 | |
| | | | | | | | |
Increase (decrease) in net assets resulting from operations | | | (402,657 | ) | | | 386,343 | |
| | | | | | | | |
FROM DISTRIBUTIONS TO SHAREHOLDERS: | | | | | | | | |
Net investment income: | | | | | | | | |
Class ADV | | | (83 | ) | | | — | |
Class I | | | (260 | ) | | | — | |
Class S | | | (1,154 | ) | | | — | |
Class S2 | | | (213 | ) | | | — | |
Net realized gains: | | | | | | | | |
Class ADV | | | (49,164 | ) | | | — | |
Class I | | | (3,012 | ) | | | — | |
Class S | | | (24,788 | ) | | | — | |
Class S2 | | | (3,098 | ) | | | — | |
Class T | | | (35 | ) | | | — | |
| | | | | | | | |
Total distributions | | | (81,807 | ) | | | — | |
| | | | | | | | |
FROM CAPITAL SHARE TRANSACTIONS: | | | | | | | | |
Net proceeds from sale of shares | | | 8,956,278 | | | | 4,196,453 | |
Reinvestment of distributions | | | 81,772 | | | | — | |
| | | | | | | | |
| | | 9,038,050 | | | | 4,196,453 | |
Cost of shares redeemed | | | (1,868,573 | ) | | | (852,612 | ) |
| | | | | | | | |
Net increase in net assets resulting from capital share transactions | | | 7,169,477 | | | | 3,343,841 | |
| | | | | | | | |
Net increase in net assets | | | 6,685,013 | | | | 3,730,184 | |
| | | | | | | | |
NET ASSETS: | | | | | | | | |
Beginning of year or period | | | 3,730,184 | | | | — | |
| | | | | | | | |
End of year or period | | $ | 10,415,197 | | | $ | 3,730,184 | |
| | | | | | | | |
Undistributed net investment income at end of year or period | | $ | 72,582 | | | $ | 1,672 | |
| | | | | | | | |
| (1) | | Commencement of operations. |
See Accompanying Notes to Financial Statements
30
FINANCIAL HIGHLIGHTS
Selected data for a share of beneficial interest outstanding throughout each year or period.
| | | | | | | | | | | | | | | | | | | | | | | | | | | | | | | | | | | | | | | | | | | | | | | | | | | | | | | | | | | | | | | | | | | | |
| | | | | | Income (loss)
from
investment
operations | | | | | | Less distributions | | | | | | | | | | | | | | | Ratios to average net assets | | | Supplemental
data | |
| | | | | | | | | | | | | | | | | | | | | | | | | | | | | | | | | | | | | | | | | | | | | | | | | | | | |
| | | Net asset value, beginning of year or period | | | Net investment income (loss) | | | Net realized and unrealized gain (loss) | | | Total from investment operations | | | From net investment income | | | From net realized gains | | | From return of capital | | | Total distributions | | | Payment by affiliate | | | Net asset value, end of year or period | | | Total Return(1) | | | Expenses before reductions/additions(2)(3)(4) | | | Expenses net of fee waivers and/or recoupments if any(2)(3)(4) | | | Expenses net of all reductions/additions(2)(3)(4) | | | Net investment income (loss)(2)(4) | | | Net assets, end of year or period | | | Portfolio turnover rate | |
| | | | | | | | | | | | | | | | | | | | | | | | | | | | | | | | | | | | | | | | | | | | | | | | | | | | | | | | | | | | | | | | | | | | |
Year or period ended | | ($) | | | ($) | | | ($) | | | ($) | | | ($) | | | ($) | | | ($) | | | ($) | | | ($) | | | ($) | | | (%) | | | (%) | | | (%) | | | (%) | | | (%) | | | ($000’s) | | | (%) | |
ING Index Solution Income Portfolio | | | | | | | | | | | | | | | | | | | | | | | | | | | | | | | | | | | | | | | | | | | | | | | | | | | | | | | | | | | | | | | | | | | | |
Class ADV | | | | | | | | | | | | | | | | | | | | | | | | | | | | | | | | | | | | | | | | | | | | | | | | | | | | | | | | | | | | | | | | | | | | |
12-31-11 | | | 10.76 | | | | 0.14 | | | | 0.09 | | | | 0.23 | | | | 0.25 | | | | 0.32 | | | | — | | | | 0.57 | | | | — | | | | 10.42 | | | | 2.35 | | | | 0.62 | | | | 0.62 | | | | 0.62 | | | | 1.46 | | | | 25,479 | | | | 78 | |
12-31-10 | | | 10.22 | | | | 0.23 | • | | | 0.52 | | | | 0.75 | | | | 0.11 | | | | 0.10 | | | | — | | | | 0.21 | | | | — | | | | 10.76 | | | | 7.37 | | | | 0.62 | | | | 0.62 | | | | 0.62 | | | | 2.24 | | | | 19,550 | | | | 45 | |
12-31-09 | | | 9.24 | | | | 0.12 | • | | | 0.89 | | �� | | 1.01 | | | | 0.03 | | | | — | | | | — | | | | 0.03 | | | | — | | | | 10.22 | | | | 11.02 | | | | 0.62 | | | | 0.62 | | | | 0.62 | | | | 1.26 | | | | 9,310 | | | | 51 | |
03-10-08(5) - 12-31-08 | | | 10.00 | | | | 0.26 | • | | | (1.02 | ) | | | (0.76 | ) | | | — | | | | — | | | | — | | | | — | | | | — | | | | 9.24 | | | | (7.60 | ) | | | 0.62 | | | | 0.62 | | | | 0.62 | | | | 3.48 | | | | 2,543 | | | | 50 | |
Class I | | | | | | | | | | | | | | | | | | | | | | | | | | | | | | | | | | | | | | | | | | | | | | | | | | | | | | | | | | | | | | | | | | | | |
12-31-11 | | | 10.90 | | | | 0.21 | • | | | 0.09 | | | | 0.30 | | | | 0.29 | | | | 0.32 | | | | — | | | | 0.61 | | | | — | | | | 10.59 | | | | 2.99 | | | | 0.12 | | | | 0.12 | | | | 0.12 | | | | 2.01 | | | | 6,699 | | | | 78 | |
12-31-10 | | | 10.31 | | | | 0.28 | • | | | 0.53 | | | | 0.81 | | | | 0.12 | | | | 0.10 | | | | — | | | | 0.22 | | | | — | | | | 10.90 | | | | 7.96 | | | | 0.12 | | | | 0.12 | | | | 0.12 | | | | 2.67 | | | | 1,702 | | | | 45 | |
12-31-09 | | | 9.29 | | | | 0.16 | • | | | 0.90 | | | | 1.06 | | | | 0.04 | | | | — | | | | — | | | | 0.04 | | | | — | | | | 10.31 | | | | 11.46 | | | | 0.12 | | | | 0.12 | | | | 0.12 | | | | 1.66 | | | | 1,198 | | | | 51 | |
03-10-08(5) - 12-31-08 | | | 10.00 | | | | 0.17 | | | | (0.88 | ) | | | (0.71 | ) | | | — | | | | — | | | | — | | | | — | | | | — | | | | 9.29 | | | | (7.10 | ) | | | 0.12 | | | | 0.12 | | | | 0.12 | | | | 2.16 | | | | 3 | | | | 50 | |
Class S | | | | | | | | | | | | | | | | | | | | | | | | | | | | | | | | | | | | | | | | | | | | | | | | | | | | | | | | | | | | | | | | | | | | |
12-31-11 | | | 10.82 | | | | 0.19 | | | | 0.08 | | | | 0.27 | | | | 0.26 | | | | 0.32 | | | | — | | | | 0.58 | | | | — | | | | 10.51 | | | | 2.73 | | | | 0.37 | | | | 0.37 | | | | 0.37 | | | | 1.64 | | | | 142,821 | | | | 78 | |
12-31-10 | | | 10.26 | | | | 0.25 | • | | | 0.52 | | | | 0.77 | | | | 0.11 | | | | 0.10 | | | | — | | | | 0.21 | | | | — | | | | 10.82 | | | | 7.61 | | | | 0.37 | | | | 0.37 | | | | 0.37 | | | | 2.39 | | | | 153,900 | | | | 45 | |
12-31-09 | | | 9.26 | | | | 0.20 | • | | | 0.84 | | | | 1.04 | | | | 0.04 | | | | — | | | | — | | | | 0.04 | | | | — | | | | 10.26 | | | | 11.27 | | | | 0.37 | | | | 0.37 | | | | 0.37 | | | | 2.01 | | | | 154,022 | | | | 51 | |
03-10-08(5) - 12-31-08 | | | 10.00 | | | | 0.39 | • | | | (1.13 | ) | | | (0.74 | ) | | | — | | | | — | | | | — | | | | — | | | | — | | | | 9.26 | | | | (7.40 | ) | | | 0.37 | | | | 0.37 | | | | 0.37 | | | | 5.38 | | | | 1,606 | | | | 50 | |
Class S2 | | | | | | | | | | | | | | | | | | | | | | | | | | | | | | | | | | | | | | | | | | | | | | | | | | | | | | | | | | | | | | | | | | | | |
12-31-11 | | | 10.75 | | | | 0.15 | • | | | 0.09 | | | | 0.24 | | | | 0.28 | | | | 0.32 | | | | — | | | | 0.60 | | | | — | | | | 10.39 | | | | 2.52 | | | | 0.62 | | | | 0.52 | | | | 0.52 | | | | 1.46 | | | | 1,763 | | | | 78 | |
12-31-10 | | | 10.21 | | | | 0.37 | • | | | 0.39 | | | | 0.76 | | | | 0.12 | | | | 0.10 | | | | — | | | | 0.22 | | | | — | | | | 10.75 | | | | 7.54 | | | | 0.62 | | | | 0.52 | | | | 0.52 | | | | 3.53 | | | | 455 | | | | 45 | |
05-28-09(5) - 12-31-09 | | | 9.30 | | | | 0.11 | • | | | 0.84 | | | | 0.95 | | | | 0.04 | | | | — | | | | — | | | | 0.04 | | | | — | | | | 10.21 | | | | 10.26 | | | | 0.62 | | | | 0.52 | | | | 0.52 | | | | 1.87 | | | | 3 | | | | 51 | |
Class T | | | | | | | | | | | | | | | | | | | | | | | | | | | | | | | | | | | | | | | | | | | | | | | | | | | | | | | | | | | | | | | | | | | | |
12-31-11 | | | 10.78 | | | | 0.13 | | | | 0.08 | | | | 0.21 | | | | 0.21 | | | | 0.32 | | | | — | | | | 0.53 | | | | — | | | | 10.46 | | | | 2.20 | | | | 0.87 | | | | 0.82 | | | | 0.82 | | | | 1.19 | | | | 3 | | | | 78 | |
12-31-10 | | | 10.21 | | | | 0.20 | | | | 0.53 | | | | 0.73 | | | | 0.06 | | | | 0.10 | | | | — | | | | 0.16 | | | | — | | | | 10.78 | | | | 7.16 | | | | 0.87 | | | | 0.82 | | | | 0.82 | | | | 1.95 | | | | 3 | | | | 45 | |
12-31-09 | | | 9.23 | | | | 0.08 | | | | 0.90 | | | | 0.98 | | | | — | | | | — | | | | — | | | | — | | | | — | | | | 10.21 | | | | 10.66 | | | | 0.87 | | | | 0.82 | | | | 0.82 | | | | 0.79 | | | | 3 | | | | 51 | |
03-10-08(5) - 12-31-08 | | | 10.00 | | | | 0.11 | | | | (0.88 | ) | | | (0.77 | ) | | | — | | | | — | | | | — | | | | — | | | | — | | | | 9.23 | | | | (7.70 | ) | | | 0.87 | | | | 0.82 | | | | 0.82 | | | | 1.47 | | | | 3 | | | | 50 | |
| | | | | | | | | | | | | | | | | |
ING Index Solution 2015 Portfolio | | | | | | | | | | | | | | | | | | | | | | | | | | | | | | | | | | | | | | | | | | | | | | | | | | | | | | | | | | | | | | | | | | | | |
Class ADV | | | | | | | | | | | | | | | | | | | | | | | | | | | | | | | | | | | | | | | | | | | | | | | | | | | | | | | | | | | | | | | | | | | | |
12-31-11 | | | 10.45 | | | | 0.14 | • | | | (0.11 | ) | | | 0.03 | | | | 0.19 | | | | 0.39 | | | | — | | | | 0.58 | | | | — | | | | 9.90 | | | | 0.53 | | | | 0.62 | | | | 0.62 | | | | 0.62 | | | | 1.32 | | | | 71,792 | | | | 90 | |
12-31-10 | | | 9.76 | | | | 0.22 | • | | | 0.61 | | | | 0.83 | | | | 0.04 | | | | 0.10 | | | | — | | | | 0.14 | | | | — | | | | 10.45 | | | | 8.68 | | | | 0.62 | | | | 0.62 | | | | 0.62 | | | | 2.25 | | | | 62,077 | | | | 49 | |
12-31-09 | | | 8.43 | | | | 0.05 | • | | | 1.32 | | | | 1.37 | | | | 0.04 | | | | — | | | | — | | | | 0.04 | | | | — | | | | 9.76 | | | | 16.28 | | | | 0.62 | | | | 0.62 | | | | 0.62 | | | | 0.60 | | | | 35,768 | | | | 28 | |
03-10-08(5) - 12-31-08 | | | 10.00 | | | | 0.30 | • | | | (1.87 | ) | | | (1.57 | ) | | | — | | | | — | | | | — | | | | — | | | | — | | | | 8.43 | | | | (15.70 | ) | | | 0.62 | | | | 0.62 | | | | 0.62 | | | | 4.34 | | | | 8,877 | | | | 39 | |
Class I | | | | | | | | | | | | | | | | | | | | | | | | | | | | | | | | | | | | | | | | | | | | | | | | | | | | | | | | | | | | | | | | | | | | |
12-31-11 | | | 10.57 | | | | 0.20 | • | | | (0.13 | ) | | | 0.07 | | | | 0.22 | | | | 0.39 | | | | — | | | | 0.61 | | | | — | | | | 10.03 | | | | 1.01 | | | | 0.12 | | | | 0.12 | | | | 0.12 | | | | 1.91 | | | | 15,152 | | | | 90 | |
12-31-10 | | | 9.85 | | | | 0.27 | • | | | 0.61 | | | | 0.88 | | | | 0.06 | | | | 0.10 | | | | — | | | | 0.16 | | | | — | | | | 10.57 | | | | 9.11 | | | | 0.12 | | | | 0.12 | | | | 0.12 | | | | 2.72 | | | | 4,813 | | | | 49 | |
12-31-09 | | | 8.46 | | | | 0.10 | • | | | 1.33 | | | | 1.43 | | | | 0.01 | | | | — | | | | — | | | | 0.04 | | | | — | | | | 9.85 | | | | 16.99 | | | | 0.12 | | | | 0.12 | | | | 0.12 | | | | 1.05 | | | | 3,331 | | | | 28 | |
03-10-08(5) - 12-31-08 | | | 10.00 | | | | 0.26 | • | | | (1.80 | ) | | | (1.54 | ) | | | — | | | | — | | | | — | | | | — | | | | — | | | | 8.46 | | | | (15.40 | ) | | | 0.12 | | | | 0.12 | | | | 0.12 | | | | 3.72 | | | | 183 | | | | 39 | |
See Accompanying Notes to Financial Statements
31
FINANCIAL HIGHLIGHTS (CONTINUED)
Selected data for a share of beneficial interest outstanding throughout each year or period.
| | | | | | | | | | | | | | | | | | | | | | | | | | | | | | | | | | | | | | | | | | | | | | | | | | | | | | | | | | | | | | | | | | | | |
| | | | | | Income (loss)
from
investment
operations | | | | | | Less distributions | | | | | | | | | | | | | | | Ratios to average net assets | | | Supplemental
data | |
| | | | | | | | | | | | | | | | | | | | | | | | | | | | | | | | | | | | | | | | | | | | | | | | | | | | |
| | | Net asset value, beginning of year or period | | | Net investment income (loss) | | | Net realized and unrealized gain (loss) | | | Total from investment operations | | | From net investment income | | | From net realized gains | | | From return of capital | | | Total distributions | | | Payment by affiliate | | | Net asset value, end of year or period | | | Total Return(1) | | | Expenses before reductions/additions(2)(3)(4) | | | Expenses net of fee waivers and/or recoupments if any(2)(3)(4) | | | Expenses net of all reductions/additions(2)(3)(4) | | | Net investment income (loss)(2)(4) | | | Net assets, end of year or period | | | Portfolio turnover rate | |
| | | | | | | | | | | | | | | | | | | | | | | | | | | | | | | | | | | | | | | | | | | | | | | | | | | | | | | | | | | | | | | | | | | | |
Year or period ended | | ($) | | | ($) | | | ($) | | | ($) | | | ($) | | | ($) | | | ($) | | | ($) | | | ($) | | | ($) | | | (%) | | | (%) | | | (%) | | | (%) | | | (%) | | | ($000’s) | | | (%) | |
ING Index Solution 2015 Portfolio (Continued) | | | | | | | | | | | | | | | | | | | | | | | | | | | | | | | | | | | | | | | | | | | | | | | | | | | | | | | | | | | | | | | | | | | | |
Class S | | | | | | | | | | | | | | | | | | | | | | | | | | | | | | | | | | | | | | | | | | | | | | | | | | | | | | | | | | | | | | | | | | | | |
12-31-11 | | | 10.51 | | | | 0.16 | | | | (0.11 | ) | | | 0.05 | | | | 0.20 | | | | 0.39 | | | | — | | | | 0.59 | | | | — | | | | 9.97 | | | | 0.80 | | | | 0.37 | | | | 0.37 | | | | 0.37 | | | | 1.55 | | | | 98,326 | | | | 90 | |
12-31-10 | | | 9.80 | | | | 0.25 | • | | | 0.61 | | | | 0.86 | | | | 0.05 | | | | 0.10 | | | | — | | | | 0.15 | | | | — | | | | 10.51 | | | | 8.97 | | | | 0.37 | | | | 0.37 | | | | 0.37 | | | | 2.50 | | | | 99,941 | | | | 49 | |
12-31-09 | | | 8.45 | | | | 0.10 | • | | | 1.29 | | | | 1.39 | | | | 0.04 | | | | — | | | | — | | | | 0.04 | | | | — | | | | 9.80 | | | | 16.50 | | | | 0.37 | | | | 0.37 | | | | 0.37 | | | | 1.09 | | | | 70,222 | | | | 28 | |
03-10-08(5) - 12-31-08 | | | 10.00 | | | | 0.27 | • | | | (1.82 | ) | | | (1.55 | ) | | | — | | | | — | | | | — | | | | — | | | | — | | | | 8.45 | | | | (15.50 | ) | | | 0.37 | | | | 0.37 | | | | 0.37 | | | | 3.92 | | | | 3,949 | | | | 39 | |
Class S2 | | | | | | | | | | | | | | | | | | | | | | | | | | | | | | | | | | | | | | | | | | | | | | | | | | | | | | | | | | | | | | | | | | | | |
12-31-11 | | | 10.43 | | | | 0.13 | • | | | (0.09 | ) | | | 0.04 | | | | 0.22 | | | | 0.39 | | | | — | | | | 0.61 | | | | — | | | | 9.86 | | | | 0.69 | | | | 0.62 | | | | 0.52 | | | | 0.52 | | | | 1.25 | | | | 6,865 | | | | 90 | |
12-31-10 | | | 9.76 | | | | 0.25 | • | | | 0.58 | | | | 0.83 | | | | 0.06 | | | | 0.10 | | | | — | | | | 0.16 | | | | — | | | | 10.43 | | | | 8.68 | | | | 0.62 | | | | 0.52 | | | | 0.52 | | | | 2.48 | | | | 2,536 | | | | 49 | |
05-28-09(5) - 12-31-09 | | | 8.52 | | | | 0.06 | • | | | 1.22 | | | | 1.28 | | | | 0.04 | | | | — | | | | — | | | | 0.04 | | | | — | | | | 9.76 | | | | 15.11 | | | | 0.62 | | | | 0.52 | | | | 0.52 | | | | 1.05 | | | | 3 | | | | 28 | |
Class T | | | | | | | | | | | | | | | | | | | | | | | | | | | | | | | | | | | | | | | | | | | | | | | | | | | | | | | | | | | | | | | | | | | | |
12-31-11 | | | 10.46 | | | | 0.11 | | | | (0.10 | ) | | | 0.01 | | | | 0.15 | | | | 0.39 | | | | — | | | | 0.54 | | | | — | | | | 9.93 | | | | 0.38 | | | | 0.87 | | | | 0.82 | | | | 0.82 | | | | 1.10 | | | | 3 | | | | 90 | |
12-31-10 | | | 9.76 | | | | 0.20 | | | | 0.60 | | | | 0.80 | | | | — | | | | 0.10 | | | | — | | | | 0.10 | | | | — | | | | 10.46 | | | | 8.31 | | | | 0.87 | | | | 0.82 | | | | 0.82 | | | | 2.05 | | | | 3 | | | | 49 | |
12-31-09 | | | 8.41 | | | | 0.02 | | | | 1.33 | | | | 1.35 | | | | — | | | | — | | | | — | | | | — | | | | — | | | | 9.76 | | | | 16.07 | | | | 0.87 | | | | 0.82 | | | | 0.82 | | | | 0.21 | | | | 3 | | | | 28 | |
03-10-08(5) - 12-31-08 | | | 10.00 | | | | 0.09 | | | | (1.68 | ) | | | (1.59 | ) | | | — | | | | — | | | | — | | | | — | | | | — | | | | 8.41 | | | | (15.90 | ) | | | 0.87 | | | | 0.82 | | | | 0.82 | | | | 1.12 | | | | 3 | | | | 39 | |
| | | | | | | | | | | | | | | | | |
ING Index Solution 2020 Portfolio | | | | | | | | | | | | | | | | | | | | | | | | | | | | | | | | | | | | | | | | | | | | | | | | | | | | | | | | | | | | | | | | | | | | |
Class ADV | | | | | | | | | | | | | | | | | | | | | | | | | | | | | | | | | | | | | | | | | | | | | | | | | | | | | | | | | | | | | | | | | | | | |
10-03-11(5) - 12-31-11 | | | 10.00 | | | | 0.01 | | | | 0.75 | | | | 0.76 | | | | — | | | | — | | | | — | | | | — | | | | — | | | | 10.76 | | | | 7.60 | | | | 0.62 | | | | 0.62 | | | | 0.62 | | | | 0.42 | | | | 3 | | | | 41 | |
Class I | | | | | | | | | | | | | | | | | | | | | | | | | | | | | | | | | | | | | | | | | | | | | | | | | | | | | | | | | | | | | | | | | | | | |
10-03-11(5) - 12-31-11 | | | 10.00 | | | | 0.02 | | | | 0.75 | | | | 0.77 | | | | — | | | | — | | | | — | | | | — | | | | — | | | | 10.77 | | | | 7.70 | | | | 0.12 | | | | 0.12 | | | | 0.12 | | | | 0.90 | | | | 3 | | | | 41 | |
Class S | | | | | | | | | | | | | | | | | | | | | | | | | | | | | | | | | | | | | | | | | | | | | | | | | | | | | | | | | | | | | | | | | | | | |
10-03-11(5) - 12-31-11 | | | 10.00 | | | | 0.02 | | | | 0.74 | | | | 0.76 | | | | — | | | | — | | | | — | | | | — | | | | — | | | | 10.76 | | | | 7.60 | | | | 0.37 | | | | 0.37 | | | | 0.37 | | | | 0.66 | | | | 3 | | | | 41 | |
Class S2 | | | | | | | | | | | | | | | | | | | | | | | | | | | | | | | | | | | | | | | | | | | | | | | | | | | | | | | | | | | | | | | | | | | | |
10-03-11(5) - 12-31-11 | | | 10.00 | | | | 0.01 | | | | 0.75 | | | | 0.76 | | | | — | | | | — | | | | — | | | | — | | | | — | | | | 10.76 | | | | 7.60 | | | | 0.62 | | | | 0.52 | | | | 0.52 | | | | 0.54 | | | | 3 | | | | 41 | |
Class T | | | | | | | | | | | | | | | | | | | | | | | | | | | | | | | | | | | | | | | | | | | | | | | | | | | | | | | | | | | | | | | | | | | | |
10-03-11(5) - 12-31-11 | | | 10.00 | | | | 0.00 | * | | | 0.75 | | | | 0.75 | | | | — | | | | — | | | | — | | | | — | | | | — | | | | 10.75 | | | | 7.50 | | | | 0.87 | | | | 0.82 | | | | 0.82 | | | | 0.18 | | | | 3 | | | | 41 | |
| | | | | | | | | | | | | | | | | |
ING Index Solution 2025 Portfolio | | | | | | | | | | | | | | | | | | | | | | | | | | | | | | | | | | | | | | | | | | | | | | | | | | | | | | | | | | | | | | | | | | | | |
Class ADV | | | | | | | | | | | | | | | | | | | | | | | | | | | | | | | | | | | | | | | | | | | | | | | | | | | | | | | | | | | | | | | | | | | | |
12-31-11 | | | 10.40 | | | | 0.12 | • | | | (0.34 | ) | | | (0.22 | ) | | | 0.15 | | | | 0.47 | | | | — | | | | 0.62 | | | | — | | | | 9.56 | | | | (1.75 | ) | | | 0.62 | | | | 0.62 | | | | 0.62 | | | | 1.19 | | | | 114,181 | | | | 95 | |
12-31-10 | | | 9.36 | | | | 0.20 | • | | | 0.87 | | | | 1.07 | | | | 0.01 | | | | 0.02 | | | | — | | | | 0.03 | | | | — | | | | 10.40 | | | | 11.43 | | | | 0.62 | | | | 0.62 | | | | 0.62 | | | | 2.12 | | | | 96,652 | | | | 48 | |
12-31-09 | | | 7.79 | | | | 0.00 | • | | | 1.60 | | | | 1.60 | | | | 0.03 | | | | — | | | | — | | | | 0.03 | | | | — | | | | 9.36 | | | | 20.58 | | | | 0.62 | | | | 0.62 | | | | 0.62 | | | | 0.04 | | | | 52,508 | | | | 15 | |
03-10-08(5) - 12-31-08 | | | 10.00 | | | | 0.28 | • | | | (2.49 | ) | | | (2.21 | ) | | | — | | | | — | | | | — | | | | — | | | | — | | | | 7.79 | | | | (22.10 | ) | | | 0.62 | | | | 0.62 | | | | 0.62 | | | | 4.29 | | | | 12,557 | | | | 17 | |
See Accompanying Notes to Financial Statements
32
FINANCIAL HIGHLIGHTS (CONTINUED)
Selected data for a share of beneficial interest outstanding throughout each year or period.
| | | | | | | | | | | | | | | | | | | | | | | | | | | | | | | | | | | | | | | | | | | | | | | | | | | | | | | | | | | | | | | | | | | | |
| | | | | | Income (loss)
from
investment
operations | | | | | | Less distributions | | | | | | | | | | | | | | | Ratios to average net assets | | | Supplemental
data | |
| | | | | | | | | | | | | | | | | | | | | | | | | | | | | | | | | | | | | | | | | | | | | | | | | | | | |
| | | Net asset value, beginning of year or period | | | Net investment income (loss) | | | Net realized and unrealized gain (loss) | | | Total from investment operations | | | From net investment income | | | From net realized gains | | | From return of capital | | | Total distributions | | | Payment by affiliate | | | Net asset value, end of year or period | | | Total Return (1) | | | Expenses before reductions/additions(2)(3)(4) | | | Expenses net of fee waivers and/or recoupments, if any(2)(3)(4) | | | Expenses net of all reductions/additions(2)(3)(4) | | | Net investment income (loss)(2)(4) | | | Net assets, end of year or period | | | Portfolio turnover rate | |
| | | | | | | | | | | | | | | | | | | | | | | | | | | | | | | | | | | | | | | | | | | | | | | | | | | | | | | | | | | | | | | | | | | | |
Year or period ended | | ($) | | | ($) | | | ($) | | | ($) | | | ($) | | | ($) | | | ($) | | | ($) | | | ($) | | | ($) | | | (%) | | | (%) | | | (%) | | | (%) | | | (%) | | | ($000’s) | | | (%) | |
ING Index Solution 2025 Portfolio (Continued) | | | | | | | | | | | | | | | | | | | | | | | | | | | | | | | | | | | | | | | | | | | | | | | | | | | | | | | | | | | | | | | | | | | | |
Class I | | | | | | | | | | | | | | | | | | | | | | | | | | | | | | | | | | | | | | | | | | | | | | | | | | | | | | | | | | | | | | | | | | | | |
12-31-11 | | | 10.52 | | | | 0.16 | • | | | (0.34 | ) | | | (0.18 | ) | | | 0.18 | | | | 0.47 | | | | — | | | | 0.65 | | | | — | | | | 9.69 | | | | (1.24 | ) | | | 0.12 | | | | 0.12 | | | | 0.12 | | | | 1.55 | | | | 15,692 | | | | 95 | |
12-31-10 | | | 9.44 | | | | 0.25 | • | | | 0.88 | | | | 1.13 | | | | 0.03 | | | | 0.02 | | | | — | | | | 0.05 | | | | — | | | | 10.52 | | | | 11.96 | | | | 0.12 | | | | 0.12 | | | | 0.12 | | | | 2.63 | | | | 7,248 | | | | 48 | |
12-31-09 | | | 7.82 | | | | 0.05 | • | | | 1.60 | | | | 1.65 | | | | 0.03 | | | | — | | | | — | | | | 0.03 | | | | — | | | | 9.44 | | | | 21.20 | | | | 0.12 | | | | 0.12 | | | | 0.12 | | | | 0.52 | | | | 4,105 | | | | 15 | |
03-10-08(5) - 12-31-08 | | | 10.00 | | | | 0.11 | | | | (2.29 | ) | | | (2.18 | ) | | | — | | | | — | | | | — | | | | — | | | | — | | | | 7.82 | | | | (21.80 | ) | | | 0.12 | | | | 0.12 | | | | 0.12 | | | | 1.50 | | | | 2 | | | | 17 | |
Class S | | | | | | | | | | | | | | | | | | | | | | | | | | | | | | | | | | | | | | | | | | | | | | | | | | | | | | | | | | | | | | | | | | | | |
12-31-11 | | | 10.46 | | | | 0.14 | • | | | (0.34 | ) | | | (0.20 | ) | | | 0.17 | | | | 0.47 | | | | — | | | | 0.64 | | | | — | | | | 9.62 | | | | (1.55 | ) | | | 0.37 | | | | 0.37 | | | | 0.37 | | | | 1.42 | | | | 98,843 | | | | 95 | |
12-31-10 | | | 9.40 | | | | 0.22 | • | | | 0.88 | | | | 1.10 | | | | 0.02 | | | | 0.02 | | | | — | | | | 0.04 | | | | — | | | | 10.46 | | | | 11.72 | | | | 0.37 | | | | 0.37 | | | | 0.37 | | | | 2.31 | | | | 92,770 | | | | 48 | |
12-31-09 | | | 7.80 | | | | 0.03 | • | | | 1.60 | | | | 1.63 | | | | 0.03 | | | | — | | | | — | | | | 0.03 | | | | — | | | | 9.40 | | | | 20.97 | | | | 0.37 | | | | 0.37 | | | | 0.37 | | | | 0.37 | | | | 48,775 | | | | 15 | |
03-10-08(5) - 12-31-08 | | | 10.00 | | | | 0.35 | • | | | (2.55 | ) | | | (2.20 | ) | | | — | | | | — | | | | — | | | | — | | | | — | | | | 7.80 | | | | (22.00 | ) | | | 0.37 | | | | 0.37 | | | | 0.37 | | | | 5.36 | | | | 4,555 | | | | 17 | |
Class S2 | | | | | | | | | | | | | | | | | | | | | | | | | | | | | | | | | | | | | | | | | | | | | | | | | | | | | | | | | | | | | | | | | | | | |
12-31-11 | | | 10.40 | | | | 0.09 | • | | | (0.31 | ) | | | (0.22 | ) | | | 0.18 | | | | 0.47 | | | | — | | | | 0.65 | | | | — | | | | 9.53 | | | | (1.70 | ) | | | 0.62 | | | | 0.52 | | | | 0.52 | | | | 0.93 | | | | 13,158 | | | | 95 | |
12-31-10 | | | 9.36 | | | | 0.17 | • | | | 0.92 | | | | 1.09 | | | | 0.03 | | | | 0.02 | | | | — | | | | 0.05 | | | | — | | | | 10.40 | | | | 11.63 | | | | 0.62 | | | | 0.52 | | | | 0.52 | | | | 1.76 | | | | 4,796 | | | | 48 | |
05-28-09(5) - 12-31-09 | | | 7.90 | | | | 0.02 | • | | | 1.47 | | | | 1.49 | | | | 0.03 | | | | — | | | | — | | | | 0.03 | | | | — | | | | 9.36 | | | | 18.96 | | | | 0.62 | | | | 0.52 | | | | 0.52 | | | | 0.34 | | | | 4 | | | | 15 | |
Class T | | | | | | | | | | | | | | | | | | | | | | | | | | | | | | | | | | | | | | | | | | | | | | | | | | | | | | | | | | | | | | | | | | | | |
12-31-11 | | | 10.37 | | | | 0.10 | | | | (0.34 | ) | | | (0.24 | ) | | | 0.11 | | | | 0.47 | | | | — | | | | 0.58 | | | | — | | | | 9.55 | | | | (1.93 | ) | | | 0.87 | | | | 0.82 | | | | 0.82 | | | | 0.97 | | | | 3 | | | | 95 | |
12-31-10 | | | 9.36 | | | | 0.18 | | | | 0.85 | | | | 1.03 | | | | — | | | | 0.02 | | | | — | | | | 0.02 | | | | — | | | | 10.37 | | | | 10.99 | | | | 0.87 | | | | 0.82 | | | | 0.82 | | | | 1.90 | | | | 3 | | | | 48 | |
12-31-09 | | | 7.78 | | | | (0.02 | ) | | | 1.60 | | | | 1.58 | | | | — | | | | — | | | | — | | | | — | | | | — | | | | 9.36 | | | | 20.31 | | | | 0.87 | | | | 0.82 | | | | 0.82 | | | | (0.25 | ) | | | 3 | | | | 15 | |
03-10-08(5) - 12-31-08 | | | 10.00 | | | | 0.06 | | | | (2.28 | ) | | | (2.22 | ) | | | — | | | | — | | | | — | | | | — | | | | — | | | | 7.78 | | | | (22.20 | ) | | | 0.87 | | | | 0.82 | | | | 0.82 | | | | 0.80 | | | | 2 | | | | 17 | |
| | | | | | | | | | | | | | | | | |
ING Index Solution 2030 Portfolio | | | | | | | | | | | | | | | | | | | | | | | | | | | | | | | | | | | | | | | | | | | | | | | | | | | | | | | | | | | | | | | | | | | | |
Class ADV | | | | | | | | | | | | | | | | | | | | | | | | | | | | | | | | | | | | | | | | | | | | | | | | | | | | | | | | | | | | | | | | | | | | |
10-03-11(5) - 12-31-11 | | | 10.00 | | | | (0.00 | )* | | | 1.00 | | | | 1.00 | | | | — | | | | — | | | | — | | | | — | | | | — | | | | 11.00 | | | | 10.00 | | | | 0.62 | | | | 0.62 | | | | 0.62 | | | | (0.00 | )* | | | 3 | | | | 50 | |
Class I | | | | | | | | | | | | | | | | | | | | | | | | | | | | | | | | | | | | | | | | | | | | | | | | | | | | | | | | | | | | | | | | | | | | |
10-03-11(5) - 12-31-11 | | | 10.00 | | | | 0.01 | | | | 1.00 | | | | 1.01 | | | | — | | | | — | | | | — | | | | — | | | | — | | | | 11.01 | | | | 10.10 | | | | 0.12 | | | | 0.12 | | | | 0.12 | | | | 0.46 | | | | 3 | | | | 50 | |
Class S | | | | | | | | | | | | | | | | | | | | | | | | | | | | | | | | | | | | | | | | | | | | | | | | | | | | | | | | | | | | | | | | | | | | |
10-03-11(5) - 12-31-11 | | | 10.00 | | | | 0.00 | * | | | 1.00 | | | | 1.00 | | | | — | | | | — | | | | — | | | | — | | | | — | | | | 11.00 | | | | 10.00 | | | | 0.37 | | | | 0.37 | | | | 0.37 | | | | 0.17 | | | | 3 | | | | 50 | |
Class S2 | | | | | | | | | | | | | | | | | | | | | | | | | | | | | | | | | | | | | | | | | | | | | | | | | | | | | | | | | | | | | | | | | | | | |
10-03-11(5) - 12-31-11 | | | 10.00 | | | | 0.00 | * | | | 1.00 | | | | 1.00 | | | | — | | | | — | | | | — | | | | — | | | | — | | | | 11.00 | | | | 10.00 | | | | 0.62 | | | | 0.52 | | | | 0.52 | | | | 0.11 | | | | 3 | | | | 50 | |
Class T | | | | | | | | | | | | | | | | | | | | | | | | | | | | | | | | | | | | | | | | | | | | | | | | | | | | | | | | | | | | | | | | | | | | |
10-03-11(5) - 12-31-11 | | | 10.00 | | | | (0.01 | ) | | | 1.00 | | | | 0.99 | | | | — | | | | — | | | | — | | | | — | | | | — | | | | 10.99 | | | | 9.90 | | | | 0.87 | | | | 0.82 | | | | 0.82 | | | | (0.29 | ) | | | 3 | | | | 50 | |
See Accompanying Notes to Financial Statements
33
FINANCIAL HIGHLIGHTS (CONTINUED)
Selected data for a share of beneficial interest outstanding throughout each year or period.
| | | | | | | | | | | | | | | | | | | | | | | | | | | | | | | | | | | | | | | | | | | | | | | | | | | | | | | | | | | | | | | | | | | | |
| | | | | | Income (loss)
from
investment
operations | | | | | | Less distributions | | | | | | | | | | | | | | | Ratios to average net assets | | | Supplemental
data | |
| | | | | | | | | | | | | | | | | | | | | | | | | | | | | | | | | | | | | | | | | | | | | | | | | | | | |
| | | Net asset value, beginning of year or period | | | Net investment income (loss) | | | Net realized and unrealized gain (loss) | | | Total from investment operations | | | From net investment income | | | From net realized gains | | | From return of capital | | | Total distributions | | | Payment by affiliate | | | Net asset value, end of year or period | | | Total Return(1) | | | Expenses before reductions/additions(2)(3)(4) | | | Expenses net of fee waivers and/or recoupments if any(2)(3)(4) | | | Expenses net of all reductions/additions(2)(3)(4) | | | Net investment income (loss)(2)(4) | | | Net assets, end of year or period | | | Portfolio turnover rate | |
| | | | | | | | | | | | | | | | | | | | | | | | | | | | | | | | | | | | | | | | | | | | | | | | | | | | | | | | | | | | | | | | | | | | |
Year or period ended | | ($) | | | ($) | | | ($) | | | ($) | | | ($) | | | ($) | | | ($) | | | ($) | | | ($) | | | ($) | | | (%) | | | (%) | | | (%) | | | (%) | | | (%) | | | ($000’s) | | | (%) | |
ING Index Solution 2035 Portfolio | | | | | | | | | | | | | | | | | | | | | | | | | | | | | | | | | | | | | | | | | | | | | | | | | | | | | | | | | | | | | | | | | | | | |
Class ADV | | | | | | | | | | | | | | | | | | | | | | | | | | | | | | | | | | | | | | | | | | | | | | | | | | | | | | | | | | | | | | | | | | | | |
12-31-11 | | | 10.27 | | | | 0.11 | • | | | (0.51 | ) | | | (0.40 | ) | | | 0.12 | | | | 0.45 | | | | — | | | | 0.57 | | | | — | | | | 9.30 | | | | (3.46 | ) | | | 0.62 | | | | 0.62 | | | | 0.62 | | | | 1.06 | | | | 94,263 | | | | 100 | |
12-31-10 | | | 9.14 | | | | 0.18 | • | | | 0.97 | | | | 1.15 | | | | — | | | | 0.02 | | | | — | | | | 0.02 | | | | — | | | | 10.27 | | | | 12.56 | | | | 0.62 | | | | 0.62 | | | | 0.62 | | | | 1.91 | | | | 77,135 | | | | 45 | |
12-31-09 | | | 7.45 | | | | (0.02 | )• | | | 1.74 | | | | 1.72 | | | | 0.03 | | | | — | | | | — | | | | 0.03 | | | | — | | | | 9.14 | | | | 23.19 | | | | 0.62 | | | | 0.62 | | | | 0.62 | | | | (0.22 | ) | | | 41,570 | | | | 14 | |
03-10-08(5) - 12-31-08 | | | 10.00 | | | | 0.33 | • | | | (2.88 | ) | | | (2.55 | ) | | | — | | | | — | | | | — | | | | — | | | | — | | | | 7.45 | | | | (25.50 | ) | | | 0.62 | | | | 0.62 | | | | 0.62 | | | | 5.29 | | | | 9,139 | | | | 19 | |
Class I | | | | | | | | | | | | | | | | | | | | | | | | | | | | | | | | | | | | | | | | | | | | | | | | | | | | | | | | | | | | | | | | | | | | |
12-31-11 | | | 10.40 | | | | 0.14 | • | | | (0.51 | ) | | | (0.37 | ) | | | 0.15 | | | | 0.45 | | | | — | | | | 0.60 | | | | — | | | | 9.43 | | | | (3.06 | ) | | | 0.12 | | | | 0.12 | | | | 0.12 | | | | 1.43 | | | | 11,109 | | | | 100 | |
12-31-10 | | | 9.22 | | | | 0.23 | • | | | 0.98 | | | | 1.21 | | | | 0.01 | | | | 0.02 | | | | — | | | | 0.03 | | | | — | | | | 10.40 | | | | 13.10 | | | | 0.12 | | | | 0.12 | | | | 0.12 | | | | 2.40 | | | | 5,521 | | | | 45 | |
12-31-09 | | | 7.48 | | | | 0.02 | • | | | 1.76 | | | | 1.78 | | | | 0.04 | | | | — | | | | — | | | | 0.04 | | | | — | | | | 9.22 | | | | 23.81 | | | | 0.12 | | | | 0.12 | | | | 0.12 | | | | 0.25 | | | | 1,947 | | | | 14 | |
03-10-08(5) - 12-31-08 | | | 10.00 | | | | 0.24 | • | | | (2.76 | ) | | | (2.52 | ) | | | — | | | | — | | | | — | | | | — | | | | — | | | | 7.48 | | | | (25.20 | ) | | | 0.12 | | | | 0.12 | | | | 0.12 | | | | 3.87 | | | | 170 | | | | 19 | |
Class S | | | | | | | | | | | | | | | | | | | | | | | | | | | | | | | | | | | | | | | | | | | | | | | | | | | | | | | | | | | | | | | | | | | | |
12-31-11 | | | 10.34 | | | | 0.13 | • | | | (0.51 | ) | | | (0.38 | ) | | | 0.14 | | | | 0.45 | | | | — | | | | 0.59 | | | | — | | | | 9.37 | | | | (3.26 | ) | | | 0.37 | | | | 0.37 | | | | 0.37 | | | | 1.30 | | | | 64,863 | | | | 100 | |
12-31-10 | | | 9.18 | | | | 0.20 | • | | | 0.98 | | | | 1.18 | | | | — | | | | 0.02 | | | | — | | | | 0.02 | | | | — | | | | 10.34 | | | | 12.89 | | | | 0.37 | | | | 0.37 | | | | 0.37 | | | | 2.15 | | | | 58,656 | | | | 45 | |
12-31-09 | | | 7.47 | | | | 0.00 | • | | | 1.75 | | | | 1.75 | | | | 0.04 | | | | — | | | | — | | | | 0.04 | | | | — | | | | 9.18 | | | | 23.42 | | | | 0.37 | | | | 0.37 | | | | 0.37 | | | | 0.05 | | | | 25,008 | | | | 14 | |
03-10-08(5) - 12-31-08 | | | 10.00 | | | | 0.37 | • | | | (2.90 | ) | | | (2.53 | ) | | | — | | | | — | | | | — | | | | — | | | | — | | | | 7.47 | | | | (25.30 | ) | | | 0.37 | | | | 0.37 | | | | 0.37 | | | | 6.06 | | | | 4,038 | | | | 19 | |
Class S2 | | | | | | | | | | | | | | | | | | | | | | | | | | | | | | | | | | | | | | | | | | | | | | | | | | | | | | | | | | | | | | | | | | | | |
12-31-11 | | | 10.29 | | | | 0.07 | • | | | (0.47 | ) | | | (0.40 | ) | | | 0.15 | | | | 0.45 | | | | — | | | | 0.60 | | | | — | | | | 9.29 | | | | (3.44 | ) | | | 0.62 | | | | 0.52 | | | | 0.52 | | | | 0.71 | | | | 8,819 | | | | 100 | |
12-31-10 | | | 9.15 | | | | 0.11 | • | | | 1.06 | | | | 1.17 | | | | 0.01 | | | | 0.02 | | | | — | | | | 0.03 | | | | — | | | | 10.29 | | | | 12.76 | | | | 0.62 | | | | 0.52 | | | | 0.52 | | | | 1.11 | | | | 3,503 | | | | 45 | |
05-28-09(5) - 12-31-09 | | | 7.60 | | | | 0.00 | • | | | 1.59 | | | | 1.59 | | | | 0.04 | | | | — | | | | — | | | | 0.04 | | | | — | | | | 9.15 | | | | 20.94 | | | | 0.62 | | | | 0.52 | | | | 0.52 | | | | (0.01 | ) | | | 4 | | | | 14 | |
Class T | | | | | | | | | | | | | | | | | | | | | | | | | | | | | | | | | | | | | | | | | | | | | | | | | | | | | | | | | | | | | | | | | | | | |
12-31-11 | | | 10.24 | | | | 0.09 | | | | (0.51 | ) | | | (0.42 | ) | | | 0.08 | | | | 0.45 | | | | — | | | | 0.53 | | | | — | | | | 9.29 | | | | (3.69 | ) | | | 0.87 | | | | 0.82 | | | | 0.82 | | | | 0.88 | | | | 3 | | | | 100 | |
12-31-10 | | | 9.14 | | | | 0.17 | | | | 0.95 | | | | 1.12 | | | | — | | | | 0.02 | | | | — | | | | 0.02 | | | | — | | | | 10.24 | | | | 12.23 | | | | 0.87 | | | | 0.82 | | | | 0.82 | | | | 1.82 | | | | 3 | | | | 45 | |
12-31-09 | | | 7.44 | | | | (0.04 | ) | | | 1.74 | | | | 1.70 | | | | — | | | | — | | | | — | | | | — | | | | — | | | | 9.14 | | | | 22.85 | | | | 0.87 | | | | 0.82 | | | | 0.82 | | | | (0.48 | ) | | | 3 | | | | 14 | |
03-10-08(5) - 12-31-08 | | | 10.00 | | | | 0.05 | | | | (2.61 | ) | | | (2.56 | ) | | | — | | | | — | | | | — | | | | — | | | | — | | | | 7.44 | | | | (25.60 | ) | | | 0.87 | | | | 0.82 | | | | 0.82 | | | | 0.64 | | | | 2 | | | | 19 | |
| | | | | | | | | | | | | | | | | |
ING Index Solution 2040 Portfolio | | | | | | | | | | | | | | | | | | | | | | | | | | | | | | | | | | | | | | | | | | | | | | | | | | | | | | | | | | | | | | | | | | | | |
Class ADV | | | | | | | | | | | | | | | | | | | | | | | | | | | | | | | | | | | | | | | | | | | | | | | | | | | | | | | | | | | | | | | | | | | | |
10-03-11(5) - 12-31-11 | | | 10.00 | | | | (0.01 | ) | | | 1.19 | | | | 1.18 | | | | — | | | | — | | | | — | | | | — | | | | — | | | | 11.18 | | | | 11.80 | | | | 0.62 | | | | 0.62 | | | | 0.62 | | | | (0.32 | ) | | | 3 | | | | 56 | |
Class I | | | | | | | | | | | | | | | | | | | | | | | | | | | | | | | | | | | | | | | | | | | | | | | | | | | | | | | | | | | | | | | | | | | | |
10-03-11(5) - 12-31-11 | | | 10.00 | | | | 0.00 | * | | | 1.19 | | | | 1.19 | | | | — | | | | — | | | | — | | | | — | | | | — | | | | 11.19 | | | | 11.90 | | | | 0.12 | | | | 0.12 | | | | 0.12 | | | | 0.11 | | | | 3 | | | | 56 | |
Class S | | | | | | | | | | | | | | | | | | | | | | | | | | | | | | | | | | | | | | | | | | | | | | | | | | | | | | | | | | | | | | | | | | | | |
10-03-11(5) - 12-31-11 | | | 10.00 | | | | (0.00 | )* | | | 1.18 | | | | 1.18 | | | | — | | | | — | | | | — | | | | — | | | | — | | | | 11.18 | | | | 11.80 | | | | 0.37 | | | | 0.37 | | | | 0.37 | | | | (0.18 | ) | | | 3 | | | | 56 | |
Class S2 | | | | | | | | | | | | | | | | | | | | | | | | | | | | | | | | | | | | | | | | | | | | | | | | | | | | | | | | | | | | | | | | | | | | |
10-03-11(5) - 12-31-11 | | | 10.00 | | | | (0.01 | ) | | | 1.19 | | | | 1.18 | | | | — | | | | — | | | | — | | | | — | | | | — | | | | 11.18 | | | | 11.80 | | | | 0.62 | | | | 0.52 | | | | 0.52 | | | | (0.21 | ) | | | 3 | | | | 56 | |
Class T | | | | | | | | | | | | | | | | | | | | | | | | | | | | | | | | | | | | | | | | | | | | | | | | | | | | | | | | | | | | | | | | | | | | |
10-03-11(5) - 12-31-11 | | | 10.00 | | | | (0.02 | ) | | | 1.19 | | | | 1.17 | | | | — | | | | — | | | | — | | | | — | | | | — | | | | 11.17 | | | | 11.70 | | | | 0.87 | | | | 0.82 | | | | 0.82 | | | | (0.57 | ) | | | 3 | | | | 56 | |
See Accompanying Notes to Financial Statements
34
FINANCIAL HIGHLIGHTS (CONTINUED)
Selected data for a share of beneficial interest outstanding throughout each year or period.
| | | | | | | | | | | | | | | | | | | | | | | | | | | | | | | | | | | | | | | | | | | | | | | | | | | | | | | | | | | | | | | | | | | | |
| | | | | | Income (loss)
from
investment
operations | | | | | | Less distributions | | | | | | | | | | | | | | | Ratios to average net assets | | | Supplemental
data | |
| | | | | | | | | | | | | | | | | | | | | | | | | | | | | | | | | | | | | | | | | | | | | | | | | | | | |
| | | Net asset value, beginning of year or period | | | Net investment income (loss) | | | Net realized and unrealized gain (loss) | | | Total from investment operations | | | From net investment income | | | From net realized gains | | | From return of capital | | | Total distributions | | | Payment by affiliate | | | Net asset value, end of year or period | | | Total Return (1) | | | Expenses before reductions/additions(2)(3)(4) | | | Expenses net of fee waivers and/or recoupments, if any(2)(3)(4) | | | Expenses net of all reductions/additions(2)(3)(4) | | | Net investment income (loss)(2)(4) | | | Net assets, end of year or period | | | Portfolio turnover rate | |
| | | | | | | | | | | | | | | | | | | | | | | | | | | | | | | | | | | | | | | | | | | | | | | | | | | | | | | | | | | | | | | | | | | | |
Year or period ended | | ($) | | | ($) | | | ($) | | | ($) | | | ($) | | | ($) | | | ($) | | | ($) | | | ($) | | | ($) | | | (%) | | | (%) | | | (%) | | | (%) | | | (%) | | | ($000’s) | | | (%) | |
ING Index Solution 2045 Portfolio | | | | | | | | | | | | | | | | | | | | | | | | | | | | | | | | | | | | | | | | | | | | | | | | | | | | | | | | | | | | | | | | | | | | |
Class ADV | | | | | | | | | | | | | | | | | | | | | | | | | | | | | | | | | | | | | | | | | | | | | | | | | | | | | | | | | | | | | | | | | | | | |
12-31-11 | | | 10.12 | | | | 0.10 | • | | | (0.58 | ) | | | (0.48 | ) | | | 0.09 | | | | 0.37 | | | | — | | | | 0.46 | | | | — | | | | 9.18 | | | | (4.48 | ) | | | 0.62 | | | | 0.62 | | | | 0.62 | | | | 1.01 | | | | 52,209 | | | | 102 | |
12-31-10 | | | 8.92 | | | | 0.16 | • | | | 1.06 | | | | 1.22 | | | | — | | | | 0.02 | | | | — | | | | 0.02 | | | | — | | | | 10.12 | | | | 13.73 | | | | 0.62 | | | | 0.62 | | | | 0.62 | | | | 1.71 | | | | 39,799 | | | | 45 | |
12-31-09 | | | 7.11 | | | | (0.04 | )• | | | 1.88 | | | | 1.84 | | | | 0.03 | | | | — | | | | — | | | | 0.03 | | | | — | | | | 8.92 | | | | 25.89 | | | | 0.62 | | | | 0.62 | | | | 0.62 | | | | (0.48 | ) | | | 18,520 | | | | 22 | |
03-10-08(5) - 12-31-08 | | | 10.00 | | | | 0.24 | • | | | (3.13 | ) | | | (2.89 | ) | | | — | | | | — | | | | — | | | | — | | | | — | | | | 7.11 | | | | (28.90 | ) | | | 0.62 | | | | 0.62 | | | | 0.62 | | | | 3.81 | | | | 3,069 | | | | 12 | |
Class I | | | | | | | | | | | | | | | | | | | | | | | | | | | | | | | | | | | | | | | | | | | | | | | | | | | | | | | | | | | | | | | | | | | | |
12-31-11 | | | 10.26 | | | | 0.15 | • | | | (0.59 | ) | | | (0.44 | ) | | | 0.11 | | | | 0.37 | | | | — | | | | 0.48 | | | | — | | | | 9.34 | | | | (3.92 | ) | | | 0.12 | | | | 0.12 | | | | 0.12 | | | | 1.50 | | | | 9,152 | | | | 102 | |
12-31-10 | | | 9.00 | | | | 0.19 | • | | | 1.09 | | | | 1.28 | | | | — | | | | 0.02 | | | | — | | | | 0.02 | | | | — | | | | 10.26 | | | | 14.28 | | | | 0.12 | | | | 0.12 | | | | 0.12 | | | | 2.03 | | | | 6,553 | | | | 45 | |
12-31-09 | | | 7.14 | | | | 0.00 | • | | | 1.89 | | | | 1.89 | | | | 0.03 | | | | — | | | | — | | | | 0.03 | | | | — | | | | 9.00 | | | | 26.53 | | | | 0.12 | | | | 0.12 | | | | 0.12 | | | | 0.00 | | | | 1,143 | | | | 22 | |
03-10-08(5) - 12-31-08 | | | 10.00 | | | | 0.20 | • | | | (3.06 | ) | | | (2.86 | ) | | | — | | | | — | | | | — | | | | — | | | | — | | | | 7.14 | | | | (28.60 | ) | | | 0.12 | | | | 0.12 | | | | 0.12 | | | | 3.32 | | | | 115 | | | | 12 | |
Class S | | | | | | | | | | | | | | | | | | | | | | | | | | | | | | | | | | | | | | | | | | | | | | | | | | | | | | | | | | | | | | | | | | | | |
12-31-11 | | | 10.19 | | | | 0.13 | • | | | (0.58 | ) | | | (0.45 | ) | | | 0.10 | | | | 0.37 | | | | — | | | | 0.47 | | | | — | | | | 9.27 | | | | (4.09 | ) | | | 0.37 | | | | 0.37 | | | | 0.37 | | | | 1.27 | | | | 38,266 | | | | 102 | |
12-31-10 | | | 8.97 | | | | 0.18 | • | | | 1.06 | | | | 1.24 | | | | — | | | | 0.02 | | | | — | | | | 0.02 | | | | — | | | | 10.19 | | | | 13.88 | | | | 0.37 | | | | 0.37 | | | | 0.37 | | | | 1.93 | | | | 29,555 | | | | 45 | |
12-31-09 | | | 7.13 | | | | (0.02 | )• | | | 1.89 | | | | 1.87 | | | | 0.03 | | | | — | | | | — | | | | 0.03 | | | | — | | | | 8.97 | | | | 26.26 | | | | 0.37 | | | | 0.37 | | | | 0.37 | | | | (0.23 | ) | | | 12,040 | | | | 22 | |
03-10-08(5) - 12-31-08 | | | 10.00 | | | | 0.28 | • | | | (3.15 | ) | | | (2.87 | ) | | | — | | | | — | | | | — | | | | — | | | | — | | | | 7.13 | | | | (28.70 | ) | | | 0.37 | | | | 0.37 | | | | 0.37 | | | | 4.44 | | | | 1,772 | | | | 12 | |
Class S2 | | | | | | | | | | | | | | | | | | | | | | | | | | | | | | | | | | | | | | | | | | | | | | | | | | | | | | | | | | | | | | | | | | | | |
12-31-11 | | | 10.14 | | | | 0.08 | • | | | (0.55 | ) | | | (0.47 | ) | | | 0.11 | | | | 0.37 | | | | — | | | | 0.48 | | | | — | | | | 9.19 | | | | (4.32 | ) | | | 0.62 | | | | 0.52 | | | | 0.52 | | | | 0.87 | | | | 5,408 | | | | 102 | |
12-31-10 | | | 8.93 | | | | 0.07 | • | | | 1.16 | | | | 1.23 | | | | — | | | | 0.02 | | | | — | | | | 0.02 | | | | — | | | | 10.14 | | | | 13.83 | | | | 0.62 | | | | 0.52 | | | | 0.52 | | | | 0.71 | | | | 1,684 | | | | 45 | |
05-28-09(5) - 12-31-09 | | | 7.29 | | | | (0.02 | )• | | | 1.69 | | | | 1.67 | | | | 0.03 | | | | — | | | | — | | | | 0.03 | | | | — | | | | 8.93 | | | | 22.97 | | | | 0.62 | | | | 0.52 | | | | 0.52 | | | | (0.35 | ) | | | 4 | | | | 22 | |
Class T | | | | | | | | | | | | | | | | | | | | | | | | | | | | | | | | | | | | | | | | | | | | | | | | | | | | | | | | | | | | | | | | | | | | |
12-31-11 | | | 10.09 | | | | 0.08 | | | | (0.57 | ) | | | (0.49 | ) | | | 0.05 | | | | 0.37 | | | | — | | | | 0.42 | | | | — | | | | 9.18 | | | | (4.61 | ) | | | 0.87 | | | | 0.82 | | | | 0.82 | | | | 0.86 | | | | 3 | | | | 102 | |
12-31-10 | | | 8.92 | | | | 0.16 | | | | 1.03 | | | | 1.19 | | | | — | | | | 0.02 | | | | — | | | | 0.02 | | | | — | | | | 10.09 | | | | 13.40 | | | | 0.87 | | | | 0.82 | | | | 0.82 | | | | 1.75 | | | | 3 | | | | 45 | |
12-31-09 | | | 7.10 | | | | (0.06 | ) | | | 1.88 | | | | 1.82 | | | | — | | | | — | | | | — | | | | — | | | | — | | | | 8.92 | | | | 25.64 | | | | 0.87 | | | | 0.82 | | | | 0.82 | | | | (0.74 | ) | | | 3 | | | | 22 | |
03-10-08(5) - 12-31-08 | | | 10.00 | | | | 0.03 | | | | (2.93 | ) | | | (2.90 | ) | | | — | | | | — | | | | — | | | | — | | | | — | | | | 7.10 | | | | (29.00 | ) | | | 0.87 | | | | 0.82 | | | | 0.82 | | | | 0.47 | | | | 2 | | | | 12 | |
| | | | | | | | | | | | | | | | | |
ING Index Solution 2050 Portfolio | | | | | | | | | | | | | | | | | | | | | | | | | | | | | | | | | | | | | | | | | | | | | | | | | | | | | | | | | | | | | | | | | | | | |
Class ADV | | | | | | | | | | | | | | | | | | | | | | | | | | | | | | | | | | | | | | | | | | | | | | | | | | | | | | | | | | | | | | | | | | | | |
10-03-11(5) - 12-31-11 | | | 10.00 | | | | (0.01 | ) | | | 1.19 | | | | 1.18 | | | | — | | | | — | | | | — | | | | — | | | | — | | | | 11.18 | | | | 11.80 | | | | 0.62 | | | | 0.62 | | | | 0.62 | | | | (0.36 | ) | | | 3 | | | | 55 | |
Class I | | | | | | | | | | | | | | | | | | | | | | | | | | | | | | | | | | | | | | | | | | | | | | | | | | | | | | | | | | | | | | | | | | | | |
10-03-11(5) - 12-31-11 | | | 10.00 | | | | 0.00 | * | | | 1.19 | | | | 1.19 | | | | — | | | | — | | | | — | | | | — | | | | — | | | | 11.19 | | | | 11.90 | | | | 0.12 | | | | 0.12 | | | | 0.12 | | | | 0.10 | | | | 3 | | | | 55 | |
Class S | | | | | | | | | | | | | | | | | | | | | | | | | | | | | | | | | | | | | | | | | | | | | | | | | | | | | | | | | | | | | | | | | | | | |
10-03-11(5) - 12-31-11 | | | 10.00 | | | | (0.01 | ) | | | 1.20 | | | | 1.19 | | | | — | | | | — | | | | — | | | | — | | | | — | | | | 11.19 | | | | 11.90 | | | | 0.37 | | | | 0.37 | | | | 0.37 | | | | (0.21 | ) | | | 3 | | | | 55 | |
Class S2 | | | | | | | | | | | | | | | | | | | | | | | | | | | | | | | | | | | | | | | | | | | | | | | | | | | | | | | | | | | | | | | | | | | | |
10-03-11(5) - 12-31-11 | | | 10.00 | | | | (0.01 | ) | | | 1.20 | | | | 1.19 | | | | — | | | | — | | | | — | | | | — | | | | — | | | | 11.19 | | | | 11.90 | | | | 0.62 | | | | 0.52 | | | | 0.52 | | | | (0.24 | ) | | | 3 | | | | 55 | |
See Accompanying Notes to Financial Statements
35
FINANCIAL HIGHLIGHTS (CONTINUED)
Selected data for a share of beneficial interest outstanding throughout each year or period.
| | | | | | | | | | | | | | | | | | | | | | | | | | | | | | | | | | | | | | | | | | | | | | | | | | | | | | | | | | | | | | | | | | | | |
| | | | | | Income (loss)
from
investment
operations | | | | | | Less distributions | | | | | | | | | | | | | | | Ratios to average net assets | | | Supplemental
data | |
| | | | | | | | | | | | | | | | | | | | | | | | | | | | | | | | | | | | | | | | | | | | | | | | | | | | |
| | | Net asset value, beginning of year or period | | | Net investment income (loss) | | | Net realized and unrealized gain (loss) | | | Total from investment operations | | | From net investment income | | | From net realized gains | | | From return of capital | | | Total distributions | | | Payment by affiliate | | | Net asset value, end of year or period | | | Total Return (1) | | | Expenses before reductions/additions(2)(3)(4) | | | Expenses net of fee waivers and/or recoupments, if any(2)(3)(4) | | | Expenses net of all reductions/additions(2)(3)(4) | | | Net investment income (loss)(2)(4) | | | Net assets, end of year or period | | | Portfolio turnover rate | |
| | | | | | | | | | | | | | | | | | | | | | | | | | | | | | | | | | | | | | | | | | | | | | | | | | | | | | | | | | | | | | | | | | | | |
Year or period ended | | ($) | | | ($) | | | ($) | | | ($) | | | ($) | | | ($) | | | ($) | | | ($) | | | ($) | | | ($) | | | (%) | | | (%) | | | (%) | | | (%) | | | (%) | | | ($000’s) | | | (%) | |
ING Index Solution 2050 Portfolio (Continued) | | | | | | | | | | | | | | | | | | | | | | | | | | | | | | | | | | | | | | | | | | | | | | | | | | | | | | | | | | | | | | | | | | | | |
Class T | | | | | | | | | | | | | | | | | | | | | | | | | | | | | | | | | | | | | | | | | | | | | | | | | | | | | | | | | | | | | | | | | | | | |
10-03-11(5) - 12-31-11 | | | 10.00 | | | | (0.02 | ) | | | 1.20 | | | | 1.18 | | | | — | | | | — | | | | — | | | | — | | | | — | | | | 11.18 | | | | 11.80 | | | | 0.87 | | | | 0.82 | | | | 0.82 | | | | (0.62 | ) | | | 3 | | | | 55 | |
ING Index Solution 2055 Portfolio | | | | | | | | | | | | | | | | | | | | | | | | | | | | | | | | | | | | | | | | | | | | | | | | | | | | | | | | | | | | | | | | | | | | |
Class ADV | | | | | | | | | | | | | | | | | | | | | | | | | | | | | | | | | | | | | | | | | | | | | | | | | | | | | | | | | | | | | | | | | | | | |
12-31-11 | | | 11.19 | | | | 0.09 | • | | | (0.59 | ) | | | (0.50 | ) | | | 0.00 | * | | | 0.12 | | | | — | | | | 0.12 | | | | — | | | | 10.57 | | | | (4.40 | ) | | | 0.62 | | | | 0.62 | | | | 0.62 | | | | 0.81 | | | | 5,676 | | | | 135 | |
03-08-10(5) - 12-31-10 | | | 10.00 | | | | 0.00 | | | | 1.19 | | | | 1.19 | | | | — | | | | — | | | | — | | | | — | | | | — | | | | 11.19 | | | | 11.90 | | | | 0.62 | | | | 0.62 | | | | 0.62 | | | | (0.06 | ) | | | 2,381 | | | | 80 | |
Class I | | | | | | | | | | | | | | | | | | | | | | | | | | | | | | | | | | | | | | | | | | | | | | | | | | | | | | | | | | | | | | | | | | | | |
12-31-11 | | | 11.24 | | | | 0.10 | • | | | (0.55 | ) | | | (0.45 | ) | | | 0.01 | | | | 0.12 | | | | — | | | | 0.13 | | | | — | | | | 10.66 | | | | (3.93 | ) | | | 0.12 | | | | 0.12 | | | | 0.12 | | | | 0.91 | | | | 618 | | | | 135 | |
03-08-10(5) - 12-31-10 | | | 10.00 | | | | 0.26 | | | | 0.98 | | | | 1.24 | | | | — | | | | — | | | | — | | | | — | | | | — | | | | 11.24 | | | | 12.40 | | | | 0.12 | | | | 0.12 | | | | 0.12 | | | | 3.32 | | | | 46 | | | | 80 | |
Class S | | | | | | | | | | | | | | | | | | | | | | | | | | | | | | | | | | | | | | | | | | | | | | | | | | | | | | | | | | | | | | | | | | | | |
12-31-11 | | | 11.21 | | | | 0.12 | • | | | (0.59 | ) | | | (0.47 | ) | | | 0.01 | | | | 0.12 | | | | — | | | | 0.13 | | | | — | | | | 10.61 | | | | (4.17 | ) | | | 0.37 | | | | 0.37 | | | | 0.37 | | | | 1.13 | | | | 3,385 | | | | 135 | |
03-08-10(5) - 12-31-10 | | | 10.00 | | | | 0.01 | | | | 1.20 | | | | 1.21 | | | | — | | | | — | | | | — | | | | — | | | | — | | | | 11.21 | | | | 12.10 | | | | 0.37 | | | | 0.37 | | | | 0.37 | | | | 0.19 | | | | 1,209 | | | | 80 | |
Class S2 | | | | | | | | | | | | | | | | | | | | | | | | | | | | | | | | | | | | | | | | | | | | | | | | | | | | | | | | | | | | | | | | | | | | |
12-31-11 | | | 11.20 | | | | 0.05 | • | | | (0.54 | ) | | | (0.49 | ) | | | 0.01 | | | | 0.12 | | | | — | | | | 0.13 | | | | — | | | | 10.58 | | | | (4.32 | ) | | | 0.62 | | | | 0.52 | | | | 0.52 | | | | 0.43 | | | | 733 | | | | 135 | |
03-08-10(5) - 12-31-10 | | | 10.00 | | | | 0.05 | • | | | 1.15 | | | | 1.20 | | | | — | | | | — | | | | — | | | | — | | | | — | | | | 11.20 | | | | 12.00 | | | | 0.62 | | | | 0.52 | | | | 0.52 | | | | 0.54 | | | | 91 | | | | 80 | |
Class T | | | | | | | | | | | | | | | | | | | | | | | | | | | | | | | | | | | | | | | | | | | | | | | | | | | | | | | | | | | | | | | | | | | | |
12-31-11 | | | 11.17 | | | | 0.10 | | | | (0.62 | ) | | | (0.52 | ) | | | — | | | | 0.12 | | | | — | | | | 0.12 | | | | — | | | | 10.53 | | | | (4.59 | ) | | | 0.87 | | | | 0.82 | | | | 0.82 | | | | 0.86 | | | | 3 | | | | 135 | |
03-08-10(5) - 12-31-10 | | | 10.00 | | | | 0.19 | | | | 0.98 | | | | 1.17 | | | | — | | | | — | | | | — | | | | — | | | | — | | | | 11.17 | | | | 11.70 | | | | 0.87 | | | | 0.82 | | | | 0.82 | | | | 2.28 | | | | 3 | | | | 80 | |
| (1) | Total return is calculated assuming reinvestment of all dividends, capital gain distributions and return of capital distributions, if any, at net asset value and does not reflect the effect of insurance contract charges. Total return for periods less than one year is not annualized. |
| (2) | Annualized for periods less than one year. |
| (3) | Expense ratios do not include fees and expenses charged under the variable annuity contract or variable life insurance policy. |
| (4) | Expense ratios reflect operating expenses of a Portfolio. Expenses before reductions/additions do not reflect amounts reimbursed by an Investment Adviser and/or Distributor or reductions from brokerage service arrangements or other expense offset arrangements and do not represent the amount paid by a Portfolio during periods when reimbursements or reductions occur. Expenses net of fee waivers reflect expenses after reimbursement by an Investment Adviser and/or Distributor but prior to reductions from brokerage service arrangements or other expense offset arrangements. Expenses net of all reductions/additions represent the net expenses paid by a Portfolio. Net investment income (loss) is net of all such additions or reductions. |
| (5) | Commencement of operations. |
| • | Calculated using average number of shares outstanding throughout the period. |
| * | Amount is less than $0.005 or 0.005% or more than $(0.005) or (0.005)%. |
See Accompanying Notes to Financial Statements
36
NOTES TO FINANCIAL STATEMENTSASOF DECEMBER 31, 2011
NOTE 1 — ORGANIZATION
Organization. ING Partners, Inc. (the “Company”) is an open-end management investment company registered under the Investment Company Act of 1940, as amended (the “1940 Act”). It was incorporated under the laws of Maryland on May 7, 1997. The Articles of Incorporation permit the Company to offer separate series, each of which has its own investment objective, policies and restrictions. The Company currently consists of forty-three active separate investment series. The ten Portfolios included in this report are: ING Index Solution Income Portfolio (“Index Solution Income”), ING Index Solution 2015 Portfolio (“Index Solution 2015”), ING Index Solution 2020 Portfolio (“Index Solution 2020”), ING Index Solution 2025 Portfolio (“Index Solution 2025”), ING Index Solution 2030 Portfolio (“Index Solution 2030”), ING Index Solution 2035 Portfolio (“Index Solution 2035”), ING Index Solution 2040 Portfolio (“Index Solution 2040”), ING Index Solution 2045 Portfolio (“Index Solution 2045”), ING Index Solution 2050 Portfolio (“Index Solution 2050”) and ING Index Solution 2055 Portfolio (“Index Solution 2055”) (each, a “Portfolio” and collectively, the “Portfolios”). With the exception of Index Solution Income, each Portfolio is structured and managed around a specific target retirement or financial goal date (“Target Date”). When Index Solution 2015, 2020, 2025, 2030, 2035, 2040, 2045, 2050 and 2055 Portfolios reach their respective Target Date, they may be combined with the Index Solution Income, without a vote of shareholders, if approved by the Board of Directors (the “Board”). The Portfolios serve as an investment option in underlying variable insurance products offered by Directed Services LLC.
The Portfolios offer the following five classes: Adviser Class (“Class ADV”), Initial Class (“Class I”), Service Class (“Class S”), Service 2 Class (“Class S2”) and Class T. Each class has equal rights as to class and voting privileges. The classes differ principally in the applicable distribution and shareholder service fees. Shareholders of each class also bear certain expenses that pertain to that particular class. All shareholders bear the common expenses of the Portfolios and earn income and realized gains/losses from the Portfolios pro rata based on the average daily net assets of each class, without distinction between share classes. Expenses that are specific to a portfolio or a class are charged directly to that portfolio or class. Other operating expenses shared by several portfolios are generally allocated among those portfolios based on average net assets. Distributions are determined separately for each class
based on income and expenses allocable to each class. Realized gain distributions are allocated to each class pro rata based on the shares outstanding of each class on the date of distribution. Differences in per share dividend rates generally result from differences in separate class expenses, including distribution and shareholder service fees, if applicable.
Directed Services LLC serves as the investment adviser (“DSL” or the “Investment Adviser”) to the Portfolios. ING Investment Management Co. LLC serves as the consultant (“IIM” or the “Consultant”) to the Investment Adviser. ING Funds Services, LLC serves as the administrator (“IFS” or the “Administrator”) for the Portfolios. ING Investments Distributor, LLC (“IID” or the “Distributor”) serves as the principal underwriter to the Portfolios.
The Investment Adviser, the Consultant, IFS and IID are indirect, wholly-owned subsidiaries of ING Groep N.V. (“ING Groep”). ING Groep is a global financial institution of Dutch origin offering banking, investments, life insurance and retirement services.
ING Groep has adopted a formal restructuring plan that was approved by the European Commission in November 2009 under which the ING life insurance businesses, including the retirement services and investment management businesses, which include the Investment Adviser and its affiliates, would be separated from ING Groep by the end of 2013. To achieve this goal, ING Groep announced in November 2010 that it plans to pursue two separate initial public offerings: one a U.S. focused offering that would include U.S. based insurance, retirement services, and investment management operations; and the other a European based offering for European and Asian based insurance and investment management operations. ING Groep recently announced that it will explore options other than an initial public offering for its Asian insurance and investment management businesses. There can be no assurance that the restructuring plan will be carried out through two offerings or at all.
The restructuring plan and the uncertainty about its implementation, whether implemented through the planned public offerings or through other means, in whole or in part, may be disruptive to the businesses of ING entities, including the ING entities that service the Portfolios, and may cause, among other things, interruption or reduction of business and services, diversion of management’s attention from day-to-day operations, and loss of key employees or customers. A failure to complete the offerings or other means of
37
NOTES TO FINANCIAL STATEMENTSASOF DECEMBER 31, 2011 (CONTINUED)
NOTE 1 — ORGANIZATION (continued)
implementation on favorable terms could have a material adverse impact on the operations of the businesses subject to the restructuring plan. The restructuring plan may result in the Investment Adviser’s loss of access to services and resources of ING Groep, which could adversely affect their businesses and profitability. In addition, the divestment of ING businesses, including the Investment Adviser, may potentially be deemed a “change of control” of the entity. A change of control would result in the termination of the Portfolios’ advisory agreement, which would trigger the necessity for new agreement that would require approval of the Board, and may trigger the need for shareholder approval. Currently, the Investment Adviser does not anticipate that the restructuring will have a material adverse impact on the Portfolios or their operations and administration.
Each Portfolio seeks to achieve its investment objective by investing primarily in other ING Funds (“Underlying Funds”) and uses asset allocation strategies to determine how much to invest in the Underlying Funds.
NOTE 2 — SIGNIFICANT ACCOUNTING POLICIES
The following significant accounting policies are consistently followed by the Portfolios in the preparation of their financial statements. Such policies are in conformity with U.S. generally accepted accounting principles (“GAAP”) for investment companies.
A. Security Valuation. All investments in Underlying Funds and securities are recorded at their estimated fair value, as described below. The valuations of the Portfolios’ investments in Underlying Funds are based on the NAVs of the Underlying Funds each business day. In general, assets of the Underlying Funds are valued based on actual or estimated market value, with special provisions for assets not having readily available market quotations and short-term debt securities, and for situations where market quotations are deemed unreliable.
Investments in securities held in the Portfolios or the Underlying Funds maturing in 60 days or less are valued at amortized cost which generally approximates fair value. Securities prices may be obtained from automated pricing services. Investments in equity securities held by the Portfolios or the Underlying Funds and traded on a national securities exchange are valued at the last reported sale price. Securities reported by NASDAQ will be valued at the NASDAQ
official closing prices. Securities traded on an exchange or NASDAQ for which there has been no sale and securities traded in the over-the-counter-market are valued at the mean between the last reported bid and ask prices. All investments quoted in foreign currencies will be valued daily in U.S. dollars on the basis of the foreign currency exchange rates prevailing at that time. Debt securities are valued at prices obtained from independent services or from one or more dealers making markets in the securities and may be adjusted based on the Portfolios’ valuation procedures. U.S. government obligations are valued by using market quotations or independent pricing services that use prices provided by market-makers or estimates of market values obtained from yield data relating to instruments or securities with similar characteristics. Investments in open-end mutual funds are valued at the net asset value (“NAV”).
Securities and assets for which market quotations are not readily available (which may include certain restricted securities which are subject to limitations as to their sale) are valued at their fair values as defined by the 1940 Act and as determined in good faith by or under the supervision of the Portfolios’ Board of Directors (the “Board”), in accordance with methods that are specifically authorized by the Board. Securities traded on exchanges, including foreign exchanges, which close earlier than the time that the Portfolios calculate their next NAV may also be valued at their fair values as defined by the 1940 Act and as determined in good faith by or under the supervision of the Board, in accordance with methods that are specifically authorized by the Board. The valuation techniques applied in any specific instance are likely to vary from case to case. With respect to a restricted security, for example, consideration is generally given to the cost of the investment, the market value of any unrestricted securities of the same class at the time of valuation, the potential expiration of restrictions on the security, the existence of any registration rights, the costs to the Portfolios related to registration of the security, as well as factors relevant to the issuer itself. Consideration may also be given to the price and extent of any public trading in similar securities of the issuer or comparable companies’ securities.
Fair value is defined as the price that the Portfolios would receive to sell an asset or pay to transfer a liability in an orderly transaction between market participants at the measurement data. Each investment asset or liability of the Portfolios is assigned a level at measurement date based on the significance and
38
NOTES TO FINANCIAL STATEMENTSASOF DECEMBER 31, 2011 (CONTINUED)
NOTE 2 — SIGNIFICANT ACCOUNTING POLICIES (continued)
source of the inputs to its valuation. Quoted prices in active markets for identical securities are classified as “Level 1,” inputs other than quoted prices for an asset or liability that are observable are classified as “Level 2” and unobservable inputs, including the investment adviser’s judgment about the assumptions that a market participant would use in pricing an asset or liability, are classified as “Level 3.” The inputs used for valuing securities are not necessarily an indication of the risks associated with investing in those securities. Short-term securities of sufficient credit quality which are valued at amortized cost, which approximates fair value, are generally considered to be Level 2 securities under applicable accounting rules. A table summarizing the Portfolios’ investments under these levels of classification is included following the Portfolio of Investments.
The Portfolios classify each of its investments in the Underlying Funds as Level 1, without consideration as to the classification level of the specific investments held by the Underlying Funds.
For the year ended December 31, 2011, there have been no significant changes to the fair valuation methodologies.
B. Security Transactions and Revenue Recognition. Security transactions are accounted for on the trade date. Dividend income received from the underlying funds is recognized on the ex-dividend date and is recorded as income distributions in the Statements of Operations. Capital gain distributions received from the underlying funds are recognized on the ex-dividend date and are recorded on the Statements of Operations as such. Realized gains and losses are reported on the basis of identified cost of securities sold.
C. Distributions to Shareholders. The Portfolios record distributions to their shareholders on the ex-dividend date. Dividends from net investment income and capital gains, if any, are declared and paid annually by the Portfolios. The Portfolios may make distributions on a more frequent basis to comply with the distribution requirements of the Internal Revenue Code. The characteristics of income and gains to be distributed are determined in accordance with income tax regulations, which may differ from U.S. generally accepted accounting principles for investment companies.
D. Federal Income Taxes. It is the policy of each Portfolio to comply with the requirements of
subchapter M of the Internal Revenue Code that are applicable to regulated investment companies and to distribute substantially all of its net investment income and any net realized capital gains to its shareholders. Therefore, a federal income tax or excise tax provision is not required. Management has considered the sustainability of the Portfolios’ tax positions taken on federal income tax returns for all open tax years in making this determination. No capital gain distributions shall be made until the capital loss carryforwards have been fully utilized or expire.
E. Use of Estimates. The preparation of financial statements in conformity with U.S. generally accepted accounting principles requires management to make estimates and assumptions that affect the reported amounts of assets and liabilities and disclosure of contingent assets and liabilities at the date of the financial statements and the reported amounts of increases and decreases in net assets from operations during the reporting period. Actual results could differ from those estimates.
F. Indemnifications. In the normal course of business, the Company may enter into contracts that provide certain indemnifications. The Company’s maximum exposure under these arrangements is dependent on future claims that may be made against the Portfolios and, therefore, cannot be estimated; however, based on experience, management considers the risk of loss from such claims remote.
NOTE 3 — INVESTMENT ADVISER AND ADMINISTRATIVE SERVICE FEES
The Portfolios each have entered into an investment management agreement with the Investment Adviser. For its services, each Portfolio pays the Investment Adviser a monthly fee in arrears equal to 0.10% of each Portfolio’s average daily net assets.
DSL pays the Consultant a consulting fee of 0.03% based on the average daily net assets of each Portfolio.
The Consultant will provide strategic and tactical asset allocation analysis to the Investment Adviser. The Investment Adviser has set up an Investment Committee made up of a team of professionals to consider, review and implement the recommendations of the Consultant, and will retain discretion over implementation of the Consultant’s recommendations. The Consultant will provide ongoing recommendations to the Investment Committee of the Investment Adviser quarterly or as warranted by market conditions.
39
NOTES TO FINANCIAL STATEMENTSASOF DECEMBER 31, 2011 (CONTINUED)
NOTE 3 — INVESTMENT ADVISER AND ADMINISTRATIVE SERVICE FEES (continued)
Under an Administrative Services Agreement between the Portfolios and IFS, IFS provides all administrative services necessary for the Portfolios’ operations and is responsible for the supervision of the Portfolios’ other service providers. IFS also assumes all ordinary recurring direct costs of the Portfolios, such as custodian fees, director fees, transfer agency fees and accounting fees. As compensation for these services, IFS receives a monthly fee from each portfolio at an annual rate of 0.02% based on the average daily net assets of each Portfolio.
NOTE 4 — INVESTMENTS IN UNDERLYING FUNDS
For the year ended December 31, 2011 the cost of purchases and the proceeds from sales of the Underlying Funds were as follows:
| | | | | | | | |
| | | Purchases | | | Sales | |
Index Solution Income | | $ | 137,908,687 | | | $ | 138,608,913 | |
Index Solution 2015 | | | 188,746,252 | | | | 164,683,151 | |
Index Solution 2020 | | | 21,652 | | | | 6,594 | |
Index Solution 2025 | | | 260,250,550 | | | | 213,025,268 | |
Index Solution 2030 | | | 23,310 | | | | 8,275 | |
Index Solution 2035 | | | 207,009,158 | | | | 164,984,411 | |
Index Solution 2040 | | | 24,535 | | | | 9,504 | |
Index Solution 2045 | | | 130,216,464 | | | | 96,980,284 | |
Index Solution 2050 | | | 24,357 | | | | 9,328 | |
Index Solution 2055 | | | 16,270,943 | | | | 9,119,444 | |
NOTE 5 — DISTRIBUTION AND SERVICE FEES
Classes ADV, S2 and T of the Portfolios have adopted a Plan of Distribution pursuant to Rule 12b-1 under the 1940 Act (the “12b-1 Plans”), whereby IID is reimbursed or compensated by the Portfolios for expenses incurred in the distribution of each Portfolio’s shares (“Distribution Fees”). The Distributor may pay, on behalf of each Portfolio, out of its distribution fee, compensation to certain financial institutions for providing distribution assistance pursuant to a Distribution Services Agreement. Under the 12b-1 Plans each Portfolio makes payments to IID at an annual rate of 0.25%, 0.25% and 0.50% of each Portfolio’s average daily net assets attributable to its Class ADV, Class S2 and Class T shares, respectively. The Distributor has contractually agreed to waive a portion of its fee equal to 0.10% of each Portfolio’s average daily net assets attributable to the distribution fee paid by Class S2 shares, so that the actual fee paid is an annual rate of 0.15%. The expense waiver will continue through at least May 1, 2012 for Index Solution Income, Index Solution 2015, Index Solution 2025, Index Solution
2035, Index Solution 2045 and Index Solution 2055 and through at least May 1, 2013 for Index Solution 2020, Index Solution 2030, Index Solution 2040 and Index Solution 2050. The Distributor has contractually agreed to waive a portion of its fee equal to 0.05% of each Portfolio’s average daily net assets attributable to the distribution fee paid by Class T shares, so that the actual fee paid is an annual rate of 0.45%. The expense waiver will continue through at least May 1, 2012 for Index Solution Income, Index Solution 2015, Index Solution 2025, Index Solution 2035, Index Solution 2045 and Index Solution 2055 and through at least May 1, 2013 for Index Solution 2020, Index Solution 2030, Index Solution 2040 and Index Solution 2050.
The Company has also adopted a Shareholder Servicing Plan (“Service Plan”) for the Classes ADV, S, S2 and T shares of each Portfolio. The Service Plan allows the Distributor to enter into shareholder servicing agreements with insurance companies, broker dealers or other financial intermediaries that provide administrative services related to Classes ADV, S, S2 and T shares and their shareholders including Variable Contract owners or Qualified Plan participants with interests in the Portfolios. Under the Service Plan, each Portfolio makes payments to IID which shall not exceed an annual rate of 0.25% of each Portfolio’s average daily net assets attributable to its Classes ADV, S, S2 and T shares.
NOTE 6 — OTHER TRANSACTIONS WITH AFFILIATES AND RELATED PARTIES
At December 31, 2011, the Portfolios had the following amounts recorded as payable to affiliates on the accompanying Statements of Assets and Liabilities (see Note 5):
| | | | | | | | | | | | | | | | |
Portfolio | | Accrued
Investment
Management
Fees | | | Accrued
Administrative
Fees | | | Accrued
Shareholder
Service and
Distribution
Fees | | | Total | |
Index Solution Income | | $ | 15,073 | | | $ | 3,015 | | | $ | 42,099 | | | $ | 60,187 | |
Index Solution 2015 | | | 16,229 | | | | 3,245 | | | | 53,892 | | | | 73,366 | |
Index Solution 2020 | | | 1 | | | | 0 | | | | 5 | | | | 6 | |
Index Solution 2025 | | | 20,323 | | | | 4,065 | | | | 73,383 | | | | 97,771 | |
Index Solution 2030 | | | 2 | | | | 0 | | | | 5 | | | | 7 | |
Index Solution 2035 | | | 15,041 | | | | 3,008 | | | | 56,424 | | | | 74,473 | |
Index Solution 2040 | | | 2 | | | | 0 | | | | 5 | | | | 7 | |
Index Solution 2045 | | | 8,920 | | | | 1,784 | | | | 32,346 | | | | 43,050 | |
Index Solution 2050 | | | 2 | | | | 0 | | | | 5 | | | | 7 | |
Index Solution 2055 | | | 851 | | | | 170 | | | | 3,248 | | | | 4,269 | |
The Company has adopted a Deferred Compensation Plan (the “Plan”), which allows eligible non-affiliated directors as described in the Plan to defer the receipt of
40
NOTES TO FINANCIAL STATEMENTSASOF DECEMBER 31, 2011 (CONTINUED)
NOTE 6 — OTHER TRANSACTIONS WITH AFFILIATES AND RELATED PARTIES (continued)
all or a portion of the directors fees payable. Amounts deferred are treated as though invested in various “notional” funds advised by DSL until distribution in accordance with the Plan.
At December 31, 2011, the following indirect, wholly-owned subsidiaries of ING Groep owned more than 5% of the following Portfolios:
| | | | | | |
Subsidiary | | Portfolios | | Percentage | |
ING Life Insurance and Annuity Company | | Index Solution 2015 | | | 67.23 | % |
| | Index Solution 2025 | | | 82.29 | % |
| | Index Solution 2035 | | | 87.13 | % |
| | Index Solution 2045 | | | 91.29 | % |
| | Index Solution 2055 | | | 96.18 | % |
| | Index Solution Income | | | 25.88 | % |
| | |
ING National Trust | | Index Solution 2015 | | | 31.19 | % |
| | Index Solution 2025 | | | 16.12 | % |
| | Index Solution 2035 | | | 11.44 | % |
| | Index Solution 2045 | | | 7.96 | % |
| | Index Solution Income | | | 73.03 | % |
| | |
Reliastar Life Insurance Company | | Index Solution 2020 | | | 99.67 | % |
| | Index Solution 2030 | | | 99.67 | % |
| | Index Solution 2040 | | | 99.67 | % |
| | Index Solution 2050 | | | 99.67 | % |
Control is defined by the 1940 Act as the beneficial ownership, either directly or through one or more controlled companies, of more than 25% of the voting securities of a company. The 1940 Act defines affiliates as companies that are under common control. Therefore, because the Portfolios have a common owner that owns over 25% of the outstanding securities of the Portfolios, they may be deemed to be affiliates of each other. Investment activities of these shareholders could have a material impact on the Portfolios.
NOTE 7 — EXPENSE LIMITATION AGREEMENT
The Investment Adviser has agreed to limit expenses, excluding interest, taxes, brokerage commissions and extraordinary expenses and Underlying Fund Fees to the levels listed below:
| | | | | | | | | | | | | | | | | | | | |
Portfolio(1) | | Class ADV | | | Class I | | | Class S | | | Class S2 | | | Class T | |
Index Solution Income | | | 0.62 | % | | | 0.12 | % | | | 0.37 | % | | | 0.52 | % | | | 0.82 | % |
Index Solution 2015 | | | 0.62 | % | | | 0.12 | % | | | 0.37 | % | | | 0.52 | % | | | 0.82 | % |
Index Solution 2020 | | | 0.62 | % | | | 0.12 | % | | | 0.37 | % | | | 0.52 | % | | | 0.82 | % |
Index Solution 2025 | | | 0.62 | % | | | 0.12 | % | | | 0.37 | % | | | 0.52 | % | | | 0.82 | % |
Index Solution 2030 | | | 0.62 | % | | | 0.12 | % | | | 0.37 | % | | | 0.52 | % | | | 0.82 | % |
Index Solution 2035 | | | 0.62 | % | | | 0.12 | % | | | 0.37 | % | | | 0.52 | % | | | 0.82 | % |
Index Solution 2040 | | | 0.62 | % | | | 0.12 | % | | | 0.37 | % | | | 0.52 | % | | | 0.82 | % |
Index Solution 2045 | | | 0.62 | % | | | 0.12 | % | | | 0.37 | % | | | 0.52 | % | | | 0.82 | % |
Index Solution 2050 | | | 0.62 | % | | | 0.12 | % | | | 0.37 | % | | | 0.52 | % | | | 0.82 | % |
Index Solution 2055 | | | 0.62 | % | | | 0.12 | % | | | 0.37 | % | | | 0.52 | % | | | 0.82 | % |
| (1) | The operating expense limits apply only at the Portfolio level and do not limit the fees payable by the underlying investment companies in which the Portfolios invest. The amount of fees and expenses of an Underlying Fund borne by each Portfolio will vary based on each Portfolio’s allocation of assets to, and the net expenses of a particular Underlying Fund. |
The Investment Adviser may at a later date recoup from a Portfolio management fees waived and other expenses assumed by the Investment Adviser during the previous 36 months, but only if, after such recoupment, the Portfolio’s expense ratio does not exceed the percentage described above. Waived and reimbursed fees and any recoupment by the Investment Adviser of such waived and reimbursed fees are reflected on the accompanying Statements of Operations for each Portfolio.
As of December 31, 2011, the Portfolios did not have any waived or reimbursed fees subject to recoupment.
Outstanding reimbursement balances due to the Portfolios, if any, under their respective expense limitation agreements are reflected in Reimbursement Due from manager on the accompanying Statements of Assets and Liabilities.
The expense limitation agreement is contractual and shall renew automatically for one-year terms unless the Investment Adviser provides written notice of the termination of the expense limitation agreement within 90 days of the end of the then current term.
NOTE 8 — LINE OF CREDIT
Certain Portfolios, in addition to certain other funds managed by the Investment Adviser, have entered into an unsecured committed revolving line of credit agreement (the “Credit Agreement”) with The Bank of New York Mellon for an aggregate amount of $125,000,000. The proceeds may be used to: (1) temporarily finance the purchase and sale of securities; or (2) finance the redemption of shares of an investor in the funds. Effective May 27, 2011, the funds pay a commitment fee equal to 0.08% per annum on the daily unused portion of the committed line amount payable quarterly in arrears. Prior to May 27, 2011, the funds to which the line of credit is available paid a commitment fee equal to 0.15% per annum on the daily unused portion of the committed line amount payable quarterly in arrears.
Generally, borrowings under the Credit Agreement accrue interest at the federal funds rate plus a specified margin. Repayments generally must be made within 60 days after the date of a revolving credit advance. The Portfolios did not utilize the line of credit during the year ended December 31, 2011.
41
NOTES TO FINANCIAL STATEMENTSASOF DECEMBER 31, 2011 (CONTINUED)
NOTE 9 — CAPITAL SHARES
Transactions in capital shares and dollars were as follows:
| | | | | | | | | | | | | | | | | | | | | | | | | | | | | | | | | | | | | | | | | | |
Year or period ended | | Shares
sold | | | Shares
issued
in
merger | | | Reinvestment
of
distributions | | | Shares
redeemed | | | Net increase
(decrease) in
shares
outstanding | | | | | Shares
sold | | | Proceeds
from
shares
issued in
merger | | | Reinvestment
of
distributions | | | Shares
redeemed | | | Net
increase
(decrease) | |
| | # | | | # | | | # | | | # | | | # | | | | | ($) | | | ($) | | | ($) | | | ($) | | | ($) | |
Index Solution Income | | | | | | | | | | | | | | | | | | | | | | | | | | | | | | | |
Class ADV | | | | | | | | | | | | | | | | | | | | | | | | | | | | | | | | | | | | | | | | | | |
12/31/2011 | | | 1,196,635 | | | | — | | | | 110,424 | | | | (679,783 | ) | | | 627,276 | | | | | | 12,667,404 | | | | — | | | | 1,105,350 | | | | (7,335,466 | ) | | | 6,437,288 | |
12/31/2010 | | | 1,204,165 | | | | — | | | | 31,234 | | | | (329,474 | ) | | | 905,925 | | | | | | 12,568,680 | | | | — | | | | 322,334 | | | | (3,450,635 | ) | | | 9,440,379 | |
Class I | | | | | | | | | | | | | | | | | | | | | | | | | | | | | | | | | | | | | | | | | | |
12/31/2011 | | | 482,116 | | | | — | | | | 11,188 | | | | (16,536 | ) | | | 476,768 | | | | | | 5,014,954 | | | | — | | | | 113,443 | | | | (178,390 | ) | | | 4,950,007 | |
12/31/2010 | | | 54,028 | | | | — | | | | 3,009 | | | | (17,002 | ) | | | 40,035 | | | | | | 570,057 | | | | — | | | | 31,381 | | | | (181,676 | ) | | | 419,762 | |
Class S | | | | | | | | | | | | | | | | | | | | | | | | | | | | | | | | | | | | | | | | | | |
12/31/2011 | | | 880,036 | | | | — | | | | 791,437 | | | | (2,296,180 | ) | | | (624,707 | ) | | | | | 9,445,397 | | | | — | | | | 7,977,685 | | | | (24,386,506 | ) | | | (6,963,424 | ) |
12/31/2010 | | | 1,312,314 | | | | — | | | | 298,814 | | | | (2,403,816 | ) | | | (792,688 | ) | | | | | 13,802,237 | | | | — | | | | 3,098,704 | | | | (25,433,475 | ) | | | (8,532,534 | ) |
Class S2 | | | | | | | | | | | | | | | | | | | | | | | | | | | | | | | | | | | | | | | | | | |
12/31/2011 | | | 213,607 | | | | — | | | | 7,333 | | | | (93,542 | ) | | | 127,398 | | | | | | 2,253,842 | | | | — | | | | 73,180 | | | | (973,027 | ) | | | 1,353,995 | |
12/31/2010 | | | 45,641 | | | | — | | | | 131 | | | | (3,766 | ) | | | 42,006 | | | | | | 482,939 | | | | — | | | | 1,347 | | | | (39,090 | ) | | | 445,196 | |
Class T | | | | | | | | | | | | | | | | | | | | | | | | | | | | | | | | | | | | | | | | | | |
12/31/2011 | | | — | | | | — | | | | — | | | | — | | | | — | | | | | | — | | | | — | | | | — | | | | — | | | | — | |
12/31/2010 | | | — | | | | — | | | | — | | | | — | | | | — | | | | | | — | | | | — | | | | — | | | | — | | | | — | |
Index Solution 2015 | | | | | | | | | | | | | | | | | | | | | | | | | | | | | | | |
Class ADV | | | | | | | | | | | | | | | | | | | | | | | | | | | | | | | | | | | | | | | | | | |
12/31/2011 | | | 2,686,178 | | | | — | | | | 390,276 | | | | (1,765,705 | ) | | | 1,310,749 | | | | | | 27,520,272 | | | | — | | | | 3,699,818 | | | | (18,244,941 | ) | | | 12,975,149 | |
12/31/2010 | | | 3,083,418 | | | | — | | | | 78,242 | | | | (883,146 | ) | | | 2,278,514 | | | | | | 30,735,636 | | | | — | | | | 761,293 | | | | (8,802,403 | ) | | | 22,694,526 | |
Class I | | | | | | | | | | | | | | | | | | | | | | | | | | | | | | | | | | | | | | | | | | |
12/31/2011 | | | 1,181,117 | | | | — | | | | 28,341 | | | | (154,626 | ) | | | 1,054,832 | | | | | | 11,810,545 | | | | — | | | | 271,793 | | | | (1,638,377 | ) | | | 10,443,961 | |
12/31/2010 | | | 249,011 | | | | — | | | | 7,005 | | | | (139,044 | ) | | | 116,972 | | | | | | 2,494,366 | | | | — | | | | 68,784 | | | | (1,387,005 | ) | | | 1,176,145 | |
Class S | | | | | | | | | | | | | | | | | | | | | | | | | | | | | | | | | | | | | | | | | | |
12/31/2011 | | | 2,581,560 | | | | — | | | | 606,780 | | | | (2,834,014 | ) | | | 354,326 | | | | | | 26,603,918 | | | | — | | | | 5,782,614 | | | | (28,916,896 | ) | | | 3,469,636 | |
12/31/2010 | | | 3,427,170 | | | | — | | | | 140,013 | | | | (1,216,538 | ) | | | 2,350,645 | | | | | | 34,268,647 | | | | — | | | | 1,367,932 | | | | (12,254,371 | ) | | | 23,382,208 | |
Class S2 | | | | | | | | | | | | | | | | | | | | | | | | | | | | | | | | | | | | | | | | | | |
12/31/2011 | | | 1,028,430 | | | | — | | | | 45,421 | | | | (620,927 | ) | | | 452,924 | | | | | | 10,481,795 | | | | — | | | | 428,777 | | | | (6,135,122 | ) | | | 4,775,450 | |
12/31/2010 | | | 265,934 | | | | — | | | | 418 | | | | (23,607 | ) | | | 242,745 | | | | | | 2,685,565 | | | | — | | | | 4,063 | | | | (237,814 | ) | | | 2,451,814 | |
Class T | | | | | | | | | | | | | | | | | | | | | | | | | | | | | | | | | | | | | | | | | | |
12/31/2011 | | | — | | | | — | | | | — | | | | — | | | | — | | | | | | — | | | | — | | | | — | | | | — | | | | — | |
12/31/2010 | | | — | | | | — | | | | — | | | | — | | | | — | | | | | | — | | | | — | | | | — | | | | — | | | | — | |
Index Solution 2020 | | | | | | | | | | | | | | | | | | | | | | | | | | | | | | | |
Class ADV | | | | | | | | | | | | | | | | | | | | | | | | | | | | | | | | | | | | | | | | | | |
10/3/2011(1) - 12/31/2011 | | | 301 | | | | — | | | | — | | | | — | | | | 301 | | | | | | 3,010 | | | | — | | | | — | | | | — | | | | 3,010 | |
Class I | | | | | | | | | | | | | | | | | | | | | | | | | | | | | | | | | | | | | | | | | | |
10/3/2011(1) - 12/31/2011 | | | 301 | | | | — | | | | — | | | | — | | | | 301 | | | | | | 3,010 | | | | — | | | | — | | | | — | | | | 3,010 | |
Class S | | | | | | | | | | | | | | | | | | | | | | | | | | | | | | | | | | | | | | | | | | |
10/3/2011(1) - 12/31/2011 | | | 301 | | | | — | | | | — | | | | — | | | | 301 | | | | | | 3,010 | | | | — | | | | — | | | | — | | | | 3,010 | |
Class S2 | | | | | | | | | | | | | | | | | | | | | | | | | | | | | | | | | | | | | | | | | | |
10/3/2011(1) - 12/31/2011 | | | 301 | | | | — | | | | — | | | | — | | | | 301 | | | | | | 3,010 | | | | — | | | | — | | | | — | | | | 3,010 | |
42
NOTES TO FINANCIAL STATEMENTSASOF DECEMBER 31, 2011 (CONTINUED)
NOTE 9 — CAPITAL SHARES (continued)
| | | | | | | | | | | | | | | | | | | | | | | | | | | | | | | | | | | | | | | | | | |
Year or period ended | | Shares
sold | | | Shares
issued
in
merger | | | Reinvestment
of
distributions | | | Shares
redeemed | | | Net increase
(decrease) in
shares
outstanding | | | | | Shares
sold | | | Proceeds
from
shares
issued in
merger | | | Reinvestment
of
distributions | | | Shares
redeemed | | | Net
increase
(decrease) | |
| | # | | | # | | | # | | | # | | | # | | | | | ($) | | | ($) | | | ($) | | | ($) | | | ($) | |
Index Solution 2020 (continued) | | | | | | | | | | | | | | | | | | | | | | | | | | | | | | | |
Class T | | | | | | | | | | | | | | | | | | | | | | | | | | | | | | | | | | | | | | | | | | |
10/3/2011(1) - 12/31/2011 | | | 301 | | | | — | | | | — | | | | — | | | | 301 | | | | | | 3,010 | | | | — | | | | — | | | | — | | | | 3,010 | |
Index Solution 2025 | | | | | | | | | | | | | | | | | | | | | | | | | | | | | | | |
Class ADV | | | | | | | | | | | | | | | | | | | | | | | | | | | | | | | | | | | | | | | | | | |
12/31/2011 | | | 3,846,668 | | | | — | | | | 689,293 | | | | (1,885,075 | ) | | | 2,650,886 | | | | | | 38,798,031 | | | | — | | | | 6,210,532 | | | | (19,479,419 | ) | | | 25,529,144 | |
12/31/2010 | | | 4,845,664 | | | | — | | | | 23,677 | | | | (1,180,899 | ) | | | 3,688,442 | | | | | | 46,545,839 | | | | — | | | | 218,541 | | | | (11,219,965 | ) | | | 35,544,415 | |
Class I | | | | | | | | | | | | | | | | | | | | | | | | | | | | | | | | | | | | | | | | | | |
12/31/2011 | | | 1,116,002 | | | | — | | | | 47,151 | | | | (232,424 | ) | | | 930,729 | | | | | | 10,781,454 | | | | — | | | | 430,020 | | | | (2,426,290 | ) | | | 8,785,184 | |
12/31/2010 | | | 323,556 | | | | — | | | | 2,806 | | | | (71,966 | ) | | | 254,396 | | | | | | 3,161,728 | | | | — | | | | 26,153 | | | | (700,594 | ) | | | 2,487,287 | |
Class S | | | | | | | | | | | | | | | | | | | | | | | | | | | | | | | | | | | | | | | | | | |
12/31/2011 | | | 2,665,344 | | | | — | | | | 672,266 | | | | (1,936,571 | ) | | | 1,401,039 | | | | | | 27,321,229 | | | | — | | | | 6,097,450 | | | | (19,405,976 | ) | | | 14,012,703 | |
12/31/2010 | | | 4,442,478 | | | | — | | | | 30,180 | | | | (788,246 | ) | | | 3,684,412 | | | | | | 42,621,154 | | | | — | | | | 280,074 | | | | (7,597,032 | ) | | | 35,304,196 | |
Class S2 | | | | | | | | | | | | | | | | | | | | | | | | | | | | | | | | | | | | | | | | | | |
12/31/2011 | | | 1,535,051 | | | | — | | | | 98,227 | | | | (713,855 | ) | | | 919,423 | | | | | | 15,709,693 | | | | — | | | | 882,076 | | | | (6,852,888 | ) | | | 9,738,881 | |
12/31/2010 | | | 497,056 | | | | — | | | | 378 | | | | (36,432 | ) | | | 461,002 | | | | | | 4,838,729 | | | | — | | | | 3,849 | | | | (346,305 | ) | | | 4,495,913 | |
Class T | | | | | | | | | | | | | | | | | | | | | | | | | | | | | | | | | | | | | | | | | | |
12/31/2011 | | | — | | | | — | | | | — | | | | — | | | | — | | | | | | — | | | | — | | | | — | | | | — | | | | — | |
12/31/2010 | | | — | | | | — | | | | — | | | | — | | | | — | | | | | | — | | | | — | | | | — | | | | — | | | | — | |
Index Solution 2030 | | | | | | | | | | | | | | | | | | | | | | | | | | | | | | | |
Class ADV | | | | | | | | | | | | | | | | | | | | | | | | | | | | | | | | | | | | | | | | | | |
10/3/2011(1) - 12/31/2011 | | | 301 | | | | — | | | | — | | | | — | | | | 301 | | | | | | 3,010 | | | | — | | | | — | | | | — | | | | 3,010 | |
Class I | | | | | | | | | | | | | | | | | | | | | | | | | | | | | | | | | | | | | | | | | | |
10/3/2011(1) - 12/31/2011 | | | 301 | | | | — | | | | — | | | | — | | | | 301 | | | | | | 3,010 | | | | — | | | | — | | | | — | | | | 3,010 | |
Class S | | | | | | | | | | | | | | | | | | | | | | | | | | | | | | | | | | | | | | | | | | |
10/3/2011(1) - 12/31/2011 | | | 301 | | | | — | | | | — | | | | — | | | | 301 | | | | | | 3,010 | | | | — | | | | — | | | | — | | | | 3,010 | |
Class S2 | | | | | | | | | | | | | | | | | | | | | | | | | | | | | | | | | | | | | | | | | | |
10/3/2011(1) - 12/31/2011 | | | 301 | | | | — | | | | — | | | | — | | | | 301 | | | | | | 3,010 | | | | — | | | | — | | | | — | | | | 3,010 | |
Class T | | | | | | | | | | | | | | | | | | | | | | | | | | | | | | | | | | | | | | | | | | |
10/3/2011(1) - 12/31/2011 | | | 301 | | | | — | | | | — | | | | — | | | | 301 | | | | | | 3,010 | | | | — | | | | — | | | | — | | | | 3,010 | |
Index Solution 2035 | | | | | | | | | | | | | | | | | | | | | | | | | | | | | | | |
Class ADV | | | | | | | | | | | | | | | | | | | | | | | | | | | | | | | | | | | | | | | | | | |
12/31/2011 | | | 3,454,322 | | | | — | | | | 571,319 | | | | (1,400,984 | ) | | | 2,624,657 | | | | | | 34,192,444 | | | | — | | | | 4,947,617 | | | | (13,819,097 | ) | | | 25,320,964 | |
12/31/2010 | | | 3,731,423 | | | | — | | | | 11,709 | | | | (779,606 | ) | | | 2,963,526 | | | | | | 34,955,652 | | | | — | | | | 104,795 | | | | (7,351,284 | ) | | | 27,709,163 | |
Class I | | | | | | | | | | | | | | | | | | | | | | | | | | | | | | | | | | | | | | | | | | |
12/31/2011 | | | 761,587 | | | | — | | | | 36,619 | | | | (151,504 | ) | | | 646,702 | | | | | | 7,213,861 | | | | — | | | | 321,154 | | | | (1,621,774 | ) | | | 5,913,241 | |
12/31/2010 | | | 350,726 | | | | — | | | | 850 | | | | (31,736 | ) | | | 319,840 | | | | | | 3,420,529 | | | | — | | | | 7,687 | | | | (305,115 | ) | | | 3,123,101 | |
Class S | | | | | | | | | | | | | | | | | | | | | | | | | | | | | | | | | | | | | | | | | | |
12/31/2011 | | | 2,206,944 | | | | — | | | | 415,862 | | | | (1,375,078 | ) | | | 1,247,728 | | | | | | 21,781,621 | | | | — | | | | 3,626,317 | | | | (13,419,667 | ) | | | 11,988,271 | |
12/31/2010 | | | 3,399,002 | | | | — | | | | 10,865 | | | | (458,665 | ) | | | 2,951,202 | | | | | | 31,941,475 | | | | — | | | | 97,673 | | | | (4,341,227 | ) | | | 27,697,921 | |
Class S2 | | | | | | | | | | | | | | | | | | | | | | | | | | | | | | | | | | | | | | | | | | |
12/31/2011 | | | 1,038,490 | | | | — | | | | 65,258 | | | | (495,467 | ) | | | 608,281 | | | | | | 10,567,926 | | | | — | | | | 564,476 | | | | (4,696,185 | ) | | | 6,436,217 | |
12/31/2010 | | | 367,762 | | | | — | | | | 148 | | | | (27,733 | ) | | | 340,177 | | | | | | 3,531,758 | | | | — | | | | 1,324 | | | | (273,933 | ) | | | 3,259,149 | |
43
NOTES TO FINANCIAL STATEMENTSASOF DECEMBER 31, 2011 (CONTINUED)
NOTE 9 — CAPITAL SHARES (continued)
| | | | | | | | | | | | | | | | | | | | | | | | | | | | | | | | | | | | | | | | | | |
Year or period ended | | Shares
sold | | | Shares
issued
in
merger | | | Reinvestment
of
distributions | | | Shares
redeemed | | | Net increase
(decrease) in
shares
outstanding | | | | | Shares
sold | | | Proceeds
from
shares
issued in
merger | | | Reinvestment
of
distributions | | | Shares
redeemed | | | Net
increase
(decrease) | |
| | # | | | # | | | # | | | # | | | # | | | | | ($) | | | ($) | | | ($) | | | ($) | | | ($) | |
Index Solution 2035 (continued) | | | | | | | | | | | | | | | | | | | | | | | | | | | | | | | |
Class T | | | | | | | | | | | | | | | | | | | | | | | | | | | | | | | | | | | | | | | | | | |
12/31/2011 | | | — | | | | — | | | | — | | | | — | | | | — | | | | | | — | | | | — | | | | — | | | | — | | | | — | |
12/31/2010 | | | — | | | | — | | | | — | | | | — | | | | — | | | | | | — | | | | — | | | | — | | | | — | | | | — | |
Index Solution 2040 | | | | | | | | | | | | | | | | | | | | | | | | | | | | | | | |
Class ADV | | | | | | | | | | | | | | | | | | | | | | | | | | | | | | | | | | | | | | | | | | |
10/3/2011(1) - 12/31/2011 | | | 301 | | | | — | | | | — | | | | — | | | | 301 | | | | | | 3,010 | | | | — | | | | — | | | | — | | | | 3,010 | |
Class I | | | | | | | | | | | | | | | | | | | | | | | | | | | | | | | | | | | | | | | | | | |
10/3/2011(1) - 12/31/2011 | | | 301 | | | | — | | | | — | | | | — | | | | 301 | | | | | | 3,010 | | | | — | | | | — | | | | — | | | | 3,010 | |
Class S | | | | | | | | | | | | | | | | | | | | | | | | | | | | | | | | | | | | | | | | | | |
10/3/2011(1) - 12/31/2011 | | | 301 | | | | — | | | | — | | | | — | | | | 301 | | | | | | 3,010 | | | | — | | | | — | | | | — | | | | 3,010 | |
Class S2 | | | | | | | | | | | | | | | | | | | | | | | | | | | | | | | | | | | | | | | | | | |
10/3/2011(1) - 12/31/2011 | | | 301 | | | | — | | | | — | | | | — | | | | 301 | | | | | | 3,010 | | | | — | | | | — | | | | — | | | | 3,010 | |
Class T | | | | | | | | | | | | | | | | | | | | | | | | | | | | | | | | | | | | | | | | | | |
10/3/2011(1) - 12/31/2011 | | | 301 | | | | — | | | | — | | | | — | | | | 301 | | | | | | 3,010 | | | | — | | | | — | | | | — | | | | 3,010 | |
Index Solution 2045 | | | | | | | | | | | | | | | | | | | | | | | | | | | | | | | |
Class ADV | | | | | | | | | | | | | | | | | | | | | | | | | | | | | | | | | | | | | | | | | | |
12/31/2011 | | | 2,260,554 | | | | — | | | | 264,381 | | | | (775,175 | ) | | | 1,749,760 | | | | | | 22,319,219 | | | | — | | | | 2,257,813 | | | | (7,420,483 | ) | | | 17,156,549 | |
12/31/2010 | | | 2,253,659 | | | | — | | | | 8,370 | | | | (403,917 | ) | | | 1,858,112 | | | | | | 20,484,970 | | | | — | | | | 72,397 | | | | (3,708,060 | ) | | | 16,849,307 | |
Class I | | | | | | | | | | | | | | | | | | | | | | | | | | | | | | | | | | | | | | | | | | |
12/31/2011 | | | 479,135 | | | | — | | | | 37,903 | | | | (175,865 | ) | | | 341,173 | | | | | | 4,618,021 | | | | — | | | | 328,616 | | | | (1,810,942 | ) | | | 3,135,695 | |
12/31/2010 | | | 545,424 | | | | — | | | | 484 | | | | (34,328 | ) | | | 511,580 | | | | | | 5,287,731 | | | | — | | | | 4,239 | | | | (323,230 | ) | | | 4,968,740 | |
Class S | | | | | | | | | | | | | | | | | | | | | | | | | | | | | | | | | | | | | | | | | | |
12/31/2011 | | | 1,681,121 | | | | — | | | | 196,412 | | | | (647,879 | ) | | | 1,229,654 | | | | | | 16,776,009 | | | | — | | | | 1,691,110 | | | | (6,311,817 | ) | | | 12,155,302 | |
12/31/2010 | | | 1,919,817 | | | | — | | | | 5,758 | | | | (369,078 | ) | | | 1,556,497 | | | | | | 17,544,739 | | | | — | | | | 50,155 | | | | (3,371,992 | ) | | | 14,222,902 | |
Class S2 | | | | | | | | | | | | | | | | | | | | | | | | | | | | | | | | | | | | | | | | | | |
12/31/2011 | | | 537,977 | | | | — | | | | 23,139 | | | | (138,665 | ) | | | 422,451 | | | | | | 5,331,208 | | | | — | | | | 197,609 | | | | (1,330,524 | ) | | | 4,198,293 | |
12/31/2010 | | | 178,235 | | | | — | | | | 70 | | | | (12,614 | ) | | | 165,691 | | | | | | 1,652,455 | | | | — | | | | 605 | | | | (121,959 | ) | | | 1,531,101 | |
Class T | | | | | | | | | | | | | | | | | | | | | | | | | | | | | | | | | | | | | | | | | | |
12/31/2011 | | | — | | | | — | | | | — | | | | — | | | | — | | | | | | — | | | | — | | | | — | | | | — | | | | — | |
12/31/2010 | | | — | | | | — | | | | — | | | | — | | | | — | | | | | | — | | | | — | | | | — | | | | — | | | | — | |
Index Solution 2050 | | | | | | | | | | | | | | | | | | | | | | | | | | | | | | | |
Class ADV | | | | | | | | | | | | | | | | | | | | | | | | | | | | | | | | | | | | | | | | | | |
10/3/2011(1) - 12/31/2011 | | | 301 | | | | — | | | | — | | | | — | | | | 301 | | | | | | 3,010 | | | | — | | | | — | | | | — | | | | 3,010 | |
Class I | | | | | | | | | | | | | | | | | | | | | | | | | | | | | | | | | | | | | | | | | | |
10/3/2011(1) - 12/31/2011 | | | 301 | | | | — | | | | — | | | | — | | | | 301 | | | | | | 3,010 | | | | — | | | | — | | | | — | | | | 3,010 | |
Class S | | | | | | | | | | | | | | | | | | | | | | | | | | | | | | | | | | | | | | | | | | |
10/3/2011(1) - 12/31/2011 | | | 301 | | | | — | | | | — | | | | — | | | | 301 | | | | | | 3,010 | | | | — | | | | — | | | | — | | | | 3,010 | |
Class S2 | | | | | | | | | | | | | | | | | | | | | | | | | | | | | | | | | | | | | | | | | | |
10/3/2011(1) - 12/31/2011 | | | 301 | | | | — | | | | — | | | | — | | | | 301 | | | | | | 3,010 | | | | — | | | | — | | | | — | | | | 3,010 | |
Class T | | | | | | | | | | | | | | | | | | | | | | | | | | | | | | | | | | | | | | | | | | |
10/3/2011(1) - 12/31/2011 | | | 301 | | | | — | | | | — | | | | — | | | | 301 | | | | | | 3,010 | | | | — | | | | — | | | | — | | | | 3,010 | |
44
NOTES TO FINANCIAL STATEMENTSASOF DECEMBER 31, 2011 (CONTINUED)
NOTE 9 — CAPITAL SHARES (continued)
| | | | | | | | | | | | | | | | | | | | | | | | | | | | | | | | | | | | | | | | | | |
Year or period ended | | Shares
sold | | | Shares
issued
in
merger | | | Reinvestment
of
distributions | | | Shares
redeemed | | | Net increase
(decrease) in
shares
outstanding | | | | | Shares
sold | | | Proceeds
from
shares
issued in
merger | | | Reinvestment
of
distributions | | | Shares
redeemed | | | Net
increase
(decrease) | |
| | # | | | # | | | # | | | # | | | # | | | | | ($) | | | ($) | | | ($) | | | ($) | | | ($) | |
Index Solution 2055 | | | | | | | | | | | | | | | | | | | | | | | | | | | | | | | |
Class ADV | | | | | | | | | | | | | | | | | | | | | | | | | | | | | | | | | | | | | | | | | | |
12/31/2011 | | | 416,830 | | | | — | | | | 5,010 | | | | (97,598 | ) | | | 324,242 | | | | | | 4,621,700 | | | | — | | | | 49,247 | | | | (1,071,208 | ) | | | 3,599,739 | |
3/8/2010(1) - 12/31/2010 | | | 279,899 | | | | — | | | | — | | | | (67,025 | ) | | | 212,874 | | | | | | 2,798,256 | | | | — | | | | — | | | | (666,354 | ) | | | 2,131,902 | |
Class I | | | | | | | | | | | | | | | | | | | | | | | | | | | | | | | | | | | | | | | | | | |
12/31/2011 | | | 59,892 | | | | — | | | | 331 | | | | (6,383 | ) | | | 53,840 | | | | | | 662,750 | | | | — | | | | 3,272 | | | | (73,293 | ) | | | 592,729 | |
3/8/2010(1) - 12/31/2010 | | | 6,235 | | | | — | | | | — | | | | (2,137 | ) | | | 4,098 | | | | | | 65,200 | | | | — | | | | — | | | | (23,085 | ) | | | 42,115 | |
Class S | | | | | | | | | | | | | | | | | | | | | | | | | | | | | | | | | | | | | | | | | | |
12/31/2011 | | | 266,748 | | | | — | | | | 2,631 | | | | (58,208 | ) | | | 211,171 | | | | | | 2,956,155 | | | | — | | | | 25,942 | | | | (661,562 | ) | | | 2,320,535 | |
3/8/2010(1) - 12/31/2010 | | | 124,390 | | | | — | | | | — | | | | (16,605 | ) | | | 107,785 | | | | | | 1,241,429 | | | | — | | | | — | | | | (160,537 | ) | | | 1,080,892 | |
Class S2 | | | | | | | | | | | | | | | | | | | | | | | | | | | | | | | | | | | | | | | | | | |
12/31/2011 | | | 66,694 | | | | — | | | | 337 | | | | (5,821 | ) | | | 61,210 | | | | | | 715,673 | | | | — | | | | 3,311 | | | | (62,510 | ) | | | 656,474 | |
3/8/2010(1) - 12/31/2010 | | | 8,368 | | | | — | | | | — | | | | (247 | ) | | | 8,121 | | | | | | 88,558 | | | | — | | | | — | | | | (2,636 | ) | | | 85,922 | |
Class T | | | | | | | | | | | | | | | | | | | | | | | | | | | | | | | | | | | | | | | | | | |
12/31/2011 | | | — | | | | — | | | | — | | | | — | | | | — | | | | | | — | | | | — | | | | — | | | | — | | | | — | |
3/8/2010(1) - 12/31/2010 | | | 301 | | | | — | | | | — | | | | — | | | | 301 | | | | | | 3,010 | | | | — | | | | — | | | | — | | | | 3,010 | |
| (1) | | Commencement of operations. |
NOTE 10 — FEDERAL INCOME TAXES
The amount of distributions from net investment income and net realized capital gains are determined in accordance with federal income tax regulations, which may differ from U.S. generally accepted accounting principles for investment companies. These book/tax differences may be either temporary or permanent. Permanent differences are reclassified within the capital accounts based on their federal tax-basis treatment; temporary differences are not reclassified. Key differences include the treatment of short-term capital gains, foreign currency transactions, and wash sale deferrals. Distributions in excess of net investment income and/or net realized capital gains for tax purposes are reported as return of capital.
The following permanent tax differences have been reclassified as of December 31, 2011:
| | | | | | | | | | | | |
| | | Paid-in
Capital | | | Undistributed
Net Investment Income | | | Accumulated
Net Realized
Gains /
(Losses) | |
Index Solution Income | | $ | — | | | $ | 1,655,350 | | | $ | (1,655,350 | ) |
Index Solution 2015 | | | — | | | | 1,394,333 | | | | (1,394,333 | ) |
Index Solution 2020 | | | (13 | ) | | | 13 | | | | — | |
Index Solution 2025 | | | — | | | | 1,004,465 | | | | (1,004,465 | ) |
Index Solution 2030 | | | (14 | ) | | | 14 | | | | — | |
Index Solution 2035 | | | — | | | | 528,444 | | | | (528,444 | ) |
Index Solution 2040 | | | (13 | ) | | | 13 | | | | — | |
Index Solution 2045 | | | — | | | | 204,003 | | | | (204,003 | ) |
Index Solution 2050 | | | (13 | ) | | | 13 | | | | — | |
Index Solution 2055 | | | — | | | | 12,213 | | | | (12,213 | ) |
Dividends paid by the Portfolios from net investment income and distributions of net realized short-term capital gains are, for federal income tax purposes, taxable as ordinary income to shareholders.
45
NOTES TO FINANCIAL STATEMENTSASOF DECEMBER 31, 2011 (CONTINUED)
NOTE 10 — FEDERAL INCOME TAXES (continued)
The tax composition of dividends and distributions to shareholders was as follows:
| | | | | | | | | | | | | | | | |
| | | Year Ended
December 31, 2011 | | | Year Ended
December 31, 2010 | |
| | | Ordinary
Income | | | Long-Term
Capital Gains | | | Ordinary Income | | | Long-Term
Capital Gains | |
Index Solution Income | | $ | 6,622,900 | | | $ | 2,646,918 | | | $ | 3,435,825 | | | $ | 17,987 | |
Index Solution 2015 | | | 5,780,585 | | | | 4,402,581 | | | | 1,285,912 | | | | 916,190 | |
Index Solution 2025 | | | 4,403,002 | | | | 9,217,251 | | | | 277,264 | | | | 250,997 | |
Index Solution 2035 | | | 2,413,802 | | | | 7,045,922 | | | | 40,229 | | | | 171,256 | |
Index Solution 2045 | | | 1,290,343 | | | | 3,184,928 | | | | — | | | | 127,402 | |
Index Solution 2055 | | | 81,807 | | | | — | | | | — | | | | — | |
The tax-basis components of distributable earnings as of December 31, 2011 were:
| | | | | | | | | | | | |
| | | Undistributed
Ordinary Income | | | Undistributed
Long-Term
Capital Gains | | | Unrealized
Appreciation/
(Depreciation) | |
Index Solution Income | | $ | 4,535,433 | | | $ | 6,207,506 | | | $ | 1,203,775 | |
Index Solution 2015 | | | 4,062,058 | | | | 6,761,153 | | | | (1,663,824 | ) |
Index Solution 2020 | | | 618 | | | | 4 | | | | 537 | |
Index Solution 2025 | | | 3,884,907 | | | | 8,176,764 | | | | (1,833,713 | ) |
Index Solution 2030 | | | 824 | | | | 4 | | | | 694 | |
Index Solution 2035 | | | 2,426,203 | | | | 7,683,920 | | | | (3,515,207 | ) |
Index Solution 2040 | | | 996 | | | | 3 | | | | 789 | |
Index Solution 2045 | | | 1,283,469 | | | | 3,617,939 | | | | (2,455,097 | ) |
Index Solution 2050 | | | 993 | | | | 2 | | | | 802 | |
Index Solution 2055 | | | 255,068 | | | | 27,978 | | | | (380,943 | ) |
The Portfolios’ major tax jurisdictions are federal and Arizona. The earliest tax year that remains subject to examination by these jurisdictions is 2008.
As of December 31, 2011, no provisions for income tax would be required in the Portfolios’ financial statements as a result of tax positions taken on federal income tax returns for open tax years. The Portfolios’ federal and state income and federal excise tax returns for tax years for which the applicable statutes of limitations have not expired are subject to examination by the Internal Revenue Service and state department of revenue.
The Regulated Investment Company Modernization Act of 2010 (the “Act”) was enacted on December 22, 2010. The Act makes changes to several tax rules impacting the Portfolios. In general, the provisions of the Act are effective for the Portfolios’ tax year ended December 31, 2011. The Act provides several benefits, including the unlimited carryforward of future capital losses generated.
NOTE 11 — CONCENTRATION OF INVESTMENT RISK
All mutual funds involve risk — some more than others — and there is always the chance that you could lose money or not earn as much as you hope. A Portfolio’s risk profile is largely a factor of the principal securities in which it invests and investment techniques that it uses. For more information regarding the types of securities and investment techniques that may be used by the Portfolios and their corresponding risks, see the Portfolios’ most recent Prospectus and/or the Statement of Additional Information.
The Portfolios are also affected by other kinds of risks, depending on the types of securities held or strategies used by an Underlying Fund.
Asset Allocation. Assets will be allocated among Underlying Funds and markets based on judgements by the Adviser or Consultant. There is a risk that the Portfolios may allocate assets to an Underlying Fund or market that underperforms other funds or asset classes.
Foreign Securities. Investments in foreign securities may entail risks not present in domestic investments. Since securities in which an Underlying Fund may invest are denominated in foreign currencies, changes in the relationship of these foreign currencies to the U.S. dollar can significantly affect the value of the investments and earnings of the Underlying Funds. Foreign investments may also subject the Underlying Funds to foreign government exchange restrictions, expropriation, taxation or other political, social or economic developments, as well as changes vis-à-vis the U.S. dollar from movements in currency, and changes in security value and interest rate, all of which could affect the market and/or credit risk of the Underlying Funds’ investments.
NOTE 12 — OTHER ACCOUNTING PRONOUNCEMENTS
In May 2011, the Financial Accounting Standards Board (“FASB”) issued Accounting Standards Update (“ASU”) No. 2011-04 “Amendments to Achieve Common Fair Value Measurement and Disclosure Requirements”. ASU No. 2011-04 amends FASB ASC Topic 820, Fair Value Measurements and Disclosures, to establish common requirements for measuring fair value and for disclosing information about fair value measurements in accordance with GAAP and the International Financial Reporting Standards (“IFRSs”). The ASU is effective prospectively for interim and annual periods beginning after December 15, 2011. As of December 31, 2011, management of the Portfolios is currently assessing the potential impact to financial statement disclosure, that may result from adopting this ASU.
46
NOTES TO FINANCIAL STATEMENTSASOF DECEMBER 31, 2011 (CONTINUED)
NOTE 13 — SUBSEQUENT EVENTS
The Portfolios have evaluated events occurring after the Statements of Assets and Liabilities date (subsequent events) to determine whether any
subsequent events necessitated adjustment to or disclosure in the financial statements. No such subsequent events were identified.
47
| | |
| ING INDEX SOLUTION INCOME PORTFOLIO | | PORTFOLIO OF INVESTMENTS ASOF DECEMBER 31, 2011 |
| | | | | | | | | | | | | | |
| Shares | | | | | | | Value | | | Percentage
of Net
Assets | |
| | | | | | | | | | | | | | |
| |
| | EXCHANGE-TRADED FUNDS: 4.0% | | | | | |
| | 183,293 | | | | | SPDR Barclays Capital High Yield Bond ETF | | $ | 7,047,616 | | | | 4.0 | |
| | | | | | Total Exchange-Traded Funds
(Cost $6,972,996) | | | 7,047,616 | | | | 4.0 | |
| | | | | | | | | | | | | | |
| | |
| | MUTUAL FUNDS: 96.0% | | | | | | | | |
| | | | | | Affiliated Investment Companies: 96.0% | |
| | 514,667 | | | @ | | ING Emerging Markets Index Portfolio - Class I | | | 5,311,367 | | | | 3.0 | |
| | 1,461,639 | | | | | ING International Index Portfolio - Class I | | | 10,713,814 | | | | 6.1 | |
| | 1,427,861 | | | | | ING RussellTM Mid Cap Index Portfolio - Class I | | | 15,906,370 | | | | 9.0 | |
| | 2,851,115 | | | | | ING U.S. Stock Index Portfolio - Class I | | | 29,680,107 | | | | 16.8 | |
| | | | | | | | | | | | | | |
| Shares | | | | | | | Value | | | Percentage
of Net
Assets | |
| | | | | | | | | | | | | | |
| | |
| | MUTUAL FUNDS: (continued) | | | | | | | | |
| | | | | | Affiliated Investment Companies: (continued) | |
| | 9,763,003 | | | | | ING U.S. Bond Index Portfolio - Class I | | $ | 108,076,441 | | | | 61.1 | |
| | | | | | Total Mutual Funds
(Cost $168,281,506) | | | 169,688,099 | | | | 96.0 | |
| | | | | | | | | | | | | | |
| | | | | | Total Investments in Securities
(Cost $175,254,502) | | $ | 176,735,715 | | | | 100.0 | |
| | | | | | Assets in Excess of Other Liabilities | | | 30,109 | | | | — | |
| | | | | | | | | | | | | | |
| | | | | | Net Assets | | $ | 176,765,824 | | | | 100.0 | |
| | | | | | | | | | | | | | |
| @ | Non-income producing security |
| | Cost for federal income tax purposes is $175,531,940. |
| | | | |
Net unrealized appreciation consists of: | | | | |
Gross Unrealized Appreciation | | $ | 3,733,362 | |
Gross Unrealized Depreciation | | | (2,529,587 | ) |
| | | | |
Net Unrealized Appreciation | | $ | 1,203,775 | |
| | | | |
Fair Value Measurements^
The following is a summary of the fair valuations according to the inputs used as of December 31, 2011 in valuing the assets and liabilities:
| | | | | | | | | | | | | | | | |
| | | Quoted Prices
in Active Markets for Identical Investments
(Level 1) | | | Significant Other
Observable
Inputs (Level 2) | | | Significant
Unobservable
Inputs (Level 3) | | | Fair Value at 12/31/2011 | |
Asset Table | | | | | | | | | | | | | | | | |
Investments, at value | | | | | | | | | | | | | | | | |
Exchange-Traded Funds | | $ | 7,047,616 | | | $ | — | | | $ | — | | | $ | 7,047,616 | |
Mutual Funds | | | 169,688,099 | | | | — | | | | — | | | | 169,688,099 | |
| | | | | | | | | | | | | | | | |
Total Investments, at value | | $ | 176,735,715 | | | $ | — | | | $ | — | | | $ | 176,735,715 | |
| | | | | | | | | | | | | | | | |
| ^ | See Note 2, “Significant Accounting Policies” in the Notes to Financial Statements for additional information. |
| | There were no significant transfers between Level 1 and 2 during the year ended December 31, 2011. |
See Accompanying Notes to Financial Statements
48
| | |
| ING INDEX SOLUTION 2015 PORTFOLIO | | PORTFOLIO OF INVESTMENTS ASOF DECEMBER 31, 2011 |
| | | | | | | | | | | | | | |
| Shares | | | | | | | Value | | | Percentage
of Net
Assets | |
| | | | | | | | | | | | | | |
| |
| | EXCHANGE-TRADED FUNDS: 4.0% | | | | | |
| | 200,609 | | | | | SPDR Barclays Capital High Yield Bond ETF | | $ | 7,713,416 | | | | 4.0 | |
| | | | | | Total Exchange-Traded Funds
(Cost $7,632,002) | | | 7,713,416 | | | | 4.0 | |
| | | | | | | | | | | | | | |
| | |
| | MUTUAL FUNDS: 96.0% | | | | | | | | |
| | | | | | Affiliated Investment Companies: 96.0% | |
| | 932,110 | | | @ | | ING Emerging Markets Index Portfolio - Class I | | | 9,619,376 | | | | 5.0 | |
| | 3,177,192 | | | | | ING International Index Portfolio - Class I | | | 23,288,817 | | | | 12.1 | |
| | 326,428 | | | | | ING RussellTM Small Cap Index Portfolio - Class I | | | 3,838,798 | | | | 2.0 | |
| | 1,895,953 | | | | | ING RussellTM Mid Cap Index Portfolio - Class I | | | 21,120,911 | | | | 11.0 | |
| | 3,279,482 | | | | | ING U.S. Stock Index Portfolio - Class I | | | 34,139,409 | | | | 17.8 | |
| | | | | | | | | | | | | | |
| Shares | | | | | | | Value | | | Percentage
of Net
Assets | |
| | | | | | | | | | | | | | |
| | |
| | MUTUAL FUNDS: (continued) | | | | | | | | |
| | | | | | Affiliated Investment Companies: (continued) | |
| | 8,346,386 | | | | | ING U.S. Bond Index Portfolio - Class I | | $ | 92,394,496 | | | | 48.1 | |
| | | | | | Total Mutual Funds
(Cost $185,839,540) | | | 184,401,807 | | | | 96.0 | |
| | | | | | | | | | | | | | |
| | | | | | Total Investments in Securities
(Cost $193,471,542) | | $ | 192,115,223 | | | | 100.0 | |
| | | | | | Assets in Excess of Other Liabilities | | | 22,722 | | | | — | |
| | | | | | | | | | | | | | |
| | | | | | Net Assets | | $ | 192,137,945 | | | | 100.0 | |
| | | | | | | | | | | | | | |
| @ | Non-income producing security |
| | Cost for federal income tax purposes is $193,779,047. |
| | | | |
Net unrealized depreciation consists of: | | | | |
Gross Unrealized Appreciation | | $ | 2,379,110 | |
Gross Unrealized Depreciation | | | (4,042,934 | ) |
| | | | |
Net Unrealized Depreciation | | $ | (1,663,824 | ) |
| | | | |
Fair Value Measurements^
The following is a summary of the fair valuations according to the inputs used as of December 31, 2011 in valuing the assets and liabilities:
| | | | | | | | | | | | | | | | |
| | | Quoted Prices
in Active Markets for Identical Investments
(Level 1) | | | Significant Other
Observable
Inputs (Level 2) | | | Significant
Unobservable
Inputs (Level 3) | | | Fair Value at 12/31/2011 | |
Asset Table | | | | | | | | | | | | | | | | |
Investments, at value | | | | | | | | | | | | | | | | |
Exchange-Traded Funds | | $ | 7,713,416 | | | $ | — | | | $ | — | | | $ | 7,713,416 | |
Mutual Funds | | | 184,401,807 | | | | — | | | | — | | | | 184,401,807 | |
| | | | | | | | | | | | | | | | |
Total Investments, at value | | $ | 192,115,223 | | | $ | — | | | $ | — | | | $ | 192,115,223 | |
| | | | | | | | | | | | | | | | |
| ^ | See Note 2, “Significant Accounting Policies” in the Notes to Financial Statements for additional information. |
| | There were no significant transfers between Level 1 and 2 during the year ended December 31, 2011. |
See Accompanying Notes to Financial Statements
49
| | |
| ING INDEX SOLUTION 2020 PORTFOLIO | | PORTFOLIO OF INVESTMENTS ASOF DECEMBER 31, 2011 |
| | | | | | | | | | | | | | |
| Shares | | | | | | | Value | | | Percentage
of Net
Assets | |
| | | | | | | | | | | | | | |
| | |
| | EXCHANGE-TRADED FUNDS: 3.8% | | | | | | | | |
| | 16 | | | | | SPDR Barclays Capital High Yield Bond ETF | | $ | 615 | | | | 3.8 | |
| | | | | | Total Exchange-Traded Funds
(Cost $609) | | | 615 | | | | 3.8 | |
| | | | | | | | | | | | | | |
| | |
| | MUTUAL FUNDS: 96.1% | | | | | | | | |
| | | | | | Affiliated Investment Companies: 96.1% | |
| | 93 | | | @ | | ING Emerging Markets Index Portfolio - Class I | | | 963 | | | | 5.9 | |
| | 332 | | | | | ING International Index Portfolio - Class I | | | 2,430 | | | | 15.0 | |
| | 41 | | | | | ING RussellTM Small Cap Index Portfolio - Class I | | | 481 | | | | 3.0 | |
| | 187 | | | | | ING RussellTM Mid Cap Index Portfolio - Class I | | | 2,084 | | | | 12.9 | |
| | 357 | | | | | ING U.S. Stock Index Portfolio - Class I | | | 3,720 | | | | 23.0 | |
| | | | | | | | | | | | | | |
| Shares | | | | | | | Value | | | Percentage
of Net
Assets | |
| | | | | | | | | | | | | | |
| | |
| | MUTUAL FUNDS: (continued) | | | | | | | | |
| | | | | | Affiliated Investment Companies: (continued) | |
| | 532 | | | | | ING U.S. Bond Index Portfolio - Class I | | $ | 5,890 | | | | 36.3 | |
| | | | | | Total Mutual Funds
(Cost $15,029) | | | 15,568 | | | | 96.1 | |
| | | | | | | | | | | | | | |
| | | | | | Total Investments in Securities
(Cost $15,638) | | $ | 16,183 | | | | 99.9 | |
| | | | | | Assets in Excess of Other Liabilities | | | 13 | | | | 0.1 | |
| | | | | | | | | | | | | | |
| | | | | | Net Assets | | $ | 16,196 | | | | 100.0 | |
| | | | | | | | | | | | | | |
| @ | Non-income producing security |
| | Cost for federal income tax purposes is $15,646. |
| | | | |
Net unrealized appreciation consists of: | | | | |
Gross Unrealized Appreciation | | $ | 562 | |
Gross Unrealized Depreciation | | | (25 | ) |
| | | | |
Net Unrealized Appreciation | | $ | 537 | |
| | | | |
Fair Value Measurements^
The following is a summary of the fair valuations according to the inputs used as of December 31, 2011 in valuing the assets and liabilities:
| | | | | | | | | | | | | | | | |
| | | Quoted Prices in Active Markets for Identical Investments (Level 1) | | | Significant Other Observable
Inputs (Level 2) | | | Significant Unobservable Inputs (Level 3) | | | Fair Value at 12/31/2011 | |
Asset Table | | | | | | | | | | | | | | | | |
Investments, at value | | | | | | | | | | | | | | | | |
Exchange-Traded Funds | | $ | 615 | | | $ | — | | | $ | — | | | $ | 615 | |
Mutual Funds | | | 15,568 | | | | — | | | | — | | | | 15,568 | |
| | | | | | | | | | | | | | | | |
Total Investments, at value | | $ | 16,183 | | | $ | — | | | $ | — | | | $ | 16,183 | |
| | | | | | | | | | | | | | | | |
| ^ | See Note 2, “Significant Accounting Policies” in the Notes to Financial Statements for additional information. |
| | There were no significant transfers between Level 1 and 2 during the year ended December 31, 2011. |
See Accompanying Notes to Financial Statements
50
| | |
| ING INDEX SOLUTION 2025 PORTFOLIO | | PORTFOLIO OF INVESTMENTS ASOF DECEMBER 31, 2011 |
| | | | | | | | | | | | | | |
| Shares | | | | | | | Value | | | Percentage
of Net
Assets | |
| | | | | | | | | | | | | | |
|
| | EXCHANGE-TRADED FUNDS: 4.0% | |
| | 253,466 | | | | | SPDR Barclays Capital High Yield Bond ETF | | $ | 9,745,768 | | | | 4.0 | |
| | | | | | Total Exchange-Traded Funds
(Cost $9,648,647) | | | 9,745,768 | | | | 4.0 | |
| | | | | | | | | | | | | | |
| | |
| | MUTUAL FUNDS: 96.0% | | | | | | | | |
| | | | | | Affiliated Investment Companies: 96.0% | |
| | 1,407,443 | | | @ | | ING Emerging Markets Index Portfolio - Class I | | | 14,524,815 | | | | 6.0 | |
| | 5,664,844 | | | | | ING International Index Portfolio - Class I | | | 41,523,305 | | | | 17.2 | |
| | 821,566 | | | | | ING RussellTM Small Cap Index Portfolio - Class I | | | 9,661,610 | | | | 4.0 | |
| | 3,038,492 | | | | | ING RussellTM Mid Cap Index Portfolio - Class I | | | 33,848,803 | | | | 14.0 | |
| | 6,676,677 | | | | | ING U.S. Stock Index Portfolio - Class I | | | 69,504,207 | | | | 28.7 | |
| | | | | | | | | | | | | | |
| Shares | | | | | | | Value | | | Percentage
of Net
Assets | |
| | | | | | | | | | | | | | |
| | |
| | MUTUAL FUNDS: (continued) | | | | | | | | |
| | | | | | Affiliated Investment Companies: (continued) | |
| | 5,695,268 | | | | | ING U.S. Bond Index Portfolio - Class I | | $ | 63,046,615 | | | | 26.1 | |
| | | | | | Total Mutual Funds
(Cost $233,626,305) | | | 232,109,355 | | | | 96.0 | |
| | | | | | | | | | | | | | |
| | | | | | Total Investments in Securities
(Cost $243,274,952) | | $ | 241,855,123 | | | | 100.0 | |
| | | | | | Assets in Excess of Other Liabilities | | | 22,287 | | | | — | |
| | | | | | | | | | | | | | |
| | | | | | Net Assets | | $ | 241,877,410 | | | | 100.0 | |
| | | | | | | | | | | | | | |
| @ | Non-income producing security |
| | Cost for federal income tax purposes is $243,688,836. |
| | | | |
Net unrealized depreciation consists of: | | | | |
Gross Unrealized Appreciation | | $ | 2,089,356 | |
Gross Unrealized Depreciation | | | (3,923,069 | ) |
| | | | |
Net Unrealized Depreciation | | $ | (1,833,713 | ) |
| | | | |
Fair Value Measurements^
The following is a summary of the fair valuations according to the inputs used as of December 31, 2011 in valuing the assets and liabilities:
| | | | | | | | | | | | | | | | |
| | | Quoted Prices in Active Markets for Identical Investments (Level 1) | | | Significant Other Observable Inputs (Level 2) | | | Significant Unobservable Inputs (Level 3) | | | Fair Value at 12/31/2011 | |
Asset Table | | | | | | | | | | | | | | | | |
Investments, at value | | | | | | | | | | | | | | | | |
Exchange-Traded Funds | | $ | 9,745,768 | | | $ | — | | | $ | — | | | $ | 9,745,768 | |
Mutual Funds | | | 232,109,355 | | | | — | | | | — | | | | 232,109,355 | |
| | | | | | | | | | | | | | | | |
Total Investments, at value | | $ | 241,855,123 | | | $ | — | | | $ | — | | | $ | 241,855,123 | |
| | | | | | | | | | | | | | | | |
| ^ | See Note 2, “Significant Accounting Policies” in the Notes to Financial Statements for additional information. |
| | There were no significant transfers between Level 1 and 2 during the year ended December 31, 2011. |
See Accompanying Notes to Financial Statements
51
| | |
| ING INDEX SOLUTION 2030 PORTFOLIO | | PORTFOLIO OF INVESTMENTS ASOF DECEMBER 31, 2011 |
| | | | | | | | | | | | | | |
| Shares | | | | | | | Value | | | Percentage of Net Assets | |
|
| | EXCHANGE-TRADED FUNDS: 3.7% | |
| | 16 | | | | | SPDR Barclays Capital High Yield Bond ETF | | $ | 615 | | | | 3.7 | |
| | | | | | Total Exchange-Traded Funds (Cost $608) | | | 615 | | | | 3.7 | |
| | | | | | | | | | | | | | |
|
| | MUTUAL FUNDS: 96.2% | |
| | | | | | Affiliated Investment Companies: 96.2% | |
| | 111 | | | @ | | ING Emerging Markets Index Portfolio - Class I | | | 1,145 | | | | 6.9 | |
| | 428 | | | | | ING International Index Portfolio - Class I | | | 3,137 | | | | 19.0 | |
| | 56 | | | | | ING RussellTM Small Cap Index Portfolio - Class I | | | 653 | | | | 3.9 | |
| | 235 | | | | | ING RussellTM Mid Cap Index Portfolio - Class I | | | 2,615 | | | | 15.8 | |
| | 529 | | | | | ING U.S. Stock Index Portfolio - Class I | | | 5,506 | | | | 33.3 | |
| | | | | | | | | | | | | | |
| Shares | | | | | | | Value | | | Percentage of Net Assets | |
|
| | MUTUAL FUNDS: (continued) | |
| | | | | | Affiliated Investment Companies:
(continued) | |
| | 259 | | | | | ING U.S. Bond Index Portfolio - Class I | | $ | 2,869 | | | | 17.3 | |
| | | | | | Total Mutual Funds
(Cost $15,233) | | | 15,925 | | | | 96.2 | |
| | | | | | | | | | | | | | |
| | | | | | Total Investments in Securities
(Cost $15,841) | | $ | 16,540 | | | | 99.9 | |
| | | | | | Assets in Excess of Other Liabilities | | | 18 | | | | 0.1 | |
| | | | | | | | | | | | | | |
| | | | | | Net Assets | | $ | 16,558 | | | | 100.0 | |
| | | | | | | | | | | | | | |
| @ | Non-income producing security |
| | Cost for federal income tax purposes is $15,846. |
| | | | |
Net unrealized appreciation consists of: | | | | |
Gross Unrealized Appreciation | | $ | 725 | |
Gross Unrealized Depreciation | | | (31 | ) |
| | | | |
Net Unrealized Appreciation | | $ | 694 | |
| | | | |
Fair Value Measurements^
The following is a summary of the fair valuations according to the inputs used as of December 31, 2011 in valuing the assets and liabilities:
| | | | | | | | | | | | | | | | |
| | | Quoted Prices in Active Markets for Identical Investments (Level 1) | | | Significant Other Observable Inputs (Level 2) | | | Significant Unobservable Inputs (Level 3) | | | Fair Value at 12/31/2011 | |
Asset Table | | | | | | | | | | | | | | | | |
Investments, at value | | | | | | | | | | | | | | | | |
Exchange-Traded Funds | | $ | 615 | | | $ | — | | | $ | — | | | $ | 615 | |
Mutual Funds | | | 15,925 | | | | — | | | | — | | | | 15,925 | |
| | | | | | | | | | | | | | | | |
Total Investments, at value | | $ | 16,540 | | | $ | — | | | $ | — | | | $ | 16,540 | |
| | | | | | | | | | | | | | | | |
| ^ | See Note 2, “Significant Accounting Policies” in the Notes to Financial Statements for additional information. |
| | There were no significant transfers between Level 1 and 2 during the year ended December 31, 2011. |
See Accompanying Notes to Financial Statements
52
| | |
| ING INDEX SOLUTION 2035 PORTFOLIO | | PORTFOLIO OF INVESTMENTS ASOF DECEMBER 31, 2011 |
| | | | | | | | | | | | | | |
| Shares | | | | | | | Value | | | Percentage of Net Assets | |
|
| | EXCHANGE-TRADED FUNDS: 4.0% | |
| | 187,440 | | | | | SPDR Barclays Capital High Yield Bond ETF | | $ | 7,207,068 | | | | 4.0 | |
| | | | | | Total Exchange-Traded Funds (Cost $7,136,834) | | | 7,207,068 | | | | 4.0 | |
| | | | | | | | | | | | | | |
|
| | MUTUAL FUNDS: 96.0% | |
| | | | | | Affiliated Investment Companies: 96.0% | |
| | 1,215,445 | | | @ | | ING Emerging Markets Index Portfolio - Class I | | | 12,543,390 | | | | 7.0 | |
| | 4,932,691 | | | | | ING International Index Portfolio - Class I | | | 36,156,624 | | | | 20.2 | |
| | 760,115 | | | | | ING RussellTM Small Cap Index Portfolio - Class I | | | 8,938,951 | | | | 5.0 | |
| | 2,573,510 | | | | | ING RussellTM Mid Cap Index Portfolio - Class I | | | 28,668,898 | | | | 16.0 | |
| | 6,668,094 | | | | | ING U.S. Stock Index Portfolio - Class I | | | 69,414,854 | | | | 38.8 | |
| | | | | | | | | | | | | | |
| Shares | | | | | | | Value | | | Percentage of Net Assets | |
|
| | MUTUAL FUNDS: (continued) | |
| | | | | | Affiliated Investment Companies: (continued) | |
| | 1,455,612 | | | | | ING U.S. Bond Index Portfolio - Class I | | $ | 16,113,627 | | | | 9.0 | |
| | | | | | Total Mutual Funds (Cost $175,019,348) | | | 171,836,344 | | | | 96.0 | |
| | | | | | | | | | | | | | |
| | | | | | Total Investments in Securities (Cost $182,156,182) | | $ | 179,043,412 | | | | 100.0 | |
| | | | | | Assets in Excess of Other Liabilities | | | 13,993 | | | | — | |
| | | | | | | | | | | | | | |
| | | | | | Net Assets | | $ | 179,057,405 | | | | 100.0 | |
| | | | | | | | | | | | | | |
| @ | Non-income producing security |
| | Cost for federal income tax purposes is $182,558,620. |
| | | | |
Net unrealized depreciation consists of: | | | | |
Gross Unrealized Appreciation | | $ | 920,140 | |
Gross Unrealized Depreciation | | | (4,435,348 | ) |
| | | | |
Net Unrealized Depreciation | | $ | (3,515,208 | ) |
| | | | |
Fair Value Measurements^
The following is a summary of the fair valuations according to the inputs used as of December 31, 2011 in valuing the assets and liabilities:
| | | | | | | | | | | | | | | | |
| | | Quoted Prices in Active Markets for Identical Investments (Level 1) | | | Significant Other Observable Inputs (Level 2) | | | Significant Unobservable Inputs (Level 3) | | | Fair Value at 12/31/2011 | |
Asset Table | | | | | | | | | | | | | | | | |
Investments, at value | | | | | | | | | | | | | | | | |
Exchange-Traded Funds | | $ | 7,207,068 | | | $ | — | | | $ | — | | | $ | 7,207,068 | |
Mutual Funds | | | 171,836,344 | | | | — | | | | — | | | | 171,836,344 | |
| | | | | | | | | | | | | | | | |
Total Investments, at value | | $ | 179,043,412 | | | $ | — | | | $ | — | | | $ | 179,043,412 | |
| | | | | | | | | | | | | | | | |
| ^ | See Note 2, “Significant Accounting Policies” in the Notes to Financial Statements for additional information. |
| | There were no significant transfers between Level 1 and 2 during the year ended December 31, 2011. |
See Accompanying Notes to Financial Statements
53
| | |
| ING INDEX SOLUTION 2040 PORTFOLIO | | PORTFOLIO OF INVESTMENTS ASOF DECEMBER 31, 2011 |
| | | | | | | | | | | | | | |
| Shares | | | | | | | Value | | | Percentage of Net Assets | |
| | | | | | | | | | | | | | |
| |
| | EXCHANGE-TRADED FUNDS: 2.7% | | | | | |
| | 12 | | | | | SPDR Barclays Capital High Yield Bond ETF | | $ | 461 | | | | 2.7 | |
| | | | | | Total Exchange-Traded Funds
(Cost $454) | | | 461 | | | | 2.7 | |
| | | | | | | | | | | | | | |
| | |
| | MUTUAL FUNDS: 97.2% | | | | | | | | |
| | | | | | Affiliated Investment Companies: 97.2% | |
| | 114 | | | @ | | ING Emerging Markets Index Portfolio - Class I | | | 1,180 | | | | 7.0 | |
| | 554 | | | | | ING International Index Portfolio - Class I | | | 4,059 | | | | 24.1 | |
| | 71 | | | | | ING RussellTM Small Cap Index Portfolio - Class I | | | 838 | | | | 5.0 | |
| | 241 | | | | | ING RussellTM Mid Cap Index Portfolio - Class I | | | 2,683 | | | | 15.9 | |
| | 677 | | | | | ING U.S. Stock Index Portfolio - Class I | | | 7,046 | | | | 41.9 | |
| | | | | | | | | | | | | | |
| Shares | | | | | | | Value | | | Percentage of Net Assets | |
| | | | | | | | | | | | | | |
| | |
| | MUTUAL FUNDS: (continued) | | | | | | | | |
| | | | | | Affiliated Investment Companies: (continued) | |
| | 50 | | | | | ING U.S. Bond Index Portfolio - Class I | | $ | 549 | | | | 3.3 | |
| | | | | | Total Mutual Funds
(Cost $15,572) | | | 16,355 | | | | 97.2 | |
| | | | | | | | | | | | | | |
| | | | | | Total Investments in Securities
(Cost $16,026) | | $ | 16,816 | | | | 99.9 | |
| | | | | | Assets in Excess of Other Liabilities | | | 9 | | | | 0.1 | |
| | | | | | | | | | | | | | |
| | | | | | Net Assets | | $ | 16,825 | | | | 100.0 | |
| | | | | | | | | | | | | | |
| @ | Non-income producing security |
| | Cost for federal income tax purposes is $16,027. |
| | | | |
Net unrealized appreciation consists of: | | | | |
Gross Unrealized Appreciation | | $ | 823 | |
Gross Unrealized Depreciation | | | (34 | ) |
| | | | |
Net Unrealized Appreciation | | $ | 789 | |
| | | | |
Fair Value Measurements^
The following is a summary of the fair valuations according to the inputs used as of December 31, 2011 in valuing the assets and liabilities:
| | | | | | | | | | | | | | | | |
| | | Quoted Prices
in Active Markets
for Identical Investments
(Level 1) | | | Significant Other
Observable
Inputs (Level 2) | | | Significant
Unobservable
Inputs
(Level 3) | | | Fair Value
at
12/31/2011 | |
Asset Table | | | | | | | | | | | | | | | | |
Investments, at value | | | | | | | | | | | | | | | | |
Exchange-Traded Funds | | $ | 461 | | | $ | — | | | $ | — | | | $ | 461 | |
Mutual Funds | | | 16,355 | | | | — | | | | — | | | | 16,355 | |
| | | | | | | | | | | | | | | | |
Total Investments, at value | | $ | 16,816 | | | $ | — | | | $ | — | | | $ | 16,816 | |
| | | | | | | | | | | | | | | | |
| ^ | See Note 2, “Significant Accounting Policies” in the Notes to Financial Statements for additional information. |
| | There were no significant transfers between Level 1 and 2 during the year ended December 31, 2011. |
See Accompanying Notes to Financial Statements
54
| | |
| ING INDEX SOLUTION 2045 PORTFOLIO | | PORTFOLIO OF INVESTMENTS ASOF DECEMBER 31, 2011 |
| | | | | | | | | | | | | | |
| Shares | | | | | | | Value | | | Percentage
of Net
Assets | |
| | | | | | | | | | | | | | |
| |
| | EXCHANGE-TRADED FUNDS: 2.0% | | | | | |
| | 55,393 | | | | | SPDR Barclays Capital High Yield Bond ETF | | $ | 2,129,861 | | | | 2.0 | |
| | | | | | Total Exchange-Traded Funds
(Cost $2,080,469) | | | 2,129,861 | | | | 2.0 | |
| | | | | | | | | | | | | | |
| | |
| | MUTUAL FUNDS: 98.0% | | | | | | | | |
| | | | | | Affiliated Investment Companies: 98.0% | |
| | 712,889 | | | @ | | ING Emerging Markets Index Portfolio - Class I | | | 7,357,016 | | | | 7.0 | |
| | 3,616,579 | | | | | ING International Index Portfolio - Class I | | | 26,509,527 | | | | 25.2 | |
| | 445,826 | | | | | ING RussellTM Small Cap Index Portfolio - Class I | | | 5,242,919 | | | | 5.0 | |
| | 1,509,445 | | | | | ING RussellTM Mid Cap Index Portfolio - Class I | | | 16,815,215 | | | | 16.0 | |
| | | | | | | | | | | | | | |
| Shares | | | | | | | Value | | | Percentage
of Net
Assets | |
| | | | | | | | | | | | | | |
| | |
| | MUTUAL FUNDS: (continued) | | | | | | | | |
| | | | | | Affiliated Investment Companies: (continued) | |
| | 4,214,246 | | | | | ING U.S. Stock Index Portfolio - Class I | | $ | 43,870,303 | | | | 41.8 | |
| | 282,613 | | | | | ING U.S. Bond Index Portfolio - Class I | | | 3,128,525 | | | | 3.0 | |
| | | | | | Total Mutual Funds
(Cost $105,078,657) | | | 102,923,505 | | | | 98.0 | |
| | | | | | | | | | | | | | |
| | | | | | Total Investments in Securities
(Cost $107,159,126) | | $ | 105,053,366 | | | | 100.0 | |
| | | | | | Liabilities in Excess of Other Assets | | | (16,002 | ) | | | — | |
| | | | | | | | | | | | | | |
| | | | | | Net Assets | | $ | 105,037,364 | | | | 100.0 | |
| | | | | | | | | | | | | | |
| @ | Non-income producing security |
| | Cost for federal income tax purposes is $107,508,463. |
| | | | |
Net unrealized depreciation consists of: | | | | |
Gross Unrealized Appreciation | | $ | 464,157 | |
Gross Unrealized Depreciation | | | (2,919,254 | ) |
| | | | |
Net Unrealized Depreciation | | $ | (2,455,097 | ) |
| | | | |
Fair Value Measurements^
The following is a summary of the fair valuations according to the inputs used as of December 31, 2011 in valuing the assets and liabilities:
| | | | | | | | | | | | | | | | |
| | | Quoted Prices in Active Markets
for Identical Investments
(Level 1) | | | Significant Other
Observable
Inputs (Level 2) | | | Significant
Unobservable
Inputs
(Level 3) | | | Fair Value
at
12/31/2011 | |
Asset Table | | | | | | | | | | | | | | | | |
Investments, at value | | | | | | | | | | | | | | | | |
Exchange-Traded Funds | | $ | 2,129,861 | | | $ | — | | | $ | — | | | $ | 2,129,861 | |
Mutual Funds | | | 102,923,505 | | | | — | | | | — | | | | 102,923,505 | |
| | | | | | | | | | | | | | | | |
Total Investments, at value | | $ | 105,053,366 | | | $ | — | | | $ | — | | | $ | 105,053,366 | |
| | | | | | | | | | | | | | | | |
| ^ | See Note 2, “Significant Accounting Policies” in the Notes to Financial Statements for additional information. |
| | There were no significant transfers between Level 1 and 2 during the year ended December 31, 2011. |
See Accompanying Notes to Financial Statements
55
| | |
| ING INDEX SOLUTION 2050 PORTFOLIO | | PORTFOLIO OF INVESTMENTS ASOF DECEMBER 31, 2011 |
| | | | | | | | | | | | | | |
| Shares | | | | | | | Value | | | Percentage of Net Assets | |
| | | | | | | | | | | | | | |
|
| | EXCHANGE-TRADED FUNDS: 1.8% | |
| | 8 | | | | | SPDR Barclays Capital High Yield Bond ETF | | $ | 308 | | | | 1.8 | |
| | | | | | Total Exchange-Traded Funds (Cost $300) | | | 308 | | | | 1.8 | |
| | | | | | | | | | | | | | |
|
| | MUTUAL FUNDS: 98.1% | |
| | | | | | Affiliated Investment Companies: 98.1% | |
| | 114 | | | @ | | ING Emerging Markets Index Portfolio - Class I | | | 1,181 | | | | 7.0 | |
| | 577 | | | | | ING International Index Portfolio - Class I | | | 4,230 | | | | 25.1 | |
| | 71 | | | | | ING RussellTM Small Cap Index Portfolio - Class I | | | 838 | | | | 5.0 | |
| | 241 | | | | | ING RussellTM Mid Cap Index Portfolio - Class I | | | 2,685 | | | | 16.0 | |
| | 677 | | | | | ING U.S. Stock Index Portfolio - Class I | | | 7,052 | | | | 41.9 | |
| | | | | | | | | | | | | | |
| Shares | | | | | | | Value | | | Percentage of Net Assets | |
| | | | | | | | | | | | | | |
| |
| | MUTUAL FUNDS: (continued) | | | | | |
| | | | | | Affiliated Investment Companies:
(continued) | |
| | 48 | | | | | ING U.S. Bond Index Portfolio - Class I | | $ | 529 | | | | 3.1 | |
| | | | | | Total Mutual Funds
(Cost $15,721) | | | 16,515 | | | | 98.1 | |
| | | | | | | | | | | | | | |
| | | | | | Total Investments in Securities
(Cost $16,021) | | $ | 16,823 | | | | 99.9 | |
| | | | | | Assets in Excess of
Other Liabilities | | | 11 | | | | 0.1 | |
| | | | | | | | | | | | | | |
| | | | | | Net Assets | | $ | 16,834 | | | | 100.0 | |
| | | | | | | | | | | | | | |
| @ | Non-income producing security |
| | Cost for federal income tax purposes is the same as for financial statement purposes. |
| | | | |
Net unrealized appreciation consists of: | | | | |
Gross Unrealized Appreciation | | $ | 835 | |
Gross Unrealized Depreciation | | | (33 | ) |
| | | | |
Net Unrealized Appreciation | | $ | 802 | |
| | | | |
Fair Value Measurements^
The following is a summary of the fair valuations according to the inputs used as of December 31, 2011 in valuing the assets and liabilities:
| | | | | | | | | | | | | | | | |
| | | Quoted Prices in Active Markets for Identical Investments (Level 1) | | | Significant Other Observable Inputs (Level 2) | | | Significant Unobservable Inputs (Level 3) | | | Fair Value at 12/31/2011 | |
Asset Table | | | | | | | | | | | | | | | | |
Investments, at value | | | | | | | | | | | | | | | | |
Exchange-Traded Funds | | $ | 308 | | | $ | — | | | $ | — | | | $ | 308 | |
Mutual Funds | | | 16,515 | | | | — | | | | — | | | | 16,515 | |
| | | | | | | | | | | | | | | | |
Total Investments, at value | | $ | 16,823 | | | $ | — | | | $ | — | | | $ | 16,823 | |
| | | | | | | | | | | | | | | | |
| ^ | See Note 2, “Significant Accounting Policies” in the Notes to Financial Statements for additional information. |
| | There were no significant transfers between Level 1 and 2 during the year ended December 31, 2011. |
See Accompanying Notes to Financial Statements
56
| | |
| ING INDEX SOLUTION 2055 PORTFOLIO | | PORTFOLIO OF INVESTMENTS ASOF DECEMBER 31, 2011 |
| | | | | | | | | | | | | | |
| Shares | | | | | | | Value | | | Percentage of Net Assets | |
| | | | | | | | | | | | | | |
|
| | EXCHANGE-TRADED FUNDS: 2.0% | |
| | 5,345 | | | | | SPDR Barclays Capital High Yield Bond ETF | | $ | 205,515 | | | | 2.0 | |
| | | | | | Total Exchange-Traded Funds
(Cost $201,394) | | | 205,515 | | | | 2.0 | |
| | | | | | | | | | | | | | |
| | |
| | MUTUAL FUNDS: 98.0% | | | | | | | | |
| | | | | | Affiliated Investment Companies: 98.0% | |
| | 70,836 | | | @ | | ING Emerging Markets Index Portfolio - Class I | | | 731,031 | | | | 7.0 | |
| | 358,474 | | | | | ING International Index Portfolio - Class I | | | 2,627,612 | | | | 25.2 | |
| | 44,194 | | | | | ING RussellTM Small Cap Index Portfolio - Class I | | | 519,726 | | | | 5.0 | |
| | 149,622 | | | | | ING RussellTM Mid Cap Index Portfolio - Class I | | | 1,666,793 | | | | 16.0 | |
| | 418,176 | | | | | ING U.S. Stock Index Portfolio - Class I | | | 4,353,213 | | | | 41.8 | |
| | | | | | | | | | | | | | |
| Shares | | | | | | | Value | | | Percentage of Net Assets | |
| | | | | | | | | | | | | | |
| |
| | MUTUAL FUNDS: (continued) | | | | | |
| | | | | | Affiliated Investment Companies:
(continued) | |
| | 28,527 | | | | | ING U.S. Bond Index Portfolio - Class I | | $ | 315,793 | | | | 3.0 | |
| | | | | | Total Mutual Funds
(Cost $10,547,984) | | | 10,214,168 | | | | 98.0 | |
| | | | | | | | | | | | | | |
| | | | | | Total Investments in Securities
(Cost $10,749,378) | | $ | 10,419,683 | | | | 100.0 | |
| | | | | | Liabilities in Excess of Other Assets | | | (4,486 | ) | | | — | |
| | | | | | | | | | | | | | |
| | | | | | Net Assets | | $ | 10,415,197 | | | | 100.0 | |
| | | | | | | | | | | | | | |
| @ | Non-income producing security |
| | Cost for federal income tax purposes is $10,800,627. |
| | | | |
Net unrealized depreciation consists of: | | | | |
Gross Unrealized Appreciation | | $ | 25,663 | |
Gross Unrealized Depreciation | | | (406,607 | ) |
| | | | |
Net Unrealized Depreciation | | $ | (380,944 | ) |
| | | | |
Fair Value Measurements^
The following is a summary of the fair valuations according to the inputs used as of December 31, 2011 in valuing the assets and liabilities:
| | | | | | | | | | | | | | | | |
| | | Quoted Prices in Active Markets for Identical Investments (Level 1) | | | Significant Other Observable Inputs (Level 2) | | | Significant Unobservable Inputs (Level 3) | | | Fair Value at 12/31/2011 | |
Asset Table | | | | | | | | | | | | | | | | |
Investments, at value | | | | | | | | | | | | | | | | |
Exchange-Traded Funds | | $ | 205,515 | | | $ | — | | | $ | — | | | $ | 205,515 | |
Mutual Funds | | | 10,214,168 | | | | — | | | | — | | | | 10,214,168 | |
| | | | | | | | | | | | | | | | |
Total Investments, at value | | $ | 10,419,683 | | | $ | — | | | $ | — | | | $ | 10,419,683 | |
| | | | | | | | | | | | | | | | |
| ^ | See Note 2, “Significant Accounting Policies” in the Notes to Financial Statements for additional information. |
| | There were no significant transfers between Level 1 and 2 during the year ended December 31, 2011. |
See Accompanying Notes to Financial Statements
57
TAX INFORMATION (UNAUDITED)
Dividends and distributions paid during the year ended December 31, 2011 were as follows:
| | | | | | |
Portfolio Name | | Type | | Per Share Amount | |
| | |
ING Index Solution Income Portfolio | | | | | | |
Class ADV | | NII | | $ | 0.2475 | |
Class I | | NII | | $ | 0.2868 | |
Class S | | NII | | $ | 0.2584 | |
Class S2 | | NII | | $ | 0.2840 | |
Class T | | NII | | $ | 0.2137 | |
All Classes | | STCG | | $ | 0.1565 | |
All Classes | | LTCG | | $ | 0.1655 | |
| | |
ING Index Solution 2015 Portfolio | | | | | | |
Class ADV | | NII | | $ | 0.1857 | |
Class I | | NII | | $ | 0.2247 | |
Class S | | NII | | $ | 0.2026 | |
Class S2 | | NII | | $ | 0.2208 | |
Class T | | NII | | $ | 0.1518 | |
All Classes | | STCG | | $ | 0.1381 | |
All Classes | | LTCG | | $ | 0.2557 | |
| | |
ING Index Solution 2025 Portfolio | | | | | | |
Class ADV | | NII | | $ | 0.1465 | |
Class I | | NII | | $ | 0.1838 | |
Class S | | NII | | $ | 0.1652 | |
Class S2 | | NII | | $ | 0.1792 | |
Class T | | NII | | $ | 0.1111 | |
All Classes | | STCG | | $ | 0.0464 | |
All Classes | | LTCG | | $ | 0.4278 | |
| | |
ING Index Solution 2035 Portfolio | | | | | | |
Class ADV | | NII | | $ | 0.1203 | |
Class I | | NII | | $ | 0.1542 | |
Class S | | NII | | $ | 0.1372 | |
Class S2 | | NII | | $ | 0.1499 | |
Class T | | NII | | $ | 0.0818 | |
All Classes | | STCG | | $ | 0.0188 | |
All Classes | | LTCG | | $ | 0.4329 | |
| | |
ING Index Solution 2045 Portfolio | | | | | | |
Class ADV | | NII | | $ | 0.0866 | |
Class I | | NII | | $ | 0.1147 | |
Class S | | NII | | $ | 0.1008 | |
Class S2 | | NII | | $ | 0.1098 | |
Class T | | NII | | $ | 0.0477 | |
All Classes | | STCG | | $ | 0.0381 | |
All Classes | | LTCG | | $ | 0.3282 | |
58
TAX INFORMATION (UNAUDITED) (CONTINUED)
| | | | | | |
Portfolio Name | | Type | | Per Share Amount | |
| | |
ING Index Solution 2055 Portfolio | | | | | | |
Class ADV | | NII | | $ | 0.0002 | |
Class I | | NII | | $ | 0.0102 | |
Class S | | NII | | $ | 0.0055 | |
Class S2 | | NII | | $ | 0.0081 | |
Class T | | NII | | $ | — | |
All Classes | | STCG | | $ | 0.1181 | |
NII - Net investment income
STCG - Short-term capital gain
LTCG - Long-term capital gain
Of the ordinary distributions made during the year ended December 31, 2011, the following percentages qualify for the dividends received deduction (DRD) available to corporate shareholders:
| | | | |
| |
ING Index Solution Income Portfolio | | | 19.77 | % |
| |
ING Index Solution 2015 Portfolio | | | 26.24 | % |
| |
ING Index Solution 2025 Portfolio | | | 48.10 | % |
| |
ING Index Solution 2035 Portfolio | | | 55.22 | % |
| |
ING Index Solution 2045 Portfolio | | | 43.64 | % |
| |
ING Index Solution 2055 Portfolio | | | 4.43 | % |
The Regulated Investment Company Modernization Act of 2010 allows qualified fund-of-funds to elect to pass through the ability to take foreign tax credits (or deductions) to the extent that foreign taxes are passed through from underlying funds. A qualified fund-of-funds is a regulated investment company that has at least 50% of the value of its total assets invested in other regulated investment companies at the end of each quarter of the taxable year. Pursuant to Section 853 of the Internal Revenue Code, the Portfolios designate the following amounts as foreign taxes paid for the year ended December 31, 2011:
| | | | | | | | | | | | |
| | | Creditable
Foreign Taxes
Paid | | | Per Share
Amount | | | Portion of Ordinary Income
Distribution Derived from
Foreign Sourced Income* | |
| | | |
ING Index Solution Income Portfolio | | $ | 29,622 | | | $ | 0.0018 | | | | 3.66 | % |
| | | |
ING Index Solution 2015 Portfolio | | $ | 64,981 | | | $ | 0.0033 | | | | 9.64 | % |
| | | |
ING Index Solution 2025 Portfolio | | $ | 116,442 | | | $ | 0.0045 | | | | 17.55 | % |
| | | |
ING Index Solution 2035 Portfolio | | $ | 101,428 | | | $ | 0.0052 | | | | 24.76 | % |
| | | |
ING Index Solution 2045 Portfolio | | $ | 74,798 | | | $ | 0.0064 | | | | 33.33 | % |
| | | |
ING Index Solution 2055 Portfolio | | $ | 7,226 | | | $ | 0.0074 | | | | 33.97 | % |
| * | None of the Portfolios listed above derived any income from ineligible foreign sources as defined under Section 901(j) of the Internal Revenue Code. |
Above figures may differ from those cited elsewhere in this report due to differences in the calculation of income and gains under U.S. generally accepted accounting principles (book) purposes and Internal Revenue Service (tax) purposes.
Shareholders are strongly advised to consult their own tax advisers with respect to the tax consequences of their investments in the Portfolios. In January, shareholders, excluding corporate shareholders, receive an IRS 1099-DIV regarding the federal tax status of the dividends and distributions they received in the calendar year.
59
DIRECTOR AND OFFICER INFORMATION (UNAUDITED)
The business and affairs of the Company are managed under the direction of the Company’s Board. A Director who is not an interested person of the Company, as defined in the 1940 Act, is an independent director (“Independent Director”). The Directors and Officers of the Company are listed below. The Statement of Additional Information includes additional information about directors of the Company and is available, without charge, upon request at (800) 992-0180.
| | | | | | | | | | |
Name, Address and Age | | Position(s) held with the Company | | Term of Office and Length of Time Served(1) | | Principal Occupation(s) during the Past 5 Years | | Number of Portfolios in
Fund Complex
Overseen by Director(2) | | Other Board Positions
held by Director |
Independent Directors: | | | | | | | | | | |
| | | | | |
Colleen D. Baldwin 7337 East Doubletree Ranch Rd. Suite 100 Scottsdale, Arizona 85258 Age: 51 | | Director | | November 2007 -Present | | President, Glantuam Partners, LLC, a business consulting firm (January 2009 - Present) and Consultant (January 2005 - Present). | | 140 | | None. |
| | | | | |
John V. Boyer 7337 East Doubletree Ranch Rd. Suite 100 Scottsdale, Arizona 85258 Age: 58 | | Director | | November 1997 - Present | | President and Chief Executive Officer, Bechtler Arts Foundation, an arts and education foundation (January 2008 - Present). Formerly, Consultant (July 2007 - February 2008) and President and Chief Executive Officer, Franklin and Eleanor Roosevelt Institute, a public policy foundation (March 2006 - July 2007). | | 140 | | None. |
| | | | | |
Patricia W. Chadwick 7337 East Doubletree Ranch Rd. Suite 100 Scottsdale, Arizona 85258 Age: 63 | | Director | | January 2006 - Present | | Consultant and President, Ravengate Partners LLC, a consulting firm that provides advice regarding financial markets and the global economy (January 2000 - Present). | | 140 | | Wisconsin Energy Corporation (June 2006 - Present) and The Royce Fund, 35 Funds (December 2009 - Present). |
| | | | | |
Peter S. Drotch 7337 East Doubletree Ranch Rd. Suite 100 Scottsdale, Arizona 85258 Age: 70 | | Director | | November 2007 - Present | | Retired. | | 140 | | First Marblehead Corporation (September 2003 - Present). |
| | | | | |
J. Michael Earley 7337 East Doubletree Ranch Rd. Suite 100 Scottsdale, Arizona 85258 Age: 66 | | Director | | January 2005 - Present | | Retired. Formerly, Banking President and Chief Executive Officer, Bankers Trust Company, N.A., Des Moines (June 1992 - December 2008). | | 140 | | None. |
| | | | | |
Patrick W. Kenny 7337 East Doubletree Ranch Rd. Suite 100 Scottsdale, Arizona 85258 Age: 69 | | Director | | March 2002 - Present | | Retired. Formerly, President and Chief Executive Officer, International Insurance Society (June 2001 - June 2009). | | 140 | | Assured Guaranty Ltd. (April 2004 - Present). |
| | | | | |
Sheryl K. Pressler 7337 East Doubletree Ranch Rd. Suite 100 Scottsdale, Arizona 85258 Age: 61 | | Director | | January 2006 - Present | | Consultant (May 2001 - Present). | | 140 | | Stillwater Mining Company (May 2002 - Present). |
| | | | | |
Roger B. Vincent 7337 East Doubletree Ranch Rd. Suite 100 Scottsdale, Arizona 85258 Age: 66 | | Chairperson/Director | | January 2005 - Present | | President, Springwell Corporation, a corporate finance firm (March 1989 - Present). | | 140 | | UGI Corporation (February 2006 - Present) and UGI Utilities, Inc. (February 2006 - Present). |
60
DIRECTOR AND OFFICER INFORMATION (UNAUDITED) (CONTINUED)
| | | | | | | | | | |
Name, Address and Age | | Position(s) held with the Company | | Term of Office and Length of Time Served(1) | | Principal Occupation(s) during the Past 5 Years | | Number of Portfolios in
Fund Complex
Overseen by Director(2) | | Other Board Positions
held by Director |
Trustees who are “Interested Persons”: |
| | | | | |
Robert W. Crispin (3) 7337 East Doubletree Ranch Rd. Suite 100 Scottsdale, Arizona 85258 Age: 65 | | Director | | November 2007 - Present | | Retired. Formerly, Chairman and Chief Executive Officer, ING Investment Management Co. (July 2001 - December 2007). | | 140 | | Intact Financial Corporation (December 2004 - Present) and PFM Group (November 2010 - Present). |
| | | | | |
Shaun P. Mathews (3) 7337 East Doubletree Ranch Rd. Suite 100 Scottsdale, Arizona 85258 Age: 56 | | Director | | November 2007 - Present | | President and Chief Executive Officer, ING Investments, LLC (November 2006 - Present). | | 177 | | ING Capital Corporation, LLC (December 2005 - Present). |
| (1) | | Directors serve until their successors are duly elected and qualified. The tenure of each Director is subject to the Board’s retirement policy which states that each duly elected or appointed Director who is not an “interested person” of the Company, as defined in the 1940 Act, as amended (“Independent Directors”), shall retire from service as a Director at the conclusion of the first regularly scheduled quarterly meeting of the Board that is held after the Director reaches the age of 72. A unanimous vote of the Board may extend the retirement date of a Director for up to one year. An extension may be permitted if the retirement would trigger a requirement to hold a meeting of shareholders of the Company under applicable law, whether for purposes of appointing a successor to the Director or if otherwise necessary under applicable law, in which case the extension would apply until such time as the shareholder meeting can be held or is no longer needed. |
| (2) | | Except for Mr. Mathews and for the purposes of this table “ING Fund Complex” means the following investment companies: ING Asia Pacific High Dividend Equity Income Fund; ING Emerging Markets High Dividend Equity Fund; ING Emerging Markets Local Bond Fund; ING Equity Trust; ING Funds Trust; ING Global Equity Dividend and Premium Opportunity Fund; ING Global Advantage and Premium Opportunity Fund; ING Infrastructure, Industrials and Materials Fund; ING International High Dividend Equity Income Fund; ING Investors Trust; ING Mayflower Trust; ING Mutual Funds; ING Partners, Inc.; ING Prime Rate Trust; ING Risk Managed Natural Resources Fund; ING Senior Income Fund; ING Separate Portfolios Trust; ING Variable Insurance Trust; and ING Variable Products Trust. For Mr. Mathews, the ING Fund Complex also includes the following investment companies: ING Balanced Portfolio, Inc.; ING Intermediate Bond Portfolio; ING Money Market Portfolio; ING Series Fund, Inc.; ING Strategic Allocation Portfolios, Inc.; ING Variable Funds; and ING Variable Portfolios, Inc. Therefore, for the purposes of this table with reference to Mr. Mathews, “Fund Complex” includes these investment companies. The number of funds in the ING Fund Complex is as of January 31, 2012. |
| (3) | | Messrs. Crispin and Matthews are deemed “Interested Persons” of the Trust because of their current or prior affiliation with ING Groep, N.V., the parent corporation of the Investment Adviser(s) and the Distributor. |
61
DIRECTOR AND OFFICER INFORMATION (UNAUDITED) (CONTINUED)
| | | | | | |
Name, Address and Age | | Position(s) Held
With the Company | | Term of Office and Length of Time Served(1) | | Principal Occupation(s) during the Past 5 Years |
| | | |
Shaun P. Mathews 7337 East Doubletree Ranch Rd. Suite 100 Scottsdale, Arizona 85258 Age: 56 | | President and Chief Executive Officer | | November 2006 - Present | | President and Chief Executive Officer, ING Investments, LLC (November 2006 - Present). |
| | | |
Michael J. Roland 7337 East Doubletree Ranch Rd. Suite 100 Scottsdale, Arizona 85258 Age: 53 | | Executive Vice President | | January 2005 - Present | | Chief Compliance Officer, Directed Services LLC and ING Investments, LLC (March 2011 - Present) and Executive Vice President and Chief Operating Officer, ING Investments, LLC and ING Funds Services, LLC (January 2007 - Present). Formerly, Chief Compliance Officer, ING Funds (March 2011 - February 2012). |
| | | |
Stanley D. Vyner 230 Park Avenue New York, New York 10169 Age: 61 | | Executive Vice President Chief Investment Risk Officer | | January 2005 - Present September 2009 - Present | | Executive Vice President, ING Investments, LLC (July 2000 - Present) and Chief Investment Risk Officer, ING Investments, LLC (January 2003 - Present). |
| | | |
Kevin M. Gleason 7337 East Doubletree Ranch Rd. Suite 100 Scottsdale, Arizona 85258 Age: 45 | | Chief Compliance Officer | | February 2012 - Present | | Chief Compliance Officer, ING Funds (February 2012 - Present). Formerly, Assistant General Counsel and Assistant Secretary, The Northwestern Mutual Life Insurance Company, (June 2004 - January 2012). |
| | | |
Kimberly A. Anderson 7337 East Doubletree Ranch Rd. Suite 100 Scottsdale, Arizona 85258 Age: 47 | | Senior Vice President | | January 2005 - Present | | Senior Vice President, ING Investments, LLC (October 2003 - Present). |
| | | |
Todd Modic 7337 East Doubletree Ranch Rd. Suite 100 Scottsdale, Arizona 85258 Age: 44 | | Senior Vice President, Chief/Principal Financial Officer and Assistant Secretary | | March 2005 - Present | | Senior Vice President, ING Funds Services, LLC (March 2005 - Present). |
| | | |
Robert Terris 7337 East Doubletree Ranch Rd. Suite 100 Scottsdale, Arizona 85258 Age: 41 | | Senior Vice President | | May 2006 - Present | | Senior Vice President, Head of Division Operations, ING Funds Services, LLC (May 2006 - Present). |
| | | |
Gregory K. Wilson 7337 East Doubletree Ranch Rd. Suite 100 Scottsdale, Arizona 85258 Age: 52 | | Senior Vice President | | September 2011 - Present | | Vice President - Fund Compliance, ING Funds Services, LLC (October 2009 - Present). Formerly, Finance Director, ING Funds Services, LLC (September 2006 - October 2009). |
| | | |
Robyn L. Ichilov 7337 East Doubletree Ranch Rd. Suite 100 Scottsdale, Arizona 85258 Age: 44 | | Vice President and Treasurer | | January 2005 - Present | | Vice President and Treasurer, ING Funds Services, LLC (November 1995 - Present) and ING Investments, LLC (August 1997 - Present). |
| | | |
Maria M. Anderson 7337 East Doubletree Ranch Rd. Suite 100 Scottsdale, Arizona 85258 Age: 53 | | Vice President | | January 2005 - Present | | Vice President, ING Funds Services, LLC (September 2004 - Present). |
| | | |
Lauren D. Bensinger 7337 East Doubletree Ranch Rd. Suite 100 Scottsdale, Arizona 85258 Age: 58 | | Vice President | | January 2005 - Present | | Vice President, ING Investments, LLC and ING Funds Services, LLC (February 1996 - Present); Director of Compliance, ING Investments, LLC (October 2004 - Present); and Vice President and Money Laundering Reporting Officer, ING Investments Distributor, LLC (April 2010 - Present). Formerly, Chief Compliance Officer, ING Investments Distributor, LLC (August 1995 - April 2010) |
62
DIRECTOR AND OFFICER INFORMATION (UNAUDITED) (CONTINUED)
| | | | | | |
Name, Address and Age | | Position(s) Held
With the Company | | Term of Office and Length of Time Served(1) | | Principal Occupation(s) during the Past 5 Years |
| | | |
William Evans One Orange Way Windsor, Connecticut 06095 Age: 39 | | Vice President | | September 2007 - Present | | Senior Vice President (March 2010 - Present) and Head of Manager Research and Selection Group, ING Investment Management (April 2007 - Present). Formerly, Vice President, U.S. Mutual Funds and Investment Products (May 2005 - April 2007). |
| | | |
Denise Lewis 7337 East Doubletree Ranch Rd. Suite 100 Scottsdale, Arizona 85258 Age: 48 | | Vice President | | January 2007 - Present | | Vice President, ING Funds Services, LLC (December 2006 - Present). |
| | | |
Kimberly K. Springer 7337 East Doubletree Ranch Rd. Suite 100 Scottsdale, Arizona 85258 Age: 54 | | Vice President | | March 2006 - Present | | Vice President, ING Investment Management -ING Funds (March 2010 - Present); Vice President, ING Funds Services, LLC (March 2006 - Present) and Managing Paralegal, Registration Statements (June 2003 - Present). |
| | | |
Craig Wheeler 7337 East Doubletree Ranch Rd. Suite 100 Scottsdale, Arizona 85258 Age: 42 | | Assistant Vice President | | May 2008 - Present | | Assistant Vice President - Director of Tax, ING Funds Services, LLC (March 2008 - Present). Formerly, Tax Manager, ING Funds Services, LLC (March 2005 - March 2008). |
| | | |
Huey P. Falgout, Jr. 7337 East Doubletree Ranch Rd. Suite 100 Scottsdale, Arizona 85258 Age: 48 | | Secretary | | August 2003 - Present | | Senior Vice President and Chief Counsel, ING Investment Management - ING Funds (March 2010 - Present). Formerly, Chief Counsel, ING Americas, U.S. Legal Services (October 2003 - March 2010). |
| | | |
Paul Caldarelli 7337 East Doubletree Ranch Rd. Suite 100 Scottsdale, Arizona 85258 Age: 60 | | Assistant Secretary | | June 2010 - Present | | Vice President and Senior Counsel, ING Investment Management - ING Funds (March 2010 - Present). Formerly, Senior Counsel, ING Americas, U.S. Legal Services (April 2008 - March 2010) and Counsel, ING Americas, U.S. Legal Services (May 2005 - April 2008). |
| | | |
Theresa K. Kelety 7337 East Doubletree Ranch Rd. Suite 100 Scottsdale, Arizona 85258 Age: 49 | | Assistant Secretary | | August 2003 - Present | | Vice President and Senior Counsel, ING Investment Management - ING Funds (March 2010 - Present). Formerly, Senior Counsel, ING Americas, U.S. Legal Services (April 2008 - March 2010) and Counsel, ING Americas, U.S. Legal Services (April 2003 - April 2008). |
| | | |
Kathleen Nichols 7337 East Doubletree Ranch Rd. Suite 100 Scottsdale, Arizona 85258 Age: 36 | | Assistant Secretary | | May 2008 - Present | | Vice President and Counsel, ING Investment Management - ING Funds (March 2010 - Present). Formerly, Counsel, ING Americas, U.S. Legal Services (February 2008 - March 2010) and Associate, Ropes & Gray LLP (September 2005 - February 2008) |
| (1) | | The Officers hold office until the next annual meeting of the Board of Directors and until their successors shall have been elected and qualified. |
63
ADVISORY CONTRACT APPROVAL DISCUSSION (UNAUDITED)
BOARD CONSIDERATION AND RE-APPROVAL OF INVESTMENT ADVISORY CONTRACTS
Section 15(c) of the Investment Company Act of 1940, as amended (the “1940 Act”) provides that, after an initial period, the Portfolios’ existing investment advisory contracts will remain in effect only if the Board of Directors (the “Board”) of ING Partners, Inc. (the “Company”), including a majority of Board members who have no direct or indirect interest in the advisory contracts, and who are not “interested persons” of the Portfolios, as such term is defined under the 1940 Act (the “Independent Directors”), annually review and approve them. Thus, at a meeting held on November 17, 2011, the Board, including a majority of the Independent Directors, considered whether to renew the investment advisory contracts (the “Advisory Contracts”) between Directed Services LLC (the “Adviser”) and the Portfolios.
The Independent Directors also held separate meetings on October 12 and November 15, 2011 to consider the renewal of the Advisory Contracts. As a result, subsequent references herein to factors considered and determinations made by the Independent Directors include, as applicable, factors considered and determinations made on those earlier dates by the Independent Directors.
At its November 17, 2011 meeting, the Board voted to renew the Advisory Contracts for the Portfolios. In reaching these decisions, the Board took into account information furnished to it throughout the year at regular meetings of the Board and the Board’s committees, as well as information prepared specifically in connection with the annual renewal process. Determinations by the Independent Directors also took into account various factors that they believed, in light of the legal advice furnished to them by K&L Gates LLP (“K&L Gates”), their independent legal counsel, and their own business judgment, to be relevant. Further, while the advisory contracts for all the Portfolios were considered at the same Board meeting, the Directors considered each Portfolio’s advisory relationship separately.
Provided below is an overview of the Board’s contract approval process in general, as well as a discussion of certain specific factors that the Board considered at its renewal meeting. While the Board gave its attention to the information furnished at the request of the Independent Directors that was most relevant to its considerations, discussed below are a number of the primary factors relevant to the Board’s consideration as
to whether to renew the Advisory Contracts for the one-year period ending November 30, 2012. Each Board member may have accorded different weight to the various factors in reaching his or her conclusions with respect to each Portfolio’s advisory arrangement.
Overview of the Contract Renewal and Approval Process
The Board follows a structured process pursuant to which it seeks and considers relevant information when it decides whether to approve new or existing advisory arrangements for the investment companies in the ING Fund complex under its jurisdiction, including the Portfolios’ existing Advisory Contracts. Among other actions, the Independent Directors of the Board: retain the services of independent consultants with experience in the mutual fund industry to assist the Independent Directors in working with the personnel employed by the Adviser or its affiliates who administer the Portfolios (“Management”) to identify the types of information presented to the Board to inform its deliberations with respect to advisory relationships and to help evaluate that information; evaluate industry best practices in regards to the consideration of investment advisory contracts; established a specific format in which certain requested information is provided to the Board; and determine the process for reviewing such information in connection with advisory contract renewals and approvals. The result is a process (the “Contract Review Process”) employed by the Board and its Independent Directors to review and analyze information in connection with the annual renewal of the ING Funds’ advisory contracts, as well as the review and approval of new advisory relationships.
Since the Contract Review Process was first implemented, the Board’s membership has changed substantially through periodic retirements of some Directors and the appointment and election of new Directors. In addition, the Independent Directors have reviewed and refined the renewal and approval process at least annually in order to request additional information from Management and address certain unique characteristics related to the introduction of new Portfolios.
The Board has established two Investment Review Committees (each, an “IRC”), which meet independently and, at times, jointly, and a Contracts Committee. Among other matters, the Contracts Committee provides oversight with respect to the contracts renewal and approval process, and each Portfolio is assigned to an IRC which provides oversight
64
ADVISORY CONTRACT APPROVAL DISCUSSION (UNAUDITED) (CONTINUED)
regarding, among other matters, the investment performance of the Adviser. The IRCs may apply a heightened level of scrutiny in cases where performance has lagged a Portfolio’s relevant benchmark and/or selected peer group of investment companies (“Selected Peer Groups”).
The type and format of the information provided to the Board or to legal counsel for the Independent Directors in connection with the contract approval and renewal process has been codified in the ING Funds’ 15(c) Methodology Guide. This Guide was developed under the direction of the Independent Directors and sets out a blueprint pursuant to which the Independent Directors request certain information that they deem important to facilitate an informed review in connection with initial and annual approvals of advisory contracts.
Management provides certain of the information requested by the 15(c) Methodology Guide in Fund Analysis and Comparison Tables (“FACT sheets”) prior to the Independent Directors’ review of advisory arrangements (including the Portfolios’ Advisory Contracts). The Independent Directors previously retained an independent firm to verify and test the accuracy of certain FACT sheet data for a representative sample of funds in the ING Fund complex. In addition, the Contracts Committee routinely employs the services of an independent consultant to assist in its review and analysis of, among other matters, the 15(c) Methodology Guide, the content and format of the FACT sheets, and Selected Peer Groups to be used by the Portfolios for certain comparison purposes during the renewal process. As part of an ongoing process, the Contracts Committee recommends or considers recommendations from Management for refinements to the 15(c) Methodology Guide and other aspects of the review process, and the Board’s IRCs review benchmarks used to assess the performance of funds in the ING Fund complex.
The Board employed its process for reviewing contracts when considering the renewals of the Portfolios’ Advisory Contracts that would be effective through November 30, 2012. Set forth below is a discussion of many of the Board’s primary considerations and conclusions resulting from this process.
Nature, Extent and Quality of Service
In determining whether to approve the Advisory Contracts for the Portfolios for the year ended November 30, 2012, the Independent Directors received
and evaluated such information as they deemed necessary regarding the nature, extent and quality of services provided to the Portfolios by the Adviser. This included information regarding the Adviser provided throughout the year at regular meetings of the Board and its committees, as well as information furnished in connection with the contract renewal meetings.
The materials requested by the Independent Directors and provided to the Board, K&L Gates and/or independent consultants that assist the Independent Directors prior to the November 17, 2011 Board meeting included, among other information, the following items for each Portfolio: (1) FACT sheets that provided information regarding the performance and expenses of the Portfolio and other similarly managed funds in its Selected Peer Group, as well as information regarding the Portfolio’s investment portfolio, objective and strategies; (2) reports providing risk and attribution analyses of the Portfolio; (3) the 15(c) Methodology Guide, which describes how the FACT sheets were prepared, including the manner in which each Portfolio’s benchmark and Selected Peer Group were selected and how profitability was determined; (4) responses from the Adviser to a series of questions posed by K&L Gates on behalf of the Independent Directors; (5) copies of the forms of Advisory Contracts; (6) copies of the Forms ADV for the Adviser; (7) financial statements for the Adviser; (8) a draft of a narrative summary addressing key factors the Board customarily considers in evaluating the renewals of the ING Funds’ (including the Portfolio’s) advisory contracts, including a written analysis for the Portfolio of how performance, fees and expenses compare to its Selected Peer Group and/or designated benchmark(s); (9) independent analyses of Portfolio performance by the Company’s Chief Investment Risk Officer; (10) for open-end Portfolios, information regarding net asset flows into and out of the Portfolio; and (11) other information relevant to the Board’s evaluations.
The Board also noted that ING Groep, N.V. the ultimate parent company of the Adviser, has announced plans for the separation of its U.S.-based insurance, retirement services and investment management operations, which include the Adviser, into an independent, standalone company by the end of 2013. The Board further noted that this separation may result in the Adviser’s loss of access to the services and resources of its current ultimate parent company, which could adversely affect its businesses and profitability. The Board recognized that, if the separation plans are deemed to be a change of control, the investment
65
ADVISORY CONTRACT APPROVAL DISCUSSION (UNAUDITED) (CONTINUED)
advisory agreements for the Portfolios would terminate and trigger the necessity for new agreements, which would require the approval of the Board and, potentially, the shareholders of a Portfolio. The Board also recognized that there can be no assurance that the separation plan will be carried out. The Board considered the potential effects of the separation on the Portfolios and the Adviser, including its ability prior to, during and after the separation to perform the same level of service to the Portfolios as the Adviser currently provides. In this regard, the Board noted that the Adviser did not currently anticipate that the separation would have a material adverse impact on the Portfolios or their operations and administration.
For each Portfolio, Class I shares were used for purposes of certain comparisons between the Portfolio and its Selected Peer Group. Class I shares generally were selected so that a Portfolio’s share class with the longest performance history was compared to the analogous class of shares for each fund in its Selected Peer Group. The mutual funds included in the Portfolios’ Selected Peer Groups were selected based upon criteria designed to mirror the Portfolio share class being compared to the Selected Peer Groups. The Portfolios invest in a combination of mutual funds (“Underlying Funds”) that, in turn, invest directly in a wide range of portfolio securities (such as stocks and bonds). It should be noted that the performance of a Portfolio primarily reflects the performance of the Underlying Funds in which it invests.
The Board noted that the Portfolios benefit from the services of the Adviser’s Investment Risk Management Department (the “IRMD”), under the leadership of the Chief Investment Risk Officer, the costs of which are shared by the Portfolios and the Adviser. The Board noted that the IRMD regularly presents written materials and reports to the IRCs that focus on the investment risks of the Portfolios. The Board also noted that the IRMD provides the IRCs with analyses that are developed to assist the IRCs in identifying trends in Portfolio performance and other areas over consecutive periods. The Board noted that the services provided by the IRMD are meant to provide an additional perspective for the benefit of the Committees.
The Board also noted the proactive approach that the Adviser, working in cooperation with the IRCs, has taken to advocate or recommend, when it believed appropriate, changes designed to assist in improving the Portfolios’ performance.
In considering the Portfolios’ Advisory Contracts, the Board also considered the extent of benefits provided
to the Portfolios’ shareholders, beyond advisory services, from being part of the ING family of funds. This includes, in most cases, the right to exchange or transfer investments, without a sales charge, between the same class of shares of such funds or among ING Funds available on a product platform, and the wide range of ING Funds available for exchange or transfer. The Board also took into account the Adviser’s ongoing efforts to reduce the expenses of the ING Funds through renegotiated arrangements with the ING Funds’ service providers. In addition, the Board considered the efforts of the Adviser and the expenses that it incurred in recent years to help make the ING Fund complex more balanced and efficient by the launch of new investment products and the combinations of similar funds.
Further, the Board received periodic reports showing that the investment policies and restrictions for each Portfolio were consistently complied with and other periodic reports covering matters such as compliance by Adviser personnel with codes of ethics. The Board considered reports from the Company’s Chief Compliance Officer (“CCO”) evaluating whether the regulatory compliance systems and procedures of the Adviser are reasonably designed to assure compliance with the federal securities laws, including those related to, among others, late trading and market timing, best execution, fair value pricing, proxy voting and trade allocation practices. The Board also took into account the CCO’s annual and periodic reports and recommendations with respect to service provider compliance programs. In this regard, the Board also considered the policies and procedures developed by the CCO in consultation with the Board’s Compliance Committee that guide the CCO’s compliance oversight function.
The Board reviewed the level of staffing, quality and experience of each Portfolio’s portfolio management team. The Board took into account the respective resources and reputation of the Adviser, and evaluated the ability of the Adviser to attract and retain qualified investment advisory personnel. The Board also considered the adequacy of the resources committed to the Portfolios (and other relevant funds in the ING Fund complex) by the Adviser, and whether those resources are commensurate with the needs of the Portfolios and are sufficient to sustain appropriate levels of performance and compliance needs. In this regard, the Board considered the financial stability of the Adviser.
66
ADVISORY CONTRACT APPROVAL DISCUSSION (UNAUDITED) (CONTINUED)
Based on their deliberations and the materials presented to them, the Board concluded that the advisory and related services provided by the Adviser are appropriate in light of the Portfolios’ operations, the competitive landscape of the investment company business, and investor needs, and that the nature and quality of the overall services provided by the Adviser were appropriate.
Portfolio Performance
In assessing advisory relationships, the Board placed emphasis on the investment returns of each Portfolio. While the Board considered the performance reports and discussions with portfolio managers at Board and committee meetings during the year, particular attention in assessing performance was given to the FACT sheets furnished in connection with the renewal process. The FACT sheet prepared for each Portfolio included its investment performance compared to the Portfolio’s Morningstar category median and/or Lipper category median, Selected Peer Group and primary benchmark. The FACT sheet performance data was as of June 30, 2011. In addition, the Board also considered at its November 17, 2011 meeting certain additional data regarding performance and Portfolio asset levels as of October 31, 2011. The Board’s findings specific to each Portfolio’s performance are discussed under “Portfolio-by-Portfolio Analysis” below.
Economies of Scale
When evaluating the reasonableness of advisory fee rates, the Board also considered whether economies of scale will be realized by the Adviser as a Portfolio grows larger and the extent to which any such economies are reflected in contractual fee rates. In this regard, the Board noted a Portfolio would benefit from waivers to fees payable at the Portfolio level, and considered the extent to which economies of scale could effectively be realized through expense reductions resulting from such waivers or breakpoint discounts. In evaluating fee breakpoint arrangements and economies of scale, the Independent Directors also considered prior periodic management reports, industry information on this topic, and the Portfolio’s investment performance based on their investments in the Underlying Funds.
Information Regarding Services to Other Clients
The Board requested and considered information regarding the nature of services and fee rates offered by the Adviser to other clients, including other registered investment companies and relevant
institutional accounts. When fee rates offered to other clients differed materially from those charged to a Portfolio, the Board considered any underlying rationale provided by the Adviser for these differences. The Board also noted that the fee rates charged to the Portfolios and other institutional clients of the Adviser (including other investment companies) may differ materially due to, among other reasons: differences in services; different regulatory requirements associated with registered investment companies, such as the Portfolios, as compared to non-registered investment company clients; market differences in fee rates that existed when a Portfolio first was organized; differences in the original sponsors of Portfolios that now are managed by the Adviser; investment capacity constraints that existed when certain contracts were first agreed upon or that might exist at present; and different pricing structures that are necessary to be competitive in different marketing channels.
Fee Rates and Profitability
The Board reviewed and considered each contractual investment advisory fee rate, combined with the administrative fee rate, payable by each Portfolio to the Adviser. In addition, the Board considered fee waivers and expense limitations applicable to the fees payable by the Portfolios.
The Board considered: (1) the fee structure of each Portfolio as it relates to the services provided under the contracts; and (2) the potential fall-out benefits to the Adviser and their respective affiliates from their association with the Portfolios.
For each Portfolio, the Board considered information on revenues, costs and profits realized by the Adviser, which was prepared by Management in accordance with the allocation methodology (including related assumptions) specified in the 15(c) Methodology Guide. In addition, the Board considered information that it requested and was provided by Management with respect to the profitability of service providers affiliated with the Adviser.
Although the 15(c) Methodology Guide establishes certain standards for profit calculation, the Board recognized that profitability analysis on a client-by-client basis is not an exact science and there is no uniform methodology within the asset management industry for determining profitability for this purpose. In this context, the Board realized that Management’s calculations regarding its costs incurred in establishing the infrastructure necessary for the Portfolios’
67
ADVISORY CONTRACT APPROVAL DISCUSSION (UNAUDITED) (CONTINUED)
operations may not be fully reflected in the expenses allocated to each Portfolio in determining profitability, and that the information presented may not portray all of the costs borne by the Adviser and Management or capture their entrepreneurial risk associated with offering and managing a mutual fund complex in the current regulatory and market environment. In addition, the Board recognized that the use of different methodologies for purposes of calculating profit data can give rise to dramatically different profit and loss results.
In making its determinations, the Board based its conclusions as to the reasonableness of the advisory fees of the Adviser primarily on the factors described for each Portfolio below. At the request of the Board, the Adviser has from time to time agreed to implement remedial actions regarding certain Portfolios. These remedial actions have included, among others: reductions in fee rates and strategy modifications.
Portfolio-by-Portfolio Analysis
The following paragraphs outline certain of the specific factors that the Board considered, and the conclusions reached, at its November 17, 2011 meeting in relation to renewing each Portfolio’s current Advisory Contracts. These specific factors are in addition to those considerations discussed above. In each case, the Portfolio’s performance was compared to its Morningstar category median and average, as well as its primary benchmark, a broad-based securities market index that appears in the Portfolio’s prospectus. With respect to Morningstar quintile rankings, the first quintile represents the highest (best) performance and the fifth quintile represents the lowest performance. Each Portfolio’s management fee and expense ratio were compared to the fees and expense ratios of the funds in its Selected Peer Group.
ING Index Solution Income Portfolio
In considering whether to approve the renewal of the Advisory Contract for ING Index Solution Income Portfolio, the Board considered that, based on performance data for the periods ended June 30, 2011: (1) the Portfolio outperformed its Morningstar category median for the most recent calendar quarter and three-year period, but underperformed for the year-to-date and one-year periods; (2) the Portfolio underperformed its primary benchmark for all periods presented, with the exception of the three-year period, during which it outperformed; and (3) the Portfolio is ranked in the second quintile for its Morningstar category for the
most recent calendar quarter and three-year periods, and the fourth quintile for the year-to-date and one-year periods.
In considering the fees payable under the Advisory Contract for the Portfolio, the Board took into account the factors described above and also considered: (1) the fairness of the compensation under an Advisory Contract with a level fee rate that does not include breakpoints; and (2) the pricing structure (including the expense ratio to be borne by shareholders) of the Portfolio, as compared to its Selected Peer Group, including that: (a) the management fee for the Portfolio is below the median and the average management fees of the funds in its Selected Peer Group; and (b) the expense ratio for the Portfolio is below the median and the average expense ratios of the funds in its Selected Peer Group.
In analyzing the fee data, the Board took into account that the Portfolio indirectly bears the fees payable by the Underlying Funds in which the Portfolio invests.
After its deliberation, the Board reached the following conclusions: (1) the Portfolio’s management fee rate is reasonable in the context of all factors considered by the Board; (2) the Portfolio’s expense ratio is reasonable in the context of all factors considered by the Board; and (3) the Portfolio’s performance is reasonable in the context of all factors considered by the Board. Based on these conclusions and other factors, the Board voted to renew the Advisory Contract for the Portfolio for the year ending November 30, 2012. During this renewal process, different Board members may have given different weight to different individual factors and related conclusions.
ING Index Solution 2015 Portfolio
In considering whether to approve the renewal of the Advisory Contract for ING Index Solution 2015 Portfolio, the Board considered that, based on performance data for the periods ended June 30, 2011: (1) the Portfolio outperformed its Morningstar category median for the most recent calendar quarter and three-year period, but underperformed for the year-to-date and one-year periods; (2) the Portfolio underperformed its primary benchmark for all periods presented; and (3) the Portfolio is ranked in the second quintile of its Morningstar category for the most recent calendar quarter and three-year periods, and the fifth (lowest) quintile for the year-to-date and one-year periods.
68
ADVISORY CONTRACT APPROVAL DISCUSSION (UNAUDITED) (CONTINUED)
In analyzing this performance data, the Board took into account: (1) Management’s analysis regarding the effect that the Portfolio’s asset allocation strategy had on its performance during certain periods; (2) Management’s representations regarding the reasonableness of the Portfolio’s performance during certain periods and Management’s expectation that longer-term performance will improve; (3) Management’s views regarding the manner in which the composition of the Portfolio’s Selected Peer Group affects relative performance data; (4) Management’s discussion of changes to the Portfolio’s underlying investment universe and investment strategy in April 2011; and (5) that Management would continue to monitor, and the Board or its IRC would periodically review, the Portfolio’s investment performance.
In considering the fees payable under the Advisory Contract for the Portfolio, the Board took into account the factors described above and also considered: (1) the fairness of the compensation under an Advisory Contract with a level fee rate that does not include breakpoints; and (2) the pricing structure (including the expense ratio to be borne by shareholders) of the Portfolio, as compared to its Selected Peer Group, including that: (a) the management fee for the Portfolio is below the median and the average management fees of the funds in its Selected Peer Group; and (b) the expense ratio for the Portfolio is below the median and the average expense ratios of the funds in its Selected Peer Group.
In analyzing the fee data, the Board took into account that the Portfolio indirectly bears the fees payable by the Underlying Funds in which the Portfolio invests.
After its deliberation, the Board reached the following conclusions: (1) the Portfolio’s management fee rate is reasonable in the context of all factors considered by the Board; (2) the Portfolio’s expense ratio is reasonable in the context of all factors considered by the Board; and (3) that Management would continue to monitor, and the Board or its IRC would periodically review, the Portfolio’s investment performance. Based on these conclusions and other factors, the Board voted to renew the Advisory Contract for the Portfolio for the year ending November 30, 2012. During this renewal process, different Board members may have given different weight to different individual factors and related conclusions.
ING Index Solution 2025 Portfolio
In considering whether to approve the renewal of the Advisory Contract for ING Index Solution 2025 Portfolio, the Board considered that, based on performance data for the periods ended June 30, 2011: (1) the Portfolio outperformed its Morningstar category median for all periods presented, with the exception of the one-year period, during which it underperformed; (2) the Portfolio underperformed its primary benchmark for all periods presented; and (3) the Portfolio is ranked in the second quintile of its Morningstar category for the year-to-date and three-year periods, the third quintile for the most recent calendar quarter, and the fourth quintile for the one-year period.
In analyzing this performance data, the Board took into account: (1) Management’s analysis regarding the effect that the asset classes in which Underlying Funds invest had on the Portfolio’s performance during certain periods; (2) Management’s views regarding the manner in which the composition of the Portfolio’s Selected Peer Group affects relative performance data; and (3) Management’s discussion of changes in April 2011 to the Portfolio’s underlying investment universe and investment strategy.
In considering the fees payable under the Advisory Contract for the Portfolio, the Board took into account the factors described above and also considered: (1) the fairness of the compensation under an Advisory Contract with a level fee rate that does not include breakpoints; and (2) the pricing structure (including the expense ratio to be borne by shareholders) of the Portfolio, as compared to its Selected Peer Group, including that: (a) the management fee for the Portfolio is below the median and the average management fees of the funds in its Selected Peer Group; and (b) the expense ratio for the Portfolio is below the median and the average expense ratios of the funds in its Selected Peer Group.
In analyzing the fee data, the Board took into account that the Portfolio indirectly bears the fees payable by the Underlying Funds in which the Portfolio invests.
After its deliberation, the Board reached the following conclusions: (1) the Portfolio’s management fee rate is reasonable in the context of all factors considered by the Board; (2) the Portfolio’s expense ratio is reasonable in the context of all factors considered by the Board; and (3) the Portfolio’s performance is reasonable in the context of all factors considered by the Board. Based on these conclusions and other factors, the Board voted to renew the Advisory
69
ADVISORY CONTRACT APPROVAL DISCUSSION (UNAUDITED) (CONTINUED)
Contract for the Portfolio for the year ending November 30, 2012. During this renewal process, different Board members may have given different weight to different individual factors and related conclusions.
ING Index Solution 2035 Portfolio
In considering whether to approve the renewal of the Advisory Contract for ING Index Solution 2035 Portfolio, the Board considered that, based on performance data for the periods ended June 30, 2011: (1) the Portfolio outperformed its Morningstar category median for all periods presented, with the exception of the one-year period, during which it underperformed; (2) the Portfolio underperformed its primary benchmark for all periods presented; and (3) the Portfolio is ranked in the second quintile of its Morningstar category for the year-to-date period, the third quintile for the most recent calendar quarter and three-year periods, and the fourth quintile for the one-year period.
In analyzing this performance data, the Board took into account: (1) Management’s analysis regarding the effect that the asset classes in which Underlying Funds invest had on the Portfolio’s performance during certain periods; (2) Management’s views regarding the manner in which the composition of the Portfolio’s Selected Peer Group affects relative performance data; and (3) Management’s discussion of changes in April 2011 to the Portfolio’s underlying investment universe and investment strategy.
In considering the fees payable under the Advisory Contract for the Portfolio, the Board took into account the factors described above and also considered: (1) the fairness of the compensation under an Advisory Contract with a level fee rate that does not include breakpoints; and (2) the pricing structure (including the expense ratio to be borne by shareholders) of the Portfolio, as compared to its Selected Peer Group, including that: (a) the management fee for the Portfolio is below the median and the average management fees of the funds in its Selected Peer Group; and (b) the expense ratio for the Portfolio is below the median and the average expense ratios of the funds in its Selected Peer Group.
In analyzing the fee data, the Board took into account that the Portfolio indirectly bears the fees payable by the Underlying Funds in which the Portfolio invests.
After its deliberation, the Board reached the following conclusions: (1) the Portfolio’s management fee rate is reasonable in the context of all factors considered by
the Board; (2) the Portfolio’s expense ratio is reasonable in the context of all factors considered by the Board; and (3) the Portfolio’s performance is reasonable in the context of all factors considered by the Board. Based on these conclusions and other factors, the Board voted to renew the Advisory Contract for the Portfolio for the year ending November 30, 2012. During this renewal process, different Board members may have given different weight to different individual factors and related conclusions.
ING Index Solution 2045 Portfolio
In considering whether to approve the renewal of the Advisory Contract for ING Index Solution 2045 Portfolio, the Board considered that, based on performance data for the periods ended June 30, 2011: (1) the Portfolio outperformed its Morningstar category median for all periods presented; (2) the Portfolio outperformed its primary benchmark for the year-to-date and one-year periods, but underperformed for the most recent calendar quarter and three-year periods; and (3) the Portfolio is ranked in the first (highest) quintile of its Morningstar category for the year-to-date and one-year periods, the second quintile for the most recent calendar quarter, and the third quintile for the three-year period.
In considering the fees payable under the Advisory Contract for the Portfolio, the Board took into account the factors described above and also considered: (1) the fairness of the compensation under an Advisory Contract with a level fee rate that does not include breakpoints; and (2) the pricing structure (including the expense ratio to be borne by shareholders) of the Portfolio, as compared to its Selected Peer Group, including that: (a) the management fee for the Portfolio is below the median and the average management fees of the funds in its Selected Peer Group; and (b) the expense ratio for the Portfolio is below the median and the average expense ratios of the funds in its Selected Peer Group.
In analyzing the fee data, the Board took into account that the Portfolio indirectly bears the fees payable by the Underlying Funds in which the Portfolio invests.
After its deliberation, the Board reached the following conclusions: (1) the Portfolio’s management fee rate is reasonable in the context of all factors considered by the Board; (2) the Portfolio’s expense ratio is reasonable in the context of all factors considered by the Board; and (3) the Portfolio’s performance is
70
ADVISORY CONTRACT APPROVAL DISCUSSION (UNAUDITED) (CONTINUED)
reasonable in the context of all factors considered by the Board. Based on these conclusions and other factors, the Board voted to renew the Advisory Contract for the Portfolio for the year ending November 30, 2012. During this renewal process, different Board members may have given different weight to different individual factors and related conclusions.
ING Index Solution 2055 Portfolio
In considering whether to approve the renewal of the Advisory Contract for ING Index Solution 2055 Portfolio, the Board considered that, based on performance data for the periods ended June 30, 2011: (1) the Portfolio outperformed its Morningstar category median for all periods presented; (2) the Portfolio outperformed its primary benchmark for all periods presented, with the exception of the most recent calendar quarter, during which it underperformed; and (3) the Portfolio is ranked in the first (highest) quintile of its Morningstar category for the year-to-date and one-year periods, and the third quintile for the most recent calendar quarter.
In considering the fees payable under the Advisory Contract for the Portfolio, the Board took into account the factors described above and also considered: (1) the fairness of the compensation under an Advisory Contract with a level fee rate that does not include breakpoints; and (2) the pricing structure (including the expense ratio to be borne by shareholders) of the Portfolio, as compared to its Selected Peer Group, including that: (a) the management fee for the Portfolio is below the median and the average management fees of the funds in its Selected Peer Group; and (b) the expense ratio for the Portfolio is below the median and the average expense ratios of the funds in its Selected Peer Group.
In analyzing the fee data, the Board took into account that the Portfolio indirectly bears the fees payable by the Underlying Funds in which the Portfolio invests.
After its deliberation, the Board reached the following conclusions: (1) the Portfolio’s management fee rate is reasonable in the context of all factors considered by the Board; (2) the Portfolio’s expense ratio is reasonable in the context of all factors considered by the Board; and (3) the Portfolio’s performance is reasonable in the context of all factors considered by the Board. Based on these conclusions and other factors, the Board voted to renew the Advisory Contract for the Portfolio for the year ending
November 30, 2012. During this renewal process, different Board members may have given different weight to different individual factors and related conclusions.
Board Consideration and Approval of New Advisory Contracts for ING Index Solution Portfolio 2020, ING Index Solution Portfolio 2030, ING Index Solution Portfolio 2040, ING Index Solution Portfolio 2050
At a meeting held on July 15, 2011, the Board considered the initial approval of Advisory and Sub-Advisory Contracts for ING Index Solution Portfolio 2020, ING Index Solution Portfolio 2030, ING Index Solution Portfolio 2040, ING Index Solution Portfolio 2050 (each a “Portfolio,” and collectively, the “Portfolios”).
In determining whether to approve the Advisory Contract for each Portfolio, the Board received and evaluated such information as it deemed necessary for an informed determination of whether each agreement, and the proposed policies and procedures for the Portfolios, should be approved. The materials provided to the Board in support of the Portfolios and the Portfolios’ advisory arrangements included the following: (1) a memorandum presenting Management’s rationale for requesting the launch of the Portfolios that discusses, among other things, the experience and expertise of Directed Services LLC (“DSL”) in the management of other Funds within the ING Funds complex, including the existing ING Solution Portfolios; (2) information about the Portfolios’ proposed investment objectives and strategies and anticipated portfolio characteristics; (3) FACT sheets for the Portfolios that compare the Portfolios’ proposed fee structures to their comparable Selected Peer Groups and Morningstar/Lipper category medians; (4) supporting documentation, including copies of the form of Advisory Contract for the Portfolios; and (5) other information relevant to the Board’s evaluation. In addition, the Board considered the information provided periodically throughout the year in presentations to the Board by DSL in the context of DSL’s oversight and management of Funds in the ING Funds complex.
At the Board meeting at which the Advisory Contract was considered, the Board considered that the Portfolios would be subject to the standard policies and procedures of ING Partners, Inc. (“IPI”) previously approved by the Board for other series of IPI and approved in accordance with Rule 38a-1 under the
71
ADVISORY CONTRACT APPROVAL DISCUSSION (UNAUDITED) (CONTINUED)
Investment Company Act of 1940. The Board also noted that, in managing the Fund, DSL would be subject to procedures adopted pursuant to Rule 206(4)-7 under the Investment Advisers Act of 1940 that had been previously approved by the Board in connection with other Funds in the ING Funds complex.
The Board’s consideration of whether to approve the Advisory Contract with DSL on behalf of the Portfolios took into account several factors including, but not limited to, the following: (1) the nature and quality of the services to be provided by DSL to the Portfolios under the proposed Advisory Contract; (2) DSL’s experience as a manager-of-managers overseeing sub-advisers to other Funds within the ING Funds complex, including similar Funds-of-Funds; (3) DSL’s strength and reputation within the industry; (4) the fairness of the compensation under the proposed Advisory Contract in light of the services to be provided to the Portfolios; (5) the costs for the services to be provided by DSL, including that the proposed advisory fee would not be subject to breakpoint discounts; (6) the pricing structure (including the estimated expense ratio to be borne by shareholders) of the Portfolios, including that: (a) the proposed management fee for each Portfolio is below the median and the average management fees of the funds in the Portfolio’s Selected Peer Group with the exception of ING Index Solution Portfolio 2020 of which the proposed management fee was equal to the median and below the average management fees of funds in its Selected Peer Group, and (b) the estimated expense ratio for each Portfolio is below the median and average expense ratios of the funds in the Portfolio’s Selected Peer Group; (7) the projected
profitability of DSL; (8) the personnel, operations, financial condition, and investment management capabilities, methodologies and resources of DSL, including its management team’s expertise in the management of other Funds, including other Funds-of-Funds and asset allocation products; (9) DSL’s compliance capabilities, as demonstrated by, among other things, its policies and procedures designed to prevent violations of the Federal securities laws, which had previously been approved by the Board in connection with their oversight of other Funds in the ING Funds complex; (10) the information that had been provided by DSL at regular Board meetings, and in anticipation of the March 2010 meeting, with respect to its capabilities in overseeing similar asset allocation products; and (11) “fall-out benefits” to DSL and its affiliates that were anticipated to arise from DSL’s management of the Portfolios.
After its deliberation, the Board reached the following conclusions: (1) each Portfolio’s proposed management fee rate is reasonable in the context of all factors considered by the Board; (2) the Portfolio’s estimated expense ratio is reasonable in the context of all factors considered by the Board; and (3) DSL maintains an appropriate compliance program, with this conclusion based upon the Board’s previous and ongoing review of the compliance program and the representations of the Fund’s CCO in materials provided to the Board in advance of the May meeting. Based on these conclusions and other factors, the Board voted to approve the Advisory Contract for the Portfolios. During its deliberations, different Board members may have given different weight to different individual factors and related conclusions.
72
Investment Adviser
Directed Services LLC
1475 Dunwoody Drive
West Chester, Pennsylvania 19380
Administrator
ING Funds Services, LLC
7337 East Doubletree Ranch Road, Suite 100
Scottsdale, Arizona 85258
Distributor
ING Investments Distributor, LLC
7337 East Doubletree Ranch Road, Suite 100
Scottsdale, Arizona 85258
Transfer Agent
BNY Mellon Investment Servicing (U.S.) Inc.
301 Bellevue Parkway
Wilmington, Delaware 19809
Independent Registered Public Accounting Firm
KPMG LLP
Two Financial Center
60 South Street
Boston, Massachusetts 02111
Custodian
The Bank of New York Mellon
One Wall Street
New York, New York 10286
Legal Counsel
Dechert LLP
1775 I Street, N.W.
Washington, D.C. 20006
Before investing, carefully consider the investment objectives, risks, charges and expenses of the variable universal life insurance policy or variable annuity contract and the underlying variable investment options. This and other information is contained in the prospectus for the variable universal life policy or variable annuity contract and the underlying variable investment options. Obtain these prospectuses from your agent/ registered representative and read them carefully before investing.
| | | | |
 | | VPAR-UISOL | | (1211-022112) |
Item 2. Code of Ethics.
As of the end of the period covered by this report, Registrant had adopted a code of ethics, as defined in Item 2 of Form N-CSR, that applies to the Registrant’s principal executive officer and principal financial officer. There were no amendments to the Code during the period covered by the report. The Registrant did not grant any waivers, including implicit waivers, from any provisions of the Code during the period covered by this report. The code of ethics is filed herewith pursuant to Item 10(a)(1), Exhibit 99.CODE ETH.
Item 3. Audit Committee Financial Expert.
The Board of Trustees has determined that J. Michael Earley and Peter Drotch are audit committee financial experts, as defined in Item 3 of Form N-CSR. Mr. Earley and Mr. Drotch are “independent” for purposes of Item 3 of Form N-CSR.
Item 4. Principal Accountant Fees and Services.
(a) Audit Fees: The aggregate fees billed for each of the last two fiscal years for professional services rendered by KPMG LLP (“KPMG”), the principal accountant for the audit of the registrant’s annual financial statements, for services that are normally provided by the accountant in connection with statutory and regulatory filings or engagements for those fiscal years were $764,500 for year ended December 31, 2011 and $709,000 for year ended December 31, 2010.
(b) Audit-Related Fees: The aggregate fees billed in each of the last two fiscal years for assurance and related services by KPMG that are reasonably related to the performance of the audit of the registrant’s financial statements and are not reported under paragraph (a) of this Item were $81,600 for year ended December 31, 2011 and $77,400 for year ended December 31, 2010.
(c) Tax Fees: The aggregate fees billed in each of the last two fiscal years for professional services rendered by KPMG for tax compliance, tax advice, and tax planning were $161,746 in the year ended December 31, 2011 and $161,189 in the year ended December 31, 2010. Such services included review of excise distribution calculations (if applicable), preparation of the Funds’ federal, state and excise tax returns, tax services related to mergers and routine consulting.
(d) All Other Fees: The aggregate fees billed in each of the last two fiscal years for products and services provided by KPMG, other than the services reported in paragraphs (a) through (c) of this Item. None
(e) (1) Audit Committee Pre-Approval Policies and Procedures
2
AUDIT AND NON-AUDIT SERVICES
PRE-APPROVAL POLICY
I. Statement of Principles
Under the Sarbanes-Oxley Act of 2002 (the “Act”), the Audit Committee of the Board of Directors or Trustees (the “Committee”) of the ING Funds (each a “Fund,” collectively, the “Funds”) set out on Exhibit A to this Audit and Non-Audit Services Pre-Approval Policy (“Policy”) is responsible for the oversight of the work of the Funds’ independent auditors. As part of its responsibilities, the Committee must pre-approve the audit and non-audit services performed by the auditors in order to assure that the provision of these services does not impair the auditors’ independence from the Funds. The Committee has adopted, and the Board has ratified, this Policy, which sets out the procedures and conditions under which the services of the independent auditors may be pre-approved.
Under Securities and Exchange Commission (“SEC”) rules promulgated in accordance with the Act, the Funds may establish two different approaches to pre-approving audit and non-audit services. The Committee may approve services without consideration of specific case-by-case services (“general pre-approval”) or it may pre-approve specific services (“specific pre-approval”). The Committee believes that the combination of these approaches contemplated in this Policy results in an effective and efficient method for pre-approving audit and non-audit services to be performed by the Funds’ independent auditors. Under this Policy, services that are not of a type that may receive general pre-approval require specific pre-approval by the Committee. Any proposed services that exceed pre-approved cost levels or budgeted amounts will also require the Committee’s specific pre-approval.
For both types of approval, the Committee considers whether the subject services are consistent with the SEC’s rules on auditor independence and that such services are compatible with maintaining the auditors independence. The Committee also considers whether a particular audit firm is in the best position to provide effective and efficient services to the Funds. Reasons that the auditors are in the best position include the auditors’ familiarity with the Funds’ business, personnel, culture, accounting systems, risk profile, and other factors, and whether the services will enhance the Funds’ ability to manage and control risk or improve audit quality. Such factors will be considered as a whole, with no one factor being determinative.
The appendices attached to this Policy describe the audit, audit-related, tax-related, and other services that have the Committee’s general pre-approval. For any service that has been approved through general pre-approval, the general pre-approval will remain in place for a period 12 months from the date of pre-approval, unless the Committee determines that a different period is appropriate. The Committee will annually review and pre-approve the services that may be provided by the independent auditors without specific pre-approval. The Committee will revise the list of services subject to general pre-approval as appropriate. This Policy does not serve as a delegation to Fund management of the Committee’s duty to pre-approve services performed by the Funds’ independent auditors.
3
II. Audit Services
The annual audit services engagement terms and fees are subject to the Committee’s specific pre-approval. Audit services are those services that are normally provided by auditors in connection with statutory and regulatory filings or engagements or those that generally only independent auditors can reasonably provide. They include the Funds’ annual financial statement audit and procedures that the independent auditors must perform in order to form an opinion on the Funds’ financial statements (e.g., information systems and procedural reviews and testing). The Committee will monitor the audit services engagement and approve any changes in terms, conditions or fees deemed by the Committee to be necessary or appropriate.
The Committee may grant general pre-approval to other audit services, such as statutory audits and services associated with SEC registration statements, periodic reports and other documents filed with the SEC or issued in connection with securities offerings.
The Committee has pre-approved the audit services listed on Appendix A. The Committee must specifically approve all audit services not listed on Appendix A.
III. Audit-related Services
Audit-related services are assurance and related services that are reasonably related to the performance of the audit or the review of the Funds’ financial statements or are traditionally performed by the independent auditors. The Committee believes that the provision of audit-related services will not impair the independent auditors’ independence, and therefore may grant pre-approval to audit-related services. Audit-related services include accounting consultations related to accounting, financial reporting or disclosure matters not classified as “audit services;” assistance with understanding and implementing new accounting and financial reporting guidance from rulemaking authorities; agreed-upon or expanded audit procedures relating to accounting and/or billing records required to respond to or comply with financial, accounting or regulatory reporting matters; and assistance with internal control reporting requirements under Form N-SAR or Form N-CSR.
The Committee has pre-approved the audit-related services listed on Appendix B. The Committee must specifically approve all audit-related services not listed on Appendix B.
IV. Tax Services
The Committee believes the independent auditors can provide tax services to the Funds, including tax compliance, tax planning, and tax advice, without compromising the auditors’ independence. Therefore, the Committee may grant general pre-approval with respect to tax services historically provided by the Funds’ independent auditors that do not, in the Committee’s view, impair auditor independence and that are consistent with the SEC’s rules on auditor independence.
The Committee will not grant pre-approval if the independent auditors initially recommends a transaction the sole business purpose of which is tax avoidance and the tax treatment of which may not be supported in the Internal Revenue Code and related regulations. The Committee may consult
4
outside counsel to determine that tax planning and reporting positions are consistent with this Policy.
The Committee has pre-approved the tax-related services listed on Appendix C. The Committee must specifically approve all tax-related services not listed on Appendix C.
V. Other Services
The Committee believes it may grant approval of non-audit services that are permissible services for independent auditors to a Fund. The Committee has determined to grant general pre-approval to other services that it believes are routine and recurring, do not impair auditor independence, and are consistent with SEC rules on auditor independence.
The Committee has pre-approved the non-audit services listed on Appendix D. The Committee must specifically approve all non-audit services not listed on Appendix D.
A list of the SEC’s prohibited non-audit services is attached to this Policy as Appendix E. The SEC’s rules and relevant guidance should be consulted to determine the precise definitions of these impermissible services and the applicability of exceptions to certain of the SEC’s prohibitions.
VI. Pre-approval of Fee levels and Budgeted Amounts
The Committee will annually establish pre-approval fee levels or budgeted amounts for audit, audit-related, tax and non-audit services to be provided to the Funds by the independent auditors. Any proposed services exceeding these levels or amounts require the Committee’s specific pre-approval. The Committee considers fees for audit and non-audit services when deciding whether to pre-approve services. The Committee may determine, for a pre-approval period of 12 months, the appropriate ratio between the total amount of fees for the Fund’s audit, audit-related, and tax services (including fees for services provided to Fund affiliates that are subject to pre-approval), and the total amount of fees for certain permissible non-audit services for the Fund classified as other services (including any such services provided to Fund affiliates that are subject to pre-approval).
VII. Procedures
Requests or applications for services to be provided by the independent auditors will be submitted to management. If management determines that the services do not fall within those services generally pre-approved by the Committee and set out in the appendices to these procedures, management will submit the services to the Committee or its delagee. Any such submission will include a detailed description of the services to be rendered. Notwithstanding this paragraph, the Committee will, on a quarterly basis, receive from the independent auditors a list of services provided for the previous calendar quarter on a cumulative basis by the auditors during the Pre-Approval Period.
5
VIII. Delegation
The Committee may delegate pre-approval authority to one or more of the Committee’s members. Any member or members to whom such pre-approval authority is delegated must report any pre-approval decisions, including any pre-approved services, to the Committee at its next scheduled meeting. The Committee will identify any member to whom pre-approval authority is delegated in writing. The member will retain such authority for a period of 12 months from the date of pre-approval unless the Committee determines that a different period is appropriate. The period of delegated authority may be terminated by the Committee or at the option of the member.
IX. Additional Requirements
The Committee will take any measures the Committee deems necessary or appropriate to oversee the work of the independent auditors and to assure the auditors’ independence from the Funds. This may include reviewing a formal written statement from the independent auditors delineating all relationships between the auditors and the Funds, consistent with Independence Standards Board No. 1, and discussing with the auditors their methods and procedures for ensuring independence.
Effective April 23, 2008, the KPMG LLP (“KPMG”) audit team for the ING Funds accepted the global responsibility for monitoring the auditor independence for KPMG relative to the ING Funds. Using a proprietary system called Sentinel, the audit team is able to identify and manage potential conflicts of interest across the member firms of the KPMG International Network and prevent the provision of prohibited services to the ING entities that would impair KPMG independence with the respect to the ING Funds. In addition to receiving pre-approval from the ING Funds Audit Committee for services provided to the ING Funds and for services for ING entities in the Investment Company Complex, the audit team has developed a process for periodic notification via email to the ING Funds’ Audit Committee Chairpersons regarding requests to provide services to ING Groep NV and its affiliates from KPMG offices worldwide. Additionally, KPMG provides a quarterly summary of the fees for services that have commenced for ING Groep NV and Affiliates at each Audit Committee Meeting.
6
Last Approved: September 29, 2010
7
Appendix A
Pre-Approved Audit Services for the Pre-Approval Period September 29, 2010 through December 31, 2011
Service
| | The Fund(s) | | Fee Range |
| | | | |
Statutory audits or financial audits (including tax services associated with audit services) | | Ö | | As presented to Audit Committee(1) |
| | | | |
Services associated with SEC registration statements, periodic reports and other documents filed with the SEC or other documents issued in connection with securities offerings (e.g., consents), and assistance in responding to SEC comment letters. | | Ö | | Not to exceed $9,750 per filing |
| | | | |
Consultations by Fund management with respect to accounting or disclosure treatment of transactions or events and/or the actual or potential effect of final or proposed rules, standards or interpretations by the SEC, Financial Accounting Standards Board, or other regulatory or standard setting bodies. | | Ö | | Not to exceed $8,000 during the Pre-Approval Period |
| | | | |
Seed capital audit and related review and issuance of consent on the N-2 registration statement | | Ö | | Not to exceed $13,000 per audit |
(1) For new Funds launched during the Pre-Approval Period, the fee ranges pre-approved will be the same as those for existing Funds, pro-rated in accordance with inception dates as provided in the auditors’ Proposal or any Engagement Letter covering the period at issue. Fees in the Engagement Letter will be controlling.
8
Appendix B
Pre-Approved Audit-Related Services for the Pre-Approval Period September 29, 2010 through December 31, 2011
Service
| | The Fund(s) | | Fund Affiliates | | Fee Range |
| | | | | | |
Services related to Fund mergers (Excludes tax services - See Appendix C for tax services associated with Fund mergers) | | Ö | | Ö | | Not to exceed $10,000 per merger |
| | | | | | |
Consultations by Fund management with respect to accounting or disclosure treatment of transactions or events and/or the actual or potential effect of final or proposed rules, standards or interpretations by the SEC, Financial Accounting Standards Board, or other regulatory or standard setting bodies. [Note: Under SEC rules some consultations may be “audit” services and others may be “audit-related” services.] | | Ö | | | | Not to exceed $5,000 per occurrence during the Pre-Approval Period |
| | | | | | |
Review of the Funds’ semi-annual and quarterly financial statements | | Ö | | | | Not to exceed $2,400 per set of financial statements per fund |
| | | | | | |
Reports to regulatory or government agencies related to the annual engagement | | Ö | | | | Up to $5,000 per occurrence during the Pre-Approval Period |
| | | | | | |
Regulatory compliance assistance | | Ö | | Ö | | Not to exceed $5,000 per quarter |
| | | | | | |
Training courses | | | | Ö | | Not to exceed $2,000 per course |
| | | | | | |
For Prime Rate Trust, agreed upon procedures for quarterly reports to rating agencies | | Ö | | | | Not to exceed $9,450 per quarter |
9
Appendix C
Pre-Approved Tax Services for the Pre-Approval Period September 29, 2010 through December 31, 2011
Service
| | The Fund(s) | | Fund
Affiliates | | Fee Range |
| | | | | | |
Preparation of federal and state income tax returns and federal excise tax returns for the Funds including assistance and review with excise tax distributions | | Ö | | | | As presented to Audit Committee(2) |
| | | | | | |
Review of IRC Sections 851(b) and 817(h) diversification testing on a real-time basis | | Ö | | | | As presented to Audit Committee(2) |
| | | | | | |
Assistance and advice regarding year-end reporting for 1099’s | | Ö | | | | As presented to Audit Committee(2) |
| | | | | | |
Tax assistance and advice regarding statutory, regulatory or administrative developments | | Ö | | Ö | | Not to exceed $5,000 for the Funds or for the Funds’ investment adviser during the Pre-Approval Period |
(2) For new Funds launched during the Pre-Approval Period, the fee ranges pre-approved will be the same as those for existing Funds, pro-rated in accordance with inception dates as provided in the auditors’ Proposal or any Engagement Letter covering the period at issue. Fees in the Engagement Letter will be controlling.
10
Service
| | The Fund(s) | | Fund
Affiliates | | Fee Range |
| | | | | | |
Tax training courses | | | | Ö | | Not to exceed $2,000 per course during the Pre-Approval Period |
| | | | | | |
Tax services associated with Fund mergers | | Ö | | Ö | | Not to exceed $4,000 per fund per merger during the Pre-Approval Period |
| | | | | | |
Other tax-related assistance and consultation, including, without limitation, assistance in evaluating derivative financial instruments and international tax issues, qualification and distribution issues, and similar routine tax consultations. | | Ö | | | | Not to exceed $120,000 during the Pre-Approval Period |
11
Appendix D
Pre-Approved Other Services for the Pre-Approval Period September 29 , 2010 through December 31, 2011
Service
| | The Fund(s) | | Fund Affiliates | | Fee Range |
| | | | | | |
Agreed-upon procedures for Class B share 12b-1 programs | | | | Ö | | Not to exceed $60,000 during the Pre-Approval Period |
| | | | | | |
Security counts performed pursuant to Rule 17f-2 of the 1940 Act (i.e., counts for Funds holding securities with affiliated sub-custodians)
Cost to be borne 50% by the Funds and 50% by ING Investments, LLC. | | Ö | | Ö | | Not to exceed $5,000 per Fund during the Pre-Approval Period |
| | | | | | |
Agreed upon procedures for 15 (c) FACT Books | | Ö | | | | Not to exceed $35,000 during the Pre-Approval Period |
12
Appendix E
Prohibited Non-Audit Services
Dated: September 29. 2010 to December 31, 2011
· Bookkeeping or other services related to the accounting records or financial statements of the Funds
· Financial information systems design and implementation
· Appraisal or valuation services, fairness opinions, or contribution-in-kind reports
· Actuarial services
· Internal audit outsourcing services
· Management functions
· Human resources
· Broker-dealer, investment adviser, or investment banking services
· Legal services
· Expert services unrelated to the audit
· Any other service that the Public Company Accounting Oversight Board determines, by regulation, is impermissible
13
EXHIBIT A
ING EQUITY TRUST
ING FUNDS TRUST
ING ASIA PACIFIC HIGH DIVIDEND EQUITY INCOME FUND
ING GLOBAL ADVANTAGE AND PREMIUM OPPORTUNITY FUND
ING GLOBAL EQUITY DIVIDEND AND PREMIUM OPPORTUNITY FUND
ING INTERNATIONAL HIGH DIVIDEND EQUITY INCOME FUND
ING INFRASTRUCTURE, INDUSTRIALS, AND MATERIALS FUND
ING RISK MANAGED NATURAL RESOURCES FUNDING INVESTORS TRUST
ING EMERGING MARKETS HIGH DIVIDEND EQUITY FUND
ING INVESTORS TRUST
ING MAYFLOWER TRUST
ING MUTUAL FUNDS
ING PARTNERS, INC.
ING PRIME RATE TRUST
ING SENIOR INCOME FUND
ING SEPARATE PORTFOLIOS TRUST
ING VARIABLE INSURANCE TRUST
ING VARIABLE PRODUCTS TRUST
14
(e) (2) Percentage of services referred to in 4(b) — (4)(d) that were approved by the audit committee
100% of the services were approved by the audit committee.
(f) Percentage of hours expended attributable to work performed by other than full time employees of KPMG if greater than 50%.
Not applicable.
(g) Non-Audit Fees: The non-audit fees billed by the registrant’s accountant for services rendered to the registrant, and rendered to the registrant’s investment adviser, and any entity controlling, controlled by, or under common control with the adviser that provides ongoing services to the registrant for each of the last two fiscal years of the registrant were $1,122,245 for year ended December 31, 2011 and $1,220,728 for year ended December 31, 2010.
(h) Principal Accountants Independence: The Registrant’s Audit committee has considered whether the provision of non-audit services that were rendered to the registrant’s investment adviser and any entity controlling, controlled by, or under common control with the investment adviser that provides ongoing services to the registrant that were not pre-approved pursuant to Rule 2-01(c)(7)(ii) of Regulation S-X is compatible with maintaining KPMG’s independence.
15
Item 5. Audit Committee of Listed Registrants.
Not applicable.
16
Item 6. Schedule of Investments
Summary Schedule is included as part of the report to shareholders filed under Item 1 of this Form, if applicable.
17
Report of Independent Registered Public Accounting Firm
The Shareholders and Board of Trustees
ING Partners, Inc.
We have audited, in accordance with the standards of the Public Company Accounting Oversight Board (United States), the statements of assets and liabilities, including the summary portfolios of investments, of ING American Century Small-Mid Cap Value Portfolio, ING Baron Small Cap Growth Portfolio, ING Columbia Small Cap Value II Portfolio, ING Davis New York Venture Portfolio, ING Global Bond Portfolio, ING Invesco Van Kampen Comstock Portfolio, and ING Invesco Van Kampen Equity and Income Portfolio, ING JPMorgan Mid Cap Value Portfolio, ING Oppenheimer Global Portfolio, ING PIMCO Total Return Portfolio, ING Pioneer High Yield Portfolio, ING T. Rowe Price Diversified Mid Cap Growth Portfolio, ING T. Rowe Price Growth Equity Portfolio, ING Templeton Foreign Equity Portfolio, and ING UBS U.S. Large Cap Equity Portfolio, each a series of ING Partners, Inc., as of December 31, 2011, and the related statements of operations for the year then ended, the statements of changes in net assets for each of the years in the two-year period then ended, and the financial highlights for each of the years or periods in the five-year period then ended and have issued our unqualified report thereon dated February 27, 2012 (which report and financial statements are included in Item 1 of this Certified Shareholder Report on Form N-CSR). In connection with our audits of the aforementioned financial statements and financial highlights, we also audited the related portfolios of investments included in Item 6 of this Form N-CSR. The portfolios of investments are the responsibility of management. Our responsibility is to express an opinion on the portfolios of investments based on our audits.
In our opinion, the portfolios of investments, when considered in relation to the basic financial statements taken as a whole, present fairly, in all material respects, the information set forth therein.

Boston, Massachusetts
February 27, 2012
| PORTFOLIO OF INVESTMENTS |
ING AMERICAN CENTURY SMALL-MID CAP VALUE PORTFOLIO | AS OF DECEMBER 31, 2011 |
Shares | | | | | | Value | | Percentage
of Net
Assets | |
COMMON STOCK: 95.3% | | | | | |
| | | | Consumer Discretionary: 9.5% | | | | | |
38,200 | | @ | | American Axle & Manufacturing Holdings, Inc. | | $ | 377,798 | | 0.2 | |
15,600 | | | | American Eagle Outfitters | | 238,524 | | 0.1 | |
7,700 | | @ | | Bally Technologies, Inc. | | 304,612 | | 0.2 | |
47,400 | | | | Belo Corp. | | 298,620 | | 0.2 | |
8,300 | | @ | | Big Lots, Inc. | | 313,408 | | 0.2 | |
5,800 | | | | Bob Evans Farms, Inc. | | 194,532 | | 0.1 | |
7,200 | | | | Brinker International, Inc. | | 192,672 | | 0.1 | |
13,700 | | | | Brunswick Corp. | | 247,422 | | 0.1 | |
4,800 | | @ | | Cabela’s, Inc. | | 122,016 | | 0.1 | |
39,000 | | | | CEC Entertainment, Inc. | | 1,343,550 | | 0.7 | |
11,100 | | @,L | | Collective Brands, Inc. | | 159,507 | | 0.1 | |
8,300 | | | | Columbia Sportswear Co. | | 386,365 | | 0.2 | |
18,600 | | | | Cooper Tire & Rubber Co. | | 260,586 | | 0.1 | |
3,200 | | | | Core-Mark Holding Co., Inc. | | 126,720 | | 0.1 | |
10,900 | | | | CSS Industries, Inc. | | 217,128 | | 0.1 | |
19,300 | | @ | | Culp, Inc. | | 164,436 | | 0.1 | |
20,400 | | @ | | Dana Holding Corp. | | 247,860 | | 0.1 | |
13,700 | | | | Destination Maternity Corp. | | 229,064 | | 0.1 | |
5,200 | | | | Dillard’s, Inc. | | 233,376 | | 0.1 | |
34,200 | | @ | | Entercom Communications Corp. | | 210,330 | | 0.1 | |
117,700 | | | | Entravision Communications Corp. | | 183,612 | | 0.1 | |
9,100 | | @ | | EW Scripps Co. | | 72,891 | | 0.0 | |
15,800 | | | | Finish Line | | 304,703 | | 0.2 | |
10,600 | | | | Fred’s, Inc. | | 154,548 | | 0.1 | |
15,900 | | | | Gannett Co., Inc. | | 212,583 | | 0.1 | |
2,300 | | @ | | Genesco, Inc. | | 142,002 | | 0.1 | |
8,500 | | | | Guess ?, Inc. | | 253,470 | | 0.1 | |
6,800 | | | | Harte-Hanks, Inc. | | 61,812 | | 0.0 | |
10,000 | | | | Hasbro, Inc. | | 318,900 | | 0.2 | |
2,570 | | @ | | Helen of Troy Ltd. | | 78,899 | | 0.0 | |
17,017 | | | | International Speedway Corp. | | 431,381 | | 0.2 | |
5,600 | | @ | | Jack in the Box, Inc. | | 117,040 | | 0.1 | |
17,900 | | @ | | La-Z-Boy, Inc. | | 213,010 | | 0.1 | |
64,400 | | @ | | Lin TV Corp. | | 272,412 | | 0.1 | |
12,400 | | | | Lithia Motors, Inc. | | 271,064 | | 0.1 | |
100,800 | | | | Lowe’s Cos., Inc. | | 2,558,304 | | 1.3 | |
4,900 | | | | MDC Holdings, Inc. | | 86,387 | | 0.0 | |
6,000 | | | | Men’s Wearhouse, Inc. | | 194,460 | | 0.1 | |
9,700 | | | | Omnicom Group | | 432,426 | | 0.2 | |
12,500 | | @ | | Orient-Express Hotels Ltd. | | 93,375 | | 0.0 | |
12,100 | | | | Penske Auto Group, Inc. | | 232,925 | | 0.1 | |
30,200 | | | | RadioShack Corp. | | 293,242 | | 0.2 | |
1,300 | | | | Rent-A-Center, Inc. | | 48,100 | | 0.0 | |
16,988 | | | | Speedway Motorsports, Inc. | | 260,426 | | 0.1 | |
95,200 | | | | Staples, Inc. | | 1,322,328 | | 0.7 | |
17,100 | | | | Target Corp. | | 875,862 | | 0.4 | |
20,100 | | | | Time Warner Cable, Inc. | | 1,277,757 | | 0.6 | |
7,200 | | | | Vail Resorts, Inc. | | 304,992 | | 0.2 | |
25,900 | | | | Whirlpool Corp. | | 1,228,955 | | 0.6 | |
5,900 | | | | Williams-Sonoma, Inc. | | 227,150 | | 0.1 | |
12,400 | | @ | | WMS Industries, Inc. | | 254,448 | | 0.1 | |
9,500 | | | | Wolverine World Wide, Inc. | | 338,580 | | 0.2 | |
| | | | | | 18,986,570 | | 9.5 | |
| | | | Consumer Staples: 6.2% | | | | | |
14,100 | | | | Clorox Co. | | 938,496 | | 0.5 | |
18,400 | | @ | | Dole Food Co., Inc. | | 159,160 | | 0.1 | |
40,100 | | | | Dr Pepper Snapple Group, Inc. | | 1,583,148 | | 0.8 | |
11,100 | | | | General Mills, Inc. | | 448,551 | | 0.2 | |
9,600 | | | | HJ Heinz Co. | | 518,784 | | 0.3 | |
9,200 | | | | Inter Parfums, Inc. | | 143,152 | | 0.1 | |
5,800 | | | | J&J Snack Foods Corp. | | 309,024 | | 0.2 | |
20,700 | | | | Kellogg Co. | | 1,046,799 | | 0.5 | |
28,223 | | | | Kimberly-Clark Corp. | | 2,076,084 | | 1.0 | |
7,400 | | @ | | Prestige Brands Holdings, Inc. | | 83,398 | | 0.0 | |
53,615 | | @,L | | Primo Water Corp. | | 162,990 | | 0.1 | |
30,397 | | @ | | Ralcorp Holdings, Inc. | | 2,598,943 | | 1.3 | |
2,000 | | | | Ruddick Corp. | | 85,280 | | 0.0 | |
9,700 | | | | Snyders-Lance, Inc. | | 218,250 | | 0.1 | |
45,200 | | | | Sysco Corp. | | 1,325,716 | | 0.7 | |
7,000 | | | | Village Super Market | | 199,150 | | 0.1 | |
10,400 | | | | Weis Markets, Inc. | | 415,376 | | 0.2 | |
| | | | | | 12,312,301 | | 6.2 | |
| | | | Energy: 5.8% | | | | | |
5,000 | | | | Apache Corp. | | 452,900 | | 0.2 | |
7,300 | | | | Berry Petroleum Co. | | 306,746 | | 0.2 | |
7,700 | | @ | | Bill Barrett Corp. | | 262,339 | | 0.1 | |
5,100 | | | | Bristow Group, Inc. | | 241,689 | | 0.1 | |
41,300 | | @ | | Cal Dive International, Inc. | | 92,925 | | 0.1 | |
12,300 | | @ | | Comstock Resources, Inc. | | 188,190 | | 0.1 | |
11,400 | | | | Devon Energy Corp. | | 706,800 | | 0.4 | |
6,900 | | | | EQT Corp. | | 378,051 | | 0.2 | |
6,400 | | @ | | Forest Oil Corp. | | 86,720 | | 0.1 | |
16,500 | | @ | | Helix Energy Solutions Group, Inc. | | 260,700 | | 0.1 | |
9,100 | | | | Hugoton Royalty Trust | | 171,626 | | 0.1 | |
57,300 | | | | Imperial Oil Ltd. | | 2,552,979 | | 1.3 | |
2,900 | | @ | | Key Energy Services, Inc. | | 44,863 | | 0.0 | |
5,206 | | @ | | Lone Pine Resources, Inc. | | 36,494 | | 0.0 | |
29,300 | | | | Murphy Oil Corp. | | 1,633,182 | | 0.8 | |
3,300 | | L | | Overseas Shipholding Group, Inc. | | 36,069 | | 0.0 | |
13,400 | | | | Peabody Energy Corp. | | 443,674 | | 0.2 | |
21,900 | | | | Penn Virginia Corp. | | 115,851 | | 0.1 | |
| | | | | | | | | | |
See Accompanying Notes to Financial Statements
2
Shares | | | | | | Value | | Percentage
of Net
Assets | |
COMMON STOCK: (continued) | | | | | |
| | | | Energy: (continued) | | | | | |
8,300 | | | | SandRidge Permian Trust | | $ | 188,825 | | 0.1 | |
14,200 | | @ | | Southwestern Energy Co. | | 453,548 | | 0.2 | |
8,900 | | @ | | Swift Energy Co. | | 264,508 | | 0.1 | |
48,800 | | @ | | Tetra Technologies, Inc. | | 455,792 | | 0.2 | |
51,000 | | @ | | Ultra Petroleum Corp. | | 1,511,130 | | 0.8 | |
4,300 | | @ | | Unit Corp. | | 199,520 | | 0.1 | |
25,400 | | @ | | Vaalco Energy, Inc. | | 153,416 | | 0.1 | |
3,100 | | | | W&T Offshore, Inc. | | 65,751 | | 0.0 | |
17,900 | | @ | | Western Refining, Inc. | | 237,891 | | 0.1 | |
| | | | | | 11,542,179 | | 5.8 | |
| | | | Financials: 23.8% | | | | | |
8,400 | | | | ACE Ltd. | | 589,008 | | 0.3 | |
50,400 | | | | Allstate Corp. | | 1,381,464 | | 0.7 | |
15,200 | | | | Alterra Capital Holdings Ltd. | | 359,176 | | 0.2 | |
5,000 | | | | American Campus Communities, Inc. | | 209,800 | | 0.1 | |
18,500 | | | | American Equity Investment Life Holding Co. | | 192,400 | | 0.1 | |
10,200 | | | | American National Bankshares, Inc. | | 198,798 | | 0.1 | |
25,200 | | | | AON Corp. | | 1,179,360 | | 0.6 | |
17,800 | | | | Apollo Investment Corp. | | 114,632 | | 0.1 | |
10,000 | | | | Ares Capital Corp. | | 154,500 | | 0.1 | |
5,000 | | | | Arthur J. Gallagher & Co. | | 167,200 | | 0.1 | |
12,700 | | L | | Artio Global Investors, Inc. | | 61,976 | | 0.0 | |
22,100 | | | | Aspen Insurance Holdings Ltd. | | 585,650 | | 0.3 | |
10,700 | | | | Associated Banc-Corp. | | 119,519 | | 0.1 | |
7,200 | | | | Associated Estates Realty Corp. | | 114,840 | | 0.1 | |
11,500 | | | | Baldwin & Lyons, Inc. | | 250,700 | | 0.1 | |
28,900 | | | | BankUnited, Inc. | | 635,511 | | 0.3 | |
14,900 | | | | BioMed Realty Trust, Inc. | | 269,392 | | 0.1 | |
9,800 | | | | BlackRock Kelso Capital Corp. | | 79,968 | | 0.0 | |
6,800 | | | | BOK Financial Corp. | | 373,524 | | 0.2 | |
37,600 | | | | Boston Private Financial Holdings, Inc. | | 298,544 | | 0.1 | |
19,400 | | | | Brookline Bancorp., Inc. | | 163,736 | | 0.1 | |
16,700 | | | | Campus Crest Communities, Inc. | | 168,002 | | 0.1 | |
136,461 | | | | Capitol Federal Financial, Inc. | | 1,574,760 | | 0.8 | |
19,500 | | | | CBL & Associates Properties, Inc. | | 306,150 | | 0.1 | |
66,000 | | | | Charles Schwab Corp. | | 743,160 | | 0.4 | |
98,500 | | | | Chimera Investment Corp. | | 247,235 | | 0.1 | |
4,700 | | | | Chubb Corp. | | 325,334 | | 0.2 | |
14,700 | | | | City National Corp. | | 649,446 | | 0.3 | |
64,036 | | | | Comerica, Inc. | | 1,652,129 | | 0.8 | |
37,901 | | | | Commerce Bancshares, Inc. | | 1,444,786 | | 0.7 | |
11,500 | | | | CommonWealth REIT | | 191,360 | | 0.1 | |
6,300 | | | | Community Bank System, Inc. | | 175,140 | | 0.1 | |
13,500 | | L | | Compass Diversified Trust | | 167,265 | | 0.1 | |
11,500 | | | | CreXus Investment Corp. | | 119,370 | | 0.1 | |
18,000 | | | | Cullen/Frost Bankers, Inc. | | 952,380 | | 0.5 | |
12,200 | | | | CVB Financial Corp. | | 122,366 | | 0.1 | |
14,000 | | | | DCT Industrial Trust, Inc. | | 71,680 | | 0.0 | |
16,200 | | | | DiamondRock Hospitality Co. | | 156,168 | | 0.1 | |
2,100 | | | | Equity Lifestyle Properties, Inc. | | 140,049 | | 0.1 | |
10,900 | | | | Fifth Street Finance Corp. | | 104,313 | | 0.0 | |
8,100 | | | | First Financial Bancorp. | | 134,784 | | 0.1 | |
103,899 | | | | First Horizon National Corp. | | 831,192 | | 0.4 | |
10,200 | | | | First Interstate Bancsystem, Inc. | | 132,906 | | 0.1 | |
9,100 | | | | First Potomac Realty Trust | | 118,755 | | 0.1 | |
31,300 | | | | FirstMerit Corp. | | 473,569 | | 0.2 | |
8,500 | | | | Flushing Financial Corp. | | 107,355 | | 0.0 | |
14,500 | | | | FNB Corp. | | 163,995 | | 0.1 | |
6,000 | | | | Franklin Resources, Inc. | | 576,360 | | 0.3 | |
65,600 | | | | Fulton Financial Corp. | | 643,536 | | 0.3 | |
37,235 | | | | Government Properties Income Trust | | 839,649 | | 0.4 | |
4,300 | | | | Hanover Insurance Group, Inc. | | 150,285 | | 0.1 | |
4,000 | | L | | Hatteras Financial Corp. | | 105,480 | | 0.0 | |
104,989 | | | | HCC Insurance Holdings, Inc. | | 2,887,198 | | 1.4 | |
5,400 | | | | Healthcare Realty Trust, Inc. | | 100,386 | | 0.0 | |
15,900 | | | | Hercules Technology Growth Capital, Inc. | | 150,096 | | 0.1 | |
19,000 | | | | Heritage Financial Corp. | | 238,640 | | 0.1 | |
26,200 | | | | Hersha Hospitality Trust | | 127,856 | | 0.1 | |
3,900 | | | | Highwoods Properties, Inc. | | 115,713 | | 0.1 | |
49,800 | | | | Host Hotels & Resorts, Inc. | | 735,546 | | 0.4 | |
202,000 | | | | Hudson City Bancorp., Inc. | | 1,262,500 | | 0.6 | |
2,154 | | | | IBERIABANK Corp. | | 106,192 | | 0.0 | |
1,900 | | | | Infinity Property & Casualty Corp. | | 107,806 | | 0.0 | |
9,400 | | | | Kaiser Federal Financial Group, Inc. | | 120,508 | | 0.1 | |
4,100 | | | | Kilroy Realty Corp. | | 156,087 | | 0.1 | |
| | | | | | | | | | |
See Accompanying Notes to Financial Statements
3
Shares | | | | | | Value | | Percentage
of Net
Assets | |
COMMON STOCK: (continued) | | | | | |
| | | | Financials: (continued) | | | | | |
9,400 | | @ | | Knight Capital Group, Inc. | | $ | 111,108 | | 0.0 | |
10,200 | | | | Lakeland Financial Corp. | | 263,874 | | 0.1 | |
7,600 | | | | LaSalle Hotel Properties | | 183,996 | | 0.1 | |
20,400 | | | | Lexington Realty Trust | | 152,796 | | 0.1 | |
7,300 | | | | Mack-Cali Realty Corp. | | 194,837 | | 0.1 | |
57,376 | | | | Marsh & McLennan Cos., Inc. | | 1,814,229 | | 0.9 | |
15,900 | | | | MCG Capital Corp. | | 63,441 | | 0.0 | |
9,400 | | | | Medical Properties Trust, Inc. | | 92,778 | | 0.0 | |
28,300 | | | | MFA Mortgage Investments, Inc. | | 190,176 | | 0.1 | |
6,500 | | | | National Bankshares, Inc. | | 181,480 | | 0.1 | |
7,500 | | | | National Retail Properties, Inc. | | 197,850 | | 0.1 | |
81,305 | | | | Northern Trust Corp. | | 3,224,556 | | 1.6 | |
13,200 | | | | Old National Bancorp. | | 153,780 | | 0.1 | |
9,100 | | | | Oritani Financial Corp. | | 116,207 | | 0.1 | |
15,800 | | | | Pacific Continental Corp. | | 139,830 | | 0.1 | |
45,000 | | @ | | Park Sterling Corp. | | 183,600 | | 0.1 | |
25,300 | | | | PennantPark Investment Corp. | | 255,277 | | 0.1 | |
92,278 | | | | People’s United Financial, Inc. | | 1,185,772 | | 0.6 | |
77,468 | | | | Piedmont Office Realty Trust, Inc. | | 1,320,055 | | 0.7 | |
10,400 | | | | Platinum Underwriters Holdings Ltd. | | 354,744 | | 0.2 | |
7,000 | | | | Primerica, Inc. | | 162,680 | | 0.1 | |
3,400 | | | | ProAssurance Corp. | | 271,388 | | 0.1 | |
11,500 | | | | Prospect Capital Corp. | | 106,835 | | 0.0 | |
15,300 | | | | Provident Financial Services, Inc. | | 204,867 | | 0.1 | |
4,200 | | | | PS Business Parks, Inc. | | 232,806 | | 0.1 | |
18,200 | | | | RLJ Lodging Trust | | 306,306 | | 0.1 | |
17,400 | | | | Sabra Healthcare REIT, Inc. | | 210,366 | | 0.1 | |
10,400 | | | | State Street Corp. | | 419,224 | | 0.2 | |
36,500 | | | | SunTrust Bank | | 646,050 | | 0.3 | |
56,885 | | | | Symetra Financial Corp. | | 515,947 | | 0.3 | |
7,700 | | | | T. Rowe Price Group, Inc. | | 438,515 | | 0.2 | |
34,100 | | | | TCF Financial Corp. | | 351,912 | | 0.2 | |
7,800 | | | | Torchmark Corp. | | 338,442 | | 0.2 | |
16,500 | | | | Travelers Cos., Inc. | | 976,305 | | 0.5 | |
12,800 | | | | Trico Bancshares | | 182,016 | | 0.1 | |
10,900 | | | | Trustmark Corp. | | 264,761 | | 0.1 | |
15,100 | | | | Umpqua Holdings Corp. | | 187,089 | | 0.1 | |
4,600 | | L | | United Bankshares, Inc. | | 130,042 | | 0.1 | |
12,300 | | | | United Fire & Casualty Co. | | 248,214 | | 0.1 | |
40,500 | | | | UnumProvident Corp. | | 853,335 | | 0.4 | |
8,700 | | | | Urstadt Biddle Properties, Inc. | | 157,296 | | 0.1 | |
16,900 | | | | Waddell & Reed Financial, Inc. | | 418,613 | | 0.2 | |
10,200 | | | | Washington Banking Co. | | 121,482 | | 0.1 | |
15,000 | | | | Washington Federal, Inc. | | 209,850 | | 0.1 | |
5,700 | | | | Washington Real Estate Investment Trust | | 155,895 | | 0.1 | |
4,699 | | | | Webster Financial Corp. | | 95,813 | | 0.0 | |
14,000 | | | | Westamerica Bancorp. | | 614,600 | | 0.3 | |
38,981 | | | | Weyerhaeuser Co. | | 727,775 | | 0.4 | |
4,900 | | | | Wintrust Financial Corp. | | 137,445 | | 0.1 | |
21,000 | | | | Zions Bancorp. | | 341,880 | | 0.2 | |
| | | | | | 47,605,320 | | 23.8 | |
| | | | Health Care: 9.0% | | | | | |
5,700 | | @ | | Amsurg Corp. | | 148,428 | | 0.1 | |
5,400 | | | | Assisted Living Concepts, Inc. | | 80,406 | | 0.0 | |
17,100 | | | | Becton Dickinson & Co. | | 1,277,712 | | 0.6 | |
167,300 | | @ | | Boston Scientific Corp. | | 893,382 | | 0.4 | |
66,851 | | @ | | CareFusion Corp. | | 1,698,684 | | 0.9 | |
4,000 | | @ | | Centene Corp. | | 158,360 | | 0.1 | |
18,700 | | | | Cigna Corp. | | 785,400 | | 0.4 | |
3,400 | | @ | | Covance, Inc. | | 155,448 | | 0.1 | |
15,800 | | | | Covidien PLC | | 711,158 | | 0.4 | |
18,200 | | @ | | Cutera, Inc. | | 135,590 | | 0.1 | |
7,500 | | | | Eli Lilly & Co. | | 311,700 | | 0.2 | |
15,200 | | @ | | Healthsouth Corp. | | 268,584 | | 0.1 | |
26,500 | | @ | | Hologic, Inc. | | 464,015 | | 0.2 | |
16,200 | | @ | | Hospira, Inc. | | 491,994 | | 0.2 | |
6,400 | | | | Humana, Inc. | | 560,704 | | 0.3 | |
5,500 | | @ | | ICU Medical, Inc. | | 247,500 | | 0.1 | |
7,200 | | @ | | Impax Laboratories, Inc. | | 145,224 | | 0.1 | |
49,800 | | @ | | LifePoint Hospitals, Inc. | | 1,850,070 | | 0.9 | |
14,400 | | | | Lincare Holdings, Inc. | | 370,224 | | 0.2 | |
4,200 | | @ | | Magellan Health Services, Inc. | | 207,774 | | 0.1 | |
2,400 | | | | Medicis Pharmaceutical Corp. | | 79,800 | | 0.0 | |
5,100 | | | | National Healthcare Corp. | | 213,690 | | 0.1 | |
12,200 | | | | Owens & Minor, Inc. | | 339,038 | | 0.2 | |
10,800 | | @ | | Par Pharmaceutical Cos., Inc. | | 353,484 | | 0.2 | |
44,000 | | | | Patterson Cos., Inc. | | 1,298,880 | | 0.6 | |
8,400 | | @ | | PSS World Medical, Inc. | | 203,196 | | 0.1 | |
13,586 | | @ | | Select Medical Holdings Corp. | | 115,209 | | 0.1 | |
6,100 | | | | US Physical Therapy, Inc. | | 120,048 | | 0.1 | |
6,400 | | | | Utah Medical Products, Inc. | | 172,800 | | 0.1 | |
19,400 | | @ | | VCA Antech, Inc. | | 383,150 | | 0.2 | |
9,500 | | @ | | Viropharma, Inc. | | 260,205 | | 0.1 | |
| | | | | | | | | | |
See Accompanying Notes to Financial Statements
4
Shares | | | | | | Value | | Percentage
of Net
Assets | |
COMMON STOCK: (continued) | | | | | |
| | | | Health Care: (continued) | | | | | |
27,800 | | | | Young Innovations, Inc. | | $ | 823,714 | | 0.4 | |
48,700 | | | | Zimmer Holdings, Inc. | | 2,601,554 | | 1.3 | |
| | | | | | 17,927,125 | | 9.0 | |
| | | | Industrials: 16.7% | | | | | |
8,300 | | | | AAR Corp. | | 159,111 | | 0.1 | |
8,000 | | | | Actuant Corp. | | 181,520 | | 0.1 | |
4,000 | | @ | | Alaska Air Group, Inc. | | 300,360 | | 0.1 | |
3,400 | | | | Alexander & Baldwin, Inc. | | 138,788 | | 0.1 | |
2,100 | | @ | | Allegiant Travel Co. | | 112,014 | | 0.1 | |
6,300 | | | | Alliant Techsystems, Inc. | | 360,108 | | 0.2 | |
19,300 | | @ | | Altra Holdings, Inc. | | 363,419 | | 0.2 | |
9,300 | | | | American Science & Engineering, Inc. | | 633,423 | | 0.3 | |
7,100 | | | | Apogee Enterprises, Inc. | | 87,046 | | 0.0 | |
6,700 | | | | Applied Industrial Technologies, Inc. | | 235,639 | | 0.1 | |
5,400 | | | | Arkansas Best Corp. | | 104,058 | | 0.0 | |
8,600 | | | | Barnes Group, Inc. | | 207,346 | | 0.1 | |
22,349 | | | | Brady Corp. | | 705,558 | | 0.4 | |
17,500 | | | | Briggs & Stratton Corp. | | 271,075 | | 0.1 | |
7,300 | | | | Brink’s Co. | | 196,224 | | 0.1 | |
19,300 | | | | CDI Corp. | | 266,533 | | 0.1 | |
3,000 | | @ | | Ceradyne, Inc. | | 80,340 | | 0.0 | |
3,900 | | | | Cintas Corp. | | 135,759 | | 0.1 | |
8,500 | | | | Comfort Systems USA, Inc. | | 91,120 | | 0.0 | |
14,300 | | | | Curtiss-Wright Corp. | | 505,219 | | 0.2 | |
34,200 | | @ | | Diana Shipping, Inc. | | 255,816 | | 0.1 | |
7,600 | | | | Douglas Dynamics, Inc. | | 111,112 | | 0.1 | |
7,100 | | | | Dynamic Materials Corp. | | 140,438 | | 0.1 | |
9,400 | | | | EMCOR Group, Inc. | | 252,014 | | 0.1 | |
13,500 | | | | Emerson Electric Co. | | 628,965 | | 0.3 | |
20,300 | | | | Encore Wire Corp. | | 525,770 | | 0.3 | |
77,600 | | | | Exelis, Inc. | | 702,280 | | 0.3 | |
7,400 | | @ | | Freightcar America, Inc. | | 155,030 | | 0.1 | |
34,700 | | | | Granite Construction, Inc. | | 823,084 | | 0.4 | |
23,900 | | | | Harsco Corp. | | 491,862 | | 0.2 | |
36,500 | | | | Heartland Express, Inc. | | 521,585 | | 0.3 | |
10,500 | | | | Heidrick & Struggles International, Inc. | | 226,170 | | 0.1 | |
13,742 | | | | Hubbell, Inc. | | 918,790 | | 0.5 | |
9,400 | | @ | | Huntington Ingalls Industries, Inc. | | 294,032 | | 0.1 | |
5,300 | | | | IDEX Corp. | | 196,683 | | 0.1 | |
9,300 | | @ | | II-VI, Inc. | | 170,748 | | 0.1 | |
19,800 | | | | Ingersoll-Rand PLC | | 603,306 | | 0.3 | |
48,000 | | | | ITT Corp. | | 927,840 | | 0.5 | |
5,100 | | | | Kaman Corp. | | 139,332 | | 0.1 | |
69,334 | | | | Kaydon Corp. | | 2,114,687 | | 1.1 | |
12,301 | | | | Kennametal, Inc. | | 449,233 | | 0.2 | |
15,600 | | @ | | Kforce, Inc. | | 192,348 | | 0.1 | |
12,800 | | | | Lawson Products | | 197,504 | | 0.1 | |
5,900 | | | | Lincoln Electric Holdings, Inc. | | 230,808 | | 0.1 | |
16,500 | | | | LSI Industries, Inc. | | 99,000 | | 0.0 | |
51,500 | | @ | | Metalico, Inc. | | 169,435 | | 0.1 | |
4,400 | | @ | | Moog, Inc. | | 193,292 | | 0.1 | |
4,600 | | | | Mueller Industries, Inc. | | 176,732 | | 0.1 | |
3,700 | | L | | National Presto Industries, Inc. | | 346,320 | | 0.2 | |
24,800 | | @ | | On Assignment, Inc. | | 277,264 | | 0.1 | |
7,800 | | @ | | Orbital Sciences Corp. | | 113,334 | | 0.1 | |
29,900 | | @ | | Oshkosh Truck Corp. | | 639,262 | | 0.3 | |
29,200 | | @ | | Pike Electric Corp. | | 209,948 | | 0.1 | |
146,212 | | | | Republic Services, Inc. | | 4,028,141 | | 2.0 | |
2,600 | | | | Robbins & Myers, Inc. | | 126,230 | | 0.1 | |
91,200 | | | | Koninklijke Philips Electronics NV | | 1,913,526 | | 0.9 | |
3,600 | | | | Simpson Manufacturing Co., Inc. | | 121,176 | | 0.1 | |
15,500 | | | | Snap-On, Inc. | | 784,610 | | 0.4 | |
146,700 | | | | Southwest Airlines Co. | | 1,255,752 | | 0.6 | |
5,100 | | | | Stanley Black & Decker, Inc. | | 344,760 | | 0.2 | |
19,200 | | @ | | SYKES Enterprises, Inc. | | 300,672 | | 0.1 | |
2,700 | | @ | | Teledyne Technologies, Inc. | | 148,095 | | 0.1 | |
29,600 | | @ | | Thomas & Betts Corp. | | 1,616,160 | | 0.8 | |
1,900 | | | | Triumph Group, Inc. | | 111,055 | | 0.1 | |
45,600 | | | | Tyco International Ltd. | | 2,129,976 | | 1.1 | |
17,900 | | | | US Ecology, Inc. | | 336,162 | | 0.2 | |
10,900 | | | | UTI Worldwide, Inc. | | 144,861 | | 0.1 | |
19,481 | | | | Waste Management, Inc. | | 637,223 | | 0.3 | |
5,000 | | | | Werner Enterprises, Inc. | | 120,500 | | 0.1 | |
3,700 | | @ | | Wesco International, Inc. | | 196,137 | | 0.1 | |
17,900 | | | | Xylem, Inc. | | 459,851 | | 0.2 | |
| | | | | | 33,403,571 | | 16.7 | |
| | | | Information Technology: 8.2% | | | | | |
172,900 | | | | Applied Materials, Inc. | | 1,851,759 | | 0.9 | |
13,800 | | | | Bel Fuse, Inc. | | 258,750 | | 0.1 | |
13,500 | | @ | | Benchmark Electronics, Inc. | | 181,845 | | 0.1 | |
3,200 | | @ | | Blue Coat Systems, Inc. | | 81,440 | | 0.0 | |
43,419 | | @ | | Booz Allen Hamilton Holding Corp. | | 748,978 | | 0.4 | |
2,200 | | @ | | Coherent, Inc. | | 114,994 | | 0.1 | |
20,500 | | @ | | Compuware Corp. | | 170,560 | | 0.1 | |
16,400 | | @ | | Convergys Corp. | | 209,428 | | 0.1 | |
4,000 | | @ | | Cymer, Inc. | | 199,040 | | 0.1 | |
16,700 | | | | DST Systems, Inc. | | 760,184 | | 0.4 | |
5,600 | | @ | | Electro Scientific Industries, Inc. | | 81,088 | | 0.0 | |
73,200 | | @ | | Emulex Corp. | | 502,152 | | 0.2 | |
6,900 | | @ | | Euronet Worldwide, Inc. | | 127,512 | | 0.1 | |
28,300 | | @ | | Formfactor, Inc. | | 143,198 | | 0.1 | |
12,500 | | | | Harris Corp. | | 450,500 | | 0.2 | |
19,200 | | | | Intersil Corp. | | 200,448 | | 0.1 | |
5,000 | | @ | | JDA Software Group, Inc. | | 161,950 | | 0.1 | |
| | | | | | | | | | |
See Accompanying Notes to Financial Statements
5
Shares | | | | | | Value | | Percentage
of Net
Assets | |
COMMON STOCK: (continued) | | | | | |
| | | | Information Technology: (continued) | | | | | |
3,200 | | | | Lexmark International, Inc. | | $ | 105,824 | | 0.0 | |
10,800 | | | | Littelfuse, Inc. | | 464,184 | | 0.2 | |
19,500 | | | | Methode Electronics, Inc. | | 161,655 | | 0.1 | |
2,500 | | | | MKS Instruments, Inc. | | 69,550 | | 0.0 | |
8,200 | | | | Molex, Inc. | | 195,652 | | 0.1 | |
33,000 | | | | Molex, Inc. | | 652,740 | | 0.3 | |
12,200 | | @ | | Nanometrics, Inc. | | 224,724 | | 0.1 | |
7,500 | | @ | | NeuStar, Inc. | | 256,275 | | 0.1 | |
5,800 | | @ | | Novellus Systems, Inc. | | 239,482 | | 0.1 | |
9,100 | | @ | | Oplink Communications, Inc. | | 149,877 | | 0.1 | |
13,200 | | | | Park Electrochemical Corp. | | 338,184 | | 0.2 | |
23,200 | | @ | | Photronics, Inc. | | 141,056 | | 0.1 | |
4,200 | | | | Plantronics, Inc. | | 149,688 | | 0.1 | |
19,500 | | @ | | Plexus Corp. | | 533,910 | | 0.3 | |
31,300 | | @ | | QLogic Corp. | | 469,500 | | 0.2 | |
87,100 | | @ | | Quest Software, Inc. | | 1,620,060 | | 0.8 | |
4,900 | | @ | | Semtech Corp. | | 121,618 | | 0.1 | |
46,000 | | @ | | Spansion, Inc. | | 380,880 | | 0.2 | |
12,700 | | @ | | Standard Microsystems Corp. | | 327,279 | | 0.2 | |
3,900 | | @ | | Synopsys, Inc. | | 106,080 | | 0.0 | |
2,300 | | @ | | Tech Data Corp. | | 113,643 | | 0.1 | |
41,900 | | | | Tellabs, Inc. | | 169,276 | | 0.1 | |
117,400 | | @ | | Teradyne, Inc. | | 1,600,162 | | 0.8 | |
30,800 | | | | Total System Services, Inc. | | 602,448 | | 0.3 | |
14,900 | | @ | | Websense, Inc. | | 279,077 | | 0.1 | |
18,800 | | @ | | Western Digital Corp. | | 581,860 | | 0.3 | |
3,900 | | @ | | Zebra Technologies Corp. | | 139,542 | | 0.1 | |
| | | | | | 16,438,052 | | 8.2 | |
| | | | Materials: 4.4% | | | | | |
2,600 | | | | A Schulman, Inc. | | 55,068 | | 0.0 | |
76,783 | | | | Bemis Co., Inc. | | 2,309,632 | | 1.2 | |
12,400 | | @ | | Century Aluminum Co. | | 105,524 | | 0.1 | |
8,700 | | @ | | Clearwater Paper Corp. | | 309,807 | | 0.2 | |
1,500 | | | | Cytec Industries, Inc. | | 66,975 | | 0.0 | |
9,500 | | @ | | Ferro Corp. | | 46,455 | | 0.0 | |
4,800 | | @ | | Georgia Gulf Corp. | | 93,552 | | 0.0 | |
3,400 | | | | Hawkins, Inc. | | 125,324 | | 0.1 | |
9,300 | | | | HB Fuller Co. | | 214,923 | | 0.1 | |
24,800 | | | | Hecla Mining Co. | | 129,704 | | 0.1 | |
4,200 | | | | Innophos Holdings, Inc. | | 203,952 | | 0.1 | |
16,700 | | @ | | KapStone Paper and Packaging Corp. | | 262,858 | | 0.1 | |
4,200 | | @ | | Kraton Performance Polymers, Inc. | | 85,260 | | 0.0 | |
— | | @ | | Martin Marietta Materials, Inc. | | — | | — | |
12,000 | | @ | | Materion Corp. | | 291,360 | | 0.1 | |
19,305 | | | | Minerals Technologies, Inc. | | 1,091,312 | | 0.5 | |
22,424 | | | | Newmont Mining Corp. | | 1,345,664 | | 0.7 | |
35,000 | | | | Olin Corp. | | 687,750 | | 0.3 | |
6,800 | | @ | | OM Group, Inc. | | 152,252 | | 0.1 | |
7,700 | | @ | | RTI International Metals, Inc. | | 178,717 | | 0.1 | |
4,400 | | | | Schnitzer Steel Industries, Inc. | | 186,032 | | 0.1 | |
1,649 | | | | Sensient Technologies Corp. | | 62,497 | | 0.0 | |
3,500 | | | | Sonoco Products Co. | | 115,360 | | 0.1 | |
43,100 | | @ | | Thompson Creek Metals Co., Inc. | | 299,976 | | 0.2 | |
10,400 | | | | Tredegar Corp. | | 231,088 | | 0.1 | |
2,900 | | @ | | WR Grace & Co. | | 133,168 | | 0.1 | |
| | | | | | 8,784,210 | | 4.4 | |
| | | | Telecommunications: 2.3% | | | | | |
21,000 | | | | American Tower Corp. | | 1,260,210 | | 0.6 | |
3,200 | | | | Atlantic Tele-Network, Inc. | | 124,960 | | 0.1 | |
41,644 | | | | CenturyTel, Inc. | | 1,549,157 | | 0.8 | |
21,300 | | | | Rogers Communications, Inc. - Class B (Canadian Denominated Security) | | 820,638 | | 0.4 | |
41,400 | | @ | | TW Telecom, Inc. | | 802,332 | | 0.4 | |
| | | | | | 4,557,297 | | 2.3 | |
| | | | Utilities: 9.4% | | | | | |
24,740 | | | | AGL Resources, Inc. | | 1,045,513 | | 0.5 | |
11,700 | | | | Artesian Resources Corp. | | 220,311 | | 0.1 | |
8,500 | | | | Atmos Energy Corp. | | 283,475 | | 0.1 | |
10,900 | | | | Avista Corp. | | 280,675 | | 0.1 | |
6,900 | | | | Black Hills Corp. | | 231,702 | | 0.1 | |
3,000 | | | | Chesapeake Utilities Corp. | | 130,050 | | 0.1 | |
8,900 | | | | Cleco Corp. | | 339,090 | | 0.2 | |
11,200 | | | | Consolidated Edison, Inc. | | 694,736 | | 0.4 | |
6,700 | | | | El Paso Electric Co. | | 232,088 | | 0.1 | |
67,800 | | | | Empire District Electric Co. | | 1,429,902 | | 0.7 | |
104,900 | | | | Great Plains Energy, Inc. | | 2,284,722 | | 1.1 | |
18,400 | | | | Idacorp, Inc. | | 780,344 | | 0.4 | |
2,600 | | | | Laclede Group, Inc. | | 105,222 | | 0.1 | |
5,300 | | | | MDU Resources Group, Inc. | | 113,738 | | 0.1 | |
1,677 | | | | MGE Energy, Inc. | | 78,433 | | 0.0 | |
28,896 | | | | Northeast Utilities | | 1,042,279 | | 0.5 | |
5,200 | | | | NorthWestern Corp. | | 186,108 | | 0.1 | |
117,200 | | | | NV Energy, Inc. | | 1,916,220 | | 1.0 | |
44,500 | | | | Pacific Gas & Electric Co. | | 1,834,290 | | 0.9 | |
39,015 | | | | Portland General Electric Co. | | 986,689 | | 0.5 | |
6,900 | | | | Unitil Corp. | | 195,822 | | 0.1 | |
77,126 | | | | Westar Energy, Inc. | | 2,219,686 | | 1.1 | |
6,700 | | | | WGL Holdings, Inc. | | 296,274 | | 0.2 | |
14,368 | | | | Wisconsin Energy Corp. | | 502,305 | | 0.3 | |
| | | | | | | | | | |
See Accompanying Notes to Financial Statements
6
Shares | | | | | | Value | | Percentage
of Net
Assets | |
COMMON STOCK: (continued) | |
| | | | Utilities: (continued) | | | | | |
45,000 | | | | Xcel Energy, Inc. | | $ | 1,243,800 | | 0.6 | |
| | | | | | 18,673,474 | | 9.4 | |
| | | | | | | | | |
| | | | Total Common Stock
(Cost $192,455,909) | | 190,230,099 | | 95.3 | |
| |
EXCHANGE-TRADED FUNDS: 2.3% | |
71,000 | | | | iShares Russell Midcap Value Index Fund | | 3,081,400 | | 1.6 | |
13,868 | | | | iShares Russell 2000 Index Fund | | 1,021,933 | | 0.5 | |
7,000 | | | | iShares S&P SmallCap 600 Index Fund | | 477,960 | | 0.2 | |
| | | | | | | | | |
| | | | Total Exchange-Traded Funds
(Cost $4,453,285) | | 4,581,293 | | 2.3 | |
| | | | | | | | | |
PREFERRED STOCK: 1.2% | | | | | |
| | | | Consumer Discretionary: 0.1% | | | | | |
1,800 | | P | | Callaway Golf Co. | | 171,871 | | 0.1 | |
128 | | # | | LodgeNet Interactive Corp. | | 110,400 | | 0.0 | |
| | | | | | 282,271 | | 0.1 | |
| | | | | | | | | |
| | | | Consumer Staples: 0.1% | | | | | |
211 | | P | | Universal Corp. | | 224,504 | | 0.1 | |
| | | | | | | | | |
| | | | Financials: 1.0% | | | | | |
18,792 | | | | Aspen Insurance Holdings Ltd. | | 1,011,010 | | 0.5 | |
5,500 | | P | | DuPont Fabros Technology, Inc. | | 138,105 | | 0.1 | |
5,600 | | | | Entertainment Properties | | 149,688 | | 0.1 | |
4,236 | | @,P | | Inland Real Estate Corp. | | 105,900 | | 0.1 | |
3,000 | | | | Lexington Realty Trust | | 125,970 | | 0.0 | |
10,900 | | P | | National Retail Properties | | 276,860 | | 0.1 | |
4,500 | | P | | PS Business Parks, Inc. | | 113,310 | | 0.1 | |
| | | | | | 1,920,843 | | 1.0 | |
| | | | | | | | | |
| | | | Total Preferred Stock (Cost $2,229,905) | | 2,427,618 | | 1.2 | |
| | | | | | | | | |
| | | | Total Long-Term Investments
(Cost $199,139,099) | | 197,239,010 | | 98.8 | |
| | | | | | | | | | |
Principal
Amount† | | | | | | | | | |
SHORT-TERM INVESTMENTS: 2.7% | | | | | |
| | | | Securities Lending Collateral(cc)(1): 0.5% | | | | | |
948,481 | | | | Merrill Lynch & Co., Inc., Repurchase Agreement dated 12/30/11, 0.05%, due 01/03/12 (Repurchase Amount $948,486, collateralized by various U.S. Government Agency Obligations, 0.000%-6.750%, Market Value plus accrued interest $967,451, due 01/03/12-03/01/47)
(Cost $948,481) | | 948,481 | | 0.5 | |
Shares | | | | | | | | | |
| | | | Mutual Funds: 2.2% | | | | | |
4,408,923 | | | | BlackRock Liquidity Funds, TempFund, Institutional Class (Cost $4,408,923) | | 4,408,923 | | 2.2 | |
| | | | | | | | | |
| | | | Total Short-Term Investments
(Cost $5,357,404) | | 5,357,404 | | 2.7 | |
| | | | | | | | | |
| | | | Total Investments in Securities
(Cost $204,496,503) | | $ | 202,596,414 | | 101.5 | |
| | | | Liabilities in Excess of Other Assets | | (2,945,918 | ) | (1.5 | ) |
| | | | Net Assets | | $ | 199,650,496 | | 100.0 | |
† | Unless otherwise indicated, principal amount is shown in USD. |
# | Securities with purchases pursuant to Rule 144A or section 4(2), under the Securities Act of 1933 and may not be resold subject to that rule except to qualified institutional buyers. |
@ | Non-income producing security |
| |
P | Preferred Stock may be called prior to convertible date. |
(cc) | Securities purchased with cash collateral for securities loaned. |
L | Loaned security, a portion or all of the security is on loan at December 31, 2011. |
(1) | Collateral received from brokers for securities lending was invested into these short-term investments. |
| |
| Cost for federal income tax purposes is $210,457,051. |
| |
| Net unrealized depreciation consists of: |
| |
| | Gross Unrealized Appreciation | | $ | 10,750,915 | |
| | Gross Unrealized Depreciation | | (18,611,552 | ) |
| | | | | | |
| | Net Unrealized Depreciation | | $ | (7,860,637 | ) |
Fair Value Measurements^
The following is a summary of the fair valuations according to the inputs used as of December 31, 2011 in valuing the assets and liabilities:
See Accompanying Notes to Financial Statements
7
| | Quoted Prices
in Active Markets
for Identical
Investments
(Level 1) | | Significant
Other
Observable
Inputs #
(Level 2) | | Significant
Unobservable
Inputs
(Level 3) | | Fair Value
at
12/31/2011 | |
Asset Table | | | | | | | | | |
Investments, at value | | | | | | | | | |
Common Stock | | | | | | | | | |
Consumer Discretionary | | $ | 18,986,570 | | $ | — | | $ | — | | $ | 18,986,570 | |
Consumer Staples | | 12,312,301 | | — | | — | | 12,312,301 | |
Energy | | 11,542,179 | | — | | — | | 11,542,179 | |
Financials | | 47,605,320 | | — | | — | | 47,605,320 | |
Health Care | | 17,927,125 | | — | | — | | 17,927,125 | |
Industrials | | 31,490,045 | | 1,913,526 | | — | | 33,403,571 | |
Information Technology | | 16,438,052 | | — | | — | | 16,438,052 | |
Materials | | 8,784,210 | | — | | — | | 8,784,210 | |
Telecommunications | | 4,557,297 | | — | | — | | 4,557,297 | |
Utilities | | 18,673,474 | | — | | — | | 18,673,474 | |
Total Common Stock | | 188,316,573 | | 1,913,526 | | — | | 190,230,099 | |
Exchange-Traded Funds | | 4,581,293 | | — | | — | | 4,581,293 | |
Preferred Stock | | 381,558 | | 2,046,060 | | — | | 2,427,618 | |
Short-Term Investments | | 4,408,923 | | 948,481 | | — | | 5,357,404 | |
Total Investments, at value | | $ | 197,688,347 | | $ | 4,908,067 | | $ | — | | $ | 202,596,414 | |
Other Financial Instruments+ | | | | | | | | | |
Forward Foreign Currency Contracts | | — | | 22,220 | | — | | 22,220 | |
Total Assets | | $ | 197,688,347 | | $ | 4,930,287 | | $ | — | | $ | 202,618,634 | |
Liabilities Table | | | | | | | | | |
Other Financial Instruments+ | | | | | | | | | |
Forward Foreign Currency Contracts | | $ | — | | $ | (6,234 | ) | $ | — | | $ | (6,234 | ) |
Total Liabilities | | $ | — | | $ | (6,234 | ) | $ | — | | $ | (6,234 | ) |
^ | See Note 2, “Significant Accounting Policies” in the Notes to Financial Statements for additional information. |
+ | Other Financial Instruments are derivatives not reflected in the Portfolio of Investments and may include open forward foreign currency contracts, equity forwards, futures, swaps, and written options. Forward foreign currency contracts, equity forwards and futures are valued at the unrealized gain (loss) on the instrument. Swaps and written options are valued at the fair value of the instrument. |
# | The earlier close of the foreign markets gives rise to the possibility that significant events, including broad market moves, may have occurred in the interim and may materially affect the value of those securities. To account for this, the Portfolio may frequently value many of its foreign equity securities using fair value prices based on third party vendor modeling tools to the extent available. Accordingly, a significant portion of the Portfolio’s investments are categorized as Level 2 investments. |
| |
| There were no significant transfers between Level 1 and 2 during the year ended December 31, 2011. |
At December 31, 2011 , the following forward foreign currency contracts were outstanding for the ING American Century Small-Mid Cap Value Portfolio :
Counterparty | | Currency | | Contract Amount | | Buy/Sell | | Settlement Date | | In Exchange For | | Fair Value | | Unrealized
Appreciation
(Depreciation) | |
| | | | | | | | | | | | | | | |
UBS Warburg LLC | | EU Euro | | 48,903 | | Sell | | 01/31/12 | | $ | 63,553 | | $ | 63,307 | | $ | 246 | |
UBS Warburg LLC | | Canadian Dollar | | 2,864,632 | | Sell | | 01/31/12 | | 2,803,652 | | 2,809,886 | | (6,234 | ) |
UBS Warburg LLC | | EU Euro | | 1,658,111 | | Sell | | 01/31/12 | | 2,168,444 | | 2,146,470 | | 21,974 | |
| | | | | | | | | | | | | | $ | 15,986 | |
| | | | | | | | | | | | | | | | | | |
See Accompanying Notes to Financial Statements
8
A summary of derivative instruments by primary risk exposure is outlined in the following tables.
The fair value of derivative instruments as of December 31, 2011 was as follows:
| | Location on Statement | | | |
Derivatives not accounted for as hedging instruments | | of Assets and Liabilities | | Fair Value | |
| | | | | |
Asset Derivatives | | | | | |
| | | | | |
Foreign exchange contracts | | Unrealized appreciation on forward foreign currency contracts | | $ | 22,220 | |
Total Asset Derivatives | | | | $ | 22,220 | |
| | | | | |
Liability Derivatives | | | | | |
| | | | | |
Foreign exchange contracts | | Unrealized depreciation on forward foreign currency contracts | | $ | 6,234 | |
Total Liability Derivatives | | | | $ | 6,234 | |
See Accompanying Notes to Financial Statements
9
| PORTFOLIO OF INVESTMENTS |
ING BARON SMALL CAP GROWTH PORTFOLIO | AS OF DECEMBER 31, 2011 |
Shares | | | | | | Value | | Percentage
of Net
Assets | |
COMMON STOCK: 98.1% | | | | | |
| | | | Consumer Discretionary: 24.4% | | | | | |
30,300 | | | | Ameristar Casinos, Inc. | | $ | 523,887 | | 0.1 | |
470,000 | | | | Anhanguera Educacional Participacoes SA | | 5,064,737 | | 0.7 | |
75,000 | | @ | | Blue Nile, Inc. | | 3,066,000 | | 0.4 | |
— | | @ | | Central European Media Enterprises Ltd. | | — | | — | |
540,000 | | | | Choice Hotels International, Inc. | | 20,547,000 | | 2.8 | |
200,000 | | | | Cia Hering | | 3,480,498 | | 0.5 | |
290,000 | | | | DeVry, Inc. | | 11,153,400 | | 1.5 | |
575,000 | | | | Dick’s Sporting Goods, Inc. | | 21,206,000 | | 2.9 | |
565,000 | | @ | | LKQ Corp. | | 16,995,200 | | 2.3 | |
80,000 | | @ | | Lumber Liquidators | | 1,412,800 | | 0.2 | |
218,000 | | | | Morningstar, Inc. | | 12,960,100 | | 1.8 | |
114,100 | | @ | | Panera Bread Co. | | 16,139,445 | | 2.2 | |
200,000 | | @ | | Peet’s Coffee & Tea, Inc. | | 12,536,000 | | 1.7 | |
405,000 | | @ | | Penn National Gaming, Inc. | | 15,418,350 | | 2.1 | |
50,000 | | | | Strayer Education, Inc. | | 4,859,500 | | 0.7 | |
190,000 | | @ | | Under Armour, Inc. | | 13,640,100 | | 1.8 | |
475,000 | | | | Vail Resorts, Inc. | | 20,121,000 | | 2.7 | |
| | | | | | 179,124,017 | | 24.4 | |
| | | | | | | | | |
| | | | Consumer Staples: 4.6% | | | | | |
210,000 | | | | Church & Dwight Co., Inc. | | 9,609,600 | | 1.3 | |
467,057 | | @ | | Dole Food Co., Inc. | | 4,040,043 | | 0.6 | |
185,000 | | @ | | TreeHouse Foods, Inc. | | 12,095,300 | | 1.6 | |
201,737 | | @ | | United Natural Foods, Inc. | | 8,071,498 | | 1.1 | |
| | | | | | 33,816,441 | | 4.6 | |
| | | | | | | | | |
| | | | Energy: 11.0% | | | | | |
110,000 | | | | CARBO Ceramics, Inc. | | 13,566,300 | | 1.8 | |
37,500 | | @ | | Concho Resources, Inc. | | 3,515,625 | | 0.5 | |
175,000 | | | | Core Laboratories NV | | 19,941,250 | | 2.7 | |
175,000 | | @ | | Denbury Resources, Inc. | | 2,642,500 | | 0.4 | |
81,500 | | @ | | Georesources, Inc. | | 2,388,765 | | 0.3 | |
140,000 | | | | Helmerich & Payne, Inc. | | 8,170,400 | | 1.1 | |
110,000 | | @ | | SEACOR Holdings, Inc. | | 9,785,600 | | 1.3 | |
171,000 | | | | SM Energy Co. | | 12,500,100 | | 1.7 | |
212,944 | | | | Targa Resources Corp. | | 8,664,691 | | 1.2 | |
| | | | | | 81,175,231 | | 11.0 | |
| | | | | | | | | |
| | | | Financials: 11.4% | | | | | |
21,500 | | | | Alexander’s, Inc. | | 7,955,645 | | 1.1 | |
100,000 | | | | Alexandria Real Estate Equities, Inc. | | 6,897,000 | | 0.9 | |
115,000 | | | | American Assets Trust, Inc. | | 2,358,650 | | 0.3 | |
85,000 | | | | American Campus Communities, Inc. | | 3,566,600 | | 0.5 | |
195,000 | | @ | | Arch Capital Group Ltd. | | 7,259,850 | | 1.0 | |
274,479 | | | | Cohen & Steers, Inc. | | 7,932,443 | | 1.1 | |
490,500 | | | | Douglas Emmett, Inc. | | 8,946,720 | | 1.2 | |
160,000 | | | | Eaton Vance Corp. | | 3,782,400 | | 0.5 | |
125,000 | | @ | | Financial Engines, Inc. | | 2,791,250 | | 0.4 | |
60,000 | | @ | | Green Dot Corp. | | 1,873,200 | | 0.3 | |
140,000 | | | | Jefferies Group, Inc. | | 1,925,000 | | 0.3 | |
135,000 | | | | LaSalle Hotel Properties | | 3,268,350 | | 0.4 | |
108,649 | | @ | | Manning & Napier, Inc. | | 1,357,026 | | 0.2 | |
500,000 | | @ | | MSCI, Inc. - Class A | | 16,465,000 | | 2.2 | |
320,000 | | | | Primerica, Inc. | | 7,436,800 | | 1.0 | |
| | | | | | 83,815,934 | | 11.4 | |
| | | | | | | | | |
| | | | Health Care: 12.9% | | | | | |
130,000 | | @ | | Allscripts Healthcare Solutions, Inc. | | 2,462,200 | | 0.3 | |
360,000 | | @ | | AMERIGROUP Corp. | | 21,268,800 | | 2.9 | |
39,500 | | @ | | Athenahealth, Inc. | | 1,940,240 | | 0.3 | |
227,728 | | @ | | CFR Pharmaceuticals SA - ADR | | 5,352,375 | | 0.7 | |
40,000 | | | | Chemed Corp. | | 2,048,400 | | 0.3 | |
490,000 | | @ | | Community Health Systems, Inc. | | 8,550,500 | | 1.2 | |
140,000 | | @ | | Edwards Lifesciences Corp. | | 9,898,000 | | 1.3 | |
130,800 | | @ | | Gen-Probe, Inc. | | 7,732,896 | | 1.1 | |
136,500 | | @ | | Idexx Laboratories, Inc. | | 10,505,040 | | 1.4 | |
117,000 | | @ | | Mettler Toledo International, Inc. | | 17,282,070 | | 2.3 | |
20,000 | | @ | | Neogen Corp. | | 612,800 | | 0.1 | |
105,000 | | | | Techne Corp. | | 7,167,300 | | 1.0 | |
| | | | | | 94,820,621 | | 12.9 | |
| | | | | | | | | |
| | | | Industrials: 17.0% | | | | | |
250,000 | | @ | | Aecom Technology Corp. | | 5,142,500 | | 0.7 | |
261,300 | | @ | | Colfax Corp. | | 7,441,824 | | 1.0 | |
267,000 | | @ | | Copart, Inc. | | 12,786,630 | | 1.7 | |
157,000 | | @ | | CoStar Group, Inc. | | 10,476,610 | | 1.4 | |
475,000 | | @ | | Generac Holdings, Inc. | | 13,314,250 | | 1.8 | |
350,000 | | @ | | Genesee & Wyoming, Inc. | | 21,203,000 | | 2.9 | |
60,000 | | | | Landstar System, Inc. | | 2,875,200 | | 0.4 | |
106,000 | | @ | | Middleby Corp. | | 9,968,240 | | 1.4 | |
250,000 | | @ | | Mistras Group, Inc. | | 6,372,500 | | 0.9 | |
105,000 | | | | MSC Industrial Direct Co. | | 7,512,750 | | 1.0 | |
160,000 | | @ | | Polypore International, Inc. | | 7,038,400 | | 1.0 | |
405,000 | | | | Ritchie Brothers Auctioneers, Inc. | | 8,942,400 | | 1.2 | |
335,000 | | @ | | Tetra Tech, Inc. | | 7,232,650 | | 1.0 | |
50,000 | | | | Valmont Industries, Inc. | | 4,539,500 | | 0.6 | |
| | | | | | 124,846,454 | | 17.0 | |
| | | | | | | | | |
| | | | Information Technology: 14.2% | | | | | |
250,450 | | @ | | Advent Software, Inc. | | 6,100,962 | | 0.8 | |
250,000 | | @ | | Ansys, Inc. | | 14,320,000 | | 2.0 | |
313,489 | | @ | | Booz Allen Hamilton Holding Corp. | | 5,407,685 | | 0.7 | |
123,000 | | @ | | Concur Technologies, Inc. | | 6,247,170 | | 0.9 | |
| | | | | | | | | | |
See Accompanying Notes to Financial Statements
10
Shares | | | | | | Value | | Percentage
of Net
Assets | |
COMMON STOCK: (continued) | | | | | |
| | | | Information Technology: (continued) | | | | | |
60,000 | | @ | | Cymer, Inc. | | $ | 2,985,600 | | 0.4 | |
115,000 | | @ | | Equinix, Inc. | | 11,661,000 | | 1.6 | |
85,000 | | | | Factset Research Systems, Inc. | | 7,418,800 | | 1.0 | |
405,300 | | @ | | Gartner, Inc. | | 14,092,281 | | 1.9 | |
200,000 | | | | MAXIMUS, Inc. | | 8,270,000 | | 1.1 | |
238,000 | | | | Pegasystems, Inc. | | 6,997,200 | | 1.0 | |
125,000 | | @ | | RealPage, Inc. | | 3,158,750 | | 0.4 | |
350,000 | | @ | | SS&C Technologies Holdings, Inc. | | 6,321,000 | | 0.9 | |
77,700 | | @ | | Synchronoss Technologies, Inc. | | 2,347,317 | | 0.3 | |
497,500 | | | | Totvs S.A. | | 8,871,117 | | 1.2 | |
| | | | | | 104,198,882 | | 14.2 | |
| | | | | | | | | |
| | | | Materials: 0.4% | | | | | |
150,000 | | @ | | Intrepid Potash, Inc. | | 3,394,500 | | 0.4 | |
| | | | | | | | | |
| | | | Telecommunications: 0.6% | | | | | |
100,000 | | @ | | SBA Communications Corp. | | 4,296,000 | | 0.6 | |
| | | | | | | | | |
| | | | Utilities: 1.6% | | | | | |
160,000 | | | | ITC Holdings Corp. | | 12,140,800 | | 1.6 | |
| | | | | | | | | |
| | | | Total Common Stock
(Cost $475,180,334) | | 721,628,880 | | 98.1 | |
| | | | | | | | | |
SHORT-TERM INVESTMENTS: 1.9% | | | | | |
| | | | Mutual Funds: 1.9% | | | | | |
13,695,478 | | | | BlackRock Liquidity Funds, TempFund, Institutional Class (Cost $13,695,478) | | 13,695,478 | | 1.9 | |
| | | | | | | | | |
| | | | Total Short-Term Investments
(Cost $13,695,478) | | 13,695,478 | | 1.9 | |
| | | | | | | | | |
| | | | Total Investments in Securities
(Cost $488,875,812) | | $ | 735,324,358 | | 100.0 | |
| | | | Liabilities in Excess of Other Assets | | (327,329 | ) | — | |
| | | | Net Assets | | $ | 734,997,029 | | 100.0 | |
@ | | Non-income producing security | | | |
| | | | | |
| | Cost for federal income tax purposes is $488,482,765. | | | |
| | | | | |
| | Net unrealized appreciation consists of: | | | |
| | | | | |
| | | Gross Unrealized Appreciation | | $ | 262,066,283 | |
| | | Gross Unrealized Depreciation | | (15,224,690 | ) |
| | | | | | |
| | | Net Unrealized Appreciation | | $ | 246,841,593 | |
Fair Value Measurements^
The following is a summary of the fair valuations according to the inputs used as of December 31, 2011 in valuing the assets and liabilities:
See Accompanying Notes to Financial Statements
11
| | Quoted Prices
in Active Markets
for Identical
Investments
(Level 1) | | Significant
Other
Observable
Inputs
(Level 2) | | Significant
Unobservable
Inputs
(Level 3) | | Fair Value
at
12/31/2011 | |
Asset Table | | | | | | | | | |
Investments, at value | | | | | | | | | |
Common Stock* | | $ | 721,628,880 | | $ | — | | $ | — | | $ | 721,628,880 | |
Short-Term Investments | | 13,695,478 | | — | | — | | 13,695,478 | |
Total Investments, at value | | $ | 735,324,358 | | $ | — | | $ | — | | $ | 735,324,358 | |
^ | See Note 2, “Significant Accounting Policies” in the Notes to Financial Statements for additional information. |
* | For further breakdown of Common Stock by Industry type, please refer to the Portfolio of Investments. |
| |
| There were no significant transfers between Level 1 and 2 during the year ended December 31, 2011. |
See Accompanying Notes to Financial Statements
12
| PORTFOLIO OF INVESTMENTS |
ING COLUMBIA SMALL CAP VALUE II PORTFOLIO | AS OF DECEMBER 31, 2011 |
Shares | | | | | | Value | | Percentage
of Net
Assets | |
COMMON STOCK: 96.5% | | | | | |
| | | | Consumer Discretionary: 9.5% | | | | | |
65,000 | | @ | | Bridgepoint Education, Inc. | | $ | 1,495,000 | | 0.9 | |
86,000 | | @ | | Dana Holding Corp. | | 1,044,900 | | 0.6 | |
57,000 | | @ | | Domino’s Pizza, Inc. | | 1,935,150 | | 1.2 | |
54,000 | | @ | | Express, Inc. | | 1,076,760 | | 0.7 | |
68,640 | | | | Finish Line | | 1,323,723 | | 0.8 | |
26,500 | | @ | | Genesco, Inc. | | 1,636,110 | | 1.0 | |
60,000 | | @ | | GNC Holdings, Inc. | | 1,737,000 | | 1.1 | |
61,000 | | @ | | Helen of Troy Ltd. | | 1,872,700 | | 1.2 | |
70,000 | | @ | | Pier 1 Imports, Inc. | | 975,100 | | 0.6 | |
83,000 | | | | Sonic Automotive, Inc. | | 1,229,230 | | 0.8 | |
90,000 | | @ | | Tower International, Inc. | | 966,600 | | 0.6 | |
| | | | | | 15,292,273 | | 9.5 | |
| | | | Consumer Staples: 4.3% | | | | | |
30,000 | | | | Andersons, Inc. | | 1,309,800 | | 0.8 | |
125,000 | | @ | | Dean Foods Co. | | 1,400,000 | | 0.9 | |
32,000 | | | | Nu Skin Enterprises, Inc. | | 1,554,240 | | 1.0 | |
30,000 | | | | Ruddick Corp. | | 1,279,200 | | 0.8 | |
27,000 | | | | Sanderson Farms, Inc. | | 1,353,510 | | 0.8 | |
| | | | | | 6,896,750 | | 4.3 | |
| | | | Energy: 4.4% | | | | | |
32,000 | | @ | | Bill Barrett Corp. | | 1,090,240 | | 0.7 | |
49,000 | | @ | | Hornbeck Offshore Services, Inc. | | 1,519,980 | | 0.9 | |
120,000 | | @ | | Key Energy Services, Inc. | | 1,856,400 | | 1.1 | |
6,884 | | | | Knightsbridge Tankers Ltd. | | 94,104 | | 0.1 | |
14,500 | | @ | | Oil States International, Inc. | | 1,107,365 | | 0.7 | |
49,000 | | @ | | Swift Energy Co. | | 1,456,280 | | 0.9 | |
| | | | | | 7,124,369 | | 4.4 | |
| | | | Financials: 31.4% | | | | | |
60,000 | | | | Alterra Capital Holdings Ltd. | | 1,417,800 | | 0.9 | |
76,000 | | | | American Assets Trust, Inc. | | 1,558,760 | | 1.0 | |
92,000 | | | | American Equity Investment Life Holding Co. | | 956,800 | | 0.6 | |
32,000 | | @ | | Amerisafe, Inc. | | 744,000 | | 0.5 | |
74,372 | | | | Apollo Investment Corp. | | 478,956 | | 0.3 | |
33,000 | | | | Argo Group International Holdings Ltd. | | 955,680 | | 0.6 | |
82,000 | | | | BioMed Realty Trust, Inc. | | 1,482,560 | | 0.9 | |
86,000 | | | | Brandywine Realty Trust | | 817,000 | | 0.5 | |
61,000 | | | | Capstead Mortgage Corp. | | 758,840 | | 0.5 | |
55,000 | | | | CBL & Associates Properties, Inc. | | 863,500 | | 0.5 | |
70,000 | | | | Community Bank System, Inc. | | 1,946,000 | | 1.2 | |
185,000 | | | | CubeSmart | | | 1,968,400 | | 1.2 | |
45,000 | | | | Delphi Financial Group | | 1,993,500 | | 1.2 | |
67,500 | | | | DuPont Fabros Technology, Inc. | | 1,634,850 | | 1.0 | |
72,000 | | | | East-West Bancorp., Inc. | | 1,422,000 | | 0.9 | |
125,000 | | @ | | First Industrial Realty Trust, Inc. | | 1,278,750 | | 0.8 | |
54,500 | | | | Flushing Financial Corp. | | 688,335 | | 0.4 | |
150,000 | | | | FNB Corp. | | 1,696,500 | | 1.1 | |
27,000 | | | | Highwoods Properties, Inc. | | 801,090 | | 0.5 | |
31,000 | | | | IBERIABANK Corp. | | 1,528,300 | | 0.9 | |
70,000 | | | | Independent Bank Corp. | | 1,910,300 | | 1.2 | |
32,000 | | | | Kilroy Realty Corp. | | 1,218,240 | | 0.8 | |
68,000 | | | | LaSalle Hotel Properties | | 1,646,280 | | 1.0 | |
120,000 | | | | MCG Capital Corp. | | 478,800 | | 0.3 | |
60,408 | | | | Medley Capital Corp. | | 628,243 | | 0.4 | |
95,000 | | | | MFA Mortgage Investments, Inc. | | 638,400 | | 0.4 | |
26,000 | | | | Mid-America Apartment Communities, Inc. | | 1,626,300 | | 1.0 | |
110,000 | | @ | | National Financial Partners Corp. | | 1,487,200 | | 0.9 | |
138,000 | | | | Northwest Bancshares, Inc. | | 1,716,720 | | 1.1 | |
43,000 | | | | Omega Healthcare Investors, Inc. | | 832,050 | | 0.5 | |
81,343 | | | | Oritani Financial Corp. | | 1,038,750 | | 0.6 | |
22,000 | | | | Platinum Underwriters Holdings Ltd. | | 750,420 | | 0.5 | |
41,000 | | | | Prosperity Bancshares, Inc. | | 1,654,350 | | 1.0 | |
153,700 | | | | Radian Group, Inc. | | 359,658 | | 0.2 | |
62,893 | | | | Sandy Spring Bancorp, Inc. | | 1,103,772 | | 0.7 | |
175,187 | | | | Sterling Bancorp. | | 1,513,616 | | 0.9 | |
91,233 | | | | Susquehanna Bancshares, Inc. | | 764,532 | | 0.5 | |
34,500 | | @ | | SVB Financial Group | | 1,645,305 | | 1.0 | |
122,000 | | | | Symetra Financial Corp. | | 1,106,540 | | 0.7 | |
60,000 | | @ | | Texas Capital Bancshares, Inc. | | 1,836,600 | | 1.1 | |
137,000 | | | | Umpqua Holdings Corp. | | 1,697,430 | | 1.1 | |
| | | | | | 50,645,127 | | 31.4 | |
| | | | Health Care: 6.6% | | | | | |
45,000 | | @ | | Centene Corp. | | 1,781,550 | | 1.1 | |
53,000 | | @ | | Conmed Corp. | | 1,360,510 | | 0.8 | |
12,500 | | | | Cooper Cos., Inc. | | 881,500 | | 0.6 | |
29,000 | | @ | | ICU Medical, Inc. | | 1,305,000 | | 0.8 | |
90,000 | | @ | | Kindred Healthcare, Inc. | | 1,059,300 | | 0.7 | |
90,000 | | @ | | Metropolitan Health Networks, Inc. | | 672,300 | | 0.4 | |
See Accompanying Notes to Financial Statements
13
Shares | | | | | | Value | | Percentage
of Net
Assets | |
COMMON STOCK: (continued) | | | | | |
| | | | Health Care: (continued) | | | | | |
220,000 | | | | Stewart Enterprises, Inc. | | $ | 1,267,200 | | 0.8 | |
69,000 | | @ | | Vanguard Health Systems, Inc. | | 705,180 | | 0.4 | |
29,000 | | @ | | WellCare Health Plans, Inc. | | 1,522,500 | | 1.0 | |
| | | | | | 10,555,040 | | 6.6 | |
| | | | Industrials: 15.8% | | | | | |
22,000 | | @ | | Alaska Air Group, Inc. | | 1,651,980 | | 1.0 | |
19,000 | | @ | | Atlas Air Worldwide Holdings, Inc. | | 730,170 | | 0.5 | |
70,000 | | @ | | Beacon Roofing Supply, Inc. | | 1,416,100 | | 0.9 | |
25,813 | | | | Brady Corp. | | 814,916 | | 0.5 | |
63,000 | | @ | | CBIZ, Inc. | | 384,930 | | 0.2 | |
225,000 | | @ | | Cenveo, Inc. | | 765,000 | | 0.5 | |
74,000 | | | | Deluxe Corp. | | 1,684,240 | | 1.0 | |
39,000 | | | | EMCOR Group, Inc. | | 1,045,590 | | 0.7 | |
56,000 | | @ | | Geo Group, Inc. | | 938,000 | | 0.6 | |
92,000 | | | | Houston Wire & Cable Co. | | 1,271,440 | | 0.8 | |
104,000 | | @ | | Navigant Consulting, Inc. | | 1,186,640 | | 0.7 | |
45,000 | | | | Progressive Waste Solutions Ltd. | | 881,550 | | 0.6 | |
28,000 | | | | Robbins & Myers, Inc. | | 1,359,400 | | 0.8 | |
55,000 | | | | Textainer Group Holdings Ltd. | | 1,601,600 | | 1.0 | |
48,212 | | @ | | Titan Machinery, Inc. | | 1,047,647 | | 0.7 | |
113,500 | | @ | | TMS International Corp. | | 1,121,380 | | 0.7 | |
39,700 | | | | Trinity Industries, Inc. | | 1,193,382 | | 0.7 | |
62,000 | | @ | | United Rentals, Inc. | | 1,832,100 | | 1.1 | |
50,000 | | | | United Stationers, Inc. | | 1,628,000 | | 1.0 | |
185,000 | | @ | | Wabash National Corp. | | 1,450,400 | | 0.9 | |
63,000 | | | | Werner Enterprises, Inc. | | 1,518,300 | | 0.9 | |
| | | | | | 25,522,765 | | 15.8 | |
| | | | Information Technology: 14.7% | | | | | |
24,000 | | @ | | Anixter International, Inc. | | 1,431,360 | | 0.9 | |
20,000 | | @ | | Ariba, Inc. | | 561,600 | | 0.4 | |
44,599 | | @ | | Brightpoint, Inc. | | 479,886 | | 0.3 | |
67,000 | | @ | | Cardtronics, Inc. | | 1,813,020 | | 1.1 | |
65,000 | | @ | | Ciena Corp. | | 786,500 | | 0.5 | |
86,000 | | @ | | Cirrus Logic, Inc. | | 1,363,100 | | 0.9 | |
105,000 | | @ | | Elster Group SE ADR | | 1,365,000 | | 0.9 | |
77,900 | | | | EPIQ Systems, Inc. | | 936,358 | | 0.6 | |
75,000 | | @ | | Fairchild Semiconductor International, Inc. | | 903,000 | | 0.6 | |
230,000 | | @ | | Global Cash Access, Inc. | | 1,023,500 | | 0.6 | |
105,000 | | @ | | IXYS Corp. | | 1,137,150 | | 0.7 | |
110,000 | | @ | | Kulicke & Soffa Industries, Inc. | | 1,017,500 | | 0.6 | |
99,000 | | @ | | Mentor Graphics Corp. | | 1,342,440 | | 0.8 | |
90,000 | | | | Micrel, Inc. | | 909,900 | | 0.6 | |
58,965 | | @ | | NeuStar, Inc. | | 2,014,834 | | 1.3 | |
42,812 | | @ | | Rofin-Sinar Technologies, Inc. | | | 978,254 | | 0.6 | |
27,700 | | @ | | Rogers Corp. | | 1,021,022 | | 0.6 | |
150,000 | | @ | | Saba Software, Inc. | | 1,183,500 | | 0.7 | |
175,000 | | @ | | Silicon Image, Inc. | | 822,500 | | 0.5 | |
49,708 | | @ | | Standard Microsystems Corp. | | 1,280,975 | | 0.8 | |
65,000 | | @ | | TTM Technologies, Inc. | | 712,400 | | 0.4 | |
90,000 | | @ | | Ultra Clean Holdings | | 549,900 | | 0.3 | |
| | | | | | 23,633,699 | | 14.7 | |
| | | | Materials: 4.8% | | | | | |
139,310 | | | | Boise, Inc. | | 991,887 | | 0.6 | |
90,000 | | @ | | Metals USA Holdings Corp. | | 1,012,500 | | 0.6 | |
36,039 | | | | Neenah Paper, Inc. | | 804,391 | | 0.5 | |
18,000 | | | | Rock-Tenn Co. | | 1,038,600 | | 0.7 | |
48,000 | | @ | | RTI International Metals, Inc. | | 1,114,080 | | 0.7 | |
26,000 | | | | Schnitzer Steel Industries, Inc. | | 1,099,280 | | 0.7 | |
24,000 | | | | Schweitzer-Mauduit International, Inc. | | 1,595,040 | | 1.0 | |
| | | | | | 7,655,778 | | 4.8 | |
| | | | Utilities: 5.0% | | | | | |
61,000 | | | | Avista Corp. | | 1,570,750 | | 1.0 | |
45,000 | | | | New Jersey Resources Corp. | | 2,214,000 | | 1.4 | |
39,000 | | | | South Jersey Industries, Inc. | | 2,215,590 | | 1.4 | |
58,000 | | | | UIL Holdings Corp. | | 2,051,460 | | 1.2 | |
| | | | | | 8,051,800 | | 5.0 | |
| | | | | | | | | |
| | | | Total Common Stock
(Cost $135,878,076) | | 155,377,601 | | 96.5 | |
|
| | | | | |
SHORT-TERM INVESTMENTS: 3.6% | | | | | |
| | | | Mutual Funds: 3.6% | | | | | |
5,826,092 | | | | BlackRock Liquidity Funds, TempFund, Institutional Class
(Cost $5,826,092) | | 5,826,092 | | 3.6 | |
| | | | | | | | | |
| | | | Total Short-Term Investments
(Cost $5,826,092) | | 5,826,092 | | 3.6 | |
| | | | | | | | | |
| | | | Total Investments in Securities
(Cost $141,704,168) | | $ | 161,203,693 | | 100.1 | |
| | | | Liabilities in Excess of Other Assets | | (160,871 | ) | (0.1 | ) |
| | | | Net Assets | | $ | 161,042,822 | | 100.0 | |
@ | | Non-income producing security |
| | |
ADR | | American Depositary Receipt |
See Accompanying Notes to Financial Statements
14
Cost for federal income tax purposes is $144,408,136.
Net unrealized appreciation consists of:
Gross Unrealized Appreciation | | $ | 28,578,213 | |
Gross Unrealized Depreciation | | (11,782,656 | ) |
Net Unrealized Appreciation | | $ | 16,795,557 | |
Fair Value Measurements^
The following is a summary of the fair valuations according to the inputs used as of December 31, 2011 in valuing the assets and liabilities:
| | Quoted Prices
in Active Markets
for Identical
Investments
(Level 1) | | Significant
Other
Observable
Inputs
(Level 2) | | Significant
Unobservable
Inputs
(Level 3) | | Fair Value
at
12/31/2011 | |
Asset Table | | | | | | | | | |
Investments, at value | | | | | | | | | |
Common Stock* | | $ | 155,377,601 | | $ | — | | $ | — | | $ | 155,377,601 | |
Short-Term Investments | | 5,826,092 | | — | | — | | 5,826,092 | |
Total Investments, at value | | $ | 161,203,693 | | $ | — | | $ | — | | $ | 161,203,693 | |
^ | | See Note 2, “Significant Accounting Policies” in the Notes to Financial Statements for additional information. |
* | | For further breakdown of Common Stock by Industry type, please refer to the Portfolio of Investments. |
| | There were no significant transfers between Level 1 and 2 during the year ended December 31, 2011. |
See Accompanying Notes to Financial Statements
15
| PORTFOLIO OF INVESTMENTS |
ING DAVIS NEW YORK VENTURE PORTFOLIO | AS OF DECEMBER 31, 2011 |
Shares | | | | | | Value | | Percentage
of Net
Assets | |
COMMON STOCK: 96.5% | | | | | |
| | | | Consumer Discretionary: 7.4% | | | | | |
183,300 | | @ | | Bed Bath & Beyond, Inc. | | $ | 10,625,901 | | 2.7 | |
91,499 | | @ | | Carmax, Inc. | | 2,788,890 | | 0.7 | |
10,300 | | | | Compagnie Financiere Richemont S.A. | | 518,118 | | 0.2 | |
— | | @ | | DIRECTV | | — | | — | |
35,835 | | | | Expedia, Inc. | | 1,039,932 | | 0.3 | |
33,520 | | | | Grupo Televisa SAB ADR | | 705,931 | | 0.2 | |
53,250 | | | | Harley-Davidson, Inc. | | 2,069,828 | | 0.5 | |
16,400 | | | | Hunter Douglas NV | | 615,968 | | 0.2 | |
492,000 | | | | Li & Fung Ltd. | | 906,570 | | 0.2 | |
84,700 | | @ | | Liberty Media Corp. - Interactive - Class A | | 1,373,410 | | 0.4 | |
19,690 | | @ | | NetFlix, Inc. | | 1,364,320 | | 0.3 | |
35,835 | | @ | | TripAdvisor, Inc. | | 903,400 | | 0.2 | |
153,880 | | | | Walt Disney Co. | | 5,770,500 | | 1.5 | |
| | | | | | 28,682,768 | | 7.4 | |
| | | | Consumer Staples: 16.9% | | | | | |
138,750 | | | | Coca-Cola Co. | | 9,708,337 | | 2.5 | |
231,665 | | | | Costco Wholesale Corp. | | 19,302,328 | | 5.0 | |
477,727 | | | | CVS Caremark Corp. | | 19,481,707 | | 5.0 | |
47,100 | | | | Diageo PLC ADR | | 4,117,482 | | 1.1 | |
102,700 | | | | Heineken Holding NV | | 4,197,015 | | 1.1 | |
57,000 | | | | Kraft Foods, Inc. | | 2,129,520 | | 0.5 | |
27,700 | | | | Natura Cosmeticos S.A. | | 538,481 | | 0.1 | |
17,550 | | | | Nestle S.A. | | 1,007,783 | | 0.3 | |
41,902 | | | | Philip Morris International, Inc. | | 3,288,469 | | 0.8 | |
53,840 | | | | Unilever NV ADR | | 1,850,481 | | 0.5 | |
| | | | | | 65,621,603 | | 16.9 | |
| | | | Energy: 12.8% | | | | | |
324,860 | | | | Canadian Natural Resources Ltd. | | 12,140,018 | | 3.1 | |
1,323,500 | | | | China Coal Energy Co. - Class H | | 1,420,728 | | 0.3 | |
72,550 | | | | Devon Energy Corp. | | 4,498,100 | | 1.2 | |
144,240 | | | | EOG Resources, Inc. | | 14,209,082 | | 3.7 | |
136,000 | | | | Occidental Petroleum Corp. | | 12,743,200 | | 3.3 | |
341,700 | | @ | | OGX Petroleo e Gas Participacoes S.A. | | 2,495,083 | | 0.6 | |
11,000 | | | | Schlumberger Ltd. | | 751,410 | | 0.2 | |
44,276 | | | | Transocean Ltd. | | 1,699,756 | | 0.4 | |
| | | | | | 49,957,377 | | 12.8 | |
| | | | Financials: 29.8% | | | | | |
38,760 | | | | ACE Ltd. | | 2,717,851 | | 0.7 | |
412,620 | | | | American Express Co. | | 19,463,285 | | 5.0 | |
47,530 | | | | Ameriprise Financial, Inc. | | 2,359,389 | | 0.6 | |
10,680 | | | | AON Corp. | | 499,824 | | 0.1 | |
34,819 | | | | Bank of America Corp. | | 193,594 | | 0.0 | |
815,890 | | | | Bank of New York Mellon Corp. | | 16,244,370 | | 4.2 | |
88 | | @ | | Berkshire Hathaway, Inc. - Class A | | | 10,098,440 | | 2.6 | |
62,848 | | | | Brookfield Asset Management, Inc. - Class A | | 1,727,063 | | 0.4 | |
155,880 | | | | Charles Schwab Corp. | | 1,755,209 | | 0.4 | |
2,770 | | | | CME Group, Inc. | | 674,966 | | 0.2 | |
16,335 | | | | Everest Re Group Ltd. | | 1,373,610 | | 0.4 | |
2,340 | | | | Fairfax Financial Holdings Ltd. | | 1,003,782 | | 0.3 | |
4,480 | | | | Fairfax Financial Holdings Ltd. | | 1,931,776 | | 0.5 | |
14,270 | | | | Goldman Sachs Group, Inc. | | 1,290,436 | | 0.3 | |
565,000 | | | | Hang Lung Group Ltd. | | 3,092,064 | | 0.8 | |
25,050 | | | | JPMorgan Chase & Co. | | 832,913 | | 0.2 | |
133,310 | | @ | | Julius Baer Group Ltd. | | 5,192,748 | | 1.3 | |
306,299 | | | | Loews Corp. | | 11,532,157 | | 3.0 | |
1,175 | | @ | | Markel Corp. | | 487,237 | | 0.1 | |
533,380 | | | | Progressive Corp. | | 10,406,244 | | 2.7 | |
90,070 | | | | Transatlantic Holdings, Inc. | | 4,929,531 | | 1.3 | |
663,367 | | | | Wells Fargo & Co. | | 18,282,395 | | 4.7 | |
| | | | | | 116,088,884 | | 29.8 | |
| | | | Health Care: 9.5% | | | | | |
36,578 | | @ | | Agilent Technologies, Inc. | | 1,277,669 | | 0.3 | |
41,200 | | | | Baxter International, Inc. | | 2,038,576 | | 0.5 | |
15,180 | | | | Becton Dickinson & Co. | | 1,134,250 | | 0.3 | |
177,820 | | @ | | Express Scripts, Inc. | | 7,946,776 | | 2.0 | |
129,450 | | | | Johnson & Johnson | | 8,489,331 | | 2.2 | |
243,915 | | | | Merck & Co., Inc. | | 9,195,595 | | 2.4 | |
41,900 | | | | Roche Holding AG - Genusschein | | 7,086,059 | | 1.8 | |
| | | | | | 37,168,256 | | 9.5 | |
| | | | Industrials: 5.5% | | | | | |
1,333,196 | | | | China Merchants Holdings International Co., Ltd. | | 3,856,036 | | 1.0 | |
958,000 | | | | China Shipping Development Co., Ltd. | | 595,888 | | 0.2 | |
285,250 | | | | Iron Mountain, Inc. | | 8,785,700 | | 2.3 | |
25,157 | | | | Kuehne & Nagel International AG | | 2,817,058 | | 0.7 | |
59,160 | | @ | | LLX Logistica S.A. | | 106,886 | | 0.0 | |
44,040 | | | | Lockheed Martin Corp. | | 3,562,836 | | 0.9 | |
40,410 | | | | Paccar, Inc. | | 1,514,163 | | 0.4 | |
| | | | | | 21,238,567 | | 5.5 | |
| | | | Information Technology: 8.0% | | | | | |
178,952 | | | | Activision Blizzard, Inc. | | 2,204,689 | | 0.6 | |
18,799 | | @ | | Google, Inc. - Class A | | 12,142,274 | | 3.1 | |
113,600 | | | | Hewlett-Packard Co. | | 2,926,336 | | 0.7 | |
53,400 | | | | Intel Corp. | | | 1,294,950 | | 0.3 | |
See Accompanying Notes to Financial Statements
16
Shares | | | | | | Value | | Percentage
of Net
Assets | |
COMMON STOCK: (continued) | | | | | |
| | | | Information Technology: (continued) | | | | | |
174,870 | | | | Microsoft Corp. | | 4,539,625 | | 1.2 | |
30,600 | | | | Oracle Corp. | | 784,890 | | 0.2 | |
201,910 | | | | Texas Instruments, Inc. | | 5,877,600 | | 1.5 | |
15,400 | | | | Visa, Inc. | | 1,563,562 | | 0.4 | |
| | | | | | 31,333,926 | | 8.0 | |
| | | | Materials: 6.2% | | | | | |
26,690 | | | | Air Products & Chemicals, Inc. | | 2,273,721 | | 0.6 | |
64,500 | | | | BHP Billiton PLC | | 1,885,686 | | 0.5 | |
35,480 | | | | Ecolab, Inc. | | 2,051,099 | | 0.5 | |
21,160 | | | | Martin Marietta Materials, Inc. | | 1,595,676 | | 0.4 | |
97,100 | | @ | | MMX Mineracao e Metalicos SA | | 148,363 | | 0.0 | |
97,440 | | | | Monsanto Co. | | 6,827,621 | | 1.8 | |
70,055 | | | | Potash Corp. of Saskatchewan | | 2,891,870 | | 0.8 | |
24,400 | | | | Praxair, Inc. | | 2,608,360 | | 0.7 | |
41,632 | | | | Rio Tinto PLC | | 2,033,564 | | 0.5 | |
99,794 | | | | Sealed Air Corp. | | 1,717,455 | | 0.4 | |
8,100 | | #,@,X | | Sino-Forest Corp. | | 5,569 | | 0.0 | |
315,280 | | X | | Sino-Forest Corp. | | 216,755 | | 0.0 | |
| | | | | | 24,255,739 | | 6.2 | |
| | | | Telecommunications: 0.4% | | | | | |
60,580 | | | | America Movil SAB de CV ADR | | 1,369,108 | | 0.4 | |
| | | | | | | | | |
| | | | Total Common Stock
(Cost $342,813,288) | | 375,716,228 | | 96.5 | |
Principal
Amount† | | | | | | | | | |
CORPORATE BONDS/NOTES: 0.0% | | | | | |
| | | | Materials: 0.0% | | | | | |
649,000 | | # | | Sino-Forest Corp., 5.000%, 08/01/13 | | 178,475 | | 0.0 | |
| | | | | | | | | |
| | | | Total Corporate Bonds/Notes
(Cost $649,000) | | 178,475 | | 0.0 | |
| | | | | | | | | |
| | | | Total Long-Term Investments
(Cost $343,462,288) | | 375,894,703 | | 96.5 | |
| | | | | | | | | |
SHORT-TERM INVESTMENTS: 3.3% | | | | | |
| | | | Commercial Paper: 3.3% | | | | | |
12,863,000 | | | | Barclays Fdg. Dis., 0.090%, 01/03/12
(Cost $12,862,904) | | 12,862,904 | | 3.3 | |
| | | | | | | | | |
| | | | Total Short-Term Investments
(Cost $12,862,904) | | 12,862,904 | | 3.3 | |
| | | | | | | | | |
| | | | Total Investments in Securities
(Cost $356,325,192) | | $ | 388,757,607 | | 99.8 | |
| | | | Assets in Excess of Other Liabilities | | 599,840 | | 0.2 | |
| | | | Net Assets | | $ | 389,357,447 | | 100.0 | |
† | | Unless otherwise indicated, principal amount is shown in USD. |
# | | Securities with purchases pursuant to Rule 144A or section 4(2), under the Securities Act of 1933 and may not be resold subject to that rule except to qualified institutional buyers. |
@ | | Non-income producing security |
| | |
ADR | | American Depositary Receipt |
X | | Fair value determined by ING Funds Valuation Committee appointed by the Funds’ Board of Directors/Trustees. |
| | |
| | Cost for federal income tax purposes is $360,151,122. |
| | |
| | Net unrealized appreciation consists of: |
Gross Unrealized Appreciation | | $ | 56,738,912 | |
Gross Unrealized Depreciation | | (28,132,427 | ) |
Net Unrealized Appreciation | | $ | 28,606,485 | |
See Accompanying Notes to Financial Statements
17
Fair Value Measurements^
The following is a summary of the fair valuations according to the inputs used as of December 31, 2011 in valuing the assets and liabilities:
| | Quoted Prices
in Active Markets
for Identical
Investments
(Level 1) | | Significant
Other
Observable
Inputs #
(Level 2) | | Significant
Unobservable
Inputs
(Level 3) | | Fair Value
at
12/31/2011 | |
Asset Table | | | | | | | | | |
Investments, at value | | | | | | | | | |
Common Stock | | | | | | | | | |
Consumer Discretionary | | $ | 27,258,080 | | $ | 1,424,688 | | $ | — | | $ | 28,682,768 | |
Consumer Staples | | 60,416,805 | | 5,204,798 | | — | | 65,621,603 | |
Energy | | 48,536,649 | | 1,420,728 | | — | | 49,957,377 | |
Financials | | 107,804,072 | | 8,284,812 | | — | | 116,088,884 | |
Health Care | | 30,082,197 | | 7,086,059 | | — | | 37,168,256 | |
Industrials | | 13,969,585 | | 7,268,982 | | — | | 21,238,567 | |
Information Technology | | 31,333,926 | | — | | — | | 31,333,926 | |
Materials | | 20,114,165 | | 3,919,250 | | 222,324 | | 24,255,739 | |
Telecommunications | | 1,369,108 | | — | | — | | 1,369,108 | |
Total Common Stock | | 340,884,587 | | 34,609,317 | | 222,324 | | 375,716,228 | |
Corporate Bonds/Notes | | — | | 178,475 | | — | | 178,475 | |
Short-Term Investments | | — | | 12,862,904 | | — | | 12,862,904 | |
Total Investments, at value | | $ | 340,884,587 | | $ | 47,650,696 | | $ | 222,324 | | $ | 388,757,607 | |
^ | | See Note 2, “Significant Accounting Policies” in the Notes to Financial Statements for additional information. |
# | | The earlier close of the foreign markets gives rise to the possibility that significant events, including broad market moves, may have occurred in the interim and may materially affect the value of those securities. To account for this, the Portfolio may frequently value many of its foreign equity securities using fair value prices based on third party vendor modeling tools to the extent available. Accordingly, a significant portion of the Portfolio’s investments are categorized as Level 2 investments. |
| | |
| | There were no significant transfers between Level 1 and 2 during the year ended December 31, 2011. |
| | |
| | Transfers in or out of Level 3 represent either the beginning value (for transfers in), or the ending value (for transfers out) of any security or derivative instrument where a change in the pricing level occurred from the beginning to the end of the period. Transfers are recognized at the end of the reporting period. |

See Accompanying Notes to Financial Statements
18
| PORTFOLIO OF INVESTMENTS |
ING GLOBAL BOND PORTFOLIO | AS OF DECEMBER 31, 2011 |
| | | | | | | | | | |
Principal
Amount† | | | | | | Value | | Percentage
of Net
Assets | |
CORPORATE BONDS/NOTES: 31.4% | | | | | |
| | | | Australia: 0.2% | | | | | |
525,000 | | # | | FMG Resources August 2006 Pty Ltd, 6.375%, 02/01/16 | | $ | 511,875 | | 0.1 | |
255,000 | | # | | FMG Resources August 2006 Pty Ltd., 7.000%, 11/01/15 | | 258,825 | | 0.1 | |
AUD | 195,000 | | | | Queensland Treasury Corp., 6.000%, 04/21/16 | | 210,185 | | 0.0 | |
| | | | | | 980,885 | | 0.2 | |
| | | | Bermuda: 0.0% | | | | | |
6,845 | | & | | Intelsat Luxembourg S.A., 11.500%, 02/04/17 | | 6,623 | | 0.0 | |
| | | | | | | | | |
| | | | Brazil: 1.9% | | | | | |
1,400,000 | | # | | Banco do Brasil SA, 5.875%, 01/26/22 | | 1,415,400 | | 0.3 | |
BRL | 3,800,000 | | # | | Banco Votorantim SA, 6.250%, 05/16/16 | | 2,078,413 | | 0.5 | |
300,000 | | # | | Centrais Eletricas Brasileiras S.A., 6.875%, 07/30/19 | | 342,000 | | 0.1 | |
950,000 | | L | | Itau Unibanco Holding SA/Cayman Island, 5.750%, 01/22/21 | | 962,848 | | 0.2 | |
1,053,140 | | #,L | | QGOG Atlantic / Alaskan Rigs Ltd., 5.250%, 07/30/18 | | 1,050,507 | | 0.2 | |
1,120,000 | | | | Vale Overseas Ltd., 4.625%, 09/15/20 | | 1,163,383 | | 0.3 | |
1,150,000 | | | | Voto-Votorantim Overseas Trading Operations NV, 6.625%, 09/25/19 | | 1,224,750 | | 0.3 | |
| | | | | | 8,237,301 | | 1.9 | |
| | | | British Virgin Islands: 0.1% | | | | | |
615,000 | | | | PCCW-HKT Capital No 3 Ltd., 5.250%, 07/20/15 | | 644,048 | | 0.1 | |
| | | | | | | | | |
| | | | Canada: 0.4% | | | | | |
82,867 | | #,& | | Ainsworth Lumber Co., Ltd., 11.000%, 07/29/15 | | 54,278 | | 0.0 | |
900,000 | | # | | Bombardier, Inc., 7.750%, 03/15/20 | | 985,500 | | 0.2 | |
515,000 | | | | Nova Chemicals Corp., 8.625%, 11/01/19 | | 570,362 | | 0.2 | |
| | | | | | 1,610,140 | | 0.4 | |
| | | | Cayman Islands: 0.6% | | | | | |
1,087,000 | | # | | IPIC GMTN Ltd., 5.500%, 03/01/22 | | 1,092,435 | | 0.3 | |
855,000 | | | | Odebrecht Finance Ltd, 7.000%, 04/21/20 | | 919,125 | | 0.2 | |
175,000 | | #,L | | Odebrecht Finance Ltd., 7.500%, 09/29/49 | | 171,938 | | 0.0 | |
585,000 | | | | Seagate HDD Cayman, 6.875%, 05/01/20 | | | 604,012 | | 0.1 | |
| | | | | | 2,787,510 | | 0.6 | |
| | | | Chile: 0.3% | | | | | |
320,000 | | # | | Empresa Nacional del Petroleo, 4.750%, 12/06/21 | | 319,337 | | 0.0 | |
1,135,000 | | | | Inversiones CMPC SA, 4.750%, 01/19/18 | | 1,190,091 | | 0.3 | |
| | | | | | 1,509,428 | | 0.3 | |
| | | | China: 0.1% | | | | | |
300,000 | | # | | Mega Advance Investments Ltd., 6.375%, 05/12/41 | | 300,921 | | 0.1 | |
| | | | | | | | | |
| | | | Colombia: 2.0% | | | | | |
920,000 | | # | | Banco de Bogota SA, 5.000%, 01/15/17 | | 929,277 | | 0.2 | |
8,066,000 | | # | | Citigroup Funding, Inc., 11.000%, 07/27/20 | | 7,188,419 | | 1.7 | |
492,000 | | # | | Empresa de Energia de Bogota SA, 6.125%, 11/10/21 | | 496,920 | | 0.1 | |
| | | | | | 8,614,616 | | 2.0 | |
| | | | Italy: 0.4% | | | | | |
1,589,000 | | | | Telecom Italia Capital S.A., 5.250%, 11/15/13 | | 1,527,242 | | 0.4 | |
| | | | | | | | | |
| | | | Kazakhstan: 0.4% | | | | | |
1,500,000 | | ± | | JSC Astana Finance, 9.160%, 03/14/12 | | 153,750 | | 0.0 | |
936,000 | | # | | KazMunaiGaz Finance Sub BV, 7.000%, 05/05/20 | | 993,330 | | 0.2 | |
569,000 | | # | | KazMunaiGaz Finance Sub BV, 8.375%, 07/02/13 | | 598,872 | | 0.2 | |
| | | | | | 1,745,952 | | 0.4 | |
| | | | Luxembourg: 0.8% | | | | | |
550,000 | | # | | Gaz Capital for Gazprom, 6.212%, 11/22/16 | | 570,625 | | 0.1 | |
890,000 | | # | | Gaz Capital for Gazprom, 9.250%, 04/23/19 | | 1,062,571 | | 0.3 | |
400,000 | | # | | Gazprom OAO Via Gaz Capital SA, 5.999%, 01/23/21 | | 399,000 | | 0.1 | |
260,000 | | | | Intelsat Jackson Holdings SA, 7.250%, 10/15/20 | | 264,550 | | 0.1 | |
880,000 | | | | TNK-BP Finance SA, 7.875%, 03/13/18 | | 949,300 | | 0.2 | |
| | | | | | 3,246,046 | | 0.8 | |
See Accompanying Notes to Financial Statements
19
Principal
Amount† | | | | | | Value | | Percentage
of Net
Assets | |
CORPORATE BONDS/NOTES: (continued) | | | | | |
| | | | Malaysia: 0.1% | | | | | |
500,000 | | # | | Malaysia Sukuk Global Berhad, 3.928%, 06/04/15 | | $ | 522,685 | | 0.1 | |
| | | | | | | | | |
| | | | Mexico: 2.6% | | | | | |
MXN | 8,400,000 | | | | America Movil S.A.B de CV, 8.460%, 12/18/36 | | 579,020 | | 0.1 | |
848,000 | | | | America Movil SAB de CV, 6.125%, 03/30/40 | | 1,014,809 | | 0.3 | |
MXN | 1,007,437 | | | | Banco Invex S.A., 6.450%, 03/13/34 | | 98,470 | | 0.0 | |
MXN | 368,584 | | | | JPMorgan Hipotecaria su Casita, 6.100%, 09/25/35 | | 45,256 | | 0.0 | |
1,589,000 | | | | Petroleos Mexicanos, 6.000%, 03/05/20 | | 1,772,212 | | 0.4 | |
MXN | 67,000,000 | | # | | Petroleos Mexicanos, 7.650%, 11/24/21 | | 4,777,243 | | 1.1 | |
1,070,000 | | | | Sigma Alimentos SA de CV, 5.625%, 04/14/18 | | 1,096,750 | | 0.3 | |
1,585,000 | | | | Southern Copper Corp., 6.750%, 04/16/40 | | 1,599,241 | | 0.4 | |
| | | | | | 10,983,001 | | 2.6 | |
| | | | Netherlands: 0.2% | | | | | |
840,000 | | | | Cooperatieve Centrale Raiffeisen-Boerenleenbank BA/Netherlands, 4.500%, 01/11/21 | | 873,922 | | 0.2 | |
| | | | | | | | | |
| | | | Philippines: 0.2% | | | | | |
PHP | 23,800,000 | | | | National Power Corp., 5.875%, 12/19/16 | | 605,740 | | 0.1 | |
660,000 | | #,+ | | Tiers Trust, 06/15/97 | | 456,944 | | 0.1 | |
| | | | | | 1,062,684 | | 0.2 | |
| | | | Qatar: 0.1% | | | | | |
430,000 | | # | | Nakilat, Inc., 6.067%, 12/31/33 | | 461,175 | | 0.1 | |
| | | | | | | | | |
| | | | Russia: 0.3% | | | | | |
300,000 | | # | | Gaz Capital for Gazprom, 8.125%, 07/31/14 | | 324,750 | | 0.1 | |
415,000 | | | | Gazprom OAO Via Gaz Capital SA, 6.510%, 03/07/22 | | 423,300 | | 0.1 | |
401,000 | | | | RZD Capital Ltd., 5.739%, 04/03/17 | | 405,010 | | 0.1 | |
| | | | | | 1,153,060 | | 0.3 | |
| | | | South Africa: 0.2% | | | | | |
593,000 | | # | | Gold Fields Orogen Holding BVI Ltd., 4.875%, 10/07/20 | | 524,306 | | 0.1 | |
ZAR | 1,000,000 | | | | Transnet SOC Ltd., 10.800%, 11/06/23 | | 137,444 | | 0.1 | |
| | | | | | 661,750 | | 0.2 | |
| | | | | | | | | |
| | | | United Arab Emirates: 0.2% | | | | | |
765,000 | | #,L | | Abu Dhabi National Energy Co., 5.875%, 12/13/21 | | | 799,425 | | 0.2 | |
| | | | | | | | | |
| | | | United Kingdom: 0.5% | | | | | |
EUR | 435,000 | | | | Bank of Scotland PLC, 4.375%, 07/13/16 | | 588,665 | | 0.1 | |
EUR | 305,000 | | | | Bank of Scotland PLC, 4.500%, 07/13/21 | | 406,249 | | 0.1 | |
520,000 | | # | | Barclays Bank PLC, 6.050%, 12/04/17 | | 472,598 | | 0.1 | |
275,000 | | # | | Intelsat Jackson Holdings SA, 7.500%, 04/01/21 | | 278,781 | | 0.1 | |
463,000 | | # | | Lloyds TSB Bank PLC, 6.500%, 09/14/20 | | 387,907 | | 0.1 | |
| | | | | | 2,134,200 | | 0.5 | |
| | | | United States: 19.3% | | | | | |
48,000 | | # | | ABI Escrow Corp., 10.250%, 10/15/18 | | 53,160 | | 0.0 | |
540,000 | | | | Abitibi-Consolidated Escrow, 6.000%, 06/20/13 | | — | | — | |
225,000 | | | | Abitibi-Consolidated Escrow, 6.000%, 06/20/13 | | — | | — | |
270,000 | | | | Abitibi-Consolidated Escrow, 6.000%, 06/20/13 | | — | | — | |
540,000 | | | | Abitibi-Consolidated Escrow, 6.000%, 06/20/13 | | — | | — | |
260,000 | | ± | | Abitibi-Consolidated Escrow, 7.750%, 06/15/11 | | — | | — | |
705,000 | | # | | AES Corp., 7.375%, 07/01/21 | | 763,163 | | 0.2 | |
400,000 | | | | Alpha Natural Resources, Inc., 6.250%, 06/01/21 | | 390,000 | | 0.1 | |
200,000 | | | | Alpha Natural Resources, Inc., 6.000%, 06/01/19 | | 195,000 | | 0.0 | |
855,000 | | | | Altria Group, Inc., 9.700%, 11/10/18 | | 1,151,552 | | 0.3 | |
740,000 | | | | AMC Entertainment, Inc., 8.750%, 06/01/19 | | 769,600 | | 0.2 | |
740,000 | | # | | AMC Networks, Inc., 7.750%, 07/15/21 | | 808,450 | | 0.2 | |
1,278,000 | | | | American Express Credit Corp., 5.125%, 08/25/14 | | 1,374,003 | | 0.3 | |
430,000 | | | | Amkor Technology, Inc., 7.375%, 05/01/18 | | 441,825 | | 0.1 | |
705,000 | | # | | Arch Coal, Inc., 7.250%, 06/15/21 | | 727,912 | | 0.2 | |
2,203,000 | | | | AT&T, Inc., 2.500%, 08/15/15 | | 2,283,506 | | 0.5 | |
EUR | 112,000 | | | | BA Covered Bond Issuer, 4.250%, 04/05/17 | | 146,188 | | 0.0 | |
See Accompanying Notes to Financial Statements
20
Principal
Amount† | | | | | | Value | | Percentage
of Net
Assets | |
CORPORATE BONDS/NOTES: (continued) | | | | | |
| | | | United States: (continued) | | | | | |
905,000 | | | | Bank of America Corp., 5.625%, 07/01/20 | | $ | 837,077 | | 0.2 | |
445,000 | | | | The Bank of New York Mellon Corp., 3.550%, 09/23/21 | | 452,158 | | 0.1 | |
382,000 | | | | Bankrate, Inc./Old, 11.750%, 07/15/15 | | 437,867 | | 0.1 | |
185,000 | | | | BE Aerospace, Inc., 6.875%, 10/01/20 | | 202,575 | | 0.0 | |
370,000 | | ±,X | | Bowater Pulp and Paper, 10.600%, 01/15/11 | | — | | — | |
875,000 | | ±,X | | Bowater, Inc. Escrow, 6.500%, 01/15/11 | | — | | — | |
530,000 | | # | | Calpine Corp., 7.875%, 07/31/20 | | 573,725 | | 0.1 | |
600,000 | | | | Case New Holland, Inc., 7.875%, 12/01/17 | | 681,000 | | 0.2 | |
9,842 | | & | | Catalent Pharma Solutions, Inc., 9.500%, 04/15/15 | | 10,162 | | 0.0 | |
255,000 | | | | CCO Holdings LLC / CCO Holdings Capital Corp., 6.500%, 04/30/21 | | 259,463 | | 0.1 | |
505,000 | | | | CCO Holdings LLC / CCO Holdings Capital Corp., 7.000%, 01/15/19 | | 528,987 | | 0.1 | |
150,000 | | | | Celanese US Holdings LLC, 5.875%, 06/15/21 | | 155,063 | | 0.0 | |
1,129,000 | | | | Cellco Partnership / Verizon Wireless Capital, LLC, 5.550%, 02/01/14 | | 1,227,344 | | 0.3 | |
200,000 | | | | Chesapeake Energy Corp., 6.625%, 08/15/20 | | 215,500 | | 0.1 | |
180,000 | | # | | Chesapeake Oilfield Operating LLC/Chesapeake Oilfield Finance, Inc., 6.625%, 11/15/19 | | 188,100 | | 0.0 | |
810,000 | | # | | CIT Group, Inc., 7.000%, 05/02/17 | | 810,000 | | 0.2 | |
7,857,000 | | # | | Citigroup Funding, Inc., 11.000%, 07/27/20 | | 7,336,867 | | 1.7 | |
825,000 | | | | Citigroup, Inc., 6.010%, 01/15/15 | | 862,596 | | 0.2 | |
2,017,000 | | | | Comcast Corp., 5.700%, 05/15/18 | | 2,323,598 | | 0.5 | |
627,000 | | | | CVS Caremark Corp., 6.125%, 09/15/39 | | 764,323 | | 0.2 | |
700,000 | | | | DaVita, Inc., 6.625%, 11/01/20 | | 722,750 | | 0.2 | |
500,000 | | #,L | | Delphi Corp., 5.875%, 05/15/19 | | 512,500 | | 0.1 | |
1,233,000 | | | | Devon Energy Corp., 5.600%, 07/15/41 | | 1,485,242 | | 0.3 | |
446,000 | | | | DIRECTV Holdings LLC / DIRECTV Financing Co., Inc., 3.500%, 03/01/16 | | | 460,325 | | 0.1 | |
887,000 | | | | Discover Bank/Greenwood DE, 7.000%, 04/15/20 | | 929,206 | | 0.2 | |
145,000 | | | | DISH DBS Corp., 6.750%, 06/01/21 | | 156,962 | | 0.0 | |
430,000 | | | | DISH DBS Corp., 7.875%, 09/01/19 | | 488,050 | | 0.1 | |
705,000 | | | | Endo Pharmaceuticals Holdings, Inc., 7.250%, 01/15/22 | | 753,469 | | 0.2 | |
1,276,000 | | | | Entergy Corp., 5.125%, 09/15/20 | | 1,273,421 | | 0.3 | |
1,365,000 | | | | Exelon Generation Co. LLC, 4.000%, 10/01/20 | | 1,405,268 | | 0.3 | |
835,000 | | | | Ferro Corp., 7.875%, 08/15/18 | | 843,350 | | 0.2 | |
959,000 | | | | First Horizon National Corp., 5.375%, 12/15/15 | | 971,778 | | 0.2 | |
1,186,000 | | | | FirstEnergy Solutions Corp., 4.800%, 02/15/15 | | 1,266,907 | | 0.3 | |
2,079,000 | | | | General Electric Capital Corp., 2.250%, 11/09/15 | | 2,090,595 | | 0.5 | |
1,103,000 | | | | Goldman Sachs Group, Inc., 5.375%, 03/15/20 | | 1,090,114 | | 0.3 | |
715,000 | | L | | Goodyear Tire & Rubber Co., 8.250%, 08/15/20 | | 782,925 | | 0.2 | |
725,000 | | X | | Greektown LLC Escrow | | — | | — | |
705,000 | | | | Hanesbrands, Inc., 6.375%, 12/15/20 | | 719,100 | | 0.2 | |
710,000 | | | | HCA, Inc., 6.375%, 01/15/15 | | 726,862 | | 0.2 | |
740,000 | | | | HCA, Inc., 7.250%, 09/15/20 | | 784,400 | | 0.2 | |
572,000 | | | | HSBC USA, Inc., 5.000%, 09/27/20 | | 541,293 | | 0.1 | |
655,000 | | L | | Huntsman International LLC, 8.625%, 03/15/21 | | 697,575 | | 0.2 | |
1,270,000 | | # | | Hyatt Hotels Corp., 6.875%, 08/15/19 | | 1,418,910 | | 0.3 | |
1,263,000 | | #,L | | Hyundai Capital America, 4.000%, 06/08/17 | | 1,251,546 | | 0.3 | |
1,165,000 | | | | Indiana Michigan Power, 7.000%, 03/15/19 | | 1,434,618 | | 0.3 | |
240,000 | | | | Inergy L.P./Inergy Finance Corp., 6.875%, 08/01/21 | | 242,400 | | 0.1 | |
375,000 | | | | International Lease Finance Corp., 5.875%, 05/01/13 | | 371,250 | | 0.1 | |
See Accompanying Notes to Financial Statements
21
Principal
Amount† | | | | | | Value | | Percentage
of Net
Assets | |
CORPORATE BONDS/NOTES: (continued) | | | | | |
| | | | United States: (continued) | | | | | |
810,000 | | X | | Jefferson Smurfit Escrow, 10/01/12 | | $ | — | | — | |
245,000 | | X | | Jefferson Smurfit Escrow, 06/01/13 | | — | | — | |
1,087,000 | | | | JPMorgan Chase Bank NA, 5.875%, 06/13/16 | | 1,177,990 | | 0.3 | |
1,760,000 | | | | Kellogg Co., 4.000%, 12/15/20 | | 1,865,535 | | 0.4 | |
92 | | # | | Kern River Funding Corp., 4.893%, 04/30/18 | | 100 | | 0.0 | |
821,000 | | | | Kraft Foods, Inc., 6.500%, 08/11/17 | | 978,040 | | 0.2 | |
828,000 | | | | Lorillard Tobacco Co., 6.875%, 05/01/20 | | 926,429 | | 0.2 | |
369,334 | | | | Lyondell Chemical Co., 11.000%, 05/01/18 | | 405,344 | | 0.1 | |
395,000 | | | | MarkWest Energy Partners L.P. / MarkWest Energy Finance Corp., 6.500%, 08/15/21 | | 413,269 | | 0.1 | |
681,000 | | | | Morgan Stanley, 4.100%, 01/26/15 | | 646,956 | | 0.2 | |
380,000 | | # | | Mylan, Inc./PA, 7.875%, 07/15/20 | | 421,325 | | 0.1 | |
765,000 | | | | News America, Inc., 4.500%, 02/15/21 | | 803,310 | | 0.2 | |
700,000 | | | | Nielsen Finance LLC / Nielsen Finance Co., 7.750%, 10/15/18 | | 759,500 | | 0.2 | |
700,000 | | | | Omnicare, Inc., 7.750%, 06/01/20 | | 755,125 | | 0.2 | |
1,422,000 | | | | Oracle Corp., 5.375%, 07/15/40 | | 1,735,690 | | 0.4 | |
700,000 | | | | Owens, 7.375%, 05/15/16 | | 770,000 | | 0.2 | |
1,075,000 | | # | | Pacific Life Insurance Co., 9.250%, 06/15/39 | | 1,433,588 | | 0.3 | |
705,000 | | | | Pinnacle Entertainment, Inc., 8.625%, 08/01/17 | | 749,063 | | 0.2 | |
740,000 | | | | Plains Exploration & Production Co., 7.625%, 04/01/20 | | 804,750 | | 0.2 | |
1,272,000 | | | | Protective Life Corp., 8.450%, 10/15/39 | | 1,459,611 | | 0.3 | |
93,250 | | & | | Radio One, Inc., 15.000%, 05/24/16 | | 66,907 | | 0.0 | |
130,000 | | | | Range Resources Corp., 7.500%, 10/01/17 | | 138,775 | | 0.0 | |
420,000 | | | | Range Resources Corp., 8.000%, 05/15/19 | | 470,400 | | 0.1 | |
365,000 | | # | | Reynolds Group Issuer, Inc., 9.000%, 04/15/19 | | 348,575 | | 0.1 | |
480,000 | | # | | Reynolds Group Issuer, Inc., 9.250%, 05/15/18 | | 462,000 | | 0.1 | |
125,000 | | # | | RSC Equipment Rental, Inc., 10.000%, 07/15/17 | | | 146,250 | | 0.0 | |
255,000 | | # | | Sealed Air Corp., 8.375%, 09/15/21 | | 283,050 | | 0.1 | |
492,000 | | | | Select Medical Corp., 7.625%, 02/01/15 | | 464,940 | | 0.1 | |
430,000 | | | | SLM Corp., 8.000%, 03/25/20 | | 435,375 | | 0.1 | |
475,000 | | X | | Smurfit-Stone Container Corp. Escrow, 03/15/17 | | — | | — | |
1,342,000 | | | | St. Jude Medical, Inc., 2.500%, 01/15/16 | | 1,385,875 | | 0.3 | |
1,510,000 | | ±,X | | Station Casinos, Inc., 6.500%, 02/01/14 | | — | | — | |
245,000 | | X | | Stone Webster Escrow, 07/01/12 | | — | | — | |
1,500,000 | | | | Symantec Corp., 4.200%, 09/15/20 | | 1,510,476 | | 0.4 | |
8,000 | | | | Thermon Industries, Inc., 9.500%, 05/01/17 | | 8,660 | | 0.0 | |
2,858,000 | | | | Time Warner Cable, Inc., 5.875%, 11/15/40 | | 3,098,449 | | 0.7 | |
1,101,000 | | | | Time Warner, Inc., 7.700%, 05/01/32 | | 1,438,440 | | 0.3 | |
705,000 | | | | Toys R Us Property Co. II LLC, 8.500%, 12/01/17 | | 733,200 | | 0.2 | |
325,000 | | X | | U.S. Oncology Escrow, 87.500%, 12/31/49 | | — | | — | |
505,000 | | # | | Valeant Pharmaceuticals International, 7.250%, 07/15/22 | | 492,375 | | 0.1 | |
718,000 | | | | Verizon Communications, Inc., 2.000%, 11/01/16 | | 721,024 | | 0.2 | |
638,000 | | | | Wells Fargo & Co., 3.676%, 06/15/16 | | 667,529 | | 0.2 | |
300,000 | | | | Windstream Corp., 7.000%, 03/15/19 | | 304,500 | | 0.1 | |
400,000 | | | | Windstream Corp., 8.125%, 09/01/18 | | 430,500 | | 0.1 | |
EUR | 585,000 | | | | WM Covered Bond Program, 4.000%, 09/27/16 | | 794,404 | | 0.2 | |
650,000 | | | | Wynn Las Vegas LLC / Wynn Las Vegas Capital Corp., 7.750%, 08/15/20 | | 724,750 | | 0.2 | |
740,000 | | # | | XM Satellite Radio, Inc., 7.625%, 11/01/18 | | 780,700 | | 0.2 | |
| | | | | | 82,404,359 | | 19.3 | |
| | | | | | | | | | | |
See Accompanying Notes to Financial Statements
22
Principal
Amount† | | | | | | Value | | Percentage
of Net
Assets | |
CORPORATE BONDS/NOTES: (continued) | | | | | |
| | | | Venezuela: 0.5% | | | | | |
2,689,800 | | | | Petroleos de Venezuela SA, 8.500%, 11/02/17 | | $ | 2,034,834 | | 0.5 | |
| | | | | | | | | |
| | | | Total Corporate Bonds/Notes
(Cost $135,005,290) | | 134,301,807 | | 31.4 | |
| | | | | | | | | |
COLLATERALIZED MORTGAGE OBLIGATIONS: 9.3% | | | | | |
| | | | United States: 9.3% | | | | | |
1,621,820 | | | | Banc of America Alternative Loan Trust, 4.750%, 02/25/19 | | 1,658,768 | | 0.4 | |
460,000 | | | | Banc of America Commercial Mortgage, Inc., 5.317%, 07/10/43 | | 398,130 | | 0.1 | |
750,000 | | | | Banc of America Commercial Mortgage, Inc., 5.377%, 07/10/43 | | 630,753 | | 0.2 | |
520,000 | | | | Banc of America Commercial Mortgage, Inc., 5.841%, 06/10/49 | | 494,414 | | 0.1 | |
2,449,626 | | | | Banc of America Funding Corp., 5.500%, 02/25/35 | | 2,414,343 | | 0.6 | |
413,851 | | | | Citigroup Mortgage Loan Trust, Inc., 4.051%, 05/25/35 | | 343,851 | | 0.1 | |
280,094 | | | | Countrywide Home Loan Mortgage Pass-through Trust, 5.500%, 11/25/35 | | 271,166 | | 0.1 | |
454,729 | | | | Countrywide Home Loan Mortgage Pass-through Trust, 5.500%, 09/25/35 | | 434,093 | | 0.1 | |
1,411,166 | | # | | Credit Suisse Mortgage Capital Certificates, 5.358%, 07/27/37 | | 1,450,221 | | 0.3 | |
1,865,805 | | | | Credit Suisse Mortgage Capital Certificates, 5.589%, 09/15/40 | | 1,891,613 | | 0.4 | |
1,451,453 | | | | CW Capital Cobalt Ltd., 5.174%, 08/15/48 | | 1,473,007 | | 0.3 | |
1,731,431 | | | | CW Capital Cobalt Ltd., 5.736%, 05/15/46 | | 1,753,931 | | 0.4 | |
500,000 | | # | | DBUBS Mortgage Trust, 5.557%, 11/10/46 | | 413,434 | | 0.1 | |
223,677 | | # | | Deutsche Alternative-A Securities, Inc. Alternate Loan Trust, 0.794%, 01/27/37 | | 101,773 | | 0.0 | |
322,413 | | | | GSR Mortgage Loan Trust, 2.722%, 09/25/35 | | 293,225 | | 0.1 | |
1,010,000 | | | | JP Morgan Chase Commercial Mortgage Securities Corp., 4.981%, 01/15/42 | | 883,842 | | 0.2 | |
1,602,293 | | | | JP Morgan Chase Commercial Mortgage Securities Corp., 5.247%, 01/12/43 | | | 1,620,783 | | 0.4 | |
420,000 | | # | | JP Morgan Chase Commercial Mortgage Securities Corp., 5.389%, 07/15/46 | | 313,583 | | 0.1 | |
179,199 | | | | JP Morgan Chase Commercial Mortgage Securities Corp., 5.802%, 06/15/49 | | 181,258 | | 0.0 | |
670,000 | | | | JP Morgan Chase Commercial Mortgage Securities Corp., 6.288%, 02/12/51 | | 689,036 | | 0.2 | |
1,291,745 | | | | JP Morgan Commercial Mortgage Finance Corp., 8.293%, 08/15/32 | | 1,331,438 | | 0.3 | |
500,000 | | | | JP Morgan Commercial Mortgage Finance Corp., 8.434%, 08/15/32 | | 502,551 | | 0.1 | |
1,006,748 | | | | JPMorgan Chase Commercial Mortgage Securities Corp., 5.305%, 01/15/49 | | 998,243 | | 0.2 | |
460,140 | | | | JPMorgan Mortgage Trust, 4.599%, 07/25/35 | | 382,738 | | 0.1 | |
520,000 | | | | LB Commercial Conduit Mortgage Trust, 5.941%, 07/15/44 | | 491,301 | | 0.1 | |
870,000 | | | | LB-UBS Commercial Mortgage Trust, 5.323%, 11/15/40 | | 814,799 | | 0.2 | |
690,000 | | | | LB-UBS Commercial Mortgage Trust, 5.713%, 09/15/45 | | 733,548 | | 0.2 | |
250,000 | | # | | LB-UBS Commercial Mortgage Trust, 5.750%, 01/15/36 | | 249,051 | | 0.1 | |
1,900,000 | | | | LB-UBS Commercial Mortgage Trust, 5.890%, 06/15/38 | | 1,553,757 | | 0.4 | |
418,043 | | | | MASTR Adjustable Rate Mortgages Trust, 2.683%, 04/25/36 | | 302,945 | | 0.1 | |
1,585,733 | | | | Merrill Lynch/Countrywide Commercial Mortgage Trust, 5.331%, 03/12/51 | | 1,590,353 | | 0.4 | |
470,000 | | | | Morgan Stanley Capital I, 5.300%, 06/15/40 | | 359,392 | | 0.1 | |
430,000 | | | | Morgan Stanley Capital I, 5.242%, 01/14/42 | | 410,823 | | 0.1 | |
See Accompanying Notes to Financial Statements
23
Principal
Amount† | | | | | | Value | | Percentage
of Net
Assets | |
COLLATERALIZED MORTGAGE OBLIGATIONS: (continued) | | | | | |
| | | | United States: (continued) | | | | | |
1,280,000 | | # | | Morgan Stanley Capital I, 5.397%, 01/13/41 | | $ | 1,214,634 | | 0.3 | |
19,813 | | | | Residential Accredit Loans, Inc., 3.187%, 04/25/35 | | 2,538 | | 0.0 | |
493,849 | | | | Salomon Brothers Mortgage Securities VII, Inc., 6.784%, 12/18/35 | | 494,070 | | 0.1 | |
1,780,236 | | | | Structured Asset Securities Corp., 5.000%, 05/25/35 | | 1,780,638 | | 0.4 | |
430,000 | | | | Wachovia Bank Commercial Mortgage Trust, 5.368%, 11/15/48 | | 273,939 | | 0.1 | |
550,000 | | | | Wachovia Bank Commercial Mortgage Trust, 5.383%, 12/15/43 | | 460,066 | | 0.1 | |
618,000 | | # | | Wachovia Bank Commercial Mortgage Trust, 5.704%, 02/15/35 | | 610,574 | | 0.1 | |
1,777,319 | | | | Wachovia Bank Commercial Mortgage Trust, 5.735%, 06/15/49 | | 1,822,732 | | 0.4 | |
1,419,335 | | | | WaMu Mortgage Pass Through Certificates, 2.533%, 01/25/36 | | 1,256,771 | | 0.3 | |
1,792,581 | | | | Wells Fargo Mortgage Backed Securities Trust, 5.500%, 09/25/37 | | 1,799,732 | | 0.4 | |
208,313 | | | | Wells Fargo Mortgage-Backed Securities Trust, 2.690%, 10/25/35 | | 184,667 | | 0.0 | |
599,358 | | | | Wells Fargo Mortgage-Backed Securities Trust, 2.719%, 02/25/35 | | 528,472 | | 0.1 | |
1,957,757 | | | | Wells Fargo Mortgage-Backed Securities Trust, 5.354%, 08/25/35 | | 1,882,816 | | 0.4 | |
| | | | | | | | | |
| | | | Total Collateralized Mortgage Obligations
(Cost $41,210,438) | | 39,743,812 | | 9.3 | |
| | | | | |
STRUCTURED PRODUCTS: 0.6% | | | | | |
| | | | Brazil: 0.5% | | | | | |
1,962,500 | | # | | Hallertau SPC 2008-2A - Doux Frangosul S.A. ARGO Avicola Credit Linked Notes, 9.264%, 09/17/13 | | 1,997,825 | | 0.5 | |
| | | | | | | | | |
| | | | Mexico: 0.1% | | | | | |
MXN | 97,261 | | | | Reforma BLN-Backed I - Class 2A Asset Backed Variable Funding Notes, 05/22/15 | | | 6,751 | | 0.0 | |
MXN | 170,161 | | | | Reforma BLN-Backed I - Class 2B Asset Backed Variable Funding Notes, 05/22/15 | | 11,810 | | 0.0 | |
MXN | 2,565,617 | | | | Reforma BLN-Backed I - Class 2C Asset Backed Variable Funding Notes, 05/22/15 | | 178,072 | | 0.1 | |
MXN | 186,979 | | | | Reforma BLN-Backed I - Class 2D Asset Backed Variable Funding Notes, 05/22/15 | | 12,978 | | 0.0 | |
MXN | 135,844 | | | | Reforma BLN-Backed I - Class 2E Asset Backed Variable Funding Notes, 05/22/15 | | 9,428 | | 0.0 | |
MXN | 86,756 | | | | Reforma BLN-Backed I - Class 2F Asset Backed Variable Funding Notes, 05/22/15 | | 6,022 | | 0.0 | |
MXN | 15,977 | | | | Reforma BLN-Backed I - Class 2G Asset Backed Variable Funding Notes, 05/22/15 | | 1,109 | | 0.0 | |
| | | | | | 226,170 | | 0.1 | |
| | | | Russia: 0.0% | | | | | |
RUB | 11,097,000 | | ±,X | | Credit Suisse International - Moitk Total Return Linked Notes, 8.990%, 03/30/11 | | — | | — | |
RUB | 19,450,000 | | X | | Credit Suisse International - SPETSSTROY-2 Credit Linked Fully Funded Total Return Linked Notes, 8.590%, 05/24/15 | | — | | — | |
RUB | 10,904,234 | | | | Morgan Stanley & Co. International PLC - EM Whole Loan SA/Russian Federation Total Return Linked Bonds, Series 007, Cl. VR, 5.000%, 08/22/34 | | 162,270 | | 0.0 | |
| | | | | | 162,270 | | 0.0 | |
| | | | | | | | | | | | |
See Accompanying Notes to Financial Statements
24
Principal
Amount† | | | | | | Value | | Percentage
of Net
Assets | |
STRUCTURED PRODUCTS: (continued) | | | | | |
| | | | United States: 0.0% | | | | | |
188,988 | | | | MicroAccess Trust 2007 - MicroFinance Institutional Loans, Credit Linked Notes, 7.550%, 05/24/12 | | $ | 57,566 | | 0.0 | |
| | | | | | | | | |
| | | | Total Structured Products
(Cost $4,047,595) | | 2,443,831 | | 0.6 | |
| | | | | |
ASSET-BACKED SECURITIES: 0.1% | | | | | |
| | | | United States: 0.1% | | | | | |
221,000 | | | | Americredit Prime Automobile Receivables, 5.620%, 09/08/14 | | 221,214 | | 0.1 | |
| | | | | | | | | |
| | | | Total Asset-Backed Securities
(Cost $193,741) | | 221,214 | | 0.1 | |
| | | | | |
U.S. TREASURY OBLIGATIONS: 10.7% | | | | | |
| | | | U.S. Treasury Bonds: 1.1% | | | | | |
4,236,000 | | | | 2.000%, due 11/15/21 | | 4,282,994 | | 1.0 | |
267,000 | | | | 3.750%, due 08/15/41 | | 313,308 | | 0.1 | |
| | | | | | 4,596,302 | | 1.1 | |
| | | | U.S. Treasury Notes: 9.6% | | | | | |
18,113,000 | | L | | 0.250%, due 11/30/13 | | 18,120,082 | | 4.3 | |
9,851,000 | | L | | 0.375%, due 11/15/14 | | 9,860,241 | | 2.3 | |
8,672,000 | | L | | 0.875%, due 11/30/16 | | 8,701,138 | | 2.0 | |
4,298,000 | | | | 1.375%, due 11/30/18 | | 4,313,447 | | 1.0 | |
| | | | | | 40,994,908 | | 9.6 | |
| | | | | | | | | |
| | | | Total U.S. Treasury Obligations
(Cost $45,445,983) | | 45,591,210 | | 10.7 | |
| | | | | | | | | |
FOREIGN GOVERNMENT BONDS: 29.8% | | | | | |
| | | | Argentina: 0.9% | | | | | |
98,889 | | | | Argentina Government International Bond, 04/17/17 | | 84,550 | | 0.0 | |
EUR | 1,450,000 | | | | Argentina Government International Bond, 4.191%, 12/15/35 | | 193,296 | | 0.1 | |
2,590,000 | | | | Argentina Government International Bond, 7.000%, 10/03/15 | | 2,428,125 | | 0.6 | |
741,472 | | | | Argentina Government International Bond, 8.280%, 12/31/33 | | 544,982 | | 0.1 | |
3,002,772 | | L | | Argentina Government International Bond, 12/15/35 | | 390,360 | | 0.1 | |
| | | | | | 3,641,313 | | 0.9 | |
| | | | Australia: 0.0% | | | | | |
AUD | 60,000 | | | | Australia Government Bond, 5.250%, 03/15/19 | | 68,225 | | 0.0 | |
AUD | 130,000 | | | | Australia Government Bond, 6.250%, 04/15/15 | | | 145,773 | | 0.0 | |
| | | | | | 213,998 | | 0.0 | |
| | | | Brazil: 4.7% | | | | | |
BRL | 5,953,000 | | | | Brazil Notas do Tesouro Nacional Series B, 6.000%, 08/15/16 | | 7,041,825 | | 1.7 | |
BRL | 705,000 | | | | Brazil Notas do Tesouro Nacional Series F, 6.000%, 05/15/45 | | 860,184 | | 0.2 | |
BRL | 18,816,000 | | | | Brazil Notas do Tesouro Nacional Series F, 10.000%, 01/01/21 | | 9,403,425 | | 2.2 | |
770,000 | | | | Brazilian Government International Bond, 4.875%, 01/22/21 | | 864,325 | | 0.2 | |
BRL | 1,059,000 | | | | Federal Republic of Brazil, 10.125%, 05/15/27 | | 1,757,940 | | 0.4 | |
| | | | | | 19,927,699 | | 4.7 | |
| | | | Canada: 0.3% | | | | | |
CAD | 840,000 | | | | Canadian Government Bond, 3.000%, 12/01/15 | | 881,977 | | 0.2 | |
CAD | 550,000 | | | | Canadian Government Bond, 3.500%, 06/01/20 | | 609,473 | | 0.1 | |
| | | | | | 1,491,450 | | 0.3 | |
| | | | Colombia: 0.5% | | | | | |
2,058,000 | | | | Colombia Government International Bond, 4.375%, 07/12/21 | | 2,222,640 | | 0.5 | |
| | | | | | | | | |
| | | | France: 4.2% | | | | | |
EUR | 4,510,000 | | L | | France Government Bond OAT, 3.250%, 10/25/21 | | 5,876,034 | | 1.4 | |
EUR | 8,978,000 | | | | French Treasury Note BTAN, 2.500%, 07/25/16 | | 11,903,725 | | 2.8 | |
| | | | | | 17,779,759 | | 4.2 | |
| | | | Germany: 1.6% | | | | | |
EUR | 4,700,000 | | | | Bundesrepublik Deutschland, 2.000%, 01/04/22 | | 6,155,519 | | 1.4 | |
EUR | 480,000 | | | | Bundesrepublik Deutschland, 3.250%, 07/04/42 | | 737,076 | | 0.2 | |
| | | | | | 6,892,595 | | 1.6 | |
| | | | Hungary: 0.1% | | | | | |
587,000 | | L | | Hungary Government International Bond, 6.250%, 01/29/20 | | 531,235 | | 0.1 | |
| | | | | | | | | | | | | | | | |
See Accompanying Notes to Financial Statements
25
Principal
Amount† | | | | | | Value | | Percentage
of Net
Assets | |
FOREIGN GOVERNMENT BONDS: (continued) | | | | | |
| | | | Indonesia: 0.7% | | | | | |
2,805,000 | | # | | Indonesia Government International Bond, 4.875%, 05/05/21 | | $ | 3,015,375 | | 0.7 | |
159,000 | | # | | Republic of Indonesia, 5.875%, 03/13/20 | | 180,862 | | 0.0 | |
| | | | | | 3,196,237 | | 0.7 | |
| | | | Lithuania: 0.2% | | | | | |
983,000 | | # | | Lithuania Government International Bond, 5.125%, 09/14/17 | | 965,797 | | 0.2 | |
| | | | | | | | | |
| | | | Mexico: 4.1% | | | | | |
MXN | 84,910,000 | | | | Mex Bonos De Desarrollo, 10.000%, 11/20/36 | | 7,554,475 | | 1.8 | |
MXN | 58,100,000 | | | | Mexican Bonos, 7.750%, 05/29/31 | | 4,289,367 | | 1.0 | |
MXN | 56,000,000 | | | | Mexican Bonos, 8.500%, 11/18/38 | | 4,351,288 | | 1.0 | |
808,000 | | | | Mexico Government International Bond, 8.300%, 08/15/31 | | 1,212,000 | | 0.3 | |
| | | | | | 17,407,130 | | 4.1 | |
| | | | New Zealand: 0.3% | | | | | |
NZD | 1,275,000 | | | | New Zealand Government Bond, 6.000%, 04/15/15 | | 1,095,170 | | 0.3 | |
| | | | | | | | | |
| | | | Norway: 0.0% | | | | | |
NOK | 415,000 | | | | Norway Government Bond, 5.000%, 05/15/15 | | 77,143 | | 0.0 | |
| | | | | | | | | |
| | | | Panama: 0.5% | | | | | |
758,000 | | | | Panama Government International Bond, 5.200%, 01/30/20 | | 862,225 | | 0.2 | |
841,000 | | | | Panama Government International Bond, 7.125%, 01/29/26 | | 1,099,608 | | 0.3 | |
| | | | | | 1,961,833 | | 0.5 | |
| | | | Peru: 1.9% | | | | | |
1,327,000 | | | | Peruvian Government International Bond, 7.350%, 07/21/25 | | 1,764,910 | | 0.4 | |
PEN | 13,200,000 | | # | | Peruvian Government International Bond, 8.200%, 08/12/26 | | 5,854,701 | | 1.4 | |
363,000 | | | | Peruvian Government International Bond, 7.125%, 03/30/19 | | 458,287 | | 0.1 | |
| | | | | | 8,077,898 | | 1.9 | |
| | | | Philippines: 0.8% | | | | | |
3,036,000 | | | | Philippine Government International Bond, 4.000%, 01/15/21 | | 3,127,080 | | 0.7 | |
279,000 | | | | Republic of the Philippines, 6.375%, 10/23/34 | | | 334,451 | | 0.1 | |
| | | | | | 3,461,531 | | 0.8 | |
| | | | Poland: 0.2% | | | | | |
457,000 | | | | Poland Government International Bond, 5.000%, 03/23/22 | | 460,999 | | 0.1 | |
173,000 | | | | Poland Government International Bond, 6.375%, 07/15/19 | | 192,030 | | 0.1 | |
| | | | | | 653,029 | | 0.2 | |
| | | | Russia: 0.8% | | | | | |
2,907,053 | | # | | Russia Government Bond, 7.500%, 03/31/30 | | 3,383,082 | | 0.8 | |
| | | | | | | | | |
| | | | South Africa: 5.4% | | | | | |
ZAR | 6,950,000 | | | | South Africa Government Bond, 6.750%, 03/31/21 | | 795,185 | | 0.2 | |
ZAR | 142,660,103 | | | | South Africa Government Bond, 7.250%, 01/15/20 | | 17,017,155 | | 4.0 | |
ZAR | 9,330,000 | | | | South Africa Government Bond, 8.000%, 12/21/18 | | 1,178,361 | | 0.3 | |
ZAR | 16,220,000 | | | | South Africa Government Bond, 10.500%, 12/21/26 | | 2,352,284 | | 0.5 | |
1,540,000 | | | | South Africa Government International Bond, 5.500%, 03/09/20 | | 1,732,500 | | 0.4 | |
| | | | | | 23,075,485 | | 5.4 | |
| | | | | | | | | |
| | | | South Korea: 0.5% | | | | | |
KRW | 2,458,000,000 | | | | Korea Treasury Bond, 5.000%, 06/10/20 | | 2,330,180 | | 0.5 | |
| | | | | | | | | |
| | | | Turkey: 0.8% | | | | | |
557,000 | | | | Turkey Government International Bond, 5.125%, 03/25/22 | | 533,327 | | 0.1 | |
310,000 | | | | Turkey Government International Bond, 7.000%, 03/11/19 | | 344,875 | | 0.1 | |
2,213,000 | | | | Turkey Government International Bond, 7.500%, 11/07/19 | | 2,522,820 | | 0.6 | |
| | | | | | 3,401,022 | | 0.8 | |
| | | | Ukraine: 0.2% | | | | | |
746,000 | | # | | Ukraine Government International Bond, 6.250%, 06/17/16 | | 658,345 | | 0.2 | |
| | | | | | | | | |
| | | | United Kingdom: 0.2% | | | | | |
GBP | 30,000 | | | | United Kingdom Gilt, 4.250%, 12/07/40 | | 57,486 | | 0.0 | |
See Accompanying Notes to Financial Statements
26
Principal
Amount† | | | | | | Value | | Percentage
of Net
Assets | |
FOREIGN GOVERNMENT BONDS: (continued) | | | | | |
| | | | United Kingdom: (continued) | | | | | |
GBP | 300,000 | | | | United Kingdom Gilt, 4.250%, 09/07/39 | | $ | 574,284 | | 0.1 | |
GBP | 10,000 | | | | United Kingdom Gilt, 4.750%, 03/07/20 | | 19,210 | | 0.0 | |
GBP | 215,000 | | | | United Kingdom Gilt, 4.750%, 09/07/15 | | 384,757 | | 0.1 | |
| | | | | | | 1,035,737 | | 0.2 | |
| | | | Uruguay: 0.5% | | | | | |
756,000 | | | | Uruguay Government International Bond, 6.875%, 09/28/25 | | 982,800 | | 0.2 | |
854,000 | | | | Uruguay Government International Bond, 7.625%, 03/21/36 | | 1,189,195 | | 0.3 | |
| | | | | | 2,171,995 | | 0.5 | |
| | | | Venezuela: 0.4% | | | | | |
592,800 | | | | Petroleos de Venezuela, 10/28/15 | | 428,298 | | 0.1 | |
775,000 | | | | Venezuela Government International Bond, 9.000%, 05/07/23 | | 558,000 | | 0.1 | |
970,000 | | # | | Venezuela Government International Bond, 13.625%, 08/15/18 | | 914,225 | | 0.2 | |
| | | | | | 1,900,523 | | 0.4 | |
| | | | | | | | | |
| | | | Total Foreign Government Bonds
(Cost $129,181,688) | | 127,552,826 | | 29.8 | |
| | | | | |
U.S. GOVERNMENT AGENCY OBLIGATIONS: 10.4% | | | | | |
| | | | Federal Home Loan Mortgage Corporation: 4.0%## | | | | | |
112,489 | | | | 0.728%, due 02/15/29 | | 112,678 | | 0.0 | |
51,470 | | | | 0.778%, due 03/15/32 | | 51,697 | | 0.0 | |
219,534 | | | | 0.778%, due 01/15/33 | | 220,511 | | 0.1 | |
3,285,000 | | | | 1.125%, due 07/27/12 | | 3,302,200 | | 0.8 | |
60,119 | | | | 1.228%, due 08/15/31 | | 60,987 | | 0.0 | |
40,813 | | | | 1.228%, due 02/15/32 | | 41,505 | | 0.0 | |
41,394 | | | | 1.278%, due 02/15/32 | | 42,005 | | 0.0 | |
42,461 | | | | 1.278%, due 02/15/32 | | 43,244 | | 0.0 | |
63,312 | | | | 1.278%, due 03/15/32 | | 64,399 | | 0.0 | |
108,000 | | W | | 4.000%, due 10/15/40 | | 112,995 | | 0.0 | |
1,937,328 | | | | 4.500%, due 02/01/41 | | 2,091,680 | | 0.5 | |
1,500,000 | | | | 5.000%, due 02/16/17 | | 1,773,369 | | 0.4 | |
21,063 | | | | 5.000%, due 01/01/20 | | 22,891 | | 0.0 | |
110,340 | | | | 5.000%, due 02/01/20 | | 118,953 | | 0.0 | |
717,387 | | | | 5.000%, due 09/15/23 | | 784,257 | | 0.2 | |
860,000 | | | | 5.000%, due 02/15/34 | | 972,318 | | 0.2 | |
870,000 | | | | 5.000%, due 11/15/34 | | 984,581 | | 0.2 | |
64,323 | | | | 5.000%, due 12/01/34 | | 69,260 | | 0.0 | |
74,171 | | | | 5.500%, due 01/01/18 | | 80,047 | | 0.0 | |
9,803,761 | | ^ | | 5.772%, due 07/15/40 | | 1,756,659 | | 0.4 | |
359,174 | | ^ | | 5.872%, due 07/15/35 | | 64,213 | | 0.0 | |
60,578 | | | | 6.000%, due 05/15/17 | | 64,601 | | 0.0 | |
117,207 | | | | 6.000%, due 02/01/34 | | 130,580 | | 0.0 | |
1,565,421 | | | | 6.000%, due 02/01/38 | | 1,722,018 | | 0.4 | |
17,551 | | | | 6.500%, due 04/01/18 | | 18,974 | | 0.0 | |
43,818 | | | | 6.500%, due 02/01/22 | | 48,906 | | 0.0 | |
47,483 | | | | 6.500%, due 09/01/22 | | 52,997 | | 0.0 | |
131,740 | | | | 6.500%, due 04/15/28 | | | 151,082 | | 0.1 | |
29,523 | | | | 6.500%, due 06/15/31 | | 34,206 | | 0.0 | |
321,132 | | | | 6.500%, due 02/15/32 | | 369,185 | | 0.1 | |
201,185 | | | | 6.500%, due 06/15/32 | | 228,349 | | 0.1 | |
14,416 | | | | 6.500%, due 08/01/32 | | 16,448 | | 0.0 | |
30,354 | | | | 6.500%, due 07/01/34 | | 34,488 | | 0.0 | |
41,605 | | | | 6.500%, due 07/01/34 | | 47,263 | | 0.0 | |
179,479 | | | | 6.750%, due 02/15/24 | | 203,294 | | 0.1 | |
223,112 | | | | 7.000%, due 09/15/26 | | 257,416 | | 0.1 | |
38,786 | | ^ | | 7.000%, due 03/15/28 | | 6,938 | | 0.0 | |
223,026 | | ^ | | 7.000%, due 04/15/28 | | 47,488 | | 0.0 | |
357,831 | | ^ | | 7.372%, due 03/15/29 | | 77,241 | | 0.0 | |
352,820 | | ^ | | 7.422%, due 03/15/29 | | 73,682 | | 0.0 | |
188,311 | | | | 7.500%, due 09/15/22 | | 214,857 | | 0.1 | |
468,219 | | ^ | | 8.672%, due 08/15/29 | | 141,395 | | 0.1 | |
60,372 | | | | 23.363%, due 06/15/34 | | 79,329 | | 0.0 | |
97,015 | | | | 23.730%, due 08/15/35 | | 136,429 | | 0.1 | |
8,216 | | | | 4.500%, due 12/15/21 | | 8,219 | | 0.0 | |
| | | | | | 16,935,834 | | 4.0 | |
| | | | Federal National Mortgage Association: 5.7%## | | | | | |
20,840 | | | | 0.694%, due 11/25/33 | | 20,942 | | 0.0 | |
29,989 | | | | 0.785%, due 10/18/32 | | 30,193 | | 0.0 | |
3,030,000 | | | | 1.125%, due 07/30/12 | | 3,046,710 | | 0.7 | |
94,661 | | | | 1.294%, due 12/25/31 | | 96,906 | | 0.0 | |
45,704 | | | | 1.294%, due 04/25/32 | | 46,779 | | 0.0 | |
14,064 | | | | 1.294%, due 04/25/32 | | 14,395 | | 0.0 | |
130,678 | | | | 1.294%, due 09/25/32 | | 133,765 | | 0.0 | |
130,696 | | | | 1.294%, due 12/25/32 | | 133,783 | | 0.0 | |
608,657 | | | | 2.590%, due 10/01/36 | | 643,928 | | 0.2 | |
57,470 | | | | 4.000%, due 07/25/17 | | 57,975 | | 0.0 | |
430,860 | | | | 4.000%, due 12/01/41 | | 453,289 | | 0.1 | |
400,000 | | | | 4.500%, due 08/25/25 | | 435,133 | | 0.1 | |
187,000 | | W | | 4.500%, due 02/15/40 | | 198,191 | | 0.1 | |
14,597,121 | | ^ | | 5.000%, due 05/25/18 | | 1,226,507 | | 0.3 | |
987,418 | | | | 5.000%, due 07/25/34 | | 1,028,436 | | 0.3 | |
2,020,485 | | | | 5.000%, due 07/25/40 | | 2,153,780 | | 0.5 | |
195,281 | | | | 5.000%, due 06/01/41 | | 211,520 | | 0.1 | |
2,000,000 | | | | 5.375%, due 06/12/17 | | 2,420,540 | | 0.6 | |
64,006 | | | | 5.500%, due 09/01/19 | | 70,123 | | 0.0 | |
66,037 | | | | 5.500%, due 09/01/19 | | 72,348 | | 0.0 | |
153,949 | | | | 5.500%, due 09/01/24 | | 168,917 | | 0.1 | |
79,000 | | | | 5.500%, due 08/25/34 | | 87,075 | | 0.0 | |
1,570,437 | | | | 5.500%, due 05/01/37 | | 1,711,586 | | 0.4 | |
64,069 | | | | 6.000%, due 03/25/17 | | 69,657 | | 0.0 | |
96,443 | | | | 6.000%, due 06/01/17 | | 104,441 | | 0.0 | |
41,860 | | | | 6.000%, due 05/01/21 | | 45,384 | | 0.0 | |
109,842 | | | | 6.000%, due 01/25/32 | | 123,755 | | 0.0 | |
651,133 | | | | 6.000%, due 11/01/34 | | 723,696 | | 0.2 | |
929,685 | | | | 6.000%, due 04/01/35 | | 1,033,291 | | 0.3 | |
472,734 | | ^ | | 6.246%, due 06/25/37 | | 67,442 | | 0.0 | |
1,625,145 | | ^ | | 6.276%, due 06/25/36 | | 225,704 | | 0.1 | |
67,367 | | ^ | | 6.456%, due 05/25/35 | | 14,740 | | 0.0 | |
53,682 | | | | 6.500%, due 04/25/29 | | 61,275 | | 0.0 | |
93,789 | | | | 6.500%, due 11/25/29 | | 107,510 | | 0.0 | |
302,552 | | | | 6.500%, due 12/01/29 | | 345,913 | | 0.1 | |
104,458 | | | | 6.500%, due 10/25/31 | | 121,305 | | 0.0 | |
106,156 | | | | 6.500%, due 04/25/32 | | 118,952 | | 0.0 | |
129,181 | | | | 6.500%, due 01/01/34 | | 147,710 | | 0.0 | |
1,628,787 | | | | 6.500%, due 09/01/36 | | 1,829,643 | | 0.4 | |
894,798 | | | | 6.500%, due 11/01/36 | | 1,005,141 | | 0.3 | |
See Accompanying Notes to Financial Statements
27
Principal
Amount† | | | | | | Value | | Percentage
of Net
Assets | |
U.S. GOVERNMENT AGENCY OBLIGATIONS: (continued) | | | | | |
| | | | Federal National Mortgage Association: (continued) | | | | | |
250,507 | | ^ | | 6.756%, due 10/25/22 | | $ | 19,062 | | 0.0 | |
132,349 | | ^ | | 6.806%, due 06/25/23 | | 19,969 | | 0.0 | |
328,670 | | ^ | | 6.936%, due 09/25/36 | | 78,239 | | 0.0 | |
6,782 | | | | 7.000%, due 09/01/14 | | 7,228 | | 0.0 | |
23,467 | | | | 7.000%, due 11/01/17 | | 25,102 | | 0.0 | |
81,144 | | | | 7.000%, due 01/01/30 | | 94,029 | | 0.0 | |
620 | | | | 7.000%, due 02/01/31 | | 698 | | 0.0 | |
10,124 | | | | 7.000%, due 07/01/32 | | 11,743 | | 0.0 | |
351,121 | | | | 7.000%, due 12/01/32 | | 409,696 | | 0.1 | |
127,501 | | ^ | | 7.000%, due 03/25/33 | | 25,056 | | 0.0 | |
144,310 | | | | 7.000%, due 04/01/33 | | 167,226 | | 0.1 | |
1,586 | | | | 7.000%, due 04/01/33 | | 1,834 | | 0.0 | |
93,469 | | ^ | | 7.000%, due 04/25/33 | | 18,508 | | 0.0 | |
274,893 | | | | 7.000%, due 04/01/34 | | 320,168 | | 0.1 | |
666,221 | | ^ | | 7.256%, due 10/25/33 | | 135,768 | | 0.0 | |
853,773 | | ^ | | 7.336%, due 03/25/23 | | 101,269 | | 0.0 | |
431,835 | | ^ | | 7.456%, due 07/25/31 | | 95,693 | | 0.0 | |
243,325 | | ^ | | 7.456%, due 02/25/32 | | 50,149 | | 0.0 | |
67,308 | | | | 7.500%, due 09/01/32 | | 80,540 | | 0.0 | |
174,882 | | | | 7.500%, due 01/01/33 | | 208,373 | | 0.1 | |
14,847 | | | | 7.500%, due 07/25/42 | | 17,090 | | 0.0 | |
15,201 | | | | 7.500%, due 02/25/44 | | 17,089 | | 0.0 | |
116,400 | | ^ | | 7.656%, due 07/25/32 | | 30,000 | | 0.0 | |
784,055 | | | | 22.826%, due 07/25/35 | | 987,876 | | 0.2 | |
163,374 | | | | 23.123%, due 06/25/36 | | 225,381 | | 0.1 | |
100,688 | | | | 23.490%, due 03/25/36 | | 142,300 | | 0.0 | |
110,209 | | | | 26.868%, due 04/25/35 | | 176,901 | | 0.1 | |
276,182 | | ^ | | 5.500%, due 07/01/33 | | 40,543 | | 0.0 | |
100,323 | | ^ | | 5.500%, due 06/01/35 | | 14,442 | | 0.0 | |
458,307 | | ^ | | 6.000%, due 12/01/32 | | 76,337 | | 0.0 | |
157,517 | | ^ | | 6.000%, due 02/01/33 | | 24,145 | | 0.0 | |
251,954 | | ^ | | 6.000%, due 03/01/33 | | 42,931 | | 0.0 | |
167,097 | | ^ | | 6.000%, due 03/01/33 | | 26,664 | | 0.0 | |
114,276 | | ^ | | 6.000%, due 09/01/35 | | 18,663 | | 0.0 | |
713,917 | | ^ | | 6.500%, due 02/01/32 | | 133,079 | | 0.0 | |
96,278 | | ^ | | 7.000%, due 02/01/28 | | 15,976 | | 0.0 | |
139,567 | | ^ | | 7.500%, due 01/01/24 | | 28,393 | | 0.0 | |
| | | | | | 24,496,540 | | 5.7 | |
| | | | Government National Mortgage Association: 0.7% | | | | | |
4,715,177 | | ^ | | 4.000%, due 04/20/38 | | 625,936 | | 0.2 | |
222,894 | | | | 5.000%, due 04/15/34 | | 248,290 | | 0.1 | |
170,274 | | | | 5.500%, due 04/15/33 | | 192,250 | | 0.0 | |
31,962 | | | | 5.500%, due 07/15/33 | | 36,110 | | 0.0 | |
65,335 | | | | 5.500%, due 04/15/34 | | 73,768 | | 0.0 | |
974,090 | | | | 6.000%, due 08/15/36 | | 1,105,379 | | 0.3 | |
137,566 | | | | 6.000%, due 07/20/39 | | 157,288 | | 0.0 | |
45,627 | | | | 6.500%, due 02/20/35 | | 52,205 | | 0.0 | |
119,756 | | | | 8.000%, due 01/16/30 | | 143,782 | | 0.0 | |
493,962 | | | | 8.000%, due 02/16/30 | | 593,064 | | 0.1 | |
| | | | | | 3,228,072 | | 0.7 | |
| | | | | | | | | |
| | | | Total U.S. Government Agency Obligations
(Cost $41,793,569) | | 44,660,446 | | 10.4 | |
| | | | | | | | | | |
Shares | | | | | | | | | | |
COMMON STOCK: 0.3% | | | | | |
| | | | Canada: 0.0% | | | | | |
182 | | @ | | AbitibiBowater, Inc. | | | 2,648 | | 0.0 | |
| | | | | | | | | |
| | | | United States: 0.3% | | | | | |
43,083 | | @,L,X | | American Media, Inc. | | 689,328 | | 0.1 | |
733 | | | | Rock-Tenn Co. | | 42,294 | | 0.0 | |
14,240 | | @ | | Visteon Corp. | | 711,146 | | 0.2 | |
| | | | | | 1,442,768 | | 0.3 | |
| | | | | | | | | |
| | | | Total Common Stock
(Cost $1,691,642) | | 1,445,416 | | 0.3 | |
| | | | | |
WARRANTS: —% | | | | | |
| | | | Consumer Discretionary: —% | | | | | |
2,406 | | X | | Media News Group | | — | | — | |
| | | | | | | | | |
| | | | Total Warrants
(Cost $—) | | — | | — | |
# of Contracts | | | | | | | | | |
PURCHASED OPTIONS: 0.2% | | | | | |
| | | | Options on Currencies: 0.2% | | | | | |
10,700,000 | | @ | | EUR Put vs. USD Call Currency Option, Strike @ 1.310, Exp. 01/31/12 Counterparty: Deutsche Bank AG | | 237,138 | | 0.0 | |
17,100,000 | | @ | | EUR Put vs. USD Call Currency Option, Strike @ 1.300, Exp. 01/16/12 Counterparty: Deutsche Bank AG | | 224,368 | | 0.0 | |
26,900,000 | | @ | | EUR Put vs. USD Call Currency Option, Strike @ 1.300, Exp. 01/16/12 Counterparty: Deutsche Bank AG | | 352,953 | | 0.1 | |
21,500,000 | | @ | | JPY Put vs. USD Call Currency Option, Strike @ 79.800, Exp. 06/01/12 Counterparty: Deutsche Bank AG | | 251,332 | | 0.1 | |
| | | | | | 1,065,791 | | 0.2 | |
| | | | | | | | | |
| | | | Total Purchased Options
(Cost $1,150,797) | | 1,065,791 | | 0.2 | |
| | | | | | | | | |
| | | | Total Long-Term Investments
(Cost $399,720,743) | | 397,026,353 | | 92.8 | |
See Accompanying Notes to Financial Statements
28
Principal
Amount† | | | | Value | | Percentage
of Net
Assets | |
SHORT-TERM INVESTMENTS: 11.2% | | | | | |
| | Securities Lending Collateral(cc)(1): 6.3% | | | | | |
6,373,139 | | BNP Paribas Bank, Repurchase Agreement dated 12/30/11, 0.06%, due 01/03/12 (Repurchase Amount $6,373,181, collateralized by various U.S. Government Agency Obligations, 5.000%-6.000%, Market Value plus accrued interest $6,500,602, due 05/15/24-04/15/41) | | $ | 6,373,139 | | 1.5 | |
6,373,139 | | Cantor Fitzgerald, Repurchase Agreement dated 12/30/11, 0.12%, due 01/03/12 (Repurchase Amount $6,373,223, collateralized by various U.S. Government Agency Obligations, 1.437%-6.014%, Market Value plus accrued interest $6,500,602, due 06/01/17-09/01/44) | | 6,373,139 | | 1.5 | |
6,373,139 | | Citigroup, Inc., Repurchase Agreement dated 12/30/11, 0.08%, due 01/03/12 (Repurchase Amount $6,373,195, collateralized by various U.S. Government and U.S. Government Agency Obligations, 0.000%-5.500%, Market Value plus accrued interest $6,500,602, due 01/19/12-12/20/41) | | 6,373,139 | | 1.5 | |
1,341,716 | | Deutsche Bank AG, Repurchase Agreement dated 12/30/11, 0.10%, due 01/03/12 (Repurchase Amount $1,341,731, collateralized by various U.S. Government and U.S. Government Agency Obligations, 0.000%-6.500%, Market Value plus accrued interest $1,368,550, due 06/28/12-11/01/41) | | 1,341,716 | | 0.3 | |
6,373,139 | | Merrill Lynch & Co., Inc., Repurchase Agreement dated 12/30/11, 0.02%, due 01/03/12 (Repurchase Amount $6,373,153, collateralized by various U.S. Government Securities, 1.875%-4.000%, Market Value plus accrued interest $6,500,611, due 02/15/15-06/30/15) | | | 6,373,139 | | 1.5 | |
| | | | 26,834,272 | | 6.3 | |
| | | | | | | |
| | Foreign Government Bonds: 0.8% | | | | | |
KRW | 1,046,000,000 | | Korea Monetary Stabilization Bond, 3.280%, 10/02/12 | | 907,186 | | 0.2 | |
KRW | 2,784,000,000 | | Korea Monetary Stabilization Bond, 3.810%, 08/02/12 | | 2,422,252 | | 0.6 | |
| | | | 3,329,438 | | 0.8 | |
Shares | | | | | | | |
| | Mutual Funds: 4.1% | | | | | |
17,645,000 | | BlackRock Liquidity Funds, TempFund, Institutional Class
(Cost $17,645,000) | | 17,645,000 | | 4.1 | |
| | | | | | | |
| | Total Short-Term Investments
(Cost $47,919,938) | | 47,808,710 | | 11.2 | |
| | | | | | | |
| | Total Investments in Securities
(Cost $447,640,681) | | $ | 444,835,063 | | 104.0 | |
| | Liabilities in Excess of Other Assets | | (16,956,230 | ) | (4.0 | ) |
| | Net Assets | | $ | 427,878,833 | | 100.0 | |
† | Unless otherwise indicated, principal amount is shown in USD. |
# | Securities with purchases pursuant to Rule 144A or section 4(2), under the Securities Act of 1933 and may not be resold subject to that rule except to qualified institutional buyers. |
## | On September 7, 2008, the Federal Housing Finance Agency placed the Federal National Mortgage Association and the Federal Home Loan Mortgage Corporation into conservatorship and the U.S. Treasury guaranteed the debt issued by those organizations. |
@ | Non-income producing security |
| |
& | Payment-in-kind |
+ | Step-up basis bonds. Interest rates shown reflect current and next coupon rates. |
(cc) | Securities purchased with cash collateral for securities loaned. |
W | Settlement is on a when-issued or delayed-delivery basis. |
See Accompanying Notes to Financial Statements
29
L | Loaned security, a portion or all of the security is on loan at December 31, 2011. |
± | Defaulted security |
X | Fair value determined by ING Funds Valuation Committee appointed by the Funds’ Board of Directors/Trustees. |
^ | Interest only securities represent the right to receive the monthly interest payments on an underlying pool of mortgage loans. Principal amount shown represents the notional amount on which current interest is calculated. Payments of principal on the pool reduce the value of the interest only security. |
(1) | Collateral received from brokers for securities lending was invested into these short-term investments. |
| |
AUD | Australian Dollar |
BRL | Brazilian Real |
CAD | Canadian Dollar |
EUR | EU Euro |
GBP | British Pound |
KRW | South Korean Won |
MXN | Mexican Peso |
NOK | Norwegian Krone |
NZD | New Zealand Dollar |
PEN | Peruvian Nuevo Sol |
PHP | Philippine Peso |
RUB | Russian Ruble |
ZAR | South African Rand |
| |
| Cost for federal income tax purposes is $447,783,505. |
| |
| Net unrealized depreciation consists of: |
|
| | | | | | |
| Gross Unrealized Appreciation | | | | $ | 10,622,030 | |
| Gross Unrealized Depreciation | | | | (13,570,472 | ) |
| Net Unrealized Depreciation | | | | $ | (2,948,442 | ) |
| | | | | | | | |
Sector Diversification | | Percentage
of Net Assets | |
Automobile Asset-Backed Securities | | 0.1 | % |
Collateralized Mortgage Obligations | | 9.3 | |
Consumer Discretionary | | 5.1 | |
Consumer Staples | | 1.5 | |
Energy | | 4.8 | |
Federal Home Loan Mortgage Corporation | | 4.0 | |
Federal National Mortgage Association | | 5.7 | |
Financials | | 10.4 | |
Foreign Government Bonds | | 30.6 | |
Government National Mortgage Association | | 0.7 | |
Health Care | | 1.6 | |
Industrials | | 1.3 | |
Information Technology | | 1.1 | |
Materials | | 1.7 | |
Options on Currencies | | 0.2 | |
Structured Products | | 0.6 | |
Telecommunications | | 2.2 | |
U.S. Treasury Bonds | | 1.1 | |
U.S. Treasury Notes | | 9.6 | |
Utilities | | 2.0 | |
Short-Term Investments | | 10.4 | |
Liabilities in Excess of Other Assets | | (4.0 | ) |
Net Assets | | 100.0 | % |
Fair Value Measurements^
The following is a summary of the fair valuations according to the inputs used as of December 31, 2011 in valuing the assets and liabilities:
See Accompanying Notes to Financial Statements
30
| | Quoted Prices
in Active Markets
for Identical
Investments
(Level 1) | | Significant
Other
Observable
Inputs
(Level 2) | | Significant
Unobservable
Inputs
(Level 3) | | Fair Value
at
12/31/2011 | |
Asset Table | | | | | | | | | |
Investments, at value | | | | | | | | | |
Common Stock | | | | | | | | | |
Canada | | $ | 2,648 | | $ | — | | $ | — | | $ | 2,648 | |
United States | | 753,440 | | — | | 689,328 | | 1,442,768 | |
Total Common Stock | | 756,088 | | — | | 689,328 | | 1,445,416 | |
Warrants | | — | | — | | — | | — | |
Purchased Options | | — | | 1,065,791 | | — | | 1,065,791 | |
Corporate Bonds/Notes | | — | | 119,524,301 | | 14,777,506 | | 134,301,807 | |
Collateralized Mortgage Obligations | | — | | 39,642,039 | | 101,773 | | 39,743,812 | |
Structured Products | | — | | — | | 2,443,831 | | 2,443,831 | |
Short-Term Investments | | 17,645,000 | | 30,163,710 | | — | | 47,808,710 | |
U.S. Treasury Obligations | | — | | 45,591,210 | | — | | 45,591,210 | |
Foreign Government Bonds | | — | | 127,552,826 | | — | | 127,552,826 | |
Asset-Backed Securities | | — | | 221,214 | | — | | 221,214 | |
U.S. Government Agency Obligations | | — | | 44,660,446 | | — | | 44,660,446 | |
Total Investments, at value | | $ | 18,401,088 | | $ | 408,421,537 | | $ | 18,012,438 | | $ | 444,835,063 | |
Other Financial Instruments+ | | | | | | | | | |
Swaps | | 354,067 | | 1,692,256 | | — | | 2,046,323 | |
Futures | | 1,919,762 | | — | | — | | 1,919,762 | |
Forward Foreign Currency Contracts | | — | | 4,529,350 | | — | | 4,529,350 | |
Total Assets | | $ | 20,674,917 | | $ | 414,643,143 | | $ | 18,012,438 | | $ | 453,330,498 | |
Liabilities Table | | | | | | | | | |
Other Financial Instruments+ | | | | | | | | | |
Swaps | | $ | (331,942 | ) | $ | (5,539,465 | ) | $ | — | | $ | (5,871,407 | ) |
Futures | | (1,150,510 | ) | — | | — | | (1,150,510 | ) |
Written Options | | — | | (371,097 | ) | — | | (371,097 | ) |
Forward Foreign Currency Contracts | | — | | (5,679,249 | ) | — | | (5,679,249 | ) |
Total Liabilities | | $ | (1,482,452 | ) | $ | (11,589,811 | ) | $ | — | | $ | (13,072,263 | ) |
^ | See Note 2, “Significant Accounting Policies” in the Notes to Financial Statements for additional information. |
+ | Other Financial Instruments are derivatives not reflected in the Portfolio of Investments and may include open forward foreign currency contracts, equity forwards, futures, swaps, and written options. Forward foreign currency contracts, equity forwards and futures are valued at the unrealized gain (loss) on the instrument. Swaps and written options are valued at the fair value of the instrument. |
| |
| There were no significant transfers between Level 1 and 2 during the year ended December 31, 2011. |
| |
| Transfers in or out of Level 3 represent either the beginning value (for transfers in), or the ending value (for transfers out) of any security or derivative instrument where a change in the pricing level occurred from the beginning to the end of the period. Transfers are recognized at the end of the reporting period. |
At December 31, 2011 , the following forward foreign currency contracts were outstanding for the ING Global Bond Portfolio:
Counterparty | | Currency | | Contract Amount | | Buy/Sell | | Settlement Date | | In Exchange For | | Fair Value | | Unrealized
Appreciation
(Depreciation) | |
| | | | | | | | | | | | | | | |
Barclays Bank PLC | | South African Rand | | 43,618,968 | | Buy | | 01/27/12 | | $ | 5,420,000 | | $ | 5,377,334 | | $ | (42,666 | ) |
Citigroup, Inc. | | Swiss Franc | | 2,381,687 | | Buy | | 01/13/12 | | 2,555,036 | | 2,536,195 | | (18,841 | ) |
Citigroup, Inc. | | EU Euro | | 3,278,135 | | Buy | | 01/27/12 | | 4,333,000 | | 4,243,508 | | (89,492 | ) |
Citigroup, Inc. | | EU Euro | | 3,292,683 | | Buy | | 01/27/12 | | 4,316,000 | | 4,262,340 | | (53,660 | ) |
Citigroup, Inc. | | Polish Zloty | | 24,540,401 | | Buy | | 01/27/12 | | 7,144,095 | | 7,092,741 | | (51,354 | ) |
Citigroup, Inc. | | Canadian Dollar | | 6,570,036 | | Buy | | 01/27/12 | | 6,440,000 | | 6,445,073 | | 5,073 | |
Citigroup, Inc. | | Canadian Dollar | | 11,576,470 | | Buy | | 01/27/12 | | 11,208,951 | | 11,356,284 | | 147,333 | |
Citigroup, Inc. | | Japanese Yen | | 3,852,835,556 | | Buy | | 01/27/12 | | 49,495,143 | | 50,077,292 | | 582,149 | |
Credit Suisse First Boston | | Singapore Dollar | | 9,096,579 | | Buy | | 01/13/12 | | 7,000,319 | | 7,012,978 | | 12,659 | |
Credit Suisse First Boston | | Japanese Yen | | 830,140,809 | | Buy | | 01/27/12 | | 10,739,000 | | 10,789,768 | | 50,768 | |
Deutsche Bank AG | | British Pound | | 1,783,958 | | Buy | | 01/13/12 | | 2,792,000 | | 2,770,130 | | (21,870 | ) |
Deutsche Bank AG | | Chilean Peso | | 3,724,551,600 | | Buy | | 01/13/12 | | 7,219,522 | | 7,155,087 | | (64,435 | ) |
Deutsche Bank AG | | British Pound | | 1,664,174 | | Buy | | 01/13/12 | | 2,597,613 | | 2,584,130 | | (13,483 | ) |
Deutsche Bank AG | | EU Euro | | 2,494,538 | | Buy | | 01/27/12 | | 3,254,000 | | 3,229,150 | | (24,850 | ) |
| | | | | | | | | | | | | | | | | | |
See Accompanying Notes to Financial Statements
31
Counterparty | | Currency | | Contract Amount | | Buy/Sell | | Settlement Date | | In Exchange For | | Fair Value | | Unrealized
Appreciation
(Depreciation) | |
Deutsche Bank AG | | Australian Dollar | | 1,082,434 | | Buy | | 01/13/12 | | $ | 1,098,000 | | $ | 1,105,322 | | $ | 7,322 | |
Deutsche Bank AG | | EU Euro | | 1,730,846 | | Buy | | 01/27/12 | | 2,260,000 | | 2,240,560 | | (19,440 | ) |
Deutsche Bank AG | | Norwegian Krone | | 5,100,569 | | Buy | | 01/27/12 | | 861,000 | | 852,016 | | (8,984 | ) |
Deutsche Bank AG | | EU Euro | | 3,300,996 | | Buy | | 01/27/12 | | 4,316,000 | | 4,273,101 | | (42,899 | ) |
Deutsche Bank AG | | EU Euro | | 3,268,654 | | Buy | | 01/27/12 | | 4,333,000 | | 4,231,235 | | (101,765 | ) |
Deutsche Bank AG | | Israeli New Shekel | | 15,983,004 | | Buy | | 01/27/12 | | 4,236,153 | | 4,191,241 | | (44,912 | ) |
Deutsche Bank AG | | Japanese Yen | | 118,060,677 | | Buy | | 01/27/12 | | 1,517,000 | | 1,534,496 | | 17,496 | |
Deutsche Bank AG | | Swedish Krona | | 12,718,263 | | Buy | | 01/27/12 | | 1,854,850 | | 1,845,312 | | (9,538 | ) |
Deutsche Bank AG | | EU Euro | | 6,491,697 | | Buy | | 01/27/12 | | 8,689,000 | | 8,403,426 | | (285,574 | ) |
Deutsche Bank AG | | Japanese Yen | | 102,537,263 | | Buy | | 01/27/12 | | 1,323,000 | | 1,332,730 | | 9,730 | |
Deutsche Bank AG | | Japanese Yen | | 317,398,403 | | Buy | | 01/27/12 | | 4,089,000 | �� | 4,125,391 | | 36,391 | |
Deutsche Bank AG | | Mexican Peso | | 69,257,171 | | Buy | | 01/27/12 | | 5,101,667 | | 4,950,869 | | (150,798 | ) |
Deutsche Bank AG | | EU Euro | | 369,657 | | Buy | | 01/27/12 | | 493,000 | | 478,517 | | (14,483 | ) |
Deutsche Bank AG | | Turkish Lira | | 9,221,664 | | Buy | | 01/27/12 | | 4,906,784 | | 4,837,021 | | (69,763 | ) |
HSBC | | British Pound | | 1,653,912 | | Buy | | 01/13/12 | | 2,593,000 | | 2,568,194 | | (24,806 | ) |
HSBC | | Brazilian Real | | 9,074,509 | | Buy | | 01/13/12 | | 4,947,933 | | 4,848,774 | | (99,159 | ) |
HSBC | | South African Rand | | 52,988,097 | | Buy | | 01/27/12 | | 6,437,000 | | 6,532,358 | | 95,358 | |
HSBC | | South African Rand | | 17,667,589 | | Buy | | 01/27/12 | | 2,146,000 | | 2,178,056 | | 32,056 | |
HSBC | | Malaysian Ringgit | | 28,118,169 | | Buy | | 01/27/12 | | 8,843,026 | | 8,852,496 | | 9,470 | |
HSBC | | EU Euro | | 7,926,846 | | Buy | | 01/27/12 | | 10,705,000 | | 10,261,210 | | (443,790 | ) |
HSBC | | Chinese Yuan | | 46,078,200 | | Buy | | 03/02/12 | | 7,245,000 | | 7,313,241 | | 68,241 | |
JPMorgan Chase & Co. | | Canadian Dollar | | 662,713 | | Buy | | 01/27/12 | | 649,000 | | 650,108 | | 1,108 | |
JPMorgan Chase & Co. | | EU Euro | | 6,074,127 | | Buy | | 01/27/12 | | 7,945,000 | | 7,862,886 | | (82,114 | ) |
JPMorgan Chase & Co. | | Japanese Yen | | 245,887,707 | | Buy | | 01/27/12 | | 3,170,000 | | 3,195,929 | | 25,929 | |
JPMorgan Chase & Co. | | Canadian Dollar | | 2,001,024 | | Buy | | 01/27/12 | | 1,961,000 | | 1,962,964 | | 1,964 | |
JPMorgan Chase & Co. | | Canadian Dollar | | 2,452,416 | | Buy | | 01/27/12 | | 2,414,000 | | 2,405,771 | | (8,229 | ) |
JPMorgan Chase & Co. | | Mexican Peso | | 108,775,364 | | Buy | | 01/27/12 | | 7,711,683 | | 7,775,839 | | 64,156 | |
JPMorgan Chase & Co. | | New Zealand Dollar | | 939,176 | | Buy | | 01/13/12 | | 708,000 | | 730,342 | | 22,342 | |
Morgan Stanley | | Indian Rupee | | 511,751,567 | | Buy | | 01/13/12 | | 9,588,750 | | 9,608,869 | | 20,119 | |
Morgan Stanley | | South Korean Won | | 9,354,153,150 | | Buy | | 01/13/12 | | 8,060,451 | | 8,111,847 | | 51,396 | |
Morgan Stanley | | Australian Dollar | | 4,409,151 | | Buy | | 01/13/12 | | 4,380,792 | | 4,502,384 | | 121,592 | |
Morgan Stanley | | Indonesian Rupiah | | 69,883,802,205 | | Buy | | 01/27/12 | | 7,654,305 | | 7,684,912 | | 30,607 | |
Morgan Stanley | | Norwegian Krone | | 68,629,907 | | Buy | | 01/27/12 | | 11,766,388 | | 11,464,161 | | (302,227 | ) |
Morgan Stanley | | Russian Ruble | | 219,033,185 | | Buy | | 01/27/12 | | 6,878,967 | | 6,774,650 | | (104,317 | ) |
Morgan Stanley | | EU Euro | | 36,384,465 | | Buy | | 01/27/12 | | 48,450,281 | | 47,099,265 | | (1,351,016 | ) |
| | | | | | | | | | | | | | $ | (2,131,206 | ) |
| | | | | | | | | | | | | | | |
Barclays Bank PLC | | Norwegian Krone | | 4,730,972 | | Sell | | 01/27/12 | | $ | 787,000 | | $ | 790,277 | | $ | (3,277 | ) |
Barclays Bank PLC | | Mexican Peso | | 69,968,242 | | Sell | | 01/27/12 | | 5,105,000 | | 5,001,701 | | 103,299 | |
Citigroup, Inc. | | Australian Dollar | | 11,073,014 | | Sell | | 01/13/12 | | 10,975,970 | | 11,307,155 | | (331,185 | ) |
Citigroup, Inc. | | Japanese Yen | | 123,213,304 | | Sell | | 01/27/12 | | 1,585,000 | | 1,601,467 | | (16,467 | ) |
Citigroup, Inc. | | Czech Koruna | | 128,382,582 | | Sell | | 01/27/12 | | 6,738,263 | | 6,499,287 | | 238,976 | |
Citigroup, Inc. | | EU Euro | | 5,093,995 | | Sell | | 01/27/12 | | 6,794,035 | | 6,594,118 | | 199,917 | |
Credit Suisse First Boston | | British Pound | | 5,445,594 | | Sell | | 01/13/12 | | 8,453,000 | | 8,455,918 | | (2,918 | ) |
Credit Suisse First Boston | | EU Euro | | 13,830,602 | | Sell | | 01/27/12 | | 18,628,342 | | 17,903,554 | | 724,788 | |
Credit Suisse First Boston | | Mexican Peso | | 67,000,000 | | Sell | | 01/27/12 | | 4,903,684 | | 4,789,515 | | 114,169 | |
Deutsche Bank AG | | New Zealand Dollar | | 5,683,142 | | Sell | | 01/13/12 | | 4,316,000 | | 4,419,444 | | (103,444 | ) |
Deutsche Bank AG | | Australian Dollar | | 4,317,788 | | Sell | | 01/13/12 | | 4,333,000 | | 4,409,089 | | (76,089 | ) |
Deutsche Bank AG | | Hungarian Forint | | 363,648,690 | | Sell | | 01/13/12 | | 1,574,630 | | 1,491,832 | | 82,798 | |
Deutsche Bank AG | | British Pound | | 995,036 | | Sell | | 01/13/12 | | 1,551,000 | | 1,545,091 | | 5,909 | |
Deutsche Bank AG | | Norwegian Krone | | 22,276,894 | | Sell | | 01/27/12 | | 3,724,000 | | 3,721,204 | | 2,796 | |
Deutsche Bank AG | | EU Euro | | 1,819,772 | | Sell | | 01/27/12 | | 2,428,000 | | 2,355,674 | | 72,326 | |
Deutsche Bank AG | | EU Euro | | 7,956,698 | | Sell | | 01/27/12 | | 10,734,000 | | 10,299,853 | | 434,147 | |
Deutsche Bank AG | | Japanese Yen | | 175,688,421 | | Sell | | 01/27/12 | | 2,271,000 | | 2,283,513 | | (12,513 | ) |
Deutsche Bank AG | | EU Euro | | 1,268,185 | | Sell | | 01/27/12 | | 1,704,000 | | 1,641,650 | | 62,350 | |
Deutsche Bank AG | | EU Euro | | 1,275,744 | | Sell | | 01/27/12 | | 1,701,000 | | 1,651,435 | | 49,565 | |
See Accompanying Notes to Financial Statements
32
Counterparty | | Currency | | Contract Amount | | Buy/Sell | | Settlement Date | | In Exchange For | | Fair Value | | Unrealized
Appreciation
(Depreciation) | |
HSBC | | South Korean Won | | 5,065,267,770 | | Sell | | 01/13/12 | | $ | 4,293,000 | | $ | 4,392,560 | | $ | (99,560 | ) |
HSBC | | British Pound | | 475,196 | | Sell | | 01/13/12 | | 737,000 | | 737,884 | | (884 | ) |
HSBC | | Indian Rupee | | 187,892,520 | | Sell | | 01/13/12 | | 3,496,000 | | 3,527,951 | | (31,951 | ) |
HSBC | | Brazilian Real | | 16,581,588 | | Sell | | 01/13/12 | | 9,021,538 | | 8,860,024 | | 161,514 | |
HSBC | | Norwegian Krone | | 23,667,768 | | Sell | | 01/27/12 | | 3,979,000 | | 3,953,540 | | 25,460 | |
HSBC | | South African Rand | | 26,289,045 | | Sell | | 01/27/12 | | 3,151,000 | | 3,240,906 | | (89,906 | ) |
HSBC | | Colombian Peso | | 13,202,782,565 | | Sell | | 01/27/12 | | 6,824,202 | | 6,841,009 | | (16,807 | ) |
HSBC | | Peruvian Nuevo Sol | | 1,531,939 | | Sell | | 01/27/12 | | 565,395 | | 566,722 | | (1,327 | ) |
HSBC | | South African Rand | | 162,292,776 | | Sell | | 01/27/12 | | 19,223,308 | | 20,007,409 | | (784,101 | ) |
JPMorgan Chase & Co. | | New Zealand Dollar | | 1,845,774 | | Sell | | 01/13/12 | | 1,425,000 | | 1,435,349 | | (10,349 | ) |
JPMorgan Chase & Co. | | New Zealand Dollar | | 1,680,346 | | Sell | | 01/13/12 | | 1,267,813 | | 1,306,706 | | (38,893 | ) |
JPMorgan Chase & Co. | | Mexican Peso | | 63,583,250 | | Sell | | 01/27/12 | | 4,641,351 | | 4,545,267 | | 96,084 | |
JPMorgan Chase & Co. | | Turkish Lira | | 7,943,950 | | Sell | | 01/27/12 | | 4,258,000 | | 4,166,825 | | 91,175 | |
JPMorgan Chase & Co. | | South African Rand | | 35,493,293 | | Sell | | 01/27/12 | | 4,301,000 | | 4,375,603 | | (74,603 | ) |
JPMorgan Chase & Co. | | EU Euro | | 795,305 | | Sell | | 01/27/12 | | 1,072,000 | | 1,029,513 | | 42,487 | |
JPMorgan Chase & Co. | | Canadian Dollar | | 3,173,183 | | Sell | | 01/27/12 | | 3,064,000 | | 3,112,828 | | (48,828 | ) |
JPMorgan Chase & Co. | | Japanese Yen | | 215,646,162 | | Sell | | 01/27/12 | | 2,770,000 | | 2,802,865 | | (32,865 | ) |
JPMorgan Chase & Co. | | EU Euro | | 8,038,519 | | Sell | | 01/27/12 | | 10,705,000 | | 10,405,769 | | 299,231 | |
Morgan Stanley | | Taiwan New Dollar | | 215,467,784 | | Sell | | 01/13/12 | | 7,103,880 | | 7,118,169 | | (14,289 | ) |
Morgan Stanley | | Australian Dollar | | 8,718,057 | | Sell | | 01/13/12 | | 8,564,000 | | 8,902,402 | | (338,402 | ) |
Morgan Stanley | | EU Euro | | 5,850,110 | | Sell | | 01/27/12 | | 7,882,000 | | 7,572,900 | | 309,100 | |
UBS Warburg LLC | | New Zealand Dollar | | 1,116,359 | | Sell | | 01/13/12 | | 862,000 | | 868,126 | | (6,126 | ) |
| | | | | | | | | | | | | | $ | 981,307 | |
| | | | | | | | | | | | | | | | | | |
ING Global Bond Portfolio Open Futures Contracts on December 31, 2011:
Contract Description | | Number
of Contracts | | Expiration
Date | | Notional
Value | | Unrealized
Appreciation/
(Depreciation) | |
Long Contracts | | | | | | | | | |
30-year German Government Bond | | 23 | | 03/08/12 | | $ | 3,808,477 | | $ | 247,669 | |
Australia 10-Year Bond | | 25 | | 03/15/12 | | 3,040,139 | | 27,476 | |
Australia 3-Year Bond | | 30 | | 03/15/12 | | 3,324,189 | | (5,637 | ) |
Canada 10-Year Bond | | 48 | | 03/21/12 | | 6,306,081 | | 50,839 | |
Euro-Bobl 5-Year | | 77 | | 03/08/12 | | 12,468,090 | | 194,187 | |
Euro-Bund | | 47 | | 03/08/12 | | 8,457,749 | | 262,513 | |
Short Gilt | | 84 | | 03/28/12 | | 13,740,403 | | 61,571 | |
U.S. Treasury 10-Year Note | | 532 | | 03/21/12 | | 69,758,500 | | 563,404 | |
U.S. Treasury 2-Year Note | | 149 | | 03/30/12 | | 32,861,485 | | 5,363 | |
U.S. Treasury Ultra Long Bond | | 104 | | 03/21/12 | | 16,659,500 | | 506,740 | |
| | | | | | $ | 170,424,613 | | $ | 1,914,125 | |
Short Contracts | | | | | | | | | |
Euro-Schatz | | 201 | | 03/08/12 | | 28,704,252 | | (70,981 | ) |
Long Gilt | | 3 | | 03/28/12 | | 544,866 | | (7,947 | ) |
Medium Gilt | | 131 | | 03/28/12 | | 23,074,326 | | (294,447 | ) |
U.S. Treasury 5-Year Note | | 642 | | 03/30/12 | | 79,131,514 | | (276,291 | ) |
U.S. Treasury Long Bond | | 258 | | 03/21/12 | | 37,361,625 | | (495,207 | ) |
| | | | | | $ | 168,816,583 | | $ | (1,144,873 | ) |
See Accompanying Notes to Financial Statements
33
ING Global Bond Portfolio Over-the-Counter Interest Rate Swap Agreements Outstanding on December 31, 2011:
| | Termination
Date | | Notional Amount | | Fair
Value | | Upfront
Payments
Paid/
(Received) | | Unrealized
Appreciation/
(Depreciation) | |
Receive a floating rate based on AUD-BBR-BBSW and pay a fixed rate equal to 4.118%
Counterparty: UBS Warburg LLC | | 11/02/13 | | AUD | 54,500,000 | | $ | (265,861 | ) | $ | — | | $ | (265,861 | ) |
Receive a floating rate based on AUD-BBR-BBSW and pay a fixed rate equal to 3.670%
Counterparty: UBS Warburg LLC | | 11/22/13 | | AUD | 75,000,000 | | 264,603 | | — | | 264,603 | |
Receive a floating rate based on AUD-BBR-BBSW and pay a fixed rate equal to 3.940%
Counterparty: UBS Warburg LLC | | 12/07/14 | | AUD | 72,900,000 | | 36,637 | | — | | 36,637 | |
Receive a fixed rate equal to 4.675% and pay a fixed rate based on AUD-BBR-BBSW
Counterparty: UBS Warburg LLC | | 11/22/21 | | AUD | 36,700,000 | | 167,521 | | — | | 167,521 | |
Receive a fixed rate equal to 9.960% and pay a floating rate based on Brazil Cetip Interbank
Counterparty: Bank of America | | 01/02/14 | | BRL | 24,000,000 | | (75,672 | ) | — | | (75,672 | ) |
Receive a fixed rate based on the calcuation of U.F.(Unidad de Fomento) 135,053 and pay a floating rate based on the 6-month Tasa Nominal Anual Promedio (TNA)
Counterparty: Deutsche Bank AG | | 08/03/13 | | CLP | 14,911,612,000 | | 354,067 | | — | | 354,067 | |
Receive a floating rate based on the 6-month CLP-CHIBNOM and pay a fixed rate equal to 4.990%
Counterparty: Deutsche Bank AG | | 08/03/13 | | CLP | 14,911,612,000 | | (331,942 | ) | — | | (331,942 | ) |
Receive a floating rate based on CZK-PRIBOR-PRBO and pay a fixed rate equal to 1.760%
Counterparty: Bank of America | | 12/05/16 | | CZK | 96,000,000 | | (23,676 | ) | — | | (23,676 | ) |
Receive a floating rate based on CZK-PRIBOR-PRBO and pay a fixed rate equal to 1.760%
Counterparty: Deutsche Bank AG | | 12/05/16 | | CZK | 96,000,000 | | (23,676 | ) | — | | (23,676 | ) |
Receive a floating rate based on CZK-PRIBOR-PRBO and pay a fixed rate equal to 1.755%
Counterparty: Deutsche Bank AG | | 12/12/16 | | CZK | 194,000,000 | | (44,836 | ) | — | | (44,836 | ) |
Receive a fixed rate equal to 2.890% and pay a floating rate based on the 3-month ILS-TELBOR
Counterparty: Morgan Stanley | | 09/10/13 | | ILS | 36,600,000 | | 74,261 | | — | | 74,261 | |
Receive a floating rate based on the 3-month ILS-TELBOR and pay a fixed rate equal to 3.470%
Counterparty: Morgan Stanley | | 09/08/16 | | ILS | 30,500,000 | | (127,307 | ) | — | | (127,307 | ) |
Receive a fixed rate equal to 4.390% and pay a floating rate based on the 3-month ILS-TELBOR
Counterparty: Morgan Stanley | | 09/09/21 | | ILS | 8,300,000 | | 32,745 | | — | | 32,745 | |
Receive a fixed rate equal to 7.540% and pay a floating rate based on INR-MIBOR-OIS-COMPOUND Counterparty: Citigroup, Inc. | | 03/09/13 | | INR | 1,000,000,000 | | (73,457 | ) | — | | (73,457 | ) |
Receive a floating rate based on INR-MIBOR-OIS-COMPOUND and pay a fixed rate equal to 8.100%
Counterparty: Citigroup, Inc. | | 03/09/16 | | INR | 420,000,000 | | (266,308 | ) | — | | (266,308 | ) |
Receive a floating rate based on the 3-month South Korean Won and pay fixed rate equal to 3.470%
Counterparty: Bank of America | | 10/05/16 | | KRW | 12,000,000,000 | | (50,591 | ) | — | | (50,591 | ) |
Receive a floating rate based on the 3-month KRW-CD and pay a fixed rate equal to 3.775%
Counterparty: Merrill Lynch | | 06/24/13 | | KRW | 27,466,100,000 | | (155,503 | ) | — | | (155,503 | ) |
Receive a floating rate based on the 3-month KRW-CD and pay a fixed rate equal to 3.830%
Counterparty: Merrill Lynch | | 06/24/13 | | KRW | 18,400,000,000 | | (116,844 | ) | — | | (116,844 | ) |
Receive a fixed rate equal to 4.830% and pay a floating rate based on the 28-day MXN-TIIE-BANXICO Counterparty: Deutsche Bank AG | | 08/09/13 | | MXN | 129,337,317 | | (34,934 | ) | — | | (34,934 | ) |
Receive a floating rate based on the 28-day MXN-TIIE-BANXICO and pay a fixed rate equal to 5.580%
Counterparty: Deutsche Bank AG | | 08/05/16 | | MXN | 113,170,152 | | 70,299 | | — | | 70,299 | |
Receive a fixed equal to 5.580% and pay a floating rate based on the 28-day MXN-TIIE-BANXICO
Counterparty: Deutsche Bank AG | | 11/25/16 | | MXN | 135,000,000 | | (118,552 | ) | — | | (118,552 | ) |
| | | | | | | | | | | | | | | |
See Accompanying Notes to Financial Statements
34
| | Termination
Date | | Notional Amount | | Fair
Value | | Upfront
Payments
Paid/
(Received) | | Unrealized
Appreciation/
(Depreciation) | |
Receive a fixed rate equal to 6.480% and pay a floating rate based on the 28-day MXN-TIIE-BANXICO
Counterparty: Deutsche Bank AG | | 07/30/21 | | MXN | 32,334,329 | | $ | (42,813 | ) | $ | — | | $ | (42,813 | ) |
Receive a floating rate based on 28-day MXN TIIE-BANXICO and pay a fixed rate equal to 6.920%
Counterparty: Goldman Sachs & Co. | | 11/17/21 | | MXN | 80,000,000 | | (72,141 | ) | — | | (72,141 | ) |
Receive a floating rate based on the 28-day MXN-TIIE-BANXICO and pay a fixed rate equal to 5.290%
Counterparty: Morgan Stanley | | 09/02/16 | | MXN | 106,000,000 | | 168,202 | | — | | 168,202 | |
Receive a fixed rate equal to 6.270% and pay a floating rate based on the 28-day MXN-TIIE-BANXICO
Counterparty: Morgan Stanley | | 08/27/21 | | MXN | 61,000,000 | | (157,470 | ) | — | | (157,470 | ) |
Receive a floating rate based on 3-month MYR-KLIBOR-BNM and pay a fixed rate equal to 3.030%
Counterparty: Deutsche Bank AG | | 11/22/13 | | MYR | 75,000,000 | | (3,362 | ) | — | | (3,362 | ) |
Receive a fixed rate equal to 4.940% and pay a floating rate based on 6-month PLZ-WIBOR-WIBO
Counterparty: Bank of America | | 12/02/13 | | PLN | 77,000,000 | | 81,669 | | — | | 81,669 | |
Receive a floating rate based on 6-month PLZ-WIBOR-WIBO and pay a fixed rate equal to 5.095%
Counterparty: Bank of America | | 12/01/16 | | PLN | 33,000,000 | | (129,892 | ) | — | | (129,892 | ) |
Receive a floating rate based on 6-month PLZ-WIBOR-WIBO and pay a fixed rate equal to 4.770%
Counterparty: Deutsche Bank AG | | 12/27/13 | | PLN | 33,000,000 | | (6,187 | ) | — | | (6,187 | ) |
Receive a floating rate based on 6-month PLZ-WIBOR-WIBO and pay a fixed rate equal to 4.785%
Counterparty: Morgan Stanley | | 12/12/13 | | PLN | 79,000,000 | | (20,850 | ) | — | | (20,850 | ) |
Receive a floating rate based on 6-month PLZ-WIBOR-WIBO and pay a fixed rate equal to 4.775%
Counterparty: Morgan Stanley | | 12/27/13 | | PLN | 78,000,000 | | (16,782 | ) | — | | (16,782 | ) |
Receive a floating rate based on the 3-month USD-LIBOR-BBA and pay a fixed rate equal to 3.768%
Counterparty: Citigroup, Inc. | | 02/10/21 | | USD | 20,000,000 | | (3,114,821 | ) | — | | (3,114,821 | ) |
Receive a floating rate based on the 3-month USD-LIBOR-BBA and pay a fixed rate equal to 0.750%
Counterparty: Credit Suisse First Boston | | 09/19/14 | | USD | 44,000,000 | | 68,432 | | — | | 68,432 | |
Receive a fixed rate equal to 1.719% and pay a floating rate based on the 3-month USD-LIBOR-BBA
Counterparty: Credit Suisse First Boston | | 09/19/17 | | USD | 29,300,000 | | 330,401 | | — | | 330,401 | |
Receive a fixed rate equal to 1.721% and pay a floating rate based on the 3-month USD-LIBOR-BBA
Counterparty: Credit Suisse First Boston | | 09/19/17 | | USD | 7,900,000 | | 90,018 | | — | | 90,018 | |
Receive a floating rate based on the 3-month USD-LIBOR-BBA and pay a fixed rate equal to 2.598%
Counterparty: Credit Suisse First Boston | | 09/19/22 | | USD | 3,100,000 | | (106,341 | ) | — | | (106,341 | ) |
Receive a floating rate based on the 3-month USD-LIBOR-BBA and pay a fixed rate equal to 2.585%
Counterparty: Credit Suisse First Boston | | 09/19/22 | | USD | 9,000,000 | | (298,512 | ) | — | | (298,512 | ) |
Receive a floating rate based on the 3-month USD-LIBOR-BBA and pay a fixed rate equal to 0.710%
Counterparty: JPMorgan Chase & Co. | | 09/23/14 | | USD | 40,500,000 | | 96,772 | | — | | 96,772 | |
Receive a fixed rate equal to 1.593% and pay a floating rate based on the 3-month USD-LIBOR-BBA
Counterparty: JPMorgan Chase & Co. | | 09/23/17 | | USD | 37,200,000 | | 183,574 | | — | | 183,574 | |
Receive a floating rate based on the 3-month USD-LIBOR-BBA and pay a fixed rate equal to 2.399%
Counterparty: JPMorgan Chase & Co. | | 09/23/22 | | USD | 12,100,000 | | (193,077 | ) | — | | (193,077 | ) |
Receive a fixed rate equal to 6.820% and pay a floating rate based on 3-month ZAR-JIBAR-SAFEX
Counterparty: Morgan Stanley | | 11/16/16 | | ZAR | 85,000,000 | | 27,122 | | — | | 27,122 | |
| | | | | | | $ | (3,825,084 | ) | $ | — | | $ | (3,825,084 | ) |
See Accompanying Notes to Financial Statements
35
ING Global Bond Portfolio Written OTC Options on December 31, 2011
# of Contracts | | Counterparty | | Description | | Exercise
Price | | Expiration
Date | | Premiums
Received | | Fair Value | |
Options On Currencies | | | | | | | | | | | |
26,900,000 | | Deutsche Bank AG | | USD Put vs. EUR Call Currency Option | | 1.370 USD | | 01/16/12 | | $ | 278,419 | | $ | (5,947 | ) |
17,100,000 | | Deutsche Bank AG | | USD Put vs. EUR Call Currency Option | | 1.380 USD | | 01/16/12 | | 160,715 | | (2,111 | ) |
10,700,000 | | Deutsche Bank AG | | USD Put vs. EUR Call Currency Option | | 1.380 USD | | 01/31/12 | | 147,552 | | (7,321 | ) |
21,500,000 | | Deutsche Bank AG | | USD Put vs. JPY Call Currency Option | | 75.000 USD | | 06/01/12 | | 402,480 | | (355,703 | ) |
Options On Securities | | | | | | | | | | | |
3,808,000 | | JPMorgan Chase & Co. | | U.S Treasury 30-Year Bond | | 93.969 USD | | 01/04/12 | | 1,190 | | (15 | ) |
| | | | | | Total Written OTC Options | | $ | 990,356 | | $ | (371,097 | ) |
See Accompanying Notes to Financial Statements
36
| PORTFOLIO OF INVESTMENTS |
ING INVESCO VAN KAMPEN COMSTOCK PORTFOLIO | AS OF DECEMBER 31, 2011 |
Shares | | | | | | Value | | Percentage
of Net
Assets | |
COMMON STOCK: 95.4% | | | | | |
| | | | Consumer Discretionary: 15.6% | | | | | |
492,983 | | | | Comcast Corp. — Class A | | $ | 11,688,627 | | 3.9 | |
180,729 | | @ | | General Motors Co. | | 3,663,377 | | 1.2 | |
43,236 | | | | Home Depot, Inc. | | 1,817,641 | | 0.6 | |
125,298 | | | | Lowe’s Cos., Inc. | | 3,180,063 | | 1.0 | |
33,103 | | | | Macy’s, Inc. | | 1,065,255 | | 0.3 | |
267,941 | | | | News Corp. - Class B | | 4,871,167 | | 1.6 | |
166,803 | | | | Staples, Inc. | | 2,316,894 | | 0.8 | |
42,330 | | | | Target Corp. | | 2,168,143 | | 0.7 | |
81,130 | | | | Time Warner Cable, Inc. | | 5,157,434 | | 1.7 | |
105,082 | | | | Time Warner, Inc. | | 3,797,663 | | 1.3 | |
163,477 | | | | Viacom - Class B | | 7,423,491 | | 2.5 | |
| | | | | | 47,149,755 | | 15.6 | |
| | | | Consumer Staples: 7.7% | | | | | |
52,548 | | | | Avon Products, Inc. | | 918,014 | | 0.3 | |
145,853 | | | | CVS Caremark Corp. | | 5,947,885 | | 2.0 | |
139,542 | | | | Kraft Foods, Inc. | | 5,213,289 | | 1.7 | |
21,992 | | | | PepsiCo, Inc. | | 1,459,169 | | 0.5 | |
18,184 | | | | Procter & Gamble Co. | | 1,213,055 | | 0.4 | |
154,352 | | | | Unilever NV ADR | | 5,305,078 | | 1.8 | |
51,266 | | | | Wal-Mart Stores, Inc. | | 3,063,656 | | 1.0 | |
| | | | | | 23,120,146 | | 7.7 | |
| | | | Energy: 11.9% | | | | | |
148,002 | | | | BP PLC ADR | | 6,325,605 | | 2.1 | |
80,473 | | | | Chesapeake Energy Corp. | | 1,793,743 | | 0.6 | |
58,296 | | | | Chevron Corp. | | 6,202,694 | | 2.1 | |
173,602 | | | | Halliburton Co. | | 5,991,005 | | 2.0 | |
62,639 | | | | Murphy Oil Corp. | | 3,491,498 | | 1.2 | |
44,690 | | | | Noble Corp. | | 1,350,532 | | 0.4 | |
87,489 | | | | Royal Dutch Shell PLC - Class A ADR | | 6,394,571 | | 2.1 | |
285,243 | | @ | | Weatherford International Ltd. | | 4,175,958 | | 1.4 | |
| | | | | | 35,725,606 | | 11.9 | |
| | | | Financials: 19.2% | | | | | |
25,915 | | | | Aflac, Inc. | | 1,121,083 | | 0.4 | |
233,724 | | | | Allstate Corp. | | 6,406,375 | | 2.1 | |
468,863 | | | | Bank of America Corp. | | 2,606,878 | | 0.9 | |
222,737 | | | | Bank of New York Mellon Corp. | | 4,434,694 | | 1.5 | |
18,921 | | | | Chubb Corp. | | 1,309,712 | | 0.4 | |
260,720 | | | | Citigroup, Inc. | | 6,859,543 | | 2.3 | |
197,227 | | | | Fifth Third Bancorp. | | 2,508,727 | | 0.8 | |
24,961 | | | | Goldman Sachs Group, Inc. | | 2,257,223 | | 0.7 | |
228,276 | | | | JPMorgan Chase & Co. | | 7,590,177 | | 2.5 | |
103,045 | | | | Metlife, Inc. | | 3,212,943 | | 1.1 | |
157,240 | | | | Morgan Stanley | | 2,379,041 | | 0.8 | |
78,145 | | | | PNC Financial Services Group, Inc. | | 4,506,622 | | 1.5 | |
33,931 | | | | State Street Corp. | | 1,367,759 | | 0.4 | |
65,554 | | | | Travelers Cos., Inc. | | 3,878,830 | | 1.3 | |
75,615 | | | | US Bancorp. | | 2,045,386 | | 0.7 | |
200,019 | | | | Wells Fargo & Co. | | 5,512,524 | | 1.8 | |
| | | | | | 57,997,517 | | 19.2 | |
| | | | Health Care: 13.4% | | | | | |
20,813 | | | | Abbott Laboratories | | 1,170,315 | | 0.4 | |
186,547 | | | | Bristol-Myers Squibb Co. | | 6,573,916 | | 2.2 | |
69,953 | | | | Cardinal Health, Inc. | | 2,840,791 | | 0.9 | |
74,356 | | | | GlaxoSmithKline PLC ADR | | 3,392,864 | | 1.1 | |
157,295 | | | | Merck & Co., Inc. | | 5,930,022 | | 2.0 | |
372,963 | | | | Pfizer, Inc. | | 8,070,919 | | 2.7 | |
60,473 | | | | Roche Holding AG ADR ADR | | 2,573,126 | | 0.8 | |
41,186 | | | | Sanofi-Aventis SA ADR | | 1,504,937 | | 0.5 | |
111,573 | | | | UnitedHealth Group, Inc. | | 5,654,520 | | 1.9 | |
39,620 | | | | WellPoint, Inc. | | 2,624,825 | | 0.9 | |
| | | | | | 40,336,235 | | 13.4 | |
| | | | Industrials: 6.1% | | | | | |
45,514 | | | | Emerson Electric Co. | | 2,120,497 | | 0.7 | |
246,104 | | | | General Electric Co. | | 4,407,723 | | 1.5 | |
82,126 | | | | Honeywell International, Inc. | | 4,463,548 | | 1.5 | |
160,787 | | | | Ingersoll-Rand PLC | | 4,899,180 | | 1.6 | |
138,530 | | | | Textron, Inc. | | 2,561,420 | | 0.8 | |
| | | | | | 18,452,368 | | 6.1 | |
| | | | Information Technology: 11.0% | | | | | |
168,985 | | | | Cisco Systems, Inc. | | 3,055,249 | | 1.0 | |
201,398 | | @ | | Dell, Inc. | | 2,946,453 | | 1.0 | |
198,489 | | @ | | eBay, Inc. | | 6,020,171 | | 2.0 | |
214,591 | | | | Hewlett-Packard Co. | | 5,527,864 | | 1.8 | |
93,982 | | | | Intel Corp. | | 2,279,064 | | 0.8 | |
23,637 | | | | KLA-Tencor Corp. | | 1,140,485 | | 0.4 | |
269,272 | | | | Microsoft Corp. | | 6,990,301 | | 2.3 | |
314,239 | | @ | | Yahoo!, Inc. | | 5,068,675 | | 1.7 | |
| | | | | | 33,028,262 | | 11.0 | |
| | | | Materials: 4.0% | | | | | |
303,506 | | | | Alcoa, Inc. | | 2,625,327 | | 0.9 | |
321,793 | | | | International Paper Co. | | 9,525,073 | | 3.1 | |
| | | | | | 12,150,400 | | 4.0 | |
| | | | Telecommunications: 3.7% | | | | | |
108,510 | | | | AT&T, Inc. | | 3,281,342 | | 1.1 | |
121,548 | | | | Verizon Communications, Inc. | | 4,876,506 | | 1.6 | |
112,117 | | | | Vodafone Group PLC ADR | | 3,142,640 | | 1.0 | |
| | | | | | 11,300,488 | | 3.7 | |
| | | | Utilities: 2.8% | | | | | |
78,810 | | | | FirstEnergy Corp. | | 3,491,283 | | 1.1 | |
| | | | | | | | | | |
See Accompanying Notes to Financial Statements
37
Shares | | | | | | Value | | Percentage
of Net
Assets |
COMMON STOCK: (continued) | | | | |
| | | | Utilities: (continued) | | | | | |
172,387 | | | | PPL Corp. | | $ | 5,071,625 | | 1.7 | |
| | | | | | 8,562,908 | | 2.8 | |
| | | | | | | | | |
| | | | Total Common Stock
(Cost $256,917,941) | | 287,823,685 | | 95.4 | |
| | | | | | | | | |
SHORT-TERM INVESTMENTS: 2.4% | | | | | |
| | | | Mutual Funds: 2.4% | | | | | |
7,196,691 | | | | BlackRock Liquidity Funds, TempFund, Institutional Class
(Cost $7,196,691) | | 7,196,691 | | 2.4 | |
| | | | | | | | | |
| | | | Total Short-Term Investments
(Cost $7,196,691) | | 7,196,691 | | 2.4 | |
| | | | | | | | | |
| | | | Total Investments in Securities
(Cost $264,114,632) | | $ | 295,020,376 | | 97.8 | |
| | | | Assets in Excess of Other Liabilities | | 6,500,692 | | 2.2 | |
| | | | Net Assets | | $ | 301,521,068 | | 100.0 | |
@ | Non-income producing security |
ADR | American Depositary Receipt |
| |
| Cost for federal income tax purposes is $296,004,215. |
| |
| Net unrealized depreciation consists of: |
| |
| | Gross Unrealized Appreciation | | $ | 54,749,626 | |
| | Gross Unrealized Depreciation | | (55,733,465 | ) |
| | Net Unrealized Depreciation | | $ | (983,839 | ) |
Fair Value Measurements^
The following is a summary of the fair valuations according to the inputs used as of December 31, 2011 in valuing the assets and liabilities:
| | Quoted Prices
in Active Markets
for Identical
Investments
(Level 1) | | Significant
Other
Observable
Inputs
(Level 2) | | Significant
Unobservable
Inputs
(Level 3) | | Fair Value
at
12/31/2011 | |
Asset Table | | | | | | | | | |
Investments, at value | | | | | | | | | |
Common Stock* | | $ | 287,823,685 | | $ | — | | $ | — | | $ | 287,823,685 | |
Short-Term Investments | | 7,196,691 | | — | | — | | 7,196,691 | |
Total Investments, at value | | $ | 295,020,376 | | $ | — | | $ | — | | $ | 295,020,376 | |
^ | See Note 2, “Significant Accounting Policies” in the Notes to Financial Statements for additional information. |
* | For further breakdown of Common Stock by Industry type, please refer to the Portfolio of Investments. |
| |
| There were no significant transfers between Level 1 and 2 during the year ended December 31, 2011. |
See Accompanying Notes to Financial Statements
38
See Accompanying Notes to Financial Statements
39
| PORTFOLIO OF INVESTMENTS |
ING INVESCO VAN KAMPEN EQUITY AND INCOME PORTFOLIO | AS OF DECEMBER 31, 2011 |
Shares | | | | | | Value | | Percentage
of Net
Assets | |
COMMON STOCK: 62.4% | | | | | |
| | | | Consumer Discretionary: 6.4% | | | | | |
444,226 | | | | Comcast Corp. — Class A | | $ | 10,532,599 | | 1.4 | |
220,808 | | | | Home Depot, Inc. | | 9,282,768 | | 1.2 | |
57,410 | | | | Sony Corp. ADR | | 1,035,676 | | 0.1 | |
112,520 | | | | Time Warner Cable, Inc. | | 7,152,897 | | 0.9 | |
263,807 | | | | Time Warner, Inc. | | 9,533,985 | | 1.3 | |
248,654 | | | | Viacom - Class B | | 11,291,378 | | 1.5 | |
| | | | | | 48,829,303 | | 6.4 | |
| | | | Consumer Staples: 8.0% | | | | | |
173,803 | | | | Archer-Daniels-Midland Co. | | 4,970,766 | | 0.6 | |
417,622 | | | | Avon Products, Inc. | | 7,295,856 | | 1.0 | |
75,034 | | | | Coca-Cola Co. | | 5,250,129 | | 0.7 | |
37,964 | | @ | | Energizer Holdings, Inc. | | 2,941,451 | | 0.4 | |
140,558 | | | | Kraft Foods, Inc. | | 5,251,247 | | 0.7 | |
38,419 | | | | PepsiCo, Inc. | | 2,549,101 | | 0.3 | |
197,654 | | | | Procter & Gamble Co. | | 13,185,498 | | 1.7 | |
234,618 | | | | Sysco Corp. | | 6,881,346 | | 0.9 | |
221,600 | | | | Unilever NV ADR | | 7,616,392 | | 1.0 | |
151,901 | | | | Walgreen Co. | | 5,021,847 | | 0.7 | |
| | | | | | 60,963,633 | | 8.0 | |
| | | | Energy: 8.7% | | | | | |
181,878 | | | | Anadarko Petroleum Corp. | | 13,882,748 | | 1.8 | |
85,037 | | | | Baker Hughes, Inc. | | 4,136,200 | | 0.5 | |
59,608 | | @ | | Cameron International Corp. | | 2,932,117 | | 0.4 | |
74,819 | | | | Devon Energy Corp. | | 4,638,778 | | 0.6 | |
79,475 | | | | ExxonMobil Corp. | | 6,736,301 | | 0.9 | |
137,782 | | | | Hess Corp. | | 7,826,018 | | 1.0 | |
55,433 | | | | Occidental Petroleum Corp. | | 5,194,072 | | 0.7 | |
165,044 | | | | Royal Dutch Shell PLC - Class A ADR | | 12,063,066 | | 1.6 | |
64,007 | | | | Schlumberger Ltd. | | 4,372,318 | | 0.6 | |
1,078 | | | | Sunoco, Inc. | | 44,219 | | 0.0 | |
137,100 | | | | Williams Cos., Inc. | | 4,527,042 | | 0.6 | |
| | | | | | 66,352,879 | | 8.7 | |
| | | | Financials: 11.9% | | | | | |
170,439 | | | | BB&T Corp. | | 4,289,950 | | 0.6 | |
398,765 | | | | Charles Schwab Corp. | | 4,490,094 | | 0.6 | |
61,121 | | | | Chubb Corp. | | 4,230,795 | | 0.5 | |
280,805 | | | | Citigroup, Inc. | | 7,387,979 | | 1.0 | |
120,730 | | | | Comerica, Inc. | | 3,114,834 | | 0.4 | |
292,428 | | | | Fifth Third Bancorp. | | 3,719,684 | | 0.5 | |
611,065 | | | | JPMorgan Chase & Co. | | 20,317,911 | | 2.7 | |
499,024 | | | | Marsh & McLennan Cos., Inc. | | 15,779,139 | | 2.1 | |
93,398 | | | | Northern Trust Corp. | | 3,704,165 | | 0.5 | |
164,845 | | | | PNC Financial Services Group, Inc. | | 9,506,611 | | 1.2 | |
108,267 | | | | State Street Corp. | | 4,364,243 | | 0.6 | |
136,634 | | | | US Bancorp. | | 3,695,950 | | 0.5 | |
197,034 | | | | Wells Fargo & Co. | | 5,430,257 | | 0.7 | |
| | | | | | 90,031,612 | | 11.9 | |
| | | | Health Care: 8.6% | | | | | |
46,587 | | | | Abbott Laboratories | | 2,619,587 | | 0.4 | |
283,069 | | | | Bristol-Myers Squibb Co. | | 9,975,352 | | 1.3 | |
96,718 | | | | Cardinal Health, Inc. | | 3,927,718 | | 0.5 | |
57,621 | | | | Cigna Corp. | | 2,420,082 | | 0.3 | |
40,559 | | | | Eli Lilly & Co. | | 1,685,632 | | 0.2 | |
72,130 | | @ | | HCA Holdings, Inc. | | 1,589,024 | | 0.2 | |
25,650 | | @ | | Hospira, Inc. | | 778,990 | | 0.1 | |
179,527 | | | | Medtronic, Inc. | | 6,866,908 | | 0.9 | |
258,611 | | | | Merck & Co., Inc. | | 9,749,635 | | 1.3 | |
672,852 | | | | Pfizer, Inc. | | 14,560,517 | | 1.9 | |
214,750 | | | | UnitedHealth Group, Inc. | | 10,883,530 | | 1.5 | |
| | | | | | 65,056,975 | | 8.6 | |
| | | | Industrials: 5.6% | | | | | |
106,357 | | | | Cintas Corp. | | 3,702,287 | | 0.5 | |
1,230,642 | | | | General Electric Co. | | 22,040,798 | | 2.9 | |
182,714 | | | | Ingersoll-Rand PLC | | 5,567,296 | | 0.8 | |
231,911 | | | | Tyco International Ltd. | | 10,832,563 | | 1.4 | |
| | | | | | 42,142,944 | | 5.6 | |
| | | | Information Technology: 7.6% | | | | | |
177,311 | | @ | | Amdocs Ltd. | | 5,058,683 | | 0.7 | |
373,923 | | | | Applied Materials, Inc. | | 4,004,715 | | 0.5 | |
327,409 | | @ | | Dell, Inc. | | 4,789,994 | | 0.6 | |
398,538 | | @ | | eBay, Inc. | | 12,087,658 | | 1.6 | |
237,102 | | | | Hewlett-Packard Co. | | 6,107,747 | | 0.8 | |
181,809 | | | | Intel Corp. | | 4,408,868 | | 0.6 | |
421,114 | | | | Microsoft Corp. | | 10,932,119 | | 1.4 | |
200,400 | | | | STMicroelectronics NV | | 1,188,372 | | 0.2 | |
349,236 | | | | STMicroelectronics NV | | 2,067,430 | | 0.3 | |
266,215 | | | | Western Union Co. | | 4,861,086 | | 0.6 | |
151,274 | | @ | | Yahoo!, Inc. | | 2,440,050 | | 0.3 | |
| | | | | | 57,946,722 | | 7.6 | |
| | | | Materials: 0.7% | | | | | |
62,027 | | | | PPG Industries, Inc. | | 5,178,634 | | 0.7 | |
| | | | | | | | | |
| | | | Telecommunications: 2.2% | | | | | |
170,511 | | | | Verizon Communications, Inc. | | 6,840,901 | | 0.9 | |
344,760 | | | | Vodafone Group PLC ADR | | 9,663,623 | | 1.3 | |
| | | | | | 16,504,524 | | 2.2 | |
| | | | Utilities: 2.7% | | | | | |
204,641 | | | | American Electric Power Co., Inc. | | 8,453,720 | | 1.1 | |
107,325 | | | | Edison International | | 4,443,255 | | 0.6 | |
43,112 | | | | Entergy Corp. | | 3,149,331 | | 0.4 | |
103,477 | | | | FirstEnergy Corp. | | 4,584,031 | | 0.6 | |
| | | | | | 20,630,337 | | 2.7 | |
| | | | | | | | | |
| | | | Total Common Stock
(Cost $419,337,327) | | 473,637,563 | | 62.4 | |
| | | | | | | | | | |
See Accompanying Notes to Financial Statements
40
Shares | | | | | | Value | | Percentage
of Net
Assets | |
EXCHANGE-TRADED FUNDS: 0.2% | | | | | |
66,540 | | | | SPDR S&P Homebuilders | | $ | 1,137,834 | | 0.2 | |
| | | | | | | | | |
| | | | Total Exchange-Traded Funds
(Cost $1,125,092) | | 1,137,834 | | 0.2 | |
| | | | | | | | | |
PREFERRED STOCK: 1.7% | | | | | |
| | | | Consumer Discretionary: 0.1% | | | | | |
7,890 | | | | Nielsen Holdings NV | | 458,113 | | 0.1 | |
| | | | | | | | | |
| | | | Energy: 0.5% | | | | | |
88,000 | | P | | El Paso Energy Capital Trust I | | 4,051,520 | | 0.5 | |
| | | | | | | | | |
| | | | Financials: 0.5% | | | | | |
35,144 | | | | Keycorp | | 3,712,612 | | 0.5 | |
| | | | | | | | | |
| | | | Health Care: 0.4% | | | | | |
1,600 | | | | Healthsouth Corp. | | 1,404,400 | | 0.2 | |
30,451 | | P | | Omnicare, Inc. | | 1,412,165 | | 0.2 | |
| | | | | | 2,816,565 | | 0.4 | |
| | | | | | | | | |
| | | | Industrials: 0.2% | | | | | |
179,631 | | # | | Swift Mandatory Common Exchange Security Trust | | 1,583,663 | | 0.2 | |
| | | | | | | | | |
| | | | Total Preferred Stock
(Cost $11,990,278) | | 12,622,473 | | 1.7 | |
| | | | | | | | | | |
Principal
Amount† | | | | | | | | | |
CORPORATE BONDS/NOTES: 20.4% | | | | | |
| | | | Consumer Discretionary: 3.2% | | | | | |
580,000 | | | | Advance Auto Parts, Inc., 5.750%, 05/01/20 | | 636,038 | | 0.1 | |
395,000 | | | | Autozone, Inc., 6.500%, 01/15/14 | | 434,201 | | 0.1 | |
390,000 | | | | Best Buy Co., Inc., 5.500%, 03/15/21 | | 373,595 | | 0.1 | |
550,000 | | | | Comcast Corp., 5.700%, 05/15/18 | | 633,604 | | 0.1 | |
295,000 | | | | Continental Airlines Pass Through Trust, 4.750%, 01/12/21 | | 299,425 | | 0.0 | |
60,000 | | # | | Cox Communications, Inc., 8.375%, 03/01/39 | | 80,460 | | 0.0 | |
950,000 | | | | DirecTV Holdings, LLC, 7.625%, 05/15/16 | | 1,009,121 | | 0.1 | |
2,575,000 | | # | | Gaylord Entertainment Co., 3.750%, 10/01/14 | | 2,877,562 | | 0.4 | |
2,333,000 | | | | Interpublic Group of Cos., Inc., 4.250%, 03/15/23 | | 2,370,911 | | 0.3 | |
803,000 | | | | Interpublic Group of Cos., Inc., 4.750%, 03/15/23 | | 885,307 | | 0.1 | |
3,415,000 | | | | International Game Technology, 3.250%, 05/01/14 | | 4,059,581 | | 0.5 | |
2,349,100 | | | | Liberty Media Corp., 3.125%, 03/30/23 | | 2,639,801 | | 0.4 | |
255,000 | | | | Macys Retail Holdings, Inc., 5.350%, 03/15/12 | | 256,765 | | 0.0 | |
4,434,000 | | | | MGM Resorts International, 4.250%, 04/15/15 | | 4,217,843 | | 0.6 | |
200,000 | | | | NBCUniversal Media LLC, 2.100%, 04/01/14 | | 203,442 | | 0.0 | |
125,000 | | | | NBCUniversal Media LLC, 5.150%, 04/30/20 | | 139,363 | | 0.0 | |
210,000 | | | | NBCUniversal Media LLC, 5.950%, 04/01/41 | | 247,280 | | 0.0 | |
175,000 | | | | Raytheon Co., 1.625%, 10/15/15 | | 176,392 | | 0.0 | |
245,000 | | | | Time Warner Cable, Inc., 8.750%, 02/14/19 | | 313,195 | | 0.1 | |
445,000 | | | | Time Warner Cable, Inc., 5.875%, 11/15/40 | | 482,439 | | 0.1 | |
160,000 | | | | Time Warner, Inc., 5.875%, 11/15/16 | | 184,914 | | 0.0 | |
555,000 | | # | | Tupperware Brands Corp., 4.750%, 06/01/21 | | 556,942 | | 0.1 | |
50,000 | | | | Wal-Mart Stores, Inc., 6.500%, 08/15/37 | | 69,194 | | 0.0 | |
200,000 | | | | WPP Finance UK, 8.000%, 09/15/14 | | 222,946 | | 0.0 | |
555,000 | | | | Wyndham Worldwide Corp., 5.625%, 03/01/21 | | 573,892 | | 0.1 | |
220,000 | | | | Yum! Brands, Inc., 5.300%, 09/15/19 | | 246,459 | | 0.0 | |
115,000 | | | | Yum! Brands, Inc., 6.250%, 03/15/18 | | 134,901 | | 0.0 | |
| | | | | | 24,325,573 | | 3.2 | |
| | | | Consumer Staples: 0.5% | | | | | |
375,000 | | | | Anheuser-Busch InBev Worldwide, Inc., 3.625%, 04/15/15 | | 399,689 | | 0.1 | |
240,000 | | | | Corn Products International, Inc., 6.625%, 04/15/37 | | 285,798 | | 0.0 | |
66,995 | | # | | CVS Lease Pass-through, 8.353%, 07/10/31 | | 82,206 | | 0.0 | |
383,653 | | | | CVS Pass-Through Trust, 6.036%, 12/10/28 | | 400,337 | | 0.1 | |
235,000 | | | | Delhaize Group, 5.875%, 02/01/14 | | 255,229 | | 0.0 | |
415,000 | | # | | FBG Finance Ltd., 5.125%, 06/15/15 | | 452,080 | | 0.1 | |
295,000 | | # | | Grupo Bimbo S.A.B de CV, 4.875%, 06/30/20 | | 313,594 | | 0.0 | |
355,000 | | | | Kraft Foods, Inc., 6.875%, 01/26/39 | | 473,738 | | 0.1 | |
170,000 | | | | Kraft Foods, Inc., 7.000%, 08/11/37 | | 227,483 | | 0.0 | |
170,000 | | | | Kraft Foods, Inc., 5.375%, 02/10/20 | | 196,417 | | 0.0 | |
See Accompanying Notes to Financial Statements
41
Principal
Amount† | | | | | | Value | | Percentage
of Net
Assets | |
CORPORATE BONDS/NOTES: (continued) | | | | | |
| | | | Consumer Staples: (continued) | | | | | |
100,000 | | | | Kraft Foods, Inc., 6.875%, 02/01/38 | | $ | 132,637 | | 0.0 | |
480,000 | | | | Safeway, Inc., 3.950%, 08/15/20 | | 474,699 | | 0.1 | |
| | | | | | 3,693,907 | | 0.5 | |
| | | | Energy: 0.5% | | | | | |
145,000 | | | | Enterprise Products Operating L.P., 5.250%, 01/31/20 | | 160,311 | | 0.0 | |
300,000 | | | | Enterprise Products Operating L.P., 6.500%, 01/31/19 | | 349,750 | | 0.1 | |
735,000 | | # | | Gold Fields Orogen Holding BVI Ltd., 4.875%, 10/07/20 | | 649,856 | | 0.1 | |
1,555,000 | | | | Helix Energy Solutions Group, Inc., 3.250%, 12/15/25 | | 1,566,662 | | 0.2 | |
250,000 | | | | Hess Corp., 5.600%, 02/15/41 | | 279,824 | | 0.0 | |
370,000 | | | | Petroleos Mexicanos, 5.500%, 01/21/21 | | 403,300 | | 0.1 | |
165,000 | | | | Spectra Energy Capital, LLC, 7.500%, 09/15/38 | | 215,036 | | 0.0 | |
215,000 | | | | Texas Eastern Transmission LP, 7.000%, 07/15/32 | | 274,605 | | 0.0 | |
| | | | | | 3,899,344 | | 0.5 | |
| | | | Financials: 5.9% | | | | | |
165,000 | | | | Abbey National Treasury Services PLC/London, 2.875%, 04/25/14 | | 153,922 | | 0.0 | |
290,000 | | # | | Abbey National Treasury Services PLC/London, 3.875%, 11/10/14 | | 272,383 | | 0.0 | |
300,000 | | | | Aegon NV, 4.625%, 12/01/15 | | 311,343 | | 0.0 | |
3,071,000 | | | | Affiliated Managers Group, Inc., 3.950%, 08/15/38 | | 3,347,390 | | 0.4 | |
700,000 | | | | Ally Financial, Inc., 2.200%, 12/19/12 | | 713,754 | | 0.1 | |
950,000 | | | | Bank of America Corp., 5.650%, 05/01/18 | | 906,059 | | 0.1 | |
400,000 | | | | Bank of America Corp., 5.750%, 12/01/17 | | 378,364 | | 0.1 | |
305,000 | | | | Barclays Bank PLC, 5.140%, 10/14/20 | | 258,527 | | 0.0 | |
525,000 | | | | Barclays Bank PLC, 6.750%, 05/22/19 | | 582,712 | | 0.1 | |
260,000 | | | | Bear Stearns Cos., Inc., 7.250%, 02/01/18 | | 305,117 | | 0.0 | |
430,000 | | # | | BPCE S.A., 2.375%, 10/04/13 | | 416,652 | | 0.1 | |
240,000 | | | | Brookfield Asset Management, Inc., 7.125%, 06/15/12 | | 245,803 | | 0.0 | |
515,000 | | | | Charles Schwab Corp., 4.450%, 07/22/20 | | 545,678 | | 0.1 | |
1,500,000 | | | | Citibank NA, 1.750%, 12/28/12 | | 1,523,358 | | 0.2 | |
4,200,000 | | | | Citigroup Funding, Inc., 2.250%, 12/10/12 | | 4,279,153 | | 0.6 | |
575,000 | | | | Citigroup, Inc., 6.125%, 11/21/17 | | 614,568 | | 0.1 | |
345,000 | | | | Citigroup, Inc., 8.500%, 05/22/19 | | 406,553 | | 0.1 | |
325,000 | | | | CNA Financial Corp., 5.875%, 08/15/20 | | 334,305 | | 0.0 | |
385,000 | | # | | Commonwealth Bank of Australia, 5.000%, 10/15/19 | | 408,835 | | 0.1 | |
130,000 | | | | Credit Suisse AG, 5.400%, 01/14/20 | | 122,768 | | 0.0 | |
185,000 | | | | Credit Suisse/New York NY, 5.300%, 08/13/19 | | 191,030 | | 0.0 | |
95,000 | | | | Credit Suisse New York, 6.000%, 02/15/18 | | 93,787 | | 0.0 | |
1,065,000 | | # | | Dexus Diversified Trust / Dexus Office Trust, 5.600%, 03/15/21 | | 1,083,816 | | 0.1 | |
340,000 | | | | Digital Realty Trust L.P., 4.500%, 07/15/15 | | 347,136 | | 0.1 | |
225,000 | | # | | ERAC USA Finance LLC, 2.750%, 07/01/13 | | 228,906 | | 0.0 | |
4,950,000 | | | | General Electric Capital Corp., 2.625%, 12/28/12 | | 5,069,914 | | 0.7 | |
380,000 | | | | General Electric Capital Corp., 4.650%, 10/17/21 | | 397,217 | | 0.1 | |
700,000 | | | | General Electric Capital Corp., 6.000%, 08/07/19 | | 805,037 | | 0.1 | |
4,011,000 | | # | | Goldman Sachs Group, Inc., 1.000%, 03/15/17 | | 3,559,061 | | 0.5 | |
1,010,000 | | | | Goldman Sachs Group, Inc., 6.150%, 04/01/18 | | 1,043,486 | | 0.1 | |
345,000 | | | | Goldman Sachs Group, Inc., 6.750%, 10/01/37 | | 321,477 | | 0.0 | |
355,000 | | | | Goldman Sachs Group, Inc./The, 5.250%, 07/27/21 | | 346,830 | | 0.0 | |
465,000 | | # | | HBOS PLC, 6.750%, 05/21/18 | | 373,196 | | 0.1 | |
450,000 | | # | | HSBC Bank PLC, 4.125%, 08/12/20 | | 444,681 | | 0.1 | |
150,000 | | | | HSBC Finance Corp., 7.000%, 05/15/12 | | 152,812 | | 0.0 | |
170,000 | | # | | Iberdrola Finance Ireland Ltd., 3.800%, 09/11/14 | | 169,855 | | 0.0 | |
435,000 | | | | Jefferies Group, Inc., 6.875%, 04/15/21 | | 395,850 | | 0.1 | |
340,000 | | | | JPMorgan Chase & Co., 4.400%, 07/22/20 | | 347,706 | | 0.1 | |
775,000 | | | | JPMorgan Chase & Co., 6.000%, 01/15/18 | | 865,535 | | 0.1 | |
| | | | | | | | | | |
See Accompanying Notes to Financial Statements
42
Principal
Amount† | | | | | | Value | | Percentage
of Net
Assets | |
CORPORATE BONDS/NOTES: (continued) | | | | | |
| | | | Financials: (continued) | | | | | |
220,000 | | | | Korea Development Bank, 4.375%, 08/10/15 | | $ | 226,701 | | 0.0 | |
625,000 | | | | Lloyds TSB Bank PLC, 4.875%, 01/21/16 | | 609,776 | | 0.1 | |
165,000 | | # | | Lloyds TSB Bank PLC, 5.800%, 01/13/20 | | 156,844 | | 0.0 | |
430,000 | | | | Merrill Lynch & Co., Inc., 6.875%, 04/25/18 | | 424,381 | | 0.1 | |
455,000 | | | | MetLife, Inc., 4.750%, 02/08/21 | | 492,947 | | 0.1 | |
1,144,000 | | | | MGIC Investment Corp., 5.000%, 05/01/17 | | 693,550 | | 0.1 | |
750,000 | | | | Morgan Stanley, 3.800%, 04/29/16 | | 691,793 | | 0.1 | |
215,000 | | | | Morgan Stanley, 5.750%, 01/25/21 | | 200,829 | | 0.0 | |
790,000 | | | | Morgan Stanley, 3.450%, 11/02/15 | | 728,112 | | 0.1 | |
675,000 | | | | Morgan Stanley, 4.000%, 07/24/15 | | 633,600 | | 0.1 | |
205,000 | | # | | National Australia Bank Ltd., 3.750%, 03/02/15 | | 211,739 | | 0.0 | |
570,000 | | # | | Nationwide Building Society, 6.250%, 02/25/20 | | 566,256 | | 0.1 | |
290,000 | | # | | Nordea Bank AB, 4.875%, 01/27/20 | | 298,207 | | 0.0 | |
225,000 | | # | | Pacific LifeCorp, 6.000%, 02/10/20 | | 239,777 | | 0.0 | |
360,000 | | | | PNC Funding Corp., 5.125%, 02/08/20 | | 407,336 | | 0.1 | |
225,000 | | | | PNC Funding Corp., 6.700%, 06/10/19 | | 274,841 | | 0.0 | |
320,000 | | | | Prudential Financial, Inc., 4.750%, 09/17/15 | | 338,230 | | 0.0 | |
85,000 | | | | Prudential Financial, Inc., 7.375%, 06/15/19 | | 100,593 | | 0.0 | |
590,000 | | # | | Cooperatieve Centrale Raiffeisen-Boerenleenbank BA/Netherlands, 4.750%, 01/15/20 | | 628,347 | | 0.1 | |
495,000 | | | | Royal Bank of Scotland PLC, 4.875%, 03/16/15 | | 473,723 | | 0.1 | |
200,000 | | # | | Santander US Debt S.A. Unipersonal, 3.724%, 01/20/15 | | 181,755 | | 0.0 | |
460,000 | | | | Senior Housing Properties Trust, 4.300%, 01/15/16 | | 453,849 | | 0.1 | |
775,000 | | # | | Societe Generale, 2.500%, 01/15/14 | | 718,065 | | 0.1 | |
100,000 | | # | | Standard Chartered Bank, 6.400%, 09/26/17 | | 103,091 | | 0.0 | |
315,000 | | # | | Standard Chartered PLC, 3.850%, 04/27/15 | | 317,330 | | 0.0 | |
195,000 | | | | Travelers Cos, Inc., 5.350%, 11/01/40 | | 225,715 | | 0.0 | |
305,000 | | | | UBS AG, 5.875%, 12/20/17 | | 317,998 | | 0.0 | |
500,000 | | | | US Bank NA/Cincinnati OH, 3.778%, 04/29/20 | | 515,362 | | 0.1 | |
300,000 | | # | | WEA Finance LLC, 7.125%, 04/15/18 | | 335,630 | | 0.0 | |
570,000 | | | | Wells Fargo & Co., 5.625%, 12/11/17 | | 650,528 | | 0.1 | |
440,000 | | | | Westpac Banking Corp., 2.100%, 08/02/13 | | 444,526 | | 0.1 | |
| | | | | | 45,026,007 | | 5.9 | |
| | | | Health Care: 4.0% | | | | | |
610,000 | | | | Aetna, Inc., 3.950%, 09/01/20 | | 632,037 | | 0.1 | |
2,365,000 | | | | Amylin Pharmaceuticals, Inc., 3.000%, 06/15/14 | | 2,116,675 | | 0.3 | |
195,000 | | | | Boston Scientific Corp., 4.500%, 01/15/15 | | 204,810 | | 0.0 | |
661,000 | | | | Dendreon Corp., 2.875%, 01/15/16 | | 466,831 | | 0.1 | |
1,835,000 | | | | Endo Pharmaceuticals Holdings, Inc., 1.750%, 04/15/15 | | 2,410,731 | | 0.3 | |
930,000 | | | | Express Scripts, Inc., 5.250%, 06/15/12 | | 947,722 | | 0.1 | |
270,000 | | | | Express Scripts, Inc., 3.125%, 05/15/16 | | 271,827 | | 0.0 | |
5,261,000 | | | | Gilead Sciences, Inc., 1.625%, 05/01/16 | | 6,017,269 | | 0.8 | |
80,000 | | | | GlaxoSmithKline Capital, Inc., 6.375%, 05/15/38 | | 107,231 | | 0.0 | |
3,195,000 | | | | Life Technologies Corp., 1.500%, 02/15/24 | | 3,210,975 | | 0.4 | |
3,470,000 | | | | LifePoint Hospitals, Inc., 3.500%, 05/15/14 | | 3,565,425 | | 0.5 | |
210,000 | | | | Medco Health Solutions, Inc., 2.750%, 09/15/15 | | 211,409 | | 0.0 | |
959,000 | | | | NuVasive, Inc., 2.750%, 07/01/17 | | 703,666 | | 0.1 | |
1,145,000 | | | | Omnicare, Inc., 3.250%, 12/15/35 | | 1,056,262 | | 0.1 | |
1,037,000 | | | | Omnicare, Inc., 3.750%, 12/15/25 | | 1,446,615 | | 0.2 | |
885,000 | | | | Pfizer, Inc., 6.200%, 03/15/19 | | 1,093,317 | | 0.2 | |
1,889,000 | | | | Salix Pharmaceuticals Ltd., 2.750%, 05/15/15 | | 2,453,339 | | 0.3 | |
2,365,000 | | | | Teleflex, Inc., 3.875%, 08/01/17 | | 2,855,738 | | 0.4 | |
375,000 | | | | WellPoint, Inc., 4.350%, 08/15/20 | | 405,677 | | 0.1 | |
| | | | | | 30,177,556 | | 4.0 | |
| | | | Industrials: 0.6% | | | | | |
4,300,000 | | | | Cemex SAB de CV, 4.875%, 03/15/15 | | 2,827,250 | | 0.4 | |
330,000 | | | | CSX Corp., 5.500%, 04/15/41 | | 374,481 | | 0.1 | |
| | | | | | | | | | |
See Accompanying Notes to Financial Statements
43
Principal
Amount† | | | | | | Value | | Percentage
of Net
Assets | |
CORPORATE BONDS/NOTES: (continued) | | | | | |
| | | | Industrials: (continued) | | | | | |
105,000 | | | | CSX Corp., 6.150%, 05/01/37 | | $ | 126,478 | | 0.0 | |
245,249 | | | | Delta Air Lines, Inc., 6.200%, 07/02/18 | | 261,190 | | 0.0 | |
285,000 | | | | General Electric Co., 5.250%, 12/06/17 | | 327,619 | | 0.0 | |
260,000 | | | | Ryder System, Inc., 3.150%, 03/02/15 | | 267,434 | | 0.0 | |
170,000 | | | | Union Pacific Corp., 6.125%, 02/15/20 | | 208,373 | | 0.0 | |
380,000 | | | | Waste Management, Inc., 5.000%, 03/15/14 | | 407,503 | | 0.1 | |
| | | | | | 4,800,328 | | 0.6 | |
| | | | Information Technology: 2.9% | | | | | |
4,727,000 | | | | Alcatel-Lucent USA, Inc., 2.875%, 06/15/25 | | 4,171,577 | | 0.5 | |
1,100,000 | | | | Cadence Design Systems, Inc., 1.500%, 12/15/13 | | 1,090,375 | | 0.1 | |
475,000 | | | | Expedia, Inc., 5.950%, 08/15/20 | | 479,646 | | 0.1 | |
370,000 | | | | Hewlett-Packard Co., 2.625%, 12/09/14 | | 373,575 | | 0.0 | |
716,000 | | | | Linear Technology Corp., 3.000%, 05/01/27 | | 734,795 | | 0.1 | |
1,927,000 | | # | | Linear Technology Corp., 3.000%, 05/01/27 | | 1,977,584 | | 0.3 | |
1,721,000 | | # | | Micron Technology, Inc., 1.500%, 08/01/31 | | 1,553,202 | | 0.2 | |
1,141,000 | | # | | Novellus Systems, Inc., 2.625%, 05/15/41 | | 1,372,052 | | 0.2 | |
6,649,000 | | | | SanDisk Corp., 1.000%, 05/15/13 | | 6,507,709 | | 0.9 | |
1,757,000 | | | | Symantec Corp., 1.000%, 06/15/13 | | 1,965,644 | | 0.3 | |
1,466,000 | | # | | Xilinx, Inc., 3.125%, 03/15/37 | | 1,671,240 | | 0.2 | |
| | | | | | 21,897,399 | | 2.9 | |
| | | | Materials: 0.7% | | | | | |
300,000 | | # | | Anglo American Capital PLC, 9.375%, 04/08/19 | | 382,149 | | 0.0 | |
570,000 | | | | ArcelorMittal, 3.750%, 08/05/15 | | 545,447 | | 0.1 | |
80,000 | | | | ArcelorMittal, 5.500%, 03/01/21 | | 73,535 | | 0.0 | |
80,000 | | | | ArcelorMittal, 6.750%, 03/01/41 | | 72,041 | | 0.0 | |
460,000 | | | | ArcelorMittal, 9.850%, 06/01/19 | | 512,166 | | 0.1 | |
390,000 | | | | Barrick Gold Corp., 2.900%, 05/30/16 | | 400,769 | | 0.1 | |
475,000 | | | | Cintas Corp. No 2, 2.850%, 06/01/16 | | 487,737 | | 0.1 | |
360,000 | | | | Freeport-McMoRan Copper & Gold, Inc., 8.375%, 04/01/17 | | 382,905 | | 0.1 | |
250,000 | | | | International Paper Co., 6.000%, 11/15/41 | | 271,871 | | 0.0 | |
870,000 | | | | Pentair, Inc., 5.000%, 05/15/21 | | 919,723 | | 0.1 | |
335,000 | | | | Rio Tinto Finance USA Ltd., 9.000%, 05/01/19 | | 457,722 | | 0.1 | |
75,000 | | | | Southern Copper Corp., 5.375%, 04/16/20 | | 79,827 | | 0.0 | |
105,000 | | | | Southern Copper Corp., 6.750%, 04/16/40 | | 105,943 | | 0.0 | |
220,000 | | | | Vale Overseas Ltd., 5.625%, 09/15/19 | | 243,376 | | 0.0 | |
250,000 | | | | Vale Overseas Ltd., 6.875%, 11/10/39 | | 287,106 | | 0.0 | |
| | | | | | 5,222,317 | | 0.7 | |
| | | | Telecommunications: 1.6% | | | | | |
225,000 | | | | America Movil SAB de CV, 2.375%, 09/08/16 | | 225,548 | | 0.0 | |
325,000 | | | | American Tower Corp., 4.500%, 01/15/18 | | 330,958 | | 0.1 | |
125,000 | | | | American Tower Corp., 4.625%, 04/01/15 | | 130,406 | | 0.0 | |
4,000 | | | | AT&T Corp., 8.000%, 11/15/31 | | 5,658 | | 0.0 | |
270,000 | | | | AT&T, Inc., 6.150%, 09/15/34 | | 320,791 | | 0.0 | |
101,000 | | | | AT&T, Inc., 5.350%, 09/01/40 | | 113,825 | | 0.0 | |
2,081,000 | | # | | Ciena Corp., 4.000%, 03/15/15 | | 2,054,987 | | 0.3 | |
45,000 | | | | Corning, Inc., 6.625%, 05/15/19 | | 54,372 | | 0.0 | |
75,000 | | | | Corning, Inc., 7.250%, 08/15/36 | | 90,580 | | 0.0 | |
345,000 | | # | | Crown Castle Towers LLC, 3.214%, 08/15/15 | | 349,212 | | 0.1 | |
165,000 | | | | Deutsche Telekom International Finance BV, 8.750%, 06/15/30 | | 230,452 | | 0.0 | |
2,000,000 | | # | | JDS Uniphase Corp., 1.000%, 05/15/26 | | 1,965,332 | | 0.3 | |
110,000 | | | | Juniper Networks, Inc., 4.600%, 03/15/21 | | 116,745 | | 0.0 | |
2,697,000 | | | | SBA Communications Corp., 1.875%, 05/01/13 | | 3,057,724 | | 0.4 | |
640,000 | | | | Telecom Italia Capital S.A., 6.999%, 06/04/18 | | 598,935 | | 0.1 | |
880,000 | | | | TW Telecom, Inc., 2.375%, 04/01/26 | | 1,040,600 | | 0.1 | |
315,000 | | | | Verizon Communications, Inc., 6.350%, 04/01/19 | | 384,289 | | 0.1 | |
280,000 | | | | Verizon Communications, Inc., 8.950%, 03/01/39 | | 449,126 | | 0.1 | |
165,000 | | | | Verizon Communications, Inc., 3.000%, 04/01/16 | | 172,993 | | 0.0 | |
| | | | | | | | | | |
See Accompanying Notes to Financial Statements
44
Principal
Amount† | | | | | | Value | | Percentage
of Net
Assets | |
CORPORATE BONDS/NOTES: (continued) | | | | | |
| | | | Telecommunications: (continued) | | | | | |
190,000 | | | | Verizon Communications, Inc., 4.750%, 11/01/41 | | $ | 204,887 | | 0.0 | |
| | | | | | 11,897,420 | | 1.6 | |
| | | | Utilities: 0.5% | | | | | |
80,407 | | | | CenterPoint Energy, Inc., 09/15/29 | | 2,758,965 | | 0.4 | |
150,000 | | # | | EDF S.A., 4.600%, 01/27/20 | | 153,518 | | 0.0 | |
425,000 | | # | | Enel Finance International S.A., 5.125%, 10/07/19 | | 380,144 | | 0.1 | |
355,000 | | | | Louisville Gas & Electric Co., 1.625%, 11/15/15 | | 357,218 | | 0.0 | |
115,000 | | | | Nisource Finance Corp., 6.800%, 01/15/19 | | 134,847 | | 0.0 | |
| | | | | | 3,784,692 | | 0.5 | |
| | | | Total Corporate Bonds/Notes
(Cost $147,982,490) | | 154,724,543 | | 20.4 | |
| | | | | | | | | |
COLLATERALIZED MORTGAGE OBLIGATIONS: 0.0% | | | | | |
350,000 | | # | | GE Dealer Floorplan Master Note Trust, 1.828%, 10/20/14 | | 353,089 | | 0.0 | |
| | | | | | | | | |
| | | | Total Collateralized Mortgage Obligations
(Cost $350,000) | | 353,089 | | 0.0 | |
| | | | | | | | | |
MUNICIPAL BONDS: 0.1% | | | | | | |
| | | | California: 0.0% | | | | | |
150,000 | | | | State of California, 5.950%, 04/01/16 | | 169,005 | | 0.0 | |
| | | | | | | | | |
| | | | Georgia: 0.1% | | | | | |
175,000 | | | | Municipal Electric Authority of Georgia, 6.637%, 04/01/57 | | 184,571 | | 0.0 | |
325,000 | | | | Municipal Electric Authority of Georgia, 6.655%, 04/01/57 | | 332,173 | | 0.1 | |
| | | | | | 516,744 | | 0.1 | |
| | | | Texas: 0.0% | | | | | |
230,000 | | | | Texas State Transportation Commission, 5.028%, 04/01/26 | | 267,754 | | 0.0 | |
| | | | | | | | | |
| | | | Total Municipal Bonds
(Cost $884,549) | | 953,503 | | 0.1 | |
| | | | | | | | | |
ASSET-BACKED SECURITIES: 0.0% | | | | | |
| | | | Automobile Asset-Backed Securities: 0.0% | | | | | |
71,679 | | # | | ARI Fleet Lease Trust, 1.728%, 08/15/18 | | 71,689 | | 0.0 | |
| | | | | | | | | |
| | | | Total Asset-Backed Securities
(Cost $71,679) | | 71,689 | | 0.0 | |
| | | | | | | | | |
U.S. TREASURY OBLIGATIONS: 7.7% | | | | | |
| | | | U.S. Treasury Bonds: 5.6% | | | | | |
2,000,000 | | | | 2.625%, due 11/15/20 | | 2,152,812 | | 0.3 | |
19,000,000 | | | | 1.000%, due 04/30/12 | | 19,062,339 | | 2.5 | |
1,910,000 | | | | 1.750%, due 08/15/12 | | 1,929,772 | | 0.3 | |
400,000 | | | | 1.750%, due 03/31/14 | | 413,219 | | 0.1 | |
2,940,000 | | | | 2.250%, due 01/31/15 | | 3,106,754 | | 0.4 | |
1,001,000 | | | | 2.500%, due 03/31/15 | | 1,067,708 | | 0.1 | |
1,400,000 | | | | 2.625%, due 06/30/14 | | 1,480,172 | | 0.2 | |
1,500,000 | | | | 2.625%, due 07/31/14 | | 1,588,359 | | 0.2 | |
2,000,000 | | | | 2.625%, due 04/30/16 | | 2,164,688 | | 0.3 | |
2,670,000 | | | | 3.500%, due 02/15/39 | | 2,997,911 | | 0.4 | |
5,000 | | | | 4.125%, due 08/31/12 | | 5,133 | | 0.0 | |
2,000,000 | | | | 4.250%, due 11/15/40 | | 2,545,312 | | 0.3 | |
1,300,000 | | | | 4.375%, due 11/15/39 | | 1,684,719 | | 0.2 | |
1,800,000 | | | | 4.625%, due 02/15/40 | | 2,423,250 | | 0.3 | |
230,000 | | | | 6.875%, due 08/15/25 | | 354,092 | | 0.0 | |
| | | | | | 42,976,240 | | 5.6 | |
| | | | U.S. Treasury Notes: 2.1% | | | | | |
1,500,000 | | | | 1.875%, due 04/30/14 | | 1,555,079 | | 0.2 | |
880,000 | | | | 2.125%, due 11/30/14 | | 924,481 | | 0.1 | |
2,630,000 | | | | 2.375%, due 10/31/14 | | 2,779,171 | | 0.4 | |
10,000,000 | | | | 2.750%, due 10/31/13 | | 10,455,470 | | 1.4 | |
| | | | | | 15,714,201 | | 2.1 | |
| | | | Total U.S. Treasury Obligations
(Cost $54,893,772) | | 58,690,441 | | 7.7 | |
| | | | | | | | | |
U.S. GOVERNMENT AGENCY OBLIGATIONS: 1.0% | | | | | |
| | | | Federal Home Loan Mortgage Corporation: 0.5%## | | | | | |
550,000 | | | | 3.000%, due 07/28/14 | | 584,103 | | 0.1 | |
2,400,000 | | | | 4.875%, due 06/13/18 | | 2,896,798 | | 0.4 | |
| | | | | | 3,480,901 | | 0.5 | |
| | | | Federal National Mortgage Association: 0.5%## | | | | | |
2,130,000 | | | | 4.375%, due 10/15/15 | | 2,409,499 | | 0.3 | |
915,000 | | | | 6.625%, due 11/15/30 | | 1,357,257 | | 0.2 | |
| | | | | | 3,766,756 | | 0.5 | |
| | | | Total U.S. Government Agency Obligations
(Cost $6,435,254) | | 7,247,657 | | 1.0 | |
| | | | | | | | | |
FOREIGN GOVERNMENT BONDS: 0.2% | | | | | |
960,000 | | | | Brazil Government International Bond, 6.000%, 01/17/17 | | 1,123,200 | | 0.1 | |
395,000 | | | | Republic of Italy, 6.875%, 09/27/23 | | 384,493 | | 0.1 | |
| | | | | | | | | | |
See Accompanying Notes to Financial Statements
45
Principal
Amount† | | | | | | Value | | Percentage
of Net
Assets | |
FOREIGN GOVERNMENT BONDS: (continued) | | | | | |
100,000 | | | | Peruvian Government International Bond, 7.125%, 03/30/19 | | $ | 126,250 | | 0.0 | |
| | | | | | | | | |
| | | | Total Foreign Government Bonds
(Cost $1,510,176) | | 1,633,943 | | 0.2 | |
| | | | | | | |
| | | | Total Long-Term Investments
(Cost $644,580,617) | | 711,072,735 | | 93.7 | |
| | | | | | | | | |
Shares | | | | | | | | | |
SHORT-TERM INVESTMENTS: 5.9% | | | | | |
| | | | Mutual Funds: 5.9% | | | | | |
44,996,916 | | | | BlackRock Liquidity Funds, TempFund, Institutional Class
(Cost $44,996,916) | | 44,996,916 | | 5.9 | |
| | | | | | | | | |
| | | | Total Short-Term Investments
(Cost $44,996,916) | | 44,996,916 | | 5.9 | |
| | | | | | | | | |
| | | | Total Investments in Securities
(Cost $689,577,533) | | $ | 756,069,651 | | 99.6 | |
| | | | Assets in Excess of Other Liabilities | | 3,338,940 | | 0.4 | |
| | | | Net Assets | | $ | 759,408,591 | | 100.0 | |
† | | Unless otherwise indicated, principal amount is shown in USD. |
# | | Securities with purchases pursuant to Rule 144A or section 4(2), under the Securities Act of 1933 and may not be resold subject to that rule except to qualified institutional buyers. |
## | | On September 7, 2008, the Federal Housing Finance Agency placed the Federal National Mortgage Association and the Federal Home Loan Mortgage Corporation into conservatorship and the U.S. Treasury guaranteed the debt issued by those organizations. |
@ | | Non-income producing security |
| | |
ADR | | American Depositary Receipt |
P | | Preferred Stock may be called prior to convertible date. |
| | |
| | Cost for federal income tax purposes is $690,883,493. |
| | |
| | Net unrealized appreciation consists of: |
Gross Unrealized Appreciation | | $ | 93,350,730 | |
Gross Unrealized Depreciation | | (28,164,572 | ) |
| | | |
Net Unrealized Appreciation | | $ | 65,186,158 | |
Fair Value Measurements^
The following is a summary of the fair valuations according to the inputs used as of December 31, 2011 in valuing the assets and liabilities:
See Accompanying Notes to Financial Statements
46
| | Quoted Prices
in Active Markets
for Identical
Investments
(Level 1) | | Significant
Other
Observable
Inputs #
(Level 2) | | Significant
Unobservable
Inputs
(Level 3) | | Fair Value
at
12/31/2011 | |
Asset Table | | | | | | | | | |
Investments, at value | | | | | | | | | |
Common Stock | | | | | | | | | |
Consumer Discretionary | | $ | 48,829,303 | | $ | — | | $ | — | | $ | 48,829,303 | |
Consumer Staples | | 60,963,633 | | — | | — | | 60,963,633 | |
Energy | | 66,352,879 | | — | | — | | 66,352,879 | |
Financials | | 90,031,612 | | — | | — | | 90,031,612 | |
Health Care | | 65,056,975 | | — | | — | | 65,056,975 | |
Industrials | | 42,142,944 | | — | | — | | 42,142,944 | |
Information Technology | | 55,879,292 | | 2,067,430 | | — | | 57,946,722 | |
Materials | | 5,178,634 | | — | | — | | 5,178,634 | |
Telecommunications | | 16,504,524 | | — | | — | | 16,504,524 | |
Utilities | | 20,630,337 | | — | | — | | 20,630,337 | |
Total Common Stock | | 471,570,133 | | 2,067,430 | | — | | 473,637,563 | |
Exchange-Traded Funds | | 1,137,834 | | — | | — | | 1,137,834 | |
Preferred Stock | | 3,712,612 | | 8,909,861 | | — | | 12,622,473 | |
Corporate Bonds/Notes | | — | | 151,165,482 | | 3,559,061 | | 154,724,543 | |
Collateralized Mortgage Obligations | | — | | 353,089 | | — | | 353,089 | |
Municipal Bonds | | — | | 953,503 | | — | | 953,503 | |
U.S. Treasury Obligations | | — | | 58,690,441 | | — | | 58,690,441 | |
U.S. Government Agency Obligations | | — | | 7,247,657 | | — | | 7,247,657 | |
Short-Term Investments | | 44,996,916 | | — | | — | | 44,996,916 | |
Foreign Government Bonds | | — | | 1,633,943 | | — | | 1,633,943 | |
Asset-Backed Securities | | — | | 71,689 | | — | | 71,689 | |
Total Investments, at value | | $ | 521,417,495 | | $ | 231,093,095 | | $ | 3,559,061 | | $ | 756,069,651 | |
Other Financial Instruments+ | | | | | | | | | |
Forward Foreign Currency Contracts | | — | | 668,565 | | — | | 668,565 | |
Total Assets | | $ | 521,417,495 | | $ | 231,761,660 | | $ | 3,559,061 | | $ | 756,738,216 | |
^ | | See Note 2, “Significant Accounting Policies” in the Notes to Financial Statements for additional information. |
+ | | Other Financial Instruments are derivatives not reflected in the Portfolio of Investments and may include open forward foreign currency contracts, equity forwards, futures, swaps, and written options. Forward foreign currency contracts, equity forwards and futures are valued at the unrealized gain (loss) on the instrument. Swaps and written options are valued at the fair value of the instrument. |
# | | The earlier close of the foreign markets gives rise to the possibility that significant events, including broad market moves, may have occurred in the interim and may materially affect the value of those securities. To account for this, the Portfolio may frequently value many of its foreign equity securities using fair value prices based on third party vendor modeling tools to the extent available. Accordingly, a significant portion of the Portfolio’s investments are categorized as Level 2 investments. |
| | |
| | There were no significant transfers between Level 1 and 2 during the year endedDecember 31, 2011. |
| | |
| | Transfers in or out of Level 3 represent either the beginning value (for transfers in), or the ending value (for transfers out) of any security or derivative instrument where a change in the pricing level occurred from the beginning to the end of the period. Transfers are recognized at the end of the reporting period. |
At December 31, 2011 , the following forward foreign currency contracts were outstanding for the ING Invesco Van Kampen Equity and Income Portfolio:
Counterparty | | Currency | | Contract Amount | | Buy/Sell | | Settlement Date | | In Exchange For | | Fair Value | | Unrealized
Appreciation
(Depreciation) | |
| | | | | | | | | | | | | | | |
The Bank of New York Mellon Corp. | | EU Euro | | 8,949,044 | | Sell | | 01/12/12 | | $ | 12,037,538 | | $ | 11,583,233 | | $ | 454,305 | |
State Street Bank | | EU Euro | | 3,136,624 | | Sell | | 01/12/12 | | 4,219,763 | | 4,059,903 | | 159,860 | |
State Street Bank | | British Pound | | 4,401,087 | | Sell | | 01/12/12 | | 6,888,471 | | 6,834,071 | | 54,400 | |
| | | | | | | | | | | | | | $ | 668,565 | |
| | | | | | | | | | | | | | | | | | |
A summary of derivative instruments by primary risk exposure is outlined in the following tables.
The fair value of derivative instruments as of December 31, 2011 was as follows:
See Accompanying Notes to Financial Statements
47
Derivatives not accounted for | | Location on Statement | | | |
as hedging instruments | | of Assets and Liabilities | | Fair Value | |
| | | | | |
Asset Derivatives | | | | | |
| | | | | |
Foreign exchange contracts | | Unrealized appreciation on forward foreign currency contracts | | $ | 668,565 | |
Total Asset Derivatives | | | | $ | 668,565 | |

See Accompanying Notes to Financial Statements
48
| | PORTFOLIO OF INVESTMENTS |
ING JPMORGAN MID CAP VALUE PORTFOLIO | | AS OF DECEMBER 31, 2011 |
Shares | | | | | | Value | | Percentage
of Net
Assets | |
COMMON STOCK: 97.0% | | | | | | | |
| | | | Consumer Discretionary: 18.8% | | | | | |
23,475 | | @ | | AMC Networks, Inc. | | $ | 882,190 | | 0.3 | |
10,950 | | @ | | Autozone, Inc. | | 3,558,422 | | 1.1 | |
53,200 | | @ | | Bed Bath & Beyond, Inc. | | 3,084,004 | | 0.9 | |
64,300 | | | | Cablevision Systems Corp. | | 914,346 | | 0.3 | |
127,800 | | | | CBS Corp. - Class B | | 3,468,492 | | 1.0 | |
118,701 | | @ | | Clear Channel Outdoor Holdings, Inc. | | 1,489,698 | | 0.5 | |
77,553 | | | | Darden Restaurants, Inc. | | 3,534,866 | | 1.1 | |
97,800 | | | | Dish Network Corp. | | 2,785,344 | | 0.8 | |
47,750 | | | | Expedia, Inc. | | 1,385,705 | | 0.4 | |
45,300 | | | | Family Dollar Stores, Inc. | | 2,611,998 | | 0.8 | |
145,800 | | | | Gannett Co., Inc. | | 1,949,346 | | 0.6 | |
147,100 | | | | Gap, Inc. | | 2,728,705 | | 0.8 | |
53,700 | | | | Genuine Parts Co. | | 3,286,440 | | 1.0 | |
60,300 | | | | Jarden Corp. | | 1,801,764 | | 0.5 | |
70,600 | | | | Kohl’s Corp. | | 3,484,110 | | 1.0 | |
139,906 | | | | Marriott International, Inc. | | 4,081,058 | | 1.2 | |
40,900 | | @ | | Mohawk Industries, Inc. | | 2,447,865 | | 0.7 | |
41,200 | | | | Petsmart, Inc. | | 2,113,148 | | 0.6 | |
42,900 | | | | PVH Corp. | | 3,024,021 | | 0.9 | |
43,500 | | | | Royal Caribbean Cruises Ltd. | | 1,077,495 | | 0.3 | |
35,000 | | | | Tiffany & Co. | | 2,319,100 | | 0.7 | |
70,400 | | | | TJX Cos., Inc. | | 4,544,320 | | 1.4 | |
47,750 | | @ | | TripAdvisor, Inc. | | 1,203,777 | | 0.4 | |
2,050 | | | | Washington Post | | 772,460 | | 0.2 | |
30,000 | | | | Williams-Sonoma, Inc. | | 1,155,000 | | 0.3 | |
54,400 | | | | Yum! Brands, Inc. | | 3,210,144 | | 1.0 | |
| | | | | | 62,913,818 | | 18.8 | |
| | | | Consumer Staples: 6.3% | | | | | |
89,700 | | | | Beam, Inc. | | 4,595,331 | | 1.4 | |
19,475 | | | | Brown-Forman Corp. | | 1,567,932 | | 0.5 | |
48,500 | | | | Dr Pepper Snapple Group, Inc. | | 1,914,780 | | 0.6 | |
37,800 | | @ | | Energizer Holdings, Inc. | | 2,928,744 | | 0.9 | |
37,900 | | | | Hershey Co. | | 2,341,462 | | 0.7 | |
45,400 | | | | JM Smucker Co. | | 3,548,918 | | 1.0 | |
48,600 | | @ | | Ralcorp Holdings, Inc. | | 4,155,300 | | 1.2 | |
| | | | | | 21,052,467 | | 6.3 | |
| | | | Energy: 4.8% | | | | | |
47,100 | | | | CVR Energy, Inc. | | 882,183 | | 0.3 | |
66,900 | | | | Devon Energy Corp. | | 4,147,800 | | 1.2 | |
44,200 | | | | EQT Corp. | | 2,421,718 | | 0.7 | |
53,000 | | @ | | Newfield Exploration Co. | | 1,999,690 | | 0.6 | |
47,200 | | | | Teekay Shipping Corp. | | 1,261,656 | | 0.4 | |
161,797 | | | | Williams Cos., Inc. | | 5,342,537 | | 1.6 | |
| | | | | | 16,055,584 | | 4.8 | |
| | | | Financials: 23.4% | | | | | |
105,700 | | | | Ameriprise Financial, Inc. | | 5,246,948 | | 1.6 | |
26,200 | | @ | | Arch Capital Group Ltd. | | 975,426 | | 0.3 | |
64,659 | | | | Bancorpsouth, Inc. | | 712,542 | | 0.2 | |
156,950 | | | | Brookfield Properties Co. | | 2,454,698 | | 0.7 | |
100,700 | | | | Capitol Federal Financial, Inc. | | 1,162,078 | | 0.3 | |
43,600 | | | | Chubb Corp. | | 3,017,992 | | 0.9 | |
62,800 | | | | City National Corp. | | 2,774,504 | | 0.8 | |
50,800 | | | | Cullen/Frost Bankers, Inc. | | 2,687,828 | | 0.8 | |
273,000 | | | | Fifth Third Bancorp. | | 3,472,560 | | 1.0 | |
63,200 | | | | HCP, Inc. | | 2,618,376 | | 0.8 | |
202,900 | | | | Huntington Bancshares, Inc. | | 1,113,921 | | 0.3 | |
160,100 | | @ | | Invesco Ltd. | | 3,216,409 | | 1.0 | |
155,100 | | | | Loews Corp. | | 5,839,515 | | 1.7 | |
52,361 | | | | M&T Bank Corp. | | 3,997,239 | | 1.2 | |
126,000 | | | | Marsh & McLennan Cos., Inc. | | 3,984,120 | | 1.2 | |
41,900 | | | | Northern Trust Corp. | | 1,661,754 | | 0.5 | |
249,950 | | | | Old Republic International Corp. | | 2,317,037 | | 0.7 | |
110,996 | | @ | | OneBeacon Insurance Group Ltd. | | 1,708,228 | | 0.5 | |
219,700 | | | | People’s United Financial, Inc. | | 2,823,145 | | 0.8 | |
69,100 | | | | Regency Centers Corp. | | 2,599,542 | | 0.8 | |
145,300 | | | | SunTrust Bank | | 2,571,810 | | 0.8 | |
61,600 | | | | T. Rowe Price Group, Inc. | | 3,508,120 | | 1.1 | |
36,100 | | | | Torchmark Corp. | | 1,566,379 | | 0.5 | |
70,700 | | | | Transatlantic Holdings, Inc. | | 3,869,411 | | 1.2 | |
33,976 | | | | Vornado Realty Trust | | 2,611,395 | | 0.8 | |
138,300 | | | | WR Berkley Corp. | | 4,756,137 | | 1.4 | |
174,100 | | | | XL Group PLC | | 3,441,957 | | 1.0 | |
92,500 | | | | Zions Bancorp. | | 1,505,900 | | 0.5 | |
| | | | | | 78,214,971 | | 23.4 | |
| | | | Health Care: 6.2% | | | | | |
107,380 | | | | AmerisourceBergen Corp. | | 3,993,462 | | 1.2 | |
40,300 | | | | Becton Dickinson & Co. | | 3,011,216 | | 0.9 | |
38,300 | | | | Cigna Corp. | | 1,608,600 | | 0.5 | |
77,900 | | @ | | Coventry Health Care, Inc. | | 2,365,823 | | 0.7 | |
66,100 | | @ | | HCA Holdings, Inc. | | 1,456,183 | | 0.4 | |
41,700 | | | | Humana, Inc. | | 3,653,337 | | 1.1 | |
174,700 | | | | Lincare Holdings, Inc. | | 4,491,537 | | 1.4 | |
| | | | | | 20,580,158 | | 6.2 | |
| | | | Industrials: 8.8% | | | | | |
40,700 | | | | Alliant Techsystems, Inc. | | 2,326,412 | | 0.7 | |
81,400 | | | | Ametek, Inc. | | 3,426,940 | | 1.0 | |
77,400 | | | | Carlisle Cos., Inc. | | 3,428,820 | | 1.0 | |
64,079 | | | | Cooper Industries PLC | | 3,469,878 | | 1.0 | |
109,500 | | @ | | Fortune Brands Home & Security, Inc. | | 1,864,785 | | 0.6 | |
27,800 | | | | L-3 Communications Holdings, Inc. | | 1,853,704 | | 0.5 | |
| | | | | | | | | | |
See Accompanying Notes to Financial Statements
49
Shares | | | | | | Value | | Percentage
of Net
Assets | |
COMMON STOCK: (continued) | | | | | |
| | | | Industrials: (continued) | | | | | |
65,200 | | | | Regal-Beloit Corp. | | $ | 3,323,244 | | 1.0 | |
237,917 | | | | Republic Services, Inc. | | 6,554,613 | | 2.0 | |
65,041 | | | | Snap-On, Inc. | | 3,292,376 | | 1.0 | |
| | | | | | 29,540,772 | | 8.8 | |
| | | | Information Technology: 6.5% | | | | | |
87,100 | | | | Amphenol Corp. | | 3,953,469 | | 1.2 | |
94,600 | | | | Analog Devices, Inc. | | 3,384,788 | | 1.0 | |
90,700 | | @ | | Arrow Electronics, Inc. | | 3,393,087 | | 1.0 | |
117,800 | | | | Jack Henry & Associates, Inc. | | 3,959,258 | | 1.2 | |
127,000 | | @ | | Synopsys, Inc. | | 3,454,400 | | 1.0 | |
115,430 | | @ | | TE Connectivity Ltd. | | 3,556,398 | | 1.1 | |
| | | | | | 21,701,400 | | 6.5 | |
| | | | Materials: 7.3% | | | | | |
36,320 | | | | Airgas, Inc. | | 2,835,866 | | 0.9 | |
64,708 | | | | Albemarle Corp. | | 3,333,109 | | 1.0 | |
138,000 | | | | Ball Corp. | | 4,927,980 | | 1.5 | |
48,500 | | | | Rock-Tenn Co. | | 2,798,450 | | 0.8 | |
40,300 | | | | Sherwin-Williams Co. | | 3,597,581 | | 1.1 | |
54,400 | | | | Sigma-Aldrich Corp. | | 3,397,824 | | 1.0 | |
89,200 | | | | Silgan Holdings, Inc. | | 3,446,688 | | 1.0 | |
| | | | | | 24,337,498 | | 7.3 | |
| | | | Telecommunications: 1.4% | | | | | |
63,500 | | | | CenturyTel, Inc. | | 2,362,200 | | 0.7 | |
89,387 | | | | Telephone & Data Systems, Inc. | | 2,128,305 | | 0.7 | |
| | | | | | 4,490,505 | | 1.4 | |
| | | | Utilities: 13.5% | | | | | |
100,100 | | | | CenterPoint Energy, Inc. | | 2,011,009 | | 0.6 | |
257,900 | | | | CMS Energy Corp. | | 5,694,432 | | 1.7 | |
121,300 | | | | Energen Corp. | | 6,065,000 | | 1.8 | |
50,500 | | | | Northeast Utilities | | 1,821,535 | | 0.5 | |
78,200 | | | | NSTAR | | 3,672,272 | | 1.1 | |
200,100 | | | | NV Energy, Inc. | | 3,271,635 | | 1.0 | |
53,800 | | | | Oneok, Inc. | | 4,663,922 | | 1.4 | |
73,300 | | | | Sempra Energy | | 4,031,500 | | 1.2 | |
153,400 | | | | Westar Energy, Inc. | | 4,414,852 | | 1.3 | |
122,900 | | | | Wisconsin Energy Corp. | | 4,296,584 | | 1.3 | |
187,900 | | | | Xcel Energy, Inc. | | 5,193,556 | | 1.6 | |
| | | | | | 45,136,297 | | 13.5 | |
| | | | Total Common Stock
(Cost $286,169,469) | | 324,023,470 | | 97.0 | |
| | | | | | | | | |
SHORT-TERM INVESTMENTS: 3.1% | | | | | |
| | | | Mutual Funds: 3.1% | | | | | |
10,315,919 | | | | BlackRock Liquidity Funds, TempFund, Institutional Class
(Cost $10,315,919) | | 10,315,919 | | 3.1 | |
| | | | | | | | | |
| | | | Total Short-Term Investments
(Cost $10,315,919) | | 10,315,919 | | 3.1 | |
| | | | | | | | | |
| | | | Total Investments in Securities
(Cost $296,485,388) | | $ | 334,339,389 | | 100.1 | |
| | | | Liabilities in Excess of Other Assets | | (174,855 | ) | (0.1 | ) |
| | | | Net Assets | | $ | 334,164,534 | | 100.0 | |
@ | | Non-income producing security |
| | |
| | Cost for federal income tax purposes is $301,250,791. |
| | |
| | Net unrealized appreciation consists of: |
Gross Unrealized Appreciation | | $ | 49,962,245 | |
Gross Unrealized Depreciation | | (16,873,647 | ) |
| | | |
Net Unrealized Appreciation | | $ | 33,088,598 | |
See Accompanying Notes to Financial Statements
50
Fair Value Measurements^
The following is a summary of the fair valuations according to the inputs used as of December 31, 2011 in valuing the assets and liabilities:
| | Quoted Prices
in Active Markets
for Identical
Investments
(Level 1) | | Significant
Other
Observable
Inputs
(Level 2) | | Significant
Unobservable
Inputs
(Level 3) | | Fair Value
at
12/31/2011 | |
Asset Table | | | | | | | | | |
Investments, at value | | | | | | | | | |
Common Stock* | | $ | 324,023,470 | | $ | — | | $ | — | | $ | 324,023,470 | |
Short-Term Investments | | 10,315,919 | | — | | — | | 10,315,919 | |
Total Investments, at value | | $ | 334,339,389 | | $ | — | | $ | — | | $ | 334,339,389 | |
^ | | See Note 2, “Significant Accounting Policies” in the Notes to Financial Statements for additional information. |
* | | For further breakdown of Common Stock by Industry type, please refer to the Portfolio of Investments. |
| | |
| | There were no significant transfers between Level 1 and 2 during the year ended December 31, 2011. |
See Accompanying Notes to Financial Statements
51
| | PORTFOLIO OF INVESTMENTS |
ING OPPENHEIMER GLOBAL PORTFOLIO | | AS OF DECEMBER 31, 2011 |
Shares | | | | | | Value | | Percentage
of Net
Assets | |
COMMON STOCK: 98.7% | | | | | | | |
| | | | Argentina: 0.3% | | | | | |
103,180 | | | | YPF SA ADR | | $ | 3,578,282 | | 0.3 | |
| | | | | | | | | |
| | | | Brazil: 4.0% | | | | | |
456,500 | | | | All America Latina Logistica SA | | 2,276,076 | | 0.2 | |
2,730,200 | | | | BM&F Bovespa S.A. | | 14,344,436 | | 1.0 | |
537,400 | | | | Cia de Bebidas das Americas ADR | | 19,394,766 | | 1.3 | |
555,480 | | | | Embraer SA ADR | | 14,009,206 | | 0.9 | |
353,150 | | | | Itau Unibanco Holding SA ADR | | 6,554,464 | | 0.4 | |
158,000 | | | | Multiplus SA | | 2,731,805 | | 0.2 | |
| | | | | | 59,310,753 | | 4.0 | |
| | | | Denmark: 0.6% | | | | | |
123,462 | | | | Carlsberg A/S | | 8,693,398 | | 0.6 | |
| | | | | | | | | |
| | | | Finland: 0.7% | | | | | |
492,816 | | | | Fortum OYJ | | 10,495,997 | | 0.7 | |
| | | | | | | | | |
| | | | France: 5.6% | | | | | |
173,158 | | L | | LVMH Moet Hennessy Louis Vuitton S.A. | | 24,391,785 | | 1.6 | |
90,370 | | | | PPR | | 12,899,318 | | 0.9 | |
177,530 | | | | Societe Generale | | 3,919,076 | | 0.3 | |
259,604 | | | | Technip S.A. | | 24,337,802 | | 1.6 | |
339,224 | | | | Total S.A. | | 17,309,844 | | 1.2 | |
| | | | | | 82,857,825 | | 5.6 | |
| | | | Germany: 9.5% | | | | | |
195,104 | | | | Allianz AG | | 18,633,202 | | 1.3 | |
277,612 | | | | Bayer AG | | 17,729,214 | | 1.2 | |
481,494 | | | | Bayerische Motoren Werke AG | | 22,732,944 | | 1.6 | |
75,982 | | | | Linde AG | | 11,291,846 | | 0.8 | |
567,667 | | | | SAP AG | | 30,024,771 | | 2.0 | |
403,847 | | | | Siemens AG | | 38,638,317 | | 2.6 | |
| | | | | | 139,050,294 | | 9.5 | |
| | | | India: 2.0% | | | | | |
1,488,707 | | | | DLF Ltd. | | 5,121,129 | | 0.4 | |
348,113 | | | | Infosys Technologies Ltd. | | 18,118,550 | | 1.2 | |
1,576,003 | | @ | | Wire and Wireless India Ltd. | | 176,257 | | 0.0 | |
307,844 | | @ | | Zee Learn Ltd. | | 68,817 | | 0.0 | |
2,471,859 | | | | Zee Telefilms Ltd. | | 5,482,457 | | 0.4 | |
| | | | | | 28,967,210 | | 2.0 | |
| | | | Ireland: 0.6% | | | | | |
435,880 | | | | XL Group PLC | | 8,617,348 | | 0.6 | |
| | | | | | | | | |
| | | | Italy: 1.5% | | | | | |
340,418 | | @,L | | Lottomatica S.p.A. | | 5,094,498 | | 0.3 | |
427,353 | | | | Prysmian S.p.A. | | 5,280,256 | | 0.4 | |
141,255 | | L | | Tod’s S.p.A. | | 11,474,548 | | 0.8 | |
| | | | | | 21,849,302 | | 1.5 | |
| | | | Japan: 9.3% | | | | | |
13,341 | | | | Dai-ichi Life Insurance Co., Ltd. | | 13,096,817 | | 0.9 | |
71,500 | | | | Fanuc Ltd. | | 10,906,056 | | 0.7 | |
425,400 | | | | Hoya Corp. | | 9,145,725 | | 0.6 | |
3,005 | | | | KDDI Corp. | | 19,299,023 | | 1.3 | |
60,683 | | | | Keyence Corp. | | 14,627,016 | | 1.0 | |
104,500 | | | | Kyocera Corp. | | 8,380,235 | | 0.6 | |
506,800 | | | | Mitsubishi Tanabe Pharma Corp. | | 8,006,468 | | 0.5 | |
337,700 | | | | Murata Manufacturing Co., Ltd. | | 17,294,200 | | 1.2 | |
129,000 | | | | Nidec Corp. | | 11,200,550 | | 0.8 | |
37,900 | | | | Nintendo Co., Ltd. | | 5,203,372 | | 0.3 | |
469,300 | | | | Sony Corp. | | 8,461,943 | | 0.6 | |
403,000 | | | | Sumitomo Mitsui Financial Group, Inc. | | 11,176,310 | | 0.8 | |
| | | | | | 136,797,715 | | 9.3 | |
| | | | Mexico: 3.4% | | | | | |
3,426,602 | | | | Fomento Economico Mexicano SA de CV ADR | | 23,948,669 | | 1.6 | |
1,452,967 | | | | Grupo Modelo S.A. | | 9,162,583 | | 0.6 | |
822,734 | | | | Grupo Televisa SAB ADR | | 17,326,778 | | 1.2 | |
| | | | | | 50,438,030 | | 3.4 | |
| | | | Netherlands: 2.6% | | | | | |
884,143 | | | | European Aeronautic Defence and Space Co. NV | | 27,531,307 | | 1.9 | |
523,829 | | | | Koninklijke Philips Electronics NV | | 10,990,797 | | 0.7 | |
| | | | | | 38,522,104 | | 2.6 | |
| | | | South Korea: 0.6% | | | | | |
38,066 | | @ | | E-Mart Co. Ltd. | | 9,204,758 | | 0.6 | |
| | | | | | | | | |
| | | | Spain: 2.7% | | | | | |
2,099,262 | | | | Banco Bilbao Vizcaya Argentaria S.A. | | 18,083,426 | | 1.2 | |
270,871 | | | | Inditex S.A. | | 22,112,474 | | 1.5 | |
| | | | | | 40,195,900 | | 2.7 | |
| | | | Sweden: 6.5% | | | | | |
932,753 | | | | Assa Abloy AB | | 23,324,103 | | 1.6 | |
5,724,696 | | | | Telefonaktiebolaget LM Ericsson | | 58,051,930 | | 3.9 | |
787,476 | | | | Investor AB | | 14,646,059 | | 1.0 | |
| | | | | | 96,022,092 | | 6.5 | |
| | | | Switzerland: 5.5% | | | | | |
778,875 | | | | Credit Suisse Group | | 18,255,410 | | 1.2 | |
332,040 | | | | Nestle S.A. | | 19,066,907 | | 1.3 | |
64,673 | | | | Roche Holding AG - Genusschein | | 10,937,391 | | 0.8 | |
312,039 | | | | Transocean Ltd. | | 11,979,177 | | 0.8 | |
1,686,609 | | | | UBS AG - Reg | | 20,007,713 | | 1.4 | |
| | | | | | 80,246,598 | | 5.5 | |
| | | | | | | | | | |
See Accompanying Notes to Financial Statements
52
Shares | | | | | | Value | | Percentage
of Net
Assets | |
COMMON STOCK: (continued) | | | | | | | |
| | | | Taiwan: 1.2% | | | | | |
7,235,111 | | | | Taiwan Semiconductor Manufacturing Co., Ltd. | | $ | 18,077,646 | | 1.2 | |
| | | | | | | | | |
| | | | United Kingdom: 3.0% | | | | | |
1,178,830 | | | | Kingfisher PLC | | 4,580,895 | | 0.3 | |
1,636,216 | | | | Prudential PLC | | 16,188,875 | | 1.1 | |
711,907 | | | | Unilever PLC | | 23,872,975 | | 1.6 | |
| | | | | | 44,642,745 | | 3.0 | |
| | | | United States: 39.1% | | | | | |
244,950 | | | | 3M Co. | | 20,019,763 | | 1.4 | |
53,500 | | | | Abercrombie & Fitch Co. | | 2,612,940 | | 0.2 | |
625,593 | | @ | | Adobe Systems, Inc. | | 17,685,514 | | 1.2 | |
646,260 | | | | Aetna, Inc. | | 27,265,709 | | 1.9 | |
298,460 | | | | Aflac, Inc. | | 12,911,380 | | 0.9 | |
64,470 | | | | Allergan, Inc. | | 5,656,598 | | 0.4 | |
880,300 | | | | Altera Corp. | | 32,659,130 | | 2.2 | |
219,920 | | | | Amgen, Inc. | | 14,121,063 | | 1.0 | |
681,710 | | @ | | Amylin Pharmaceuticals, Inc. | | 7,757,860 | | 0.5 | |
264,790 | | | | Automatic Data Processing, Inc. | | 14,301,308 | | 1.0 | |
693,410 | | | | Carnival Corp. | | 22,632,902 | | 1.5 | |
292,420 | | | | Colgate-Palmolive Co. | | 27,016,684 | | 1.8 | |
865,490 | | | | Corning, Inc. | | 11,234,060 | | 0.8 | |
1,528,770 | | @ | | eBay, Inc. | | 46,367,594 | | 3.2 | |
280,710 | | | | Emerson Electric Co. | | 13,078,279 | | 0.9 | |
507,490 | | | | Fidelity National Title Group, Inc. | | 8,084,316 | | 0.5 | |
184,460 | | @ | | Gilead Sciences, Inc. | | 7,549,948 | | 0.5 | |
161,640 | | | | Goldman Sachs Group, Inc. | | 14,617,105 | | 1.0 | |
31,220 | | @ | | Google, Inc. - Class A | | 20,164,998 | | 1.4 | |
595,950 | | | | Intuit, Inc. | | 31,341,011 | | 2.1 | |
791,740 | | @ | | Juniper Networks, Inc. | | 16,159,413 | | 1.1 | |
902,530 | | | | Maxim Integrated Products | | 23,501,881 | | 1.6 | |
328,160 | | | | McDonald’s Corp. | | 32,924,293 | | 2.2 | |
396,090 | | | | McGraw-Hill Cos., Inc. | | 17,812,167 | | 1.2 | |
880,900 | | | | Microsoft Corp. | | 22,868,164 | | 1.6 | |
361,530 | | @,L | | Theravance, Inc. | | 7,989,813 | | 0.5 | |
402,300 | | | | Tiffany & Co. | | 26,656,398 | | 1.8 | |
682,060 | | | | Walt Disney Co. | | 25,577,250 | | 1.7 | |
410,430 | | | | WellPoint, Inc. | | 27,190,988 | | 1.8 | |
336,920 | | | | Zimmer Holdings, Inc. | | 17,998,266 | | 1.2 | |
| | | | | | 575,756,795 | | 39.1 | |
| | | | Total Common Stock
(Cost $1,309,918,679) | | 1,453,324,792 | | 98.7 | |
| | | | | | | | | |
Principal
Amount† | | | | | | | | | |
SHORT-TERM INVESTMENTS: 1.6% | | | | | |
| | | | Securities Lending Collateral(cc)(1): 0.6% | | | | | |
1,951,685 | | | | Citigroup, Inc., Repurchase Agreement dated 12/30/11, 0.08%, due 01/03/12 (Repurchase Amount $1,951,702, collateralized by various U.S. Government and U.S. Government Agency Obligations, 0.000%-5.500%, Market Value plus accrued interest $1,990,719, due 01/19/12-12/20/41) | | 1,951,685 | | 0.1 | |
1,951,685 | | | | Deutsche Bank AG, Repurchase Agreement dated 12/30/11, 0.08%, due 01/03/12 (Repurchase Amount $1,951,702, collateralized by various U.S. Government and U.S. Government Agency Obligations, 0.000%-6.500%, Market Value plus accrued interest $1,990,719, due 06/28/12-11/01/41) | | 1,951,685 | | 0.1 | |
1,951,685 | | | | Goldman Sachs & Co., Repurchase Agreement dated 12/30/11, 0.10%, due 01/03/12 (Repurchase Amount $1,951,706, collateralized by various U.S. Government Agency Obligations, 2.163%-6.500%, Market Value plus accrued interest $1,990,719, due 04/01/20-12/01/48) | | 1,951,685 | | 0.2 | |
1,951,685 | | | | Morgan Stanley, Repurchase Agreement dated 12/30/11, 0.08%, due 01/03/12 (Repurchase Amount $1,951,702, collateralized by various U.S. Government and U.S. Government Agency Obligations, 0.000%-6.375%, Market Value plus accrued interest $1,990,719, due 11/15/12-10/01/44) | | 1,951,685 | | 0.2 | |
| | | | | | | | | | |
See Accompanying Notes to Financial Statements
53
Principal
Amount† | | | | | | Value | | Percentage
of Net
Assets | |
SHORT-TERM INVESTMENTS: (continued) | | | | | |
| | | | Securities Lending Collateral(cc)(1) (continued) | | | | | |
410,881 | | | | Royal Bank of Canada, Repurchase Agreement dated 12/30/11, 0.01%, due 01/03/12 (Repurchase Amount $410,881, collateralized by various U.S. Government Securities, 0.000%-4.250%, Market Value plus accrued interest $419,099, due 08/15/12-11/15/40) | | $ | 410,881 | | 0.0 | |
| | | | | | 8,217,621 | | 0.6 | |
| | | | | | | | | |
Shares | | | | | | | | | |
| | Mutual Funds: 1.0% | | | | | |
14,603,441 | | | | BlackRock Liquidity Funds, TempFund, Institutional Class (Cost $14,603,441) | | 14,603,441 | | 1.0 | |
| | | | | | | | | |
| | | | Total Short-Term Investments
(Cost $22,821,062) | | 22,821,062 | | 1.6 | |
| | | | | | | | | |
| | | | Total Investments in Securities
(Cost $1,332,739,741) | | $ | 1,476,145,854 | | 100.3 | |
| | | | Liabilities in Excess of Other Assets | | (4,033,568 | ) | (0.3 | ) |
| | | | Net Assets | | $ | 1,472,112,286 | | 100.0 | |
| | | | | | | | | | | |
† | | Unless otherwise indicated, principal amount is shown in USD. |
@ | | Non-income producing security |
ADR | | American Depositary Receipt |
(cc) | | Securities purchased with cash collateral for securities loaned. |
L | | Loaned security, a portion or all of the security is on loan at December 31, 2011. |
(1) | | Collateral received from brokers for securities lending was invested into these short-term investments. |
| | |
| | Cost for federal income tax purposes is $1,349,564,798. |
| | |
| | Net unrealized appreciation consists of: |
Gross Unrealized Appreciation | | $ | 271,258,590 | |
Gross Unrealized Depreciation | | (144,677,534 | ) |
Net Unrealized Appreciation | | $ | 126,581,056 | |
Sector Diversification | | Percentage
of Net Assets | |
Consumer Discretionary | | 17.8 | % |
Consumer Staples | | 9.4 | |
Energy | | 3.9 | |
Financials | | 14.0 | |
Health Care | | 10.3 | |
Industrials | | 12.3 | |
Information Technology | | 28.2 | |
Materials | | 0.8 | |
Telecommunications | | 1.3 | |
Utilities | | 0.7 | |
Short-Term Investments | | 1.6 | |
Liabilities in Excess of Other Assets | | (0.3 | ) |
Net Assets | | 100.0 | % |
See Accompanying Notes to Financial Statements
54
Fair Value Measurements^
The following is a summary of the fair valuations according to the inputs used as of December 31, 2011 in valuing the assets and liabilities:
| | Quoted Prices
in Active Markets
for Identical
Investments
(Level 1) | | Significant
Other
Observable
Inputs #
(Level 2) | | Significant
Unobservable
Inputs
(Level 3) | | Fair Value
at
12/31/2011 | |
Asset Table | | | | | | | | | |
Investments, at value | | | | | | | | | |
Common Stock | | | | | | | | | |
Argentina | | $ | 3,578,282 | | $ | — | | $ | — | | $ | 3,578,282 | |
Brazil | | 52,756,289 | | 6,554,464 | | — | | 59,310,753 | |
Denmark | | — | | 8,693,398 | | — | | 8,693,398 | |
Finland | | — | | 10,495,997 | | — | | 10,495,997 | |
France | | — | | 82,857,825 | | — | | 82,857,825 | |
Germany | | — | | 139,050,294 | | — | | 139,050,294 | |
India | | — | | 28,967,210 | | — | | 28,967,210 | |
Ireland | | 8,617,348 | | — | | — | | 8,617,348 | |
Italy | | — | | 21,849,302 | | — | | 21,849,302 | |
Japan | | — | | 136,797,715 | | — | | 136,797,715 | |
Mexico | | 50,438,030 | | — | | — | | 50,438,030 | |
Netherlands | | — | | 38,522,104 | | — | | 38,522,104 | |
South Korea | | — | | 9,204,758 | | — | | 9,204,758 | |
Spain | | — | | 40,195,900 | | — | | 40,195,900 | |
Sweden | | — | | 96,022,092 | | — | | 96,022,092 | |
Switzerland | | 11,979,177 | | 68,267,421 | | — | | 80,246,598 | |
Taiwan | | — | | 18,077,646 | | — | | 18,077,646 | |
United Kingdom | | — | | 44,642,745 | | — | | 44,642,745 | |
United States | | 575,756,795 | | — | | — | | 575,756,795 | |
Total Common Stock | | 703,125,921 | | 750,198,871 | | — | | 1,453,324,792 | |
Short-Term Investments | | 14,603,441 | | 8,217,621 | | — | | 22,821,062 | |
Total Investments, at value | | $ | 717,729,362 | | $ | 758,416,492 | | $ | — | | $ | 1,476,145,854 | |
^ | | See Note 2, “Significant Accounting Policies” in the Notes to Financial Statements for additional information. |
# | | The earlier close of the foreign markets gives rise to the possibility that significant events, including broad market moves, may have occurred in the interim and may materially affect the value of those securities. To account for this, the Portfolio may frequently value many of its foreign equity securities using fair value prices based on third party vendor modeling tools to the extent available. Accordingly, a significant portion of the Portfolio’s investments are categorized as Level 2 investments. |
| | |
| | There were no significant transfers between Level 1 and 2 during the year ended December 31, 2011. |
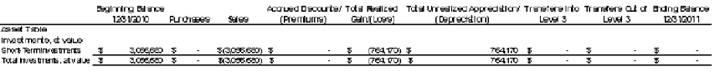
See Accompanying Notes to Financial Statements
55
| | PORTFOLIO OF INVESTMENTS |
ING PIMCO TOTAL RETURN PORTFOLIO | | AS OF DECEMBER 31, 2011 |
Principal
Amount† | | | | | | Value | | Percentage
of Net
Assets | |
CORPORATE BONDS/NOTES: 29.9% | | | | | |
| | | | Consumer Discretionary: 0.2% | | | | | |
2,105,731 | | | | Access Group, Inc., 1.718%, 10/27/25 | | $ | 2,116,290 | | 0.2 | |
91,343 | | | | CVS Pass-Through Trust, 6.943%, 01/10/30 | | 101,514 | | 0.0 | |
| | | | | | 2,217,804 | | 0.2 | |
| | | | Consumer Staples: 0.6% | | | | | |
3,000,000 | | | | Anheuser-Busch InBev Worldwide, Inc., 4.125%, 01/15/15 | | 3,237,270 | | 0.3 | |
3,000,000 | | | | Anheuser-Busch InBev Worldwide, Inc., 5.375%, 01/15/20 | | 3,523,101 | | 0.3 | |
400,000 | | | | Philip Morris International, Inc., 5.650%, 05/16/18 | | 473,646 | | 0.0 | |
300,000 | | | | Reynolds American, Inc., 7.625%, 06/01/16 | | 358,142 | | 0.0 | |
| | | | | | 7,592,159 | | 0.6 | |
| | | | Energy: 2.2% | | | | | |
6,910,000 | | Z | | British Transco International Finance, 11/04/21 | | 4,668,589 | | 0.4 | |
200,000 | | #,L | | ENN Energy Holdings Ltd.., 6.000%, 05/13/21 | | 180,852 | | 0.0 | |
90,889 | | | | Gazprom OAO, 7.201%, 02/01/20 | | 96,683 | | 0.0 | |
2,600,000 | | | | Kinder Morgan Energy Partners LP, 5.950%, 02/15/18 | | 2,973,443 | | 0.3 | |
2,000,000 | | | | Morgan Stanley Bank AG for OAO Gazprom, 9.625%, 03/01/13 | | 2,135,000 | | 0.2 | |
1,000,000 | | | | NV Energy, Inc., 6.250%, 11/15/20 | | 1,040,803 | | 0.1 | |
300,000 | | # | | Odebrecht Drilling Norbe VIII/IX Ltd., 6.350%, 06/30/21 | | 310,500 | | 0.0 | |
3,100,000 | | | | Petrobras International Finance Co. - Pifco, 5.375%, 01/27/21 | | 3,271,194 | | 0.3 | |
1,300,000 | | | | Petroleos Mexicanos, 6.000%, 03/05/20 | | 1,449,890 | | 0.1 | |
2,500,000 | | | | Petroleos Mexicanos, 8.000%, 05/03/19 | | 3,131,250 | | 0.3 | |
3,084,200 | | | | Ras Laffan Liquefied Natural Gas Co. Ltd. II, 5.298%, 09/30/20 | | 3,323,226 | | 0.3 | |
2,600,000 | | L | | Reliance Holdings USA, Inc., 4.500%, 10/19/20 | | 2,365,709 | | 0.2 | |
400,000 | | | | Total Capital S.A., 4.450%, 06/24/20 | | 446,178 | | 0.0 | |
300,000 | | | | Trans-Canada Pipelines, 7.625%, 01/15/39 | | 433,390 | | 0.0 | |
| | | | | | 25,826,707 | | 2.2 | |
| | | | Financials: 21.7% | | | | | |
700,000 | | | | Allstate Life Global Funding Trusts, 5.375%, 04/30/13 | | 739,467 | | 0.1 | |
2,100,000 | | L | | Ally Financial, Inc., 6.000%, 05/23/12 | | 2,110,500 | | 0.2 | |
100,000 | | | | Ally Financial, Inc., 7.500%, 09/15/20 | | 101,375 | | 0.0 | |
200,000 | | | | American Express Bank FSB, 6.000%, 09/13/17 | | 226,935 | | 0.0 | |
200,000 | | | | American Express Centurion Bank, 6.000%, 09/13/17 | | 226,493 | | 0.0 | |
700,000 | | | | American Express Co., 7.000%, 03/19/18 | | 846,767 | | 0.1 | |
600,000 | | | | American Express Credit Corp., 5.875%, 05/02/13 | | 630,961 | | 0.1 | |
EUR | 6,100,000 | | | | American General Finance Corp., 4.125%, 11/29/13 | | 6,303,183 | | 0.5 | |
300,000 | | | | American General Finance Corp., 4.875%, 07/15/12 | | 288,750 | | 0.0 | |
CAD | 1,000,000 | | | | American International Group, Inc., 4.900%, 06/02/14 | | 975,460 | | 0.1 | |
3,300,000 | | | | American International Group, Inc., 5.850%, 01/16/18 | | 3,234,723 | | 0.3 | |
800,000 | | # | | ANZ National International Ltd., 6.200%, 07/19/13 | | 849,266 | | 0.1 | |
700,000 | | # | | Banco Santander Brazil SA/Cayman Islands, 2.659%, 03/18/14 | | 667,301 | | 0.1 | |
300,000 | | | | Bank of America Corp., 0.787%, 08/15/16 | | 232,995 | | 0.0 | |
900,000 | | | | Bank of America Corp., 5.750%, 12/01/17 | | 851,319 | | 0.1 | |
4,400,000 | | | | Bank of America Corp., 6.500%, 08/01/16 | | 4,436,309 | | 0.4 | |
300,000 | | # | | Bank of China Hong Kong Ltd., 5.550%, 02/11/20 | | 311,818 | | 0.0 | |
900,000 | | | | Bank of India, 6.250%, 02/16/21 | | 865,138 | | 0.1 | |
1,700,000 | | | | Bank of India, 4.750%, 09/30/15 | | 1,643,312 | | 0.1 | |
600,000 | | # | | Bank of Montreal, 2.850%, 06/09/15 | | 622,544 | | 0.1 | |
800,000 | | #,L | | Bank of Nova Scotia, 1.650%, 10/29/15 | | 799,913 | | 0.1 | |
4,100,000 | | | | Barclays Bank PLC, 5.450%, 09/12/12 | | 4,189,425 | | 0.4 | |
700,000 | | # | | Barclays Bank PLC, 6.050%, 12/04/17 | | 636,189 | | 0.1 | |
| | | | | | | | | | | |
See Accompanying Notes to Financial Statements
56
Principal
Amount† | | | | | | Value | | Percentage
of Net
Assets | |
CORPORATE BONDS/NOTES: (continued) | | | | | |
| | | | Financials: (continued) | | | | | |
1,200,000 | | # | | BBVA Bancomer SA/Texas, 6.500%, 03/10/21 | | $ | 1,162,500 | | 0.1 | |
1,900,000 | | | | Bear Stearns Cos., Inc., 6.400%, 10/02/17 | | 2,125,828 | | 0.2 | |
2,200,000 | | # | | BNP Paribas, 5.186%, 06/29/49 | | 1,474,000 | | 0.1 | |
300,000 | | # | | BPCE S.A., 2.375%, 10/04/13 | | 290,688 | | 0.0 | |
300,000 | | # | | CIT Group, Inc., 5.250%, 04/01/14 | | 300,375 | | 0.0 | |
448,096 | | | | CIT Group, Inc., 7.000%, 05/01/15 | | 449,552 | | 0.0 | |
246,829 | | | | CIT Group, Inc., 7.000%, 05/01/16 | | 247,138 | | 0.0 | |
345,563 | | | | CIT Group, Inc., 7.000%, 05/01/17 | | 345,995 | | 0.0 | |
400,000 | | | | CitiFinancial, 6.625%, 06/01/15 | | 421,292 | | 0.0 | |
3,200,000 | | | | Citigroup Capital XXI, 8.300%, 12/21/57 | | 3,204,000 | | 0.3 | |
700,000 | | | | Citigroup, Inc., 5.300%, 10/17/12 | | 711,533 | | 0.1 | |
2,300,000 | | | | Citigroup, Inc., 5.500%, 04/11/13 | | 2,349,071 | | 0.2 | |
1,900,000 | | | | Citigroup, Inc., 5.500%, 08/27/12 | | 1,930,947 | | 0.2 | |
500,000 | | | | Citigroup, Inc., 5.625%, 08/27/12 | | 507,645 | | 0.0 | |
500,000 | | | | Citigroup, Inc., 5.850%, 07/02/13 | | 514,246 | | 0.0 | |
7,700,000 | | | | Citigroup, Inc., 5.000%, 09/15/14 | | 7,626,450 | | 0.6 | |
300,000 | | | | Citigroup, Inc., 6.125%, 05/15/18 | | 319,644 | | 0.0 | |
1,900,000 | | | | Citigroup, Inc., 6.000%, 08/15/17 | | 1,993,968 | | 0.2 | |
300,000 | | | | Citigroup, Inc., 8.500%, 05/22/19 | | 353,524 | | 0.0 | |
6,300,000 | | # | | Commonwealth Bank of Australia, 1.000%, 07/12/13 | | 6,299,899 | | 0.5 | |
1,100,000 | | # | | Commonwealth Bank of Australia, 6.024%, 03/29/49 | | 1,017,978 | | 0.1 | |
700,000 | | # | | Corp. Nacional del Cobre de Chile - CODELCO, 7.500%, 01/15/19 | | 894,790 | | 0.1 | |
5,700,000 | | # | | Credit Agricole S.A., 8.375%, 12/13/49 | | 4,303,500 | | 0.4 | |
700,000 | | | | Credit Suisse/New York NY, 2.200%, 01/14/14 | | 692,700 | | 0.1 | |
1,600,000 | | | | Deutsche Bank AG/London, 6.000%, 09/01/17 | | 1,789,464 | | 0.1 | |
3,300,000 | | # | | Dexia Credit Local, 0.908%, 04/29/14 | | 2,995,799 | | 0.3 | |
SGD | 2,100,000 | | | | Export Import Bank of South Korea, 1.050%, 03/03/12 | | 1,617,415 | | 0.1 | |
1,800,000 | | | | Export-Import Bank of Korea, 4.125%, 09/09/15 | | 1,854,785 | | 0.2 | |
500,000 | | | | Export-Import Bank of Korea, 5.125%, 06/29/20 | | 525,846 | | 0.0 | |
11,900,000 | | # | | FIH Erhvervsbank A/S, 0.912%, 06/13/13 | | 11,893,693 | | 1.0 | |
2,100,000 | | | | Ford Motor Credit Co., LLC, 12.000%, 05/15/15 | | 2,588,596 | | 0.2 | |
EUR | 300,000 | | | | Fortis Bank Nederland Holding NV, 3.000%, 04/17/12 | | 390,628 | | 0.0 | |
900,000 | | | | General Electric Capital Corp., 5.875%, 01/14/38 | | 955,189 | | 0.1 | |
EUR | 4,800,000 | | | | General Electric Capital Corp., 5.500%, 09/15/67 | | 4,907,785 | | 0.4 | |
800,000 | | | | General Electric Capital Corp., 6.875%, 01/10/39 | | 959,971 | | 0.1 | |
EUR | 5,500,000 | | | | Goldman Sachs Group, Inc., 1.884%, 02/04/13 | | 6,830,898 | | 0.6 | |
50,000 | | | | Goldman Sachs Group, Inc., 5.950%, 01/18/18 | | 51,263 | | 0.0 | |
800,000 | | | | Goldman Sachs Group, Inc., 6.150%, 04/01/18 | | 826,523 | | 0.1 | |
2,000,000 | | | | Goldman Sachs Group, Inc., 6.250%, 09/01/17 | | 2,093,856 | | 0.2 | |
3,200,000 | | | | Goldman Sachs Group, Inc., 6.750%, 10/01/37 | | 2,981,814 | | 0.2 | |
10,900,000 | | | | HSBC Holdings PLC, 5.100%, 04/05/21 | | 11,599,420 | | 1.0 | |
1,800,000 | | | | ICICI Bank Ltd., 5.500%, 03/25/15 | | 1,802,043 | | 0.1 | |
4,800,000 | | # | | ICICI Bank Ltd../Dubai, 4.750%, 11/25/16 | | 4,585,656 | | 0.4 | |
4,400,000 | | | | International Lease Finance Corp., 5.300%, 05/01/12 | | 4,411,000 | | 0.4 | |
1,100,000 | | | | International Lease Finance Corp., 5.400%, 02/15/12 | | 1,102,074 | | 0.1 | |
300,000 | | | | International Lease Finance Corp., 5.750%, 05/15/16 | | 278,576 | | 0.0 | |
700,000 | | # | | International Lease Finance Corp., 6.750%, 09/01/16 | | 721,000 | | 0.1 | |
1,900,000 | | | | IPIC GMTN Ltd., 5.000%, 11/15/20 | | 1,921,375 | | 0.2 | |
2,100,000 | | | | JPMorgan Chase & Co., 3.150%, 07/05/16 | | 2,112,470 | | 0.2 | |
1,000,000 | | | | JPMorgan Chase & Co., 6.000%, 01/15/18 | | 1,116,819 | | 0.1 | |
| | | | | | | | | | | |
See Accompanying Notes to Financial Statements
57
Principal
Amount† | | | | | | Value | | Percentage
of Net
Assets | |
CORPORATE BONDS/NOTES: (continued) | | | | | |
| | | | Financials: (continued) | | | | | |
900,000 | | | | JPMorgan Chase Bank NA, 0.872%, 06/13/16 | | $ | 806,342 | | 0.1 | |
2,700,000 | | | | Korea Development Bank, 4.375%, 08/10/15 | | 2,782,245 | | 0.2 | |
EUR | 1,700,000 | | | | Kreditanstalt fuer Wiederaufbau, 2.000%, 09/07/16 | | 2,249,740 | | 0.2 | |
2,700,000 | | ± | | Lehman Brothers Holdings, Inc., 6.200%, 09/26/14 | | 725,625 | | 0.1 | |
300,000 | | ± | | Lehman Brothers Holdings, Inc., 6.875%, 05/02/18 | | 81,000 | | 0.0 | |
2,000,000 | | ± | | Lehman Brothers Holdings, Inc., 05/25/10 | | 520,000 | | 0.0 | |
EUR | 2,364,000 | | ± | | Lehman Brothers Holdings, Inc., 06/12/13 | | 841,390 | | 0.1 | |
1,200,000 | | | | Lloyds TSB Bank PLC, 4.875%, 01/21/16 | | 1,170,770 | | 0.1 | |
6,700,000 | | # | | Lloyds TSB Bank PLC, 5.800%, 01/13/20 | | 6,368,819 | | 0.5 | |
3,000,000 | | # | | Macquarie Group Ltd., 7.300%, 08/01/14 | | 3,125,496 | | 0.3 | |
1,100,000 | | | | Merrill Lynch & Co., Inc., 0.757%, 06/05/12 | | 1,079,151 | | 0.1 | |
GBP | 600,000 | | | | Merrill Lynch & Co., Inc., 1.201%, 02/21/12 | | 927,654 | | 0.1 | |
8,000,000 | | | | Merrill Lynch & Co., Inc., 5.450%, 02/05/13 | | 8,060,936 | | 0.7 | |
300,000 | | L | | Merrill Lynch & Co., Inc., 6.050%, 08/15/12 | | 304,385 | | 0.0 | |
1,900,000 | | | | Merrill Lynch & Co., Inc., 6.875%, 04/25/18 | | 1,875,173 | | 0.2 | |
500,000 | | # | | Monumental Global Funding Ltd., 5.500%, 04/22/13 | | 520,896 | | 0.0 | |
800,000 | | | | Morgan Stanley, 5.950%, 12/28/17 | | 763,316 | | 0.1 | |
1,600,000 | | | | Morgan Stanley, 6.250%, 08/28/17 | | 1,568,032 | | 0.1 | |
500,000 | | # | | National Bank of Canada, 2.200%, 10/19/16 | | 504,825 | | 0.0 | |
1,400,000 | | # | | Nationwide Building Society, 6.250%, 02/25/20 | | 1,390,803 | | 0.1 | |
4,800,000 | | | | Nomura Holdings, Inc., 6.700%, 03/04/20 | | 5,060,458 | | 0.4 | |
300,000 | | # | | Nordea Bank AB, 2.125%, 01/14/14 | | 294,397 | | 0.0 | |
DKK | 3,083,119 | | | | Nykredit Realkredit A/S, 2.092%, 10/01/38 | | 524,070 | | 0.1 | |
DKK | 2,701,267 | | | | Nykredit Realkredit A/S, 2.092%, 04/01/38 | | 457,870 | | 0.0 | |
600,000 | | | | Principal Life Income Funding Trusts, 5.300%, 04/24/13 | | 629,770 | | 0.1 | |
900,000 | | | | Principal Life Income Funding Trusts, 5.550%, 04/27/15 | | 961,908 | | 0.1 | |
4,000,000 | | L | | Province of Ontario Canada, 1.600%, 09/21/16 | | 3,993,100 | | 0.3 | |
CAD | 1,700,000 | | | | Province of Ontario Canada, 4.000%, 06/02/21 | | 1,833,881 | | 0.2 | |
CAD | 7,900,000 | | | | Province of Ontario Canada, 4.700%, 06/02/37 | | 9,407,494 | | 0.8 | |
CAD | 1,000,000 | | | | Province of Quebec Canada, 4.250%, 12/01/21 | | 1,091,710 | | 0.1 | |
CAD | 100,000 | | | | Province of Quebec Canada, 4.500%, 12/01/17 | | 111,409 | | 0.0 | |
2,900,000 | | | | Qatari Diar Finance QSC, 5.000%, 07/21/20 | | 3,103,000 | | 0.3 | |
DKK | 2,678,735 | | | | Realkredit Danmark A/S, 2.440%, 01/01/38 | | 453,351 | | 0.0 | |
DKK | 8,561,791 | | | | Realkredit Danmark A/S, 2.440%, 01/01/38 | | 1,460,929 | | 0.1 | |
100,000 | | | | Royal Bank of Scotland PLC, 3.950%, 09/21/15 | | 93,866 | | 0.0 | |
600,000 | | # | | Royal Bank of Scotland PLC, 6.990%, 10/29/49 | | 378,750 | | 0.0 | |
1,600,000 | | # | | Royal Bank of Scotland PLC, 2.625%, 05/11/12 | | 1,610,504 | | 0.1 | |
200,000 | | # | | Royal Bank of Scotland PLC, 4.875%, 08/25/14 | | 195,839 | | 0.0 | |
3,300,000 | | | | Royal Bank of Scotland PLC, 4.375%, 03/16/16 | | 3,151,738 | | 0.3 | |
GBP | 1,600,000 | | | | Santander Issuances S.A Unipersonal, 7.300%, 07/27/19 | | 2,099,724 | | 0.2 | |
6,400,000 | | # | | Santander US Debt S.A. Unipersonal, 1.379%, 03/30/12 | | 6,389,018 | | 0.5 | |
900,000 | | | | Sberbank of Russia Via SB Capital SA, 5.499%, 07/07/15 | | 913,500 | | 0.1 | |
1,900,000 | | | | SLM Corp., 8.450%, 06/15/18 | | 1,966,500 | | 0.2 | |
EUR | 2,800,000 | | | | SLM Corp., 3.125%, 09/17/12 | | 3,581,529 | | 0.3 | |
8,400,000 | | | | SLM Corp., 5.000%, 10/01/13 | | 8,421,000 | | 0.7 | |
700,000 | | | | SLM Corp., 5.375%, 01/15/13 | | 705,061 | | 0.1 | |
200,000 | | #,L | | Societe Generale, 5.922%, 12/31/49 | | 121,860 | | 0.0 | |
1,000,000 | | | | Springleaf Finance Corp., 6.900%, 12/15/17 | | 725,000 | | 0.1 | |
| | | | | | | | | | | |
See Accompanying Notes to Financial Statements
58
Principal
Amount† | | | | | | Value | | Percentage
of Net
Assets | |
CORPORATE BONDS/NOTES: (continued) | | | | | |
| | | | Financials: (continued) | | | | | |
2,900,000 | | # | | State Bank of India/London, 4.500%, 07/27/15 | | $ | 2,871,162 | | 0.2 | |
700,000 | | # | | Temasek Financial I Ltd., 4.300%, 10/25/19 | | 754,900 | | 0.1 | |
300,000 | | # | | TransCapitalInvest Ltd. for OJSC AK Transneft, 8.700%, 08/07/18 | | 362,535 | | 0.0 | |
400,000 | | # | | Turkiye Garanti Bankasi AS, 2.909%, 04/20/16 | | 364,000 | | 0.0 | |
500,000 | | | | UBS AG, 5.750%, 04/25/18 | | 518,584 | | 0.0 | |
1,000,000 | | | | UBS AG, 1.595%, 02/23/12 | | 1,001,271 | | 0.1 | |
1,100,000 | | | | UBS Preferred Funding Trust V, 6.243%, 05/29/49 | | 941,875 | | 0.1 | |
400,000 | | #,L | | Vnesheconombank Via VEB Finance Ltd., 5.450%, 11/22/17 | | 397,000 | | 0.0 | |
1,800,000 | | | | Wachovia Corp., 5.750%, 02/01/18 | | 2,046,965 | | 0.2 | |
137,031 | | | | Washington Mutual Mortgage Pass-through Certificates, 0.614%, 01/25/45 | | 102,595 | | 0.0 | |
1,200,000 | | | | Wells Fargo & Co., 5.625%, 12/11/17 | | 1,369,532 | | 0.1 | |
3,400,000 | | # | | Westpac Banking Corp., 3.585%, 08/14/14 | | 3,627,576 | | 0.3 | |
1,500,000 | | | | White Nights Finance BV for Gazprom, 10.500%, 03/25/14 | | 1,687,384 | | 0.1 | |
500,000 | | | | White Nights Finance BV for Gazprom, 10.500%, 03/08/14 | | 563,303 | | 0.0 | |
146,000 | | # | | ZFS Finance USA Trust IV, 5.875%, 05/09/32 | | 138,700 | | 0.0 | |
| | | | | | 256,392,580 | | 21.7 | |
| | | | Health Care: 0.5% | | | | | |
2,400,000 | | | | Amgen, Inc., 6.150%, 06/01/18 | | 2,794,656 | | 0.2 | |
300,000 | | | | AstraZeneca PLC, 5.900%, 09/15/17 | | 362,910 | | 0.0 | |
1,900,000 | | | | HCA, Inc., 8.500%, 04/15/19 | | 2,090,000 | | 0.2 | |
600,000 | | | | UnitedHealth Group, Inc., 4.875%, 02/15/13 | | 625,015 | | 0.1 | |
| | | | | | 5,872,581 | | 0.5 | |
| | | | | | | | | |
| | | | Industrials: 0.9% | | | | | |
7,100,000 | | # | | Asciano Finance Ltd., 5.000%, 04/07/18 | | 7,128,982 | | 0.6 | |
400,000 | | # | | Braskem Finance Ltd., 5.750%, 04/15/21 | | 401,000 | | 0.0 | |
600,000 | | # | | C8 Capital SPV Ltd., 6.640%, 12/31/49 | | 330,000 | | 0.0 | |
2,000,000 | | # | | Noble Group Ltd., 6.750%, 01/29/20 | | 1,740,000 | | 0.2 | |
400,000 | | # | | Sydney Air, 5.125%, 02/22/21 | | 406,451 | | 0.1 | |
| | | | | | 10,006,433 | | 0.9 | |
| | | | Information Technology: 0.7% | | | | | |
1,300,000 | | | | Dell, Inc., 4.700%, 04/15/13 | | 1,361,578 | | 0.1 | |
5,700,000 | | | | International Business Machines Corp., 5.700%, 09/14/17 | | 6,912,322 | | 0.6 | |
| | | | | | 8,273,900 | | 0.7 | |
| | | | Materials: 1.3% | | | | | |
3,800,000 | | #,L | | Braskem Finance Ltd., 7.000%, 05/07/20 | | 4,094,500 | | 0.4 | |
3,400,000 | | # | | CSN Islands XI Corp., 6.875%, 09/21/19 | | 3,609,100 | | 0.3 | |
1,500,000 | | # | | CSN Resources S.A., 6.500%, 07/21/20 | | 1,575,000 | | 0.1 | |
3,000,000 | | # | | Gerdau Holdings, Inc., 7.000%, 01/20/20 | | 3,180,000 | | 0.3 | |
300,000 | | # | | Gerdau Trade, Inc., 5.750%, 01/30/21 | | 299,250 | | 0.0 | |
400,000 | | | | Rohm & Haas Co., 6.000%, 09/15/17 | | 455,474 | | 0.0 | |
1,400,000 | | | | Union Pacific Corp., 4.163%, 07/15/22 | | 1,522,080 | | 0.1 | |
200,000 | | | | Vale Overseas Ltd., 6.250%, 01/23/17 | | 226,432 | | 0.0 | |
500,000 | | | | Vale Overseas Ltd., 6.875%, 11/10/39 | | 574,212 | | 0.1 | |
| | | | | | 15,536,048 | | 1.3 | |
| | | | Telecommunications: 0.8% | | | | | |
3,416,000 | | | | AT&T, Inc., 4.950%, 01/15/13 | | 3,561,269 | | 0.3 | |
600,000 | | | | AT&T, Inc., 5.500%, 02/01/18 | | 695,248 | | 0.1 | |
1,500,000 | | | | AT&T, Inc., 6.300%, 01/15/38 | | 1,844,704 | | 0.2 | |
2,500,000 | | | | BellSouth Corp., 5.200%, 09/15/14 | | 2,765,845 | | 0.2 | |
200,000 | | # | | Qtel International Finance Ltd., 4.750%, 02/16/21 | | 202,500 | | 0.0 | |
| | | | | | 9,069,566 | | 0.8 | |
| | | | Utilities: 1.0% | | | | | |
200,000 | | # | | AES Corp., 7.375%, 07/01/21 | | 216,500 | | 0.0 | |
300,000 | | | | Columbus Southern Power Co., 6.600%, 03/01/33 | | 387,704 | | 0.0 | |
6,600,000 | | # | | Comision Federal de Electricidad, 4.875%, 05/26/21 | | 6,864,000 | | 0.6 | |
600,000 | | #,L | | EDF S.A., 5.500%, 01/26/14 | | 641,156 | | 0.1 | |
600,000 | | # | | EDF S.A., 6.500%, 01/26/19 | | 679,517 | | 0.1 | |
| | | | | | | | | | |
See Accompanying Notes to Financial Statements
59
Principal
Amount† | | | | | | Value | | Percentage
of Net
Assets | |
CORPORATE BONDS/NOTES: (continued) | | | | | |
| | | | Utilities: (continued) | | | | | |
500,000 | | # | | Electricite de France SA, 6.950%, 01/26/39 | | $ | 589,391 | | 0.0 | |
2,100,000 | | # | | Enel Finance International S.A., 6.250%, 09/15/17 | | 2,007,067 | | 0.2 | |
500,000 | | | | Majapahit Holding BV, 7.250%, 06/28/17 | | 560,600 | | 0.0 | |
JPY | 1,000,000 | | | | Tokyo Electric Power Co., Inc./The, 1.500%, 05/30/14 | | 10,918 | | 0.0 | |
JPY | 7,000,000 | | | | Tokyo Electric Power Co., Inc./The, 1.850%, 07/28/14 | | 76,099 | | 0.0 | |
| | | | | | 12,032,952 | | 1.0 | |
| | | | Total Corporate Bonds/Notes
(Cost $351,715,607) | | 352,820,730 | | 29.9 | |
| | | | | | | |
COLLATERALIZED MORTGAGE OBLIGATIONS: 5.0% | | | | | |
43,628 | | | | Adjustable Rate Mortgage Trust, 2.766%, 05/25/35 | | 42,003 | | 0.0 | |
345,468 | | | | American Home Mortgage Investment Trust, 2.294%, 02/25/45 | | 255,567 | | 0.0 | |
651,432 | | | | Arran Residential Mortgages Funding PLC, 2.620%, 05/16/47 | | 842,160 | | 0.1 | |
1,700,000 | | | | Arran Residential Mortgages Funding PLC, 2.820%, 05/16/47 | | 2,189,021 | | 0.2 | |
800,000 | | | | Banc of America Commercial Mortgage, Inc., 5.921%, 05/10/45 | | 899,160 | | 0.1 | |
465,561 | | | | Banc of America Funding Corp., 2.695%, 05/25/35 | | 454,491 | | 0.0 | |
380,957 | | | | Banc of America Funding Corp., 5.743%, 01/20/47 | | 241,827 | | 0.0 | |
254,431 | | | | Banc of America Mortgage Securities, Inc., 2.873%, 07/25/33 | | 242,152 | | 0.0 | |
17,008 | | | | Banc of America Mortgage Securities, Inc., 5.000%, 05/25/34 | | 17,026 | | 0.0 | |
561,153 | | # | | Banc of America Re-Remic Trust, 1.765%, 02/17/40 | | 559,035 | | 0.1 | |
200,000 | | # | | BCAP LLC Trust, 5.636%, 03/25/37 | | 147,600 | | 0.0 | |
1,600,000 | | # | | BCRR Trust, 5.858%, 07/17/40 | | 1,795,726 | | 0.2 | |
2,229,325 | | | | Bear Stearns Adjustable Rate Mortgage Trust, 2.710%, 03/25/35 | | 2,077,138 | | 0.2 | |
577,312 | | | | Bear Stearns Adjustable Rate Mortgage Trust, 2.732%, 11/25/34 | | 453,180 | | 0.0 | |
1,252,241 | | | | Bear Stearns Adjustable Rate Mortgage Trust, 3.016%, 03/25/35 | | 1,184,298 | | 0.1 | |
90,581 | | | | Bear Stearns Adjustable Rate Mortgage Trust, 5.397%, 02/25/36 | | 76,303 | | 0.0 | |
307,012 | | | | Bear Stearns Alternative-A Trust, 2.592%, 05/25/35 | | 225,216 | | 0.0 | |
184,331 | | | | Bear Stearns Alternative-A Trust, 2.772%, 09/25/35 | | 116,901 | | 0.0 | |
538,559 | | | | Bear Stearns Alternative-A Trust, 2.823%, 11/25/36 | | 261,289 | | 0.0 | |
100,000 | | | | Bear Stearns Commercial Mortgage Securities, 5.331%, 02/11/44 | | 105,701 | | 0.0 | |
300,000 | | | | Bear Stearns Commercial Mortgage Securities, 5.471%, 01/12/45 | | 339,225 | | 0.0 | |
478,103 | | | | Bear Stearns Structured Products, Inc., 2.553%, 01/26/36 | | 281,208 | | 0.0 | |
301,761 | | | | Bear Stearns Structured Products, Inc., 3.618%, 12/26/46 | | 178,971 | | 0.0 | |
454,987 | | | | Citigroup Mortgage Loan Trust, Inc., 2.700%, 08/25/35 | | 403,218 | | 0.0 | |
900,000 | | | | Commercial Mortgage Pass-through Certificates, 5.306%, 12/10/46 | | 979,568 | | 0.1 | |
159,720 | | | | Countrywide Home Loan Mortgage Pass-through Trust, 0.614%, 03/25/35 | | 90,518 | | 0.0 | |
698,617 | | # | | Countrywide Home Loan Mortgage Pass-through Trust, 0.634%, 06/25/35 | | 589,108 | | 0.1 | |
702,475 | | | | Countrywide Home Loan Mortgage Pass-through Trust, 2.745%, 02/20/35 | | 541,015 | | 0.1 | |
411,538 | | | | Countrywide Home Loan Mortgage Pass-through Trust, 2.751%, 11/25/34 | | 297,360 | | 0.0 | |
466,809 | | # | | Credit Suisse Mortgage Capital Certificates, 0.448%, 10/15/21 | | 430,579 | | 0.0 | |
| | | | | | | | | | | |
See Accompanying Notes to Financial Statements
60
Principal
Amount† | | | | | | Value | | Percentage
of Net
Assets | |
COLLATERALIZED MORTGAGE OBLIGATIONS: (continued) | | | | | |
2,385,382 | | # | | Credit Suisse Mortgage Capital Certificates, 0.508%, 10/15/21 | | $ | 2,233,138 | | 0.2 | |
100,000 | | | | Credit Suisse Mortgage Capital Certificates, 5.661%, 03/15/39 | | 107,701 | | 0.0 | |
2,300,000 | | | | Credit Suisse Mortgage Capital Certificates, 5.695%, 09/15/40 | | 2,409,560 | | 0.2 | |
130,058 | | | | Downey Savings & Loan Association Mortgage Loan Trust, 2.688%, 07/19/44 | | 91,800 | | 0.0 | |
EUR | 108,934 | | | | European Loan Conduit, 1.612%, 05/15/19 | | 116,315 | | 0.0 | |
252,556 | | | | First Horizon Mortgage Pass-through Trust, 2.746%, 08/25/35 | | 194,516 | | 0.0 | |
6,568,642 | | | | Granite Master Issuer PLC, 0.465%, 12/20/54 | | 6,279,621 | | 0.5 | |
241,270 | | | | Greenpoint Mortgage Pass-through Certificates, 2.798%, 10/25/33 | | 192,522 | | 0.0 | |
100,000 | | | | Greenwich Capital Commercial Funding Corp., 4.799%, 08/10/42 | | 107,704 | | 0.0 | |
600,000 | | | | Greenwich Capital Commercial Funding Corp., 5.444%, 03/10/39 | | 651,898 | | 0.1 | |
640,353 | | # | | GS Mortgage Securities Corp. II, 1.143%, 03/06/20 | | 635,128 | | 0.1 | |
53,091 | | | | GSR Mortgage Loan Trust, 2.429%, 06/25/34 | | 42,701 | | 0.0 | |
485,802 | | | | GSR Mortgage Loan Trust, 2.685%, 09/25/35 | | 425,054 | | 0.0 | |
959 | | | | GSR Mortgage Loan Trust, 6.000%, 03/25/32 | | 967 | | 0.0 | |
196,002 | | | | Harborview Mortgage Loan Trust, 0.505%, 05/19/35 | | 104,062 | | 0.0 | |
369,823 | | | | Harborview Mortgage Loan Trust, 2.768%, 07/19/35 | | 240,782 | | 0.0 | |
3,300,000 | | # | | Hillmark Funding, 0.729%, 05/21/21 | | 3,053,120 | | 0.3 | |
202,868 | | | | Indymac Index Mortgage Loan Trust, 2.592%, 12/25/34 | | 140,608 | | 0.0 | |
1,700,000 | | # | | JPMorgan Chase Commercial Mortgage Securities Corp., 4.070%, 11/15/43 | | 1,795,942 | | 0.2 | |
800,000 | | | | JPMorgan Chase Commercial Mortgage Securities Corp., 5.336%, 05/15/47 | | 851,580 | | 0.1 | |
2,600,000 | | | | JPMorgan Chase Commercial Mortgage Securities Corp., 5.420%, 01/15/49 | | 2,821,615 | | 0.2 | |
4,300,000 | | | | JPMorgan Chase Commercial Mortgage Securities Corp., 5.440%, 06/12/47 | | 4,626,260 | | 0.4 | |
300,000 | | | | JPMorgan Chase Commercial Mortgage Securities Corp., 5.882%, 02/15/51 | | 327,178 | | 0.0 | |
798,577 | | | | JPMorgan Mortgage Trust, 2.798%, 07/25/35 | | 730,054 | | 0.1 | |
160,572 | | | | JPMorgan Mortgage Trust, 5.024%, 02/25/35 | | 156,315 | | 0.0 | |
233,018 | | | | Merrill Lynch Mortgage Investors Trust, 0.504%, 02/25/36 | | 151,560 | | 0.0 | |
266,745 | | | | Merrill Lynch Mortgage Investors Trust, 2.200%, 05/25/33 | | 236,800 | | 0.0 | |
300,000 | | | | Merrill Lynch/Countrywide Commercial Mortgage Trust, 5.485%, 03/12/51 | | 316,775 | | 0.0 | |
189,749 | | | | MLCC Mortgage Investors, Inc., 0.544%, 11/25/35 | | 143,578 | | 0.0 | |
105,200 | | | | MLCC Mortgage Investors, Inc., 1.270%, 10/25/35 | | 83,630 | | 0.0 | |
100,000 | | | | Morgan Stanley Capital I, 5.809%, 12/12/49 | | 110,576 | | 0.0 | |
4,700,000 | | | | Morgan Stanley Capital I, 5.879%, 06/11/49 | | 5,187,625 | | 0.5 | |
68,331 | | | | Residential Accredit Loans, Inc., 0.694%, 03/25/33 | | 61,864 | | 0.0 | |
48,210 | | | | Residential Asset Securitization Trust, 0.694%, 05/25/33 | | 46,141 | | 0.0 | |
8,604 | | | | Residential Funding Mortgage Securities I, 6.500%, 03/25/32 | | 8,948 | | 0.0 | |
189,201 | | | | Sequoia Mortgage Trust, 0.635%, 07/20/33 | | 159,421 | | 0.0 | |
| | | | | | | | | | | |
See Accompanying Notes to Financial Statements
61
Principal
Amount† | | | | | | Value | | Percentage
of Net
Assets | |
COLLATERALIZED MORTGAGE OBLIGATIONS: (continued) | | | | | |
323,536 | | | | Sequoia Mortgage Trust, 2.664%, 04/20/35 | | $ | 293,824 | | 0.0 | |
30,098 | | | | SLM Student Loan Trust, 0.718%, 01/25/15 | | 30,104 | | 0.0 | |
193,006 | | | | Structured Adjustable Rate Mortgage Loan Trust, 2.532%, 08/25/35 | | 138,411 | | 0.0 | |
471,140 | | | | Structured Asset Mortgage Investments, Inc., 0.535%, 07/19/35 | | 389,476 | | 0.0 | |
178,816 | | # | | Structured Asset Securities Corp., 2.650%, 10/25/35 | | 141,419 | | 0.0 | |
2,436,189 | | | | Thornburg Mortgage Securities Trust, 5.314%, 10/25/46 | | 2,210,628 | | 0.2 | |
679,963 | | # | | Wachovia Bank Commercial Mortgage Trust, 0.358%, 06/15/20 | | 608,700 | | 0.1 | |
400,000 | | | | Wachovia Bank Commercial Mortgage Trust, 5.509%, 04/15/47 | | 423,416 | | 0.0 | |
2,500,000 | | | | WaMu Mortgage Pass Through Certificates, 5.466%, 02/25/37 | | 1,918,210 | | 0.2 | |
133,837 | | | | Washington Mutual Mortgage Pass-through Certificates, 0.604%, 01/25/45 | | 100,057 | | 0.0 | |
17,860 | | | | Washington Mutual Mortgage Pass-through Certificates, 1.608%, 08/25/42 | | 14,289 | | 0.0 | |
38,409 | | | | Washington Mutual Mortgage Pass-through Certificates, 2.468%, 02/27/34 | | 36,605 | | 0.0 | |
817,407 | | | | Washington Mutual Mortgage Pass-through Certificates, 2.718%, 07/25/46 | | 533,924 | | 0.1 | |
886,480 | | | | Washington Mutual Mortgage Pass-through Certificates, 2.718%, 08/25/46 | | 582,530 | | 0.1 | |
266,276 | | | | Wells Fargo Mortgage-Backed Securities Trust, 2.665%, 05/25/35 | | 248,363 | | 0.0 | |
561,111 | | | | Wells Fargo Mortgage-Backed Securities Trust, 2.710%, 12/25/34 | | 529,197 | | 0.1 | |
333,299 | | | | Wells Fargo Mortgage-Backed Securities Trust, 2.948%, 01/25/35 | | 307,181 | | 0.0 | |
| | | | Total Collateralized Mortgage Obligations
(Cost $59,740,379) | | 59,665,957 | | 5.0 | |
| | | | | | | | | |
MUNICIPAL BONDS: 4.2% | | | | | |
| | | | California: 2.0% | | | | | |
4,000,000 | | | | Bay Area Toll Authority, 7.043%, 04/01/50 | | 5,302,280 | | 0.5 | |
1,000,000 | | | | California Infrastructure & Economic Development Bank, 6.486%, 05/15/49 | | 1,152,160 | | 0.1 | |
1,200,000 | | | | California State Public Works Board, 7.804%, 03/01/35 | | 1,375,596 | | 0.1 | |
500,000 | | | | California State University, 6.434%, 11/01/30 | | 568,725 | | 0.1 | |
200,000 | | | | Los Angeles County Public Works Financing Authority, 7.488%, 08/01/33 | | 252,002 | | 0.0 | |
300,000 | | | | Los Angeles County Public Works Financing Authority, 7.618%, 08/01/40 | | 368,340 | | 0.0 | |
3,500,000 | | | | Los Angeles Department of Airports, 6.582%, 05/15/39 | | 4,223,870 | | 0.4 | |
450,000 | | # | | Orange County Sanitation District, 9.250%, 02/01/33 | | 468,666 | | 0.0 | |
6,000,000 | | | | Southern California Public Power Authority, 5.943%, 07/01/40 | | 7,095,780 | | 0.6 | |
400,000 | | | | State of California, 5.650%, 04/01/39 | | 421,956 | | 0.0 | |
500,000 | | | | State of California, 7.500%, 04/01/34 | | 598,345 | | 0.1 | |
500,000 | | | | State of California, 7.550%, 04/01/39 | | 611,880 | | 0.1 | |
100,000 | | | | State of California, 7.700%, 11/01/30 | | 113,647 | | 0.0 | |
200,000 | | | | University of California, 6.398%, 05/15/31 | | 230,932 | | 0.0 | |
300,000 | | | | University of California, 6.548%, 05/15/48 | | 359,817 | | 0.0 | |
| | | | | | 23,143,996 | | 2.0 | |
| | | | | | | | | | |
See Accompanying Notes to Financial Statements
62
Principal
Amount† | | | | | | Value | | Percentage
of Net
Assets | | |
MUNICIPAL BONDS: (continued) | | | | | |
| | | | Illinois: 0.4% | | | | | |
1,000,000 | | | | Chicago Transit Authority, 6.200%, 12/01/40 | | $ | 1,124,760 | | 0.1 | |
100,000 | | | | Chicago Transit Authority, 6.300%, 12/01/21 | | 110,404 | | 0.0 | |
700,000 | | | | Chicago Transit Authority, 6.899%, 12/01/40 | | 826,623 | | 0.1 | |
700,000 | | | | Chicago Transit Authority, 6.899%, 12/01/40 | | 826,623 | | 0.1 | |
900,000 | | | | State of Illinois, 4.071%, 01/01/14 | | 928,161 | | 0.1 | |
400,000 | | | | State of Illinois, 6.725%, 04/01/35 | | 422,008 | | 0.0 | |
| | | | | | 4,238,579 | | 0.4 | |
| | | | Nebraska: 0.0% | | | | | |
500,000 | | | | Public Power Generation Agency, 7.242%, 01/01/41 | | 582,700 | | 0.0 | |
| | | | | | | | | |
| | | | Nevada: 0.4% | | | | | |
3,300,000 | | | | City of North Las Vegas NV, 6.572%, 06/01/40 | | 3,771,702 | | 0.3 | |
600,000 | | | | County of Clark NV, 6.820%, 07/01/45 | | 762,594 | | 0.1 | |
| | | | | | 4,534,296 | | 0.4 | |
| | | | New Jersey: 0.1% | | | | | |
600,000 | | | | New Jersey Economic Development Authority, 1.546%, 06/15/13 | | 600,132 | | 0.1 | |
| | | | | | | | | |
| | | | New York: 0.8% | | | | | |
1,000,000 | | | | New York City Municipal Water Finance Authority, 5.000%, 06/15/44 | | 1,076,350 | | 0.1 | |
2,900,000 | | | | New York City Municipal Water Finance Authority, 5.882%, 06/15/44 | | 3,621,201 | | 0.3 | |
1,000,000 | | | | New York City Municipal Water Finance Authority, 6.011%, 06/15/42 | | 1,249,180 | | 0.1 | |
2,900,000 | | | | New York City Municipal Water Finance Authority, 6.282%, 06/15/42 | | 3,291,210 | | 0.3 | |
100,000 | | | | Tobacco Settlement Financing Corp., 5.875%, 05/15/39 | | 100,034 | | 0.0 | |
200,000 | | | | Tobacco Settlement Financing Corp., 6.250%, 06/01/42 | | 194,684 | | 0.0 | |
| | | | | | 9,532,659 | | 0.8 | |
| | | | Ohio: 0.0% | | | | | |
400,000 | | | | Buckeye Tobacco Settlement Financing Authority, 5.875%, 06/01/30 | | 296,260 | | 0.0 | |
| | | | | | | | | |
| | | | Texas: 0.5% | | | | | |
2,200,000 | | | | City of San Antonio TX, 5.808%, 02/01/41 | | 2,686,596 | | 0.2 | |
2,900,000 | | | | City of San Antonio TX, 6.308%, 02/01/37 | | 3,268,735 | | 0.3 | |
400,000 | | | | Texas State Transportation Commission, 5.178%, 04/01/30 | | 472,060 | | 0.0 | |
| | | | | | 6,427,391 | | 0.5 | |
| | | | Wisconsin: 0.0% | | | | | |
70,000 | | | | Badger TOB Asset Securitization Corp., 6.125%, 06/01/27 | | 71,719 | | 0.0 | |
| | | | Total Municipal Bonds
(Cost $42,112,168) | | 49,427,732 | | 4.2 | |
| | | | | |
ASSET-BACKED SECURITIES: 0.2% | | | | | |
| | | | Home Equity Asset-Backed Securities: 0.1% | | | | | |
492,283 | | | | Household Home Equity Loan Trust, 0.575%, 01/20/34 | | 448,589 | | 0.1 | |
| | | | | | | | | |
| | | | Other Asset-Backed Securities: 0.1% | | | | | |
127,857 | | | | Countrywide Asset-Backed Certificates, 0.374%, 10/25/47 | | 126,232 | | 0.0 | |
1,418,195 | | | | Countrywide Asset-Backed Certificates, 0.474%, 09/25/36 | | 1,116,488 | | 0.1 | |
206,472 | | | | JPMorgan Mortgage Acquisition Corp., 0.354%, 03/25/47 | | 169,750 | | 0.0 | |
58,753 | | | | Long Beach Mortgage Loan Trust, 0.854%, 10/25/34 | | 43,315 | | 0.0 | |
| | | | | | 1,455,785 | | 0.1 | |
| | | | Total Asset-Backed Securities
(Cost $2,293,442) | | 1,904,374 | | 0.2 | |
| | | | | | | | | |
U.S. TREASURY OBLIGATIONS: 25.2% | | | | | |
| | | | Treasury Inflation Indexed Protected Securities: 2.8% | | | | | |
10,454,106 | | S | | 1.125%, due 01/15/21 | | 11,665,308 | | 1.0 | |
648,474 | | | | 1.750%, due 01/15/28 | | 780,145 | | 0.0 | |
3,536,449 | | S | | 2.000%, due 01/15/26 | | 4,349,280 | | 0.4 | |
2,522,499 | | | | 2.375%, due 01/15/25 | | 3,208,303 | | 0.3 | |
1,908,692 | | | | 2.375%, due 01/15/27 | | 2,466,687 | | 0.2 | |
6,011,163 | | S | | 2.500%, due 01/15/29 | | 8,028,191 | | 0.7 | |
1,119,928 | | | | 3.625%, due 04/15/28 | | 1,665,106 | | 0.1 | |
1,406,440 | | | | 0.625%, due 07/15/21 | | 1,505,220 | | 0.1 | |
| | | | | | 33,668,240 | | 2.8 | |
| | | | | | | | | | | | | | |
See Accompanying Notes to Financial Statements
63
Principal
Amount† | | | | | | Value | | Percentage
of Net
Assets | |
U.S. TREASURY OBLIGATIONS: (continued) | | | | | |
| | | | U.S. Treasury Bonds: 13.7% | | | | | |
300,000 | | | | 2.000%, due 11/15/21 | | $ | 303,328 | | 0.0 | |
23,300,000 | | | | 2.625%, due 11/15/20 | | 25,080,260 | | 2.1 | |
66,600,000 | | S | | 3.625%, due 02/15/21 | | 77,308,015 | | 6.6 | |
21,900,000 | | | | 2.625%, due 08/15/20 | | 23,619,500 | | 2.0 | |
9,900,000 | | | | 3.000%, due 02/28/17 | | 10,953,420 | | 0.9 | |
1,500,000 | | | | 3.375%, due 11/15/19 | | 1,710,117 | | 0.2 | |
8,400,000 | | | | 3.500%, due 05/15/20 | | 9,661,310 | | 0.8 | |
10,900,000 | | | | 3.625%, due 02/15/20 | | 12,640,599 | | 1.1 | |
| | | | | | 161,276,549 | | 13.7 | |
| | | | U.S. Treasury Notes: 8.7% | | | | | |
2,000,000 | | | | 1.375%, due 11/30/18 | | 2,007,188 | | 0.2 | |
34,500,000 | | | | 0.250%, due 12/15/14 | | 34,397,569 | | 2.9 | |
25,500,000 | | | | 0.875%, due 12/31/16 | | 25,555,794 | | 2.2 | |
40,000,000 | | S | | 1.500%, due 08/31/18 | | 40,600,000 | | 3.4 | |
| | | | | | 102,560,551 | | 8.7 | |
| | | | Total U.S. Treasury Obligations
(Cost $291,798,336) | | 297,505,340 | | 25.2 | |
| | | | | | | | | |
FOREIGN GOVERNMENT BONDS: 7.6% | | | | | |
BRL | 2,000,000 | | | | Brazil Government International Bond, 10.250%, 01/10/28 | | 1,227,717 | | 0.1 | |
CAD | 2,600,000 | | # | | Canada Housing Trust No 1, 3.350%, 12/15/20 | | 2,761,474 | | 0.2 | |
CAD | 900,000 | | # | | Canada Housing Trust No 1, 3.750%, 03/15/20 | | 984,306 | | 0.1 | |
CAD | 400,000 | | # | | Canada Housing Trust No 1, 3.800%, 06/15/21 | | 439,244 | | 0.0 | |
600,000 | | | | Canadian Government, 3.750%, 06/01/19 | | 674,067 | | 0.1 | |
100,000 | | | | Canadian Government, 4.250%, 06/01/18 | | 114,572 | | 0.0 | |
CAD | 2,300,000 | | | | Canadian Government Bond, 2.750%, 09/01/16 | | 2,408,255 | | 0.2 | |
CAD | 600,000 | | | | Canadian Government Bond, 3.250%, 06/01/21 | | 654,950 | | 0.1 | |
EUR | 100,000 | | | | European Investment Bank, 3.625%, 01/15/21 | | 136,292 | | 0.0 | |
EUR | 100,000 | | | | European Investment Bank, 4.625%, 04/15/20 | | 146,409 | | 0.0 | |
600,000 | | # | | Export-Import Bank of China, 4.875%, 07/21/15 | | 648,265 | | 0.1 | |
900,000 | | | | Federative Republic of Brazil, 12.500%, 01/05/22 | | 615,778 | | 0.1 | |
EUR | 1,800,000 | | | | Instituto de Credito Oficial, 3.154%, 03/25/14 | | 2,200,648 | | 0.2 | |
EUR | 310,698 | | | | Italy Buoni Poliennali Del Tesoro, 2.100%, 09/15/16 | | 350,265 | | 0.0 | |
EUR | 3,144,330 | | | | Italy Buoni Poliennali Del Tesoro, 2.100%, 09/15/21 | | 3,052,196 | | 0.3 | |
JPY | 1,300,000,000 | | | | Japan Treasury Bill, 02/06/12 | | 16,888,469 | | 1.4 | |
JPY | 1,690,000,000 | | | | Japan Treasury Bill, 02/13/12 | | 21,954,358 | | 1.9 | |
JPY | 1,120,000,000 | | | | Japan Treasury Bill, 02/20/12 | | 14,549,421 | | 1.2 | |
400,000 | | # | | Korea Housing Finance Corp., 4.125%, 12/15/15 | | 415,117 | | 0.0 | |
600,000 | | | | Mexico Government International Bond, 6.050%, 01/11/40 | | 736,500 | | 0.1 | |
250,000 | | | | Panama Government International Bond, 8.875%, 09/30/27 | | 376,250 | | 0.0 | |
71,000 | | | | Panama Government International Bond, 9.375%, 04/01/29 | | 113,245 | | 0.0 | |
CAD | 100,000 | | | | Province of British Columbia Canada, 3.250%, 12/18/21 | | 101,858 | | 0.0 | |
CAD | 100,000 | | | | Province of British Columbia Canada, 4.300%, 06/18/42 | | 115,643 | | 0.0 | |
1,300,000 | | | | Province of Ontario Canada, 1.375%, 01/27/14 | | 1,314,413 | | 0.1 | |
CAD | 500,000 | | | | Province of Ontario Canada, 3.150%, 06/02/22 | | 501,070 | | 0.0 | |
300,000 | | | | Province of Ontario Canada, 3.000%, 07/16/18 | | 315,989 | | 0.0 | |
CAD | 200,000 | | | | Province of Ontario Canada, 4.200%, 03/08/18 | | 220,001 | | 0.0 | |
CAD | 1,600,000 | | | | Province of Ontario Canada, 4.200%, 06/02/20 | | 1,754,684 | | 0.2 | |
CAD | 700,000 | | | | Province of Ontario Canada, 4.300%, 03/08/17 | | 769,529 | | 0.1 | |
CAD | 1,000,000 | | | | Province of Ontario Canada, 4.400%, 06/02/19 | | 1,113,355 | | 0.1 | |
CAD | 600,000 | | | | Province of Ontario Canada, 4.600%, 06/02/39 | | 711,719 | | 0.1 | |
CAD | 300,000 | | | | Province of Ontario Canada, 5.500%, 06/02/18 | | 352,367 | | 0.0 | |
CAD | 300,000 | | | | Province of Quebec Canada, 3.500%, 12/01/22 | | 306,608 | | 0.0 | |
CAD | 400,000 | | | | Quebec Province, 4.500%, 12/01/18 | | 446,826 | | 0.0 | |
| | | | | | | | | | | |
See Accompanying Notes to Financial Statements
64
Principal
Amount† | | | | | | Value | | Percentage
of Net
Assets | |
FOREIGN GOVERNMENT BONDS: (continued) | | | | | |
RUB | 200,000 | | | | Russian Foreign Bond - Eurobond, 3.625%, 04/29/15 | | $ | 201,500 | | 0.0 | |
668,000 | | + | | Russian Foreign Bond - Eurobond, 7.500%, 03/31/30 | | 777,385 | | 0.1 | |
1,000,000 | | # | | Societe Financement de l’Economie Francaise, 0.780%, 07/16/12 | | 1,002,310 | | 0.1 | |
EUR | 700,000 | | | | Societe Financement de l’Economie Francaise, 2.125%, 05/20/12 | | 908,433 | | 0.1 | |
200,000 | | # | | Societe Financement de l’Economie Francaise, 3.375%, 05/05/14 | | 205,133 | | 0.0 | |
EUR | 5,700,000 | | | | Spain Government Bond, 4.650%, 07/30/25 | | 6,722,112 | | 0.6 | |
GBP | 200,000 | | | | United Kingdom Gilt, 4.250%, 12/07/40 | | 383,236 | | 0.0 | |
GBP | 100,000 | | | | United Kingdom Gilt, 4.250%, 09/07/39 | | 191,428 | | 0.0 | |
| | | | | Total Foreign Government Bonds
(Cost $90,773,136) | | 89,863,397 | | 7.6 | |
| | | | | | | | | |
U.S. GOVERNMENT AGENCY OBLIGATIONS: 48.0% | | | | | |
| | | | Federal Home Loan Mortgage Corporation: 1.6%## | | | | | |
1,175,589 | | | | 1.609%, due 07/25/44 | | 1,198,786 | | 0.1 | |
302,843 | | | | 0.428%, due 07/15/19 | | 302,298 | | 0.0 | |
740,039 | | | | 0.428%, due 08/15/19 | | 738,643 | | 0.1 | |
238,982 | | | | 1.399%, due 10/25/44 | | 233,899 | | 0.0 | |
357,635 | | | | 1.875%, due 03/25/24 | | 366,658 | | 0.1 | |
300,000 | | | | 2.000%, due 08/25/16 | | 312,445 | | 0.0 | |
74,636 | | | | 2.095%, due 09/01/35 | | 77,743 | | 0.0 | |
12,875 | | | | 2.490%, due 04/01/32 | | 13,550 | | 0.0 | |
300,000 | | | | 2.500%, due 05/27/16 | | 318,188 | | 0.0 | |
11,261 | | | | 3.500%, due 07/15/32 | | 11,649 | | 0.0 | |
— | | W | | 4.000%, due 08/15/40 | | — | | — | |
333,575 | | | | 4.500%, due 03/01/41 | | 353,776 | | 0.0 | |
7,709,934 | | | | 4.500%, due 09/01/41 | | 8,175,036 | | 0.7 | |
2,291 | | | | 5.500%, due 03/15/17 | | 2,291 | | 0.0 | |
69,555 | | | | 5.500%, due 03/01/23 | | 76,023 | | 0.0 | |
118,820 | | | | 5.500%, due 05/01/23 | | 129,871 | | 0.0 | |
1,693 | | | | 5.500%, due 08/15/30 | | 1,928 | | 0.0 | |
977,641 | | | | 5.500%, due 06/01/36 | | 1,065,052 | | 0.1 | |
1,652,122 | | | | 5.500%, due 12/01/37 | | 1,808,099 | | 0.2 | |
477,401 | | | | 5.500%, due 07/01/38 | | 518,743 | | 0.1 | |
2,018 | | | | 6.000%, due 10/01/17 | | 2,202 | | 0.0 | |
13,694 | | | | 6.000%, due 02/01/22 | | 15,049 | | 0.0 | |
311,228 | | | | 6.000%, due 03/01/23 | | 342,994 | | 0.0 | |
304,828 | | | | 6.000%, due 09/01/37 | | 335,322 | | 0.0 | |
13,210 | | | | 6.000%, due 10/01/37 | | 14,590 | | 0.0 | |
78,013 | | | | 6.000%, due 06/01/38 | | 86,914 | | 0.0 | |
151,897 | | | | 6.000%, due 04/01/39 | | 166,902 | | 0.0 | |
54,879 | | | | 6.000%, due 05/01/39 | | 60,300 | | 0.0 | |
1,209,157 | | | | 6.000%, due 08/01/39 | | 1,328,604 | | 0.1 | |
400,000 | | | | 4.875%, due 06/13/18 | | 482,800 | | 0.1 | |
227,403 | | | | 4.500%, due 02/01/39 | | 241,246 | | 0.0 | |
216,057 | | | | 4.500%, due 02/01/39 | | 229,209 | | 0.0 | |
| | | | | | 19,010,810 | | 1.6 | |
| | | | | | | | | |
| | | | Federal National Mortgage Association: 46.4%## | | | | | |
351,309 | | | | 0.354%, due 07/25/37 | | 337,598 | | 0.0 | |
91,031 | | | | 0.414%, due 03/25/34 | | 90,447 | | 0.0 | |
655,034 | | | | 0.604%, due 04/25/37 | | 652,263 | | 0.1 | |
1,312,404 | | | | 0.744%, due 09/25/35 | | 1,307,517 | | 0.1 | |
82,302 | | | | 1.408%, due 10/01/44 | | 82,758 | | 0.0 | |
118,591 | | | | 1.408%, due 10/01/44 | | 119,281 | | 0.0 | |
712,718 | | | | 1.623%, due 02/01/33 | | 735,876 | | 0.1 | |
4,685 | | | | 1.750%, due 02/01/20 | | 4,711 | | 0.0 | |
496,931 | | | | 1.752%, due 09/01/35 | | 510,761 | | 0.1 | |
74,255 | | | | 1.813%, due 04/25/24 | | 76,471 | | 0.0 | |
184,720 | | | | 2.183%, due 08/01/35 | | 192,323 | | 0.0 | |
10,076 | | | | 2.403%, due 09/01/31 | | 10,637 | | 0.0 | |
69,642 | | | | 2.460%, due 04/01/32 | | 70,344 | | 0.0 | |
798,309 | | | | 2.499%, due 11/01/34 | | 847,756 | | 0.1 | |
262,151 | | | | 2.550%, due 02/01/35 | | 275,716 | | 0.0 | |
239,263 | | | | 2.560%, due 09/01/34 | | 253,442 | | 0.0 | |
— | | W | | 3.000%, due 09/25/26 | | — | | — | |
51,000,000 | | W | | 3.000%, due 10/25/26 | | 52,522,029 | | 4.5 | |
299,581 | | | | 3.330%, due 11/01/21 | | 317,941 | | 0.0 | |
1,000,000 | | | | 3.500%, due 08/01/25 | | 1,046,985 | | 0.1 | |
961,744 | | | | 3.500%, due 08/01/25 | | 1,006,932 | | 0.1 | |
50,018 | | | | 3.500%, due 09/01/25 | | 52,368 | | 0.0 | |
881,154 | | | | 3.500%, due 09/01/25 | | 922,555 | | 0.1 | |
9,000,000 | | W | | 3.500%, due 09/25/25 | | 9,414,885 | | 0.8 | |
25,194 | | | | 3.500%, due 10/01/25 | | 26,377 | | 0.0 | |
1,762,965 | | | | 3.500%, due 10/01/25 | | 1,845,799 | | 0.2 | |
75,700,000 | | W | | 3.500%, due 01/25/26 | | 79,177,469 | | 6.7 | |
199,981 | | | | 3.500%, due 02/01/26 | | 209,377 | | 0.0 | |
64,793 | | | | 3.500%, due 02/01/26 | | 67,837 | | 0.0 | |
54,053 | | | | 3.500%, due 06/01/26 | | 56,593 | | 0.0 | |
5,000,000 | | | | 3.500%, due 12/01/26 | | 5,234,926 | | 0.5 | |
19,775 | | | | 4.000%, due 06/01/13 | | 20,856 | | 0.0 | |
247,027 | | | | 4.000%, due 07/01/13 | | 260,427 | | 0.0 | |
740,618 | | | | 4.000%, due 08/01/13 | | 780,522 | | 0.1 | |
143,122 | | | | 4.000%, due 01/01/14 | | 151,036 | | 0.0 | |
298,423 | | | | 4.000%, due 03/01/14 | | 314,925 | | 0.0 | |
43,373 | | | | 4.000%, due 04/01/14 | | 45,771 | | 0.0 | |
95,166 | | | | 4.000%, due 05/01/14 | | 100,428 | | 0.0 | |
165,127 | | | | 4.000%, due 07/01/18 | | 175,701 | | 0.0 | |
5,000,000 | | W | | 4.000%, due 01/25/24 | | 5,274,219 | | 0.5 | |
20,069 | | | | 4.000%, due 04/01/24 | | 21,179 | | 0.0 | |
223,558 | | | | 4.000%, due 04/01/24 | | 235,917 | | 0.0 | |
241,630 | | | | 4.000%, due 05/01/24 | | 254,988 | | 0.0 | |
61,447 | | | | 4.000%, due 07/01/24 | | 64,844 | | 0.0 | |
216,220 | | | | 4.000%, due 09/01/24 | | 228,173 | | 0.0 | |
27,400 | | | | 4.000%, due 09/01/24 | | 28,915 | | 0.0 | |
175,785 | | | | 4.000%, due 09/01/24 | | 185,503 | | 0.0 | |
635,126 | | | | 4.000%, due 10/01/24 | | 670,239 | | 0.1 | |
15,698 | | | | 4.000%, due 10/01/24 | | 16,565 | | 0.0 | |
42,585 | | | | 4.000%, due 01/01/25 | | 44,939 | | 0.0 | |
132,972 | | | | 4.000%, due 01/01/25 | | 140,324 | | 0.0 | |
62,850 | | | | 4.000%, due 02/01/25 | | 66,325 | | 0.0 | |
51,719 | | | | 4.000%, due 05/01/25 | | 54,578 | | 0.0 | |
61,926 | | | | 4.000%, due 06/01/25 | | 65,349 | | 0.0 | |
44,629 | | | | 4.000%, due 07/01/25 | | 47,096 | | 0.0 | |
25,348 | | | | 4.000%, due 08/01/25 | | 26,749 | | 0.0 | |
56,008 | | | | 4.000%, due 10/01/25 | | 59,401 | | 0.0 | |
50,438 | | | | 4.000%, due 11/01/25 | | 53,226 | | 0.0 | |
657,346 | | | | 4.000%, due 01/01/26 | | 693,687 | | 0.1 | |
| | | | | | | | | | | |
See Accompanying Notes to Financial Statements
65
Principal
Amount† | | | | | | Value | | Percentage
of Net
Assets | |
U.S. GOVERNMENT AGENCY OBLIGATIONS: (continued) | | | | | |
| | | | Federal National Mortgage Association: (continued) | | | | | |
48,311 | | | | 4.000%, due 02/01/26 | | $ | 50,982 | | 0.0 | |
23,952 | | | | 4.000%, due 02/01/26 | | 25,493 | | 0.0 | |
357,319 | | | | 4.000%, due 03/01/26 | | 378,782 | | 0.0 | |
224,693 | | | | 4.000%, due 04/01/26 | | 237,396 | | 0.0 | |
35,651 | | | | 4.000%, due 04/01/26 | | 37,667 | | 0.0 | |
3,999,997 | | | | 4.000%, due 04/01/26 | | 4,226,137 | | 0.4 | |
57,453 | | | | 4.000%, due 04/01/26 | | 60,701 | | 0.0 | |
147,925 | | | | 4.000%, due 06/01/26 | | 157,443 | | 0.0 | |
243,595 | | | | 4.000%, due 06/01/26 | | 258,356 | | 0.0 | |
209,586 | | | | 4.000%, due 06/01/26 | | 221,435 | | 0.0 | |
34,087,083 | | | | 4.000%, due 04/01/41 | | 35,861,537 | | 3.1 | |
920,974 | | | | 4.000%, due 06/01/41 | | 968,916 | | 0.1 | |
8,504 | | | | 4.500%, due 08/01/13 | | 8,631 | | 0.0 | |
983,394 | | | | 4.500%, due 01/01/15 | | 1,049,168 | | 0.1 | |
51,257 | | | | 4.500%, due 07/01/17 | | 54,741 | | 0.0 | |
46,325 | | | | 4.500%, due 06/01/18 | | 49,494 | | 0.0 | |
105,047 | | | | 4.500%, due 07/01/18 | | 112,512 | | 0.0 | |
222,632 | | | | 4.500%, due 10/01/18 | | 238,454 | | 0.0 | |
24,378 | | | | 4.500%, due 03/01/19 | | 26,050 | | 0.0 | |
81,672 | | | | 4.500%, due 01/01/20 | | 87,272 | | 0.0 | |
157,513 | | | | 4.500%, due 03/01/20 | | 168,510 | | 0.0 | |
161,850 | | | | 4.500%, due 03/01/23 | | 172,745 | | 0.0 | |
22,176 | | | | 4.500%, due 03/01/23 | | 23,669 | | 0.0 | |
8,103 | | | | 4.500%, due 05/01/23 | | 8,648 | | 0.0 | |
73,717 | | | | 4.500%, due 03/01/24 | | 78,634 | | 0.0 | |
69,894 | | | | 4.500%, due 05/01/24 | | 74,598 | | 0.0 | |
234,290 | | | | 4.500%, due 06/01/24 | | 249,915 | | 0.0 | |
67,942 | | | | 4.500%, due 07/01/24 | | 72,473 | | 0.0 | |
76,196 | | | | 4.500%, due 06/01/25 | | 81,278 | | 0.0 | |
154,048 | | | | 4.500%, due 07/01/25 | | 164,417 | | 0.0 | |
10,874,000 | | | | 4.500%, due 01/01/26 | | 11,605,996 | | 1.0 | |
239,264 | | | | 4.500%, due 07/01/26 | | 256,119 | | 0.0 | |
12,469,236 | | | | 4.500%, due 04/01/29 | | 13,347,676 | | 1.1 | |
11,999,994 | | | | 4.500%, due 04/01/29 | | 12,845,377 | | 1.1 | |
107,302 | | | | 4.500%, due 05/01/29 | | 114,861 | | 0.0 | |
359,168 | | | | 4.500%, due 02/01/31 | | 384,247 | | 0.0 | |
50,722 | | | | 4.500%, due 08/01/35 | | 54,097 | | 0.0 | |
36,883 | | | | 4.500%, due 04/01/38 | | 39,291 | | 0.0 | |
342,332 | | | | 4.500%, due 08/01/38 | | 364,683 | | 0.0 | |
6,623,060 | | | | 4.500%, due 01/01/39 | | 7,055,495 | | 0.6 | |
1,267,469 | | | | 4.500%, due 01/01/39 | | 1,350,225 | | 0.1 | |
327,307 | | | | 4.500%, due 01/01/39 | | 348,677 | | 0.0 | |
93,000,000 | | W | | 4.500%, due 01/25/39 | | 98,986,875 | | 8.4 | |
183,256 | | | | 4.500%, due 02/01/39 | | 195,221 | | 0.0 | |
807,280 | | | | 4.500%, due 02/01/39 | | 859,989 | | 0.1 | |
14,166 | | | | 4.500%, due 02/01/39 | | 15,129 | | 0.0 | |
61,800 | | | | 4.500%, due 02/01/39 | | 65,835 | | 0.0 | |
18,992 | | | | 4.500%, due 03/01/39 | | 20,233 | | 0.0 | |
21,486 | | | | 4.500%, due 03/01/39 | | 22,888 | | 0.0 | |
18,177 | | | | 4.500%, due 03/01/39 | | 19,363 | | 0.0 | |
1,199,009 | | | | 4.500%, due 04/01/39 | | 1,277,295 | | 0.1 | |
1,140,717 | | | | 4.500%, due 04/01/39 | | 1,215,197 | | 0.1 | |
863,179 | | | | 4.500%, due 04/01/39 | | 919,538 | | 0.1 | |
5,459,472 | | | | 4.500%, due 05/01/39 | | 5,815,933 | | 0.5 | |
390,692 | | | | 4.500%, due 05/01/39 | | 416,201 | | 0.0 | |
86,191 | | | | 4.500%, due 05/01/39 | | 91,819 | | 0.0 | |
986,449 | | | | 4.500%, due 05/01/39 | | 1,055,018 | | 0.1 | |
798,171 | | | | 4.500%, due 05/01/39 | | 850,286 | | 0.1 | |
3,833,892 | | | | 4.500%, due 06/01/39 | | 4,084,215 | | 0.4 | |
24,805,963 | | | | 4.500%, due 06/01/39 | | 26,425,602 | | 2.3 | |
482,515 | | | | 4.500%, due 08/01/39 | | 514,019 | | 0.1 | |
86,434 | | | | 4.500%, due 08/01/39 | | 92,077 | | 0.0 | |
36,058 | | | | 4.500%, due 08/01/39 | | 38,412 | | 0.0 | |
1,733,864 | | | | 4.500%, due 08/01/39 | | 1,847,072 | | 0.2 | |
3,708,407 | | | | 4.500%, due 09/01/39 | | 3,950,537 | | 0.3 | |
3,317,130 | | | | 4.500%, due 09/01/39 | | 3,533,713 | | 0.3 | |
706,175 | | | | 4.500%, due 10/01/39 | | 752,283 | | 0.1 | |
7,790,490 | | | | 4.500%, due 10/01/39 | | 8,299,149 | | 0.7 | |
34,405 | | | | 4.500%, due 10/01/39 | | 36,651 | | 0.0 | |
754,640 | | | | 4.500%, due 11/01/39 | | 803,912 | | 0.1 | |
194,631 | | | | 4.500%, due 12/01/39 | | 207,339 | | 0.0 | |
136,494 | | | | 4.500%, due 12/01/39 | | 145,406 | | 0.0 | |
784,873 | | | | 4.500%, due 12/01/39 | | 836,119 | | 0.1 | |
74,255 | | | | 4.500%, due 01/01/40 | | 79,103 | | 0.0 | |
144,628 | | | | 4.500%, due 01/01/40 | | 154,071 | | 0.0 | |
454,840 | | | | 4.500%, due 02/01/40 | | 484,537 | | 0.1 | |
427,906 | | | | 4.500%, due 02/01/40 | | 455,845 | | 0.1 | |
394,903 | | | | 4.500%, due 03/01/40 | | 420,687 | | 0.0 | |
268,763 | | | | 4.500%, due 05/01/40 | | 286,311 | | 0.0 | |
25,613 | | | | 4.500%, due 07/01/40 | | 27,285 | | 0.0 | |
193,104 | | | | 4.500%, due 07/01/40 | | 205,713 | | 0.0 | |
24,970 | | | | 4.500%, due 07/01/40 | | 26,600 | | 0.0 | |
3,164,235 | | | | 4.500%, due 08/01/40 | | 3,370,835 | | 0.3 | |
571,634 | | | | 4.500%, due 08/01/40 | | 608,540 | | 0.1 | |
28,041 | | | | 4.500%, due 08/01/40 | | 29,872 | | 0.0 | |
1,976,002 | | | | 4.500%, due 09/01/40 | | 2,105,019 | | 0.2 | |
7,938,422 | | | | 4.500%, due 09/01/40 | | 8,490,231 | | 0.7 | |
27,192 | | | | 4.500%, due 09/01/40 | | 28,968 | | 0.0 | |
27,516 | | | | 4.500%, due 09/01/40 | | 29,313 | | 0.0 | |
39,669 | | | | 4.500%, due 10/01/40 | | 42,259 | | 0.0 | |
410,923 | | | | 4.500%, due 10/01/40 | | 437,487 | | 0.1 | |
6,864,474 | | | | 4.500%, due 10/01/40 | | 7,312,672 | | 0.6 | |
71,500 | | | | 4.500%, due 11/01/40 | | 76,169 | | 0.0 | |
859,606 | | | | 4.500%, due 11/01/40 | | 915,732 | | 0.1 | |
4,643,549 | | | | 4.500%, due 11/01/40 | | 4,946,737 | | 0.4 | |
220,665 | | | | 4.500%, due 12/01/40 | | 235,073 | | 0.0 | |
86,649 | | | | 4.500%, due 12/01/40 | | 92,307 | | 0.0 | |
272,737 | | | | 4.500%, due 02/01/41 | | 290,544 | | 0.0 | |
56,808 | | | | 4.500%, due 02/01/41 | | 60,517 | | 0.0 | |
180,225 | | | | 4.500%, due 02/01/41 | | 191,992 | | 0.0 | |
286,062 | | | | 4.500%, due 02/01/41 | | 304,739 | | 0.0 | |
76,962 | | | | 4.500%, due 02/01/41 | | 81,988 | | 0.0 | |
720,597 | | | | 4.500%, due 03/01/41 | | 773,726 | | 0.1 | |
480,488 | | | | 4.500%, due 03/01/41 | | 511,860 | | 0.1 | |
43,109 | | | | 4.500%, due 03/01/41 | | 45,924 | | 0.0 | |
291,651 | | | | 4.500%, due 04/01/41 | | 310,694 | | 0.0 | |
52,926 | | | | 4.500%, due 04/01/41 | | 56,382 | | 0.0 | |
24,496 | | | | 4.500%, due 04/01/41 | | 26,095 | | 0.0 | |
143,384 | | | | 4.500%, due 04/01/41 | | 152,746 | | 0.0 | |
689,471 | | | | 4.500%, due 04/01/41 | | 734,488 | | 0.1 | |
26,062 | | | | 4.500%, due 04/01/41 | | 27,764 | | 0.0 | |
157,781 | | | | 4.500%, due 04/01/41 | | 168,083 | | 0.0 | |
591,569 | | | | 4.500%, due 04/01/41 | | 630,194 | | 0.1 | |
796,746 | | | | 4.500%, due 05/01/41 | | 848,767 | | 0.1 | |
176,075 | | | | 4.500%, due 05/01/41 | | 187,571 | | 0.0 | |
141,940 | | | | 4.500%, due 05/01/41 | | 151,207 | | 0.0 | |
284,244 | | | | 4.500%, due 05/01/41 | | 302,803 | | 0.0 | |
451,921 | | | | 4.500%, due 05/01/41 | | 481,428 | | 0.1 | |
622,360 | | | | 4.500%, due 05/01/41 | | 662,995 | | 0.1 | |
440,451 | | | | 4.500%, due 05/01/41 | | 469,209 | | 0.1 | |
1,425,919 | | | | 4.500%, due 05/01/41 | | 1,519,020 | | 0.1 | |
8,996,082 | | | | 4.500%, due 05/01/41 | | 9,583,457 | | 0.8 | |
7,604,899 | | | | 4.500%, due 05/01/41 | | 8,101,440 | | 0.7 | |
371,489 | | | | 4.500%, due 06/01/41 | | 395,745 | | 0.0 | |
77,587 | | | | 4.500%, due 06/01/41 | | 82,653 | | 0.0 | |
338,331 | | | | 4.500%, due 06/01/41 | | 360,421 | | 0.0 | |
| | | | | | | | | | |
See Accompanying Notes to Financial Statements
66
Principal
Amount† | | | | | | Value | | Percentage
of Net
Assets | |
U.S. GOVERNMENT AGENCY OBLIGATIONS: (continued) | | | | | |
| | | | Federal National Mortgage Association: (continued) | | | | | |
271,801 | | | | 4.500%, due 06/01/41 | | $ | 289,547 | | 0.0 | |
1,046,613 | | | | 4.500%, due 06/01/41 | | 1,114,949 | | 0.1 | |
37,044 | | | | 4.500%, due 06/01/41 | | 39,462 | | 0.0 | |
241,730 | | | | 4.500%, due 06/01/41 | | 257,513 | | 0.0 | |
37,575 | | | | 4.500%, due 07/01/41 | | 40,028 | | 0.0 | |
301,943 | | | | 4.500%, due 07/01/41 | | 321,657 | | 0.0 | |
293,086 | | | | 4.500%, due 07/01/41 | | 312,222 | | 0.0 | |
2,107,767 | | | | 4.500%, due 07/01/41 | | 2,245,388 | | 0.2 | |
88,435 | | | | 4.500%, due 07/01/41 | | 94,209 | | 0.0 | |
98,422 | | | | 4.500%, due 07/01/41 | | 104,848 | | 0.0 | |
169,179 | | | | 4.500%, due 08/01/41 | | 180,939 | | 0.0 | |
388,174 | | | | 4.500%, due 08/01/41 | | 413,519 | | 0.0 | |
204,986 | | | | 4.500%, due 10/01/41 | | 218,370 | | 0.0 | |
68,256 | | | | 4.519%, due 12/01/36 | | 71,795 | | 0.0 | |
823,064 | | | | 5.000%, due 03/01/34 | | 890,225 | | 0.1 | |
1,544,616 | | | | 5.000%, due 03/01/35 | | 1,670,653 | | 0.2 | |
8,921 | | | | 5.500%, due 04/01/21 | | 9,724 | | 0.0 | |
68,076 | | | | 5.500%, due 06/01/22 | | 73,928 | | 0.0 | |
184,606 | | | | 5.500%, due 11/01/22 | | 200,477 | | 0.0 | |
11,578 | | | | 5.500%, due 11/01/22 | | 12,619 | | 0.0 | |
8,766 | | | | 5.500%, due 11/01/22 | | 9,519 | | 0.0 | |
114,488 | | | | 5.500%, due 05/01/23 | | 125,858 | | 0.0 | |
79,300 | | | | 5.500%, due 06/01/23 | | 87,010 | | 0.0 | |
77,527 | | | | 5.500%, due 07/01/23 | | 84,192 | | 0.0 | |
303,607 | | | | 5.500%, due 07/01/23 | | 329,709 | | 0.0 | |
206,637 | | | | 5.500%, due 09/01/23 | | 224,402 | | 0.0 | |
242,218 | | | | 5.500%, due 02/01/24 | | 266,070 | | 0.0 | |
25,690 | | | | 5.500%, due 04/01/28 | | 28,003 | | 0.0 | |
77,520 | | | | 5.500%, due 11/01/33 | | 84,753 | | 0.0 | |
96,967 | | | | 5.500%, due 12/01/33 | | 106,016 | | 0.0 | |
110,299 | | | | 5.500%, due 02/01/35 | | 120,523 | | 0.0 | |
3,720 | | | | 5.500%, due 12/01/36 | | 4,059 | | 0.0 | |
1,043,647 | | | | 5.500%, due 03/01/37 | | 1,138,753 | | 0.1 | |
77,156 | | | | 5.500%, due 04/01/37 | | 84,091 | | 0.0 | |
26,948 | | | | 5.500%, due 05/01/37 | | 29,370 | | 0.0 | |
9,771 | | | | 5.500%, due 05/01/37 | | 10,649 | | 0.0 | |
324,059 | | | | 5.500%, due 05/01/37 | | 353,185 | | 0.0 | |
14,832 | | | | 5.500%, due 06/01/37 | | 16,165 | | 0.0 | |
117,069 | | | | 5.500%, due 07/01/37 | | 127,591 | | 0.0 | |
1,748,399 | | | | 5.500%, due 07/01/37 | | 1,905,543 | | 0.2 | |
43,540 | | | | 5.500%, due 07/01/37 | | 47,453 | | 0.0 | |
7,973 | | | | 5.500%, due 07/01/37 | | 8,690 | | 0.0 | |
40,621 | | | | 5.500%, due 08/01/37 | | 44,272 | | 0.0 | |
97,513 | | | | 5.500%, due 09/01/37 | | 106,278 | | 0.0 | |
686,682 | | | | 5.500%, due 03/01/38 | | 754,194 | | 0.1 | |
180,834 | | | | 5.500%, due 08/01/38 | | 197,483 | | 0.0 | |
10,000,000 | | W | | 5.500%, due 01/25/39 | | 10,890,627 | | 0.9 | |
83,011 | | | | 6.000%, due 06/01/17 | | 89,896 | | 0.0 | |
21,233 | | | | 6.000%, due 01/01/18 | | 23,134 | | 0.0 | |
10,100 | | | | 6.000%, due 12/01/18 | | 11,129 | | 0.0 | |
152,940 | | | | 6.000%, due 04/01/22 | | 168,526 | | 0.0 | |
331,728 | | | | 6.000%, due 06/01/22 | | 365,534 | | 0.0 | |
61,138 | | | | 6.000%, due 01/01/23 | | 67,636 | | 0.0 | |
3,510 | | | | 6.000%, due 11/01/32 | | 3,913 | | 0.0 | |
6,000,000 | | W | | 6.000%, due 01/15/33 | | 6,607,502 | | 0.6 | |
59,136 | | | | 6.000%, due 07/01/35 | | 65,412 | | 0.0 | |
52,640 | | | | 6.000%, due 07/01/35 | | 58,226 | | 0.0 | |
73,415 | | | | 6.000%, due 10/01/35 | | 81,207 | | 0.0 | |
10,639 | | | | 6.000%, due 06/01/36 | | 11,739 | | 0.0 | |
49,163 | | | | 6.000%, due 07/01/36 | | 54,242 | | 0.0 | |
1,449,281 | | | | 6.000%, due 09/01/36 | | 1,599,016 | | 0.1 | |
23,189 | | | | 6.000%, due 09/01/36 | | 25,585 | | 0.0 | |
879,351 | | | | 6.000%, due 10/01/36 | | 970,202 | | 0.1 | |
418,348 | | | | 6.000%, due 11/01/36 | | 461,571 | | 0.1 | |
115,962 | | | | 6.000%, due 12/01/36 | | 129,198 | | 0.0 | |
10,608 | | | | 6.000%, due 01/01/37 | | 11,704 | | 0.0 | |
120,709 | | | | 6.000%, due 02/01/37 | | 133,067 | | 0.0 | |
162,642 | | | | 6.000%, due 03/01/37 | | 179,293 | | 0.0 | |
183,690 | | | | 6.000%, due 04/01/37 | | 202,496 | | 0.0 | |
344,954 | | | | 6.000%, due 04/01/37 | | 380,270 | | 0.0 | |
32,315 | | | | 6.000%, due 04/01/37 | | 35,624 | | 0.0 | |
542,563 | | | | 6.000%, due 04/01/37 | | 599,466 | | 0.1 | |
84,844 | | | | 6.000%, due 05/01/37 | | 93,530 | | 0.0 | |
105,139 | | | | 6.000%, due 05/01/37 | | 115,903 | | 0.0 | |
1,942,632 | | | | 6.000%, due 05/01/37 | | 2,143,338 | | 0.2 | |
8,777 | | | | 6.000%, due 06/01/37 | | 9,708 | | 0.0 | |
1,291,985 | | | | 6.000%, due 07/01/37 | | 1,424,257 | | 0.1 | |
360,578 | | | | 6.000%, due 07/01/37 | | 397,493 | | 0.0 | |
579,856 | | | | 6.000%, due 07/01/37 | | 639,221 | | 0.1 | |
392,754 | | | | 6.000%, due 07/01/37 | | 432,964 | | 0.1 | |
362,276 | | | | 6.000%, due 08/01/37 | | 399,366 | | 0.0 | |
24,655 | | | | 6.000%, due 08/01/37 | | 27,595 | | 0.0 | |
1,011,496 | | | | 6.000%, due 08/01/37 | | 1,115,053 | | 0.1 | |
80,537 | | | | 6.000%, due 09/01/37 | | 88,782 | | 0.0 | |
187,685 | | | | 6.000%, due 09/01/37 | | 206,900 | | 0.0 | |
313,987 | | | | 6.000%, due 09/01/37 | | 346,133 | | 0.0 | |
27,133 | | | | 6.000%, due 09/01/37 | | 29,911 | | 0.0 | |
6,937 | | | | 6.000%, due 09/01/37 | | 7,648 | | 0.0 | |
145,748 | | | | 6.000%, due 10/01/37 | | 160,669 | | 0.0 | |
464,110 | | | | 6.000%, due 10/01/37 | | 515,614 | | 0.1 | |
448,858 | | | | 6.000%, due 10/01/37 | | 494,812 | | 0.1 | |
48,982 | | | | 6.000%, due 11/01/37 | | 53,997 | | 0.0 | |
1,246,390 | | | | 6.000%, due 11/01/37 | | 1,373,994 | | 0.1 | |
71,461 | | | | 6.000%, due 11/01/37 | | 78,777 | | 0.0 | |
26,609 | | | | 6.000%, due 12/01/37 | | 29,333 | | 0.0 | |
325,463 | | | | 6.000%, due 12/01/37 | | 358,784 | | 0.0 | |
0 | | | | 6.000%, due 01/01/38 | | 0 | | — | |
319,462 | | | | 6.000%, due 02/01/38 | | 352,068 | | 0.0 | |
0 | | | | 6.000%, due 03/01/38 | | 0 | | — | |
720,286 | | | | 6.000%, due 07/01/38 | | 793,803 | | 0.1 | |
27,683 | | | | 6.000%, due 08/01/38 | | 30,509 | | 0.0 | |
845,067 | | | | 6.000%, due 08/01/38 | | 931,321 | | 0.1 | |
8,303 | | | | 6.000%, due 08/01/38 | | 9,151 | | 0.0 | |
1,106,825 | | | | 6.000%, due 09/01/38 | | 1,219,795 | | 0.1 | |
823,043 | | | | 6.000%, due 09/01/38 | | 907,048 | | 0.1 | |
0 | | | | 6.000%, due 09/01/38 | | 0 | | — | |
0 | | | | 6.000%, due 09/01/38 | | 0 | | — | |
975,879 | | | | 6.000%, due 09/01/38 | | 1,075,483 | | 0.1 | |
38,959 | | | | 6.000%, due 09/01/38 | | 43,045 | | 0.0 | |
24,577 | | | | 6.000%, due 09/01/38 | | 27,085 | | 0.0 | |
363,639 | | | | 6.000%, due 09/01/38 | | 400,754 | | 0.0 | |
0 | | | | 6.000%, due 10/01/38 | | 0 | | — | |
694,853 | | | | 6.000%, due 10/01/38 | | 765,774 | | 0.1 | |
327,007 | | | | 6.000%, due 10/01/38 | | 360,485 | | 0.0 | |
657,171 | | | | 6.000%, due 10/01/38 | | 724,247 | | 0.1 | |
694,070 | | | | 6.000%, due 10/01/38 | | 764,912 | | 0.1 | |
0 | | | | 6.000%, due 10/01/38 | | 0 | | — | |
28,012 | | | | 6.000%, due 12/01/38 | | 30,871 | | 0.0 | |
6,000,000 | | W | | 6.000%, due 01/15/39 | | 6,589,689 | | 0.6 | |
0 | | | | 6.000%, due 03/01/39 | | 0 | | — | |
0 | | | | 6.000%, due 09/01/39 | | 0 | | — | |
38,330 | | | | 6.500%, due 03/01/17 | | 42,126 | | 0.0 | |
21,028 | | | | 6.500%, due 07/01/29 | | 24,042 | | 0.0 | |
1,500,000 | | | | 6.500%, due 06/17/38 | | 1,567,873 | | 0.1 | |
| | | | | | 547,579,779 | | 46.4 | |
| | | | | | | | | | |
See Accompanying Notes to Financial Statements
67
Principal
Amount† | | | | | | Value | | Percentage
of Net
Assets | |
U.S. GOVERNMENT AGENCY OBLIGATIONS: (continued) | | | | | |
| | | | Government National Mortgage Association: 0.0% | | | | | |
22,283 | | | | 0.683%, due 03/16/32 | | $ | 22,389 | | 0.0 | |
| | | | | | | | | |
| | | | Total U.S. Government Agency Obligations
(Cost $558,106,422) | | 566,612,978 | | 48.0 | |
| | | | | | | | | | |
Shares | | | | | | | | | |
COMMON STOCK: —% | | | | | | | |
| | | | Consumer Discretionary: —% | | | | | |
60,000 | | X | | General Motors Co. | | — | | — | |
| | | | | | | | | |
| | | | Total Common Stock
(Cost $0) | | — | | — | |
| | | | | | | | | |
PREFERRED STOCK: 0.8% | | | | | | |
| | | | Financials: 0.8% | | | | | |
858,000 | | | | Citigroup, Inc. | | 6,122,688 | | 0.5 | |
3,400 | | | | Wells Fargo & Co. | | 3,619,300 | | 0.3 | |
| | | | | | | | | |
| | | | Total Preferred Stock
(Cost $18,445,540) | | 9,741,988 | | 0.8 | |
# of Contracts | | | | | | | | | |
PURCHASED OPTIONS: 0.0% | | | | | | |
| | | | Options on Exchange Traded Futures Contracts: 0.0% | | | | | |
220 | | @ | | 90-day Eurodollar June Futures, Strike @ 93.500, Exp. 06/18/12 | | 1,375 | | 0.0 | |
3,300 | | @ | | 90-Day Eurodollar September Futures, Strike @ 93.000, Exp. 09/17/12 | | 20,625 | | 0.0 | |
| | | | | | 22,000 | | 0.0 | |
| | | | | | | | | |
| | | | Options on Interest Rate Swaptions: 0.0% | | | | | |
10,900,000 | | @ | | Put OTC Swaption, Strike @ 1.250%, Exp. 04/30/12 | | 58,983 | | 0.0 | |
| | | | | | | | | |
| | | | Total Purchased Options
(Cost $70,857) | | 80,983 | | 0.0 | |
| | | | | | | | | |
| | | | Total Long-Term Investments
(Cost $1,415,055,887) | | 1,427,623,479 | | 120.9 | |
Principal
Amount† | | | | | | | | | |
SHORT-TERM INVESTMENTS: 4.7% | | | | | |
| | | | U.S. Treasury Bills: 2.5% | | | | | |
1,480,000 | | S | | United States Treasury Bill, 0.010%, 03/01/12 | | 1,479,970 | | 0.1 | |
1,120,000 | | S | | United States Treasury Bill, 0.040%, 04/12/12 | | 1,119,953 | | 0.1 | |
26,700,000 | | | | United States Treasury Bill, 0.040%, 06/21/12 | | 26,693,779 | | 2.3 | |
170,000 | | S | | United States Treasury Bill, 0.070%, 05/31/12 | | | 169,976 | | 0.0 | |
360,000 | | S | | United States Treasury Bill, 0.100%, 02/23/12 | | 359,996 | | 0.0 | |
| | | | | | 29,823,674 | | 2.5 | |
| | | | | | | | | |
| | | | Securities Lending Collateral(cc)(1): 0.7% | | | | | |
2,084,742 | | | | BNP Paribas Bank, Repurchase Agreement dated 12/30/11, 0.06%, due 01/03/12 (Repurchase Amount $2,084,756, collateralized by various U.S. Government Agency Obligations, 5.000%-6.000%, Market Value plus accrued interest $2,126,437, due 05/15/24-04/15/41) | | 2,084,742 | | 0.2 | |
2,084,742 | | | | Cantor Fitzgerald, Repurchase Agreement dated 12/30/11, 0.12%, due 01/03/12 (Repurchase Amount $2,084,769, collateralized by various U.S. Government Agency Obligations, 1.437%-6.014%, Market Value plus accrued interest $2,126,437, due 06/01/17-09/01/44) | | 2,084,742 | | 0.2 | |
2,084,742 | | | | Citigroup, Inc., Repurchase Agreement dated 12/30/11, 0.08%, due 01/03/12 (Repurchase Amount $2,084,760, collateralized by various U.S. Government and U.S. Government Agency Obligations, 0.000%-5.500%, Market Value plus accrued interest $2,126,437, due 01/19/12-12/20/41) | | 2,084,742 | | 0.1 | |
| | | | | | | | | | |
See Accompanying Notes to Financial Statements
68
Principal
Amount† | | | | | | Value | | Percentage
of Net
Assets | |
SHORT-TERM INVESTMENTS: (continued) | | | | | |
| | | | Securities Lending Collateral(cc)(1) (continued) | | | | | |
438,894 | | | | Deutsche Bank AG, Repurchase Agreement dated 12/30/11, 0.10%, due 01/03/12 (Repurchase Amount $438,899, collateralized by various U.S. Government and U.S. Government Agency Obligations, 0.000%-6.500%, Market Value plus accrued interest $447,672, due 06/28/12-11/01/41) | | $ | 438,894 | | 0.0 | |
2,084,742 | | | | Merrill Lynch & Co., Inc., Repurchase Agreement dated 12/30/11, 0.02%, due 01/03/12 (Repurchase Amount $2,084,747, collateralized by various U.S. Government Securities, 1.875%-4.000%, Market Value plus accrued interest $2,126,440, due 02/15/15-06/30/15) | | 2,084,742 | | 0.2 | |
| | | | | | 8,777,862 | | 0.7 | |
| | | | | | | | | |
| | | | Foreign Government Bonds: 0.6% | | | | | |
1,700,000 | | # | | Banco Santander Chile, 1.659%, 04/20/12 | | 1,700,692 | | 0.2 | |
JPY | 30,000,000 | | Z | | Japan Treasury Discount Bill, 0.090%, 01/30/12 | | 389,732 | | 0.0 | |
JPY | 350,000,000 | | Z | | Japan Treasury Discount Bill, 03/29/12 | | 4,549,045 | | 0.4 | |
| | | | | | 6,639,469 | | 0.6 | |
| | | | | | | | | | | |
Shares | | | | | | | | | |
| | | | Foreign Government Securities: 0.4% | | | | | |
400,000,000 | | Z | | Japan Treasury Discount Bill
(Cost $5,152,005) | | 5,195,733 | | 0.4 | |
| | | | | | | | | |
| | | | Financials: 0.5% | | | | | |
5,600,000 | | | | Intesa Sanpaolo
(Cost $5,596,640) | | 5,210,470 | | 0.5 | |
| | | | | | | | | |
| | | | Total Short-Term Investments
(Cost $55,924,762) | | 55,647,208 | | 4.7 | |
| | | | | | | | | |
| | | | Total Investments in Securities
(Cost $1,470,980,649) | | $ | 1,483,270,687 | | 125.6 | |
| | | | Liabilities in Excess of Other Assets | | (302,227,792 | ) | (25.6 | ) |
| | | | Net Assets | | $ | 1,181,042,895 | | 100.0 | |
† | Unless otherwise indicated, principal amount is shown in USD. |
# | Securities with purchases pursuant to Rule 144A or section 4(2), under the Securities Act of 1933 and may not be resold subject to that rule except to qualified institutional buyers. |
## | On September 7, 2008, the Federal Housing Finance Agency placed the Federal National Mortgage Association and the Federal Home Loan Mortgage Corporation into conservatorship and the U.S. Treasury guaranteed the debt issued by those organizations. |
@ | Non-income producing security |
| |
+ | Step-up basis bonds. Interest rates shown reflect current and next coupon rates. |
(cc) | Securities purchased with cash collateral for securities loaned. |
W | Settlement is on a when-issued or delayed-delivery basis. |
S | All or a portion of this security has been identified by the Fund to cover future collateral requirements for applicable futures, options, swaps, foreign currency contracts and/or when-issued or delayed-delivery securities. |
L | Loaned security, a portion or all of the security is on loan at December 31, 2011. |
± | Defaulted security |
X | Fair value determined by ING Funds Valuation Committee appointed by the Funds’ Board of Directors/Trustees. |
Z | Indicates Zero Coupon Bond; rate shown reflects current effective yield. |
(1) | Collateral received from brokers for securities lending was invested into these short-term investments. |
| |
BRL | Brazilian Real |
CAD | Canadian Dollar |
DKK | Danish Krone |
EUR | EU Euro |
GBP | British Pound |
JPY | Japanese Yen |
RUB | Russian Ruble |
SGD | Singapore Dollar |
| |
| Cost for federal income tax purposes is $1,471,547,510. |
| |
| Net unrealized appreciation consists of: |
Gross Unrealized Appreciation | | $ | 43,639,655 | |
Gross Unrealized Depreciation | | (31,916,478 | ) |
Net Unrealized Appreciation | | $ | 11,723,177 | |
Fair Value Measurements^
The following is a summary of the fair valuations according to the inputs used as of December 31, 2011 in valuing the assets and liabilities:
See Accompanying Notes to Financial Statements
69
| | Quoted Prices
in Active Markets
for Identical
Investments
(Level 1) | | Significant
Other
Observable
Inputs
(Level 2) | | Significant
Unobservable
Inputs
(Level 3) | | Fair Value
at
12/31/2011 | |
Asset Table | | | | | | | | | |
Investments, at value | | | | | | | | | |
Common Stock | | | | | | | | | |
Consumer Discretionary | | $ | — | | $ | — | | $ | — | | $ | — | |
Total Common Stock | | — | | — | | — | | — | |
Preferred Stock | | 3,619,300 | | 6,122,688 | | — | | 9,741,988 | |
Purchased Options | | 22,000 | | 58,983 | | — | | 80,983 | |
Corporate Bonds/Notes | | 977,421 | | 350,155,925 | | 1,687,384 | | 352,820,730 | |
Collateralized Mortgage Obligations | | — | | 59,665,957 | | — | | 59,665,957 | |
Municipal Bonds | | — | | 49,427,732 | | — | | 49,427,732 | |
Short-Term Investments | | — | | 55,647,208 | | — | | 55,647,208 | |
U.S. Treasury Obligations | | — | | 297,505,340 | | — | | 297,505,340 | |
U.S. Government Agency Obligations | | — | | 566,612,978 | | — | | 566,612,978 | |
Foreign Government Bonds | | — | | 88,861,087 | | 1,002,310 | | 89,863,397 | |
Asset-Backed Securities | | — | | 1,904,374 | | — | | 1,904,374 | |
Total Investments, at value | | $ | 4,618,721 | | $ | 1,475,962,272 | | $ | 2,689,694 | | $ | 1,483,270,687 | |
Other Financial Instruments+ | | | | | | | | | |
Futures | | 2,990,229 | | — | | — | | 2,990,229 | |
Swaps | | 1,224,747 | | 7,996,018 | | — | | 9,220,765 | |
Forward Foreign Currency Contracts | | — | | 6,674,869 | | — | | 6,674,869 | |
Total Assets | | $ | 8,833,697 | | $ | 1,490,633,159 | | $ | 2,689,694 | | $ | 1,502,156,550 | |
Liabilities Table | | | | | | | | | |
Other Financial Instruments+ | | | | | | | | | |
Sales Commitments | | $ | — | | $ | (25,218,751 | ) | $ | — | | $ | (25,218,751 | ) |
Written Options | | (9,994 | ) | (952,126 | ) | — | | (962,120 | ) |
Swaps | | (8,732,977 | ) | (5,384,749 | ) | — | | (14,117,726 | ) |
Forward Foreign Currency Contracts | | — | | (4,276,214 | ) | — | | (4,276,214 | ) |
Total Liabilities | | $ | (8,742,971 | ) | $ | (35,831,840 | ) | $ | — | | $ | (44,574,811 | ) |
^ | See Note 2, “Significant Accounting Policies” in the Notes to Financial Statements for additional information. |
+ | Other Financial Instruments are derivatives not reflected in the Portfolio of Investments and may include open forward foreign currency contracts, equity forwards, futures, swaps, and written options. Forward foreign currency contracts, equity forwards and futures are valued at the unrealized gain (loss) on the instrument. Swaps and written options are valued at the fair value of the instrument. |
| |
| There were no significant transfers between Level 1 and 2 during the year endedDecember 31, 2011. |
| |
| Transfers in or out of Level 3 represent either the beginning value (for transfers in), or the ending value (for transfers out) of any security or derivative instrument where a change in the pricing level occurred from the beginning to the end of the period. Transfers are recognized at the end of the reporting period. |
At December 31, 2011 , the following forward foreign currency contracts were outstanding for the ING PIMCO Total Return Portfolio:
Counterparty | | Currency | | Contract Amount | | Buy/Sell | | Settlement Date | | In Exchange For | | Fair Value | | Unrealized
Appreciation
(Depreciation) | |
| | | | | | | | | | | | | | | |
Barclays Bank PLC | | EU Euro | | 1,084,000 | | Buy | | 01/17/12 | | $ | 1,436,371 | | $ | 1,403,129 | | $ | (33,242 | ) |
Barclays Bank PLC | | EU Euro | | 975,000 | | Buy | | 01/17/12 | | 1,340,006 | | 1,262,039 | | (77,967 | ) |
Barclays Bank PLC | | EU Euro | | 6,437,000 | | Buy | | 01/17/12 | | 8,904,450 | | 8,332,046 | | (572,404 | ) |
Barclays Bank PLC | | Mexican Peso | | 7,000,000 | | Buy | | 03/15/12 | | 504,432 | | 498,601 | | (5,831 | ) |
Barclays Bank PLC | | Mexican Peso | | 463,710 | | Buy | | 03/15/12 | | 33,202 | | 33,030 | | (172 | ) |
Barclays Bank PLC | | Mexican Peso | | 4,637,096 | | Buy | | 03/15/12 | | 330,136 | | 330,294 | | 158 | |
Barclays Bank PLC | | Chinese Yuan | | 12,550,000 | | Buy | | 02/13/12 | | 1,962,900 | | 1,992,152 | | 29,252 | |
Barclays Bank PLC | | Chinese Yuan | | 21,792,290 | | Buy | | 06/01/12 | | 3,419,203 | | 3,454,886 | | 35,683 | |
Barclays Bank PLC | | Chinese Yuan | | 5,189,653 | | Buy | | 06/01/12 | | 814,511 | | 822,753 | | 8,242 | |
Barclays Bank PLC | | Taiwan New Dollar | | 17,103,035 | | Buy | | 01/11/12 | | 596,756 | | 564,988 | | (31,768 | ) |
Barclays Bank PLC | | Chinese Yuan | | 4,473,000 | | Buy | | 06/01/12 | | 700,000 | | 709,136 | | 9,136 | |
Barclays Bank PLC | | Chinese Yuan | | 11,520,540 | | Buy | | 06/01/12 | | 1,800,000 | | 1,826,433 | | 26,433 | |
Citigroup, Inc. | | British Pound | | 366,000 | | Buy | | 01/04/12 | | 568,368 | | 568,372 | | 4 | |
Citigroup, Inc. | | Philippine Peso | | 170,355,000 | | Buy | | 03/15/12 | | 3,907,225 | | 3,869,773 | | (37,452 | ) |
Citigroup, Inc. | | Indonesian Rupiah | | 12,368,840,000 | | Buy | | 01/31/12 | | 1,363,258 | | 1,359,595 | | (3,663 | ) |
Citigroup, Inc. | | Chinese Yuan | | 3,834,120 | | Buy | | 06/01/12 | | 600,000 | | 607,850 | | 7,850 | |
Citigroup, Inc. | | Chinese Yuan | | 3,202,250 | | Buy | | 06/01/12 | | 500,000 | | 507,675 | | 7,675 | |
| | | | | | | | | | | | | | | | | | |
See Accompanying Notes to Financial Statements
70
Counterparty | | Currency | | Contract Amount | | Buy/Sell | | Settlement Date | | In Exchange For | | Fair Value | | Unrealized
Appreciation
(Depreciation) | |
Credit Suisse First Boston | | EU Euro | | 1,259,000 | | Buy | | 01/04/12 | | $ | 1,681,923 | | $ | 1,629,502 | | $ | (52,421 | ) |
Deutsche Bank AG | | EU Euro | | 2,065,000 | | Buy | | 01/17/12 | | 2,699,079 | | 2,672,934 | | (26,145 | ) |
Deutsche Bank AG | | EU Euro | | 861,000 | | Buy | | 01/17/12 | | 1,218,715 | | 1,114,477 | | (104,238 | ) |
Deutsche Bank AG | | EU Euro | | 8,851,000 | | Buy | | 01/17/12 | | 12,331,213 | | 11,456,725 | | (874,488 | ) |
Deutsche Bank AG | | EU Euro | | 327,000 | | Buy | | 01/17/12 | | 453,389 | | 423,269 | | (30,120 | ) |
Goldman Sachs & Co. | | EU Euro | | 1,259,000 | | Buy | | 02/02/12 | | 1,652,173 | | 1,629,841 | | (22,332 | ) |
HSBC | | Mexican Peso | | 410,871 | | Buy | | 03/15/12 | | 29,222 | | 29,266 | | 44 | |
HSBC | | Chinese Yuan | | 1,278,500 | | Buy | | 06/01/12 | | 200,000 | | 202,690 | | 2,690 | |
HSBC | | Chinese Yuan | | 1,278,100 | | Buy | | 06/01/12 | | 200,000 | | 202,626 | | 2,626 | |
HSBC | | Chinese Yuan | | 1,278,900 | | Buy | | 06/01/12 | | 200,000 | | 202,753 | | 2,753 | |
HSBC | | Chinese Yuan | | 1,278,600 | | Buy | | 06/01/12 | | 200,000 | | 202,706 | | 2,706 | |
HSBC | | Chinese Yuan | | 4,466,000 | | Buy | | 06/01/12 | | 700,000 | | 708,027 | | 8,027 | |
HSBC | | Chinese Yuan | | 1,276,700 | | Buy | | 06/01/12 | | 200,000 | | 202,404 | | 2,404 | |
HSBC | | Chinese Yuan | | 2,551,000 | | Buy | | 06/01/12 | | 400,000 | | 404,428 | | 4,428 | |
HSBC | | Chinese Yuan | | 3,838,800 | | Buy | | 06/01/12 | | 600,000 | | 608,592 | | 8,592 | |
HSBC | | Indonesian Rupiah | | 28,923,496,000 | | Buy | | 07/02/12 | | 3,201,272 | | 3,133,051 | | (68,221 | ) |
JPMorgan Chase & Co. | | EU Euro | | 550,000 | | Buy | | 01/17/12 | | 735,457 | | 711,919 | | (23,538 | ) |
JPMorgan Chase & Co. | | EU Euro | | 268,000 | | Buy | | 01/17/12 | | 359,226 | | 346,899 | | (12,327 | ) |
JPMorgan Chase & Co. | | Brazilian Real | | 15,939,883 | | Buy | | 03/02/12 | | 8,431,570 | | 8,428,321 | | (3,249 | ) |
JPMorgan Chase & Co. | | South African Rand | | 1,520,050 | | Buy | | 01/26/12 | | 208,412 | | 187,425 | | (20,987 | ) |
JPMorgan Chase & Co. | | Malaysian Ringgit | | 5,727,962 | | Buy | | 04/23/12 | | 1,888,547 | | 1,798,211 | | (90,336 | ) |
JPMorgan Chase & Co. | | Chinese Yuan | | 3,190,000 | | Buy | | 06/01/12 | | 500,000 | | 505,733 | | 5,733 | |
JPMorgan Chase & Co. | | Chinese Yuan | | 2,551,600 | | Buy | | 06/01/12 | | 400,000 | | 404,523 | | 4,523 | |
JPMorgan Chase & Co. | | Chinese Yuan | | 1,283,400 | | Buy | | 06/01/12 | | 200,000 | | 203,466 | | 3,466 | |
JPMorgan Chase & Co. | | Chinese Yuan | | 1,925,100 | | Buy | | 06/01/12 | | 300,000 | | 305,200 | | 5,200 | |
JPMorgan Chase & Co. | | Chinese Yuan | | 1,283,400 | | Buy | | 06/01/12 | | 200,000 | | 203,466 | | 3,466 | |
JPMorgan Chase & Co. | | Chinese Yuan | | 12,810,000 | | Buy | | 06/01/12 | | 2,000,000 | | 2,030,860 | | 30,860 | |
JPMorgan Chase & Co. | | Chinese Yuan | | 2,559,200 | | Buy | | 06/01/12 | | 400,000 | | 405,728 | | 5,728 | |
JPMorgan Chase & Co. | | Indian Rupee | | 183,483,000 | | Buy | | 07/12/12 | | 3,947,569 | | 3,345,453 | | (602,116 | ) |
Morgan Stanley | | Brazilian Real | | 27,657,091 | | Buy | | 01/04/12 | | 15,556,044 | | 14,812,301 | | (743,743 | ) |
Morgan Stanley | | Chinese Yuan | | 4,458,650 | | Buy | | 06/01/12 | | 700,000 | | 706,861 | | 6,861 | |
Morgan Stanley | | Philippine Peso | | 25,991,500 | | Buy | | 03/15/12 | | 596,888 | | 590,421 | | (6,467 | ) |
Royal Bank of Scotland | | Chinese Yuan | | 3,205,500 | | Buy | | 06/01/12 | | 500,000 | | 508,191 | | 8,191 | |
Royal Bank of Canada | | British Pound | | 5,442,000 | | Buy | | 01/04/12 | | 8,522,172 | | 8,451,046 | | (71,126 | ) |
Royal Bank of Canada | | EU Euro | | 444,000 | | Buy | | 01/17/12 | | 607,947 | | 574,713 | | (33,234 | ) |
UBS Warburg LLC | | Mexican Peso | | 2,000,000 | | Buy | | 03/15/12 | | 144,430 | | 142,457 | | (1,973 | ) |
| | | | | | | | | | | | | | $ | (3,316,829 | ) |
| | | | | | | | | | | | | | | |
Barclays Bank PLC | | British Pound | | 1,038,000 | | Sell | | 01/04/12 | | $ | 1,627,714 | | $ | 1,611,942 | | $ | 15,772 | |
Barclays Bank PLC | | EU Euro | | 1,351,000 | | Sell | | 01/17/12 | | 1,813,320 | | 1,748,733 | | 64,587 | |
Barclays Bank PLC | | Canadian Dollar | | 512,000 | | Sell | | 02/09/12 | | 501,971 | | 502,114 | | (143 | ) |
Barclays Bank PLC | | Canadian Dollar | | 4,000 | | Sell | | 02/09/12 | | 3,847 | | 3,922 | | (75 | ) |
Barclays Bank PLC | | EU Euro | | 400,000 | | Sell | | 01/17/12 | | 541,326 | | 517,760 | | 23,566 | |
Barclays Bank PLC | | EU Euro | | 200,000 | | Sell | | 01/17/12 | | 270,663 | | 258,880 | | 11,783 | |
Barclays Bank PLC | | Canadian Dollar | | 304,000 | | Sell | | 02/09/12 | | 300,593 | | 298,130 | | 2,463 | |
Barclays Bank PLC | | Canadian Dollar | | 16,000 | | Sell | | 02/09/12 | | 15,570 | | 15,691 | | (121 | ) |
Barclays Bank PLC | | South African Rand | | 220,050 | | Sell | | 01/26/12 | | 27,229 | | 27,133 | | 96 | |
See Accompanying Notes to Financial Statements
71
Counterparty | | Currency | | Contract Amount | | Buy/Sell | | Settlement Date | | In Exchange For | | Fair Value | | Unrealized
Appreciation
(Depreciation) | |
Barclays Bank PLC | | Japanese Yen | | 479,073,440 | | Sell | | 02/06/12 | | $ | 6,310,448 | | $ | 6,227,876 | | $ | 82,572 | |
Barclays Bank PLC | | Indonesian Rupiah | | 9,565,000,000 | | Sell | | 01/31/12 | | 1,065,145 | | 1,051,395 | | 13,750 | |
Barclays Bank PLC | | Taiwan New Dollar | | 7,942,035 | | Sell | | 01/11/12 | | 259,416 | | 262,360 | | (2,944 | ) |
Barclays Bank PLC | | Philippine Peso | | 4,800,000 | | Sell | | 03/15/12 | | 111,888 | | 109,036 | | 2,852 | |
Barclays Bank PLC | | Philippine Peso | | 6,218,137 | | Sell | | 03/15/12 | | 144,742 | | 141,250 | | 3,492 | |
Barclays Bank PLC | | Philippine Peso | | 8,100,000 | | Sell | | 03/15/12 | | 188,372 | | 183,999 | | 4,373 | |
Barclays Bank PLC | | Philippine Peso | | 115,187,863 | | Sell | | 03/15/12 | | 2,694,768 | | 2,616,599 | | 78,169 | |
Barclays Bank PLC | | Chinese Yuan | | 640,550 | | Sell | | 06/01/12 | | 100,000 | | 101,551 | | (1,551 | ) |
Barclays Bank PLC | | Indian Rupee | | 84,175,000 | | Sell | | 07/12/12 | | 1,631,615 | | 1,534,766 | | 96,849 | |
Barclays Bank PLC | | Indonesian Rupiah | | 1,914,000,000 | | Sell | | 07/02/12 | | 205,255 | | 207,329 | | (2,074 | ) |
Citigroup, Inc. | | EU Euro | | 743,000 | | Sell | | 01/17/12 | | 970,484 | | 961,739 | | 8,745 | |
Citigroup, Inc. | | EU Euro | | 1,090,000 | | Sell | | 01/17/12 | | 1,418,973 | | 1,410,895 | | 8,078 | |
Citigroup, Inc. | | EU Euro | | 444,000 | | Sell | | 01/17/12 | | 578,004 | | 574,714 | | 3,290 | |
Citigroup, Inc. | | EU Euro | | 800,000 | | Sell | | 01/17/12 | | 1,041,448 | | 1,035,519 | | 5,929 | |
Citigroup, Inc. | | EU Euro | | 282,000 | | Sell | | 01/17/12 | | 378,807 | | 365,020 | | 13,787 | |
Citigroup, Inc. | | Canadian Dollar | | 832,000 | | Sell | | 02/09/12 | | 800,077 | | 815,934 | | (15,857 | ) |
Citigroup, Inc. | | Canadian Dollar | | 729,000 | | Sell | | 02/09/12 | | 704,979 | | 714,923 | | (9,944 | ) |
Citigroup, Inc. | | Canadian Dollar | | 600,000 | | Sell | | 02/09/12 | | 586,984 | | 588,415 | | (1,431 | ) |
Citigroup, Inc. | | Canadian Dollar | | 300,000 | | Sell | | 02/09/12 | | 293,492 | | 294,207 | | (715 | ) |
Citigroup, Inc. | | Australian Dollar | | 100,000 | | Sell | | 02/23/12 | | 100,806 | | 101,642 | | (836 | ) |
Citigroup, Inc. | | Australian Dollar | | 100,000 | | Sell | | 02/23/12 | | 100,806 | | 101,642 | | (836 | ) |
Citigroup, Inc. | | Australian Dollar | | 399,000 | | Sell | | 02/23/12 | | 398,790 | | 405,550 | | (6,760 | ) |
Citigroup, Inc. | | Singapore Dollar | | 2,117,268 | | Sell | | 02/10/12 | | 1,657,106 | | 1,632,199 | | 24,907 | |
Citigroup, Inc. | | Australian Dollar | | 196,000 | | Sell | | 02/23/12 | | 193,706 | | 199,218 | | (5,512 | ) |
Citigroup, Inc. | | Japanese Yen | | 400,000,000 | | Sell | | 03/26/12 | | 5,154,706 | | 5,205,303 | | (50,597 | ) |
Citigroup, Inc. | | Japanese Yen | | 7,394,171 | | Sell | | 01/30/12 | | 96,520 | | 96,111 | | 409 | |
Citigroup, Inc. | | Japanese Yen | | 341,853,119 | | Sell | | 02/06/12 | | 4,502,908 | | 4,444,034 | | 58,874 | |
Citigroup, Inc. | | Japanese Yen | | 421,307,344 | | Sell | | 02/13/12 | | 5,397,363 | | 5,477,650 | | (80,287 | ) |
Citigroup, Inc. | | Philippine Peso | | 2,000,000 | | Sell | | 03/15/12 | | 45,075 | | 45,431 | | (356 | ) |
Citigroup, Inc. | | Philippine Peso | | 3,000,000 | | Sell | | 03/15/12 | | 67,492 | | 68,148 | | (656 | ) |
Citigroup, Inc. | | Malaysian Ringgit | | 5,727,962 | | Sell | | 04/23/12 | | 1,850,715 | | 1,798,210 | | 52,505 | |
Credit Suisse First Boston | | Chinese Yuan | | 1,277,400 | | Sell | | 06/01/12 | | 200,000 | | 202,515 | | (2,515 | ) |
Credit Suisse First Boston | | Japanese Yen | | 350,000,000 | | Sell | | 03/29/12 | | 4,504,157 | | 4,554,954 | | (50,797 | ) |
Deutsche Bank AG | | British Pound | | 100,000 | | Sell | | 01/04/12 | | 155,280 | | 155,293 | | (13 | ) |
Deutsche Bank AG | | EU Euro | | 881,000 | | Sell | | 01/17/12 | | 1,154,467 | | 1,140,366 | | 14,101 | |
Deutsche Bank AG | | EU Euro | | 1,500,000 | | Sell | | 01/17/12 | | 2,026,447 | | 1,941,598 | | 84,849 | |
Deutsche Bank AG | | Canadian Dollar | | 50,000 | | Sell | | 02/09/12 | | 48,513 | | 49,034 | | (521 | ) |
Deutsche Bank AG | | EU Euro | | 500,000 | | Sell | | 01/17/12 | | 691,447 | | 647,199 | | 44,248 | |
Deutsche Bank AG | | EU Euro | | 45,000 | | Sell | | 01/17/12 | | 62,230 | | 58,248 | | 3,982 | |
Deutsche Bank AG | | Canadian Dollar | | 819,000 | | Sell | | 02/09/12 | | 787,001 | | 803,186 | | (16,185 | ) |
Deutsche Bank AG | | EU Euro | | 100,000 | | Sell | | 01/17/12 | | 141,546 | | 129,439 | | 12,107 | |
Deutsche Bank AG | | Japanese Yen | | 7,394,171 | | Sell | | 01/30/12 | | 96,569 | | 96,111 | | 458 | |
Deutsche Bank AG | | Indian Rupee | | 35,644,000 | | Sell | | 07/12/12 | | 700,000 | | 649,898 | | 50,102 | |
Goldman Sachs & Co. | | EU Euro | | 1,259,000 | | Sell | | 01/04/12 | | 1,651,808 | | 1,629,502 | | 22,306 | |
Goldman Sachs & Co. | | EU Euro | | 100,000 | | Sell | | 01/17/12 | | 130,815 | | 129,439 | | 1,376 | |
Goldman Sachs & Co. | | EU Euro | | 499,000 | | Sell | | 01/17/12 | | 652,769 | | 645,905 | | 6,864 | |
Goldman Sachs & Co. | | British Pound | | 4,160,000 | | Sell | | 01/04/12 | | 6,508,965 | | 6,460,189 | | 48,776 | |
Goldman Sachs & Co. | | EU Euro | | 481,000 | | Sell | | 01/17/12 | | 644,619 | | 622,606 | | 22,013 | |
Goldman Sachs & Co. | | EU Euro | | 2,000,000 | | Sell | | 01/17/12 | | 2,680,330 | | 2,588,798 | | 91,532 | |
Goldman Sachs & Co. | | Canadian Dollar | | 309,000 | | Sell | | 02/09/12 | | 299,840 | | 303,033 | | (3,193 | ) |
Goldman Sachs & Co. | | Japanese Yen | | 6,304,391 | | Sell | | 01/30/12 | | 82,335 | | 81,945 | | 390 | |
Goldman Sachs & Co. | | Japanese Yen | | 591,000,000 | | Sell | | 02/21/12 | | 7,627,184 | | 7,685,076 | | (57,892 | ) |
Goldman Sachs & Co. | | Philippine Peso | | 8,570,000 | | Sell | | 03/15/12 | | 200,000 | | 194,676 | | 5,324 | |
| | | | | | | | | | | | | | | | | | |
See Accompanying Notes to Financial Statements
72
Counterparty | | Currency | | Contract Amount | | Buy/Sell | | Settlement Date | | In Exchange For | | Fair Value | | Unrealized
Appreciation
(Depreciation) | |
Goldman Sachs & Co. | | Indonesian Rupiah | | 176,336,000 | | Sell | | 07/02/12 | | $ | 18,951 | | $ | 19,101 | | $ | (150 | ) |
HSBC | | Brazilian Real | | 445,920 | | Sell | | 01/04/12 | | 240,000 | | 238,821 | | 1,179 | |
HSBC | | Brazilian Real | | 743,000 | | Sell | | 01/04/12 | | 400,000 | | 397,928 | | 2,072 | |
HSBC | | Brazilian Real | | 541,860 | | Sell | | 01/04/12 | | 300,000 | | 290,204 | | 9,796 | |
HSBC | | Danish Krone | | 15,573,000 | | Sell | | 03/08/12 | | 2,803,370 | | 2,713,509 | | 89,861 | |
HSBC | | Japanese Yen | | 561,135,612 | | Sell | | 02/13/12 | | 7,178,585 | | 7,295,634 | | (117,049 | ) |
HSBC | | Japanese Yen | | 280,000,000 | | Sell | | 02/21/12 | | 3,615,236 | | 3,640,984 | | (25,748 | ) |
HSBC | | Mexican Peso | | 2,659,400 | | Sell | | 03/15/12 | | 200,000 | | 189,426 | | 10,574 | |
HSBC | | Mexican Peso | | 2,658,700 | | Sell | | 03/15/12 | | 200,000 | | 189,376 | | 10,624 | |
HSBC | | Indonesian Rupiah | | 8,268,000,000 | | Sell | | 07/02/12 | | 885,272 | | 895,606 | | (10,334 | ) |
HSBC | | Indonesian Rupiah | | 3,965,000,000 | | Sell | | 07/02/12 | | 428,649 | | 429,497 | | (848 | ) |
JPMorgan Chase & Co. | | British Pound | | 100,000 | | Sell | | 01/04/12 | | 154,882 | | 155,294 | | (412 | ) |
JPMorgan Chase & Co. | | Brazilian Real | | 15,939,883 | | Sell | | 01/04/12 | | 8,535,413 | | 8,536,920 | | (1,507 | ) |
JPMorgan Chase & Co. | | British Pound | | 410,000 | | Sell | | 01/04/12 | | 641,004 | | 636,701 | | 4,303 | |
JPMorgan Chase & Co. | | EU Euro | | 543,000 | | Sell | | 01/17/12 | | 706,594 | | 702,859 | | 3,735 | |
JPMorgan Chase & Co. | | Canadian Dollar | | 397,000 | | Sell | | 02/09/12 | | 383,542 | | 389,335 | | (5,793 | ) |
JPMorgan Chase & Co. | | EU Euro | | 1,731,000 | | Sell | | 01/17/12 | | 2,339,637 | | 2,240,605 | | 99,032 | |
JPMorgan Chase & Co. | | Canadian Dollar | | 511,000 | | Sell | | 02/09/12 | | 496,792 | | 501,133 | | (4,341 | ) |
JPMorgan Chase & Co. | | Canadian Dollar | | 710,000 | | Sell | | 02/09/12 | | 693,166 | | 696,290 | | (3,124 | ) |
JPMorgan Chase & Co. | | Canadian Dollar | | 1,000 | | Sell | | 02/09/12 | | 980 | | 981 | | (1 | ) |
JPMorgan Chase & Co. | | Canadian Dollar | | 712,000 | | Sell | | 02/09/12 | | 697,533 | | 698,251 | | (718 | ) |
JPMorgan Chase & Co. | | Canadian Dollar | | 425,000 | | Sell | | 02/09/12 | | 418,975 | | 416,793 | | 2,182 | |
JPMorgan Chase & Co. | | EU Euro | | 572,000 | | Sell | | 01/17/12 | | 779,017 | | 740,396 | | 38,621 | |
JPMorgan Chase & Co. | | Canadian Dollar | | 260,000 | | Sell | | 02/09/12 | | 254,703 | | 254,980 | | (277 | ) |
JPMorgan Chase & Co. | | Canadian Dollar | | 310,000 | | Sell | | 02/09/12 | | 304,860 | | 304,014 | | 846 | |
JPMorgan Chase & Co. | | Canadian Dollar | | 1,858,000 | | Sell | | 02/09/12 | | 1,799,220 | | 1,822,123 | | (22,903 | ) |
JPMorgan Chase & Co. | | Brazilian Real | | 2,475,900 | | Sell | | 01/04/12 | | 1,400,871 | | 1,326,017 | | 74,854 | |
JPMorgan Chase & Co. | | Canadian Dollar | | 3,000 | | Sell | | 02/09/12 | | 2,916 | | 2,942 | | (26 | ) |
JPMorgan Chase & Co. | | South African Rand | | 600,000 | | Sell | | 01/26/12 | | 74,667 | | 73,981 | | 686 | |
JPMorgan Chase & Co. | | South African Rand | | 700,000 | | Sell | | 01/26/12 | | 87,058 | | 86,311 | | 747 | |
JPMorgan Chase & Co. | | EU Euro | | 68,888,000 | | Sell | | 01/17/12 | | 93,665,291 | | 89,168,556 | | 4,496,735 | |
JPMorgan Chase & Co. | | Japanese Yen | | 7,394,171 | | Sell | | 01/30/12 | | 96,517 | | 96,110 | | 407 | |
JPMorgan Chase & Co. | | Japanese Yen | | 479,073,440 | | Sell | | 02/06/12 | | 6,310,240 | | 6,227,876 | | 82,364 | |
JPMorgan Chase & Co. | | Philippine Peso | | 4,314,500 | | Sell | | 03/15/12 | | 100,000 | | 98,008 | | 1,992 | |
JPMorgan Chase & Co. | | Philippine Peso | | 13,272,000 | | Sell | | 03/15/12 | | 300,000 | | 301,486 | | (1,486 | ) |
JPMorgan Chase & Co. | | Philippine Peso | | 26,532,000 | | Sell | | 03/15/12 | | 600,000 | | 602,699 | | (2,699 | ) |
JPMorgan Chase & Co. | | Chinese Yuan | | 1,277,500 | | Sell | | 06/01/12 | | 200,000 | | 202,531 | | (2,531 | ) |
JPMorgan Chase & Co. | | Chinese Yuan | | 638,250 | | Sell | | 06/01/12 | | 100,000 | | 101,186 | | (1,186 | ) |
| | | | | | | | | | | | | | | | | | |
See Accompanying Notes to Financial Statements
73
Counterparty | | Currency | | Contract Amount | | Buy/Sell | | Settlement Date | | In Exchange For | | Fair Value | | Unrealized
Appreciation
(Depreciation) | |
JPMorgan Chase & Co. | | Philippine Peso | | 4,352,000 | | Sell | | 03/15/12 | | $ | 100,000 | | $ | 98,860 | | $ | 1,140 | |
JPMorgan Chase & Co. | | Indian Rupee | | 16,500,000 | | Sell | | 07/12/12 | | 324,509 | | 300,845 | | 23,664 | |
JPMorgan Chase & Co. | | Indian Rupee | | 21,719,000 | | Sell | | 07/12/12 | | 426,699 | | 396,003 | | 30,696 | |
JPMorgan Chase & Co. | | Indian Rupee | | 25,445,000 | | Sell | | 07/12/12 | | 500,000 | | 463,940 | | 36,060 | |
Morgan Stanley | | Brazilian Real | | 377,500 | | Sell | | 01/04/12 | | 200,000 | | 202,178 | | (2,178 | ) |
Morgan Stanley | | Brazilian Real | | 674,373 | | Sell | | 01/04/12 | | 357,000 | | 361,174 | | (4,174 | ) |
Morgan Stanley | | Brazilian Real | | 1,756,550 | | Sell | | 01/04/12 | | 950,000 | | 940,755 | | 9,245 | |
Morgan Stanley | | Brazilian Real | | 557,100 | | Sell | | 01/04/12 | | 300,000 | | 298,366 | | 1,634 | |
Morgan Stanley | | EU Euro | | 738,000 | | Sell | | 01/17/12 | | 965,887 | | 955,266 | | 10,621 | |
Morgan Stanley | | Canadian Dollar | | 720,000 | | Sell | | 02/09/12 | | 701,139 | | 706,097 | | (4,958 | ) |
Morgan Stanley | | Canadian Dollar | | 199,000 | | Sell | | 02/09/12 | | 193,023 | | 195,157 | | (2,134 | ) |
Morgan Stanley | | Indonesian Rupiah | | 10,765,000,000 | | Sell | | 01/31/12 | | 1,191,873 | | 1,183,299 | | 8,574 | |
Morgan Stanley | | Taiwan New Dollar | | 6,104,000 | | Sell | | 01/11/12 | | 200,000 | | 201,642 | | (1,642 | ) |
Morgan Stanley | | Taiwan New Dollar | | 3,057,000 | | Sell | | 01/11/12 | | 100,000 | | 100,986 | | (986 | ) |
Morgan Stanley | | Mexican Peso | | 4,011,300 | | Sell | | 03/15/12 | | 300,000 | | 285,720 | | 14,280 | |
Royal Bank of Canada | | EU Euro | | 1,271,000 | | Sell | | 01/17/12 | | 1,679,321 | | 1,645,181 | | 34,140 | |
Royal Bank of Canada | | British Pound | | 5,442,000 | | Sell | | 02/02/12 | | 8,520,022 | | 8,448,762 | | 71,260 | |
Royal Bank of Canada | | Canadian Dollar | | 415,000 | | Sell | | 02/09/12 | | 401,842 | | 406,987 | | (5,145 | ) |
Royal Bank of Canada | | Canadian Dollar | | 622,000 | | Sell | | 02/09/12 | | 600,869 | | 609,990 | | (9,121 | ) |
Royal Bank of Canada | | EU Euro | | 986,000 | | Sell | | 01/17/12 | | 1,317,907 | | 1,276,277 | | 41,630 | |
Royal Bank of Canada | | Canadian Dollar | | 15,688,000 | | Sell | | 02/09/12 | | 15,397,526 | | 15,385,070 | | 12,456 | |
UBS Warburg LLC | | Brazilian Real | | 376,400 | | Sell | | 01/04/12 | | 200,000 | | 201,588 | | (1,588 | ) |
UBS Warburg LLC | | Brazilian Real | | 377,100 | | Sell | | 01/04/12 | | 200,000 | | 201,963 | | (1,963 | ) |
UBS Warburg LLC | | Brazilian Real | | 1,757,025 | | Sell | | 01/04/12 | | 950,000 | | 941,009 | | 8,991 | |
UBS Warburg LLC | | Brazilian Real | | 371,100 | | Sell | | 01/04/12 | | 200,000 | | 198,750 | | 1,250 | |
UBS Warburg LLC | | EU Euro | | 2,378,000 | | Sell | | 01/17/12 | | 3,101,369 | | 3,078,081 | | 23,288 | |
UBS Warburg LLC | | EU Euro | | 696,000 | | Sell | | 01/17/12 | | 905,711 | | 900,902 | | 4,809 | |
UBS Warburg LLC | | EU Euro | | 1,892,000 | | Sell | | 01/17/12 | | 2,532,302 | | 2,449,003 | | 83,299 | |
UBS Warburg LLC | | Canadian Dollar | | 102,000 | | Sell | | 02/09/12 | | 99,894 | | 100,030 | | (136 | ) |
UBS Warburg LLC | | Canadian Dollar | | 11,000 | | Sell | | 02/09/12 | | 10,606 | | 10,788 | | (182 | ) |
UBS Warburg LLC | | Canadian Dollar | | 311,000 | | Sell | | 02/09/12 | | 299,847 | | 304,994 | | (5,147 | ) |
UBS Warburg LLC | | EU Euro | | 861,000 | | Sell | | 01/17/12 | | 1,165,316 | | 1,114,477 | | 50,839 | |
UBS Warburg LLC | | Brazilian Real | | 721,760 | | Sell | | 01/04/12 | | 400,000 | | 386,553 | | 13,447 | |
UBS Warburg LLC | | Brazilian Real | | 541,620 | | Sell | | 01/04/12 | | 300,000 | | 290,075 | | 9,925 | |
UBS Warburg LLC | | Indonesian Rupiah | | 6,639,000,000 | | Sell | | 01/31/12 | | 734,809 | | 729,765 | | 5,044 | |
UBS Warburg LLC | | Japanese Yen | | 1,513,096 | | Sell | | 01/30/12 | | 19,764 | | 19,667 | | 97 | |
UBS Warburg LLC | | Japanese Yen | | 249,000,000 | | Sell | | 02/21/12 | | 3,213,857 | | 3,237,875 | | (24,018 | ) |
UBS Warburg LLC | | Mexican Peso | | 1,329,150 | | Sell | | 03/15/12 | | 100,000 | | 94,674 | | 5,326 | |
UBS Warburg LLC | | Mexican Peso | | 1,329,150 | | Sell | | 03/15/12 | | 100,000 | | 94,674 | | 5,326 | |
UBS Warburg LLC | | Mexican Peso | | 5,346,000 | | Sell | | 03/15/12 | | 400,000 | | 380,789 | | 19,211 | |
UBS Warburg LLC | | Chinese Yuan | | 1,277,400 | | Sell | | 06/01/12 | | 200,000 | | 202,515 | | (2,515 | ) |
Westpac | | Japanese Yen | | 707,557,044 | | Sell | | 02/13/12 | | 9,051,516 | | 9,199,339 | | (147,823 | ) |
| | | | | | | | | | | | | | $ | 5,715,484 | |
| | | | | | | | | | | | | | | | | | |
ING PIMCO Total Return Portfolio Open Futures Contracts on December 31, 2011:
Contract Description | | Number
of Contracts | | Expiration
Date | | Notional
Value | | Unrealized
Appreciation/
(Depreciation) | |
Long Contracts | | | | | | | | | |
90-Day Eurodollar | | 477 | | 06/18/12 | | $ | 118,409,288 | | $ | 7,004 | |
90-Day Eurodollar | | 976 | | 03/18/13 | | 242,170,000 | | 854,658 | |
90-Day Eurodollar | | 667 | | 06/17/13 | | 165,474,363 | | 713,359 | |
90-Day Eurodollar | | 231 | | 09/16/13 | | 57,293,775 | | 330,141 | |
90-Day Eurodollar | | 73 | | 12/16/13 | | 18,095,788 | | 22,810 | |
90-Day Eurodollar | | 160 | | 03/17/14 | | 39,628,000 | | 282,217 | |
| | | | | | | | | | | |
See Accompanying Notes to Financial Statements
74
Contract Description | | Number
of Contracts | | Expiration
Date | | Notional
Value | | Unrealized
Appreciation/
(Depreciation) | |
90-Day Eurodollar | | 53 | | 06/16/14 | | $ | 13,108,887 | | $ | 5,465 | |
90-Day Eurodollar (NYL) | | 35 | | 12/19/12 | | 8,683,938 | | 16,595 | |
90-Day Eurodollar (NYL) | | 162 | | 03/18/13 | | 40,196,250 | | 5,687 | |
U.S. Treasury 10-Year Note | | 598 | | 03/21/12 | | 78,412,750 | | 532,465 | |
U.S. Treasury 5-Year Note | | 587 | | 03/30/12 | | 72,352,334 | | 219,828 | |
| | | | | | $ | 853,825,373 | | $ | 2,990,229 | |
ING PIMCO Total Return Portfolio Over-the-Counter Credit Default Swap Agreements Outstanding on December 31, 2011:
Credit Default Swaps on Credit Indices - Sell Protection(1)
Counterparty | | Reference
Entity/Obligation | | Buy/Sell
Protection | | (Pay)/
Receive
Fixed
Rate (%) | | Termination
Date | | Notional Amount(2) | | Fair
Value(3) | | Upfront
Payments
Paid/
(Received) | | Unrealized
Appreciation/
(Depreciation) | |
Barclays Bank PLC | | CDX.EM.13 Index | | Sell | | 5.000 | | 06/20/15 | | USD | 7,500,000 | | $ | 534,357 | | $ | 680,701 | | $ | (146,344 | ) |
Deutsche Bank AG | | CDX.EM.13 Index | | Sell | | 5.000 | | 06/20/15 | | USD | 900,000 | | 64,123 | | 79,184 | | (15,061 | ) |
Goldman Sachs & Co. | | CDX.EM.13 Index | | Sell | | 5.000 | | 06/20/15 | | USD | 200,000 | | 14,250 | | 16,761 | | (2,511 | ) |
HSBC | | CDX.EM.13 Index | | Sell | | 5.000 | | 06/20/15 | | USD | 5,600,000 | | 398,987 | | 466,680 | | (67,693 | ) |
Morgan Stanley | | CDX.EM.13 Index | | Sell | | 5.000 | | 06/20/15 | | USD | 3,000,000 | | 213,743 | | 245,082 | | (31,339 | ) |
Barclays Bank PLC | | CDX.EM.14 Index | | Sell | | 5.000 | | 12/20/15 | | USD | 5,300,000 | | 415,181 | | 569,529 | | (154,348 | ) |
Citigroup, Inc. | | CDX.EM.14 Index | | Sell | | 5.000 | | 12/20/15 | | USD | 4,900,000 | | 383,846 | | 502,579 | | (118,733 | ) |
Deutsche Bank AG | | CDX.EM.14 Index | | Sell | | 5.000 | | 12/20/15 | | USD | 800,000 | | 62,669 | | 73,914 | | (11,245 | ) |
HSBC | | CDX.EM.14 Index | | Sell | | 5.000 | | 12/20/15 | | USD | 700,000 | | 54,835 | | 69,338 | | (14,503 | ) |
Morgan Stanley | | CDX.EM.14 Index | | Sell | | 5.000 | | 12/20/15 | | USD | 1,400,000 | | 109,670 | | 138,144 | | (28,474 | ) |
UBS Warburg LLC | | CDX.EM.14 Index | | Sell | | 5.000 | | 12/20/15 | | USD | 300,000 | | 23,501 | | 31,671 | | (8,170 | ) |
Barclays Bank PLC | | CDX.EM.15 Index | | Sell | | 5.000 | | 06/20/16 | | USD | 800,000 | | 66,816 | | 78,902 | | (12,086 | ) |
Deutsche Bank AG | | CDX.EM.15 Index | | Sell | | 5.000 | | 06/20/16 | | USD | 200,000 | | 16,704 | | 23,071 | | (6,367 | ) |
Citigroup, Inc. | | CDX.NA.HY.8 Index (35-100% Tranche) | | Sell | | 0.401 | | 06/20/12 | | USD | 948,370 | | 1,356 | | — | | 1,356 | |
Deutsche Bank AG | | CDX.NA.IG.10 Index (30-100% Tranche) | | Sell | | 0.530 | | 06/20/13 | | USD | 964,499 | | 7,323 | | — | | 7,323 | |
Deutsche Bank AG | | CDX.NA.IG.9 Index (30-100% Tranche) | | Sell | | 0.708 | | 12/20/12 | | USD | 2,893,497 | | 20,110 | | — | | 20,110 | |
Goldman Sachs & Co. | | CDX.NA.IG.9 Index (30-100% Tranche) | | Sell | | 0.548 | | 12/20/17 | | USD | 675,149 | | 8,731 | | — | | 8,731 | |
| | | | | | | | | | | | | $ | 2,396,202 | | $ | 2,975,556 | | $ | (579,354 | ) |
Credit Default Swaps on Corporate and Sovereign Issues - Sell Protection(1)
Counterparty | | Reference
Entity/Obligation | | Buy/Sell
Protection | | (Pay)/
Receive
Fixed
Rate (%) | | Termination
Date | | Implied
Credit
Spread at
12/31/11
(%) (4) | | Notional
Amount(2) | | Fair
Value(3) | | Upfront
Payments
Paid/
(Received) | | Unrealized
Appreciation/
(Depreciation) | |
Citigroup, Inc. | | Federal Republic of Germany | | Sell | | 0.250 | | 12/20/16 | | 0.989 | | USD | 600,000 | | $ | (21,141 | ) | $ | (22,672 | ) | $ | 1,531 | |
Goldman Sachs & Co. | | Federal Republic of Germany | | Sell | | 0.250 | | 12/20/16 | | 0.989 | | USD | 1,100,000 | | (38,758 | ) | (41,316 | ) | 2,558 | |
Barclays Bank PLC | | Federative Republic of Brazil | | Sell | | 1.000 | | 06/20/15 | | 1.306 | | USD | 500,000 | | (5,167 | ) | (4,774 | ) | (393 | ) |
Barclays Bank PLC | | Federative Republic of Brazil | | Sell | | 1.000 | | 06/20/16 | | 1.476 | | USD | 2,900,000 | | (59,196 | ) | (3,657 | ) | (55,539 | ) |
Citigroup, Inc. | | Federative Republic of Brazil | | Sell | | 1.000 | | 06/20/15 | | 1.306 | | USD | 500,000 | | (5,167 | ) | (9,541 | ) | 4,374 | |
Citigroup, Inc. | | Federative Republic of Brazil | | Sell | | 1.000 | | 09/20/15 | | 1.350 | | USD | 1,000,000 | | (12,639 | ) | (11,551 | ) | (1,088 | ) |
Citigroup, Inc. | | Federative Republic of Brazil | | Sell | | 1.000 | | 06/20/16 | | 1.476 | | USD | 4,800,000 | | (97,980 | ) | (10,126 | ) | (87,854 | ) |
Deutsche Bank AG | | Federative Republic of Brazil | | Sell | | 1.000 | | 06/20/16 | | 1.476 | | USD | 1,100,000 | | (22,454 | ) | (2,313 | ) | (20,141 | ) |
Goldman Sachs & Co. | | Federative Republic of Brazil | | Sell | | 1.000 | | 06/20/15 | | 1.306 | | USD | 500,000 | | (5,167 | ) | (4,458 | ) | (709 | ) |
Goldman Sachs & Co. | | Federative Republic of Brazil | | Sell | | 1.000 | | 09/20/16 | | 1.525 | | USD | 500,000 | | (11,827 | ) | (2,799 | ) | (9,028 | ) |
| | | | | | | | | | | | | | | | | | | | | | | |
See Accompanying Notes to Financial Statements
75
Counterparty | | Reference
Entity/Obligation | | Buy/Sell
Protection | | (Pay)/
Receive
Fixed
Rate (%) | | Termination
Date | | Implied
Credit
Spread at
12/31/11
(%) (4) | | Notional
Amount(2) | | Fair
Value(3) | | Upfront
Payments
Paid/
(Received) | | Unrealized
Appreciation/
(Depreciation) | |
HSBC | | Federative Republic of Brazil | | Sell | | 1.000 | | 06/20/15 | | 1.306 | | USD | 800,000 | | $ | (8,267 | ) | $ | (14,766 | ) | $ | 6,499 | |
HSBC | | Federative Republic of Brazil | | Sell | | 1.000 | | 06/20/15 | | 1.306 | | USD | 1,600,000 | | (16,535 | ) | (11,738 | ) | (4,797 | ) |
HSBC | | Federative Republic of Brazil | | Sell | | 1.000 | | 09/20/15 | | 1.350 | | USD | 900,000 | | (11,375 | ) | (6,636 | ) | (4,739 | ) |
HSBC | | Federative Republic of Brazil | | Sell | | 1.000 | | 03/20/16 | | 1.422 | | USD | 600,000 | | (10,276 | ) | (1,781 | ) | (8,495 | ) |
HSBC | | Federative Republic of Brazil | | Sell | | 1.000 | | 06/20/16 | | 1.476 | | USD | 3,500,000 | | (71,444 | ) | (4,414 | ) | (67,030 | ) |
UBS Warburg LLC | | Federative Republic of Brazil | | Sell | | 1.000 | | 09/20/15 | | 1.350 | | USD | 500,000 | | (6,320 | ) | (3,507 | ) | (2,813 | ) |
Barclays Bank PLC | | General Electric Capital Corp. | | Sell | | 0.640 | | 12/20/12 | | 1.562 | | USD | 1,200,000 | | (10,748 | ) | — | | (10,748 | ) |
BNP Paribas Bank | | General Electric Capital Corp. | | Sell | | 4.700 | | 12/20/13 | | 1.936 | | USD | 600,000 | | 31,985 | | — | | 31,985 | |
Citigroup, Inc. | | General Electric Capital Corp. | | Sell | | 4.325 | | 12/20/13 | | 1.936 | | USD | 300,000 | | 13,823 | | — | | 13,823 | |
Morgan Stanley | | General Electric Capital Corp. | | Sell | | 1.000 | | 12/20/15 | | 2.342 | | USD | 1,700,000 | | (84,369 | ) | (26,257 | ) | (58,112 | ) |
Deutsche Bank AG | | Government of France O.A.T. | | Sell | | 0.250 | | 03/20/16 | | 2.031 | | USD | 900,000 | | (63,295 | ) | (29,620 | ) | (33,675 | ) |
Morgan Stanley | | Government of France O.A.T. | | Sell | | 0.250 | | 03/20/16 | | 2.031 | | USD | 500,000 | | (35,164 | ) | (14,000 | ) | (21,164 | ) |
Royal Bank of Scotland Group PLC | | Government of France O.A.T. | | Sell | | 0.250 | | 12/20/15 | | 1.997 | | USD | 700,000 | | (45,712 | ) | (10,666 | ) | (35,046 | ) |
Royal Bank of Scotland Group PLC | | Government of France O.A.T. | | Sell | | 0.250 | | 03/20/16 | | 2.031 | | USD | 500,000 | | (35,164 | ) | (13,808 | ) | (21,356 | ) |
UBS Warburg LLC | | Government of France O.A.T. | | Sell | | 0.250 | | 03/20/16 | | 2.031 | | USD | 800,000 | | (56,262 | ) | (26,304 | ) | (29,958 | ) |
Deutsche Bank AG | | Japanese Government 20-Year Issue | | Sell | | 1.000 | | 03/20/15 | | 1.080 | | USD | 1,000,000 | | (2,517 | ) | 7,379 | | (9,896 | ) |
Citigroup, Inc. | | Metlife Inc. | | Sell | | 1.000 | | 12/20/15 | | 3.060 | | USD | 2,900,000 | | (216,627 | ) | (83,384 | ) | (133,243 | ) |
Deutsche Bank AG | | Metlife Inc. | | Sell | | 1.000 | | 03/20/18 | | 3.305 | | USD | 2,500,000 | | (301,603 | ) | (125,824 | ) | (175,779 | ) |
UBS Warburg LLC | | Metlife Inc. | | Sell | | 1.000 | | 12/20/15 | | 3.060 | | USD | 1,600,000 | | (119,518 | ) | (68,497 | ) | (51,021 | ) |
Barclays Bank PLC | | Morgan Stanley | | Sell | | 1.000 | | 09/20/12 | | 4.707 | | USD | 100,000 | | (2,641 | ) | (1,351 | ) | (1,290 | ) |
Barclays Bank PLC | | People’s Republic of China | | Sell | | 1.000 | | 03/20/16 | | 1.290 | | USD | 1,000,000 | | (11,732 | ) | 9,825 | | (21,557 | ) |
Deutsche Bank AG | | People’s Republic of China | | Sell | | 1.000 | | 03/20/15 | | 1.087 | | USD | 5,000,000 | | (13,660 | ) | 17,927 | | (31,587 | ) |
Deutsche Bank AG | | People’s Republic of China | | Sell | | 1.000 | | 09/20/16 | | 1.403 | | USD | 400,000 | | (7,235 | ) | 1,990 | | (9,225 | ) |
Goldman Sachs & Co. | | People’s Republic of China | | Sell | | 1.000 | | 09/20/16 | | 1.403 | | USD | 100,000 | | (1,809 | ) | 493 | | (2,302 | ) |
Morgan Stanley | | People’s Republic of China | | Sell | | 1.000 | | 09/20/16 | | 1.403 | | USD | 600,000 | | (10,852 | ) | 2,815 | | (13,667 | ) |
UBS Warburg LLC | | People’s Republic of China | | Sell | | 1.000 | | 09/20/16 | | 1.403 | | USD | 300,000 | | (5,426 | ) | 1,403 | | (6,829 | ) |
Goldman Sachs & Co. | | Republic of France | | Sell | | 0.250 | | 12/20/16 | | 2.168 | | USD | 4,600,000 | | (402,241 | ) | (328,144 | ) | (74,097 | ) |
HSBC | | Republic of France | | Sell | | 0.250 | | 09/20/16 | | 2.128 | | USD | 300,000 | | (24,565 | ) | (10,494 | ) | (14,071 | ) |
UBS Warburg LLC | | Republic of France | | Sell | | 0.250 | | 09/20/16 | | 2.128 | | USD | 100,000 | | (8,188 | ) | (4,881 | ) | (3,307 | ) |
UBS Warburg LLC | | Republic of Indonesia | | Sell | | 1.000 | | 09/20/16 | | 1.997 | | USD | 300,000 | | (13,179 | ) | (4,353 | ) | (8,826 | ) |
Barclays Bank PLC | | Republic of Italy | | Sell | | 1.000 | | 03/20/16 | | 4.859 | | USD | 800,000 | | (109,341 | ) | (25,505 | ) | (83,836 | ) |
Goldman Sachs & Co. | | Republic of Italy | | Sell | | 1.000 | | 03/20/16 | | 4.859 | | USD | 2,800,000 | | (382,694 | ) | (77,743 | ) | (304,951 | ) |
Goldman Sachs & Co. | | Republic of Italy | | Sell | | 1.000 | | 03/20/16 | | 4.859 | | USD | 200,000 | | (27,335 | ) | (6,303 | ) | (21,032 | ) |
Goldman Sachs & Co. | | Republic of Italy | | Sell | | 1.000 | | 06/20/16 | | 4.846 | | USD | 1,000,000 | | (142,762 | ) | (16,871 | ) | (125,891 | ) |
Goldman Sachs & Co. | | Republic of Italy | | Sell | | 1.000 | | 06/20/16 | | 4.846 | | USD | 16,400,000 | | (2,341,304 | ) | (267,741 | ) | (2,073,563 | ) |
Deutsche Bank AG | | Reynolds American Inc. | | Sell | | 1.280 | | 06/20/17 | | 2.076 | | USD | 600,000 | | (24,067 | ) | — | | (24,067 | ) |
| | | | | | | | | | | | | | | | | | | | | | | |
See Accompanying Notes to Financial Statements
76
Counterparty | | Reference
Entity/Obligation | | Buy/Sell
Protection | | (Pay)/
Receive
Fixed
Rate (%) | | Termination
Date | | Implied
Credit
Spread at
12/31/11
(%) (4) | | Notional
Amount(2) | | Fair
Value(3) | | Upfront
Payments
Paid/
(Received) | | Unrealized
Appreciation/
(Depreciation) | |
Citigroup, Inc. | | Ruplic of Kazakhstan | | Sell | | 1.000 | | 03/20/16 | | 2.874 | | USD | 300,000 | | $ | (22,016 | ) | $ | (7,118 | ) | $ | (14,898 | ) |
Deutsche Bank AG | | Ruplic of Kazakhstan | | Sell | | 1.000 | | 03/20/16 | | 2.874 | | USD | 300,000 | | (22,016 | ) | (7,461 | ) | (14,555 | ) |
HSBC | | Ruplic of Kazakhstan | | Sell | | 1.000 | | 03/20/16 | | 2.874 | | USD | 400,000 | | (29,355 | ) | (9,644 | ) | (19,711 | ) |
Goldman Sachs & Co. | | Spanish Government Bond | | Sell | | 1.000 | | 03/20/16 | | 3.724 | | USD | 300,000 | | (30,295 | ) | (16,640 | ) | (13,655 | ) |
Goldman Sachs & Co. | | Spanish Government Bond | | Sell | | 1.000 | | 06/20/16 | | 3.736 | | USD | 1,000,000 | | (106,475 | ) | (51,672 | ) | (54,803 | ) |
Citigroup, Inc. | | United Kingdom Gilt | | Sell | | 1.000 | | 12/20/16 | | 0.946 | | USD | 6,100,000 | | 15,798 | | 23,040 | | (7,242 | ) |
Goldman Sachs & Co. | | United Kingdom Gilt | | Sell | | 1.000 | | 06/20/15 | | 0.703 | | USD | 4,600,000 | | 46,554 | | 28,098 | | 18,456 | |
Goldman Sachs & Co. | | United Kingdom Gilt | | Sell | | 1.000 | | 12/20/15 | | 0.792 | | USD | 1,000,000 | | 8,059 | | 17,801 | | (9,742 | ) |
Goldman Sachs & Co. | | United Kingdom Gilt | | Sell | | 1.000 | | 12/20/15 | | 0.792 | | USD | 800,000 | | 6,447 | | 14,101 | | (7,654 | ) |
Goldman Sachs & Co. | | United Kingdom Gilt | | Sell | | 1.000 | | 12/20/16 | | 0.946 | | USD | 4,100,000 | | 10,618 | | 11,604 | | (986 | ) |
Morgan Stanley | | United Kingdom Gilt | | Sell | | 1.000 | | 06/20/16 | | 0.872 | | USD | 400,000 | | 2,215 | | 6,161 | | (3,946 | ) |
Barclays Bank PLC | | United Mexican States | | Sell | | 1.000 | | 03/20/15 | | 1.173 | | USD | 600,000 | | (3,272 | ) | (8,480 | ) | 5,208 | |
Citigroup, Inc. | | United Mexican States | | Sell | | 1.000 | | 03/20/15 | | 1.173 | | USD | 600,000 | | (3,272 | ) | (8,654 | ) | 5,382 | |
Citigroup, Inc. | | United Mexican States | | Sell | | 1.000 | | 09/20/15 | | 1.281 | | USD | 1,000,000 | | (10,166 | ) | (11,178 | ) | 1,012 | |
Citigroup, Inc. | | United Mexican States | | Sell | | 1.000 | | 03/20/16 | | 1.362 | | USD | 8,000,000 | | (117,835 | ) | (37,894 | ) | (79,941 | ) |
Deutsche Bank AG | | United Mexican States | | Sell | | 1.000 | | 03/20/15 | | 1.173 | | USD | 200,000 | | (1,091 | ) | (2,885 | ) | 1,794 | |
UBS Warburg LLC | | United States Treasury Note | | Sell | | 0.250 | | 09/20/15 | | 0.411 | | EUR | 5,000,000 | | (37,912 | ) | (53,004 | ) | 15,092 | |
| | | | | | | | | | | | | | (5,151,929 | ) | (1,369,788 | ) | $ | (3,782,141 | ) |
| | | | | | | | | | | | | | | | | | | | | | | |
(1) | If the Portfolio is a seller of protection, and a credit event occurs, as defined under the terms of that particular swap agreement, the Portfolio will generally either 1.) Pay to the buyer an amount equal to the notional amount of the swap and take delivery of the referenced obligation, other deliverable obligations, or underlying securities comprising a referenced index or 2.) Pay a net settlement amount in the form of cash or securities equal to the notional amount of the swap less the recovery value of the referenced obligation or underlying securities comprising a referenced index. |
(2) | The maximum amount of future payments (undiscounted) that a Portfolio as seller of protection could be required to make or receive as a buyer of credit protection under a credit default swap agreement would be an amount equal to the notional amount of the agreement. |
(3) | The fair values for credit default swap agreements serve as an indicator of the current status of the payment/performance risk and represent the likelihood or risk of default for the credit derivative. Increasing fair values, in absolute terms, when compared to the notional amount of the agreement, represent a deterioration of the referenced obligation’s credit soundness and a greater likelihood or risk of default or other credit event occurring. |
(4) | Implied credit spreads, represented in absolute terms, utilized in determining the fair value of credit default swap agreements on corporate issues or sovereign issues are disclosed in each Portfolio’s Portfolio of Investment and serve as an indicator of the current status of the payment/performance risk and represent the likelihood or risk of default for the credit derivative. The implied credit spread of a particular referenced entity reflects the cost of buying/selling protection and may include upfront payments required to be made to enter into the agreement. For credit default swaps on asset-backed securities or credit indices, the quoted market prices and resulting market values serve as the indicator of the current status of the payment/performance risk. Wider credit spreads and increasing fair values, in absolute terms when compared to the notional amount of the swap, represent a deterioration of the referenced entity’s credit soundness and a greater likelihood or risk of default or other credit event occurring as defined under the terms of the agreement. |
ING PIMCO Total Return Portfolio Centrally Cleared Interest Rate Swap Agreements Outstanding on December 31, 2011:
| | Termination
Date | | Notional Amount | | Fair
Value | | Unrealized
Appreciation/
(Depreciation) | |
Receive a fixed rate equal to 3.650% and pay a floating rate based on the 6-month EUR-EURIBOR Reuters | | 09/21/21 | | EUR | 1,300,000 | | $ | 197,277 | | $ | 37,477 | |
Receive a fixed rate equal to 2.750% and pay a floating rate based on the 6-month EUR-EURIBOR Reuters | | 03/21/22 | | EUR | 12,000,000 | | 490,548 | | 349,899 | |
Receive a fixed rate equal to 3.000% and pay a floating rate based on the 6-month EUR-EURIBOR Reuters | | 03/21/22 | | EUR | 5,400,000 | | 381,573 | | 101,564 | |
Receive a fixed rate equal to 2.500% and pay a floating rate based on the 6-month EUR-EURIBOR Reuters | | 03/21/22 | | EUR | 14,000,000 | | 155,349 | | 597,915 | |
Receive a floating rate based on the 3-month USD-LIBOR-BBA and pay a fixed rate equal to 4.250% | | 06/15/41 | | USD | 24,500,000 | | (8,732,977 | ) | (2,577,239 | ) |
| | | | | | $ | (7,508,230 | ) | $ | (1,490,384 | ) |
See Accompanying Notes to Financial Statements
77
ING PIMCO Total Return Portfolio Over-the-Counter Interest Rate Swap Agreements Outstanding on December 31, 2011:
| | Termination
Date | | Notional Amount | | Fair
Value | | Upfront
Payments
Paid/
(Received) | | Unrealized
Appreciation/
(Depreciation) | |
Receive a fixed rate equal to 4.250% and pay a floating rate based on AUD-BBR-BBSW
Counterparty: Barclays Bank PLC | | 06/15/17 | | AUD | 300,000 | | $ | (1,887 | ) | $ | (292 | ) | $ | (1,595 | ) |
Receive a fixed rate equal to 5.000% and pay a floating rate based on AUD-BBR-BBSW
Counterparty: Citigroup, Inc. | | 06/15/17 | | AUD | 700,000 | | 19,457 | | 4,966 | | 14,491 | |
Receive a fixed rate equal to 5.000% and pay a floating rate based on AUD-BBR-BBSW
Counterparty: Deutsche Bank AG | | 06/15/17 | | AUD | 300,000 | | 8,341 | | 2,224 | | 6,117 | |
Receive a fixed rate equal to 4.250% and pay a floating rate based on AUD-BBR-BBSW
Counterparty: Deutsche Bank AG | | 06/15/17 | | AUD | 500,000 | | (3,145 | ) | (271 | ) | (2,874 | ) |
Receive a fixed rate equal to 5.000% and pay a floating rate based on AUD-BBR-BBSW
Counterparty: Royal Bank of Scotland Group PLC | | 06/15/17 | | AUD | 700,000 | | 19,463 | | 5,253 | | 14,210 | |
Receive a fixed rate equal to 12.285% and pay a floating rate based on the Brazil Cetip Interbank Deposit Rate Annualized
Counterparty: Barclays Bank PLC | | 01/02/13 | | BRL | 12,500,000 | | 272,597 | | 8,716 | | 263,881 | |
Receive a fixed rate equal to 11.910% and pay a floating rate based on the Brazil Cetip Interbank Deposit Rate Annualized
Counterparty: Barclays Bank PLC | | 01/02/13 | | BRL | 3,900,000 | | 62,066 | | 3,000 | | 59,066 | |
Receive a fixed rate equal to 11.990% and pay a floating rate based on the Brazil Cetip Interbank Deposit Rate Annualized
Counterparty: Barclays Bank PLC | | 01/02/14 | | BRL | 3,200,000 | | 61,313 | | 7,962 | | 53,351 | |
Receive a fixed rate equal to 11.930% and pay a floating rate based on the Brazil Cetip Interbank Deposit Rate Annualized
Counterparty: Goldman Sachs & Co. | | 01/02/13 | | BRL | 3,500,000 | | 58,696 | | (1,599 | ) | 60,295 | |
Receive a fixed rate equal to 11.890% and pay a floating rate based on the Brazil Cetip Interbank Deposit Rate Annualized
Counterparty: Goldman Sachs & Co. | | 01/02/13 | | BRL | 8,500,000 | | 140,792 | | 583 | | 140,209 | |
Receive a fixed rate equal to 12.650% and pay a floating rate based on the Brazil Cetip Interbank Deposit Rate Annualized
Counterparty: Goldman Sachs & Co. | | 01/02/14 | | BRL | 4,200,000 | | 126,725 | | 16,374 | | 110,351 | |
Receive a fixed rate equal to 11.140% and pay a floating rate based on the Brazil Cetip Interbank Deposit Rate Annualized
Counterparty: HSBC | | 01/02/12 | | BRL | 2,000,000 | | 22,291 | | (67 | ) | 22,358 | |
Receive a fixed rate equal to 10.610% and pay a floating rate based on the Brazil Cetip Interbank Deposit Rate Annualized
Counterparty: HSBC | | 01/02/12 | | BRL | 1,400,000 | | 5,790 | | — | | 5,790 | |
Receive a fixed rate equal to 10.450% and pay a floating rate based on Brazil Cetip Interbank
Counterparty: HSBC | | 01/02/13 | | BRL | 6,200,000 | | 2,449 | | (3,637 | ) | 6,086 | |
Receive a fixed rate equal to 11.890% and pay a floating rate based on the Brazil Cetip Interbank Deposit Rate Annualized
Counterparty: HSBC | | 01/02/13 | | BRL | 11,200,000 | | 185,514 | | 5,736 | | 179,778 | |
Receive a fixed rate equal to 12.300% and pay a floating rate based on the Brazil Cetip Interbank Deposit Rate Annualized
Counterparty: HSBC | | 01/02/13 | | BRL | 5,000,000 | | 110,559 | | 4,771 | | 105,788 | |
Receive a fixed rate equal to 12.830% and pay a floating rate based on the Brazil Cetip Interbank Deposit Rate Annualized
Counterparty: HSBC | | 01/02/13 | | BRL | 14,300,000 | | 341,085 | | — | | 341,085 | |
| | | | | | | | | | | | | | | |
See Accompanying Notes to Financial Statements
78
| | Termination
Date | | Notional Amount | | Fair
Value | | Upfront
Payments
Paid/
(Received) | | Unrealized
Appreciation/
(Depreciation) | |
Receive a fixed rate equal to 11.880% and pay a floating rate based on the Brazil Cetip Interbank Deposit Rate Annualized
Counterparty: HSBC | | 01/02/13 | | BRL | 5,300,000 | | $ | 79,817 | | $ | (1,373 | ) | $ | 81,190 | |
Receive a fixed rate equal to 10.990% and pay a floating rate based on Brazil Cetip Interbank
Counterparty: HSBC | | 01/02/14 | | BRL | 5,600,000 | | 19,487 | | 7,017 | | 12,470 | |
Receive a fixed rate equal to 10.530% and pay a floating rate based on Brazil Cetip Interbank
Counterparty: HSBC | | 01/02/14 | | BRL | 8,100,000 | | (5,708 | ) | (21,278 | ) | 15,570 | |
Receive a fixed rate equal to 11.980% and pay a floating rate based on the Brazil Cetip Interbank Deposit Rate Annualized
Counterparty: Merrill Lynch | | 01/02/12 | | BRL | 2,100,000 | | 44,764 | | — | | 44,764 | |
Receive a fixed rate equal to 12.540% and pay a floating rate based on the Brazil Cetip Interbank Deposit Rate Annualized
Counterparty: Merrill Lynch | | 01/02/12 | | BRL | 2,900,000 | | 88,843 | | (415 | ) | 89,258 | |
Receive a fixed rate equal to 12.540% and pay a floating rate based on the Brazil Cetip Interbank Deposit Rate Annualized
Counterparty: Merrill Lynch | | 01/02/14 | | BRL | 400,000 | | 11,418 | | 1,255 | | 10,163 | |
Receive a fixed rate equal to 10.455% and pay a floating rate based on Brazil Cetip Interbank
Counterparty: Morgan Stanley | | 01/02/13 | | BRL | 4,600,000 | | 2,292 | | (1,119 | ) | 3,411 | |
Receive a fixed rate equal to 11.980% and pay a floating rate based on the Brazil Cetip Interbank Deposit Rate Annualized
Counterparty: Morgan Stanley | | 01/02/13 | | BRL | 2,500,000 | | 43,706 | | 1,291 | | 42,415 | |
Receive a fixed rate equal to 12.590% and pay a floating rate based on the Brazil Cetip Interbank Deposit Rate Annualized
Counterparty: Morgan Stanley | | 01/02/13 | | BRL | 9,200,000 | | 193,316 | | 11,588 | | 181,728 | |
Receive a fixed rate equal to 10.580% and pay a floating rate based on Brazil Cetip Interbank
Counterparty: Morgan Stanley | | 01/02/14 | | BRL | 16,400,000 | | (3,319 | ) | (28,819 | ) | 25,500 | |
Receive a fixed rate equal to 11.890% and pay a floating rate based on the Brazil Cetip Interbank Deposit Rate Annualized
Counterparty: Morgan Stanley | | 01/02/14 | | BRL | 3,100,000 | | 46,645 | | (307 | ) | 46,952 | |
Receive a fixed rate equal to 12.510% and pay a floating rate based on the Brazil Cetip Interbank Deposit Rate Annualized
Counterparty: Morgan Stanley | | 01/02/14 | | BRL | 1,600,000 | | 44,984 | | 3,887 | | 41,097 | |
Receive a fixed rate equal to 11.950% and pay a floating rate based on the Brazil Cetip Interbank Deposit Rate Annualized
Counterparty: Royal Bank of Scotland Group PLC | | 01/02/13 | | BRL | 3,200,000 | | 39,523 | | 1,342 | | 38,181 | |
Receive a fixed rate equal to 10.605% and pay a floating rate based on Brazil Cetip Interbank
Counterparty: UBS Warburg LLC | | 01/02/13 | | BRL | 6,000,000 | | 8,838 | | — | | 8,838 | |
Receive a fixed rate equal to 12.070% and pay a floating rate based on the Brazil Cetip Interbank Deposit Rate Annualized
Counterparty: UBS Warburg LLC | | 01/02/13 | | BRL | 2,100,000 | | 39,716 | | 1,649 | | 38,067 | |
Receive a fixed rate equal to 10.770% and pay a floating rate based on Brazil Cetip Interbank
Counterparty: UBS Warburg LLC | | 01/02/14 | | BRL | 3,500,000 | | 5,629 | | (1,465 | ) | 7,094 | |
Receive a fixed rate equal to 12.250% and pay a floating rate based on the Brazil Cetip Interbank Deposit Rate Annualized
Counterparty: UBS Warburg LLC | | 01/02/14 | | BRL | 2,600,000 | | 62,519 | | 3,498 | | 59,021 | |
Receive a fixed rate equal to 2.500% and pay a floating rate based on the 6-month EUR-EURIBOR Reuters
Counterparty: Barclays Bank PLC | | 09/21/18 | | EUR | 900,000 | | 34,020 | | (14,354 | ) | 48,374 | |
| | | | | | | | | | | | | | | |
See Accompanying Notes to Financial Statements
79
| | Termination
Date | | Notional Amount | | Fair
Value | | Upfront
Payments
Paid/
(Received) | | Unrealized
Appreciation/
(Depreciation) | |
Receive a fixed rate equal to 3.000% and pay a floating rate based on the 6-month EUR-EURIBOR Reuters
Counterparty: Barclays Bank PLC | | 09/21/21 | | EUR | 2,600,000 | | $ | 190,724 | | $ | 22,810 | | $ | 167,914 | |
Receive a fixed rate equal to 3.500% and pay a floating rate based on the 6-month EUR-EURIBOR-Reuters
Counterparty: Barclays Bank PLC | | 09/21/21 | | EUR | 9,500,000 | | 1,270,404 | | 150,390 | | 1,120,014 | |
Receive a fixed rate equal to 2.500% and pay a floating rate based on the 6-month EUR-EURIBOR-Reuters
Counterparty: Barclays Bank PLC | | 03/21/22 | | EUR | 2,300,000 | | 14,362 | | (73,122 | ) | 87,484 | |
Receive a fixed rate equal to 3.000% and pay a floating rate based on the 6-month EUR-EURIBOR-Reuters
Counterparty: Barclays Bank PLC | | 03/21/22 | | EUR | 3,700,000 | | 251,297 | | 104,898 | | 146,399 | |
Receive a fixed rate equal to 3.000% and pay a floating rate based on the 6-month GBP LIBOR
Counterparty: Barclays Bank PLC | | 03/21/22 | | GBP | 700,000 | | 66,421 | | 12,095 | | 54,326 | |
Receive a fixed rate equal to 3.000% and pay a floating rate based on the 6-month GBP LIBOR
Counterparty: HSBC | | 03/21/22 | | GBP | 12,800,000 | | 1,214,547 | | 694,163 | | 520,384 | |
Receive a fixed rate equal to 5.600% and pay a floating rate based on 28-day MXN TIIE-BANXICO
Counterparty: Barclays Bank PLC | | 09/06/16 | | MXN | 111,000,000 | | (69,441 | ) | 50,565 | | (120,006 | ) |
Receive a fixed rate equal to 8.860% and pay a floating rate based on 28-day MXN-TIIE-BANXICO
Counterparty: Citigroup, Inc. | | 09/12/16 | | MXN | 5,700,000 | | 54,611 | | — | | 54,611 | |
Receive a fixed rate equal to 5.600% and pay a floating rate based on 28-day MXN TIIE-BANXICO
Counterparty: HSBC | | 09/06/16 | | MXN | 16,100,000 | | (10,072 | ) | 6,514 | | (16,586 | ) |
Receive a fixed rate equal to 5.600% and pay a floating rate based on 28-day MXN TIIE-BANXICO
Counterparty: Morgan Stanley | | 09/06/16 | | MXN | 6,000,000 | | (3,749 | ) | 3,206 | | (6,955 | ) |
Receive a fixed rate equal to 1.000% and pay a floating rate based on the 3-month USD-LIBOR-BBA
Counterparty: BNP Paribas Bank | | 09/19/14 | | USD | 6,600,000 | | 95,869 | | (1,991 | ) | 97,860 | |
Receive a fixed rate equal to 1.000% and pay a floating rate based on the 3-month USD-LIBOR-BBA
Counterparty: Goldman Sachs & Co. | | 09/19/14 | | USD | 3,300,000 | | 47,934 | | (12,294 | ) | 60,228 | |
Receive a fixed rate equal to 0.500% and pay a floating rate based on the 3-month USD-LIBOR-BBA
Counterparty: Morgan Stanley | | 09/19/13 | | USD | 16,600,000 | | 55,493 | | (16,977 | ) | 72,470 | |
| | | | | | | $ | 5,366,996 | | $ | 956,373 | | $ | 4,410,623 | |
ING PIMCO Total Return Portfolio Written Inflation Floors Outstanding on December 31, 2011:
Inflation Floors
Counterparty | | Underlying Reference
Entity/Obligation | | Strike
Index | | Floor Rate | | Termination
Date | | Notional
Amount | | Premiums
Received | | Fair Value | |
Citigroup, Inc. | | CPURNSA Index | | 215.949 | | 0.000 | % | 03/12/20 | | USD | 1,600,000 | | $ | 13,760 | | $ | (6,118 | ) |
Citigroup, Inc. | | CPURNSA Index | | 216.687 | | 0.000 | % | 04/07/20 | | USD | 2,000,000 | | 17,600 | | (7,935 | ) |
Citigroup, Inc. | | CPURNSA Index | | 217.965 | | 0.000 | % | 09/29/20 | | USD | 2,200,000 | | 28,380 | | (9,265 | ) |
Deutsche Bank AG | | CPURNSA Index | | 215.949 | | 0.000 | % | 03/10/20 | | USD | 1,000,000 | | 7,500 | | (4,505 | ) |
| | | | | | | | | | | | | $ | 67,240 | | $ | (27,823 | ) |
ING PIMCO Total Return Portfolio Written Options Open on December 31, 2011:
Options on Exchange Traded Futures Contracts
Description/Name of Issuer | | Exercise
Price | | Expiration
Date | | # of Contracts | | Premiums
Received | | Value | |
90-Day Eurodollar March Futures Put Option CME | | USD | 99.00 | | 03/19/12 | | 123 | | $ | 100,566 | | $ | (9,994 | ) |
| | | | | | | | $ | 100,566 | | $ | (9,994 | ) |
| | | | | | | | | | | | | | |
See Accompanying Notes to Financial Statements
80
ING PIMCO Total Return Portfolio Written Swaptions Open on December 31, 2011:
Written Interest Rate Swaptions
Description | | Counterparty | | Floating Rate
Index/Underlying
Reference Entity | | Pay/
Receive
Floating | | Exercise
Rate | | Expiration
Date | | Notional
Amount | | Premiums
Received | | Fair Value | |
Put OTC Swaption | | Barclays Bank PLC | | 3-month USD-LIBOR-BBA | | Pay | | 3.000 | % | 06/18/12 | | USD | 21,800,000 | | $ | 197,358 | | $ | (743 | ) |
Put OTC Swaption | | Citigroup, Inc. | | 3-month USD-LIBOR-BBA | | Pay | | 0.920 | % | 11/14/12 | | USD | 6,300,000 | | 28,350 | | (22,517 | ) |
Put OTC Swaption | | Citigroup, Inc. | | 3-month USD-LIBOR-BBA | | Pay | | 1.700 | % | 08/13/12 | | USD | 27,600,000 | | 476,100 | | (181,979 | ) |
Put OTC Swaption | | Citigroup, Inc. | | 3-month USD-LIBOR-BBA | | Pay | | 2.250 | % | 09/24/12 | | USD | 2,900,000 | | 19,756 | | (1,174 | ) |
Put OTC Swaption | | Citigroup, Inc. | | 3-month USD-LIBOR-BBA | | Pay | | 3.000 | % | 06/18/12 | | USD | 16,900,000 | | 182,931 | | (576 | ) |
Put OTC Swaption | | Citigroup, Inc. | | 3-month USD-LIBOR-BBA | | Pay | | 3.250 | % | 07/16/12 | | USD | 9,100,000 | | 224,982 | | (1,456 | ) |
Put OTC Swaption | | Deutsche Bank AG | | 3-month USD-LIBOR-BBA | | Pay | | 1.000 | % | 08/13/12 | | USD | 4,700,000 | | 48,293 | | (24,140 | ) |
Put OTC Swaption | | Deutsche Bank AG | | 3-month USD-LIBOR-BBA | | Pay | | 1.200 | % | 07/11/13 | | USD | 12,600,000 | | 88,928 | | (71,998 | ) |
Put OTC Swaption | | Deutsche Bank AG | | 3-month USD-LIBOR-BBA | | Pay | | 1.700 | % | 08/13/12 | | USD | 23,900,000 | | 329,612 | | (157,583 | ) |
Put OTC Swaption | | Deutsche Bank AG | | 3-month USD-LIBOR-BBA | | Pay | | 1.750 | % | 07/11/13 | | USD | 84,400,000 | | 396,405 | | (115,544 | ) |
Put OTC Swaption | | Deutsche Bank AG | | 3-month USD-LIBOR-BBA | | Pay | | 2.750 | % | 06/18/12 | | USD | 11,800,000 | | 122,491 | | (764 | ) |
Put OTC Swaption | | Deutsche Bank AG | | 3-month USD-LIBOR-BBA | | Pay | | 3.000 | % | 06/18/12 | | USD | 13,000,000 | | 141,396 | | (443 | ) |
Put OTC Swaption | | Morgan Stanley | | 3-month USD-LIBOR-BBA | | Pay | | 0.920 | % | 11/14/12 | | USD | 43,900,000 | | 121,809 | | (156,903 | ) |
Put OTC Swaption | | Morgan Stanley | | 3-month USD-LIBOR-BBA | | Pay | | 2.250 | % | 09/24/12 | | USD | 18,400,000 | | 112,916 | | (7,447 | ) |
Put OTC Swaption | | Morgan Stanley | | 3-month USD-LIBOR-BBA | | Pay | | 10.000 | % | 07/10/12 | | USD | 4,900,000 | | 29,522 | | (1 | ) |
Put OTC Swaption | | Royal Bank of Scotland Group PLC | | 3-month USD-LIBOR-BBA | | Pay | | 1.700 | % | 08/13/12 | | USD | 21,600,000 | | 299,766 | | (142,418 | ) |
Put OTC Swaption | | Royal Bank of Scotland Group PLC | | 3-month USD-LIBOR-BBA | | Pay | | 1.750 | % | 11/19/12 | | USD | 19,700,000 | | 74,368 | | (10,882 | ) |
Put OTC Swaption | | Royal Bank of Scotland Group PLC | | 3-month USD-LIBOR-BBA | | Pay | | 2.000 | % | 04/30/12 | | USD | 21,800,000 | | 43,600 | | (1,210 | ) |
Put OTC Swaption | | Royal Bank of Scotland Group PLC | | 3-month USD-LIBOR-BBA | | Pay | | 2.250 | % | 09/24/12 | | USD | 60,000,000 | | 470,204 | | (24,285 | ) |
Put OTC Swaption | | Royal Bank of Scotland Group PLC | | 3-month USD-LIBOR-BBA | | Pay | | 2.750 | % | 06/18/12 | | USD | 10,800,000 | | 105,840 | | (699 | ) |
Put OTC Swaption | | Royal Bank of Scotland Group PLC | | 3-month USD-LIBOR-BBA | | Pay | | 3.000 | % | 06/18/12 | | USD | 31,100,000 | | 274,720 | | (1,061 | ) |
Put OTC Swaption | | Royal Bank of Scotland Group PLC | | 3-month USD-LIBOR-BBA | | Pay | | 3.250 | % | 07/16/12 | | USD | 3,000,000 | | 75,330 | | (480 | ) |
| | | | | | | | | | Total Written Swaptions | | $ | 3,864,677 | | $ | (924,303 | ) |
The following sales commitments were held by the ING PIMCO Total Return Portfolio at December 31, 2011:
Principal Amount | | Description | | Fair Value | |
$ | (24,000,000 | ) | Fannie Mae | | $ | (25,218,751 | ) |
| | Total Sales Commitments
Cost $(25,138,124) | | $ | (25,218,751 | ) |
| | | | | | | |
See Accompanying Notes to Financial Statements
81
| PORTFOLIO OF INVESTMENTS |
ING PIONEER HIGH YIELD PORTFOLIO | AS OF DECEMBER 31, 2011 |
Principal
Amount† | | | | | | Value | | Percentage
of Net
Assets | |
CORPORATE BONDS/NOTES: 77.3% | | | | | |
| | | | Consumer Discretionary: 10.8% | | | | | |
200,000 | | # | | Allison Transmission, Inc., 7.125%, 05/15/19 | | $ | 197,000 | | 0.2 | |
385,000 | | | | Beazer Homes USA, Inc., 9.125%, 06/15/18 | | 266,613 | | 0.3 | |
200,000 | | | | Brown Shoe Co., Inc., 7.125%, 05/15/19 | | 190,500 | | 0.2 | |
545,000 | | #,+ | | Burger King Capital Holdings LLC / Burger King Capital Finance, Inc., 04/15/19 | | 341,987 | | 0.4 | |
550,000 | | | | CCO Holdings LLC / CCO Holdings Capital Corp., 6.500%, 04/30/21 | | 559,625 | | 0.6 | |
548,625 | | | | Chrysler Group LLC, 6.000%, 04/28/17 | | 520,508 | | 0.6 | |
250,000 | | # | | Chrysler Group LLC/CG Co-Issuer, Inc., 8.000%, 06/15/19 | | 230,000 | | 0.3 | |
100,000 | | # | | Commercial Vehicle Group, Inc., 7.875%, 04/15/19 | | 96,750 | | 0.1 | |
350,000 | | | | DR Horton, Inc., 2.000%, 05/15/14 | | 410,375 | | 0.5 | |
477,000 | | | | DynCorp International, Inc., 10.375%, 07/01/17 | | 417,375 | | 0.5 | |
250,000 | | | | Emergency Medical Services Corp., 8.125%, 06/01/19 | | 250,625 | | 0.3 | |
66,358 | | | | Federal Mogul Corp., 2.238%, 12/28/15 | | 61,575 | | 0.1 | |
130,062 | | | | Federal Mogul Corp., 2.238%, 12/29/14 | | 120,686 | | 0.1 | |
100,000 | | | | Ferrellgas L.P. / Ferrellgas Finance Corp., 6.500%, 05/01/21 | | 88,500 | | 0.1 | |
622,000 | | | | Ford Motor Co., 4.250%, 11/15/16 | | 894,902 | | 1.0 | |
104,000 | | # | | Lennar Corp., 2.750%, 12/15/20 | | 116,480 | | 0.1 | |
1,010,000 | | #,± | | Mashantucket Western Pequot Tribe, 8.500%, 11/15/15 | | 50,500 | | 0.1 | |
145,000 | | # | | MDC Partners, Inc., 11.000%, 11/01/16 | | 154,425 | | 0.2 | |
820,000 | | | | Navistar International Corp., 3.000%, 10/15/14 | | 887,650 | | 1.0 | |
577,718 | | #,& | | Pegasus Solutions, Inc., 13.000%, 04/15/14 | | 550,276 | | 0.6 | |
495,000 | | | | Pierre Foods, Inc., 7.000%, 07/29/16 | | 494,072 | | 0.6 | |
175,000 | | # | | Pittsburgh Glass Works LLC, 8.500%, 04/15/16 | | 169,313 | | 0.2 | |
150,000 | | | | Regal Entertainment Group, 9.125%, 08/15/18 | | 161,625 | | 0.2 | |
235,000 | | # | | Reynolds Group Issuer, Inc. / Reynolds Group Issuer LLC / Reynolds Group Issuer Lu, 8.250%, 02/15/21 | | 209,150 | | 0.2 | |
105,000 | | # | | Sally Holdings LLC / Sally Capital, Inc., 6.875%, 11/15/19 | | 110,250 | | 0.1 | |
205,000 | | | | Scientific Games International, Inc., 9.250%, 06/15/19 | | 218,325 | | 0.2 | |
500,000 | | | | Sitel LLC / Sitel Finance Corp., 11.500%, 04/01/18 | | 371,250 | | 0.4 | |
360,000 | | | | Sonic Automotive, Inc., 5.000%, 10/01/29 | | 478,350 | | 0.5 | |
117,000 | | | | Star Gas Partners L.P./Star Gas Finance Co., 8.875%, 12/01/17 | | 119,340 | | 0.1 | |
416,000 | | # | | Tower Automotive Holdings USA LLC / TA Holdings Finance, Inc., 10.625%, 09/01/17 | | 420,160 | | 0.5 | |
480,000 | | | | Wesco Distribution, Inc., 7.500%, 10/15/17 | | 492,600 | | 0.5 | |
| | | | | | 9,650,787 | | 10.8 | |
| | | | Consumer Staples: 4.6% | | | | | |
430,000 | | | | Alliance One International, Inc., 5.500%, 07/15/14 | | 330,563 | | 0.4 | |
825,000 | | | | Alliance One International, Inc., 10.000%, 07/15/16 | | 746,625 | | 0.8 | |
265,279 | | | | Ardent Health Services, 6.500%, 09/15/15 | | 263,621 | | 0.3 | |
220,000 | | | | Del Monte Corp., 7.625%, 02/15/19 | | 212,300 | | 0.2 | |
650,000 | | | | NCO Group, Inc., 5.332%, 11/15/13 | | 609,375 | | 0.7 | |
264,835 | | | | NCO Group, Inc., 8.000%, 05/15/13 | | 261,304 | | 0.3 | |
575,000 | | | | Pilgrim’s Pride Corp., 7.875%, 12/15/18 | | 543,375 | | 0.6 | |
620,000 | | | | Ticketmaster Entertainment, Inc., 10.750%, 08/01/16 | | 663,400 | | 0.8 | |
480,000 | | | | Yankee Acquisition Corp., 9.750%, 02/15/17 | | 470,400 | | 0.5 | |
| | | | | | 4,100,963 | | 4.6 | |
| | | | Energy: 9.3% | | | | | |
197,000 | | | | American Petroleum Tankers Parent LLC / AP Tankers Co., 10.250%, 05/01/15 | | 201,925 | | 0.2 | |
218,598 | | | | Aquilex Holdings LLC, 7.000%, 03/11/16 | | 196,192 | | 0.2 | |
475,000 | | # | | Arch Coal, Inc., 7.250%, 06/15/21 | | 490,437 | | 0.6 | |
| | | | | | | | | | |
See Accompanying Notes to Financial Statements
82
Principal
Amount† | | | | | | Value | | Percentage
of Net
Assets | |
CORPORATE BONDS/NOTES: (continued) | | | | | |
| | | | Energy: (continued) | | | | | |
200,000 | | # | | Arch Coal, Inc., 7.000%, 06/15/19 | | $ | 205,000 | | 0.2 | |
239,000 | | | | Carrizo Oil & Gas, Inc., 8.625%, 10/15/18 | | 242,585 | | 0.3 | |
170,000 | | | | Chaparral Energy, Inc., 8.250%, 09/01/21 | | 172,975 | | 0.2 | |
300,000 | | | | Chesapeake Energy Corp., 2.250%, 12/15/38 | | 249,000 | | 0.3 | |
468,000 | | | | Chesapeake Energy Corp., 2.500%, 05/15/37 | | 419,445 | | 0.5 | |
152,000 | | | | Chesapeake Energy Corp., 2.500%, 05/15/37 | | 137,180 | | 0.2 | |
250,000 | | # | | Coffeyville Resources LLC / Coffeyville Finance, Inc., 9.000%, 04/01/15 | | 266,250 | | 0.3 | |
125,000 | | | | Comstock Resources, Inc., 7.750%, 04/01/19 | | 119,375 | | 0.1 | |
225,000 | | | | Concho Resources, Inc./Midland TX, 6.500%, 01/15/22 | | 236,250 | | 0.3 | |
150,000 | | | | Copano Energy LLC / Copano Energy Finance Corp., 7.125%, 04/01/21 | | 152,250 | | 0.2 | |
130,000 | | | | Energy Partners Ltd, 8.250%, 02/15/18 | | 124,800 | | 0.1 | |
200,000 | | | | Enterprise Products Operating L.P., 7.000%, 06/01/67 | | 197,167 | | 0.2 | |
500,000 | | # | | Expro Finance Luxembourg SCA, 8.500%, 12/15/16 | | 442,500 | | 0.5 | |
300,000 | | | | Exterran Holdings, Inc., 4.250%, 06/15/14 | | 267,750 | | 0.3 | |
305,000 | | # | | Goodrich Petroleum Corp., 8.875%, 03/15/19 | | 306,525 | | 0.3 | |
75,000 | | # | | Green Field Energy Services, Inc., 13.000%, 11/15/16 | | 73,125 | | 0.1 | |
500,000 | | | | Holly Energy Partners LP, 6.250%, 03/01/15 | | 506,250 | | 0.6 | |
150,000 | | # | | James River Coal Co., 3.125%, 03/15/18 | | 88,875 | | 0.1 | |
970,000 | | | | Massey Energy Co., 3.250%, 08/01/15 | | 900,887 | | 1.0 | |
300,000 | | # | | Midwest Vanadium Pty Ltd., 11.500%, 02/15/18 | | 220,500 | | 0.2 | |
500,000 | | # | | Murray Energy Corp., 10.250%, 10/15/15 | | 498,750 | | 0.6 | |
71,000 | | | | Newpark Resources, Inc., 4.000%, 10/01/17 | | 81,650 | | 0.1 | |
175,000 | | # | | Peabody Energy Corp., 6.000%, 11/15/18 | | 179,375 | | 0.2 | |
175,000 | | | | Petrohawk Energy Corp., 7.250%, 08/15/18 | | 197,750 | | 0.2 | |
75,000 | | | | Pioneer Drilling Co., 9.875%, 03/15/18 | | 78,750 | | 0.1 | |
785,000 | | | | Quicksilver Resources, Inc., 7.125%, 04/01/16 | | 785,000 | | 0.9 | |
110,000 | | # | | SM Energy Co., 6.500%, 11/15/21 | | 113,850 | | 0.1 | |
130,000 | | | | Venoco, Inc., 8.875%, 02/15/19 | | 117,650 | | 0.1 | |
| | | | | | 8,270,018 | | 9.3 | |
| | | | Financials: 8.5% | | | | | |
650 | | | | AES Red Oak, LLC, 8.540%, 11/30/19 | | 673 | | 0.0 | |
545,000 | | # | | Alliant Holdings I, Inc., 11.000%, 05/01/15 | | 564,075 | | 0.6 | |
139,796 | | | | Alliant Insurance Services, 3.579%, 08/21/14 | | 136,417 | | 0.2 | |
301,842 | | | | Amwins Group, Inc., 4.830%, 06/11/13 | | 294,296 | | 0.3 | |
140,000 | | | | BAC Capital Trust VI, 5.625%, 03/08/35 | | 116,335 | | 0.1 | |
460,000 | | #,± | | Buffalo Thunder Development Authority, 9.375%, 12/15/14 | | 149,500 | | 0.2 | |
300,000 | | # | | CEVA Group PLC, 11.500%, 04/01/18 | | 272,250 | | 0.3 | |
145,000 | | # | | CEVA Group PLC, 11.625%, 10/01/16 | | 144,637 | | 0.2 | |
200,000 | | | | Ford Motor Credit Co. LLC, 5.875%, 08/02/21 | | 208,747 | | 0.2 | |
1,645,000 | | | | Forest City Enterprises, Inc., 6.500%, 02/01/17 | | 1,546,300 | | 1.7 | |
40,000 | | | | Forest City Enterprises, Inc., 7.625%, 06/01/15 | | 39,500 | | 0.0 | |
365,000 | | # | | Forest City Enterprises, Inc., 4.250%, 08/15/18 | | 320,287 | | 0.4 | |
100,000 | | | | Holly Energy Partners L.P./Holly Energy Finance Corp., 8.250%, 03/15/18 | | 105,500 | | 0.1 | |
150,000 | | # | | Host Hotels & Resorts L.P., 2.500%, 10/15/29 | | 186,562 | | 0.2 | |
215,050 | | | | HUB International Holdings, Inc., 6.750%, 06/13/14 | | 213,975 | | 0.2 | |
360,000 | | # | | HUB International Holdings, Inc., 10.250%, 06/15/15 | | 359,100 | | 0.4 | |
70,000 | | | | Janus Capital Group, Inc., 6.700%, 06/15/17 | | 74,385 | | 0.1 | |
1,000,000 | | # | | Liberty Mutual Group, Inc., 7.000%, 03/15/37 | | 850,000 | | 0.9 | |
305,000 | | | | National Money Mart Co., 10.375%, 12/15/16 | | 327,113 | | 0.4 | |
540,000 | | | | Offshore Group Investments Ltd., 11.500%, 08/01/15 | | 586,575 | | 0.7 | |
335,000 | | # | | Reynolds Group Issuer, Inc., 9.250%, 05/15/18 | | 322,437 | | 0.4 | |
200,000 | | | | Sabra Health Care L.P. / Sabra Capital Corp., 8.125%, 11/01/18 | | 203,000 | | 0.2 | |
180,556 | | | | SHG Services, Inc., 8.750%, 09/23/16 | | 147,604 | | 0.2 | |
| | | | | | | | | | |
See Accompanying Notes to Financial Statements
83
Principal
Amount† | | | | | | Value | | Percentage
of Net
Assets | |
CORPORATE BONDS/NOTES: (continued) | | | | | |
| | | | Financials: (continued) | | | | | |
525,000 | | # | | USB Realty Corp., 6.091%, 12/22/49 | | $ | 367,500 | | 0.4 | |
110,000 | | # | | USI Holdings Corp., 4.332%, 11/15/14 | | 100,925 | | 0.1 | |
| | | | | | 7,637,693 | | 8.5 | |
| | | | Health Care: 7.6% | | | | | |
710,000 | | | | Alere, Inc., 3.000%, 05/15/16 | | 676,275 | | 0.7 | |
75,000 | | | | BioMarin Pharmaceuticals, Inc., 1.875%, 04/23/17 | | 133,781 | | 0.1 | |
253,000 | | | | BioScrip, Inc., 10.250%, 10/01/15 | | 251,103 | | 0.3 | |
250,000 | | | | Cubist Pharmaceuticals, Inc., 2.250%, 06/15/13 | | 338,125 | | 0.4 | |
532,000 | | | | Cubist Pharmaceuticals, Inc., 2.500%, 11/01/17 | | 799,330 | | 0.9 | |
228,000 | | | | Gentiva Health Services, Inc., 11.500%, 09/01/18 | | 188,385 | | 0.2 | |
488,229 | | | | Gentiva Health Services, Inc., 4.750%, 05/23/16 | | 439,000 | | 0.5 | |
250,000 | | + | | Hologic, Inc., 2.000%, 12/15/37 | | 274,687 | | 0.3 | |
400,000 | | | | Kindred Healthcare, Inc., 8.250%, 06/01/19 | | 338,000 | | 0.4 | |
332,000 | | | | Lantheus Medical Imaging, Inc., 9.750%, 05/15/17 | | 264,770 | | 0.3 | |
210,000 | | | | NuVasive, Inc., 2.750%, 07/01/17 | | 154,087 | | 0.2 | |
425,000 | | | | PDL BioPharma, Inc., 3.750%, 05/01/15 | | 427,656 | | 0.5 | |
297,750 | | | | Surgery Center Holdings, Inc., 6.500%, 09/20/16 | | 287,329 | | 0.3 | |
878,852 | | #,& | | Surgical Care Affiliates, Inc., 8.875%, 07/15/15 | | 881,049 | | 1.0 | |
415,000 | | # | | Tenet Healthcare Corp., 6.250%, 11/01/18 | | 423,300 | | 0.5 | |
145,000 | | | | Vanguard Health Holding Co. II LLC / Vanguard Holding Co. II, Inc., 7.750%, 02/01/19 | | 139,925 | | 0.1 | |
16,000 | | Z | | Vanguard Health Systems, Inc., 02/01/16 | | 10,080 | | 0.0 | |
746,000 | | | | Vertex Pharmaceuticals, Inc., 3.350%, 10/01/15 | | 786,098 | | 0.9 | |
| | | | | | 6,812,980 | | 7.6 | |
| | | | Industrials: 10.3% | | | | | |
250,000 | | # | | ADS Tactical, Inc., 11.000%, 04/01/18 | | 248,750 | | 0.3 | |
199,500 | | | | Aeroflex, Inc., 4.250%, 04/25/18 | | 188,527 | | 0.2 | |
175,000 | | | | Atkore International, Inc., 9.875%, 01/01/18 | | 168,438 | | 0.2 | |
225,000 | | | | Coleman Cable, Inc., 9.000%, 02/15/18 | | 224,156 | | 0.3 | |
85,000 | | | | Continental Airlines, Inc., 4.500%, 01/15/15 | | 103,594 | | 0.1 | |
20,903 | | | | Continental Airlines, Inc., 7.461%, 04/01/13 | | 20,720 | | 0.0 | |
121,096 | | | | DAE Aviation Holdings, 5.430%, 07/31/14 | | 117,918 | | 0.1 | |
126,690 | | | | DAE Aviation Holdings, 5.430%, 07/31/14 | | 123,365 | | 0.1 | |
509,000 | | + | | General Cable Corp., 4.500%, 11/15/29 | | 484,186 | | 0.6 | |
279,250 | | | | Goodman Global, Inc., 5.750%, 10/06/16 | | 279,555 | | 0.3 | |
120,000 | | # | | Greenbrier Cos, Inc., 3.500%, 04/01/18 | | 116,850 | | 0.1 | |
188,788 | | | | Horizon Lines, Inc., 6.000%, 04/15/17 | | 63,565 | | 0.1 | |
339,818 | | | | Horizon Lines, Inc., 6.000%, 04/15/17 | | 270,733 | | 0.3 | |
223,723 | | | | Hudson Product Corp., 8.500%, 08/27/15 | | 199,114 | | 0.2 | |
239,084 | | | | Hunter Defense Technologies, 3.830%, 08/01/14 | | 217,566 | | 0.3 | |
2,600,000 | | X | | Lear Corp. Escrow | | — | | — | |
190,000 | | # | | Liberty Tire Recycling, 11.000%, 10/01/16 | | 190,475 | | 0.2 | |
465,000 | | | | MasTec, Inc., 4.000%, 06/15/14 | | 607,987 | | 0.7 | |
500,000 | | | | Mueller Water Products, 7.375%, 06/01/17 | | 457,500 | | 0.5 | |
255,000 | | | | New Enterprise Stone & Lime Co., 11.000%, 09/01/18 | | 210,375 | | 0.2 | |
100,000 | | | | Park-Ohio Industries, Inc., 8.125%, 04/01/21 | | 99,000 | | 0.1 | |
1,065,000 | | + | | Roper Industries, Inc., 01/15/34 | | 1,160,850 | | 1.3 | |
399,000 | | | | Sunpower Corp. - Class A, 4.750%, 04/15/14 | | 349,624 | | 0.4 | |
255,000 | | | | SunPower Corp., 4.500%, 03/15/15 | | 210,694 | | 0.2 | |
135,000 | | | | Swift Services Holdings, Inc., 10.000%, 11/15/18 | | 142,762 | | 0.2 | |
545,000 | | # | | Vishay Intertechnology, Inc., 2.250%, 05/15/41 | | 384,225 | | 0.4 | |
1,166,000 | | | | Wesco International, Inc., 6.000%, 09/15/29 | | 2,365,522 | | 2.7 | |
200,000 | | & | | YCC Holdings LLC / Yankee Finance, Inc., 10.250%, 02/15/16 | | 176,000 | | 0.2 | |
| | | | | | 9,182,051 | | 10.3 | |
| | | | Information Technology: 7.6% | | | | | |
316,000 | | # | | Allen Systems Group, Inc., 10.500%, 11/15/16 | | 276,500 | | 0.3 | |
| | | | | | | | | | |
See Accompanying Notes to Financial Statements
84
Principal
Amount† | | | | | | Value | | Percentage
of Net
Assets | |
CORPORATE BONDS/NOTES: (continued) | | | | | |
| | | | Information Technology: (continued) | | | | | |
150,000 | | # | | Emdeon, Inc., 11.000%, 12/31/19 | | $ | 157,688 | | 0.2 | |
350,000 | | | | Equinix, Inc., 3.000%, 10/15/14 | | 393,313 | | 0.4 | |
89,000 | | | | First Data Corp., 12.625%, 01/15/21 | | 77,875 | | 0.1 | |
89,000 | | # | | First Data Corp., 8.250%, 01/15/21 | | 80,100 | | 0.1 | |
21,000 | | | | First Data Corp., 9.875%, 09/24/15 | | 19,845 | | 0.0 | |
625,641 | | | | Frac Tech International LLC, 6.250%, 04/19/16 | | 618,651 | | 0.7 | |
571,000 | | # | | Lam Research Corp., 1.250%, 05/15/18 | | 538,167 | | 0.6 | |
250,000 | | | | MedAssets, Inc., 8.000%, 11/15/18 | | 246,250 | | 0.3 | |
450,000 | | # | | Mentor Graphics Corp., 4.000%, 04/01/31 | | 457,312 | | 0.5 | |
1,445,000 | | X | | Millicom International Cellular S.A. Escrow | | — | | — | |
460,000 | | # | | Novellus Systems, Inc., 2.625%, 05/15/41 | | 553,150 | | 0.6 | |
550,000 | | | | Nuance Communications, Inc., 2.750%, 08/15/27 | | 796,125 | | 0.9 | |
200,000 | | # | | Nuance Communications, Inc., 2.750%, 11/01/31 | | 215,750 | | 0.2 | |
556,000 | | | | ON Semiconductor Corp., 2.625%, 12/15/26 | | 616,465 | | 0.7 | |
225,000 | | | | Rovi Corp., 2.625%, 02/15/40 | | 225,000 | | 0.3 | |
125,000 | | | | SanDisk Corp., 1.500%, 08/15/17 | | 147,812 | | 0.2 | |
250,000 | | # | | Seagate HDD Cayman, 7.000%, 11/01/21 | | 257,500 | | 0.3 | |
210,000 | | # | | Seagate HDD Cayman, 7.750%, 12/15/18 | | 224,438 | | 0.2 | |
150,000 | | # | | WebMD Health Corp., 2.250%, 03/31/16 | | 144,750 | | 0.2 | |
750,000 | | # | | WebMD Health Corp., 2.500%, 01/31/18 | | 702,188 | | 0.8 | |
| | | | | | 6,748,879 | | 7.6 | |
| | | | Materials: 8.8% | | | | | |
300,000 | | | | AEP Industries, Inc., 8.250%, 04/15/19 | | 306,000 | | 0.3 | |
550,000 | | # | | Algoma Acquisition Corp., 9.875%, 06/15/15 | | 475,750 | | 0.5 | |
250,000 | | # | | APERAM, 7.375%, 04/01/16 | | 215,000 | | 0.2 | |
150,000 | | # | | Appleton Papers, Inc., 10.500%, 06/15/15 | | 148,687 | | 0.2 | |
317,892 | | #,& | | ARD Finance SA, 11.125%, 06/01/18 | | 273,387 | | 0.3 | |
135,000 | | # | | Building Materials Corp. of America, 6.750%, 05/01/21 | | 142,087 | | 0.2 | |
640,000 | | | | Crown Cork & Seal Co., Inc., 7.375%, 12/15/26 | | 662,400 | | 0.7 | |
400,000 | | | | Graham Packaging Co. L.P. / GPC Capital Corp. I, 8.250%, 01/01/17 | | 406,500 | | 0.4 | |
225,000 | | | | Graham Packaging Co., Inc., 9.875%, 10/15/14 | | 229,781 | | 0.3 | |
475,000 | | | | Hexion US Finance Corp. / Hexion Nova Scotia Finance ULC, 8.875%, 02/01/18 | | 447,688 | | 0.5 | |
219,000 | | | | Hexion US Finance Corp. / Hexion Nova Scotia Finance ULC, 9.000%, 11/15/20 | | 181,770 | | 0.2 | |
248,747 | | | | HHI Holdings LLC, 7.750%, 03/09/17 | | 246,259 | | 0.3 | |
215,000 | | # | | Ineos Finance PLC, 9.000%, 05/15/15 | | 219,300 | | 0.2 | |
235,000 | | # | | Ineos Group Holdings PLC, 8.500%, 02/15/16 | | 188,000 | | 0.2 | |
150,000 | | # | | JMC Steel Group, 8.250%, 03/15/18 | | 147,000 | | 0.2 | |
225,000 | | # | | LyondellBasell Industries NV, 6.000%, 11/15/21 | | 234,563 | | 0.3 | |
155,000 | | # | | Millar Western Forest Products Ltd., 8.500%, 04/01/21 | | 118,575 | | 0.1 | |
264,000 | | | | Momentive Performance Materials, Inc., 9.000%, 01/15/21 | | 201,960 | | 0.2 | |
400,333 | | & | | Noranda Aluminium Acquisition Corp., 4.659%, 05/15/15 | | 372,310 | | 0.4 | |
1,400,000 | | | | Nova Chemicals Corp., 7.875%, 09/15/25 | | 1,400,000 | | 1.6 | |
325,000 | | # | | Packaging Dynamics Corp., 8.750%, 02/01/16 | | 326,625 | | 0.4 | |
180,000 | | | | Steel Dynamics, Inc., 5.125%, 06/15/14 | | 196,875 | | 0.2 | |
570,000 | | | | Texas Industries, Inc., 9.250%, 08/15/20 | | 513,000 | | 0.6 | |
253,000 | | # | | USG Corp., 8.375%, 10/15/18 | | 234,025 | | 0.3 | |
| | | | | | 7,887,542 | | 8.8 | |
| | | | Telecommunications: 7.1% | | | | | |
240,451 | | | | BCE, Inc., 3.300%, 10/31/14 | | 238,548 | | 0.3 | |
145,000 | | | | Cambium Learning Group, Inc., 9.750%, 02/15/17 | | 141,375 | | 0.2 | |
245,513 | | | | Cengage Learning Acquisitions, Inc., 2.550%, 07/04/14 | | 210,220 | | 0.2 | |
250,000 | | | | Ciena Corp., 0.875%, 06/15/17 | | 190,625 | | 0.2 | |
450,000 | | | | Cincinnati Bell, Inc., 8.250%, 10/15/17 | | 454,500 | | 0.5 | |
230,000 | | | | Cincinnati Bell, Inc., 8.375%, 10/15/20 | | 230,000 | | 0.3 | |
| | | | | | | | | | |
See Accompanying Notes to Financial Statements
85
Principal
Amount† | | | | | | Value | | Percentage
of Net
Assets | |
CORPORATE BONDS/NOTES: (continued) | | | | | |
| | | | Telecommunications: (continued) | | | | | |
600,000 | | | | Cricket Communications, Inc., 7.750%, 10/15/20 | | $ | 526,500 | | 0.6 | |
245,000 | | | | Frontier Communications Corp., 8.500%, 04/15/20 | | 252,044 | | 0.3 | |
555,000 | | | | Frontier Communications Corp., 8.750%, 04/15/22 | | 552,225 | | 0.6 | |
220,000 | | | | GeoEye, Inc., 9.625%, 10/01/15 | | 242,000 | | 0.3 | |
590,000 | | #,& | | Intelsat Bermuda Ltd., 11.500%, 02/04/17 | | 570,825 | | 0.6 | |
150,000 | | | | Intelsat Corp., 3.391%, 02/01/14 | | 143,175 | | 0.2 | |
50,000 | | # | | Intelsat Jackson Holdings SA, 7.250%, 04/01/19 | | 50,875 | | 0.1 | |
2,406 | | & | | Intelsat Luxembourg S.A., 11.500%, 02/04/17 | | 2,328 | | 0.0 | |
105,000 | | # | | InterDigital, Inc./PA, 2.500%, 03/15/16 | | 110,250 | | 0.1 | |
85,000 | | # | | MPL 2 Acquisition Canco, Inc., 9.875%, 08/15/18 | | 74,800 | | 0.1 | |
700,000 | | | | PAETEC Holding Corp., 8.875%, 06/30/17 | | 759,500 | | 0.8 | |
20,656 | | | | Telesat Canada / Telesat LLC, 3.300%, 10/31/14 | | 20,492 | | 0.0 | |
270,000 | | | | Telesat Canada / Telesat LLC, 11.000%, 11/01/15 | | 291,262 | | 0.3 | |
244,727 | | | | Wide Open West, 8.750%, 06/18/14 | | 235,244 | | 0.3 | |
200,000 | | | | Windstream Corp., 7.750%, 10/15/20 | | 207,750 | | 0.2 | |
460,000 | | # | | Windstream Corp., 7.500%, 06/01/22 | | 460,000 | | 0.5 | |
350,000 | | | | Windstream Corp., 7.750%, 10/01/21 | | 360,500 | | 0.4 | |
| | | | | | 6,325,038 | | 7.1 | |
| | | | Utilities: 2.7% | | | | | |
700,000 | | # | | Foresight Energy LLC / Foresight Energy Corp., 9.625%, 08/15/17 | | 721,000 | | 0.8 | |
330,000 | | # | | Intergen NV, 9.000%, 06/30/17 | | 348,975 | | 0.4 | |
275,000 | | | | NRG Energy, Inc., 7.625%, 01/15/18 | | 276,375 | | 0.3 | |
550,000 | | # | | NRG Energy, Inc., 7.625%, 05/15/19 | | 541,750 | | 0.6 | |
200,000 | | # | | NRG Energy, Inc., 7.875%, 05/15/21 | | 196,000 | | 0.2 | |
100,000 | | # | | Texas Competitive Electric Holdings Co. LLC / TCEH Finance, Inc., 11.500%, 10/01/20 | | 85,375 | | 0.1 | |
375,000 | | | | Texas Competitive Electric Holdings Co. LLC / TCEH Finance, Inc., 15.000%, 04/01/21 | | 208,125 | | 0.3 | |
| | | | | | 2,377,600 | | 2.7 | |
| | | | Total Corporate Bonds/Notes
(Cost $66,845,457) | | 68,993,551 | | 77.3 | |
| | | | | | | | | |
COLLATERALIZED MORTGAGE OBLIGATIONS: 1.1% | | | | | |
1,000,000 | | # | | Timberstar Trust, 7.530%, 10/15/36 | | 927,504 | | 1.1 | |
| | | | | | | | | |
| | | | Total Collateralized Mortgage Obligations
(Cost $1,008,473) | | 927,504 | | 1.1 | |
| | | | | | | | | |
MUNICIPAL BONDS: 0.4% | | | | | |
| | | | Ohio: 0.4% | | | | | |
335,000 | | | | State of Ohio, 5.650%, 03/01/33 | | 242,814 | | 0.3 | |
160,000 | | | | State of Ohio, 5.600%, 08/01/32 | | 115,661 | | 0.1 | |
| | | | | | | | | |
| | | | Total Municipal Bonds
(Cost $379,167) | | 358,475 | | 0.4 | |
| | | | | | | | | |
ASSET-BACKED SECURITIES: 0.2% | | | | | |
| | | | Other Asset-Backed Securities: 0.2% | | | | | |
120,000 | | | | Bear Stearns Asset-Backed Securities, Inc., 0.744%, 01/25/47 | | 41,313 | | 0.0 | |
150,000 | | # | | Dominos Pizza Master Issuer LLC, 5.261%, 04/25/37 | | 150,766 | | 0.2 | |
| | | | | | | | | |
| | | | Total Asset-Backed Securities
(Cost $209,010) | | 192,079 | | 0.2 | |
| | | | | | | | | | |
Shares | | | | | | | | | |
COMMON STOCK: 14.6% | | | | | |
| | | | Consumer Discretionary: 1.0% | | | | | |
2,908 | | | | Lear Corp. | | 115,738 | | 0.1 | |
1,476 | | @ | | Perseus Holding Corp. | | 6,273 | | 0.0 | |
25,931 | | | | Service Corp. International | | 276,165 | | 0.3 | |
10,709 | | | | Starbucks Corp. | | 492,721 | | 0.5 | |
2,267 | | @ | | WMS Industries, Inc. | | 46,519 | | 0.1 | |
| | | | | | 937,416 | | 1.0 | |
| | | | Consumer Staples: 0.1% | | | | | |
35,400 | | @ | | Alliance One International, Inc. | | 96,288 | | 0.1 | |
| | | | | | | | | |
| | | | Energy: 0.8% | | | | | |
43,381 | | @ | | Hercules Offshore, Inc. | | 192,612 | | 0.2 | |
6,900 | | | | Marathon Oil Corp. | | 201,963 | | 0.2 | |
3,450 | | | | Marathon Petroleum Corp. | | 114,850 | | 0.1 | |
See Accompanying Notes to Financial Statements
86
Shares | | | | | | Value | | Percentage
of Net
Assets | |
COMMON STOCK: (continued) | | | | | |
| | | | Energy: (continued) | | | | | |
17,091 | | @ | | SandRidge Energy, Inc. | | $ | 139,463 | | 0.2 | |
2,859 | | | | Transocean Ltd. | | 109,757 | | 0.1 | |
| | | | | | 758,645 | | 0.8 | |
| | | | Financials: 0.2% | | | | | |
651 | | | | CME Group, Inc. | | 158,629 | | 0.2 | |
2,445 | | | | Legg Mason, Inc. | | 58,802 | | 0.0 | |
| | | | | | 217,431 | | 0.2 | |
| | | | Health Care: 3.4% | | | | | |
7,538 | | | | Aetna, Inc. | | 318,028 | | 0.4 | |
1,400 | | @ | | Alere, Inc. | | 32,326 | | 0.0 | |
3,611 | | | | Alere, Inc. | | 758,310 | | 0.9 | |
4,804 | | @ | | Bio-Rad Laboratories, Inc. | | 461,376 | | 0.5 | |
5,600 | | | | Cigna Corp. | | 235,200 | | 0.3 | |
11,045 | | @ | | Thermo Fisher Scientific, Inc. | | 496,694 | | 0.6 | |
5,900 | | | | UnitedHealth Group, Inc. | | 299,012 | | 0.3 | |
5,350 | | @ | | Waters Corp. | | 396,168 | | 0.4 | |
| | | | | | 2,997,114 | | 3.4 | |
| | | | Industrials: 3.5% | | | | | |
17,548 | | @ | | BE Aerospace, Inc. | | 679,283 | | 0.8 | |
19,600 | | @ | | Commercial Vehicle Group, Inc. | | 177,184 | | 0.2 | |
8,080 | | | | Cooper Industries PLC | | 437,532 | | 0.5 | |
16,312 | | @ | | DigitalGlobe, Inc. | | 279,098 | | 0.3 | |
7,920 | | | | ESCO Technologies, Inc. | | 227,938 | | 0.2 | |
6,900 | | | | Exelis, Inc. | | 62,445 | | 0.1 | |
4,100 | | @ | | General Cable Corp. | | 102,541 | | 0.1 | |
8,355 | | @ | | GeoEye, Inc. | | 185,648 | | 0.2 | |
785 | | | | Horizon Lines, Inc. | | 3,415 | | 0.0 | |
3,450 | | | | ITT Corp. | | 66,688 | | 0.1 | |
8,019 | | | | Kennametal, Inc. | | 292,854 | | 0.3 | |
5,300 | | | | Lennox International, Inc. | | 178,875 | | 0.2 | |
16,300 | | @ | | Orbital Sciences Corp. | | 236,839 | | 0.3 | |
6,900 | | | | Xylem, Inc. | | 177,261 | | 0.2 | |
| | | | | | 3,107,601 | | 3.5 | |
| | | | Information Technology: 1.7% | | | | | |
7,400 | | @ | | Arrow Electronics, Inc. | | 276,834 | | 0.3 | |
14,400 | | @ | | Ingram Micro, Inc. | | 261,936 | | 0.3 | |
7,419 | | @ | | Itron, Inc. | | 265,377 | | 0.3 | |
21 | | | | Magnachip Semiconductors S.A. | | — | | — | |
51,400 | | @ | | PMC - Sierra, Inc. | | 283,214 | | 0.3 | |
4,000 | | @ | | Research In Motion Ltd. | | 58,000 | | 0.1 | |
10,664 | | @ | | TE Connectivity Ltd. | | 328,558 | | 0.4 | |
| | | | | | 1,473,919 | | 1.7 | |
| | | | Materials: 3.2% | | | | | |
2,371 | | | | FMC Corp. | | 204,001 | | 0.2 | |
16,600 | | | | Freeport-McMoRan Copper & Gold, Inc. | | 610,714 | | 0.7 | |
34,947 | | @ | | Georgia Gulf Corp. | | 681,117 | | 0.8 | |
31,949 | | | | LyondellBasell Industries NV | | 1,038,023 | | 1.1 | |
13,200 | | @ | | Owens-Illinois, Inc. | | 255,816 | | 0.3 | |
91,233 | | @ | | Polymet Mining Corp. | | 95,795 | | 0.1 | |
| | | | | | 2,885,466 | | 3.2 | |
| | | | Telecommunications: 0.4% | | | | | |
28,800 | | | | Windstream Corp. | | 338,112 | | 0.4 | |
| | | | | | | | | |
| | | | Utilities: 0.3% | | | | | |
10,564 | | | | CMS Energy Corp. | | 233,253 | | 0.3 | |
| | | | | | | | | |
| | | | Total Common Stock
(Cost $10,165,487) | | 13,045,245 | | 14.6 | |
| | | | | | | | | |
PREFERRED STOCK: 2.9% | | | | | |
| | | | Energy: 0.7% | | | | | |
11,500 | | | | Petroquest Energy, Inc. | | 425,799 | | 0.5 | |
1,400 | | | | SandRidge Energy, Inc. | | 173,894 | | 0.2 | |
| | | | | | 599,693 | | 0.7 | |
| | | | Financials: 1.9% | | | | | |
325 | | #,P | | Ally Financial, Inc. | | 232,994 | | 0.3 | |
27,580 | | P | | Forest City Enterprises, Inc. | | 1,272,616 | | 1.4 | |
10,000 | | @,P | | GMAC Capital Trust I | | 193,400 | | 0.2 | |
775 | | #,@ | | Perseus Holding Corp. | | 28,675 | | 0.0 | |
| | | | | | 1,727,685 | | 1.9 | |
| | | | Industrials: 0.3% | | | | | |
2,200 | | P | | General Cable Corp. | | 275,688 | | 0.3 | |
| | | | | | | | | |
| | | | Total Preferred Stock
(Cost $2,626,653) | | 2,603,066 | | 2.9 | |
| | | | | | | | | |
WARRANTS: 0.0% | | | | | |
| | | | Energy: 0.0% | | | | | |
75 | | | | Green Field Energy Services, Inc. | | 3,450 | | 0.0 | |
| | | | | | | | | |
| | | | Industrials: 0.0% | | | | | |
74,759 | | | | Horizon Lines, Inc. | | 13,008 | | 0.0 | |
| | | | | | | | | |
| | | | Information Technology: —% | | | | | |
840 | | | | Magnachip Semiconductors S.A. | | — | | — | |
| | | | | | | | | |
| | | | Total Warrants
(Cost $24,243) | | 16,458 | | 0.0 | |
| | | | | | | | | |
| | | | Total Long-Term Investments
(Cost $81,258,490) | | 86,136,378 | | 96.5 | |
| | | | | | | | | |
SHORT-TERM INVESTMENTS: 2.2% | | | | | |
| | | | Mutual Funds: 2.2% | | | | | |
1,985,452 | | | | BlackRock Liquidity Funds, TempFund, Institutional Class (Cost $1,985,452) | | 1,985,452 | | 2.2 | |
| | | | | | | | | |
| | | | Total Short-Term Investments
(Cost $1,985,452) | | 1,985,452 | | 2.2 | |
| | | | | | | | | |
| | | | Total Investments in Securities
(Cost $83,243,942) | | $ | 88,121,830 | | 98.7 | |
| | | | Assets in Excess of Other Liabilities | | 1,119,666 | | 1.3 | |
| | | | Net Assets | | $ | 89,241,496 | | 100.0 | |
See Accompanying Notes to Financial Statements
87
† | Unless otherwise indicated, principal amount is shown in USD. |
# | Securities with purchases pursuant to Rule 144A or section 4(2), under the Securities Act of 1933 and may not be resold subject to that rule except to qualified institutional buyers. |
@ | Non-income producing security |
& | Payment-in-kind |
+ | Step-up basis bonds. Interest rates shown reflect current and next coupon rates. |
P | Preferred Stock may be called prior to convertible date. |
± | Defaulted security |
X | Fair value determined by ING Funds Valuation Committee appointed by the Funds’ Board of Directors/Trustees. |
Z | Indicates Zero Coupon Bond; rate shown reflects current effective yield. |
| |
| Cost for federal income tax purposes is $83,322,937. |
| |
| Net unrealized appreciation consists of: |
Gross Unrealized Appreciation | | $ | 10,895,933 | |
Gross Unrealized Depreciation | | (6,097,040 | ) |
Net Unrealized Appreciation | | $ | 4,798,893 | |
Fair Value Measurements^
The following is a summary of the fair valuations according to the inputs used as of December 31, 2011 in valuing the assets and liabilities:
| | Quoted Prices
in Active Markets
for Identical
Investments
(Level 1) | | Significant
Other
Observable
Inputs #
(Level 2) | | Significant
Unobservable
Inputs
(Level 3) | | Fair Value
at
12/31/2011 | |
Asset Table | | | | | | | | | |
Investments, at value | | | | | | | | | |
Common Stock | | | | | | | | | |
Consumer Discretionary | | $ | 931,143 | | $ | — | | $ | 6,273 | | $ | 937,416 | |
Consumer Staples | | 96,288 | | — | | — | | 96,288 | |
Energy | | 758,645 | | — | | — | | 758,645 | |
Financials | | 217,431 | | — | | — | | 217,431 | |
Health Care | | 2,997,114 | | — | | — | | 2,997,114 | |
Industrials | | 3,107,601 | | — | | — | | 3,107,601 | |
Information Technology | | 1,473,919 | | — | | — | | 1,473,919 | |
Materials | | 2,885,466 | | — | | — | | 2,885,466 | |
Telecommunications | | 338,112 | | — | | — | | 338,112 | |
Utilities | | 233,253 | | — | | — | | 233,253 | |
Total Common Stock | | 13,038,972 | | — | | 6,273 | | 13,045,245 | |
Preferred Stock | | — | | 1,301,775 | | 1,301,291 | | 2,603,066 | |
Warrants | | — | | 13,008 | | 3,450 | | 16,458 | |
Corporate Bonds/Notes | | — | | 68,108,977 | | 884,574 | | 68,993,551 | |
Collateralized Mortgage Obligations | | — | | 927,504 | | — | | 927,504 | |
Municipal Bonds | | — | | 358,475 | | — | | 358,475 | |
Short-Term Investments | | 1,985,452 | | — | | — | | 1,985,452 | |
Asset-Backed Securities | | — | | 192,079 | | — | | 192,079 | |
Total Investments, at value | | $ | 15,024,424 | | $ | 70,901,818 | | $ | 2,195,588 | | $ | 88,121,830 | |
^ | See Note 2, “Significant Accounting Policies” in the Notes to Financial Statements for additional information. |
# | The earlier close of the foreign markets gives rise to the possibility that significant events, including broad market moves, may have occurred in the interim and may materially affect the value of those securities. To account for this, the Portfolio may frequently value many of its foreign equity securities using fair value prices based on third party vendor modeling tools to the extent available. Accordingly, a significant portion of the Portfolio’s investments are categorized as Level 2 investments. |
See Accompanying Notes to Financial Statements
88
| There were no significant transfers between Level 1 and 2 during the year endedDecember 31, 2011. |
| |
| Transfers in or out of Level 3 represent either the beginning value (for transfers in), or the ending value (for transfers out) of any security or derivative instrument where a change in the pricing level occurred from the beginning to the end of the period. Transfers are recognized at the end of the reporting period. |

See Accompanying Notes to Financial Statements
89
| PORTFOLIO OF INVESTMENTS |
ING T. ROWE PRICE DIVERSIFIED MID CAP GROWTH PORTFOLIO | AS OF DECEMBER 31, 2011 |
Shares | | | | | | Value | | Percentage
of Net
Assets | |
COMMON STOCK: 99.6% | | | | | |
| | | | Consumer Discretionary: 20.7% | | | | | |
8,100 | | @ | | Autozone, Inc. | | $ | 2,632,257 | | 0.4 | |
95,400 | | @ | | Bed Bath & Beyond, Inc. | | 5,530,338 | | 0.8 | |
176,500 | | @ | | Carmax, Inc. | | 5,379,720 | | 0.8 | |
62,100 | | @,L | | Central European Media Enterprises Ltd. | | 404,892 | | 0.1 | |
83,200 | | | | Chico’s FAS, Inc. | | 926,848 | | 0.1 | |
8,900 | | @ | | Chipotle Mexican Grill, Inc. | | 3,005,886 | | 0.4 | |
83,500 | | | | Choice Hotels International, Inc. | | 3,177,175 | | 0.4 | |
79,000 | | | | CTC Media, Inc. | | 692,830 | | 0.1 | |
72,600 | | @,L | | Ctrip.com International Ltd. ADR | | 1,698,840 | | 0.2 | |
56,400 | | | | Dick’s Sporting Goods, Inc. | | 2,080,032 | | 0.3 | |
153,950 | | @ | | Discovery Communications, Inc. - Class C | | 5,803,915 | | 0.8 | |
80,700 | | @ | | Dollar General Corp. | | 3,319,998 | | 0.5 | |
46,650 | | @ | | Dollar Tree, Inc. | | 3,877,081 | | 0.5 | |
33,400 | | @ | | Fossil, Inc. | | 2,650,624 | | 0.4 | |
61,100 | | | | Gap, Inc. | | 1,133,405 | | 0.2 | |
99,200 | | | | Gentex Corp. | | 2,935,328 | | 0.4 | |
21,100 | | @,L | | Groupon, Inc. | | 435,293 | | 0.1 | |
35,800 | | | | Guess ?, Inc. | | 1,067,556 | | 0.1 | |
29,000 | | @ | | Hyatt Hotels Corp. | | 1,091,560 | | 0.2 | |
114,600 | | | | International Game Technology | | 1,971,120 | | 0.3 | |
77,000 | | | | Kohl’s Corp. | | 3,799,950 | | 0.5 | |
306,300 | | @ | | Liberty Media Corp. - Interactive - Class A | | 4,966,655 | | 0.7 | |
12,866 | | @ | | Liberty Media Corp. | | 1,004,191 | | 0.1 | |
68,150 | | @ | | Madison Square Garden, Inc. | | 1,951,816 | | 0.3 | |
184,812 | | | | Marriott International, Inc. | | 5,390,966 | | 0.8 | |
18,481 | | @ | | Marriott Vacations Worldwide Corp. | | 317,134 | | 0.0 | |
177,900 | | | | Mattel, Inc. | | 4,938,504 | | 0.7 | |
110,600 | | | | McGraw-Hill Cos., Inc. | | 4,973,682 | | 0.7 | |
41,600 | | | | Men’s Wearhouse, Inc. | | 1,348,256 | | 0.2 | |
35,200 | | @ | | Michael Kors Holdings Ltd. | | 959,200 | | 0.1 | |
141,219 | | @,X | | Michael Kors Holdings Ltd. | | 3,655,817 | | 0.5 | |
22,392 | | @ | | NetFlix, Inc. | | 1,551,542 | | 0.2 | |
97,600 | | @ | | New Oriental Education & Technology Group ADR | | 2,347,280 | | 0.3 | |
133,900 | | | | Omnicom Group | | 5,969,262 | | 0.8 | |
61,400 | | @ | | O’Reilly Automotive, Inc. | | 4,908,930 | | 0.7 | |
97,200 | | @,L | | Pandora Media, Inc. | | 972,972 | | 0.1 | |
23,900 | | @ | | Panera Bread Co. | | 3,380,655 | | 0.5 | |
48,800 | | | | Petsmart, Inc. | | 2,502,952 | | 0.4 | |
138,000 | | | | Ross Stores, Inc. | | 6,559,140 | | 0.9 | |
101,200 | | | | Royal Caribbean Cruises Ltd. | | 2,506,724 | | 0.4 | |
149,600 | | | | Sotheby’s | | 4,268,088 | | 0.6 | |
112,000 | | | | Starwood Hotels & Resorts Worldwide, Inc. | | 5,372,640 | | 0.8 | |
8,800 | | | | Strayer Education, Inc. | | 855,272 | | 0.1 | |
48,400 | | | | Tiffany & Co. | | 3,206,984 | | 0.5 | |
82,150 | | | | Tim Hortons, Inc. | | 3,977,703 | | 0.6 | |
66,800 | | @ | | Toll Brothers, Inc. | | 1,364,056 | | 0.2 | |
27,400 | | | | Tractor Supply Co. | | 1,922,110 | | 0.3 | |
86,100 | | @ | | TRW Automotive Holdings Corp. | | 2,806,860 | | 0.4 | |
51,600 | | @ | | Urban Outfitters, Inc. | | 1,422,096 | | 0.2 | |
24,200 | | | | Weight Watchers International, Inc. | | 1,331,242 | | 0.2 | |
42,700 | | | | Williams-Sonoma, Inc. | | 1,643,950 | | 0.2 | |
53,550 | | @ | | WMS Industries, Inc. | | 1,098,846 | | 0.2 | |
27,700 | | | | Wynn Resorts Ltd. | | 3,060,573 | | 0.4 | |
| | | | | | 146,150,746 | | 20.7 | |
| | | | Consumer Staples: 4.7% | | | | | |
133,400 | | | | Avon Products, Inc. | | 2,330,498 | | 0.3 | |
34,100 | | | | Beam, Inc. | | 1,746,943 | | 0.3 | |
37,700 | | | | Brown-Forman Corp. | | 3,035,227 | | 0.4 | |
30,000 | | | | Campbell Soup Co. | | 997,200 | | 0.1 | |
77,200 | | | | Church & Dwight Co., Inc. | | 3,532,672 | | 0.5 | |
20,500 | | | | Clorox Co. | | 1,364,480 | | 0.2 | |
90,900 | | | | Dr Pepper Snapple Group, Inc. | | 3,588,732 | | 0.5 | |
116,600 | | | | Flowers Foods, Inc. | | 2,213,068 | | 0.3 | |
41,700 | | | | Hershey Co. | | 2,576,226 | | 0.4 | |
16,600 | | | | JM Smucker Co. | | 1,297,622 | | 0.2 | |
13,000 | | | | Lorillard, Inc. | | 1,482,000 | | 0.2 | |
54,200 | | | | McCormick & Co., Inc. | | 2,732,764 | | 0.4 | |
19,200 | | | | Mead Johnson Nutrition Co. | | 1,319,616 | | 0.2 | |
69,100 | | | | Whole Foods Market, Inc. | | 4,807,978 | | 0.7 | |
| | | | | | 33,025,026 | | 4.7 | |
| | | | Energy: 9.0% | | | | | |
115,269 | | | | Arch Coal, Inc. | | 1,672,553 | | 0.2 | |
119,600 | | @ | | Cameron International Corp. | | 5,883,124 | | 0.8 | |
22,300 | | | | Cimarex Energy Co. | | 1,380,370 | | 0.2 | |
54,100 | | @ | | Concho Resources, Inc. | | 5,071,875 | | 0.7 | |
34,100 | | @,L | | Continental Resources, Inc. | | 2,274,811 | | 0.3 | |
31,800 | | | | Core Laboratories NV | | 3,623,610 | | 0.5 | |
40,100 | | | | Diamond Offshore Drilling | | 2,215,926 | | 0.3 | |
35,200 | | @ | | Dresser-Rand Group, Inc. | | 1,756,832 | | 0.3 | |
20,700 | | @ | | Dril-Quip, Inc. | | 1,362,474 | | 0.2 | |
66,200 | | | | EQT Corp. | | 3,627,098 | | 0.5 | |
122,600 | | @ | | FMC Technologies, Inc. | | 6,403,398 | | 0.9 | |
76,400 | | @ | | Kosmos Energy LLC | | 936,664 | | 0.1 | |
192,200 | | @ | | McDermott International, Inc. | | 2,212,222 | | 0.3 | |
20,800 | | | | Murphy Oil Corp. | | 1,159,392 | | 0.2 | |
128,900 | | @ | | Nabors Industries Ltd. | | 2,235,126 | | 0.3 | |
37,500 | | @ | | Newfield Exploration Co. | | 1,414,875 | | 0.2 | |
95,100 | | | | Oceaneering International, Inc. | | 4,386,963 | | 0.6 | |
123,300 | | | | Peabody Energy Corp. | | 4,082,463 | | 0.6 | |
63,700 | | | | QEP Resources, Inc. | | 1,866,410 | | 0.3 | |
85,100 | | | | Range Resources Corp. | | 5,271,094 | | 0.8 | |
37,900 | | | | SM Energy Co. | | 2,770,490 | | 0.4 | |
34,500 | | @ | | Southwestern Energy Co. | | 1,101,930 | | 0.2 | |
| | | | | | | | | | |
See Accompanying Notes to Financial Statements
90
Shares | | | | | | Value | | Percentage
of Net
Assets | |
COMMON STOCK: (continued) | | | | | |
| | | | Energy: (continued) | | | | | |
28,000 | | @ | | Ultra Petroleum Corp. | | $ | 829,640 | | 0.1 | |
| | | | | | 63,539,340 | | 9.0 | |
| | | | Financials: 6.7% | | | | | |
41,100 | | @ | | Arch Capital Group Ltd. | | 1,530,153 | | 0.2 | |
44,600 | | | | Axis Capital Holdings Ltd. | | 1,425,416 | | 0.2 | |
46,100 | | | | BankUnited, Inc. | | 1,013,739 | | 0.1 | |
92,200 | | | | Brown & Brown, Inc. | | 2,086,486 | | 0.3 | |
102,133 | | | | CBOE Holdings, Inc. | | 2,641,160 | | 0.4 | |
101,700 | | | | Fifth Third Bancorp. | | 1,293,624 | | 0.2 | |
127,413 | | | | First Horizon National Corp. | | 1,019,304 | | 0.1 | |
117,000 | | @ | | Forest City Enterprises, Inc. | | 1,382,940 | | 0.2 | |
46,100 | | @,L | | Green Dot Corp. | | 1,439,242 | | 0.2 | |
43,600 | | | | HCC Insurance Holdings, Inc. | | 1,199,000 | | 0.2 | |
39,600 | | @ | | IntercontinentalExchange, Inc. | | 4,773,780 | | 0.7 | |
62,900 | | @ | | Invesco Ltd. | | 1,263,661 | | 0.2 | |
86,600 | | | | Jones Lang LaSalle, Inc. | | 5,305,116 | | 0.8 | |
100,800 | | | | Lazard Ltd. | | 2,631,888 | | 0.4 | |
102,000 | | | | Moody’s Corp. | | 3,435,360 | | 0.5 | |
92,100 | | @ | | MSCI, Inc. - Class A | | 3,032,853 | | 0.4 | |
30,200 | | | | Northern Trust Corp. | | 1,197,732 | | 0.2 | |
40,200 | | | | Principal Financial Group, Inc. | | 988,920 | | 0.1 | |
18,500 | | | | RenaissanceRe Holdings Ltd. | | 1,375,845 | | 0.2 | |
67,000 | | | | SLM Corp. | | 897,800 | | 0.1 | |
23,300 | | @ | | SVB Financial Group | | 1,111,177 | | 0.2 | |
97,100 | | | | TCF Financial Corp. | | 1,002,072 | | 0.1 | |
110,000 | | | | TD Ameritrade Holding Corp. | | 1,721,500 | | 0.2 | |
33,600 | | | | Willis Group Holdings Ltd. | | 1,303,680 | | 0.2 | |
31,700 | | | | WR Berkley Corp. | | 1,090,163 | | 0.2 | |
56,800 | | | | Zions Bancorp. | | 924,704 | | 0.1 | |
| | | | | | 47,087,315 | | 6.7 | |
| | | | Health Care: 12.7% | | | | | |
77,000 | | @ | | Alexion Pharmaceuticals, Inc. | | 5,505,500 | | 0.8 | |
175,900 | | @ | | Allscripts Healthcare Solutions, Inc. | | 3,331,546 | | 0.5 | |
45,100 | | @ | | AMERIGROUP Corp. | | 2,664,508 | | 0.4 | |
170,800 | | | | AmerisourceBergen Corp. | | 6,352,052 | | 0.9 | |
45,500 | | @ | | BioMarin Pharmaceuticals, Inc. | | 1,564,290 | | 0.2 | |
91,800 | | @ | | Bruker BioSciences Corp. | | 1,140,156 | | 0.2 | |
46,700 | | @ | | Catalyst Health Solutions, Inc. | | 2,428,400 | | 0.3 | |
47,400 | | @ | | Cerner Corp. | | 2,903,250 | | 0.4 | |
22,700 | | @ | | Charles River Laboratories International, Inc. | | 620,391 | | 0.1 | |
31,100 | | | | Cigna Corp. | | 1,306,200 | | 0.2 | |
56,800 | | @ | | Community Health Systems, Inc. | | 991,160 | | 0.1 | |
35,600 | | @ | | Covance, Inc. | | 1,627,632 | | 0.2 | |
55,600 | | | | CR Bard, Inc. | | 4,753,800 | | 0.7 | |
50,100 | | @ | | DaVita, Inc. | | 3,798,081 | | 0.5 | |
79,300 | | @,L | | Dendreon Corp. | | 602,680 | | 0.1 | |
74,200 | | | | Densply International, Inc. | | 2,596,258 | | 0.4 | |
17,900 | | @ | | Edwards Lifesciences Corp. | | 1,265,530 | | 0.2 | |
44,900 | | @ | | Henry Schein, Inc. | | 2,892,907 | | 0.4 | |
284,100 | | @ | | Human Genome Sciences, Inc. | | 2,099,499 | | 0.3 | |
16,600 | | | | Humana, Inc. | | 1,454,326 | | 0.2 | |
31,200 | | @,L | | Idexx Laboratories, Inc. | | 2,401,152 | | 0.3 | |
47,100 | | @ | | Illumina, Inc. | | 1,435,608 | | 0.2 | |
202,300 | | @,L | | Incyte Corp., Ltd. | | 3,036,523 | | 0.4 | |
1,600 | | @ | | Intuitive Surgical, Inc. | | 740,816 | | 0.1 | |
39,000 | | @ | | Laboratory Corp. of America Holdings | | 3,352,830 | | 0.5 | |
27,500 | | @ | | Life Technologies Corp. | | 1,070,025 | | 0.1 | |
38,100 | | @ | | Mednax, Inc. | | 2,743,581 | | 0.4 | |
18,300 | | @ | | Mettler Toledo International, Inc. | | 2,703,093 | | 0.4 | |
51,000 | | @ | | Myriad Genetics, Inc. | | 1,067,940 | | 0.1 | |
74,900 | | | | Quest Diagnostics | | 4,348,694 | | 0.6 | |
62,600 | | @,L | | Regeneron Pharmaceuticals, Inc. | | 3,469,918 | | 0.5 | |
61,300 | | @ | | SXC Health Solutions Corp. | | 3,462,224 | | 0.5 | |
37,200 | | @ | | Thoratec Corp. | | 1,248,432 | | 0.2 | |
38,900 | | | | Universal Health Services, Inc. | | 1,511,654 | | 0.2 | |
47,800 | | @ | | Valeant Pharmaceuticals International, Inc. | | 2,231,782 | | 0.3 | |
27,500 | | @ | | Varian Medical Systems, Inc. | | 1,846,075 | | 0.3 | |
66,600 | | @ | | Vertex Pharmaceuticals, Inc. | | 2,211,786 | | 0.3 | |
16,900 | | @ | | Waters Corp. | | 1,251,445 | | 0.2 | |
| | | | | | 90,031,744 | | 12.7 | |
| | | | Industrials: 15.9% | | | | | |
54,000 | | @,L | | Air Lease Corp. | | 1,280,340 | | 0.2 | |
82,600 | | @ | | American Reprographics Co. | | 379,134 | | 0.1 | |
72,975 | | | | Ametek, Inc. | | 3,072,248 | | 0.4 | |
107,850 | | @ | | Babcock & Wilcox Co. | | 2,603,499 | | 0.4 | |
72,100 | | | | CH Robinson Worldwide, Inc. | | 5,031,138 | | 0.7 | |
29,500 | | | | Clarcor, Inc. | | 1,474,705 | | 0.2 | |
29,800 | | @ | | Clean Harbors, Inc. | | 1,899,154 | | 0.3 | |
87,300 | | | | Cooper Industries PLC | | 4,727,295 | | 0.7 | |
40,500 | | | | Copa Holdings S.A. | | 2,376,135 | | 0.3 | |
32,100 | | @ | | Copart, Inc. | | 1,537,269 | | 0.2 | |
39,300 | | | | Cummins, Inc. | | 3,459,186 | | 0.5 | |
38,400 | | | | Donaldson Co., Inc. | | 2,614,272 | | 0.4 | |
17,200 | | | | The Dun & Bradstreet Corp. | | 1,287,076 | | 0.2 | |
80,800 | | | | Embraer SA ADR | | 2,037,776 | | 0.3 | |
95,700 | | | | Expeditors International Washington, Inc. | | 3,919,872 | | 0.6 | |
73,600 | | L | | Fastenal Co. | | 3,209,696 | | 0.5 | |
15,300 | | | | Flowserve Corp. | | 1,519,596 | | 0.2 | |
82,900 | | | | Fluor Corp. | | 4,165,725 | | 0.6 | |
102,500 | | @ | | Fortune Brands Home & Security, Inc. | | 1,745,575 | | 0.2 | |
| | | | | | | | | | |
See Accompanying Notes to Financial Statements
91
Shares | | | | | | Value | | Percentage
of Net
Assets | |
COMMON STOCK: (continued) | | | | | |
| | | | Industrials: (continued) | | | | | |
42,300 | | @ | | General Cable Corp. | | $ | 1,057,923 | | 0.1 | |
33,300 | | | | Graco, Inc. | | 1,361,637 | | 0.2 | |
89,900 | | @ | | Hertz Global Holdings, Inc. | | 1,053,628 | | 0.1 | |
43,800 | | | | Hubbell, Inc. | | 2,928,468 | | 0.4 | |
32,100 | | | | IDEX Corp. | | 1,191,231 | | 0.2 | |
66,400 | | @ | | II-VI, Inc. | | 1,219,104 | | 0.2 | |
49,300 | | | | JB Hunt Transport Services, Inc. | | 2,221,951 | | 0.3 | |
60,600 | | | | Joy Global, Inc. | | 4,543,182 | | 0.6 | |
74,900 | | @ | | Kansas City Southern | | 5,093,949 | | 0.7 | |
64,100 | | | | Landstar System, Inc. | | 3,071,672 | | 0.4 | |
100,000 | | | | Manpower, Inc. | | 3,575,000 | | 0.5 | |
25,100 | | | | Paccar, Inc. | | 940,497 | | 0.1 | |
59,000 | | | | Pall Corp. | | 3,371,850 | | 0.5 | |
62,800 | | @ | | Quanta Services, Inc. | | 1,352,712 | | 0.2 | |
40,600 | | | | Ritchie Brothers Auctioneers, Inc. | | 896,448 | | 0.1 | |
72,800 | | | | Robert Half International, Inc. | | 2,071,888 | | 0.3 | |
47,200 | | | | Roper Industries, Inc. | | 4,100,264 | | 0.6 | |
103,400 | | | | Skywest, Inc. | | 1,301,806 | | 0.2 | |
266,300 | | | | Southwest Airlines Co. | | 2,279,528 | | 0.3 | |
18,500 | | @ | | Stericycle, Inc. | | 1,441,520 | | 0.2 | |
43,500 | | @ | | Terex Corp. | | 587,685 | | 0.1 | |
19,800 | | @ | | TransDigm Group, Inc. | | 1,894,464 | | 0.3 | |
33,200 | | | | Valmont Industries, Inc. | | 3,014,228 | | 0.4 | |
54,600 | | @ | | Verisk Analytics, Inc. | | 2,191,098 | | 0.3 | |
62,000 | | @ | | WABCO Holdings, Inc. | | 2,690,800 | | 0.4 | |
32,500 | | | | Wabtec Corp. | | 2,273,375 | | 0.3 | |
56,100 | | | | Waste Connections, Inc. | | 1,859,154 | | 0.3 | |
22,300 | | | | WW Grainger, Inc. | | 4,174,337 | | 0.6 | |
| | | | | | 112,099,090 | | 15.9 | |
| | | | Information Technology: 21.0% | | | | | |
109,500 | | | | Altera Corp. | | 4,062,450 | | 0.6 | |
72,200 | | | | Amphenol Corp. | | 3,277,158 | | 0.5 | |
119,200 | | | | Analog Devices, Inc. | | 4,264,976 | | 0.6 | |
62,000 | | @ | | Ansys, Inc. | | 3,551,360 | | 0.5 | |
80,400 | | @ | | Ariba, Inc. | | 2,257,632 | | 0.3 | |
104,400 | | | | ARM Holdings PLC ADR | | 2,888,748 | | 0.4 | |
108,000 | | @ | | Aruba Networks, Inc. | | 2,000,160 | | 0.3 | |
425,800 | | @ | | Atmel Corp. | | 3,448,980 | | 0.5 | |
142,000 | | @ | | Autodesk, Inc. | | 4,306,860 | | 0.6 | |
51,000 | | @ | | Check Point Software Technologies | | 2,679,540 | | 0.4 | |
79,900 | | @ | | Ciena Corp. | | 966,790 | | 0.1 | |
29,400 | | @ | | Citrix Systems, Inc. | | 1,785,168 | | 0.3 | |
31,800 | | @ | | Commvault Systems, Inc. | | 1,358,496 | | 0.2 | |
64,900 | | @ | | Concur Technologies, Inc. | | 3,296,271 | | 0.5 | |
318,224 | | @,X | | Coupon.com | | 1,748,116 | | 0.2 | |
13,900 | | @ | | Equinix, Inc. | | 1,409,460 | | 0.2 | |
17,200 | | @ | | F5 Networks, Inc. | | 1,825,264 | | 0.3 | |
17,000 | | | | Factset Research Systems, Inc. | | 1,483,760 | | 0.2 | |
92,200 | | @ | | Fortinet, Inc. | | 2,010,882 | | 0.3 | |
78,200 | | @ | | Gartner, Inc. | | 2,719,014 | | 0.4 | |
84,800 | | @ | | Genpact Ltd. | | 1,267,760 | | 0.2 | |
233,880 | | @,X | | Groupon, Inc. | | 4,583,697 | | 0.7 | |
60,000 | | @ | | Informatica Corp. | | 2,215,800 | | 0.3 | |
69,200 | | | | Intersil Corp. | | 722,448 | | 0.1 | |
84,800 | | | | Intuit, Inc. | | 4,459,632 | | 0.6 | |
18,000 | | @ | | Itron, Inc. | | 643,860 | | 0.1 | |
83,200 | | | | Jabil Circuit, Inc. | | 1,635,712 | | 0.2 | |
187,000 | | @ | | JDS Uniphase Corp. | | 1,952,280 | | 0.3 | |
105,800 | | @ | | Juniper Networks, Inc. | | 2,159,378 | | 0.3 | |
30,400 | | | | KLA-Tencor Corp. | | 1,466,800 | | 0.2 | |
77,500 | | @ | | Lam Research Corp. | | 2,869,050 | | 0.4 | |
126,300 | | | | Linear Technology Corp. | | 3,792,789 | | 0.5 | |
267,900 | | @ | | Marvell Technology Group Ltd. | | 3,710,415 | | 0.5 | |
79,700 | | L | | Microchip Technology, Inc. | | 2,919,411 | | 0.4 | |
40,900 | | @ | | Micros Systems, Inc. | | 1,905,122 | | 0.3 | |
62,400 | | | | National Instruments Corp. | | 1,619,280 | | 0.2 | |
30,500 | | @ | | NetApp, Inc. | | 1,106,235 | | 0.2 | |
243,500 | | @ | | Nuance Communications, Inc. | | 6,126,460 | | 0.9 | |
256,600 | | @ | | Nvidia Corp. | | 3,556,476 | | 0.5 | |
157,800 | | @ | | ON Semiconductor Corp. | | 1,218,216 | | 0.2 | |
56,500 | | | | Paychex, Inc. | | 1,701,215 | | 0.2 | |
87,500 | | @ | | QLogic Corp. | | 1,312,500 | | 0.2 | |
32,600 | | @ | | Rackspace Hosting, Inc. | | 1,402,126 | | 0.2 | |
107,000 | | @ | | Red Hat, Inc. | | 4,418,030 | | 0.6 | |
48,000 | | @ | | Riverbed Technolgoy, Inc. | | 1,128,000 | | 0.2 | |
72,300 | | @ | | Rovi Corp. | | 1,777,134 | | 0.2 | |
14,400 | | @ | | Salesforce.com, Inc. | | 1,461,024 | | 0.2 | |
84,300 | | @,L | | Silicon Laboratories, Inc. | | 3,660,306 | | 0.5 | |
53,500 | | @,L | | Sina Corp. | | 2,782,000 | | 0.4 | |
112,200 | | @ | | Skyworks Solutions, Inc. | | 1,819,884 | | 0.3 | |
36,600 | | | | Solera Holdings, Inc. | | 1,630,164 | | 0.2 | |
62,600 | | @ | | Teradata Corp. | | 3,036,726 | | 0.4 | |
129,000 | | @ | | TIBCO Software, Inc. | | 3,084,390 | | 0.4 | |
114,600 | | @ | | Trimble Navigation Ltd. | | 4,973,640 | | 0.7 | |
139,600 | | @ | | Triquint Semiconductor, Inc. | | 679,852 | | 0.1 | |
349,400 | | | | Western Union Co. | | 6,380,044 | | 0.9 | |
142,700 | | | | Xilinx, Inc. | | 4,574,962 | | 0.6 | |
32,800 | | @ | | Zebra Technologies Corp. | | 1,173,584 | | 0.2 | |
| | | | | | 148,267,487 | | 21.0 | |
| | | | Materials: 6.8% | | | | | |
24,300 | | | | Agnico-Eagle Mines Ltd. | | 882,576 | | 0.1 | |
15,400 | | | | Air Products & Chemicals, Inc. | | 1,311,926 | | 0.2 | |
22,000 | | | | Albemarle Corp. | | 1,133,220 | | 0.2 | |
36,900 | | | | Carpenter Technology Corp. | | 1,899,612 | | 0.3 | |
26,300 | | | | CF Industries Holdings, Inc. | | 3,812,974 | | 0.5 | |
63,000 | | | | Cliffs Natural Resources, Inc. | | 3,928,050 | | 0.6 | |
83,600 | | | | Compass Minerals International, Inc. | | 5,755,860 | | 0.8 | |
165,200 | | | | Eldorado Gold Corp. | | 2,264,892 | | 0.3 | |
270,900 | | | | HudBay Minerals, Inc. | | 2,673,783 | | 0.4 | |
44,000 | | @ | | Intrepid Potash, Inc. | | 995,720 | | 0.1 | |
184,100 | | @ | | Osisko Mining Corp. | | 1,780,247 | | 0.2 | |
23,500 | | | | PPG Industries, Inc. | | 1,962,015 | | 0.3 | |
| | | | | | | | | | |
See Accompanying Notes to Financial Statements
92
Shares | | | | | | Value | | Percentage
of Net
Assets | |
COMMON STOCK: (continued) | | | | | |
| | | | Materials: (continued) | | | | | |
91,200 | | @ | | Rockwood Holdings, Inc. | | $ | 3,590,544 | | 0.5 | |
63,100 | | | | Sherwin-Williams Co. | | 5,632,937 | | 0.8 | |
21,200 | | | | Sigma-Aldrich Corp. | | 1,324,152 | | 0.2 | |
53,000 | | L | | Sociedad Quimica y Minera de Chile SA ADR | | 2,854,050 | | 0.4 | |
78,700 | | @ | | Stillwater Mining Co. | | 823,202 | | 0.1 | |
47,900 | | | | Ternium SA ADR | | 880,881 | | 0.1 | |
28,500 | | L | | United States Steel Corp. | | 754,110 | | 0.1 | |
34,200 | | L | | Vulcan Materials Co. | | 1,345,770 | | 0.2 | |
41,500 | | | | Walter Industries, Inc. | | 2,513,240 | | 0.4 | |
| | | | | | 48,119,761 | | 6.8 | |
| | | | Telecommunications: 1.7% | | | | | |
140,200 | | @ | | Crown Castle International Corp. | | 6,280,960 | | 0.9 | |
34,600 | | @ | | NII Holdings, Inc. | | 736,980 | | 0.1 | |
114,950 | | @ | | SBA Communications Corp. | | 4,938,252 | | 0.7 | |
| | | | | | 11,956,192 | | 1.7 | |
| | | | Utilities: 0.4% | | | | | |
178,800 | | @ | | Calpine Corp. | | 2,919,804 | | 0.4 | |
| | | | | | | | | |
| | | | Total Common Stock
(Cost $647,555,286) | | 703,196,505 | | 99.6 | |
| | | | | |
PREFERRED STOCK: 0.1% | | | | | |
| | | | Information Technology: 0.1% | | | | | |
32,539 | | @,X | | Workday, Inc. | | 431,467 | | 0.1 | |
| | | | | | | | | |
| | | | Total Preferred Stock
(Cost $431,467) | | 431,467 | | 0.1 | |
| | | | | | | | | |
| | | | Total Long-Term Investments
(Cost $647,986,753) | | 703,627,972 | | 99.7 | |
| | | | | | | | | | |
Principal
Amount† | | | | | | | | | |
SHORT-TERM INVESTMENTS: 3.5% | | | | | |
| | | | Securities Lending Collateral(cc)(1): 3.4% | | | | | |
5,591,715 | | | | Citigroup, Inc., Repurchase Agreement dated 12/30/11, 0.08%, due 01/03/12 (Repurchase Amount $5,591,764, collateralized by various U.S. Government and U.S. Government Agency Obligations, 0.000%-5.500%, Market Value plus accrued interest $5,703,550, due 01/19/12-12/20/41) | | 5,591,715 | | 0.8 | |
5,591,715 | | | | Deutsche Bank AG, Repurchase Agreement dated 12/30/11, 0.10%, due 01/03/12 (Repurchase Amount $5,591,776, collateralized by various U.S. Government and U.S. Government Agency Obligations, 0.000%-6.500%, Market Value plus accrued interest $5,703,550, due 06/28/12-11/01/41) | | 5,591,715 | | 0.8 | |
5,591,715 | | | | Goldman Sachs & Co., Repurchase Agreement dated 12/30/11, 0.10%, due 01/03/12 (Repurchase Amount $5,591,776, collateralized by various U.S. Government Agency Obligations, 2.163%-6.500%, Market Value plus accrued interest $5,703,549, due 04/01/20-12/01/48) | | 5,591,715 | | 0.8 | |
5,591,715 | | | | Morgan Stanley, Repurchase Agreement dated 12/30/11, 0.08%, due 01/03/12 (Repurchase Amount $5,591,764, collateralized by various U.S. Government and U.S. Government Agency Obligations, 0.000%-6.375%, Market Value plus accrued interest $5,703,549, due 11/15/12-10/01/44) | | 5,591,715 | | 0.8 | |
1,177,203 | | | | Royal Bank of Canada, Repurchase Agreement dated 12/30/11, 0.01%, due 01/03/12 (Repurchase Amount $1,177,204, collateralized by various U.S. Government Securities, 0.000%-4.250%, Market Value plus accrued interest $1,200,748, due 08/15/12-11/15/40) | | 1,177,203 | | 0.2 | |
| | | | | | 23,544,063 | | 3.4 | |
See Accompanying Notes to Financial Statements
93
Shares | | | | | | Value | | Percentage
of Net
Assets | |
| | | | Mutual Funds: 0.1% | | | | | |
810,229 | | | | T. Rowe Price Reserve Investment Fund
(Cost $810,229) | | $ | 810,229 | | 0.1 | |
| | | | | | | | | |
| | | | Total Short-Term Investments
(Cost $24,354,292) | | 24,354,292 | | 3.5 | |
| | | | | | | | | |
| | | | Total Investments in Securities
(Cost $672,341,045) | | $ | 727,982,264 | | 103.2 | |
| | | | Liabilities in Excess of Other Assets | | (22,677,317 | ) | (3.2 | ) |
| | | | Net Assets | | $ | 705,304,947 | | 100.0 | |
† | Unless otherwise indicated, principal amount is shown in USD. |
@ | Non-income producing security |
ADR | American Depositary Receipt |
(cc) | Securities purchased with cash collateral for securities loaned. |
L | Loaned security, a portion or all of the security is on loan at December 31, 2011. |
X | Fair value determined by ING Funds Valuation Committee appointed by the Funds’ Board of Directors/Trustees. |
(1) | Collateral received from brokers for securities lending was invested into these short-term investments. |
| |
| Cost for federal income tax purposes is $672,636,441. |
| |
| Net unrealized appreciation consists of: |
Gross Unrealized Appreciation | | $ | 136,852,286 | |
Gross Unrealized Depreciation | | (81,506,463 | ) |
Net Unrealized Appreciation | | $ | 55,345,823 | |
Fair Value Measurements^
The following is a summary of the fair valuations according to the inputs used as of December 31, 2011 in valuing the assets and liabilities:
| | Quoted Prices
in Active Markets
for Identical
Investments
(Level 1) | | Significant
Other
Observable
Inputs #
(Level 2) | | Significant
Unobservable
Inputs
(Level 3) | | Fair Value
at
12/31/2011 | |
Asset Table | | | | | | | | | |
Investments, at value | | | | | | | | | |
Common Stock | | | | | | | | | |
Consumer Discretionary | | $ | 142,494,929 | | $ | 3,655,817 | | $ | — | | $ | 146,150,746 | |
Consumer Staples | | 33,025,026 | | — | | — | | 33,025,026 | |
Energy | | 63,539,340 | | — | | — | | 63,539,340 | |
Financials | | 47,087,315 | | — | | — | | 47,087,315 | |
Health Care | | 90,031,744 | | — | | — | | 90,031,744 | |
Industrials | | 112,099,090 | | — | | — | | 112,099,090 | |
Information Technology | | 141,935,674 | | 4,583,697 | | 1,748,116 | | 148,267,487 | |
Materials | | 45,265,711 | | 2,854,050 | | — | | 48,119,761 | |
Telecommunications | | 11,956,192 | | — | | — | | 11,956,192 | |
Utilities | | 2,919,804 | | — | | — | | 2,919,804 | |
Total Common Stock | | 690,354,825 | | 11,093,564 | | 1,748,116 | | 703,196,505 | |
Preferred Stock | | — | | 431,467 | | — | | 431,467 | |
| | | | | | | | | | | | | |
See Accompanying Notes to Financial Statements
94
| | Quoted Prices
in Active Markets
for Identical
Investments
(Level 1) | | Significant
Other
Observable
Inputs #
(Level 2) | | Significant
Unobservable
Inputs
(Level 3) | | Fair Value
at
12/31/2011 | |
Short-Term Investments | | $ | 810,229 | | $ | 23,544,063 | | $ | — | | $ | 24,354,292 | |
Total Investments, at value | | $ | 691,165,054 | | $ | 35,069,094 | | $ | 1,748,116 | | $ | 727,982,264 | |
^ | See Note 2, “Significant Accounting Policies” in the Notes to Financial Statements for additional information. |
# | The earlier close of the foreign markets gives rise to the possibility that significant events, including broad market moves, may have occurred in the interim and may materially affect the value of those securities. To account for this, the Portfolio may frequently value many of its foreign equity securities using fair value prices based on third party vendor modeling tools to the extent available. Accordingly, a significant portion of the Portfolio’s investments are categorized as Level 2 investments. |
| |
| There were no significant transfers between Level 1 and 2 during the year ended December 31, 2011. |
| |
| Transfers in or out of Level 3 represent either the beginning value (for transfers in), or the ending value (for transfers out) of any security or derivative instrument where a change in the pricing level occurred from the beginning to the end of the period. Transfers are recognized at the end of the reporting period. |

See Accompanying Notes to Financial Statements
95
| | PORTFOLIO OF INVESTMENTS |
ING T. ROWE PRICE GROWTH EQUITY PORTFOLIO | | AS OF DECEMBER 31, 2011 |
Shares | | | | | | Value | | Percentage
of Net
Assets | |
COMMON STOCK: 97.9% | | | | | |
| | | | Consumer Discretionary: 18.5% | | | | | |
194,000 | | @ | | Amazon.com, Inc. | | $ | 33,581,400 | | 3.4 | |
15,900 | | @ | | Autozone, Inc. | | 5,167,023 | | 0.5 | |
215,400 | | @ | | Carmax, Inc. | | 6,565,392 | | 0.7 | |
146,800 | | | | Carnival PLC | | 4,838,784 | | 0.5 | |
26,200 | | @ | | Chipotle Mexican Grill, Inc. | | 8,848,788 | | 0.9 | |
55,900 | | | | Coach, Inc. | | 3,412,136 | | 0.3 | |
142,700 | | @,L | | Ctrip.com International Ltd. ADR | | 3,339,180 | | 0.3 | |
51,200 | | @ | | Discovery Communications, Inc. - Class A | | 2,097,664 | | 0.2 | |
44,304 | | @ | | Fossil, Inc. | | 3,515,965 | | 0.4 | |
29,000 | | @,L | | Groupon, Inc. | | 598,270 | | 0.1 | |
98,200 | | | | Harley-Davidson, Inc. | | 3,817,034 | | 0.4 | |
124,500 | | | | Johnson Controls, Inc. | | 3,891,870 | | 0.4 | |
176,800 | | @ | | Las Vegas Sands Corp. | | 7,554,664 | | 0.8 | |
211,500 | | @ | | Liberty Media Corp. - Interactive - Class A | | 3,429,473 | | 0.3 | |
278,411 | | | | Marriott International, Inc. | | 8,121,249 | | 0.8 | |
129,900 | | @ | | MGM Resorts International | | 1,354,857 | | 0.1 | |
132,000 | | | | Nike, Inc. | | 12,720,840 | | 1.3 | |
765,500 | | @,L | | Prada SpA | | 3,445,219 | | 0.3 | |
46,359 | | @ | | Priceline.com, Inc. | | 21,682,568 | | 2.2 | |
40,000 | | | | Ralph Lauren Corp. | | 5,523,200 | | 0.6 | |
107,800 | | | | Ross Stores, Inc. | | 5,123,734 | | 0.5 | |
283,800 | | | | Starbucks Corp. | | 13,057,638 | | 1.3 | |
133,900 | | | | Starwood Hotels & Resorts Worldwide, Inc. | | 6,423,183 | | 0.7 | |
212,400 | | | | Walt Disney Co. | | 7,965,000 | | 0.8 | |
115,300 | | | | Yum! Brands, Inc. | | 6,803,853 | | 0.7 | |
| | | | | | 182,878,984 | | 18.5 | |
| | | | Consumer Staples: 1.9% | | | | | |
96,400 | | | | Costco Wholesale Corp. | | 8,032,048 | | 0.8 | |
88,400 | | | | CVS Caremark Corp. | | 3,604,952 | | 0.4 | |
37,900 | | @ | | Hansen Natural Corp. | | 3,492,106 | | 0.3 | |
56,600 | | | | Whole Foods Market, Inc. | | 3,938,228 | | 0.4 | |
| | | | | | 19,067,334 | | 1.9 | |
| | | | Energy: 7.6% | | | | | |
163,200 | | @ | | Cameron International Corp. | | 8,027,808 | | 0.8 | |
47,900 | | | | Cimarex Energy Co. | | 2,965,010 | | 0.3 | |
103,200 | | @,L | | Continental Resources, Inc. | | 6,884,472 | | 0.7 | |
129,800 | | | | EOG Resources, Inc. | | 12,786,598 | | 1.3 | |
229,900 | | @ | | FMC Technologies, Inc. | | 12,007,677 | | 1.2 | |
250,900 | | @ | | McDermott International, Inc. | | 2,887,859 | | 0.3 | |
122,000 | | | | Occidental Petroleum Corp. | | 11,431,400 | | 1.2 | |
123,000 | | | | Peabody Energy Corp. | | 4,072,530 | | 0.4 | |
199,900 | | | | Schlumberger Ltd. | | 13,655,169 | | 1.4 | |
| | | | | | 74,718,523 | | 7.6 | |
| | | | Financials: 4.1% | | | | | |
271,900 | | | | American Express Co. | | 12,825,523 | | 1.3 | |
60,276 | | @ | | CBRE Group, Inc. | | 917,401 | | 0.1 | |
107,208 | | | | Franklin Resources, Inc. | | 10,298,400 | | 1.0 | |
53,100 | | @ | | IntercontinentalExchange, Inc. | | 6,401,205 | | 0.6 | |
338,100 | | @ | | Invesco Ltd. | | 6,792,429 | | 0.7 | |
139,400 | | | | US Bancorp. | | 3,770,770 | | 0.4 | |
| | | | | | 41,005,728 | | 4.1 | |
| | | | Health Care: 6.0% | | | | | |
53,800 | | @ | | Alexion Pharmaceuticals, Inc. | | 3,846,700 | | 0.4 | |
62,900 | | | | Allergan, Inc. | | 5,518,846 | | 0.6 | |
51,400 | | | | Baxter International, Inc. | | 2,543,272 | | 0.3 | |
47,100 | | @ | | Biogen Idec, Inc. | | 5,183,355 | | 0.5 | |
80,458 | | @ | | Celgene Corp. | | 5,438,961 | | 0.6 | |
30,000 | | | | Covidien PLC | | 1,350,300 | | 0.1 | |
60,500 | | @ | | Edwards Lifesciences Corp. | | 4,277,350 | | 0.4 | |
148,500 | | @ | | Express Scripts, Inc. | | 6,636,465 | | 0.7 | |
197,100 | | @ | | Human Genome Sciences, Inc. | | 1,456,569 | | 0.1 | |
174,700 | | | | McKesson Corp. | | 13,610,877 | | 1.4 | |
108,300 | | | | Stryker Corp. | | 5,383,593 | | 0.5 | |
80,100 | | @ | | Valeant Pharmaceuticals International, Inc. | | 3,739,869 | | 0.4 | |
| | | | | | 58,986,157 | | 6.0 | |
| | | | Industrials: 15.4% | | | | | |
100,500 | | @ | | Babcock & Wilcox Co. | | 2,426,070 | | 0.2 | |
116,300 | | | | Boeing Co. | | 8,530,605 | | 0.9 | |
30,900 | | | | Caterpillar, Inc. | | 2,799,540 | | 0.3 | |
77,700 | | | | Cooper Industries PLC | | 4,207,455 | | 0.4 | |
48,300 | | | | Cummins, Inc. | | 4,251,366 | | 0.4 | |
601,800 | | | | Danaher Corp. | | 28,308,672 | | 2.9 | |
59,300 | | | | Deere & Co. | | 4,586,855 | | 0.5 | |
75,400 | | | | Emerson Electric Co. | | 3,512,886 | | 0.4 | |
126,000 | | | | Expeditors International Washington, Inc. | | 5,160,960 | | 0.5 | |
347,900 | | L | | Fastenal Co. | | 15,171,919 | | 1.5 | |
187,000 | | | | FedEx Corp. | | 15,616,370 | | 1.6 | |
47,300 | | | | Fluor Corp. | | 2,376,825 | | 0.2 | |
65,700 | | | | Joy Global, Inc. | | 4,925,529 | | 0.5 | |
89,700 | | @ | | Kansas City Southern | | 6,100,497 | | 0.6 | |
88,800 | | | | Precision Castparts Corp. | | 14,633,352 | | 1.5 | |
58,800 | | | | Roper Industries, Inc. | | 5,107,956 | | 0.5 | |
111,500 | | | | Union Pacific Corp. | | 11,812,310 | | 1.2 | |
119,200 | | | | United Parcel Service, Inc. - Class B | | 8,724,248 | | 0.9 | |
21,700 | | | | WW Grainger, Inc. | | 4,062,023 | | 0.4 | |
| | | | | | 152,315,438 | | 15.4 | |
| | | | Information Technology: 35.5% | | | | | |
199,800 | | | | Accenture PLC | | 10,635,354 | | 1.1 | |
50,200 | | @ | | Akamai Technologies, Inc. | | 1,620,456 | | 0.2 | |
224,800 | | @ | | Apple, Inc. | | 91,044,000 | | 9.2 | |
126,300 | | @ | | Autodesk, Inc. | | 3,830,679 | | 0.4 | |
181,900 | | @ | | Baidu.com ADR | | 21,185,893 | | 2.1 | |
219,800 | | | | Broadcom Corp. | | 6,453,328 | | 0.7 | |
496,900 | | | | Corning, Inc. | | 6,449,762 | | 0.7 | |
360,100 | | @ | | eBay, Inc. | | 10,921,833 | | 1.1 | |
| | | | | | | | | | |
See Accompanying Notes to Financial Statements
96
Shares | | | | | | Value | | Percentage
of Net
Assets | |
COMMON STOCK: (continued) | | | | | |
| | | | Information Technology: (continued) | | | | | |
145,200 | | @ | | EMC Corp. | | $ | 3,127,608 | | 0.3 | |
279,291 | | @,X | | Facebook, Inc. | | 8,699,105 | | 0.9 | |
74,150 | | @ | | Google, Inc. - Class A | | 47,893,485 | | 4.8 | |
252,012 | | @,X | | Groupon, Inc. | | 4,939,057 | | 0.5 | |
76,200 | | @ | | Informatica Corp. | | 2,814,066 | | 0.3 | |
371,400 | | @ | | Juniper Networks, Inc. | | 7,580,274 | | 0.8 | |
66,100 | | @,L | | LinkedIn Corp. | | 4,164,961 | | 0.4 | |
84,501 | | @,X | | LivingSocial.com | | 649,813 | | 0.1 | |
97,711 | | #,@ | | Mail.ru Group Ltd. GDR | | 2,536,268 | | 0.2 | |
76,600 | | | | Mastercard, Inc. | | 28,558,012 | | 2.9 | |
134,400 | | @ | | NetApp, Inc. | | 4,874,688 | | 0.5 | |
157,806 | | @ | | Nuance Communications, Inc. | | 3,970,399 | | 0.4 | |
511,400 | | | | Qualcomm, Inc. | | 27,973,580 | | 2.8 | |
122,900 | | @ | | Red Hat, Inc. | | 5,074,541 | | 0.5 | |
37,416 | | @ | | Salesforce.com, Inc. | | 3,796,227 | | 0.4 | |
75,100 | | @ | | Sandisk Corp. | | 3,695,671 | | 0.4 | |
348,600 | | | | Tencent Holdings Ltd. | | 6,980,147 | | 0.7 | |
91,000 | | @ | | Teradata Corp. | | 4,414,410 | | 0.4 | |
99,300 | | @ | | Trimble Navigation Ltd. | | 4,309,620 | | 0.4 | |
44,243 | | @,X | | Twitter, Inc. | | 619,402 | | 0.1 | |
72,209 | | @,X | | Twitter, Inc. | | 1,010,926 | | 0.1 | |
115 | | @,X | | Twitter, Inc. - Series A | | 1,610 | | 0.0 | |
1,793 | | @,X | | Twitter, Inc. - Series B | | 25,102 | | 0.0 | |
460 | | @,X | | Twitter, Inc. - Series C | | 6,440 | | 0.0 | |
16,982 | | @,X | | Twitter, Inc. - Series D | | 237,748 | | 0.0 | |
143,200 | | | | Visa, Inc. | | 14,539,096 | | 1.5 | |
275,100 | | | | Western Union Co. | | 5,023,326 | | 0.5 | |
189,420 | | @,X | | Zynga, Inc.- Class B | | 1,693,320 | | 0.1 | |
| | | | | | 351,350,207 | | 35.5 | |
| | | | Materials: 4.4% | | | | | |
44,900 | | | | Air Products & Chemicals, Inc. | | 3,825,031 | | 0.4 | |
194,057 | | | | BHP Billiton Ltd. | | 6,849,938 | | 0.7 | |
112,900 | | | | Freeport-McMoRan Copper & Gold, Inc. | | 4,153,591 | | 0.4 | |
101,200 | | | | Potash Corp. of Saskatchewan | | 4,177,536 | | 0.4 | |
224,400 | | | | Praxair, Inc. | | 23,988,360 | | 2.5 | |
| | | | | | 42,994,456 | | 4.4 | |
| | | | Telecommunications: 4.5% | | | | | |
358,100 | | | | American Tower Corp. | | 21,489,581 | | 2.2 | |
519,112 | | @ | | Crown Castle International Corp. | | 23,256,218 | | 2.3 | |
| | | | | | 44,745,799 | | 4.5 | |
| | | | | | | | | |
| | | | Total Common Stock
(Cost $750,798,347) | | 968,062,626 | | 97.9 | |
| | | | | | | | | | |
Principal
Amount† | | | | | | | | | |
SHORT-TERM INVESTMENTS: 4.9% | | | | | |
| | | | Securities Lending Collateral(cc)(1): 2.9% | | | | | |
6,778,929 | | | | Citigroup, Inc., Repurchase Agreement dated 12/30/11, 0.08%, due 01/03/12 (Repurchase Amount $6,778,988, collateralized by various U.S. Government and U.S. Government Agency Obligations, 0.000%-5.500%, Market Value plus accrued interest $6,914,508, due 01/19/12-12/20/41) | | $ | 6,778,929 | | 0.7 | |
6,778,929 | | | | Deutsche Bank AG, Repurchase Agreement dated 12/30/11, 0.08%, due 01/03/12 (Repurchase Amount $6,778,988, collateralized by various U.S. Government and U.S. Government Agency Obligations, 0.000%-6.500%, Market Value plus accrued interest $6,914,508, due 06/28/12-11/01/41) | | 6,778,929 | | 0.7 | |
6,778,929 | | | | Goldman Sachs & Co., Repurchase Agreement dated 12/30/11, 0.10%, due 01/03/12 (Repurchase Amount $6,779,003, collateralized by various U.S. Government Agency Obligations, 2.163%-6.500%, Market Value plus accrued interest $6,914,508, due 04/01/20-12/01/48) | | 6,778,929 | | 0.7 | |
6,778,929 | | | | Morgan Stanley, Repurchase Agreement dated 12/30/11, 0.08%, due 01/03/12 (Repurchase Amount $6,778,988, collateralized by various U.S. Government and U.S. Government Agency Obligations, 0.000%-6.375%, Market Value plus accrued interest $6,914,508, due 11/15/12-10/01/44) | | 6,778,929 | | 0.7 | |
| | | | | | | | | | |
See Accompanying Notes to Financial Statements
97
Principal
Amount† | | | | | | Value | | Percentage
of Net
Assets | |
SHORT-TERM INVESTMENTS: (continued) | | | | | |
| | | | Securities Lending Collateral(cc)(1) (continued) | | | | | |
1,427,143 | | | | Royal Bank of Canada, Repurchase Agreement dated 12/30/11, 0.01%, due 01/03/12 (Repurchase Amount $1,427,145, collateralized by various U.S. Government Securities, 0.000%-4.250%, Market Value plus accrued interest $1,455,686, due 08/15/12-11/15/40) | | $ | 1,427,143 | | 0.1 | |
| | | | | | 28,542,859 | | 2.9 | |
| | | | | | | | | |
Shares | | | | | | | | | |
| | | | Mutual Funds: 2.0% | | | | | |
19,974,295 | | | | T. Rowe Price Reserve Investment Fund
(Cost $19,974,295) | | 19,974,295 | | 2.0 | |
| | | | | | | | | |
| | | | Total Short-Term Investments
(Cost $48,517,154) | | 48,517,154 | | 4.9 | |
| | | | | | | | | |
| | | | Total Investments in Securities
(Cost $799,315,501) | | $ | 1,016,579,780 | | 102.8 | |
| | | | Liabilities in Excess of Other Assets | | (27,655,455 | ) | (2.8 | ) |
| | | | Net Assets | | $ | 988,924,325 | | 100.0 | |
† | Unless otherwise indicated, principal amount is shown in USD. |
# | Securities with purchases pursuant to Rule 144A or section 4(2), under the Securities Act of 1933 and may not be resold subject to that rule except to qualified institutional buyers. |
@ | Non-income producing security |
ADR | American Depositary Receipt |
GDR | Global Depositary Receipt |
(cc) | Securities purchased with cash collateral for securities loaned. |
L | Loaned security, a portion or all of the security is on loan at December 31, 2011. |
X | Fair value determined by ING Funds Valuation Committee appointed by the Funds' Board of Directors/Trustees. |
(1) | Collateral received from brokers for securities lending was invested into these short-term investments. |
| |
| Cost for federal income tax purposes is $803,815,682. |
| |
| Net unrealized appreciation consists of: |
| |
| | Gross Unrealized Appreciation | | $ | 253,297,675 | |
| | Gross Unrealized Depreciation | | | (40,533,577 | ) |
| | Net Unrealized Appreciation | | $ | 212,764,098 | |
See Accompanying Notes to Financial Statements
98
Fair Value Measurements^
The following is a summary of the fair valuations according to the inputs used as of December 31, 2011 in valuing the assets and liabilities:
| | Quoted Prices
in Active Markets
for Identical
Investments
(Level 1) | | Significant
Other
Observable
Inputs #
(Level 2) | | Significant
Unobservable
Inputs
(Level 3) | | Fair Value
at
12/31/2011 | |
Asset Table | | | | | | | | | |
Investments, at value | | | | | | | | | |
Common Stock | | | | | | | | | |
Consumer Discretionary | | $ | 174,594,981 | | $ | 8,284,003 | | $ | — | | $ | 182,878,984 | |
Consumer Staples | | 19,067,334 | | — | | — | | 19,067,334 | |
Energy | | 74,718,523 | | — | | — | | 74,718,523 | |
Financials | | 41,005,728 | | — | | — | | 41,005,728 | |
Health Care | | 58,986,157 | | — | | — | | 58,986,157 | |
Industrials | | 152,315,438 | | — | | — | | 152,315,438 | |
Information Technology | | 323,951,269 | | 17,006,513 | | 10,392,425 | | 351,350,207 | |
Materials | | 36,144,518 | | 6,849,938 | | — | | 42,994,456 | |
Telecommunications | | 44,745,799 | | — | | — | | 44,745,799 | |
Total Common Stock | | 925,529,747 | | 32,140,454 | | 10,392,425 | | 968,062,626 | |
Short-Term Investments | | 19,974,295 | | 28,542,859 | | — | | 48,517,154 | |
Total Investments, at value | | $ | 945,504,042 | | $ | 60,683,313 | | $ | 10,392,425 | | $ | 1,016,579,780 | |
^ | | See Note 2, “Significant Accounting Policies” in the Notes to Financial Statements for additional information. |
# | | The earlier close of the foreign markets gives rise to the possibility that significant events, including broad market moves, may have occurred in the interim and may materially affect the value of those securities. To account for this, the Portfolio may frequently value many of its foreign equity securities using fair value prices based on third party vendor modeling tools to the extent available. Accordingly, a significant portion of the Portfolio’s investments are categorized as Level 2 investments. |
| | |
| | There were no significant transfers between Level 1 and 2 during the year ended December 31, 2011. |
| | |
| | Transfers in or out of Level 3 represent either the beginning value (for transfers in), or the ending value (for transfers out) of any security or derivative instrument where a change in the pricing level occurred from the beginning to the end of the period. Transfers are recognized at the end of the reporting period. |

See Accompanying Notes to Financial Statements
99
| | PORTFOLIO OF INVESTMENTS |
ING TEMPLETON FOREIGN EQUITY PORTFOLIO | | AS OF DECEMBER 31, 2011 |
Shares | | | | | | Value | | Percentage
of Net
Assets | |
COMMON STOCK: 97.4% | | | | | |
| | | | Austria: 0.7% | | | | | |
285,860 | | | | Telekom Austria AG | | $ | 3,419,836 | | 0.7 | |
| | | | | | | | | |
| | | | Bermuda: 0.5% | | | | | |
43,930 | | | | PartnerRe Ltd. | | 2,820,745 | | 0.5 | |
| | | | | | | | | |
| | | | Brazil: 1.4% | | | | | |
206,834 | | | | Petroleo Brasileiro SA ADR | | 5,139,825 | | 1.0 | |
100,920 | | | | Vale SA ADR | | 2,078,952 | | 0.4 | |
| | | | | | 7,218,777 | | 1.4 | |
| | | | Canada: 2.1% | | | | | |
137,400 | | | | Husky Energy, Inc. | | 3,311,087 | | 0.6 | |
596,300 | | | | Talisman Energy, Inc. | | 7,597,521 | | 1.5 | |
| | | | | | 10,908,608 | | 2.1 | |
| | | | China: 6.7% | | | | | |
1,833,000 | | | | China Life Insurance Co., Ltd. | | 4,517,522 | | 0.9 | |
795,000 | | | | China Mobile Ltd. | | 7,723,892 | | 1.5 | |
22,294,000 | | | | China Telecom Corp., Ltd. | | 12,680,540 | | 2.4 | |
1,987,570 | | | | Citic Pacific Ltd. | | 3,569,261 | | 0.7 | |
13,026,153 | | | | Shanghai Electric Group Co., Ltd. | | 6,006,988 | | 1.2 | |
| | | | | | 34,498,203 | | 6.7 | |
| | | | Denmark: 0.2% | | | | | |
119,830 | | @ | | Vestas Wind Systems A/S | | 1,288,783 | | 0.2 | |
| | | | | | | | | |
| | | | France: 8.8% | | | | | |
79,980 | | | | Alstom | | 2,416,180 | | 0.5 | |
476,931 | | | | AXA S.A. | | 6,164,896 | | 1.2 | |
110,730 | | | | Cie Generale des Etablissements Michelin | | 6,524,332 | | 1.2 | |
446,220 | | | | France Telecom S.A. | | 6,984,063 | | 1.3 | |
130,246 | | | | Gaz de France | | 3,539,182 | | 0.7 | |
155,898 | | | | Sanofi-Aventis | | 11,395,758 | | 2.2 | |
172,448 | | | | Total S.A. | | 8,799,637 | | 1.7 | |
| | | | | | 45,824,048 | | 8.8 | |
| | | | Germany: 10.8% | | | | | |
251,590 | | | | Celesio AG | | 3,979,628 | | 0.8 | |
393,350 | | | | Deutsche Post AG | | 6,047,443 | | 1.1 | |
241,782 | | | | E.ON AG | | 5,210,426 | | 1.0 | |
1,029,094 | | | | Infineon Technologies AG | | 7,729,011 | | 1.5 | |
76,740 | | | | Merck KGaA | | 7,642,074 | | 1.5 | |
46,660 | | | | Muenchener Rueckversicherungs AG | | 5,717,831 | | 1.1 | |
193,706 | | | | SAP AG | | 10,245,405 | | 2.0 | |
96,313 | | | | Siemens AG | | 9,214,807 | | 1.8 | |
| | | | | | 55,786,625 | | 10.8 | |
| | | | Hong Kong: 3.6% | | | | | |
2,414,500 | | | | AIA Group Ltd. | | 7,516,151 | | 1.5 | |
273,700 | | | | Cheung Kong Holdings Ltd. ADR ADR | | 3,237,871 | | 0.6 | |
415,000 | | | | Hutchison Whampoa Ltd. | | 3,463,108 | | 0.7 | |
361,500 | | | | Swire Pacific Ltd. | | 4,355,548 | | 0.8 | |
| | | | | | 18,572,678 | | 3.6 | |
| | | | India: 3.0% | | | | | |
799,122 | | | | Housing Development Finance Corp. | | 9,800,446 | | 1.9 | |
218,930 | | | | ICICI Bank Ltd. ADR | | 5,786,320 | | 1.1 | |
| | | | | | 15,586,766 | | 3.0 | |
| | | | Italy: 2.7% | | | | | |
387,065 | | | | ENI S.p.A. | | 7,980,346 | | 1.6 | |
2,201,636 | | | | Intesa Sanpaolo S.p.A. | | 3,666,852 | | 0.7 | |
272,317 | | | | UniCredit SpA | | 2,246,102 | | 0.4 | |
| | | | | | 13,893,300 | | 2.7 | |
| | | | Japan: 2.8% | | | | | |
589,400 | | | | Itochu Corp. | | 5,976,198 | | 1.2 | |
1,162,300 | | | | Mitsubishi UFJ Financial Group, Inc. | | 4,920,576 | | 0.9 | |
107,500 | | | | Toyota Motor Corp. | | 3,554,715 | | 0.7 | |
| | | | | | 14,451,489 | | 2.8 | |
| | | | Netherlands: 8.1% | | | | | |
93,000 | | | | Akzo Nobel NV | | 4,481,620 | | 0.9 | |
111,010 | | | | Randstad Holdings NV | | 3,265,624 | | 0.6 | |
348,450 | | | | Royal Dutch Shell PLC - Class B | | 13,254,197 | | 2.5 | |
357,255 | | | | Koninklijke Philips Electronics NV | | 7,495,800 | | 1.4 | |
272,512 | | | | SBM Offshore NV | | 5,586,132 | | 1.1 | |
237,050 | | | | Unilever NV | | 8,150,602 | | 1.6 | |
| | | | | | 42,233,975 | | 8.1 | |
| | | | Norway: 4.4% | | | | | |
428,280 | | | | Statoil ASA | | 10,968,377 | | 2.1 | |
715,540 | | | | Telenor ASA | | 11,708,928 | | 2.3 | |
| | | | | | 22,677,305 | | 4.4 | |
| | | | Portugal: 0.6% | | | | | |
580,950 | | | | Portugal Telecom SGPS S.A. | | 3,345,923 | | 0.6 | |
| | | | | | | | | |
| | | | Singapore: 3.2% | | | | | |
1,154,500 | | | | DBS Group Holdings Ltd. | | 10,247,668 | | 2.0 | |
2,728,000 | | | | Singapore Telecommunications Ltd. | | 6,497,412 | | 1.2 | |
| | | | | | 16,745,080 | | 3.2 | |
| | | | South Korea: 5.6% | | | | | |
145,608 | | | | KB Financial Group, Inc. ADR | | 4,563,355 | | 0.9 | |
105,784 | | @ | | LG Electronics, Inc. | | 6,845,887 | | 1.3 | |
7,830 | | | | Posco | | 2,582,812 | | 0.5 | |
32,483 | | @ | | Samsung Electronics Co., Ltd. GDR | | 14,936,904 | | 2.9 | |
| | | | | | 28,928,958 | | 5.6 | |
| | | | | | | | | | |
See Accompanying Notes to Financial Statements
100
Shares | | | | | | Value | | Percentage
of Net
Assets | |
COMMON STOCK: (continued) | | | | | |
| | | | Spain: 3.3% | | | | | |
486,591 | | | | Banco Santander Central Hispano S.A. | | $ | 3,676,017 | | 0.7 | |
135,271 | | | | Repsol YPF S.A. | | 4,138,646 | | 0.8 | |
531,199 | | | | Telefonica S.A. | | 9,151,560 | | 1.8 | |
| | | | | | 16,966,223 | | 3.3 | |
| | | | Sweden: 1.5% | | | | | |
744,650 | | | | Telefonaktiebolaget LM Ericsson | | 7,551,208 | | 1.5 | |
| | | | | | | | | |
| | | | Switzerland: 8.2% | | | | | |
99,019 | | | | Adecco S.A. | | 4,126,743 | | 0.8 | |
83,700 | | | | Credit Suisse Group | | 1,961,775 | | 0.4 | |
153,740 | | | | Nestle S.A. | | 8,828,293 | | 1.7 | |
92,996 | | | | Novartis AG | | 5,309,428 | | 1.0 | |
59,950 | | | | Roche Holding AG - Genusschein | | 10,138,645 | | 2.0 | |
183,721 | | | | Swiss Re Ltd. | | 9,340,326 | | 1.8 | |
222,812 | | | | UBS AG - Reg | | 2,643,149 | | 0.5 | |
| | | | | | 42,348,359 | | 8.2 | |
| | | | Taiwan: 2.2% | | | | | |
626,784 | | | | Compal Electronics, Inc. | | 3,125,772 | | 0.6 | |
195,316 | | | | Taiwan Semiconductor Manufacturing Co., Ltd. ADR | | 2,521,529 | | 0.5 | |
2,305,251 | | | | Taiwan Semiconductor Manufacturing Co., Ltd. | | 5,759,900 | | 1.1 | |
| | | | | | 11,407,201 | | 2.2 | |
| | | | United Kingdom: 17.0% | | | | | |
949,290 | | | | Aviva PLC | | 4,415,433 | | 0.8 | |
1,533,120 | | | | BAE Systems PLC | | 6,774,532 | | 1.3 | |
931,060 | | | | BP PLC | | 6,632,159 | | 1.3 | |
233,610 | | | | CRH PLC | | 4,636,808 | | 0.9 | |
544,857 | | | | GlaxoSmithKline PLC | | 12,414,976 | | 2.4 | |
846,400 | | | | HSBC Holdings PLC | | 6,447,526 | | 1.2 | |
1,509,100 | | @ | | International Consolidated Airlines Group SA | | 3,447,721 | | 0.7 | |
1,598,725 | | | | Kingfisher PLC | | 6,212,593 | | 1.2 | |
988,660 | | | | Marks & Spencer Group PLC | | 4,774,995 | | 0.9 | |
115,060 | | | | Pearson PLC | | 2,159,509 | | 0.4 | |
710,950 | | | | Rolls-Royce Holdings PLC | | 8,231,432 | | 1.6 | |
229,268 | | | | Standard Chartered PLC | | 5,014,631 | | 1.0 | |
1,051,970 | | | | Tesco PLC | | 6,581,957 | | 1.3 | |
3,777,936 | | | | Vodafone Group PLC | | 10,533,209 | | 2.0 | |
| | | | | | 88,277,481 | | 17.0 | |
| | | | | | | | | |
| | | | Total Common Stock
(Cost $560,678,241) | | 504,751,571 | | 97.4 | |
| | | | | | | | | |
| | | | Assets in Excess of Other Liabilities | | 13,629,880 | | 2.6 | |
| | | | Net Assets | | $ | 518,381,451 | | 100.0 | |
@ | Non-income producing security |
ADR | American Depositary Receipt |
| |
| Cost for federal income tax purposes is $563,173,471. |
| |
| Net unrealized depreciation consists of: |
| |
| | Gross Unrealized Appreciation | | $ | 47,523,439 | |
| | Gross Unrealized Depreciation | | | (105,945,339 | ) |
| | Net Unrealized Depreciation | | $ | (58,421,900 | ) |
Sector Diversification | | Percentage
of Net Assets | |
Consumer Discretionary | | 5.7 | % |
Consumer Staples | | 4.6 | |
Energy | | 14.2 | |
Financials | | 20.9 | |
Health Care | | 9.9 | |
Industrials | | 13.8 | |
Information Technology | | 10.1 | |
Materials | | 2.7 | |
Telecommunications | | 13.8 | |
Utilities | | 1.7 | |
Assets in Excess of Other Liabilities | | 2.6 | |
Net Assets | | 100.0 | % |
See Accompanying Notes to Financial Statements
101
Fair Value Measurements^
The following is a summary of the fair valuations according to the inputs used as of December 31, 2011 in valuing the assets and liabilities:
| | Quoted Prices
in Active Markets
for Identical
Investments
(Level 1) | | Significant
Other
Observable
Inputs #
(Level 2) | | Significant
Unobservable
Inputs
(Level 3) | | Fair Value
at
12/31/2011 | |
Asset Table | | | | | | | | | |
Investments, at value | | | | | | | | | |
Common Stock | | | | | | | | | |
Austria | | $ | — | | $ | 3,419,836 | | $ | — | | $ | 3,419,836 | |
Bermuda | | 2,820,745 | | — | | — | | 2,820,745 | |
Brazil | | 7,218,777 | | — | | — | | 7,218,777 | |
Canada | | 10,908,608 | | — | | — | | 10,908,608 | |
China | | — | | 34,498,203 | | — | | 34,498,203 | |
Denmark | | — | | 1,288,783 | | — | | 1,288,783 | |
France | | — | | 45,824,048 | | — | | 45,824,048 | |
Germany | | — | | 55,786,625 | | — | | 55,786,625 | |
Hong Kong | | 3,237,871 | | 15,334,807 | | — | | 18,572,678 | |
India | | 5,786,320 | | 9,800,446 | | — | | 15,586,766 | |
Italy | | — | | 13,893,300 | | — | | 13,893,300 | |
Japan | | — | | 14,451,489 | | — | | 14,451,489 | |
Netherlands | | — | | 42,233,975 | | — | | 42,233,975 | |
Norway | | — | | 22,677,305 | | — | | 22,677,305 | |
Portugal | | 3,345,923 | | — | | — | | 3,345,923 | |
Singapore | | — | | 16,745,080 | | — | | 16,745,080 | |
South Korea | | 7,146,167 | | 21,782,791 | | — | | 28,928,958 | |
Spain | | — | | 16,966,223 | | — | | 16,966,223 | |
Sweden | | — | | 7,551,208 | | — | | 7,551,208 | |
Switzerland | | — | | 42,348,359 | | — | | 42,348,359 | |
Taiwan | | 5,647,301 | | 5,759,900 | | — | | 11,407,201 | |
United Kingdom | | — | | 88,277,481 | | — | | 88,277,481 | |
Total Common Stock | | 46,111,712 | | 458,639,859 | | — | | 504,751,571 | |
Total Investments, at value | | $ | 46,111,712 | | $ | 458,639,859 | | $ | — | | $ | 504,751,571 | |
^ | | See Note 2, “Significant Accounting Policies” in the Notes to Financial Statements for additional information. |
# | | The earlier close of the foreign markets gives rise to the possibility that significant events, including broad market moves, may have occurred in the interim and may materially affect the value of those securities. To account for this, the Portfolio may frequently value many of its foreign equity securities using fair value prices based on third party vendor modeling tools to the extent available. Accordingly, a significant portion of the Portfolio’s investments are categorized as Level 2 investments. |
| | |
| | There were no significant transfers between Level 1 and 2 during the year ended December 31, 2011. |
See Accompanying Notes to Financial Statements
102
| | PORTFOLIO OF INVESTMENTS |
ING THORNBURG VALUE PORTFOLIO | | AS OF DECEMBER 31, 2011 |
Shares | | | | | | Value | | Percentage
of Net
Assets | |
COMMON STOCK: 95.8% | | | | | |
| | | | Consumer Discretionary: 14.0% | | | | | |
183,100 | | | | Best Buy Co., Inc. | | $ | 4,279,047 | | 1.9 | |
349,600 | | | | Gap, Inc. | | 6,485,080 | | 3.0 | |
118,096 | | @ | | Life Time Fitness, Inc. | | 5,520,988 | | 2.5 | |
934,600 | | @ | | Office Depot, Inc. | | 2,009,390 | | 0.9 | |
293,500 | | @ | | OfficeMax, Inc. | | 1,332,490 | | 0.6 | |
545,000 | | @ | | Pulte Homes, Inc. | | 3,438,950 | | 1.6 | |
559,600 | | | | Staples, Inc. | | 7,772,844 | | 3.5 | |
| | | | | | 30,838,789 | | 14.0 | |
| | | | Energy: 13.8% | | | | | |
63,192 | | | | Apache Corp. | | 5,723,931 | | 2.6 | |
312,100 | | @ | | Bankers Petroleum Ltd. | | 1,360,220 | | 0.6 | |
94,600 | | | | ExxonMobil Corp. | | 8,018,296 | | 3.6 | |
1,540 | | | | Inpex Holdings, Inc. | | 9,696,191 | | 4.4 | |
694,042 | | @ | | SandRidge Energy, Inc. | | 5,663,383 | | 2.6 | |
| | | | | | 30,462,021 | | 13.8 | |
| | | | Financials: 16.0% | | | | | |
839,100 | | | | Bank of America Corp. | | 4,665,396 | | 2.1 | |
709,200 | | | | Charles Schwab Corp. | | 7,985,592 | | 3.6 | |
639,600 | | @ | | Genworth Financial, Inc. | | 4,189,380 | | 1.9 | |
331,900 | | | | Hartford Financial Services Group, Inc. | | 5,393,375 | | 2.5 | |
138,935 | | | | JPMorgan Chase & Co. | | 4,619,589 | | 2.1 | |
265,600 | | | | Metlife, Inc. | | 8,281,408 | | 3.8 | |
| | | | | | 35,134,740 | | 16.0 | |
| | | | Health Care: 15.5% | | | | | |
194,044 | | @ | | Alere, Inc. | | 4,480,476 | | 2.0 | |
206,965 | | @ | | Community Health Systems, Inc. | | 3,611,539 | | 1.6 | |
244,581 | | @ | | Gilead Sciences, Inc. | | 10,010,700 | | 4.6 | |
208,777 | | @ | | Thermo Fisher Scientific, Inc. | | 9,388,702 | | 4.3 | |
99,775 | | @ | | Varian Medical Systems, Inc. | | 6,697,896 | | 3.0 | |
| | | | | | 34,189,313 | | 15.5 | |
| | | | Industrials: 1.2% | | | | | |
128,000 | | @ | | Oshkosh Truck Corp. | | 2,736,640 | | 1.2 | |
| | | | | | | | | |
| | | | Information Technology: 24.3% | | | | | |
232,429 | | @ | | Amdocs Ltd. | | 6,631,199 | | 3.0 | |
4,400 | | @ | | Apple, Inc. | | 1,782,000 | | 0.8 | |
109,523 | | | | Corning, Inc. | | 1,421,609 | | 0.6 | |
345,597 | | @ | | Dell, Inc. | | 5,056,084 | | 2.3 | |
15,731 | | @ | | Google, Inc. - Class A | | 10,160,653 | | 4.6 | |
338,200 | | | | Hewlett-Packard Co. | | 8,712,032 | | 4.0 | |
107,600 | | @ | | Juniper Networks, Inc. | | 2,196,116 | | 1.0 | |
833,202 | | @ | | MEMC Electronic Materials, Inc. | | 3,282,816 | | 1.5 | |
169,474 | | | | Microsoft Corp. | | 4,399,545 | | 2.0 | |
302,638 | | @ | | ON Semiconductor Corp. | | 2,336,365 | | 1.1 | |
458,900 | | @ | | Yahoo!, Inc. | | 7,402,057 | | 3.4 | |
| | | | | | 53,380,476 | | 24.3 | |
| | | | Materials: 6.4% | | | | | |
774,800 | | | | Tokyo Steel Manufacturing Co., Ltd. | | 6,275,958 | | 2.9 | |
290,837 | | L | | United States Steel Corp. | | 7,695,547 | | 3.5 | |
| | | | | | 13,971,505 | | 6.4 | |
| | | | Telecommunications: 4.6% | | | | | |
955 | | | | KDDI Corp. | | 6,133,300 | | 2.8 | |
236,002 | | @ | | Level 3 Communications, Inc. | | 4,009,674 | | 1.8 | |
| | | | | | 10,142,974 | | 4.6 | |
| | | | Total Common Stock
(Cost $236,033,765) | | 210,856,458 | | 95.8 | |
| | | | | | | | | | |
Principal
Amount† | | | | | | | | | |
CORPORATE BONDS/NOTES: 0.5% | | | | | |
| | | | Telecommunications: 0.5% | | | | | |
891,000 | | | | Level 3 Communications, Inc., 6.500%, 10/01/16 | | 1,088,134 | | 0.5 | |
| | | | | | | | | |
| | | | Total Corporate Bonds/Notes
(Cost $891,000) | | 1,088,134 | | 0.5 | |
| | | | | | | | | |
| | | | Total Long-Term Investments
(Cost $236,924,765) | | 211,944,592 | | 96.3 | |
| | | | | | | |
SHORT-TERM INVESTMENTS: 6.9% | | | | | |
| | | | Securities Lending Collateral(cc)(1): 3.2% | | | | | |
1,679,761 | | | | BNP Paribas Bank, Repurchase Agreement dated 12/30/11, 0.06%, due 01/03/12 (Repurchase Amount $1,679,772, collateralized by various U.S. Government Agency Obligations, 5.000%-6.000%, Market Value plus accrued interest $1,713,356, due 05/15/24-04/15/41) | | 1,679,761 | | 0.8 | |
1,679,761 | | | | Cantor Fitzgerald, Repurchase Agreement dated 12/30/11, 0.12%, due 01/03/12 (Repurchase Amount $1,679,783, collateralized by various U.S. Government Agency Obligations, 1.437%-6.014%, Market Value plus accrued interest $1,713,356, due 06/01/17-09/01/44) | | 1,679,761 | | 0.8 | |
See Accompanying Notes to Financial Statements
103
Principal
Amount† | | | | | | Value | | Percentage
of Net
Assets | |
SHORT-TERM INVESTMENTS: (continued) | | | | | |
| | | | Securities Lending Collateral(cc)(1) (continued) | | | | | |
1,679,761 | | | | Citigroup, Inc., Repurchase Agreement dated 12/30/11, 0.08%, due 01/03/12 (Repurchase Amount $1,679,776, collateralized by various U.S. Government and U.S. Government Agency Obligations, 0.000%-5.500%, Market Value plus accrued interest $1,713,356, due 01/19/12-12/20/41) | | $ | 1,679,761 | | 0.7 | |
353,635 | | | | Deutsche Bank AG, Repurchase Agreement dated 12/30/11, 0.10%, due 01/03/12 (Repurchase Amount $353,639, collateralized by various U.S. Government and U.S. Government Agency Obligations, 0.000%-6.500%, Market Value plus accrued interest $360,708, due 06/28/12-11/01/41) | | 353,635 | | 0.1 | |
1,679,761 | | | | Merrill Lynch & Co., Inc., Repurchase Agreement dated 12/30/11, 0.02%, due 01/03/12 (Repurchase Amount $1,679,765, collateralized by various U.S. Government Securities, 1.875%-4.000%, Market Value plus accrued interest $1,713,359, due 02/15/15-06/30/15) | | 1,679,761 | | 0.8 | |
| | | | | | 7,072,679 | | 3.2 | |
| | | | | | | | | |
Shares | | | | | | | | | |
| | | | Mutual Funds: 3.7% | | | | | |
8,167,794 | | | | BlackRock Liquidity Funds, TempFund, Institutional Class (Cost $8,167,794) | | 8,167,794 | | 3.7 | |
| | | | | | | | | |
| | | | Total Short-Term Investments
(Cost $15,240,473) | | 15,240,473 | | 6.9 | |
| | | | | | | | | |
| | | | Total Investments in Securities
(Cost $252,165,238) | | $ | 227,185,065 | | 103.2 | |
| | | | Liabilities in Excess of Other Assets | | (7,077,865 | ) | (3.2 | ) |
| | | | Net Assets | | $ | 220,107,200 | | 100.0 | |
† | Unless otherwise indicated, principal amount is shown in USD. |
@ | Non-income producing security |
(cc) | Securities purchased with cash collateral for securities loaned. |
L | Loaned security, a portion or all of the security is on loan at December 31, 2011. |
(1) | Collateral received from brokers for securities lending was invested into these short-term investments. |
| |
| Cost for federal income tax purposes is $254,654,302. |
| |
| Net unrealized depreciation consists of: |
| |
| | Gross Unrealized Appreciation | | $ | 12,690,604 | |
| | Gross Unrealized Depreciation | | (40,159,841 | ) |
| | Net Unrealized Depreciation | | $ | (27,469,237 | ) |
Fair Value Measurements^
The following is a summary of the fair valuations according to the inputs used as of December 31, 2011 in valuing the assets and liabilities:
See Accompanying Notes to Financial Statements
104
| | Quoted Prices
in Active Markets
for Identical
Investments
(Level 1) | | Significant
Other
Observable
Inputs #
(Level 2) | | Significant
Unobservable
Inputs
(Level 3) | | Fair Value
at
12/31/2011 | |
Asset Table | | | | | | | | | |
Investments, at value | | | | | | | | | |
Common Stock | | | | | | | | | |
Consumer Discretionary | | $ | 30,838,789 | | $ | — | | $ | — | | $ | 30,838,789 | |
Energy | | 20,765,830 | | 9,696,191 | | — | | 30,462,021 | |
Financials | | 35,134,740 | | — | | — | | 35,134,740 | |
Health Care | | 34,189,313 | | — | | — | | 34,189,313 | |
Industrials | | 2,736,640 | | — | | — | | 2,736,640 | |
Information Technology | | 53,380,476 | | — | | — | | 53,380,476 | |
Materials | | 7,695,547 | | 6,275,958 | | — | | 13,971,505 | |
Telecommunications | | 4,009,674 | | 6,133,300 | | — | | 10,142,974 | |
Total Common Stock | | 188,751,009 | | 22,105,449 | | — | | 210,856,458 | |
Corporate Bonds/Notes | | — | | 1,088,134 | | — | | 1,088,134 | |
Short-Term Investments | | 8,167,794 | | 7,072,679 | | — | | 15,240,473 | |
Total Investments, at value | | $ | 196,918,803 | | $ | 30,266,262 | | $ | — | | $ | 227,185,065 | |
^ | See Note 2, “Significant Accounting Policies” in the Notes to Financial Statements for additional information. |
# | The earlier close of the foreign markets gives rise to the possibility that significant events, including broad market moves, may have occurred in the interim and may materially affect the value of those securities. To account for this, the Portfolio may frequently value many of its foreign equity securities using fair value prices based on third party vendor modeling tools to the extent available. Accordingly, a significant portion of the Portfolio’s investments are categorized as Level 2 investments. |
| |
| There were no significant transfers between Level 1 and 2 during the year endedDecember 31, 2011. |

^ | See Note 2, “Significant Accounting Policies” in the Notes to Financial Statements for additional information. |
# | The earlier close of the foreign markets gives rise to the possibility that significant events, including broad market moves, may have occurred in the interim and may materially affect the value of those securities. To account for this, the Portfolio may frequently value many of its foreign equity securities using fair value prices based on third party vendor modeling tools to the extent available. Accordingly, a significant portion of the Portfolio’s investments are categorized as Level 2 investments. |
There were no significant transfers between Level 1 and 2 during the year ending December 31, 2011.
See Accompanying Notes to Financial Statements
105
| | PORTFOLIO OF INVESTMENTS |
ING UBS U.S. LARGE CAP EQUITY PORTFOLIO | | AS OF DECEMBER 31, 2011 |
Shares | | | | | | Value | | Percentage
of Net
Assets | |
COMMON STOCK: 96.6% | | | | | | | |
| | | | Consumer Discretionary: 15.7% | | | | | |
11,300 | | @ | | Amazon.com, Inc. | | $ | 1,956,030 | | 1.4 | |
24,100 | | @ | | Apollo Group, Inc. - Class A | | 1,298,267 | | 0.9 | |
60,300 | | | | Carnival Corp. | | 1,968,192 | | 1.4 | |
38,300 | | | | Coach, Inc. | | 2,337,832 | | 1.7 | |
128,500 | | | | Comcast Corp. — Class A | | 3,046,735 | | 2.2 | |
56,800 | | @,L | | GameStop Corp. | | 1,370,584 | | 1.0 | |
83,300 | | @ | | General Motors Co. | | 1,688,491 | | 1.2 | |
90,000 | | | | International Game Technology | | 1,548,000 | | 1.1 | |
40,100 | | | | Kohl’s Corp. | | 1,978,935 | | 1.4 | |
82,900 | | | | Time Warner, Inc. | | 2,996,006 | | 2.1 | |
39,400 | | | | Viacom - Class B | | 1,789,154 | | 1.3 | |
| | | | | | 21,978,226 | | 15.7 | |
| | | | Consumer Staples: 6.1% | | | | | |
30,300 | | | | Colgate-Palmolive Co. | | 2,799,417 | | 2.0 | |
92,700 | | | | Kraft Foods, Inc. | | 3,463,272 | | 2.5 | |
90,300 | | | | Kroger Co. | | 2,187,066 | | 1.6 | |
| | | | | | 8,449,755 | | 6.1 | |
| | | | Energy: 11.9% | | | | | |
30,900 | | | | Baker Hughes, Inc. | | 1,502,976 | | 1.1 | |
38,200 | | | | Ensco International PLC ADR | | 1,792,344 | | 1.3 | |
21,600 | | | | EOG Resources, Inc. | | 2,127,816 | | 1.5 | |
34,700 | | | | ExxonMobil Corp. | | 2,941,172 | | 2.1 | |
39,000 | | | | Hess Corp. | | 2,215,200 | | 1.6 | |
152,800 | | @ | | McDermott International, Inc. | | 1,758,728 | | 1.3 | |
58,000 | | | | Noble Corp. | | 1,752,760 | | 1.2 | |
35,700 | | | | Peabody Energy Corp. | | 1,182,027 | | 0.8 | |
47,700 | | @ | | Ultra Petroleum Corp. | | 1,413,351 | | 1.0 | |
| | | | | | 16,686,374 | | 11.9 | |
| | | | Financials: 15.2% | | | | | |
37,700 | | | | Aflac, Inc. | | 1,630,902 | | 1.2 | |
77,400 | | | | Annaly Capital Management, Inc. | | 1,235,304 | | 0.9 | |
106,679 | | | | Citigroup, Inc. | | 2,806,725 | | 2.0 | |
6,000 | | | | CME Group, Inc. | | 1,462,020 | | 1.0 | |
79,700 | | @ | | Invesco Ltd. | | 1,601,173 | | 1.1 | |
87,200 | | | | JPMorgan Chase & Co. | | 2,899,400 | | 2.1 | |
55,900 | | | | Metlife, Inc. | | 1,742,962 | | 1.3 | |
119,800 | | | | Morgan Stanley | | 1,812,574 | | 1.3 | |
79,300 | | | | US Bancorp. | | 2,145,065 | | 1.5 | |
140,200 | | | | Wells Fargo & Co. | | 3,863,912 | | 2.8 | |
| | | | | | 21,200,037 | | 15.2 | |
| | | | Health Care: 14.4% | | | | | |
38,200 | | @ | | Acorda Therapeutics, Inc. | | 910,688 | | 0.6 | |
25,900 | | @ | | Alexion Pharmaceuticals, Inc. | | 1,851,850 | | 1.3 | |
15,000 | | | | Allergan, Inc. | | 1,316,100 | | 0.9 | |
71,300 | | @ | | Amylin Pharmaceuticals, Inc. | | 811,394 | | 0.6 | |
36,300 | | | | Baxter International, Inc. | | 1,796,124 | | 1.3 | |
7,400 | | @ | | Bio-Rad Laboratories, Inc. | | 710,696 | | 0.5 | |
38,800 | | @ | | Gilead Sciences, Inc. | | 1,588,084 | | 1.1 | |
56,800 | | @ | | HCA Holdings, Inc. | | 1,251,304 | | 0.9 | |
49,700 | | @ | | Hospira, Inc. | | 1,509,389 | | 1.1 | |
63,000 | | | | Medtronic, Inc. | | 2,409,750 | | 1.7 | |
72,873 | | | | Merck & Co., Inc. | | 2,747,312 | | 2.0 | |
33,400 | | | | Teva Pharmaceutical Industries Ltd. ADR | | 1,348,024 | | 1.0 | |
38,300 | | | | UnitedHealth Group, Inc. | | 1,941,044 | | 1.4 | |
| | | | | | 20,191,759 | | 14.4 | |
| | | | Industrials: 10.6% | | | | | |
37,500 | | | | Boeing Co. | | 2,750,625 | | 2.0 | |
29,800 | | | | FedEx Corp. | | 2,488,598 | | 1.8 | |
45,800 | | | | General Dynamics Corp. | | 3,041,578 | | 2.2 | |
174,100 | | @ | | Hertz Global Holdings, Inc. | | 2,040,452 | | 1.4 | |
57,400 | | | | Illinois Tool Works, Inc. | | 2,681,154 | | 1.9 | |
97,700 | | | | Textron, Inc. | | 1,806,473 | | 1.3 | |
| | | | | | 14,808,880 | | 10.6 | |
| | | | Information Technology: 16.1% | | | | | |
101,400 | | @ | | Adobe Systems, Inc. | | 2,866,578 | | 2.0 | |
14,000 | | @ | | Apple, Inc. | | 5,670,000 | | 4.1 | |
74,100 | | @ | | Atmel Corp. | | 600,210 | | 0.4 | |
43,200 | | | | Broadcom Corp. | | 1,268,352 | | 0.9 | |
138,900 | | | | Cisco Systems, Inc. | | 2,511,312 | | 1.8 | |
61,300 | | | | Hewlett-Packard Co. | | 1,579,088 | | 1.1 | |
117,400 | | | | Intersil Corp. | | 1,225,656 | | 0.9 | |
6,000 | | | | Qualcomm, Inc. | | 328,200 | | 0.2 | |
49,100 | | @ | | ServiceSource International, Inc. | | 770,379 | | 0.6 | |
69,600 | | @ | | Skyworks Solutions, Inc. | | 1,128,912 | | 0.8 | |
150,500 | | @ | | Symantec Corp. | | 2,355,325 | | 1.7 | |
21,900 | | | | Visa, Inc. | | 2,223,507 | | 1.6 | |
| | | | | | 22,527,519 | | 16.1 | |
| | | | Materials: 3.9% | | | | | |
52,800 | | | | Celanese Corp. | | 2,337,456 | | 1.7 | |
72,500 | | | | Dow Chemical Co. | | 2,085,100 | | 1.5 | |
14,100 | | L | | Martin Marietta Materials, Inc. | | 1,063,281 | | 0.7 | |
| | | | | | 5,485,837 | | 3.9 | |
| | | | Utilities: 2.7% | | | | | |
42,900 | | | | Edison International | | 1,776,060 | | 1.3 | |
31,600 | | | | NextEra Energy, Inc. | | 1,923,808 | | 1.4 | |
| | | | | | 3,699,868 | | 2.7 | |
| | | | Total Common Stock
(Cost $129,808,121) | | 135,028,255 | | 96.6 | |
| | | | | | | | | | |
See Accompanying Notes to Financial Statements
106
Shares | | | | | | Value | | Percentage
of Net
Assets | |
EXCHANGE-TRADED FUNDS: 0.6% | | | | | |
7,600 | | | | SPDR Trust Series 1 | | $ | 953,800 | | 0.6 | |
| | | | | | | | | |
| | | | Total Exchange-Traded Funds
(Cost $951,798) | | 953,800 | | 0.6 | |
| | | | | | | | | |
| | | | Total Long-Term Investments
(Cost $130,759,919) | | 135,982,055 | | 97.2 | |
| | | | | | | | | | |
Principal
Amount† | | | | | | | | | |
SHORT-TERM INVESTMENTS: 4.4% | | | | | |
| | | | Securities Lending Collateral(cc)(1): 1.5% | | | | | |
58,668 | | | | BNP Paribas Bank, Repurchase Agreement dated 12/30/11, 0.06%, due 01/03/12 (Repurchase Amount $58,668, collateralized by various U.S. Government Agency Obligations, 5.000%-6.000%, Market Value plus accrued interest $59,841, due 05/15/24-04/15/41) | | 58,668 | | 0.1 | |
1,000,000 | | | | Cantor Fitzgerald, Repurchase Agreement dated 12/30/11, 0.12%, due 01/03/12 (Repurchase Amount $1,000,013, collateralized by various U.S. Government Agency Obligations, 1.437%-6.014%, Market Value plus accrued interest $1,020,000, due 06/01/17-09/01/44) | | 1,000,000 | | 0.7 | |
1,000,000 | | | | Citigroup, Inc., Repurchase Agreement dated 12/30/11, 0.08%, due 01/03/12 (Repurchase Amount $1,000,009, collateralized by various U.S. Government and U.S. Government Agency Obligations, 0.000%-5.500%, Market Value plus accrued interest $1,020,000, due 01/19/12-12/20/41) | | 1,000,000 | | 0.7 | |
| | | | | | 2,058,668 | | 1.5 | |
| | | | | | | | | |
Shares | | | | | | | | | |
| | | | Mutual Funds: 2.9% | | | | | |
4,054,031 | | | | BlackRock Liquidity Funds, TempFund, Institutional Class (Cost $4,054,031) | | $ | 4,054,031 | | 2.9 | |
| | | | | | | | | |
| | | | Total Short-Term Investments
(Cost $6,112,699) | | 6,112,699 | | 4.4 | |
| | | | | | | | | |
| | | | Total Investments in Securities
(Cost $136,872,618) | | $ | 142,094,754 | | 101.6 | |
| | | | Liabilities in Excess of Other Assets | | (2,291,022 | ) | (1.6 | ) |
| | | | Net Assets | | $ | 139,803,732 | | 100.0 | |
† | Unless otherwise indicated, principal amount is shown in USD. |
@ | Non-income producing security |
ADR | American Depositary Receipt |
(cc) | Securities purchased with cash collateral for securities loaned. |
L | Loaned security, a portion or all of the security is on loan at December 31, 2011. |
(1) | Collateral received from brokers for securities lending was invested into these short-term investments. |
| |
| Cost for federal income tax purposes is $138,213,798. |
| |
| Net unrealized appreciation consists of: |
| |
| | Gross Unrealized Appreciation | | $ | 15,269,528 | |
| | Gross Unrealized Depreciation | | (11,388,572 | ) |
| | Net Unrealized Appreciation | | $ | 3,880,956 | |
Fair Value Measurements^
The following is a summary of the fair valuations according to the inputs used as of December 31, 2011 in valuing the assets and liabilities:
See Accompanying Notes to Financial Statements
107
| | Quoted Prices
in Active Markets
for Identical
Investments
(Level 1) | | Significant
Other
Observable
Inputs
(Level 2) | | Significant
Unobservable
Inputs
(Level 3) | | Fair Value
at
12/31/2011 | |
Asset Table | | | | | | | | | |
Investments, at value | | | | | | | | | |
Common Stock* | | $ | 135,028,255 | | $ | — | | $ | — | | $ | 135,028,255 | |
Exchange-Traded Funds | | 953,800 | | — | | — | | 953,800 | |
Short-Term Investments | | 4,054,031 | | 2,058,668 | | — | | 6,112,699 | |
Total Investments, at value | | $ | 140,036,086 | | $ | 2,058,668 | | $ | — | | $ | 142,094,754 | |
^ | See Note 2, “Significant Accounting Policies” in the Notes to Financial Statements for additional information. |
* | For further breakdown of Common Stock by Industry type, please refer to the Portfolio of Investments. |
| |
| There were no significant transfers between Level 1 and 2 during the year ended December 31, 2011. |

See Accompanying Notes to Financial Statements
108
Item 7. Disclosure of Proxy Voting Policies and Procedures for Closed-End Management Investment Companies.
Not applicable.
Item 8. Portfolio Managers of Closed-End Management Investment Companies.
Not applicable.
Item 9. Purchases of Equity Securities by Closed-End Management Investment Company and Affiliated Purchasers
Not applicable.
Item 10. Submission of Matters to a Vote of Security Holders.
The Board has a Nominating Committee for the purpose of considering and presenting to the Board candidates it proposes for nomination to fill Independent Trustee vacancies on the Board. The Committee currently consists of all Independent Trustees of the Board (6 individuals). The Nominating Committee operates pursuant to a Charter approved by the Board. The primary purpose of the Nominating Committee is to consider and present to the Board the candidates it proposes for nomination to fill vacancies on the Board. In evaluating candidates, the Nominating Committee may consider a variety of factors, but it has not at this time set any specific minimum qualifications that must be met. Specific qualifications of candidates for Board membership will be based on the needs of the Board at the time of nomination.
The Nominating Committee is willing to consider nominations received from shareholders and shall assess shareholder nominees in the same manner as it reviews its own nominees. A shareholder nominee for director should be submitted in writing to the Fund’s Secretary. Any such shareholder nomination should include at a minimum the following information as to each individual proposed for nomination as trustee: such individual’s written consent to be named in the proxy statement as a nominee (if nominated) and to serve as a trustee (if elected), and all information relating to such individual that is required to be disclosed in the solicitation of proxies for election of trustees, or is otherwise required, in each case under applicable federal securities laws, rules and regulations.
The Secretary shall submit all nominations received in a timely manner to the Nominating Committee. To be timely, any such submission must be delivered to the Fund’s Secretary not earlier than the 90th day prior to such meeting and not later than the close of business on the later of the 60th day prior to such meeting or the 10th day following the day on which public announcement of the date of the meeting is first made, by either disclosure in a press release or in a document publicly filed by the Fund with the Securities and Exchange Commission.
Item 11. Controls and Procedures.
(a) Based on our evaluation conducted within 90 days of the filing date, hereof, the design and operation of the registrant’s disclosure controls and procedures are effective to ensure that material information relating to the registrant is made known to the certifying officers by others within the appropriate entities, particularly during the period in which Forms N-CSR are being prepared, and the registrant’s disclosure controls and procedures allow timely preparation and review of the information for the registrant’s Form N-CSR and the officer certifications of such Form N-CSR.
(b) There were no significant changes in the registrant’s internal controls that occurred during the second fiscal quarter of the period covered by this report that has materially affected, or is reasonably likely to materially affect, the registrant’s internal control over financial reporting.
Item 12. Exhibits.
(a)(1) Code of Ethics pursuant to Item 2 of Form N-CSR is filed and attached hereto as EX-99.CODE ETH.
(a)(2) A separate certification for each principal executive officer and principal financial officer of the registrant as required by Rule 30a-2 under the Act (17 CFR 270.30a-2) is attached hereto as EX-99.CERT.
(b) The officer certifications required by Section 906 of the Sarbanes-Oxley Act of 2002 are attached hereto as EX-99.906CERT.
(3) Not applicable.
18
SIGNATURES
Pursuant to the requirements of the Securities Exchange Act of 1934 and the Investment Company Act of 1940, the registrant has duly caused this report to be signed on its behalf by the undersigned, thereunto duly authorized.
(Registrant): ING Partners, Inc.
By | /s/ Shaun P. Mathews | |
| Shaun P. Mathews | |
| President and Chief Executive Officer | |
| | |
Date: | March 2, 2012 | |
| | |
| | |
Pursuant to the requirements of the Securities Exchange Act of 1934 and the Investment Company Act of 1940, this report has been signed below by the following persons on behalf of the registrant and in the capacities and on the dates indicated. |
| | |
| | |
By | /s/ Shaun P. Mathews | |
| Shaun P. Mathews | |
| President and Chief Executive Officer | |
| | |
Date: | March 2, 2012 | |
| | |
| | |
By | /s/ Todd Modic | |
| Todd Modic | |
| Senior Vice President and Chief Financial Officer | |
| | |
Date: | March 2, 2012 | |
19