OMB APPROVAL
OMB Number: 3235-0570
Expires: August 31, 2011
Estimated average burden hours per response: 18.9
UNITED STATES
SECURITIES AND EXCHANGE COMMISSION
Washington, D.C. 20549
FORM N-CSR
CERTIFIED SHAREHOLDER REPORT OF
REGISTERED MANAGEMENT INVESTMENT COMPANIES
Investment Company Act file number: 811-8319
ING Partners, Inc.
(Exact name of registrant as specified in charter)
7337 E. Doubletree Ranch Rd., Scottsdale, AZ | | 85258 |
(Address of principal executive offices) | | (Zip code) |
The Corporation Trust Company, 1209 Orange Street, Wilmington, DE 19801
(Name and address of agent for service)
Registrant’s telephone number, including area code: 1-800-992-0180
Date of fiscal year end: | December 31 |
| |
Date of reporting period: | January 1, 2008 to December 31, 2008 |
ITEM 1. REPORTS TO STOCKHOLDERS.
The following is a copy of the report transmitted to stockholders pursuant to Rule 30e-1 under the Act (17 CFR 270.30e-1):

Annual Report
December 31, 2008
Classes ADV, I and S
ING Partners, Inc.
n ING American Century Large Company Value Portfolio
n ING American Century Small-Mid Cap Value Portfolio
n ING Baron Asset Portfolio
n ING Baron Small Cap Growth Portfolio
n ING Columbia Small Cap Value II Portfolio
n ING Davis New York Venture Portfolio
n ING JPMorgan Mid Cap Value Portfolio
n ING Legg Mason Partners Aggressive Growth Portfolio
n ING Neuberger Berman Partners Portfolio
n ING Oppenheimer Global Portfolio
n ING Oppenheimer Strategic Income Portfolio
n ING PIMCO Total Return Portfolio
n ING Pioneer High Yield Portfolio
n ING T. Rowe Price Diversified Mid Cap Growth Portfolio
n ING T. Rowe Price Growth Equity Portfolio
n ING Templeton Foreign Equity Portfolio
n ING Thornburg Value Portfolio
n ING UBS U.S. Large Cap Equity Portfolio
n ING Van Kampen Comstock Portfolio
n ING Van Kampen Equity and Income Portfolio
This report is submitted for general information to shareholders of the ING Funds. It is not authorized for distribution to prospective shareholders unless accompanied or preceded by a prospectus which includes details regarding the funds' investment objectives, risks, charges, expenses and other information. This information should be read carefully.
 E-Delivery Sign-up – details inside
MUTUAL FUNDS

TABLE OF CONTENTS
| President's Letter | | | 1 | | |
|
| Market Perspective | | | 2 | | |
|
| Portfolio Managers' Report | | | 4 | | |
|
| Shareholder Expense Examples | | | 44 | | |
|
| Report of Independent Registered Public Accounting Firm | | | 48 | | |
|
| Statements of Assets and Liabilities | | | 49 | | |
|
| Statements of Operations | | | 59 | | |
|
| Statements of Changes in Net Assets | | | 64 | | |
|
| Financial Highlights | | | 74 | | |
|
| Notes to Financial Statements | | | 81 | | |
|
| Portfolios of Investments | | | 109 | | |
|
| Tax Information | | | 242 | | |
|
| Director and Officer Information | | | 244 | | |
|
| Advisory Contract Approval Discussion | | | 249 | | |
|
 Go Paperless with E-Delivery!
Sign up now for on-line prospectuses, fund reports, and proxy statements. In less than five minutes, you can help reduce paper mail and lower fund costs.
Just go to www.ingfunds.com, click on the E-Delivery icon from the home page, follow the directions and complete the quick 5 Steps to Enroll.
You will be notified by e-mail when these communications become available on the internet. Documents that are not available on the internet will continue to be sent by mail.
PROXY VOTING INFORMATION
A description of the policies and procedures that the Portfolios use to determine how to vote proxies related to portfolio securities is available: (1) without charge, upon request, by calling Shareholder Services toll-free at (800) 992-0180; (2) on the ING Funds' website at www.ingfunds.com; and (3) on the U.S. Securities and Exchange Commission's ("SEC") website at www.sec.gov. Information regarding how the Portfolios voted proxies related to portfolio securities during the most recent 12-month period ended June 30 is available without charge on the ING Funds' website at www.ingfunds.com and on the SEC's website at www.sec.gov.
QUARTERLY PORTFOLIO HOLDINGS
The Portfolios file their complete schedule of portfolio holdings with the SEC for the first and third quarters of each fiscal year on Form N-Q. The Portfolios' Forms N-Q are available on the SEC's website at www.sec.gov. The Portfolios' Forms N-Q may be reviewed and copied at the SEC's Public Reference Room in Washington, DC, and information on the operation of the Public Reference Room may be obtained by calling (800) SEC-0330; and is available upon request from the Portfolios by calling Shareholder Services toll-free at (800) 992-0180.
(THIS PAGE INTENTIONALLY LEFT BLANK)
PRESIDENT'S LETTER

Dear Shareholders,
We are in the midst of one of the most challenging periods ever faced by investors, and we at ING Funds are aware of the anxiety that you may be feeling at this time.
I want to assure you that we are actively engaged in monitoring the situation and are committed to keeping you fully informed of how the rapidly unfolding events around us may impact your investments with our company.
We recognize that the confidence of many investors is being tested, perhaps as never before. It is understandable that some of you may be second guessing your investment strategy due to these recent events. We encourage you to work with your investment professional and seek out their advice about your portfolio in light of the current conditions. But we also urge investors not to make rash decisions. ING Funds still believes that a well-diversified, globally allocated portfolio remains the most effective investment strategy of all. We ask that investors not lose sight of their commitment to the long-term.
We thank you for your support and confidence and we look forward to continuing to do business with you in the future.
Sincerely,

Shaun Mathews
President & Chief Executive Officer
ING Funds
January 23, 2009
The views expressed in the President's Letter reflect those of the President as of the date of the letter. Any such views are subject to change at any time based upon market or other conditions and ING Funds disclaims any responsibility to update such views. These views may not be relied on as investment advice and because investment decisions for an ING Fund are based on numerous factors, may not be relied on as an indication of investment intent on behalf of any ING Fund. Reference to specific company securities should not be construed as recommendations or investment advice. Consider the fund's investment objectives, risks, and charges and expenses carefully before investing. The prospectus contains this information and other information about the fund.
International investing poses special risks including currency fluctuation, economic and political risks not found in investments that are solely domestic.
1
MARKET PERSPECTIVE: YEAR ENDED DECEMBER 31, 2008
In our semi-annual report, we described a failed second quarter rally that fizzled when investors realized that borderline recessionary conditions and a credit crunch had not gone away. By year-end, governments were committing previously unimaginable sums of taxpayer money to prevent systemic collapse. Global equities in the form of the MSCI World® Index(1) measured in local currencies, including net reinvested dividends ("MSCI" for regions discussed below) plunged 29.70% in the six months ended December 31, 2008 (down 38.70% for the entire fiscal year). (The MSCI World® Index plunged 40.71% for the entire fiscal year, measured in U.S. dollars.) In currencies, the dollar at first drifted near record lows against the euro. But the tide turned in mid-July and for the six months ended December 31, 2008, the dollar strengthened by 12.10% (4.50% for the entire fiscal year). The dollar also soared 37.80% against the pound for the six months ended December 31, 2008 (37.90% for the entire fiscal year). But the yen advanced as carry trades (essentially short yen positions) were unwound and the dollar fell 14.90% for the six months ended December 31, 2008 (down 19.60% for the entire fiscal year).
Even more dramatic was the price of oil which marched to an all-time high of around $147 per barrel in mid-July, only to lose more than two thirds of that price by December 31, 2008.
The economic statistics remained bleak. By the end of October, the Standard & Poor's ("S&P")/Case-Shiller National U.S. Home Price Index(2) of house prices had fallen a record 18% over the year. New home sales were at 1991 levels. Some 45% of existing home sales were distressed.
Payrolls declined in every month of 2008, as the number of people claiming unemployment reached 4.1 million, a 26-year high. Gross domestic product ("GDP") fell at an annualized rate of 0.50% in the third quarter, and the National Bureau of Economic Research announced that the recession had actually started in December 2007.
Yet these were side-shows to the fireworks display in the financial sector, where major institutions — hanging by a thread through problems rooted in unwise mortgage borrowing, lending and investment — met different fates in September 2008 at the hands of the U.S. government.
The Federal National Mortgage Association ("Fannie Mae") and the Federal Home Loan Mortgage Corporation ("Freddie Mac") were taken into "conservatorship." Merrill Lynch was acquired by the Bank of America with a wink from the authorities. AIG received an $85 billion loan from a reluctant government, which also took a 79.90% equity stake in AIG. But Lehman Brothers having sought capital, then a buyer, found neither and was left to file for Chapter 11 bankruptcy protection.
The U.S. government was now in the position of choosing winners and losers among financial institutions: none too successfully, for it quickly became obvious that by pointedly leaving Lehman Brothers to go under, a credit crisis had become a credit market collapse. Lending all but seized up.
Policy response was huge but at least initially muddled. A Troubled Asset Relief Plan ("TARP") would set up a $700 billion fund to buy illiquid mortgage securities from financial institutions. But on November 12, 2008 with half of the money already used to recapitalize banks, Treasury Secretary Paulson announced that the rest of the funds would not be used to buy illiquid mortgage securities after all. This merely renewed the pressure on the holders of such securities like Citigroup, which within two weeks received guarantees from the government against losses and another $20 billion in capital.
Other programs were of more practical use, like support for the commercial paper market and a guarantee facility for money market funds. Arguably the most effective measure was the announced intention to buy vast quantities of agency mortgage-backed securities and debentures. This had the effect of driving down rates on the 30-year mortgage towards 5.00%, a record low. In the meantime, the newly-elected president promised a stimulus package worth approximately $1 trillion. And by year end, the Federal Open Market Committee ("FOMC") reduced interest rates to a range of between 0% and 0.25%.
2008 ended with much gloom and bad news still to come, but the platform for recovery was perhaps taking shape.
In U.S. fixed-income markets, yields on the 90-day Treasury Bills briefly turned negative in December 2008, while the yield on the ten-year Treasury Note fell below 2.50%, something we had not seen in 50 years. The Barclays Capital U.S. Aggregate Bond Index(3), formerly known as the Lehman Brothers U.S. Aggregate Bond Index, of investment grade bonds returned 4.10% for the six months ended December 31, 2008, (5.20% for the entire fiscal year). By contrast, high yield bonds,
2
MARKET PERSPECTIVE: YEAR ENDED DECEMBER 31, 2008
represented by the Barclays Capital High Yield Bond — 2% Issuer Constrained Composite Index(4), formerly known as the Lehman Brothers High Yield Bond — 2% Issuer Constrained Composite Index, behaved more like a stock index and returned (25.10)% for the six months ended December 31, 2008 (down 25.90% for the entire fiscal year).
U.S. equities, represented by the S&P 500® Composite Stock Price ("S&P 500®") Index(5), including dividends, returned (28.50)% for the six months ended December 31, 2008, (down 37.00% for the entire fiscal year), increasingly unimpressed by sharply falling oil prices. Profits for S&P 500® Index companies suffered their fifth straight quarter of decline, led again by the financials sector, although taxpayer money was also potentially committed to save the big three auto makers from bankru ptcy. On November 20, 2008, the S&P 500® Index plumbed a level not seen since April 1997, before a December recovery.
In international markets, plainly entering recession, the MSCI Japan® Index(6) slumped 35.90% for the six months ended December 31, 2008, (down 42.60% for the entire fiscal year). The strengthening yen hit exports in an export-dependent economy even as global demand slowed for other reasons. The MSCI Europe ex UK® Index(7) sagged 29.40% for the six months ended December 31, 2008 (down 43.20% for the entire fiscal year), beset by sharply falling economic activity and a European Central Bank in denial that inflation was falling fast. Finally, rates were reduced by an unprecedented 175 basis points (or 1.75%) in two months near the end of the year while governments, one after the other, proposed large stimulus packages. In the UK, the MSCI UK® Index(8) fell 19.40% for the six months ended December 31, 2008 (down 28.50% for the entire fiscal year). The UK had allowed a bigger housing bubble than the United States and deeper personal indebtedness in an economy more dependent on the financial sector. Rates were reduced to 1951 levels as venerable banks ceased to exist as independent entities.
(1) The MSCI World® Index is an unmanaged index that measures the performance of over 1,400 securities listed on exchanges in the U.S., Europe, Canada, Australia, New Zealand and the Far East.
(2) The S&P/Case-Shiller National U.S. Home Price Index tracks the value of single-family housing within the United States. The index is a composite of single-family home price indices for the nine U.S. Census divisions and is calculated quarterly.
(3) The Barclays Capital U.S. Aggregate Bond Index is an unmanaged index of publicly issued investment grade U.S. Government, mortgage-backed, asset-backed and corporate debt securities.
(4) The Barclays Capital High Yield Bond — 2% Issuer Constrained Composite Index is an unmanaged index that measures the performance of non-investment grade fixed-income securities.
(5) The S&P 500® Index is an unmanaged index that measures the performance of securities of approximately 500 of the largest companies in the United States.
(6) The MSCI Japan® Index is a free float-adjusted market capitalization index that is designed to measure developed market equity performance in Japan.
(7) The MSCI Europe ex UK® Index is a free float-adjusted market capitalization index that is designed to measure developed market equity performance in Europe, excluding the UK.
(8) The MSCI UK® Index is a free float-adjusted market capitalization index that is designed to measure developed market equity performance in the UK.
All indices are unmanaged and investors cannot invest directly in an index.
Past performance does not guarantee future results. The performance quoted represents past performance. Investment return and principal value of an investment will fluctuate, and shares, when redeemed, may be worth more or less than their original cost. The Portfolios' performance is subject to change since the period's end and may be lower or higher than the performance data shown. Please call (800) 262-3862 or log on to www.ingfunds.com to obtain performance data current to the most recent month end.
Market Perspective reflects the views of ING's Chief Investment Risk Officer only through the end of the period, and is subject to change based on market and other conditions.
3
ING AMERICAN CENTURY LARGE COMPANY VALUE PORTFOLIO
PORTFOLIO MANAGERS' REPORT
ING American Century Large Company Value Portfolio (the "Portfolio") seeks long-term capital growth. Income is a secondary objective. The Portfolio is managed by a team of portfolio managers comprised of Charles A. Ritter, CFA, Vice President and Senior Portfolio Manager and Brendan Healy, CFA, Vice President and Portfolio Manager, American Century Investment Management, Inc. — the Sub-Adviser.
Performance: For the year ended December 31, 2008, the Portfolio's Class S shares provided a total return of (36.99)% compared to the Russell 1000® Value Index(1) and the Standard & Poor's 500® Composite Stock Price Index(2) ("S&P 500 Index"), which returned (36.85)% and (37.00)%, respectively, for the same period.
Portfolio Specifics: Extraordinary, if not unprecedented market conditions characterized the period. Few investors anticipated the scope of the credit crunch, which grew into a full-blown financial crisis. In the stock market, volatility was extreme on a day-to-day basis as investors lost confidence in the financial system and worried about the government's ability to remedy the situation. U.S. equity indexes were universally down for the 12-month period, with value and growth stocks generally providing similar returns.
The Portfolio's holdings in the healthcare sector contributed to relative results. During difficult economic times or periods of stock market turbulence, investors often regard healthcare stocks as lower-risk, defensive investments. Moreover, our preference for large industry leaders proved advantageous. A significant holding was Abbott Laboratories, which develops and manufactures laboratory diagnostics, medical devices and pharmaceutical therapies.
The Portfolio's relative returns also benefited from effective security selection in information technology, primarily from large leading software and technology companies. A notable contributor was Hewlett-Packard Co., a computer and peripheral maker.
The Portfolio's positioning within the materials sector boosted relative performance. For some time, the share prices of metals and mining firms have been momentum-driven; many have not met the management team's valuation criteria and thus have not merited sizeable exposure. This limited exposure was particularly beneficial when commodities prices fell during the final months of 2008.
Despite an underweight, the financials sector was the Portfolio's largest source of underperformance versus the Russell 1000® Value Index. Although the portfolio management team continues to approach the sector with caution and selectivity, the best relative values were the most adversely affected by the financial crisis. In particular, the Portfolio was hampered by its mix of insurance, mortgage finance, and diversified financial services stocks. Three top detractors were financial giant Citigroup, Inc.; life, property and casualty insurer Hartford Financial Services Group, Inc. ("Hartford"); and American International Group ("AIG"), the leading U.S.-based international insurer. The Portfolio's positions in Hartford and AIG have been eliminated.
Current Strategy and Outlook: The portfolio management team takes a fundamental, bottom-up approach, evaluating each company individually on its own merits and building the portfolio from the ground up, one stock at a time.
As of December 31, 2008, the Portfolio was broadly diversified, with continued overweight positions in the information technology and healthcare sectors. Our valuation work contributed to our smaller relative weightings in financials and utilities stocks. We have also continued to find greater value opportunities among mega-cap stocks and have maintained our bias toward these firms.
Top Ten Holdings*
as of December 31, 2008
(as a percent of net assets)
| ExxonMobil Corp. | | | 5.8 | % | |
| Chevron Corp. | | | 5.4 | % | |
| AT&T, Inc. | | | 4.4 | % | |
| General Electric Co. | | | 4.3 | % | |
| Pfizer, Inc. | | | 3.4 | % | |
| Johnson & Johnson | | | 3.1 | % | |
| JPMorgan Chase & Co. | | | 3.0 | % | |
| ConocoPhillips | | | 2.9 | % | |
| Verizon Communications, Inc. | | | 2.5 | % | |
| Royal Dutch Shell PLC ADR — Class A | | | 2.4 | % | |
* Excludes short-term investments related to ING Institutional Prime Money Market Fund — Class I.
Portfolio holdings are subject to change daily.
Portfolio holdings and characteristics are subject to change and may not be representative of current holdings and characteristics. The outlook for this Portfolio may differ from that presented for other ING Funds. Performance for the different classes of shares will vary based on differences in fees associated with each class.
4
PORTFOLIO MANAGERS' REPORT
ING AMERICAN CENTURY LARGE COMPANY VALUE PORTFOLIO

| Average Annual Total Returns for the Periods Ended December 31, 2008 | |
| | | 1 Year | | 5 Year | | Since Inception
of Classes ADV, I and S
December 10, 2001 | |
| Class ADV | | | (37.19 | )% | | | (4.12 | )% | | | (2.85 | )% | |
| Class I | | | (36.86 | )% | | | (3.64 | )% | | | (2.35 | )% | |
| Class S | | | (36.99 | )% | | | (3.87 | )% | | | (2.59 | )% | |
| Russell 1000® Value Index(1) | | | (36.85 | )% | | | (0.79 | )% | | | 1.10 | %(3) | |
| S&P 500® Index(2) | | | (37.00 | )% | | | (2.19 | )% | | | (1.39 | )%(3) | |
Based on a $10,000 initial investment, the graph and table above illustrate the total return of ING American Century Large Company Value Portfolio against the indices indicated. An index is unmanaged and has no cash in its portfolio, imposes no sales charges and incurs no operating expenses. An investor cannot invest directly in an index. The Portfolio's performance is shown without the imposition of any expenses or charges which are, or may be, imposed under your annuity contract. Total returns would have been lower if such expenses or charges were included.
The performance graph and table do not reflect the deduction of taxes that a shareholder will pay on portfolio distributions or the redemption of portfolio shares.
The performance shown may include the effect of fee waivers and/or expense reimbursements by the Investment Adviser and/or other service providers, which have the effect of increasing total return. Had all fees and expenses been considered, the total returns would have been lower.
The performance update illustrates performance for a variable investment option available through a variable annuity contract. The performance shown indicates past performance and is not a projection or prediction of future results. Actual investment returns and principal value will fluctuate so that shares and/or units, at redemption, may be worth more or less than their original cost. Please call (800) 262-3862 to get performance through the most recent month end.
This report contains statements that may be "forward-looking" statements. Actual results may differ materially from those projected in the "forward-looking" statements.
The views expressed in this report reflect those of the portfolio manager only through the end of the period as stated on the cover. The portfolio manager's views are subject to change at any time based on marked and other conditions.
Portfolio holdings are subject to change daily.
(1) The Russell 1000® Value Index is an unmanaged index that measures the performance of those Russell 1000® companies with lower price-to-book ratios and lower than forecasted growth values.
(2) The S&P 500® Index is an unmanaged index that measures the performance of the securities of approximately 500 of the largest companies in the U.S.
(3) Since inception performance of the indices is shown as of December 1, 2001.
5
ING AMERICAN CENTURY SMALL-MID CAP VALUE PORTFOLIO
PORTFOLIO MANAGERS' REPORT
ING American Century Small-Mid Cap Value Portfolio (the "Portfolio") seeks long-term capital growth, income is a secondary objective. The Portfolio is managed by a team of portfolio managers comprised of Benjamin Z. Giele and James Pitman (responsible for the management of the Small Cap Value portion of the Portfolio) and Kevin Toney*, Phillip N. Davidson, and Michael Liss (responsible for the Mid Cap Value portion of the Portfolio), Portfolio Managers of American Century Investment Management, Inc. — the Sub-Adviser.
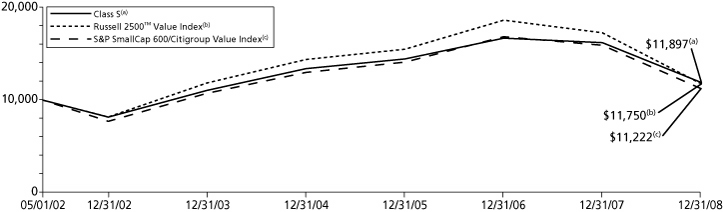
Performance: For the year ended December 31, 2008, the Portfolio's Class S shares provided a total return of (26.56)% compared to the Russell 2500TM Value Index(1) and the Standard & Poor's ("S&P") Small Cap 600/CitigroupValue Index(2), which returned (31.99)%, and (29.51)%, respectively, for the same period.
Portfolio Specifics: Extraordinary, if not unprecedented market conditions characterized the annual period. Few investors anticipated the scope of the credit crunch, which grew into a full-blown financial crisis. In the stock market, volatility was extreme on a day-to-day basis as investors lost confidence in the financial system and worried about the U.S. government's ability to remedy the situation. U.S. equity indexes were universally down for the year ended December 31, 2008, with value and growth stocks generally providing similar returns.
Small Cap Value** — Against this backdrop, the Portfolio benefited from positions in the consumer discretionary, industrials, and information technology sectors. In consumer discretionary, security selection in the hotels, restaurants and leisure segment was a plus. A top holding was casual restaurant chain, Chipotle Mexican Grill. Within industrials, investments in construction and engineering, machinery, and commercial services and supplies contributed. Holdings among software and semiconductor companies added value. A notable contributor was data management software maker, Sybase. The weakest performing sectors were financials and energy. In financials, investments among commercial banks and capital markets firms slowed relative results. A top detractor was MCG Capital Corp., which provides capital to finance activities such as acquisitions, recapitalizati ons, and buyouts. In energy, holdings among energy equipment and services companies, such as Global Industries Ltd., hampered progress.
Mid Cap Value** — Against this backdrop, the Portfolio benefited from positions in the consumer discretionary, financials, and utilities sectors. In consumer discretionary, an underweight and strong security selection, including a lack of exposure to media companies or internet and catalog retailers, was advantageous. In financials, investments among thrifts and insurance companies added value. Two top holdings were People's United Financial and The Chubb Corp. In utilities, the Portfolio did not own any independent power producers, which contributed to relative progress. Furthermore, its holdings in electric and gas utilities boosted results. Although the Portfolio received positive relative contributions from all 10 sectors in which it was invested, performance was hampered by certain holdings and by select underweights. For example, the financials sector p rovided top detractor, AllianceBernstein Holding LP.
Current Strategy and Outlook: The management team takes a fundamental, bottom-up approach, evaluating each company individually on its own merits and building the Portfolio from the ground up, one stock at a time. In searching for companies that we believe are undervalued, the team will structure exposure to stocks and market segments as warranted based on the attractiveness of individual companies.
Small Cap Value** — As of December 31, 2008, the Portfolio was broadly diversified, with an overweight position in energy and an underweight position in financials relative to the benchmark.
Mid Cap Value** — As of December 31, 2008, we continued to see opportunities in consumer staples and healthcare stocks, reflected by our overweight positions in these sectors relative to the benchmark. Our fundamental analysis and valuation work contributed to our smaller relative weightings in financials and energy stocks.
Top Ten Holdings*
as of December 31, 2008
(as a percent of net assets)
| Aspen Insurance Holdings Ltd. | | | 1.9 | % | |
| Marsh & McLennan Cos., Inc. | | | 1.2 | % | |
| HCC Insurance Holdings, Inc. | | | 1.1 | % | |
| iShares Russell 2000 Index Fund | | | 1.1 | % | |
| Kimberly-Clark Corp. | | | 0.9 | % | |
| Molex, Inc. | | | 0.9 | % | |
| WGL Holdings, Inc. | | | 0.9 | % | |
| Westar Energy, Inc. | | | 0.9 | % | |
| Beckman Coulter, Inc. | | | 0.9 | % | |
| Parametric Technology Corp. | | | 0.9 | % | |
* Excludes short-term investments related to ING Institutional Prime Money Market Fund — Class I and securities lending collateral.
Portfolio holdings are subject to change daily.
* Effective August 29, 2008, Kevin Toney replaced Scott Moore as portfolio manager to the Portfolio.
** For purposes of these discussions, "the Portfolio" refers to each respectively managed portion of ING American Century Small-Mid Cap Value Portfolio.
Portfolio holdings and characteristics are subject to change and may not be representative of current holdings and characteristics. The outlook for this Portfolio may differ from that presented for other ING Funds. Performance for the different classes of shares will vary based on differences in fees associated with each class.
6
PORTFOLIO MANAGERS' REPORT
ING AMERICAN CENTURY SMALL-MID CAP VALUE PORTFOLIO
| Average Annual Total Returns for the Periods Ended December 31, 2008 | |
| | | 1 Year | | 5 Year | | Since Inception
of Classes ADV, I and S
May 1, 2002 | |
| Class ADV | | | (26.69 | )% | | | 1.26 | % | | | 2.39 | % | |
| Class I | | | (26.37 | )% | | | 1.75 | % | | | 2.89 | % | |
| Class S | | | (26.56 | )% | | | 1.50 | % | | | 2.64 | % | |
| Russell 2500TM Value Index(1) | | | (31.99 | )% | | | (0.15 | )% | | | 2.45 | % | |
| S&P SmallCap 600/Citigroup Value Index(2) | | | (29.51 | )% | | | 0.90 | % | | | 1.74 | % | |
Based on a $10,000 initial investment, the graph and table above illustrate the total return of ING American Century Small-Mid Cap Value Portfolio against the indices indicated. An index is unmanaged and has no cash in its portfolio, imposes no sales charges and incurs no operating expenses. An investor cannot invest directly in an index. The Portfolio's performance is shown without the imposition of any expenses or charges which are, or may be, imposed under your annuity contract. Total returns would have been lower if such expenses or charges were included.
The performance graph and table do not reflect the deduction of taxes that a shareholder will pay on portfolio distributions or the redemption of portfolio shares.
The performance shown may include the effect of fee waivers and/or expense reimbursements by the Investment Adviser and/or other service providers, which have the effect of increasing total return. Had all fees and expenses been considered, the total returns would have been lower.
The performance update illustrates performance for a variable investment option available through a variable annuity contract. The performance shown indicates past performance and is not a projection or prediction of future results. Actual investment returns and principal value will fluctuate so that shares and/or units, at redemption, may be worth more or less than their original cost. Please call (800) 262-3862 to get performance through the most recent month end.
This report contains statements that may be "forward-looking" statements. Actual results may differ materially from those projected in the "forward-looking" statements.
The views expressed in this report reflect those of the portfolio manager only through the end of the period as stated on the cover. The portfolio manager's views are subject to change at any time based on marked and other conditions.
Portfolio holdings are subject to change daily.
(1) The Russell 2500TM Value Index measures the performance of those Russell 2500 companies with lower price-to-book ratios and lower forecasted growth values.
(2) The S&P SmallCap 600/Citigroup Value Index measures the performance of those S&P 600 Index companies with lower price-to-book ratios.
7
ING BARON ASSET PORTFOLIO
PORTFOLIO MANAGERS' REPORT
ING Baron Asset Portfolio (the "Portfolio") seeks capital appreciation. The Portfolio is managed by Andrew Peck*, Senior Vice President, of BAMCO, Inc. ("BAMCO") — the Sub-Adviser.
Performance: For the year ended December 31, 2008, the Portfolio's Class I shares provided a total return of (41.04)% compared to the Russell Midcap® Growth Index(1) and the Russell Midcap® Index(2), which returned (44.32)% and (41.46)%, respectively, for the same period.
Portfolio Specifics: The sectors that positively impacted the Portfolio's performance relative to the Russell Midcap® Growth Index were industrials and information technology. Performance attribution for both sectors was positive mainly due to stock selection.
The financial sector had the largest negative impact led by its investments in CME Group, Inc. ("CME") and CB Richard Ellis Group, Inc ("CB Richard Ellis"). CME's share price declined as the company's trading volumes disappointed expectations. The credit crisis negatively impacted CME's volumes through several channels. Unprecedented volatility and dislocations in the credit markets caused CME's interest rate products to be less effective than usual for traditional hedging and speculating strategies. In addition, across product categories customers had less access to credit and therefore capital with which to trade. CB Richard Ellis performed poorly in 2008 (along with most commercial real estate stocks) as the combination of a slowdown in leasing and investment sales activity, rising cap rates, and credit market concerns weighed on the shares. Though we believe that the commercial real estate market will continue to face headwinds in 2009, we believe that most of these concerns are discounted in the stock at this stage.
The consumer discretionary sector had the second largest negative impact, mainly due to Lamar Advertising Co. ("Lamar") and Wynn Resorts Ltd. ("Wynn"). Lamar shares had softened early in the year, as advertising demand started to slow, and the shares weakened substantially starting in September, as evidence mounted of a more substantial economic and advertising recession. Adding to this was a constrained credit environment, as investors grew concerned about potential refinancing risk. Still, unlike other traditional media, the outdoor advertising business is experiencing little, if any audience erosion, and therefore, we believe should outgrow other media in a cyclical recovery. In the meantime, the company is managing the business with a keen eye on costs and capital expenditures, and has taken the steps necessary to produce significant free cash flow and avoid violating any of its credit covenants during this difficult time. With a longsta nding management in place, with experience through many past cycles and having strong relationships with its lenders for decades, we believe the company should be well positioned to manage through this difficult time toward an eventual recovery. Wynn's stock fell because both properties, Macau and Las Vegas are anticipated to have lower than expected earnings.
The healthcare sector also had a negative impact. Investors turning to traditionally defensive healthcare services stocks in 2008 did not find much safety. Our facility based stocks — hospitals and nursing homes — were hit hard by concerns over admission trends, bad debt and negative patient mix as growing unemployment and years of cost shifting made affordability an issue even for the insured. Assisted living stocks got hammered as seniors, unable to sell their homes, delayed move-ins and worries mounted over the negative leverage of lower occupancy and indications the industry was resorting to discounting and promotions. Lastly, investors dumping companies with levered balance sheets, with little regard for underlying cash flows, covenant cushions or maturity schedules, also pressured our holdings.
The top five most positively impacting stocks were DeVry, Inc., CH Robinson Worldwide, Inc., Arch Capital Group Ltd., Choice Hotels International, Inc. and Ecolab, Inc. The top five most negatively impacting stocks were CME Group, Inc., Lamar Advertising Co., Wynn Resorts Ltd., CB Richard Ellis Group, Inc. and Covance, Inc.
Current Strategy and Outlook: We focus on the long-term fundamental prospects of the businesses in which it invests. We believe we can gain an investment advantage through our independent and exhaustive research of businesses. We attempt to purchase what we believe are great companies with exciting prospects at attractive prices when prospects are misunderstood; markets react to short term events; and/or when experts are wrong.
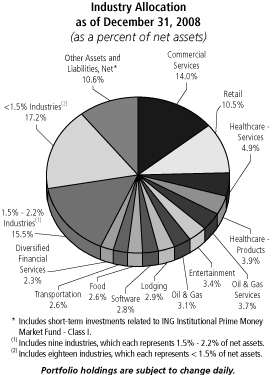
Top Ten Holdings
as of December 31, 2008
(as a percent of net assets)
| Charles Schwab Corp. | | | 4.2 | % | |
| Arch Capital Group Ltd. | | | 3.7 | % | |
| DeVry, Inc. | | | 3.6 | % | |
| CH Robinson Worldwide, Inc. | | | 3.5 | % | |
| Stericycle, Inc. | | | 2.9 | % | |
| Polo Ralph Lauren Corp. | | | 2.9 | % | |
| SAIC, Inc. | | | 2.8 | % | |
| Idexx Laboratories, Inc. | | | 2.7 | % | |
| Gartner, Inc. | | | 2.6 | % | |
| XTO Energy, Inc. | | | 2.5 | % | |
Portfolio holdings are subject to change daily.
* Effective January 24, 2008, Andrew Peck was named sole lead portfolio manager of the Portfolio.
Portfolio holdings and characteristics are subject to change and may not be representative of current holdings and characteristics. The outlook for this Portfolio may differ from that presented for other ING Funds. Performance for the different classes of shares will vary based on differences in fees associated with each class.
8
PORTFOLIO MANAGERS' REPORT
ING BARON ASSET PORTFOLIO
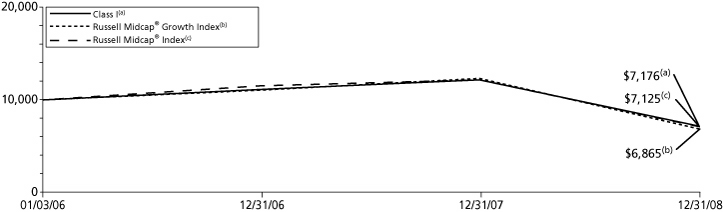
| Average Annual Total Returns for the Periods Ended December 31, 2008 | |
| | | 1 Year | | Since Inception
of Class ADV
January 18, 2006 | | Since Inception
of Class I
January 3, 2006 | | Since Inception
of Class S
May 3, 2006 | |
| Class ADV | | | (41.20 | )% | | | (11.13 | )% | | | — | | | | — | | |
| Class I | | | (41.04 | )% | | | — | | | | (10.49 | )% | | | — | | |
| Class S | | | (41.06 | )% | | | — | | | | — | | | | (14.24 | )% | |
| Russell Midcap® Growth Index(1) | | | (44.32 | )% | | | (13.84 | )%(3) | | | (11.79 | )%(4) | | | (15.65 | )%(5) | |
| Russell Midcap® Index(2) | | | (41.46 | )% | | | (12.49 | )%(3) | | | (10.68 | )%(4) | | | (14.55 | )%(5) | |
Based on a $10,000 initial investment, the graph and table above illustrate the total return of ING Baron Asset Portfolio against the index indicated. An index is unmanaged and has no cash in its portfolio, imposes no sales charges and incurs no operating expenses. An investor cannot invest directly in an index. The Portfolio's performance is shown without the imposition of any expenses or charges which are, or may be, imposed under your annuity contract. Total returns would have been lower if such expenses or charges were included.
The performance graph and table do not reflect the deduction of taxes that a shareholder will pay on portfolio distributions or the redemption of portfolio shares.
The performance shown may include the effect of fee waivers and/or expense reimbursements by the Investment Adviser and/or other service providers, which have the effect of increasing total return. Had all fees and expenses been considered, the total returns would have been lower.
The performance update illustrates performance for a variable investment option available through a variable annuity contract. The performance shown indicates past performance and is not a projection or prediction of future results. Actual investment returns and principal value will fluctuate so that shares and/or units, at redemption, may be worth more or less than their original cost. Please call (800) 262-3862 to get performance through the most recent month end.
This report contains statements that may be "forward-looking" statements. Actual results may differ materially from those projected in the "forward-looking" statements.
The views expressed in this report reflect those of the portfolio manager only through the end of the period as stated on the cover. The portfolio manager's views are subject to change at any time based on marked and other conditions.
Portfolio holdings are subject to change daily.
(1) The Russell Midcap® Growth Index is an unmanaged index that measures the performance of those companies included in the Russell Midcap® Index with relatively higher price-to-book ratios and higher forcosted growth values.
(2) The Russell Midcap® Index is an unmanaged index that measures the performance of the 800 smallest companies in the Russell 1000® Index, which represents approximately 26% of the total market capitalization of the Russell 1000® Index.
(3) Since inception performance of the index is shown from February 1, 2006.
(4) Since inception performance of the index is shown from January 1, 2006.
(5) Since inception performance of the index is shown from May 1, 2006.
9
ING BARON SMALL CAP GROWTH PORTFOLIO
PORTFOLIO MANAGERS' REPORT
ING Baron Small Cap Growth Portfolio (the "Portfolio") seeks capital appreciation. The Portfolio is managed by Ronald Baron, Founder, Chief Executive Officer, Chief Investment Officer, Chairman, and Portfolio Manager of BAMCO, Inc. ("BAMCO") — the Sub-Adviser.
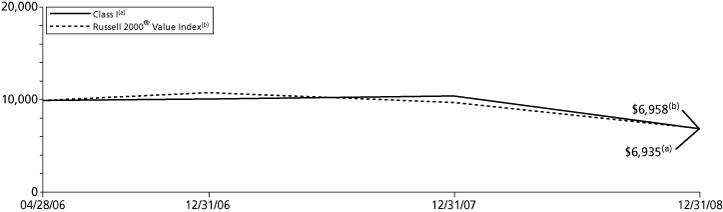
Performance: For the year ended December 31, 2008, the Portfolio's Class S shares provided a total return of (41.25)% compared to the Russell 2000® Index(1), which returned (33.79)% for the same period.
Portfolio Specifics: The sectors that positively impacted the Portfolio's performance relative to the Russell 2000® Index were information technology and materials. Information technology had a positive impact relative to the Russell 2000® Index due to its underweighting and stock selection and materials was due to its underweighting relative to the index.
The consumer discretionary sector had the largest negative impact, led by Sotheby's, which also had the largest negative impact on the Portfolio. The global economic crunch impacted the art market as collectors were unwilling to speculate at auctions. The downturn in the market led to significant losses on guaranteed pieces.
The financial sector had the second largest negative impact mainly due to its investments in FCStone Group, Inc. ("FCStone") and Cohen & Steers, Inc ("Cohen & Steers"). The sector had a very difficult period as a result of the struggling economy. The falling stock market coupled with heavy investor redemptions led to lower assets under management and a significant reduction in revenue for asset management companies like Cohen & Steers. The operating environment in 2008 became extremely difficult for FCStone's commodity risk consulting and brokerage businesses. Declining government interest rates were a headwind to FCStone's net interest revenue. The credit crisis caused customers to have less access to capital with which to execute hedging strategies. Commodity price volatility caused trading to become more expensive for customers and increased FCStone's financial risk from customer failures. In spite of these difficulties, FCSto ne continued to see growing demand for its products and services.
The energy sector also had a negative impact as the deteriorating world economy led to a drop in oil prices (54% in 2008). In addition, energy stocks were hurt by the tight credit markets. Energy is a capital intensive business, and less available credit is resulting in sharp cuts to drilling budgets and major capital projects. Our energy holdings, for example, FMC Technologies, Inc. and Core Laboratories NV are, in our opinion, in excellent financial condition; however, their customers are scaling back spending plans for 2009 due to low commodity prices and the credit crunch.
The top five most positively impacting stocks were DeVry, Inc., Panera Bread Co., Aecom Technology Corp., Mohawk Industries, Inc. and Choice Hotels International, Inc. The top five most negatively impacting stocks were Sotheby's, SunPower Corp., FCStone Group, Inc., Central European Media Enterprises Ltd. and J. Crew Group.
Current Strategy and Outlook: We focus on the long-term fundamental prospects of the businesses in which it invests. This contrasts with other investors' focus on historical operating results or current earnings expectations. We believe that historical results and the outlook for near-term earnings are often not indicative of superior longer-term prospects that can be identified through its research efforts. We believe we can gain an investment advantage through our independent and exhaustive research of businesses. We attempt to purchase what we believe are great small cap companies with exciting prospects at attractive prices when prospects are misunderstood; markets react to short-term events; and/or when experts are wrong.
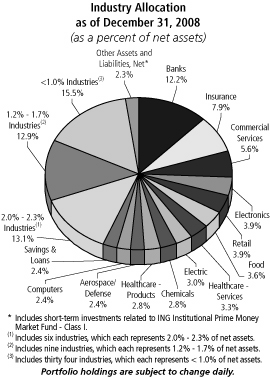
Top Ten Holdings*
as of December 31, 2008
(as a percent of net assets)
| DeVry, Inc. | | | 4.2 | % | |
| Ralcorp Holdings, Inc. | | | 2.6 | % | |
| Panera Bread Co. | | | 2.5 | % | |
| Choice Hotels International, Inc. | | | 2.4 | % | |
| MSCI, Inc. — Class A | | | 2.2 | % | |
| Under Armour, Inc. | | | 2.1 | % | |
| Genesee & Wyoming, Inc. | | | 2.0 | % | |
| Aecom Technology Corp. | | | 1.9 | % | |
| AMERIGROUP Corp. | | | 1.9 | % | |
| Dick's Sporting Goods, Inc. | | | 1.8 | % | |
* Excludes short-term investments related to ING Institutional Prime Money Market Fund — Class I.
Portfolio holdings are subject to change daily.
Portfolio holdings and characteristics are subject to change and may not be representative of current holdings and characteristics. The outlook for this Portfolio may differ from that presented for other ING Funds. Performance for the different classes of shares will vary based on differences in fees associated with each class.
10
PORTFOLIO MANAGERS' REPORT
ING BARON SMALL CAP GROWTH PORTFOLIO
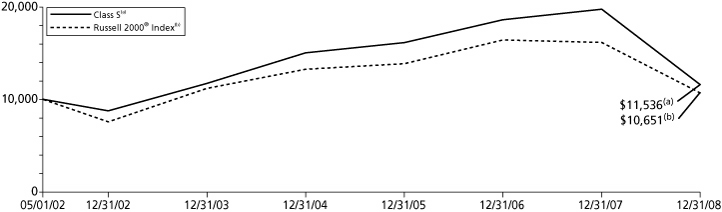
| Average Annual Total Returns for the Periods Ended December 31, 2008 | |
| | | 1 Year | | 5 Year | | Since Inception
of Classes ADV, I and S
May 1, 2002 | |
| Class ADV | | | (41.41 | )% | | | (0.53 | )% | | | 1.90 | % | |
| Class I | | | (41.12 | )% | | | (0.02 | )% | | | 2.42 | % | |
| Class S | | | (41.25 | )% | | | (0.26 | )% | | | 2.17 | % | |
| Russell 2000® Index(1) | | | (33.79 | )% | | | (0.93 | )% | | | 0.95 | % | |
Based on a $10,000 initial investment, the graph and table above illustrate the total return of ING Baron Small Cap Growth Portfolio against the index indicated. An index is unmanaged and has no cash in its portfolio, imposes no sales charges and incurs no operating expenses. An investor cannot invest directly in an index. The Portfolio's performance is shown without the imposition of any expenses or charges which are, or may be, imposed under your annuity contract. Total returns would have been lower if such expenses or charges were included.
The performance graph and table do not reflect the deduction of taxes that a shareholder will pay on portfolio distributions or the redemption of portfolio shares.
The performance shown may include the effect of fee waivers and/or expense reimbursements by the Investment Adviser and/or other service providers, which have the effect of increasing total return. Had all fees and expenses been considered, the total returns would have been lower.
The performance update illustrates performance for a variable investment option available through a variable annuity contract. The performance shown indicates past performance and is not a projection or prediction of future results. Actual investment returns and principal value will fluctuate so that shares and/or units, at redemption, may be worth more or less than their original cost. Please call (800) 262-3862 to get performance through the most recent month end.
This report contains statements that may be "forward-looking" statements. Actual results may differ materially from those projected in the "forward-looking" statements.
The views expressed in this report reflect those of the portfolio manager only through the end of the period as stated on the cover. The portfolio manager's views are subject to change at any time based on marked and other conditions.
Portfolio holdings are subject to change daily.
(1) The Russell 2000® Index is a broad-based unmanaged capitalization weighted index of small capitalization companies.
11
ING COLUMBIA SMALL CAP VALUE II PORTFOLIO
PORTFOLIO MANAGERS' REPORT
ING Columbia Small Cap Value II Portfolio (the "Portfolio") seeks long-term growth of capital. The Portfolio is managed by two investment sleeves. The first sleeve is managed by Christian Stadlinger and Jarl Ginsberg, Portfolio Managers, and the second sleeve* is managed by Stephen Barbaro and Jeremy Javidi, Portfolio Managers, of Columbia Management Advisors, LLC — the Sub-Adviser.
Performance: For the year ended December 31, 2008, the Portfolio's Class I shares provided a total return of (33.93)% compared to the Russell 2000® Value Index(1), which returned (28.92)% for the same period.
Portfolio Specifics: Columbia Sleeve I — 2008 marked a disappointing and volatile year for small-cap value stocks as all sectors of the Russell 2000 Value® Index posted losses. For the year, volatility and a dislocation of fundamentals from stock price movements continued to impact the broader universe of stocks as well as those in the Portfolio. The weakest returns came from the industrial, technology, financials and consumer staples sectors, while the Portfolio experienced positive relative results from the consumer discretionary and telecom sectors. Stock specific returns drove the Portfolio's performance versus the benchmark, yet sector impacts were evident as well. In terms of stock s pecific impact, performance versus the benchmark can be in large part traced to some stock specific weakness in names such as National Financial Partners and Great Atlantic & Pacific Tea Co. ("Great A&P") amongst others. In the case of Great A&P, the stock was weak in spite of the stability of supermarkets in this environment, as the volatility and decreasing risk tolerance punished anyone with "perceived" balance sheet risk. The Portfolio did reap the benefit from positions in companies such as Delta Airlines, Inc., Massey Energy Co. and Community Bank System, Inc. to name a few. Additionally, looking at performance throughout the year, much of the shortfall can be traced to weakness experienced in the third quarter where three factors affected the portfolio. First, the Portfolio had less exposure than the Russell 2000 Value® Index to the very small-cap, lower quality, high-risk financials that received a short term bounce. These weaker names were pushed higher on the belief that their poor fundamentals had stabilized and the effect was evident across the space including banks, insurance companies and thrifts. Second, the Portfolio's positions in aerospace companies such as BE Aerospace, Inc. and AAR Corp. underperformed as fears of an economic slowdown and a labor strike at a major aircraft maker pressured the sector downward. Last, the high degree of trading volatility during the period caused a dislocation between company fundamentals and stock prices. The Portfolio experienced many examples of companies whose fundamentals had not changed for the worse, yet were pressured. We fully expect that when markets regain some sense of normalcy, fundamentals will be the major determinants of stock price movement.
Columbia Sleeve II — Since its inception on August 29, 2008, the Portfolio was able to add significant value through its holdings and positioning within the consumer discretionary and technology sectors. The strategy was appropriately positioned in the consumer discretionary sector with a strategic underweight, as the Russell 2000® Value consumer discretionary sector was one of the weaker sectors in the quarter. The Portfolio generated outperformance through strong stock selection in the auto and the retail industry coupled with our avoidance of stocks in the very weak media industry. The technology sector was another positive relative performer. The outperformance was spread across almost all of the industries within the tech sector, as the market was more attracted to stable and quality companies throughout the fourth quarter. IT services sto od out in the sector as a particular bright spot with many of the companies also contributing to our business outsourcing basket. The Portfolio's significant overweight in the healthcare sector helped offset negative stock selection as healthcare underperformed in the fourth quarter. However, a lack of holdings in the pharmaceuticals industry was also major contributor to the underperformance within healthcare. The life science tools industry also was a weak performer in the fourth quarter, due to the slowdown in spending by research companies and hospitals. Negative stock selection within the industrials sector detracted from relative performance. In the airline space, for example, the stocks of the major carriers that were not held in the portfolio rose as oil prices plunged and excess capacity declined. Stock selection within construction and engineering industry was also weak as one portfolio holding with overseas exposure was particularly weak on the fear of a reduction of cement demand by the emerging markets. We feel that this long-term position may substantially benefit the Portfolio in time, as it appears the world wide government response has been centered on increasing infrastructure spending, thereby improving the likelihood of increased cement demand.
Current Strategy and Outlook: Columbia Sleeve I — It is reasonable to assume that a difficult environment will continue into 2009 as the global recession serves as a headwind to many companies and industries. Furthermore, should the dislocation between company fundamentals and stock price movements continue, this will only serve to create additional challenges. However, in similar periods stock prices have tended to lead both heading into and exiting recessionary periods. We believe it is specifically in these types of environments where adherence to our strategy will serve our shareholders best. It is worth reiterating that our strategy entails finding the companies that, based on underlying fundamental s, represent the best value opportunities. We specifically focus on those which show incremental improvements in fundamental metrics, or as we often say "upward inflection points." Our discipline in executing this approach is combined with our diligence in controlling for risk as well. While we naturally will have sector and industry level exposures that vary from the benchmark, we ensure that these variances do not constitute more than a minimal amount of the Portfolio's overall risk exposure. This ensures that the Portfolio is not swayed by unintended bets, but rather driven by our work and success in stock selection that has served us well over various market cycles, and we expect to serve us well throughout the coming year.
Columbia Sleeve II — Throughout the fourth quarter, we began to buy inexpensive beta as the market sell off presented attractive, long term opportunities. The sell off provided a great opportunity to create a strategic overweight within the technology sector, which is now our largest active exposure. Balance sheets are particularly strong within technology and many of the companies are better prepared for a downturn relative to 2000 recession. We believe this exposure will add significant value over our time horizon. At year end, the Portfolio was weighted toward higher-quality companies (consistent with the portfolio managers' philosophy) with stable, positive earnings and low volatility when compared to its peers, and a consistent value bias. We believe that the market will present us with a number of high quality value opportunities, as our competitors' sh ort term view often creates exaggerated market moves. We feel the current positioning of the Portfolio is appropriate as we continually hunt for attractive "value opportunities" to fuel our longer term success.
Top Ten Holdings*
as of December 31, 2008
(as a percent of net assets)
| Platinum Underwriters Holdings Ltd. | | | 1.2 | % | |
| Argo Group International Holdings Ltd. | | | 1.2 | % | |
| Watson Wyatt Worldwide, Inc. | | | 1.2 | % | |
| Bancorpsouth, Inc. | | | 1.2 | % | |
| Olin Corp. | | | 1.2 | % | |
| Magellan Health Services, Inc. | | | 1.2 | % | |
| Omega Healthcare Investors, Inc. | | | 1.2 | % | |
| Community Bank System, Inc. | | | 1.2 | % | |
| Westar Energy, Inc. | | | 1.2 | % | |
| EMCOR Group, Inc. | | | 1.1 | % | |
* Excludes short-term investments related to ING Institutional Prime Money Market Fund — Class I.
Portfolio holdings are subject to change daily.
* The second sleeve was added effective August 29, 2008.
** For purposes of these discussions, "the Portfolio" refers to each respectively managed portion of ING Columbia Small Cap Value II Portfolio.
Portfolio holdings and characteristics are subject to change and may not be representative of current holdings and characteristics. The outlook for this Portfolio may differ from that presented for other ING Funds. Performance for the different classes of shares will vary based on differences in fees associated with each class.
12
PORTFOLIO MANAGERS' REPORT
ING COLUMBIA SMALL CAP VALUE II PORTFOLIO
| Average Annual Total Returns for the Periods Ended December 31, 2008 | |
| | | 1 Year | | Since Inception
of Class ADV
December 29, 2006 | | Since Inception
of Class I
April 28, 2006 | | Since Inception
of Class S
May 1, 2006 | |
| Class ADV | | | (34.22 | )% | | | (17.73 | )% | | | — | | | | — | | |
| Class I | | | (33.93 | )% | | | — | | | | (12.77 | )% | | | — | | |
| Class S | | | (34.08 | )% | | | — | | | | — | | | | (12.85 | )% | |
| Russell 2000® Value Index(1) | | | (28.92 | )% | | | (19.92 | )%(2) | | | (12.72 | )%(3) | | | (12.72 | )% | |
Based on a $10,000 initial investment, the graph and table above illustrate the total return of ING Columbia Small Cap Value II Portfolio against the index indicated. An index is unmanaged and has no cash in its portfolio, imposes no sales charges and incurs no operating expenses. An investor cannot invest directly in an index. The Portfolio's performance is shown without the imposition of any expenses or charges which are, or may be, imposed under your annuity contract. Total returns would have been lower if such expenses or charges were included.
The performance graph and table do not reflect the deduction of taxes that a shareholder will pay on portfolio distributions or the redemption of portfolio shares.
The performance shown may include the effect of fee waivers and/or expense reimbursements by the Investment Adviser and/or other service providers, which have the effect of increasing total return. Had all fees and expenses been considered, the total returns would have been lower.
The performance update illustrates performance for a variable investment option available through a variable annuity contract. The performance shown indicates past performance and is not a projection or prediction of future results. Actual investment returns and principal value will fluctuate so that shares and/or units, at redemption, may be worth more or less than their original cost. Please call (800) 262-3862 to get performance through the most recent month end.
This report contains statements that may be "forward-looking" statements. Actual results may differ materially from those projected in the "forward-looking" statements.
The views expressed in this report reflect those of the portfolio manager only through the end of the period as stated on the cover. The portfolio manager's views are subject to change at any time based on marked and other conditions.
Portfolio holdings are subject to change daily.
(1) The Russell 2000® Value Index is an unmanaged index measures the performance of those Russell 2000 securities with lower price-to-book ratios and lower forecasted growth values.
(2) Since inception performance of the index is shown from January 1, 2007.
(3) Since inception performance of the index is shown from May 1, 2006.
13
ING DAVIS NEW YORK VENTURE PORTFOLIO
PORTFOLIO MANAGERS' REPORT
ING Davis New York Venture Portfolio (the "Portfolio") seeks long-term growth of capital. The Portfolio is managed by Christopher C. Davis and Kenneth C. Feinberg, Portfolio Managers, with Davis Selected Advisers, L.P. ("Davis Advisers") — the Sub-Adviser.
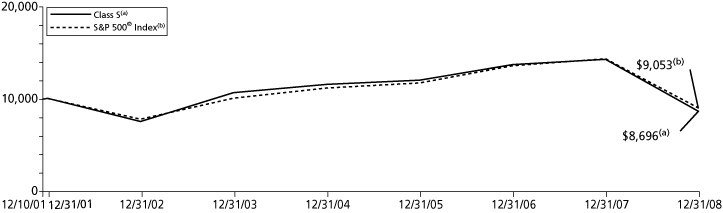
Performance: For the year ended December 31, 2008, the Portfolio's Class S shares provided a total return of (39.22)% compared to the Standard & Poor's 500® Composite Stock Price Index(1) ("S&P 500® Index"), which returned (37.00)% for the same period.
Portfolio Specifics: The Portfolio's financial companies out-performed the corresponding sector within the S&P 500® Index, but were still the largest detractors from absolute performance. A higher relative average weighting in this sector detracted from relative performance versus the benchmark. American International Group, Inc. ("AIG"), American Express Co., Merrill Lynch & Co., Inc., Loews Corp., Berkshire Hathaway, Inc., Bank of New York Mellon Corp., and JPMorgan Chase & Co. were among the top detractors from performance. Wells Fargo & Co. was among the top contributors to the Portfolio's performance.
The Portfolio's underweight and adverse stock selection in telecommunications and utilities was a detractor to relative performance. The second largest detractors from absolute performance were energy companies. On a relative basis, the Portfolio's energy companies also underperformed the corresponding sector within the S&P 500® Index. A higher relative average weighting in this sector also detracted from performance. ConocoPhillips was among the top detractors from performance.
Additional factors contributing to the Portfolio underperforming the S&P 500® Index included a lower relative average weighting in the healthcare sector than the S&P 500® Index and weak stock selection in the consumer staples sector.
Like all sectors in the S&P 500® Index, healthcare companies declined in value over the year; however, on average they declined in value less than the S&P 500® Index did. Schering-Plough Corp. was among the most important contributors to relative performance. However, the Portfolio's relative performance overall was harmed because it had a lower relative average weighting in this sector, which out-performed (lost less) the S&P 500® Index.
The Portfolio's consumer staple companies underperformed the average company included in the S&P 500® Index's consumer staples sector. Costco Wholesale Corp. was among the most important detractors from performance.
Individual companies contributing positively to the Portfolio's absolute performance over the year included H&R Block, Inc. (a consumer discretionary company) and Wal-Mart Stores, Inc. (a consumer staples company). Microsoft Corp. (an information technology company) was an important detractor from performance.
The Portfolio held approximately 10% of its assets in foreign companies as of December 31, 2008. As a whole, these companies underperformed the domestic companies held by the Portfolio during 2008.
Current Strategy and Outlook: Davis Advisors' long-term focus usually results in low portfolio turnover. We do not overreact to past short-term performance from individual holdings on either the upside or the downside. We focus deliberately on the future, considering each company's long-term business fundamentals.
As of December 31, 2008, five companies had dropped out of the Portfolio's top 10 holdings from the end of 2007. Three of these holdings, American Express, Loews, and Microsoft, are still among the Portfolio's top 20 holdings. Four of the five new additions to the Portfolio's top 10 holdings at the end of 2008 were among the Portfolio's top 20 holdings as of the end of 2007.

Top Ten Holdings*
as of December 31, 2008
(as a percent of net assets)
| Costco Wholesale Corp. | | | 4.4 | % | |
| Wells Fargo & Co. | | | 4.3 | % | |
| JPMorgan Chase & Co. | | | 4.2 | % | |
| ConocoPhillips | | | 4.0 | % | |
| Berkshire Hathaway, Inc. — Class A | | | 3.9 | % | |
| Philip Morris International, Inc. | | | 3.5 | % | |
| Devon Energy Corp. | | | 3.3 | % | |
| Occidental Petroleum Corp. | | | 2.8 | % | |
| Bank of New York Mellon Corp. | | | 2.7 | % | |
| EOG Resources, Inc. | | | 2.6 | % | |
* Excludes short-term investments related to commercial paper.
Portfolio holdings are subject to change daily.
Portfolio holdings and characteristics are subject to change and may not be representative of current holdings and characteristics. The outlook for this Portfolio may differ from that presented for other ING Funds. Performance for the different classes of shares will vary based on differences in fees associated with each class.
14
PORTFOLIO MANAGERS' REPORT
ING DAVIS NEW YORK VENTURE PORTFOLIO
| Average Annual Total Returns for the Periods Ended December 31, 2008 | |
| | | 1 Year | | 5 Year | | Since Inception
of Classes ADV, I and S
December 10, 2001 | |
| Class ADV | | | (39.35 | )% | | | (4.30 | )% | | | (2.19 | )% | |
| Class I | | | (39.06 | )% | | | (3.83 | )% | | | (1.71 | )% | |
| Class S | | | (39.22 | )% | | | (4.07 | )% | | | (1.96 | )% | |
| S&P 500® Index(1) | | | (37.00 | )% | | | (2.19 | )% | | | (1.39 | )%(2) | |
Based on a $10,000 initial investment, the graph and table above illustrate the total return of ING Davis New York Venture Portfolio against the index indicated. An index is unmanaged and has no cash in its portfolio, imposes no sales charges and incurs no operating expenses. An investor cannot invest directly in an index. The Portfolio's performance is shown without the imposition of any expenses or charges which are, or may be, imposed under your annuity contract. Total returns would have been lower if such expenses or charges were included.
The performance graph and table do not reflect the deduction of taxes that a shareholder will pay on portfolio distributions or the redemption of portfolio shares.
The performance shown may include the effect of fee waivers and/or expense reimbursements by the Investment Adviser and/or other service providers, which have the effect of increasing total return. Had all fees and expenses been considered, the total returns would have been lower.
The performance update illustrates performance for a variable investment option available through a variable annuity contract. The performance shown indicates past performance and is not a projection or prediction of future results. Actual investment returns and principal value will fluctuate so that shares and/or units, at redemption, may be worth more or less than their original cost. Please call (800) 262-3862 to get performance through the most recent month end.
This report contains statements that may be "forward-looking" statements. Actual results may differ materially from those projected in the "forward-looking" statements.
The views expressed in this report reflect those of the portfolio manager only through the end of the period as stated on the cover. The portfolio manager's views are subject to change at any time based on marked and other conditions.
Portfolio holdings are subject to change daily.
(1) The S&P 500® Index is an unmanaged index that measures the performance of the securities of approximately 500 of the largest companies in the U.S.
(2) Since inception performance of the index is shown as of December 1, 2001.
Prior to October 31, 2005, the Portfolio was sub-advised by Salomon Brothers Asset Management Inc. Effective October 31, 2005, the Portfolio's principal investment strategies and name changed.
15
ING JPMORGAN MID CAP VALUE PORTFOLIO
PORTFOLIO MANAGERS' REPORT
ING JPMorgan Mid Cap Value Fund (the "Portfolio") seeks growth from capital appreciation. The Portfolio is managed by Jonathan K.L. Simon, Lawrence Playford and Gloria Fu, Portfolio Managers of J.P. Morgan Investment Management Inc. — the Sub-Adviser.
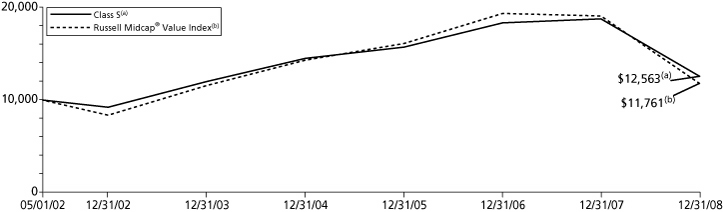
Performance: For the year ended December 31, 2008, the Portfolio's Class S shares provided a total return of (33.04)% compared to the Russell Midcap® Value Index(1), which returned (38.44)% for the same period.
Portfolio Specifics: The Portfolio outperformed its benchmark, the Russell Midcap® Value Index due primarily to stock selection in the consumer discretionary and financial sectors, while stock selection in healthcare and energy detracted from results.
A top contributor to performance was Public Storage Inc., ("Public Storage") a real estate investment trust ("REIT") that acquires, develops, owns and operates self-storage facilities in the U.S. and Europe. The company reported better-than-expected rental revenue, combined with an unexpected decline in operating expenses and continued currency gains, which resulted in double-digit growth in net operating income year over year. The company also benefited from increased demand for storage space due to the unfortunate increase in foreclosure activity. Public Storage continued to generate strong cash flow, allowing management to pursue strategic options designed to enhance shareholder value.
AutoZone, Inc., the largest U.S. auto parts retail chain, also was a top contributor to performance, as the company's earnings remained resilient throughout the year, despite a steep downturn in U.S. auto sales. The company reported consecutive quarters of better-than-expected earnings aided by improved profit margins and sales to the commercial sector. In addition, the company also expanded the number of its stores during the year to capitalize on increasing demand for replacement parts as car owners tried to extend the life of existing cars in this uncertain economic environment.
Alternatively, Coventry Health Care, Inc., the sixth-largest U.S. health insurer by market value, detracted from results throughout the year following profit warnings and a dampened 2008 outlook from major competitors. These announcements sparked a broad sell-off in the managed healthcare sector and fears of a downturn in business fundamentals for the industry. The company would later reduce its 2008 outlook, prompted by higher medical cost trends in its Medicare and commercial risk businesses as well as lower revenue growth expectations. While we believe that the company can pass through a large portion of its higher costs to members, we believe the environment will remain challenged.
Shares of Williams Cos., Inc., a natural gas producer and pipeline company, declined partly in sympathy with the sector due to the sharp drop in energy prices. Further impacting the stock was weaker-than-expected midstream results from disruptions caused by Gulf Coast storms. We believe that the company remains attractive, as the pipeline business provides reliable cash flows while the exploration and production segments continue to increase its reserve base. During the latest earnings release, the company announced that it is exploring options designed to enhanced shareholder value, which has helped to reduce the stock's volatility.
Current Strategy and Outlook: We employ a bottom-up approach to stock selection, constructing the Portfolio based on company fundamentals, quantitative screening and proprietary fundamental analysis. Our aim is to identify undervalued companies that have the potential to increase their intrinsic values per share and to purchase these companies at a discount.
Top Ten Holdings*
as of December 31, 2008
(as a percent of net assets)
| Old Republic International Corp. | | | 2.7 | % | |
| American Electric Power Co., Inc. | | | 2.5 | % | |
| Safeway, Inc. | | | 2.3 | % | |
| Cincinnati Financial Corp. | | | 2.1 | % | |
| Assurant, Inc. | | | 2.0 | % | |
| Ball Corp. | | | 1.8 | % | |
| Fortune Brands, Inc. | | | 1.8 | % | |
| Republic Services, Inc. | | | 1.8 | % | |
| Pacific Gas & Electric Co. | | | 1.8 | % | |
| Energen Corp. | | | 1.8 | % | |
* Excludes short-term investments related to ING Institutional Prime Money Market Fund — Class I and securities lending collateral.
Portfolio holdings are subject to change daily.
Portfolio holdings and characteristics are subject to change and may not be representative of current holdings and characteristics. The outlook for this Portfolio may differ from that presented for other ING Funds. Performance for the different classes of shares will vary based on differences in fees associated with each class.
16
PORTFOLIO MANAGERS' REPORT
ING JPMORGAN MID CAP VALUE PORTFOLIO
| Average Annual Total Returns for the Periods Ended December 31, 2008 | |
| | | 1 Year | | 5 Year | | Since Inception
of Classes ADV, I and S
May 1, 2002 | |
| Class ADV | | | (33.17 | )% | | | 0.62 | % | | | 3.22 | % | |
| Class I | | | (32.86 | )% | | | 1.13 | % | | | 3.74 | % | |
| Class S | | | (33.04 | )% | | | 0.88 | % | | | 3.48 | % | |
| Russell Midcap® Value Index(1) | | | (38.44 | )% | | | 0.33 | % | | | 2.46 | % | |
Based on a $10,000 initial investment, the graph and table above illustrate the total return of ING JPMorgan Mid Cap Value Portfolio against the index indicated. An index is unmanaged and has no cash in its portfolio, imposes no sales charges and incurs no operating expenses. An investor cannot invest directly in an index. The Portfolio's performance is shown without the imposition of any expenses or charges which are, or may be, imposed under your annuity contract. Total returns would have been lower if such expenses or charges were included.
The performance graph and table do not reflect the deduction of taxes that a shareholder will pay on portfolio distributions or the redemption of portfolio shares.
The performance shown may include the effect of fee waivers and/or expense reimbursements by the Investment Adviser and/or other service providers, which have the effect of increasing total return. Had all fees and expenses been considered, the total returns would have been lower.
The performance update illustrates performance for a variable investment option available through a variable annuity contract. The performance shown indicates past performance and is not a projection or prediction of future results. Actual investment returns and principal value will fluctuate so that shares and/or units, at redemption, may be worth more or less than their original cost. Please call (800) 262-3862 to get performance through the most recent month end.
This report contains statements that may be "forward-looking" statements. Actual results may differ materially from those projected in the "forward-looking" statements.
The views expressed in this report reflect those of the portfolio manager only through the end of the period as stated on the cover. The portfolio manager's views are subject to change at any time based on marked and other conditions.
Portfolio holdings are subject to change daily.
(1) The Russell Midcap® Value Index measures the performance of those Russell Midcap companies with lower price-to-book ratios and lower forecasted growth values.
17
ING LEGG MASON PARTNERS AGGRESSIVE GROWTH PORTFOLIO
PORTFOLIO MANAGERS' REPORT
ING Legg Mason Partners Aggressive Growth Portfolio (the "Portfolio") seeks long-term growth of capital. The Portfolio is managed by Richard Freeman, Managing Director, Senior Portfolio Manager and Evan Bauman, Managing Director, Portfolio Manager, of ClearBridge Advisors, LLC — the Sub-Adviser.
Performance: For the year ended December 31, 2008, the Portfolio's Class I shares provided a total return of (39.21)% compared to the Russell 3000® Growth Index(1) and the Standard & Poor's 500® Composite Stock Price Index(2) ("S&P 500® Index"), which returned (38.44)% and (37.00)%, respectively, for the same period.
Portfolio Specifics: In 2008, the S&P 500® Index decreased the most since 1937, while the Dow Jones Industrial Average dropped 34% for its worst year since 1931. Not only was the decline sharp, but it was extraordinarily broad based, with every sector in the S&P 500® Index down over 15% and more than half of the sectors down over 30% (financials reported the biggest decline, losing 55%). The decline was certainly not limited to the United States as exactly 1 global market out of 69 in the MSCI Indexes rose in 2008 (Tunisia), with 28 national benchmarks losing more than half of their value.
For the year 2008, overall sector allocation made a positive contribution to the Portfolio's relative performance, while overall stock selection detracted from relative performance. Overweight positions in the healthcare and consumer discretionary sectors and an underweight position in the information technology sector helped relative performance. The Portfolio had no significant holdings in the materials or utilities sectors, which also helped performance. An overweight position in the Energy sector detracted from relative performance. The Portfolio had no significant holdings in the consumer staples sector, which also hurt performance during the year.
Stock selection in the healthcare and industrials sectors made positive contributions to Portfolio performance, while stock selection in the financials, information technology, energy and consumer discretionary sectors detracted from performance. Leading individual contributors to Portfolio performance included ImClone Systems, Inc., Amgen, Inc., Valeant Pharmaceuticals International, Millennium Pharmaceuticals, Inc. and Vertex Pharmaceuticals, Inc., all in the healthcare sector. Leading individual detractors from performance included Weatherford International Ltd. and Anadarko Petroleum Corp. in the energy sector, Lehman Brothers Holdings, Inc. and Merrill Lynch & Co., Inc. in the financials sector, and Unitedhealth Group, Inc. in the healthcare sector.
Current Strategy and Outlook: As a forward-looking, discounting mechanism, the equity market tends to discount a recovery many months before the data show improvement. Most importantly, as bottom-up/stock pickers, it will be the success of companies in which we invest to grow their businesses that will drive our results. As we review the holdings within the Portfolio, we feel the risk/reward profile has rarely, if ever, been better. Across industries, we strive to find companies that have the balance sheet strength and defendable business models to grow even during economic weakness and thrive as economies recover. In our view, our biotechnology companies are good examples of this as they use their strong cash and cash flow to develop innovative ways to treat unmet medical needs. We believe the same holds for our energy holdings, currently at historically l ow valuation levels with the ability to grow as they drill in more regions around the world using innovative methods of removing the oil/gas from the ground.
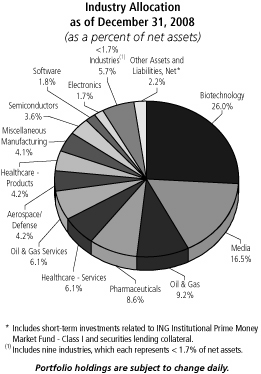
Top Ten Holdings
as of December 31, 2008
(as a percent of net assets)
| Anadarko Petroleum Corp. | | | 9.2 | % | |
| Genzyme Corp. | | | 9.1 | % | |
| Biogen Idec, Inc. | | | 8.0 | % | |
| Amgen, Inc. | | | 7.8 | % | |
| UnitedHealth Group, Inc. | | | 6.1 | % | |
| Forest Laboratories, Inc. | | | 6.1 | % | |
| Comcast Corp. — Special Class A | | | 6.0 | % | |
| Weatherford International Ltd. | | | 4.4 | % | |
| L-3 Communications Holdings, Inc. | | | 4.2 | % | |
| Cablevision Systems Corp. | | | 3.8 | % | |
Portfolio holdings are subject to change daily.
Portfolio holdings and characteristics are subject to change and may not be representative of current holdings and characteristics. The outlook for this Portfolio may differ from that presented for other ING Funds. Performance for the different classes of shares will vary based on differences in fees associated with each class.
18
PORTFOLIO MANAGERS' REPORT
ING LEGG MASON PARTNERS AGGRESSIVE GROWTH PORTFOLIO
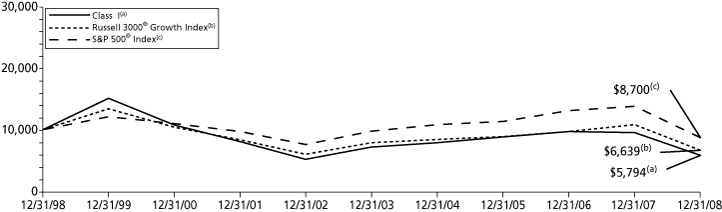
| Average Annual Total Returns for the Periods Ended December 31, 2008 | |
| | | 1 Year | | 5 Year | | 10 Year | | Since Inception
of Classes ADV and S
December 10, 2001 | |
| Class ADV | | | (39.48 | )% | | | (4.67 | )% | | | — | | | | (5.11 | )% | |
| Class I | | | (39.21 | )% | | | (4.20 | )% | | | (5.30 | )% | | | — | | |
| Class S | | | (39.34 | )% | | | (4.44 | )% | | | — | | | | (4.88 | )% | |
| Russell 3000® Growth Index(1) | | | (38.44 | )% | | | (3.33 | )% | | | (4.01 | )% | | | (3.15 | )%(3) | |
| S&P 500® Index(2) | | | (37.00 | )% | | | (2.19 | )% | | | (1.38 | )% | | | (1.39 | )%(3) | |
Based on a $10,000 initial investment, the graph and table above illustrate the total return of ING Legg Mason Partners Aggressive Growth Portfolio against the indices indicated. An index is unmanaged and has no cash in its portfolio, imposes no sales charges and incurs no operating expenses. An investor cannot invest directly in an index. The Portfolio's performance is shown without the imposition of any expenses or charges which are, or may be, imposed under your annuity contract. Total returns would have been lower if such expenses or charges were included.
The performance graph and table do not reflect the deduction of taxes that a shareholder will pay on portfolio distributions or the redemption of portfolio shares.
The performance shown may include the effect of fee waivers and/or expense reimbursements by the Investment Adviser and/or other service providers, which have the effect of increasing total return. Had all fees and expenses been considered, the total returns would have been lower.
The performance update illustrates performance for a variable investment option available through a variable annuity contract. The performance shown indicates past performance and is not a projection or prediction of future results. Actual investment returns and principal value will fluctuate so that shares and/or units, at redemption, may be worth more or less than their original cost. Please call (800) 262-3862 to get performance through the most recent month end.
This report contains statements that may be "forward-looking" statements. Actual results may differ materially from those projected in the "forward-looking" statements.
The views expressed in this report reflect those of the portfolio manager only through the end of the period as stated on the cover. The portfolio manager's views are subject to change at any time based on marked and other conditions.
Portfolio holdings are subject to change daily.
(1) The Russell 3000® Growth Index measures the performance of the 3000 largest U.S. companies based on total market capitalization, which represent approximately 98% of the U.S. equity market.
(2) The S&P 500® Index is an unmanaged index that measures the performance of the securities of approximately 500 of the largest companies in the U.S.
(3) Since inception performance for the indices is shown from December 1, 2001.
Prior to December 16, 2002, the Portfolio was managed by Massachusetts Financial Services Company. Effective December 16, 2002, the Portfolio's name changed.
19
ING NEUBERGER BERMAN PARTNERS PORTFOLIO
PORTFOLIO MANAGERS' REPORT
ING Neuberger Berman Partners Portfolio (the "Portfolio") seeks capital growth. The Portfolio is managed by S. Basu Mullick, Vice President and Portfolio Manager of Neuberger Berman Management Inc. — the Sub-Adviser.
Performance: For the year ended December 31, 2008, the Portfolio's Class S shares provided a total return of (51.29)% compared to the Standard & Poor's 500® Composite Stock Price Index(1) ("S&P 500® Index"), which returned (37.00)% for the same period.
Portfolio Specifics: Despite a negative return, the Portfolio outperformed the S&P 500® Index benchmark in the first half of 2008. In the second half of 2008, economic and market conditions deteriorated even further as the collapse of Bear Stearns and Lehman Brothers and the ensuing credit crisis turned a smoldering U.S. recession into a serious global economic slowdown. Forced liquidation by highly leveraged hedge funds faced with margin calls and broad based selling by mutual funds to meet rising redemptions further undermined stocks. Due primarily to lagging performance in the energy, materials, and industrials sectors, the Portfolio finished 2008 trailing the S&P 500® Index. Underweights and poor stock selection in healthcare and consumer staples also detracted from relative performance.
The Portfolio was overweight energy and our holdings, primarily oil oriented exploration and production companies and oil services firms, declined sharply as energy prices collapsed in the fourth quarter. Our modest exposure to the major integrated oils, which held up much better as energy prices plummeted also penalized relative returns. Materials sector investments, primarily metals and mining stocks, also under-performed as materials prices cratered in anticipation of the global economic slowdown. Our industrials sector investments were concentrated in secular growth businesses, most notably energy infrastructure. With falling energy prices and constrained infrastructure spending threatening to delay projects, these holdings were hit particularly hard.
We remain constructive on energy because we still believe that over the longer term, demand will outpace supply growth that is constrained by the relatively high decline rates of existing wells, the lack of major new discoveries, the rising cost of exploration and production, and ongoing political instability in major energy producing nations. We make a similar case for materials sector holdings. While demand in emerging market economies (the real underpinning of global materials demand) has slowed temporarily, we believe government stimulus packages and essential infrastructure spending will eventually result in a substantial increase in materials prices from currently depressed levels. Over the intermediate term, the building of refineries, pipelines, liquefied natural gas processing facilities, and power generation plants may temporarily be put on hold. However, when the global economy regains traction, the well positioned portfolio compa nies in these businesses should quickly regain earnings momentum, especially those with a significant percentage of revenue coming from developing nations.
Information technology was our only significant relative performance bright spot. The Portfolio was underweight the sector, and holdings in the sector declined approximately half as much as the corresponding benchmark sector.
Current Strategy and Outlook: It is difficult to predict precisely when the U.S. and global economies will begin to stabilize. However, we note that the November rescue of Citigroup, along with the U.S. Department of the Treasury and the Federal Reserve Board's moves to lower interest rates, promote inter-bank lending and narrow credit spreads is beginning to have a positive impact on the credit markets. Also, in our opinion, we have yet to receive the full benefit of much cheaper energy prices, the equivalent of a major tax break for consumers. Finally, we believe a substantial fiscal stimulus package will be put into effect shortly after President Elect Obama takes office.
While there will certainly be more negative economic headlines, we believe the stage is set for the U.S. and global economies to emerge from recession in the second half of 2009. Traditionally, the stock market has begun anticipating better economic news six to nine months ahead of its arrival. With high quality stocks in most market sectors trading at historically low valuations, we think equities may be poised to begin regaining lost ground in the quarters ahead.
With unprecedented fundamental bargains abounding in the severely depressed energy, materials, and industrials sectors, we feel the Portfolio is well positioned to benefit when the stock market regains traction.

Top Ten Holdings
as of December 31, 2008
(as a percent of net assets)
| Berkshire Hathaway, Inc. — Class B | | | 3.2 | % | |
| Shire PLC ADR | | | 2.5 | % | |
| Invesco Ltd. | | | 2.3 | % | |
| Aetna, Inc. | | | 2.3 | % | |
| China Mobile Ltd. ADR | | | 2.3 | % | |
| Petroleo Brasileiro SA ADR | | | 2.3 | % | |
| Energizer Holdings, Inc. | | | 2.2 | % | |
| Moody's Corp. | | | 2.2 | % | |
| Canadian Natural Resources Ltd. | | | 2.2 | % | |
| Constellation Brands, Inc. | | | 2.2 | % | |
Portfolio holdings are subject to change daily.
Portfolio holdings and characteristics are subject to change and may not be representative of current holdings and characteristics. The outlook for this Portfolio may differ from that presented for other ING Funds. Performance for the different classes of shares will vary based on differences in fees associated with each class.
20
PORTFOLIO MANAGERS' REPORT
ING NEUBERGER BERMAN PARTNERS PORTFOLIO

| Average Annual Total Returns for the Periods Ended December 31, 2008 | |
| | | 1 Year | | Since Inception
of Class ADV
December 29, 2006 | | Since Inception
of Class I
January 19, 2006 | | Since Inception
of Class S
January 3, 2006 | |
| Class ADV | | | (51.52 | )% | | | (27.41 | )% | | | — | | | | — | | |
| Class I | | | (51.12 | )% | | | — | | | | (17.34 | )% | | | — | | |
| Class S | | | (51.29 | )% | | | — | | | | — | | | | (16.79 | )% | |
| S&P 500® Index(1) | | | (37.00 | )% | | | (18.47 | )%(2) | | | (9.40 | )%(3) | | | (8.36 | )%(4) | |
Based on a $10,000 initial investment, the graph and table above illustrate the total return of ING Neuberger Berman Partners Portfolio against the index indicated. An index is unmanaged and has no cash in its portfolio, imposes no sales charges and incurs no operating expenses. An investor cannot invest directly in an index. The Portfolio's performance is shown without the imposition of any expenses or charges which are, or may be, imposed under your annuity contract. Total returns would have been lower if such expenses or charges were included.
The performance graph and table do not reflect the deduction of taxes that a shareholder will pay on portfolio distributions or the redemption of portfolio shares.
The performance shown may include the effect of fee waivers and/or expense reimbursements by the Investment Advisor and/or other service providers, which have the effect of increasing total return. Had all fees and expenses been considered, the total returns would have been lower.
The performance update illustrates performance for a variable investment option available through a variable annuity contract. The performance shown indicates past performance and is not a projection or prediction of future results. Actual investment returns and principal value will fluctuate so that shares and/or units, at redemption, may be worth more or less than their original cost. Please call (800) 262-3862 to get performance through the most recent month end.
This report contains statements that may be "forward-looking" statements. Actual results may differ materially from those projected in the "forward-looking" statements.
The views expressed in this report reflect those of the portfolio manager only through the end of the period as stated on the cover. The portfolio manager's views are subject to change at any time based on marked and other conditions.
Portfolio holdings are subject to change daily.
(1) The S&P 500® Index is an unmanaged index that measures the performance of the securities of approximately 500 of the largest companies in the U.S.
(2) Since inception performance of the index is shown from January 1, 2007.
(3) Since inception performance of the index is shown from February 1, 2006.
(4) Since inception performance of the index is shown from January 1, 2006.
21
ING OPPENHEIMER GLOBAL PORTFOLIO
PORTFOLIO MANAGERS' REPORT
ING Oppenheimer Global Portfolio (the "Portfolio") seeks capital appreciation. The Portfolio is managed by Rajeev Bhaman, Senior Vice President of OppenheimerFunds, Inc. — the Sub-Adviser.
Performance: For the year ended December 31, 2008, the Portfolio's Class S shares provided a total return of (40.55)% compared to the MSCI World IndexSM(1) and the MSCI All Country World IndexSM(2), which returned (40.71)% and (42.19)%, respectively, for the same period.
Portfolio Specifics: The fall out in the sub-prime lending markets cascaded into the broader financial markets, negatively impacting many financial firms around the world. Widespread aversion to risk permeated the markets triggering significant declines, as growing uncertainty in the credit markets depressed investors' confidence across almost every asset dependent on an expected cash flow. Due to this panic, most companies, regardless of their financial stability, saw declines in their stock prices. This has resulted in anomalous behavior in a variety of stocks as weak outperform strong.
Our strategy during the reporting period resulted in materials and financials being the most underweighted sectors, decisions that contributed to relative performance. We underweighted materials because we viewed commodity prices to be unjustifiably inflated. We believed that that double-digit growth rates in industrial production and infrastructure development of commodities was either unsustainable in large emerging markets or would not continue to offset slowdowns in the developed world.
As for financials, the rationale behind our underweight was the belief that the extreme leverage in financial institutions during a period of high stock prices was a recipe for disaster, the risk of which was not well priced into the market.
In information technology we continue to find opportunity and therefore have an overweight in the sector. The information technology companies we choose to invest in have sustainable business models where demand for their products or services become integral to their customers, where the cost of switching is high and the value added to the customer is many times the cost of the product or service.
From a sector perspective, underweights in energy and utilities, and stock selection in consumer discretionary, contributed to the Portfolio's underperformance. While we will not mention all of the year's detracting stocks, it is important to mention Telefonaktiebolaget LM Ericsson ("Ericsson"), our largest holding. Ericsson is the world's leading vendor of mobile telecommunications networks. It enjoys leading market shares in both second and third generation networks and is in an excellent position to be a leader in the fourth generation as well. With the internet going mobile worldwide, the capacity required in these networks is growing manifold and we believe will continue to do so regardless of the rate of economic growth since it has become integral to today's lifestyle. As the market leader with a market share of about 40%, we believe Ericsson is well positioned to take advantage of this rapid growth.
Other holdings which hindered performance during the reporting period included American International Group, Inc. ("AIG"), Technip SA and Credit Suisse Group AG. On the flip side, of our larger holdings, notable successes included Wal-Mart Stores, Inc., Gilead Sciences, Inc., and Intuit, Inc.
Current Strategy and Outlook: The Portfolio continues to be diversified across a number of geographies. Currently, just over one-third of the Portfolio is invested in the U.S., a country that we believe remains the largest and most innovative economy in the world, with stocks priced reasonably. Our second largest geographic weight was Japan, a country whose economy is expansive. Many Japanese companies are reputable and have long track records of significant innovations. Likewise, the Portfolio is invested in the U.K. for the same reasons — we believe it is one of the world's most open economies and offers extremely high quality companies. Other large markets that the Portfolio had exposure to at period end were the U.K., Sweden, Germany, and France. While we tend to find more of these high margin businesses in advanced economies rather than in develop ing economies, we are expecting to increase our position in emerging market companies in the upcoming year as their prices are finally coming into an attractive zone.
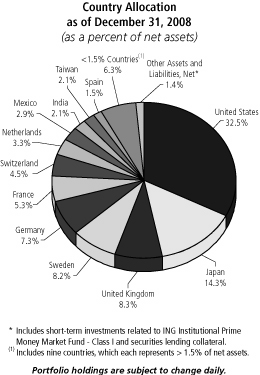
Top Ten Holdings*
as of December 31, 2008
(as a percent of net assets)
| Telefonaktiebolaget LM Ericsson | | | 3.9 | % | |
| Roche Holding AG | | | 2.9 | % | |
| Siemens AG | | | 2.6 | % | |
| KDDI Corp. | | | 2.0 | % | |
| Juniper Networks, Inc. | | | 1.9 | % | |
| Wal-Mart Stores, Inc. | | | 1.8 | % | |
| Hennes & Mauritz AB | | | 1.8 | % | |
| SAP AG | | | 1.8 | % | |
| LVMH Moet Hennessy Louis Vuitton SA | | | 1.7 | % | |
| Microsoft Corp. | | | 1.7 | % | |
* Excludes short-term investments related to securities lending collateral.
Portfolio holdings are subject to change daily.
Portfolio holdings and characteristics are subject to change and may not be representative of current holdings and characteristics. The outlook for this Portfolio may differ from that presented for other ING Funds. Performance for the different classes of shares will vary based on differences in fees associated with each class.
22
PORTFOLIO MANAGERS' REPORT
ING OPPENHEIMER GLOBAL PORTFOLIO
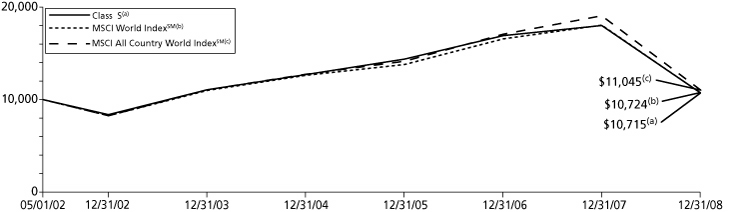
| Average Annual Total Returns for the Periods Ended December 31, 2008 | |
| | | 1 Year | | 5 Year | | Since Inception
of Classes ADV, I and S
May 1, 2002 | |
| Class ADV | | | (40.65 | )% | | | (0.85 | )% | | | 0.82 | % | |
| Class I | | | (40.38 | )% | | | (0.37 | )% | | | 1.47 | % | |
| Class S | | | (40.55 | )% | | | (0.63 | )% | | | 1.04 | % | |
| MSCI World IndexSM(1) | | | (40.71 | )% | | | (0.51 | )% | | | 1.06 | % | |
| MSCI All Country World IndexSM(2) | | | (42.19 | )% | | | (0.06 | )% | | | 1.50 | % | |
Based on a $10,000 initial investment, the graph and table above illustrate the total return of ING Oppenheimer Global Portfolio against the indices indicated. An index is unmanaged and has no cash in its portfolio, imposes no sales charges and incurs no operating expenses. An investor cannot invest directly in an index. The Portfolio's performance is shown without the imposition of any expenses or charges which are, or may be, imposed under your annuity contract. Total returns would have been lower if such expenses or charges were included.
The performance graph and table do not reflect the deduction of taxes that a shareholder will pay on portfolio distributions or the redemption of portfolio shares.
The performance shown may include the effect of fee waivers and/or expense reimbursements by the Investment Adviser and/or other service providers, which have the effect of increasing total return. Had all fees and expenses been considered, the total returns would have been lower.
The performance update illustrates performance for a variable investment option available through a variable annuity contract. The performance shown indicates past performance and is not a projection or prediction of future results. Actual investment returns and principal value will fluctuate so that shares and/or units, at redemption, may be worth more or less than their original cost. Please call (800) 262-3862 to get performance through the most recent month end.
This report contains statements that may be "forward-looking" statements. Actual results may differ materially from those projected in the "forward-looking" statements.
The views expressed in this report reflect those of the portfolio manager only through the end of the period as stated on the cover. The portfolio manager's views are subject to change at any time based on marked and other conditions.
Portfolio holdings are subject to change daily.
(1) The MSCI World IndexSM is an unmanaged index that measures the performance of over 1,400 securities listed on exchanges in the U.S., Europe, Canada, Australia, New Zealand and the Far East.
(2) The MSCI All Country World IndexSM is a broad-based unmanaged index comprised of equity securities in countries around the world, including the United States, other developed countries and emerging markets.
Prior to November 8, 2004, the Portfolio was sub-advised by Massachusetts Financial Services Company. Effective November 8, 2004, the Portfolio's principal investment strategies and name changed.
23
ING OPPENHEIMER STRATEGIC INCOME PORTFOLIO
PORTFOLIO MANAGERS' REPORT
ING Oppenheimer Strategic Income Portfolio (the "Portfolio") seeks a high level of current income principally derived from interest on debt securities. The Portfolio is managed by Arthur P. Steinmetz, Vice President and Senior Portfolio Manager of OppenheimerFunds, Inc. — the Sub-Adviser.
Performance: For the year ended December 31, 2008, the Portfolio's Class S shares provided a total return of (16.10)% compared to the Barclays Capital U.S. Aggregate Bond Index*(1) and the S&P/Citigroup World Government Bond Index(2), which returned 5.24% and 10.89%, respectively, for the same period.
Portfolio Specifics: The Portfolio's results lagged that of its benchmark's, primarily due to its relatively heavy allocation to emerging-market currencies and its security selection strategy among high-yield corporate bonds.
Like most other asset classes international bonds, many foreign currencies, and U.S. high yield corporate securities declined substantially when a U.S. credit crunch developed into a full-blow global financial crisis over the summer of 2008. The fall out in the sub-prime lending markets cascaded into the broader financial markets, as uncertainty surrounding the sub-prime debacle made investors risk-averse. This waning confidence spread to other areas of the fixed-income markets, diminishing the value of financial instruments and forcing their holders, primarily highly leveraged banks and institutional investors, to write down or write off a significant portion of their value. In swallowing these losses, several major commercial banks, investment banks, mortgage agencies and insurers became insolvent.
These dramatic developments sparked a "flight to quality" among investors who sold riskier assets in favor of the sovereign debt of developed nations, particularly U.S. Treasury securities. Selling pressure appeared to be indiscriminate as investors rushed for the exits, punishing fundamentally sound investments along with less creditworthy ones. The flight to quality was particularly damaging for securities issued by developing nations, which have been historically volatile. Currencies of emerging markets also suffered as investors flocked toward the traditional safe haven of the U.S. dollar.
The Portfolio proved to be vulnerable to the credit and economic crises due to its longstanding emphasis on currencies from emerging markets, such as Brazil, Mexico, Turkey and Russia. In fact, because we believed that real interest rates in these markets were attractive relative to other nations and their central banks had room to reduce short-term rates, we increased the Portfolio's exposure to the emerging markets in the spring of 2008. However, the timing of this move proved to be unfortunate when the financial crisis intensified over the summer. Some of the markets that previously had been most supportive of the Portfolio's returns, such as Brazil and Russia, became some of the harder hit areas during ensuing market turbulence. On the other hand, Mexico's debt and currency held up relatively well due to its proactive monetary policy, and Turkey benefited from lower oil prices as commodity prices moderated over the second half of the yea r. In the summer, we attempted to manage risks more effectively by shifting some assets from the emerging markets to European bonds and the Japanese yen, which fared relatively well.
An overweight position in commercial mortgage-backed securities proved especially detrimental when these securities declined sharply in the fall amid economic concerns. The Portfolio's performance also was hindered by an underweight position in U.S. government securities.
Current Strategy and Outlook: As of year-end, we have maintained the Portfolio's underweight exposure to high yield bonds and a corresponding emphasis on international bonds and currencies, especially those in emerging markets, where we believe local interest rates have plenty of room to fall. Indeed, we have found a number of opportunities where, in our analysis, currencies have been punished too severely given relatively sound economic fundamentals. Similar value-oriented opportunities appear to be available in the U.S. high yield bond market, where default rates have remained below historical averages. On the other hand, U.S. Treasury securities seem overvalued to us and offer meager opportunities for income.
While we expect economic weakness and volatility in global credit markets to persist, we believe the worst of the downturn's impact on financial assets is probably behind us. Therefore, we have maintained an investment posture designed to earn high levels of current income and participate as fully as we deem prudent in an eventual market rebound. In our view, remaining disciplined and keeping an eye on potential opportunities is key to prudent investing.
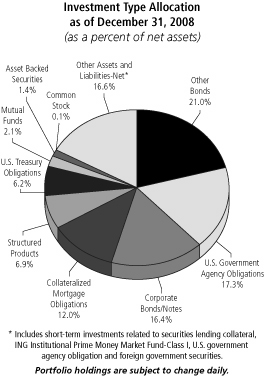
Top Ten Holdings*
as of December 31, 2008
(as a percent of net assets)
Treasury Inflation Protected Security,
0.625%, due 04/15/13 | | 6.0% | |
| Oppenheimer Master Loan Fund | | 2.1% | |
Federal National Mortgage Association,
5.000%, due 01/12/36 | | 1.6% | |
Japan Government 5-Year Bond,
1.500%, due 06/20/13 | | 1.5% | |
Japan Government 2-Year Bond,
0.900%, due 06/15/10 | | 1.3% | |
Bundesrepublik Deutschland,
3.750%, due 07/04/13 | | 1.1% | |
Federal National Mortgage Association,
5.500%, due 01/01/33 | | 0.9% | |
Federal National Mortgage Association,
5.500%, due 02/01/33 | | 0.8% | |
Turkey Government International Bond,
16.000%, due 03/07/12 | | 0.8% | |
Bundesrepublik Deutschland,
4.000%, due 01/04/37 | | 0.8% | |
* Excludes short-term investments related to ING Institutional Prime Money Market Fund — Class I, securities lending collateral and U.S. government agency obligation.
Portfolio holdings are subject to change daily.
* Formerly known as the Lehman Brothers U.S. Aggregate Bond Index. As of October 31, 2008, all Lehman Brothers indices were renamed: the words "Lehman Brothers" changed to "Barclays Capital."
Portfolio holdings and characteristics are subject to change and may not be representative of current holdings and characteristics. The outlook for this Portfolio may differ from that presented for other ING Funds. Performance for the different classes of shares will vary based on differences in fees associated with each class.
24
PORTFOLIO MANAGERS' REPORT
ING OPPENHEIMER STRATEGIC INCOME PORTFOLIO
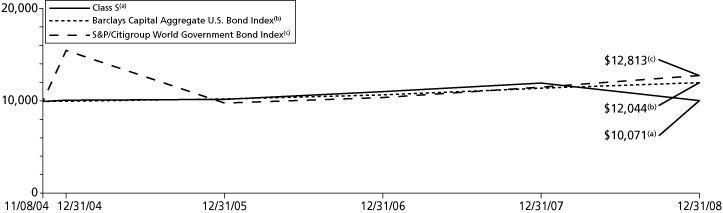
| Average Annual Total Returns for the Periods Ended December 31, 2008 | |
| | | 1 Year | | Since Inception
of Classes ADV, I and S
November 8, 2004 | |
| Class ADV | | | (16.38 | )% | | | (0.10 | )% | |
| Class I | | | (15.89 | )% | | | 0.40 | % | |
| Class S | | | (16.10 | )% | | | 0.17 | % | |
| Barclays Capital Aggregate U.S. Bond Index(1) | | | 5.24 | % | | | 4.57 | %(3) | |
| S&P/Citigroup World Government Bond Index(2) | | | 10.89 | % | | | 6.13 | %(3) | |
Based on a $10,000 initial investment, the graph and table above illustrate the total return of ING Oppenheimer Strategic Income Portfolio against the indices indicated. An index is unmanaged and has no cash in its portfolio, imposes no sales charges and incurs no operating expenses. An investor cannot invest directly in an index. The Portfolio's performance is shown without the imposition of any expenses or charges which are, or may be, imposed under your annuity contract. Total returns would have been lower if such expenses or charges were included.
The performance graph and table do not reflect the deduction of taxes that a shareholder will pay on portfolio distributions or the redemption of portfolio shares.
The performance shown may include the effect of fee waivers and/or expense reimbursements by the Investment Adviser and/or other service providers, which have the effect of increasing total return. Had all fees and expenses been considered, the total returns would have been lower.
The performance update illustrates performance for a variable investment option available through a variable annuity contract. The performance shown indicates past performance and is not a projection or prediction of future results. Actual investment returns and principal value will fluctuate so that shares and/or units, at redemption, may be worth more or less than their original cost. Please call (800) 262-3862 to get performance through the most recent month end.
This report contains statements that may be "forward-looking" statements. Actual results may differ materially from those projected in the "forward-looking" statements.
The views expressed in this report reflect those of the portfolio manager only through the end of the period as stated on the cover. The portfolio manager's views are subject to change at any time based on marked and other conditions.
Portfolio holdings are subject to change daily.
(1) The Barclays Capital Aggregate U.S. Bond Index in an unmanaged index of publicly issued investment grade U.S. Government, mortgage-backed, asset-backed and corporate debt securities.
(2) The S&P/Citigroup World Government Bond Index is an unmanaged index of bonds from 14 world government bond markets with maturities of at least one year.
(3) Since inception performance for the indices is shown from November 1, 2004.
25
ING PIMCO TOTAL RETURN PORTFOLIO
PORTFOLIO MANAGERS' REPORT
ING PIMCO Total Return Portfolio (the "Portfolio") seeks maximum total return, consistent with preservation of capital and prudent investment management. The Portfolio is managed by William H. Gross, CFA, Managing Director and Portfolio Manager, Pacific Investment Management Company LLC — the Sub-Adviser.
Performance: For year ended December 31, 2008, the Fund's Class S shares, excluding sales charges, provided a total return of (0.28)% compared to the Barclays Capital U.S. Aggregate Bond Index*(1), which returned 5.24% for the same period.
Portfolio Specifics: The Portfolio was positioned on the front end of yield curves in certain developed countries outside the U.S., such as the U.K., where we felt that the market had not fully priced in a slowdown. This paid off as markets began to price in rate cuts by global central banks.
In the U.S. and the U.K., the Portfolio was positioned for yield curve steepening which added to returns. Though we added to the Portfolio's corporate positioning, we stayed underweight throughout the year. As spreads ballooned, this was a source of outperformance.
As the financial system de-levered, large institutions sold their most liquid assets to raise cash; in many cases, their most liquid assets were agency mortgage-backed securities. An overweight to agency mortgage-backed securities detracted from returns as spreads on agency mortgages widened to well over 200 basis points (or 2.00%) over Treasuries. When Bear Stearns was taken over by JPMorgan with government assistance in March, we saw opportunities in banks under the umbrella of the federal government, banks that we felt were "too intertwined to fail." One of the financials, unfortunately, stood outside this umbrella; as a result, it was a significant detractor from portfolio performance. Our overweight to financials and security selection within that sector hurt performance as well. The swap spread curve inverted in August of last year. Since then, the inversion has grown larger, culminating in September with two-year swap spreads reaching near 160 basis points (or 1.60%) and 30-year swap spreads turning negative. We've been positioned since late last year for a re-steepening of the swap spread curve. In October of this year as LIBOR fell sharply, we began to see the positive effects of this trade where the portfolio is long the front-end of swap curves and short the back-end. In November, 30-year swap spreads dipped sharply negative, falling as low as negative 60 basis points (or 0.60%). This was one of the material detractors to portfolio performance.
Current Strategy and Outlook: In 2009, we believe pressures of global deleveraging will drive developed economies into one of the most severe recessions since World War II. We believe conditions should improve by 2010 as policy responses in the U.S. and elsewhere gain traction. Recovery of risk appetites in financial markets will be a leading indicator for recovery. As the global economy weakens into 2009, we will likely place less emphasis on interest rate strategies and more on high grade sectors/securities that offer unusually attractive valuations after the massive selling of the last several months. Our approach over the next year will likely be to avoid assets such as Treasuries that have benefitted from the flight to liquidity associated with global deleveraging. In our opinion, U.S. Treasuries are now overvalued. We might seek to own assets that hav e been victims of the economic crisis but that can be expected to benefit from policy support. These assets include high quality mortgage-backed securities, bonds of financial companies, treasury inflation protected securities ("TIPs") and municipal bonds. We will likely also shun assets that have been victims of the crisis but have no policy support, such as all but the highest quality emerging market bonds.
Investment Type Allocation
as of December 31, 2008
(as a percent of net assets)
| U.S. Government Agency Obligations | | | 115.4 | % | |
| Corporate Bonds/Notes | | | 35.9 | % | |
| Collateralized Mortgage Obligations | | | 9.2 | % | |
| U.S. Treasury Obligations | | | 8.7 | % | |
| Municipal Bonds | | | 2.2 | % | |
| Asset-Backed Securities | | | 2.0 | % | |
| Preferred Stock | | | 1.3 | % | |
| Positions In Purchased Options | | | 0.9 | % | |
| Other Bonds | | | 0.6 | % | |
| Other Assets and Liabilities — Net* | | | (76.2 | )% | |
| Net Assets | | | 100.0 | % | |
* Includes short-term investments related to securities lending collateral, U.S. government agency obligation and U.S. Treasury Bill.
Portfolio holdings are subject to change daily.
Top Ten Holdings*
as of December 31, 2008
(as a percent of net assets)
Federal National Mortgage Association,
6.000%, due 01/11/37 | | | 29.9 | % | |
Federal National Mortgage Association,
5.500%, due 01/12/36 | | | 29.7 | % | |
Federal Home Loan Mortgage Corporation,
5.000%, due 01/15/35 | | | 10.0 | % | |
Federal Home Loan Mortgage Corporation,
5.500%, due 08/01/38 | | | 6.4 | % | |
Federal National Mortgage Association,
5.000%, due 01/12/36 | | | 5.7 | % | |
| Wachovia Corp., 7.980%, due 02/08/49 | | | 3.9 | % | |
Federal National Mortgage Association,
5.000%, due 03/01/36 | | | 2.9 | % | |
Federal Home Loan Mortgage Corporation,
6.000%, due 12/01/37 | | | 2.6 | % | |
Treasury Inflation Protected Security,
2.375%, due 01/15/25 | | | 2.5 | % | |
Federal National Mortgage Association,
5.500%, due 07/01/36 | | | 2.2 | % | |
* Excludes short-term investments related to securities lending collateral.
Portfolio holdings are subject to change daily.
* Formerly known as the Lehman Brothers U.S. Aggregate Bond Index. As of October 31, 2008, all Lehman Brothers indices were renamed: the words "Lehman Brothers" changed to "Barclays Capital."
Portfolio holdings and characteristics are subject to change and may not be representative of current holdings and characteristics. The outlook for this Portfolio may differ from that presented for other ING Funds. Performance for the different classes of shares will vary based on differences in fees associated with each class.
26
PORTFOLIO MANAGERS' REPORT
ING PIMCO TOTAL RETURN PORTFOLIO
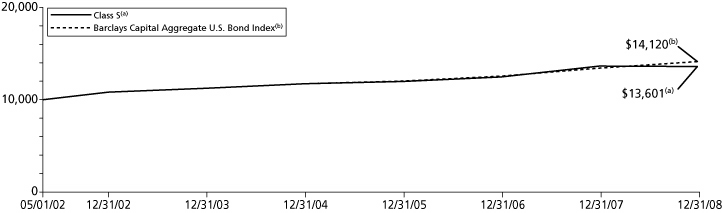
| Average Annual Total Returns for the Periods Ended December 31, 2008 | |
| | | 1 Year | | 5 Year | | Since Inception
of Classes ADV, I and S
May 1, 2002 | |
| Class ADV | | | (0.54 | )% | | | 3.60 | % | | | 4.45 | % | |
| Class I | | | (0.04 | )% | | | 4.13 | % | | | 4.98 | % | |
| Class S | | | (0.28 | )% | | | 3.87 | % | | | 4.72 | % | |
| Barclays Capital Aggregate U.S. Bond Index(1) | | | 5.24 | % | | | 4.65 | % | | | 5.31 | % | |
Based on a $10,000 initial investment, the graph and table above illustrate the total return of ING PIMCO Total Return Portfolio against the index indicated. An index is unmanaged and has no cash in its portfolio, imposes no sales charges and incurs no operating expenses. An investor cannot invest directly in an index. The Portfolio's performance is shown without the imposition of any expenses or charges which are, or may be, imposed under your annuity contract. Total returns would have been lower if such expenses or charges were included.
The performance graph and table do not reflect the deduction of taxes that a shareholder will pay on portfolio distributions or the redemption of portfolio shares.
The performance shown may include the effect of fee waivers and/or expense reimbursements by the Investment Adviser and/or other service providers, which have the effect of increasing total return. Had all fees and expenses been considered, the total returns would have been lower.
The performance update illustrates performance for a variable investment option available through a variable annuity contract. The performance shown indicates past performance and is not a projection or prediction of future results. Actual investment returns and principal value will fluctuate so that shares and/or units, at redemption, may be worth more or less than their original cost. Please call (800) 262-3862 to get performance through the most recent month end.
This report contains statements that may be "forward-looking" statements. Actual results may differ materially from those projected in the "forward-looking" statements.
The views expressed in this report reflect those of the portfolio manager only through the end of the period as stated on the cover. The portfolio manager's views are subject to change at any time based on marked and other conditions.
Portfolio holdings are subject to change daily.
(1) The Barclays Capital Aggregate U.S. Bond Index is an unmanaged index of publicly issued investment grade U.S. Government, mortgage-backed, asset-backed and corporate debt securities.
27
ING PIONEER HIGH YIELD PORTFOLIO
PORTFOLIO MANAGERS' REPORT
ING Pioneer High Yield Bond Portfolio (the "Portfolio") seeks to maximize total return through income and capital appreciation. The Portfolio is managed by Andrew Feltus and Tracy Wright, Portfolio Managers, Pioneer Investment Management, Inc. — the Sub-Adviser.
Performance: For the year ended December 31, 2008, the Portfolio's Class I shares provided a total return of (29.27)% compared to the Merrill Lynch High Yield Master II Index(1) and the Merrill Lynch Convertible Bonds (Speculative Quality) Index(2), which returned (26.39)% and (42.85)%, respectively, for the same period.
Portfolio Specifics: The Portfolio's underperformance occurred primarily in the fourth quarter of 2008, and more specifically in December, amid frozen credit markets, forced deleveraging by hedge funds and collateralized loan obligations ("CLOs"), and perhaps the worst economic downturn since the Great Depression. The high yield market suffered its worst performance ever, declining 17.6% in the fourth quarter, as spreads widened to highs of almost 2200 basis points (or 22.00%) over treasuries, 1000 basis points (or 10.00%) higher than their prior wides, and ended at 1812 basis points (or 18.12)% over treasuries. In December, the market rallied 7.47%; 44% or 3.3% of that performance reflected a 79% return on auto loans, which rose upon the extension of government loans to GMAC and the auto original equipment manufacturers ("OEMs"). The primary factor affecti ng December performance was the Portfolio's significant underweight to auto loans. In addition, our significant 12% overweight to capital goods hurt performance. Our allocation to convertible debt and preferred and common equity also detracted from performance, as convertibles and the S&P 500® Index rallied only 3.4% and 1.1%, respectively. The common equity portfolio contributed to performance, due to strong security selection. Finally, cash investments made in the Portfolio throughout the fourth quarter helped performance, as they mitigated negative high yield returns.
In 2008, our performance was hurt by our equity-linked exposure, which averaged approximately 27% of the Portfolio, as convertibles and the S&P 500® Index returned (43.00%) and (37.00%), respectively, and our common equity portfolio underperformed the S&P 500® Index. Our higher quality fixed income allocation helped performance, as higher quality high yield outperformed: BBs returned (19.00%), Bs returned (28.00%), while CCCs posted a (38.00%) return. In addition, the cash investments made into the Portfolio, which increased the net Portfolio size from $111 million to $280 million at year end, helped performance throughout the year, especially in the second half of 2008. Sector allocation in our fixed-income portfolio hurt 2008 performance; the benefit of our underweight to media and overweight to capital goods was more than offset by the negative impact of our overweight to real estate and finance and i nvestments and underweight to telecom. Securities that helped performance during the year included the common stock of heart device manufacturer, Thoratec Corp. and Annaly Capital Management, Inc.; convertibles of "smart" utility meter manufacturer, ESCO Technologies, Inc. and bonds of BF Saul REIT and NRG Energy, Inc. Securities that detracted from performance included Washington Mutual preferred, Lyondell Chemical Co. bonds, General Growth Properties, Inc. and Freeport McMoRan Copper & Gold, Inc. convertibles and the common equity of Commercial Vehicle Group, Inc., refiners Valero Energy Corp. and Tesoro Corp., and BE Aerospace, Inc.
Current Strategy and Outlook: We believe high yield valuations are compelling. Although high yield spreads have recently tightened over 400 basis points (or 4.00%) to their current levels of 1665 basis points (or 16.65%), even at these levels investors are being compensated for an estimated 17% implied default rate, compared to our 12-month forecast of 8% to 9%, and the 20 year high in June,1991 of 13%. We believe the convertible bond market also offers significant value. Certain convertible bonds are trading at dramatic discounts (and higher yields) than their straight debt equivalents, often enabling us to receive the equity optionality of the convert for free. We continue to believe that the high yield strategy of investing across the capital structure in high yield loans, bonds, convertibles, and common equity, enables investors to achieve superior retu rns and capture more upside potential compared to investing in a straight high yield bond portfolio. We may increase our convertibles exposure going forward, given attractive valuations in that market, with a corresponding decrease in our common equity exposure, to control overall volatility of the Portfolio. We will maintain our current sector positioning, with an overweight to capital goods and underweight to consumer cyclicals and media, and will seek to add value primarily through security selection.

Top Ten Holdings*
as of December 31, 2008
(as a percent of net assets)
DRS Technologies, Inc.,
6.875%, due 11/01/13 | | | 2.1 | % | |
First Data Corporation,
9.875%, due 09/24/15 | | | 1.1 | % | |
Baldor Electric Co.,
8.625%, due 02/15/17 | | | 1.0 | % | |
Graphic Packaging International Corp.,
9.500%, due 08/15/13 | | | 0.9 | % | |
| Tesoro Corp., 6.625%, due 11/01/15 | | | 0.9 | % | |
| Roper Industries, Inc., 1.481%, due 01/15/34 | | | 0.9 | % | |
| Mueller Water Products, 7.375%, due 06/01/17 | | | 0.9 | % | |
| Sally Holdings, LLC, 10.500%, due 11/15/16 | | | 0.9 | % | |
Freeport-McMoRan Copper &
Gold, Inc. — Non Voting | | | 0.8 | % | |
| Novelis, Inc., 7.250%, due 02/15/15 | | | 0.8 | % | |
* Excludes short-term investments related to ING Institutional Prime Money Market Fund — Class I.
Portfolio holdings are subject to change daily.
Portfolio holdings and characteristics are subject to change and may not be representative of current holdings and characteristics. The outlook for this Portfolio may differ from that presented for other ING Funds. Performance for the different classes of shares will vary based on differences in fees associated with each class.
28
PORTFOLIO MANAGERS' REPORT
ING PIONEER HIGH YIELD PORTFOLIO
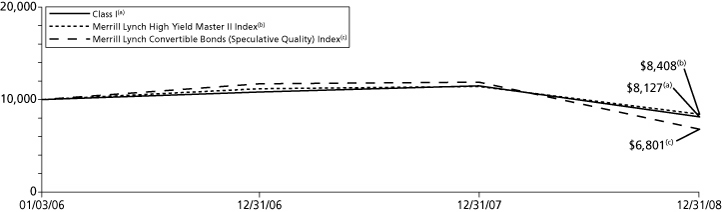
| Average Annual Total Returns for the Periods Ended December 31, 2008 | |
| | | 1 Year | | Since Inception
of Class I
January 3, 2006 | | Since Inception
of Classes ADV and S
January 20, 2006 | |
| Class ADV | | | (29.60 | )% | | | — | | | | (7.23 | )% | |
| Class I | | | (29.27 | )% | | | (6.69 | )% | | | — | | |
| Class S | | | (29.45 | )% | | | — | | | | (7.02 | )% | |
| Merrill Lynch High Yield Master II Index(1) | | | (26.39 | )% | | | (5.62 | )%(3) | | | (6.28 | )%(4) | |
| Merrill Lynch Convertible Bonds (Speculative Quality) Index(2) | | | (42.85 | )% | | | (12.06 | )%(3) | | | (13.85 | )%(4) | |
Based on a $10,000 initial investment, the graph and table above illustrate the total return of ING Pioneer High Yield Portfolio against the indices indicated. An index is unmanaged and has no cash in its portfolio, imposes no sales charges and incurs no operating expenses. An investor cannot invest directly in an index. The Portfolio's performance is shown without the imposition of any expenses or charges which are, or may be, imposed under your annuity contract. Total returns would have been lower if such expenses or charges were included.
The performance graph and table do not reflect the deduction of taxes that a shareholder will pay on portfolio distributions or the redemption of portfolio shares.
The performance shown may include the effect of fee waivers and/or expense reimbursements by the Investment Adviser and/or other service providers, which have the effect of increasing total return. Had all fees and expenses been considered, the total returns would have been lower.
The performance update illustrates performance for a variable investment option available through a variable annuity contract. The performance shown indicates past performance and is not a projection or prediction of future results. Actual investment returns and principal value will fluctuate so that shares and/or units, at redemption, may be worth more or less than their original cost. Please call (800) 262-3862 to get performance through the most recent month end.
This report contains statements that may be "forward-looking" statements. Actual results may differ materially from those projected in the "forward-looking" statements.
The views expressed in this report reflect those of the portfolio manager only through the end of the period as stated on the cover. The portfolio manager's views are subject to change at any time based on marked and other conditions.
Portfolio holdings are subject to change daily.
(1) The Merrill Lynch High Yield Master II Index is a broad-based index consisting of all U.S. dollar-denominated high-yield bonds with a minimum outstanding amount of $100 million and with a maturity of greater than one year period. The quality rating is less than BBB by Standard & Poor's.
(2) The Merrill Lynch Convertible Bonds (Speculative Quality) Index is a market-capitalization weighted index including mandatory and non-mandatory domestic corporate convertible securities. Securities in this index are convertible to U.S. dollar-denominated common stocks, ADRs, or cash equivalent and have an average rating of Ba1/BB+ or lower from Moody's and Standard & Poor's, respectively.
(3) Since inception performance of the indices is shown from January 1, 2006.
(4) Since inception performance of the indices is shown from February 1, 2006.
29
ING T. ROWE PRICE DIVERSIFIED MID CAP GROWTH PORTFOLIO
PORTFOLIO MANAGERS' REPORT
ING T. Rowe Price Diversified Mid Cap Growth Portfolio (the "Portfolio") seeks long-term capital appreciation. The Portfolio is managed by Donald J. Peters, Portfolio Manager of T. Rowe Price Associates, Inc. — the Sub-Adviser.
Performance: For the year ended December 31, 2008, the Portfolio's Class S shares provided a total return of (43.27)% compared to the Standard & Poor's ("S&P") MidCap 400 Index(1) and the Russell Midcap® Growth Index(2), which returned (36.23)% and (44.32)%, respectively, for the same period.
Portfolio Specifics: In a difficult economic environment in which mid-cap growth underperformed most other investment styles, the Portfolio outpaced the Russell Midcap® Growth Index. Broadly speaking, the outperformance was due to stock selection. Industrials and business services, information technology, and healthcare were positive contributors, while energy detracted.
Stock selection in industrials and business services was the primary contributor. Strong holdings included Landstar System, Inc. ("Landstar") and Ritchie Brothers Auctioneers, Inc. ("Ritchie Bros."). Transportation and logistics service provider Landstar was among many firms to benefit from the recent decline in fuel costs. Ritchie Bros. is an auctioneer of industrial equipment that has seen increased business as companies have viewed the downturn as an opportunity to make capital investments cheaply. Anticipated increases in global demand for industrial equipment as various nations seek to stimulate their economies through infrastructure projects should also help the company.
Our stock choices in information technology were another area of strength. We did well to limit our exposure to firms involved with semi-conductors, as they were particularly hard-hit this year. On the positive side, our holdings in automated fingerprint identification system provider Cogent, Inc. proved productive. The company is relatively insulated from the economic downturn, as most of its end users are government agencies. Accordingly, it was able to maintain its earnings forecasts at a time when many companies have been forced to revise them downward.
An overweight to healthcare was another significant contributor. Our strategic stance of overweighting biotechnology proved especially beneficial for the period. Important holdings here included Celgene Corp. ("Celgene") and Myriad Genetics, Inc. ("Myriad"). Celgene continued to see promising results in clinical trials for drugs designed to treat cancer and immune-inflammatory related diseases, while Myriad announced that it would spin off its drug development business in order to focus on its core competency of diagnostics.
Energy was the leading detractor, due both to a detrimental underweight and weak stock selection. Energy prices plummeted from record highs in the second half of the year, in response to the global economic slowdown. Poor performance here stemmed in part from our lack of exposure to natural gas-oriented firms, as natural gas held up better than other fuel sources. Coal was particularly hard-hit, and coal-producing holdings like Peabody Energy Corp. and Massey Energy Co. suffered. Massey's business was doubly hurt, as it mines coal specifically for use in electricity production and metallurgy, and the recessionary environment has depressed demand for both.
Current Strategy and Outlook: Our outlook has not changed in the last six months. We believe that the era of easy credit, reckless risk taking, and financial excess is over and we are now facing the consequences of that excess. Credit standards are likely to be tighter than normal and investors could remain risk averse for some time. As a result, we anticipate that economic and financial market performance in the period ahead will be more challenging than in the last few years.
As our longer-term investors know, we do not make investment decisions predicated on economic forecasts, nor do we attempt to time the markets. We are comfortable with the composition of the Portfolio and, as mentioned earlier, we believe the current risk-averse environment is one in which our investment strategy will do well relative to others. We remain committed to finding, buying, and holding what we believe are attractively valued, high-quality mid-cap growth companies with good business models, strong managements, and favorable long-term prospects.
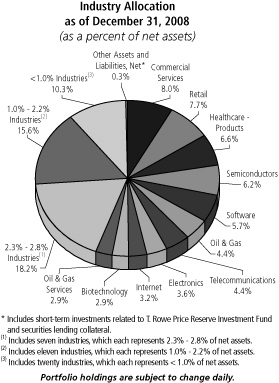
Top Ten Holdings*
as of December 31, 2008
(as a percent of net assets)
| Yum! Brands, Inc. | | | 1.2 | % | |
| Avon Products, Inc. | | | 1.1 | % | |
| American Tower Corp. | | | 1.0 | % | |
| Express Scripts, Inc. | | | 1.0 | % | |
| Apollo Group, Inc. — Class A | | | 0.9 | % | |
| Northern Trust Corp. | | | 0.9 | % | |
| St. Jude Medical, Inc. | | | 0.9 | % | |
| Allergan, Inc. | | | 0.9 | % | |
| CH Robinson Worldwide, Inc. | | | 0.9 | % | |
| Expeditors International Washington, Inc. | | | 0.9 | % | |
* Excludes short-term investments related to securities lending collateral.
Portfolio holdings are subject to change daily.
Portfolio holdings and characteristics are subject to change and may not be representative of current holdings and characteristics. The outlook for this Portfolio may differ from that presented for other ING Funds. Performance for the different classes of shares will vary based on differences in fees associated with each class.
30
PORTFOLIO MANAGERS' REPORT
ING T. ROWE PRICE DIVERSIFIED MID CAP GROWTH PORTFOLIO
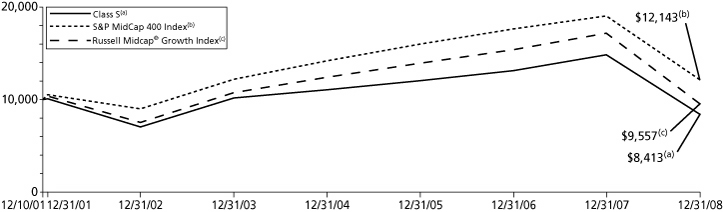
| Average Annual Total Returns for the Periods Ended December 31, 2008 | |
| | | 1 Year | | 5 Year | | Since Inception
of Classes ADV, I and S
December 10, 2001 | |
| Class ADV | | | (43.35 | )% | | | (3.96 | )% | | | (2.64 | )% | |
| Class I | | | (43.15 | )% | | | (3.49 | )% | | | (2.17 | )% | |
| Class S | | | (43.27 | )% | | | (3.74 | )% | | | (2.42 | )% | |
| S&P MidCap 400 Index(1) | | | (36.23 | )% | | | (0.08 | )% | | | 2.78 | %(3) | |
| Russell Midcap® Growth Index(2) | | | (44.32 | )% | | | (2.33 | )% | | | (0.64 | )%(3) | |
Based on a $10,000 initial investment, the graph and table above illustrate the total return of ING T. Rowe Price Diversified Mid cap Growth Portfolio against the indices indicated. An index is unmanaged and has no cash in its portfolio, imposes no sales charges and incurs no operating expenses. An investor cannot invest directly in an index. The Portfolio's performance is shown without the imposition of any expenses or charges which are, or may be, imposed under your annuity contract. Total returns would have been lower if such expenses or charges were included.
The performance graph and table do not reflect the deduction of taxes that a shareholder will pay on portfolio distributions or the redemption of portfolio shares.
The performance shown may include the effect of fee waivers and/or expense reimbursements by the Investment Adviser and/or other service providers, which have the effect of increasing total return. Had all fees and expenses been considered, the total returns would have been lower.
The performance update illustrates performance for a variable investment option available through a variable annuity contract. The performance shown indicates past performance and is not a projection or prediction of future results. Actual investment returns and principal value will fluctuate so that shares and/or units, at redemption, may be worth more or less than their original cost. Please call (800) 262-3862 to get performance through the most recent month end.
This report contains statements that may be "forward-looking" statements. Actual results may differ materially from those projected in the "forward-looking" statements.
The views expressed in this report reflect those of the portfolio manager only through the end of the period as stated on the cover. The portfolio manager's views are subject to change at any time based on marked and other conditions.
Portfolio holdings are subject to change daily.
(1) The S&P 400 MidCap Index is a broad-based unmanaged capitalization weighted index of mid-capitalization companies.
(2) The Russell Midcap® Growth Index measures the performance of the 800 smallest companies the Russell 1000® Index with higher price-to-book ratios and higher forecasted growth values.
(3) Since inception performance for the indices is shown from December 1, 2001.
Prior to November 8, 2004, the Portfolio was sub-advised by Fred Alger Management, Inc. Effective November 8, 2004, T. Rowe Price became the sub-adviser and the Portfolio's principal investment strategies and name changed.
31
ING T. ROWE PRICE GROWTH EQUITY PORTFOLIO
PORTFOLIO MANAGERS' REPORT
ING T. Rowe Price Growth Equity Portfolio (the "Portfolio") seeks long-term capital growth, and secondarily, increasing dividend income. The Portfolio is managed by Robert Bartolo, Portfolio Manager of T. Rowe Price Associates, Inc. — the Sub-Adviser.
Performance: For the year ended December 31, 2008, the Portfolio's Class I shares, provided a total return of (42.21)% compared to the Standard & Poor's 500® Composite Stock Price Index(1) ("S&P 500® Index"), which returned (37.00)% for the same period.
Portfolio Specifics: Stock selection was the overwhelming reason for relative underperformance by the Portfolio. Significantly underweighting financials helped relative performance. Consumer discretionary, energy, and consumer staples sectors were the leading relative detractors.
Favorable substantial underweighting of financials led to Portfolio outperformance in the declining economy. Performance also benefited from avoiding several major companies, including Lehman Brothers, Citigroup, and American International Group that suffered huge losses due to the credit crunch.
Stock selection in consumer discretionary was the leading cause of the Portfolio's underperformance. The hotels, restaurants, and leisure industry weighed heavily on results. Gaming holdings such as Las Vegas Sands Corp. and International Game Technology notably disappointed. In past downturns, gaming stocks have typically held up better than other groups in this sector, but this time the restricted access to capital undercut company development efforts. With consumer belt-tightening, online travel agent Expedia, Inc. saw a significant drop in business.
Energy was a major source of weakness on stock selection. The Portfolio's oil services holdings were hard hit, as exploration activity became less attractive in the face of dropping energy prices. Schlumberger Ltd. declined on leveraging exploration spending, and on economic problems in Russia, where it has significant exposure. Smith International, Inc. saw sharply decreasing revenues and margins from its major exposure in North America, but the company is poised for a rebound in exploration, particularly in deepwater drilling. Underweighting ExxonMobil Corp. hurt as the company has outperformed many energy firms. In a period of falling oil prices, the large integrated energy companies outperform because they are less leveraged to the price of oil.
Underweighting and stock selection combined for detrimental relative results in consumer staples, which was the best performer in the S&P 500® Index. Significantly overweighting healthcare was advantageous for the Portfolio, but was more than offset by unfavorable stock selection.
U.S. stocks plunged deep into bear market territory in 2008, as the economy went into its first recession since 2001. The year was marked by extreme volatility, heightened risk aversion, and intense pressures on financial companies stemming from severe mortgage losses and a credit crunch. Commodity prices tumbled, and the materials sector was the second-worst performer in the index. Consumer staples and healthcare were comparatively better performing sectors in the index, as consumer demand in these sectors is generally less affected by an economic downturn.
Current Strategy and Outlook: While many hope that the worst of the market volatility has run its course, we believe it is very likely that markets will continue to be challenging. Our objective is to identify high-quality large-cap growth companies with what we believe are strong fundamentals and attractive valuations. Amid tempered growth prospects, we see opportunities to invest in companies that we have been monitoring whose valuations and fundamentals are, in our opinion, compelling. We believe that market fears and indiscriminate selling due to forced liquidations can lead to prices becoming disconnected from fundamentals, presenting significant buying opportunities.
The Portfolio remains notably cautious and underweight in financials. Energy is also underweight. Despite the recent strong performance of consumer staples stocks, we believe that heavy investor inflows to this defensive sector have inflated valuations and we do not find attractive long-term growth opportunities here. Healthcare continues notably overweight against the S&P 500® Index, although limited to key industries. Information technology remains overweight, as the sector affords opportunities for investing in strong long-term growth companies.
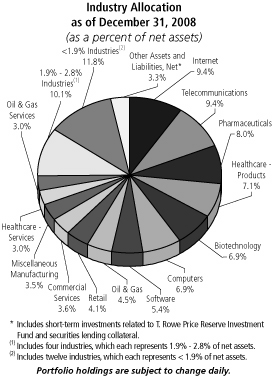
Top Ten Holdings*
as of December 31, 2008
(as a percent of net assets)
| Apple, Inc. | | | 3.5 | % | |
| Danaher Corp. | | | 3.5 | % | |
| Gilead Sciences, Inc. | | | 3.4 | % | |
| Amazon.com, Inc. | | | 3.3 | % | |
| Google, Inc. — Class A | | | 2.9 | % | |
| Medco Health Solutions, Inc. | | | 2.8 | % | |
| Microsoft Corp. | | | 2.5 | % | |
| Genentech, Inc. | | | 2.2 | % | |
| ExxonMobil Corp. | | | 2.2 | % | |
| Qualcomm, Inc. | | | 2.1 | % | |
* Excludes short-term investments related to T. Rowe Price Reserve Investment Fund.
Portfolio holdings are subject to change daily.
Portfolio holdings and characteristics are subject to change and may not be representative of current holdings and characteristics. The outlook for this Portfolio may differ from that presented for other ING Funds. Performance for the different classes of shares will vary based on differences in fees associated with each class.
32
PORTFOLIO MANAGERS' REPORT
ING T. ROWE PRICE GROWTH EQUITY PORTFOLIO
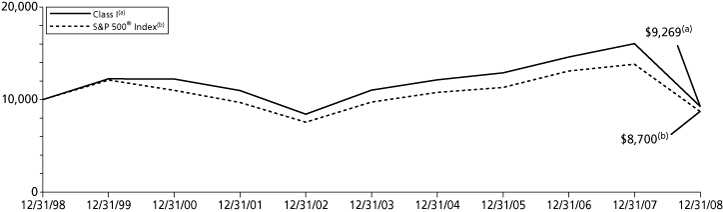
| Average Annual Total Returns for the Periods Ended December 31, 2008 | |
| | | 1 Year | | 5 Year | | 10 Year | | Since Inception
of Classes ADV and S
December 10, 2001 | |
| Class ADV | | | (42.51 | )% | | | (3.89 | )% | | | — | | | | (2.90 | )% | |
| Class I | | | (42.21 | )% | | | (3.41 | )% | | | (0.76 | )% | | | — | | |
| Class S | | | (42.35 | )% | | | (3.65 | )% | | | — | | | | (2.65 | )% | |
| S&P 500® Index(1) | | | (37.00 | )% | | | (2.19 | )% | | | (1.38 | )% | | | (1.39 | )%(2) | |
Based on a $10,000 initial investment, the graph and table above illustrate the total return of ING T. Rowe Price Growth Equity Portfolio against the index indicated. An index is unmanaged and has no cash in its portfolio, imposes no sales charges and incurs no operating expenses. An investor cannot invest directly in an index. The Portfolio's performance is shown without the imposition of any expenses or charges which are, or may be, imposed under your annuity contract. Total returns would have been lower if such expenses or charges were included.
The performance graph and table do not reflect the deduction of taxes that a shareholder will pay on portfolio distributions or the redemption of portfolio shares.
The performance shown may include the effect of fee waivers and/or expense reimbursements by the Investment Adviser and/or other service providers, which have the effect of increasing total return. Had all fees and expenses been considered, the total returns would have been lower.
The performance update illustrates performance for a variable investment option available through a variable annuity contract. The performance shown indicates past performance and is not a projection or prediction of future results. Actual investment returns and principal value will fluctuate so that shares and/or units, at redemption, may be worth more or less than their original cost. Please call (800) 262-3862 to get performance through the most recent month end.
This report contains statements that may be "forward-looking" statements. Actual results may differ materially from those projected in the "forward-looking" statements.
The views expressed in this report reflect those of the portfolio manager only through the end of the period as stated on the cover. The portfolio manager's views are subject to change at any time based on marked and other conditions.
Portfolio holdings are subject to change daily.
(1) The S&P 500® Index is an unmanaged index that measures the performance of the securities of approximately 500 of the largest companies in the U.S.
(2) Since inception performance for the index is shown from December 1, 2001.
33
ING TEMPLETON FOREIGN EQUITY PORTFOLIO
PORTFOLIO MANAGERS' REPORT
ING Templeton Foreign Equity Portfolio (the "Portfolio") seeks long-term capital growth. The Portfolio is managed by Gary P. Motyl, Cindy L. Sweeting, Antonio T. Docal and Peter A. Nori of Templeton Investment Counsel, LLC, — the Sub-Adviser.
Performance: For the year ended December 31, 2008, the Portfolio's Class I shares provided a total return of (40.72)% compared to Morgan Stanley Capital International ("MSCI") All Country World ex U.S. IndexSM(1) and the MSCI Europe, Australasia, Far East® ("EAFE") Index(2), which returned (45.53)% and (43.38)%, respectively, for the same period.
Portfolio Specifics: The year 2008 was unusually difficult for most investors. At period-end, all major gauges of stock market performance had registered double-digit negative returns. No main region, country or sector was spared in the dramatic stock market sell-off triggered by the global financial crisis and slowing economic growth or recessionary environments.
The financials sector suffered most, erasing more than half of its entire market capitalization during the year. But financials were not alone; they were followed closely by materials-related stocks. The materials and energy sectors, which were the only sectors to have positive returns during the first half of the year, experienced an abrupt reversal. With virtually no safe haven in the global market downturn, the healthcare, utilities and consumer staples sectors lived up to their "defensive" reputations and declined less in value than other sectors.
For the Portfolio, stock selection in the consumer discretionary sector and our underweighting in consumer staples compared to the benchmark hurt relative performance. Also, underweighting and stock selection in utilities hindered results.
The U.S. dollar appreciated versus most foreign currencies for the year, which also hurt the Portfolio's performance because investments in securities with non-U.S. currency exposure lost value as the dollar rose.
On a positive note, the Portfolio performed better than the benchmark index for the year because of several factors. During the review period, our research indicated most chemicals companies were overvalued as were many in the metals and mining industry. As a result, the Portfolio maintained little or no exposure to these areas and was significantly underweighted in the materials sector relative to the benchmark. Although the Portfolio's underweighted exposure to materials stocks hurt relative Portfolio performance during the first half of the year, the sector was a key contributor in 2008 due to a sharp correction in the second half of the year. In addition, stock selection in the materials and energy sectors boosted relative performance.
We believe the Portfolio's relatively better result in the financials sector was another affirmation of our investment philosophy. The lofty multiples, balance sheet opacity and dubious earnings quality of many investment banks and brokerages steered us away from the industry's most-leveraged segments, and despite absolute losses from our sector holdings, our underweighted exposure helped relative Portfolio performance. Although the Portfolio's healthcare holdings, like everything else, were down in absolute terms in 2008, our bottom-up-based decision to overweight the sector also contributed to the Portfolio's relative performance during the year.
Current Strategy and Outlook: Looking beyond the turbulence of 2008, we continue to manage the Portfolio as always — with a focus on the longer term.
One area of continued conviction for us where our investment thesis had yet to materialize was the health care sector. The Portfolio's overweighted allocation to healthcare evolved over a time when the consensus view was that pharmaceutical companies faced a difficult pricing environment, political headwinds and insurmountable competition from cheaper generics. However, we saw bargain valuations, high free cash-flow yields, and the implications of aging global demographics for revenue growth.
Our overweighted telecommunication services sector position was another contrarian call. By purchasing telecommunication stocks when they were out of favor in the wake of the technology, media and telecommunications bubble, we were able to invest in companies that we felt had solid balance sheets, desirable products, and a growing global presence at largely discounted prices.
While we invested in some financial company stocks we saw as well-capitalized, we remained cautious of the sector. In addition, we continued to monitor the materials sector closely, seeking proper re-entry points, but as of period-end we had yet to find compelling valuations in the materials sector, in general.
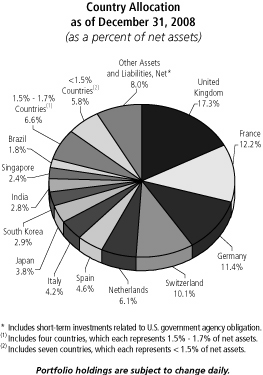
Top Ten Holdings*
as of December 31, 2008
(as a percent of net assets)
| Novartis AG | | | 3.1 | % | |
| Telefonica SA | | | 3.0 | % | |
| Nestle SA | | | 3.0 | % | |
| GlaxoSmithKline PLC | | | 2.5 | % | |
| ENI S.p.A. | | | 2.4 | % | |
| Total SA | | | 2.2 | % | |
| Sanofi-Aventis | | | 2.1 | % | |
| AXA SA | | | 2.1 | % | |
| HSBC Holdings PLC | | | 2.1 | % | |
| Vodafone Group PLC | | | 2.0 | % | |
* Excludes short-term investments related to U.S. government agency obligation.
Portfolio holdings are subject to change daily.
Portfolio holdings and characteristics are subject to change and may not be representative of current holdings and characteristics. The outlook for this Portfolio may differ from that presented for other ING Funds. Performance for the different classes of shares will vary based on differences in fees associated with each class.
34
PORTFOLIO MANAGERS' REPORT
ING TEMPLETON FOREIGN EQUITY PORTFOLIO

| Average Annual Total Returns for the Periods Ended December 31, 2008 | |
| | | 1 Year | | Since Inception
of Class ADV
December 20, 2006 | | Since Inception
of Class I
January 3, 2006 | | Since Inception
of Class S
January 12, 2006 | |
| Class ADV | | | (40.88 | )% | | | (16.87 | )% | | | — | | | | — | | |
| Class I | | | (40.72 | )% | | | — | | | | (5.91 | )% | | | — | | |
| Class S | | | (40.97 | )% | | | — | | | | — | | | | (6.31 | )% | |
| MSCI ACWI (ex-U.S)(1) | | | (45.53 | )% | | | (20.28 | )%(3) | | | (6.98 | )%(4) | | | (6.98 | )%(4) | |
| MSCI EAFE® Index(2) | | | (43.38 | )% | | | (20.66 | )%(3) | | | (7.35 | )%(4) | | | (7.35 | )%(4) | |
Based on a $10,000 initial investment, the graph and table above illustrate the total return of ING Templeton Foreign Equity Portfolio against the indices indicated. An index is unmanaged and has no cash in its portfolio, imposes no sales charges and incurs no operating expenses. An investor cannot invest directly in an index. The Portfolio's performance is shown without the imposition of any expenses or charges which are, or may be, imposed under your annuity contract. Total returns would have been lower if such expenses or charges were included.
The performance graph and table do not reflect the deduction of taxes that a shareholder will pay on portfolio distributions or the redemption of portfolio shares.
The performance shown may include the effect of fee waivers and/or expense reimbursements by the Investment Adviser and/or other service providers, which have the effect of increasing total return. Had all fees and expenses been considered, the total returns would have been lower.
The performance update illustrates performance for a variable investment option available through a variable annuity contract. The performance shown indicates past performance and is not a projection or prediction of future results. Actual investment returns and principal value will fluctuate so that shares and/or units, at redemption, may be worth more or less than their original cost. Please call (800) 262-3862 to get performance through the most recent month end.
This report contains statements that may be "forward-looking" statements. Actual results may differ materially from those projected in the "forward-looking" statements.
The views expressed in this report reflect those of the portfolio manager only through the end of the period as stated on the cover. The portfolio manager's views are subject to change at any time based on marked and other conditions.
Portfolio holdings are subject to change daily.
(1) The MSCI ACWI (ex-U.S.) is a free float-adjusted market capitalization index that is designed to measure equity market performance in the global developed and emerging markets, excluding the U.S. It includes the reinvestment of dividends and distributions net of withholding taxes, but does not reflect fees, brokerage commissions or other expenses of investing.
(2) The MSCI EAFE® Index is an unmanaged index that measures the performance of securities listed on exchanges in Europe, Australasia and the Far East. It includes the reinvestment of dividends net of withholding taxes, but does not reflect fees, brokerage commissions or other expenses of investing.
(3) Since inception performance for the index is shown from January 1, 2007.
(4) Since inception performance of the index is shown from January 1, 2006.
35
ING THORNBURG VALUE PORTFOLIO
PORTFOLIO MANAGERS' REPORT
ING Thornburg Value Portfolio (the "Portfolio") seeks capital appreciation. The Portfolio is managed by William V. Fries, CFA, Managing Director, Edward Maran, CFA, Managing Director and Connor Browne, CFA, Managing Director, all of Thornburg Investment Management ("Thornburg") — the Sub-Adviser.
Performance: For the year ended December 31, 2008, the Portfolio's Class I shares provided a total return of (39.75)% compared to the Standard & Poor's 500® Composite Stock Price Index(1) ("S&P 500® Index"), which returned (37.00)% for the same period.
Portfolio Specifics: Of all stocks owned during the year, only around one-fifth contributed positively to performance. These included basic value stocks Apache Corp.("Apache"), JetBlue Airways Corp. ("Jet Blue Airways"), and recent purchases ACE Ltd.("Ace"), Cincinnati Financial Corp.("Cincinnati Financial"), and Swiss Reinsurance ("Swiss Re") along with consistent earners Genentech, Inc. ("Genentech"), Gilead Sciences, Inc. ("Gilead Sciences"), DirecTV Group, Inc. ("DirecTV"), and Visa, Inc. ("Visa"). Visa and Apache were sold at price targets during the year. Notably, we experienced positive results in our financial services names relative to the benchmark as the fundamentals for the insurers such as ACE , Cincinnati Financial, and Swiss Re were not as bad as some investors had feared. For ACE and Swiss Re, reinsurance pricing and asset quality remain sol id. Cincinnati Financial maintains a diversified portfolio of financial stocks on its balance sheet and, in our opinion, has a strong balance sheet. Healthcare stocks were another area of relative strength. Gilead Sciences benefited from a steady customer base and strong execution of its business model. Unfortunately HIV/AIDS is a growing problem worldwide, but Gilead Sciences' products are helping to improve life expectancy and quality of life for victims of that disease. Travel related stocks such as JetBlue Airways rebounded on the back of lower oil prices late in the year.
The stocks which hurt portfolio performance tended to be highly financially levered. Las Vegas Sands Corp., Rite Aid Corp. ("Rite Aid"), Hartford Financial Services Group, Inc., Level 3 Communications, Inc., and Crown Castle International were all among the leading detractors and had significant debt on their balance sheets. WellPoint Inc.("WellPoint"), Dell, Inc. ("Dell") and CME Group, Inc. ("CME Group") were bottom underperformers also, but do not have a heavy debt burden. Rather, specific business disappointments were more at play with these holdings. WellPoint suffered lower underwriting margins when the company underestimated the cost of medical services that it had already contracted to provide its customers. Dell reduced its fourth quarter guidance and indicated that global demand for PC's would be slower than anticipated for 2009. Management is taking steps to accelerate growth in faster growing economies. The CME Group experienced a rapid reduction within their derivatives volumes due to the lack of hedging activities that are common with normally functioning credit markets. We sold other poor performers during the year, particularly in financial services — American International Group ("AIG"), Freddie Mac, Wachovia and UBS — and believe we did a reasonably good job exercising our risk management. Our stock selection under consumer staples was particularly weak as Rite Aid not only suffered from the high debt load acquired with the Jean Coutu acquisition during 2006 but also from heightened economic sensitivity to the front end of their stores (we underestimated this risk). At this point, we feel the share price of Rite Aid may recover at some point under a better credit market environment and believe that management can still execute on the merger strategy. Overall, our underweight within consumer staples was the largest detractor from a sector allocation perspective.
Current Strategy and Outlook: In this challenging environment we are executing the same investment philosophy and approach that has proven successful over the long-term. In December, our performance improved relative to the benchmark, with contributions coming from a number of areas (financials, healthcare, industrials, and telecom). We continue to seek promising companies at a discount and attempt to buy them when they are out of favor. Our basket approach provides the Portfolio with a spectrum of opportunities as well as diversification. In our "consistent earners" basket, we own stocks that we believe will prove more resilient than the average U.S. stock in a tough environment. Within our "basic value" and "emerging franchise" baskets we invest in those companies that we believe should lead when investors believe the U.S. and global economies will eventu ally recover.
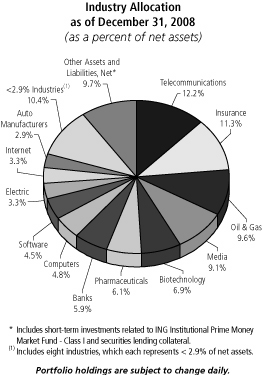
Top Ten Holdings*
as of December 31, 2008
(as a percent of net assets)
| AT&T, Inc. | | | 5.0 | % | |
| Eli Lilly & Co. | | | 4.4 | % | |
| Gilead Sciences, Inc. | | | 4.2 | % | |
| ConocoPhillips | | | 3.7 | % | |
| Entergy Corp. | | | 3.3 | % | |
| DIRECTV Group, Inc. | | | 3.3 | % | |
| Priceline.com, Inc. | | | 3.2 | % | |
| Comcast Corp. — Special Class A | | | 3.2 | % | |
| Marathon Oil Corp. | | | 3.2 | % | |
| Microsoft Corp. | | | 3.1 | % | |
* Excludes short-term investments related to ING Institutional Prime Money Market Fund — Class I and securities lending collateral.
Portfolio holdings are subject to change daily.
Portfolio holdings and characteristics are subject to change and may not be representative of current holdings and characteristics. The outlook for this Portfolio may differ from that presented for other ING Funds. Performance for the different classes of shares will vary based on differences in fees associated with each class.
36
PORTFOLIO MANAGERS' REPORT
ING THORNBURG VALUE PORTFOLIO
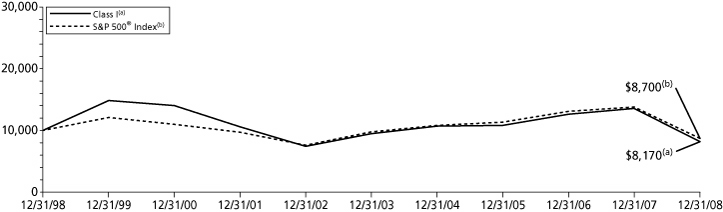
| Average Annual Total Returns for the Periods Ended December 31, 2008 | |
| | | 1 Year | | 5 Year | | 10 Year | | Since Inception
of Classes ADV and S
December 10, 2001 | |
| Class ADV | | | (40.04 | )% | | | (3.32 | )% | | | — | | | | (4.08 | )% | |
| Class I | | | (39.75 | )% | | | (2.85 | )% | | | (2.00 | )% | | | — | | |
| Class S | | | (39.90 | )% | | | (3.09 | )% | | | — | | | | (3.85 | )% | |
| S&P 500® Index(1) | | | (37.00 | )% | | | (2.19 | )% | | | (1.38 | )% | | | (1.39 | )%(2) | |
Based on a $10,000 initial investment, the graph and table above illustrate the total return of ING Thornburg Value Portfolio against the index indicated. An index is unmanaged and has no cash in its portfolio, imposes no sales charges and incurs no operating expenses. An investor cannot invest directly in an index. The Portfolio's performance is shown without the imposition of any expenses or charges which are, or may be, imposed under your annuity contract. Total returns would have been lower if such expenses or charges were included.
The performance graph and table do not reflect the deduction of taxes that a shareholder will pay on portfolio distributions or the redemption of portfolio shares.
The performance shown may include the effect of fee waivers and/or expense reimbursements by the Investment Adviser and/or other service providers, which have the effect of increasing total return. Had all fees and expenses been considered, the total returns would have been lower.
The performance update illustrates performance for a variable investment option available through a variable annuity contract. The performance shown indicates past performance and is not a projection or prediction of future results. Actual investment returns and principal value will fluctuate so that shares and/or units, at redemption, may be worth more or less than their original cost. Please call (800) 262-3862 to get performance through the most recent month end.
This report contains statements that may be "forward-looking" statements. Actual results may differ materially from those projected in the "forward-looking" statements.
The views expressed in this report reflect those of the portfolio manager only through the end of the period as stated on the cover. The portfolio manager's views are subject to change at any time based on marked and other conditions.
Portfolio holdings are subject to change daily.
(1) The S&P 500® Index is an unmanaged index that measures the performance of the securities of approximately 500 of the largest companies in the U.S.
(2) Since inception performance for the index is shown from December 1, 2001.
Prior to August 7, 2006, the Portfolio was sub-advised by Massachusetts Financial Services Company and was known as MFS Capital Opportunities Portfolio. Effective August 7, 2006, Thornburg became the sub–adviser and the Portfolio's principal investment strategies changed.
37
ING UBS U.S. LARGE CAP EQUITY PORTFOLIO
PORTFOLIO MANAGERS' REPORT
ING UBS U.S. Large Cap Equity Portfolio (the "Portfolio") seeks long-term growth of capital and future income. The Portfolio is managed by the North American Equities Investment Management Team ("N.A. Equities Team") consisting of Thomas Cole, Head of N.A. Equities Team, Research Director and Managing Director, John Leonard, Thomas Digenan and Scott Hazen, Portfolio Managers for North American Equities of UBS Global Asset Management (Americas) Inc. — the Sub-Adviser.
Performance: For the year ended December 31, 2008, the Portfolio's Class I shares provided a total return of (39.76)% compared to the compared to the Standard & Poor's 500® Composite Stock Price Index(1) ("S&P 500® Index") and the Russell 1000® Index(2), which returned (37.00)% and (37.60)%, respectively, for the same period.
Portfolio Specifics: 2008 proved to be a challenging year, as heightened risk aversion, an ongoing credit crunch, forced selling by highly leveraged investors and a lack of liquidity led to poor performance in the global equity markets. In addition, there were periods of extreme volatility and sectors moving in and out of favor. For example, energy and materials were the only positive performing S&P 500® sectors during the first half of the year, only to significantly decline and underperform the overall market as the year progressed. During the dramatic sell-off in the fourth quarter of 2008, panic selling ensued and more defensive sectors, including consumer staples and healthcare, generated some of the best relative results.
Turning to the Portfolio, it performed in line with its benchmark during the first half of the year. Over that time, overall strong stock selection was offset by underweights in the energy and materials sectors and an overweight in the financials sector. Performance improved markedly during the third quarter of the year, as our energy and materials underweights were rewarded as these sectors lagged given sharply falling oil and commodity prices. In addition, our overweights in the financials, healthcare and consumer discretionary sectors were positive contributors to relative results.
The Portfolio underperformed in the fourth quarter, more than offsetting the outperformance in the first nine months of the year, and culminating in underperformance for the full calendar year. An underweight to consumer staples, combined with an overweight to financials and consumer discretionary (particularly auto parts), detracted from results at the sector level. These positions more than offset the positive impact of being overweight utilities and pharmaceuticals while underweight the poorly performing materials sector.
Security selection detracted from results in a number of sectors, but most notably in energy, where we did not own ExxonMobil Corp. ("ExxonMobil"), and telecom services, where owning Sprint Nextel Corp. while not owning Verizon Communications, Inc. had a negative impact. Unlike most energy stocks, ExxonMobil posted positive absolute returns in the fourth quarter as many investors viewed it to be a safe haven in this period of panic due to the large amount of cash on its balance sheet.
Current Strategy and Outlook: It is our belief that the U.S. equity market is currently undervalued. In addition, we feel that there is a large gap between the most and least attractive areas of the market. Given these views, we believe the Portfolio is well positioned going forward. In particular, we currently have an underweight in consumer staples and have reduced our overweights to healthcare and utilities, as we don't find these sectors to be as attractive given their relative outperformance in recent months. In contrast, we have added to positions in energy and materials as they now appear to be attractively valued given their decline during the second half of the year. Elsewhere, we are overweight consumer discretionary and modestly overweight financials given a number of what we believe to be compelling opportunities we have identified in these sect ors.

Top Ten Holdings
as of December 31, 2008
(as a percent of net assets)
| Intel Corp. | | | 3.4 | % | |
| General Electric Co. | | | 3.1 | % | |
| Comcast Corp. — Class A | | | 3.0 | % | |
| Wells Fargo & Co. | | | 2.6 | % | |
| Genzyme Corp. | | | 2.6 | % | |
| Microsoft Corp. | | | 2.5 | % | |
| Exelon Corp. | | | 2.5 | % | |
| FedEx Corp. | | | 2.4 | % | |
| Illinois Tool Works, Inc. | | | 2.3 | % | |
| Aflac, Inc. | | | 2.1 | % | |
Portfolio holdings are subject to change daily.
Portfolio holdings and characteristics are subject to change and may not be representative of current holdings and characteristics. The outlook for this Portfolio may differ from that presented for other ING Funds. Performance for the different classes of shares will vary based on differences in fees associated with each class.
38
PORTFOLIO MANAGERS' REPORT
ING UBS U.S. LARGE CAP EQUITY PORTFOLIO

| Average Annual Total Returns for the Periods Ended December 31, 2008 | |
| | | 1 Year | | 5 Year | | 10 Year | | Since Inception
of Classes ADV and S
December 10, 2001 | |
| Class ADV | | | (40.07 | )% | | | (3.11 | )% | | | — | | | | (3.25 | )% | |
| Class I | | | (39.76 | )% | | | (2.61 | )% | | | (2.57 | )% | | | — | | |
| Class S | | | (40.00 | )% | | | (2.86 | )% | | | — | | | | (3.04 | )% | |
| S&P 500® Index(1) | | | (37.00 | )% | | | (2.19 | )% | | | (1.38 | )% | | | (1.39 | )%(3) | |
| Russell 1000® Index(2) | | | (37.60 | )% | | | (2.04 | )% | | | (1.09 | )% | | | (1.05 | )%(3) | |
Based on a $10,000 initial investment, the graph and table above illustrate the total return of ING UBS U.S. Large Cap Equity Portfolio against the indices indicated. An index is unmanaged and has no cash in its portfolio, imposes no sales charges and incurs no operating expenses. An investor cannot invest directly in an index. The Portfolio's performance is shown without the imposition of any expenses or charges which are, or may be, imposed under your annuity contract. Total returns would have been lower if such expenses or charges were included.
The performance graph and table do not reflect the deduction of taxes that a shareholder will pay on portfolio distributions or the redemption of portfolio shares.
The performance shown may include the effect of fee waivers and/or expense reimbursements by the Investment Adviser and/or other service providers, which have the effect of increasing total return. Had all fees and expenses been considered, the total returns would have been lower.
The performance update illustrates performance for a variable investment option available through a variable annuity contract. The performance shown indicates past performance and is not a projection or prediction of future results. Actual investment returns and principal value will fluctuate so that shares and/or units, at redemption, may be worth more or less than their original cost. Please call (800) 262-3862 to get performance through the most recent month end.
This report contains statements that may be "forward-looking" statements. Actual results may differ materially from those projected in the "forward-looking" statements.
The views expressed in this report reflect those of the portfolio manager only through the end of the period as stated on the cover. The portfolio manager's views are subject to change at any time based on marked and other conditions.
Portfolio holdings are subject to change daily.
(1) The S&P 500® Index is an unmanaged index that measures the performance of the securities of approximately 500 of the largest companies in the U.S.
(2) The Russell 1000® Index is a comprehensive large-cap index measuring the performance of the largest 1,000 U.S. incorporated companies.
(3) Since inception performance for the indices is shown from December 1, 2001.
39
ING VAN KAMPEN COMSTOCK PORTFOLIO
PORTFOLIO MANAGERS' REPORT
ING Van Kampen Comstock Portfolio (the "Portfolio") seeks capital growth and income. The Portfolio is managed by B. Robert Baker, Jr., CFA, Managing Director, Jason Leder, Managing Director, Kevin Holt, Managing Director, Devin E. Armstrong, CFA, Vice President and James N. Warwick, Executive Director of Morgan Stanley Investment Management, Inc., d/b/a "Van Kampen" — the Sub-Adviser.
Performance: For the year ended December 31, 2008, the Portfolio's Class S shares, provided a total return of (36.48)% compared to the Russell 1000® Value Index(1) and the Standard & Poor's 500® Composite Stock Price Index(2) ("S&P 500® Index"), which returned (36.85)% and (37.00)%, respectively, for the same period.
Portfolio Specifics: Fear and a major loss of investor confidence drove the stock market to one of its worst years in history. With stock and bond prices in a downward spiral and global recession imminent, risk aversion intensified and investors fled to cash and Treasuries. Stock market volatility registered extreme levels, leaving investors no escape from declining values. In this environment, both value stocks (in which the Portfolio invests) and growth stocks sustained negative returns, as did all segments of the market capitalization spectrum. Every sector of the market finished the year with double-digit declines.
Relative to the Russell 1000® Value Index ("the Index"), the Portfolio was bolstered primarily by an overweight in the consumer staples sector, and stock selection. Although the sector had a negative absolute return during the period, it sustained smaller declines than other areas of the market, owing to its "defensiveness," or lower sensitivity to economic conditions. An underweight in the industrials sector and stock selection in the telecommunication services sector also benefited relative results. Finally, the Portfolio's cash position also contributed favorably to relative performance, as it reduced the Portfolio's exposure to the market's decline, whereas the Russell 1000® Value Index holds no cash.
The chief detractor from relative performance was the Portfolio's significant underweight in energy stocks. Very few energy stocks have looked attractive to us, even with oil prices falling dramatically in recent months, as energy companies for the most part have not yet had to adjust to the less robust economic scenario. The Portfolio's minimal exposure to the utilities sector was another area of relative weakness.
Current Strategy and Outlook: We continue to position the Portfolio from a bottom-up basis, selecting stocks that we believe have reasonable valuations relative to our assessment of fair value. At period-end, over 45 percent of the Portfolio's investment portfolio was held in what we believe to be high quality, yet undervalued growth companies exhibiting attractive future prospects and a healthy free cash flow. Many "cyclical" stocks (those in more economically sensitive sectors such as energy and industrials) still appear unattractive by our risk-reward standards. The financials sector remained the largest sector weight, broadly diversified across banks, brokerage and insurance stocks. In the healthcare sector, given the Food and Drug Administration's ("FDA") more conservative stance, we are carefully evaluating the Portfolio's exposure to potential regula tory surprises.
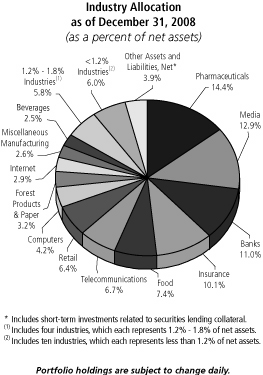
Top Ten Holdings
as of December 31, 2008
(as a percent of net assets)
| Chubb Corp. | | | 5.0 | % | |
| Comcast Corp. — Class A | | | 4.2 | % | |
| Bristol-Myers Squibb Co. | | | 3.6 | % | |
| Verizon Communications, Inc. | | | 3.5 | % | |
| Viacom — Class B | | | 3.3 | % | |
| International Paper Co. | | | 3.2 | % | |
| Time Warner, Inc. | | | 3.1 | % | |
| Wal-Mart Stores, Inc. | | | 2.7 | % | |
| Bank of New York Mellon Corp. | | | 2.7 | % | |
| General Electric Co. | | | 2.6 | % | |
Portfolio holdings are subject to change daily.
Portfolio holdings and characteristics are subject to change and may not be representative of current holdings and characteristics. The outlook for this Portfolio may differ from that presented for other ING Funds. Performance for the different classes of shares will vary based on differences in fees associated with each class.
40
PORTFOLIO MANAGERS' REPORT
ING VAN KAMPEN COMSTOCK PORTFOLIO

| Average Annual Total Returns for the Periods Ended December 31, 2008 | |
| | | 1 Year | | 5 Year | | Since Inception
of Classes ADV, I and S
May 1, 2002 | |
| Class ADV | | | (36.64 | )% | | | (3.02 | )% | | | (1.12 | )% | |
| Class I | | | (36.36 | )% | | | (2.56 | )% | | | (0.63 | )% | |
| Class S | | | (36.48 | )% | | | (2.77 | )% | | | (0.86 | )% | |
| Russell 1000® Value Index(1) | | | (36.85 | )% | | | (0.79 | )% | | | 0.74 | % | |
| S&P 500® Index(2) | | | (37.00 | )% | | | (2.19 | )% | | | (0.72 | )% | |
Based on a $10,000 initial investment, the graph and table above illustrate the total return of ING Van Kampen Comstock Portfolio against the indices indicated. An index is unmanaged and has no cash in its portfolio, imposes no sales charges and incurs no operating expenses. An investor cannot invest directly in an index. The Portfolio's performance is shown without the imposition of any expenses or charges which are, or may be, imposed under your annuity contract. Total returns would have been lower if such expenses or charges were included.
The performance graph and table do not reflect the deduction of taxes that a shareholder will pay on portfolio distributions or the redemption of portfolio shares.
The performance shown may include the effect of fee waivers and/or expense reimbursements by the Investment Adviser and/or other service providers, which have the effect of increasing total return. Had all fees and expenses been considered, the total returns would have been lower.
The performance update illustrates performance for a variable investment option available through a variable annuity contract. The performance shown indicates past performance and is not a projection or prediction of future results. Actual investment returns and principal value will fluctuate so that shares and/or units, at redemption, may be worth more or less than their original cost. Please call (800) 262-3862 to get performance through the most recent month end.
This report contains statements that may be "forward-looking" statements. Actual results may differ materially from those projected in the "forward-looking" statements.
The views expressed in this report reflect those of the portfolio manager only through the end of the period as stated on the cover. The portfolio manager's views are subject to change at any time based on marked and other conditions.
Portfolio holdings are subject to change daily.
(1) The Russell 1000® Value Index is an unmanaged index that measures the performance of those Russell 1000 securities with lower price-to-book ratios and lower forecasted growth values.
(2) The S&P 500® Index is an unmanaged index that measures the performance of the securities of approximately 500 of the largest companies in the U.S.
41
ING VAN KAMPEN EQUITY AND INCOME PORTFOLIO
PORTFOLIO MANAGERS' REPORT
ING Van Kampen Equity and Income Portfolio (the "Portfolio") seeks total return, consisting of long-term capital appreciation and current income. The Portfolio is managed by Thomas Bastian, Steven Kreider, James Roeder, Sergio Marcheli, Mark Laskin, Sanjay Verma and Mary Jayne Maly* of Morgan Stanley Investment Management, Inc., d/b/a "Van Kampen" — the Sub-Adviser.
Performance: For the year ended December 31, 2008, the Portfolio's Class S shares provided a total return of (23.56)% compared to the Russell 1000® Value Index(2), Barclays Capital U.S. Government/Credit Bond Index**(3) and the Composite Index(4) (60% Russell 1000® Value Index/40% Barclays Capital U.S. Government/Credit Bond Index), which returned (36.85)%, 5.70% and (21.80)%, respectively, for the same period.
Portfolio Specifics: All sectors in the Russell 1000® Value Index had negative absolute returns for the period, although the same was true for the Portfolio. On a relative basis, the Portfolio lost less value than the Russell 1000® Value Index. Specifically, stock selection in the financial services sector was a positive contributor to relative performance. The Portfolio had better relative performance in diversified financial services, due to a holding that was more resilient than many of its peers because of its lower sub-prime mortgage exposure, and in property and casualty insurance. An overweight position in the consumer staples sector was another positive relative contributor, due to a food and staples retailer that benefited from prudent inventory management and scaling down its growth strategy. Stock selection in the ma terials sector helped the Portfolio sidestep some of the sector's volatility. The Portfolio avoided exposure to the heavily commodity-oriented companies that declined strongly when commodity prices began to fall and instead owned a gold mining company which held up better than its peers in the difficult environment.
In contrast, the Portfolio's underweight positions in the energy and utilities sectors were relative detractors. Although the sectors had negative returns for the period, they were among the better performing sectors in the Russell 1000® Value Index. Stock selection in the consumer discretionary sector was an area of weakness, as retail holdings were hurt by falling consumer spending and media holdings saw declining advertising revenues.
In the fixed-income portfolio, the primary detractor from performance relative to the Barclays Capital U.S. Government/Credit Bond Index was an overweight to asset-backed securities backed by home equity loans (a segment not represented in the Barclays Capital U.S. Government/Credit Bond Index). Unfortunately, as a result of the sub-prime crisis, all mortgage-related securities have suffered price declines this year. However, the Portfolio's yield curve positioning was beneficial during the 12-month period. For the first half of 2008, we underweighted longer dated issues and overweighted intermediate dated issues, a strategy that helped enhance returns as the spread between intermediate- and long-dated yields widened and the curve steepened. The Portfolio maintained an underweight corporate credit position relative to the Barclays Capital U.S. Government/Credit Index for most of the reporting period, which also boosted performance as credit spreads widened significantly during the period, causing prices to decline. The Portfolio's convertible securities allocation detracted from performance for the period.
Current Strategy and Outlook: The turmoil of the past year has not changed our underlying investment philosophy or our stock selection process. We continue to seek undervalued companies that are experiencing a positive change or catalyst that we believe should have a positive impact on the stock valuation. Such catalysts could be new company management, growth or consolidation within an industry or sector, or new products. As a result of this process, during the year, the Portfolio's financials and energy weightings increased. The consumer staples weighting declined as we pared down good performing holdings that no longer fit our risk-return profile. The Portfolio's top five sectors as of the end of the period were financials, healthcare, consumer staples, consumer discretionary, and energy. The Portfolio held approximately 60% in equities, 23% in fixed inc ome, and 11.5% in convertible securities at period-end.
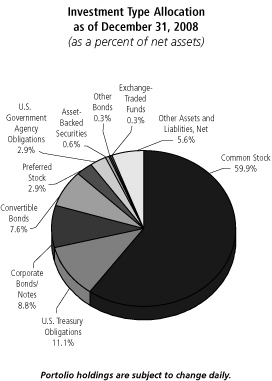
Top Ten Holdings
as of December 31, 2008
(as a percent of net assets)
| U.S. Treasury Note, 2.750%, due 10/31/13 | | | 3.6 | % | |
| JPMorgan Chase & Co. | | | 3.2 | % | |
| Marsh & McLennan Cos., Inc. | | | 2.1 | % | |
| Unilever NV ADR | | | 1.9 | % | |
| Time Warner, Inc. | | | 1.9 | % | |
| American Electric Power Co., Inc. | | | 1.8 | % | |
| Schering-Plough Corp. | | | 1.7 | % | |
| U.S. Treasury Note, 2.000%, due 02/28/10 | | | 1.7 | % | |
| Cadbury PLC ADR | | | 1.6 | % | |
| Bayer AG ADR | | | 1.6 | % | |
Portfolio holdings are subject to change daily.
* Effective January 1, 2009, Thomas Bastian replaced Jim Gilligan as the lead portfolio manager to the Portfolio and Sanjay Verma replaced Steven Kreider as a portfolio manager. In addition, Mary Jayne Maly was added as a co-portfolio manager to the Portfolio.
** Formerly known as the Lehman Brothers U.S. Government/Credit Bond Index. As of October 31, 2008, all Lehman Brothers indices were renamed: the words "Lehman Brothers" changed to "Barclays Capital."
Portfolio holdings and characteristics are subject to change and may not be representative of current holdings and characteristics. The outlook for this Portfolio may differ from that presented for other ING Funds. Performance for the different classes of shares will vary based on differences in fees associated with each class.
42
PORTFOLIO MANAGERS' REPORT
ING VAN KAMPEN EQUITY AND INCOME PORTFOLIO
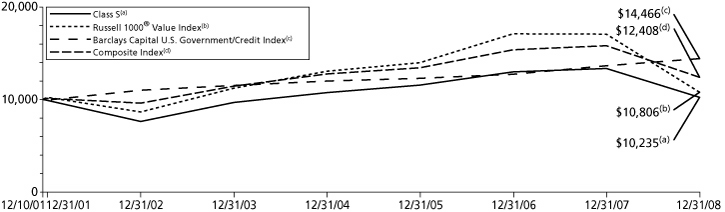
| Average Annual Total Returns for the Periods Ended December 31, 2008 | |
| | | 1 Year | | 5 Year | | Since Inception
of Classes ADV, I and S
December 10, 2001 | |
| Class ADV | | | (23.76 | )% | | | 0.88 | % | | | 0.08 | % | |
| Class I | | | (23.38 | )% | | | 1.38 | % | | | 0.58 | % | |
| Class S | | | (23.56 | )% | | | 1.13 | % | | | 0.33 | % | |
| Russell 1000® Value Index(1) | | | (36.85 | )% | | | (0.79 | )% | | | 1.10 | %(4) | |
| Barclays Capital U.S. Government/Credit Index(2) | | | 5.70 | % | | | 4.64 | % | | | 5.35 | %(4) | |
| Composite Index(3) | | | (21.80 | )% | | | 1.58 | % | | | 3.09 | %(4) | |
Based on a $10,000 initial investment, the graph and table above illustrate the total return of ING Van Kampen Equity and Income Portfolio against the indices indicated. An index is unmanaged and has no cash in its portfolio, imposes no sales charges and incurs no operating expenses. An investor cannot invest directly in an index. The Portfolio's performance is shown without the imposition of any expenses or charges which are, or may be, imposed under your annuity contract. Total returns would have been lower if such expenses or charges were included.
The performance graph and table do not reflect the deduction of taxes that a shareholder will pay on portfolio distributions or the redemption of portfolio shares.
The performance shown may include the effect of fee waivers and/or expense reimbursements by the Investment Adviser and/or other service providers, which have the effect of increasing total return. Had all fees and expenses been considered, the total returns would have been lower.
The performance update illustrates performance for a variable investment option available through a variable annuity contract. The performance shown indicates past performance and is not a projection or prediction of future results. Actual investment returns and principal value will fluctuate so that shares and/or units, at redemption, may be worth more or less than their original cost. Please call (800) 262-3862 to get performance through the most recent month end.
This report contains statements that may be "forward-looking" statements. Actual results may differ materially from those projected in the "forward-looking" statements.
The views expressed in this report reflect those of the portfolio manager only through the end of the period as stated on the cover. The portfolio manager's views are subject to change at any time based on marked and other conditions.
Portfolio holdings are subject to change daily.
(1) The Russell 1000® Value Index is an unmanaged index that measures the performance of those Rusell 1000® companies with lower price-to-book ratios and lower than forecasted growth values.
(2) The Barclays Capital U.S. Government/Credit Index is an index made up of the Barclays Capital Government and Credit indices, including securities issued by the U.S. government and its agencies and publicly issued U.S. corporate and foreign debentures and secured notes that meet specified maturity, liquidity and quality requirements.
(3) The Composite Index consists of 60% of the return of (securities included in) Russell 1000® Value Index and 40% of the return of (securities included in) Barclays Capital U.S. Government/Credit Index.
(4) Since inception performance for the indices is shown from December 1, 2001.
43
SHAREHOLDER EXPENSE EXAMPLES (UNAUDITED)
As a shareholder of a Portfolio, you incur two types of costs: (1) transaction costs, redemption fees, and exchange fees; and (2) ongoing costs, including management fees, distribution and/or service (12b-1) fees, and other Portfolio expenses. These Examples are intended to help you understand your ongoing costs (in dollars) of investing in a Fund and to compare these costs with the ongoing costs of investing in other mutual funds.
The Examples are based on an investment of $1,000 invested at the beginning of the period and held for the entire period from July 1, 2008 to December 31, 2008. The Portfolios' expenses are shown without the imposition of any charges which are, or may be, imposed under your annuity contract. Expenses would have been higher if such charges were included.
Actual Expenses
The first section of the table shown, "Actual Portfolio Return," provides information about actual account values and actual expenses. You may use the information in this section, together with the amount you invested, to estimate the expenses that you paid over the period. Simply divide your account value by $1,000 (for example, an $8,600 account value divided by $1,000 = 8.6), then multiply the result by the number in the first section under the heading entitled "Expenses Paid During the Period'' to estimate the expenses you paid on your account during this period.
Hypothetical Example for Comparison Purposes
The second section of the table shown, "Hypothetical (5% return before expenses)," provides information about hypothetical account values and hypothetical expenses based on the Portfolio's actual expense ratio and an assumed rate of return of 5% per year before expenses, which is not the Portfolio's actual return. The hypothetical account values and expenses may not be used to estimate the actual ending account balance or expenses you paid for the period. You may use this information to compare the ongoing costs of investing in the Portfolio and other mutual funds. To do so, compare this 5% hypothetical example with the 5% hypothetical examples that appear in the shareholder reports of the other mutual funds.
Please note that the expenses shown in the table are meant to highlight your ongoing costs only and do not reflect any transactional costs, redemption fees, or exchange fees. Therefore, the hypothetical lines of the table are useful in comparing ongoing costs only, and will not help you determine the relative total costs of owning different funds. In addition, if these transactional costs were included, your costs would have been higher.
| | | Actual Portfolio Return | | Hypothetical (5% return before expenses) | |
ING American Century
Large Company Value Portfolio | | Beginning
Account
Value
July 1,
2008 | | Ending
Account
Value
December 31,
2008 | | Annualized
Expense
Ratio | | Expenses Paid
During the
Period Ended
December 31,
2008* | | Beginning
Account
Value
July 1,
2008 | | Ending
Account
Value
December 31,
2008 | | Annualized
Expense
Ratio | | Expenses Paid
During the
Period Ended
December 31,
2008* | |
| Class ADV | | $ | 1,000.00 | | | $ | 733.20 | | | | 1.40 | % | | $ | 6.10 | | | $ | 1,000.00 | | | $ | 1,018.10 | | | | 1.40 | % | | $ | 7.10 | | |
| Class I | | | 1,000.00 | | | | 734.70 | | | | 0.90 | | | | 3.92 | | | | 1,000.00 | | | | 1,020.61 | | | | 0.90 | | | | 4.57 | | |
| Class S | | | 1,000.00 | | | | 734.10 | | | | 1.15 | | | | 5.01 | | | | 1,000.00 | | | | 1,019.36 | | | | 1.15 | | | | 5.84 | | |
| ING American Century Small-Mid Cap Value Portfolio | |
| Class ADV | | $ | 1,000.00 | | | $ | 804.70 | | | | 1.52 | % | | $ | 6.90 | | | $ | 1,000.00 | | | $ | 1,017.50 | | | | 1.52 | % | | $ | 7.71 | | |
| Class I | | | 1,000.00 | | | | 806.00 | | | | 1.02 | | | | 4.63 | | | | 1,000.00 | | | | 1,020.01 | | | | 1.02 | | | | 5.18 | | |
| Class S | | | 1,000.00 | | | | 805.00 | | | | 1.27 | | | | 5.76 | | | | 1,000.00 | | | | 1,018.75 | | | | 1.27 | | | | 6.44 | | |
| ING Baron Asset Portfolio | |
| Class ADV | | $ | 1,000.00 | | | $ | 664.70 | | | | 1.57 | % | | $ | 6.57 | | | $ | 1,000.00 | | | $ | 1,017.24 | | | | 1.57 | % | | $ | 7.96 | | |
| Class I | | | 1,000.00 | | | | 663.70 | | | | 1.07 | | | | 4.47 | | | | 1,000.00 | | | | 1,019.76 | | | | 1.07 | | | | 5.43 | | |
| Class S | | | 1,000.00 | | | | 665.30 | | | | 1.32 | | | | 5.53 | | | | 1,000.00 | | | | 1,018.50 | | | | 1.32 | | | | 6.70 | | |
* Expenses are equal to each Portfolio's respective annualized expense ratios multiplied by the average account value over the period, multiplied by 184/366 to reflect the most recent fiscal half-year.
44
SHAREHOLDER EXPENSE EXAMPLES (UNAUDITED) (CONTINUED)
| | | Actual Portfolio Return | | Hypothetical (5% return before expenses) | |
ING Baron
Small Cap Growth Portfolio | | Beginning
Account
Value
July 1,
2008 | | Ending
Account
Value
December 31,
2008 | | Annualized
Expense
Ratio | | Expenses Paid
During the
Period Ended
December 31,
2008* | | Beginning
Account
Value
July 1,
2008 | | Ending
Account
Value
December 31,
2008 | | Annualized
Expense
Ratio | | Expenses Paid
During the
Period Ended
December 31,
2008* | |
| Class ADV | | $ | 1,000.00 | | | $ | 679.60 | | | | 1.58 | % | | $ | 6.67 | | | $ | 1,000.00 | | | $ | 1,017.19 | | | | 1.58 | % | | $ | 8.01 | | |
| Class I | | | 1,000.00 | | | | 681.40 | | | | 1.08 | | | | 4.56 | | | | 1,000.00 | | | | 1,019.71 | | | | 1.08 | | | | 5.48 | | |
| Class S | | | 1,000.00 | | | | 680.60 | | | | 1.31 | | | | 5.53 | | | | 1,000.00 | | | | 1,018.55 | | | | 1.31 | | | | 6.65 | | |
| ING Columbia Small Cap Value II Portfolio | |
| Class ADV | | $ | 1,000.00 | | | $ | 717.00 | | | | 1.41 | % | | $ | 6.09 | | | $ | 1,000.00 | | | $ | 1,018.05 | | | | 1.41 | % | | $ | 7.15 | | |
| Class I | | | 1,000.00 | | | | 718.20 | | | | 0.91 | | | | 3.93 | | | | 1,000.00 | | | | 1,020.56 | | | | 0.91 | | | | 4.62 | | |
| Class S | | | 1,000.00 | | | | 717.70 | | | | 1.16 | | | | 5.01 | | | | 1,000.00 | | | | 1,019.30 | | | | 1.16 | | | | 5.89 | | |
| ING Davis New York Venture Portfolio | |
| Class ADV | | $ | 1,000.00 | | | $ | 686.60 | | | | 1.40 | % | | $ | 5.94 | | | $ | 1,000.00 | | | $ | 1,018.10 | | | | 1.40 | % | | $ | 7.10 | | |
| Class I | | | 1,000.00 | | | | 688.30 | | | | 0.90 | | | | 3.82 | | | | 1,000.00 | | | | 1,020.61 | | | | 0.90 | | | | 4.57 | | |
| Class S | | | 1,000.00 | | | | 687.00 | | | | 1.15 | | | | 4.88 | | | | 1,000.00 | | | | 1,019.36 | | | | 1.15 | | | | 5.84 | | |
| ING JPMorgan Mid Cap Value Portfolio | |
| Class ADV | | $ | 1,000.00 | | | $ | 734.60 | | | | 1.50 | % | | $ | 6.54 | | | $ | 1,000.00 | | | $ | 1,017.60 | | | | 1.50 | % | | $ | 7.61 | | |
| Class I | | | 1,000.00 | | | | 736.80 | | | | 1.00 | | | | 4.37 | | | | 1,000.00 | | | | 1,020.11 | | | | 1.00 | | | | 5.08 | | |
| Class S | | | 1,000.00 | | | | 735.80 | | | | 1.25 | | | | 5.45 | | | | 1,000.00 | | | | 1,018.85 | | | | 1.25 | | | | 6.34 | | |
| ING Legg Mason Partners Aggressive Growth Portfolio | |
| Class ADV | | $ | 1,000.00 | | | $ | 664.10 | | | | 1.31 | % | | $ | 5.48 | | | $ | 1,000.00 | | | $ | 1,018.55 | | | | 1.31 | % | | $ | 6.65 | | |
| Class I | | | 1,000.00 | | | | 665.50 | | | | 0.81 | | | | 3.39 | | | | 1,000.00 | | | | 1,021.06 | | | | 0.81 | | | | 4.12 | | |
| Class S | | | 1,000.00 | | | | 664.70 | | | | 1.06 | | | | 4.44 | | | | 1,000.00 | | | | 1,019.81 | | | | 1.06 | | | | 5.38 | | |
| ING Neuberger Berman Partners Portfolio | |
| Class ADV | | $ | 1,000.00 | | | $ | 511.80 | | | | 1.17 | % | | $ | 4.45 | | | $ | 1,000.00 | | | $ | 1,019.25 | | | | 1.17 | % | | $ | 5.94 | | |
| Class I | | | 1,000.00 | | | | 513.80 | | | | 0.67 | | | | 2.55 | | | | 1,000.00 | | | | 1,021.77 | | | | 0.67 | | | | 3.40 | | |
| Class S | | | 1,000.00 | | | | 512.60 | | | | 0.89 | | | | 3.38 | | | | 1,000.00 | | | | 1,020.66 | | | | 0.89 | | | | 4.52 | | |
| ING Oppenheimer Global Portfolio | |
| Class ADV | | $ | 1,000.00 | | | $ | 688.90 | | | | 1.16 | % | | $ | 4.92 | | | $ | 1,000.00 | | | $ | 1,019.30 | | | | 1.16 | % | | $ | 5.89 | | |
| Class I | | | 1,000.00 | | | | 690.40 | | | | 0.66 | | | | 2.80 | | | | 1,000.00 | | | | 1,021.82 | | | | 0.66 | | | | 3.35 | | |
| Class S | | | 1,000.00 | | | | 689.20 | | | | 0.91 | | | | 3.86 | | | | 1,000.00 | | | | 1,020.56 | | | | 0.91 | | | | 4.62 | | |
| ING Oppenheimer Strategic Income Portfolio | |
| Class ADV | | $ | 1,000.00 | | | $ | 828.00 | | | | 1.00 | % | | $ | 4.59 | | | $ | 1,000.00 | | | $ | 1,020.11 | | | | 1.00 | % | | $ | 5.08 | | |
| Class I | | | 1,000.00 | | | | 830.80 | | | | 0.54 | | | | 2.49 | | | | 1,000.00 | | | | 1,022.42 | | | | 0.54 | | | | 2.75 | | |
| Class S | | | 1,000.00 | | | | 830.10 | | | | 0.75 | | | | 3.45 | | | | 1,000.00 | | | | 1,021.37 | | | | 0.75 | | | | 3.81 | | |
* Expenses are equal to each Portfolio's respective annualized expense ratios multiplied by the average account value over the period, multiplied by 184/366 to reflect the most recent fiscal half-year.
45
SHAREHOLDER EXPENSE EXAMPLES (UNAUDITED) (CONTINUED)
| | | Actual Portfolio Return | | Hypothetical (5% return before expenses) | |
ING PIMCO
Total Return Portfolio | | Beginning
Account
Value
July 1,
2008 | | Ending
Account
Value
December 31,
2008 | | Annualized
Expense
Ratio | | Expenses Paid
During the
Period Ended
December 31,
2008* | | Beginning
Account
Value
July 1,
2008 | | Ending
Account
Value
December 31,
2008 | | Annualized
Expense
Ratio | | Expenses Paid
During the
Period Ended
December 31,
2008* | |
| Class ADV | | $ | 1,000.00 | | | $ | 991.20 | | | | 1.15 | % | | $ | 5.76 | | | $ | 1,000.00 | | | $ | 1,019.36 | | | | 1.15 | % | | $ | 5.84 | | |
| Class I | | | 1,000.00 | | | | 993.70 | | | | 0.65 | | | | 3.26 | | | | 1,000.00 | | | | 1,021.87 | | | | 0.65 | | | | 3.30 | | |
| Class S | | | 1,000.00 | | | | 992.10 | | | | 0.90 | | | | 4.51 | | | | 1,000.00 | | | | 1,020.61 | | | | 0.90 | | | | 4.57 | | |
| ING Pioneer High Yield Portfolio | |
| Class ADV | | $ | 1,000.00 | | | $ | 716.00 | | | | 1.23 | % | | $ | 5.31 | | | $ | 1,000.00 | | | $ | 1,018.95 | | | | 1.23 | % | | $ | 6.24 | | |
| Class I | | | 1,000.00 | | | | 717.50 | | | | 0.73 | | | | 3.15 | | | | 1,000.00 | | | | 1,021.47 | | | | 0.73 | | | | 3.71 | | |
| Class S | | | 1,000.00 | | | | 716.60 | | | | 0.98 | | | | 4.23 | | | | 1,000.00 | | | | 1,020.21 | | | | 0.98 | | | | 4.98 | | |
| ING T. Rowe Price Diversified Mid Cap Growth Portfolio | |
| Class ADV | | $ | 1,000.00 | | | $ | 602.50 | | | | 1.16 | % | | $ | 4.67 | | | $ | 1,000.00 | | | $ | 1,019.30 | | | | 1.16 | % | | $ | 5.89 | | |
| Class I | | | 1,000.00 | | | | 603.40 | | | | 0.66 | | | | 2.66 | | | | 1,000.00 | | | | 1,021.82 | | | | 0.66 | | | | 3.35 | | |
| Class S | | | 1,000.00 | | | | 602.70 | | | | 0.91 | | | | 3.67 | | | | 1,000.00 | | | | 1,020.56 | | | | 0.91 | | | | 4.62 | | |
| ING T. Rowe Price Growth Equity Portfolio | |
| Class ADV | | $ | 1,000.00 | | | $ | 639.30 | | | | 1.24 | % | | $ | 5.11 | | | $ | 1,000.00 | | | $ | 1,018.90 | | | | 1.24 | % | | $ | 6.29 | | |
| Class I | | | 1,000.00 | | | | 641.00 | | | | 0.74 | | | | 3.05 | | | | 1,000.00 | | | | 1,021.42 | | | | 0.74 | | | | 3.76 | | |
| Class S | | | 1,000.00 | | | | 640.30 | | | | 0.99 | | | | 4.08 | | | | 1,000.00 | | | | 1,020.16 | | | | 0.99 | | | | 5.03 | | |
| ING Templeton Foreign Equity Portfolio | |
| Class ADV | | $ | 1,000.00 | | | $ | 679.90 | | | | 1.47 | % | | $ | 6.21 | | | $ | 1,000.00 | | | $ | 1,017.75 | | | | 1.47 | % | | $ | 7.46 | | |
| Class I | | | 1,000.00 | | | | 682.20 | | | | 0.97 | | | | 4.10 | | | | 1,000.00 | | | | 1,020.26 | | | | 0.97 | | | | 4.93 | | |
| Class S | | | 1,000.00 | | | | 679.50 | | | | 1.22 | | | | 5.15 | | | | 1,000.00 | | | | 1,019.00 | | | | 1.22 | | | | 6.19 | | |
| ING Thornburg Value Portfolio | |
| Class ADV | | $ | 1,000.00 | | | $ | 694.50 | | | | 1.40 | % | | $ | 5.96 | | | $ | 1,000.00 | | | $ | 1,018.10 | | | | 1.40 | % | | $ | 7.10 | | |
| Class I | | | 1,000.00 | | | | 696.10 | | | | 0.90 | | | | 3.84 | | | | 1,000.00 | | | | 1,020.61 | | | | 0.90 | | | | 4.57 | | |
| Class S | | | 1,000.00 | | | | 695.40 | | | | 1.15 | | | | 4.90 | | | | 1,000.00 | | | | 1,019.36 | | | | 1.15 | | | | 5.84 | | |
| ING UBS U.S. Large Cap Equity Portfolio | |
| Class ADV | | $ | 1,000.00 | | | $ | 679.00 | | | | 1.35 | % | | $ | 5.70 | | | $ | 1,000.00 | | | $ | 1,018.35 | | | | 1.35 | % | | $ | 6.85 | | |
| Class I | | | 1,000.00 | | | | 680.70 | | | | 0.85 | | | | 3.59 | | | | 1,000.00 | | | | 1,020.86 | | | | 0.85 | | | | 4.32 | | |
| Class S | | | 1,000.00 | | | | 679.80 | | | | 1.10 | | | | 4.64 | | | | 1,000.00 | | | | 1,019.61 | | | | 1.10 | | | | 5.58 | | |
| ING Van Kampen Comstock Portfolio | |
| Class ADV | | $ | 1,000.00 | | | $ | 762.00 | | | | 1.31 | % | | $ | 5.80 | | | $ | 1,000.00 | | | $ | 1,018.55 | | | | 1.31 | % | | $ | 6.65 | | |
| Class I | | | 1,000.00 | | | | 763.50 | | | | 0.81 | | | | 3.59 | | | | 1,000.00 | | | | 1,021.06 | | | | 0.81 | | | | 4.12 | | |
| Class S | | | 1,000.00 | | | | 762.90 | | | | 1.06 | | | | 4.70 | | | | 1,000.00 | | | | 1,019.81 | | | | 1.06 | | | | 5.38 | | |
* Expenses are equal to each Portfolio's respective annualized expense ratios multiplied by the average account value over the period, multiplied by 184/366 to reflect the most recent fiscal half-year.
46
SHAREHOLDER EXPENSE EXAMPLES (UNAUDITED) (CONTINUED)
| | | Actual Portfolio Return | | Hypothetical (5% return before expenses) | |
ING Van Kampen
Equity and Income Portfolio | | Beginning
Account
Value
July 1,
2008 | | Ending
Account
Value
December 31,
2008 | | Annualized
Expense
Ratio | | Expenses Paid
During the
Period Ended
December 31,
2008* | | Beginning
Account
Value
July 1,
2008 | | Ending
Account
Value
December 31,
2008 | | Annualized
Expense
Ratio | | Expenses Paid
During the
Period Ended
December 31,
2008* | |
| Class ADV | | $ | 1,000.00 | | | $ | 833.60 | | | | 1.07 | % | | $ | 4.93 | | | $ | 1,000.00 | | | $ | 1,019.76 | | | | 1.07 | % | | $ | 5.43 | | |
| Class I | | | 1,000.00 | | | | 835.70 | | | | 0.57 | | | | 2.63 | | | | 1,000.00 | | | | 1,022.27 | | | | 0.57 | | | | 2.90 | | |
| Class S | | | 1,000.00 | | | | 834.70 | | | | 0.82 | | | | 3.78 | | | | 1,000.00 | | | | 1,021.01 | | | | 0.82 | | | | 4.17 | | |
Effective September 6, 2008, the contractual obligations for ING Pioneer High Yield Portfolio have changed. If this change had been in place during the entire six-month period, actual and hypothetical ending account balances, annualized expense ratios and expenses paid would have been as follows:
| | | Actual Portfolio Return | | Hypothetical (5% return before expenses) | |
| ING Pioneer High Yield Portfolio | | Beginning
Account
Value
July 1,
2008 | | Ending
Account
Value
December 31,
2008 | | Annualized
Expense
Ratio | | Expenses Paid
During the
Period Ended
December 31,
2008** | | Beginning
Account
Value
July 1,
2008 | | Ending
Account
Value
December 31,
2008 | | Annualized
Expense
Ratio | | Expenses Paid
During the
Period Ended
December 31,
2008** | |
| Class ADV | | $ | 1,000.00 | | | $ | 716.00 | | | | 1.21 | % | | $ | 5.22 | | | $ | 1,000.00 | | | $ | 1,019.05 | | | | 1.21 | % | | $ | 6.14 | | |
| Class I | | | 1,000.00 | | | | 717.50 | | | | 0.71 | | | | 3.07 | | | | 1,000.00 | | | | 1,021.57 | | | | 0.71 | | | | 3.61 | | |
| Class S | | | 1,000.00 | | | | 716.60 | | | | 0.96 | | | | 4.14 | | | | 1,000.00 | | | | 1,020.31 | | | | 0.96 | | | | 4.88 | | |
* Expenses are equal to each Portfolio's respective annualized expense ratios multiplied by the average account value over the period, multiplied by 184/366 to reflect the most recent fiscal half-year.
** Expenses are equal to each Portfolio's respective annualized expense ratios, adjusted for contractual changes, multiplied by the average account value over the period, multiplied by 184/366 to reflect the most recent fiscal half-year.
47
REPORT OF INDEPENDENT REGISTERED PUBLIC ACCOUNTING FIRM
The Shareholders and Board of Trustees
ING Partners, Inc.
We have audited the accompanying statements of assets and liabilities, including the portfolios of investments, of ING American Century Large Company Value Portfolio, ING American Century Small-Mid Cap Value Portfolio, ING Baron Asset Portfolio, ING Baron Small Cap Growth Portfolio, ING Columbia Small Cap Value II Portfolio, ING Davis New York Venture Portfolio, ING JPMorgan Mid Cap Value Portfolio, ING Legg Mason Partners Aggressive Growth Portfolio, ING Neuberger Berman Partners Portfolio, ING Oppenheimer Global Portfolio, ING Oppenheimer Strategic Income Portfolio, ING PIMCO Total Return Portfolio, ING Pioneer High Yield Portfolio, ING T. Rowe Price Diversified Mid Cap Growth Portfolio, ING T. Rowe Price Growth Equity Portfolio, ING Templeton Foreign Equity Portfolio, ING Thornburg Value Portfolio, ING UBS U.S. Large Cap Equity Portfolio, ING Van Kampen Comstock Portfolio, and ING Van Kampen Equity and Income Portfolio, each a series of I NG Partners, Inc., as of December 31, 2008, and the related statements of operations for the year then ended, the statements of changes in net assets for each of the years in the two-year period then ended, and the financial highlights for each of the years or periods in the five-year period then ended. These financial statements and financial highlights are the responsibility of management. Our responsibility is to express an opinion on these financial statements and financial highlights based on our audits.
We conducted our audits in accordance with the standards of the Public Company Accounting Oversight Board (United States). Those standards require that we plan and perform the audit to obtain reasonable assurance about whether the financial statements and financial highlights are free of material misstatement. An audit includes examining, on a test basis, evidence supporting the amounts and disclosures in the financial statements. Our procedures included confirmation of securities owned as of December 31, 2008, by correspondence with the custodian and brokers, or by other appropriate auditing procedures when replies from brokers were not received. An audit also includes assessing the accounting principles used and significant estimates made by management, as well as evaluating the overall financial statement presentation. We believe that our audits provide a reasonable basis for our opinion.
In our opinion, the financial statements and financial highlights referred to above present fairly, in all material respects, the financial position of the aforementioned portfolios of ING Partners, Inc. as of December 31, 2008, and the results of their operations, the changes in their net assets, and the financial highlights for the periods specified in the first paragraph above, in conformity with U.S. generally accepted accounting principles.

Boston, Massachusetts
February 27, 2009
48
STATEMENTS OF ASSETS AND LIABILITIES AS OF DECEMBER 31, 2008
| | | ING
American Century Large
Company Value
Portfolio | | ING
American Century
Small-Mid Cap Value
Portfolio | | ING
Baron
Asset
Portfolio | | ING
Baron Small
Cap Growth
Portfolio | |
| ASSETS: | |
| Investments in securities at value+* | | $ | 14,666,768 | | | $ | 72,517,694 | | | $ | 6,087,121 | | | $ | 399,343,136 | | |
| Short-term investments** | | | 43,990 | | | | 3,548,271 | | | | — | | | | — | | |
| Short-term investments in affiliates*** | | | 645,059 | | | | 1,587,950 | | | | — | | | | 42,852,540 | | |
| Cash | | | — | | | | 602 | | | | 610,202 | | | | — | | |
| Receivables: | |
| Investment securities sold | | | 53,568 | | | | 2,089,671 | | | | — | | | | 1,688,090 | | |
| Fund shares sold | | | 28,583 | | | | 80,895 | | | | 4,684 | | | | 3,515,587 | | |
| Dividends and interest | | | 36,546 | | | | 246,788 | | | | 5,149 | | | | 298,522 | | |
| Variation margin | | | 7,338 | | | | — | | | | — | | | | — | | |
Unrealized appreciation on forward foreign
currency contracts | | | — | | | | 2,101 | | | | — | | | | — | | |
| Prepaid expenses | | | — | | | | — | | | | 142 | | | | — | | |
| Reimbursement due from manager | | | 1,246 | | | | 9,203 | | | | 2,814 | | | | — | | |
| Total assets | | | 15,483,098 | | | | 80,083,175 | | | | 6,710,112 | | | | 447,697,875 | | |
| LIABILITIES: | |
| Payable for investment securities purchased | | | 22,352 | | | | 1,269,044 | | | | — | | | | — | | |
| Payable for fund shares redeemed | | | 81,128 | | | | 85,362 | | | | 23,998 | | | | 680,179 | | |
| Payable upon receipt of securities loaned | | | 50,811 | | | | 3,598,795 | | | | — | | | | — | | |
Unrealized depreciation on forward foreign
currency contracts | | | — | | | | 8,141 | | | | — | | | | — | | |
| Payable to affiliates | | | 15,255 | | | | 79,080 | | | | 10,907 | | | | 443,633 | | |
| Payable to custodian due to bank overdraft | | | 198 | | | | — | | | | — | | | | — | | |
| Payable for directors fees | | | — | | | | — | | | | 2,349 | | | | — | | |
| Other accrued expenses and liabilities | | | — | | | | — | | | | 9,020 | | | | — | | |
| Total liabilities | | | 169,744 | | | | 5,040,422 | | | | 46,274 | | | | 1,123,812 | | |
| NET ASSETS | | $ | 15,313,354 | | | $ | 75,042,753 | | | $ | 6,663,838 | | | $ | 446,574,063 | | |
| NET ASSETS WERE COMPRISED OF: | |
| Paid-in capital | | $ | 33,209,817 | | | $ | 112,529,824 | | | $ | 10,869,320 | | | $ | 615,500,765 | | |
| Undistributed net investment income | | | 48,350 | | | | 1,607,412 | | | | 139 | | | | 23,826 | | |
Accumulated net realized loss on Investments,
foreign currency related
transactions, and futures | | | (11,446,312 | ) | | | (23,358,542 | ) | | | (1,245,269 | ) | | | (141,986,591 | ) | |
Net unrealized depreciation on investments,
foreign currency related
transactions, and futures | | | (6,498,501 | ) | | | (15,735,941 | ) | | | (2,960,352 | ) | | | (26,963,937 | ) | |
| NET ASSETS | | $ | 15,313,354 | | | $ | 75,042,753 | | | $ | 6,663,838 | | | $ | 446,574,063 | | |
| + Including securities loaned at value | | $ | 53,682 | | | $ | 3,616,563 | | | $ | — | | | $ | — | | |
| * Cost of investments in securities | | $ | 21,157,821 | | | $ | 88,196,961 | | | $ | 9,047,473 | | | $ | 426,307,073 | | |
| ** Cost of short-term investments | | $ | 50,811 | | | $ | 3,598,795 | | | $ | — | | | $ | — | | |
| *** Cost of short-term investments in affiliates | | $ | 645,059 | | | $ | 1,587,950 | | | $ | — | | | $ | 42,852,540 | | |
See Accompanying Notes to Financial Statements
49
STATEMENTS OF ASSETS AND LIABILITIES AS OF DECEMBER 31, 2008 (CONTINUED)
| | | ING
American Century Large
Company Value
Portfolio | | ING
American Century
Small-Mid Cap Value
Portfolio | | ING
Baron
Asset
Portfolio | | ING
Baron Small
Cap Growth
Portfolio | |
| Class ADV: | |
| Net assets | | $ | 2,096,985 | | | $ | 7,860,802 | | | $ | 1,645,532 | | | $ | 23,542,462 | | |
| Shares authorized | | | 100,000,000 | | | | 100,000,000 | | | | 100,000,000 | | | | 100,000,000 | | |
| Par value | | $ | 0.001 | | | $ | 0.001 | | | $ | 0.001 | | | $ | 0.001 | | |
| Shares outstanding | | | 451,784 | | | | 1,087,592 | | | | 235,881 | | | | 2,163,598 | | |
Net asset value and redemption
price per share | | $ | 4.64 | | | $ | 7.23 | | | $ | 6.98 | | | $ | 10.88 | | |
| Class I: | |
| Net assets | | $ | 5,460,537 | | | $ | 35,921,513 | | | $ | 1,747,782 | | | $ | 131,198,948 | | |
| Shares authorized | | | 100,000,000 | | | | 100,000,000 | | | | 100,000,000 | | | | 100,000,000 | | |
| Par value | | $ | 0.001 | | | $ | 0.001 | | | $ | 0.001 | | | $ | 0.001 | | |
| Shares outstanding | | | 1,184,330 | | | | 4,865,806 | | | | 247,104 | | | | 11,641,849 | | |
Net asset value and redemption
price per share | | $ | 4.61 | | | $ | 7.38 | | | $ | 7.07 | | | $ | 11.27 | | |
| Class S: | |
| Net assets | | $ | 7,755,832 | | | $ | 31,260,438 | | | $ | 3,270,524 | | | $ | 291,832,653 | | |
| Shares authorized | | | 100,000,000 | | | | 100,000,000 | | | | 100,000,000 | | | | 100,000,000 | | |
| Par value | | $ | 0.001 | | | $ | 0.001 | | | $ | 0.001 | | | $ | 0.001 | | |
| Shares outstanding | | | 1,661,318 | | | | 4,257,739 | | | | 465,869 | | | | 26,342,353 | | |
Net asset value and redemption
price per share | | $ | 4.67 | | | $ | 7.34 | | | $ | 7.02 | | | $ | 11.08 | | |
See Accompanying Notes to Financial Statements
50
STATEMENTS OF ASSETS AND LIABILITIES AS OF DECEMBER 31, 2008
| | | ING
Columbia Small
Cap Value II
Portfolio | | ING
Davis New
York Venture
Portfolio | | ING
JPMorgan
Mid Cap Value
Portfolio | | ING
Legg Mason
Partners
Aggressive Growth
Portfolio | |
| ASSETS: | |
| Investments in securities at value+* | | $ | 367,742,447 | | | $ | 317,699,457 | | | $ | 165,736,357 | | | $ | 534,056,774 | | |
| Short-term investments** | | | — | | | | — | | | | 13,084,960 | | | | 123,703 | | |
| Short-term investments in affiliates*** | | | 6,762,892 | | | | — | | | | 6,263,329 | | | | 10,685,626 | | |
| Short-term investments at amortized cost | | | — | | | | 31,607,168 | | | | — | | | | — | | |
| Cash | | | 1,741,660 | | | | 233,429 | | | | 15,726 | | | | 4,441 | | |
| Foreign currencies at value**** | | | — | | | | 522 | | | | — | | | | — | | |
| Receivables: | |
| Investment securities sold | | | 455,909 | | | | 464,696 | | | | 1,332,608 | | | | — | | |
| Fund shares sold | | | 674,066 | | | | 3,286,450 | | | | 78,929 | | | | 1,471,367 | | |
| Dividends and interest | | | 871,103 | | | | 352,891 | | | | 391,210 | | | | 383,437 | | |
| Prepaid expenses | | | 762 | | | | — | | | | — | | | | — | | |
| Total assets | | | 378,248,839 | | | | 353,644,613 | | | | 186,903,119 | | | | 546,725,348 | | |
| LIABILITIES: | |
| Payable for investment securities purchased | | | 1,323,669 | | | | — | | | | 54,922 | | | | 154,628 | | |
| Payable for fund shares redeemed | | | 135,827 | | | | 58,829 | | | | 702,266 | | | | 358,280 | | |
| Payable upon receipt of securities loaned | | | — | | | | — | | | | 13,247,554 | | | | — | | |
| Payable to affiliates | | | 280,299 | | | | 302,224 | | | | 155,386 | | | | 388,937 | | |
| Payable for directors fees | | | 2,148 | | | | — | | | | — | | | | — | | |
| Other accrued expenses and liabilities | | | 81,281 | | | | — | | | | — | | | | — | | |
| Total liabilities | | | 1,823,224 | | | | 361,053 | | | | 14,160,128 | | | | 901,845 | | |
| NET ASSETS | | $ | 376,425,615 | | | $ | 353,283,560 | | | $ | 172,742,991 | | | $ | 545,823,503 | | |
| NET ASSETS WERE COMPRISED OF: | |
| Paid-in capital | | $ | 536,784,326 | | | $ | 530,397,202 | | | $ | 245,770,877 | | | $ | 826,523,860 | | |
| Undistributed net investment income | | | 4,995,273 | | | | 2,934,589 | | | | 88,539 | | | | — | | |
Accumulated net realized loss on investments and
foreign currency related transactions | | | (50,049,407 | ) | | | (25,863,931 | ) | | | (8,442,648 | ) | | | (174,552,186 | ) | |
Net unrealized depreciation on
investments and foreign currency related transactions | | | (115,304,577 | ) | | | (154,184,300 | ) | | | (64,673,777 | ) | | | (106,148,171 | ) | |
| NET ASSETS | | $ | 376,425,615 | | | $ | 353,283,560 | | | $ | 172,742,991 | | | $ | 545,823,503 | | |
| + Including securities loaned at value | | $ | — | | | $ | — | | | $ | 13,147,685 | | | $ | — | | |
| * Cost of investments in securities | | $ | 483,047,024 | | | $ | 471,885,793 | | | $ | 230,247,540 | | | $ | 640,174,020 | | |
| ** Cost of short-term investments | | $ | — | | | $ | — | | | $ | 13,247,554 | | | $ | 154,628 | | |
| *** Cost of short-term investments in affiliates | | $ | 6,762,892 | | | $ | — | | | $ | 6,263,329 | | | $ | 10,685,626 | | |
| **** Cost of foreign currencies | | $ | — | | | $ | 535 | | | $ | — | | | $ | — | | |
See Accompanying Notes to Financial Statements
51
STATEMENTS OF ASSETS AND LIABILITIES AS OF DECEMBER 31, 2008 (CONTINUED)
| | | ING
Columbia Small
Cap Value II
Portfolio | | ING
Davis New
York Venture
Portfolio | | ING
JPMorgan
Mid Cap Value
Portfolio | | ING
Legg Mason
Partners
Aggressive Growth
Portfolio | |
| Class ADV: | |
| Net assets | | $ | 443,754 | | | $ | 5,661,855 | | | $ | 13,623,598 | | | $ | 3,631,098 | | |
| Shares authorized | | | 100,000,000 | | | | 100,000,000 | | | | 100,000,000 | | | | 100,000,000 | | |
| Par value | | $ | 0.001 | | | $ | 0.001 | | | $ | 0.001 | | | $ | 0.001 | | |
| Shares outstanding | | | 65,445 | | | | 471,108 | | | | 1,474,834 | | | | 128,012 | | |
| Net asset value and redemption price per share | | $ | 6.78 | | | $ | 12.02 | | | $ | 9.24 | | | $ | 28.37 | | |
| Class I: | |
| Net assets | | $ | 225,673,236 | | | $ | 133,935,839 | | | $ | 80,515,090 | | | $ | 455,681,822 | | |
| Shares authorized | | | 100,000,000 | | | | 100,000,000 | | | | 100,000,000 | | | | 100,000,000 | | |
| Par value | | $ | 0.001 | | | $ | 0.001 | | | $ | 0.001 | | | $ | 0.001 | | |
| Shares outstanding | | | 32,923,029 | | | | 10,871,394 | | | | 8,633,640 | | | | 15,512,779 | | |
| Net asset value and redemption price per share | | $ | 6.85 | | | $ | 12.32 | | | $ | 9.33 | | | $ | 29.37 | | |
| Class S: | |
| Net assets | | $ | 150,308,625 | | | $ | 213,685,866 | | | $ | 78,604,303 | | | $ | 86,510,583 | | |
| Shares authorized | | | 100,000,000 | | | | 100,000,000 | | | | 100,000,000 | | | | 100,000,000 | | |
| Par value | | $ | 0.001 | | | $ | 0.001 | | | $ | 0.001 | | | $ | 0.001 | | |
| Shares outstanding | | | 22,033,872 | | | | 17,538,509 | | | | 8,463,554 | | | | 2,997,332 | | |
| Net asset value and redemption price per share | | $ | 6.82 | | | $ | 12.18 | | | $ | 9.29 | | | $ | 28.86 | | |
See Accompanying Notes to Financial Statements
52
STATEMENTS OF ASSETS AND LIABILITIES AS OF DECEMBER 31, 2008
| | | ING
Neuberger Berman
Partners
Portfolio | | ING
Oppenheimer
Global
Portfolio | | ING
Oppenheimer
Strategic Income
Portfolio | | ING
PIMCO Total
Return
Portfolio | |
| ASSETS: | |
| Investments in securities at value+* | | $ | 241,289,905 | | | $ | 1,304,447,228 | | | $ | 463,612,564 | | | $ | 884,774,915 | | |
| Short-term investments** | | | — | | | | 131,116,555 | | | | 17,795,629 | | | | 20,288,173 | | |
| Short-term investments in affiliates*** | | | — | | | | 20,084,110 | | | | 67,160,961 | | | | — | | |
| Short-term investments at amortized cost | | | — | | | | — | | | | 50,980,240 | | | | 14,909,817 | | |
| Cash | | | 8,554,856 | | | | — | | | | — | | | | 6,028,938 | | |
| Cash collateral for futures | | | — | | | | — | | | | — | | | | 3,933,000 | | |
| Foreign currencies at value**** | | | — | | | | 535,622 | | | | — | | | | 7,239,490 | | |
| Receivables: | |
| Investment securities sold | | | 2,943,296 | | | | 117,573 | | | | 3,312,784 | | | | 1,489,518 | | |
Investment securities sold on a delayed-delivery
or when-issued basis | | | — | | | | — | | | | 1,658,001 | | | | 12,572,344 | | |
| Fund shares sold | | | 1,184,719 | | | | 1,337,144 | | | | 173,486 | | | | 301,790 | | |
| Dividends and interest | | | 518,540 | | | | 2,112,809 | | | | 6,665,225 | | | | 4,732,157 | | |
| Variation margin | | | — | | | | — | | | | 187,552 | | | | 12,287 | | |
Unrealized appreciation on forward foreign
currency contracts | | | — | | | | — | | | | 20,674,921 | | | | 646,476 | | |
| Upfront payments made on swap agreements | | | — | | | | — | | | | 2,646,196 | | | | 2,480,780 | | |
| Unrealized appreciation on swap agreements | | | — | | | | — | | | | 12,945,169 | | | | 5,086,541 | | |
| Unrealized appreciation on unfunded commitments | | | — | | | | — | | | | 275,749 | | | | — | | |
| Prepaid expenses | | | 1,784 | | | | — | | | | — | | | | — | | |
| Reimbursement due from manager | | | 31,876 | | | | — | | | | — | | | | — | | |
| Total assets | | | 254,524,976 | | | | 1,459,751,041 | | | | 648,088,477 | | | $ | 964,496,226 | | |
| LIABILITIES: | |
| Payable for investment securities purchased | | | 3,261,136 | | | | 2,987,676 | | | | 8,439,068 | | | | 4,570,111 | | |
Payable for investment securities purchased
on a delayed-delivery or when-issued basis | | | — | | | | — | | | | 17,844,787 | | | | 397,670,814 | | |
| Payable for fund shares redeemed | | | 38,001 | | | | 1,597,923 | | | | 968,825 | | | | 546,066 | | |
| Payable for futures variation margin | | | — | | | | — | | | | 869,587 | | | | 694,406 | | |
| Payable upon receipt of securities loaned | | | — | | | | 132,214,332 | | | | 15,242,603 | | | | 20,332,470 | | |
| Payable for terminated investment contracts (Note 14) | | | — | | | | — | | | | 2,433,179 | | | | 266,045 | | |
| Payable for collateral due to counterparties | | | — | | | | — | | | | — | | | | 2,010,000 | | |
Unrealized depreciation on
forward foreign currency contracts | | | — | | | | — | | | | 22,119,752 | | | | 2,195,103 | | |
| Upfront payments received on swap agreements | | | — | | | | — | | | | 5,428,112 | | | | 3,487,820 | | |
| Unrealized depreciation on swap agreements | | | — | | | | — | | | | 17,578,663 | | | | 26,077,325 | | |
| Payable to affiliates | | | 189,642 | | | | 750,015 | | | | 265,521 | | | | 326,515 | | |
| Payable to custodian due to bank overdraft | | | — | | | | — | | | | 520,066 | | | | — | | |
Payable to custodian due to foreign
currency overdraft***** | | | — | | | | — | | | | 165,895 | | | | — | | |
| Payable for directors fees | | | 7,092 | | | | — | | | | — | | | | — | | |
| Other accrued expenses and liabilities | | | 58,786 | | | | — | | | | 6,740 | | | | 4,688 | | |
| Written options^ | | | — | | | | — | | | | 23,201 | | | | 4,146,304 | | |
| Total liabilities | | | 3,554,657 | | | | 137,549,946 | | | | 91,905,999 | | | | 462,327,667 | | |
| NET ASSETS | | $ | 250,970,319 | | | $ | 1,322,201,095 | | | $ | 556,182,478 | | | $ | 502,168,559 | | |
| NET ASSETS WERE COMPRISED OF: | |
| Paid-in capital | | $ | 501,253,716 | | | $ | 1,716,163,398 | | | $ | 656,076,248 | | | $ | 495,681,990 | | |
| Undistributed net investment income | | | 2,624,225 | | | | 34,325,717 | | | | 13,599,645 | | | | 25,571,574 | | |
Accumulated net realized gain (loss) on investments,
foreign currency related transactions, futures,
swaps, written options, and sales commitments | | | (131,385,110 | ) | | | (11,042,670 | ) | | | (15,682,438 | ) | | | 16,286,357 | | |
Net unrealized depreciation on investments,
foreign currency related transactions, futures,
swaps, written options, and unfunded commitments | | | (121,522,512 | ) | | | (417,245,350 | ) | | | (97,810,977 | ) | | | (35,371,362 | ) | |
| NET ASSETS | | $ | 250,970,319 | | | $ | 1,322,201,095 | | | $ | 556,182,478 | | | $ | 502,168,559 | | |
| + Including securities loaned at value | | $ | — | | | $ | 118,751,371 | | | $ | 14,877,978 | | | $ | 19,932,705 | | |
| * Cost of investments in securities | | $ | 362,806,838 | | | $ | 1,720,605,939 | | | $ | 556,823,246 | | | $ | 908,045,177 | | |
| ** Cost of short-term investments | | $ | — | | | $ | 132,214,332 | | | $ | 17,941,955 | | | $ | 20,332,470 | | |
| *** Cost of short-term investments in affiliates | | $ | — | | | $ | 20,084,110 | | | $ | 67,160,961 | | | $ | — | | |
| **** Cost of foreign currencies | | $ | — | | | $ | 525,681 | | | $ | — | | | $ | 7,325,890 | | |
| ***** Cost of foreign currency overdraft | | $ | — | | | $ | — | | | $ | 165,682 | | | $ | — | | |
| ^ Premiums received on written options | | $ | — | | | $ | — | | | $ | 25,248 | | | $ | 1,146,887 | | |
See Accompanying Notes to Financial Statements
53
STATEMENTS OF ASSETS AND LIABILITIES AS OF DECEMBER 31, 2008 (CONTINUED)
| | | ING
Neuberger Berman
Partners
Portfolio | | ING
Oppenheimer
Global
Portfolio | | ING
Oppenheimer
Strategic Income
Portfolio | | ING
PIMCO Total
Return
Portfolio | |
| Class ADV: | |
| Net assets | | $ | 1,594 | | | $ | 40,813,076 | | | $ | 16,393,433 | | | $ | 44,599,220 | | |
| Shares authorized | | | 100,000,000 | | | | 100,000,000 | | | | 100,000,000 | | | | 100,000,000 | | |
| Par value | | $ | 0.001 | | | $ | 0.001 | | | $ | 0.001 | | | $ | 0.001 | | |
| Shares outstanding | | | 293 | | | | 4,639,131 | | | | 1,853,480 | | | | 4,089,645 | | |
| Net asset value and redemption price per share | | $ | 5.44 | | | $ | 8.80 | | | $ | 8.84 | | | $ | 10.91 | | |
| Class I: | |
| Net assets | | $ | 187,621,010 | | | $ | 1,124,126,933 | | | $ | 451,196,552 | | | $ | 265,310,543 | | |
| Shares authorized | | | 100,000,000 | | | | 250,000,000 | | | | 100,000,000 | | | | 100,000,000 | | |
| Par value | | $ | 0.001 | | | $ | 0.001 | | | $ | 0.001 | | | $ | 0.001 | | |
| Shares outstanding | | | 34,081,480 | | | | 123,942,541 | | | | 50,594,259 | | | | 23,954,247 | | |
| Net asset value and redemption price per share | | $ | 5.51 | | | $ | 9.07 | | | $ | 8.92 | | | $ | 11.08 | | |
| Class S: | |
| Net assets | | $ | 63,347,715 | | | $ | 157,261,086 | | | $ | 88,592,493 | | | $ | 192,258,796 | | |
| Shares authorized | | | 100,000,000 | | | | 100,000,000 | | | | 100,000,000 | | | | 100,000,000 | | |
| Par value | | $ | 0.001 | | | $ | 0.001 | | | $ | 0.001 | | | $ | 0.001 | | |
| Shares outstanding | | | 11,556,312 | | | | 17,820,457 | | | | 9,932,674 | | | | 17,468,586 | | |
| Net asset value and redemption price per share | | $ | 5.48 | | | $ | 8.82 | | | $ | 8.92 | | | $ | 11.01 | | |
See Accompanying Notes to Financial Statements
54
STATEMENTS OF ASSETS AND LIABILITIES AS OF DECEMBER 31, 2008
| | | ING
Pioneer High
Yield
Portfolio | | ING
T. Rowe Price
Diversified Mid Cap
Growth
Portfolio | | ING
T. Rowe Price
Growth Equity
Portfolio | | ING
Templeton
Foreign Equity
Portfolio | |
| ASSETS: | |
| Investments in securities at value+* | | $ | 236,381,059 | | | $ | 511,298,985 | | | $ | 837,024,600 | | | $ | 536,081,728 | | |
| Short-term investments** | | | — | | | | 40,336,507 | | | | 4,811,244 | | | | — | | |
| Short-term investments in affiliates*** | | | 41,944,919 | | | | — | | | | — | | | | — | | |
| Short-term investments at amortized cost | | | — | | | | 1,388,762 | | | | 23,328,156 | | | | 34,999,998 | | |
| Cash | | | — | | | | 488,294 | | | | 4,870,118 | | | | 7,512,979 | | |
| Foreign currencies at value**** | | | — | | | | 3,791 | | | | 18,283 | | | | 884,057 | | |
| Receivables: | |
| Investment securities sold | | | — | | | | — | | | | 282,497 | | | | 211 | | |
| Fund shares sold | | | 208,141 | | | | 392,046 | | | | 785,876 | | | | 3,766,784 | | |
| Dividends and interest | | | 5,915,501 | | | | 423,777 | | | | 1,473,500 | | | | 2,076,367 | | |
| Prepaid expenses | | | 401 | | | | — | | | | — | | | | 714 | | |
| Reimbursement due from manager | | | 6,974 | | | | — | | | | — | | | | — | | |
| Total assets | | | 284,456,995 | | | | 554,332,162 | | | | 872,594,274 | | | | 585,322,838 | | |
| LIABILITIES: | |
| Payable for investment securities purchased | | | 1,874,449 | | | | 74,058 | | | | 485,429 | | | | 767,808 | | |
| Payable for fund shares redeemed | | | 214,975 | | | | 577,470 | | | | 1,154,781 | | | | 886,815 | | |
| Payable upon receipt of securities loaned | | | — | | | | 41,021,680 | | | | 5,150,389 | | | | — | | |
| Income distribution payable | | | 920 | | | | — | | | | — | | | | — | | |
| Payable to affiliates | | | 142,880 | | | | 281,524 | | | | 566,702 | | | | 528,366 | | |
| Payable to custodian due to bank overdraft | | | 23,178 | | | | — | | | | — | | | | — | | |
| Payable for directors fees | | | 2,911 | | | | — | | | | — | | | | 2,798 | | |
| Other accrued expenses and liabilities | | | 87,157 | | | | — | | | | — | | | | 207,449 | | |
| Total liabilities | | | 2,346,470 | | | | 41,954,732 | | | | 7,357,301 | | | | 2,393,236 | | |
| NET ASSETS | | $ | 282,110,525 | | | $ | 512,377,430 | | | $ | 865,236,973 | | | $ | 582,929,602 | | |
| NET ASSETS WERE COMPRISED OF: | |
| Paid-in capital | | $ | 373,311,123 | | | $ | 776,055,083 | | | $ | 1,242,527,913 | | | $ | 916,108,951 | | |
| Undistributed net investment income | | | — | | | | 216,631 | | | | — | | | | 14,343 | | |
Accumulated net realized loss on investments
and foreign currency related transactions | | | (15,915,715 | ) | | | (16,360,916 | ) | | | (109,289,116 | ) | | | (35,222,274 | ) | |
Net unrealized depreciation on investments
and foreign currency related transactions | | | (75,284,883 | ) | | | (247,533,368 | ) | | | (268,001,824 | ) | | | (297,971,418 | ) | |
| NET ASSETS | | $ | 282,110,525 | | | $ | 512,377,430 | | | $ | 865,236,973 | | | $ | 582,929,602 | | |
| + Including securities loaned at value | | $ | — | | | $ | 40,917,865 | | | $ | 5,267,973 | | | $ | — | | |
| * Cost of investments in securities | | $ | 311,665,942 | | | $ | 758,147,138 | | | $ | 1,104,718,927 | | | $ | 833,996,992 | | |
| ** Cost of short-term investments | | $ | — | | | $ | 41,021,680 | | | $ | 5,150,389 | | | $ | — | | |
| *** Cost of short-term investments in affiliates | | $ | 41,944,919 | | | $ | — | | | $ | — | | | $ | — | | |
| **** Cost of foreign currencies | | $ | — | | | $ | 3,833 | | | $ | 18,485 | | | $ | 885,667 | | |
See Accompanying Notes to Financial Statements
55
STATEMENTS OF ASSETS AND LIABILITIES AS OF DECEMBER 31, 2008 (CONTINUED)
| | | ING
Pioneer High
Yield
Portfolio | | ING
T. Rowe Price
Diversified Mid Cap
Growth
Portfolio | | ING
T. Rowe Price
Growth Equity
Portfolio | | ING
Templeton
Foreign Equity
Portfolio | |
| Class ADV: | |
| Net assets | | $ | 772,604 | | | $ | 15,400,884 | | | $ | 49,551,082 | | | $ | 9,417,631 | | |
| Shares authorized | | | 100,000,000 | | | | 100,000,000 | | | | 100,000,000 | | | | 100,000,000 | | |
| Par value | | $ | 0.001 | | | $ | 0.001 | | | $ | 0.001 | | | $ | 0.001 | | |
| Shares outstanding | | | 118,676 | | | | 3,472,369 | | | | 1,533,499 | | | | 1,201,936 | | |
| Net asset value and redemption price per share | | $ | 6.51 | | | $ | 4.44 | | | $ | 32.31 | | | $ | 7.84 | | |
| Class I: | |
| Net assets | | $ | 279,168,309 | | | $ | 487,967,669 | | | $ | 745,789,863 | | | $ | 405,874,033 | | |
| Shares authorized | | | 100,000,000 | | | | 250,000,000 | | | | 100,000,000 | | | | 100,000,000 | | |
| Par value | | $ | 0.001 | | | $ | 0.001 | | | $ | 0.001 | | | $ | 0.001 | | |
| Shares outstanding | | | 42,827,116 | | | | 106,061,463 | | | | 22,822,930 | | | | 51,865,058 | | |
| Net asset value and redemption price per share | | $ | 6.52 | | | $ | 4.60 | | | $ | 32.68 | | | $ | 7.83 | | |
| Class S: | |
| Net assets | | $ | 2,169,612 | | | $ | 9,008,877 | | | $ | 69,896,028 | | | $ | 167,637,938 | | |
| Shares authorized | | | 100,000,000 | | | | 100,000,000 | | | | 100,000,000 | | | | 100,000,000 | | |
| Par value | | $ | 0.001 | | | $ | 0.001 | | | $ | 0.001 | | | $ | 0.001 | | |
| Shares outstanding | | | 332,563 | | | | 1,988,765 | | | | 2,154,064 | | | | 21,469,699 | | |
| Net asset value and redemption price per share | | $ | 6.52 | | | $ | 4.53 | | | $ | 32.45 | | | $ | 7.81 | | |
See Accompanying Notes to Financial Statements
56
STATEMENTS OF ASSETS AND LIABILITIES AS OF DECEMBER 31, 2008
| | | ING
Thornburg
Value
Portfolio | | ING
UBS U.S.
Large Cap Equity
Portfolio | | ING
Van Kampen
Comstock
Portfolio | | ING
Van Kampen
Equity and Income
Portfolio | |
| ASSETS: | |
| Investments in securities at value+* | | $ | 239,423,183 | | | $ | 258,823,327 | | | $ | 546,791,026 | | | $ | 679,729,030 | | |
| Short-term investments** | | | 14,985,514 | | | | 3,251,795 | | | | 5,698,201 | | | | — | | |
| Short-term investments in affiliates*** | | | 28,774,517 | | | | 1,812,774 | | | | — | | | | — | | |
| Cash | | | 72,907 | | | | — | | | | 28,317,218 | | | | 39,386,885 | | |
| Foreign currencies at value**** | | | — | | | | — | | | | — | | | | 3,914 | | |
| Receivables: | |
| Investment securities sold | | | 399,870 | | | | 176,528 | | | | 485,037 | | | | 711,439 | | |
| Fund shares sold | | | 199,537 | | | | 169,533 | | | | 746,561 | | | | 21,210 | | |
| Dividends and interest | | | 514,264 | | | | 606,794 | | | | 1,428,602 | | | | 3,045,574 | | |
| Prepaid expenses | | | — | | | | — | | | | — | | | | 336 | | |
| Reimbursement due from manager | | | — | | | | — | | | | 17,045 | | | | — | | |
| Total assets | | | 284,369,792 | | | | 264,840,751 | | | | 583,483,690 | | | | 722,898,388 | | |
| LIABILITIES: | |
| Payable for investment securities purchased | | | 3,772,956 | | | | 40,109 | | | | 8,179,271 | | | | 349,267 | | |
| Payable for fund shares redeemed | | | 56,115 | | | | 72,131 | | | | 187,556 | | | | 2,314,095 | | |
| Payable upon receipt of securities loaned | | | 15,093,475 | | | | 3,487,032 | | | | 5,891,520 | | | | — | | |
| Payable to affiliates | | | 193,984 | | | | 186,683 | | | | 458,554 | | | | 381,114 | | |
Payable to custodian due to foreign
currency overdraft***** | | | 409 | | | | — | | | | — | | | | — | | |
| Total liabilities | | | 19,116,939 | | | | 3,785,955 | | | | 14,716,901 | | | | 3,044,476 | | |
| NET ASSETS | | $ | 265,252,853 | | | $ | 261,054,796 | | | $ | 568,766,789 | | | $ | 719,853,912 | | |
| NET ASSETS WERE COMPRISED OF: | |
| Paid-in capital | | $ | 552,812,289 | | | $ | 455,050,402 | | | $ | 917,965,073 | | | $ | 894,492,779 | | |
| Undistributed net investment income | | | 3,486,313 | | | | 450,538 | | | | 1,191,721 | | | | 1,506,382 | | |
Accumulated net realized loss on investments,
foreign currency related transactions, and futures | | | (187,784,683 | ) | | | (79,073,719 | ) | | | (154,409,769 | ) | | | (70,801,888 | ) | |
Net unrealized depreciation on investments and
foreign currency related transactions | | | (103,261,066 | ) | | | (115,372,425 | ) | | | (195,980,236 | ) | | | (105,343,361 | ) | |
| NET ASSETS | | $ | 265,252,853 | | | $ | 261,054,796 | | | $ | 568,766,789 | | | $ | 719,853,912 | | |
| + Including securities loaned at value | | $ | 13,072,926 | | | $ | 3,438,514 | | | $ | 5,762,234 | | | $ | — | | |
| * Cost of investments in securities | | $ | 342,575,725 | | | $ | 373,960,515 | | | $ | 742,577,943 | | | $ | 785,073,120 | | |
| ** Cost of short-term investments | | $ | 15,093,475 | | | $ | 3,487,032 | | | $ | 5,891,520 | | | $ | — | | |
| *** Cost of short-term investments in affiliates | | $ | 28,774,517 | | | $ | 1,812,774 | | | $ | — | | | $ | — | | |
| **** Cost of foreign currencies | | $ | — | | | $ | — | | | $ | — | | | $ | 3,185 | | |
| ***** Cost of foreign currency overdraft | | $ | 371 | | | $ | — | | | $ | — | | | $ | — | | |
See Accompanying Notes to Financial Statements
57
STATEMENTS OF ASSETS AND LIABILITIES AS OF DECEMBER 31, 2008 (CONTINUED)
| | | ING
Thornburg
Value
Portfolio | | ING
UBS U.S.
Large Cap Equity
Portfolio | | ING
Van Kampen
Comstock
Portfolio | | ING
Van Kampen
Equity and Income
Portfolio | |
| Class ADV: | |
| Net assets | | $ | 2,280,741 | | | $ | 6,041,358 | | | $ | 13,777,914 | | | $ | 10,333,872 | | |
| Shares authorized | | | 100,000,000 | | | | 100,000,000 | | | | 100,000,000 | | | | 100,000,000 | | |
| Par value | | $ | 0.001 | | | $ | 0.001 | | | $ | 0.001 | | | $ | 0.001 | | |
| Shares outstanding | | | 114,274 | | | | 987,279 | | | | 1,943,014 | | | | 406,238 | | |
| Net asset value and redemption price per share | | $ | 19.96 | | | $ | 6.12 | | | $ | 7.09 | | | $ | 25.44 | | |
| Class I: | |
| Net assets | | $ | 256,368,592 | | | $ | 235,656,906 | | | $ | 357,862,649 | | | $ | 516,377,991 | | |
| Shares authorized | | | 100,000,000 | | | | 100,000,000 | | | | 100,000,000 | | | | 100,000,000 | | |
| Par value | | $ | 0.001 | | | $ | 0.001 | | | $ | 0.001 | | | $ | 0.001 | | |
| Shares outstanding | | | 12,577,714 | | | | 38,024,021 | | | | 50,227,536 | | | | 20,052,054 | | |
| Net asset value and redemption price per share | | $ | 20.38 | | | $ | 6.20 | | | $ | 7.12 | | | $ | 25.75 | | |
| Class S: | |
| Net assets | | $ | 6,603,520 | | | $ | 19,356,532 | | | $ | 197,126,226 | | | $ | 193,142,049 | | |
| Shares authorized | | | 100,000,000 | | | | 100,000,000 | | | | 100,000,000 | | | | 100,000,000 | | |
| Par value | | $ | 0.001 | | | $ | 0.001 | | | $ | 0.001 | | | $ | 0.001 | | |
| Shares outstanding | | | 325,943 | | | | 3,146,057 | | | | 27,680,092 | | | | 7,550,471 | | |
| Net asset value and redemption price per share | | $ | 20.26 | | | $ | 6.15 | | | $ | 7.12 | | | $ | 25.58 | | |
See Accompanying Notes to Financial Statements
58
STATEMENTS OF OPERATIONS FOR THE YEAR ENDED DECEMBER 31, 2008
| | | ING
American
Century
Large Company
Value
Portfolio | | ING
American
Century
Small-Mid Cap
Value
Portfolio | | ING
Baron
Asset
Portfolio | | ING
Baron
Small Cap
Growth
Portfolio | |
| INVESTMENT INCOME: | |
| Dividends, net of foreign taxes withheld*(1) | | $ | 1,414,626 | | | $ | 2,617,039 | | | $ | 93,971 | | | $ | 3,863,964 | | |
| Interest | | | 39,291 | | | | 9,068 | | | | 3,588 | | | | 576,531 | | |
| Securities lending income, net | | | 25,007 | | | | 81,775 | | | | — | | | | — | | |
| Total investment income | | | 1,478,924 | | | | 2,707,882 | | | | 97,559 | | | | 4,440,495 | | |
| EXPENSES: | |
| Investment management fees | | | 392,392 | | | | 885,499 | | | | 145,517 | | | | 4,804,907 | | |
| Distribution and service fees: | | | | | | | | | | | | | | | | | |
| Class ADV | | | 14,628 | | | | 51,858 | | | | 13,780 | | | | 190,236 | | |
| Class S | | | 31,381 | | | | 88,874 | | | | 9,934 | | | | 903,972 | | |
| Transfer agent fees | | | — | | | | — | | | | 770 | | | | — | | |
| Administrative service fees | | | 98,098 | | | | 221,375 | | | | 15,317 | | | | 1,300,163 | | |
| Shareholder reporting expense | | | — | | | | — | | | | 3,436 | | | | — | | |
| Registration fees | | | — | | | | — | | | | 23 | | | | — | | |
| Professional fees | | | — | | | | — | | | | 1,212 | | | | — | | |
| Custody and accounting expense | | | — | | | | — | | | | 5,128 | | | | — | | |
| Directors fees | | | — | | | | — | | | | 598 | | | | — | | |
| Miscellaneous expense | | | — | | | | — | | | | 7,151 | | | | — | | |
| Total expenses | | | 536,499 | | | | 1,247,606 | | | | 202,866 | | | | 7,199,278 | | |
| Net waived and reimbursed fees | | | (49,150 | ) | | | (204,237 | ) | | | (15,002 | ) | | | (82,255 | ) | |
| Net expenses | | | 487,349 | | | | 1,043,369 | | | | 187,864 | | | | 7,117,023 | | |
| Net investment income (loss) | | | 991,575 | | | | 1,664,513 | | | | (90,305 | ) | | | (2,676,528 | ) | |
REALIZED AND UNREALIZED GAIN (LOSS)
ON INVESTMENTS, FOREIGN CURRENCY
RELATED TRANSACTIONS, AND FUTURES: | |
| Net realized gain (loss) on: | |
| Investments | | | (9,611,414 | ) | | | (19,653,925 | ) | | | (1,241,430 | ) | | | (141,993,482 | ) | |
| Foreign currency related transactions | | | — | | | | 20,128 | | | | (256 | ) | | | — | | |
| Futures | | | (1,306,073 | ) | | | — | | | | — | | | | — | | |
Net realized loss on investments, foreign
currency related transactions, and futures | | | (10,917,487 | ) | | | (19,633,797 | ) | | | (1,241,686 | ) | | | (141,993,482 | ) | |
Net change in unrealized appreciation
or depreciation on: | |
| Investments | | | (6,923,359 | ) | | | (8,771,928 | ) | | | (5,407,522 | ) | | | (148,498,258 | ) | |
| Foreign currency related transactions | | | — | | | | (5,498 | ) | | | — | | | | — | | |
| Futures | | | 86,266 | | | | — | | | | — | | | | — | | |
Net change in unrealized appreciation
or depreciation on investments, foreign
currency related transactions, and futures | | | (6,837,093 | ) | | | (8,777,426 | ) | | | (5,407,522 | ) | | | (148,498,258 | ) | |
Net realized and unrealized loss on investments,
foreign currency related transactions, and futures | | | (17,754,580 | ) | | | (28,411,223 | ) | | | (6,649,208 | ) | | | (290,491,740 | ) | |
| Decrease in net assets resulting from operations | | $ | (16,763,005 | ) | | $ | (26,746,710 | ) | | $ | (6,739,513 | ) | | $ | (293,168,268 | ) | |
| * Foreign taxes withheld | | $ | 7,934 | | | $ | 2,896 | | | $ | 536 | | | $ | 21,171 | | |
| (1) Dividends from affiliates | | $ | 3,964 | | | $ | 14,477 | | | $ | — | | | $ | 261,291 | | |
See Accompanying Notes to Financial Statements
59
STATEMENTS OF OPERATIONS FOR THE YEAR ENDED DECEMBER 31, 2008
| | | ING
Columbia
Small Cap
Value II
Portfolio | | ING
Davis
New York
Venture
Portfolio | | ING
JPMorgan
Mid Cap
Value
Portfolio | | ING
Legg Mason
Partners Aggressive
Growth
Portfolio | |
| INVESTMENT INCOME: | |
| Dividends, net of foreign taxes withheld*(1) | | $ | 8,438,929 | | | $ | 6,625,251 | | | $ | 4,931,438 | | | $ | 6,024,063 | | |
| Interest | | | 183,618 | | | | 552,419 | | | | 94,911 | | | | 227,433 | | |
| Securities lending income, net | | | — | | | | — | | | | 197,634 | | | | 773,292 | | |
| Total investment income | | | 8,622,547 | | | | 7,177,670 | | | | 5,223,983 | | | | 7,024,788 | | |
| EXPENSES: | |
| Investment management fees | | | 2,651,583 | | | | 3,163,478 | | | | 1,574,829 | | | | 6,107,349 | | |
| Distribution and service fees: | | | | | | | | | | | | | | | | | |
| Class ADV | | | 2,264 | | | | 41,524 | | | | 95,292 | | | | 29,492 | | |
| Class S | | | 415,167 | | | | 593,870 | | | | 202,780 | | | | 327,262 | | |
| Transfer agent fees | | | 994 | | | | — | | | | — | | | | — | | |
| Administrative service fees | | | 353,539 | | | | 395,429 | | | | 524,943 | | | | 1,171,490 | | |
| Shareholder reporting expense | | | 63,148 | | | | — | | | | — | | | | — | | |
| Registration fees | | | 235 | | | | — | | | | — | | | | — | | |
| Professional fees | | | 25,103 | | | | — | | | | — | | | | — | | |
| Custody and accounting expense | | | 98,376 | | | | — | | | | — | | | | — | | |
| Directors fees | | | 10,450 | | | | — | | | | — | | | | — | | |
| Miscellaneous expense | | | 8,850 | | | | — | | | | — | | | | — | | |
| Total expenses | | | 3,629,709 | | | | 4,194,301 | | | | 2,397,844 | | | | 7,635,593 | | |
| Net waived and reimbursed fees | | | (2,168 | ) | | | — | | | | (1,306 | ) | | | (6,425 | ) | |
| Brokerage commission recapture | | | (83,041 | ) | | | — | | | | — | | | | — | | |
| Net expenses | | | 3,544,500 | | | | 4,194,301 | | | | 2,396,538 | | | | 7,629,168 | | |
| Net investment income (loss) | | | 5,078,047 | | | | 2,983,369 | | | | 2,827,445 | | | | (604,380 | ) | |
REALIZED AND UNREALIZED GAIN (LOSS)
ON INVESTMENTS AND FOREIGN CURRENCY
RELATED TRANSACTIONS: | |
| Net realized gain (loss) on: | |
| Investments | | | (49,907,569 | ) | | | (25,655,197 | ) | | | (8,271,977 | ) | | | 38,163,206 | | |
| Foreign currency related transactions | | | — | | | | (43,799 | ) | | | — | | | | — | | |
Net realized gain (loss) on investments and foreign
currency related transactions | | | (49,907,569 | ) | | | (25,698,996 | ) | | | (8,271,977 | ) | | | 38,163,206 | | |
Net change in unrealized appreciation
or depreciation on: | |
| Investments | | | (114,109,681 | ) | | | (174,939,737 | ) | | | (76,236,525 | ) | | | (425,820,606 | ) | |
| Foreign currency related transactions | | | — | | | | 4,827 | | | | — | | | | — | | |
Net change in unrealized appreciation
or depreciation on investments and foreign
currency related transactions | | | (114,109,681 | ) | | | (174,934,910 | ) | | | (76,236,525 | ) | | | (425,820,606 | ) | |
Net realized and unrealized loss on investments
and foreign currency related transactions | | | (164,017,250 | ) | | | (200,633,906 | ) | | | (84,508,502 | ) | | | (387,657,400 | ) | |
| Decrease in net assets resulting from operations | | $ | (158,939,203 | ) | | $ | (197,650,537 | ) | | $ | (81,681,057 | ) | | $ | (388,261,780 | ) | |
| * Foreign taxes withheld | | $ | 59 | | | $ | 81,772 | | | $ | 14,113 | | | $ | 42,077 | | |
| (1) Dividends from affiliates | | $ | 56,754 | | | $ | — | | | $ | 34,131 | | | $ | 163,755 | | |
See Accompanying Notes to Financial Statements
60
STATEMENTS OF OPERATIONS FOR THE YEAR ENDED DECEMBER 31, 2008
| | | ING
Neuberger
Berman
Partners
Portfolio | | ING
Oppenheimer
Global
Portfolio | | ING
Oppenheimer
Strategic
Income
Portfolio | | ING
PIMCO Total
Return
Portfolio | |
| INVESTMENT INCOME: | |
| Dividends, net of foreign taxes withheld*(1) | | $ | 5,707,179 | | | $ | 49,592,116 | | | $ | 393,131 | | | $ | 343,905 | | |
| Interest | | | 13,635 | | | | 251,868 | | | | 34,266,493 | | | | 25,232,597 | | |
| Securities lending income, net | | | — | | | | 4,392,538 | | | | 309,044 | | | | 72,108 | | |
| Total investment income | | | 5,720,814 | | | | 54,236,522 | | | | 34,968,668 | | | | 25,648,610 | | |
| EXPENSES: | |
| Investment management fees | | | 2,490,516 | | | | 11,909,749 | | | | 3,133,756 | | | | 2,465,411 | | |
| Distribution and service fees: | | | | | | | | | | | | | | | | | |
| Class ADV | | | 12 | | | | 361,184 | | | | 109,932 | | | | 212,974 | | |
| Class S | | | 292,092 | | | | 516,220 | | | | 225,844 | | | | 416,300 | | |
| Transfer agent fees | | | 696 | | | | — | | | | — | | | | — | | |
| Administrative service fees | | | 415,081 | | | | 1,190,945 | | | | 249,003 | | | | 787,921 | | |
| Shareholder reporting expense | | | 69,912 | | | | — | | | | — | | | | — | | |
| Registration fees | | | 323 | | | | — | | | | — | | | | — | | |
| Professional fees | | | 48,746 | | | | — | | | | — | | | | — | | |
| Custody and accounting expense | | | 51,231 | | | | — | | | | — | | | | — | | |
| Directors fees | | | 15,006 | | | | — | | | | — | | | | — | | |
| Miscellaneous expense | | | 12,879 | | | | — | | | | — | | | | — | | |
| Total expenses | | | 3,396,494 | | | | 13,978,098 | | | | 3,718,535 | | | | 3,882,606 | | |
| Net waived and reimbursed fees | | | (351,898 | ) | | | (5,293 | ) | | | (98,182 | ) | | | (30,979 | ) | |
| Net expenses | | | 3,044,596 | | | | 13,972,805 | | | | 3,620,353 | | | | 3,851,627 | | |
| Net investment income | | | 2,676,218 | | | | 40,263,717 | | | | 31,348,315 | | | | 21,796,983 | | |
REALIZED AND UNREALIZED GAIN (LOSS)
ON INVESTMENTS, FUTURES, WRITTEN OPTIONS,
SWAPS, SALES COMMITMENTS,
AND UNFUNDED COMMITMENTS: | |
| Net realized gain (loss) on: | |
| Investments | | | (117,953,182 | ) | | | 874,216 | | | | (14,810,681 | ) | | | 23,853,246 | | |
| Foreign currency related transactions | | | (45,555 | ) | | | (1,045,861 | ) | | | (1,433,099 | ) | | | 4,418,315 | | |
| Futures | | | — | | | | — | | | | 11,239,552 | | | | 14,126,840 | | |
| Swaps | | | — | | | | — | | | | (30,906,775 | ) | | | (701,181 | ) | |
| Written options | | | — | | | | — | | | | 3,004,990 | | | | (6,157,009 | ) | |
| Sales commitments | | | — | | | | — | | | | — | | | | (3,942,544 | ) | |
Net realized gain (loss) on
investments, foreign currency
related transactions, futures,
swaps, written options, and sales commitments | | | (117,998,737 | ) | | | (171,645 | ) | | | (32,906,013 | ) | | | 31,597,667 | | |
Net change in unrealized appreciation
or depreciation on: | |
| Investments** | | | (190,064,282 | ) | | | (1,010,135,139 | ) | | | (102,798,776 | ) | | | (31,060,229 | ) | |
| Foreign currency related transactions | | | (5,579 | ) | | | 4,341 | | | | (3,235,503 | ) | | | (3,801,908 | ) | |
| Futures | | | — | | | | — | | | | 1,361,808 | | | | 4,951,475 | | |
| Swaps | | | — | | | | — | | | | (3,996,266 | ) | | | (24,249,101 | ) | |
| Written options | | | — | | | | — | | | | (40,661 | ) | | | 289,778 | | |
| Sales commitments | | | — | | | | — | | | | (210 | ) | | | 151,985 | | |
| Unfunded commitments | | | — | | | | — | | | | 275,749 | | | | — | | |
Net change in unrealized appreciation or depreciation
on investments, foreign currency related transactions,
futures, swaps, written options, sales commitments,
and undfunded commitments | | | (190,069,861 | ) | | | (1,010,130,798 | ) | | | (108,433,859 | ) | | | (53,718,000 | ) | |
Net realized and unrealized loss on investments,
foreign currency related transactions, futures, swaps,
written options, sales commitments,
and unfunded commitments | | | (308,068,598 | ) | | | (1,010,302,443 | ) | | | (141,339,872 | ) | | | (22,120,333 | ) | |
| Decrease in net assets resulting from operations | | $ | (305,392,380 | ) | | $ | (970,038,726 | ) | | $ | (109,991,557 | ) | | $ | (323,350 | ) | |
| * Foreign taxes withheld | | $ | 17,680 | | | $ | 4,248,107 | | | $ | 32,780 | | | $ | 4,754 | | |
| ** Foreign tax accrued on Indian investments | | $ | — | | | $ | 9,875 | | | $ | — | | | $ | — | | |
| (1) Dividends from affiliates | | $ | — | | | $ | 137,526 | | | $ | 337,629 | | | $ | — | | |
See Accompanying Notes to Financial Statements
61
STATEMENTS OF OPERATIONS FOR THE YEAR ENDED DECEMBER 31, 2008
| | | ING
Pioneer High
Yield
Portfolio | | ING
T. Rowe Price
Diversified
Mid Cap
Growth
Portfolio | | ING
T. Rowe Price
Growth Equity
Portfolio | | ING
Templeton
Foreign
Equity
Portfolio | |
| INVESTMENT INCOME: | |
| Dividends, net of foreign taxes withheld*(1) | | $ | 832,434 | | | $ | 6,563,540 | | | $ | 13,770,198 | | | $ | 21,620,728 | | |
| Interest | | | 14,477,814 | | | | 1,604 | | | | 206,968 | | | | 958,263 | | |
| Securities lending income, net | | | — | | | | 921,145 | | | | 748,533 | | | | 95,734 | | |
| Total investment income | | | 15,310,248 | | | | 7,486,289 | | | | 14,725,699 | | | | 22,674,725 | | |
| EXPENSES: | |
| Investment management fees | | | 965,933 | | | | 5,219,296 | | | | 7,622,916 | | | | 4,748,210 | | |
| Distribution and service fees: | | | | | | | | | | | | | | | | | |
| Class ADV | | | 4,848 | | | | 140,112 | | | | 404,518 | | | | 43,126 | | |
| Class S | | | 9,266 | | | | 29,535 | | | | 215,176 | | | | 501,360 | | |
| Transfer agent fees | | | 1,169 | | | | — | | | | — | | | | 1,275 | | |
| Administrative service fees | | | 160,987 | | | | 163,089 | | | | 1,905,557 | | | | 604,395 | | |
| Shareholder reporting expense | | | 12,070 | | | | — | | | | — | | | | 81,832 | | |
| Registration fees | | | — | | | | — | | | | — | | | | 367 | | |
| Professional fees | | | 7,466 | | | | — | | | | — | | | | 49,442 | | |
| Custody and accounting expense | | | 19,130 | | | | — | | | | — | | | | 255,860 | | |
| Directors fees | | | 2,928 | | | | — | | | | — | | | | 16,494 | | |
| Miscellaneous expense | | | 15,530 | | | | — | | | | — | | | | 38,572 | | |
| Total expenses | | | 1,199,327 | | | | 5,552,032 | | | | 10,148,167 | | | | 6,340,933 | | |
| Net recouped (waived and reimbursed) fees | | | (17,209 | ) | | | — | | | | (71,722 | ) | | | 71,653 | | |
| Brokerage commission recapture | | | (1,909 | ) | | | (1,457 | ) | | | (32,890 | ) | | | (755 | ) | |
| Net expenses | | | 1,180,209 | | | | 5,550,575 | | | | 10,043,555 | | | | 6,411,831 | | |
| Net investment income | | | 14,130,039 | | | | 1,935,714 | | | | 4,682,144 | | | | 16,262,894 | | |
REALIZED AND UNREALIZED GAIN (LOSS) ON
INVESTMENTS, FOREIGN CURRENCY RELATED
TRANSACTIONS, AND PAYMENTS BY AFFILIATES: | |
| Net realized gain (loss) on: | |
| Investments | | | (7,358,005 | ) | | | (14,210,097 | ) | | | (103,404,968 | ) | | | (34,033,057 | ) | |
| Foreign currency related transactions | | | — | | | | 394 | | | | (913,811 | ) | | | 1,154,891 | | |
| Payments by affiliates (Note 18) | | | 30,107 | | | | — | | | | — | | | | — | | |
Net realized loss on investments, foreign
currency related transactions,
and payments by affiliates | | | (7,327,898 | ) | | | (14,209,703 | ) | | | (104,318,779 | ) | | | (32,878,166 | ) | |
Net change in unrealized appreciation
or depreciation on: | |
| Investments** | | | (71,064,875 | ) | | | (402,305,838 | ) | | | (536,987,111 | ) | | | (344,441,217 | ) | |
| Foreign currency related transactions | | | — | | | | — | | | | 6,053 | | | | (32,129 | ) | |
Net change in unrealized appreciation
or depreciation on investments and foreign
currency related transactions | | | (71,064,875 | ) | | | (402,305,838 | ) | | | (536,981,058 | ) | | | (344,473,346 | ) | |
Net realized and unrealized loss on investments,
foreign currency related transactions,
and payments by affiliates | | | (78,392,773 | ) | | | (416,515,541 | ) | | | (641,299,837 | ) | | | (377,351,512 | ) | |
| Decrease in net assets resulting from operations | | $ | (64,262,734 | ) | | $ | (414,579,827 | ) | | $ | (636,617,693 | ) | | $ | (361,088,618 | ) | |
| * Foreign taxes withheld | | $ | 375 | | | $ | 39,312 | | | $ | 440,722 | | | $ | 2,394,209 | | |
| ** Foreign tax accrued on Indian investments | | $ | — | | | $ | — | | | $ | 1,127,203 | | | $ | 76,793 | | |
| (1) Dividends from affiliates | | $ | 87,993 | | | $ | — | | | $ | — | | | $ | — | | |
See Accompanying Notes to Financial Statements
62
STATEMENTS OF OPERATIONS FOR THE YEAR ENDED DECEMBER 31, 2008
| | | ING
Thornburg
Value
Portfolio | | ING
UBS U.S.
Large Cap Equity
Portfolio | | ING
Van Kampen
Comstock
Portfolio | | ING
Van Kampen
Equity and Income
Portfolio | |
| INVESTMENT INCOME: | |
| Dividends, net of foreign taxes withheld*(1) | | $ | 5,733,794 | | | $ | 7,988,561 | | | $ | 23,782,129 | | | $ | 16,210,282 | | |
| Interest | | | 356,699 | | | | 90,373 | | | | 511,477 | | | | 11,982,041 | | |
| Securities lending income, net | | | 418,048 | | | | 253,615 | | | | 449,370 | | | | 3,489 | | |
| Total investment income | | | 6,508,541 | | | | 8,332,549 | | | | 24,742,976 | | | | 28,195,812 | | |
| EXPENSES: | |
| Investment management fees | | | 2,058,151 | | | | 2,582,685 | | | | 4,931,226 | | | | 4,731,858 | | |
| Distribution and service fees: | | | | | | | | | | | | | | | | | |
| Class ADV | | | 17,478 | | | | 43,826 | | | | 132,378 | | | | 63,082 | | |
| Class S | | | 24,673 | | | | 82,152 | | | | 673,538 | | | | 460,295 | | |
| Administrative service fees | | | 791,461 | | | | 553,437 | | | | 2,054,683 | | | | 172,053 | | |
| Directors fees | | | — | | | | — | | | | — | | | | 362 | | |
| Miscellaneous expense | | | — | | | | — | | | | — | | | | 545 | | |
| Total expenses | | | 2,891,763 | | | | 3,262,100 | | | | 7,791,825 | | | | 5,428,195 | | |
| Net waived and reimbursed fees | | | (5,004 | ) | | | (949 | ) | | | (330,050 | ) | | | — | | |
| Brokerage commission recapture | | | — | | | | (58,661 | ) | | | — | | | | — | | |
| Net expenses | | | 2,886,759 | | | | 3,202,490 | | | | 7,461,775 | | | | 5,428,195 | | |
| Net investment income | | | 3,621,782 | | | | 5,130,059 | | | | 17,281,201 | | | | 22,767,617 | | |
REALIZED AND UNREALIZED GAIN (LOSS)
ON INVESTMENTS, FOREIGN CURRENCY
RELATED TRANSACTIONS, AND FUTURES: | |
| Net realized loss on: | |
| Investments | | | (42,695,383 | ) | | | (43,759,073 | ) | | | (153,164,561 | ) | | | (66,517,091 | ) | |
| Foreign currency related transactions | | | (132,489 | ) | | | — | | | | — | | | | (13,299 | ) | |
| Futures | | | — | | | | — | | | | — | | | | 121,827 | | |
Net realized loss on investments, foreign currency
related transactions, and futures | | | (42,827,872 | ) | | | (43,759,073 | ) | | | (153,164,561 | ) | | | (66,408,563 | ) | |
Net change in unrealized appreciation
or depreciation on: | |
| Investments | | | (112,923,798 | ) | | | (138,249,926 | ) | | | (218,129,573 | ) | | | (183,213,451 | ) | |
| Foreign currency related transactions | | | (3,673 | ) | | | — | | | | — | | | | 204 | | |
Net change in unrealized appreciation
or depreciation on investments and foreign
currency related transactions | | | (112,927,471 | ) | | | (138,249,926 | ) | | | (218,129,573 | ) | | | (183,213,247 | ) | |
Net realized and unrealized loss on investments,
foreign currency related transactions, and futures | | | (155,755,343 | ) | | | (182,008,999 | ) | | | (371,294,134 | ) | | | (249,621,810 | ) | |
| Decrease in net assets resulting from operations | | $ | (152,133,561 | ) | | $ | (176,878,940 | ) | | $ | (354,012,933 | ) | | $ | (226,854,193 | ) | |
| * Foreign taxes withheld | | $ | 156,401 | | | $ | 3,175 | | | $ | 151,460 | | | $ | 346,216 | | |
| (1) Dividends from affiliates | | $ | 128,112 | | | $ | 26,014 | | | $ | — | | | $ | — | | |
See Accompanying Notes to Financial Statements
63
STATEMENTS OF CHANGES IN NET ASSETS
| | | ING American Century
Large Company Value Portfolio | | ING American Century
Small-Mid Cap Value Portfolio | |
| | | Year
Ended
December 31,
2008 | | Year
Ended
December 31,
2007 | | Year
Ended
December 31,
2008 | | Year
Ended
December 31,
2007 | |
| FROM OPERATIONS: | |
| Net investment income | | $ | 991,575 | | | $ | 1,968,839 | | | $ | 1,664,513 | | | $ | 979,713 | | |
Net realized gain (loss) on investments, foreign currency
related transactions, and futures | | | (10,917,487 | ) | | | 8,794,610 | | | | (19,633,797 | ) | | | 9,701,759 | | |
Net change in unrealized appreciation or depreciation on
investments, foreign currency related transactions,
and futures | | | (6,837,093 | ) | | | (13,657,697 | ) | | | (8,777,426 | ) | | | (13,408,442 | ) | |
| Decrease in net assets resulting from operations | | | (16,763,005 | ) | | | (2,894,248 | ) | | | (26,746,710 | ) | | | (2,726,970 | ) | |
| FROM DISTRIBUTIONS TO SHAREHOLDERS: | |
| Net investment income: | | | | | | | | | | | | | | | | | |
| Class ADV | | | (330,589 | ) | | | (99,016 | ) | | | (52,433 | ) | | | (24,752 | ) | |
| Class I | | | (1,044,372 | ) | | | (1,330,944 | ) | | | (470,920 | ) | | | (302,597 | ) | |
| Class S | | | (1,529,165 | ) | | | (256,957 | ) | | | (286,055 | ) | | | (181,755 | ) | |
| Net realized gains: | | | | | | | | | | | | | | | | | |
| Class ADV | | | (1,103,337 | ) | | | (693,173 | ) | | | (1,361,076 | ) | | | (1,692,685 | ) | |
| Class I | | | (2,919,108 | ) | | | (5,750,073 | ) | | | (5,384,236 | ) | | | (5,866,192 | ) | |
| Class S | | | (4,695,828 | ) | | | (1,415,763 | ) | | | (4,599,777 | ) | | | (5,719,356 | ) | |
| Total distributions | | | (11,622,399 | ) | | | (9,545,926 | ) | | | (12,154,497 | ) | | | (13,787,337 | ) | |
| FROM CAPITAL SHARE TRANSACTIONS: | |
| Net proceeds from sale of shares | | | 21,843,681 | | | | 74,727,098 | | | | 21,014,161 | | | | 23,051,965 | | |
| Reinvestment of distributions | | | 11,622,399 | | | | 9,545,926 | | | | 12,154,497 | | | | 13,787,337 | | |
| | | | 33,466,080 | | | | 84,273,024 | | | | 33,168,658 | | | | 36,839,302 | | |
| Cost of shares redeemed | | | (120,411,184 | ) | | | (56,986,540 | ) | | | (18,922,252 | ) | | | (29,156,836 | ) | |
Net increase (decrease) in net assets resulting from capital
share transactions | | | (86,945,104 | ) | | | 27,286,484 | | | | 14,246,406 | | | | 7,682,466 | | |
| Net increase (decrease) in net assets | | | (115,330,508 | ) | | | 14,846,310 | | | | (24,654,801 | ) | | | (8,831,841 | ) | |
| NET ASSETS: | |
| Beginning of year | | | 130,643,862 | | | | 115,797,552 | | | | 99,697,554 | | | | 108,529,395 | | |
| End of year | | $ | 15,313,354 | | | $ | 130,643,862 | | | $ | 75,042,753 | | | $ | 99,697,554 | | |
| Undistributed net investment income at end of year | | $ | 48,350 | | | $ | 1,963,858 | | | $ | 1,607,412 | | | $ | 876,695 | | |
See Accompanying Notes to Financial Statements
64
STATEMENTS OF CHANGES IN NET ASSETS
| | | ING Baron Asset Portfolio | | ING Baron Small Cap
Growth Portfolio | |
| | | Year
Ended
December 31,
2008 | | Year
Ended
December 31,
2007 | | Year
Ended
December 31,
2008 | | Year
Ended
December 31,
2007 | |
| FROM OPERATIONS: | |
| Net investment loss | | $ | (90,305 | ) | | $ | (7,081 | ) | | $ | (2,676,528 | ) | | $ | (1,662,178 | ) | |
Net realized gain (loss) on investments and foreign currency
related transactions | | | (1,241,686 | ) | | | 362,294 | | | | (141,993,482 | ) | | | 20,624,026 | | |
Net change in unrealized appreciation or depreciation on
investments | | | (5,407,522 | ) | | | 1,314,017 | | | | (148,498,258 | ) | | | 10,257,100 | | |
| Increase (decrease) in net assets resulting from operations | | | (6,739,513 | ) | | | 1,669,230 | | | | (293,168,268 | ) | | | 29,218,948 | | |
| FROM DISTRIBUTIONS TO SHAREHOLDERS: | |
| Net realized gains: | | | | | | | | | | | | | | | | | |
| Class ADV | | | (45,629 | ) | | | — | | | | (1,313,418 | ) | | | — | | |
| Class I | | | (39,018 | ) | | | — | | | | (5,600,475 | ) | | | — | | |
| Class S | | | (61,397 | ) | | | — | | | | (12,175,271 | ) | | | — | | |
| Total distributions | | | (146,044 | ) | | | — | | | | (19,089,164 | ) | | | — | | |
| FROM CAPITAL SHARE TRANSACTIONS: | |
| Net proceeds from sale of shares | | | 6,282,750 | | | | 26,601,942 | | | | 191,045,184 | | | | 241,145,808 | | |
| Reinvestment of distributions | | | 107,025 | | | | — | | | | 19,089,164 | | | | — | | |
| | | | 6,389,775 | | | | 26,601,942 | | | | 210,134,348 | | | | 241,145,808 | | |
| Cost of shares redeemed | | | (26,851,287 | ) | | | (3,367,729 | ) | | | (96,549,470 | ) | | | (100,775,969 | ) | |
Net increase (decrease) in net assets resulting from capital
share transactions | | | (20,461,512 | ) | | | 23,234,213 | | | | 113,584,878 | | | | 140,369,839 | | |
| Net increase (decrease) in net assets | | | (27,347,069 | ) | | | 24,903,443 | | | | (198,672,554 | ) | | | 169,588,787 | | |
| NET ASSETS: | |
| Beginning of year | | | 34,010,907 | | | | 9,107,464 | | | | 645,246,617 | | | | 475,657,830 | | |
| End of year | | $ | 6,663,838 | | | $ | 34,010,907 | | | $ | 446,574,063 | | | $ | 645,246,617 | | |
| Undistributed net investment income at end of year | | $ | 139 | | | $ | — | | | $ | 23,826 | | | $ | 23,826 | | |
See Accompanying Notes to Financial Statements
65
STATEMENTS OF CHANGES IN NET ASSETS
| | | ING Columbia Small Cap
Value II Portfolio | | ING Davis New York
Venture Portfolio | |
| | | Year
Ended
December 31,
2008 | | Year
Ended
December 31,
2007 | | Year
Ended
December 31,
2008 | | Year
Ended
December 31,
2007 | |
| FROM OPERATIONS: | |
| Net investment income | | $ | 5,078,047 | | | $ | 965,561 | | | $ | 2,983,369 | | | $ | 3,584,456 | | |
Net realized gain (loss) on investments and foreign currency
related transactions | | | (49,907,569 | ) | | | 4,558,621 | | | | (25,698,996 | ) | | | 4,428,969 | | |
Net change in unrealized appreciation or depreciation on
investments and foreign currency related transactions | | | (114,109,681 | ) | | | (6,366,221 | ) | | | (174,934,910 | ) | | | 1,102,011 | | |
| Increase (decrease) in net assets resulting from operations | | | (158,939,203 | ) | | | (842,039 | ) | | | (197,650,537 | ) | | | 9,115,436 | | |
| FROM DISTRIBUTIONS TO SHAREHOLDERS: | |
| Net investment income: | | | | | | | | | | | | | | | | | |
| Class ADV | | | (902 | ) | | | (226 | ) | | | (19,106 | ) | | | — | | |
| Class I | | | (726,065 | ) | | | (20,982 | ) | | | (1,684,243 | ) | | | (284,154 | ) | |
| Class S | | | (158,973 | ) | | | (149,906 | ) | | | (1,840,225 | ) | | | (483,957 | ) | |
| Net realized gains: | | | | | | | | | | | | | | | | | |
| Class ADV | | | (4,862 | ) | | | — | | | | (87,886 | ) | | | (34,332 | ) | |
| Class I | | | (2,457,450 | ) | | | — | | | | (1,944,357 | ) | | | (303,465 | ) | |
| Class S | | | (1,601,218 | ) | | | — | | | | (2,647,445 | ) | | | (726,408 | ) | |
| Total distributions | | | (4,949,470 | ) | | | (171,114 | ) | | | (8,223,262 | ) | | | (1,832,316 | ) | |
| FROM CAPITAL SHARE TRANSACTIONS: | |
| Net proceeds from sale of shares | | | 448,854,134 | | | | 152,702,805 | | | | 265,891,024 | | | | 185,311,189 | | |
| Reinvestment of distributions | | | 4,949,470 | | | | 171,114 | | | | 8,223,262 | | | | 1,832,316 | | |
| | | | 453,803,604 | | | | 152,873,919 | | | | 274,114,286 | | | | 187,143,505 | | |
| Cost of shares redeemed | | | (122,041,487 | ) | | | (31,017,289 | ) | | | (58,445,154 | ) | | | (58,711,455 | ) | |
Net increase in net assets resulting from capital share
transactions | | | 331,762,117 | | | | 121,856,630 | | | | 215,669,132 | | | | 128,432,050 | | |
| Net increase in net assets | | | 167,873,444 | | | | 120,843,477 | | | | 9,795,333 | | | | 135,715,170 | | |
| NET ASSETS: | |
| Beginning of year | | | 208,552,171 | | | | 87,708,694 | | | | 343,488,227 | | | | 207,773,057 | | |
| End of year | | $ | 376,425,615 | | | $ | 208,552,171 | | | $ | 353,283,560 | | | $ | 343,488,227 | | |
| Undistributed net investment income at end of year | | $ | 4,995,273 | | | $ | 946,098 | | | $ | 2,934,589 | | | $ | 3,537,474 | | |
See Accompanying Notes to Financial Statements
66
STATEMENTS OF CHANGES IN NET ASSETS
| | | ING JPMorgan
Mid Cap Value Portfolio | | ING Legg Mason Partners
Aggressive Growth Portfolio | |
| | | Year
Ended
December 31,
2008 | | Year
Ended
December 31,
2007 | | Year
Ended
December 31,
2008 | | Year
Ended
December 31,
2007 | |
| FROM OPERATIONS: | |
| Net investment income (loss) | | $ | 2,827,445 | | | $ | 2,662,565 | | | $ | (604,380 | ) | | $ | (1,934,682 | ) | |
| Net realized gain (loss) on investments | | | (8,271,977 | ) | | | 19,782,786 | | | | 38,163,206 | | | | 26,487,762 | | |
Net change in unrealized appreciation or depreciation on
investments | | | (76,236,525 | ) | | | (17,633,034 | ) | | | (425,820,606 | ) | | | (41,450,102 | ) | |
| Increase (decrease) in net assets resulting from operations | | | (81,681,057 | ) | | | 4,812,317 | | | | (388,261,780 | ) | | | (16,897,022 | ) | |
| FROM DISTRIBUTIONS TO SHAREHOLDERS: | |
| Net investment income: | | | | | | | | | | | | | | | | | |
| Class ADV | | | (256,569 | ) | | | (117,731 | ) | | | — | | | | — | | |
| Class I | | | (2,734,472 | ) | | | (1,069,126 | ) | | | — | | | | — | | |
| Class S | | | (2,001,035 | ) | | | (524,023 | ) | | | — | | | | — | | |
| Net realized gains: | | | | | | | | | | | | | | | | | |
| Class ADV | | | (1,837,541 | ) | | | (1,307,919 | ) | | | — | | | | — | | |
| Class I | | | (10,039,897 | ) | | | (6,921,274 | ) | | | — | | | | — | | |
| Class S | | | (8,240,468 | ) | | | (4,728,001 | ) | | | — | | | | — | | |
| Total distributions | | | (25,109,982 | ) | | | (14,668,074 | ) | | | — | | | | — | | |
| FROM CAPITAL SHARE TRANSACTIONS: | |
| Net proceeds from sale of shares | | | 63,636,239 | | | | 76,989,470 | | | | 158,464,372 | | | | 326,015,465 | | |
| Reinvestment of distributions | | | 25,109,982 | | | | 14,668,074 | | | | — | | | | — | | |
| | | | 88,746,221 | | | | 91,657,544 | | | | 158,464,372 | | | | 326,015,465 | | |
| Cost of shares redeemed | | | (69,524,372 | ) | | | (60,552,182 | ) | | | (505,221,820 | ) | | | (378,341,494 | ) | |
Net increase (decrease) in net assets resulting from capital
share transactions | | | 19,221,849 | | | | 31,105,362 | | | | (346,757,448 | ) | | | (52,326,029 | ) | |
| Net increase (decrease) in net assets | | | (87,569,190 | ) | | | 21,249,605 | | | | (735,019,228 | ) | | | (69,223,051 | ) | |
| NET ASSETS: | |
| Beginning of year | | | 260,312,181 | | | | 239,062,576 | | | | 1,280,842,731 | | | | 1,350,065,782 | | |
| End of year | | $ | 172,742,991 | | | $ | 260,312,181 | | | $ | 545,823,503 | | | $ | 1,280,842,731 | | |
| Undistributed net investment income at end of year | | $ | 88,539 | | | $ | 2,431,848 | | | $ | — | | | $ | — | | |
See Accompanying Notes to Financial Statements
67
STATEMENTS OF CHANGES IN NET ASSETS
| | | ING Neuberger Berman
Partners Portfolio | | ING Oppenheimer
Global Portfolio | |
| | | Year
Ended
December 31,
2008 | | Year
Ended
December 31,
2007 | | Year
Ended
December 31,
2008 | | Year
Ended
December 31,
2007 | |
| FROM OPERATIONS: | |
| Net investment income | | $ | 2,676,218 | | | $ | 990,373 | | | $ | 40,263,717 | | | $ | 42,790,930 | | |
Net realized gain (loss) on investments and foreign
currency related transactions | | | (117,998,737 | ) | | | (13,341,407 | ) | | | (171,645 | ) | | | 160,407,238 | | |
Net change in unrealized appreciation or
depreciation on investments and foreign currency
related transactions | | | (190,069,861 | ) | | | 49,540,515 | | | | (1,010,130,798 | ) | | | (25,056,406 | ) | |
Increase (decrease) in net assets resulting from
operations | | | (305,392,380 | ) | | | 37,189,481 | | | | (970,038,726 | ) | | | 178,141,762 | | |
| FROM DISTRIBUTIONS TO SHAREHOLDERS: | |
| Net investment income: | | | | | | | | | | | | | | | | | |
| Class ADV | | | — | | | | (20 | ) | | | (1,219,420 | ) | | | (697,050 | ) | |
| Class I | | | (961,325 | ) | | | (735,348 | ) | | | (38,789,825 | ) | | | (26,306,990 | ) | |
| Class S | | | — | | | | (401,596 | ) | | | (4,718,117 | ) | | | (1,992,610 | ) | |
| Net realized gains: | | | | | | | | | | | | | | | | | |
| Class ADV | | | — | | | | (320 | ) | | | (5,996,239 | ) | | | (4,651,568 | ) | |
| Class I | | | — | | | | (11,957,793 | ) | | | (134,022,900 | ) | | | (98,523,340 | ) | |
| Class S | | | — | | | | (7,987,123 | ) | | | (17,982,621 | ) | | | (8,314,597 | ) | |
| Total distributions | | | (961,325 | ) | | | (21,082,200 | ) | | | (202,729,122 | ) | | | (140,486,155 | ) | |
| FROM CAPITAL SHARE TRANSACTIONS: | |
| Net proceeds from sale of shares | | | 325,179,170 | | | | 86,086,803 | | | | 95,409,426 | | | | 162,375,715 | | |
| Reinvestment of distributions | | | 961,325 | | | | 21,082,146 | | | | 202,729,122 | | | | 140,486,155 | | |
| | | | 326,140,495 | | | | 107,168,949 | | | | 298,138,548 | | | | 302,861,870 | | |
| Cost of shares redeemed | | | (197,624,034 | ) | | | (107,998,199 | ) | | | (425,078,861 | ) | | | (477,615,687 | ) | |
Net increase (decrease) in net assets resulting from
capital share transactions | | | 128,516,461 | | | | (829,250 | ) | | | (126,940,313 | ) | | | (174,753,817 | ) | |
| Net increase (decrease) in net assets | | | (177,837,244 | ) | | | 15,278,031 | | | | (1,299,708,161 | ) | | | (137,098,210 | ) | |
| NET ASSETS: | |
| Beginning of year | | | 428,807,563 | | | | 413,529,532 | | | | 2,621,909,256 | | | | 2,759,007,466 | | |
| End of year | | $ | 250,970,319 | | | $ | 428,807,563 | | | $ | 1,322,201,095 | | | $ | 2,621,909,256 | | |
| Undistributed net investment income at end of year | | $ | 2,624,225 | | | $ | 954,887 | | | $ | 34,325,717 | | | $ | 43,956,836 | | |
See Accompanying Notes to Financial Statements
68
STATEMENTS OF CHANGES IN NET ASSETS
| | | ING Oppenheimer
Strategic Income Portfolio | | ING PIMCO Total Return Portfolio | |
| | | Year
Ended
December 31,
2008 | | Year
Ended
December 31,
2007 | | Year
Ended
December 31,
2008 | | Year
Ended
December 31,
2007 | |
| FROM OPERATIONS: | |
| Net investment income | | $ | 31,348,315 | | | $ | 26,563,992 | | | $ | 21,796,983 | | | $ | 17,123,891 | | |
Net realized gain (loss) on investments, foreign currency
related transactions, futures, swaps, written options,
and sales commitments | | | (32,906,013 | ) | | | 10,293,869 | | | | 31,597,667 | | | | 3,027,999 | | |
Net change in unrealized appreciation or depreciation on
investments, foreign currency related transactions,
futures, swaps, written options, sales commitments,
and unfunded commitments | | | (108,433,859 | ) | | | 1,534,707 | | | | (53,718,000 | ) | | | 18,748,656 | | |
| Increase (decrease) in net assets resulting from operations | | | (109,991,557 | ) | | | 38,392,568 | | | | (323,350 | ) | | | 38,900,546 | | |
| FROM DISTRIBUTIONS TO SHAREHOLDERS: | |
| Net investment income: | | | | | | | | | | | | | | | | | |
| Class ADV | | | (1,096,915 | ) | | | (1,147,519 | ) | | | (2,029,942 | ) | | | (947,855 | ) | |
| Class I | | | (28,021,136 | ) | | | (16,544,242 | ) | | | (11,994,802 | ) | | | (9,593,260 | ) | |
| Class S | | | (4,682,124 | ) | | | (2,774,380 | ) | | | (7,934,148 | ) | | | (3,498,142 | ) | |
| Net realized gains: | | | | | | | | | | | | | | | | | |
| Class ADV | | | (80,551 | ) | | | — | | | | (671,421 | ) | | | — | | |
| Class I | | | (1,875,430 | ) | | | — | | | | (3,706,855 | ) | | | — | | |
| Class S | | | (323,861 | ) | | | — | | | | (2,531,892 | ) | | | — | | |
| Total distributions | | | (36,080,017 | ) | | | (20,466,141 | ) | | | (28,869,060 | ) | | | (14,039,257 | ) | |
| FROM CAPITAL SHARE TRANSACTIONS: | |
| Net proceeds from sale of shares | | | 269,949,196 | | | | 167,160,488 | | | | 234,514,089 | | | | 163,411,362 | | |
| Reinvestment of distributions | | | 36,080,017 | | | | 20,466,141 | | | | 28,869,060 | | | | 14,039,257 | | |
| | | | 306,029,213 | | | | 187,626,629 | | | | 263,383,149 | | | | 177,450,619 | | |
| Cost of shares redeemed | | | (123,246,765 | ) | | | (111,289,160 | ) | | | (208,466,742 | ) | | | (58,691,524 | ) | |
Net increase in net assets resulting from capital share
transactions | | | 182,782,448 | | | | 76,337,469 | | | | 54,916,407 | | | | 118,759,095 | | |
| Net increase in net assets | | | 36,710,874 | | | | 94,263,896 | | | | 25,723,997 | | | | 143,620,384 | | |
| NET ASSETS: | |
| Beginning of year | | | 519,471,604 | | | | 425,207,708 | | | | 476,444,562 | | | | 332,824,178 | | |
| End of year | | $ | 556,182,478 | | | $ | 519,471,604 | | | $ | 502,168,559 | | | $ | 476,444,562 | | |
| Undistributed net investment income at end of year | | $ | 13,599,645 | | | $ | 33,948,150 | | | $ | 25,571,574 | | | $ | 17,469,733 | | |
See Accompanying Notes to Financial Statements
69
STATEMENTS OF CHANGES IN NET ASSETS
| | | ING Pioneer High Yield Portfolio | | ING T. Rowe Price Diversified
Mid Cap Growth Portfolio | |
| | | Year
Ended
December 31,
2008 | | Year
Ended
December 31,
2007 | | Year
Ended
December 31,
2008 | | Year
Ended
December 31,
2007 | |
| FROM OPERATIONS: | |
| Net investment income | | $ | 14,130,039 | | | $ | 6,918,879 | | | $ | 1,935,714 | | | $ | 1,742,576 | | |
Net realized gain (loss) on investments, foreign currency
related transactions, and payments by affiliates | | | (7,327,898 | ) | | | 3,593,207 | | | | (14,209,703 | ) | | | 129,203,347 | | |
Net change in unrealized appreciation or depreciation on
investments and foreign currency related transactions | | | (71,064,875 | ) | | | (2,411,487 | ) | | | (402,305,838 | ) | | | 9,773,622 | | |
| Increase (decrease) in net assets resulting from operations | | | (64,262,734 | ) | | | 8,100,599 | | | | (414,579,827 | ) | | | 140,719,545 | | |
| FROM DISTRIBUTIONS TO SHAREHOLDERS: | |
| Net investment income: | | | | | | | | | | | | | | | | | |
| Class ADV | | | (70,081 | ) | | | (49,613 | ) | | | — | | | | — | | |
| Class I | | | (13,809,706 | ) | | | (6,426,076 | ) | | | (3,444,847 | ) | | | (1,960,207 | ) | |
| Class S | | | (272,724 | ) | | | (445,431 | ) | | | (4,767 | ) | | | — | | |
| Net realized gains: | | | | | | | | | | | | | | | | | |
| Class ADV | | | (25,349 | ) | | | — | | | | (4,409,896 | ) | | | (3,939,115 | ) | |
| Class I | | | (3,505,979 | ) | | | — | | | | (121,659,616 | ) | | | (90,261,425 | ) | |
| Class S | | | (87,139 | ) | | | — | | | | (2,022,706 | ) | | | (1,209,603 | ) | |
| Total distributions | | | (17,770,978 | ) | | | (6,921,120 | ) | | | (131,541,832 | ) | | | (97,370,350 | ) | |
| FROM CAPITAL SHARE TRANSACTIONS: | |
| Net proceeds from sale of shares | | | 207,631,097 | | | | 48,224,001 | | | | 22,742,767 | | | | 24,781,765 | | |
| Proceeds from shares issued in merger (Note 13) | | | 64,846,767 | | | | — | | | | — | | | | — | | |
| Reinvestment of distributions | | | 17,770,978 | | | | 6,919,827 | | | | 131,541,832 | | | | 97,370,350 | | |
| | | | 290,248,842 | | | | 55,143,828 | | | | 154,284,599 | | | | 122,152,115 | | |
| Cost of shares redeemed | | | (38,126,383 | ) | | | (73,049,481 | ) | | | (145,270,502 | ) | | | (241,797,598 | ) | |
Net increase (decrease) in net assets resulting from capital
share transactions | | | 252,122,459 | | | | (17,905,653 | ) | | | 9,014,097 | | | | (119,645,483 | ) | |
| Net increase (decrease) in net assets | | | 170,088,747 | | | | (16,726,174 | ) | | | (537,107,562 | ) | | | (76,296,288 | ) | |
| NET ASSETS: | |
| Beginning of year | | | 112,021,778 | | | | 128,747,952 | | | | 1,049,484,992 | | | | 1,125,781,280 | | |
| End of year | | $ | 282,110,525 | | | $ | 112,021,778 | | | $ | 512,377,430 | | | $ | 1,049,484,992 | | |
| Undistributed net investment income at end of year | | $ | — | | | $ | 5,483 | | | $ | 216,631 | | | $ | 1,740,086 | | |
See Accompanying Notes to Financial Statements
70
STATEMENTS OF CHANGES IN NET ASSETS
| | | ING T. Rowe Price
Growth Equity Portfolio | | ING Templeton
Foreign Equity Portfolio | |
| | | Year
Ended
December 31,
2008 | | Year
Ended
December 31,
2007 | | Year
Ended
December 31,
2008 | | Year
Ended
December 31,
2007 | |
| FROM OPERATIONS: | |
| Net investment income | | $ | 4,682,144 | | | $ | 7,665,938 | | | $ | 16,262,894 | | | $ | 1,420,256 | | |
Net realized gain (loss) on investments and foreign currency
related transactions | | | (104,318,779 | ) | | | 95,487,453 | | | | (32,878,166 | ) | | | 961,802 | | |
Net change in unrealized appreciation or depreciation on
investments and foreign currency related transactions | | | (536,981,058 | ) | | | 35,488,768 | | | | (344,473,346 | ) | | | 7,826,519 | | |
| Increase (decrease) in net assets resulting from operations | | | (636,617,693 | ) | | | 138,642,159 | | | | (361,088,618 | ) | | | 10,208,577 | | |
| FROM DISTRIBUTIONS TO SHAREHOLDERS: | |
| Net investment income: | | | | | | | | | | | | | | | | | |
| Class ADV | | | (122,722 | ) | | | (52,430 | ) | | | (267,904 | ) | | | (11 | ) | |
| Class I | | | (13,342,311 | ) | | | (6,544,980 | ) | | | (13,346,515 | ) | | | (429,134 | ) | |
| Class S | | | (806,370 | ) | | | (169,564 | ) | | | (4,749,346 | ) | | | (1,000,610 | ) | |
| Net realized gains: | | | | | | | | | | | | | | | | | |
| Class ADV | | | (6,279,129 | ) | | | (5,000,494 | ) | | | — | | | | (9 | ) | |
| Class I | | | (80,268,118 | ) | | | (61,978,334 | ) | | | — | | | | (345,586 | ) | |
| Class S | | | (7,026,819 | ) | | | (3,766,933 | ) | | | — | | | | (996,073 | ) | |
| Return of capital: | | | | | | | | | | | | | | | | | |
| Class ADV | | | (79,211 | ) | | | — | | | | — | | | | — | | |
| Class I | | | (1,175,375 | ) | | | — | | | | — | | | | — | | |
| Class S | | | (110,449 | ) | | | — | | | | — | | | | — | | |
| Total distributions | | | (109,210,504 | ) | | | (77,512,735 | ) | | | (18,363,765 | ) | | | (2,771,423 | ) | |
| FROM CAPITAL SHARE TRANSACTIONS: | |
| Net proceeds from sale of shares | | | 250,841,675 | | | | 386,482,105 | | | | 419,265,708 | | | | 170,278,145 | | |
| Proceeds from shares issued in merger (Note 13) | | | — | | | | — | | | | 485,926,153 | | | | — | | |
| Reinvestment of distributions | | | 109,210,504 | | | | 77,512,735 | | | | 18,363,765 | | | | 2,645,202 | | |
| | | | 360,052,179 | | | | 463,994,840 | | | | 923,555,626 | | | | 172,923,347 | | |
| Cost of shares redeemed | | | (396,413,848 | ) | | | (292,305,674 | ) | | | (139,837,079 | ) | | | (48,889,820 | ) | |
Net increase (decrease) in net assets resulting from capital
share transactions | | | (36,361,669 | ) | | | 171,689,166 | | | | 783,718,547 | | | | 124,033,527 | | |
| Net increase (decrease) in net assets | | | (782,189,866 | ) | | | 232,818,590 | | | | 404,266,164 | | | | 131,470,681 | | |
| NET ASSETS: | |
| Beginning of year | | | 1,647,426,839 | | | | 1,414,608,249 | | | | 178,663,438 | | | | 47,192,757 | | |
| End of year | | $ | 865,236,973 | | | $ | 1,647,426,839 | | | $ | 582,929,602 | | | $ | 178,663,438 | | |
| Undistributed net investment income at end of year | | $ | — | | | $ | 10,503,070 | | | $ | 14,343 | | | $ | 812,669 | | |
See Accompanying Notes to Financial Statements
71
STATEMENTS OF CHANGES IN NET ASSETS
| | | ING Thornburg Value Portfolio | | ING UBS U.S. Large Cap
Equity Portfolio | |
| | | Year
Ended
December 31,
2008 | | Year
Ended
December 31,
2007 | | Year
Ended
December 31,
2008 | | Year
Ended
December 31,
2007 | |
| FROM OPERATIONS: | |
| Net investment income | | $ | 3,621,782 | | | $ | 1,852,156 | | | $ | 5,130,059 | | | $ | 4,363,890 | | |
Net realized gain (loss) on investments and foreign currency
related transactions | | | (42,827,872 | ) | | | 25,273,208 | | | | (43,759,073 | ) | | | 36,381,562 | | |
Net change in unrealized appreciation or depreciation on
investments and foreign currency related transactions | | | (112,927,471 | ) | | | (13,080,793 | ) | | | (138,249,926 | ) | | | (36,024,660 | ) | |
| Increase (decrease) in net assets resulting from operations | | | (152,133,561 | ) | | | 14,044,571 | | | | (176,878,940 | ) | | | 4,720,792 | | |
| FROM DISTRIBUTIONS TO SHAREHOLDERS: | |
| Net investment income: | | | | | | | | | | | | | | | | | |
| Class ADV | | | (7,643 | ) | | | (9,561 | ) | | | (128,584 | ) | | | (67,611 | ) | |
| Class I | | | (1,812,798 | ) | | | (845,816 | ) | | | (8,396,878 | ) | | | (2,678,126 | ) | |
| Class S | | | (11,937 | ) | | | (76,409 | ) | | | (512,862 | ) | | | (342,587 | ) | |
| Total distributions | | | (1,832,378 | ) | | | (931,786 | ) | | | (9,038,324 | ) | | | (3,088,324 | ) | |
| FROM CAPITAL SHARE TRANSACTIONS: | |
| Net proceeds from sale of shares | | | 227,467,929 | | | | 68,502,537 | | | | 105,198,682 | | | | 105,677,385 | | |
| Proceeds from shares issued in merger (Note 13) | | | — | | | | — | | | | — | | | | 36,384,223 | | |
| Reinvestment of distributions | | | 1,832,378 | | | | 931,786 | | | | 9,038,324 | | | | 3,088,324 | | |
| | | | 229,300,307 | | | | 69,434,323 | | | | 114,237,006 | | | | 145,149,932 | | |
| Cost of shares redeemed | | | (44,404,345 | ) | | | (41,806,736 | ) | | | (88,145,775 | ) | | | (113,345,397 | ) | |
Net increase in net assets resulting from capital share
transactions | | | 184,895,962 | | | | 27,627,587 | | | | 26,091,231 | | | | 31,804,535 | | |
| Net increase (decrease) in net assets | | | 30,930,023 | | | | 40,740,372 | | | | (159,826,033 | ) | | | 33,437,003 | | |
| NET ASSETS: | |
| Beginning of year | | | 234,322,830 | | | | 193,582,458 | | | | 420,880,829 | | | | 387,443,826 | | |
| End of year | | $ | 265,252,853 | | | $ | 234,322,830 | | | $ | 261,054,796 | | | $ | 420,880,829 | | |
| Undistributed net investment income at end of year | | $ | 3,486,313 | | | $ | 1,829,398 | | | $ | 450,538 | | | $ | 4,358,803 | | |
See Accompanying Notes to Financial Statements
72
STATEMENTS OF CHANGES IN NET ASSETS
| | | ING Van Kampen
Comstock Portfolio | | ING Van Kampen
Equity and Income Portfolio | |
| | | Year
Ended
December 31,
2008 | | Year
Ended
December 31,
2007 | | Year
Ended
December 31,
2008 | | Year
Ended
December 31,
2007 | |
| FROM OPERATIONS: | |
| Net investment income | | $ | 17,281,201 | | | $ | 18,141,386 | | | $ | 22,767,617 | | | $ | 24,073,687 | | |
Net realized gain (loss) on investments, foreign currency
related transactions, and futures | | | (153,164,561 | ) | | | 51,676,010 | | | | (66,408,563 | ) | | | 50,110,886 | | |
Net change in unrealized appreciation or depreciation on
investments and foreign currency related transactions | | | (218,129,573 | ) | | | (91,003,406 | ) | | | (183,213,247 | ) | | | (37,763,499 | ) | |
Increase (decrease) in net assets resulting from
operations | | | (354,012,933 | ) | | | (21,186,010 | ) | | | (226,854,193 | ) | | | 36,421,074 | | |
| FROM DISTRIBUTIONS TO SHAREHOLDERS: | |
| Net investment income: | | | | | | | | | | | | | | | | | |
| Class ADV | | | (653,242 | ) | | | (504,981 | ) | | | (534,645 | ) | | | (330,029 | ) | |
| Class I | | | (23,047,363 | ) | | | (10,143,475 | ) | | | (33,581,199 | ) | | | (21,491,852 | ) | |
| Class S | | | (10,516,572 | ) | | | (4,424,869 | ) | | | (11,202,908 | ) | | | (2,278,945 | ) | |
| Net realized gains: | | | | | | | | | | | | | | | | | |
| Class ADV | | | (1,553,677 | ) | | | (1,177,101 | ) | | | (733,342 | ) | | | (462,445 | ) | |
| Class I | | | (32,982,142 | ) | | | (17,981,166 | ) | | | (36,302,415 | ) | | | (24,251,403 | ) | |
| Class S | | | (16,571,671 | ) | | | (9,810,845 | ) | | | (12,079,329 | ) | | | (2,802,542 | ) | |
| Total distributions | | | (85,324,667 | ) | | | (44,042,437 | ) | | | (94,433,838 | ) | | | (51,617,216 | ) | |
| FROM CAPITAL SHARE TRANSACTIONS: | |
| Net proceeds from sale of shares | | | 220,220,774 | | | | 316,790,683 | | | | 78,093,893 | | | | 77,017,123 | | |
| Proceeds from shares issued in merger (Note 13) | | | — | | | | — | | | | 82,425,445 | | | | — | | |
| Reinvestment of distributions | | | 85,324,667 | | | | 44,042,437 | | | | 94,433,838 | | | | 51,617,216 | | |
| | | | 305,545,441 | | | | 360,833,120 | | | | 254,953,176 | | | | 128,634,339 | | |
| Cost of shares redeemed | | | (288,658,828 | ) | | | (334,718,811 | ) | | | (172,876,816 | ) | | | (186,472,061 | ) | |
Net increase (decrease) in net assets resulting from capital
share transactions | | | 16,886,613 | | | | 26,114,309 | | | | 82,076,360 | | | | (57,837,722 | ) | |
| Net decrease in net assets | | | (422,450,987 | ) | | | (39,114,138 | ) | | | (239,211,671 | ) | | | (73,033,864 | ) | |
| NET ASSETS: | |
| Beginning of year | | | 991,217,776 | | | | 1,030,331,914 | | | | 959,065,583 | | | | 1,032,099,447 | | |
| End of year | | $ | 568,766,789 | | | $ | 991,217,776 | | | $ | 719,853,912 | | | $ | 959,065,583 | | |
| Undistributed net investment income at end of year | | $ | 1,191,721 | | | $ | 18,136,074 | | | $ | 1,506,382 | | | $ | 24,074,970 | | |
See Accompanying Notes to Financial Statements
73
FINANCIAL HIGHLIGHTS
Selected data for a share of beneficial interest outstanding throughout each year or period.
| | | | | Income (loss)
from investment
operations | | | | Less distributions | |
| | | Net asset value, beginning of year or period | | Net investment income (loss) | | Net realized and unrealized gain (loss) | | Total from investment operations | | From net investment income | | From net realized gains | | From return of capital | |
| | | | | | | | | | | | | | | | |
| Year or period ended | | ($) | | ($) | | ($) | | ($) | | ($) | | ($) | | ($) | |
| ING American Century Large Company Value Portfolio | |
| Class ADV | |
| 12-31-08 | | | 14.24 | | | | 0.18 | • | | | (3.94 | ) | | | (3.76 | ) | | | 1.17 | | | | 4.67 | | | | — | | |
| 12-31-07 | | | 15.80 | | | | 0.19 | | | | (0.49 | ) | | | (0.30 | ) | | | 0.16 | | | | 1.10 | | | | — | | |
| 12-31-06 | | | 14.08 | | | | 0.18 | • | | | 2.38 | | | | 2.56 | | | | 0.09 | | | | 0.75 | | | | — | | |
| 12-31-05 | | | 14.05 | | | | 0.12 | • | | | 0.03 | | | | 0.15 | | | | 0.12 | | | | — | | | | — | | |
| 12-31-04 | | | 12.89 | | | | 0.10 | | | | 1.14 | | | | 1.24 | | | | 0.08 | | | | — | | | | — | | |
| Class I | |
| 12-31-08 | | | 14.44 | | | | 0.24 | • | | | (3.97 | ) | | | (3.73 | ) | | | 1.43 | | | | 4.67 | | | | — | | |
| 12-31-07 | | | 16.03 | | | | 0.27 | • | | | (0.50 | ) | | | (0.23 | ) | | | 0.26 | | | | 1.10 | | | | — | | |
| 12-31-06 | | | 14.24 | | | | 0.26 | • | | | 2.42 | | | | 2.68 | | | | 0.14 | | | | 0.75 | | | | — | | |
| 12-31-05 | | | 14.22 | | | | 0.21 | | | | 0.00 | * | | | 0.21 | | | | 0.19 | | | | — | | | | — | | |
| 12-31-04 | | | 13.03 | | | | 0.17 | | | | 1.15 | | | | 1.32 | | | | 0.13 | | | | — | | | | — | | |
| Class S | |
| 12-31-08 | | | 14.47 | | | | 0.21 | • | | | (3.99 | ) | | | (3.78 | ) | | | 1.35 | | | | 4.67 | | | | — | | |
| 12-31-07 | | | 16.05 | | | | 0.23 | • | | | (0.51 | ) | | | (0.28 | ) | | | 0.20 | | | | 1.10 | | | | — | | |
| 12-31-06 | | | 14.20 | | | | 0.21 | • | | | 2.43 | | | | 2.64 | | | | 0.04 | | | | 0.75 | | | | — | | |
| 12-31-05 | | | 14.17 | | | | 0.15 | | | | 0.02 | | | | 0.17 | | | | 0.14 | | | | — | | | | — | | |
| 12-31-04 | | | 12.98 | | | | 0.15 | | | | 1.14 | | | | 1.29 | | | | 0.10 | | | | — | | | | — | | |
| ING American Century Small-Mid Cap Value Portfolio | |
| Class ADV | |
| 12-31-08 | | | 11.24 | | | | 0.15 | | | | (2.80 | ) | | | (2.65 | ) | | | 0.05 | | | | 1.31 | | | | — | | |
| 12-31-07 | | | 13.35 | | | | 0.08 | • | | | (0.42 | ) | | | (0.34 | ) | | | 0.03 | | | | 1.74 | | | | — | | |
| 12-31-06 | | | 11.63 | | | | 0.02 | | | | 1.73 | | | | 1.75 | | | | 0.00 | * | | | 0.03 | | | | — | | |
| 12-31-05 | | | 12.13 | | | | 0.01 | | | | 0.92 | | | | 0.93 | | | | 0.01 | | | | 1.42 | | | | — | | |
| 12-31-04 | | | 10.71 | | | | (0.02 | ) | | | 2.26 | | | | 2.24 | | | | — | | | | 0.82 | | | | — | | |
| Class I | |
| 12-31-08 | | | 11.46 | | | | 0.20 | • | | | (2.86 | ) | | | (2.66 | ) | | | 0.11 | | | | 1.31 | | | | — | | |
| 12-31-07 | | | 13.58 | | | | 0.14 | • | | | (0.43 | ) | | | (0.29 | ) | | | 0.09 | | | | 1.74 | | | | — | | |
| 12-31-06 | | | 11.77 | | | | 0.09 | • | | | 1.75 | | | | 1.84 | | | | 0.00 | * | | | 0.03 | | | | — | | |
| 12-31-05 | | | 12.24 | | | | 0.06 | | | | 0.94 | | | | 1.00 | | | | 0.05 | | | | 1.42 | | | | — | | |
| 12-31-04 | | | 10.77 | | | | 0.03 | | | | 2.28 | | | | 2.31 | | | | 0.02 | | | | 0.82 | | | | — | | |
| Class S | |
| 12-31-08 | | | 11.40 | | | | 0.17 | • | | | (2.84 | ) | | | (2.67 | ) | | | 0.08 | | | | 1.31 | | | | — | | |
| 12-31-07 | | | 13.51 | | | | 0.11 | • | | | (0.42 | ) | | | (0.31 | ) | | | 0.06 | | | | 1.74 | | | | — | | |
| 12-31-06 | | | 11.74 | | | | 0.05 | | | | 1.75 | | | | 1.80 | | | | 0.00 | * | | | 0.03 | | | | — | | |
| 12-31-05 | | | 12.22 | | | | 0.04 | | | | 0.92 | | | | 0.96 | | | | 0.02 | | | | 1.42 | | | | — | | |
| 12-31-04 | | | 10.76 | | | | 0.00 | * | | | 2.28 | | | | 2.28 | | | | 0.00 | * | | | 0.82 | | | | — | | |
| ING Baron Asset Portfolio | |
| Class ADV | |
| 12-31-08 | | | 12.05 | | | | (0.10 | ) | | | (4.81 | ) | | | (4.91 | ) | | | — | | | | 0.16 | | | | — | | |
| 12-31-07 | | | 11.09 | | | | (0.05 | ) | | | 1.01 | | | | 0.96 | | | | — | | | | — | | | | — | | |
| 01-18-06(4)-12-31-06 | | | 10.04 | | | | (0.06 | ) | | | 1.11 | | | | 1.05 | | | | — | | | | — | | | | — | | |
| Class I | |
| 12-31-08 | | | 12.17 | | | | (0.05 | )• | | | (4.89 | ) | | | (4.94 | ) | | | — | | | | 0.16 | | | | — | | |
| 12-31-07 | | | 11.14 | | | | 0.01 | | | | 1.02 | | | | 1.03 | | | | — | | | | — | | | | — | | |
| 01-03-06(4)-12-31-06 | | | 10.00 | | | | (0.00 | )* | | | 1.14 | | | | 1.14 | | | | — | | | | — | | | | — | | |
| Class S | |
| 12-31-08 | | | 12.09 | | | | (0.06 | )• | | | (4.85 | ) | | | (4.91 | ) | | | — | | | | 0.16 | | | | — | | |
| 12-31-07 | | | 11.10 | | | | (0.01 | ) | | | 1.00 | | | | 0.99 | | | | — | | | | — | | | | — | | |
| 05-03-06(4)-12-31-06 | | | 10.73 | | | | 0.03 | • | | | 0.34 | | | | 0.37 | | | | — | | | | — | | | | — | | |
| | | | | Ratios to average net assets | | Supplemental data | |
| | | Total distributions | | Net asset value, end of year or period | | Total Return(1) | | Expenses before reductions/additions(2)(3) | | Expenses net of fee waivers and/or recoupments, if any(2)(3) | | Expenses net of all reductions/additions(2)(3) | | Net investment income (loss)(2)(3) | | Net assets, end of year or period | | Portfolio turnover rate | |
| | | | | | | | | | | | | | | | | | | | |
| Year or period ended | | ($) | | ($) | | (%) | | (%) | | (%) | | (%) | | (%) | | ($000's) | | (%) | |
| ING American Century Large Company Value Portfolio | |
| Class ADV | |
| 12-31-08 | | | 5.84 | | | | 4.64 | | | | (37.19 | ) | | | 1.50 | | | | 1.40 | † | | | 1.40 | † | | | 1.93 | † | | | 2,097 | | | | 42 | | |
| 12-31-07 | | | 1.26 | | | | 14.24 | | | | (2.17 | ) | | | 1.50 | | | | 1.50 | | | | 1.50 | | | | 1.20 | | | | 9,497 | | | | 44 | | |
| 12-31-06 | | | 0.84 | | | | 15.80 | | | | 18.89 | | | | 1.50 | | | | 1.50 | | | | 1.50 | | | | 1.21 | | | | 10,524 | | | | 56 | | |
| 12-31-05 | | | 0.12 | | | | 14.08 | | | | 1.09 | | | | 1.50 | | | | 1.50 | | | | 1.50 | | | | 0.87 | | | | 11,806 | | | | 105 | | |
| 12-31-04 | | | 0.08 | | | | 14.05 | | | | 9.70 | | | | 1.50 | | | | 1.50 | | | | 1.50 | | | | 0.81 | | | | 8,684 | | | | 38 | | |
| Class I | |
| 12-31-08 | | | 6.10 | | | | 4.61 | | | | (36.86 | ) | | | 1.00 | | | | 0.90 | † | | | 0.90 | † | | | 1.96 | † | | | 5,461 | | | | 42 | | |
| 12-31-07 | | | 1.36 | | | | 14.44 | | | | (1.72 | ) | | | 1.00 | | | | 1.00 | | | | 1.00 | | | | 1.72 | | | | 104,021 | | | | 44 | | |
| 12-31-06 | | | 0.89 | | | | 16.03 | | | | 19.58 | | | | 1.00 | | | | 1.00 | | | | 1.00 | | | | 1.73 | | | | 82,254 | | | | 56 | | |
| 12-31-05 | | | 0.19 | | | | 14.24 | | | | 1.51 | | | | 1.00 | | | | 1.00 | | | | 1.00 | | | | 1.50 | | | | 39,624 | | | | 105 | | |
| 12-31-04 | | | 0.13 | | | | 14.22 | | | | 10.24 | | | | 1.00 | | | | 1.00 | | | | 1.00 | | | | 1.39 | | | | 2,956 | | | | 38 | | |
| Class S | |
| 12-31-08 | | | 6.02 | | | | 4.67 | | | | (36.99 | ) | | | 1.25 | | | | 1.15 | † | | | 1.15 | † | | | 2.22 | † | | | 7,756 | | | | 42 | | |
| 12-31-07 | | | 1.30 | | | | 14.47 | | | | (2.00 | ) | | | 1.25 | | | | 1.25 | | | | 1.25 | | | | 1.44 | | | | 17,126 | | | | 44 | | |
| 12-31-06 | | | 0.79 | | | | 16.05 | | | | 19.30 | | | | 1.25 | | | | 1.25 | | | | 1.25 | | | | 1.43 | | | | 23,019 | | | | 56 | | |
| 12-31-05 | | | 0.14 | | | | 14.20 | | | | 1.26 | | | | 1.25 | | | | 1.25 | | | | 1.25 | | | | 1.06 | | | | 43,127 | | | | 105 | | |
| 12-31-04 | | | 0.10 | | | | 14.17 | | | | 10.05 | | | | 1.25 | | | | 1.25 | | | | 1.25 | | | | 1.05 | | | | 66,267 | | | | 38 | | |
| ING American Century Small-Mid Cap Value Portfolio | |
| Class ADV | |
| 12-31-08 | | | 1.36 | | | | 7.23 | | | | (26.69 | ) | | | 1.75 | | | | 1.52 | | | | 1.52 | | | | 1.50 | | | | 7,861 | | | | 191 | | |
| 12-31-07 | | | 1.77 | | | | 11.24 | | | | (3.17 | ) | | | 1.75 | | | | 1.52 | | | | 1.52 | | | | 0.58 | | | | 12,309 | | | | 146 | | |
| 12-31-06 | | | 0.03 | | | | 13.35 | | | | 15.14 | | | | 1.75 | | | | 1.72 | | | | 1.72 | | | | 0.18 | | | | 12,602 | | | | 156 | | |
| 12-31-05 | | | 1.43 | | | | 11.63 | | | | 7.65 | | | | 1.80 | | | | 1.80 | | | | 1.80 | | | | 0.10 | | | | 11,023 | | | | 101 | | |
| 12-31-04 | | | 0.82 | | | | 12.13 | | | | 21.03 | | | | 1.80 | | | | 1.80 | | | | 1.80 | | | | (0.14 | ) | | | 5,266 | | | | 107 | | |
| Class I | |
| 12-31-08 | | | 1.42 | | | | 7.38 | | | | (26.37 | ) | | | 1.25 | | | | 1.02 | | | | 1.02 | | | | 2.04 | | | | 35,922 | | | | 191 | | |
| 12-31-07 | | | 1.83 | | | | 11.46 | | | | (2.70 | ) | | | 1.25 | | | | 1.02 | | | | 1.02 | | | | 1.09 | | | | 47,079 | | | | 146 | | |
| 12-31-06 | | | 0.03 | | | | 13.58 | | | | 15.75 | | | | 1.25 | | | | 1.22 | | | | 1.22 | | | | 0.71 | | | | 48,088 | | | | 156 | | |
| 12-31-05 | | | 1.47 | | | | 11.77 | | | | 8.17 | | | | 1.30 | | | | 1.30 | | | | 1.30 | | | | 0.61 | | | | 46,237 | | | | 101 | | |
| 12-31-04 | | | 0.84 | | | | 12.24 | | | | 21.61 | | | | 1.30 | | | | 1.30 | | | | 1.30 | | | | 0.35 | | | | 28,433 | | | | 107 | | |
| Class S | |
| 12-31-08 | | | 1.39 | | | | 7.34 | | | | (26.56 | ) | | | 1.50 | | | | 1.27 | | | | 1.27 | | | | 1.80 | | | | 31,260 | | | | 191 | | |
| 12-31-07 | | | 1.80 | | | | 11.40 | | | | (2.90 | ) | | | 1.50 | | | | 1.27 | | | | 1.27 | | | | 0.82 | | | | 40,309 | | | | 146 | | |
| 12-31-06 | | | 0.03 | | | | 13.51 | | | | 15.43 | | | | 1.50 | | | | 1.47 | | | | 1.47 | | | | 0.39 | | | �� | 47,839 | | | | 156 | | |
| 12-31-05 | | | 1.44 | | | | 11.74 | | | | 7.85 | | | | 1.55 | | | | 1.55 | | | | 1.55 | | | | 0.35 | | | | 43,053 | | | | 101 | | |
| 12-31-04 | | | 0.82 | | | | 12.22 | | | | 21.34 | | | | 1.55 | | | | 1.55 | | | | 1.55 | | | | 0.09 | | | | 37,816 | | | | 107 | | |
| ING Baron Asset Portfolio | |
| Class ADV | |
| 12-31-08 | | | 0.16 | | | | 6.98 | | | | (41.20 | ) | | | 1.67 | | | | 1.57 | | | | 1.57 | | | | (0.89 | ) | | | 1,646 | | | | 51 | | |
| 12-31-07 | | | — | | | | 12.05 | | | | 8.66 | | | | 1.64 | | | | 1.55 | | | | 1.55 | | | | (0.44 | ) | | | 3,499 | | | | 18 | | |
| 01-18-06(4)-12-31-06 | | | — | | | | 11.09 | | | | 10.46 | | | | 2.08 | | | | 1.55 | | | | 1.55 | | | | (0.57 | ) | | | 3,211 | | | | 23 | | |
| Class I | |
| 12-31-08 | | | 0.16 | | | | 7.07 | | | | (41.04 | ) | | | 1.17 | | | | 1.07 | | | | 1.07 | | | | (0.47 | ) | | | 1,748 | | | | 51 | | |
| 12-31-07 | | | — | | | | 12.17 | | | | 9.25 | | | | 1.14 | | | | 1.05 | | | | 1.05 | | | | 0.07 | | | | 25,781 | | | | 18 | | |
| 01-03-06(4)-12-31-06 | | | — | | | | 11.14 | | | | 11.40 | | | | 1.58 | | | | 1.05 | | | | 1.05 | | | | (0.05 | ) | | | 5,583 | | | | 23 | | |
| Class S | |
| 12-31-08 | | | 0.16 | | | | 7.02 | | | | (41.06 | ) | | | 1.42 | | | | 1.32 | | | | 1.32 | | | | (0.64 | ) | | | 3,271 | | | | 51 | | |
| 12-31-07 | | | — | | | | 12.09 | | | | 8.92 | | | | 1.39 | | | | 1.30 | | | | 1.30 | | | | (0.14 | ) | | | 4,731 | | | | 18 | | |
| 05-03-06(4)-12-31-06 | | | — | | | | 11.10 | | | | 3.45 | | | | 1.83 | | | | 1.30 | | | | 1.30 | | | | 0.31 | | | | 313 | | | | 23 | | |
See Accompanying Notes to Financial Statements
74
FINANCIAL HIGHLIGHTS (CONTINUED)
Selected data for a share of beneficial interest outstanding throughout each year or period.
| | | | | Income (loss)
from investment
operations | | | | Less distributions | |
| | | Net asset value, beginning of year or period | | Net investment income (loss) | | Net realized and unrealized gain (loss) | | Total from investment operations | | From net investment income | | From net realized gains | | From return of capital | |
| | | | | | | | | | | | | | | | |
| Year or period ended | | ($) | | ($) | | ($) | | ($) | | ($) | | ($) | | ($) | |
| ING Baron Small Cap Growth Portfolio | |
| Class ADV | |
| 12-31-08 | | | 19.16 | | | | (0.14 | ) | | | (7.62 | ) | | | (7.76 | ) | | | — | | | | 0.52 | | | | — | | |
| 12-31-07 | | | 18.11 | | | | (0.12 | ) | | | 1.17 | | | | 1.05 | | | | — | | | | — | | | | — | | |
| 12-31-06 | | | 15.90 | | | | (0.10 | ) | | | 2.46 | | | | 2.36 | | | | — | | | | 0.15 | | | | — | | |
| 12-31-05 | | | 14.85 | | | | (0.19 | )• | | | 1.24 | | | | 1.05 | | | | — | | | | — | | | | — | | |
| 12-31-04 | | | 11.64 | | | | (0.09 | ) | | | 3.30 | | | | 3.21 | | | | — | | | | — | | | | — | | |
| Class I | |
| 12-31-08 | | | 19.73 | | | | (0.05 | )• | | | (7.89 | ) | | | (7.94 | ) | | | — | | | | 0.52 | | | | — | | |
| 12-31-07 | | | 18.55 | | | | (0.02 | ) | | | 1.20 | | | | 1.18 | | | | — | | | | — | | | | — | | |
| 12-31-06 | | | 16.21 | | | | (0.02 | ) | | | 2.51 | | | | 2.49 | | | | — | | | | 0.15 | | | | — | | |
| 12-31-05 | | | 15.06 | | | | (0.14 | )• | | | 1.29 | | | | 1.15 | | | | — | | | | — | | | | — | | |
| 12-31-04 | | | 11.74 | | | | (0.07 | ) | | | 3.39 | | | | 3.32 | | | | — | | | | — | | | | — | | |
| Class S | |
| 12-31-08 | | | 19.45 | | | | (0.08 | )• | | | (7.77 | ) | | | (7.85 | ) | | | — | | | | 0.52 | | | | — | | |
| 12-31-07 | | | 18.33 | | | | (0.06 | ) | | | 1.18 | | | | 1.12 | | | | — | | | | — | | | | — | | |
| 12-31-06 | | | 16.06 | | | | (0.06 | ) | | | 2.48 | | | | 2.42 | | | | — | | | | 0.15 | | | | — | | |
| 12-31-05 | | | 14.96 | | | | (0.14 | )• | | | 1.24 | | | | 1.10 | | | | — | | | | — | | | | — | | |
| 12-31-04 | | | 11.69 | | | | (0.09 | ) | | | 3.36 | | | | 3.27 | | | | — | | | | — | | | | — | | |
| ING Columbia Small Cap Value II Portfolio | |
| Class ADV | |
| 12-31-08 | | | 10.41 | | | | 0.09 | • | | | (3.62 | ) | | | (3.53 | ) | | | 0.02 | | | | 0.08 | | | | — | | |
| 12-31-07 | | | 10.15 | | | | 0.05 | • | | | 0.23 | | | | 0.28 | | | | 0.02 | | | | — | | | | — | | |
| 12-29-06(4)-12-31-06 | | | 10.15 | | | | (0.00 | )* | | | — | | | | (0.00 | )* | | | — | | | | — | | | | — | | |
| Class I | |
| 12-31-08 | | | 10.48 | | | | 0.14 | • | | | (3.67 | ) | | | (3.53 | ) | | | 0.02 | | | | 0.08 | | | | — | | |
| 12-31-07 | | | 10.17 | | | | 0.10 | • | | | 0.23 | | | | 0.33 | | | | 0.02 | | | | — | | | | — | | |
| 04-28-06(4)-12-31-06 | | | 10.00 | | | | 0.05 | | | | 0.12 | | | | 0.17 | | | | — | | | | — | | | | — | | |
| Class S | |
| 12-31-08 | | | 10.44 | | | | 0.11 | • | | | (3.64 | ) | | | (3.53 | ) | | | 0.01 | | | | 0.08 | | | | — | | |
| 12-31-07 | | | 10.15 | | | | 0.07 | • | | | 0.23 | | | | 0.30 | | | | 0.01 | | | | — | | | | — | | |
| 05-01-06(4)-12-31-06 | | | 9.95 | | | | 0.04 | • | | | 0.16 | | | | 0.20 | | | | — | | | | — | | | | — | | |
| ING Davis New York Venture Portfolio | |
| Class ADV | |
| 12-31-08 | | | 20.07 | | | | 0.09 | | | | (7.92 | ) | | | (7.83 | ) | | | 0.04 | | | | 0.18 | | | | — | | |
| 12-31-07 | | | 19.39 | | | | 0.19 | • | | | 0.57 | | | | 0.76 | | | | — | | | | 0.08 | | | | — | | |
| 12-31-06 | | | 18.46 | | | | 0.07 | | | | 2.29 | | | | 2.36 | | | | — | | | | 1.43 | | | | — | | |
| 12-31-05 | | | 17.82 | | | | (0.03 | )• | | | 0.67 | | | | 0.64 | | | | 0.00 | * | | | — | | | | — | | |
| 12-31-04 | | | 16.47 | | | | (0.02 | ) | | | 1.37 | | | | 1.35 | | | | — | | | | — | | | | — | | |
| Class I | |
| 12-31-08 | | | 20.60 | | | | 0.15 | • | | | (8.09 | ) | | | (7.94 | ) | | | 0.16 | | | | 0.18 | | | | — | | |
| 12-31-07 | | | 19.87 | | | | 0.31 | • | | | 0.57 | | | | 0.88 | | | | 0.07 | | | | 0.08 | | | | — | | |
| 12-31-06 | | | 18.79 | | | | 0.18 | • | | | 2.34 | | | | 2.52 | | | | 0.01 | | | | 1.43 | | | | — | | |
| 12-31-05 | | | 18.09 | | | | 0.06 | • | | | 0.66 | | | | 0.72 | | | | 0.02 | | | | — | | | | — | | |
| 12-31-04 | | | 16.64 | | | | 0.05 | | | | 1.40 | | | | 1.45 | | | | — | | | | — | | | | — | | |
| Class S | |
| 12-31-08 | | | 20.39 | | | | 0.11 | • | | | (8.02 | ) | | | (7.91 | ) | | | 0.12 | | | | 0.18 | | | | — | | |
| 12-31-07 | | | 19.70 | | | | 0.25 | • | | | 0.57 | | | | 0.82 | | | | 0.05 | | | | 0.08 | | | | — | | |
| 12-31-06 | | | 18.69 | | | | 0.13 | • | | | 2.31 | | | | 2.44 | | | | — | | | | 1.43 | | | | — | | |
| 12-31-05 | | | 17.99 | | | | 0.01 | • | | | 0.69 | | | | 0.70 | | | | — | | | | — | | | | — | | |
| 12-31-04 | | | 16.59 | | | | 0.00 | * | | | 1.40 | | | | 1.40 | | | | — | | | | — | | | | — | | |
| | | | | Ratios to average net assets | | Supplemental data | |
| | | Total distributions | | Net asset value, end of year or period | | Total Return(1) | | Expenses before reductions/additions(2)(3) | | Expenses net of fee waivers and/or recoupments, if any(2)(3) | | Expenses net of all reductions/additions(2)(3) | | Net investment income (loss)(2)(3) | | Net assets, end of year or period | | Portfolio turnover rate | |
| | | | | | | | | | | | | | | | | | | | |
| Year or period ended | | ($) | | ($) | | (%) | | (%) | | (%) | | (%) | | (%) | | ($000's) | | (%) | |
| ING Baron Small Cap Growth Portfolio | |
| Class ADV | |
| 12-31-08 | | | 0.52 | | | | 10.88 | | | | (41.41 | ) | | | 1.58 | | | | 1.58 | † | | | 1.58 | † | | | (0.80 | )† | | | 23,542 | | | | 30 | | |
| 12-31-07 | | | — | | | | 19.16 | | | | 5.80 | | | | 1.58 | | | | 1.58 | | | | 1.58 | | | | (0.61 | ) | | | 48,449 | | | | 23 | | |
| 12-31-06 | | | 0.15 | | | | 18.11 | | | | 15.02 | | | | 1.58 | | | | 1.58 | | | | 1.58 | | | | (0.63 | ) | | | 45,591 | | | | 15 | | |
| 12-31-05 | | | — | | | | 15.90 | | | | 7.07 | | | | 1.75 | | | | 1.70 | | | | 1.70 | | | | (1.23 | ) | | | 31,565 | | | | 11 | | |
| 12-31-04 | | | — | | | | 14.85 | | | | 27.58 | | | | 1.70 | | | | 1.70 | | | | 1.70 | | | | (1.22 | ) | | | 17,106 | | | | 19 | | |
| Class I | |
| 12-31-08 | | | 0.52 | | | | 11.27 | | | | (41.12 | ) | | | 1.08 | | | | 1.08 | † | | | 1.08 | † | | | (0.29 | )† | | | 131,199 | | | | 30 | | |
| 12-31-07 | | | — | | | | 19.73 | | | | 6.36 | | | | 1.08 | | | | 1.08 | | | | 1.08 | | | | (0.10 | ) | | | 181,259 | | | | 23 | | |
| 12-31-06 | | | 0.15 | | | | 18.55 | | | | 15.54 | | | | 1.08 | | | | 1.08 | | | | 1.08 | | | | (0.13 | ) | | | 130,780 | | | | 15 | | |
| 12-31-05 | | | — | | | | 16.21 | | | | 7.64 | | | | 1.25 | | | | 1.20 | | | | 1.20 | | | | (0.87 | ) | | | 81,664 | | | | 11 | | |
| 12-31-04 | | | — | | | | 15.06 | | | | 28.28 | | | | 1.20 | | | | 1.20 | | | | 1.20 | | | | (0.71 | ) | | | 29,954 | | | | 19 | | |
| Class S | |
| 12-31-08 | | | 0.52 | | | | 11.08 | | | | (41.25 | ) | | | 1.33 | | | | 1.31 | † | | | 1.31 | † | | | (0.52 | )† | | | 291,833 | | | | 30 | | |
| 12-31-07 | | | — | | | | 19.45 | | | | 6.11 | | | | 1.33 | | | | 1.32 | | | | 1.32 | | | | (0.34 | ) | | | 415,539 | | | | 23 | | |
| 12-31-06 | | | 0.15 | | | | 18.33 | | | | 15.24 | | | | 1.33 | | | | 1.33 | | | | 1.33 | | | | (0.38 | ) | | | 299,287 | | | | 15 | | |
| 12-31-05 | | | — | | | | 16.06 | | | | 7.35 | | | | 1.50 | | | | 1.45 | | | | 1.45 | | | | (0.92 | ) | | | 207,527 | | | | 11 | | |
| 12-31-04 | | | — | | | | 14.96 | | | | 27.97 | | | | 1.45 | | | | 1.45 | | | | 1.45 | | | | (0.96 | ) | | | 114,112 | | | | 19 | | |
| ING Columbia Small Cap Value II Portfolio | |
| Class ADV | |
| 12-31-08 | | | 0.10 | | | | 6.78 | | | | (34.22 | ) | | | 1.41 | | | | 1.41 | † | | | 1.38 | † | | | 1.03 | † | | | 444 | | | | 73 | | |
| 12-31-07 | | | 0.02 | | | | 10.41 | | | | 2.73 | | | | 1.38 | | | | 1.38 | | | | 1.35 | | | | 0.50 | | | | 330 | | | | 50 | | |
| 12-29-06(4)-12-31-06 | | | — | | | | 10.15 | | | | — | | | | 1.49 | | | | 1.49 | | | | 1.46 | | | | (1.46 | ) | | | 1 | | | | 48 | | |
| Class I | |
| 12-31-08 | | | 0.10 | | | | 6.85 | | | | (33.93 | ) | | | 0.91 | | | | 0.91 | † | | | 0.88 | † | | | 1.63 | † | | | 225,673 | | | | 73 | | |
| 12-31-07 | | | 0.02 | | | | 10.48 | | | | 3.21 | | | | 0.88 | | | | 0.88 | | | | 0.85 | | | | 0.94 | | | | 46,922 | | | | 50 | | |
| 04-28-06(4)-12-31-06 | | | — | | | | 10.17 | | | | 1.70 | | | | 0.99 | | | | 0.99 | | | | 0.96 | | | | 0.78 | | | | 11,698 | | | | 48 | | |
| Class S | |
| 12-31-08 | | | 0.09 | | | | 6.82 | | | | (34.08 | ) | | | 1.16 | | | | 1.16 | † | | | 1.13 | † | | | 1.22 | † | | | 150,309 | | | | 73 | | |
| 12-31-07 | | | 0.01 | | | | 10.44 | | | | 2.97 | | | | 1.13 | | | | 1.13 | | | | 1.10 | | | | 0.65 | | | | 161,301 | | | | 50 | | |
| 05-01-06(4)-12-31-06 | | | — | | | | 10.15 | | | | 2.01 | | | | 1.24 | | | | 1.24 | | | | 1.21 | | | | 0.53 | | | | 76,010 | | | | 48 | | |
| ING Davis New York Venture Portfolio | |
| Class ADV | |
| 12-31-08 | | | 0.22 | | | | 12.02 | | | | (39.35 | ) | | | 1.40 | | | | 1.40 | | | | 1.40 | | | | 0.41 | | | | 5,662 | | | | 20 | | |
| 12-31-07 | | | 0.08 | | | | 20.07 | | | | 3.91 | | | | 1.40 | | | | 1.40 | | | | 1.40 | | | | 0.94 | | | | 10,214 | | | | 10 | | |
| 12-31-06 | | | 1.43 | | | | 19.39 | | | | 13.58 | | | | 1.40 | | | | 1.40 | | | | 1.40 | | | | 0.44 | | | | 13,203 | | | | 6 | | |
| 12-31-05 | | | 0.00 | * | | | 18.46 | | | | 3.62 | | | | 1.57 | | | | 1.57 | | | | 1.57 | | | | (0.18 | ) | | | 11,305 | | | | 110 | | |
| 12-31-04 | | | — | | | | 17.82 | | | | 8.20 | | | | 1.60 | | | | 1.60 | | | | 1.60 | | | | (0.18 | ) | | | 10,195 | | | | 33 | | |
| Class I | |
| 12-31-08 | | | 0.34 | | | | 12.32 | | | | (39.06 | ) | | | 0.90 | | | | 0.90 | | | | 0.90 | | | | 0.92 | | | | 133,936 | | | | 20 | | |
| 12-31-07 | | | 0.15 | | | | 20.60 | | | | 4.43 | | | | 0.90 | | | | 0.90 | | | | 0.90 | | | | 1.49 | | | | 101,763 | | | | 10 | | |
| 12-31-06 | | | 1.44 | | | | 19.87 | | | | 14.19 | | | | 0.90 | | | | 0.90 | | | | 0.90 | | | | 0.94 | | | | 59,749 | | | | 6 | | |
| 12-31-05 | | | 0.02 | | | | 18.79 | | | | 4.10 | | | | 1.07 | | | | 1.07 | | | | 1.07 | | | | 0.33 | | | | 3,108 | | | | 110 | | |
| 12-31-04 | | | — | | | | 18.09 | | | | 8.71 | | | | 1.10 | | | | 1.10 | | | | 1.10 | | | | 0.31 | | | | 3,295 | | | | 33 | | |
| Class S | |
| 12-31-08 | | | 0.30 | | | | 12.18 | | | | (39.22 | ) | | | 1.15 | | | | 1.15 | | | | 1.15 | | | | 0.67 | | | | 213,686 | | | | 20 | | |
| 12-31-07 | | | 0.13 | | | | 20.39 | | | | 4.16 | | | | 1.15 | | | | 1.15 | | | | 1.15 | | | | 1.23 | | | | 231,511 | | | | 10 | | |
| 12-31-06 | | | 1.43 | | | | 19.70 | | | | 13.85 | | | | 1.15 | | | | 1.15 | | | | 1.15 | | | | 0.69 | | | | 134,821 | | | | 6 | | |
| 12-31-05 | | | — | | | | 18.69 | | | | 3.89 | | | | 1.32 | | | | 1.32 | | | | 1.32 | | | | 0.06 | | | | 41,822 | | | | 110 | | |
| 12-31-04 | | | — | | | | 17.99 | | | | 8.44 | | | | 1.35 | | | | 1.35 | | | | 1.35 | | | | 0.02 | | | | 56,159 | | | | 33 | | |
See Accompanying Notes to Financial Statements
75
FINANCIAL HIGHLIGHTS (CONTINUED)
Selected data for a share of beneficial interest outstanding throughout each year or period.
| | | | | Income (loss)
from investment
operations | | | | Less distributions | |
| | | Net asset value, beginning of year or period | | Net investment income (loss) | | Net realized and unrealized gain (loss) | | Total from investment operations | | From net investment income | | From net realized gains | | From return of capital | |
| | | | | | | | | | | | | | | | |
| Year or period ended | | ($) | | ($) | | ($) | | ($) | | ($) | | ($) | | ($) | |
| ING JPMorgan Mid Cap Value Portfolio | |
| Class ADV | |
| 12-31-08 | | | 15.50 | | | | 0.14 | | | | (4.90 | ) | | | (4.76 | ) | | | 0.18 | | | | 1.32 | | | | — | | |
| 12-31-07 | | | 16.03 | | | | 0.09 | | | | 0.25 | | | | 0.34 | | | | 0.07 | | | | 0.80 | | | | — | | |
| 12-31-06 | | | 13.89 | | | | 0.07 | | | | 2.18 | | | | 2.25 | | | | 0.00 | * | | | 0.11 | | | | — | | |
| 12-31-05 | | | 13.84 | | | | 0.02 | | | | 1.11 | | | | 1.13 | | | | 0.03 | | | | 1.05 | | | | — | | |
| 12-31-04 | | | 11.86 | | | | (0.00 | )* | | | 2.40 | | | | 2.40 | | | | — | | | | 0.42 | | | | — | | |
| Class I | |
| 12-31-08 | | | 15.77 | | | | 0.22 | | | | (5.00 | ) | | | (4.78 | ) | | | 0.34 | | | | 1.32 | | | | — | | |
| 12-31-07 | | | 16.26 | | | | 0.19 | • | | | 0.24 | | | | 0.43 | | | | 0.12 | | | | 0.80 | | | | — | | |
| 12-31-06 | | | 14.02 | | | | 0.14 | | | | 2.21 | | | | 2.35 | | | | 0.00 | * | | | 0.11 | | | | — | | |
| 12-31-05 | | | 13.93 | | | | 0.08 | | | | 1.14 | | | | 1.22 | | | | 0.08 | | | | 1.05 | | | | — | | |
| 12-31-04 | | | 11.91 | | | | 0.04 | | | | 2.44 | | | | 2.48 | | | | 0.04 | | | | 0.42 | | | | — | | |
| Class S | |
| 12-31-08 | | | 15.67 | | | | 0.16 | • | | | (4.94 | ) | | | (4.78 | ) | | | 0.28 | | | | 1.32 | | | | — | | |
| 12-31-07 | | | 16.17 | | | | 0.15 | | | | 0.24 | | | | 0.39 | | | | 0.09 | | | | 0.80 | | | | — | | |
| 12-31-06 | | | 13.98 | | | | 0.12 | | | | 2.18 | | | | 2.30 | | | | 0.00 | * | | | 0.11 | | | | — | | |
| 12-31-05 | | | 13.89 | | | | 0.05 | | | | 1.13 | | | | 1.18 | | | | 0.04 | | | | 1.05 | | | | — | | |
| 12-31-04 | | | 11.89 | | | | 0.02 | | | | 2.42 | | | | 2.44 | | | | 0.02 | | | | 0.42 | | | | — | | |
| ING Legg Mason Partners Aggressive Growth Portfolio | |
| Class ADV | |
| 12-31-08 | | | 46.88 | | | | (0.25 | ) | | | (18.26 | ) | | | (18.51 | ) | | | — | | | | — | | | | — | | |
| 12-31-07 | | | 47.89 | | | | (0.29 | ) | | | (0.72 | ) | | | (1.01 | ) | | | — | | | | — | | | | — | | |
| 12-31-06 | | | 43.64 | | | | (0.27 | )• | | | 4.52 | | | | 4.25 | | | | — | | | | — | | | | — | | |
| 12-31-05 | | | 39.35 | | | | (0.33 | )• | | | 4.62 | | | | 4.29 | | | | — | | | | — | | | | — | | |
| 12-31-04 | | | 36.04 | | | | (0.12 | ) | | | 3.43 | | | | 3.31 | | | | — | | | | — | | | | — | | |
| Class I | |
| 12-31-08 | | | 48.31 | | | | (0.01 | ) | | | (18.93 | ) | | | (18.94 | ) | | | — | | | | — | | | | — | | |
| 12-31-07 | | | 49.10 | | | | (0.05 | ) | | | (0.74 | ) | | | (0.79 | ) | | | — | | | | — | | | | — | | |
| 12-31-06 | | | 44.52 | | | | (0.02 | )• | | | 4.60 | | | | 4.58 | | | | — | | | | — | | | | — | | |
| 12-31-05 | | | 39.95 | | | | (0.15 | ) | | | 4.72 | | | | 4.57 | | | | — | | | | — | | | | — | | |
| 12-31-04 | | | 36.41 | | | | 0.03 | | | | 3.51 | | | | 3.54 | | | | — | | | | — | | | | — | | |
| Class S | |
| 12-31-08 | | | 47.58 | | | | (0.11 | ) | | | (18.61 | ) | | | (18.72 | ) | | | — | | | | — | | | | — | | |
| 12-31-07 | | | 48.49 | | | | (0.18 | ) | | | (0.73 | ) | | | (0.91 | ) | | | — | | | | — | | | | — | | |
| 12-31-06 | | | 44.08 | | | | (0.18 | )• | | | 4.59 | | | | 4.41 | | | | — | | | | — | | | | — | | |
| 12-31-05 | | | 39.65 | | | | (0.23 | ) | | | 4.66 | | | | 4.43 | | | | — | | | | — | | | | — | | |
| 12-31-04 | | | 36.23 | | | | (0.01 | ) | | | 3.43 | | | | 3.42 | | | | — | | | | — | | | | — | | |
| ING Neuberger Berman Partners Portfolio | |
| Class ADV | |
| 12-31-08 | | | 11.22 | | | | 0.00 | •* | | | (5.78 | ) | | | (5.78 | ) | | | — | | | | — | | | | — | | |
| 12-31-07 | | | 10.90 | | | | (0.02 | )• | | | 0.91 | | | | 0.89 | | | | 0.03 | | | | 0.54 | | | | — | | |
| 12-29-06(4)-12-31-06 | | | 10.90 | | | | (0.00 | )* | | | — | | | | (0.00 | )* | | | — | | | | — | | | | — | | |
| Class I | |
| 12-31-08 | | | 11.30 | | | | 0.06 | • | | | (5.83 | ) | | | (5.77 | ) | | | 0.02 | | | | — | | | | — | | |
| 12-31-07 | | | 10.93 | | | | 0.04 | • | | | 0.90 | | | | 0.94 | | | | 0.03 | | | | 0.54 | | | | — | | |
| 01-19-06(4)-12-31-06 | | | 10.20 | | | | 0.06 | • | | | 0.67 | | | | 0.73 | | | | — | | | | — | | | | — | | |
| Class S | |
| 12-31-08 | | | 11.25 | | | | 0.05 | | | | (5.82 | ) | | | (5.77 | ) | | | — | | | | — | | | | — | | |
| 12-31-07 | | | 10.90 | | | | 0.01 | • | | | 0.90 | | | | 0.91 | | | | 0.03 | | | | 0.53 | | | | — | | |
| 01-03-06(4)-12-31-06 | | | 10.00 | | | | 0.04 | • | | | 0.86 | | | | 0.90 | | | | — | | | | — | | | | — | | |
| | | | | Ratios to average net assets | | Supplemental data | |
| | | Total distributions | | Net asset value, end of year or period | | Total Return(1) | | Expenses before reductions/additions(2)(3) | | Expenses net of fee waivers and/or recoupments, if any(2)(3) | | Expenses net of all reductions/additions(2)(3) | | Net investment income (loss)(2)(3) | | Net assets, end of year or period | | Portfolio turnover rate | |
| | | | | | | | | | | | | | | | | | | | |
| Year or period ended | | ($) | | ($) | | (%) | | (%) | | (%) | | (%) | | (%) | | ($000's) | | (%) | |
| ING JPMorgan Mid Cap Value Portfolio | |
| Class ADV | |
| 12-31-08 | | | 1.50 | | | | 9.24 | | | | (33.17 | ) | | | 1.50 | | | | 1.50 | † | | | 1.50 | † | | | 0.94 | † | | | 13,624 | | | | 58 | | |
| 12-31-07 | | | 0.87 | | | | 15.50 | | | | 2.06 | | | | 1.50 | | | | 1.50 | | | | 1.50 | | | | 0.64 | | | | 24,824 | | | | 52 | | |
| 12-31-06 | | | 0.11 | | | | 16.03 | | | | 16.26 | | | | 1.53 | | | | 1.53 | | | | 1.53 | | | | 0.61 | | | | 22,123 | | | | 44 | | |
| 12-31-05 | | | 1.08 | | | | 13.89 | | | | 8.11 | | | | 1.60 | | | | 1.60 | | | | 1.60 | | | | 0.20 | | | | 12,408 | | | | 52 | | |
| 12-31-04 | | | 0.42 | | | | 13.84 | | | | 20.31 | | | | 1.60 | | | | 1.60 | | | | 1.60 | | | | (0.02 | ) | | | 4,980 | | | | 45 | | |
| Class I | |
| 12-31-08 | | | 1.66 | | | | 9.33 | | | | (32.86 | ) | | | 1.00 | | | | 1.00 | † | | | 1.00 | † | | | 1.46 | † | | | 80,515 | | | | 58 | | |
| 12-31-07 | | | 0.92 | | | | 15.77 | | | | 2.61 | | | | 1.00 | | | | 1.00 | | | | 1.00 | | | | 1.15 | | | | 145,638 | | | | 52 | | |
| 12-31-06 | | | 0.11 | | | | 16.26 | | | | 16.84 | | | | 1.03 | | | | 1.03 | | | | 1.03 | | | | 1.08 | | | | 125,602 | | | | 44 | | |
| 12-31-05 | | | 1.13 | | | | 14.02 | | | | 8.71 | | | | 1.10 | | | | 1.10 | | | | 1.10 | | | | 0.67 | | | | 80,426 | | | | 52 | | |
| 12-31-04 | | | 0.46 | | | | 13.93 | | | | 20.88 | | | | 1.10 | | | | 1.10 | | | | 1.10 | | | | 0.49 | | | | 55,163 | | | | 45 | | |
| Class S | |
| 12-31-08 | | | 1.60 | | | | 9.29 | | | | (33.04 | ) | | | 1.25 | | | | 1.25 | † | | | 1.25 | † | | | 1.29 | † | | | 78,604 | | | | 58 | | |
| 12-31-07 | | | 0.89 | | | | 15.67 | | | | 2.34 | | | | 1.25 | | | | 1.25 | | | | 1.25 | | | | 0.89 | | | | 89,851 | | | | 52 | | |
| 12-31-06 | | | 0.11 | | | | 16.17 | | | | 16.52 | | | | 1.28 | | | | 1.28 | | | | 1.28 | | | | 0.81 | | | | 91,338 | | | | 44 | | |
| 12-31-05 | | | 1.09 | | | | 13.98 | | | | 8.49 | | | | 1.35 | | | | 1.35 | | | | 1.35 | | | | 0.39 | | | | 78,459 | | | | 52 | | |
| 12-31-04 | | | 0.44 | | | | 13.89 | | | | 20.59 | | | | 1.35 | | | | 1.35 | | | | 1.35 | | | | 0.26 | | | | 64,420 | | | | 45 | | |
| ING Legg Mason Partners Aggressive Growth Portfolio | |
| Class ADV | |
| 12-31-08 | | | — | | | | 28.37 | | | | (39.48 | ) | | | 1.31 | | | | 1.31 | † | | | 1.31 | † | | | (0.54 | )† | | | 3,631 | | | | 4 | | |
| 12-31-07 | | | — | | | | 46.88 | | | | (2.11 | ) | | | 1.30 | | | | 1.30 | | | | 1.30 | | | | (0.60 | ) | | | 8,325 | | | | 5 | | |
| 12-31-06 | | | — | | | | 47.89 | | | | 9.74 | | | | 1.30 | | | | 1.30 | | | | 1.30 | | | | (0.59 | ) | | | 8,459 | | | | 6 | | |
| 12-31-05 | | | — | | | | 43.64 | | | | 10.90 | (a) | | | 1.31 | | | | 1.31 | | | | 1.31 | | | | (0.82 | ) | | | 7,843 | | | | 10 | | |
| 12-31-04 | | | — | | | | 39.35 | | | | 9.18 | | | | 1.32 | | | | 1.32 | | | | 1.32 | | | | (0.45 | ) | | | 3,196 | | | | 3 | | |
| Class I | |
| 12-31-08 | | | — | | | | 29.37 | | | | (39.21 | ) | | | 0.81 | | | | 0.81 | † | | | 0.81 | † | | | (0.03 | )† | | | 455,682 | | | | 4 | | |
| 12-31-07 | | | — | | | | 48.31 | | | | (1.61 | ) | | | 0.80 | | | | 0.80 | | | | 0.80 | | | | (0.11 | ) | | | 1,103,033 | | | | 5 | | |
| 12-31-06 | | | — | | | | 49.10 | | | | 10.29 | | | | 0.80 | | | | 0.80 | | | | 0.80 | | | | (0.05 | ) | | | 1,155,244 | | | | 6 | | |
| 12-31-05 | | | — | | | | 44.52 | | | | 11.44 | (a) | | | 0.81 | | | | 0.81 | | | | 0.81 | | | | (0.33 | ) | | | 531,343 | | | | 10 | | |
| 12-31-04 | | | — | | | | 39.95 | | | | 9.72 | | | | 0.82 | | | | 0.82 | | | | 0.82 | | | | 0.06 | | | | 575,903 | | | | 3 | | |
| Class S | |
| 12-31-08 | | | — | | | | 28.86 | | | | (39.34 | ) | | | 1.06 | | | | 1.06 | † | | | 1.06 | † | | | (0.26 | )† | | | 86,511 | | | | 4 | | |
| 12-31-07 | | | — | | | | 47.58 | | | | (1.88 | ) | | | 1.05 | | | | 1.05 | | | | 1.05 | | | | (0.36 | ) | | | 169,485 | | | | 5 | | |
| 12-31-06 | | | — | | | | 48.49 | | | | 10.00 | | | | 1.05 | | | | 1.05 | | | | 1.05 | | | | (0.40 | ) | | | 186,363 | | | | 6 | | |
| 12-31-05 | | | — | | | | 44.08 | | | | 11.17 | (a) | | | 1.06 | | | | 1.06 | | | | 1.06 | | | | (0.58 | ) | | | 437,476 | | | | 10 | | |
| 12-31-04 | | | — | | | | 39.65 | | | | 9.44 | | | | 1.07 | | | | 1.07 | | | | 1.07 | | | | (0.04 | ) | | | 355,857 | | | | 3 | | |
| ING Neuberger Berman Partners Portfolio | |
| Class ADV | |
| 12-31-08 | | | — | | | | 5.44 | | | | (51.52 | ) | | | 1.25 | | | | 1.17 | | | | 1.17 | | | | 0.04 | | | | 2 | | | | 63 | | |
| 12-31-07 | | | 0.57 | | | | 11.22 | | | | 8.40 | | | | 1.23 | | | | 1.17 | | | | 1.17 | | | | (0.20 | ) | | | 12 | | | | 47 | | |
| 12-29-06(4)-12-31-06 | | | — | | | | 10.90 | | | | — | | | | 1.25 | | | | 1.17 | | | | 1.17 | | | | (1.17 | ) | | | 1 | | | | 111 | | |
| Class I | |
| 12-31-08 | | | 0.02 | | | | 5.51 | | | | (51.12 | ) | | | 0.75 | | | | 0.67 | | | | 0.67 | | | | 0.72 | | | | 187,621 | | | | 63 | | |
| 12-31-07 | | | 0.57 | | | | 11.30 | | | | 8.85 | | | | 0.73 | | | | 0.67 | | | | 0.67 | | | | 0.32 | | | | 271,555 | | | | 47 | | |
| 01-19-06(4)-12-31-06 | | | — | | | | 10.93 | | | | 7.16 | | | | 0.75 | | | | 0.67 | | | | 0.67 | | | | 0.65 | | | | 232,030 | | | | 111 | | |
| Class S | |
| 12-31-08 | | | — | | | | 5.48 | | | | (51.29 | ) | | | 1.00 | | | | 0.89 | | | | 0.89 | | | | 0.45 | | | | 63,348 | | | | 63 | | |
| 12-31-07 | | | 0.56 | | | | 11.25 | | | | 8.62 | | | | 0.98 | | | | 0.89 | | | | 0.89 | | | | 0.10 | | | | 157,241 | | | | 47 | | |
| 01-03-06(4)-12-31-06 | | | — | | | | 10.90 | | | | 9.00 | | | | 1.00 | | | | 0.92 | | | | 0.92 | | | | 0.37 | | | | 181,499 | | | | 111 | | |
See Accompanying Notes to Financial Statements
76
FINANCIAL HIGHLIGHTS (CONTINUED)
Selected data for a share of beneficial interest outstanding throughout each year or period.
| | | | | Income (loss)
from investment
operations | | | | Less distributions | |
| | | Net asset value, beginning of year or period | | Net investment income (loss) | | Net realized and unrealized gain (loss) | | Total from investment operations | | From net investment income | | From net realized gains | | From return of capital | |
| | | | | | | | | | | | | | | | |
| Year or period ended | | ($) | | ($) | | ($) | | ($) | | ($) | | ($) | | ($) | |
| ING Oppenheimer Global Portfolio | |
| Class ADV | |
| 12-31-08 | | | 16.38 | | | | 0.30 | | | | (6.53 | ) | | | (6.23 | ) | | | 0.23 | | | | 1.12 | | | | — | | |
| 12-31-07 | | | 16.22 | | | | 0.17 | • | | | 0.81 | | | | 0.98 | | | | 0.11 | | | | 0.71 | | | | — | | |
| 12-31-06 | | | 13.85 | | | | 0.07 | • | | | 2.33 | | | | 2.40 | | | | 0.01 | | | | 0.02 | | | | — | | |
| 12-31-05 | | | 12.50 | | | | 0.07 | • | | | 1.56 | | | | 1.63 | | | | 0.04 | | | | 0.24 | | | | — | | |
| 12-31-04 | | | 11.02 | | | | 0.03 | | | | 1.57 | | | | 1.60 | | | | 0.00 | * | | | 0.12 | | | | — | | |
| Class I | |
| 12-31-08 | | | 16.87 | | | | 0.32 | | | | (6.67 | ) | | | (6.35 | ) | | | 0.33 | | | | 1.12 | | | | — | | |
| 12-31-07 | | | 16.68 | | | | 0.27 | • | | | 0.82 | | | | 1.09 | | | | 0.19 | | | | 0.71 | | | | — | | |
| 12-31-06 | | | 14.17 | | | | 0.15 | • | | | 2.39 | | | | 2.54 | | | | 0.01 | | | | 0.02 | | | | — | | |
| 12-31-05 | | | 12.80 | | | | 0.14 | • | | | 1.60 | | | | 1.74 | | | | 0.12 | | | | 0.25 | | | | — | | |
| 12-31-04 | | | 11.23 | | | | 0.01 | | | | 1.69 | | | | 1.70 | | | | 0.01 | | | | 0.12 | | | | — | | |
| Class S | |
| 12-31-08 | | | 16.46 | | | | 0.23 | • | | | (6.46 | ) | | | (6.23 | ) | | | 0.29 | | | | 1.12 | | | | — | | |
| 12-31-07 | | | 16.31 | | | | 0.23 | • | | | 0.80 | | | | 1.03 | | | | 0.17 | | | | 0.71 | | | | — | | |
| 12-31-06 | | | 13.90 | | | | 0.10 | • | | | 2.34 | | | | 2.44 | | | | 0.01 | | | | 0.02 | | | | — | | |
| 12-31-05 | | | 12.58 | | | | 0.09 | • | | | 1.58 | | | | 1.67 | | | | 0.10 | | | | 0.25 | | | | — | | |
| 12-31-04 | | | 11.06 | | | | 0.02 | | | | 1.62 | | | | 1.64 | | | | 0.00 | * | | | 0.12 | | | | — | | |
| ING Oppenheimer Strategic Income Portfolio | |
| Class ADV | |
| 12-31-08 | | | 11.12 | | | | 0.55 | • | | | (2.28 | ) | | | (1.73 | ) | | | 0.51 | | | | 0.04 | | | | — | | |
| 12-31-07 | | | 10.76 | | | | 0.59 | • | | | 0.28 | | | | 0.87 | | | | 0.51 | | | | — | | | | — | | |
| 12-31-06 | | | 9.98 | | | | 0.62 | • | | | 0.18 | | | | 0.80 | | | | 0.02 | | | | — | | | | — | | |
| 12-31-05 | | | 10.11 | | | | 0.30 | • | | | (0.24 | ) | | | 0.06 | | | | 0.19 | | | | — | | | | — | | |
| 11-08-04(4)-12-31-04 | | | 10.00 | | | | 0.02 | | | | 0.11 | | | | 0.13 | | | | 0.02 | | | | — | | | | — | | |
| Class I | |
| 12-31-08 | | | 11.20 | | | | 0.54 | • | | | (2.22 | ) | | | (1.68 | ) | | | 0.56 | | | | 0.04 | | | | — | | |
| 12-31-07 | | | 10.80 | | | | 0.64 | • | | | 0.28 | | | | 0.92 | | | | 0.52 | | | | — | | | | — | | |
| 12-31-06 | | | 10.00 | | | | 0.66 | • | | | 0.18 | | | | 0.84 | | | | 0.04 | | | | — | | | | — | | |
| 12-31-05 | | | 10.12 | | | | 0.35 | • | | | (0.24 | ) | | | 0.11 | | | | 0.23 | | | | — | | | | — | | |
| 11-08-04(4)-12-31-04 | | | 10.00 | | | | 0.02 | | | | 0.12 | | | | 0.14 | | | | 0.02 | | | | — | | | | — | | |
| Class S | |
| 12-31-08 | | | 11.21 | | | | 0.48 | • | | | (2.19 | ) | | | (1.71 | ) | | | 0.54 | | | | 0.04 | | | | — | | |
| 12-31-07 | | | 10.81 | | | | 0.62 | • | | | 0.27 | | | | 0.89 | | | | 0.49 | | | | — | | | | — | | |
| 12-31-06 | | | 9.99 | | | | 0.64 | • | | | 0.19 | | | | 0.83 | | | | 0.01 | | | | — | | | | — | | |
| 12-31-05 | | | 10.11 | | | | 0.32 | • | | | (0.24 | ) | | | 0.08 | | | | 0.20 | | | | — | | | | — | | |
| 11-08-04(4)-12-31-04 | | | 10.00 | | | | 0.02 | | | | 0.11 | | | | 0.13 | | | | 0.02 | | | | — | | | | — | | |
| ING PIMCO Total Return Portfolio | |
| Class ADV | |
| 12-31-08 | | | 11.66 | | | | 0.46 | • | | | (0.52 | ) | | | (0.06 | ) | | | 0.52 | | | | 0.17 | | | | — | | |
| 12-31-07 | | | 11.03 | | | | 0.44 | • | | | 0.55 | | | | 0.99 | | | | 0.36 | | | | — | | | | — | | |
| 12-31-06 | | | 10.81 | | | | 0.36 | • | | | 0.03 | | | | 0.39 | | | | 0.17 | | | | — | | | | — | | |
| 12-31-05 | | | 10.91 | | | | 0.28 | • | | | (0.08 | ) | | | 0.20 | | | | 0.16 | | | | 0.14 | | | | — | | |
| 12-31-04 | | | 10.59 | | | | 0.09 | • | | | 0.34 | | | | 0.43 | | | | — | | | | 0.11 | | | | — | | |
| Class I | |
| 12-31-08 | | | 11.81 | | | | 0.53 | • | | | (0.54 | ) | | | (0.01) | | | | 0.55 | | | | 0.17 | | | | — | | |
| 12-31-07 | | | 11.16 | | | | 0.51 | • | | | 0.55 | | | | 1.06 | | | | 0.41 | | | | — | | | | — | | |
| 12-31-06 | | | 10.92 | | | | 0.42 | • | | | 0.03 | | | | 0.45 | | | | 0.21 | | | | — | | | | — | | |
| 12-31-05 | | | 11.00 | | | | 0.34 | • | | | (0.08 | ) | | | 0.26 | | | | 0.20 | | | | 0.14 | | | | — | | |
| 12-31-04 | | | 10.62 | | | | 0.16 | • | | | 0.33 | | | | 0.49 | | | | — | | | | 0.11 | | | | — | | |
| Class S | |
| 12-31-08 | | | 11.75 | | | | 0.49 | • | | | (0.52 | ) | | | (0.03 | ) | | | 0.54 | | | | 0.17 | | | | — | | |
| 12-31-07 | | | 11.11 | | | | 0.48 | • | | | 0.55 | | | | 1.03 | | | | 0.39 | | | | — | | | | — | | |
| 12-31-06 | | | 10.87 | | | | 0.39 | • | | | 0.04 | | | | 0.43 | | | | 0.19 | | | | — | | | | — | | |
| 12-31-05 | | | 10.96 | | | | 0.30 | • | | | (0.07 | ) | | | 0.23 | | | | 0.18 | | | | 0.14 | | | | — | | |
| 12-31-04 | | | 10.61 | | | | 0.14 | • | | | 0.32 | | | | 0.46 | | | | — | | | | 0.11 | | | | — | | |
| | | | | Ratios to average net assets | | Supplemental data | |
| | | Total distributions | | Net asset value, end of year or period | | Total Return(1) | | Expenses before reductions/additions(2)(3) | | Expenses net of fee waivers and/or recoupments, if any(2)(3) | | Expenses net of all reductions/additions(2)(3) | | Net investment income (loss)(2)(3) | | Net assets, end of year or period | | Portfolio turnover rate | |
| | | | | | | | | | | | | | | | | | | | |
| Year or period ended | | ($) | | ($) | | (%) | | (%) | | (%) | | (%) | | (%) | | ($000's) | | (%) | |
| ING Oppenheimer Global Portfolio | |
| Class ADV | |
| 12-31-08 | | | 1.35 | | | | 8.80 | | | | (40.65 | ) | | | 1.16 | | | | 1.16 | † | | | 1.16 | † | | | 1.60 | † | | | 40,813 | | | | 12 | | |
| 12-31-07 | | | 0.82 | | | | 16.38 | | | | 6.04 | | | | 1.16 | | | | 1.15 | | | | 1.15 | | | | 1.08 | | | | 99,669 | | | | 14 | | |
| 12-31-06 | | | 0.03 | | | | 16.22 | | | | 17.36 | | | | 1.16 | | | | 1.15 | | | | 1.15 | | | | 0.51 | | | | 95,286 | | | | 23 | | |
| 12-31-05 | | | 0.28 | | | | 13.85 | | | | 13.07 | | | | 1.16 | | | | 1.15 | | | | 1.15 | | | | 0.60 | | | | 106,510 | | | | 53 | | |
| 12-31-04 | | | 0.12 | | | | 12.50 | | | | 14.71 | | | | 1.28 | | | | 1.27 | | | | 1.27 | | | | 0.55 | | | | 127,653 | | | | 390 | | |
| Class I | |
| 12-31-08 | | | 1.45 | | | | 9.07 | | | | (40.38 | ) | | | 0.66 | | | | 0.66 | † | | | 0.66 | † | | | 2.07 | † | | | 1,124,127 | | | | 12 | | |
| 12-31-07 | | | 0.90 | | | | 16.87 | | | | 6.57 | | | | 0.66 | | | | 0.66 | | | | 0.66 | | | | 1.57 | | | | 2,289,589 | | | | 14 | | |
| 12-31-06 | | | 0.03 | | | | 16.68 | | | | 17.98 | | | | 0.66 | | | | 0.66 | | | | 0.66 | | | | 0.96 | | | | 2,518,662 | | | | 23 | | |
| 12-31-05 | | | 0.37 | | | | 14.17 | | | | 13.57 | | | | 0.66 | | | | 0.66 | | | | 0.66 | | | | 1.05 | | | | 2,262,201 | | | | 53 | | |
| 12-31-04 | | | 0.13 | | | | 12.80 | | | | 15.28 | | | | 0.77 | | | | 0.77 | | | | 0.77 | | | | 1.11 | | | | 843,253 | | | | 390 | | |
| Class S | |
| 12-31-08 | | | 1.41 | | | | 8.82 | | | | (40.55 | ) | | | 0.91 | | | | 0.91 | † | | | 0.91 | † | | | 1.80 | † | | | 157,261 | | | | 12 | | |
| 12-31-07 | | | 0.88 | | | | 16.46 | | | | 6.35 | | | | 0.91 | | | | 0.91 | | | | 0.91 | | | | 1.37 | | | | 232,651 | | | | 14 | | |
| 12-31-06 | | | 0.03 | | | | 16.31 | | | | 17.60 | | | | 0.91 | | | | 0.91 | | | | 0.91 | | | | 0.66 | | | | 145,060 | | | | 23 | | |
| 12-31-05 | | | 0.35 | | | | 13.90 | | | | 13.27 | | | | 0.91 | | | | 0.91 | | | | 0.91 | | | | 0.71 | | | | 40,831 | | | | 53 | | |
| 12-31-04 | | | 0.12 | | | | 12.58 | | | | 15.01 | | | | 1.02 | | | | 1.02 | | | | 1.02 | | | | 0.19 | | | | 19,143 | | | | 390 | | |
| ING Oppenheimer Strategic Income Portfolio | |
| Class ADV | |
| 12-31-08 | | | 0.55 | | | | 8.84 | | | | (16.38 | ) | | | 1.04 | | | | 1.00 | † | | | 1.00 | † | | | 5.19 | † | | | 16,393 | | | | 108 | | |
| 12-31-07 | | | 0.51 | | | | 11.12 | | | | 8.28 | | | | 1.04 | | | | 1.00 | | | | 1.00 | | | | 5.41 | | | | 20,460 | | | | 104 | | |
| 12-31-06 | | | 0.02 | | | | 10.76 | | | | 7.99 | | | | 1.04 | | | | 1.00 | | | | 1.00 | | | | 6.09 | | | | 9,266 | | | | 140 | | |
| 12-31-05 | | | 0.19 | | | | 9.98 | | | | 0.61 | | | | 1.04 | | | | 1.00 | | | | 1.00 | | | | 2.94 | | | | 5,082 | | | | 216 | | |
| 11-08-04(4)-12-31-04 | | | 0.02 | | | | 10.11 | | | | 1.26 | | | | 1.06 | | | | 1.02 | | | | 1.02 | | | | 2.15 | | | | 3,655 | | | | 145 | | |
| Class I | |
| 12-31-08 | | | 0.60 | | | | 8.92 | | | | (15.89 | ) | | | 0.54 | | | | 0.54 | † | | | 0.54 | † | | | 5.12 | † | | | 451,197 | | | | 108 | | |
| 12-31-07 | | | 0.52 | | | | 11.20 | | | | 8.76 | | | | 0.54 | | | | 0.54 | | | | 0.54 | | | | 5.80 | | | | 415,035 | | | | 104 | | |
| 12-31-06 | | | 0.04 | | | | 10.80 | | | | 8.42 | | | | 0.54 | | | | 0.54 | | | | 0.54 | | | | 6.39 | | | | 359,888 | | | | 140 | | |
| 12-31-05 | | | 0.23 | | | | 10.00 | | | | 1.09 | | | | 0.54 | | | | 0.54 | | | | 0.54 | | | | 3.50 | | | | 302,941 | | | | 216 | | |
| 11-08-04(4)-12-31-04 | | | 0.02 | | | | 10.12 | | | | 1.39 | | | | 0.52 | | | | 0.52 | | | | 0.52 | | | | 2.56 | | | | 103,283 | | | | 145 | | |
| Class S | |
| 12-31-08 | | | 0.58 | | | | 8.92 | | | | (16.10 | ) | | | 0.79 | | | | 0.75 | † | | | 0.75 | † | | | 4.53 | † | | | 88,592 | | | | 108 | | |
| 12-31-07 | | | 0.49 | | | | 11.21 | | | | 8.50 | | | | 0.79 | | | | 0.75 | | | | 0.75 | | | | 5.61 | | | | 83,977 | | | | 104 | | |
| 12-31-06 | | | 0.01 | | | | 10.81 | | | | 8.33 | | | | 0.79 | | | | 0.75 | | | | 0.75 | | | | 6.20 | | | | 56,054 | | | | 140 | | |
| 12-31-05 | | | 0.20 | | | | 9.99 | | | | 0.84 | | | | 0.79 | | | | 0.75 | | | | 0.75 | | | | 3.14 | | | | 60,478 | | | | 216 | | |
| 11-08-04(4)-12-31-04 | | | 0.02 | | | | 10.11 | | | | 1.27 | | | | 0.81 | | | | 0.77 | | | | 0.77 | | | | 2.40 | | | | 60,836 | | | | 145 | | |
| ING PIMCO Total Return Portfolio | |
| Class ADV | |
| 12-31-08 | | | 0.69 | | | | 10.91 | | | | (0.54 | ) | | | 1.16 | | | | 1.15 | | | | 1.15 | | | | 4.04 | | | | 44,599 | | | | 872 | | |
| 12-31-07 | | | 0.36 | | | | 11.66 | | | | 9.25 | | | | 1.21 | (b) | | | 1.21 | (b) | | | 1.21 | (b) | | | 3.98 | (b) | | | 33,445 | | | | 863 | | |
| 12-31-06 | | | 0.17 | | | | 11.03 | | | | 3.71 | | | | 1.27 | (b) | | | 1.27 | (b) | | | 1.27 | (b) | | | 3.36 | (b) | | | 25,603 | | | | 826 | | |
| 12-31-05 | | | 0.30 | | | | 10.81 | | | | 1.80 | | | | 1.35 | | | | 1.35 | | | | 1.35 | | | | 2.54 | | | | 23,018 | | | | 926 | | |
| 12-31-04 | | | 0.11 | | | | 10.91 | | | | 4.06 | | | | 1.35 | | | | 1.35 | | | | 1.35 | | | | 0.81 | | | | 14,827 | | | | 377 | | |
| Class I | |
| 12-31-08 | | | 0.72 | | | | 11.08 | | | | (0.04 | ) | | | 0.66 | | | | 0.65 | | | | 0.65 | | | | 4.55 | | | | 265,311 | | | | 872 | | |
| 12-31-07 | | | 0.41 | | | | 11.81 | | | | 9.79 | | | | 0.71 | (b) | | | 0.71 | (b) | �� | | 0.71 | (b) | | | 4.49 | (b) | | | 320,725 | | | | 863 | | |
| 12-31-06 | | | 0.21 | | | | 11.16 | | | | 4.21 | | | | 0.77 | (b) | | | 0.77 | (b) | | | 0.77 | (b) | | | 3.86 | (b) | | | 213,734 | | | | 826 | | |
| 12-31-05 | | | 0.34 | | | | 10.92 | | | | 2.36 | | | | 0.85 | | | | 0.85 | | | | 0.85 | | | | 3.07 | | | | 176,607 | | | | 926 | | |
| 12-31-04 | | | 0.11 | | | | 11.00 | | | | 4.61 | | | | 0.85 | | | | 0.85 | | | | 0.85 | | | | 1.51 | | | | 78,521 | | | | 377 | | |
| Class S | |
| 12-31-08 | | | 0.71 | | | | 11.01 | | | | (0.28 | ) | | | 0.91 | | | | 0.90 | | | | 0.90 | | | | 4.30 | | | | 192,259 | | | | 872 | | |
| 12-31-07 | | | 0.39 | | | | 11.75 | | | | 9.51 | | | | 0.96 | (b) | | | 0.96 | (b) | | | 0.96 | (b) | | | 4.23 | (b) | | | 122,274 | | | | 863 | | |
| 12-31-06 | | | 0.19 | | | | 11.11 | | | | 4.00 | | | | 1.02 | (b) | | | 1.02 | (b) | | | 1.02 | (b) | | | 3.61 | (b) | | | 93,487 | | | | 826 | | |
| 12-31-05 | | | 0.32 | | | | 10.87 | | | | 2.08 | | | | 1.10 | | | | 1.10 | | | | 1.10 | | | | 2.73 | | | | 83,782 | | | | 926 | | |
| 12-31-04 | | | 0.11 | | | | 10.96 | | | | 4.33 | | | | 1.10 | | | | 1.10 | | | | 1.10 | | | | 1.32 | | | | 88,424 | | | | 377 | | |
See Accompanying Notes to Financial Statements
77
FINANCIAL HIGHLIGHTS (CONTINUED)
Selected data for a share of beneficial interest outstanding throughout each year or period.
| | | | | Income (loss)
from investment
operations | | | | Less distributions | |
| | | Net asset value, beginning of year or period | | Net investment income (loss) | | Net realized and unrealized gain (loss) | | Total from investment operations | | From net investment income | | From net realized gains | | From return of capital | |
| | | | | | | | | | | | | | | | |
| Year or period ended | | ($) | | ($) | | ($) | | ($) | | ($) | | ($) | | ($) | |
| ING Pioneer High Yield Portfolio | |
| Class ADV | |
| 12-31-08 | | | 10.23 | | | | 0.66 | | | | (3.50 | ) | | | (2.84 | ) | | | 0.65 | | | | 0.23 | | | | — | | |
| 12-31-07 | | | 10.22 | | | | 0.54 | • | | | 0.01 | | | | 0.55 | | | | 0.54 | | | | — | | | | — | | |
| 01-20-06(4)-12-31-06 | | | 9.99 | | | | 0.47 | • | | | 0.30 | | | | 0.77 | | | | 0.51 | | | | 0.03 | | | | — | | |
| Class I | |
| 12-31-08 | | | 10.25 | | | | 0.74 | • | | | (3.54 | ) | | | (2.80 | ) | | | 0.70 | | | | 0.23 | | | | — | | |
| 12-31-07 | | | 10.22 | | | | 0.59 | • | | | 0.03 | | | | 0.62 | | | | 0.59 | | | | — | | | | — | | |
| 01-03-06(4)-12-31-06 | | | 10.00 | | | | 0.57 | • | | | 0.23 | | | | 0.80 | | | | 0.55 | | | | 0.03 | | | | — | | |
| Class S | |
| 12-31-08 | | | 10.25 | | | | 0.67 | • | | | (3.49 | ) | | | (2.82 | ) | | | 0.68 | | | | 0.23 | | | | — | | |
| 12-31-07 | | | 10.22 | | | | 0.57 | • | | | 0.03 | | | | 0.60 | | | | 0.57 | | | | — | | | | — | | |
| 01-20-06(4)-12-31-06 | | | 9.99 | | | | 0.54 | • | | | 0.24 | | | | 0.78 | | | | 0.52 | | | | 0.03 | | | | — | | |
| ING T. Rowe Price Diversified Mid Cap Growth Portfolio | |
| Class ADV | |
| 12-31-08 | | | 9.22 | | | | (0.02 | ) | | | (3.48 | ) | | | (3.50 | ) | | | — | | | | 1.28 | | | | — | | |
| 12-31-07 | | | 8.99 | | | | (0.03 | ) | | | 1.14 | | | | 1.11 | | | | — | | | | 0.88 | | | | — | | |
| 12-31-06 | | | 8.47 | | | | (0.03 | ) | | | 0.74 | | | | 0.71 | | | | — | | | | 0.19 | | | | — | | |
| 12-31-05 | | | 7.94 | | | | (0.05 | ) | | | 0.72 | | | | 0.67 | | | | — | | | | 0.14 | | | | — | | |
| 12-31-04 | | | 7.33 | | | | (0.10 | ) | | | 0.71 | | | | 0.61 | | | | — | | | | — | | | | — | | |
| Class I | |
| 12-31-08 | | | 9.52 | | | | 0.02 | | | | (3.63 | ) | | | (3.61 | ) | | | 0.03 | | | | 1.28 | | | | — | | |
| 12-31-07 | | | 9.22 | | | | 0.02 | | | | 1.18 | | | | 1.20 | | | | 0.02 | | | | 0.88 | | | | — | | |
| 12-31-06 | | | 8.65 | | | | 0.02 | | | | 0.74 | | | | 0.76 | | | | — | | | | 0.19 | | | | — | | |
| 12-31-05 | | | 8.06 | | | | (0.00 | )* | | | 0.73 | | | | 0.73 | | | | — | | | | 0.14 | | | | — | | |
| 12-31-04 | | | 7.40 | | | | (0.00 | )* | | | 0.66 | | | | 0.66 | | | | — | | | | — | | | | — | | |
| Class S | |
| 12-31-08 | | | 9.37 | | | | (0.00 | )* | | | (3.56 | ) | | | (3.56 | ) | | | 0.00 | * | | | 1.28 | | | | — | | |
| 12-31-07 | | | 9.10 | | | | (0.01 | ) | | | 1.16 | | | | 1.15 | | | | — | | | | 0.88 | | | | — | | |
| 12-31-06 | | | 8.55 | | | | (0.01 | ) | | | 0.75 | | | | 0.74 | | | | — | | | | 0.19 | | | | — | | |
| 12-31-05 | | | 7.99 | | | | (0.03 | ) | | | 0.73 | | | | 0.70 | | | | — | | | | 0.14 | | | | — | | |
| 12-31-04 | | | 7.36 | | | | (0.07 | ) | | | 0.70 | | | | 0.63 | | | | — | | | | — | | | | — | | |
| ING T. Rowe Price Growth Equity Portfolio | |
| Class ADV | |
| 12-31-08 | | | 60.78 | | | | (0.04 | )• | | | (24.38 | ) | | | (24.42 | ) | | | 0.08 | | | | 3.92 | | | | 0.05 | | |
| 12-31-07 | | | 58.37 | | | | 0.03 | • | | | 5.34 | | | | 5.37 | | | | 0.03 | | | | 2.93 | | | | — | | |
| 12-31-06 | | | 51.87 | | | | 0.05 | | | | 6.54 | | | | 6.59 | | | | — | | | | 0.09 | | | | — | | |
| 12-31-05 | | | 49.14 | | | | (0.06 | )• | | | 2.84 | | | | 2.78 | | | | — | | | | 0.05 | | | | — | | |
| 12-31-04 | | | 44.89 | | | | 0.11 | | | | 4.14 | | | | 4.25 | | | | — | | | | — | | | | — | | |
| Class I | |
| 12-31-08 | | | 61.89 | | | | 0.26 | | | | (24.86 | ) | | | (24.60 | ) | | | 0.64 | | | | 3.92 | | | | 0.05 | | |
| 12-31-07 | | | 59.36 | | | | 0.32 | | | | 5.45 | | | | 5.77 | | | | 0.31 | | | | 2.93 | | | | — | | |
| 12-31-06 | | | 52.62 | | | | 0.33 | • | | | 6.64 | | | | 6.97 | | | | 0.14 | | | | 0.09 | | | | — | | |
| 12-31-05 | | | 49.81 | | | | 0.19 | • | | | 2.87 | | | | 3.06 | | | | 0.25 | | | | — | | | | — | | |
| 12-31-04 | | | 45.35 | | | | 0.29 | | | | 4.24 | | | | 4.53 | | | | 0.07 | | | | — | | | | — | | |
| Class S | |
| 12-31-08 | | | 61.35 | | | | 0.07 | • | | | (24.56 | ) | | | (24.49 | ) | | | 0.44 | | | | 3.92 | | | | 0.05 | | |
| 12-31-07 | | | 58.85 | | | | 0.15 | • | | | 5.41 | | | | 5.56 | | | | 0.13 | | | | 2.93 | | | | — | | |
| 12-31-06 | | | 52.16 | | | | 0.28 | • | | | 6.50 | | | | 6.78 | | | | — | | | | 0.09 | | | | — | | |
| 12-31-05 | | | 49.48 | | | | 0.06 | • | | | 2.85 | | | | 2.91 | | | | — | | | | 0.23 | | | | — | | |
| 12-31-04 | | | 45.12 | | | | 0.22 | | | | 4.16 | | | | 4.38 | | | | — | | | | 0.02 | | | | — | | |
| | | | | Ratios to average net assets | | Supplemental data | |
| | | Total distributions | | Net asset value, end of year or period | | Total Return(1) | | Expenses before reductions/additions(2)(3) | | Expenses net of fee waivers and/or recoupments, if any(2)(3) | | Expenses net of all reductions/additions(2)(3) | | Net investment income (loss)(2)(3) | | Net assets, end of year or period | | Portfolio turnover rate | |
| | | | | | | | | | | | | | | | | | | | |
| Year or period ended | | ($) | | ($) | | (%) | | (%) | | (%) | | (%) | | (%) | | ($000's) | | (%) | |
| ING Pioneer High Yield Portfolio | |
| Class ADV | |
| 12-31-08 | | | 0.88 | | | | 6.51 | | | | (29.60 | )(c) | | | 1.24 | | | | 1.23 | † | | | 1.23 | † | | | 7.25 | † | | | 773 | | | | 38 | | |
| 12-31-07 | | | 0.54 | | | | 10.23 | | | | 5.43 | | | | 1.28 | | | | 1.27 | | | | 1.27 | | | | 5.22 | | | | 1,018 | | | | 68 | | |
| 01-20-06(4)-12-31-06 | | | 0.54 | | | | 10.22 | | | | 7.98 | | | | 1.30 | | | | 1.23 | | | | 1.23 | | | | 4.97 | | | | 510 | | | | 20 | | |
| Class I | |
| 12-31-08 | | | 0.93 | | | | 6.52 | | | | (29.27 | )(c) | | | 0.74 | | | | 0.73 | † | | | 0.72 | † | | | 8.82 | † | | | 279,168 | | | | 38 | | |
| 12-31-07 | | | 0.59 | | | | 10.25 | | | | 6.15 | | | | 0.78 | | | | 0.77 | | | | 0.77 | | | | 5.67 | | | | 105,105 | | | | 68 | | |
| 01-03-06(4)-12-31-06 | | | 0.58 | | | | 10.22 | | | | 8.24 | | | | 0.80 | | | | 0.73 | | | | 0.73 | | | | 5.70 | | | | 119,959 | | | | 20 | | |
| Class S | |
| 12-31-08 | | | 0.91 | | | | 6.52 | | | | (29.45 | )(c) | | | 0.99 | | | | 0.98 | † | | | 0.98 | † | | | 7.32 | † | | | 2,170 | | | | 38 | | |
| 12-31-07 | | | 0.57 | | | | 10.25 | | | | 5.89 | | | | 1.03 | | | | 1.02 | | | | 1.02 | | | | 5.43 | | | | 5,899 | | | | 68 | | |
| 01-20-06(4)-12-31-06 | | | 0.55 | | | | 10.22 | | | | 8.01 | | | | 1.05 | | | | 0.98 | | | | 0.98 | | | | 5.43 | | | | 8,280 | | | | 20 | | |
| ING T. Rowe Price Diversified Mid Cap Growth Portfolio | |
| Class ADV | |
| 12-31-08 | | | 1.28 | | | | 4.44 | | | | (43.35 | ) | | | 1.16 | | | | 1.16 | | | | 1.16 | | | | (0.25 | ) | | | 15,401 | | | | 28 | | |
| 12-31-07 | | | 0.88 | | | | 9.22 | | | | 12.71 | | | | 1.16 | | | | 1.15 | | | | 1.15 | | | | (0.31 | ) | | | 40,695 | | | | 31 | | |
| 12-31-06 | | | 0.19 | | | | 8.99 | | | | 8.70 | | | | 1.16 | | | | 1.15 | | | | 1.15 | | | | (0.23 | ) | | | 48,165 | | | | 37 | | |
| 12-31-05 | | | 0.14 | | | | 8.47 | | | | 8.64 | | | | 1.16 | | | | 1.15 | | | | 1.15 | | | | (0.54 | ) | | | 69,686 | | | | 94 | | |
| 12-31-04 | | | — | | | | 7.94 | | | | 8.32 | | | | 1.47 | | | | 1.46 | | | | 1.46 | | | | (1.13 | ) | | | 80,813 | | | | 441 | | |
| Class I | |
| 12-31-08 | | | 1.31 | | | | 4.60 | | | | (43.15 | ) | | | 0.66 | | | | 0.66 | | | | 0.66 | | | | 0.26 | | | | 487,968 | | | | 28 | | |
| 12-31-07 | | | 0.90 | | | | 9.52 | | | | 13.39 | | | | 0.66 | | | | 0.66 | | | | 0.66 | | | | 0.18 | | | | 995,471 | | | | 31 | | |
| 12-31-06 | | | 0.19 | | | | 9.22 | | | | 9.10 | | | | 0.66 | | | | 0.66 | | | | 0.66 | | | | 0.19 | | | | 1,067,515 | | | | 37 | | |
| 12-31-05 | | | 0.14 | | | | 8.65 | | | | 9.26 | | | | 0.66 | | | | 0.66 | | | | 0.66 | | | | (0.04 | ) | | | 1,131,231 | | | | 94 | | |
| 12-31-04 | | | — | | | | 8.06 | | | | 8.92 | | | | 0.96 | | | | 0.96 | | | | 0.96 | | | | (0.06 | ) | | | 474,397 | | | | 441 | | |
| Class S | |
| 12-31-08 | | | 1.28 | | | | 4.53 | | | | (43.27 | ) | | | 0.91 | | | | 0.91 | | | | 0.91 | | | | 0.03 | | | | 9,009 | | | | 28 | | |
| 12-31-07 | | | 0.88 | | | | 9.37 | | | | 13.01 | | | | 0.91 | | | | 0.91 | | | | 0.91 | | | | (0.07 | ) | | | 13,319 | | | | 31 | | |
| 12-31-06 | | | 0.19 | | | | 9.10 | | | | 8.97 | | | | 0.91 | | | | 0.91 | | | | 0.91 | | | | (0.07 | ) | | | 10,100 | | | | 37 | | |
| 12-31-05 | | | 0.14 | | | | 8.55 | | | | 8.96 | | | | 0.91 | | | | 0.91 | | | | 0.91 | | | | (0.30 | ) | | | 21,871 | | | | 94 | | |
| 12-31-04 | | | — | | | | 7.99 | | | | 8.56 | | | | 1.21 | | | | 1.21 | | | | 1.21 | | | | (0.88 | ) | | | 29,155 | | | | 441 | | |
| ING T. Rowe Price Growth Equity Portfolio | |
| Class ADV | |
| 12-31-08 | | | 4.05 | | | | 32.31 | | | | (42.51 | ) | | | 1.25 | | | | 1.24 | | | | 1.24 | | | | (0.09 | ) | | | 49,551 | | | | 54 | | |
| 12-31-07 | | | 2.96 | | | | 60.78 | | | | 9.36 | | | | 1.25 | | | | 1.24 | | | | 1.24 | | | | 0.05 | | | | 103,588 | | | | 58 | | |
| 12-31-06 | | | 0.09 | | | | 58.37 | | | | 12.73 | | | | 1.25 | | | | 1.25 | | | | 1.25 | | | | 0.11 | | | | 105,821 | | | | 43 | | |
| 12-31-05 | | | 0.05 | | | | 51.87 | | | | 5.66 | | | | 1.25 | | | | 1.25 | | | | 1.25 | | | | (0.12 | ) | | | 86,781 | | | | 41 | | |
| 12-31-04 | | | — | | | | 49.14 | | | | 9.47 | | | | 1.25 | | | | 1.25 | | | | 1.25 | | | | 0.19 | | | | 78,870 | | | | 39 | | |
| Class I | |
| 12-31-08 | | | 4.61 | | | | 32.68 | | | | (42.21 | ) | | | 0.75 | | | | 0.74 | | | | 0.74 | | | | 0.42 | | | | 745,790 | | | | 54 | | |
| 12-31-07 | | | 3.24 | | | | 61.89 | | | | 9.91 | | | | 0.75 | | | | 0.74 | | | | 0.74 | | | | 0.55 | | | | 1,442,336 | | | | 58 | | |
| 12-31-06 | | | 0.23 | | | | 59.36 | | | | 13.30 | | | | 0.75 | | | | 0.75 | | | | 0.75 | | | | 0.60 | | | | 1,271,481 | | | | 43 | | |
| 12-31-05 | | | 0.25 | | | | 52.62 | | | | 6.17 | | | | 0.75 | | | | 0.75 | | | | 0.75 | | | | 0.38 | | | | 898,102 | | | | 41 | | |
| 12-31-04 | | | 0.07 | | | | 49.81 | | | | 10.02 | | | | 0.75 | | | | 0.75 | | | | 0.75 | | | | 0.66 | | | | 830,034 | | | | 39 | | |
| Class S | |
| 12-31-08 | | | 4.41 | | | | 32.45 | | | | (42.35 | ) | | | 1.00 | | | | 0.99 | | | | 0.99 | | | | 0.15 | | | | 69,896 | | | | 54 | | |
| 12-31-07 | | | 3.06 | | | | 61.35 | | | | 9.62 | | | | 1.00 | | | | 0.99 | | | | 0.99 | | | | 0.25 | | | | 101,503 | | | | 58 | | |
| 12-31-06 | | | 0.09 | | | | 58.85 | | | | 13.03 | | | | 1.00 | | | | 1.00 | | | | 1.00 | | | | 0.51 | | | | 37,306 | | | | 43 | | |
| 12-31-05 | | | 0.23 | | | | 52.16 | | | | 5.92 | | | | 1.00 | | | | 1.00 | | | | 1.00 | | | | 0.12 | | | | 163,188 | | | | 41 | | |
| 12-31-04 | | | 0.02 | | | | 49.48 | | | | 9.74 | | | | 1.00 | | | | 1.00 | | | | 1.00 | | | | 0.62 | | | | 18,642 | | | | 39 | | |
See Accompanying Notes to Financial Statements
78
FINANCIAL HIGHLIGHTS (CONTINUED)
Selected data for a share of beneficial interest outstanding throughout each year or period.
| | | | | Income (loss)
from investment
operations | | | | Less distributions | |
| | | Net asset value, beginning of year or period | | Net investment income (loss) | | Net realized and unrealized gain (loss) | | Total from investment operations | | From net investment income | | From net realized gains | | From return of capital | |
| | | | | | | | | | | | | | | | |
| Year or period ended | | ($) | | ($) | | ($) | | ($) | | ($) | | ($) | | ($) | |
| ING Templeton Foreign Equity Portfolio | |
| Class ADV | |
| 12-31-08 | | | 13.65 | | | | 0.23 | • | | | (5.81 | ) | | | (5.58 | ) | | | 0.23 | | | | — | | | | — | | |
| 12-31-07 | | | 12.03 | | | | 0.18 | • | | | 1.68 | | | | 1.86 | | | | 0.13 | | | | 0.11 | | | | — | | |
| 12-20-06(4)-12-31-06 | | | 12.09 | | | | 0.00 | * | | | 0.08 | | | | 0.08 | | | | 0.13 | | | | 0.01 | | | | — | | |
| Class I | |
| 12-31-08 | | | 13.66 | | | | 0.29 | • | | | (5.85 | ) | | | (5.56 | ) | | | 0.27 | | | | — | | | | — | | |
| 12-31-07 | | | 12.03 | | | | 0.24 | • | | | 1.63 | | | | 1.87 | | | | 0.13 | | | | 0.11 | | | | — | | |
| 01-03-06(4)-12-31-06 | | | 10.00 | | | | 0.27 | | | | 1.90 | | | | 2.17 | | | | 0.13 | | | | 0.01 | | | | — | | |
| Class S | |
| 12-31-08 | | | 13.63 | | | | 0.28 | • | | | (5.87 | ) | | | (5.59 | ) | | | 0.23 | | | | — | | | | — | | |
| 12-31-07 | | | 12.01 | | | | 0.20 | • | | | 1.63 | | | | 1.83 | | | | 0.10 | | | | 0.11 | | | | — | | |
| 01-12-06(4)-12-31-06 | | | 10.02 | | | | 0.17 | • | | | 1.95 | | | | 2.12 | | | | 0.12 | | | | 0.01 | | | | — | | |
| ING Thornburg Value Portfolio | |
| Class ADV | |
| 12-31-08 | | | 33.36 | | | | 0.18 | | | | (13.52 | ) | | | (13.34 | ) | | | 0.06 | | | | — | | | | — | | |
| 12-31-07 | | | 31.38 | | | | 0.18 | • | | | 1.93 | | | | 2.11 | | | | 0.13 | | | | — | | | | — | | |
| 12-31-06 | | | 27.03 | | | | 0.05 | • | | | 4.34 | | | | 4.39 | | | | 0.04 | | | | — | | | | — | | |
| 12-31-05 | | | 26.86 | | | | (0.02 | )• | | | 0.29 | | | | 0.27 | | | | 0.10 | | | | — | | | | — | | |
| 12-31-04 | | | 23.98 | | | | 0.03 | • | | | 2.92 | | | | 2.95 | | | | 0.07 | | | | — | | | | — | | |
| Class I | |
| 12-31-08 | | | 34.00 | | | | 0.32 | • | | | (13.79 | ) | | | (13.47 | ) | | | 0.15 | | | | — | | | | — | | |
| 12-31-07 | | | 31.85 | | | | 0.28 | | | | 2.02 | | | | 2.30 | | | | 0.15 | | | | — | | | | — | | |
| 12-31-06 | | | 27.40 | | | | 0.15 | • | | | 4.44 | | | | 4.59 | | | | 0.14 | | | | — | | | | — | | |
| 12-31-05 | | | 27.20 | | | | 0.11 | • | | | 0.31 | | | | 0.42 | | | | 0.22 | | | | — | | | | — | | |
| 12-31-04 | | | 24.21 | | | | 0.24 | • | | | 2.86 | | | | 3.10 | | | | 0.11 | | | | — | | | | — | | |
| Class S | |
| 12-31-08 | | | 33.75 | | | | 0.30 | | | | (13.76 | ) | | | (13.46 | ) | | | 0.03 | | | | — | | | | — | | |
| 12-31-07 | | | 31.68 | | | | 0.19 | • | | | 2.03 | | | | 2.22 | | | | 0.15 | | | | — | | | | — | | |
| 12-31-06 | | | 27.24 | | | | 0.36 | • | | | 4.14 | | | | 4.50 | | | | 0.06 | | | | — | | | | — | | |
| 12-31-05 | | | 27.04 | | | | 0.05 | • | | | 0.28 | | | | 0.33 | | | | 0.13 | | | | — | | | | — | | |
| 12-31-04 | | | 24.09 | | | | 0.16 | • | | | 2.87 | | | | 3.03 | | | | 0.08 | | | | — | | | | — | | |
| ING UBS U.S. Large Cap Equity Portfolio | |
| Class ADV | |
| 12-31-08 | | | 10.40 | | | | 0.08 | | | | (4.23 | ) | | | (4.15 | ) | | | 0.13 | | | | — | | | | — | | |
| 12-31-07 | | | 10.40 | | | | 0.06 | • | | | 0.01 | | | | 0.07 | | | | 0.07 | | | | — | | | | — | | |
| 12-31-06 | | | 9.19 | | | | 0.06 | • | | | 1.22 | | | | 1.28 | | | | 0.07 | | | | — | | | | — | | |
| 12-31-05 | | | 8.52 | | | | 0.03 | • | | | 0.70 | | | | 0.73 | | | | 0.06 | | | | — | | | | — | | |
| 12-31-04 | | | 7.49 | | | | 0.05 | | | | 1.01 | | | | 1.06 | | | | 0.03 | | | | — | | | | — | | |
| Class I | |
| 12-31-08 | | | 10.61 | | | | 0.13 | • | | | (4.32 | ) | | | (4.19 | ) | | | 0.22 | | | | — | | | | — | | |
| 12-31-07 | | | 10.56 | | | | 0.11 | | | | 0.02 | | | | 0.13 | | | | 0.08 | | | | — | | | | — | | |
| 12-31-06 | | | 9.30 | | | | 0.09 | | | | 1.25 | | | | 1.34 | | | | 0.08 | | | | — | | | | — | | |
| 12-31-05 | | | 8.58 | | | | 0.08 | • | | | 0.72 | | | | 0.80 | | | | 0.08 | | | | — | | | | — | | |
| 12-31-04 | | | 7.54 | | | | 0.10 | | | | 1.00 | | | | 1.10 | | | | 0.06 | | | | — | | | | — | | |
| Class S | |
| 12-31-08 | | | 10.48 | | | | 0.10 | • | | | (4.27 | ) | | | (4.17 | ) | | | 0.16 | | | | — | | | | — | | |
| 12-31-07 | | | 10.45 | | | | 0.08 | • | | | 0.02 | | | | 0.10 | | | | 0.07 | | | | — | | | | — | | |
| 12-31-06 | | | 9.21 | | | | 0.08 | • | | | 1.23 | | | | 1.31 | | | | 0.07 | | | | — | | | | — | | |
| 12-31-05 | | | 8.52 | | | | 0.06 | • | | | 0.70 | | | | 0.76 | | | | 0.07 | | | | — | | | | — | | |
| 12-31-04 | | | 7.49 | | | | 0.09 | | | | 1.00 | | | | 1.09 | | | | 0.06 | | | | — | | | | — | | |
| | | | | Ratios to average net assets | | Supplemental data | |
| | | Total distributions | | Net asset value, end of year or period | | Total Return(1) | | Expenses before reductions/additions(2)(3) | | Expenses net of fee waivers and/or recoupments, if any(2)(3) | | Expenses net of all reductions/additions(2)(3) | | Net investment income (loss)(2)(3) | | Net assets, end of year or period | | Portfolio turnover rate | |
| | | | | | | | | | | | | | | | | | | | |
| Year or period ended | | ($) | | ($) | | (%) | | (%) | | (%) | | (%) | | (%) | | ($000's) | | (%) | |
| ING Templeton Foreign Equity Portfolio | |
| Class ADV | |
| 12-31-08 | | | 0.23 | | | | 7.84 | | | | (40.88 | ) | | | 1.46 | | | | 1.47 | | | | 1.47 | | | | 2.22 | | | | 9,418 | | | | 11 | | |
| 12-31-07 | | | 0.24 | | | | 13.65 | | | | 15.42 | | | | 1.49 | | | | 1.48 | | | | 1.48 | | | | 1.40 | | | | 1 | | | | 20 | | |
| 12-20-06(4)-12-31-06 | | | 0.14 | | | | 12.03 | | | | 0.66 | | | | 1.74 | | | | 1.48 | | | | 1.48 | | | | 0.00 | * | | | 1 | | | | 5 | | |
| Class I | |
| 12-31-08 | | | 0.27 | | | | 7.83 | | | | (40.72 | ) | | | 0.96 | | | | 0.97 | | | | 0.97 | | | | 2.77 | | | | 405,874 | | | | 11 | | |
| 12-31-07 | | | 0.24 | | | | 13.66 | | | | 15.50 | | | | 0.99 | | | | 0.98 | | | | 0.98 | | | | 1.85 | | | | 46,781 | | | | 20 | | |
| 01-03-06(4)-12-31-06 | | | 0.14 | | | | 12.03 | | | | 21.70 | | | | 1.24 | | | | 0.98 | | | | 0.98 | | | | 2.53 | | | | 10,991 | | | | 5 | | |
| Class S | |
| 12-31-08 | | | 0.23 | | | | 7.81 | | | | (40.97 | ) | | | 1.21 | | | | 1.22 | | | | 1.22 | | | | 2.56 | | | | 167,638 | | | | 11 | | |
| 12-31-07 | | | 0.21 | | | | 13.63 | | | | 15.23 | | | | 1.24 | | | | 1.23 | | | | 1.23 | | | | 1.49 | | | | 131,882 | | | | 20 | | |
| 01-12-06(4)-12-31-06 | | | 0.13 | | | | 12.01 | | | | 21.14 | | | | 1.49 | | | | 1.23 | | | | 1.23 | | | | 1.57 | | | | 36,200 | | | | 5 | | |
| ING Thornburg Value Portfolio | |
| Class ADV | |
| 12-31-08 | | | 0.06 | | | | 19.96 | | | | (40.04 | ) | | | 1.40 | | | | 1.40 | † | | | 1.40 | † | | | 0.53 | † | | | 2,281 | | | | 77 | | |
| 12-31-07 | | | 0.13 | | | | 33.36 | | | | 6.73 | | | | 1.40 | | | | 1.40 | | | | 1.40 | | | | 0.54 | | | | 4,196 | | | | 88 | | |
| 12-31-06 | | | 0.04 | | | | 31.38 | | | | 16.26 | | | | 1.40 | | | | 1.40 | | | | 1.40 | | | | 0.18 | | | | 673 | | | | 171 | | |
| 12-31-05 | | | 0.10 | | | | 27.03 | | �� | | 1.03 | | | | 1.40 | | | | 1.40 | | | | 1.40 | | | | (0.08 | ) | | | 214 | | | | 95 | | |
| 12-31-04 | | | 0.07 | | | | 26.86 | | | | 12.36 | | | | 1.40 | | | | 1.40 | | | | 1.40 | | | | 0.27 | | | | 267 | | | | 74 | | |
| Class I | |
| 12-31-08 | | | 0.15 | | | | 20.38 | | | | (39.75 | ) | | | 0.90 | | | | 0.90 | † | | | 0.90 | † | | | 1.16 | † | | | 256,369 | | | | 77 | | |
| 12-31-07 | | | 0.15 | | | | 34.00 | | | | 7.24 | | | | 0.90 | | | | 0.90 | | | | 0.90 | | | | 0.92 | | | | 216,408 | | | | 88 | | |
| 12-31-06 | | | 0.14 | | | | 31.85 | | | | 16.84 | | | | 0.90 | | | | 0.90 | | | | 0.90 | | | | 0.51 | | | | 186,115 | | | | 171 | | |
| 12-31-05 | | | 0.22 | | | | 27.40 | | | | 1.56 | | | | 0.90 | | | | 0.90 | | | | 0.90 | | | | 0.43 | | | | 191,985 | | | | 95 | | |
| 12-31-04 | | | 0.11 | | | | 27.20 | | | | 12.88 | | | | 0.90 | | | | 0.90 | | | | 0.90 | | | | 0.85 | | | | 234,606 | | | | 74 | | |
| Class S | |
| 12-31-08 | | | 0.03 | | | | 20.26 | | | | (39.90 | ) | | | 1.15 | | | | 1.15 | † | | | 1.15 | † | | | 0.78 | † | | | 6,604 | | | | 77 | | |
| 12-31-07 | | | 0.15 | | | | 33.75 | | | | 7.00 | | | | 1.15 | | | | 1.15 | | | | 1.15 | | | | 0.56 | | | | 13,719 | | | | 88 | | |
| 12-31-06 | | | 0.06 | | | | 31.68 | | | | 16.57 | | | | 1.15 | | | | 1.15 | | | | 1.15 | | | | 1.19 | | | | 6,795 | | | | 171 | | |
| 12-31-05 | | | 0.13 | | | | 27.24 | | | | 1.25 | | | | 1.15 | | | | 1.15 | | | | 1.15 | | | | 0.18 | | | | 277 | | | | 95 | | |
| 12-31-04 | | | 0.08 | | | | 27.04 | | | | 12.63 | | | | 1.15 | | | | 1.15 | | | | 1.15 | | | | 0.62 | | | | 445 | | | | 74 | | |
| ING UBS U.S. Large Cap Equity Portfolio | |
| Class ADV | |
| 12-31-08 | | | 0.13 | | | | 6.12 | | | | (40.07 | ) | | | 1.35 | | | | 1.35 | † | | | 1.33 | † | | | 0.92 | † | | | 6,041 | | | | 65 | | |
| 12-31-07 | | | 0.07 | | | | 10.40 | | | | 0.65 | | | | 1.35 | | | | 1.35 | | | | 1.34 | | | | 0.52 | | | | 10,494 | | | | 48 | | |
| 12-31-06 | | | 0.07 | | | | 10.40 | | | | 14.05 | | | | 1.35 | | | | 1.35 | | | | 1.34 | | | | 0.58 | | | | 4,033 | | | | 39 | | |
| 12-31-05 | | | 0.06 | | | | 9.19 | | | | 8.67 | | | | 1.35 | | | | 1.35 | | | | 1.35 | | | | 0.37 | | | | 426 | | | | 51 | | |
| 12-31-04 | | | 0.03 | | | | 8.52 | | | | 14.21 | | | | 1.35 | | | | 1.35 | | | | 1.35 | | | | 0.73 | | | | 48 | | | | 140 | | |
| Class I | |
| 12-31-08 | | | 0.22 | | | | 6.20 | | | | (39.76 | ) | | | 0.85 | | | | 0.85 | † | | | 0.83 | † | | | 1.43 | † | | | 235,657 | | | | 65 | | |
| 12-31-07 | | | 0.08 | | | | 10.61 | | | | 1.18 | | | | 0.85 | | | | 0.85 | | | | 0.84 | | | | 1.02 | | | | 365,084 | | | | 48 | | |
| 12-31-06 | | | 0.08 | | | | 10.56 | | | | 14.51 | | | | 0.85 | | | | 0.85 | | | | 0.84 | | | | 0.99 | | | | 355,204 | | | | 39 | | |
| 12-31-05 | | | 0.08 | | | | 9.30 | | | | 9.38 | | | | 0.85 | | | | 0.85 | | | | 0.85 | | | | 0.92 | | | | 270,692 | | | | 51 | | |
| 12-31-04 | | | 0.06 | | | | 8.58 | | | | 14.76 | | | | 0.85 | | | | 0.85 | | | | 0.85 | | | | 1.22 | | | | 267,249 | | | | 140 | | |
| Class S | |
| 12-31-08 | | | 0.16 | | | | 6.15 | | | | (40.00 | ) | | | 1.10 | | | | 1.10 | † | | | 1.08 | † | | | 1.13 | † | | | 19,357 | | | | 65 | | |
| 12-31-07 | | | 0.07 | | | | 10.48 | | | | 0.93 | | | | 1.10 | | | | 1.10 | | | | 1.09 | | | | 0.75 | | | | 45,303 | | | | 48 | | |
| 12-31-06 | | | 0.07 | | | | 10.45 | | | | 14.32 | | | | 1.10 | | | | 1.10 | | | | 1.09 | | | | 0.79 | | | | 28,207 | | | | 39 | | |
| 12-31-05 | | | 0.07 | | | | 9.21 | | | | 8.99 | | | | 1.10 | | | | 1.10 | | | | 1.10 | | | | 0.64 | | | | 9,667 | | | | 51 | | |
| 12-31-04 | | | 0.06 | | | | 8.52 | | | | 14.59 | | | | 1.10 | | | | 1.10 | | | | 1.10 | | | | 1.06 | | | | 2,356 | | | | 140 | | |
See Accompanying Notes to Financial Statements
79
FINANCIAL HIGHLIGHTS (CONTINUED)
Selected data for a share of beneficial interest outstanding throughout each year or period.
| | | | | Income (loss)
from investment
operations | | | | Less distributions | |
| | | Net asset value, beginning of year or period | | Net investment income (loss) | | Net realized and unrealized gain (loss) | | Total from investment operations | | From net investment income | | From net realized gains | | From return of capital | |
| | | | | | | | | | | | | | | | |
| Year or period ended | | ($) | | ($) | | ($) | | ($) | | ($) | | ($) | | ($) | |
| ING Van Kampen Comstock Portfolio | |
| Class ADV | |
| 12-31-08 | | | 12.34 | | | | 0.17 | • | | | (4.47 | ) | | | (4.30 | ) | | | 0.30 | | | | 0.65 | | | | — | | |
| 12-31-07 | | | 13.17 | | | | 0.17 | • | | | (0.48 | ) | | | (0.31 | ) | | | 0.16 | | | | 0.36 | | | | — | | |
| 12-31-06 | | | 12.08 | | | | 0.18 | • | | | 1.62 | | | | 1.80 | | | | 0.09 | | | | 0.62 | | | | — | | |
| 12-31-05 | | | 12.22 | | | | 0.13 | • | | | 0.24 | | | | 0.37 | | | | 0.04 | | | | 0.47 | | | | — | | |
| 12-31-04 | | | 10.55 | | | | 0.08 | | | | 1.64 | | | | 1.72 | | | | — | | | | 0.05 | | | | — | | |
| Class I | |
| 12-31-08 | | | 12.55 | | | | 0.23 | | | | (4.55 | ) | | | (4.32 | ) | | | 0.46 | | | | 0.65 | | | | — | | |
| 12-31-07 | | | 13.37 | | | | 0.24 | | | | (0.49 | ) | | | (0.25 | ) | | | 0.21 | | | | 0.36 | | | | — | | |
| 12-31-06 | | | 12.22 | | | | 0.24 | • | | | 1.66 | | | | 1.90 | | | | 0.13 | | | | 0.62 | | | | — | | |
| 12-31-05 | | | 12.33 | | | | 0.19 | • | | | 0.24 | | | | 0.43 | | | | 0.08 | | | | 0.46 | | | | — | | |
| 12-31-04 | | | 10.60 | | | | 0.12 | | | | 1.66 | | | | 1.78 | | | | — | | | | 0.05 | | | | — | | |
| Class S | |
| 12-31-08 | | | 12.49 | | | | 0.21 | | | | (4.53 | ) | | | (4.32 | ) | | | 0.40 | | | | 0.65 | | | | — | | |
| 12-31-07 | | | 13.30 | | | | 0.21 | | | | (0.49 | ) | | | (0.28 | ) | | | 0.17 | | | | 0.36 | | | | — | | |
| 12-31-06 | | | 12.16 | | | | 0.21 | • | | | 1.64 | | | | 1.85 | | | | 0.09 | | | | 0.62 | | | | — | | |
| 12-31-05 | | | 12.29 | | | | 0.16 | • | | | 0.24 | | | | 0.40 | | | | 0.07 | | | | 0.46 | | | | — | | |
| 12-31-04 | | | 10.58 | | | | 0.09 | | | | 1.67 | | | | 1.76 | | | | — | | | | 0.05 | | | | — | | |
| ING Van Kampen Equity and Income Portfolio | |
| Class ADV | |
| 12-31-08 | | | 37.09 | | | | 0.71 | • | | | (9.08 | ) | | | (8.37 | ) | | | 1.37 | | | | 1.91 | | | | — | | |
| 12-31-07 | | | 37.82 | | | | 0.74 | • | | | 0.41 | | | | 1.15 | | | | 0.78 | | | | 1.10 | | | | — | | |
| 12-31-06 | | | 35.55 | | | | 0.72 | • | | | 3.43 | | | | 4.15 | | | | 0.59 | | | | 1.29 | | | | — | | |
| 12-31-05 | | | 33.11 | | | | 0.53 | • | | | 1.95 | | | | 2.48 | | | | 0.01 | | | | 0.03 | | | | — | | |
| 12-31-04 | | | 30.07 | | | | 0.15 | | | | 2.96 | | | | 3.11 | | | | 0.07 | | | | — | | | | — | | |
| Class I | |
| 12-31-08 | | | 37.76 | | | | 1.03 | | | | (9.38 | ) | | | (8.35 | ) | | | 1.75 | | | | 1.91 | | | | — | | |
| 12-31-07 | | | 38.47 | | | | 0.95 | • | | | 0.41 | | | | 1.36 | | | | 0.97 | | | | 1.10 | | | | — | | |
| 12-31-06 | | | 36.09 | | | | 0.92 | • | | | 3.48 | | | | 4.40 | | | | 0.73 | | | | 1.29 | | | | — | | |
| 12-31-05 | | | 33.47 | | | | 0.73 | • | | | 1.95 | | | | 2.68 | | | | 0.03 | | | | 0.03 | | | | — | | |
| 12-31-04 | | | 30.35 | | | | 0.14 | | | | 3.15 | | | | 3.29 | | | | 0.17 | | | | — | | | | — | | |
| Class S | |
| 12-31-08 | | | 37.50 | | | | 0.79 | • | | | (9.16 | ) | | | (8.37 | ) | | | 1.64 | | | | 1.91 | | | | — | | |
| 12-31-07 | | | 38.24 | | | | 0.83 | • | | | 0.42 | | | | 1.25 | | | | 0.89 | | | | 1.10 | | | | — | | |
| 12-31-06 | | | 35.93 | | | | 0.82 | • | | | 3.47 | | | | 4.29 | | | | 0.69 | | | | 1.29 | | | | — | | |
| 12-31-05 | | | 33.37 | | | | 0.63 | • | | | 1.96 | | | | 2.59 | | | | — | | | | 0.03 | | | | — | | |
| 12-31-04 | | | 30.27 | | | | 0.17 | | | | 3.03 | | | | 3.20 | | | | 0.10 | | | | — | | | | — | | |
| | | | | Ratios to average net assets | | Supplemental data | |
| | | Total distributions | | Net asset value, end of year or period | | Total Return(1) | | Expenses before reductions/additions(2)(3) | | Expenses net of fee waivers and/or recoupments, if any(2)(3) | | Expenses net of all reductions/additions(2)(3) | | Net investment income (loss)(2)(3) | | Net assets, end of year or period | | Portfolio turnover rate | |
| | | | | | | | | | | | | | | | | | | | |
| Year or period ended | | ($) | | ($) | | (%) | | (%) | | (%) | | (%) | | (%) | | ($000's) | | (%) | |
| ING Van Kampen Comstock Portfolio | |
| Class ADV | |
| 12-31-08 | | | 0.95 | | | | 7.09 | | | | (36.64 | ) | | | 1.35 | | | | 1.31 | | | | 1.31 | | | | 1.66 | | | | 13,778 | | | | 47 | | |
| 12-31-07 | | | 0.52 | | | | 12.34 | | | | (2.51 | ) | | | 1.35 | | | | 1.34 | | | | 1.34 | | | | 1.27 | | | | 40,111 | | | | 26 | | |
| 12-31-06 | | | 0.71 | | | | 13.17 | | | | 15.57 | | | | 1.38 | | | | 1.34 | | | | 1.34 | | | | 1.42 | | | | 37,431 | | | | 27 | | |
| 12-31-05 | | | 0.51 | | | | 12.08 | | | | 3.20 | | | | 1.45 | | | | 1.37 | | | | 1.37 | | | | 1.06 | | | | 25,455 | | | | 27 | | |
| 12-31-04 | | | 0.05 | | | | 12.22 | | | | 16.41 | | | | 1.40 | | | | 1.40 | | | | 1.40 | | | | 0.86 | | | | 12,569 | | | | 30 | | |
| Class I | |
| 12-31-08 | | | 1.11 | | | | 7.12 | | | | (36.36 | ) | | | 0.85 | | | | 0.81 | | | | 0.81 | | | | 2.20 | | | | 357,863 | | | | 47 | | |
| 12-31-07 | | | 0.57 | | | | 12.55 | | | | (2.04 | ) | | | 0.85 | | | | 0.84 | | | | 0.84 | | | | 1.78 | | | | 608,951 | | | | 26 | | |
| 12-31-06 | | | 0.75 | | | | 13.37 | | | | 16.19 | | | | 0.88 | | | | 0.84 | | | | 0.84 | | | | 1.91 | | | | 634,470 | | | | 27 | | |
| 12-31-05 | | | 0.54 | | | | 12.22 | | | | 3.74 | | | | 0.95 | | | | 0.87 | | | | 0.87 | | | | 1.57 | | | | 133,987 | | | | 27 | | |
| 12-31-04 | | | 0.05 | | | | 12.33 | | | | 16.90 | | | | 0.90 | | | | 0.90 | | | | 0.90 | | | | 1.40 | | | | 70,308 | | | | 30 | | |
| Class S | |
| 12-31-08 | | | 1.05 | | | | 7.12 | | | | (36.48 | ) | | | 1.10 | | | | 1.06 | | | | 1.06 | | | | 1.95 | | | | 197,126 | | | | 47 | | |
| 12-31-07 | | | 0.53 | | | | 12.49 | | | | (2.28 | ) | | | 1.10 | | | | 1.09 | | | | 1.09 | | | | 1.52 | | | | 342,155 | | | | 26 | | |
| 12-31-06 | | | 0.71 | | | | 13.30 | | | | 15.86 | | | | 1.13 | | | | 1.09 | | | | 1.09 | | | | 1.67 | | | | 358,431 | | | | 27 | | |
| 12-31-05 | | | 0.53 | | | | 12.16 | | | | 3.47 | | | | 1.20 | | | | 1.12 | | | | 1.12 | | | | 1.31 | | | | 537,092 | | | | 27 | | |
| 12-31-04 | | | 0.05 | | | | 12.29 | | | | 16.74 | | | | 1.15 | | | | 1.15 | | | | 1.15 | | | | 1.15 | | | | 317,797 | | | | 30 | | |
| ING Van Kampen Equity and Income Portfolio | |
| Class ADV | |
| 12-31-08 | | | 3.28 | | | | 25.44 | | | | (23.76 | ) | | | 1.07 | | | | 1.07 | | | | 1.07 | | | | 2.21 | | | | 10,334 | | | | 111 | | |
| 12-31-07 | | | 1.88 | | | | 37.09 | | | | 3.06 | | | | 1.07 | | | | 1.07 | | | | 1.07 | | | | 1.92 | | | | 14,242 | | | | 89 | | |
| 12-31-06 | | | 1.88 | | | | 37.82 | | | | 12.12 | | | | 1.07 | | | | 1.07 | | | | 1.07 | | | | 1.98 | | | | 18,385 | | | | 57 | | |
| 12-31-05 | | | 0.04 | | | | 35.55 | | | | 7.49 | | | | 1.07 | | | | 1.07 | | | | 1.07 | | | | 1.56 | | | | 14,307 | | | | 125 | | |
| 12-31-04 | | | 0.07 | | | | 33.11 | | | | 10.32 | | | | 1.24 | | | | 1.24 | | | | 1.24 | | | | 1.29 | | | | 8,611 | | | | 797 | | |
| Class I | |
| 12-31-08 | | | 3.66 | | | | 25.75 | | | | (23.38 | ) | | | 0.57 | | | | 0.57 | | | | 0.57 | | | | 2.70 | | | | 516,378 | | | | 111 | | |
| 12-31-07 | | | 2.07 | | | | 37.76 | | | | 3.56 | | | | 0.57 | | | | 0.57 | | | | 0.57 | | | | 2.42 | | | | 811,810 | | | | 89 | | |
| 12-31-06 | | | 2.02 | | | | 38.47 | | | | 12.67 | | | | 0.57 | | | | 0.57 | | | | 0.57 | | | | 2.49 | | | | 925,305 | | | | 57 | | |
| 12-31-05 | | | 0.06 | | | | 36.09 | | | | 8.02 | | | | 0.57 | | | | 0.57 | | | | 0.57 | | | | 2.10 | | | | 847,997 | | | | 125 | | |
| 12-31-04 | | | 0.17 | | | | 33.47 | | | | 10.86 | | | | 0.74 | | | | 0.74 | | | | 0.74 | | | | 1.88 | | | | 551,489 | | | | 797 | | |
| Class S | |
| 12-31-08 | | | 3.55 | | | | 25.58 | | | | (23.56 | ) | | | 0.82 | | | | 0.82 | | | | 0.82 | | | | 2.49 | | | | 193,142 | | | | 111 | | |
| 12-31-07 | | | 1.99 | | | | 37.50 | | | | 3.29 | | | | 0.82 | | | | 0.82 | | | | 0.82 | | | | 2.16 | | | | 133,013 | | | | 89 | | |
| 12-31-06 | | | 1.98 | | | | 38.24 | | | | 12.40 | | | | 0.82 | | | | 0.82 | | | | 0.82 | | | | 2.25 | | | | 88,409 | | | | 57 | | |
| 12-31-05 | | | 0.03 | | | | 35.93 | | | | 7.77 | | | | 0.82 | | | | 0.82 | | | | 0.82 | | | | 1.84 | | | | 59,793 | | | | 125 | | |
| 12-31-04 | | | 0.10 | | | | 33.37 | | | | 10.62 | | | | 0.99 | | | | 0.99 | | | | 0.99 | | | | 0.99 | | | | 34,477 | | | | 797 | | |
(1) Total return is calculated assuming reinvestment of all dividends and capital gain distributions at net asset value and does not reflect the effect of insurance contract charges. Total return for periods less than one year is not annualized.
(2) Annualized for periods less than one year.
(3) Expense ratios reflect operating expenses of a Portfolio. Expenses before reductions do not reflect amounts reimbursed by the Investment Adviser and/or Distributor or reductions from brokerage service arrangements or other expense offset arrangements and do not represent the amount paid by a Portfolio during periods when reimbursements or reductions occur. Expenses net of fee waivers reflect expenses after reimbursement by the Investment Adviser and/or Distributor but prior to reductions from brokerage service arrangements or other expense offset arrangements. Expenses net of all reductions represent the net expenses paid by a Portfolio. Net investment income (loss) is net of all such additions or reductions.
(4) Commencement of operations.
• Calculated using average number of shares outstanding throughout the period.
* Amount is less than $0.005 or 0.005% or more than $(0.005).
† Impact of waiving the advisory fee for the ING Institutional Prime Money Market Fund holding has less than 0.005% impact on the expense ratio and net investment income or loss ratio.
(a) In 2005, there was no impact on total return from the gain realized on the disposal of investments made in violation of the Portfolio's investment restrictions.
(b) Includes impact of interest expense on inverse floaters.
(c) There was no impact on total return by the affiliate payment in Note 18.
See Accompanying Notes to Financial Statements
80
NOTES TO FINANCIAL STATEMENTS AS OF DECEMBER 31, 2008
NOTE 1 — ORGANIZATION
ING Partners, Inc. (the "Fund") is an open-end management investment company registered under the Investment Company Act of 1940, as amended (the "1940 Act" or "Act"). It was incorporated under the laws of Maryland on May 7, 1997. The Articles of Incorporation permit the Fund to offer separate series (each, a "Portfolio" and collectively, the "Portfolios"), each of which has its own investment objective, policies and restrictions. The Fund serves as an investment option in underlying variable insurance products offered by Directed Services LLC ("DSL" or the "Investment Adviser").
The Fund currently consists of thirty-six Portfolios of which nineteen diversified Portfolios and one non-diversified Portfolio are included in this report. The Portfolios are: ING American Century Large Company Value Portfolio ("American Century Large Company Value"); ING American Century Small-Mid Cap Value Portfolio ("American Century Small-Mid Cap Value"); ING Baron Asset Portfolio ("Baron Asset"); ING Baron Small Cap Growth Portfolio ("Baron Small Cap Growth"); ING Columbia Small Cap Value II Portfolio ("Columbia Small Cap Value II"); ING Davis New York Venture Portfolio ("Davis New York Venture") formerly, ING Davis Venture Value Portfolio; ING JPMorgan Mid Cap Value Portfolio ("JPMorgan Mid Cap Value"); ING Legg Mason Partners Aggressive Growth Portfolio ("Legg Mason Partners Aggressive Growth"); ING Neuberger Berman Partners Portfolio ("Neuberger Berman Partners"); ING Oppenheimer Global Portfolio ("Oppenheimer Global"); ING Oppenhei mer Strategic Income Portfolio ("Oppenheimer Strategic Income"); ING PIMCO Total Return Portfolio ("PIMCO Total Return"); ING Pioneer High Yield Portfolio ("Pioneer High Yield"); ING T. Rowe Price Diversified Mid Cap Growth Portfolio ("T. Rowe Price Diversified Mid Cap Growth"); ING T. Rowe Price Growth Equity Portfolio ("T. Rowe Price Growth Equity"); ING Templeton Foreign Equity Portfolio ("Templeton Foreign Equity"); ING Thornburg Value Portfolio ("Thornburg Value"); ING UBS U.S. Large Cap Equity Portfolio ("UBS U.S. Large Cap Equity"); ING Van Kampen Comstock Portfolio ("Van Kampen Comstock"); and ING Van Kampen Equity and Income Portfolio ("Van Kampen Equity and Income").
Davis New York Venture is classified as a "non-diversified" portfolio under the 1940 Act.
The following is a brief description of each Portfolio's investment objective:
• American Century Large Company Value seeks long-term capital growth, income is a secondary objective;
• American Century Small-Mid Cap Value seeks long-term capital growth, income is a secondary objective;
• Baron Asset seeks capital appreciation;
• Baron Small Cap Growth seeks capital appreciation;
• Columbia Small Cap Value II seeks long-term growth of capital;
• Davis New York Venture seeks long-term growth of capital;
• JPMorgan Mid Cap Value seeks growth from capital appreciation;
• Legg Mason Partners Aggressive Growth seeks long-term growth of capital;
• Neuberger Berman Partners seeks capital growth;
• Oppenheimer Global seeks capital appreciation;
• Oppenheimer Strategic Income seeks a high level of current income principally derived from interest on debt securities;
• PIMCO Total Return seeks maximum total return, consistent with capital preservation and prudent investment management;
• Pioneer High Yield seeks to maximize total return through income and capital appreciation;
• T. Rowe Price Diversified Mid Cap Growth seeks long-term capital appreciation;
• T. Rowe Price Growth Equity seeks long-term capital growth, and secondarily, increasing dividend income;
• Templeton Foreign Equity seeks long-term capital growth;
• Thornburg Value seeks capital appreciation;
• UBS U.S. Large Cap Equity seeks long-term growth of capital and future income;
• Van Kampen Comstock seeks capital growth and income; and
• Van Kampen Equity and Income seeks total return, consisting of long-term capital appreciation and current income.
The Fund offers three classes of shares, referred to as Adviser Class (Class "ADV"), Initial Class (Class "I") and Service Class (Class "S"). The classes differ principally in applicable distribution and shareholder service fees. Shareholders of each class also bear certain expenses that pertain to that particular class. All shareholders bear the common expenses of the Portfolios and earn income and realized gains/losses from the Portfolio pro rata based on the average daily net assets of each class, without discrimination between share classes. Common expenses of the Portfolios (including custodial asset-based fees,
81
NOTES TO FINANCIAL STATEMENTS AS OF DECEMBER 31, 2008 (CONTINUED)
NOTE 1 — ORGANIZATION (continued)
legal and audit fees, printing and mailing expenses, transfer agency out-of-pocket expenses, and fees and expenses of the independent trustees) are allocated to each Portfolio in proportion to its average net assets. Expenses directly attributable to a particular portfolio (including advisory, administration, custodial transaction-based, registration, other professional, distribution and/or service fees, certain taxes, and offering costs) are charged directly to that Portfolio. Dividends are determined separately for each class based on income and expenses allocable to each class. Realized gain distributions are allocated to each class pro rata based on the shares outstanding of each class on the date of distribution. Differences in per share dividend rates generally result from differences in separate class expenses, including distribution and shareholder service fee, if applicable. Class I shares are intended for distribution networks incl uding non-qualified annuity and life insurance contracts and qualified retirement plans offered through an annuity contract, as well as qualified retirement plans offered through a custodial account where the sale is made on a direct basis without the involvement of a financial intermediary or where the qualified retirement plan has assets of $50 million or more. Class S and Class ADV shares of a Portfolio are intended for distribution networks including qualified retirement plans offered through an annuity contract or custodial account. Shareholders of the Class I shares of each Portfolio will generally be entitled to exchange those shares at net asset value ("NAV") for Class I shares of other Portfolios that offer Class I shares. Shareholders of the Class ADV shares of each Portfolio will generally be entitled to exchange those shares at NAV for Class ADV shares of other Portfolios that offer Class ADV shares. Shareholders of the Class ADV shares continue to be subject to the Rule 12b-1 Plan fee applicable to Class ADV shares after the exchange. Shareholders of Class S shares of each Portfolio will generally be entitled to exchange those shares at net asset value for Class S shares of other Portfolios that offer Class S shares. Each Portfolio's shares may be offered to variable annuity and variable life insurance separate accounts, qualified pension and retirement plans outside the separate account context, and to certain investment advisers and their affiliates.
DSL, a Delaware limited liability company, serves as the investment adviser to the Portfolios. ING Funds Distributor, LLC ("IFD" or the "Distributor") serves as the principal underwriter to the Portfolios. DSL and IFD are indirect, wholly-owned subsidiaries of ING Groep N.V. ("ING Groep"). ING Groep is a global financial institution of Dutch origin offering banking, investments, life insurance and retirement services to over 75 million private, corporate and institutional clients in more than 50 countries. With a diverse workforce of about 125,000 people, ING Groep comprises a broad spectrum of prominent companies that increasingly serve their clients under the ING brand.
On October 19, 2008, ING Groep announced that it reached an agreement with the Dutch government to strengthen its capital position, creating a strong buffer to navigate the current market and economic environment. ING Groep will issue non-voting core Tier-1 securities for a total consideration of EUR 10 billion to the Dutch State. The transaction boosts ING Bank's core Tier-1 ratio, strengthens the insurance balance sheet and reduces ING Groep's Debt/Equity ratio.
NOTE 2 — SIGNIFICANT ACCOUNTING POLICIES
The following significant accounting policies are consistently followed by the Portfolios in the preparation of their financial statements. Such policies are in conformity with U.S. generally accepted accounting principles for investment companies.
A. Security Valuation. Investments in equity securities traded on a national securities exchange are valued at the last reported sale price. Securities reported by NASDAQ are valued at the NASDAQ official closing prices. Securities traded on an exchange or NASDAQ for which there has been no sale and securities traded in the over-the-counter-market are valued at the mean between the last reported bid and ask prices. All investments quoted in foreign currencies will be valued daily in U.S. dollars on the basis of the foreign currency exchange rates prevailing at that time. Debt securities are valued at prices obtained from independent services or from one or more dealers making markets in the securities and may be adjusted based on the Portfolios' valuation procedures. U.S. government obligations are valued by using market quotations or independent pricing services that use prices provided by market-makers or estimates of market values obtained from yield data relating to instruments or securities with similar characteristics.
Securities and assets for which market quotations are not readily available (which may include certain restricted securities, which are subject to limitations as to their sale) are valued at their fair values, as defined by the 1940 Act, and as determined in good faith by or under the supervision of the Portfolios' Board of Directors ("Board"), in accordance with methods that are specifically authorized by the Board. Securities traded on exchanges, including
82
NOTES TO FINANCIAL STATEMENTS AS OF DECEMBER 31, 2008 (CONTINUED)
NOTE 2 — SIGNIFICANT ACCOUNTING POLICIES (continued)
foreign exchanges, which close earlier than the time that a Portfolio calculates its NAV may also be valued at their fair values, as defined by the Act, and as determined in good faith by or under the supervision of the Board, in accordance with methods that are specifically authorized by the Board. The valuation techniques applied in any specific instance are likely to vary from case to case. With respect to a restricted security, for example, consideration is generally given to the cost of the investment, the market value of any unrestricted securities of the same class at the time of valuation, the potential expiration of restrictions on the security, the existence of any registration rights, the costs to the Portfolios related to registration of the security, as well as factors relevant to the issuer itself. Consideration may also be given to the price and extent of any public trading in similar securities of the issuer or comparable com panies' securities. If an event occurs after the time at which the market for foreign securities held by a Portfolio closes but before the time that a Portfolio's NAV is calculated, such event may cause the closing price on the foreign exchange to not represent a readily available reliable market value quotation for such securities at the time a Portfolio determines its NAV. In such a case, a Portfolio will use the fair value of such securities as determined under a Portfolio's valuation procedures. Events after the close of trading on a foreign market that could require a Portfolio to fair value some or all of its foreign securities include, among others, securities trading in the U.S. and other markets, corporate announcements, natural and other disasters, and political and other events. Among other elements of analysis in the determination of a security's fair value, the Board has authorized the use of one or more independent research services to assist with such determinations. An independent research se rvice may use statistical analyses and quantitative models to help determine fair value as of the time a Portfolio calculates its NAV. There can be no assurance that such models accurately reflect the behavior of the applicable markets or the effect of the behavior of such markets on the fair value of securities, or that such markets will continue to behave in a fashion that is consistent with such models. Unlike the closing price of a security on an exchange, fair value determinations employ elements of judgment. Consequently, the fair value assigned to a security may not represent the actual value that a Portfolio could obtain if it were to sell the security at the time of the close of the NYSE. Pursuant to procedures adopted by the Board, a Portfolio is not obligated to use the fair valuations suggested by any research service, and valuation recommendations provided by such research services may be overridden if other events have occu rred or if other fair valuations are determined in good faith to be more accurate. Unless an event is such that it causes a Portfolio to determine that the closing prices for one or more securities do not represent readily available reliable market value quotations at the time a Portfolio determines its NAV, events that occur between the time of the close of the foreign market on which they are traded and the close of regular trading on the NYSE will not be reflected in a Portfolio's NAV. Investments in securities maturing in 60 days or less from date of acquisition are valued at amortized cost which approximates market value.
Effective for fiscal years beginning after November 15, 2007, Financial Accounting Standards Board ("FASB") Statement of Financial Accounting Standards No. 157, "Fair Value Measurements", establishes a hierarchy for measuring fair value of assets and liabilities. As required by the standard, each investment asset or liability of the Portfolios is assigned a level at measurement date based on the significance and source of the inputs to its valuation. Quoted prices in active markets for identical securities are classified as "Level 1", inputs other than quoted prices for an asset that are observable are classified as "Level 2" and unobservable inputs, including the sub-adviser's judgment about the assumptions that a market participant would use in pricing an asset or liability are classified as "Level 3". The inputs used for valuing securities are not necessarily an indication of the risks associated with investing in those securities. A tabl e summarizing the Portfolios' investments under these levels of classification is included following the Portfolios of Investments.
Effective for fiscal years and interim periods ending after November 15, 2008, the FASB issued FASB Staff Position ("FSP") No. FAS 133-1 and FASB Interpretation Number ("FIN") 45-4, "Disclosures about Credit Derivatives and Certain Guarantees: An Amendment of FASB Statement No. 133 and FASB Interpretation No. 45; and Clarification of the Effective Date of FASB Statement No. 161." The amendments to FAS 133 require enhanced disclosure regarding credit derivatives sold, including (1) the nature and terms of the credit derivative, reasons for entering into the credit
83
NOTES TO FINANCIAL STATEMENTS AS OF DECEMBER 31, 2008 (CONTINUED)
NOTE 2 — SIGNIFICANT ACCOUNTING POLICIES (continued)
derivative, the events or circumstances that would require the seller to perform under the credit derivative, and the current status of the payment/performance risk of the credit derivative, (2) the maximum potential amount of future payments (undiscounted) the seller could be required to make under the credit derivative, (3) the fair value of the credit derivative, and (4) the nature of any recourse provisions and assets held either as collateral or by third parties. The amendments to FIN 45 require additional disclosures about the current status of the payment/performance risk of a guarantee. All changes to accounting policies have been made in accordance with the FSP and incorporated for the current period as part of the Notes to Financial Statements and Portfolio of Investments.
B. Security Transactions and Revenue Recognition. Securities transactions are accounted for on the trade date. Realized gains and losses are reported on the basis of identified cost of securities sold. Interest income is recorded on an accrual basis. Dividend income is recorded on the ex-dividend date, or for certain foreign securities, when the information becomes available to the Portfolios. Premium amortization and discount accretion are determined by the effective yield method.
C. Foreign Currency Translation. The books and records of the Portfolios are maintained in U.S. dollars. Any foreign currency amounts are translated into U.S. dollars on the following basis:
(1) Market value of investment securities, other assets and liabilities — at the exchange rates prevailing at the end of the day.
(2) Purchases and sales of investment securities, income and expenses — at the rates of exchange prevailing on the respective dates of such transactions.
Although the net assets and the market values are presented at the foreign exchange rates at the end of the day, the Portfolios do not isolate the portion of the results of operations resulting from changes in foreign exchange rates on investments from the fluctuations arising from changes in market prices of securities held. Such fluctuations are included with the net realized and unrealized gains or losses from investments. For securities, which are subject to foreign withholding tax upon disposition, liabilities are recorded on the Statements of Assets and Liabilities for the estimated tax withholding based on the securities' current market value. Upon disposition, realized gains or losses on such securities are recorded net of foreign withholding tax. Reported net realized foreign exchange gains or losses arise from sales of foreign currencies, currency gains or loss es realized between the trade and settlement dates on securities transactions, the difference between the amounts of dividends, interest, and foreign withholding taxes recorded on the Portfolios' books, and the U.S. dollar equivalent of the amounts actually received or paid. Net unrealized foreign exchange gains and losses arise from changes in the value of assets and liabilities other than investments in securities at fiscal year end, resulting from changes in the exchange rate. Foreign security and currency transactions may involve certain considerations and risks not typically associated with investing in U.S. companies and U.S. government securities. These risks include, but are not limited to, revaluation of currencies and future adverse political and economic developments, which could cause securities and their markets to be less liquid and prices more volatile than those of comparable U.S. companies and U.S. government securities.
D. Forward Foreign Currency Contracts. Certain Portfolios may enter into forward foreign currency contracts primarily to hedge against foreign currency exchange rate risks on their non-U.S. dollar denominated investment securities. When entering into a forward currency contract, a Portfolio agrees to receive or deliver a fixed quantity of foreign currency for an agreed-upon price on an agreed future date. These contracts are valued daily and a Portfolio's net equity therein, representing unrealized gain or loss on the contracts as measured by the difference between the forward foreign exchange rates at the dates of entry into the contracts and the forward rates at the reporting date, is included in the Statement of Assets and Liabilities. Realized and unrealized gains and losses are included in the Statement of Operations. These instruments involve market and/or credit risk in excess of the amount recognized in the Statement of Assets and Liabilities. Risks arise from the possible inability of counterparties to meet the terms of their contracts and from movement in currency and securities values and interest rates. Open forward foreign currency contracts are presented following the Portfolio of Investments.
84
NOTES TO FINANCIAL STATEMENTS AS OF DECEMBER 31, 2008 (CONTINUED)
NOTE 2 — SIGNIFICANT ACCOUNTING POLICIES (continued)
E. Futures Contracts. Certain Portfolios may enter into futures contracts involving foreign currency, interest rates, securities and securities indices. A futures contract obligates the seller of the contract to deliver and the purchaser of the contract to take delivery of the type of foreign currency, financial instrument or security called for in the contract at a specified future time for a specified price. Upon entering into such a contract, a Portfolio is required to deposit and maintain as collateral such initial margin as required by the exchange on which the contract is traded. Pursuant to the contract, a Portfolio agrees to receive from or pay to the broker an amount equal to the daily fluctuations in the value of the contract. Such receipts or payments are known as variati on margins and are recorded as unrealized gains or losses by a Portfolio. When the contract is closed, a Portfolio records a realized gain or loss equal to the difference between the value of the contract at the time it was opened and the value at the time it was closed. Futures contracts are subject to market, credit and counterparty risk occasionally in excess of the amount recognized in the Statements of Assets and Liabilities.
F. Distributions to Shareholders. The Portfolios record distributions to their shareholders on the ex-dividend date. Dividends from net investment income and capital gains, if any, are declared and paid annually. The Portfolios may make distributions on a more frequent basis to comply with the distribution requirements of subchapter M of the Internal Revenue Code. The characteristics of income and gains to be distributed are determined in accordance with income tax regulations, which may differ from U.S. generally accepted accounting principles for investment companies.
G. Federal Income Taxes. It is the policy of the Portfolios to comply with subchapter M of the Internal Revenue Code and related excise tax provisions applicable to regulated investment companies and to distribute substantially all of their net investment income and any net realized capital gains to their shareholders. Therefore, no federal income tax provision is required. Management has considered the sustainability of the Portfolios' tax positions taken on federal income tax returns for all open tax years in making this determination. No capital gain distributions shall be made until any capital loss carryforwards have been fully utilized or expired.
H. Use of Estimates. Management of the Portfolios has made certain estimates and assumptions relating to the reporting of assets, liabilities, income, and expenses to prepare these financial statements in conformity with U.S. generally accepted accounting principles for investment companies. Actual results could differ from these estimates.
I. Repurchase Agreements. Each Portfolio may invest in repurchase agreements only with government securities dealers recognized by the Board of Governors of the Federal Reserve System. Under such agreements, the seller of the security agrees to repurchase it at a mutually agreed upon time and price. The resale price is in excess of the purchase price and reflects an agreed upon interest rate for the period of time the agreement is outstanding. The period of the repurchase agreements is usually short, from overnight to one week, while the underlying securities generally have longer maturities. Each Portfolio will receive as collateral securities acceptable to it whose market value is equal to at least 100% of the carrying amount of the repurchase agreements, plus accrued interest, be ing invested by a Portfolio. The underlying collateral is valued daily on a mark-to-market basis to assure that the value, including accrued interest is at least equal to the repurchase price. There would be a potential loss to a Portfolio in the event a Portfolio is delayed or prevented from exercising its right to dispose of the collateral, and it might incur disposition costs in liquidating the collateral.
J. Securities Lending. Each Portfolio has the option to temporarily loan up to 30% of its total assets to brokers, dealers or other financial institutions in exchange for a negotiated lender's fee. The borrower is required to fully collateralize the loans with cash or U.S. Government securities. Generally, in the event of counterparty default, the Portfolio has the right to use collateral to offset losses incurred. There would be potential loss to the Portfolio in the event a Portfolio is delayed or prevented from exercising its right to dispose of the collateral. A Portfolio bears the risk of loss with respect to the investment of collateral. Engaging in securities lending could have a leveraging effect, which may intensify the credit, market and other risks associated with investi ng in a Portfolio.
K. Illiquid and Restricted Securities. The Portfolios may not invest more than 15% of their net assets in illiquid securities. Illiquid securities are not readily
85
NOTES TO FINANCIAL STATEMENTS AS OF DECEMBER 31, 2008 (CONTINUED)
NOTE 2 — SIGNIFICANT ACCOUNTING POLICIES (continued)
marketable. Disposing of illiquid investments may involve time consuming negotiation and legal expenses, and it may be difficult or impossible for the Portfolios to sell them promptly at an acceptable price. The Portfolios may also invest in restricted securities, which include those sold under Rule 144A of the Securities Act of 1933 ("1933 Act") or securities offered pursuant to Section 4(2) of the 1933 Act, and/or are subject to legal or contractual restrictions on resale and may not be publicly sold without registration under the 1933 Act. Certain restricted securities may be considered liquid pursuant to guidelines approved by the Board or may be deemed to be illiquid because they may not be readily marketable. Illiquid and restricted securities are valued using market quotations when readily available. In the absence of market quotations, the securities are valued based upon their fair value, as defined by the Act, determined under proc edures approved by the Board.
L. When-Issued and Delayed-Delivery Transactions. Certain Portfolios may purchase or sell securities on a when-issued or forward commitment basis. The price of the underlying securities and date when the securities will be delivered and paid for are fixed at the time the transaction is negotiated. The market value of such is identified in the Portfolios' Portfolio of Investments. Losses may arise due to changes in the market value of the securities or from the inability of counterparties to meet the terms of the contract. In connection with such purchases, the Portfolios are required to hold liquid assets as collateral with the Portfo lios' custodian sufficient to cover the purchase price.
M. Mortgage Dollar Roll Transactions. Certain Portfolios may engage in dollar roll transactions with respect to mortgage-backed securities issued by Government National Mortgage Association, Federal National Mortgage Association and Federal Home Loan Mortgage Corp. In a dollar roll transaction, a Portfolio sells a mortgage-backed security to a financial institution, such as a bank or broker/dealer, and simultaneously agrees to repurchase a substantially similar (i.e., same type, coupon, and maturity) security from the institution on a delayed delivery basis at an agreed upon price. The mortgage-backed securities that are repurchased will bear the same interest rate as those sold, but generally will be collateralized by different pools of mortgages with different prepayment histories . The Portfolios account for dollar roll transactions as purchases and sales. For fee based dollar roll transactions, the fee is recorded as income.
N. Options Contracts. Certain Portfolios may purchase put and call options and may write (sell) put options and covered call options. The Portfolios may engage in option transactions as a hedge against adverse movements in the value of portfolio holdings or to increase market exposure. Option contracts are valued daily and unrealized gains or losses are recorded based upon the last sales price on the principal exchange on which the options are traded. An amount equal to the proceeds of the premium received by the Portfolios upon the writing of a put or call option is included in the Statements of Assets and Liabilities as an asset and equivalent liability which is subsequently marked-to-market until it is exercised or closed, or it expires. The Portfolios will realize a gain or loss upon the expiration or closing of the option contract. When an option is exercised, the proceeds on sales of the underlying security for a written call option, the purchase cost of the security for a written put option, or the cost of the security for a purchased put or call option is adjusted by the amount of premium received or paid. Realized and unrealized gains or losses on option contracts are reflected in the accompanying financial statements. The risk in writing a covered call option is that the Portfolios give up the opportunity for profit if the market price of the security increases and the option is exercised. The risk in writing a put option is that the Portfolios may incur a loss if the market price of the security decreases and the option is exercised. The risk in buying an option is that the Portfolios pay a premium whether or not the option is exercised. Risks may also arise from an illiquid secondary market or from the inability of counterparties to meet the terms of the contract.
O. Swap Agreements. Certain Portfolios may enter into swap agreements. A swap is an agreement between two parties pursuant to which each party agrees to make one or more payments to the other at specified future intervals based on the return of an asset (such as a stock, bond or currency) or non-asset reference (such as an interest rate or index). The swap agreement will specify the "notional" amount of the asset or non-asset reference to which the contract relates. Subsequent changes in market value, if any, are calculated based upon changes in the performance of the asset or non-asset reference
86
NOTES TO FINANCIAL STATEMENTS AS OF DECEMBER 31, 2008 (CONTINUED)
NOTE 2 — SIGNIFICANT ACCOUNTING POLICIES (continued)
multiplied by the notional value of the contract. A Portfolio may enter into credit default, interest rate, total return and currency swaps to manage its exposure to credit, currency and interest rate risk. All outstanding swap agreements are reported following each Portfolio's Portfolio of Investments.
Swaps are marked to market daily using quotations primarily from third party pricing services, counterparties or brokers. The value of the swap contract is recorded on each Portfolio's Statements of Assets or Liabilities. During the term of the swap, changes in the value of the swap, if any, are recorded as unrealized gains or losses on the Statements of Operations. Upfront payments paid or received by a Portfolio when entering into the agreements are reported on the Statements of Assets and Liabilities and as a component of the changes in unrealized gains or losses on the Statements of Operations. These upfront payments represent the amounts paid or received when initially entering into the swap agreement to compensate for differences between the stated terms of the swap agreement and the prevailing market conditions. The upfront payments are included as a component in the realized gains or losses on each Portfolio's Statement of Operations upon termination or maturity of the swap. A Portfolio also records net periodic payments paid or received on the swap contract as a realized gain or loss on the Statements of Operations.
Entering into swap agreements involves the risk that the maximum potential loss of an investment exceeds the current value of the investment as reported on each Portfolio's Statements of Assets and Liabilities. Other risks involve the possibility that the counterparty to the agreements may default on its obligation to perform, that there will be no liquid market for these investments and that unfavorable changes in the market will have a negative impact on the value of the index or securities underlying the respective swap agreement.
Credit Default Swap Contracts. A credit default swap is a bilateral agreement between counterparties in which the buyer of the protection agrees to make a stream of periodic payments to the seller of protection in exchange for the right to receive a specified return in the event of a default or other credit event for a referenced entity, obligation or index. As a seller of protection on credit default swaps, a Portfolio will generally receive from the buyer a fixed payment stream based on the notional amount of the swap contract. This fixed payment stream will continue until the swap contract expires or a defined credit event occurs.
A Portfolio is subject to credit risk in the normal course of pursuing its investment objectives. As a seller of protection in a credit default swap, a Portfolio may execute these contracts to manage its exposure to the market or certain sectors of the market. Certain Portfolios may also enter into credit default swaps to speculate on changes in an issuer's credit quality, to take advantage of perceived spread advantages, or to offset an existing short equivalent (i.e. buying protection on an equivalent reference entity).
Certain Portfolios may sell credit default swaps which expose these Portfolios to the risk of loss from credit risk- related events specified in the contract. Although contract specific, credit events are generally defined as bankruptcy, failure to pay, restructuring, obligation acceleration, obligation default or repudiation/moratorium. If a Portfolio is a seller of protection, and a credit event occurs, as defined under the terms of that particular swap agreement, a Portfolio will generally either (i) pay to the buyer an amount equal to the notional amount of the swap and take delivery of the referenced obligation, other deliverable obligations, or underlying securities comprising a referenced index or (ii) pay a net settlement amount in the form of cash or securities equal to the notional amount of the swap less the recovery value of the referenced obligation or underlying securities comprising a referenced index. If a Portfolio is a buye r of protection and a credit event occurs, as defined under the terms of that particular swap agreement, a Portfolio will either (i) receive from the seller of protection an amount equal to the notional amount of the swap and deliver the referenced obligation, other deliverable obligations or underlying securities comprising the referenced index or (ii) receive a net settlement amount in the form of cash or securities equal to the notional amount of the swap less the recovery value of the referenced obligation or underlying securities comprising the referenced index. Recovery values are assumed by market makers considering either industry standard recovery rates or entity specific factors and considerations until a credit event occurs. If a credit event has
87
NOTES TO FINANCIAL STATEMENTS AS OF DECEMBER 31, 2008 (CONTINUED)
NOTE 2 — SIGNIFICANT ACCOUNTING POLICIES (continued)
occurred, the recovery value is determined by a facilitated auction whereby a minimum number of allowable broker bids, together with a specified valuation method, are used to calculate the settlement value.
Implied credit spreads, represented in absolute terms, utilized in determining the market value of credit default swap agreements on corporate issues or sovereign issues are disclosed in each Portfolio's Portfolio of Investment and serve as an indicator of the current status of the payment/performance risk and represent the likelihood or risk of default for the credit derivative. The implied credit spread of a particular referenced entity reflects the cost of buying/selling protection and may include upfront payments required to be made to enter into the agreement. For credit default swaps on asset-backed securities or credit indices, the quoted market prices and resulting market values serve as the indicator of the current status of the payment/performance risk. Wider credit spreads and increasing market values, in absolute terms when compared to the notional amount of the swap, represent a deterioration of the referenced entity's credit so undness and a greater likelihood or risk of default or other credit event occurring as defined under the terms of the agreement.
The maximum amount of future payments (undiscounted) that a Portfolio as seller of protection could be required to make under a credit default swap agreement would be an amount equal to the notional amount of the agreement. Notional amounts of all credit default swap agreements outstanding as of December 31, 2008, for which a Portfolio is seller of protection are disclosed in each Portfolio's Portfolio of Investments. These potential amounts would be partially offset by any recovery values of the respective referenced obligations, upfront payments received upon entering into the agreements, or net amounts received from the settlement of buy protection credit default swap agreements entered into by a Portfolio for the same referenced entity or entities
Interest Rate Swap Contracts. An interest rate swap involves the agreement between counterparties to exchange periodic payments based on interest rates. One payment will be based on a floating rate of a specified interest rate while the other will be a fixed rate. Risks involve the future fluctuations of interest rates in which a Portfolio may make payments that are greater than what a Portfolio received from the counterparty. Other risks include credit, liquidity and market risk.
Total Return Swap Contracts. A total return swap involves the agreement between counterparties to exchange periodic payments based on an asset (such as a basket of securities) or non-asset (such as an index) reference. The periodic payments or cash flows, are usually based on the non-asset reference versus the total return or the asset-based reference. The asset-based reference generally includes unrealized appreciation or depreciation and to the extent that the total return falls short of or exceeds the non-asset reference, a Portfolio will make or receive a payment to the counterparty. Risks of total return swaps include credit, liquidity and market risks.
Currency Swaps. A currency swap involves the agreement between counterparties to exchange two different currencies at contract inception at the prevailing spot rate, and to reverse the exchange at a later agreed upon termination date. The currency exchange at termination may take place at the original exchange rate, an agreed upon exchange rate or the prevailing spot rate on the date of termination. The contract may also include periodic interest payments based on a specified interest rate. Risks related to currency swaps include, but are not limited to, credit, liquidity, market, and exchange rate fluctuations.
Certain Portfolios are party to International Swap Dealers Association, Inc. Master Agreements ("ISDA Master Agreements"). These agreements are with select counterparties and they govern transactions, including certain over-the counter derivative and foreign exchange contracts, entered into by the Portfolios and the counterparty. The ISDA Master Agreements maintain provisions for general obligations, representations, agreements, collateral, and events of default or termination. The occurrence of a specified event of termination may give a counterparty the right to terminate all of its contracts and affect settlement of all outstanding transactions under the applicable ISDA Master Agreement.
P. Structured Products. Certain Portfolios invest in structured products which are specially-designed derivative investments whose principal payments or interest payments are linked to the performance of underlying foreign currencies, interest rate spreads, stock market indices, prices
88
NOTES TO FINANCIAL STATEMENTS AS OF DECEMBER 31, 2008 (CONTINUED)
NOTE 2 — SIGNIFICANT ACCOUNTING POLICIES (continued)
of individual securities, commodities or other financial instruments or the occurrence of other specific events. The terms and conditions of these products may be 'structured' by the purchaser (a Portfolio) and the borrower issuing the note. The market value of these products will increase or decrease based on the performance of the underlying asset or reference. A Portfolio records the net change in the market value of the structured product on the accompanying Statements of Operations as a change in unrealized appreciation or depreciation on investments. A Portfolio records a realized gain or loss on the Statements of Operations upon the sale or maturity of the structured product.
Q. Event-Linked Bonds. Oppenheimer Strategic Income invests in event-linked bonds, which are fixed income securities for which the return of principal and payment of interest is contingent on the non-occurrence of a specific trigger event, such as a hurricane, earthquake, or other occurrence that leads to physical or economic loss. If the specific trigger event occurs prior to maturity of the event-linked bond, the Portfolio may lose all or a portion of its principal in addition to interest otherwise due from the bond. Event-linked bonds may expose the Portfolio to certain other risks, including issuer default, adverse regulatory or jurisdictional interpretations, liquidity risk and adverse tax consequences. The Portfolio records the net change in the market value of the bonds on th e accompanying Statements of Operations as a change in unrealized appreciation or depreciation on investments. The Portfolio records a realized gain or loss on the Statements of Operations upon the sale or maturity of the event-linked bond.
R. Reverse Repurchase Agreements. A reverse repurchase agreement involves the sale of a security, with an agreement to repurchase the same or a substantially similar security at an agreed upon price and date. Reverse repurchase agreements are considered borrowings and the difference between the sale and repurchase prices represents interest expense at an agreed upon rate. Whether such a transaction produces a gain for a Portfolio depends upon whether the income and gains on the securities purchased with the proceeds received from the sale of the security exceeds the interest expense incurred by a Portfolio. Reverse repurchase agreements, as a leveraging technique, may increase a Portfolio's yield; however, such transactions also increase a Portfolio's risk to capital and may result in a shareholder's loss of principal.
S. Sale Commitments. Sale commitments involve commitments where the unit price and the estimated principal amount are established upon entering into the contract, with the actual principal amount being within a specified range of the estimate. A Portfolio will enter into sale commitments to hedge its portfolio positions or to sell mortgage-backed securities it owns under delayed delivery arrangements. Proceeds of sale commitments are not received until the contractual settlement date. During the time a sale commitment is outstanding, a Portfolio will maintain, in a segregated account, cash or marketable securities in an amount sufficient to meet the purchase price. Unsettled sale commitments are valued at current market value of the underlying securities. If the sale commitment is c losed through the acquisition of an offsetting purchase commitment, a Portfolio realizes a gain or loss on the commitment without regard to any unrealized gain or loss on the underlying security. If a Portfolio delivers securities under the commitment, a Portfolio realizes a gain or loss from the sale of the securities, based upon the unit price established at the date the commitment was entered into.
T. Indemnifications. In the normal course of business, the Fund may enter into contracts that provide certain indemnifications. The Fund's maximum exposure under these arrangements is dependent on future claims that may be made against the Portfolios and, therefore, cannot be estimated; however, based on experience, the risk of loss from such claims is considered remote.
NOTE 3 — INVESTMENT TRANSACTIONS
For the year ended December 31, 2008, the cost of purchases and the proceeds from the sales of securities, excluding U.S. government and short-term securities, were as follows:
| Portfolio | | Purchases | | Sales | |
American Century Large
Company Value | | $ | 20,306,457 | | | $ | 109,612,618 | | |
American Century Small-Mid
Cap Value | | | 169,896,497 | | | | 166,152,410 | | |
| Baron Asset | | | 7,447,751 | | | | 26,092,144 | | |
| Baron Small Cap Growth | | | 257,603,065 | | | | 157,103,310 | | |
| Columbia Small Cap Value II | | | 585,545,794 | | | | 250,705,656 | | |
| Davis New York Venture | | | 267,456,009 | | | | 72,574,926 | | |
| JPMorgan Mid Cap Value | | | 118,703,826 | | | | 123,226,240 | | |
Legg Mason Partners Aggressive
Growth | | | 36,144,162 | | | | 359,175,294 | | |
| Neuberger Berman Partners | | | 382,880,370 | | | | 257,489,975 | | |
| Oppenheimer Global | | | 240,169,668 | | | | 544,044,148 | | |
89
NOTES TO FINANCIAL STATEMENTS AS OF DECEMBER 31, 2008 (CONTINUED)
NOTE 3 — INVESTMENT TRANSACTIONS (continued)
| Portfolio | | Purchases | | Sales | |
| Oppenheimer Strategic Income | | $ | 457,252,918 | | | $ | 309,532,992 | | |
| PIMCO Total Return | | | 619,895,300 | | | | 525,232,002 | | |
| Pioneer High Yield | | | 207,419,512 | | | | 58,497,243 | | |
T. Rowe Price Diversified Mid Cap
Growth | | | 230,201,223 | | | | 354,324,229 | | |
| T. Rowe Price Growth Equity | | | 680,120,142 | | | | 804,917,909 | | |
| Templeton Foreign Equity | | | 618,926,253 | | | | 59,267,880 | | |
| Thornburg Value | | | 396,335,729 | | | | 227,662,255 | | |
| UBS U.S. Large Cap Equity | | | 266,269,969 | | | | 237,988,940 | | |
| Van Kampen Comstock | | | 374,307,552 | | | | 393,185,112 | | |
| Van Kampen Equity and Income | | | 407,003,246 | | | | 377,427,239 | | |
U.S. government securities not included above were as follows:
| | | Purchases | | Sales | |
| Oppenheimer Strategic Income | | $ | 261,191,481 | | | $ | 247,747,922 | | |
| PIMCO Total Return | | | 5,587,936,197 | | | | 5,310,153,903 | | |
| Van Kampen Equity And Income | | | 524,878,715 | | | | 584,133,323 | | |
NOTE 4 — INVESTMENT ADVISORY AND ADMINISTRATIVE FEES
For its services, each Portfolio pays the Investment Adviser a monthly fee in arrears equal to the following as a percentage of each Portfolio's average daily net assets during the month:
| Portfolio | | Fee | |
| American Century Large Company Value | | 0.80% | |
| American Century Small-Mid Cap Value | | 1.00% | |
| Baron Asset | | 0.95% on the first $2 billion | |
| | | 0.90% on the next $1 billion | |
| | | 0.85% on the next $1 billion | |
| �� | | 0.80% on assets over $4 billion | |
| Baron Small Cap Growth | | 0.85% on the first $4 billion | |
| | | 0.80% on assets over $4 billion | |
| Columbia Small Cap Value II | | 0.75% | |
| Davis New York Venture | | 0.80% | |
| JPMorgan Mid Cap Value | | 0.75% | |
| Legg Mason Partners Aggressive Growth | | 0.70% on the first $500 million | |
| | | 0.65% on assets over $500 million | |
| Neuberger Berman Partners | | 0.60% | |
| Oppenheimer Global | | 0.60% on the first $11 billion | |
| | | 0.58% on the next $4 billion | |
| | | 0.56% on assets over
$15 billion | |
| Oppenheimer Strategic Income | | 0.50% on the first $6.5 billion | |
| | | 0.475% on the next $5 billion | |
| | | 0.45% on the next $5 billion | |
| | | 0.43% on assets over $16.5 billion | |
| PIMCO Total Return | | 0.50% | |
| Portfolio | | Fee | |
| Pioneer High Yield | | 0.60% on the first $5 billion | |
| | | 0.50% on the next $2 billion | |
| | | 0.40% on the next $2 billion | |
| | | 0.30% on assets over $9 billion | |
| T. Rowe Price Diversified Mid Cap Growth | | 0.64% | |
| T. Rowe Price Growth Equity | | 0.60% | |
| Templeton Foreign Equity | | 0.80% on the first $500 million | |
| | | 0.75% on assets over $500 million | |
| Thornburg Value | | 0.65% | |
| UBS U.S. Large Cap Equity | | 0.70% on the first $500 million | |
| | | 0.65% on assets over $500 million | |
| Van Kampen Comstock | | 0.60% | |
| Van Kampen Equity and Income | | 0.55% | |
DSL has contractually agreed to waive a portion of the advisory fee for American Century Small-Mid Cap Value, Columbia Small Cap Value II(1), PIMCO Total Return, T. Rowe Price Growth Equity and Van Kampen Comstock.
Waiver = 50% x (former sub-advisory fee minus new sub-advisory fee)
For the year ended December 31, 2008, DSL waived $66,417, $—, $30,979, $71,722 and $83,545 for American Century Small-Mid Cap Value, Columbia Small Cap Value II(1), PIMCO Total Return, T. Rowe Price Growth Equity and Van Kampen Comstock, respectively.
These waivers (except, PIMCO Total Return) will continue through at least May 1, 2010. For PIMCO Total Return, the waiver will continue through April 1, 2010. There is no guarantee that the waivers will continue after said dates. The waiver only renews at the election of DSL.
ING Portfolios are permitted to invest end-of-day cash balances into ING Institutional Prime Money Market Fund. Investment management fees paid by the Portfolios will be reduced by an amount equal to the management fees paid indirectly to the ING Institutional Prime Money Market Fund with respect to assets invested by the Portfolios. For the year ended December 31, 2008, the Investment Adviser for American Century Large Company Value, American Century Small-Mid Cap Value, Baron Small Cap Growth, Columbia Small Cap Value II, JPMorgan Mid Cap Value, Legg Mason Partners Aggressive Growth, Oppenheimer Global, Oppenheimer Strategic Income, Pioneer High Yield, Thornburg Value and UBS U.S. Large Cap Equity waived $160, $525, $9,944, $2,168,
(1) Effective August 29, 2008, the sub-advisory fee for Columbia Small Cap Value II was reduced, with a corresponding reduction to a portion of the advisory fee.
90
NOTES TO FINANCIAL STATEMENTS AS OF DECEMBER 31, 2008 (CONTINUED)
NOTE 4 — INVESTMENT ADVISORY AND ADMINISTRATIVE FEES (continued)
$1,306, $6,425, $5,293, $13,559, $3,917, $5,004 and $949 of such management fees, respectively. These fees are not subject to recoupment.
Effective January 1, 2008, Oppenheimer Strategic Income may invest its assets in Oppenheimer Master Loan Fund. Oppenheimer Strategic Income's purchase of shares of Oppenheimer Master Loan Fund will result in Oppenheimer Strategic Income paying a proportionate share of the expenses of Oppenheimer Master Loan Fund. DSL will waive its fee in an amount equal to the advisory fee received by the adviser of the Oppenheimer Master Loan Fund resulting from the Oppenheimer Strategic Income's investment into the Oppenheimer Master Loan Fund. For the year ended December 31, 2008, the Investment Adviser waived $39,693 of such management fees. These fees are not subject to recoupment.
American Century Investment Management, Inc. serves as sub-adviser to American Century Large Company Value and American Century Small-Mid Cap Value. BAMCO, Inc. serves as sub-adviser to Baron Asset and Baron Small Cap Growth. Columbia Management Advisors, LLC serves as sub-adviser to Columbia Small Cap Value II. Davis Selected Advisers, L.P. serves as sub-adviser to Davis New York Venture. J.P. Morgan Investment Management Inc. serves as sub-adviser to JPMorgan Mid Cap Value. ClearBridge Advisors, LLC serves as sub-adviser to Legg Mason Partners Aggressive Growth. Neuberger Berman Management LLC serves as sub-adviser to Neuberger Berman Partners. OppenheimerFunds, Inc. serves as sub-adviser to Oppenheimer Global and Oppenheimer Strategic Income. Pacific Investment Management Company LLC serves as sub-adviser to PIMCO Total Return. Pioneer Investment Management, Inc. serves as sub-adviser to Pioneer High Yield. T. Rowe Price Associates, Inc . serves as sub-adviser to T. Rowe Price Diversified Mid Cap Growth and T. Rowe Price Growth Equity. Templeton Investment Counsel, LLC serves as sub-adviser to Templeton Foreign Equity. Thornburg Investment Management, Inc. serves as sub-adviser to Thornburg Value. UBS Global Asset Management (Americas) Inc. serves as sub-adviser to UBS U.S. Large Cap Equity. Morgan Stanley Investment Management Inc., d/b/a Van Kampen, serves as sub-adviser to Van Kampen Comstock and Van Kampen Equity and Income.
Under an Administrative Services Agreement, ING Funds Services, LLC (the "Administrator"), an indirect, wholly-owned subsidiary of ING Groep, acts as administrator and provides certain administrative and shareholder services necessary for the following Portfolios' operations and is responsible for the supervision of other service providers. For its services, the Administrator is entitled to receive from each of the following Portfolios a fee at an annual rate based on the average daily net assets of each Portfolio as follows:
| Portfolio | | Fee | |
| Baron Asset | | 0.10% | |
| Columbia Small Cap Value II | | 0.10% | |
| Neuberger Berman Partners | | 0.10% | |
| Pioneer High Yield | | 0.10% | |
| Templeton Foreign Equity | | 0.10% | |
In addition to providing all administrative services necessary for the Portfolios' operations, the administrator also assumes all ordinary recurring direct costs of the Portfolios below, such as custodian fees, director's fees, transfer agency fees and accounting fees. As compensation for these services, the Administrator receives a monthly fee from each Portfolio below at an annual rate based on the average daily net assets of each Portfolio as follows:
| Portfolio | | Fee | |
| American Century Large Company Value | | 0.20% | |
| American Century Small-Mid Cap Value | | 0.25% | |
| Baron Small Cap Growth | | 0.23% | |
| Davis New York Venture | | 0.10% | |
| JPMorgan Mid Cap Value | | 0.25% | |
| Legg Mason Partners Aggressive Growth | | 0.13% | |
| Oppenheimer Global | | 0.06% | |
| Oppenheimer Strategic Income | | 0.04% | |
| PIMCO Total Return | | 0.25% on the first $250 million | |
| | | 0.10% on next $100 million | |
| | | 0.05% on next $100 million | |
| | | 0.03% on assets over $450 million | |
| T. Rowe Price Diversified Mid Cap Growth | | 0.02% | |
| T. Rowe Price Growth Equity | | 0.15% | |
| Thornburg Value | | 0.25% | |
| UBS U.S. Large Cap Equity | | 0.15% | |
| Van Kampen Comstock | | 0.25% on the first $1.1 billion | |
| | | 0.20% on assets over $1.1 billion | |
| Van Kampen Equity and Income | | 0.02% | |
NOTE 5 — DISTRIBUTION AND SERVICE FEES
The Fund has adopted a Plan of Distribution pursuant to Rule 12b-1 ("the Plan") for the ADV Class shares of each Portfolio. The Plan provides for a distribution fee, payable to the Distributor. The Distributor may pay, on behalf of each Portfolio, out of its distribution fee, compensation to certain financial institutions for providing distribution assistance. Under the Plan, a Portfolio makes payments at an annual rate of 0.25% of the Portfolio's average daily net assets attributable to its ADV Class shares.
Class S and ADV Class of shares are further subject to a shareholder servicing fee payable to Shareholder Organizations pursuant to the Shareholder Servicing Plan adopted for Class S and ADV Class which shall not exceed an annual rate of 0.25% of the average daily net
91
NOTES TO FINANCIAL STATEMENTS AS OF DECEMBER 31, 2008 (CONTINUED)
NOTE 5 — DISTRIBUTION AND SERVICE FEES (continued)
assets of each of the Class S and ADV Class. Effective May 1, 2008, the Distributor has voluntarily agreed to waive all or a portion of the services fees for Oppenheimer Strategic Income, so that total net operating expenses for ADV Class shares do not exceed 1.00% and for Class S shares do not exceed 0.75%, through May 1, 2009. Effective January 1, 2007, the Distributor has contractually agreed to waive all or a portion of service fee for the Neuberger Berman Partners so that total net operating expenses do not exceed 0.89% for the Portfolio's respective Class S shares through April 30, 2009. Effective July 27, 2007, the Distributor has contractually agreed to waive all or a portion of the service fee for Baron Small Cap Growth so that net total expenses do not exceed 1.31% for Class S through July 27, 2009.
Fees paid to the Distributor and Shareholder Organizations by class during the year ended December 31, 2008 are shown in the accompanying Statements of Operations.
NOTE 6 — OTHER TRANSACTIONS WITH AFFILIATES AND RELATED PARTIES
At December 31, 2008, the Portfolios had the following amounts recorded in payable to affiliates on the accompanying Statements of Assets and Liabilities (See Note 4):
| Portfolio | | Accrued
Investment
Management
Fees | | Accrued
Administrative
Fees | | Accrued
Shareholder
Service and
Distribution
Fees | | Accrued
Recoupment | | Total | |
American Century
Large Company
Value | | $ | 10,197 | | | $ | 2,563 | | | $ | 2,495 | | | $ | — | | | $ | 15,255 | | |
American Century
Small-Mid Cap
Value | | | 54,935 | | | | 14,885 | | | | 9,260 | | | | — | | | | 79,080 | | |
| Baron Asset | | | 5,127 | | | | 540 | | | | 1,334 | | | | 3,906 | | | | 10,907 | | |
Baron Small Cap
Growth | | | 299,144 | | | | 81,799 | | | | 62,690 | | | | — | | | | 443,633 | | |
Columbia Small
Cap Value II | | | 221,224 | | | | 29,574 | | | | 29,501 | | | | — | | | | 280,299 | | |
Davis New York
Venture | | | 228,458 | | | | 28,557 | | | | 45,209 | | | | — | | | | 302,224 | | |
JPMorgan Mid
Cap Value | | | 101,020 | | | | 33,799 | | | | 20,567 | | | | — | | | | 155,386 | | |
Legg Mason
Partners
Aggressive
Growth | | | 311,785 | | | | 58,451 | | | | 18,701 | | | | — | | | | 388,937 | | |
Neuberger Berman
Partners | | | 153,106 | | | | 25,517 | | | | 11,019 | | | | — | | | | 189,642 | | |
Oppenheimer
Global | | | 637,988 | | | | 63,946 | | | | 48,081 | | | | — | | | | 750,015 | | |
Oppenheimer
Strategic
Income | | | 225,380 | | | | 18,392 | | | | 21,749 | | | | — | | | | 265,521 | | |
PIMCO Total
Return | | | 202,696 | | | | 66,476 | | | | 57,343 | | | | — | | | | 326,515 | | |
Pioneer High
Yield | | | 121,595 | | | | 20,541 | | | | 744 | | | | — | | | | 142,880 | | |
T. Rowe Price
Diversified
Mid Cap
Growth | | | 265,126 | | | | 8,283 | | | | 8,115 | | | | — | | | | 281,524 | | |
| Portfolio | | Accrued
Investment
Management
Fees | | Accrued
Administrative
Fees | | Accrued
Shareholder
Service and
Distribution
Fees | | Accrued
Recoupment | | Total | |
T. Rowe Price
Growth Equity | | $ | 425,921 | | | $ | 106,287 | | | $ | 34,494 | | | $ | — | | | $ | 566,702 | | |
Templeton
Foreign Equity | | | 372,877 | | | | 46,893 | | | | 36,943 | | | | 71,653 | | | | 528,366 | | |
| Thornburg Value | | | 138,134 | | | | 53,582 | | | | 2,268 | | | | — | | | | 193,984 | | |
UBS U.S. Large
Cap Equity | | | 148,406 | | | | 31,844 | | | | 6,433 | | | | — | | | | 186,683 | | |
Van Kampen
Comstock | | | 290,292 | | | | 122,584 | | | | 45,678 | | | | — | | | | 458,554 | | |
Van Kampen
Equity and
Income | | | 325,568 | | | | 11,838 | | | | 43,708 | | | | — | | | | 381,114 | | |
At December 31, 2008, all shares of the Portfolios were owned by 1) separate accounts of DSL and its insurance company affiliates for the benefit of variable contract policyholders 2) ING National Trust, an indirect, wholly-owned subsidiary of ING Groep, as trustee or custodian of qualified pension and retirement plans that invest in the Portfolios directly and 3) DSL in connection with seed capital contributions made to the Portfolios.
Control is defined by the 1940 Act as the beneficial ownership, either directly or through one or more controlled companies, of more than 25% of the voting securities of a company. The 1940 Act defines affiliates as companies that are under common control. Therefore, because the Portfolios have a common owner that owns over 25% of the outstanding securities of the Portfolios, they may be deemed to be affiliates of each other. Investment activities of these shareholders could have a material impact on the Portfolios.
The following Portfolio placed a portion of its portfolio transactions with brokerage firms that are affiliates of the Investment Adviser. The commissions paid to these affiliated firms were:
| Portfolio | | Affiliated
Brokers | | Commissions
Paid | |
| Oppenheimer Global | | ING Baring LLC | | $ | 10,448 | | |
| T. Rowe Price Growth Equity | | ING Baring LLC | | | 5,978 | | |
| Templeton Foreign Equity | | ING Baring LLC | | | 3,237 | | |
NOTE 7 — OTHER ACCRUED EXPENSES AND LIABILITIES
At December 31, 2008, the Portfolios did not have any expenses included in Other Accrued Expenses and Liabilities on the Statements of Assets and Liabilities that exceded 5% of total liabilities.
NOTE 8 — EXPENSE LIMITATIONS
The Investment Adviser has entered into a written expense limitation agreement ("Expense Limitation Agreement") with certain of the Portfolios, whereby the Investment Adviser has agreed to limit expenses, excluding interest, taxes, brokerage commissions,
92
NOTES TO FINANCIAL STATEMENTS AS OF DECEMBER 31, 2008 (CONTINUED)
NOTE 8 — EXPENSE LIMITATIONS (continued)
extraordinary expenses, and acquired fund fees and expenses to the following annual expenses to average daily net assets:
| Portfolio | | Class ADV | | Class I | | Class S | |
American Century
Small-Mid Cap Value | | | 1.52 | % | | | 1.02 | % | | | 1.27 | % | |
| Baron Asset | | | 1.55 | % | | | 1.05 | % | | | 1.30 | % | |
Columbia Small Cap
Value II | | | 1.65 | % | | | 1.15 | % | | | 1.40 | % | |
| Neuberger Berman Partners | | | 1.17 | % | | | 0.67 | % | | | 0.92 | %(1) | |
| Pioneer High Yield(2) | | | 1.21 | % | | | 0.71 | % | | | 0.96 | % | |
| Templeton Foreign Equity | | | 1.48 | % | | | 0.98 | % | | | 1.23 | % | |
(1) Please see Note 5 for more information on Class S expenses.
(2) Prior to September 6, 2008, the expense limits for Pioneer High Yield were 1.25%, 0.75% and 1.00% for Classes ADV, I and S, respectively.
The Expense Limitation Agreement is contractual and shall renew automatically unless DSL provides written notice of the termination of the Expense Limitation Agreement within 90 days of the end of the then current term.
Effective January 1, 2008, pursuant to a side agreement, DSL implemented expense limits for American Century Large Company Value and Van Kampen Comstock through at least December 31, 2009 to the following annual expenses to average daily net assets:
| Portfolio | | Class ADV | | Class I | | Class S | |
American Century
Large Company Value | | | 1.40 | % | | | 0.90 | % | | | 1.15 | % | |
| Van Kampen Comstock | | | 1.31 | % | | | 0.81 | % | | | 1.06 | % | |
If, after December 31, 2009, DSL elects not to renew the side agreement, the Portfolios will no longer have an expense limitation. There is no guarantee that these side agreements will continue after that date. The side agreement will only renew if DSL elects to renew it. Any fees waived pursuant to the side agreements shall not be eligible for recoupment.
The Investment Adviser may, at a later date, recoup from a Portfolio for management fees waived and other expenses assumed by the Investment Adviser during the previous 36 months, but only if, after such recoupment, the Portfolio's expense ratio does not exceed the percentage described above. Waived and reimbursed fees by, and any recoupment to the Investment Adviser of such waived and reimbursed fees are reflected on the accompanying Statements of Operations for each Portfolio. Amounts payable by the Investment Adviser are reflected on the accompanying Statements of Assets and Liabilities for each Portfolio.
At December 31, 2008, the amounts of waived and reimbursed fees that are subject to possible recoupment by the Investment Adviser, and the related expiration dates are as follows:
| | | December 31, | |
| Portfolio | | 2009 | | 2010 | | 2011 | | Total | |
American Century
Small-Mid Cap Value | | $ | — | | | $ | 168,652 | | | $ | 137,295 | | | $ | 305,947 | | |
| Baron Asset | | | 42,786 | | | | 23,737 | | | | 15,002 | | | | 81,525 | | |
Neuberger Berman
Partners | | | 144,882 | | | | 272,418 | | | | 316,846 | | | | 734,146 | | |
| Pioneer High Yield | | | 55,492 | | | | 2,872 | | | | 13,292 | | | | 71,656 | | |
NOTE 9 — WRITTEN OPTIONS
Transactions in written options for Oppenheimer Strategic Income for the year ended December 31, 2008 were as follows:
| | | EURGBP
Notional | | JPYZAR
Notional | | Notional | | Notional | | Premium | |
| Balance at 12/31/07 | | | 1,300,000 | | | | 620,000 | | | | 405,000,000 | | | | — | | | $ | 61,354 | | |
| Options Written | | | 132,310,000 | | | | 22,390,000 | | | | 8,878,000,000 | | | | 24,030,000 | | | | 3,088,229 | | |
| Options Terminated in Closing Purchase Transactions | | | — | | | | — | | | | — | | | | (7,945,000 | ) | | | (13,836 | ) | |
| Options Expired | | | (67,940,000 | ) | | | (11,620,000 | ) | | | (4,883,000,000 | ) | | | (16,085,000 | ) | | | (1,612,430 | ) | |
| Options Exercised | | | (64,080,000 | ) | | | (11,390,000 | ) | | | (4,400,000,000 | ) | | | — | | | | (1,498,069 | ) | |
| Balance at 12/31/08 | | | 1,590,000 | | | | — | | | | — | | | | — | | | $ | 25,248 | | |
Transactions in written options for PIMCO Total Return for the year ended December 31, 2008 were as follows:
| | | USD
Notional | | Premium | |
| Balance at 12/31/07 | | | 127,900,000 | | | $ | 1,535,620 | | |
| Options Written | | | 58,800,000 | | | | 1,488,958 | | |
| Options Terminated in Closing Purchase Transactions | | | (95,800,000 | ) | | | (1,271,548 | ) | |
| Options Exercised | | | (50,300,000 | ) | | | (702,272 | ) | |
| Balance at 12/31/08 | | | 40,600,000 | | | $ | 1,050,758 | | |
93
NOTES TO FINANCIAL STATEMENTS AS OF DECEMBER 31, 2008 (CONTINUED)
NOTE 9 — WRITTEN OPTIONS (continued)
| | | Number of
Contracts | | Premium | |
| Balance at 12/31/07 | | | 128 | | | $ | 86,625 | | |
| Options Written | | | 1,429 | | | | 1,258,214 | | |
| Options Expired | | | (1,107 | ) | | | (1,052,342 | ) | |
| Options Exercised | | | (248 | ) | | | (196,368 | ) | |
| Balance at 12/31/08 | | | 202 | | | $ | 96,129 | | |
| 12/31/08 Balance of Premiums Received for Written Options: | | | | | | $ | 1,146,887 | | |
NOTE 10 — COMMITMENTS
For the year ended December 31, 2008, Oppenheimer Strategic Income had the following unfunded loan commitment pursuant to the terms of the following loan agreement:
Deutsche Bank AG, London — Government of Peru CRPAO Pass-Through Notes, Peru 8.375% due 05/30/16 + 2.750%, due 04/30/25.
The unrealized appreciation on this commitment of $275,749 as of December 31, 2008 is reported as such on the Statements of Assets and Liabilities.
NOTE 11 — CAPITAL SHARES
Transactions in capital shares and dollars were as follows:
| | | Shares sold | | Proceeds
from shares
issued
in merger | | Reinvestment
of
distributions | | Shares
redeemed | | Net increase
(decrease)
in shares
outstanding | | Shares sold | | Proceeds
from shares
issued
in merger | | Reinvestment
of
distributions | | Shares
redeemed | | Net increase
(decrease)
in shares
outstanding | |
| Year or period ended | | # | | # | | # | | # | | # | | ($) | | ($) | | ($) | | ($) | | ($) | |
| American Century Large Company Value | |
| Class ADV | |
| 12-31-08 | | | 121,203 | | | | — | | | | 219,003 | | | | (555,574 | ) | | | (215,368 | ) | | | 1,060,645 | | | | — | | | | 1,433,923 | | | | (6,990,882 | ) | | | (4,496,314 | ) | |
| 12-31-07 | | | 101,881 | | | | — | | | | 53,635 | | | | (154,324 | ) | | | 1,192 | | | | 1,594,897 | | | | — | | | | 792,188 | | | | (2,421,442 | ) | | | (34,357 | ) | |
| Class I | |
| 12-31-08 | | | 1,393,251 | | | | — | | | | 608,180 | | | | (8,022,921 | ) | | | (6,021,490 | ) | | | 17,994,242 | | | | — | | | | 3,963,479 | | | | (106,626,609 | ) | | | (84,668,888 | ) | |
| 12-31-07 | | | 4,303,882 | | | | — | | | | 473,964 | | | | (2,704,777 | ) | | | 2,073,069 | | | | 67,969,486 | | | | — | | | | 7,081,018 | | | | (43,828,890 | ) | | | 31,221,614 | | |
| Class S | |
| 12-31-08 | | | 308,649 | | | | — | | | | 939,696 | | | | (770,520 | ) | | | 477,825 | | | | 2,788,794 | | | | — | | | | 6,224,997 | | | | (6,793,693 | ) | | | 2,220,098 | | |
| 12-31-07 | | | 316,328 | | | | — | | | | 111,515 | | | | (678,972 | ) | | | (251,129 | ) | | | 5,162,715 | | | | — | | | | 1,672,720 | | | | (10,736,208 | ) | | | (3,900,773 | ) | |
| 12-31-07 | | | 3,359,481 | | | | — | | | | 259,773 | | | | (1,313,484 | ) | | | 2,305,770 | | | | 37,262,805 | | | | — | | | | 2,774,380 | | | | (14,501,828 | ) | | | 25,535,357 | | |
| American Century Small-Mid Cap Value | |
| Class ADV | |
| 12-31-08 | | | 244,761 | | | | — | | | | 145,573 | | | | (397,903 | ) | | | (7,569 | ) | | | 2,346,479 | | | | — | | | | 1,413,510 | | | | (3,632,070 | ) | | | 127,919 | | |
| 12-31-07 | | | 346,990 | | | | — | | | | 146,289 | | | | (342,064 | ) | | | 151,215 | | | | 4,528,867 | | | | — | | | | 1,717,436 | | | | (4,422,963 | ) | | | 1,823,340 | | |
| Class I | |
| 12-31-08 | | | 1,110,123 | | | | — | | | | 591,430 | | | | (943,452 | ) | | | 758,101 | | | | 10,790,779 | | | | — | | | | 5,855,155 | | | | (8,956,298 | ) | | | 7,689,636 | | |
| 12-31-07 | | | 982,507 | | | | — | | | | 516,649 | | | | (932,848 | ) | | | 566,308 | | | | 12,652,037 | | | | — | | | | 6,168,790 | | | | (12,246,025 | ) | | | 6,574,802 | | |
| Class S | |
| 12-31-08 | | | 882,652 | | | | — | | | | 495,520 | | | | (656,575 | ) | | | 721,597 | | | | 7,876,903 | | | | — | | | | 4,885,832 | | | | (6,333,884 | ) | | | 6,428,851 | | |
| 12-31-07 | | | 440,146 | | | | — | | | | 496,309 | | | | (940,661 | ) | | | (4,206 | ) | | | 5,871,061 | | | | — | | | | 5,901,111 | | | | (12,487,848 | ) | | | (715,676 | ) | |
| Baron Asset | |
| Class ADV | |
| 12-31-08 | | | 12,332 | | | | — | | | | 4,362 | | | | (71,248 | ) | | | (54,554 | ) | | | 124,065 | | | | — | | | | 45,628 | | | | (662,921 | ) | | | (493,228 | ) | |
| 12-31-07 | | | 15,944 | | | | — | | | | — | | | | (15,089 | ) | | | 855 | | | | 189,749 | | | | — | | | | — | | | | (177,363 | ) | | | 12,386 | | |
| Class I | |
| 12-31-08 | | | 377,300 | | | | — | | | | — | | | | (2,248,823 | ) | | | (1,871,523 | ) | | | 4,163,855 | | | | — | | | | — | | | | (24,816,513 | ) | | | (20,652,658 | ) | |
| 12-31-07 | | | 1,781,105 | | | | — | | | | — | | | | (163,523 | ) | | | 1,617,582 | | | | 20,939,377 | | | | — | | | | — | | | | (1,962,537 | ) | | | 18,976,840 | | |
| Class S | |
| 12-31-08 | | | 219,475 | | | | — | | | | 5,836 | | | | (150,603 | ) | | | 74,708 | | | | 1,994,830 | | | | — | | | | 61,397 | | | | (1,371,853 | ) | | | 684,374 | | |
| 12-31-07 | | | 465,622 | | | | — | | | | — | | | | (102,632 | ) | | | 362,990 | | | | 5,472,816 | | | | — | | | | — | | | | (1,227,829 | ) | | | 4,244,987 | | |
94
NOTES TO FINANCIAL STATEMENTS AS OF DECEMBER 31, 2008 (CONTINUED)
NOTE 11 — CAPITAL SHARES (continued)
| | | Shares sold | | Proceeds
from shares
issued
in merger | | Reinvestment
of
distributions | | Shares
redeemed | | Net increase
(decrease)
in shares
outstanding | | Shares sold | | Proceeds
from shares
issued
in merger | | Reinvestment
of
distributions | | Shares
redeemed | | Net increase
(decrease)
in shares
outstanding | |
| Year or period ended | | # | | # | | # | | # | | # | | ($) | | ($) | | ($) | | ($) | | ($) | |
| Baron Small Cap Growth | |
| Class ADV | |
| 12-31-08 | | | 397,158 | | | | — | | | | 79,940 | | | | (841,579 | ) | | | (364,481 | ) | | | 6,175,457 | | | | — | | | | 1,313,418 | | | | (11,723,504 | ) | | | (4,234,629 | ) | |
| 12-31-07 | | | 711,825 | | | | — | | | | — | | | | (701,331 | ) | | | 10,494 | | | | 13,622,077 | | | | — | | | | — | | | | (13,679,041 | ) | | | (56,964 | ) | |
| Class I | |
| 12-31-08 | | | 3,813,598 | | | | — | | | | 329,828 | | | | (1,689,206 | ) | | | 2,454,220 | | | | 62,091,764 | | | | — | | | | 5,600,475 | | | | (27,202,199 | ) | | | 40,490,040 | | |
| 12-31-07 | | | 3,368,711 | | | | — | | | | — | | | | (1,231,779 | ) | | | 2,136,932 | | | | 66,286,573 | | | | — | | | | — | | | | (24,071,737 | ) | | | 42,214,836 | | |
| Class S | |
| 12-31-08 | | | 7,894,590 | | | | — | | | | 728,622 | | | | (3,647,513 | ) | | | 4,975,699 | | | | 122,777,963 | | | | — | | | | 12,175,271 | | | | (57,623,767 | ) | | | 77,329,467 | | |
| 12-31-07 | | | 8,289,274 | | | | — | | | | — | | | | (3,250,673 | ) | | | 5,038,601 | | | | 161,237,158 | | | | — | | | | — | | | | (63,025,191 | ) | | | 98,211,967 | | |
| Columbia Small Cap Value II | |
| Class ADV | |
| 12-31-08 | | | 41,049 | | | | — | | | | 578 | | | | (7,846 | ) | | | 33,781 | | | | 373,105 | | | | — | | | | 5,763 | | | | (59,067 | ) | | | 319,801 | | |
| 12-31-07 | | | 39,601 | | | | — | | | | 21 | | | | (8,057 | ) | | | 31,565 | | | | 428,184 | | | | — | | | | 225 | | | | (89,746 | ) | | | 338,663 | | |
| Class I | |
| 12-31-08 | | | 36,084,309 | | | | — | | | | 316,138 | | | | (7,953,025 | ) | | | 28,447,422 | | | | 339,574,146 | | | | — | | | | 3,183,516 | | | | (75,352,517 | ) | | | 267,405,145 | | |
| 12-31-07 | | | 4,014,136 | | | | — | | | | 1,998 | | | | (690,399 | ) | | | 3,325,735 | | | | 43,132,497 | | | | — | | | | 20,983 | | | | (7,333,930 | ) | | | 35,819,550 | | |
| Class S | |
| 12-31-08 | | | 11,978,992 | | | | — | | | | 175,318 | | | | (5,565,993 | ) | | | 6,588,317 | | | | 108,906,883 | | | | — | | | | 1,760,191 | | | | (46,629,903 | ) | | | 64,037,171 | | |
| 12-31-07 | | | 10,171,761 | | | | — | | | | 14,318 | | | | (2,227,183 | ) | | | 7,958,896 | | | | 109,142,124 | | | | — | | | | 149,906 | | | | (23,593,613 | ) | | | 85,698,417 | | |
| Davis New York Venture | |
| Class ADV | |
| 12-31-08 | | | 114,443 | | | | — | | | | 6,224 | | | | (158,424 | ) | | | (37,757 | ) | | | 1,905,163 | | | | — | | | | 106,992 | | | | (2,620,880 | ) | | | (608,725 | ) | |
| 12-31-07 | | | 211,403 | | | | — | | | | 1,730 | | | | (385,091 | ) | | | (171,958 | ) | | | 4,263,560 | | | | — | | | | 34,332 | | | | (7,968,705 | ) | | | (3,670,813 | ) | |
| Class I | |
| 12-31-08 | | | 7,658,549 | | | | — | | | | 206,288 | | | | (1,932,731 | ) | | | 5,932,106 | | | | 140,457,166 | | | | — | | | | 3,628,600 | | | | (31,072,811 | ) | | | 113,012,955 | | |
| 12-31-07 | | | 2,886,372 | | | | — | | | | 28,904 | | | | (982,438 | ) | | | 1,932,838 | | | | 59,326,898 | | | | — | | | | 587,619 | | | | (20,596,940 | ) | | | 39,317,577 | | |
| Class S | |
| 12-31-08 | | | 7,384,368 | | | | — | | | | 257,764 | | | | (1,455,736 | ) | | | 6,186,396 | | | | 123,528,695 | | | | — | | | | 4,487,670 | | | | (24,751,463 | ) | | | 103,264,902 | | |
| 12-31-07 | | | 5,928,191 | | | | — | | | | 60,068 | | | | (1,478,561 | ) | | | 4,509,698 | | | | 121,720,731 | | | | — | | | | 1,210,365 | | | | (30,145,810 | ) | | | 92,785,286 | | |
| JPMorgan Mid Cap Value | |
| Class ADV | |
| 12-31-08 | | | 233,973 | | | | — | | | | 167,820 | | | | (528,206 | ) | | | (126,413 | ) | | | 2,818,266 | | | | — | | | | 2,094,109 | | | | (6,758,039 | ) | | | (1,845,664 | ) | |
| 12-31-07 | | | 497,189 | | | | — | | | | 90,575 | | | | (366,173 | ) | | | 221,591 | | | | 8,263,787 | | | | — | | | | 1,425,650 | | | | (5,893,439 | ) | | | 3,795,998 | | |
| Class I | |
| 12-31-08 | | | 1,415,114 | | | | — | | | | 1,028,339 | | | | (3,047,177 | ) | | | (603,724 | ) | | | 18,324,420 | | | | — | | | | 12,774,371 | | | | (42,353,433 | ) | | | (11,254,642 | ) | |
| 12-31-07 | | | 3,088,269 | | | | — | | | | 500,338 | | | | (2,074,434 | ) | | | 1,514,173 | | | | 51,757,122 | | | | — | | | | 7,990,400 | | | | (34,003,961 | ) | | | 25,743,561 | | |
| Class S | |
| 12-31-08 | | | 3,672,159 | | | | — | | | | 830,299 | | | | (1,773,988 | ) | | | 2,728,470 | | | | 42,493,553 | | | | — | | | | 10,241,502 | | | | (20,412,900 | ) | | | 32,322,155 | | |
| 12-31-07 | | | 1,016,458 | | | | — | | | | 330,524 | | | | (1,259,703 | ) | | | 87,279 | | | | 16,968,561 | | | | — | | | | 5,252,024 | | | | (20,654,782 | ) | | | 1,565,803 | | |
| Legg Mason Partners Aggressive Growth | |
| Class ADV | |
| 12-31-08 | | | 37,387 | | | | — | | | | — | | | | (86,938 | ) | | | (49,551 | ) | | | 1,459,048 | | | | — | | | | — | | | | (3,546,924 | ) | | | (2,087,876 | ) | |
| 12-31-07 | | | 63,611 | | | | — | | | | — | | | | (62,671 | ) | | | 940 | | | | 3,084,206 | | | | — | | | | — | | | | (3,062,798 | ) | | | 21,408 | | |
| Class I | |
| 12-31-08 | | | 3,677,458 | | | | — | | | | — | | | | (10,997,957 | ) | | | (7,320,499 | ) | | | 150,351,175 | | | | — | | | | — | | | | (471,514,308 | ) | | | (321,163,133 | ) | |
| 12-31-07 | | | 6,005,976 | | | | — | | | | — | | | | (6,698,908 | ) | | | (692,932 | ) | | | 297,998,788 | | | | — | | | | — | | | | (336,570,469 | ) | | | (38,571,681 | ) | |
| Class S | |
| 12-31-08 | | | 171,483 | | | | — | | | | — | | | | (735,941 | ) | | | (564,458 | ) | | | 6,654,149 | | | | — | | | | — | | | | (30,160,588 | ) | | | (23,506,439 | ) | |
| 12-31-07 | | | 505,175 | | | | — | | | | — | | | | (786,710 | ) | | | (281,535 | ) | | | 24,932,471 | | | | — | | | | — | | | | (38,708,227 | ) | | | (13,775,756 | ) | |
95
NOTES TO FINANCIAL STATEMENTS AS OF DECEMBER 31, 2008 (CONTINUED)
NOTE 11 — CAPITAL SHARES (continued)
| | | Shares sold | | Proceeds
from shares
issued
in merger | | Reinvestment
of
distributions | | Shares
redeemed | | Net increase
(decrease)
in shares
outstanding | | Shares sold | | Proceeds
from shares
issued
in merger | | Reinvestment
of
distributions | | Shares
redeemed | | Net increase
(decrease)
in shares
outstanding | |
| Year or period ended | | # | | # | | # | | # | | # | | ($) | | ($) | | ($) | | ($) | | ($) | |
| Neuberger Berman Partners | |
| Class ADV | |
| 12-31-08 | | | 206 | | | | — | | | | — | | | | (954 | ) | | | (748 | ) | | | 1,326 | | | | — | | | | — | | | | (9,803 | ) | | | (8,477 | ) | |
| 12-31-07 | | | 1,477 | | | | — | | | | 27 | | | | (555 | ) | | | 949 | | | | 16,502 | | | | — | | | | 287 | | | | (6,050 | ) | | | 10,739 | | |
| Class I | |
| 12-31-08 | | | 36,746,468 | | | | — | | | | 100,874 | | | | (26,786,689 | ) | | | 10,060,653 | | | | 318,985,437 | | | | — | | | | 961,325 | | | | (168,969,705 | ) | | | 150,977,057 | | |
| 12-31-07 | | | 6,939,602 | | | | — | | | | 1,180,757 | | | | (5,336,876 | ) | | | 2,783,483 | | | | 77,846,499 | | | | — | | | | 12,693,141 | | | | (60,909,432 | ) | | | 29,630,208 | | |
| Class S | |
| 12-31-08 | | | 775,046 | | | | — | | | | — | | | | (3,191,431 | ) | | | (2,416,385 | ) | | | 6,192,407 | | | | — | | | | — | | | | (28,644,526 | ) | | | (22,452,119 | ) | |
| 12-31-07 | | | 721,744 | | | | — | | | | 782,530 | | | | (4,190,016 | ) | | | (2,685,742 | ) | | | 8,223,802 | | | | — | | | | 8,388,718 | | | | (47,082,717 | ) | | | (30,470,197 | ) | |
| Oppenheimer Global | |
| Class ADV | |
| 12-31-08 | | | 795,215 | | | | — | | | | 558,488 | | | | (2,800,638 | ) | | | (1,446,935 | ) | | | 10,762,643 | | | | — | | | | 7,215,659 | | | | (34,927,968 | ) | | | (16,949,666 | ) | |
| 12-31-07 | | | 1,854,454 | | | | — | | | | 326,733 | | | | (1,971,448 | ) | | | 209,739 | | | | 31,658,965 | | | | — | | | | 5,348,617 | | | | (32,972,048 | ) | | | 4,035,534 | | |
| Class I | |
| 12-31-08 | | | 1,846,364 | | | | — | | | | 13,003,215 | | | | (26,659,479 | ) | | | (11,809,900 | ) | | | 23,795,381 | | | | — | | | | 172,812,725 | | | | (358,886,330 | ) | | | (162,278,224 | ) | |
| 12-31-07 | | | 1,530,215 | | | | — | | | | 7,421,542 | | | | (24,241,211 | ) | | | (15,289,454 | ) | | | 26,007,458 | | | | — | | | | 124,830,332 | | | | (418,073,150 | ) | | | (267,235,360 | ) | |
| Class S | |
| 12-31-08 | | | 4,554,571 | | | | — | | | | 1,752,953 | | | | (2,622,039 | ) | | | 3,685,485 | | | | 60,851,402 | | | | — | | | | 22,700,738 | | | | (31,264,563 | ) | | | 52,287,577 | | |
| 12-31-07 | | | 6,197,564 | | | | — | | | | 627,341 | | | | (1,581,234 | ) | | | 5,243,671 | | | | 104,709,292 | | | | — | | | | 10,307,206 | | | | (26,570,489 | ) | | | 88,446,009 | | |
| Oppenheimer Strategic Income | |
| Class ADV | |
| 12-31-08 | | | 845,440 | | | | — | | | | 111,608 | | | | (943,898 | ) | | | 13,150 | | | | 9,308,482 | | | | — | | | | 1,177,465 | | | | (9,568,124 | ) | | | 917,823 | | |
| 12-31-07 | | | 2,141,421 | | | | — | | | | 108,257 | | | | (1,270,661 | ) | | | 979,017 | | | | 23,394,127 | | | | — | | | | 1,147,519 | | | | (14,018,615 | ) | | | 10,523,031 | | |
| Class I | |
| 12-31-08 | | | 18,956,144 | | | | — | | | | 2,815,119 | | | | (8,226,487 | ) | | | 13,544,776 | | | | 210,674,987 | | | | — | | | | 29,896,568 | | | | (83,775,594 | ) | | | 156,795,961 | | |
| 12-31-07 | | | 9,622,685 | | | | — | | | | 1,551,993 | | | | (7,443,050 | ) | | | 3,731,628 | | | | 106,503,556 | | | | — | | | | 16,544,242 | | | | (82,768,717 | ) | | | 40,279,081 | | |
| Class S | |
| 12-31-08 | | | 4,854,766 | | | | — | | | | 470,930 | | | | (2,886,503 | ) | | | 2,439,193 | | | | 49,965,727 | | | | — | | | | 5,005,984 | | | | (29,903,047 | ) | | | 25,068,664 | | |
| PIMCO Total Return | |
| Class ADV | |
| 12-31-08 | | | 2,189,404 | | | | — | | | | 246,925 | | | | (1,214,446 | ) | | | 1,221,883 | | | | 25,363,072 | | | | — | | | | 2,701,362 | | | | (13,568,021 | ) | | | 14,496,413 | | |
| 12-31-07 | | | 1,565,518 | | | | — | | | | 87,360 | | | | (1,107,027 | ) | | | 545,851 | | | | 17,518,400 | | | | — | | | | 947,855 | | | | (12,352,811 | ) | | | 6,113,444 | | |
| Class I | |
| 12-31-08 | | | 9,444,338 | | | | — | | | | 1,415,839 | | | | (14,057,403 | ) | | | (3,197,226 | ) | | | 110,583,007 | | | | — | | | | 15,701,659 | | | | (167,743,461 | ) | | | (41,458,795 | ) | |
| 12-31-07 | | | 10,130,841 | | | | — | | | | 874,500 | | | | (3,012,294 | ) | | | 7,993,047 | | | | 114,568,437 | | | | — | | | | 9,593,260 | | | | (34,005,280 | ) | | | 90,156,417 | | |
| Class S | |
| 12-31-08 | | | 8,596,922 | | | | — | | | | 948,870 | | | | (2,479,979 | ) | | | 7,065,813 | | | | 98,568,010 | | | | — | | | | 10,466,039 | | | | (27,155,260 | ) | | | 81,878,789 | | |
| 12-31-07 | | | 2,761,334 | | | | — | | | | 320,343 | | | | (1,096,037 | ) | | | 1,985,640 | | | | 31,324,525 | | | | — | | | | 3,498,142 | | | | (12,333,433 | ) | | | 22,489,234 | | |
| Pioneer High Yield | |
| Class ADV | |
| 12-31-08 | | | 88,572 | | | | — | | | | 11,051 | | | | (80,538 | ) | | | 19,085 | | | | 807,700 | | | | — | | | | 95,745 | | | | (744,930 | ) | | | 158,515 | | |
| 12-31-07 | | | 106,724 | | | | — | | | | 4,762 | | | | (61,790 | ) | | | 49,696 | | | | 1,114,967 | | | | — | | | | 49,541 | | | | (642,402 | ) | | | 522,106 | | |
| Class I | |
| 12-31-08 | | | 27,498,668 | | | | 7,029,582 | | | | 2,143,399 | | | | (4,095,057 | ) | | | 32,576,592 | | | | 206,064,923 | | | | 64,846,767 | | | | 17,315,751 | | | | (34,016,546 | ) | | | 254,210,895 | | |
| 12-31-07 | | | 4,373,553 | | | | — | | | | 615,591 | | | | (6,478,867 | ) | | | (1,489,723 | ) | | | 45,648,012 | | | | — | | | | 6,424,994 | | | | (68,037,070 | ) | | | (15,964,064 | ) | |
| Class S | |
| 12-31-08 | | | 84,859 | | | | — | | | | 40,966 | | | | (368,757 | ) | | | (242,932 | ) | | | 758,474 | | | | — | | | | 359,482 | | | | (3,364,907 | ) | | | (2,246,951 | ) | |
| 12-31-07 | | | 139,291 | | | | — | | | | 42,674 | | | | (416,873 | ) | | | (234,908 | ) | | | 1,461,022 | | | | — | | | | 445,292 | | | | (4,370,009 | ) | | | (2,463,695 | ) | |
| T. Rowe Price Diversified Mid Cap Growth | |
| Class ADV | |
| 12-31-08 | | | 588,083 | | | | — | | | | 609,102 | | | | (2,136,736 | ) | | | (939,551 | ) | | | 4,401,116 | | | | — | | | | 4,409,896 | | | | (15,541,126 | ) | | | (6,730,114 | ) | |
| 12-31-07 | | | 909,722 | | | | — | | | | 441,110 | | | | (2,298,671 | ) | | | (947,839 | ) | | | 8,574,224 | | | | — | | | | 3,939,115 | | | | (21,756,841 | ) | | | (9,243,502 | ) | |
| Class I | |
| 12-31-08 | | | 1,658,904 | | | | — | | | | 16,799,345 | | | | (16,936,117 | ) | | | 1,522,132 | | | | 13,139,034 | | | | — | | | | 125,104,463 | | | | (126,725,097 | ) | | | 11,518,400 | | |
| 12-31-07 | | | 1,022,088 | | | | — | | | | 10,024,090 | | | | (22,226,680 | ) | | | (11,180,502 | ) | | | 9,701,757 | | | | — | | | | 92,221,632 | | | | (215,580,871 | ) | | | (113,657,482 | ) | |
| Class S | |
| 12-31-08 | | | 697,265 | | | | — | | | | 274,677 | | | | (404,118 | ) | | | 567,824 | | | | 5,202,617 | | | | — | | | | 2,027,473 | | | | (3,004,279 | ) | | | 4,225,811 | | |
| 12-31-07 | | | 659,974 | | | | — | | | | 133,510 | | | | (482,616 | ) | | | 310,868 | | | | 6,505,784 | | | | — | | | | 1,209,603 | | | | (4,459,886 | ) | | | 3,255,501 | | |
96
NOTES TO FINANCIAL STATEMENTS AS OF DECEMBER 31, 2008 (CONTINUED)
NOTE 11 — CAPITAL SHARES (continued)
| | | Shares sold | | Proceeds
from shares
issued
in merger | | Reinvestment
of
distributions | | Shares
redeemed | | Net increase
(decrease)
in shares
outstanding | | Shares sold | | Proceeds
from shares
issued
in merger | | Reinvestment
of
distributions | | Shares
redeemed | | Net increase
(decrease)
in shares
outstanding | |
| Year or period ended | | # | | # | | # | | # | | # | | ($) | | ($) | | ($) | | ($) | | ($) | |
| T. Rowe Price Growth Equity | |
| Class ADV | |
| 12-31-08 | | | 275,733 | | | | — | | | | 130,482 | | | | (577,130 | ) | | | (170,915 | ) | | | 13,468,718 | | | | — | | | | 6,481,061 | | | | (26,303,864 | ) | | | (6,354,085 | ) | |
| 12-31-07 | | | 436,142 | | | | — | | | | 85,861 | | | | (630,547 | ) | | | (108,544 | ) | | | 26,571,606 | | | | — | | | | 5,052,924 | | | | (38,729,774 | ) | | | (7,105,244 | ) | |
| Class I | |
| 12-31-08 | | | 3,853,277 | | | | — | | | | 1,935,283 | | | | (6,270,345 | ) | | | (481,785 | ) | | | 186,275,920 | | | | — | | | | 94,785,805 | | | | (334,372,493 | ) | | | (53,310,768 | ) | |
| 12-31-07 | | | 4,286,947 | | | | — | | | | 1,145,875 | | | | (3,548,185 | ) | | | 1,884,637 | | | | 265,645,399 | | | | — | | | | 68,523,314 | | | | (218,818,550 | ) | | | 115,350,163 | | |
| Class S | |
| 12-31-08 | | | 1,039,030 | | | | — | | | | 161,732 | | | | (701,081 | ) | | | 499,681 | | | | 51,097,037 | | | | — | | | | 7,943,638 | | | | (35,737,491 | ) | | | 23,303,184 | | |
| 12-31-07 | | | 1,516,329 | | | | — | | | | 66,327 | | | | (562,225 | ) | | | 1,020,431 | | | | 94,265,100 | | | | — | | | | 3,936,497 | | | | (34,757,350 | ) | | | 63,444,247 | | |
| Templeton Foreign Equity | |
| Class ADV | |
| 12-31-08 | | | 122,339 | | | | 1,222,612 | | | | 34,187 | | | | (177,286 | ) | | | 1,201,852 | | | | 1,376,832 | | | | 16,008,831 | | | | 267,904 | | | | (1,778,876 | ) | | | 15,874,691 | | |
| 12-31-07 | | | 1 | | | | — | | | | — | | | | (3 | ) | | | (2 | ) | | | 10 | | | | — | | | | — | | | | (42 | ) | | | (32 | ) | |
| Class I | |
| 12-31-08 | | | 30,171,909 | | | | 22,602,000 | | | | 1,710,873 | | | | (6,045,425 | ) | | | 48,439,357 | | | | 364,040,785 | | | | 296,004,090 | | | | 13,346,515 | | | | (61,366,888 | ) | | | 612,024,502 | | |
| 12-31-07 | | | 2,842,901 | | | | — | | | | 47,303 | | | | (378,132 | ) | | | 2,512,072 | | | | 39,542,642 | | | | — | | | | 648,519 | | | | (4,802,215 | ) | | | 35,388,946 | | |
| Class S | |
| 12-31-08 | | | 4,709,983 | | | | 13,317,799 | | | | 615,916 | | | | (6,850,387 | ) | | | 11,793,311 | | | | 53,848,091 | | | | 173,913,232 | | | | 4,749,346 | | | | (76,691,315 | ) | | | 155,819,354 | | |
| 12-31-07 | | | 9,869,197 | | | | — | | | | 145,910 | | | | (3,353,116 | ) | | | 6,661,991 | | | | 130,735,493 | | | | — | | | | 1,996,683 | | | | (44,087,563 | ) | | | 88,644,613 | | |
| Thornburg Value | |
| Class ADV | |
| 12-31-08 | | | 39,236 | | | | — | | | | 269 | | | | (51,015 | ) | | | (11,510 | ) | | | 1,134,245 | | | | — | | | | 7,643 | | | | (1,368,320 | ) | | | (226,432 | ) | |
| 12-31-07 | | | 127,102 | | | | — | | | | 287 | | | | (23,054 | ) | | | 104,335 | | | | 4,315,405 | | | | — | | | | 9,561 | | | | (774,103 | ) | | | 3,550,863 | | |
| Class I | |
| 12-31-08 | | | 7,551,952 | | | | — | | | | 62,575 | | | | (1,400,904 | ) | | | 6,213,623 | | | | 223,258,840 | | | | — | | | | 1,812,798 | | | | (37,750,042 | ) | | | 187,321,596 | | |
| 12-31-07 | | | 1,345,326 | | | | — | | | | 24,972 | | | | (850,590 | ) | | | 519,708 | | | | 46,207,864 | | | | — | | | | 845,816 | | | | (28,670,588 | ) | | | 18,383,092 | | |
| Class S | |
| 12-31-08 | | | 103,872 | | | | — | | | | 414 | | | | (184,841 | ) | | | (80,555 | ) | | | 3,074,844 | | | | — | | | | 11,937 | | | | (5,285,983 | ) | | | (2,199,202 | ) | |
| 12-31-07 | | | 550,984 | | | | — | | | | 2,271 | | | | (361,252 | ) | | | 192,003 | | | | 17,979,268 | | | | — | | | | 76,409 | | | | (12,362,045 | ) | | | 5,693,632 | | |
| UBS U.S. Large Cap Equity | |
| Class ADV | |
| 12-31-08 | | | 216,432 | | | | — | | | | 18,163 | | | | (255,949 | ) | | | (21,354 | ) | | | 1,955,043 | | | | — | | | | 128,584 | | | | (2,205,483 | ) | | | (121,856 | ) | |
| 12-31-07 | | | 476,545 | | | | 294,433 | | | | 6,331 | | | | (156,393 | ) | | | 620,916 | | | | 5,153,428 | | | | 3,082,920 | | | | 67,611 | | | | (1,679,350 | ) | | | 6,624,609 | | |
| Class I | |
| 12-31-08 | | | 10,523,270 | | | | — | | | | 1,162,037 | | | | (8,058,435 | ) | | | 3,626,872 | | | | 97,219,896 | | | | — | | | | 8,396,878 | | | | (69,547,957 | ) | | | 36,068,817 | | |
| 12-31-07 | | | 8,396,965 | | | | 77 | | | | 246,377 | | | | (7,873,477 | ) | | | 769,942 | | | | 91,879,112 | | | | 820 | | | | 2,678,126 | | | | (85,893,516 | ) | | | 8,664,542 | | |
| Class S | |
| 12-31-08 | | | 630,399 | | | | — | | | | 72,280 | | | | (1,880,619 | ) | | | (1,177,940 | ) | | | 6,023,743 | | | | — | | | | 512,862 | | | | (16,392,335 | ) | | | (9,855,730 | ) | |
| 12-31-07 | | | 809,896 | | | | 3,166,308 | | | | 31,898 | | | | (2,384,412 | ) | | | 1,623,690 | | | | 8,644,845 | | | | 33,300,483 | | | | 342,587 | | | | (25,772,531 | ) | | | 16,515,384 | | |
| Van Kampen Comstock | |
| Class ADV | |
| 12-31-08 | | | 176,933 | | | | — | | | | 231,389 | | | | (1,716,160 | ) | | | (1,307,838 | ) | | | 1,783,310 | | | | — | | | | 2,206,919 | | | | (17,177,558 | ) | | | (13,187,329 | ) | |
| 12-31-07 | | | 888,697 | | | | — | | | | 131,003 | | | | (610,607 | ) | | | 409,093 | | | | 11,900,015 | | | | — | | | | 1,682,082 | | | | (7,995,106 | ) | | | 5,586,991 | | |
| Class I | |
| 12-31-08 | | | 18,766,093 | | | | — | | | | 5,977,915 | | | | (23,045,144 | ) | | | 1,698,864 | | | | 192,399,550 | | | | — | | | | 56,029,504 | | | | (216,840,058 | ) | | | 31,588,996 | | |
| 12-31-07 | | | 19,609,336 | | | | — | | | | 2,158,453 | | | | (20,695,922 | ) | | | 1,071,867 | | | | 264,513,052 | | | | — | | | | 28,124,641 | | | | (277,927,077 | ) | | | 14,710,616 | | |
| Class S | |
| 12-31-08 | | | 2,734,823 | | | | — | | | | 2,899,219 | | | | (5,345,107 | ) | | | 288,935 | | | | 26,037,914 | | | | — | | | | 27,088,244 | | | | (54,641,212 | ) | | | (1,515,054 | ) | |
| 12-31-07 | | | 3,020,733 | | | | — | | | | 1,095,898 | | | | (3,668,044 | ) | | | 448,587 | | | | 40,377,616 | | | | — | | | | 14,235,714 | | | | (48,796,628 | ) | | | 5,816,702 | | |
97
NOTES TO FINANCIAL STATEMENTS AS OF DECEMBER 31, 2008 (CONTINUED)
NOTE 11 — CAPITAL SHARES (continued)
| | | Shares sold | | Proceeds
from shares
issued
in merger | | Reinvestment
of
distributions | | Shares
redeemed | | Net increase
(decrease)
in shares
outstanding | | Shares sold | | Proceeds
from shares
issued
in merger | | Reinvestment
of
distributions | | Shares
redeemed | | Net increase
(decrease)
in shares
outstanding | |
| Year or period ended | | # | | # | | # | | # | | # | | ($) | | ($) | | ($) | | ($) | | ($) | |
| Van Kampen Equity and Income | |
| Class ADV | |
| 12-31-08 | | | 73,375 | | | | — | | | | 42,347 | | | | (93,527 | ) | | | 22,195 | | | | 2,375,976 | | | | — | | | | 1,267,987 | | | | (2,994,279 | ) | | | 649,684 | | |
| 12-31-07 | | | 121,956 | | | | — | | | | 21,389 | | | | (245,462 | ) | | | (102,117 | ) | | | 4,741,908 | | | | — | | | | 792,474 | | | | (9,625,953 | ) | | | (4,091,571 | ) | |
| Class I | |
| 12-31-08 | | | 315,609 | | | | — | | | | 2,312,353 | | | | (4,073,005 | ) | | | (1,445,043 | ) | | | 10,189,467 | | | | — | | | | 69,883,615 | | | | (134,228,563 | ) | | | (54,155,481 | ) | |
| 12-31-07 | | | 280,649 | | | | — | | | | 1,214,960 | | | | (4,050,329 | ) | | | (2,554,720 | ) | | | 11,031,962 | | | | — | | | | 45,743,256 | | | | (157,940,915 | ) | | | (101,165,697 | ) | |
| Class S | |
| 12-31-08 | | | 2,092,189 | | | | 2,267,584 | | | | 778,614 | | | | (1,134,667 | ) | | | 4,003,720 | | | | 65,528,450 | | | | 82,425,445 | | | | 23,282,236 | | | | (35,653,974 | ) | | | 135,582,157 | | |
| 12-31-07 | | | 1,583,978 | | | | — | | | | 135,760 | | | | (485,219 | ) | | | 1,234,519 | | | | 61,243,253 | | | | — | | | | 5,081,486 | | | | (18,905,193 | ) | | | 47,419,546 | | |
NOTE 12 — ILLIQUID SECURITIES
| Portfolio | | Security | | Notional/
Principal
Amount/
Shares | | Initial
Acquisition
Date | | Cost/
Upfront
Payments | | Value | | Percent
of Net
Assets | |
American Century
Small-Mid
Cap Value | | Aspen Insurance Holdings Ltd. | | | 33,900 | | | 01/16/07 | | $ | 1,610,026 | | | $ | 1,423,800 | | | | 1.9 | % | |
| | | D & E Communications, Inc. | | | 11,500 | | | 09/10/08 | | | 94,799 | | | | 77,050 | | | | 0.1 | % | |
| | | Entertainment Properties | | | 5,300 | | | 10/16/08 | | | 95,843 | | | | 93,810 | | | | 0.1 | % | |
| | | Hawkins, Inc. | | | 8,878 | | | 01/17/08 | | | 133,444 | | | | 135,745 | | | | 0.2 | % | |
| | | HFF, Inc. | | | 12,000 | | | 11/02/07 | | | 75,263 | | | | 29,400 | | | | 0.0 | % | |
| | | Highland Distressed Opportunities, Inc. | | | 21,500 | | | 02/21/07 | | | 288,100 | | | | 46,225 | | | | 0.1 | % | |
| | | Intellon Corp. | | | 30,743 | | | 09/02/08 | | | 112,453 | | | | 77,165 | | | | 0.1 | % | |
| | | Lawson Products | | | 3,500 | | | 05/07/08 | | | 83,557 | | | | 79,975 | | | | 0.1 | % | |
| | | Lexington Realty Trust | | | 3,400 | | | 01/17/08 | | | 118,701 | | | | 54,502 | | | | 0.1 | % | |
| | | Medquist, Inc. | | | 6,409 | | | 09/05/08 | | | 20,824 | | | | 13,138 | | | | 0.0 | % | |
| | | Mercer Insurance Group, Inc. | | | 10,342 | | | 09/26/08 | | | 153,007 | | | | 130,723 | | | | 0.2 | % | |
| | | Midwest Banc Holdings, Inc. | | | 8,800 | | | 12/05/07 | | | 207,427 | | | | 112,112 | | | | 0.1 | % | |
| | | National Retail Properties | | | 12,800 | | | 02/10/06 | | | 297,746 | | | | 211,200 | | | | 0.3 | % | |
| | | Odyssey Re Holdings Corp. | | | 6,031 | | | 02/21/08 | | | 139,923 | | | | 112,780 | | | | 0.2 | % | |
| | | PS Business Parks, Inc. | | | 11,815 | | | 02/21/08 | | | 275,995 | | | | 218,341 | | | | 0.3 | % | |
| | | Schiff Nutrition International, Inc. | | | 21,900 | | | 01/30/08 | | | 126,513 | | | | 130,743 | | | | 0.2 | % | |
| | | Ulticom, Inc. | | | 87,018 | | | 12/07/05 | | | 763,547 | | | | 443,792 | | | | 0.6 | % | |
| | | Utah Medical Products, Inc. | | | 7,143 | | | 01/30/08 | | | 207,944 | | | | 156,789 | | | | 0.2 | % | |
| | | Value Line, Inc. | | | 2,931 | | | 10/07/08 | | | 93,295 | | | | 101,178 | | | | 0.1 | % | |
| | | Village Super Market | | | 2,800 | | | 04/14/08 | | | 127,715 | | | | 160,692 | | | | 0.2 | % | |
| | | Weyco Group, Inc. | | | 4,400 | | | 03/14/08 | | | 123,102 | | | | 145,420 | | | | 0.2 | % | |
| | | Young Innovations, Inc. | | | 32,965 | | | 05/10/07 | | | 739,067 | | | | 507,661 | | | | 0.7 | % | |
| | | | | | | | | | | $ | 5,888,291 | | | $ | 4,462,241 | | | | 6.0 | % | |
Davis New York
Venture | | Sino-Forest Corp., 5.000%, due 08/01/13 | | | 649,000 | | | 07/17/08 | | $ | 649,000 | | | $ | 464,035 | | | | 0.1 | % | |
| | | | | | | | | | | $ | 649,000 | | | $ | 464,035 | | | | 0.1 | % | |
JPMorgan Mid
Cap Value | | OneBeacon Insurance Group Ltd. | | | 163,500 | | | 11/08/06 | | $ | 3,575,579 | | | $ | 1,706,940 | | | | 1.0 | % | |
| | | | | | | | | | | $ | 3,575,579 | | | $ | 1,706,940 | | | | 1.0 | % | |
Oppenheimer
Global | | Dish TV India Ltd. | | | 1,757,913 | | | 12/06/04 | | $ | 1,914,064 | | | $ | 727,654 | | | | 0.1 | % | |
| | | | | | | | | | | $ | 1,914,064 | | | $ | 727,654 | | | | 0.1 | % | |
Oppenheimer
Strategic
Income | | Americredit Prime Automobile Receivables,
5.620%, due 09/08/14 | | | 221,000 | | | 06/05/08 | | $ | 171,378 | | | $ | 164,645 | | | | 0.0 | % | |
| | | Arco Capital Corp. Ltd | | | 144,498 | | | 02/27/07 | | | 2,167,470 | | | | 144,498 | | | | 0.0 | % | |
| | | Barclays Bank PLC — Custom Basket of
African Currencies Unsecured Linked Nts.,
10.250%, 05/07/09 | | | 520,000 | | | 04/23/08 | | | 520,185 | | | | 452,920 | | | | 0.1 | % | |
| | | Barclays Bank PLC — Custom Basket of
African Currencies Unsecured Linked Nts.,
10.250%, 05/15/09 | | | 520,000 | | | 04/24/08 | | | 520,193 | | | | 454,792 | | | | 0.1 | % | |
| | | Bear Stearns Adjustable Rate Mortgage Trust,
4.404%, due 05/25/34 | | | 927,173 | | | 04/14/08 | | | 867,121 | | | | 633,235 | | | | 0.1 | % | |
| | | Citigroup Funding Inc. — Brazil T-Bond Unsecured
Credit Linked Nts., 9.762%, 01/03/17 | | | 1,250,000 | | | 08/06/08 | | | 680,120 | | | | 450,936 | | | | 0.1 | % | |
98
NOTES TO FINANCIAL STATEMENTS AS OF DECEMBER 31, 2008 (CONTINUED)
NOTE 12 — ILLIQUID SECURITIES (continued)
| Portfolio | | Security | | Notional/
Principal
Amount/
Shares | | Initial
Acquisition
Date | | Cost/
Upfront
Payments | | Value | | Percent
of Net
Assets | |
Oppenheimer
Strategic
Income
(continued) | | Citigroup Funding Inc. — Colombia (TES) Unsecured
Credit Linked Nts., 7.000%, 02/26/15 | | | 361,000,000 | | | 07/18/08 | | $ | 366,246 | | | $ | 313,271 | | | | 0.1 | % | |
| | | Citigroup Funding Inc. — Colombia (TES) Unsecured
Credit Linked Nts., 7.000%, 02/26/15 | | | 132,000,000 | | | 07/31/08 | | | 135,900 | | | | 114,548 | | | | 0.0 | % | |
| | | Citigroup Funding Inc. — Colombia (TES) Unsecured
Credit Linked Nts., 7.000%, 02/26/15 | | | 207,000,000 | | | 08/08/08 | | | 216,122 | | | | 179,632 | | | | 0.0 | % | |
| | | Citigroup Funding Inc. — Dominican Republic
T-Bond Unsecured Credit Linked Nts.,
12%, 02/22/11 | | | 3,770,000 | | | 05/07/08 | | | 105,413 | | | | 86,691 | | | | 0.0 | % | |
| | | Citigroup Funding Inc. — Nigeria Unsecured
Credit Linked Nts (linked to Nigerian Treasury
Bonds), 14.500%, 03/01/11 | | | 96,000,000 | | | 02/24/06 | | | 749,902 | | | | 699,295 | | | | 0.1 | % | |
| | | Citigroup Mortgage Loan Trust, Inc.,
4.951%, due 05/25/35 | | | 713,633 | | | 04/15/08 | | | 666,719 | | | | 494,962 | | | | 0.1 | % | |
| | | Citigroup Mortgage Loan Trust, Inc.,
5.500%, due 03/25/36 | | | 744,024 | | | 04/28/08 | | | 525,939 | | | | 219,809 | | | | 0.0 | % | |
| | | Citigroup Mortgage Loan Trust, Inc.,
5.591%, due 03/25/36 | | | 673,491 | | | 04/28/08 | | | 476,053 | | | | 192,554 | | | | 0.0 | % | |
| | | Cloverie PLC — Series 2005-93 Secured Credit Linked
Nts., 3-month USD-LIBOR +4.250%, 12/20/10 | | | 400,000 | | | 12/06/05 | | | 400,000 | | | | 255,720 | | | | 0.1 | % | |
| | | Coriolanus Limited — Argentine Republic Credit
Linked Nts., one-month USD-LIBOR
+ 3.000%, 12/22/11 | | | 325,000 | | | 12/08/08 | | | 325,000 | | | | 325,000 | | | | 0.1 | % | |
| | | Coriolanus Limited — Coriolanus Limited Pass-Through
Emerging Markets Portfolio Credit Linked Nts.,
10.620%, 09/10/10 | | | 500,000 | | | 08/02/07 | | | 500,000 | | | | 32,750 | | | | 0.0 | % | |
| | | Coriolanus Limited — JSC Halyk Bank of Kazakhstan
Credit Linked Nts., 7.250%, 03/25/09 | | | 630,000 | | | 12/08/08 | | | 630,000 | | | | 623,700 | | | | 0.1 | % | |
| | | Countrywide Alternative Loan Trust,
6.000%, due 02/25/37 | | | 2,450,270 | | | 04/01/08 | | | 2,042,952 | | | | 1,173,655 | | | | 0.2 | % | |
| | | Countrywide Home Loan Mortgage Pass-through
Trust, 5.471%, due 01/25/36 | | | 227,867 | | | 03/28/08 | | | 148,063 | | | | 70,489 | | | | 0.0 | % | |
| | | Countrywide Home Loan Mortgage Pass-through
Trust, 5.616%, due 06/25/47 | | | 484,809 | | | 03/04/08 | | | 446,835 | | | | 295,476 | | | | 0.1 | % | |
| | | Countrywide Home Loan Mortgage Pass-through
Trust, 5.930%, due 09/25/47 | | | 689,472 | | | 03/31/08 | | | 481,155 | | | | 200,578 | | | | 0.0 | % | |
| | | Countrywide Home Loan Mortgage Pass-through
Trust, 6.001%, due 09/25/37 | | | 179,481 | | | 03/31/08 | | | 125,252 | | | | 52,758 | | | | 0.0 | % | |
| | | Countrywide Home Loan Mortgage Pass-through
Trust, 6.086%, due 09/25/47 | | | 624,624 | | | 04/11/08 | | | 440,619 | | | | 521,539 | | | | 0.1 | % | |
| | | Countrywide Home Loan Mortgage Pass-through
Trust, 6.201%, due 09/25/37 | | | 443,488 | | | 03/31/08 | | | 309,492 | | | | 132,704 | | | | 0.0 | % | |
| | | Countrywide Home Loan Mortgage Pass-through
Trust, 6.232%, due 11/25/37 | | | 140,272 | | | 04/11/08 | | | 99,202 | | | | 36,296 | | | | 0.0 | % | |
| | | Countrywide Home Loan Mortgage Pass-through
Trust, 6.388%, due 11/25/37 | | | 146,829 | | | 04/11/08 | | | 103,839 | | | | 38,393 | | | | 0.0 | % | |
| | | Credit and Repackaged Securities Limited
("CARS") — Republic of Colombia COP-Linked
Medium Term Credit Linked Nts.,
10.476%, 02/08/37 | | | 13,368,000,000 | | | 01/18/07 | | | 347,521 | | | | 87,393 | | | | 0.0 | % | |
| | | Credit and Repackaged Securities Limited
("CARS") — Republic of Turkey Medium Term
Credit Linked Nts., 14.802%, 03/29/17 | | | 4,540,000 | | | 03/08/07 | | | 1,008,593 | | | | 638,865 | | | | 0.1 | % | |
| | | Credit Suisse First Boston International for CJSC
The EXIM of Ukraine, 8.400%, due 02/09/16 | | | 1,050,000 | | | 07/20/06 | | | 1,008,167 | | | | 157,500 | | | | 0.0 | % | |
| | | Credit Suisse First Boston, Nassau — Ukraine
Government International Bonds Series
EMG 27 Credit Linked Nts., 11.940%, 12/30/09 | | | 4,600,000 | | | 11/02/05 | | | 944,507 | | | | 422,319 | | | | 0.1 | % | |
| | | Credit Suisse First Boston, Nassau — Ukraine Series
EMG 13 Credit Linked Nts., 11.940%, 12/30/09 | | | 400,000 | | | 03/04/05 | | | 78,379 | | | | 36,723 | | | | 0.0 | % | |
| | | Credit Suisse First Boston, Nassau — Ukraine Series
NPC 12 Credit Linked Nts., 11.940%, 12/30/09 | | | 1,440,000 | | | 04/27/05 | | | 298,089 | | | | 132,204 | | | | 0.0 | % | |
| | | Credit Suisse International — Moitk Total Return
Linked Nts., 8.990%, 03/26/11 | | | 12,330,000 | | | 03/27/07 | | | 474,436 | | | | 130,831 | | | | 0.0 | % | |
| | | Credit Suisse International — Moscoblgaz-Finans
RUR Total Return Linked Nts., 9.250%, 06/24/12 | | | 21,800,000 | | | 06/26/07 | | | 846,976 | | | | 289,144 | | | | 0.1 | % | |
| | | Credit Suisse International — Oreniz Total Return
Linked Nts., 9.240%, 02/21/12 | | | 24,380,000 | | | 02/27/07 | | | 936,407 | | | | 323,363 | | | | 0.1 | % | |
| | | Credit Suisse International — Russian Railways
Total Return Linked Bonds, 6.670%, 01/22/09 | | | 10,610,000 | | | 12/19/06 | | | 403,069 | | | | 334,312 | | | | 0.1 | % | |
99
NOTES TO FINANCIAL STATEMENTS AS OF DECEMBER 31, 2008 (CONTINUED)
NOTE 12 — ILLIQUID SECURITIES (continued)
| Portfolio | | Security | | Notional/
Principal
Amount/
Shares | | Initial
Acquisition
Date | | Cost/
Upfront
Payments | | Value | | Percent
of Net
Assets | |
Oppenheimer
Strategic
Income
(continued) | | Credit Suisse International — SPETSSTROY-2
Credit Linked Fully Funded Total Return Linked
Nts., 9.250%, 5/20/10 | | | 19,450,000 | | | 05/24/07 | | $ | 751,322 | | | $ | 51,595 | | | | 0.0 | % | |
| | | Credit Suisse International — Vietnam Shipbuilding
Industry Group Total Return Credit Linked Nts.,
10.500%, 01/19/17 | | | 3,048,000,000 | | | 02/06/07 | | | 201,143 | | | | 106,348 | | | | 0.0 | % | |
| | | Deutsche Alternative-A Securities, Inc. Alternate
Loan Trust, 0.971%, due 01/27/37 | | | 279,078 | | | 05/29/08 | | | 199,785 | | | | 82,677 | | | | 0.0 | % | |
| | | Deutsche Bank AG, London — Arrendadora
Capita Corporation SA de CV and The Capita
Corporation de Mexico, SA de CV Credit Linked
Nts., 9.090%, 01/05/11 | | | 2,200,634 | | | 05/25/06 | | | 196,336 | | | | 147,784 | | | | 0.0 | % | |
| | | Deutsche Bank AG, London — Arrendadora
Capita Corporation SA de CV and The Capita
Corporation de Mexico, SA de CV Credit Linked
Nts., 9.520%, 01/05/11 | | | 1,438,126 | | | 06/30/06 | | | 126,805 | | | | 96,578 | | | | 0.0 | % | |
| | | Deutsche Bank AG, London — Arrendadora Capita
Corporation SA de CV and The Capita
Corporation de Mexico, SA de CV Credit Linked
Nts., 9.650%, 01/05/11 | | | 1,438,336 | | | 06/01/06 | | | 127,768 | | | | 96,592 | | | | 0.0 | % | |
| | | Deutsche Bank AG, London — TMM SA Credit
Linked Nts., 6.000%, 09/07/12 | | | 457,170 | | | 09/01/06 | | | 457,170 | | | | 251,444 | | | | 0.1 | % | |
| | | Dresdner Bank AG, London — Lukoil Credit Linked
Nts., 7.100%, 12/12/11 | | | 7,890,000 | | | 12/14/06 | | | 299,762 | | | | 191,727 | | | | 0.0 | % | |
| | | Eirles Two Limited 335 — Floating Rate Credit
Linked Nts., 6-month USD-LIBOR
+1.650%,04/30/12 | | | 900,000 | | | 09/17/07 | | | 899,370 | | | | 313,920 | | | | 0.1 | % | |
| | | Eirles Two Ltd. 324 — Floating Rate Credit Linked
Nts., 6-month USD-LIBOR +3.200%, 04/30/12 | | | 900,000 | | | 04/17/07 | | | 901,964 | | | | 349,740 | | | | 0.1 | % | |
| | | Emblem Finance Co. Limited — Kingdom of
Swaziland Floating Rate Credit Linked Nts.,
3-month USD-LIBOR +4.000%, 06/20/10 | | | 505,000 | | | 05/10/05 | | | 505,000 | | | | 534,492 | | | | 0.1 | % | |
| | | GSR Mortgage Loan Trust, 5.826%, due 03/25/37 | | | 541,752 | | | 01/08/08 | | | 545,475 | | | | 296,072 | | | | 0.1 | % | |
| | | Hallertau SPC 2007-01- Republic of Philippines
Credit Linked Nts., 6-month USD-LIBOR
+2.050%, 12/20/17 | | | 3,000,000 | | | 12/13/07 | | | 3,000,000 | | | | 2,185,500 | | | | 0.4 | % | |
| | | Hallertau SPC 2008-2A — Doux Frangosul
S.A. ARGO Avicola Credit Linked Nts.,
9.264%, 09/17/13 | | | 3,140,000 | | | 10/23/08 | | | 3,219,769 | | | | 3,179,878 | | | | 0.6 | % | |
| | | Hallertau SPC, Series 2008-1, Certificado de
Direitos Creditorios do Agronegocio/Frigorifico
Margen Ltda. Credit Linked Nts.,
9.888%, 08/02/10 | | | 2,532,671 | | | 04/18/08 | | | 1,301,341 | | | | 220,251 | | | | 0.0 | % | |
| | | ICE EM CLO, 4.795%, due 08/15/22 | | | 1,110,000 | | | 11/06/07 | | | 974,147 | | | | 499,500 | | | | 0.1 | % | |
| | | ICE EM CLO, 8.095%, due 08/15/22 | | | 930,000 | | | 06/08/07 | | | 930,000 | | | | 216,132 | | | | 0.0 | % | |
| | | Johor Corp., 1.000%, due 07/31/12 | | | 1,920,000 | | | 04/06/05 | | | 516,366 | | | | 566,012 | | | | 0.1 | % | |
| | | JPMorgan Chase Bank N.A, London. — Brazil
Unsecured Credit Linked Nts., 12.184%, 01/02/15 | | | 12,716,000 | | | 09/15/05 | | | 3,342,095 | | | | 2,498,097 | | | | 0.5 | % | |
| | | JPMorgan Chase Bank N.A. — COP and Colombia
Credit Linked Nts., 10.190%, 01/05/16 | | | 6,500,000,000 | | | 12/06/06 | | | 1,453,900 | | | | 1,399,972 | | | | 0.3 | % | |
| | | JPMorgan Chase Bank N.A. — COP and Colombia
Credit Linked Nts., 10.218%, 10/31/16 | | | 2,663,000,000 | | | 10/18/06 | | | 536,151 | | | | 526,186 | | | | 0.1 | % | |
| | | JPMorgan Chase Bank N.A. — COP and Colombia
Credit Linked Nts., 10.218%, 10/31/16 | | | 2,674,000,000 | | | 10/16/06 | | | 536,094 | | | | 528,359 | | | | 0.1 | % | |
| | | JPMorgan Chase Bank N.A. — PEN and Peru
Credit Linked Nts., 8.115%, 09/02/15 | | | 1,360,000 | | | 08/03/05 | | | 268,258 | | | | 231,843 | | | | 0.0 | % | |
| | | JPMorgan Chase Bank N.A., London — Brazil
NTN-B Credit Linked Nts., Rate Linked to
Inflation, 05/16/45 | | | 405,000 | | | 02/10/06 | | | 231,974 | | | | 259,968 | | | | 0.1 | % | |
| | | JPMorgan Chase Bank, N.A., Singapore — Indonesia
Credit Linked Nts., 12.800%, 06/17/21 | | | 4,190,000,000 | | | 07/15/06 | | | 467,677 | | | | 402,701 | | | | 0.1 | % | |
| | | JPMorgan Mortgage Trust, 5.298%, due 07/25/35 | | | 1,015,179 | | | 03/27/08 | | | 937,400 | | | | 783,300 | | | | 0.2 | % | |
| | | JPMorgan Mortgage Trust, 6.009%, due 05/25/37 | | | 314,369 | | | 04/24/08 | | | 228,777 | | | | 59,007 | | | | 0.0 | % | |
| | | JSC Astana Finance, 9.160%, due 03/14/12 | | | 1,500,000 | | | 02/09/07 | | | 1,500,000 | | | | 694,489 | | | | 0.1 | % | |
| | | LatAm Walker Cayman Trust Series 2006-102 — COP
and Colombia Credit Linked Nts.,
10.000%, 11/17/16 | | | 392,000,000 | | | 10/20/06 | | | 167,521 | | | | 163,297 | | | | 0.0 | % | |
| | | Lehman Brothers Holdings, Inc., 7.500%,
due 05/11/38 | | | 755,000 | | | 09/10/08 | | | 549,207 | | | | 76 | | | | 0.0 | % | |
| | | MicroAccess Trust 2007 — MicroFinance Institutional
Loans, Credit Linked Nts., 7.550%, 5/24/12 | | | 1,307,692 | | | 06/20/07 | | | 1,322,190 | | | | 1,181,108 | | | | 0.2 | % | |
100
NOTES TO FINANCIAL STATEMENTS AS OF DECEMBER 31, 2008 (CONTINUED)
NOTE 12 — ILLIQUID SECURITIES (continued)
| Portfolio | | Security | | Notional/
Principal
Amount/
Shares | | Initial
Acquisition
Date | | Cost/
Upfront
Payments | | Value | | Percent
of Net
Assets | |
Oppenheimer
Strategic
Income
(continued) | | Morgan Stanley — Brazil Sr. Unsecured Credit Linked
Nts., 14.400%, 08/04/16 | | | 2,049,837 | | | 08/02/06 | | $ | 940,366 | | | $ | 667,516 | | | | 0.1 | % | |
| | | Morgan Stanley — Brazilian Real and Credit Linked
Nts., 12.551%, 01/05/22 | | | 6,135,000 | | | 01/04/07 | | | 606,209 | | | | 60,508 | | | | 0.0 | % | |
| | | Morgan Stanley — PEN Denominated Credit Linked
Nts., 6.250%, 03/23/17 | | | 832,000 | | | 07/10/07 | | | 257,088 | | | | 161,126 | | | | 0.0 | % | |
| | | Morgan Stanley — The State Road Administration
of Ukraine (Republic of ) Credit Linked
Nts., 6-month USD-LIBOR +2.67%, 10/15/17 | | | 200,000 | | | 02/04/08 | | | 200,000 | | | | 50,000 | | | | 0.0 | % | |
| | | Morgan Stanley — The State Road Administration
of Ukraine/Republic of Ukraine Credit Linked
Nts., 6-month USD-LIBOR +1.80%, 10/15/17 | | | 1,200,000 | | | 11/02/07 | | | 1,200,000 | | | | 300,000 | | | | 0.1 | % | |
| | | Morgan Stanley — United Mexican States Credit
Linked Nts., 6-month USD LIBOR
+1.130%, 11/20/15 | | | 900,000 | | | 11/03/05 | | | 900,000 | | | | 810,000 | | | | 0.2 | % | |
| | | Morgan Stanley & Co. International Ltd. — Red
Arrow International Leasing PLC Total Return
Linked Nts., 8.375%, 07/06/12 | | | 5,859,618 | | | 03/24/06 | | | 211,720 | | | | 155,438 | | | | 0.0 | % | |
| | | Morgan Stanley Capital Services Inc. — WTI Trading
Limited Total Return Linked Nts.,
15.000%, 03/08/12 | | | 954,155 | | | 04/24/06 | | | 956,789 | | | | 586,424 | | | | 0.1 | % | |
| | | Morgan Stanley Capital Services Inc. — WTI Trading
Limited Total Return Linked Nts.,
15.000%, 03/08/12 | | | 1,272,553 | | | 04/24/08 | | | 1,265,666 | | | | 786,819 | | | | 0.2 | % | |
| | | Reforma BLN-Backed I — Class 1B Asset-Backed
Variable Funding Notes, TIIE +2.000%, 07/31/14 | | | 414,000 | | | 06/12/08 | | | 39,913 | | | | 29,895 | | | | 0.0 | % | |
| | | Reforma BLN-Backed I — Class 1C Asset-Backed
Variable Funding Notes, TIIE +2.000%, 07/31/14 | | | 690,000 | | | 08/12/08 | | | 67,897 | | | | 49,825 | | | | 0.0 | % | |
| | | Reforma BLN-Backed I — Class 2B Asset-Backed
Variable Funding Notes, TIIE +3.500%, 05/20/15 | | | 345,571 | | | 06/12/08 | | | 33,316 | | | | 24,954 | | | | 0.0 | % | |
| | | Reforma BLN-Backed I — Class 2C Asset-Backed
Variable Funding Notes, TIIE +3.500%, 05/20/15 | | | 5,210,380 | | | 06/18/08 | | | 505,487 | | | | 376,241 | | | | 0.1 | % | |
| | | Reforma BLN-Backed I — Class 2D Asset-Backed
Variable Funding Notes, TIIE +3.500%, 05/20/15 | | | 379,725 | | | 07/08/08 | | | 36,812 | | | | 27,420 | | | | 0.0 | % | |
| | | Reforma BLN-Backed I — Class 2E Asset-Backed
Variable Funding Notes, TIIE +3.500%, 05/20/15 | | | 275,878 | | | 07/15/08 | | | 26,789 | | | | 19,921 | | | | 0.0 | % | |
| | | Reforma BLN-Backed I — Class 2F Asset-Backed
Variable Funding Notes, TIIE +3.500%, 05/20/15 | | | 176,189 | | | 08/08/08 | | | 17,344 | | | | 12,723 | | | | 0.0 | % | |
| | | Reforma BLN-Backed I — Class 2G Asset-Backed
Variable Funding Notes, TIIE +3.500%, 05/20/15 | | | 32,447 | | | 08/22/08 | | | 3,200 | | | | 2,343 | | | | 0.0 | % | |
| | | Reforma BLN-Backed I — Class 1A -Asset-Backed
Variable Funding Notes, TIIE +2.000%, 07/31/14 | | | 2,070,000 | | | 12/27/07 | | | 190,240 | | | | 149,475 | | | | 0.0 | % | |
| | | Reforma BLN-Backed I — Class 2A Asset-Backed
Variable Funding Notes, TIIE +3.500%, 05/20/15 | | | 197,523 | | | 05/21/08 | | | 19,044 | | | | 14,263 | | | | 0.0 | % | |
| | | Residential Funding Mortgage Securities I,
5.764%, due 07/27/37 | | | 507,619 | | | 04/03/08 | | | 359,147 | | | | 131,698 | | | | 0.0 | % | |
| | | Salisbury Intl. Investments Ltd. — Series 2006-003
Tranche E, Secured Credit Linked Nts., 3-month
USD-LIBOR +4.150%, 07/22/11 | | | 300,000 | | | 07/12/06 | | | 300,000 | | | | 127,770 | | | | 0.0 | % | |
| | | Start CLO Ltd., 19.193%, due 06/07/11 | | | 320,000 | | | 11/29/06 | | | 310,035 | | | | 211,200 | | | | 0.1 | % | |
| | | Structured Asset Mortgage Investments, Inc.,
1.081%, due 09/19/32 | | | 112,109 | | | 06/12/08 | | | — | | | | 31,084 | | | | 0.0 | % | |
| | | Suntrust Adjustable Rate Mortgage Loan Trust,
5.660%, due 06/25/37 | | | 666,288 | | | 06/06/08 | | | 630,347 | | | | 448,637 | | | | 0.1 | % | |
| | | Taganka Car Loan Finance PLC, 4.739%,
due 11/14/13 | | | 115,214 | | | 10/17/06 | | | 115,214 | | | | 103,693 | | | | 0.0 | % | |
| | | TransCapitalInvest Ltd for OJSC AK Transneft,
5.670%, due 03/05/14 | | | 110,000 | | | 12/23/08 | | | 72,640 | | | | 71,313 | | | | 0.0 | % | |
| | | UBS AG, Jersey — Ghana (Republic of) Credit Linked
Nts., 14.470%, 12/28/11 | | | 263,055 | | | 12/22/06 | | | 288,522 | | | | 109,215 | | | | 0.0 | % | |
| | | Vega Capital LTD. — Class D Catastrophe Linked
Nts., 0.000%, 06/24/11, 0.001%, due 06/24/11 | | | 701,000 | | | 06/10/08 | | | 701,000 | | | | 718,525 | | | | 0.1 | % | |
| | | Washington Mutual Mortgage Pass-through
Certificates, 3.096%, due 11/25/46 | | | 262,038 | | | 06/10/08 | | | 199,089 | | | | 97,121 | | | | 0.0 | % | |
| | | Washington Mutual Mortgage Pass-through
Certificates, 4.375%, due 04/25/47 | | | 182,085 | | | 06/04/08 | | | 132,738 | | | | 60,088 | | | | 0.0 | % | |
| | | Washington Mutual Mortgage Pass-through
Certificates, 5.606%, due 12/25/36 | | | 268,105 | | | 05/30/08 | | | 189,338 | | | | 79,358 | | | | 0.0 | % | |
| | | Washington Mutual Mortgage Pass-through
Certificates, 5.706%, due 02/25/37 | | | 222,432 | | | 05/29/08 | | | 142,915 | | | | 57,334 | | | | 0.0 | % | |
| | | Washington Mutual Mortgage Pass-through
Certificates, 5.752%, due 11/25/36 | | | 104,385 | | | 06/19/08 | | | 74,439 | | | | 29,556 | | | | 0.0 | % | |
101
NOTES TO FINANCIAL STATEMENTS AS OF DECEMBER 31, 2008 (CONTINUED)
NOTE 12 — ILLIQUID SECURITIES (continued)
| Portfolio | | Security | | Notional/
Principal
Amount/
Shares | | Initial
Acquisition
Date | | Cost/
Upfront
Payments | | Value | | Percent
of Net
Assets | |
Oppenheimer
Strategic
Income
(continued) | | Wells Fargo Mortgage-Backed Securities Trust,
4.818%, due 07/25/36 | | | 162,338 | | | 05/05/08 | | $ | 124,276 | | | $ | 45,370 | | | | 0.0 | % | |
| | | Wells Fargo Mortgage-Backed Securities Trust,
5.557%, due 07/25/36 | | | 590,316 | | | 05/05/08 | | | 451,912 | | | | 161,730 | | | | 0.0 | % | |
| | | Wells Fargo Mortgage-Backed Securities Trust,
5.628%, due 07/25/36 | | | 406,320 | | | 05/05/08 | | | 311,055 | | | | 112,662 | | | | 0.0 | % | |
| | | | | | | | | | | $ | 59,142,628 | | | $ | 35,909,390 | | | | 6.4 | % | |
PIMCO Total
Return | | Credit Suisse Mortgage Capital
Certificates, 1.425%, due 10/15/21 | | | 2,392,546 | | | 10/29/08 | | $ | 1,959,385 | | | $ | 1,565,432 | | | | 0.3 | % | |
| | | Currency Options | |
| | | Call Option OTC — Credit Suisse, London
USD vs JPY
Strike @ 104 (JPY) — Exp 03/17/10 | | | 3,000,000 | | | 03/20/07 | | | 127,785 | | | | 22,398 | | | | 0.0 | % | |
| | | Put Option OTC — Credit Suisse, London
USD vs JPY
Strike @ 104 (JPY) — Exp 03/17/10 | | | 3,000,000 | | | 03/20/07 | | | 127,785 | | | | 497,064 | | | | 0.1 | % | |
| | | Fixed Income Options | |
| | | Put Option OTC — Merrill Lynch Government
Securities Inc. FNMA 6.000% 30-Year January TBA
Strike @ $81.250-Exp 01/06/09 | | | 81,100,000 | | | 10/08/08 | | | 9,352 | | | | — | | | | 0.0 | % | |
| | | Put Option OTC — Credit Suisse International
FNMA 6.000% 30-Year February TBA
Strike @ $68.000 — Exp 02/05/09 | | | 54,000,000 | | | 12/03/08 | | | 6,328 | | | | — | | | | 0.0 | % | |
| | | Put Option OTC — Credit Suisse International
FNMA 5.500% 30-Year January TBA
Strike @ $73.000 — Exp 01/06/09 | | | 100,000,000 | | | 10/06/08 | | | 11,375 | | | | — | | | | 0.0 | % | |
| | | Interest Rate Swaptions | |
| | | Call Swaption OTC — Merrill Lynch Capital
Services, Inc. 3 Month USD-LIBOR — Fund
Pays Floating
Strike @ 3.450% — Exp 08/03/09 | | | 4,900,000 | | | 04/15/08 | | | 54,880 | | | | 162,548 | | | | 0.0 | % | |
| | | Call Swaption OTC — The Royal Bank of
Scotland PLC 3 Month USD-LIBOR — Fund Pays
Floating Strike @ 3.850% — Exp 08/03/09 | | | 17,900,000 | | | 04/29/08 | | | 189,293 | | | | 728,336 | | | | 0.2 | % | |
| | | Credit Default Swaps | |
| | | CDX.NA.HY.10 Index, pay 5.000% | | | 2,400,000 | | | 07/16/08 | | | 157,751 | | | | 373,175 | | | | 0.1 | % | |
| | | CDX.NA.IG.9 Index (30-100% Tranche),
receive 0.548% | | | 680,599 | | | 07/22/08 | | | — | | | | 1,612 | | | | 0.0 | % | |
| | | CDX.NA.IG.9 Index, pay 0.800% | | | 1,073,600 | | | 12/11/08 | | | 98,180 | | | | 60,025 | | | | 0.0 | % | |
| | | CVS Corp. 5.750%, 08/15/11, pay 0.235% | | | 2,800,000 | | | 10/19/06 | | | — | | | | 58,851 | | | | 0.0 | % | |
| | | Federative Republic of Brazil 12.250%, 03/06/30,
receive 3.350% | | | 1,000,000 | | | 12/15/08 | | | — | | | | 10,193 | | | | 0.0 | % | |
| | | General Electric Capital Corp. 5.625%, 09/15/17,
receive 4.325% | | | 300,000 | | | 11/06/08 | | | — | | | | 8,169 | | | | 0.0 | % | |
| | | General Electric Capital Corp. 5.625%, 09/15/17,
receive 4.700% | | | 600,000 | | | 11/24/08 | | | — | | | | 25,562 | | | | 0.0 | % | |
| | | iTraxx Europe HiVol Series 6 Version 1 Index,
pay 0.850% | | | 4,500,000 | | | 12/14/06 | | | (42,024 | ) | | | 865,972 | | | | 0.2 | % | |
| | | Noble Corp. 5.875%, 06/01/13, pay 0.520% | | | 1,000,000 | | | 04/27/07 | | | — | | | | 48,012 | | | | 0.0 | % | |
| | | Interest Rate Swaps | |
| | | Receive a fixed rate equal to 1.948% and pay
a floating rate based on France CPI Ex Tobacco
Index (FRCPXTOB) Counterparty: Barclays
Bank PLC, London | | | 1,000,000 | | | 03/15/07 | | | 370 | | | | 26,288 | | | | 0.0 | % | |
| | | Receive a fixed rate equal to 1.950% and pay a
floating rate based on France CPI Ex Tobacco
Index (FRCPXTOB) Counterparty: The Royal Bank
of Scotland PLC | | | 300,000 | | | 03/29/07 | | | — | | | | 6,931 | | | | 0.0 | % | |
| | | Receive a fixed rate equal to 1.955% and pay a
floating rate based on France CPI Ex Tobacco Index
(FRCPXTOB) Counterparty: The Royal Bank of
Scotland PLC | | | 300,000 | | | 03/26/07 | | | — | | | | 7,109 | | | | 0.0 | % | |
| | | Receive a fixed rate equal to 1.960% and pay a
floating rate based on France CPI Ex Tobacco
Index (FRCPXTOB) Counterparty: Barclays
Bank PLC, London | | | 200,000 | | | 04/03/07 | | | — | | | | 5,033 | | | | 0.0 | % | |
102
NOTES TO FINANCIAL STATEMENTS AS OF DECEMBER 31, 2008 (CONTINUED)
NOTE 12 — ILLIQUID SECURITIES (continued)
| Portfolio | | Security | | Notional/
Principal
Amount/
Shares | | Initial
Acquisition
Date | | Cost/
Upfront
Payments | | Value | | Percent
of Net
Assets | |
PIMCO Total
| |
Return
| |
| (continued) | | Receive a fixed rate equal to 1.960% and pay a | | | | | | | | | | | | | | | | |
| | |
| | | floating rate based on France CPI Ex Tobacco | | | | | | | | | | | | | | | | |
| | |
| | | Index (FRCPXTOB) Counterparty: Goldman Sachs | | | | | | | | | | | | | | | | |
| | |
| | | Capital Markets, L.P. | | | 300,000 | | | 03/28/07 | | $ | — | | | $ | 9,006 | | | | 0.0 | % | |
| | | Receive a fixed rate equal to 1.980% and pay
a floating rate based on France CPI Ex Tobacco
Index (FRCPXTOB) Counterparty: Barclays Bank
PLC, London | | | 300,000 | | | 04/10/07 | | | — | | | | 7,437 | | | | 0.0 | % | |
| | | Receive a fixed rate equal to 0.710% and pay a
floating rate based on 2 Year USD Mid-Market
Swap Spread Counterparty: BNP Paribas | | | 2,000,000 | | | 02/06/08 | | | 848 | | | | 4,339 | | | | 0.0 | % | |
| | | Receive a fixed rate equal to 0.763% and pay a
floating rate based on 5 Year USD Mid-Market
Swap Spread Counterparty: BNP Paribas | | | 3,900,000 | | | 02/12/08 | | | 858 | | | | 38,878 | | | | 0.0 | % | |
| | | | | | | | | | | $ | 2,702,166 | | | $ | 4,532,370 | | | | 0.9 | % | |
Templeton
Foreign
Equity | | Rolls-Royce Group PLC — Class C | | | 42,136,380 | | | 01/05/06 | | $ | 121,152 | | | $ | 60,582 | | | | 0.0 | % | |
| | | | | | | | | | | $ | 121,152 | | | $ | 60,582 | | | | 0.0 | % | |
NOTE 13 — REORGANIZATIONS
On September 7, 2008, Pioneer High Yield, as listed below ("Acquiring Portfolio"), acquired the assets and certain liabilities of ING VP High Yield Bond Portfolio, also listed below ("Acquired Portfolio"), in a tax-free reorganization in exchange for shares of the Acquiring Portfolio, pursuant to a plan or reorganization approved by the Acquired Portfolio's shareholders. The number and value of shares issued by the Acquiring Portfolio are presented in Note 11 — Capital Shares. Net assets and unrealized depreciation as of the reorganization date were as follows:
Acquiring
Portfolios | | Acquired
Portfolios | | Total
Net Assets of
Acquired
Portfolio (000's) | | Total
Net Assets of
Acquiring
Portfolio (000's) | | Acquired
Capital Loss
Carryforward
(000's) | | Acquired Portfolio
Unrealized
Appreciation/
(Depreciation) (000's) | | Conversion
Ratio | |
| Pioneer | | ING VP High | | | | | | | | | | | | | | | | | | |
| | |
| High Yield | | Yield Bond Portfolio | | $ | 64,847 | | | $ | 153,339 | | | $ | (11,172 | ) | | $ | (4,398 | ) | | | 0.28 | | |
The net assets of Pioneer High Yield after the acquisition were $218,185,642.
On April 27, 2008, Van Kampen Equity and Income and Templeton Foreign Equity, as listed below ("Acquiring Portfolios"), acquired the assets and certain liabilities of ING UBS U.S. Allocation Portfolio and ING JPMorgan International Portfolio, also listed below ("Acquired Portfolios"), respectively, in a tax-free reorganization in exchange for shares of the Acquiring Portfolio, pursuant to a plan of reorganization approved by the Acquired Portfolio's shareholders. The number and value of shares issued by the Acquiring Portfolio are presented in Note 11 — Capital Shares. Net assets and unrealized depreciation as of the reorganization date were as follows:
Acquiring
Portfolios | | Acquired
Portfolios | | Total
Net Assets of
Acquired
Portfolio (000's) | | Total
Net Assets of
Acquiring
Portfolio (000's) | | Acquired
Capital Loss
Carryforwards
(000's) | | Acquired Portfolio
Unrealized
Appreciation/
(Depreciation) (000's) | | Conversion
Ratio | |
| Van Kampen | | ING UBS U.S. | | | | | | | | | |
| |
| Equity and | | Allocation | | | | | | | | | |
| |
| Income | | Portfolio | | $ | 82,425 | | | $ | 895,993 | | | $ | — | | | $ | (1,836 | ) | | | 0.22 | | |
Templeton
Foreign Equity | | ING JPMorgan
International Portfolio | | | 485,926 | | | | 469,316 | | | | — | | | | 33,005 | | | | 0.58 | | |
The net assets of Van Kampen Equity and Income and Templeton Foreign Equity after the acquisitions were $978,418,126 and $955,242,378, respectively.
103
NOTES TO FINANCIAL STATEMENTS AS OF DECEMBER 31, 2008 (CONTINUED)
NOTE 13 — REORGANIZATIONS (continued)
On January 13, 2007, UBS U.S. Large Cap Equity, as listed below ("Acquiring Portfolio"), acquired the assets and certain liabilities of ING Goldman Sachs Structured Equity Portfolio, also listed below ("Acquired Portfolio"), in a tax-free reorganization in exchange for shares of the Acquiring Portfolio, pursuant to a plan of reorganization approved by the Acquired Portfolio's shareholders. The number and value of shares issued by the Acquiring Portfolio are presented in Note 11 — Capital Share Transactions. Net assets and unrealized appreciation as of the reorganization date were as follows:
Acquiring
Portfolio | | Acquired
Portfolio | | Total
Net Assets of
Acquired
Portfolio (000's) | | Total
Net Assets of
Acquiring
Portfolio (000's) | | Acquired
Capital Loss
Carryforwards
(000's) | | Acquired Portfolio
Unrealized
Appreciation
(Depreciation) (000's) | | Conversion
Ratio | |
| UBS U.S. Large | | ING Goldman Sachs | | | | | | | | | | | | | | | | | | |
| | |
| Cap Equity | | Structured Equity | | | | | | | | | | | | | | | | | | |
| | |
| | | Portfolio | | | | | | | | | | | | | | | | | | |
| | |
| Class I | | Class I | | $ | 1 | | | $ | 359,756 | | | $ | — | | | $ | — | | | | 0.89 | | |
| Class S | | Class S | | | 33,300 | | | | 29,312 | | | | — | | | | 4,276 | | | | 0.91 | | |
| Class ADV | | Class ADV | | | 3,083 | | | | 4,235 | | | | — | | | | (237 | ) | | | 0.89 | | |
| | | | | $ | 36,384 | | | $ | 393,303 | | | $ | — | | | $ | 4,039 | | | | | | |
The net assets of UBS U.S. Large Cap Equity after the acquisition were $429,687,347.
NOTE 14 — CONCENTRATION OF RISKS
Non-Diversified. Certain Portfolios are each classified as non-diversified investment companies under the 1940 Act, which means that each Portfolio is not limited by the 1940 Act in the proportion of assets that they may invest in the obligations of a single issuer. Declines in the value of that single company can significantly impact the value of a Portfolio. The investment of a large percentage of a Portfolio's assets in the securities of a small number of issuers may cause the Portfolios' share price to fluctuate more than that of a diversified investment company. Conversely, even though classified as non-diversified, a Portfolio may actually maintain a portfolio that is diversified with a large number of issuers. In such an event, a Portfolio would benefit less from appreciation in a single corporate issuer than if it had greater exposure to that issuer.
Foreign Securities. Investments in foreign securities may entail risks not present in domestic investments. Since securities in which a Portfolio may invest are denominated in foreign currencies, changes in the relationship of these foreign currencies to the U.S. dollar can significantly affect the value of the investments and earnings of a Portfolio. Foreign investments may also subject a Portfolio to foreign government exchange restrictions, expropriation, taxation or other political, social or economic developments, as well as changes vis-a-vis the U.S. dollar from movements in currency, and changes in security value and interest rate, all of which could affect the market and/or credit risk of a Portfolio investments.
Emerging Markets Risk. Emerging market countries are generally defined as countries in the initial stage of their industrialization cycles with low per capita income. Investments in emerging market countries present risks in a greater degree than, and in addition to, those presented by investments in foreign issuers in general as these countries may be less politically and economically stable than other countries. A number of emerging market countries restrict, to varying degrees, foreign investment in stocks. Repatriation of investment income, capital and proceeds of sales by foreign investors may require governmental registration and/or approval in some emerging market countries. A number of the currencies of developing countries have experienced significant declines against the U.S. dollar from time to time, and devaluation may occur after investments in those currencies by a Portfolio. Inflation and rapid fluctuations in inflation rates have had, and may continue to have, negative effects on the economies and securities markets of certain emerging market countries.
High-Yield, Lower-Grade Debt Securities Risk. High-yield debt securities (commonly referred to as "junk bonds") generally present greater credit risk that an issuer cannot make timely payment of interest or principal than an issuer of a higher quality debt security, and typically have greater potential price volatility and principal and income risk. Changes in interest rates, the market's perception of the issuers and the credit worthiness of the issuers may significantly affect the value of these bonds. High-yield bonds are not considered investment grade, and are regarded as predominantly speculative with respect to the issuing company's continuing ability to meet principal and interest payments. The secondary market in which high yield securities are traded may be less liquid than the market for higher grade bonds. It may be more difficult to value less liquid high yield
104
NOTES TO FINANCIAL STATEMENTS AS OF DECEMBER 31, 2008 (CONTINUED)
NOTE 14 — CONCENTRATION OF RISKS (continued)
securities, and determination of their value may involve elements of judgment.
Derivatives. Generally, derivatives can be characterized as financial instruments whose performance is derived, at least in part, from the performance of an underlying asset or assets. Some derivatives are sophisticated instruments that typically involve a small investment of cash relative to the magnitude of risks assumed. These may include swap agreements, options, forwards and futures. Derivative securities are subject to market risk which could be significant for those that have a leveraging effect. Derivatives are also subject to credit risks related to the counterparty's ability to perform and any deterioration in the counterparty's creditworthiness could adversely affect the instrument. In addition, derivatives and their underlying securities may experience periods of illiquidity which could cause a Portfolio to hold a security it might otherwise sell or co uld force the sale of a security at inopportune times or for prices that do not reflect current market value. A risk of using derivatives is that a Portfolio's adviser or sub-adviser might imperfectly judge the market's direction.
During the period, Lehman Brothers Holdings, Inc. (LBHI) and certain of its affiliates sought protection under the insolvency laws of their jurisdictions of organization, including the United States, the United Kingdom and Japan. For the period ended December 31, 2008, Oppenheimer Strategic Income and PIMCO Total Return had outstanding securities trades with counterparties affiliated with LBHI. As a result of these events, LBHI's affiliates were unable to fulfill their commitments and, in certain cases, Oppenheimer Strategic Income and PIMCO Total Return may have terminated its trades and related agreements with the relevant entities and, where appropriate, is in the process of initiating claims for damages. Management has determined that the financial impact to the Portfolios relating to these events is immaterial.
NOTE 15 — SECURITIES LENDING
Under an agreement with The Bank of New York Mellon ("BNY"), the Portfolios can lend their securities to approved brokers, dealers and other financial institutions. Loans are collateralized by cash and U.S. government securities. The collateral is equal to at least 105% of the market value of non-U.S. securities loaned and 102% of the market value of U.S. securities loaned when the transaction is entered into and is adjusted daily for changes in the market values of the securities on loan. The cash collateral received is invested in approved investments as defined in the Securities Lending Agreement with BNY (the "Agreement"). The Portfolios bear the risk of loss with respect to the investment of collateral. Currently, the cash collateral is invested in the Bank of New York Mellon Corp. Institutional Cash Reserves Fund ("BICR Fund"). BNY serves as investment manager, cus todian and operational trustee of the BICR Fund. As of December 31, 2008, the BICR Fund held certain defaulted securities that had market values significantly below amortized cost. The investment in the BICR Fund is included in the Portfolio of Investments under Securities Lending Collateral and the unrealized loss on such investment is included in Net Unrealized Depreciation on the Statements of Assets and Liabilities. The Portfolios agreed, in principle, to the terms of capital support extended by The Bank of New York Mellon Corporation ("BNYC"), an affiliated company of BNY, for the certain defaulted securities held by the BICR Fund. BNYC will support the value of these securities up to a certain amount and subject, in part, to the Portfolios' continued lending of securities. The recorded value of each Portfolio's investment in the BICR Fund includes the value of the underlying securities held by the BICR Fund and the estimated value of the support to be provided by BNYC.
Generally, in the event of counterparty default, the Portfolios have the right to use the collateral to offset losses incurred. The Agreement contains certain guarantees by BNY in the event of counterparty default and/or a borrower's failure to return a loaned security; however, there would be a potential loss to the Portfolios in the event the Portfolios are delayed or prevented from exercising their right to dispose of the collateral. Engaging in securities lending could have a leveraging effect, which may intensify the credit, market and other risks associated with investing in a Portfolio. At December 31, 2008, the following Portfolios had securities on loan with the following market values:
| Portfolio | | Value of
Securities
Loaned | | Cash
Collateral
Received* | |
American Century Large
Company Value | | $ | 53,682 | | | $ | 50,811 | | |
American Century
Small-Mid Cap Value | | | 3,616,563 | | | | 3,598,795 | | |
| JPMorgan Mid Cap Value | | | 13,147,685 | | | | 13,247,554 | | |
| Oppenheimer Global | | | 118,751,371 | | | | 132,214,332 | | |
| Oppenheimer Strategic Income | | | 14,877,978 | | | | 15,242,603 | | |
| PIMCO Total Return | | | 19,932,705 | | | | 20,332,470 | | |
T. Rowe Price Diversified
Mid Cap Growth | | | 40,917,865 | | | | 41,021,680 | | |
| T. Rowe Price Growth Equity | | | 5,267,973 | | | | 5,150,389 | | |
| Thornburg Value | | | 13,072,926 | | | | 15,093,475 | | |
| UBS U.S. Large Cap Equity | | | 3,438,514 | | | | 3,487,032 | | |
| Van Kampen Comstock | | | 5,762,234 | | | | 5,891,520 | | |
* Cash Collateral received was invested in the BICR Fund, the fair value of which is presented in the respective Portfolios' Portfolio of Investments.
105
NOTES TO FINANCIAL STATEMENTS AS OF DECEMBER 31, 2008 (CONTINUED)
NOTE 16 — FEDERAL INCOME TAXES
The amount of distributions from net investment income and net realized capital gains are determined in accordance with federal income tax regulations, which may differ from U.S. generally accepted accounting principles for investment companies. These book/tax differences may be either temporary or permanent. Permanent differences are reclassified within the capital accounts based on their federal tax-basis treatment; temporary differences are not reclassified. Key differences include the treatment of short-term capital gains, foreign currency transactions, and wash sale deferrals. Distributions in excess of net investment income and/or net realized capital gains for tax purposes are reported as return of capital.
The following permanent tax differences have been reclassified as of December 31, 2008:
| | | Paid-in
Capital | | Undistributed
Net
Investment
Income | | Accumulated
Net Realized
Gains/
(Losses) | |
American Century
Large Company Value | | $ | — | | | $ | (2,957 | ) | | $ | 2,957 | | |
American Century
Small-Mid Cap Value | | | 2,076 | | | | (124,388 | ) | | | 122,312 | | |
| Baron Asset | | | (91,691 | ) | | | 90,444 | | | | 1,247 | | |
| | | Paid-in
Capital | | Undistributed
Net
Investment
Income | | Accumulated
Net Realized
Gains/
(Losses) | |
| Baron Small Cap Growth | | $ | (2,778,476 | ) | | $ | 2,676,528 | | | $ | 101,948 | | |
| Columbia Small Cap Value II | | | — | | | | (142,932 | ) | | | 142,932 | | |
| Davis New York Venture | | | — | | | | (42,680 | ) | | | 42,680 | | |
| JPMorgan Mid Cap Value | | | — | | | | (178,678 | ) | | | 178,678 | | |
Legg Mason Partners
Aggressive Growth | | | (604,380 | ) | | | 604,380 | | | | — | | |
Neuberger Berman
Partners | | | — | | | | (45,555 | ) | | | 45,555 | | |
| Oppenheimer Global | | | — | | | | (5,167,474 | ) | | | 5,167,474 | | |
Oppenheimer
Strategic Income | | | — | | | | (17,896,645 | ) | | | 17,896,645 | | |
| PIMCO Total Return | | | — | | | | 8,263,750 | | | | (8,263,750 | ) | |
| Pioneer High Yield | | | (2,692,967 | ) | | | 16,989 | | | | 2,675,978 | | |
T. Rowe Price Diversified
Mid Cap Growth | | | — | | | | (9,555 | ) | | | 9,555 | | |
T. Rowe Price Growth
Equity | | | (8,868 | ) | | | (913,811 | ) | | | 922,679 | | |
| Templeton Foreign Equity | | | (144,297 | ) | | | 1,300,121 | | | | (1,155,824 | ) | |
| Thornburg Value | | | — | | | | (132,489 | ) | | | 132,489 | | |
| Van Kampen Comstock | | | — | | | | (8,377 | ) | | | 8,377 | | |
Van Kampen Equity
and Income | | | — | | | | (17,453 | ) | | | 17,453 | | |
Dividends paid by the Portfolios from net investment income and distributions of net realized short-term capital gains are, for federal income tax purposes, taxable as ordinary income to shareholders.
The tax composition of dividends and distributions to shareholders was as follows:
| | | Year Ended
December 31, 2008 | | Year Ended
December 31, 2007 | |
| | | Ordinary
Income | | Long-Term
Capital
Gains | | Return
of
Capital | | Ordinary
Income | | Long-Term
Capital
Gains | |
| American Century Large Company Value | | $ | 3,193,911 | | | $ | 8,428,488 | | | $ | — | | | $ | 2,664,402 | | | $ | 6,881,524 | | |
| American Century Small-Mid Cap Value | | | 9,053,365 | | | | 3,101,132 | | | | — | | | | 9,409,419 | | | | 4,377,918 | | |
| Baron Asset | | | — | | | | 146,044 | | | | — | | | | — | | | | — | | |
| Baron Small Cap Growth | | | — | | | | 19,089,164 | | | | — | | | | — | | | | — | | |
| Columbia Small Cap Value II | | | 2,896,771 | | | | 2,052,699 | | | | — | | | | 171,114 | | | | — | | |
| Davis New York Venture | | | 4,561,240 | | | | 3,662,022 | | | | — | | | | 1,736,952 | | | | 95,364 | | |
| JPMorgan Mid Cap Value | | | 5,228,811 | | | | 19,881,171 | | | | — | | | | 4,101,685 | | | | 10,566,389 | | |
| Neuberger Berman Partners | | | 961,325 | | | | — | | | | — | | | | 3,748,694 | | | | 17,333,506 | | |
| Oppenheimer Global | | | 46,091,386 | | | | 156,637,736 | | | | — | | | | 53,603,497 | | | | 86,882,658 | | |
| Oppenheimer Strategic Income | | | 33,804,028 | | | | 2,275,989 | | | | — | | | | 20,466,141 | | | | — | | |
| PIMCO Total Return | | | 24,536,591 | | | | 4,332,469 | | | | — | | | | 14,039,257 | | | | — | | |
| Pioneer High Yield | | | 17,062,041 | | | | 708,937 | | | | — | | | | 6,921,120 | | | | — | | |
| T. Rowe Price Diversified Mid Cap Growth | | | 28,290,755 | | | | 103,251,077 | | | | — | | | | 19,205,474 | | | | 78,164,876 | | |
| T. Rowe Price Growth Equity | | | 23,172,886 | | | | 84,672,583 | | | | 1,365,035 | | | | 18,410,547 | | | | 59,102,188 | | |
| Templeton Foreign Equity | | | 18,363,765 | | | | — | | | | — | | | | 1,867,499 | | | | 903,924 | | |
| Thornburg Value | | | 1,832,378 | | | | — | | | | — | | | | 931,786 | | | | — | | |
| UBS U.S. Large Cap Equity | | | 9,038,324 | | | | — | | | | — | | | | 3,088,324 | | | | — | | |
| Van Kampen Comstock | | | 40,591,710 | | | | 44,732,957 | | | | — | | | | 17,879,359 | | | | 26,163,078 | | |
| Van Kampen Equity and Income | | | 51,853,055 | | | | 42,580,783 | | | | — | | | | 32,047,391 | | | | 19,569,825 | | |
The tax-basis components of distributable earnings and the expiration dates of the capital loss carryforwards which may be used to offset future realized capital gains for federal income tax purposes as of December 31, 2008 were:
| | | Ordinary
Income | | Undistributed
Long-Term
Capital Gains | | Undistributed
Appreciation/
(Depreciation) | | Post-October
Unrealized
Loss
Deferred | | Post-October
Capital
Loss
Deferred | | Currency
Loss
Carryforwards | | Capital
Expiration
Dates | |
American Century Large
Company Value | | $ | 47,911 | | | $ | — | | | $ | (7,881,243 | ) | | $ | — | | | $ | — | | | $ | (10,063,131 | ) | | | 2016 | | |
American Century Small-Mid
Cap Value | | | 1,600,924 | | | | — | | | | (26,620,021 | ) | | | (4,137,037 | ) | | | (9,513 | ) | | | (8,321,424 | ) | | | 2016 | | |
| Baron Asset | | | — | | | | — | | | | (3,049,274 | ) | | | (249,138 | ) | | | — | | | | (907,070 | ) | | | 2016 | | |
| Baron Small Cap Growth | | | — | | | | — | | | | (26,970,115 | ) | | | — | | | | — | | | | (141,956,587 | ) | | | 2016 | | |
| Columbia Small Cap Value II | | | 4,820,204 | | | | — | | | | (122,839,918 | ) | | | (19,127,212 | ) | | | — | | | | (23,211,785 | ) | | | 2016 | | |
| Davis New York Venture | | | 2,934,701 | | | | — | | | | (156,682,103 | ) | | | — | | | | — | | | | (23,366,240 | ) | | | 2016 | | |
| JPMorgan Mid Cap Value | | | 36,366 | | | | 3,205,983 | | | | (69,703,330 | ) | | | (6,566,905 | ) | | | — | | | | — | | | | — | | |
106
NOTES TO FINANCIAL STATEMENTS AS OF DECEMBER 31, 2008 (CONTINUED)
NOTE 16 — FEDERAL INCOME TAXES (continued)
| | | Undistributed
Ordinary
Income | | Undistributed
Long-Term
Capital Gains | | Unrealized
Appreciation/
(Depreciation) | | Post-October
Capital
Loss
Deferred | | Post-October
Currency
Loss
Deferred | | Capital
Loss
Carryforwards | | Expiration
Dates | |
Legg Mason Partners
Aggressive Growth | | $ | — | | | $ | — | | | | (106,572,553 | ) | | $ | — | | | $ | — | | | $ | (174,127,804 | ) | | | 2010 | | |
| Neuberger Berman Partners | | | 2,672,458 | | | | — | | | | (174,261,838 | ) | | | (51,795,686 | ) | | | (48,233 | ) | | | (13,186,377 | ) | | | 2015 | | |
| | | | | | | | | | | | | | | | | | | | | | | | (13,663,721 | ) | | | 2016 | | |
| | | | | | | | | | | | | | | | | | | | | | | $ | (26,850,098 | ) | | | | | |
| Oppenheimer Global | | | 34,285,125 | | | | 25,396,221 | | | | (432,661,893 | ) | | | (20,981,756 | ) | | | — | | | | — | | | | — | | |
Oppenheimer
Strategic Income | | | 5,436,822 | | | | — | | | | (91,582,751 | ) | | | — | | | | — | | | | (13,747,841 | ) | | | 2016 | | |
| PIMCO Total Return | | | 33,475,906 | | | | 11,780,452 | | | | (38,769,789 | ) | | | — | | | | — | | | | — | | | | — | | |
| Pioneer High Yield | | | — | | | | — | | | | (75,352,312 | ) | | | — | | | | — | | | | (1,198,181 | ) | | | 2009 | | |
| | | | | | | | | | | | | | | | | | | | | | | | (436,910 | ) | | | 2013 | | |
| | | | | | | | | | | | | | | | | | | | | | | | (6,878,115 | ) | | | 2015 | | |
| | | | | | | | | | | | | | | | | | | | | | | | (7,335,080 | ) | | | 2016 | | |
| | | | | | | | | | | | | | | | | | | | | | | $ | (15,848,286 | )* | | | | | |
T. Rowe Price Diversified
Mid Cap Growth | | | 216,631 | | | | — | | | | (248,634,645 | ) | | | — | | | | — | | | | (15,259,639 | ) | | | 2016 | | |
| T. Rowe Price Growth Equity | | | — | | | | — | | | | (273,029,375 | ) | | | — | | | | — | | | | (104,261,565 | ) | | | 2016 | | |
| Templeton Foreign Equity | | | — | | | | — | | | | (299,226,049 | ) | | | — | | | | — | | | | (33,953,300 | ) | | | 2016 | | |
| Thornburg Value | | | 3,486,313 | | | | — | | | | (104,932,967 | ) | | | — | | | | — | | | | (29,495,368 | ) | | | 2009 | | |
| | | | | | | | | | | | | | | | | | | | | | | | (113,367,765 | ) | | | 2010 | | |
| | | | | | | | | | | | | | | | | | | | | | | | (43,249,649 | ) | | | 2016 | | |
| | | | | | | | | | | | | | | | | | | | | | | $ | (186,112,782 | ) | | | | | |
| UBS U.S. Large Cap Equity | | | 450,538 | | | | — | | | | (120,338,515 | ) | | | — | | | | — | | | | (34,168,348 | ) | | | 2010 | | |
| | | | | | | | | | | | | | | | | | | | | | | | (39,939,281 | ) | | | 2016 | | |
| | | | | | | | | | | | | | | | | | | | | | | $ | (74,107,629 | ) | | | | | |
| Van Kampen Comstock | | | 1,191,721 | | | | — | | | | (223,180,919 | ) | | | — | | | | — | | | | (127,209,086 | ) | | | 2016 | | |
Van Kampen
Equity and Income | | | 1,506,382 | | | | — | | | | (108,471,999 | ) | | | — | | | | — | | | | (67,673,250 | ) | | | 2016 | | |
* Utilization of these capital losses is subject to annual limitations under Section 382 of the Internal Revenue Code.
The Portfolios' major tax jurisdictions are federal and Arizona. The earliest tax year that remains subject to examination by these jurisdictions is 2004.
NOTE 17 — OTHER ACCOUNTING PRONOUNCEMENTS
On March 19, 2008, the FASB issued Statement of Financial Accounting Standards No. 161 ("SFAS No. 161"), "Disclosure about Derivative Instruments and Hedging Activities." This new accounting statement requires enhanced disclosures about an entity's derivative and hedging activities. Entities are required to provide enhanced disclosures about (a) how and why an entity invests in derivatives, (b) how derivatives are accounted for under SFAS No. 133, and (c) how derivatives affect an entity's financial position, financial performance, and cash flows. SFAS No. 161 also requires enhanced disclosures regarding credit-risk-related contingent features of derivative instruments. SFAS No. 161 is effective for financial statements issued for fiscal years and interim periods beginning after November 15, 2008. As of December 31, 2008, management of the Portfolios is currently assessing the impact of the expanded financial statement disclosures that will result from adopting SFAS No. 161.
NOTE 18 — INFORMATION REGARDING TRADING OF ING'S U.S. MUTUAL FUNDS
As discussed in earlier supplements that were previously filed with the SEC, DSL, the adviser to the ING Funds, has reported to the Boards of Directors/Trustees (the "Boards") of the ING Funds that, like many U.S. financial services companies, ING Investments and certain of its U.S. affiliates have received informal and formal requests for information since September 2003 from various governmental and self-regulatory agencies in connection with investigations related to mutual funds and variable insurance products. DSL has advised the Boards that it and its affiliates have cooperated fully with each request.
In addition to responding to regulatory and governmental requests, DSL reported that management of U.S. affiliates of ING Groep N.V., including DSL (collectively, "ING"), on their own initiative, have conducted, through independent special counsel and a national accounting firm, an extensive internal review of trading in ING insurance, retirement, and mutual fund products. ING's internal review related to mutual fund trading has been completed. ING has reported that, of the millions of customer relationships that ING maintains, the
107
NOTES TO FINANCIAL STATEMENTS AS OF DECEMBER 31, 2008 (CONTINUED)
NOTE 18 — INFORMATION REGARDING TRADING OF ING'S U.S. MUTUAL FUNDS (continued)
internal review identified several isolated arrangements allowing third parties to engage in frequent trading of mutual funds within ING's variable insurance and mutual fund products, and identified other circumstances where frequent trading occurred, despite measures taken by ING intended to combat market timing. ING further reported that each of these arrangements has been terminated and fully disclosed to regulators. The results of the internal review were also reported to the independent members of the Boards.
DSL has advised the Boards that most of the identified arrangements were initiated prior to ING's acquisition of the businesses in question in the U.S. DSL further reported that the companies in question did not receive special benefits in return for any of these arrangements, which have all been terminated.
Based on the internal review, DSL has advised the Boards that the identified arrangements do not represent a systemic problem in any of the companies that were involved.
Despite the extensive internal review conducted through independent special counsel and a national accounting firm, there can be no assurance that the instances of inappropriate trading reported to the Boards are the only instances of such trading respecting the ING Funds.
DSL reported to the Boards that ING is committed to conducting its business with the highest standards of ethical conduct with zero tolerance for noncompliance. Accordingly, DSL advised the Boards that ING management was disappointed that its voluntary internal review identified these situations. Viewed in the context of the breadth and magnitude of its U.S. business as a whole, ING management does not believe that ING's acquired companies had systemic ethical or compliance issues in these areas. Nonetheless, DSL reported that given ING's refusal to tolerate any lapses, it has taken the steps noted below, and will continue to seek opportunities to further strengthen the internal controls of its affiliates.
• ING has agreed with the ING Funds to indemnify and hold harmless the ING Funds from all damages resulting from wrongful conduct by ING or its employees or from ING's internal investigation, any investigations conducted by any governmental or self-regulatory agencies, litigation or other formal proceedings, including any proceedings by the SEC. DSL reported to the Boards that the indemnification commitments made by ING Funds related to mutual fund trading have been settled and restitution amounts prepared by an independent consultant have been paid to the affected ING Funds. The net aggregate settlement amounts received by Pioneer High Yield on December 17, 2008 was $30,107.
• ING updated its Code of Conduct for employees reinforcing its employees' obligation to conduct personal trading activity consistent with the law, disclosed limits, and other requirements.
Other Regulatory Matters
The New York Attorney General and other federal and state regulators are also conducting broad inquiries and investigations involving the insurance industry. These initiatives currently focus on, among other things, compensation and other sales incentives; potential conflicts of interest; potential anti-competitive activity; reinsurance; marketing practices (including suitability); specific product types (including group annuities and indexed annuities); fund selection for investment products and brokerage sales; and disclosure. It is likely that the scope of these industry investigations will further broaden before they conclude. ING has received formal and informal requests in connection with such investigations, and is cooperating fully with each request.
Other federal and state regulators could initiate similar actions in this or other areas of ING's businesses. These regulatory initiatives may result in new legislation and regulation that could significantly affect the financial services industry, including businesses in which ING is engaged. In light of these and other developments, ING continuously reviews whether modifications to its business practices are appropriate. At this time, in light of the current regulatory factors, ING U.S. is actively engaged in reviewing whether any modifications in our practices are appropriate for the future.
There can be no assurance that these matters, or the adverse publicity associated with them, will not result in increased fund redemptions, reduced sale of fund shares, or other adverse consequences to ING Funds.
NOTE 19 — SUBSEQUENT EVENTS
Subsequent to December 31, 2008, the following Portfolio declared dividends from net investment income:
| | | Per Share
Amount | | Payable Date | | Record Date | |
| Pioneer High Yield | |
| Class ADV | | $ | 0.0679 | | | February 2, 2009 | | Daily | |
| Class I | | $ | 0.0709 | | | February 2, 2009 | | Daily | |
| Class S | | $ | 0.0695 | | | February 2, 2009 | | Daily | |
Effective May 1, 2009, the name of "ING Columbia Small Cap Value II Portfolio" will be renamed to "ING Columbia Small Cap Value Portfolio."
108
ING AMERICAN CENTURY PORTFOLIO OF INVESTMENTS
LARGE COMPANY VALUE PORTFOLIO AS OF DECEMBER 31, 2008
| Shares | | | | | | Value | |
| COMMON STOCK: 95.6% | | | |
| | | | | Aerospace/Defense: 1.2% | |
| | 3,900 | | | | | Northrop Grumman Corp. | | $ | 175,656 | | |
| | | | 175,656 | | |
| | | | | Agriculture: 1.3% | |
| | 5,900 | | | | | Altria Group, Inc. | | | 88,854 | | |
| | 1,900 | | | | | Lorillard, Inc. | | | 107,065 | | |
| | | | 195,919 | | |
| | | | | Apparel: 0.7% | |
| | 1,900 | | | | | VF Corp. | | | 104,063 | | |
| | | | 104,063 | | |
| | | | | Banks: 11.8% | |
| | 19,500 | | | | | Bank of America Corp. | | | 274,560 | | |
| | 5,300 | | | | | Bank of New York Mellon Corp. | | | 150,149 | | |
| | 27,400 | | | S | | Citigroup, Inc. | | | 183,854 | | |
| | 1,600 | | | | | Goldman Sachs Group, Inc. | | | 135,024 | | |
| | 14,600 | | | | | JPMorgan Chase & Co. | | | 460,338 | | |
| | 5,300 | | | S | | Morgan Stanley | | | 85,012 | | |
| | 13,700 | | | | | National City Corp. | | | 24,797 | | |
| | 5,000 | | | S | | US Bancorp. | | | 125,050 | | |
| | 12,400 | | | S | | Wells Fargo & Co. | | | 365,552 | | |
| | | | 1,804,336 | | |
| | | | | Beverages: 2.4% | |
| | 5,500 | | | | | Coca-Cola Co. | | | 248,985 | | |
| | 5,400 | | | | | Pepsi Bottling Group, Inc. | | | 121,554 | | |
| | | | 370,539 | | |
| | | | | Biotechnology: 1.3% | |
| | 3,400 | | | @ | | Amgen, Inc. | | | 196,350 | | |
| | | | 196,350 | | |
| | | | | Chemicals: 1.8% | |
| | 5,600 | | | | | EI Du Pont de Nemours & Co. | | | 141,680 | | |
| | 3,000 | | | | | PPG Industries, Inc. | | | 127,290 | | |
| | | | 268,970 | | |
| | | | | Commercial Services: 1.5% | |
| | 6,100 | | | | | H&R Block, Inc. | | | 138,592 | | |
| | 1,100 | | | | | Robert Half International, Inc. | | | 22,902 | | |
| | 5,300 | | | | | RR Donnelley & Sons Co. | | | 71,974 | | |
| | | | 233,468 | | |
| | | | | Computers: 1.9% | |
| | 3,800 | | | S | | Hewlett-Packard Co. | | | 137,902 | | |
| | 1,800 | | | | | International Business
Machines Corp. | | | 151,488 | | |
| | | | 289,390 | | |
| | | | | Diversified Financial Services: 0.9% | |
| | 4,000 | | | | | Discover Financial Services | | | 38,120 | | |
| | 1,400 | | | | | Legg Mason, Inc. | | | 30,674 | | |
| | 6,200 | | | | | Merrill Lynch & Co., Inc. | | | 72,168 | | |
| | | | 140,962 | | |
| | | | | Electric: 3.3% | |
| | 4,600 | | | | | Exelon Corp. | | | 255,806 | | |
| | 2,500 | | | @,L | | NRG Energy, Inc. | | | 58,325 | | |
| | 6,000 | | | | | PPL Corp. | | | 184,140 | | |
| | | | 498,271 | | |
| Shares | | | | | | Value | |
| | | | | Environmental Control: 0.7% | |
| | 3,200 | | | | | Waste Management, Inc. | | $ | 106,048 | | |
| | | | 106,048 | | |
| | | | | Food: 1.7% | |
| | 4,800 | | | S | | Kroger Co. | | | 126,768 | | |
| | 5,400 | | | @@,S | | Unilever NV ADR | | | 132,570 | | |
| | | | 259,338 | | |
| | | | | Forest Products & Paper: 0.7% | |
| | 2,500 | | | | | International Paper Co. | | | 29,500 | | |
| | 2,700 | | | | | Weyerhaeuser Co. | | | 82,647 | | |
| | | | 112,147 | | |
| | | | | Healthcare-Products: 3.7% | |
| | 8,000 | | | S | | Johnson & Johnson | | | 478,640 | | |
| | 2,900 | | | | | Medtronic, Inc. | | | 91,118 | | |
| | | | 569,758 | | |
| | | | | Healthcare-Services: 0.6% | |
| | 1,700 | | | | | Quest Diagnostics | | | 88,247 | | |
| | | | 88,247 | | |
| | | | | Household Products/Wares: 0.5% | |
| | 2,400 | | | | | Avery Dennison Corp. | | | 78,552 | | |
| | | | 78,552 | | |
| | | | | Housewares: 0.5% | |
| | 8,300 | | | | | Newell Rubbermaid, Inc. | | | 81,174 | | |
| | | | 81,174 | | |
| | | | | Insurance: 3.6% | |
| | 5,400 | | | S | | Allstate Corp. | | | 176,904 | | |
| | 2,340 | | | | | Loews Corp. | | | 66,105 | | |
| | 2,100 | | | | | Torchmark Corp. | | | 93,870 | | |
| | 4,600 | | | | | Travelers Cos., Inc. | | | 207,920 | | |
| | | | 544,799 | | |
| | | | | Iron/Steel: 0.8% | |
| | 2,700 | | | | | Nucor Corp. | | | 124,740 | | |
| | | | 124,740 | | |
| | | | | | | Machinery-Construction &
Mining: 0.8% | | | | | |
| | 2,900 | | | | | Caterpillar, Inc. | | | 129,543 | | |
| | | | 129,543 | | |
| | | | | Media: 2.9% | |
| | 7,900 | | | | | CBS Corp. - Class B | | | 64,701 | | |
| | 5,600 | | | S | | Gannett Co., Inc. | | | 44,800 | | |
| | 20,800 | | | | | Time Warner, Inc. | | | 209,248 | | |
| | 6,400 | | | @ | | Viacom - Class B | | | 121,984 | | |
| | | | 440,733 | | |
| | | | | Miscellaneous Manufacturing: 6.5% | |
| | 3,300 | | | | | Dover Corp. | | | 108,636 | | |
| | 40,700 | | | S | | General Electric Co. | | | 659,340 | | |
| | 4,700 | | | @@ | | Ingersoll-Rand Co. | | | 81,545 | | |
| | 2,100 | | | | | Parker Hannifin Corp. | | | 89,334 | | |
| | 2,600 | | | @@ | | Tyco International Ltd. | | | 56,160 | | |
| | | | 995,015 | | |
See Accompanying Notes to Financial Statements
109
ING AMERICAN CENTURY PORTFOLIO OF INVESTMENTS
LARGE COMPANY VALUE PORTFOLIO AS OF DECEMBER 31, 2008 (CONTINUED)
| Shares | | | | | | Value | |
| | | | | Office/Business Equipment: 0.8% | |
| | 1,700 | | | | | Pitney Bowes, Inc. | | $ | 43,316 | | |
| | 10,200 | | | | | Xerox Corp. | | | 81,294 | | |
| | | | 124,610 | | |
| | | | | Oil & Gas: 17.9% | |
| | 1,100 | | | | | Apache Corp. | | | 81,983 | | |
| | 11,100 | | | S | | Chevron Corp. | | | 821,067 | | |
| | 8,700 | | | S | | ConocoPhillips | | | 450,660 | | |
| | 1,200 | | | | | Devon Energy Corp. | | | 78,852 | | |
| | 11,100 | | | S | | ExxonMobil Corp. | | | 886,113 | | |
| | 900 | | | | | Occidental Petroleum Corp. | | | 53,991 | | |
| | 7,000 | | | @@,S | | Royal Dutch Shell PLC ADR - Class A | | | 370,580 | | |
| | | | 2,743,246 | | |
| | | | | Oil & Gas Services: 0.5% | |
| | 3,100 | | | @ | | National Oilwell Varco, Inc. | | | 75,764 | | |
| | | | 75,764 | | |
| | | | | Pharmaceuticals: 8.4% | |
| | 2,900 | | | S | | Abbott Laboratories | | | 154,773 | | |
| | 4,000 | | | | | Eli Lilly & Co. | | | 161,080 | | |
| | 7,700 | | | | | Merck & Co., Inc. | | | 234,080 | | |
| | 29,000 | | | | | Pfizer, Inc. | | | 513,590 | | |
| | 6,000 | | | | | Wyeth | | | 225,060 | | |
| | | | 1,288,583 | | |
| | | | | Retail: 5.9% | |
| | 3,100 | | | | | Best Buy Co., Inc. | | | 87,141 | | |
| | 1,600 | | | | | Darden Restaurants, Inc. | | | 45,088 | | |
| | 5,600 | | | S | | Gap, Inc. | | | 74,984 | | |
| | 5,300 | | | | | Home Depot, Inc. | | | 122,006 | | |
| | 2,900 | | | @ | | Kohl's Corp. | | | 104,980 | | |
| | 6,200 | | | | | Staples, Inc. | | | 111,104 | | |
| | 3,700 | | | @ | | Starbucks Corp. | | | 35,002 | | |
| | 4,700 | | | | | Walgreen Co. | | | 115,949 | | |
| | 3,800 | | | | | Wal-Mart Stores, Inc. | | | 213,028 | | |
| | | | 909,282 | | |
| | | | | Semiconductors: 1.0% | |
| | 4,800 | | | | | Applied Materials, Inc. | | | 48,624 | | |
| | 5,000 | | | | | Intel Corp. | | | 73,300 | | |
| | 2,200 | | | | | Texas Instruments, Inc. | | | 34,144 | | |
| | | | 156,068 | | |
| | | | | Software: 1.8% | |
| | 1,700 | | | @ | | Fiserv, Inc. | | | 61,829 | | |
| | 6,700 | | | | | Microsoft Corp. | | | 130,248 | | |
| | 5,000 | | | @ | | Oracle Corp. | | | 88,650 | | |
| | | | 280,727 | | |
| | | | | Telecommunications: 8.2% | |
| | 23,700 | | | S | | AT&T, Inc. | | | 675,450 | | |
| | 5,200 | | | @ | | Cisco Systems, Inc. | | | 84,760 | | |
| | 1,800 | | | | | Embarq Corp. | | | 64,728 | | |
| | 4,500 | | | | | Motorola, Inc. | | | 19,935 | | |
| | 11,900 | | | | | Sprint Nextel Corp. | | | 21,777 | | |
| | 11,400 | | | S | | Verizon Communications, Inc. | | | 386,460 | | |
| | | | 1,253,110 | | |
Total Common Stock
(Cost $21,082,132) | | | 14,639,408 | | |
| Shares | | | | | | Value | |
| REAL ESTATE INVESTMENT TRUSTS: 0.1% | | | |
| | | | | Shopping Centers: 0.1% | |
| | 2,000 | | | | | Developers Diversified Realty Corp. | | $ | 9,760 | | |
Total Real Estate Investment Trusts
(Cost $60,551) | | | 9,760 | | |
| PREFERRED STOCK: 0.1% | | | |
| | | | | Diversified Financial Services: 0.1% | |
| | 800 | | | | | Legg Mason, Inc. | | | 17,600 | | |
Total Preferred Stock
(Cost $15,138) | | | 17,600 | | |
Total Long-Term Investments
(Cost $21,157,821) | | | 14,666,768 | | |
| SHORT-TERM INVESTMENTS: 4.5% | | | |
| | | | | Affiliated Mutual Fund: 4.2% | |
| | 645,059 | | | | | ING Institutional Prime Money
Market Fund - Class I | | | 645,059 | | |
Total Mutual Fund
(Cost $645,059) | | | 645,059 | | |
Principal
Amount | | | | Value | |
| | | Securities Lending Collateralcc: 0.3% | |
| $ | 50,811 | | | Bank of New York Mellon Corp.
Institutional Cash Reserves | | | 43,990 | | |
Total Securities Lending Collateral
(Cost $50,811) | | | 43,990 | | |
Total Short-Term Investments
(Cost $695,870) | | | 689,049 | | |
Total Investments in
Securities
(Cost $21,853,691)* | | | 100.3 | % | | $ | 15,355,817 | | |
Other Assets and
Liabilities - Net | | | (0.3 | ) | | | (42,463 | ) | |
| Net Assets | | | 100.0 | % | | $ | 15,313,354 | | |
@ Non-income producing security
@@ Foreign Issuer
ADR American Depositary Receipt
cc Securities purchased with cash collateral for securities loaned.
S All or a portion of this security is segregated to cover collateral requirements for applicable futures, options, swaps, foreign forward currency contracts and/or when-issued or delayed-delivery securities.
L Loaned security, a portion or all of the security is on loan at December 31, 2008.
* Cost for federal income tax purposes is $23,237,060.
Net unrealized depreciation consists of:
| Gross Unrealized Appreciation | | $ | 113,919 | | |
| Gross Unrealized Depreciation | | | (7,995,162 | ) | |
| Net Unrealized Depreciation | | $ | (7,881,243 | ) | |
See Accompanying Notes to Financial Statements
110
ING AMERICAN CENTURY PORTFOLIO OF INVESTMENTS
LARGE COMPANY VALUE PORTFOLIO AS OF DECEMBER 31, 2008 (CONTINUED)
The following table summarizes the inputs used as of December 31, 2008 in determining the Portfolio's investments at fair value for purposes of SFAS 157:
| | | Investments in
Securities | | Other Financial
Instruments* | |
| Level 1 — Quoted Prices | | $ | 15,294,227 | | | $ | (627 | ) | |
Level 2 — Other Significant
Observable Inputs | | | 61,590 | | | | — | | |
Level 3 — Significant
Unobservable Inputs | | | — | | | | — | | |
| Total | | $ | 15,355,817 | | | $ | (627 | ) | |
"Fair value" for purposes of SFAS 157 is different from "fair value" as used in the 1940 Act. The former generally implies market value, and can include market quotations as a source of value, and the latter refers to determinations of actual value in absence of available market quotations.
* Other financial instruments may include forward foreign currency contracts, futures, swaps, and written options. Forward foreign currency contracts and futures are reported at their unrealized gain/loss at year end. Swaps and written options are reported at their market value at year end.
ING American Century Large Company Value Portfolio Open Futures Contracts on December 31, 2008:
Contract
Description | | Number of
Contracts | | Expiration
Date | | Unrealized
Depreciation | |
| Long Contracts | |
| S&P 500 E-Mini | | | 12 | | | 03/20/09 | | $ | (627 | ) | |
| | | $ | (627 | ) | |
See Accompanying Notes to Financial Statements
111
ING AMERICAN CENTURY PORTFOLIO OF INVESTMENTS
SMALL-MID CAP VALUE PORTFOLIO AS OF DECEMBER 31, 2008
| Shares | | | | | | Value | |
| COMMON STOCK: 87.3% | | | |
| | | | | Aerospace/Defense: 1.1% | |
| | 3,700 | | | | | Curtiss-Wright Corp. | | $ | 123,543 | | |
| | 2,100 | | | @ | | Esterline Technologies Corp. | | | 79,569 | | |
| | 7,600 | | | | | Kaman Corp. | | | 137,788 | | |
| | 4,300 | | | @ | | Moog, Inc. | | | 157,251 | | |
| | 3,700 | | | | | Northrop Grumman Corp. | | | 166,648 | | |
| | 4,400 | | | L | | Triumph Group, Inc. | | | 186,824 | | |
| | | | 851,623 | | |
| | | | | Agriculture: 0.1% | |
| | 2,800 | | | | | Universal Corp. | | | 83,636 | | |
| | | | 83,636 | | |
| | | | | Airlines: 0.4% | |
| | 5,900 | | | | | Skywest, Inc. | | | 109,740 | | |
| | 22,219 | | | | | Southwest Airlines Co. | | | 191,527 | | |
| | | | 301,267 | | |
| | | | | Apparel: 0.7% | |
| | 62,161 | | | @,L | | CROCS, Inc. | | | 77,080 | | |
| | 7,100 | | | @,L | | True Religion Apparel, Inc. | | | 88,324 | | |
| | 4,400 | | | I | | Weyco Group, Inc. | | | 145,420 | | |
| | 9,700 | | | | | Wolverine World Wide, Inc. | | | 204,088 | | |
| | | | 514,912 | | |
| | | | | Auto Manufacturers: 0.2% | |
| | 4,000 | | | @@ | | Bayerische Motoren Werke AG | | | 122,157 | | |
| | | | 122,157 | | |
| | | | | Auto Parts & Equipment: 0.4% | |
| | 3,800 | | | @ | | ATC Technology Corp. | | | 55,594 | | |
| | 7,500 | | | @@ | | Autoliv, Inc. | | | 160,950 | | |
| | 11,700 | | | | | Cooper Tire & Rubber Co. | | | 72,072 | | |
| | 29,100 | | | @ | | Dana Holding Corp. | | | 21,534 | | |
| | | | 310,150 | | |
| | | | | Banks: 6.6% | |
| | 1,383 | | | | | American National Bankshares I | | | 23,511 | | |
| | 20,700 | | | L | | Associated Banc-Corp. | | | 433,251 | | |
| | 4,500 | | | | | Bancorpsouth, Inc. | | | 105,120 | | |
| | 25,900 | | | | | Boston Private Financial
Holdings, Inc. | | | 177,156 | | |
| | 4,500 | | | | | Central Pacific Financial Corp. | | | 45,180 | | |
| | 44,100 | | | | | Citizens Banking Corp. | | | 131,418 | | |
| | 2,500 | | | | | City National Corp. | | | 121,750 | | |
| | 4,819 | | | | | Commerce Bancshares, Inc. | | | 211,795 | | |
| | 1,900 | | | | | Cullen/Frost Bankers, Inc. | | | 96,292 | | |
| | 18,600 | | | | | First Horizon National Corp. | | | 196,602 | | |
| | 6,400 | | | | | First Midwest Bancorp., Inc. | | | 127,808 | | |
| | 3,900 | | | | | FirstMerit Corp. | | | 80,301 | | |
| | 5,300 | | | L | | FNB Corp. | | | 69,960 | | |
| | 38,500 | | | | | Fulton Financial Corp. | | | 370,370 | | |
| | 10,000 | | | | | Hampton Roads Bankshares, Inc. | | | 86,700 | | |
| | 21,100 | | | | | Hanmi Financial Corp. | | | 43,466 | | |
| | 6,530 | | | | | Heritage Financial Corp. | | | 79,993 | | |
| | 11,900 | | | | | Keycorp | | | 101,388 | | |
| | 18,917 | | | L | | Marshall & Ilsley Corp. | | | 258,028 | | |
| | 3,374 | | | | | National Bankshares, Inc. | | | 65,557 | | |
| | 296 | | | | | Norwood Financial Corp. | | | 8,436 | | |
| | 3,600 | | | L | | Old National Bancorp. | | | 65,376 | | |
| | 7,500 | | | L | | Provident Bankshares Corp. | | | 72,450 | | |
| | 35,600 | | | | | Sterling Bancshares, Inc. | | | 216,448 | | |
| Shares | | | | | | Value | |
| | 4,300 | | | | | Susquehanna Bancshares, Inc. | | $ | 68,413 | | |
| | 56,000 | | | L | | Synovus Financial Corp. | | | 464,800 | | |
| | 5,100 | | | | | TCF Financial Corp. | | | 69,666 | | |
| | 11,600 | | | | | UCBH Holdings, Inc. | | | 79,808 | | |
| | 772 | | | | | United Security Bancshares | | | 15,425 | | |
| | 6,825 | | | | | Washington Banking Co. | | | 59,378 | | |
| | 21,400 | | | L | | Webster Financial Corp. | | | 294,892 | | |
| | 13,500 | | | | | Whitney Holding Corp. | | | 215,865 | | |
| | 11,200 | | | | | Wilmington Trust Corp. | | | 249,088 | | |
| | 8,800 | | | L | | Zions Bancorp. | | | 215,688 | | |
| | | | 4,921,379 | | |
| | | | | Beverages: 0.8% | |
| | 24,300 | | | | | Coca-Cola Enterprises, Inc. | | | 292,329 | | |
| | 4,000 | | | | | Farmer Bros Co. | | | 99,760 | | |
| | 7,800 | | | | | Pepsi Bottling Group, Inc. | | | 175,578 | | |
| | | | 567,667 | | |
| | | | | Building Materials: 0.5% | |
| | 11,800 | | | | | Comfort Systems USA, Inc. | | | 125,788 | | |
| | 27,395 | | | | | LSI Industries, Inc. | | | 188,204 | | |
| | 2,800 | | | | | Simpson Manufacturing Co., Inc. | | | 77,728 | | |
| | | | 391,720 | | |
| | | | | Chemicals: 2.1% | |
| | 5,400 | | | | | Arch Chemicals, Inc. | | | 140,778 | | |
| | 1,600 | | | | | CF Industries Holdings, Inc. | | | 78,656 | | |
| | 8,200 | | | | | Cytec Industries, Inc. | | | 174,004 | | |
| | 8,878 | | | I | | Hawkins, Inc. | | | 135,745 | | |
| | 11,200 | | | | | HB Fuller Co. | | | 180,432 | | |
| | 10,891 | | | | | International Flavors &
Fragrances, Inc. | | | 323,681 | | |
| | 5,905 | | | | | Minerals Technologies, Inc. | | | 241,515 | | |
| | 9,500 | | | | | Olin Corp. | | | 171,760 | | |
| | 5,400 | | | @ | | OM Group, Inc. | | | 113,994 | | |
| | 1,708 | | | | | Sensient Technologies Corp. | | | 40,787 | | |
| | | | 1,601,352 | | |
| | | | | Coal: 0.1% | |
| | 6,500 | | | @ | | Alpha Natural Resources, Inc. | | | 105,235 | | |
| | | | 105,235 | | |
| | | | | Commercial Services: 1.5% | |
| | 3,900 | | | | | ABM Industries, Inc. | | | 74,295 | | |
| | 6,800 | | | @ | | AMN Healthcare Services, Inc. | | | 57,528 | | |
| | 5,100 | | | @ | | Brink's Home Security
Holdings, Inc. | | | 111,792 | | |
| | 5,800 | | | | | CDI Corp. | | | 75,052 | | |
| | 3,300 | | | @ | | Consolidated Graphics, Inc. | | | 74,712 | | |
| | 8,300 | | | | | Corporate Executive Board Co. | | | 183,098 | | |
| | 3,000 | | | | | Heidrick & Struggles
International, Inc. | | | 64,620 | | |
| | 2,100 | | | | | MAXIMUS, Inc. | | | 73,731 | | |
| | 6,409 | | | @,I | | Medquist, Inc. | | | 13,138 | | |
| | 11,600 | | | @ | | MPS Group, Inc. | | | 87,348 | | |
| | 2,800 | | | L | | Pharmaceutical Product
Development, Inc. | | | 81,228 | | |
| | 5,600 | | | @ | | Rent-A-Center, Inc. | | | 98,840 | | |
| | 2,300 | | | @,@@ | | Steiner Leisure Ltd. | | | 67,896 | | |
| | 939 | | | @ | | Valassis Communications, Inc. | | | 1,239 | | |
| | 716 | | | | | Watson Wyatt Worldwide, Inc. | | | 34,239 | | |
| | | | 1,098,756 | | |
See Accompanying Notes to Financial Statements
112
ING AMERICAN CENTURY PORTFOLIO OF INVESTMENTS
SMALL-MID CAP VALUE PORTFOLIO AS OF DECEMBER 31, 2008 (CONTINUED)
| Shares | | | | | | Value | |
| | | | | Computers: 1.9% | |
| | 1,600 | | | @ | | CACI International, Inc. | | $ | 72,144 | | |
| | 17,800 | | | @ | | Cadence Design Systems, Inc. | | | 65,148 | | |
| | 9,778 | | | | | Diebold, Inc. | | | 274,664 | | |
| | 22,700 | | | @ | | Electronics for Imaging | | | 217,012 | | |
| | 7,800 | | | @ | | Insight Enterprises, Inc. | | | 53,820 | | |
| | 5,800 | | | @ | | Lexmark International, Inc. | | | 156,020 | | |
| | 7,000 | | | @ | | Perot Systems Corp. | | | 95,690 | | |
| | 11,500 | | | @ | | Rackable Systems, Inc. | | | 45,310 | | |
| | 4,900 | | | @ | | SYKES Enterprises, Inc. | | | 93,688 | | |
| | 20,572 | | | @ | | Synopsys, Inc. | | | 380,993 | | |
| | | | 1,454,489 | | |
| | | | | Cosmetics/Personal Care: 0.5% | |
| | 3,900 | | | | | Alberto-Culver Co. | | | 95,589 | | |
| | 10,400 | | | @ | | Bare Escentuals, Inc. | | | 54,392 | | |
| | 4,400 | | | | | Estee Lauder Cos., Inc. | | | 136,224 | | |
| | 9,711 | | | | | Inter Parfums, Inc. | | | 74,580 | | |
| | | | 360,785 | | |
| | | | | Distribution/Wholesale: 1.2% | |
| | 11,900 | | | @ | | Core-Mark Holding Co., Inc. | | | 256,088 | | |
| | 7,359 | | | | | Genuine Parts Co. | | | 278,612 | | |
| | 5,300 | | | @ | | Tech Data Corp. | | | 94,552 | | |
| | 7,700 | | | @ | | Wesco International, Inc. | | | 148,071 | | |
| | 1,900 | | | | | WW Grainger, Inc. | | | 149,796 | | |
| | | | 927,119 | | |
| | | | | Diversified Financial Services: 2.7% | |
| | 15,200 | | | @ | | AllianceBernstein Holding LP | | | 316,008 | | |
| | 12,800 | | | | | Ameriprise Financial, Inc. | | | 299,008 | | |
| | 14,700 | | | L | | Calamos Asset Management, Inc. | | | 108,780 | | |
| | 14,700 | | | @ | | Cowen Group, Inc. | | | 91,728 | | |
| | 18,600 | | | | | Federated Investors, Inc. | | | 315,456 | | |
| | 10,200 | | | | | Legg Mason, Inc. | | | 223,482 | | |
| | 5,400 | | | L | | National Financial Partners Corp. | | | 16,416 | | |
| | 24,500 | | | @ | | TradeStation Group, Inc. | | | 158,025 | | |
| | 32,500 | | | | | Waddell & Reed Financial, Inc. | | | 502,450 | | |
| | | | 2,031,353 | | |
| | | | | Electric: 6.1% | |
| | 11,400 | | | | | Ameren Corp. | | | 379,164 | | |
| | 4,400 | | | | | Black Hills Corp. | | | 118,624 | | |
| | 4,200 | | | | | Central Vermont Public
Service Corp. | | | 100,212 | | |
| | 256 | | | | | Cleco Corp. | | | 5,844 | | |
| | 26,452 | | | L | | Empire District Electric Co. | | | 465,555 | | |
| | 28,000 | | | | | Great Plains Energy, Inc. | | | 541,240 | | |
| | 14,250 | | | | | Idacorp, Inc. | | | 419,663 | | |
| | 2,100 | | | | | MGE Energy, Inc. | | | 69,300 | | |
| | 32,511 | | | | | Portland General Electric Co. | | | 632,989 | | |
| | 6,837 | | | S | | Puget Energy, Inc. | | | 186,445 | | |
| | 3,700 | | | L | | Unitil Corp. | | | 76,405 | | |
| | 32,978 | | | | | Westar Energy, Inc. | | | 676,379 | | |
| | 12,684 | | | | | Wisconsin Energy Corp. | | | 532,474 | | |
| | 21,435 | | | | | Xcel Energy, Inc. | | | 397,619 | | |
| | | | 4,601,913 | | |
| | | | | | | Electrical Components &
Equipment: 2.3% | | | | | |
| | 6,200 | | | | | Belden CDT, Inc. | | | 129,456 | | |
| | 3,200 | | | | | Emerson Electric Co. | | | 117,152 | | |
| | 3,300 | | | @,L | | General Cable Corp. | | | 58,377 | | |
| | 15,000 | | | | | Hubbell, Inc. | | | 490,200 | | |
| Shares | | | | | | Value | |
| | 13,276 | | | @ | | Littelfuse, Inc. | | $ | 220,382 | | |
| | 47,589 | | | | | Molex, Inc. | | | 689,566 | | |
| | | | 1,705,133 | | |
| | | | | Electronics: 2.2% | |
| | 5,105 | | | L | | Analogic Corp. | | | 139,264 | | |
| | 27,518 | | | | | AVX Corp. | | | 218,493 | | |
| | 7,000 | | | | | Bel Fuse, Inc. | | | 148,400 | | |
| | 15,300 | | | @ | | Benchmark Electronics, Inc. | | | 195,381 | | |
| | 2,100 | | | | | Brady Corp. | | | 50,295 | | |
| | 1,400 | | | @ | | Coherent, Inc. | | | 30,044 | | |
| | 4,000 | | | @ | | Cymer, Inc. | | | 87,640 | | |
| | 20,889 | | | @ | | Electro Scientific Industries, Inc. | | | 141,836 | | |
| | 7,400 | | | | | Gentex Corp. | | | 65,342 | | |
| | 5,600 | | | | | Park Electrochemical Corp. | | | 106,176 | | |
| | 4,700 | | | @ | | Rogers Corp. | | | 130,519 | | |
| | 4,700 | | | @ | | Thomas & Betts Corp. | | | 112,894 | | |
| | 7,902 | | | @@ | | Tyco Electronics Ltd. | | | 128,091 | | |
| | 31,400 | | | @ | | Vishay Intertechnology, Inc. | | | 107,388 | | |
| | | | 1,661,763 | | |
| | | | | Engineering & Construction: 0.9% | |
| | 7,800 | | | @ | | EMCOR Group, Inc. | | | 174,954 | | |
| | 3,300 | | | | | Granite Construction, Inc. | | | 144,969 | | |
| | 2,000 | | | @ | | Jacobs Engineering Group, Inc. | | | 96,200 | | |
| | 5,900 | | | | | KBR, Inc. | | | 89,680 | | |
| | 10,500 | | | @,@@,L | | Khd Humboldt Wedag
International | | | 117,285 | | |
| | 3,600 | | | @ | | Sterling Construction Co., Inc. | | | 66,744 | | |
| | | | 689,832 | | |
| | | | | Entertainment: 1.4% | |
| | 7,900 | | | @ | | Bally Technologies, Inc. | | | 189,837 | | |
| | 15,417 | | | | | International Speedway Corp. | | | 442,930 | | |
| | 25,365 | | | | | Speedway Motorsports, Inc. | | | 408,630 | | |
| | | | 1,041,397 | | |
| | | | | Environmental Control: 1.4% | |
| | 11,900 | | | | | American Ecology Corp. | | | 240,737 | | |
| | 13,917 | | | | | Republic Services, Inc. | | | 345,002 | | |
| | 14,632 | | | | | Waste Management, Inc. | | | 484,904 | | |
| | | | 1,070,643 | | |
| | | | | Food: 4.0% | |
| | 33,300 | | | | | B&G Foods, Inc. | | | 179,820 | | |
| | 13,100 | | | | | Campbell Soup Co. | | | 393,131 | | |
| | 30,278 | | | S | | ConAgra Foods, Inc. | | | 499,587 | | |
| | 2,300 | | | | | Corn Products International, Inc. | | | 66,355 | | |
| | 3,137 | | | | | Hershey Co. | | | 108,979 | | |
| | 7,200 | | | | | HJ Heinz Co. | | | 270,720 | | |
| | 12,200 | | | | | Hormel Foods Corp. | | | 379,176 | | |
| | 4,900 | | | | | J&J Snack Foods Corp. | | | 175,812 | | |
| | 3,000 | | | | | JM Smucker Co. | | | 130,080 | | |
| | 3,100 | | | | | Kellogg Co. | | | 135,935 | | |
| | 342 | | | | | Lancaster Colony Corp. | | | 11,731 | | |
| | 1,200 | | | @ | | Ralcorp Holdings, Inc. | | | 70,080 | | |
| | 9,151 | | | | | Tyson Foods, Inc. | | | 80,163 | | |
| | 2,800 | | | I | | Village Super Market | | | 160,692 | | |
| | 10,000 | | | | | Weis Markets, Inc. | | | 336,300 | | |
| | | | 2,998,561 | | |
| | | | | Forest Products & Paper: 0.9% | |
| | 9,400 | | | | | Glatfelter | | | 87,420 | | |
| | 9,900 | | | | | International Paper Co. | | | 116,820 | | |
See Accompanying Notes to Financial Statements
113
ING AMERICAN CENTURY PORTFOLIO OF INVESTMENTS
SMALL-MID CAP VALUE PORTFOLIO AS OF DECEMBER 31, 2008 (CONTINUED)
| Shares | | | | | | Value | |
| | | | | Forest Products & Paper (continued) | |
| | 17,036 | | | | | MeadWestvaco Corp. | | $ | 190,633 | | |
| | 8,467 | | | | | Weyerhaeuser Co. | | | 259,175 | | |
| | | | 654,048 | | |
| | | | | Gas: 2.6% | |
| | 15,800 | | | | | AGL Resources, Inc. | | | 495,330 | | |
| | 9,800 | | | | | Atmos Energy Corp. | | | 232,260 | | |
| | 2,200 | | | | | Chesapeake Utilities Corp. | | | 69,256 | | |
| | 1,600 | | | | | Nicor, Inc. | | | 55,584 | | |
| | 12,517 | | | | | Southwest Gas Corp. | | | 315,679 | | |
| | 5,100 | | | | | Vectren Corp. | | | 127,551 | | |
| | 21,033 | | | | | WGL Holdings, Inc. | | | 687,569 | | |
| | | | 1,983,229 | | |
| | | | | Hand/Machine Tools: 0.6% | |
| | 9,100 | | | | | Kennametal, Inc. | | | 201,929 | | |
| | 2,900 | | | | | Lincoln Electric Holdings, Inc. | | | 147,697 | | |
| | 3,500 | | | | | Regal-Beloit Corp. | | | 132,965 | | |
| | | | 482,591 | | |
| | | | | Healthcare-Products: 3.6% | |
| | 14,788 | | | | | Beckman Coulter, Inc. | | | 649,785 | | |
| | 14,600 | | | @ | | Boston Scientific Corp. | | | 113,004 | | |
| | 27,200 | | | @ | | Cutera, Inc. | | | 241,264 | | |
| | 3,700 | | | @ | | Hospira, Inc. | | | 99,234 | | |
| | 4,883 | | | @ | | ICU Medical, Inc. | | | 161,823 | | |
| | 11,000 | | | @ | | Patterson Cos., Inc. | | | 206,250 | | |
| | 2,100 | | | | | Steris Corp. | | | 50,169 | | |
| | 25,206 | | | @ | | Symmetry Medical, Inc. | | | 200,892 | | |
| | 7,143 | | | I | | Utah Medical Products, Inc. | | | 156,789 | | |
| | 32,965 | | | I | | Young Innovations, Inc. | | | 507,661 | | |
| | 7,000 | | | @ | | Zimmer Holdings, Inc. | | | 282,940 | | |
| | | | 2,669,811 | | |
| | | | | Healthcare-Services: 2.5% | |
| | 3,200 | | | @ | | AMERIGROUP Corp. | | | 94,464 | | |
| | 6,100 | | | @ | | Amsurg Corp. | | | 142,374 | | |
| | 30,300 | | | @ | | Assisted Living Concepts, Inc. | | | 125,745 | | |
| | 5,300 | | | @ | | Kindred Healthcare, Inc. | | | 69,006 | | |
| | 12,900 | | | @ | | LifePoint Hospitals, Inc. | | | 294,636 | | |
| | 10,900 | | | @ | | Magellan Health Services, Inc. | | | 426,844 | | |
| | 4,700 | | | | | National Healthcare Corp. | | | 238,008 | | |
| | 7,928 | | | | | Universal Health Services, Inc. | | | 297,855 | | |
| | 13,000 | | | @ | | US Physical Therapy, Inc. | | | 173,290 | | |
| | | | 1,862,222 | | |
| | | | | Home Builders: 0.1% | |
| | 2,200 | | | | | MDC Holdings, Inc. | | | 66,660 | | |
| | | | 66,660 | | |
| | | | | Home Furnishings: 0.3% | |
| | 5,800 | | | | | Whirlpool Corp. | | | 239,830 | | |
| | | | 239,830 | | |
| | | | | Household Products/Wares: 1.7% | |
| | 5,400 | | | | | American Greetings Corp. | | | 40,878 | | |
| | 3,500 | | | | | Avery Dennison Corp. | | | 114,555 | | |
| | 1,600 | | | | | Clorox Co. | | | 88,896 | | |
| | 7,000 | | | | | CSS Industries, Inc. | | | 124,180 | | |
| | 4,400 | | | @ | | Helen of Troy Ltd. | | | 76,384 | | |
| | 13,423 | | | | | Kimberly-Clark Corp. | | | 707,929 | | |
| Shares | | | | | | Value | |
| | 2,900 | | | | | Tupperware Corp. | | $ | 65,830 | | |
| | 2,100 | | | | | WD-40 Co. | | | 59,409 | | |
| | | | 1,278,061 | | |
| | | | | Insurance: 7.5% | |
| | 5,200 | | | @@ | | ACE Ltd. | | | 275,184 | | |
| | 4,786 | | | | | Allstate Corp. | | | 156,789 | | |
| | 19,700 | | | | | American Equity Investment Life
Holding Co. | | | 137,900 | | |
| | 8,700 | | | | | AON Corp. | | | 397,416 | | |
| | 9,411 | | | | | Arthur J. Gallagher & Co. | | | 243,839 | | |
| | 5,000 | | | @@ | | Aspen Insurance Holdings Ltd. | | | 121,250 | | |
| | 6,300 | | | @@,L | | Assured Guaranty Ltd. | | | 71,820 | | |
| | 11,200 | | | | | Baldwin & Lyons, Inc. | | | 203,728 | | |
| | 9,100 | | | | | Chubb Corp. | | | 464,100 | | |
| | 8,600 | | | | | Erie Indemnity Co. | | | 323,618 | | |
| | 4,900 | | | | | Hanover Insurance Group, Inc. | | | 210,553 | | |
| | 30,537 | | | | | HCC Insurance Holdings, Inc. | | | 816,865 | | |
| | 4,700 | | | @@ | | IPC Holdings Ltd. | | | 140,530 | | |
| | 36,655 | | | | | Marsh & McLennan Cos., Inc. | | | 889,617 | | |
| | 8,800 | | | @@ | | Max Re Capital Ltd. | | | 155,760 | | |
| | 10,342 | | | I | | Mercer Insurance Group, Inc. | | | 130,723 | | |
| | 5,944 | | | | | Metlife, Inc. | | | 207,208 | | |
| | 16,500 | | | | | OneBeacon Insurance Group Ltd. | | | 172,260 | | |
| | 8,700 | | | | | Phoenix Cos., Inc. | | | 28,449 | | |
| | 4,700 | | | @@ | | Platinum Underwriters
Holdings Ltd. | | | 169,576 | | |
| | 1,420 | | | @ | | ProAssurance Corp. | | | 74,948 | | |
| | 3,500 | | | | | United Fire & Casualty Co. | | | 108,745 | | |
| | 8,000 | | | | | Unitrin, Inc. | | | 127,520 | | |
| | | | 5,628,398 | | |
| | | | | Investment Companies: 1.2% | |
| | 7,100 | | | | | Apollo Investment Corp. | | | 66,101 | | |
| | 66,400 | | | | | Ares Capital Corp. | | | 420,312 | | |
| | 21,500 | | | I | | Highland Distressed
Opportunities, Inc. | | | 46,225 | | |
| | 105,068 | | | | | MCG Capital Corp. | | | 74,598 | | |
| | 5,100 | | | | | MVC Capital, Inc. | | | 55,947 | | |
| | 28,100 | | | | | Patriot Capital Funding, Inc. | | | 102,284 | | |
| | 22,900 | | | | | PennantPark Investment Corp. | | | 82,669 | | |
| | 1,800 | | | | | Prospect Capital Corp. | | | 21,546 | | |
| | | | 869,682 | | |
| | | | | Iron/Steel: 0.4% | |
| | 6,100 | | | | | Carpenter Technology Corp. | | | 125,294 | | |
| | 9,000 | | | | | Mesabi Trust | | | 78,030 | | |
| | 3,300 | | | | | Schnitzer Steel Industries, Inc. | | | 124,245 | | |
| | | | 327,569 | | |
| | | | | Leisure Time: 0.2% | |
| | 9,200 | | | | | Callaway Golf Co. | | | 85,468 | | |
| | 3,500 | | | @ | | WMS Industries, Inc. | | | 94,150 | | |
| | | | 179,618 | | |
| | | | | Machinery-Diversified: 1.2% | |
| | 35,919 | | | @ | | Altra Holdings, Inc. | | | 284,119 | | |
| | 1,001 | | | | | Applied Industrial
Technologies, Inc. | | | 18,939 | | |
| | 9,100 | | | | | IDEX Corp. | | | 219,765 | | |
| | 6,700 | | | @ | | Kadant, Inc. | | | 90,316 | | |
| | 8,800 | | | | | Robbins & Myers, Inc. | | | 142,296 | | |
| | 1,800 | | | | | Wabtec Corp. | | | 71,550 | | |
| | 2,104 | | | @ | | Zebra Technologies Corp. | | | 42,627 | | |
| | | | 869,612 | | |
See Accompanying Notes to Financial Statements
114
ING AMERICAN CENTURY PORTFOLIO OF INVESTMENTS
SMALL-MID CAP VALUE PORTFOLIO AS OF DECEMBER 31, 2008 (CONTINUED)
| Shares | | | | | | Value | |
| | | | | Media: 0.5% | |
| | 17,600 | | | | | Belo Corp. | | $ | 27,456 | | |
| | 20,700 | | | @ | | Entravision Communications Corp. | | | 32,292 | | |
| | 10,900 | | | | | Hearst-Argyle Television, Inc. | | | 66,054 | | |
| | 51,600 | | | | | Journal Communications, Inc. | | | 126,420 | | |
| | 12,700 | | | L | | McClatchy Co. | | | 10,160 | | |
| | 2,931 | | | I | | Value Line, Inc. | | | 101,178 | | |
| | | | 363,560 | | |
| | | | | Metal Fabricate/Hardware: 1.8% | |
| | 5,100 | | | @ | | Hawk Corp. | | | 84,660 | | |
| | 7,000 | | | @ | | Haynes International, Inc. | | | 172,340 | | |
| | 12,900 | | | | | Kaydon Corp. | | | 443,115 | | |
| | 3,500 | | | I | | Lawson Products | | | 79,975 | | |
| | 16,700 | | | | | Mueller Industries, Inc. | | | 418,836 | | |
| | 14,300 | | | | | Mueller Water Products, Inc. | | | 120,692 | | |
| | | | 1,319,618 | | |
| | | | | Mining: 0.4% | |
| | 3,700 | | | | | Alcoa, Inc. | | | 41,662 | | |
| | 3,000 | | | L | | Kaiser Aluminum Corp. | | | 67,560 | | |
| | 3,000 | | | | | Newmont Mining Corp. | | | 122,100 | | |
| | 5,400 | | | @ | | RTI International Metals, Inc. | | | 77,274 | | |
| | | | 308,596 | | |
| | | | | Miscellaneous Manufacturing: 1.3% | |
| | 2,100 | | | | | Acuity Brands, Inc. | | | 73,311 | | |
| | 2,100 | | | | | Aptargroup, Inc. | | | 74,004 | | |
| | 17,200 | | | | | Barnes Group, Inc. | | | 249,400 | | |
| | 3,000 | | | | | Brink's Co. | | | 80,640 | | |
| | 4,500 | | | @ | | Ceradyne, Inc. | | | 91,395 | | |
| | 5,800 | | | | | Dover Corp. | | | 190,936 | | |
| | 21,084 | | | @ | | Griffon Corp. | | | 196,714 | | |
| | | | 956,400 | | |
| | | | | Office Furnishings: 0.2% | |
| | 1,741 | | | | | Herman Miller, Inc. | | | 22,685 | | |
| | 6,172 | | | | | HNI, Corp. | | | 97,764 | | |
| | | | 120,449 | | |
| | | | | Office/Business Equipment: 0.3% | |
| | 7,793 | | | | | Pitney Bowes, Inc. | | | 198,566 | | |
| | | | 198,566 | | |
| | | | | Oil & Gas: 3.0% | |
| | 3,568 | | | | | Apache Corp. | | | 265,923 | | |
| | 7,700 | | | | | Berry Petroleum Co. | | | 58,212 | | |
| | 1,400 | | | | | BP Prudhoe Bay Royalty Trust | | | 102,676 | | |
| | 3,700 | | | | | Cimarex Energy Co. | | | 99,086 | | |
| | 6,800 | | | @,L | | Continental Resources, Inc. | | | 140,828 | | |
| | 17,086 | | | | | Equitable Resources, Inc. | | | 573,235 | | |
| | 11,900 | | | | | Frontier Oil Corp. | | | 150,297 | | |
| | 6,500 | | | | | Hugoton Royalty Trust | | | 104,325 | | |
| | 2,100 | | | | | Murphy Oil Corp. | | | 93,135 | | |
| | 3,600 | | | | | Noble Energy, Inc. | | | 177,192 | | |
| | 13,500 | | | @ | | PetroHawk Energy Corp. | | | 211,005 | | |
| | 9,600 | | | | | St. Mary Land & Exploration Co. | | | 194,976 | | |
| | 8,500 | | | @@ | | Talisman Energy, Inc. | | | 84,915 | | |
| | | | 2,255,805 | | |
| | | | | Oil & Gas Services: 1.2% | |
| | 6,000 | | | @ | | Cameron International Corp. | | | 123,000 | | |
| | 115,200 | | | @,L | | Global Industries Ltd. | | | 402,048 | | |
| | 24,400 | | | @ | | Helix Energy Solutions Group, Inc. | | | 176,656 | | |
| Shares | | | | | | Value | |
| | 17,400 | | | @ | | Key Energy Services, Inc. | | $ | 76,734 | | |
| | 2,000 | | | | | Lufkin Industries, Inc. | | | 69,000 | | |
| | 24,100 | | | @,@@ | | North American Energy
Partners, Inc. | | | 80,494 | | |
| | | | 927,932 | | |
| | | | | Packaging & Containers: 0.8% | |
| | 26,298 | | | S | | Bemis Co. | | | 622,737 | | |
| | | | 622,737 | | |
| | | | | Pharmaceuticals: 1.0% | |
| | 8,120 | | | @ | | Matrixx Initiatives, Inc. | | | 133,899 | | |
| | 16,100 | | | @ | | Obagi Medical Products, Inc. | | | 120,106 | | |
| | 3,800 | | | @ | | Par Pharmaceutical Cos., Inc. | | | 50,958 | | |
| | 21,900 | | | @,I | | Schiff Nutrition International, Inc. | | | 130,743 | | |
| | 12,700 | | | @ | | Sepracor, Inc. | | | 139,446 | | |
| | 3,700 | | | @ | | VCA Antech, Inc. | | | 73,556 | | |
| | 4,967 | | | @ | | Watson Pharmaceuticals, Inc. | | | 131,973 | | |
| | | | 780,681 | | |
| | | | | Real Estate: 0.0% | |
| | 12,000 | | | @,I | | HFF, Inc. | | | 29,400 | | |
| | | | 29,400 | | |
| | | | | Retail: 3.2% | |
| | 9,800 | | | | | American Eagle Outfitters | | | 91,728 | | |
| | 2,100 | | | @ | | BJ's Wholesale Club, Inc. | | | 71,946 | | |
| | 2,600 | | | | | Casey's General Stores, Inc. | | | 59,202 | | |
| | 10,000 | | | | | Cato Corp. | | | 151,000 | | |
| | 22,200 | | | @ | | Chico's FAS, Inc. | | | 92,796 | | |
| | 830 | | | @ | | Childrens Place Retail Stores, Inc. | | | 17,994 | | |
| | 7,400 | | | @ | | Chipotle Mexican Grill, Inc. | | | 423,946 | | |
| | 24,200 | | | | | Christopher & Banks Corp. | | | 135,520 | | |
| | 3,100 | | | | | Costco Wholesale Corp. | | | 162,750 | | |
| | 1,600 | | | @ | | Dollar Tree, Inc. | | | 66,880 | | |
| | 8,600 | | | @ | | Dress Barn, Inc. | | | 92,364 | | |
| | 7,400 | | | @,L | | DSW, Inc. | | | 92,204 | | |
| | 7,246 | | | | | Fred's, Inc. | | | 77,967 | | |
| | 4,400 | | | @ | | Jack in the Box, Inc. | | | 97,196 | | |
| | 8,400 | | | L | | Men's Wearhouse, Inc. | | | 113,736 | | |
| | 18,679 | | | @ | | PC Connection, Inc. | | | 95,636 | | |
| | 9,600 | | | L | | Penske Auto Group, Inc. | | | 73,728 | | |
| | 9,300 | | | @ | | Red Robin Gourmet Burgers, Inc. | | | 156,519 | | |
| | 4,300 | | | | | Regis Corp. | | | 62,479 | | |
| | 31,600 | | | @ | | Ruby Tuesday, Inc. | | | 49,296 | | |
| | 15,709 | | | | | Sport Supply Group, Inc. | | | 109,963 | | |
| | 9,800 | | | | | Stage Stores, Inc. | | | 80,850 | | |
| | | | 2,375,700 | | |
| | | | | Savings & Loans: 1.6% | |
| | 5,000 | | | | | Astoria Financial Corp. | | | 82,400 | | |
| | 10,500 | | | | | Brookline Bancorp., Inc. | | | 111,825 | | |
| | 6,364 | | | L | | First Financial Northwest, Inc. | | | 59,440 | | |
| | 1,830 | | | | | K-Fed Bancorp | | | 11,895 | | |
| | 16,178 | | | | | People's United Financial, Inc. | | | 288,454 | | |
| | 7,800 | | | | | Provident Financial Services, Inc. | | | 119,340 | | |
| | 34,112 | | | | | Washington Federal, Inc. | | | 510,316 | | |
| | | | 1,183,670 | | |
| | | | | Semiconductors: 2.4% | |
| | 21,500 | | | | | Applied Materials, Inc. | | | 217,795 | | |
| | 1,000 | | | @ | | Cabot Microelectronics Corp. | | | 26,070 | | |
| | 2,449 | | | | | Cohu, Inc. | | | 29,755 | | |
| | 47,700 | | | @ | | Emulex Corp. | | | 332,946 | | |
See Accompanying Notes to Financial Statements
115
ING AMERICAN CENTURY PORTFOLIO OF INVESTMENTS
SMALL-MID CAP VALUE PORTFOLIO AS OF DECEMBER 31, 2008 (CONTINUED)
| Shares | | | | | | Value | |
| | | | | Semiconductors (continued) | |
| | 30,743 | | | @,I | | Intellon Corp. | | $ | 77,165 | | |
| | 9,300 | | | | | KLA-Tencor Corp. | | | 202,647 | | |
| | 19,900 | | | @ | | Mattson Technology, Inc. | | | 28,059 | | |
| | 8,400 | | | @ | | MEMC Electronic Materials, Inc. | | | 119,952 | | |
| | 3,300 | | | @ | | MKS Instruments, Inc. | | | 48,807 | | |
| | 15,100 | | | @ | | Rudolph Technologies, Inc. | | | 53,303 | | |
| | 5,700 | | | @ | | Semtech Corp. | | | 64,239 | | |
| | 38,500 | | | @ | | Teradyne, Inc. | | | 162,470 | | |
| | 16,000 | | | @ | | Varian Semiconductor Equipment
Associates, Inc. | | | 289,920 | | |
| | 17,000 | | | @,@@ | | Verigy Ltd. | | | 163,540 | | |
| | | | 1,816,668 | | |
| | | | | Software: 2.7% | |
| | 17,000 | | | @ | | Aspen Technology, Inc. | | | 126,140 | | |
| | 3,700 | | | @ | | Autodesk, Inc. | | | 72,705 | | |
| | 9,400 | | | | | IMS Health, Inc. | | | 142,504 | | |
| | 51,300 | | | @ | | Parametric Technology Corp. | | | 648,945 | | |
| | 18,600 | | | @ | | Sybase, Inc. | | | 460,722 | | |
| | 32,200 | | | @ | | THQ, Inc. | | | 134,918 | | |
| | 87,018 | | | @,I | | Ulticom, Inc. | | | 443,792 | | |
| | | | 2,029,726 | | |
| | | | | Telecommunications: 2.5% | |
| | 10,200 | | | | | Adtran, Inc. | | | 151,776 | | |
| | 3,300 | | | @ | | Anixter International, Inc. | | | 99,396 | | |
| | 7,900 | | | | | Atlantic Tele-Network, Inc. | | | 209,745 | | |
| | 30,196 | | | @@ | | BCE, Inc. | | | 614,682 | | |
| | 1,600 | | | | | Black Box Corp. | | | 41,792 | | |
| | 3,100 | | | | | CenturyTel, Inc. | | | 84,723 | | |
| | 11,500 | | | I | | D & E Communications, Inc. | | | 77,050 | | |
| | 4,500 | | | | | Embarq Corp. | | | 161,820 | | |
| | 10,900 | | | | | Frontier Communications Corp. | | | 95,266 | | |
| | 7,700 | | | | | Iowa Telecommunications
Services, Inc. | | | 109,956 | | |
| | 8,300 | | | @ | | NeuStar, Inc. | | | 158,779 | | |
| | 5,000 | | | | | Plantronics, Inc. | | | 66,000 | | |
| | | | 1,870,985 | | |
| | | | | Textiles: 0.1% | |
| | 3,800 | | | | | G&K Services, Inc. | | | 76,836 | | |
| | | | 76,836 | | |
| | | | | Toys/Games/Hobbies: 0.5% | |
| | 3,200 | | | @ | | Jakks Pacific, Inc. | | | 66,016 | | |
| | 11,400 | | | | | Mattel, Inc. | | | 182,400 | | |
| | 10,438 | | | @ | | RC2 Corp. | | | 111,373 | | |
| | | | 359,789 | | |
| | | | | Transportation: 1.7% | |
| | 5,100 | | | L | | Arkansas Best Corp. | | | 153,561 | | |
| | 2,600 | | | @,L | | Bristow Group, Inc. | | | 69,654 | | |
| | 87,745 | | | | | DHT Maritime, Inc. | | | 486,107 | | |
| | 9,300 | | | L | | Genco Shipping & Trading Ltd. | | | 137,640 | | |
| | 4,200 | | | | | Heartland Express, Inc. | | | 66,192 | | |
| | 2,800 | | | @ | | HUB Group, Inc. | | | 74,284 | | |
| | 16,000 | | | L | | OceanFreight, Inc. | | | 47,520 | | |
| | 10,800 | | | @@ | | UTI Worldwide, Inc. | | | 154,872 | | |
| | 5,300 | | | | | Werner Enterprises, Inc. | | | 91,902 | | |
| | | | 1,281,732 | | |
| | | | | Trucking & Leasing: 0.1% | |
| | 2,500 | | | | | GATX Corp. | | | 77,425 | | |
| | | | 77,425 | | |
| Shares | | | | | | Value | |
| | | | | Water: 0.1% | |
| | 1,605 | | | | | American Water Works Co., Inc. | | $ | 33,512 | | |
| | 556 | | | | | Artesian Resources Corp. | | | 8,796 | | |
| | | | 42,308 | | |
Total Common Stock
(Cost $80,487,310) | | | 65,522,756 | | |
| REAL ESTATE INVESTMENT TRUSTS: 3.0% | | | |
| | | | | Health Care: 0.6% | |
| | 5,800 | | | | | Healthcare Realty Trust, Inc. | | | 136,184 | | |
| | 5,200 | | | | | National Health Investors, Inc. | | | 142,636 | | |
| | 8,800 | | | | | Senior Housing Properties Trust | | | 157,696 | | |
| | | | 436,516 | | |
| | | | | Hotels: 0.1% | |
| | 12,400 | | | | | Host Hotels & Resorts, Inc. | | | 93,868 | | |
| | | | 93,868 | | |
| | | | | Mortgage: 0.8% | |
| | 14,900 | | | | | Capstead Mortgage Corp. | | | 160,473 | | |
| | 4,800 | | | | | Hatteras Financial Corp. | | | 127,680 | | |
| | 59,700 | | | | | MFA Mortgage Investments, Inc. | | | 351,633 | | |
| | | | 639,786 | | |
| | | | | Office Property: 0.3% | |
| | 2,600 | | | | | Boston Properties, Inc. | | | 143,000 | | |
| | 2,800 | | | | | Mack-Cali Realty Corp. | | | 68,600 | | |
| | | | 211,600 | | |
| | | | | Paper & Related Products: 0.7% | |
| | 15,792 | | | | | Rayonier, Inc. | | | 495,079 | | |
| | | | 495,079 | | |
| | | | | Single Tenant: 0.2% | |
| | 4,000 | | | | | National Retail Properties, Inc. | | | 68,760 | | |
| | 4,400 | | | | | Realty Income Corp. | | | 101,860 | | |
| | | | 170,620 | | |
| | | | | Storage: 0.3% | |
| | 2,500 | | | | | Public Storage, Inc. | | | 198,750 | | |
| | | | 198,750 | | |
Total Real Estate Investment Trusts
(Cost $2,376,030) | | | 2,246,219 | | |
| EXCHANGE-TRADED FUNDS: 2.7% | | | |
| | | | | Exchange-Traded Funds: 2.7% | |
| | 16,300 | | | | | iShares Russell 2000 Index Fund | | | 803,101 | | |
| | 7,900 | | | L | | iShares Russell 2000 Value
Index Fund | | | 388,443 | | |
| | 14,900 | | | S | | iShares Russell Midcap Value
Index Fund | | | 423,756 | | |
| | 4,400 | | | | | iShares S&P SmallCap 600
Index Fund | | | 193,600 | | |
| | 4,000 | | | L | | iShares S&P SmallCap 600/BARRA
Value Index Fund | | | 195,800 | | |
Total Exchange-Traded Funds
(Cost $1,901,976) | | | 2,004,700 | | |
See Accompanying Notes to Financial Statements
116
ING AMERICAN CENTURY PORTFOLIO OF INVESTMENTS
SMALL-MID CAP VALUE PORTFOLIO AS OF DECEMBER 31, 2008 (CONTINUED)
| Shares | | | | | | Value | |
| PREFERRED STOCK: 3.6% | | | |
| | | | | Agriculture: 0.2% | |
| | 181 | | | P | | Universal Corp. | | $ | 126,700 | | |
| | | | 126,700 | | |
| | | | | Banks: 0.4% | |
| | 232 | | | | | Huntington Bancshares, Inc. | | | 180,728 | | |
| | 8,800 | | | P,I | | Midwest Banc Holdings, Inc. | | | 112,112 | | |
| | | | 292,840 | | |
| | | | | Insurance: 2.0% | |
| | 33,900 | | | @@,I | | Aspen Insurance Holdings Ltd. | | | 1,423,800 | | |
| | 6,031 | | | P,I | | Odyssey Re Holdings Corp. | | | 112,780 | | |
| | | | 1,536,580 | | |
| | | | | Real Estate: 1.0% | |
| | 5,200 | | | P | | Ashford Hospitality Trust, Inc. | | | 32,240 | | |
| | 8,700 | | | | | Digital Realty Trust, Inc. | | | 177,806 | | |
| | 5,300 | | | I | | Entertainment Properties | | | 93,810 | | |
| | 3,400 | | | I | | Lexington Realty Trust | | | 54,502 | | |
| | 12,800 | | | P,I | | National Retail Properties | | | 211,200 | | |
| | 11,815 | | | P,I | | PS Business Parks, Inc. | | | 218,341 | | |
| | | | 787,899 | | |
Total Preferred Stock
(Cost $3,431,645) | | | 2,744,019 | | |
Total Long-Term Investments
(Cost $88,196,961) | | | 72,517,694 | | |
| SHORT-TERM INVESTMENTS: 6.9% | | | |
| | | | | Affiliated Mutual Fund: 2.1% | |
| | 1,587,950 | | | | | ING Institutional Prime Money
Market Fund - Class I | | | 1,587,950 | | |
Total Mutual Fund
(Cost $1,587,950) | | | 1,587,950 | | |
Principal
Amount | | | | Value | |
| | | Securities Lending Collateralcc: 4.8% | |
| $ | 3,598,795 | | | Bank of New York Mellon Corp.
Institutional Cash Reserves | | | 3,548,271 | | |
Total Securities Lending Collateral
(Cost $3,598,795) | | | 3,548,271 | | |
Total Short-Term Investments
(Cost $5,186,745) | | | 5,136,221 | | |
Total Investments in
Securities
(Cost $93,383,706)* | | | 103.5 | % | | $ | 77,653,915 | | |
Other Assets and
Liabilities - Net | | | (3.5 | ) | | | (2,611,162 | ) | |
| Net Assets | | | 100.0 | % | | $ | 75,042,753 | | |
@ Non-income producing security
@@ Foreign Issuer
P Preferred Stock may be called prior to convertible date.
cc Securities purchased with cash collateral for securities loaned.
S All or a portion of this security is segregated to cover collateral requirements for applicable futures, options, swaps, foreign forward currency contracts and/or when-issued or delayed-delivery securities.
I Illiquid security
L Loaned security, a portion or all of the security is on loan at December 31, 2008.
* Cost for federal income tax purposes is $104,273,738.
Net unrealized depreciation consists of:
| Gross Unrealized Appreciation | | $ | 2,811,466 | | |
| Gross Unrealized Depreciation | | | (29,431,289 | ) | |
| Net Unrealized Depreciation | | $ | (26,619,823 | ) | |
The following table summarizes the inputs used as of December 31, 2008 in determining the Portfolio's investments at fair value for purposes of SFAS 157:
| | | Investments in
Securities | | Other Financial
Instruments* | |
| Level 1 — Quoted Prices | | $ | 71,361,625 | | | $ | — | | |
Level 2 — Other Significant
Observable Inputs | | | 6,292,290 | | | | (6,040 | ) | |
Level 3 — Significant
Unobservable Inputs | | | — | | | | — | | |
| Total | | $ | 77,653,915 | | | $ | (6,040 | ) | |
"Fair value" for purposes of SFAS 157 is different from "fair value" as used in the 1940 Act. The former generally implies market value, and can include market quotations as a source of value, and the latter refers to determinations of actual value in absence of available market quotations.
* Other financial instruments may include forward foreign currency contracts, futures, swaps, and written options. Forward foreign currency contracts and futures are reported at their unrealized gain/loss at year end. Swaps and written options are reported at their market value at year end.
At December 31, 2008 the following forward foreign currency contracts were outstanding for the ING American Century Small-Mid Cap Value Portfolio:
| Currency | | Buy/Sell | | Settlement
Date | | In
Exchange
For | | Value | | Unrealized
Appreciation/
(Depreciation) | |
| Canadian Dollar | | | | | | USD | | | | | | | | |
| | |
| CAD 104 | | BUY | | 01/30/09 | | | 82 | | | | 84 | | | $ | 2 | | |
EU Euro
EUR 67 | | BUY | | 01/30/09 | | | 84 | | | | 92 | | | | 8 | | |
EU Euro
EUR 560 | | BUY | | 01/30/09 | | | 711 | | | | 778 | | | | 67 | | |
EU Euro
EUR 651 | | BUY | | 01/30/09 | | | 825 | | | | 903 | | | | 78 | | |
EU Euro
EUR 2,705 | | BUY | | 01/30/09 | | | 3,847 | | | | 3,755 | | | | (92 | ) | |
EU Euro
EUR 2,925 | | BUY | | 01/30/09 | | | 4,092 | | | | 4,060 | | | | (32 | ) | |
| | | $ | 31 | | |
Canadian Dollar
CAD 71,636 | | SELL | | 01/30/09 | | | 58,262 | | | | 57,999 | | | $ | 263 | | |
Canadian Dollar
CAD 84,546 | | SELL | | 01/30/09 | | | 68,177 | | | | 68,451 | | | | (274 | ) | |
Canadian Dollar
CAD 70,372 | | SELL | | 01/30/09 | | | 56,016 | | | | 56,975 | | | | (959 | ) | |
Canadian Dollar
CAD 6,902 | | SELL | | 01/30/09 | | | 5,452 | | | | 5,588 | | | | (136 | ) | |
Canadian Dollar
CAD 5,297 | | SELL | | 01/30/09 | | | 4,177 | | | | 4,289 | | | | (112 | ) | |
Canadian Dollar
CAD 4,066 | | SELL | | 01/30/09 | | | 3,209 | | | | 3,292 | | | | (83 | ) | |
See Accompanying Notes to Financial Statements
117
ING AMERICAN CENTURY PORTFOLIO OF INVESTMENTS
SMALL-MID CAP VALUE PORTFOLIO AS OF DECEMBER 31, 2008 (CONTINUED)
| Currency | | Buy/Sell | | Settlement
Date | | In
Exchange
For | | Value | | Unrealized
Appreciation/
(Depreciation) | |
| Canadian Dollar | | | | | | USD | | | | | | | | |
| | |
| CAD 6,596 | | SELL | | 01/30/09 | | | 5,237 | | | | 5,340 | | | $ | (103 | ) | |
Canadian Dollar
CAD 6,596 | | SELL | | 01/30/09 | | | 5,227 | | | | 5,340 | | | | (113 | ) | |
Canadian Dollar
CAD 14,574 | | SELL | | 01/30/09 | | | 11,620 | | | | 11,799 | | | | (179 | ) | |
Canadian Dollar
CAD 10,580 | | SELL | | 01/30/09 | | | 8,656 | | | | 8,566 | | | | 90 | | |
Canadian Dollar
CAD 7,586 | | SELL | | 01/30/09 | | | 6,155 | | | | 6,141 | | | | 14 | | |
Canadian Dollar
CAD 16,424 | | SELL | | 01/30/09 | | | 13,129 | | | | 13,297 | | | | (168 | ) | |
Canadian Dollar
CAD 16,424 | | SELL | | 01/30/09 | | | 13,209 | | | | 13,297 | | | | (88 | ) | |
Canadian Dollar
CAD 14,985 | | SELL | | 01/30/09 | | | 12,064 | | | | 12,132 | | | | (68 | ) | |
Canadian Dollar
CAD 10,949 | | SELL | | 01/30/09 | | | 8,806 | | | | 8,865 | | | | (59 | ) | |
Canadian Dollar
CAD 40,762 | | SELL | | 01/30/09 | | | 32,865 | | | | 33,002 | | | | (137 | ) | |
Canadian Dollar
CAD 18,343 | | SELL | | 01/30/09 | | | 14,833 | | | | 14,851 | | | | (18 | ) | |
Canadian Dollar
CAD 32,858 | | SELL | | 01/30/09 | | | 26,821 | | | | 26,603 | | | | 218 | | |
Canadian Dollar
CAD 72,356 | | SELL | | 01/30/09 | | | 59,000 | | | | 58,581 | | | | 419 | | |
Canadian Dollar
CAD 72,234 | | SELL | | 01/30/09 | | | 58,795 | | | | 58,482 | | | | 313 | | |
Canadian Dollar
CAD 14,023 | | SELL | | 01/30/09 | | | 11,435 | | | | 11,353 | | | | 82 | | |
Canadian Dollar
CAD 7,904 | | SELL | | 01/30/09 | | | 6,463 | | | | 6,399 | | | | 64 | | |
Canadian Dollar
CAD 14,023 | | SELL | | 01/30/09 | | | 11,602 | | | | 11,353 | | | | 249 | | |
Canadian Dollar
CAD 25,690 | | SELL | | 01/30/09 | | | 21,033 | | | | 20,799 | | | | 234 | | |
EU Euro
EUR 52,500 | | SELL | | 01/30/09 | | | 68,146 | | | | 72,877 | | | | (4,731 | ) | |
EU Euro
EUR 188 | | SELL | | 01/30/09 | | | 241 | | | | 261 | | | | (20 | ) | |
EU Euro
EUR 405 | | SELL | | 01/30/09 | | | 513 | | | | 562 | | | | (49 | ) | |
EU Euro
EUR 2,293 | | SELL | | 01/30/09 | | | 2,962 | | | | 3,183 | | | | (221 | ) | |
EU Euro
EUR 764 | | SELL | | 01/30/09 | | | 980 | | | | 1,061 | | | | (81 | ) | |
EU Euro
EUR 1,829 | | SELL | | 01/30/09 | | | 2,373 | | | | 2,539 | | | | (166 | ) | |
EU Euro
EUR 1,829 | | SELL | | 01/30/09 | | | 2,378 | | | | 2,539 | | | | (161 | ) | |
EU Euro
EUR 915 | | SELL | | 01/30/09 | | | 1,209 | | | | 1,270 | | | | (61 | ) | |
EU Euro
EUR 305 | | SELL | | 01/30/09 | | | 407 | | | | 423 | | | | (16 | ) | |
EU Euro
EUR 610 | | SELL | | 01/30/09 | | | 832 | | | | 846 | | | | (14 | ) | |
| | | $ | (6,071 | ) | |
See Accompanying Notes to Financial Statements
118
PORTFOLIO OF INVESTMENTS
ING BARON ASSET PORTFOLIO AS OF DECEMBER 31, 2008
| Shares | | | | | | Value | |
| COMMON STOCK: 90.4% | | | |
| | | | | Advertising: 1.5% | |
| | 7,900 | | | @ | | Lamar Advertising Co. | | $ | 99,224 | | |
| | | | 99,224 | | |
| | | | | Apparel: 2.9% | |
| | 4,200 | | | | | Polo Ralph Lauren Corp. | | | 190,722 | | |
| | | | 190,722 | | |
| | | | | Chemicals: 2.1% | |
| | 1,400 | | | | | Airgas, Inc. | | | 54,586 | | |
| | 2,400 | | | | | Ecolab, Inc. | | | 84,360 | | |
| | | | 138,946 | | |
| | | | | Commercial Services: 17.0% | |
| | 1,200 | | | @ | | Corrections Corp. of America | | | 19,632 | | |
| | 4,200 | | | | | DeVry, Inc. | | | 241,122 | | |
| | 3,500 | | | | | Equifax, Inc. | | | 92,820 | | |
| | 9,850 | | | @ | | Gartner, Inc. | | | 175,626 | | |
| | 5,200 | | | @ | | Iron Mountain, Inc. | | | 128,596 | | |
| | 800 | | | @ | | Morningstar, Inc. | | | 28,400 | | |
| | 4,400 | | | @ | | Quanta Services, Inc. | | | 87,120 | | |
| | 4,850 | | | @@ | | Ritchie Brothers Auctioneers, Inc. | | | 103,887 | | |
| | 3,300 | | | | | Robert Half International, Inc. | | | 68,706 | | |
| | 9,550 | | | @ | | SAIC, Inc. | | | 186,034 | | |
| | | | 1,131,943 | | |
| | | | | Computers: 0.2% | |
| | 400 | | | @ | | IHS, Inc. | | | 14,968 | | |
| | | | 14,968 | | |
| | | | | Distribution/Wholesale: 2.2% | |
| | 4,150 | | | | | Fastenal Co. | | | 144,628 | | |
| | | | 144,628 | | |
| | | | | Diversified Financial Services: 9.6% | |
| | 1,000 | | | @ | | AllianceBernstein Holding LP | | | 20,790 | | |
| | 17,500 | | | | | Charles Schwab Corp. | | | 282,972 | | |
| | 650 | | | | | CME Group, Inc. | | | 135,272 | | |
| | 7,400 | | | | | Eaton Vance Corp. | | | 155,474 | | |
| | 1,300 | | | | | T. Rowe Price Group, Inc. | | | 46,072 | | |
| | | | 640,580 | | |
| | | | | | | Electrical Components &
Equipment: 0.5% | | | | | |
| | 850 | | | @ | | Sunpower Corp. - Class A | | | 31,450 | | |
| | | | 31,450 | | |
| | | | | Electronics: 1.7% | |
| | 500 | | | @,@@ | | Mettler Toledo International, Inc. | | | 33,700 | | |
| | 2,250 | | | @ | | Thermo Fisher Scientific, Inc. | | | 76,658 | | |
| | | | 110,358 | | |
| | | | | Energy-Alternate Sources: 1.2% | |
| | 3,700 | | | @ | | Covanta Holding Corp. | | | 81,252 | | |
| | | | 81,252 | | |
| | | | | Entertainment: 1.2% | |
| | 4,650 | | | @ | | Scientific Games Corp. | | | 81,561 | | |
| | | | 81,561 | | |
| | | | | Environmental Control: 2.9% | |
| | 3,700 | | | @ | | Stericycle, Inc. | | | 192,696 | | |
| | | | 192,696 | | |
| Shares | | | | | | Value | |
| | | | | Gas: 1.3% | |
| | 6,500 | | | | | Southern Union Co. | | $ | 84,760 | | |
| | | | 84,760 | | |
| | | | | Hand/Machine Tools: 0.3% | |
| | 800 | | | | | Kennametal, Inc. | | | 17,752 | | |
| | | | 17,752 | | |
| | | | | Healthcare-Products: 5.9% | |
| | 3,400 | | | | | Densply International, Inc. | | | 96,016 | | |
| | 2,300 | | | @ | | Henry Schein, Inc. | | | 84,387 | | |
| | 4,900 | | | @ | | Idexx Laboratories, Inc. | | | 176,792 | | |
| | 300 | | | @ | | Intuitive Surgical, Inc. | | | 38,097 | | |
| | | | 395,292 | | |
| | | | | Healthcare-Services: 3.3% | |
| | 4,600 | | | @ | | Community Health Systems, Inc. | | | 67,068 | | |
| | 3,300 | | | @ | | Covance, Inc. | | | 151,899 | | |
| | | | 218,967 | | |
| | | | | Insurance: 5.7% | |
| | 3,550 | | | @,@@ | | Arch Capital Group Ltd. | | | 248,855 | | |
| | 6,300 | | | | | Brown & Brown, Inc. | | | 131,670 | | |
| | | | 380,525 | | |
| | | | | Internet: 1.8% | |
| | 2,200 | | | @ | | Equinix, Inc. | | | 117,018 | | |
| | | | 117,018 | | |
| | | | | Lodging: 3.4% | |
| | 2,250 | | | | | Choice Hotels International, Inc. | | | 67,635 | | |
| | 3,800 | | | @ | | Wynn Resorts Ltd. | | | 160,588 | | |
| | | | 228,223 | | |
| | | | | Media: 2.0% | |
| | 3,050 | | | | | Factset Research Systems, Inc. | | | 134,932 | | |
| | | | 134,932 | | |
| | | | | Oil & Gas: 4.9% | |
| | 3,500 | | | | | Helmerich & Payne, Inc. | | | 79,625 | | |
| | 2,350 | | | | | Range Resources Corp. | | | 80,817 | | |
| | 4,762 | | | | | XTO Energy, Inc. | | | 167,956 | | |
| | | | 328,398 | | |
| | | | | Oil & Gas Services: 0.7% | |
| | 800 | | | | | Core Laboratories NV | | | 47,888 | | |
| | | | 47,888 | | |
| | | | | Pharmaceuticals: 1.8% | |
| | 6,200 | | | @ | | VCA Antech, Inc. | | | 123,256 | | |
| | | | 123,256 | | |
| | | | | Real Estate: 0.8% | |
| | 13,000 | | | @ | | CB Richard Ellis Group, Inc. | | | 56,160 | | |
| | | | 56,160 | | |
| | | | | Retail: 6.4% | |
| | 2,650 | | | @ | | Carmax, Inc. | | | 20,882 | | |
| | 1,550 | | | @ | | Cheesecake Factory | | | 15,655 | | |
| | 4,100 | | | @ | | Copart, Inc. | | | 111,479 | | |
| | 4,500 | | | @ | | Dick's Sporting Goods, Inc. | | | 63,495 | | |
| | 1,900 | | | @ | | J Crew Group, Inc. | | | 23,180 | | |
| | 2,750 | | | | | MSC Industrial Direct Co. | | | 101,283 | | |
| | 3,900 | | | | | Tiffany & Co. | | | 92,157 | | |
| | | | 428,131 | | |
See Accompanying Notes to Financial Statements
119
PORTFOLIO OF INVESTMENTS
ING BARON ASSET PORTFOLIO AS OF DECEMBER 31, 2008 (CONTINUED)
| Shares | | | | | | Value | |
| | | | | Software: 1.6% | |
| | 4,500 | | | @ | | MSCI, Inc. - Class A | | $ | 79,920 | | |
| | 2,500 | | | @ | | Nuance Communications, Inc. | | | 25,900 | | |
| | | | 105,820 | | |
| | | | | Telecommunications: 1.5% | |
| | 1,500 | | | @ | | NII Holdings, Inc. | | | 27,270 | | |
| | 4,350 | | | @ | | SBA Communications Corp. | | | 70,992 | | |
| | | | 98,262 | | |
| | | | | Textiles: 0.3% | |
| | 500 | | | @ | | Mohawk Industries, Inc. | | | 21,485 | | |
| | | | 21,485 | | |
| | | | | Transportation: 5.7% | |
| | 4,300 | | | | | CH Robinson Worldwide, Inc. | | | 236,629 | | |
| | 4,400 | | | | | Expeditors International
Washington, Inc. | | | 146,388 | | |
| | | | 383,017 | | |
Total Common Stock
(Cost $8,966,912) | | | 6,028,214 | | |
| REAL ESTATE INVESTMENT TRUSTS: 0.9% | | | |
| | | | | Diversified: 0.5% | |
| | 500 | | | | | Vornado Realty Trust | | | 30,175 | | |
| | | | 30,175 | | |
| | | | | Office Property: 0.4% | |
| | 2,200 | | | | | Douglas Emmett, Inc. | | | 28,732 | | |
| | | | 28,732 | | |
Total Real Estate Investment Trusts
(Cost $80,561) | | | 58,907 | | |
Total Investments in
Securities
(Cost $9,047,473)* | | | 91.3 | % | | $ | 6,087,121 | | |
Other Assets and
Liabilities - Net | | | 8.7 | | | | 576,717 | | |
| Net Assets | | | 100.0 | % | | $ | 6,663,838 | | |
@ Non-income producing security
@@ Foreign Issuer
* Cost for federal income tax purposes is $9,136,395.
Net unrealized depreciation consists of:
| Gross Unrealized Appreciation | | $ | 116,628 | | |
| Gross Unrealized Depreciation | | | (3,165,902 | ) | |
| Net Unrealized Depreciation | | $ | (3,049,274 | ) | |
The following table summarizes the inputs used as of December 31, 2008 in determining the Portfolio's investments at fair value for purposes of SFAS 157:
| | | Investments in
Securities | | Other Financial
Instruments* | |
| Level 1 — Quoted Prices | | $ | 6,087,121 | | | $ | — | | |
Level 2 — Other Significant
Observable Inputs | | | — | | | | — | | |
Level 3 — Significant
Unobservable Inputs | | | — | | | | — | | |
| Total | | $ | 6,087,121 | | | $ | — | | |
"Fair value" for purposes of SFAS 157 is different from "fair value" as used in the 1940 Act. The former generally implies market value, and can include market quotations as a source of value, and the latter refers to determinations of actual value in absence of available market quotations.
* Other financial instruments may include forward foreign currency contracts, futures, swaps, and written options. Forward foreign currency contracts and futures are reported at their unrealized gain/loss at year end. Swaps and written options are reported at their market value at year end.
See Accompanying Notes to Financial Statements
120
ING BARON SMALL CAP PORTFOLIO OF INVESTMENTS
GROWTH PORTFOLIO AS OF DECEMBER 31, 2008
| Shares | | | | | | Value | |
| COMMON STOCK: 86.6% | | | |
| | | | | Advertising: 1.0% | |
| | 350,000 | | | @ | | Lamar Advertising Co. | | $ | 4,396,000 | | |
| | | | 4,396,000 | | |
| | | | | Apparel: 2.2% | |
| | 10,000 | | | | | Polo Ralph Lauren Corp. | | | 454,100 | | |
| | 400,269 | | | @ | | Under Armour, Inc. | | | 9,542,413 | | |
| | | | 9,996,513 | | |
| | | | | Banks: 1.5% | |
| | 200,000 | | | | | Glacier Bancorp., Inc. | | | 3,804,000 | | |
| | 110,000 | | | @ | | SVB Financial Group | | | 2,885,300 | | |
| | | | 6,689,300 | | |
| | | | | Beverages: 1.0% | |
| | 200,000 | | | @ | | Peet's Coffee & Tea, Inc. | | | 4,650,000 | | |
| | | | 4,650,000 | | |
| | | | | Biotechnology: 1.0% | |
| | 170,000 | | | @ | | Charles River Laboratories
International, Inc. | | | 4,454,000 | | |
| | | | 4,454,000 | | |
| | | | | Commercial Services: 14.0% | |
| | 150,000 | | | @ | | Bankrate, Inc. | | | 5,700,000 | | |
| | 95,246 | | | | | Chemed Corp. | | | 3,787,933 | | |
| | 120,000 | | | @ | | CoStar Group, Inc. | | | 3,952,800 | | |
| | 325,000 | | | | | DeVry, Inc. | | | 18,658,250 | | |
| | 360,000 | | | @ | | Gartner, Inc. | | | 6,418,800 | | |
| | 217,590 | | | @ | | Morningstar, Inc. | | | 7,724,445 | | |
| | 200,000 | | | @ | | Riskmetrics Group, Inc. | | | 2,978,000 | | |
| | 377,151 | | | @@ | | Ritchie Brothers Auctioneers, Inc. | | | 8,078,574 | | |
| | 25,000 | | | | | Strayer Education, Inc. | | | 5,360,250 | | |
| | | | 62,659,052 | | |
| | | | | Distribution/Wholesale: 1.4% | |
| | 550,000 | | | @ | | LKQ Corp. | | | 6,413,000 | | |
| | | | 6,413,000 | | |
| | | | | Diversified Financial Services: 2.3% | |
| | 200,000 | | | | | Cohen & Steers, Inc. | | | 2,198,000 | | |
| | 230,958 | | | | | Eaton Vance Corp. | | | 4,852,428 | | |
| | 56,654 | | | @ | | FCStone Group, Inc. | | | 250,977 | | |
| | 200,000 | | | | | Jefferies Group, Inc. | | | 2,812,000 | | |
| | | | 10,113,405 | | |
| | | | | Electric: 1.6% | |
| | 160,000 | | | | | ITC Holdings Corp. | | | 6,988,800 | | |
| | | | 6,988,800 | | |
| | | | | | | Electrical Components &
Equipment: 0.8% | | | | | |
| | 100,000 | | | @ | | Sunpower Corp. - Class A | | | 3,700,000 | | |
| | | | 3,700,000 | | |
| | | | | Electronics: 0.9% | |
| | 60,000 | | | @,@@ | | Mettler Toledo International, Inc. | | | 4,044,000 | | |
| | | | 4,044,000 | | |
| | | | | Engineering & Construction: 1.9% | |
| | 275,000 | | | @ | | Aecom Technology Corp. | | | 8,450,750 | | |
| | | | 8,450,750 | | |
| Shares | | | | | | Value | |
| | | | | Entertainment: 3.4% | |
| | 300,000 | | | @ | | Penn National Gaming, Inc. | | $ | 6,414,000 | | |
| | 300,000 | | | @ | | Scientific Games Corp. | | | 5,262,000 | | |
| | 130,724 | | | @ | | Vail Resorts, Inc. | | | 3,477,258 | | |
| | | | 15,153,258 | | |
| | | | | Environmental Control: 0.5% | |
| | 95,000 | | | @ | | Tetra Tech, Inc. | | | 2,294,250 | | |
| | | | 2,294,250 | | |
| | | | | Food: 2.6% | |
| | 200,000 | | | @ | | Ralcorp Holdings, Inc. | | | 11,680,000 | | |
| | | | 11,680,000 | | |
| | | | | Gas: 1.2% | |
| | 400,000 | | | | | Southern Union Co. | | | 5,216,000 | | |
| | | | 5,216,000 | | |
| | | | | Hand/Machine Tools: 1.0% | |
| | 206,000 | | | | | Kennametal, Inc. | | | 4,571,140 | | |
| | | | 4,571,140 | | |
| | | | | Healthcare-Products: 3.9% | |
| | 100,000 | | | @ | | Edwards Lifesciences Corp. | | | 5,495,000 | | |
| | 120,000 | | | @ | | Gen-Probe, Inc. | | | 5,140,800 | | |
| | 75,000 | | | @ | | Idexx Laboratories, Inc. | | | 2,706,000 | | |
| | 15,000 | | | @ | | Intuitive Surgical, Inc. | | | 1,904,850 | | |
| | 123,700 | | | @ | | PSS World Medical, Inc. | | | 2,328,034 | | |
| | | | 17,574,684 | | |
| | | | | Healthcare-Services: 4.9% | |
| | 285,000 | | | @ | | AMERIGROUP Corp. | | | 8,413,200 | | |
| | 401,000 | | | @ | | Community Health Systems, Inc. | | | 5,846,580 | | |
| | 90,438 | | | @ | | Covance, Inc. | | | 4,162,861 | | |
| | 199,040 | | | @ | | Skilled Healthcare Group, Inc. | | | 1,679,898 | | |
| | 185,000 | | | @ | | Sun Healthcare Group, Inc. | | | 1,637,250 | | |
| | | | 21,739,789 | | |
| | | | | Household Products/Wares: 1.6% | |
| | 125,000 | | | | | Church & Dwight Co., Inc. | | | 7,015,000 | | |
| | | | 7,015,000 | | |
| | | | | Insurance: 1.1% | |
| | 65,000 | | | @,@@ | | Arch Capital Group Ltd. | | | 4,556,500 | | |
| | 10,000 | | | | | Brown & Brown, Inc. | | | 209,000 | | |
| | | | 4,765,500 | | |
| | | | | Internet: 2.1% | |
| | 80,000 | | | @ | | Blue Nile, Inc. | | | 1,959,200 | | |
| | 24,870 | | | @ | | Emdeon Corp. | | | 260,140 | | |
| | 120,000 | | | @ | | Equinix, Inc. | | | 6,382,800 | | |
| | 143,446 | | | @ | | TechTarget, Inc. | | | 619,687 | | |
| | 11,537 | | | @ | | WebMD Health Corp. | | | 272,158 | | |
| | | | 9,493,985 | | |
| | | | | Lodging: 2.9% | |
| | 350,000 | | | | | Choice Hotels International, Inc. | | | 10,521,000 | | |
| | 55,000 | | | @ | | Wynn Resorts Ltd. | | | 2,324,300 | | |
| | | | 12,845,300 | | |
| | | | | Machinery-Diversified: 0.2% | |
| | 30,761 | | | | | Lindsay Manufacturing Co. | | | 977,892 | | |
| | | | 977,892 | | |
See Accompanying Notes to Financial Statements
121
ING BARON SMALL CAP PORTFOLIO OF INVESTMENTS
GROWTH PORTFOLIO AS OF DECEMBER 31, 2008 (CONTINUED)
| Shares | | | | | | Value | |
| | | | | Media: 1.4% | |
| | 125,000 | | | @,@@ | | Central European Media
Enterprises Ltd. | | $ | 2,715,000 | | |
| | 78,300 | | | | | Factset Research Systems, Inc. | | | 3,463,992 | | |
| | | | 6,178,992 | | |
| | | | | Metal Fabricate/Hardware: 1.0% | |
| | 125,000 | | | | | Kaydon Corp. | | | 4,293,750 | | |
| | | | 4,293,750 | | |
| | | | | Miscellaneous Manufacturing: 0.8% | |
| | 194,267 | | | | | American Railcar Industries, Inc. | | | 2,045,632 | | |
| | 150,000 | | | @ | | Colfax Corp. | | | 1,558,500 | | |
| | | | 3,604,132 | | |
| | | | | Oil & Gas: 3.1% | |
| | 275,000 | | | @ | | Encore Acquisition Co. | | | 7,018,000 | | |
| | 175,000 | | | | | Helmerich & Payne, Inc. | | | 3,981,250 | | |
| | 45,000 | | | | | Range Resources Corp. | | | 1,547,550 | | |
| | 45,000 | | | @ | | Whiting Petroleum Corp. | | | 1,505,700 | | |
| | | | 14,052,500 | | |
| | | | | Oil & Gas Services: 3.7% | |
| | 80,000 | | | | | Core Laboratories NV | | | 4,788,800 | | |
| | 150,000 | | | @ | | FMC Technologies, Inc. | | | 3,574,500 | | |
| | 115,000 | | | @ | | SEACOR Holdings, Inc. | | | 7,664,750 | | |
| | 90,000 | | | @ | | Tetra Technologies, Inc. | | | 437,400 | | |
| | | | 16,465,450 | | |
| | | | | Pharmaceuticals: 1.5% | |
| | 335,228 | | | @ | | VCA Antech, Inc. | | | 6,664,333 | | |
| | | | 6,664,333 | | |
| | | | | Real Estate: 0.5% | |
| | 509,568 | | | @ | | CB Richard Ellis Group, Inc. | | | 2,201,334 | | |
| | | | 2,201,334 | | |
| | | | | Retail: 10.5% | |
| | 70,000 | | | @ | | Carmax, Inc. | | | 551,600 | | |
| | 200,400 | | | @ | | Cheesecake Factory | | | 2,024,040 | | |
| | 5,735 | | | @@ | | China Nepstar Chain
Drugstore Ltd. ADR | | | 28,962 | | |
| | 275,000 | | | @ | | Copart, Inc. | | | 7,477,250 | | |
| | 575,000 | | | @ | | Dick's Sporting Goods, Inc. | | | 8,113,250 | | |
| | 250,000 | | | @ | | J Crew Group, Inc. | | | 3,050,000 | | |
| | 150,000 | | | | | MSC Industrial Direct Co. | | | 5,524,500 | | |
| | 215,000 | | | @ | | Panera Bread Co. | | | 11,231,600 | | |
| | 500,000 | | | | | Penske Auto Group, Inc. | | | 3,840,000 | | |
| | 300,000 | | | @ | | Sonic Corp. | | | 3,651,000 | | |
| | 49,884 | | | | | Tiffany & Co. | | | 1,178,759 | | |
| | | | 46,670,961 | | |
| | | | | Software: 2.8% | |
| | 125,225 | | | @ | | Advent Software, Inc. | | | 2,500,743 | | |
| | 563,875 | | | @ | | MSCI, Inc. - Class A | | | 10,014,420 | | |
| | | | 12,515,163 | | |
| | | | | Telecommunications: 0.6% | |
| | 151,764 | | | @ | | SBA Communications Corp. | | | 2,476,788 | | |
| | | | 2,476,788 | | |
| | | | | Textiles: 1.6% | |
| | 167,547 | | | @ | | Mohawk Industries, Inc. | | | 7,199,495 | | |
| | | | 7,199,495 | | |
| Shares | | | | | | Value | |
| | | | | Toys/Games/Hobbies: 1.5% | |
| | 225,000 | | | @ | | Marvel Entertainment, Inc. | | $ | 6,918,750 | | |
| | | | 6,918,750 | | |
| | | | | Transportation: 2.6% | |
| | 300,000 | | | @ | | Genesee & Wyoming, Inc. | | | 9,150,000 | | |
| | 60,000 | | | | | Landstar System, Inc. | | | 2,305,800 | | |
| | | | 11,455,800 | | |
Total Common Stock
(Cost $411,555,647) | | | 386,579,066 | | |
| REAL ESTATE INVESTMENT TRUSTS: 2.8% | | | |
| | | | | Diversified: 1.4% | |
| | 200,000 | | | | | Digital Realty Trust, Inc. | | | 6,570,000 | | |
| | | | 6,570,000 | | |
| | | | | Single Tenant: 1.4% | |
| | 24,300 | | | | | Alexander's, Inc. | | | 6,194,070 | | |
| | | | 6,194,070 | | |
Total Real Estate
Investment Trusts
(Cost $14,751,426) | | | 12,764,070 | | |
Total Long-Term Investments
(Cost $426,307,073) | | | 399,343,136 | | |
| SHORT-TERM INVESTMENTS: 9.6% | |
| | | Affiliated Mutual Fund: 9.6% | |
| | 42,852,540 | | | ING Institutional Prime Money
Market Fund - Class I | | | 42,852,540 | | |
Total Short-Term Investments
(Cost $42,852,540) | | | 42,852,540 | | |
Total Investments in
Securities
(Cost $469,159,613)* | | | 99.0 | % | | $ | 442,195,676 | | |
Other Assets and
Liabilities - Net | | | 1.0 | | | | 4,378,387 | | |
| Net Assets | | | 100.0 | % | | $ | 446,574,063 | | |
@ Non-income producing security
@@ Foreign Issuer
ADR American Depositary Receipt
* Cost for federal income tax purposes is $469,165,791.
Net unrealized depreciation consists of:
| Gross Unrealized Appreciation | | $ | 54,544,966 | | |
| Gross Unrealized Depreciation | | | (81,515,081 | ) | |
| Net Unrealized Depreciation | | $ | (26,970,115 | ) | |
See Accompanying Notes to Financial Statements
122
ING BARON SMALL CAP PORTFOLIO OF INVESTMENTS
GROWTH PORTFOLIO AS OF DECEMBER 31, 2008 (CONTINUED)
The following table summarizes the inputs used as of December 31, 2008 in determining the Portfolio's investments at fair value for purposes of SFAS 157:
| | | Investments in
Securities | | Other Financial
Instruments* | |
| Level 1 — Quoted Prices | | $ | 442,195,676 | | | $ | — | | |
Level 2 — Other Significant
Observable Inputs | | | — | | | | — | | |
Level 3 — Significant
Unobservable Inputs | | | — | | | | — | | |
| Total | | $ | 442,195,676 | | | $ | — | | |
"Fair value" for purposes of SFAS 157 is different from "fair value" as used in the 1940 Act. The former generally implies market value, and can include market quotations as a source of value, and the latter refers to determinations of actual value in absence of available market quotations.
* Other financial instruments may include forward foreign currency contracts, futures, swaps, and written options. Forward foreign currency contracts and futures are reported at their unrealized gain/loss at year end. Swaps and written options are reported at their market value at year end.
See Accompanying Notes to Financial Statements
123
ING COLUMBIA PORTFOLIO OF INVESTMENTS
SMALL CAP VALUE II PORTFOLIO AS OF DECEMBER 31, 2008
| Shares | | | | | | Value | |
| COMMON STOCK: 89.7% | | | |
| | | | | Aerospace/Defense: 2.4% | |
| | 8,090 | | | @ | | AAR Corp. | | $ | 148,937 | | |
| | 232,000 | | | @ | | BE Aerospace, Inc. | | | 1,784,080 | | |
| | 99,450 | | | @ | | Esterline Technologies Corp. | | | 3,768,161 | | |
| | 9,540 | | | | | Kaman Corp. | | | 172,960 | | |
| | 3,280 | | | @ | | Moog, Inc. | | | 119,950 | | |
| | 71,000 | | | | | Triumph Group, Inc. | | | 3,014,660 | | |
| | | | 9,008,748 | | |
| | | | | Agriculture: 0.9% | |
| | 8,352 | | | @ | | Maui Land & Pineapple Co. | | | 112,167 | | |
| | 111,000 | | | | | Universal Corp. | | | 3,315,570 | | |
| | | | 3,427,737 | | |
| | | | | Airlines: 1.7% | |
| | 259,000 | | | @ | | Airtran Holdings, Inc. | | | 1,149,960 | | |
| | 282,000 | | | @ | | Delta Airlines, Inc. | | | 3,231,720 | | |
| | 7,502 | | | @ | | Republic Airways Holdings, Inc. | | | 80,046 | | |
| | 14,682 | | | | | Skywest, Inc. | | | 273,085 | | |
| | 149,000 | | | @ | | UAL Corp. | | | 1,641,980 | | |
| | | | 6,376,791 | | |
| | | | | Apparel: 0.6% | |
| | 4,938 | | | @ | | Hampshire Group Ltd. | | | 19,752 | | |
| | 110,000 | | | @ | | Warnaco Group, Inc. | | | 2,159,300 | | |
| | 9,412 | | | | | Wolverine World Wide, Inc. | | | 198,028 | | |
| | | | 2,377,080 | | |
| | | | | Auto Parts & Equipment: 0.1% | |
| | 7,390 | | | | | BorgWarner, Inc. | | | 160,880 | | |
| | | | 160,880 | | |
| | | | | Banks: 12.2% | |
| | 5,780 | | | | | Bancfirst Corp. | | | 305,878 | | |
| | 189,897 | | | | | Bancorpsouth, Inc. | | | 4,435,994 | | |
| | 18,950 | | | | | BancTrust Financial Group, Inc. | | | 279,702 | | |
| | 27,232 | | | | | Bank Mutual Corp. | | | 314,257 | | |
| | 21,212 | | | | | Bank of Granite Corp. | | | 51,969 | | |
| | 11,392 | | | | | Bryn Mawr Bank Corp. | | | 228,979 | | |
| | 16,490 | | | | | Capital Corp. of the West | | | 15,501 | | |
| | 14,100 | | | | | Capitol Bancorp., Ltd. | | | 109,980 | | |
| | 15,652 | | | | | Chemical Financial Corp. | | | 436,378 | | |
| | 11,820 | | | | | Columbia Banking System, Inc. | | | 141,013 | | |
| | 180,000 | | | | | Community Bank System, Inc. | | | 4,390,200 | | |
| | 7,322 | | | | | Community Trust Bancorp., Inc. | | | 269,084 | | |
| | 43,336 | | | | | Corus Bankshares, Inc. | | | 48,103 | | |
| | 259,000 | | | | | East-West Bancorp., Inc. | | | 4,136,230 | | |
| | 2,252 | | | | | First Citizens BancShares, Inc. | | | 344,106 | | |
| | 9,541 | | | | | First Financial Corp. | | | 391,086 | | |
| | 315,694 | | | | | First Horizon National Corp. | | | 3,336,886 | | |
| | 187,000 | | | | | First Midwest Bancorp., Inc. | | | 3,734,390 | | |
| | 74 | | | | | First National Bank of Alaska | | | 117,660 | | |
| | 310,000 | | | | | Fulton Financial Corp. | | | 2,982,200 | | |
| | 161,300 | | | | | Independent Bank Corp. | | | 4,219,608 | | |
| | 11,082 | | | | | Merchants Bancshares, Inc. | | | 208,231 | | |
| | 12,380 | | | | | Northrim Bancorp, Inc. | | | 127,019 | | |
| | 165,000 | | | | | Pacific Capital Bancorp. | | | 2,785,200 | | |
| | 94,000 | | | | | Prosperity Bancshares, Inc. | | | 2,781,460 | | |
| | 33,600 | | | | | South Financial Group, Inc. | | | 145,152 | | |
| | 17,060 | | | | | Sterling Bancorp. | | | 239,352 | | |
| | 211,600 | | | | | Susquehanna Bancshares, Inc. | | | 3,366,556 | | |
| | 12,960 | | | | | Taylor Capital Group, Inc. | | | 75,816 | | |
| | 187,355 | | | @ | | Texas Capital Bancshares, Inc. | | | 2,503,063 | | |
| Shares | | | | | | Value | |
| | 22,210 | | | | | Trustco Bank Corp. | | $ | 211,217 | | |
| | 205,321 | | | | | Umpqua Holdings Corp. | | | 2,970,995 | | |
| | 15,352 | | | | | West Coast Bancorp. | | | 101,170 | | |
| | 14,502 | | | | | Whitney Holding Corp. | | | 231,887 | | |
| | | | 46,036,322 | | |
| | | | | Building Materials: 2.0% | |
| | 27,487 | | | @ | | Builders FirstSource, Inc. | | | 42,055 | | |
| | 310,000 | | | | | Comfort Systems USA, Inc. | | | 3,304,600 | | |
| | 104,446 | | | | | Eagle Materials, Inc. | | | 1,922,851 | | |
| | 7,180 | | | | | Lennox International, Inc. | | | 231,842 | | |
| | 9,552 | | | @ | | NCI Building Systems, Inc. | | | 155,698 | | |
| | 62,000 | | | | | Simpson Manufacturing Co., Inc. | | | 1,721,120 | | |
| | 4,822 | | | | | Universal Forest Products, Inc. | | | 129,760 | | |
| | | | 7,507,926 | | |
| | | | | Chemicals: 2.8% | |
| | 5,950 | | | | | Cytec Industries, Inc. | | | 126,259 | | |
| | 19,150 | | | | | HB Fuller Co. | | | 308,507 | | |
| | 245,000 | | | | | Olin Corp. | | | 4,429,600 | | |
| | 107,740 | | | @ | | OM Group, Inc. | | | 2,274,391 | | |
| | 325,000 | | | @ | | Rockwood Holdings, Inc. | | | 3,510,000 | | |
| | | | 10,648,757 | | |
| | | | | Commercial Services: 5.6% | |
| | 224,340 | | | | | ABM Industries, Inc. | | | 4,273,677 | | |
| | 70,000 | | | | | Bowne & Co., Inc. | | | 411,600 | | |
| | 268,250 | | | @ | | CBIZ, Inc. | | | 2,320,363 | | |
| | 12,527 | | | | | CDI Corp. | | | 162,099 | | |
| | 9,450 | | | @ | | Consolidated Graphics, Inc. | | | 213,948 | | |
| | 172,000 | | | @ | | Cornell Cos., Inc. | | | 3,197,480 | | |
| | 23,622 | | | @ | | Cross Country Healthcare, Inc. | | | 207,637 | | |
| | 140,000 | | | | | Deluxe Corp. | | | 2,094,400 | | |
| | 12,970 | | | @ | | Korn/Ferry International | | | 148,117 | | |
| | 5,730 | | | | | MAXIMUS, Inc. | | | 201,180 | | |
| | 14,360 | | | | | Monro Muffler, Inc. | | | 366,180 | | |
| | 39,802 | | | @ | | MPS Group, Inc. | | | 299,709 | | |
| | 13,212 | | | @ | | Parexel International Corp. | | | 128,289 | | |
| | 17,682 | | | @ | | Rent-A-Center, Inc. | | | 312,087 | | |
| | 8,662 | | | | | Sotheby's | | | 77,005 | | |
| | 640,000 | | | | | Stewart Enterprises, Inc. | | | 1,926,400 | | |
| | 10,177 | | | @ | | TeleTech Holdings, Inc. | | | 84,978 | | |
| | 95,000 | | | | | Watson Wyatt Worldwide, Inc. | | | 4,542,900 | | |
| | | | 20,968,049 | | |
| | | | | Computers: 2.4% | |
| | 636,882 | | | @ | | Brocade Communications
Systems, Inc. | | | 1,783,270 | | |
| | 5,212 | | | @ | | CACI International, Inc. | | | 235,009 | | |
| | 13,212 | | | @ | | Electronics for Imaging | | | 126,307 | | |
| | 280,149 | | | @ | | Insight Enterprises, Inc. | | | 1,933,028 | | |
| | 6,630 | | | | | Jack Henry & Associates, Inc. | | | 128,688 | | |
| | 391,660 | | | @ | | Mentor Graphics Corp. | | | 2,024,882 | | |
| | 101,870 | | | | | MTS Systems Corp. | | | 2,713,817 | | |
| | | | 8,945,001 | | |
| | | | | Cosmetics/Personal Care: 0.5% | |
| | 260,000 | | | | | Inter Parfums, Inc. | | | 1,996,800 | | |
| | | | 1,996,800 | | |
| | | | | Distribution/Wholesale: 1.6% | |
| | 28,187 | | | @ | | Brightpoint, Inc. | | | 122,613 | | |
| | 140,000 | | | | | Houston Wire & Cable Co. | | | 1,303,400 | | |
| | 103,780 | | | | | Owens & Minor, Inc. | | | 3,907,317 | | |
See Accompanying Notes to Financial Statements
124
ING COLUMBIA PORTFOLIO OF INVESTMENTS
SMALL CAP VALUE II PORTFOLIO AS OF DECEMBER 31, 2008 (CONTINUED)
| Shares | | | | | | Value | |
| | | | | Distribution/Wholesale (continued) | |
| | 5,150 | | | @ | | United Stationers, Inc. | | $ | 172,474 | | |
| | 8,722 | | | | | Watsco, Inc. | | | 334,925 | | |
| | | | 5,840,729 | | |
| | | | | Diversified Financial Services: 1.6% | |
| | 6,990 | | | | | Federated Investors, Inc. | | | 118,550 | | |
| | 14,400 | | | | | Janus Capital Group, Inc. | | | 115,632 | | |
| | 250,000 | | | @ | | Knight Capital Group, Inc. | | | 4,037,500 | | |
| | 485,000 | | | | | National Financial Partners Corp. | | | 1,474,400 | | |
| | 6,458 | | | @ | | Piper Jaffray Cos. | | | 256,770 | | |
| | | | 6,002,852 | | |
| | | | | Electric: 3.0% | |
| | 8,330 | | | | | Allete, Inc. | | | 268,809 | | |
| | 15,350 | | | | | Avista Corp. | | | 297,483 | | |
| | 11,270 | | | | | Black Hills Corp. | | | 303,839 | | |
| | 9,100 | | | | | CH Energy Group, Inc. | | | 467,649 | | |
| | 15,910 | | | @ | | El Paso Electric Co. | | | 287,812 | | |
| | 9,740 | | | | | Great Plains Energy, Inc. | | | 188,274 | | |
| | 6,422 | | | | | Hawaiian Electric Industries | | | 142,183 | | |
| | 95,000 | | | | | Integrys Energy Group, Inc. | | | 4,083,100 | | |
| | 2,692 | | | | | Maine & Maritimes Corp. | | | 104,584 | | |
| | 8,190 | | | | | MGE Energy, Inc. | | | 270,270 | | |
| | 11,660 | | | | | NorthWestern Corp. | | | 273,660 | | |
| | 8,652 | | | | | UIL Holdings Corp. | | | 259,820 | | |
| | 214,000 | | | | | Westar Energy, Inc. | | | 4,389,140 | | |
| | | | 11,336,623 | | |
| | | | | | | Electrical Components &
Equipment: 1.3% | | | | | |
| | 8,222 | | | @ | | Advanced Energy Industries, Inc. | | | 81,809 | | |
| | 8,132 | | | | | Belden CDT, Inc. | | | 169,796 | | |
| | 385,000 | | | @ | | C&D Technologies, Inc. | | | 1,205,050 | | |
| | 26,110 | | | @ | | GrafTech International Ltd. | | | 217,235 | | |
| | 142,200 | | | | | Insteel Industries, Inc. | | | 1,605,438 | | |
| | 390,000 | | | @,@@ | | JA Solar Holdings Co., Ltd. ADR | | | 1,704,300 | | |
| | | | 4,983,628 | | |
| | | | | Electronics: 3.9% | |
| | 4,252 | | | | | Analogic Corp. | | | 115,995 | | |
| | 4,380 | | | | | Bel Fuse, Inc. | | | 92,856 | | |
| | 21,620 | | | @ | | Benchmark Electronics, Inc. | | | 276,087 | | |
| | 144,000 | | | @ | | FEI Co. | | | 2,715,840 | | |
| | 297,992 | | | @@ | | Nam Tai Electronics, Inc. | | | 1,638,956 | | |
| | 6,362 | | | @ | | Plexus Corp. | | | 107,836 | | |
| | 146,500 | | | @ | | Rofin-Sinar Technologies, Inc. | | | 3,014,970 | | |
| | 114,000 | | | @ | | Rogers Corp. | | | 3,165,780 | | |
| | 98,740 | | | @ | | Varian, Inc. | | | 3,308,777 | | |
| | 4,242 | | | | �� | Woodward Governor Co. | | | 97,651 | | |
| | | | 14,534,748 | | |
| | | | | Engineering & Construction: 1.3% | |
| | 14,842 | | | @ | | Dycom Industries, Inc. | | | 122,001 | | |
| | 190,610 | | | @ | | EMCOR Group, Inc. | | | 4,275,382 | | |
| | 10,790 | | | | | KBR, Inc. | | | 164,008 | | |
| | 12,160 | | | @,@@ | | Khd Humboldt
Wedag International | | | 135,827 | | |
| | | | 4,697,218 | | |
| | | | | Entertainment: 0.7% | |
| | 115,000 | | | @ | | Bally Technologies, Inc. | | | 2,763,450 | | |
| | | | 2,763,450 | | |
| Shares | | | | | | Value | |
| | | | | Environmental Control: 0.0% | |
| | 16,102 | | | @ | | Casella Waste Systems, Inc. | | $ | 65,696 | | |
| | | | 65,696 | | |
| | | | | Food: 3.6% | |
| | 91,000 | | | | | Corn Products International, Inc. | | | 2,625,350 | | |
| | 5,350 | | | | | Flowers Foods, Inc. | | | 130,326 | | |
| | 11,212 | | | @,@@ | | Fresh Del Monte Produce, Inc. | | | 251,373 | | |
| | 400,000 | | | @ | | Great Atlantic & Pacific Tea Co. | | | 2,508,000 | | |
| | 5,650 | | | | | J&J Snack Foods Corp. | | | 202,722 | | |
| | 3,402 | | | | | Lancaster Colony Corp. | | | 116,689 | | |
| | 11,060 | | | | | Lance, Inc. | | | 253,716 | | |
| | 3,300 | | | @ | | Ralcorp Holdings, Inc. | | | 192,720 | | |
| | 7,532 | | | | | Ruddick Corp. | | | 208,260 | | |
| | 75,000 | | | | | Sanderson Farms, Inc. | | | 2,592,000 | | |
| | 6,070 | | | | | Spartan Stores, Inc. | | | 141,128 | | |
| | 12,020 | | | | | Weis Markets, Inc. | | | 404,233 | | |
| | 9,480 | | | | | Whole Foods Market, Inc. | | | 89,491 | | |
| | 235,000 | | | @ | | Winn-Dixie Stores, Inc. | | | 3,783,500 | | |
| | | | 13,499,508 | | |
| | | | | Forest Products & Paper: 0.7% | |
| | 15,793 | | | @ | | Clearwater Paper Corp. | | | 132,503 | | |
| | 24,512 | | | @ | | Mercer International, Inc. | | | 47,063 | | |
| | 126,986 | | | | | Schweitzer-Mauduit
International, Inc. | | | 2,542,260 | | |
| | | | 2,721,826 | | |
| | | | | Gas: 2.2% | |
| | 170,000 | | | | | Atmos Energy Corp. | | | 4,029,000 | | |
| | 105,000 | | | | | New Jersey Resources Corp. | | | 4,131,750 | | |
| | | | 8,160,750 | | |
| | | | | Healthcare-Products: 2.8% | |
| | 121,000 | | | @ | | Conmed Corp. | | | 2,896,740 | | |
| | 73,000 | | | @ | | Haemonetics Corp. | | | 4,124,500 | | |
| | 3,141 | | | | | Hill-Rom Holdings, Inc. | | | 51,701 | | |
| | 210,000 | | | | | Invacare Corp. | | | 3,259,200 | | |
| | 9,457 | | | | | Steris Corp. | | | 225,928 | | |
| | | | 10,558,069 | | |
| | | | | Healthcare-Services: 3.3% | |
| | 7,700 | | | @ | | Amsurg Corp. | | | 179,718 | | |
| | 180,000 | | | @ | | Centene Corp. | | | 3,547,800 | | |
| | 9,832 | | | @ | | Gentiva Health Services, Inc. | | | 287,684 | | |
| | 5,930 | | | @ | | Healthspring, Inc. | | | 118,422 | | |
| | 214,642 | | | @ | | Kindred Healthcare, Inc. | | | 2,794,639 | | |
| | 112,960 | | | @ | | Magellan Health Services, Inc. | | | 4,423,514 | | |
| | 34,760 | | | @ | | Novamed, Inc. | | | 120,270 | | |
| | 5,480 | | | @ | | Pediatrix Medical Group, Inc. | | | 173,716 | | |
| | 17,512 | | | @ | | RehabCare Group, Inc. | | | 265,482 | | |
| | 19,510 | | | @ | | Res-Care, Inc. | | | 293,040 | | |
| | 9,430 | | | @ | | US Physical Therapy, Inc. | | | 125,702 | | |
| | | | 12,329,987 | | |
| | | | | Home Builders: 0.0% | |
| | 4,822 | | | @ | | Cavco Industries, Inc. | | | 129,664 | | |
| | | | 129,664 | | |
| | | | | Home Furnishings: 0.1% | |
| | 5,070 | | | | | Ethan Allen Interiors, Inc. | | | 72,856 | | |
| | 10,890 | | | | | Furniture Brands
International, Inc. | | | 24,067 | | |
| | 5,204 | | | @ | | Universal Electronics, Inc. | | | 84,409 | | |
| | | | 181,332 | | |
See Accompanying Notes to Financial Statements
125
ING COLUMBIA PORTFOLIO OF INVESTMENTS
SMALL CAP VALUE II PORTFOLIO AS OF DECEMBER 31, 2008 (CONTINUED)
| Shares | | | | | | Value | |
| | | | | Household Products/Wares: 2.2% | |
| | 22,412 | | | | | American Greetings Corp. | | $ | 169,659 | | |
| | 6,162 | | | | | CSS Industries, Inc. | | | 109,314 | | |
| | 230,000 | | | @ | | Helen of Troy Ltd. | | | 3,992,800 | | |
| | 173,000 | | | | | Tupperware Corp. | | | 3,927,100 | | |
| | | | 8,198,873 | | |
| | | | | Insurance: 7.9% | |
| | 288,000 | | | | | AMBAC Financial Group, Inc. | | | 374,400 | | |
| | 135,000 | | | @,@@ | | Argo Group International
Holdings Ltd. | | | 4,579,194 | | |
| | 150,000 | | | | | Arthur J. Gallagher & Co. | | | 3,886,500 | | |
| | 148,000 | | | @@ | | Aspen Insurance Holdings Ltd. | | | 3,589,000 | | |
| | 10,362 | | | | | Baldwin & Lyons, Inc. | | | 188,485 | | |
| | 18,982 | | | @ | | CNA Surety Corp. | | | 364,454 | | |
| | 95,800 | | | | | Delphi Financial Group | | | 1,766,552 | | |
| | 11,179 | | | @ | | eHealth, Inc. | | | 148,457 | | |
| | 11,340 | | | | | EMC Insurance Group, Inc. | | | 290,871 | | |
| | 8,534 | | | | | FBL Financial Group, Inc. | | | 131,850 | | |
| | 91,000 | | | | | First American Corp. | | | 2,628,990 | | |
| | 19,525 | | | | | Genworth Financial, Inc. | | | 55,256 | | |
| | 6,180 | | | | | Harleysville Group, Inc. | | | 214,631 | | |
| | 22,672 | | | | | Horace Mann Educators Corp. | | | 208,356 | | |
| | 261,800 | | | | | MGIC Investment Corp. | | | 911,064 | | |
| | 1,150 | | | | | National Western Life
Insurance Co. | | | 194,546 | | |
| | 6,130 | | | @ | | Navigators Group, Inc. | | | 336,598 | | |
| | 53,000 | | | | | NYMAGIC, Inc. | | | 1,009,650 | | |
| | 45,972 | | | | | Phoenix Cos., Inc. | | | 150,328 | | |
| | 128,000 | | | @@ | | Platinum Underwriters
Holdings Ltd. | | | 4,618,240 | | |
| | 49,772 | | | @,@@ | | RAM Holdings Ltd. | | | 18,416 | | |
| | 3,922 | | | | | RLI Corp. | | | 239,870 | | |
| | 8,252 | | | | | Safety Insurance Group, Inc. | | | 314,071 | | |
| | 11,392 | | | | | Selective Insurance Group | | | 261,219 | | |
| | 11,942 | | | | | Stewart Information
Services Corp. | | | 280,518 | | |
| | 36,107 | | | @,@@ | | United America Indemnity Ltd. | | | 462,531 | | |
| | 4,337 | | | | | United Fire & Casualty Co. | | | 134,751 | | |
| | 80,000 | | | | | Zenith National Insurance Corp. | | | 2,525,600 | | |
| | | | 29,884,398 | | |
| | | | | Internet: 0.0% | |
| | 6,652 | | | | | Nutri/System, Inc. | | | 97,053 | | |
| | | | 97,053 | | |
| | | | | Investment Companies: 0.7% | |
| | 269,800 | | | | | Apollo Investment Corp. | | | 2,511,838 | | |
| | 27,430 | | | | | Medallion Financial Corp. | | | 209,291 | | |
| | | | 2,721,129 | | |
| | | | | Iron/Steel: 0.8% | |
| | 5,450 | | | | | Carpenter Technology Corp. | | | 111,943 | | |
| | 3,980 | | | | | Schnitzer Steel Industries, Inc. | | | 149,847 | | |
| | 230,000 | | | | | Steel Dynamics, Inc. | | | 2,571,400 | | |
| | | | 2,833,190 | | |
| | | | | Leisure Time: 0.0% | |
| | 19,365 | | | | | Brunswick Corp. | | | 81,527 | | |
| | | | 81,527 | | |
| | | | | Machinery-Construction & Mining: 0.1% | |
| | 5,439 | | | @ | | Astec Industries, Inc. | | | 170,404 | | |
| | | | 170,404 | | |
| Shares | | | | | | Value | |
| | | | | Machinery-Diversified: 0.5% | |
| | 79,000 | | | @ | | AGCO Corp. | | $ | 1,863,610 | | |
| | 5,040 | | | @ | | Kadant, Inc. | | | 67,939 | | |
| | 6,750 | | | | | Robbins & Myers, Inc. | | | 109,148 | | |
| | | | 2,040,697 | | |
| | | | | Media: 0.8% | |
| | 275,000 | | | | | World Wrestling
Entertainment, Inc. | | | 3,047,000 | | |
| | | | 3,047,000 | | |
| | | | | Metal Fabricate/Hardware: 0.1% | |
| | 4,942 | | | @ | | Haynes International, Inc. | | | 121,672 | | |
| | 4,459 | | | @ | | LB Foster Co. | | | 139,478 | | |
| | 16,292 | | | | | Worthington Industries | | | 179,538 | | |
| | | | 440,688 | | |
| | | | | Mining: 0.1% | |
| | 20,175 | | | @@ | | Harry Winston Diamon Corp. | | | 92,603 | | |
| | 12,990 | | | @ | | RTI International Metals, Inc. | | | 185,887 | | |
| | | | 278,490 | | |
| | | | | Miscellaneous Manufacturing: 0.8% | |
| | 2,645 | | | | | Ameron International Corp. | | | 166,423 | | |
| | 95,000 | | | @ | | AZZ, Inc. | | | 2,384,500 | | |
| | 10,362 | | | @ | | EnPro Industries, Inc. | | | 223,197 | | |
| | 6,908 | | | | | Freightcar America, Inc. | | | 126,209 | | |
| | 4,390 | | | | | Harsco Corp. | | | 121,515 | | |
| | 13,972 | | | | | Movado Group, Inc. | | | 131,197 | | |
| | | | 3,153,041 | | |
| | | | | Oil & Gas: 1.2% | |
| | 4,042 | | | @ | | Comstock Resources, Inc. | | | 190,985 | | |
| | 200,000 | | | @ | | EXCO Resources, Inc. | | | 1,812,000 | | |
| | 12,330 | | | | | Holly Corp. | | | 224,776 | | |
| | 5,392 | | | | | Patterson-UTI Energy, Inc. | | | 62,062 | | |
| | 71,672 | | | @ | | Stone Energy Corp. | | | 789,825 | | |
| | 88,002 | | | @ | | Swift Energy Co. | | | 1,479,314 | | |
| | | | 4,558,962 | | |
| | | | | Oil & Gas Services: 0.9% | |
| | 163,000 | | | @ | | Complete Production
Services, Inc. | | | 1,328,450 | | |
| | 3,850 | | | | | Lufkin Industries, Inc. | | | 132,825 | | |
| | 109,000 | | | @ | | Oil States International, Inc. | | | 2,037,210 | | |
| | 16,690 | | | @ | | T.G.C. Industries, Inc. | | | 34,548 | | |
| | | | 3,533,033 | | |
| | | | | Packaging & Containers: 2.1% | |
| | 185,000 | | | @ | | Crown Holdings, Inc. | | | 3,552,000 | | |
| | 4,042 | | | | | Greif, Inc. - Class A | | | 135,124 | | |
| | 9,550 | | | | | Greif, Inc. - Class B | | | 324,700 | | |
| | 9,420 | | | | | Packaging Corp. of America | | | 126,793 | | |
| | 107,000 | | | | | Rock-Tenn Co. | | | 3,657,260 | | |
| | | | 7,795,877 | | |
| | | | | Pharmaceuticals: 0.8% | |
| | 7,590 | | | @ | | NBTY, Inc. | | | 118,784 | | |
| | 172,312 | | | @ | | PharMerica Corp. | | | 2,700,129 | | |
| | | | 2,818,913 | | |
| | | | | Real Estate: 0.0% | |
| | 4,066 | | | @ | | Avatar Holdings, Inc. | | | 107,830 | | |
| | | | 107,830 | | |
See Accompanying Notes to Financial Statements
126
ING COLUMBIA PORTFOLIO OF INVESTMENTS
SMALL CAP VALUE II PORTFOLIO AS OF DECEMBER 31, 2008 (CONTINUED)
| Shares | | | | | | Value | |
| | | | | Retail: 3.9% | |
| | 17,216 | | | @ | | America's Car-Mart, Inc. | | $ | 237,753 | | |
| | 30,111 | | | @ | | Benihana, Inc. - Class A | | | 63,233 | | |
| | 6,880 | | | @ | | BJ's Wholesale Club, Inc. | | | 235,709 | | |
| | 8,220 | | | | | Bob Evans Farms, Inc. | | | 167,935 | | |
| | 270,000 | | | | | Brown Shoe Co., Inc. | | | 2,286,900 | | |
| | 5,260 | | | | | Casey's General Stores, Inc. | | | 119,770 | | |
| | 12,702 | | | | | Cash America International, Inc. | | | 347,400 | | |
| | 6,740 | | | @ | | CEC Entertainment, Inc. | | | 163,445 | | |
| | 10,630 | | | | | Foot Locker, Inc. | | | 78,024 | | |
| | 375,800 | | | @ | | HOT Topic, Inc. | | | 3,483,666 | | |
| | 7,040 | | | @ | | Jack in the Box, Inc. | | | 155,514 | | |
| | 10,982 | | | | | Landry's Restaurants, Inc. | | | 127,391 | | |
| | 235,000 | | | | | Nu Skin Enterprises, Inc. | | | 2,451,050 | | |
| | 22,270 | | | | | OfficeMax, Inc. | | | 170,143 | | |
| | 170,000 | | | @ | | Papa John's International, Inc. | | | 3,133,100 | | |
| | 6,230 | | | | | Phillips-Van Heusen | | | 125,410 | | |
| | 700,000 | | | @ | | Pier 1 Imports, Inc. | | | 259,000 | | |
| | 7,900 | | | @ | | Red Robin Gourmet Burgers, Inc. | | | 132,957 | | |
| | 7,936 | | | | | Regis Corp. | | | 115,310 | | |
| | 20,242 | | | @ | | Saks, Inc. | | | 88,660 | | |
| | 11,110 | | | @ | | Shoe Carnival, Inc. | | | 106,101 | | |
| | 140,000 | | | | | Sonic Automotive, Inc. | | | 557,200 | | |
| | 7,390 | | | @ | | Zale Corp. | | | 24,609 | | |
| | | | 14,630,280 | | |
| | | | | Savings & Loans: 2.4% | |
| | 19,292 | | | | | BankFinancial Corp. | | | 196,585 | | |
| | 23,362 | | | @ | | Beneficial Mutual Bancorp, Inc. | | | 262,823 | | |
| | 291,300 | | | | | Brookline Bancorp., Inc. | | | 3,102,345 | | |
| | 18,970 | | | | | Clifton Savings Bancorp, Inc. | | | 224,984 | | |
| | 12,652 | | | | | ESSA Bancorp, Inc. | | | 178,773 | | |
| | 240,000 | | | | | First Niagara Financial Group, Inc. | | | 3,880,800 | | |
| | 150 | | | | | Flagstar Bancorp., Inc. | | | 107 | | |
| | 24,232 | | | | | Home Federal Bancorp, Inc. | | | 259,767 | | |
| | 13,140 | | | | | Northfield Bancorp, Inc. | | | 147,825 | | |
| | 15,632 | | | | | United Financial Bancorp, Inc. | | | 236,668 | | |
| | 16,760 | | | | | Washington Federal, Inc. | | | 250,730 | | |
| | 28,140 | | | | | Westfield Financial, Inc. | | | 290,405 | | |
| | | | 9,031,812 | | |
| | | | | Semiconductors: 1.7% | |
| | 15,342 | | | @ | | Actel Corp. | | | 179,808 | | |
| | 8,130 | | | @ | | ATMI, Inc. | | | 125,446 | | |
| | 17,352 | | | @ | | Emulex Corp. | | | 121,117 | | |
| | 25,182 | | | @ | | Fairchild Semiconductor
International, Inc. | | | 123,140 | | |
| | 287,295 | | | | | IXYS Corp. | | | 2,373,057 | | |
| | 29,222 | | | @ | | Kulicke & Soffa Industries, Inc. | | | 49,677 | | |
| | 29,580 | | | @ | | Mattson Technology, Inc. | | | 41,708 | | |
| | 8,340 | | | @ | | MKS Instruments, Inc. | | | 123,349 | | |
| | 11,512 | | | @ | | QLogic Corp. | | | 154,721 | | |
| | 424,660 | | | @ | | Skyworks Solutions, Inc. | | | 2,352,616 | | |
| | 7,810 | | | @ | | Standard Microsystems Corp. | | | 127,615 | | |
| | 260,000 | | | @ | | Ultra Clean Holdings | | | 522,600 | | |
| | 3,220 | | | @ | | Varian Semiconductor
Equipment Associates, Inc. | | | 58,346 | | |
| | 15,831 | | | @ | | Zoran Corp. | | | 108,126 | | |
| | | | 6,461,326 | | |
| | | | | Software: 1.3% | |
| | 270,000 | | | @ | | Ariba, Inc. | | | 1,946,700 | | |
| | 9,492 | | | @ | | CSG Systems International | | | 165,825 | | |
| | 456,229 | | | @ | | Lawson Software, Inc. | | | 2,162,525 | | |
| Shares | | | | | | Value | |
| | 21,950 | | | @ | | MSCSoftware Corp. | | $ | 146,626 | | |
| | 5,760 | | | @ | | Progress Software Corp. | | | 110,938 | | |
| | 4,400 | | | @ | | SPSS, Inc. | | | 118,624 | | |
| | 10,582 | | | @ | | Sybase, Inc. | | | 262,116 | | |
| | | | 4,913,354 | | |
| | | | | Telecommunications: 0.9% | |
| | 21,010 | | | @ | | ADC Telecommunications, Inc. | | | 114,925 | | |
| | 13,720 | | | @ | | Anaren, Inc. | | | 163,954 | | |
| | 6,750 | | | @ | | Anixter International, Inc. | | | 203,310 | | |
| | 7,350 | | | | | Black Box Corp. | | | 191,982 | | |
| | 16,000 | | | @ | | Ciena Corp. | | | 107,200 | | |
| | 1,010,000 | | | @ | | Cincinnati Bell, Inc. | | | 1,949,300 | | |
| | 2,760 | | | @ | | Comtech Telecommunications | | | 126,463 | | |
| | 13,590 | | | @ | | CPI International, Inc. | | | 117,689 | | |
| | 17,182 | | | @ | | Syniverse Holdings, Inc. | | | 205,153 | | |
| | 42,690 | | | @ | | Tellabs, Inc. | | | 175,883 | | |
| | 12,642 | | | | | Warwick Valley Telephone Co. | | | 115,548 | | |
| | | | 3,471,407 | | |
| | | | | Transportation: 2.3% | |
| | 226,726 | | | | | General Maritime Corp. | | | 2,448,641 | | |
| | 6,662 | | | @ | | Genesee & Wyoming, Inc. | | | 203,191 | | |
| | 12,652 | | | | | Heartland Express, Inc. | | | 199,396 | | |
| | 7,550 | | | | | Knight Transportation, Inc. | | | 121,706 | | |
| | 94,670 | | | @@ | | Nordic American Tanker Shipping | | | 3,195,113 | | |
| | 2,332 | | | | | Ryder System, Inc. | | | 90,435 | | |
| | 5,262 | | | | | Tidewater, Inc. | | | 211,901 | | |
| | 124,962 | | | | | Werner Enterprises, Inc. | | | 2,166,841 | | |
| | | | 8,637,224 | | |
| | | | | Trucking & Leasing: 0.9% | |
| | 110,000 | | | | | GATX Corp. | | | 3,406,700 | | |
| | | | 3,406,700 | | |
| | | | | Water: 0.0% | |
| | 4,830 | | | @ | | Pico Holdings, Inc. | | | 128,381 | | |
| | | | 128,381 | | |
| | | Total Common Stock
(Cost $448,203,406) | | | 337,701,760 | | |
| REAL ESTATE INVESTMENT TRUSTS: 8.0% | | | |
| | | | | Apartments: 0.8% | |
| | 86,000 | | | | | Mid-America Apartment
Communities, Inc. | | | 3,195,760 | | |
| | | | 3,195,760 | | |
| | | | | Diversified: 0.9% | |
| | 99,000 | | | | | Digital Realty Trust, Inc. | | | 3,252,150 | | |
| | 11,850 | | | | | Duke Realty Corp. | | | 129,876 | | |
| | 17,732 | | | | | DuPont Fabros Technology, Inc. | | | 36,705 | | |
| | | | 3,418,731 | | |
| | | | | Health Care: 2.3% | |
| | 178,000 | | | | | LTC Properties, Inc. | | | 3,609,840 | | |
| | 9,980 | | | | | National Health Investors, Inc. | | | 273,751 | | |
| | 275,000 | | | | | Omega Healthcare Investors, Inc. | | | 4,391,750 | | |
| | 8,340 | | | | | Universal Health Realty
Income Trust | | | 274,469 | | |
| | | | 8,549,810 | | |
See Accompanying Notes to Financial Statements
127
ING COLUMBIA PORTFOLIO OF INVESTMENTS
SMALL CAP VALUE II PORTFOLIO AS OF DECEMBER 31, 2008 (CONTINUED)
| Shares | | | | | | Value | |
| | | | | Hotels: 0.8% | |
| | 36,732 | | | | | DiamondRock Hospitality Co. | | $ | 186,231 | | |
| | 245,695 | | | | | LaSalle Hotel Properties | | | 2,714,930 | | |
| | 21,200 | | | | | Sunstone Hotel Investors, Inc. | | | 131,228 | | |
| | | | 3,032,389 | | |
| | | | | Manufactured Homes: 0.1% | |
| | 16,792 | | | | | Sun Communities, Inc. | | | 235,088 | | |
| | | | 235,088 | | |
| | | | | Mortgage: 0.7% | |
| | 249,159 | | | | | Capstead Mortgage Corp. | | | 2,683,442 | | |
| | | | 2,683,442 | | |
| | | | | Office Property: 1.2% | |
| | 65,000 | | | | | Alexandria Real Estate
Equities, Inc. | | | 3,922,100 | | |
| | 23,810 | | | | | Franklin Street Properties Corp. | | | 351,198 | | |
| | 3,310 | | | | | Mack-Cali Realty Corp. | | | 81,095 | | |
| | | | 4,354,393 | | |
| | | | | Paper & Related Products: 0.1% | |
| | 11,632 | | | | | Potlatch Corp. | | | 302,548 | | |
| | | | 302,548 | | |
| | | | | Shopping Centers: 0.9% | |
| | 89,000 | | | | | Tanger Factory
Outlet Centers, Inc. | | | 3,348,180 | | |
| | 15,372 | | | | | Urstadt Biddle Properties, Inc. | | | 244,876 | | |
| | | | 3,593,056 | | |
| | | | | Single Tenant: 0.1% | |
| | 7,752 | | | | | Getty Realty Corp. | | | 163,257 | | |
| | 13,260 | | | | | Realty Income Corp. | | | 306,969 | | |
| | | | 470,226 | | |
| | | | | Warehouse/Industrial: 0.1% | |
| | 40,562 | | | | | DCT Industrial Trust, Inc. | | | 205,244 | | |
| | | | 205,244 | | |
| | | Total Real Estate
Investment Trusts
(Cost $34,843,618) | | | 30,040,687 | | |
| | | Total Long-Term Investments
(Cost $483,047,024) | | | 367,742,447 | | |
| SHORT-TERM INVESTMENTS: 1.8% | |
| | | Affiliated Mutual Fund: 1.8% | |
| | 6,762,892 | | | ING Institutional Prime Money
Market Fund - Class I | | | 6,762,892 | | |
Total Short-Term Investments
(Cost $6,762,892) | | | 6,762,892 | | |
Total Investments in
Securities
(Cost $489,809,916)* | | | 99.5 | % | | $ | 374,505,339 | | |
Other Assets and
Liabilities - Net | | | 0.5 | | | | 1,920,276 | | |
| Net Assets | | | 100.0 | % | | $ | 376,425,615 | | |
@ Non-income producing security
@@ Foreign Issuer
ADR American Depositary Receipt
* Cost for federal income tax purposes is $497,345,257.
Net unrealized depreciation consists of:
| Gross Unrealized Appreciation | | $ | 8,765,224 | | |
| Gross Unrealized Depreciation | | | (131,605,142 | ) | |
| Net Unrealized Depreciation | | $ | (122,839,918 | ) | |
The following table summarizes the inputs used as of December 31, 2008 in determining the Portfolio's investments at fair value for purposes of SFAS 157:
| | | Investments in
Securities | | Other Financial
Instruments* | |
| Level 1 — Quoted Prices | | $ | 374,505,339 | | | $ | — | | |
Level 2 — Other Significant
Observable Inputs | | | — | | | | — | | |
Level 3 — Significant
Unobservable Inputs | | | — | | | | — | | |
| Total | | $ | 374,505,339 | | | $ | — | | |
"Fair value" for purposes of SFAS 157 is different from "fair value" as used in the 1940 Act. The former generally implies market value, and can include market quotations as a source of value, and the latter refers to determinations of actual value in absence of available market quotations.
* Other financial instruments may include forward foreign currency contracts, futures, swaps, and written options. Forward foreign currency contracts and futures are reported at their unrealized gain/loss at year end. Swaps and written options are reported at their market value at year end.
See Accompanying Notes to Financial Statements
128
PORTFOLIO OF INVESTMENTS
ING DAVIS NEW YORK VENTURE PORTFOLIO AS OF DECEMBER 31, 2008
| Shares | | | | | | Value | |
| COMMON STOCK: 89.8% | | | |
| | | | | Agriculture: 3.5% | |
| | 14,500 | | | | | Altria Group, Inc. | | $ | 218,370 | | |
| | 280,302 | | | | | Philip Morris International, Inc. | | | 12,195,940 | | |
| | | | 12,414,310 | | |
| | | | | Auto Manufacturers: 0.1% | |
| | 15,760 | | | | | Paccar, Inc. | | | 450,736 | | |
| | | | 450,736 | | |
| | | | | Banks: 12.2% | |
| | 330,650 | | | | | Bank of New York Mellon Corp. | | | 9,367,315 | | |
| | 135,360 | | | | | Citigroup, Inc. | | | 908,266 | | |
| | 12,900 | | | | | Goldman Sachs Group, Inc. | | | 1,088,631 | | |
| | 469,400 | | | | | JPMorgan Chase & Co. | | | 14,800,182 | | |
| | 17,100 | | | | | Morgan Stanley | | | 274,284 | | |
| | 18,950 | | | | | State Street Corp. | | | 745,304 | | |
| | 101,090 | | | | | Wachovia Corp. | | | 560,039 | | |
| | 519,340 | | | | | Wells Fargo & Co. | | | 15,310,138 | | |
| | | | 43,054,159 | | |
| | | | | Beverages: 2.3% | |
| | 95,000 | | | @@ | | Diageo PLC ADR | | | 5,390,300 | | |
| | 92,600 | | | @@ | | Heineken Holding NV | | | 2,645,081 | | |
| | | | 8,035,381 | | |
| | | | | Building Materials: 0.6% | |
| | 22,300 | | | | | Martin Marietta Materials, Inc. | | | 2,164,884 | | |
| | | | 2,164,884 | | |
| | | | | Chemicals: 0.5% | |
| | 24,500 | | | | | Monsanto Co. | | | 1,723,575 | | |
| | | | 1,723,575 | | |
| | | | | Coal: 0.3% | |
| | 1,390,500 | | | @@ | | China Coal Energy
Co. - Shares H | | | 1,123,740 | | |
| | | | 1,123,740 | | |
| | | | | Commercial Services: 4.4% | |
| | 468,010 | | | @@ | | Cosco Pacific Ltd. | | | 481,192 | | |
| | 286,000 | | | | | H&R Block, Inc. | | | 6,497,920 | | |
| | 238,650 | | | @ | | Iron Mountain, Inc. | | | 5,901,815 | | |
| | 102,800 | | | | | Moody's Corp. | | | 2,065,252 | | |
| | 12,400 | | | | | Visa, Inc. | | | 650,380 | | |
| | | | 15,596,559 | | |
| | | | | Computers: 1.5% | |
| | 103,300 | | | @ | | Dell, Inc. | | | 1,057,792 | | |
| | 117,700 | | | | | Hewlett-Packard Co. | | | 4,271,333 | | |
| | | | 5,329,125 | | |
| | | | | Cosmetics/Personal Care: 2.2% | |
| | 39,260 | | | | | Avon Products, Inc. | | | 943,418 | | |
| | 109,150 | | | | | Procter & Gamble Co. | | | 6,747,653 | | |
| | | | 7,691,071 | | |
| | | | | Diversified Financial Services: 3.3% | |
| | 484,220 | | | | | American Express Co. | | | 8,982,282 | | |
| | 69,830 | | | | | Ameriprise Financial, Inc. | | | 1,631,229 | | |
| | 33,600 | | | | | Discover Financial Services | | | 320,208 | | |
| | 101,800 | | | @ | | E*Trade Financial Corp. | | | 117,070 | | |
| | 50,285 | | | | | Merrill Lynch & Co., Inc. | | | 585,317 | | |
| | | | 11,636,106 | | |
| Shares | | | | | | Value | |
| | | | | Electric: 0.4% | |
| | 160,200 | | | @ | | AES Corp. | | $ | 1,320,048 | | |
| | | | 1,320,048 | | |
| | | | | Electronics: 1.2% | |
| | 157,468 | | | @ | | Agilent Technologies, Inc. | | | 2,461,225 | | |
| | 20,900 | | | @@ | | Garmin Ltd. | | | 400,653 | | |
| | 79,535 | | | @@ | | Tyco Electronics Ltd. | | | 1,289,262 | | |
| | | | 4,151,140 | | |
| | | | | Engineering & Construction: 0.1% | |
| | 33,170 | | | @@ | | ABB Ltd. ADR | | | 497,882 | | |
| | | | 497,882 | | |
| | | | | Food: 0.4% | |
| | 28,950 | | | | | Hershey Co. | | | 1,005,723 | | |
| | 30,100 | | | | | Whole Foods Market, Inc. | | | 284,144 | | |
| | | | 1,289,867 | | |
| | | | | Food Service: 0.0% | |
| | 5,486 | | | X | | FHC Delaware, Inc. | | | 55 | | |
| | | | 55 | | |
| | | | | Forest Products & Paper: 0.5% | |
| | 239,000 | | | @,@@ | | Sino-Forest Corp. | | | 1,910,838 | | |
| | | | 1,910,838 | | |
| | | | | Healthcare-Products: 0.6% | |
| | 36,800 | | | | | Johnson & Johnson | | | 2,201,744 | | |
| | | | 2,201,744 | | |
| | | | | Healthcare-Services: 1.4% | |
| | 188,400 | | | | | UnitedHealth Group, Inc. | | | 5,011,440 | | |
| | | | 5,011,440 | | |
| | | | | Holding Companies-Diversified: 0.5% | |
| | 918,166 | | | @@ | | China Merchants Holdings
International Co., Ltd. | | | 1,793,116 | | |
| | | | 1,793,116 | | |
| | | | | Housewares: 0.1% | |
| | 13,500 | | | @@ | | Hunter Douglas NV | | | 444,432 | | |
| | | | 444,432 | | |
| | | | | Insurance: 10.6% | |
| | 372,450 | | | | | American International
Group, Inc. | | | 584,747 | | |
| | 142 | | | @ | | Berkshire Hathaway,
Inc. - Class A | | | 13,717,200 | | |
| | 168 | | | @ | | Berkshire Hathaway,
Inc. - Class B | | | 539,952 | | |
| | 7,555 | | | @@ | | Everest Re Group Ltd. | | | 575,238 | | |
| | 286,149 | | | | | Loews Corp. | | | 8,083,709 | | |
| | 930 | | | @ | | Markel Corp. | | | 278,070 | | |
| | 28,060 | | | | | MBIA, Inc. | | | 114,204 | | |
| | 242,600 | | | @@ | | Nipponkoa Insurance Co., Ltd. | | | 1,887,381 | | |
| | 31,700 | | | | | Principal Financial Group, Inc. | | | 715,469 | | |
| | 497,080 | | | | | Progressive Corp. | | | 7,361,755 | | |
| | 17,000 | | | @@ | | Sun Life Financial, Inc. | | | 393,380 | | |
| | 77,070 | | | | | Transatlantic Holdings, Inc. | | | 3,087,424 | | |
| | | | 37,338,529 | | |
See Accompanying Notes to Financial Statements
129
PORTFOLIO OF INVESTMENTS
ING DAVIS NEW YORK VENTURE PORTFOLIO AS OF DECEMBER 31, 2008 (CONTINUED)
| Shares | | | | | | Value | |
| | | | | Internet: 1.8% | |
| | 35,150 | | | @ | | Amazon.com, Inc. | | $ | 1,802,492 | | |
| | 50,170 | | | @ | | eBay, Inc. | | | 700,373 | | |
| | 12,011 | | | @ | | Google, Inc. - Class A | | | 3,695,184 | | |
| | 70,200 | | | @ | | Liberty Media
Corp. - Interactive - Class A | | | 219,024 | | |
| | | | 6,417,073 | | |
| | | | | Leisure Time: 0.5% | |
| | 111,500 | | | | | Harley-Davidson, Inc. | | | 1,892,155 | | |
| | | | 1,892,155 | | |
| | | | | Media: 4.9% | |
| | 486,471 | | | | | Comcast Corp. - Special Class A | | | 7,856,507 | | |
| | 253,100 | | | @@ | | Grupo Televisa SA ADR | | | 3,781,314 | | |
| | 10,500 | | | @@ | | Lagardere SCA | | | 426,596 | | |
| | 56,760 | | | @ | | Liberty Media
Corp. - Entertainment | | | 992,165 | | |
| | 421,770 | | | | | News Corp. - Class A | | | 3,833,889 | | |
| | 8,000 | | | @@ | | WPP PLC ADR | | | 236,720 | | |
| | | | 17,127,191 | | |
| | | | | Mining: 1.5% | |
| | 53,500 | | | @@ | | BHP Billiton PLC | | | 1,037,665 | | |
| | 22,500 | | | @@ | | Rio Tinto PLC | | | 500,098 | | |
| | 52,650 | | | | | Vulcan Materials Co. | | | 3,663,387 | | |
| | | | 5,201,150 | | |
| | | | | | | Miscellaneous
Manufacturing: 0.9% | | | | | |
| | 20,100 | | | @@ | | Siemens AG | | | 1,516,355 | | |
| | 82,165 | | | @@ | | Tyco International Ltd. | | | 1,774,764 | | |
| | | | 3,291,119 | | |
| | | | | Oil & Gas: 14.9% | |
| | 142,810 | | | @@ | | Canadian Natural Resources Ltd. | | | 5,709,544 | | |
| | 273,100 | | | | | ConocoPhillips | | | 14,146,580 | | |
| | 177,920 | | | | | Devon Energy Corp. | | | 11,691,123 | | |
| | 138,700 | | | | | EOG Resources, Inc. | | | 9,234,646 | | |
| | 163,130 | | | | | Occidental Petroleum Corp. | | | 9,786,169 | | |
| | 1,600 | | | @,@@ | | OGX Petroleo e Gas
Participacoes SA | | | 360,899 | | |
| | 36,376 | | | @ | | Transocean, Ltd. | | | 1,718,766 | | |
| | | | 52,647,727 | | |
| | | | | Packaging & Containers: 1.4% | |
| | 323,994 | | | | | Sealed Air Corp. | | | 4,840,470 | | |
| | | | 4,840,470 | | |
| | | | | Pharmaceuticals: 3.0% | |
| | 62,300 | | | | | Cardinal Health, Inc. | | | 2,147,481 | | |
| | 69,920 | | | @ | | Express Scripts, Inc. | | | 3,844,202 | | |
| | 258,555 | | | | | Schering-Plough Corp. | | | 4,403,192 | | |
| | | | 10,394,875 | | |
| | | | | Real Estate: 0.6% | |
| | 64,648 | | | @@ | | Brookfield Asset Management,
Inc. - Class A | | | 987,175 | | |
| | 412,000 | | | @@ | | Hang Lung Group Ltd. | | | 1,258,597 | | |
| | | | 2,245,772 | | |
| | | | | Retail: 8.2% | |
| | 141,600 | | | @ | | Bed Bath & Beyond, Inc. | | | 3,599,472 | | |
| | 121,700 | | | @ | | Carmax, Inc. | | | 958,996 | | |
| Shares | | | | | | Value | |
| | 294,225 | | | | | Costco Wholesale Corp. | | $ | 15,446,813 | | |
| | 191,127 | | | | | CVS Caremark Corp. | | | 5,492,990 | | |
| | 83,050 | | | | | Lowe's Cos., Inc. | | | 1,787,236 | | |
| | 16,850 | | | @ | | Sears Holding Corp. | | | 654,960 | | |
| | 49,200 | | | | | Staples, Inc. | | | 881,664 | | |
| | | | 28,822,131 | | |
| | | | | Semiconductors: 1.6% | |
| | 361,050 | | | | | Texas Instruments, Inc. | | | 5,603,496 | | |
| | | | 5,603,496 | | |
| | | | | Software: 1.7% | |
| | 309,840 | | | | | Microsoft Corp. | | | 6,023,290 | | |
| | | | 6,023,290 | | |
| | | | | Telecommunications: 0.7% | |
| | 121,480 | | | @ | | Cisco Systems, Inc. | | | 1,980,124 | | |
| | 274,900 | | | | | Sprint Nextel Corp. | | | 503,067 | | |
| | | | 2,483,191 | | |
| | | | | Transportation: 1.4% | |
| | 738,000 | | | @@ | | China Shipping Development
Co., Ltd. | | | 743,693 | | |
| | 38,357 | | | @@ | | Kuehne & Nagel
International AG | | | 2,484,318 | | |
| | 33,340 | | | | | United Parcel Service,
Inc. - Class B | | | 1,839,034 | | |
| | | | 5,067,045 | | |
Total Common Stock
(Cost $471,236,793) | | | 317,235,422 | | |
Principal
Amount | | | | | | Value | |
| CONVERTIBLE BONDS: 0.1% | | | |
| | | | | Forest Products & Paper: 0.1% | |
| $ | 649,000 | | | @@,#,I | | Sino-Forest Corp.,
5.000%, due 08/01/13 | | | 464,035 | | |
Total Convertible Bonds
(Cost $649,000) | | | 464,035 | | |
Total Long-Term Investments
(Cost $471,885,793) | | | 317,699,457 | | |
| SHORT-TERM INVESTMENTS: 9.0% | |
| | | Commercial Paper: 9.0% | |
| | 15,248,000 | | | Sanpaolo IMI U.S. Financial Co.,
0.350%, due 01/05/09 | | | 15,247,259 | | |
| | 16,360,000 | | | Toyota Motor Credit Corp.,
0.100%, due 01/02/09 | | | 16,359,909 | | |
Total Short-Term Investments
(Cost $31,607,168) | | | 31,607,168 | | |
Total Investments in
Securities
(Cost $503,492,961)* | | | 98.9 | % | | $ | 349,306,625 | | |
Other Assets and
Liabilities - Net | | | 1.1 | | | | 3,976,935 | | |
| Net Assets | | | 100.0 | % | | $ | 353,283,560 | | |
@ Non-income producing security
@@ Foreign Issuer
ADR American Depositary Receipt
See Accompanying Notes to Financial Statements
130
PORTFOLIO OF INVESTMENTS
ING DAVIS NEW YORK VENTURE PORTFOLIO AS OF DECEMBER 31, 2008 (CONTINUED)
# Securities with purchases pursuant to Rule 144A or section 4(2), under the Securities Act of 1933 and may not be resold subject to that rule except to qualified institutional buyers. Unless otherwise noted, these securities have been determined to be liquid under the guidelines established by the Funds' Board of Directors/Trustees.
I Illiquid security
X Fair value determined by ING Funds Valuation Committee appointed by the Funds' Board of Directors/Trustees.
* Cost for federal income tax purposes is $505,990,652.
Net unrealized depreciation consists of:
| Gross Unrealized Appreciation | | $ | 1,069,791 | | |
| Gross Unrealized Depreciation | | | (157,753,818 | ) | |
| Net Unrealized Depreciation | | $ | (156,684,027 | ) | |
The following table summarizes the inputs used as of December 31, 2008 in determining the Portfolio's investments at fair value for purposes of SFAS 157:
| | | Investments in
Securities | | Other Financial
Instruments* | |
| Level 1 — Quoted Prices | | $ | 295,502,803 | | | $ | — | | |
Level 2 — Other Significant
Observable Inputs | | | 53,803,767 | | | | — | | |
Level 3 — Significant
Unobservable Inputs | | | 55 | | | | — | | |
| Total | | $ | 349,306,625 | | | $ | — | | |
"Fair value" for purposes of SFAS 157 is different from "fair value" as used in the 1940 Act. The former generally implies market value, and can include market quotations as a source of value, and the latter refers to determinations of actual value in absence of available market quotations.
* Other financial instruments may include forward foreign currency contracts, futures, swaps, and written options. Forward foreign currency contracts and futures are reported at their unrealized gain/loss at year end. Swaps and written options are reported at their market value at year end.
A roll forward of fair value measurements using significant unobservable inputs (Level 3) for the year ended December 31, 2008, was as follows:
| | | Investments in
Securities | | Other Financial
Instruments* | |
| Beginning Balance at 12/31/07 | | $ | 55 | | | $ | — | | |
| Net Purchases/(Sales) | | | — | | | | — | | |
| Accrued Discounts/(Premiums) | | | — | | | | — | | |
| Total Realized Gain/(Loss) | | | — | | | | — | | |
Total Unrealized
Appreciation/(Depreciation) | | | — | | | | — | | |
Net Transfers In/(Out) of
Level 3 | | | — | | | | — | | |
| Ending Balance at 12/31/08 | | $ | 55 | | | $ | — | | |
* Other financial instruments may include forward foreign currency contracts, futures, swaps, and written options. Forward foreign currency contracts and futures are reported at their unrealized gain/loss at year end. Swaps and written options are reported at their market value at year end.
For the year ended December 31, 2008, total change in unrealized gain (loss) on Level 3 securities included in the change in net assets was $—. Total unrealized gain (loss) for all securities (including Level 1 and Level 2) can be found on the accompanying Statement of Operations.
See Accompanying Notes to Financial Statements
131
PORTFOLIO OF INVESTMENTS
ING JPMORGAN MID CAP VALUE PORTFOLIO AS OF DECEMBER 31, 2008
| Shares | | | | | | Value | |
| COMMON STOCK: 90.2% | | | |
| | | | | Advertising: 1.2% | |
| | 145,501 | | | @,L | | Clear Channel Outdoor
Holdings, Inc. | | $ | 894,832 | | |
| | 22,600 | | | @,L | | Lamar Advertising Co. | | | 283,856 | | |
| | 31,600 | | | | | Omnicom Group | | | 850,672 | | |
| | | | 2,029,360 | | |
| | | | | Aerospace/Defense: 1.7% | |
| | 34,200 | | | @,L | | Alliant Techsystems, Inc. | | | 2,932,992 | | |
| | | | 2,932,992 | | |
| | | | | Agriculture: 0.7% | |
| | 22,800 | | | | | Lorillard, Inc. | | | 1,284,780 | | |
| | | | 1,284,780 | | |
| | | | | Apparel: 1.7% | |
| | 20,100 | | | L | | Columbia Sportswear Co. | | | 710,937 | | |
| | 41,600 | | | | | VF Corp. | | | 2,278,432 | | |
| | | | 2,989,369 | | |
| | | | | Auto Manufacturers: 0.2% | |
| | 34,200 | | | | | Oshkosh Truck Corp. | | | 304,038 | | |
| | | | 304,038 | | |
| | | | | Auto Parts & Equipment: 0.6% | |
| | 60,000 | | | | | WABCO Holdings, Inc. | | | 947,400 | | |
| | | | 947,400 | | |
| | | | | Banks: 4.8% | |
| | 47,300 | | | L | | Cullen/Frost Bankers, Inc. | | | 2,397,164 | | |
| | 47,251 | | | L | | M&T Bank Corp. | | | 2,712,680 | | |
| | 11,900 | | | | | Northern Trust Corp. | | | 620,466 | | |
| | 177,313 | | | L | | Synovus Financial Corp. | | | 1,471,698 | | |
| | 51,800 | | | L | | Wilmington Trust Corp. | | | 1,152,032 | | |
| | | | 8,354,040 | | |
| | | | | Beverages: 0.5% | |
| | 16,275 | | | | | Brown-Forman Corp. | | | 838,000 | | |
| | | | 838,000 | | |
| | | | | Building Materials: 0.6% | |
| | 60,800 | | | @,L | | Owens Corning, Inc. | | | 1,051,840 | | |
| | | | 1,051,840 | | |
| | | | | Chemicals: 4.8% | |
| | 14,700 | | | | | Air Products & Chemicals, Inc. | | | 738,969 | | |
| | 113,408 | | | | | Albemarle Corp. | | | 2,528,998 | | |
| | 45,100 | | | | | PPG Industries, Inc. | | | 1,913,593 | | |
| | 27,800 | | | | | Sherwin-Williams Co. | | | 1,661,050 | | |
| | 33,700 | | | | | Sigma-Aldrich Corp. | | | 1,423,488 | | |
| | | | 8,266,098 | | |
| | | | | Commercial Services: 1.4% | |
| | 27,200 | | | | | H&R Block, Inc. | | | 617,984 | | |
| | 64,084 | | | | | Total System Services, Inc. | | | 897,176 | | |
| | 58,600 | | | | | Western Union Co. | | | 840,324 | | |
| | | | 2,355,484 | | |
| | | | | Computers: 1.7% | |
| | 108,700 | | | | | Jack Henry & Associates, Inc. | | | 2,109,867 | | |
| | 58,800 | | | @ | | NCR Corp. | | | 831,432 | | |
| | | | 2,941,299 | | |
| Shares | | | | | | Value | |
| | | | | Distribution/Wholesale: 1.8% | |
| | 80,500 | | | | | Genuine Parts Co. | | $ | 3,047,730 | | |
| | | | 3,047,730 | | |
| | | | | Diversified Financial Services: 1.1% | |
| | 11,100 | | | @ | | Affiliated Managers Group, Inc. | | | 465,312 | | |
| | 40,300 | | | L | | T. Rowe Price Group, Inc. | | | 1,428,232 | | |
| | | | 1,893,544 | | |
| | | | | Electric: 9.8% | |
| | 130,092 | | | | | American Electric Power Co., Inc. | | | 4,329,462 | | |
| | 266,300 | | | | | CMS Energy Corp. | | | 2,692,293 | | |
| | 31,300 | | | | | FirstEnergy Corp. | | | 1,520,554 | | |
| | 80,519 | | | | | Pacific Gas & Electric Co. | | | 3,116,890 | | |
| | 120,000 | | | | | Westar Energy, Inc. | | | 2,461,200 | | |
| | 154,500 | | | | | Xcel Energy, Inc. | | | 2,865,975 | | |
| | | | 16,986,374 | | |
| | | | | Electronics: 3.4% | |
| | 72,700 | | | | | Amphenol Corp. | | | 1,743,346 | | |
| | 119,800 | | | @ | | Arrow Electronics, Inc. | | | 2,257,032 | | |
| | 113,300 | | | @@ | | Tyco Electronics Ltd. | | | 1,836,593 | | |
| | | | 5,836,971 | | |
| | | | | Environmental Control: 1.8% | |
| | 126,450 | | | | | Republic Services, Inc. | | | 3,134,696 | | |
| | | | 3,134,696 | | |
| | | | | Food: 3.5% | |
| | 36,900 | | | | | JM Smucker Co. | | | 1,599,984 | | |
| | 165,800 | | | | | Safeway, Inc. | | | 3,941,066 | | |
| | 28,300 | | | | | Supervalu, Inc. | | | 413,180 | | |
| | | | 5,954,230 | | |
| | | | | Gas: 1.8% | |
| | 104,600 | | | | | Energen Corp. | | | 3,067,918 | | |
| | | | 3,067,918 | | |
| | | | | Healthcare-Products: 1.2% | |
| | 31,000 | | | | | Becton Dickinson & Co. | | | 2,120,090 | | |
| | | | 2,120,090 | | |
| | | | | Healthcare-Services: 2.4% | |
| | 44,500 | | | @ | | Community Health Systems, Inc. | | | 648,810 | | |
| | 87,700 | | | @ | | Coventry Health Care, Inc. | | | 1,304,976 | | |
| | 79,100 | | | @ | | Lincare Holdings, Inc. | | | 2,130,163 | | |
| | | | 4,083,949 | | |
| | | | | Household Products/Wares: 3.0% | |
| | 28,300 | | | | | Clorox Co. | | | 1,572,348 | | |
| | 76,800 | | | | | Fortune Brands, Inc. | | | 3,170,304 | | |
| | 38,800 | | | @ | | Jarden Corp. | | | 446,200 | | |
| | | | 5,188,852 | | |
| | | | | Insurance: 12.1% | |
| | 116,650 | | | | | Assurant, Inc. | | | 3,499,500 | | |
| | 124,161 | | | | | Cincinnati Financial Corp. | | | 3,609,360 | | |
| | 34,300 | | | @@ | | Everest Re Group Ltd. | | | 2,611,602 | | |
| | 391,950 | | | | | Old Republic International Corp. | | | 4,672,043 | | |
| | 163,500 | | | I | | OneBeacon Insurance Group Ltd. | | | 1,706,940 | | |
| | 96,200 | | | L | | Principal Financial Group, Inc. | | | 2,171,234 | | |
| | 86,200 | | | | | WR Berkley Corp. | | | 2,672,200 | | |
| | | | 20,942,879 | | |
See Accompanying Notes to Financial Statements
132
PORTFOLIO OF INVESTMENTS
ING JPMORGAN MID CAP VALUE PORTFOLIO AS OF DECEMBER 31, 2008 (CONTINUED)
| Shares | | | | | | Value | |
| | | | | Lodging: 1.3% | |
| | 118,900 | | | | | Marriott International, Inc. | | $ | 2,312,605 | | |
| | | | 2,312,605 | | |
| | | | | Media: 2.3% | |
| | 87,900 | | | | | Cablevision Systems Corp. | | | 1,480,236 | | |
| | 22,400 | | | | | Scripps Networks
Interactive - Class A | | | 492,800 | | |
| | 5,040 | | | L | | Washington Post | | | 1,966,860 | | |
| | | | 3,939,896 | | |
| | | | | Metal Fabricate/Hardware: 0.9% | |
| | 25,280 | | | | | Precision Castparts Corp. | | | 1,503,654 | | |
| | | | 1,503,654 | | |
| | | | | Mining: 0.6% | |
| | 32,500 | | | @ | | Century Aluminum Co. | | | 325,000 | | |
| | 9,700 | | | L | | Vulcan Materials Co. | | | 674,926 | | |
| | | | 999,926 | | |
| | | | | Miscellaneous Manufacturing: 2.1% | |
| | 90,800 | | | | | Carlisle Cos., Inc. | | | 1,879,560 | | |
| | 53,300 | | | | | Dover Corp. | | | 1,754,636 | | |
| | | | 3,634,196 | | |
| | | | | Oil & Gas: 3.4% | |
| | 123,000 | | | @ | | CVR Energy, Inc. | | | 492,000 | | |
| | 32,400 | | | | | Devon Energy Corp. | | | 2,129,004 | | |
| | 55,200 | | | | | Equitable Resources, Inc. | | | 1,851,960 | | |
| | 42,400 | | | | | Questar Corp. | | | 1,386,056 | | |
| | | | 5,859,020 | | |
| | | | | Oil & Gas Services: 0.4% | |
| | 96,900 | | | @ | | Helix Energy Solutions
Group, Inc. | | | 701,556 | | |
| | | | 701,556 | | |
| | | | | Packaging & Containers: 1.8% | |
| | 76,600 | | | | | Ball Corp. | | | 3,185,794 | | |
| | | | 3,185,794 | | |
| | | | | Pharmaceuticals: 0.9% | |
| | 67,100 | | | @,L | | VCA Antech, Inc. | | | 1,333,948 | | |
| | 19,600 | | | @ | | Warner Chilcott Ltd. | | | 284,200 | | |
| | | | 1,618,148 | | |
| | | | | Pipelines: 3.1% | |
| | 48,007 | | | @ | | Kinder Morgan
Management, LLC | | | 1,919,320 | | |
| | 41,600 | | | | | Oneok, Inc. | | | 1,211,392 | | |
| | 157,397 | | | | | Williams Cos., Inc. | | | 2,279,109 | | |
| | | | 5,409,821 | | |
| | | | | Real Estate: 0.8% | |
| | 185,750 | | | @@ | | Brookfield Properties Co. | | | 1,435,848 | | |
| | | | 1,435,848 | | |
| | | | | Retail: 5.3% | |
| | 116,523 | | | @,L | | Autonation, Inc. | | | 1,151,247 | | |
| | 14,150 | | | @,L | | Autozone, Inc. | | | 1,973,501 | | |
| | 16,500 | | | @ | | Bed Bath & Beyond, Inc. | | | 419,430 | | |
| | 77,900 | | | | | Burger King Holdings, Inc. | | | 1,860,252 | | |
| | 82,300 | | | | | Staples, Inc. | | | 1,474,816 | | |
| Shares | | | | | | Value | |
| | 64,900 | | | L | | Tiffany & Co. | | $ | 1,533,587 | | |
| | 35,500 | | | | | TJX Cos., Inc. | | | 730,235 | | |
| | | | 9,143,068 | | |
| | | | | Savings & Loans: 1.2% | |
| | 114,000 | | | L | | People's United Financial, Inc. | | | 2,032,620 | | |
| | | | 2,032,620 | | |
| | | | | Telecommunications: 2.7% | |
| | 43,000 | | | | | CenturyTel, Inc. | | | 1,175,190 | | |
| | 100,900 | | | | | Telephone & Data Systems, Inc. | | | 2,835,290 | | |
| | 78,521 | | | | | Windstream Corp. | | | 722,393 | | |
| | | | 4,732,873 | | |
| | | | | Transportation: 1.1% | |
| | 98,500 | | | @@,L | | Teekay Shipping Corp. | | | 1,935,525 | | |
| | | | 1,935,525 | | |
| | | | | Water: 0.5% | |
| | 39,800 | | | | | American Water Works Co., Inc. | | | 831,024 | | |
| | | | 831,024 | | |
Total Common Stock
(Cost $219,123,060) | | | 155,827,507 | | |
| REAL ESTATE INVESTMENT TRUSTS: 5.7% | | | |
| | | | | Diversified: 1.4% | |
| | 40,900 | | | | | Vornado Realty Trust | | | 2,468,315 | | |
| | | | 2,468,315 | | |
| | | | | Forestry: 0.3% | |
| | 14,600 | | | | | Plum Creek Timber Co., Inc. | | | 507,204 | | |
| | | | 507,204 | | |
| | | | | Health Care: 0.5% | |
| | 23,500 | | | | | Ventas, Inc. | | | 788,895 | | |
| | | | 788,895 | | |
| | | | | Paper & Related Products: 0.3% | |
| | 16,166 | | | | | Rayonier, Inc. | | | 506,804 | | |
| | | | 506,804 | | |
| | | | | Shopping Centers: 2.4% | |
| | 116,900 | | | | | Kimco Realty Corp. | | | 2,136,932 | | |
| | 45,000 | | | | | Regency Centers Corp. | | | 2,101,500 | | |
| | | | 4,238,432 | | |
| | | | | Storage: 0.8% | |
| | 17,600 | | | | | Public Storage, Inc. | | | 1,399,200 | | |
| | | | 1,399,200 | | |
Total Real Estate
Investment Trusts
(Cost $11,124,480) | | | 9,908,850 | | |
Total Long-Term Investments
(Cost $230,247,540) | | | 165,736,357 | | |
| SHORT-TERM INVESTMENTS: 11.2% | | | |
| | | | | Affiliated Mutual Fund: 3.6% | |
| | 6,263,329 | | | | | ING Institutional Prime Money
Market Fund - Class I | | | 6,263,329 | | |
Total Mutual Fund
(Cost $6,263,329) | | | 6,263,329 | | |
See Accompanying Notes to Financial Statements
133
PORTFOLIO OF INVESTMENTS
ING JPMORGAN MID CAP VALUE PORTFOLIO AS OF DECEMBER 31, 2008 (CONTINUED)
Principal
Amount | | | | Value | |
| | | Securities Lending Collateralcc: 7.6% | |
| $ | 13,247,554 | | | Bank of New York Mellon Corp.
Institutional Cash Reserves | | $ | 13,084,960 | | |
Total Securities Lending
Collateral
(Cost $13,247,554) | | | 13,084,960 | | |
Total Short-Term Investments
(Cost $19,510,883) | | | 19,348,289 | | |
Total Investments in
Securities
(Cost $249,758,423)* | | | 107.1 | % | | $ | 185,084,646 | | |
Other Assets and
Liabilities - Net | | | (7.1 | ) | | | (12,341,655 | ) | |
| Net Assets | | | 100.0 | % | | $ | 172,742,991 | | |
@ Non-income producing security
@@ Foreign Issuer
cc Securities purchased with cash collateral for securities loaned.
I Illiquid security
L Loaned security, a portion or all of the security is on loan at December 31, 2008.
* Cost for federal income tax purposes is $254,787,976.
Net unrealized depreciation consists of:
| Gross Unrealized Appreciation | | $ | 1,813,695 | | |
| Gross Unrealized Depreciation | | | (71,517,025 | ) | |
| Net Unrealized Depreciation | | $ | (69,703,330 | ) | |
The following table summarizes the inputs used as of December 31, 2008 in determining the Portfolio's investments at fair value for purposes of SFAS 157:
| | | Investments in
Securities | | Other Financial
Instruments* | |
| Level 1 — Quoted Prices | | $ | 171,999,686 | | | $ | — | | |
Level 2 — Other Significant
Observable Inputs | | | 13,084,960 | | | | — | | |
Level 3 — Significant
Unobservable Inputs | | | — | | | | — | | |
| Total | | $ | 185,084,646 | | | $ | — | | |
"Fair value" for purposes of SFAS 157 is different from "fair value" as used in the 1940 Act. The former generally implies market value, and can include market quotations as a source of value, and the latter refers to determinations of actual value in absence of available market quotations.
* Other financial instruments may include forward foreign currency contracts, futures, swaps, and written options. Forward foreign currency contracts and futures are reported at their unrealized gain/loss at year end. Swaps and written options are reported at their market value at year end.
See Accompanying Notes to Financial Statements
134
ING LEGG MASON PARTNERS PORTFOLIO OF INVESTMENTS
AGGRESSIVE GROWTH PORTFOLIO AS OF DECEMBER 31, 2008
| Shares | | | | | | Value | |
| COMMON STOCK: 96.2% | | | |
| | | | | Aerospace/Defense: 4.2% | |
| | 310,500 | | | | | L-3 Communications
Holdings, Inc. | | $ | 22,908,690 | | |
| | | | 22,908,690 | | |
| | | | | Banks: 0.0% | |
| | 2,696 | | | | | Goldman Sachs Group, Inc. | | | 227,515 | | |
| | | | 227,515 | | |
| | | | | Biotechnology: 26.0% | |
| | 739,190 | | | @ | | Amgen, Inc. | | | 42,688,223 | | |
| | 916,200 | | | @ | | Biogen Idec, Inc. | | | 43,638,606 | | |
| | 746,070 | | | @ | | Genzyme Corp. | | | 49,516,666 | | |
| | 192,300 | | | @ | | Vertex Pharmaceuticals, Inc. | | | 5,842,074 | | |
| | | | 141,685,569 | | |
| | | | | Computers: 1.6% | |
| | 31,500 | | | @ | | LaserCard Corp. | | | 114,660 | | |
| | 578,800 | | | @ | | Sandisk Corp. | | | 5,556,480 | | |
| | 637,166 | | | | | Seagate Technology, Inc. | | | 2,822,645 | | |
| | 83,100 | | | | | Seagate Technology,
Inc. - Escrow | | | 1 | | |
| | | | 8,493,786 | | |
| | | | | Diversified Financial Services: 0.8% | |
| | 121,200 | | | | | Cohen & Steers, Inc. | | | 1,331,988 | | |
| | 262,870 | | | | | Merrill Lynch & Co., Inc. | | | 3,059,807 | | |
| | | | 4,391,795 | | |
| | | | | Electronics: 1.7% | |
| | 40,000 | | | @ | | Dolby Laboratories, Inc. | | | 1,310,400 | | |
| | 500,848 | | | @@ | | Tyco Electronics Ltd. | | | 8,118,746 | | |
| | | | 9,429,146 | | |
| | | | | Engineering & Construction: 0.2% | |
| | 18,240 | | | | | Fluor Corp. | | | 818,429 | | |
| | | | 818,429 | | |
| | | | | Entertainment: 0.0% | |
| | 9,410 | | | @ | | Ascent Media Corp. | | | 205,514 | | |
| | | | 205,514 | | |
| | | | | Healthcare-Products: 4.2% | |
| | 216,900 | | | @ | | BioMimetic Therapeutics, Inc. | | | 1,999,818 | | |
| | 475,848 | | | @@ | | Covidien Ltd. | | | 17,244,732 | | |
| | 65,000 | | | | | Johnson & Johnson | | | 3,888,950 | | |
| | | | 23,133,500 | | |
| | | | | Healthcare-Services: 6.1% | |
| | 1,248,500 | | | | | UnitedHealth Group, Inc. | | | 33,210,100 | | |
| | | | 33,210,100 | | |
| | | | | Internet: 0.4% | |
| | 748,275 | | | @ | | Liberty Media
Corp. - Interactive - Class A | | | 2,334,618 | | |
| | | | 2,334,618 | | |
| | | | | Media: 16.5% | |
| | 1,223,700 | | | | | Cablevision Systems Corp. | | | 20,607,107 | | |
| | 176,805 | | | | | CBS Corp. - Class B | | | 1,448,033 | | |
| | 166,450 | | | | | Comcast Corp. - Class A | | | 2,809,676 | | |
| | 2,016,285 | | | | | Comcast Corp. - Special Class A | | | 32,563,003 | | |
| Shares | | | | | | Value | |
| | 94,105 | | | @ | | Discovery Communications,
Inc. - Class A | | $ | 1,332,527 | | |
| | 94,105 | | | @ | | Discovery Communications,
Inc. - Class C | | | 1,260,066 | | |
| | 59,346 | | | @ | | Liberty Global, Inc. | | | 944,788 | | |
| | 60,213 | | | @ | | Liberty Global, Inc. - Series C | | | 914,033 | | |
| | 154,855 | | | @ | | Liberty Media
Corp. - Capital Shares A | | | 729,367 | | |
| | 619,420 | | | @ | | Liberty Media
Corp. - Entertainment | | | 10,827,462 | | |
| | 2,466,720 | | | @ | | Sirius XM Radio, Inc. | | | 296,006 | | |
| | 116,805 | | | @ | | Viacom - Class B | | | 2,226,303 | | |
| | 585,500 | | | | | Walt Disney Co. | | | 13,284,995 | | |
| | 91,300 | | | | | World Wrestling
Entertainment, Inc. | | | 1,011,604 | | |
| | | | 90,254,970 | | |
| | | | | Miscellaneous Manufacturing: 4.1% | |
| | 397,300 | | | | | Pall Corp. | | | 11,295,239 | | |
| | 500,848 | | | @@ | | Tyco International Ltd. | | | 10,818,317 | | |
| | | | 22,113,556 | | |
| | | | | Oil & Gas: 9.2% | |
| | 1,306,000 | | | | | Anadarko Petroleum Corp. | | | 50,346,300 | | |
| | | | 50,346,300 | | |
| | | | | Oil & Gas Services: 6.1% | |
| | 386,459 | | | @ | | National Oilwell Varco, Inc. | | | 9,445,058 | | |
| | 2,207,600 | | | @ | | Weatherford International Ltd. | | | 23,886,232 | | |
| | | | 33,331,290 | | |
| | | | | Pharmaceuticals: 8.6% | |
| | 132,500 | | | @ | | Alkermes, Inc. | | | 1,411,125 | | |
| | 1,302,044 | | | @ | | Forest Laboratories, Inc. | | | 33,163,061 | | |
| | 92,400 | | | @ | | Isis Pharmaceuticals, Inc. | | | 1,310,232 | | |
| | 65,832 | | | @@ | | Teva Pharmaceutical Industries
Ltd. ADR | | | 2,802,468 | | |
| | 365,600 | | | @ | | Valeant Pharmaceuticals
International | | | 8,372,240 | | |
| | | | 47,059,126 | | |
| | | | | Retail: 0.1% | |
| | 188,300 | | | @ | | Charming Shoppes, Inc. | | | 459,452 | | |
| | | | 459,452 | | |
| | | | | Semiconductors: 3.6% | |
| | 624,800 | | | @ | | Broadcom Corp. | | | 10,602,856 | | |
| | 114,000 | | | @ | | Cree, Inc. | | | 1,809,180 | | |
| | 84,600 | | | @ | | DSP Group, Inc. | | | 678,492 | | |
| | 434,100 | | | | | Intel Corp. | | | 6,363,906 | | |
| | | | 19,454,434 | | |
| | | | | Software: 1.8% | |
| | 95,800 | | | @ | | Advent Software, Inc. | | | 1,913,126 | | |
| | 320,400 | | | @ | | Autodesk, Inc. | | | 6,295,860 | | |
| | 91,900 | | | | | Microsoft Corp. | | | 1,786,536 | | |
| | | | 9,995,522 | | |
| | | | | Telecommunications: 1.0% | |
| | 114,527 | | | @ | | Arris Group, Inc. | | | 910,490 | | |
| | 294,900 | | | @@ | | Nokia OYJ ADR | | | 4,600,440 | | |
| | | | 5,510,930 | | |
Total Common Stock
(Cost $630,134,925) | | | 525,364,242 | | |
See Accompanying Notes to Financial Statements
135
ING LEGG MASON PARTNERS PORTFOLIO OF INVESTMENTS
AGGRESSIVE GROWTH PORTFOLIO AS OF DECEMBER 31, 2008 (CONTINUED)
| Shares | | | | | | Value | |
| EXCHANGE-TRADED FUNDS: 1.6% | | | |
| | | | | Exchange-Traded Funds: 1.6% | |
| | 138,800 | | | | | Powershares QQQ | | $ | 4,127,912 | | |
| | 158,000 | | | | | Proshares Ultra Oil & Gas | | | 4,564,620 | | |
Total Exchange-Traded Funds
(Cost $10,039,095) | | | 8,692,532 | | |
Total Long-Term Investments
(Cost $640,174,020) | | | 534,056,774 | | |
| SHORT-TERM INVESTMENTS: 2.0% | | | |
| | | | | Affiliated Mutual Fund: 2.0% | |
| | 10,685,626 | | | | | ING Institutional Prime Money
Market Fund - Class I | | | 10,685,626 | | |
Total Mutual Fund
(Cost $10,685,626) | | | 10,685,626 | | |
Principal
Amount | | | | Value | |
| | | Institutional Cash Reserves: 0.0% | |
| $ | 154,628 | | | Bank of New York Mellon Corp.
Institutional Cash Reserves | | | 123,703 | | |
Total Institutional Cash Reserves
(Cost $154,628) | | | 123,703 | | |
Total Short-Term Investments
(Cost $10,840,254) | | | 10,809,329 | | |
Total Investments in
Securities
(Cost $651,014,274)* | | | 99.8 | % | | $ | 544,866,103 | | |
Other Assets and
Liabilities - Net | | | 0.2 | | | | 957,400 | | |
| Net Assets | | | 100.0 | % | | $ | 545,823,503 | | |
@ Non-income producing security
@@ Foreign Issuer
ADR American Depositary Receipt
* Cost for federal income tax purposes is $651,438,657.
Net unrealized depreciation consists of:
| Gross Unrealized Appreciation | | $ | 34,475,503 | | |
| Gross Unrealized Depreciation | | | (141,048,056 | ) | |
| Net Unrealized Depreciation | | $ | (106,572,553 | ) | |
The following table summarizes the inputs used as of December 31, 2008 in determining the Portfolio's investments at fair value for purposes of SFAS 157:
| | | Investments in
Securities | | Other Financial
Instruments* | |
| Level 1 — Quoted Prices | | $ | 544,742,400 | | | $ | — | | |
Level 2 — Other Significant
Observable Inputs | | | 123,703 | | | | — | | |
Level 3 — Significant
Unobservable Inputs | | | — | | | | — | | |
| Total | | $ | 544,866,103 | | | $ | — | | |
"Fair value" for purposes of SFAS 157 is different from "fair value" as used in the 1940 Act. The former generally implies market value, and can include market quotations as a source of value, and the latter refers to determinations of actual value in absence of available market quotations.
* Other financial instruments may include forward foreign currency contracts, futures, swaps, and written options. Forward foreign currency contracts and futures are reported at their unrealized gain/loss at year end. Swaps and written options are reported at their market value at year end.
See Accompanying Notes to Financial Statements
136
ING NEUBERGER PORTFOLIO OF INVESTMENTS
BERMAN PARTNERS PORTFOLIO AS OF DECEMBER 31, 2008
| Shares | | | | | | Value | |
| COMMON STOCK: 94.1% | | | |
| | | | | Aerospace/Defense: 1.8% | |
| | 61,100 | | | | | L-3 Communications
Holdings, Inc. | | $ | 4,507,958 | | |
| | | | 4,507,958 | | |
| | | | | Banks: 5.4% | |
| | 88,700 | | | | | Bank of America Corp. | | | 1,248,896 | | |
| | 79,000 | | | | | Bank of New York Mellon Corp. | | | 2,238,070 | | |
| | 481,800 | | | | | Citigroup, Inc. | | | 3,232,878 | | |
| | 57,550 | | | | | Goldman Sachs Group, Inc. | | | 4,856,645 | | |
| | 126,800 | | | | | Morgan Stanley | | | 2,033,872 | | |
| | | | 13,610,361 | | |
| | | | | Beverages: 3.5% | |
| | 342,242 | | | @ | | Constellation Brands, Inc. | | | 5,397,156 | | |
| | 207,300 | | | @ | | Dr Pepper Snapple Group, Inc. | | | 3,368,625 | | |
| | | | 8,765,781 | | |
| | | | | Coal: 1.8% | |
| | 112,800 | | | | | Peabody Energy Corp. | | | 2,566,200 | | |
| | 107,400 | | | | | Walter Industries, Inc. | | | 1,880,574 | | |
| | | | 4,446,774 | | |
| | | | | Commercial Services: 3.8% | |
| | 131,650 | | | | | Lender Processing Services, Inc. | | | 3,877,093 | | |
| | 276,200 | | | | | Moody's Corp. | | | 5,548,858 | | |
| | | | 9,425,951 | | |
| | | | | Computers: 1.9% | |
| | 105,100 | | | @ | | Affiliated Computer Services, Inc. | | | 4,829,345 | | |
| | | | 4,829,345 | | |
| | | | | Diversified Financial Services: 3.8% | |
| | 203,300 | | | | | American Express Co. | | | 3,771,215 | | |
| | 405,300 | | | | | Invesco Ltd. | | | 5,852,532 | | |
| | | | 9,623,747 | | |
| | | | | Electric: 3.6% | |
| | 78,900 | | | | | FirstEnergy Corp. | | | 3,832,962 | | |
| | 217,000 | | | @ | | NRG Energy, Inc. | | | 5,062,610 | | |
| | | | 8,895,572 | | |
| | | | | | | Electrical Components &
Equipment: 2.2% | | | | | |
| | 102,500 | | | @ | | Energizer Holdings, Inc. | | | 5,549,350 | | |
| | | | 5,549,350 | | |
| | | | | Engineering & Construction: 5.0% | |
| | 252,300 | | | @@ | | ABB Ltd. ADR | | | 3,787,023 | | |
| | 344,500 | | | @@ | | Chicago Bridge & Iron Co. NV | | | 3,462,225 | | |
| | 203,200 | | | | | KBR, Inc. | | | 3,088,640 | | |
| | 228,200 | | | @ | | McDermott International, Inc. | | | 2,254,616 | | |
| | | | 12,592,504 | | |
| | | | | Healthcare-Products: 1.2% | |
| | 37,300 | | | @@ | | Covidien Ltd. | | | 1,351,752 | | |
| | 43,600 | | | @ | | Zimmer Holdings, Inc. | | | 1,762,312 | | |
| | | | 3,114,064 | | |
| | | | | Healthcare-Services: 4.3% | |
| | 204,600 | | | | | Aetna, Inc. | | | 5,831,100 | | |
| | 117,300 | | | @ | | WellPoint, Inc. | | | 4,941,849 | | |
| | | | 10,772,949 | | |
| Shares | | | | | | Value | |
| | | | | Home Builders: 1.6% | |
| | 8,700 | | | @ | | NVR, Inc. | | $ | 3,969,375 | | |
| | | | 3,969,375 | | |
| | | | | Insurance: 6.3% | |
| | 158,300 | | | | | Assurant, Inc. | | | 4,749,000 | | |
| | 2,500 | | | @ | | Berkshire Hathaway, Inc. - Class B | | | 8,035,000 | | |
| | 87,900 | | | | | Metlife, Inc. | | | 3,064,194 | | |
| | | | 15,848,194 | | |
| | | | | Internet: 1.0% | |
| | 185,500 | | | @ | | Symantec Corp. | | | 2,507,960 | | |
| | | | 2,507,960 | | |
| | | | | Iron/Steel: 1.6% | |
| | 67,400 | | | | | Cliffs Natural Resources, Inc. | | | 1,726,114 | | |
| | 62,500 | | | | | United States Steel Corp. | | | 2,325,000 | | |
| | | | 4,051,114 | | |
| | | | | Leisure Time: 0.4% | |
| | 52,400 | | | | | Harley-Davidson, Inc. | | | 889,228 | | |
| | | | 889,228 | | |
| | | | | | | Machinery-Construction &
Mining: 1.8% | | | | | |
| | 266,800 | | | @ | | Terex Corp. | | | 4,620,976 | | |
| | | | 4,620,976 | | |
| | | | | Media: 2.3% | |
| | 47,000 | | | | | Cablevision Systems Corp. | | | 791,480 | | |
| | 215,400 | | | | | McGraw-Hill Cos., Inc. | | | 4,995,126 | | |
| | | | 5,786,606 | | |
| | | | | Metal Fabricate/Hardware: 0.5% | |
| | 225,900 | | | @@ | | Sterlite Industries India Ltd. ADR | | | 1,246,968 | | |
| | | | 1,246,968 | | |
| | | | | Mining: 2.8% | |
| | 149,600 | | | | | Freeport-McMoRan
Copper & Gold, Inc. | | | 3,656,224 | | |
| | 343,300 | | | @@ | | Teck Cominco Ltd. - Class B | | | 1,689,036 | | |
| | 183,100 | | | @@ | | Xstrata PLC | | | 1,713,336 | | |
| | | | 7,058,596 | | |
| | | | | Oil & Gas: 14.0% | |
| | 136,400 | | | @@ | | Canadian Natural Resources Ltd. | | | 5,453,272 | | |
| | 231,500 | | | @ | | Denbury Resources, Inc. | | | 2,527,980 | | |
| | 62,700 | | | | | EOG Resources, Inc. | | | 4,174,566 | | |
| | 14,400 | | | | | ExxonMobil Corp. | | | 1,149,552 | | |
| | 127,100 | | | | | Noble Corp. | | | 2,807,639 | | |
| | 231,900 | | | @@ | | Petroleo Brasileiro SA ADR | | | 5,679,231 | | |
| | 167,800 | | | @ | | Southwestern Energy Co. | | | 4,861,166 | | |
| | 154,660 | | | @@ | | Suncor Energy, Inc. | | | 3,015,870 | | |
| | 225,480 | | | @@ | | Talisman Energy, Inc. | | | 2,252,545 | | |
| | 92,650 | | | | | XTO Energy, Inc. | | | 3,267,766 | | |
| | | | 35,189,587 | | |
| | | | | Oil & Gas Services: 2.7% | |
| | 192,400 | | | | | Halliburton Co. | | | 3,497,832 | | |
| | 134,800 | | | @ | | National Oilwell Varco, Inc. | | | 3,294,512 | | |
| | | | 6,792,344 | | |
See Accompanying Notes to Financial Statements
137
ING NEUBERGER PORTFOLIO OF INVESTMENTS
BERMAN PARTNERS PORTFOLIO AS OF DECEMBER 31, 2008 (CONTINUED)
| Shares | | | | | | Value | |
| | | | | Pharmaceuticals: 5.4% | |
| | 81,900 | | | | | Cardinal Health, Inc. | | $ | 2,823,093 | | |
| | 278,500 | | | @ | | NBTY, Inc. | | | 4,358,525 | | |
| | 141,600 | | | @@ | | Shire PLC ADR | | | 6,340,847 | | |
| | | | 13,522,465 | | |
| | | | | Retail: 5.0% | |
| | 140,700 | | | | | Best Buy Co., Inc. | | | 3,955,077 | | |
| | 200,600 | | | | | JC Penney Co., Inc. | | | 3,951,820 | | |
| | 438,700 | | | | | Macy's, Inc. | | | 4,540,545 | | |
| | | | 12,447,442 | | |
| | | | | Semiconductors: 0.8% | |
| | 148,700 | | | @ | | International Rectifier Corp. | | | 2,007,450 | | |
| | | | 2,007,450 | | |
| | | | | Software: 5.4% | |
| | 104,200 | | | @,@@ | | Check Point
Software Technologies | | | 1,978,758 | | |
| | 278,800 | | | | | Fidelity National Information
Services, Inc. | | | 4,536,076 | | |
| | 174,480 | | | | | Microsoft Corp. | | | 3,391,891 | | |
| | 208,310 | | | @ | | Oracle Corp. | | | 3,693,336 | | |
| | | | 13,600,061 | | |
| | | | | Telecommunications: 2.3% | |
| | 113,900 | | | @@ | | China Mobile Ltd. ADR | | | 5,791,815 | | |
| | | | 5,791,815 | | |
| | | | | Transportation: 1.9% | |
| | 135,500 | | | | | DryShips, Inc. | | | 1,444,430 | | |
| | 60,750 | | | @@ | | Frontline Ltd. | | | 1,783,498 | | |
| | 137,972 | | | @@ | | Ship Finance International Ltd. | | | 1,524,591 | | |
| | | | 4,752,519 | | |
Total Common Stock
(Cost $357,946,551) | | | 236,217,056 | | |
| REAL ESTATE INVESTMENT TRUSTS: 2.0% | | | |
| | | | | Diversified: 0.3% | |
| | 10,900 | | | | | Vornado Realty Trust | | | 657,815 | | |
| | | | 657,815 | | |
| | | | | Mortgage: 1.7% | |
| | 278,200 | | | | | Annaly Capital Management, Inc. | | | 4,415,034 | | |
| | | | 4,415,034 | | |
Total Real Estate Investment Trusts
(Cost $4,860,287) | | | 5,072,849 | | |
Total Investments in
Securities
(Cost $362,806,838)* | | | 96.1 | % | | $ | 241,289,905 | | |
Other Assets and
Liabilities - Net | | | 3.9 | | | | 9,680,414 | | |
| Net Assets | | | 100.0 | % | | $ | 250,970,319 | | |
@ Non-income producing security
@@ Foreign Issuer
ADR American Depositary Receipt
* Cost for federal income tax purposes is $415,546,164.
Net unrealized depreciation consists of:
| Gross Unrealized Appreciation | | $ | 1,954,392 | | |
| Gross Unrealized Depreciation | | | (176,210,651 | ) | |
| Net Unrealized Depreciation | | $ | (174,256,259 | ) | |
The following table summarizes the inputs used as of December 31, 2008 in determining the Portfolio's investments at fair value for purposes of SFAS 157:
| | | Investments in
Securities | | Other Financial
Instruments* | |
| Level 1 — Quoted Prices | | $ | 237,793,071 | | | $ | — | | |
Level 2 — Other Significant
Observable Inputs | | | 3,496,834 | | | | — | | |
Level 3 — Significant
Unobservable Inputs | | | — | | | | — | | |
| Total | | $ | 241,289,905 | | | $ | — | | |
"Fair value" for purposes of SFAS 157 is different from "fair value" as used in the 1940 Act. The former generally implies market value, and can include market quotations as a source of value, and the latter refers to determinations of actual value in absence of available market quotations.
* Other financial instruments may include forward foreign currency contracts, futures, swaps, and written options. Forward foreign currency contracts and futures are reported at their unrealized gain/loss at year end. Swaps and written options are reported at their market value at year end.
See Accompanying Notes to Financial Statements
138
PORTFOLIO OF INVESTMENTS
ING OPPENHEIMER GLOBAL PORTFOLIO AS OF DECEMBER 31, 2008
| Shares | | | | | | Value | |
| COMMON STOCK: 97.7% | | | |
| | | | | Australia: 0.1% | |
| | 298,985 | | | L | | Aristocrat Leisure Ltd. | | $ | 813,503 | | |
| | | | 813,503 | | |
| | | | | Bermuda: 0.2% | |
| | 917,600 | | | | | XL Capital, Ltd. | | | 3,395,120 | | |
| | | | 3,395,120 | | |
| | | | | Brazil: 1.4% | |
| | 228,700 | | | L | | Cia de Bebidas das
Americas ADR | | | 10,133,697 | | |
| | 546,600 | | | | | Empresa Brasileira de
Aeronautica SA ADR | | | 8,860,386 | | |
| | | | 18,994,083 | | |
| | | | | Canada: 1.1% | |
| | 565,100 | | | L | | Husky Energy, Inc. | | | 14,130,933 | | |
| | | | 14,130,933 | | |
| | | | | Finland: 0.9% | |
| | 567,000 | | | | | Fortum OYJ | | | 12,323,918 | | |
| | | | 12,323,918 | | |
| | | | | France: 5.3% | |
| | 343,028 | | | L | | LVMH Moet Hennessy Louis
Vuitton SA | | | 22,989,223 | | |
| | 152,646 | | | @,L | | NicOx SA | | | 1,668,011 | | |
| | 214,329 | | | | | Sanofi-Aventis | | | 13,709,152 | | |
| | 157,458 | | | L | | Societe Generale | | | 7,988,302 | | |
| | 351,934 | | | | | Technip SA | | | 10,805,754 | | |
| | 225,214 | | | | | Total SA | | | 12,382,069 | | |
| | | | 69,542,511 | | |
| | | | | Germany: 6.6% | |
| | 170,570 | | | | | Allianz AG | | | 18,124,555 | | |
| | 394,994 | | | | | Bayerische Motoren Werke AG | | | 12,330,411 | | |
| | 649,373 | | | | | SAP AG | | | 23,381,763 | | |
| | 448,622 | | | | | Siemens AG | | | 33,844,287 | | |
| | | | 87,681,016 | | |
| | | | | India: 2.1% | |
| | 1,757,913 | | | @,I | | Dish TV India Ltd. | | | 727,654 | | |
| | 618,672 | | | | | Hindustan Lever Ltd. | | | 3,198,701 | | |
| | 6,300 | | | L | | ICICI Bank Ltd. ADR | | | 121,275 | | |
| | 762,165 | | | | | Infosys Technologies Ltd. | | | 17,664,063 | | |
| | 1,622,138 | | | @ | | Wire and Wireless India Ltd. | | | 410,827 | | |
| | 1,907,076 | | | | | Zee Telefilms Ltd. | | | 5,501,932 | | |
| | | | 27,624,452 | | |
| | | | | Italy: 1.2% | |
| | 1,181,700 | | | L | | Bulgari S.p.A. | | | 7,530,351 | | |
| | 189,125 | | | L | | Tod's S.p.A. | | | 8,231,507 | | |
| | | | 15,761,858 | | |
| | | | | Japan: 14.3% | |
| | 79,700 | | | | | Fanuc Ltd. | | | 5,712,242 | | |
| | 621,000 | | | | | Hoya Corp. | | | 10,846,502 | | |
| | 3,650 | | | | | KDDI Corp. | | | 26,062,088 | | |
| | 61,230 | | | | | Keyence Corp. | | | 12,583,498 | | |
| | 98,000 | | | | | Kyocera Corp. | | | 7,094,984 | | |
| | 1,071,000 | �� | | | | Mitsubishi Electric Corp. | | | 6,711,692 | | |
| | 376,300 | | | | | Murata Manufacturing Co., Ltd. | | | 14,755,260 | | |
| | 104,000 | | | | | Nidec Corp. | | | 4,067,368 | | |
| Shares | | | | | | Value | |
| | 30,400 | | | | | Nintendo Co., Ltd. | | $ | 11,617,411 | | |
| | 245,400 | | | | | Secom Co., Ltd. | | | 12,663,249 | | |
| | 380,100 | | | L | | Sega Sammy Holdings, Inc. | | | 4,432,311 | | |
| | 317,571 | | | | | Seven & I Holdings Co., Ltd. | | | 10,915,421 | | |
| | 492,000 | | | | | Shionogi & Co., Ltd. | | | 12,705,935 | | |
| | 862,100 | | | | | Sony Corp. | | | 18,855,776 | | |
| | 1,517 | | | | | Sony Financial Holdings, Inc. | | | 5,789,555 | | |
| | 3,284 | | | X | | Sumitomo Mitsui Financial
Group, Inc. | | | 13,076,587 | | |
| | 332,500 | | | | | Toyota Motor Corp. | | | 10,991,894 | | |
| | | | 188,881,773 | | |
| | | | | Mexico: 2.9% | |
| | 5,257,600 | | | | | Fomento Economico
Mexicano SA de CV ADR | | | 15,717,561 | | |
| | 2,313,900 | | | | | Grupo Modelo SA | | | 7,351,814 | | |
| | 1,048,400 | | | | | Grupo Televisa SA ADR | | | 15,663,096 | | |
| | | | 38,732,471 | | |
| | | | | Netherlands: 3.3% | |
| | 925,303 | | | L | | European Aeronautic
Defence and Space Co. NV | | | 15,670,336 | | |
| | 847,977 | | | | | Koninklijke Philips
Electronics NV | | | 16,812,588 | | |
| | 554,600 | | | | | TNT NV | | | 10,773,305 | | |
| | | | 43,256,229 | | |
| | | | | Norway: 0.6% | |
| | 688,400 | | | | | Tandberg ASA | | | 7,586,465 | | |
| | | | 7,586,465 | | |
| | | | | South Korea: 0.5% | |
| | 371,900 | | | | | SK Telecom Co., Ltd. ADR | | | 6,761,142 | | |
| | | | 6,761,142 | | |
| | | | | Spain: 1.5% | |
| | 443,600 | | | L | | Inditex SA | | | 19,753,865 | | |
| | | | 19,753,865 | | |
| | | | | Sweden: 8.2% | |
| | 1,554,000 | | | | | Assa Abloy AB | | | 18,071,587 | | |
| | 595,000 | | | L | | Hennes & Mauritz AB | | | 23,666,191 | | |
| | 927,075 | | | | | Investor AB | | | 14,140,661 | | |
| | 6,695,520 | | | L | | Telefonaktiebolaget LM
Ericsson | | | 52,197,480 | | |
| | | | 108,075,919 | | |
| | | | | Switzerland: 4.5% | |
| | 18,590 | | | @ | | Basilea Pharmaceutica-Reg | | | 2,638,675 | | |
| | 660,379 | | | | | Credit Suisse Group | | | 18,506,838 | | |
| | 246,967 | | | | | Roche Holding AG | | | 38,234,719 | | |
| | | | 59,380,232 | | |
| | | | | Taiwan: 2.1% | |
| | 1,654,788 | | | | | MediaTek, Inc. | | | 11,192,173 | | |
| | 7,997,311 | | | | | Taiwan Semiconductor
Manufacturing Co., Ltd. | | | 10,912,171 | | |
| | 679,500 | | | | | Taiwan Semiconductor
Manufacturing Co., Ltd. ADR | | | 5,368,050 | | |
| | | | 27,472,394 | | |
| | | | | Turkey: 0.3% | |
| | 310,500 | | | L | | Turkcell Iletisim Hizmet AS ADR | | | 4,527,090 | | |
| | | | 4,527,090 | | |
See Accompanying Notes to Financial Statements
139
PORTFOLIO OF INVESTMENTS
ING OPPENHEIMER GLOBAL PORTFOLIO AS OF DECEMBER 31, 2008 (CONTINUED)
| Shares | | | | | | Value | |
| | | | | United Kingdom: 8.3% | |
| | 675,820 | | | | | 3i Group PLC | | $ | 2,646,568 | | |
| | 270,700 | | | | | BP PLC ADR | | | 12,652,518 | | |
| | 988,118 | | | | | Burberry Group PLC | | | 3,199,246 | | |
| | 1,281,678 | | | | | Cadbury PLC | | | 11,157,765 | | |
| | 598,259 | | | | | Diageo PLC | | | 8,406,051 | | |
| | 1,584,352 | | | L | | HSBC Holdings PLC | | | 15,723,408 | | |
| | 1,744,956 | | | | | Prudential PLC | | | 10,592,299 | | |
| | 378,206 | | | | | Reckitt Benckiser PLC | | | 14,171,743 | | |
| | 4,579,739 | | | | | Royal Bank of Scotland
Group PLC | | | 3,371,273 | | |
| | 2,882,870 | | | | | Tesco PLC | | | 15,011,192 | | |
| | 6,622,026 | | | | | Vodafone Group PLC | | | 13,559,611 | | |
| | | | 110,491,674 | | |
| | | | | United States: 32.3% | |
| | 302,700 | | | | | 3M Co. | | | 17,417,358 | | |
| | 219,900 | | | @,L | | Acadia Pharmaceuticals, Inc. | | | 197,910 | | |
| | 787,583 | | | @ | | Adobe Systems, Inc. | | | 16,767,642 | | |
| | 445,300 | | | | | Aetna, Inc. | | | 12,691,050 | | |
| | 344,700 | | | | | Aflac, Inc. | | | 15,801,048 | | |
| | 825,500 | | | | | Altera Corp. | | | 13,794,105 | | |
| | 558,900 | | | | | Automatic Data
Processing, Inc. | | | 21,987,126 | | |
| | 152,300 | | | | | Boeing Co. | | | 6,498,641 | | |
| | 703,900 | | | | | Carnival Corp. | | | 17,118,848 | | |
| | 394,900 | | | | | Citigroup, Inc. | | | 2,649,779 | | |
| | 6,700 | | | | | CME Group, Inc. | | | 1,394,337 | | |
| | 245,400 | | | | | Colgate-Palmolive Co. | | | 16,819,716 | | |
| | 1,173,600 | | | | | Corning, Inc. | | | 11,184,408 | | |
| | 356,500 | | | @,L | | Cree, Inc. | | | 5,657,655 | | |
| | 1,330,700 | | | @ | | eBay, Inc. | | | 18,576,572 | | |
| | 291,900 | | | | | Emerson Electric Co. | | | 10,686,459 | | |
| | 199,500 | | | @,L | | InterMune, Inc. | | | 2,110,710 | | |
| | 300,200 | | | | | International Game
Technology | | | 3,569,378 | | |
| | 936,800 | | | @ | | Intuit, Inc. | | | 22,286,472 | | |
| | 1,425,900 | | | @ | | Juniper Networks, Inc. | | | 24,967,509 | | |
| | 330,700 | | | | | Linear Technology Corp. | | | 7,315,084 | | |
| | 108,500 | | | | | Lockheed Martin Corp. | | | 9,122,680 | | |
| | 808,700 | | | | | Maxim Integrated Products | | | 9,235,354 | | |
| | 337,300 | | | | | McDonald's Corp. | | | 20,976,687 | | |
| | 1,180,300 | | | | | Microsoft Corp. | | | 22,945,032 | | |
| | 150,300 | | | | | Northrop Grumman Corp. | | | 6,769,512 | | |
| | 267,300 | | | | | Raytheon Co. | | | 13,642,992 | | |
| | 130,500 | | | @ | | Regeneron
Pharmaceuticals, Inc. | | | 2,395,980 | | |
| | 370,354 | | | @,L | | Seattle Genetics, Inc. | | | 3,310,965 | | |
| | 381,800 | | | @ | | Shuffle Master, Inc. | | | 1,893,728 | | |
| | 8,056,439 | | | @,L | | Sirius XM Radio, Inc. | | | 966,773 | | |
| | 1,265,800 | | | @ | | SLM Corp. | | | 11,265,620 | | |
| | 322,300 | | | @,L | | Theravance, Inc. | | | 3,993,297 | | |
| | 548,800 | | | | | Tiffany & Co. | | | 12,968,144 | | |
| | 246,379 | | | @ | | Transocean, Ltd. | | | 11,641,408 | | |
| | 423,200 | | | | | Wal-Mart Stores, Inc. | | | 23,724,592 | | |
| | 801,200 | | | | | Walt Disney Co. | | | 18,179,228 | | |
| | 120,600 | | | @ | | WellPoint, Inc. | | | 5,080,878 | | |
| | | | 427,604,677 | | |
Total Common Stock
(Cost $1,705,027,312) | | | 1,292,791,325 | | |
| Shares | | | | | | Value | |
| PREFERRED STOCK: 0.8% | | | |
| | | | | Germany: 0.7% | |
| | 145,376 | | | | | Bayerische Motoren
Werke AG | | $ | 2,880,560 | | |
| | 83,402 | | | | | Porsche AG | | | 6,640,145 | | |
| | | | 9,520,705 | | |
| | | | | United States: 0.1% | |
| | 5,500 | | | | | Schering-Plough Corp. | | | 959,750 | | |
| | | | 959,750 | | |
Total Preferred Stock
(Cost $13,688,627) | | | 10,480,455 | | |
| RIGHTS: 0.0% | | | |
| | | | | India: 0.0% | |
| | 2,039,712 | | | | | Dish TV India Ltd. | | | 8,373 | | |
Total Rights
(Cost $—) | | | 8,373 | | |
Principal
Amount | | | | | | Value | |
| CONVERTIBLE BONDS: 0.1% | | | |
| | | | | United States: 0.1% | |
| $ | 1,890,000 | | | | | Theravance, Inc., 3.000%,
due 01/15/15 | | | 1,167,075 | | |
Total Convertible Bonds
(Cost $1,890,000) | | | 1,167,075 | | |
Total Long-Term Investments
(Cost $1,720,605,939) | | | 1,304,447,228 | | |
| Shares | | | | | | Value | |
| SHORT-TERM INVESTMENTS: 11.5% | | | |
| | | | | Affiliated Mutual Fund: 1.5% | |
| | 20,084,110 | | | | | ING Institutional Prime
Money Market Fund - Class I | | | 20,084,110 | | |
Total Mutual Fund
(Cost $20,084,110) | | | 20,084,110 | | |
Principal
Amount | | | | Value | |
| | | Securities Lending Collateralcc: 10.0% | |
| $ | 132,214,333 | | | Bank of New York Mellon Corp.
Institutional Cash Reserves | | | 131,116,555 | | |
Total Securities Lending
Collateral
(Cost $132,214,332) | | | 131,116,555 | | |
Total Short-Term Investments
(Cost $152,298,442) | | | 151,200,665 | | |
Total Investments in
Securities
(Cost $1,872,904,381)* | | | 110.1 | % | | $ | 1,455,647,893 | | |
Other Assets and
Liabilities - Net | | | (10.1 | ) | | | (133,446,798 | ) | |
| Net Assets | | | 100.0 | % | | $ | 1,322,201,095 | | |
See Accompanying Notes to Financial Statements
140
PORTFOLIO OF INVESTMENTS
ING OPPENHEIMER GLOBAL PORTFOLIO AS OF DECEMBER 31, 2008 (CONTINUED)
@ Non-income producing security
ADR American Depositary Receipt
cc Securities purchased with cash collateral for securities loaned.
I Illiquid security
L Loaned security, a portion or all of the security is on loan at December 31, 2008.
X Fair value determined by ING Funds Valuation Committee appointed by the Funds' Board of Directors/Trustees.
* Cost for federal income tax purposes is $1,888,361,516.
Net unrealized depreciation consists of:
| Gross Unrealized Appreciation | | $ | 76,314,761 | | |
| Gross Unrealized Depreciation | | | (509,028,384 | ) | |
| Net Unrealized Depreciation | | $ | (432,713,623 | ) | |
| Industry | | Percentage of
Net Assets | |
| Aerospace/Defense | | | 4.6 | % | |
| Apparel | | | 0.9 | | |
| Auto Manufacturers | | | 2.5 | | |
| Banks | | | 4.6 | | |
| Beverages | | | 3.2 | | |
| Biotechnology | | | 0.9 | | |
| Commercial Services | | | 2.6 | | |
| Cosmetics/Personal Care | | | 1.3 | | |
| Diversified Financial Services | | | 1.0 | | |
| Electric | | | 0.9 | | |
| Electrical Components & Equipment | | | 1.3 | | |
| Electronics | | | 5.0 | | |
| Entertainment | | | 0.5 | | |
| Food | | | 2.0 | | |
| Healthcare-Services | | | 1.3 | | |
| Holding Companies - Diversified | | | 1.7 | | |
| Home Furnishings | | | 1.4 | | |
| Household Products/Wares | | | 1.3 | | |
| Insurance | | | 4.1 | | |
| Internet | | | 1.4 | | |
| Investment Companies | | | 1.1 | | |
| Leisure Time | | | 1.6 | | |
| Machinery - Diversified | | | 0.4 | | |
| Media | | | 3.1 | | |
| Metal Fabricate/Hardware | | | 1.4 | | |
| Miscellaneous Manufacturing | | | 3.9 | | |
| Oil & Gas | | | 3.8 | | |
| Oil & Gas Services | | | 0.8 | | |
| Pharmaceuticals | | | 5.4 | | |
| Retail | | | 9.0 | | |
| Semiconductors | | | 4.8 | | |
| Software | | | 7.8 | | |
| Telecommunications | | | 11.1 | | |
| Toys/Games/Hobbies | | | 0.9 | | |
| Transportation | | | 0.8 | | |
| Venture Capital | | | 0.2 | | |
| Short-Term Investments | | | 11.5 | | |
| Other Assets and Liabilities - Net | | | (10.1 | ) | |
| Net Assets | | | 100.0 | % | |
The following table summarizes the inputs used as of December 31, 2008 in determining the Portfolio's investments at fair value for purposes of SFAS 157:
| | | Investments in
Securities | | Other Financial
Instruments* | |
| Level 1 — Quoted Prices | | $ | 567,915,325 | | | $ | — | | |
Level 2 — Other Significant
Observable Inputs | | | 887,732,568 | | | | — | | |
Level 3 — Significant
Unobservable Inputs | | | — | | | | — | | |
| Total | | $ | 1,455,647,893 | | | $ | — | | |
"Fair value" for purposes of SFAS 157 is different from "fair value" as used in the 1940 Act. The former generally implies market value, and can include market quotations as a source of value, and the latter refers to determinations of actual value in absence of available market quotations.
* Other financial instruments may include forward foreign currency contracts, futures, swaps, and written options. Forward foreign currency contracts and futures are reported at their unrealized gain/loss at year end. Swaps and written options are reported at their market value at year end.
See Accompanying Notes to Financial Statements
141
PORTFOLIO OF INVESTMENTS
ING OPPENHEIMER STRATEGIC INCOME PORTFOLIO AS OF DECEMBER 31, 2008
Principal
Amount | | | | | | Value | |
| CORPORATE BONDS/NOTES: 16.4% | | | |
| | | | | Advertising: 0.1% | |
| $ | 490,000 | | | C,S,L | | Lamar Media Corp.,
7.250%, due 01/01/13 | | $ | 393,225 | | |
| | | | 393,225 | | |
| | | | | Aerospace/Defense: 0.2% | |
| | 155,000 | | | C,S | | BE Aerospace, Inc.,
8.500%, due 07/01/18 | | | 139,888 | | |
| | 460,000 | | | C,S | | L-3 Communications
Corp., 5.875%,
due 01/15/15 | | | 416,300 | | |
| | 175,000 | | | C,S | | L-3 Communications
Corp., 6.375%,
due 10/15/15 | | | 164,500 | | |
| | 133,000 | | | C | | United Technologies
Corp., 6.125%,
due 07/15/38 | | | 145,056 | | |
| | | | 865,744 | | |
| | | | | Agriculture: 0.0% | |
| | 300,000 | | | @@,#,C,S | | MHP SA, 10.250%,
due 11/30/11 | | | 133,500 | | |
| | 148,000 | | | | | Philip Morris
International, Inc.,
5.650%, due 05/16/18 | | | 146,981 | | |
| | | | 280,481 | | |
| | | | | Apparel: 0.1% | |
| | 590,000 | | | C,S | | Levi Strauss & Co.,
9.750%, due 01/15/15 | | | 439,550 | | |
| | | | 439,550 | | |
| | | | | Auto Parts & Equipment: 0.1% | |
| | 205,000 | | | C,S,L | | Goodyear Tire & Rubber
Co., 7.857%,
due 08/15/11 | | | 171,175 | | |
| | 135,000 | | | C,S,L | | Goodyear Tire & Rubber
Co., 9.000%,
due 07/01/15 | | | 109,350 | | |
| | 1,645,000 | | | C,S | | Lear Corp., 8.750%,
due 12/01/16 | | | 485,275 | | |
| | | | 765,800 | | |
| | | | | Banks: 4.4% | |
| EUR | 300,000 | | | @@,S | | Banco Bilbao Vizcaya
Argentaria SA,
4.250%, due 07/15/14 | | | 421,157 | | |
| $ | 930,000 | | | @@,#,S | | Banco BMG SA, 9.150%,
due 01/15/16 | | | 562,650 | | |
| | 305,000 | | | @@,#,C,S | | Banco de Credito del
Peru, 6.950%,
due 11/07/21 | | | 259,250 | | |
| | 241,000 | | | @@,#,S | | Banco Hipotecario SA,
9.750%, due 04/27/16 | | | 75,915 | | |
| MXN | 1,007,479 | | | @@,S | | Banco Invex SA, 6.450%,
due 03/13/34 | | | 264,934 | | |
| $ | 445,000 | | | | | Bank of America Corp.,
4.900%, due 05/01/13 | | | 441,198 | | |
| | 625,000 | | | C,S | | Bank of America Corp.,
8.000%, due 12/01/49 | | | 450,200 | | |
| | 400,000 | | | C,S | | Bank of America Corp.,
8.125%, due 12/29/49 | | | 299,700 | | |
Principal
Amount | | | | | | Value | |
| EUR | 1,380,000 | | | @@,S | | Bank of Scotland PLC,
4.375%, due 07/13/16 | | $ | 1,805,799 | | |
| EUR | 755,000 | | | @@,S | | Bank of Scotland PLC,
4.500%, due 07/13/21 | | | 940,569 | | |
| $ | 2,150,000 | | | @@,C,S | | Barclays Bank PLC,
6.278%, due 12/15/49 | | | 1,244,571 | | |
| | 1,111,000 | | | | | Citigroup, Inc., 5.500%,
due 04/11/13 | | | 1,082,774 | | |
| | 445,000 | | | | | Citigroup, Inc., 6.500%,
due 08/19/13 | | | 449,486 | | |
| | 1,110,000 | | | C,S | | Citigroup, Inc., 8.400%,
due 04/29/49 | | | 734,309 | | |
| | 445,000 | | | @@ | | Credit Suisse New York,
5.000%, due 05/15/13 | | | 428,694 | | |
| EUR | 70,000 | | | @@,S | | Depfa ACS Bank,
3.875%, due 11/14/16 | | | 85,716 | | |
| $ | 887,000 | | | | | Goldman Sachs Group,
Inc., 6.150%,
due 04/01/18 | | | 853,846 | | |
| | 2,300,000 | | | @@,#,C,S | | HBOS PLC, 6.413%,
due 10/01/35 | | | 893,472 | | |
| | 210,000 | | | @@,#,S | | HSBK Europe BV,
7.250%, due 05/03/17 | | | 114,450 | | |
| | 2,550,000 | | | @@,#,S | | HSBK Europe BV,
9.250%, due 10/16/13 | | | 1,874,250 | | |
| | 1,000,000 | | | @@,#,C,S | | ICICI Bank Ltd., 6.375%,
due 04/30/22 | | | 526,513 | | |
| | 888,000 | | | | | JPMorgan Chase & Co.,
6.400%, due 05/15/38 | | | 1,054,261 | | |
| | 1,095,000 | | | C,S | | JPMorgan Chase & Co.,
7.900%, due 04/29/49 | | | 913,258 | | |
| | 360,000 | | | @@,#,S | | Kuznetski Capital for
Bank of Moscow,
7.375%, due 11/26/10 | | | 295,230 | | |
| | 1,333,000 | | | | | Morgan Stanley,
6.000%, due 04/28/15 | | | 1,151,468 | | |
| | 1,100,000 | | | @@,#,S | | VTB Capital SA, 6.875%,
due 05/29/18 | | | 726,000 | | |
| | 2,365,000 | | | @@,C,S | | VTB Capital SA for
Vneshtorgbank,
6.315%, due 02/04/15 | | | 1,690,976 | | |
| | 905,000 | | | | | Wells Fargo & Co.,
5.250%, due 10/23/12 | | | 922,562 | | |
| EUR | 1,388,000 | | | S | | WM Covered Bond
Program, 3.875%,
due 09/27/11 | | | 1,774,182 | | |
| EUR | 1,675,000 | | | S | | WM Covered Bond
Program, 4.000%,
due 09/27/16 | | | 1,935,680 | | |
| | | | 24,273,070 | | |
| | | | | Beverages: 0.1% | |
| BRL | 860,000 | | | @@,#,S | | Ambev International
Finance Co., Ltd.,
9.500%, due 07/24/17 | | | 250,772 | | |
| $ | 213,000 | | | C | | Anheuser-Busch Cos.,
Inc., 5.500%,
due 01/15/18 | | | 193,942 | | |
| | | | 444,714 | | |
See Accompanying Notes to Financial Statements
142
PORTFOLIO OF INVESTMENTS
ING OPPENHEIMER STRATEGIC INCOME PORTFOLIO AS OF DECEMBER 31, 2008 (CONTINUED)
Principal
Amount | | | | | | Value | |
| | | | | Building Materials: 0.1% | |
| $ | 425,000 | | | C,S | | Nortek, Inc., 8.500%,
due 09/01/14 | | $ | 99,875 | | |
| | 995,000 | | | +,C,S,L | | NTK Holdings, Inc.,
0.000% (step
rate 10.750%),
due 03/01/14 | | | 218,900 | | |
| | | | 318,775 | | |
| | | | | Chemicals: 0.2% | |
| | 900,000 | | | @@,#,C,S | | Braskem Finance Ltd.,
7.250%, due 06/05/18 | | | 643,500 | | |
| | 145,000 | | | C | | EI Du Pont de Nemours
& Co., 6.000%,
due 07/15/18 | | | 152,568 | | |
| | 640,000 | | | C,S,L | | Momentive
Performance
Materials, Inc.,
11.500%,
due 12/01/16 | | | 192,000 | | |
| | | | 988,068 | | |
| | | | | Commercial Services: 0.2% | |
| | 1,140,000 | | | C,S | | Avis Budget Car Rental
LLC/Avis Budget
Finance, Inc., 7.625%,
due 05/15/14 | | | 336,300 | | |
| | 220,000 | | | C,S | | Hertz Corp., 8.875%,
due 01/01/14 | | | 136,400 | | |
| | 140,000 | | | C,S,L | | Hertz Corp., 10.500%,
due 01/01/16 | | | 64,575 | | |
| | 240,000 | | | C,S | | Iron Mountain, Inc.,
8.625%, due 04/01/13 | | | 226,800 | | |
| | 175,000 | | | C,S | | Service Corp.
International, 6.750%,
due 04/01/15 | | | 139,125 | | |
| | 640,000 | | | C,S | | United Rentals
North America, Inc.,
7.000%, due 02/15/14 | | | 393,600 | | |
| | | | 1,296,800 | | |
| | | | | Computers: 0.2% | |
| | 667,000 | | | C | | International Business
Machines Corp.,
8.000%, due 10/15/38 | | | 890,929 | | |
| | | | 890,929 | | |
| | | | | Cosmetics/Personal Care: 0.0% | |
| | 380,000 | | | C,S | | Elizabeth Arden, Inc.,
7.750%, due 01/15/14 | | | 248,900 | | |
| | | | 248,900 | | |
| | | | | | | Diversified Financial
Services: 1.6% | | | | | |
| | 33,000 | | | | | Allstate Life Global
Funding Trusts,
5.375%, due 04/30/13 | | | 32,516 | | |
| | 106,000 | | | | | American Express
Credit Corp., 5.875%,
due 05/02/13 | | | 101,852 | | |
| | 893,492 | | | @@,#,C,S | | Autopistas Del Nordeste,
9.390%, due 04/15/24 | | | 384,201 | | |
| EUR | 400,000 | | | S | | BA Covered Bond Issuer,
4.250%, due 04/05/17 | | | 522,256 | | |
Principal
Amount | | | | | | Value | |
| RUB | 7,800,000 | | | @@,S | | Bank of Moscow,
7.250%, due 11/25/09 | | $ | 166,039 | | |
| $ | 540,000 | | | @@,#,C,S | | C10 Capital, Ltd.,
6.722%, due 12/31/16 | | | 257,408 | | |
| | 445,000 | | | | | Caterpillar Financial
Services Corp.,
5.450%, due 04/15/18 | | | 417,388 | | |
| | 190,000 | | | #,C,S | | CCM Merger, Inc.,
8.000%, due 08/01/13 | | | 98,800 | | |
| | 156,000 | | | | | CIT Group, Inc., 7.625%,
due 11/30/12 | | | 131,796 | | |
| | 445,000 | | | | | General Electric
Capital Corp., 5.400%,
due 09/20/13 | | | 446,100 | | |
| | 813,000 | | | #,S | | General Motors
Acceptance Corp.,
8.000%, due 11/01/31 | | | 365,119 | | |
| | 855,000 | | | C,S | | Goldman Sachs
Group, Inc., 6.345%,
due 02/15/34 | | | 622,053 | | |
| | 2,000,000 | | | C,S | | HSBC Finance Capital
Trust IX, 5.911%,
due 11/30/35 | | | 837,744 | | |
| | 1,430,266 | | | @@,#,S | | IIRSA Norte Finance Ltd.,
8.750%, due 05/30/24 | | | 1,036,943 | | |
| | 300,000 | | | @@,#,C,S | | ISA Capital do Brasil SA,
8.800%, due 01/30/17 | | | 265,500 | | |
| MXN | 598,529 | | | @@,S | | JPMorgan Hipotecaria
su Casita, 6.100%,
due 09/25/35 | | | 124,214 | | |
| $ | 1,500,000 | | | @@,I | | JSC Astana Finance,
9.160%, due 03/14/12 | | | 694,489 | | |
| RUB | 7,600,000 | | | @@,C,S | | JSC RosBank, 8.000%,
due 09/30/09 | | | 174,226 | | |
| $ | 755,000 | | | ±,C,S,I | | Lehman Brothers
Holdings, Inc., 7.500%,
due 05/11/38 | | | 76 | | |
| | 480,000 | | | C,S,L | | Pinnacle Foods Finance
LLC/Pinnacle Foods
Finance Corp.,
10.625%, due 04/01/17 | | | 261,600 | | |
| | 315,000 | | | #,C,S | | Rainbow National
Services, LLC, 8.750%,
due 09/01/12 | | | 285,075 | | |
| | 685,000 | | | S | | SLM Corp., 4.500%,
due 07/26/10 | | | 594,699 | | |
| | 785,000 | | | @@,+,S | | Tiers Trust, 0.000%
(step rate 8.600%),
due 06/15/97 | | | 488,652 | | |
| | 110,000 | | | @@,#,I | | TransCapitalInvest Ltd
for OJSC AK
Transneft, 5.670%,
due 03/05/14 | | | 71,313 | | |
| | 455,000 | | | +,C,S | | Vanguard Health
Holding Co. I, LLC,
0.000% (step
rate 11.250%),
due 10/01/15 | | | 359,450 | | |
| | | | 8,739,509 | | |
See Accompanying Notes to Financial Statements
143
PORTFOLIO OF INVESTMENTS
ING OPPENHEIMER STRATEGIC INCOME PORTFOLIO AS OF DECEMBER 31, 2008 (CONTINUED)
Principal
Amount | | | | | | Value | |
| | | | | Electric: 0.6% | |
| $ | 280,000 | | | @@,#,C | | AES Dominicana
Energia Finance SA,
11.000%,
due 12/13/15 | | $ | 110,600 | | |
| | 135,000 | | | @@,#,C,S | | AES Panama SA,
6.350%, due 12/21/16 | | | 108,425 | | |
| | 470,000 | | | @@,#,C,S | | EEB International Ltd.,
8.750%, due 10/31/14 | | | 438,275 | | |
| BRL | 475,000 | | | @@,#,S | | Eletropaulo
Metropolitana de Sao
Paulo SA, 19.125%,
due 06/28/10 | | | 206,234 | | |
| $ | 1,365,000 | | | @@,#,C,S | | Israel Electric Corp. Ltd.,
7.250%, due 01/15/19 | | | 1,275,266 | | |
| | 465,000 | | | @@,#,S | | Majapahit Holding BV,
7.250%, due 10/17/11 | | | 355,725 | | |
| | 480,000 | | | @@,#,S | | Majapahit Holding BV,
7.750%, due 10/17/16 | | | 276,000 | | |
| PHP | 23,800,000 | | | @@,S | | National Power Corp.,
5.875%, due 12/19/16 | | | 425,447 | | |
| $ | 144,000 | | | C | | Peco Energy Co.,
5.350%, due 03/01/18 | | | 137,713 | | |
| | | | 3,333,685 | | |
| | | | | Entertainment: 0.5% | |
| | 150,000 | | | C,S | | AMC Entertainment,
Inc., 8.000%,
due 03/01/14 | | | 93,000 | | |
| | 350,000 | | | +,C,S | | Cinemark, Inc., 0.000%
(step rate 9.750%),
due 03/15/14 | | | 284,813 | | |
| | 405,000 | | | #,±,C,S,L | | Greektown Holdings,
LLC, 10.750%,
due 12/01/13 | | | 97,200 | | |
| | 1,175,000 | | | C,S,L | | Isle of Capri Casinos,
Inc., 7.000%,
due 03/01/14 | | | 505,250 | | |
| | 340,000 | | | +,C,S | | Marquee Holdings, Inc.,
0.000% (step rate
12.000%),
due 08/15/14 | | | 175,100 | | |
| | 1,065,000 | | | #,C,S | | Mashantucket Western
Pequot Tribe, 8.500%,
due 11/15/15 | | | 423,338 | | |
| | 300,000 | | | C,S | | Mohegan Tribal Gaming
Authority, 6.125%,
due 02/15/13 | | | 190,500 | | |
| | 620,000 | | | C,S,L | | Mohegan Tribal Gaming
Authority, 8.000%,
due 04/01/12 | | | 381,300 | | |
| | 525,000 | | | C,S,L | | Pinnacle Entertainment,
Inc., 8.250%,
due 03/15/12 | | | 401,625 | | |
| | 220,000 | | | #,C,S | | Pokagon Gaming
Authority, 10.375%,
due 06/15/14 | | | 190,300 | | |
| | 790,000 | | | +,C,S | | WMG Holdings Corp.,
0.000% (step rate
9.500%), due 12/15/14 | | | 296,250 | | |
| | | | 3,038,676 | | |
Principal
Amount | | | | | | Value | |
| | | | | Environmental Control: 0.1% | |
| $ | 490,000 | | | C,S,L | | Allied Waste North
America, Inc., 7.375%,
due 04/15/14 | | $ | 463,545 | | |
| | | | 463,545 | | |
| | | | | Food: 0.2% | |
| | 535,000 | | | C,S | | Delhaize America, Inc.,
9.000%, due 04/15/31 | | | 542,360 | | |
| | 120,000 | | | C,S | | Dole Food Co., Inc.,
7.250%, due 06/15/10 | | | 84,300 | | |
| | 89,000 | | | C | | General Mills, Inc.,
5.250%, due 08/15/13 | | | 89,627 | | |
| | 41,000 | | | | | Kraft Foods, Inc.,
6.125%, due 08/23/18 | | | 40,493 | | |
| | 220,000 | | | S | | Smithfield Foods, Inc.,
7.000%, due 08/01/11 | | | 157,300 | | |
| | | | 914,080 | | |
| | | | | Forest Products & Paper: 0.1% | |
| | 240,000 | | | C | | International Paper Co.,
7.400%, due 06/15/14 | | | 196,938 | | |
| | 600,000 | | | C,S | | NewPage Corp.,
10.000%,
due 05/01/12 | | | 267,000 | | |
| | | | 463,938 | | |
| | | | | Healthcare-Products: 0.2% | |
| | 165,000 | | | #,C,S | | Bausch & Lomb, Inc.,
9.875%, due 11/01/15 | | | 124,163 | | |
| | 140,000 | | | C,S | | Biomet, Inc., 10.000%,
due 10/15/17 | | | 135,100 | | |
| | 390,000 | | | C,S | | DJO Finance,LLC/DJO
Finance Corp.,
10.875%,
due 11/15/14 | | | 281,775 | | |
| | 140,000 | | | @@,S | | Fresenius Medical Care
Capital Trust, 7.875%,
due 06/15/11 | | | 133,700 | | |
| | 241,000 | | | C | | Johnson & Johnson,
5.850%, due 07/15/38 | | | 292,284 | | |
| | 320,000 | | | &,C,S | | Universal Hospital
Services, Inc., 8.500%,
due 06/01/15 | | | 228,800 | | |
| | | | 1,195,822 | | |
| | | | | Healthcare-Services: 0.4% | |
| | 325,000 | | | C,S | | Community Health
Systems, Inc., 8.875%,
due 07/15/15 | | | 300,625 | | |
| | 345,000 | | | C,S | | DaVita, Inc., 6.625%,
due 03/15/13 | | | 329,475 | | |
| | 690,000 | | | C,S | | HCA, Inc., 6.375%,
due 01/15/15 | | | 424,350 | | |
| | 190,000 | | | C,S | | HCA, Inc., 9.250%,
due 11/15/16 | | | 174,800 | | |
| | 255,000 | | | C,S,L | | Healthsouth Corp.,
10.750%,
due 06/15/16 | | | 235,238 | | |
| | 380,000 | | | C,S | | Select Medical Corp.,
7.625%, due 02/01/15 | | | 203,300 | | |
| | 209,000 | | | &,C,S | | US Oncology Holdings,
Inc., 8.334%,
due 03/15/12 | | | 132,715 | | |
See Accompanying Notes to Financial Statements
144
PORTFOLIO OF INVESTMENTS
ING OPPENHEIMER STRATEGIC INCOME PORTFOLIO AS OF DECEMBER 31, 2008 (CONTINUED)
Principal
Amount | | | | | | Value | |
| | | | | Healthcare-Services (continued) | |
| $ | 295,000 | | | C,S | | US Oncology, Inc.,
9.000%, due 08/15/12 | | $ | 269,925 | | |
| | | | 2,070,428 | | |
| | | | | Home Builders: 0.1% | |
| | 375,000 | | | C,S | | Centex Corp., 5.800%,
due 09/15/09 | | | 358,125 | | |
| | 65,000 | | | C,S,L | | K Hovnanian
Enterprises, Inc.,
7.750%, due 05/15/13 | | | 14,625 | | |
| | 125,000 | | | C,S,L | | K Hovnanian
Enterprises, Inc.,
8.875%, due 04/01/12 | | | 36,875 | | |
| | 150,000 | | | C,S | | Toll Corp., 8.250%,
due 12/01/11 | | | 137,250 | | |
| | 25,000 | | | C,S | | William Lyon Homes,
Inc., 7.500%,
due 02/15/14 | | | 6,125 | | |
| | 235,000 | | | C,S | | William Lyon Homes,
Inc., 10.750%,
due 04/01/13 | | | 59,925 | | |
| | | | 612,925 | | |
| | | | | Household Products/Wares: 0.0% | |
| | 370,000 | | | C,S | | Jarden Corp., 7.500%,
due 05/01/17 | | | 254,375 | | |
| | | | 254,375 | | |
| | | | | Insurance: 0.0% | |
| | 100,000 | | | # | | American International
Group, Inc., 8.250%,
due 08/15/18 | | | 73,300 | | |
| | | | 73,300 | | |
| | | | | Iron/Steel: 0.3% | |
| | 950,000 | | | @@,#,S | | GTL Trade Finance, Inc.,
7.250%, due 10/20/17 | | | 798,137 | | |
| | 425,000 | | | @@,C,S | | Ispat Inland ULC,
9.750%, due 04/01/14 | | | 363,785 | | |
| | 870,000 | | | @@,#,S | | Steel Capital SA for
OAO Severstal,
9.750%, due 07/29/13 | | | 465,450 | | |
| | 360,000 | | | S | | Steel Dynamics, Inc.,
7.375%, due 11/01/12 | | | 264,600 | | |
| | | | 1,891,972 | | |
| | | | | Leisure Time: 0.0% | |
| | 215,000 | | | C,S | | Leslie's Poolmart,
7.750%, due 02/01/13 | | | 173,075 | | |
| | 160,000 | | | C,S | | Travelport, LLC,
11.875%,
due 09/01/16 | | | 45,600 | | |
| | | | 218,675 | | |
| | | | | Lodging: 0.3% | |
| | 885,000 | | | C,S,L | | Caesars Entertainment,
Inc., 7.875%,
due 03/15/10 | | | 588,525 | | |
| | 965,000 | | | #,C,S | | Harrah's Operating Co.,
Inc., 10.750%,
due 02/01/16 | | | 279,850 | | |
| | 480,000 | | | C,S,L | | MGM Mirage, Inc.,
8.375%, due 02/01/11 | | | 288,000 | | |
Principal
Amount | | | | | | Value | |
| $ | 1,195,000 | | | C,S | | Station Casinos, Inc.,
6.500%, due 02/01/14 | | $ | 74,688 | | |
| | 210,000 | | | C,S | | Trump Entertainment
Resorts, Inc., 8.500%,
due 06/01/15 | | | 28,875 | | |
| | 740,000 | | | C,S | | Wynn Las Vegas, LLC,
6.625%, due 12/01/14 | | | 562,400 | | |
| | | | 1,822,338 | | |
| | | | | Machinery-Diversified: 0.1% | |
| | 965,000 | | | C,S | | Case New Holland, Inc.,
7.125%, due 03/01/14 | | | 689,975 | | |
| | | | 689,975 | | |
| | | | | Media: 0.7% | |
| | 325,000 | | | C,S | | Allbritton
Communications Co.,
7.750%, due 12/15/12 | | | 161,281 | | |
| | 240,000 | | | C | | CBS Corp., 5.625%,
due 08/15/12 | | | 197,676 | | |
| | 645,000 | | | C,S | | CCH I, LLC, 11.000%,
due 10/01/15 | | | 116,100 | | |
| | 533,000 | | | C | | Comcast Corp., 5.700%,
due 05/15/18 | | | 500,736 | | |
| | 96,000 | | | C | | COX Communications,
Inc., 4.625%,
due 01/15/10 | | | 92,914 | | |
| | 215,000 | | | S | | CSC Holdings, Inc.,
7.625%, due 04/01/11 | | | 203,713 | | |
| | 440,000 | | | C,S | | Echostar DBS Corp.,
6.375%, due 10/01/11 | | | 410,300 | | |
| | 465,000 | | | C,S | | Idearc, Inc., 8.000%,
due 11/15/16 | | | 37,200 | | |
| | 630,000 | | | C,S,L | | LIN Television Corp.,
6.500%, due 05/15/13 | | | 303,975 | | |
| | 860,000 | | | C,S | | Medianews Group, Inc.,
6.875%, due 10/01/13 | | | 59,125 | | |
| | 283,000 | | | C | | News America, Inc.,
6.150%, due 03/01/37 | | | 264,895 | | |
| | 760,000 | | | C,S | | R.H. Donnelley Corp.,
6.875%, due 01/15/13 | | | 106,400 | | |
| | 260,000 | | | C,S,L | | Radio One, Inc., 8.875%,
due 07/01/11 | | | 129,350 | | |
| | 505,000 | | | C,S,L | | Sinclair Broadcast
Group, Inc., 8.000%,
due 03/15/12 | | | 381,275 | | |
| | 311,000 | | | C | | Time Warner Cable, Inc.,
6.200%, due 07/01/13 | | | 294,454 | | |
| | 285,000 | | | @@,#,C,S | | Videotron Ltd., 9.125%,
due 04/15/18 | | | 266,475 | | |
| | 111,000 | | | C | | Walt Disney Company,
4.500%, due 12/15/13 | | | 111,855 | | |
| | | | 3,637,724 | | |
| | | | | Mining: 0.8% | |
| | 333,000 | | | C | | Alcoa, Inc., 6.750%,
due 07/15/18 | | | 272,887 | | |
| | 3,120,000 | | | @@,#,S, L | | ALROSA Finance SA,
8.875%, due 11/17/14 | | | 1,924,869 | | |
| | 944,000 | | | C,S | | Freeport-McMoRan
Copper & Gold, Inc.,
8.375%, due 04/01/17 | | | 772,900 | | |
See Accompanying Notes to Financial Statements
145
PORTFOLIO OF INVESTMENTS
ING OPPENHEIMER STRATEGIC INCOME PORTFOLIO AS OF DECEMBER 31, 2008 (CONTINUED)
Principal
Amount | | | | | | Value | |
| | | | | Mining (continued) | |
| $ | 450,000 | | | @@,C,S | | Novelis, Inc., 7.250%,
due 02/15/15 | | $ | 263,250 | | |
| | 2,020,000 | | | @@,#,C,S | | Vedanta Resources PLC,
9.500%, due 07/18/18 | | | 1,060,500 | | |
| | | | 4,294,406 | | |
| | | | | Municipal: 0.2% | |
| | 1,190,000 | | | @@,#,S | | Bayerische Hypo- und
Vereinsbank AG for
City of Kiev Ukraine,
8.625%, due 07/15/11 | | | 756,959 | | |
| COP | 516,000,000 | | | @@,#,S | | Santa Fe de Bogota DC,
9.750%, due 07/26/28 | | | 183,009 | | |
| | | | 939,968 | | |
| | | | | Oil & Gas: 1.6% | |
| $ | 620,000 | | | #,C,S | | Atlas Energy Resources
LLC, 10.750%,
due 02/01/18 | | | 381,300 | | |
| | 135,000 | | | C,S | | Berry Petroleum Co.,
8.250%, due 11/01/16 | | | 73,575 | | |
| | 585,000 | | | C,S | | Denbury Resources, Inc.,
7.500%, due 12/15/15 | | | 418,275 | | |
| | 90,000 | | | C,S | | Forest Oil Corp.,
7.750%, due 05/01/14 | | | 76,050 | | |
| | 1,710,000 | | | @@,#,C,S | | Gaz Capital SA, 7.288%,
due 08/16/37 | | | 1,017,450 | | |
| | 980,000 | | | @@,#,S | | Gaz Capital SA, 7.510%,
due 07/31/13 | | | 793,846 | | |
| | 560,000 | | | @@,#,C,S | | Gaz Capital SA, 8.146%,
due 04/11/18 | | | 397,600 | | |
| | 710,000 | | | @@,#,S | | Gaz Capital SA, 8.625%,
due 04/28/34 | | | 571,550 | | |
| | 241,503 | | | @@,#,C,S | | Gazprom
International SA,
7.201%, due 02/01/20 | | | 177,504 | | |
| | 2,480,000 | | | @@,#,S | | KazMunaiGaz Finance
Sub BV, 9.125%,
due 07/02/18 | | | 1,624,400 | | |
| | 1,130,000 | | | #,C,S | | Pemex Project Funding
Master Trust, 6.625%,
due 06/15/38 | | | 946,375 | | |
| | 1,430,000 | | | @@,C,S | | Petrobras International
Finance Co., 5.875%,
due 03/01/18 | | | 1,292,720 | | |
| | 440,000 | | | C,S | | Quicksilver
Resources, Inc.,
7.125%, due 04/01/16 | | | 237,600 | | |
| | 215,000 | | | C,S | | Quicksilver
Resources, Inc.,
8.250%, due 08/01/15 | | | 137,600 | | |
| | 150,000 | | | C,S | | Sabine Pass LNG LP,
7.500%, due 11/30/16 | | | 108,750 | | |
| | 490,360 | | | @@,#,S | | Tengizchevroil Finance
Co. SARL, 6.124%,
due 11/15/14 | | | 375,125 | | |
| | 380,000 | | | C,S | | Tesoro Corp., 6.625%,
due 11/01/15 | | | 222,300 | | |
| | 316,000 | | | C | | XTO Energy, Inc.,
6.500%, due 12/15/18 | | | 306,445 | | |
| | | | 9,158,465 | | |
Principal
Amount | | | | | | Value | |
| | | | | Oil & Gas Services: 0.1% | |
| $ | 545,000 | | | #,C,S | | Helix Energy Solutions
Group, Inc., 9.500%,
due 01/15/16 | | $ | 291,575 | | |
| | 330,000 | | | C,S | | Key Energy Services, Inc.,
8.375%, due 12/01/14 | | | 219,450 | | |
| | | | 511,025 | | |
| | | | | Packaging & Containers: 0.3% | |
| | 790,000 | | | C,S | | Berry Plastics
Holding Corp.,
8.875%, due 09/15/14 | | | 347,600 | | |
| | 445,000 | | | C,S | | Crown Americas, LLC
and Crown Americas
Capital Corp., 7.750%,
due 11/15/15 | | | 445,000 | | |
| | 480,000 | | | C,S,L | | Graham Packaging
Co., Inc., 9.875%,
due 10/15/14 | | | 297,600 | | |
| | 495,000 | | | C,S | | Graphic Packaging
International Corp.,
8.500%, due 08/15/11 | | | 415,800 | | |
| | | | 1,506,000 | | |
| | | | | Pharmaceuticals: 0.1% | |
| | 645,000 | | | C,S | | Catalent Pharma
Solutions, Inc.,
9.500%, due 04/15/15 | | | 248,325 | | |
| | 66,000 | | | C | | GlaxoSmithKline
Capital, Inc., 6.375%,
due 05/15/38 | | | 74,833 | | |
| | | | 323,158 | | |
| | | | | Pipelines: 0.2% | |
| | 405,000 | | | C,S | | Atlas Pipeline
Partners LP, 8.125%,
due 12/15/15 | | | 275,400 | | |
| | 445,000 | | | #,C,S | | Copano Energy,
LLC/Copano Energy
Finance Corp.,
7.750%, due 06/01/18 | | | 302,600 | | |
| | 1,190,000 | | | C,S | | Enterprise Products
Operating L.P.,
8.375%, due 08/01/66 | | | 655,247 | | |
| | 123 | | | #,C,S | | Kern River
Funding Corp.,
4.893%, due 04/30/18 | | | 97 | | |
| | 169,000 | | | C,S | | Kinder Morgan Energy
Partners LP, 7.300%,
due 08/15/33 | | | 140,641 | | |
| | | | 1,373,985 | | |
| | | | | Real Estate: 0.1% | |
| | 295,000 | | | S,L | | iStar Financial, Inc.,
2.471%, due 03/16/09 | | | 212,769 | | |
| MYR | 1,920,000 | | | @@,I | | Johor Corp., 1.000%,
due 07/31/12 | | | 566,012 | | |
| | | | 778,781 | | |
| | | | | Regional (state/province): 0.1% | |
| AUD | 265,000 | | | @@,S | | New South Wales
Treasury Corp.,
5.500%, due 08/01/14 | | | 191,318 | | |
See Accompanying Notes to Financial Statements
146
PORTFOLIO OF INVESTMENTS
ING OPPENHEIMER STRATEGIC INCOME PORTFOLIO AS OF DECEMBER 31, 2008 (CONTINUED)
Principal
Amount | | | | | | Value | |
| | | | | | | Regional (state/province)
(continued) | | | | | |
| AUD | 180,000 | | | @@,S | | New South Wales
Treasury Corp.,
6.000%, due 05/01/12 | | $ | 130,873 | | |
| | | | 322,191 | | |
| | | | | Retail: 0.4% | |
| $ | 680,000 | | | C,S | | Albertson's, Inc.,
8.000%, due 05/01/31 | | | 411,400 | | |
| | 1,730,000 | | | C,S,L | | Claire's Stores, Inc.,
10.500%, due 06/01/17 | | | 302,750 | | |
| | 95,000 | | | #,C,S | | Ferrellgas Partners LP,
6.750%, due 05/01/14 | | | 66,025 | | |
| | 305,000 | | | C,S | | GSC Holdings Corp.,
8.000%, due 10/01/12 | | | 285,175 | | |
| | 356,000 | | | C | | Home Depot, Inc.,
5.875%, due 12/16/36 | | | 279,973 | | |
| | 285,000 | | | C,S,L | | Sally Holdings, LLC,
9.250%, due 11/15/14 | | | 246,525 | | |
| | 215,000 | | | C,S,L | | Sally Holdings, LLC,
10.500%, due 11/15/16 | | | 147,275 | | |
| | | | | | 400,000 | | | Wal-Mart Stores, Inc.,
5.800%, due 02/15/18 | | | 443,413 | | |
| | | | 2,182,536 | | |
| | | | | Software: 0.1% | |
| | 323,000 | | | C | | Oracle Corp., 5.750%,
due 04/15/18 | | | 338,455 | | |
| | | | 338,455 | | |
| | | | | Telecommunications: 1.2% | |
| MXN | 8,400,000 | | | @@,S | | America Movil SAB
de CV, 8.460%,
due 12/18/36 | | | 421,635 | | |
| $ | 270,000 | | | C,S | | American Tower Corp.,
7.500%, due 05/01/12 | | | 267,300 | | |
| | 240,000 | | | C | | BellSouth Corp., 5.200%,
due 12/15/16 | | | 230,561 | | |
| | 810,000 | | | #,C,S | | Fairpoint
Communications, Inc.,
13.125%, due 04/01/18 | | | 392,850 | | |
| | 810,000 | | | C,S | | Frontier
Communications Co.,
6.250%, due 01/15/13 | | | 692,550 | | |
| | 282,000 | | | C | | New Cingular Wireless
Services, Inc., 8.125%,
due 05/01/12 | | | 302,628 | | |
| | 745,000 | | | C,S | | Nextel Communications,
Inc., 7.375%,
due 08/01/15 | | | 313,042 | | |
| | 280,000 | | | @@,C,S | | NTL Cable PLC, 8.750%,
due 04/15/14 | | | 211,400 | | |
| | 435,000 | | | @@,C,S | | NTL Cable PLC, 9.125%,
due 08/15/16 | | | 324,075 | | |
| | 780,000 | | | C,S | | Qwest Corp., 8.875%,
due 03/15/12 | | | 725,400 | | |
| | 1,570,000 | | | C,S | | Sprint Capital Corp.,
8.750%, due 03/15/32 | | | 1,061,745 | | |
| PEN | 1,194,600 | | | @@,#,S | | Telefonica del Peru SAA,
8.000%, due 04/11/16 | | | 346,641 | | |
| $ | 223,000 | | | C | | Verizon
Communications, Inc.,
6.900%, due 04/15/38 | | | 251,773 | | |
Principal
Amount | | | | | | Value | |
| $ | 1,130,000 | | | @@,#,S | | VIP FIN (Vimpelcom),
9.125%, due 04/30/18 | | $ | 615,850 | | |
| | 460,000 | | | C,S | | Windstream Corp.,
8.125%, due 08/01/13 | | | 425,500 | | |
| | 320,000 | | | C,S | | Windstream Corp.,
8.625%, due 08/01/16 | | | 284,800 | | |
| | | | 6,867,750 | | |
| | | | | Transportation: 0.3% | |
| | 222,000 | | | C | | CSX Corp., 6.250%,
due 04/01/15 | | | 218,195 | | |
| | 480,000 | | | #,C,S | | Panama Canal
Railway Co., 7.000%,
due 11/01/26 | | | 266,400 | | |
| | 870,000 | | | @@,#,C,S | | TGI International Ltd.,
9.500%, due 10/03/17 | | | 796,050 | | |
| | 222,000 | | | C | | Union Pacific Corp.,
7.875%, due 01/15/19 | | | 254,070 | | |
| | 191,000 | | | C | | United Parcel Service,
5.500%, due 01/15/18 | | | 204,378 | | |
| | | | 1,739,093 | | |
Total Corporate
Bonds/Notes
(Cost $123,199,644) | | | 90,962,836 | | |
| U.S. GOVERNMENT AGENCY OBLIGATIONS: 17.3% | | | |
| | | | | Federal Home Loan Bank: 0.3% | |
| | 1,760,000 | | | S,L | | 3.625%, due 10/18/13 | | | 1,853,539 | | |
| | | | 1,853,539 | | |
| | | | | | | Federal Home Loan Mortgage
Corporation##: 4.1% | | | | | |
| | 247,200 | | | C,S | | 1.645%, due 02/15/29 | | | 233,499 | | |
| | 742,660 | | | C,S | | 1.695%,
due 03/15/32-01/15/33 | | | 719,136 | | |
| | 230,293 | | | C,S | | 2.145%,
due 08/15/31-02/15/32 | | | 224,527 | | |
| | 616,999 | | | C,S | | 2.175%, due 02/15/32 | | | 601,947 | | |
| | 400,047 | | | C,S | | 2.195%,
due 02/15/32-03/15/32 | | | 384,221 | | |
| | 670,466 | | | C,S | | 3.300%, due 11/15/26 | | | 668,936 | | |
| | 145,416 | | | C,S | | 3.500%,
due 10/15/22-09/15/25 | | | 145,311 | | |
| | 735,000 | | | S,L | | 3.750%, due 06/28/13 | | | 783,513 | | |
| | 34,885 | | | C,S | | 4.000%, due 05/15/24 | | | 34,901 | | |
| | 3,070,000 | | | S,L | | 4.125%, due 09/27/13 | | | 3,311,581 | | |
| | 1,305,065 | | | S | | 4.500%,
due 02/01/18-02/01/20 | | | 1,342,358 | | |
| | 1,384,983 | | | C,S,^ | | 4.955%,
due 07/15/25-07/15/35 | | | 125,763 | | |
| | 5,533,387 | | | C,S | | 5.000%,
due 09/15/23-08/15/35 | | | 5,662,324 | | |
| | 1,022,949 | | | S | | 5.000%,
due 01/01/20-12/01/34 | | | 1,049,604 | | |
| | 419,317 | | | C,S | | 5.500%, due 11/15/25 | | | 425,097 | | |
| | 955,771 | | | S | | 5.500%,
due 01/01/18-12/01/34 | | | 983,095 | | |
| | 425,609 | | | C,S | | 6.000%,
due 05/15/17-05/15/31 | | | 437,499 | | |
| | 201,361 | | | S | | 6.000%, due 02/01/34 | | | 207,914 | | |
| | 616,234 | | | S,^ | | 6.000%,
due 12/01/31-03/01/33 | | | 199,626 | | |
| | 238,708 | | | S,^ | | 6.055%, due 04/15/33 | | | 22,711 | | |
See Accompanying Notes to Financial Statements
147
PORTFOLIO OF INVESTMENTS
ING OPPENHEIMER STRATEGIC INCOME PORTFOLIO AS OF DECEMBER 31, 2008 (CONTINUED)
Principal
Amount | | | | | | Value | |
| | | | | | | Federal Home Loan Mortgage
Corporation## (continued) | | | | | |
| $ | 619,871 | | | C,S,^ | | 6.455%, due 03/15/29 | | $ | 57,773 | | |
| | 2,699,031 | | | C,S | | 6.500%,
due 12/15/23-06/15/32 | | | 2,802,242 | | |
| | 639,041 | | | S | | 6.500%,
due 04/01/18-07/01/34 | | | 665,599 | | |
| | 664,820 | | | C,S,^ | | 6.505%, due 03/15/29 | | | 62,804 | | |
| | 325,085 | | | C,S | | 6.750%, due 02/15/24 | | | 346,311 | | |
| | 444,484 | | | C,S | | 7.000%, due 09/15/26 | | | 476,795 | | |
| | 486,270 | | | C,S,^ | | 7.000%,
due 03/15/28-04/15/28 | | | 72,445 | | |
| | 359,778 | | | C,S | | 7.500%, due 09/15/22 | | | 387,937 | | |
| | 824,141 | | | C,S,^ | | 7.755%, due 08/15/29 | | | 89,109 | | |
| | 97,916 | | | C,S | | 20.002%, due 06/15/34 | | | 109,060 | | |
| | 163,993 | | | C,S | | 20.368%, due 08/15/35 | | | 187,495 | | |
| | | | 22,821,133 | | |
| | | | | | | Federal National Mortgage
Association##: 12.1% | | | | | |
| | 39,075 | | | S | | 0.871%, due 11/25/33 | | | 37,997 | | |
| | 203,735 | | | S | | 0.921%, due 01/25/31 | | | 198,918 | | |
| | 1,321,718 | | | S | | 0.971%,
due 03/25/17-12/25/31 | | | 1,286,385 | | |
| | 74,462 | | | S | | 1.384%, due 10/18/32 | | | 72,238 | | |
| | 1,314,136 | | | S | | 1.471%,
due 12/25/31-12/25/32 | | | 1,262,882 | | |
| | 2,045,000 | | | S,L | | 3.250%, due 04/09/13 | | | 2,133,015 | | |
| | 1,075,000 | | | S,L | | 3.875%, due 07/12/13 | | | 1,141,974 | | |
| | 114,629 | | | S | | 4.000%, due 03/25/25 | | | 114,662 | | |
| | 580,372 | | | S | | 4.500%,
due 07/25/24-08/25/25 | | | 578,474 | | |
| | 2,864,000 | | | W | | 4.500%, due 01/15/19 | | | 2,927,546 | | |
| | 1,465,000 | | | S,L | | 4.625%, due 10/15/14 | | | 1,628,718 | | |
| | 5,490,194 | | | S | | 5.000%,
due 12/01/17-09/01/20 | | | 5,669,697 | | |
| | 8,731,000 | | | W | | 5.000%, due 01/12/36 | | | 8,915,172 | | |
| | 3,263,809 | | | S | | 5.292%, due 10/01/36 | | | 3,314,986 | | |
| | 13,075,347 | | | S | | 5.500%,
due 09/01/19-08/25/37 | | | 13,447,548 | | |
| | 6,527,235 | | | S,^ | | 5.500%,
due 04/01/33-06/01/35 | | | 2,354,339 | | |
| | 140,000 | | | W | | 5.500%, due 01/15/20 | | | 144,178 | | |
| | 2,442,883 | | | S,^ | | 5.579%, due 10/25/35 | | | 173,436 | | |
| | 736,027 | | | S,^ | | 5.999%, due 08/25/36 | | | 88,442 | | |
| | 942,357 | | | S,^^ | | 6.000%, due 04/01/32 | | | 825,716 | | |
| | 6,701,763 | | | S | | 6.000%,
due 03/25/17-04/01/33 | | | 6,930,381 | | |
| | 5,754,506 | | | S,^ | | 6.000%,
due 05/01/29-09/01/35 | | | 1,754,402 | | |
| | 1,319,000 | | | W | | 6.000%,
due 01/15/19-01/20/24 | | | 1,366,972 | | |
| | 3,612,732 | | | S,^ | | 6.099%, due 06/25/36 | | | 426,957 | | |
| | 3,467,169 | | | S,^ | | 6.129%, due 06/25/36 | | | 399,632 | | |
| | 1,746,321 | | | S,^ | | 6.229%,
due 05/25/35-12/25/36 | | | 154,953 | | |
| | 427,834 | | | S,^ | | 6.279%,
due 08/25/25-05/25/35 | | | 34,976 | | |
| | 2,355,565 | | | S | | 6.500%,
due 05/01/17-01/01/34 | | | 2,461,516 | | |
| | 1,221,694 | | | S,^ | | 6.500%, due 02/01/32 | | | 172,218 | | |
| | 2,941,000 | | | W | | 6.500%, due 06/25/34 | | | 3,054,505 | | |
| | 1,377,704 | | | S,^ | | 6.729%, due 05/25/36 | | | 143,536 | | |
| | 571,707 | | | S,^ | | 6.759%, due 09/25/36 | | | 65,289 | | |
Principal
Amount | | | | | | Value | |
| $ | 1,716,375 | | | S | | 7.000%,
due 09/01/14-04/01/34 | | $ | 1,814,788 | | |
| | 581,510 | | | S,^ | | 7.000%,
due 02/01/28-04/25/33 | | | 99,077 | | |
| | 2,493,842 | | | S,^ | | 7.159%, due 03/25/23 | | | 269,006 | | |
| | 1,477,869 | | | S,^ | | 7.279%,
due 07/25/31-02/25/32 | | | 199,870 | | |
| | 217,805 | | | S,^ | | 7.479%, due 07/25/32 | | | 33,898 | | |
| | 422,288 | | | S | | 7.500%,
due 09/01/32-01/01/33 | | | 447,682 | | |
| | 241,326 | | | S,^ | | 7.500%, due 01/01/24 | | | 55,094 | | |
| | 788,790 | | | S,^ | | 7.629%, due 12/25/33 | | | 95,275 | | |
| | 129,443 | | | S,^ | | 7.779%, due 02/25/33 | | | 16,603 | | |
| | 256,189 | | | S | | 22.471%, due 06/25/36 | | | 286,301 | | |
| | 222,345 | | | S | | 22.472%, due 06/25/36 | | | 249,878 | | |
| | 153,523 | | | S | | 22.839%, due 03/25/36 | | | 175,028 | | |
| | 165,559 | | | | | 26.087%, due 04/25/35 | | | 195,630 | | |
| | | | 67,219,790 | | |
| | | | | | | Government National Mortgage
Association: 0.5% | | | | | |
| | 393,026 | | | S | | 5.000%, due 04/15/34 | | | 404,489 | | |
| | 462,667 | | | S | | 5.500%,
due 04/15/33-04/15/34 | | | 478,167 | | |
| | 296,315 | | | S | | 6.000%, due 10/20/34 | | | 305,718 | | |
| | 653,309 | | | C,S | | 6.500%, due 12/16/31 | | | 684,433 | | |
| | 87,868 | | | S | | 6.500%, due 02/20/35 | | | 91,912 | | |
| | 996,037 | | | C,S | | 8.000%,
due 01/16/30-02/16/30 | | | 1,096,490 | | |
| | | | 3,061,209 | | |
| | | | | | | Other U.S. Agency
Obligations: 0.3% | | | | | |
| | 2,233,000 | | | S,Z | | Resolution Funding
Corp., 4.800%,
due 01/15/21 | | | 1,407,652 | | |
| | | | 1,407,652 | | |
Total U.S. Government
Agency Obligations
(Cost $93,554,646) | | | 96,363,323 | | |
| U.S. TREASURY OBLIGATIONS: 6.2% | | | |
| | | | | U.S. Treasury Bonds: 0.2% | |
| | 55,000 | | | L | | 4.500%, due 02/15/36 | | | 73,090 | | |
| | 310,000 | | | | | 5.375%, due 02/15/31 | | | 426,056 | | |
| NGN | 85,700,000 | | | @@,S | | 9.350%, due 08/31/17 | | | 476,235 | | |
| | | | 975,381 | | |
| | | | | U.S. Treasury Notes: 0.0% | |
| NGN | 40,200,000 | | | @@,S | | 9.500%, due 02/23/12 | | | 273,372 | | |
| | | | 273,372 | | |
| | | | | | | Treasury Inflation Indexed
Protected Securitiesip: 6.0% | | | | | |
| $ | 34,724,711 | | | | | 0.625%, due 04/15/13 | | | 33,096,990 | | |
| | | | 33,096,990 | | |
Total U.S. Treasury
Obligations
(Cost $33,131,279) | | | 34,345,743 | | |
See Accompanying Notes to Financial Statements
148
PORTFOLIO OF INVESTMENTS
ING OPPENHEIMER STRATEGIC INCOME PORTFOLIO AS OF DECEMBER 31, 2008 (CONTINUED)
Principal
Amount | | | | | | Value | |
| ASSET-BACKED SECURITIES: 1.4% | | | |
| | | | | | | Automobile Asset-Backed
Securities: 0.7% | | | | | |
| $ | 221,000 | | | C,I | | Americredit Prime
Automobile
Receivables, 5.620%,
due 09/08/14 | | $ | 164,645 | | |
| | 500,000 | | | C,S | | Capital Auto Receivables
Asset Trust, 3.740%,
due 03/15/11 | | | 489,769 | | |
| | 44,000 | | | C,S | | Capital Auto Receivables
Asset Trust, 5.150%,
due 09/17/12 | | | 33,680 | | |
| | 222,000 | | | C,S | | Capital One Auto
Finance Trust, 1.225%,
due 05/15/13 | | | 154,390 | | |
| | 799,907 | | | C,S | | Capital One Prime Auto
Receivables Trust,
1.215%, due 04/15/11 | | | 776,605 | | |
| | 500,000 | | | C,S | | Daimler Chrysler
Auto Trust, 3.810%,
due 07/08/11 | | | 489,411 | | |
| | 1,120,000 | | | C,S | | Harley-Davidson
Motorcycle Trust,
1.545%, due 06/15/12 | | | 1,072,137 | | |
| | 790,000 | | | C,S | | Hyundai Auto
Receivables Trust,
4.160%, due 05/16/11 | | | 775,767 | | |
| | 115,214 | | | @@,#,C,I | | Taganka Car Loan
Finance PLC, 4.739%,
due 11/14/13 | | | 103,693 | | |
| | | | 4,060,097 | | |
| | | | | | | Home Equity Asset-Backed
Securities: 0.2% | | | | | |
| | 871 | | | C,S | | ACE Securities Corp.,
0.651%, due 11/25/35 | | | 863 | | |
| | 130,000 | | | C,S | | Argent Securities, Inc.,
0.571%, due 10/25/36 | | | 104,203 | | |
| | 226,496 | | | C,S | | Argent Securities, Inc.,
0.951%, due 05/25/34 | | | 174,934 | | |
| | 97,541 | | | C,S | | Centex Home Equity,
0.571%, due 06/25/36 | | | 93,451 | | |
| | 176,000 | | | C,S | | Home Equity
Mortgage Trust,
5.363%, due 06/25/35 | | | 55,906 | | |
| | 74,417 | | | C,S | | Home Equity
Mortgage Trust,
5.500%, due 01/25/37 | | | 17,468 | | |
| | 90,000 | | | C,S | | Household Home Equity
Loan Trust, 0.618%,
due 03/20/36 | | | 75,409 | | |
| | 79,719 | | | C,S | | Household Home Equity
Loan Trust, 0.768%,
due 01/20/35 | | | 56,673 | | |
| | 310,000 | | | C,S | | MASTR Asset-Backed
Securities Trust,
0.571%, due 08/25/36 | | | 92,325 | | |
| | 273,018 | | | C,S | | Option One Mortgage
Loan Trust, 0.571%,
due 07/25/36 | | | 240,588 | | |
| | 199,546 | | | C,S | | Residential Asset
Securities Corp.,
0.571%, due 09/25/36 | | | 181,559 | | |
Principal
Amount | | | | | | Value | |
| $ | 36,716 | | | #,C,S | | Terwin Mortgage Trust,
4.500%, due 05/25/37 | | $ | 9,529 | | |
| | | | 1,102,908 | | |
| | | | | | | Other Asset-Backed
Securities: 0.5% | | | | | |
| | 103,413 | | | C,S | | Argent Securities, Inc.,
0.571%, due 06/25/36 | | | 94,519 | | |
| | 66,138 | | | C,S | | Chase Funding Mortgage
Loan Asset-Backed
Certificates, 1.031%,
due 02/25/33 | | | 55,083 | | |
| | 115,834 | | | C,S | | Citigroup Mortgage
Loan Trust, Inc.,
0.571%, due 10/25/36 | | | 106,263 | | |
| | 8,045 | | | C,S | | Citigroup Mortgage
Loan Trust, Inc.,
5.536%, due 03/25/36 | | | 7,979 | | |
| | 24,623 | | | C,S | | Countrywide
Asset-Backed
Certificates, 0.501%,
due 01/25/46 | | | 24,372 | | |
| | 230,000 | | | C,S | | Countrywide
Asset-Backed
Certificates, 0.591%,
due 06/25/37 | | | 176,842 | | |
| | 55,958 | | | C,S | | Countrywide
Asset-Backed
Certificates, 5.363%,
due 05/25/36 | | | 48,255 | | |
| | 370,000 | | | C,S | | Countrywide
Asset-Backed
Certificates, 5.382%,
due 05/25/36 | | | 295,906 | | |
| | 16,353 | | | C,S | | Countrywide Home
Equity Loan Trust,
1.345%, due 11/15/36 | | | 4,237 | | |
| | 45,448 | | | C,S | | Countrywide Home
Equity Loan Trust,
1.425%, due 12/15/35 | | | 17,836 | | |
| | 190,000 | | | C,S | | First Franklin Mortgage
Loan Asset-Backed
Certificates, 0.561%,
due 07/25/36 | | | 164,739 | | |
| | 100,000 | | | C,S | | First Franklin Mortgage
Loan Asset-Backed
Certificates, 0.581%,
due 06/25/36 | | | 85,239 | | |
| | 172,399 | | | C,S | | First Franklin Mortgage
Loan Asset-Backed
Certificates, 0.591%,
due 09/25/26 | | | 40,331 | | |
| | 30,697 | | | C,S | | First Franklin Mortgage
Loan Asset-Backed
Certificates, 0.681%,
due 11/25/35 | | | 30,300 | | |
| | 1,110,000 | | | @@,#,C,I | | ICE EM CLO, 4.795%,
due 08/15/22 | | | 499,500 | | |
| | 930,000 | | | @@,#,C | | ICE EM CLO, 6.095%,
due 08/15/22 | | | 216,132 | | |
| | 930,000 | | | @@,#,C,I | | ICE EM CLO, 8.095%,
due 08/15/22 | | | 160,518 | | |
See Accompanying Notes to Financial Statements
149
PORTFOLIO OF INVESTMENTS
ING OPPENHEIMER STRATEGIC INCOME PORTFOLIO AS OF DECEMBER 31, 2008 (CONTINUED)
Principal
Amount | | | | | | Value | |
| | | | | | | Other Asset-Backed
Securities (continued) | | | | | |
| $ | 29,806 | | | C,S | | Lehman XS Trust,
5.180%, due 08/25/35 | | $ | 29,247 | | |
| | 100,000 | | | C,S | | Popular Mortgage
Pass-through Trust,
5.680%, due 01/25/36 | | | 90,898 | | |
| | 3,308 | | | C,S | | Residential Asset
Mortgage Products,
Inc., 0.551%,
due 07/25/36 | | | 3,276 | | |
| | 132,223 | | | C,S | | Securitized Asset-Backed
Receivables, LLC Trust,
0.701%, due 02/25/37 | | | 61,493 | | |
| | 1,549 | | | C,S | | Specialty Underwriting &
Residential Finance,
0.721%, due 06/25/36 | | | 1,535 | | |
| | 320,000 | | | @@,#,I | | Start CLO Ltd., 19.193%,
due 06/07/11 | | | 211,200 | | |
| | 159,420 | | | C,S | | Wells Fargo Home
Equity Trust, 0.571%,
due 07/25/36 | | | 150,454 | | |
| | | | 2,576,154 | | |
Total Asset-Backed
Securities
(Cost $10,699,014) | | | 7,739,159 | | |
| COLLATERALIZED MORTGAGE OBLIGATIONS: 12.0% | | | |
| | 400,000 | | | C,S | | Banc of America
Commercial Mortgage,
Inc., 5.317%,
due 09/10/47 | | | 339,605 | | |
| | 650,000 | | | C,S | | Banc of America
Commercial Mortgage,
Inc., 5.482%,
due 01/15/49 | | | 299,993 | | |
| | 1,130,000 | | | C,S | | Banc of America
Commercial Mortgage,
Inc., 5.812%,
due 02/10/51 | | | 523,788 | | |
| | 590,000 | | | C,S | | Banc of America
Commercial Mortgage,
Inc., 6.158%,
due 02/10/51 | | | 457,172 | | |
| | 160,000 | | | C,S | | Banc of America
Commercial Mortgage,
Inc., 6.201%,
due 02/10/51 | | | 44,758 | | |
| | 420,000 | | | C,S | | Banc of America
Commercial Mortgage,
Inc., 6.201%,
due 02/10/51 | | | 197,218 | | |
| | 382,378 | | | C,S | | Banc of America
Mortgage Securities,
Inc., 4.710%,
due 06/25/33 | | | 302,226 | | |
| | 927,173 | | | C,I | | Bear Stearns Adjustable
Rate Mortgage Trust,
4.404%, due 05/25/34 | | | 633,235 | | |
| | 590,978 | | | C,S | | Bear Stearns Adjustable
Rate Mortgage Trust,
5.028%, due 11/25/34 | | | 456,488 | | |
Principal
Amount | | | | | | Value | |
| $ | 467,972 | | | C,S | | Bear Stearns Adjustable
Rate Mortgage Trust,
5.779%, due 10/25/36 | | $ | 226,329 | | |
| | 940,000 | | | C,S | | Bear Stearns Commercial
Mortgage Securities,
5.540%, due 09/11/41 | | | 740,240 | | |
| | 560,864 | | | C,S | | Chase Mortgage Finance
Corp., 4.568%,
due 02/25/37 | | | 456,684 | | |
| | 670,000 | | | C,S | | Chase Mortgage Finance
Corp., 6.000%,
due 11/25/36 | | | 313,762 | | |
| | 32,575 | | | C,S | | Chaseflex Trust, 1.495%,
due 09/25/36 | | | 31,211 | | |
| | 1,190,000 | | | C,S | | Citigroup Commercial
Mortgage Trust,
5.700%, due 12/10/49 | | | 904,711 | | |
| | 490,000 | | | C,S | | Citigroup Commercial
Mortgage Trust,
5.724%, due 03/15/49 | | | 383,453 | | |
| | 630,000 | | | C,S | | Citigroup Commercial
Mortgage Trust,
6.096%, due 12/10/49 | | | 488,419 | | |
| | 1,049,185 | | | C,S | | Citigroup Mortgage
Loan Trust, Inc.,
4.900%, due 10/25/35 | | | 663,290 | | |
| | 713,633 | | | C,I | | Citigroup Mortgage
Loan Trust, Inc.,
4.951%, due 05/25/35 | | | 494,962 | | |
| | 1,315,941 | | | C,S | | Citigroup Mortgage
Loan Trust, Inc.,
5.198%, due 08/25/35 | | | 747,471 | | |
| | 744,024 | | | C,I | | Citigroup Mortgage
Loan Trust, Inc.,
5.500%, due 03/25/36 | | | 219,809 | | |
| | 1,462,161 | | | C,S | | Citigroup Mortgage
Loan Trust, Inc.,
5.521%, due 03/25/36 | | | 789,124 | | |
| | 673,491 | | | C,I | | Citigroup Mortgage
Loan Trust, Inc.,
5.591%, due 03/25/36 | | | 192,554 | | |
| | 1,350,000 | | | C,S | | Citigroup/Deutsche Bank
Commercial Mortgage
Trust, 5.205%,
due 12/11/49 | | | 1,123,053 | | |
| | 970,000 | | | C,S | | Citigroup/Deutsche Bank
Commercial Mortgage
Trust, 5.366%,
due 12/11/49 | | | 438,075 | | |
| | 460,000 | | | C,S | | Citigroup/Deutsche Bank
Commercial Mortgage
Trust, 5.398%,
due 12/11/49 | | | 117,870 | | |
| | 351,190 | | | C,S | | Citimortgage Alternative
Loan Trust, 0.921%,
due 10/25/36 | | | 143,483 | | |
| | 504,340 | | | C,S | | Citimortgage Alternative
Loan Trust, 5.500%,
due 10/25/21 | | | 369,054 | | |
| | 916,360 | | | C,S | | Citimortgage Alternative
Loan Trust, 6.000%,
due 02/25/37 | | | 544,002 | | |
See Accompanying Notes to Financial Statements
150
PORTFOLIO OF INVESTMENTS
ING OPPENHEIMER STRATEGIC INCOME PORTFOLIO AS OF DECEMBER 31, 2008 (CONTINUED)
Principal
Amount | | | | | | Value | |
| COLLATERALIZED MORTGAGE OBLIGATIONS (continued) | | | |
| $ | 850,000 | | | C,S | | Commercial Mortgage
Pass-through
Certificates, 5.816%,
due 12/10/49 | | $ | 647,194 | | |
| | 931,190 | | | C,S | | Countrywide Alternative
Loan Trust, 5.500%,
due 05/25/37 | | | 823,992 | | |
| | 2,450,270 | | | C,I | | Countrywide Alternative
Loan Trust, 6.000%,
due 02/25/37 | | | 1,173,655 | | |
| | 264,699 | | | C,S | | Countrywide Alternative
Loan Trust, 6.500%,
due 08/25/32 | | | 169,533 | | |
| | 600,966 | | | C,S | | Countrywide Home Loan
Mortgage Pass-through
Trust, 5.150%,
due 01/19/34 | | | 506,873 | | |
| | 227,867 | | | C,I | | Countrywide Home Loan
Mortgage Pass-through
Trust, 5.471%,
due 01/25/36 | | | 70,489 | | |
| | 540,000 | | | C,S | | Countrywide Home
Loan Mortgage
Pass-through Trust,
5.500%, due 09/25/35 | | | 408,115 | | |
| | 586,111 | | | C,S | | Countrywide Home
Loan Mortgage
Pass-through Trust,
5.500%, due 11/25/35 | | | 543,903 | | |
| | 310,000 | | | C,S | | Countrywide Home
Loan Mortgage
Pass-through Trust,
5.500%, due 11/25/35 | | | 218,864 | | |
| | 530,990 | | | C,S | | Countrywide Home
Loan Mortgage
Pass-through Trust,
5.500%, due 12/25/35 | | | 333,267 | | |
| | 35,904 | | | C,S | | Countrywide Home
Loan Mortgage
Pass-through Trust,
5.563%, due 12/20/35 | | | 20,224 | | |
| | 484,809 | | | C,I | | Countrywide Home
Loan Mortgage
Pass-through Trust,
5.616%, due 06/25/47 | | | 295,476 | | |
| | 764,112 | | | C,S | | Countrywide Home
Loan Mortgage
Pass-through Trust,
5.680%, due 04/25/37 | | | 416,927 | | |
| | 689,472 | | | C,I | | Countrywide Home
Loan Mortgage
Pass-through Trust,
5.930%, due 09/25/47 | | | 200,578 | | |
| | 179,481 | | | C,I | | Countrywide Home
Loan Mortgage
Pass-through Trust,
6.001%, due 09/25/37 | | | 52,758 | | |
| | 2,894,387 | | | C,S,I | | Countrywide Home
Loan Mortgage
Pass-through Trust,
6.086%, due 09/25/47 | | | 1,539,708 | | |
Principal
Amount | | | | | | Value | |
| $ | 624,624 | | | C,S,I | | Countrywide Home
Loan Mortgage
Pass-through Trust,
6.086%, due 09/25/47 | | $ | 521,539 | | |
| | 443,488 | | | C,I | | Countrywide Home
Loan Mortgage
Pass-through Trust,
6.201%, due 09/25/37 | | | 132,704 | | |
| | 140,272 | | | C,I | | Countrywide Home
Loan Mortgage
Pass-through Trust,
6.232%, due 11/25/37 | | | 36,296 | | |
| | 146,829 | | | C,I | | Countrywide Home
Loan Mortgage
Pass-through Trust,
6.388%, due 11/25/37 | | | 38,393 | | |
| | 250,000 | | | C,S | | Credit Suisse Mortgage
Capital Certificates,
5.723%, due 06/15/39 | | | 159,495 | | |
| | 279,078 | | | #,C,I | | Deutsche Alternative-A
Securities, Inc.
Alternate Loan Trust,
0.971%, due 01/27/37 | | | 82,677 | | |
| | 55,604 | | | C,S | | Deutsche Alternative-A
Securities, Inc.
Alternate Loan Trust,
5.961%, due 06/25/36 | | | 51,180 | | |
| | 299,288 | | | C,S | | Deutsche Alternative-A
Securities, Inc.
Alternate Loan Trust,
6.005%, due 10/25/36 | | | 239,801 | | |
| | 21,637 | | | C,S | | Deutsche Alternative-A
Securities, Inc.
Alternate Loan Trust,
6.360%, due 07/25/36 | | | 20,853 | | |
| | 189,362 | | | C,S | | First Horizon Alternative
Mortgage Securities,
5.500%, due 04/25/37 | | | 178,022 | | |
| | 918,271 | | | C,S | | First Horizon Mortgage
Pass-through Trust,
6.132%, due 11/25/37 | | | 611,839 | | |
| | 705,000 | | | C,S | | GE Capital Commercial
Mortgage Corp.,
4.433%, due 07/10/39 | | | 693,966 | | |
| | 233,000 | | | C,S | | GMAC Commercial
Mortgage Securities,
Inc., 6.987%,
due 05/15/30 | | | 232,301 | | |
| | 962,000 | | | C,S | | Greenwich Capital
Commercial Funding
Corp., 5.381%,
due 03/10/39 | | | 760,970 | | |
| | 1,235,000 | | | C,S | | Greenwich Capital
Commercial Funding
Corp., 5.736%,
due 12/10/49 | | | 925,860 | | |
| | 310,000 | | | C,S | | GS Mortgage Securities
Corp. II, 5.560%,
due 11/10/39 | | | 246,834 | | |
| | 166,217 | | | C,S | | GSR Mortgage Loan
Trust, 4.506%,
due 05/25/34 | | | 114,648 | | |
See Accompanying Notes to Financial Statements
151
PORTFOLIO OF INVESTMENTS
ING OPPENHEIMER STRATEGIC INCOME PORTFOLIO AS OF DECEMBER 31, 2008 (CONTINUED)
Principal
Amount | | | | | | Value | |
| COLLATERALIZED MORTGAGE OBLIGATIONS (continued) | | | |
| $ | 778,530 | | | C,S | | GSR Mortgage Loan
Trust, 4.560%,
due 09/25/35 | | $ | 498,133 | | |
| | 509,095 | | | C,S | | GSR Mortgage Loan
Trust, 4.586%,
due 09/25/35 | | | 391,540 | | |
| | 742,184 | | | C | | GSR Mortgage Loan
Trust, 5.346%,
due 11/25/35 | | | 408,201 | | |
| | 541,752 | | | C,I | | GSR Mortgage Loan
Trust, 5.826%,
due 03/25/37 | | | 296,072 | | |
| | 3,882,285 | | | C,S | | GSR Mortgage Loan
Trust, 5.999%,
due 03/25/47 | | | 2,063,695 | | |
| | 101,163 | | | C,S | | Indymac Index Mortgage
Loan Trust, 5.315%,
due 01/25/36 | | | 32,592 | | |
| | 490,000 | | | C,S | | JPMorgan Chase
Commercial Mortgage
Securities Corp.,
5.305%, due 01/15/49 | | | 387,356 | | |
| | 700,000 | | | C,S | | JPMorgan Chase
Commercial Mortgage
Securities Corp.,
5.420%, due 01/15/49 | | | 497,048 | | |
| | 920,000 | | | C,S | | JPMorgan Chase
Commercial Mortgage
Securities Corp.,
5.440%, due 06/12/47 | | | 666,701 | | |
| | 1,090,000 | | | C,S | | JPMorgan Chase
Commercial Mortgage
Securities Corp.,
5.466%, due 06/12/47 | | | 502,580 | | |
| | 110,000 | | | C,S | | JPMorgan Chase
Commercial Mortgage
Securities Corp.,
5.502%, due 06/12/47 | | | 28,783 | | |
| | 770,000 | | | C,S | | JPMorgan Chase
Commercial Mortgage
Securities Corp.,
5.804%, due 06/15/49 | | | 590,956 | | |
| | 1,430,000 | | | C,S | | JPMorgan Chase
Commercial Mortgage
Securities Corp.,
6.068%, due 02/12/51 | | | 1,017,740 | | |
| | 550,000 | | | C,S | | JPMorgan Chase
Commercial Mortgage
Securities Corp.,
6.579%, due 02/12/51 | | | 149,648 | | |
| | 850,000 | | | C,S | | JPMorgan Chase
Commercial Mortgage
Securities Corp.,
6.579%, due 02/12/51 | | | 407,026 | | |
| | 349,448 | | | C,S | | JPMorgan Commercial
Mortgage Finance
Corp., 7.770%,
due 10/15/32 | | | 349,631 | | |
| | 390,131 | | | C,S | | JPMorgan Mortgage
Trust, 5.138%,
due 11/25/33 | | | 303,005 | | |
Principal
Amount | | | | | | Value | |
| $ | 1,015,179 | | | C,I | | JPMorgan Mortgage
Trust, 5.298%,
due 07/25/35 | | $ | 783,300 | | |
| | 483,968 | | | C,S | | JPMorgan Mortgage
Trust, 5.678%,
due 04/25/36 | | | 162,698 | | |
| | 204,531 | | | C,S | | JPMorgan Mortgage
Trust, 5.793%,
due 01/25/37 | | | 150,226 | | |
| | 314,369 | | | C,I | | JPMorgan Mortgage
Trust, 6.009%,
due 05/25/37 | | | 59,007 | | |
| | 1,140,000 | | | C,S | | LB-UBS Commercial
Mortgage Trust,
5.318%, due 02/15/40 | | | 912,122 | | |
| | 450,000 | | | C,S | | LB-UBS Commercial
Mortgage Trust,
6.149%, due 04/15/41 | | | 190,818 | | |
| | 1,720,000 | | | C,S | | LB-UBS Commercial
Mortgage Trust,
6.166%, due 09/15/45 | | | 813,656 | | |
| | 550,394 | | | C,S | | MASTR Adjustable Rate
Mortgages Trust,
5.036%, due 04/25/36 | | | 393,316 | | |
| | 32,008 | | | C,S | | MASTR Alternative
Loans Trust, 6.000%,
due 07/25/34 | | | 23,402 | | |
| | 925,829 | | | C,S | | MASTR Asset
Securitization Trust,
0.921%, due 10/25/36 | | | 583,654 | | |
| | 234,913 | | | C,S | | Merrill Lynch Mortgage
Investors Trust,
4.487%, due 02/25/35 | | | 143,314 | | |
| | 567,245 | | | C,S | | Merrill Lynch Mortgage
Investors Trust,
5.492%, due 12/25/35 | | | 370,994 | | |
| | 200,000 | | | C,S | | Merrill Lynch Mortgage
Trust, 5.657%,
due 05/12/39 | | | 63,064 | | |
| | 377,793 | | | C | | MLCC Mortgage
Investors, Inc., 5.801%,
due 09/25/37 | | | 321,810 | | |
| | 1,011,029 | | | C,S | | MLCC Mortgage
Investors, Inc., 6.076%,
due 10/25/36 | | | 753,005 | | |
| | 540,000 | | | C,S | | Morgan Stanley Capital I,
5.809%, due 12/12/49 | | | 406,036 | | |
| | 23,732 | | | C,S | | Nomura Asset Securities
Corp., 6.590%,
due 03/15/30 | | | 23,700 | | |
| | 28,014 | | | C,S | | Residential Accredit
Loans, Inc., 5.376%,
due 04/25/35 | | | 7,083 | | |
| | 81,842 | | | C,S | | Residential Accredit
Loans, Inc., 5.750%,
due 01/25/33 | | | 81,582 | | |
| | 765,142 | | | C,S | | Residential Accredit
Loans, Inc., 5.750%,
due 04/25/37 | | | 334,128 | | |
| | 58,322 | | | C,S | | Residential Accredit
Loans, Inc., 6.000%,
due 05/25/36 | | | 57,027 | | |
See Accompanying Notes to Financial Statements
152
PORTFOLIO OF INVESTMENTS
ING OPPENHEIMER STRATEGIC INCOME PORTFOLIO AS OF DECEMBER 31, 2008 (CONTINUED)
Principal
Amount | | | | | | Value | |
| COLLATERALIZED MORTGAGE OBLIGATIONS (continued) | | | |
| $ | 141,398 | | | C,S | | Residential Accredit
Loans, Inc., 6.000%,
due 09/25/36 | | $ | 136,094 | | |
| | 600,000 | | | C,S | | Residential Asset
Securitization Trust,
5.500%, due 12/25/35 | | | 235,696 | | |
| | 1,040,787 | | | C,S | | Residential Asset
Securitization Trust,
6.000%, due 06/25/35 | | | 709,049 | | |
| | 238,775 | | | C,S | | Residential Asset
Securitization Trust,
6.000%, due 09/25/36 | | | 116,809 | | |
| | 198,465 | | | C,S | | Residential Asset
Securitization Trust,
6.250%, due 11/25/36 | | | 113,104 | | |
| | 507,619 | | | C,I | | Residential Funding
Mortgage Securities I,
5.764%, due 07/27/37 | | | 131,698 | | |
| | 417,000 | | | C,S | | SLM Student Loan Trust,
2.396%, due 06/15/39 | | | 165,432 | | |
| | 112,109 | | | C,I | | Structured Asset
Mortgage
Investments, Inc.,
1.081%, due 09/19/32 | | | 31,084 | | |
| | 666,288 | | | C,I | | Suntrust Adjustable Rate
Mortgage Loan Trust,
5.660%, due 06/25/37 | | | 448,637 | | |
| | 2,260,455 | | | C,S | | Suntrust Adjustable Rate
Mortgage Loan Trust,
5.827%, due 02/25/37 | | | 1,297,815 | | |
| | 296,000 | | | C,S | | Wachovia Bank
Commercial Mortgage
Trust, 5.275%,
due 11/15/48 | | | 242,931 | | |
| | 910,000 | | | C,S | | Wachovia Bank
Commercial Mortgage
Trust, 5.902%,
due 02/15/51 | | | 660,571 | | |
| | 430,000 | | | C,S | | Wachovia Bank
Commercial Mortgage
Trust, 5.952%,
due 05/15/46 | | | 114,298 | | |
| | 734,343 | | | C,S | | Wachovia Mortgage
Loan Trust, LLC,
5.981%, due 03/20/37 | | | 396,163 | | |
| | 262,038 | | | C,I | | Washington Mutual
Mortgage
Pass-through
Certificates, 3.096%,
due 11/25/46 | | | 97,121 | | |
| | 182,085 | | | C,I | | Washington Mutual
Mortgage
Pass-through
Certificates, 4.375%,
due 04/25/47 | | | 60,088 | | |
| | 241,148 | | | C,S | | Washington Mutual
Mortgage
Pass-through
Certificates, 4.491%,
due 09/25/33 | | | 207,954 | | |
Principal
Amount | | | | | | Value | |
| $ | 617,318 | | | C,S | | Washington Mutual
Mortgage
Pass-through
Certificates, 4.834%,
due 10/25/35 | | $ | 451,719 | | |
| | 575,174 | | | C,S | | Washington Mutual
Mortgage
Pass-through
Certificates, 5.047%,
due 12/25/35 | | | 463,792 | | |
| | 2,109,814 | | | C,S | | Washington Mutual
Mortgage
Pass-through
Certificates, 5.347%,
due 03/25/37 | | | 1,209,591 | | |
| | 3,080,608 | | | C,S | | Washington Mutual
Mortgage
Pass-through
Certificates, 5.449%,
due 02/25/37 | | | 1,840,258 | | |
| | 1,791,118 | | | C,S | | Washington Mutual
Mortgage
Pass-through
Certificates, 5.506%,
due 09/25/36 | | | 1,256,297 | | |
| | 156,272 | | | C,S | | Washington Mutual
Mortgage
Pass-through
Certificates, 5.548%,
due 11/25/36 | | | 102,694 | | |
| | 2,078,844 | | | C,S,I | | Washington Mutual
Mortgage
Pass-through
Certificates, 5.606%,
due 12/25/36 | | | 1,034,713 | | |
| | 268,105 | | | C,S,I | | Washington Mutual
Mortgage
Pass-through
Certificates, 5.606%,
due 12/25/36 | | | 79,358 | | |
| | 346,932 | | | C,S | | Washington Mutual
Mortgage
Pass-through
Certificates, 5.631%,
due 11/25/36 | | | 112,669 | | |
| | 166,143 | | | C,S | | Washington Mutual
Mortgage
Pass-through
Certificates, 5.646%,
due 05/25/37 | | | 106,242 | | |
| | 648,270 | | | C,S | | Washington Mutual
Mortgage
Pass-through
Certificates, 5.667%,
due 03/25/37 | | | 167,550 | | |
| | 926,813 | | | C,S | | Washington Mutual
Mortgage
Pass-through
Certificates, 5.688%,
due 06/25/37 | | | 485,715 | | |
See Accompanying Notes to Financial Statements
153
PORTFOLIO OF INVESTMENTS
ING OPPENHEIMER STRATEGIC INCOME PORTFOLIO AS OF DECEMBER 31, 2008 (CONTINUED)
Principal
Amount | | | | | | Value | |
| COLLATERALIZED MORTGAGE OBLIGATIONS (continued) | | | |
| $ | 222,432 | | | C,I | | Washington Mutual
Mortgage
Pass-through
Certificates, 5.706%,
due 02/25/37 | | $ | 57,334 | | |
| | 569,044 | | | C,S | | Washington Mutual
Mortgage
Pass-through
Certificates, 5.750%,
due 10/25/36 | | | 322,604 | | |
| | 104,385 | | | C,I | | Washington Mutual
Mortgage
Pass-through
Certificates, 5.752%,
due 11/25/36 | | | 29,556 | | |
| | 1,910,555 | | | C,S | | Washington Mutual
Mortgage
Pass-through
Certificates, 5.762%,
due 02/25/37 | | | 1,194,150 | | |
| | 541,831 | | | C,S | | Washington Mutual
Mortgage
Pass-through
Certificates, 5.859%,
due 07/25/37 | | | 274,168 | | |
| | 113,548 | | | C,S | | Washington Mutual
Mortgage
Pass-through
Certificates, 5.863%,
due 02/25/37 | | | 48,816 | | |
| | 1,118,169 | | | C,S | | Washington Mutual
Mortgage
Pass-through
Certificates, 5.871%,
due 08/25/46 | | | 622,441 | | |
| | 780,585 | | | C,S | | Washington Mutual
Mortgage
Pass-through
Certificates, 5.929%,
due 09/25/36 | | | 662,974 | | |
| | 515,301 | | | C,S | | Wells Fargo
Mortgage-Backed
Securities Trust,
3.986%, due 10/25/34 | | | 473,077 | | |
| | 81,425 | | | C,S | | Wells Fargo
Mortgage-Backed
Securities Trust,
4.368%, due 09/25/34 | | | 58,291 | | |
| | 1,469,022 | | | C,S | | Wells Fargo
Mortgage-Backed
Securities Trust,
4.388%, due 12/25/34 | | | 1,120,830 | | |
| | 1,040,392 | | | C,S | | Wells Fargo
Mortgage-Backed
Securities Trust,
4.542%, due 02/25/35 | | | 657,466 | | |
| | 216,449 | | | C,S | | Wells Fargo
Mortgage-Backed
Securities Trust,
4.543%, due 11/25/34 | | | 131,956 | | |
Principal
Amount | | | | | | Value | |
| $ | 162,338 | | | C,I | | Wells Fargo
Mortgage-Backed
Securities Trust,
4.818%, due 07/25/36 | | $ | 45,370 | | |
| | 351,836 | | | C,S | | Wells Fargo
Mortgage-Backed
Securities Trust,
4.876%, due 10/25/35 | | | 236,325 | | |
| | 440,983 | | | C,S | | Wells Fargo
Mortgage-Backed
Securities Trust,
5.092%, due 03/25/36 | | | 316,716 | | |
| | 300,862 | | | C,S | | Wells Fargo
Mortgage-Backed
Securities Trust,
5.093%, due 03/25/36 | | | 187,281 | | |
| | 598,268 | | | C,S | | Wells Fargo
Mortgage-Backed
Securities Trust,
5.205%, due 04/25/36 | | | 393,257 | | |
| | 427,467 | | | C,S | | Wells Fargo
Mortgage-Backed
Securities Trust,
5.240%, due 04/25/36 | | | 218,023 | | |
| | 198,558 | | | C,S | | Wells Fargo
Mortgage-Backed
Securities Trust,
5.245%, due 10/25/34 | | | 169,538 | | |
| | 1,750,302 | | | C,S | | Wells Fargo
Mortgage-Backed
Securities Trust,
5.545%, due 04/25/36 | | | 979,629 | | |
| | 590,316 | | | C,I | | Wells Fargo
Mortgage-Backed
Securities Trust,
5.557%, due 07/25/36 | | | 161,730 | | |
| | 3,225,561 | | | C,S | | Wells Fargo
Mortgage-Backed
Securities Trust,
5.594%, due 07/25/36 | | | 1,784,101 | | |
| | 268,324 | | | C,S,I | | Wells Fargo
Mortgage-Backed
Securities Trust,
5.628%, due 07/25/36 | | | 143,736 | | |
| | 406,320 | | | C,S,I | | Wells Fargo
Mortgage-Backed
Securities Trust,
5.628%, due 07/25/36 | | | 112,662 | | |
| | 5,086,374 | | | C,S | | Wells Fargo
Mortgage-Backed
Securities Trust,
5.750%, due 09/25/36 | | | 2,758,504 | | |
| | 251,365 | | | C,S | | Wells Fargo
Mortgage-Backed
Securities Trust,
6.000%, due 10/25/36 | | | 230,149 | | |
| | 933,524 | | | C,S | | Wells Fargo
Mortgage-Backed
Securities Trust,
6.099%, due 09/25/36 | | | 646,212 | | |
Total Collateralized
Mortgage Obligations
(Cost $98,896,612) | | | 66,847,660 | | |
See Accompanying Notes to Financial Statements
154
PORTFOLIO OF INVESTMENTS
ING OPPENHEIMER STRATEGIC INCOME PORTFOLIO AS OF DECEMBER 31, 2008 (CONTINUED)
Principal
Amount | | | | | | Value | |
| OTHER BONDS: 21.0% | | | |
| | | | | Event Linked Notes: 1.5% | |
| EUR | 250,000 | | | #,S | | Aiolos Ltd. - Floating
Rate Catastrophe
Linked Nts., 3-month
EUR-EURIBOR
+4.750%, 04/08/09,
7.547%, due 04/08/09 | | $ | 342,699 | | |
| $ | 500,000 | | | #,S | | Akibare Ltd. -
Catastrophe Linked
Class A Floating
Rate Nts., 3-month
USD LIBOR +2.950%,
05/22/12, 5.103%,
due 05/22/12 | | | 484,925 | | |
| | 500,000 | | | #,S | | Calabash Re Ltd. -
Class A-1 Floating Rate
Catastrophe Linked
Nts., 3-month
USD-LIBOR +8.500%,
06/01/09, 10.653%,
due 06/01/09 | | | 501,175 | | |
| | 500,000 | | | #,S | | Cat-Mex Ltd. - Class A
Floating Rate
Catastrophe Linked
Nts., 3-month
USD-LIBOR +2.350%,
05/19/09, 4.585%,
due 05/19/09 | | | 489,200 | | |
| | 300,000 | | | #,S | | Champlain Ltd. - Class A
Floating Rate
Catastrophe Linked
Nts., 3-month
US-LIBOR +12.750%,
01/7/09, 17.084%,
due 01/07/09 | | | 300,170 | | |
| | 310,000 | | | #,S | | Eurus Ltd. - Floating
Rate Catastrophe
Linked Nts., 3-month
USD LIBOR +6.250%,
04/08/09, 9.758%,
due 04/08/09 | | | 302,932 | | |
| | 360,000 | | | #,S | | Fhu-Jin Ltd. - Class B
Floating Rate
Catastrophe Linked
Nts., 3-month
USD-LIBOR +3.900%,
08/10/11, 7.093%,
due 08/10/11 | | | 347,652 | | |
| | 250,000 | | | #,S | | Foundation Re II
Ltd. - Series 2006-I,
Class G Floating Rate
Catastrophe Linked
Nts., 3-month
USD-LIBOR +9.800%,
01/08/09, 11.841%,
due 01/08/09 | | | 249,261 | | |
| | 450,000 | | | #,S | | Fusion 2007 Ltd. Floating
Rate Note, 3-month
USD-LIBOR +6.000%,
05/19/09, 8.239%,
due 05/19/09 | | | 445,793 | | |
Principal
Amount | | | | | | Value | |
| $ | 750,000 | | | #,S | | Lakeside RE Ltd. -
Floating Rate
Catastrophe Linked
Nts., 3-month
USD-LIBOR +6.500%,
12/31/09, 7.959%,
due 12/31/09 | | $ | 743,325 | | |
| | 250,000 | | | #,S | | Medquake Ltd. -
Catastrophe Linked
Class B Floating Rate
Nts., 3-month
USD-LIBOR +5.100%,
05/31/10, 7.249%,
due 05/31/10 | | | 244,575 | | |
| | 250,000 | | | #,S | | Midori Ltd. -
Catastrophe Linked
Floating Rate Nts.,
3-month USD-LIBOR
+2.750%, 10/24/12,
7.503%, due 10/24/12 | | | 240,725 | | |
| | 250,000 | | | #,S | | Muteki Ltd. -
Catastrophe Linked
Floating Rate Nts.,
Japan Earthquake,
3-month USD-LIBOR
+4.400%, 05/24/11,
6.549%, due 05/24/11 | | | 237,375 | | |
| | 630,000 | | | #,S | | Nelson RE Ltd. -
Catastrophe Linked
Class A Series 2007-I
Floating Rate Nts.,
3-month USD-LIBOR
+11.900%, 06/21/10,
14.049%, due 06/21/10 | | | 610,848 | | |
| | 500,000 | | | #,S | | Osiris Capital PLC -
Mortality Index
Catastrophe Linked
Nts. Series D3,
3-month USD-LIBOR
+5.000%, 01/15/10,
9.753%, due 01/15/10 | | | 489,250 | | |
| | 250,000 | | | #,S | | Residential RE
2007 - Catastrophe
Linked Class 3 Floating
Rate Nts., 3-month
USD-LIBOR +12.250%,
06/07/10, 14.453%,
due 06/07/10 | | | 241,475 | | |
| | 450,000 | | | #,S | | Residential Reinsurance
Ltd. - Class 2 Floating
Rate Catastrophe
Linked Nts.,
US Hurricane and
US Earthquake,
3-month USD-LIBOR
+11.500%, 06/06/11,
13.703%, due 06/06/11 | | | 434,306 | | |
See Accompanying Notes to Financial Statements
155
PORTFOLIO OF INVESTMENTS
ING OPPENHEIMER STRATEGIC INCOME PORTFOLIO AS OF DECEMBER 31, 2008 (CONTINUED)
Principal
Amount | | | | | | Value | |
| | | | | Event Linked Notes (continued) | |
| $ | 610,000 | | | #,S | | VASCO Re 2006 Ltd. -
Floating Rate
Catastrophe Linked
Nts., 3-month
USD-LIBOR +8.500%,
06/05/09, 10.701%,
due 06/05/09 | | $ | 612,349 | | |
| | 701,000 | | | #,I | | Vega Capital LTD. -
Class D Catastrophe
Linked Nts., 0.000%*,
06/24/11, 0.001%,
due 06/24/11 | | | 718,525 | | |
| | 680,000 | | | #,S | | Willow RE Ltd. -
Catastrophe Linked
Floating Rate Nts.,
3-month USD-LIBOR
+5.125%, 06/16/10,
8.545%, due 06/16/10 | | | 409,870 | | |
| | | | 8,446,430 | | |
| | | | | Foreign Government Bonds: 19.5% | |
| EGP | 3,885,000 | | | #,S | | Arab Republic of Egypt,
8.750%, due 07/18/12 | | | 583,323 | | |
| $ | 1,290,000 | | | S | | Argentina Government
International Bond,
1.318%, due 12/15/35 | | | 38,700 | | |
| | 1,294,000 | | | S | | Argentina Government
International Bond,
7.000%, due 03/28/11 | | | 527,629 | | |
| | 900,000 | | | #,S | | Banco Nacional de
Desenvolvimento
Economico e Social,
6.369%, due 06/16/18 | | | 859,500 | | |
| EUR | 355,000 | | | S | | Belgium Government
International Bond,
5.000%, due 03/28/35 | | | 560,936 | | |
| BRL | 5,457,000 | | | S | | Brazil Notas do Tesouro
Nacional Series F,
10.000%, due 01/01/12 | | | 2,312,298 | | |
| BRL | 8,767,000 | | | S | | Brazil Notas do Tesouro
Nacional Series F,
10.000%, due 01/01/17 | | | 3,384,261 | | |
| EUR | 4,155,000 | | | S | | Bundesrepublik
Deutschland, 3.750%,
due 07/04/13 | | | 6,121,602 | | |
| EUR | 2,810,000 | | | S | | Bundesrepublik
Deutschland, 4.000%,
due 01/04/37 | | | 4,188,662 | | |
| EUR | 1,055,000 | | | S | | Bundesrepublik
Deutschland, 5.500%,
due 01/04/31 | | | 1,819,718 | | |
| CAD | 375,000 | | | S | | Canadian Government
International Bond,
3.500%, due 06/01/13 | | | 326,929 | | |
| CAD | 280,000 | | | S | | Canadian Government
International Bond,
3.750%, due 06/01/10 | | | 235,626 | | |
| CAD | 170,000 | | | S | | Canadian Government
International Bond,
4.250%, due 06/01/18 | | | 155,437 | | |
| CAD | 395,000 | | | S | | Canadian Government
International Bond,
5.000%, due 06/01/37 | | | 409,175 | | |
Principal
Amount | | | | | | Value | |
| $ | 1,050,000 | | | C, I | | Credit Suisse First Boston
International for CJSC
The EXIM of Ukraine,
8.400%, due 02/09/16 | | $ | 157,500 | | |
| DKK | 2,405,000 | | | S | | Denmark Government
International Bond,
5.000%, due 11/15/13 | | | 487,597 | | |
| $ | 2,470,000 | | | C,S,L | | Federative Republic of
Brazil, 6.000%,
due 01/17/17 | | | 2,562,625 | | |
| | 2,530,000 | | | S | | Federative Republic of
Brazil, 8.000%,
due 01/15/18 | | | 2,846,250 | | |
| | 415,000 | | | S | | Federative Republic of
Brazil, 8.875%,
due 10/14/19 | | | 508,375 | | |
| EUR | 1,860,000 | | | S | | French Treasury Note,
3.750%, due 01/12/13 | | | 2,693,908 | | |
| EUR | 735,000 | | | S | | French Treasury Note,
4.500%, due 07/12/12 | | | 1,087,543 | | |
| EUR | 2,000,000 | | | S | | Government of France,
4.000%, due 10/25/38 | | | 2,931,429 | | |
| EUR | 825,000 | | | S | | Hellenic Republic
Government
International Bond,
4.600%, due 05/20/13 | | | 1,126,780 | | |
| HUF | 81,200,000 | | | S | | Hungary Government
International Bond,
5.500%, due 02/12/14 | | | 364,826 | | |
| HUF | 260,000,000 | | | S | | Hungary Government
International Bond,
6.000%, due 10/24/12 | | | 1,214,679 | | |
| $ | 930,000 | | | #,S | | Indonesia Government
International Bond,
6.750%, due 03/10/14 | | | 832,350 | | |
| | 860,000 | | | #,S | | Indonesia Government
International Bond,
6.875%, due 01/17/18 | | | 718,100 | | |
| | 555,000 | | | #,S | | Indonesia Government
International Bond,
7.250%, due 04/20/15 | | | 496,725 | | |
| | 130,000 | | | #,S | | Indonesia Government
International Bond,
7.750%, due 01/17/38 | | | 108,550 | | |
| | 1,330,000 | | | #,S | | Indonesia Government
International Bond,
8.500%, due 10/12/35 | | | 1,137,150 | | |
| ILS | 3,700,000 | | | S | | Israel Government
International Bond,
7.500%, due 03/31/14 | | | 1,208,255 | | |
| EUR | 1,100,000 | | | S | | Italy Certificati di
Credito del Tesoro,
2.200%, due 07/01/09 | | | 1,529,511 | | |
| JPY | 329,000,000 | | | S | | Japan Government
10-Year Bond, 1.700%,
due 09/20/16 | | | 3,867,138 | | |
| JPY | 118,000,000 | | | S | | Japan Government
10-Year Bond, 2.000%,
due 03/20/16 | | | 1,413,213 | | |
| JPY | 196,000,000 | | | S | | Japan Government
20-Year Bond, 1.000%,
due 03/20/23 | | | 2,000,383 | | |
See Accompanying Notes to Financial Statements
156
PORTFOLIO OF INVESTMENTS
ING OPPENHEIMER STRATEGIC INCOME PORTFOLIO AS OF DECEMBER 31, 2008 (CONTINUED)
Principal
Amount | | | | | | Value | |
| | | | | | | Foreign Government Bonds
(continued) | | | | | |
| JPY | 146,000,000 | | | S | | Japan Government
20-Year Bond, 2.000%,
due 12/20/24 | | $ | 1,686,333 | | |
| JPY | 82,000,000 | | | S | | Japan Government
20-Year Bond, 2.100%,
due 03/20/25 | | | 965,869 | | |
| JPY | 629,000,000 | | | S | | Japan Government
2-Year Bond, 0.900%,
due 06/15/10 | | | 6,988,204 | | |
| JPY | 722,000,000 | | | S | | Japan Government
5-Year Bond, 1.500%,
due 06/20/13 | | | 8,265,861 | | |
| MXN | 18,760,000 | | | S | | Mexico Government
International Bond,
8.000%, due 12/19/13 | | | 1,366,038 | | |
| MXN | 12,800,000 | | | S | | Mexico Government
International Bond,
10.000%, due 12/05/24 | | | 1,064,040 | | |
| $ | 395,000 | | | | | Mexico Government
International Bond,
8.375%, due 01/14/11 | | | 428,575 | | |
| NGN | 40,200,000 | | | S | | Nigeria Treasury Bond,
9.230%, due 05/25/12 | | | 272,364 | | |
| NGN | 12,700,000 | | | S | | Nigeria Treasury Bond,
12.500%, due 02/24/09 | | | 90,909 | | |
| NGN | 17,600,000 | | | S | | Nigeria Treasury Bond,
15.000%, due 01/27/09 | | | 126,347 | | |
| NOK | 1,335,000 | | | S | | Norway Government
International Bond,
6.500%, due 05/15/13 | | | 216,199 | | |
| $ | 65,000 | | | S | | Panama Government
International Bond,
6.700%, due 01/26/36 | | | 58,825 | | |
| | 435,000 | | | S | | Panama Government
International Bond,
7.125%, due 01/29/26 | | | 412,163 | | |
| | 2,234,000 | | | S | | Panama Government
International Bond,
7.250%, due 03/15/15 | | | 2,289,850 | | |
| | 240,000 | | | S | | Panama Government
International Bond,
8.875%, due 09/30/27 | | | 259,824 | | |
| | 450,000 | | | S | | Panama Government
International Bond,
9.375%, due 04/01/29 | | | 497,250 | | |
| PEN | 3,800,000 | | | S | | Peru Government
International Bond,
7.840%, due 08/12/20 | | | 1,237,005 | | |
| PEN | 4,570,000 | | | S | | Peru Government
International Bond,
8.600%, due 08/12/17 | | | 1,558,571 | | |
| PEN | 3,550,000 | | | S | | Peru Government
International Bond,
9.910%, due 05/05/15 | | | 1,273,194 | | |
| PEN | 4,355,000 | | | S | | Peru Government
International Bond,
12.250%, due 08/10/11 | | | 1,544,098 | | |
| PEN | 4,131,000 | | | S,Z | | Peruvian Certificates of
Deposit, 6.890%,
due 01/05/09 | | | 1,314,557 | | |
Principal
Amount | | | | | | Value | |
| PEN | 97,000 | | | S,Z | | Peruvian Certificates of
Deposit, 8.610%,
due 04/13/09 | | $ | 30,154 | | |
| $ | 200,000 | | | S | | Philippine Government
International Bond,
9.000%, due 02/15/13 | | | 213,000 | | |
| PLN | 1,815,000 | | | S | | Poland Government
International Bond,
5.250%, due 04/25/13 | | | 613,098 | | |
| PLN | 635,000 | | | S | | Poland Government
International Bond,
5.750%, due 09/23/22 | | | 222,032 | | |
| $ | 495,000 | | | S | | Republic of Colombia,
7.375%, due 09/18/37 | | | 487,575 | | |
| | 335,000 | | | S | | Republic of Colombia,
8.250%, due 12/22/14 | | | 363,040 | | |
| | 20,000 | | | S | | Republic of Colombia,
10.750%, due 01/15/13 | | | 23,400 | | |
| COP | 3,183,000,000 | | | S | | Republic of Colombia,
12.000%, due 10/22/15 | | | 1,563,500 | | |
| $ | 785,000 | | | S | | Republic of Turkey,
6.750%, due 04/03/18 | | | 749,675 | | |
| | 1,405,000 | | | S | | Republic of Turkey,
7.000%, due 09/26/16 | | | 1,382,450 | | |
| | 210,000 | | | S | | Republic of Turkey,
7.000%, due 03/11/19 | | | 198,571 | | |
| | 270,000 | | | S | | Republic of Turkey,
7.250%, due 03/15/15 | | | 270,000 | | |
| UYU | 9,900,000 | | | S | | Republica Orient
Uruguay, 4.250%,
due 04/05/27 | | | 222,141 | | |
| UYU | 11,880,000 | | | S | | Republica Orient
Uruguay, 5.000%,
due 09/14/18 | | | 400,424 | | |
| $ | 400,000 | | | S | | Republica Orient
Uruguay, 7.625%,
due 03/21/36 | | | 338,000 | | |
| | 340,000 | | | #,S | | RSHB Capital SA for
OJSC Russian
Agricultural Bank,
7.750%, due 05/29/18 | | | 221,000 | | |
| ILS | 3,590,000 | | | S | | State of Israel, 5.500%,
due 02/28/17 | | | 1,046,109 | | |
| SEK | 3,940,000 | | | S | | Sweden Government
International Bond,
4.500%, due 08/12/15 | | | 568,009 | | |
| TRY | 1,075,000 | | | S | | Turkey Government
International Bond,
10.000%, due 02/15/12 | | | 635,368 | | |
| TRY | 235,000 | | | S | | Turkey Government
International Bond,
12.000%, due 08/14/13 | | | 124,846 | | |
| TRY | 2,260,000 | | | S | | Turkey Government
International Bond,
14.000%, due 01/19/11 | | | 1,404,172 | | |
| TRY | 6,940,000 | | | S | | Turkey Government
International Bond,
16.000%, due 03/07/12 | | | 4,415,342 | | |
| TRY | 2,700,000 | | | S,Z | | Turkey Government
International Bond,
16.010%, due 10/07/09 | | | 1,555,539 | | |
| TRY | 4,565,000 | | | S,Z | | Turkey Government
International Bond,
16.517%, due 01/13/10 | | | 2,523,663 | | |
See Accompanying Notes to Financial Statements
157
PORTFOLIO OF INVESTMENTS
ING OPPENHEIMER STRATEGIC INCOME PORTFOLIO AS OF DECEMBER 31, 2008 (CONTINUED)
Principal
Amount | | | | | | Value | |
| | | | | | | Foreign Government Bonds
(continued) | | | | | |
| TRY | 1,000,000 | | | Z | | Turkey Government
International Bond,
17.098%,
due 06/23/10 | | $ | 517,169 | | |
| GBP | 825,000 | | | S | | United Kingdom Gilt,
4.750%, due 12/07/38 | | | 1,409,515 | | |
| GBP | 385,000 | | | S | | United Kingdom Gilt,
5.000%, due 03/07/12 | | | 599,700 | | |
| GBP | 425,000 | | | S | | United Kingdom
Gilt Bond, 4.750%,
due 06/07/10 | | | 643,377 | | |
| GBP | 410,000 | | | S | | United Kingdom
Gilt Bond, 5.000%,
due 03/07/18 | | | 682,601 | | |
| $ | 1,085,000 | | | S | | Uruguay Government
International Bond,
8.000%, due 11/18/22 | | | 1,009,050 | | |
| | 1,330,000 | | | S | | Venezuela Government
International Bond,
7.650%, due 04/21/25 | | | 525,350 | | |
| | 540,000 | | | S | | Venezuela Government
International Bond,
9.000%, due 05/07/23 | | | 235,278 | | |
| | 410,000 | | | S | | Venezuela Government
International Bond,
10.750%, due 09/19/13 | | | 270,600 | | |
| | | | 108,196,507 | | |
Total Other Bonds
(Cost $122,418,463) | | | 116,642,937 | | |
| STRUCTURED PRODUCTS: 6.9% | | | |
| | 520,000 | | | I | | Barclays Bank
PLC - Custom Basket of
African Currencies
Unsecured Linked Nts.,
10.250%, 05/07/09 | | | 452,920 | | |
| | 520,000 | | | I | | Barclays Bank
PLC - Custom Basket of
African Currencies
Unsecured Linked Nts.,
10.000%*, 05/15/09 | | | 454,792 | | |
| BRL | 1,250,000 | | | I | | Citigroup Funding Inc. -
Brazil T-Bond
Unsecured Credit
Linked Nts.,
9.762%, 01/03/17 | | | 450,936 | | |
| COP | 525,000,000 | | | S | | Citigroup Funding Inc. -
Colombia (TES)
Unsecured Credit
Linked Nts.,
11.250%, 10/25/18 | | | 241,567 | | |
| COP | 132,000,000 | | | I | | Citigroup Funding Inc. -
Colombia (TES)
Unsecured Credit
Linked Nts.,
7.000%, 02/26/15 | | | 114,548 | | |
| COP | 207,000,000 | | | I | | Citigroup Funding Inc. -
Colombia (TES)
Unsecured Credit
Linked Nts.,
7.000%, 02/26/15 | | | 179,632 | | |
Principal
Amount | | | | | | Value | |
| COP | 361,000,000 | | | I | | Citigroup Funding Inc. -
Colombia (TES)
Unsecured Credit
Linked Nts., 7.000%,
02/26/15 | | $ | 313,271 | | |
| $ | 1,030,000 | | | S | | Citigroup Funding Inc. -
Custom Basket of
African Currencies
Credit Linked Nts.,
04/29/09 | | | 909,336 | | |
| DOP | 3,770,000 | | | I | | Citigroup Funding Inc. -
Dominican Republic
T-Bond Unsecured
Credit Linked Nts.,
12.000%, 02/22/11 | | | 86,691 | | |
| DOP | 10,390,000 | | | S | | Citigroup Funding Inc. -
Dominican Republic
T-Bond Unsecured
Credit Linked Nts.,
14.218%*, 05/11/09 | | | 271,602 | | |
| DOP | 14,500,000 | | | S | | Citigroup Funding Inc. -
Dominican Republic
Unsecured Credit
Linked Nts.,
13.182%*, 02/23/09 | | | 396,979 | | |
| DOP | 10,200,000 | | | S | | Citigroup Funding Inc. -
Dominican Republic
Unsecured Credit
Linked Nts.,
15.000%, 03/12/12 | | | 228,924 | | |
| EGP | 2,650,000 | | | S | | Citigroup Funding Inc. -
Egypt (The Arab
Republic of) T-Bill
Unsecured Credit
Linked Nts.,
5.765%*, 02/05/09 | | | 475,256 | | |
| EGP | 1,900,000 | | | S | | Citigroup Funding Inc. -
Egypt (The Arab
Republic of) T-Bill
Unsecured Credit
Linked Nts.,
6.089%*, 03/05/09 | | | 337,861 | | |
| EGP | 2,810,000 | | | S | | Citigroup Funding Inc. -
Egypt (The Arab
Republic of) T-Bill
Unsecured Credit
Linked Nts.,
6.267%*, 03/26/09 | | | 496,324 | | |
| EGP | 2,820,000 | | | S | | Citigroup Funding Inc. -
Egypt (The Arab
Republic of) T-Bill
Unsecured Credit
Linked Nts.,
6.529%*, 03/26/09 | | | 498,090 | | |
| EGP | 2,620,000 | | | S | | Citigroup Funding Inc. -
Egypt (The Arab
Republic of) T-Bill
Unsecured Credit
Linked Nts.,
6.641%*, 02/17/09 | | | 467,730 | | |
See Accompanying Notes to Financial Statements
158
PORTFOLIO OF INVESTMENTS
ING OPPENHEIMER STRATEGIC INCOME PORTFOLIO AS OF DECEMBER 31, 2008 (CONTINUED)
Principal
Amount | | | | | | Value | |
| STRUCTURED PRODUCTS (continued) | | | |
| EGP | 1,140,000 | | | S | | Citigroup Funding Inc. -
Egypt (The Arab
Republic of) T-Bill
Unsecured Credit
Linked Nts.,
7.812%*, 04/16/09 | | $ | 200,011 | | |
| GHS | 610,000 | | | S | | Citigroup Funding Inc. -
Ghana (Republic of)
Unsecured Credit
Linked Nts.
13.500%, 04/02/10 | | | 418,313 | | |
| NGN | 96,000,000 | | | I | | Citigroup Funding Inc. -
Nigeria Unsecured
Credit Linked Nts
(linked to Nigerian
Treasury Bonds),
14.500%, 03/01/11 | | | 699,295 | | |
| ZMK | 565,000,000 | | | S | | Citigroup Funding Inc. -
Zambia T-Bill
Unsecured Credit
Linked Nts.,
10.717%*, 03/04/09 | | | 114,156 | | |
| ZMK | 565,000,000 | | | S | | Citigroup Funding Inc. -
Zambia T-Bill
Unsecured Credit
Linked Nts.,
10.793%*, 02/25/09 | | | 114,457 | | |
| ZMK | 365,000,000 | | | S | | Citigroup Funding Inc. -
Zambia T-Bill
Unsecured Credit
Linked Nts.,
11.399%*, 06/11/09 | | | 69,623 | | |
| UAH | 300,000 | | | S | | Citigroup Global
Markets Holdings Inc. -
Ukraine Currency
Indexed Unsecured
Credit Linked Nts.,
11.940%, 01/02/10 | | | 33,801 | | |
| $ | 400,000 | | | @@,C,S,I | | Cloverie PLC - Series
2005-93 Secured
Credit Linked Nts.,
3-month
USD-LIBOR+4.250%,
12/20/10 | | | 255,720 | | |
| | 325,000 | | | @@,#,I | | Coriolanus Limited -
Argentine Republic
Credit Linked Nts.,
one-month USD-LIBOR
+ 3.000%, 12/22/11 | | | 325,000 | | |
| | 500,000 | | | @@,#,I | | Coriolanus Limited -
Coriolanus Limited
Pass-Through
Emerging Markets
Portfolio Credit
Linked Nts.,
10.620%, 09/10/10 | | | 32,750 | | |
| | 630,000 | | | @@,#,I,Z | | Coriolanus Limited - JSC
Halyk Bank of
Kazakhstan Credit
Linked Nts.,
7.250%, 03/25/09 | | | 623,700 | | |
Principal
Amount | | | | | | Value | |
| BRL | 3,700,000 | | | @@,# | | Coriolanus Limited -
Secured Pass-Through
Rondonia Precatorio
Inflation Linked Nts.,
0.000%, 12/31/17 | | $ | 1,090,008 | | |
| COP | 13,368,000,000 | | | I | | Credit and Repackaged
Securities Limited
("CARS") - Republic of
Colombia COP - Linked
Medium Term Credit
Linked Nts.,
10.476%*, 02/08/37 | | | 87,393 | | |
| TRY | 4,540,000 | | | I | | Credit and
Repackaged Securities
Limited ("CARS") -
Republic of Turkey
Medium Term Credit
Linked Nts.,
14.802%*, 03/29/17 | | | 638,865 | | |
| UAH | 4,600,000 | | | I | | Credit Suisse First
Boston, Nassau -
Ukraine Government
International Bonds
Series EMG 27 Credit
Linked Nts.,
11.940%, 12/30/09 | | | 422,319 | | |
| UAH | 400,000 | | | I | | Credit Suisse First
Boston, Nassau -
Ukraine Series EMG 13
Credit Linked Nts.,
11.940%, 12/30/09 | | | 36,723 | | |
| UAH | 1,440,000 | | | I | | Credit Suisse First
Boston, Nassau -
Ukraine Series NPC
12 Credit Linked Nts.,
11.940%, 12/30/09 | | | 132,204 | | |
| UAH | 995,000 | | | S | | Credit Suisse
International - Boryspil
Airport Total Return
Linked Nts.,
10.000%, 04/19/10 | | | 55,583 | | |
| IDR | 3,700,000,000 | | | S | | Credit Suisse
International -
Indonesia (Republic
of) Total Return
Linked Nts., 12.000%,
09/16/11 | | | 342,073 | | |
| RUB | 12,330,000 | | | I | | Credit Suisse
International - Moitk
Total Return Linked
Nts., 8.990%, 03/26/11 | | | 130,831 | | |
| RUB | 21,800,000 | | | I | | Credit Suisse
International -
Moscoblgaz - Finans
RUR Total Return
Linked Nts., 9.250%,
06/24/12 | | | 289,144 | | |
| $ | 830,000 | | | S | | Credit Suisse
International - NJSC
Naftogaz of Ukraine
Credit Linked Nts. -
Multiple LPN
Reference Obligations,
5.000%, 01/20/09 | | | 816,883 | | |
See Accompanying Notes to Financial Statements
159
PORTFOLIO OF INVESTMENTS
ING OPPENHEIMER STRATEGIC INCOME PORTFOLIO AS OF DECEMBER 31, 2008 (CONTINUED)
Principal
Amount | | | | | | Value | |
| STRUCTURED PRODUCTS (continued) | | | |
| RUB | 24,380,000 | | | @@,I | | Credit Suisse
International - Oreniz
Total Return
Linked Nts., 9.240%,
02/21/12 | | $ | 323,363 | | |
| RUB | 10,610,000 | | | @@,I | | Credit Suisse
International - Russian
Railways Total Return
Linked Bonds,
6.670%, 01/22/09 | | | 333,685 | | |
| RUB | 19,450,000 | | | I,± | | Credit Suisse
International -
SPETSSTROY - 2 Credit
Linked Fully Funded
Total Return Linked
Nts., 8.590%, 5/20/10 | | | 51,595 | | |
| VND | 3,048,000,000 | | | @@,I | | Credit Suisse
International -
Vietnam Shipbuilding
Industry Group Total
Return Credit Linked
Nts., 10.500%,
01/19/17 | | | 106,348 | | |
| VND | 7,600,000,000 | | | @@,S | | Deutsche Bank A.G.,
Singapore - Vietnam
Shipping Industry
Group Total Return
Linked Nts.,
9.000%, 04/20/17 | | | 184,142 | | |
| MXN | 2,200,634 | | | I | | Deutsche Bank AG,
London - Arrendadora
Capita Corporation SA
de CV and The Capita
Corporation de Mexico,
SA de CV Credit Linked
Nts., 9.090%, 01/05/11 | | | 147,784 | | |
| MXN | 1,438,126 | | | I | | Deutsche Bank AG,
London - Arrendadora
Capita Corporation SA
de CV and The Capita
Corporation de Mexico,
SA de CV Credit Linked
Nts., 9.520%, 01/05/11 | | | 96,578 | | |
| MXN | 1,438,336 | | | I | | Deutsche Bank AG,
London - Arrendadora
Capita Corporation SA
de CV and The Capita
Corporation de Mexico,
SA de CV Credit Linked
Nts., 9.650%, 01/05/11 | | | 96,592 | | |
| BRL | 595,000 | | | S | | Deutsche Bank AG,
London - Brazil IPCA
Total Return Credit
Linked Nts.,
6.000%, 08/18/10 | | | 454,402 | | |
| COP | 457,000,000 | | | S | | Deutsche Bank AG,
London - Colombia
(Republic of) Total
Return Credit Linked
Nts., 13.500%, 09/16/14 | | | 227,250 | | |
Principal
Amount | | | | | | Value | |
| NGN | 19,500,000 | | | S | | Deutsche Bank AG,
London - Nigeria Total
Return Credit
Linked Nts., 12.500%,
02/27/09 | | $ | 144,934 | | |
| NGN | 26,000,000 | | | S | | Deutsche Bank AG,
London - Nigeria Total
Return Credit Linked
Nts., 15.000%, 01/30/09 | | | 190,800 | | |
| $ | 457,170 | | | @@,I | | Deutsche Bank AG,
London - TMM SA
Credit Linked Nts.,
6.000%, 09/07/12 | | | 251,444 | | |
| | 420,000 | | | @@,S | | Deutsche Bank AG,
London - Ukrtelecom
Floating Rate Credit
Linked Total Return
Nts., 6-month
USD-LIBOR +3.400%,
08/25/10 | | | 237,325 | | |
| | 420,000 | | | @@,S | | Deutsche Bank AG,
London - Ukrtelecom
Floating Rate Credit
Linked Total Return
Nts., 6-month
USD-LIBOR +3.500%,
02/25/11 | | | 212,642 | | |
| | 420,000 | | | @@,S | | Deutsche Bank AG,
London - Ukrtelecom
Floating Rate Credit
Linked Total Return
Nts., 6-month
USD-LIBOR +3.600%,
08/25/11 | | | 192,864 | | |
| | 420,000 | | | @@,S | | Deutsche Bank AG,
London - Ukrtelecom
Floating Rate Credit
Linked Total Return
Nts., 6-month
USD-LIBOR +3.680%,
02/27/12 | | | 179,252 | | |
| | 420,000 | | | @@,S | | Deutsche Bank AG,
London - Ukrtelecom
Floating Rate Credit
Linked Total Return
Nts., 6-month
USD-LIBOR +3.750%,
08/28/12 | | | 170,415 | | |
| IDR | 4,800,000,000 | | | S | | Deutsche Bank AG,
Singapore - Indonesia
Credit Linked Nts.,
12.800%, 06/22/21 | | | 369,072 | | |
| $ | 157,867 | | | S | | Deutsche Bank
International Asia
Limited, Singapore -
Indonesia Credit
Linked Nts., 14.250%,
06/22/13 | | | 172,005 | | |
| RUB | 7,890,000 | | | @@,I | | Dresdner Bank AG,
London - Lukoil Credit
Linked Nts., 7.100%,
12/12/11 | | | 191,727 | | |
See Accompanying Notes to Financial Statements
160
PORTFOLIO OF INVESTMENTS
ING OPPENHEIMER STRATEGIC INCOME PORTFOLIO AS OF DECEMBER 31, 2008 (CONTINUED)
Principal
Amount | | | | | | Value | |
| STRUCTURED PRODUCTS (continued) | | | |
| $ | 900,000 | | | @@,#,I | | Eirles Two Limited
335 - Floating Rate
Credit Linked Nts.,
6-month USD-LIBOR +1.650%,04/30/12 | | $ | 313,920 | | |
| | 900,000 | | | @@,#,I | | Eirles Two Ltd.
324 - Floating Rate
Credit Linked Nts.,
6-month USD-LIBOR
+3.200%, 04/30/12 | | | 349,740 | | |
| | 505,000 | | | I | | Emblem Finance Co.
Limited - Kingdom of
Swaziland Floating
Rate Credit Linked
Nts., 3-month
USD-LIBOR +4.000%,
06/20/10 | | | 534,492 | | |
| RUB | 19,300,000 | | | @@,S | | Goldman Sachs Capital
Markets LP - OJSC
Russian Agricultural
Bank Total Return
Linked Nts., 8.000%,
05/13/09 | | | 572,733 | | |
| $ | 3,000,000 | | | @@,#,I | | Hallertau SPC 2007-01 -
Republic of Philippines
Credit Linked Nts.,
6-month USD-LIBOR
+2.050%, 12/20/17 | | | 2,185,500 | | |
| | 3,140,000 | | | @@,#,I | | Hallertau SPC 2008-2A -
Doux Frangosul S.A.
ARGO Avicola Credit
Linked Nts., 9.264%,
09/17/13 | | | 3,179,878 | | |
| BRL | 2,532,671 | | | @@,#,I,± | | Hallertau SPC,Series
2008-1, Certificado de
Direitos Creditorios do Agronegocio/Frigorifico
Margen Ltda. Credit
Linked Nts., 9.888%*,
08/02/10 | | | 220,251 | | |
| $ | 290,000 | | | @@,S | | HSBC Bank PLC -
Unsecured Currency
Linked Nts., USD/TRY,
03/09/09 | | | 264,364 | | |
| | 290,000 | | | @@,S,Z | | HSBC Bank PLC -
Unsecured Currency
Linked Nts., USD/TRY,
07/08/09 | | | 263,030 | | |
| | 920,000 | | | @@,S,Z | | HSBC Bank PLC -
Unsecured Currency
Linked Nts., Zero
Coupon, 01/12/10 | | | 718,152 | | |
| BRL | 12,716,000 | | | I | | JPMorgan Chase Bank
N.A, London. - Brazil
Unsecured Credit
Linked Nts., 12.184%*,
01/02/15 | | | 2,498,097 | | |
| COP | 6,500,000,000 | | | I | | JPMorgan Chase Bank
N.A. - COP and
Colombia Credit
Linked Nts., 10.190%*,
01/05/16 | | | 1,399,972 | | |
Principal
Amount | | | | | | Value | |
| COP | 2,663,000,000 | | | I | | JPMorgan Chase Bank
N.A. - COP and
Colombia Credit
Linked Nts.,
10.218%*, 10/31/16 | | $ | 526,186 | | |
| COP | 2,674,000,000 | | | I | | JPMorgan Chase Bank
N.A. - COP and
Colombia Credit
Linked Nts.,
10.218%*, 10/31/16 | | | 528,359 | | |
| PEN | 1,360,000 | | | I | | JPMorgan Chase Bank
N.A. - PEN and Peru
Credit Linked Nts.,
8.115%*, 09/02/15 | | | 231,843 | | |
| BRL | 405,000 | | | I | | JPMorgan Chase Bank
N.A., London - Brazil
NTN - B Credit Linked
Nts., Rate Linked to
Inflation, 05/16/45 | | | 259,968 | | |
| IDR | 4,190,000,000 | | | I | | JPMorgan Chase Bank,
N.A., Singapore -
Indonesia Credit
Linked Nts., 12.800%,
06/17/21 | | | 402,701 | | |
| COP | 392,000,000 | | | I | | LatAm Walker Cayman
Trust Series 2006-102 -
COP and Colombia
Credit Linked Nts.,
10.000%, 11/17/16 | | | 163,297 | | |
| BRL | 2,200,458 | | | S,± | | Lehman Brothers
Treasury Co., BV -
Banco BMG Loan
Portfolio Pass-
Through Notes,
6.357%* 04/20/11 | | | 207,475 | | |
| $ | 1,307,692 | | | @@,I | | MicroAccess Trust 2007 -
MicroFinance
Institutional Loans,
Credit Linked Nts.,
7.550%, 5/24/12 | | | 1,181,108 | | |
| BRL | 2,049,837 | | | @@,#,I | | Morgan Stanley - Brazil
Sr. Unsecured Credit
Linked Nts.,
14.400%, 08/04/16 | | | 667,516 | | |
| BRL | 6,135,000 | | | I | | Morgan Stanley -
Brazilian Real and
Credit Linked Nts.,
12.551%*, 01/05/22 | | | 60,508 | | |
| PEN | 832,000 | | | @@,#,I | | Morgan Stanley - PEN
Denominated Credit
Linked Nts., 6.250%,
03/23/17 | | | 161,126 | | |
| $ | 200,000 | | | @@,I | | Morgan Stanley -
The State Road
Administration of
Ukraine (Republic of)
Credit Linked Nts.,
6-month USD-LIBOR
+2.67%, 10/15/17 | | | 50,000 | | |
See Accompanying Notes to Financial Statements
161
PORTFOLIO OF INVESTMENTS
ING OPPENHEIMER STRATEGIC INCOME PORTFOLIO AS OF DECEMBER 31, 2008 (CONTINUED)
Principal
Amount | | | | | | Value | |
| STRUCTURED PRODUCTS (continued) | | | |
| $ | 1,200,000 | | | @@,I | | Morgan Stanley -
The State Road
Administration of
Ukraine/Republic of
Ukraine Credit Linked
Nts., 6-month
USD-LIBOR +1.80%,
10/15/17 | | $ | 300,000 | | |
| | 900,000 | | | @@,S,I | | Morgan Stanley - United
Mexican States Credit
Linked Nts., 6-month
USD LIBOR +1.130%,
11/20/15 | | | 810,000 | | |
| RUB | 5,859,618 | | | @@,I | | Morgan Stanley & Co.
International Ltd. - Red
Arrow International
Leasing PLC Total
Return Linked Nts.,
8.375%, 07/06/12 | | | 155,438 | | |
| RUB | 16,393,246 | | | @@,S | | Morgan Stanley & Co.
International PLC - EM
Whole Loan SA
/Russian Federation
Total Return Linked
Bonds, Series 007,
Cl. VR, 5.000%,
08/22/34 | | | 277,122 | | |
| $ | 954,155 | | | I | | Morgan Stanley Capital
Services Inc. - WTI
Trading Limited Total
Return Linked Nts.,
15.000%, 03/08/12 | | | 586,424 | | |
| | 1,272,553 | | | I | | Morgan Stanley Capital
Services Inc. - WTI
Trading Limited Total
Return Linked Nts.,
15.000%, 03/08/12 | | | 786,819 | | |
| MXN | 414,000 | | | I | | Reforma BLN-Backed
I - Class 1B Asset-Backed
Variable Funding
Notes, TIIE +2.000%,
07/31/14 | | | 29,895 | | |
| MXN | 690,000 | | | I | | Reforma BLN-Backed
I - Class 1C Asset-Backed
Variable Funding
Notes, TIIE +2.000%,
07/31/14 | | | 49,825 | | |
| MXN | 345,571 | | | I | | Reforma BLN-Backed
I - Class 2B Asset-Backed
Variable Funding
Notes, TIIE +3.500%,
05/20/15 | | | 24,954 | | |
| MXN | 5,210,380 | | | I | | Reforma BLN-Backed
I - Class 2C Asset-Backed
Variable Funding
Notes, TIIE +3.500%,
05/20/15 | | | 376,241 | | |
| MXN | 379,725 | | | I | | Reforma BLN-Backed
I - Class 2D Asset-Backed
Variable Funding
Notes, TIIE +3.500%,
05/20/15 | | | 27,420 | | |
Principal
Amount | | | | | | Value | |
| MXN | 275,878 | | | I | | Reforma BLN-Backed
I - Class 2E Asset-Backed
Variable Funding
Notes, TIIE +3.500%,
05/20/15 | | $ | 19,921 | | |
| MXN | 176,189 | | | I | | Reforma BLN-Backed
I - Class 2F Asset-Backed
Variable Funding
Notes, TIIE +3.500%,
05/20/15 | | | 12,723 | | |
| MXN | 32,447 | | | I | | Reforma BLN-Backed
I - Class 2G Asset-Backed
Variable Funding
Notes, TIIE +3.500%,
05/20/15 | | | 2,343 | | |
| MXN | 2,070,000 | | | @@,I | | Reforma BLN-Backed
I - Class 1A -
Asset-Backed Variable
Funding Notes, TIIE
+2.000%, 07/31/14 | | | 149,475 | | |
| MXN | 197,523 | | | I | | Reforma BLN-Backed
I - Class 2A Asset-Backed
Variable Funding
Notes, TIIE +3.500%,
05/20/15 | | | 14,263 | | |
| $ | 300,000 | | | @@,#,C,I | | Salisbury Intl.
Investments Ltd. -
Series 2006-003
Tranche E, Secured
Credit Linked Nts.,
3-month USD-LIBOR
+4.150%, 07/22/11 | | | 127,770 | | |
| GHS | 263,055 | | | I | | UBS AG, Jersey-Ghana
(Republic of) Credit
Linked Nts., 14.470%,
12/28/11 | | | 109,215 | | |
Total Structured
Products
(Cost $55,659,699) | | | 38,439,594 | | |
| Shares | | | | | | Value | |
| COMMON STOCK: 0.1% | | | |
| | | | | Agriculture: 0.0% | |
| | 12,144 | | | @@,S | | MHP S.A. (Low Exercise
Price Warrant, Issuer:
Morgan Stanley) | | $ | 39,468 | | |
| | | | 39,468 | | |
| | | | | Cosmetics/Personal Care: 0.1% | |
| | 22,230 | | | @,S | | Revlon, Inc. - Class A | | | 148,274 | | |
| | | | 148,274 | | |
| | | | | Investment Companies: 0.0% | |
| | 144,498 | | | @,#,I | | Arco Capital Corp. Ltd | | | 144,498 | | |
| | | | 144,498 | | |
Total Common Stock
(Cost $2,454,428) | | | 332,240 | | |
See Accompanying Notes to Financial Statements
162
PORTFOLIO OF INVESTMENTS
ING OPPENHEIMER STRATEGIC INCOME PORTFOLIO AS OF DECEMBER 31, 2008 (CONTINUED)
| Shares | | | | | | Value | |
| MUTUAL FUNDS: 2.1% | | | |
| | | | | Open-End Funds: 2.1% | |
| | 1,614,531 | | | S | | Oppenheimer Master
Loan Fund | | $ | 11,613,217 | | |
Total Mutual Funds
(Cost $16,000,000) | | | 11,613,217 | | |
| PREFERRED STOCK: 0.0% | | | |
| | | | | | | Diversified Financial
Services: 0.0% | | | | | |
| | 203 | | | #,P | | Preferred Blocker, Inc. | | | 203,000 | | |
| | | | 203,000 | | |
| | | | | Sovereign: 0.0% | |
| | 21,860 | | | P,S | | Federal National
Mortgage
Association - Series S | | | 18,144 | | |
| | | | 18,144 | | |
Total Preferred Stock
(Cost $753,751) | | | 221,144 | | |
# of
Contracts | | | | | | Value | |
| POSITIONS IN PURCHASED OPTIONS: 0.0% | | | |
| | 19,655,000 | | | @@,S | | Call Swaption OTC -
J. Aron & Company
28-Day
MXN-TIIE-BANXICO -
Fund Pays Floating
Strike @ 9.320%-Exp
06/11/09 | | $ | 104,711 | | |
Total Positions in
Purchased Options
(Cost $55,710) | | | 104,711 | | |
Total Long-Term
Investments
(Cost $556,823,246) | | | 463,612,564 | | |
| Shares | | | | | | Value | |
| SHORT-TERM INVESTMENTS: 24.4% | | | |
| | | | | Affiliated Mutual Fund: 12.1% | |
| | 67,160,961 | | | | | ING Institutional Prime
Money Market
Fund - Class I | | $ | 67,160,961 | | |
Total Mutual Fund
(Cost $67,160,961) | | | 67,160,961 | | |
Principal
Amount | | | | | | Value | |
| | | | | | | Foreign Government
Securities: 0.8% | | | | | |
| $ | 1,900,000 | | | S,Z | | Egypt Treasury Bill,
13.190%,
due 01/06/09 | | $ | 343,993 | | |
| EGP | 1,650,000 | | | S,Z | | Egypt Treasury Bill,
13.370%, due 01/06/09 | | | 298,722 | | |
| MXN | 34,700,000 | | | Z | | Mexican Cetes,
8.390%, due 04/02/09 | | | 2,453,067 | | |
Principal
Amount | | | | | | Value | |
| NGN | 26,400,000 | | | S,Z | | Nigeria Treasury Bill,
0.000%, due 04/09/09 | | $ | 187,087 | | |
| NGN | 95,300,000 | | | S,Z | | Nigeria Treasury Bill,
5.660%, due 02/05/09 | | | 678,392 | | |
| NGN | 122,000,000 | | | S,Z | | Nigeria Treasury Bill,
9.720%, due 01/08/09 | | | 871,532 | | |
Total Foreign
Government Securities
(Cost $4,891,991) | | | 4,832,793 | | |
| | | | | | | U.S. Government Agency
Obligations: 8.8% | | | | | |
| $ | 48,800,000 | | | S,Z | | Fannie Mae, 0.170%,
due 02/23/09 | | | 48,787,601 | | |
Total U.S. Government
Agency Obligations
(Cost $48,787,601) | | | 48,787,601 | | |
| | | | | | | Securities Lending
Collateralcc: 2.7% | | | | | |
| | 15,242,603 | | | | | Bank of New York
Mellon Corp.
Institutional Cash
Reserves | | | 15,155,475 | | |
Total Securities Lending
Collateral
(Cost $15,242,603) | | | 15,155,475 | | |
Total Short-Term
Investments
(Cost $136,083,156) | | | 135,936,830 | | |
Total Investments
in Securities
(Cost
$692,906,402)* | | | 107.8 | % | | $ | 599,549,394 | | |
Other Assets and
Liabilities - Net | | | (7.8 | ) | | | (43,366,916 | ) | |
| Net Assets | | | 100.0 | % | | $ | 556,182,478 | | |
@ Non-income producing security
@@ Foreign Issuer
& Payment-in-kind
MASTR Mortgage Asset Securitization Transaction, Inc.
+ Step-up basis bonds. Interest rates shown reflect current and next coupon rates.
# Securities with purchases pursuant to Rule 144A or section 4(2), under the Securities Act of 1933 and may not be resold subject to that rule except to qualified institutional buyers. Unless otherwise noted, these securities have been determined to be liquid under the guidelines established by the Funds' Board of Directors/Trustees.
C Bond may be called prior to maturity date.
P Preferred Stock may be called prior to convertible date.
cc Securities purchased with cash collateral for securities loaned.
ip Treasury inflation indexed protected security whose principal value is adjusted in accordance with changes to the Consumer Price Index.
## On September 7, 2008, the Federal Housing Finance Agency placed the Federal National Mortgage Association and the Federal Home Loan Mortgage Corporation into conservatorship and the U.S. Treasury guaranteed the debt issued by those organizations.
W Settlement is on a when-issued or delayed-delivery basis.
See Accompanying Notes to Financial Statements
163
PORTFOLIO OF INVESTMENTS
ING OPPENHEIMER STRATEGIC INCOME PORTFOLIO AS OF DECEMBER 31, 2008 (CONTINUED)
S All or a portion of this security is segregated to cover collateral requirements for applicable futures, options, swaps, foreign forward currency contracts and/or when-issued or delayed-delivery securities.
I Illiquid security
L Loaned security, a portion or all of the security is on loan at December 31, 2008.
± Defaulted security
^ Interest only securities represent the right to receive the monthly interest payments on an underlying pool of mortgage loans. Principal amount shown represents the notional amount on which current interest is calculated. Payments of principal on the pool reduce the value of the interest only security.
^^ Principal only securities represent the right to receive the monthly principal payments on an underlying pool of mortgage loans. No payments of interest on the pool are passed through the principal only security.
Z Indicates Zero Coupon Bond; rate shown reflects current effective yield.
AUD Australian Dollar
BRL Brazilian Real
CAD Canadian Dollar
COP Colombian Peso
DOP Dominican Peso
DKK Danish Krone
EGP Egyptian Pound
EUR EU Euro
GBP British Pound
GHS Ghanian Cedi
HUF Hungarian Forint
IDR Indonesian Rupiah
ILS Israeli New Shekel
JPY Japanese Yen
MXN Mexican Peso
MYR Malaysian Ringgit
NGN Nigerian Naira
NOK Norwegian Krone
PEN Peruvian Nuevo Sol
PHP Philippine Peso
PLN Polish Zloty
RUB Russian Ruble
SEK Swedish Krona
TRY Turkish Lira
UAH Ukrainian Hryvnia
UYU Uruguayan Peso Uruguayo
VND Vietnamese Dong
ZMK Zambian Kwacha
* Cost for federal income tax purposes is $693,548,872.
Net unrealized depreciation consists of:
| Gross Unrealized Appreciation | | $ | 12,987,969 | | |
| Gross Unrealized Depreciation | | | (106,987,447 | ) | |
| Net Unrealized Depreciation | | $ | (93,999,478 | ) | |
The following table summarizes the inputs used as of December 31, 2008 in determining the Portfolio's investments at fair value for purposes of SFAS 157:
| | | Investments in
Securities | | Other Financial
Instruments* | |
| Level 1 — Quoted Prices | | $ | 78,922,452 | | | $ | 1,470,297 | | |
Level 2 — Other Significant
Observable Inputs | | | 440,616,988 | | | | (13,078,350 | ) | |
Level 3 — Significant
Unobservable Inputs | | | 80,009,954 | | | | 4,470,657 | | |
| Total | | $ | 599,549,394 | | | $ | (7,137,396 | ) | |
"Fair value" for purposes of SFAS 157 is different from "fair value" as used in the 1940 Act. The former generally implies market value, and can include market quotations as a source of value, and the latter refers to determinations of actual value in absence of available market quotations.
* Other financial instruments may include forward foreign currency contracts, futures, unfunded commitments, swaps, and written options. Forward foreign currency contracts, futures, and unfunded commitments are reported at their unrealized gain/loss at year end. Swaps and written options are reported at their market value at year end.
A roll forward of fair value measurements using significant unobservable inputs (Level 3) for the year ended December 31, 2008, was as follows:
| | | Investments in
Securities | | Other Financial
Instruments* | |
| Beginning Balance at 12/31/07 | | $ | 110,412,667 | | | $ | 1,893,269 | | |
| Net Purchases/(Sales) | | | 320,259 | | | | 6,991,522 | | |
| Accrued Discounts/(Premiums) | | | 1,719,426 | | | | — | | |
| Total Realized Gain/(Loss) | | | 198,537 | | | | (6,641,046 | ) | |
Total Unrealized
Appreciation/(Depreciation) | | | (33,049,196 | ) | | | 2,356,441 | | |
Net Transfers In/(Out) of
Level 3 | | | 408,261 | | | | (129,529 | ) | |
| Ending Balance at 12/31/08 | | $ | 80,009,954 | | | $ | 4,470,657 | | |
* Other financial instruments may include forward foreign currency contracts, futures, swaps, and written options. Forward foreign currency contracts and futures are reported at their unrealized gain/loss at year end. Swaps and written options are reported at their market value at year end.
For the year ended December 31, 2008, total change in unrealized gain (loss) on Level 3 securities included in the change in net assets was $(27,326,919). Total unrealized gain (loss) for all securities (including Level 1 and Level 2) can be found on the accompanying Statement of Operations.
See Accompanying Notes to Financial Statements
164
PORTFOLIO OF INVESTMENTS
ING OPPENHEIMER STRATEGIC INCOME PORTFOLIO AS OF DECEMBER 31, 2008 (CONTINUED)
At December 31, 2008 the following forward foreign currency contracts were outstanding for the ING Oppenheimer Strategic Income Portfolio:
| Currency | | Buy/Sell | | Settlement
Date | | In
Exchange
For | | Value | | Unrealized
Appreciation/
(Depreciation) | |
| United Arab | | | | | | USD | | | | | | | | |
| | |
Emirates Dirham
| |
| AED 1,280,000 | | BUY | | 1/29/09 | | | 358,042 | | | | 347,981 | | | $ | (10,061 | ) | |
Argentine Peso
ARS 3,600,000 | | BUY | | 2/3/09 | | | 882,353 | | | | 994,131 | | | | 111,778 | | |
Australian Dollar
AUD 830,000 | | BUY | | 1/9/09 | | | 584,436 | | | | 578,074 | | | | (6,362 | ) | |
Australian Dollar
AUD 2,180,000 | | BUY | | 1/9/09 | | | 1,319,445 | | | | 1,518,314 | | | | 198,869 | | |
Australian Dollar
AUD 10,050,000 | | BUY | | 1/9/09 | | | 6,794,704 | | | | 6,999,566 | | | | 204,862 | | |
Australian Dollar
AUD 5,510,000 | | BUY | | 1/9/09 | | | 3,542,159 | | | | 3,837,573 | | | | 295,414 | | |
Australian Dollar
AUD 223,000 | | BUY | | 1/16/09 | | | 145,173 | | | | 155,188 | | | | 10,015 | | |
Australian Dollar
AUD 1,660,000 | | BUY | | 2/3/09 | | | 1,062,191 | | | | 1,152,948 | | | | 90,757 | | |
Australian Dollar
AUD 4,860,000 | | BUY | | 2/3/09 | | | 3,120,169 | | | | 3,375,499 | | | | 255,330 | | |
Australian Dollar
AUD 3,270,000 | | BUY | | 2/3/09 | | | 2,189,121 | | | | 2,271,169 | | | | 82,048 | | |
Australian Dollar
AUD 10,170,000 | | BUY | | 2/3/09 | | | 6,801,493 | | | | 7,063,545 | | | | 262,052 | | |
Brazilian Real
BRL 4,090,000 | | BUY | | 1/5/09 | | | 1,717,766 | | | | 1,750,293 | | | | 32,527 | | |
Brazilian Real
BRL 8,090,000 | | BUY | | 1/5/09 | | | 3,397,732 | | | | 3,462,072 | | | | 64,340 | | |
Brazilian Real
BRL 2,500,000 | | BUY | | 1/5/09 | | | 1,070,100 | | | | 1,069,861 | | | | (239 | ) | |
Brazilian Real
BRL 2,660,000 | | BUY | | 1/5/09 | | | 1,093,435 | | | | 1,138,333 | | | | 44,898 | | |
Brazilian Real
BRL 2,500,000 | | BUY | | 1/5/09 | | | 1,057,230 | | | | 1,069,861 | | | | 12,631 | | |
Brazilian Real
BRL 1,350,000 | | BUY | | 1/5/09 | | | 547,223 | | | | 577,725 | | | | 30,502 | | |
Brazilian Real
BRL 1,290,000 | | BUY | | 1/5/09 | | | 542,701 | | | | 552,049 | | | | 9,348 | | |
Brazilian Real
BRL 2,270,000 | | BUY | | 1/5/09 | | | 943,083 | | | | 971,434 | | | | 28,351 | | |
Brazilian Real
BRL 11,460,000 | | BUY | | 2/3/09 | | | 4,699,610 | | | | 4,846,432 | | | | 146,822 | | |
Brazilian Real
BRL 2,500,000 | | BUY | | 2/3/09 | | | 1,025,220 | | | | 1,057,250 | | | | 32,030 | | |
Brazilian Real
BRL 1,310,000 | | BUY | | 2/3/09 | | | 541,591 | | | | 553,999 | | | | 12,408 | | |
Brazilian Real
BRL 245,000 | | BUY | | 2/3/09 | | | 100,041 | | | | 103,610 | | | | 3,569 | | |
Canadian Dollar
CAD 775,000 | | BUY | | 1/9/09 | | | 695,754 | | | | 627,687 | | | | (68,067 | ) | |
Canadian Dollar
CAD 2,060,000 | | BUY | | 1/9/09 | | | 1,603,223 | | | | 1,668,432 | | | | 65,209 | | |
Canadian Dollar
CAD 8,010,000 | | BUY | | 1/9/09 | | | 6,758,353 | | | | 6,487,448 | | | | (270,905 | ) | |
Canadian Dollar
CAD 1,100,000 | | BUY | | 1/9/09 | | | 856,364 | | | | 890,910 | | | | 34,546 | | |
| Currency | | Buy/Sell | | Settlement
Date | | In
Exchange
For | | Value | | Unrealized
Appreciation/
(Depreciation) | |
| Canadian Dollar | | | | | | USD | | | | | | | | |
| | |
| CAD 8,300,000 | | BUY | | 1/9/09 | | | 6,675,052 | | | | 6,722,325 | | | $ | 47,273 | | |
Canadian Dollar
CAD 8,400,000 | | BUY | | 1/9/09 | | | 6,841,171 | | | | 6,803,317 | | | | (37,854 | ) | |
Canadian Dollar
CAD 670,000 | | BUY | | 1/16/09 | | | 527,144 | | | | 542,580 | | | | 15,436 | | |
Canadian Dollar
CAD 1,000,000 | | BUY | | 2/2/09 | | | 807,331 | | | | 809,661 | | | | 2,330 | | |
Canadian Dollar
CAD 1,010,000 | | BUY | | 2/2/09 | | | 822,878 | | | | 817,758 | | | | (5,120 | ) | |
Canadian Dollar
CAD 1,010,000 | | BUY | | 2/3/09 | | | 824,624 | | | | 817,770 | | | | (6,854 | ) | |
Canadian Dollar
CAD 900,000 | | BUY | | 2/9/09 | | | 746,300 | | | | 728,771 | | | | (17,529 | ) | |
Canadian Dollar
CAD 1,250,000 | | BUY | | 2/9/09 | | | 1,011,695 | | | | 1,012,181 | | | | 486 | | |
Swiss Franc
CHF 3,850,000 | | BUY | | 1/9/09 | | | 3,421,614 | | | | 3,617,558 | | | | 195,944 | | |
Swiss Franc
CHF 3,515,000 | | BUY | | 1/9/09 | | | 3,125,834 | | | | 3,302,783 | | | | 176,949 | | |
Swiss Franc
CHF 2,810,000 | | BUY | | 1/9/09 | | | 2,426,179 | | | | 2,640,347 | | | | 214,168 | | |
Swiss Franc
CHF 15,760,000 | | BUY | | 1/9/09 | | | 13,412,309 | | | | 14,808,495 | | | | 1,396,186 | | |
Swiss Franc
CHF 2,625,000 | | BUY | | 1/9/09 | | | 2,147,889 | | | | 2,466,516 | | | | 318,627 | | |
Swiss Franc
CHF 3,145,000 | | BUY | | 1/9/09 | | | 2,599,603 | | | | 2,955,122 | | | | 355,519 | | |
Swiss Franc
CHF 170,000 | | BUY | | 1/9/09 | | | 141,807 | | | | 159,736 | | | | 17,929 | | |
Swiss Franc
CHF 3,160,000 | | BUY | | 1/9/09 | | | 2,709,098 | | | | 2,969,216 | | | | 260,118 | | |
Swiss Franc
CHF 385,000 | | BUY | | 1/9/09 | | | 370,634 | | | | 361,756 | | | | (8,878 | ) | |
Swiss Franc
CHF 163,000 | | BUY | | 1/16/09 | | | 134,267 | | | | 153,170 | | | | 18,903 | | |
Swiss Franc
CHF 1,290,000 | | BUY | | 2/3/09 | | | 1,073,908 | | | | 1,212,425 | | | | 138,517 | | |
Swiss Franc
CHF 16,160,000 | | BUY | | 2/3/09 | | | 13,412,681 | | | | 15,188,208 | | | | 1,775,527 | | |
Swiss Franc
CHF 630,000 | | BUY | | 2/3/09 | | | 575,390 | | | | 592,115 | | | | 16,725 | | |
Chinese Yuan
CNY 2,710,000 | | BUY | | 5/13/09 | | | 413,425 | | | | 391,035 | | | | (22,390 | ) | |
Chinese Yuan
CNY 2,710,000 | | BUY | | 5/13/09 | | | 412,167 | | | | 391,035 | | | | (21,132 | ) | |
Chinese Yuan
CNY 2,730,000 | | BUY | | 5/13/09 | | | 411,765 | | | | 393,921 | | | | (17,844 | ) | |
Chinese Yuan
CNY 2,710,000 | | BUY | | 5/14/09 | | | 413,740 | | | | 391,020 | | | | (22,720 | ) | |
Chinese Yuan
CNY 2,730,000 | | BUY | | 5/14/09 | | | 416,095 | | | | 393,905 | | | | (22,190 | ) | |
Chinese Yuan
CNY 1,920,000 | | BUY | | 6/8/09 | | | 294,253 | | | | 276,755 | | | | (17,498 | ) | |
Chinese Yuan
CNY 1,290,000 | | BUY | | 6/8/09 | | | 196,356 | | | | 185,945 | | | | (10,411 | ) | |
Chinese Yuan
CNY 14,100,000 | | BUY | | 9/2/09 | | | 2,118,708 | | | | 2,030,705 | | | | (88,003 | ) | |
See Accompanying Notes to Financial Statements
165
PORTFOLIO OF INVESTMENTS
ING OPPENHEIMER STRATEGIC INCOME PORTFOLIO AS OF DECEMBER 31, 2008 (CONTINUED)
| Currency | | Buy/Sell | | Settlement
Date | | In
Exchange
For | | Value | | Unrealized
Appreciation/
(Depreciation) | |
| Chinese Yuan | | | | | | USD | | | | | | | | |
| | |
| CNY 7,800,000 | | BUY | | 12/17/09 | | | 1,103,253 | | | | 1,123,369 | | | $ | 20,116 | | |
EU Euro
EUR 1,100,000 | | BUY | | 1/9/09 | | | 1,396,120 | | | | 1,528,415 | | | | 132,295 | | |
EU Euro
EUR 65,000 | | BUY | | 1/9/09 | | | 81,601 | | | | 90,315 | | | | 8,714 | | |
EU Euro
EUR 50,000 | | BUY | | 1/9/09 | | | 62,805 | | | | 69,473 | | | | 6,668 | | |
EU Euro
EUR 1,025,000 | | BUY | | 1/9/09 | | | 1,285,822 | | | | 1,424,205 | | | | 138,383 | | |
EU Euro
EUR 2,045,000 | | BUY | | 1/9/09 | | | 2,580,524 | | | | 2,841,463 | | | | 260,939 | | |
EU Euro
EUR 1,580,000 | | BUY | | 1/9/09 | | | 2,158,817 | | | | 2,195,360 | | | | 36,543 | | |
EU Euro
EUR 425,000 | | BUY | | 1/9/09 | | | 575,871 | | | | 590,524 | | | | 14,653 | | |
EU Euro
EUR 1,050,000 | | BUY | | 1/9/09 | | | 1,439,120 | | | | 1,458,942 | | | | 19,822 | | |
EU Euro
EUR 105,000 | | BUY | | 1/9/09 | | | 150,150 | | | | 145,894 | | | | (4,256 | ) | |
EU Euro
EUR 2,580,000 | | BUY | | 1/16/09 | | | 4,061,255 | | | | 3,583,667 | | | | (477,588 | ) | |
EU Euro
EUR 990,000 | | BUY | | 1/16/09 | | | 1,439,975 | | | | 1,375,128 | | | | (64,847 | ) | |
EU Euro
EUR 2,565,000 | | BUY | | 1/16/09 | | | 3,283,200 | | | | 3,562,832 | | | | 279,632 | | |
EU Euro
EUR 155,000 | | BUY | | 1/29/09 | | | 231,393 | | | | 215,168 | | | | (16,225 | ) | |
EU Euro
EUR 705,000 | | BUY | | 1/29/09 | | | 1,052,466 | | | | 978,668 | | | | (73,798 | ) | |
EU Euro
EUR 435,000 | | BUY | | 1/29/09 | | | 587,942 | | | | 603,859 | | | | 15,917 | | |
EU Euro
EUR 650,000 | | BUY | | 1/29/09 | | | 872,008 | | | | 902,318 | | | | 30,310 | | |
EU Euro
EUR 595,000 | | BUY | | 1/29/09 | | | 744,369 | | | | 825,968 | | | | 81,599 | | |
EU Euro
EUR 725,000 | | BUY | | 1/29/09 | | | 936,250 | | | | 1,006,432 | | | | 70,182 | | |
EU Euro
EUR 1,275,000 | | BUY | | 1/29/09 | | | 1,646,510 | | | | 1,769,932 | | | | 123,422 | | |
EU Euro
EUR 5,350,000 | | BUY | | 1/30/09 | | | 6,793,034 | | | | 7,426,430 | | | | 633,396 | | |
EU Euro
EUR 2,720,000 | | BUY | | 1/30/09 | | | 3,633,158 | | | | 3,775,680 | | | | 142,522 | | |
EU Euro
EUR 1,080,000 | | BUY | | 2/2/09 | | | 1,549,908 | | | | 1,499,044 | | | | (50,864 | ) | |
EU Euro
EUR 1,120,000 | | BUY | | 2/2/09 | | | 1,560,608 | | | | 1,554,565 | | | | (6,043 | ) | |
EU Euro
EUR 90,000 | | BUY | | 2/5/09 | | | 112,365 | | | | 124,910 | | | | 12,545 | | |
EU Euro
EUR 110,000 | | BUY | | 2/5/09 | | | 142,472 | | | | 152,668 | | | | 10,196 | | |
EU Euro
EUR 2,310,000 | | BUY | | 3/3/09 | | | 3,251,094 | | | | 3,203,774 | | | | (47,320 | ) | |
EU Euro
EUR 540,000 | | BUY | | 3/3/09 | | | 770,753 | | | | 748,934 | | | | (21,819 | ) | |
EU Euro
EUR 1,080,000 | | BUY | | 3/3/09 | | | 1,529,680 | | | | 1,497,868 | | | | (31,812 | ) | |
| Currency | | Buy/Sell | | Settlement
Date | | In
Exchange
For | | Value | | Unrealized
Appreciation/
(Depreciation) | |
| British Pound | | | | | | USD | | | | | | | | |
| | |
| GBP 220,000 | | BUY | | 1/9/09 | | | 379,038 | | | | 316,222 | | | $ | (62,816 | ) | |
British Pound
GBP 630,000 | | BUY | | 1/9/09 | | | 970,402 | | | | 905,546 | | | | (64,856 | ) | |
British Pound
GBP 4,180,000 | | BUY | | 1/9/09 | | | 6,617,609 | | | | 6,008,226 | | | | (609,383 | ) | |
British Pound
GBP 110,000 | | BUY | | 1/9/09 | | | 163,048 | | | | 158,111 | | | | (4,937 | ) | |
British Pound
GBP 2,270,000 | | BUY | | 1/9/09 | | | 3,369,633 | | | | 3,262,840 | | | | (106,793 | ) | |
British Pound
GBP 70,000 | | BUY | | 1/16/09 | | | 131,453 | | | | 100,596 | | | | (30,857 | ) | |
British Pound
GBP 335,000 | | BUY | | 1/16/09 | | | 492,450 | | | | 481,422 | | | | (11,028 | ) | |
British Pound
GBP 750,000 | | BUY | | 1/30/09 | | | 1,081,245 | | | | 1,077,369 | | | | (3,876 | ) | |
British Pound
GBP 2,170,000 | | BUY | | 2/3/09 | | | 3,234,602 | | | | 3,116,950 | | | | (117,652 | ) | |
British Pound
GBP 4,490,000 | | BUY | | 2/3/09 | | | 6,865,165 | | | | 6,449,358 | | | | (415,807 | ) | |
British Pound
GBP 10,000 | | BUY | | 2/5/09 | | | 19,360 | | | | 14,363 | | | | (4,997 | ) | |
British Pound
GBP 70,000 | | BUY | | 2/5/09 | | | 123,081 | | | | 100,543 | | | | (22,538 | ) | |
British Pound
GBP 80,000 | | BUY | | 2/5/09 | | | 127,737 | | | | 114,906 | | | | (12,831 | ) | |
Hungarian Forint
HUF 57,000,000 | | BUY | | 2/2/09 | | | 297,011 | | | | 296,412 | | | | (599 | ) | |
Hungarian Forint
HUF 232,000,000 | | BUY | | 2/2/09 | | | 1,237,089 | | | | 1,206,449 | | | | (30,640 | ) | |
Hungarian Forint
HUF 289,000,000 | | BUY | | 2/2/09 | | | 1,577,804 | | | | 1,502,862 | | | | (74,942 | ) | |
Hungarian Forint
HUF 143,000,000 | | BUY | | 2/2/09 | | | 755,614 | | | | 743,630 | | | | (11,984 | ) | |
Indonesian Rupiah
IDR 4,080,000,000 | | BUY | | 2/17/09 | | | 364,286 | | | | 365,601 | | | | 1,315 | | |
Indonesian Rupiah
IDR 4,340,000,000 | | BUY | | 2/19/09 | | | 381,371 | | | | 388,664 | | | | 7,293 | | |
Indian Rupee
INR 52,000,000 | | BUY | | 1/30/09 | | | 1,013,843 | | | | 1,063,639 | | | | 49,796 | | |
Japanese Yen
JPY 309,000,000 | | BUY | | 1/9/09 | | | 3,053,360 | | | | 3,409,360 | | | | 356,000 | | |
Japanese Yen
JPY 309,000,000 | | BUY | | 1/9/09 | | | 3,052,606 | | | | 3,409,360 | | | | 356,754 | | |
Japanese Yen
JPY 220,000,000 | | BUY | | 1/9/09 | | | 2,195,390 | | | | 2,427,376 | | | | 231,986 | | |
Japanese Yen
JPY 635,000,000 | | BUY | | 1/9/09 | | | 6,854,712 | | | | 7,006,289 | | | | 151,577 | | |
Japanese Yen
JPY 1,033,000,000 | | BUY | | 1/9/09 | | | 11,151,052 | | | | 11,397,632 | | | | 246,580 | | |
Japanese Yen
JPY 1,314,000,000 | | BUY | | 1/9/09 | | | 13,304,365 | | | | 14,498,053 | | | | 1,193,688 | | |
Japanese Yen
JPY 40,000,000 | | BUY | | 1/9/09 | | | 443,744 | | | | 441,341 | | | | (2,403 | ) | |
Japanese Yen
JPY 38,000,000 | | BUY | | 1/16/09 | | | 390,244 | | | | 419,336 | | | | 29,092 | | |
Japanese Yen
JPY 87,000,000 | | BUY | | 1/16/09 | | | 942,579 | | | | 960,058 | | | | 17,479 | | |
See Accompanying Notes to Financial Statements
166
PORTFOLIO OF INVESTMENTS
ING OPPENHEIMER STRATEGIC INCOME PORTFOLIO AS OF DECEMBER 31, 2008 (CONTINUED)
| Currency | | Buy/Sell | | Settlement
Date | | In
Exchange
For | | Value | | Unrealized
Appreciation/
(Depreciation) | |
| Japanese Yen | | | | | | USD | | | | | | | | |
| | |
| JPY 240,000,000 | | BUY | | 1/30/09 | | | 2,573,727 | | | | 2,649,214 | | | $ | 75,487 | | |
Japanese Yen
JPY 477,000,000 | | BUY | | 1/30/09 | | | 5,256,633 | | | | 5,265,313 | | | | 8,680 | | |
Japanese Yen
JPY 1,229,000,000 | | BUY | | 2/3/09 | | | 13,223,272 | | | | 13,567,242 | | | | 343,970 | | |
Japanese Yen
JPY 23,000,000 | | BUY | | 2/5/09 | | | 220,918 | | | | 253,913 | | | | 32,995 | | |
Japanese Yen
JPY 43,000,000 | | BUY | | 2/5/09 | | | 430,000 | | | | 474,706 | | | | 44,706 | | |
Japanese Yen
JPY 521,000,000 | | BUY | | 3/3/09 | | | 5,614,224 | | | | 5,754,646 | | | | 140,422 | | |
Japanese Yen
JPY 220,000,000 | | BUY | | 3/10/09 | | | 2,106,977 | | | | 2,430,404 | | | | 323,427 | | |
Japanese Yen
JPY 222,000,000 | | BUY | | 3/10/09 | | | 2,128,272 | | | | 2,452,498 | | | | 324,226 | | |
South Korean Won
KRW 392,000,000 | | BUY | | 2/3/09 | | | 272,506 | | | | 312,214 | | | | 39,708 | | |
South Korean Won
KRW 760,000,000 | | BUY | | 2/3/09 | | | 567,800 | | | | 605,313 | | | | 37,513 | | |
Kuwait Dinar
KWD 96,000 | | BUY | | 1/29/09 | | | 357,942 | | | | 344,689 | | | | (13,253 | ) | |
Mexican Peso
MXN 3,695,000 | | BUY | | 1/21/09 | | | 261,223 | | | | 264,784 | | | | 3,561 | | |
Mexican Peso
MXN 14,840,000 | | BUY | | 1/21/09 | | | 1,105,359 | | | | 1,063,436 | | | | (41,923 | ) | |
Mexican Peso
MXN 15,090,000 | | BUY | | 1/21/09 | | | 1,111,029 | | | | 1,081,352 | | | | (29,677 | ) | �� |
Mexican Peso
MXN 14,200,000 | | BUY | | 1/30/09 | | | 1,041,705 | | | | 1,014,228 | | | | (27,477 | ) | |
Mexican Peso
MXN 11,600,000 | | BUY | | 2/18/09 | | | 839,941 | | | | 824,758 | | | | (15,183 | ) | |
Mexican Peso
MXN 7,130,000 | | BUY | | 2/18/09 | | | 532,975 | | | | 506,942 | | | | (26,033 | ) | |
Mexican Peso
MXN 15,120,000 | | BUY | | 2/18/09 | | | 1,093,671 | | | | 1,075,030 | | | | (18,641 | ) | |
Malaysian Ringgit
MYR 1,655,000 | | BUY | | 1/9/09 | | | 474,348 | | | | 478,152 | | | | 3,804 | | |
Malaysian Ringgit
MYR 4,050,000 | | BUY | | 2/17/09 | | | 1,162,457 | | | | 1,168,744 | | | | 6,287 | | |
Norwegian Krone
NOK 6,215,000 | | BUY | | 1/9/09 | | | 855,290 | | | | 886,960 | | | | 31,670 | | |
Norwegian Krone
NOK 6,180,000 | | BUY | | 1/9/09 | | | 879,340 | | | | 881,965 | | | | 2,625 | | |
Norwegian Krone
NOK 10,650,000 | | BUY | | 1/16/09 | | | 2,066,617 | | | | 1,519,049 | | | | (547,568 | ) | |
Norwegian Krone
NOK 3,920,000 | | BUY | | 1/16/09 | | | 712,617 | | | | 559,124 | | | | (153,493 | ) | |
Norwegian Krone
NOK 11,360,000 | | BUY | | 2/3/09 | | | 1,602,422 | | | | 1,618,231 | | | | 15,809 | | |
Norwegian Krone
NOK 5,590,000 | | BUY | | 2/3/09 | | | 788,601 | | | | 796,295 | | | | 7,694 | | |
New Zealand Dollar
NZD 3,810,000 | | BUY | | 1/16/09 | | | 2,833,611 | | | | 2,220,670 | | | | (612,941 | ) | |
New Zealand Dollar
NZD 1,420,000 | | BUY | | 1/16/09 | | | 987,724 | | | | 827,651 | | | | (160,073 | ) | |
New Zealand Dollar
NZD 995,000 | | BUY | | 2/3/09 | | | 540,763 | | | | 578,381 | | | | 37,618 | | |
| Currency | | Buy/Sell | | Settlement
Date | | In
Exchange
For | | Value | | Unrealized
Appreciation/
(Depreciation) | |
| New Zealand Dollar | | | | | | USD | | | | | | | | |
| | |
| NZD 495,000 | | BUY | | 2/3/09 | | | 283,016 | | | | 287,738 | | | $ | 4,722 | | |
Philippine Peso
PHP 52,000,000 | | BUY | | 1/26/09 | | | 1,020,608 | | | | 1,089,932 | | | | 69,324 | | |
Polish Zloty
PLN 540,000 | | BUY | | 1/9/09 | | | 213,018 | | | | 182,031 | | | | (30,987 | ) | |
Polish Zloty
PLN 1,100,000 | | BUY | | 1/9/09 | | | 355,435 | | | | 370,805 | | | | 15,370 | | |
Polish Zloty
PLN 18,710,000 | | BUY | | 1/9/09 | | | 6,781,443 | | | | 6,307,051 | | | | (474,392 | ) | |
Polish Zloty
PLN 10,890,000 | | BUY | | 1/9/09 | | | 3,578,274 | | | | 3,670,967 | | | | 92,693 | | |
Polish Zloty
PLN 9,390,000 | | BUY | | 2/3/09 | | | 3,108,757 | | | | 3,155,383 | | | | 46,626 | | |
Polish Zloty
PLN 19,780,000 | | BUY | | 2/3/09 | | | 6,719,298 | | | | 6,646,802 | | | | (72,496 | ) | |
Qatar Rial
QAR 1,250,000 | | BUY | | 1/29/09 | | | 356,328 | | | | 342,531 | | | | (13,797 | ) | |
Russian Ruble
RUB 12,820,000 | | BUY | | 2/11/09 | | | 433,694 | | | | 393,690 | | | | (40,004 | ) | |
Russian Ruble
RUB 14,830,000 | | BUY | | 2/11/09 | | | 501,691 | | | | 455,415 | | | | (46,276 | ) | |
Russian Ruble
RUB 22,745,000 | | BUY | | 9/18/09 | | | 638,904 | | | | 642,871 | | | | 3,967 | | |
Russian Ruble
RUB 22,745,000 | | BUY | | 9/21/09 | | | 646,165 | | | | 642,871 | | | | (3,294 | ) | |
Saudi Arabian Riyal
SAR 1,320,000 | | BUY | | 1/29/09 | | | 357,481 | | | | 351,573 | | | | (5,908 | ) | |
Swedish Krona
SEK 4,655,000 | | BUY | | 1/16/09 | | | 579,175 | | | | 588,458 | | | | 9,283 | | |
Singapore Dollar
SGD 500,000 | | BUY | | 1/9/09 | | | 341,997 | | | | 346,933 | | | | 4,936 | | |
Singapore Dollar
SGD 3,240,000 | | BUY | | 2/3/09 | | | 2,155,760 | | | | 2,246,365 | | | | 90,605 | | |
Singapore Dollar
SGD 1,600,000 | | BUY | | 2/3/09 | | | 1,105,110 | | | | 1,109,316 | | | | 4,206 | | |
Slovak Koruna
SKK 25,000,000 | | BUY | | 1/30/09 | | | 1,056,100 | | | | 1,151,917 | | | | 95,817 | | |
Turkish Lira
TRY 1,190,000 | | BUY | | 1/20/09 | | | 774,906 | | | | 764,803 | | | | (10,103 | ) | |
Turkish Lira
TRY 1,725,000 | | BUY | | 1/26/09 | | | 1,074,458 | | | | 1,105,959 | | | | 31,501 | | |
Turkish Lira
TRY 345,000 | | BUY | | 2/13/09 | | | 217,803 | | | | 219,804 | | | | 2,001 | | |
Taiwan New Dollar
TWD 35,000,000 | | BUY | | 1/23/09 | | | 1,045,400 | | | | 1,067,486 | | | | 22,086 | | |
Taiwan New Dollar
TWD 18,000,000 | | BUY | | 2/3/09 | | | 540,378 | | | | 549,272 | | | | 8,894 | | |
Taiwan New Dollar
TWD 36,000,000 | | BUY | | 2/3/09 | | | 1,085,416 | | | | 1,098,544 | | | | 13,128 | | |
Ukrainian Hryvnia
UAH 1,860,000 | | BUY | | 1/28/09 | | | 356,937 | | | | 237,866 | | | | (119,071 | ) | |
Vietnamese Dong
VND 2,830,000,000 | | BUY | | 1/30/09 | | | 178,212 | | | | 161,872 | | | | (16,340 | ) | |
Vietnamese Dong
VND 2,830,000,000 | | BUY | | 1/30/09 | | | 177,987 | | | | 161,872 | | | | (16,115 | ) | |
| | | $ | 8,121,105 | | |
See Accompanying Notes to Financial Statements
167
PORTFOLIO OF INVESTMENTS
ING OPPENHEIMER STRATEGIC INCOME PORTFOLIO AS OF DECEMBER 31, 2008 (CONTINUED)
| Currency | | Buy/Sell | | Settlement
Date | | In
Exchange
For | | Value | | Unrealized
Appreciation/
(Depreciation) | |
| United Arab | | | | | | USD | | | | | | | | |
| | |
Emirates Dirham
| |
| AED 1,280,000 | | SELL | | 1/29/09 | | | 345,013 | | | | 347,981 | | | $ | (2,968 | ) | |
Australian Dollar
AUD 2,650,000 | | SELL | | 1/9/09 | | | 1,758,010 | | | | 1,845,657 | | | | (87,647 | ) | |
Australian Dollar
AUD 5,560,000 | | SELL | | 1/9/09 | | | 3,365,190 | | | | 3,872,397 | | | | (507,207 | ) | |
Australian Dollar
AUD 930,000 | | SELL | | 1/9/09 | | | 616,218 | | | | 647,721 | | | | (31,503 | ) | |
Australian Dollar
AUD 4,490,000 | | SELL | | 1/9/09 | | | 3,066,984 | | | | 3,127,169 | | | | (60,185 | ) | |
Australian Dollar
AUD 5,510,000 | | SELL | | 1/9/09 | | | 3,782,582 | | | | 3,837,573 | | | | (54,991 | ) | |
Australian Dollar
AUD 1,760,000 | | SELL | | 1/9/09 | | | 1,134,760 | | | | 1,225,795 | | | | (91,035 | ) | |
Australian Dollar
AUD 580,000 | | SELL | | 1/27/09 | | | 399,753 | | | | 403,114 | | | | (3,361 | ) | |
Australian Dollar
AUD 3,300,000 | | SELL | | 2/3/09 | | | 2,174,162 | | | | 2,292,006 | | | | (117,844 | ) | |
Australian Dollar
AUD 10,220,000 | | SELL | | 2/3/09 | | | 6,747,305 | | | | 7,098,273 | | | | (350,968 | ) | |
Australian Dollar
AUD 1,630,000 | | SELL | | 2/3/09 | | | 1,107,373 | | | | 1,132,112 | | | | (24,739 | ) | |
Brazilian Real
BRL 2,270,000 | | SELL | | 1/5/09 | | | 953,381 | | | | 971,434 | | | | (18,053 | ) | |
Brazilian Real
BRL 1,690,000 | | SELL | | 1/5/09 | | | 709,786 | | | | 723,226 | | | | (13,440 | ) | |
Brazilian Real
BRL 810,000 | | SELL | | 1/5/09 | | | 340,193 | | | | 346,635 | | | | (6,442 | ) | |
Brazilian Real
BRL 2,480,000 | | SELL | | 1/5/09 | | | 1,079,387 | | | | 1,061,303 | | | | 18,084 | | |
Brazilian Real
BRL 730,000 | | SELL | | 1/5/09 | | | 324,517 | | | | 312,400 | | | | 12,117 | | |
Brazilian Real
BRL 1,420,000 | | SELL | | 1/5/09 | | | 541,985 | | | | 607,681 | | | | (65,696 | ) | |
Brazilian Real
BRL 1,390,000 | | SELL | | 1/5/09 | | | 540,856 | | | | 594,843 | | | | (53,987 | ) | |
Brazilian Real
BRL 11,460,000 | | SELL | | 1/5/09 | | | 4,761,113 | | | | 4,904,245 | | | | (143,132 | ) | |
Brazilian Real
BRL 2,500,000 | | SELL | | 1/5/09 | | | 1,038,637 | | | | 1,069,861 | | | | (31,224 | ) | |
Brazilian Real
BRL 2,270,000 | | SELL | | 2/3/09 | | | 930,900 | | | | 959,983 | | | | (29,083 | ) | |
Canadian Dollar
CAD 2,855,000 | | SELL | | 1/9/09 | | | 2,575,320 | | | | 2,312,318 | | | | 263,002 | | |
Canadian Dollar
CAD 2,860,000 | | SELL | | 1/9/09 | | | 2,578,784 | | | | 2,316,367 | | | | 262,417 | | |
Canadian Dollar
CAD 10,100,000 | | SELL | | 1/9/09 | | | 7,860,460 | | | | 8,180,178 | | | | (319,718 | ) | |
Canadian Dollar
CAD 7,920,000 | | SELL | | 1/9/09 | | | 6,648,758 | | | | 6,414,556 | | | | 234,202 | | |
Canadian Dollar
CAD 1,020,000 | | SELL | | 1/9/09 | | | 795,154 | | | | 826,117 | | | | (30,963 | ) | |
Canadian Dollar
CAD 8,400,000 | | SELL | | 1/9/09 | | | 6,711,243 | | | | 6,803,317 | | | | (92,074 | ) | |
Canadian Dollar
CAD 485,000 | | SELL | | 1/27/09 | | | 397,222 | | | | 392,688 | | | | 4,534 | | |
Canadian Dollar
CAD 2,010,000 | | SELL | | 2/2/09 | | | 1,600,331 | | | | 1,627,418 | | | | (27,087 | ) | |
| Currency | | Buy/Sell | | Settlement
Date | | In
Exchange
For | | Value | | Unrealized
Appreciation/
(Depreciation) | |
| Canadian Dollar | | | | | | USD | | | | | | | | |
| | |
| CAD 1,010,000 | | SELL | | 2/3/09 | | | 827,394 | | | | 817,770 | | | $ | 9,624 | | |
Canadian Dollar
CAD 4,780,000 | | SELL | | 2/9/09 | | | 3,684,008 | | | | 3,870,581 | | | | (186,573 | ) | |
Swiss Franc
CHF 1,125,000 | | SELL | | 1/9/09 | | | 993,062 | | | | 1,057,078 | | | | (64,016 | ) | |
Swiss Franc
CHF 4,075,000 | | SELL | | 1/9/09 | | | 3,543,047 | | | | 3,828,973 | | | | (285,926 | ) | |
Swiss Franc
CHF 4,075,000 | | SELL | | 1/9/09 | | | 3,544,412 | | | | 3,828,973 | | | | (284,561 | ) | |
Swiss Franc
CHF 15,560,000 | | SELL | | 1/9/09 | | | 13,260,271 | | | | 14,620,570 | | | | (1,360,299 | ) | |
Swiss Franc
CHF 3,010,000 | | SELL | | 1/9/09 | | | 2,492,857 | | | | 2,828,272 | | | | (335,415 | ) | |
Swiss Franc
CHF 3,315,000 | | SELL | | 1/9/09 | | | 2,729,233 | | | | 3,114,858 | | | | (385,625 | ) | |
Swiss Franc
CHF 640,000 | | SELL | | 2/3/09 | | | 529,867 | | | | 601,513 | | | | (71,646 | ) | |
Swiss Franc
CHF 13,110,000 | | SELL | | 2/3/09 | | | 10,873,171 | | | | 12,321,622 | | | | (1,448,451 | ) | |
Swiss Franc
CHF 650,000 | | SELL | | 2/3/09 | | | 557,648 | | | | 610,912 | | | | (53,264 | ) | |
Swiss Franc
CHF 630,000 | | SELL | | 2/3/09 | | | 540,457 | | | | 592,115 | | | | (51,658 | ) | |
Swiss Franc
CHF 15,840,000 | | SELL | | 2/3/09 | | | 13,589,101 | | | | 14,887,451 | | | | (1,298,350 | ) | |
Swiss Franc
CHF 1,290,000 | | SELL | | 2/4/09 | | | 1,074,185 | | | | 1,212,438 | | | | (138,253 | ) | |
Chinese Yuan
CNY 2,730,000 | | SELL | | 5/13/09 | | | 416,013 | | | | 393,921 | | | | 22,092 | | |
Chinese Yuan
CNY 5,440,000 | | SELL | | 5/14/09 | | | 753,724 | | | | 784,925 | | | | (31,201 | ) | |
Chinese Yuan
CNY 3,210,000 | | SELL | | 6/8/09 | | | 443,677 | | | | 462,699 | | | | (19,022 | ) | |
Colombian Peso
COP 1,430,000,000 | | SELL | | 1/6/09 | | | 596,295 | | | | 635,309 | | | | (39,014 | ) | |
Colombian Peso
COP 975,000,000 | | SELL | | 1/21/09 | | | 410,526 | | | | 432,062 | | | | (21,536 | ) | |
Colombian Peso
COP 1,430,000,000 | | SELL | | 2/4/09 | | | 591,119 | | | | 632,187 | | | | (41,068 | ) | |
Colombian Peso
COP 1,430,000,000 | | SELL | | 3/3/09 | | | 604,907 | | | | 629,316 | | | | (24,409 | ) | |
Colombian Peso
COP 1,430,000,000 | | SELL | | 4/2/09 | | | 629,956 | | | | 626,257 | | | | 3,699 | | |
Czech Koruna
CZK 21,900,000 | | SELL | | 2/9/09 | | | 1,079,552 | | | | 1,131,701 | | | | (52,149 | ) | |
Czech Koruna
CZK 22,000,000 | | SELL | | 2/9/09 | | | 1,097,531 | | | | 1,136,868 | | | | (39,337 | ) | |
EU Euro
EUR 2,245,000 | | SELL | | 1/9/09 | | | 3,061,282 | | | | 3,119,357 | | | | (58,075 | ) | |
EU Euro
EUR 1,070,000 | | SELL | | 1/9/09 | | | 1,439,278 | | | | 1,486,731 | | | | (47,453 | ) | |
EU Euro
EUR 915,000 | | SELL | | 1/9/09 | | | 1,231,064 | | | | 1,271,364 | | | | (40,300 | ) | |
EU Euro
EUR 1,600,000 | | SELL | | 1/9/09 | | | 2,133,376 | | | | 2,223,149 | | | | (89,773 | ) | |
EU Euro
EUR 1,600,000 | | SELL | | 1/9/09 | | | 2,129,984 | | | | 2,223,149 | | | | (93,165 | ) | |
See Accompanying Notes to Financial Statements
168
PORTFOLIO OF INVESTMENTS
ING OPPENHEIMER STRATEGIC INCOME PORTFOLIO AS OF DECEMBER 31, 2008 (CONTINUED)
| Currency | | Buy/Sell | | Settlement
Date | | In
Exchange
For | | Value | | Unrealized
Appreciation/
(Depreciation) | |
| EU Euro | | | | | | USD | | | | | | | | |
| | |
| EUR 2,135,000 | | SELL | | 1/9/09 | | | 2,720,788 | | | | 2,966,515 | | | $ | (245,727 | ) | |
EU Euro
EUR 575,000 | | SELL | | 1/16/09 | | | 729,244 | | | | 798,685 | | | | (69,441 | ) | |
EU Euro
EUR 1,455,000 | | SELL | | 1/29/09 | | | 2,266,890 | | | | 2,019,805 | | | | 247,085 | | |
EU Euro
EUR 3,850,000 | | SELL | | 1/29/09 | | | 5,998,300 | | | | 5,344,501 | | | | 653,799 | | |
EU Euro
EUR 85,000 | | SELL | | 1/29/09 | | | 106,056 | | | | 117,995 | | | | (11,939 | ) | |
EU Euro
EUR 2,600,000 | | SELL | | 1/30/09 | | | 3,378,232 | | | | 3,609,106 | | | | (230,874 | ) | |
EU Euro
EUR 2,750,000 | | SELL | | 1/30/09 | | | 3,473,775 | | | | 3,817,324 | | | | (343,549 | ) | |
EU Euro
EUR 2,720,000 | | SELL | | 1/30/09 | | | 3,440,283 | | | | 3,775,680 | | | | (335,397 | ) | |
EU Euro
EUR 5,530,000 | | SELL | | 2/2/09 | | | 7,155,820 | | | | 7,675,663 | | | | (519,843 | ) | |
EU Euro
EUR 215,000 | | SELL | | 2/2/09 | | | 301,806 | | | | 298,421 | | | | 3,385 | | |
EU Euro
EUR 870,000 | | SELL | | 2/2/09 | | | 1,246,553 | | | | 1,207,564 | | | | 38,989 | | |
EU Euro
EUR 1,080,000 | | SELL | | 2/2/09 | | | 1,581,714 | | | | 1,499,044 | | | | 82,670 | | |
EU Euro
EUR 540,000 | | SELL | | 2/2/09 | | | 753,867 | | | | 749,522 | | | | 4,345 | | |
EU Euro
EUR 1,760,000 | | SELL | | 2/5/09 | | | 2,713,920 | | | | 2,442,687 | | | | 271,233 | | |
EU Euro
EUR 10,000 | | SELL | | 2/5/09 | | | 15,428 | | | | 13,879 | | | | 1,549 | | |
EU Euro
EUR 100,000 | | SELL | | 2/5/09 | | | 142,143 | | | | 138,789 | | | | 3,354 | | |
EU Euro
EUR 250,000 | | SELL | | 2/5/09 | | | 318,875 | | | | 346,973 | | | | (28,098 | ) | |
EU Euro
EUR 5,200,000 | | SELL | | 3/3/09 | | | 6,578,468 | | | | 7,211,959 | | | | (633,491 | ) | |
EU Euro
EUR 2,310,000 | | SELL | | 3/3/09 | | | 2,922,266 | | | | 3,203,774 | | | | (281,508 | ) | |
British Pound
GBP 1,170,000 | | SELL | | 1/9/09 | | | 2,029,482 | | | | 1,681,728 | | | | 347,754 | | |
British Pound
GBP 2,190,000 | | SELL | | 1/9/09 | | | 3,373,301 | | | | 3,147,850 | | | | 225,451 | | |
British Pound
GBP 4,260,000 | | SELL | | 1/9/09 | | | 6,689,180 | | | | 6,123,216 | | | | 565,964 | | |
British Pound
GBP 850,000 | | SELL | | 1/16/09 | | | 1,669,494 | | | | 1,221,518 | | | | 447,976 | | |
British Pound
GBP 390,000 | | SELL | | 1/16/09 | | | 718,126 | | | | 560,461 | | | | 157,665 | | |
British Pound
GBP 275,000 | | SELL | | 1/27/09 | | | 401,918 | | | | 395,070 | | | | 6,848 | | |
British Pound
GBP 370,000 | | SELL | | 1/30/09 | | | 538,399 | | | | 531,502 | | | | 6,897 | | |
British Pound
GBP 4,490,000 | | SELL | | 2/3/09 | | | 6,655,527 | | | | 6,449,358 | | | | 206,169 | | |
British Pound
GBP 1,050,000 | | SELL | | 2/5/09 | | | 2,044,875 | | | | 1,508,144 | | | | 536,731 | | |
British Pound
GBP 100,000 | | SELL | | 2/5/09 | | | 175,449 | | | | 143,633 | | | | 31,816 | | |
| Currency | | Buy/Sell | | Settlement
Date | | In
Exchange
For | | Value | | Unrealized
Appreciation/
(Depreciation) | |
| Hong Kong Sar Dollar | | | | | | USD | | | | | | | | |
| | |
| HKD 8,300,000 | | SELL | | 2/4/09 | | | 1,071,239 | | | | 1,071,214 | | | $ | 25 | | |
Hungarian Forint
HUF 64,000,000 | | SELL | | 2/2/09 | | | 313,495 | | | | 332,814 | | | | (19,319 | ) | |
Hungarian Forint
HUF 150,000,000 | | SELL | | 2/2/09 | | | 734,754 | | | | 780,032 | | | | (45,278 | ) | |
Israeli New Shekel
ILS 1,790,000 | | SELL | | 1/30/09 | | | 474,197 | | | | 473,270 | | | | 927 | | |
Israeli New Shekel
ILS 2,760,000 | | SELL | | 1/30/09 | | | 706,153 | | | | 729,734 | | | | (23,581 | ) | |
Israeli New Shekel
ILS 3,060,000 | | SELL | | 2/9/09 | | | 764,579 | | | | 808,907 | | | | (44,328 | ) | |
Indian Rupee
INR 25,600,000 | | SELL | | 2/3/09 | | | 495,164 | | | | 523,486 | | | | (28,322 | ) | |
Indian Rupee
INR 25,600,000 | | SELL | | 2/3/09 | | | 495,164 | | | | 523,486 | | | | (28,322 | ) | |
Indian Rupee
INR 25,000,000 | | SELL | | 2/3/09 | | | 501,505 | | | | 511,217 | | | | (9,712 | ) | |
Indian Rupee
INR 50,000,000 | | SELL | | 3/9/09 | | | 965,997 | | | | 1,019,951 | | | | (53,954 | ) | |
Japanese Yen
JPY 70,000,000 | | SELL | | 1/9/09 | | | 704,119 | | | | 772,347 | | | | (68,228 | ) | |
Japanese Yen
JPY 154,000,000 | | SELL | | 1/9/09 | | | 1,662,403 | | | | 1,699,163 | | | | (36,760 | ) | |
Japanese Yen
JPY 1,320,000,000 | | SELL | | 1/9/09 | | | 13,398,308 | | | | 14,564,254 | | | | (1,165,946 | ) | |
Japanese Yen
JPY 14,000,000 | | SELL | | 1/9/09 | | | 147,260 | | | | 154,469 | | | | (7,209 | ) | |
Japanese Yen
JPY 629,000,000 | | SELL | | 1/9/09 | | | 6,702,684 | | | | 6,940,088 | | | | (237,404 | ) | |
Japanese Yen
JPY 205,000,000 | | SELL | | 1/9/09 | | | 2,240,437 | | | | 2,261,873 | | | | (21,436 | ) | |
Japanese Yen
JPY 97,000,000 | | SELL | | 1/9/09 | | | 1,076,367 | | | | 1,070,252 | | | | 6,115 | | |
Japanese Yen
JPY 181,000,000 | | SELL | | 1/16/09 | | | 1,724,138 | | | | 1,997,362 | | | | (273,224 | ) | |
Japanese Yen
JPY 59,000,000 | | SELL | | 1/16/09 | | | 542,170 | | | | 651,074 | | | | (108,904 | ) | |
Japanese Yen
JPY 100,000,000 | | SELL | | 1/30/09 | | | 1,044,823 | | | | 1,103,839 | | | | (59,016 | ) | |
Japanese Yen
JPY 480,000,000 | | SELL | | 1/30/09 | | | 5,238,888 | | | | 5,298,428 | | | | (59,540 | ) | |
Japanese Yen
JPY 477,000,000 | | SELL | | 1/30/09 | | | 5,284,411 | | | | 5,265,313 | | | | 19,098 | | |
Japanese Yen
JPY 621,000,000 | | SELL | | 2/3/09 | | | 6,629,912 | | | | 6,855,376 | | | | (225,464 | ) | |
Japanese Yen
JPY 1,225,000,000 | | SELL | | 2/3/09 | | | 13,543,244 | | | | 13,523,085 | | | | 20,159 | | |
Japanese Yen
JPY 221,000,000 | | SELL | | 2/5/09 | | | 2,076,092 | | | | 2,439,770 | | | | (363,678 | ) | |
Japanese Yen
JPY 2,000,000 | | SELL | | 2/5/09 | | | 18,694 | | | | 22,079 | | | | (3,385 | ) | |
Japanese Yen
JPY 220,000,000 | | SELL | | 3/10/09 | | | 2,169,625 | | | | 2,430,404 | | | | (260,779 | ) | |
Japanese Yen
JPY 222,000,000 | | SELL | | 3/10/09 | | | 2,185,384 | | | | 2,452,498 | | | | (267,114 | ) | |
South Korean Won
KRW 1,540,000,000 | | SELL | | 1/30/09 | | | 1,039,031 | | | | 1,226,554 | | | | (187,523 | ) | |
See Accompanying Notes to Financial Statements
169
PORTFOLIO OF INVESTMENTS
ING OPPENHEIMER STRATEGIC INCOME PORTFOLIO AS OF DECEMBER 31, 2008 (CONTINUED)
| Currency | | Buy/Sell | | Settlement
Date | | In
Exchange
For | | Value | | Unrealized
Appreciation/
(Depreciation) | |
| South Korean Won | | | | | | USD | | | | | | | | |
| | |
| KRW 783,000,000 | | SELL | | 2/3/09 | | | 546,175 | | | | 623,631 | | | $ | (77,456 | ) | |
South Korean Won
KRW 369,000,000 | | SELL | | 2/3/09 | | | 280,459 | | | | 293,895 | | | | (13,436 | ) | |
Kuwait Dinar
KWD 96,000 | | SELL | | 1/29/09 | | | 344,704 | | | | 344,689 | | | | 15 | | |
Mexican Peso
MXN 6,925,000 | | SELL | | 1/21/09 | | | 516,791 | | | | 496,246 | | | | 20,545 | | |
Mexican Peso
MXN 3,995,000 | | SELL | | 1/21/09 | | | 298,960 | | | | 286,282 | | | | 12,678 | | |
Mexican Peso
MXN 14,200,000 | | SELL | | 1/30/09 | | | 1,028,129 | | | | 1,014,228 | | | | 13,901 | | |
Mexican Peso
MXN 6,230,000 | | SELL | | 2/18/09 | | | 458,425 | | | | 442,952 | | | | 15,473 | | |
Mexican Peso
MXN 10,770,000 | | SELL | | 2/18/09 | | | 792,494 | | | | 765,746 | | | | 26,748 | | |
Mexican Peso
MXN 5,200,000 | | SELL | | 2/18/09 | | | 375,451 | | | | 369,719 | | | | 5,732 | | |
Malaysian Ringgit
MYR 3,660,000 | | SELL | | 1/9/09 | | | 1,049,011 | | | | 1,057,423 | | | | (8,412 | ) | |
Malaysian Ringgit
MYR 545,000 | | SELL | | 1/9/09 | | | 154,830 | | | | 157,458 | | | | (2,628 | ) | |
Malaysian Ringgit
MYR 330,000 | | SELL | | 1/9/09 | | | 90,535 | | | | 95,341 | | | | (4,806 | ) | |
Malaysian Ringgit
MYR 2,300,000 | | SELL | | 2/17/09 | | | 634,921 | | | | 663,731 | | | | (28,810 | ) | |
Malaysian Ringgit
MYR 2,230,000 | | SELL | | 2/18/09 | | | 627,904 | | | | 643,519 | | | | (15,615 | ) | |
Norwegian Krone
NOK 7,125,000 | | SELL | | 1/9/09 | | | 1,018,366 | | | | 1,016,828 | | | | 1,538 | | |
Norwegian Krone
NOK 31,200,000 | | SELL | | 1/9/09 | | | 4,459,373 | | | | 4,452,637 | | | | 6,736 | | |
Norwegian Krone
NOK 2,380,000 | | SELL | | 1/16/09 | | | 386,552 | | | | 339,468 | | | | 47,084 | | |
Norwegian Krone
NOK 785,000 | | SELL | | 1/16/09 | | | 125,910 | | | | 111,967 | | | | 13,943 | | |
Norwegian Krone
NOK 5,630,000 | | SELL | | 2/3/09 | | | 789,057 | | | | 801,993 | | | | (12,936 | ) | |
Norwegian Krone
NOK 11,320,000 | | SELL | | 2/3/09 | | | 1,629,715 | | | | 1,612,533 | | | | 17,182 | | |
New Zealand Dollar
NZD 560,000 | | SELL | | 1/16/09 | | | 332,640 | | | | 326,398 | | | | 6,242 | | |
New Zealand Dollar
NZD 595,000 | | SELL | | 1/16/09 | | | 320,455 | | | | 346,797 | | | | (26,342 | ) | |
New Zealand Dollar
NZD 695,000 | | SELL | | 1/27/09 | | | 400,893 | | | | 404,344 | | | | (3,451 | ) | |
New Zealand Dollar
NZD 500,000 | | SELL | | 2/3/09 | | | 265,805 | | | | 290,644 | | | | (24,839 | ) | |
New Zealand Dollar
NZD 990,000 | | SELL | | 2/3/09 | | | 543,698 | | | | 575,475 | | | | (31,777 | ) | |
Peruvian Nuevo Sol
PEN 2,170,000 | | SELL | | 1/7/09 | | | 719,520 | | | | 690,375 | | | | 29,145 | | |
Peruvian Nuevo Sol
PEN 540,000 | | SELL | | 1/7/09 | | | 181,208 | | | | 171,798 | | | | 9,410 | | |
Peruvian Nuevo Sol
PEN 810,000 | | SELL | | 1/7/09 | | | 268,746 | | | | 257,698 | | | | 11,048 | | |
Peruvian Nuevo Sol
PEN 611,000 | | SELL | | 1/7/09 | | | 195,520 | | | | 194,387 | | | | 1,133 | | |
| Currency | | Buy/Sell | | Settlement
Date | | In
Exchange
For | | Value | | Unrealized
Appreciation/
(Depreciation) | |
| Peruvian Nuevo Sol | | | | | | USD | | | | | | | | |
| | |
| PEN 3,210,000 | | SELL | | 2/4/09 | | | 1,021,968 | | | | 1,016,682 | | | $ | 5,286 | | |
Peruvian Nuevo Sol
PEN 1,580,000 | | SELL | | 2/4/09 | | | 503,025 | | | | 500,423 | | | | 2,602 | | |
Peruvian Nuevo Sol
PEN 2,910,000 | | SELL | | 2/17/09 | | | 925,278 | | | | 920,277 | | | | 5,001 | | |
Peruvian Nuevo Sol
PEN 1,630,000 | | SELL | | 2/26/09 | | | 519,770 | | | | 514,943 | | | | 4,827 | | |
Philippine Peso
PHP 20,200,000 | | SELL | | 2/17/09 | | | 392,927 | | | | 422,624 | | | | (29,697 | ) | |
Polish Zloty
PLN 4,990,000 | | SELL | | 1/9/09 | | | 2,076,899 | | | | 1,682,105 | | | | 394,794 | | |
Polish Zloty
PLN 5,440,000 | | SELL | | 1/9/09 | | | 1,757,787 | | | | 1,833,798 | | | | (76,011 | ) | |
Polish Zloty
PLN 4,880,000 | | SELL | | 1/9/09 | | | 1,595,136 | | | | 1,645,024 | | | | (49,888 | ) | |
Polish Zloty
PLN 19,280,000 | | SELL | | 1/9/09 | | | 6,621,334 | | | | 6,499,195 | | | | 122,139 | | |
Polish Zloty
PLN 1,010,000 | | SELL | | 1/9/09 | | | 335,660 | | | | 340,466 | | | | (4,806 | ) | |
Polish Zloty
PLN 2,665,000 | | SELL | | 1/30/09 | | | 897,457 | | | | 895,868 | | | | 1,589 | | |
Polish Zloty
PLN 3,290,000 | | SELL | | 1/30/09 | | | 1,080,236 | | | | 1,105,968 | | | | (25,732 | ) | |
Polish Zloty
PLN 4,470,000 | | SELL | | 1/30/09 | | | 1,551,114 | | | | 1,502,637 | | | | 48,477 | | |
Polish Zloty
PLN 20,190,000 | | SELL | | 2/3/09 | | | 6,603,218 | | | | 6,784,577 | | | | (181,359 | ) | |
Qatar Rial
QAR 1,250,000 | | SELL | | 1/29/09 | | | 340,414 | | | | 342,531 | | | | (2,117 | ) | |
Russian Ruble
RUB 20,300,000 | | SELL | | 9/18/09 | | | 758,595 | | | | 573,765 | | | | 184,830 | | |
Russian Ruble
RUB 20,300,000 | | SELL | | 9/18/09 | | | 757,321 | | | | 573,765 | | | | 183,556 | | |
Russian Ruble
RUB 17,400,000 | | SELL | | 9/18/09 | | | 648,891 | | | | 491,798 | | | | 157,093 | | |
Russian Ruble
RUB 28,200,000 | | SELL | | 9/21/09 | | | 1,065,961 | | | | 797,053 | | | | 268,908 | | |
Russian Ruble
RUB 13,580,000 | | SELL | | 9/21/09 | | | 513,713 | | | | 383,829 | | | | 129,884 | | |
Russian Ruble
RUB 12,600,000 | | SELL | | 11/16/09 | | | 369,610 | | | | 356,130 | | | | 13,480 | | |
Russian Ruble
RUB 15,500,000 | | SELL | | 11/16/09 | | | 454,679 | | | | 438,096 | | | | 16,583 | | |
Russian Ruble
RUB 15,520,000 | | SELL | | 11/18/09 | | | 437,800 | | | | 438,662 | | | | (862 | ) | |
Saudi Arabian Riyal
SAR 1,320,000 | | SELL | | 1/29/09 | | | 350,505 | | | | 351,573 | | | | (1,068 | ) | |
Swedish Krona
SEK 10,140,000 | | SELL | | 1/16/09 | | | 1,680,422 | | | | 1,281,840 | | | | 398,582 | | |
Swedish Krona
SEK 3,730,000 | | SELL | | 1/16/09 | | | 578,680 | | | | 471,525 | | | | 107,155 | | |
Swedish Krona
SEK 365,000 | | SELL | | 1/16/09 | | | 51,302 | | | | 46,141 | | | | 5,161 | | |
Swedish Krona
SEK 3,880,000 | | SELL | | 1/16/09 | | | 475,123 | | | | 490,487 | | | | (15,364 | ) | |
Singapore Dollar
SGD 55,000 | | SELL | | 1/9/09 | | | 37,538 | | | | 38,163 | | | | (625 | ) | |
See Accompanying Notes to Financial Statements
170
PORTFOLIO OF INVESTMENTS
ING OPPENHEIMER STRATEGIC INCOME PORTFOLIO AS OF DECEMBER 31, 2008 (CONTINUED)
| Currency | | Buy/Sell | | Settlement
Date | | In
Exchange
For | | Value | | Unrealized
Appreciation/
(Depreciation) | |
| Singapore Dollar | | | | | | USD | | | | | | | | |
| | |
| SGD 55,000 | | SELL | | 1/9/09 | | | 36,436 | | | | 38,163 | | | $ | (1,727 | ) | |
Singapore Dollar
SGD 1,575,000 | | SELL | | 1/30/09 | | | 1,044,776 | | | | 1,092,044 | | | | (47,268 | ) | |
Singapore Dollar
SGD 1,630,000 | | SELL | | 2/3/09 | | | 1,064,664 | | | | 1,130,116 | | | | (65,452 | ) | |
Singapore Dollar
SGD 3,210,000 | | SELL | | 2/3/09 | | | 2,173,442 | | | | 2,225,566 | | | | (52,124 | ) | |
Slovak Koruna
SKK 25,000,000 | | SELL | | 1/30/09 | | | 1,072,593 | | | | 1,151,917 | | | | (79,324 | ) | |
Turkish Lira
TRY 1,210,000 | | SELL | | 1/20/09 | | | 700,231 | | | | 777,657 | | | | (77,426 | ) | |
Turkish Lira
TRY 360,000 | | SELL | | 1/20/09 | | | 207,912 | | | | 231,369 | | | | (23,457 | ) | |
Turkish Lira
TRY 845,000 | | SELL | | 1/20/09 | | | 533,763 | | | | 543,074 | | | | (9,311 | ) | |
Turkish Lira
TRY 1,210,000 | | SELL | | 1/26/09 | | | 750,388 | | | | 775,774 | | | | (25,386 | ) | |
Turkish Lira
TRY 1,210,000 | | SELL | | 1/26/09 | | | 769,231 | | | | 775,774 | | | | (6,543 | ) | |
Turkish Lira
TRY 4,100,000 | | SELL | | 2/13/09 | | | 2,579,914 | | | | 2,612,164 | | | | (32,250 | ) | |
Taiwan New Dollar
TWD 35,000,000 | | SELL | | 1/23/09 | | | 1,050,010 | | | | 1,067,486 | | | | (17,476 | ) | |
Taiwan New Dollar
TWD 36,000,000 | | SELL | | 2/3/09 | | | 1,072,802 | | | | 1,098,544 | | | | (25,742 | ) | |
Taiwan New Dollar
TWD 18,000,000 | | SELL | | 2/3/09 | | | 545,620 | | | | 549,272 | | | | (3,652 | ) | |
Taiwan New Dollar
TWD 67,000,000 | | SELL | | 3/2/09 | | | 2,013,947 | | | | 2,047,490 | | | | (33,543 | ) | |
Ukrainian Hryvnia
UAH 650,000 | | SELL | | 1/28/09 | | | 89,041 | | | | 83,125 | | | | 5,916 | | |
Ukrainian Hryvnia
UAH 1,210,000 | | SELL | | 1/28/09 | | | 165,753 | | | | 154,741 | | | | 11,012 | | |
Vietnamese Dong
VND 2,830,000,000 | | SELL | | 1/30/09 | | | 147,396 | | | | 161,872 | | | | (14,476 | ) | |
Vietnamese Dong
VND 2,830,000,000 | | SELL | | 1/30/09 | | | 148,947 | | | | 161,872 | | | | (12,925 | ) | |
South African Rand
ZAR 21,060,000 | | SELL | | 1/20/09 | | | 2,000,437 | | | | 2,263,492 | | | | (263,055 | ) | |
South African Rand
ZAR 6,895,000 | | SELL | | 1/20/09 | | | 605,276 | | | | 741,062 | | | | (135,786 | ) | |
| | | $ | (9,565,936 | ) | |
ING Oppenheimer Strategic Income Portfolio Open Futures Contracts on December 31, 2008:
Contract
Description | | Number of
Contracts | | Expiration
Date | | Unrealized
Appreciation/
(Depreciation) | |
| Long Contracts | |
| Amsterdam Exchanges Index | | | 8 | | | 01/16/09 | | $ | (7,818 | ) | |
| Canada 10-Year Bond | | | 39 | | | 03/20/09 | | | 243,992 | | |
| Euro-Bobl 5-Year | | | 308 | | | 03/06/09 | | | 468,162 | | |
| Euro-Bund | | | 427 | | | 03/06/09 | | | 425,677 | | |
| Euro-Schatz | | | 106 | | | 03/06/09 | | | 66,732 | | |
| MSCI Taiwan Index | | | 28 | | | 01/20/09 | | | 32,994 | | |
| S&P/MIB Index | | | 4 | | | 03/20/09 | | | 2,959 | | |
| S&P/TSX 60 Index | | | 11 | | | 03/19/09 | | | 46,137 | | |
| U.S. Treasury 10-Year Note | | | 72 | | | 03/20/09 | | | (89,234 | ) | |
| U.S. Treasury Long Bond | | | 199 | | | 03/20/09 | | | 1,357,858 | | |
| | | $ | 2,547,459 | | |
| Short Contracts | |
| CAC40 10 Euro | | | 22 | | | 01/16/09 | | $ | (8,017 | ) | |
| DAX Index | | | 10 | | | 03/20/09 | | | (54,144 | ) | |
| FTSE 100 Index | | | 26 | | | 03/20/09 | | | (55,723 | ) | |
| H-Shares Index | | | 11 | | | 01/29/09 | | | (23,563 | ) | |
Japanese Government Bonds
10-Year Mini | | | 71 | | | 03/10/09 | | | (60,881 | ) | |
| Long Gilt | | | 1 | | | 03/27/09 | | | (5,872 | ) | |
| Mexico Bolsa Index | | | 33 | | | 03/20/09 | | | (55,850 | ) | |
| NASDAQ 100 E-Mini | | | 75 | | | 03/20/09 | | | 15,776 | | |
| NIKKEI 225 | | | 10 | | | 03/12/09 | | | (50,186 | ) | |
| OMXS30 Index | | | 115 | | | 01/23/09 | | | 6,108 | | |
| S&P 500 E-Mini | | | 130 | | | 03/20/09 | | | (96,434 | ) | |
| SGX CNX Nifty Index | | | 99 | | | 01/29/09 | | | 27,342 | | |
| U.S. Treasury 2-Year Note | | | 197 | | | 03/31/09 | | | (126,029 | ) | |
| U.S. Treasury 5-Year Note | | | 289 | | | 03/31/09 | | | (589,689 | ) | |
| | | $ | (1,077,162 | ) | |
ING Oppenheimer Strategic Income Portfolio Written Options Open on December 31, 2008:
Currency Options
| Description | | Counterparty | | Exercise
Price | | Expiration
Date | | Notional
Amount | | Premium
Received | | Value | |
| Currency Option OTC | |
| EUR Call/USD Put | | RBS Greenwich Capital | | | 1.4110 | | | 01/06/09 | | EUR | 400,000 | | | $ | 6,547 | | | $ | (2,752 | ) | |
| Currency Option OTC | |
| EUR Put/USD Call | | RBS Greenwich Capital | | | 1.4110 | | | 01/06/09 | | EUR | 400,000 | | | | 6,547 | | | | (8,635 | ) | |
| Currency Option OTC | |
| EUR Call/USD Put | | Barclays Capital | | | 1.3923 | | | 01/07/09 | | EUR | 395,000 | | | | 6,077 | | | | (7,009 | ) | |
| Currency Option OTC | |
| EUR Put/USD Call | | Barclays Capital | | | 1.3923 | | | 01/07/09 | | EUR | 395,000 | | | | 6,077 | | | | (4,805 | ) | |
| | | $ | 25,248 | | | $ | (23,201 | ) | |
See Accompanying Notes to Financial Statements
171
PORTFOLIO OF INVESTMENTS
ING OPPENHEIMER STRATEGIC INCOME PORTFOLIO AS OF DECEMBER 31, 2008 (CONTINUED)
ING Oppenheimer Strategic Income Portfolio Credit Default Swap Agreements Outstanding on December 31, 2008:
Credit Default Swaps on Credit Indices — Buy Protection(1)
| Counterparty | | Reference
Entity/Obligation | | Buy/Sell
Protection | | (Pay)/
Receive
Fixed
Rate (%) | | Termination
Date | | Notional
Amount(4) | | Market
Value(5) | | Upfront
Premium
Paid/
(Received) | | Unrealized
Appreciation/
(Depreciation) | |
Credit Suisse
International | | CMBX.NA.AAA.4 Index | | Buy | | | (0.350 | ) | | 02/17/51 | | USD | 950,000 | | | $ | 285,807 | | | $ | 309,507 | | | $ | (23,700 | ) | |
JPMorgan Chase
Bank, N.A.,
New York | | CMBX.NA.AAA.4 Index | | Buy | | | (0.350 | ) | | 02/17/51 | | USD | 1,900,000 | | | | 571,614 | | | | 619,014 | | | | (47,400 | ) | |
Morgan Stanley
Capital Services Inc. | | CMBX.NA.AAA.4 Index | | Buy | | | (0.350 | ) | | 02/17/51 | | USD | 1,900,000 | | | | 571,614 | | | | 587,114 | | | | (15,500 | ) | |
Morgan Stanley
Capital Services Inc. | | CMBX-NA-AAA 4 Index | | Buy | | | (0.350 | ) | | 02/17/51 | | USD | 1,900,000 | | | | 571,614 | | | | 604,344 | | | | (32,730 | ) | |
| | | $ | 2,000,649 | | | $ | 2,119,979 | | | $ | (119,330 | ) | |
Credit Default Swaps on Corporate and Soverign Issues — Buy Protection(1)
Credit Suisse
International | | Cemex S.A.B de C.V.
9.625%, 10/01/09 | | Buy | | | (5.300 | ) | | 10/20/13 | | USD | 270,000 | | | $ | 22,325 | | | $ | — | | | $ | 22,325 | | |
| UBS AG | | Cemex S.A.B de C.V.
9.625%, 10/01/09 | | Buy | | | (5.300 | ) | | 10/20/13 | | USD | 270,000 | | | | 22,325 | | | | — | | | | 22,325 | | |
| Deutsche Bank AG | | CVRD INCO Ltd.
7.750%, 05/15/12 | | Buy | | | (0.630 | ) | | 03/20/17 | | USD | 200,000 | | | | 34,434 | | | | — | | | | 34,434 | | |
Credit Suisse
International | | Eastman Kodak Co.
7.250%, 11/15/13 | | Buy | | | (3.700 | ) | | 12/20/18 | | USD | 180,000 | | | | 30,623 | | | | — | | | | 30,623 | | |
Credit Suisse
International | | Eastman Kodak Co.
7.250%, 11/15/13 | | Buy | | | (4.050 | ) | | 12/20/18 | | USD | 95,000 | | | | 14,371 | | | | — | | | | 14,371 | | |
Credit Suisse
International | | Eastman Kodak Co.
7.250%, 11/15/13 | | Buy | | | (4.010 | ) | | 12/20/18 | | USD | 105,000 | | | | 16,110 | | | | — | | | | 16,110 | | |
Goldman Sachs
International | | Pemex Project Funding
Master Trust
6.625%, 06/15/35 | | Buy | | | (3.450 | ) | | 11/20/13 | | USD | 170,000 | | | | (2,137 | ) | | | — | | | | (2,137 | ) | |
| Deutsche Bank AG | | Republic of Peru
8.750%, 11/21/33 | | Buy | | | (1.710 | ) | | 12/20/16 | | USD | 420,000 | | | | 39,189 | | | | — | | | | 39,189 | | |
Citibank N.A.,
New York | | Republic of Turkey
11.875%, 01/15/30 | | Buy | | | (5.250 | ) | | 12/20/13 | | USD | 520,000 | | | | (24,226 | ) | | | — | | | | (24,226 | ) | |
Goldman Sachs
International | | Republic of Turkey
11.875%, 01/15/30 | | Buy | | | (5.290 | ) | | 12/20/13 | | USD | 1,040,000 | | | | (50,196 | ) | | | — | | | | (50,196 | ) | |
Morgan Stanley
Capital Services Inc. | | Republic of Turkey
11.875%, 01/15/30 | | Buy | | | (2.670 | ) | | 09/20/13 | | USD | 520,000 | | | | 30,895 | | | | — | | | | 30,895 | | |
Citibank N.A.,
New York | | Ukraine Government
7.650%, 06/11/13 | | Buy | | | (4.180 | ) | | 08/20/13 | | USD | 360,000 | | | | 193,584 | | | | — | | | | 193,584 | | |
Citibank N.A.,
New York | | Ukraine Government
7.650%, 06/11/13 | | Buy | | | (6.650 | ) | | 10/20/13 | | USD | 680,000 | | | | 336,384 | | | | — | | | | 336,384 | | |
Goldman Sachs
International | | Ukraine Government
7.650%, 06/11/13 | | Buy | | | (4.220 | ) | | 08/20/13 | | USD | 1,530,000 | | | | 821,533 | | | | — | | | | 821,533 | | |
Merrill Lynch
International | | Ukraine Government
7.650%, 06/11/13 | | Buy | | | (4.300 | ) | | 08/20/13 | | USD | 1,530,000 | | | | 819,141 | | | | — | | | | 819,141 | | |
| UBS AG | | Ukraine Government
7.650%, 06/11/13 | | Buy | | | (4.180 | ) | | 08/20/13 | | USD | 600,000 | | | | 322,639 | | | | — | | | | 322,639 | | |
Goldman Sachs
International | | VTB Capital S.A.
6.875%, 05/29/18 | | Buy | | | (7.400 | ) | | 05/28/13 | | USD | 520,000 | | | | 64,279 | | | | — | | | | 64,279 | | |
| | | $ | 2,691,273 | | | $ | — | | | $ | 2,691,273 | | |
See Accompanying Notes to Financial Statements
172
PORTFOLIO OF INVESTMENTS
ING OPPENHEIMER STRATEGIC INCOME PORTFOLIO AS OF DECEMBER 31, 2008 (CONTINUED)
Credit Default Swaps on Credit Indices — Sell Protection(2)(6)
| Counterparty | | Reference
Entity/Obligation | | Buy/Sell
Protection | | (Pay)/
Receive
Fixed
Rate (%) | | Termination
Date | | Notional
Amount(4) | | Market
Value(5) | | Upfront
Premium
Paid/
(Received) | | Unrealized
Appreciation/
(Depreciation) | |
| Barclays Bank PLC | | ABX.HE.AA.06-2 Index | | Sell | | | 0.170 | | | 05/25/46 | | USD | 260,000 | | | $ | (227,793 | ) | | $ | (199,766 | ) | | $ | (28,027 | ) | |
| Deutsche Bank AG | | ABX.HE.AA.06-2 Index | | Sell | | | 0.170 | | | 05/25/46 | | USD | 110,000 | | | | (96,374 | ) | | | (12,850 | ) | | | (83,524 | ) | |
Goldman Sachs
Capital Markets L.P. | | ABX.HE.AA.06-2 Index | | Sell | | | 0.170 | | | 05/25/46 | | USD | 35,000 | | | | (30,664 | ) | | | (2,806 | ) | | | (27,858 | ) | |
Goldman Sachs
Capital Markets L.P. | | ABX.HE.AA.06-2 Index | | Sell | | | 0.170 | | | 05/25/46 | | USD | 150,000 | | | | (131,419 | ) | | | (57,681 | ) | | | (73,738 | ) | |
Morgan Stanley
Capital Services Inc. | | ABX.HE.AA.06-2 Index | | Sell | | | 0.170 | | | 05/25/46 | | USD | 35,000 | | | | (30,664 | ) | | | (2,722 | ) | | | (27,942 | ) | |
Morgan Stanley
Capital Services Inc. | | ABX.HE.AA.06-2 Index | | Sell | | | 0.170 | | | 05/25/46 | | USD | 70,000 | | | | (61,329 | ) | | | (6,814 | ) | | | (54,515 | ) | |
| Deutsche Bank AG | | ABX.HE.AAA.06-2 Index | | Sell | | | 0.110 | | | 05/25/46 | | USD | 260,000 | | | | (131,517 | ) | | | (12,654 | ) | | | (118,863 | ) | |
| Deutsche Bank AG | | ABX.HE.AAA.06-2 Index | | Sell | | | 0.110 | | | 05/25/46 | | USD | 260,000 | | | | (131,517 | ) | | | (12,651 | ) | | | (118,866 | ) | |
Goldman Sachs
Capital Markets L.P. | | ABX.HE.AAA.06-2 Index | | Sell | | | 0.110 | | | 05/25/46 | | USD | 110,000 | | | | (55,642 | ) | | | (11,844 | ) | | | (43,798 | ) | |
Morgan Stanley
Capital Services Inc. | | ABX.HE.AAA.06-2 Index | | Sell | | | 0.110 | | | 05/25/46 | | USD | 380,000 | | | | (192,217 | ) | | | (115,307 | ) | | | (76,910 | ) | |
Credit Suisse
International | | CDX.NA.HY.7 Index | | Sell | | | 3.250 | | | 12/20/11 | | USD | 268,520 | | | | (42,852 | ) | | | 8,441 | | | | (51,293 | ) | |
| Deutsche Bank AG | | CDX.NA.HY.7 Index | | Sell | | | 3.250 | | | 12/20/11 | | USD | 744,800 | | | | (118,858 | ) | | | 23,412 | | | | (142,270 | ) | |
Credit Suisse
International | | CDX.NA.HY.8 Index | | Sell | | | 2.750 | | | 06/20/12 | | USD | 426,300 | | | | (69,119 | ) | | | (15,300 | ) | | | (53,819 | ) | |
JPMorgan Chase
Bank N.A.,
New York | | CDX.NA.HY.8 Index | | Sell | | | 2.750 | | | 06/20/12 | | USD | 509,600 | | | | (82,625 | ) | | | (18,290 | ) | | | (64,335 | ) | |
| Deutsche Bank AG | | CDX.NA.HY.9 Index | | Sell | | | 3.750 | | | 12/20/12 | | USD | 1,073,100 | | | | (180,490 | ) | | | 5,385 | | | | (185,875 | ) | |
JPMorgan Chase
Bank N.A.,
New York | | CDX.NA.HY.9 Index | | Sell | | | 3.750 | | | 12/20/12 | | USD | 891,800 | | | | (149,996 | ) | | | 2,288 | | | | (152,284 | ) | |
Morgan Stanley
Capital Services Inc. | | CDX.NA.HY.9 Index | | Sell | | | 3.750 | | | 12/20/12 | | USD | 823,200 | | | | (138,458 | ) | | | (740 | ) | | | (137,718 | ) | |
Credit Suisse
International | | CDX.NA.HY.10 Index | | Sell | | | 5.000 | | | 06/20/13 | | USD | 1,820,000 | | | | (282,991 | ) | | | (87,601 | ) | | | (195,390 | ) | |
| Deutsche Bank AG | | CDX.NA.HY.10 Index | | Sell | | | 5.000 | | | 06/20/13 | | USD | 2,650,000 | | | | (412,047 | ) | | | (75,651 | ) | | | (336,396 | ) | |
| Deutsche Bank AG | | CDX.NA.HY.10 Index | | Sell | | | 5.000 | | | 06/20/13 | | USD | 2,085,000 | | | | (324,196 | ) | | | (109,425 | ) | | | (214,771 | ) | |
| Deutsche Bank AG | | CDX.NA.HY.10 Index | | Sell | | | 5.000 | | | 06/20/13 | | USD | 1,585,000 | | | | (246,451 | ) | | | (94,972 | ) | | | (151,479 | ) | |
| Deutsche Bank AG | | CDX.NA.HY.10 Index | | Sell | | | 5.000 | | | 06/20/13 | | USD | 875,000 | | | | (136,053 | ) | | | (74,042 | ) | | | (62,011 | ) | |
| Deutsche Bank AG | | CDX.NA.HY.10 Index | | Sell | | | 5.000 | | | 06/20/13 | | USD | 1,315,000 | | | | (204,469 | ) | | | (115,834 | ) | | | (88,635 | ) | |
Goldman Sachs
International | | CDX.NA.HY.10 Index | | Sell | | | 5.000 | | | 06/20/13 | | USD | 2,650,000 | | | | (412,047 | ) | | | (68,573 | ) | | | (343,474 | ) | |
JPMorgan Chase
Bank N.A.,
New York | | CDX.NA.HY.10 Index | | Sell | | | 5.000 | | | 06/20/13 | | USD | 2,650,000 | | | | (412,047 | ) | | | (78,599 | ) | | | (333,448 | ) | |
JPMorgan Chase
Bank N.A.,
New York | | CDX.NA.HY.10 Index | | Sell | | | 5.000 | | | 06/20/13 | | USD | 660,000 | | | | (102,623 | ) | | | (58,137 | ) | | | (44,486 | ) | |
JPMorgan Chase
Bank, N.A.
New York | | CDX.NA.HY.10 Index | | Sell | | | 5.000 | | | 06/20/13 | | USD | 540,000 | | | | (83,964 | ) | | | (45,694 | ) | | | (38,270 | ) | |
Morgan Stanley
Capital Services Inc. | | CDX.NA.HY.10 Index | | Sell | | | 5.000 | | | 06/20/13 | | USD | 2,640,000 | | | | (410,492 | ) | | | (81,045 | ) | | | (329,447 | ) | |
| UBS AG | | CDX.NA.HY.10 Index | | Sell | | | 5.000 | | | 06/20/13 | | USD | 2,650,000 | | | | (412,047 | ) | | | (76,923 | ) | | | (335,124 | ) | |
| UBS AG | | CDX.NA.HY.10 Index | | Sell | | | 5.000 | | | 06/20/13 | | USD | 540,000 | | | | (83,964 | ) | | | (45,694 | ) | | | (38,270 | ) | |
| UBS AG | | CDX.NA.HY.10 Index | | Sell | | | 5.000 | | | 06/20/13 | | USD | 440,000 | | | | (68,415 | ) | | | (38,758 | ) | | | (29,657 | ) | |
| Barclays Bank PLC | | CDX.NA.HY.11 Index | | Sell | | | 5.000 | | | 12/20/13 | | USD | 940,000 | | | | (188,835 | ) | | | (170,315 | ) | | | (18,520 | ) | |
| Barclays Bank PLC | | CDX.NA.HY.11 Index | | Sell | | | 5.000 | | | 12/20/13 | | USD | 425,000 | | | | (85,377 | ) | | | (74,152 | ) | | | (11,225 | ) | |
| Barclays Bank PLC | | CDX.NA.HY.11 Index | | Sell | | | 5.000 | | | 12/20/13 | | USD | 90,000 | | | | (18,080 | ) | | | (15,703 | ) | | | (2,377 | ) | |
| Barclays Bank PLC | | CDX.NA.HY.11 Index | | Sell | | | 5.000 | | | 12/20/13 | | USD | 425,000 | | | | (85,377 | ) | | | (71,040 | ) | | | (14,337 | ) | |
| Barclays Bank PLC | | CDX.NA.HY.11 Index | | Sell | | | 5.000 | | | 12/20/13 | | USD | 125,000 | | | | (25,111 | ) | | | (21,367 | ) | | | (3,744 | ) | |
| Barclays Bank PLC | | CDX.NA.HY.11 Index | | Sell | | | 5.000 | | | 12/20/13 | | USD | 920,000 | | | | (184,817 | ) | | | (174,933 | ) | | | (9,884 | ) | |
| Barclays Bank PLC | | CDX.NA.HY.11 Index | | Sell | | | 5.000 | | | 12/20/13 | | USD | 665,000 | | | | (133,591 | ) | | | (132,105 | ) | | | (1,486 | ) | |
| Barclays Bank PLC | | CDX.NA.HY.11 Index | | Sell | | | 5.000 | | | 12/20/13 | | USD | 1,240,000 | | | | (249,101 | ) | | | (240,238 | ) | | | (8,863 | ) | |
| Barclays Bank PLC | | CDX.NA.HY.11 Index | | Sell | | | 5.000 | | | 12/20/13 | | USD | 1,240,000 | | | | (249,101 | ) | | | (246,295 | ) | | | (2,806 | ) | |
Credit Suisse
International | | CDX.NA.HY.11 Index | | Sell | | | 5.000 | | | 12/20/13 | | USD | 940,000 | | | | (188,835 | ) | | | (166,913 | ) | | | (21,922 | ) | |
Credit Suisse
International | | CDX.NA.HY.11 Index | | Sell | | | 5.000 | | | 12/20/13 | | USD | 525,000 | | | | (105,466 | ) | | | (103,637 | ) | | | (1,829 | ) | |
See Accompanying Notes to Financial Statements
173
PORTFOLIO OF INVESTMENTS
ING OPPENHEIMER STRATEGIC INCOME PORTFOLIO AS OF DECEMBER 31, 2008 (CONTINUED)
| Counterparty | | Reference
Entity/Obligation | | Buy/Sell
Protection | | (Pay)/
Receive
Fixed
Rate (%) | | Termination
Date | | Notional
Amount(4) | | Market
Value(5) | | Upfront
Premium
Paid/
(Received) | | Unrealized
Appreciation/
(Depreciation) | |
| Deutsche Bank AG | | CDX.NA.HY.11 Index | | Sell | | | 5.000 | | | 12/20/13 | | USD | 1,640,000 | | | $ | (329,456 | ) | | $ | (301,516 | ) | | $ | (27,940 | ) | |
Merrill Lynch
International | | CDX.NA.HY.11 Index | | Sell | | | 5.000 | | | 12/20/13 | | USD | 285,000 | | | | (57,253 | ) | | | (47,677 | ) | | | (9,576 | ) | |
Morgan Stanley
Capital Services Inc. | | CDX.NA.HY.11 Index | | Sell | | | 5.000 | | | 12/20/13 | | USD | 985,000 | | | | (197,874 | ) | | | (182,277 | ) | | | (15,597 | ) | |
Morgan Stanley
Capital Services Inc. | | CDX.NA.HY.11 Index | | Sell | | | 5.000 | | | 12/20/13 | | USD | 1,000,000 | | | | (200,888 | ) | | | (201,850 | ) | | | 962 | | |
Morgan Stanley
Capital Services Inc. | | CDX.NA.HY.11 Index | | Sell | | | 5.000 | | | 12/20/13 | | USD | 940,000 | | | | (188,835 | ) | | | (174,850 | ) | | | (13,985 | ) | |
| UBS AG | | CDX.NA.HY.11 Index | | Sell | | | 5.000 | | | 12/20/13 | | USD | 985,000 | | | | (197,875 | ) | | | (183,461 | ) | | | (14,414 | ) | |
| Barclays Bank PLC | | CDX.NA.IG.10 Index | | Sell | | | 1.550 | | | 06/20/13 | | USD | 2,522,960 | | | | (59,602 | ) | | | 45,320 | | | | (104,922 | ) | |
| Barclays Bank PLC | | CDX.NA.IG.10 Index | | Sell | | | 1.550 | | | 06/20/13 | | USD | 1,010,160 | | | | (23,864 | ) | | | 20,120 | | | | (43,984 | ) | |
| Barclays Bank PLC | | CDX.NA.IG.10 Index | | Sell | | | 1.550 | | | 06/20/13 | | USD | 756,400 | | | | (17,869 | ) | | | 3,895 | | | | (21,764 | ) | |
Morgan Stanley
Capital Services Inc. | | CDX.NA.IG.10 Index | | Sell | | | 1.550 | | | 06/20/13 | | USD | 2,522,960 | | | | (59,602 | ) | | | 46,956 | | | | (106,558 | ) | |
Morgan Stanley
Capital Services Inc. | | CDX.NA.IG.10 Index | | Sell | | | 1.550 | | | 06/20/13 | | USD | 1,512,800 | | | | (35,738 | ) | | | 24,764 | | | | (60,502 | ) | |
Morgan Stanley
Capital Services Inc. | | CDX.NA.IG.10 Index | | Sell | | | 1.550 | | | 06/20/13 | | USD | 756,400 | | | | (17,869 | ) | | | 9,743 | | | | (27,612 | ) | |
Goldman Sachs
Capital Markets L.P. | | CMBX-NA-AJ 3 Index | | Sell | | | 1.470 | | | 12/13/49 | | USD | 200,000 | | | | (115,189 | ) | | | (24,056 | ) | | | (91,133 | ) | |
JPMorgan Chase
Bank N.A.,
New York | | CMBX-NA-AJ 3 Index | | Sell | | | 1.470 | | | 12/13/49 | | USD | 100,000 | | | | (57,595 | ) | | | (11,730 | ) | | | (45,865 | ) | |
JPMorgan Chase
Bank N.A.,
New York | | CMBX-NA-AJ 3 Index | | Sell | | | 1.470 | | | 12/13/49 | | USD | 900,000 | | | | (518,350 | ) | | | (195,001 | ) | | | (323,349 | ) | |
Morgan Stanley
Capital Services Inc. | | CMBX-NA-AJ 3 Index | | Sell | | | 1.470 | | | 12/13/49 | | USD | 300,000 | | | | (172,783 | ) | | | (39,153 | ) | | | (133,630 | ) | |
JPMorgan Chase
Bank N.A.,
New York | | CMBX-NA-AJ 4 Index | | Sell | | | 0.960 | | | 02/17/51 | | USD | 100,000 | | | | (62,043 | ) | | | (16,578 | ) | | | (45,465 | ) | |
Morgan Stanley
Capital Services Inc. | | CMBX-NA-AJ 4 Index | | Sell | | | 0.960 | | | 02/17/51 | | USD | 540,000 | | | | (335,031 | ) | | | (109,855 | ) | | | (225,176 | ) | |
Morgan Stanley
Capital Services Inc. | | CMBX-NA-AJ 4 Index | | Sell | | | 0.960 | | | 02/17/51 | | USD | 300,000 | | | | (186,128 | ) | | | (50,651 | ) | | | (135,477 | ) | |
| | | $ | (9,810,875 | ) | | $ | (4,285,402 | ) | | $ | (5,525,473 | ) | |
Credit Default Swaps on Corporate and Soverign Issues — Sell Protection(2)(6)
| Counterparty | | Reference
Entity/Obligation | | Buy/Sell
Protection | | (Pay)/
Receive
Fixed
Rate (%) | | Termination
Date | | Implied
Credit Spread
At 12/31/08(3) | | Notional
Amount(4) | | Market
Value(5) | | Upfront
Premium
Paid/
(Received) | | Unrealized
Appreciation/
(Depreciation) | |
Credit Suisse
International | | Aramark Corp.
5.000%, 06/01/12 | | Sell | | | 6.000 | | | 03/20/13 | | | 6.17 | % | | USD | 100,000 | | | $ | (575 | ) | | $ | — | | | $ | (575 | ) | |
Morgan Stanley
Capital Services Inc. | | Aramark Corp.
5.000%, 06/01/12 | | Sell | | | 5.920 | | | 03/20/13 | | | 6.17 | % | | USD | 110,000 | | | | (933 | ) | | | — | | | | (933 | ) | |
Credit Suisse
International | | Aramark Corp.
8.500%, 02/01/15 | | Sell | | | 4.750 | | | 12/20/13 | | | 6.42 | % | | USD | 110,000 | | | | (7,035 | ) | | | — | | | | (7,035 | ) | |
| Citibank N.A., New York | | Cablevision Systems
Corp.
8.000%, 04/15/12 | | Sell | | | 3.100 | | | 12/20/10 | | | 7.40 | % | | USD | 15,000 | | | | (1,133 | ) | | | — | | | | (1,133 | ) | |
| Citibank N.A., New York | | Capmark Financial
Group
5.875%, 05/10/12 | | Sell | | | 7.125 | | | 12/20/12 | | | 34.99 | % | | USD | 355,000 | | | | (153,889 | ) | | | — | | | | (153,889 | ) | |
| Citibank N.A., New York | | Capmark Financial
Group
5.875%, 05/10/12 | | Sell | | | 9.700 | | | 12/20/12 | | | 34.99 | % | | USD | 255,000 | | | | (100,327 | ) | | | — | | | | (100,327 | ) | |
| Citibank N.A., New York | | Capmark Financial
Group
5.875%, 05/10/12 | | Sell | | | 9.750 | | | 12/20/12 | | | 34.99 | % | | USD | 215,000 | | | | (84,422 | ) | | | — | | | | (84,422 | ) | |
Credit Suisse
International | | Capmark Financial
Group
5.875%, 05/10/12 | | Sell | | | 5.200 | | | 12/20/12 | | | 34.99 | % | | USD | 110,000 | | | | (50,977 | ) | | | — | | | | (50,977 | ) | |
See Accompanying Notes to Financial Statements
174
PORTFOLIO OF INVESTMENTS
ING OPPENHEIMER STRATEGIC INCOME PORTFOLIO AS OF DECEMBER 31, 2008 (CONTINUED)
| Counterparty | | Reference
Entity/Obligation | | Buy/Sell
Protection | | (Pay)/
Receive
Fixed
Rate (%) | | Termination
Date | | Implied
Credit Spread
At 12/31/08(3) | | Notional
Amount(4) | | Market
Value(5) | | Upfront
Premium
Paid/
(Received) | | Unrealized
Appreciation/
(Depreciation) | |
Morgan Stanley
Capital Services Inc. | | Capmark Financial
Group
5.875%, 05/10/12 | | Sell | | | 7.400 | | | 12/20/12 | | | 34.99 | % | | USD | 60,000 | | | $ | (25,753 | ) | | $ | — | | | $ | (25,753 | ) | |
Morgan Stanley
Capital Services Inc. | | Capmark Financial
Group
5.875%, 05/10/12 | | Sell | | | 7.150 | | | 12/20/12 | | | 34.99 | % | | USD | 60,000 | | | | (25,986 | ) | | | — | | | | (25,986 | ) | |
Credit Suisse
International | | Capmark Financial
Group
6.300%, 05/10/17 | | Sell | | | 6.250 | | | 12/20/12 | | | 34.99 | % | | USD | 60,000 | | | | (26,826 | ) | | | — | | | | (26,826 | ) | |
Credit Suisse
International | | Charter
Communications
Holdings
10.000%, 04/01/09 | | Sell | | | 5.000 | | | 09/20/17 | | | 83.17 | % | | USD | 35,000 | | | | (29,854 | ) | | | (6,226 | ) | | | (23,628 | ) | |
Credit Suisse
International | | Charter
Communications
Holdings
10.000%, 04/01/09 | | Sell | | | 5.000 | | | 09/20/17 | | | 83.17 | % | | USD | 40,000 | | | | (34,118 | ) | | | (7,116 | ) | | | (27,002 | ) | |
JPMorgan
Chase Bank, N.A.
New York | | Constellation Brands Inc.
7.250%, 09/01/16 | | Sell | | | 3.970 | | | 09/20/13 | | | 3.44 | % | | USD | 85,000 | | | | 1,856 | | | | — | | | | 1,856 | | |
JPMorgan
Chase Bank N.A.,
New York | | Dean Foods Co.
7.000%, 06/01/16 | | Sell | | | 1.030 | | | 06/20/11 | | | 4.36 | % | | USD | 180,000 | | | | (13,581 | ) | | | — | | | | (13,581 | ) | |
JPMorgan
Chase Bank N.A.,
New York | | Dean Foods Co.
7.000%, 06/01/16 | | Sell | | | 1.060 | | | 06/20/11 | | | 4.36 | % | | USD | 185,000 | | | | (13,832 | ) | | | — | | | | (13,832 | ) | |
JPMorgan
Chase Bank N.A.,
New York | | Dean Foods Co.
7.000%, 06/01/16 | | Sell | | | 1.050 | | | 06/20/11 | | | 4.36 | % | | USD | 10,000 | | | | (750 | ) | | | — | | | | (750 | ) | |
JPMorgan
Chase Bank N.A.,
New York | | Dean Foods Co.
7.000%, 06/01/16 | | Sell | | | 1.080 | | | 06/20/11 | | | 4.36 | % | | USD | 190,000 | | | | (14,120 | ) | | | — | | | | (14,120 | ) | |
Credit Suisse
International | | Development Bank
of Kazakhstan
7.375%, 11/12/13 | | Sell | | | 3.750 | | | 02/20/13 | | | 10.53 | % | | USD | 1,210,000 | | | | (251,756 | ) | | | — | | | | (251,756 | ) | |
| Barclays Bank PLC | | Eastman Kodak Co.
7.250%, 11/15/13 | | Sell | | | 4.000 | | | 12/20/13 | | | 7.49 | % | | USD | 95,000 | | | | (11,882 | ) | | | — | | | | (11,882 | ) | |
| Barclays Bank PLC | | Eastman Kodak Co.
7.250%, 11/15/13 | | Sell | | | 3.960 | | | 12/20/13 | | | 7.49 | % | | USD | 105,000 | | | | (13,284 | ) | | | — | | | | (13,284 | ) | |
Credit Suisse
International | | Eastman Kodak Co.
7.250%, 11/15/13 | | Sell | | | 3.650 | | | 12/20/13 | | | 7.49 | % | | USD | 180,000 | | | | (24,769 | ) | | | — | | | | (24,769 | ) | |
Credit Suisse
International | | El Paso Corp.
7.875% , 06/15/12 | | Sell | | | 2.800 | | | 03/20/18 | | | 7.73 | % | | USD | 65,000 | | | | (15,881 | ) | | | — | | | | (15,881 | ) | |
Merrill Lynch
International | | El Paso Corp.
7.875% , 06/15/12 | | Sell | | | 2.900 | | | 03/20/18 | | | 7.73 | % | | USD | 70,000 | | | | (16,756 | ) | | | — | | | | (16,756 | ) | |
Merrill Lynch
International | | El Paso Corp.
7.875% , 06/15/12 | | Sell | | | 2.890 | | | 03/20/18 | | | 7.73 | % | | USD | 170,000 | | | | (40,777 | ) | | | — | | | | (40,777 | ) | |
Citibank N.A.,
New York | | Federative
Republic of Brazil
12.250%, 03/06/30 | | Sell | | | 4.250 | | | 12/20/13 | | | 3.04 | % | | USD | 520,000 | | | | 27,607 | | | | — | | | | 27,607 | | |
Morgan Stanley
Capital Services Inc. | | Finansbank,
A.S./USD 6.250%
Eurobonds, 03/24/11
and USD 6.50%
Eurobonds, 03/24/13* | | Sell | | | 1.300 | | | 03/24/13 | | | 5.40 | % | | USD | 1,290,000 | | | | (182,658 | ) | | | — | | | | (182,658 | ) | |
Merrill Lynch
International | | Ford Motor Co.
6.500%, 08/01/18 | | Sell | | | 5.300 | | | 12/20/12 | | | 57.97 | % | | USD | 350,000 | | | | (235,509 | ) | | | — | | | | (235,509 | ) | |
Morgan Stanley
Capital Services Inc. | | Ford Motor Co.
6.500%, 08/01/18 | | Sell | | | 5.000 | | | 12/20/13 | | | 53.56 | % | | USD | 295,000 | | | | (203,904 | ) | | | (155,479 | ) | | | (48,425 | ) | |
See Accompanying Notes to Financial Statements
175
PORTFOLIO OF INVESTMENTS
ING OPPENHEIMER STRATEGIC INCOME PORTFOLIO AS OF DECEMBER 31, 2008 (CONTINUED)
| Counterparty | | Reference
Entity/Obligation | | Buy/Sell
Protection | | (Pay)/
Receive
Fixed
Rate (%) | | Termination
Date | |
Implied
Credit Spread
At 12/31/08(3) | | Notional
Amount(4) | | Market
Value(5) | | Upfront
Premium
Paid/
(Received) | | Unrealized
Appreciation/
(Depreciation) | |
| Deutsche Bank AG | | Ford Motor Co.
7.450%, 07/16/31 | | Sell | | | 5.800 | | | 12/20/16 | | | 46.38 | % | | USD | 555,000 | | | $ | (387,128 | ) | | $ | — | | | $ | (387,128 | ) | |
| Deutsche Bank AG | | Ford Motor Co.
7.450%, 07/16/31 | | Sell | | | 5.850 | | | 12/20/16 | | | 46.38 | % | | USD | 695,000 | | | | (484,184 | ) | | | — | | | | (484,184 | ) | |
| Deutsche Bank AG | | Ford Motor Co.
7.450%, 07/16/31 | | Sell | | | 6.000 | | | 12/20/16 | | | 46.38 | % | | USD | 455,000 | | | | (315,811 | ) | | | — | | | | (315,811 | ) | |
JPMorgan
Chase Bank N.A.,
New York | | Ford Motor Co.
7.450%, 07/16/31 | | Sell | | | 6.000 | | | 12/20/16 | | | 46.38 | % | | USD | 455,000 | | | | (315,811 | ) | | | — | | | | (315,811 | ) | |
Morgan Stanley
Capital Services Inc. | | Ford Motor Co.
7.450%, 07/16/31 | | Sell | | | 5.900 | | | 12/20/16 | | | 46.38 | % | | USD | 60,000 | | | | (41,749 | ) | | | — | | | | (41,749 | ) | |
Morgan Stanley
Capital Services Inc. | | Ford Motor Co.
7.450%, 07/16/31 | | Sell | | | 6.150 | | | 12/20/16 | | | 46.38 | % | | USD | 455,000 | | | | (314,638 | ) | | | — | | | | (314,638 | ) | |
Citibank N.A.,
New York | | Ford Motor Credit Co.
7.000%, 10/01/13 | | Sell | | | 2.320 | | | 03/20/12 | | | 13.17 | % | | USD | 390,000 | | | | (101,337 | ) | | | — | | | | (101,337 | ) | |
Credit Suisse
International | | Ford Motor Credit Co.
7.000%, 10/01/13 | | Sell | | | 2.385 | | | 03/20/12 | | | 13.17 | % | | USD | 570,000 | | | | (147,220 | ) | | | — | | | | (147,220 | ) | |
Credit Suisse
International | | Ford Motor Credit Co.
7.000%, 10/01/13 | | Sell | | | 2.550 | | | 03/20/12 | | | 13.17 | % | | USD | 240,000 | | | | (61,039 | ) | | | — | | | | (61,039 | ) | |
| Deutsche Bank AG | | Ford Motor Credit Co.
7.000%, 10/01/13 | | Sell | | | 2.390 | | | 03/20/12 | | | 13.17 | % | | USD | 615,000 | | | | (158,769 | ) | | | — | | | | (158,769 | ) | |
| Barclays Bank PLC | | General Electric
Capital Corp.
6.000%, 06/15/12 | | Sell | | | 8.000 | | | 12/20/09 | | | 4.46 | % | | USD | 165,000 | | | | 5,507 | | | | — | | | | 5,507 | | |
| Barclays Bank PLC | | General Electric
Capital Corp.
6.000%, 06/15/12 | | Sell | | | 5.750 | | | 12/20/09 | | | 4.46 | % | | USD | 250,000 | | | | 3,047 | | | | — | | | | 3,047 | | |
Credit Suisse
International | | General Electric
Capital Corp.
6.000%, 06/15/12 | | Sell | | | 8.000 | | | 12/20/09 | | | 4.46 | % | | USD | 145,000 | | | | 4,839 | | | | — | | | | 4,839 | | |
| Deutsche Bank AG | | General Motors
7.125%, 07/15/13 | | Sell | | | 4.750 | | | 12/20/16 | | | 88.99 | % | | USD | 365,000 | | | | (300,707 | ) | | | — | | | | (300,707 | ) | |
| Deutsche Bank AG | | General Motors
7.125%, 07/15/13 | | Sell | | | 4.680 | | | 12/20/16 | | | 88.99 | % | | USD | 445,000 | | | | (366,920 | ) | | | — | | | | (366,920 | ) | |
Goldman Sachs
Capital Markets L.P. | | General Motors
7.125%, 07/15/13 | | Sell | | | 4.950 | | | 12/20/16 | | | 88.99 | % | | USD | 365,000 | | | | (299,993 | ) | | | — | | | | (299,993 | ) | |
JPMorgan
Chase Bank N.A.,
New York | | General Motors
7.125%, 07/15/13 | | Sell | | | 4.750 | | | 12/20/16 | | | 88.99 | % | | USD | 555,000 | | | | (457,240 | ) | | | — | | | | (457,240 | ) | |
Merrill Lynch
International | | General Motors
7.125%, 07/15/13 | | Sell | | | 4.050 | | | 12/20/12 | | | 94.97 | % | | USD | 235,000 | | | | (180,348 | ) | | | — | | | | (180,348 | ) | |
Morgan Stanley
Capital Services Inc. | | General Motors
7.125%, 07/15/13 | | Sell | | | 4.900 | | | 12/20/16 | | | 88.99 | % | | USD | 365,000 | | | | (300,172 | ) | | | — | | | | (300,172 | ) | |
Morgan Stanley
Capital Services Inc. | | General Motors
7.125%, 07/15/13 | | Sell | | | 4.620 | | | 12/20/16 | | | 88.99 | % | | USD | 40,000 | | | | (33,005 | ) | | | — | | | | (33,005 | ) | |
| Deutsche Bank AG | | General Motors
7.125%, 07/15/13 | | Sell | | | 5.000 | | | 12/20/13 | | | 93.73 | % | | USD | 555,000 | | | | (449,765 | ) | | | (340,377 | ) | | | (109,388 | ) | |
| Deutsche Bank AG | | General Motors
7.125%, 07/15/13 | | Sell | | | 5.000 | | | 12/20/18 | | | 85.97 | % | | USD | 170,000 | | | | (139,348 | ) | | | (111,510 | ) | | | (27,838 | ) | |
Morgan Stanley
Capital Services Inc. | | GISAD DIS TICARET A.S.
7.67%, 03/23/14 | | Sell | | | 3.000 | | | 03/23/13 | | | 9.09 | % | | EUR | 1,445,000 | | | | (171,355 | ) | | | — | | | | (171,355 | ) | |
Credit Suisse
International | | GMAC LLC
6.875%, 08/28/12 | | Sell | | | 5.000 | | | 03/20/09 | | | 7.60 | % | | USD | 55,000 | | | | (309 | ) | | | (1,676 | ) | | | 1,367 | | |
Credit Suisse
International | | GMAC LLC
6.875%, 08/28/12 | | Sell | | | 1.390 | | | 03/20/17 | | | 7.43 | % | | USD | 375,000 | | | | (116,573 | ) | | | — | | | | (116,573 | ) | |
Goldman Sachs
International | | GMAC LLC
6.875%, 08/28/12 | | Sell | | | 1.390 | | | 03/20/17 | | | 7.43 | % | | USD | 220,000 | | | | (68,389 | ) | | | — | | | | (68,389 | ) | |
Goldman Sachs
International | | GMAC LLC
6.875%, 08/28/12 | | Sell | | | 1.370 | | | 03/20/17 | | | 7.43 | % | | USD | 90,000 | | | | (28,070 | ) | | | — | | | | (28,070 | ) | |
See Accompanying Notes to Financial Statements
176
PORTFOLIO OF INVESTMENTS
ING OPPENHEIMER STRATEGIC INCOME PORTFOLIO AS OF DECEMBER 31, 2008 (CONTINUED)
| Counterparty | | Reference
Entity/Obligation | | Buy/Sell
Protection | | (Pay)/
Receive
Fixed
Rate (%) | | Termination
Date | | Implied
Credit Spread
At 12/31/08(3) | | Notional
Amount(4) | | Market
Value(5) | | Upfront
Premium
Paid/
(Received) | | Unrealized
Appreciation/
(Depreciation) | |
Credit Suisse
International | | HSBK Europe BV
7.250%, 05/03/17 | | Sell | | | 4.950 | | | 03/20/13 | | | 10.28 | % | | USD | 250,000 | | | $ | (40,818 | ) | | $ | — | | | $ | (40,818 | ) | |
Morgan Stanley
Capital Services Inc. | | HSBK Europe BV
7.750%, 05/13/13 | | Sell | | | 4.780 | | | 03/20/13 | | | 10.28 | % | | USD | 500,000 | | | | (84,242 | ) | | | — | | | | (84,242 | ) | |
Morgan Stanley
Capital Services Inc. | | HSBK Europe BV
7.750%, 05/13/13 | | Sell | | | 4.880 | | | 03/20/13 | | | 10.28 | % | | USD | 500,000 | | | | (82,709 | ) | | | — | | | | (82,709 | ) | |
Credit Suisse
International | | Harrah's Operating Co. Inc.
5.625%, 06/01/15 | | Sell | | | 5.000 | | | 03/20/10 | | | 28.60 | % | | USD | 205,000 | | | | (48,475 | ) | | | (7,537 | ) | | | (40,938 | ) | |
Credit Suisse
International | | Idearc Inc.
8.000%, 11/15/16 | | Sell | | | 5.000 | | | 12/20/09 | | | 202.75 | % | | USD | 5,000 | | | | (3,833 | ) | | | (822 | ) | | | (3,011 | ) | |
Goldman Sachs
International | | Idearc Inc.
8.000%, 11/15/16 | | Sell | | | 5.000 | | | 09/20/09 | | | 226.71 | % | | USD | 255,000 | | | | (195,757 | ) | | | (17,494 | ) | | | (178,263 | ) | |
JPMorgan
Chase Bank, N.A.
New York | | Idearc Inc.
8.000%, 11/15/16 | | Sell | | | 5.000 | | | 09/20/09 | | | 226.71 | % | | USD | 50,000 | | | | (38,384 | ) | | | (4,226 | ) | | | (34,158 | ) | |
Citibank N.A.,
New York | | Intelsat Ltd.,
6.500%, 11/01/13 | | Sell | | | 5.000 | | | 03/20/09 | | | 3.74 | % | | USD | 65,000 | | | | 177 | | | | — | | | | 177 | | |
Credit Suisse
International | | Intelsat Ltd.,
6.500%, 11/01/13 | | Sell | | | 4.400 | | | 03/20/09 | | | 3.74 | % | | USD | 60,000 | | | | 86 | | | | — | | | | 86 | | |
Credit Suisse
International | | Intelsat Ltd.,
6.500%, 11/01/13 | | Sell | | | 5.750 | | | 03/20/09 | | | 3.74 | % | | USD | 5,000 | | | | 22 | | | | — | | | | 22 | | |
| Deutsche Bank AG | | Intelsat Ltd.,
6.500%, 11/01/13 | | Sell | | | 4.400 | | | 03/20/09 | | | 3.74 | % | | USD | 20,000 | | | | 29 | | | | — | | | | 29 | | |
| Deutsche Bank AG | | Intelsat Ltd.,
6.500%, 11/01/13 | | Sell | | | 4.750 | | | 03/20/09 | | | 3.74 | % | | USD | 65,000 | | | | 142 | | | | — | | | | 142 | | |
| Deutsche Bank AG | | Intelsat Ltd.,
6.500%, 11/01/13 | | Sell | | | 5.000 | | | 03/20/09 | | | 3.74 | % | | USD | 35,000 | | | | 96 | | | | — | | | | 96 | | |
Citibank N.A.,
New York | | Islamic
Republic of Pakistan
6.750%, 02/19/09 | | Sell | | | 5.100 | | | 03/20/13 | | | 32.70 | % | | USD | 270,000 | | | | (140,153 | ) | | | — | | | | (140,153 | ) | |
Credit Suisse
International | | IStar Financial Inc.
6.000%, 12/15/10 | | Sell | | | 12.000 | | | 03/20/09 | | | 81.17 | % | | USD | 75,000 | | | | (10,079 | ) | | | — | | | | (10,079 | ) | |
Credit Suisse
International | | IStar Financial Inc.
6.000%, 12/15/10 | | Sell | | | 4.150 | | | 12/20/12 | | | 70.49 | % | | USD | 115,000 | | | | (70,851 | ) | | | — | | | | (70,851 | ) | |
| Deutsche Bank AG | | IStar Financial Inc.
6.000%, 12/15/10 | | Sell | | | 12.000 | | | 03/20/09 | | | 81.17 | % | | USD | 190,000 | | | | (25,533 | ) | | | — | | | | (25,533 | ) | |
| Deutsche Bank AG | | IStar Financial Inc.
6.000%, 12/15/10 | | Sell | | | 4.320 | | | 12/20/12 | | | 70.49 | % | | USD | 80,000 | | | | (49,161 | ) | | | — | | | | (49,161 | ) | |
| Deutsche Bank AG | | IStar Financial Inc.
6.000%, 12/15/10 | | Sell | | | 4.500 | | | 12/20/12 | | | 70.49 | % | | USD | 105,000 | | | | (64,349 | ) | | | — | | | | (64,349 | ) | |
| Deutsche Bank AG | | IStar Financial Inc.
6.000%, 12/15/10 | | Sell | | | 4.000 | | | 12/20/12 | | | 70.49 | % | | USD | 135,000 | | | | (83,361 | ) | | | — | | | | (83,361 | ) | |
Goldman Sachs
International | | IStar Financial Inc.
6.000%, 12/15/10 | | Sell | | | 3.950 | | | 12/20/12 | | | 70.49 | % | | USD | 285,000 | | | | (176,117 | ) | | | — | | | | (176,117 | ) | |
Morgan Stanley
Capital Services Inc. | | IStar Financial Inc.
6.000%, 12/15/10 | | Sell | | | 4.860 | | | 12/20/12 | | | 70.49 | % | | USD | 85,000 | | | | (51,808 | ) | | | — | | | | (51,808 | ) | |
| UBS AG | | IStar Financial Inc.
6.000%, 12/15/10 | | Sell | | | 4.560 | | | 12/20/12 | | | 70.49 | % | | USD | 55,000 | | | | (33,676 | ) | | | — | | | | (33,676 | ) | |
Citibank N.A.,
New York | | Jefferson Smurfit Corp.
7.500%, 06/01/13 | | Sell | | | 8.000 | | | 12/20/13 | | | 80.20 | % | | USD | 40,000 | | | | (27,649 | ) | | | — | | | | (27,649 | ) | |
Merrill Lynch
International | | Jefferson Smurfit Corp.
7.500%, 06/01/13 | | Sell | | | 6.700 | | | 06/20/13 | | | 81.03 | % | | USD | 85,000 | | | | (59,489 | ) | | | — | | | | (59,489 | ) | |
Merrill Lynch
International | | Jefferson Smurfit Corp.
7.500%, 06/01/13 | | Sell | | | 6.800 | | | 06/20/13 | | | 81.03 | % | | USD | 110,000 | | | | (76,882 | ) | | | — | | | | (76,882 | ) | |
Merrill Lynch
International | | Jefferson Smurfit Corp.
7.500%, 06/01/13 | | Sell | | | 7.950 | | | 12/20/13 | | | 80.20 | % | | USD | 100,000 | | | | (69,171 | ) | | | — | | | | (69,171 | ) | |
Credit Suisse
International | | Massey Energy Co.
6.875%, 12/15/13 | | Sell | | | 5.000 | | | 03/20/13 | | | 8.07 | % | | USD | 80,000 | | | | (7,858 | ) | | | — | | | | (7,858 | ) | |
See Accompanying Notes to Financial Statements
177
PORTFOLIO OF INVESTMENTS
ING OPPENHEIMER STRATEGIC INCOME PORTFOLIO AS OF DECEMBER 31, 2008 (CONTINUED)
| Counterparty | | Reference
Entity/Obligation | | Buy/Sell
Protection | | (Pay)/
Receive
Fixed
Rate (%) | | Termination
Date | | Implied
Credit Spread
At 12/31/08(3) | | Notional
Amount(4) | | Market
Value(5) | | Upfront
Premium
Paid/
(Received) | | Unrealized
Appreciation/
(Depreciation) | |
Credit Suisse
International | | Massey Energy Co.
6.875%, 12/15/13 | | Sell | | | 5.000 | | | 03/20/13 | | | 8.07 | % | | USD | 35,000 | | | $ | (3,438 | ) | | $ | — | | | $ | (3,438 | ) | |
| UBS AG | | Massey Energy Co.
6.875%, 12/15/13 | | Sell | | | 5.050 | | | 09/20/12 | | | 7.92 | % | | USD | 55,000 | | | | (4,627 | ) | | | — | | | | (4,627 | ) | |
| UBS AG | | Massey Energy Co.
6.875%, 12/15/13 | | Sell | | | 5.100 | | | 09/20/12 | | | 7.92 | % | | USD | 85,000 | | | | (7,027 | ) | | | — | | | | (7,027 | ) | |
Citibank N.A.,
New York | | MGM Mirage Inc.
5.875%, 02/27/14 | | Sell | | | 5.000 | | | 12/20/13 | | | 18.13 | % | | USD | 210,000 | | | | (70,304 | ) | | | (66,974 | ) | | | (3,330 | ) | |
Credit Suisse
International | | MGM Mirage Inc.
5.875%, 02/27/14 | | Sell | | | 8.400 | | | 12/20/13 | | | 18.13 | % | | USD | 90,000 | | | | (22,330 | ) | | | — | | | | (22,330 | ) | |
Credit Suisse
International | | MGM Mirage Inc.
5.875%, 02/27/14 | | Sell | | | 5.000 | | | 12/20/13 | | | 18.13 | % | | USD | 225,000 | | | | (75,325 | ) | | | (54,275 | ) | | | (21,050 | ) | |
Goldman Sachs
International | | MGM Mirage Inc.
5.875%, 02/27/14 | | Sell | | | 8.400 | | | 12/20/13 | | | 18.13 | % | | USD | 140,000 | | | | (34,735 | ) | | | — | | | | (34,735 | ) | |
Citibank N.A.,
New York | | Morgan Stanley
6.600%, 04/01/12 | | Sell | | | 7.800 | | | 12/20/13 | | | 3.93 | % | | USD | 305,000 | | | | 47,589 | | | | — | | | | 47,589 | | |
JPMorgan
Chase Bank N.A.,
New York | | Morgan Stanley
6.600%, 04/01/12 | | Sell | | | 7.800 | | | 12/20/13 | | | 3.93 | % | | USD | 360,000 | | | | 56,171 | | | | — | | | | 56,171 | | |
| Barclays Bank PLC | | Nalco Co.
7.750%, 11/15/11 | | Sell | | | 4.500 | | | 09/20/13 | | | 7.18 | % | | USD | 100,000 | | | | (9,489 | ) | | | — | | | | (9,489 | ) | |
Citibank N.A.,
New York | | Nalco Co.
7.750%, 11/15/11 | | Sell | | | 3.600 | | | 09/20/12 | | | 7.01 | % | | USD | 85,000 | | | | (8,642 | ) | | | — | | | | (8,642 | ) | |
Citibank N.A.,
New York | | Nalco Co.
7.750%, 11/15/11 | | Sell | | | 4.170 | | | 09/20/13 | | | 7.18 | % | | USD | 95,000 | | | | (10,124 | ) | | | — | | | | (10,124 | ) | |
Goldman Sachs
International | | Nalco Co.
7.750%, 11/15/11 | | Sell | | | 3.700 | | | 09/20/12 | | | 7.01 | % | | USD | 90,000 | | | | (8,883 | ) | | | — | | | | (8,883 | ) | |
Goldman Sachs
International | | Nalco Co.
7.750%, 11/15/11 | | Sell | | | 4.250 | | | 09/20/13 | | | 7.18 | % | | USD | 95,000 | | | | (9,855 | ) | | | — | | | | (9,855 | ) | |
Goldman Sachs
International | | Nalco Co.
7.750%, 11/15/11 | | Sell | | | 4.700 | | | 09/20/13 | | | 7.18 | % | | USD | 105,000 | | | | (9,221 | ) | | | — | | | | (9,221 | ) | |
Goldman Sachs
International | | Nalco Co.
7.750%, 11/15/11 | | Sell | | | 4.700 | | | 09/20/13 | | | 7.18 | % | | USD | 185,000 | | | | (16,246 | ) | | | — | | | | (16,246 | ) | |
JPMorgan
Chase Bank N.A.,
New York | | Nalco Co.
7.750%, 11/15/11 | | Sell | | | 4.650 | | | 09/20/13 | | | 7.18 | % | | USD | 100,000 | | | | (8,959 | ) | | | — | | | | (8,959 | ) | |
Credit Suisse
International | | NJSC
Naftogaz of Ukraine
8.125%, 09/30/09 | | Sell | | | 3.250 | | | 04/20/11 | | | 43.14 | % | | USD | 530,000 | | | | (261,662 | ) | | | — | | | | (261,662 | ) | |
Citibank N.A.,
New York | | Owens-Illinois, Inc.
7.800%, 05/15/18 | | Sell | | | 2.500 | | | 06/20/13 | | | 3.89 | % | | USD | 95,000 | | | | (5,068 | ) | | | — | | | | (5,068 | ) | |
Credit Suisse
International | | Owens-Illinois,
Inc. 7.800%, 05/15/18 | | Sell | | | 2.500 | | | 06/20/13 | | | 3.89 | % | | USD | 55,000 | | | | (2,934 | ) | | | — | | | | (2,934 | ) | |
| Deutsche Bank AG | | Owens-Illinois,
Inc. 7.800%, 05/15/18 | | Sell | | | 2.500 | | | 06/20/13 | | | 3.89 | % | | USD | 30,000 | | | | (1,601 | ) | | | — | | | | (1,601 | ) | |
| Barclays Bank PLC | | R.H. Donnelley Corp.
8.875%, 01/15/16 | | Sell | | | 5.000 | | | 09/20/10 | | | 48.43 | % | | USD | 85,000 | | | | (41,875 | ) | | | (12,999 | ) | | | (28,876 | ) | |
Goldman Sachs
International | | R.H. Donnelley Corp.
8.875%, 01/15/16 | | Sell | | | 5.000 | | | 09/20/10 | | | 48.43 | % | | USD | 120,000 | | | | (59,118 | ) | | | (21,610 | ) | | | (37,508 | ) | |
Morgan Stanley
Capital Services Inc. | | R.H. Donnelley Corp.
8.875%, 01/15/16 | | Sell | | | 5.000 | | | 09/20/10 | | | 48.43 | % | | USD | 55,000 | | | | (27,095 | ) | | | (8,399 | ) | | | (18,696 | ) | |
Citibank N.A.,
New York | | Reliant Energy Inc.
6.750%, 12/15/14 | | Sell | | | 2.450 | | | 09/20/11 | | | 6.94 | % | | USD | 70,000 | | | | (6,875 | ) | | | — | | | | (6,875 | ) | |
Citibank N.A.,
New York | | Reliant Energy Inc.
6.750%, 12/15/14 | | Sell | | | 2.600 | | | 09/20/11 | | | 6.94 | % | | USD | 210,000 | | | | (19,935 | ) | | | — | | | | (19,935 | ) | |
See Accompanying Notes to Financial Statements
178
PORTFOLIO OF INVESTMENTS
ING OPPENHEIMER STRATEGIC INCOME PORTFOLIO AS OF DECEMBER 31, 2008 (CONTINUED)
| Counterparty | | Reference
Entity/Obligation | | Buy/Sell
Protection | | (Pay)/
Receive
Fixed
Rate (%) | | Termination
Date | | Implied
Credit Spread
At 12/31/08(3) | | Notional
Amount(4) | | Market
Value(5) | | Upfront
Premium
Paid/
(Received) | | Unrealized
Appreciation/
(Depreciation) | |
Credit Suisse
International | | Reliant Energy Inc.
6.750%, 12/15/14 | | Sell | | | 5.750 | | | 12/20/13 | | | 9.69 | % | | USD | 130,000 | | | $ | (17,089 | ) | | $ | — | | | $ | (17,089 | ) | |
Merrill Lynch
International | | Reliant Energy Inc.
6.750%, 12/15/14 | | Sell | | | 2.050 | | | 09/20/11 | | | 6.94 | % | | USD | 115,000 | | | | (12,300 | ) | | | — | | | | (12,300 | ) | |
| UBS AG | | Republic of Philippines
10.625%, 03/16/25 | | Sell | | | 1.450 | | | 06/20/17 | | | 3.84 | % | | USD | 540,000 | | | | (82,489 | ) | | | — | | | | (82,489 | ) | |
JPMorgan
Chase Bank N.A.,
London | | Republic of Turkey
11.875%, 01/15/30 | | Sell | | | 2.640 | | | 08/20/13 | | | 4.15 | % | | USD | 270,000 | | | | (16,157 | ) | | | — | | | | (16,157 | ) | |
JPMorgan
Chase Bank N.A.,
London | | Republic of Turkey
11.875%, 01/15/30 | | Sell | | | 2.680 | | | 09/20/13 | | | 4.15 | % | | USD | 205,000 | | | | (11,520 | ) | | | — | | | | (11,520 | ) | |
Goldman Sachs
International | | Republic of Venezuela
9.250%, 09/15/27 | | Sell | | | 6.350 | | | 05/20/13 | | | 32.64 | % | | USD | 205,000 | | | | (101,287 | ) | | | — | | | | (101,287 | ) | |
Credit Suisse
International | | Rite Aid Corp.
7.700%, 02/15/27 | | Sell | | | 7.500 | | | 03/20/09 | | | 29.41 | % | | USD | 55,000 | | | | (2,540 | ) | | | — | | | | (2,540 | ) | |
Goldman Sachs
International | | Rite Aid Corp.
7.700%, 02/15/27 | | Sell | | | 8.060 | | | 03/20/09 | | | 29.41 | % | | USD | 100,000 | | | | (4,500 | ) | | | — | | | | (4,500 | ) | |
Goldman Sachs
International | | Rite Aid Corp.
7.700%, 02/15/27 | | Sell | | | 5.000 | | | 12/20/09 | | | 36.61 | % | | USD | 260,000 | | | | (67,475 | ) | | | (14,629 | ) | | | (52,846 | ) | |
| Barclays Bank PLC | | Station Casinos
6.000%, 04/01/12 | | Sell | | | 5.000 | | | 06/20/13 | | | 87.73 | % | | USD | 80,000 | | | | (62,661 | ) | | | (12,341 | ) | | | (50,320 | ) | |
Goldman Sachs
International | | Station Casinos
6.000%, 04/01/12 | | Sell | | | 5.000 | | | 06/20/13 | | | 87.73 | % | | USD | 45,000 | | | | (35,247 | ) | | | (6,815 | ) | | | (28,432 | ) | |
Citibank N.A.,
New York | | Tribune Co.
5.250%, 08/15/15** | | Sell | | | 5.000 | | | 03/20/10 | | | See below
footnote | | | USD | 65,000 | | | | (61,966 | ) | | | (11,782 | ) | | | (50,184 | ) | |
Citibank N.A.,
New York | | Tribune Co.
5.250%, 08/15/15** | | Sell | | | 5.000 | | | 03/20/10 | | | See below
footnote | | | USD | 65,000 | | | | (61,967 | ) | | | (12,060 | ) | | | (49,907 | ) | |
Citibank N.A.,
New York | | Tribune Co.
5.250%, 08/15/15** | | Sell | | | 5.000 | | | 03/20/10 | | | See below
footnote | | | USD | 75,000 | | | | (71,500 | ) | | | (14,075 | ) | | | (57,425 | ) | |
Citibank N.A.,
New York | | Tribune Co.
5.250%, 08/15/15** | | Sell | | | 5.000 | | | 03/20/10 | | | See below
footnote | | | USD | 70,000 | | | | (66,733 | ) | | | (13,951 | ) | | | (52,782 | ) | |
Credit Suisse
International | | Tribune Co.
5.250%, 08/15/15** | | Sell | | | 6.350 | | | 12/20/08 | | | See below
footnote | | | USD | 55,000 | | | | (52,433 | ) | | | — | | | | (52,433 | ) | |
Credit Suisse
International | | Tribune Co.
5.250%, 08/15/15** | | Sell | | | 5.000 | | | 12/20/09 | | | See below
footnote | | | USD | 15,000 | | | | (14,300 | ) | | | (2,606 | ) | | | (11,694 | ) | |
Credit Suisse
International | | Tribune Co.
5.250%, 08/15/15** | | Sell | | | 5.000 | | | 12/20/09 | | | See below
footnote | | | USD | 60,000 | | | | (57,200 | ) | | | (10,947 | ) | | | (46,253 | ) | |
JPMorgan
Chase Bank, N.A.,
New York | | Tribune Co.
5.250%, 08/15/15** | | Sell | | | 5.000 | | | 12/20/09 | | | See below
footnote | | | USD | 95,000 | | | | (90,567 | ) | | | (18,292 | ) | | | (72,275 | ) | |
Credit Suisse
International | | TXU Corp.
5.550%, 11/15/14 | | Sell | | | 1.530 | | | 06/20/11 | | | 15.77 | % | | USD | 150,000 | | | | (39,318 | ) | | | — | | | | (39,318 | ) | |
Credit Suisse
International | | TXU Corp.
5.550%, 11/15/14 | | Sell | | | 1.610 | | | 06/20/11 | | | 15.77 | % | | USD | 85,000 | | | | (22,155 | ) | | | — | | | | (22,155 | ) | |
Merrill Lynch
International | | TXU Corp.
5.550%, 11/15/14 | | Sell | | | 1.530 | | | 06/20/11 | | | 15.77 | % | | USD | 185,000 | | | | (48,492 | ) | | | — | | | | (48,492 | ) | |
Merrill Lynch
International | | TXU Corp.
5.550%, 11/15/14 | | Sell | | | 1.580 | | | 06/20/11 | | | 15.77 | % | | USD | 165,000 | | | | (43,098 | ) | | | — | | | | (43,098 | ) | |
See Accompanying Notes to Financial Statements
179
PORTFOLIO OF INVESTMENTS
ING OPPENHEIMER STRATEGIC INCOME PORTFOLIO AS OF DECEMBER 31, 2008 (CONTINUED)
| Counterparty | | Reference
Entity/Obligation | | Buy/Sell
Protection | | (Pay)/
Receive
Fixed
Rate (%) | | Termination
Date | | Implied
Credit Spread
At 12/31/08(3) | | Notional
Amount(4) | | Market
Value(5) | | Upfront
Premium
Paid/
(Received) | | Unrealized
Appreciation/
(Depreciation) | |
Merrill Lynch
International | | TXU Corp.
5.550%, 11/15/14 | | Sell | | | 1.590 | | | 06/20/11 | | | 15.77 | % | | USD | 165,000 | | | $ | (43,068 | ) | | $ | — | | | $ | (43,068 | ) | |
Merrill Lynch
International | | TXU Corp.
5.550%, 11/15/14 | | Sell | | | 1.620 | | | 06/20/11 | | | 15.77 | % | | USD | 210,000 | | | | (54,697 | ) | | | — | | | | (54,697 | ) | |
Merrill Lynch
International | | TXU Corp.
5.550%, 11/15/14 | | Sell | | | 2.060 | | | 06/20/11 | | | 15.77 | % | | USD | 245,000 | | | | (61,829 | ) | | | — | | | | (61,829 | ) | |
Citibank N.A.,
New York | | Univision
Communications Inc.
9.750%, 03/15/15 | | Sell | | | 5.000 | | | 12/20/09 | | | 37.54 | % | | USD | 190,000 | | | | (49,912 | ) | | | (10,503 | ) | | | (39,409 | ) | |
Credit Suisse
International | | Univision
Communications Inc.
9.750%, 03/15/15 | | Sell | | | 14.600 | | | 03/20/09 | | | 35.86 | % | | USD | 15,000 | | | | (669 | ) | | | — | | | | (669 | ) | |
Goldman Sachs
International | | Univision
Communications Inc.
9.750%, 03/15/15 | | Sell | | | 5.000 | | | 06/20/09 | | | 35.86 | % | | USD | 50,000 | | | | (6,654 | ) | | | (1,893 | ) | | | (4,761 | ) | |
Goldman Sachs
International | | Univision
Communications Inc.
9.750%, 03/15/15 | | Sell | | | 5.000 | | | 06/20/09 | | | 35.86 | % | | USD | 15,000 | | | | (1,996 | ) | | | (645 | ) | | | (1,351 | ) | |
Goldman Sachs
International | | Univision
Communications Inc.
9.750%, 03/15/15 | | Sell | | | 5.000 | | | 06/20/09 | | | 35.86 | % | | USD | 35,000 | | | | (4,658 | ) | | | (860 | ) | | | (3,798 | ) | |
JPMorgan
Chase Bank N.A.,
New York | | Univision
Communications Inc.
9.750%, 03/15/15 | | Sell | | | 5.000 | | | 06/20/09 | | | 35.86 | % | | USD | 35,000 | | | | (4,658 | ) | | | (1,770 | ) | | | (2,888 | ) | |
| UBS AG | | Univision
Communications Inc.
9.750%, 03/15/15 | | Sell | | | 5.000 | | | 06/20/09 | | | 35.86 | % | | USD | 70,000 | | | | (9,316 | ) | | | (2,496 | ) | | | (6,820 | ) | |
| Deutsche Bank AG | | Vale Overseas Limited
8.250%, 01/17/34 | | Sell | | | 1.050 | | | 03/20/17 | | | 3.39 | % | | USD | 200,000 | | | | (30,364 | ) | | | — | | | | (30,364 | ) | |
Morgan Stanley
Capital Services Inc. | | YASAR, Multiple loan
facility agreements
to the YASAR
Group Entities | | Sell | | | 8.500 | | | 10/20/09 | | | 26.12 | % | | USD | 230,000 | | | | (24,876 | ) | | | — | | | | (24,876 | ) | |
Morgan Stanley
Capital Services Inc. | | YASAR, Multiple loan
facility agreements
to the YASAR
Group Entities | | Sell | | | 8.750 | | | 06/20/10 | | | 24.85 | % | | USD | 230,000 | | | | (42,495 | ) | | | — | | | | (42,495 | ) | |
| | | $ | (10,217,908 | ) | | $ | (952,385 | ) | | $ | (9,265,523 | ) | |
* Issued by Istanbul Bond Company to provide funds to finance loans to Finansbank, A.S. For the purposes of this transaction each such loan shall be an underlying loan.
** The Tribune Company announced on December 9, 2008 (Event Determination Date) that it was voluntarily restructuring its debt obligations under the protection of Chapter 11 of the US Bankruptcy Code. Cash settlement is based on a final price of 1.5, which was determined at auction on January 6, 2009. As the seller of protection, the fund will be required to pay an amount equal to notional amount of each transaction multiplied by one minus the final price (notional amount x .985). The coupon for each deal stopped accruing on the Event Determination Date.
(1) If a Portfolio is a buyer of protection and a credit event occurs, as defined under the terms of that particular swap agreement, a Portfolio will either 1.) receive from the seller of protection an amount equal to the notional amount of the swap and deliver the referenced obligation, other deliverable obligations or underlying securities comprising the referenced index or 2.) receive a net settlement amount in the form of cash or securities equal to the notional amount of the swap less the recovery value of the referenced obligation or underlying securities comprising the referenced index.
(2) If the Portfolio is a seller of protection, and a credit event occurs, as defined under the terms of that particular swap agreement, the Portfolio will generally either 1.) Pay to the buyer an amount equal to the notional amount of the swap and take delivery of the referenced obligation, other deliverable obligations, or underlying securities comprising a referenced index or 2.) Pay a net settlement amount in the form of cash or securities equal to the notional amount of the swap less the recovery value of the referenced obligation or underlying securities comprising a referenced index.
(3) Implied credit spreads, represented in absolute terms, utilized in determining the market value of credit default swap agreements on corporate issues or sovereign issues are disclosed for credit default swaps sold and serve as an indicator of the current status of the payment/performance risk and represent the likelihood or risk of default for the credit derivative. The implied credit spread of a particular referenced entity reflects the cost of buying/selling protection and may include upfront payments required to be made to enter into the agreement. For credit default swaps on asset-backed securities or credit indices, the quoted market prices and resulting
See Accompanying Notes to Financial Statements
180
PORTFOLIO OF INVESTMENTS
ING OPPENHEIMER STRATEGIC INCOME PORTFOLIO AS OF DECEMBER 31, 2008 (CONTINUED)
market values, as well as the receive fixed rate, serve as indicators of the current status of the payment/performance risk. Wider credit spreads and increasing market values, in absolute terms when compared to the notional amount of the swap, and high receive fixed rate, represent a deterioration of the referenced entity's credit soundness and a greater likelihood or risk of default or other credit event occurring as defined under the terms of the agreement.
(4) The maximum amount of future payments (undiscounted) that a Portfolio as seller of protection could be required to make or receive as a buyer of credit protection under a credit default swap agreement would be an amount equal to the notional amount of the agreement.
(5) The market values for credit default swap agreements serve as an indicator of the current status of the payment/performance risk and represent the likelihood or risk of default for the credit derivative. Increasing market values, in absolute terms, when compared to the notional amount of the agreement, represent a deterioration of the referenced obligation's credit soundness and a greater likelihood or risk of default or other credit event occurring.
(6) For the reason(s) or why a Portfolio may sell credit protection, please see NOTE 2, "Significant Accounting Policies" in the Notes to Financial Statements.
ING Oppenheimer Strategic Income Portfolio Interest Rate Swap Agreements Outstanding on December 31, 2008:
| | | Termination
Date | | Notional
Principal
Amount | | Unrealized
Appreciation/
(Depreciation) | |
Receive a fixed rate
equal to 12.610% and
pay a floating rate
based on the Brazil
Cetip Interbank Deposit
Rate Annualized
Counterparty: J. Aron &
Company | | 01/04/10 | | BRL | 3,600,000 | | | $ | 17,063 | | |
Receive a fixed rate
equal to 12.710% and
pay a floating rate
based on the Brazil
Cetip Interbank Deposit
Rate Annualized
Counterparty: J. Aron &
Company | | 01/04/10 | | BRL | 1,910,000 | | | | 10,956 | | |
Receive a fixed rate
equal to 14.890% and
pay a floating rate
based on the Brazil
Cetip Interbank Deposit
Rate Annualized
Counterparty: J. Aron &
Company | | 01/04/10 | | BRL | 8,390,000 | | | | 232,393 | | |
Receive a fixed rate
equal to 6.140% and
pay a floating rate
based on 6-month
PLZ-WIBOR-WIBO
Counterparty: Goldman
Sachs International | | 08/26/10 | | PLN | 3,870,000 | | | | 27,282 | | |
Receive a fixed rate
equal to 3.560% and
pay a floating rate
based on 6-month
CZK-PRIBOR-PRBO
Counterparty: JPMorgan
Chase Bank, N.A., London | | 09/12/10 | | CZK | 39,000,000 | | | | 26,866 | | |
Receive a fixed rate
equal to 3.470% and
pay a floating rate
based on 6-month
CZK-PRIBOR-PRBO
Counterparty: JPMorgan
Chase Bank, N.A., London | | 09/18/10 | | CZK | 47,600,000 | | | | 27,943 | | |
Receive a fixed rate
equal to 3.560% and
pay a floating rate
based on 6-month
CZK-PRIBOR-PRBO
Counterparty: Citibank
N.A., New York | | 09/27/10 | | CZK | 47,000,000 | | | | 30,568 | | |
| | | Termination
Date | | Notional
Principal
Amount | | Unrealized
Appreciation/
(Depreciation) | |
Receive a fixed rate
equal to 3.300% and
pay a floating rate
based on 6-month
CZK-PRIBOR-PRBO
Counterparty: JPMorgan
Chase Bank, N.A., London | | 10/17/10 | | CZK | 49,000,000 | | | $ | 12,919 | | |
Receive a fixed rate
equal to 2.760% and
pay a floating rate
based on 6-month
CZK-PRIBOR-PRBO
Counterparty: Goldman
Sachs International | | 12/05/10 | | CZK | 55,000,000 | | | | 4,226 | | |
Receive a fixed rate
equal to 2.750% and
pay a floating rate
based on 6-month
CZK-PRIBOR-PRBO
Counterparty: JPMorgan
Chase Bank, N.A., London | | 12/05/10 | | CZK | 55,000,000 | | | | 3,688 | | |
Receive a fixed rate
equal to 8.600% and
pay a floating rate
based on 6-month
HUF-BUBOR
Counterparty: JPMorgan
Chase Bank, N.A., London | | 12/17/10 | | HUF | 305,000,000 | | | | 6,385 | | |
Receive a fixed rate
equal to 10.000% and
pay a floating rate
based on 28-day
MXN-TIIE-BANXICO
Counterparty: J. Aron &
Company | | 11/11/11 | | MXN | 89,000,000 | | | | 105,818 | | |
Receive a fixed rate
equal to 10.000% and
pay a floating rate
based on 28-day
MXN-TIIE-BANXICO
Counterparty: JPMorgan
Chase Bank, N.A.,
New York | | 11/11/11 | | MXN | 88,000,000 | | | | 104,629 | | |
Receive a fixed rate
equal to 9.350% and
pay a floating rate
based on 28-day
MXN-TIIE-BANXICO
Counterparty: J. Aron &
Company | | 11/18/11 | | MXN | 27,600,000 | | | | 74,026 | | |
See Accompanying Notes to Financial Statements
181
PORTFOLIO OF INVESTMENTS
ING OPPENHEIMER STRATEGIC INCOME PORTFOLIO AS OF DECEMBER 31, 2008 (CONTINUED)
| | | Termination
Date | | Notional
Principal
Amount | | Unrealized
Appreciation/
(Depreciation) | |
Receive a fixed rate
equal to 9.270% and
pay a floating rate
based on 28-day
MXN-TIIE-BANXICO
Counterparty: J. Aron &
Company | | 11/21/11 | | MXN | 33,600,000 | | | $ | 77,160 | | |
Receive a fixed rate
equal to 9.080% and
pay a floating rate
based on 28-day
MXN-TIIE-BANXICO
Counterparty: J. Aron &
Company | | 11/22/11 | | MXN | 33,800,000 | | | | 65,694 | | |
Receive a fixed rate
equal to 8.920% and
pay a floating rate
based on 28-day
MXN-TIIE-BANXICO
Counterparty: Citibank
N.A., New York | | 11/24/11 | | MXN | 28,100,000 | | | | 46,295 | | |
Receive a fixed rate
equal to 8.920% and
pay a floating rate
based on 28-day
MXN-TIIE-BANXICO
Counterparty: JPMorgan
Chase Bank, N.A.,
New York | | 11/24/11 | | MXN | 27,500,000 | | | | 51,671 | | |
Receive a fixed rate
equal to 14.900% and
pay a floating rate
based on the Brazil
Cetip Interbank Deposit
Rate Annualized
Counterparty: Banco
Santander S.A., New York | | 01/02/12 | | BRL | 5,060,000 | | | | 103,462 | | |
Receive a fixed rate
equal to 14.050% and
pay a floating rate
based on the Brazil
Cetip Interbank Deposit
Rate Annualized
Counterparty: J. Aron &
Company | | 01/02/12 | | BRL | 1,040,000 | | | | 24,215 | | |
Receive a fixed rate
equal to 13.910% and
pay a floating rate
based on the Brazil
Cetip Interbank Deposit
Rate Annualized
Counterparty: JPMorgan
Chase Bank, N.A. | | 01/02/12 | | BRL | 2,070,000 | | | | 44,514 | | |
Receive a fixed rate
equal to 14.000% and
pay a floating rate
based on the Brazil
Cetip Interbank Deposit
Rate Annualized
Counterparty: Banco
Santander Central
Hispano, S.A. | | 01/03/12 | | BRL | 1,040,000 | | | | 23,556 | | |
| | | Termination
Date | | Notional
Principal
Amount | | Unrealized
Appreciation/
(Depreciation) | |
Receive an initial exchange
of USD 292,335.12.
Pay an initial exchange
of TRY 410,000.00.
Receive a fixed rate
equal to 17.100% on
TRY 410,000 and
pay a floating rate
based on 3-month USD
LIBOR on USD 292,335.12
Upon termination of the
contract, receive
TRY 410,000.00 and
pay USD 292,335.12.
Counterparty: Merrill Lynch
International | | 02/06/12 | | TRY | 410,000 | | | $ | 41,810 | | |
Receive an initial exchange
of USD 184,921.76.
Pay an initial exchange
of TRY 260,000.00.
Receive a fixed rate
equal to 17.250% on
TRY 260,000 and
pay a floating rate
based on 3-month USD
LIBOR on USD 184,921.76
Upon termination of the
contract, receive
TRY 260,000.00 and
pay USD 184,921.76.
Counterparty: Credit Suisse
International | | 02/07/12 | | TRY | 260,000 | | | | 17,420 | | |
Receive an initial exchange
of USD 281,539.56.
Pay an initial exchange
of TRY 395,000.00.
Receive a fixed rate
equal to 17.300% on
TRY 395,000 and
pay a floating rate
based on 3-month USD
LIBOR on USD 281,539.56.
Upon termination of the
contract, receive
TRY 395,000.00 and
pay USD 281,539.56.
Counterparty: Credit Suisse
International | | 02/09/12 | | TRY | 395,000 | | | | 40,347 | | |
Receive an initial exchange
of USD 477,085.44.
Pay an initial exchange
of TRY 660,000.00.
Receive a fixed rate
equal to 16.750% on
TRY 660, 000 and
pay a floating rate
based on 3-month USD
LIBOR on USD 477,085.44.
Upon termination of the
contract, receive
TRY 660,000.00 and
pay USD 477,085.44.
Counterparty: Credit Suisse
International | | 02/26/12 | | TRY | 660,000 | | | | 32,834 | | |
See Accompanying Notes to Financial Statements
182
PORTFOLIO OF INVESTMENTS
ING OPPENHEIMER STRATEGIC INCOME PORTFOLIO AS OF DECEMBER 31, 2008 (CONTINUED)
| | | Termination
Date | | Notional
Principal
Amount | | Unrealized
Appreciation/
(Depreciation) | |
Receive a fixed rate
equal to 8.480% and
pay a floating rate
based on 6-month
HUF-BUBOR
Counterparty: JPMorgan
Chase Bank, N.A., London | | 06/06/13 | | HUF | 192,000,000 | | | $ | 30,370 | | |
Receive a fixed rate
equal to 6.040% and
pay a floating rate
based on 6-month
PLZ-WIBOR-WIBO
Counterparty: JPMorgan
Chase Bank, N.A., London | | 08/08/13 | | PLN | 2,580,000 | | | | 62,610 | | |
Receive a fixed rate
equal to 7.880% and
pay a floating rate
based on 6-month
HUF-BUBOR
Counterparty: JPMorgan
Chase Bank, N.A., London | | 08/12/13 | | HUF | 123,000,000 | | | | 7,188 | | |
Receive a fixed rate
equal to 7.890% and
pay a floating rate
based on 6-month
HUF-BUBOR
Counterparty: JPMorgan
Chase Bank, N.A., London | | 09/12/13 | | HUF | 107,000,000 | | | | 3,482 | | |
Receive a fixed rate
equal to 7.820% and
pay a floating rate
based on 6-month
HUF-BUBOR
Counterparty: Barclays
Bank PLC | | 09/19/13 | | HUF | 231,000,000 | | | | 11,422 | | |
Receive a fixed rate
equal to 8.540% and
pay a floating rate
based on 28-day
MXN-TIIE-BANXICO
Counterparty: Banco
Santander S.A., New York | | 09/27/13 | | MXN | 14,000,000 | | | | 19,542 | | |
Receive a fixed rate
equal to 8.560% and
pay a floating rate
based on 28-day
MXN-TIIE-BANXICO
Counterparty: Credit
Suisse International | | 09/27/13 | | MXN | 5,500,000 | | | | 7,993 | | |
Receive a fixed rate
equal to 8.540% and
pay a floating rate
based on 28-day
MXN-TIIE-BANXICO
Counterparty: J. Aron &
Company | | 09/27/13 | | MXN | 8,500,000 | | | | 11,865 | | |
Receive a fixed rate
equal to 12.870% and
pay a floating rate
based on the Brazil
Cetip Interbank Deposit
Rate Annualized
Counterparty: J. Aron &
Company | | 01/02/14 | | BRL | 960,000 | | | | 5,985 | | |
| | | Termination
Date | | Notional
Principal
Amount | | Unrealized
Appreciation/
(Depreciation) | |
Receive a fixed rate
equal to 12.920% and
pay a floating rate
based on the Brazil
Cetip Interbank Deposit
Rate Annualized
Counterparty: J. Aron &
Company | | 01/02/14 | | BRL | 1,920,000 | | | $ | 13,316 | | |
Receive a fixed rate
equal to 12.260% and
pay a floating rate
based on the Brazil
Cetip Interbank Deposit
Rate Annualized
Counterparty: J. Aron &
Company | | 01/02/15 | | BRL | 80,000 | | | | (211 | ) | |
Receive a fixed rate
equal to 12.290% and
pay a floating rate
based on the Brazil
Cetip Interbank Deposit
Rate Annualized
Counterparty: J. Aron &
Company | | 01/02/15 | | BRL | 40,000 | | | | (88 | ) | |
Receive a fixed rate
of 5.460% on
UDI 2,252,229.80.
Pay a floating rate based
on 6-month USD-LIBOR
on USD 730,000.00.
Upon termination of the
contract, receive
UDI 2,252,229.80 and
pay USD 730,000.00.
Counterparty: Deutsche
Bank AG, London | | 05/13/15 | | USD | 730,000 | | | | 28,246 | | |
Receive a fixed rate
equal to 5.250% on
UDI 1,184,117.66
converted to MXN.
Pay a floating rate based
on 6-month USD-LIBOR
on USD 390,000.00.
Upon termination of the
contract, receive
UDI 1,184,117.66
(converted into MXN) and
pay USD 390,000.00.
Counterparty: Deutsche
Bank AG, London | | 06/23/15 | | USD | 390,000 | | | | 4,424 | | |
Receive a fixed rate
equal to 13.550% and
pay a floating rate
based on the Brazil
Cetip Interbank Deposit
Rate Annualized
Counterparty: Banco
Santander, S.A., New York | | 01/02/17 | | BRL | 1,730,000 | | | | 19,664 | | |
Receive a fixed rate
equal to 13.100% and
pay a floating rate
based on the Brazil
Cetip Interbank Deposit
Rate Annualized
Counterparty: J. Aron &
Company | | 01/02/17 | | BRL | 1,610,000 | | | | 10,721 | | |
See Accompanying Notes to Financial Statements
183
PORTFOLIO OF INVESTMENTS
ING OPPENHEIMER STRATEGIC INCOME PORTFOLIO AS OF DECEMBER 31, 2008 (CONTINUED)
| | | Termination
Date | | Notional
Principal
Amount | | Unrealized
Appreciation/
(Depreciation) | |
Receive a fixed rate
equal to 13.670% and
pay a floating rate
based on the Brazil
Cetip Interbank Deposit
Rate Annualized
Counterparty: J. Aron &
Company | | 01/02/17 | | BRL | 1,750,000 | | | $ | 22,287 | | |
Receive a fixed rate
equal to 13.900% and
pay a floating rate
based on the Brazil
Cetip Interbank Deposit
Rate Annualized
Counterparty: J. Aron &
Company | | 01/02/17 | | BRL | 2,760,000 | | | | 39,825 | | |
Receive a fixed rate
equal to 14.100% and
pay a floating rate
based on the Brazil
Cetip Interbank Deposit
Rate Annualized
Counterparty: J. Aron &
Company | | 01/02/17 | | BRL | 430,000 | | | | 7,159 | | |
Receive a fixed rate
equal to 14.160% and
pay a floating rate
based on the Brazil
Cetip Interbank Deposit
Rate Annualized
Counterparty: J. Aron &
Company | | 01/02/17 | | BRL | 1,770,000 | | | | 32,135 | | |
Receive a fixed rate
equal to 14.300% and
pay a floating rate
based on the Brazil
Cetip Interbank Deposit
Rate Annualized
Counterparty: J. Aron &
Company | | 01/02/17 | | BRL | 2,700,000 | | | | 53,013 | | |
Receive a fixed rate
equal to 13.900% and
pay a floating rate
based on the Brazil
Cetip Interbank Deposit
Rate Annualized
Counterparty: JPMorgan
Chase Bank, N.A. | | 01/02/17 | | BRL | 2,770,000 | | | | 39,969 | | |
Receive a fixed rate
equal to 13.900% and
pay a floating rate
based on the Brazil
Cetip Interbank Deposit
Rate Annualized
Counterparty: JPMorgan
Chase Bank, N.A. | | 01/02/17 | | BRL | 2,500,000 | | | | 36,909 | | |
Receive a fixed rate
equal to 13.900% and
pay a floating rate
based on the Brazil
Cetip Interbank Deposit
Rate Annualized
Counterparty: Morgan
Stanley Capital
Services Inc. | | 01/02/17 | | BRL | 5,000,000 | | | | 73,819 | | |
| | | Termination
Date | | Notional
Principal
Amount | | Unrealized
Appreciation/
(Depreciation) | |
Receive a fixed rate
equal to 13.930% and
pay a floating rate
based on the Brazil
Cetip Interbank Deposit
Rate Annualized
Counterparty: Morgan
Stanley Capital
Services Inc. | | 01/02/17 | | BRL | 1,710,000 | | | $ | 26,746 | | |
Receive a fixed rate
equal to 14.860% and
pay a floating rate
based on the Brazil
Cetip Interbank Deposit
Rate Annualized
Counterparty: Morgan
Stanley Capital
Services Inc. | | 01/02/17 | | BRL | 1,680,000 | | | | 42,534 | | |
Receive a fixed rate
equal to 14.880% and
pay a floating rate
based on the Brazil
Cetip Interbank Deposit
Rate Annualized
Counterparty: Morgan
Stanley Capital
Services Inc. | | 01/02/17 | | BRL | 1,680,000 | | | | 42,899 | | |
Receive a fixed rate
equal to 14.950% and
pay a floating rate
based on the Brazil
Cetip Interbank Deposit
Rate Annualized
Counterparty: Morgan
Stanley Capital
Services Inc. | | 01/02/17 | | BRL | 2,000,000 | | | | 51,098 | | |
Receive a fixed rate
equal to 15.000% and
pay a floating rate
based on the Brazil
Cetip Interbank Deposit
Rate Annualized
Counterparty: Morgan
Stanley Capital
Services Inc. | | 01/02/17 | | BRL | 2,000,000 | | | | 52,081 | | |
Receive a fixed rate
equal to 14.340% and
pay a floating rate
based on the Brazil
Cetip Interbank Deposit
Rate Annualized
Counterparty: UBS AG,
London | | 01/02/17 | | BRL | 1,900,000 | | | | 38,165 | | |
Receive a floating rate
based on 7-Day Repo
Fixing Rates for Chinese
Renminbi, pay a fixed rate
equal to 4.000%
Counterparty: Goldman
Sachs International | | 02/16/17 | | CNY | 3,800,000 | | | | (6,817 | ) | |
See Accompanying Notes to Financial Statements
184
PORTFOLIO OF INVESTMENTS
ING OPPENHEIMER STRATEGIC INCOME PORTFOLIO AS OF DECEMBER 31, 2008 (CONTINUED)
| | | Termination
Date | | Notional
Principal
Amount | | Unrealized
Appreciation/
(Depreciation) | |
Receive a floating rate
based on the price of
specified swaption
straddle struck at the
five year forward
five year swap rate as of
the floating rate
payer reset date (divided
by 10,000) and pay a fixed
rate equal to 4.660%.
Counterparty: Merrill Lynch
Capital Services, Inc. | | 06/11/17 | | USD | 9,650,000 | | | $ | (862,641 | ) | |
Receive a floating rate
based on the price of
specified swaption
straddle struck at the
five year forward
five year swap rate as of
the floating rate
payer reset date (divided
by 10,000) and pay a fixed
rate equal to 5.330%.
Counterparty: Merrill Lynch
Capital Services, Inc. | | 08/13/17 | | USD | 2,380,000 | | | | (328,629 | ) | |
Receive a fixed rate
equal to 8.140% and
pay a floating rate
based on 28-day
MXN-TIIE-BANXICO
Counterparty: J. Aron &
Company | | 01/10/18 | | MXN | 8,910,000 | | | | (12,430 | ) | |
Receive a fixed rate
equal to 8.570% and
pay a floating rate
based on 28-day
MXN-TIIE-BANXICO
Counterparty: Banco
Santander, S.A., New York | | 05/03/18 | | MXN | 7,140,000 | | | | 4,076 | | |
Receive a fixed rate
equal to 8.570% and
pay a floating rate
based on 28-day
MXN-TIIE-BANXICO
Counterparty: Merrill Lynch
Capital Services, Inc. | | 05/11/18 | | MXN | 6,150,000 | | | | 7,075 | | |
Receive a fixed rate
equal to 8.645% and
pay a floating rate
based on 28-day
MXN-TIIE-BANXICO
Counterparty: Banco
Santander S.A., New York | | 05/17/18 | | MXN | 4,700,000 | | | | 7,070 | | |
Receive a fixed rate
equal to 9.320% and
pay a floating rate
based on 28-day
MXN-TIIE-BANXICO
Counterparty: JPMorgan
Chase Bank, N.A.,
New York | | 06/01/18 | | MXN | 4,520,000 | | | | 21,833 | | |
Receive a fixed rate
equal to 5.110% and
pay a floating rate
based on 3-month
SEK-STIBOR-SIDE
Counterparty: Deutsche
Bank AG, Frankfurt | | 07/16/18 | | SEK | 9,900,000 | | | | 193,292 | | |
| | | Termination
Date | | Notional
Principal
Amount | | Unrealized
Appreciation/
(Depreciation) | |
Receive a fixed rate
equal to 5.080% and
pay a floating rate
based on 3-month
SEK-STIBOR-SIDE
Counterparty: Goldman
Sachs International | | 07/17/18 | | SEK | 9,900,000 | | | $ | 184,058 | | |
Receive a fixed rate
equal to 4.840% and
pay a floating rate
based on 3-month
SEK-STIBOR-SIDE
Counterparty: Goldman
Sachs International | | 08/21/18 | | SEK | 6,700,000 | | | | 119,895 | | |
Receive a fixed rate
equal to 5.880% and
pay a floating rate
based on 3-month
ILS-TELBOR01
Counterparty: UBS AG,
London | | 08/28/18 | | ILS | 2,450,000 | | | | 58,398 | | |
Receive a fixed rate
equal to 5.850% and
pay a floating rate
based on 3-month
ILS-TELBOR01
Counterparty: UBS AG,
London | | 09/04/18 | | ILS | 2,500,000 | | | | 68,735 | | |
Receive a fixed rate
equal to 7.180% and
pay a floating rate
based on 6-month
HUF-BUBOR
Counterparty: Citibank
N.A., New York | | 10/03/18 | | HUF | 134,000,000 | | | | (695 | ) | |
Receive a fixed rate
equal to 5.320% and
pay a floating rate
based on 6-month
PLZ-WIBOR-WIBO
Counterparty: Goldman
Sachs International | | 10/03/18 | | PLN | 3,400,000 | | | | 71,358 | | |
Receive a fixed rate
equal to 3.830% and
pay a floating rate
based on 6-month
CZK-PRIBOR-PRBO
Counterparty: Morgan
Stanley Capital
Services Inc. | | 10/03/18 | | CZK | 22,100,000 | | | | 59,324 | | |
Receive a fixed rate
equal to 3.760% and
pay a floating rate
based on 6-month
CZK-PRIBOR-PRBO
Counterparty: Goldman
Sachs International | | 10/06/18 | | CZK | 21,900,000 | | | | 51,411 | | |
Receive a fixed rate
equal to 5.330% and
pay a floating rate
based on 6-month
PLZ-WIBOR-WIBO
Counterparty: Goldman
Sachs International | | 10/06/18 | | PLN | 3,340,000 | | | | 70,421 | | |
See Accompanying Notes to Financial Statements
185
PORTFOLIO OF INVESTMENTS
ING OPPENHEIMER STRATEGIC INCOME PORTFOLIO AS OF DECEMBER 31, 2008 (CONTINUED)
| | | Termination
Date | | Notional
Principal
Amount | | Unrealized
Appreciation/
(Depreciation) | |
Receive a fixed rate
equal to 7.200% and
pay a floating rate
based on 6-month
HUF-BUBOR
Counterparty: JPMorgan
Chase Bank, N.A., London | | 10/06/18 | | HUF | 134,000,000 | | | $ | (18 | ) | |
Receive a fixed rate
equal to 7.180% and
pay a floating rate
based on 6-month
HUF-BUBOR
Counterparty: Barclays
Bank PLC | | 10/08/18 | | HUF | 134,000,000 | | | | (1,025 | ) | |
Receive a fixed rate
equal to 7.200% and
pay a floating rate
based on 6-month
HUF-BUBOR
Counterparty: Citibank
N.A., New York | | 10/08/18 | | HUF | 132,000,000 | | | | (18 | ) | |
Receive a fixed rate
equal to 9.580% and
pay a floating rate
based on 28-day
MXN-TIIE-BANXICO
Counterparty: JPMorgan
Chase Bank, N.A.,
New York | | 10/23/18 | | MXN | 34,800,000 | | | | 215,123 | | |
Receive a floating rate
based on 3-month
ZAR-JIBAR-SAFEX and
pay a fixed rate equal
to 8.930%
Counterparty: JPMorgan
Chase Bank, N.A., London | | 11/03/18 | | ZAR | 13,250,000 | | | | (122,722 | ) | |
Receive a floating rate
based on 3-month
ZAR-JIBAR-SAFEX and
pay a fixed rate equal
to 8.920%
Counterparty: UBS AG,
London | | 11/03/18 | | ZAR | 13,250,000 | | | | (121,724 | ) | |
Receive a fixed rate
equal to 9.070% and
pay a floating rate
based on 28-day
MXN-TIIE-BANXICO
Counterparty: Morgan
Stanley Capital
Services Inc. | | 11/26/18 | | MXN | 10,800,000 | | | | 38,983 | | |
Receive a fixed rate
equal to 4.880% and
pay a floating rate
based on 6-month
AUD-BBR-BBSW
Counterparty: Westpac
Banking Corp. | | 12/03/18 | | AUD | 4,175,000 | | | | 128,699 | | |
Receive a floating rate
based on 3-month
SEK-STIBOR-SIDE and
pay a fixed rate equal
to 3.135%
Counterparty: Barclays
Bank PLC | | 12/09/18 | | SEK | 6,640,000 | | | | (55 | ) | |
| | | Termination
Date | | Notional
Principal
Amount | | Unrealized
Appreciation/
(Depreciation) | |
Receive a floating rate
based on 3-month
SEK-STIBOR-SIDE and
pay a fixed rate equal
to 3.130%
Counterparty: Deutsche
Bank AG, Frankfurt | | 12/09/18 | | SEK | 1,660,000 | | | $ | 77 | | |
Receive a fixed rate
equal to 5.036% and
pay a floating rate
based on 3-month
ILS-TELBOR01
Counterparty: UBS AG | | 12/12/18 | | ILS | 2,740,000 | | | | 22,106 | | |
Receive a floating rate
based on 3-month
SEK-STIBOR-SIDE and
pay a fixed rate equal
to 3.520%
Counterparty: Barclays
Bank PLC | | 12/15/18 | | SEK | 8,300,000 | | | | (39,374 | ) | |
Receive a fixed rate
equal to 4.940% and
pay a floating
rate based on 3-month
ILS-TELBOR01
Counterparty: Credit Suisse
International | | 12/15/18 | | ILS | 1,070,000 | | | | 8,985 | | |
Receive a floating rate
based on 3-month
SEK-STIBOR-SIDE and
pay a fixed rate equal
to 3.220%
Counterparty: Barclays
Bank PLC | | 12/22/18 | | SEK | 5,000,000 | | | | (7,008 | ) | |
Receive a fixed rate
equal to 4.650% and
pay a floating rate
based on 3-month
ILS-TELBOR01
Counterparty: Credit Suisse
International | | 12/22/18 | | ILS | 1,000,000 | | | | 1,006 | | |
Receive a fixed rate
equal to 9.150% and
pay a floating rate
based on 28-day
MXN-TIIE-BANXICO
Counterparty: J. Aron &
Company | | 08/27/26 | | MXN | 5,270,000 | | | | 23,462 | | |
Receive a fixed rate
equal to 9.330% and
pay a floating rate
based on 28-day
MXN-TIIE-BANXICO
Counterparty: J. Aron &
Company | | 09/16/26 | | MXN | 2,200,000 | | | | 12,587 | | |
Receive a fixed rate
equal to 8.300% and
pay a floating rate
based on 28-day
MXN-TIIE-BANXICO
Counterparty: Credit Suisse
International | | 12/17/26 | | MXN | 4,750,000 | | | | (8,794 | ) | |
| | | $ | 1,904,935 | | |
See Accompanying Notes to Financial Statements
186
PORTFOLIO OF INVESTMENTS
ING OPPENHEIMER STRATEGIC INCOME PORTFOLIO AS OF DECEMBER 31, 2008 (CONTINUED)
ING Oppenheimer Strategic Income Portfolio Total Return Swap Agreements Outstanding on December 31, 2008:
| | | Termination
Date | | Notional
Principal
Amount | | Unrealized
Appreciation/
(Depreciation) | |
Receive carry amount plus
absolute value of the
total return of the
Barclays Capital CMBS
AAA 8.5+ Index, if the
return is negative.
Pay total return of the
Barclays Capital CMBS
AAA 8.5+ Index, if the
return is positive.
Counterparty: Goldman
Sachs Capital Markets, L.P. | | 01/01/09 | | USD | 1,120,000 | | | $ | 193,156 | | |
Receive carry amount plus
absolute value of the
total return of the
Barclays Capital CMBS
AAA 8.5+ Index, if the
return is negative.
Pay total return of the
Barclays Capital CMBS
AAA 8.5+ Index, if the
return is positive.
Counterparty:
Morgan Stanley
Capital Services Inc. | | 01/01/09 | | USD | 2,060,000 | | | | 346,354 | | |
Receive carry amount plus
15 bps, plus absolute
value of the total return
of the Barclays Capital
CMBS AAA Index, if the
return is negative.
Pay total return of the
Barclays Capital CMBS
AAA Index, if the
return is positive.
Counterparty:
Citibank N.A., New York | | 02/01/09 | | USD | 1,100,000 | | | | 120,908 | | |
Receive carry amount plus
absolute value of the
total return of the
Barclays Capital CMBS
AAA Index, if the
return is negative.
Pay total return of the
Barclays Capital CMBS
AAA Index, if the
return is positive.
Counterparty:
Citibank N.A., New York | | 02/01/09 | | USD | 2,300,000 | | | | 251,305 | | |
Receive carry amount plus
absolute value of the
total return of the
Barclays Capital CMBS
AAA 8.5+ Index, if the
return is negative. Pay
total return of the
Barclays Capital CMBS
AAA 8.5+ Index, if the
return is positive.
Counterparty: Goldman
Sachs International | | 02/01/09 | | USD | 3,740,000 | | | | 646,278 | | |
| | | Termination
Date | | Notional
Principal
Amount | | Unrealized
Appreciation/
(Depreciation) | |
Receive carry amount plus
130 bps, plus absolute
value of the total return
of the Barclays Capital
CMBS AAA 8.5+ Index, if
the return is negative.
Pay total return of the
Barclays Capital CMBS
AAA 8.5+ Index, if the
return is positive.
Counterparty: JPMorgan
Chase Bank, N.A. | | 02/01/09 | | USD | 1,070,000 | | | $ | 181,137 | | |
Receive carry amount minus
95 bps, plus absolute
value of the total return
of the Barclays Capital
CMBS AAA 8.5+ Index, if
the return is negative.
Pay total return of the
Barclays Capital CMBS
AAA 8.5+ Index, if the
return is positive.
Counterparty:
Morgan Stanley
Capital Services Inc. | | 02/01/09 | | USD | 740,000 | | | | 106,021 | | |
Receive carry amount minus
70 bps, plus absolute
value of the total return
of the Barclays Capital
CMBS AAA 8.5+ Index, if
the return is negative.
Pay total return of the
Barclays Capital CMBS
AAA 8.5+ Index, if the
return is positive.
Counterparty:
Morgan Stanley
Capital Services Inc. | | 02/01/09 | | USD | 1,780,000 | | | | 255,764 | | |
Receive carry amount minus
50 bps, plus absolute
value of the total return
of the Barclays Capital
CMBS AAA 8.5+ Index, if
the return is negative.
Pay total return of the
Barclays Capital CMBS
AAA 8.5+ Index, if the
return is positive.
Counterparty:
Morgan Stanley
Capital Services Inc. | | 02/01/09 | | USD | 1,780,000 | | | | 256,356 | | |
See Accompanying Notes to Financial Statements
187
PORTFOLIO OF INVESTMENTS
ING OPPENHEIMER STRATEGIC INCOME PORTFOLIO AS OF DECEMBER 31, 2008 (CONTINUED)
| | | Termination
Date | | Notional
Principal
Amount | | Unrealized
Appreciation/
(Depreciation) | |
Receive absolute value of
price depreciation on the
Bovespa Index Futures
Exchange-Traded Contract
(February 09). Pay price
appreciation on the
Bovespa Index Futures
Exchange-Traded
Contract (February 09).
Counterparty:
Citibank N.A., New York | | 02/20/09 | | BRL | 1,407,012 | | | $ | 33,774 | | |
Receive carry amount plus
250 bps, plus absolute
value of the total return
of the Barclays Capital
CMBS AAA 8.5+ Index, if
the return is negative.
Pay total return of the
Barclays Capital CMBS
AAA 8.5+ Index, if the
return is positive.
Counterparty:
Goldman Sachs
Capital Markets, L.P. | | 03/01/09 | | USD | 2,360,000 | | | | 422,540 | | |
Receive carry amount plus
absolute value of the
total return of the
Barclays Capital CMBS
AAA Index, if the return
is negative. Pay total
return of the Barclays
Capital CMBS AAA Index,
if the return is positive.
Counterparty:
Morgan Stanley
Capital Services Inc. | | 03/01/09 | | USD | 4,200,000 | | | | 458,509 | | |
Receive carry amount plus
250 bps, plus absolute
value of the total return
of the Barclays Capital
CMBS AAA 8.5+ Index, if
the return is negative.
Pay total return of the
Barclays Capital CMBS
AAA 8.5+ Index, if the
return is positive.
Counterparty:
Morgan Stanley
Capital Services Inc. | | 03/01/09 | | USD | 800,000 | | | | 102,268 | | |
Receive, if positive, the
total return of a custom
basket of securities
plus 90% of the dividends
from the basket. Pay
one-month EUR-LIBOR
plus 25 basis pts. and, if
negative, the absolute
value of the total return
of a custom
basket of securities
Morgan Stanley & Co.
International PLC | | 03/06/09 | | EUR | 867,600 | | | | 84,027 | | |
| | | Termination
Date | | Notional
Principal
Amount | | Unrealized
Appreciation/
(Depreciation) | |
Receive absolute value of
price depreciation on the
Swiss Market Index
Futures (March 09).
Pay price appreciation on
the Swiss Market Index
Futures (March 09).
Counterparty: Goldman
Sachs International | | 03/24/09 | | CHF | 598,950 | | | $ | (3,138 | ) | |
Receive carry amount minus
660 bps, plus absolute
value of the total return
of The Banc of America
Securities LLC AAA 10yr
CMBS Daily Index, if the
return is negative. Pay
total return of The Banc
of America Securities LLC
AAA 10yr CMBS Daily
Index, if the return is
positive. Counterparty:
Goldman Sachs
International | | 03/31/09 | | USD | 7,020,000 | | | | 1,162,298 | | |
Receive carry amount plus
3000 bps, plus absolute
value of the total return
of The Banc of America
Securities LLC AAA 10yr
CMBS Daily Index, if the
return is negative. Pay
total return of The Banc
of America Securities LLC
AAA 10yr CMBS Daily
Index, if the return is
positive. Counterparty:
Morgan Stanley
Capital Services Inc. | | 03/31/09 | | USD | 2,060,000 | | | | 657,681 | | |
Receive, if positive, the
total return of a custom
basket of securities plus
93% of the dividends
from the basket. Pay a
floating rate based on
one-month JPY-LIBOR
plus 40 basis pts. and, if
negative, the absolute
value of the total
return of a custom
basket of securities.
Counterparty:
Citibank N.A., New York | | 04/13/09 | | JPY | 145,964,313 | | | | 223,967 | | |
Receive, if positive, the
total return of a custom
basket of securities plus
the dividends from the
basket. Pay a floating
rate based on one-month
GBP-LIBOR plus 35
basis pts. and, if negative,
the absolute value of the
total return of a custom
basket of securities.
Counterparty:
Citibank N.A., New York | | 05/08/09 | | GBP | 1,055,988 | | | | (15,023 | ) | |
See Accompanying Notes to Financial Statements
188
PORTFOLIO OF INVESTMENTS
ING OPPENHEIMER STRATEGIC INCOME PORTFOLIO AS OF DECEMBER 31, 2008 (CONTINUED)
| | | Termination
Date | | Notional
Principal
Amount | | Unrealized
Appreciation/
(Depreciation) | |
Receive, if positive, the
total return of custom
basket of securities plus
the dividends from the
basket. Pay one-month
USD-LIBOR plus 20
basis pts. and, if negative,
the absolute value of the
total return of a cus tom
equity basket.
Counterparty: Deutsche
Bank AG, London | | 10/05/09 | | USD | 1,417,085 | | | $ | 51,007 | | |
Receive the price return
on MSCI Daily TR Net
Belgium USD Market
Index, if positive. Pay
one-month USD-LIBOR
and, if negative, the
absolute value of the
price return of the MSCI
Daily TR Net Belgium
USD Market Index.
Counterparty:
Citibank N.A., New York | | 10/07/09 | | USD | 55,600 | | | | 7,185 | | |
Receive the price return
on MSCI Daily TR Net
Belgium USD Market
Index, if positive. Pay
one-month USD-LIBOR
and, if negative, the
absolute value of the
price return of the MSCI
Daily TR Net Belgium
USD Market I ndex.
Counterparty:
Citibank N.A., New York | | 10/07/09 | | USD | 111,200 | | | | 14,371 | | |
Receive the price return on
MSCI Daily TR Net
Belgium USD Market
Index, if positive. Pay
one-month USD-LIBOR
and, if negative, the
absolute value of the
price return of the MSCI
Daily TR Net Belgium
USD Market I ndex.
Counterparty:
Citibank N.A., New York | | 10/07/09 | | USD | 355,221 | | | | 45,907 | | |
Receive, if positive, the
total return of custom
basket of securities plus
90% of the dividends
from the basket. Pay
one-month EUR-LIBOR
plus 30 basis pts. and, if
negative, the absolute
value of the total return
of custom basket
of securities.
Counterparty:
Morgan Stanley & Co.
International | | 10/07/09 | | EUR | 842,100 | | | | 48,065 | | |
| | | Termination
Date | | Notional
Principal
Amount | | Unrealized
Appreciation/
(Depreciation) | |
Receive, if positive, the
total return of custom
basket of securities plus
the dividends from the
basket. Pay one-month
USD-LIBOR plus 30 basis
pts. and, if negative, the
absolute value of the
total return of a custom
equity basket.
Counterparty: Goldman
Sachs International | | 12/07/09 | | USD | 5,546,846 | | | $ | 835,757 | | |
Receive a fixed rate equal
to 7.750%, and pay a
floating rate based on
3-month USD LIBOR.
On the termination date,
receive total return
amount on reference
obligation, if total return
amount is positive, and
pa y absolute value of the
total return amount on
reference obligation, if
total return amount is
negative. Reference
Obligation: Loan under
the loan facility
agreement between each
of JSC "Rushydro" and
OJSC Saratovskaya and
any Successor(s) and
Morgan Stanley Bank
International Limited
dated 13 December 2006
Counterparty:
Morgan Stanley
Capital Services Inc. | | 12/26/13 | | RUB | 56,780,000 | | | | (911,871 | ) | |
| | | $ | 5,680,624 | | |
See Accompanying Notes to Financial Statements
189
PORTFOLIO OF INVESTMENTS
ING PIMCO TOTAL RETURN PORTFOLIO AS OF DECEMBER 31, 2008
Principal
Amount | | | | | | Value | |
| CORPORATE BONDS/NOTES: 35.9% | | | |
| | | | | Agriculture: 0.1% | |
| $ | 400,000 | | | | | Philip Morris International,
Inc., 5.650%,
due 05/16/18 | | $ | 397,246 | | |
| | 300,000 | | | C | | Reynolds American, Inc.,
7.625%, due 06/01/16 | | | 250,177 | | |
| | | | 647,423 | | |
| | | | | Auto Manufacturers: 0.5% | |
| | 1,400,000 | | | C,S | | Daimler Finance NA, LLC,
2.346%, due 03/13/09 | | | 1,399,362 | | |
| | 1,975,000 | | | | | DaimlerChrysler NA
Holding Corp., 6.000%,
due 08/03/14 | | | 1,038,285 | | |
| | | | 2,437,647 | | |
| | | | | Banks: 19.1% | |
| | 200,000 | | | | | American Express Bank FSB,
6.000%, due 09/13/17 | | | 187,617 | | |
| | 3,700,000 | | | S | | American Express Centurion
Bank, 0.426%,
due 06/12/09 | | | 3,591,035 | | |
| | 200,000 | | | | | American Express Centurion
Bank, 6.000%,
due 09/13/17 | | | 187,616 | | |
| | 800,000 | | | @@,# | | ANZ National International
Ltd., 6.200%,
due 07/19/13 | | | 774,799 | | |
| | 300,000 | | | | | Bank of America Corp.,
2.479%, due 08/15/16 | | | 221,507 | | |
| | 900,000 | | | S | | Bank of America Corp.,
5.750%, due 12/01/17 | | | 900,147 | | |
| | 7,050,000 | | | C,S | | Bank of America Corp.,
8.000%, due 12/01/49 | | | 5,078,256 | | |
| | 800,000 | | | C | | Bank of America Corp.,
8.125%, due 12/29/49 | | | 599,400 | | |
| | 5,500,000 | | | S | | Bank of America NA,
2.099%, due 06/12/09 | | | 5,482,620 | | |
| | 4,100,000 | | | @@,S | | Barclays Bank PLC, 5.450%,
due 09/12/12 | | | 4,155,551 | | |
| | 700,000 | | | @@,#,S | | Barclays Bank PLC, 6.050%,
due 12/04/17 | | | 618,559 | | |
| | 2,200,000 | | | @@,#,C,S | | BNP Paribas, 5.186%,
due 06/29/15 | | | 1,249,538 | | |
| | 700,000 | | | S | | Citigroup, Inc., 5.300%,
due 10/17/12 | | | 675,176 | | |
| | 1,900,000 | | | S | | Citigroup, Inc., 5.500%,
due 08/27/12 | | | 1,845,860 | | |
| | 2,300,000 | | | S | | Citigroup, Inc., 5.500%,
due 04/11/13 | | | 2,241,566 | | |
| | 100,000 | | | S | | Citigroup, Inc., 5.625%,
due 08/27/12 | | | 93,818 | | |
| | 500,000 | | | | | Citigroup, Inc., 5.850%,
due 07/02/13 | | | 482,997 | | |
| | 1,900,000 | | | S | | Citigroup, Inc., 6.000%,
due 08/15/17 | | | 1,894,424 | | |
| | 300,000 | | | | | Citigroup, Inc., 6.125%,
due 05/15/18 | | | 303,873 | | |
| | 5,200,000 | | | C,S | | Citigroup, Inc., 8.400%,
due 04/29/49 | | | 3,440,008 | | |
| | 1,100,000 | | | @@,#,C | | Commonwealth Bank of
Australia, 6.024%,
due 03/29/49 | | | 635,600 | | |
Principal
Amount | | | | | | Value | |
| $ | 600,000 | | | @@,# | | Credit Agricole SA, 2.181%,
due 05/28/09 | | $ | 598,384 | | |
| | 700,000 | | | @@,# | | Credit Agricole SA, 2.231%,
due 05/28/10 | | | 691,968 | | |
| | 1,600,000 | | | @@,C,S | | Deutsche Bank AG/London,
6.000%, due 09/01/17 | | | 1,700,558 | | |
| | 4,000,000 | | | S | | Goldman Sachs Group, Inc.,
4.164%, due 07/23/09 | | | 3,895,660 | | |
| | 200,000 | | | | | Goldman Sachs Group, Inc.,
5.950%, due 01/18/18 | | | 189,958 | | |
| | 800,000 | | | | | Goldman Sachs Group, Inc.,
6.150%, due 04/01/18 | | | 770,098 | | |
| | 2,000,000 | | | S | | Goldman Sachs Group, Inc.,
6.250%, due 09/01/17 | | | 1,942,456 | | |
| | 3,200,000 | | | C,S | | Goldman Sachs Group, Inc.,
6.750%, due 10/01/37 | | | 2,605,187 | | |
| | 1,000,000 | | | | | JPMorgan Chase & Co.,
6.000%, due 01/15/18 | | | 1,057,367 | | |
| | 900,000 | | | | | JPMorgan Chase Bank NA,
2.326%, due 06/13/16 | | | 686,247 | | |
| | 1,200,000 | | | S | | KeyBank NA, 4.467%,
due 06/02/10 | | | 1,157,825 | | |
| | 3,230,000 | | | | | Manuf & Traders Trust Co.,
8.000%, due 10/01/10 | | | 3,165,368 | | |
| | 1,800,000 | | | S | | Morgan Stanley, 2.556%,
due 05/07/09 | | | 1,770,791 | | |
| | 100,000 | | | C | | Morgan Stanley, 5.300%,
due 03/01/13 | | | 90,771 | | |
| | 800,000 | | | | | Morgan Stanley, 5.950%,
due 12/28/17 | | | 665,078 | | |
| | 1,600,000 | | | C,S | | Morgan Stanley, 6.250%,
due 08/28/17 | | | 1,365,187 | | |
| | 6,400,000 | | | @@,#,S | | National Australia Bank Ltd.,
2.838%, due 02/08/10 | | | 6,406,355 | | |
| DKK | 2,900,980 | | | @@ | | Nykredit Realkredit A/S,
5.000%, due 10/01/38 | | | 514,680 | | |
| DKK | 3,098,093 | | | @@ | | Nykredit Realkredit A/S,
5.000%, due 10/01/38 | | | 540,394 | | |
| DKK | 8,657,599 | | | @@ | | Realkredit Danmark A/S,
5.000%, due 01/01/38 | | | 1,508,509 | | |
| DKK | 2,893,334 | | | @@ | | Realkredit Danmark A/S,
5.000%, due 10/01/38 | | | 513,053 | | |
| $ | 600,000 | | | @@,#,C | | Royal Bank of Scotland
Group PLC, 6.990%,
due 10/05/17 | | | 280,876 | | |
| | 1,500,000 | | | @@,#,S | | Santander U.S. Debt SA
Unipersonal, 2.766%,
due 02/06/09 | | | 1,498,438 | | |
| | 2,700,000 | | | @@,S | | UBS AG, 3.779%,
due 05/05/10 | | | 2,696,126 | | |
| | 500,000 | | | @@ | | UBS AG, 5.750%,
due 04/25/18 | | | 454,589 | | |
| | 1,800,000 | | | S | | Wachovia Corp., 5.750%,
due 02/01/18 | | | 1,806,741 | | |
| | 22,900,000 | | | | | Wachovia Corp., 7.980%,
due 02/08/49 | | | 19,572,241 | | |
| | 2,800,000 | | | S | | Wells Fargo & Co., 5.625%,
due 12/11/17 | | | 2,926,300 | | |
| | | | 95,731,172 | | |
| | | | | Biotechnology: 0.5% | |
| | 2,400,000 | | | C,S | | Amgen, Inc., 6.150%,
due 06/01/18 | | | 2,550,302 | | |
| | | | 2,550,302 | | |
See Accompanying Notes to Financial Statements
190
PORTFOLIO OF INVESTMENTS
ING PIMCO TOTAL RETURN PORTFOLIO AS OF DECEMBER 31, 2008 (CONTINUED)
Principal
Amount | | | | | | Value | |
| | | | | Building Materials: 0.1% | |
| $ | 800,000 | | | @@,#,C | | C8 Capital SPV Ltd.,
6.640%, due 12/31/49 | | $ | 406,384 | | |
| | | | 406,384 | | |
| | | | | Chemicals: 0.1% | |
| | 400,000 | | | C | | Rohm & Haas Co., 6.000%,
due 09/15/17 | | | 364,633 | | |
| | | | 364,633 | | |
| | | | | Computers: 1.5% | |
| | 1,300,000 | | | C | | Dell, Inc., 4.700%,
due 04/15/13 | | | 1,224,141 | | |
| | 5,700,000 | | | C,S | | International Business
Machines Corp., 5.700%,
due 09/14/17 | | | 6,104,444 | | |
| | | | 7,328,585 | | |
| | | | | Diversified Financial Services: 7.5% | |
| | 700,000 | | | | | Allstate Life Global
Funding Trusts, 5.375%,
due 04/30/13 | | | 689,733 | | |
| | 700,000 | | | | | American Express Co.,
7.000%, due 03/19/18 | | | 708,992 | | |
| | 600,000 | | | | | American Express Credit
Corp., 5.875%,
due 05/02/13 | | | 576,523 | | |
| | 1,300,000 | | | S | | American General Finance
Corp., 6.900%,
due 12/15/17 | | | 563,306 | | |
| | 900,000 | | | | | Bear Stearns Cos., Inc.,
2.263%, due 08/21/09 | | | 885,206 | | |
| | 3,900,000 | | | S | | Bear Stearns Cos., Inc.,
4.905%, due 07/16/09 | | | 3,850,150 | | |
| | 1,900,000 | | | | | Bear Stearns Cos., Inc.,
6.400%, due 10/02/17 | | | 1,977,739 | | |
| | 2,100,000 | | | S | | Bear Stearns Cos., Inc.,
6.950%, due 08/10/12 | | | 2,182,727 | | |
| | 3,000,000 | | | S | | Caterpillar Financial
Services Corp., 4.850%,
due 12/07/12 | | | 2,848,857 | | |
| | 1,300,000 | | | | | CIT Group, Inc., 3.615%,
due 01/30/09 | | | 1,293,652 | | |
| | 400,000 | | | | | CitiFinancial, 6.625%,
due 06/01/15 | | | 371,400 | | |
| | 1,200,000 | | | C,S | | Citigroup Capital XXI,
8.300%, due 12/21/57 | | | 927,572 | | |
| | 500,000 | | | S | | Citigroup Funding, Inc.,
1.466%, due 06/26/09 | | | 489,756 | | |
| | 500,000 | | | | | Ford Motor Credit Co., LLC,
5.700%, due 01/15/10 | | | 425,012 | | |
| | 800,000 | | | | | Ford Motor Credit Co., LLC,
5.800%, due 01/12/09 | | | 782,491 | | |
| | 200,000 | | | | | Ford Motor Credit Co., LLC,
7.250%, due 10/25/11 | | | 146,186 | | |
| | 100,000 | | | | | Ford Motor Credit Co., LLC,
7.375%, due 02/01/11 | | | 76,079 | | |
| | 300,000 | | | | | Ford Motor Credit Co., LLC,
7.875%, due 06/15/10 | | | 240,128 | | |
| | 300,000 | | | | | Ford Motor Credit Co., LLC,
8.625%, due 11/01/10 | | | 227,195 | | |
| | 1,200,000 | | | S | | General Electric Capital
Corp., 2.129%,
due 03/12/10 | | | 1,139,106 | | |
Principal
Amount | | | | | | Value | |
| $ | 1,500,000 | | | S | | General Electric Capital
Corp., 2.219%,
due 08/15/11 | | $ | 1,316,178 | | |
| | 4,800,000 | | | | | General Electric Capital
Corp., 5.500%,
due 09/15/67 | | | 3,773,611 | | |
| | 900,000 | | | | | General Electric Capital
Corp., 5.875%,
due 01/14/38 | | | 883,999 | | |
| | 1,600,000 | | | S | | HSBC Finance Corp.,
4.479%, due 10/21/09 | | | 1,501,498 | | |
| | 2,000,000 | | | ±,S | | Lehman Brothers Holdings,
Inc., 2.951%,
due 05/25/10 | | | 190,000 | | |
| | 2,700,000 | | | ±,S | | Lehman Brothers Holdings,
Inc., 6.200%,
due 09/26/14 | | | 270,000 | | |
| | 300,000 | | | ±,S | | Lehman Brothers Holdings,
Inc., 6.875%,
due 05/02/18 | | | 30,000 | | |
| | 2,364,000 | | | ± | | Lehman Brothers Holdings,
Inc., 0.000%,
due 06/12/13 | | | 287,965 | | |
| | 3,700,000 | | | S | | Merrill Lynch & Co., Inc.,
2.438%, due 05/08/09 | | | 3,635,679 | | |
| | 1,800,000 | | | S | | Merrill Lynch & Co., Inc.,
3.735%, due 07/25/11 | | | 1,595,014 | | |
| | 300,000 | | | | | Merrill Lynch & Co., Inc.,
6.050%, due 08/15/12 | | | 296,210 | | |
| | 1,900,000 | | | S | | Merrill Lynch & Co., Inc.,
6.875%, due 04/25/18 | | | 1,990,868 | | |
| | 700,000 | | | @@,#,C | | Santander Perpetual SA
Unipersonal, 6.671%,
due 10/24/17 | | | 445,872 | | |
| | 300,000 | | | @@,# | | TransCapitalInvest Ltd for
OJSC AK Transneft,
8.700%, due 08/07/18 | | | 193,449 | | |
| | 1,100,000 | | | C | | UBS Preferred Funding
Trust V, 6.243%,
due 05/15/49 | | | 601,487 | | |
| | 500,000 | | | #,C | | ZFS Finance USA Trust IV,
5.875%, due 05/09/32 | | | 174,951 | | |
| | | | 37,588,591 | | |
| | | | | Electric: 0.4% | |
| | 300,000 | | | C,S | | Columbus Southern Power
Co., 6.600%, due 03/01/33 | | | 280,724 | | |
| | 2,100,000 | | | @@,#,C,S | | Enel Finance International
SA, 6.250%, due 09/15/17 | | | 1,776,184 | | |
| | | | 2,056,908 | | |
| | | | | Healthcare-Services: 0.4% | |
| | 1,984,848 | | | | | HCA, Inc., 6.010%,
due 11/14/13 | | | 1,569,271 | | |
| | 600,000 | | | C | | UnitedHealth Group, Inc.,
4.875%, due 02/15/13 | | | 560,684 | | |
| | | | 2,129,955 | | |
| | | | | Insurance: 1.6% | |
| | 3,000,000 | | | S | | American International
Group, Inc., 5.850%,
due 01/16/18 | | | 2,014,008 | | |
See Accompanying Notes to Financial Statements
191
PORTFOLIO OF INVESTMENTS
ING PIMCO TOTAL RETURN PORTFOLIO AS OF DECEMBER 31, 2008 (CONTINUED)
Principal
Amount | | | | | | Value | |
| | | | | Insurance (continued) | |
| $ | 1,300,000 | | | #,S | | Metropolitan Life Global
Funding I, 2.189%,
due 05/17/10 | | $ | 1,166,534 | | |
| | 500,000 | | | @@,# | | Monumental Global
Funding Ltd., 5.500%,
due 04/22/13 | | | 472,145 | | |
| | 600,000 | | | | | Principal Life Income
Funding Trusts, 5.300%,
due 04/24/13 | | | 562,565 | | |
| | 900,000 | | | | | Principal Life Income
Funding Trusts, 5.550%,
due 04/27/15 | | | 865,136 | | |
| | 3,400,000 | | | S | | Protective Life Secured
Trusts, 0.566%,
due 11/09/10 | | | 2,877,624 | | |
| | | | 7,958,012 | | |
| | | | | Lodging: 0.2% | |
| | 800,000 | | | C | | Mandalay Resort Group,
6.500%, due 07/31/09 | | | 780,000 | | |
| | | | 780,000 | | |
| | | | | Media: 0.1% | |
| | 1,766 | | | | | Cable Vision, 4.570%,
due 03/30/13 | | | 1,515 | | |
| | 686,784 | | | | | CSC Holdings, Inc., 2.950%,
due 02/24/13 | | | 589,204 | | |
| | | | 590,719 | | |
| | | | | Mining: 0.0% | |
| | 200,000 | | | @@,C | | Vale Overseas Ltd., 6.250%,
due 01/23/17 | | | 189,060 | | |
| | | | 189,060 | | |
| | | | | Office/Business Equipment: 0.1% | |
| | 700,000 | | | C | | Xerox Corp., 9.750%,
due 01/15/09 | | | 698,446 | | |
| | | | 698,446 | | |
| | | | | Pharmaceuticals: 0.1% | |
| | 300,000 | | | @@,C | | AstraZeneca PLC, 5.900%,
due 09/15/17 | | | 319,364 | | |
| | 200,000 | | | @@,C | | AstraZeneca PLC, 6.450%,
due 09/15/37 | | | 228,130 | | |
| | | | 547,494 | | |
| | | | | Pipelines: 0.5% | |
| | 2,600,000 | | | C,S | | Kinder Morgan Energy
Partners LP, 5.950%,
due 02/15/18 | | | 2,222,730 | | |
| | 300,000 | | | # | | Williams Cos., Inc., 6.375%,
due 10/01/10 | | | 279,780 | | |
| | | | 2,502,510 | | |
| | | | | Retail: 0.5% | |
| | 2,700,000 | | | C,S | | CVS Caremark Corp.,
5.750%, due 08/15/11 | | | 2,710,957 | | |
| | | | 2,710,957 | | |
| | | | | Student Loan ABS: 0.5% | |
| | 2,900,000 | | | C | | Access Group, Inc., 4.835%,
due 10/27/25 | | | 2,666,759 | | |
| | | | 2,666,759 | | |
Principal
Amount | | | | | | Value | |
| | | | | Telecommunications: 1.8% | |
| $ | 24,000 | | | C | | AT&T Corp., 7.300%,
due 11/15/11 | | $ | 24,951 | | |
| | 400,000 | | | C,S | | AT&T, Inc., 4.125%,
due 09/15/09 | | | 401,707 | | |
| | 600,000 | | | C | | AT&T, Inc., 4.950%,
due 01/15/13 | | | 603,861 | | |
| | 600,000 | | | C | | AT&T, Inc., 5.500%,
due 02/01/18 | | | 607,450 | | |
| | 4,500,000 | | | C,S | | AT&T, Inc., 6.300%,
due 01/15/38 | | | 4,773,281 | | |
| | 2,500,000 | | | C,S | | BellSouth Corp., 5.200%,
due 09/15/14 | | | 2,436,790 | | |
| | 30,000 | | | C,S | | New Cingular Wireless
Services, Inc., 7.875%,
due 03/01/11 | | | 31,073 | | |
| | 200,000 | | | C | | Qwest Corp., 8.875%,
due 03/15/12 | | | 186,000 | | |
| | | | 9,065,113 | | |
| | | | | Transportation: 0.3% | |
| | 1,600,000 | | | C,S | | Union Pacific Corp.,
5.700%, due 08/15/18 | | | 1,543,174 | | |
| | | | 1,543,174 | | |
Total Corporate
Bonds/Notes
(Cost $202,655,525) | | | 180,493,844 | | |
| U.S. GOVERNMENT AGENCY OBLIGATIONS: 115.4% | | | |
| | | | | | | Federal Home Loan Mortgage
Corporation##: 29.1% | | | | | |
| | 188,146 | | | C,S | | 0.791%, due 01/25/45 | | | 95,080 | | |
| | 872,839 | | | C | | 1.345%, due 07/15/19 | | | 851,711 | | |
| | 9,354,410 | | | C,S | | 1.345%,
due 08/15/19-10/15/20 | | | 9,105,881 | | |
| | 3,683,807 | | | C,S | | 1.425%, due 02/15/19 | | | 3,541,598 | | |
| | 592,265 | | | C | | 1.875%, due 03/25/24 | | | 584,955 | | |
| | 24,335 | | | C | | 3.500%, due 07/15/32 | | | 23,985 | | |
| | 517,483 | | | C,S | | 3.500%, due 11/15/22 | | | 517,265 | | |
| | 336,404 | | | C | | 3.678%, due 10/25/44 | | | 322,659 | | |
| | 1,695,502 | | | C,S | | 3.878%, due 07/25/44 | | | 1,531,389 | | |
| | 404,495 | | | C | | 4.000%, due 06/15/22 | | | 404,379 | | |
| | 396,710 | | | C | | 4.500%, due 11/15/13 | | | 396,749 | | |
| | 1,326,514 | | | C,S | | 4.500%, due 06/15/17 | | | 1,346,390 | | |
| | 1,529,812 | | | | | 5.000%,
due 12/14/18-01/01/37 | | | 1,573,265 | | |
| | 20,827 | | | C | | 5.000%, due 09/15/16 | | | 20,942 | | |
| | 6,507,302 | | | C,S | | 5.000%,
due 12/15/23-04/15/26 | | | 6,575,960 | | |
| | 49,000,000 | | | W | | 5.000%, due 01/15/35 | | | 50,079,519 | | |
| | 1,230,000 | | | S | | 5.302%, due 09/01/35 | | | 1,246,722 | | |
| | 16,173 | | | | | 5.353%, due 04/01/32 | | | 16,192 | | |
| | 7,330,399 | | | | | 5.500%,
due 03/01/23-06/01/38 | | | 7,516,461 | | |
| | 130,139 | | | C | | 5.500%, due 03/15/17 | | | 133,375 | | |
| | 33,348,881 | | | S | | 5.500%,
due 02/01/38-08/01/38 | | | 34,173,781 | | |
| | 8,500,000 | | | W | | 5.500%, due 01/11/37 | | | 8,705,195 | | |
| | 3,460,165 | | | | | 5.500%,
due 05/01/38-09/01/38 | | | 3,545,735 | | |
See Accompanying Notes to Financial Statements
192
PORTFOLIO OF INVESTMENTS
ING PIMCO TOTAL RETURN PORTFOLIO AS OF DECEMBER 31, 2008 (CONTINUED)
Principal
Amount | | | | | | Value | |
| | | | | | | Federal Home Loan Mortgage
Corporation## (continued) | | | | | |
| $ | 12,812,818 | | | | | 6.000%,
due 10/01/17-06/01/38 | | $ | 13,215,260 | | |
| | 631,028 | | | S | | 6.000%, due 03/01/23 | | | 653,464 | | |
| | | | 146,177,912 | | |
| | | | | | | Federal National Mortgage
Association##: 86.1% | | | | | |
| | 1,045,875 | | | S | | 0.531%, due 07/25/37 | | | 926,433 | | |
| | 125,304 | | | | | 0.591%, due 03/25/34 | | | 120,731 | | |
| | 135,708 | | | | | 1.969%, due 04/25/24 | | | 135,694 | | |
| | 6,550 | | | | | 3.625%, due 02/01/20 | | | 6,656 | | |
| | 317,017 | | | S | | 3.678%, due 10/01/44 | | | 312,371 | | |
| | 999,999 | | | | | 4.500%, due 06/01/23 | | | 1,023,883 | | |
| | 1,444,904 | | | S | | 4.521%, due 11/01/34 | | | 1,421,015 | | |
| | 1,024,404 | | | S | | 4.720%, due 09/01/35 | | | 1,037,120 | | |
| | 438,508 | | | | | 4.801%, due 08/01/35 | | | 438,713 | | |
| | 900,000 | | | S,L | | 4.875%, due 06/13/18 | | | 1,036,356 | | |
| | 8,451,851 | | | | | 5.000%,
due 05/01/18-07/01/37 | | | 8,654,194 | | |
| | 31,275,295 | | | S | | 5.000%,
due 11/01/18-03/01/36 | | | 32,060,856 | | |
| | 29,000,000 | | | W | | 5.000%,
due 01/15/20-01/12/36 | | | 29,617,031 | | |
| | 107,363 | | | | | 5.131%, due 12/01/36 | | | 107,363 | | |
| | 13,665 | | | | | 5.259%, due 09/01/31 | | | 13,716 | | |
| | 17,651,584 | | | | | 5.500%,
due 03/01/16-09/01/38 | | | 18,137,349 | | |
| | 8,220,932 | | | S | | 5.500%,
due 11/01/33-02/01/35 | | | 8,444,005 | | |
| | 145,700,000 | | | W | | 5.500%, due 01/12/36 | | | 149,365,229 | | |
| | 7,428,442 | | | | | 5.500%,
due 11/01/22-06/01/38 | | | 7,636,884 | | |
| | 911,967 | | | | | 5.507%, due 02/01/33 | | | 913,505 | | |
| | 125,456 | | | | | 5.582%, due 04/01/32 | | | 124,350 | | |
| | 147,726,679 | | | | | 6.000%,
due 04/01/17-11/01/38 | | | 152,096,528 | | |
| | 12,653,255 | | | S | | 6.000%,
due 06/01/22-11/01/36 | | | 13,046,404 | | |
| | 608,257 | | | | | 6.223%, due 02/01/35 | | | 614,798 | | |
| | 1,085,997 | | | | | 6.500%,
due 03/01/17-11/01/36 | | | 1,129,595 | | |
| | 1,500,000 | | | S | | 6.500%, due 06/17/38 | | | 1,589,441 | | |
| | 2,326,633 | | | S | | 7.500%, due 08/25/35 | | | 2,383,558 | | |
| | | | 432,393,778 | | |
| | | | | | | Government National Mortgage
Association: 0.2% | | | | | |
| | 35,352 | | | C,S | | 1.440%, due 03/16/32 | | | 34,485 | | |
| | 1,000,000 | | | W | | 6.000%, due 01/01/34 | | | 1,031,719 | | |
| | | | 1,066,204 | | |
Total U.S. Government
Agency Obligations
(Cost $568,985,821) | | | 579,637,894 | | |
| U.S. TREASURY OBLIGATIONS: 8.7% | | | |
| | | | | | | Treasury Inflation Indexed
Protected Securitiesip: 8.7% | | | | | |
| | 2,495,284 | | | | | 1.625%, due 01/15/15 | | | 2,314,768 | | |
| | 1,240,536 | | | | | 1.750%, due 01/15/28 | | | 1,146,527 | | |
Principal
Amount | | | | | | Value | |
| | | | | | | Treasury Inflation Indexed
Protected Securitiesip (continued) | | | | | |
| $ | 3,484,508 | | | | | 1.875%,
due 07/15/13-07/15/15 | | $ | 3,290,746 | | |
| | 2,349,237 | | | | | 2.000%,
due 07/15/14-01/15/16 | | | 2,236,763 | | |
| | 12,868,240 | | | L | | 2.375%, due 01/15/25 | | | 12,651,101 | | |
| | 1,394,120 | | | | | 2.500%, due 07/15/16 | | | 1,383,555 | | |
| | 2,821,365 | | | | | 2.625%, due 07/15/17 | | | 2,892,122 | | |
| | 9,154,352 | | | | | 3.000%, due 07/15/12 | | | 8,974,844 | | |
| | 8,959,320 | | | L | | 3.500%, due 01/15/11 | | | 8,796,234 | | |
| | | | 43,686,660 | | |
Total U.S. Treasury
Obligations
(Cost $41,821,645) | | | 43,686,660 | | |
| ASSET-BACKED SECURITIES: 2.0% | | | |
| | | | | | | Automobile Asset-Backed
Securities: 0.3% | | | | | |
| | 1,100,000 | | | C,S | | Daimler Chrysler Auto Trust,
1.351%, due 07/08/11 | | | 1,063,474 | | |
| | 500,000 | | | C,S | | Daimler Chrysler Auto Trust,
1.901%, due 09/10/12 | | | 444,779 | | |
| | | | 1,508,253 | | |
| | | | | | | Credit Card Asset-Backed
Securities: 0.8% | | | | | |
| | 700,000 | | | C | | BA Credit Card Trust,
1.775%, due 04/15/13 | | | 636,562 | | |
| | 3,700,000 | | | C,S | | BA Credit Card Trust,
2.395%, due 12/16/13 | | | 3,294,025 | | |
| | | | 3,930,587 | | |
| | | | | | | Home Equity Asset-Backed
Securities: 0.1% | | | | | |
| | 667,593 | | | C,S | | Household Home Equity
Loan Trust, 0.798%,
due 01/20/34 | | | 459,657 | | |
| | | | 459,657 | | |
| | | | | | | Other Asset-Backed
Securities: 0.8% | | | | | |
| | 46,510 | | | C,S | | Countrywide Asset-Backed
Certificates, 0.501%,
due 01/25/46 | | | 46,035 | | |
| | 945,359 | | | C,S | | Countrywide Asset-Backed
Certificates, 0.551%,
due 10/25/47 | | | 829,039 | | |
| | 2,431,452 | | | C,S | | Countrywide Asset-Backed
Certificates, 0.651%,
due 09/25/36 | | | 1,933,398 | | |
| | 210,653 | | | C | | JPMorgan Mortgage
Acquisition Corp.,
0.521%, due 08/25/36 | | | 195,927 | | |
| | 544,393 | | | C | | JPMorgan Mortgage
Acquisition Corp.,
0.531%, due 03/25/47 | | | 428,690 | | |
| | 58,753 | | | C | | Long Beach Mortgage
Loan Trust, 0.751%,
due 10/25/34 | | | 19,981 | | |
See Accompanying Notes to Financial Statements
193
PORTFOLIO OF INVESTMENTS
ING PIMCO TOTAL RETURN PORTFOLIO AS OF DECEMBER 31, 2008 (CONTINUED)
Principal
Amount | | | | | | Value | |
| | | | | | | Other Asset-Backed
Securities (continued) | | | | | |
| $ | 323,653 | | | C | | Morgan Stanley Capital, Inc.,
0.521%, due 11/25/36 | | $ | 304,393 | | |
| | 647,157 | | | C | | WAMU Asset-Backed
Certificates, 0.521%,
due 01/25/37 | | | 582,976 | | |
| | | | 4,340,439 | | |
Total Asset-Backed Securities
(Cost $11,861,716) | | | 10,238,936 | | |
| COLLATERALIZED MORTGAGE OBLIGATIONS: 9.2% | | | |
| | 383,349 | | | C | | Adjustable Rate Mortgage
Trust, 4.581%,
due 05/25/35 | | | 310,766 | | |
| | 561,223 | | | C | | American Home Mortgage
Investment Trust, 4.390%,
due 02/25/45 | | | 283,102 | | |
| | 800,000 | | | C | | Banc of America
Commercial Mortgage,
Inc., 5.739%, due 05/10/45 | | | 655,855 | | |
| | 803,503 | | | C | | Banc of America Funding
Corp., 4.155%,
due 05/25/35 | | | 574,653 | | |
| | 554,877 | | | C | | Banc of America Funding
Corp., 6.124%,
due 01/20/47 | | | 298,936 | | |
| | 178,728 | | | C,S | | Banc of America Mortgage
Securities, Inc., 0.921%,
due 01/25/34 | | | 168,845 | | |
| | 616,486 | | | C | | Banc of America Mortgage
Securities, Inc., 3.994%,
due 07/25/33 | | | 562,899 | | |
| | 336,580 | | | C | | Banc of America Mortgage
Securities, Inc., 5.000%,
due 05/25/34 | | | 284,590 | | |
| | 4,416,892 | | | C,S | | Bear Stearns Adjustable
Rate Mortgage Trust A1,
4.125%, due 03/25/35 | | | 3,742,441 | | |
| | 3,671,063 | | | C,S | | Bear Stearns Adjustable
Rate Mortgage Trust A2,
4.125%, due 03/25/35 | | | 2,864,837 | | |
| | 553,807 | | | C | | Bear Stearns Adjustable
Rate Mortgage Trust,
4.750%, due 10/25/35 | | | 519,038 | | |
| | 947,777 | | | C,S | | Bear Stearns Adjustable
Rate Mortgage Trust,
5.111%, due 11/25/34 | | | 880,173 | | |
| | 418,123 | | | C,S | | Bear Stearns Alternative-A
Trust, 5.364%,
due 05/25/35 | | | 283,113 | | |
| | 248,568 | | | C,S | | Bear Stearns Alternative-A
Trust, 5.495%,
due 09/25/35 | | | 115,980 | | |
| | 716,451 | | | C,S | | Bear Stearns Alternative-A
Trust, 5.747%,
due 11/25/36 | | | 334,592 | | |
| | 100,000 | | | C | | Bear Stearns Commercial
Mortgage Securities,
5.331%, due 02/11/44 | | | 77,375 | | |
| | 300,000 | | | C | | Bear Stearns Commercial
Mortgage Securities,
5.471%, due 01/12/45 | | | 232,237 | | |
Principal
Amount | | | | | | Value | |
| $ | 650,701 | | | | | Bear Stearns Structured
Products, Inc., 5.661%,
due 01/26/36 | | $ | 409,001 | | |
| | 422,720 | | | | | Bear Stearns Structured
Products, Inc., 5.761%,
due 12/26/46 | | | 294,544 | | |
| | 793,064 | | | C | | Citigroup Mortgage Loan
Trust, Inc., 4.685%,
due 08/25/35 | | | 661,144 | | |
| | 900,000 | | | C | | Commercial Mortgage
Pass-through Certificates,
5.306%, due 12/10/46 | | | 659,635 | | |
| | 89,978 | | | C | | Countrywide Alternative
Loan Trust, 0.718%,
due 11/20/35 | | | 86,013 | | |
| | 205,487 | | | C,S | | Countrywide Home Loan
Mortgage Pass-through
Trust, 0.791%,
due 03/25/35 | | | 93,309 | | |
| | 1,158,646 | | | #,C,S | | Countrywide Home Loan
Mortgage Pass-through
Trust, 0.811%,
due 06/25/35 | | | 787,687 | | |
| | 1,116,729 | | | C,S | | Countrywide Home Loan
Mortgage Pass-through
Trust, 4.730%,
due 02/20/35 | | | 696,439 | | |
| | 611,723 | | | C | | Countrywide Home Loan
Mortgage Pass-through
Trust, 4.789%,
due 11/25/34 | | | 382,221 | | |
| | 2,392,546 | | | #,C,I | | Credit Suisse Mortgage
Capital Certificates,
1.425%, due 10/15/21 | | | 1,565,432 | | |
| | 100,000 | | | C | | Credit Suisse Mortgage
Capital Certificates,
5.658%, due 03/15/39 | | | 81,717 | | |
| | 2,300,000 | | | C | | Credit Suisse Mortgage
Capital Certificates,
5.695%, due 09/15/40 | | | 1,528,733 | | |
| | 203,265 | | | C | | Downey Savings & Loan
Association Mortgage
Loan Trust, 4.574%,
due 07/19/44 | | | 134,683 | | |
| | 395,414 | | | C | | First Horizon Mortgage
Pass-through Trust,
5.354%, due 08/25/35 | | | 280,817 | | |
| | 300,396 | | | C | | GMAC Mortgage Corp.
Loan Trust, 5.500%,
due 09/25/34 | | | 267,812 | | |
| | 372,682 | | | C | | Greenpoint Mortgage
Pass-through Certificates,
5.497%, due 10/25/33 | | | 288,439 | | |
| | 600,000 | | | C | | Greenwich Capital
Commercial Funding
Corp., 5.444%,
due 03/10/39 | | | 458,505 | | |
| | 725,709 | | | # | | GS Mortgage Securities
Corp. II, 0.520%,
due 03/06/20 | | | 535,474 | | |
| | 900,000 | | | C,L | | GS Mortgage Securities
Corp. II, 5.799%,
due 08/10/45 | | | 655,964 | | |
See Accompanying Notes to Financial Statements
194
PORTFOLIO OF INVESTMENTS
ING PIMCO TOTAL RETURN PORTFOLIO AS OF DECEMBER 31, 2008 (CONTINUED)
Principal
Amount | | | | | | Value | |
| COLLATERALIZED MORTGAGE OBLIGATIONS (continued) | | | |
| $ | 89,325 | | | C | | GSR Mortgage Loan Trust,
4.524%, due 06/25/34 | | $ | 66,549 | | |
| | 836,719 | | | C | | GSR Mortgage Loan Trust,
4.540%, due 09/25/35 | | | 618,242 | | |
| | 5,426 | | | C | | GSR Mortgage Loan Trust,
6.000%, due 03/25/32 | | | 4,872 | | |
| | 246,136 | | | C | | Harborview Mortgage
Loan Trust, 0.801%,
due 05/19/35 | | | 115,162 | | |
| | 537,126 | | | C | | Harborview Mortgage
Loan Trust, 5.142%,
due 07/19/35 | | | 293,009 | | |
| | 280,455 | | | C | | Indymac Index Mortgage
Loan Trust, 5.055%,
due 12/25/34 | | | 192,895 | | |
| | 800,000 | | | C | | JPMorgan Chase
Commercial Mortgage
Securities Corp., 5.336%,
due 05/15/47 | | | 602,568 | | |
| | 2,600,000 | | | C,S | | JPMorgan Chase
Commercial Mortgage
Securities Corp., 5.420%,
due 01/15/49 | | | 1,846,177 | | |
| | 4,300,000 | | | C,S | | JPMorgan Chase
Commercial Mortgage
Securities Corp., 5.440%,
due 06/12/47 | | | 3,116,103 | | |
| | 300,000 | | | C | | JPMorgan Chase
Commercial Mortgage
Securities Corp., 5.882%,
due 02/15/51 | | | 214,299 | | |
| | 1,546,152 | | | C,S | | JPMorgan Mortgage Trust,
4.767%, due 07/25/35 | | | 1,096,084 | | |
| | 487,904 | | | C | | JPMorgan Mortgage Trust,
5.024%, due 02/25/35 | | | 366,894 | | |
| | 2,100,000 | | | C | | LB-UBS Commercial
Mortgage Trust, 5.858%,
due 07/15/40 | | | 1,500,861 | | |
| | 115,261 | | | C | | Lehman XS Trust, 0.551%,
due 07/25/46 | | | 113,454 | | |
| | 227,664 | | | C | | MASTR Adjustable Rate
Mortgages Trust, 3.788%,
due 11/21/34 | | | 221,016 | | |
| | 275,807 | | | C | | Merrill Lynch Mortgage
Investors Trust, 0.681%,
due 02/25/36 | | | 147,412 | | |
| | 427,272 | | | C | | Merrill Lynch Mortgage
Investors Trust, 5.297%,
due 05/25/33 | | | 314,313 | | |
| | 300,000 | | | C | | Merrill Lynch/Countrywide
Commercial Mortgage
Trust, 5.485%,
due 03/12/51 | | | 207,485 | | |
| | 221,705 | | | C | | MLCC Mortgage Investors,
Inc., 0.721%,
due 11/25/35 | | | 125,429 | | |
| | 132,227 | | | C | | MLCC Mortgage Investors,
Inc., 2.395%,
due 10/25/35 | | | 84,224 | | |
| | 100,000 | | | C | | Morgan Stanley Capital I,
5.809%, due 12/12/49 | | | 75,192 | | |
| | 4,700,000 | | | C | | Morgan Stanley Capital I,
5.881%, due 06/11/49 | | | 3,497,081 | | |
Principal
Amount | | | | | | Value | |
| $ | 622,546 | | | C,S | | RAAC Series, 5.000%,
due 09/25/34 | | $ | 571,889 | | |
| | 145,899 | | | C,S | | Residential Accredit Loans,
Inc., 0.871%, due 03/25/33 | | | 131,301 | | |
| | 151,784 | | | C | | Residential Asset
Securitization Trust,
0.871%, due 05/25/33 | | | 128,181 | | |
| | 28,493 | | | C,S | | Residential Funding
Mortgage Securities I,
6.500%, due 03/25/32 | | | 27,311 | | |
| | 202,432 | | | C,S | | Sequoia Mortgage Trust,
0.858%, due 07/20/33 | | | 144,761 | | |
| | 589,712 | | | C | | Sequoia Mortgage Trust,
4.474%, due 04/20/35 | | | 442,836 | | |
| | 558,215 | | | C | | SLM Student Loan Trust,
3.525%, due 10/27/14 | | | 540,468 | | |
| | 279,416 | | | C | | SLM Student Loan Trust,
3.835%, due 01/25/15 | | | 270,597 | | |
| | 266,045 | | | C | | Structured Adjustable Rate
Mortgage Loan Trust,
5.528%, due 08/25/35 | | | 137,539 | | |
| | 581,496 | | | C | | Structured Asset Mortgage
Investments, Inc., 0.831%,
due 07/19/35 | | | 389,071 | | |
| | 353,450 | | | #,C | | Structured Asset Securities
Corp., 5.048%,
due 10/25/35 | | | 255,972 | | |
| | 1,211,025 | | | C,S | | Thornburg Mortgage
Securities Trust, 0.591%,
due 09/25/46 | | | 1,005,340 | | |
| | 824,179 | | | # | | Wachovia Bank Commercial
Mortgage Trust, 1.275%,
due 06/15/20 | | | 584,997 | | |
| | 400,000 | | | C | | Wachovia Bank Commercial
Mortgage Trust, 5.509%,
due 04/15/47 | | | 289,131 | | |
| | 195,647 | | | C | | Washington Mutual
Mortgage Pass-through
Certificates, 0.781%,
due 01/25/45 | | | 100,883 | | |
| | 461,521 | | | C,S | | Washington Mutual
Mortgage Pass-through
Certificates, 1.011%,
due 12/25/27 | | | 382,951 | | |
| | 27,443 | | | C | | Washington Mutual
Mortgage Pass-through
Certificates, 3.656%,
due 08/25/42 | | | 19,380 | | |
| | 59,476 | | | C,S | | Washington Mutual
Mortgage Pass-through
Certificates, 4.375%,
due 02/27/34 | | | 48,272 | | |
| | 1,050,528 | | | C | | Washington Mutual
Mortgage Pass-through
Certificates, 4.625%,
due 07/25/46 | | | 879,345 | | |
| | 1,161,576 | | | C | | Washington Mutual
Mortgage Pass-through
Certificates, 4.625%,
due 08/25/46 | | | 611,162 | | |
| | 1,139,213 | | | C,S | | Wells Fargo Mortgage-
Backed Securities Trust,
4.161%, due 12/25/34 | | | 815,202 | | |
See Accompanying Notes to Financial Statements
195
PORTFOLIO OF INVESTMENTS
ING PIMCO TOTAL RETURN PORTFOLIO AS OF DECEMBER 31, 2008 (CONTINUED)
Principal
Amount | | | | | | Value | |
| COLLATERALIZED MORTGAGE OBLIGATIONS (continued) | | | |
| $ | 515,388 | | | C,S | | Wells Fargo Mortgage-
Backed Securities Trust,
4.777%, due 05/25/35 | | $ | 391,353 | | |
| | 828,926 | | | C | | Wells Fargo Mortgage-
Backed Securities Trust,
4.963%, due 01/25/35 | | | 644,242 | | |
| | 476,420 | | | C | | Wells Fargo Mortgage-
Backed Securities Trust,
5.512%, due 08/25/36 | | | 340,746 | | |
Total Collateralized
Mortgage Obligations
(Cost $59,965,398) | | | 46,029,252 | | |
| MUNICIPAL BONDS: 2.2% | | | |
| | | | | California: 0.6% | |
| | 2,300,000 | | | C | | Golden State Tobacco
Securitization Corp.,
6.750%, due 06/01/39 | | | 2,674,808 | | |
| | 450,000 | | | C | | Orange County Sanitation
District, 6.970%,
due 02/01/33 | | | 383,508 | | |
| | | | 3,058,316 | | |
| | | | | Florida: 0.3% | |
| | 1,500,000 | | | C | | Florida State Board of
Governors, 5.250%,
due 07/01/19 | | | 1,556,355 | | |
| | | | 1,556,355 | | |
| | | | | Illinois: 0.3% | |
| | 1,400,000 | | | C | | Chicago Transit Authority,
6.899%, due 12/01/40 | | | 1,436,764 | | |
| | 100,000 | | | C | | Chicago Transit Authority,
6.300%, due 12/01/21 | | | 100,565 | | |
| | | | 1,537,329 | | |
| | | | | Lousiana: 0.0% | |
| | 100,000 | | | C,S | | Tobacco Settlement
Financing Corp., 5.875%,
due 05/15/39 | | | 62,449 | | |
| | | | 62,449 | | |
| | | | | New Jersey: 0.3% | |
| | 1,500,000 | | | C | | New Jersey Economic
Development Authority,
5.000%, due 09/01/33 | | | 1,328,895 | | |
| | | | 1,328,895 | | |
| | | | | Ohio: 0.1% | |
| | 400,000 | | | C | | Buckeye Tobacco Settlement
Financing Authority,
5.875%, due 06/01/30 | | | 245,376 | | |
| | | | 245,376 | | |
| | | | | Rhode Island: 0.0% | |
| | 200,000 | | | C,S | | Tobacco Settlement
Financing Corp., 6.250%,
due 06/01/42 | | | 125,066 | | |
| | | | 125,066 | | |
Principal
Amount | | | | | | Value | |
| | | | | Texas: 0.1% | |
| $ | 700,000 | | | C | | State of Texas, 4.750%,
due 04/01/37 | | $ | 649,670 | | |
| | | | 649,670 | | |
| | | | | Washington: 0.3% | |
| | 2,080,000 | | | Z | | State of Washington,
4.460%, due 06/01/16 | | | 1,557,067 | | |
| | | | 1,557,067 | | |
| | | | | Wisconsin: 0.2% | |
| | 155,000 | | | C | | Badger TOB Asset
Securitization Corp.,
6.125%, due 06/01/27 | | | 136,417 | | |
| | 800,000 | | | C,S | | Badger TOB Asset
Securitization Corp.,
6.375%, due 06/01/32 | | | 631,088 | | |
| | | | 767,505 | | |
Total Municipal Bonds
(Cost $11,141,444) | | | 10,888,028 | | |
| OTHER BONDS: 0.6% | | | |
| | | | | Foreign Government Bonds: 0.6% | |
| | 600,000 | | | # | | Export-Import Bank of
China, 4.875%,
due 07/21/15 | | | 604,260 | | |
| | 600,000 | | | | | Federative Republic of
Brazil, 8.000%,
due 01/15/18 | | | 675,000 | | |
| BRL | 2,000,000 | | | | | Federative Republic of
Brazil, 10.250%,
due 01/10/28 | | | 776,158 | | |
| BRL | 900,000 | | | | | Federative Republic of
Brazil, 12.500%,
due 01/05/22 | | | 399,250 | | |
| $ | 250,000 | | | | | Panama Government
International Bond,
8.875%, due 09/30/27 | | | 273,750 | | |
| | 71,000 | | | | | Panama Government
International Bond,
9.375%, due 04/01/29 | | | 78,455 | | |
Total Other Bonds
(Cost $3,043,575) | | | 2,806,873 | | |
| Shares | | | | | | Value | |
| PREFERRED STOCK: 1.3% | | | |
| | | | | Banks: 1.3% | |
| | 5,000 | | | S | | Bank of America Corp. | | | 3,250,000 | | |
| | 17,000 | | | P | | Citigroup, Inc. | | | 475,830 | | |
| | 3,400 | | | | | Wachovia Corp. | | | 2,550,000 | | |
Total Preferred Stock
(Cost $7,012,020) | | | 6,275,830 | | |
See Accompanying Notes to Financial Statements
196
PORTFOLIO OF INVESTMENTS
ING PIMCO TOTAL RETURN PORTFOLIO AS OF DECEMBER 31, 2008 (CONTINUED)
# of Contracts/
Notional Amount | | | | | | Value
in $ | |
| POSITIONS IN PURCHASED OPTIONS: 0.9% | | | |
| | | | | | | Options on Exchange-Traded
Futures Contracts: 0.0% | | | | | |
| | 55 | | | | | Call Option CBOT
US Treasury 10-Year
Note Future 02/09
Strike @ $142.000 -
Exp 01/23/09 | | | 860 | | |
| | 27 | | | | | Put Option CBOT
US Treasury 2-Year
Note Future 03/09
Strike @ $85.000 -
Exp 02/20/09 | | | 422 | | |
| | 29 | | | | | Put Option CBOT
US Treasury 5-Year
Note Future 03/09
Strike @ $85.000 -
Exp 02/20/09 | | | 226 | | |
| | 245 | | | | | Put Option CBOT
US Treasury 10-Year
Note Future 03/09
Strike @ $87.000 -
Exp 02/20/09 | | | 3,829 | | |
| | 510 | | | | | Put Option CME
90-Day Eurodollar
Future 03/09
Strike @ $93.000 -
Exp 03/16/09 | | | 3,188 | | |
| | 760 | | | | | Put Option LIFFE
90-Day Sterling
Future 03/09
Strike @ 95.750 (GBP) -
Exp 03/18/09 | | | — | | |
| | 180 | | | | | Put Option LIFFE
90-Day Sterling
Future 12/09
Strike @ 90.500 (GBP) -
Exp 12/16/09 | | | — | | |
| | | | 8,525 | | |
| | | | | Currency Options: 0.1% | |
| | 3,000,000 | | | I | | Call Option OTC -
Credit Suisse, London
USD vs JPY
Strike @ 104 (JPY) -
Exp 03/17/10 | | | 22,398 | | |
| | 3,000,000 | | | I | | Put Option OTC -
Credit Suisse, London
USD vs JPY
Strike @ 104 (JPY) -
Exp 03/17/10 | | | 497,064 | | |
| | | | 519,462 | | |
| | | | | Fixed Income Options: 0.0% | |
| | 100,000,000 | | | I | | Put Option OTC -
Credit Suisse
International FNMA
5.500% 30-Year
January TBA
Strike @ $73.000 -
Exp 01/06/09 | | | — | | |
# of Contracts/
Notional Amount | | | | | | Value
in $ | |
| | 8,500,000 | | | | | Put Option OTC -
Merrill Lynch Government
Securities Inc.
FHLMC Gold 5.500%
30-Year January TBA
Strike @ $73.000 -
Exp 01/06/09 | | | — | | |
| | 31,300,000 | | | | | Put Option OTC -
Merrill Lynch Government
Securities Inc.
FNMA 5.000% 30-Year
January TBA
Strike @ $73.000 -
Exp 01/06/09 | | | — | | |
| | 81,100,000 | | | I | | Put Option OTC -
Merrill Lynch Government
Securities Inc.
FNMA 6.000% 30-Year
January TBA
Strike @ $81.250 -
Exp 01/06/09 | | | — | | |
| | 54,000,000 | | | I | | Put Option OTC -
Credit Suisse
International FNMA
6.000% 30-Year
February TBA
Strike @ $68.000 -
Exp 02/05/09 | | | — | | |
| | 49,000,000 | | | | | Put Option OTC -
Merrill Lynch Government
Securities Inc.
FHLMC Gold 5.000%
30-Year February TBA
Strike @ $62.250 -
Exp 02/05/09 | | | — | | |
| | | | — | | |
| | | | | Interest Rate Swaptions: 0.8% | |
| | 39,000,000 | | | | | Call Swaption OTC -
Barclays Bank PLC
3 Month USD-LIBOR -
Fund Pays Floating
Strike @ 3.500% -
Exp 02/02/09 | | | 1,489,715 | | |
| | 5,300,000 | | | | | Call Swaption OTC -
Barclays Bank PLC
3 Month USD-LIBOR -
Fund Pays Floating
Strike @ 3.450% -
Exp 08/03/09 | | | 175,817 | | |
| | 4,900,000 | | | I | | Call Swaption OTC -
Merrill Lynch Capital
Services, Inc.
3 Month USD-LIBOR -
Fund Pays Floating
Strike @ 3.450% -
Exp 08/03/09 | | | 162,548 | | |
| | 11,400,000 | | | | | Call Swaption OTC - The
Royal Bank of Scotland
PLC 3 Month USD-LIBOR -
Fund Pays Floating
Strike @ 3.150% -
Exp 02/02/09 | | | 357,112 | | |
See Accompanying Notes to Financial Statements
197
PORTFOLIO OF INVESTMENTS
ING PIMCO TOTAL RETURN PORTFOLIO AS OF DECEMBER 31, 2008 (CONTINUED)
# of Contracts/
Notional Amount | | | | | | Value
in $ | |
| | | | | Interest Rate Swaptions (continued) | |
| | 5,300,000 | | | | | Call Swaption OTC - The
Royal Bank of Scotland
PLC 3 Month USD-LIBOR -
Fund Pays Floating
Strike @ 3.600% -
Exp 07/02/09 | | | 194,642 | | |
| | 32,600,000 | | | | | Call Swaption OTC - The
Royal Bank of Scotland
PLC 3 Month USD-LIBOR -
Fund Pays Floating
Strike @ 3.450% -
Exp 08/03/09 | | | 1,081,441 | | |
| | 17,900,000 | | | I | | Call Swaption OTC - The
Royal Bank of Scotland
PLC 3 Month USD-LIBOR -
Fund Pays Floating
Strike @ 3.850% -
Exp 08/03/09 | | | 728,336 | | |
| | | | 4,189,611 | | |
Total Positions in
Purchased Options
(Cost $1,558,033) | | | 4,717,598 | | |
Total Long-Term Investments
(Cost $908,045,177) | | | 884,774,915 | | |
Principal
Amount | | | | | | Value | |
| SHORT-TERM INVESTMENTS: 7.0% | | | |
| | | | | | | U.S. Government Agency
Obligations: 0.5% | | | | | |
| $ | 1,400,000 | | | Z | | Fannie Mae, 0.060%,
due 02/13/09 | | $ | 1,399,897 | | |
| | 1,000,000 | | | Z | | Federal Home Loan Bank,
0.100%, due 01/28/09 | | | 999,922 | | |
Total U.S. Government
Agency Obligations
(Cost $2,399,819) | | | 2,399,819 | | |
| | | | | U.S. Treasury Bills: 2.5% | |
| | 2,690,000 | | | | | 0.010%, due 01/29/09 | | | 2,690,000 | | |
| | 9,820,000 | | | L | | 0.018%, due 01/02/09 | | | 9,819,998 | | |
Total U.S. Treasury Bills
(Cost $12,509,998) | | | 12,509,998 | | |
| | | | | Securities Lending Collateralcc: 4.0% | |
| | 20,332,470 | | | | | Bank of New York
Mellon Corp.
Institutional Cash Reserves | | | 20,288,173 | | |
Total Securities Lending
Collateral
(Cost $20,332,470) | | | 20,288,173 | | |
Total Short-Term Investments
(Cost $35,242,287) | | | 35,197,990 | | |
Total Investments in
Securities
(Cost $943,287,464)* | | | 183.2 | % | | $ | 919,972,905 | | |
Other Assets and
Liabilities - Net | | | (83.2 | ) | | | (417,804,346 | ) | |
| Net Assets | | | 100.0 | % | | $ | 502,168,559 | | |
@@ Foreign Issuer
MASTR Mortgage Asset Securitization Transaction, Inc.
# Securities with purchases pursuant to Rule 144A or section 4(2), under the Securities Act of 1933 and may not be resold subject to that rule except to qualified institutional buyers. Unless otherwise noted, these securities have been determined to be liquid under the guidelines established by the Funds' Board of Directors/Trustees.
C Bond may be called prior to maturity date.
P Preferred Stock may be called prior to convertible date.
cc Securities purchased with cash collateral for securities loaned.
ip Treasury inflation indexed protected security whose principal value is adjusted in accordance with changes to the Consumer Price Index.
## On September 7, 2008, the Federal Housing Finance Agency placed the Federal National Mortgage Association and the Federal Home Loan Mortgage Corporation into conservatorship and the U.S. Treasury guaranteed the debt issued by those organizations.
W Settlement is on a when-issued or delayed-delivery basis.
S All or a portion of this security is segregated to cover collateral requirements for applicable futures, options, swaps, foreign forward currency contracts and/or when-issued or delayed-delivery securities.
I Illiquid security
L Loaned security, a portion or all of the security is on loan at December 31, 2008.
± Defaulted security
Z Indicates Zero Coupon Bond; rate shown reflects current effective yield.
BRL Brazilian Real
DKK Danish Krone
The Portfolio received $3,070,000 principal value in U.S. Treasury Bills and $2,010,000 in cash as collateral for swaps, when issued or delayed delivery securities and forward foreign currency contracts. Cash collateral received may be invested in accordance with the Portfolio's investment strategy. Collateral received as securities can not be repledged.
* Cost for federal income tax purposes is $943,287,138.
Net unrealized depreciation consists of:
| Gross Unrealized Appreciation | | $ | 19,435,979 | | |
| Gross Unrealized Depreciation | | | (42,750,212 | ) | |
| Net Unrealized Depreciation | | $ | (23,314,233 | ) | |
The following table summarizes the inputs used as of December 31, 2008 in determining the Portfolio's investments at fair value for purposes of SFAS 157:
| | | Investments in
Securities | | Other Financial
Instruments* | |
| Level 1 — Quoted Prices | | $ | 527,987 | | | $ | 13,467,611 | | |
Level 2 — Other Significant
Observable Inputs | | | 917,992,221 | | | | (26,387,456 | ) | |
Level 3 — Significant
Unobservable Inputs | | | 1,452,697 | | | | (1,197,639 | ) | |
| Total | | $ | 919,972,905 | | | $ | (14,117,484 | ) | |
"Fair value" for purposes of SFAS 157 is different from "fair value" as used in the 1940 Act. The former generally implies market value, and can include market quotations as a source of value, and the latter refers to determinations of actual value in absence of available market quotations.
* Other financial instruments may include forward foreign currency contracts, futures, swaps, and written options. Forward foreign currency contracts and futures are reported at their unrealized gain/loss at year end. Swaps and written options are reported at their market value at year end.
See Accompanying Notes to Financial Statements
198
PORTFOLIO OF INVESTMENTS
ING PIMCO TOTAL RETURN PORTFOLIO AS OF DECEMBER 31, 2008 (CONTINUED)
A roll forward of fair value measurements using significant unobservable inputs (Level 3) for the year ended December 31, 2008, was as follows:
| | | Investments in
Securities | | Other Financial
Instruments* | |
| Beginning Balance at 12/31/07 | | $ | 1,691,870 | | | $ | (58,961 | ) | |
| Net Purchases/(Sales) | | | (13,266 | ) | | | 85,612 | | |
| Accrued Discounts/(Premiums) | | | (1,802 | ) | | | 4,255 | | |
| Total Realized Gain/(Loss) | | | 1,234 | | | | — | | |
Total Unrealized
Appreciation/(Depreciation) | | | (225,339 | ) | | | (802,118 | ) | |
Net Transfers In/(Out) of
Level 3 | | | — | | | | (426,427 | ) | |
| Ending Balance at 12/31/08 | | $ | 1,452,697 | | | $ | (1,197,639 | ) | |
* Other financial instruments may include forward foreign currency contracts, futures, swaps, and written options. Forward foreign currency contracts and futures are reported at their unrealized gain/loss at year end. Swaps and written options are reported at their market value at year end.
For the year ended December 31, 2008, total change in unrealized gain (loss) on Level 3 securities included in the change in net assets was $(1,512,845). Total unrealized gain (loss) for all securities (including Level 1 and Level 2) can be found on the accompanying Statement of Operations.
At December 31, 2008 the following forward foreign currency contracts were outstanding for the ING PIMCO Total Return Portfolio:
| Currency | | Buy/Sell | | Settlement
Date | | In
Exchange
For | | Value | | Unrealized
Appreciation/
(Depreciation) | |
| Brazilian Real | | | | | | USD | | | | | | | | |
| | |
| BRL 2,815,220 | | BUY | | 02/03/09 | | | 1,282,853 | | | | 1,190,556 | | | $ | (92,297 | ) | |
Chilean Peso
CLP 45,500,000 | | BUY | | 05/14/09 | | | 69,519 | | | | 69,729 | | | | 210 | | |
Chinese Yuan
CNY 1,559,085 | | BUY | | 07/15/09 | | | 242,000 | | | | 224,542 | | | | (17,458 | ) | |
Chinese Yuan
CNY 3,412,695 | | BUY | | 07/15/09 | | | 529,100 | | | | 491,502 | | | | (37,598 | ) | |
Chinese Yuan
CNY 1,217,933 | | BUY | | 07/15/09 | | | 188,900 | | | | 175,409 | | | | (13,491 | ) | |
Chinese Yuan
CNY 1,208,652 | | BUY | | 07/15/09 | | | 188,000 | | | | 174,072 | | | | (13,928 | ) | |
Chinese Yuan
CNY 1,813,006 | | BUY | | 07/15/09 | | | 282,000 | | | | 261,112 | | | | (20,888 | ) | |
Chinese Yuan
CNY 346,464 | | BUY | | 07/15/09 | | | 54,000 | | | | 49,898 | | | | (4,102 | ) | |
Chinese Yuan
CNY 346,572 | | BUY | | 07/15/09 | | | 54,000 | | | | 49,914 | | | | (4,086 | ) | |
Chinese Yuan
CNY 1,219,040 | | BUY | | 07/15/09 | | | 190,000 | | | | 175,568 | | | | (14,432 | ) | |
Chinese Yuan
CNY 3,268,254 | | BUY | | 07/15/09 | | | 506,000 | | | | 470,699 | | | | (35,301 | ) | |
Chinese Yuan
CNY 1,051,024 | | BUY | | 07/15/09 | | | 163,000 | | | | 151,370 | | | | (11,630 | ) | |
Chinese Yuan
CNY 3,395,184 | | BUY | | 07/15/09 | | | 520,000 | | | | 488,980 | | | | (31,020 | ) | |
Chinese Yuan
CNY 2,817,575 | | BUY | | 07/15/09 | | | 430,000 | | | | 405,792 | | | | (24,208 | ) | |
Chinese Yuan
CNY 1,503,280 | | BUY | | 07/15/09 | | | 230,000 | | | | 216,505 | | | | (13,495 | ) | |
| Currency | | Buy/Sell | | Settlement
Date | | In
Exchange
For | | Value | | Unrealized
Appreciation/
(Depreciation) | |
| Chinese Yuan | | | | | | USD | | | | | | | | |
| | |
| CNY 836,820 | | BUY | | 09/08/09 | | | 120,000 | | | | 120,520 | | | $ | 520 | | |
Chinese Yuan
CNY 834,480 | | BUY | | 09/08/09 | | | 120,000 | | | | 120,183 | | | | 183 | | |
Chinese Yuan
CNY 827,280 | | BUY | | 09/08/09 | | | 120,000 | | | | 119,146 | | | | (854 | ) | |
Chinese Yuan
CNY 828,360 | | BUY | | 09/08/09 | | | 120,000 | | | | 119,302 | | | | (698 | ) | |
Chinese Yuan
CNY 690,300 | | BUY | | 09/08/09 | | | 100,000 | | | | 99,418 | | | | (582 | ) | |
Chinese Yuan
CNY 1,310,050 | | BUY | | 09/08/09 | | | 190,000 | | | | 188,676 | | | | (1,324 | ) | |
Chinese Yuan
CNY 1,735,625 | | BUY | | 09/08/09 | | | 250,000 | | | | 249,968 | | | | (32 | ) | |
Chinese Yuan
CNY 832,920 | | BUY | | 09/08/09 | | | 120,000 | | | | 119,959 | | | | (41 | ) | |
Chinese Yuan
CNY 513,171 | | BUY | | 09/08/09 | | | 73,880 | | | | 73,908 | | | | 28 | | |
Danish Krone
DKK 3,085,000 | | BUY | | 02/05/09 | | | 585,711 | | | | 574,513 | | | | (11,198 | ) | |
Danish Krone
DKK 1,542,000 | | BUY | | 02/05/09 | | | 291,141 | | | | 287,164 | | | | (3,977 | ) | |
EU Euro
EUR 73,400 | | BUY | | 01/13/09 | | | 97,259 | | | | 101,968 | | | | 4,709 | | |
EU Euro
EUR 61,100 | | BUY | | 01/13/09 | | | 80,953 | | | | 84,881 | | | | 3,928 | | |
EU Euro
EUR 73,400 | | BUY | | 01/13/09 | | | 97,235 | | | | 101,968 | | | | 4,733 | | |
EU Euro
EUR 73,400 | | BUY | | 01/13/09 | | | 97,322 | | | | 101,968 | | | | 4,646 | | |
EU Euro
EUR 107,500 | | BUY | | 01/13/09 | | | 142,524 | | | | 149,340 | | | | 6,816 | | |
EU Euro
EUR 117,239 | | BUY | | 01/13/09 | | | 168,500 | | | | 162,870 | | | | (5,630) | | |
EU Euro
EUR 116,981 | | BUY | | 01/13/09 | | | 168,500 | | | | 162,511 | | | | (5,989) | | |
EU Euro
EUR 77,400 | | BUY | | 01/13/09 | | | 110,613 | | | | 107,525 | | | | (3,088) | | |
EU Euro
EUR 96,700 | | BUY | | 01/13/09 | | | 138,296 | | | | 134,337 | | | | (3,959) | | |
EU Euro
EUR 96,700 | | BUY | | 01/13/09 | | | 138,330 | | | | 134,337 | | | | (3,993) | | |
British Pound
GBP 791,000 | | BUY | | 01/13/09 | | | 1,183,898 | | | | 1,136,830 | | | | (47,068 | ) | |
Indonesian Rupiah
IDR 307,200,000 | | BUY | | 03/31/09 | | | 30,000 | | | | 27,186 | | | | (2,814 | ) | |
Indonesian Rupiah
IDR 308,700,000 | | BUY | | 03/31/09 | | | 30,000 | | | | 27,319 | | | | (2,681 | ) | |
Indonesian Rupiah
IDR 448,400,000 | | BUY | | 03/31/09 | | | 40,000 | | | | 39,681 | | | | (319 | ) | |
Indonesian Rupiah
IDR 215,800,000 | | BUY | | 03/31/09 | | | 20,000 | | | | 19,097 | | | | (903 | ) | |
Indonesian Rupiah
IDR 413,600,000 | | BUY | | 03/31/09 | | | 40,000 | | | | 36,602 | | | | (3,398 | ) | |
Indonesian Rupiah
IDR 794,900,000 | | BUY | | 03/31/09 | | | 76,669 | | | | 70,345 | | | | (6,324 | ) | |
Indian Rupee
INR 6,000,000 | | BUY | | 04/09/09 | | | 120,000 | | | | 122,162 | | | | 2,162 | | |
See Accompanying Notes to Financial Statements
199
PORTFOLIO OF INVESTMENTS
ING PIMCO TOTAL RETURN PORTFOLIO AS OF DECEMBER 31, 2008 (CONTINUED)
| Currency | | Buy/Sell | | Settlement
Date | | In
Exchange
For | | Value | | Unrealized
Appreciation/
(Depreciation) | |
| Indian Rupee | | | | | | USD | | | | | | | | |
| | |
| INR 5,898,000 | | BUY | | 04/09/09 | | | 120,000 | | | | 120,085 | | | $ | 85 | | |
Indian Rupee
INR 9,003,006 | | BUY | | 04/09/09 | | | 180,000 | | | | 183,303 | | | | 3,303 | | |
Indian Rupee
INR 6,048,000 | | BUY | | 04/09/09 | | | 120,000 | | | | 123,139 | | | | 3,139 | | |
Indian Rupee
INR 12,060,856 | | BUY | | 04/09/09 | | | 237,185 | | | | 245,562 | | | | 8,377 | | |
Mexican Peso
MXN 60,730 | | BUY | | 05/19/09 | | | 4,555 | | | | 4,229 | | | | (326 | ) | |
Malaysian Ringgit
MYR 1,866,464 | | BUY | | 02/12/09 | | | 584,000 | | | | 538,670 | | | | (45,330 | ) | |
Malaysian Ringgit
MYR 820,000 | | BUY | | 02/12/09 | | | 235,058 | | | | 236,656 | | | | 1,598 | | |
Malaysian Ringgit
MYR 315,585 | | BUY | | 02/12/09 | | | 90,000 | | | | 91,079 | | | | 1,079 | | |
Malaysian Ringgit
MYR 282,780 | | BUY | | 02/12/09 | | | 80,000 | | | | 81,612 | | | | 1,612 | | |
Malaysian Ringgit
MYR 718,350 | | BUY | | 02/12/09 | | | 200,000 | | | | 207,319 | | | | 7,319 | | |
Malaysian Ringgit
MYR 376,919 | | BUY | | 02/12/09 | | | 106,474 | | | | 108,780 | | | | 2,306 | | |
Malaysian Ringgit
MYR 315,315 | | BUY | | 04/14/09 | | | 90,000 | | | | 90,979 | | | | 979 | | |
Malaysian Ringgit
MYR 314,595 | | BUY | | 04/14/09 | | | 90,000 | | | | 90,771 | | | | 771 | | |
Malaysian Ringgit
MYR 597,720 | | BUY | | 04/14/09 | | | 170,000 | | | | 172,462 | | | | 2,462 | | |
Malaysian Ringgit
MYR 70,220 | | BUY | | 04/14/09 | | | 20,000 | | | | 20,261 | | | | 261 | | |
Malaysian Ringgit
MYR 316,530 | | BUY | | 04/14/09 | | | 90,000 | | | | 91,330 | | | | 1,330 | | |
Malaysian Ringgit
MYR 396,495 | | BUY | | 04/14/09 | | | 110,000 | | | | 114,402 | | | | 4,402 | | |
Norwegian Krone
NOK 5,192,000 | | BUY | | 03/05/09 | | | 726,988 | | | | 738,549 | | | | 11,561 | | |
New Zealand Dollar
NZD 152,800 | | BUY | | 01/15/09 | | | 88,308 | | | | 89,075 | | | | 767 | | |
Philippine Peso
PHP 1,200,000 | | BUY | | 02/06/09 | | | 26,613 | | | | 25,126 | | | | (1,487 | ) | |
Philippine Peso
PHP 1,300,000 | | BUY | | 02/06/09 | | | 28,844 | | | | 27,220 | | | | (1,624 | ) | |
Philippine Peso
PHP 1,100,000 | | BUY | | 02/06/09 | | | 24,444 | | | | 23,033 | | | | (1,411 | ) | |
Philippine Peso
PHP 4,190,000 | | BUY | | 02/06/09 | | | 93,715 | | | | 87,733 | | | | (5,982 | ) | |
Philippine Peso
PHP 1,700,000 | | BUY | | 02/06/09 | | | 38,349 | | | | 35,596 | | | | (2,753 | ) | |
Philippine Peso
PHP 1,700,000 | | BUY | | 02/06/09 | | | 38,375 | | | | 35,596 | | | | (2,779 | ) | |
Philippine Peso
PHP 2,200,000 | | BUY | | 02/06/09 | | | 49,684 | | | | 46,065 | | | | (3,619 | ) | |
Philippine Peso
PHP 2,800,000 | | BUY | | 02/06/09 | | | 63,177 | | | | 58,628 | | | | (4,549 | ) | |
Philippine Peso
PHP 2,200,000 | | BUY | | 02/06/09 | | | 49,184 | | | | 46,065 | | | | (3,119 | ) | |
| Currency | | Buy/Sell | | Settlement
Date | | In
Exchange
For | | Value | | Unrealized
Appreciation/
(Depreciation) | |
| Philippine Peso | | | | | | | |
| |
| PHP 1,100,000 | | BUY | | 02/06/09 | | | 24,543 | | | | 23,033 | | | $ | (1,510 | ) | |
Philippine Peso
PHP 1,100,000 | | BUY | | 02/06/09 | | | 24,455 | | | | 23,033 | | | | (1,422 | ) | |
Philippine Peso
PHP 1,100,000 | | BUY | | 02/06/09 | | | 24,369 | | | | 23,033 | | | | (1,336 | ) | |
Philippine Peso
PHP 2,200,000 | | BUY | | 02/06/09 | | | 48,748 | | | | 46,065 | | | | (2,683 | ) | |
Philippine Peso
PHP 1,100,000 | | BUY | | 02/06/09 | | | 24,358 | | | | 23,033 | | | | (1,325 | ) | |
Philippine Peso
PHP 1,100,000 | | BUY | | 02/06/09 | | | 24,344 | | | | 23,033 | | | | (1,311 | ) | |
Philippine Peso
PHP 1,100,000 | | BUY | | 02/06/09 | | | 24,096 | | | | 23,033 | | | | (1,063 | ) | |
Philippine Peso
PHP 2,212,990 | | BUY | | 02/06/09 | | | 48,297 | | | | 46,337 | | | | (1,960 | ) | |
Philippine Peso
PHP 15,520,000 | | BUY | | 02/06/09 | | | 321,992 | | | | 324,969 | | | | 2,977 | | |
Philippine Peso
PHP 8,773,200 | | BUY | | 05/06/09 | | | 180,000 | | | | 182,531 | | | | 2,531 | | |
Philippine Peso
PHP 5,335,000 | | BUY | | 05/06/09 | | | 110,000 | | | | 110,997 | | | | 997 | | |
Philippine Peso
PHP 8,634,600 | | BUY | | 05/06/09 | | | 180,000 | | | | 179,647 | | | | (353 | ) | |
Philippine Peso
PHP 691,600 | | BUY | | 05/06/09 | | | 14,071 | | | | 14,389 | | | | 318 | | |
Russian Ruble
RUB 15,941,178 | | BUY | | 05/06/09 | | | 660,000 | | | | 462,493 | | | | (197,507 | ) | |
Russian Ruble
RUB 4,965,822 | | BUY | | 05/06/09 | | | 207,601 | | | | 144,071 | | | | (63,530 | ) | |
Singapore Dollar
SGD 734,900 | | BUY | | 01/16/09 | | | 500,000 | | | | 509,799 | | | | 9,799 | | |
Singapore Dollar
SGD 438,510 | | BUY | | 04/14/09 | | | 300,000 | | | | 303,906 | | | | 3,906 | | |
Singapore Dollar
SGD 438,810 | | BUY | | 04/14/09 | | | 300,000 | | | | 304,114 | | | | 4,114 | | |
Singapore Dollar
SGD 439,350 | | BUY | | 04/14/09 | | | 300,000 | | | | 304,488 | | | | 4,488 | | |
Singapore Dollar
SGD 340,245 | | BUY | | 04/14/09 | | | 230,000 | | | | 235,804 | | | | 5,804 | | |
Singapore Dollar
SGD 430,012 | | BUY | | 04/14/09 | | | 290,000 | | | | 298,017 | | | | 8,017 | | |
Singapore Dollar
SGD 424,502 | | BUY | | 04/14/09 | | | 290,000 | | | | 294,198 | | | | 4,198 | | |
Singapore Dollar
SGD 407,008 | | BUY | | 04/14/09 | | | 280,000 | | | | 282,074 | | | | 2,074 | | |
Singapore Dollar
SGD 465,898 | | BUY | | 04/14/09 | | | 316,981 | | | | 322,888 | | | | 5,907 | | |
Singapore Dollar
SGD 32,855 | | BUY | | 04/14/09 | | | 21,555 | | | | 22,770 | | | | 1,215 | | |
Singapore Dollar
SGD 419,456 | | BUY | | 07/30/09 | | | 290,000 | | | | 290,633 | | | | 633 | | |
Taiwan New Dollar
TWD 500,000 | | BUY | | 02/09/09 | | | 16,351 | | | | 15,263 | | | | (1,088 | ) | |
See Accompanying Notes to Financial Statements
200
PORTFOLIO OF INVESTMENTS
ING PIMCO TOTAL RETURN PORTFOLIO AS OF DECEMBER 31, 2008 (CONTINUED)
| Currency | | Buy/Sell | | Settlement
Date | | In
Exchange
For | | Value | | Unrealized
Appreciation/
(Depreciation) | |
| Taiwan New Dollar | | | | | | USD | | | | | | | | |
| | |
| TWD 500,000 | | BUY | | 02/09/09 | | | 16,340 | | | | 15,263 | | | $ | (1,077 | ) | |
Taiwan New Dollar
TWD 298,991 | | BUY | | 02/09/09 | | | 9,664 | | | | 9,127 | | | | (537 | ) | |
Taiwan New Dollar
TWD 500,000 | | BUY | | 02/09/09 | | | 16,176 | | | | 15,263 | | | | (913 | ) | |
| | | $ | (653,136 | ) | |
Australian Dollar
AUD 760,000 | | SELL | | 01/29/09 | | | 490,124 | | | | 528,096 | | | | (37,972) | | |
Brazilian Real
BRL 202,444 | | SELL | | 02/03/09 | | | 86,000 | | | | 85,614 | | | | 386 | | |
Brazilian Real
BRL 842,929 | | SELL | | 02/03/09 | | | 357,476 | | | | 356,475 | | | | 1,001 | | |
Brazilian Real
BRL 408,020 | | SELL | | 02/03/09 | | | 173,000 | | | | 172,552 | | | | 448 | | |
Brazilian Real
BRL 204,624 | | SELL | | 02/03/09 | | | 87,000 | | | | 86,535 | | | | 465 | | |
Brazilian Real
BRL 327,400 | | SELL | | 02/03/09 | | | 131,671 | | | | 138,457 | | | | (6,786 | ) | |
Brazilian Real
BRL 181,500 | | SELL | | 02/03/09 | | | 75,000 | | | | 76,756 | | | | (1,756 | ) | |
Brazilian Real
BRL 179,625 | | SELL | | 02/03/09 | | | 75,000 | | | | 75,963 | | | | (963 | ) | |
Brazilian Real
BRL 181,725 | | SELL | | 02/03/09 | | | 75,000 | | | | 76,851 | | | | (1,851 | ) | |
Brazilian Real
BRL 181,575 | | SELL | | 02/03/09 | | | 75,000 | | | | 76,788 | | | | (1,788 | ) | |
Brazilian Real
BRL 718,393 | | SELL | | 02/03/09 | | | 292,000 | | | | 303,808 | | | | (11,808 | ) | |
Brazilian Real
BRL 73,845 | | SELL | | 02/03/09 | | | 30,000 | | | | 31,229 | | | | (1,229 | ) | |
Brazilian Real
BRL 71,746 | | SELL | | 02/03/09 | | | 29,000 | | | | 30,341 | | | | (1,341 | ) | |
Brazilian Real
BRL 171,010 | | SELL | | 02/03/09 | | | 70,000 | | | | 72,320 | | | | (2,320 | ) | |
Brazilian Real
BRL 205,700 | | SELL | | 02/03/09 | | | 81,000 | | | | 86,990 | | | | (5,990 | ) | |
Brazilian Real
BRL 668,955 | | SELL | | 02/03/09 | | | 277,000 | | | | 282,901 | | | | (5,901 | ) | |
Brazilian Real
BRL 733,108 | | SELL | | 02/03/09 | | | 303,000 | | | | 310,031 | | | | (7,031 | ) | |
Brazilian Real
BRL 242,302 | | SELL | | 02/03/09 | | | 99,000 | | | | 102,470 | | | | (3,470 | ) | |
Chilean Peso
CLP 45,500,000 | | SELL | | 05/14/09 | | | 70,625 | | | | 69,729 | | | | 896 | | |
Chinese Yuan
CNY 13,400,000 | | SELL | | 07/15/09 | | | 1,949,658 | | | | 1,929,890 | | | | 19,768 | | |
Danish Krone
DKK 17,299,000 | | SELL | | 02/05/09 | | | 2,974,125 | | | | 3,221,558 | | | | (247,433 | ) | |
EU Euro
EUR 5,096,000 | | SELL | | 01/13/09 | | | 6,436,452 | | | | 7,079,420 | | | | (642,968 | ) | |
British Pound
GBP 1,637,000 | | SELL | | 01/13/09 | | | 2,427,475 | | | | 2,352,707 | | | | 74,768 | | |
British Pound
GBP 1,846,000 | | SELL | | 01/13/09 | | | 2,736,437 | | | | 2,653,083 | | | | 83,354 | | |
British Pound
GBP 1,702,000 | | SELL | | 01/13/09 | | | 2,521,002 | | | | 2,446,126 | | | | 74,876 | | |
| Currency | | Buy/Sell | | Settlement
Date | | In
Exchange
For | | Value | | Unrealized
Appreciation/
(Depreciation) | |
| Indonesian Rupiah | | | | | | USD | | | | | | | | |
| | |
| IDR 833,000,000 | | SELL | | 03/31/09 | | | 68,279 | | | | 73,717 | | | $ | (5,438 | ) | |
Indonesian Rupiah
IDR 823,600,000 | | SELL | | 03/31/09 | | | 67,233 | | | | 72,885 | | | | (5,652 | ) | |
Indonesian Rupiah
IDR 832,000,000 | | SELL | | 03/31/09 | | | 67,918 | | | | 73,628 | | | | (5,710 | ) | |
Indian Rupee
INR 14,165,580 | | SELL | | 04/09/09 | | | 286,000 | | | | 288,415 | | | | (2,415 | ) | |
Indian Rupee
INR 9,766,075 | | SELL | | 04/09/09 | | | 187,000 | | | | 198,840 | | | | (11,840 | ) | |
Indian Rupee
INR 5,904,270 | | SELL | | 04/09/09 | | | 112,000 | | | | 120,212 | | | | (8,212 | ) | |
Indian Rupee
INR 4,900,170 | | SELL | | 04/09/09 | | | 93,000 | | | | 99,769 | | | | (6,769 | ) | |
Indian Rupee
INR 4,273,767 | | SELL | | 04/09/09 | | | 81,560 | | | | 87,015 | | | | (5,455 | ) | |
Japanese Yen
JPY 123,993,062 | | SELL | | 01/08/09 | | | 1,309,000 | | | | 1,368,052 | | | | (59,052 | ) | |
Japanese Yen
JPY 21,369,000 | | SELL | | 01/08/09 | | | 224,901 | | | | 235,770 | | | | (10,869 | ) | |
Japanese Yen
JPY 39,589,000 | | SELL | | 01/08/09 | | | 415,414 | | | | 436,797 | | | | (21,383 | ) | |
Japanese Yen
JPY 21,243,000 | | SELL | | 01/08/09 | | | 222,953 | | | | 234,380 | | | | (11,427 | ) | |
Mexican Peso
MXN 60,730 | | SELL | | 05/19/09 | | | 4,265 | | | | 4,229 | | | | 36 | | |
Malaysian Ringgit
MYR 275,852 | | SELL | | 02/12/09 | | | 77,000 | | | | 79,612 | | | | (2,612 | ) | |
Malaysian Ringgit
MYR 220,999 | | SELL | | 02/12/09 | | | 62,000 | | | | 63,781 | | | | (1,781 | ) | |
Malaysian Ringgit
MYR 164,404 | | SELL | | 02/12/09 | | | 46,000 | | | | 47,448 | | | | (1,448 | ) | |
Malaysian Ringgit
MYR 440,586 | | SELL | | 02/12/09 | | | 123,000 | | | | 127,155 | | | | (4,155 | ) | |
Malaysian Ringgit
MYR 1,326,481 | | SELL | | 02/12/09 | | | 369,000 | | | | 382,828 | | | | (13,828 | ) | |
Malaysian Ringgit
MYR 238,920 | | SELL | | 02/12/09 | | | 66,000 | | | | 68,953 | | | | (2,953 | ) | |
Malaysian Ringgit
MYR 239,580 | | SELL | | 02/12/09 | | | 66,000 | | | | 69,144 | | | | (3,144 | ) | |
Malaysian Ringgit
MYR 238,821 | | SELL | | 02/12/09 | | | 66,000 | | | | 68,925 | | | | (2,925 | ) | |
Malaysian Ringgit
MYR 238,491 | | SELL | | 02/12/09 | | | 66,000 | | | | 68,830 | | | | (2,830 | ) | |
Malaysian Ringgit
MYR 399,465 | | SELL | | 02/12/09 | | | 110,000 | | | | 115,287 | | | | (5,287 | ) | |
Malaysian Ringgit
MYR 217,740 | | SELL | | 02/12/09 | | | 60,000 | | | | 62,841 | | | | (2,841 | ) | |
Malaysian Ringgit
MYR 214,465 | | SELL | | 02/12/09 | | | 59,000 | | | | 61,896 | | | | (2,896 | ) | |
Malaysian Ringgit
MYR 164,293 | | SELL | | 02/12/09 | | | 44,767 | | | | 47,416 | | | | (2,649 | ) | |
Malaysian Ringgit
MYR 2,010,875 | | SELL | | 04/14/09 | | | 547,028 | | | | 580,205 | | | | (33,177 | ) | |
New Zealand Dollar
NZD 135,000 | | SELL | | 01/15/09 | | | 73,426 | | | | 78,698 | | | | (5,272 | ) | |
New Zealand Dollar
NZD 164,000 | | SELL | | 01/15/09 | | | 94,174 | | | | 95,604 | | | | (1,430 | ) | |
See Accompanying Notes to Financial Statements
201
PORTFOLIO OF INVESTMENTS
ING PIMCO TOTAL RETURN PORTFOLIO AS OF DECEMBER 31, 2008 (CONTINUED)
| Currency | | Buy/Sell | | Settlement
Date | | In
Exchange
For | | Value | | Unrealized
Appreciation/
(Depreciation) | |
| Philippine Peso | | | | | | USD | | | | | | | | |
| | |
| PHP 29,179,800 | | SELL | | 02/06/09 | | | 585,000 | | | | 610,989 | | | $ | (25,989 | ) | |
Philippine Peso
PHP 15,743,190 | | SELL | | 02/06/09 | | | 315,558 | | | | 329,643 | | | | (14,085 | ) | |
Philippine Peso
PHP 23,434,400 | | SELL | | 05/06/09 | | | 464,231 | | | | 487,564 | | | | (23,333 | ) | |
Russian Ruble
RUB 20,907,000 | | SELL | | 05/06/09 | | | 860,778 | | | | 606,564 | | | | 254,214 | | |
Singapore Dollar
SGD 470,932 | | SELL | | 01/16/09 | | | 319,406 | | | | 326,684 | | | | (7,278 | ) | |
Singapore Dollar
SGD 263,968 | | SELL | | 01/16/09 | | | 176,840 | | | | 183,114 | | | | (6,274 | ) | |
Singapore Dollar
SGD 1,850,000 | | SELL | | 04/14/09 | | | 1,245,120 | | | | 1,282,129 | | | | (37,009 | ) | |
Singapore Dollar
SGD 131,386 | | SELL | | 04/14/09 | | | 87,340 | | | | 91,056 | | | | (3,716 | ) | |
Singapore Dollar
SGD 30,094 | | SELL | | 04/14/09 | | | 20,000 | | | | 20,856 | | | | (856 | ) | |
Singapore Dollar
SGD 64,982 | | SELL | | 04/14/09 | | | 43,000 | | | | 45,035 | | | | (2,035 | ) | |
Singapore Dollar
SGD 65,007 | | SELL | | 04/14/09 | | | 43,000 | | | | 45,053 | | | | (2,053 | ) | |
Singapore Dollar
SGD 65,085 | | SELL | | 04/14/09 | | | 43,000 | | | | 45,107 | | | | (2,107 | ) | |
Singapore Dollar
SGD 64,947 | | SELL | | 04/14/09 | | | 43,000 | | | | 45,011 | | | | (2,011 | ) | |
Singapore Dollar
SGD 142,589 | | SELL | | 04/14/09 | | | 94,000 | | | | 98,820 | | | | (4,820 | ) | |
Singapore Dollar
SGD 142,603 | | SELL | | 04/14/09 | | | 94,000 | | | | 98,830 | | | | (4,830 | ) | |
Singapore Dollar
SGD 144,149 | | SELL | | 04/14/09 | | | 95,000 | | | | 99,902 | | | | (4,902 | ) | |
Singapore Dollar
SGD 142,574 | | SELL | | 04/14/09 | | | 94,000 | | | | 98,810 | | | | (4,810 | ) | |
Singapore Dollar
SGD 71,532 | | SELL | | 04/14/09 | | | 47,000 | | | | 49,574 | | | | (2,574 | ) | |
Singapore Dollar
SGD 71,518 | | SELL | | 04/14/09 | | | 47,000 | | | | 49,565 | | | | (2,565 | ) | |
Singapore Dollar
SGD 73,090 | | SELL | | 04/14/09 | | | 48,000 | | | | 50,654 | | | | (2,654 | ) | |
Singapore Dollar
SGD 143,032 | | SELL | | 04/14/09 | | | 94,000 | | | | 99,128 | | | | (5,128 | ) | |
Singapore Dollar
SGD 143,084 | | SELL | | 04/14/09 | | | 94,000 | | | | 99,163 | | | | (5,163 | ) | |
Singapore Dollar
SGD 71,518 | | SELL | | 04/14/09 | | | 47,000 | | | | 49,565 | | | | (2,565 | ) | |
Singapore Dollar
SGD 419,456 | | SELL | | 07/30/09 | | | 275,795 | | | | 290,633 | | | | (14,838 | ) | |
Taiwan New Dollar
TWD 1,798,991 | | SELL | | 02/09/09 | | | 54,864 | | | | 54,915 | | | | (51) | | |
| | | $ | (895,491 | ) | |
ING PIMCO Total Return Portfolio Open Futures Contracts on December 31, 2008:
Contract
Description | | Number of
Contracts | | Expiration
Date | | Unrealized
Appreciation | |
| Long Contracts | | | | | | | |
| 90-Day Eurodollar | | | 340 | | | 03/16/09 | | $ | 1,704,584 | | |
| 90-Day Eurodollar | | | 330 | | | 06/15/09 | | | 1,757,367 | | |
| 90-Day Eurodollar | | | 227 | | | 09/14/09 | | | 1,265,531 | | |
| 90-Day Eurodollar | | | 190 | | | 12/14/09 | | | 1,185,664 | | |
| 90-Day Eurodollar | | | 141 | | | 03/15/10 | | | 985,765 | | |
| 90-Day Eurodollar | | | 5 | | | 06/14/10 | | | 27,724 | | |
| 90-Day Eurodollar | | | 5 | | | 09/13/10 | | | 28,622 | | |
| 90-Day Sterling | | | 437 | | | 03/18/09 | | | 3,843,280 | | |
| 90-Day Sterling | | | 217 | | | 06/17/09 | | | 1,901,442 | | |
| 90-Day Sterling | | | 13 | | | 12/16/09 | | | 69,902 | | |
| 3-Month Euro Euribor | | | 25 | | | 03/16/09 | | | 264,157 | | |
| 3-Month Euro Euribor | | | 15 | | | 06/15/09 | | | 168,842 | | |
U.S. Treasury
2-Year Note | | | 63 | | | 03/31/09 | | | 91,748 | | |
U.S. Treasury
5-Year Note | | | 48 | | | 03/31/09 | | | 25,939 | | |
U.S. Treasury
10-Year Note | | | 361 | | | 03/20/09 | | | 254,704 | | |
| | | | | $13,575,271 | |
See Accompanying Notes to Financial Statements
202
PORTFOLIO OF INVESTMENTS
ING PIMCO TOTAL RETURN PORTFOLIO AS OF DECEMBER 31, 2008 (CONTINUED)
ING PIMCO Total Return Portfolio Written Options Open on December 31, 2008:
Options on Exchange-Traded Futures Contracts
| Description/Name of Issuer | | Exercise
Price | | Expiration
Date | | Number of
Contracts | | Premium
Received | | Value | |
| Put Option CBOT US Treasury 5-Year Note Future 03/09 | | USD | 118.00 | | | 02/20/09 | | | 62 | | | $ | 36,440 | | | $ | (52,797 | ) | |
| Put Option CBOT US Treasury 10-Year Note Future 03/09 | | USD | 124.00 | | | 02/20/09 | | | 26 | | | | 31,717 | | | | (42,656 | ) | |
| Put Option CME 90-Day Eurodollar Future 03/09 | | USD | 98.00 | | | 03/16/09 | | | 33 | | | | 9,155 | | | | (1,856 | ) | |
| Put Option CME 90-Day Eurodollar Future 03/09 | | USD | 98.25 | | | 03/16/09 | | | 23 | | | | 10,192 | | | | (2,013 | ) | |
| Put Option CME 90-Day Eurodollar Future 03/09 | | USD | 98.50 | | | 03/16/09 | | | 58 | | | | 8,625 | | | | (8,338 | ) | |
| | | | | | | $ | 96,129 | | | $ | (107,660 | ) | |
| Interest Rate Swaptions | |
| Description | | Counterparty | | Floating Rate Index/
Underlying Reference Entity | | Pay/Receive
Floating | | Exercise
Rate | | Expiration
Date | | Notional
Amount | | Premium
Received | | Value | |
Put - OTC Interest
Rate Swap | | Barclays
Bank PLC | | 3-Month USD-LIBOR | | Pay | | | 2.750 | % | | 05/22/09 | | USD | 4,500,000 | | | $ | 35,038 | | | $ | (48,462 | ) | |
Put - OTC Interest
Rate Swap | | Deutsche Bank
AG, New York | | 3-Month USD-LIBOR | | Pay | | | 2.750 | % | | 05/22/09 | | USD | 1,500,000 | | | | 10,225 | | | | (16,154 | ) | |
Put - OTC Interest
Rate Swap | | The Royal Bank
of Scotland PLC | | 3-Month USD-LIBOR | | Pay | | | 2.750 | % | | 05/22/09 | | USD | 1,000,000 | | | | 7,100 | | | | (10,769 | ) | |
Call - OTC Interest
Rate Swap | | Barclays
Bank PLC | | 3-month USD-LIBOR | | Receive | | | 4.300 | % | | 02/02/09 | | USD | 4,900,000 | | | | 123,970 | | | | (493,023 | ) | |
Call - OTC Interest
Rate Swap | | Barclays
Bank PLC | | 3-Month USD LIBOR | | Receive | | | 4.600 | % | | 02/02/09 | | USD | 1,800,000 | | | | 57,780 | | | | (258,341 | ) | |
Call - OTC Interest
Rate Swap | | Barclays
Bank PLC | | 3-Month USD-LIBOR | | Receive | | | 4.150 | % | | 08/03/09 | | USD | 2,300,000 | | | | 57,730 | | | | (200,485 | ) | |
Call - OTC Interest
Rate Swap | | Merrill Lynch
Capital
Services, Inc. | | 3-Month USD-LIBOR | | Receive | | | 4.400 | % | | 08/03/09 | | USD | 1,600,000 | | | | 52,800 | | | | (198,040 | ) | |
Call - OTC Interest
Rate Swap | | The Royal Bank
of Scotland PLC | | 3-Month USD-LIBOR | | Receive | | | 4.250 | % | | 02/02/09 | | USD | 3,800,000 | | | | 114,570 | | | | (459,415 | ) | |
Call - OTC Interest
Rate Swap | | The Royal Bank
of Scotland PLC | | 3-month USD-LIBOR | | Receive | | | 4.200 | % | | 07/02/09 | | USD | 2,300,000 | | | | 50,830 | | | | (207,746 | ) | |
Call - OTC Interest
Rate Swap | | The Royal Bank
of Scotland PLC | | 3-Month USD-LIBOR | | Receive | | | 4.400 | % | | 08/03/09 | | USD | 10,900,000 | | | | 357,008 | | | | (1,349,148 | ) | |
Call - OTC Interest
Rate Swap | | The Royal Bank
of Scotland PLC | | 3-Month USD-LIBOR | | Receive | | | 4.550 | % | | 08/03/09 | | USD | 6,000,000 | | | | 183,707 | | | | (797,061 | ) | |
| | | | | | | | | | | | | | | | | | | $ | 1,050,758 | | | $ | (4,038,644 | ) | |
ING PIMCO Total Return Portfolio Credit Default Swap Agreements Outstanding on December 31, 2008:
Credit Default Swaps on Credit Indices — Buy Protection(1)
| Counterparty | | Reference
Entity/Obligation | | Buy/Sell
Protection | | (Pay)/
Receive
Fixed
Rate (%) | | Termination
Date | | Notional
Amount(4) | | Market
Value(5) | | Upfront
Premium
Paid/
(Received) | | Unrealized
Appreciation/
(Depreciation) | |
Morgan Stanley
Capital
Services Inc. | | CDX.NA.HY.10 Index | | Buy | | | (5.000 | ) | | 06/20/13 | | USD | 2,400,000 | | | $ | 373,175 | | | $ | 157,751 | | | $ | 215,424 | | |
Morgan Stanley
Capital
Services Inc. | | CDX.NA.IG.9 Index | | Buy | | | (0.800 | ) | | 12/20/17 | | USD | 1,073,600 | | | | 60,025 | | | | 98,180 | | | | (38,155 | ) | |
| BNP Paribas | | iTraxx Europe HiVol
Series 6 Version 1 Index | | Buy | | | (0.850 | ) | | 12/20/16 | | EUR | 1,200,000 | | | | 230,926 | | | | (7,013 | ) | | | 237,939 | | |
Deutsche
Bank AG | | iTraxx Europe HiVol
Series 6 Version 1 Index | | Buy | | | (0.850 | ) | | 12/20/16 | | EUR | 4,500,000 | | | | 865,972 | | | | (42,024 | ) | | | 907,996 | | |
| | | | | | | | | | | | | | | | | $ | 1,530,098 | | | $ | 206,894 | | | $ | 1,323,204 | | |
Credit Default Swaps on Corporate and Soverign Issues — Buy Protection(1)
Deutsche
Bank AG | | Bellsouth Corp.
5.200%, 09/15/14 | | Buy | | | (0.395 | ) | | | 09/20/14 | | | USD | 3,500,000 | | | $ | 92,210 | | | $ | — | | | $ | 92,210 | | |
Morgan Stanley
Capital
Services Inc. | | CVS Corp.
5.750%, 08/15/11 | | Buy | | | (0.235 | ) | | | 09/20/11 | | | USD | 2,800,000 | | | | 58,851 | | | | — | | | | 58,851 | | |
Citibank N.A.,
New York | | Noble Corp.
5.875%, 06/01/13 | | Buy | | | (0.520 | ) | | | 06/20/12 | | | USD | 1,000,000 | | | | 48,012 | | | | — | | | | 48,012 | | |
See Accompanying Notes to Financial Statements
203
PORTFOLIO OF INVESTMENTS
ING PIMCO TOTAL RETURN PORTFOLIO AS OF DECEMBER 31, 2008 (CONTINUED)
| Counterparty | | Reference
Entity/Obligation | | Buy/Sell
Protection | | (Pay)/
Receive
Fixed
Rate (%) | | Termination
Date | | Notional
Amount(4) | | Market
Value(5) | | Upfront
Premium
Paid/
(Received) | | Unrealized
Appreciation/
(Depreciation) | |
Morgan Stanley
Capital
Services Inc. | | Republic of Turkey
11.875%, 01/15/30 | | Buy | | | (2.200 | ) | | | 10/20/10 | | | USD | 100,000 | | | $ | 3,575 | | | $ | — | | | $ | 3,575 | | |
| | | | | | | | | | | | | | | | | | | $ | 202,648 | | | $ | — | | | $ | 202,648 | | |
Credit Default Swaps on Credit Indices — Sell Protection(2)(6)
Morgan Stanley
Capital
Services Inc. | | CDX.EM.3 Index | | Sell | | | 2.100 | | | 06/20/10 | | USD | 900,000 | | | $ | (35,745 | ) | | $ | (6,634 | ) | | $ | (29,111 | ) | |
Citibank N.A.,
New York | | CDX.NA.HY.8 Index
(25-35% Tranche) | | Sell | | | 2.144 | | | 06/20/12 | | USD | 500,000 | | | | (82,976 | ) | | | — | | | | (82,976 | ) | |
Merrill Lynch
International | | CDX.NA.HY.8 Index
(25-35% Tranche) | | Sell | | | 1.833 | | | 06/20/12 | | USD | 1,000,000 | | | | (175,529 | ) | | | — | | | | (175,529 | ) | |
Morgan Stanley
Capital
Services Inc. | | CDX.NA.HY.8 Index
(25-35% Tranche) | | Sell | | | 2.080 | | | 06/20/12 | | USD | 1,000,000 | | | | (167,923 | ) | | | — | | | | (167,923 | ) | |
Citibank N.A.,
New York | | CDX.NA.HY.8 Index
(35-100% Tranche) | | Sell | | | 0.401 | | | 06/20/12 | | USD | 980,885 | | | | (63,503 | ) | | | — | | | | (63,503 | ) | |
Morgan Stanley
Capital
Services Inc. | | CDX.NA.HY.11 Index | | Sell | | | 5.000 | | | 12/20/13 | | USD | 1,700,000 | | | | (341,510 | ) | | | (415,399 | ) | | | 73,889 | | |
Morgan Stanley
Capital
Services Inc. | | CDX.NA.IG.5 Index
(10-15% Tranche) | | Sell | | | 0.460 | | | 12/20/15 | | USD | 1,400,000 | | | | (384,527 | ) | | | — | | | | (384,527 | ) | |
Goldman Sachs
International | | CDX.NA.IG.7 Index | | Sell | | | 0.650 | | | 12/20/16 | | USD | 12,590,400 | | | | (883,376 | ) | | | (88,826 | ) | | | (794,550 | ) | |
Deutsche
Bank AG | | CDX.NA.IG.9 Index
(30-100% Tranche) | | Sell | | | 0.708 | | | 12/20/12 | | USD | 2,916,854 | | | | 14,028 | | | | — | | | | 14,028 | | |
Goldman Sachs
International | | CDX.NA.IG.9 Index
(30-100% Tranche) | | Sell | | | 0.548 | | | 12/20/17 | | USD | 680,599 | | | | 1,612 | | | | — | | | | 1,612 | | |
Deutsche
Bank AG | | CDX.NA.IG.10 Index
(30-100% Tranche) | | Sell | | | 0.530 | | | 06/20/13 | | USD | 972,285 | | | | (1,597 | ) | | | — | | | | (1,597 | ) | |
Deutsche
Bank AG | | CDX.NA.IG.11 Index | | Sell | | | 1.500 | | | 12/20/13 | | USD | 2,100,000 | | | | (44,101 | ) | | | (48,542 | ) | | | 4,441 | | |
Morgan Stanley
Capital
Services Inc. | | CMBX-NA-AAA 3 Index | | Sell | | | 0.080 | | | 12/13/49 | | USD | 100,000 | | | | (29,805 | ) | | | (16,587 | ) | | | (13,218 | ) | |
| | | | | | | | | | | | | | | | | $ | (2,194,952 | ) | | $ | (575,988 | ) | | $ | (1,618,964 | ) | |
Credit Default Swaps on Corporate and Soverign Issues — Sell Protection(2)(6)
| Counterparty | | Reference
Entity/Obligation | | Buy/Sell
Protection | | (Pay)/
Receive
Fixed
Rate (%) | | Termination
Date | | Implied
Credit Spread
At 12/31/08(3) | | Notional
Amount(4) | | Market
Value(5) | | Upfront
Premium
Paid/
(Received) | | Unrealized
Appreciation/
(Depreciation) | |
| Deutsche Bank AG | | American
International Group
6.250%, 05/01/36 | | Sell | | | 5.000 | | | 12/20/13 | | | 5.40 | % | | USD | 1,000,000 | | | $ | (15,711 | ) | | $ | (90,456 | ) | | $ | 74,745 | | |
Citibank N.A.,
New York | | CIT Group
5.650%, 02/13/17 | | Sell | | | 5.000 | | | 12/20/13 | | | 7.34 | % | | USD | 600,000 | | | | (50,444 | ) | | | (150,185 | ) | | | 99,741 | | |
The Royal Bank of
Scotland PLC | | CIT Group
7.750%, 04/02/12 | | Sell | | | 5.170 | | | 03/20/13 | | | 7.48 | % | | USD | 800,000 | | | | (59,178 | ) | | | — | | | | (59,178 | ) | |
Credit Suisse
International | | Federative
Republic of Brazil
12.250%, 03/06/30 | | Sell | | | 3.350 | | | 12/20/09 | | | 2.29 | % | | USD | 1,000,000 | | | | 10,193 | | | | — | | | | 10,193 | | |
Goldman Sachs
International | | Ford Motor Credit Co.
7.000%, 10/01/13 | | Sell | | | 3.850 | | | 09/20/12 | | | 12.71 | % | | USD | 100,000 | | | | (23,593 | ) | | | — | | | | (23,593 | ) | |
See Accompanying Notes to Financial Statements
204
PORTFOLIO OF INVESTMENTS
ING PIMCO TOTAL RETURN PORTFOLIO AS OF DECEMBER 31, 2008 (CONTINUED)
| Counterparty | | Reference
Entity/Obligation | | Buy/Sell
Protection | | (Pay)/
Receive
Fixed
Rate (%) | | Termination
Date | | Implied
Credit Spread
At 12/31/08(3) | | Notional
Amount(4) | | Market
Value(5) | | Upfront
Premium
Paid/
(Received) | | Unrealized
Appreciation/
(Depreciation) | |
Barclays Bank PLC,
London | | GAZ Capital
(GAZPROM) LPN
8.625%, 04/28/34 | | Sell | | | 1.600 | | | 12/20/12 | | | 10.13 | % | | USD | 1,300,000 | | | $ | (327,324 | ) | | $ | — | | | $ | (327,324 | ) | |
Morgan Stanley
Capital Services Inc. | | GAZ Capital
(GAZPROM) LPN
8.625%, 04/28/34 | | Sell | | | 2.480 | | | 02/20/13 | | | 10.03 | % | | USD | 2,300,000 | | | | (528,574 | ) | | | — | | | | (528,574 | ) | |
Morgan Stanley
Capital Services Inc. | | GAZ Capital
(GAZPROM) LPN
8.625%, 04/28/34 | | Sell | | | 2.180 | | | 02/20/13 | | | 10.03 | % | | USD | 500,000 | | | | (119,475 | ) | | | — | | | | (119,475 | ) | |
| BNP Paribas | | General Electric
Capital Corp.
5.625%, 09/15/17 | | Sell | | | 4.700 | | | 12/20/13 | | | 3.66 | % | | USD | 600,000 | | | | 25,562 | | | | — | | | | 25,562 | | |
Citibank N.A.,
New York | | General Electric
Capital Corp.
5.625%, 09/15/17 | | Sell | | | 4.325 | | | 12/20/13 | | | 3.66 | % | | USD | 300,000 | | | | 8,169 | | | | — | | | | 8,169 | | |
| Barclays Bank PLC | | General Electric
Capital Corp.
6.000%, 06/15/12 | | Sell | | | 0.620 | | | 03/20/11 | | | 4.28 | % | | USD | 1,200,000 | | | | (89,493 | ) | | | — | | | | (89,493 | ) | |
| Barclays Bank PLC | | General Electric
Capital Corp.
6.000%, 06/15/12 | | Sell | | | 0.640 | | | 12/20/12 | | | 3.86 | % | | USD | 1,200,000 | | | | (131,688 | ) | | | — | | | | (131,688 | ) | |
Citibank N.A.,
New York | | General Electric
Capital Corp.
6.000%, 06/15/12 | | Sell | | | 1.050 | | | 03/20/10 | | | 4.45 | % | | USD | 600,000 | | | | (23,823 | ) | | | — | | | | (23,823 | ) | |
| Deutsche Bank AG | | General Electric
Capital Corp.
6.000%, 06/15/12 | | Sell | | | 1.500 | | | 09/20/11 | | | 4.12 | % | | USD | 200,000 | | | | (12,848 | ) | | | — | | | | (12,848 | ) | |
| BNP Paribas | | General Motors Corp.
7.125%, 07/15/13 | | Sell | | | 4.800 | | | 12/20/12 | | | 94.97 | % | | USD | 100,000 | | | | (76,111 | ) | | | — | | | | (76,111 | ) | |
Citibank N.A.,
New York | | General Motors Corp.
7.125%, 07/15/13 | | Sell | | | 4.600 | | | 12/20/12 | | | 94.97 | % | | USD | 100,000 | | | | (76,280 | ) | | | — | | | | (76,280 | ) | |
| Deutsche Bank AG | | General Motors Corp.
7.125%, 07/15/13 | | Sell | | | 4.500 | | | 12/20/12 | | | 94.97 | % | | USD | 100,000 | | | | (76,364 | ) | | | — | | | | (76,364 | ) | |
Goldman Sachs
International | | General Motors Corp.
7.125%, 07/15/13 | | Sell | | | 8.900 | | | 03/20/13 | | | 92.78 | % | | USD | 700,000 | | | | (509,526 | ) | | | — | | | | (509,526 | ) | |
Goldman Sachs
International | | General Motors Corp.
7.125%, 07/15/13 | | Sell | | | 9.050 | | | 03/20/13 | | | 92.78 | % | | USD | 700,000 | | | | (508,615 | ) | | | — | | | | (508,615 | ) | |
| Deutsche Bank AG | | GMAC LLC
6.875%, 08/28/12 | | Sell | | | 3.200 | | | 09/20/12 | | | 8.86 | % | | USD | 200,000 | | | | (33,394 | ) | | | — | | | | (33,394 | ) | |
| Deutsche Bank AG | | GMAC LLC
6.875%, 08/28/12 | | Sell | | | 4.000 | | | 09/20/12 | | | 8.86 | % | | USD | 1,900,000 | | | | (272,425 | ) | | | — | | | | (272,425 | ) | |
Merrill Lynch
International | | GMAC LLC
6.875%, 08/28/12 | | Sell | | | 1.850 | | | 09/20/09 | | | 7.60 | % | | USD | 1,000,000 | | | | (40,271 | ) | | | — | | | | (40,271 | ) | |
| Deutsche Bank AG | | Reynolds American Inc.
7.625%, 06/01/16 | | Sell | | | 1.280 | | | 06/20/17 | | | 3.80 | % | | USD | 600,000 | | | | (92,651 | ) | | | — | | | | (92,651 | ) | |
| Barclays Bank PLC | | SLM Corp.
5.125%, 08/27/12 | | Sell | | | 5.100 | | | 06/20/09 | | | 12.92 | % | | USD | 100,000 | | | | (3,515 | ) | | | — | | | | (3,515 | ) | |
| BNP Paribas | | SLM Corp.
5.125%, 08/27/12 | | Sell | | | 5.150 | | | 03/20/09 | | | 12.92 | % | | USD | 1,400,000 | | | | (23,242 | ) | | | — | | | | (23,242 | ) | |
Citibank N.A.,
New York | | SLM Corp.
5.125%, 08/27/12 | | Sell | | | 4.850 | | | 03/20/13 | | | 8.04 | % | | USD | 700,000 | | | | (68,812 | ) | | | — | | | | (68,812 | ) | |
| | | $ | (3,119,433 | ) | | $ | (240,641 | ) | | $ | (2,878,792 | ) | |
(1) If a Portfolio is a buyer of protection and a credit event occurs, as defined under the terms of that particular swap agreement, a Portfolio will either 1.) receive from the seller of protection an amount equal to the notional amount of the swap and deliver the referenced obligation, other deliverable obligations or underlying securities comprising the referenced index or 2.) receive a net settlement amount in the form of cash or securities equal to the notional amount of the swap less the recovery value of the referenced obligation or underlying securities comprising the referenced index.
(2) If the Portfolio is a seller of protection, and a credit event occurs, as defined under the terms of that particular swap agreement, the Portfolio will generally either 1.) Pay to the buyer an amount equal to the notional amount of the swap and take delivery of the referenced obligation, other deliverable obligations, or underlying securities comprising a referenced index or 2.) Pay a net settlement amount in the form of cash or securities equal to the notional amount of the swap less the recovery value of the referenced obligation or underlying securities comprising a referenced index.
See Accompanying Notes to Financial Statements
205
PORTFOLIO OF INVESTMENTS
ING PIMCO TOTAL RETURN PORTFOLIO AS OF DECEMBER 31, 2008 (CONTINUED)
(3) Implied credit spreads, represented in absolute terms, utilized in determining the market value of credit default swap agreements on corporate issues or sovereign issues are disclosed for credit default swaps sold and serve as an indicator of the current status of the payment/performance risk and represent the likelihood or risk of default for the credit derivative. The implied credit spread of a particular referenced entity reflects the cost of buying/selling protection and may include upfront payments required to be made to enter into the agreement. For credit default swaps on asset-backed securities or credit indices, the quoted market prices and resulting market values, as well as the receive fixed rate, serve as indicators of the current status of the payment/performance risk. Wider credit spreads and increasing market values, in absolute terms when compared to the notional amount of the swap, and high receive fixed rate, represent a deterioration of the referenced entity's credit soundness and a greater likelihood or risk of default or other credit event occurring as defined under the terms of the agreement.
(4) The maximum amount of future payments (undiscounted) that a Portfolio as seller of protection could be required to make or receive as a buyer of credit protection under a credit default swap agreement would be an amount equal to the notional amount of the agreement.
(5) The market values for credit default swap agreements serve as an indicator of the current status of the payment/performance risk and represent the likelihood or risk of default for the credit derivative. Increasing market values, in absolute terms, when compared to the notional amount of the agreement, represent a deterioration of the referenced obligation's credit soundness and a greater likelihood or risk of default or other credit event occurring.
(6) For the reason(s) or why a Portfolio may sell credit protection, please see NOTE 2, "Significant Accounting Policies" in the Notes to Financial Statements.
ING PIMCO Total Return Portfolio Interest Rate Swap Agreements Outstanding on December 31, 2008:
| | | Termination
Date | | Notional
Amount | | Unrealized
Appreciation/
(Depreciation) | |
Receive a fixed rate
equal to 0.710%
and pay a floating rate
based on 2 Year
USD Mid-Market
Swap Spread
Counterparty: BNP Paribas I | | 02/05/09 | | USD | 2,000,000 | | | $ | 3,491 | | |
Receive a fixed rate
equal to 0.763%
and pay a floating rate
based on 5 Year
USD Mid-Market
Swap Spread
Counterparty: BNP Paribas I | | 02/05/09 | | USD | 3,900,000 | | | | 38,020 | | |
Receive a floating rate
based on 30-Day
USD-CMM Rate
(Constant Maturity
Mortgage Rate)
and pay a fixed rate
equal to 5.000%
Counterparty:
Merrill Lynch Capital
Services, Inc. | | 02/20/09 | | USD | 1,400,000 | | | | (249,046 | ) | |
Receive a floating rate
based on 30-Day
USD-CMM Rate
(Constant Maturity
Mortgage Rate)
and pay a fixed rate
equal to 5.500%
Counterparty:
Merrill Lynch Capital
Services, Inc. | | 05/21/09 | | USD | 1,700,000 | | | | (294,244 | ) | |
Receive a fixed rate
equal to 7.250%
and pay a floating rate
based on 3-month
NZD-BBR-FRA
Counterparty:
Citibank N.A., London | | 06/15/09 | | NZD | 5,200,000 | | | | 26,698 | | |
Receive a fixed rate
equal to 7.250%
and pay a floating rate
based on 3-month
NZD-BBR-FRA
Counterparty: UBS AG | | 06/15/09 | | NZD | 21,000,000 | | | | 121,316 | | |
| | | Termination
Date | | Notional
Amount | | Unrealized
Appreciation/
(Depreciation) | |
Receive a fixed rate
equal to 6.000%
and pay a floating rate
based on 6-month
GBP-LIBOR
Counterparty:
Goldman Sachs
Capital Markets, L.P. | | 06/19/09 | | GBP | 7,400,000 | | | $ | 146,526 | | |
Receive a fixed rate
equal to 6.000%
and pay a floating rate
based on 6-month
GBP-LIBOR
Counterparty: The Royal
Bank of Scotland PLC | | 06/19/09 | | GBP | 2,100,000 | | | | 41,197 | | |
Receive a fixed rate
equal to 6.000%
and pay a floating rate
based on 6-month
GBP-LIBOR
Counterparty:
Goldman Sachs
Capital Markets, L.P. | | 12/19/09 | | GBP | 800,000 | | | | 43,514 | | |
Receive a fixed rate
equal to 12.670%
and pay a floating
rate based on the Brazil
Cetip Interbank Deposit
Rate Annualized
Counterparty:
Morgan Stanley Capital
Services, Inc. | | 01/04/10 | | BRL | 1,200,000 | | | | 4,624 | | |
Receive a fixed rate
equal to 12.410%
and pay a floating
rate based on the Brazil
Cetip Interbank Deposit
Rate Annualized
Counterparty:
UBS AG, London | | 01/04/10 | | BRL | 1,200,000 | | | | 4,791 | | |
Receive a fixed rate
equal to 7.500%
and pay a floating rate
based on 3-month
Australian Bank Bill
Counterparty: UBS AG | | 03/15/10 | | AUD | 1,000,000 | | | | 32,041 | | |
See Accompanying Notes to Financial Statements
206
PORTFOLIO OF INVESTMENTS
ING PIMCO TOTAL RETURN PORTFOLIO AS OF DECEMBER 31, 2008 (CONTINUED)
| | | Termination
Date | | Notional
Amount | | Unrealized
Appreciation/
(Depreciation) | |
Receive a fixed rate
equal to 7.000%
and pay a floating rate
based on 3-month
Australian Bank Bill
Counterparty: UBS AG | | 06/15/10 | | AUD | 13,600,000 | | | $ | 312,675 | | |
Receive a fixed rate
equal to 4.000%
and pay a floating rate
based on 3-month
USD-LIBOR
Counterparty: Morgan
Stanley Capital
Services, Inc. | | 06/17/10 | | USD | 5,000,000 | | | | 140,589 | | |
Receive a fixed rate
equal to 4.000%
and pay a floating rate
based on 3-month
USD-LIBOR
Counterparty:
The Royal Bank of
Scotland PLC | | 06/17/10 | | USD | 6,700,000 | | | | 186,739 | | |
Receive a fixed rate
equal to 5.000%
and pay a floating
rate based on 6-month
GBP-LIBOR
Counterparty:
The Royal Bank of
Scotland PLC | | 09/15/10 | | GBP | 900,000 | | | | 67,396 | | |
Receive a fixed rate
equal to 4.000%
and pay a floating rate
based on 3-month
USD-LIBOR
Counterparty: Barclays
Bank PLC | | 12/16/10 | | USD | 1,100,000 | | | | 23,998 | | |
Receive a fixed rate
equal to 7.500%
and pay a floating rate
based on 6-month
Australian Bank Bill
Counterparty: UBS AG | | 03/15/11 | | AUD | 6,100,000 | | | | 298,385 | | |
Receive a fixed rate
equal to 4.000%
and pay a floating rate
based on 3-month
USD-LIBOR
Counterparty:
Merrill Lynch Capital
Services, Inc. | | 06/17/11 | | USD | 4,700,000 | | | | 111,999 | | |
Receive a fixed rate
equal to 4.000%
and pay a floating rate
based on 3-month
USD-LIBOR
Counterparty:
The Royal Bank of
Scotland PLC | | 06/17/11 | | USD | 26,200,000 | | | | 286,504 | | |
| | | Termination
Date | | Notional
Amount | | Unrealized
Appreciation/
(Depreciation) | |
Receive a fixed rate
equal to 11.980%
and pay a floating
rate based on the Brazil
Cetip Interbank Deposit
Rate Annualized
Counterparty:
Merrill Lynch Capital
Services, Inc. | | 01/02/12 | | BRL | 2,100,000 | | | $ | (6,407 | ) | |
Receive a fixed rate
equal to 12.540%
and pay a floating
rate based on the Brazil
Cetip Interbank Deposit
Rate Annualized
Counterparty:
Merrill Lynch Capital
Services, Inc. | | 01/02/12 | | BRL | 2,900,000 | | | | 22,858 | | |
Receive a fixed rate
equal to 14.765%
and pay a floating
rate based on the Brazil
Cetip Interbank Deposit
Rate Annualized
Counterparty:
Merrill Lynch Capital
Services, Inc. | | 01/02/12 | | BRL | 400,000 | | | | 11,727 | | |
Receive a fixed rate
equal to 10.575%
and pay a floating
rate based on the Brazil
Cetip Interbank Deposit
Rate Annualized
Counterparty:
UBS AG, London | | 01/02/12 | | BRL | 2,500,000 | | | | (20,754 | ) | |
Receive a fixed rate
equal to 1.948%
and pay a floating rate
based on France
CPI Ex Tobacco Index
(FRCPXTOB)
Counterparty: Barclays
Bank PLC, London I | | 03/15/12 | | EUR | 1,000,000 | | | | 25,918 | | |
Receive a fixed rate
equal to 1.955%
and pay a floating rate
based on France
CPI Ex Tobacco Index
(FRCPXTOB)
Counterparty: The Royal
Bank of Scotland PLC I | | 03/28/12 | | EUR | 300,000 | | | | 7,109 | | |
Receive a fixed rate
equal to 1.960%
and pay a floating rate
based on France
CPI Ex Tobacco Index
(FRCPXTOB)
Counterparty: Goldman
Sachs Capital Markets, L.P. I | | 03/30/12 | | EUR | 300,000 | | | | 9,006 | | |
See Accompanying Notes to Financial Statements
207
PORTFOLIO OF INVESTMENTS
ING PIMCO TOTAL RETURN PORTFOLIO AS OF DECEMBER 31, 2008 (CONTINUED)
| | | Termination
Date | | Notional
Amount | | Unrealized
Appreciation/
(Depreciation) | |
Receive a fixed rate
equal to 1.950%
and pay a floating rate
based on France
CPI Ex Tobacco Index
(FRCPXTOB)
Counterparty: The Royal
Bank of Scotland PLC I | | 03/30/12 | | EUR | 300,000 | | | $ | 6,931 | | |
Receive a fixed rate
equal to 1.960%
and pay a floating rate
based on France
CPI Ex Tobacco Index
(FRCPXTOB)
Counterparty: Barclays
Bank PLC, London I | | 04/05/12 | | EUR | 200,000 | | | | 5,033 | | |
Receive a fixed rate
equal to 1.940%
and pay a floating rate
based on France
CPI Ex Tobacco Index
(FRCPXTOB)
Counterparty: BNP Paribas | | 04/10/12 | | EUR | 500,000 | | | | 13,223 | | |
Receive a fixed rate
equal to 1.940%
and pay a floating rate
based on France
CPI Ex Tobacco Index
(FRCPXTOB)
Counterparty: The Royal
Bank of Scotland PLC | | 04/10/12 | | EUR | 500,000 | | | | 10,527 | | |
Receive a fixed rate
equal to 1.980%
and pay a floating rate
based on France
CPI Ex Tobacco Index
(FRCPXTOB)
Counterparty: Barclays
Bank PLC, London I | | 04/30/12 | | EUR | 300,000 | | | | 7,437 | | |
Receive a fixed rate
equal to 7.000%
and pay a floating rate
based on 6-month
Australian Bank Bill
Counterparty: Deutsche
Bank AG, Frankfurt | | 03/20/13 | | AUD | 800,000 | | | | 52,735 | | |
Receive a fixed rate
equal to 5.000%
and pay a floating rate
based on 6-month
GBP-LIBOR
Counterparty: Goldman
Sachs Capital Markets, L.P. | | 09/17/13 | | GBP | 200,000 | | | | 20,689 | | |
Receive a fixed rate
equal to 5.000%
and pay a floating rate
based on 6-month
GBP-LIBOR
Counterparty: HSBC
Bank USA, N.A. | | 09/17/13 | | GBP | 1,200,000 | | | | 122,912 | | |
Receive a fixed rate
equal to 4.500%
and pay a floating rate
based on 6-month
EUR-EURIBOR
Counterparty: BNP Paribas | | 03/18/14 | | EUR | 900,000 | | | | 83,692 | | |
| | | Termination
Date | | Notional
Amount | | Unrealized
Appreciation/
(Depreciation) | |
Receive a fixed rate
equal to 5.000%
and pay a floating rate
based on 6-month
GBP-LIBOR
Counterparty: Deutsche
Bank AG, Frankfurt | | 03/18/14 | | GBP | 1,300,000 | | | $ | 157,266 | | |
Receive a fixed rate
equal to 5.000%
and pay a floating rate
based on 6-month
GBP-LIBOR
Counterparty: Deutsche
Bank AG, Frankfurt | | 03/18/14 | | GBP | 3,900,000 | | | | 470,328 | | |
Receive a fixed rate
equal to 5.250%
and pay a floating rate
based on 6-month
GBP-LIBOR
Counterparty: Goldman
Sachs Capital Markets, L.P. | | 03/18/14 | | GBP | 300,000 | | | | 41,517 | | |
Receive a fixed rate
equal to 5.250%
and pay a floating rate
based on 6-month
GBP-LIBOR
Counterparty: The Royal
Bank of Scotland PLC | | 03/18/14 | | GBP | 600,000 | | | | 83,370 | | |
Receive a floating rate
based on 3-month
USD-LIBOR and pay a
fixed rate equal to 4.000%
Counterparty: The Royal
Bank of Scotland PLC | | 06/17/16 | | USD | 100,000 | | | | (1,450 | ) | |
Receive a fixed rate
equal to 8.860%
and pay a floating rate
based on 28-day
MXN-TIIE-BANXICO
Counterparty:
Citibank N.A., New York | | 09/12/16 | | MXN | 5,700,000 | | | | 14,443 | | |
Receive a floating rate
based on 3-month
USD-LIBOR and pay a
fixed rate equal to 5.000%
Counterparty: Goldman
Sachs Capital Markets, L.P. | | 12/17/18 | | USD | 400,000 | | | | (66,021 | ) | |
Receive a floating rate
based on 3-month
USD-LIBOR and pay a
fixed rate equal to 5.000%
Counterparty:
Morgan Stanley
Capital Services, Inc. | | 12/17/18 | | USD | 100,000 | | | | (16,495 | ) | |
Receive a floating rate
based on 3-month
USD-LIBOR and pay a
fixed rate equal to 4.000%
Counterparty:
Barclays Bank PLC | | 06/17/19 | | USD | 6,900,000 | | | | (226,635 | ) | |
Receive a floating rate
based on 3-month
USD-LIBOR and pay a
fixed rate equal to 4.000%
Counterparty: Credit
Suisse International | | 06/17/24 | | USD | 3,000,000 | | | | (41,570 | ) | |
See Accompanying Notes to Financial Statements
208
PORTFOLIO OF INVESTMENTS
ING PIMCO TOTAL RETURN PORTFOLIO AS OF DECEMBER 31, 2008 (CONTINUED)
| | | Termination
Date | | Notional
Amount | | Unrealized
Appreciation/
(Depreciation) | |
Receive a floating rate
based on 3-month
USD-LIBOR and pay a
fixed rate equal to 5.000%
Counterparty: Barclays
Bank PLC | | 12/17/28 | | USD | 27,000,000 | | | $ | (9,681,066 | ) | |
Receive a floating rate
based on 3-month
USD-LIBOR and pay a
fixed rate equal to 5.000%
Counterparty:
Morgan Stanley
Capital Services, Inc. | | 12/17/28 | | USD | 2,700,000 | | | | (901,275 | ) | |
Receive a floating rate
based on 3-month
USD-LIBOR and pay a
fixed rate equal to 5.000%
Counterparty: The Royal
Bank of Scotland PLC | | 12/17/28 | | USD | 700,000 | | | | (236,591 | ) | |
Receive a floating rate
based on 3-month
USD-LIBOR and pay a
fixed rate equal to 3.000%
Counterparty:
Citibank N.A., New York | | 06/17/29 | | USD | 1,900,000 | | | | 125,443 | | |
Receive a floating rate
based on 3-month
USD-LIBOR and pay a
fixed rate equal to 3.000%
Counterparty: The Royal
Bank of Scotland PLC | | 06/17/29 | | USD | 1,000,000 | | | | 27,487 | | |
Receive a floating rate
based on 6-month
GBP-LIBOR and pay a
fixed rate equal to 4.000%
Counterparty: Barclays
Bank PLC, London | | 12/15/35 | | GBP | 1,100,000 | | | | (86,386 | ) | |
Receive a floating rate
based on 6-month
GBP-LIBOR and pay a
fixed rate equal to 4.000%
Counterparty:
Deutsche Bank AG | | 12/15/35 | | GBP | 2,900,000 | | | | (294,826 | ) | |
Receive a floating rate
based on 6-month
GBP-LIBOR and pay a
fixed rate equal to 4.000%
Counterparty: Goldman
Sachs Capital Markets, L.P. | | 12/15/35 | | GBP | 4,900,000 | | | | (444,352 | ) | |
Receive a floating rate
based on 6-month
GBP-LIBOR and pay a
fixed rate equal to 4.250%
Counterparty: Goldman
Sachs Capital Markets, L.P. | | 06/12/36 | | GBP | 600,000 | | | | (189,021 | ) | |
| | | Termination
Date | | Notional
Amount | | Unrealized
Appreciation/
(Depreciation) | |
Receive a floating rate
based on 6-month
GBP-LIBOR and pay a
fixed rate equal to 5.500%
Counterparty: Goldman
Sachs Capital Markets, L.P. | | 12/15/36 | | GBP | 500,000 | | | $ | (208,354 | ) | |
Receive a floating rate
based on 6-month
GBP-LIBOR and pay a
fixed rate equal to 5.500%
Counterparty: The Royal
Bank of Scotland PLC | | 12/15/36 | | GBP | 100,000 | | | | (42,402 | ) | |
Receive a floating rate
based on 6-month
GBP-LIBOR and pay a
fixed rate equal to 5.000%
Counterparty: Goldman
Sachs Capital Markets, L.P. | | 12/19/37 | | GBP | 100,000 | | | | (47,431 | ) | |
Receive a floating rate
based on 3-month
USD-LIBOR and pay a
fixed rate equal to 5.000%
Counterparty:
Citibank N.A., New York | | 12/17/38 | | USD | 4,500,000 | | | | (2,093,591 | ) | |
Receive a floating rate
based on 3-month
USD-LIBOR and pay a
fixed rate equal to 5.000%
Counterparty: Merrill
Lynch Capital Services, Inc. | | 12/17/38 | | USD | 2,500,000 | | | | (1,107,182 | ) | |
Receive a floating rate
based on 3-month
USD-LIBOR and pay a
fixed rate equal to 5.000%
Counterparty:
Morgan Stanley
Capital Services, Inc. | | 12/17/38 | | USD | 900,000 | | | | (423,696 | ) | |
Receive a floating rate
based on 3-month
USD-LIBOR and pay a
fixed rate equal to 5.000%
Counterparty: The Royal
Bank of Scotland PLC | | 12/17/38 | | USD | 12,500,000 | | | | (4,550,239 | ) | |
| | | $ | (18,018,880 | ) | |
See Accompanying Notes to Financial Statements
209
PORTFOLIO OF INVESTMENTS
ING PIONEER HIGH YIELD PORTFOLIO AS OF DECEMBER 31, 2008
| Shares | | | | | | Value | |
| COMMON STOCK: 10.0% | | | |
| | | | | Aerospace/Defense: 0.4% | |
| | 164,500 | | | @ | | BE Aerospace, Inc. | | $ | 1,265,005 | | |
| | | | 1,265,005 | | |
| | | | | Auto Parts & Equipment: 0.0% | |
| | 16,900 | | | @ | | Commercial Vehicle Group, Inc. | | | 15,717 | | |
| | | | 15,717 | | |
| | | | | Biotechnology: 0.6% | |
| | 22,470 | | | @ | | Bio-Rad Laboratories, Inc. | | | 1,692,216 | | |
| | | | 1,692,216 | | |
| | | | | Building Materials: 0.3% | |
| | 13,600 | | | | | Lennox International, Inc. | | | 439,144 | | |
| | 11,600 | | | | | Texas Industries, Inc. | | | 400,200 | | |
| | | | 839,344 | | |
| | | | | Commercial Services: 0.4% | |
| | 211,529 | | | | | Service Corp. International | | | 1,051,299 | | |
| | | | 1,051,299 | | |
| | | | | Electric: 0.6% | |
| | 53,000 | | | @ | | NRG Energy, Inc. | | | 1,236,490 | | |
| | 13,600 | | | | | Public Service Enterprise
Group, Inc. | | | 396,712 | | |
| | | | 1,633,202 | | |
| | | | | | | Electrical Components &
Equipment: 0.2% | | | | | |
| | 30,600 | | | @ | | General Cable Corp. | | | 541,314 | | |
| | | | 541,314 | | |
| | | | | Electronics: 2.1% | |
| | 28,508 | | | @ | | Itron, Inc. | | | 1,817,100 | | |
| | 46,800 | | | @ | | Thermo Electron Corp. | | | 1,594,476 | | |
| | 58,764 | | | @@ | | Tyco Electronics Ltd. | | | 952,564 | | |
| | 38,500 | | | @ | | Waters Corp. | | | 1,411,025 | | |
| | | | 5,775,165 | | |
| | | | | Entertainment: 0.8% | |
| | 7,330 | | | | | Cinemark Holdings, Inc. | | | 54,462 | | |
| | 90,700 | | | | | International Game Technology | | | 1,078,423 | | |
| | 65,790 | | | @ | | Scientific Games Corp. | | | 1,153,957 | | |
| | | | 2,286,842 | | |
| | | | | Gas: 0.2% | |
| | 15,942 | | | | | Sempra Energy | | | 679,607 | | |
| | | | 679,607 | | |
| | | | | Healthcare-Products: 0.3% | |
| | 15,000 | | | @ | | Inverness Medical
Innovations, Inc. | | | 283,650 | | |
| | 17,141 | | | @ | | Thoratec Corp. | | | 556,911 | | |
| | | | 840,561 | | |
| | | | | Healthcare-Services: 0.5% | |
| | 41,800 | | | | | Cigna Corp. | | | 704,330 | | |
| | 30,000 | | | | | UnitedHealth Group, Inc. | | | 798,000 | | |
| | | | 1,502,330 | | |
| | | | | Media: 0.2% | |
| | 25,500 | | | | | McGraw-Hill Cos., Inc. | | | 591,345 | | |
| | | | 591,345 | | |
| Shares | | | | | | Value | |
| | | | | Mining: 0.4% | |
| | 6,000 | | | @@ | | Barrick Gold Corp. | | $ | 220,620 | | |
| | 138,576 | | | @,@@ | | Polymet Mining Corp. | | | 92,846 | | |
| | 91,100 | | | | | Titanium Metals Corp. | | | 802,591 | | |
| | | | 1,116,057 | | |
| | | | | Miscellaneous Manufacturing: 1.2% | |
| | 31,033 | | | | | Cooper Industries Ltd. | | | 907,095 | | |
| | 35,254 | | | @ | | ESCO Technologies, Inc. | | | 1,443,651 | | |
| | 21,900 | | | | | ITT Corp. | | | 1,007,181 | | |
| | | | 3,357,927 | | |
| | | | | Oil & Gas: 0.7% | |
| | 31,600 | | | | | Marathon Oil Corp. | | | 864,576 | | |
| | 20,900 | | | | | Questar Corp. | | | 683,221 | | |
| | 49,641 | | | @ | | SandRidge Energy, Inc. | | | 305,292 | | |
| | | | 1,853,089 | | |
| | | | | Retail: 0.3% | |
| | 40,100 | | | | | JC Penney Co., Inc. | | | 789,970 | | |
| | | | 789,970 | | |
| | | | | Telecommunications: 0.8% | |
| | 67,240 | | | @ | | CommScope, Inc. | | | 1,044,910 | | |
| | 11,651 | | | @ | | General Communication, Inc. | | | 94,257 | | |
| | 133,100 | | | | | Windstream Corp. | | | 1,224,520 | | |
| | | | 2,363,687 | | |
Total Common Stock
(Cost $35,332,157) | | | 28,194,677 | | |
| REAL ESTATE INVESTMENT TRUSTS: 0.7% | | | |
| | | | | Mortgage: 0.7% | |
| | 128,234 | | | | | Annaly Capital Management, Inc. | | | 2,035,074 | | |
Total Real Estate
Investment Trusts
(Cost $1,809,121) | | | 2,035,074 | | |
| PREFERRED STOCK: 2.7% | | | |
| | | | | Banks: 0.7% | |
| | 3,295 | | | | | Bank of America Corp. | | | 2,141,750 | | |
| | | | 2,141,750 | | |
| | | | | Diversified Financial Services: 0.2% | |
| | 10,000 | | | | | Legg Mason, Inc. | | | 220,000 | | |
| | 232 | | | #,P | | Preferred Blocker, Inc. | | | 231,819 | | |
| | | | 451,819 | | |
| | | | | Electric: 0.2% | |
| | 10,700 | | | | | CMS Energy Corp. | | | 567,769 | | |
| | | | 567,769 | | |
| | | | | | | Electrical Components &
Equipment: 0.1% | | | | | |
| | 2,200 | | | P | | General Cable Corp. | | | 272,525 | | |
| | | | 272,525 | | |
| | | | | Healthcare-Products: 0.1% | |
| | 3,080 | | | | | Inverness Medical
Innovations, Inc. | | | 372,629 | | |
| | | | 372,629 | | |
| | | | | Media: 0.0% | |
| | 2 | | | &,P | | ION Media Networks, Inc. | | | 14,017 | | |
| | | | 14,017 | | |
See Accompanying Notes to Financial Statements
210
PORTFOLIO OF INVESTMENTS
ING PIONEER HIGH YIELD PORTFOLIO AS OF DECEMBER 31, 2008 (CONTINUED)
| Shares | | | | | | Value | |
| | | | | Mining: 1.2% | |
| | 1,650 | | | | | Freeport-McMoRan Copper &
Gold, Inc. | | $ | 1,025,475 | | |
| | 49,820 | | | | | Freeport-McMoRan Copper &
Gold, Inc. - Non Voting | | | 2,363,959 | | |
| | | | 3,389,434 | | |
| | | | | Oil & Gas: 0.1% | |
| | 13,600 | | | | | Petroquest Energy, Inc. | | | 334,288 | | |
| | | | 334,288 | | |
| | | | | Savings & Loans: 0.1% | |
| | 10,000 | | | | | Sovereign Capital Trust | | | 189,400 | | |
| | | | 189,400 | | |
Total Preferred Stock
(Cost $9,478,706) | | | 7,733,631 | | |
| WARRANTS: 0.0% | | | |
| | | | | Building Materials: 0.0% | |
| | 195 | | | # | | Dayton Superior Corp. | | | 2 | | |
| | | | 2 | | |
| | | | | Media: 0.0% | |
| | 48 | | | | | Sirius XM Radio, Inc. | | | 25 | | |
| | | | 25 | | |
| | | | | Telecommunications: 0.0% | |
| | 218 | | | # | | NTELOS, Inc. - CW10 | | | — | | |
| | | | — | | |
Total Warrants
(Cost $6,440) | | | 27 | | |
Principal
Amount | | | | | | Value | |
| CONVERTIBLE BONDS: 8.8% | | | |
| | | | | Advertising: 0.2% | |
| $ | 865,000 | | | #,C | | Interpublic Group of Cos., Inc.,
4.250%, due 03/15/23 | | | 565,494 | | |
| | | | 565,494 | | |
| | | | | Coal: 0.5% | |
| | 2,350,000 | | | | | Massey Energy Co., 3.250%,
due 08/01/15 | | | 1,286,625 | | |
| | | | 1,286,625 | | |
| | | | | Distribution/Wholesale: 0.8% | |
| | 3,865,000 | | | C | | WESCO International, Inc.,
1.750%, due 11/15/26 | | | 2,149,906 | | |
| | | | 2,149,906 | | |
| | | | | | | Electrical Components &
Equipment: 0.6% | | | | | |
| | 2,785,000 | | | | | General Cable Corp., 1.000%,
due 10/15/12 | | | 1,751,069 | | |
| | | | 1,751,069 | | |
| | | | | Electronics: 0.6% | |
| | 1,000,000 | | | C | | Itron, Inc., 2.500%, due 08/01/26 | | | 1,077,500 | | |
| | 1,000,000 | | | # | | Newport Corp., 2.500%,
due 02/15/12 | | | 590,000 | | |
| | | | 1,667,500 | | |
Principal
Amount | | | | | | Value | |
| | | | | Energy-Alternate Sources: 0.0% | |
| $ | 465,000 | | | #,C | | Diversa Corp., 5.500%,
due 04/01/27 | | $ | 111,600 | | |
| | | | 111,600 | | |
| | | | | Entertainment: 1.0% | |
| | 555,000 | | | | | Macrovision Corp., 2.625%,
due 08/15/11 | | | 398,213 | | |
| | 2,060,000 | | | +,C | | Scientific Games Corp.,
0.750% (step rate 0.500%),
due 12/01/24 | | | 1,784,475 | | |
| | 800,000 | | | C | | Shuffle Master, Inc., 1.250%,
due 04/15/24 | | | 720,000 | | |
| | | | 2,902,688 | | |
| | | | | Healthcare-Products: 0.0% | |
| | 35,000 | | | # | | Inverness Medical Innovations,
Inc., 3.000%, due 05/15/16 | | | 22,225 | | |
| | | | 22,225 | | |
| | | | | Healthcare-Services: 0.5% | |
| | 2,035,000 | | | C | | LifePoint Hospitals, Inc.,
3.250%, due 08/15/25 | | | 1,472,831 | | |
| | | | 1,472,831 | | |
| | | | | Machinery-Diversified: 0.9% | |
| | 4,585,000 | | | +,C | | Roper Industries, Inc.,
1.481% (step rate 0.000%),
due 01/15/34 | | | 2,481,631 | | |
| | | | 2,481,631 | | |
| | | | | Oil & Gas: 0.8% | |
| | 1,890,000 | | | C | | Chesapeake Energy Corp.,
2.500%, due 05/15/37 | | | 1,112,738 | | |
| | 2,425,000 | | | +,#,C | | Hercules Offshore, LLC,
3.375% (step rate 0.000%),
due 06/01/38 | | | 1,121,563 | | |
| | | | 2,234,301 | | |
| | | | | Pharmaceuticals: 1.4% | |
| | 1,525,000 | | | | | BioMarin Pharmaceuticals, Inc.,
1.875%, due 04/23/17 | | | 1,427,781 | | |
| | 390,000 | | | C | | EPIX Pharmaceuticals, Inc.,
3.000%, due 06/15/24 | | | 120,900 | | |
| | 690,000 | | | | | MannKind Corp., 3.750%,
due 12/15/13 | | | 371,738 | | |
| | 3,510,000 | | | C | | Omnicare, Inc., 3.250%,
due 12/15/35 | | | 1,987,538 | | |
| | | | 3,907,957 | | |
| | | | | Real Estate: 0.5% | |
| | 1,700,000 | | | #,C | | Alexandria Real Estate
Equities, Inc., 3.700%,
due 01/15/27 | | | 1,158,125 | | |
| | 2,065,000 | | | #,C | | General Growth Properties, Inc.,
3.980%, due 04/15/27 | | | 167,781 | | |
| | | | 1,325,906 | | |
See Accompanying Notes to Financial Statements
211
PORTFOLIO OF INVESTMENTS
ING PIONEER HIGH YIELD PORTFOLIO AS OF DECEMBER 31, 2008 (CONTINUED)
Principal
Amount | | | | | | Value | |
| | | | | Telecommunications: 0.5% | |
| $ | 630,000 | | | # | | Anixter International, Inc.,
1.000%, due 02/15/13 | | $ | 396,113 | | |
| | 1,070,000 | | | @@,C | | Nortel Networks Corp., 2.125%,
due 04/15/14 | | | 155,150 | | |
| | 1,445,000 | | | C | | TW Telecom, Inc., 2.375%,
due 04/01/26 | | | 924,800 | | |
| | | | 1,476,063 | | |
| | | | | Transportation: 0.4% | |
| | 2,190,000 | | | | | Horizon Lines, Inc., 4.250%,
due 08/15/12 | | | 1,133,325 | | |
| | | | 1,133,325 | | |
| | | | | Trucking & Leasing: 0.1% | |
| | 585,000 | | | C | | Greenbrier Cos., Inc., 2.375%,
due 05/15/26 | | | 234,731 | | |
| | | | 234,731 | | |
Total Convertible Bonds
(Cost $32,406,107) | | | 24,723,852 | | |
| CORPORATE BONDS/NOTES: 61.0% | | | |
| | | | | Advertising: 0.4% | |
| | 1,830,000 | | | C | | Interpublic Group of Cos., Inc.,
7.250%, due 08/15/11 | | | 960,750 | | |
| | 115,000 | | | C | | Visant Holding Corp., 10.250%,
due 12/01/13 | | | 85,675 | | |
| | | | 1,046,425 | | |
| | | | | Aerospace/Defense: 4.2% | |
| | 2,310,000 | | | C | | BE Aerospace, Inc., 8.500%,
due 07/01/18 | | | 2,084,775 | | |
| | 5,815,000 | | | C | | DRS Technologies, Inc., 6.875%,
due 11/01/13 | | | 5,791,810 | | |
| | 2,000,000 | | | C | | Esterline Technologies Corp.,
6.625%, due 03/01/17 | | | 1,710,000 | | |
| | 2,500,000 | | | C | | Esterline Technologies Corp.,
7.750%, due 06/15/13 | | | 2,187,500 | | |
| | | | 11,774,085 | | |
| | | | | Agriculture: 0.9% | |
| | 1,765,000 | | | C | | Alliance One International, Inc.,
8.500%, due 05/15/12 | | | 1,306,100 | | |
| | 1,415,000 | | | C | | Alliance One International, Inc.,
11.000%, due 05/15/12 | | | 1,181,525 | | |
| | | | 2,487,625 | | |
| | | | | Airlines: 0.2% | |
| | 390,000 | | | C | | AMR Corp., 8.608%, due 04/01/11 | | | 253,500 | | |
| | 120,959 | | | C | | Continental Airlines, Inc.,
7.461%, due 04/01/13 | | | 84,672 | | |
| | 284,194 | | | C | | Continental Airlines, Inc.,
7.461%, due 04/01/15 | | | 196,094 | | |
| | | | 534,266 | | |
| | | | | Auto Manufacturers: 0.0% | |
| | 555,000 | | | C | | General Motors Corp., 8.375%,
due 07/15/33 | | | 99,900 | | |
| | | | 99,900 | | |
Principal
Amount | | | | | | Value | |
| | | | | Auto Parts & Equipment: 1.8% | |
| $ | 760,000 | | | C | | Accuride Corp., 8.500%,
due 02/01/15 | | $ | 252,700 | | |
| | 2,065,000 | | | &,#,C | | Allison Transmission, Inc.,
11.250%, due 11/01/15 | | | 826,000 | | |
| | 380,000 | | | C | | Cooper Standard Automotive,
Inc., 7.000%, due 12/15/12 | | | 115,900 | | |
| | 345,000 | | | C | | Cooper Standard Automotive,
Inc., 8.375%, due 12/15/14 | | | 62,100 | | |
| | 571,000 | | | | | Goodyear Tire & Rubber Co.,
4.943%, due 04/30/14 | | | 312,623 | | |
| | 2,600,000 | | | C | | Lear Corp., 8.750%, due 12/01/16 | | | 767,000 | | |
| | 1,971,000 | | | C | | Tenneco, Inc., 8.625%,
due 11/15/14 | | | 758,835 | | |
| | 1,000,000 | | | C | | Titan International, Inc.,
8.000%, due 01/15/12 | | | 745,000 | | |
| | 2,470,000 | | | #,C | | TRW Automotive, Inc.,
7.250%, due 03/15/17 | | | 1,272,050 | | |
| | 220,000 | | | C | | United Components, Inc.,
9.375%, due 06/15/13 | | | 93,500 | | |
| | | | 5,205,708 | | |
| | | | | Banks: 0.4% | |
| | 140,000 | | | C | | BAC Capital Trust VI,
5.625%, due 03/08/35 | | | 117,962 | | |
| | 306,000 | | | C | | Bank of America Corp.,
8.000%, due 12/01/49 | | | 220,418 | | |
| | 1,040,000 | | | C | | Citigroup, Inc., 8.400%,
due 04/29/49 | | | 688,002 | | |
| | | | 1,026,382 | | |
| | | | | Beverages: 0.1% | |
| | 175,000 | | | C | | Constellation Brands, Inc.,
8.375%, due 12/15/14 | | | 167,125 | | |
| | | | 167,125 | | |
| | | | | Biotechnology: 0.3% | |
| | 1,200,000 | | | C | | Bio-Rad Laboratories, Inc.,
6.125%, due 12/15/14 | | | 969,000 | | |
| | | | 969,000 | | |
| | | | | Building Materials: 0.7% | |
| | 310,000 | | | | | Hudson Product Corp.,
8.000%, due 08/27/15 | | | 244,900 | | |
| | 400,000 | | | C | | Nortek, Inc., 10.000%,
due 12/01/13 | | | 274,000 | | |
| | 1,790,000 | | | C | | Texas Industries, Inc., 7.250%,
due 07/15/13 | | | 1,391,725 | | |
| | | | 1,910,625 | | |
| | | | | Chemicals: 1.4% | |
| | 4,000,000 | | | ± | | Arco Chemical Co., 9.800%,
due 02/01/20 | | | 460,000 | | |
| | 1,250,000 | | | C | | Chemtura Corp., 6.875%,
due 06/01/16 | | | 643,750 | | |
| | 4,500,000 | | | C | | Georgia Gulf Corp., 9.500%,
due 10/15/14 | | | 1,372,500 | | |
| | 1,500,000 | | | C | | Georgia Gulf Corp., 10.750%,
due 10/15/16 | | | 367,500 | | |
| | 320,000 | | | @@,#,C | | Ineos Group Holdings PLC,
8.500%, due 02/15/16 | | | 30,400 | | |
See Accompanying Notes to Financial Statements
212
PORTFOLIO OF INVESTMENTS
ING PIONEER HIGH YIELD PORTFOLIO AS OF DECEMBER 31, 2008 (CONTINUED)
Principal
Amount | | | | | | Value | |
| | | | | Chemicals (continued) | |
| $ | 2,050,000 | | | ± | | Millennium America, Inc.,
7.625%, due 11/15/26 | | $ | 71,750 | | |
| | 1,956,000 | | | @@,C | | Nova Chemicals Corp., 6.500%,
due 01/15/12 | | | 821,520 | | |
| | 1,200,000 | | | @@,C | | Nova Chemicals Corp., 7.875%,
due 09/15/25 | | | 312,000 | | |
| | | | 4,079,420 | | |
| | | | | Coal: 0.7% | |
| | 420,000 | | | @@,#,C | | Griffin Coal Mining Co. Pty Ltd.,
9.500%, due 12/01/16 | | | 142,800 | | |
| | 2,620,000 | | | C | | Massey Energy Co., 6.875%,
due 12/15/13 | | | 1,951,900 | | |
| | | | 2,094,700 | | |
| | | | | Commercial Services: 1.4% | |
| | 234,891 | | | | | ACE Cash Express, Inc.,
6.035%, due 10/05/13 | | | 120,382 | | |
| | 630,000 | | | #,C | | Ceridian Corp., 11.500%,
due 11/15/15 | | | 336,263 | | |
| | 500,000 | | | &,#,C | | Ceridian Corp., 12.250%,
due 11/15/15 | | | 246,875 | | |
| | 342,018 | | | | | NCO Group, Inc., 6.193%,
due 05/15/13 | | | 271,904 | | |
| | 1,350,000 | | | C | | NCO Group, Inc., 7.024%,
due 11/15/13 | | | 681,750 | | |
| | 350,000 | | | C | | NCO Group, Inc., 11.875%,
due 11/15/14 | | | 176,750 | | |
| | 210,000 | | | C | | Sheridan Group, Inc., 10.250%,
due 08/15/11 | | | 148,313 | | |
| | 2,130,000 | | | #,C | | Ticketmaster, 10.750%,
due 08/01/16 | | | 1,160,850 | | |
| | 1,000,000 | | | C | | United Rentals North America,
Inc., 6.500%, due 02/15/12 | | | 795,000 | | |
| | | | 3,938,087 | | |
| | | | | Computers: 0.4% | |
| | 345,000 | | | C | | Activant Solutions, Inc.,
9.500%, due 05/01/16 | | | 162,150 | | |
| | 472,000 | | | C | | Sungard Data Systems, Inc.,
9.125%, due 08/15/13 | | | 410,640 | | |
| | 626,000 | | | C | | SunGard Data Systems, Inc.,
10.250%, due 08/15/15 | | | 416,290 | | |
| | | | 989,080 | | |
| | | | | Distribution/Wholesale: 1.1% | |
| | 1,000,000 | | | #,C | | ACE Hardware Corp., 9.125%,
due 06/01/16 | | | 665,000 | | |
| | 750,000 | | | C | | Intcomex, Inc., 11.750%,
due 01/15/11 | | | 339,375 | | |
| | 3,130,000 | | | C | | Wesco Distribution, Inc.,
7.500%, due 10/15/17 | | | 2,061,888 | | |
| | | | 3,066,263 | | |
| | | | | Diversified Financial Services: 3.3% | |
| | 820 | | | C | | AES Red Oak, LLC, 8.540%,
due 11/30/19 | | | 726 | | |
| | 760,000 | | | C | | Altra Industrial Motion, Inc.,
9.000%, due 12/01/11 | | | 722,000 | | |
| | 460,000 | | | #,C | | Buffalo Thunder Development
Authority, 9.375%,
due 12/15/14 | | | 94,300 | | |
Principal
Amount | | | | | | Value | |
| $ | 800,000 | | | @@,#,C | | CEVA Group PLC, 10.000%,
due 09/01/14 | | $ | 597,000 | | |
| | 360,000 | | | #,C | | FireKeepers Development
Authority, 13.875%,
due 05/01/15 | | | 225,000 | | |
| | 635,000 | | | | | Ford Motor Credit Co., LLC,
7.250%, due 10/25/11 | | | 464,141 | | |
| | 320,000 | | | | | Ford Motor Credit Co., LLC,
7.569%, due 01/13/12 | | | 208,400 | | |
| | 555,000 | | | | | Ford Motor Credit Co., LLC,
7.800%, due 06/01/12 | | | 389,637 | | |
| | 620,000 | | | | | Ford Motor Credit Co., LLC,
9.203%, due 04/15/09 | | | 599,075 | | |
| | 315,000 | | | | | Ford Motor Credit Co., LLC,
9.875%, due 08/10/11 | | | 232,502 | | |
| | 147,000 | | | | | General Motors Acceptance Corp.,
6.750%, due 12/01/14 | | | 168,745 | | |
| | 927,000 | | | | | General Motors Acceptance Corp.,
6.875%, due 09/15/11 | | | 949,710 | | |
| | 230,000 | | | &,C | | Hawker Beechcraft Acquisition
Co. LLC/Hawker Beechcraft
Notes Co., 8.875%,
due 04/01/15 | | | 79,350 | | |
| | 645,000 | | | C,W | | Hawker Beechcraft Acquisition
Co. LLC/Hawker Beechcraft
Notes Co., 9.750%,
due 04/01/17 | | | 177,375 | | |
| | 420,000 | | | C | | Hexion US Finance Corp./Hexion
Nova Scotia Finance ULC,
9.750%, due 11/15/14 | | | 121,800 | | |
| | 2,335,000 | | | C | | Hughes Network Systems
LLC/HNS Finance Corp.,
9.500%, due 04/15/14 | | | 1,908,863 | | |
| | 410,000 | | | C | | JPMorgan Chase Capital XVIII,
6.950%, due 08/17/36 | | | 346,413 | | |
| | 350,000 | | | C | | KAR Holdings, Inc., 8.750%,
due 05/01/14 | | | 155,750 | | |
| | 645,000 | | | #,C | | Nuveen Investments, Inc.,
10.500%, due 11/15/15 | | | 145,931 | | |
| | 625,341 | | | #,C | | Piper Jaffray Equipment
Trust Securities, 6.750%,
due 04/01/11 | | | 443,992 | | |
| | 235,000 | | | | | SLM Corp., 3.675%,
due 07/27/09 | | | 221,540 | | |
| | 300,000 | | | @@,# | | Successor II Ltd., 18.943%,
due 04/06/10 | | | 293,235 | | |
| | 250,000 | | | @@,# | | Successor II Ltd., 27.193%,
due 04/06/10 | | | 239,775 | | |
| | 615,000 | | | C | | Universal City Florida
Holding Co. I/II, 7.943%,
due 05/01/10 | | | 267,525 | | |
| | 525,000 | | | #,C | | USB Realty Corp., 6.091%,
due 12/22/49 | | | 219,328 | | |
| | | | 9,272,113 | | |
| | | | | Electric: 3.0% | |
| | 71,000 | | | C | | Allegheny Energy Supply,
7.800%, due 03/15/11 | | | 70,290 | | |
| | 1,105,000 | | | #,C | | Energy Future Holdings,
10.875%, due 11/01/17 | | | 790,075 | | |
| | 750,000 | | | @@,#,C | | Intergen NV, 9.000%,
due 06/30/17 | | | 618,750 | | |
| | 286,203 | | | | | NRG Energy, Inc., 4.200%,
due 02/01/13 | | | 249,641 | | |
See Accompanying Notes to Financial Statements
213
PORTFOLIO OF INVESTMENTS
ING PIONEER HIGH YIELD PORTFOLIO AS OF DECEMBER 31, 2008 (CONTINUED)
Principal
Amount | | | | | | Value | |
| | | | | Electric (continued) | |
| $ | 582,556 | | | | | NRG Energy, Inc., 4.450%,
due 02/01/13 | | $ | 508,134 | | |
| | 1,750,000 | | | C | | NRG Energy, Inc., 7.250%,
due 02/01/14 | | | 1,640,625 | | |
| | 2,395,000 | | | C | | NRG Energy, Inc., 7.375%,
due 01/15/17 | | | 2,209,388 | | |
| | 665,000 | | | | | PNM Resources, Inc., 9.250%,
due 05/15/15 | | | 532,000 | | |
| | 2,550,000 | | | #,C | | Texas Competitive Electric
Holdings Co., LLC, 10.500%,
due 11/01/15 | | | 1,823,250 | | |
| | | | 8,442,153 | | |
| | | | | | | Electrical Components &
Equipment: 1.6% | | | | | |
| | 2,000,000 | | | C | | Anixter International, Inc.,
5.950%, due 03/01/15 | | | 1,600,000 | | |
| | 1,325,000 | | | C | | Belden, Inc., 7.000%,
due 03/15/17 | | | 1,000,375 | | |
| | 3,050,000 | | | C | | General Cable Corp., 7.125%,
due 04/01/17 | | | 2,028,250 | | |
| | | | 4,628,625 | | |
| | | | | Electronics: 0.3% | |
| | 1,000,000 | | | C | | Itron, Inc., 7.750%,
due 05/15/12 | | | 866,250 | | |
| | | | 866,250 | | |
| | | | | Energy-Alternate Sources: 0.0% | |
| | 225,000 | | | ±,C | | VeraSun Energy Corp., 9.375%,
due 06/01/17 | | | 28,125 | | |
| | | | 28,125 | | |
| | | | | Engineering & Construction: 0.6% | |
| | 290,000 | | | C | | Dycom Industries, Inc., 8.125%,
due 10/15/15 | | | 205,900 | | |
| | 1,980,000 | | | #,C | | Esco Corp., 8.625%,
due 12/15/13 | | | 1,395,900 | | |
| | 500,000 | | | | | Landsource Communities
Development, 9.820%,
due 02/22/14 | | | 17,292 | | |
| | | | 1,619,092 | | |
| | | | | Entertainment: 1.6% | |
| | 450,000 | | | C | | AMC Entertainment, Inc.,
11.000%, due 02/01/16 | | | 316,688 | | |
| | 215,000 | | | C | | Marquee Holdings, Inc.,
12.000%, due 08/15/14 | | | 110,725 | | |
| | 2,310,000 | | | #,C | | Mashantucket Western
Pequot Tribe, 8.500%,
due 11/15/15 | | | 918,225 | | |
| | 526,460 | | | | | New World Gaming Partners,
8.750%, due 07/16/14 | | | 234,274 | | |
| | 387,000 | | | C | | Pinnacle Entertainment, Inc.,
8.250%, due 03/15/12 | | | 296,055 | | |
| | 2,500,000 | | | C | | Scientific Games Corp., 6.250%,
due 12/15/12 | | | 2,025,000 | | |
| | 255,000 | | | #,C | | Scientific Games Corp., 7.875%,
due 06/15/16 | | | 206,550 | | |
| | 775,000 | | | #,C | | Shingle Springs Tribal Gaming
Authority, 9.375%,
due 06/15/15 | | | 391,375 | | |
| | | | 4,498,892 | | |
Principal
Amount | | | | | | Value | |
| | | | | Environmental Control: 0.3% | |
| $ | 825,000 | | | C | | Waste Services, Inc., 9.500%,
due 04/15/14 | | $ | 589,875 | | |
| | 425,000 | | | C | | WCA Waste Corp., 9.250%,
due 06/15/14 | | | 316,625 | | |
| | | | 906,500 | | |
| | | | | Forest Products & Paper: 0.5% | |
| | 2,000,000 | | | C | | Exopack Holding Corp.,
11.250%, due 02/01/14 | | | 1,180,000 | | |
| | 400,000 | | | #,C | | Georgia-Pacific Corp., 7.125%,
due 01/15/17 | | | 338,000 | | |
| | | | 1,518,000 | | |
| | | | | Hand/Machine Tools: 1.0% | |
| | 3,575,000 | | | C | | Baldor Electric Co., 8.625%,
due 02/15/17 | | | 2,681,250 | | |
| | | | 2,681,250 | | |
| | | | | Healthcare-Products: 1.2% | |
| | 1,860,000 | | | &,C | | Biomet, Inc., 10.375%,
due 10/15/17 | | | 1,478,700 | | |
| | 400,000 | | | C | | Biomet, Inc., 11.625%,
due 10/15/17 | | | 344,000 | | |
| | 812,184 | | | | | PTS Acquisition, 5.122%,
due 04/10/14 | | | 493,402 | | |
| | 1,750,000 | | | C | | Universal Hospital Services, Inc.,
5.943%, due 06/01/15 | | | 1,076,250 | | |
| | | | 3,392,352 | | |
| | | | | Healthcare-Services: 2.6% | |
| | 2,365,000 | | | C | | Community Health Systems, Inc.,
8.875%, due 07/15/15 | | | 2,187,625 | | |
| | 660,000 | | | C | | HCA, Inc., 9.250%, due 11/15/16 | | | 607,200 | | |
| | 1,725,000 | | | &,C | | HCA, Inc., 9.625%, due 11/15/16 | | | 1,349,813 | | |
| | 915,000 | | | C | | LifePoint Hospitals, Inc.,
3.500%, due 05/15/14 | | | 623,344 | | |
| | 2,035,000 | | | C | | Psychiatric Solutions, Inc.,
7.750%, due 07/15/15 | | | 1,505,900 | | |
| | 415,000 | | | C | | Select Medical Corp., 7.625%,
due 02/01/15 | | | 222,025 | | |
| | 205,000 | | | C | | Select Medical Corp., 8.834%,
due 09/15/15 | | | 107,625 | | |
| | 800,000 | | | &,#,C | | Surgical Care Affiliates, Inc.,
8.875%, due 07/15/15 | | | 492,000 | | |
| | 145,000 | | | C | | United Surgical Partners
International, Inc., 8.875%,
due 05/01/17 | | | 100,050 | | |
| | 200,000 | | | &,C | | United Surgical Partners
International, Inc., 9.250%,
due 05/01/17 | | | 124,000 | | |
| | | | 7,319,582 | | |
| | | | | Holding Companies-Diversified: 0.3% | |
| | 1,200,000 | | | C | | Leucadia National Corp.,
7.125%, due 03/15/17 | | | 897,000 | | |
| | | | 897,000 | | |
| | | | | Home Builders: 0.1% | |
| | 570,000 | | | C | | Meritage Homes Corp., 6.250%,
due 03/15/15 | | | 304,950 | | |
| | | | 304,950 | | |
See Accompanying Notes to Financial Statements
214
PORTFOLIO OF INVESTMENTS
ING PIONEER HIGH YIELD PORTFOLIO AS OF DECEMBER 31, 2008 (CONTINUED)
Principal
Amount | | | | | | Value | |
| | | | | Household Products/Wares: 1.2% | |
| $ | 365,000 | | | #,C | | American Achievement Corp.,
8.250%, due 04/01/12 | | $ | 282,875 | | |
| | 805,000 | | | C | | Central Garden & Pet Co.,
9.125%, due 02/01/13 | | | 478,975 | | |
| | 1,690,000 | | | C | | Jarden Corp., 7.500%,
due 05/01/17 | | | 1,161,875 | | |
| | 765,000 | | | C,W | | Yankee Acquisition Corp.,
8.500%, due 02/15/15 | | | 360,506 | | |
| | 2,800,000 | | | C | | Yankee Acquisition Corp.,
9.750%, due 02/15/17 | | | 1,190,000 | | |
| | | | 3,474,231 | | |
| | | | | Insurance: 1.1% | |
| | 545,000 | | | #,C | | Alliant Holdings I, Inc., 11.000%,
due 05/01/15 | | | 297,025 | | |
| | 148,500 | | | | | Alliant Insurance Services,
5.843%, due 08/21/14 | | | 89,100 | | |
| | 296,498 | | | | | Amwins Group, Inc., 5.213%,
due 06/11/13 | | | 174,934 | | |
| | 900,000 | | | #,C | | HUB International Holdings, Inc.,
10.250%, due 06/15/15 | | | 401,625 | | |
| | 403,391 | | | | | HUB International Ltd., 3.967%,
due 06/13/14 | | | 233,967 | | |
| | 90,668 | | | | | HUB International Ltd., 5.300%,
due 06/13/14 | | | 52,588 | | |
| | 1,000,000 | | | #,C | | Liberty Mutual Group, Inc.,
7.000%, due 03/15/37 | | | 477,466 | | |
| | 1,950,000 | | | #,C | | Liberty Mutual Group, Inc.,
10.750%, due 06/15/58 | | | 1,073,885 | | |
| | 390,000 | | | #,C | | MBIA Insurance Corp., 14.000%,
due 01/15/33 | | | 199,049 | | |
| | | | 2,999,639 | | |
| | | | | Internet: 0.6% | |
| | 2,330,000 | | | #,C | | Expedia, Inc., 8.500%,
due 07/01/16 | | | 1,747,500 | | |
| | | | 1,747,500 | | |
| | | | | Iron/Steel: 0.4% | |
| | 3,175,000 | | | @@,#,C | | Algoma Acquisition Corp.,
9.875%, due 06/15/15 | | | 1,222,375 | | |
| | | | 1,222,375 | | |
| | | | | Leisure Time: 0.2% | |
| | 775,000 | | | #,C | | Pegasus Solutions, Inc.,
10.500%, due 04/15/15 | | | 530,875 | | |
| | | | 530,875 | | |
| | | | | Machinery-Diversified: 0.6% | |
| | 27,000 | | | C | | Columbus McKinnon Corp.,
8.875%, due 11/01/13 | | | 22,815 | | |
| | 1,800,000 | | | C | | Gardner Denver, Inc., 8.000%,
due 05/01/13 | | | 1,593,000 | | |
| | | | 1,615,815 | | |
| | | | | Media: 0.9% | |
| | 745,000 | | | C | | Charter Communications
Holdings II, LLC, 10.250%,
due 09/15/10 | | | 346,425 | | |
| | 680,000 | | | #,C | | Charter Communications
Operating, LLC, 8.375%,
due 04/30/14 | | | 523,600 | | |
Principal
Amount | | | | | | Value | |
| $ | 840,000 | | | C | | Dex Media West, LLC, 9.875%,
due 08/15/13 | | $ | 201,600 | | |
| | 250,000 | | | C | | Echostar DBS Corp., 6.625%,
due 10/01/14 | | | 209,375 | | |
| | 710,000 | | | C | | Echostar DBS Corp., 7.125%,
due 02/01/16 | | | 596,400 | | |
| | 310,003 | | | C | | Nexstar Finance Holdings, LLC,
11.375%, due 04/01/13 | | | 135,239 | | |
| | 370,000 | | | @@,C | | Quebecor Media, Inc., 7.750%,
due 03/15/16 | | | 251,600 | | |
| | 1,375,000 | | | &,#,C | | Univision Communications, Inc.,
9.750%, due 03/15/15 | | | 178,750 | | |
| | | | 2,442,989 | | |
| | | | | Metal Fabricate/Hardware: 1.0% | |
| | 3,575,000 | | | C | | Mueller Water Products,
7.375%, due 06/01/17 | | | 2,448,875 | | |
| | 100,703 | | | | | Niagara Corp., 7.801%,
due 07/03/14 | | | 46,323 | | |
| | 612,646 | | | &,#,C | | Rexnord Holdings, Inc., 9.810%,
due 03/01/13 | | | 336,956 | | |
| | | | 2,832,154 | | |
| | | | | Mining: 1.6% | |
| | 1,545,000 | | | C | | Freeport-McMoRan Copper &
Gold, Inc., 7.084%,
due 04/01/15 | | | 1,021,631 | | |
| | 2,755,000 | | | C | | Noranda Aluminium
Acquisition Corp.,
6.595%, due 05/15/15 | | | 950,475 | | |
| | 375,000 | | | &,C | | Noranda Aluminium Holding
Corp., 8.345%, due 11/15/14 | | | 61,875 | | |
| | 4,000,000 | | | @@,C | | Novelis, Inc., 7.250%,
due 02/15/15 | | | 2,340,000 | | |
| | | | 4,373,981 | | |
| | | | | Miscellaneous Manufacturing: 0.6% | |
| | 505,000 | | | C | | AGY Holding Corp., 11.000%,
due 11/15/14 | | | 305,525 | | |
| | 1,695,000 | | | C | | American Railcar Industries, Inc.,
7.500%, due 03/01/14 | | | 1,127,175 | | |
| | 883,000 | | | C | | Park-Ohio Industries, Inc.,
8.375%, due 11/15/14 | | | 366,445 | | |
| | | | 1,799,145 | | |
| | | | | Oil & Gas: 6.1% | |
| | 335,000 | | | #,C | | Atlas Energy Resources LLC,
10.750%, due 02/01/18 | | | 206,025 | | |
| | 380,000 | | | C | | Berry Petroleum Co., 8.250%,
due 11/01/16 | | | 207,100 | | |
| | 415,000 | | | C | | Chaparral Energy, Inc., 8.875%,
due 02/01/17 | | | 85,075 | | |
| | 1,331,000 | | | C | | Frontier Oil Corp., 6.625%,
due 10/01/11 | | | 1,211,210 | | |
| | 2,215,000 | | | #,C | | Hilcorp Energy I LP, 7.750%,
due 11/01/15 | | | 1,572,650 | | |
| | 750,000 | | | #,C | | Hilcorp Energy I LP, 9.000%,
due 06/01/16 | | | 540,000 | | |
| | 760,000 | | | C | | Mariner Energy, Inc., 7.500%,
due 04/15/13 | | | 490,200 | | |
| | 360,000 | | | C | | McMoRan Exploration Co.,
11.875%, due 11/15/14 | | | 257,400 | | |
| | 850,000 | | | C | | Parallel Petroleum Corp.,
10.250%, due 08/01/14 | | | 544,000 | | |
See Accompanying Notes to Financial Statements
215
PORTFOLIO OF INVESTMENTS
ING PIONEER HIGH YIELD PORTFOLIO AS OF DECEMBER 31, 2008 (CONTINUED)
Principal
Amount | | | | | | Value | |
| | | | | Oil & Gas (continued) | |
| $ | 2,490,000 | | | #,C | | PetroHawk Energy Corp.,
7.875%, due 06/01/15 | | $ | 1,855,050 | | |
| | 1,225,000 | | | C | | PetroHawk Energy Corp.,
9.125%, due 07/15/13 | | | 998,375 | | |
| | 1,930,000 | | | C | | Plains Exploration &
Production Co., 7.625%,
due 06/01/18 | | | 1,331,700 | | |
| | 3,745,000 | | | C | | Quicksilver Resources, Inc.,
7.125%, due 04/01/16 | | | 2,022,300 | | |
| | 350,000 | | | C | | Quicksilver Resources, Inc.,
8.250%, due 08/01/15 | | | 224,000 | | |
| | 200,000 | | | C | | SandRidge Energy, Inc.,
5.060%, due 04/01/14 | | | 106,495 | | |
| | 1,865,000 | | | #,C | | SandRidge Energy, Inc.,
8.000%, due 06/01/18 | | | 1,044,400 | | |
| | 1,600,000 | | | &,C | | SandRidge Energy, Inc.,
8.625%, due 04/01/15 | | | 848,000 | | |
| | 2,170,000 | | | C | | Tesoro Corp., 6.500%,
due 06/01/17 | | | 1,201,638 | | |
| | 4,260,000 | | | C | | Tesoro Corp., 6.625%,
due 11/01/15 | | | 2,492,100 | | |
| | | | 17,237,718 | | |
| | | | | Oil & Gas Services: 0.1% | |
| | 200,000 | | | C | | Complete Production Services,
Inc., 8.000%, due 12/15/16 | | | 127,000 | | |
| | 500,000 | | | @@,#,C | | Sevan Marine ASA, 5.525%,
due 05/14/13 | | | 275,000 | | |
| | | | 402,000 | | |
| | | | | Packaging & Containers: 3.0% | |
| | 2,075,000 | | | C | | AEP Industries, Inc., 7.875%,
due 03/15/13 | | | 1,182,750 | | |
| | 2,510,000 | | | C | | Crown Cork & Seal Co., Inc.,
7.375%, due 12/15/26 | | | 1,869,950 | | |
| | 1,370,000 | | | C | | Graham Packaging Co., Inc.,
8.500%, due 10/15/12 | | | 982,975 | | |
| | 3,110,000 | | | C | | Graham Packaging Co., Inc.,
9.875%, due 10/15/14 | | | 1,928,200 | | |
| | 3,770,000 | | | C | | Graphic Packaging
International Corp.,
9.500%, due 08/15/13 | | | 2,620,150 | | |
| | | | 8,584,025 | | |
| | | | | Pharmaceuticals: 0.9% | |
| | 14,000 | | | @@,C | | Elan Finance PLC, 7.750%,
due 11/15/11 | | | 8,330 | | |
| | 907,531 | | | | | Rexnord Loan 03/02/13,
6.176%, due 12/06/13 | | | 796,358 | | |
| | 2,000,000 | | | C | | Warner Chilcott Corp.,
8.750%, due 02/01/15 | | | 1,790,000 | | |
| | | | 2,594,688 | | |
| | | | | Pipelines: 0.8% | |
| | 1,500,000 | | | C | | Holly Energy Partners LP,
6.250%, due 03/01/15 | | | 1,012,500 | | |
| | 1,500,000 | | | C | | MarkWest Energy Partners L.P./
MarkWest Energy
Finance Corp., 8.750%,
due 04/15/18 | | | 937,500 | | |
| | 450,000 | | | C | | TEPPCO Partners L.P., 7.000%,
due 06/01/67 | | | 241,524 | | |
| | | | 2,191,524 | | |
Principal
Amount | | | | | | Value | |
| | | | | Real Estate: 1.2% | |
| $ | 1,200,000 | | | C | | BF Saul Reit, 7.500%,
due 03/01/14 | | $ | 1,056,000 | | |
| | 2,425,000 | | | C | | Forest City Enterprises, Inc.,
6.500%, due 02/01/17 | | | 860,875 | | |
| | 1,915,000 | | | C | | Forest City Enterprises, Inc.,
7.625%, due 06/01/15 | | | 679,825 | | |
| | 54,000 | | | C | | iStar Financial, Inc., 6.500%,
due 12/15/13 | | | 16,212 | | |
| | 1,750,000 | | | #,C | | Rouse Co. LP/TRC Co. - Issuer, Inc.,
6.750%, due 05/01/13 | | | 638,750 | | |
| | | | 3,251,662 | | |
| | | | | Retail: 2.0% | |
| | 800,000 | | | C | | Brown Shoe Co., Inc., 8.750%,
due 05/01/12 | | | 596,000 | | |
| | 390,000 | | | &,C,W | | General Nutrition Centers, Inc.,
7.584%, due 03/15/14 | | | 220,350 | | |
| | 3,570,000 | | | C | | Sally Holdings, LLC, 10.500%,
due 11/15/16 | | | 2,445,450 | | |
| | 1,845,000 | | | C | | Sonic Automotive, Inc., 5.250%,
due 05/07/09 | | | 1,577,475 | | |
| | 1,850,000 | | | C | | Sonic Automotive, Inc., 8.625%,
due 08/15/13 | | | 698,375 | | |
| | | | 5,537,650 | | |
| | | | | Savings & Loans: 0.0% | |
| | 34,000 | | | C | | Western Financial Bank,
9.625%, due 05/15/12 | | | 33,521 | | |
| | | | 33,521 | | |
| | | | | Semiconductors: 0.2% | |
| | 1,980,000 | | | C | | Freescale Semiconductor, Inc.,
5.871%, due 12/15/14 | | | 683,100 | | |
| | 14,000 | | | @@,C | | MagnaChip Semiconductor SA,
8.000%, due 12/15/14 | | | 140 | | |
| | | | 683,240 | | |
| | | | | Software: 1.4% | |
| | 5,230,000 | | | C | | First Data Corporation, 9.875%,
due 09/24/15 | | | 3,190,289 | | |
| | 1,225,000 | | | C | | Vangent, Inc., 9.625%,
due 02/15/15 | | | 718,156 | | |
| | | | 3,908,445 | | |
| | | | | Telecommunications: 5.5% | |
| | 159,134 | | | | | Aeroflex, Inc., 5.239%,
due 08/15/14 | | | 100,255 | | |
| | 900,000 | | | #,C | | Aeroflex, Inc., 11.750%,
due 02/15/15 | | | 590,625 | | |
| | 461,965 | | �� | @@ | | BCE, Inc., 7.840%, due 10/31/14 | | | 319,251 | | |
| | 700,000 | | | C | | Broadview Networks Holdings,
Inc., 11.375%, due 09/01/12 | | | 486,500 | | |
| | 325,000 | | | C | | Cincinnati Bell, Inc., 8.375%,
due 01/15/14 | | | 251,875 | | |
| | 1,000,000 | | | | | Corning, Inc., 8.875%,
due 08/15/21 | | | 983,524 | | |
| | 2,050,000 | | | C | | Cricket Communications, Inc.,
9.375%, due 11/01/14 | | | 1,855,250 | | |
| | 465,000 | | | C | | Frontier Communications Co.,
9.000%, due 08/15/31 | | | 295,275 | | |
| | 995,000 | | | C | | GCI, Inc., 7.250%, due 02/15/14 | | | 781,075 | | |
See Accompanying Notes to Financial Statements
216
PORTFOLIO OF INVESTMENTS
ING PIONEER HIGH YIELD PORTFOLIO AS OF DECEMBER 31, 2008 (CONTINUED)
Principal
Amount | | | | | | Value | |
| | | | | Telecommunications (continued) | |
| $ | 500,000 | | | #,C | | Intelsat Corp., 9.250%,
due 06/15/16 | | $ | 457,500 | | |
| | 590,000 | | | @@,C | | Intelsat Jackson Holdings Ltd.,
11.250%, due 06/15/16 | | | 539,850 | | |
| | 1,500,000 | | | @@,#,C | | Intelsat Jackson Holdings Ltd.,
11.500%, due 06/15/16 | | | 1,402,500 | | |
| | 1,000,000 | | | @@,#,C | | Intelsat Subsidiary Holding
Co., Ltd., 8.500%, due 01/15/13 | | | 930,000 | | |
| | 520,000 | | | &,C | | iPCS, Inc., 6.443%, due 05/01/14 | | | 319,800 | | |
| | 200,000 | | | C | | MasTec, Inc., 7.625%,
due 02/01/17 | | | 151,250 | | |
| | 1,575,000 | | | C | | PAETEC Holding Corp., 9.500%,
due 07/15/15 | | | 945,000 | | |
| | 540,000 | | | C | | Qwest Communications
International, Inc., 7.500%,
due 02/15/14 | | | 388,800 | | |
| | 960,000 | | | C | | Qwest Corp., 8.875%,
due 03/15/12 | | | 892,800 | | |
| | 910,000 | | | C | | Sprint Capital Corp., 6.875%,
due 11/15/28 | | | 542,549 | | |
| | 300,000 | | | C | | Sprint Capital Corp., 8.750%,
due 03/15/32 | | | 202,881 | | |
| | 670,000 | | | C | | Sprint Nextel Corp., 6.000%,
due 12/01/16 | | | 473,027 | | |
| | 39,677 | | | @@ | | Telesat Canada, Inc., 5.801%,
due 10/31/14 | | | 27,420 | | |
| | 220,000 | | | #,C | | Telesat Canada/Telesat, LLC,
11.000%, due 11/01/15 | | | 158,400 | | |
| | 550,000 | | | #,C | | Telesat Canada/Telesat, LLC,
12.500%, due 11/01/17 | | | 332,750 | | |
| | 200,000 | | | C | | West Corp., 9.500%,
due 10/15/14 | | | 111,000 | | |
| | 220,000 | | | C | | West Corp., 11.000%,
due 10/15/16 | | | 103,400 | | |
| | 1,980,000 | | | C | | Windstream Corp., 8.625%,
due 08/01/16 | | | 1,762,200 | | |
| | | | 15,404,757 | | |
| | | | | Textiles: 0.2% | |
| | 1,000,000 | | | #,C | | Invista, 9.250%, due 05/01/12 | | | 705,000 | | |
| | | | 705,000 | | |
| | | | | Transportation: 0.4% | |
| | 405,000 | | | C | | Bristow Group, Inc., 7.500%,
due 09/15/17 | | | 273,375 | | |
| | 880,000 | | | @@,C | | Kansas City Southern de
Mexico SA de CV, 7.375%,
due 06/01/14 | | | 724,416 | | |
| | | | 997,791 | | |
| | | | | Trucking & Leasing: 0.6% | |
| | 2,335,000 | | | C | | Greenbrier Cos., Inc., 8.375%,
due 05/15/15 | | | 1,672,444 | | |
| | | | 1,672,444 | | |
Total Corporate Bonds/Notes
(Cost $230,524,491) | | | 172,006,744 | | |
| ASSET-BACKED SECURITIES: 0.1% | | | |
| | | | | Home Equity Asset-Backed Securities: 0.1% | |
| | 205,631 | | | C | | Ameriquest Mortgage
Securities, Inc., 1.821%,
due 02/25/33 | | | 119,943 | | |
Principal
Amount | | | | | | Value | |
| $ | 158,766 | | | C | | Morgan Stanley Capital, Inc.,
1.671%, due 06/25/33 | | $ | 100,616 | | |
| | | | 220,559 | | |
| | | | | Other Asset-Backed Securities: 0.0% | |
| | 120,000 | | | C | | Bear Stearns Asset-Backed
Securities, Inc., 0.921%,
due 01/25/47 | | | 35,905 | | |
| | | | 35,905 | | |
Total Asset-Backed Securities
(Cost $356,999) | | | 256,464 | | |
| COLLATERALIZED MORTGAGE OBLIGATIONS: 0.2% | | | |
| | 1,000,000 | | | #,C | | Timberstar Trust, 7.530%,
due 10/15/36 | | | 639,400 | | |
Total Collateralized Mortgage
Obligations
(Cost $1,008,792) | | | 639,400 | | |
| MUNICIPAL BONDS: 0.3% | | | |
| | | | | North Carolina: 0.3% | |
| | 1,500,000 | | | C | | City of Charlotte,
5.600%, due 07/01/27 | | | 791,190 | | |
Total Municipal Bonds
(Cost $743,129) | | | 791,190 | | |
Total Long-Term Investments
(Cost $311,665,942) | | | 236,381,059 | | |
| Shares | | | | | | Value | |
| SHORT-TERM INVESTMENTS: 14.9% | | | |
| | | | | Affiliated Mutual Fund: 14.9% | |
| | 41,944,919 | | | | | ING Institutional Prime Money
Market Fund - Class I | | | 41,944,919 | | |
Total Short-Term Investments
(Cost $41,944,919) | | | 41,944,919 | | |
Total Investments in
Securities
(Cost $353,610,861)* | | | 98.7 | % | | $ | 278,325,978 | | |
Other Assets and
Liabilities - Net | | | 1.3 | | | | 3,784,547 | | |
| Net Assets | | | 100.0 | % | | $ | 282,110,525 | | |
@ Non-income producing security
@@ Foreign Issuer
& Payment-in-kind
+ Step basis bonds. Interest rates shown reflect current and next coupon rates.
# Securities with purchases pursuant to Rule 144A or section 4(2), under the Securities Act of 1933 and may not be resold subject to that rule except to qualified institutional buyers. Unless otherwise noted, these securities have been determined to be liquid under the guidelines established by the Funds' Board of Directors/Trustees.
C Bond may be called prior to maturity date.
P Preferred Stock may be called prior to convertible date.
W Settlement is on a when-issued or delayed-delivery basis.
± Defaulted security
* Cost for federal income tax purposes is $353,678,290.
Net unrealized depreciation consists of:
| Gross Unrealized Appreciation | | $ | 3,273,990 | | |
| Gross Unrealized Depreciation | | | (78,626,302 | ) | |
| Net Unrealized Depreciation | | $ | (75,352,312 | ) | |
See Accompanying Notes to Financial Statements
217
PORTFOLIO OF INVESTMENTS
ING PIONEER HIGH YIELD PORTFOLIO AS OF DECEMBER 31, 2008 (CONTINUED)
The following table summarizes the inputs used as of December 31, 2008 in determining the Portfolio's investments at fair value for purposes of SFAS 157:
| | | Investments in
Securities | | Other Financial
Instruments* | |
| Level 1 — Quoted Prices | | $ | 72,174,695 | | | $ | — | | |
Level 2 — Other Significant
Observable Inputs | | | 203,420,808 | | | | — | | |
Level 3 — Significant
Unobservable Inputs | | | 2,730,475 | | | | — | | |
| Total | | $ | 278,325,978 | | | $ | — | | |
"Fair value" for purposes of SFAS 157 is different from "fair value" as used in the 1940 Act. The former generally implies market value, and can include market quotations as a source of value, and the latter refers to determinations of actual value in absence of available market quotations.
* Other financial instruments may include forward foreign currency contracts, futures, swaps, and written options. Forward foreign currency contracts and futures are reported at their unrealized gain/loss at year end. Swaps and written options are reported at their market value at year end.
A roll forward of fair value measurements using significant unobservable inputs (Level 3) for the year ended December 31, 2008, was as follows:
| | | Investments in
Securities | | Other Financial
Instruments* | |
| Beginning Balance at 12/31/07 | | $ | 1,945,402 | | | $ | — | | |
| Net Purchases/(Sales) | | | 1,980,910 | | | | — | | |
| Accrued Discounts/(Premiums) | | | 513 | | | | — | | |
| Total Realized Gain/(Loss) | | | 1,252,373 | | | | — | | |
Total Unrealized
Appreciation/(Depreciation) | | | (503,321 | ) | | | — | | |
Net Transfers In/(Out) of
Level 3 | | | (1,945,402 | ) | | | — | | |
| Ending Balance at 12/31/08 | | $ | 2,730,475 | | | $ | — | | |
* Other financial instruments may include forward foreign currency contracts, futures, swaps, and written options. Forward foreign currency contracts and futures are reported at their unrealized gain/loss at year end. Swaps and written options are reported at their market value at year end.
For the year ended December 31, 2008, total change in unrealized gain (loss) on Level 3 securities included in the change in net assets was $(1,224,943). Total unrealized gain (loss) for all securities (including Level 1 and Level 2) can be found on the accompanying Statement of Operations.
See Accompanying Notes to Financial Statements
218
ING T. ROWE PRICE PORTFOLIO OF INVESTMENTS
DIVERSIFIED MID CAP GROWTH PORTFOLIO AS OF DECEMBER 31, 2008
| Shares | | | | | | Value | |
| COMMON STOCK: 99.7% | | | |
| | | | | Advertising: 0.6% | |
| | 119,100 | | | @ | | Clear Channel Outdoor
Holdings, Inc. | | $ | 732,464 | | |
| | 52,200 | | | @,L | | Lamar Advertising Co. | | | 655,632 | | |
| | 53,600 | | | | | Omnicom Group | | | 1,442,912 | | |
| | | | 2,831,008 | | |
| | | | | Aerospace/Defense: 2.3% | |
| | 26,400 | | | @,L | | Alliant Techsystems, Inc. | | | 2,264,064 | | |
| | 83,700 | | | @@,L | | Empresa Brasileira de
Aeronautica SA ADR | | | 1,356,777 | | |
| | 106,100 | | | | | Goodrich Corp. | | | 3,927,822 | | |
| | 106,900 | | | | | Rockwell Collins, Inc. | | | 4,178,721 | | |
| | | | 11,727,384 | | |
| | | | | Agriculture: 0.6% | |
| | 57,600 | | | | | Lorillard, Inc. | | | 3,245,760 | | |
| | | | 3,245,760 | | |
| | | | | Airlines: 0.5% | |
| | 75,300 | | | | | Skywest, Inc. | | | 1,400,580 | | |
| | 125,000 | | | | | Southwest Airlines Co. | | | 1,077,500 | | |
| | | | 2,478,080 | | |
| | | | | Apparel: 0.5% | |
| | 120,400 | | | @ | | Coach, Inc. | | | 2,500,708 | | |
| | | | 2,500,708 | | |
| | | | | Auto Manufacturers: 0.2% | |
| | 43,100 | | | | | Paccar, Inc. | | | 1,232,660 | | |
| | | | 1,232,660 | | |
| | | | | Auto Parts & Equipment: 0.3% | |
| | 80,000 | | | | | WABCO Holdings, Inc. | | | 1,263,200 | | |
| | | | 1,263,200 | | |
| | | | | Banks: 1.1% | |
| | 91,900 | | | | | Northern Trust Corp. | | | 4,791,666 | | |
| | 27,500 | | | @ | | SVB Financial Group | | | 721,325 | | |
| | | | 5,512,991 | | |
| | | | | Beverages: 0.7% | |
| | 64,500 | | | | | Brown-Forman Corp. | | | 3,321,105 | | |
| | | | 3,321,105 | | |
| | | | | Biotechnology: 2.9% | |
| | 33,200 | | | @ | | Alexion Pharmaceuticals, Inc. | | | 1,201,508 | | |
| | 47,500 | | | @,L | | Amylin Pharmaceuticals, Inc. | | | 515,375 | | |
| | 28,200 | | | @ | | Biogen Idec, Inc. | | | 1,343,166 | | |
| | 54,700 | | | @ | | Charles River Laboratories
International, Inc. | | | 1,433,140 | | |
| | 128,000 | | | @,L | | Illumina, Inc. | | | 3,334,400 | | |
| | 40,300 | | | @ | | Life Technologies Corp. | | | 939,393 | | |
| | 45,100 | | | @,L | | Martek Biosciences Corp. | | | 1,366,981 | | |
| | 27,000 | | | @ | | Millipore Corp. | | | 1,391,040 | | |
| | 23,600 | | | @ | | Myriad Genetics, Inc. | | | 1,563,736 | | |
| | 56,400 | | | @ | | Vertex Pharmaceuticals, Inc. | | | 1,713,432 | | |
| | | | 14,802,171 | | |
| | | | | Chemicals: 2.8% | |
| | 31,400 | | | | | Air Products & Chemicals, Inc. | | | 1,578,478 | | |
| | 48,800 | | | | | Albemarle Corp. | | | 1,088,240 | | |
| | 23,200 | | | | | CF Industries Holdings, Inc. | | | 1,140,512 | | |
| Shares | | | | | | Value | |
| | 114,500 | | | | | Ecolab, Inc. | | $ | 4,024,675 | | |
| | 149,400 | | | @,L | | Intrepid Potash, Inc. | | | 3,103,038 | | |
| | 36,800 | | | | | Sherwin-Williams Co. | | | 2,198,800 | | |
| | 34,000 | | | L | | Sigma-Aldrich Corp. | | | 1,436,160 | | |
| | | | 14,569,903 | | |
| | | | | Coal: 1.0% | |
| | 70,900 | | | | | Arch Coal, Inc. | | | 1,154,961 | | |
| | 49,500 | | | | | Consol Energy, Inc. | | | 1,414,710 | | |
| | 74,200 | | | | | Foundation Coal Holdings, Inc. | | | 1,040,284 | | |
| | 48,800 | | | | | Massey Energy Co. | | | 672,952 | | |
| | 44,400 | | | | | Peabody Energy Corp. | | | 1,010,100 | | |
| | | | 5,293,007 | | |
| | | | | Commercial Services: 8.0% | |
| | 63,100 | | | @ | | Apollo Group, Inc. - Class A | | | 4,834,722 | | |
| | 55,700 | | | | | Corporate Executive Board Co. | | | 1,228,742 | | |
| | 54,200 | | | | | DeVry, Inc. | | | 3,111,622 | | |
| | 51,800 | | | | | Equifax, Inc. | | | 1,373,736 | | |
| | 37,600 | | | | | Global Payments, Inc. | | | 1,232,904 | | |
| | 93,400 | | | @ | | Iron Mountain, Inc. | | | 2,309,782 | | |
| | 35,100 | | | @ | | ITT Educational Services, Inc. | | | 3,333,798 | | |
| | 41,600 | | | | | Manpower, Inc. | | | 1,413,984 | | |
| | 39,000 | | | | | McKesson Corp. | | | 1,510,470 | | |
| | 106,800 | | | @ | | Monster Worldwide, Inc. | | | 1,291,212 | | |
| | 83,200 | | | | | Moody's Corp. | | | 1,671,488 | | |
| | 27,000 | | | @,@@ | | New Oriental Education &
Technology Group ADR | | | 1,482,570 | | |
| | 136,600 | | | | | Paychex, Inc. | | | 3,589,848 | | |
| | 126,500 | | | @ | | Quanta Services, Inc. | | | 2,504,700 | | |
| | 175,500 | | | @@,L | | Ritchie Brothers Auctioneers, Inc. | | | 3,759,210 | | |
| | 79,400 | | | | | Robert Half International, Inc. | | | 1,653,108 | | |
| | 62,500 | | | @,L | | Vistaprint Ltd. | | | 1,163,125 | | |
| | 245,800 | | | | | Western Union Co. | | | 3,524,772 | | |
| | | | 40,989,793 | | |
| | | | | Computers: 2.3% | |
| | 151,000 | | | @ | | Cognizant Technology
Solutions Corp. | | | 2,727,060 | | |
| | 73,600 | | | | | Jack Henry & Associates, Inc. | | | 1,428,576 | | |
| | 62,500 | | | @,@@,L | | Logitech International SA | | | 973,750 | | |
| | 167,700 | | | @ | | NetApp, Inc. | | | 2,342,769 | | |
| | 117,600 | | | @ | | Perot Systems Corp. | | | 1,607,592 | | |
| | 262,400 | | | | | Seagate Technology, Inc. | | | 1,162,432 | | |
| | 70,800 | | | @ | | Synopsys, Inc. | | | 1,311,216 | | |
| | | | 11,553,395 | | |
| | | | | Cosmetics/Personal Care: 1.1% | |
| | 229,600 | | | | | Avon Products, Inc. | | | 5,517,287 | | |
| | | | 5,517,287 | | |
| | | | | Distribution/Wholesale: 0.9% | |
| | 61,500 | | | L | | Fastenal Co. | | | 2,143,275 | | |
| | 32,900 | | | | | WW Grainger, Inc. | | | 2,593,836 | | |
| | | | 4,737,111 | | |
| | | | | Diversified Financial Services: 2.8% | |
| | 15,400 | | | L | | Blackrock, Inc. | | | 2,065,910 | | |
| | 5,400 | | | | | CME Group, Inc. | | | 1,123,794 | | |
| | 76,000 | | | | | Eaton Vance Corp. | | | 1,596,760 | | |
| | 52,200 | | | | | Federated Investors, Inc. | | | 885,312 | | |
| | 20,300 | | | | | Franklin Resources, Inc. | | | 1,294,734 | | |
| | 59,000 | | | @ | | Interactive Brokers Group, Inc. | | | 1,055,510 | | |
| | 37,200 | | | @ | | IntercontinentalExchange, Inc. | | | 3,066,768 | | |
See Accompanying Notes to Financial Statements
219
ING T. ROWE PRICE PORTFOLIO OF INVESTMENTS
DIVERSIFIED MID CAP GROWTH PORTFOLIO AS OF DECEMBER 31, 2008 (CONTINUED)
| Shares | | | | | | Value | |
| | | | | Diversified Financial Services (continued) | |
| | 100,100 | | | | | Janus Capital Group, Inc. | | $ | 803,803 | | |
| | 50,000 | | | @@ | | Lazard Ltd. | | | 1,487,000 | | |
| | 70,000 | | | | | OptionsXpress Holdings, Inc. | | | 935,200 | | |
| | | | 14,314,791 | | |
| | | | | | | Electrical Components &
Equipment: 0.5% | | | | | |
| | 76,150 | | | | | Ametek, Inc. | | | 2,300,492 | | |
| | 25,200 | | | @,L | | General Cable Corp. | | | 445,788 | | |
| | | | 2,746,280 | | |
| | | | | Electronics: 3.6% | |
| | 62,200 | | | | | Amphenol Corp. | | | 1,491,556 | | |
| | 90,900 | | | @ | | Cogent, Inc. | | | 1,233,513 | | |
| | 44,700 | | | @ | | Cymer, Inc. | | | 979,377 | | |
| | 69,300 | | | @ | | Dolby Laboratories, Inc. | | | 2,270,268 | | |
| | 47,600 | | | @ | | Flir Systems, Inc. | | | 1,460,368 | | |
| | 109,400 | | | | | Gentex Corp. | | | 966,002 | | |
| | 48,600 | | | @ | | II-VI, Inc. | | | 927,774 | | |
| | 18,000 | | | @,L | | Itron, Inc. | | | 1,147,320 | | |
| | 128,600 | | | | | Jabil Circuit, Inc. | | | 868,050 | | |
| | 15,500 | | | @,@@ | | Mettler Toledo International, Inc. | | | 1,044,700 | | |
| | 70,600 | | | | | National Instruments Corp. | | | 1,719,816 | | |
| | 109,500 | | | @ | | Trimble Navigation Ltd. | | | 2,366,295 | | |
| | 55,800 | | | @ | | Waters Corp. | | | 2,045,070 | | |
| | | | 18,520,109 | | |
| | | | | Energy-Alternate Sources: 0.1% | |
| | 206,300 | | | @ | | GT Solar International, Inc. | | | 596,207 | | |
| | | | 596,207 | | |
| | | | | Engineering & Construction: 1.3% | |
| | 80,000 | | | | | Fluor Corp. | | | 3,589,600 | | |
| | 82,100 | | | @,@@ | | Foster Wheeler Ltd. | | | 1,919,498 | | |
| | 117,700 | | | @ | | McDermott International, Inc. | | | 1,162,876 | | |
| | | | 6,671,974 | | |
| | | | | Entertainment: 0.7% | |
| | 68,200 | | | @ | | DreamWorks Animation SKG, Inc. | | | 1,722,732 | | |
| | 140,300 | | | | | International Game Technology | | | 1,668,167 | | |
| | | | 3,390,899 | | |
| | | | | Environmental Control: 0.9% | |
| | 80,200 | | | | | Republic Services, Inc. | | | 1,988,158 | | |
| | 48,400 | | | @ | | Stericycle, Inc. | | | 2,520,672 | | |
| | | | 4,508,830 | | |
| | | | | Food: 1.3% | |
| | 50,400 | | | | | Hershey Co. | | | 1,750,896 | | |
| | 33,100 | | | | | JM Smucker Co. | | | 1,435,216 | | |
| | 114,100 | | | | | McCormick & Co., Inc. | | | 3,635,226 | | |
| | | | 6,821,338 | | |
| | | | | Healthcare-Products: 6.6% | |
| | 103,900 | | | @ | | American Medical Systems
Holdings, Inc. | | | 934,061 | | |
| | 46,300 | | | @,L | | Arthrocare Corp. | | | 220,851 | | |
| | 18,600 | | | | | Becton Dickinson & Co. | | | 1,272,054 | | |
| | 49,300 | | | | | CR Bard, Inc. | | | 4,154,018 | | |
| | 58,100 | | | | | Densply International, Inc. | | | 1,640,744 | | |
| | 23,300 | | | @ | | Edwards Lifesciences Corp. | | | 1,280,335 | | |
| | 41,700 | | | @ | | Gen-Probe, Inc. | | | 1,786,428 | | |
| | 52,900 | | | @ | | Henry Schein, Inc. | | | 1,940,901 | | |
| | 84,000 | | | @,L | | Hologic, Inc. | | | 1,097,880 | | |
| Shares | | | | | | Value | |
| | 62,100 | | | @,L | | Idexx Laboratories, Inc. | | $ | 2,240,568 | | |
| | 19,000 | | | @,L | | Intuitive Surgical, Inc. | | | 2,412,810 | | |
| | 40,300 | | | @ | | Masimo Corp. | | | 1,202,149 | | |
| | 53,900 | | | @ | | Patterson Cos., Inc. | | | 1,010,625 | | |
| | 85,500 | | | @,@@,L | | Qiagen NV | | | 1,501,380 | | |
| | 36,800 | | | @ | | Resmed, Inc. | | | 1,379,264 | | |
| | 141,800 | | | @ | | St. Jude Medical, Inc. | | | 4,673,728 | | |
| | 33,200 | | | | | Techne Corp. | | | 2,142,064 | | |
| | 52,700 | | | @ | | Varian Medical Systems, Inc. | | | 1,846,608 | | |
| | 30,800 | | | @ | | Zimmer Holdings, Inc. | | | 1,244,936 | | |
| | | | 33,981,404 | | |
| | | | | Healthcare-Services: 2.8% | |
| | 41,800 | | | | | Cigna Corp. | | | 704,330 | | |
| | 22,000 | | | @ | | Covance, Inc. | | | 1,012,660 | | |
| | 51,750 | | | @ | | Coventry Health Care, Inc. | | | 770,040 | | |
| | 34,400 | | | @ | | DaVita, Inc. | | | 1,705,208 | | |
| | 70,000 | | | @ | | Health Net, Inc. | | | 762,300 | | |
| | 51,100 | | | @ | | Humana, Inc. | | | 1,905,008 | | |
| | 39,000 | | | @ | | Laboratory Corp. of
America Holdings | | | 2,511,990 | | |
| | 59,700 | | | @ | | Lincare Holdings, Inc. | | | 1,607,721 | | |
| | 64,000 | | | | | Quest Diagnostics | | | 3,322,240 | | |
| | | | 14,301,497 | | |
| | | | | Home Builders: 0.6% | |
| | 33,500 | | | L | | Centex Corp. | | | 356,440 | | |
| | 41,000 | | | L | | KB Home | | | 558,420 | | |
| | 41,700 | | | | | Lennar Corp. | | | 361,539 | | |
| | 46,900 | | | | | Pulte Homes, Inc. | | | 512,617 | | |
| | 65,000 | | | @ | | Toll Brothers, Inc. | | | 1,392,950 | | |
| | | | 3,181,966 | | |
| | | | | Household Products/Wares: 0.4% | |
| | 41,000 | | | | | Clorox Co. | | | 2,277,960 | | |
| | | | 2,277,960 | | |
| | | | | Insurance: 1.8% | |
| | 35,100 | | | | | AON Corp. | | | 1,603,368 | | |
| | 28,400 | | | @,@@ | | Arch Capital Group Ltd. | | | 1,990,840 | | |
| | 27,100 | | | | | Assurant, Inc. | | | 813,000 | | |
| | 51,000 | | | @@ | | Axis Capital Holdings Ltd. | | | 1,485,120 | | |
| | 69,500 | | | | | HCC Insurance Holdings, Inc. | | | 1,859,125 | | |
| | 28,000 | | | @@ | | RenaissanceRe Holdings Ltd. | | | 1,443,680 | | |
| | | | 9,195,133 | | |
| | | | | Internet: 3.2% | |
| | 7,100 | | | @,@@,L | | Baidu.com ADR | | | 927,047 | | |
| | 41,200 | | | @@,L | | Ctrip.com International Ltd. ADR | | | 980,560 | | |
| | 55,600 | | | @ | | Digital River, Inc. | | | 1,378,880 | | |
| | 240,300 | | | @ | | Expedia, Inc. | | | 1,980,072 | | |
| | 70,200 | | | @ | | F5 Networks, Inc. | | | 1,604,772 | | |
| | 90,300 | | | @ | | McAfee, Inc. | | | 3,121,671 | | |
| | 30,400 | | | @,L | | Priceline.com, Inc. | | | 2,238,960 | | |
| | 44,700 | | | @,@@,L | | Sina Corp. | | | 1,034,805 | | |
| | 86,500 | | | @ | | Symantec Corp. | | | 1,169,480 | | |
| | 108,300 | | | @ | | VeriSign, Inc. | | | 2,066,364 | | |
| | | | 16,502,611 | | |
| | | | | Iron/Steel: 0.6% | |
| | 73,400 | | | | | Carpenter Technology Corp. | | | 1,507,636 | | |
| | 53,300 | | | | | Cliffs Natural Resources, Inc. | | | 1,365,013 | | |
| | | | 2,872,649 | | |
See Accompanying Notes to Financial Statements
220
ING T. ROWE PRICE PORTFOLIO OF INVESTMENTS
DIVERSIFIED MID CAP GROWTH PORTFOLIO AS OF DECEMBER 31, 2008 (CONTINUED)
| Shares | | | | | | Value | |
| | | | | Leisure Time: 0.4% | |
| | 41,500 | | | L | | Royal Caribbean Cruises Ltd. | | $ | 570,625 | | |
| | 46,550 | | | @,L | | WMS Industries, Inc. | | | 1,252,195 | | |
| | | | 1,822,820 | | |
| | | | | Lodging: 1.4% | |
| | 64,400 | | | | | Choice Hotels International, Inc. | | | 1,935,864 | | |
| | 134,000 | | | | | Marriott International, Inc. | | | 2,606,300 | | |
| | 63,000 | | | | | Starwood Hotels & Resorts
Worldwide, Inc. | | | 1,127,700 | | |
| | 38,600 | | | @,L | | Wynn Resorts Ltd. | | | 1,631,236 | | |
| | | | 7,301,100 | | |
| | | | | Machinery-Construction & Mining: 0.5% | |
| | 84,500 | | | | | Joy Global, Inc. | | | 1,934,205 | | |
| | 46,600 | | | @ | | Terex Corp. | | | 807,112 | | |
| | | | 2,741,317 | | |
| | | | | Machinery-Diversified: 1.8% | |
| | 62,400 | | | | | Cummins, Inc. | | | 1,667,952 | | |
| | 27,400 | | | | | Flowserve Corp. | | | 1,411,100 | | |
| | 51,500 | | | | | Graco, Inc. | | | 1,222,095 | | |
| | 58,500 | | | | | IDEX Corp. | | | 1,412,775 | | |
| | 53,500 | | | | | Roper Industries, Inc. | | | 2,322,435 | | |
| | 55,800 | | | @ | | Zebra Technologies Corp. | | | 1,130,508 | | |
| | | | 9,166,865 | | |
| | | | | Media: 2.2% | |
| | 76,600 | | | | | Cablevision Systems Corp. | | | 1,289,944 | | |
| | 28,200 | | | @,@@,L | | Central European Media
Enterprises Ltd. | | | 612,504 | | |
| | 95,800 | | | @,@@,L | | CTC Media, Inc. | | | 459,840 | | |
| | 70,750 | | | @ | | Discovery Communications,
Inc. - Class C | | | 947,343 | | |
| | 50,400 | | | L | | Factset Research Systems, Inc. | | | 2,229,696 | | |
| | 114,400 | | | | | McGraw-Hill Cos., Inc. | | | 2,652,936 | | |
| | 70,200 | | | @@ | | Shaw Communications,
Inc. - Class B | | | 1,241,136 | | |
| | 68,600 | | | @@ | | WPP PLC ADR | | | 2,029,874 | | |
| | | | 11,463,273 | | |
| | | | | Metal Fabricate/Hardware: 1.0% | |
| | 63,200 | | | | | Precision Castparts Corp. | | | 3,759,136 | | |
| | 19,300 | | | | | Valmont Industries, Inc. | | | 1,184,248 | | |
| | | | 4,943,384 | | |
| | | | | Mining: 0.7% | |
| | 69,200 | | | @@ | | Agnico-Eagle Mines Ltd. | | | 3,552,036 | | |
| | | | 3,552,036 | | |
| | | | | Miscellaneous Manufacturing: 1.6% | |
| | 82,500 | | | | | Donaldson Co., Inc. | | | 2,776,125 | | |
| | 40,200 | | | | | Harsco Corp. | | | 1,112,736 | | |
| | 68,100 | | | | | ITT Corp. | | | 3,131,919 | | |
| | 45,800 | | | | | Pall Corp. | | | 1,302,094 | | |
| | | | 8,322,874 | | |
| | | | | Oil & Gas: 4.4% | |
| | 50,600 | | | @ | | Bill Barrett Corp. | | | 1,069,178 | | |
| | 80,300 | | | | | Cabot Oil & Gas Corp. | | | 2,087,800 | | |
| | 125,500 | | | @ | | Concho Resources, Inc. | | | 2,863,910 | | |
| | 30,100 | | | | | Diamond Offshore Drilling | | | 1,774,094 | | |
| | 89,800 | | | @ | | Forest Oil Corp. | | | 1,480,802 | | |
| | 67,800 | | | @ | | Mariner Energy, Inc. | | | 691,560 | | |
| Shares | | | | | | Value | |
| | 93,000 | | | | | Murphy Oil Corp. | | $ | 4,124,550 | | |
| | 152,500 | | | @,@@ | | Nabors Industries Ltd. | | | 1,825,425 | | |
| | 111,900 | | | @ | | Newfield Exploration Co. | | | 2,210,025 | | |
| | 54,950 | | | @ | | SandRidge Energy, Inc. | | | 337,943 | | |
| | 34,100 | | | | | Sunoco, Inc. | | | 1,481,986 | | |
| | 82,000 | | | @ | | Ultra Petroleum Corp. | | | 2,829,820 | | |
| | | | 22,777,093 | | |
| | | | | Oil & Gas Services: 2.9% | |
| | 33,900 | | | | | Baker Hughes, Inc. | | | 1,087,173 | | |
| | 114,400 | | | | | BJ Services Co. | | | 1,335,048 | | |
| | 153,100 | | | @ | | Cameron International Corp. | | | 3,138,550 | | |
| | 54,300 | | | @ | | Complete Production
Services, Inc. | | | 442,545 | | |
| | 40,900 | | | | | Core Laboratories NV | | | 2,448,274 | | |
| | 101,900 | | | @ | | FMC Technologies, Inc. | | | 2,428,277 | | |
| | 154,100 | | | | | Smith International, Inc. | | | 3,527,349 | | |
| | 121,600 | | | @ | | Tetra Technologies, Inc. | | | 590,976 | | |
| | | | 14,998,192 | | |
| | | | | Pharmaceuticals: 2.7% | |
| | 111,164 | | | | | Allergan, Inc. | | | 4,482,132 | | |
| | 45,500 | | | @,L | | BioMarin Pharmaceuticals, Inc. | | | 809,900 | | |
| | 23,400 | | | @,L | | Cephalon, Inc. | | | 1,802,736 | | |
| | 90,200 | | | @,@@ | | Elan Corp. PLC ADR | | | 541,200 | | |
| | 90,300 | | | @ | | Express Scripts, Inc. | | | 4,964,694 | | |
| | 92,600 | | | @,L | | Warner Chilcott Ltd. | | | 1,342,700 | | |
| | | | 13,943,362 | | |
| | | | | Pipelines: 0.3% | |
| | 113,900 | | | | | Williams Cos., Inc. | | | 1,649,272 | | |
| | | | 1,649,272 | | |
| | | | | Retail: 7.7% | |
| | 43,000 | | | | | Advance Auto Parts, Inc. | | | 1,446,950 | | |
| | 35,600 | | | @ | | AnnTaylor Stores Corp. | | | 205,412 | | |
| | 103,900 | | | @ | | Bed Bath & Beyond, Inc. | | | 2,641,138 | | |
| | 19,400 | | | @ | | Chipotle Mexican Grill, Inc. | | | 1,111,426 | | |
| | 42,100 | | | @ | | Copart, Inc. | | | 1,144,699 | | |
| | 65,400 | | | @ | | Dick's Sporting Goods, Inc. | | | 922,794 | | |
| | 83,400 | | | | | Family Dollar Stores, Inc. | | | 2,174,238 | | |
| | 41,600 | | | | | Men's Wearhouse, Inc. | | | 563,264 | | |
| | 65,100 | | | @ | | O'Reilly Automotive, Inc. | | | 2,001,174 | | |
| | 36,600 | | | @,L | | Panera Bread Co. | | | 1,911,984 | | |
| | 57,500 | | | | | Petsmart, Inc. | | | 1,060,875 | | |
| | 97,200 | | | | | Ross Stores, Inc. | | | 2,889,756 | | |
| | 72,755 | | | | | Staples, Inc. | | | 1,303,770 | | |
| | 155,000 | | | @ | | Starbucks Corp. | | | 1,466,300 | | |
| | 105,400 | | | | | Tiffany & Co. | | | 2,490,602 | | |
| | 86,050 | | | @@ | | Tim Hortons, Inc. | | | 2,481,682 | | |
| | 199,500 | | | | | TJX Cos., Inc. | | | 4,103,715 | | |
| | 36,100 | | | @ | | Tractor Supply Co. | | | 1,304,654 | | |
| | 72,500 | | | @ | | Urban Outfitters, Inc. | | | 1,086,050 | | |
| | 91,700 | | | | | Williams-Sonoma, Inc. | | | 720,762 | | |
| | 196,500 | | | | | Yum! Brands, Inc. | | | 6,189,750 | | |
| | | | 39,220,995 | | |
| | | | | Semiconductors: 6.2% | |
| | 196,100 | | | | | Altera Corp. | | | 3,276,831 | | |
| | 149,500 | | | | | Analog Devices, Inc. | | | 2,843,490 | | |
| | 229,750 | | | @ | | Broadcom Corp. | | | 3,898,858 | | |
| | 121,400 | | | @ | | Fairchild Semiconductor
International, Inc. | | | 593,646 | | |
| | 133,500 | | | @ | | Integrated Device
Technology, Inc. | | | 748,935 | | |
See Accompanying Notes to Financial Statements
221
ING T. ROWE PRICE PORTFOLIO OF INVESTMENTS
DIVERSIFIED MID CAP GROWTH PORTFOLIO AS OF DECEMBER 31, 2008 (CONTINUED)
| Shares | | | | | | Value | |
| | | | | Semiconductors (continued) | |
| | 69,200 | | | | | Intersil Corp. | | $ | 635,948 | | |
| | 31,800 | | | | | KLA-Tencor Corp. | | | 692,922 | | |
| | 39,000 | | | @ | | Lam Research Corp. | | | 829,920 | | |
| | 103,400 | | | | | Linear Technology Corp. | | | 2,287,208 | | |
| | 307,600 | | | @,@@,L | | Marvell Technology Group Ltd. | | | 2,051,692 | | |
| | 86,100 | | | | | Maxim Integrated Products | | | 983,262 | | |
| | 81,100 | | | @ | | MEMC Electronic Materials, Inc. | | | 1,158,108 | | |
| | 115,700 | | | | | Microchip Technology, Inc. | | | 2,259,621 | | |
| | 89,200 | | | | | National Semiconductor Corp. | | | 898,244 | | |
| | 189,400 | | | @ | | ON Semiconductor Corp. | | | 643,960 | | |
| | 112,900 | | | @ | | QLogic Corp. | | | 1,517,376 | | |
| | 74,700 | | | @ | | Silicon Laboratories, Inc. | | | 1,851,066 | | |
| | 113,400 | | | @ | | Teradyne, Inc. | | | 478,548 | | |
| | 56,500 | | | @ | | Varian Semiconductor
Equipment Associates, Inc. | | | 1,023,780 | | |
| | 186,500 | | | | | Xilinx, Inc. | | | 3,323,430 | | |
| | | | 31,996,845 | | |
| | | | | Software: 5.7% | |
| | 170,560 | | | @ | | Activision Blizzard, Inc. | | | 1,473,638 | | |
| | 85,400 | | | @ | | Adobe Systems, Inc. | | | 1,818,166 | | |
| | 116,600 | | | @ | | American Reprographics Co. | | | 804,540 | | |
| | 52,000 | | | @ | | Ansys, Inc. | | | 1,450,280 | | |
| | 139,200 | | | @ | | Autodesk, Inc. | | | 2,735,280 | | |
| | 72,600 | | | @ | | BMC Software, Inc. | | | 1,953,666 | | |
| | 62,500 | | | @,@@ | | Check Point Software
Technologies | | | 1,186,875 | | |
| | 79,600 | | | @ | | Citrix Systems, Inc. | | | 1,876,172 | | |
| | 38,300 | | | | | Dun & Bradstreet Corp. | | | 2,956,760 | | |
| | 114,400 | | | @ | | Electronic Arts, Inc. | | | 1,834,976 | | |
| | 39,700 | | | | | Fidelity National Information
Services, Inc. | | | 645,919 | | |
| | 35,000 | | | @ | | Fiserv, Inc. | | | 1,272,950 | | |
| | 116,700 | | | @ | | Intuit, Inc. | | | 2,776,293 | | |
| | 194,200 | | | @ | | Red Hat, Inc. | | | 2,567,324 | | |
| | 85,600 | | | @ | | Salesforce.com, Inc. | | | 2,740,056 | | |
| | 65,300 | | | | | SEI Investments Co. | | | 1,025,863 | | |
| | | | 29,118,758 | | |
| | | | | Telecommunications: 4.4% | |
| | 173,400 | | | @ | | American Tower Corp. | | | 5,084,088 | | |
| | 136,300 | | | @ | | Crown Castle International Corp. | | | 2,396,154 | | |
| | 138,000 | | | @ | | JDS Uniphase Corp. | | | 503,700 | | |
| | 247,200 | | | @ | | Juniper Networks, Inc. | | | 4,328,472 | | |
| | 76,600 | | | @,L | | Leap Wireless International, Inc. | | | 2,059,774 | | |
| | 125,000 | | | @ | | MetroPCS Communications, Inc. | | | 1,856,250 | | |
| | 64,100 | | | @,L | | NeuStar, Inc. | | | 1,226,233 | | |
| | 66,600 | | | @ | | NII Holdings, Inc. | | | 1,210,788 | | |
| | 234,550 | | | @ | | SBA Communications Corp. | | | 3,827,856 | | |
| | | | 22,493,315 | | |
| | | | | Toys/Games/Hobbies: 0.3% | |
| | 86,300 | | | | | Mattel, Inc. | | | 1,380,800 | | |
| | | | 1,380,800 | | |
| | | | | Transportation: 2.5% | |
| | 81,400 | | | | | CH Robinson Worldwide, Inc. | | | 4,479,442 | | |
| | 132,200 | | | | | Expeditors International
Washington, Inc. | | | 4,398,294 | | |
| | 105,900 | | | | | Landstar System, Inc. | | | 4,069,737 | | |
| | | | 12,947,473 | | |
Total Common Stock
(Cost $758,147,138) | | | 511,298,985 | | |
| Shares | | | | | | Value | |
| SHORT-TERM INVESTMENTS: 8.2% | |
| | | | | Mutual Fund: 0.3% | |
| | 1,388,762 | | | | | T. Rowe Price Reserve
Investment Fund | | $ | 1,388,762 | | |
Total Mutual Fund
(Cost $1,388,762) | | | 1,388,762 | | |
Principal
Amount | | | | | | Value | |
| | | | | Securities Lending Collateralcc: 7.9% | |
| $ | 41,021,680 | | | | | Bank of New York Mellon Corp.
Institutional Cash Reserves | | | 40,336,507 | | |
Total Securities Lending Collateral
(Cost $41,021,680) | | | 40,336,507 | | |
Total Short-Term Investments
(Cost $42,410,442) | | | 41,725,269 | | |
Total Investments in
Securities
(Cost $800,557,580)* | | | 107.9 | % | | $ | 553,024,254 | | |
Other Assets and
Liabilities - Net | | | (7.9 | ) | | | (40,646,824 | ) | |
| Net Assets | | | 100.0 | % | | $ | 512,377,430 | | |
@ Non-income producing security
@@ Foreign Issuer
ADR American Depositary Receipt
cc Securities purchased with cash collateral for securities loaned.
L Loaned security, a portion or all of the security is on loan at December 31, 2008.
* Cost for federal income tax purposes is $801,658,857.
Net unrealized depreciation consists of:
| Gross Unrealized Appreciation | | $ | 20,177,370 | | |
| Gross Unrealized Depreciation | | | (268,811,973 | ) | |
| Net Unrealized Depreciation | | $ | (248,634,603 | ) | |
The following table summarizes the inputs used as of December 31, 2008 in determining the Portfolio's investments at fair value for purposes of SFAS 157:
| | | Investments in
Securities | | Other Financial
Instruments* | |
| Level 1 — Quoted Prices | | $ | 511,704,485 | | | $ | — | | |
Level 2 — Other Significant
Observable Inputs | | | 41,319,769 | | | | — | | |
Level 3 — Significant
Unobservable Inputs | | | — | | | | — | | |
| Total | | $ | 553,024,254 | | | $ | — | | |
"Fair value" for purposes of SFAS 157 is different from "fair value" as used in the 1940 Act. The former generally implies market value, and can include market quotations as a source of value, and the latter refers to determinations of actual value in absence of available market quotations.
See Accompanying Notes to Financial Statements
222
ING T. ROWE PRICE PORTFOLIO OF INVESTMENTS
GROWTH EQUITY PORTFOLIO AS OF DECEMBER 31, 2008
| Shares | | | | | | Value | |
| COMMON STOCK: 96.7% | | | |
| | | | | Aerospace/Defense: 0.3% | |
| | 40,400 | | | | | General Dynamics Corp. | | $ | 2,326,637 | | |
| | | | 2,326,637 | | |
| | | | | Apparel: 0.9% | |
| | 145,600 | | | | | Nike, Inc. | | | 7,425,600 | | |
| | | | 7,425,600 | | |
| | | | | Banks: 1.4% | |
| | 60,000 | | | | | Goldman Sachs Group, Inc. | | | 5,063,400 | | |
| | 66,600 | | | | | Northern Trust Corp. | | | 3,472,524 | | |
| | 92,326 | | | | | State Street Corp. | | | 3,631,182 | | |
| | | | 12,167,106 | | |
| | | | | Beverages: 2.8% | |
| | 160,500 | | | | | Coca-Cola Co. | | | 7,265,835 | | |
| | 303,300 | | | | | PepsiCo, Inc. | | | 16,611,741 | | |
| | | | 23,877,576 | | |
| | | | | Biotechnology: 6.9% | |
| | 92,500 | | | @ | | Amgen, Inc. | | | 5,341,875 | | |
| | 105,358 | | | @ | | Celgene Corp. | | | 5,824,190 | | |
| | 232,207 | | | @ | | Genentech, Inc. | | | 19,252,282 | | |
| | 578,500 | | | @ | | Gilead Sciences, Inc. | | | 29,584,489 | | |
| | | | 60,002,836 | | |
| | | | | Chemicals: 1.8% | |
| | 61,900 | | | | | Monsanto Co. | | | 4,354,665 | | |
| | 195,100 | | | | | Praxair, Inc. | | | 11,581,136 | | |
| | | | 15,935,801 | | |
| | | | | Commercial Services: 3.6% | |
| | 312,300 | | | | | Automatic Data Processing, Inc. | | | 12,285,882 | | |
| | 3,100 | | | | | Mastercard, Inc. | | | 443,083 | | |
| | 144,000 | | | | | McKesson Corp. | | | 5,577,120 | | |
| | 205,031 | | | | | Moody's Corp. | | | 4,119,073 | | |
| | 10,200 | | | | | Visa, Inc. | | | 534,990 | | |
| | 583,100 | | | | | Western Union Co. | | | 8,361,654 | | |
| | | | 31,321,802 | | |
| | | | | Computers: 6.9% | |
| | 467,900 | | | @@ | | Accenture Ltd. | | | 15,342,441 | | |
| | 359,300 | | | @ | | Apple, Inc. | | | 30,666,255 | | |
| | 311,400 | | | @ | | Dell, Inc. | | | 3,188,736 | | |
| | 303,200 | | | @ | | EMC Corp. | | | 3,174,504 | | |
| | 177,200 | | | @,@@ | | Research In Motion Ltd. | | | 7,190,776 | | |
| | | | 59,562,712 | | |
| | | | | Cosmetics/Personal Care: 1.6% | |
| | 226,980 | | | | | Procter & Gamble Co. | | | 14,031,904 | | |
| | | | 14,031,904 | | |
| | | | | Diversified Financial Services: 1.2% | |
| | 27,700 | | | | | Blackrock, Inc. | | | 3,715,955 | | |
| | 76,508 | | | | | Franklin Resources, Inc. | | | 4,879,680 | | |
| | 142,400 | | | @@ | | Redecard SA | | | 1,569,331 | | |
| | | | 10,164,966 | | |
| | | | | Electronics: 0.7% | |
| | 193,200 | | | @,L | | Dolby Laboratories, Inc. | | | 6,329,232 | | |
| | | | 6,329,232 | | |
| Shares | | | | | | Value | |
| | | | | Food: 2.7% | |
| | 143,656 | | | @@ | | Groupe Danone | | $ | 8,679,663 | | |
| | 240,700 | | | @@ | | Nestle SA | | | 9,531,273 | | |
| | 211,900 | | | | | Sysco Corp. | | | 4,860,986 | | |
| | | | 23,071,922 | | |
| | | | | Healthcare-Products: 7.1% | |
| | 63,800 | | | @@ | | Alcon, Inc. | | | 5,690,322 | | |
| | 120,100 | | | | | Baxter International, Inc. | | | 6,436,159 | | |
| | 129,500 | | | | | Becton Dickinson & Co. | | | 8,856,505 | | |
| | 239,250 | | | @@ | | Covidien Ltd. | | | 8,670,420 | | |
| | 116,000 | | | | | Densply International, Inc. | | | 3,275,840 | | |
| | 16,800 | | | @ | | Intuitive Surgical, Inc. | | | 2,133,432 | | |
| | 467,200 | | | | | Medtronic, Inc. | | | 14,679,424 | | |
| | 182,700 | | | @ | | St. Jude Medical, Inc. | | | 6,021,792 | | |
| | 151,300 | | | | | Stryker Corp. | | | 6,044,435 | | |
| | | | 61,808,329 | | |
| | | | | Healthcare-Services: 3.0% | |
| | 294,100 | | | | | Aetna, Inc. | | | 8,381,850 | | |
| | 54,200 | | | @ | | Humana, Inc. | | | 2,020,576 | | |
| | 369,700 | | | @ | | WellPoint, Inc. | | | 15,575,461 | | |
| | | | 25,977,887 | | |
| | | | | Internet: 9.4% | |
| | 560,500 | | | @,L | | Amazon.com, Inc. | | | 28,742,440 | | |
| | 328,140 | | | @ | | Expedia, Inc. | | | 2,703,874 | | |
| | 82,300 | | | @ | | Google, Inc. - Class A | | | 25,319,595 | | |
| | 194,100 | | | @ | | McAfee, Inc. | | | 6,710,037 | | |
| | 46,559 | | | @,L | | Priceline.com, Inc. | | | 3,429,070 | | |
| | 707,400 | | | @@ | | Tencent Holdings Ltd. | | | 4,596,494 | | |
| | 500,820 | | | @ | | VeriSign, Inc. | | | 9,555,646 | | |
| | | | 81,057,156 | | |
| | | | | Lodging: 0.0% | |
| | 4,800 | | | @,L | | Wynn Resorts Ltd. | | | 202,848 | | |
| | | | 202,848 | | |
| | | | | Machinery-Diversified: 0.7% | |
| | 166,100 | | | | | Deere & Co. | | | 6,364,952 | | |
| | | | 6,364,952 | | |
| | | | | Media: 2.7% | |
| | 709,400 | | | | | McGraw - Hill Cos., Inc. | | | 16,450,986 | | |
| | 398,300 | | | @@ | | Shaw Communications,
Inc. - Class B | | | 7,041,944 | | |
| | | | 23,492,930 | | |
| | | | | Mining: 0.6% | |
| | 244,200 | | | @@ | | BHP Billiton Ltd. | | | 5,187,827 | | |
| | | | 5,187,827 | | |
| | | | | Miscellaneous Manufacturing: 3.5% | |
| | 531,600 | | | | | Danaher Corp. | | | 30,093,876 | | |
| | | | 30,093,876 | | |
| | | | | Oil & Gas: 4.5% | |
| | 76,400 | | | | | Chevron Corp. | | | 5,651,308 | | |
| | 101,700 | | | | | EOG Resources, Inc. | | | 6,771,186 | | |
| | 240,038 | | | | | ExxonMobil Corp. | | | 19,162,234 | | |
| | 349,700 | | | @@ | | Petroleo Brasileiro SA ADR | | | 7,137,377 | | |
| | | | 38,722,105 | | |
See Accompanying Notes to Financial Statements
223
ING T. ROWE PRICE PORTFOLIO OF INVESTMENTS
GROWTH EQUITY PORTFOLIO AS OF DECEMBER 31, 2008 (CONTINUED)
| Shares | | | | | | Value | |
| | | | | Oil & Gas Services: 3.0% | |
| | 28,000 | | | | | Baker Hughes, Inc. | | $ | 897,960 | | |
| | 163,000 | | | @ | | Cameron International Corp. | | | 3,341,500 | | |
| | 403,700 | | | | | Schlumberger Ltd. | | | 17,088,621 | | |
| | 208,300 | | | | | Smith International, Inc. | | | 4,767,987 | | |
| | | | 26,096,068 | | |
| | | | | Pharmaceuticals: 8.0% | |
| | 260,300 | | | | | Allergan, Inc. | | | 10,495,296 | | |
| | 422,500 | | | @,@@ | | Elan Corp. PLC ADR | | | 2,535,000 | | |
| | 201,800 | | | @ | | Express Scripts, Inc. | | | 11,094,964 | | |
| | 576,300 | | | @ | | Medco Health Solutions, Inc. | | | 24,152,733 | | |
| | 60,300 | | | @@ | | Novo-Nordisk A/S | | | 3,110,508 | | |
| | 95,900 | | | @@ | | Teva Pharmaceutical
Industries Ltd. ADR | | | 4,082,463 | | |
| | 361,400 | | | | | Wyeth | | | 13,556,114 | | |
| | | | 69,027,078 | | |
| | | | | Retail: 4.1% | |
| | 203,300 | | | | | Costco Wholesale Corp. | | | 10,673,250 | | |
| | 288,226 | | | | | CVS Caremark Corp. | | | 8,283,615 | | |
| | 202,100 | | | | | TJX Cos., Inc. | | | 4,157,197 | | |
| | 394,700 | | | | | Yum! Brands, Inc. | | | 12,433,050 | | |
| | | | 35,547,112 | | |
| | | | | Semiconductors: 1.4% | |
| | 120,900 | | | @ | | Broadcom Corp. | | | 2,051,673 | | |
| | 292,400 | | | | | Intel Corp. | | | 4,286,584 | | |
| | 935,000 | | | @,@@ | | Marvell Technology Group Ltd. | | | 6,236,450 | | |
| | | | 12,574,707 | | |
| | | | | Software: 5.4% | |
| | 145,800 | | | @ | | Adobe Systems, Inc. | | | 3,104,082 | | |
| | 384,300 | | | @ | | Autodesk, Inc. | | | 7,551,495 | | |
| | 169,900 | | | @ | | Electronic Arts, Inc. | | | 2,725,196 | | |
| | 150,900 | | | @ | | Fiserv, Inc. | | | 5,488,233 | | |
| | 1,091,825 | | | | | Microsoft Corp. | | | 21,225,078 | | |
| | 196,000 | | | @ | | Salesforce.com, Inc. | | | 6,273,960 | | |
| | | | 46,368,044 | | |
| | | | | Telecommunications: 9.4% | |
| | 495,000 | | | @ | | American Tower Corp. | | | 14,513,400 | | |
| | 311,900 | | | @,@@ | | Bharti Airtel Ltd. | | | 4,597,660 | | |
| | 738,900 | | | @ | | Cisco Systems, Inc. | | | 12,044,070 | | |
| | 744,000 | | | @ | | Crown Castle
International Corp. | | | 13,079,520 | | |
| | 342,800 | | | @ | | Juniper Networks, Inc. | | | 6,002,428 | | |
| | 166,000 | | | @,L | | Leap Wireless International, Inc. | | | 4,463,740 | | |
| | 557,000 | | | @ | | MetroPCS Communications, Inc. | | | 8,271,450 | | |
| | 506,100 | | | | | Qualcomm, Inc. | | | 18,133,563 | | |
| | | | 81,105,831 | | |
| | | | | Toys/Games/Hobbies: 1.2% | |
| | 27,400 | | | @@ | | Nintendo Co., Ltd. | | | 10,470,956 | | |
| | | | 10,470,956 | | |
| | | | | Transportation: 1.9% | |
| | 259,600 | | | | | Expeditors International
Washington, Inc. | | | 8,636,892 | | |
| | 38,700 | | | | | Union Pacific Corp. | | | 1,849,860 | | |
| | 112,800 | | | | | United Parcel Service,
Inc. - Class B | | | 6,222,048 | | |
| | | | 16,708,800 | | |
Total Common Stock
(Cost $1,104,718,927) | | | 837,024,600 | | |
| Shares | | | | Value | |
| SHORT-TERM INVESTMENTS: 3.3% | |
| | | Mutual Fund: 2.7% | |
| | 23,328,156 | | | T. Rowe Price Reserve Investment Fund | | $ | 23,328,156 | | |
Total Mutual Fund
(Cost $23,328,156) | | | 23,328,156 | | |
Principal
Amount | | | | Value | |
| | | Securities Lending Collateralcc: 0.6% | |
| $ | 5,150,389 | | | Bank of New York Mellon Corp.
Institutional Cash Reserves | | | 4,811,244 | | |
Total Securities Lending Collateral
(Cost $5,150,389) | | | 4,811,244 | | |
Total Short-Term Investments
(Cost $28,478,545) | | | 28,139,400 | | |
Total Investments in
Securities
(Cost $1,133,197,472)* | | | 100.0 | % | | $ | 865,164,000 | | |
Other Assets and
Liabilities - Net | | | 0.0 | | | | 72,973 | | |
| Net Assets | | | 100.0 | % | | $ | 865,236,973 | | |
@ Non-income producing security
@@ Foreign Issuer
ADR American Depositary Receipt
cc Securities purchased with cash collateral for securities loaned.
L Loaned security, a portion or all of the security is on loan at December 31, 2008.
* Cost for federal income tax purposes is $1,138,225,023.
| Net unrealized depreciation consists of: | |
| Gross Unrealized Appreciation | | $ | 19,163,463 | | |
| Gross Unrealized Depreciation | | | (292,224,486 | ) | |
| Net Unrealized Depreciation | | $ | (273,061,023 | ) | |
The following table summarizes the inputs used as of December 31, 2008 in determining the Portfolio's investments at fair value for purposes of SFAS 157:
| | | Investments in
Securities | | Other Financial
Instruments* | |
| Level 1 — Quoted Prices | | $ | 814,178,375 | | | $ | — | | |
Level 2 — Other Significant
Observable Inputs | | | 50,985,625 | | | | — | | |
Level 3 — Significant
Unobservable Inputs | | | — | | | | — | | |
| Total | | $ | 865,164,000 | | | $ | — | | |
"Fair value" for purposes of SFAS 157 is different from "fair value" as used in the 1940 Act. The former generally implies market value, and can include market quotations as a source of value, and the latter refers to determinations of actual value in absence of available market quotations.
* Other financial instruments may include forward foreign currency contracts, futures, swaps, and written options. Forward foreign currency contracts and futures are reported at their unrealized gain/loss at year end. Swaps and written options are reported at their market value at year end.
See Accompanying Notes to Financial Statements
224
PORTFOLIO OF INVESTMENTS
ING TEMPLETON FOREIGN EQUITY PORTFOLIO AS OF DECEMBER 31, 2008
| Shares | | | | | | Value | |
| COMMON STOCK: 91.8% | | | |
| | | | | Australia: 0.6% | |
| | 228,986 | | | | | National Australia Bank Ltd. | | $ | 3,366,473 | | |
| | | | 3,366,473 | | |
| | | | | Austria: 1.1% | |
| | 433,480 | | | | | Telekom Austria AG | | | 6,307,189 | | |
| | | | 6,307,189 | | |
| | | | | Brazil: 1.8% | |
| | 277,660 | | | | | Empresa Brasileira de
Aeronautica SA ADR | | | 4,500,869 | | |
| | 235,084 | | | | | Petroleo Brasileiro SA ADR | | | 5,757,207 | | |
| | | | 10,258,076 | | |
| | | | | China: 1.7% | |
| | 989,500 | | | | | China Shenhua Energy Co., Ltd. | | | 2,121,348 | | |
| | 16,226,000 | | | | | China Telecom Corp., Ltd. | | | 6,134,040 | | |
| | 4,728,000 | | | @ | | Shanghai Electric Group Co., Ltd. | | | 1,936,977 | | |
| | | | 10,192,365 | | |
| | | | | Denmark: 0.6% | |
| | 64,610 | | | @ | | Vestas Wind Systems A/S | | | 3,802,091 | | |
| | | | 3,802,091 | | |
| | | | | France: 12.2% | |
| | 116,880 | | | | | Accor SA | | | 5,757,453 | | |
| | 535,409 | | | | | AXA SA | | | 12,017,570 | | |
| | 110,340 | | | | | Compagnie Generale des
Etablissements Michelin | | | 5,829,664 | | |
| | 66,470 | | | | | Electricite de France | | | 3,866,014 | | |
| | 319,260 | | | | | France Telecom SA | | | 8,898,628 | | |
| | 50,856 | | | | | Gaz de France | | | 2,524,341 | | |
| | 188,098 | | | | | Sanofi-Aventis | | | 12,031,335 | | |
| | 235,898 | | | | | Total SA | | | 12,969,466 | | |
| | 222,360 | | | | | Vivendi | | | 7,247,603 | | |
| | | | 71,142,074 | | |
| | | | | Germany: 11.4% | |
| | 176,880 | | | | | Bayerische Motoren Werke AG | | | 5,521,611 | | |
| | 223,650 | | | | | Celesio AG | | | 6,020,225 | | |
| | 443,180 | | | | | Deutsche Post AG | | | 7,429,700 | | |
| | 272,692 | | | | | E.ON AG | | | 10,549,708 | | |
| | 1,048,290 | | �� | @ | | Infineon Technologies AG | | | 1,397,656 | | |
| | 81,770 | | | | | Merck KGaA | | | 7,316,297 | | |
| | 42,390 | | | | | Muenchener
Rueckversicherungs AG | | | 6,494,980 | | |
| | 285,016 | | | | | SAP AG | | | 10,262,478 | | |
| | 132,023 | | | | | Siemens AG | | | 9,959,887 | | |
| | 20,820 | | | | | Siemens AG ADR | | | 1,577,115 | | |
| | | | 66,529,657 | | |
| | | | | Hong Kong: 1.7% | |
| | 306,300 | | | | | Cheung Kong Holdings Ltd. ADR | | | 2,897,598 | | |
| | 477,500 | | | | | China Mobile Ltd. | | | 4,844,770 | | |
| | 287,000 | | | | | Hutchison Whampoa Ltd. | | | 1,448,838 | | |
| | 84,500 | | | | | Swire Pacific Ltd. | | | 585,350 | | |
| | | | 9,776,556 | | |
| | | | | India: 2.8% | |
| | 227,548 | | | | | Housing Development
Finance Corp. | | | 6,963,398 | | |
| | 327,550 | | | | | ICICI Bank Ltd. ADR | | | 6,305,338 | | |
| Shares | | | | | | Value | |
| | 351,120 | | | | | Satyam Computer Services
Ltd. ADR | | $ | 3,174,125 | | |
| | | | 16,442,861 | | |
| | | | | Israel: 0.8% | |
| | 250,680 | | | @ | | Check Point Software
Technologies | | | 4,760,413 | | |
| | | | 4,760,413 | | |
| | | | | Italy: 4.2% | |
| | 569,517 | | | | | ENI S.p.A. | | | 13,704,650 | | |
| | 1,620,943 | | | | | Intesa Sanpaolo S.p.A. | | | 5,888,376 | | |
| | 1,857,978 | | | | | UniCredito Italiano S.p.A. | | | 4,723,952 | | |
| | | | 24,316,978 | | |
| | | | | Japan: 3.8% | |
| | 143,300 | | | | | Fuji Photo Film Co., Ltd. | | | 3,199,045 | | |
| | 109,000 | | | | | Konica Minolta Holdings, Inc. | | | 848,111 | | |
| | 208,000 | | | | | NGK Spark Plug Co., Ltd. | | | 1,671,086 | | |
| | 18,100 | | | | | Nintendo Co., Ltd. | | | 6,916,945 | | |
| | 321,500 | | | | | Sony Corp. | | | 7,031,820 | | |
| | 43,400 | | | | | Takeda Pharmaceutical Co., Ltd. | | | 2,262,108 | | |
| | | | 21,929,115 | | |
| | | | | Netherlands: 6.1% | |
| | 381,895 | | | | | Koninklijke Philips
Electronics NV | | | 7,571,719 | | |
| | 34,782 | | | | | Randstad Holdings NV | | | 709,824 | | |
| | 561,233 | | | | | Reed Elsevier NV | | | 6,672,719 | | |
| | 419,380 | | | | | Royal Dutch Shell PLC - Class B | | | 10,630,631 | | |
| | 287,130 | | | | | SBM Offshore NV | | | 3,772,255 | | |
| | 245,390 | | | | | Unilever NV | | | 5,947,752 | | |
| | | | 35,304,900 | | |
| | | | | Norway: 1.1% | |
| | 960,030 | | | | | Telenor ASA | | | 6,476,735 | | |
| | | | 6,476,735 | | |
| | | | | Portugal: 1.2% | |
| | 791,410 | | | | | Portugal Telecom SGPS SA | | | 6,772,750 | | |
| | | | 6,772,750 | | |
| | | | | Singapore: 2.2% | |
| | 963,000 | | | | | DBS Group Holdings Ltd. | | | 5,672,435 | | |
| | 542,690 | | | @ | | Flextronics International Ltd. | | | 1,389,286 | | |
| | 3,287,000 | | | | | Singapore
Telecommunications Ltd. | | | 5,857,613 | | |
| | | | 12,919,334 | | |
| | | | | South Korea: 2.9% | |
| | 161,660 | | | @ | | KB Financial Group, Inc. ADR | | | 4,235,492 | | |
| | 154,230 | | | | | Korea Electric Power Corp. ADR | | | 1,790,610 | | |
| | 10,963 | | | | | LG Electronics, Inc. | | | 665,705 | | |
| | 45,093 | | | # | | Samsung Electronics Co.,
Ltd. GDR | | | 8,073,099 | | |
| | 105,740 | | | | | SK Telecom Co., Ltd. ADR | | | 1,922,353 | | |
| | | | 16,687,259 | | |
| | | | | Spain: 4.6% | |
| | 536,898 | | | | | Banco Santander Central
Hispano SA | | | 5,186,804 | | |
| | 199,034 | | | | | Repsol YPF SA | | | 4,249,410 | | |
| | 781,591 | | | | | Telefonica SA | | | 17,641,813 | | |
| | | | 27,078,027 | | |
See Accompanying Notes to Financial Statements
225
PORTFOLIO OF INVESTMENTS
ING TEMPLETON FOREIGN EQUITY PORTFOLIO AS OF DECEMBER 31, 2008 (CONTINUED)
| Shares | | | | | | Value | |
| | | | | Sweden: 1.7% | |
| | 656,230 | | | | | Atlas Copco AB - Class A | | $ | 5,773,831 | | |
| | 598,620 | | | | | Nordea Bank AB | | | 4,331,920 | | |
| | 55,703 | | | | | Securitas Systems AB | | | 48,961 | | |
| | | | 10,154,712 | | |
| | | | | Switzerland: 10.1% | |
| | 19,200 | | | | | ACE Ltd. | | | 1,016,064 | | |
| | 190,169 | | | | | Adecco SA | | | 6,510,257 | | |
| | 64,680 | | | | | Lonza Group AG | | | 5,996,568 | | |
| | 437,470 | | | | | Nestle SA | | | 17,322,999 | | |
| | 359,706 | | | | | Novartis AG | | | 18,014,599 | | |
| | 128,551 | | | | | Swiss Reinsurance | | | 6,294,578 | | |
| | 255,222 | | | @ | | UBS AG-Reg | | | 3,713,316 | | |
| | | | 58,868,381 | | |
| | | | | Taiwan: 1.5% | |
| | 1,271,669 | | | | | Chinatrust Financial
Holding Co., Ltd. | | | 544,265 | | |
| | 180,088 | | | # | | Compal Electronics, Inc. GDR | | | 473,289 | | |
| | 2,534,579 | | | | | Taiwan Semiconductor
Manufacturing Co., Ltd. | | | 3,458,382 | | |
| | 541,290 | | | | | Taiwan Semiconductor
Manufacturing Co., Ltd. ADR | | | 4,276,191 | | |
| | | | 8,752,127 | | |
| | | | | United Kingdom: 17.3% | |
| | 873,420 | | | | | Aviva PLC | | | 4,949,228 | | |
| | 964,850 | | | | | BAE Systems PLC | | | 5,250,849 | | |
| | 825,960 | | | | | BP PLC | | | 6,375,947 | | |
| | 471,300 | | | | | British Sky Broadcasting PLC | | | 3,328,287 | | |
| | 1,100,457 | | | | | Burberry Group PLC | | | 3,562,968 | | |
| | 384,346 | | | | | Cadbury PLC | | | 3,345,959 | | |
| | 507,190 | | | | | Compass Group PLC | | | 2,529,705 | | |
| | 777,437 | | | | | GlaxoSmithKline PLC | | | 14,458,581 | | |
| | 1,206,400 | | | | | HSBC Holdings PLC | | | 11,972,541 | | |
| | 2,352,315 | | | | | Kingfisher PLC | | | 4,633,888 | | |
| | 143,800 | | | | | National Grid PLC | | | 1,420,954 | | |
| | 346,370 | | | | | Pearson PLC | | | 3,264,661 | | |
| | 264,350 | | | | | Rexam PLC | | | 1,353,023 | | |
| | 744,550 | | | @ | | Rolls-Royce Group PLC | | | 3,642,270 | | |
| | 42,136,380 | | | @,I | | Rolls-Royce Group PLC - Class C | | | 60,582 | | |
| | 1,896,781 | | | | | Royal Bank of Scotland
Group PLC | | | 1,396,273 | | |
| | 2,133 | | | | | Schroders PLC-Non Voting | | | 21,377 | | |
| | 160,523 | | | | | Smiths Group PLC | | | 2,062,716 | | |
| | 448,178 | | | | | Standard Chartered PLC | | | 5,734,909 | | |
| | 1,547,870 | | | | | Tesco PLC | | | 8,059,806 | | |
| | 5,558,776 | | | | | Vodafone Group PLC | | | 11,382,444 | | |
| | 401,247 | | | | | Wolseley PLC | | | 2,235,160 | | |
| | | | 101,042,128 | | |
| | | | | United States: 0.4% | |
| | 152,240 | | | | | Invesco Ltd. | | | 2,198,346 | | |
| | | | 2,198,346 | | |
Total Common Stock
(Cost $833,920,199) | | | 535,078,547 | | |
| RIGHTS: 0.2% | | | |
| | | | | Singapore: 0.2% | |
| | 481,500 | | | | | DBS Group Holdings Ltd. | | | 1,003,181 | | |
Total Rights
(Cost $—) | | | 1,003,181 | | |
Total Long-Term Investments
(Cost $833,996,992) | | | 536,081,728 | | |
Principal
Amount | | | | | | Value | |
| SHORT-TERM INVESTMENTS: 6.0% | |
| | | | | U.S. Government
Agency Obligations: 6.0% | | | |
| $ | 35,000,000 | | | Z | | Federal Home Loan Bank,
0.020%, due 01/02/09 | | $ | 34,999,998 | | |
Total Short-Term Investments
(Cost $34,999,998) | | | 34,999,998 | | |
Total Investments in
Securities
(Cost $868,996,990)* | | | 98.0 | % | | $ | 571,081,726 | | |
Other Assets and
Liabilities - Net | | | 2.0 | | | | 11,847,876 | | |
| Net Assets | | | 100.0 | % | | $ | 582,929,602 | | |
@ Non-income producing security
ADR American Depositary Receipt
GDR Global Depositary Receipt
# Securities with purchases pursuant to Rule 144A or section 4(2), under the Securities Act of 1933 and may not be resold subject to that rule except to qualified institutional buyers. Unless otherwise noted, these securities have been determined to be liquid under the guidelines established by the Funds' Board of Directors/Trustees.
I Illiquid security
Z Indicates Zero Coupon Bond; rate shown reflects current effective yield.
* Cost for federal income tax purposes is $870,265,964.
| Net unrealized depreciation consists of: | |
| Gross Unrealized Appreciation | | $ | 3,678,021 | | |
| Gross Unrealized Depreciation | | | (302,862,259 | ) | |
| Net Unrealized Depreciation | | $ | (299,184,238 | ) | |
| Industry | | Percentage of
Net Assets | |
| Aerospace/Defense | | | 2.3 | % | |
| Apparel | | | 0.6 | | |
| Auto Manufacturers | | | 1.0 | | |
| Auto Parts & Equipment | | | 1.3 | | |
| Banks | | | 10.2 | | |
| Chemicals | | | 1.0 | | |
| Coal | | | 0.4 | | |
| Commercial Services | | | 1.2 | | |
| Computers | | | 0.1 | | |
| Distribution/Wholesale | | | 0.4 | | |
| Diversified Financial Services | | | 2.4 | | |
| Electric | | | 3.0 | | |
| Electrical Components & Equipment | | | 0.8 | | |
| Electronics | | | 1.5 | | |
| Food | | | 6.0 | | |
| Food Service | | | 0.4 | | |
| Gas | | | 0.4 | | |
| Holding Companies - Diversified | | | 0.4 | | |
| Home Furnishings | | | 1.2 | | |
| Insurance | | | 5.3 | | |
| Lodging | | | 1.0 | | |
| Machinery - Construction & Mining | | | 1.0 | | |
| Machinery - Diversified | | | 0.3 | | |
| Media | | | 3.5 | | |
| Miscellaneous Manufacturing | | | 3.0 | | |
| Oil & Gas | | | 9.2 | | |
| Oil & Gas Services | | | 0.6 | | |
| Packaging & Containers | | | 0.2 | | |
| Pharmaceuticals | | | 10.3 | | |
See Accompanying Notes to Financial Statements
226
PORTFOLIO OF INVESTMENTS
ING TEMPLETON FOREIGN EQUITY PORTFOLIO AS OF DECEMBER 31, 2008 (CONTINUED)
| Industry | | Percentage of
Net Assets | |
| Real Estate | | | 0.5 | % | |
| Retail | | | 0.8 | | |
| Semiconductors | | | 3.0 | | |
| Software | | | 3.1 | | |
| Telecommunications | | | 13.1 | | |
| Toys/Games/Hobbies | | | 1.2 | | |
| Transportation | | | 1.3 | | |
| Short-Term Investments | | | 6.0 | | |
| Other Assets and Liabilities - Net | | | 2.0 | | |
| Net Assets | | | 100.0 | % | |
The following table summarizes the inputs used as of December 31, 2008 in determining the Portfolio's investments at fair value for purposes of SFAS 157:
| | | Investments in
Securities | | Other Financial
Instruments* | |
| Level 1 — Quoted Prices | | $ | 49,620,255 | | | $ | — | | |
Level 2 — Other Significant
Observable Inputs | | | 521,461,471 | | | | — | | |
Level 3 — Significant
Unobservable Inputs | | | — | | | | — | | |
| Total | | $ | 571,081,726 | | | $ | — | | |
"Fair value" for purposes of SFAS 157 is different from "fair value" as used in the 1940 Act. The former generally implies market value, and can include market quotations as a source of value, and the latter refers to determinations of actual value in absence of available market quotations.
* Other financial instruments may include forward foreign currency contracts, futures, swaps, and written options. Forward foreign currency contracts and futures are reported at their unrealized gain/loss at year end. Swaps and written options are reported at their market value at year end.
See Accompanying Notes to Financial Statements
227
PORTFOLIO OF INVESTMENTS
ING THORNBURG VALUE PORTFOLIO AS OF DECEMBER 31, 2008
| Shares | | | | | | Value | |
| COMMON STOCK: 87.7% | | | |
| | | | | Airlines: 0.2% | |
| | 86,685 | | | @ | | JetBlue Airways Corp. | | $ | 615,464 | | |
| | | | 615,464 | | |
| | | | | Auto Manufacturers: 2.9% | |
| | 233,500 | | | @@ | | Toyota Motor Corp. | | | 7,719,119 | | |
| | | | 7,719,119 | | |
| | | | | Banks: 5.6% | |
| | 552,292 | | | | | Fifth Third Bancorp. | | | 4,561,932 | | |
| | 73,574 | | | | | Goldman Sachs Group, Inc. | | | 6,208,910 | | |
| | 126,150 | | | | | JPMorgan Chase & Co. | | | 3,977,510 | | |
| | | | 14,748,352 | | |
| | | | | Beverages: 2.1% | |
| | 340,034 | | | @ | | Dr Pepper Snapple Group, Inc. | | | 5,525,553 | | |
| | | | 5,525,553 | | |
| | | | | Biotechnology: 6.9% | |
| | 88,400 | | | @ | | Genentech, Inc. | | | 7,329,244 | | |
| | 215,400 | | | @ | | Gilead Sciences, Inc. | | | 11,015,556 | | |
| | | | 18,344,800 | | |
| | | | | Commercial Services: 1.1% | |
| | 104,900 | | | | | Paychex, Inc. | | | 2,756,772 | | |
| | | | 2,756,772 | | |
| | | | | Computers: 4.8% | |
| | 71,005 | | | @ | | Apple, Inc. | | | 6,060,277 | | |
| | 660,100 | | | @ | | Dell, Inc. | | | 6,759,424 | | |
| | 64,800 | | | | | Seagate Technology,
Inc. - Escrow | | | 1 | | |
| | | | 12,819,702 | | |
| | | | | Diversified Financial Services: 1.0% | |
| | 282,200 | | | @@ | | Hong Kong Exchanges
and Clearing Ltd. | | | 2,709,384 | | |
| | | | 2,709,384 | | |
| | | | | Electric: 3.3% | |
| | 104,965 | | | | | Entergy Corp. | | | 8,725,740 | | |
| | | | 8,725,740 | | |
| | | | | Healthcare-Products: 1.0% | |
| | 73,910 | | | @ | | Varian Medical Systems, Inc. | | | 2,589,806 | | |
| | | | 2,589,806 | | |
| | | | | Insurance: 11.3% | |
| | 123,704 | | | @@ | | ACE Ltd. | | | 6,546,416 | | |
| | 234,100 | | | | | Allstate Corp. | | | 7,669,116 | | |
| | 205,400 | | | | | Cincinnati Financial Corp. | | | 5,970,978 | | |
| | 284,232 | | | | | Hartford Financial Services
Group, Inc. | | | 4,667,089 | | |
| | 105,700 | | | @@ | | Swiss Reinsurance | | | 5,175,665 | | |
| | | | 30,029,264 | | |
| | | | | Internet: 3.3% | |
| | 117,041 | | | @,L | | Priceline.com, Inc. | | | 8,620,070 | | |
| | | | 8,620,070 | | |
| | | | | Leisure Time: 0.6% | |
| | 127,300 | | | @,L | | Life Time Fitness, Inc. | | | 1,648,535 | | |
| | | | 1,648,535 | | |
| Shares | | | | | | Value | |
| | | | | Media: 8.2% | |
| | 532,900 | | | | | Comcast Corp. - Special Class A | | $ | 8,606,335 | | |
| | 379,600 | | | @ | | DIRECTV Group, Inc. | | | 8,696,636 | | |
| | 410,400 | | | @ | | Dish Network Corp. | | | 4,551,336 | | |
| | | | 21,854,307 | | |
| | | | | Oil & Gas: 9.6% | |
| | 187,800 | | | | | ConocoPhillips | | | 9,728,040 | | |
| | 90,978 | | | | | Helmerich & Payne, Inc. | | | 2,069,750 | | |
| | 307,100 | | | | | Marathon Oil Corp. | | | 8,402,256 | | |
| | 88,800 | | | @,@@ | | OAO Gazprom ADR | | | 1,279,368 | | |
| | 82,350 | | | @ | | Transocean, Ltd. | | | 3,891,038 | | |
| | | | 25,370,452 | | |
| | | | | Pharmaceuticals: 6.1% | |
| | 292,975 | | | | | Eli Lilly & Co. | | | 11,798,103 | | |
| | 105,000 | | | @@ | | Teva Pharmaceutical
Industries Ltd. ADR | | | 4,469,850 | | |
| | | | 16,267,953 | | |
| | | | | Retail: 0.3% | |
| | 2,388,500 | | | @,L | | Rite Aid Corp. | | | 740,435 | | |
| | | | 740,435 | | |
| | | | | Semiconductors: 2.7% | |
| | 371,500 | | | | | Intel Corp. | | | 5,446,190 | | |
| | 500,025 | | | @ | | ON Semiconductor Corp. | | | 1,700,085 | | |
| | | | 7,146,275 | | |
| | | | | Software: 4.5% | |
| | 252,379 | | | @,L | | Eclipsys Corp. | | | 3,581,258 | | |
| | 426,000 | | | | | Microsoft Corp. | | | 8,281,440 | | |
| | | | 11,862,698 | | |
| | | | | Telecommunications: 12.2% | |
| | 221,900 | | | @,@@ | | Amdocs Ltd. | | | 4,058,551 | | |
| | 469,600 | | | | | AT&T, Inc. | | | 13,383,598 | | |
| | 376,600 | | | @@ | | China Mobile Ltd. | | | 3,821,027 | | |
| | 420,689 | | | | | Corning, Inc. | | | 4,009,166 | | |
| | 320,650 | | | @ | | Crown Castle International Corp. | | | 5,637,027 | | |
| | 2,154,600 | | | @,L | | Level 3 Communications, Inc. | | | 1,508,220 | | |
| | | | 32,417,589 | | |
Total Common Stock
(Cost $335,904,848) | | | 232,512,270 | | |
| PREFERRED STOCK: 0.3% | | | |
| | | | | Diversified Financial Services: 0.3% | |
| | 25,300 | | | | | CIT Group, Inc. | | | 730,158 | | |
Total Preferred Stock
(Cost $1,265,000) | | | 730,158 | | |
Principal
Amount | | | | | | Value | |
| CONVERTIBLE BONDS: 0.2% | | | |
| | | | | Airlines: 0.2% | |
| $ | 694,000 | | | C | | JetBlue Airways Corp.,
3.750%, due 03/15/35 | | | 537,850 | | |
Total Convertible Bonds
(Cost $525,509) | | | 537,850 | | |
See Accompanying Notes to Financial Statements
228
PORTFOLIO OF INVESTMENTS
ING THORNBURG VALUE PORTFOLIO AS OF DECEMBER 31, 2008 (CONTINUED)
Principal
Amount | | | | | | Value | |
| CORPORATE BONDS/NOTES: 2.1% | | | |
| | | | | Banks: 0.3% | |
| $ | 1,683,000 | | | C | | Fifth Third Capital Trust IV,
6.500%, due 04/15/37 | | $ | 842,109 | | |
| | | | 842,109 | | |
| | | | | Diversified Financial Services: 0.6% | |
| | 363,900 | | | | | CIT Group, Inc., 5.000%,
due 02/13/14 | | | 264,761 | | |
| | 531,500 | | | | | CIT Group, Inc., 5.000%,
due 02/01/15 | | | 374,629 | | |
| | 1,050,900 | | | | | CIT Group, Inc., 5.400%,
due 01/30/16 | | | 732,715 | | |
| | 290,900 | | | | | CIT Group, Inc., 5.850%,
due 09/15/16 | | | 205,121 | | |
| | | | 1,577,226 | | |
| | | | | Media: 0.9% | |
| | 897,000 | | | C | | DirecTV Holdings, LLC, 8.375%,
due 03/15/13 | | | 897,000 | | |
| | 1,669,000 | | | C | | Echostar DBS Corp., 7.750%,
due 05/31/15 | | | 1,426,995 | | |
| | | | 2,323,995 | | |
| | | | | Retail: 0.3% | |
| | 125,000 | | | C | | Rite Aid Corp., 7.500%,
due 03/01/17 | | | 81,875 | | |
| | 1,105,000 | | | C,L | | Rite Aid Corp., 10.375%,
due 07/15/16 | | | 817,700 | | |
| | | | 899,575 | | |
Total Corporate Bonds/Notes
(Cost $4,880,368) | | | 5,642,905 | | |
Total Long-Term Investments
(Cost $342,575,725) | | | 239,423,183 | | |
| Shares | | | | | | Value | |
| SHORT-TERM INVESTMENTS: 16.5% | | | |
| | | | | Affiliated Mutual Fund: 10.8% | |
| | 28,774,517 | | | | | ING Institutional Prime Money
Market Fund - Class I | | | 28,774,517 | | |
Total Mutual Fund
(Cost $28,774,517) | | | 28,774,517 | | |
Principal
Amount | | | | Value | |
| | | Securities Lending Collateralcc: 5.7% | |
| $ | 15,093,475 | | | Bank of New York Mellon Corp.
Institutional Cash Reserves | | | 14,985,514 | | |
Total Securities Lending Collateral
(Cost $15,093,475) | | | 14,985,514 | | |
Total Short-Term Investments
(Cost $43,867,992) | | | 43,760,031 | | |
Total Investments in
Securities
(Cost $386,443,717)* | | | 106.8 | % | | $ | 283,183,214 | | |
Other Assets and
Liabilities - Net | | | (6.8 | ) | | | (17,930,361 | ) | |
| Net Assets | | | 100.0 | % | | $ | 265,252,853 | | |
@ Non-income producing security
@@ Foreign Issuer
ADR American Depositary Receipt
C Bond may be called prior to maturity date.
cc Securities purchased with cash collateral for securities loaned.
L Loaned security, a portion or all of the security is on loan at December 31, 2008.
* Cost for federal income tax purposes is $388,115,618.
| Net unrealized depreciation consists of: | |
| Gross Unrealized Appreciation | | $ | 3,509,445 | | |
| Gross Unrealized Depreciation | | | (108,441,849 | ) | |
| Net Unrealized Depreciation | | $ | (104,932,404 | ) | |
The following table summarizes the inputs used as of December 31, 2008 in determining the Portfolio's investments at fair value for purposes of SFAS 157:
| | | Investments in
Securities | | Other Financial
Instruments* | |
| Level 1 — Quoted Prices | | $ | 240,582,223 | | | $ | — | | |
Level 2 — Other Significant
Observable Inputs | | | 42,600,991 | | | | — | | |
Level 3 — Significant
Unobservable Inputs | | | — | | | | — | | |
| Total | | $ | 283,183,214 | | | $ | — | | |
"Fair value" for purposes of SFAS 157 is different from "fair value" as used in the 1940 Act. The former generally implies market value, and can include market quotations as a source of value, and the latter refers to determinations of actual value in absence of available market quotations.
* Other financial instruments may include forward foreign currency contracts, futures, swaps, and written options. Forward foreign currency contracts and futures are reported at their unrealized gain/loss at year end. Swaps and written options are reported at their market value at year end.
See Accompanying Notes to Financial Statements
229
PORTFOLIO OF INVESTMENTS
ING UBS U.S. LARGE CAP EQUITY PORTFOLIO AS OF DECEMBER 31, 2008
| Shares | | | | | | Value | |
| COMMON STOCK: 98.6% | | | |
| | | | | Advertising: 1.8% | |
| | 466,500 | | | @ | | Interpublic Group of Cos., Inc. | | $ | 1,847,340 | | |
| | 105,800 | | | | | Omnicom Group | | | 2,848,136 | | |
| | | | 4,695,476 | | |
| | | | | Apparel: 0.6% | |
| | 71,700 | | | @ | | Coach, Inc. | | | 1,489,209 | | |
| | | | 1,489,209 | | |
| | | | | Auto Manufacturers: 1.7% | |
| | 157,550 | | | | | Paccar, Inc. | | | 4,505,930 | | |
| | | | 4,505,930 | | |
| | | | | Auto Parts & Equipment: 2.5% | |
| | 132,900 | | | | | BorgWarner, Inc. | | | 2,893,233 | | |
| | 199,100 | | | | | Johnson Controls, Inc. | | | 3,615,656 | | |
| | | | 6,508,889 | | |
| | | | | Banks: 8.6% | |
| | 161,392 | | | | | Bank of New York Mellon Corp. | | | 4,572,235 | | |
| | 36,900 | | | | | City National Corp. | | | 1,797,030 | | |
| | 292,200 | | | | | Fifth Third Bancorp. | | | 2,413,572 | | |
| | 240,100 | | | | | Morgan Stanley | | | 3,851,204 | | |
| | 105,000 | | | | | SunTrust Bank | | | 3,101,700 | | |
| | 231,100 | | | | | Wells Fargo & Co. | | | 6,812,828 | | |
| | | | 22,548,569 | | |
| | | | | Beverages: 3.0% | |
| | 152,500 | | | @ | | Constellation Brands, Inc. | | | 2,404,925 | | |
| | 99,100 | | | | | PepsiCo, Inc. | | | 5,427,707 | | |
| | | | 7,832,632 | | |
| | | | | Biotechnology: 4.9% | |
| | 70,400 | | | @ | | Amgen, Inc. | | | 4,065,600 | | |
| | 100,400 | | | @ | | Genzyme Corp. | | | 6,663,548 | | |
| | 40,900 | | | @ | | Millipore Corp. | | | 2,107,168 | | |
| | | | 12,836,316 | | |
| | | | | Building Materials: 0.6% | |
| | 151,300 | | | | | Masco Corp. | | | 1,683,969 | | |
| | | | 1,683,969 | | |
| | | | | Chemicals: 0.5% | |
| | 105,200 | | | | | Celanese Corp. | | | 1,307,636 | | |
| | | | 1,307,636 | | |
| | | | | Coal: 1.0% | |
| | 116,300 | | | | | Peabody Energy Corp. | | | 2,645,825 | | |
| | | | 2,645,825 | | |
| | | | | Commercial Services: 0.5% | |
| | 48,500 | | | | | Pharmaceutical Product
Development, Inc. | | | 1,406,985 | | |
| | | | 1,406,985 | | |
| | | | | Computers: 2.5% | |
| | 35,700 | | | @ | | Apple, Inc. | | | 3,046,995 | | |
| | 165,100 | | | @ | | NetApp, Inc. | | | 2,306,447 | | |
| | 283,300 | | | | | Seagate Technology, Inc. | | | 1,255,019 | | |
| | 71,600 | | | | | Seagate Technology,
Inc. - Escrow | | | 1 | | |
| | | | 6,608,462 | | |
| Shares | | | | | | Value | |
| | | | | Diversified Financial Services: 1.3% | |
| | 368,900 | | | | | Discover Financial Services | | $ | 3,515,617 | | |
| | | | 3,515,617 | | |
| | | | | Electric: 4.3% | |
| | 89,800 | | | | | American Electric Power Co., Inc. | | | 2,988,544 | | |
| | 254,200 | | | @ | | Dynegy, Inc. - Class A | | | 508,400 | | |
| | 116,300 | | | L | | Exelon Corp. | | | 6,467,443 | | |
| | 69,100 | | | | | Pepco Holdings, Inc. | | | 1,227,216 | | |
| | | | 11,191,603 | | |
| | | | | Electronics: 0.2% | |
| | 12,300 | | | @ | | Waters Corp. | | | 450,795 | | |
| | | | 450,795 | | |
| | | | | Food: 1.5% | |
| | 166,900 | | | | | Sysco Corp. | | | 3,828,686 | | |
| | | | 3,828,686 | | |
| | | | | Gas: 1.6% | |
| | 41,500 | | | | | NiSource, Inc. | | | 455,255 | | |
| | 87,600 | | | | | Sempra Energy | | | 3,734,388 | | |
| | | | 4,189,643 | | |
| | | | | Healthcare-Products: 3.2% | |
| | 94,800 | | | @@ | | Covidien Ltd. | | | 3,435,552 | | |
| | 102,400 | | | | | Medtronic, Inc. | | | 3,217,408 | | |
| | 40,500 | | | @ | | Zimmer Holdings, Inc. | | | 1,637,010 | | |
| | | | 8,289,970 | | |
| | | | | Healthcare-Services: 0.7% | |
| | 34,800 | | | @ | | DaVita, Inc. | | | 1,725,036 | | |
| | | | 1,725,036 | | |
| | | | | Household Products/Wares: 1.0% | |
| | 66,000 | | | | | Fortune Brands, Inc. | | | 2,724,480 | | |
| | | | 2,724,480 | | |
| | | | | Insurance: 5.8% | |
| | 88,200 | | | @@ | | ACE Ltd. | | | 4,667,544 | | |
| | 120,000 | | | | | Aflac, Inc. | | | 5,500,800 | | |
| | 53,400 | | | | | Metlife, Inc. | | | 1,861,524 | | |
| | 134,300 | | | | | Principal Financial Group, Inc. | | | 3,031,151 | | |
| | | | 15,061,019 | | |
| | | | | Leisure Time: 1.4% | |
| | 146,800 | | | | | Carnival Corp. | | | 3,570,176 | | |
| | | | 3,570,176 | | |
| | | | | Lodging: 0.7% | |
| | 95,700 | | | | | Starwood Hotels & Resorts
Worldwide, Inc. | | | 1,713,030 | | |
| | | | 1,713,030 | | |
| | | | | Media: 4.2% | |
| | 468,600 | | | | | Comcast Corp. - Class A | | | 7,909,968 | | |
| | 343,600 | | | | | News Corp. - Class A | | | 3,123,324 | | |
| | | | 11,033,292 | | |
| | | | | Miscellaneous Manufacturing: 6.4% | |
| | 496,500 | | | | | General Electric Co. | | | 8,043,300 | | |
| | 168,100 | | | | | Illinois Tool Works, Inc. | | | 5,891,905 | | |
| | 97,200 | | | | | Pall Corp. | | | 2,763,396 | | |
| | | | 16,698,601 | | |
See Accompanying Notes to Financial Statements
230
PORTFOLIO OF INVESTMENTS
ING UBS U.S. LARGE CAP EQUITY PORTFOLIO AS OF DECEMBER 31, 2008 (CONTINUED)
| Shares | | | | | | Value | |
| | | | | Oil & Gas: 7.5% | |
| | 98,900 | | | | | Anadarko Petroleum Corp. | | $ | 3,812,595 | | |
| | 68,200 | | | | | Chevron Corp. | | | 5,044,754 | | |
| | 29,000 | | | | | EOG Resources, Inc. | | | 1,930,820 | | |
| | 48,400 | | | | | Hess Corp. | | | 2,596,176 | | |
| | 101,400 | | | | | Marathon Oil Corp. | | | 2,774,304 | | |
| | 45,300 | | | | | Sunoco, Inc. | | | 1,968,738 | | |
| | 44,200 | | | @ | | Ultra Petroleum Corp. | | | 1,525,342 | | |
| | | | 19,652,729 | | |
| | | | | Oil & Gas Services: 3.1% | |
| | 116,800 | | | | | Baker Hughes, Inc. | | | 3,745,776 | | |
| | 236,300 | | | | | Halliburton Co. | | | 4,295,934 | | |
| | | | 8,041,710 | | |
| | | | | Pharmaceuticals: 5.7% | |
| | 118,200 | | | | | Allergan, Inc. | | | 4,765,824 | | |
| | 16,500 | | | @,L | | Cephalon, Inc. | | | 1,271,160 | | |
| | 90,200 | | | @ | | Medco Health Solutions, Inc. | | | 3,780,282 | | |
| | 133,300 | | | | | Wyeth | | | 5,000,083 | | |
| | | | 14,817,349 | | |
| | | | | Retail: 3.4% | |
| | 139,300 | | | | | JC Penney Co., Inc. | | | 2,744,210 | | |
| | 253,500 | | | | | Macy's, Inc. | | | 2,623,725 | | |
| | 362,200 | | | @ | | Starbucks Corp. | | | 3,426,412 | | |
| | | | 8,794,347 | | |
| | | | | Semiconductors: 6.3% | |
| | 216,900 | | | | | Analog Devices, Inc. | | | 4,125,438 | | |
| | 107,200 | | | @ | | Broadcom Corp. | | | 1,819,184 | | |
| | 601,500 | | | | | Intel Corp. | | | 8,817,990 | | |
| | 264,000 | | | @,@@ | | Marvell Technology Group Ltd. | | | 1,760,880 | | |
| | | | 16,523,492 | | |
| | | | | Software: 5.2% | |
| | 146,900 | | | @ | | Intuit, Inc. | | | 3,494,751 | | |
| | 338,000 | | | | | Microsoft Corp. | | | 6,570,720 | | |
| | 152,700 | | | @,L | | VMware, Inc. | | | 3,617,463 | | |
| | | | 13,682,934 | | |
| | | | | Telecommunications: 2.7% | |
| | 185,800 | | | | | AT&T, Inc. | | | 5,295,300 | | |
| | 4,849 | | | @,@@,L | | Nortel Networks Corp. | | | 1,261 | | |
| | 896,189 | | | | | Sprint Nextel Corp. | | | 1,640,026 | | |
| | | | 6,936,587 | | |
| | | | | Transportation: 4.2% | |
| | 24,300 | | | | | Burlington Northern Santa Fe Corp. | | | 1,839,753 | | |
| | 97,900 | | | | | FedEx Corp. | | | 6,280,285 | | |
| | 73,200 | | | | | Ryder System, Inc. | | | 2,838,695 | | |
| | | | 10,958,733 | | |
Total Common Stock
(Cost $372,403,186) | | | 257,469,727 | | |
| EXCHANGE-TRADED FUNDS: 0.5% | | | |
| | | | | Exchange-Traded Funds: 0.5% | |
| | 15,000 | | | | | SPDR Trust Series 1 | | | 1,353,600 | | |
Total Exchange-Traded Funds
(Cost $1,557,329) | | | 1,353,600 | | |
Total Long-Term Investments
(Cost $373,960,515) | | | 258,823,327 | | |
| Shares | | | | | | Value | |
| SHORT-TERM INVESTMENTS: 2.0% | |
| | | | | Affiliated Mutual Fund: 0.7% | |
| | 1,812,773 | | | | | ING Institutional Prime Money
Market Fund - Class I | | $ | 1,812,774 | | |
Total Mutual Fund
(Cost $1,812,774) | | | 1,812,774 | | |
Principal
Amount | | | | Value | |
| | | Securities Lending Collateralcc: 1.3% | |
| $ | 3,487,032 | | | Bank of New York Mellon Corp.
Institutional Cash Reserves | | | 3,251,795 | | |
Total Securities Lending
Collateral (Cost $3,487,032) | | | 3,251,795 | | |
Total Short-Term Investments
(Cost $5,299,806) | | | 5,064,569 | | |
Total Investments in
Securities
(Cost $379,260,321)* | | | 101.1 | % | | $ | 263,887,896 | | |
Other Assets and
Liabilities - Net | | | (1.1 | ) | | | (2,833,100 | ) | |
| Net Assets | | | 100.0 | % | | $ | 261,054,796 | | |
@ Non-income producing security
@@ Foreign Issuer
cc Securities purchased with cash collateral for securities loaned.
L Loaned security, a portion or all of the security is on loan at December 31, 2008.
* Cost for federal income tax purposes is $384,226,411.
Net unrealized depreciation consists of:
| Gross Unrealized Appreciation | | $ | 3,017,613 | | |
| Gross Unrealized Depreciation | | | (123,356,128 | ) | |
| Net Unrealized Depreciation | | $ | (120,338,515 | ) | |
The following table summarizes the inputs used as of December 31, 2008 in determining the Portfolio's investments at fair value for purposes of SFAS 157:
| | | Investments in
Securities | | Other Financial
Instruments* | |
| Level 1 — Quoted Prices | | $ | 260,636,101 | | | $ | — | | |
Level 2 — Other Significant
Observable Inputs | | | 3,251,795 | | | | — | | |
Level 3 — Significant
Unobservable Inputs | | | — | | | | — | | |
| Total | | $ | 263,887,896 | | | $ | — | | |
"Fair value" for purposes of SFAS 157 is different from "fair value" as used in the 1940 Act. The former generally implies market value, and can include market quotations as a source of value, and the latter refers to determinations of actual value in absence of available market quotations.
* Other financial instruments may include forward foreign currency contracts, futures, swaps, and written options. Forward foreign currency contracts and futures are reported at their unrealized gain/loss at year end. Swaps and written options are reported at their market value at year end.
See Accompanying Notes to Financial Statements
231
PORTFOLIO OF INVESTMENTS
ING VAN KAMPEN COMSTOCK PORTFOLIO AS OF DECEMBER 31, 2008
| Shares | | | | | | Value | |
| COMMON STOCK: 96.1% | | | |
| | | | | Agriculture: 1.5% | |
| | 230,400 | | | | | Altria Group, Inc. | | $ | 3,469,824 | | |
| | 118,900 | | | | | Philip Morris International, Inc. | | | 5,173,339 | | |
| | | | 8,643,163 | | |
| | | | | Airlines: 0.2% | |
| | 96,100 | | | | | Southwest Airlines Co. | | | 828,382 | | |
| | | | 828,382 | | |
| | | | | Banks: 11.0% | |
| | 915,500 | | | | | Bank of America Corp. | | | 12,890,240 | | |
| | 538,431 | | | | | Bank of New York Mellon Corp. | | | 15,253,750 | | |
| | 35,000 | | | @@,L | | Barclays PLC ADR | | | 343,000 | | |
| | 25,000 | | | | | Goldman Sachs Group, Inc. | | | 2,109,750 | | |
| | 404,300 | | | | | JPMorgan Chase & Co. | | | 12,747,579 | | |
| | 112,400 | | | | | PNC Financial Services
Group, Inc. | | | 5,507,600 | | |
| | 160,500 | | | | | US Bancorp. | | | 4,014,105 | | |
| | 335,500 | | | | | Wells Fargo & Co. | | | 9,890,540 | | |
| | | | 62,756,564 | | |
| | | | | Beverages: 2.5% | |
| | 240,900 | | | | | Coca-Cola Co. | | | 10,905,543 | | |
| | 183,616 | | | @ | | Dr Pepper Snapple Group, Inc. | | | 2,983,760 | | |
| | | | 13,889,303 | | |
| | | | | Chemicals: 1.2% | |
| | 277,888 | | | | | EI Du Pont de Nemours & Co. | | | 7,030,566 | | |
| | | | 7,030,566 | | |
| | | | | Commercial Services: 0.2% | |
| | 88,300 | | | | | Western Union Co. | | | 1,266,222 | | |
| | | | 1,266,222 | | |
| | | | | Computers: 4.2% | |
| | 90,000 | | | @ | | Computer Sciences Corp. | | | 3,162,600 | | |
| | 797,300 | | | @ | | Dell, Inc. | | | 8,164,352 | | |
| | 142,300 | | | | | Hewlett-Packard Co. | | | 5,164,067 | | |
| | 85,400 | | | | | International Business
Machines Corp. | | | 7,187,264 | | |
| | | | 23,678,283 | | |
| | | | | Diversified Financial Services: 0.2% | |
| | 88,100 | | | | | Merrill Lynch & Co., Inc. | | | 1,025,484 | | |
| | | | 1,025,484 | | |
| | | | | | | Electrical Components &
Equipment: 0.6% | | | | | |
| | 99,700 | | | | | Emerson Electric Co. | | | 3,650,017 | | |
| | | | 3,650,017 | | |
| | | | | Food: 7.4% | |
| | 399,287 | | | @@ | | Cadbury PLC ADR | | | 14,242,567 | | |
| | 514,240 | | | | | Kraft Foods, Inc. | | | 13,807,344 | | |
| | 294,000 | | | | | Sara Lee Corp. | | | 2,878,260 | | |
| | 454,900 | | | @@ | | Unilever NV ADR | | | 11,167,795 | | |
| | | | 42,095,966 | | |
| | | | | Forest Products & Paper: 3.2% | |
| | 1,545,577 | | | | | International Paper Co. | | | 18,237,809 | | |
| | | | 18,237,809 | | |
| Shares | | | | | | Value | |
| | | | | Healthcare-Products: 0.9% | |
| | 673,300 | | | @ | | Boston Scientific Corp. | | $ | 5,211,342 | | |
| | | | 5,211,342 | | |
| | | | | Healthcare-Services: 1.0% | |
| | 110,000 | | | | | UnitedHealth Group, Inc. | | | 2,926,000 | | |
| | 67,800 | | | @ | | WellPoint, Inc. | | | 2,856,414 | | |
| | | | 5,782,414 | | |
| | | | | Household Products/Wares: 0.3% | |
| | 36,000 | | | | | Kimberly-Clark Corp. | | | 1,898,640 | | |
| | | | 1,898,640 | | |
| | | | | Insurance: 10.1% | |
| | 55,300 | | | | | Aflac, Inc. | | | 2,534,952 | | |
| | 1,370 | | | @ | | Berkshire Hathaway, Inc. - Class B | | | 4,403,180 | | |
| | 562,360 | | | | | Chubb Corp. | | | 28,680,360 | | |
| | 187,100 | | | | | Metlife, Inc. | | | 6,522,306 | | |
| | 116,070 | | | | | Torchmark Corp. | | | 5,188,329 | | |
| | 225,105 | | | | | Travelers Cos., Inc. | | | 10,174,746 | | |
| | | | 57,503,873 | | |
| | | | | Internet: 2.9% | |
| | 892,200 | | | @ | | eBay, Inc. | | | 12,455,112 | | |
| | 570,575 | | | @ | | Liberty Media Corp. -
Interactive - Class A | | | 1,780,194 | | |
| | 187,700 | | | @ | | Yahoo!, Inc. | | | 2,289,940 | | |
| | | | 16,525,246 | | |
| | | | | Media: 12.9% | |
| | 1,422,000 | | | | | Comcast Corp. - Class A | | | 24,003,360 | | |
| | 348,640 | | | @ | | Liberty Media
Corp. - Entertainment | | | 6,094,227 | | |
| | 695,000 | | | L | | News Corp. - Class B | | | 6,658,100 | | |
| | 1,747,900 | | | L | | Time Warner, Inc. | | | 17,583,874 | | |
| | 994,250 | | | @ | | Viacom - Class B | | | 18,950,405 | | |
| | | | 73,289,966 | | |
| | | | | Mining: 0.9% | |
| | 425,800 | | | | | Alcoa, Inc. | | | 4,794,508 | | |
| | | | 4,794,508 | | |
| | | | | Miscellaneous Manufacturing: 2.6% | |
| | 920,700 | | | | | General Electric Co. | | | 14,915,340 | | |
| | | | 14,915,340 | | |
| | | | | Oil & Gas: 1.8% | |
| | 45,600 | | | @@ | | BP PLC ADR | | | 2,131,344 | | |
| | 82,200 | | | | | ConocoPhillips | | | 4,257,960 | | |
| | 73,800 | | | @@ | | Total SA ADR | | | 4,081,140 | | |
| | | | 10,470,444 | | |
| | | | | Oil & Gas Services: 1.1% | |
| | 337,800 | | | | | Halliburton Co. | | | 6,141,204 | | |
| | | | 6,141,204 | | |
| | | | | Pharmaceuticals: 14.4% | |
| | 81,400 | | | | | Abbott Laboratories | | | 4,344,318 | | |
| | 888,500 | | | | | Bristol-Myers Squibb Co. | | | 20,657,625 | | |
| | 283,350 | | | | | Cardinal Health, Inc. | | | 9,767,075 | | |
| | 173,300 | | | | | Eli Lilly & Co. | | | 6,978,791 | | |
| | 63,100 | | | @@ | | GlaxoSmithKline PLC ADR | | | 2,351,737 | | |
| | 660,600 | | | | | Pfizer, Inc. | | | 11,699,226 | | |
| | 46,800 | | | @@ | | Roche Holding AG ADR | | | 3,582,540 | | |
See Accompanying Notes to Financial Statements
232
PORTFOLIO OF INVESTMENTS
ING VAN KAMPEN COMSTOCK PORTFOLIO AS OF DECEMBER 31, 2008 (CONTINUED)
| Shares | | | | | | Value | |
| | | | | Pharmaceuticals (continued) | |
| | 820,100 | | | | | Schering-Plough Corp. | | $ | 13,966,303 | | |
| | 234,200 | | | | | Wyeth | | | 8,784,842 | | |
| | | | 82,132,457 | | |
| | | | | Retail: 6.4% | |
| | 195,400 | | | | | CVS Caremark Corp. | | | 5,615,796 | | |
| | 185,700 | | | | | Home Depot, Inc. | | | 4,274,814 | | |
| | 148,800 | | | | | JC Penney Co., Inc. | | | 2,931,360 | | |
| | 214,400 | | | | | Lowe's Cos., Inc. | | | 4,613,888 | | |
| | 319,800 | | | | | Macy's, Inc. | | | 3,309,930 | | |
| | 277,600 | | | | | Wal-Mart Stores, Inc. | | | 15,562,256 | | |
| | | | 36,308,044 | | |
| | | | | Semiconductors: 1.3% | |
| | 277,880 | | | | | Intel Corp. | | | 4,073,721 | | |
| | 158,200 | | | | | KLA-Tencor Corp. | | | 3,447,178 | | |
| | | | 7,520,899 | | |
| | | | | Software: 0.6% | |
| | 164,600 | | | | | Microsoft Corp. | | | 3,199,824 | | |
| | | | 3,199,824 | | |
| | | | | Telecommunications: 6.7% | |
| | 379,600 | | | | | AT&T, Inc. | | | 10,818,600 | | |
| | 289,200 | | | @ | | Cisco Systems, Inc. | | | 4,713,960 | | |
| | 303,454 | | | @@,L | | Telefonaktiebolaget LM
Ericsson ADR | | | 2,369,976 | | |
| | 592,700 | | | | | Verizon Communications, Inc. | | | 20,092,530 | | |
| | | | 37,995,066 | | |
Total Common Stock
(Cost $742,577,943) | | | 546,791,026 | | |
Principal
Amount | | | | | | Value | |
| SHORT-TERM INVESTMENTS: 1.0% | | | |
| | | | | Securities Lending Collateralcc: 1.0% | |
| $ | 5,891,520 | | | | | Bank of New York Mellon Corp.
Institutional Cash Reserves | | | 5,698,201 | | |
Total Short-Term Investments
(Cost $5,891,520) | | | 5,698,201 | | |
Total Investments in
Securities
(Cost $748,469,463)* | | | 97.1 | % | | $ | 552,489,227 | | |
Other Assets and
Liabilities - Net | | | 2.9 | | | | 16,277,562 | | |
| Net Assets | | | 100.0 | % | | $ | 568,766,789 | | |
@ Non-income producing security
@@ Foreign Issuer
ADR American Depositary Receipt
cc Securities purchased with cash collateral for securities loaned.
L Loaned security, a portion or all of the security is on loan at December 31, 2008.
* Cost for federal income tax purposes is $775,670,146.
Net unrealized depreciation consists of:
| Gross Unrealized Appreciation | | $ | 6,352,556 | | |
| Gross Unrealized Depreciation | | | (229,533,475 | ) | |
| Net Unrealized Depreciation | | $ | (223,180,919 | ) | |
The following table summarizes the inputs used as of December 31, 2008 in determining the Portfolio's investments at fair value for purposes of SFAS 157:
| | | Investments in
Securities | | Other Financial
Instruments* | |
| Level 1 — Quoted Prices | | $ | 546,791,026 | | | $ | — | | |
Level 2 — Other Significant
Observable Inputs | | | 5,698,201 | | | | — | | |
Level 3 — Significant
Unobservable Inputs | | | — | | | | — | | |
| Total | | $ | 552,489,227 | | | $ | — | | |
"Fair value" for purposes of SFAS 157 is different from "fair value" as used in the 1940 Act. The former generally implies market value, and can include market quotations as a source of value, and the latter refers to determinations of actual value in absence of available market quotations.
* Other financial instruments may include forward foreign currency contracts, futures, swaps, and written options. Forward foreign currency contracts and futures are reported at their unrealized gain/loss at year end. Swaps and written options are reported at their market value at year end.
See Accompanying Notes to Financial Statements
233
ING VAN KAMPEN EQUITY AND PORTFOLIO OF INVESTMENTS
INCOME PORTFOLIO AS OF DECEMBER 31, 2008
| Shares | | | | | | Value | |
| COMMON STOCK: 59.9% | | | |
| | | | | Aerospace/Defense: 1.5% | |
| | 206,570 | | | | | Raytheon Co. | | $ | 10,543,333 | | |
| | | | 10,543,333 | | |
| | | | | Agriculture: 0.6% | |
| | 108,380 | | | | | Philip Morris International, Inc. | | | 4,715,614 | | |
| | | | 4,715,614 | | |
| | | | | Airlines: 0.4% | |
| | 153,800 | | | @ | | Continental Airlines, Inc. | | | 2,777,628 | | |
| | | | 2,777,628 | | |
| | | | | Auto Parts & Equipment: 0.2% | |
| | 55,558 | | | @@ | | Autoliv, Inc. | | | 1,192,275 | | |
| | | | 1,192,275 | | |
| | | | | Banks: 7.0% | |
| | 511,124 | | | | | Bank of America Corp. | | | 7,196,626 | | |
| | 724,703 | | | S | | JPMorgan Chase & Co. | | | 22,849,886 | | |
| | 311,122 | | | | | Keycorp | | | 2,650,759 | | |
| | 130,951 | | | @@ | | Mitsubishi UFJ Financial
Group, Inc. ADR | | | 813,206 | | |
| | 302,900 | | | @@ | | Mizuho Financial
Group, Inc. ADR | | | 1,747,733 | | |
| | 166,929 | | | | | PNC Financial Services
Group, Inc. | | | 8,179,521 | | |
| | 367 | | | @@,X | | Sumitomo Mitsui Financial
Group, Inc. | | | 1,461,360 | | |
| | 181,381 | | | | | SunTrust Bank | | | 5,357,995 | | |
| | | | 50,257,086 | | |
| | | | | Beverages: 0.6% | |
| | 101,160 | | | | | Coca-Cola Co. | | | 4,579,513 | | |
| | | | 4,579,513 | | |
| | | | | Chemicals: 1.6% | |
| | 194,770 | | | @@,S | | Bayer AG ADR | | | 11,569,338 | | |
| | | | 11,569,338 | | |
| | | | | Commercial Services: 0.4% | |
| | 49,604 | | | | | Manpower, Inc. | | | 1,686,040 | | |
| | 45,600 | | | | | Robert Half International, Inc. | | | 949,392 | | |
| | | | 2,635,432 | | |
| | | | | Computers: 1.1% | |
| | 87,590 | | | @ | | EMC Corp. | | | 917,067 | | |
| | 193,486 | | | | | Hewlett-Packard Co. | | | 7,021,607 | | |
| | | | 7,938,674 | | |
| | | | | Cosmetics/Personal Care: 1.3% | |
| | 141,250 | | | | | Estee Lauder Cos., Inc. | | | 4,373,100 | | |
| | 82,960 | | | | | Procter & Gamble Co. | | | 5,128,587 | | |
| | | | 9,501,687 | | |
| | | | | Diversified Financial Services: 0.8% | |
| | 360,005 | | | | | Charles Schwab Corp. | | | 5,821,281 | | |
| | | | 5,821,281 | | |
| | | | | Electric: 3.5% | |
| | 381,550 | | | | | American Electric Power
Co., Inc. | | | 12,697,984 | | |
| | 62,562 | | | | | Entergy Corp. | | | 5,200,779 | | |
| | 151,160 | | | | | FirstEnergy Corp. | | | 7,343,353 | | |
| | | | 25,242,116 | | |
| Shares | | | | | | Value | |
| | | | | Food: 4.2% | |
| | 327,318 | | | @@ | | Cadbury PLC ADR | | $ | 11,675,433 | | |
| | 170,160 | | | | | Kraft Foods, Inc. | | | 4,568,796 | | |
| | 559,760 | | | @@,S | | Unilever NV ADR | | | 13,742,108 | | |
| | | | 29,986,337 | | |
| | | | | Gas: 0.0% | |
| | 11,000 | | | C | | CenterPoint Energy, Inc. | | | 148,500 | | |
| | | | 148,500 | | |
| | | | | Healthcare-Products: 1.3% | |
| | 456,710 | | | @ | | Boston Scientific Corp. | | | 3,534,935 | | |
| | 152,840 | | | @@ | | Covidien Ltd. | | | 5,538,922 | | |
| | | | 9,073,857 | | |
| | | | | Home Furnishings: 0.7% | |
| | 234,600 | | | @@ | | Sony Corp. ADR | | | 5,130,702 | | |
| | | | 5,130,702 | | |
| | | | | Household Products/Wares: 0.3% | |
| | 37,570 | | | | | Kimberly-Clark Corp. | | | 1,981,442 | | |
| | | | 1,981,442 | | |
| | | | | Insurance: 4.6% | |
| | 182,132 | | | | | Chubb Corp. | | | 9,288,732 | | |
| | 623,288 | | | S | | Marsh & McLennan Cos., Inc. | | | 15,127,192 | | |
| | 201,137 | | | | | Travelers Cos., Inc. | | | 9,091,392 | | |
| | | | 33,507,316 | | |
| | | | | Internet: 1.1% | |
| | 489,760 | | | @ | | eBay, Inc. | | | 6,837,050 | | |
| | 62,681 | | | @ | | Symantec Corp. | | | 847,447 | | |
| | | | 7,684,497 | | |
| | | | | Leisure Time: 0.3% | |
| | 125,251 | | | | | Harley-Davidson, Inc. | | | 2,125,509 | | |
| | | | 2,125,509 | | |
| | | | | Media: 4.4% | |
| | 507,654 | | | | | Comcast Corp. - Class A | | | 8,569,200 | | |
| | 1,353,536 | | | | | Time Warner, Inc. | | | 13,616,572 | | |
| | 495,642 | | | @ | | Viacom - Class B | | | 9,446,937 | | |
| | | | 31,632,709 | | |
| | | | | Mining: 0.9% | |
| | 161,280 | | | | | Newmont Mining Corp. | | | 6,564,096 | | |
| | | | 6,564,096 | | |
| | | | | Miscellaneous Manufacturing: 1.7% | |
| | 317,060 | | | | | General Electric Co. | | | 5,136,372 | | |
| | 59,140 | | | @@ | | Siemens AG ADR | | | 4,479,855 | | |
| | 111,640 | | | @@ | | Tyco International Ltd. | | | 2,411,424 | | |
| | | | 12,027,651 | | |
| | | | | Oil & Gas: 6.4% | |
| | 92,800 | | | | | Anadarko Petroleum Corp. | | | 3,577,440 | | |
| | 105,560 | | | @@ | | BP PLC ADR | | | 4,933,874 | | |
| | 55,360 | | | | | ConocoPhillips | | | 2,867,648 | | |
| | 60,350 | | | | | Devon Energy Corp. | | | 3,965,599 | | |
| | 126,370 | | | | | ExxonMobil Corp. | | | 10,088,117 | | |
| | 37,600 | | | | | Hess Corp. | | | 2,016,864 | | |
| | 161,920 | | | | | Occidental Petroleum Corp. | | | 9,713,581 | | |
| | 170,450 | | | @@ | | Royal Dutch Shell PLC
ADR - Class A | | | 9,023,623 | | |
| | | | 46,186,746 | | |
See Accompanying Notes to Financial Statements
234
ING VAN KAMPEN EQUITY AND PORTFOLIO OF INVESTMENTS
INCOME PORTFOLIO AS OF DECEMBER 31, 2008 (CONTINUED)
| Shares | | | | | | Value | |
| | | | | Oil & Gas Services: 0.4% | |
| | 68,270 | | | | | Schlumberger Ltd. | | $ | 2,889,869 | | |
| | | | 2,889,869 | | |
| | | | | Pharmaceuticals: 7.6% | |
| | 184,780 | | | | | Abbott Laboratories | | | 9,861,709 | | |
| | 414,940 | | | | | Bristol-Myers Squibb Co. | | | 9,647,355 | | |
| | 92,520 | | | | | Cardinal Health, Inc. | | | 3,189,164 | | |
| | 145,690 | | | @@ | | Novartis AG ADR | | | 7,249,534 | | |
| | 102,370 | | | @@ | | Roche Holding AG ADR | | | 7,836,424 | | |
| | 710,380 | | | | | Schering-Plough Corp. | | | 12,097,771 | | |
| | 132,570 | | | | | Wyeth | | | 4,972,701 | | |
| | | | 54,854,658 | | |
| | | | | Retail: 3.3% | |
| | 382,254 | | | | | Home Depot, Inc. | | | 8,799,487 | | |
| | 275,730 | | | | | Macy's, Inc. | | | 2,853,806 | | |
| | 260,600 | | | @ | | Starbucks Corp. | | | 2,465,276 | | |
| | 169,920 | | | S | | Wal-Mart Stores, Inc. | | | 9,525,715 | | |
| | | | 23,644,284 | | |
| | | | | Semiconductors: 1.1% | |
| | 167,500 | | | @@ | | ASML Holding NV | | | 3,026,725 | | |
| | 355,857 | | | | | Intel Corp. | | | 5,216,864 | | |
| | 12 | | | @ | | Macrovision Solutions Corp. | | | 152 | | |
| | | | 8,243,741 | | |
| | | | | Software: 0.0% | |
| | 32 | | | | | CA, Inc. | | | 593 | | |
| | | | 593 | | |
| | | | | Telecommunications: 2.6% | |
| | 786,660 | | | @,@@ | | Alcatel SA ADR | | | 1,691,319 | | |
| | 347,580 | | | @ | | Cisco Systems, Inc. | | | 5,665,554 | | |
| | 330,881 | | | | | Verizon Communications, Inc. | | | 11,216,866 | | |
| | | | 18,573,739 | | |
Total Common Stock
(Cost $514,076,886) | | | 431,030,223 | | |
| EXCHANGE-TRADED FUNDS: 0.3% | | | |
| | | | | Exchange-Traded Funds: 0.3% | |
| | 51,905 | | | | | KBW Regional Banking ETF | | | 1,513,550 | | |
| | 11,643 | | | | | Regional Bank Holders Trust | | | 880,560 | | |
Total Exchange-Traded Funds
(Cost $2,884,935) | | | 2,394,110 | | |
| PREFERRED STOCK: 2.9% | | | |
| | | | | Agriculture: 0.2% | |
| | 45,000 | | | | | Archer-Daniels-Midland Co. | | | 1,705,500 | | |
| | | | 1,705,500 | | |
| | | | | Banks: 0.9% | |
| | 7,460 | | | | | Bank of America Corp. | | | 4,849,000 | | |
| | 23,944 | | | | | Keycorp | | | 1,712,954 | | |
| | | | 6,561,954 | | |
| | | | | Diversified Financial Services: 0.2% | |
| | 35,000 | | | P | | Omnicare, Inc. | | | 1,281,875 | | |
| | | | 1,281,875 | | |
| | | | | Healthcare-Services: 0.1% | |
| | 1,700 | | | # | | Healthsouth Corp. | | | 716,550 | | |
| | | | 716,550 | | |
| Shares | | | | | | Value | |
| | | | | Household Products/Wares: 0.1% | |
| | 26,425 | | | | | Avery Dennison Corp. | | $ | 905,056 | | |
| | | | 905,056 | | |
| | | | | Housewares: 0.2% | |
| | 46,000 | | | P | | Newell Financial Trust I | | | 1,207,500 | | |
| | | | 1,207,500 | | |
| | | | | Mining: 0.1% | |
| | 1,183 | | | | | Freeport-McMoRan Copper &
Gold, Inc. | | | 738,584 | | |
| | | | 738,584 | | |
| | | | | Pharmaceuticals: 0.4% | |
| | 18,488 | | | | | Schering-Plough Corp. | | | 3,226,156 | | |
| | | | 3,226,156 | | |
| | | | | Pipelines: 0.4% | |
| | 107,000 | | | P | | El Paso Energy Capital Trust I | | | 2,739,200 | | |
| | | | 2,739,200 | | |
| | | | | Telecommunications: 0.3% | |
| | 6,000 | | | P | | Lucent Technologies
Capital Trust I | | | 2,040,000 | | |
| | | | 2,040,000 | | |
Total Preferred Stock
(Cost $33,147,495) | | | 21,122,375 | | |
Principal
Amount | | | | | | Value | |
| CONVERTIBLE BONDS: 7.6% | | | |
| | | | | Advertising: 0.5% | |
| $ | 1,060,000 | | | C | | Interpublic Group of Cos., Inc.,
4.250%, due 03/15/23 | | | 692,975 | | |
| | 1,833,000 | | | #,C | | Interpublic Group of Cos., Inc.,
4.750%, due 03/15/23 | | | 1,065,431 | | |
| | 1,453,000 | | | C,Z | | Omnicom Group, 0.180%,
due 07/31/32 | | | 1,393,064 | | |
| | | | 3,151,470 | | |
| | | | | Aerospace/Defense: 0.5% | |
| | 3,625,000 | | | C | | L-3 Communications Corp.,
3.000%, due 08/01/35 | | | 3,625,000 | | |
| | | | 3,625,000 | | |
| | | | | Airlines: 0.1% | |
| | 1,500,000 | | | C | | UAL Corp., 4.500%,
due 06/30/21 | | | 699,750 | | |
| | | | 699,750 | | |
| | | | | Banks: 0.0% | |
| | 108,000 | | | | | National City Corp., 4.000%,
due 02/01/11 | | | 96,795 | | |
| | | | 96,795 | | |
| | | | | Biotechnology: 1.4% | |
| | 8,000,000 | | | # | | Amgen, Inc., 0.375%,
due 02/01/13 | | | 7,650,000 | | |
| | 2,550,000 | | | C | | Life Technologies Corp.,
1.500%, due 02/15/24 | | | 1,925,250 | | |
| | 725,000 | | | C | | Life Technologies Corp.,
3.250%, due 06/15/25 | | | 619,875 | | |
| | | | 10,195,125 | | |
See Accompanying Notes to Financial Statements
235
ING VAN KAMPEN EQUITY AND PORTFOLIO OF INVESTMENTS
INCOME PORTFOLIO AS OF DECEMBER 31, 2008 (CONTINUED)
Principal
Amount | | | | | | Value | |
| | | | | Computers: 0.6% | |
| $ | 1,000,000 | | | | | Cadence Design Systems, Inc.,
1.375%, due 12/15/11 | | $ | 630,000 | | |
| | 1,100,000 | | | | | Cadence Design Systems, Inc.,
1.500%, due 12/15/13 | | | 503,250 | | |
| | 1,851,000 | | | +,C | | DST Systems, Inc., 4.125%
(step rate 0.000%),
due 08/15/23 | | | 1,779,274 | | |
| | 520,000 | | | # | | NetApp, Inc., 1.750%,
due 06/01/13 | | | 395,850 | | |
| | 2,548,000 | | | | | SanDisk Corp., 1.000%,
due 05/15/13 | | | 1,031,940 | | |
| | | | 4,340,314 | | |
| | | | | Entertainment: 0.4% | |
| | 3,014,000 | | | C | | International Game Technology,
2.600%, due 12/15/36 | | | 2,863,300 | | |
| | | | 2,863,300 | | |
| | | | | Environmental Control: 0.2% | |
| | 1,161,000 | | | C | | Allied Waste North America, Inc.,
4.250%, due 04/15/34 | | | 1,044,900 | | |
| | | | 1,044,900 | | |
| | | | | Healthcare-Products: 0.6% | |
| | 1,300,000 | | | C | | Advanced Medical Optics, Inc.,
2.500%, due 07/15/24 | | | 1,059,500 | | |
| | 2,250,000 | | | C | | Advanced Medical Optics, Inc.,
3.250%, due 08/01/26 | | | 798,750 | | |
| | 1,402,000 | | | C | | Affymetrix, Inc., 3.500%,
due 01/15/38 | | | 548,533 | | |
| | 2,310,000 | | | | | Medtronic, Inc., 1.500%,
due 04/15/11 | | | 2,159,850 | | |
| | | | 4,566,633 | | |
| | | | | Internet: 0.2% | |
| | 1,683,000 | | | | | Symantec Corp., 0.750%,
due 06/15/11 | | | 1,598,850 | | |
| | | | 1,598,850 | | |
| | | | | Media: 0.3% | |
| | 1,477,100 | | | C | | Liberty Media Corp., 3.125%,
due 03/30/23 | | | 1,067,205 | | |
| | 1,615,000 | | | C | | Sinclair Broadcast Group, Inc.,
6.000%, due 09/15/12 | | | 742,900 | | |
| | | | 1,810,105 | | |
| | | | | Miscellaneous Manufacturing: 0.7% | |
| | 3,750,000 | | | C | | 3M Co., 2.400%, due 11/21/32 | | | 2,756,250 | | |
| | 2,700,000 | | | C | | Eastman Kodak Co., 3.375%,
due 10/15/33 | | | 2,190,375 | | |
| | | | 4,946,625 | | |
| | | | | Oil & Gas Services: 0.1% | |
| | 974,000 | | | C | | Cameron International Corp.,
2.500%, due 06/15/26 | | | 966,695 | | |
| | | | 966,695 | | |
| | | | | Packaging & Containers: 0.4% | |
| | 3,400,000 | | | #,C | | Sealed Air Corp., 3.000%,
due 06/30/33 | | | 3,077,000 | | |
| | | | 3,077,000 | | |
Principal
Amount | | | | | | Value | |
| | | | | Pharmaceuticals: 1.1% | |
| $ | 3,400,000 | | | | | Mylan, Inc., 1.250%,
due 03/15/12 | | $ | 2,516,000 | | |
| | 3,890,000 | | | C | | Omnicare, Inc., 3.250%,
due 12/15/35 | | | 2,202,713 | | |
| | 3,512,000 | | | C | | Watson Pharmaceuticals, Inc.,
1.750%, due 03/15/23 | | | 3,283,720 | | |
| | | | 8,002,433 | | |
| | | | | Semiconductors: 0.2% | |
| | 2,208,000 | | | # | | Xilinx, Inc., 3.125%,
due 03/15/37 | | | 1,509,720 | | |
| | | | 1,509,720 | | |
| | | | | Telecommunications: 0.3% | |
| | 2,000,000 | | | #,C | | JDS Uniphase Corp.,
1.000%, due 05/15/26 | | | 1,090,000 | | |
| | 1,928,000 | | | C | | Lucent Technologies, Inc.,
2.875%, due 06/15/25 | | | 908,570 | | |
| | | | 1,998,570 | | |
Total Convertible Bonds
(Cost $68,017,088) | | | 54,493,285 | | |
| CORPORATE BONDS/NOTES: 8.8% | | | |
| | | | | Agriculture: 0.1% | |
| | 290,000 | | | C | | Archer-Daniels-Midland Co.,
5.450%, due 03/15/18 | | | 285,962 | | |
| | 270,000 | | | @@,#,C | | BAT International Finance PLC,
9.500%, due 11/15/18 | | | 300,627 | | |
| | 495,000 | | | | | Philip Morris International, Inc.,
5.650%, due 05/16/18 | | | 491,592 | | |
| | | | 1,078,181 | | |
| | | | | Airlines: 0.2% | |
| | 414,702 | | | | | America West Airlines, Inc.,
7.100%, due 04/02/21 | | | 257,115 | | |
| | 1,300,000 | | | C | | AMR Corp., 4.500%,
due 02/15/24 | | | 1,267,500 | | |
| | | | 1,524,615 | | |
| | | | | Auto Manufacturers: 0.0% | |
| | 325,000 | | | @@ | | Daimler Finance NA, LLC,
7.750%, due 01/18/11 | | | 294,208 | | |
| | | | 294,208 | | |
| | | | | Banks: 1.5% | |
| | 1,270,000 | | | | | Bank of America Corp.,
5.650%, due 05/01/18 | | | 1,279,832 | | |
| | 615,000 | | | | | Bank of America Corp.,
5.750%, due 12/01/17 | | | 615,100 | | |
| | 330,000 | | | | | Bank of New York Mellon Corp.,
4.500%, due 04/01/13 | | | 328,440 | | |
| | 275,000 | | | | | Bank of New York Mellon Corp.,
5.125%, due 08/27/13 | | | 281,293 | | |
| | 365,000 | | | | | Citigroup, Inc., 5.875%,
due 05/29/37 | | | 365,979 | | |
| | 575,000 | | | | | Citigroup, Inc., 6.125%,
due 11/21/17 | | | 582,047 | | |
| | 545,000 | | | | | Citigroup, Inc., 6.125%,
due 05/15/18 | | | 552,036 | | |
| | 150,000 | | | @@ | | Credit Suisse New York,
5.000%, due 05/15/13 | | | 144,504 | | |
| | 370,000 | | | @@ | | Credit Suisse New York,
6.000%, due 02/15/18 | | | 340,359 | | |
See Accompanying Notes to Financial Statements
236
ING VAN KAMPEN EQUITY AND PORTFOLIO OF INVESTMENTS
INCOME PORTFOLIO AS OF DECEMBER 31, 2008 (CONTINUED)
Principal
Amount | | | | | | Value | |
| | | | | Banks (continued) | |
| $ | 1,065,000 | | | | | Goldman Sachs Group, Inc.,
6.150%, due 04/01/18 | | $ | 1,025,192 | | |
| | 725,000 | | | C | | Goldman Sachs Group, Inc.,
6.750%, due 10/01/37 | | | 590,238 | | |
| | 465,000 | | | @@,# | | HBOS PLC, 6.750%, due 05/21/18 | | | 409,926 | | |
| | 930,000 | | | | | JPMorgan Chase & Co.,
4.750%, due 05/01/13 | | | 918,581 | | |
| | 305,000 | | | | | JPMorgan Chase & Co.,
6.000%, due 01/15/18 | | | 322,497 | | |
| | 500,000 | | | | | JPMorgan Chase & Co.,
6.750%, due 02/01/11 | | | 512,833 | | |
| | 320,000 | | | | | Popular North America, Inc.,
5.650%, due 04/15/09 | | | 317,050 | | |
| | 305,000 | | | @@ | | UBS AG, 5.875%, due 12/20/17 | | | 280,660 | | |
| | 1,120,000 | | | C | | Wachovia Capital Trust III,
5.800%, due 12/31/49 | | | 661,091 | | |
| | 245,000 | | | | | Wachovia Corp., 5.500%,
due 05/01/13 | | | 242,496 | | |
| | 905,000 | | | | | Wells Fargo & Co., 5.625%,
due 12/11/17 | | | 945,822 | | |
| | | | 10,715,976 | | |
| | | | | Beverages: 0.2% | |
| | 360,000 | | | @@,C | | Diageo Capital PLC, 7.375%,
due 01/15/14 | | | 383,894 | | |
| | 300,000 | | | #,C | | Dr Pepper Snapple Group, Inc.,
6.820%, due 05/01/18 | | | 296,409 | | |
| | 485,000 | | | @@,# | | FBG Finance Ltd., 5.125%,
due 06/15/15 | | | 400,300 | | |
| | | | 1,080,603 | | |
| | | | | Biotechnology: 0.1% | |
| | 425,000 | | | C | | Amgen, Inc., 5.850%,
due 06/01/17 | | | 439,642 | | |
| | 340,000 | | | C | | Biogen Idec, Inc., 6.875%,
due 03/01/18 | | | 332,753 | | |
| | | | 772,395 | | |
| | | | | Chemicals: 0.0% | |
| | 215,000 | | | C | | EI Du Pont de Nemours & Co.,
6.000%, due 07/15/18 | | | 226,222 | | |
| | 80,000 | | | C | | Monsanto Co., 5.125%,
due 04/15/18 | | | 84,093 | | |
| | | | 310,315 | | |
| | | | | Computers: 0.1% | |
| | 240,000 | | | C | | Dell, Inc., 5.650%, due 04/15/18 | | | 215,188 | | |
| | 135,000 | | | C | | Hewlett-Packard Co., 5.500%,
due 03/01/18 | | | 136,489 | | |
| | 400,000 | | | C | | International Business Machines
Corp., 7.625%, due 10/15/18 | | | 480,536 | | |
| | | | 832,213 | | |
| | | | | Cosmetics/Personal Care: 0.1% | |
| | 525,000 | | | C | | Procter & Gamble Co., 4.600%,
due 01/15/14 | | | 550,765 | | |
| | | | 550,765 | | |
| | | | | Diversified Financial Services: 1.3% | |
| | 1,100,000 | | | # | | AIG SunAmerica Global
Financing VI, 6.300%,
due 05/10/11 | | | 946,345 | | |
| | 550,000 | | | | | American Express Credit Corp.,
7.300%, due 08/20/13 | | | 563,523 | | |
Principal
Amount | | | | | | Value | |
| $ | 320,000 | | | | | Bear Stearns Cos., Inc., 6.400%,
due 10/02/17 | | $ | 333,093 | | |
| | 480,000 | | | | | Bear Stearns Cos., Inc., 7.250%,
due 02/01/18 | | | 526,896 | | |
| | 125,000 | | | | | Caterpillar Financial Services
Corp., 4.900%, due 08/15/13 | | | 117,272 | | |
| | 150,000 | | | | | Credit Suisse First Boston USA,
Inc., 5.125%, due 08/15/15 | | | 136,424 | | |
| | 475,000 | | | # | | Farmers Exchange Capital,
7.050%, due 07/15/28 | | | 291,386 | | |
| | 250,000 | | | | | General Electric Capital Corp.,
4.250%, due 12/01/10 | | | 251,066 | | |
| | 970,000 | | | | | General Electric Capital Corp.,
5.625%, due 09/15/17 | | | 977,429 | | |
| | 1,170,000 | | | | | General Electric Capital Corp.,
5.625%, due 05/01/18 | | | 1,180,601 | | |
| | 260,000 | | | #,C | | Harley-Davidson Funding Corp.,
6.800%, due 06/15/18 | | | 140,502 | | |
| | 160,000 | | | | | HSBC Finance Corp., 4.125%,
due 11/16/09 | | | 158,560 | | |
| | 150,000 | | | | | HSBC Finance Corp., 6.375%,
due 10/15/11 | | | 147,670 | | |
| | 775,000 | | | | | HSBC Finance Corp., 6.750%,
due 05/15/11 | | | 772,057 | | |
| | 50,000 | | | | | HSBC Finance Corp., 8.000%,
due 07/15/10 | | | 50,850 | | |
| | 305,000 | | | | | John Deere Capital Corp.,
5.750%, due 09/10/18 | | | 297,397 | | |
| | 75,000 | | | # | | John Hancock Global
Funding II, 7.900%,
due 07/02/10 | | | 77,414 | | |
| | 990,000 | | | | | Merrill Lynch & Co., Inc.,
6.875%, due 04/25/18 | | | 1,037,347 | | |
| | 345,000 | | | | | NYSE Euronext, 4.800%,
due 06/28/13 | | | 334,966 | | |
| | 200,000 | | | @@,#,C | | Pearson Dollar Finance PLC,
6.250%, due 05/06/18 | | | 168,804 | | |
| | 355,000 | | | @@,#,C | | Two-Rock Pass-through Trust,
3.230%, due 02/11/50 | | | 7,544 | | |
| | 690,000 | | | # | | Xlliac Global Funding,
4.800%, due 08/10/10 | | | 483,103 | | |
| | | | 9,000,249 | | |
| | | | | Electric: 0.8% | |
| | 150,000 | | | C | | Alabama Power Co., 5.800%,
due 11/15/13 | | | 156,276 | | |
| | 485,000 | | | C | | Carolina Power & Light Co.,
5.125%, due 09/15/13 | | | 487,029 | | |
| | 110,000 | | | C | | Consumers Energy Co., 4.000%,
due 05/15/10 | | | 107,179 | | |
| | 215,000 | | | C | | Consumers Energy Co., 4.800%,
due 02/17/09 | | | 214,568 | | |
| | 280,000 | | | C | | Detroit Edison Co., 6.125%,
due 10/01/10 | | | 281,732 | | |
| | 650,000 | | | @@,#,C | | E.ON International
Finance BV, 5.800%,
due 04/30/18 | | | 608,798 | | |
| | 225,000 | | | C | | Entergy Gulf States, Inc.,
2.603%, due 12/01/09 | | | 216,760 | | |
| | 105,000 | | | C | | Georgia Power Co., 6.000%,
due 11/01/13 | | | 110,485 | | |
| | 235,000 | | | C | | Nisource Finance Corp.,
2.723%, due 11/23/09 | | | 211,792 | | |
See Accompanying Notes to Financial Statements
237
ING VAN KAMPEN EQUITY AND PORTFOLIO OF INVESTMENTS
INCOME PORTFOLIO AS OF DECEMBER 31, 2008 (CONTINUED)
Principal
Amount | | | | | | Value | |
| | | | | Electric (continued) | |
| $ | 250,000 | | | C | | Nisource Finance Corp.,
6.800%, due 01/15/19 | | $ | 157,433 | | |
| | 210,000 | | | C | | Ohio Edison Co., 6.400%,
due 07/15/16 | | | 188,803 | | |
| | 470,000 | | | C | | Ohio Power Co., 6.000%,
due 06/01/16 | | | 450,346 | | |
| | 518,000 | | | | | Pacific Gas & Electric Co.,
9.500%, due 06/30/10 | | | 1,348,095 | | |
| | 190,000 | | | C | | Peco Energy Co., 5.350%,
due 03/01/18 | | | 181,705 | | |
| | 200,000 | | | C | | PPL Energy Supply, LLC,
6.300%, due 07/15/13 | | | 185,355 | | |
| | 175,000 | | | C | | Public Service Co. of Colorado,
6.500%, due 08/01/38 | | | 195,922 | | |
| | 230,000 | | | C | | Union Electric Co., 6.700%,
due 02/01/19 | | | 209,942 | | |
| | 140,000 | | | | | Virginia Electric and Power Co.,
8.875%, due 11/15/38 | | | 177,720 | | |
| | | | 5,489,940 | | |
| | | | | | | Electrical Components &
Equipment: 0.0% | | | | | |
| | 280,000 | | | @@,# | | LG Electronics, Inc., 5.000%,
due 06/17/10 | | | 248,772 | | |
| | | | 248,772 | | |
| | | | | Electronics: 0.1% | |
| | 445,000 | | | @@,C | | Koninklijke Philips
Electronics NV, 5.750%,
due 03/11/18 | | | 410,713 | | |
| | | | 410,713 | | |
| | | | | Environmental Control: 0.0% | |
| | 150,000 | | | C | | Waste Management, Inc.,
7.375%, due 08/01/10 | | | 152,064 | | |
| | | | 152,064 | | |
| | | | | Food: 0.2% | |
| | 205,000 | | | C | | ConAgra Foods, Inc., 7.000%,
due 10/01/28 | | | 201,637 | | |
| | 190,000 | | | C | | ConAgra Foods, Inc., 8.250%,
due 09/15/30 | | | 208,921 | | |
| | 90,000 | | | C | | Delhaize America, Inc., 9.000%,
due 04/15/31 | | | 91,238 | | |
| | 240,000 | | | C | | General Mills, Inc., 5.250%,
due 08/15/13 | | | 241,691 | | |
| | 370,000 | | | | | Kraft Foods, Inc., 6.125%,
due 08/23/18 | | | 365,429 | | |
| | 65,000 | | | | | Kraft Foods, Inc., 6.750%,
due 02/19/14 | | | 67,527 | | |
| | 160,000 | | | C | | Kroger Co., 5.000%,
due 04/15/13 | | | 154,176 | | |
| | 60,000 | | | C | | Kroger Co., 6.400%,
due 08/15/17 | | | 60,607 | | |
| | | | 1,391,226 | | |
| | | | | Healthcare-Products: 0.1% | |
| | 100,000 | | | C | | Baxter International, Inc.,
5.375%, due 06/01/18 | | | 104,729 | | |
| | 325,000 | | | @@,C | | Covidien International
Finance SA, 6.000%,
due 10/15/17 | | | 321,154 | | |
| | | | 425,883 | | |
Principal
Amount | | | | | | Value | |
| | | | | Healthcare-Services: 0.3% | |
| $ | 2,544,000 | | | C | | LifePoint Hospitals, Inc.,
3.500%, due 05/15/14 | | $ | 1,733,100 | | |
| | 265,000 | | | C | | UnitedHealth Group, Inc.,
6.000%, due 02/15/18 | | | 244,915 | | |
| | 95,000 | | | C | | WellPoint, Inc., 4.250%,
due 12/15/09 | | | 91,379 | | |
| | | | 2,069,394 | | |
| | | | | Insurance: 0.3% | |
| | 275,000 | | | C | | Ace INA Holdings, Inc., 5.600%,
due 05/15/15 | | | 249,966 | | |
| | 660,000 | | | C | | Berkshire Hathaway Finance,
5.400%, due 05/15/18 | | | 679,691 | | |
| | 295,000 | | | #,C | | Catlin Insurance Co., Ltd.,
7.249%, due 12/31/49 | | | 117,460 | | |
| | 75,000 | | | C | | Chubb Corp., 5.750%,
due 05/15/18 | | | 72,140 | | |
| | 225,000 | | | # | | Farmers Insurance Exchange,
8.625%, due 05/01/24 | | | 150,622 | | |
| | 300,000 | | | C | | Metlife, Inc., 6.817%,
due 08/15/18 | | | 286,213 | | |
| | 250,000 | | | | | Nationwide Financial Services,
6.250%, due 11/15/11 | | | 234,303 | | |
| | 205,000 | | | C | | Platinum Underwriters
Finance, Inc., 7.500%,
due 06/01/17 | | | 133,254 | | |
| | 135,000 | | | | | Prudential Financial, Inc.,
6.625%, due 12/01/37 | | | 92,273 | | |
| | 235,000 | | | C | | Travelers Cos., Inc., 5.800%,
due 05/15/18 | | | 226,787 | | |
| | | | 2,242,709 | | |
| | | | | Iron/Steel: 0.0% | |
| | 355,000 | | | @@,C | | ArcelorMittal, 6.125%,
due 06/01/18 | | | 243,478 | | |
| | | | 243,478 | | |
| | | | | Lodging: 0.0% | |
| | 295,000 | | | C | | Starwood Hotels & Resorts
Worldwide, Inc., 6.750%,
due 05/15/18 | | | 162,482 | | |
| | | | 162,482 | | |
| | | | | Media: 0.4% | |
| | 955,000 | | | C | | Comcast Corp., 5.700%,
due 05/15/18 | | | 897,192 | | |
| | 290,000 | | | @@,C | | Grupo Televisa SA, 6.000%,
due 05/15/18 | | | 245,311 | | |
| | 445,000 | | | C | | Time Warner Cable, Inc.,
6.750%, due 07/01/18 | | | 429,183 | | |
| | 310,000 | | | C | | Time Warner Cable, Inc.,
8.750%, due 02/14/19 | | | 337,647 | | |
| | 530,000 | | | C | | Time Warner, Inc.,
5.875%, due 11/15/16 | | | 475,861 | | |
| | 495,000 | | | C | | Viacom, Inc., 6.875%,
due 04/30/36 | | | 392,226 | | |
| | 435,000 | | | @@,#,C | | Vivendi, 6.625%, due 04/04/18 | | | 351,610 | | |
| | | | 3,129,030 | | |
| | | | | Mining: 0.0% | |
| | 240,000 | | | @@,C | | Rio Tinto Finance USA Ltd.,
6.500%, due 07/15/18 | | | 176,245 | | |
| | | | 176,245 | | |
See Accompanying Notes to Financial Statements
238
ING VAN KAMPEN EQUITY AND PORTFOLIO OF INVESTMENTS
INCOME PORTFOLIO AS OF DECEMBER 31, 2008 (CONTINUED)
Principal
Amount | | | | | | Value | |
| | | | | Miscellaneous Manufacturing: 0.2% | |
| $ | 285,000 | | | C | | Cooper Industries, Inc., 5.250%,
due 11/15/12 | | $ | 288,133 | | |
| | 710,000 | | | | | General Electric Co., 5.250%,
due 12/06/17 | | | 709,081 | | |
| | 315,000 | | | C | | Honeywell International, Inc.,
5.300%, due 03/01/18 | | | 321,967 | | |
| | 270,000 | | | C | | Parker Hannifin Corp.,
5.500%, due 05/15/18 | | | 261,498 | | |
| | | | 1,580,679 | | |
| | | | | Office/Business Equipment: 0.0% | |
| | 250,000 | | | C | | Xerox Corp., 6.350%,
due 05/15/18 | | | 195,844 | | |
| | | | 195,844 | | |
| | | | | Oil & Gas: 0.4% | |
| | 580,000 | | | C | | ConocoPhillips, 5.200%,
due 05/15/18 | | | 565,501 | | |
| | 215,000 | | | C | | Devon Financing Corp. ULC,
7.875%, due 09/30/31 | | | 237,393 | | |
| | 100,000 | | | C | | Equitable Resources, Inc.,
6.500%, due 04/01/18 | | | 93,564 | | |
| | 175,000 | | | C | | Marathon Oil Corp., 5.900%,
due 03/15/18 | | | 146,400 | | |
| | 285,000 | | | C | | Marathon Oil Corp., 6.000%,
due 10/01/17 | | | 243,406 | | |
| | 275,000 | | | @@,C | | Petro-Canada, 6.050%,
due 05/15/18 | | | 227,029 | | |
| | 355,000 | | | C | | Questar Market Resources, Inc.,
6.800%, due 04/01/18 | | | 342,158 | | |
| | 350,000 | | | C | | Valero Energy Corp., 3.500%,
due 04/01/09 | | | 347,644 | | |
| | 395,000 | | | C | | XTO Energy, Inc., 5.500%,
due 06/15/18 | | | 358,222 | | |
| | | | 2,561,317 | | |
| | | | | Oil & Gas Services: 0.0% | |
| | 220,000 | | | @@,C | | Weatherford International Ltd.,
6.000%, due 03/15/18 | | | 185,057 | | |
| | | | 185,057 | | |
| | | | | Pharmaceuticals: 0.5% | |
| | 1,487,000 | | | C | | Allergan, Inc., 1.500%,
due 04/01/26 | | | 1,496,294 | | |
| | 300,000 | | | @@,C | | AstraZeneca PLC, 5.900%,
due 09/15/17 | | | 319,364 | | |
| | 565,000 | | | C | | Bristol-Myers Squibb Co.,
5.450%, due 05/01/18 | | | 586,058 | | |
| | 530,000 | | | C | | GlaxoSmithKline Capital, Inc.,
5.650%, due 05/15/18 | | | 557,687 | | |
| | 305,000 | | | C | | Medco Health Solutions, Inc.,
7.125%, due 03/15/18 | | | 282,309 | | |
| | 190,000 | | | C | | Wyeth, 5.450%, due 04/01/17 | | | 193,834 | | |
| | 60,000 | | | C | | Wyeth, 5.500%, due 02/15/16 | | | 61,186 | | |
| | | | 3,496,732 | | |
| | | | | Pipelines: 0.2% | |
| | 135,000 | | | C | | CenterPoint Energy Resources
Corp., 6.250%, due 02/01/37 | | | 95,552 | | |
| | 90,000 | | | C | | CenterPoint Energy Resources
Corp., 7.875%, due 04/01/13 | | | 83,439 | | |
| | 175,000 | | | C | | Dominion Resources, Inc.,
6.250%, due 11/01/11 | | | 176,003 | | |
Principal
Amount | | | | | | Value | |
| $ | 230,000 | | | C | | Kinder Morgan Energy Partners
LP, 5.950%, due 02/15/18 | | $ | 196,626 | | |
| | 485,000 | | | C | | Plains All American Pipeline LP,
6.700%, due 05/15/36 | | | 321,751 | | |
| | 215,000 | | | C | | Texas Eastern Transmission LP,
7.000%, due 07/15/32 | | | 199,300 | | |
| | 300,000 | | | @@,C | | TransCanada Pipelines Ltd.,
6.500%, due 08/15/18 | | | 294,836 | | |
| | | | 1,367,507 | | |
| | | | | Real Estate: 0.1% | |
| | 110,000 | | | @@,C | | Brookfield Asset Management,
Inc., 5.800%, due 04/25/17 | | | 95,658 | | |
| | 575,000 | | | @@ | | Brookfield Asset Management,
Inc., 7.125%, due 06/15/12 | | | 585,502 | | |
| | | | 681,160 | | |
| | | | | Retail: 0.3% | |
| | 130,000 | | | C | | CVS Caremark Corp., 5.750%,
due 08/15/11 | | | 130,528 | | |
| | 130,000 | | | C | | CVS Caremark Corp., 5.750%,
due 06/01/17 | | | 122,590 | | |
| | 419,627 | | | #,C | | CVS Lease Pass-through,
6.036%, due 12/10/28 | | | 255,813 | | |
| | 430,000 | | | C | | Home Depot, Inc., 5.400%,
due 03/01/16 | | | 385,369 | | |
| | 180,000 | | | C | | Walgreen Co., 4.875%,
due 08/01/13 | | | 185,564 | | |
| | 470,000 | | | | | Wal-Mart Stores, Inc., 4.250%,
due 04/15/13 | | | 484,232 | | |
| | 50,000 | | | | | Wal-Mart Stores, Inc., 5.800%,
due 02/15/18 | | | 55,427 | | |
| | 380,000 | | | C | | Yum! Brands, Inc., 8.875%,
due 04/15/11 | | | 385,093 | | |
| | | | 2,004,616 | | |
| | | | | Savings & Loans: 0.2% | |
| | 595,000 | | | @@,# | | Nationwide Building Society,
4.250%, due 02/01/10 | | | 589,008 | | |
| | 830,000 | | | | | Sovereign Bancorp., Inc.,
1.728%, due 03/23/10 | | | 737,202 | | |
| | | | 1,326,210 | | |
| | | | | Semiconductors: 0.2% | |
| | 340,000 | | | C | | Kla-Tencor Corp., 6.900%,
due 05/01/18 | | | 257,557 | | |
| | 1,927,000 | | | #,C | | Linear Technology Corp.,
3.000%, due 05/01/27 | | | 1,404,301 | | |
| | | | 1,661,858 | | |
| | | | | Software: 0.1% | |
| | 450,000 | | | C | | Oracle Corp., 5.750%,
due 04/15/18 | | | 471,532 | | |
| | | | 471,532 | | |
| | | | | Telecommunications: 0.7% | |
| | 200,000 | | | C | | AT&T Corp., 8.000%,
due 11/15/31 | | | 251,964 | | |
| | 140,000 | | | C | | AT&T, Inc., 5.600%,
due 05/15/18 | | | 142,798 | | |
| | 270,000 | | | C | | AT&T, Inc., 6.150%,
due 09/15/34 | | | 278,408 | | |
| | 795,000 | | | C | | AT&T, Inc., 6.300%,
due 01/15/38 | | | 843,280 | | |
See Accompanying Notes to Financial Statements
239
ING VAN KAMPEN EQUITY AND PORTFOLIO OF INVESTMENTS
INCOME PORTFOLIO AS OF DECEMBER 31, 2008 (CONTINUED)
Principal
Amount | | | | | | Value | |
| | | | | Telecommunications (continued) | |
| $ | 245,000 | | | @@ | | Deutsche Telekom International
Finance BV, 8.750%,
due 06/15/30 | | $ | 302,932 | | |
| | 425,000 | | | @@,C | | France Telecom SA, 8.500%,
due 03/01/31 | | | 535,076 | | |
| | 515,000 | | | @@,C | | Telecom Italia Capital SA,
4.000%, due 01/15/10 | | | 473,914 | | |
| | 55,000 | | | @@,C | | Telecom Italia Capital SA,
4.875%, due 10/01/10 | | | 49,795 | | |
| | 185,000 | | | @@,C | | Telecom Italia Capital SA,
6.999%, due 06/04/18 | | | 150,323 | | |
| | 550,000 | | | @@,C | | Telefonica Europe BV, 8.250%,
due 09/15/30 | | | 645,841 | | |
| | 800,000 | | | C | | Verizon Communications, Inc.,
5.500%, due 02/15/18 | | | 770,830 | | |
| | 165,000 | | | C | | Verizon Communications, Inc.,
8.950%, due 03/01/39 | | | 213,787 | | |
| | 395,000 | | | @@,C | | Vodafone Group PLC, 5.625%,
due 02/27/17 | | | 372,783 | | |
| | | | 5,031,731 | | |
| | | | | Transportation: 0.1% | |
| | 400,000 | | | C | | Burlington Northern Santa Fe
Corp., 6.125%, due 03/15/09 | | | 400,909 | | |
| | 80,000 | | | @@,C | | Canadian National Railway Co.,
5.550%, due 05/15/18 | | | 80,023 | | |
| | 330,000 | | | C | | Union Pacific Corp., 7.875%,
due 01/15/19 | | | 377,672 | | |
| | | | 858,604 | | |
Total Corporate Bonds/Notes
(Cost $68,527,082) | | | 63,724,303 | | |
| U.S. GOVERNMENT AGENCY OBLIGATIONS: 2.9% | | | |
| | | | | | | Federal Home Loan
Mortgage Corporation##: 1.1% | | | | | |
| | 260,000 | | | | | 5.125%, due 11/17/17 | | | 301,798 | | |
| | 2,150,000 | | | | | 6.250%, due 07/15/32 | | | 3,013,165 | | |
| | 3,200,000 | | | | | 6.750%, due 03/15/31 | | | 4,708,346 | | |
| | | | 8,023,309 | | |
| | | | | | | Federal National Mortgage
Association##: 1.8% | | | | | |
| | 4,600,000 | | | | | 5.000%, due 05/11/17 | | | 5,254,106 | | |
| | 5,275,000 | | | | | 6.625%, due 11/15/30 | | | 7,641,455 | | |
| | | | 12,895,561 | | |
Total U.S. Government
Agency Obligations
(Cost $17,141,750) | | | 20,918,870 | | |
| U.S. TREASURY OBLIGATIONS: 11.1% | | | |
| | | | | U.S. Treasury Bonds: 2.9% | |
| | 155,000 | | | | | 3.750%, due 11/15/18 | | | 175,513 | | |
| | 5,900,000 | | | | | 4.000%, due 02/15/15 | | | 6,724,159 | | |
| | 1,130,000 | | | | | 4.625%, due 02/15/17 | | | 1,336,755 | | |
| | 475,000 | | | | | 4.750%, due 02/15/37 | | | 662,031 | | |
| | 10,000,000 | | | | | 5.750%, due 08/15/10 | | | 10,861,720 | | |
| | 89,000 | | | | | 8.750%, due 05/15/17 | | | 130,997 | | |
| | 379,000 | | | | | 8.875%, due 08/15/17-02/15/19 | | | 572,113 | | |
| | 231,000 | | | | | 9.000%, due 11/15/18 | | | 356,859 | | |
| | 35,000 | | | | | 9.125%, due 05/15/18 | | | 54,127 | | |
| | | | 20,874,274 | | |
Principal
Amount | | | | | | Value | |
| | | | | U.S. Treasury Notes: 7.9% | |
| $ | 11,800,000 | | | | | 2.000%, due 02/28/10 | | $ | 12,016,188 | | |
| | 25,520,000 | | | | | 2.750%, due 02/28/13-10/31/13 | | | 27,144,251 | | |
| | 2,870,000 | | | | | 3.250%, due 12/31/09 | | | 2,952,851 | | |
| | 1,835,000 | | | | | 3.625%, due 12/31/12 | | | 2,022,515 | | |
| | 5,000 | | | | | 4.125%, due 08/31/12 | | | 5,531 | | |
| | 9,975,000 | | | | | 4.500%, due 02/28/11 | | | 10,788,591 | | |
| | 2,100,000 | | | | | 5.125%, due 06/30/11 | | | 2,324,931 | | |
| | | | 57,254,858 | | |
| | | | | U.S. Treasury STRIP: 0.3% | |
| | 3,100,000 | | | ^,Z | | 4.100%, due 05/15/25 | | | 1,844,636 | | |
| | | | 1,844,636 | | |
Total U.S. Treasury Obligations
(Cost $75,135,213) | | | 79,973,768 | | |
| ASSET-BACKED SECURITIES: 0.6% | | | |
| | | | | Automobile Asset-Backed Securities: 0.5% | |
| | 908,334 | | | C | | Capital Auto Receivables Asset
Trust, 1.255%, due 07/15/10 | | | 847,766 | | |
| | 792,730 | | | C | | Capital Auto Receivables Asset
Trust, 4.980%, due 05/15/11 | | | 779,335 | | |
| | 251,106 | | | C | | Capital One Auto Finance Trust,
5.070%, due 07/15/11 | | | 243,518 | | |
| | 57,462 | | | C | | Ford Credit Auto Owner Trust,
5.050%, due 03/15/10 | | | 57,350 | | |
| | 630,011 | | | C | | Ford Credit Auto Owner Trust,
5.260%, due 10/15/10 | | | 624,830 | | |
| | 442,164 | | | C | | Harley-Davidson Motorcycle
Trust, 4.070%, due 02/15/12 | | | 431,725 | | |
| | 615,516 | | | C | | Harley-Davidson Motorcycle
Trust, 4.410%, due 06/15/12 | | | 605,825 | | |
| | 200,000 | | | #,C | | Hertz Vehicle Financing, LLC,
4.930%, due 02/25/10 | | | 198,737 | | |
| | | | 3,789,086 | | |
| | | | | Other Asset-Backed Securities: 0.1% | |
| | 79,593 | | | C | | Caterpillar Financial Asset Trust,
5.570%, due 05/25/10 | | | 79,585 | | |
| | 284,641 | | | C | | CIT Equipment Collateral,
5.070%, due 02/20/10 | | | 283,752 | | |
| | 73,039 | | | C | | CNH Equipment Trust,
5.200%, due 06/15/10 | | | 72,949 | | |
| | | | 436,286 | | |
Total Asset-Backed Securities
(Cost $4,334,149) | | | 4,225,372 | | |
| OTHER BONDS: 0.3% | | | |
| | | | | Foreign Government Bonds: 0.3% | |
| | 960,000 | | | C | | Federative Republic of Brazil,
6.000%, due 01/17/17 | | | 996,000 | | |
| | 295,000 | | | # | | Korea Railroad Corp.,
5.375%, due 05/15/13 | | | 247,724 | | |
| | 600,000 | | | C | | Mexico Government
International Bond,
5.625%, due 01/15/17 | | | 603,000 | | |
Total Other Bonds
(Cost $1,808,522) | | | 1,846,724 | | |
Total Investments in
Securities
(Cost $785,073,120)* | | | 94.4 | % | | $ | 679,729,030 | | |
Other Assets and
Liabilities - Net | | | 5.6 | | | | 40,124,882 | | |
| Net Assets | | | 100.0 | % | | $ | 719,853,912 | | |
See Accompanying Notes to Financial Statements
240
ING VAN KAMPEN EQUITY AND PORTFOLIO OF INVESTMENTS
INCOME PORTFOLIO AS OF DECEMBER 31, 2008 (CONTINUED)
@ Non-income producing security
@@ Foreign Issuer
ADR American Depositary Receipt
STRIP Separate Trading of Registered Interest and Principal of Securities
+ Step basis bonds. Interest rates shown reflect current and next coupon rates.
# Securities with purchases pursuant to Rule 144A or section 4(2), under the Securities Act of 1933 and may not be resold subject to that rule except to qualified institutional buyers. Unless otherwise noted, these securities have been determined to be liquid under the guidelines established by the Funds' Board of Directors/Trustees.
C Bond may be called prior to maturity date.
P Preferred Stock may be called prior to convertible date.
## On September 7, 2008, the Federal Housing Finance Agency placed the Federal National Mortgage Association and the Federal Home Loan Mortgage Corporation into conservatorship and the U.S. Treasury guaranteed the debt issued by those organizations.
S All or a portion of this security is segregated to cover collateral requirements for applicable futures, options, swaps, foreign forward currency contracts and/or when-issued or delayed-delivery securities.
X Fair value determined by ING Funds Valuation Committee appointed by the Funds' Board of Directors/Trustees.
^ Interest only securities represent the right to receive the monthly interest payments on an underlying pool of mortgage loans. Principal amount shown represents the notional amount on which current interest is calculated. Payments of principal on the pool reduce the value of the interest only security.
Z Indicates Zero Coupon Bond; rate shown reflects current effective yield.
* Cost for federal income tax purposes is $788,201,758.
Net unrealized depreciation consists of:
| Gross Unrealized Appreciation | | $ | 29,375,218 | | |
| Gross Unrealized Depreciation | | | (137,847,946 | ) | |
| Net Unrealized Depreciation | | $ | (108,472,728 | ) | |
The following table summarizes the inputs used as of December 31, 2008 in determining the Portfolio's investments at fair value for purposes of SFAS 157:
| | | Investments in
Securities | | Other Financial
Instruments* | |
| Level 1 — Quoted Prices | | $ | 433,275,833 | | | $ | — | | |
Level 2 — Other Significant
Observable Inputs | | | 246,196,082 | | | | — | | |
Level 3 — Significant
Unobservable Inputs | | | 257,115 | | | | — | | |
| Total | | $ | 679,729,030 | | | $ | — | | |
"Fair value" for purposes of SFAS 157 is different from "fair value" as used in the 1940 Act. The former generally implies market value, and can include market quotations as a source of value, and the latter refers to determinations of actual value in absence of available market quotations.
* Other financial instruments may include forward foreign currency contracts, futures, swaps, and written options. Forward foreign currency contracts and futures are reported at their unrealized gain/loss at year end. Swaps and written options are reported at their market value at year end.
A roll forward of fair value measurements using significant unobservable inputs (Level 3) for the year ended December 31, 2008, was as follows:
| | | Investments in
Securities | | Other Financial
Instruments* | |
| Beginning Balance at 12/31/07 | | $ | 1,258,017 | | | $ | — | | |
| Net Purchases/(Sales) | | | (808,303 | ) | | | — | | |
| Accrued Discounts/(Premiums) | | | (1,290 | ) | | | — | | |
| Total Realized Gain/(Loss) | | | (123,209 | ) | | | — | | |
Total Unrealized
Appreciation/(Depreciation) | | | (68,100 | ) | | | — | | |
Net Transfers In/(Out) of
Level 3 | | | — | | | | — | | |
| Ending Balance at 12/31/08 | | $ | 257,115 | | | $ | — | | |
* Other financial instruments may include forward foreign currency contracts, futures, swaps, and written options. Forward foreign currency contracts and futures are reported at their unrealized gain/loss at year end. Swaps and written options are reported at their market value at year end.
For the year ended December 31, 2008, total change in unrealized gain (loss) on Level 3 securities included in the change in net assets was $(171,600). Total unrealized gain (loss) for all securities (including Level 1 and Level 2) can be found on the accompanying Statement of Operations.
See Accompanying Notes to Financial Statements
241
TAX INFORMATION (UNAUDITED)
Dividends paid during the year ended December 31, 2008 were as follows:
| Fund Name | | Type | | Per Share Amount | |
ING American Century Large
Company Value Portfolio | |
| Class ADV | | NII | | $ | 1.1745 | | |
| Class I | | NII | | $ | 1.4257 | | |
| Class S | | NII | | $ | 1.3547 | | |
| All Classes | | STCG | | $ | 0.1540 | | |
| All Classes | | LTCG | | $ | 4.5115 | | |
ING American Century Small-Mid Cap
Value Portfolio | |
| Class ADV | | NII | | $ | 0.0509 | | |
| Class I | | NII | | $ | 0.1148 | | |
| Class S | | NII | | $ | 0.0818 | | |
| All Classes | | STCG | | $ | 0.9482 | | |
| All Classes | | LTCG | | $ | 0.3569 | | |
| ING Baron Asset Portfolio | |
| All Classes | | LTCG | | $ | 0.1579 | | |
ING Baron Small Cap Growth
Portfolio | |
| All Classes | | LTCG | | $ | 0.5232 | | |
ING Columbia Small Cap
Value II Portfolio | |
| Class ADV | | NII | | $ | 0.0156 | | |
| Class I | | NII | | $ | 0.0248 | | |
| Class S | | NII | | $ | 0.0084 | | |
| All Classes | | STCG | | $ | 0.0413 | | |
| All Classes | | LTCG | | $ | 0.0422 | | |
ING Davis New York Venture
Portfolio | |
| Class ADV | | NII | | $ | 0.0392 | | |
| Class I | | NII | | $ | 0.1556 | | |
| Class S | | NII | | $ | 0.1249 | | |
| All Classes | | STCG | | $ | 0.0388 | | |
| All Classes | | LTCG | | $ | 0.1404 | | |
ING JPMorgan Mid Cap
Value Portfolio | |
| Class ADV | | NII | | $ | 0.1803 | | |
| Class I | | NII | | $ | 0.3397 | | |
| Class S | | NII | | $ | 0.2763 | | |
| All Classes | | STCG | | $ | 0.0155 | | |
| All Classes | | LTCG | | $ | 1.3017 | | |
ING Neuberger Berman
Partners Portfolio | |
| Class ADV | | NII | | $ | — | | |
| Class I | | NII | | $ | 0.0240 | | |
| Class S | | NII | | $ | — | | |
| ING Oppenheimer Global Portfolio | |
| Class ADV | | NII | | $ | 0.2285 | | |
| Class I | | NII | | $ | 0.3252 | | |
| Class S | | NII | | $ | 0.2948 | | |
| All Classes | | STCG | | $ | 0.0097 | | |
| All Classes | | LTCG | | $ | 1.1139 | | |
ING Oppenheimer Strategic
Income Portfolio | |
| Class ADV | | NII | | $ | 0.5094 | | |
| Class I | | NII | | $ | 0.5589 | | |
| Class S | | NII | | $ | 0.5408 | | |
| All Classes | | LTCG | | $ | 0.0373 | | |
| Fund Name | | Type | | Per Share Amount | |
| ING PIMCO Total Return Portfolio | |
| Class ADV | | NII | | $ | 0.5179 | | |
| Class I | | NII | | $ | 0.5543 | | |
| Class S | | NII | | $ | 0.5368 | | |
| All Classes | | STCG | | $ | 0.0639 | | |
| All Classes | | LTCG | | $ | 0.1074 | | |
| ING Pioneer High Yield Portfolio | |
| Class ADV | | NII | | $ | 0.6531 | | |
| Class I | | NII | | $ | 0.6999 | | |
| Class S | | NII | | $ | 0.6771 | | |
| All Classes | | STCG | | $ | 0.1814 | | |
| All Classes | | LTCG | | $ | 0.0442 | | |
ING T. Rowe Price Diversified Mid Cap
Growth Portfolio | |
| Class ADV | | NII | | $ | — | | |
| Class I | | NII | | $ | 0.0344 | | |
| Class S | | NII | | $ | 0.0026 | | |
| All Classes | | STCG | | $ | 0.2476 | | |
| All Classes | | LTCG | | $ | 1.0296 | | |
ING T. Rowe Price Growth
Equity Portfolio | |
| Class ADV | | NII | | $ | 0.0747 | | |
| Class I | | NII | | $ | 0.6349 | | |
| Class S | | NII | | $ | 0.4386 | | |
| All Classes | | ROC | | $ | 0.0518 | | |
| All Classes | | STCG | | $ | 0.3732 | | |
| All Classes | | LTCG | | $ | 3.5507 | | |
ING Templeton Foreign
Equity Portfolio | |
| Class ADV | | NII | | $ | 0.2292 | | |
| Class I | | NII | | $ | 0.2661 | | |
| Class S | | NII | | $ | 0.2319 | | |
| ING Thornburg Value Portfolio | |
| Class ADV | | NII | | $ | 0.0599 | | |
| Class I | | NII | | $ | 0.1494 | | |
| Class S | | NII | | $ | 0.0334 | | |
ING UBS U.S. Large Cap
Equity Portfolio | |
| Class ADV | | NII | | $ | 0.1294 | | |
| Class I | | NII | | $ | 0.2210 | | |
| Class S | | NII | | $ | 0.1559 | | |
| ING Van Kampen Comstock Portfolio | |
| Class ADV | | NII | | $ | 0.3033 | | |
| Class I | | NII | | $ | 0.4628 | | |
| Class S | | NII | | $ | 0.4016 | | |
| All Classes | | STCG | | $ | 0.0808 | | |
| All Classes | | LTCG | | $ | 0.5672 | | |
ING Van Kampen Equity and
Income Portfolio | |
| Class ADV | | NII | | $ | 1.3709 | | |
| Class I | | NII | | $ | 1.7469 | | |
| Class S | | NII | | $ | 1.6443 | | |
| All Classes | | STCG | | $ | 0.2537 | | |
| All Classes | | LTCG | | $ | 1.6542 | | |
NII — Net investment income
ROC — Return of capital
STCG — Short-term capital gain
LTCG — Long-term capital gain
242
TAX INFORMATION (UNAUDITED) (CONTINUED)
Of the ordinary distributions made during the year ended December 31, 2008, the following percentages qualify for the dividends received deduction (DRD) available to corporate shareholders:
| ING American Century Large Company Value Portfolio | | | 100.00 | % | |
| ING American Century Small-Mid Cap Value Portfolio | | | 17.96 | % | |
| ING Columbia Small Cap Value II Portfolio | | | 57.56 | % | |
| ING Davis New York Venture Portfolio | | | 87.77 | % | |
| ING JPMorgan Mid Cap Value Portfolio | | | 100.00 | % | |
| ING Neuberger Berman Partners Portfolio | | | 100.00 | % | |
| ING Oppenheimer Global Portfolio | | | 20.40 | % | |
| ING Oppenheimer Strategic Income Portfolio | | | 0.13 | % | |
| ING Pioneer High Yield Portfolio | | | 3.49 | % | |
| ING T. Rowe Price Diversified Mid Cap Growth Portfolio | | | 35.46 | % | |
| ING T. Rowe Price Growth Equity Portfolio | | | 73.45 | % | |
| ING Templeton Foreign Equity Portfolio | | | 0.31 | % | |
| ING Thornburg Value Portfolio | | | 100.00 | % | |
| ING UBS U.S. Large Cap Equity Portfolio | | | 100.00 | % | |
| ING Van Kampen Comstock Portfolio | | | 94.77 | % | |
| ING Van Kampen Equity and Income Portfolio | | | 50.33 | % | |
Pursuant to Section 853 of the Internal Revenue Code, the Portfolios designate the following amounts as foreign taxes paid for the year ended December 31, 2008. Foreign taxes paid for purposes of Section 853 may be less than actual foreign taxes paid for financial statement purposes.
| | | Creditable
Foreign
Taxes Paid | | Per Share
Amount | | Portion of Ordinary
Income Distribution
Derived from Foreign
Sourced Income* | |
| ING Oppenheimer Global Portfolio | | $ | 4,232,490 | | | $ | 0.0289 | | | | 73.65 | % | |
| ING Templeton Foreign Equity Portfolio | | $ | 2,341,770 | | | $ | 0.0316 | | | | 99.36 | % | |
* None of the Portfolios listed above derived any income from ineligible foreign sources as defined under Section 901(j) of the Internal Revenue Code.
Foreign taxes paid or withheld should be included in taxable income with an offsetting deduction from gross income or as a credit for taxes paid to foreign governments. Shareholders are strongly advised to consult their own tax advisors regarding the appropriate treatment of foreign taxes paid.
Above figures may differ from those cited elsewhere in this report due to differences in the calculation of income and gains under U.S. generally accepted accounting principles (book) purposes and Internal Revenue Service (tax) purposes.
Shareholders are strongly advised to consult their own tax advisers with respect to the tax consequences of their investments in the Portfolios. In January, shareholders, excluding corporate shareholders, receive an IRS 1099-DIV regarding the federal tax status of the dividends and distributions they received in the calendar year.
243
DIRECTOR AND OFFICER INFORMATION (UNAUDITED)
The business and affair of the Fund are managed under the direction of the Board. A Director who is not an interested person of the Fund, as defined in the 1940 Act, is an independent director ("Independent Director"). The Directors and Officers of the Fund are listed below. The Statement of Additional Information includes additional information about directors of the Funds and is available, without charge, upon request at (800) 992-0180.
Name, Address,
and Age | | Position(s)
Held With
the Fund | | Term of
Office and
Length of
Time
Served(1) | | Principal
Occupation(s) -
During the
Past 5 Years | | Number of
Portfolios in
Fund Complex
Overseen
by Trustee(2) | | Other
Directorships/
Trusteeships
Held by
Director | |
| Independent Directors: | |
|
Colleen D. Baldwin
7337 E. Doubletree Ranch Rd.
Scottsdale, Arizona 85258
Age: 48 | | Director | | November 2007 - Present | | President, National Charity League/Canaan Parish Board (June 2008 - Present) and Consultant (January 2005 - Present). Formerly, Chief Operating Officer, Ivy Asset Management Group (April 2002 - October 2004) | | | 161 | | | None. | |
|
John V. Boyer(4)
7337 E. Doubletree Ranch Rd.
Scottsdale, Arizona 85258
Age: 55 | | Director | | November 1997 - Present | | President, Bechtler Arts Foundation (March 2008 - Present). Formerly, Consultant (July 2007 - February 2008); President and Chief Executive Officer, Franklin and Eleanor Roosevelt Institute (March 2006 - July 2007); and Executive Director, The Mark Twain House & Museum (September 1989 - November 2005). | | | 161 | | | None. | |
|
Patricia W. Chadwick
7337 E. Doubletree Ranch Rd.
Scottsdale, Arizona 85258
Age: 60 | | Director | | January 2006 - Present | | Consultant and President of self-owned company, Ravengate Partners LLC (January 2000 - Present). | | | 161 | | | Wisconsin Energy Corporation (June 2006 - Present). | |
|
Peter S. Drotch
7337 E. Doubletree Ranch Rd.
Scottsdale, Arizona 85258
Age: 66 | | Director | | November 2007 - Present | | Retired partner, PricewaterhouseCoopers, LLP. | | | 161 | | | First Marblehead Corporation (September 2003 - Present). | |
|
J. Michael Earley
7337 E. Doubletree Ranch Rd.
Scottsdale, Arizona 85258
Age: 63 | | Director | | January 2005 - Present | | Retired. Formerly, President and Chief Executive Officer, Bankers Trust Company, N.A., Des Moines (June 1992 - December 2008). | | | 161 | | | Bankers Trust Company, N.A. (June 1992 - Present) and Midamerica Financial Corporation (December 2002 - Present). | |
|
Patrick W. Kenny
7337 E. Doubletree Ranch Rd.
Scottsdale, Arizona 85258
Age: 65 | | Director | | March 2002 - Present | | President and Chief Executive Officer, International Insurance Society (June 2001 - Present). | | | 161 | | | Assured Guaranty Ltd. (April 2004 - Present) and Odyssey Re Holdings Corporation (November 2006 - Present). | |
|
Sheryl K. Pressler
7337 E. Doubletree Ranch Rd.
Scottsdale, Arizona 85258
Age: 58 | | Director | | January 2006 - Present | | Consultant (May 2001 - Present). | | | 161 | | | Global Alternative Asset Management, Inc. (October 2007 - Present) and Stillwater Mining Company (May 2002 - Present). | |
|
Roger B. Vincent
7337 E. Doubletree Ranch Rd.
Scottsdale, Arizona 85258
Age: 63 | | Director | | January 2005 - Present | | President, Springwell Corporation (March 1989 - Present). | | | 161 | | | UGI Corporation (February 2006 - Present) and UGI Utilities, Inc. (February 2006 - Present). | |
|
244
DIRECTOR AND OFFICER INFORMATION (UNAUDITED) (CONTINUED)
Name, Address,
and Age | | Position(s)
Held With
the Fund | | Term of
Office and
Length of
Time
Served(1) | | Principal
Occupation(s) -
During the
Past 5 Years | | Number of
Portfolios in
Fund Complex
Overseen
by Trustee(2) | | Other
Directorships/
Trusteeships
Held by
Director | |
| Trustees who are "Interested Persons": | |
|
Robert W. Crispin(5)
7337 E. Doubletree Ranch Rd.
Scottsdale, Arizona 85258
Age: 62 | | Director | | November 2007 - Present | | Retired. Chairman and Chief Investment Officer, ING Investment Management Co. (June 2001 - December 2007). | | | 161 | | | ING Canada Inc. (December 2004 - Present) and ING Bank, fsb (June 2001 - Present). | |
|
Shaun P. Mathews(3)(5)
7337 E. Doubletree Ranch Rd.
Scottsdale, Arizona 85258
Age: 53 | | Director | | November 2007 - Present | | President and Chief Executive Officer, ING Investments, LLC(5) (November 2006 - Present). Formerly, President, ING Mutual Funds and Investment Products (November 2004 - November 2006); Chief Marketing Officer, ING USFS (April 2002 - October 2004); and Head of Rollover/Payout (October 2001 - December 2003). | | | 200 | | | ING Services Holding Company, Inc. (May 2000 - Present); Southland Life Insurance Company (June 2002 - Present); and ING Capital Corporation, LLC, ING Funds Distributor, LLC(6), ING Funds Services, LLC(7), ING Investments, LLC(5) and ING Pilgrim Funding, Inc. (December 2006 - Present). | |
|
(1) Directors serve until their successors are duly elected and qualified. The tenure of each Director is subject to the Board's retirement policy, which states that each Independent Director shall retire from service as a Director at the conclusion of the first regularly scheduled meeting of the Board that is held after (a) the Director reaches the age of 70, if that Director qualifies for a retirement benefit as discussed in the board's retirement policy; or (b) the Director reaches the age of 72 or has served as a Director for 15 years, whichever comes first, if that Director does not qualify for the retirement benefit. A unanimous vote of the Board may extend the retirement date of a Director for up to one year. An extension may be permitted if the retirement would trigger a requirement to hold a meeting of shareholders of the Fund under applicable law, whether for purposes of appointing a successor to the Directo r or if otherwise necessary under applicable law, in which case the extension would apply until such time as the shareholder meeting can be held or is no longer needed.
(2) For the purposes of this table (except for Mr. Mathews),"Fund Complex" means the following investment companies: ING Asia Pacific High Dividend Equity Income Fund, ING Equity Trust; ING Funds Trust; ING Global Equity Dividend and Premium Opportunity Fund; ING Global Advantage and Premium Opportunity Fund; ING International High Dividend Equity Income Fund; ING Investors Trust; ING Mayflower Trust; ING Mutual Funds; ING Prime Rate Trust; ING Risk Managed Natural Resources Fund; ING Senior Income Fund; ING Separate Portfolios Trust; ING Variable Insurance Trust; ING Variable Products Trust; and ING Partners, Inc.
(3) For Mr. Mathews, the Fund Complex also includes the following investment companies: ING Series Fund, Inc.; ING Strategic Allocation Portfolios, Inc.; ING Variable Funds; ING Variable Portfolios, Inc.; ING VP Balanced Portfolio, Inc.; ING VP Intermediate Bond Portfolio; and ING VP Money Market Portfolio.
(4) Mr. Boyer held a seat on the Board of Directors of The Mark Twain House & Museum from September 1989 to November 2005. ING Groep N.V. makes non-material, charitable contributions to The Mark Twain House & Museum.
(5) Messrs. Mathews and Crispin are deemed to be "interested persons" of the Fund as defined in the 1940 Act because of their relationship with ING Groep, N.V., the parent corporation of the Manager, ING Investment Manager.
(6) ING Investments, LLC was previously named ING Pilgrim Investments, LLC. ING Pilgrim Investments, LLC is the successor in interest to ING Pilgrim Investments, Inc., which was previously known as Pilgrim Investments, Inc. and before that was known as Pilgrim America Investments, Inc.
(7) ING Funds Distributor, LLC is the successor in interest to ING Funds Distributor, Inc., which was previously known as ING Pilgrim Securities, Inc., and before that was known as Pilgrim Securities, Inc., and before that was known as Pilgrim America Securities, Inc.
(8) ING Funds Services, LLC was previously named ING Pilgrim Group, LLC. ING Pilgrim Group, LLC is the successor in interest to ING Pilgrim Group, Inc., which was previously known as Pilgrim Group, Inc. and before that was known as Pilgrim America Group, Inc.
245
DIRECTOR AND OFFICER INFORMATION (UNAUDITED) (CONTINUED)
Name, Address
and Age | | Position(s)
Held With the Fund | | Term of Office and
Length of Time Served(1) | | Principal Occupation(s) - During the
Past 5 Years | |
Shaun P. Mathews(5)
7337 East Doubletree Ranch Rd.
Scottsdale, Arizona 85258
Age: 53 | | President and Chief Executive Officer | | November 2006 - Present | | President and Chief Executive Officer, ING Investments, LLC (November 2006 - Present). Formerly, President, ING Mutual Funds and Investment Products (November 2004 - November 2006); Chief Marketing Officer, ING USFS (April 2002 - October 2004); and Head of Rollover/Payout (October 2001 - December 2003). | |
|
Michael J. Roland
7337 East Doubletree Ranch Rd.
Scottsdale, Arizona 85258
Age: 50 | | Executive Vice President | | January 2005 - Present | | Head of Mutual Fund Platform (February 2007 - Present) and Executive Vice President, ING Investments, LLC(2) and ING Funds Services, LLC(3) (December 2001 - Present). Formerly, Executive Vice President, Head of Product Management (January 2005 - January 2007); Chief Compliance Officer, ING Investments, LLC(2) and Directed Services LLC(6) (October 2004 - December 2005); and Chief Financial Officer and Treasurer, ING Investments, LLC(2) (December 2001 - March 2005). | |
|
Stanley D. Vyner
230 Park Avenue
New York, New York 10169
Age: 58 | | Executive Vice President | | January 2005 - Present | | Executive Vice President, ING Investments, LLC(2) (July 2000 - Present) and Chief Investment Risk Officer, ING Investments, LLC(2) (January 2003 - Present). | |
|
Joseph M. O'Donnell
7337 East Doubletree Ranch Rd.
Scottsdale, Arizona 85258
Age: 54 | | Executive Vice President and Chief Compliance Officer | | March 2006 - Present
January 2005 - Present | | Chief Compliance Officer of the ING Funds (November 2004 - Present) and Executive Vice President of the ING Funds (March 2006 - Present). Formerly, Chief Compliance Officer of ING Investments, LLC(2) (March 2006 - July 2008); Investment Advisor Chief Compliance Officer, Directed Services LLC(6) (March 2006 - July 2008) ING Life Insurance and Annuity Company (March 2006 - December 2006); and Vice President, Chief Legal Counsel, Chief Compliance Officer and Secretary of Atlas Securities, Inc., Atlas Advisers, Inc. and Atlas Funds (October 2001 - October 2004). | |
|
Todd Modic
7337 East Doubletree Ranch Rd.
Scottsdale, Arizona 85258
Age: 41 | | Senior Vice President, Chief/Principal Financial Officer and Assistant Secretary | | March 2005 - Present | | Senior Vice President, ING Funds Services, LLC(3) (March 2005 - Present). Formerly, Vice President, ING Funds Services, LLC(3) (September 2002 - March 2005). | |
|
Kimberly A. Anderson
7337 East Doubletree Ranch Rd.
Scottsdale, Arizona 85258
Age: 44 | | Senior Vice President | | January 2005 - Present | | Senior Vice President, ING Investments, LLC(2) (October 2003 - Present). | |
|
Robert Terris
7337 East Doubletree Ranch Rd.
Scottsdale, Arizona 85258
Age: 38 | | Senior Vice President | | May 2006 - Present | | Senior Vice President, Head of Division Operations, ING Funds Services, LLC(3) (May 2006 - Present). Formerly, Vice President of Administration, ING Funds Services, LLC(3) (October 2001 - March 2006). | |
|
246
DIRECTOR AND OFFICER INFORMATION (UNAUDITED) (CONTINUED)
Name, Address
and Age | | Position(s)
Held With the Fund | | Term of Office and
Length of Time Served(1) | | Principal Occupation(s) - During the
Past 5 Years | |
Ernest J. C'DeBaca
7337 East Doubletree Ranch Rd.
Scottsdale, Arizona 85258
Age: 39 | | Senior Vice President | | May 2006 - Present | | Chief Compliance Officer, ING Investments, LLC(2) (July 2008 - Present); Investment Advisor Chief Compliance Officer, Directed Services LLC(6) (July 2008 - Present); Head of Retail Compliance, ING Funds Distributor, LLC(4) and ING Funds Services, LLC(3), (July 2008 - Present); and Senior Vice President, ING Investments, LLC(2) (December 2006 - Present), ING Funds Services, LLC(3) (April 2006 - Present), ING Funds Distributor, LLC(4) (July 2008 - Present), and Directed Services LLC(6) (July 2008 - Present). Formerly, Counsel, ING Americas, U.S. Legal Services (January 2004 - March 2006) and Attorney-Adviser, U.S. Securities and Exchange Commission (May 2001 - December 2003). | |
|
Robyn L. Ichilov
7337 East Doubletree Ranch Rd.
Scottsdale, Arizona 85258
Age: 41 | | Vice President and Treasurer | | January 2005 - Present | | Vice President and Treasurer, ING Funds Services, LLC(3) (November 1995 - Present) and ING Investments, LLC(2) (August 1997 - Present). | |
|
Lauren D. Bensinger
7337 East Doubletree Ranch Rd.
Scottsdale, Arizona 85258
Age: 54 | | Vice President | | January 2005 - Present | | Vice President and Chief Compliance Officer, ING Funds Distributor, LLC(4) (August 1995 - Present); Vice President, ING Investments, LLC(2) and ING Funds Services, LLC(3) (February 1996 - Present); and Director of Compliance, ING Investments, LLC(2) (October 2004 - Present). Formerly, Chief Compliance Officer, ING Investments, LLC(2) (October 2001 - October 2004). | |
|
William Evans
10 State House Square
Hartford, Connecticut 06103
Age: 36 | | Vice President | | September 2007 - Present | | Vice President, Head of Mutual Fund Advisory Group (April 2007 - Present). Formerly, Vice President, U.S. Mutual Funds and Investment Products (May 2005 - April 2007) and Senior Fund Analyst, U.S. Mutual Funds and Investment Products (May 2002 - May 2005). | |
|
Maria M. Anderson
7337 East Doubletree Ranch Rd.
Scottsdale, Arizona 85258
Age: 50 | | Vice President | | January 2005 - Present | | Vice President, ING Funds Services, LLC(3) (September 2004 - Present). Formerly, Assistant Vice President, ING Funds Services, LLC(3) (October 2001 - September 2004). | |
|
Denise Lewis
7337 East Doubletree Ranch Rd.
Scottsdale, Arizona 85258
Age: 45 | | Vice President | | January 2007 - Present | | Vice President, ING Funds Services, LLC (December 2006 - Present). Formerly, Senior Vice President, UMB Investment Services Group, LLC (November 2003 - December 2006). | |
|
Kimberly K. Springer
7337 East Doubletree Ranch Rd.
Scottsdale, Arizona 85258
Age: 51 | | Vice President | | March 2006 - Present | | Vice President, ING Funds Services, LLC(3) (March 2006 - Present). Formerly, Assistant Vice President, ING Funds Services, LLC(3) (August 2004 - March 2006) and Manager, Registration Statements, ING Funds Services, LLC(3) (May 2003 - August 2004). | |
|
Susan P. Kinens
7337 East Doubletree Ranch Rd.
Scottsdale, Arizona 85258
Age: 32 | | Assistant Vice President | | January 2005 - Present | | Assistant Vice President, ING Funds Services, LLC(3) (December 2002 - Present). | |
|
Craig Wheeler
7337 East Doubletree Ranch Rd.
Scottsdale, Arizona 85258
Age: 39 | | Assistant Vice President | | May 2008 - Present | | Assistant Vice President - Director of Tax, ING Funds Services (March 2008 - Present). Formerly, Tax Manager, ING Funds Services (March 2005 - March 2008); Tax Senior, ING Funds Services (January 2004 - March 2005); and Tax Senior, KPMG LLP (August 2002 - December 2003). | |
|
247
DIRECTOR AND OFFICER INFORMATION (UNAUDITED) (CONTINUED)
Name, Address
and Age | | Position(s)
Held With the Trust | | Term of Office and
Length of Time Served(1) | | Principal Occupation(s) - During the
Past 5 Years | |
Huey P. Falgout, Jr.
7337 East Doubletree Ranch Rd.
Scottsdale, Arizona 85258
Age: 45 | | Secretary | | August 2003 - Present | | Chief Counsel, ING Americas, U.S. Legal Services (September 2003 - Present). | |
|
Theresa K. Kelety
7337 East Doubletree Ranch Rd.
Scottsdale, Arizona 85258
Age: 45 | | Assistant Secretary | | August 2003 - Present | | Senior Counsel, ING Americas, U.S. Legal Services (April 2008 - Present). Formerly, Counsel, ING Americas, U.S. Legal Services (April 2003 - April 2008). | |
|
Kathleen Nichols
7337 East Doubletree Ranch Rd.
Scottsdale, Arizona 85258
Age: 33 | | Assistant Secretary | | May 2008 - Present | | Counsel, ING Americas, U.S. Legal Services (February 2008 - Present). Formerly, Associate, Ropes & Gray LLP (September 2005 - February 2008) | |
|
(1) The officers hold office until the next annual meeting of the Directors/Trustees and until their successors shall have been elected and qualified.
(2) ING Investments, LLC was previously named ING Pilgrim Investments, LLC. ING Pilgrim Investments, LLC is the successor in interest to ING Pilgrim Investments, Inc., which was previously known as Pilgrim Investments, Inc. and before that was known as Pilgrim America Investments, Inc.
(3) ING Funds Services, LLC was previously named ING Pilgrim Group, LLC. ING Pilgrim Group, LLC is the successor in interest to ING Pilgrim Group, Inc., which was previously known as Pilgrim Group, Inc. and before that was known as Pilgrim America Group, Inc.
(4) ING Funds Distributor, LLC is the successor in interest to ING Funds Distributor, Inc., which was previously known as ING Pilgrim Securities, Inc., and before that was known as Pilgrim Securities, Inc., and before that was known as Pilgrim America Securities, Inc.
(5) Mr. Mathews commenced services as CEO and President of the ING Funds on November 11, 2006.
(6) Directed Services, LLC is the successor in interest to Directed Services, Inc.
248
ADVISORY CONTRACT APPROVAL DISCUSSION (UNAUDITED)
BOARD CONSIDERATION AND RE-APPROVAL OF INVESTMENT ADVISORY AND SUB-ADVISORY CONTRACTS
Section 15(c) of the Investment Company Act of 1940, as amended (the "1940 Act") provides that, after an initial period, the Portfolios' existing investment advisory and sub-advisory contracts will remain in effect only if the Board of Directors (the "Board") of ING Partners, Inc. (the "Company"), including a majority of Board members who have no direct or indirect interest in the advisory and sub-advisory contracts, and who are not "interested persons" of the Portfolios, as such term is defined under the 1940 Act (the "Independent Directors"), annually review and approve them. Thus, at a meeting held on November 14, 2008, the Board, including a majority of the Independent Directors, considered whether to renew the investment advisory contracts (the "Advisory Contracts") between Directed Services LLC (the "Adviser") and the sub-advisory contracts ("Sub-Advisory Contracts") with the sub-adviser to each Portfolio (collectively, the "Sub-Advise rs").
The Independent Directors also held separate meetings on October 24 and November 12, 2008 to consider the renewal of the Advisory Contracts and Sub-Advisory Contracts. As a result, subsequent references herein to factors considered and determinations made by the Independent Directors include, as applicable, factors considered and determinations made on those earlier dates by the Independent Directors.
At its November 14, 2008 meeting, the Board voted to renew the Advisory and Sub-Advisory Contracts for the Portfolios. In reaching these decisions, the Board took into account information furnished to it throughout the year at regular meetings of the Board and the Board's committees, as well as information prepared specifically in connection with the annual renewal process. Determinations by the Independent Directors also took into account various factors that they believed, in light of the legal advice furnished to them by K&L Gates LLP ("K&L Gates"), their independent legal counsel, and their own business judgment, to be relevant. Further, while the Advisory Contracts and Sub-Advisory Contracts for all the Portfolios were considered at the same Board meeting, the Directors considered each Portfolio's advisory and sub-advisory relationships separately.
Provided below is an overview of the Board's contract approval process in general, as well as a discussion of certain specific factors that the Board considered at its renewal meeting. While the Board gave its attention to the information furnished, at its request, that was most relevant to its considerations, discussed below are a number of the primary factors relevant to the Board's consideration as to whether to renew the Advisory and Sub-Advisory Contracts for the one-year period ending November 30, 2009. Each Board member may have accorded different weight to the various factors in reaching his or her conclusions with respect to each Portfolio's advisory and sub-advisory arrangements.
Overview of the Contract Renewal and Approval Process
Several years ago, the Independent Directors instituted a revised process by which they seek and consider relevant information when they decide whether to approve new or existing advisory and sub-advisory arrangements for the investment companies in the ING Funds complex under their jurisdiction, including the Portfolios' existing Advisory and Sub-Advisory Contracts. Among other actions, the Independent Directors: retained the services of independent consultants with experience in the mutual fund industry to assist the Independent Directors in working with the personnel employed by the Adviser or its affiliates who administer the Portfolios ("Management") to identify the types of information presented to the Board to inform its deliberations with respect to advisory and sub-advisory relationships and to help evaluate that information; established a specific format in which certain requested information is provided to the Board; and determine d the process for reviewing such information in connection with advisory and sub-advisory contract renewals and approvals. The end result was an enhanced process which is currently employed by the Independent Directors to review and analyze information in connection with their annual renewal of the ING Funds' advisory and sub-advisory contracts, as well as their review and approval of new advisory relationships.
Since the current renewal and approval process was first implemented, the Board's membership has changed substantially through periodic retirements of some Directors and the appointment and election of new Directors. In addition, throughout this period the Independent Directors have reviewed and refined the renewal and approval process at least annually. The Board also established a Contracts Committee and two Investment Review Committees ("IRCs"). Among other matters, the Contracts Committee provides oversight with respect to the contracts renewal process, and each Portfolio is assigned to an IRC, which
249
ADVISORY CONTRACT APPROVAL DISCUSSION (UNAUDITED) (CONTINUED)
provides oversight regarding, among other matters, investment performance.
The type and format of the information provided to the Board or to legal counsel for the Independent Directors in connection with the contract approval and renewal process has been codified in the Portfolios' 15(c) Methodology Guide. This Guide was developed under the direction of the Independent Directors and sets out a blueprint pursuant to which the Independent Directors request certain information that they deem important to facilitate an informed review in connection with initial and annual approvals of advisory and sub-advisory contracts.
Management provides certain of the information requested by the 15(c) Methodology Guide in Fund Analysis and Comparison Tables ("FACT sheets") prior to the Independent Directors' review of advisory and sub-advisory arrangements (including the Portfolios' Advisory and Sub-Advisory Contracts). The Independent Directors previously retained an independent firm to verify and test the accuracy of certain FACT sheet data for a representative sample of funds in the ING Funds complex. In addition, in 2007 and 2008, the Contracts Committee employed the services of an independent consultant to assist in its review and analysis of, among other matters, the 15(c) Methodology Guide, the content and format of the FACT sheets, and proposed Selected Peer Groups of investment companies ("SPGs") to be used by the Portfolios for certain comparison purposes during the renewal process.
As part of an ongoing process, the Contracts Committee recommends or considers recommendations from Management for refinements to the 15(c) Methodology Guide and other aspects of the review process, and the Board's IRCs review benchmarks used to assess the performance of the funds in the ING Funds complex. The Investment Review Committees may apply a heightened level of scrutiny in cases where performance has lagged an ING Fund's relevant benchmark and/or SPG.
The Board employed its process for reviewing contracts when considering the renewals of the Portfolios' Advisory and Sub-Advisory Contracts that would be effective through November 30, 2009. Set forth below is a discussion of many of the Board's primary considerations and conclusions resulting from this process.
Nature, Extent and Quality of Service
In determining whether to approve the Advisory and Sub-Advisory Contracts for the Portfolios for the year ending November 30, 2009, the Independent Directors received and evaluated such information as they deemed necessary regarding the nature, extent and quality of services provided to the Portfolios by the Adviser and each Sub-Adviser. This included information regarding the Adviser and Sub-Advisers provided throughout the year at regular meetings of the Board and its committees, as well as information furnished in connection with the contract renewal meetings.
The materials requested by and provided to the Board and/or to K&L Gates prior to the November 14, 2008 Board meeting included, among other information, the following items for each Portfolio: (1) FACT sheets that provided information regarding the performance and expenses of the Portfolio and other similarly managed funds in its SPG, as well as information regarding the Portfolio's investment portfolio, objective and strategies; (2) reports providing risk and attribution analyses of the Portfolio; (3) the 15(c) Methodology Guide, which describes how the FACT sheets were prepared, including the manner in which the Portfolio's benchmark and SPG were selected and how profitability was determined; (4) responses from the Adviser and Sub-Advisers to a series of questions posed by K&L Gates on behalf of the Directors; (5) copies of the forms of Advisory Contract and Sub-Advisory Contract; (6) copies of the Forms ADV for the Adviser and the relevant Sub-Adviser; (7) financial statements for the Adviser and the relevant Sub-Adviser; (8) a draft of a narrative summary addressing key factors the Board customarily considers in evaluating the renewals of the ING Funds' (including the Portfolios') advisory contracts and sub-advisory contracts, including a written analysis for the Portfolio of how performance, fees and expenses compare to its SPG and/or designated benchmark; (9) independent analyses of Portfolio performance by the Company's Chief Investment Risk Officer; (10) information regarding net asset flows into and out of each Portfolio; and (11) other information relevant to the Board's evaluations.
Class I shares were used for purposes of certain comparisons between each Portfolio and its SPG. This share class was selected so that a Portfolio's share class with the longest performance history was compared to the analogous class of shares for each fund in its SPG. The mutual funds included in the Portfolios' SPGs were selected based upon criteria designed to mirror the Portfolio share class being compared to the SPG.
In arriving at its conclusions with respect to the Advisory Contracts, the Board was mindful of the
250
ADVISORY CONTRACT APPROVAL DISCUSSION (UNAUDITED) (CONTINUED)
"manager-of-managers" platform of the ING Funds that has been developed by Management. The Board also considered the techniques that the Adviser has developed, at the Board's direction, to screen and perform due diligence on the sub-advisers that are recommended to the Board to manage the investment portfolios of the funds in the ING Funds complex. The Board noted the resources that the Adviser has committed to the Board and the IRCs to assist the Board and the IRCs with their assessment of the investment performance of the Portfolios on an ongoing basis throughout the year. This includes the appointment of a Chief Investment Risk Officer and his staff, who report directly to the Board and who have developed attribution analyses and other metrics used by the Board's IRCs to analyze the key factors underlying investment performance for the funds in the ING Funds complex.
The Board also noted the techniques used by the Adviser to monitor the performance of the Sub-Advisers and the proactive approach that the Adviser, working in cooperation with the IRCs, has taken to advocate or recommend, when it believed appropriate, changes designed to assist in improving the Portfolios' performance.
In considering the Portfolios' Advisory Contracts, the Board also considered the extent of benefits provided to the Portfolios' shareholders, beyond advisory services, from being part of the ING family of funds. This includes, in most cases, the right to exchange or transfer investments, without a sales charge, between the same class of shares of such funds or among ING Funds available on a product platform, and the wide range of ING Funds available for exchange or transfer. The Board also took into account the Adviser's efforts in recent years to reduce the expenses of the ING Funds through renegotiated arrangements with the ING Funds' service providers.
Further, the Board received periodic reports showing that the investment policies and restrictions for each Portfolio were consistently complied with and other periodic reports covering matters such as compliance by Adviser and Sub-Adviser personnel with codes of ethics. The Board considered reports from the Company's Chief Compliance Officer ("CCO") evaluating whether the regulatory compliance systems and procedures of the Adviser and Sub-Advisers are reasonably designed to assure compliance with the federal securities laws, including those related to, among others, late trading and market timing, best execution, fair value pricing, proxy voting and trade allocation practices. The Board also took into account the CCO's annual and periodic reports and recommendations with respect to service provider compliance programs. In this regard, the Board also considered the policies and procedures developed by the CCO in consultation with the Board's Compliance Committee that guide the CCO's compliance oversight function.
The Board reviewed the level of staffing, quality and experience of each Portfolio's portfolio management team. The Board took into account the respective resources and reputations of the Adviser and each Sub-Adviser, and evaluated the ability of the Adviser and each Sub-Adviser to attract and retain qualified investment advisory personnel. The Board also considered the adequacy of the resources committed to the Portfolios (and other relevant funds in the ING Funds complex) by the Adviser and each Sub-Adviser, and whether those resources are commensurate with the needs of the Portfolios and are sufficient to sustain appropriate levels of performance and compliance needs.
Based on their deliberations and the materials presented to them, the Board concluded that the advisory and related services provided by the Adviser and each Sub-Adviser are appropriate in light of the Portfolios' operations, the competitive landscape of the investment company business, and investor needs, and that the nature and quality of the overall services provided by the Adviser and each Sub-Adviser were appropriate.
Portfolio Performance
In assessing advisory and sub-advisory relationships, the Board placed emphasis on the net investment returns of each Portfolio. While the Board considered the performance reports and discussions with portfolio managers at Board and committee meetings during the year, particular attention in assessing performance was given to the FACT sheets furnished in connection with the renewal process. The FACT sheet prepared for each Portfolio included its investment performance compared to the Portfolio's Morningstar category median, Lipper category median, SPG and primary benchmark. The FACT sheet performance data was as of June 30, 2008. In addition, the Board also considered at its November 14, 2008 meeting certain additional data regarding performance and Portfolio asset levels as of October 31, 2008. The Board's findings specific to each Portfolio's performance are discussed under "Portfolio-by-Portfolio Analysis" below.
251
ADVISORY CONTRACT APPROVAL DISCUSSION (UNAUDITED) (CONTINUED)
Economies of Scale
When evaluating the reasonableness of advisory fee rates, the Board also considered whether economies of scale will be realized by the Adviser as a Portfolio grows larger and the extent to which any such economies are reflected in contractual fee rates. In this regard, the Board noted any breakpoints in advisory fee schedules that resulted in a lower advisory fee rate because a Portfolio achieved sufficient asset levels to receive a breakpoint discount. In the case of sub-advisory fees, the Board considered that breakpoints would inure to the benefit of the Adviser, except to the extent that there are corresponding advisory fee breakpoints or waivers. For a Portfolio that did not have advisory fee breakpoints, but did benefit from waivers or reimbursements of advisory or other fees, the Board also considered the extent to which economies of scale could be realized through waivers, reimbursements or expense reductions.
In evaluating economies of scale, the Independent Directors also considered prior periodic management reports and industry information on this topic, and the Independent Directors who were Board members at that time also considered a November 2006 evaluation and analysis presented to them by an independent consultant regarding fee breakpoint arrangements and economies of scale.
The Board also considered that many of the Portfolios had experienced material declines in assets, especially during October 2008, due to general market declines precipitated by the credit crises and other generally adverse market developments. As a result of these asset declines, the Board considered that there were fewer opportunities to realize economies of scale.
Information Regarding Services to Other Clients
The Board requested and considered information regarding the nature of services and fee rates offered by the Adviser and Sub-Advisers to other clients, including other registered investment companies and institutional accounts. When fee rates offered to other clients differed materially from those charged to the Portfolios, the Board considered any underlying rationale provided by the Adviser or Sub-Advisers for these differences. For unaffiliated Sub-Advisers, the Board did not view this information as being a key factor in its deliberations because of the arms-length nature of negotiations between the Adviser and unaffiliated Sub-Advisers with respect to sub-advisory fee rates. The Board also noted that the fee rates charged to the Portfolios and other institutional clients of the Adviser or a Sub-Adviser (including other investment companies) may differ materially due to, among other reasons: differences in services; different regulatory requirements associated with registered investment companies, such as the Portfolios, as compared to non-registered investment company clients; market differences in fee rates that existed when a Portfolio first was organized; differences in the original sponsors of Portfolios that now are managed by the Adviser; investment capacity constraints that existed when certain contracts were first agreed upon or that might exist at present; and different pricing structures that are necessary to be competitive in different marketing channels.
Fee Rates and Profitability
The Board reviewed and considered each contractual investment advisory fee rate, combined with any applicable administrative fee rate, payable by each Portfolio to the Adviser. The Board also considered the contractual sub-advisory fee rate payable by the Adviser to each Sub-Adviser for sub-advisory services for each Portfolio. In addition, the Board considered fee waivers and expense limitations applicable to the fees payable by the Portfolios.
The Board considered the fee structure of each Portfolio as it relates to the services provided under the contracts and the potential fall-out benefits to the Adviser and Sub-Advisers and their respective affiliates from their association with the Portfolios. For each Portfolio, the Board determined that the fees payable to the Adviser and Sub-Advisers are reasonable for the services that each performs, which were considered in light of the nature and quality of the services that each has performed and is expected to perform.
For each Portfolio, the Board considered information on revenues, costs and profits realized by the Adviser, which was prepared by Management in accordance with the allocation methodology (including related assumptions) specified in the 15(c) Methodology Guide. In analyzing the profitability of the Adviser in connection with its services to a Portfolio, the Board took into account the sub-advisory fee rate payable by the Adviser to the relevant Sub-Adviser. The Board also considered information that it requested and was provided by Management with respect to the profitability of service providers affiliated with the Adviser, as well as information provided by certain Sub-Advisers with respect to their profitability. In the case of non-affiliated Sub-Advisers, the Board gave less weight to prof itability considerations, or did not view this data as imperative to its deliberations, given
252
ADVISORY CONTRACT APPROVAL DISCUSSION (UNAUDITED) (CONTINUED)
the arm's-length nature of the relationship between the Adviser and these Sub-Advisers with respect to the negotiation of sub-advisory fee rates. Further, the Board considered that the decline in asset levels of many Portfolios caused by recent adverse economic conditions was likely to cause a similar decline in any profits realized by the Adviser and Sub-Advisers.
The Board determined that it had requested and received sufficient information to gain a reasonable understanding regarding the Adviser's and affiliated Sub-Advisers' profitability. The Board also recognized that profitability analysis is not an exact science and there is no uniform methodology for determining profitability for this purpose. In this context, the Board realized that Management's calculations regarding its costs incurred in establishing the infrastructure necessary for the Portfolios' operations may not be fully reflected in the expenses allocated to each Portfolio in determining profitability, and that the information presented may not portray all of the costs borne by Management or capture Management's entrepreneurial risk associated with offering and managing a mutual fund complex in the current regulatory and market environment.
Based on the information on revenues, costs, and profitability considered by the Board, and after considering the factors described in this section, the Board concluded that the profits, if any, realized by the Adviser and each Sub-Adviser were not excessive. In making its determinations, the Board based its conclusions on the reasonableness of the advisory and sub-advisory fees of the Adviser and Sub-Advisers primarily on the factors described for each Portfolio below.
Portfolio-by-Portfolio Analysis
The following paragraphs outline certain of the specific factors that the Board considered, and the conclusions reached, at its November 14, 2008 meeting in relation to renewing each Portfolio's current Advisory and Sub-Advisory Contracts for the year ending November 30, 2009. These specific factors are in addition to those considerations discussed above. In each case, the Portfolio's performance was compared to its Morningstar category median and its primary benchmark, a broad-based securities market index that appears in the Portfolio's prospectus. With respect to Morningstar quintile rankings, the first quintile represents the highest (best) performance and the fifth quintile represents the lowest performance. Each Portfolio's management fee and expense ratio were compared to the fees and expense ratios of the funds in its SPG.
ING American Century Large Company Value Portfolio
In considering whether to approve the renewal of the Advisory and Sub-Advisory Contracts for ING American Century Large Company Value Portfolio, the Board considered that, based on performance data for the periods ended June 30, 2008: (1) the Portfolio underperformed its Morningstar category median for all periods presented; (2) the Portfolio underperformed its primary benchmark for all periods presented; and (3) the Portfolio is ranked in the fourth quintile of its Morningstar category for the most recent calendar qu arter, year-to-date, one-year, and three-year periods, and the fifth (lowest) quintile for the five-year period.
In analyzing this performance data, the Board took into account: (1) Management's analysis regarding the Sub-Adviser's rationale for underperformance, including its analysis regarding the negative effect of investments in the financial sector; and (2) Management's analysis regarding a potential merger of the Portfolio to address the Board's concerns regarding the Portfolio's performance.
In considering the fees payable under the Advisory and Sub-Advisory Contracts for the Portfolio, the Board took into account the factors described above and also considered: (1) the fairness of the compensation under an Advisory Contract with level fees that does not include breakpoints; (2) the pricing structure (including the expense ratio to be borne by shareholders) of the Portfolio, as compared to its SPG, including that: (a) the management fee for the Portfolio is above the median and the average management fees of the funds in its SPG; and (b) the expense ratio for the Portfolio is above the median and below the average expense ratios of the funds in its SPG.
In analyzing this fee data, the Board also considered that, effective January 1, 2008, new expense limits were added to the Portfolio.
After its deliberation, the Board reached the following conclusions: (1) the Portfolio's management fee rate is reasonable in the context of all factors considered by the Board; (2) the Portfolio's expense ratio is reasonable in the context of all factors considered by the board; (3) the Portfolio was launched in January 2006 and it is reasonable too permit it to establish a longer operating history for the purposes of evaluating performance; and (4) the sub-advisory fee rate payable by the Adviser to the Sub-Adviser is reasonable in the context of all factors considered by the Board. Based on these conclusions and other factors, the Board voted to renew the
253
ADVISORY CONTRACT APPROVAL DISCUSSION (UNAUDITED) (CONTINUED)
Advisory and Sub-Advisory Contracts for the Portfolio for the year ending November 30, 2009. During this renewal process, different Board members may have given different weight to different individual factors and related conclusions.
ING American Century Small-Mid Cap Value Portfolio
In considering whether to approve the renewal of the Advisory and Sub-Advisory Contracts for ING American Century Small-Mid Cap Value Portfolio, the Board considered that, based on performance data for the periods ended June 30, 2008: (1) the Portfolio outperformed its Morningstar category median for all periods presented with the exception of the most recent calendar quarter and year-to-date periods, during which it underperformed; (2) the Portfolio outperformed its primary benchmark for the one-year and three-year periods, but underperformed for the most recent calendar quarter, year-to-date, and five-year periods; and (3) the Portfolio is ranked in the second quintile of its Morningstar category for the one-year period, and the third quintile for the most recent calendar quarter, year-to-date, three-year, and five-year periods.
In considering the fees payable under the Advisory and Sub-Advisory Contracts for the Portfolio, the Board took into account the factors described above and also considered: (1) the fairness of the compensation under an Advisory Contract with level fees that does not include breakpoints; and (2) the pricing structure (including the expense ratio to be borne by shareholders) of the Portfolio, as compared to its SPG, including that: (a) the management fee for the Portfolio is above the median and the average management fees of the funds in its SPG; and (b) the expense ratio for the Portfolio is above the median and the average expense ratios of the funds in its SPG.
The Board also considered that expense limits were implemented at the Board's direction in 2006, which reduced the Portfolio's total expenses.
After its deliberation, the Board reached the following conclusions: (1) the Portfolio's management fee rate is reasonable in the context of all factors considered by the Board; (2) the Portfolio's expense ratio is reasonable in the context of all factors considered by the Board; (3) the Portfolio's performance is reasonable in context of all factors considered by the Board; and (4) the sub-advisory fee rate payable by the Adviser to the Sub-Adviser is reasonable in the context of all factors considered by the Board. Based on these conclusions and other factors, the Board voted to renew the Advisory and Sub-Advisory Contracts for the Portfolio for the year ending November 30, 2009. During this renewal process, different Board members may have given different weight to different individual factors and related conclusions.
ING Baron Asset Portfolio
In considering whether to approve the renewal of the Advisory and Sub-Advisory Contracts for ING Baron Asset Portfolio, the Board considered that, based on performance data for the periods ended June 30, 2008: (1) the Portfolio underperformed its Morningstar category median for all periods presented; (2) the Portfolio underperformed its primary benchmark for the most recent calendar quarter and year-to-date periods, but outperformed for the one-year period; and (3) the Portfolio is ranked in the fourth quintile of its Morningstar category for the year-to-date and one-year periods, and the fifth (lowest) quintile for the most recent calendar quarter.
In analyzing this performance data, the Board took into account: (1) Management's analysis of the negative impact that stock selection and overweighting in the financial services sector had on the Portfolio's performance; and (2) the Portfolio commenced operations in January 2006 and therefore had a limited operating history for the purpose of analyzing performance.
In considering the fees payable under the Advisory and Sub-Advisory Contracts for the Portfolio, the Board took into account the factors described above and also considered: (1) the fairness of the compensation under an advisory contract with a breakpoint fee schedule where asset levels necessary to achieve a breakpoint discount had not been reached by the Portfolio; and (2) the pricing structure (including the expense ratio to be borne by shareholders) of the Portfolio, as compared to its SPG, including that: (a) the management fee (inclusive of a 0.10% administration fee) for the Portfolio is above the median and the average management fees of the funds in its SPG; and (b) the expense ratio for the Portfolio is above the median and the average expense ratios of the funds in its SPG.
After its deliberation, the Board reached the following conclusions: (1) the Portfolio's management fee rate is reasonable in the context of all factors considered by the Board; (2) the Portfolio's expense ratio is reasonable in the context of all factors considered by the Board; (3) the Portfolio was launched in January 2006 and it is reasonable to permit it to establish a longer operating history for
254
ADVISORY CONTRACT APPROVAL DISCUSSION (UNAUDITED) (CONTINUED)
the purposes of evaluating performance; and; (4) the sub-advisory fee rate payable by the Adviser to the Sub-Adviser is reasonable in the context of all factors considered by the Board. Based on these conclusions and other factors, the Board voted to renew the Advisory and Sub-Advisory Contracts for the Portfolio for the year ending November 30, 2009. During this renewal process, different Board members may have given different weight to different individual factors and related conclusions.
ING Baron Small Cap Growth Portfolio
In considering whether to approve the renewal of the Advisory and Sub-Advisory Contracts for ING Baron Small Cap Growth Portfolio, the Board considered that, based on performance data for the periods ended June 30, 2008: (1) the Portfolio underperformed its Morningstar category median for all periods presented with the exception of the five-year period, during which it outperformed; (2) the Portfolio underperformed its primary benchmark for the most recent calendar quarter, year-to-date, and three year periods, but outperformed for the one-year and five-year periods; and (3) the Portfolio is ranked in the second quintile of its Morningstar category for the five-year period, the third quintile for the one-year and three-year periods, the fourth quintile for the year-to-date period, and the fifth (lowe st) quintile for the most recent calendar quarter.
In analyzing this performance data, the Board took into account: (1) Management's analysis of the negative effect that sector allocation in health care had on the Portfolio's performance; (2) Management's view that the Sub-Adviser historically had been successful in managing the Portfolio in its current style, and its expectation that longer-term performance will improve; and (3) Management will continue to monitor, and the Board and its IRC will periodically review, the Portfolio's performance.
In considering the fees payable under the Advisory and Sub-Advisory Contracts for the Portfolio, the Board took into account the factors described above and also considered: (1) the fairness of the compensation under an Advisory Contract with a breakpoint fee schedule where the asset level necessary to achieve a breakpoint discount had not been reached by the Portfolio; and (2) the pricing structure (including the expense ratio to be borne by shareholders) of the Portfolio, as compared to its SPG, including that: (a) the management fee for the Portfolio is below the median and above the average management fees of the funds in its SPG; and (b) the expense ratio for the Portfolio is above the median and the average expense ratios of the funds in its SPG.
After its deliberation, the Board reached the following conclusions: (1) the Portfolio's management fee rate is reasonable in the context of all factors considered by the Board; (2) the Portfolio's expense ratio is reasonable in the context of all factors considered by the board; (3) taking into account that Management will continue to monitor, and the Board or its IRC will periodically review, its performance, it is reasonable to permit the Sub-Adviser to continue to manage the Portfolio to assess whether Management's expectations of improved longer-term performance are realized; and (4) the sub-advisory fee rate payable by the Adviser to the Sub-Adviser is reasonable in the context of all factors considered by the Board. Based on these conclusions and other factors, the Board voted to renew the Advisory and Sub-Advisory Contracts for the Portfolio for the year ending November 30, 2009. During this renewal process, different Board members m ay have given different weight to different individual factors and related conclusions.
ING Columbia Small Cap Value II Portfolio
In considering whether to approve the renewal of the Advisory and Sub-Advisory Contracts for ING Columbia Small Cap Value II Portfolio, the Board considered that, based on performance data for the periods ended June 30, 2008: (1) the Portfolio outperformed its Morningstar category median for all periods presented; (2) the Portfolio outperformed its primary benchmark for all periods presented; and (3) the Portfolio is ranked in the first (highest) quintile of its Morningstar category for the one-year period, the second quintile for the most recent calendar quarter, and the third quintile for the year-to-date period.
In considering the fees payable under the Advisory and Sub-Advisory Contracts for the Portfolio, the Board took into account the factors described above and also considered: (1) the fairness of the compensation under an Advisory Contract with level fees that does not include breakpoints; and (2) the pricing structure (including the expense ratio to be borne by shareholders) of the Portfolio, as compared to its SPG, including that: (a) the management fee (inclusive of a 0.10% administration fee) for the Portfolio is above the median and the average management fees of the funds in its SPG; and (b) the expense ratio for the Portfolio is below the median and the average expense ratios of the funds in its SPG.
255
ADVISORY CONTRACT APPROVAL DISCUSSION (UNAUDITED) (CONTINUED)
After its deliberation, the Board reached the following conclusions: (1) the Portfolio's management fee rate is reasonable in the context of all factors considered by the Board; (2) the Portfolio's expense ratio is reasonable in the context of all factors considered by the Board; (3) the Portfolio's performance is reasonable in the context of all factors considered by the Board; and (4) the sub-advisory fee rate payable by the Adviser to the Sub-Adviser is reasonable in the context of all factors considered by the Board. Based on these conclusions and other factors, the Board voted to renew the Advisory and Sub-Advisory Contracts for the Portfolio for the year ending November 30, 2009. During this renewal process, different Board members may have given different weight to different individual factors and related conclusions.
ING Davis New York Venture Portfolio
In considering whether to approve the renewal of the Advisory and Sub-Advisory Contracts for ING Davis New York Venture Portfolio, the Board considered that, based on performance data for the periods ended June 30, 2008: (1) the Portfolio underperformed its Morningstar category median for all periods presented with the exception of the five-year period, during which it outperformed; (2) the Portfolio underperformed its primary benchmark for all periods presented with the exception of the year-to-date period, during which it outperformed; and (3) the Portfolio is ranked in the third quintile of its Morningstar category for the year-to-date, three-year, and five-year periods, and the fourth quintile for the most recent calendar quarter and one-year periods.
In analyzing this performance data, the Board took into account: (1) Management's analysis of the negative effect that sector allocation had on the Portfolio's performance; (2) Management's view that the Sub-Adviser historically had been successful in managing a similar fund with a style similar to that of the Portfolio, and its expectations that longer-term performance will improve; and (3) Management would continue to monitor, and the Board or its IRC would periodically review, the Portfolio's performance.
In considering the fees payable under the Advisory and Sub-Advisory Contracts for the Portfolio, the Board took into account the factors described above and also considered: (1) the fairness of the compensation under an Advisory Contract with level fees that does not include breakpoints; and (2) the pricing structure (including the expense ratio to be borne by shareholders) of the Portfolio, as compared to its SPG, including that: (a) the management fee (inclusive of a 0.10% administration fee) for the Portfolio is above the median and the average management fees of the funds in its SPG; and (b) the expense ratio for the Portfolio is above the median and the average expense ratios of the funds in its SPG.
After its deliberation, the Board reached the following conclusions: (1) the Portfolio's management fee rate is reasonable in the context of all factors considered by the Board; (2) the Portfolio's expense ratio is reasonable in the context of all factors considered by the board; (3) taking into account that Management will continue to monitor, and the Board or its IRC will periodically review, its performance, it is reasonable to permit the Sub-Adviser to continue to manage the Portfolio to assess whether Management's expectations of improved longer-term performance is realized; and (4) the sub-advisory fee rate payable by the Adviser to the Sub-Adviser is reasonable in the context of all factors considered by the Board. Based on these conclusions and other factors, the Board voted to renew the Advisory and Sub-Advisory Contracts for the Portfolio for the year ending November 30, 2009. During this renewal process, different Board members ma y have given different weight to different individual factors and related conclusions.
ING JPMorgan Mid Cap Value Portfolio
In considering whether to approve the renewal of the Advisory and Sub-Advisory Contracts for the Portfolio, the Board considered that, based on performance data for the periods ended June 30, 2008: (1) the Portfolio outperformed its Morningstar category median for all periods presented with the exception of the most recent calendar quarter, during which it underperformed; (2) the Portfolio underperformed its primary benchmark for all periods presented with the exception of the one-year period, during which it outperformed; and (3) the Portfolio is ranked in the second quintile of its Morningstar category for the one-year period, and the third quintile for the most recent calendar quarter, year-to-date, three-year, and five-year periods.
In considering the fees payable under the Advisory and Sub-Advisory Contracts for the Portfolio, the Board took into account the factors described above and also considered: (1) the fairness of the compensation under an Advisory Contract with level fees that does not include breakpoints; and (2) the pricing structure (including the expense ratio to be borne by shareholders) of the Portfolio, as compared to its SPG, including that: (a) the management fee for the Portfolio is equal to the median and below the
256
ADVISORY CONTRACT APPROVAL DISCUSSION (UNAUDITED) (CONTINUED)
average management fees of the funds in its SPG; and (b) the expense ratio for the Portfolio is above the median and the average expense ratios of the funds in its SPG.
After its deliberation, the Board reached the following conclusions: (1) the Portfolio's management fee rate is reasonable in the context of all factors considered by the Board; (2) the Portfolio's expense ratio is reasonable in the context of all factors considered by the Board; (3) the Portfolio's performance is reasonable in the context of all factors considered by the Board; and (4) the sub-advisory fee rate payable by the Adviser to the Sub-Adviser is reasonable in the context of all factors considered by the Board. Based on these conclusions and other factors, the Board voted to renew the Advisory and Sub-Advisory Contracts for the Portfolio for the year ending November 30, 2009. During this renewal process, different Board members may have given different weight to different individual factors and related conclusions.
ING Legg Mason Partners Aggressive Growth Portfolio
In considering whether to approve the renewal of the Advisory and Sub-Advisory Contracts for ING Legg Mason Partners Aggressive Growth Portfolio, the Board considered that, based on performance data for the periods ended June 30, 2008: (1) the Portfolio underperformed its Morningstar category median for all periods presented, with the exception of the year-to-date period, during which it outperformed; (2) the Portfolio underperformed its primary benchmark for all periods presented, with the exception of the year-to-date period, during which it outperformed; and (3) the Portfolio is ranked in the second quintile of its Morningstar category for the year-to-date period, the third quintile for the most recent calendar quarter, the fourth quintile for the three-year and five-year periods, and the fifth (lowest) quintile for the one-year and ten-year periods.
In analyzing this performance data, the Board took into account: (1) Management's analysis of the negative effect that stock selection had on the Portfolio's more recent performance; (2) that Management would continue to monitor, and the Board or its IRC would periodically review, the Portfolio's investment performance; and (3) Management's view that the Sub-Adviser's longer-term performance has been reasonable, and Management's expectation that the Sub-Adviser's performance will improve.
In considering the fees payable under the Advisory and Sub-Advisory Contracts for the Portfolio, the Board took into account the factors described above and also considered: (1) the economies of scale benefits to the Portfolio and its shareholders from breakpoint discounts applicable to the Portfolio's advisory fees, which result in lower fees at higher asset levels; (2) the pricing structure (including the expense ratio to be borne by shareholders) of the Portfolio, as compared to its SPG, including that: (a) the management fee for the Portfolio is below the median and the average management fees of the funds in its SPG; and (b) the expense ratio for the Portfolio is equal to the median and above the average expense ratios of the funds in its SPG.
After its deliberation, the Board reached the following conclusions: (1) the Portfolio's management fee rate is reasonable in the context of all factors considered by the Board; (2) the Portfolio's expense ratio is reasonable in the context of all factors considered by the Board; (3) taking into account that Management will continue to monitor, and the Board or its IRC will periodically review, its performance, the Portfolio's performance is reasonable in the context of all factors considered by the Board; and (4) the sub-advisory fee rate payable by the Adviser to the Sub-Adviser is reasonable in the context of all factors considered by the Board. Based on these conclusions and other factors, the Board voted to renew the Advisory and Sub-Advisory Contracts for the Portfolio for the year ending November 30, 2009. During this renewal process, different Board members may have given different weight to different individual factors and related c onclusions.
ING Neuberger Berman Partners Portfolio
In considering whether to approve the renewal of the Advisory and Sub-Advisory Contracts for ING Neuberger Berman Partners Portfolio, the Board considered that, based on performance data for the periods ended June 30, 2008: (1) the Portfolio outperformed its Morningstar category median for all periods presented; (2) the Portfolio outperformed its primary benchmark for all periods presented; and (3) the Portfolio is ranked in the first (highest) quintile of its Morningstar category for all periods presented.
In analyzing this performance data, the Board took into account: (1) that there was a change in control of the sub-adviser; and (2) Management's representation that it will continue to monitor the Portfolio's performance in light of the sub-advisers' change in control.
257
ADVISORY CONTRACT APPROVAL DISCUSSION (UNAUDITED) (CONTINUED)
In considering the fees payable under the Advisory and Sub-Advisory Contracts for the Portfolio, the Board took into account the factors described above and also considered: (1) the fairness of the compensation under an Advisory Contract with level fees that does not include breakpoints; and (2) the pricing structure (including the expense ratio to be borne by shareholders) of the Portfolio, as compared to its SPG, including that: (a) the management fee (inclusive of the advisory fee and a 0.10% administration fee) for the Portfolio is below the median and below the average management fees of the funds in its SPG; and (b) the expense ratio for the Portfolio is below the median and the average expense ratios of the funds in its SPG.
After its deliberation, the Board reached the following conclusions: (1) the Portfolio's management fee rate is reasonable in the context of all factors considered by the Board; (2) the Portfolio's expense ratio is reasonable in the context of all factors considered by the Board; (3) the Portfolio's performance is reasonable in the context of all factors considered by the Board; and (4) the sub-advisory fee rate payable by the Adviser to the Sub-Adviser is reasonable in the context of all factors considered by the Board. Based on these conclusions and other factors, the Board voted to renew the Advisory and Sub-Advisory Contracts for the Portfolio for the year ending November 30, 2009. During this renewal process, different Board members may have given different weight to different individual factors and related conclusions.
ING OpCap Balanced Value Portfolio
In considering whether to approve the renewal of the Advisory and Sub-Advisory Contracts for ING OpCap Balanced Value Portfolio, the Board considered that, based on performance data for the periods ended June 30, 2008: (1) the Portfolio underperformed its Morningstar category median for all periods presented with the exception of the three-year and five-year periods, during which it outperformed; (2) the Portfolio underperformed its primary benchmark for all periods presented, with the exception of the three-year and five-year periods, during which it outperformed; and (3) the Portfolio is ranked in the fourth quintile of its Morningstar category for the most recent calendar quarter, and the fifth (lowest) quintile for the year-to-date, one-year, three-year, and five-year periods.
In analyzing this performance data, the Board took into account that it had approved, at the Board's July 2008 meeting, the liquidation and dissolution of the Portfolio, and that this liquidation would be completed during November 2008 if approved by the Portfolio's shareholders.
In considering the fees payable under the Advisory and Sub-Advisory Contracts for the Portfolio, the Board took into account the factors described above and also considered: (1) the fairness of the compensation under an Advisory Contract with level fees that does not include breakpoints; (2) the pricing structure (including the expense ratio to be borne by shareholders) of the Portfolio, as compared to its SPG, including that: (a) the management fee for the Portfolio is above the median and the average management fees of the funds in its SPG; and (b) the expense ratio for the Portfolio is above the median and below the average expense ratios of the funds in its SPG.
In analyzing this fee data, the Board took into account that, effective January 1, 2008, at the Board's direction, lower expense limits were instituted for the Portfolio.
After its deliberation, the Board reached the following conclusions: (1) the Portfolio's management fee rate is reasonable in the context of all factors considered by the Board; (2) the Portfolio's expense ratio is reasonable in the context of all factors considered by the Board; (3) the Portfolio's performance is reasonable in the context of all factors considered by the Board; and (4) the sub-advisory fee rate payable by the Adviser to the Sub-Adviser is reasonable in the context of all factors considered by the Board. Based on these conclusions and other factors, the Board voted to renew the Advisory and Sub-Advisory Contracts for the Portfolio for the year ending November 30, 2009. During this renewal process, different Board members may have given different weight to different individual factors and related conclusions.
ING Oppenheimer Global Portfolio
In considering whether to approve the renewal of the Advisory and Sub-Advisory Contracts for ING Oppenheimer Global Portfolio, the Board considered that, based on performance data for the periods ended June 30, 2008: (1) the Portfolio underperformed its Morningstar category median for all periods presented; (2) the Portfolio underperformed its primary benchmark for all periods presented; and (3) the Portfolio is ranked in the fourth quintile of its Morningstar category for all periods presented.
In analyzing this performance data, the Board took into account: (1) Management's analysis of the
258
ADVISORY CONTRACT APPROVAL DISCUSSION (UNAUDITED) (CONTINUED)
negative effect that stock selection and sector allocation had on the Portfolio's performance; and (2) that Management would continue to monitor, and the Board or its IRC would periodically review, the Portfolio's performance; and (3) Management's expectation that the Portfolio's longer-term performance will improve.
In considering the fees payable under the Advisory and Sub-Advisory Contracts for the Portfolio, the Board took into account the factors described above and also considered: (1) the economies of scale benefits to the Portfolio and its shareholders from breakpoint discounts applicable to the Portfolio's advisory fees, which result in lower fees at higher asset levels; (2) the pricing structure (including the expense ratio to be borne by shareholders) of the Portfolio, as compared to its SPG, including that: (a) the management fee for the Portfolio is below the median and the average management fees of the funds in its SPG; and (b) the expense ratio for the Portfolio is below the median and the average expense ratios of the funds in its SPG.
After its deliberation, the Board reached the following conclusions: (1) the Portfolio's management fee rate is reasonable in the context of all factors considered by the Board; (2) the Portfolio's expense ratio is reasonable in the context of all factors considered by the Board; (3) taking into account that Management will continue to monitor, and the Board or its IRC will periodically review, its performance, the Portfolio's performance is reasonable in the context of all factors considered by the Board; and (4) the sub-advisory fee rate payable by the Adviser to the Sub-Adviser is reasonable in the context of all factors considered by the Board. Based on these conclusions and other factors, the Board voted to renew the Advisory and Sub-Advisory Contracts for the Portfolio for the year ending November 30, 2009. During this renewal process, different Board members may have given different weight to different individual factors and related c onclusions.
ING Oppenheimer Strategic Income Portfolio
In considering whether to approve the renewal of the Advisory and Sub-Advisory Contracts for ING Oppenheimer Strategic Income Portfolio, the Board considered that, based on performance data for the periods ended June 30, 2008: (1) the Portfolio outperformed its Morningstar category median for all periods presented, with the exception of the most recent calendar quarter, during which it underperformed; (2) the Portfolio outperformed its primary benchmark for all periods presented, with the exception of the one-year period, during which it underperformed; and (3) the Portfolio is ranked in the first (highest) quintile of its Morningstar category for the year-to-date, one-year, and three-year periods, and the third quintile for the most recent calendar quarter.
In considering the fees payable under the Advisory and Sub-Advisory Contracts for the Portfolio, the Board took into account the factors described above and also considered: (1) the fairness of the compensation under an Advisory Contract with a breakpoint fee schedule where the asset level necessary to achieve a breakpoint discount had not been reached by the Portfolio; and (2) the pricing structure (including the expense ratio to be borne by shareholders) of the Portfolio, as compared to its SPG, including that: (a) the management fee for the Portfolio is below the median and the average management fees of the funds in its SPG; and (b) the expense ratio for the Portfolio is below the median and the average expense ratios of the funds in its SPG.
After its deliberation, the Board reached the following conclusions: (1) the Portfolio's management fee rate is reasonable in the context of all factors considered by the Board; (2) the Portfolio's expense ratio is reasonable in the context of all factors considered by the Board; (3) the Portfolio's performance in reasonable in the context of all factors considered by the Board; and (4) the sub-advisory fee rate payable by the Adviser to the Sub-Adviser is reasonable in the context of all factors considered by the Board. Based on these conclusions and other factors, the Board voted to renew the Advisory and Sub-Advisory Contracts for the Portfolio for the year ending November 30, 2009. During this renewal process, different Board members may have given different weight to different individual factors and related conclusions.
ING PIMCO Total Return Portfolio
In considering whether to approve the renewal of the Advisory and Sub-Advisory Contracts for ING PIMCO Total Return Portfolio, the Board considered that, based on performance data for the periods ended June 30, 2008: (1) the Portfolio outperformed its Morningstar category median for all periods presented, with the exception of the most recent calendar quarter, during which it underperformed; (2) the Portfolio outperformed its primary benchmark for all periods presented with the exception of the most recent calendar quarter and year-to-date periods, during which it underperformed; and (3) the Portfolio is ranked in the first (highest) quintile of its
259
ADVISORY CONTRACT APPROVAL DISCUSSION (UNAUDITED) (CONTINUED)
Morningstar category for the one-year, three-year, and five-year periods, the second quintile for the year-to-date period, and the fifth (lowest) quintile for the most recent calendar quarter.
In considering the fees payable under the Advisory and Sub-Advisory Contracts for the Portfolio, the Board took into account the factors described above and also considered: (1) the fairness of the compensation under an Advisory Contract with level fees that does not include breakpoints; (2) the pricing structure (including the expense ratio to be borne by shareholders) of the Portfolio, as compared to its SPG, including that: (a) the management fee for the Portfolio is equal to the median and above the average management fees of the funds in its SPG; and (b) the expense ratio for the Portfolio is above the median and the average expense ratios of the funds in its SPG.
In analyzing this fee data, the Board took into account Management's representations that in April 2008 a management fee waiver arrangement was put into place under which 50% of the savings resulting from corresponding sub-advisory fee reductions would be shared with the Portfolio's investors.
After its deliberation, the Board reached the following conclusions: (1) the Portfolio's management fee rate is reasonable in the context of all factors considered by the Board; (2) the Portfolio's expense ratio is reasonable in the context of all factors considered by the Board; (3) the Portfolio's performance is reasonable in the context of all factors considered by the Board; and (4) the sub-advisory fee rate payable by the Adviser to the Sub-Adviser is reasonable in the context of all factors considered by the Board. Based on these conclusions and other factors, the Board voted to renew the Advisory and Sub-Advisory Contracts for the Portfolio for the year ending November 30, 2009. During this renewal process, different Board members may have given different weight to different individual factors and related conclusions.
ING Pioneer High Yield Portfolio
In considering whether to approve the renewal of the Advisory and Sub-Advisory Contracts for ING Pioneer High Yield Portfolio, the Board considered that, based on performance data for the periods ended June 30, 2008: (1) the Portfolio outperformed its Morningstar category median for all periods presented; (2) the Portfolio outperformed its primary benchmark for all periods presented, with the exception of the year-to-date period, during which it underperformed; and (3) the Portfolio is ranked in the first (highest) quintile of its Morningstar category for the most recent calendar quarter, the second quintile for the one-year period, and the third quintile for the year-to-date period.
In considering the fees payable under the Advisory and Sub-Advisory Contracts for the Portfolio, the Board took into account the factors described above and also considered: (1) the fairness of the compensation under an Advisory Contract with a breakpoint fee schedule where the asset level necessary to achieve a breakpoint discount had not been reached by the Portfolio; and (2) the pricing structure (including the expense ratio to be borne by shareholders) of the Portfolio, as compared to its SPG, including that: (a) the management fee (inclusive of the advisory fee and a 0.10% administration fee) for the Portfolio is above the median and the average management fees of the funds in its SPG; and (b) the expense ratio for the Portfolio is above the median and below the average expense ratios of the funds in its SPG.
After its deliberation, the Board reached the following conclusions: (1) the Portfolio's management fee rate is reasonable in the context of all factors considered by the Board; (2) the Portfolio's expense ratio is reasonable in the context of all factors considered by the Board; (3) the Portfolio's performance is reasonable in the context of all factors considered by the Board; and (4) the sub-advisory fee rate payable by the Adviser to the Sub-Adviser is reasonable in the context of all factors considered by the Board. Based on these conclusions and other factors, the Board voted to renew the Advisory and Sub-Advisory Contracts for the Portfolio for the year ending November 30, 2009. During this renewal process, different Board members may have given different weight to different individual factors and related conclusions.
ING T. Rowe Price Diversified Mid Cap Growth Portfolio
In considering whether to approve the renewal of the Advisory and Sub-Advisory Contracts for ING T. Rowe Price Diversified Mid Cap Growth Portfolio, the Board considered that, based on performance data for the periods ended June 30, 2008: (1) the Portfolio outperformed its Morningstar category median for all periods presented, with the exception of the five-year period, during which it underperformed; (2) the Portfolio outperformed its primary benchmark for all periods presented, with the exception of the year-to-date and five-year periods, during which it
260
ADVISORY CONTRACT APPROVAL DISCUSSION (UNAUDITED) (CONTINUED)
underperformed; and (3) the Portfolio is ranked in the second quintile of its Morningstar category for the most recent calendar quarter, year-to-date, one-year, and three-year periods, and the third quintile for the five-year period.
In considering the fees payable under the Advisory and Sub-Advisory Contracts for the Portfolio, the Board took into account the factors described above and also considered: (1) the fairness of the compensation under an Advisory Contract with level fees that does not include breakpoints; and (2) the pricing structure (including the expense ratio to be borne by shareholders) of the Portfolio, as compared to its SPG, including that: (a) the management fee for the Portfolio is below the median and the average management fees of the funds in its SPG; and (b) the expense ratio for the Portfolio is below the median and the average expense ratios of the funds in its SPG.
After its deliberation, the Board reached the following conclusions: (1) the Portfolio's management fee rate is reasonable in the context of all factors considered by the Board; (2) the Portfolio's expense ratio is reasonable in the context of all factors considered by the Board; (3) the Portfolio's performance is reasonable in the context of all factors considered by the Board; and (4) the sub-advisory fee rate payable by the Adviser to the Sub-Adviser is reasonable in the context of all factors considered by the Board. Based on these conclusions and other factors, the Board voted to renew the Advisory and Sub-Advisory Contracts for the Portfolio for the year ending November 30, 2009. During this renewal process, different Board members may have given different weight to different individual factors and related conclusions.
ING T. Rowe Price Growth Equity Portfolio
In considering whether to approve the renewal of the Advisory and Sub-Advisory Contracts for the Portfolio, the Board considered that, based on performance data for the periods ended June 30, 2008: (1) the Portfolio outperformed its Morningstar category median for all periods presented with the exception of the one-year period, during which it underperformed; (2) the Portfolio outperformed its primary benchmark for all periods presented; and (3) the Portfolio is ranked in the first (highest) quintile of its Morningstar category for the ten-year period, the second quintile for the most recent calendar quarter, three-year, and five-year periods, the third quintile for the year-to-date period, and the fourth quintile for the one-year period.
In considering the fees payable under the Advisory and Sub-Advisory Contracts for the Portfolio, the Board took into account the factors described above and also considered: (1) the fairness of the compensation under an Advisory Contract with level fees that does not include breakpoints; and (2) the pricing structure (including the expense ratio to be borne by shareholders) of the Portfolio, as compared to its SPG, including that: (a) the management fee for the Portfolio is below the median and the average management fees of the funds in its SPG; and (b) the expense ratio for the Portfolio is below the median and equal to the average expense ratios of the funds in its SPG.
After its deliberation, the Board reached the following conclusions: (1) the Portfolio's management fee rate is reasonable in the context of all factors considered by the Board; (2) the Portfolio's expense ratio is reasonable in the context of all factors considered by the Board; (3) the Portfolio's performance is reasonable in the context of all factors considered by the Board; and (4) the sub-advisory fee rate payable by the Adviser to the Sub-Adviser is reasonable in the context of all factors considered by the Board. Based on these conclusions and other factors, the Board voted to renew the Advisory and Sub-Advisory Contracts for the Portfolio for the year ending November 30, 2009. During this renewal process, different Board members may have given different weight to different individual factors and related conclusions.
ING Templeton Foreign Equity Portfolio
In considering whether to approve the renewal of the Advisory and Sub-Advisory Contracts for the Portfolio, the Board considered that, based on performance data for the periods ended June 30, 2008: (1) the Portfolio underperformed its Morningstar category median for the most recent calendar quarter and year-to-date periods, but outperformed for the one-year period; (2) the Portfolio underperformed its primary benchmark for all periods presented; and (3) the Portfolio is ranked in the second quintile of its Morningstar category for the one-year period, the third quintile for the year-to-date period, and the fourth quintile for the most recent calendar quarter.
In analyzing this performance data, the Board took into account that the Portfolio launched in January 2006 and therefore had a limited operating history for the purpose of analyzing its performance.
In considering the fees payable under the Advisory and Sub-Advisory Contracts for the Portfolio, the
261
ADVISORY CONTRACT APPROVAL DISCUSSION (UNAUDITED) (CONTINUED)
Board took into account the factors described above and also considered: (1) the fairness of the compensation under an Advisory Contract with a breakpoint fee schedule where the asset level necessary to achieve a breakpoint discount had not been reached by the Portfolio; and (2) the pricing structure (including the expense ratio to be borne by shareholders) of the Portfolio, as compared to its SPG, including that: (a) the management fee (inclusive of a 0.10% administration fee) for the Portfolio is above the median and the average management fees of the funds in its SPG; and (b) the expense ratio for the Portfolio is below the median and above the average expense ratios of the funds in its SPG.
In analyzing this fee data, the Board took into account that, in connection with a merger of ING JPMorgan International Portfolio that was completed in April 2008, the term of Portfolio's expense limitation agreement was extended to May 1, 2010.
After its deliberation, the Board reached the following conclusions: (1) the Portfolio's management fee rate is reasonable in the context of all factors considered by the Board; (2) the Portfolio's expense ratio is reasonable in the context of all factors considered by the Board; (3) the Portfolio was launched in January 2006 and it is reasonable to permit it to establish a longer operating history for the purposes of evaluating performance; and (4) the sub-advisory fee rate payable by the Adviser to the Sub-Adviser is reasonable in the context of all factors considered by the Board. Based on these conclusions and other factors, the Board voted to renew the Advisory and Sub-Advisory Contracts for the Portfolio for the year ending November 30, 2009. During this renewal process, different Board members may have given different weight to different individual factors and related conclusions.
ING Thornburg Value Portfolio
In considering whether to approve the renewal of the Advisory and Sub-Advisory Contracts for ING Thornburg Value Portfolio, the Board considered that, based on performance data for the periods ended June 30, 2008: (1) the Portfolio underperformed its Morningstar category median for all periods presented; (2) the Portfolio underperformed its primary benchmark for all periods presented with the exception of the most recent calendar quarter, during which it outperformed; and (3) the Portfolio is ranked in the third quintile of its Morningstar category for the three-year period, the fourth quintile for the most recent calendar quarter, five-year, and ten-year periods, and the fifth (lowest) quintile for the year-to-date and one-year periods.
In analyzing this performance data, the Board took into account: (1) that the Sub-Adviser was engaged to manage the Portfolio in August 2006 with a new investment objective and strategy, and therefore the Portfolio's performance history for the three- and five-year periods includes that of a former sub-adviser; and (2) that Management would continue to monitor, and the Board or its IRC would review, the Portfolio's investment performance.
In considering the fees payable under the Advisory and Sub-Advisory Contracts for the Portfolio, the Board took into account the factors described above and also considered: (1) the fairness of the compensation under an Advisory Contract with level fees that does not include breakpoints; and (2) the pricing structure (including the expense ratio to be borne by shareholders) of the Portfolio, as compared to its SPG, including that: (a) the management fee for the Portfolio is below the median and below the average management fees of the funds in its SPG; and (b) the expense ratio for the Portfolio is above the median and above the average expense ratios of the funds in its SPG.
After its deliberation, the Board reached the following conclusions: (1) the Portfolio's management fee rate is reasonable in the context of all factors considered by the Board; (2) the Portfolio's expense ratio is reasonable in the context of all factors considered by the Board; (3) in August 2006 the Portfolio's investment objective, strategy and portfolio management team were changed, and it is reasonable to permit the Sub-Adviser to continue to manage the Portfolio to establish a longer operating history for the purposes of evaluating performance; and (4) the sub-advisory fee rate payable by the Adviser to the Sub-Adviser is reasonable in the context of all factors considered by the Board. Based on these conclusions and other factors, the Board voted to renew the Advisory and Sub-Advisory Contracts for the Portfolio for the year ending November 30, 2009. During this renewal process, different Board members may have given different weight to different individual factors and related conclusions.
ING UBS U.S. Large Cap Equity Portfolio
In considering whether to approve the renewal of the Advisory and Sub-Advisory Contracts for ING UBS U.S. Large Cap Equity Portfolio, the Board considered that, based on performance data for the periods ended June 30, 2008: (1) the Portfolio underperformed its Morningstar category median for all periods presented, with the exception of the five-year period, during which it outperformed; (2) the Portfolio
262
ADVISORY CONTRACT APPROVAL DISCUSSION (UNAUDITED) (CONTINUED)
outperformed its primary benchmark for the most recent calendar quarter, year-to-date, and five-year periods, but underperformed for the one-year, three-year, and ten-year periods; and (3) the Portfolio is ranked in the third quintile of its Morningstar category for the most recent quarter, year-to-date, and five-year periods, the fourth quintile for the three-year period, and the fifth (lowest) quintile for the one-year and ten-year periods.
In analyzing this performance data, the Board took into account: (1) Management's analysis of the negative effect that sector allocation and stock selection had on the Portfolio's performance; (2) Management's view that the Sub-Adviser historically had been successful in managing the Portfolio in its current style, and its expectation that longer-term performance will improve; and (3) Management will continue to monitor, and the Board or its IRC will periodically review, the Portfolio's performance.
In considering the fees payable under the Advisory and Sub-Advisory Contracts for the Portfolio, the Board took into account the factors described above and also considered: (1) the fairness of the compensation under an Advisory Contract with a breakpoint fee schedule where the asset level necessary to achieve a breakpoint discount had not been reached by the Portfolio; and (2) the pricing structure (including the expense ratio to be borne by shareholders) of the Portfolio, as compared to its SPG, including that: (a) the management fee for the Portfolio is above the median and above the average management fees of the funds in its SPG; and (b) the expense ratio for the Portfolio is above the median and above the average expense ratios of the funds in its SPG.
After its deliberation, the Board reached the following conclusions: (1) the Portfolio's management fee rate is reasonable in the context of all factors considered by the Board; (2) the Portfolio's expense ratio is reasonable in the context of all factors considered by the Board; (3) taking into account that Management will continue to monitor, and the Board or its IRC will periodically review, its performance, the Portfolio's performance is reasonable in the context of all factors considered by the Board; and (4) the sub-advisory fee rate payable by the Adviser to the Sub-Adviser is reasonable in the context of all factors considered by the Board. Based on these conclusions and other factors, the Board voted to renew the Advisory and Sub-Advisory Contracts for the Portfolio for the year ending November 30, 2009. During this renewal process, different Board members may have given different weight to different individual factors and related c onclusions.
ING Van Kampen Comstock Portfolio
In considering whether to approve the renewal of the Advisory and Sub-Advisory Contracts for ING Van Kampen Comstock Portfolio, the Board considered that, based on performance data for the periods ended June 30, 2008: (1) the Portfolio underperformed its Morningstar category median for all periods presented; (2) the Portfolio underperformed its primary benchmark for all periods presented; and (3) the Portfolio is ranked in the fifth (lowest) quintile of its Morningstar category for the most recent calendar quarter, year-to-date, one-year, three-year, and five-year periods, all periods presented.
In analyzing this performance data, the Board took into account: (1) Management's analysis regarding the negative effect of sector allocation on the Portfolio's performance, particularly a significant underweight in the energy sector; (2) Management's representations that the Sub-Adviser's investment philosophy, applied over longer periods, had historically resulted in reasonable performance; and (3) Management would continue to monitor, and the Board or its IRC would periodically review, the Portfolio's investment performance.
In considering the fees payable under the Advisory and Sub-Advisory Contracts for the Portfolio, the Board took into account the factors described above and also considered: (1) the fairness of the compensation under an Advisory Contract with level fees that does not include breakpoints; (2) the pricing structure (including the expense ratio to be borne by shareholders) of the Portfolio, as compared to its SPG, including that: (a) the management fee for the Portfolio is below the median and the average management fees of the funds in its SPG; and (b) the expense ratio for the Portfolio is above the median and the average expense ratios of the funds in its SPG.
In analyzing this fee data, the Board took into account that: (1) effective January 2008, at the Board's direction following the 2007 annual contracts renewal process, an expense limit was put into place for the Portfolio; (2) effective April 2007, breakpoints were added to the Portfolio's administrative fee; and (3) effective April 2007, a fee waiver was put into place with respect to a portion the management fee.
After its deliberation, the Board reached the following conclusions: (1) the Portfolio's management fee rate is reasonable in the context of all factors
263
ADVISORY CONTRACT APPROVAL DISCUSSION (UNAUDITED) (CONTINUED)
considered by the Board; (2) the Portfolio's expense ratio is reasonable in the context of all factors considered by the Board; (3) taking into account that Management will continue to monitor, and the Board or its IRC will periodically review its performance, the Portfolio's investment performance is reasonable in the context of all factors considered by the Board; and (4) the sub-advisory fee rate payable by the Adviser to the Sub-Adviser is reasonable in the context of all factors considered by the Board. Based on these conclusions and other factors, the Board voted to renew the Advisory and Sub-Advisory Contracts for the Portfolio for the year ending November 30, 2009. During this renewal process, different Board members may have given different weight to different individual factors and related conclusions.
ING Van Kampen Equity and Income Portfolio
In considering whether to approve the renewal of the Advisory and Sub-Advisory Contracts for ING Van Kampen Equity and Income Portfolio, the Board considered that, based on performance data for the periods ended June 30, 2008: (1) the Portfolio underperformed its Morningstar category median for all periods presented, with the exception of the five-year period, during which it outperformed; (2) the Portfolio outperformed its primary benchmark for all periods presented, with the exception of the five-year period, during which it underperformed; and (3) the Portfolio is ranked in the second quintile of its Morningstar category for the five-year period, the third quintile for the three-year period, the fourth quintile for the year-to-date period, and the fifth (lowest) quintile for the most recent calendar quarter and one-year periods.
In analyzing this performance data, the Board took into account: (1) Management's analysis of the negative impact that the Portfolio's value focus had on the Portfolio's performance; (2) the effect sector weightings had on the Portfolio's performance; and (3) in April 2008 the Portfolio's investment strategy was changed.
In considering the fees payable under the Advisory and Sub-Advisory Contracts for the Portfolio, the Board took into account the factors described above and also considered: (1) the fairness of the compensation under an Advisory Contract with level fees that does not include breakpoints; (2) the pricing structure (including the expense ratio to be borne by shareholders) of the Portfolio, as compared to its SPG, including that: (a) the management fee for the Portfolio is below the median and the average management fees of the funds in its SPG; and (b) the expense ratio for the Portfolio is below the median and the average expense ratios of the funds in its SPG.
After its deliberation, the Board reached the following conclusions: (1) the Portfolio's management fee rate is reasonable in the context of all factors considered by the Board; (2) the Portfolio's expense ratio is reasonable in the context of all factors considered by the Board; (3) the Portfolio's performance is reasonable in the context of all factors considered by the Board; and (4) the sub-advisory fee rate payable by the Adviser to the Sub-Adviser is reasonable in the context of all factors considered by the Board. Based on these conclusions and other factors, the Board voted to renew the Advisory and Sub-Advisory Contracts for the Portfolio for the year ending November 30, 2009. During this renewal process, different Board members may have given different weight to different individual factors and related conclusions.
264
Investment Adviser
Directed Services LLC
1475 Dunwoody Drive
West Chester, Pennsylvania 19380
Administrator
ING Funds Services, LLC
7337 East Doubletree Ranch Road
Scottsdale, Arizona 85258
Distributor
ING Funds Distributor, LLC
7337 East Doubletree Ranch Road
Scottsdale, Arizona 85258
Transfer Agent
DST Systems, Inc.
P.O. Box 419368
Kansas City, Missouri 64141
Independent Registered Public
Accounting Firm
KPMG LLP
99 High Street
Boston, Massachusetts 02110
Custodian
The Bank of New York Mellon
One Wall Street
New York, New York 10286
Legal Counsel
Dechert LLP
1775 I Street, N.W.
Washington, D.C. 20006
Before investing, carefully consider the investment objectives, risks, charges and expenses of the variable universal life insurance policy or variable annuity contract and the underlying variable investment options. This and other information is contained in the prospectus for the variable universal life policy or variable annuity contract and the underlying variable investment options. Obtain these prospectuses from your agent/registered representative and read them carefully before investing.
VPAR-UIPI (1208-022509)


Annual Report
December 31, 2008
Service Class ("Class S") and
Adviser Class ("Class ADV")
ING Partners, Inc.
n ING Fidelity® VIP Contrafund® Portfolio*
n ING Fidelity® VIP Equity-Income Portfolio*
n ING Fidelity® VIP Growth Portfolio*
n ING Fidelity® VIP Mid Cap Portfolio*
This report is submitted for general information to shareholders of the ING Funds. It is not authorized for distribution to prospective shareholders unless accompanied or preceded by a prospectus which includes details regarding the funds' investment objectives, risks, charges, expenses and other information. This information should be read carefully.
* Fidelity and Contrafund are registered trademarks of FMR Corp.
MUTUAL FUNDS

TABLE OF CONTENTS
| President's Letter | | | 1 | | |
|
| Market Perspective | | | 2 | | |
|
| Portfolio Managers' Report | | | 4 | | |
|
| Shareholder Expense Examples | | | 8 | | |
|
| Report of Independent Registered Public Accounting Firm | | | 9 | | |
|
| Statements of Assets and Liabilities | | | 10 | | |
|
| Statements of Operations | | | 11 | | |
|
| Statements of Changes in Net Assets | | | 12 | | |
|
| Financial Highlights | | | 14 | | |
|
| Notes to Financial Statements | | | 16 | | |
|
| Portfolios of Investments | | | 23 | | |
|
| Tax Information | | | 27 | | |
|
| Director and Officer Information | | | 28 | | |
|
| Advisory Contract Approval Discussion | | | 33 | | |
|
PROXY VOTING INFORMATION
A description of the policies and procedures that the Portfolios use to determine how to vote proxies related to portfolio securities is available: (1) without charge, upon request, by calling Shareholder Services toll-free at (800) 992-0180; (2) on the ING Funds' website at www.ingfunds.com; and (3) on the U.S. Securities and Exchange Commission's ("SEC") website at www.sec.gov. Information regarding how the Portfolios voted proxies related to portfolio securities during the most recent 12-month period ended June 30 is available without charge on the ING Funds' website at www.ingfunds.com and on the SEC's website at www.sec.gov.
QUARTERLY PORTFOLIO HOLDINGS
The Portfolios file their complete schedule of portfolio holdings with the SEC for the first and third quarters of each fiscal year on Form N-Q. The Portfolio's Forms N-Q are available on the SEC's website at www.sec.gov. The Portfolio's Forms N-Q may be reviewed and copied at the SEC's Public Reference Room in Washington, DC, and information on the operation of the Public Reference Room may be obtained by calling (800) SEC-0330; and is available upon request from the Portfolio by calling Shareholder Services toll-free at (800) 992-0180.
MARKET PERSPECTIVE: YEAR ENDED DECEMBER 31, 2008
In our semi-annual report, we described a failed second quarter rally that fizzled when investors realized that borderline recessionary conditions and a credit crunch had not gone away. By year-end, governments were committing previously unimaginable sums of taxpayer money to prevent systemic collapse. Global equities in the form of the MSCI World® Index(1) measured in local currencies, including net reinvested dividends ("MSCI" for regions discussed below) plunged 29.70% in the six months ended December 31, 2008 (down 38.70% for the entire fiscal year). (The MSCI World® Index plunged 40.71% for the entire fiscal year, measured in U.S. dollars.) In currencies, the dollar at first drifted near record lows against the euro. But the tide turned in mid-July and for the six months ended December 31, 2008, the dollar strengthened by 12.10% (4.50% for the entire fiscal year). The dollar also soared 37.80% against the pound for the six months ended December 31, 2008 (37.90% for the entire fiscal year). But the yen advanced as carry trades (essentially short yen positions) were unwound and the dollar fell 14.90% for the six months ended December 31, 2008 (down 19.60% for the entire fiscal year).
Even more dramatic was the price of oil which marched to an all-time high of around $147 per barrel in mid-July, only to lose more than two thirds of that price by December 31, 2008.
The economic statistics remained bleak. By the end of October, the Standard & Poor's ("S&P")/Case-Shiller National U.S. Home Price Index(2) of house prices had fallen a record 18% over the year. New home sales were at 1991 levels. Some 45% of existing home sales were distressed.
Payrolls declined in every month of 2008, as the number of people claiming unemployment reached 4.1 million, a 26-year high. Gross domestic product ("GDP") fell at an annualized rate of 0.50% in the third quarter, and the National Bureau of Economic Research announced that the recession had actually started in December 2007.
Yet these were side-shows to the fireworks display in the financial sector, where major institutions — hanging by a thread through problems rooted in unwise mortgage borrowing, lending and investment — met different fates in September 2008 at the hands of the U.S. government.
The Federal National Mortgage Association ("Fannie Mae") and the Federal Home Loan Mortgage Corporation ("Freddie Mac") were taken into "conservatorship." Merrill Lynch was acquired by the Bank of America with a wink from the authorities. AIG received an $85 billion loan from a reluctant government, which also took a 79.90% equity stake in AIG. But Lehman Brothers having sought capital, then a buyer, found neither and was left to file for Chapter 11 bankruptcy protection.
The U.S. government was now in the position of choosing winners and losers among financial institutions: none too successfully, for it quickly became obvious that by pointedly leaving Lehman Brothers to go under, a credit crisis had become a credit market collapse. Lending all but seized up.
Policy response was huge but at least initially muddled. A Troubled Asset Relief Plan ("TARP") would set up a $700 billion fund to buy illiquid mortgage securities from financial institutions. But on November 12, 2008 with half of the money already used to recapitalize banks, Treasury Secretary Paulson announced that the rest of the funds would not be used to buy illiquid mortgage securities after all. This merely renewed the pressure on the holders of such securities like Citigroup, which within two weeks received guarantees from the government against losses and another $20 billion in capital.
Other programs were of more practical use, like support for the commercial paper market and a guarantee facility for money market funds. Arguably the most effective measure was the announced intention to buy vast quantities of agency mortgage-backed securities and debentures. This had the effect of driving down rates on the 30-year mortgage towards 5.00%, a record low. In the meantime, the newly-elected president promised a stimulus package worth approximately $1 trillion. And by year end, the Federal Open Market Committee ("FOMC") reduced interest rates to a range of between 0% and 0.25%.
2008 ended with much gloom and bad news still to come, but the platform for recovery was perhaps taking shape.
In U.S. fixed-income markets, yields on the 90-day Treasury Bills briefly turned negative in December 2008, while the yield on the ten-year Treasury Note fell below 2.50%, something we had not seen in 50 years. The Barclays Capital U.S. Aggregate Bond Index(3), formerly known as the Lehman Brothers U.S. Aggregate Bond Index, of investment grade bonds returned 4.10% for the six months ended December 31, 2008, (5.20% for the entire fiscal year). By contrast, high yield bonds,
2
MARKET PERSPECTIVE: YEAR ENDED DECEMBER 31, 2008
represented by the Barclays Capital High Yield Bond — 2% Issuer Constrained Composite Index(4), formerly known as the Lehman Brothers High Yield Bond — 2% Issuer Constrained Composite Index, behaved more like a stock index and returned (25.10)% for the six months ended December 31, 2008 (down 25.90% for the entire fiscal year).
U.S. equities, represented by the S&P 500® Composite Stock Price ("S&P 500®") Index(5), including dividends, returned (28.50)% for the six months ended December 31, 2008, (down 37.00% for the entire fiscal year), increasingly unimpressed by sharply falling oil prices. Profits for S&P 500® Index companies suffered their fifth straight quarter of decline, led again by the financials sector, although taxpayer money was also potentially committed to save the big three auto makers from bankruptcy. On November 20, 2008, the S&P 500® Index plumbed a level not seen since April 1997, before a December recovery.
In international markets, plainly entering recession, the MSCI Japan® Index(6) slumped 35.90% for the six months ended December 31, 2008, (down 42.60% for the entire fiscal year). The strengthening yen hit exports in an export-dependent economy even as global demand slowed for other reasons. The MSCI Europe ex UK® Index(7) sagged 29.40% for the six months ended December 31, 2008 (down 43.20% for the entire fiscal year) , beset by sharply falling economic activity and a European Central Bank in denial that inflation was falling fast. Finally, rates were reduced by an unprecedented 175 basis points (or 1.75%) in two months near the end of the year while governments, one after the other, proposed large stimulus packages. In the UK, the MSCI UK® Index(8) fell 19.40% for the six months ended December 31, 2008 (down 28.50% for the entire fiscal year). The UK had allowed a bigger housing bubble than the United States and deeper personal indebtedness in an economy more dependent on the financial sector. Rates were reduced to 1951 levels as venerable banks ceased to exist as independent entities.
(1) The MSCI World® Index is an unmanaged index that measures the performance of over 1,400 securities listed on exchanges in the U.S., Europe, Canada, Australia, New Zealand and the Far East.
(2) The S&P/Case-Shiller National U.S. Home Price Index tracks the value of single-family housing within the United States. The index is a composite of single-family home price indices for the nine U.S. Census divisions and is calculated quarterly.
(3) The Barclays Capital U.S. Aggregate Bond Index is an unmanaged index of publicly issued investment grade U.S. Government, mortgage-backed, asset-backed and corporate debt securities.
(4) The Barclays Capital High Yield Bond — 2% Issuer Constrained Composite Index is an unmanaged index that measures the performance of non-investment grade fixed-income securities.
(5) The S&P 500® Index is an unmanaged index that measures the performance of securities of approximately 500 of the largest companies in the United States.
(6) The MSCI Japan® Index is a free float-adjusted market capitalization index that is designed to measure developed market equity performance in Japan.
(7) The MSCI Europe ex UK® Index is a free float-adjusted market capitalization index that is designed to measure developed market equity performance in Europe, excluding the UK.
(8) The MSCI UK® Index is a free float-adjusted market capitalization index that is designed to measure developed market equity performance in the UK.
All indices are unmanaged and investors cannot invest directly in an index.
Past performance does not guarantee future results. The performance quoted represents past performance. Investment return and principal value of an investment will fluctuate, and shares, when redeemed, may be worth more or less than their original cost. The Portfolios' performance is subject to change since the period's end and may be lower or higher than the performance data shown. Please call (800) 262-3862 or log on to www.ingfunds.com to obtain performance data current to the most recent month end.
Market Perspective reflects the views of ING's Chief Investment Risk Officer only through the end of the period, and is subject to change based on market and other conditions.
3
ING FIDELITY® VIP CONTRAFUND® PORTFOLIO
PORTFOLIO MANAGERS' REPORT
ING Fidelity® VIP Contrafund® Portfolio (the "Portfolio") seeks long-term capital appreciation by investing all of its assets in the Service Class 2 shares of the VIP Contrafund® Portfolio, a series of Fidelity Variable Insurance Products Fund II, a registered open-end investment company. Please refer to Management's Discussion of Fund Performance on page 4 of the included Fidelity® Variable Insurance Products: Contrafund® Portfolio Annual Report.
For the year ended December 31, 2008, the Portfolio's Class S and Class ADV shares returned (42.90)% and (43.00)%, respectively, compared to the S&P 500® Index(1), which returned (37.00)%.
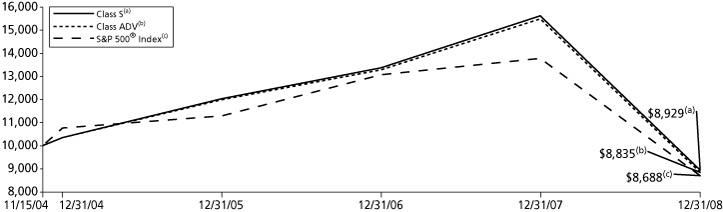
| Average Annual Total Returns for the Periods Ended December 31, 2008 | |
| | | 1 Year | | Since Inception
of Classes S and ADV
November 15, 2004 | |
| Class S | | | (42.90 | )% | | | (2.71 | )% | |
| Class ADV | | | (43.00 | )% | | | (2.96 | )% | |
| S&P 500® Index(1) | | | (37.00 | )% | | | (3.32 | )%(2) | |
Based on a $10,000 initial investment, the graph and table above illustrate the total return of ING Fidelity® VIP Contrafund® Portfolio against the index indicated. An index is unmanaged, has no cash in its portfolio, imposes no sales charges and incurs no operating expenses. An investor cannot invest directly in the index. The Portfolio's performance is shown without the imposition of any expenses or charges which are, or may be, imposed under your annuity contract. Total returns would have been lower if such expenses or charges were included.
The performance graph and table do not reflect the deduction of taxes that a shareholder will pay on Portfolio distributions or the redemption of Portfolio Shares.
The performance shown may include the effect of fee waivers and/or expense reimbursements by the Investment Adviser and/or other service providers, which have the effect of increasing total return. Had all fees and expenses been considered, the total returns would have been lower.
The performance update illustrates performance for a variable investment option available through a variable annuity contract. The performance shown indicates past performance and is not a projection or prediction of future results. Actual investment returns and principal value will fluctuate so that shares and/or units, at redemption, may be worth more or less than their original cost. Please call (800) 992-0180 to get performance through the most recent month end.
(1) The S&P 500® Index is an unmanaged index that measures the performance of the securities of approximately 500 of the largest companies in the U.S.
(2) Since inception performance of the index is shown from November 1, 2004.
This report contains statements that may be "forward-looking" statements. Actual results may differ materially from those projected in the "forward-looking" statements.
The views expressed in this report reflect those of the portfolio managers, only through the end of the period as stated on the cover. The portfolio managers' views are subject to change at any time based on market and other conditions.
4
PORTFOLIO MANAGERS' REPORT
ING FIDELITY® VIP EQUITY-INCOME PORTFOLIO
ING Fidelity® VIP Equity-Income Portfolio (the "Portfolio") seeks reasonable income by investing all of its assets in the Service Class 2 shares of the VIP Equity-Income Portfolio, a series of Fidelity Variable Insurance Products Fund, a registered open-end investment company. Please refer to Management's Discussion of Fund Performance on page 4 of the included Fidelity® Variable Insurance Products: Equity-Income Portfolio Annual Report.
For the year ended December 31, 2008, the Portfolio's Class S and Class ADV shares returned (42.96)% and (43.07)%, respectively, compared to the Russell 3000® Value Index(1), which returned (36.25)%.

| Average Annual Total Returns for the Periods Ended December 31, 2008 | |
| | | 1 Year | | Since Inception
of Classes S and ADV
November 15, 2004 | |
| Class S | | | (42.96 | )% | | | (6.85 | )% | |
| Class ADV | | | (43.07 | )% | | | (7.15 | )% | |
| Russell 3000® Value Index(1) | | | (36.25 | )% | | | (2.56 | )%(2) | |
Based on a $10,000 initial investment, the graph and table above illustrate the total return of ING Fidelity® VIP Equity-Income Portfolio against the index indicated. An index is unmanaged, has no cash in its portfolio, imposes no sales charges and incurs no operating expenses. An investor cannot invest directly in the index. The Portfolio's performance is shown without the imposition of any expenses or charges which are, or may be, imposed under your annuity contract. Total returns would have been lower if such expenses or charges were included.
The performance graph and table do not reflect the deduction of taxes that a shareholder will pay on Portfolio distributions or the redemption of Portfolio Shares.
The performance shown may include the effect of fee waivers and/or expense reimbursements by the Investment Adviser and/or other service providers, which have the effect of increasing total return. Had all fees and expenses been considered, the total returns would have been lower.
The performance update illustrates performance for a variable investment option available through a variable annuity contract. The performance shown indicates past performance and is not a projection or prediction of future results. Actual investment returns and principal value will fluctuate so that shares and/or units, at redemption, may be worth more or less than their original cost. Please call (800) 992-0181 to get performance through the most recent month end.
(1) The Russell 3000® Value Index measures the performance of those Russell 3000 securities with lower price-to-book ratios and lower forecasted growth values.
(2) Since inception performance of the index is shown from November 1, 2004.
This report contains statements that may be "forward-looking" statements. Actual results may differ materially from those projected in the "forward-looking" statements.
The views expressed in this report reflect those of the portfolio managers, only through the end of the period as stated on the cover. The portfolio managers' views are subject to change at any time based on market and other conditions.
5
ING FIDELITY® VIP GROWTH PORTFOLIO
PORTFOLIO MANAGERS' REPORT
ING Fidelity® VIP Growth Portfolio (the "Portfolio") seeks capital appreciation by investing all of its assets in the Service Class 2 shares of the VIP Growth Portfolio, a series of Fidelity Variable Insurance Products Fund, a registered open-end investment company. Please refer to Management's Discussion of Fund Performance on page 4 of the included Fidelity® Variable Insurance Products: Growth Portfolio Annual Report.
For the year ended December 31, 2008, the Portfolio's Class S and Class ADV shares returned (47.49)% and (47.66)%, respectively, compared to the Russell 3000® Growth Index(1), which returned (38.44)%.
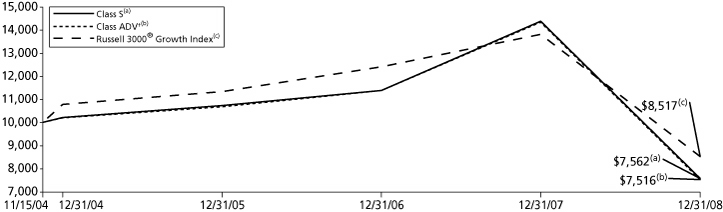
| Average Annual Total Returns for the Periods Ended December 31, 2008 | |
| | | 1 Year | | Since Inception
of Classes S and ADV
November 15, 2004 | |
| Class S | | | (47.49 | )% | | | (6.55 | )% | |
| Class ADV† | | | (47.66 | )% | | | (9.00 | )% | |
| Russell 3000® Growth Index(1) | | | (38.44 | )% | | | (3.78 | )%(2) | |
Based on a $10,000 initial investment, the graph and table above illustrate the total return of ING Fidelity® VIP Growth Portfolio against the index indicated. An index is unmanaged, has no cash in its portfolio, imposes no sales charges and incurs no operating expenses. An investor cannot invest directly in the index. The Portfolio's performance is shown without the imposition of any expenses or charges which are, or may be, imposed under your annuity contract. Total returns would have been lower if such expenses or charges were included.
The performance graph and table do not reflect the deduction of taxes that a shareholder will pay on Portfolio distributions or the redemption of Portfolio Shares.
The performance shown may include the effect of fee waivers and/or expense reimbursements by the Investment Adviser and/or other service providers, which have the effect of increasing total return. Had all fees and expenses been considered, the total returns would have been lower.
The performance update illustrates performance for a variable investment option available through a variable annuity contract. The performance shown indicates past performance and is not a projection or prediction of future results. Actual investment returns and principal value will fluctuate so that shares and/or units, at redemption, may be worth more or less than their original cost. Please call (800) 992-0181 to get performance through the most recent month end.
† On May 5, 2006, all outstanding shares of Class ADV were fully redeemed. On October 30, 2006, Class ADV re-commenced operations. The returns for Class ADV include the performance of Class S, adjusted to reflect the higher expenses of Class ADV, for the period between May 6, 2006 to October 29, 2006.
(1) The Russell 3000® Growth Index is an index that measures the performance of those Russell 3000® Index companies with higher price-to-book ratios and higher forecasted growth values.
(2) Since inception performance of the index is shown from November 1, 2004.
This report contains statements that may be "forward-looking" statements. Actual results may differ materially from those projected in the "forward-looking" statements.
The views expressed in this report reflect those of the portfolio managers, only through the end of the period as stated on the cover. The portfolio managers' views are subject to change at any time based on market and other conditions.
6
PORTFOLIO MANAGERS' REPORT
ING FIDELITY® VIP MID CAP PORTFOLIO
ING Fidelity® VIP Mid Cap Portfolio (the "Portfolio") seeks long-term growth of capital by investing all of its assets in the Service Class 2 shares of the VIP Mid Cap Portfolio, a series of Fidelity Variable Insurance Products Fund III, a registered open-end investment company. Please refer to Management's Discussion of Fund Performance on page 4 of the included Fidelity® Variable Insurance Products: Mid Cap Portfolio Annual Report.
For the year ended December 31, 2008, the Portfolio's Class S and Class ADV shares returned (39.82)% and (39.90)%, respectively, compared to the S&P MidCap 400® Index(1), which returned (36.23)%.
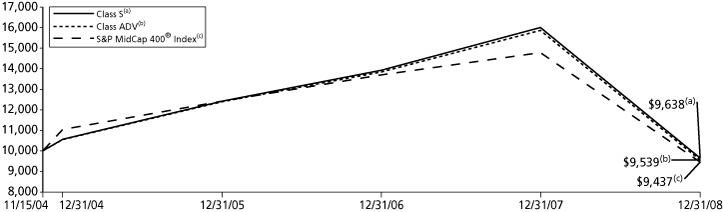
| Average Annual Total Returns for the Periods Ended December 31, 2008 | |
| | | 1 Year | | Since Inception
of Classes S and ADV
November 15, 2004 | |
| Class S | | | (39.82 | )% | | | (0.88 | )% | |
| Class ADV | | | (39.90 | )% | | | (1.13 | )% | |
| S&P MidCap 400 Index(1) | | | (36.23 | )% | | | (1.38 | )%(2) | |
Based on a $10,000 initial investment, the graph and table above illustrate the total return of ING Fidelity® VIP Mid Cap Portfolio against the index indicated. An index is unmanaged, has no cash in its portfolio, imposes no sales charges and incurs no operating expenses. An investor cannot invest directly in the index. The Portfolio's performance is shown without the imposition of any expenses or charges which are, or may be, imposed under your annuity contract. Total returns would have been lower if such expenses or charges were included.
The performance graph and table do not reflect the deduction of taxes that a shareholder will pay on Portfolio distributions or the redemption of Portfolio Shares.
The performance shown may include the effect of fee waivers and/or expense reimbursements by the Investment Adviser and/or other service providers, which have the effect of increasing total return. Had all fees and expenses been considered, the total returns would have been lower.
The performance update illustrates performance for a variable investment option available through a variable annuity contract. The performance shown indicates past performance and is not a projection or prediction of future results. Actual investment returns and principal value will fluctuate so that shares and/or units, at redemption, may be worth more or less than their original cost. Please call (800) 992-0181 to get performance through the most recent month end.
(1) The S&P MidCap 400® Index is an unmanaged index that measures the performance of the mid-size company segment of the U.S. market.
(2) Since inception performance of the index is shown from November 1, 2004.
This report contains statements that may be "forward-looking" statements. Actual results may differ materially from those projected in the "forward-looking" statements.
The views expressed in this report reflect those of the portfolio managers, only through the end of the period as stated on the cover. The portfolio managers' views are subject to change at any time based on market and other conditions.
7
SHAREHOLDER EXPENSE EXAMPLES (UNAUDITED)
As a shareholder of a Portfolio, you incur two types of costs: (1) transaction costs, including redemption fees and exchange fees; and (2) ongoing costs, including management fees, distribution and/or service (12b-1) fees, and other Portfolio expenses. These Examples are intended to help you understand your ongoing costs (in dollars) of investing in a Portfolio and to compare these costs with the ongoing costs of investing in other mutual funds.
The Examples are based on an investment of $1,000 invested at the beginning of the period and held for the entire period from July 1, 2008 to December 31, 2008, unless otherwise indicated. The Portfolios' expenses are shown without the imposition of any charges which are, or may be, imposed under your annuity contract. Expenses would have been higher if such charges were included.
Actual Expenses
The first section of the table shown, "Actual Portfolio Return," provides information about actual account values and actual expenses. You may use the information in this section, together with the amount you invested, to estimate the expenses that you paid over the period. Simply divide your account value by $1,000 (for example, an $8,600 account value divided by $1,000 = 8.6), then multiply the result by the number in the first section under the heading entitled "Expenses Paid During the Period" to estimate the expenses you paid on your account during this period.
Hypothetical Example for Comparison Purposes
The second section of the table shown, "Hypothetical (5% return before expenses)," provides information about hypothetical account values and hypothetical expenses based on the Portfolio's actual expense ratio and an assumed rate of return of 5% per year before expenses, which is not the Portfolio's actual return. The hypothetical account values and expenses may not be used to estimate the actual ending account balance or expenses you paid for the period. You may use this information to compare the ongoing costs of investing in the Portfolio and other mutual funds. To do so, compare this 5% hypothetical example with the 5% hypothetical examples that appear in the shareholder reports of the other mutual funds.
Please note that the expenses shown in the table are meant to highlight your ongoing costs only and do not reflect any transactional costs, such as redemption fees or exchange fees. Therefore, the hypothetical lines of the table are useful in comparing ongoing costs only, and will not help you determine the relative total costs of owning different funds. In addition, if these transactional costs were included, your costs would have been higher.
| | | Actual Portfolio Return | | Hypothetical (5% return before expenses) | |
ING Fidelity® VIP Contrafund®
Portfolio | | Beginning
Account
Value
July 1,
2008 | | Ending
Account
Value
December 31,
2008 | | Annualized
Expense
Ratio | | Expenses Paid
During the
Period Ended
December 31,
2008* | | Beginning
Account
Value
July 1,
2008 | | Ending
Account
Value
December 31,
2008 | | Annualized
Expense
Ratio | | Expenses Paid
During the
Period Ended
December 31,
2008* | |
| Class S | | $ | 1,000.00 | | | $ | 652.10 | | | | 1.21 | % | | $ | 5.02 | | | $ | 1,000.00 | | | $ | 1,019.05 | | | | 1.21 | % | | $ | 6.14 | | |
| Class ADV | | | 1,000.00 | | | | 651.50 | | | | 1.46 | | | | 6.06 | | | | 1,000.00 | | | | 1,017.80 | | | | 1.46 | | | | 7.41 | | |
| ING Fidelity® VIP Equity-Income Portfolio | |
| Class S | | $ | 1,000.00 | | | $ | 669.80 | | | | 1.12 | % | | $ | 4.70 | | | $ | 1,000.00 | | | $ | 1,019.51 | | | | 1.12 | % | | $ | 5.69 | | |
| Class ADV | | | 1,000.00 | | | | 669.00 | | | | 1.37 | | | | 5.75 | | | | 1,000.00 | | | | 1,018.25 | | | | 1.37 | | | | 6.95 | | |
| ING Fidelity® VIP Growth Portfolio | |
| Class S | | $ | 1,000.00 | | | $ | 586.60 | | | | 1.23 | % | | $ | 4.91 | | | $ | 1,000.00 | | | $ | 1,018.95 | | | | 1.23 | % | | $ | 6.24 | | |
| Class ADV | | | 1,000.00 | | | | 585.30 | | | | 1.48 | | | | 5.90 | | | | 1,000.00 | | | | 1,017.70 | | | | 1.48 | | | | 7.51 | | |
| ING Fidelity® VIP Mid Cap Portfolio | |
| Class S | | $ | 1,000.00 | | | $ | 647.10 | | | | 1.23 | % | | $ | 5.09 | | | $ | 1,000.00 | | | $ | 1,018.95 | | | | 1.23 | % | | $ | 6.24 | | |
| Class ADV | | | 1,000.00 | | | | 646.60 | | | | 1.48 | | | | 6.13 | | | | 1,000.00 | | | | 1,017.70 | | | | 1.48 | | | | 7.51 | | |
* Expenses are equal to each Portfolio's respective annualized expense ratios, including the expenses of the underlying fund, multiplied by the average account value over the period, multiplied by 184/366 to reflect the most recent fiscal half-year.
8
REPORT OF INDEPENDENT REGISTERED PUBLIC ACCOUNTING FIRM
The Shareholders and Board of Directors
ING Partners, Inc.
We have audited the accompanying statements of assets and liabilities, including the portfolios of investments, of ING Fidelity VIP Contrafund Portfolio, ING Fidelity VIP Equity-Income Portfolio, ING Fidelity VIP Growth Portfolio, and ING Fidelity VIP Mid Cap Portfolio, each a series of ING Partners, Inc., as of December 31, 2008, and the related statements of operations for the year then ended, the statements of changes in net assets for each of the years in the two-year period then ended, and the financial highlights for each of the years in the four-year period then ended and the period from November 15, 2004 (commencement of operations) to December 31, 2004. These financial statements and financial highlights are the responsibility of management. Our responsibility is to express an opinion on these financial statements and financial highlights based on our audits.
We conducted our audits in accordance with the standards of the Public Company Accounting Oversight Board (United States). Those standards require that we plan and perform the audit to obtain reasonable assurance about whether the financial statements and financial highlights are free of material misstatement. An audit includes examining, on a test basis, evidence supporting the amounts and disclosures in the financial statements. Our procedures included confirmation of securities owned as of December 31, 2008, by correspondence with the transfer agent of the master funds. An audit also includes assessing the accounting principles used and significant estimates made by management, as well as evaluating the overall financial statement presentation. We believe that our audits provide a reasonable basis for our opinion.
In our opinion, the financial statements and financial highlights referred to above present fairly, in all material respects, the financial position of the aforementioned portfolios as of December 31, 2008, and the results of their operations, the changes in their net assets, and the financial highlights for the periods specified in the first paragraph above, in conformity with U.S. generally accepted accounting principles.
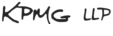
Boston, Massachusetts
February 25, 2009
9
STATEMENTS OF ASSETS AND LIABILITIES AS OF DECEMBER 31, 2008
| | | ING
Fidelity® VIP
Contrafund®
Portfolio | | ING
Fidelity® VIP
Equity-Income
Portfolio | | ING
Fidelity® VIP
Growth
Portfolio | | ING
Fidelity® VIP
Mid Cap
Portfolio | |
| ASSETS: | |
| Investments in affiliated master fund(1) at value* | | $ | 294,138,616 | | | $ | 33,165,625 | | | $ | 24,527,588 | | | $ | 51,203,296 | | |
| Cash | | | 311 | | | | 975 | | | | 2 | | | | 264 | | |
| Receivables: | |
| Investments in affiliated master fund sold | | | 842,960 | | | | 101,884 | | | | 32,338 | | | | 201 | | |
| Fund shares sold | | | 1,471 | | | | 20 | | | | — | | | | 8,123 | | |
| Total assets | | | 294,983,358 | | | | 33,268,504 | | | | 24,559,928 | | | | 51,211,884 | | |
| LIABILITIES: | |
Payable for investments in affiliated
master fund purchased | | | 1,447 | | | | — | | | | — | | | | 8,123 | | |
| Payable for fund shares redeemed | | | 842,984 | | | | 101,904 | | | | 32,338 | | | | 201 | | |
| Payable to affiliates | | | 72,065 | | | | 8,224 | | | | 6,036 | | | | 12,738 | | |
| Total liabilities | | | 916,496 | | | | 110,128 | | | | 38,374 | | | | 21,062 | | |
| NET ASSETS | | $ | 294,066,862 | | | $ | 33,158,376 | | | $ | 24,521,554 | | | $ | 51,190,822 | | |
| NET ASSETS WERE COMPRISED OF: | |
| Paid-in capital | | $ | 555,270,321 | | | $ | 62,727,875 | | | $ | 39,665,289 | | | $ | 80,784,986 | | |
| Undistributed net investment income | | | 2,521,994 | | | | 979,171 | | | | 115,451 | | | | 2,903,690 | | |
Accumulated net realized gain (loss) on
affiliated master fund | | | (1,586,569 | ) | | | (3,250,758 | ) | | | 68,710 | | | | 5,503,345 | | |
Net unrealized depreciation on
affiliated master fund | | | (262,138,884 | ) | | | (27,297,912 | ) | | | (15,327,896 | ) | | | (38,001,199 | ) | |
| NET ASSETS | | $ | 294,066,862 | | | $ | 33,158,376 | | | $ | 24,521,554 | | | $ | 51,190,822 | | |
| * Cost of investments in affiliated master fund | | $ | 556,277,500 | | | $ | 60,463,537 | | | $ | 39,855,484 | | | $ | 89,204,495 | | |
| Class S: | |
| Net assets | | $ | 290,170,085 | | | $ | 32,759,292 | | | $ | 24,505,611 | | | $ | 49,238,009 | | |
| Shares authorized | | | 100,000,000 | | | | 100,000,000 | | | | 100,000,000 | | | | 100,000,000 | | |
| Par value | | $ | 0.001 | | | $ | 0.001 | | | $ | 0.001 | | | $ | 0.001 | | |
| Shares outstanding | | | 46,173,808 | | | | 5,428,097 | | | | 3,384,853 | | | | 5,543,919 | | |
| Net asset value and redemption price per share | | $ | 6.28 | | | $ | 6.04 | | | $ | 7.24 | | | $ | 8.88 | | |
| Class ADV: | |
| Net assets | | $ | 3,896,777 | | | $ | 399,084 | | | $ | 15,943 | | | $ | 1,952,813 | | |
| Shares authorized | | | 100,000,000 | | | | 100,000,000 | | | | 100,000,000 | | | | 100,000,000 | | |
| Par value | | $ | 0.001 | | | $ | 0.001 | | | $ | 0.001 | | | $ | 0.001 | | |
| Shares outstanding | | | 624,536 | | | | 66,666 | | | | 2,213 | | | | 221,734 | | |
| Net asset value and redemption price per share | | $ | 6.24 | | | $ | 5.99 | | | $ | 7.20 | | | $ | 8.81 | | |
(1) The affiliated master funds for the ING Fidelity® VIP Contrafund®, ING Fidelity® VIP Equity-Income, ING Fidelity® VIP Growth and ING Fidelity® VIP Mid Cap Portfolios are the Fidelity® VIP Contrafund®, Fidelity® VIP Equity-Income, Fidelity® VIP Growth and Fidelity® VIP MidCap Portfolios, respectively. These financial statements should be read in conjunction with the affiliated master Fidelity funds' financial statements.
See Accompanying Notes to Financial Statements
10
STATEMENTS OF OPERATIONS FOR THE YEAR ENDED DECEMBER 31, 2008
| | | ING
Fidelity® VIP
Contrafund®
Portfolio | | ING
Fidelity® VIP
Equity-Income
Portfolio | | ING
Fidelity® VIP
Growth
Portfolio | | ING
Fidelity® VIP
Mid Cap
Portfolio | |
| INVESTMENT INCOME: | |
| Dividends from affiliated master fund(1) | | $ | 3,370,677 | | | $ | 1,124,463 | | | $ | 224,295 | | | $ | 167,054 | | |
| Total investment income | | | 3,370,677 | | | | 1,124,463 | | | | 224,295 | | | | 167,054 | | |
| EXPENSES: | |
| Distribution and service fees: | |
| Class S | | | 943,013 | | | | 113,482 | | | | 86,473 | | | | 167,080 | | |
| Class ADV | | | 30,582 | | | | 3,552 | | | | 120 | | | | 14,010 | | |
| Administrative service fees | | | 191,658 | | | | 23,051 | | | | 17,306 | | | | 34,816 | | |
| Total expenses | | | 1,165,253 | | | | 140,085 | | | | 103,899 | | | | 215,906 | | |
| Net investment income (loss) | | | 2,205,424 | | | | 984,378 | | | | 120,396 | | | | (48,852 | ) | |
REALIZED AND UNREALIZED GAIN (LOSS)
ON AFFILIATED MASTER FUND: | |
Realized gain distributions from
affiliated master fund | | | 10,468,407 | | | | 47,566 | | | | — | | | | 11,013,281 | | |
Net realized gain (loss) on sales of
affiliated master fund | | | (11,725,242 | ) | | | (3,293,221 | ) | | | 76,015 | | | | (2,542,616 | ) | |
| Net realized gain (loss) on affiliated master fund | | | (1,256,835 | ) | | | (3,245,655 | ) | | | 76,015 | | | | 8,470,665 | | |
Net change in unrealized appreciation
or depreciation on affiliated master fund | | | (207,595,158 | ) | | | (22,117,601 | ) | | | (21,331,658 | ) | | | (42,284,695 | ) | |
Net realized and unrealized loss on
affiliated master fund and realized
gain distributions from affiliated master fund | | | (208,851,993 | ) | | | (25,363,256 | ) | | | (21,255,643 | ) | | | (33,814,030 | ) | |
| Decrease in net assets resulting from operations | | $ | (206,646,569 | ) | | $ | (24,378,878 | ) | | $ | (21,135,247 | ) | | $ | (33,862,882 | ) | |
(1) The affiliated master funds for the ING Fidelity® VIP Contrafund®, ING Fidelity® VIP Equity-Income, ING Fidelity® VIP Growth and ING Fidelity® VIP Mid Cap Portfolios are the Fidelity® VIP Contrafund®, Fidelity® VIP Equity-Income, Fidelity® VIP Growth and Fidelity® VIP MidCap Portfolios, respectively. These financial statements should be read in conjunction with the affiliated master Fidelity funds' financial statements.
See Accompanying Notes to Financial Statements
11
STATEMENTS OF CHANGES IN NET ASSETS
| | | ING Fidelity® VIP
Contrafund® Portfolio | | ING Fidelity® VIP
Equity-Income Portfolio | |
| | | Year Ended
December 31,
2008 | | Year Ended
December 31,
2007 | | Year Ended
December 31,
2008 | | Year Ended
December 31,
2007 | |
| FROM OPERATIONS: | |
| Net investment income | | $ | 2,205,424 | | | $ | 1,970,306 | | | $ | 984,378 | | | $ | 759,754 | | |
| Net realized gain on affiliated master fund | | | (1,256,835 | ) | | | 102,158,037 | | | | (3,245,655 | ) | | | 5,238,106 | | |
Net change in unrealized appreciation or depreciation on
affiliated master fund | | | (207,595,158 | ) | | | (55,789,807 | ) | | | (22,117,601 | ) | | | (6,157,491 | ) | |
| Increase (decrease) in net assets resulting from operations | | | (206,646,569 | ) | | | 48,338,536 | | | | (24,378,878 | ) | | | (159,631 | ) | |
| FROM DISTRIBUTIONS TO SHAREHOLDERS: | |
| Net investment income: | |
| Class S | | | (20,316,461 | ) | | | (1,252,172 | ) | | | (1,067,800 | ) | | | (836,704 | ) | |
| Class ADV | | | (287,679 | ) | | | (12,185 | ) | | | (13,082 | ) | | | (16,751 | ) | |
| Net realized gains: | |
| Class S | | | (82,261,044 | ) | | | (17,199,853 | ) | | | (4,837,903 | ) | | | (2,784,603 | ) | |
| Class ADV | | | (1,262,009 | ) | | | (386,039 | ) | | | (74,580 | ) | | | (62,662 | ) | |
| Total distributions | | | (104,127,193 | ) | | | (18,850,249 | ) | | | (5,993,365 | ) | | | (3,700,720 | ) | |
| FROM CAPITAL SHARE TRANSACTIONS: | |
| Net proceeds from sale of shares | | | 106,764,151 | | | | 161,358,701 | | | | 13,467,673 | | | | 27,321,682 | | |
| Reinvestment of distributions | | | 104,127,193 | | | | 18,850,249 | | | | 5,993,365 | | | | 3,700,720 | | |
| | | | 210,891,344 | | | | 180,208,950 | | | | 19,461,038 | | | | 31,022,402 | | |
| Cost of shares redeemed | | | (28,515,023 | ) | | | (11,476,560 | ) | | | (10,447,381 | ) | | | (6,684,616 | ) | |
Net increase in net assets resulting from
capital share transactions | | | 182,376,321 | | | | 168,732,390 | | | | 9,013,657 | | | | 24,337,786 | | |
| Net increase (decrease) in net assets | | | (128,397,441 | ) | | | 198,220,677 | | | | (21,358,586 | ) | | | 20,477,435 | | |
| NET ASSETS: | |
| Beginning of year | | | 422,464,303 | | | | 224,243,626 | | | | 54,516,962 | | | | 34,039,527 | | |
| End of year | | $ | 294,066,862 | | | $ | 422,464,303 | | | $ | 33,158,376 | | | $ | 54,516,962 | | |
| Undistributed net investment income at end of year | | $ | 2,521,994 | | | $ | 20,598,762 | | | $ | 979,171 | | | $ | 1,075,675 | | |
See Accompanying Notes to Financial Statements
12
STATEMENTS OF CHANGES IN NET ASSETS
| | | ING Fidelity® VIP
Growth Portfolio | | ING Fidelity® VIP
Mid Cap Portfolio | |
| | | Year Ended
December 31,
2008 | | Year Ended
December 31,
2007 | | Year Ended
December 31,
2008 | | Year Ended
December 31,
2007 | |
| FROM OPERATIONS: | |
| Net investment income | | $ | 120,396 | | | $ | 1,706 | | | $ | (48,852 | ) | | $ | 117,953 | | |
| Net realized gain (loss) on affiliated master fund | | | 76,015 | | | | 931,881 | | | | 8,470,665 | | | | 4,618,018 | | |
Net change in unrealized appreciation or
depreciation on affiliated master fund | | | (21,331,658 | ) | | | 5,160,396 | | | | (42,284,695 | ) | | | 2,935,542 | | |
| Increase (decrease) in net assets resulting from operations | | | (21,135,247 | ) | | | 6,093,983 | | | | (33,862,882 | ) | | | 7,671,513 | | |
| FROM DISTRIBUTIONS TO SHAREHOLDERS: | |
| Net investment income | | | (27,897 | ) | | | — | | | | (168,121 | ) | | | (45,625 | ) | |
| Net realized gains: | |
| Class S | | | (910,084 | ) | | | (463,744 | ) | | | (4,381,013 | ) | | | (1,054,533 | ) | |
| Class ADV | | | (582 | ) | | | (429 | ) | | | (186,341 | ) | | | (48,540 | ) | |
| Total distributions | | | (938,563 | ) | | | (464,173 | ) | | | (4,735,475 | ) | | | (1,148,698 | ) | |
| FROM CAPITAL SHARE TRANSACTIONS: | |
| Net proceeds from sale of shares | | | 14,153,777 | | | | 19,651,816 | | | | 13,230,418 | | | | 35,867,528 | | |
| Reinvestment of distributions | | | 938,563 | | | | 464,173 | | | | 4,735,475 | | | | 1,148,698 | | |
| | | | 15,092,340 | | | | 20,115,989 | | | | 17,965,893 | | | | 37,016,226 | | |
| Cost of shares redeemed | | | (6,764,021 | ) | | | (4,932,973 | ) | | | (9,100,049 | ) | | | (3,368,052 | ) | |
Net increase in net assets resulting from
capital share transactions | | | 8,328,319 | | | | 15,183,016 | | | | 8,865,844 | | | | 33,648,174 | | |
| Net increase (decrease) in net assets | | | (13,745,491 | ) | | | 20,812,826 | | | | (29,732,513 | ) | | | 40,170,989 | | |
| NET ASSETS: | |
| Beginning of year | | | 38,267,045 | | | | 17,454,219 | | | | 80,923,335 | | | | 40,752,346 | | |
| End of year | | $ | 24,521,554 | | | $ | 38,267,045 | | | $ | 51,190,822 | | | $ | 80,923,335 | | |
| Undistributed net investment income at end of year | | $ | 115,451 | | | $ | 22,952 | | | $ | 2,903,690 | | | $ | 163,189 | | |
See Accompanying Notes to Financial Statements
13
FINANCIAL HIGHLIGHTS
Selected data for a share of beneficial interest outstanding throughout each year or period.
| | | | | Income (loss)
from investment
operations | | | | Less distributions | | | | Ratios to average
net assets | | Supplemental data | | Ratios and supplemental
data of the master fund | |
| | | Net asset value, beginning of year or period | | Net investment income (loss) | | Net realized and unrealized gain (loss) on affiliated master fund | | Total from investment operations | | From net investment income | | From net realized gains from affiliated master fund | | From return of capital from affiliated master fund | | Total distributions | | Net asset value, end of year or period | | Total Return(1) | | Expenses excluding expenses of the master fund(2)(3) | | Net investment income (loss) excluding expenses of the master fund(2)(3) | | Net assets, end of year or period | | Portfolio turnover rate(4) | | Expenses including gross expenses of the master fund(2) | | Expenses including expenses net of voluntary waivers, if any, of the master fund(2) | | Expenses including expenses net of all reductions of the master fund(2) | | Portfolio turnover rate of the master fund | |
| | | | | | | | | | | | | | | | | | | | | | | | | | | | | | | | | | | | | | |
| Year or period ended | | ($) | | ($) | | ($) | | ($) | | ($) | | ($) | | ($) | | ($) | | ($) | | (%) | | (%) | | (%) | | ($000's) | | (%) | | (%) | | (%) | | (%) | | (%) | |
| ING Fidelity® VIP Contrafund® Portfolio | | | |
| Class S | | | |
| | 12-31-08 | | | | 14.72 | | | | 0.06 | • | | | (5.37 | ) | | | (5.31 | ) | | | 0.62 | | | | 2.51 | | | | — | | | | 3.13 | | | | 6.28 | | | | (42.90 | ) | | | 0.30 | | | | 0.58 | | | | 290,170 | | | | 8 | | | | 1.21 | | | | 1.21 | | | | 1.20 | | | | 172 | | |
| | 12-31-07 | | | | 13.37 | | | | 0.09 | | | | 2.11 | | | | 2.20 | | | | 0.06 | | | | 0.79 | | | | — | | | | 0.85 | | | | 14.72 | | | | 16.92 | | | | 0.30 | | | | 0.63 | | | | 414,723 | | | | 35 | | | | 1.20 | | | | 1.20 | | | | 1.19 | | | | 134 | | |
| | 12-31-06 | | | | 12.03 | | | | 0.11 | • | | | 1.23 | | | | 1.34 | | | | — | | | | 0.00 | * | | | — | | | | 0.00 | * | | | 13.37 | | | | 11.16 | | | | 0.30 | | | | 0.84 | | | | 217,927 | | | | 16 | | | | 1.21 | | | | 1.21 | | | | 1.20 | | | | 75 | | |
| | 12-31-05 | | | | 10.34 | | | | (0.01 | ) | | | 1.70 | | | | 1.69 | | | | — | | | | — | | | | — | | | | — | | | | 12.03 | | | | 16.34 | | | | 0.30 | | | | (0.29 | ) | | | 57,988 | | | | 5 | | | | 1.21 | | | | 1.21 | | | | 1.19 | | | | 60 | | |
| | 11-15-04 | (5)-12-31-04 | | | 10.00 | | | | 0.00 | * | | | 0.34 | | | | 0.34 | | | | — | | | | — | | | | — | | | | — | | | | 10.34 | | | | 3.40 | | | | 0.30 | | | | (0.30 | ) | | | 33 | | | | 0 | * | | | 1.23 | † | | | 1.23 | † | | | 1.21 | † | | | 64 | † | |
| Class ADV | | | |
| | 12-31-08 | | | | 14.62 | | | | 0.05 | • | | | (5.34 | ) | | | (5.29 | ) | | | 0.58 | | | | 2.51 | | | | — | | | | 3.09 | | | | 6.24 | | | | (43.00 | ) | | | 0.55 | | | | 0.51 | | | | 3,897 | | | | 8 | | | | 1.46 | | | | 1.46 | | | | 1.45 | | | | 172 | | |
| | 12-31-07 | | | | 13.28 | | | | 0.03 | | | | 2.12 | | | | 2.15 | | | | 0.02 | | | | 0.79 | | | | — | | | | 0.81 | | | | 14.62 | | | | 16.69 | | | | 0.55 | | | | 0.24 | | | | 7,741 | | | | 35 | | | | 1.45 | | | | 1.45 | | | | 1.44 | | | | 134 | | |
| | 12-31-06 | | | | 11.99 | | | | 0.07 | • | | | 1.22 | | | | 1.29 | | | | — | | | | 0.00 | * | | | — | | | | 0.00 | * | | | 13.28 | | | | 10.78 | | | | 0.55 | | | | 0.53 | | | | 6,317 | | | | 16 | | | | 1.46 | | | | 1.46 | | | | 1.45 | | | | 75 | | |
| | 12-31-05 | | | | 10.34 | | | | (0.03 | ) | | | 1.68 | | | | 1.65 | | | | — | | | | — | | | | — | | | | — | | | | 11.99 | | | | 15.96 | | | | 0.55 | | | | (0.50 | ) | | | 3,358 | | | | 5 | | | | 1.46 | | | | 1.46 | | | | 1.44 | | | | 60 | | |
| | 11-15-04 | (5)-12-31-04 | | | 10.00 | | | | (0.01 | ) | | | 0.35 | | | | 0.34 | | | | — | | | | — | | | | — | | | | — | | | | 10.34 | | | | 3.40 | | | | 0.55 | | | | (0.55 | ) | | | 1 | | | | 0 | * | | | 1.48 | † | | | 1.48 | † | | | 1.46 | † | | | 64 | † | |
| ING Fidelity® VIP Equity-Income Portfolio | | | |
| Class S | | | |
| | 12-31-08 | | | | 12.06 | | | | 0.20 | • | | | (4.98 | ) | | | (4.78 | ) | | | 0.22 | | | | 1.02 | | | | — | | | | 1.24 | | | | 6.04 | | | | (42.96 | ) | | | 0.30 | | | | 2.14 | | | | 32,759 | | | | 23 | | | | 1.12 | | | | 1.12 | | | | 1.12 | | | | 34 | | |
| | 12-31-07 | | | | 12.94 | | | | 0.21 | | | | (0.05 | ) | | | 0.16 | | | | 0.24 | | | | 0.80 | | | | — | | | | 1.04 | | | | 12.06 | | | | 0.97 | | | | 0.30 | | | | 1.61 | | | | 53,573 | | | | 24 | | | | 1.10 | | | | 1.10 | | | | 1.10 | | | | 20 | | |
| | 12-31-06 | | | | 10.83 | | | | 0.33 | • | | | 1.79 | | | | 2.12 | | | | — | | | | 0.01 | | | | — | | | | 0.01 | | | | 12.94 | | | | 19.61 | | | | 0.30 | | | | 2.77 | | | | 33,038 | | | | 25 | | | | 1.12 | | | | 1.12 | | | | 1.12 | | | | 22 | | |
| | 12-31-05 | | | | 10.28 | | | | (0.01 | ) | | | 0.56 | | | | 0.55 | | | | — | | | | — | | | | — | | | | — | | | | 10.83 | | | | 5.35 | | | | 0.30 | | | | (0.30 | ) | | | 10,259 | | | | 22 | | | | 1.11 | | | | 1.11 | | | | 1.10 | | | | 19 | | |
| | 11-15-04 | (5)-12-31-04 | | | 10.00 | | | | 0.00 | * | | | 0.28 | | | | 0.28 | | | | — | | | | — | | | | — | | | | — | | | | 10.28 | | | | 2.80 | | | | 0.30 | | | | (0.30 | ) | | | 1 | | | | 0 | * | | | 1.13 | † | | | 1.13 | † | | | 1.12 | † | | | 22 | † | |
| Class ADV | | | |
| | 12-31-08 | | | | 11.94 | | | | 0.22 | | | | (4.97 | ) | | | (4.75 | ) | | | 0.18 | | | | 1.02 | | | | — | | | | 1.20 | | | | 5.99 | | | | (43.07 | ) | | | 0.55 | | | | 1.83 | | | | 399 | | | | 23 | | | | 1.37 | | | | 1.37 | | | | 1.37 | | | | 34 | | |
| | 12-31-07 | | | | 12.83 | | | | 0.13 | • | | | (0.01 | ) | | | 0.12 | | | | 0.21 | | | | 0.80 | | | | — | | | | 1.01 | | | | 11.94 | | | | 0.69 | | | | 0.55 | | | | 1.01 | | | | 944 | | | | 24 | | | | 1.35 | | | | 1.35 | | | | 1.35 | | | | 20 | | |
| | 12-31-06 | | | | 10.78 | | | | 0.33 | • | | | 1.73 | | | | 2.06 | | | | — | | | | 0.01 | | | | — | | | | 0.01 | | | | 12.83 | | | | 19.14 | | | | 0.55 | | | | 2.80 | | | | 1,002 | | | | 25 | | | | 1.37 | | | | 1.37 | | | | 1.37 | | | | 22 | | |
| | 12-31-05 | | | | 10.27 | | | | (0.03 | ) | | | 0.54 | | | | 0.51 | | | | — | | | | — | | | | — | | | | — | | | | 10.78 | | | | 4.97 | | | | 0.55 | | | | (0.44 | ) | | | 78 | | | | 22 | | | | 1.36 | | | | 1.36 | | | | 1.35 | | | | 19 | | |
| | 11-15-04 | (5)-12-31-04 | | | 10.00 | | | | (0.01 | ) | | | 0.28 | | | | 0.27 | | | | — | | | | — | | | | — | | | | — | | | | 10.27 | | | | 2.70 | | | | 0.55 | | | | (0.55 | ) | | | 1 | | | | 0 | * | | | 1.38 | † | | | 1.38 | † | | | 1.37 | † | | | 22 | † | |
See Accompanying Notes to Financial Statements
14
FINANCIAL HIGHLIGHTS (CONTINUED)
Selected data for a share of beneficial interest outstanding throughout each year or period.
| | | | | Income (loss)
from investment
operations | | | | Less distributions | | | | Ratios to average
net assets | | Supplemental data | | Ratios and supplemental
data of the master fund | |
| | | Net asset value, beginning of year or period | | Net investment income (loss) | | Net realized and unrealized gain (loss) on affiliated master fund | | Total from investment operations | | From net investment income | | From net realized gains from affiliated master fund | | From return of capital from affiliated master fund | | Total distributions | | Net asset value, end of year or period | | Total Return(1) | | Expenses excluding expenses of the master fund(2)(3) | | Net investment income (loss) excluding expenses of the master fund(2)(3) | | Net assets, end of year or period | | Portfolio turnover rate(4) | | Expenses including gross expenses of the master fund(2) | | Expenses including expenses net of voluntary waivers, if any, of the master fund(2) | | Expenses including expenses net of all reductions of the master fund(2) | | Portfolio turnover rate of the master fund | |
| | | | | | | | | | | | | | | | | | | | | | | | | | | | | | | | | | | | | | |
Year or period
ended | | ($) | | ($) | | ($) | | ($) | | ($) | | ($) | | ($) | | ($) | | ($) | | (%) | | (%) | | (%) | | ($000's) | | (%) | | (%) | | (%) | | (%) | | (%) | |
| ING Fidelity® VIP Growth Portfolio | | | |
| Class S | | | |
| | 12-31-08 | | | | 14.13 | | | | 0.04 | • | | | (6.64 | ) | | | (6.60 | ) | | | 0.01 | | | | 0.28 | | | | — | | | | 0.29 | | | | 7.24 | | | | (47.49 | ) | | | 0.30 | | | | 0.35 | | | | 24,506 | | | | 20 | | | | 1.23 | | | | 1.23 | | | | 1.22 | | | | 161 | | |
| | 12-31-07 | | | | 11.38 | | | | 0.00 | * | | | 2.98 | | | | 2.98 | | | | — | | | | 0.23 | | | | — | | | | 0.23 | | | | 14.13 | | | | 26.37 | | | | 0.30 | | | | 0.01 | | | | 38,239 | | | | 18 | | | | 1.20 | | | | 1.20 | | | | 1.19 | | | | 109 | | |
| | 12-31-06 | | | | 10.73 | | | | (0.02 | ) | | | 0.68 | | | | 0.66 | | | | — | | | | 0.01 | | | | — | | | | 0.01 | | | | 11.38 | | | | 6.19 | | | | 0.30 | | | | (0.18 | ) | | | 17,434 | | | | 43 | | | | 1.24 | | | | 1.24 | | | | 1.22 | | | | 114 | | |
| | 13-31-05 | | | | 10.21 | | | | (0.01 | ) | | | 0.53 | | | | 0.52 | | | | — | | | | — | | | | — | | | | — | | | | 10.73 | | | | 5.09 | | | | 0.30 | | | | (0.28 | ) | | | 10,679 | | | | 29 | | | | 1.22 | | | | 1.22 | | | | 1.18 | | | | 79 | | |
| | 11-15-04 | (5)-12-31-04 | | | 10.00 | | | | (0.00 | )* | | | 0.21 | | | | 0.21 | | | | — | | | | — | | | | — | | | | — | | | | 10.21 | | | | 2.10 | | | | 0.30 | | | | (0.30 | ) | | | 1 | | | | 0 | * | | | 1.23 | † | | | 1.23 | † | | | 1.20 | † | | | 72 | † | |
| Class ADV | | | |
| | 12-31-08 | | | | 14.09 | | | | — | | | | (6.61 | ) | | | (6.61 | ) | | | — | | | | 0.28 | | | | — | | | | 0.28 | | | | 7.20 | | | | (47.66 | ) | | | 0.55 | | | | (0.02 | ) | | | 16 | | | | 20 | | | | 1.48 | | | | 1.48 | | | | 1.47 | | | | 161 | | |
| | 12-31-07 | | | | 11.38 | | | | (0.02 | ) | | | 2.96 | | | | 2.94 | | | | — | | | | 0.23 | | | | — | | | | 0.23 | | | | 14.09 | | | | 26.01 | | | | 0.55 | | | | (0.16 | ) | | | 28 | | | | 18 | | | | 1.45 | | | | 1.45 | | | | 1.44 | | | | 109 | | |
| | 10-30-06 | (6)-12-31-06 | | | 11.34 | | | | (0.01 | ) | | | 0.05 | | | | 0.04 | | | | — | | | | — | | | | — | | | | — | | | | 11.38 | | | | 0.35 | | | | 0.55 | | | | (0.55 | ) | | | 21 | | | | 43 | | | | 1.49 | | | | 1.49 | | | | 1.47 | | | | 114 | | |
| | 01-01-06-05-04-06 | (6) | | | 10.68 | | | | (0.01 | ) | | | 0.53 | | | | 0.52 | | | | — | | | | — | | | | — | | | | — | | | | 11.20 | | | | 4.87 | | | | 0.55 | | | | (0.20 | ) | | | 1 | | | | 43 | | | | 1.49 | | | | 1.49 | | | | 1.47 | | | | 114 | | |
| | 12-31-05 | | | | 10.20 | | | | (0.05 | ) | | | 0.53 | | | | 0.48 | | | | — | | | | — | | | | — | | | | — | | | | 10.68 | | | | 4.71 | | | | 0.55 | | | | (0.25 | ) | | | 1 | | | | 29 | | | | 1.47 | | | | 1.47 | | | | 1.43 | | | | 79 | | |
| | 11-15-04 | (5)-12-31-04 | | | 10.00 | | | | (0.01 | ) | | | 0.21 | | | | 0.20 | | | | — | | | | — | | | | — | | | | — | | | | 10.20 | | | | 2.00 | | | | 0.55 | | | | (0.55 | ) | | | 1 | | | | 0 | * | | | 1.48 | † | | | 1.48 | † | | | 1.45 | † | | | 72 | † | |
| ING Fidelity® VIP Mid Cap Portfolio | | | |
| Class S | | | |
| | 12-31-08 | | | | 15.72 | | | | (0.01 | )• | | | (5.95 | ) | | | (5.96 | ) | | | 0.04 | | | | 0.84 | | | | — | | | | 0.88 | | | | 8.88 | | | | (39.82 | ) | | | 0.30 | | | | (0.06 | ) | | | 49,238 | | | | 13 | | | | 1.23 | | | | 1.23 | | | | 1.22 | | | | 145 | | |
| | 12-31-07 | | | | 13.92 | | | | 0.03 | • | | | 2.05 | | | | 2.08 | | | | 0.01 | | | | 0.27 | | | | — | | | | 0.28 | | | | 15.72 | | | | 15.00 | | | | 0.30 | | | | 0.20 | | | | 77,608 | | | | 12 | | | | 1.21 | | | | 1.21 | | | | 1.20 | | | | 113 | | |
| | 12-31-06 | | | | 12.42 | | | | (0.03 | )• | | | 1.54 | | | | 1.51 | | | | — | | | | 0.01 | | | | — | | | | 0.01 | | | | 13.92 | | | | 12.15 | | | | 0.30 | | | | (0.24 | ) | | | 38,562 | | | | 12 | | | | 1.23 | | | | 1.23 | | | | 1.21 | | | | 149 | | |
| | 13-31-05 | | | | 10.56 | | | | (0.01 | ) | | | 1.87 | | | | 1.86 | | | | — | | | | — | | | | — | | | | — | | | | 12.42 | | | | 17.61 | | | | 0.30 | | | | (0.32 | ) | | | 4,065 | | | | 14 | | | | 1.24 | | | | 1.24 | | | | 1.19 | | | | 107 | | |
| | 11-15-04 | (5)-12-31-04 | | | 10.00 | | | | (0.00 | )* | | | 0.56 | | | | 0.56 | | | | — | | | | — | | | | — | | | | — | | | | 10.56 | | | | 5.60 | | | | 0.30 | | | | (0.30 | ) | | | 17 | | | | 0 | * | | | 1.26 | † | | | 1.26 | † | | | 1.23 | † | | | 55 | † | |
| Class ADV | | | |
| | 12-31-08 | | | | 15.59 | | | | (0.03 | )• | | | (5.91 | ) | | | (5.94 | ) | | | — | | | | 0.84 | | | | — | | | | 0.84 | | | | 8.81 | | | | (39.90 | ) | | | 0.55 | | | | (0.20 | ) | | | 1,953 | | | | 13 | | | | 1.48 | | | | 1.48 | | | | 1.47 | | | | 145 | | |
| | 12-31-07 | | | | 13.84 | | | | (0.01 | ) | | | 2.03 | | | | 2.02 | | | | — | | | | 0.27 | | | | — | | | | 0.27 | | | | 15.59 | | | | 14.64 | | | | 0.55 | | | | (0.06 | ) | | | 3,315 | | | | 12 | | | | 1.46 | | | | 1.46 | | | | 1.45 | | | | 113 | | |
| | 12-31-06 | | | | 12.39 | | | | (0.05 | )* | | | 1.51 | | | | 1.46 | | | | — | | | | 0.01 | | | | — | | | | 0.01 | | | | 13.84 | | | | 11.77 | | | | 0.55 | | | | (0.40 | ) | | | 2,190 | | | | 12 | | | | 1.48 | | | | 1.48 | | | | 1.46 | | | | 149 | | |
| | 13-31-05 | | | | 10.55 | | | | (0.02 | ) | | | 1.86 | | | | 1.84 | | | | — | | | | — | | | | — | | | | — | | | | 12.39 | | | | 17.44 | | | | 0.55 | | | | (0.48 | ) | | | 1,501 | | | | 14 | | | | 1.49 | | | | 1.49 | | | | 1.44 | | | | 107 | | |
| | 11-15-04 | (5)-12-31-04 | | | 10.00 | | | | (0.00 | )* | | | 0.55 | | | | 0.55 | | | | — | | | | — | | | | — | | | | — | | | | 10.55 | | | | 5.50 | | | | 0.55 | | | | (0.55 | ) | | | 1 | | | | 0 | * | | | 1.51 | † | | | 1.51 | † | | | 1.48 | † | | | 55 | † | |
(1) Total return is calculated assuming reinvestment of all dividends and capital gain distributions at net asset value. Total return for periods less than one year is not annualized. The Portfolio's performance is shown without the imposition of any expenses or charges, which are, or may be, imposed under your annuity contract. Total returns would have been lower if such expenses or charges were included.
(2) Annualized for periods less than one year.
(3) Expense ratios do not include fees and expenses charged under the variable annuity contract or variable life insurance policy.
(4) Portfolio turnover rate is calculated based on the Portfolio's purchases or sales of the master fund.
(5) Commencement of operations.
(6) Class ADV was fully redeemed on May 5, 2006 and recommenced operations on October 30, 2006.
• Calculated using average number of shares outstanding throughout the period.
* Amount is less than 0.500% or $0.005 or more than $(0.005).
† Expenses of the master fund included in the ratio, as well as the portfolio turnover rate, are for the year ended December 31, 2004.
See Accompanying Notes to Financial Statements
15
NOTES TO FINANCIAL STATEMENTS AS OF DECEMBER 31, 2008
NOTE 1 — ORGANIZATION
ING Partners, Inc. (the "Fund") is an open-end management investment company registered under the Investment Company Act of 1940, as amended (the "1940 Act"). It was incorporated under the laws of Maryland on May 7, 1997. The Articles of Incorporation permit the Fund to offer separate series ("Portfolios"), each of which has its own investment objective, policies and restrictions. The Portfolios serve as investment options underlying variable insurance products offered by ING Directed Services LLC ("DSL" or the "Investment Adviser") and its insurance company affiliates. At December 31, 2008 there were thirty-six active separate investment series which comprise the Fund. The four Portfolios included in this report are: ING Fidelity® VIP Contrafund® Portfolio* ("Contrafund"); ING Fidelity® VIP Equity-Income Portfolio ("Equity-Income"), ING Fidelity® VIP Growth Portfolio ("Growth") and ING Fidelity® VIP Mid Cap Portfolio ("Mid Cap") (each, a "Portfolio" and collectively, the "Portfolios").
Contrafund seeks long-term capital appreciation by investing all of its assets in the Service Class 2 Shares of the VIP Contrafund® Portfolio, a series of Fidelity Variable Insurance Products Fund II, a registered open-end investment company.
Equity-Income seeks reasonable income and also considers the potential for capital appreciation and seeks to achieve a yield that exceeds the composite yield on the securities comprising the S&P 500® Index by investing all of its assets in the Service Class 2 Shares of the VIP Equity-Income Portfolio, a series of Fidelity Variable Insurance Products Fund, a registered open-end investment company.
Growth seeks capital appreciation by investing all of its assets in the Service Class 2 Shares of the VIP Growth Portfolio, a series of Fidelity Variable Insurance Products Fund, a registered open-end investment company.
Mid Cap seeks long-term growth of capital by investing all of its assets in the Service Class 2 Shares of the VIP Mid Cap Portfolio, a series of Fidelity Variable Insurance Products Fund III, a registered open-end investment company.
* Fidelity and Contrafund are registered trademarks of FMR Corp.
Each Portfolio in this report operates as a "feeder fund" which means it invests all of its assets in a separate mutual fund, the master fund: VIP Contrafund® Portfolio, VIP Equity-Income Portfolio, VIP Growth Portfolio and VIP Mid Cap Portfolio (each a "Master Fund" and collectively, the "Master Funds"). VIP Contrafund Portfolio is a series of Fidelity Variable Insurance Products Fund II; VIP Equity-Income Portfolio and VIP Growth Portfolio are series of Fidelity Variable Insurance Products Fund; and VIP Mid Cap Growth Portfolio is a series of Fidelity Variable Insurance Products Fund III. Each Portfolio has the same investment objective and limitations as the Master Fund in which it invests. Typically, the Portfolios do not buy investment securities directly. The Master Funds, on the other hand, invest directly in portfolio securities. At December 31, 2008, Contrafund, Equity-Income, Growth and Mid Cap Portfolios each held 2 .1% or less of their respective Master Fund.
The Portfolios offer two classes of shares, referred to as Service Class ("Class S") and Adviser Class ("Class ADV"). Each share class represents interests in the same portfolio of investments of the particular Portfolio, and shall be identical in all respects, except for the impact of expenses, voting, exchange privileges, and any different shareholder services relating to a class of shares. Shareholders of Class ADV of each Portfolio will generally be entitled to exchange those shares at net asset value for Adviser Class shares of other Portfolios that offer Adviser Class shares. Shareholders of the Adviser Class shares continue to be subject to the Rule 12b-1 Plan fee applicable to Adviser Class shares after an exchange. Shareholders of Service Class shares of each Portfolio will generally be entitled to exchange those shares at net asset value for Service Class shares of other Portfolios that offer Service Class shares. Shares of the Por tfolios may be offered to seperate accounts ("Separate Accounts") of insurance companies as investment options in connection with variable annuity contracts and variable life insurance policies ("Variable Contracts") and to certain of the Portfolios' investment advisers and their affiliates. In the future, shares may also be offered to qualified pension and retirement plans ("Qualified Plans") outside the Separate Account context. Shares of the Portfolios are
16
NOTES TO FINANCIAL STATEMENTS AS OF DECEMBER 31, 2008 (CONTINUED)
NOTE 1 — ORGANIZATION (continued)
not currently offered directly to Qualified Plans or custodial accounts.
Each Portfolio is distributed by ING Funds Distributor, LLC ("IFD" or the "Distributor"). DSL serves as the investment adviser to each Portfolio. IFD and DSL are both indirect, wholly-owned subsidiaries of ING Groep N.V. ("ING Groep"). ING Groep is one of the largest financial services institutions in the world, and offers an array of banking, insurance and asset management services to both individuals and institutional investors.
On October 19, 2008, ING Groep announced that it reached an agreement with the Dutch government to strengthen its capital position, creating a strong buffer to navigate the current market and economic environment. ING Groep will issue non-voting core Tier-1 securities for a total consideration of EUR 10 billion to the Dutch State. The transaction boosts ING Bank's core Tier-1 ratio, strengthens the insurance balance sheet and reduces ING Groep's Debt/Equity ratio.
NOTE 2 — SIGNIFICANT ACCOUNTING POLICIES
The following significant accounting policies are consistently followed by the Portfolios in the preparation of their financial statements. Such policies are in conformity with U.S. generally accepted accounting principles for investment companies.
A. Security Valuation. The valuation of each Portfolio's investment in its corresponding Master Fund is based on the net asset value of that Master Fund each business day. Valuation of the investments by the Master Funds is discussed in the Master Funds' notes to their financial statements, which accompany this report.
Effective for fiscal years beginning after November 15, 2007, Financial Accounting Standards Board ("FASB") Statement of Financial Accounting Standards No. 157, "Fair Value Measurements", establishes a hierarchy for measuring fair value of assets and liabilities. As required by the standard, each investment asset or liability of the Portfolios is assigned a level at measurement date based on the significance and source of the inputs to its valuation. Quoted prices in active markets for identical securities are classified as "Level 1", inputs other than quoted prices for an asset that are observable are classified as "Level 2" and unobservable inputs, including the sub-adviser's judgment about the assumptions that a market participant would use in pricing an asset or liability are classified as "Level 3". The inputs used for valuing securities are not necessarily an indic ation of the risks associated with investing in those securities. A table summarizing the Portfolios' investments under these levels of classification is included following the Portfolios of Investments.
Effective for fiscal years and interim periods ending after November 15, 2008, the FASB issued FASB Staff Position ("FSP") No. FAS 133-1 and FASB Interpretation Number ("FIN") 45-4, "Disclosures about Credit Derivatives and Certain Guarantees: An Amendment of FASB Statement No. 133 and FASB Interpretation No. 45; and Clarification of the Effective Date of FASB Statement No. 161." The amendments to FAS 133 require enhanced disclosure regarding credit derivatives sold, including (1) the nature and terms of the credit derivative, reasons for entering into the credit derivative, the events or circumstances that would require the seller to perform under the credit derivative, and the current status of the payment/performance risk of the credit derivative, (2) the maximum potential amount of future payments (undiscounted) the seller could be required to make under the credit derivative, (3) the fair value of the credit derivative, and (4) the natu re of any recourse provisions and assets held either as collateral or by third parties. The amendments to FIN 45 require additional disclosures about the current status of the payment/performance risk of a guarantee. All changes to accounting policies have been made in accordance with the FSP and incorporated for the current period as part of the Notes to Financial Statements and Portfolio of Investments.
B. Security Transactions and Revenue Recognition. Security transactions are accounted for on trade date. Dividend income received from the affiliated funds is recognized on the ex-dividend date and is recorded as income distributions in the Statement of Operations. Capital gain distributions received from the affiliated funds are recognized on ex-dividend date and are recorded on the Statement of Operations as such. Costs used in determining realized gains and losses on the sales of investment securities are on the basis of specific identification.
C. Distributions to Shareholders. The Portfolios record distributions to their shareholders on the ex-dividend date. Each Portfolio distributes
17
NOTES TO FINANCIAL STATEMENTS AS OF DECEMBER 31, 2008 (CONTINUED)
NOTE 2 — SIGNIFICANT ACCOUNTING POLICIES (continued)
dividends and capital gains, if any, annually. The Portfolios may make distributions on a more frequent basis to comply with the distribution requirements of the Internal Revenue Code. The characteristics of income and gains to be distributed are determined in accordance with income tax regulations, which may differ from U.S. generally accepted accounting principles for investment companies.
D. Federal Income Taxes. It is the policy of the Portfolios to comply with subchapter M of the Internal Revenue Code and related excise tax provisions applicable to regulated investment companies and to distribute substantially all of their net investment income and any net realized capital gains to their shareholders. Therefore, no federal income tax provision is required. Management has considered the sustainability of the Portfolios' tax positions taken on federal income tax returns for all open tax years in making this determination. The Board of Directors ("Board") intends to offset any net capital gains with any available capital loss carryforward until each carryforward has been fully utilized or expires. In addition, no capital gain distribution shall be made until the capit al loss carryforward has been fully utilized or expired.
E. Use of Estimates. The preparation of financial statements in conformity with U.S. generally accepted accounting principles requires management to make estimates and assumptions that affect the reported amounts of assets and liabilities and disclosure of contingent assets and liabilities at the date of the financial statements and the reported amounts of increases and decreases in net assets from operations during the reporting period. Actual results could differ from those estimates.
F. Repurchase Agreements. Each Portfolio may invest in repurchase agreements only with government securities dealers recognized by the Board of Governors of the Federal Reserve System. Under such agreements, the seller of the security agrees to repurchase it at a mutually agreed upon time and price. The resale price is in excess of the purchase price and reflects an agreed upon interest rate for the period of time the agreement is outstanding. The period of the repurchase agreements is usually short, from overnight to one week, while the underlying securities generally have longer maturities. Each Portfolio will always receive as collateral securities acceptable to it whose market value is equal to at least 100% of the carrying amount of the repurchase agreements, plus accrued interest, being invested by a Portfolio. The underlying collateral is valued daily on a mark-to-market basis to assure that the value, including accrued interest is at least equal to the repurchase price. There would be potential loss to the Portfolio in the event Portfolio is delayed or prevented from exercising its right to dispose of the collateral, and it might incur disposition costs in liquidating the collateral.
G. Indemnifications. In the normal course of business, the Fund may enter into contracts that provide certain indemnifications. The Fund's maximum exposure under these arrangements is dependent on future claims that may be made against the Portfolios and, therefore, cannot be estimated; however, based on experience, the risk of loss from such claims is considered remote.
NOTE 3 — INVESTMENT MANAGEMENT AND ADMINISTRATIVE FEES
Fidelity Management & Research Company ("FMR") serves as investment adviser to each Master Fund. FMR has day-to-day responsibility for choosing investments for each Master Fund. As shareholders of the Master Funds, the Portfolios indirectly pay a portion of the master-level management fee.
Each Master Fund, VIP Contrafund® Portfolio, VIP Equity-Income Portfolio, VIP Growth Portfolio, and VIP Mid Cap Portfolio, pays FMR a management fee for advisory services at annual rates of 0.56%, 0.46%, 0.56%, and 0.56%, of each respective Master Fund's current average daily net assets. Pursuant to its Investment Management Agreement with the Fund, DSL may charge an annual advisory fee to a respective Portfolio at annual rates equal to 0.58%, 0.48%, 0.58% and 0.58% of average daily net assets if the respective Portfolio does not invest substantially all of its assets in another investment company. If a Portfolio invests substantially all of its assets in another investment company, DSL does not charge an advisory fee. Each Portfolio anticipates investing substantially all of its assets in another investment company.
If a Portfolio invests substantially all of its assets in another investment company, ING Funds Services, LLC will charge an administration fee of 0.05% of average
18
NOTES TO FINANCIAL STATEMENTS AS OF DECEMBER 31, 2008 (CONTINUED)
NOTE 3 — INVESTMENT MANAGEMENT AND ADMINISTRATIVE FEES (continued)
daily net assets for that Portfolio. Pursuant to its administration agreement with the Portfolios, ING Funds Services, LLC may receive an annual administration fee equal to 0.15%, 0.15%, 0.15% and 0.17% of average daily net assets for Contrafund, Equity-Income, Growth and Mid Cap, respectively, if the respective Portfolio does not invest substantially all of its assets in another investment company.
NOTE 4 — INVESTMENT IN UNDERLYING PORTFOLIOS
For the year ended December 31, 2008, the cost of purchases and proceeds from sales of the Master Funds were as follows:
| | | Purchases | | Sales | |
| Contrafund | | $ | 119,067,792 | | | $ | 29,003,933 | | |
| Equity-Income | | | 14,483,570 | | | | 10,499,303 | | |
| Growth | | | 14,307,207 | | | | 6,982,481 | | |
| Mid Cap | | | 24,111,467 | | | | 9,413,411 | | |
NOTE 5 — DISTRIBUTION AND SERVICE FEES
Each Portfolio has adopted a Shareholder Servicing Plan ("Service Plan") for the Class S and Class ADV shares of each Portfolio. Under the Service Plan, a Portfolio makes payments at an annual rate of 0.25% of the Portfolio's average daily net assets attributable to its Class S and Class ADV shares.
Each Portfolio has adopted a Plan of Distribution pursuant to Rule 12b-1 under the 1940 Act ("Distribution Plan") for the Class ADV shares of each Portfolio. The Distribution Plan provides for a distribution fee, payable to IFD as the Fund's Distributor at an annual rate of 0.25% of the Portfolio's average daily net assets attributable to Class ADV shares.
Fidelity Distributors Corporation ("FDC") distributes Service Class 2 shares of each Master Fund. Service Class 2 of each Master Fund currently pays FDC a 12b-1 (service) fee at an annual rate of 0.25% of its average net assets throughout the month. Shareholders of Class S and Class ADV of each respective Portfolio pay only their proportionate share of the Master Fund 12b-1 plan expenses.
NOTE 6 — OTHER TRANSACTIONS WITH AFFILIATES AND RELATED PARTIES
At December 31, 2008, the Portfolios had the following amounts recorded as payable to affiliates on the accompanying Statements of Assets and Liabilities:
| | | Accrued
Administrative
Fees | | Accrued
Shareholder
Service and
Distribution
Fees | | Total | |
| Contrafund | | $ | 11,876 | | | $ | 60,189 | | | $ | 72,065 | | |
| Equity-Income | | | 1,354 | | | | 6,870 | | | | 8,224 | | |
| Growth | | | 1,005 | | | | 5,031 | | | | 6,036 | | |
| Mid Cap | | | 2,058 | | | | 10,680 | | | | 12,738 | | |
At December 31, 2008, the following indirect, wholly-owned subsidiary of ING Groep owned more than 5% of the following Portfolios:
ING Life Insurance and Annuity Company — Contrafund (99.74%); Equity-Income (99.50%); Growth (99.69%); Mid Cap (99.56%).
Control is defined by the 1940 Act as the beneficial ownership, either directly or through one or more controlled companies, of more than 25% of the voting securities of a company. The 1940 Act defines affiliates as companies that are under common control. Therefore, because the Portfolios have a common owner that owns over 25% of the outstanding securities of the Portfolios, they may be deemed to be affiliates of each other. Investment activities of these shareholders could have a material impact on the Portfolios.
The Fund has adopted a Retirement Policy ("Policy") covering all independent directors of the Portfolio who will have served as an independent director for at least five years at the time of retirement. Benefits under this Policy are based on an annual rate as defined in the Policy.
Investors in the Portfolios should recognize that an investment in the Portfolios bears not only a proportionate share of the expenses of the Portfolios (including operating costs and management fees, if any), but also indirectly similar expenses of the underlying mutual funds in which each Portfolio invests. Investors also bear their proportionate share of any sales charges incurred by the Portfolios related to the purchase of shares of the mutual fund investments.
19
NOTES TO FINANCIAL STATEMENTS AS OF DECEMBER 31, 2008 (CONTINUED)
Transactions in capital shares and dollars were as follows:
| | | Shares sold | | Reinvestment
of
distributions | | Shares
redeemed | | Net increase
(decrease)
in shares
outstanding | | Shares sold | | Reinvestment
of
distributions | | Shares
redeemed | | Net increase
(decrease)
in shares
outstanding | |
| Year or period ended | | # | | # | | # | | # | | ($) | | ($) | | ($) | | ($) | |
| Contrafund | | | |
| Class S | | | |
| | 12-31-08 | | | | 9,644,843 | | | | 11,077,484 | | | | (2,720,771 | ) | | | 18,001,556 | | | | 105,378,321 | | | | 102,577,506 | | | | (26,463,339 | ) | | | 181,492,488 | | |
| | 12-31-07 | | | | 11,233,736 | | | | 1,355,770 | | | | (721,415 | ) | | | 11,868,091 | | | | 159,693,325 | | | | 18,452,025 | | | | (10,138,909 | ) | | | 168,006,441 | | |
| Class ADV | | | |
| | 12-31-08 | | | | 118,246 | | | | 168,444 | | | | (191,662 | ) | | | 95,028 | | | | 1,385,830 | | | | 1,549,687 | | | | (2,051,684 | ) | | | 883,833 | | |
| | 12-31-07 | | | | 118,842 | | | | 29,433 | | | | (94,324 | ) | | | 53,951 | | | | 1,665,376 | | | | 398,224 | | | | (1,337,651 | ) | | | 725,949 | | |
| Equity-Income | | | |
| Class S | | | |
| | 12-31-08 | | | | 1,426,932 | | | | 660,593 | | | | (1,103,323 | ) | | | 984,202 | | | | 13,383,194 | | | | 5,905,703 | | | | (10,207,398 | ) | | | 9,081,499 | | |
| | 12-31-07 | | | | 2,086,783 | | | | 290,402 | | | | (487,257 | ) | | | 1,889,928 | | | | 27,022,729 | | | | 3,621,307 | | | | (6,319,144 | ) | | | 24,324,892 | | |
| Class ADV | | | |
| | 12-31-08 | | | | 9,366 | | | | 9,872 | | | | (31,625 | ) | | | (12,387 | ) | | | 84,479 | | | | 87,662 | | | | (239,983 | ) | | | (67,842 | ) | |
| | 12-31-07 | | | | 23,188 | | | | 6,420 | | | | (28,657 | ) | | | 951 | | | | 298,953 | | | | 79,413 | | | | (365,472 | ) | | | 12,894 | | |
| Growth | | | |
| Class S | | | |
| | 12-31-08 | | | | 1,218,202 | | | | 81,706 | | | | (622,235 | ) | | | 677,673 | | | | 14,121,971 | | | | 937,981 | | | | (6,735,493 | ) | | | 8,324,459 | | |
| | 12-31-07 | | | | 1,520,557 | | | | 36,573 | | | | (381,368 | ) | | | 1,175,762 | | | | 19,599,609 | | | | 463,744 | | | | (4,882,310 | ) | | | 15,181,043 | | |
| Class ADV | | | |
| | 12-31-08 | | | | 2,501 | | | | 51 | | | | (2,321 | ) | | | 231 | | | | 31,806 | | | | 582 | | | | (28,528 | ) | | | 3,860 | | |
| | 12-31-07 | | | | 3,893 | | | | 34 | | | | (3,752 | ) | | | 175 | | | | 52,207 | | | | 429 | | | | (50,663 | ) | | | 1,973 | | |
| Mid Cap | | | |
| Class S | | | |
| | 12-31-08 | | | | 943,868 | | | | 339,488 | | | | (677,625 | ) | | | 605,731 | | | | 12,693,295 | | | | 4,549,134 | | | | (8,569,504 | ) | | | 8,672,925 | | |
| | 12-31-07 | | | | 2,285,513 | | | | 72,714 | | | | (190,942 | ) | | | 2,167,285 | | | | 34,715,923 | | | | 1,100,158 | | | | (2,995,720 | ) | | | 32,820,361 | | |
| Class ADV | | | |
| | 12-31-08 | | | | 39,566 | | | | 14,011 | | | | (44,412 | ) | | | 9,165 | | | | 537,123 | | | | 186,341 | | | | (530,545 | ) | | | 192,919 | | |
| | 12-31-07 | | | | 75,712 | | | | 3,230 | | | | (24,673 | ) | | | 54,269 | | | | 1,151,605 | | | | 48,540 | | | | (372,332 | ) | | | 827,813 | | |
NOTE 8 — FEDERAL INCOME TAXES
The amount of distributions from net investment income and net realized capital gains are determined in accordance with federal income tax regulations, which may differ from U.S. generally accepted accounting principles for investment companies. These book/tax differences may be either temporary or permanent. Permanent differences are reclassified within the capital accounts based on their federal tax-basis treatment; temporary differences are not reclassified. Key differences include the treatment of short-term capital gains, foreign currency transactions, and wash sale deferrals. Distributions in excess of net investment income and/or net realized capital gains for tax purposes are reported as return of capital.
The following permanent tax differences have been reclassified as of December 31, 2008:
| | | Undistributed
Net Investment
Income | | Accumulated
Net Realized
Gains/(Losses) | |
| Contrafund | | $ | 321,948 | | | $ | (321,948 | ) | |
| Mid Cap | | | 2,957,474 | | | | (2,957,474 | ) | |
Dividends paid by the Portfolios from net investment income and distributions of net realized short-term capital gains are, for federal income tax purposes, taxable as ordinary income to shareholders.
The tax composition of dividends and distributions to shareholders was as follows:
| | | Year Ended
December 31, 2008 | | Year Ended
December 31, 2007 | |
| | | Ordinary
Income | | Long-Term
Capital Gains | | Ordinary
Income | | Long-Term
Capital Gains | |
| Contrafund | | $ | 20,607,464 | | | $ | 83,519,729 | | | $ | 1,454,608 | | | $ | 17,395,641 | | |
| Equity-Income | | | 1,080,882 | | | | 4,912,483 | | | | 959,239 | | | | 2,741,481 | | |
| Growth | | | 27,897 | | | | 910,666 | | | | 262,206 | | | | 201,967 | | |
| Mid Cap | | | 168,121 | | | | 4,567,354 | | | | 89,615 | | | | 1,059,083 | | |
The tax-basis components of distributable earnings as of December 31, 2008 were:
| | | Undistributed
Ordinary
Income | | Undistributed
Long-Term
Capital Gains | | Unrealized
Appreciation/
(Depreciation) | |
| Contrafund | | $ | 2,521,994 | | | $ | 10,140,567 | | | $ | (273,866,020 | ) | |
| Equity-Income | | | 979,171 | | | | 24,426 | | | | (30,573,096 | ) | |
| Growth | | | 115,451 | | | | 745,448 | | | | (16,004,634 | ) | |
| Mid Cap | | | 2,903,690 | | | | 7,444,937 | | | | (39,942,791 | ) | |
20
NOTES TO FINANCIAL STATEMENTS AS OF DECEMBER 31, 2008 (CONTINUED)
NOTE 8 — FEDERAL INCOME TAXES (continued)
The Portfolios' major tax jurisdictions are federal and Arizona. The earliest tax year that remains subject to examination by these jurisdictions is 2004.
NOTE 9 — OTHER ACCOUNTING PRONOUNCEMENTS
On March 19, 2008, the FASB issued Statement of Financial Accounting Standards No. 161 ("SFAS No. 161"), "Disclosure about Derivative Instruments and Hedging Activities." This new accounting statement requires enhanced disclosures about an entity's derivative and hedging activities. Entities are required to provide enhanced disclosures about (a) how and why an entity invests in derivatives, (b) how derivatives are accounted for under SFAS No. 133, and (c) how derivatives affect an entity's financial position, financial performance, and cash flows. SFAS No. 161 also requires enhanced disclosures regarding credit-risk-related contingent features of derivative instruments. SFAS No. 161 is effective for financial statements issued for fiscal years and interim periods beginning after November 15, 2008. As of December 31, 2008, management of the Portfolios is currently assessing the impact of the expanded financial statement disclosures that will result from adopting SFAS No. 161.
NOTE 10 — INFORMATION REGARDING TRADING OF ING'S U.S. MUTUAL FUNDS
As discussed in earlier supplements that were previously filed with the SEC, DSL, the adviser to the ING Funds, has reported to the Boards of Directors/Trustees (the "Boards") of the ING Funds that, like many U.S. financial services companies, ING Investments and certain of its U.S. affiliates have received informal and formal requests for information since September 2003 from various governmental and self-regulatory agencies in connection with investigations related to mutual funds and variable insurance products. DSL has advised the Boards that it and its affiliates have cooperated fully with each request.
In addition to responding to regulatory and governmental requests, DSL reported that management of U.S. affiliates of ING Groep N.V., including DSL (collectively, "ING"), on their own initiative, have conducted, through independent special counsel and a national accounting firm, an extensive internal review of trading in ING insurance, retirement, and mutual fund products. ING's internal review related to mutual fund trading has been completed. ING has reported that, of the millions of customer relationships that ING maintains, the internal review identified several isolated arrangements allowing third parties to engage in frequent trading of mutual funds within ING's variable insurance and mutual fund products, and identified other circumstances where frequent trading occurred, despite measures taken by ING intended to combat market timing. ING further reported that eac h of these arrangements has been terminated and fully disclosed to regulators. The results of the internal review were also reported to the independent members of the Boards.
DSL has advised the Boards that most of the identified arrangements were initiated prior to ING's acquisition of the businesses in question in the U.S. DSL further reported that the companies in question did not receive special benefits in return for any of these arrangements, which have all been terminated.
Based on the internal review, DSL has advised the Boards that the identified arrangements do not represent a systemic problem in any of the companies that were involved.
Despite the extensive internal review conducted through independent special counsel and a national accounting firm, there can be no assurance that the instances of inappropriate trading reported to the Boards are the only instances of such trading respecting the ING Funds.
DSL reported to the Boards that ING is committed to conducting its business with the highest standards of ethical conduct with zero tolerance for noncompliance. Accordingly, DSL advised the Boards that ING management was disappointed that its voluntary internal review identified these situations. Viewed in the context of the breadth and magnitude of its U.S. business as a whole, ING management does not believe that ING's acquired companies had systemic ethical or compliance issues in these areas. Nonetheless, DSL reported that given ING's refusal to tolerate any lapses, it has taken the steps noted below, and will continue to seek opportunities to further strengthen the internal controls of its affiliates.
• ING has agreed with the ING Funds to indemnify and hold harmless the ING Funds from all damages resulting from wrongful conduct by ING or its employees or from ING's internal investigation, any investigations conducted by any governmental or self-regulatory agencies, litigation or other formal proceedings, including any proceedings by the SEC. DSL reported to the Boards that the indemnification commitments made by ING Funds related to mutual
21
NOTES TO FINANCIAL STATEMENTS AS OF DECEMBER 31, 2008 (CONTINUED)
NOTE 10 — INFORMATION REGARDING TRADING OF ING'S U.S. MUTUAL FUNDS (continued)
fund trading have been settled and restitution amounts prepared by an independent consultant have been paid to the affected ING Funds.
• ING updated its Code of Conduct for employees reinforcing its employees' obligation to conduct personal trading activity consistent with the law, disclosed limits, and other requirements.
Other Regulatory Matters
The New York Attorney General and other federal and state regulators are also conducting broad inquiries and investigations involving the insurance industry. These initiatives currently focus on, among other things, compensation and other sales incentives; potential conflicts of interest; potential anti- competitive activity; reinsurance; marketing practices (including suitability); specific product types (including group annuities and indexed annuities); fund selection for investment products and brokerage sales; and disclosure. It is likely that the scope of these industry investigations will further broaden before they conclude. ING has received formal and informal requests in connection with such investigations, and is cooperating fully with each request.
Other federal and state regulators could initiate similar actions in this or other areas of ING's businesses. These regulatory initiatives may result in new legislation and regulation that could significantly affect the financial services industry, including businesses in which ING is engaged. In light of these and other developments, ING continuously reviews whether modifications to its business practices are appropriate. At this time, in light of the current regulatory factors, ING U.S. is actively engaged in reviewing whether any modifications in our practices are appropriate for the future.
There can be no assurance that these matters, or the adverse publicity associated with them, will not result in increased fund redemptions, reduced sale of fund shares, or other adverse consequences to ING Funds.
22
PORTFOLIO OF INVESTMENTS
ING FIDELITY® VIP CONTRAFUND® PORTFOLIO AS OF DECEMBER 31, 2008
| Shares | | | | | | Value | |
| AFFILIATED MASTER FUND: 100.0% | |
| | 19,427,914 | | | Fidelity® VIP Contrafund® Portfolio - Service Class 2 Shares | | | | | | $ | 294,138,616 | | |
| | | Total Investments in Affiliated Master Fund
(Cost $556,277,500)* | | | 100.0 | % | | $ | 294,138,616 | | |
| | | Other Assets and Liabilities - Net | | | (0.0 | ) | | | (71,754 | ) | |
| | | Net Assets | | | 100.0 | % | | $ | 294,066,862 | | |
* Cost for federal income tax purposes is $568,004,636.
| Net unrealized depreciation consists of: | |
| Gross Unrealized Appreciation | | $ | — | | |
| Gross Unrealized Depreciation | | | (273,866,020 | ) | |
| Net Unrealized Depreciation | | $ | (273,866,020 | ) | |
The following table summarizes the inputs used as of December 31, 2008 in determining the Portfolio's investments at fair value for purposes of SFAS 157:
| | | Investments in
Securities | | Other Financial
Instruments* | |
| Level 1 — Quoted Prices | | $ | 294,138,616 | | | $ | — | | |
Level 2 — Other Significant
Observable Inputs | | | — | | | | — | | |
Level 3 — Significant
Unobservable Inputs | | | — | | | | — | | |
| Total | | $ | 294,138,616 | | | $ | — | | |
"Fair value" for purposes of SFAS 157 is different from "fair value" as used in the 1940 Act. The former generally implies market value, and can include market quotations as a source of value, and the latter refers to determinations of actual value in absence of available market quotations.
* Other financial instruments may include forward foreign currency contracts, futures, swaps, and written options. Forward foreign currency contracts and futures are reported at their unrealized gain/loss at year end. Swaps and written options are reported at their market value at year end.
See Accompanying Notes to Financial Statements
23
PORTFOLIO OF INVESTMENTS
ING FIDELITY® VIP EQUITY-INCOME PORTFOLIO AS OF DECEMBER 31, 2008
| Shares | | | | | | Value | |
| AFFILIATED MASTER FUND: 100.0% | |
| | 2,551,202 | | | Fidelity® VIP Equity-Income Portfolio - Service Class 2 Shares | | | | | | $ | 33,165,625 | | |
| | | Total Investments in Affiliated Master Fund
(Cost $60,463,537)* | | | 100.0 | % | | $ | 33,165,625 | | |
| | | Other Assets and Liabilities - Net | | | (0.0 | ) | | | (7,249 | ) | |
| | | Net Assets | | | 100.0 | % | | $ | 33,158,376 | | |
* Cost for federal income tax purposes is $63,738,721.
| Net unrealized depreciation consists of: | |
| Gross Unrealized Appreciation | | $ | — | | |
| Gross Unrealized Depreciation | | | (30,573,096 | ) | |
| Net Unrealized Depreciation | | $ | (30,573,096 | ) | |
The following table summarizes the inputs used as of December 31, 2008 in determining the Portfolio's investments at fair value for purposes of SFAS 157:
| | | Investments in
Securities | | Other Financial
Instruments* | |
| Level 1 — Quoted Prices | | $ | 33,165,625 | | | $ | — | | |
Level 2 — Other Significant
Observable Inputs | | | — | | | | — | | |
Level 3 — Significant
Unobservable Inputs | | | — | | | | — | | |
| Total | | $ | 33,165,625 | | | $ | — | | |
"Fair value" for purposes of SFAS 157 is different from "fair value" as used in the 1940 Act. The former generally implies market value, and can include market quotations as a source of value, and the latter refers to determinations of actual value in absence of available market quotations.
* Other financial instruments may include forward foreign currency contracts, futures, swaps, and written options. Forward foreign currency contracts and futures are reported at their unrealized gain/loss at year end. Swaps and written options are reported at their market value at year end.
See Accompanying Notes to Financial Statements
24
PORTFOLIO OF INVESTMENTS
ING FIDELITY® VIP GROWTH PORTFOLIO AS OF DECEMBER 31, 2008
| Shares | | | | | | Value | |
| AFFILIATED MASTER FUND: 100.0% | |
| | 1,052,235 | | | Fideility® VIP Growth Portfolio - Service Class 2 shares | | | | | | $ | 24,527,588 | | |
| | | Total Investments in Affiliated Master Fund
(Cost $39,855,484)* | | | 100.0 | % | | $ | 24,527,588 | | |
| | | Other Assets and Liabilities - Net | | | 0.0 | | | | (6,034 | ) | |
| | | Net Assets | | | 100.0 | % | | $ | 24,521,554 | | |
* Cost for federal income tax purposes is $40,532,222.
| Net unrealized depreciation consists of: | |
| Gross Unrealized Appreciation | | $ | — | | |
| Gross Unrealized Depreciation | | | (16,004,634 | ) | |
| Net Unrealized Depreciation | | $ | (16,004,634 | ) | |
The following table summarizes the inputs used as of December 31, 2008 in determining the Portfolio's investments at fair value for purposes of SFAS 157:
| | | Investments in
Securities | | Other Financial
Instruments* | |
| Level 1 — Quoted Prices | | $ | 24,527,588 | | | $ | — | | |
Level 2 — Other Significant
Observable Inputs | | | — | | | | — | | |
Level 3 — Significant
Unobservable Inputs | | | — | | | | — | | |
| Total | | $ | 24,527,588 | | | $ | — | | |
"Fair value" for purposes of SFAS 157 is different from "fair value" as used in the 1940 Act. The former generally implies market value, and can include market quotations as a source of value, and the latter refers to determinations of actual value in absence of available market quotations.
* Other financial instruments may include forward foreign currency contracts, futures, swaps, and written options. Forward foreign currency contracts and futures are reported at their unrealized gain/loss at year end. Swaps and written options are reported at their market value at year end.
See Accompanying Notes to Financial Statements
25
PORTFOLIO OF INVESTMENTS
ING FIDELITY® VIP MID CAP PORTFOLIO AS OF DECEMBER 31, 2008
| Shares | | | | | | Value | |
| AFFILIATED MASTER FUND: 100.0% | |
| | 2,825,789 | | | Fidelity® VIP MidCap Portfolio - Service Class 2 Shares | | | | | | $ | 51,203,296 | | |
| | | Total Investments in Affiliated Master Fund
(Cost $89,204,495)* | | | 100.0 | % | | $ | 51,203,296 | | |
| | | Other Assets and Liabilities - Net | | | (0.0 | ) | | | (12,474 | ) | |
| | | Net Assets | | | 100.0 | % | | $ | 51,190,822 | | |
* Cost for federal income tax purposes is $91,146,087.
| Net unrealized depreciation consists of: | |
| Gross Unrealized Appreciation | | $ | — | | |
| Gross Unrealized Depreciation | | | (39,942,791 | ) | |
| Net Unrealized Depreciation | | $ | (39,942,791 | ) | |
The following table summarizes the inputs used as of December 31, 2008 in determining the Portfolio's investments at fair value for purposes of SFAS 157:
| | | Investments in
Securities | | Other Financial
Instruments* | |
| Level 1 — Quoted Prices | | $ | 51,203,296 | | | $ | — | | |
Level 2 — Other Significant
Observable Inputs | | | — | | | | — | | |
Level 3 — Significant
Unobservable Inputs | | | — | | | | — | | |
| Total | | $ | 51,203,296 | | | $ | — | | |
"Fair value" for purposes of SFAS 157 is different from "fair value" as used in the 1940 Act. The former generally implies market value, and can include market quotations as a source of value, and the latter refers to determinations of actual value in absence of available market quotations.
* Other financial instruments may include forward foreign currency contracts, futures, swaps, and written options. Forward foreign currency contracts and futures are reported at their unrealized gain/loss at year end. Swaps and written options are reported at their market value at year end.
See Accompanying Notes to Financial Statements
26
TAX INFORMATION (UNAUDITED)
Dividends paid during the year ended December 31, 2008 were as follows:
| Fund Name | | Type | | Per Share Amount | |
| ING Fidelity® VIP Contrafund® Portfolio | |
| Class ADV | | NII | | $ | 0.5728 | | |
| Class S | | NII | | $ | 0.6206 | | |
| All Classes | | STCG | | $ | 0.0001 | | |
| All Classes | | LTCG | | $ | 2.5127 | | |
| ING Fidelity® VIP Equity-Income Portfolio | |
| Class ADV | | NII | | $ | 0.1785 | | |
| Class S | | NII | | $ | 0.2246 | | |
| All Classes | | LTCG | | $ | 1.0176 | | |
| Fund Name | | Type | | Per Share Amount | |
| ING Fidelity® VIP Growth Portfolio | |
| Class ADV | | NII | | $ | — | | |
| Class S | | NII | | $ | 0.0085 | | |
| All Classes | | LTCG | | $ | 0.2773 | | |
| ING Fidelity® VIP Mid Cap Portfolio | |
| Class ADV | | NII | | $ | — | | |
| Class S | | NII | | $ | 0.0324 | | |
| All Classes | | LTCG | | $ | 0.8443 | | |
NII — Net investment income
STCG — Short-term capital gain
LTCG — Long-term capital gain
Of the ordinary distributions made during the year ended December 31, 2008, the following percentages qualify for the dividends received deduction (DRD) available to corporate shareholders:
| ING Fidelity® VIP Contrafund® Portfolio | | | 15.67 | % | |
| ING Fidelity® VIP Equity-Income Portfolio | | | 100.00 | % | |
| ING Fidelity® VIP Growth Portfolio | | | 100.00 | % | |
| ING Fidelity® VIP Mid Cap Portfolio | | | 97.30 | % | |
Above figures may differ from those cited elsewhere in this report due to differences in the calculation of income and gains under U.S. generally accepted accounting principles (book) purposes and Internal Revenue Service (tax) purposes.
Shareholders are strongly advised to consult their own tax advisers with respect to the tax consequences of their investments in the Portfolios. In January, shareholders, excluding corporate shareholders, receive an IRS 1099-DIV regarding the federal tax status of the dividends and distributions they received in the calendar year.
27
DIRECTOR AND OFFICER INFORMATION (UNAUDITED)
The business and affair of the Funds are managed under the direction of the Funds' Board. A Director who is not an interested person of the Funds, as defined in the 1940 Act, is an independent director ("Independent Director"). The Directors and Officers of the Fund are listed below. The Statement of Additional Information includes additional information about directors of the Funds and is available, without charge, upon request at (800) 992-0180.
Name, Address,
and Age | | Position(s)
Held With
Trust | | Term of
Office and
Length of
Time
Served(1) | | Principal
Occupation(s) -
During the
Past 5 Years | | Number of
Portfolios in
Fund Complex
Overseen
by Trustee(2) | | Other
Directorships/
Trusteeships
Held by
Director/Trustee | |
| Independent Directors: | |
|
Colleen D. Baldwin
7337 E. Doubletree Ranch Rd.
Scottsdale, Arizona 85258
Age: 48 | | Director | | November 2007 - Present | | President, National Charity League/Canaan Parish Board (June 2008 - Present) and Consultant (January 2005 - Present). Formerly, Chief Operating Officer, Ivy Asset Management Group (April 2002 - October 2004) | | | 161 | | | None. | |
|
John V. Boyer(4)
7337 E. Doubletree Ranch Rd.
Scottsdale, Arizona 85258
Age: 55 | | Director | | November 1997 - Present | | President, Bechtler Arts Foundation (March 2008 - Present). Formerly, Consultant (July 2007 - February 2008); President and Chief Executive Officer, Franklin and Eleanor Roosevelt Institute (March 2006 - July 2007); and Executive Director, The Mark Twain House & Museum (September 1989 - November 2005). | | | 161 | | | None. | |
|
Patricia W. Chadwick
7337 E. Doubletree Ranch Rd.
Scottsdale, Arizona 85258
Age: 60 | | Director | | January 2006 - Present | | Consultant and President of self-owned company, Ravengate Partners LLC (January 2000 - Present). | | | 161 | | | Wisconsin Energy Corporation (June 2006 - Present). | |
|
Peter S. Drotch
7337 E. Doubletree Ranch Rd.
Scottsdale, Arizona 85258
Age: 66 | | Director | | November 2007 - Present | | Retired partner, PricewaterhouseCoopers, LLP. | | | 161 | | | First Marblehead Corporation (October 2003 - Present). | |
|
J. Michael Earley
7337 E. Doubletree Ranch Rd.
Scottsdale, Arizona 85258
Age: 63 | | Director | | January 2005 - Present | | Retired. Formerly, President and Chief Executive Officer, Bankers Trust Company, N.A., Des Moines (June 1992 - Present). | | | 161 | | | Bankers Trust Company, N.A. (June 1992 - Present) and Midamerica Financial Corporation (December 2002 - Present). | |
|
Patrick W. Kenny
7337 E. Doubletree Ranch Rd.
Scottsdale, Arizona 85258
Age: 65 | | Director | | March 2002 - Present | | President and Chief Executive Officer, International Insurance Society (June 2001 - Present). | | | 161 | | | Assured Guaranty Ltd. (April 2004 - Present) and Odyssey Re Holdings Corporation (November 2006 - Present). | |
|
Sheryl K. Pressler
7337 E. Doubletree Ranch Rd.
Scottsdale, Arizona 85258
Age: 58 | | Director | | January 2006 - Present | | Consultant (May 2001 - Present). | | | 161 | | | Global Alternative Asset Management, Inc. (October 2007 - Present) and Stillwater Mining Company (May 2002 - Present). | |
|
Roger B. Vincent
7337 E. Doubletree Ranch Rd.
Scottsdale, Arizona 85258
Age: 63 | | Director | | January 2005 - Present | | President, Springwell Corporation (March 1989 - Present). | | | 161 | | | UGI Corporation (February 2006 - Present) and UGI Utilities, Inc. (February 2006 - Present). | |
|
28
DIRECTOR AND OFFICER INFORMATION (UNAUDITED) (CONTINUED)
Name, Address,
and Age | | Position(s)
Held With
Trust | | Term of
Office and
Length of
Time
Served(1) | | Principal
Occupation(s) -
During the
Past 5 Years | | Number of
Portfolios in
Fund Complex
Overseen
by Trustee(2) | | Other
Directorships/
Trusteeships
Held by
Director/Trustee | |
| Trustees who are "Interested Persons": | |
|
Robert W. Crispin(5)
7337 E. Doubletree Ranch Rd.
Scottsdale, Arizona 85258
Age: 62 | | Director | | November 2007 - Present | | Retired. Chairman and Chief Investment Officer, ING Investment Management Co. (June 2001 - December 2007). | | | 161 | | | ING Canada Inc. (December 2004 - Present) and ING Bank, fsb (June 2001 - Present). | |
|
Shaun P. Mathews(3)(5)
7337 E. Doubletree Ranch Rd.
Scottsdale, Arizona 85258
Age: 53 | | Director | | November 2007 - Present | | President and Chief Executive Officer, ING Investments, LLC(5) (November 2006 - Present). Formerly, President, ING Mutual Funds and Investment Products (November 2004 - November 2006); Chief Marketing Officer, ING USFS (April 2002 - October 2004); and Head of Rollover/Payout (October 2001 - December 2003). | | | 200 | | | ING Services Holding Company, Inc. (May 2000 - Present); Southland Life Insurance Company (June 2002 - Present); and ING Capital Corporation, LLC, ING Funds Distributor, LLC(6), ING Funds Services, LLC(7), ING Investments, LLC(5) and ING Pilgrim Funding, Inc. (December 2006 - Present). | |
|
(1) Directors serve until their successors are duly elected and qualified. The tenure of each Director is subject to the Board's retirement policy, which states that each Independent Director shall retire from service as a Director at the conclusion of the first regularly scheduled meeting of the Board that is held after (a) the Director reaches the age of 70, if that Director qualifies for a retirement benefit as discussed in the board's retirement policy; or (b) the Director reaches the age of 72 or has served as a Director for 15 years, whichever comes first, if that Director does not qualify for the retirement benefit. A unanimous vote of the Board may extend the retirement date of a Director for up to one year. An extension may be permitted if the retirement would trigger a requirement to hold a meeting of shareholders of the Fund under applicable law, whether for purposes of appointing a successor to the Directo r or if otherwise necessary under applicable law, in which case the extension would apply until such time as the shareholder meeting can be held or is no longer needed.
(2) For the purposes of this table (except for Mr. Mathews),"Fund Complex" means the following investment companies: ING Asia Pacific High Dividend Equity Income Fund, ING Equity Trust; ING Funds Trust; ING Global Equity Dividend and Premium Opportunity Fund; ING Global Advantage and Premium Opportunity Fund; ING International High Dividend Equity Income Fund; ING Investors Trust; ING Mayflower Trust; ING Mutual Funds; ING Prime Rate Trust; ING Risk Managed Natural Resources Fund; ING Senior Income Fund; ING Separate Portfolios Trust; ING Variable Insurance Trust; ING Variable Products Trust; and ING Partners, Inc.
(3) For Mr. Mathews, the Fund Complex also includes the following investment companies: ING Series Fund, Inc.; ING Strategic Allocation Portfolios, Inc.; ING Variable Funds; ING Variable Portfolios, Inc.; ING VP Balanced Portfolio, Inc.; ING VP Intermediate Bond Portfolio; and ING VP Money Market Portfolio.
(4) Mr. Boyer held a seat on the Board of Directors of The Mark Twain House & Museum from September 1989 to November 2005. ING Groep N.V. makes non-material, charitable contributions to The Mark Twain House & Museum.
(5) Messrs. Mathews and Crispin are deemed to be "interested persons" of the Fund as defined in the 1940 Act because of their relationship with ING Groep, N.V., the parent corporation of the Manager, ING Investment Manager.
(6) ING Investments, LLC was previously named ING Pilgrim Investments, LLC. ING Pilgrim Investments, LLC is the successor in interest to ING Pilgrim Investments, Inc., which was previously known as Pilgrim Investments, Inc. and before that was known as Pilgrim America Investments, Inc.
(7) ING Funds Distributor, LLC is the successor in interest to ING Funds Distributor, Inc., which was previously known as ING Pilgrim Securities, Inc., and before that was known as Pilgrim Securities, Inc., and before that was known as Pilgrim America Securities, Inc.
(8) ING Funds Services, LLC was previously named ING Pilgrim Group, LLC. ING Pilgrim Group, LLC is the successor in interest to ING Pilgrim Group, Inc., which was previously known as Pilgrim Group, Inc. and before that was known as Pilgrim America Group, Inc.
29
DIRECTOR AND OFFICER INFORMATION (UNAUDITED) (CONTINUED)
Name, Address
and Age | | Position(s)
Held With the Trust | | Term of Office and
Length of Time Served(1) | | Principal Occupation(s) - During the
Past 5 Years | |
Shaun P. Mathews(5)
7337 East Doubletree Ranch Rd.
Scottsdale, Arizona 85258
Age: 53 | | President and Chief Executive Officer | | November 2006 - Present | | President and Chief Executive Officer, ING Investments, LLC (November 2006 - Present). Formerly, President, ING Mutual Funds and Investment Products (November 2004 - November 2006); Chief Marketing Officer, ING USFS (April 2002 - October 2004); and Head of Rollover/Payout (October 2001 - December 2003). | |
|
Michael J. Roland
7337 East Doubletree Ranch Rd.
Scottsdale, Arizona 85258
Age: 50 | | Executive Vice President | | January 2005 - Present | | Head of Mutual Fund Platform (February 2007 - Present) and Executive Vice President, ING Investments, LLC(2) and ING Funds Services, LLC(3) (December 2001 - Present). Formerly, Executive Vice President, Head of Product Management (January 2005 - January 2007); Chief Compliance Officer, ING Investments, LLC(2) and Directed Services LLC(6) (October 2004 - December 2005); and Chief Financial Officer and Treasurer, ING Investments, LLC(2) (December 2001 - March 2005). | |
|
Stanley D. Vyner
230 Park Avenue
New York, New York 10169
Age: 58 | | Executive Vice President | | January 2005 - Present | | Executive Vice President, ING Investments, LLC(2) (July 2000 - Present) and Chief Investment Risk Officer, ING Investments, LLC(2) (January 2003 - Present). | |
|
Joseph M. O'Donnell
7337 East Doubletree Ranch Rd.
Scottsdale, Arizona 85258
Age: 54 | | Executive Vice President and Chief Compliance Officer | | March 2006 - Present
January 2005 - Present | | Chief Compliance Officer of the ING Funds (November 2004 - Present) and Executive Vice President of the ING Funds (March 2006 - Present). Formerly, Chief Compliance Officer of ING Investments, LLC(2) (March 2006 - July 2008); Investment Advisor Chief Compliance Officer, Directed Services LLC(6) (March 2006 - July 2008) ING Life Insurance and Annuity Company (March 2006 - December 2006); and Vice President, Chief Legal Counsel, Chief Compliance Officer and Secretary of Atlas Securities, Inc., Atlas Advisers, Inc. and Atlas Funds (October 2001 - October 2004). | |
|
Todd Modic
7337 East Doubletree Ranch Rd.
Scottsdale, Arizona 85258
Age: 41 | | Senior Vice President, Chief/Principal Financial Officer and Assistant Secretary | | March 2005 - Present | | Senior Vice President, ING Funds Services, LLC(3) (March 2005 - Present). Formerly, Vice President, ING Funds Services, LLC(3) (September 2002 - March 2005). | |
|
Kimberly A. Anderson
7337 East Doubletree Ranch Rd.
Scottsdale, Arizona 85258
Age: 44 | | Senior Vice President | | January 2005 - Present | | Senior Vice President, ING Investments, LLC(2) (October 2003 - Present). | |
|
Robert Terris
7337 East Doubletree Ranch Rd.
Scottsdale, Arizona 85258
Age: 38 | | Senior Vice President | | May 2006 - Present | | Senior Vice President, Head of Division Operations, ING Funds Services, LLC(3) (May 2006 - Present). Formerly, Vice President of Administration, ING Funds Services, LLC(3) (October 2001 - March 2006). | |
|
30
DIRECTOR AND OFFICER INFORMATION (UNAUDITED) (CONTINUED)
Name, Address
and Age | | Position(s)
Held With the Trust | | Term of Office and
Length of Time Served(1) | | Principal Occupation(s) - During the
Past 5 Years | |
Ernest J. C'DeBaca
7337 East Doubletree Ranch Rd.
Scottsdale, Arizona 85258
Age: 39 | | Senior Vice President | | May 2006 - Present | | Chief Compliance Officer, ING Investments, LLC(2) (July 2008 - Present); Investment Advisor Chief Compliance Officer, Directed Services LLC(6) (July 2008 - Present); Head of Retail Compliance, ING Funds Distributor, LLC(4) and ING Funds Services, LLC(3), (July 2008 - Present); and Senior Vice President, ING Investments, LLC(2) (December 2006 - Present), ING Funds Services, LLC(3) (April 2006 - Present), ING Funds Distributor, LLC(4) (July 2008 - Present), and Directed Services LLC(6) (July 2008 - Present). Formerly, Counsel, ING Americas, U.S. Legal Services (January 2004 - March 2006) and Attorney-Adviser, U.S. Securities and Exchange Commission (May 2001 - December 2003). | |
|
Robyn L. Ichilov
7337 East Doubletree Ranch Rd.
Scottsdale, Arizona 85258
Age: 41 | | Vice President and Treasurer | | January 2005 - Present | | Vice President and Treasurer, ING Funds Services, LLC(3) (November 1995 - Present) and ING Investments, LLC(2) (August 1997 - Present). | |
|
Lauren D. Bensinger
7337 East Doubletree Ranch Rd.
Scottsdale, Arizona 85258
Age: 54 | | Vice President | | January 2005 - Present | | Vice President and Chief Compliance Officer, ING Funds Distributor, LLC(4) (August 1995 - Present); Vice President, ING Investments, LLC(2) and ING Funds Services, LLC(3) (February 1996 - Present); and Director of Compliance, ING Investments, LLC(2) (October 2004 - Present). Formerly, Chief Compliance Officer, ING Investments, LLC(2) (October 2001 - October 2004). | |
|
William Evans
10 State House Square
Hartford, Connecticut 06103
Age: 36 | | Vice President | | September 2007 - Present | | Vice President, Head of Mutual Fund Advisory Group (April 2007 - Present). Formerly, Vice President, U.S. Mutual Funds and Investment Products (May 2005 - April 2007) and Senior Fund Analyst, U.S. Mutual Funds and Investment Products (May 2002 - May 2005). | |
|
Maria M. Anderson
7337 East Doubletree Ranch Rd.
Scottsdale, Arizona 85258
Age: 50 | | Vice President | | January 2005 - Present | | Vice President, ING Funds Services, LLC(3) (September 2004 - Present). Formerly, Assistant Vice President, ING Funds Services, LLC(3) (October 2001 - September 2004). | |
|
Denise Lewis
7337 East Doubletree Ranch Rd.
Scottsdale, Arizona 85258
Age: 45 | | Vice President | | January 2007 - Present | | Vice President, ING Funds Services, LLC (December 2006 - Present). Formerly, Senior Vice President, UMB Investment Services Group, LLC (November 2003 - December 2006). | |
|
Kimberly K. Springer
7337 East Doubletree Ranch Rd.
Scottsdale, Arizona 85258
Age: 51 | | Vice President | | March 2006 - Present | | Vice President, ING Funds Services, LLC(3) (March 2006 - Present). Formerly, Assistant Vice President, ING Funds Services, LLC(3) (August 2004 - March 2006) and Manager, Registration Statements, ING Funds Services, LLC(3) (May 2003 - August 2004). | |
|
Susan P. Kinens
7337 East Doubletree Ranch Rd.
Scottsdale, Arizona 85258
Age: 32 | | Assistant Vice President | | January 2005 - Present | | Assistant Vice President, ING Funds Services, LLC(3) (December 2002 - Present). | |
|
Craig Wheeler
7337 East Doubletree Ranch Rd.
Scottsdale, Arizona 85258
Age: 39 | | Assistant Vice President | | May 2008 - Present | | Assistant Vice President - Director of Tax, ING Funds Services (March 2008 - Present). Formerly, Tax Manager, ING Funds Services (March 2005 - March 2008); Tax Senior, ING Funds Services (January 2004 - March 2005); and Tax Senior, KPMG LLP (August 2002 - December 2003). | |
|
31
DIRECTOR AND OFFICER INFORMATION (UNAUDITED) (CONTINUED)
Name, Address
and Age | | Position(s)
Held With the Trust | | Term of Office and
Length of Time Served(1) | | Principal Occupation(s) - During the
Past 5 Years | |
Huey P. Falgout, Jr.
7337 East Doubletree Ranch Rd.
Scottsdale, Arizona 85258
Age: 45 | | Secretary | | August 2003 - Present | | Chief Counsel, ING Americas, U.S. Legal Services (September 2003 - Present). | |
|
Theresa K. Kelety
7337 East Doubletree Ranch Rd.
Scottsdale, Arizona 85258
Age: 45 | | Assistant Secretary | | August 2003 - Present | | Senior Counsel, ING Americas, U.S. Legal Services (April 2008 - Present). Formerly, Counsel, ING Americas, U.S. Legal Services (April 2003 - April 2008). | |
|
Kathleen Nichols
7337 East Doubletree Ranch Rd.
Scottsdale, Arizona 85258
Age: 33 | | Assistant Secretary | | May 2008 - Present | | Counsel, ING Americas, U.S. Legal Services (February 2008 - Present). Formerly, Associate, Ropes & Gray LLP (September 2005 - February 2008) | |
|
(1) The officers hold office until the next annual meeting of the Trustees and until their successors shall have been elected and qualified.
(2) ING Investments, LLC was previously named ING Pilgrim Investments, LLC. ING Pilgrim Investments, LLC is the successor in interest to ING Pilgrim Investments, Inc., which was previously known as Pilgrim Investments, Inc. and before that was known as Pilgrim America Investments, Inc.
(3) ING Funds Services, LLC was previously named ING Pilgrim Group, LLC. ING Pilgrim Group, LLC is the successor in interest to ING Pilgrim Group, Inc., which was previously known as Pilgrim Group, Inc. and before that was known as Pilgrim America Group, Inc.
(4) ING Funds Distributor, LLC is the successor in interest to ING Funds Distributor, Inc., which was previously known as ING Pilgrim Securities, Inc., and before that was known as Pilgrim Securities, Inc., and before that was known as Pilgrim America Securities, Inc.
(5) Mr. Mathews commenced services as CEO and President of the ING Funds on November 11, 2006.
(6) Directed Services, LLC is the successor in interest to Directed Services, Inc.
32
ADVISORY CONTRACT APPROVAL DISCUSSION (UNAUDITED)
BOARD CONSIDERATION AND RE-APPROVAL OF INVESTMENT ADVISORY CONTRACT
Section 15(c) of the Investment Company Act of 1940, as amended (the "1940 Act") provides that, after an initial period, the Portfolios' existing investment advisory contract will remain in effect only if the Board of Directors (the "Board") of ING Partners, Inc. (the "Company"), including a majority of Board members who have no direct or indirect interest in the advisory contract, and who are not "interested persons" of the Company, as such term is defined under the 1940 Act (the "Independent Directors"), annually review and approve the contract. Thus, at a meeting held on November 14, 2008, the Board, including a majority of the Independent Directors, considered whether to renew the investment advisory contract (the "Advisory Contract") between Directed Services LLC (the "Adviser") and the Company, on behalf of the Portfolios.
The Independent Directors also held separate meetings on October 24 and November 12, 2008 to consider the renewal of the Advisory Contract. As a result, subsequent references herein to factors considered and determinations made by the Independent Directors include, as applicable, factors considered and determinations made on those earlier dates by the Independent Directors.
At its November 14, 2008 meeting, the Board voted to renew the Advisory Contract for the Portfolios. In reaching this decision, the Board took into account information furnished to it throughout the year at regular meetings of the Board and the Board's committees, as well as information prepared specifically in connection with the annual renewal process. Determinations by the Independent Directors also took into account various factors that they believed, in light of the legal advice furnished to them by K&L Gates LLP ("K&L Gates"), their independent legal counsel, and their own business judgment, to be relevant. Further, while the advisory contracts for all the ING Funds were considered at the same Board meeting, the Directors considered each Portfolio's advisory relationship separately.
Provided below is an overview of the Board's contract approval process in general, as well as a discussion of certain specific factors that the Board considered at its renewal meeting. While the Board gave its attention to the information furnished, at its request, that was most relevant to its considerations, discussed below are a number of the primary factors relevant to the Board's consideration as to whether to renew the Advisory Contract for the one-year period ending November 30, 2009. Each Board member may have accorded different weight to the various factors in reaching his or her conclusions with respect to each Portfolio's advisory arrangement.
Overview of the Contract Renewal and Approval Process
Several years ago, the Independent Directors instituted a revised process by which they seek and consider relevant information when they decide whether to approve new or existing advisory arrangements for the investment companies in the ING Funds complex under their jurisdiction, including the Portfolios' existing Advisory Contract. Among other actions, the Independent Directors: retained the services of independent consultants with experience in the mutual fund industry to assist the Independent Directors in working with the personnel employed by the Adviser or its affiliates who administer the Portfolios ("Management") to identify the types of information presented to the Board to inform its deliberations with respect to advisory relationships and to help evaluate that information; established a specific format in which certain requested information is provided to the Board; and determined the process for reviewing such information in conn ection with advisory contract renewal and approval. The end result was an enhanced process which is currently employed by the Independent Directors to review and analyze information in connection with their annual renewal of the ING Funds' advisory contracts, as well as their review and approval of new advisory relationships.
Since the current renewal and approval process was first implemented, the Board's membership has changed substantially through periodic retirements of some Directors and the appointment and election of new Directors. In addition, throughout this period the Independent Directors have reviewed and refined the renewal and approval process at least annually. The Board also established a Contracts Committee and two Investment Review Committees, including the Domestic Equity Investment Review Committee (the "DE IRC"). Among other matters, the Contracts Committee provides oversight with respect to the contracts renewal process, and the Portfolios are assigned to the DE IRC, which provides oversight regarding, among other matters, investment performance.
The type and format of the information provided to the Board or to legal counsel for the Independent Directors in connection with the contract approval and renewal process has been codified in the Portfolios' 15(c) Methodology Guide. This Guide was developed under the direction of the Independent Directors and sets out a blueprint pursuant to which
33
ADVISORY CONTRACT APPROVAL DISCUSSION (UNAUDITED) (CONTINUED)
the Independent Directors request certain information that they deem important to facilitate an informed review in connection with initial and annual approvals of advisory contracts.
Management provides certain of the information requested by the 15(c) Methodology Guide in Fund Analysis and Comparison Tables ("FACT sheets") prior to the Independent Directors' review of advisory arrangements (including the Portfolios' Advisory Contract). The Independent Directors previously retained an independent firm to verify and test the accuracy of certain FACT sheet data for a representative sample of funds in the ING Funds complex. In addition, in 2007 and 2008, the Contracts Committee employed the services of an independent consultant to assist in its review and analysis of, among other matters, the 15(c) Methodology Guide, the content and format of the FACT sheets, and proposed Selected Peer Groups of investment companies ("SPGs") to be used by the Portfolios for certain comparison purposes during the renewal process.
As part of an ongoing process, the Contracts Committee recommends or considers recommendations from Management for refinements to the 15(c) Methodology Guide and other aspects of the review process, and the Board's Investment Review Committees, including the DE IRC, reviews benchmarks used to assess the performance of the funds in the ING Funds complex. The IRCs may apply a heightened level of scrutiny in cases where performance has lagged an ING Fund's relevant benchmark and/or SPG.
The Board employed its process for reviewing contracts when considering the renewal of the Portfolios' Advisory Contract that would be effective through November 30, 2009. Set forth below is a discussion of many of the Board's primary considerations and conclusions resulting from this process.
Nature, Extent and Quality of Service
In determining whether to approve the Advisory Contract for the Portfolios for the year ending November 30, 2009, the Independent Directors received and evaluated such information as they deemed necessary regarding the nature, extent and quality of services provided to the Portfolios by the Adviser. This included information regarding the Adviser provided throughout the year at regular meetings of the Board and its committees, as well as information furnished in connection with the contract renewal meetings.
The materials requested by and provided to the Board and/or to K&L Gates prior to the November 14, 2008 Board meeting included, among other information, the following items for each Portfolio: (1) FACT sheets that provided information regarding the performance and expenses of the Portfolio and other similarly managed funds in its SPG, as well as information regarding the Portfolio's investment portfolio, objective and strategies; (2) reports providing risk and attribution analyses of the Portfolio; (3) the 15(c) Methodology Guide, which describes how the FACT sheets were prepared, including the manner in which the Portfolios' benchmarks and SPGs were selected and how profitability was determined; (4) responses from the Adviser to a series of questions posed by K&L Gates on behalf of th e Directors; (5) copies of the form of Advisory Contract; (6) a copy of the Form ADV for the Adviser; (7) financial statements for the Adviser; (8) a draft of a narrative summary addressing key factors the Board customarily considers in evaluating the renewals of the ING Funds' (including the Portfolios') advisory contracts, including a written analysis for the Portfolio of how performance, fees and expenses compare to its SPG and/or designated benchmark; (9) independent analyses of Portfolio performance by the Company's Chief Investment Risk Officer; (10) information regarding net asset flows into and out of the Portfolio; and (11) other information relevant to the Board's evaluations.
For each Portfolio, Class S shares were used for purposes of certain comparisons between the Portfolios and their SPGs. Class S shares generally were selected so that a Portfolio's share class with the longest performance history was compared to the analogous class of shares for each fund in its SPG. The mutual funds included in the Portfolios' SPGs were selected based upon criteria designed to mirror the Portfolio share class being compared to the SPG.
In arriving at its conclusions with respect to the Advisory Contract, the Board noted the resources that the Adviser has committed to assist the Board and the DE IRC with their assessment of the investment performance of the Portfolios on an ongoing basis throughout the year. This includes the appointment of a Chief Investment Risk Officer and his staff, who report directly to the Board and who have developed attribution analyses and other metrics used by the Board's IRCs to analyze the key factors underlying investment performance for the funds in the ING Funds complex.
The Board also noted the proactive approach that the Adviser, working in cooperation with the IRCs, has taken to advocate or recommend, when it believed
34
ADVISORY CONTRACT APPROVAL DISCUSSION (UNAUDITED) (CONTINUED)
appropriate, changes designed to assist in improving the Portfolios' performance.
In considering the Portfolios' Advisory Contract, the Board also considered the extent of benefits provided to the Portfolios' shareholders, beyond advisory services, from being part of the ING family of funds. This includes, in most cases, the right to exchange or transfer investments, without a sales charge, between the same class of shares of such funds or among ING Funds available on a product platform, and the wide range of ING Funds available for exchange or transfer. The Board also took into account the Adviser's efforts in recent years to reduce the expenses of the ING Funds through renegotiated arrangements with the ING Funds' service providers.
Further, the Board received periodic reports showing that the investment policies and restrictions for each Portfolio were consistently complied with and other periodic reports covering matters such as compliance by Adviser personnel with codes of ethics. The Board considered reports from the Company's Chief Compliance Officer ("CCO") evaluating whether the regulatory compliance systems and procedures of the Adviser are reasonably designed to assure compliance with the federal securities laws, including those related to, among others, late trading and market timing, best execution, fair value pricing, proxy voting and trade allocation practices. The Board also took into account the CCO's annual and periodic reports and recommendations with respect to service provider compliance programs. In this regard, the Board also considered the policies and procedures developed by the CCO in consultation with the Board's Compliance Committee that guide the CCO's compliance oversight function.
The Board reviewed the level of staffing, quality and experience of the Portfolios' portfolio management team. The Board took into account the resources and reputation of the Adviser, and evaluated the ability of the Adviser to attract and retain qualified investment advisory personnel. The Board also considered the adequacy of the resources committed to the Portfolios (and other relevant funds in the ING Funds complex) by the Adviser, and whether those resources are commensurate with the needs of the Portfolios and are sufficient to sustain appropriate levels of performance and compliance needs.
Based on their deliberations and the materials presented to them, the Board concluded that the advisory and related services provided by the Adviser are appropriate in light of the Portfolios' operations, the competitive landscape of the investment company business, and investor needs, and that the nature and quality of the overall services provided by the Adviser were appropriate.
Portfolio Performance
In assessing the advisory relationship, the Board placed emphasis on the net investment returns of each Portfolio. While the Board considered the performance reports and discussions with portfolio managers at Board and committee meetings during the year, particular attention in assessing performance was given to the FACT sheets furnished in connection with the renewal process. The FACT sheet prepared for each Portfolio included its investment performance compared to the Portfolio's Morningstar category median, Lipper category median, SPG and primary benchmark. The FACT sheet performance data was as of June 30, 2008. In addition, the Board also considered at its November 14, 2008 meeting certain additional data regarding performance and Portfolio asset levels as of October 31, 2008. The Board's findings specific to each Portfolio's performance are discussed below.
Economies of Scale
When evaluating the reasonableness of advisory fee rates, the Board also considered whether economies of scale will be realized by the Adviser as a Portfolio grows larger and the extent to which any such economies are reflected in contractual fee rates. In this regard, the Board noted that any breakpoints in advisory fee schedules applicable to the underlying Master Fund in which each Portfolio invests results in a lower, aggregate advisory fee payable by Portfolio shareholders. As the Portfolio does not have advisory fee breakpoints, but may benefit from waivers or reimbursements of advisory or other fees, the Board also considered the extent to which economies of scale could be realized through waivers, reimbursements or expense reductions.
In evaluating economies of scale, the Independent Directors also considered prior periodic management reports and industry information on this topic, and the Independent Directors who were Board members at that time also considered a November 2006 evaluation and analysis presented to them by an independent consultant regarding fee breakpoint arrangements and economies of scale.
The Board also considered that the Portfolios had experienced material declines in assets, especially during October 2008, due to general market declines precipitated by the credit crises and other generally adverse market developments. As a result of these
35
ADVISORY CONTRACT APPROVAL DISCUSSION (UNAUDITED) (CONTINUED)
asset declines, the Board considered that there were fewer opportunities to realize economies of scale.
Information Regarding Services to Other Clients
The Board requested and considered information regarding the nature of services and fee rates offered by the Adviser to other clients, including other registered investment companies and institutional accounts. When fee rates offered to other clients differed materially from those charged to the Portfolios, the Board considered any underlying rationale provided by the Adviser for these differences. The Board also noted that the fee rates charged to the Portfolios and other institutional clients of the Adviser (including other investment companies) may differ materially due to, among other reasons: differences in services; different regulatory requirements associated with registered investment companies, such as the Portfolios, as compared to non-registered investment company clients; market differences in fee rates that existed when a Portfolio first was organized; differences in the original sponsors of Portfolios that now are managed by th e Adviser; investment capacity constraints that existed when certain contracts were first agreed upon or that might exist at present; and different pricing structures that are necessary to be competitive in different marketing channels.
Fee Rates and Profitability
The Board reviewed and considered the contractual investment advisory fee rate, combined with the administrative fee rate, payable by the Portfolios to the Adviser. In addition, the Board considered fee waivers and expense limitations applicable to the fees payable by the Portfolios. In analyzing this fee data, the Board took into account that no advisory fees are charged when the Portfolios are invested in the corresponding Master Funds, and that advisory fees charged by the corresponding Master Funds are indirectly borne by Portfolio shareholders.
The Board considered the fee structure of each Portfolio as it relates to the services provided under the contract and the potential fall-out benefits to the Adviser and its affiliates from their association with the Portfolios. For each Portfolio, the Board determined that the fees payable to the Adviser are reasonable for the services that it performs, which were considered in light of the nature and quality of the services that it has performed and is expected to perform.
The Board considered information on revenues, costs and profits realized by the Adviser, which was prepared by Management in accordance with the allocation methodology (including related assumptions) specified in the 15(c) Methodology Guide. The Board also considered information that it requested and was provided by Management with respect to the profitability of service providers affiliated with the Adviser.
Further, the Board considered that the decline in asset levels of the Portfolios caused by recent adverse economic conditions was likely to cause a similar decline in any profits realized by the Adviser.
The Board determined that it had requested and received sufficient information to gain a reasonable understanding regarding the Adviser's profitability. The Board also recognized that profitability analysis is not an exact science and there is no uniform methodology for determining profitability for this purpose. In this context, the Board realized that Management's calculations regarding its costs incurred in establishing the infrastructure necessary for the Portfolios' operations may not be fully reflected in the expenses allocated to each Portfolio in determining profitability, and that the information presented may not portray all of the costs borne by Management or capture Management's entrepreneurial risk associated with offering and managing a mutual fund complex in the current regulatory and market environment.
Based on the information on revenues, costs, and profitability considered by the Board, and after considering the factors described in this section, the Board concluded that the profits, if any, realized by the Adviser were not excessive. In making its determinations, the Board based its conclusions on the reasonableness of the advisory fees of the Advisers primarily on the factors described for the Portfolios below.
Portfolio-by-Portfolio Analysis
The following paragraphs outline certain of the specific factors that the Board considered, and the conclusions reached, at its November 14, 2008 meeting in relation to renewing the Portfolios' current Advisory Contract for the year ending November 30, 2009. These specific factors are in addition to those considerations discussed above. In each case, a Portfolio's performance was compared to its Morningstar category median and its primary benchmark, a broad-based securities market index that appears in the Portfolios' prospectus. With respect to Morningstar quintile rankings, the first quintile represents the highest (best) performance
36
ADVISORY CONTRACT APPROVAL DISCUSSION (UNAUDITED) (CONTINUED)
and the fifth quintile represents the lowest performance. The Portfolios' management fee and expense ratio were compared to the fees and expense ratios of the funds in its SPG.
ING Fidelity® VIP Contrafund® Portfolio
In considering whether to approve the renewal of the Advisory Contract for ING Fidelity® VIP Contrafund® Portfolio, the Board considered that, based on performance data for the periods ended June 30, 2008: (1) the Portfolio outperformed its Morningstar category median for all periods presented, with the exception of the year-to-date period, during which it underperformed; (2) the Portfolio outperformed its primary benchmark for all periods presented, with the exception of the year-to-date period, during which it underperformed; and (3) the Portfolio is ranked in the first (highest) quintile of its Morningstar category for the one- and three-year periods, the second quintile for the most recent calendar quarter, and the fourth quintile for the year-to-date period.
In considering the fees payable under the Advisory Contract for the Portfolio, the Board took into account the factors described above and also considered: (1) the fairness of the compensation under an Advisory Contract (a) under which no advisory fees are charged when the Portfolio is fully invested in Fidelity's VIP Contrafund Portfolio (the "Contrafund Master Fund"); and (b) advisory fees are charged by the Contrafund Master Fund and indirectly borne by Portfolio shareholders; and (2) the pricing structure (including the expense ratio to be borne by shareholders) of the Portfolio, as compared to its SPG, including that: (a) the management fee for the Portfolio (consisting of a 0.05% administration fee) is below the median and the average management fees of the funds in its SPG; and (b) the expense ratio for the Portfolio is below the median and average expense ratios of the funds in its SPG.
After its deliberation, the Board reached the following conclusions: (1) the Portfolio's management fee rate is reasonable in the context of all factors considered by the Board; (2) the Portfolio's expense ratio is reasonable in the context of all factors considered by the Board; and (3) the Portfolio's performance is reasonable in the context of all factors considered by the Board. Based on these conclusions and other factors, the Board voted to renew the Advisory Contract for the Portfolio for the year ending November 30, 2009. During this renewal process, different Board members may have given different weight to different individual factors and related conclusions.
ING Fidelity® VIP Equity-Income Portfolio
In considering whether to approve the renewal of the Advisory Contract for ING Fidelity® VIP Equity-Income Portfolio, the Board considered that, based on performance data for the periods ended June 30, 2008: (1) the Portfolio underperformed its Morningstar category median for all periods presented, with the exception of the three-year period, during which it outperformed; (2) the Portfolio underperformed its primary benchmark for all periods presented; and (3) the Portfolio is ranked in the third quintile of its Morningstar category for the three-year period, and the fourth quintile for the most recent calendar quarter, year-to-date, and one-year periods.
In analyzing this performance data, the Board took into account: (1) Management's representations that the Portfolio's longer-term performance had been reasonable; and (2) Management's expectation that its performance will improve.
In considering the fees payable under the Advisory Contract for the Portfolio, the Board took into account the factors described above and also considered: (1) the fairness of the compensation under an Advisory Contract (a) under which no advisory fees are charged when the Portfolio is fully invested in Fidelity's VIP Equity-Income Portfolio (the "Equity-Income Master Fund"); and (b) advisory fees are charged by the Equity-Income Master Fund and indirectly borne by Portfolio shareholders; and (2) the pricing structure (including the expense ratio to be borne by shareholders) of the Portfolio, as compared to its SPG, including that: (a) the management fee for the Portfolio (consisting of a 0.05% administration fee) is below the median and the average management fees of the funds in its SPG; and (b) the expense ratio for the Portfolio is below the median and average expense ratios of the funds in its SPG.
After its deliberation, the Board reached the following conclusions: (1) the Portfolio's management fee rate is reasonable in the context of all factors considered by the Board; (2) the Portfolio's expense ratio is reasonable in the context of all factors considered by the Board; (3) the Portfolio's performance is reasonable in the context of all factors considered by the Board. Based on these conclusions and other factors, the Board voted to renew the Advisory Contract for the Portfolio for the year ending November 30, 2009. During this renewal process, different Board members may have given different weight to different individual factors and related conclusions.
37
ADVISORY CONTRACT APPROVAL DISCUSSION (UNAUDITED) (CONTINUED)
ING Fidelity® VIP Growth Portfolio
In considering whether to approve the renewal of the Advisory Contract for ING Fidelity® VIP Growth Portfolio, the Board considered that, based on performance data for the periods ended June 30, 2008: (1) the Portfolio outperformed its Morningstar category median for all periods presented, with the exception of the year-to-date period, during which it underperformed; (2) the Portfolio outperformed its primary benchmark for all periods presented, with the exception of the year-to-date period, during which it underperformed; and (3) the Portfolio is ranked in the first (highest) quintile of its Morningstar category for the one-year and three-year periods, the second quintile for the most recent calendar quarter, and the third quintile for the year-to-date period.
In considering the fees payable under the Advisory Contract for ING Fidelity® VIP Growth Portfolio, the Board took into account the factors described above and also considered: (1) the fairness of the compensation under an Advisory Contract (a) under which no advisory fees are charged when the Portfolio is fully invested in Fidelity's VIP Growth Portfolio (the "Growth Master Fund"); and (b) advisory fees are charged by the Growth Master Fund and indirectly borne by Portfolio shareholders; and (2) the pricing structure (including the expense ratio to be borne by shareholders) of the Portfolio, as compared to its SPG, including that: (a) the management fee for the Portfolio (consisting of a 0.05% administration fee) is below the median and the average management fees of the funds in its SPG; and (b) the expense ratio for the Portfolio is below the median and the average expense ratios of the funds in its SPG.
After its deliberation, the Board reached the following conclusions: (1) the Portfolio's management fee rate is reasonable in the context of all factors considered by the Board; (2) the Portfolio's expense ratio is reasonable in the context of all factors considered by the Board; and (3) the Portfolio's performance is reasonable in the context of all factors considered by the Board. Based on these conclusions and other factors, the Board voted to renew the Advisory Contract for the Portfolio for the year ending November 30, 2009. During this renewal process, different Board members may have given different weight to different individual factors and related conclusions.
ING Fidelity® VIP Mid Cap Portfolio
In considering whether to approve the renewal of the Advisory Contract for ING Fidelity® VIP Mid Cap Portfolio, the Board considered that, based on performance data for the periods ended June 30, 2008: (1) the Portfolio outperformed its Morningstar category median for all periods presented; (2) the Portfolio outperformed its primary benchmark for all periods presented, with the exception of the most recent calendar quarter and year-to-date periods, during which it underperformed; and (3) the Portfolio is ranked in the first quintile of its Morningstar category for the one-year and three-year periods, and the third quintile for the most recent calendar quarter and year-to-date periods.
In considering the fees payable under the Advisory Contract for the Portfolio, the Board took into account the factors described above and also considered: (1) the fairness of the compensation under an Advisory Contract (a) under which no advisory fees are charged when the Portfolio is fully invested in Fidelity's VIP Mid Cap Portfolio (the "Mid Cap Master Fund"); and (b) advisory fees are charged by the Mid Cap Master Fund and indirectly borne by Portfolio shareholders; and (2) the pricing structure (including the expense ratio to be borne by shareholders) of the Portfolio, as compared to its SPG, including that: (a) the management fee for the Portfolio is below the median and the average management fees of the funds in its SPG; and (b) the expense ratio for the Portfolio is below the median and the average expense ratios of the portfolios in its SPG.
After its deliberation, the Board reached the following conclusions: (1) the Portfolio's management fee rate is reasonable in the context of all factors considered by the Board; (2) the Portfolio's expense ratio is reasonable in the context of all factors considered by the Board; and (3) the Portfolio's performance is reasonable in the context of all factors considered by the Board. Based on these conclusions and other factors, the Board voted to renew the Advisory Contract for the Portfolio for the year ending November 30, 2009. During this renewal process, different Board members may have given different weight to different individual factors and related conclusions.
38
Investment Adviser
ING Directed Services LLC
1475 Dunwoody Drive
West Chester, Pennsylvania 19380
Distributor
ING Funds Distributor, LLC
7337 East Doubletree Ranch Road
Scottsdale, Arizona 85258
Custodian
The Bank of New York Mellon
One Wall Street
New York, New York 10286
Independent Registered Public
Accounting Firm
KPMG LLP
99 High Street
Boston, Massachusetts 02110
Legal Counsel
Dechert LLP
1775 I Street, N.W.
Washington, D.C. 20006
Before investing, carefully consider the investment objectives, risks, charges and expenses of the variable annuity contract and the underlying variable investment options. This and other information is contained in the prospectus for the variable annuity contract and the underlying variable investment options. Obtain these prospectuses from your agent/registered representative and read them carefully before investing.
VPAR-UFID (1208-022509)


Annual Report
December 31, 2008
Adviser Class (“ADV”), Initial Class (“I”),
Service Class (“S”) and Class T
ING Partners, Inc.
| n | ING Solution Growth and Income Portfolio |
| n | ING Solution Growth Portfolio |
| n | ING Solution Income Portfolio |
| n | ING Solution 2015 Portfolio |
| n | ING Solution 2025 Portfolio |
| n | ING Solution 2035 Portfolio |
| n | ING Solution 2045 Portfolio |
| | |
 | | E-Delivery Sign-up – details inside |
This report is submitted for general information to shareholders of the ING Funds. It is not authorized for distribution to prospective shareholders unless accompanied or preceded by a prospectus which includes details regarding the funds’ investment objectives, risks, charges, expenses and other information. This information should be read carefully.
MUTUAL FUNDS | 
|
TABLE OF CONTENTS
| | | | |
| | | |
| | Go Paperless with E-Delivery! | | |
Sign up now for on-line prospectuses, fund reports, and proxy statements. In less than five minutes, you can help reduce paper mail and lower fund costs. Just go to www.ingfunds.com, click on the E-Delivery icon from the home page, follow the directions and complete the quick 5 Steps to Enroll. You will be notified by e-mail when these communications become available on the internet. Documents that are not available on the internet will continue to be sent by mail. |
PROXY VOTING INFORMATION
A description of the policies and procedures that the Portfolios use to determine how to vote proxies related to portfolio securities is available: (1) without charge, upon request, by calling Shareholder Services toll-free at (800) 992-0180; (2) on the ING Funds’ website at www.ingfunds.com; and (3) on the U.S. Securities and Exchange Commission’s (“SEC”) website at www.sec.gov. Information regarding how the Portfolios voted proxies related to portfolio securities during the most recent 12-month period ended June 30 is available without charge on the ING Funds’ website at www.ingfunds.com and on the SEC’s website at www.sec.gov.
QUARTERLY PORTFOLIO HOLDINGS
The Portfolios file their complete schedule of portfolio holdings with the SEC for the first and third quarters of each fiscal year on Form N-Q. The Portfolios’ Forms N-Q are available on the SEC’s website at www.sec.gov. The Portfolios’ Forms N-Q may be reviewed and copied at the SEC’s Public Reference Room in Washington, DC, and information on the operation of the Public Reference Room may be obtained by calling (800) SEC-0330; and is available upon request from the Portfolios by calling Shareholder Services toll-free at (800) 992-0180.
PRESIDENT’S LETTER

Dear Shareholders,
We are in the midst of one of the most challenging periods ever faced by investors, and we at ING Funds are aware of the anxiety that you may be feeling at this time.
I want to assure you that we are actively engaged in monitoring the situation and are committed to keeping you fully informed of how the rapidly unfolding events around us may impact your investments with our company.
We recognize that the confidence of many investors is being tested, perhaps as never before. It is understandable that some of you may be second guessing your investment strategy due to these recent events. We encourage you to work with your investment professional and seek out their advice about your portfolio in light of the current conditions. But we also urge investors not to make rash decisions. ING Funds still believes that a well-diversified, globally allocated portfolio remains the most effective
investment strategy of all. We ask that investors not lose sight of their commitment to the long-term.
We thank you for your support and confidence and we look forward to continuing to do business with you in the future.
Sincerely,

Shaun Mathews
President & Chief Executive Officer
ING Funds
January 23, 2009
The views expressed in the President’s Letter reflect those of the President as of the date of the letter. Any such views are subject to change at any time based upon market or other conditions and ING Funds disclaims any responsibility to update such views. These views may not be relied on as investment advice and because investment decisions for an ING Fund are based on numerous factors, may not be relied on as an indication of investment intent on behalf of any ING Fund. Reference to specific company securities should not be construed as recommendations or investment advice. Consider the fund’s investment objectives, risks, and charges and expenses carefully before investing. The prospectus contains this information and other information about the fund.
International investing poses special risks including currency fluctuation, economic and political risks not found in investments that are solely domestic.
1
MARKET PERSPECTIVE: YEAR ENDED DECEMBER 31, 2008
In our semi-annual report, we described a failed second quarter rally that fizzled when investors realized that borderline recessionary conditions and a credit crunch had not gone away. By year-end, governments were committing previously unimaginable sums of taxpayer money to prevent systemic collapse. Global equities in the form of the MSCI World® Index(1) measured in local currencies, including net reinvested dividends (“MSCI” for regions discussed below) plunged 29.70% in the six months ended December 31, 2008 (down 38.70% for the entire fiscal year). (The MSCI World® Index plunged 40.71% for the entire fiscal year, measured in U.S. dollars.) In currencies, the dollar at first drifted near record lows against the euro. But the tide turned in mid-July and for the six months ended December 31, 2008, the dollar strengthened by 12.10% (4.50% for the entire fiscal year). The dollar also soared 37.80% against the pound for the six months ended December 31, 2008 (37.90% for the entire fiscal year). But the yen advanced as carry trades (essentially short yen positions) were unwound and the dollar fell 14.90% for the six months ended December 31, 2008 (down 19.60% for the entire fiscal year).
Even more dramatic was the price of oil which marched to an all-time high of around $147 per barrel in mid-July, only to lose more than two thirds of that price by December 31, 2008.
The economic statistics remained bleak. By the end of October, the Standard & Poor’s (“S&P”)/Case-Shiller National U.S. Home Price Index(2) of house prices had fallen a record 18% over the year. New home sales were at 1991 levels. Some 45% of existing home sales were distressed.
Payrolls declined in every month of 2008, as the number of people claiming unemployment reached 4.1 million, a 26-year high. Gross domestic product (“GDP”) fell at an annualized rate of 0.50% in the third quarter, and the National Bureau of Economic Research announced that the recession had actually started in December 2007.
Yet these were side-shows to the fireworks display in the financial sector, where major institutions — hanging by a thread through problems rooted in unwise mortgage borrowing, lending and investment — met different fates in September 2008 at the hands of the U.S. government.
The Federal National Mortgage Association (“Fannie Mae”) and the Federal Home Loan Mortgage Corporation (“Freddie Mac”) were taken into “conservatorship.” Merrill Lynch was acquired by the
Bank of America with a wink from the authorities. AIG received an $85 billion loan from a reluctant government, which also took a 79.90% equity stake in AIG. But Lehman Brothers having sought capital, then a buyer, found neither and was left to file for Chapter 11 bankruptcy protection.
The U.S. government was now in the position of choosing winners and losers among financial institutions: none too successfully, for it quickly became obvious that by pointedly leaving Lehman Brothers to go under, a credit crisis had become a credit market collapse. Lending all but seized up.
Policy response was huge but at least initially muddled. A Troubled Asset Relief Plan (“TARP”) would set up a $700 billion fund to buy illiquid mortgage securities from financial institutions. But on November 12, 2008 with half of the money already used to recapitalize banks, Treasury Secretary Paulson announced that the rest of the funds would not be used to buy illiquid mortgage securities after all. This merely renewed the pressure on the holders of such securities like Citigroup, which within two weeks received guarantees from the government against losses and another $20 billion in capital.
Other programs were of more practical use, like support for the commercial paper market and a guarantee facility for money market funds. Arguably the most effective measure was the announced intention to buy vast quantities of agency mortgage-backed securities and debentures. This had the effect of driving down rates on the 30-year mortgage towards 5.00%, a record low. In the meantime, the newly-elected president promised a stimulus package worth approximately $1 trillion. And by year end, the Federal Open Market Committee (“FOMC”) reduced interest rates to a range of between 0% and 0.25%.
2008 ended with much gloom and bad news still to come, but the platform for recovery was perhaps taking shape.
In U.S. fixed-income markets, yields on the 90-day Treasury Bills briefly turned negative in December 2008, while the yield on the ten-year Treasury Note fell below 2.50%, something we had not seen in 50 years. The Barclays Capital U.S. Aggregate Bond Index(3), formerly known as the Lehman Brothers U.S. Aggregate Bond Index, of investment grade bonds returned 4.10% for the six months ended December 31, 2008, (5.20% for the entire fiscal year). By contrast, high yield bonds, represented by the Barclays Capital High Yield Bond — 2% Issuer Constrained
2
MARKET PERSPECTIVE: YEAR ENDED DECEMBER 31, 2008
Composite Index(4), formerly known as the Lehman Brothers High Yield Bond — 2% Issuer Constrained Composite Index, behaved more like a stock index and returned (25.10)% for the six months ended December 31, 2008 (down 25.90% for the entire fiscal year).
U.S. equities, represented by the S&P 500® Composite Stock Price (“S&P 500®”) Index(5), including dividends, returned (28.50)% for the six months ended December 31, 2008, (down 37.00% for the entire fiscal year), increasingly unimpressed by sharply falling oil prices. Profits for S&P 500® Index companies suffered their fifth straight quarter of decline, led again by the financials sector, although taxpayer money was also potentially committed to save the big three auto makers from bankruptcy. On November 20, 2008, the S&P 500® Index plumbed a level not seen since April 1997, before a December recovery.
In international markets, plainly entering recession, the MSCI Japan® Index(6) slumped 35.90% for the six months ended December 31, 2008, (down 42.60% for the entire fiscal year). The strengthening yen hit exports in an export-dependent economy even as global demand slowed for other reasons. The MSCI Europe ex UK® Index(7) sagged 29.40% for the six months ended December 31, 2008 (down 43.20% for the entire fiscal year), beset by sharply falling economic activity and a European Central Bank in denial that inflation was falling fast. Finally, rates were reduced by an unprecedented 175 basis points (or 1.75%) in two months near the end of the year while governments, one after the other, proposed large stimulus packages. In the UK, the MSCI UK® Index(8) fell 19.40% for the six months ended December 31, 2008 (down 28.50% for the entire fiscal year). The UK had allowed a bigger housing bubble than the United States and deeper personal indebtedness in an economy more dependent on the financial sector. Rates were reduced to 1951 levels as venerable banks ceased to exist as independent entities.
(1) The MSCI World® Index is an unmanaged index that measures the performance of over 1,400 securities listed on exchanges in the U.S., Europe, Canada, Australia, New Zealand and the Far East.
(2) The S&P/Case-Shiller National U.S. Home Price Index tracks the value of single-family housing within the United States. The index is a composite of single-family home price indices for the nine U.S. Census divisions and is calculated quarterly.
(3) The Barclays Capital U.S. Aggregate Bond Index is an unmanaged index of publicly issued investment grade U.S. Government, mortgage-backed, asset-backed and corporate debt securities.
(4) The Barclays Capital High Yield Bond — 2% Issuer Constrained Composite Index is an unmanaged index that measures the performance of non-investment grade fixed-income securities.
(5) The S&P 500® Index is an unmanaged index that measures the performance of securities of
approximately 500 of the largest companies in the United States.
(6) The MSCI Japan® Index is a free float-adjusted market capitalization index that is designed to measure developed market equity performance in Japan.
(7) The MSCI Europe ex UK® Index is a free float-adjusted market capitalization index that is designed to measure developed market equity performance in Europe, excluding the UK.
(8) The MSCI UK® Index is a free float-adjusted market capitalization index that is designed to measure developed market equity performance in the UK.
All indices are unmanaged and investors cannot invest directly in an index.
Past performance does not guarantee future results. The performance quoted represents past performance. Investment return and principal value of an investment will fluctuate, and shares, when redeemed, may be worth more or less than their original cost. The Portfolios’ performance is subject to change since the period’s end and may be lower or higher than the performance data shown. Please call (800) 262-3862 or log on to www.ingfunds.com to obtain performance data current to the most recent month end.
Market Perspective reflects the views of ING’s Chief Investment Risk Officer only through the end of the period, and is subject to change based on market and other conditions.
3
| | |
| ING SOLUTION PORTFOLIOS | | PORTFOLIO MANAGERS’ REPORT |
The ING Solution Portfolios consist of ING Solution Growth Portfolio, ING Solution Growth and Income Portfolio, ING Solution Income Portfolio, ING Solution 2015 Portfolio, ING Solution 2025 Portfolio, ING Solution 2035 Portfolio, and ING Solution 2045 Portfolio (each a “Portfolio” or collectively, the “Portfolios” or the “Solution Portfolios”). Each Portfolio seeks to achieve its investment objective by investing in a combination of other ING Funds (“Underlying Funds”) according to target allocations determined by Directed Services LLC (“DSL” or “Investment Adviser”), under the guidance of an Investment Committee(1). ING Investment Management Co. (“Consultant”) is a consultant to the Investment Adviser. Both the Investment Adviser and the Consultant are indirect, wholly-owned subsidiaries of ING Groep.
Portfolio Specifics: The Investment Adviser uses an asset allocation process to determine each Portfolio’s investment mix. This asset allocation process can be found in the Prospectus. Each Portfolio’s approximate target investment allocations (expressed as a percentage of its net assets) among the asset classes in which the Portfolios invest are set out on page 6. As these are target allocations, the actual allocations of the Portfolios’ assets may deviate from the percentages shown.
Assets will be allocated among the Underlying Funds and markets based on judgments made by DSL. The performance of the Portfolios reflects the performance of the Underlying Funds in which each Portfolio invests and the weightings of each Portfolio’s assets in each Underlying Fund.
There is a risk that the Portfolios may allocate assets to an Underlying Fund or market that underperforms other asset classes. The Portfolios may be underweighted in assets or a market that is experiencing significant returns (or relative out performance) or overweighted in assets or a market with significant declines (or relative under performance).
The Investment Committee allocates each Portfolio’s assets among the Underlying Funds based on advice from the Consultant.
With respect to each Portfolio, we made a few tactical moves over the course of the year, including reducing, then eliminating, overweight positions in large cap blend and international stocks. We also moved from an overweight position in core bonds to an underweight, and are currently overweight high yield bonds. In addition, we increased our holdings in mid-cap, small-cap and real estate stocks to arrive at neutral positions.
For the one-year period ending December 31, 2008, in terms of underlying asset classes, mid-cap, large-cap value, domestic and global real estate, high-yield and short-term bond and emerging markets were among the most positive contributors to performance relative to their respective peer groups. Individual contributors to relative performance included ING BlackRock Large Cap Value Portfolio, ING Legg Mason Partners Aggressive Growth Portfolio, ING Van Kampen Real Estate Portfolio, ING Global Real Estate Portfolio, ING Limited Maturity Bond Portfolio, ING Julius Baer Foreign Portfolio and ING JPMorgan Emerging Markets Equity Portfolio. ING BlackRock Large Cap Value Portfolio’s relative results were driven primarily by positive stock selection within and a favorable underweighting of the troubled financials sector. ING Legg Mason Partners Aggressive Growth Portfolio benefited from a significant overweight allocation to and positive stock selection within the healthcare sector. However, the Portfolio underperformed its index as a result of poor security selection in financials and information technology. Positive stock selection in office real estate investment trusts (“REITs”), an overweight in residential REITs and positive stock selection coupled with an underweight in retail REITs was beneficial to ING Van Kampen Real Estate Portfolio. ING Global Real Estate Portfolio’s success for the period came mainly from positive stock selection across all major regions and an overweight allocation to the U.S. For ING Limited Maturity Bond Portfolio, an above-index duration stance and favorable yield curve positioning were the key drivers behind its solid relative results. However, an overweight in financials and poor security selection translated to its underperformance relative to its benchmark. ING Julius Baer Foreign Portfolio’s positive stock selection and overweight allocation to the materials sector was helpful to relative performance. However, the Portfolio underperformed its index as a result of poor security selection across the remaining sectors and a regional underweight to Japan. ING JPMorgan Emerging Markets Equity Portfolio benefited from positive stock selection in energy and technology, along with an overweight allocation to consumer staples.
Among the largest asset class detractors for the year relative to their respective peer groups were large-cap blend, foreign large growth and intermediate bond. In terms of individual underlying funds, detractors to relative performance included ING Davis New York Venture Portfolio, ING UBS U.S. Large Cap Equity Portfolio, ING Legg Mason Value Portfolio, ING Marsico International Opportunities Portfolio, and ING VP Intermediate Bond Portfolio. ING Davis New York Venture Portfolio’s underperformance was due mainly to stock selection in consumer staples coupled with a large and unfavorable overweight allocation to financials. Stock selection in consumer discretionary and an unfavorable underweight allocation to consumer staples combined to hurt ING UBS U.S. Large Cap Equity Portfolio’s results. ING Legg Mason Value Portfolio, a highly concentrated portfolio (fewer than 50 holdings), held large positions in several controversial names that dramatically underperformed the broad market; it was eliminated from the Portfolios during the period. ING Marsico International Opportunities Portfolio’s broadly unfavorable stock selection across multiple sectors and regions accounted for the bulk of its underperformance during the period. ING VP Intermediate Bond Portfolio’s underperformance was due primarily to an overweight allocation to non-agency mortgages plus an overweight and poor security selection among financials.
On an absolute basis, the Portfolios’ short term bond allocation contributed a positive return, while all other asset classes detracted from the Portfolios’ performance.
Current Strategy and Outlook: The year 2008 turned out to be a painful one for investors. Negative absolute returns in all equity classes were the result of a year underscored by a litany of issues: an escalating financial crisis, global recession fears, geopolitics, collapses of storied financial firms, unparalleled levels of market volatility, threat of deflation and a credit crunch that dried up liquidity in the bond markets. The housing market continues to remain weakened, industrial production has slowed and unemployment has risen. Intervention from the Federal Reserve Board and the U.S. Department of the Treasury appears to have slowed down the pace of negative news, but has not, as yet, halted it. Looking forward, we believe the recession will continue for the next two quarters, with growth resuming in the second half of 2009. We believe headline inflation will decline, and perhaps turn negative, but we don’t believe we are in the midst of a deflationary spiral. Finally, we believe a large fiscal stimulus program will be enacted by Congress early in 2009.
(1) | | The members of the Investment Committee are: William A. Evans, Michael J. Roland, and Paul Zemsky. |
Portfolio holdings and characteristics are subject to change and may not be representative of current holdings and characteristics. The outlook for these Portfolios may differ from that presented for other ING Funds. Performance for the different classes of shares will vary based on differences in fees associated with each class.
4
| | |
| PORTFOLIO MANAGERS’ REPORT | | ING SOLUTION PORTFOLIOS |
| | | | | | | |
| | | |
| | | Average Annual Total Returns for the Period Ended December 31, 2008 | | | |
| | | | | 1 Year | | | |
| | | ING Solution Growth and Income Portfolio, Class S | | (23.63 | )% | | |
| | | Dow Jones Moderate Portfolio Index(3) | | (24.75 | )% | | |
| | | ING Solution Growth Portfolio, Class S | | (31.81 | )% | | |
| | | Dow Jones Moderately Aggressive Portfolio Index(1) | | (33.17 | )% | | |
| | | ING Solution Income Portfolio, Class S | | (16.66 | )% | | |
| | | Dow Jones Target Today Index— Global Series(4) | | (3.06 | )% | | |
| | | ING Solution Income Composite Index(2) | | (10.68 | )% | | |
| | | ING Solution 2015 Portfolio, Class S | | (26.86 | )% | | |
| | | Dow Jones Target 2015 Index — Global Series(4) | | (16.65 | )% | | |
| | | ING Solution 2015 Composite Index(2) | | (22.51 | )% | | |
| | | ING Solution 2025 Portfolio, Class S | | (33.87 | )% | | |
| | | Dow Jones Target 2025 Index — Global Series(4) | | (27.61 | )% | | |
| | | ING Solution 2025 Composite Index(2) | | (30.52 | )% | | |
| | | ING Solution 2035 Portfolio, Class S | | (37.01 | )% | | |
| | | Dow Jones Target 2035 Index — Global Series(4) | | (35.15 | )% | | |
| | | ING Solution 2035 Composite Index(2) | | (33.01 | )% | | |
| | | ING Solution 2045 Portfolio, Class S | | (39.86 | )% | | |
| | | Dow Jones Target 2045 Index — Global Series(4) | | (37.03 | )% | | |
| | | ING Solution 2045 Composite Index(2) | | (38.45 | )% | | |
(1) | | The Dow Jones Moderately Aggressive Portfolio Index consists of 80% equities and 20% fixed income and is one of the Dow Jones Relative Risk Indexes which measure the performance of conservative, moderate and aggressive portfolios based on incremental levels of potential risk. |
(2) | | The ING Solution Income Composite Index, ING Solution 2015 Composite Index, ING Solution 2025 Composite Index, ING Solution 2035 Composite Index and ING Solution 2045 Composite Index are each comprised of the asset class indices that correspond to the particular asset classes in which each Portfolio invests and their benchmark weightings. |
(3) | | The Dow Jones Moderate Portfolio Index consists of 57% equities and 43% fixed income and is one of the Dow Jones Relative Risk Indexes which measure the performance of conservative, moderate and aggressive portfolios based on incremental levels of potential risk. |
(4) | | The Dow Jones Target Today Index — Global Series, Dow Jones Target 2015 Index — Global Series, Dow Jones Target 2025 Index — Global Series, Dow Jones Target 2035 Index — Global Series and Dow Jones Target 2045 Index – Global Series are each comprised of a set of equity, bond and cash sub-indices. |
5
| | |
| ING SOLUTION PORTFOLIOS | | PORTFOLIO MANAGERS’ REPORT |
Asset Allocation
as of December 31, 2008
(as a percentage of net assets)
| | | | | | | | | | | | | | | | | | | | | | | |
| Affiliated Underlying Funds | | | | ING
Solution
Growth
and
Income
Portfolio | | | ING
Solution
Growth
Portfolio | | | ING
Solution
Income
Portfolio | | | ING
Solution
2015
Portfolio | | | ING
Solution
2025
Portfolio | | | ING
Solution
2035
Portfolio | | | ING
Solution
2045
Portfolio | |
ING Baron Small Cap Growth Portfolio - Class I | | % | | — | | | — | | | — | | | — | | | 1.5 | | | 2.0 | | | 2.5 | |
ING BlackRock Inflation Protected Bond Portfolio - Class I | | % | | 3.2 | | | — | | | 5.2 | | | 5.3 | | | — | | | — | | | — | |
ING BlackRock Large Cap Value Portfolio - Class I | | % | | 3.1 | | | 4.4 | | | — | | | 3.2 | | | 4.3 | | | 5.4 | | | 5.4 | |
ING Columbia Small Cap Value II Portfolio - Class I | | % | | — | | | — | | | — | | | — | | | 1.5 | | | 2.0 | | | 2.4 | |
ING Davis New York Venture Portfolio - Class I | | % | | 4.8 | | | 6.7 | | | 3.8 | | | 5.3 | | | 5.4 | | | 4.9 | | | 4.9 | |
ING Global Real Estate Portfolio - Class I | | % | | — | | | 5.8 | | | — | | | 4.6 | | | 4.7 | | | 4.7 | | | 4.7 | |
ING JPMorgan Emerging Markets Equity Portfolio - Class I | | % | | — | | | 1.0 | | | — | | | — | | | 2.1 | | | 4.1 | | | 5.2 | |
ING Julius Baer Foreign Portfolio - Class I | | % | | 4.1 | | | 6.3 | | | 3.0 | | | 3.1 | | | 6.2 | | | 6.2 | | | 9.3 | |
ING Legg Mason Partners Aggressive Growth Portfolio - Class I | | % | | 3.0 | | | 4.2 | | | — | | | 3.1 | | | 5.1 | | | 5.2 | | | 6.2 | |
ING Limited Maturity Bond Portfolio - Class I | | % | | 12.3 | | | 6.4 | | | 19.5 | | | 6.2 | | | 5.2 | | | — | | | — | |
ING Marsico Growth Portfolio - Class I | | % | | 2.8 | | | 3.8 | | | — | | | 2.9 | | | 4.8 | | | 5.8 | | | 5.8 | |
ING Marsico International Opportunities Portfolio - Class I | | % | | 2.5 | | | 2.7 | | | 1.8 | | | 1.9 | | | 3.3 | | | 4.7 | | | 5.7 | |
ING Oppenheimer Strategic Income Portfolio - Class I | | % | | — | | | — | | | 6.1 | | | 8.3 | | | 4.2 | | | — | | | — | |
ING PIMCO Core Bond Portfolio - Class I | | % | | 13.8 | | | 9.6 | | | 17.8 | | | 6.7 | | | 2.0 | | | 2.1 | | | 0.1 | |
ING PIMCO High Yield Portfolio - Class I | | % | | 4.0 | | | 3.4 | | | 3.3 | | | 3.1 | | | 3.4 | | | 3.5 | | | — | |
ING Pioneer Mid Cap Value Portfolio - Class I | | % | | 1.0 | | | 1.6 | | | — | | | 1.5 | | | 2.6 | | | 3.6 | | | 4.7 | |
ING Real Estate Fund - Class I | | % | | 3.8 | | | — | | | 3.6 | | | — | | | — | | | — | | | — | |
ING T. Rowe Price Equity Income Portfolio - Class I | | % | | 2.9 | | | 4.0 | | | 2.9 | | | 3.0 | | | 6.0 | | | 6.0 | | | 7.0 | |
ING T. Rowe Price Growth Equity Portfolio - Class I | | % | | 2.9 | | | 3.8 | | | 1.9 | | | 2.9 | | | 3.9 | | | 4.9 | | | 4.9 | |
ING UBS U.S. Large Cap Equity Portfolio - Class I | | % | | 3.8 | | | 5.7 | | | 3.3 | | | 4.8 | | | 4.8 | | | 3.9 | | | 3.9 | |
ING Van Kampen Comstock Portfolio - Class I | | % | | 2.9 | | | 3.9 | | | — | | | 2.9 | | | 4.0 | | | 5.0 | | | 5.0 | |
ING Van Kampen Real Estate Portfolio - Class I | | % | | 3.8 | | | 4.0 | | | 4.5 | | | 5.5 | | | 4.6 | | | 3.7 | | | 1.9 | |
ING VP Growth and Income Portfolio - Class I | | % | | 3.8 | | | 4.9 | | | 3.3 | | | 4.4 | | | 4.4 | | | 3.9 | | | 4.0 | |
ING VP Intermediate Bond Portfolio - Class I | | % | | 16.1 | | | 10.4 | | | 19.0 | | | 14.9 | | | 8.0 | | | 6.9 | | | 1.9 | |
ING VP International Value Portfolio - Class I | | % | | 2.5 | | | 3.0 | | | 1.0 | | | 2.0 | | | 3.5 | | | 5.0 | | | 6.0 | |
ING VP MidCap Opportunities Portfolio - Class I | | % | | 1.0 | | | 1.5 | | | — | | | 1.5 | | | 2.5 | | | 3.5 | | | 4.5 | |
ING VP Small Company Portfolio - Class I | | % | | 1.9 | | | 2.9 | | | — | | | 2.9 | | | 2.0 | | | 3.0 | | | 4.0 | |
Other assets and liabilities - Net | | % | | (0.0 | )* | | (0.0 | )* | | (0.0 | )* | | (0.0 | )* | | (0.0 | )* | | (0.0 | )* | | (0.0 | )* |
| | | | | | | | | | | | | | | | | | | | | | | |
| | % | | 100.0 | | | 100.0 | | | 100.0 | | | 100.0 | | | 100.0 | | | 100.0 | | | 100.0 | |
| | | | | | | | | | | | | | | | | | | | | | | |
| * | | Amount is more than (0.05)% |
Target Allocations
as of December 31, 2008
(as a percentage of net assets)
| | | | | | | | | | | | | | | | |
| Target Allocations(1) | | | | ING
Solution
Growth
and
Income
Portfolio | | ING
Solution
Growth
Portfolio | | ING
Solution
Income
Portfolio | | ING
Solution
2015
Portfolio | | ING
Solution
2025
Portfolio | | ING
Solution
2035
Portfolio | | ING
Solution
2045
Portfolio |
U.S. Large Cap Stocks - Core | | % | | 11.0 | | 16.0 | | 10.0 | | 13.0 | | 12.0 | | 10.0 | | 10.0 |
U.S. Large Cap Stocks - Growth | | % | | 9.0 | | 12.0 | | 2.0 | | 9.0 | | 14.0 | | 16.0 | | 17.0 |
U.S. Large Cap Stocks - Value | | % | | 9.0 | | 12.0 | | 3.0 | | 9.0 | | 14.0 | | 16.0 | | 17.0 |
U.S. Mid Cap Stocks | | % | | 2.0 | | 3.0 | | — | | 3.0 | | 5.0 | | 7.0 | | 9.0 |
U.S. Small Cap Stocks | | % | | 2.0 | | 3.0 | | — | | 3.0 | | 5.0 | | 7.0 | | 9.0 |
Non-U.S./International Stocks | | % | | 9.0 | | 11.0 | | 6.0 | | 7.0 | | 12.0 | | 15.0 | | 19.0 |
Domestic Real Estate Investment Trusts (“REITs”) | | % | | 8.0 | | 7.0 | | 9.0 | | 8.0 | | 7.0 | | 6.0 | | 4.0 |
Core Fixed-Income | | % | | 30.0 | | 19.0 | | 39.0 | | 25.0 | | 12.0 | | 12.0 | | 2.0 |
High Yield Bond | | % | | 3.0 | | 3.0 | | 6.0 | | 7.0 | | 5.0 | | 3.0 | | 3.0 |
Short-Term Bonds | | % | | 14.0 | | 8.0 | | 20.0 | | 8.0 | | 8.0 | | — | | — |
Treasury Inflation Protected Securities | | % | | 3.0 | | — | | 5.0 | | 5.0 | | — | | — | | — |
Emerging Markets Equity | | % | | — | | 2.0 | | — | | — | | 3.0 | | 5.0 | | 7.0 |
International REITs | | % | | — | | 4.0 | | — | | 3.0 | | 3.0 | | 3.0 | | 3.0 |
| | | | | | | | | | | | | | | | |
| | % | | 100.0 | | 100.0 | | 100.0 | | 100.0 | | 100.0 | | 100.0 | | 100.0 |
| | | | | | | | | | | | | | | | |
(1) | | Although the Solution Portfolios expect to be fully invested at all times, they may maintain liquidity reserves to meet redemption requests. |
Portfolio holdings are subject to change daily.
6
| | |
| PORTFOLIO MANAGERS’ REPORT | | ING SOLUTION GROWTHAND INCOME PORTFOLIO |
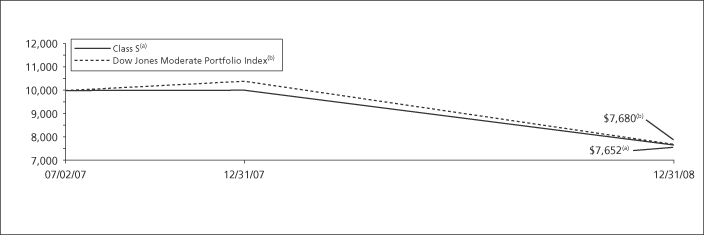
| | | | | | | | | | |
| | | |
| | | Average Annual Total Returns for the Periods Ended December 31, 2008 | | | |
| | | | | 1 Year | | | Since Inception
of Classes ADV, I and S
July 2, 2007 | | | |
| | | Class ADV | | (23.88 | )% | | (16.62 | )% | | |
| | | Class I | | (23.32 | )% | | (15.98 | )% | | |
| | | Class S | | (23.63 | )% | | (16.32 | )% | | |
| | | Dow Jones Moderate Portfolio Index(1) | | (24.75 | )% | | (16.07 | )%(2) | | |
Based on a $10,000 initial investment, the graph and table above illustrate the total return of ING Solution Growth and Income Portfolio against the index indicated. An index is unmanaged and has no cash in its portfolio, imposes no sales charges and incurs no operating expenses. An investor cannot invest directly in an index.
The performance graph and table do not reflect the deduction of taxes that a shareholder will pay on Portfolio distributions or the redemption of Portfolio shares.
The performance shown may include the effect of fee waivers and/or expense reimbursements by the Investment Adviser and/or other service providers, which have the effect of increasing total return. Had all fees and expenses been considered, the total returns would have been lower.
Performance data represents past performance and is no assurance of future results. Investment return and principal value of an investment in the Portfolio will fluctuate. Shares, when sold, may be worth more or less than their original cost. The Portfolio’s current performance may be lower or higher than the performance data
shown. Please log on to www.ingfunds.com or call (800) 262-3862 to get performance through the most recent month end.
It is important to note that the Portfolio has a limited operating history. Performance over a longer period of time may be more meaningful than short-term performance.
This report contains statements that may be “forward-looking” statements. Actual results may differ materially from those projected in the “forward-looking” statements.
The views expressed in this report reflect those of the Investment Adviser, only through the end of the period as stated on the cover. The Investment Adviser’s views are subject to change at any time based on market and other conditions.
Portfolio holdings are subject to change daily.
(1) | | The Dow Jones Moderate Portfolio Index is comprised of a set of equity, bond and cash sub-indexes. |
(2) | | Since inception performance for the index is shown as of July 1, 2007. |
7
| | |
| ING SOLUTION GROWTH PORTFOLIO | | PORTFOLIO MANAGERS’ REPORT |
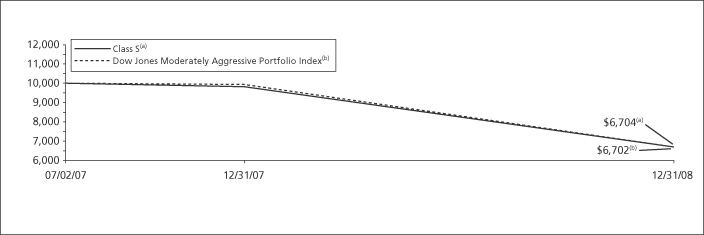
| | | | | | | | | | |
| | | |
| | | Average Annual Total Returns for the Periods Ended December 31, 2008 | | | |
| | | | | 1 Year | | | Since Inception
of Classes ADV, I and S
July 2, 2007 | | | |
| | | Class ADV | | (32.00 | )% | | (23.39 | )% | | |
| | | Class I | | (31.57 | )% | | (23.10 | )% | | |
| | | Class S | | (31.81 | )% | | (23.39 | )% | | |
| | | Dow Jones Moderately Aggressive Portfolio Index(1) | | (33.17 | )% | | (23.32 | )%(2) | | |
Based on a $10,000 initial investment, the graph and table above illustrate the total return of ING Solution Growth Portfolio against the index indicated. An index is unmanaged and has no cash in its portfolio, imposes no sales charges and incurs no operating expenses. An investor cannot invest directly in an index.
The performance graph and table do not reflect the deduction of taxes that a shareholder will pay on Portfolio distributions or the redemption of Portfolio shares.
The performance shown may include the effect of fee waivers and/or expense reimbursements by the Investment Adviser and/or other service providers, which have the effect of increasing total return. Had all fees and expenses been considered, the total returns would have been lower.
Performance data represents past performance and is no assurance of future results. Investment return and principal value of an investment in the Portfolio will fluctuate. Shares, when sold, may be worth more or less than their original cost. The Portfolio’s current performance may be lower or higher than the performance data
shown. Please log on to www.ingfunds.com or call (800) 262-3862 to get performance through the most recent month end.
It is important to note that the Portfolio has a limited operating history. Performance over a longer period of time may be more meaningful than short-term performance.
This report contains statements that may be “forward-looking” statements. Actual results may differ materially from those projected in the “forward-looking” statements.
The views expressed in this report reflect those of the Investment Adviser, only through the end of the period as stated on the cover. The Investment Adviser’s views are subject to change at any time based on market and other conditions.
Portfolio holdings are subject to change daily.
(1) | | The Dow Jones Moderately Aggressive Portfolio Index is comprised of a set of equity, bond and cash sub-indexes. |
(2) | | Since inception performance for the index is shown as of July 1, 2007. |
8
| | |
| PORTFOLIO MANAGERS’ REPORT | | ING SOLUTION INCOME PORTFOLIO |
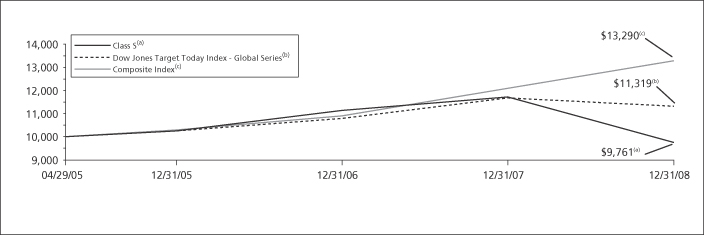
| | | | | | | | | | | | | |
| | | |
| | | Average Annual Total Returns for the Periods Ended December 31, 2008 | | | |
| | | | | 1 Year | | | Since Inception
of Classes ADV, I and S
April 29, 2005 | | | Since Inception
of Class T
August 31, 2005 | | | |
| | | Class ADV | | (16.93 | )% | | (0.93 | )% | | — | | | |
| | | Class I | | (16.49 | )% | | (0.41 | )% | | — | | | |
| | | Class S | | (16.66 | )% | | (0.65 | )% | | — | | | |
| | | Class T | | (17.14 | )% | | — | | | (2.05 | )% | | |
| | | Dow Jones Target Today Index — Global Series(1) | | (3.06 | )% | | 3.43 | %(3) | | 3.15 | %(4) | | |
| | | Composite Index(2) | | (10.68 | )% | | 8.05 | %(3) | | 4.08 | %(4) | | |
Based on a $10,000 initial investment, the graph and table above illustrate the total return of ING Solution Income Portfolio against the indices indicated. An index is unmanaged and has no cash in its portfolio, imposes no sales charges and incurs no operating expenses. An investor cannot invest directly in an index.
The performance graph and table do not reflect the deduction of taxes that a shareholder will pay on Portfolio distributions or the redemption of Portfolio shares.
The performance shown may include the effect of fee waivers and/or expense reimbursements by the Investment Adviser and/or other service providers, which have the effect of increasing total return. Had all fees and expenses been considered, the total returns would have been lower.
Performance data represents past performance and is no assurance of future results. Investment return and principal value of an investment in the Portfolio will fluctuate. Shares, when sold, may be worth more or less than their original cost. The Portfolio’s current performance may be lower or higher than the performance data shown. Please log on to www.ingfunds.com or call (800) 262-3862 to get performance through the most recent month end.
It is important to note that the Portfolio has a limited operating history. Performance over a longer period of time may be more meaningful than short-term performance.
This report contains statements that may be “forward-looking” statements. Actual results may differ materially from those projected in the “forward-looking” statements.
The views expressed in this report reflect those of the Investment Adviser, only through the end of the period as stated on the cover. The Investment Adviser’s views are subject to change at any time based on market and other conditions.
Portfolio holdings are subject to change daily.
(1) | | The Dow Jones Target Today Index — Global Series is comprised of a set of equity, bond and cash sub-indexes. |
(2) | | The Composite Index is comprised of 10% S&P 500® Index/2% Russell 1000® Growth Index/3% Russell 1000® Value Index/6% MSCI EAFE® Index/9% DJ Wilshire Real Estate Securities Index/42% Barclays Capital Aggregate Bond Index/3% Barclays Capital High Yield Index/20% Barclays Capital 1-3 Year Government/Credit Index/5% Citigroup U.S. Inflation-Linked Securities Index. |
(3) | | Since inception performance for the indices is shown as of May 1, 2005. |
(4) | | Since inception performance for the indices is shown as of September 1, 2005. |
9
| | |
| ING SOLUTION 2015 PORTFOLIO | | PORTFOLIO MANAGERS’ REPORT |
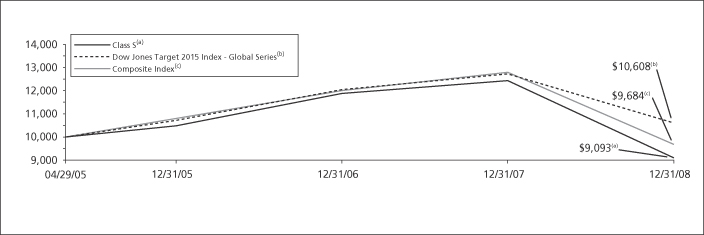
| | | | | | | | | | | | | |
| | | |
| | | Average Annual Total Returns for the Periods Ended December 31, 2008 | | | |
| | | | | 1 Year | | | Since Inception
of Classes ADV, I and S
April 29, 2005 | | | Since Inception
of Class T
August 31, 2005 | | | |
| | | Class ADV | | (27.05 | )% | | (2.83 | )% | | — | | | |
| | | Class I | | (26.71 | )% | | (2.31 | )% | | — | | | |
| | | Class S | | (26.86 | )% | | (2.56 | )% | | — | | | |
| | | Class T | | (27.17 | )% | | — | | | (4.65 | )% | | |
| | | Dow Jones Target 2015 Index — Global Series(1) | | (16.65 | )% | | 1.62 | %(3) | | 0.18 | %(4) | | |
| | | Composite Index(2) | | (22.51 | )% | | (0.87 | )%(3) | | (6.14 | )%(4) | | |
Based on a $10,000 initial investment, the graph and table above illustrate the total return of ING Solution 2015 Portfolio against the indices indicated. An index is unmanaged and has no cash in its portfolio, imposes no sales charges and incurs no operating expenses. An investor cannot invest directly in an index.
The performance graph and table do not reflect the deduction of taxes that a shareholder will pay on Portfolio distributions or the redemption of Portfolio shares.
The performance shown may include the effect of fee waivers and/or expense reimbursements by the Investment Adviser and/or other service providers, which have the effect of increasing total return. Had all fees and expenses been considered, the total returns would have been lower.
Performance data represents past performance and is no assurance of future results. Investment return and principal value of an investment in the Portfolio will fluctuate. Shares, when sold, may be worth more or less than their original cost. The Portfolio’s current performance may be lower or higher than the performance data shown. Please log on to www.ingfunds.com or call (800) 262-3862 to get performance through the most recent month end.
It is important to note that the Portfolio has a limited operating history. Performance over a longer period of time may be more meaningful than short-term performance.
This report contains statements that may be “forward-looking” statements. Actual results may differ materially from those projected in the “forward-looking” statements.
The views expressed in this report reflect those of the Investment Adviser, only through the end of the period as stated on the cover. The Investment Adviser’s views are subject to change at any time based on market and other conditions.
Portfolio holdings are subject to change daily.
(1) | | The Dow Jones 2015 Index — Global Series is comprised of a set of equity, bond and cash sub-indexes. |
(2) | | The Composite Index is comprised of 13% S&P 500® Index/9% Russell 1000® Growth Index/9% Russell 1000® Value Index/3% Russell MidCap® Index/3% Russell 2000® Index/7% MSCI EAFE® Index/8% DJ Wilshire Real Estate Securities Index/28% Barclays Capital U.S. Aggregate Bond Index/4% Barclays Capital High Yield Index/8% Barclays Capital 1-3 Year Government/Credit Index/5% Citigroup U.S. Inflation-Linked Securities Index/3% S&P/Citigroup World Property ex U.S. Index. |
(3) | | Since inception performance for the indices is shown from May 1, 2005. |
(4) | | Since inception performance for the indices is shown from September 1, 2005. |
10
| | |
| PORTFOLIO MANAGERS’ REPORT | | ING SOLUTION 2025 PORTFOLIO |
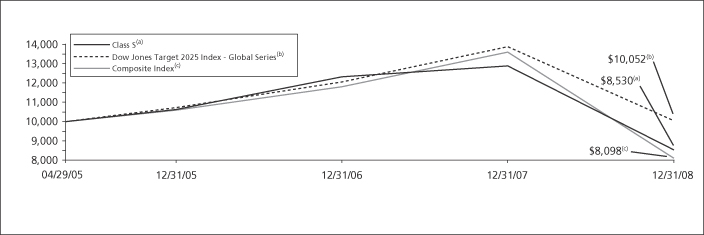
| | | | | | | | | | | | | |
| | | |
| | | Average Annual Total Returns for the Periods Ended December 31, 2008 | | | |
| | | | | 1 Year | | | Since Inception
of Classes ADV, I and S
April 29, 2005 | | | Since Inception
of Class T
August 31, 2005 | | | |
| | | Class ADV | | (34.05 | )% | | (4.52 | )% | | — | | | |
| | | Class I | | (33.72 | )% | | (3.98 | )% | | — | | | |
| | | Class S | | (33.87 | )% | | (4.24 | )% | | — | | | |
| | | Class T | | (34.18 | )% | | — | | | (6.84 | )% | | |
| | | Dow Jones Target 2025 Index — Global Series(1) | | (27.61 | )% | | 0.14 | %(3) | | (2.13 | )%(4) | | |
| | | Composite Index(2) | | (30.52 | )% | | (5.58 | )%(3) | | (11.81 | )%(4) | | |
Based on a $10,000 initial investment, the graph and table above illustrate the total return of ING Solution 2025 Portfolio against the indices indicated. An index is unmanaged and has no cash in its portfolio, imposes no sales charges and incurs no operating expenses. An investor cannot invest directly in an index.
The performance graph and table do not reflect the deduction of taxes that a shareholder will pay on Portfolio distributions or the redemption of Portfolio shares.
The performance shown may include the effect of fee waivers and/or expense reimbursements by the Investment Adviser and/or other service providers, which have the effect of increasing total return. Had all fees and expenses been considered, the total returns would have been lower.
Performance data represents past performance and is no assurance of future results. Investment return and principal value of an investment in the Portfolio will fluctuate. Shares, when sold, may be worth more or less than their original cost. The Portfolio’s current performance may be lower or higher than the performance data shown. Please log on to www.ingfunds.com or call (800) 262-3862 to get performance through the most recent month end.
It is important to note that the Portfolio has a limited operating history. Performance over a longer period of time may be more meaningful than short-term performance.
This report contains statements that may be “forward-looking” statements. Actual results may differ materially from those projected in the “forward-looking” statements.
The views expressed in this report reflect those of the Investment Adviser, only through the end of the period as stated on the cover. The Investment Adviser’s views are subject to change at any time based on market and other conditions.
Portfolio holdings are subject to change daily.
(1) | | The Dow Jones Target 2025 Index — Global Series is comprised of a set of equity, bond and cash sub-indexes. |
(2) | | The Composite Index is comprised of 12% S&P 500® Index/14% Russell 1000® Growth Index/14% Russell 1000® Value Index/5% Russell MidCap® Index/5% Russell 2000® Index/12% MSCI EAFE® Index/7% DJ Wilshire Real Estate Securities Index/15% Barclays Capital U.S. Aggregate Bond Index/2% Barclays Capital High Yield Index/8% Barclays Capital 1-3 Year Government/Credit Index/3% MSCI Emerging Markets Index/3% S&P/Citigroup World Property ex U.S. Index. |
(3) | | Since inception performance for the indices is shown from May 1, 2005. |
(4) | | Since inception performance for the indices is shown from September 1, 2005. |
11
| | |
| ING SOLUTION 2035 PORTFOLIO | | PORTFOLIO MANAGERS’ REPORT |

| | | | | | | | | | | | | |
| | | |
| | | Average Annual Total Returns for the Periods Ended December 31, 2008 | | | |
| | | | | 1 Year | | | Since Inception
of Classes ADV, I and S
April 29, 2005 | | | Since Inception
of Class T
August 31, 2005 | | | |
| | | Class ADV | | (37.18 | )% | | (4.92 | )% | | — | | | |
| | | Class I | | (36.85 | )% | | (4.40 | )% | | — | | | |
| | | Class S | | (37.01 | )% | | (4.66 | )% | | — | | | |
| | | Class T | | (37.30 | )% | | — | | | (7.47 | )% | | |
| | | Dow Jones Target 2035 Index — Global Series(1) | | (35.15 | )% | | (1.51 | )%(3) | | (4.29 | )%(4) | | |
| | | Composite Index(2) | | (33.01 | )% | | (5.77 | )%(3) | | (12.74 | )%(4) | | |
Based on a $10,000 initial investment, the graph and table above illustrate the total return of ING Solution 2035 Portfolio against the indices indicated. An index is unmanaged and has no cash in its portfolio, imposes no sales charges and incurs no operating expenses. An investor cannot invest directly in an index.
The performance graph and table do not reflect the deduction of taxes that a shareholder will pay on Portfolio distributions or the redemption of Portfolio shares.
The performance shown may include the effect of fee waivers and/or expense reimbursements by the Investment Adviser and/or other service providers, which have the effect of increasing total return. Had all fees and expenses been considered, the total returns would have been lower.
Performance data represents past performance and is no assurance of future results. Investment return and principal value of an investment in the Portfolio will fluctuate. Shares, when sold, may be worth more or less than their original cost. The Portfolio’s current performance may be lower or higher than the performance data shown. Please log on to www.ingfunds.com or call (800) 262-3862 to get performance through the most recent month end.
It is important to note that the Portfolio has a limited operating history. Performance over a longer period of time may be more meaningful than short-term performance.
This report contains statements that may be “forward-looking” statements. Actual results may differ materially from those projected in the “forward-looking” statements.
The views expressed in this report reflect those of the Investment Adviser, only through the end of the period as stated on the cover. The Investment Adviser’s views are subject to change at any time based on market and other conditions.
Portfolio holdings are subject to change daily.
(1) | | The Dow Jones Target 2035 Index — Global Series is comprised of a set of equity, bond and cash sub-indexes. |
(2) | | The Composite Index is comprised of 10% S&P 500® Index/16% Russell 1000® Growth Index/16% Russell 1000® Value Index/7% Russell MidCap® Index/7% Russell 2000® Index/15% MSCI EAFE® Index/6% DJ Wilshire Real Estate Securities Index/15% Barclays Capital U.S. Aggregate Bond Index/5% MSCI Emerging Markets Index/3% S&P/Citigroup World Property ex U.S. Index. |
(3) | | Since inception performance for the indices is shown from May 1, 2005. |
(4) | | Since inception performance for the indices is shown from September 1, 2005. |
12
| | |
| PORTFOLIO MANAGERS’ REPORT | | ING SOLUTION 2045 PORTFOLIO |
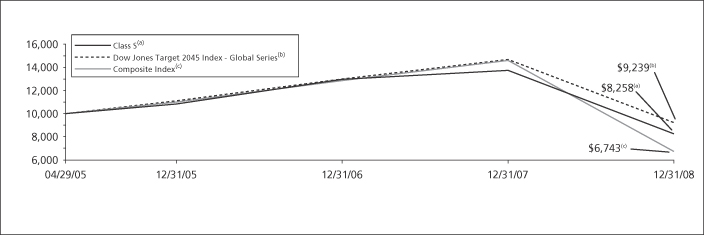
| | | | | | | | | | | | | |
| | | |
| | | Average Annual Total Returns for the Periods Ended December 31, 2008 | | | |
| | | | | 1 Year | | | Since Inception
of Classes ADV, I and S
April 29, 2005 | | | Since Inception
of Class T
August 31, 2005 | | | |
| | | Class ADV | | (40.02 | )% | | (5.31 | )% | | — | | | |
| | | Class I | | (39.70 | )% | | (4.82 | )% | | — | | | |
| | | Class S | | (39.86 | )% | | (5.08 | )% | | — | | | |
| | | Class T | | (40.12 | )% | | — | | | (8.23 | )% | | |
| | | Dow Jones Target 2045 Index — Global Series(1) | | (37.03 | )% | | (2.13 | )%(3) | | (4.99 | )%(4) | | |
| | | Composite Index(2) | | (38.45 | )% | | (10.17 | )%(3) | | (17.46 | )%(4) | | |
Based on a $10,000 initial investment, the graph and table above illustrate the total return of ING Solution 2045 Portfolio against the indices indicated. An index is unmanaged and has no cash in its portfolio, imposes no sales charges and incurs no operating expenses. An investor cannot invest directly in an index.
The performance graph and table do not reflect the deduction of taxes that a shareholder will pay on Portfolio distributions or the redemption of Portfolio shares.
The performance shown may include the effect of fee waivers and/or expense reimbursements by the Investment Adviser and/or other service providers, which have the effect of increasing total return. Had all fees and expenses been considered, the total returns would have been lower.
Performance data represents past performance and is no assurance of future results. Investment return and principal value of an investment in the Portfolio will fluctuate. Shares, when sold, may be worth more or less than their original cost. The Portfolio’s current performance may be lower or higher than the performance data shown. Please log on to www.ingfunds.com or call (800) 262-3862 to get performance through the most recent month end.
It is important to note that the Portfolio has a limited operating history. Performance over a longer period of time may be more meaningful than short-term performance.
This report contains statements that may be “forward-looking” statements. Actual results may differ materially from those projected in the “forward-looking” statements.
The views expressed in this report reflect those of the Investment Adviser, only through the end of the period as stated on the cover. The Investment Adviser’s views are subject to change at any time based on market and other conditions.
Portfolio holdings are subject to change daily.
(1) | | The Dow Jones Target 2045 Index — Global Series is comprised of a set of equity, bond and cash sub-indexes. |
(2) | | The Composite Index is comprised of 10% S&P 500® Index/17% Russell 1000® Growth Index/17% Russell 1000® Value Index/9% Russell MidCap® Index/9% Russell 2000® Index/19% MSCI EAFE® Index/4% DJ Wilshire Real Estate Securities Index/5% Barclays Capital U.S. Aggregate Bond Index/7% MSCI Emerging Markets Index/3% S&P/Citigroup World Property ex U.S. Index. |
(3) | | Since inception performance for the indices is shown from May 1, 2005. |
(4) | | Since inception performance for the indices is shown from September 1, 2005. |
13
SHAREHOLDER EXPENSE EXAMPLE (UNAUDITED)
As a shareholder of a Portfolio, you incur two types of costs: (1) transaction costs, including redemption and exchange fees; and (2) ongoing costs including management fees, distribution and/or service (12b-1) fees, and other Portfolio expenses. These Examples are intended to help you understand your ongoing costs (in dollars) of investing in a Portfolio and to compare these costs with the ongoing costs of investing in other mutual funds.
The Examples are based on an investment of $1,000 invested at the beginning of the period (except as noted) and held for the entire period from July 1, 2008 to December 31, 2008. The Portfolios’ expenses are shown without the imposition of any charges which are, or may be, imposed under your annuity contract. Expenses would have been higher if such charges were included.
Actual Expenses
The first section of the table shown, “Actual Portfolio Return,” provides information about actual account values and actual expenses. You may use the information in this section, together with the amount you invested, to estimate the expenses that you paid over the period. Simply divide your account value by $1,000 (for example, an $8,600 account value divided by $1,000 = 8.6), then multiply the result by the number in the first section under the heading entitled “Expenses Paid During the Period” to estimate the expenses you paid on your account during this period.
Hypothetical Example for Comparison Purposes
The second section of the table shown, “Hypothetical (5% return before expenses),” provides information about hypothetical account values and hypothetical expenses based on the Portfolio’s actual expense ratio and an assumed rate of return of 5% per year before expenses, which is not the Portfolio’s actual return. The hypothetical account values and expenses may not be used to estimate the actual ending account balance or expenses you paid for the period. You may use this information to compare the ongoing costs of investing in the Fund and other mutual funds. To do so, compare this 5% hypothetical example with the 5% hypothetical examples that appear in the shareholder reports of the other mutual funds.
Please note that the expenses shown in the table are meant to highlight your ongoing costs only and do not reflect any transactional costs, such as redemption fees or exchange fees. Therefore, the hypothetical lines of the table are useful in comparing ongoing costs only, and will not help you determine the relative total costs of owning different mutual funds. In addition, if these transactional costs were included, your costs would have been higher.
| | | | | | | | | | | | | | | | | | | | | | | | |
| | | Actual Portfolio Return | | Hypothetical (5% return before expenses) |
| | | Beginning
Account
Value
July 1, 2008 | | Ending
Account Value
December 31, 2008 | | Annualized
Expense
Ratio* | | | Expenses Paid
During the
Period Ended
December 31, 2008** | | Beginning
Account
Value
July 1, 2008 | | Ending
Account Value
December 31, 2008 | | Annualized
Expense
Ratio* | | | Expenses Paid
During the
Period Ended
December 31, 2008** |
ING Solution Growth and Income Portfolio | | | | | | | | | | | | | | | | |
Class ADV | | $ | 1,000.00 | | $ | 809.80 | | 0.62 | % | | $ | 2.82 | | $ | 1,000.00 | | $ | 1,022.02 | | 0.62 | % | | $ | 3.15 |
Class I | | | 1,000.00 | | | 812.10 | | 0.12 | | | | 0.55 | | | 1,000.00 | | | 1,024.53 | | 0.12 | | | | 0.61 |
Class S | | | 1,000.00 | | | 810.70 | | 0.37 | | | | 1.68 | | | 1,000.00 | | | 1,023.28 | | 0.37 | | | | 1.88 |
ING Solution Growth Portfolio | | | | | | | | | | | | | | | | |
Class ADV | | $ | 1,000.00 | | $ | 746.20 | | 0.62 | % | | $ | 2.72 | | $ | 1,000.00 | | $ | 1,022.02 | | 0.62 | % | | $ | 3.15 |
Class I | | | 1,000.00 | | | 748.10 | | 0.12 | | | | 0.53 | | | 1,000.00 | | | 1,024.53 | | 0.12 | | | | 0.61 |
Class S | | | 1,000.00 | | | 747.40 | | 0.37 | | | | 1.62 | | | 1,000.00 | | | 1,023.28 | | 0.37 | | | | 1.88 |
ING Solution Income Portfolio | | | | | | | | | | | | | | | | |
Class ADV | | $ | 1,000.00 | | $ | 856.70 | | 0.62 | % | | $ | 2.89 | | $ | 1,000.00 | | $ | 1,022.02 | | 0.62 | % | | $ | 3.15 |
Class I | | | 1,000.00 | | | 858.60 | | 0.12 | | | | 0.56 | | | 1,000.00 | | | 1,024.53 | | 0.12 | | | | 0.61 |
Class S | | | 1,000.00 | | | 857.70 | | 0.37 | | | | 1.73 | | | 1,000.00 | | | 1,023.28 | | 0.37 | | | | 1.88 |
Class T | | | 1,000.00 | | | 855.20 | | 0.82 | | | | 3.82 | | | 1,000.00 | | | 1,021.01 | | 0.82 | | | | 4.17 |
| * | | Expense ratios do not include expenses of Underlying Funds. |
| ** | | Expenses are equal to each Portfolio’s respective annualized expense ratios multiplied by the average account value over the period, multiplied by 184/366 to reflect the most recent fiscal half-year. |
14
SHAREHOLDER EXPENSE EXAMPLE (UNAUDITED) (CONTINUED)
| | | | | | | | | | | | | | | | | | | | | | | | |
| | | Actual Portfolio Return | | Hypothetical (5% return before expenses) |
| | | Beginning
Account
Value
July 1, 2008 | | Ending
Account Value
December 31, 2008 | | Annualized
Expense
Ratio* | | | Expenses Paid
During the
Period Ended
December 31, 2008** | | Beginning
Account
Value
July 1, 2008 | | Ending
Account Value
December 31, 2008 | | Annualized
Expense
Ratio* | | | Expenses Paid
During the
Period Ended
December 31, 2008** |
ING Solution 2015 Portfolio | | | | | | | | | | | | | | | | |
Class ADV | | $ | 1,000.00 | | $ | 780.40 | | 0.62 | % | | $ | 2.77 | | $ | 1,000.00 | | $ | 1,022.02 | | 0.62 | % | | $ | 3.15 |
Class I | | | 1,000.00 | | | 782.60 | | 0.12 | | | | 0.54 | | | 1,000.00 | | | 1,024.53 | | 0.12 | | | | 0.61 |
Class S | | | 1,000.00 | | | 781.40 | | 0.37 | | | | 1.66 | | | 1,000.00 | | | 1,023.28 | | 0.37 | | | | 1.88 |
Class T | | | 1,000.00 | | | 780.40 | | 0.82 | | | | 3.67 | | | 1,000.00 | | | 1,021.01 | | 0.82 | | | | 4.17 |
ING Solution 2025 Portfolio | | | | | | | | | | | | | | | | |
Class ADV | | $ | 1,000.00 | | $ | 728.30 | | 0.62 | % | | $ | 2.69 | | $ | 1,000.00 | | $ | 1,022.02 | | 0.62 | % | | $ | 3.15 |
Class I | | | 1,000.00 | | | 730.10 | | 0.12 | | | | 0.52 | | | 1,000.00 | | | 1,024.53 | | 0.12 | | | | 0.61 |
Class S | | | 1,000.00 | | | 729.60 | | 0.37 | | | | 1.61 | | | 1,000.00 | | | 1,023.28 | | 0.37 | | | | 1.88 |
Class T | | | 1,000.00 | | | 728.00 | | 0.82 | | | | 3.56 | | | 1,000.00 | | | 1,021.01 | | 0.82 | | | | 4.17 |
ING Solution 2035 Portfolio | | | | | | | | | | | | | | | | |
Class ADV | | $ | 1,000.00 | | $ | 704.00 | | 0.62 | % | | $ | 2.66 | | $ | 1,000.00 | | $ | 1,022.02 | | 0.62 | % | | $ | 3.15 |
Class I | | | 1,000.00 | | | 705.90 | | 0.12 | | | | 0.51 | | | 1,000.00 | | | 1,024.53 | | 0.12 | | | | 0.61 |
Class S | | | 1,000.00 | | | 704.70 | | 0.37 | | | | 1.59 | | | 1,000.00 | | | 1,023.28 | | 0.37 | | | | 1.88 |
Class T | | | 1,000.00 | | | 703.30 | | 0.82 | | | | 3.51 | | | 1,000.00 | | | 1,021.01 | | 0.82 | | | | 4.17 |
ING Solution 2045 Portfolio | | | | | | | | | | | | | | | | |
Class ADV | | $ | 1,000.00 | | $ | 678.30 | | 0.62 | % | | $ | 2.62 | | $ | 1,000.00 | | $ | 1,022.02 | | 0.62 | % | | $ | 3.15 |
Class I | | | 1,000.00 | | | 680.20 | | 0.12 | | | | 0.51 | | | 1,000.00 | | | 1,024.53 | | 0.12 | | | | 0.61 |
Class S | | | 1,000.00 | | | 679.50 | | 0.37 | | | | 1.56 | | | 1,000.00 | | | 1,023.28 | | 0.37 | | | | 1.88 |
Class T | | | 1,000.00 | | | 677.90 | | 0.82 | | | | 3.46 | | | 1,000.00 | | | 1,021.01 | | 0.82 | | | | 4.17 |
| * | | Expense ratios do not include expenses of Underlying Funds. |
| ** | | Expenses are equal to each Portfolio’s respective annualized expense ratios multiplied by the average account value over the period, multiplied by 184/366 to reflect the most recent fiscal half-year. |
15
REPORT OF INDEPENDENT REGISTERED PUBLIC ACCOUNTING FIRM
The Shareholders and Board of Directors
ING Partners, Inc.
We have audited the accompanying statements of assets and liabilities, including the portfolios of investments, of ING Solution Growth and Income Portfolio, ING Solution Growth Portfolio, ING Solution Income Portfolio, ING Solution 2015 Portfolio, ING Solution 2025 Portfolio, ING Solution 2035 Portfolio, and ING Solution 2045 Portfolio, each a series of ING Partners, Inc., as of December 31, 2008, and the related statements of operations for the year then ended, the statements of changes in net assets for each of the years or periods in the two-year period then ended, and the financial highlights for each of the years or periods in the four-year period then ended. These financial statements and financial highlights are the responsibility of management. Our responsibility is to express an opinion on these financial statements and financial highlights based on our audits.
We conducted our audits in accordance with the standards of the Public Company Accounting Oversight Board (United States). Those standards require that we plan and perform the audit to obtain reasonable assurance about whether the financial statements and financial highlights are free of material misstatement. An audit includes examining, on a test basis, evidence supporting the amounts and disclosures in the financial statements. Our procedures included confirmation of securities owned as of December 31, 2008, by correspondence with the transfer agent of the underlying funds. An audit also includes assessing the accounting principles used and significant estimates made by management, as well as evaluating the overall financial statement presentation. We believe that our audits provide a reasonable basis for our opinion.
In our opinion, the financial statements and financial highlights referred to above present fairly, in all material respects, the financial position of the aforementioned portfolios as of December 31, 2008, and the results of their operations, the changes in their net assets, and the financial highlights for the periods specified in the first paragraph above, in conformity with U.S. generally accepted accounting principles.
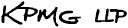
Boston, Massachusetts
February 27, 2009
16
STATEMENTS OF ASSETS AND LIABILITIESASOF DECEMBER 31, 2008
| | | | | | | | | | | | | | | | |
| | | ING Solution Growth and Income Portfolio | | | ING Solution Growth Portfolio | | | ING Solution Income Portfolio | | | ING Solution 2015 Portfolio | |
ASSETS: | | | | | | | | | | | | | | | | |
Investments in affiliated underlying funds* | | $ | 627,034 | | | $ | 174,929 | | | $ | 187,530,117 | | | $ | 552,268,882 | |
Receivables: | | | | | | | | | | | | | | | | |
Investments in affiliated underlying funds sold | | | — | | | | 55,295 | | | | — | | | | 493,249 | |
Fund shares sold | | | 11 | | | | — | | | | 264,073 | | | | 290,492 | |
Dividends and interest | | | 487 | | | | 76 | | | | 129,590 | | | | 152,463 | |
| | | | | | | | | | | | | | | | |
Total assets | | | 627,532 | | | | 230,300 | | | | 187,923,780 | | | | 553,205,086 | |
| | | | | | | | | | | | | | | | |
LIABILITIES: | | | | | | | | | | | | | | | | |
Payable for investments in affiliated underlying funds purchased | | | 498 | | | | 77 | | | | 295,412 | | | | 152,585 | |
Payable for fund shares redeemed | | | — | | | | 55,295 | | | | 98,295 | | | | 783,741 | |
Payable to affiliates | | | 185 | | | | 79 | | | | 70,265 | | | | 203,778 | |
| | | | | | | | | | | | | | | | |
Total liabilities | | | 683 | | | | 55,451 | | | | 463,972 | | | | 1,140,104 | |
| | | | | | | | | | | | | | | | |
NET ASSETS | | $ | 626,849 | | | $ | 174,849 | | | $ | 187,459,808 | | | $ | 552,064,982 | |
| | | | | | | | | | | | | | | | |
NET ASSETS WERE COMPRISED OF: | | | | | | | | | | | | | | | | |
Paid-in capital | | $ | 660,336 | | | $ | 235,759 | | | $ | 225,625,657 | | | $ | 740,392,543 | |
Undistributed net investment income | | | 9,419 | | | | 3,008 | | | | 10,359,604 | | | | 23,876,149 | |
Accumulated net realized loss on investments | | | (27,795 | ) | | | (55,838 | ) | | | (6,393,458 | ) | | | (8,148,150 | ) |
Net unrealized depreciation on investments | | | (15,111 | ) | | | (8,080 | ) | | | (42,131,995 | ) | | | (204,055,560 | ) |
| | | | | | | | | | | | | | | | |
NET ASSETS | | $ | 626,849 | | | $ | 174,849 | | | $ | 187,459,808 | | | $ | 552,064,982 | |
| | | | | | | | | | | | | | | | |
| | | | | | | | | | | | | | | | |
* Cost of investments in affiliated underlying funds | | $ | 642,145 | | | $ | 183,009 | | | $ | 229,662,112 | | | $ | 756,324,442 | |
| | | | | | | | | | | | | | | | |
Class ADV: | | | | | | | | | | | | | | | | |
Net assets | | $ | 768 | | | $ | 674 | | | $ | 85,343,358 | | | $ | 231,718,915 | |
Shares authorized | | | 100,000,000 | | | | 100,000,000 | | | | 100,000,000 | | | | 100,000,000 | |
Par value | | $ | 0.001 | | | $ | 0.001 | | | $ | 0.001 | | | $ | 0.001 | |
Shares outstanding | | | 101 | | | | 101 | | | | 9,207,014 | | | | 26,837,623 | |
Net asset value and redemption price per share | | $ | 7.61 | | | $ | 6.67 | | | $ | 9.27 | | | $ | 8.63 | |
Class I: | | | | | | | | | | | | | | | | |
Net assets | | $ | 776 | | | $ | 681 | | | $ | 24,417,040 | | | $ | 51,793,406 | |
Shares authorized | | | 100,000,000 | | | | 100,000,000 | | | | 100,000,000 | | | | 100,000,000 | |
Par value | | $ | 0.001 | | | $ | 0.001 | | | $ | 0.001 | | | $ | 0.001 | |
Shares outstanding | | | 101 | | | | 101 | | | | 2,588,856 | | | | 5,897,673 | |
Net asset value and redemption price per share | | $ | 7.69 | | | $ | 6.74 | | | $ | 9.43 | | | $ | 8.78 | |
Class S: | | | | | | | | | | | | | | | | |
Net assets | | $ | 625,305 | | | $ | 173,494 | | | $ | 77,076,343 | | | $ | 265,937,281 | |
Shares authorized | | | 100,000,000 | | | | 100,000,000 | | | | 100,000,000 | | | | 100,000,000 | |
Par value | | $ | 0.001 | | | $ | 0.001 | | | $ | 0.001 | | | $ | 0.001 | |
Shares outstanding | | | 81,823 | | | | 25,880 | | | | 8,229,755 | | | | 30,499,826 | |
Net asset value and redemption price per share | | $ | 7.64 | | | $ | 6.70 | | | $ | 9.37 | | | $ | 8.72 | |
Class T: | | | | | | | | | | | | | | | | |
Net assets | | | n/a | | | | n/a | | | $ | 623,067 | | | $ | 2,615,380 | |
Shares authorized | | | n/a | | | | n/a | | | | 100,000,000 | | | | 100,000,000 | |
Par value | | | n/a | | | | n/a | | | $ | 0.001 | | | $ | 0.001 | |
Shares outstanding | | | n/a | | | | n/a | | | | 66,682 | | | | 300,727 | |
Net asset value and redemption price per share | | | n/a | | | | n/a | | | $ | 9.34 | | | $ | 8.70 | |
See Accompanying Notes to Financial Statements
17
STATEMENTS OF ASSETS AND LIABILITIESASOF DECEMBER 31, 2008
| | | | | | | | | | | | |
| | | ING Solution 2025 Portfolio | | | ING Solution 2035 Portfolio | | | ING Solution 2045 Portfolio | |
ASSETS: | | | | | | | | | | | | |
Investments in affiliated underlying funds* | | | 740,593,283 | | | | 575,313,133 | | | | 327,657,917 | |
Receivables: | | | | | | | | | | | | |
Investments in affiliated underlying funds sold | | | 306,683 | | | | — | | | | — | |
Fund shares sold | | | 597,116 | | | | 753,676 | | | | 668,841 | |
Dividends and interest | | | 223,824 | | | | 174,481 | | | | — | |
| | | | | | | | | | | | |
Total assets | | | 741,720,906 | | | | 576,241,290 | | | | 328,326,758 | |
| | | | | | | | | | | | |
LIABILITIES: | | | | | | | | | | | | |
Payable for investments in affiliated underlying funds purchased | | | 223,983 | | | | 543,844 | | | | 503,901 | |
Payable for fund shares redeemed | | | 903,799 | | | | 384,403 | | | | 164,940 | |
Payable to affiliates | | | 273,000 | | | | 212,181 | | | | 137,033 | |
| | | | | | | | | | | | |
Total liabilities | | | 1,400,782 | | | | 1,140,428 | | | | 805,874 | |
| | | | | | | | | | | | |
NET ASSETS | | $ | 740,320,124 | | | $ | 575,100,862 | | | $ | 327,520,884 | |
| | | | | | | | | | | | |
NET ASSETS WERE COMPRISED OF: | | | | | | | | | | | | |
Paid-in capital | | $ | 1,083,216,193 | | | $ | 870,877,855 | | | $ | 508,890,515 | |
Undistributed net investment income | | | 28,078,922 | | | | 19,844,522 | | | | 10,134,862 | |
Accumulated net realized gain (loss) on investments | | | (12,106,248 | ) | | | (10,491,939 | ) | | | (1,709,578 | ) |
Net unrealized depreciation on investments | | | (358,868,743 | ) | | | (305,129,576 | ) | | | (189,794,915 | ) |
| | | | | | | | | | | | |
NET ASSETS | | $ | 740,320,124 | | | $ | 575,100,862 | | | $ | 327,520,884 | |
| | | | | | | | | | | | |
| | | | | | | | | | | | |
* Cost of investments in affiliated underlying funds | | $ | 1,099,462,026 | | | $ | 880,442,709 | | | $ | 517,452,832 | |
| | | | | | | | | | | | |
Class ADV: | | | | | | | | | | | | |
Net assets | | $ | 321,459,649 | | | $ | 252,225,876 | | | $ | 136,525,908 | |
Shares authorized | | | 100,000,000 | | | | 100,000,000 | | | | 100,000,000 | |
Par value | | $ | 0.001 | | | $ | 0.001 | | | $ | 0.001 | |
Shares outstanding | | | 39,860,451 | | | | 31,760,160 | | | | 17,338,354 | |
Net asset value and redemption price per share | | $ | 8.06 | | | $ | 7.94 | | | $ | 7.87 | |
Class I: | | | | | | | | | | | | |
Net assets | | $ | 72,518,171 | | | $ | 50,607,206 | | | $ | 33,161,267 | |
Shares authorized | | | 100,000,000 | | | | 100,000,000 | | | | 100,000,000 | |
Par value | | $ | 0.001 | | | $ | 0.001 | | | $ | 0.001 | |
Shares outstanding | | | 8,830,496 | | | | 6,265,742 | | | | 4,143,407 | |
Net asset value and redemption price per share | | $ | 8.21 | | | $ | 8.08 | | | $ | 8.00 | |
Class S: | | | | | | | | | | | | |
Net assets | | $ | 341,919,401 | | | $ | 269,288,295 | | | $ | 156,122,190 | |
Shares authorized | | | 100,000,000 | | | | 100,000,000 | | | | 100,000,000 | |
Par value | | $ | 0.001 | | | $ | 0.001 | | | $ | 0.001 | |
Shares outstanding | | | 41,957,586 | | | | 33,572,247 | | | | 19,655,910 | |
Net asset value and redemption price per share | | $ | 8.15 | | | $ | 8.02 | | | $ | 7.94 | |
Class T: | | | | | | | | | | | | |
Net assets | | $ | 4,422,903 | | | $ | 2,979,485 | | | $ | 1,711,519 | |
Shares authorized | | | 100,000,000 | | | | 100,000,000 | | | | 100,000,000 | |
Par value | | $ | 0.001 | | | $ | 0.001 | | | $ | 0.001 | |
Shares outstanding | | | 546,087 | | | | 373,422 | | | | 217,136 | |
Net asset value and redemption price per share | | $ | 8.10 | | | $ | 7.98 | | | $ | 7.88 | |
See Accompanying Notes to Financial Statements
18
STATEMENTS OF OPERATIONSFORTHE YEAR ENDED DECEMBER 31, 2008
| | | | | | | | | | | | | | | | |
| | | ING Solution Growth and
Income Portfolio | | | ING
Solution Growth Portfolio | | | ING Solution Income Portfolio | | | ING Solution 2015 Portfolio | |
INVESTMENT INCOME: | | | | | | | | | | | | | | | | |
Dividends from affiliated underlying funds | | $ | 8,576 | | | $ | 2,920 | | | $ | 8,831,494 | | | $ | 19,695,465 | |
| | | | | | | | | | | | | | | | |
Total investment income | | | 8,576 | | | | 2,920 | | | | 8,831,494 | | | | 19,695,465 | |
| | | | | | | | | | | | | | | | |
EXPENSES: | | | | | | | | | | | | | | | | |
Investment management fees | | | 135 | | | | 84 | | | | 214,339 | | | | 621,728 | |
Distribution and service fees: | | | | | | | | | | | | | | | | |
Class ADV | | | 8 | | | | 6 | | | | 502,604 | | | | 1,297,978 | |
Class S | | | 330 | | | | 206 | | | | 223,182 | | | | 758,940 | |
Class T | | | — | | | | — | | | | 8,562 | | | | 22,258 | |
Administrative service fees | | | 27 | | | | 16 | | | | 42,865 | | | | 124,338 | |
| | | | | | | | | | | | | | | | |
Total expenses | | | 500 | | | | 312 | | | | 991,552 | | | | 2,825,242 | |
Net waived and reimbursed fees | | | — | | | | — | | | | (571 | ) | | | (1,484 | ) |
| | | | | | | | | | | | | | | | |
Net expenses | | | 500 | | | | 312 | | | | 990,981 | | | | 2,823,758 | |
| | | | | | | | | | | | | | | | |
Net investment income | | | 8,076 | | | | 2,608 | | | | 7,840,513 | | | | 16,871,707 | |
| | | | | | | | | | | | | | | | |
REALIZED AND UNREALIZED GAIN (LOSS) ON AFFILIATED UNDERLYING FUNDS: | | | | | | | | | | | | | | | | |
Realized gain distributions from affiliated underlying funds | | | 1,589 | | | | 957 | | | | 7,890,972 | | | | 24,386,095 | |
Net realized loss on sale of affiliated underlying funds | | | (28,033 | ) | | | (56,392 | ) | | | (11,343,501 | ) | | | (24,996,524 | ) |
| | | | | | | | | | | | | | | | |
Net realized loss on affiliated underlying funds | | | (26,444 | ) | | | (55,435 | ) | | | (3,452,529 | ) | | | (610,429 | ) |
Net change in unrealized appreciation or depreciation on affiliated underlying funds | | | (15,068 | ) | | | (7,994 | ) | | | (43,404,206 | ) | | | (208,674,736 | ) |
| | | | | | | | | | | | | | | | |
Net realized and unrealized loss on affiliated underlying funds | | | (41,512 | ) | | | (63,429 | ) | | | (46,856,735 | ) | | | (209,285,165 | ) |
| | | | | | | | | | | | | | | | |
Decrease in net assets resulting from operations | | $ | (33,436 | ) | | $ | (60,821 | ) | | $ | (39,016,222 | ) | | $ | (192,413,458 | ) |
| | | | | | | | | | | | | | | | |
See Accompanying Notes to Financial Statements
19
STATEMENTS OF OPERATIONSFORTHE YEAR ENDED DECEMBER 31, 2008
| | | | | | | | | | | | |
| | | ING Solution 2025 Portfolio | | | ING Solution 2035
Portfolio | | | ING Solution 2045
Portfolio | |
INVESTMENT INCOME: | | | | | | | | | | | | |
Dividends from affiliated underlying funds | | $
| 21,287,623
|
| | $ | 13,386,805 | | | $
| 6,516,099
|
|
| | | | | | | | | | | | |
Total investment income | | | 21,287,623 | | | | 13,386,805 | | | | 6,516,099 | |
| | | | | | | | | | | | |
EXPENSES: | | | | | | | | | | | | |
Investment management fees | | | 864,475 | | | | 675,054 | | | | 376,514 | |
Distribution and service fees: | | | | | | | | | | | | |
Class ADV | | | 1,847,072 | | | | 1,454,752 | | | | 771,597 | |
Class S | | | 1,021,080 | | | | 811,805 | | | | 461,954 | |
Class T | | | 50,365 | | | | 45,906 | | | | 19,863 | |
Administrative service fees | | | 172,882 | | | | 135,001 | | | | 75,297 | |
| | | | | | | | | | | | |
Total expenses | | | 3,955,874 | | | | 3,122,518 | | | | 1,705,225 | |
Net waived and reimbursed fees | | | (3,358 | ) | | | (3,060 | ) | | | (1,324 | ) |
| | | | | | | | | | | | |
Net expenses | | | 3,952,516 | | | | 3,119,458 | | | | 1,703,901 | |
| | | | | | | | | | | | |
Net investment income | | | 17,335,107 | | | | 10,267,347 | | | | 4,812,198 | |
| | | | | | | | | | | | |
REALIZED AND UNREALIZED GAIN (LOSS) ON AFFILIATED UNDERLYING FUNDS: | | | | | | | | | | | | |
Realized gain distributions from affiliated underlying funds | | | 42,269,147 | | | | 37,271,495 | | | | 22,340,594 | |
Net realized loss on sale of affiliated underlying funds | | | (42,666,486 | ) | | | (37,668,210 | ) | | | (18,328,247 | ) |
| | | | | | | | | | | | |
Net realized gain (loss) on affiliated underlying funds | | | (397,339 | ) | | | (396,715 | ) | | | 4,012,347 | |
Net change in unrealized appreciation or depreciation on affiliated underlying funds | | | (367,056,165 | ) | | | (314,538,327 | ) | | | (195,754,299 | ) |
| | | | | | | | | | | | |
Net realized and unrealized loss on affiliated underlying funds | | | (367,453,504 | ) | | | (314,935,042 | ) | | | (191,741,952 | ) |
| | | | | | | | | | | | |
Decrease in net assets resulting from operations | | $ | (350,118,397 | ) | | $ | (304,667,695 | ) | | $ | (186,929,754 | ) |
| | | | | | | | | | | | |
See Accompanying Notes to Financial Statements
20
STATEMENTS OF CHANGES IN NET ASSETS
| | | | | | | | | | | | | | | | |
| | | ING Solution Growth
and Income Portfolio | | | ING Solution Growth Portfolio | |
| | | Year Ended December 31, 2008 | | | July 2, 2007(1) to December 31, 2007 | | | Year Ended December 31, 2008 | | | July 2, 2007(1) to December 31, 2007 | |
FROM OPERATIONS: | | | | | | | | | | | | | | | | |
Net investment income | | $ | 8,076 | | | $ | 40 | | | $ | 2,608 | | | $ | 26 | |
Net realized gain (loss) on affiliated underlying funds | | | (26,444 | ) | | | 10 | | | | (55,435 | ) | | | 10 | |
Net change in unrealized appreciation or depreciation on affiliated underlying funds | | | (15,068 | ) | | | (43 | ) | | | (7,994 | ) | | | (86 | ) |
| | | | | | | | | | | | | | | | |
Increase (decrease) in net assets resulting from operations | | | (33,436 | ) | | | 7 | | | | (60,821 | ) | | | (50 | ) |
| | | | | | | | | | | | | | | | |
FROM DISTRIBUTIONS TO SHAREHOLDERS: | | | | | | | | | | | | | | | | |
Net investment income: | | | | | | | | | | | | | | | | |
Class I | | | (1 | ) | | | — | | | | — | | | | — | |
Class S | | | (49 | ) | | | — | | | | (32 | ) | | | — | |
Net realized gains — Class S | | | (11 | ) | | | — | | | | (10 | ) | | | — | |
| | | | | | | | | | | | | | | | |
Total distributions | | | (61 | ) | | | — | | | | (42 | ) | | | — | |
| | | | | | | | | | | | | | | | |
FROM CAPITAL SHARE TRANSACTIONS: | | | | | | | | | | | | | | | | |
Net proceeds from sale of shares | | | 908,118 | | | | 3,030 | | | | 443,431 | | | | 3,030 | |
Reinvestment of distributions | | | 61 | | | | — | | | | 42 | | | | — | |
| | | | | | | | | | | | | | | | |
| | | 908,179 | | | | 3,030 | | | | 443,473 | | | | 3,030 | |
Cost of shares redeemed | | | (250,870 | ) | | | — | | | | (210,741 | ) | | | — | |
| | | | | | | | | | | | | | | | |
Net increase in net assets resulting from capital share transactions | | | 657,309 | | | | 3,030 | | | | 232,732 | | | | 3,030 | |
| | | | | | | | | | | | | | | | |
Net increase in net assets | | | 623,812 | | | | 3,037 | | | | 171,869 | | | | 2,980 | |
| | | | | | | | | | | | | | | | |
NET ASSETS: | | | | | | | | | | | | | | | | |
Beginning of period | | | 3,037 | | | | — | | | | 2,980 | | | | — | |
| | | | | | | | | | | | | | | | |
End of period | | $ | 626,849 | | | $ | 3,037 | | | $ | 174,849 | | | $ | 2,980 | |
| | | | | | | | | | | | | | | | |
Undistributed net investment income at end of period | | $ | 9,419 | | | $ | 45 | | | $ | 3,008 | | | $ | 31 | |
| | | | | | | | | | | | | | | | |
(1) | | Commencement of operations |
See Accompanying Notes to Financial Statements
21
STATEMENTS OF CHANGES IN NET ASSETS
| | | | | | | | | | | | | | | | |
| | | ING Solution Income Portfolio | | | ING Solution 2015 Portfolio | |
| | | Year Ended December 31, 2008 | | | Year Ended December 31, 2007 | | | Year Ended December 31, 2008 | | | Year Ended December 31, 2007 | |
FROM OPERATIONS: | | | | | | | | | | | | | | | | |
Net investment income | | $ | 7,840,513 | | | $ | 3,722,203 | | | $ | 16,871,707 | | | $ | 8,669,638 | |
Net realized gain (loss) on affiliated underlying funds | | | (3,452,529 | ) | | | 3,403,134 | | | | (610,429 | ) | | | 14,733,940 | |
Net change in unrealized appreciation or depreciation on affiliated underlying funds | | | (43,404,206 | ) | | | (782,798 | ) | | | (208,674,736 | ) | | | (7,974,407 | ) |
| | | | | | | | | | | | | | | | |
Increase (decrease) in net assets resulting from operations | | | (39,016,222 | ) | | | 6,342,539 | | | | (192,413,458 | ) | | | 15,429,171 | |
| | | | | | | | | | | | | | | | |
FROM DISTRIBUTIONS TO SHAREHOLDERS: | | | | | | | | | | | | | | | | |
Net investment income: | | | | | | | | | | | | | | | | |
Class ADV | | | (1,740,408 | ) | | | (374,184 | ) | | | (4,216,315 | ) | | | (929,591 | ) |
Class I | | | (511,129 | ) | | | (67,894 | ) | | | (1,060,101 | ) | | | (173,501 | ) |
Class S | | | (1,560,007 | ) | | | (451,344 | ) | | | (5,059,477 | ) | | | (1,359,222 | ) |
Class T | | | (7,710 | ) | | | — | | | | (20,554 | ) | | | — | |
Net realized gains: | | | | | | | | | | | | | | | | |
Class ADV | | | (1,719,778 | ) | | | (52,417 | ) | | | (5,716,660 | ) | | | (272,277 | ) |
Class I | | | (438,658 | ) | | | (9,059 | ) | | | (1,216,587 | ) | | | (46,931 | ) |
Class S | | | (1,493,209 | ) | | | (65,686 | ) | | | (6,515,523 | ) | | | (407,766 | ) |
Class T | | | (18,829 | ) | | | (1,873 | ) | | | (58,737 | ) | | | (7,683 | ) |
| | | | | | | | | | | | | | | | |
Total distributions | | | (7,489,728 | ) | | | (1,022,457 | ) | | | (23,863,954 | ) | | | (3,196,971 | ) |
| | | | | | | | | | | | | | | | |
FROM CAPITAL SHARE TRANSACTIONS: | | | | | | | | | | | | | | | | |
Net proceeds from sale of shares | | | 95,980,424 | | | | 144,337,737 | | | | 237,250,383 | | | | 335,555,784 | |
Reinvestment of distributions | | | 7,489,728 | | | | 1,022,457 | | | | 23,863,954 | | | | 3,196,971 | |
| | | | | | | | | | | | | | | | |
| | | 103,470,152 | | | | 145,360,194 | | | | 261,114,337 | | | | 338,752,755 | |
Cost of shares redeemed | | | (71,727,881 | ) | | | (28,865,911 | ) | | | (76,927,400 | ) | | | (48,897,153 | ) |
| | | | | | | | | | | | | | | | |
Net increase in net assets resulting from capital share transactions | | | 31,742,271 | | | | 116,494,283 | | | | 184,186,937 | | | | 289,855,602 | |
| | | | | | | | | | | | | | | | |
Net increase (decrease) in net assets | | | (14,763,679 | ) | | | 121,814,365 | | | | (32,090,475 | ) | | | 302,087,802 | |
| | | | | | | | | | | | | | | | |
NET ASSETS: | | | | | | | | | | | | | | | | |
Beginning of year | | | 202,223,487 | | | | 80,409,122 | | | | 584,155,457 | | | | 282,067,655 | |
| | | | | | | | | | | | | | | | |
End of year | | $ | 187,459,808 | | | $ | 202,223,487 | | | $ | 552,064,982 | | | $ | 584,155,457 | |
| | | | | | | | | | | | | | | | |
Undistributed net investment income at end of year | | $ | 10,359,604 | | | $ | 3,814,234 | | | $ | 23,876,149 | | | $ | 10,350,134 | |
| | | | | | | | | | | | | | | | |
See Accompanying Notes to Financial Statements
22
STATEMENTS OF CHANGES IN NET ASSETS
| | | | | | | | | | | | | | | | |
| | | ING Solution 2025 Portfolio | | | ING Solution 2035 Portfolio | |
| | | Year Ended December 31, 2008 | | | Year Ended December 31, 2007 | | | Year Ended December 31, 2008 | | | Year Ended December 31, 2007 | |
FROM OPERATIONS: | | | | | | | | | | | | | | | | |
Net investment income | | $ | 17,335,107 | | | $ | 7,723,982 | | | $ | 10,267,347 | | | $ | 4,786,912 | |
Net realized gain (loss) on affiliated underlying funds | | | (397,339 | ) | | | 28,126,529 | | | | (396,715 | ) | | | 25,906,738 | |
Net change in unrealized appreciation or depreciation on affiliated underlying funds | | | (367,056,165 | ) | | | (14,894,305 | ) | | | (314,538,327 | ) | | | (10,954,687 | ) |
| | | | | | | | | | | | | | | | |
Increase (decrease) in net assets resulting from operations | | | (350,118,397 | ) | | | 20,956,206 | | | | (304,667,695 | ) | | | 19,738,963 | |
| | | | | | | | | | | | | | | | |
FROM DISTRIBUTIONS TO SHAREHOLDERS: | | | | | | | | | | | | | | | | |
Net investment income: | | | | | | | | | | | | | | | | |
Class ADV | | | (4,704,284 | ) | | | (1,055,258 | ) | | | (3,688,612 | ) | | | (859,961 | ) |
Class I | | | (1,282,849 | ) | | | (166,637 | ) | | | (862,011 | ) | | | (138,756 | ) |
Class S | | | (5,330,309 | ) | | | (1,523,586 | ) | | | (4,205,618 | ) | | | (1,303,842 | ) |
Class T | | | (41,555 | ) | | | — | | | | (25,445 | ) | | | — | |
Net realized gains: | | | | | | | | | | | | | | | | |
Class ADV | | | (10,936,486 | ) | | | (794,407 | ) | | | (9,751,030 | ) | | | (533,769 | ) |
Class I | | | (2,404,367 | ) | | | (113,925 | ) | | | (1,835,332 | ) | | | (78,913 | ) |
Class S | | | (11,737,332 | ) | | | (1,203,303 | ) | | | (10,543,787 | ) | | | (838,184 | ) |
Class T | | | (198,139 | ) | | | (31,400 | ) | | | (193,565 | ) | | | (28,825 | ) |
| | | | | | | | | | | | | | | | |
Total distributions | | | (36,635,321 | ) | | | (4,888,516 | ) | | | (31,105,400 | ) | | | (3,782,250 | ) |
| | | | | | | | | | | | | | | | |
FROM CAPITAL SHARE TRANSACTIONS: | | | | | | | | | | | | | | | | |
Net proceeds from sale of shares | | | 318,542,475 | | | | 473,518,467 | | | | 258,929,778 | | | | 372,578,074 | |
Reinvestment of distributions | | | 36,635,321 | | | | 4,888,516 | | | | 31,105,400 | | | | 3,782,250 | |
| | | | | | | | | | | | | | | | |
| | | 355,177,796 | | | | 478,406,983 | | | | 290,035,178 | | | | 376,360,324 | |
Cost of shares redeemed | | | (87,720,238 | ) | | | (44,151,502 | ) | | | (58,556,632 | ) | | | (34,277,635 | ) |
| | | | | | | | | | | | | | | | |
Net increase in net assets resulting from capital share transactions | | | 267,457,558 | | | | 434,255,481 | | | | 231,478,546 | | | | 342,082,689 | |
| | | | | | | | | | | | | | | | |
Net increase (decrease) in net assets | | | (119,296,160 | ) | | | 450,323,171 | | | | (104,294,549 | ) | | | 358,039,402 | |
| | | | | | | | | | | | | | | | |
NET ASSETS: | | | | | | | | | | | | | | | | |
Beginning of year | | | 859,616,284 | | | | 409,293,113 | | | | 679,395,411 | | | | 321,356,009 | |
| | | | | | | | | | | | | | | | |
End of year | | $ | 740,320,124 | | | $ | 859,616,284 | | | $ | 575,100,862 | | | $ | 679,395,411 | |
| | | | | | | | | | | | | | | | |
Undistributed net investment income at end of year | | $ | 28,078,922 | | | $ | 11,353,908 | | | $ | 19,844,522 | | | $ | 8,776,610 | |
| | | | | | | | | | | | | | | | |
See Accompanying Notes to Financial Statements
23
STATEMENTS OF CHANGES IN NET ASSETS
| | | | | | | | |
| | | ING Solution 2045 Portfolio | |
| | | Year Ended December 31, 2008 | | | Year Ended December 31, 2007 | |
FROM OPERATIONS: | | | | | | | | |
Net investment income | | $ | 4,812,198 | | | $ | 1,353,864 | |
Net realized gain (loss) on affiliated underlying funds | | | 4,012,347 | | | | 14,994,399 | |
Net change in unrealized appreciation or depreciation on affiliated underlying funds | | | (195,754,299 | ) | | | (5,337,828 | ) |
| | | | | | | | |
Increase (decrease) in net assets resulting from operations | | | (186,929,754 | ) | | | 11,010,435 | |
| | | | | | | | |
FROM DISTRIBUTIONS TO SHAREHOLDERS: | | | | | | | | |
Net investment income: | | | | | | | | |
Class ADV | | | (1,619,346 | ) | | | (242,428 | ) |
Class I | | | (479,356 | ) | | | (56,679 | ) |
Class S | | | (1,977,748 | ) | | | (396,764 | ) |
Class T | | | (10,175 | ) | | | — | |
Net realized gains: | | | | | | | | |
Class ADV | | | (5,281,873 | ) | | | (240,224 | ) |
Class I | | | (1,216,567 | ) | | | (48,646 | ) |
Class S | | | (6,006,370 | ) | | | (410,575 | ) |
Class T | | | (89,034 | ) | | | (9,245 | ) |
| | | | | | | | |
Total distributions | | | (16,680,469 | ) | | | (1,404,561 | ) |
| | | | | | | | |
FROM CAPITAL SHARE TRANSACTIONS: | | | | | | | | |
Net proceeds from sale of shares | | | 168,391,531 | | | | 222,131,104 | |
Reinvestment of distributions | | | 16,680,469 | | | | 1,404,561 | |
| | | | | | | | |
| | | 185,072,000 | | | | 223,535,665 | |
Cost of shares redeemed | | | (33,964,504 | ) | | | (18,197,614 | ) |
| | | | | | | | |
Net increase in net assets resulting from capital share transactions | | | 151,107,496 | | | | 205,338,051 | |
| | | | | | | | |
Net increase (decrease) in net assets | | | (52,502,727 | ) | | | 214,943,925 | |
| | | | | | | | |
NET ASSETS: | | | | | | | | |
Beginning of year | | | 380,023,611 | | | | 165,079,686 | |
| | | | | | | | |
End of year | | $ | 327,520,884 | | | $ | 380,023,611 | |
| | | | | | | | |
Undistributed net investment income at end of year | | $ | 10,134,862 | | | $ | 4,082,363 | |
| | | | | | | | |
See Accompanying Notes to Financial Statements
24
FINANCIAL HIGHLIGHTS
Selected data for a share of beneficial interest outstanding throughout each year or period.
| | | | | | | | | | | | | | | | | | | | | | | | | | | | | | | | | | | | | | |
| | | | | Income (loss)
from
investment
operations | | | | | | Less distributions | | | | | | | | | Ratios to average net assets | | Supplemental
data |
| | | | | | | | | | | | | | | | | | | | | | | | | | | | | | | | | | | | | | | |
| | | Net asset value, beginning of year or period | | Net investment income (loss) | | | Net realized and unrealized gain (loss) | | | Total from investment operations | | | From net investment income | | | From net realized gains | | | From return of capital | | Total distributions | | Net asset value, end of year or period | | Total Return(1) | | | Expenses before reductions/ additions(2)(3)(4) | | Expenses net of fee waivers and/or recoupments, if any(2)(3)(4) | | Expenses net of all reductions/ additions(2)(3)(4) | | Net investment income (loss)(2)(3)(4) | | Net assets, end of year or period | | Portfolio turnover rate |
| | | | | | | | | | | | | | | | | | | | | | | | | | | | | | | | | | | | | | |
Year or period ended | | ($) | | ($) | | | ($) | | | ($) | | | ($) | | | ($) | | | ($) | | ($) | | ($) | | (%) | | | (%) | | (%) | | (%) | | (%) | | ($000's) | | (%) |
ING Solution Growth and Income Portfolio | | | | | | | | | | | | | | | | | | | | | | | | | | | | | | | | | | | | | | |
Class ADV | | | | | | | | | | | | | | | | | | | | | | | | | | | | | | | | | | | | | | |
12-31-08 | | 10.00 | | 0.16 | | | (2.55 | ) | | (2.39 | ) | | — | | | 0.00 | * | | — | | — | | 7.61 | | (23.88 | ) | | 0.62 | | 0.62 | | 0.62 | | 1.78 | | 1 | | 212 |
07-02-07(5) – 12-31-07 | | 10.00 | | 0.13 | | | (0.13 | ) | | — | | | — | | | — | | | — | | — | | 10.00 | | 0.00 | * | | 0.62 | | 0.62 | | 0.62 | | 2.55 | | 1 | | 7 |
Class I | | | | | | | | | | | | | | | | | | | | | | | | | | | | | | | | | | | | | | |
12-31-08 | | 10.04 | | 0.21 | · | | (2.55 | ) | | (2.34 | ) | | 0.01 | | | 0.00 | * | | — | | 0.01 | | 7.69 | | (23.32 | ) | | 0.12 | | 0.12 | | 0.12 | | 2.26 | | 1 | | 212 |
07-02-07(5) – 12-31-07 | | 10.00 | | 0.15 | | | (0.11 | ) | | 0.04 | | | — | | | — | | | — | | — | | 10.04 | | 0.40 | | | 0.12 | | 0.12 | | 0.12 | | 3.04 | | 1 | | 7 |
Class S | | | | | | | | | | | | | | | | | | | | | | | | | | | | | | | | | | | | | | |
12-31-08 | | 10.02 | | 0.46 | · | | (2.82 | ) | | (2.36 | ) | | 0.02 | | | 0.00 | * | | — | | 0.02 | | 7.64 | | (23.63 | ) | | 0.37 | | 0.37 | | 0.37 | | 6.07 | | 625 | | 212 |
07-02-07(5) – 12-31-07 | | 10.00 | | 0.14 | | | (0.12 | ) | | 0.02 | | | — | | | — | | | — | | — | | 10.02 | | 0.20 | | | 0.37 | | 0.37 | | 0.37 | | 2.79 | | 1 | | 7 |
| | | | | | | | | | | | | | | | |
ING Solution Growth Portfolio | | | | | | | | | | | | | | | | | | | | | | | | | | | | | | | | | | | | | | |
Class ADV | | | | | | | | | | | | | | | | | | | | | | | | | | | | | | | | | | | | | | |
12-31-08 | | 9.81 | | 0.14 | · | | (3.28 | ) | | (3.14 | ) | | — | | | 0.00 | * | | — | | — | | 6.67 | | (32.00 | ) | | 0.62 | | 0.62 | | 0.62 | | 1.59 | | 1 | | 283 |
07-02-07(5) – 12-31-07 | | 10.00 | | 0.08 | | | (0.27 | ) | | (0.19 | ) | | — | | | — | | | — | | — | | 9.81 | | (1.90 | ) | | 0.62 | | 0.62 | | 0.62 | | 1.58 | | 1 | | 8 |
Class I | | | | | | | | | | | | | | | | | | | | | | | | | | | | | | | | | | | | | | |
12-31-08 | | 9.85 | | 0.19 | · | | (3.30 | ) | | (3.11 | ) | | — | | | 0.00 | * | | — | | — | | 6.74 | | (31.57 | ) | | 0.12 | | 0.12 | | 0.12 | | 2.19 | | 1 | | 283 |
07-02-07(5) – 12-31-07 | | 10.00 | | 0.11 | | | (0.26 | ) | | (0.15 | ) | | — | | | — | | | — | | — | | 9.85 | | (1.50 | ) | | 0.12 | | 0.12 | | 0.12 | | 2.28 | | 1 | | 8 |
Class S | | | | | | | | | | | | | | | | | | | | | | | | | | | | | | | | | | | | | | |
12-31-08 | | 9.83 | | 0.22 | · | | (3.35 | ) | | (3.13 | ) | | 0.00 | * | | 0.00 | * | | — | | — | | 6.70 | | (31.81 | ) | | 0.37 | | 0.37 | | 0.37 | | 3.14 | | 173 | | 283 |
07-02-07(5) – 12-31-07 | | 10.00 | | 0.09 | | | (0.26 | ) | | (0.17 | ) | | — | | | — | | | — | | — | | 9.83 | | (1.70 | ) | | 0.37 | | 0.37 | | 0.37 | | 1.83 | | 1 | | 8 |
| | | | | | | | | | | | | | | | |
ING Solution Income Portfolio | | | | | | | | | | | | | | | | | | | | | | | | | | | | | | | | | | | | | | |
Class ADV | | | | | | | | | | | | | | | | | | | | | | | | | | | | | | | | | | | | | | |
12-31-08 | | 11.54 | | 0.37 | · | | (2.27 | ) | | (1.90 | ) | | 0.19 | | | 0.18 | | | — | | 0.37 | | 9.27 | | (16.93 | ) | | 0.62 | | 0.62 | | 0.62 | | 3.46 | | 85,343 | | 84 |
12-31-07 | | 11.08 | | 0.32 | · | | 0.22 | | | 0.54 | | | 0.07 | | | 0.01 | | | — | | 0.08 | | 11.54 | | 4.91 | | | 0.62 | | 0.62 | | 0.62 | | 2.80 | | 93,760 | | 35 |
12-31-06 | | 10.36 | | 0.57 | · | | 0.17 | | | 0.74 | | | 0.02 | | | 0.00 | * | | — | | 0.02 | | 11.08 | | 7.21 | | | 0.62 | | 0.62 | | 0.62 | | 5.29 | | 20,477 | | 32 |
04-29-05(5) – 12-31-05 | | 10.02 | | 0.54 | · | | (0.20 | ) | | 0.34 | | | — | | | — | | | — | | — | | 10.36 | | 3.39 | | | 0.62 | | 0.62 | | 0.62 | | 7.93 | | 188 | | 21 |
Class I | | | | | | | | | | | | | | | | | | | | | | | | | | | | | | | | | | | | | | |
12-31-08 | | 11.70 | | 0.48 | · | | (2.35 | ) | | (1.87 | ) | | 0.22 | | | 0.18 | | | — | | 0.40 | | 9.43 | | (16.49 | ) | | 0.12 | | 0.12 | | 0.12 | | 4.41 | | 24,417 | | 84 |
12-31-07 | | 11.18 | | 0.37 | · | | 0.24 | | | 0.61 | | | 0.08 | | | 0.01 | | | — | | 0.09 | | 11.70 | | 5.44 | | | 0.12 | | 0.12 | | 0.12 | | 3.20 | | 18,104 | | 35 |
12-31-06 | | 10.41 | | 0.42 | · | | 0.37 | | | 0.79 | | | 0.02 | | | 0.00 | * | | — | | 0.02 | | 11.18 | | 7.66 | | | 0.12 | | 0.12 | | 0.12 | | 3.89 | | 3,053 | | 32 |
04-29-05(5) – 12-31-05 | | 10.02 | | 0.29 | | | 0.10 | | | 0.39 | | | — | | | — | | | — | | — | | 10.41 | | 3.89 | | | 0.12 | | 0.12 | | 0.12 | | 4.27 | | 1 | | 21 |
Class S | | | | | | | | | | | | | | | | | | | | | | | | | | | | | | | | | | | | | | |
12-31-08 | | 11.63 | | 0.40 | · | | (2.29 | ) | | (1.89 | ) | | 0.19 | | | 0.18 | | | — | | 0.37 | | 9.37 | | (16.66 | ) | | 0.37 | | 0.37 | | 0.37 | | 3.70 | | 77,076 | | 84 |
12-31-07 | | 11.13 | | 0.30 | · | | 0.28 | | | 0.58 | | | 0.07 | | | 0.01 | | | — | | 0.08 | | 11.63 | | 5.23 | | | 0.37 | | 0.37 | | 0.37 | | 2.61 | | 88,723 | | 35 |
12-31-06 | | 10.39 | | 0.36 | · | | 0.40 | | | 0.76 | | | 0.02 | | | 0.00 | * | | — | | 0.02 | | 11.13 | | 7.37 | | | 0.37 | | 0.37 | | 0.37 | | 3.28 | | 54,634 | | 32 |
04-29-05(5) – 12-31-05 | | 10.02 | | 0.36 | · | | 0.01 | | | 0.37 | | | — | | | — | | | — | | — | | 10.39 | | 3.69 | | | 0.37 | | 0.37 | | 0.37 | | 5.22 | | 507 | | 21 |
See Accompanying Notes to Financial Statements
25
FINANCIAL HIGHLIGHTS (CONTINUED)
Selected data for a share of beneficial interest outstanding throughout each year or period.
| | | | | | | | | | | | | | | | | | | | | | | | | | | | | | | | | | | | | |
| | | | | Income (loss)
from
investment
operations | | | | | | Less distributions | | | | | | | | | Ratios to average net assets | | Supplemental
data |
| | | | | | | | | | | | | | | | | | | | | | | | | | | | | | | | | | | | | | |
| | | Net asset value, beginning of year or period | | Net investment income (loss) | | | Net realized and unrealized gain (loss) | | | Total from investment operations | | | From net investment income | | From net realized gains | | | From return of capital | | Total distributions | | Net asset value, end of year or period | | Total Return (1) | | | Expenses before reductions/ additions(2)(4) | | Expenses net of fee waivers and/or recoupments, if any (2)(3)(4) | | Expenses net of all reductions/additions(2)(3)(4) | | Net investment income (loss)(2)(3)(4) | | Net assets, end of year or period | | Portfolio turnover rate |
| | | | | | | | | | | | | | | | | | | | | | | | | | | | | | | | | | | | | |
Year or period ended | | ($) | | ($) | | | ($) | | | ($) | | | ($) | | ($) | | | ($) | | ($) | | ($) | | (%) | | | (%) | | (%) | | (%) | | (%) | | ($000's) | | (%) |
| | | | | | | | | | | | | | | | |
ING Solution Income Portfolio (Continued) | | | | | | | | | | | | | | | | | | | | | | | | | | | | | | | | | | | | | |
Class T | | | | | | | | | | | | | | | | | | | | | | | | | | | | | | | | | | | | | |
12-31-08 | | 11.54 | | 0.31 | · | | (2.25 | ) | | (1.94 | ) | | 0.08 | | 0.18 | | | — | | 0.26 | | 9.34 | | (17.14 | ) | | 0.87 | | 0.82 | | 0.82 | | 2.89 | | 623 | | 84 |
12-31-07 | | 11.03 | | 0.20 | | | 0.32 | | | 0.52 | | | — | | 0.01 | | | — | | 0.01 | | 11.54 | | 4.72 | | | 0.87 | | 0.82 | | 0.82 | | 1.75 | | 1,636 | | 35 |
12-31-06 | | 10.34 | | 0.10 | · | | 0.61 | | | 0.71 | | | 0.02 | | 0.00 | * | | — | | 0.02 | | 11.03 | | 6.93 | | | 0.87 | | 0.82 | | 0.82 | | 0.94 | | 2,245 | | 32 |
08-31-05(5) – 12-31-05 | | 10.28 | | 0.12 | | | (0.06 | ) | | 0.06 | | | — | | — | | | — | | — | | 10.34 | | 0.58 | | | 0.87 | | 0.82 | | 0.82 | | 6.36 | | 103 | | 21 |
| | | | | | | | | | | | | | | | |
ING Solution 2015 Portfolio | | | | | | | | | | | | | | | | | | | | | | | | | | | | | | | | | | | | | |
Class ADV | | | | | | | | | | | | | | | | | | | | | | | | | | | | | | | | | | | | | |
12-31-08 | | 12.26 | | 0.28 | · | | (3.51 | ) | | (3.23 | ) | | 0.17 | | 0.23 | | | — | | 0.40 | | 8.63 | | (27.05 | ) | | 0.62 | | 0.62 | | 0.62 | | 2.56 | | 231,719 | | 59 |
12-31-07 | | 11.84 | | 0.24 | · | | 0.27 | | | 0.51 | | | 0.07 | | 0.02 | | | — | | 0.09 | | 12.26 | | 4.30 | | | 0.62 | | 0.62 | | 0.62 | | 1.99 | | 237,369 | | 39 |
12-31-06 | | 10.74 | | 0.40 | · | | 0.73 | | | 1.13 | | | 0.02 | | 0.01 | | | — | | 0.03 | | 11.84 | | 10.54 | | | 0.62 | | 0.62 | | 0.62 | | 3.49 | | 71,923 | | 14 |
04-29-05(5) – 12-31-05 | | 10.04 | | 0.44 | · | | 0.26 | | | 0.70 | | | — | | — | | | — | | — | | 10.74 | | 6.97 | | | 0.62 | | 0.62 | | 0.62 | | 6.29 | | 1,032 | | 49 |
Class I | | | | | | | | | | | | | | | | | | | | | | | | | | | | | | | | | | | | | |
12-31-08 | | 12.44 | | 0.34 | · | | (3.57 | ) | | (3.23 | ) | | 0.20 | | 0.23 | | | — | | 0.43 | | 8.78 | | (26.71 | ) | | 0.12 | | 0.12 | | 0.12 | | 3.10 | | 51,793 | | 59 |
12-31-07 | | 11.95 | | 0.30 | · | | 0.28 | | | 0.58 | | | 0.07 | | 0.02 | | | — | | 0.09 | | 12.44 | | 4.90 | | | 0.12 | | 0.12 | | 0.12 | | 2.41 | | 41,863 | | 39 |
12-31-06 | | 10.80 | | 0.33 | · | | 0.85 | | | 1.18 | | | 0.02 | | 0.01 | | | — | | 0.03 | | 11.95 | | 10.96 | | | 0.12 | | 0.12 | | 0.12 | | 2.85 | | 14,384 | | 14 |
04-29-05(5) – 12-31-05 | | 10.04 | | 0.11 | | | 0.65 | | | 0.76 | | | — | | — | | | — | | — | | 10.80 | | 7.57 | | | 0.12 | | 0.12 | | 0.12 | | 1.51 | | 1 | | 49 |
Class S | | | | | | | | | | | | | | | | | | | | | | | | | | | | | | | | | | | | | |
12-31-08 | | 12.36 | | 0.30 | · | | (3.53 | ) | | (3.23 | ) | | 0.18 | | 0.23 | | | — | | 0.41 | | 8.72 | | (26.86 | ) | | 0.37 | | 0.37 | | 0.37 | | 2.78 | | 265,937 | | 59 |
12-31-07 | | 11.90 | | 0.24 | · | | 0.31 | | | 0.55 | | | 0.07 | | 0.02 | | | — | | 0.09 | | 12.36 | | 4.60 | | | 0.37 | | 0.37 | | 0.37 | | 1.96 | | 300,704 | | 39 |
12-31-06 | | 10.77 | | 0.29 | · | | 0.87 | | | 1.16 | | | 0.02 | | 0.01 | | | — | | 0.03 | | 11.90 | | 10.78 | | | 0.37 | | 0.37 | | 0.37 | | 2.52 | | 191,100 | | 14 |
04-29-05(5) – 12-31-05 | | 10.04 | | 0.27 | · | | 0.46 | | | 0.73 | | | — | | — | | | — | | — | | 10.77 | | 7.27 | | | 0.37 | | 0.37 | | 0.37 | | 3.82 | | 4,114 | | 49 |
Class T | | | | | | | | | | | | | | | | | | | | | | | | | | | | | | | | | | | | | |
12-31-08 | | 12.28 | | 0.27 | | | (3.54 | ) | | (3.27 | ) | | 0.08 | | 0.23 | | | — | | 0.31 | | 8.70 | | (27.17 | ) | | 0.87 | | 0.82 | | 0.82 | | 2.27 | | 2,615 | | 59 |
12-31-07 | | 11.81 | | 0.17 | | | 0.32 | | | 0.49 | | | — | | 0.02 | | | — | | 0.02 | | 12.28 | | 4.15 | | | 0.87 | | 0.82 | | 0.82 | | 1.38 | | 4,220 | | 39 |
12-31-06 | | 10.74 | | 0.04 | · | | 1.06 | | | 1.10 | | | 0.02 | | 0.01 | | | — | | 0.03 | | 11.81 | | 10.26 | | | 0.87 | | 0.82 | | 0.82 | | 0.38 | | 4,661 | | 14 |
08-31-05(5) – 12-31-05 | | 10.53 | | 0.13 | | | 0.08 | | | 0.21 | | | — | | — | | | — | | — | | 10.74 | | 1.99 | | | 0.87 | | 0.82 | | 0.82 | | 11.28 | | 694 | | 49 |
| | | | | | | | | | | | | | | | |
ING Solution 2025 Portfolio | | | | | | | | | | | | | | | | | | | | | | | | | | | | | | | | | | | | | |
Class ADV | | | | | | | | | | | | | | | | | | | | | | | | | | | | | | | | | | | | | |
12-31-08 | | 12.71 | | 0.20 | · | | (4.41 | ) | | (4.21 | ) | | 0.13 | | 0.31 | | | — | | 0.44 | | 8.06 | | (34.05 | ) | | 0.62 | | 0.62 | | 0.62 | | 1.87 | | 321,460 | | 62 |
12-31-07 | | 12.28 | | 0.15 | · | | 0.37 | | | 0.52 | | | 0.05 | | 0.04 | | | — | | 0.09 | | 12.71 | | 4.28 | | | 0.62 | | 0.62 | | 0.62 | | 1.16 | | 345,763 | | 39 |
12-31-06 | | 10.97 | | 0.27 | · | | 1.08 | | | 1.35 | | | 0.02 | | 0.02 | | | — | | 0.04 | | 12.28 | | 12.37 | | | 0.62 | | 0.62 | | 0.62 | | 2.29 | | 100,091 | | 23 |
04-29-05(5) – 12-31-05 | | 10.05 | | 0.24 | · | | 0.68 | | | 0.92 | | | — | | — | | | — | | — | | 10.97 | | 9.15 | | | 0.62 | | 0.62 | | 0.62 | | 3.37 | | 944 | | 47 |
See Accompanying Notes to Financial Statements
26
FINANCIAL HIGHLIGHTS (CONTINUED)
Selected data for a share of beneficial interest outstanding throughout each year or period.
| | | | | | | | | | | | | | | | | | | | | | | | | | | | | | | | | | | | |
| | | | | Income (loss)
from
investment
operations | | | | | | Less distributions | | | | | | | | | Ratios to average net assets | | Supplemental
data |
| | | | | | | | | | | | | | | | | | | | | | | | | | | | | | | | | | | | | |
| | | Net asset value, beginning of year or period | | Net investment income (loss) | | | Net realized and unrealized gain (loss) | | | Total from investment operations | | | From net investment income | | From net realized gains | | From return of capital | | Total distributions | | Net asset value, end of year or period | | Total Return(1) | | | Expenses before reductions/additions(2)(4) | | Expenses net of fee waivers and/or recoupments, if any(2)(3)(4) | | Expenses net of all reductions/additions(2)(3)(4) | | Net investment income (loss)(2)(3)(4) | | Net assets, end of year or period | | Portfolio turnover rate |
| | | | | | | | | | | | | | | | | | | | | | | | | | | | | | | | | | | | |
Year or period ended | | ($) | | ($) | | | ($) | | | ($) | | | ($) | | ($) | | ($) | | ($) | | ($) | | (%) | | | (%) | | (%) | | (%) | | (%) | | ($000's) | | (%) |
| | | | | | | | | | | | | | | | |
ING Solution 2025 Portfolio (Continued) | | | | | | | | | | | | | | | | | | | | | | | | | | | | | | | | | | | | |
Class I | | | | | | | | | | | | | | | | | | | | | | | | | | | | | | | | | | | | |
12-31-08 | | 12.91 | | 0.26 | · | | (4.49 | ) | | (4.23 | ) | | 0.16 | | 0.31 | | — | | 0.47 | | 8.21 | | (33.72 | ) | | 0.12 | | 0.12 | | 0.12 | | 2.41 | | 72,518 | | 62 |
12-31-07 | | 12.41 | | 0.22 | · | | 0.38 | | | 0.60 | | | 0.06 | | 0.04 | | — | | 0.10 | | 12.91 | | 4.84 | | | 0.12 | | 0.12 | | 0.12 | | 1.74 | | 59,212 | | 39 |
12-31-06 | | 11.03 | | 0.22 | · | | 1.21 | | | 1.43 | | | 0.03 | | 0.02 | | — | | 0.05 | | 12.41 | | 12.94 | | | 0.12 | | 0.12 | | 0.12 | | 1.87 | | 17,540 | | 23 |
04-29-05(5) – 12-31-05 | | 10.05 | | 0.05 | · | | 0.93 | | | 0.98 | | | — | | — | | — | | — | | 11.03 | | 9.75 | | | 0.12 | | 0.12 | | 0.12 | | 0.79 | | 36 | | 47 |
Class S | | | | | | | | | | | | | | | | | | | | | | | | | | | | | | | | | | | | |
12-31-08 | | 12.82 | | 0.22 | · | | (4.44 | ) | | (4.22 | ) | | 0.14 | | 0.31 | | — | | 0.45 | | 8.15 | | (33.87 | ) | | 0.37 | | 0.37 | | 0.37 | | 2.06 | | 341,919 | | 62 |
12-31-07 | | 12.34 | | 0.15 | · | | 0.42 | | | 0.57 | | | 0.05 | | 0.04 | | — | | 0.09 | | 12.82 | | 4.64 | | | 0.37 | | 0.37 | | 0.37 | | 1.18 | | 446,724 | | 39 |
12-31-06 | | 11.00 | | 0.19 | · | | 1.19 | | | 1.38 | | | 0.02 | | 0.02 | | — | | 0.04 | | 12.34 | | 12.59 | | | 0.37 | | 0.37 | | 0.37 | | 1.58 | | 282,074 | | 23 |
04-29-05(5) – 12-31-05 | | 10.05 | | 0.24 | · | | 0.71 | | | 0.95 | | | — | | — | | — | | — | | 11.00 | | 9.45 | | | 0.37 | | 0.37 | | 0.37 | | 3.38 | | 15,503 | | 47 |
Class T | | | | | | | | | | | | | | | | | | | | | | | | | | | | | | | | | | | | |
12-31-08 | | 12.72 | | 0.16 | · | | (4.41 | ) | | (4.25 | ) | | 0.06 | | 0.31 | | — | | 0.37 | | 8.10 | | (34.18 | ) | | 0.87 | | 0.82 | | 0.82 | | 1.45 | | 4,423 | | 62 |
12-31-07 | | 12.25 | | 0.07 | · | | 0.44 | | | 0.51 | | | — | | 0.04 | | — | | 0.04 | | 12.72 | | 4.17 | | | 0.87 | | 0.82 | | 0.82 | | 0.53 | | 7,917 | | 39 |
12-31-06 | | 10.97 | | 0.02 | · | | 1.31 | | | 1.33 | | | 0.03 | | 0.02 | | — | | 0.05 | | 12.25 | | 12.09 | | | 0.87 | | 0.82 | | 0.82 | | 0.19 | | 9,588 | | 23 |
08-31-05(5) – 12-31-05 | | 10.68 | | 0.08 | | | 0.21 | | | 0.29 | | | — | | — | | — | | — | | 10.97 | | 2.72 | | | 0.87 | | 0.82 | | 0.82 | | 6.79 | | 971 | | 47 |
| | | | | | | | | | | | | | | | |
ING Solution 2035 Portfolio | | | | | | | | | | | | | | | | | | | | | | | | | | | | | | | | | | | | |
Class ADV | | | | | | | | | | | | | | | | | | | | | | | | | | | | | | | | | | | | |
12-31-08 | | 13.19 | | 0.15 | · | | (4.91 | ) | | (4.76 | ) | | 0.14 | | 0.35 | | — | | 0.49 | | 7.94 | | (37.18 | ) | | 0.62 | | 0.62 | | 0.62 | | 1.38 | | 252,226 | | 62 |
12-31-07 | | 12.65 | | 0.12 | · | | 0.51 | | | 0.63 | | | 0.05 | | 0.04 | | — | | 0.09 | | 13.19 | | 5.03 | | | 0.62 | | 0.62 | | 0.62 | | 0.88 | | 279,171 | | 32 |
12-31-06 | | 11.13 | | 0.31 | · | | 1.23 | | | 1.54 | | | 0.01 | | 0.01 | | — | | 0.02 | | 12.65 | | 13.91 | | | 0.62 | | 0.62 | | 0.62 | | 2.60 | | 73,683 | | 15 |
04-29-05(5) – 12-31-05 | | 10.07 | | 0.34 | · | | 0.72 | | | 1.06 | | | — | | — | | — | | — | | 11.13 | | 10.53 | | | 0.62 | | 0.62 | | 0.62 | | 4.59 | | 542 | | 33 |
Class I | | | | | | | | | | | | | | | | | | | | | | | | | | | | | | | | | | | | |
12-31-08 | | 13.38 | | 0.21 | · | | (4.99 | ) | | (4.78 | ) | | 0.17 | | 0.35 | | — | | 0.52 | | 8.08 | | (36.85 | ) | | 0.12 | | 0.12 | | 0.12 | | 1.96 | | 50,607 | | 62 |
12-31-07 | | 12.76 | | 0.19 | · | | 0.53 | | | 0.72 | | | 0.06 | | 0.04 | | — | | 0.10 | | 13.38 | | 5.66 | | | 0.12 | | 0.12 | | 0.12 | | 1.43 | | 44,254 | | 32 |
12-31-06 | | 11.19 | | 0.22 | · | | 1.37 | | | 1.59 | | | 0.01 | | 0.01 | | — | | 0.02 | | 12.76 | | 14.29 | | | 0.12 | | 0.12 | | 0.12 | | 1.84 | | 16,647 | | 15 |
04-29-05(5) – 12-31-05 | | 10.07 | | 0.98 | · | | 0.14 | | | 1.12 | | | — | | — | | — | | — | | 11.19 | | 11.12 | | | 0.12 | | 0.12 | | 0.12 | | 13.21 | | 20 | | 33 |
Class S | | | | | | | | | | | | | | | | | | | | | | | | | | | | | | | | | | | | |
12-31-08 | | 13.29 | | 0.17 | · | | (4.94 | ) | | (4.77 | ) | | 0.15 | | 0.35 | | — | | 0.50 | | 8.02 | | (37.01 | ) | | 0.37 | | 0.37 | | 0.37 | | 1.59 | | 269,288 | | 62 |
12-31-07 | | 12.71 | | 0.12 | · | | 0.55 | | | 0.67 | | | 0.05 | | 0.04 | | — | | 0.09 | | 13.29 | | 5.30 | | | 0.37 | | 0.37 | | 0.37 | | 0.93 | | 347,197 | | 32 |
12-31-06 | | 11.16 | | 0.22 | · | | 1.35 | | | 1.57 | | | 0.01 | | 0.01 | | — | | 0.02 | | 12.71 | | 14.13 | | | 0.37 | | 0.37 | | 0.37 | | 1.85 | | 222,502 | | 15 |
04-29-05(5) – 12-31-05 | | 10.07 | | 0.23 | · | | 0.86 | | | 1.09 | | | — | | — | | — | | — | | 11.16 | | 10.82 | | | 0.37 | | 0.37 | | 0.37 | | 3.16 | | 4,656 | | 33 |
Class T | | | | | | | | | | | | | | | | | | | | | | | | | | | | | | | | | | | | |
12-31-08 | | 13.18 | | 0.09 | · | | (4.89 | ) | | (4.80 | ) | | 0.05 | | 0.35 | | — | | 0.40 | | 7.98 | | (37.30 | ) | | 0.87 | | 0.82 | | 0.82 | | 0.78 | | 2,979 | | 62 |
12-31-07 | | 12.60 | | 0.05 | | | 0.57 | | | 0.62 | | | — | | 0.04 | | — | | 0.04 | | 13.18 | | 4.89 | | | 0.87 | | 0.82 | | 0.82 | | 0.38 | | 8,774 | | 32 |
12-31-06 | | 11.12 | | 0.02 | · | | 1.48 | | | 1.50 | | | 0.01 | | 0.01 | | — | | 0.02 | | 12.60 | | 13.56 | | | 0.87 | | 0.82 | | 0.82 | | 0.18 | | 8,525 | | 15 |
08-31-05(5) – 12-31-05 | | 10.76 | | 0.12 | | | 0.24 | | | 0.36 | | | — | | — | | — | | — | | 11.12 | | 3.35 | | | 0.87 | | 0.82 | | 0.82 | | 15.26 | | 460 | | 33 |
See Accompanying Notes to Financial Statements
27
FINANCIAL HIGHLIGHTS (CONTINUED)
Selected data for a share of beneficial interest outstanding throughout each year or period.
| | | | | | | | | | | | | | | | | | | | | | | | | | | | | | | | | | | | | | |
| | | | | Income (loss)
from
investment
operations | | | | | | Less distributions | | | | | | | | | Ratios to average net assets | | | Supplemental
data |
| | | | | | | | | | | | | | | | | | | | | | | | | | | | | | | | | | | | | | | |
| | | Net asset value, beginning of year or period | | Net investment income (loss) | | | Net realized and unrealized gain (loss) | | | Total from investment operations | | | From net investment income | | | From net realized gains | | From return of capital | | Total distributions | | Net asset value, end of year or period | | Total Return(1) | | | Expenses before reductions/ additions(2)(4) | | Expenses net of fee waivers and/or recoupments, if any (2)(3)(4) | | Expenses net of all reductions/ additions(2)(3)(4) | | Net investment income (loss)(2)(3)(4) | | | Net assets, end of year or period | | Portfolio turnover rate |
| | | | | | | | | | | | | | | | | | | | | | | | | | | | | | | | | | | | | | |
Year or period ended | | ($) | | ($) | | | ($) | | | ($) | | | ($) | | | ($) | | ($) | | ($) | | ($) | | (%) | | | (%) | | (%) | | (%) | | (%) | | | ($000's) | | (%) |
| | | | | | | | | | | | | | | | |
ING Solution 2045 Portfolio | | | | | | | | | | | | | | | | | | | | | | | | | | | | | | | | | | | | | | |
Class ADV | | | | | | | | | | | | | | | | | | | | | | | | | | | | | | | | | | | | | | |
12-31-08 | | 13.66 | | 0.12 | · | | (5.44 | ) | | (5.32 | ) | | 0.11 | | | 0.36 | | — | | 0.47 | | 7.87 | | (40.02 | ) | | 0.62 | | 0.62 | | 0.62 | | 1.14 | | | 136,526 | | 57 |
12-31-07 | | 13.01 | | 0.05 | | | 0.66 | | | 0.71 | | | 0.03 | | | 0.03 | | — | | 0.06 | | 13.66 | | 5.51 | | | 0.62 | | 0.62 | | 0.62 | | 0.33 | | | 148,649 | | 39 |
12-31-06 | | 11.35 | | 0.15 | · | | 1.53 | | | 1.68 | | | 0.00 | * | | 0.02 | | — | | 0.02 | | 13.01 | | 14.82 | | | 0.62 | | 0.62 | | 0.62 | | 1.22 | | | 36,741 | | 20 |
04-29-05(5) – 12-31-05 | | 10.08 | | 0.19 | · | | 1.08 | | | 1.27 | | | — | | | — | | — | | — | | 11.35 | | 12.6 | | | 0.62 | | 0.62 | | 0.62 | | 2.54 | | | 334 | | 106 |
Class I | | | | | | | | | | | | | | | | | | | | | | | | | | | | | | | | | | | | | | |
12-31-08 | | 13.84 | | 0.19 | · | | (5.53 | ) | | (5.34 | ) | | 0.14 | | | 0.36 | | — | | 0.50 | | 8.00 | | (39.70 | ) | | 0.12 | | 0.12 | | 0.12 | | 1.71 | | | 33,161 | | 57 |
12-31-07 | | 13.13 | | 0.12 | | | 0.66 | | | 0.78 | | | 0.04 | | | 0.03 | | — | | 0.07 | | 13.84 | | 5.96 | | | 0.12 | | 0.12 | | 0.12 | | 0.84 | | | 28,381 | | 39 |
12-31-06 | | 11.40 | | 0.12 | · | | 1.64 | | | 1.76 | | | 0.01 | | | 0.02 | | — | | 0.03 | | 13.13 | | 15.38 | | | 0.12 | | 0.12 | | 0.12 | | 0.98 | | | 10,442 | | 20 |
04-29-05(5) – 12-31-05 | | 10.08 | | 0.08 | · | | 1.24 | | | 1.32 | | | — | | | — | | — | | — | | 11.40 | | 13.10 | | | 0.12 | | 0.12 | | 0.12 | | 1.12 | | | 2 | | 106 |
Class S | | | | | | | | | | | | | | | | | | | | | | | | | | | | | | | | | | | | | | |
12-31-08 | | 13.75 | | 0.15 | · | | (5.48 | ) | | (5.33 | ) | | 0.12 | | | 0.36 | | — | | 0.48 | | 7.94 | | (39.86 | ) | | 0.37 | | 0.37 | | 0.37 | | 1.32 | | | 156,122 | | 57 |
12-31-07 | | 13.06 | | 0.07 | | | 0.68 | | | 0.75 | | | 0.03 | | | 0.03 | | — | | 0.06 | | 13.75 | | 5.79 | | | 0.37 | | 0.37 | | 0.37 | | 0.54 | | | 199,688 | | 39 |
12-31-06 | | 11.37 | | 0.11 | · | | 1.60 | | | 1.71 | | | 0.00 | * | | 0.02 | | — | | 0.02 | | 13.06 | | 15.06 | | | 0.37 | | 0.37 | | 0.37 | | 0.90 | | | 114,650 | | 20 |
04-29-05(5) – 12-31-05 | | 10.08 | | 0.08 | · | | 1.21 | | | 1.29 | | | — | | | — | | — | | — | | 11.37 | | 12.80 | | | 0.37 | | 0.37 | | 0.37 | | 1.11 | | | 783 | | 106 |
Class T | | | | | | | | | | | | | | | | | | | | | | | | | | | | | | | | | | | | | | |
12-31-08 | | 13.62 | | 0.10 | | | (5.44 | ) | | (5.34 | ) | | 0.04 | | | 0.36 | | — | | 0.40 | | 7.88 | | (40.12 | ) | | 0.87 | | 0.82 | | 0.82 | | 0.73 | | | 1,712 | | 57 |
12-31-07 | | 12.97 | | 0.01 | | | 0.67 | | | 0.68 | | | — | | | 0.03 | | — | | 0.03 | | 13.62 | | 5.27 | | | 0.87 | | 0.82 | | 0.82 | | 0.06 | | | 3,306 | | 39 |
12-31-06 | | 11.34 | | (0.04 | )· | | 1.69 | | | 1.65 | | | 0.00 | * | | 0.02 | | — | | 0.02 | | 12.97 | | 14.57 | | | 0.87 | | 0.82 | | 0.82 | | (0.29 | ) | | 3,247 | | 20 |
08-31-05(5) – 12-31-05 | | 10.91 | | 0.33 | · | | 0.10 | | | 0.43 | | | — | | | — | | — | | — | | 11.34 | | 3.94 | | | 0.87 | | 0.82 | | 0.82 | | 9.02 | | | 183 | | 106 |
(1) | | Total return is calculated assuming reinvestment of all dividends and capital gain distributions at net asset value and does not reflect the effect of insurance contract charges. Total return for periods less than one year is not annualized. |
(2) | | Annualized for periods less than one year. |
(3) | | Expense ratios reflect operating expenses of a Portfolio. Expenses before reductions do not reflect amounts reimbursed by the Investment Adviser and/or Distributor or reductions from brokerage commission recapture arrangements or other expense offset arrangements and do not represent the amount paid by a Portfolio during periods when reimbursements or reductions occur. Expenses net of fee waivers reflect expenses after reimbursement by the Investment Adviser and/or Distributor but prior to reductions from brokerage commission recapture arrangements or other expense offset arrangements. Expenses net of all reductions represent the net expenses paid by a Portfolio. Net investment income (loss) is net of all such additions or reductions. |
(4) | | Expense ratios do not include expenses of Underlying Funds and do not include fees and expenses charged under the variable annuity contract or variable life insurance policy. |
(5) | | Commencement of operations. |
| • | | Calculated using average number of shares outstanding throughout the period. |
| * | | Amount is less than $0.005 or 0.005%. |
See Accompanying Notes to Financial Statements
28
NOTES TO FINANCIAL STATEMENTSASOF DECEMBER 31, 2008
NOTE 1 — ORGANIZATION
Organization. ING Partners, Inc. (the “Fund”) is an open-end management investment company registered under the Investment Company Act of 1940, as amended (the “1940 Act”). It was incorporated under the laws of Maryland on May 7, 1997. The Articles of Incorporation permit the Fund to offer separate series, each of which has its own investment objective, policies and restrictions. The Fund currently consists of thirty-six active separate investment series. The seven Portfolios included in this report are: ING Solution Growth and Income Portfolio (“Solution Growth and Income”), ING Solution Growth Portfolio (“Solution Growth”), ING Solution Income Portfolio (“Solution Income”), ING Solution 2015 Portfolio (“Solution 2015”), ING Solution 2025 Portfolio (“Solution 2025”), ING Solution 2035 Portfolio (“Solution 2035”) and ING Solution 2045 Portfolio (“Solution 2045”) (each, a “Portfolio” and collectively, the “Portfolios”). With the exception of Solution Growth and Income, Solution Growth and Solution Income, each Portfolio is structured and managed around a specific target retirement or financial goal date (“Target Date”). The investment objectives of the Portfolios are as follows: Solution Growth and Income — seeks to provide a combination of total return and stability of principal through a diversified asset allocation strategy; Solution Growth — seeks to provide capital growth through a diversified asset allocation strategy; Solution Income — seeks to provide a combination of total return and stability of principal consistent with an asset allocation targeted to retirement; and for each of Solution 2015, 2025, 2035 and 2045 Portfolios — until the day prior to the Target Date, the Portfolio will seek to provide total return consistent with an asset allocation targeted at retirement in approximately 2015, 2025, 2035 and 2045, respectively. On the Target Date, the investment objective will be to seek to provide a combination of total return and stability of principal consistent with an asset allocation targeted to retirement. When Solution 2015, 2025, 2035 and 2045 Portfolios reach their respective Target Date, they may be combined with the Solution Income, without a vote of shareholders, if approved by the Board of Directors (the “Board”). The Portfolios serve as an investment option in underlying variable insurance products offered by Direct Services LLC (“DSL” or “Investment Adviser”).
Shares of the Portfolios are currently being offered only to participating insurance companies for allocation to certain of their separate accounts established for the purpose of funding variable annuity contracts and variable life insurance policies issued by the participating insurance companies.
The Portfolios offer at least three of the following four classes: Adviser Class (“Class ADV”), Initial Class
(“Class I”), Service Class (“Class S”) and Class T. The classes differ principally in applicable distribution and shareholder service fees. Shareholders of each class also bear certain expenses that pertain to that particular class. All shareholders bear the common expenses of the Portfolios and earn income and realized gains/losses from the Portfolio pro rata based on the average daily net assets of each class, without discrimination between share classes. Common expenses of the Portfolios (including custodial asset-based fees, legal and audit fees, printing and mailing expenses, transfer agency out-of-pocket expenses, and fees and expenses of the independent trustees) are allocated to each Portfolio in proportion to its average net assets. Expenses directly attributable to a particular Portfolio (including advisory, administration, custodial transaction-based, registration, other professional, distribution and/or service fees, certain taxes, and offering costs) are charged directly to that Portfolio. Differences in per share dividend rates generally result from differences in separate class expenses, including distribution and shareholder service fees, if applicable.
Each Portfolio seeks to achieve its investment objective by investing in other ING Funds (“Underlying Funds”) and uses asset allocation strategies to determine how much to invest in the Underlying Funds.
NOTE 2 — SIGNIFICANT ACCOUNTING POLICIES
The following significant accounting policies are consistently followed by the Portfolios in the preparation of their financial statements. Such policies are in conformity with U.S. generally accepted accounting principles for investment companies.
| A. | Security Valuation. The valuation of each Portfolio’s investments in its Underlying Funds is based on the net asset values of the Underlying Funds each business day. |
Effective for fiscal years beginning after November 15, 2007, Financial Accounting Standards Board (“FASB”) Statement of Financial Accounting Standards No. 157, “Fair Value Measurements”, establishes a hierarchy for measuring fair value of assets and liabilities. As required by the standard, each investment asset or liability of the Portfolios is assigned a level at measurement date based on the significance and source of the inputs to its valuation. Quoted prices in active markets for identical securities are classified as “Level 1”, inputs other than quoted prices for an asset that are observable are classified as “Level 2” and unobservable inputs, including the investment adviser’s judgment about the assumptions that a market participant would use in pricing an asset or liability are classified as
29
NOTES TO FINANCIAL STATEMENTSASOF DECEMBER 31, 2008 (CONTINUED)
NOTE 2 — SIGNIFICANT ACCOUNTING POLICIES (continued)
“Level 3”. The inputs used for valuing securities are not necessarily an indication of the risks associated with investing in those securities. A table summarizing the Portfolios’ investments under these levels of classification is included following each portfolios Portfolio of Investments.
Effective for fiscal years and interim periods ending after November 15, 2008, the FASB issued FASB Staff Position (“FSP”) No. FAS 133-1 and FASB Interpretation Number (“FIN”) 45-4, “Disclosures about Credit Derivatives and Certain Guarantees: An Amendment of FASB Statement No. 133 and FASB Interpretation No. 45; and Clarification of the Effective Date of FASB Statement No. 161.” The amendments to FAS 133 require enhanced disclosure regarding credit derivatives sold, including (1) the nature and terms of the credit derivative, reasons for entering into the credit derivative, the events or circumstances that would require the seller to perform under the credit derivative, and the current status of the payment/performance risk of the credit derivative, (2) the maximum potential amount of future payments (undiscounted) the seller could be required to make under the credit derivative, (3) the fair value of the credit derivative, and (4) the nature of any recourse provisions and assets held either as collateral or by third parties. The amendments to FIN 45 require additional disclosures about the current status of the payment/performance risk of a guarantee. All changes to accounting policies have been made in accordance with the FSP and incorporated for the current period as part of the Notes to Financial Statements and Portfolio of Investments.
| B. | Security Transactions and Revenue Recognition. Security transactions are accounted for on trade date. Dividend income received from the affiliated funds is recognized on the ex-dividend date and is recorded as income distributions in the Statement of Operations. Capital gain distributions received from the affiliated funds are recognized on ex-dividend date and are recorded on the Statement of Operations as such. Costs used in determining realized gains and losses on the sales of investment securities are on the basis of specific identification. |
| C. | Distributions to Shareholders. The Portfolios record distributions to their shareholders on the ex-dividend date. Each Portfolio distributes dividends and capital gains, if any, annually. The |
| | Portfolios may make distributions on a more frequent basis to comply with the distribution requirements of the Internal Revenue Code. The characteristics of income and gains to be distributed are determined in accordance with income tax regulations, which may differ from U.S. generally accepted accounting principles for investment companies. |
| D. | Federal Income Taxes. It is the policy of the Portfolios to comply with subchapter M of the Internal Revenue Code and related excise tax provisions applicable to regulated investment companies and to distribute substantially all of their net investment income and any net realized capital gains to their shareholders. Therefore, no federal income tax provision is required. Management has considered the sustainability of the Portfolios’ tax positions taken on federal income tax returns for all open tax years in making this determination. No capital gain distributions shall be made until any capital loss carryforwards have been fully utilized or expired. |
| E. | Use of Estimates. The preparation of financial statements in conformity with U.S. generally accepted accounting principles requires management to make estimates and assumptions that affect the reported amounts of assets and liabilities and disclosure of contingent assets and liabilities at the date of the financial statements and the reported amounts of increases and decreases in net assets from operations during the reporting period. Actual results could differ from those estimates. |
| F. | Repurchase Agreements. Certain Underlying Funds may invest in repurchase agreements only with government securities dealers recognized by the Board of Governors of the Federal Reserve System. Under such agreements, the seller of the security agrees to repurchase it at a mutually agreed upon time and price. The resale price is in excess of the purchase price and reflects an agreed upon interest rate for the period of time the agreement is outstanding. The period of the repurchase agreements is usually short, from overnight to one week, while the underlying securities generally have longer maturities. An Underlying Fund will receive as collateral securities acceptable to it whose market value is equal to at least 100% of the carrying amount of the repurchase agreements, plus accrued interest, being invested by the Underlying Fund. The underlying collateral is valued daily on a mark to market basis to assure that the value, including accrued interest is at least equal to the repurchase price. There would be potential loss to the Underlying Fund in the event |
30
NOTES TO FINANCIAL STATEMENTSASOF DECEMBER 31, 2008 (CONTINUED)
NOTE 2 — SIGNIFICANT ACCOUNTING POLICIES (continued)
| | the Underlying Fund is delayed or prevented from exercising its right to dispose of the collateral, and it might incur disposition costs in liquidating the collateral. |
| G. | Indemnifications. In the normal course of business, the Fund may enter into contracts that provide certain indemnifications. The Fund’s maximum exposure under these arrangements is dependent on future claims that may be made against the Portfolios and, therefore, cannot be estimated; however, based on experience, the risk of loss from such claims is considered remote. |
NOTE 3 — INVESTMENT ADVISER AND ADMINISTRATIVE SERVICE FEES
The Portfolios entered into an investment management agreement with the Investment Adviser. For its services, each Portfolio pays the Investment Adviser a monthly fee in arrears equal to 0.10% of each Portfolio’s average daily net assets during the month.
ING Investment Management Co. (the “Consultant”) is a consultant to the Investment Adviser. DSL pays the Consultant a consulting fee of 0.03% of the first $500 million, 0.025% of the next $500 million, 0.02% of the next $1 billion and 0.01% of amounts over $2 billion based on each Portfolio’s average daily net assets. Both the Investment Adviser and the Consultant are indirect, wholly-owned subsidiaries of ING Groep N.V. (“ING Groep”).
The Consultant will provide tactical allocation recommendations to the Investment Adviser. The Investment Adviser has set up an Investment Committee made up of a team of professionals to consider, review and implement the recommendations of the Consultant, and will retain discretion over implementation of the Consultant’s recommendations. The Consultant will provide ongoing recommendations to the Investment Committee of the Investment Adviser quarterly or as warranted by market conditions.
ING Groep is a global financial institution of Dutch origin offering banking, investments, life insurance and retirement services to over 75 million private, corporate and institutional clients in more than 50 countries. With a diverse workforce of about 125,000 people, ING Groep comprises a broad spectrum of prominent companies that increasingly serve their clients under the ING brand.
On October 19, 2008, ING Groep announced that it reached an agreement with the Dutch government to strengthen its capital position, creating a strong buffer to navigate the current market and economic
environment. ING Groep will issue non-voting core Tier-1 securities for a total consideration of EUR 10 billion to the Dutch State. The transaction boosts ING Bank’s core Tier-1 ratio, strengthens the insurance balance sheet and reduces ING Groep’s Debt/Equity ratio.
Under an Administrative Services Agreement between the Portfolios and ING Fund Services, LLC (“IFS”), an indirect, wholly-owned subsidiary of ING Groep, IFS provides all administrative services necessary for the Portfolios’ operations and is responsible for the supervision of the Portfolios’ other service providers. IFS also assumes all ordinary recurring direct costs of the Portfolios, such as custodian fees, director fees, transfer agency fees and accounting fees. As compensation for these services, IFS receives a monthly fee from each portfolio at an annual rate of 0.02% based on the average daily net assets of each Portfolio.
NOTE 4 — INVESTMENTS IN AFFILIATED UNDERLYING FUNDS
For the year ended December 31, 2008, the cost of purchases and the proceeds from sales of the Underlying Funds were as follows:
| | | | | | |
| | | Non U.S. Government |
| | | Purchases | | Sales |
Solution Growth and Income | | $ | 986,402 | | $ | 320,893 |
Solution Growth | | | 476,435 | | | 241,055 |
Solution Income | | | 219,852,754 | | | 180,356,596 |
Solution 2015 | | | 542,021,873 | | | 365,212,795 |
Solution 2025 | | | 792,131,619 | | | 542,615,038 |
Solution 2035 | | | 630,999,246 | | | 418,801,550 |
Solution 2045 | | | 358,025,992 | | | 218,037,479 |
NOTE 5 — DISTRIBUTION AND SERVICE FEES
Class ADV and Class T of the Portfolios have adopted a Plan of Distribution pursuant to Rule 12b-1 under the 1940 Act (the “12b-1 Plans”), whereby ING Funds Distributor, LLC (the “Distributor” or “IFD”), an indirect, wholly-owned subsidiary of ING Groep, is reimbursed or compensated by the Portfolios for expenses incurred in the distribution of each Portfolio’s shares (“Distribution Fees”). The Distributor may pay, on behalf of each Portfolio, out of its distribution fee, compensation to certain financial institutions for providing distribution assistance pursuant to a Distribution Services Agreement. Under the Rule 12b-1 Plan, each Portfolio makes payments to IFD at an annual rate of 0.25% and 0.50% of each Portfolio’s average daily net assets attributable to its Class ADV and Class T shares, respectively. The Distributor has contractually agreed to waive a portion of this fee equal to 0.05% of each Portfolio’s average daily net assets attributable to the distribution fee paid by Class T shares, so that the actual fee paid is an annual rate of 0.45%. The expense waiver will continue through at least May 1, 2010.
31
NOTES TO FINANCIAL STATEMENTSASOF DECEMBER 31, 2008 (CONTINUED)
NOTE 5 — DISTRIBUTION AND SERVICE FEES
(continued)
The Fund has also adopted a Shareholder Servicing Plan (“Service Plan”) for the Classes ADV, S and T shares of each Portfolio. The Service Plan allows the Fund’s Distributor to enter into shareholder servicing agreements with insurance companies, broker dealers or other financial intermediaries that provide administrative services related to Classes ADV, S and T shares and their shareholders including Variable Contract owners or Qualified Plan participants with interests in the Portfolios. Under the Service Plan, each Portfolio makes payments to IFD at an annual rate of 0.25% of each Portfolio’s average daily net assets attributable to its Class ADV, S and T shares.
NOTE 6 — OTHER TRANSACTIONS WITH AFFILIATES AND RELATED PARTIES
At December 31, 2008, the Portfolios had the following amounts recorded in payable to affiliates on the accompanying Statements of Assets and Liabilities (see Notes 3 and 5):
| | | | | | | | | | | | |
Portfolio | | Accrued
Investment
Management
Fees | | Accrued
Administrative
Fees | | Accrued
Shareholder
Service and
Distribution
Fees | | Total |
Solution Growth and Income | | $ | 50 | | $ | 10 | | $ | 125 | | $ | 185 |
Solution Growth | | | 21 | | | 4 | | | 54 | | | 79 |
Solution Income | | | 15,484 | | | 3,097 | | | 51,684 | | | 70,265 |
Solution 2015 | | | 44,926 | | | 8,985 | | | 149,867 | | | 203,778 |
Solution 2025 | | | 59,747 | | | 11,949 | | | 201,304 | | | 273,000 |
Solution 2035 | | | 46,113 | | | 9,222 | | | 156,846 | | | 212,181 |
Solution 2045 | | | 26,093 | | | 5,218 | | | 105,722 | | | 137,033 |
The Fund has adopted a Retirement Policy (“Policy”) covering all independent directors of the Fund who will have served as independent directors for at least five years at the time of retirement. Benefits under this Policy are based on an annual rate as defined in the Policy.
At December 31, 2008, the following indirect, wholly-owned subsidiaries of ING Groep owned more than 5% of the following Series:
ING Life Insurance and Annuity Company — Solution Growth and Income (100.00%); Solution Growth (99.99%); Solution Income (76.59%); Solution 2015 (83.49%); Solution 2025 (83.39%); Solution 2035 (84.53%); Solution 2045 (84.89%).
ING National Trust — Solution Income (19.07%); Solution 2015 (14.30%); Solution 2025 (15.11%); Solution 2035 (13.99%); Solution 2045 (15.54%).
Control is defined by the 1940 Act as the beneficial ownership, either directly or through one or more
controlled companies, of more than 25% of the voting securities of a company. The 1940 Act defines affiliates as companies that are under common control. Therefore, because the Portfolios have a common owner that owns over 25% of the outstanding securities of the Portfolios, they may be deemed to be affiliates of each other. Investment activities of these shareholders could have a material impact on the Portfolios.
NOTE 7 — EXPENSE LIMITATIONS
The Investment Adviser has agreed to limit expenses, excluding interest, taxes, brokerage commissions and extraordinary expenses to the levels listed below:
| | | | | | | | | | | | |
Portfolio(1) | | Class ADV | | | Class I | | | Class S | | | Class T | |
Solution Growth and Income | | 0.62 | % | | 0.12 | % | | 0.37 | % | | N/A | |
Solution Growth | | 0.62 | % | | 0.12 | % | | 0.37 | % | | N/A | |
Solution Income | | 0.62 | % | | 0.12 | % | | 0.37 | % | | 0.82 | % |
Solution 2015 | | 0.62 | % | | 0.12 | % | | 0.37 | % | | 0.82 | % |
Solution 2025 | | 0.62 | % | | 0.12 | % | | 0.37 | % | | 0.82 | % |
Solution 2035 | | 0.62 | % | | 0.12 | % | | 0.37 | % | | 0.82 | % |
Solution 2045 | | 0.62 | % | | 0.12 | % | | 0.37 | % | | 0.82 | % |
(1) | The operating expense limits apply only at the Portfolio level and do not limit the fees payable by the underlying investment companies in which the Portfolios invest. |
The Investment Adviser may at a later date recoup from a Portfolio management fees waived and other expenses assumed by the Investment Adviser during the previous 36 months, but only if, after such recoupment, the Portfolio’s expense ratio does not exceed the percentage described above. Waived and reimbursed fees and any recoupment by the Investment Adviser of such waived and reimbursed fees are reflected on the accompanying Statements of Operations for each Portfolio.
As of December 31, 2008, the Portfolios did not have any waived or reimbursed fees subject to recoupment.
Outstanding reimbursement balances due to the Portfolios, if any, under their respective expense limitation agreements are reflected in Reimbursement Due from Manager on the accompanying Statements of Assets and Liabilities.
The expense limitation agreement is contractual and shall renew automatically for one-year terms unless the Investment Adviser provides written notice of the termination of the expense limitation agreement within 90 days of the end of the then current term.
32
NOTES TO FINANCIAL STATEMENTSASOF DECEMBER 31, 2008 (CONTINUED)
NOTE 8 — CAPITAL SHARES
Transactions in capital shares and dollars were as follows:
| | | | | | | | | | | | | | | | | | | | | | |
| | | Shares sold | | Reinvestment
of distributions | | Shares
redeemed | | | Net increase
(decrease) in
shares
outstanding | | | | | Shares sold | | Reinvestment
of distributions | | Shares
redeemed | | | Net increase
(decrease) in
shares
outstanding | |
Year or period ended | | # | | # | | # | | | # | | | | | ($) | | ($) | | ($) | | | ($) | |
Solution Growth and Income | | | | | | | | | | | | | | | | |
Class ADV | | | | | | | | | | | | | | | | | | | | | | |
12-31-08 | | — | | — | | — | | | — | | | | | — | | — | | — | | | — | |
07-02-07(1)-12-31-07 | | 101 | | — | | — | | | 101 | | | | | 1,010 | | — | | — | | | 1,010 | |
Class I | | | | | | | | | | | | | | | | | | | | | | |
12-31-08 | | — | | — | | — | | | — | | | | | — | | — | | — | | | — | |
07-02-07(1)-12-31-07 | | 101 | | — | | — | | | 101 | | | | | 1,010 | | — | | — | | | 1,010 | |
Class S | | | | | | | | | | | | | | | | | | | | | | |
12-31-08 | | 111,501 | | 6 | | (29,785 | ) | | 81,722 | | | | | 908,118 | | 61 | | (250,870 | ) | | 657,309 | |
07-02-07(1)-12-31-07 | | 101 | | — | | — | | | 101 | | | | | 1,010 | | — | | — | | | 1,010 | |
Solution Growth | | | | | | | | | | | | | | | | |
Class ADV | | | | | | | | | | | | | | | | | | | | | | |
12-31-08 | | — | | — | | — | | | — | | | | | — | | — | | — | | | — | |
07-02-07(1)-12-31-07 | | 101 | | — | | — | | | 101 | | | | | 1,010 | | — | | — | | | 1,010 | |
Class I | | | | | | | | | | | | | | | | | | | | | | |
12-31-08 | | — | | — | | — | | | — | | | | | — | | — | | — | | | — | |
07-02-07(1)-12-31-07 | | 101 | | — | | — | | | 101 | | | | | 1,010 | | — | | — | | | 1,010 | |
Class S | | | | | | | | | | | | | | | | | | | | | | |
12-31-08 | | 56,092 | | 5 | | (30,318 | ) | | 25,779 | | | | | 443,431 | | 42 | | (210,741 | ) | | 232,732 | |
07-02-07(1)-12-31-07 | | 101 | | — | | — | | | 101 | | | | | 1,010 | | — | | — | | | 1,010 | |
Solution Income | | | | | | | | | | | | | | | | |
Class ADV | | | | | | | | | | | | | | | | | | | | | | |
12-31-08 | | 3,888,994 | | 320,091 | | (3,128,924 | ) | | 1,080,161 | | | | | 43,381,977 | | 3,460,185 | | (33,485,644 | ) | | 13,356,518 | |
12-31-07 | | 7,237,328 | | 38,021 | | (997,394 | ) | | 6,277,955 | | | | | 82,362,845 | | 426,601 | | (11,282,023 | ) | | 71,507,423 | |
Class I | | | | | | | | | | | | | | | | | | | | | | |
12-31-08 | | 1,731,967 | | 86,502 | | (776,572 | ) | | 1,041,897 | | | | | 19,377,206 | | 949,787 | | (8,573,157 | ) | | 11,753,836 | |
12-31-07 | | 1,652,599 | | 6,774 | | (385,358 | ) | | 1,274,015 | | | | | 18,979,355 | | 76,953 | | (4,437,475 | ) | | 14,618,833 | |
Class S | | | | | | | | | | | | | | | | | | | | | | |
12-31-08 | | 3,005,910 | | 279,858 | | (2,684,616 | ) | | 601,152 | | | | | 32,898,988 | | 3,053,216 | | (28,540,704 | ) | | 7,411,500 | |
12-31-07 | | 3,667,575 | | 45,755 | | (991,697 | ) | | 2,721,633 | | | | | 41,982,136 | | 517,030 | | (11,422,695 | ) | | 31,076,471 | |
Class T | | | | | | | | | | | | | | | | | | | | | | |
12-31-08 | | 30,609 | | 2,435 | | (108,173 | ) | | (75,129 | ) | | | | 322,253 | | 26,540 | | (1,128,376 | ) | | (779,583 | ) |
12-31-07 | | 89,716 | | 167 | | (151,644 | ) | | (61,761 | ) | | | | 1,013,401 | | 1,873 | | (1,723,718 | ) | | (708,444 | ) |
Solution 2015 | | | | | | | | | | | | | | | | |
Class ADV | | | | | | | | | | | | | | | | | | | | | | |
12-31-08 | | 8,755,491 | | 898,099 | | (2,171,246 | ) | | 7,482,344 | | | | | 98,275,207 | | 9,932,975 | | (22,574,676 | ) | | 85,633,506 | |
12-31-07 | | 14,429,321 | | 99,989 | | (1,250,862 | ) | | 13,278,448 | | | | | 176,412,557 | | 1,201,868 | | (15,207,346 | ) | | 162,407,079 | |
Class I | | | | | | | | | | | | | | | | | | | | | | |
12-31-08 | | 3,153,770 | | 202,733 | | (824,746 | ) | | 2,531,757 | | | | | 35,715,362 | | 2,276,688 | | (8,804,485 | ) | | 29,187,565 | |
12-31-07 | | 2,938,413 | | 18,113 | | (794,396 | ) | | 2,162,130 | | | | | 36,140,606 | | 220,432 | | (9,783,725 | ) | | 26,577,313 | |
(1) | | Commencement of operations. |
33
NOTES TO FINANCIAL STATEMENTSASOF DECEMBER 31, 2008 (CONTINUED)
NOTE 8 — CAPITAL SHARES (continued)
| | | | | | | | | | | | | | | | | | | | | | |
| | | Shares sold | | Reinvestment
of distributions | | Shares
redeemed | | | Net increase
(decrease) in
shares
outstanding | | | | | Shares sold | | Reinvestment
of distributions | | Shares
redeemed | | | Net increase
(decrease) in
shares
outstanding | |
Year or period ended | | # | | # | | # | | | # | | | | | ($) | | ($) | | ($) | | | ($) | |
Class S | | | | | | | | | | | | | | | | | | | | | | |
12-31-08 | | 9,223,269 | | 1,037,186 | | (4,089,611 | ) | | 6,170,844 | | | | | 102,302,525 | | 11,575,000 | | (43,888,500 | ) | | 69,989,025 | |
12-31-07 | | 9,824,043 | | 146,032 | | (1,704,508 | ) | | 8,265,567 | | | | | 120,665,807 | | 1,766,988 | | (20,959,510 | ) | | 101,473,285 | |
Class T | | | | | | | | | | | | | | | | | | | | | | |
12-31-08 | | 96,137 | | 7,111 | | (146,245 | ) | | (42,997 | ) | | | | 957,289 | | 79,291 | | (1,659,739 | ) | | (623,159 | ) |
12-31-07 | | 191,986 | | 638 | | (243,672 | ) | | (51,048 | ) | | | | 2,336,814 | | 7,683 | | (2,946,572 | ) | | (602,075 | ) |
Solution 2025 | | | | | | | | | | | | | | | | |
Class ADV | | | | | | | | | | | | | | | | | | | | | | |
12-31-08 | | 13,708,461 | | 1,418,021 | | (2,459,941 | ) | | 12,666,541 | | | | | 152,139,308 | | 15,640,771 | | (25,619,511 | ) | | 142,160,568 | |
12-31-07 | | 19,838,440 | | 147,855 | | (946,702 | ) | | 19,039,593 | | | | | 252,696,867 | | 1,849,665 | | (11,865,610 | ) | | 242,680,922 | |
Class I | | | | | | | | | | | | | | | | | | | | | | |
12-31-08 | | 4,664,361 | | 328,922 | | (749,395 | ) | | 4,243,888 | | | | | 53,362,188 | | 3,687,216 | | (7,620,429 | ) | | 49,428,975 | |
12-31-07 | | 3,738,402 | | 22,144 | | (587,751 | ) | | 3,172,795 | | | | | 47,618,442 | | 280,562 | | (7,598,424 | ) | | 40,300,580 | |
Class S | | | | | | | | | | | | | | | | | | | | | | |
12-31-08 | | 10,216,883 | | 1,532,104 | | (4,639,016 | ) | | 7,109,971 | | | | | 111,161,431 | | 17,067,641 | | (51,682,451 | ) | | 76,546,621 | |
12-31-07 | | 13,305,242 | | 216,420 | | (1,529,397 | ) | | 11,992,265 | | | | | 170,138,444 | | 2,726,889 | | (19,564,309 | ) | | 153,301,024 | |
Class T | | | | | | | | | | | | | | | | | | | | | | |
12-31-08 | | 169,734 | | 21,613 | | (267,859 | ) | | (76,512 | ) | | | | 1,879,548 | | 239,693 | | (2,797,847 | ) | | (678,606 | ) |
12-31-07 | | 242,058 | | 2,508 | | (404,703 | ) | | (160,137 | ) | | | | 3,064,714 | | 31,400 | | (5,123,159 | ) | | (2,027,045 | ) |
Solution 2035 | | | | | | | | | | | | | | | | |
Class ADV | | | | | | | | | | | | | | | | | | | | | | |
12-31-08 | | 10,661,928 | | 1,198,898 | | (1,265,300 | ) | | 10,595,526 | | | | | 118,690,126 | | 13,439,644 | | (13,883,983 | ) | | 118,245,787 | |
12-31-07 | | 15,692,755 | | 107,790 | | (462,668 | ) | | 15,337,877 | | | | | 206,813,701 | | 1,393,730 | | (6,028,697 | ) | | 202,178,734 | |
Class I | | | | | | | | | | | | | | | | | | | | | | |
12-31-08 | | 3,182,802 | | 237,025 | | (462,514 | ) | | 2,957,313 | | | | | 35,874,930 | | 2,697,342 | | (4,938,312 | ) | | 33,633,960 | |
12-31-07 | | 2,408,122 | | 16,629 | | (420,452 | ) | | 2,004,299 | | | | | 31,958,692 | | 217,669 | | (5,614,492 | ) | | 26,561,869 | |
Class S | | | | | | | | | | | | | | | | | | | | | | |
12-31-08 | | 9,342,105 | | 1,304,103 | | (3,193,106 | ) | | 7,453,102 | | | | | 102,809,865 | | 14,749,404 | | (34,859,454 | ) | | 82,699,815 | |
12-31-07 | | 9,849,051 | | 164,518 | | (1,400,827 | ) | | 8,612,742 | | | | | 130,046,033 | | 2,142,026 | | (18,697,541 | ) | | 113,490,518 | |
Class T | | | | | | | | | | | | | | | | | | | | | | |
12-31-08 | | 141,981 | | 19,433 | | (453,852 | ) | | (292,438 | ) | | | | 1,554,857 | | 219,010 | | (4,874,883 | ) | | (3,101,016 | ) |
12-31-07 | | 286,776 | | 2,229 | | (299,614 | ) | | (10,609 | ) | | | | 3,759,648 | | 28,825 | | (3,936,905 | ) | | (148,432 | ) |
Solution 2045 | | | | | | | | | | | | | | | | |
Class ADV | | | | | | | | | | | | | | | | | | | | | | |
12-31-08 | | 6,628,857 | | 600,628 | | (776,045 | ) | | 6,453,440 | | | | | 74,285,813 | | 6,901,222 | | (8,847,567 | ) | | 72,339,468 | |
12-31-07 | | 8,364,192 | | 36,073 | | (338,761 | ) | | 8,061,504 | | | | | 113,782,181 | | 482,652 | | (4,627,426 | ) | | 109,637,407 | |
Class I | | | | | | | | | | | | | | | | | | | | | | |
12-31-08 | | 2,436,920 | | 145,573 | | (489,632 | ) | | 2,092,861 | | | | | 27,921,973 | | 1,695,922 | | (5,273,872 | ) | | 24,344,023 | |
12-31-07 | | 1,535,768 | | 7,785 | | (288,482 | ) | | 1,255,071 | | | | | 21,114,561 | | 105,325 | | (4,002,764 | ) | | 17,217,122 | |
Class S | | | | | | | | | | | | | | | | | | | | | | |
12-31-08 | | 5,944,067 | | 689,475 | | (1,505,648 | ) | | 5,127,894 | | | | | 65,129,898 | | 7,984,117 | | (18,413,690 | ) | | 54,700,325 | |
12-31-07 | | 6,251,430 | | 60,025 | | (559,627 | ) | | 5,751,828 | | | | | 85,467,661 | | 807,339 | | (7,686,957 | ) | | 78,588,043 | |
Class T | | | | | | | | | | | | | | | | | | | | | | |
12-31-08 | | 94,016 | | 8,619 | | (128,282 | ) | | (25,647 | ) | | | | 1,053,847 | | 99,208 | | (1,429,375 | ) | | (276,320 | ) |
12-31-07 | | 131,307 | | 692 | | (139,533 | ) | | (7,534 | ) | | | | 1,766,701 | | 9,245 | | (1,880,467 | ) | | (104,521 | ) |
34
NOTES TO FINANCIAL STATEMENTSASOF DECEMBER 31, 2008 (CONTINUED)
NOTE 9 — FEDERAL INCOME TAXES
The amount of distributions from net investment income and net realized capital gains are determined in accordance with federal income tax regulations, which may differ from U.S. generally accepted accounting principles for investment companies. These book/tax differences may be either temporary or permanent. Permanent differences are reclassified within the capital accounts based on their federal tax-basis treatment; temporary differences are not reclassified. Key differences include the treatment of short-term capital gains, foreign currency transactions, and wash sale deferrals. Distributions in excess of net investment income and/or net realized capital gains for tax purposes are reported as return of capital.
The following permanent tax differences have been reclassified as of December 31, 2008:
| | | | | | | |
| | | Undistributed Net
Investment Income | | Accumulated
Net Realized
Gains / (Losses) | |
Solution Growth and Income | | $ | 1,348 | | $ | (1,348 | ) |
Solution Growth | | | 401 | | | (401 | ) |
Solution Income | | | 2,524,111 | | | (2,524,111 | ) |
Solution 2015 | | | 7,010,755 | | | (7,010,755 | ) |
Solution 2025 | | | 10,748,904 | | | (10,748,904 | ) |
Solution 2035 | | | 9,582,251 | | | (9,582,251 | ) |
Solution 2045 | | | 5,326,926 | | | (5,326,926 | ) |
Dividends paid by the Portfolios from net investment income and distributions of net realized short-term capital gains are, for federal income tax purposes, taxable as ordinary income to shareholders.
The tax composition of dividends and distributions to shareholders was as follows:
| | | | | | | | | | | | |
| | | Year Ended December 31, 2008 | | Year Ended December 31, 2007 |
| | | Ordinary
Income | | Long-Term
Capital Gains | | Ordinary
Income | | Long-Term
Capital Gains |
Solution Growth and Income | | $ | 50 | | $ | 11 | | $ | — | | $ | — |
Solution Growth | | | 32 | | | 10 | | | — | | | — |
Solution Income | | | 5,970,724 | | | 1,519,004 | | | 984,130 | | | 38,327 |
Solution 2015 | | | 15,884,638 | | | 7,979,316 | | | 2,966,927 | | | 230,044 |
Solution 2025 | | | 20,437,171 | | | 16,198,150 | | | 4,115,530 | | | 772,986 |
Solution 2035 | | | 18,164,573 | | | 12,940,827 | | | 3,317,791 | | | 464,459 |
Solution 2045 | | | 9,031,469 | | | 7,649,000 | | | 1,174,833 | | | 229,728 |
The tax-basis components of distributable earnings as of December 31, 2008 were:
| | | | | | | | | | | | | | |
| | | Undistributed
Ordinary
Income | | Undistributed
Long-Term
Capital Gains | | Unrealized
Appreciation/
(Depreciation) | | | Post-October
Capital Loss
Deferred | |
Solution Growth and Income | | $ | 10,531 | | $ | 192 | | $ | (44,206 | ) | | $ | (5 | ) |
Solution Growth | | | 3,008 | | | 458 | | | (32,551 | ) | | | (31,825 | ) |
Solution Income | | | 10,359,604 | | | 756,847 | | | (49,016,985 | ) | | | (265,315 | ) |
Solution 2015 | | | 23,876,149 | | | 5,687,304 | | | (217,891,014 | ) | | | — | |
Solution 2025 | | | 28,078,922 | | | 729,104 | | | (371,235,594 | ) | | | (468,501 | ) |
Solution 2035 | | | 19,844,522 | | | 666,138 | | | (315,762,592 | ) | | | (525,060 | ) |
Solution 2045 | | | 10,134,862 | | | 3,712,226 | | | (195,216,200 | ) | | | (519 | ) |
The Portfolios’ major tax jurisdictions are federal and Arizona. The earliest tax year that remains subject to examination by these jurisdictions is 2005.
NOTE 10 — OTHER ACCOUNTING PRONOUNCEMENTS
On March 19, 2008, the FASB issued Statement of Financial Accounting Standards No. 161 (“SFAS No. 161”), “Disclosure about Derivative Instruments and Hedging Activities.” This new accounting statement requires enhanced disclosures about an entity’s derivative and hedging activities. Entities are required to provide enhanced disclosures about (a) how and why an entity invests in derivatives, (b) how derivatives are accounted for under SFAS No. 133, and (c) how derivatives affect an entity’s financial position, financial performance, and cash flows. SFAS No. 161 also requires enhanced disclosures regarding credit-risk-related contingent features of derivative instruments. SFAS No. 161 is effective for financial statements issued for fiscal years and interim periods beginning after November 15, 2008. As of December 31, 2008, management of the Portfolios is currently assessing the impact of the expanded financial statement disclosures that will result from adopting SFAS No. 161.
NOTE 11 — CONCENTRATION OF INVESTMENT RISK
The Portfolios are also affected by other kinds of risks, depending on the types of securities held or strategies used by an Underlying Fund.
Investment by Funds-of-Funds. Each of the Underlying Funds’ shares may be purchased by other investment companies. In some cases, an Underlying Fund may experience large inflows or redemptions due to allocations or rebalancing. While it is impossible to predict the overall impact of these transactions over time, there could be adverse effects on portfolio management. The Investment Adviser will monitor transactions by each Underlying Fund and will attempt to minimize any adverse effects on the Underlying Funds and the Portfolios as a result of these transactions. So long as an Underlying Fund accepts investments by other investment companies, it will not purchase securities of other investment companies, except to the extent permitted by the 1940 Act or under the terms of an exemptive order granted by the SEC.
Asset Allocation. Although asset allocation seeks to optimize returns given various levels of risk tolerance, you still may lose money and experience volatility. Market and asset class performance may differ in the future from the historical performance and the
35
NOTES TO FINANCIAL STATEMENTSASOF DECEMBER 31, 2008 (CONTINUED)
assumptions used to form the asset allocations for the Portfolios. Furthermore, the Investment Adviser’s allocation of a Portfolio’s assets may not anticipate market trends successfully. Assets will be allocated among Underlying Funds and markets based on judgments made by the Investment Adviser. There is a risk that the Portfolios may allocate assets to an asset class or market that underperforms other Underlying Funds. For example, a Portfolio may be underweighted in assets or a market that is experiencing significant returns or overweighted in assets or a market with significant declines.
Foreign Securities. Investments in foreign securities may entail risks not present in domestic investments. Since securities in which an Underlying Fund may invest are denominated in foreign currencies, changes in the relationship of these foreign currencies to the U.S. dollar can significantly affect the value of the investments and earnings of the Underlying Funds. Foreign investments may also subject the Underlying Funds to foreign government exchange restrictions, expropriation, taxation or other political, social or economic developments, as well as changes vis-à-vis the U.S. dollar from movements in currency, and changes in security value and interest rate, all of which could affect the market and/or credit risk of the Underlying Funds’ investments.
NOTE 12 — INFORMATION REGARDING TRADING OF ING’S U.S. MUTUAL FUNDS
As discussed in earlier supplements that were previously filed with the SEC, DSL, the adviser to the ING Funds, has reported to the Boards of Directors/Trustees (the “Boards”) of the ING Funds that, like many U.S. financial services companies, DSL and certain of its U.S. affiliates have received informal and formal requests for information since September 2003 from various governmental and self-regulatory agencies in connection with investigations related to mutual funds and variable insurance products. DSL has advised the Boards that it and its affiliates have cooperated fully with each request.
In addition to responding to regulatory and governmental requests, DSL reported that management of U.S. affiliates of ING Groep N.V., including DSL (collectively, “ING”), on their own initiative, have conducted, through independent special counsel and a national accounting firm, an
extensive internal review of trading in ING insurance, retirement, and mutual fund products. ING’s internal review related to mutual fund trading has been completed. ING has reported that, of the millions of customer relationships that ING maintains, the internal review identified several isolated arrangements allowing third parties to engage in frequent trading of mutual funds within ING’s variable insurance and mutual fund products, and identified other circumstances where frequent trading occurred, despite measures taken by ING intended to combat market timing. ING further reported that each of these arrangements has been terminated and fully disclosed to regulators. The results of the internal review were also reported to the independent members of the Boards.
DSL has advised the Boards that most of the identified arrangements were initiated prior to ING’s acquisition of the businesses in question in the U.S. DSL further reported that the companies in question did not receive special benefits in return for any of these arrangements, which have all been terminated.
Based on the internal review, DSL has advised the Boards that the identified arrangements do not represent a systemic problem in any of the companies that were involved.
Despite the extensive internal review conducted through independent special counsel and a national accounting firm, there can be no assurance that the instances of inappropriate trading reported to the Boards are the only instances of such trading respecting the ING Funds.
DSL reported to the Boards that ING is committed to conducting its business with the highest standards of ethical conduct with zero tolerance for noncompliance. Accordingly, DSL advised the Boards that ING management was disappointed that its voluntary internal review identified these situations. Viewed in the context of the breadth and magnitude of its U.S. business as a whole, ING management does not believe that ING’s acquired companies had systemic ethical or compliance issues in these areas. Nonetheless, DSL reported that given ING’s refusal to tolerate any lapses, it has taken the steps noted below, and will continue to seek opportunities to further strengthen the internal controls of its affiliates.
| • | | ING has agreed with the ING Funds to indemnify and hold harmless the ING Funds from all damages resulting from wrongful conduct by ING or its employees or from ING’s internal investigation, any |
36
NOTE 11 — CONCENTRATION OF INVESTMENT RISK (continued)
NOTES TO FINANCIAL STATEMENTSASOF DECEMBER 31, 2008 (CONTINUED)
NOTE 12 — INFORMATION REGARDING TRADING OF ING’S U.S. MUTUAL FUNDS (continued)
| | investigations conducted by any governmental or self-regulatory agencies, litigation or other formal proceedings, including any proceedings by the SEC. DSL reported to the Boards that the indemnification commitments made by ING Funds related to mutual fund trading have been settled and restitution amounts prepared by an independent consultant have been paid to the affected ING Funds. |
| • | | ING updated its Code of Conduct for employees reinforcing its employees’ obligation to conduct personal trading activity consistent with the law, disclosed limits, and other requirements. |
Other Regulatory Matters
The New York Attorney General and other federal and state regulators are also conducting broad inquiries and investigations involving the insurance industry. These initiatives currently focus on, among other things compensation and other sales incentives; potential conflicts of interest; potential anti-competitive activity; reinsurance; marketing practices (including suitability); specific product types (including group annuities and indexed annuities); fund selection for investment products and brokerage sales; and disclosure. It is likely
that the scope of these industry investigations will further broaden before they conclude. ING has received formal and informal requests in connection with such investigations, and is cooperating fully with each request. In connection with one such investigation, affiliates of DSL were named in a petition for relief and cease and desist order filed by the New Hampshire Bureau of Securities Regulation concerning their administration of the New Hampshire state employees deferred compensation plan.
Other federal and state regulators could initiate similar actions in this or other areas of ING’s businesses. These regulatory initiatives may result in new legislation and regulation that could significantly affect the financial services industry, including businesses in which ING is engaged. In light of these and other developments, ING continuously reviews whether modifications to its business practices are appropriate. At this time, in light of the current regulatory factors, ING U.S. is actively engaged in reviewing whether any modifications in our practices are appropriate for the future.
There can be no assurance that these matters, or the adverse publicity associated with them, will not result in increased fund redemptions, reduced sale of fund shares, or other adverse consequences to ING Funds.
37
| | |
ING SOLUTION GROWTHAND INCOME PORTFOLIO | | PORTFOLIO OF INVESTMENTS ASOF DECEMBER 31, 2008 |
| | | | | | | | | | | |
| Shares | | | | | | | | | Value | |
| AFFILIATED INVESTMENT COMPANIES: 100.0% | |
| 2,117 | | | | ING BlackRock Inflation Protected Bond Portfolio - Class I | | | | | $ | 19,857 | |
| 2,245 | | | | ING BlackRock Large Cap Value Portfolio - Class I | | | | | | 19,309 | |
| 2,427 | | | | ING Davis New York Venture
Portfolio - Class I | | | | | | 29,896 | |
| 2,725 | | | | ING Julius Baer Foreign
Portfolio - Class I | | | | | | 25,611 | |
| 639 | | @ | | ING Legg Mason Partners Aggressive Growth Portfolio - Class I | | | | | | 18,766 | |
| 7,506 | | | | ING Limited Maturity Bond
Portfolio - Class I | | | | | | 77,157 | |
| 1,573 | | | | ING Marsico Growth Portfolio - Class I | | | | | | 17,869 | |
| 2,013 | | | | ING Marsico International Opportunities Portfolio - Class I | | | | | | 15,499 | |
| 7,534 | | | | ING PIMCO Core Bond
Portfolio - Class I | | | | | | 86,411 | |
| 3,602 | | | | ING PIMCO High Yield
Portfolio - Class I | | | | | | 25,286 | |
| 840 | | | | ING Pioneer Mid Cap Value
Portfolio - Class I | | | | | | 6,376 | |
| 2,567 | | | | ING Real Estate Fund - Class I | | | | | | 23,774 | |
| 2,170 | | | | ING T. Rowe Price Equity Income
Portfolio - Class I | | | | | | 18,340 | |
| 554 | | | | ING T. Rowe Price Growth Equity
Portfolio - Class I | | | | | | 18,117 | |
| 3,860 | | | | ING UBS U.S. Large Cap Equity
Portfolio - Class I | | | | | | 23,934 | |
| 2,547 | | | | ING Van Kampen Comstock
Portfolio - Class I | | | | | | 18,138 | |
| 1,682 | | | | ING Van Kampen Real Estate
Portfolio - Class I | | | | | | 23,787 | |
| 1,599 | | | | ING VP Growth and Income
Portfolio - Class I | | | | | | 24,162 | |
| 9,104 | | | | ING VP Intermediate Bond
Portfolio - Class I | | | | | | 100,867 | |
| 2,285 | | | | ING VP International Value
Portfolio - Class I | | | | | | 15,469 | |
| 956 | | @ | | ING VP MidCap Opportunities
Portfolio - Class I | | | | | | 6,117 | |
| 1,051 | | | | ING VP Small Company
Portfolio - Class I | | | | | | 12,292 | |
| | | | | | | | | | | |
| | | | Total Investments in Affiliated Investment Companies
(Cost $ 642,145)* | | 100.0 | % | | $ | 627,034 | |
| | | | Other Assets and Liabilities - Net | | (0.0 | ) | | | (185 | ) |
| | | | | | | | | | | |
| | | | Net Assets | | 100.0 | % | | $ | 626,849 | |
| | | | | | | | | | | |
| @ | Non-income producing security |
| * | Cost for federal income tax purposes is $671,240. |
| | | | |
Net unrealized depreciation consists of: | | | | |
Gross Unrealized Appreciation | | $ | 6,415 | |
Gross Unrealized Depreciation | | | (50,621 | ) |
| | | | |
Net Unrealized Depreciation | | $ | (44,206 | ) |
| | | | |
The following table summarizes the inputs used as of December 31, 2008 in determining the Portfolio’s investments at fair value for purposes of SFAS 157:
| | | | | | |
| | | Investments in Securities | | Other Financial Instruments* |
Level 1 — Quoted Prices | | $ | 627,034 | | $ | — |
Level 2 — Other Significant Observable Inputs | | | — | | | — |
Level 3 — Significant Unobservable Inputs | | | — | | | — |
| | | | | | |
Total | | $ | 627,034 | | $ | — |
| | | | | | |
“Fair value” for purposes of SFAS 157 is different from “fair value” as used in the 1940 Act. The former generally implies market value, and can include market quotations as a source of value, and the latter refers to determinations of actual value in absence of available market quotations.
| * | Other financial instruments may include forward foreign currency contracts, futures, swaps, and written options. Forward foreign currency contracts and futures are reported at their unrealized gain/loss at year end. Swaps and written options are reported at their market value at year end. |
See Accompanying Notes to Financial Statements
38
| | |
| ING SOLUTION GROWTH PORTFOLIO | | PORTFOLIO OF INVESTMENTS ASOF DECEMBER 31, 2008 |
| | | | | | | | | | | |
| Shares | | | | | | | | | Value | |
| AFFILIATED INVESTMENT COMPANIES: 100.0% | | | | | |
| 897 | | | | ING BlackRock Large Cap Value Portfolio - Class I | | | | | $ | 7,711 | |
| 954 | | | | ING Davis New York Venture
Portfolio - Class I | | | | | | 11,754 | |
| 1,430 | | | | ING Global Real Estate
Portfolio - Class I | | | | | | 10,180 | |
| 153 | | | | ING JPMorgan Emerging Markets Equity Portfolio - Class I | | | | | | 1,843 | |
| 1,175 | | | | ING Julius Baer Foreign
Portfolio - Class I | | | | | | 11,042 | |
| 248 | | @ | | ING Legg Mason Partners Aggressive Growth
Portfolio - Class I | | | | | | 7,279 | |
| 1,083 | | | | ING Limited Maturity Bond
Portfolio - Class I | | | | | | 11,134 | |
| 578 | | | | ING Marsico Growth Portfolio - Class I | | | | | | 6,566 | |
| 623 | | | | ING Marsico International Opportunities Portfolio - Class I | | | | | | 4,796 | |
| 1,460 | | | | ING PIMCO Core Bond
Portfolio - Class I | | | | | | 16,751 | |
| 847 | | | | ING PIMCO High Yield
Portfolio - Class I | | | | | | 5,949 | |
| 364 | | | | ING Pioneer Mid Cap Value
Portfolio - Class I | | | | | | 2,763 | |
| 827 | | | | ING T. Rowe Price Equity Income
Portfolio - Class I | | | | | | 6,986 | |
| 204 | | | | ING T. Rowe Price Growth Equity
Portfolio - Class I | | | | | | 6,676 | |
| 1,604 | | | | ING UBS U.S. Large Cap Equity
Portfolio - Class I | | | | | | 9,945 | |
| 968 | | | | ING Van Kampen Comstock
Portfolio - Class I | | | | | | 6,895 | |
| 500 | | | | ING Van Kampen Real Estate
Portfolio - Class I | | | | | | 7,069 | |
| 564 | | | | ING VP Growth and Income
Portfolio - Class I | | | | | | 8,527 | |
| 1,641 | | | | ING VP Intermediate Bond
Portfolio - Class I | | | | | | 18,180 | |
| 768 | | | | ING VP International Value
Portfolio - Class I | | | | | | 5,198 | |
| 404 | | @ | | ING VP MidCap Opportunities
Portfolio - Class I | | | | | | 2,584 | |
| 436 | | | | ING VP Small Company
Portfolio - Class I | | | | | | 5,101 | |
| | | | | | | | | | | |
| | | | Total Investments in Affiliated Investment Companies
(Cost $ 183,009)* | | 100.0 | % | | $ | 174,929 | |
| | | | Other Assets and Liabilities - Net | | (0.0 | ) | | | (80 | ) |
| | | | | | | | | | | |
| | | | Net Assets | | 100.0 | % | | $ | 174,849 | |
| | | | | | | | | | | |
| @ | Non-income producing security |
| * | Cost for federal income tax purposes is $207,480. |
| | | | |
Net unrealized depreciation consists of: | | | | |
Gross Unrealized Appreciation | | $ | 1,070 | |
Gross Unrealized Depreciation | | | (33,621 | ) |
| | | | |
Net Unrealized Depreciation | | $ | (32,551 | ) |
| | | | |
The following table summarizes the inputs used as of December 31, 2008 in determining the Portfolio’s investments at fair value for purposes of SFAS 157:
| | | | | | |
| | | Investments in Securities | | Other Financial Instruments* |
Level 1 — Quoted Prices | | $ | 174,929 | | $ | — |
Level 2 — Other Significant Observable Inputs | | | — | | | — |
Level 3 — Significant Unobservable Inputs | | | — | | | — |
| | | | | | |
Total | | $ | 174,929 | | $ | — |
| | | | | | |
“Fair value” for purposes of SFAS 157 is different from “fair value” as used in the 1940 Act. The former generally implies market value, and can include market quotations as a source of value, and the latter refers to determinations of actual value in absence of available market quotations.
| * | Other financial instruments may include forward foreign currency contracts, futures, swaps, and written options. Forward foreign currency contracts and futures are reported at their unrealized gain/loss at year end. Swaps and written options are reported at their market value at year end. |
See Accompanying Notes to Financial Statements
39
| | |
| ING SOLUTION INCOME PORTFOLIO | | PORTFOLIO OF INVESTMENTS ASOF DECEMBER 31, 2008 |
| | | | | | | | | |
| Shares | | | | | | | Value | |
| AFFILIATED INVESTMENT COMPANIES: 100.0% | | | | | |
| 1,041,019 | | ING BlackRock Inflation Protected Bond
Portfolio - Class I | | | | | $ | 9,764,761 | |
| 578,234 | | ING Davis New York Venture
Portfolio - Class I | | | | | | 7,123,843 | |
| 601,738 | | ING Julius Baer Foreign
Portfolio - Class I | | | | | | 5,656,341 | |
| 3,549,572 | | ING Limited Maturity Bond
Portfolio - Class I | | | | | | 36,489,603 | |
| 443,771 | | ING Marsico International Opportunities
Portfolio - Class I | | | | | | 3,417,040 | |
| 1,285,641 | | ING Oppenheimer Strategic Income Portfolio - Class I | | | | | | 11,519,341 | |
| 2,909,664 | | ING PIMCO Core Bond
Portfolio - Class I | | | | | | 33,373,844 | |
| 875,437 | | ING PIMCO High Yield
Portfolio - Class I | | | | | | 6,145,567 | |
| 721,917 | | ING Real Estate Fund - Class I | | | | | | 6,684,947 | |
| 647,312 | | ING T. Rowe Price Equity Income Portfolio - Class I | | | | | | 5,469,784 | |
| 108,570 | | ING T. Rowe Price Growth Equity Portfolio - Class I | | | | | | 3,548,057 | |
| 997,423 | | ING UBS U.S. Large Cap Equity
Portfolio - Class I | | | | | | 6,184,023 | |
| 592,305 | | ING Van Kampen Real Estate
Portfolio - Class I | | | | | | 8,375,196 | |
| 416,595 | | ING VP Growth and Income
Portfolio - Class I | | | | | | 6,294,753 | |
| 3,219,896 | | ING VP Intermediate Bond
Portfolio - Class I | | | | | | 35,676,449 | |
| 266,849 | | ING VP International Value
Portfolio - Class I | | | | | | 1,806,568 | |
| | | | | | | | | |
| | Total Investments in Affiliated Investment Companies
(Cost $ 229,662,112)* | | 100.0 | % | | $ | 187,530,117 | |
| | Other Assets and
Liabilities - Net | | (0.0 | ) | | | (70,309 | ) |
| | | | | | | | | |
| | Net Assets | | 100.0 | % | | $ | 187,459,808 | |
| | | | | | | | | |
| * | Cost for federal income tax purposes is $236,547,102. |
| | | | |
Net unrealized depreciation consists of: | | | | |
Gross Unrealized Appreciation | | $ | 597 | |
Gross Unrealized Depreciation | | | (49,017,582 | ) |
| | | | |
Net Unrealized Depreciation | | $ | (49,016,985 | ) |
| | | | |
The following table summarizes the inputs used as of December 31, 2008 in determining the Portfolio’s investments at fair value for purposes of SFAS 157:
| | | | | | |
| | | Investments in Securities | | Other Financial Instruments* |
Level 1 — Quoted Prices | | $ | 187,530,117 | | $ | — |
Level 2 — Other Significant Observable Inputs | | | — | | | — |
Level 3 — Significant Unobservable Inputs | | | — | | | — |
| | | | | | |
Total | | $ | 187,530,117 | | $ | — |
| | | | | | |
“Fair value” for purposes of SFAS 157 is different from “fair value” as used in the 1940 Act. The former generally implies market value, and can include market quotations as a source of value, and the latter refers to determinations of actual value in absence of available market quotations.
| * | Other financial instruments may include forward foreign currency contracts, futures, swaps, and written options. Forward foreign currency contracts and futures are reported at their unrealized gain/loss at year end. Swaps and written options are reported at their market value at year end. |
See Accompanying Notes to Financial Statements
40
| | |
| ING SOLUTION 2015 PORTFOLIO | | PORTFOLIO OF INVESTMENTS ASOF DECEMBER 31, 2008 |
| | | | | | | | | | | |
| Shares | | | | | | | | | Value | |
| AFFILIATED INVESTMENT COMPANIES: 100.0% | | | | | |
| 3,112,159 | | | | ING BlackRock Inflation Protected Bond
Portfolio - Class I | | | | | $ | 29,192,047 | |
| 2,039,903 | | | | ING BlackRock Large Cap Value Portfolio - Class I | | | | | | 17,543,169 | |
| 2,382,903 | | | | ING Davis New York Venture
Portfolio - Class I | | | | | | 29,357,369 | |
| 3,563,303 | | | | ING Global Real Estate
Portfolio - Class I | | | | | | 25,370,720 | |
| 1,801,571 | | | | ING Julius Baer Foreign
Portfolio - Class I | | | | | | 16,934,772 | |
| 574,305 | | @ | | ING Legg Mason Partners Aggressive Growth
Portfolio - Class I | | | | | | 16,867,342 | |
| 3,350,011 | | | | ING Limited Maturity Bond
Portfolio - Class I | | | | | | 34,438,113 | |
| 1,390,321 | | | | ING Marsico Growth
Portfolio - Class I | | | | | | 15,794,046 | |
| 1,334,413 | | | | ING Marsico International Opportunities
Portfolio - Class I | | | | | | 10,274,979 | |
| 5,141,058 | | | | ING Oppenheimer Strategic Income Portfolio - Class I | | | | | | 46,063,878 | |
| 3,238,122 | | | | ING PIMCO Core Bond
Portfolio - Class I | | | | | | 37,141,263 | |
| 2,471,613 | | | | ING PIMCO High Yield
Portfolio - Class I | | | | | | 17,350,721 | |
| 1,123,783 | | | | ING Pioneer Mid Cap Value
Portfolio - Class I | | | | | | 8,529,512 | |
| 1,938,968 | | | | ING T. Rowe Price Equity Income Portfolio - Class I | | | | | | 16,384,282 | |
| 488,335 | | | | ING T. Rowe Price Growth Equity Portfolio - Class I | | | | | | 15,958,790 | |
| 4,273,448 | | | | ING UBS U.S. Large Cap Equity Portfolio - Class I | | | | | | 26,495,375 | |
| 2,286,045 | | | | ING Van Kampen Comstock
Portfolio - Class I | | | | | | 16,276,637 | |
| 2,141,785 | | | | ING Van Kampen Real Estate
Portfolio - Class I | | | | | | 30,284,834 | |
| 1,605,092 | | | | ING VP Growth and Income
Portfolio - Class I | | | | | | 24,252,934 | |
| 7,446,054 | | | | ING VP Intermediate Bond
Portfolio - Class I | | | | | | 82,502,284 | |
| 1,599,791 | | | | ING VP International Value
Portfolio - Class I | | | | | | 10,830,583 | |
| 1,275,569 | | @ | | ING VP MidCap Opportunities
Portfolio - Class I | | | | | | 8,163,642 | |
| 1,389,880 | | | | ING VP Small Company
Portfolio - Class I | | | | | | 16,261,590 | |
| | | | | | | | | | | |
| | | | Total Investments in Affiliated Investment Companies
(Cost $ 756,324,442)* | | 100.0 | % | | $ | 552,268,882 | |
| | | | Other Assets and
Liabilities - Net | | (0.0 | ) | | | (203,900 | ) |
| | | | | | | | | | | |
| | | | Net Assets | | 100.0 | % | | $ | 552,064,982 | |
| | | | | | | | | | | |
| @ | Non-income producing security |
| * | Cost for federal income tax purposes is $770,159,896. |
| | | | |
Net unrealized depreciation consists of: | | | | |
Gross Unrealized Appreciation | | $ | 108,443 | |
Gross Unrealized Depreciation | | | (217,999,457 | ) |
| | | | |
Net Unrealized Depreciation | | $ | (217,891,014 | ) |
| | | | |
The following table summarizes the inputs used as of December 31, 2008 in determining the Portfolio’s investments at fair value for purposes of SFAS 157:
| | | | | | |
| | | Investments in Securities | | Other Financial Instruments* |
Level 1 — Quoted Prices | | $ | 552,268,882 | | $ | — |
Level 2 — Other Significant Observable Inputs | | | — | | | — |
Level 3 — Significant Unobservable Inputs | | | — | | | — |
| | | | | | |
Total | | $ | 552,268,882 | | $ | — |
| | | | | | |
“Fair value” for purposes of SFAS 157 is different from “fair value” as used in the 1940 Act. The former generally implies market value, and can include market quotations as a source of value, and the latter refers to determinations of actual value in absence of available market quotations.
| * | Other financial instruments may include forward foreign currency contracts, futures, swaps, and written options. Forward foreign currency contracts and futures are reported at their unrealized gain/loss at year end. Swaps and written options are reported at their market value at year end. |
See Accompanying Notes to Financial Statements
41
| | |
| ING SOLUTION 2025 PORTFOLIO | | PORTFOLIO OF INVESTMENTS ASOF DECEMBER 31, 2008 |
| | | | | | | | | | | |
| Shares | | | | | | | | | Value | |
| AFFILIATED INVESTMENT COMPANIES: 100.0% | |
| 967,860 | | | | ING Baron Small Cap Growth Portfolio - Class I | | | | | $ | 10,907,786 | |
| 3,681,888 | | | | ING BlackRock Large Cap Value Portfolio - Class I | | | | | | 31,664,237 | |
| 1,583,907 | | | | ING Columbia Small Cap Value II Portfolio - Class I | | | | | | 10,865,602 | |
| 3,228,215 | | | | ING Davis New York Venture Portfolio - Class I | | | | | | 39,771,607 | |
| 4,836,114 | | | | ING Global Real Estate
Portfolio - Class I | | | | | | 34,433,134 | |
| 1,264,251 | | | | ING JPMorgan Emerging Markets Equity
Portfolio - Class I | | | | | | 15,221,583 | |
| 4,880,085 | | | | ING Julius Baer Foreign Portfolio - Class I | | | | | | 45,872,802 | |
| 1,296,274 | | @ | | ING Legg Mason Partners Aggressive Growth
Portfolio - Class I | | | | | | 38,071,571 | |
| 3,776,879 | | | | ING Limited Maturity Bond Portfolio - Class I | | | | | | 38,826,315 | |
| 3,139,677 | | | | ING Marsico Growth
Portfolio - Class I | | | | | | 35,666,726 | |
| 3,168,801 | | | | ING Marsico International Opportunities
Portfolio - Class I | | | | | | 24,399,764 | |
| 3,487,147 | | | | ING Oppenheimer Strategic Income Portfolio - Class I | | | | | | 31,244,835 | |
| 1,317,015 | | | | ING PIMCO Core Bond
Portfolio - Class I | | | | | | 15,106,161 | |
| 3,633,256 | | | | ING PIMCO High Yield
Portfolio - Class I | | | | | | 25,505,458 | |
| 2,536,804 | | | | ING Pioneer Mid Cap Value
Portfolio - Class I | | | | | | 19,254,344 | |
| 5,252,772 | | | | ING T. Rowe Price Equity Income Portfolio - Class I | | | | | | 44,385,922 | |
| 882,291 | | | | ING T. Rowe Price Growth Equity Portfolio - Class I | | | | | | 28,833,278 | |
| 5,791,422 | | | | ING UBS U.S. Large Cap Equity Portfolio - Class I | | | | | | 35,906,819 | |
| 4,129,330 | | | | ING Van Kampen Comstock Portfolio - Class I | | | | | | 29,400,828 | |
| 2,424,642 | | | | ING Van Kampen Real Estate Portfolio - Class I | | | | | | 34,284,436 | |
| 2,174,306 | | | | ING VP Growth and Income
Portfolio - Class I | | | | | | 32,853,767 | |
| 5,352,477 | | | | ING VP Intermediate Bond Portfolio - Class I | | | | | | 59,305,450 | |
| 3,793,828 | | | | ING VP International Value Portfolio - Class I | | | | | | 25,684,215 | |
| 2,880,203 | | @ | | ING VP MidCap Opportunities
Portfolio - Class I | | | | | | 18,433,296 | |
| 1,255,842 | | | | ING VP Small Company Portfolio - Class I | | | | | | 14,693,347 | |
| | | | | | | | | | | |
| | | | Total Investments in Affiliated Investment
Companies
(Cost $ 1,099,462,026)* | | 100.0 | % | | $ | 740,593,283 | |
| | | | Other Assets and
Liabilities - Net | | (0.0 | ) | | | (273,159 | ) |
| | | | | | | | | | | |
| | | | Net Assets | | 100.0 | % | | $ | 740,320,124 | |
| | | | | | | | | | | |
| @ | Non-income producing security |
| * | Cost for federal income tax purposes is $1,111,828,877. |
| | | | |
Net unrealized depreciation consists of: | |
Gross Unrealized Appreciation | | $ | 518,380 | |
Gross Unrealized Depreciation | | | (371,753,974 | ) |
| | | | |
Net Unrealized Depreciation | | $ | (371,235,594 | ) |
| | | | |
The following table summarizes the inputs used as of December 31, 2008 in determining the Portfolio’s investments at fair value for purposes of SFAS 157:
| | | | | | |
| | | Investments in
Securities | | Other Financial Instruments* |
Level 1 — Quoted Prices | | $ | 740,593,283 | | $ | — |
Level 2 — Other Significant Observable Inputs | | | — | | | — |
Level 3 — Significant Unobservable Inputs | | | — | | | — |
| | | | | | |
Total | | $ | 740,593,283 | | $ | — |
| | | | | | |
“Fair value” for purposes of SFAS 157 is different from “fair value” as used in the 1940 Act. The former generally implies market value, and can include market quotations as a source of value, and the latter refers to determinations of actual value in absence of available market quotations.
| * | Other financial instruments may include forward foreign currency contracts, futures, swaps, and written options. Forward foreign currency contracts and futures are reported at their unrealized gain/loss at year end. Swaps and written options are reported at their market value at year end. |
See Accompanying Notes to Financial Statements
42
| | |
| ING SOLUTION 2035 PORTFOLIO | | PORTFOLIO OF INVESTMENTS ASOF DECEMBER 31, 2008 |
| | | | | | | | | | | |
| Shares | | | | | | | | | Value | |
| AFFILIATED INVESTMENT COMPANIES: 100.0% | | | | | |
| 1,006,887 | | | | ING Baron Small Cap Growth
Portfolio - Class I | | | | | $ | 11,347,620 | |
| 3,587,174 | | | | ING BlackRock Large Cap Value
Portfolio - Class I | | | | | | 30,849,692 | |
| 1,648,100 | | | | ING Columbia Small Cap
Value II Portfolio - Class I | | | | | | 11,305,969 | |
| 2,288,963 | | | | ING Davis New York Venture
Portfolio - Class I | | | | | | 28,200,030 | |
| 3,776,242 | | | | ING Global Real Estate
Portfolio - Class I | | | | | | 26,886,843 | |
| 1,971,848 | | | | ING JPMorgan Emerging Markets Equity
Portfolio - Class I | | | | | | 23,741,055 | |
| 3,804,511 | | | | ING Julius Baer Foreign
Portfolio - Class I | | | | | | 35,762,405 | |
| 1,010,639 | | @ | | ING Legg Mason Partners Aggressive Growth
Portfolio - Class I | | | | | | 29,682,473 | |
| 2,938,458 | | | | ING Marsico Growth
Portfolio - Class I | | | | | | 33,380,886 | |
| 3,533,669 | | | | ING Marsico International Opportunities
Portfolio - Class I | | | | | | 27,209,248 | |
| 1,047,805 | | | | ING PIMCO Core Bond
Portfolio - Class I | | | | | | 12,018,327 | |
| 2,839,374 | | | | ING PIMCO High Yield
Portfolio - Class I | | | | | | 19,932,405 | |
| 2,769,304 | | | | ING Pioneer Mid Cap Value
Portfolio - Class I | | | | | | 21,019,017 | |
| 4,096,453 | | | | ING T. Rowe Price Equity Income Portfolio - Class I | | | | | | 34,615,031 | |
| 860,252 | | | | ING T. Rowe Price Growth Equity Portfolio - Class I | | | | | | 28,113,028 | |
| 3,614,388 | | | | ING UBS U.S. Large Cap Equity
Portfolio - Class I | | | | | | 22,409,205 | |
| 4,025,680 | | | | ING Van Kampen Comstock
Portfolio - Class I | | | | | | 28,662,840 | |
| 1,515,587 | | | | ING Van Kampen Real Estate
Portfolio - Class I | | | | | | 21,430,405 | |
| 1,507,301 | | | | ING VP Growth and Income
Portfolio - Class I | | | | | | 22,775,316 | |
| 3,612,888 | | | | ING VP Intermediate Bond
Portfolio - Class I | | | | | | 40,030,799 | |
| 4,227,067 | | | | ING VP International Value
Portfolio - Class I | | | | | | 28,617,241 | |
| 3,145,023 | | @ | | ING VP MidCap Opportunities
Portfolio - Class I | | | | | | 20,128,145 | |
| 1,469,671 | | | | ING VP Small Company
Portfolio - Class I | | | | | | 17,195,153 | |
| | | | | | | | | | | |
| | | | Total Investments in Affiliated Investment Companies
(Cost $ 880,442,709)* | | 100.0 | % | | $ | 575,313,133 | |
| | | | Other Assets and
Liabilities - Net | | (0.0 | ) | | | (212,271 | ) |
| | | | | | | | | | | |
| | | | Net Assets | | 100.0 | % | | $ | 575,100,862 | |
| | | | | | | | | | | |
| @ | Non-income producing security |
| * | Cost for federal income tax purposes is $891,075,725. |
| | | | |
Net unrealized depreciation consists of: | | | | |
Gross Unrealized Appreciation | | $ | 419,041 | |
Gross Unrealized Depreciation | | | (316,181,633 | ) |
| | | | |
Net Unrealized Depreciation | | $ | (315,762,592 | ) |
| | | | |
The following table summarizes the inputs used as of December 31, 2008 in determining the Portfolio’s investments at fair value for purposes of SFAS 157:
| | | | | | |
| | | Investments in Securities | | Other Financial Instruments* |
Level 1 — Quoted Prices | | $ | 575,313,133 | | $ | — |
Level 2 — Other Significant Observable Inputs | | | — | | | — |
Level 3 — Significant Unobservable Inputs | | | — | | | — |
| | | | | | |
Total | | $ | 575,313,133 | | $ | — |
| | | | | | |
“Fair value” for purposes of SFAS 157 is different from “fair value” as used in the 1940 Act. The former generally implies market value, and can include market quotations as a source of value, and the latter refers to determinations of actual value in absence of available market quotations.
| * | Other financial instruments may include forward foreign currency contracts, futures, swaps, and written options. Forward foreign currency contracts and futures are reported at their unrealized gain/loss at year end. Swaps and written options are reported at their market value at year end. |
See Accompanying Notes to Financial Statements
43
| | |
| ING SOLUTION 2045 PORTFOLIO | | PORTFOLIO OF INVESTMENTS ASOF DECEMBER 31, 2008 |
| | | | | | | | | | | |
| Shares | | | | | | | | | Value | |
| AFFILIATED INVESTMENT COMPANIES: 100.0% | | | | | |
| 718,213 | | | | ING Baron Small Cap Growth
Portfolio - Class I | | | | | $ | 8,094,260 | |
| 2,044,669 | | | | ING BlackRock Large Cap Value
Portfolio - Class I | | | | | | 17,584,152 | |
| 1,175,991 | | | | ING Columbia Small Cap
Value II Portfolio - Class I | | | | | | 8,067,300 | |
| 1,305,845 | | | | ING Davis New York Venture
Portfolio - Class I | | | | | | 16,088,010 | |
| 2,157,438 | | | | ING Global Real Estate
Portfolio - Class I | | | | | | 15,360,955 | |
| 1,406,260 | | | | ING JPMorgan Emerging Markets Equity
Portfolio - Class I | | | | | | 16,931,373 | |
| 3,255,081 | | | | ING Julius Baer Foreign
Portfolio - Class I | | | | | | 30,597,757 | |
| 691,594 | | @ | | ING Legg Mason Partners Aggressive Growth
Portfolio - Class I | | | | | | 20,312,112 | |
| 1,676,815 | | | | ING Marsico Growth
Portfolio - Class I | | | | | | 19,048,620 | |
| 2,423,203 | | | | ING Marsico International Opportunities
Portfolio - Class I | | | | | | 18,658,667 | |
| 43,385 | | | | ING PIMCO Core Bond
Portfolio - Class I | | | | | | 497,626 | |
| 2,030,681 | | | | ING Pioneer Mid Cap Value
Portfolio - Class I | | | | | | 15,412,872 | |
| 2,726,049 | | | | ING T. Rowe Price Equity Income Portfolio - Class I | | | | | | 23,035,112 | |
| 490,920 | | | | ING T. Rowe Price Growth Equity Portfolio - Class I | | | | | | 16,043,251 | |
| 2,062,725 | | | | ING UBS U.S. Large Cap Equity
Portfolio - Class I | | | | | | 12,788,894 | |
| 2,296,373 | | | | ING Van Kampen Comstock
Portfolio - Class I | | | | | | 16,350,177 | |
| 433,137 | | | | ING Van Kampen Real Estate
Portfolio - Class I | | | | | | 6,124,553 | |
| 859,918 | | | | ING VP Growth and Income
Portfolio - Class I | | | | | | 12,993,356 | |
| 561,553 | | | | ING VP Intermediate Bond
Portfolio - Class I | | | | | | 6,222,012 | |
| 2,894,585 | | | | ING VP International Value
Portfolio - Class I | | | | | | 19,596,342 | |
| 2,307,044 | | @ | | ING VP MidCap Opportunities
Portfolio - Class I | | | | | | 14,765,080 | |
| 1,118,413 | | | | ING VP Small Company
Portfolio - Class I | | | | | | 13,085,436 | |
| | | | | | | | | | | |
| | | | Total Investments in Affiliated Investment Companies
(Cost $ 517,452,832)* | | 100.0 | % | | $ | 327,657,917 | |
| | | | Other Assets and
Liabilities - Net | | (0.0 | ) | | | (137,033 | ) |
| | | | | | | | | | | |
| | | | Net Assets | | 100.0 | % | | $ | 327,520,884 | |
| | | | | | | | | | | |
| @ | Non-income producing security |
| * | Cost for federal income tax purposes is $522,874,117. |
| | | | |
Net unrealized depreciation consists of: | | | | |
Gross Unrealized Appreciation | | $ | 17,508 | |
Gross Unrealized Depreciation | | | (195,233,708 | ) |
| | | | |
Net Unrealized Depreciation | | $ | (195,216,200 | ) |
| | | | |
The following table summarizes the inputs used as of December 31, 2008 in determining the Portfolio’s investments at fair value for purposes of SFAS 157:
| | | | | | |
| | | Investments in Securities | | Other Financial Instruments* |
Level 1 — Quoted Prices | | $ | 327,657,917 | | $ | — |
Level 2 — Other Significant Observable Inputs | | | — | | | — |
Level 3 — Significant Unobservable Inputs | | | — | | | — |
| | | | | | |
Total | | $ | 327,657,917 | | $ | — |
| | | | | | |
“Fair value” for purposes of SFAS 157 is different from “fair value” as used in the 1940 Act. The former generally implies market value, and can include market quotations as a source of value, and the latter refers to determinations of actual value in absence of available market quotations.
| * | Other financial instruments may include forward foreign currency contracts, futures, swaps, and written options. Forward foreign currency contracts and futures are reported at their unrealized gain/loss at year end. Swaps and written options are reported at their market value at year end. |
See Accompanying Notes to Financial Statements
44
TAX INFORMATION (UNAUDITED)
Dividends paid during the year ended December 31, 2008 were as follows:
| | | | | |
Fund Name | | Type | | Per Share Amount |
| | |
ING Solution Growth and Income Portfolio | | | | | |
Class ADV | | NII | | $ | — |
Class I | | NII | | $ | 0.0082 |
Class S | | NII | | $ | 0.0125 |
All Classes | | LTCG | | $ | 0.0029 |
| | |
ING Solution Growth Portfolio | | | | | |
Class ADV | | NII | | $ | — |
Class I | | NII | | $ | — |
Class S | | NII | | $ | 0.0031 |
All Classes | | LTCG | | $ | 0.0010 |
| | |
ING Solution Income Portfolio | | | | | |
Class ADV | | NII | | $ | 0.1856 |
Class I | | NII | | $ | 0.2137 |
Class S | | NII | | $ | 0.1916 |
Class T | | NII | | $ | 0.0751 |
All Classes | | STCG | | $ | 0.1075 |
All Classes | | LTCG | | $ | 0.0759 |
| | |
ING Solution 2015 Portfolio | | | | | |
Class ADV | | NII | | $ | 0.1703 |
Class I | | NII | | $ | 0.2012 |
Class S | | NII | | $ | 0.1793 |
Class T | | NII | | $ | 0.0808 |
All Classes | | STCG | | $ | 0.0945 |
All Classes | | LTCG | | $ | 0.1364 |
| | |
ING Solution 2025 Portfolio | | | | | |
Class ADV | | NII | | $ | 0.1327 |
Class I | | NII | | $ | 0.1646 |
Class S | | NII | | $ | 0.1401 |
Class T | | NII | | $ | 0.0647 |
All Classes | | STCG | | $ | 0.1108 |
All Classes | | LTCG | | $ | 0.1977 |
| | |
ING Solution 2035 Portfolio | | | | | |
Class ADV | | NII | | $ | 0.1341 |
Class I | | NII | | $ | 0.1665 |
Class S | | NII | | $ | 0.1414 |
Class T | | NII | | $ | 0.0466 |
All Classes | | STCG | | $ | 0.1490 |
All Classes | | LTCG | | $ | 0.2055 |
45
TAX INFORMATION (UNAUDITED) (CONTINUED)
| | | | | |
Fund Name | | Type | | Per Share Amount |
| | |
ING Solution 2045 Portfolio | | | | | |
Class ADV | | NII | | $ | 0.1108 |
Class I | | NII | | $ | 0.1424 |
Class S | | NII | | $ | 0.1190 |
Class T | | NII | | $ | 0.0413 |
All Classes | | STCG | | $ | 0.1419 |
All Classes | | LTCG | | $ | 0.2195 |
NII - Net investment income
STCG - Short-term capital gain
LTCG - Long-term capital gain
Of the ordinary distributions made during the year ended December 31, 2008, the following percentages qualify for the dividends received deduction (DRD) available to corporate shareholders:
| | | |
| |
ING Solution Growth and Income Portfolio | | 9.91 | % |
| |
ING Solution Growth Portfolio | | 17.11 | % |
| |
ING Solution Income Portfolio | | 4.41 | % |
| |
ING Solution 2015 Portfolio | | 9.60 | % |
| |
ING Solution 2025 Portfolio | | 14.28 | % |
| |
ING Solution 2035 Portfolio | | 14.12 | % |
| |
ING Solution 2045 Portfolio | | 16.83 | % |
Above figures may differ from those cited elsewhere in this report due to differences in the calculation of income and gains under U.S. generally accepted accounting principles (book) purposes and Internal Revenue Service (tax) purposes.
Shareholders are strongly advised to consult their own tax advisers with respect to the tax consequences of their investments in the Portfolios. In January, shareholders, excluding corporate shareholders, receive an IRS 1099-DIV regarding the federal tax status of the dividends and distributions they received in the calendar year.
46
DIRECTOR AND OFFICER INFORMATION (UNAUDITED)
The business and affairs of the Fund are managed under the direction of the Fund’s Board. A Director who is not an interested person of the Fund, as defined in the 1940 Act, is an independent director (“Independent Director”). The Directors and Officers of the Fund are listed below. The Statement of Additional Information includes additional information about directors of the Fund and is available, without charge, upon request at (800) 992-0180.
| | | | | | | | | | |
Name, Address, and Age | | Position(s) held with the Fund | | Term of Office and Length of Time Served(1) | | Principal Occupation(s) during the Past 5 Years | | Number of Portfolios in Fund Complex Overseen by Trustee(2) | | Other Directorships/
Trusteeships held by Director |
Independent Directors: | | | | | | | | | | |
| | | | | |
Colleen D. Baldwin 7337 E. Doubletree Ranch Rd. Scottsdale, Arizona 85258 Age: 48 | | Director | | November 2007 -Present | | President, National Charity League/Canaan Parish Board (June 2008 - Present) and Consultant (January 2005 - Present). Formerly, Chief Operating Officer, Ivy Asset Management Group (April 2002 - October 2004) | | 161 | | None. |
| | | | | |
John V. Boyer(4) 7337 E. Doubletree Ranch Rd. Scottsdale, Arizona 85258 Age: 55 | | Director | | November 1997 - Present | | President, Bechtler Arts Foundation (March 2008 - Present). Formerly, Consultant (July 2007 - February 2008); President and Chief Executive Officer, Franklin and Eleanor Roosevelt Institute (March 2006 - July 2007); and Executive Director, The Mark Twain House & Museum (September 1989 - November 2005). | | 161 | | None. |
| | | | | |
Patricia W. Chadwick 7337 E. Doubletree Ranch Rd. Scottsdale, Arizona 85258 Age: 60 | | Director | | January 2006 - Present | | Consultant and President of self - owned company, Ravengate Partners LLC (January 2000 - Present). | | 161 | | Wisconsin Energy Corporation (June 2006 - Present). |
| | | | | |
Peter S. Drotch 7337 E. Doubletree Ranch Rd. Scottsdale, Arizona 85258 Age: 66 | | Director | | November 2007 - Present | | Retired partner, PricewaterhouseCoopers, LLP. | | 161 | | First Marblehead Corporation (September 2003 - Present). |
| | | | | |
J. Michael Earley 7337 E. Doubletree Ranch Rd. Scottsdale, Arizona 85258 Age: 63 | | Director | | January 2005 - Present | | Retired. Formerly, President and Chief Executive Officer, Bankers Trust Company, N.A., Des Moines (June 1992 - December 2008). | | 161 | | Bankers Trust Company, N.A. (June 1992 - Present) and Midamerica Financial Corporation (December 2002 - Present). |
| | | | | |
Patrick W. Kenny 7337 E. Doubletree Ranch Rd. Scottsdale, Arizona 85258 Age: 65 | | Director | | March 2002 - Present | | President and Chief Executive Officer, International Insurance Society (June 2001 - Present). | | 161 | | Assured Guaranty Ltd. (April 2004 - Present) and Odyssey Re Holdings Corporation (November 2006 - Present). |
| | | | | |
Sheryl K. Pressler 7337 E. Doubletree Ranch Rd. Scottsdale, Arizona 85258 Age: 58 | | Director | | January 2006 - Present | | Consultant (May 2001 - Present). | | 161 | | Global Alternative Asset Management, Inc. (October 2007 - Present) and Stillwater Mining Company (May 2002 - Present). |
| | | | | |
Roger B. Vincent 7337 E. Doubletree Ranch Rd. Scottsdale, Arizona 85258 Age: 63 | | Director | | January 2005 - Present | | President, Springwell Corporation (March 1989 - Present). | | 161 | | UGI Corporation (February 2006 - Present) and UGI Utilities, Inc. (February 2006 - Present). |
47
DIRECTOR AND OFFICER INFORMATION (UNAUDITED) (CONTINUED)
| | | | | | | | | | |
Name, Address, and Age | | Position(s) held with the Fund | | Term of Office and Length of Time Served(1) | | Principal Occupation(s) during the Past 5 Years | | Number of Portfolios in Fund Complex Overseen by Trustee(2) | | Other Directorships/
Trusteeships held by Director |
Directors who are “Interested Persons”: | | | | | | | | |
| | | | | |
Robert W. Crispin(5) 7337 E. Doubletree Ranch Rd. Scottsdale, Arizona 85258 Age: 62 | | Director | | November 2007 - Present | | Retired. Chairman and Chief Investment Officer, ING Investment Management Co. (June 2001 - December 2007). | | 161 | | ING Canada Inc. (December 2004 - Present) and ING Bank, fsb (June 2001 - Present). |
| | | | | |
Shaun P. Mathews(3)(5) 7337 E. Doubletree Ranch Rd. Scottsdale, Arizona 85258 Age: 53 | | Director | | November 2007 - Present | | President and Chief Executive Officer, ING Investments, LLC(5) (November 2006 - Present). Formerly, President, ING Mutual Funds and Investment Products (November 2004 - November 2006); Chief Marketing Officer, ING USFS (April 2002 - October 2004); and Head of Rollover/Payout (October 2001 - December 2003). | | 200 | | ING Services Holding Company, Inc. (May 2000 - Present); Southland Life Insurance Company (June 2002 - Present); and ING Capital Corporation, LLC, ING Funds Distributor, LLC(6), ING Funds Services, LLC(7), ING Investments, LLC(5) and ING Pilgrim Funding, Inc. (December 2006 - Present). |
(1) | | Directors serve until their successors are duly elected and qualified. The tenure of each Director is subject to the Board’s retirement policy, which states that each Independent Director shall retire from service as a Trustee at the conclusion of the first regularly scheduled meeting of the Board that is held after (a) the Director reaches the age of 70, if that Director qualifies for a retirement benefit as discussed in the board’s retirement policy; or (b) the Director reaches the age of 72 or has served as a Director for 15 years, whichever comes first, if that Director does not qualify for the retirement benefit. A unanimous vote of the Board may extend the retirement date of a Director for up to one year. An extension may be permitted if the retirement would trigger a requirement to hold a meeting of shareholders of the Fund under applicable law, whether for purposes of appointing a successor to the Director or if otherwise necessary under applicable law, in which case the extension would apply until such time as the shareholder meeting can be held or is no longer needed. |
(2) | | For the purposes of this table (except for Mr. Mathews), ”Fund Complex” means the following investment companies: ING Asia Pacific High Dividend Equity Income Fund, ING Equity Trust; ING Funds Trust; ING Global Equity Dividend and Premium Opportunity Fund; ING Global Advantage and Premium Opportunity Fund; ING International High Dividend Equity Income Fund; ING Investors Trust; ING Mayflower Trust; ING Mutual Funds; ING Prime Rate Trust; ING Risk Managed Natural Resources Fund; ING Senior Income Fund; ING Separate Portfolios Trust; ING Variable Insurance Trust; ING Variable Products Trust; and ING Partners, Inc. |
(3) | | For Mr. Mathews, the Fund Complex also includes the following investment companies: ING Series Fund, Inc.; ING Strategic Allocation Portfolios, Inc.; ING Variable Funds; ING Variable Portfolios, Inc.; ING VP Balanced Portfolio, Inc.; ING VP Intermediate Bond Portfolio; and ING VP Money Market Portfolio. |
(4) | | Mr. Boyer held a seat on the Board of Directors of The Mark Twian House & Museum from September 1989 to November 2005. ING Groep N.V. makes non-material, charitable contributions to The Mark Twain House & Museum. |
(5) | | Messrs. Mathews and Crispin are deemed to be “interested persons” of the Fund as defined in the 1940 Act because of their relationship with ING Groep, N.V., the parent corporation of the Manager, ING Investment Manager. |
(6) | | ING Investments, LLC was previously named ING Pilgrim Investments, LLC. ING Pilgrim Investments, LLC is the successor in interest to ING Pilgrim Investments, Inc., which was previously known as Pilgrim Investments, Inc. and before that was known as Pilgrim America Investments, Inc. |
(7) | | ING Funds Distributor, LLC is the successor in interest to ING Funds Distributor, Inc., which was previously known as ING Pilgrim Securities, Inc., and before that was known as Pilgrim Securities, Inc., and before that was known as Pilgrim America Securities, Inc. |
(8) | | ING Funds Services, LLC was previously named ING Pilgrim Group, LLC. ING Pilgrim Group, LLC is the successor in interest to ING Pilgrim Group, Inc., which was previously known as Pilgrim Group, Inc. and before that was known as Pilgrim America Group, Inc. |
48
DIRECTOR AND OFFICER INFORMATION (UNAUDITED) (CONTINUED)
| | | | | | |
Name, Address and Age | | Position(s) Held with the Fund | | Term of Office and Length of Time Served(1) | | Principal Occupation(s) during the Past 5 Years |
Officers: | | | | | | |
| | | |
Shaun P. Mathews(5) 7337 East Doubletree Ranch Rd. Scottsdale, Arizona 85258 Age: 53 | | President and Chief Executive Officer | | November 2006 - Present | | President and Chief Executive Officer, ING Investments, LLC (November 2006 - Present). Formerly, President, ING Mutual Funds and Investment Products (November 2004 - November 2006); Chief Marketing Officer, ING USFS (April 2002 - October 2004); and Head of Rollover/Payout (October 2001- December 2003). |
| | | |
Michael J. Roland 7337 East Doubletree Ranch Rd. Scottsdale, Arizona 85258 Age: 50 | | Executive Vice President | | January 2005 - Present | | Head of Mutual Fund Platform (February 2007 - Present) and Executive Vice President, ING Investments, LLC(2) and ING Funds Services, LLC(3) (December 2001 - Present). Formerly, Executive Vice President, Head of Product Management (January 2005 - January 2007); Chief Compliance Officer, ING Investments, LLC(2) and Directed Services LLC(6) (October 2004 - December 2005); and Chief Financial Officer and Treasurer, ING Investments, LLC(2) (December 2001 - March 2005). |
| | | |
Stanley D. Vyner 230 Park Avenue New York, New York 10169 Age: 58 | | Executive Vice President | | January 2005 - Present | | Executive Vice President, ING Investments, LLC(2) (July 2000 - Present) and Chief Investment Risk Officer, ING Investments, LLC(2) (January 2003 - Present). |
| | | |
Joseph M. O’Donnell 7337 East Doubletree Ranch Rd. Scottsdale, Arizona 85258 Age: 54 | | Executive Vice President and Chief Compliance Officer | | March 2006 - Present January 2005 - Present | | Chief Compliance Officer of the ING Funds (November 2004 - Present) and Executive Vice President of the ING Funds (March 2006 - Present). Formerly, Chief Compliance Officer of ING Investments, LLC(2) (March 2006 - July 2008); Investment Advisor Chief Compliance Officer, Directed Services LLC(6) (March 2006 - July 2008) ING Life Insurance and Annuity Company (March 2006 - December 2006); and Vice President, Chief Legal Counsel, Chief Compliance Officer and Secretary of Atlas Securities, Inc., Atlas Advisers, Inc. and Atlas Funds (October 2001 - October 2004). |
| | | |
Todd Modic 7337 East Doubletree Ranch Rd. Scottsdale, Arizona 85258 Age: 41 | | Senior Vice President, Chief/Principal Financial Officer and Assistant Secretary | | March 2005 - Present | | Senior Vice President, ING Funds Services, LLC(3) (March 2005 - Present). Formerly, Vice President, ING Funds Services, LLC(3) (September 2002 - March 2005). |
| | | |
Kimberly A. Anderson 7337 East Doubletree Ranch Rd. Scottsdale, Arizona 85258 Age: 44 | | Senior Vice President | | January 2005 - Present | | Senior Vice President, ING Investments, LLC(2) (October 2003 - Present). |
| | | |
Robert Terris 7337 East Doubletree Ranch Rd. Scottsdale, Arizona 85258 Age: 38 | | Senior Vice President | | May 2006 - Present | | Senior Vice President, Head of Division Operations, ING Funds Services, LLC(3) (May 2006 - Present). Formerly, Vice President of Administration, ING Funds Services, LLC(3) (October 2001 - March 2006). |
| | | |
Ernest J. C’DeBaca 7337 East Doubletree Ranch Rd. Scottsdale, Arizona 85258 Age: 39 | | Senior Vice President | | May 2006 - Present | | Chief Compliance Officer, ING Investments, LLC(2) (July 2008 - Present); Investment Advisor Chief Compliance Officer, Directed Services LLC(6) (July 2008 - Present); Head of Retail Compliance, ING Funds Distributor, LLC(4) and ING Funds Services, LLC(3), (July 2008 - Present); and Senior Vice President, ING Investments, LLC(2) (December 2006 - Present), ING Funds Services, LLC(3) (April 2006 - Present), ING Funds Distributor, LLC(4) (July 2008 - Present), and Directed Services LLC(6) (July 2008 - Present). Formerly, Counsel, ING Americas, U.S. Legal Services (January 2004 - March 2006) and Attorney - Adviser, U.S. Securities and Exchange Commission (May 2001 - December 2003). |
| | | |
Robyn L. Ichilov 7337 East Doubletree Ranch Rd. Scottsdale, Arizona 85258 Age: 41 | | Vice President and Treasurer | | January 2005 - Present | | Vice President and Treasurer, ING Funds Services, LLC(3) (November 1995 - Present) and ING Investments, LLC(2) (August 1997 - Present). |
| | | |
Lauren D. Bensinger 7337 East Doubletree Ranch Rd. Scottsdale, Arizona 85258 Age: 54 | | Vice President | | January 2005 - Present | | Vice President and Chief Compliance Officer, ING Funds Distributor, LLC(4) (August 1995 - Present); Vice President, ING Investments, LLC(2) and ING Funds Services, LLC(3) (February 1996 - Present); and Director of Compliance, ING Investments, LLC(2) (October 2004 - Present). Formerly, Chief Compliance Officer, ING Investments, LLC(2) (October 2001 - October 2004). |
49
DIRECTOR AND OFFICER INFORMATION (UNAUDITED) (CONTINUED)
| | | | | | |
Name, Address and Age | | Position(s) Held with the Fund | | Term of Office and Length of Time Served(1) | | Principal Occupation(s) during the Past 5 Years |
| | | |
William Evans 10 State House Square Hartford, Connecticut 06103 Age: 36 | | Vice President | | September 2007 - Present | | Vice President, Head of Mutual Fund Advisory Group (April 2007 - Present). Formerly, Vice President, U.S. Mutual Funds and Investment Products (May 2005 - April 2007) and Senior Fund Analyst, U.S. Mutual Funds and Investment Products (May 2002 - May 2005). |
| | | |
Maria M. Anderson 7337 East Doubletree Ranch Rd. Scottsdale, Arizona 85258 Age: 50 | | Vice President | | January 2005 - Present | | Vice President, ING Funds Services, LLC(3) (September 2004 - Present). Formerly, Assistant Vice President, ING Funds Services, LLC(3) (October 2001 - September 2004). |
| | | |
Denise Lewis 7337 East Doubletree Ranch Rd. Scottsdale, Arizona 85258 Age: 45 | | Vice President | | January 2007 - Present | | Vice President, ING Funds Services, LLC (December 2006 - Present). Formerly, Senior Vice President, UMB Investment Services Group, LLC (November 2003 - December 2006). |
| | | |
Kimberly K. Springer 7337 East Doubletree Ranch Rd. Scottsdale, Arizona 85258 Age: 51 | | Vice President | | March 2006 - Present | | Vice President, ING Funds Services, LLC(3) (March 2006 - Present). Formerly, Assistant Vice President, ING Funds Services, LLC(3) (August 2004 - March 2006) and Manager, Registration Statements, ING Funds Services, LLC(3) (May 2003 - August 2004). |
| | | |
Susan P. Kinens 7337 East Doubletree Ranch Rd. Scottsdale, Arizona 85258 Age: 32 | | Assistant Vice President | | January 2005 - Present | | Assistant Vice President, ING Funds Services, LLC(3) (December 2002 - Present). |
| | | |
Craig Wheeler 7337 East Doubletree Ranch Rd. Scottsdale, Arizona 85258 Age: 39 | | Assistant Vice President | | May 2008 - Present | | Assistant Vice President - Director of Tax, ING Funds Services (March 2008 - Present). Formerly, Tax Manager, ING Funds Services (March 2005 - March 2008); Tax Senior, ING Funds Services (January 2004 - March 2005); and Tax Senior, KPMG LLP (August 2002 - December 2003). |
| | | |
Huey P. Falgout, Jr. 7337 East Doubletree Ranch Rd. Scottsdale, Arizona 85258 Age: 45 | | Secretary | | August 2003 - Present | | Chief Counsel, ING Americas, U.S. Legal Services (September 2003 - Present). |
| | | |
Theresa K. Kelety 7337 East Doubletree Ranch Rd. Scottsdale, Arizona 85258 Age: 45 | | Assistant Secretary | | August 2003 - Present | | Senior Counsel, ING Americas, U.S. Legal Services (April 2008 - Present). Formerly, Counsel, ING Americas, U.S. Legal Services (April 2003 - April 2008). |
| | | |
Kathleen Nichols 7337 East Doubletree Ranch Rd. Scottsdale, Arizona 85258 Age: 33 | | Assistant Secretary | | May 2008 - Present | | Counsel, ING Americas, U.S. Legal Services (February 2008 - Present). Formerly, Associate, Ropes & Gray LLP (September 2005 - February 2008) |
(1) | | The officers hold office until the next annual meeting of the Directors and until their successors shall have been elected and qualified. |
(2) | | ING Investments, LLC was previously named ING Pilgrim Investments, LLC. ING Pilgrim Investments, LLC is the successor in interest to ING Pilgrim Investments, Inc., which was previously known as Pilgrim Investments, Inc. and before that was known as Pilgrim America Investments, Inc. |
(3) | | ING Funds Services, LLC was previously named ING Pilgrim Group, LLC. ING Pilgrim Group, LLC is the successor in interest to ING Pilgrim Group, Inc., which was previously known as Pilgrim Group, Inc. and before that was known as Pilgrim America Group, Inc. |
(4) | | ING Funds Distributor, LLC is the successor in interest to ING Funds Distributor, Inc., which was previously known as ING Pilgrim Securities, Inc., and before that was known as Pilgrim Securities, Inc., and before that was known as Pilgrim America Securities, Inc. |
(5) | | Mr. Mathews commenced services as CEO and President of the ING Funds on November 11, 2006. |
(6) | | Directed Services, LLC is the successor in interest to Directed Services, Inc. |
50
ADVISORY CONTRACT APPROVAL DISCUSSION (UNAUDITED)
BOARD CONSIDERATION AND RE-APPROVAL OF INVESTMENT ADVISORY CONTRACT
Section 15(c) of the Investment Company Act of 1940, as amended (the “1940 Act”) provides that, after an initial period, the Portfolios’ existing investment advisory contract will remain in effect only if the Board of Directors (the “Board”) of ING Partners, Inc. (the “Company”), including a majority of Board members who have no direct or indirect interest in the advisory contract, and who are not “interested persons” of the Company, as such term is defined under the 1940 Act (the “Independent Directors”), annually review and approve the contract. Thus, at a meeting held on November 14, 2008, the Board, including a majority of the Independent Directors, considered whether to renew the investment advisory contract (the “Advisory Contract”) between Directed Services LLC (the “Adviser”) and the Company, on behalf of the Portfolios.
The Independent Directors also held separate meetings on October 24 and November 12, 2008 to consider the renewal of the Advisory Contract. As a result, subsequent references herein to factors considered and determinations made by the Independent Directors include, as applicable, factors considered and determinations made on those earlier dates by the Independent Directors.
At its November 14, 2008 meeting, the Board voted to renew the Advisory Contract for the Portfolios. In reaching these decisions, the Board took into account information furnished to it throughout the year at regular meetings of the Board and the Board’s committees, as well as information prepared specifically in connection with the annual renewal process. Determinations by the Independent Directors also took into account various factors that they believed, in light of the legal advice furnished to them by K&L Gates LLP (“K&L Gates”), their independent legal counsel, and their own business judgment, to be relevant. Further, while the advisory contracts for all the funds in the ING Funds complex were considered at the same Board meeting, the Directors considered each Portfolio’s advisory relationship separately.
Provided below is an overview of the Board’s contract approval process in general, as well as a discussion of certain specific factors that the Board considered at its renewal meeting. While the Board gave its attention to the information furnished, at its request, that was most relevant to its considerations, discussed below are a number of the primary factors relevant to the Board’s consideration as to whether to renew the Advisory
Contract for the one-year period ending November 30, 2009. Each Board member may have accorded different weight to the various factors in reaching his or her conclusions with respect to each Portfolio’s advisory arrangement.
Overview of the Contract Renewal and Approval Process
Several years ago, the Independent Directors instituted a revised process by which they seek and consider relevant information when they decide whether to approve new or existing advisory arrangements for the investment companies in the ING Funds complex under their jurisdiction, including the Portfolios’ existing Advisory Contract. Among other actions, the Independent Directors: retained the services of independent consultants with experience in the mutual fund industry to assist the Independent Directors in working with the personnel employed by the Adviser or its affiliates who administer the Portfolios (“Management”) to identify the types of information presented to the Board to inform its deliberations with respect to advisory relationships and to help evaluate that information; established a specific format in which certain requested information is provided to the Board; and determined the process for reviewing such information in connection with Advisory Contract renewals and approvals. The end result was an enhanced process which is currently employed by the Independent Directors to review and analyze information in connection with their annual renewal of the ING Funds’ advisory contracts, as well as their review and approval of new advisory relationships.
Since the current renewal and approval process was first implemented, the Board’s membership has changed substantially through periodic retirements of some Directors and the appointment and election of new Directors. In addition, throughout this period the Independent Directors have reviewed and refined the renewal and approval process at least annually. The Board also established a Contracts Committee and two Investment Review Committees, including the International/Balanced/Fixed Income Funds Investment Review Committee (the “I/B/F IRC”). Among other matters, the Contracts Committee provides oversight with respect to the contracts renewal process, and each Portfolio is assigned to the I/B/F IRC, which provides oversight regarding, among other matters, investment performance.
The type and format of the information provided to the Board or to legal counsel for the Independent
51
ADVISORY CONTRACT APPROVAL DISCUSSION (UNAUDITED) (CONTINUED)
Directors in connection with the contract approval and renewal process has been codified in the Portfolios’ 15(c) Methodology Guide. This Guide was developed under the direction of the Independent Directors and sets out a blueprint pursuant to which the Independent Directors request certain information that they deem important to facilitate an informed review in connection with initial and annual approvals of advisory contracts.
Management provides certain of the information requested by the 15(c) Methodology Guide in Fund Analysis and Comparison Tables (“FACT sheets”) prior to the Independent Directors’ review of advisory arrangements (including the Portfolios’ Advisory Contract). The Independent Directors previously retained an independent firm to verify and test the accuracy of certain FACT sheet data for a representative sample of funds in the ING Funds complex. In addition, in 2007 and 2008, the Contracts Committee employed the services of an independent consultant to assist in its review and analysis of, among other matters, the 15(c) Methodology Guide, the content and format of the FACT sheets, and proposed Selected Peer Groups of investment companies (��Selected Peer Group”) to be used by the Portfolios for certain comparison purposes during the renewal process.
As part of an ongoing process, the Contracts Committee recommends or considers recommendations from Management for refinements to the 15(c) Methodology Guide and other aspects of the review process, and the Board’s Investment Review Committees, including the I/B/F IRC, reviews benchmarks used to assess the performance of the funds in the ING Funds complex. The Investment Review Committees may apply a heightened level of scrutiny in cases where performance has lagged an ING Fund’s relevant benchmark and/or Selected Peer Group.
The Board employed its process for reviewing contracts when considering the renewal of the Portfolios’ Advisory Contract that would be effective through November 30, 2009. Set forth below is a discussion of many of the Board’s primary considerations and conclusions resulting from this process.
Nature, Extent and Quality of Service
In determining whether to approve the Advisory Contract for the Portfolios for the year ending November 30, 2009, the Independent Directors received and evaluated such information as they deemed necessary regarding the nature, extent and quality of
services provided to the Portfolios by the Adviser. This included information regarding the Adviser provided throughout the year at regular meetings of the Board and its committees, as well as information furnished in connection with the contract renewal meetings.
The materials requested by and provided to the Board and/or to K&L Gates prior to the November 14, 2008 Board meeting included, among other information, the following items for each Portfolio: (1) FACT sheets that provided information regarding the performance and expenses of the Portfolio and other similarly managed funds in its Selected Peer Group, as well as information regarding the Portfolio’s investment portfolio, objective and strategies; (2) reports providing risk and attribution analyses of each Portfolio; (3) the 15(c) Methodology Guide, which describes how the FACT sheets were prepared, including the manner in which each Portfolio’s benchmark and Selected Peer Group was selected and how profitability was determined; (4) responses from the Adviser to a series of questions posed by K&L Gates on behalf of the Directors; (5) copies of the form of Advisory Contract; (6) copies of the Form ADV for the Adviser; (7) financial statements for the Adviser; (8) a draft of a narrative summary addressing key factors the Board customarily considers in evaluating the renewals of the ING Funds’ (including the Portfolios’) advisory contracts, including a written analysis for the Portfolio of how performance, fees and expenses compare to its Selected Peer Group and/or designated benchmark; (9) independent analyses of Portfolio performance by the Company’s Chief Investment Risk Officer; (10) information regarding net asset flows into and out of each Portfolio; and (11) other information relevant to the Board’s evaluations.
Class I shares of the Portfolios were used for purposes of certain comparisons between the Portfolios and their Selected Peer Groups. Class I shares generally were selected so that a Portfolio’s share class with the longest performance history was compared to the analogous class of shares for each fund in its Selected Peer Group. The mutual funds included in each Portfolio’s Selected Peer Group were selected based upon criteria designed to mirror the Portfolio share class being compared to the Selected Peer Group.
In arriving at its conclusions with respect to the Advisory Contract, the Board was mindful of the “manager-of-managers” platform of the ING Funds that has been developed by Management, under which it oversees the sub-advisers to the underlying funds in which the Portfolios invest. The Board noted the
52
ADVISORY CONTRACT APPROVAL DISCUSSION (UNAUDITED) (CONTINUED)
resources that the Adviser has committed to the Board and the I/B/F IRC to assist the Board and the I/B/F IRC with their assessment of the investment performance of the Portfolios on an ongoing basis throughout the year. This includes the appointment of a Chief Investment Risk Officer and his staff, who report directly to the Board and who have developed attribution analyses and other metrics used by the Board’s Investment Review Committees to analyze the key factors underlying investment performance for the funds in the ING Funds complex.
The Board also noted the proactive approach that the Adviser, working in cooperation with the IRCs, has taken to advocate or recommend, when it believed appropriate, changes designed to assist in improving the Portfolios’ performance.
In considering the Portfolios’ Advisory Contract, the Board also considered the extent of benefits provided to the Portfolios’ shareholders, beyond advisory services, from being part of the ING family of funds. This includes, in most cases, the right to exchange or transfer investments, without a sales charge, between the same class of shares of such funds or among ING Funds available on a product platform, and the wide range of ING Funds available for exchange or transfer. The Board also took into account the Adviser’s efforts in recent years to reduce the expenses of the ING Funds through renegotiated arrangements with the ING Funds’ service providers.
Further, the Board received periodic reports showing that the investment policies and restrictions for each Portfolio were consistently complied with and other periodic reports covering matters such as compliance by Adviser personnel with codes of ethics. The Board considered reports from the Company’s Chief Compliance Officer (“CCO”) evaluating whether the regulatory compliance systems and procedures of the Adviser are reasonably designed to assure compliance with the federal securities laws, including those related to, among others, late trading and market timing, best execution, fair value pricing, proxy voting and trade allocation practices. The Board also took into account the CCO’s annual and periodic reports and recommendations with respect to service provider compliance programs. In this regard, the Board also considered the policies and procedures developed by the CCO in consultation with the Board’s Compliance Committee that guide the CCO’s compliance oversight function.
The Board reviewed the level of staffing, quality and experience of the Portfolios’ portfolio management
team. The Board took into account the resources and reputation of the Adviser, and evaluated the ability of the Adviser to attract and retain qualified investment advisory personnel. The Board also considered the adequacy of the resources committed to the Portfolios (and other relevant funds in the ING Funds complex) by the Adviser, and whether those resources are commensurate with the needs of the Portfolios and are sufficient to sustain appropriate levels of performance and compliance needs.
Based on their deliberations and the materials presented to them, the Board concluded that the advisory and related services provided by the Adviser are appropriate in light of the Portfolios’ operations, the competitive landscape of the investment company business, and investor needs, and that the nature and quality of the overall services provided by the Adviser were appropriate.
Portfolio Performance
In assessing the advisory relationship, the Board placed emphasis on the net investment returns of each Portfolio. While the Board considered the performance reports and discussions with portfolio managers at Board and committee meetings during the year, particular attention in assessing performance was given to the FACT sheets furnished in connection with the renewal process. The FACT sheet prepared for each Portfolio included its investment performance compared to the Portfolio’s Morningstar category median, Lipper category median, Selected Peer Group and primary benchmark. The FACT sheet performance data was as of June 30, 2008. In addition, the Board also considered at its November 14, 2008 meeting certain additional data regarding performance and Portfolio asset levels as of October 31, 2008. The Board’s findings specific to each Portfolio’s performance is discussed below.
Economies of Scale
When evaluating the reasonableness of advisory fee rates, the Board also considered whether economies of scale will be realized by the Adviser as a Portfolio grows larger and the extent to which any such economies are reflected in contractual fee rates. In this regard, while each Portfolio is subject to a level advisory fee rate, the Board noted that any breakpoints in advisory fee schedules of certain underlying funds in which the Portfolios invest would result in a lower advisory fee rate for the underlying fund when the fund achieves sufficient asset levels to receive a breakpoint discount.
53
ADVISORY CONTRACT APPROVAL DISCUSSION (UNAUDITED) (CONTINUED)
Further, each Portfolio benefits from expense limits and waivers of certain fees, and the Board also considered the extent to which economies of scale could be realized through such limitations and waivers.
In evaluating economies of scale, the Independent Directors also considered prior periodic management reports and industry information on this topic, and the Independent Directors who were Board members at that time also considered a November 2006 evaluation and analysis presented to them by an independent consultant regarding fee breakpoint arrangements and economies of scale.
The Board also considered that the Portfolios had experienced material declines in assets, especially during October 2008, due to general market declines precipitated by the credit crises and other generally adverse market developments. As a result of these asset declines, the Board considered that there were fewer opportunities to realize economies of scale.
Information Regarding Services to Other Clients
The Board requested and considered information regarding the nature of services and fee rates offered by the Adviser to other clients, including other registered investment companies and institutional accounts. When fee rates offered to other clients differed materially from those charged to a Portfolio, the Board considered any underlying rationale provided by the Adviser for these differences. The Board also noted that the fee rates charged to the Portfolios and other institutional clients of the Adviser (including other investment companies) may differ materially due to, among other reasons: differences in services; different regulatory requirements associated with registered investment companies, such as the Portfolios, as compared to non-registered investment company clients; market differences in fee rates that existed when a Portfolio first was organized; differences in the original sponsors of Portfolios that now are managed by the Adviser; investment capacity constraints that existed when certain contracts were first agreed upon or that might exist at present; and different pricing structures that are necessary to be competitive in different marketing channels.
Fee Rates and Profitability
The Board reviewed and considered the contractual investment advisory fee rate, combined with the administrative fee rate, payable by the Portfolios to the Adviser. In addition, the Board considered fee waivers
and expense limitations applicable to the fees payable by the Portfolios.
The Board considered the fee structure of the Portfolios as it relates to the services provided under the contracts and the potential fall-out benefits to the Adviser and its affiliates from their association with the Portfolios. For each Portfolio, the Board determined that the fees payable to the Adviser are reasonable for the services that it performs, which were considered in light of the nature and quality of the services that it has performed and is expected to perform.
The Board considered information on revenues, costs and profits realized by the Adviser, which was prepared by Management in accordance with the allocation methodology (including related assumptions) specified in the 15(c) Methodology Guide. The Board also considered information that it requested and was provided by Management with respect to the profitability of service providers affiliated with the Adviser.
Further, the Board considered that the decline in asset levels of the Portfolios caused by recent adverse economic conditions was likely to cause a similar decline in any profits realized by the Adviser.
The Board determined that it had requested and received sufficient information to gain a reasonable understanding regarding the Adviser’s profitability. The Board also recognized that profitability analysis is not an exact science and there is no uniform methodology for determining profitability for this purpose. In this context, the Board realized that Management’s calculations regarding its costs incurred in establishing the infrastructure necessary for the Portfolios’ operations may not be fully reflected in the expenses allocated to each Portfolio in determining profitability, and that the information presented may not portray all of the costs borne by Management or capture Management’s entrepreneurial risk associated with offering and managing a mutual fund complex in the current regulatory and market environment.
Based on the information on revenues, costs, and profitability considered by the Board, and after considering the factors described in this section, the Board concluded that the profits, if any, realized by the Adviser were not excessive. In making its determinations, the Board based its conclusions on the reasonableness of the advisory fees of the Adviser primarily on the factors described for the Portfolios below.
54
ADVISORY CONTRACT APPROVAL DISCUSSION (UNAUDITED) (CONTINUED)
Portfolio-by- Portfolio Analysis
The following paragraphs outline certain of the specific factors that the Board considered, and the conclusions reached, at its November 14, 2008 meeting in relation to renewing the Portfolios’ current Advisory Contract for the year ending November 30, 2009. These specific factors are in addition to those considerations discussed above. In each case, each Portfolio’s performance was compared to its Morningstar category median and its primary benchmark, a broad-based securities market index that appears in the Portfolio’s prospectus. With respect to Morningstar quintile rankings, the first quintile represents the highest (best) performance and the fifth quintile represents the lowest performance. The Portfolios’ management fees and expense ratios were compared to the fees and expense ratios of the funds in its Selected Peer Groups.
ING Solution Growth and Income Portfolio
In considering whether to approve the renewal of the Advisory Contract for ING Solution Growth and Income Portfolio, the Board considered that, based on performance data for the periods ended June 30, 2008: (1) the Portfolio underperformed its Morningstar category median for all periods presented; (2) the Portfolio underperformed its primary benchmark for all periods presented; and (3) the Portfolio is ranked in the fifth (lowest) quintile of its Morningstar category for all periods presented.
In analyzing this performance data, the Board took into account the Portfolio launched in July 2007 and, therefore, had a limited operating history for the purpose of analyzing its performance.
In considering the fees payable under the Advisory Contract for the Portfolio, the Board took into account the factors described above and also considered: (1) the fairness of the compensation under an Advisory Contract with level fees that does not include breakpoints; (2) the pricing structure (including the expense ratio to be borne by shareholders) of the Portfolio, as compared to its Selected Peer Group, including that: (a) the management fee (including a 0.02% administration fee) for the Portfolio is below the median and the average management fees of the funds in its Selected Peer Group; and (b) the expense ratio for the Portfolio is below the median and the average expense ratios of the funds in its Selected Peer Group. In analyzing the fee data, the Board took into account that the Portfolio indirectly bears the fees payable by the underlying funds in which the Portfolio invests.
After its deliberation, the Board reached the following conclusions: (1) the Portfolio’s management fee rate is reasonable in the context of all factors considered by the Board; (2) the Portfolio’s expense ratio is reasonable in the context of all factors considered by the Board; and (3) the Portfolio was launched in July 2007 and it is reasonable to permit the Portfolio to establish a longer operating history for the purposes of evaluating performance. Based on these conclusions and other factors, the Board voted to renew the Advisory Contract for the Portfolio for the year ending November 30, 2009. During this renewal process, different Board members may have given different weight to different individual factors and related conclusions.
ING Solution Growth Portfolio
In considering whether to approve the renewal of the Advisory Contract for ING Solution Growth Portfolio, the Board considered that, based on performance data for the periods ended June 30, 2008: (1) the Portfolio underperformed its Morningstar category median for all periods presented; (2) the Portfolio underperformed its primary benchmark for all periods presented; and (3) the Portfolio is ranked in the fourth quintile of its Morningstar category for the year-to-date period, and the fifth (lowest) quintile for the most recent calendar quarter.
In analyzing this performance data, the Board took into account the Portfolio launched in July 2007, and therefore, had a limited operating history for the purpose of analyzing its performance.
In considering the fees payable under the Advisory Contract for the Portfolio, the Board took into account the factors described above and also considered: (1) the fairness of the compensation under an Advisory Contract with level fees that does not include breakpoints; (2) the pricing structure (including the expense ratio to be borne by shareholders) of the Portfolio, as compared to its Selected Peer Group, including that: (a) the management fee (including a 0.02% administration fee) for the Portfolio is below the median and the average management fees of the funds in its Selected Peer Group; and (b) the expense ratio for the Portfolio is below the median and the average expense ratios of the funds in its Selected Peer Group. In analyzing the fee data, the Board took into account that the Portfolio indirectly bears the fees payable by the underlying funds in which the Portfolio invests.
After its deliberation, the Board reached the following conclusions: (1) the Portfolio’s management fee rate is
55
ADVISORY CONTRACT APPROVAL DISCUSSION (UNAUDITED) (CONTINUED)
reasonable in the context of all factors considered by the Board; (2) the Portfolio’s expense ratio is reasonable in the context of all factors considered by the Board; and (3) the Portfolio was launched in July 2007 and it is reasonable to permit the Portfolio to establish a longer operating history for the purposes of evaluating performance. Based on these conclusions and other factors, the Board voted to renew the Advisory Contract for the Portfolio for the year ending November 30, 2009. During this renewal process, different Board members may have given different weight to different individual factors and related conclusions.
ING Solution Income Portfolio
In considering whether to approve the renewal of the Advisory Contract for ING Solution Income Portfolio, the Board considered that, based on performance data for the periods ended June 30, 2008: (1) the Portfolio outperformed its Morningstar category median for all periods presented with the exception of the most recent calendar quarter, during which it underperformed; (2) the Portfolio underperformed its primary benchmark for all periods presented; and (3) the Portfolio is ranked in the first (highest) quintile of its Morningstar category for the year-to-date and one-year periods, the third quintile for the three-year period, and the fifth (lowest) quintile for the most recent calendar quarter.
In analyzing this performance data, the Board took into account: (1) Management’s discussion of peer group construction and its analysis regarding adjustments to the Portfolio’s asset allocation; (2) the recent removal of a poorly performing fund from the underlying funds in which the Portfolio invests; and (3) the negative effect of sector allocations in the underlying funds.
In considering the fees payable under the Advisory Contract for the Portfolio, the Board took into account the factors described above and also considered: (1) the fairness of the compensation under an Advisory Contract with level fees that does not include breakpoints; (2) the pricing structure (including the expense ratio to be borne by shareholders) of the Portfolio, as compared to its Selected Peer Group, including that: (a) the management fee (including a 0.02% administration fee) for the Portfolio is below the median and the average management fees of the funds in its Selected Peer Group; and (b) the expense ratio for the Portfolio is below the median and the average expense ratios of the funds in its Selected Peer Group. In analyzing the fee data, the Board took into account
that the Portfolio indirectly bears the fees payable by the underlying funds in which the Portfolio invests.
After its deliberation, the Board reached the following conclusions: (1) the Portfolio’s management fee rate is reasonable in the context of all factors considered by the Board; (2) the Portfolio’s expense ratio is reasonable in the context of all factors considered by the Board; and (3) the Adviser recently removed a poorly performing fund from the underlying funds in which the Portfolio invests, and it is reasonable to provide time to evaluate the effect of this change. Based on these conclusions and other factors, the Board voted to renew the Advisory Contract for the Portfolio for the year ending November 30, 2009. During this renewal process, different Board members may have given different weight to different individual factors and related conclusions.
ING Solution 2015 Portfolio
In considering whether to approve the renewal of the Advisory Contract for ING Solution 2015 Portfolio, the Board considered that, based on performance data for the periods ended June 30, 2008: (1) the Portfolio outperformed its Morningstar category median for the year-to-date and one-year periods, but underperformed for the most recent calendar quarter and three-year periods; (2) the Portfolio underperformed its primary benchmark for all periods presented; and (3) the Portfolio is ranked in the second quintile of its Morningstar category for the year-to-date and one-year periods, the fourth quintile for the three-year period, and the fifth (lowest) quintile for the most recent calendar quarter.
In analyzing this performance data, the Board took into account: (1) Management’s discussion of peer group construction and its analysis regarding adjustments to the Portfolio’s asset allocation; (2) the recent removal of a poorly performing fund from the underlying funds in which the Portfolio invests; and (3) the negative effect of sector allocations in the underlying funds.
In considering the fees payable under the Advisory Contract for the Portfolio, the Board took into account the factors described above and also considered: (1) the fairness of the compensation under an Advisory Contract with level fees that does not include breakpoints; (2) the pricing structure (including the expense ratio to be borne by shareholders) of the Portfolio, as compared to its Selected Peer Group, including that: (a) the management fee (including a 0.02% administration fee) for the Portfolio is below the
56
ADVISORY CONTRACT APPROVAL DISCUSSION (UNAUDITED) (CONTINUED)
median and the average management fees of the funds in its Selected Peer Group; and (b) the expense ratio for the Portfolio is below the median and the average expense ratios of the funds in its Selected Peer Group. In analyzing the fee data, the Board took into account that the Portfolio indirectly bears the fees payable by the underlying funds in which the Portfolio invests.
After its deliberation, the Board reached the following conclusions: (1) the Portfolio’s management fee rate is reasonable in the context of all factors considered by the Board; (2) the Portfolio’s expense ratio is reasonable in the context of all factors considered by the Board; and (3) the Adviser recently removed a poorly performing fund from the underlying funds in which the Portfolio invests, and it is reasonable to provide time to evaluate the effect of this change. Based on these conclusions and other factors, the Board voted to renew the Advisory Contract for the Portfolio for the year ending November 30, 2009. During this renewal process, different Board members may have given different weight to different individual factors and related conclusions.
ING Solution 2025 Portfolio
In considering whether to approve the renewal of the Advisory Contract for ING Solution 2025 Portfolio, the Board considered that, based on performance data for the periods ended June 30, 2008: (1) the Portfolio underperformed its Morningstar category median for all periods presented; (2) the Portfolio underperformed its primary benchmark for all periods presented; and (3) the Portfolio is ranked in the fourth quintile of its Morningstar category for the year-to-date, one-year, and three-year periods, and the fifth (lowest) quintile for the most recent calendar quarter.
In analyzing this performance data, the Board took into account: (1) Management’s discussion of peer group construction and its analysis regarding adjustments to the Portfolio’s asset allocation; (2) the recent removal of a poorly performing fund from the underlying funds in which the Portfolio invests; and (3) the negative effect of sector allocations in the underlying funds.
In considering the fees payable under the Advisory Contract for the Portfolio, the Board took into account the factors described above and also considered: (1) the fairness of the compensation under an Advisory Contract with level fees that does not include breakpoints; (2) the pricing structure (including the expense ratio to be borne by shareholders) of the Portfolio, as compared to its Selected Peer Group,
including that: (a) the management fee (including a 0.02% administration fee) for the Portfolio is below the median and the average management fees of the funds in its Selected Peer Group; and (b) the expense ratio for the Portfolio is below the median and the average expense ratios of the funds in its Selected Peer Group. In analyzing the fee data, the Board took into account that the Portfolio indirectly bears the fees payable by the underlying funds in which the Portfolio invests.
After its deliberation, the Board reached the following conclusions: (1) the Portfolio’s management fee rate is reasonable in the context of all factors considered by the Board; (2) the Portfolio’s expense ratio is reasonable in the context of all factors considered by the Board; and (3) the Adviser recently removed a poorly performing fund from the underlying funds in which the Portfolio invests, and it is reasonable to provide time to evaluate the effect of this change. Based on these conclusions and other factors, the Board voted to renew the Advisory Contract for the Portfolio for the year ending November 30, 2009. During this renewal process, different Board members may have given different weight to different individual factors and related conclusions.
ING Solution 2035 Portfolio
In considering whether to approve the renewal of the Advisory Contract for ING Solution 2035 Portfolio, the Board considered that, based on performance data for the periods ended June 30, 2008: (1) the Portfolio underperformed its Morningstar category median for all periods presented; (2) the Portfolio underperformed its primary benchmark for all periods presented; and (3) the Portfolio is ranked in the fourth quintile of its Morningstar category for the year-to-date, one-year, and three-year periods, and the fifth (lowest) quintile for the most recent calendar quarter.
In analyzing this performance data, the Board took into account: (1) Management’s discussion of peer group construction and its analysis regarding adjustments to the Portfolio’s asset allocation; (2) the recent removal of a poorly performing fund from the underlying funds in which the Portfolio invests; and (3) the negative effect of sector allocations in the underlying funds.
In considering the fees payable under the Advisory Contract for the Portfolio, the Board took into account the factors described above and also considered: (1) the fairness of the compensation under an Advisory Contract with level fees that does not include breakpoints; (2) the pricing structure (including the expense ratio to be borne by shareholders) of the
57
ADVISORY CONTRACT APPROVAL DISCUSSION (UNAUDITED) (CONTINUED)
Portfolio, as compared to its Selected Peer Group, including that: (a) the management fee (including a 0.02% administration fee) for the Portfolio is below the median and the average management fees of the funds in its Selected Peer Group; and (b) the expense ratio for the Portfolio is below the median and the average expense ratios of the funds in its Selected Peer Group. In analyzing the fee data, the Board took into account that the Portfolio indirectly bears the fees payable by the underlying funds in which the Portfolio invests.
After its deliberation, the Board reached the following conclusions: (1) the Portfolio’s management fee rate is reasonable in the context of all factors considered by the Board; (2) the Portfolio’s expense ratio is reasonable in the context of all factors considered by the Board; and (3) the Adviser recently removed a poorly performing fund from the underlying funds in which the Portfolio invests, and it is reasonable to provide time to evaluate the effect of this change. Based on these conclusions and other factors, the Board voted to renew the Advisory Contract for the Portfolio for the year ending November 30, 2009. During this renewal process, different Board members may have given different weight to different individual factors and related conclusions.
ING Solution 2045 Portfolio
In considering whether to approve the renewal of the Advisory Contract for ING Solution 2045 Portfolio, the Board considered that, based on performance data for the periods ended June 30, 2008: (1) the Portfolio underperformed its Morningstar category median for all periods presented; (2) the Portfolio underperformed its primary benchmark for all periods presented; and (3) the Portfolio is ranked in the third quintile of its Morningstar category for the three-year period, the fourth quintile for the one-year period, and the fifth (lowest) quintile for the most recent calendar quarter and year-to-date periods.
In analyzing this performance data, the Board took into account: (1) Management’s discussion of peer group construction and its analysis regarding adjustments to the Portfolio’s asset allocation; (2) the recent removal of a poorly performing fund from the underlying funds in which the Portfolio invests; and (3) the negative effect of sector allocations in the underlying funds.
In considering the fees payable under the Advisory Contract for the Portfolio, the Board took into account the factors described above and also considered: (1) the fairness of the compensation under an Advisory Contract with level fees that does not include breakpoints; (2) the pricing structure (including the expense ratio to be borne by shareholders) of ING Solution 2045 Portfolio, as compared to its Selected Peer Group, including that: (a) the management fee (including a 0.02% administration fee) for the Portfolio is below the median and the average management fees of the portfolios in its Selected Peer Group; and (b) the expense ratio for the Portfolio is below the median and the average expense ratios of the portfolios in its Selected Peer Group. In analyzing the fee data, the Board took into account that the Portfolio indirectly bears the fees payable by the underlying funds in which the Portfolio invests.
After its deliberation, the Board reached the following conclusions: (1) the Portfolio’s management fee rate is reasonable in the context of all factors considered by the Board; (2) the Portfolio’s expense ratio is reasonable in the context of all factors considered by the Board; and (3) the Adviser recently removed a poorly performing fund from the underlying funds in which the Portfolio invests, and it is reasonable to provide time to evaluate the effect of this change. Based on these conclusions and other factors, the Board voted to renew the Advisory Contract for the Portfolio for the year ending November 30, 2009. During this renewal process, different Board members may have given different weight to different individual factors and related conclusions.
58
Investment Adviser
Directed Services LLC
1475 Dunwoody Drive
West Chester, Pennsylvania 19380
Administrator
ING Funds Services, LLC
7337 East Doubletree Ranch Road
Scottsdale, Arizona 85258
Distributor
ING Funds Distributor, LLC
7337 East Doubletree Ranch Road
Scottsdale, Arizona 85258
Transfer Agent
DST Systems, Inc.
P.O. Box 419368
Kansas City, Missouri 64141
Independent Registered Public Accounting Firm
KPMG LLP
99 High Street
Boston, Massachusetts 02110
Custodian
The Bank of New York Mellon
One Wall Street
New York, New York 10286
Legal Counsel
Dechert LLP
1775 I Street, N.W.
Washington, D.C. 20006
Before investing, carefully consider the investment objectives, risks, charges and expenses of the variable universal life insurance policy or variable annuity contract and the underlying variable investment options. This and other information is contained in the prospectus for the variable universal life policy or variable annuity contract and the underlying variable investment options. Obtain these prospectuses from your agent/registered representative and read them carefully before investing.
| | | | |
 | | VPAR-USOL | | (1208-021709) |

Annual Report
December 31, 2008
Adviser Class (“ADV”), Initial Class (“I”),
Service Class (“S”) and Class T
ING Partners, Inc.
| n | ING Index Solution Income Portfolio |
| n | ING Index Solution 2015 Portfolio |
| n | ING Index Solution 2025 Portfolio |
| n | ING Index Solution 2035 Portfolio |
| n | ING Index Solution 2045 Portfolio |
| | |
 | | E-Delivery Sign-up – details inside |
This report is submitted for general information to shareholders of the ING Funds. It is not authorized for distribution to prospective shareholders unless accompanied or preceded by a prospectus which includes details regarding the funds’ investment objectives, risks, charges, expenses and other information. This information should be read carefully.
MUTUAL FUNDS 
| |
TABLE OF CONTENTS
| | | | |
| | | |
| | Go Paperless with E-Delivery! | | |
Sign up now for on-line prospectuses, fund reports, and proxy statements. In less than five minutes, you can help reduce paper mail and lower fund costs. Just go to www.ingfunds.com, click on the E-Delivery icon from the home page, follow the directions and complete the quick 5 Steps to Enroll. You will be notified by e-mail when these communications become available on the internet. Documents that are not available on the internet will continue to be sent by mail. |
PROXY VOTING INFORMATION
A description of the policies and procedures that the Portfolios use to determine how to vote proxies related to portfolio securities is available: (1) without charge, upon request, by calling Shareholder Services toll-free at (800) 992-0180; (2) on the ING Funds’ website at www.ingfunds.com; and (3) on the U.S. Securities and Exchange Commission’s (“SEC”) website at www.sec.gov. Information regarding how the Portfolios voted proxies related to portfolio securities during the most recent 12-month period ended June 30 is available without charge on the ING Funds’ website at www.ingfunds.com and on the SEC’s website at www.sec.gov.
QUARTERLY PORTFOLIO HOLDINGS
The Portfolios file their complete schedule of portfolio holdings with the SEC for the first and third quarters of each fiscal year on Form N-Q. The Portfolios’ Forms N-Q are available on the SEC’s website at www.sec.gov. The Portfolios’ Forms N-Q may be reviewed and copied at the SEC’s Public Reference Room in Washington, DC, and information on the operation of the Public Reference Room may be obtained by calling (800) SEC-0330; and is available upon request from the Portfolios by calling Shareholder Services toll-free at (800) 992-0180.
PRESIDENT’S LETTER

Dear Shareholders,
We are in the midst of one of the most challenging periods ever faced by investors, and we at ING Funds are aware of the anxiety that you may be feeling at this time.
I want to assure you that we are actively engaged in monitoring the situation and are committed to keeping you fully informed of how the rapidly unfolding events around us may impact your investments with our company.
We recognize that the confidence of many investors is being tested, perhaps as never before. It is understandable that some of you may be second guessing your investment strategy due to these recent events. We encourage you to work with your investment professional and seek out their advice about your portfolio in light of the current conditions. But we also urge investors not to make rash decisions. ING Funds still believes that a well-diversified, globally allocated portfolio remains the most effective
investment strategy of all. We ask that investors not lose sight of their commitment to the long-term.
We thank you for your support and confidence and we look forward to continuing to do business with you in the future.
Sincerely,

Shaun Mathews
President & Chief Executive Officer
ING Funds
January 23, 2009
The views expressed in the President’s Letter reflect those of the President as of the date of the letter. Any such views are subject to change at any time based upon market or other conditions and ING Funds disclaims any responsibility to update such views. These views may not be relied on as investment advice and because investment decisions for an ING Fund are based on numerous factors, may not be relied on as an indication of investment intent on behalf of any ING Fund. Reference to specific company securities should not be construed as recommendations or investment advice. Consider the fund’s investment objectives, risks, and charges and expenses carefully before investing. The prospectus contains this information and other information about the fund.
International investing poses special risks including currency fluctuation, economic and political risks not found in investments that are solely domestic.
1
MARKET PERSPECTIVE FOR THEYEARENDED DECEMBER 31, 2008
In our semi-annual report, we described a failed second quarter rally that fizzled when investors realized that borderline recessionary conditions and a credit crunch had not gone away. By year-end, governments were committing previously unimaginable sums of taxpayer money to prevent systemic collapse. Global equities in the form of the MSCI World® Index(1) measured in local currencies, including net reinvested dividends (“MSCI” for regions discussed below) plunged 29.70% in the six months ended December 31, 2008 (down 38.70% for the entire fiscal year). (The MSCI World® Index plunged 40.71% for the entire fiscal year, measured in U.S. dollars.) In currencies, the dollar at first drifted near record lows against the euro. But the tide turned in mid-July and for the six months ended December 31, 2008, the dollar strengthened by 12.10% (4.50% for the entire fiscal year). The dollar also soared 37.80% against the pound for the six months ended December 31, 2008 (37.90% for the entire fiscal year). But the yen advanced as carry trades (essentially short yen positions) were unwound and the dollar fell 14.90% for the six months ended December 31, 2008 (down 19.60% for the entire fiscal year).
Even more dramatic was the price of oil which marched to an all-time high of around $147 per barrel in mid-July, only to lose more than two thirds of that price by December 31, 2008.
The economic statistics remained bleak. By the end of October, the Standard & Poor’s (“S&P”)/Case-Shiller National U.S. Home Price Index(2) of house prices had fallen a record 18% over the year. New home sales were at 1991 levels. Some 45% of existing home sales were distressed.
Payrolls declined in every month of 2008, as the number of people claiming unemployment reached 4.1 million, a 26-year high. Gross domestic product (“GDP”) fell at an annualized rate of 0.50% in the third quarter, and the National Bureau of Economic Research announced that the recession had actually started in December 2007.
Yet these were side-shows to the fireworks display in the financial sector, where major institutions — hanging by a thread through problems rooted in unwise mortgage borrowing, lending and investment — met different fates in September 2008 at the hands of the U.S. government.
The Federal National Mortgage Association (“Fannie Mae”) and the Federal Home Loan Mortgage Corporation (“Freddie Mac”) were taken into “conservatorship.” Merrill Lynch was acquired by the
Bank of America with a wink from the authorities. AIG received an $85 billion loan from a reluctant government, which also took a 79.90% equity stake in AIG. But Lehman Brothers having sought capital, then a buyer, found neither and was left to file for Chapter 11 bankruptcy protection.
The U.S. government was now in the position of choosing winners and losers among financial institutions: none too successfully, for it quickly became obvious that by pointedly leaving Lehman Brothers to go under, a credit crisis had become a credit market collapse. Lending all but seized up.
Policy response was huge but at least initially muddled. A Troubled Asset Relief Plan (“TARP”) would set up a $700 billion fund to buy illiquid mortgage securities from financial institutions. But on November 12, 2008 with half of the money already used to recapitalize banks, Treasury Secretary Paulson announced that the rest of the funds would not be used to buy illiquid mortgage securities after all. This merely renewed the pressure on the holders of such securities like Citigroup, which within two weeks received guarantees from the government against losses and another $20 billion in capital.
Other programs were of more practical use, like support for the commercial paper market and a guarantee facility for money market funds. Arguably the most effective measure was the announced intention to buy vast quantities of agency mortgage-backed securities and debentures. This had the effect of driving down rates on the 30-year mortgage towards 5.00%, a record low. In the meantime, the newly-elected president promised a stimulus package worth approximately $1 trillion. And by year end, the Federal Open Market Committee (“FOMC”) reduced interest rates to a range of between 0% and 0.25%.
2008 ended with much gloom and bad news still to come, but the platform for recovery was perhaps taking shape.
In U.S. fixed-income markets, yields on the 90-day Treasury Bills briefly turned negative in December 2008, while the yield on the ten-year Treasury Note fell below 2.50%, something we had not seen in 50 years. The Barclays Capital U.S. Aggregate Bond Index(3), formerly known as the Lehman Brothers U.S. Aggregate Bond Index, of investment grade bonds returned 4.10% for the six months ended December 31, 2008, (5.20% for the entire fiscal year). By contrast, high yield bonds, represented by the Barclays Capital High Yield Bond—2% Issuer Constrained
2
MARKET PERSPECTIVE FORTHEYEARENDED DECEMBER 31, 2008
Composite Index(4), formerly known as the Lehman Brothers High Yield Bond — 2% Issuer Constrained Composite Index, behaved more like a stock index and returned (25.10)% for the six months ended December 31, 2008 (down 25.90% for the entire fiscal year).
U.S. equities, represented by the S&P 500® Composite Stock Price (“S&P 500®”) Index(5), including dividends, returned (28.50)% for the six months ended December 31, 2008, (down 37.00% for the entire fiscal year), increasingly unimpressed by sharply falling oil prices. Profits for S&P 500® Index companies suffered their fifth straight quarter of decline, led again by the financials sector, although taxpayer money was also potentially committed to save the big three auto makers from bankruptcy. On November 20, 2008, the S&P 500® Index plumbed a level not seen since April 1997, before a December recovery.
In international markets, plainly entering recession, the MSCI Japan® Index(6) slumped 35.90% for the six months ended December 31, 2008, (down 42.60% for the entire fiscal year). The strengthening yen hit exports in an export-dependent economy even as global demand slowed for other reasons. The MSCI Europe ex UK® Index(7) sagged 29.40% for the six months ended December 31, 2008 (down 43.20% for the entire fiscal year), beset by sharply falling economic activity and a European Central Bank in denial that inflation was falling fast. Finally, rates were reduced by an unprecedented 175 basis points (or 1.75%) in two months near the end of the year while governments, one after the other, proposed large stimulus packages. In the UK, the MSCI UK® Index(8) fell 19.40% for the six months ended December 31, 2008 (down 28.50% for the entire fiscal year). The UK had allowed a bigger housing bubble than the United States and deeper personal indebtedness in an economy more dependent on the financial sector. Rates were reduced to 1951 levels as venerable banks ceased to exist as independent entities.
(1) The MSCI World® Index is an unmanaged index that measures the performance of over 1,400 securities listed on exchanges in the U.S., Europe, Canada, Australia, New Zealand and the Far East.
(2) The S&P/Case-Shiller National U.S. Home Price Index tracks the value of single-family housing within the United States. The index is a composite of single-family home price indices for the nine U.S. Census divisions and is calculated quarterly.
(3) The Barclays Capital U.S. Aggregate Bond Index is an unmanaged index of publicly issued investment grade U.S. Government, mortgage-backed, asset-backed and corporate debt securities.
(4) The Barclays Capital High Yield Bond — 2% Issuer Constrained Composite Index is an unmanaged index that measures the performance of non-investment grade fixed-income securities.
(5) The S&P 500® Index is an unmanaged index that measures the performance of securities of approximately 500 of the largest companies in the United States.
(6) The MSCI Japan® Index is a free float-adjusted market capitalization index that is designed to measure developed market equity performance in Japan.
(7) The MSCI Europe ex UK® Index is a free float-adjusted market capitalization index that is designed to measure developed market equity performance in Europe, excluding the UK.
(8) The MSCI UK® Index is a free float-adjusted market capitalization index that is designed to measure developed market equity performance in the UK.
All indices are unmanaged and investors cannot invest directly in an index.
Past performance does not guarantee future results. The performance quoted represents past performance. Investment return and principal value of an investment will fluctuate, and shares, when redeemed, may be worth more or less than their original cost. The Portfolios’ performance is subject to change since the period’s end and may be lower or higher than the performance data shown. Please call (800) 262-3862 or log on to www.ingfunds.com to obtain performance data current to the most recent month end.
Market Perspective reflects the views of ING’s Chief Investment Risk Officer only through the end of the period, and is subject to change based on market and other conditions.
3
| | |
| ING INDEX SOLUTION PORTFOLIOS | | PORTFOLIO MANAGERS’ REPORT |
The ING Index Solution Portfolios consist of ING Index Solution Income Portfolio, ING Index Solution 2015 Portfolio, ING Index Solution 2025 Portfolio, ING Index Solution 2035 Portfolio, and ING Index Solution 2045 Portfolio (each a “Portfolio” or collectively, the “Portfolios” or the “Index Solution Portfolios”). Each Portfolio seeks to achieve its investment objective by investing in a combination of other ING Funds (“Underlying Funds”) according to target allocations determined by Directed Services LLC (“DSL” or “Investment Adviser”), under the guidance of an Investment Committee(1). ING Investment Management Co. (“Consultant”) is a consultant to the Investment Adviser. Both the Investment Adviser and the Consultant are indirect, wholly-owned subsidiaries of ING Groep.
Portfolio Specifics: The Investment Adviser uses an asset allocation process to determine each Portfolio’s investment mix. This asset allocation process can be found in the Prospectus. Each Portfolio’s approximate target investment allocations (expressed as a percentage of its net assets) among the asset classes in which the Portfolios invest are set out on page 5. As these are target allocations, the actual allocations of the Portfolios’ assets may deviate from the percentages shown.
Assets will be allocated among the Underlying Funds and markets based on judgments made by DSL. The performance of the Portfolios reflects the performance of the Underlying Funds in which each Portfolio invests and the weightings of each Portfolio’s assets in each Underlying Fund.
There is a risk that the Portfolios may allocate assets to an Underlying Fund or market that underperforms other asset classes. The Portfolios may be underweighted in assets or a market that is experiencing significant returns (or relative out performance) or overweighted in assets or a market with significant declines (or relative under performance).
The Investment Committee allocates each Portfolio’s assets among the Underlying Funds based on advice from the Consultant.
Since the Portfolios’ inception in March 2008, all equity asset classes experienced negative returns. Fixed income was the best performing asset class, while international equities and REITs were the worst performing asset classes. On a relative basis, domestic equities outperformed international equities. Within international, developed non-U.S. stocks outperformed emerging markets stocks. Within domestic equity, small cap stocks outperformed large cap stocks and large cap stocks outperformed mid cap stocks. Within fixed income, Treasury inflation-protected securities (“TIPS”) underperformed other investment grade bonds and high yield bonds lagged all investment grade bonds significantly from the period of the Portfolios’ inception through December 31, 2008.
The Portfolios are comprised of the following five underlying funds:
ING Russell Large Cap Index Portfolio
ING Russell Mid Cap Index Portfolio
ING Russell Small Cap Index Portfolio
ING International Index Portfolio
ING Lehman Brothers U.S. Aggregate Bond Index Portfolio
Several small tactical moves were made during the year. An overweight position within international equities, along with an underweight position within small cap and mid cap domestic equities, was implemented at the beginning of the second quarter and unwound at the end of that quarter. An overweight to domestic large cap equities and a corresponding underweight to fixed income was implemented at the beginning of the second quarter and unwound at the end of the third quarter. The year closed with the Portfolios neutral with respect to their target strategic weightings within each asset class.
Current Strategy and Outlook: The year 2008 turned out to be a painful one for investors. Negative absolute returns in all equity classes were the result of a year underscored by a litany of issues: an escalating financial crisis, global recession fears, geopolitics, collapses of storied financial firms, unparalleled levels of market volatility, threat of deflation and a credit crunch that dried up liquidity in the bond markets. The housing market continues to remain weakened, industrial production has slowed and unemployment has risen. Intervention from the Federal Reserve Board and the U.S. Department of the Treasury appears to have slowed down the pace of negative news, but has not, as yet, halted it. Looking forward, we believe the recession will continue for the next two quarters, with growth resuming in the second half of 2009. Net exports should continue to contribute to growth, but not as much as in the past few years. Housing should be less of a drag on the economy in 2009. With two-thirds of its loans related to real estate, we believe the banking sector is unlikely to recover fully until house prices stop falling. We believe headline inflation will decline, and perhaps turn negative, but we don’t believe we are in the midst of a deflationary spiral. Finally, we believe a large fiscal stimulus program will be enacted by Congress early in 2009. Without further clarity in the vastly fluctuating markets, we intend to remain neutral until such time we have additional information.
(1) The members of the Investment Committee are: William A. Evans, Michael J. Roland, and Paul Zemsky.
Portfolio holdings and characteristics are subject to change and may not be representative of current holdings and characteristics. The outlook for these Portfolios may differ from that presented for other ING Funds. Performance for the different classes of shares will vary based on differences in fees associated with each class.
4
| | |
| PORTFOLIO MANAGERS’ REPORT | | ING INDEX SOLUTION PORTFOLIOS |
| | | |
| Cumulative Total Returns for the Period Ended December 31, 2008 | |
| | | Since Inception March 10, 2008 | |
ING Index Solution Income Portfolio, Class S | | (7.40 | )% |
Dow Jones Target Today Index – Global Series(1)(2) | | (3.60 | )% |
ING Index Solution Income Composite Index(2)(3) | | (8.16 | )% |
ING Index Solution 2015 Portfolio, Class S | | (15.50 | )% |
Dow Jones Target 2015 Index – Global Series(1)(2) | | (14.92 | )% |
ING Index Solution 2015 Composite Index(2)(3) | | (17.15 | )% |
ING Index Solution 2025 Portfolio, Class S | | (22.00 | )% |
Dow Jones Target 2025 Index – Global Series(1)(2) | | (23.94 | )% |
ING Index Solution 2025 Composite Index(2)(3) | | (24.06 | )% |
ING Index Solution 2035 Portfolio, Class S | | (25.30 | )% |
Dow Jones Target 2035 Index – Global Series(1)(2) | | (30.47 | )% |
ING Index Solution 2035 Composite Index(2)(3) | | (27.69 | )% |
ING Index Solution 2045 Portfolio, Class S | | (28.70 | )% |
Dow Jones Target 2045 Index – Global Series(1)(2) | | (32.16 | )% |
ING Index Solution 2045 Composite Index(2)(3) | | (31.45 | )% |
(1) The Dow Jones Target Today Index – Global Series, Dow Jones Target 2015 Index – Global Series, Dow Jones Target 2025 Index – Global Series, Dow Jones Target 2035 Index – Global Series and Dow Jones Target 2045 Index – Global Series are each comprised of a set of equity, bond and cash sub-indices.
(2) Index returns are for the period beginning March 1, 2008.
(3) The ING Index Solution Income Composite Index, ING Index Solution 2015 Composite Index, ING Index Solution 2025 Composite Index, ING Index Solution 2035 Composite Index and ING Index Solution 2045 Composite Index are each comprised of the asset class indices that correspond to the particular asset classes in which each Portfolio invests and their benchmark weightings.
Asset Allocation
as of December 31, 2008
(as a percentage of net assets)
| | | | | | | | | | | | | | | | | |
| Underlying Affiliated Funds | | | | ING Index Solution Income Portfolio | | | ING Index Solution 2015 Portfolio | | | ING Index Solution 2025 Portfolio | | | ING Index Solution 2035 Portfolio | | | ING Index Solution 2045 Portfolio | |
ING Russell Large Cap Index Portfolio – Class I | | % | | 24.3 | | | 35.9 | | | 45.6 | | | 43.3 | | | 37.1 | |
ING Russell Mid Cap Index Portfolio – Class I | | % | | — | | | 3.1 | | | 5.2 | | | 8.2 | | | 11.3 | |
ING Russell Small Cap Index Portfolio – Class I | | % | | — | | | 4.3 | | | 6.3 | | | 9.4 | | | 13.5 | |
ING International Index Portfolio – Class I | | % | | 6.3 | | | 12.4 | | | 18.4 | | | 24.5 | | | 33.3 | |
ING Lehman Brothers U.S. Aggregate Bond Index Portfolio – Class I | | % | | 69.4 | | | 44.3 | | | 24.5 | | | 14.6 | | | 4.8 | |
Other assets and liabilities – Net | | % | | (0.0 | )* | | (0.0 | )* | | (0.0 | )* | | (0.0 | )* | | (0.0 | )* |
| | | | | | | | | | | | | | | | | |
| | % | | 100.0 | | | 100.0 | | | 100.0 | | | 100.0 | | | 100.0 | |
| | | | | | | | | | | | | | | | | |
* Amount is more than (0.05)%
Target Allocations
as of December 31, 2008
(as a percentage of net assets)
| | | | | | | | | | | | |
| | | | | ING Index
Solution Income
Portfolio | | ING Index
Solution 2015
Portfolio | | ING Index
Solution 2025
Portfolio | | ING Index
Solution 2035
Portfolio | | ING Index
Solution 2045
Portfolio |
U.S. Large-Cap Stocks | | % | | 24 | | 36 | | 46 | | 44 | | 38 |
U.S. Mid-Cap Stocks | | % | | — | | 3 | | 5 | | 8 | | 11 |
U.S. Small-Cap Stocks | | % | | — | | 4 | | 6 | | 9 | | 13 |
Non-U.S./International Stocks | | % | | 6 | | 12 | | 18 | | 24 | | 33 |
Intermediate-Term Bonds | | % | | 70 | | 45 | | 25 | | 15 | | 5 |
| | | | | | | | | | | | |
| | % | | 100.0 | | 100.0 | | 100.0 | | 100.0 | | 100.0 |
| | | | | | | | | | | | |
5
| | |
| ING INDEX SOLUTION INCOME PORTFOLIO | | PORTFOLIO MANAGERS’ REPORT |
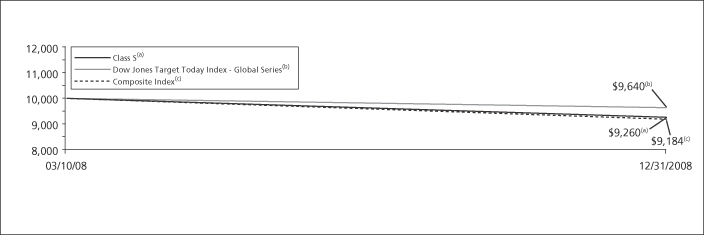
| | | | | | | |
| | �� | |
| | | Cumulative Total Returns for the Period Ended December 31, 2008 | | | |
| | | | | Since Inception
of Classes ADV, I, S and T
March 10, 2008 | | | |
| | | Class ADV | | (7.60 | )% | | |
| | | Class I | | (7.10 | )% | | |
| | | Class S | | (7.40 | )% | | |
| | | Class T | | (7.70 | )% | | |
| | | Dow Jones Target Today Index — Global Series(1) | | (3.60 | )%(3) | | |
| | | Composite Index(2) | | (8.16 | )%(3) | | |
Based on a $10,000 initial investment, the graph and table above illustrate the total return of ING Index Solution Income Portfolio against the indices indicated. An index is unmanaged and has no cash in its portfolio, imposes no sales charges and incurs no operating expenses. An investor cannot invest directly in an index.
The performance graph and table do not reflect the deduction of taxes that a shareholder will pay on Portfolio distributions or the redemption of Portfolio shares.
The performance shown may include the effect of fee waivers and/or expense reimbursements by the Investment Adviser and/or other service providers, which have the effect of increasing total return. Had all fees and expenses been considered, the total returns would have been lower.
Performance data represents past performance and is no assurance of future results. Investment return and principal value of an investment in the Portfolio will fluctuate. Shares, when sold, may be worth more or less than their original cost. The Portfolio’s current performance may be lower or higher than the performance data shown. Please log on to www.ingfunds.com or call (800) 262-3862 to get performance through the most recent month end.
It is important to note that the Portfolio has a limited operating history. Performance over a longer period of time may be more meaningful than short-term performance.
This report contains statements that may be “forward-looking” statements. Actual results may differ materially from those projected in the “forward-looking” statements.
The views expressed in this report reflect those of the Investment Adviser, only through the end of the period as stated on the cover. The Investment Adviser’s views are subject to change at any time based on market and other conditions.
Portfolio holdings are subject to change daily.
(1) | | The Dow Jones Target Today Index — Global Series is comprised of a set of equity, bond and cash sub-indexes. |
(2) | | The Composite Index is comprised of 24% Russell Top 200 Index/6% MSCI EAFE® Index/70% Barclays Capital U.S. Aggregate Bond Index. |
(3) | | Since inception performance for the indices is shown as of March 1, 2008. |
6
| | |
| PORTFOLIO MANAGERS’ REPORT | | ING INDEX SOLUTION 2015 PORTFOLIO |
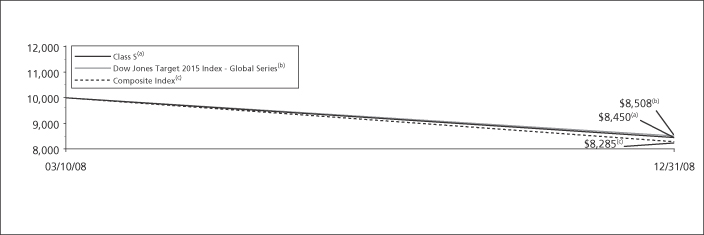
| | | | | | | |
| | | |
| | | Cumulative Total Returns for the Period Ended December 31, 2008 | | | |
| | | | | Since Inception
of Classes ADV, I, S and T
March 10, 2008 | | | |
| | | Class ADV | | (15.70)%
|
| | |
| | | Class I | | (15.40 | )% | | |
| | | Class S | | (15.50 | )% | | |
| | | Class T | | (15.90 | )% | | |
| | | Dow Jones Target 2015 Index — Global Series(1) | | (14.92 | )%(3) | | |
| | | Composite Index(2) | | (17.15 | )%(3) | | |
Based on a $10,000 initial investment, the graph and table above illustrate the total return of ING Index Solution 2015 Portfolio against the indices indicated. An index is unmanaged and has no cash in its portfolio, imposes no sales charges and incurs no operating expenses. An investor cannot invest directly in an index.
The performance graph and table do not reflect the deduction of taxes that a shareholder will pay on Portfolio distributions or the redemption of Portfolio shares.
The performance shown may include the effect of fee waivers and/or expense reimbursements by the Investment Adviser and/or other service providers, which have the effect of increasing total return. Had all fees and expenses been considered, the total returns would have been lower.
Performance data represents past performance and is no assurance of future results. Investment return and principal value of an investment in the Portfolio will fluctuate. Shares, when sold, may be worth more or less than their original cost. The Portfolio’s current performance may be lower or higher than the performance data shown. Please log on to www.ingfunds.com or call (800) 262-3862 to get performance through the most recent month end.
It is important to note that the Portfolio has a limited operating history. Performance over a longer period of time may be more meaningful than short-term performance.
This report contains statements that may be “forward-looking” statements. Actual results may differ materially from those projected in the “forward-looking” statements.
The views expressed in this report reflect those of the Investment Adviser, only through the end of the period as stated on the cover. The Investment Adviser’s views are subject to change at any time based on market and other conditions.
Portfolio holdings are subject to change daily.
(1) | | The Dow Jones 2015 Index — Global Series is comprised of a set of equity, bond and cash sub-indexes. |
(2) | | The Composite Index is comprised of 36% Russell Top 200 Index/3% Russell Midcap Index/4% Russell 2000 Index/12% MSCI EAFE Index/45% Barclays Capital U.S. Aggregate Bond Index. |
(3) | | Since inception performance for the indices is shown from March 1, 2008. |
7
| | |
| ING INDEX SOLUTION 2025 PORTFOLIO | | PORTFOLIO MANAGERS’ REPORT |
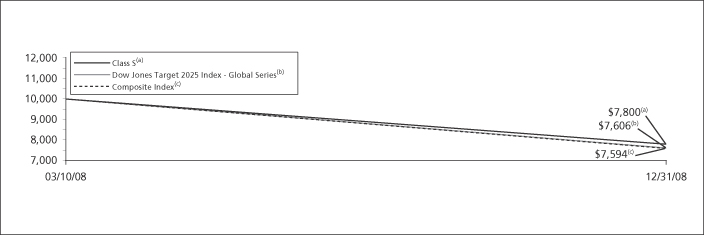
| | | | | | | |
| | | |
| | | Cumulative Total Returns for the Period Ended December 31, 2008 | | | |
| | | | | Since Inception
of Classes ADV, I, S and T
March 10, 2008 | | | |
| | | Class ADV | | (22.10 | )% | | |
| | | Class I | | (21.80 | )% | | |
| | | Class S | | (22.00 | )% | | |
| | | Class T | | (22.20 | )% | | |
| | | Dow Jones Target 2025 Index — Global Series(1) | | (23.94 | )%(3) | | |
| | | Composite Index(2) | | (24.06 | )%(3) | | |
Based on a $10,000 initial investment, the graph and table above illustrate the total return of ING Index Solution 2025 Portfolio against the indices indicated. An index is unmanaged and has no cash in its portfolio, imposes no sales charges and incurs no operating expenses. An investor cannot invest directly in an index.
The performance graph and table do not reflect the deduction of taxes that a shareholder will pay on Portfolio distributions or the redemption of Portfolio shares.
The performance shown may include the effect of fee waivers and/or expense reimbursements by the Investment Adviser and/or other service providers, which have the effect of increasing total return. Had all fees and expenses been considered, the total returns would have been lower.
Performance data represents past performance and is no assurance of future results. Investment return and principal value of an investment in the Portfolio will fluctuate. Shares, when sold, may be worth more or less than their original cost. The Portfolio’s current performance may be lower or higher than the performance data shown. Please log on to www.ingfunds.com or call (800) 262-3862 to get performance through the most recent month end.
It is important to note that the Portfolio has a limited operating history. Performance over a longer period of time may be more meaningful than short-term performance.
This report contains statements that may be “forward-looking” statements. Actual results may differ materially from those projected in the “forward-looking” statements.
The views expressed in this report reflect those of the Investment Adviser, only through the end of the period as stated on the cover. The Investment Adviser’s views are subject to change at any time based on market and other conditions.
Portfolio holdings are subject to change daily.
(1) | | The Dow Jones Target 2025 Index — Global Series is comprised of a set of equity, bond and cash sub-indexes. |
(2) | | The Composite Index is comprised of 46% Russell Top 200 Index/5% Russell Midcap Index/6% Russell 2000 Index/18% MSCI EAFE Index/25% Barclays Capital U.S. Aggregate Bond Index. |
(3) | | Since inception performance for the indices is shown from March 1, 2008. |
8
| | |
| PORTFOLIO MANAGERS’ REPORT | | ING INDEX SOLUTION 2035 PORTFOLIO |
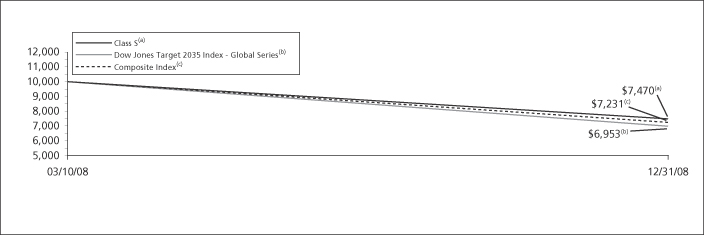
| | | | | | | |
| | | |
| | | Cumulative Total Returns for the Period Ended December 31, 2008 | | | |
| | | | | Since Inception
of Classes ADV, I, S and T
March 10, 2008 | | | |
| | | Class ADV | | (25.50 | )% | | |
| | | Class I | | (25.20 | )% | | |
| | | Class S | | (25.30 | )% | | |
| | | Class T | | (25.60 | )% | | |
| | | Dow Jones Target 2035 Index — Global Series(1) | | (30.47 | )%(3) | | |
| | | Composite Index(2) | | (27.69 | )%(3) | | |
Based on a $10,000 initial investment, the graph and table above illustrate the total return of ING Index Solution 2035 Portfolio against the indices indicated. An index is unmanaged and has no cash in its portfolio, imposes no sales charges and incurs no operating expenses. An investor cannot invest directly in an index.
The performance graph and table do not reflect the deduction of taxes that a shareholder will pay on Portfolio distributions or the redemption of Portfolio shares.
The performance shown may include the effect of fee waivers and/or expense reimbursements by the Investment Adviser and/or other service providers, which have the effect of increasing total return. Had all fees and expenses been considered, the total returns would have been lower.
Performance data represents past performance and is no assurance of future results. Investment return and principal value of an investment in the Portfolio will fluctuate. Shares, when sold, may be worth more or less than their original cost. The Portfolio’s current performance may be lower or higher than the performance data shown. Please log on to www.ingfunds.com or call (800) 262-3862 to get performance through the most recent month end.
It is important to note that the Portfolio has a limited operating history. Performance over a longer period of time may be more meaningful than short-term performance.
This report contains statements that may be “forward-looking” statements. Actual results may differ materially from those projected in the “forward-looking” statements.
The views expressed in this report reflect those of the Investment Adviser, only through the end of the period as stated on the cover. The Investment Adviser’s views are subject to change at any time based on market and other conditions.
Portfolio holdings are subject to change daily.
(1) | | The Dow Jones Target 2035 Index — Global Series is comprised of a set of equity, bond and cash sub-indexes. |
(2) | | The Composite Index is comprised of 44% Russell Top 200 Index/8% Russell Midcap Index/9% Russell 2000 Index/24% MSCI EAFE Index/15% Barclays Capital U.S. Aggregate Bond Index. |
(3) | | Since inception performance for the indices is shown from March 1, 2008. |
9
| | |
| ING INDEX SOLUTION 2045 PORTFOLIO | | PORTFOLIO MANAGERS’ REPORT |
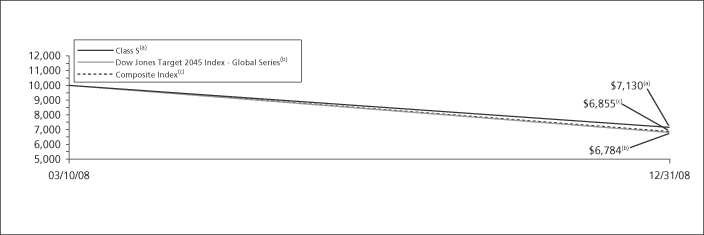
| | | | | | | |
| | | |
| | | Cumulative Total Returns for the Period Ended December 31, 2008 | | | |
| | | | | Since Inception
of Classes ADV, I, S and T
March 10, 2008 | | | |
| | | Class ADV | | (28.90 | )% | | |
| | | Class I | | (28.60 | )% | | |
| | | Class S | | (28.70 | )% | | |
| | | Class T | | (29.00 | )% | | |
| | | Dow Jones Target 2045 Index — Global Series(1) | | (32.16 | )%(3) | | |
| | | Composite Index(2) | | (31.45 | )%(3) | | |
Based on a $10,000 initial investment, the graph and table above illustrate the total return of ING Index Solution 2045 Portfolio against the indices indicated. An index is unmanaged and has no cash in its portfolio, imposes no sales charges and incurs no operating expenses. An investor cannot invest directly in an index.
The performance graph and table do not reflect the deduction of taxes that a shareholder will pay on Portfolio distributions or the redemption of Portfolio shares.
The performance shown may include the effect of fee waivers and/or expense reimbursements by the Investment Adviser and/or other service providers, which have the effect of increasing total return. Had all fees and expenses been considered, the total returns would have been lower.
Performance data represents past performance and is no assurance of future results. Investment return and principal value of an investment in the Portfolio will fluctuate. Shares, when sold, may be worth more or less than their original cost. The Portfolio’s current performance may be lower or higher than the performance data shown. Please log on to www.ingfunds.com or call (800) 262-3862 to get performance through the most recent month end.
It is important to note that the Portfolio has a limited operating history. Performance over a longer period of time may be more meaningful than short-term performance.
This report contains statements that may be “forward-looking” statements. Actual results may differ materially from those projected in the “forward-looking” statements.
The views expressed in this report reflect those of the Investment Adviser, only through the end of the period as stated on the cover. The Investment Adviser’s views are subject to change at any time based on market and other conditions.
Portfolio holdings are subject to change daily.
(1) | | The Dow Jones Target 2045 Index — Global Series is comprised of a set of equity, bond and cash sub-indexes. |
(2) | | The Composite Index is comprised of 38% Russell Top 200 Index/11% Russell Midcap Index/13% Russell 2000 Index/33% MSCI EAFE Index/5% Barclays Capital U.S. Aggregate Bond Index. |
(3) | | Since inception performance for the indices is shown from March 1, 2008. |
10
SHAREHOLDER EXPENSE EXAMPLES (UNAUDITED)
As a shareholder of a Portfolio, you incur two types of costs: (1) transaction costs, including redemption and exchange fees; and (2) ongoing costs including management fees, distribution and/or service (12b-1) fees, and other Portfolio expenses. These Examples are intended to help you understand your ongoing costs (in dollars) of investing in a Portfolio and to compare these costs with the ongoing costs of investing in other mutual funds.
The Examples are based on an investment of $1,000 invested at the beginning of the period (except as noted) and held for the entire period from July 1, 2008 to December 31, 2008. The Portfolios’ expenses are shown without the imposition of any charges which are, or may be, imposed under your annuity contract. Expenses would have been higher if such charges were included.
Actual Expenses
The first section of the table shown, “Actual Portfolio Return,” provides information about actual account values and actual expenses. You may use the information in this section, together with the amount you invested, to estimate the expenses that you paid over the period. Simply divide your account value by $1,000 (for example, an $8,600 account value divided by $1,000 = 8.6), then multiply the result by the number in the first section under the heading entitled “Expenses Paid During the Period” to estimate the expenses you paid on your account during this period.
Hypothetical Example for Comparison Purposes
The second section of the table shown, “Hypothetical (5% return before expenses),” provides information about hypothetical account values and hypothetical expenses based on the Portfolio’s actual expense ratio and an assumed rate of return of 5% per year before expenses, which is not the Portfolio’s actual return. The hypothetical account values and expenses may not be used to estimate the actual ending account balance or expenses you paid for the period. You may use this information to compare the ongoing costs of investing in the Fund and other mutual funds. To do so, compare this 5% hypothetical example with the 5% hypothetical examples that appear in the shareholder reports of the other mutual funds.
Please note that the expenses shown in the table are meant to highlight your ongoing costs only and do not reflect any transactional costs, such as redemption fees or exchange fees. Therefore, the hypothetical lines of the table are useful in comparing ongoing costs only, and will not help you determine the relative total costs of owning different mutual funds. In addition, if these transactional costs were included, your costs would have been higher.
| | | | | | | | | | | | | | | | | | | | | | | | |
| | | Actual Portfolio Return | | Hypothetical (5% return before expenses) |
| | | Beginning
Account
Value
July 1, 2008 | | Ending
Account Value
December 31, 2008 | | Annualized Expense Ratio* | | | Expenses Paid
During the
Period Ended
December 31, 2008** | | Beginning
Account
Value
July 1, 2008 | | Ending
Account Value
December 31, 2008 | | Annualized Expense Ratio* | | | Expenses Paid
During the
Period Ended
December 31, 2008** |
ING Index Solution Income Portfolio | | | | | | | | | | | | |
Class ADV | | $ | 1,000.00 | | $ | 929.60 | | 0.62 | % | | $ | 3.01 | | $ | 1,000.00 | | $ | 1,022.02 | | 0.62 | % | | $ | 3.15 |
Class I | | | 1,000.00 | | | 932.70 | | 0.12 | | | | 0.58 | | | 1,000.00 | | | 1,024.53 | | 0.12 | | | | 0.61 |
Class S | | | 1,000.00 | | | 929.70 | | 0.37 | | | | 1.79 | | | 1,000.00 | | | 1,023.28 | | 0.37 | | | | 1.88 |
Class T | | | 1,000.00 | | | 928.60 | | 0.82 | | | | 3.98 | | | 1,000.00 | | | 1,021.01 | | 0.82 | | | | 4.17 |
ING Index Solution 2015 Portfolio | | | | | | | | | | | | |
Class ADV | | $ | 1,000.00 | | $ | 843.00 | | 0.62 | % | | $ | 2.87 | | $ | 1,000.00 | | $ | 1,022.02 | | 0.62 | % | | $ | 3.15 |
Class I | | | 1,000.00 | | | 844.30 | | 0.12 | | | | 0.56 | | | 1,000.00 | | | 1,024.53 | | 0.12 | | | | 0.61 |
Class S | | | 1,000.00 | | | 844.20 | | 0.37 | | | | 1.72 | | | 1,000.00 | | | 1,023.28 | | 0.37 | | | | 1.88 |
Class T | | | 1,000.00 | | | 841.80 | | 0.82 | | | | 3.80 | | | 1,000.00 | | | 1,021.01 | | 0.82 | | | | 4.17 |
| * | | Expense ratios do not include expense of the Underlying Funds. |
| ** | | Expenses are equal to each Portfolio’s respective annualized expense ratios multiplied by the average account value over the period, multiplied by 184/366 to reflect the most recent fiscal half-year. |
11
SHAREHOLDER EXPENSE EXAMPLES (UNAUDITED) (CONTINUED)
| | | | | | | | | | | | | | | | | | | | | | | | |
| | | Actual Portfolio Return | | Hypothetical (5% return before expenses) |
| | | Beginning
Account
Value
July 1, 2008 | | Ending
Account Value
December 31, 2008 | | Annualized Expense Ratio* | | | Expenses Paid
During the
Period Ended
December 31, 2008** | | Beginning
Account
Value
July 1, 2008 | | Ending
Account Value
December 31, 2008 | | Annualized Expense Ratio* | | | Expenses Paid
During the
Period Ended
December 31, 2008** |
ING Index Solution 2025 Portfolio | | | | | | | | | | | | |
Class ADV | | $ | 1,000.00 | | $ | 776.70 | | 0.62 | % | | $ | 2.77 | | $ | 1,000.00 | | $ | 1,022.02 | | 0.62 | % | | $ | 3.15 |
Class I | | | 1,000.00 | | | 778.10 | | 0.12 | | | | 0.54 | | | 1,000.00 | | | 1,024.53 | | 0.12 | | | | 0.61 |
Class S | | | 1,000.00 | | | 776.90 | | 0.37 | | | | 1.65 | | | 1,000.00 | | | 1,023.28 | | 0.37 | | | | 1.88 |
Class T | | | 1,000.00 | | | 776.40 | | 0.82 | | | | 3.66 | | | 1,000.00 | | | 1,021.01 | | 0.82 | | | | 4.17 |
ING Index Solution 2035 Portfolio | | | | | | | | | | | | |
Class ADV | | $ | 1,000.00 | | $ | 739.80 | | 0.62 | % | | $ | 2.71 | | $ | 1,000.00 | | $ | 1,022.02 | | 0.62 | % | | $ | 3.15 |
Class I | | | 1,000.00 | | | 741.30 | | 0.12 | | | | 0.53 | | | 1,000.00 | | | 1,024.53 | | 0.12 | | | | 0.61 |
Class S | | | 1,000.00 | | | 741.10 | | 0.37 | | | | 1.62 | | | 1,000.00 | | | 1,023.28 | | 0.37 | | | | 1.88 |
Class T | | | 1,000.00 | | | 738.80 | | 0.82 | | | | 3.58 | | | 1,000.00 | | | 1,021.01 | | 0.82 | | | | 4.17 |
ING Index Solution 2045 Portfolio | | | | | | | | | | | | |
Class ADV | | $ | 1,000.00 | | $ | 702.60 | | 0.62 | % | | $ | 2.65 | | $ | 1,000.00 | | $ | 1,022.02 | | 0.62 | % | | $ | 3.15 |
Class I | | | 1,000.00 | | | 704.10 | | 0.12 | | | | 0.51 | | | 1,000.00 | | | 1,024.53 | | 0.12 | | | | 0.61 |
Class S | | | 1,000.00 | | | 703.80 | | 0.37 | | | | 1.58 | | | 1,000.00 | | | 1,023.28 | | 0.37 | | | | 1.88 |
Class T | | | 1,000.00 | | | 701.60 | | 0.82 | | | | 3.51 | | | 1,000.00 | | | 1,021.01 | | 0.82 | | | | 4.17 |
| * | | Expense ratios do not include expense of the Underlying Funds. |
| ** | | Expenses are equal to each Portfolio’s respective annualized expense ratios multiplied by the average account value over the period, multiplied by 184/366 to reflect the most recent fiscal half-year. |
12
REPORT OF INDEPENDENT REGISTERED PUBLIC ACCOUNTING FIRM
The Shareholders and Board of Directors
ING Partners, Inc.
We have audited the accompanying statements of assets and liabilities, including the portfolios of investments, of ING Index Solution Income Portfolio, ING Index Solution 2015 Portfolio, ING Index Solution 2025 Portfolio, ING Index Solution 2035 Portfolio, and ING Index Solution 2045 Portfolio, each a series of ING Partners, Inc., as of December 31, 2008, and the related statements of operations, statements of changes in net assets, and the financial highlights for the period from March 10, 2008 (commencement of operations) through December 31, 2008. These financial statements and financial highlights are the responsibility of management. Our responsibility is to express an opinion on these financial statements and financial highlights based on our audits.
We conducted our audits in accordance with the standards of the Public Company Accounting Oversight Board (United States). Those standards require that we plan and perform the audit to obtain reasonable assurance about whether the financial statements and financial highlights are free of material misstatement. An audit includes examining, on a test basis, evidence supporting the amounts and disclosures in the financial statements. Our procedures included confirmation of securities owned as of December 31, 2008, by correspondence with the transfer agent of the underlying funds. An audit also includes assessing the accounting principles used and significant estimates made by management, as well as evaluating the overall financial statement presentation. We believe that our audits provide a reasonable basis for our opinion.
In our opinion, the financial statements and financial highlights referred to above present fairly, in all material respects, the financial position of the aforementioned portfolios as of December 31, 2008, and the results of their operations, the changes in their net assets, and the financial highlights for the period specified in the first paragraph above, in conformity with U.S. generally accepted accounting principles.

Boston, Massachusetts
February 27, 2009
13
STATEMENTS OF ASSETS AND LIABILITIESASOF DECEMBER 31, 2008
| | | | | | | | | | | | |
| | | ING Index Solution Income
Portfolio | | | ING Index Solution 2015 Portfolio | | | ING Index Solution 2025 Portfolio | |
ASSETS: | | | | | | | | | | | | |
Investments in affiliated underlying funds* | | $ | 4,155,517 | | | $ | 13,015,769 | | | $ | 17,123,366 | |
Fund shares sold receivable | | | 135,076 | | | | 366,354 | | | | 2,584,606 | |
| | | | | | | | | | | | |
Total assets | | | 4,290,593 | | | | 13,382,123 | | | | 19,707,972 | |
| | | | | | | | | | | | |
LIABILITIES: | | | | | | | | | | | | |
Payable for investments in affiliated underlying funds purchased | | | 134,815 | | | | 366,354 | | | | 2,583,901 | |
Payable for fund shares redeemed | | | 261 | | | | — | | | | 705 | |
Payable to affiliates | | | 1,725 | | | | 5,248 | | | | 6,144 | |
| | | | | | | | | | | | |
Total liabilities | | | 136,801 | | | | 371,602 | | | | 2,590,750 | |
| | | | | | | | | | | | |
NET ASSETS | | $ | 4,153,792 | | | $ | 13,010,521 | | | $ | 17,117,222 | |
| | | | | | | | | | | | |
NET ASSETS WERE COMPRISED OF: | | | | | | | | | | | | |
Paid-in capital | | $ | 4,169,190 | | | $ | 13,750,893 | | | $ | 18,387,397 | |
Undistributed net investment income | | | 42,603 | | | | 140,253 | | | | 162,477 | |
Accumulated net realized loss on investments | | | (49,827 | ) | | | (276,234 | ) | | | (102,052 | ) |
Net unrealized depreciation on investments | | | (8,174 | ) | | | (604,391 | ) | | | (1,330,600 | ) |
| | | | | | | | | | | | |
NET ASSETS | | $ | 4,153,792 | | | $ | 13,010,521 | | | $ | 17,117,222 | |
| | | | | | | | | | | | |
| | | | | | | | | | | | |
* Cost of investments in affiliated underlying funds | | $ | 4,163,691 | | | $ | 13,620,160 | | | $ | 18,453,966 | |
| | | | | | | | | | | | |
Class ADV: | | | | | | | | | | | | |
Net assets | | $ | 2,542,580 | | | $ | 8,876,569 | | | $ | 12,557,096 | |
Shares authorized | | | 100,000,000 | | | | 100,000,000 | | | | 100,000,000 | |
Par value | | $ | 0.001 | | | $ | 0.001 | | | $ | 0.001 | |
Shares outstanding | | | 275,068 | | | | 1,053,048 | | | | 1,612,595 | |
Net asset value and redemption price per share | | $ | 9.24 | | | $ | 8.43 | | | $ | 7.79 | |
Class I: | | | | | | | | | | | | |
Net assets | | $ | 2,795 | | | $ | 182,711 | | | $ | 2,353 | |
Shares authorized | | | 100,000,000 | | | | 100,000,000 | | | | 100,000,000 | |
Par value | | $ | 0.001 | | | $ | 0.001 | | | $ | 0.001 | |
Shares outstanding | | | 301 | | | | 21,599 | | | | 301 | |
Net asset value and redemption price per share | | $ | 9.29 | | | $ | 8.46 | | | $ | 7.82 | |
Class S: | | | | | | | | | | | | |
Net assets | | $ | 1,605,640 | | | $ | 3,948,711 | | | $ | 4,555,435 | |
Shares authorized | | | 100,000,000 | | | | 100,000,000 | | | | 100,000,000 | |
Par value | | $ | 0.001 | | | $ | 0.001 | | | $ | 0.001 | |
Shares outstanding | | | 173,332 | | | | 467,545 | | | | 583,874 | |
Net asset value and redemption price per share | | $ | 9.26 | | | $ | 8.45 | | | $ | 7.80 | |
Class T: | | | | | | | | | | | | |
Net assets | | $ | 2,777 | | | $ | 2,530 | | | $ | 2,338 | |
Shares authorized | | | 100,000,000 | | | | 100,000,000 | | | | 100,000,000 | |
Par value | | $ | 0.001 | | | $ | 0.001 | | | $ | 0.001 | |
Shares outstanding | | | 301 | | | | 301 | | | | 301 | |
Net asset value and redemption price per share | | $ | 9.23 | | | $ | 8.41 | | | $ | 7.78 | |
See Accompanying Notes to Financial Statements
14
STATEMENTS OF ASSETS AND LIABILITIESASOF DECEMBER 31, 2008
| | | | | | | | |
| | | ING
Index Solution
2035 Portfolio | | | ING
Index Solution
2045 Portfolio | |
ASSETS: | | | | | | | | |
Investments in affiliated underlying funds* | | $ | 13,354,028 | | | $ | 4,960,158 | |
Fund shares sold receivable | | | 1,372,275 | | | | 474,602 | |
| | | | | | | | |
Total assets | | | 14,726,303 | | | | 5,434,760 | |
| | | | | | | | |
LIABILITIES: | | | | | | | | |
Payable for investments in affiliated underlying funds purchased | | | 1,372,275 | | | | 474,602 | |
Payable to affiliates | | | 4,866 | | | | 1,776 | |
| | | | | | | | |
Total liabilities | | | 1,377,141 | | | | 476,378 | |
| | | | | | | | |
NET ASSETS | | $ | 13,349,162 | | | $ | 4,958,382 | |
| | | | | | | | |
NET ASSETS WERE COMPRISED OF: | | | | | | | | |
Paid-in capital | | $ | 14,286,445 | | | $ | 5,774,437 | |
Undistributed net investment income | | | 139,823 | | | | 53,447 | |
Accumulated net realized loss on investments | | | (107,683 | ) | | | (58,943 | ) |
Net unrealized depreciation on investments | | | (969,423 | ) | | | (810,559 | ) |
| | | | | | | | |
NET ASSETS | | $ | 13,349,162 | | | $ | 4,958,382 | |
| | | | | | | | |
| | | | | | | | |
* Cost of investments in affiliated underlying funds | | $ | 14,323,451 | | | $ | 5,770,717 | |
| | | | | | | | |
Class ADV: | | | | | | | | |
Net assets | | $ | 9,139,239 | | | $ | 3,069,359 | |
Shares authorized | | | 100,000,000 | | | | 100,000,000 | |
Par value | | $ | 0.001 | | | $ | 0.001 | |
Shares outstanding | | | 1,226,693 | | | | 431,806 | |
Net asset value and redemption price per share | | $ | 7.45 | | | $ | 7.11 | |
Class I: | | | | | | | | |
Net assets | | $ | 169,538 | | | $ | 115,290 | |
Shares authorized | | | 100,000,000 | | | | 100,000,000 | |
Par value | | $ | 0.001 | | | $ | 0.001 | |
Shares outstanding | | | 22,673 | | | | 16,150 | |
Net asset value and redemption price per share | | $ | 7.48 | | | $ | 7.14 | |
Class S: | | | | | | | | |
Net assets | | $ | 4,038,147 | | | $ | 1,771,597 | |
Shares authorized | | | 100,000,000 | | | | 100,000,000 | |
Par value | | $ | 0.001 | | | $ | 0.001 | |
Shares outstanding | | | 540,882 | | | | 248,464 | |
Net asset value and redemption price per share | | $ | 7.47 | | | $ | 7.13 | |
Class T: | | | | | | | | |
Net assets | | $ | 2,238 | | | $ | 2,136 | |
Shares authorized | | | 100,000,000 | | | | 100,000,000 | |
Par value | | $ | 0.001 | | | $ | 0.001 | |
Shares outstanding | | | 301 | | | | 301 | |
Net asset value and redemption price per share | | $ | 7.44 | | | $ | 7.10 | |
See Accompanying Notes to Financial Statements
15
STATEMENTS OF OPERATIONS
| | | | | | | | | | | | |
| | | ING
Index Solution Income Portfolio | | | ING
Index Solution 2015 Portfolio | | | ING
Index Solution 2025 Portfolio | |
| | | March 10, 2008(1)
to December 31, 2008 | | | March 10, 2008(1)
to December 31, 2008 | | | March 10, 2008(1)
to December 31, 2008 | |
INVESTMENT INCOME: | | | | | | | | | | | | |
Dividends from affiliated underlying funds | | $ | 43,172 | | | $ | 147,391 | | | $ | 175,420 | |
| | | | | | | | | | | | |
Total investment income | | | 43,172 | | | | 147,391 | | | | 175,420 | |
| | | | | | | | | | | | |
EXPENSES: | | | | | | | | | | | | |
Investment management fees | | | 949 | | | | 3,134 | | | | 3,417 | |
Distribution and service fees: | | | | | | | | | | | | |
Class ADV | | | 3,422 | | | | 9,933 | | | | 12,309 | |
Class S | | | 652 | | | | 2,695 | | | | 2,377 | |
Class T | | | 19 | | | | 18 | | | | 18 | |
Administrative service fees | | | 190 | | | | 627 | | | | 684 | |
| | | | | | | | | | | | |
Total expenses | | | 5,232 | | | | 16,407 | | | | 18,805 | |
Net waived and reimbursed fees | | | (1 | ) | | | (1 | ) | | | (1 | ) |
| | | | | | | | | | | | |
Net expenses | | | 5,231 | | | | 16,406 | | | | 18,804 | |
| | | | | | | | | | | | |
Net investment income | | | 37,941 | | | | 130,985 | | | | 156,616 | |
| | | | | | | | | | | | |
REALIZED AND UNREALIZED GAIN (LOSS) ON AFFILIATED UNDERLYING FUNDS: | | | | | | | | | | | | |
Realized gain distributions from affiliated underlying funds | | | 4,651 | | | | 9,246 | | | | 5,837 | |
Net realized loss on sale of affiliated underlying funds | | | (49,827 | ) | | | (276,234 | ) | | | (102,052 | ) |
| | | | | | | | | | | | |
Net realized loss on affiliated underlying funds | | | (45,176 | ) | | | (266,988 | ) | | | (96,215 | ) |
Net change in unrealized appreciation or depreciation on affiliated underlying funds | | | (8,174 | ) | | | (604,391 | ) | | | (1,330,600 | ) |
| | | | | | | | | | | | |
Net realized and unrealized loss on affiliated underlying funds | | | (53,350 | ) | | | (871,379 | ) | | | (1,426,815 | ) |
| | | | | | | | | | | | |
Decrease in net assets resulting from operations | | $ | (15,409 | ) | | $ | (740,394 | ) | | $ | (1,270,199 | ) |
| | | | | | | | | | | | |
| | | | | | | | | | | | |
(1) Commencement of operations | | | | | | | | | | | | |
See Accompanying Notes to Financial Statements
16
STATEMENTS OF OPERATIONS
| | | | | | | | |
| | | ING Index Solution 2035 Portfolio | | | ING Index Solution 2045 Portfolio | |
| | | March 10, 2008(1)
to December 31, 2008 | | | March 10, 2008(1)
to December 31, 2008 | |
INVESTMENT INCOME: | | | | | | | | |
Dividends from affiliated underlying funds | | $ | 150,137 | | | $ | 59,833 | |
| | | | | | | | |
Total investment income | | | 150,137 | | | | 59,833 | |
| | | | | | | | |
EXPENSES: | | | | | | | | |
Investment management fees | | | 2,491 | | | | 1,321 | |
Distribution and service fees: | | | | | | | | |
Class ADV | | | 8,224 | | | | 3,955 | |
Class S | | | 1,968 | | | | 1,205 | |
Class T | | | 17 | | | | 17 | |
Administrative service fees | | | 498 | | | | 264 | |
| | | | | | | | |
Total expenses | | | 13,198 | | | | 6,762 | |
Net waived and reimbursed fees | | | (1 | ) | | | (1 | ) |
| | | | | | | | |
Net expenses | | | 13,197 | | | | 6,761 | |
| | | | | | | | |
Net investment income | | | 136,940 | | | | 53,072 | |
| | | | | | | | |
REALIZED AND UNREALIZED GAIN (LOSS) ON
AFFILIATED UNDERLYING FUNDS: | | | | | | | | |
Realized gain distributions from affiliated underlying funds | | | 2,871 | | | | 356 | |
Net realized loss on sale of affiliated underlying funds | | | (107,683 | ) | | | (58,943 | ) |
| | | | | | | | |
Net realized loss on affiliated underlying funds | | | (104,812 | ) | | | (58,587 | ) |
Net change in unrealized appreciation or depreciation on affiliated underlying funds | | | (969,423 | ) | | | (810,559 | ) |
| | | | | | | | |
Net realized and unrealized loss on affiliated underlying funds | | | (1,074,235 | ) | | | (869,146 | ) |
| | | | | | | | |
Decrease in net assets resulting from operations | | $ | (937,295 | ) | | $ | (816,074 | ) |
| | | | | | | | |
| | | | | | | | |
(1) Commencement of operations | | | | | | | | |
See Accompanying Notes to Financial Statements
17
STATEMENTS OF CHANGES IN NET ASSETS
| | | | | | | | |
| | | ING
Index Solution
Income Portfolio | | | ING
Index Solution 2015 Portfolio | |
| | | March 10, 2008(1)
to December 31, 2008 | | | March 10, 2008(1)
to December 31, 2008 | |
FROM OPERATIONS: | | | | | | | | |
Net investment income | | $ | 37,941 | | | $ | 130,985 | |
Net realized loss on affiliated underlying funds | | | (45,176 | ) | | | (266,988 | ) |
Net change in unrealized appreciation or depreciation on affiliated underlying funds | | | (8,174 | ) | | | (604,391 | ) |
| | | | | | | | |
Decrease in net assets resulting from operations | | | (15,409 | ) | | | (740,394 | ) |
| | | | | | | | |
FROM CAPITAL SHARE TRANSACTIONS: | | | | | | | | |
Net proceeds from sale of shares | | | 4,738,152 | | | | 15,310,678 | |
Cost of shares redeemed | | | (568,951 | ) | | | (1,559,763 | ) |
| | | | | | | | |
Net increase in net assets resulting from capital share transactions | | | 4,169,201 | | | | 13,750,915 | |
| | | | | | | | |
Net increase in net assets | | | 4,153,792 | | | | 13,010,521 | |
| | | | | | | | |
NET ASSETS: | | | | | | | | |
Beginning of period | | | — | | | | — | |
| | | | | | | | |
End of period | | $ | 4,153,792 | | | $ | 13,010,521 | |
| | | | | | | | |
Undistributed net investment income at end of period | | $ | 42,603 | | | $ | 140,253 | |
| | | | | | | | |
(1) | | Commencement of operations |
See Accompanying Notes to Financial Statements
18
STATEMENTS OF CHANGES IN NET ASSETS
| | | | | | | | |
| | | ING Index Solution
2025
Portfolio | | | ING Index Solution
2035
Portfolio | |
| | | March 10, 2008(1)
to December 31, 2008 | | | March 10, 2008(1)
to December 31, 2008 | |
FROM OPERATIONS: | | | | | | | | |
Net investment income | | $ | 156,616 | | | $ | 136,940 | |
Net realized loss on affiliated underlying funds | | | (96,215 | ) | | | (104,812 | ) |
Net change in unrealized appreciation or depreciation on affiliated underlying funds | | | (1,330,600 | ) | | | (969,423 | ) |
| | | | | | | | |
Decrease in net assets resulting from operations | | | (1,270,199 | ) | | | (937,295 | ) |
| | | | | | | | |
FROM CAPITAL SHARE TRANSACTIONS: | | | | | | | | |
Net proceeds from sale of shares | | | 18,842,076 | | | | 14,986,309 | |
Cost of shares redeemed | | | (454,655 | ) | | | (699,852 | ) |
| | | | | | | | |
Net increase in net assets resulting from capital share transactions | | | 18,387,421 | | | | 14,286,457 | |
| | | | | | | | |
Net increase in net assets | | | 17,117,222 | | | | 13,349,162 | |
| | | | | | | | |
NET ASSETS: | | | | | | | | |
Beginning of period | | | — | | | | — | |
| | | | | | | | |
End of period | | $ | 17,117,222 | | | $ | 13,349,162 | |
| | | | | | | | |
Undistributed net investment income at end of period | | $ | 162,477 | | | $ | 139,823 | |
| | | | | | | | |
(1) | | Commencement of operations |
See Accompanying Notes to Financial Statements
19
STATEMENTS OF CHANGES IN NET ASSETS
| | | | |
| | | ING Index Solution 2045 Portfolio | |
| | | March 10, 2008(1)
to December 31, 2008 | |
FROM OPERATIONS: | | | | |
Net investment income | | $ | 53,072 | |
Net realized loss on affiliated underlying funds | | | (58,587 | ) |
Net change in unrealized appreciation or depreciation on affiliated underlying funds | | | (810,559 | ) |
| | | | |
Decrease in net assets resulting from operations | | | (816,074 | ) |
| | | | |
FROM CAPITAL SHARE TRANSACTIONS: | | | | |
Net proceeds from sale of shares | | | 5,875,012 | |
Cost of shares redeemed | | | (100,556 | ) |
| | | | |
Net increase in net assets resulting from capital share transactions | | | 5,774,456 | |
| | | | |
Net increase in net assets | | | 4,958,382 | |
| | | | |
NET ASSETS: | | | | |
Beginning of period | | | — | |
| | | | |
End of period | | $ | 4,958,382 | |
| | | | |
Undistributed net investment income at end of period | | $ | 53,447 | |
| | | | |
(1) | | Commencement of operations |
See Accompanying Notes to Financial Statements
20
FINANCIAL HIGHLIGHTS
Selected data for a share of beneficial interest outstanding throughout each year or period.
| | | | | | | | | | | | | | | | | | | | | | | | | | | | | | | | | | | | |
| | | | | Income (loss)
from
investment
operations | | | | | | Less distributions | | | | | | | | | Ratios to average net assets | | Supplemental
data |
| | | | | | | | | | | | | | | | | | | | | | | | | | | | | | | | | | | | | |
| | | Net asset value, beginning of year or period | | Net investment income (loss) | | | Net realized and unrealized gain (loss) | | | Total from investment operations | | | From net investment income | | From net realized gains | | From return of capital | | Total distributions | | Net asset value, end of year or period | | Total Return (1) | | | Expenses before reductions/additions(2)(3)(4) | | Expenses net of fee waivers and/or recoupments, if any (2)(3)(4) | | Expenses net of all reductions/additions(2)(3)(4) | | Investment income (loss) net of all reductions/additions(2)(3)(4) | | Net assets, end of year or period | | Portfolio turnover rate |
| | | | | | | | | | | | | | | | | | | | | | | | | | | | | | | | | | | | |
Year or period ended | | ($) | | ($) | | | ($) | | | ($) | | | ($) | | ($) | | ($) | | ($) | | ($) | | (%) | | | (%) | | (%) | | (%) | | (%) | | ($000's) | | (%) |
ING Index Solution Income Portfolio | | | | | | | | | | | | | | | | | | | | | | | | | | | | | | | | | | | | |
Class ADV | | | | | | | | | | | | | | | | | | | | | | | | | | | | | | | | | | | | |
03-10-2008(5) - 12-31-08 | | 10.00 | | 0.26 | · | | (1.02 | ) | | (0.76 | ) | | — | | — | | — | | — | | 9.24 | | (7.60 | ) | | 0.62 | | 0.62 | | 0.62 | | 3.48 | | 2,543 | | 50 |
| | | | | | | | | | | | | | | | |
Class I | | | | | | | | | | | | | | | | | | | | | | | | | | | | | | | | | | | | |
03-10-2008(5) - 12-31-08 | | 10.00 | | 0.17 | | | (0.88 | ) | | (0.71 | ) | | — | | — | | — | | — | | 9.29 | | (7.10 | ) | | 0.12 | | 0.12 | | 0.12 | | 2.16 | | 3 | | 50 |
| | | | | | | | | | | | | | | | |
Class S | | | | | | | | | | | | | | | | | | | | | | | | | | | | | | | | | | | | |
03-10-2008(5) - 12-31-08 | | 10.00 | | 0.39 | · | | (1.13 | ) | | (0.74 | ) | | — | | — | | — | | — | | 9.26 | | (7.40 | ) | | 0.37 | | 0.37 | | 0.37 | | 5.38 | | 1,606 | | 50 |
| | | | | | | | | | | | | | | | |
Class T | | | | | | | | | | | | | | | | | | | | | | | | | | | | | | | | | | | | |
03-10-2008(5) - 12-31-08 | | 10.00 | | 0.11 | | | (0.88 | ) | | (0.77 | ) | | — | | — | | — | | — | | 9.23 | | (7.70 | ) | | 0.87 | | 0.82 | | 0.82 | | 1.47 | | 3 | | 50 |
| | | | | | | | | | | | | | | | |
ING Index Solution 2015 Portfolio | | | | | | | | | | | | | | | | | | | | | | | | | | | | | | | | | | | | |
Class ADV | | | | | | | | | | | | | | | | | | | | | | | | | | | | | | | | | | | | |
03-10-2008(5) - 12-31-08 | | 10.00 | | 0.30 | · | | (1.87 | ) | | (1.57 | ) | | — | | — | | — | | — | | 8.43 | | (15.70 | ) | | 0.62 | | 0.62 | | 0.62 | | 4.34 | | 8,877 | | 39 |
| | | | | | | | | | | | | | | | |
Class I | | | | | | | | | | | | | | | | | | | | | | | | | | | | | | | | | | | | |
03-10-2008(5) - 12-31-08 | | 10.00 | | 0.26 | · | | (1.80 | ) | | (1.54 | ) | | — | | — | | — | | — | | 8.46 | | (15.40 | ) | | 0.12 | | 0.12 | | 0.12 | | 3.72 | | 183 | | 39 |
| | | | | | | | | | | | | | | | |
Class S | | | | | | | | | | | | | | | | | | | | | | | | | | | | | | | | | | | | |
03-10-2008(5) - 12-31-08 | | 10.00 | | 0.27 | · | | (1.82 | ) | | (1.55 | ) | | — | | — | | — | | — | | 8.45 | | (15.50 | ) | | 0.37 | | 0.37 | | 0.37 | | 3.92 | | 3,949 | | 39 |
| | | | | | | | | | | | | | | | |
Class T | | | | | | | | | | | | | | | | | | | | | | | | | | | | | | | | | | | | |
03-10-2008(5) - 12-31-08 | | 10.00 | | 0.09 | | | (1.68 | ) | | (1.59 | ) | | — | | — | | — | | — | | 8.41 | | (15.90 | ) | | 0.87 | | 0.82 | | 0.82 | | 1.12 | | 3 | | 39 |
| | | | | | | | | | | | | | | | |
ING Index Solution 2025 Portfolio | | | | | | | | | | | | | | | | | | | | | | | | | | | | | | | | | | | | |
Class ADV | | | | | | | | | | | | | | | | | | | | | | | | | | | | | | | | | | | | |
03-10-08(5) - 12-31-08 | | 10.00 | | 0.28 | · | | (2.49 | ) | | (2.21 | ) | | — | | — | | — | | — | | 7.79 | | (22.10 | ) | | 0.62 | | 0.62 | | 0.62 | | 4.29 | | 12,557 | | 17 |
Class I | | | | | | | | | | | | | | | | | | | | | | | | | | | | | | | | | | | | |
03-10-08(5) - 12-31-08 | | 10.00 | | 0.11 | | | (2.29 | ) | | (2.18 | ) | | — | | — | | — | | — | | 7.82 | | (21.80 | ) | | 0.12 | | 0.12 | | 0.12 | | 1.50 | | 2 | | 17 |
Class S | | | | | | | | | | | | | | | | | | | | | | | | | | | | | | | | | | | | |
03-10-08(5) - 12-31-08 | | 10.00 | | 0.35 | · | | (2.55 | ) | | (2.20 | ) | | — | | — | | — | | — | | 7.80 | | (22.00 | ) | | 0.37 | | 0.37 | | 0.37 | | 5.36 | | 4,555 | | 17 |
Class T | | | | | | | | | | | | | | | | | | | | | | | | | | | | | | | | | | | | |
03-10-08(5) - 12-31-08 | | 10.00 | | 0.06 | | | (2.28 | ) | | (2.22 | ) | | — | | — | | — | | — | | 7.78 | | (22.20 | ) | | 0.87 | | 0.82 | | 0.82 | | 0.80 | | 2 | | 17 |
See Accompanying Notes to Financial Statements
21
FINANCIAL HIGHLIGHTS (CONTINUED)
Selected data for a share of beneficial interest outstanding throughout each year or period.
| | | | | | | | | | | | | | | | | | | | | | | | | | | | | | | | | | | | |
| | | | | Income (loss)
from
investment
operations | | | | | | Less distributions | | | | | | | | | Ratios to average net assets | | Supplemental
data |
| | | | | | | | | | | | | | | | | | | | | | | | | | | | | | | | | | | | | |
| | | Asset value, beginning of year or period | | Net investment income (loss) | | | Net realized and unrealized gain (loss) | | | Total from investment operations | | | From net investment income | | From net realized gains | | From return of capital | | Total distributions | | Net asset value, end of year or period | | Total Return (1) | | | Expenses before reductions/additions(2)(3)(4) | | Expenses net of fee waivers and/or recoupments, if any(2)(3)(4) | | Expenses net of all reductions/additions(2)(3)(4) | | Investment income (loss) net of all reductions/additions(2)(3)(4) | | Net assets, end of year or period | | Portfolio turnover rate |
| | | | | | | | | | | | | | | | | | | | | | | | | | | | | | | | | | | | |
Year or period ended | | ($) | | ($) | | | ($) | | | ($) | | | ($) | | ($) | | ($) | | ($) | | ($) | | (%) | | | (%) | | (%) | | (%) | | (%) | | ($000's) | | (%) |
ING Index Solution 2035 Portfolio | | | | | | | | | | | | | | | | | | | | | | | | | | | | | | | | | | | | |
Class ADV | | | | | | | | | | | | | | | | | | | | | | | | | | | | | | | | | | | | |
03-10-2008(5) - 12-31-08 | | 10.00 | | 0.33 | · | | (2.88 | ) | | (2.55 | ) | | — | | — | | — | | — | | 7.45 | | (25.50 | ) | | 0.62 | | 0.62 | | 0.62 | | 5.29 | | 9,139 | | 19 |
Class I | | | | | | | | | | | | | | | | | | | | | | | | | | | | | | | | | | | | |
03-10-2008(5) - 12-31-08 | | 10.00 | | 0.24 | · | | (2.76 | ) | | (2.52 | ) | | — | | — | | — | | — | | 7.48 | | (25.20 | ) | | 0.12 | | 0.12 | | 0.12 | | 3.87 | | 170 | | 19 |
Class S | | | | | | | | | | | | | | | | | | | | | | | | | | | | | | | | | | | | |
03-10-2008(5) - 12-31-08 | | 10.00 | | 0.37 | · | | (2.90 | ) | | (2.53 | ) | | — | | — | | — | | — | | 7.47 | | (25.30 | ) | | 0.37 | | 0.37 | | 0.37 | | 6.06 | | 4,038 | | 19 |
Class T | | | | | | | | | | | | | | | | | | | | | | | | | | | | | | | | | | | | |
03-10-2008(5) - 12-31-08 | | 10.00 | | 0.05 | | | (2.61 | ) | | (2.56 | ) | | — | | — | | — | | — | | 7.44 | | (25.60 | ) | | 0.87 | | 0.82 | | 0.82 | | 0.64 | | 2 | | 19 |
| | | | | | | | | | | | | | | | |
ING Index Solution 2045 Portfolio | | | | | | | | | | | | | | | | | | | | | | | | | | | | | | | | | | | | |
Class ADV | | | | | | | | | | | | | | | | | | | | | | | | | | | | | | | | | | | | |
03-10-2008(5) - 12-31-08 | | 10.00 | | 0.24 | · | | (3.13 | ) | | (2.89 | ) | | — | | — | | — | | — | | 7.11 | | (28.90 | ) | | 0.62 | | 0.62 | | 0.62 | | 3.81 | | 3,069 | | 12 |
Class I | | | | | | | | | | | | | | | | | | | | | | | | | | | | | | | | | | | | |
03-10-2008(5) - 12-31-08 | | 10.00 | | 0.20 | · | | (3.06 | ) | | (2.86 | ) | | — | | — | | — | | — | | 7.14 | | (28.60 | ) | | 0.12 | | 0.12 | | 0.12 | | 3.32 | | 115 | | 12 |
Class S | | | | | | | | | | | | | | | | | | | | | | | | | | | | | | | | | | | | |
03-10-2008(5) - 12-31-08 | | 10.00 | | 0.28 | · | | (3.15 | ) | | (2.87 | ) | | — | | — | | — | | — | | 7.13 | | (28.70 | ) | | 0.37 | | 0.37 | | 0.37 | | 4.44 | | 1,772 | | 12 |
Class T | | | | | | | | | | | | | | | | | | | | | | | | | | | | | | | | | | | | |
03-10-2008(5) - 12-31-08 | | 10.00 | | 0.03 | | | (2.93 | ) | | (2.90 | ) | | — | | — | | — | | — | | 7.10 | | (29.00 | ) | | 0.87 | | 0.82 | | 0.82 | | 0.47 | | 2 | | 12 |
(1) | | Total return is calculated assuming reinvestment of all dividends and capital gain distributions at net asset value and does not reflect the effect of insurance contract charges. Total return for periods less than one year is not annualized. |
(2) | | Annualized for periods less than one year. |
(3) | | Expense ratios reflect operating expenses of a Portfolio. Expenses before reductions do not reflect amounts reimbursed by the Investment Adviser and/or Distributor or reductions from brokerage Commission Recapture arrangements or other expense offset arrangements and do not represent the amount paid by a Portfolio during periods when reimbursements or reductions occur. Expenses net of fee waivers reflect expenses after reimbursement by the Investment Adviser and/or Distributor but prior to reductions from brokerage Commission Recapture arrangements or other expense offset arrangements. Expenses net of all reductions represent the net expenses paid by a Portfolio. Net investment income (loss) is net of all such additions or reductions. |
(4) | | Expense ratios do not include expenses of Underlying Funds and do not include fees and expenses charged under the variable annuity contract or variable life insurance policy. |
(5) | | Commencement of operations. |
· | | Calculated using average number of shares outstanding throughout the period. |
See Accompanying Notes to Financial Statements
22
NOTES TO FINANCIAL STATEMENTSASOF DECEMBER 31, 2008
NOTE 1 — ORGANIZATION
Organization. ING Partners, Inc. (the “Fund”) is an open-end management investment company registered under the Investment Company Act of 1940, as amended (the “1940 Act”). It was incorporated under the laws of Maryland on May 7, 1997. The Articles of Incorporation permit the Fund to offer separate series, each of which has its own investment objective, policies and restrictions. The Fund currently consists of thirty-six Portfolios. The five Portfolios included in this report are: ING Index Solution Income Portfolio (“Index Solution Income”), ING Index Solution 2015 Portfolio (“Index Solution 2015”), ING Index Solution 2025 Portfolio (“Index Solution 2025”), ING Index Solution 2035 Portfolio (“Index Solution 2035”) and ING Index Solution 2045 Portfolio (“Index Solution 2045”) (each, a “Portfolio” and collectively, the “Portfolios”). With the exception of Index Solution Income, each Portfolio is structured and managed around a specific target retirement or financial goal date (“Target Date”). The investment objectives of the Portfolios are as follows: Index Solution Income — seeks to provide a combination of total return and stability of principal consistent with an asset allocation targeted to retirement; for each of Index Solution 2015, 2025, 2035 and 2045 Portfolios — until the day prior to the Target Date, the Portfolio will seek to provide total return consistent with an asset allocation targeted at retirement in approximately 2015, 2025, 2035 and 2045, respectively. On the Target Date, the investment objective will be to seek to provide a combination of total return and stability of principal consistent with an asset allocation targeted to retirement. When Index Solution 2015, 2025, 2035 and 2045 Portfolios reach their respective Target Date, they may be combined with the Index Solution Income, without a vote of shareholders, if approved by the Board of Directors (the “Board”). The Portfolios serve as an investment option in underlying variable insurance products offered by Direct Services LLC (“DSL” or “Investment Adviser”).
Shares of the Portfolios are currently being offered only to participating insurance companies for allocation to certain of their separate accounts established for the purpose of funding variable annuity contracts and variable life insurance policies issued by the participating insurance companies.
The Portfolios offer the following four classes: Adviser Class (“Class ADV”), Initial Class (“Class I”), Service Class (“Class S”) and Class T. The classes differ principally in applicable distribution and shareholder service fees. Shareholders of each class also bear certain expenses that pertain to that particular class. All shareholders bear the common expenses of the Portfolios and earn
income and realized gains/losses from the Portfolio pro rata based on the average daily net assets of each class, without discrimination between share classes. Common expenses of the Portfolios (including custodial asset-based fees, legal and audit fees, printing and mailing expenses, transfer agency out-of-pocket expenses, and fees and expenses of the independent trustees) are allocated to each Portfolio in proportion to its relative daily net assets. Expenses directly attributable to a particular Portfolio (including advisory, administration, custodial transaction-based, registration, other professional, distribution and/or service fees, certain taxes, and offering costs) are charged directly to that Portfolio. Differences in per share dividend rates generally result from differences in separate class expenses, including distribution and shareholder service fees, if applicable.
Each Portfolio seeks to achieve its investment objective by investing in other ING Funds (“Underlying Funds”) and uses asset allocation strategies to determine how much to invest in the Underlying Funds.
NOTE 2 — SIGNIFICANT ACCOUNTING POLICIES
The following significant accounting policies are consistently followed by the Portfolios in the preparation of their financial statements. Such policies are in conformity with U.S. generally accepted accounting principles for investment companies.
| A. | Security Valuation. The valuation of each Portfolio’s investments in its Underlying Funds is based on the net asset values of the Underlying Funds each business day. |
Effective for fiscal years beginning after November 15, 2007, Financial Accounting Standards Board (“FASB”) Statement of Financial Accounting Standards No. 157, “Fair Value Measurements”, establishes a hierarchy for measuring fair value of assets and liabilities. As required by the standard, each investment asset or liability of the Portfolios is assigned a level at measurement date based on the significance and source of the inputs to its valuation. Quoted prices in active markets for identical securities are classified as “Level 1”, inputs other than quoted prices for an asset that are observable are classified as “Level 2” and unobservable inputs, including the investment-adviser’s judgment about the assumptions that a market participant would use in pricing an asset or liability are classified as “Level 3”. The inputs used for valuing securities are not necessarily an indication of the risks associated with investing in those securities. A table
23
NOTES TO FINANCIAL STATEMENTSASOF DECEMBER 31, 2008 (CONTINUED)
NOTE 2 — SIGNIFICANT ACCOUNTING POLICIES (continued)
summarizing the Portfolios’ investments under these levels of classification is included following each portfolios Portfolio of Investments.
Effective for fiscal years and interim periods ending after November 15, 2008, the FASB issued FASB Staff Position (“FSP”) No. FAS 133-1 and FASB Interpretation Number (“FIN”) 45-4, “Disclosures about Credit Derivatives and Certain Guarantees: An Amendment of FASB Statement No. 133 and FASB Interpretation No. 45; and Clarification of the Effective Date of FASB Statement No. 161.” The amendments to FAS 133 require enhanced disclosure regarding credit derivatives sold, including (1) the nature and terms of the credit derivative, reasons for entering into the credit derivative, the events or circumstances that would require the seller to perform under the credit derivative, and the current status of the payment/performance risk of the credit derivative, (2) the maximum potential amount of future payments (undiscounted) the seller could be required to make under the credit derivative, (3) the fair value of the credit derivative, and (4) the nature of any recourse provisions and assets held either as collateral or by third parties. The amendments to FIN 45 require additional disclosures about the current status of the payment/performance risk of a guarantee. All changes to accounting policies will be made in accordance with the FSP and will be incorporated for the relevant period as part of the Notes to Financial Statements and Portfolio of Investments, if applicable.
| B. | Security Transactions and Revenue Recognition. Security transactions are accounted for on trade date. Dividend income received from the affiliated funds is recognized on the ex-dividend date and is recorded as income distributions in the Statement of Operations. Capital gain distributions received from the affiliated funds are recognized on ex-dividend date and are recorded on the Statement of Operations as such. Costs used in determining realized gains and losses on the sales of investment securities are on the basis of specific identification. |
| C. | Distributions to Shareholders. The Portfolios record distributions to their shareholders on the ex-dividend date. Each Portfolio distributes dividends and capital gains, if any, annually. The Portfolios may make distributions on a more frequent basis to comply with the distribution requirements of the Internal Revenue Code. The characteristics of income and gains to be distributed are determined in accordance with |
| | income tax regulations, which may differ from U.S. generally accepted accounting principles for investment companies. |
| D. | Federal Income Taxes. It is the policy of the Portfolios to comply with subchapter M of the Internal Revenue Code and related excise tax provisions applicable to regulated investment companies and to distribute substantially all of their net investment income and any net realized capital gains to their shareholders. Therefore, no federal income tax provision is required. Management has considered the sustainability of the Portfolios’ tax positions taken on federal income tax returns for all open tax years in making this determination. No capital gain distributions shall be made until any capital loss carryforwards have been fully utilized or expired. |
| E. | Use of Estimates. The preparation of financial statements in conformity with U.S. generally accepted accounting principles requires management to make estimates and assumptions that affect the reported amounts of assets and liabilities and disclosure of contingent assets and liabilities at the date of the financial statements and the reported amounts of increases and decreases in net assets from operations during the reporting period. Actual results could differ from those estimates. |
| F. | Repurchase Agreements. Certain Underlying Funds may invest in repurchase agreements only with government securities dealers recognized by the Board of Governors of the Federal Reserve System. Under such agreements, the seller of the security agrees to repurchase it at a mutually agreed upon time and price. The resale price is in excess of the purchase price and reflects an agreed upon interest rate for the period of time the agreement is outstanding. The period of the repurchase agreements is usually short, from overnight to one week, while the underlying securities generally have longer maturities. An Underlying Fund will receive as collateral securities acceptable to it whose market value is equal to at least 100% of the carrying amount of the repurchase agreements, plus accrued interest, being invested by the Underlying Fund. The underlying collateral is valued daily on a mark to market basis to assure that the value, including accrued interest is at least equal to the repurchase price. There would be potential loss to the Underlying Fund in the event the Underlying Fund is delayed or prevented from exercising its right to dispose of the collateral, and it might incur disposition costs in liquidating the collateral. |
| G. | Indemnifications. In the normal course of business, the Fund may enter into contracts that provide |
24
NOTES TO FINANCIAL STATEMENTSASOF DECEMBER 31, 2008 (CONTINUED)
NOTE 2 — SIGNIFICANT ACCOUNTING POLICIES (continued)
| | certain indemnifications. The Fund’s maximum exposure under these arrangements is dependent on future claims that may be made against the Portfolios and, therefore, cannot be estimated; however, based on experience, the risk of loss from such claims is considered remote. |
NOTE 3 — INVESTMENT ADVISER AND ADMINISTRATIVE SERVICE FEES
The Portfolios each have entered into an investment management agreement with the Investment Adviser. For its services, each Portfolio pays the Investment Adviser a monthly fee in arrears equal to 0.10% of each Portfolio’s average daily net assets during the month.
ING Investment Management Co. (the “Consultant”) is a consultant to the Investment Adviser. DSL pays the Consultant a consulting fee of 0.03% based on the average daily net assets of each Portfolio. Both the Investment Adviser and the Consultant are indirect, wholly-owned subsidiaries of ING Groep N.Y. (“ING Groep”).
The Consultant will provide tactical allocation recommendations to the Investment Adviser. The Investment Adviser has set up an Investment Committee made up of a team of professionals to consider, review and implement the recommendations of the Consultant, and will retain discretion over implementation of the Consultant’s recommendations. The Consultant will provide ongoing recommendations to the Investment Committee of the Investment Adviser quarterly or as warranted by market conditions.
ING Groep is a global financial institution of Dutch origin offering banking, investments, life insurance and retirement services to over 75 million private, corporate and institutional clients in more than 50 countries. With a diverse workforce of about 125,000 people, ING Groep comprises a broad spectrum of prominent companies that increasingly serve their clients under the ING brand.
On October 19, 2008, ING Groep announced that it reached an agreement with the Dutch government to strengthen its capital position, creating a strong buffer to navigate the current market and economic environment. ING Groep will issue non-voting core Tier-1 securities for a total consideration of EUR 10 billion to the Dutch State. The transaction boosts ING Bank’s core Tier-1 ratio, strengthens the insurance balance sheet and reduces ING Groep’s Debt/Equity ratio.
Under an Administrative Services Agreement between the Portfolios and ING Fund Services, LLC (“IFS”), an
indirect, wholly-owned subsidiary of ING Groep, IFS provides all administrative services necessary for the Portfolios’ operations and is responsible for the supervision of the Portfolios’ other service providers. IFS also assumes all ordinary recurring direct costs of the Portfolios, such as custodian fees, director fees, transfer agency fees and accounting fees. As compensation for these services, IFS receives a monthly fee from each portfolio at an annual rate of 0.02% based on the average daily net assets of each Portfolio.
NOTE 4 — INVESTMENTS IN AFFILIATED UNDERLYING FUNDS
For the period ended December 31, 2008, the cost of purchases and the proceeds from sales of the Underlying Funds were as follows:
| | | | | | |
| | | Non U.S. Government |
| | | Purchases | | Sales |
Index Solution Income | | $ | 4,849,054 | | $ | 640,187 |
Index Solution 2015 | | | 15,603,924 | | | 1,716,777 |
Index Solution 2025 | | | 19,374,856 | | | 824,675 |
Index Solution 2035 | | | 15,112,930 | | | 684,667 |
Index Solution 2045 | | | 6,053,116 | | | 223,812 |
NOTE 5 — DISTRIBUTION AND SERVICE FEES
Class ADV and Class T of the Portfolios have adopted a Plan of Distribution pursuant to Rule 12b-1 under the 1940 Act (the “12b-1 Plans”), whereby ING Funds Distributor, LLC (the “Distributor” or “IFD”), an indirect, wholly-owned subsidiary of ING Groep, is reimbursed or compensated by the Portfolios for expenses incurred in the distribution of each Portfolio’s shares (“Distribution Fees”). The Distributor may pay, on behalf of each Portfolio, out of its distribution fee, compensation to certain financial institutions for providing distribution assistance pursuant to a Distribution Services Agreement. Under the Rule 12b-1 Plan, each Portfolio makes payments to IFD at an annual rate of 0.25% and 0.50% of the Portfolio’s average daily net assets attributable to its Class ADV and Class T shares, respectively. The Distributor has contractually agreed to waive a portion of its fee equal to 0.05% of each Portfolio’s average daily net assets attributable to the distribution fee paid by Class T shares, so that the actual fee paid is an annual rate of 0.45%. The expense waiver will continue through at least May 1, 2010.
The Fund has also adopted a Shareholder Servicing Plan (“Service Plan”) for the Classes ADV, S and T shares of each Portfolio. The Service Plan allows the Fund’s Distributor to enter into shareholder servicing agreements with insurance companies, broker dealers
25
NOTES TO FINANCIAL STATEMENTSASOF DECEMBER 31, 2008 (CONTINUED)
or other financial intermediaries that provide administrative services related to Classes ADV, S and T shares and their shareholders including Variable Contract owners or Qualified Plan participants with interests in the Portfolios. Under the Service Plan, each Portfolio makes payments to IFD at an annual rate of 0.25% of each Portfolio’s average daily net assets attributable to its Class ADV, S and T shares.
NOTE 6 — OTHER TRANSACTIONS WITH AFFILIATES AND RELATED PARTIES
At December 31, 2008, the Portfolios had the following amounts recorded in payable to affiliates on the accompanying Statements of Assets and Liabilities (see Note 5):
| | | | | | | | | | | | |
Fund | | Accrued Investment Management Fees | | Accrued Administrative Fees | | Accrued Shareholder Service and Distribution Fees | | Total |
Index Solution Income | | $ | 333 | | $ | 67 | | $ | 1,325 | | $ | 1,725 |
Index Solution 2015 | | | 985 | | | 197 | | | 4,066 | | | 5,248 |
Index Solution 2025 | | | 1,130 | | | 226 | | | 4,788 | | | 6,144 |
Index Solution 2035 | | | 926 | | | 185 | | | 3,755 | | | 4,866 |
Index Solution 2045 | | | 350 | | | 70 | | | 1,356 | | | 1,776 |
The Fund has adopted a Retirement Policy (“Policy”) covering all independent directors of the Fund who will have served as independent directors for at least five years at the time of retirement. Benefits under this Policy are based on an annual rate as defined in the Policy.
At December 31, 2008, the following indirect, wholly-owned subsidiaries of ING Groep owned more than 5% of the following Series:
ING Life Insurance and Annuity Company — Index Solution Income (94.11%); Index Solution 2015 (98.10%); Index Solution 2025 (98.80%); Index Solution 2035 (97.28%); Index Solution 2045 (94.08%).
Control is defined by the 1940 Act as the beneficial ownership, either directly or through one or more controlled companies, of more than 25% of the voting securities of a company. The 1940 Act defines affiliates as companies that are under common control.
Therefore, because the Portfolios have a common owner that owns over 25% of the outstanding securities of the Portfolios, they may be deemed to be affiliates of each other. Investment activities of these shareholders could have a material impact on the Portfolios.
NOTE 7 — EXPENSE LIMITATIONS
The Investment Adviser has agreed to limit expenses, excluding interest, taxes, brokerage commissions and extraordinary expenses to the levels listed below:
| | | | | | | | | | | | |
Portfolio(1) | | Class ADV | | | Class I | | | Class S | | | Class T | |
Index Solution Income | | 0.62 | % | | 0.12 | % | | 0.37 | % | | 0.82 | % |
Index Solution 2015 | | 0.62 | % | | 0.12 | % | | 0.37 | % | | 0.82 | % |
Index Solution 2025 | | 0.62 | % | | 0.12 | % | | 0.37 | % | | 0.82 | % |
Index Solution 2035 | | 0.62 | % | | 0.12 | % | | 0.37 | % | | 0.82 | % |
Index Solution 2045 | | 0.62 | % | | 0.12 | % | | 0.37 | % | | 0.82 | % |
(1) | The operating expense limits apply only at the Portfolio level and do not limit the fees payable by the underlying investment companies in which the Portfolios invest. |
The Investment Adviser may at a later date recoup from a Portfolio management fees waived and other expenses assumed by the Investment Adviser during the previous 36 months, but only if, after such recoupment, the Portfolio’s expense ratio does not exceed the percentage described above. Waived and reimbursed fees and any recoupment by the Investment Adviser of such waived and reimbursed fees are reflected on the accompanying Statements of Operations for each Portfolio.
As of December 31, 2008, the Portfolios did not have any waived or reimbursed fees subject to recoupment.
Outstanding reimbursement balances due to the Portfolios, if any, under their respective expense limitation agreements are reflected in Reimbursement Due from Manager on the accompanying Statements of Assets and Liabilities.
The expense limitation agreement is contractual and shall renew automatically for one-year terms unless the Investment Adviser provides written notice of the termination of the expense limitation agreement within 90 days of the end of the then current term.
26
NOTE 5 — DISTRIBUTION AND SERVICE FEES (continued)
NOTES TO FINANCIAL STATEMENTSASOF DECEMBER 31, 2008 (CONTINUED)
NOTE 8 — CAPITAL SHARES
Transactions in capital shares and dollars were as follows:
| | | | | | | | | | | | | | | | |
| | | Shares sold | | Shares
redeemed | | | Net increase
(decrease) in
shares
outstanding | | | | Shares sold | | Shares
redeemed | | | Net increase
(decrease) in
shares
outstanding |
Year or period ended | | # | | # | | | # | | | | ($) | | ($) | | | ($) |
Index Solution Income | | | | | | | | | | | | | | | | |
Class ADV | | | | | | | | | | | | | | | | |
03-10-08(1) - 12-31-08 | | 317,801 | | (42,733 | ) | | 275,068 | | | | 2,996,269 | | (394,339 | ) | | 2,601,930 |
Class I | | | | | | | | | | | | | | | | |
03-10-08(1) - 12-31-08 | | 301 | | — | | | 301 | | | | 3,019 | | — | | | 3,019 |
Class S | | | | | | | | | | | | | | | | |
03-10-08(1) - 12-31-08 | | 192,409 | | (19,077 | ) | | 173,332 | | | | 1,735,854 | | (174,612 | ) | | 1,561,242 |
Class T | | | | | | | | | | | | | | | | |
03-10-08(1) - 12-31-08 | | 301 | | — | | | 301 | | | | 3,010 | | — | | | 3,010 |
Index Solution 2015 | | | | | | | | | | | | | | | | |
Class ADV | | | | | | | | | | | | | | | | |
03-10-08(1) - 12-31-08 | | 1,220,679 | | (167,631 | ) | | 1,053,048 | | | | 10,765,736 | | (1,394,872 | ) | | 9,370,864 |
Class I | | | | | | | | | | | | | | | | |
03-10-08(1) - 12-31-08 | | 27,994 | | (6,395 | ) | | 21,599 | | | | 274,028 | | (52,095 | ) | | 221,933 |
Class S | | | | | | | | | | | | | | | | |
03-10-08(1) - 12-31-08 | | 479,828 | | (12,283 | ) | | 467,545 | | | | 4,267,904 | | (112,796 | ) | | 4,155,108 |
Class T | | | | | | | | | | | | | | | | |
03-10-08(1) - 12-31-08 | | 301 | | — | | | 301 | | | | 3,010 | | — | | | 3,010 |
Index Solution 2025 | | | | | | | | | | | | | | | | |
Class ADV | | | | | | | | | | | | | | | | |
03-10-08(1) - 12-31-08 | | 1,641,480 | | (28,885 | ) | | 1,612,595 | | | | 13,818,340 | | (245,278 | ) | | 13,573,062 |
Class I | | | | | | | | | | | | | | | | |
03-10-08(1) - 12-31-08 | | 301 | | — | | | 301 | | | | 3,010 | | — | | | 3,010 |
Class S | | | | | | | | | | | | | | | | |
03-10-08(1) - 12-31-08 | | 609,599 | | (25,725 | ) | | 583,874 | | | | 5,017,716 | | (209,377 | ) | | 4,808,339 |
Class T | | | | | | | | | | | | | | | | |
03-10-08(1) - 12-31-08 | | 301 | | — | | | 301 | | | | 3,010 | | — | | | 3,010 |
Index Solution 2035 | | | | | | | | | | | | | | | | |
Class ADV | | | | | | | | | | | | | | | | |
03-10-08(1) - 12-31-08 | | 1,269,760 | | (43,067 | ) | | 1,226,693 | | | | 10,149,394 | | (353,813 | ) | | 9,795,581 |
Class I | | | | | | | | | | | | | | | | |
03-10-08(1) - 12-31-08 | | 24,099 | | (1,426 | ) | | 22,673 | | | | 231,351 | | (12,576 | ) | | 218,775 |
Class S | | | | | | | | | | | | | | | | |
03-10-08(1) - 12-31-08 | | 579,998 | | (39,116 | ) | | 540,882 | | | | 4,602,554 | | (333,463 | ) | | 4,269,091 |
Class T | | | | | | | | | | | | | | | | |
03-10-08(1) - 12-31-08 | | 301 | | — | | | 301 | | | | 3,010 | | — | | | 3,010 |
Index Solution 2045 | | | | | | | | | | | | | | | | |
Class ADV | | | | | | | | | | | | | | | | |
03-10-08(1) - 12-31-08 | | 441,434 | | (9,628 | ) | | 431,806 | | | | 3,665,156 | | (72,455 | ) | | 3,592,701 |
Class I | | | | | | | | | | | | | | | | |
03-10-08(1) - 12-31-08 | | 18,916 | | (2,766 | ) | | 16,150 | | | | 184,918 | | (19,173 | ) | | 165,745 |
Class S | | | | | | | | | | | | | | | | |
03-10-08(1) - 12-31-08 | | 249,731 | | (1,267 | ) | | 248,464 | | | | 2,021,928 | | (8,928 | ) | | 2,013,000 |
Class T | | | | | | | | | | | | | | | | |
03-10-08(1) - 12-31-08 | | 301 | | — | | | 301 | | | | 3,010 | | — | | | 3,010 |
(1) | | Commencement of operations |
27
NOTES TO FINANCIAL STATEMENTSASOF DECEMBER 31, 2008 (CONTINUED)
NOTE 9 — FEDERAL INCOME TAXES
The amount of distributions from net investment income and net realized capital gains are determined in accordance with federal income tax regulations, which may differ from U.S. generally accepted accounting principles for investment companies. These book/tax differences may be either temporary or permanent. Permanent differences are reclassified within the capital accounts based on their federal tax-basis treatment; temporary differences are not reclassified. Key differences include the treatment of short-term capital gains, foreign currency transactions, and wash sale deferrals. Distributions in excess of net investment income and/or net realized capital gains for tax purposes are reported as return of capital.
The following permanent tax differences have been reclassified as of December 31, 2008:
| | | | | | | | | | | |
| | | Paid-in
Capital | | | Undistributed
Net
Investment
Income | | Accumulated
Net Realized
Gains/
(Losses) | |
Index Solution Income | | $ | (11 | ) | | $ | 4,662 | | $ | (4,651 | ) |
Index Solution 2015 | | | (22 | ) | | | 9,268 | | | (9,246 | ) |
Index Solution 2025 | | | (24 | ) | | | 5,861 | | | (5,837 | ) |
Index Solution 2035 | | | (12 | ) | | | 2,883 | | | (2,871 | ) |
Index Solution 2045 | | | (19 | ) | | | 375 | | | (356 | ) |
Dividends paid by the Portfolios from net investment income and distributions of net realized short-term capital gains are, for federal income tax purposes, taxable as ordinary income to shareholders.
No dividends or distributions were made during the period ended December 31, 2008.
The tax-basis components of distributable earnings as of December 31, 2008 were:
| | | | | | | |
| | | Undistributed
Ordinary
Income | | Unrealized
Appreciation/
(Depreciation) | |
Index Solution Income | | $ | 46,922 | | $ | (62,320 | ) |
Index Solution 2015 | | | 143,728 | | | (884,100 | ) |
Index Solution 2025 | | | 163,846 | | | (1,434,021 | ) |
Index Solution 2035 | | | 140,603 | | | (1,077,886 | ) |
Index Solution 2045 | | | 53,759 | | | (869,814 | ) |
The Portfolios’ major tax jurisdictions are federal and Arizona. The earliest tax year that remains subject to examination by these jurisdictions is 2008.
NOTE 10 — OTHER ACCOUNTING PRONOUNCEMENTS
On March 19, 2008, the FASB issued Statement of Financial Accounting Standards No. 161 (“SFAS No. 161”), “Disclosure about Derivative Instruments and Hedging Activities.” This new accounting
statement requires enhanced disclosures about an entity’s derivative and hedging activities. Entities are required to provide enhanced disclosures about (a) how and why an entity invests in derivatives, (b) how derivatives are accounted for under SFAS No. 133, and (c) how derivatives affect an entity’s financial position, financial performance, and cash flows. SFAS No. 161 also requires enhanced disclosures regarding credit-risk-related contingent features of derivative instruments. SFAS No. 161 is effective for financial statements issued for fiscal years and interim periods beginning after November 15, 2008. As of December 31, 2008, management of the Portfolios is currently assessing the impact of the expanded financial statement disclosures that will result from adopting SFAS No. 161.
NOTE 11 — CONCENTRATION OF INVESTMENT RISK
The Portfolios are also affected by other kinds of risks, depending on the types of securities held or strategies used by an Underlying Fund.
Investment by Funds-of-Funds. Each of the Underlying Funds’ shares may be purchased by other investment companies. In some cases, an Underlying Fund may experience large inflows or redemptions due to allocations or rebalancing. While it is impossible to predict the overall impact of these transactions over time, there could be adverse effects on portfolio management. The Investment Adviser will monitor transactions by each Underlying Fund and will attempt to minimize any adverse effects on the Underlying Funds and the Portfolios as a result of these transactions. So long as an Underlying Fund accepts investments by other investment companies, it will not purchase securities of other investment companies, except to the extent permitted by the 1940 Act or under the terms of an exemptive order granted by the SEC.
Asset Allocation. Although asset allocation seeks to optimize returns given various levels of risk tolerance, you still may lose money and experience volatility. Market and asset class performance may differ in the future from the historical performance and the assumptions used to form the asset allocations for the Portfolios. Furthermore, the Investment Adviser’s allocation of a Portfolio’s assets may not anticipate market trends successfully. Assets will be allocated among Underlying Funds and markets based on judgments made by the Investment Adviser. There is a risk that the Portfolios may allocate assets to an asset class or market that underperforms other Underlying Funds. For example, a Portfolio may be underweighted
28
NOTES TO FINANCIAL STATEMENTSASOF DECEMBER 31, 2008 (CONTINUED)
NOTE 11 — CONCENTRATION OF INVESTMENT RISK (continued)
in assets or a market that is experiencing significant returns or overweighted in assets or a market with significant declines.
Foreign Securities: Investments in foreign securities may entail risks not present in domestic investments. Since securities in which an Underlying Fund may invest are denominated in foreign currencies, changes in the relationship of these foreign currencies to the U.S. dollar can significantly affect the value of the investments and earnings of the Underlying Funds. Foreign investments may also subject the Underlying Funds to foreign government exchange restrictions, expropriation, taxation or other political, social or economic developments, as well as changes vis-à-vis the U.S. dollar from movements in currency, and changes in security value and interest rate, all of which could affect the market and/or credit risk of the Underlying Funds’ investments.
NOTE 12 — INFORMATION REGARDING TRADING OF ING’S U.S. MUTUAL FUNDS
As discussed in earlier supplements that were previously filed with the SEC, DSL, the adviser to the ING Funds, has reported to the Boards of Directors/Trustees (the “Boards”) of the ING Funds that, like many U.S. financial services companies, DSL and certain of its U.S. affiliates have received informal and formal requests for information since September 2003 from various governmental and self-regulatory agencies in connection with investigations related to mutual funds and variable insurance products. DSL has advised the Boards that it and its affiliates have cooperated fully with each request.
In addition to responding to regulatory and governmental requests, DSL reported that management of U.S. affiliates of ING Groep N.V., including DSL (collectively, “ING”), on their own initiative, have conducted, through independent special counsel and a national accounting firm, an extensive internal review of trading in ING insurance, retirement, and mutual fund products. ING’s internal review related to mutual fund trading has been completed. ING has reported that, of the millions of customer relationships that ING maintains, the internal review identified several isolated arrangements allowing third parties to engage in frequent trading of mutual funds within ING’s variable insurance and mutual fund products, and identified other
circumstances where frequent trading occurred, despite measures taken by ING intended to combat market timing. ING further reported that each of these arrangements has been terminated and fully disclosed to regulators. The results of the internal review were also reported to the independent members of the Boards.
DSL has advised the Boards that most of the identified arrangements were initiated prior to ING’s acquisition of the businesses in question in the U.S. DSL further reported that the companies in question did not receive special benefits in return for any of these arrangements, which have all been terminated.
Based on the internal review, DSL has advised the Boards that the identified arrangements do not represent a systemic problem in any of the companies that were involved.
Despite the extensive internal review conducted through independent special counsel and a national accounting firm, there can be no assurance that the instances of inappropriate trading reported to the Boards are the only instances of such trading respecting the ING Funds.
DSL reported to the Boards that ING is committed to conducting its business with the highest standards of ethical conduct with zero tolerance for noncompliance. Accordingly, DSL advised the Boards that ING management was disappointed that its voluntary internal review identified these situations. Viewed in the context of the breadth and magnitude of its U.S. business as a whole, ING management does not believe that ING’s acquired companies had systemic ethical or compliance issues in these areas. Nonetheless, DSL reported that given ING’s refusal to tolerate any lapses, it has taken the steps noted below, and will continue to seek opportunities to further strengthen the internal controls of its affiliates.
| • | | ING has agreed with the ING Funds to indemnify and hold harmless the ING Funds from all damages resulting from wrongful conduct by ING or its employees or from ING’s internal investigation, any investigations conducted by any governmental or self-regulatory agencies, litigation or other formal proceedings, including any proceedings by the SEC. DSL reported to the Boards that the indemnification commitments made by ING Funds related to mutual fund trading have been settled and restitution amounts prepared by an independent consultant have been paid to the affected ING Funds. |
29
NOTES TO FINANCIAL STATEMENTSASOF DECEMBER 31, 2008 (CONTINUED)
NOTE 12 — INFORMATION REGARDING TRADING OF ING’S U.S. MUTUAL FUNDS (continued)
| • | | ING updated its Code of Conduct for employees reinforcing its employees’ obligation to conduct personal trading activity consistent with the law, disclosed limits, and other requirements. |
Other Regulatory Matters
The New York Attorney General and other federal and state regulators are also conducting broad inquiries and investigations involving the insurance industry. These initiatives currently focus on, among other things, compensation and other sales incentives; potential conflicts of interest; potential anti-competitive activity; reinsurance; marketing practices (including suitability); specific product types (including group annuities and indexed annuities); fund selection for investment products and brokerage sales; and disclosure. It is likely that the scope of these industry investigations will further broaden before they conclude. ING has received formal and informal requests in connection with such investigations, and is cooperating fully with each
request. In connection with one such investigation, affiliates of DSL were named in a petition for relief and cease and desist order filed by the New Hampshire Bureau of Securities Regulation concerning their administration of the New Hampshire state employees deferred compensation plan.
Other federal and state regulators could initiate similar actions in this or other areas of ING’s businesses. These regulatory initiatives may result in new legislation and regulation that could significantly affect the financial services industry, including businesses in which ING is engaged. In light of these and other developments, ING continuously reviews whether modifications to its business practices are appropriate. At this time, in light of the current regulatory factors, ING U.S. is actively engaged in reviewing whether any modifications in our practices are appropriate for the future.
There can be no assurance that these matters, or the adverse publicity associated with them, will not result in increased fund redemptions, reduced sale of fund shares, or other adverse consequences to ING Funds.
30
| | |
| ING INDEX SOLUTION INCOME PORTFOLIO | | PORTFOLIO OF INVESTMENTS ASOF DECEMBER 31, 2008 |
| | | | | | | | | |
| Shares | | | | | | | Value | |
| AFFILIATED INVESTMENT COMPANIES: 100.0% | |
| 40,878 | | ING International Index Portfolio - Class I | | | | | $ | 262,030 | |
| 285,084 | | ING Lehman Brothers U.S. Aggregate Bond Index Portfolio - Class I | | | | | | 2,885,051 | |
| 139,866 | | ING Russell Large Cap Index Portfolio - Class I | | | | | | 1,008,436 | |
| | | | | | | | | |
| | Total Investments in Affiliated Investment Companies
(Cost $4,163,691)* | | 100.0 | % | | $ | 4,155,517 | |
| | Other Assets and Liabilities - Net | | (0.0 | ) | | | (1,725 | ) |
| | | | | | | | | |
| | Net Assets | | 100.0 | % | | $ | 4,153,792 | |
| | | | | | | | | |
| * | Cost for federal income tax purposes is $4,217,837. |
| | | | | | |
Net unrealized depreciation consists of: | | | | | | |
Gross Unrealized Appreciation | | | | $ | 29,079 | |
Gross Unrealized Depreciation | | | | | (91,399 | ) |
| | | | | | |
Net Unrealized Depreciation | | | | $ | (62,320 | ) |
| | | | | | |
The following table summarizes the inputs used as of December 31, 2008 in determining the Portfolio’s investments at fair value for purposes of SFAS 157:
| | | | | | |
| | | Investments in Securities | | Other Financial Instruments* |
Level 1 — Quoted Prices | | $ | 4,155,517 | | | — |
Level 2 — Other Significant Observable Inputs | | | — | | | — |
Level 3 — Significant Unobservable Inputs | | | — | | | — |
| | | | | | |
Total | | $ | 4,155,517 | | $ | — |
| | | | | | |
“Fair value” for purposes of SFAS 157 is different from “fair value” as used in the 1940 Act. The former generally implies market value, and can include market quotations as a source of value, and the latter refers to determinations of actual value in absence of available market quotations.
| * | Other financial instruments may include forward foreign currency contracts, futures, swaps, and written options. Forward foreign currency contracts and futures are reported at their unrealized gain/loss at year end. Swaps and written options are reported at their market value at year end. |
See Accompanying Notes to Financial Statements
31
| | |
| ING INDEX SOLUTION 2015 PORTFOLIO | | PORTFOLIO OF INVESTMENTS ASOF DECEMBER 31, 2008 |
| | | | | | | | | |
| Shares | | | | | | | Value | |
| AFFILIATED INVESTMENT COMPANIES: 100.0% | |
| 251,899 | | ING International Index Portfolio - Class I | | | | | $ | 1,614,676 | |
| 569,659 | | ING Lehman Brothers U.S. Aggregate Bond Index Portfolio - Class I | | | | | | 5,764,952 | |
| 648,011 | | ING Russell Large Cap Index Portfolio - Class I | | | | | | 4,672,156 | |
| 61,629 | | ING Russell Mid Cap Index Portfolio - Class I | | | | | | 408,602 | |
| 71,662 | | ING Russell Small Cap Index Portfolio - Class I | | | | | | 555,383 | |
| | | | | | | | | |
| | Total Investments in Affiliated Investment Companies
(Cost $13,620,160)* | | 100.0 | % | | $ | 13,015,769 | |
| | Other Assets and Liabilities - Net | | (0.0 | ) | | | (5,248 | ) |
| | | | | | | | | |
| | Net Assets | | 100.0 | % | | $ | 13,010,521 | |
| | | | | | | | | |
| * | Cost for federal income tax purposes is $13,899,869. |
| | | | | | |
Net unrealized depreciation consists of: | | | | | | |
Gross Unrealized Appreciation | | | | $ | 140,921 | |
Gross Unrealized Depreciation | | | | | (1,025,021 | ) |
| | | | | | |
Net Unrealized Depreciation | | | | $ | (884,100 | ) |
| | | | | | |
The following table summarizes the inputs used as of December 31, 2008 in determining the Portfolio’s investments at fair value for purposes of SFAS 157:
| | | | | | |
| | | Investments in Securities | | Other Financial Instruments* |
Level 1 — Quoted Prices | | $ | 13,015,769 | | | — |
Level 2 — Other Significant Observable Inputs | | | — | | | — |
Level 3 — Significant Unobservable Inputs | | | — | | | — |
| | | | | | |
Total | | $ | 13,015,769 | | $ | — |
| | | | | | |
“Fair value” for purposes of SFAS 157 is different from “fair value” as used in the 1940 Act. The former generally implies market value, and can include market quotations as a source of value, and the latter refers to determinations of actual value in absence of available market quotations.
| * | Other financial instruments may include forward foreign currency contracts, futures, swaps, and written options. Forward foreign currency contracts and futures are reported at their unrealized gain/loss at year end. Swaps and written options are reported at their market value at year end. |
See Accompanying Notes to Financial Statements
32
| | |
| ING INDEX SOLUTION 2025 PORTFOLIO | | PORTFOLIO OF INVESTMENTS ASOF DECEMBER 31, 2008 |
| | | | | | | | | |
| Shares | | | | | | | Value | |
| AFFILIATED INVESTMENT COMPANIES: 100.0% | |
| 492,544 | | ING International Index Portfolio - Class I | | | | | $ | 3,157,205 | |
| 413,581 | | ING Lehman Brothers U.S. Aggregate Bond Index Portfolio - Class I | | | | | | 4,185,435 | |
| 1,083,700 | | ING Russell Large Cap Index Portfolio - Class I | | | | | | 7,813,475 | |
| 133,586 | | ING Russell Mid Cap Index Portfolio - Class I | | | | | | 885,676 | |
| 139,558 | | ING Russell Small Cap Index Portfolio - Class I | | | | | | 1,081,575 | |
| | | | | | | | | |
| | Total Investments in Affiliated Investment Companies
(Cost $18,453,966)* | | 100.0 | % | | $ | 17,123,366 | |
| | Other Assets and Liabilities - Net | | (0.0 | ) | | | (6,144 | ) |
| | | | | | | | | |
| | Net Assets | | 100.0 | % | | $ | 17,117,222 | |
| | | | | | | | | |
| * | Cost for federal income tax purposes is $18,557,387. |
| | | | | | |
Net unrealized depreciation consists of: | | | | | | |
Gross Unrealized Appreciation | | | | $ | 95,181 | |
Gross Unrealized Depreciation | | | | | (1,529,202 | ) |
| | | | | | |
Net Unrealized Depreciation | | | | $ | (1,434,021 | ) |
| | | | | | |
The following table summarizes the inputs used as of December 31, 2008 in determining the Portfolio’s investments at fair value for purposes of SFAS 157:
| | | | | | |
| | | Investments in Securities | | Other Financial Instruments* |
Level 1 — Quoted Prices | | $ | 17,123,366 | | | — |
Level 2 — Other Significant Observable Inputs | | | — | | | — |
Level 3 — Significant Unobservable Inputs | | | — | | | — |
| | | | | | |
Total | | $ | 17,123,366 | | $ | — |
| | | | | | |
“Fair value” for purposes of SFAS 157 is different from “fair value” as used in the 1940 Act. The former generally implies market value, and can include market quotations as a source of value, and the latter refers to determinations of actual value in absence of available market quotations.
| * | Other financial instruments may include forward foreign currency contracts, futures, swaps, and written options. Forward foreign currency contracts and futures are reported at their unrealized gain/loss at year end. Swaps and written options are reported at their market value at year end. |
See Accompanying Notes to Financial Statements
33
| | |
| ING INDEX SOLUTION 2035 PORTFOLIO | | PORTFOLIO OF INVESTMENTS ASOF DECEMBER 31, 2008 |
| | | | | | | | | |
| Shares | | | | | | | Value | |
| AFFILIATED INVESTMENT COMPANIES: 100.0% | |
| 509,111 | | ING International Index Portfolio - Class I | | | | | $ | 3,263,401 | |
| 191,998 | | ING Lehman Brothers U.S. Aggregate Bond Index Portfolio - Class I | | | | | | 1,943,016 | |
| 802,561 | | ING Russell Large Cap Index Portfolio - Class I | | | | | | 5,786,464 | |
| 165,936 | | ING Russell Mid Cap Index Portfolio - Class I | | | | | | 1,100,155 | |
| 162,709 | | ING Russell Small Cap Index Portfolio - Class I | | | | | | 1,260,992 | |
| | | | | | | | | |
| | Total Investments in Affiliated Investment Companies
(Cost $14,323,451)* | | 100.0 | % | | $ | 13,354,028 | |
| | Other Assets and Liabilities - Net | | (0.0 | ) | | | (4,866 | ) |
| | | | | | | | | |
| | Net Assets | | 100.0 | % | | $ | 13,349,162 | |
| | | | | | | | | |
| * | Cost for federal income tax purposes is $14,431,914. |
| | | | | | |
Net unrealized depreciation consists of: | | | | | | |
Gross Unrealized Appreciation | | | | $ | 50,752 | |
Gross Unrealized Depreciation | | | | | (1,128,638 | ) |
| | | | | | |
Net Unrealized Depreciation | | | | $ | (1,077,886 | ) |
| | | | | | |
The following table summarizes the inputs used as of December 31, 2008 in determining the Portfolio’s investments at fair value for purposes of SFAS 157:
| | | | | | |
| | | Investments in Securities | | Other Financial Instruments* |
Level 1 — Quoted Prices | | $ | 13,354,028 | | | — |
Level 2 — Other Significant Observable Inputs | | | — | | | — |
Level 3 — Significant Unobservable Inputs | | | — | | | — |
| | | | | | |
Total | | $ | 13,354,028 | | $ | — |
| | | | | | |
“Fair value” for purposes of SFAS 157 is different from “fair value” as used in the 1940 Act. The former generally implies market value, and can include market quotations as a source of value, and the latter refers to determinations of actual value in absence of available market quotations.
| * | Other financial instruments may include forward foreign currency contracts, futures, swaps, and written options. Forward foreign currency contracts and futures are reported at their unrealized gain/loss at year end. Swaps and written options are reported at their market value at year end. |
See Accompanying Notes to Financial Statements
34
| | |
| ING INDEX SOLUTION 2045 PORTFOLIO | | PORTFOLIO OF INVESTMENTS ASOF DECEMBER 31, 2008 |
| | | | | | | | | |
| Shares | | | | | | | Value | |
| AFFILIATED INVESTMENT COMPANIES: 100.0% | |
| 257,850 | | ING International Index Portfolio - Class I | | | | | $ | 1,652,816 | |
| 23,611 | | ING Lehman Brothers U.S. Aggregate Bond Index Portfolio - Class I | | | | | | 238,941 | |
| 255,235 | | ING Russell Large Cap Index Portfolio - Class I | | | | | | 1,840,241 | |
| 84,087 | | ING Russell Mid Cap Index Portfolio - Class I | | | | | | 557,494 | |
| 86,538 | | ING Russell Small Cap Index Portfolio - Class I | | | | | | 670,666 | |
| | | | | | | | | |
| | Total Investments in Affiliated Investment Companies
(Cost $5,770,717) * | | 100.0 | % | | $ | 4,960,158 | |
| | Other Assets and Liabilities - Net | | (0.0 | ) | | | (1,776 | ) |
| | | | | | | | | |
| | Net Assets | | 100.0 | % | | $ | 4,958,382 | |
| | | | | | | | | |
| * | Cost for federal income tax purposes is $5,829,972. |
| | | | | | |
Net unrealized depreciation consists of: | | | | | | |
Gross Unrealized Appreciation | | | | $ | 5,613 | |
Gross Unrealized Depreciation | | | | | (875,427 | ) |
| | | | | | |
Net Unrealized Depreciation | | | | $ | (869,814 | ) |
| | | | | | |
The following table summarizes the inputs used as of December 31, 2008 in determining the Portfolio’s investments at fair value for purposes of SFAS 157:
| | | | | | |
| | | Investments in Securities | | Other Financial Instruments* |
Level 1 — Quoted Prices | | $ | 4,960,158 | | | — |
Level 2 — Other Significant Observable Inputs | | | — | | | — |
Level 3 — Significant Unobservable Inputs | | | — | | | — |
| | | | | | |
Total | | $ | 4,960,158 | | $ | — |
| | | | | | |
“Fair value” for purposes of SFAS 157 is different from “fair value” as used in the 1940 Act. The former generally implies market value, and can include market quotations as a source of value, and the latter refers to determinations of actual value in absence of available market quotations.
| * | Other financial instruments may include forward foreign currency contracts, futures, swaps, and written options. Forward foreign currency contracts and futures are reported at their unrealized gain/loss at year end. Swaps and written options are reported at their market value at year end. |
See Accompanying Notes to Financial Statements
35
DIRECTOR AND OFFICER INFORMATION (UNAUDITED)
The business and affairs of the Fund are managed under the direction of the Fund’s Board. A Director who is not an interested person of the Fund, as defined in the 1940 Act, is an independent director (“Independent Director”). The Directors and Officers of the Fund are listed below. The Statement of Additional Information includes additional information about directors of the Fund and is available, without charge, upon request at (800) 992-0180.
| | | | | | | | | | |
Name, Address, and Age | | Position(s) held with
the Fund | | Term of Office and Length of Time Served(1) | | Principal Occupation(s) during the Past 5 Years | | Number of Portfolios in Fund Complex Overseen by Trustee(2) | | Other Directorships/ Trusteeships
held by Director |
Independent Directors: | | | | | | | | | | |
| | | | | |
Colleen D. Baldwin
7337 E. Doubletree Ranch Rd.
Scottsdale, Arizona 85258
Age: 48 | | Director | | November 2007 -Present | | President, National Charity League/Canaan Parish Board (June 2008 - Present) and Consultant (January 2005 - Present). Formerly, Chief Operating Officer, Ivy Asset Management Group (April 2002 - October 2004) | | 161 | | None |
| | | | | |
John V. Boyer(4)
7337 E. Doubletree Ranch Rd.
Scottsdale, Arizona 85258
Age: 55 | | Director | | November 1997 - Present | | President, Bechtler Arts Foundation (March 2008 - Present). Formerly, Consultant (July 2007 - February 2008); President and Chief Executive Officer, Franklin and Eleanor Roosevelt Institute (March 2006 - July 2007); and Executive Director, The Mark Twain House & Museum (September 1989 - November 2005). | | 161 | | None |
| | | | | |
Patricia W. Chadwick
7337 E. Doubletree Ranch Rd.
Scottsdale, Arizona 85258
Age: 60 | | Director | | January 2006 - Present | | Consultant and President of self-owned company, Ravengate Partners LLC (January 2000 - Present). | | 161 | | Wisconsin Energy Corporation (June 2006 - Present). |
| | | | | |
Peter S. Drotch
7337 E. Doubletree Ranch Rd.
Scottsdale, Arizona 85258
Age: 66 | | Director | | November 2007 - Present | | Retired partner, PricewaterhouseCoopers, LLP. | | 161 | | First Marblehead Corporation (September 2003 - Present). |
| | | | | |
J. Michael Earley
7337 E. Doubletree Ranch Rd.
Scottsdale, Arizona 85258
Age: 63 | | Director | | January 2005 - Present | | Retired. Formerly, President and Chief Executive Officer, Bankers Trust Company, N.A., Des Moines (June 1992 - December 2008). | | 161 | | Bankers Trust Company, N.A. (June 1992 - Present) and Midamerica Financial Corporation (December 2002 - Present). |
| | | | | |
Patrick W. Kenny
7337 E. Doubletree Ranch Rd.
Scottsdale, Arizona 85258
Age: 65 | | Director | | March 2002 - Present | | President and Chief Executive Officer, International Insurance Society (June 2001 - Present). | | 161 | | Assured Guaranty Ltd. (April 2004 - Present) and Odyssey Re Holdings Corporation (November 2006 - Present). |
| | | | | |
Sheryl K. Pressler
7337 E. Doubletree Ranch Rd.
Scottsdale, Arizona 85258
Age: 58 | | Director | | January 2006 - Present | | Consultant (May 2001 - Present). | | 161 | | Global Alternative Asset Management, Inc. (October 2007 - Present) and Stillwater Mining Company (May 2002 - Present). |
| | | | | |
Roger B. Vincent
7337 E. Doubletree Ranch Rd.
Scottsdale, Arizona 85258
Age: 63 | | Director | | January 2005 - Present | | President, Springwell Corporation (March 1989 - Present). | | 161 | | UGI Corporation (February 2006 - Present) and UGI Utilities, Inc. (February 2006 - Present). |
36
DIRECTOR AND OFFICER INFORMATION (UNAUDITED) (CONTINUED)
| | | | | | | | | | |
Name, Address, and Age | | Position(s) held with
the Fund | | Term of Office and Length of Time Served(1) | | Principal Occupation(s) during the Past 5 Years | | Number of Portfolios in Fund Complex Overseen by Trustee(2) | | Other Directorships/ Trusteeships
held by Director |
Directors who are “Interested Persons”: | | | | | | | | |
| | | | | |
Robert W. Crispin(5)
7337 E. Doubletree Ranch Rd.
Scottsdale, Arizona 85258
Age: 62 | | Director | | November 2007 - Present | | Retired. Chairman and Chief Investment Officer, ING Investment Management Co. (June 2001 - December 2007). | | 161 | | ING Canada Inc. (December 2004 - Present) and ING Bank, fsb (June 2001 - Present). |
| | | | | |
Shaun P. Mathews(3)(5)
7337 E. Doubletree Ranch Rd.
Scottsdale, Arizona 85258
Age: 53 | | Director | | November 2007 - Present | | President and Chief Executive Officer, ING Investments, LLC(5) (November 2006 - Present). Formerly, President, ING Mutual Funds and Investment Products (November 2004 - November 2006); Chief Marketing Officer, ING USFS (April 2002 - October 2004); and Head of Rollover/Payout (October 2001 - December 2003). | | 200 | | ING Services Holding Company, Inc. (May 2000 - Present); Southland Life Insurance Company (June 2002 - Present); and ING Capital Corporation, LLC, ING Funds Distributor, LLC(6), ING Funds Services, LLC(7), ING Investments, LLC(5) and ING Pilgrim Funding, Inc. (December 2006 - Present). |
(1) | | Directors serve until their successors are duly elected and qualified. The tenure of each Director is subject to the Board’s retirement policy, which states that each Independent Director shall retire from service as a Trustee at the conclusion of the first regularly scheduled meeting of the Board that is held after (a) the Director reaches the age of 70, if that Director qualifies for a retirement benefit as discussed in the board’s retirement policy; or (b) the Director reaches the age of 72 or has served as a Director for 15 years, whichever comes first, if that Director does not qualify for the retirement benefit. A unanimous vote of the Board may extend the retirement date of a Director for up to one year. An extension may be permitted if the retirement would trigger a requirement to hold a meeting of shareholders of the Fund under applicable law, whether for purposes of appointing a successor to the Director or if otherwise necessary under applicable law, in which case the extension would apply until such time as the shareholder meeting can be held or is no longer needed. |
(2) | | For the purposes of this table (except for Mr. Mathews), “Fund Complex” means the following investment companies: ING Asia Pacific High Dividend Equity Income Fund, ING Equity Trust; ING Funds Trust; ING Global Equity Dividend and Premium Opportunity Fund; ING Global Advantage and Premium Opportunity Fund; ING International High Dividend Equity Income Fund; ING Investors Trust; ING Mayflower Trust; ING Mutual Funds; ING Prime Rate Trust; ING Risk Managed Natural Resources Fund; ING Senior Income Fund; ING Separate Portfolios Trust; ING Variable Insurance Trust; ING Variable Products Trust; and ING Partners, Inc. |
(3) | | For Mr. Mathews, the Fund Complex also includes the following investment companies: ING Series Fund, Inc.; ING Strategic Allocation Portfolios, Inc.; ING Variable Funds; ING Variable Portfolios, Inc.; ING VP Balanced Portfolio, Inc.; ING VP Intermediate Bond Portfolio; and ING VP Money Market Portfolio. |
(4) | | Mr. Boyer held a seat on the Board of Directors of The Mark Twian House & Museum from September 1989 to November 2005. ING Groep N.V. makes non-material, charitable contributions to The Mark Twain House & Museum. |
(5) | | Messrs. Mathews and Crispin are deemed to be “interested persons” of the Fund as defined in the 1940 Act because of their relationship with ING Groep, N.V., the parent corporation of the Manager, ING Investment Manager. |
(6) | | ING Investments, LLC was previously named ING Pilgrim Investments, LLC. ING Pilgrim Investments, LLC is the successor in interest to ING Pilgrim Investments, Inc., which was previously known as Pilgrim Investments, Inc. and before that was known as Pilgrim America Investments, Inc. |
(7) | | ING Funds Distributor, LLC is the successor in interest to ING Funds Distributor, Inc., which was previously known as ING Pilgrim Securities, Inc., and before that was known as Pilgrim Securities, Inc., and before that was known as Pilgrim America Securities, Inc. |
(8) | | ING Funds Services, LLC was previously named ING Pilgrim Group, LLC. ING Pilgrim Group, LLC is the successor in interest to ING Pilgrim Group, Inc., which was previously known as Pilgrim Group, Inc. and before that was known as Pilgrim America Group, Inc. |
37
DIRECTOR AND OFFICER INFORMATION (UNAUDITED) (CONTINUED)
| | | | | | |
Name, Address and Age | | Position(s) Held with the Fund | | Term of Office and Length of Time Served(1) | | Principal Occupation(s) during the Past 5 Years |
Officers: | | | | | | |
| | | |
Shaun P. Mathews(5)
7337 East Doubletree Ranch Rd.
Scottsdale, Arizona 85258
Age: 53 | | President and Chief Executive Officer | | November 2006 - Present | | President and Chief Executive Officer, ING Investments, LLC (November 2006 - Present). Formerly, President, ING Mutual Funds and Investment Products (November 2004 - November 2006); Chief Marketing Officer, ING USFS (April 2002 - October 2004); and Head of Rollover/Payout (October 2001 - December 2003). |
| | | |
Michael J. Roland
7337 East Doubletree Ranch Rd.
Scottsdale, Arizona 85258
Age: 50 | | Executive Vice President | | January 2005 - Present | | Head of Mutual Fund Platform (February 2007 - Present) and Executive Vice President, ING Investments, LLC(2) and ING Funds Services, LLC(3) (December 2001 - Present). Formerly, Executive Vice President, Head of Product Management (January 2005 - January 2007); Chief Compliance Officer, ING Investments, LLC(2) and Directed Services LLC(6) (October 2004 - December 2005); and Chief Financial Officer and Treasurer, ING Investments, LLC(2) (December 2001 - March 2005). |
| | | |
Stanley D. Vyner
230 Park Avenue
New York, New York 10169
Age: 58 | | Executive Vice President | | January 2005 - Present | | Executive Vice President, ING Investments, LLC(2) (July 2000 - Present) and Chief Investment Risk Officer, ING Investments, LLC(2) (January 2003 - Present). |
| | | |
Joseph M. O’Donnell
7337 East Doubletree Ranch Rd.
Scottsdale, Arizona 85258
Age: 54 | | Executive Vice President and Chief Compliance Officer | | March 2006 - Present January 2005 - Present | | Chief Compliance Officer of the ING Funds (November 2004 - Present) and Executive Vice President of the ING Funds (March 2006 - Present). Formerly, Chief Compliance Officer of ING Investments, LLC(2) (March 2006 - July 2008); Investment Advisor Chief Compliance Officer, Directed Services LLC(6) (March 2006 - July 2008) ING Life Insurance and Annuity Company (March 2006 - December 2006); and Vice President, Chief Legal Counsel, Chief Compliance Officer and Secretary of Atlas Securities, Inc., Atlas Advisers, Inc. and Atlas Funds (October 2001 - October 2004). |
| | | |
Todd Modic
7337 East Doubletree Ranch Rd.
Scottsdale, Arizona 85258
Age: 41 | | Senior Vice President, Chief/Principal Financial Officer and Assistant Secretary | | March 2005 - Present | | Senior Vice President, ING Funds Services, LLC(3) (March 2005 - Present). Formerly, Vice President, ING Funds Services, LLC(3) (September 2002 - March 2005). |
| | | |
Kimberly A. Anderson
7337 East Doubletree Ranch Rd.
Scottsdale, Arizona 85258
Age: 44 | | Senior Vice President | | January 2005 - Present | | Senior Vice President, ING Investments, LLC(2) (October 2003 - Present). |
| | | |
Robert Terris
7337 East Doubletree Ranch Rd.
Scottsdale, Arizona 85258
Age: 38 | | Senior Vice President | | May 2006 - Present | | Senior Vice President, Head of Division Operations, ING Funds Services, LLC(3) (May 2006 - Present). Formerly, Vice President of Administration, ING Funds Services, LLC(3) (October 2001 - March 2006). |
| | | |
Ernest J. C’DeBaca
7337 East Doubletree Ranch Rd.
Scottsdale, Arizona 85258
Age: 39 | | Senior Vice President | | May 2006 - Present | | Chief Compliance Officer, ING Investments, LLC(2) (July 2008 - Present); Investment Advisor Chief Compliance Officer, Directed Services LLC(6) (July 2008 - Present); Head of Retail Compliance, ING Funds Distributor, LLC(4) and ING Funds Services, LLC(3), (July 2008 - Present); and Senior Vice President, ING Investments, LLC(2) (December 2006 - Present), ING Funds Services, LLC(3) (April 2006 - Present), ING Funds Distributor, LLC(4) (July 2008 - Present), and Directed Services LLC(6) (July 2008 - Present). Formerly, Counsel, ING Americas, U.S. Legal Services (January 2004 - March 2006) and Attorney-Adviser, U.S. Securities and Exchange Commission (May 2001 - December 2003). |
| | | |
Robyn L. Ichilov
7337 East Doubletree Ranch Rd.
Scottsdale, Arizona 85258
Age: 41 | | Vice President and Treasurer | | January 2005 - Present | | Vice President and Treasurer, ING Funds Services, LLC(3) (November 1995 - Present) and ING Investments, LLC(2) (August 1997 - Present). |
| | | |
Lauren D. Bensinger
7337 East Doubletree Ranch Rd.
Scottsdale, Arizona 85258
Age: 54 | | Vice President | | January 2005 - Present | | Vice President and Chief Compliance Officer, ING Funds Distributor, LLC(4) (August 1995 - Present); Vice President, ING Investments, LLC(2) and ING Funds Services, LLC(3) (February 1996 - Present); and Director of Compliance, ING Investments, LLC(2) (October 2004 - Present). Formerly, Chief Compliance Officer, ING Investments, LLC(2) (October 2001 - October 2004). |
38
DIRECTOR AND OFFICER INFORMATION (UNAUDITED) (CONTINUED)
| | | | | | |
Name, Address and Age | | Position(s) Held with the Fund | | Term of Office and Length of Time Served(1) | | Principal Occupation(s) during the Past 5 Years |
| | | |
William Evans
10 State House Square
Hartford, Connecticut 06103
Age: 36 | | Vice President | | September 2007 - Present | | Vice President, Head of Mutual Fund Advisory Group (April 2007 - Present). Formerly, Vice President, U.S. Mutual Funds and Investment Products (May 2005 - April 2007) and Senior Fund Analyst, U.S. Mutual Funds and Investment Products (May 2002 - May 2005). |
| | | |
Maria M. Anderson
7337 East Doubletree Ranch Rd.
Scottsdale, Arizona 85258
Age: 50 | | Vice President | | January 2005 - Present | | Vice President, ING Funds Services, LLC(3) (September 2004 - Present). Formerly, Assistant Vice President, ING Funds Services, LLC(3) (October 2001 - September 2004). |
| | | |
Denise Lewis
7337 East Doubletree Ranch Rd.
Scottsdale, Arizona 85258
Age: 45 | | Vice President | | January 2007 - Present | | Vice President, ING Funds Services, LLC (December 2006 - Present). Formerly, Senior Vice President, UMB Investment Services Group, LLC (November 2003 - December 2006). |
| | | |
Kimberly K. Springer
7337 East Doubletree Ranch Rd.
Scottsdale, Arizona 85258
Age: 51 | | Vice President | | March 2006 - Present | | Vice President, ING Funds Services, LLC(3) (March 2006 - Present). Formerly, Assistant Vice President, ING Funds Services, LLC(3) (August 2004 - March 2006) and Manager, Registration Statements, ING Funds Services, LLC(3) (May 2003 - August 2004). |
| | | |
Susan P. Kinens
7337 East Doubletree Ranch Rd.
Scottsdale, Arizona 85258
Age: 32 | | Assistant Vice President | | January 2005 - Present | | Assistant Vice President, ING Funds Services, LLC(3) (December 2002 - Present). |
| | | |
Craig Wheeler
7337 East Doubletree Ranch Rd.
Scottsdale, Arizona 85258
Age: 39 | | Assistant Vice President | | May 2008 - Present | | Assistant Vice President - Director of Tax, ING Funds Services (March 2008 - Present). Formerly, Tax Manager, ING Funds Services (March 2005 - March 2008); Tax Senior, ING Funds Services (January 2004 - March 2005); and Tax Senior, KPMG LLP (August 2002 - December 2003). |
| | | |
Huey P. Falgout, Jr.
7337 East Doubletree Ranch Rd.
Scottsdale, Arizona 85258
Age: 45 | | Secretary | | August 2003 - Present | | Chief Counsel, ING Americas, U.S. Legal Services (September 2003 - Present). |
| | | |
Theresa K. Kelety
7337 East Doubletree Ranch Rd.
Scottsdale, Arizona 85258 Age: 45 | | Assistant Secretary | | August 2003 - Present | | Senior Counsel, ING Americas, U.S. Legal Services (April 2008 - Present). Formerly, Counsel, ING Americas, U.S. Legal Services (April 2003 - April 2008). |
| | | |
Kathleen Nichols
7337 East Doubletree Ranch Rd.
Scottsdale, Arizona 85258
Age: 33 | | Assistant Secretary | | May 2008 - Present | | Counsel, ING Americas, U.S. Legal Services (February 2008 - Present). Formerly, Associate, Ropes & Gray LLP (September 2005 - February 2008) |
(1) | | The officers hold office until the next annual meeting of the Directors and until their successors shall have been elected and qualified. |
(2) | | ING Investments, LLC was previously named ING Pilgrim Investments, LLC. ING Pilgrim Investments, LLC is the successor in interest to ING Pilgrim Investments, Inc., which was previously known as Pilgrim Investments, Inc. and before that was known as Pilgrim America Investments, Inc. |
(3) | | ING Funds Services, LLC was previously named ING Pilgrim Group, LLC. ING Pilgrim Group, LLC is the successor in interest to ING Pilgrim Group, Inc., which was previously known as Pilgrim Group, Inc. and before that was known as Pilgrim America Group, Inc. |
(4) | | ING Funds Distributor, LLC is the successor in interest to ING Funds Distributor, Inc., which was previously known as ING Pilgrim Securities, Inc., and before that was known as Pilgrim Securities, Inc., and before that was known as Pilgrim America Securities, Inc. |
(5) | | Mr. Mathews commenced services as CEO and President of the ING Funds on November 11, 2006. |
(6) | | Directed Services, LLC is the successor in interest to Directed Services, Inc. |
39
Investment Adviser
Directed Services LLC
1475 Dunwoody Drive
West Chester, Pennsylvania 19380
Administrator
ING Funds Services, LLC
7337 East Doubletree Ranch Road
Scottsdale, Arizona 85258
Distributor
ING Funds Distributor, LLC
7337 East Doubletree Ranch Road
Scottsdale, Arizona 85258
Transfer Agent
DST Systems, Inc.
P.O. Box 419368
Kansas City, Missouri 64141
Independent Registered Public Accounting Firm
KPMG LLP
99 High Street
Boston, Massachusetts 02110
Custodian
The Bank of New York Mellon
One Wall Street
New York, New York 10286
Legal Counsel
Dechert LLP
1775 I Street, N.W.
Washington, D.C. 20006
Before investing, carefully consider the investment objectives, risks, charges and expenses of the variable universal life insurance policy or variable annuity contract and the underlying variable investment options. This and other information is contained in the prospectus for the variable universal life policy or variable annuity contract and the underlying variable investment options. Obtain these prospectuses from your agent/registered representative and read them carefully before investing.
| | | | | | | | |
 | | | | | | VPAR-UISOL | | (1208-022709) |
Item 2. Code of Ethics.
As of the end of the period covered by this report, Registrant had adopted a code of ethics, as defined in Item 2 of Form N-CSR, that applies to the Registrant’s principal executive officer and principal financial officer. There were no amendments to the Code during the period covered by the report. The Registrant did not grant any waivers, including implicit waivers, from any provisions of the Code during the period covered by this report. The code of ethics is filed herewith pursuant to Item 10(a)(1), Exhibit 99.CODE ETH.
Item 3. Audit Committee Financial Expert.
The Board of Trustees has determined that J. Michael Earley and Peter Drotch are audit committee financial experts, as defined in Item 3 of Form N-CSR. Mr. Earley and Mr. Drotch are “independent” for purposes of Item 3 of Form N-CSR.
Item 4. Principal Accountant Fees and Services.
(a) Audit Fees: The aggregate fees billed for each of the last two fiscal years for professional services rendered by KPMG LLP (“KPMG”), the principal accountant for the audit of the registrant’s annual financial statements, for services that are normally provided by the accountant in connection with statutory and regulatory filings or engagements for those fiscal years were $646,000 for year ended December 31, 2008 and $653,000 for year ended December 31, 2007.
(b) Audit-Related Fees: The aggregate fees billed in each of the last two fiscal years for assurance and related services by KPMG that are reasonably related to the performance of the audit of the registrant’s financial statements and are not reported under paragraph (a) of this Item were $81,700 for year ended December 31, 2008 and $74,700 for year ended December 31, 2007.
(c) Tax Fees: The aggregate fees billed in each of the last two fiscal years for professional services rendered by KPMG for tax compliance, tax advice, and tax planning were $194,451 in the year ended December 31, 2008 and $176,537 in the year ended December 31, 2007. Such services included review of excise distribution calculations (if applicable), preparation of the Funds’ federal, state and excise tax returns, tax services related to mergers and routine consulting.
(d) All Other Fees: The aggregate fees billed in each of the last two fiscal years for products and services provided by KPMG, other than the services reported in paragraphs (a) through (c) of this Item were $42,500 in the year ended December 31, 2008 and $0 in the year ended December 31, 2007.
(e) (1) Audit Committee Pre-Approval Policies and Procedures
2
AUDIT AND NON-AUDIT SERVICES
PRE-APPROVAL POLICY
I. Statement of Principles
Under the Sarbanes-Oxley Act of 2002 (the “Act”), the Audit Committee of the Board of Directors or Trustees (the “Committee”) of the ING Funds (each a “Fund,” collectively, the “Funds”) set out on Exhibit A to this Audit and Non-Audit Services Pre-Approval Policy (“Policy”) is responsible for the oversight of the work of the Funds’ independent auditors. As part of its responsibilities, the Committee must pre-approve the audit and non-audit services performed by the auditors in order to assure that the provision of these services does not impair the auditors’ independence from the Funds. The Committee has adopted, and the Board has ratified, this Policy, which sets out the procedures and conditions under which the services of the independent auditors may be pre-approved.
Under Securities and Exchange Commission (“SEC”) rules promulgated in accordance with the Act, the Funds may establish two different approaches to pre-approving audit and non-audit services. The Committee may approve services without consideration of specific case-by-case services (“general pre-approval”) or it may pre-approve specific services (“specific pre-approval”). The Committee believes that the combination of these approaches contemplated in this Policy results in an effective and efficient method for pre-approving audit and non-audit services to be performed by the Funds’ independent auditors. Under this Policy, services that are not of a type that may receive general pre-approval require specific pre-approval by the Committee. Any proposed services that exceed pre-approved cost levels or budgeted amounts will also require the Committee’s specific pre-approval.
For both types of approval, the Committee considers whether the subject services are consistent with the SEC’s rules on auditor independence and that such services are compatible with maintaining the auditors independence. The Committee also considers whether a particular audit firm is in the best position to provide effective and efficient services to the Funds. Reasons that the auditors are in the best position include the auditors’ familiarity with the Funds’ business, personnel, culture, accounting systems, risk profile, and other factors, and whether the services will enhance the Funds’ ability to manage and control risk or improve audit quality. Such factors will be considered as a whole, with no one factor being determinative.
The appendices attached to this Policy describe the audit, audit-related, tax-related, and other services that have the Committee’s general pre-approval. For any service that has been approved through general pre-approval, the general pre-approval will remain in place for a period 12 months from the date of pre-approval, unless the Committee determines that a different period is appropriate. The Committee will annually review and pre-approve the services that may be provided by the independent auditors without specific pre-approval. The Committee will revise the list of services subject to general pre-approval as appropriate. This Policy does not serve as a delegation to Fund management of the Committee’s duty to pre-approve services performed by the Funds’ independent auditors.
3
II. Audit Services
The annual audit services engagement terms and fees are subject to the Committee’s specific pre-approval. Audit services are those services that are normally provided by auditors in connection with statutory and regulatory filings or engagements or those that generally only independent auditors can reasonably provide. They include the Funds’ annual financial statement audit and procedures that the independent auditors must perform in order to form an opinion on the Funds’ financial statements (e.g., information systems and procedural reviews and testing). The Committee will monitor the audit services engagement and approve any changes in terms, conditions or fees deemed by the Committee to be necessary or appropriate.
The Committee may grant general pre-approval to other audit services, such as statutory audits and services associated with SEC registration statements, periodic reports and other documents filed with the SEC or issued in connection with securities offerings.
The Committee has pre-approved the audit services listed on Appendix A. The Committee must specifically approve all audit services not listed on Appendix A.
III. Audit-related Services
Audit-related services are assurance and related services that are reasonably related to the performance of the audit or the review of the Funds’ financial statements or are traditionally performed by the independent auditors. The Committee believes that the provision of audit-related services will not impair the independent auditors’ independence, and therefore may grant pre-approval to audit-related services. Audit-related services include accounting consultations related to accounting, financial reporting or disclosure matters not classified as “audit services;” assistance with understanding and implementing new accounting and financial reporting guidance from rulemaking authorities; agreed-upon or expanded audit procedures relating to accounting and/or billing records required to respond to or comply with financial, accounting or regulatory reporting matters; and assistance with internal control reporting requirements under Form N-SAR or Form N-CSR.
The Committee has pre-approved the audit-related services listed on Appendix B. The Committee must specifically approve all audit-related services not listed on Appendix B.
IV. Tax Services
The Committee believes the independent auditors can provide tax services to the Funds, including tax compliance, tax planning, and tax advice, without compromising the auditors’ independence. Therefore, the Committee may grant general pre-approval with respect to tax services historically provided by the Funds’ independent auditors that do not, in the Committee’s view, impair auditor independence and that are consistent with the SEC’s rules on auditor independence.
The Committee will not grant pre-approval if the independent auditors initially recommends a transaction the sole business purpose of which is tax avoidance and the tax treatment of which may not be supported in the Internal Revenue Code and related regulations. The Committee may consult
4
outside counsel to determine that tax planning and reporting positions are consistent with this Policy.
The Committee has pre-approved the tax-related services listed on Appendix C. The Committee must specifically approve all tax-related services not listed on Appendix C.
V. Other Services
The Committee believes it may grant approval of non-audit services that are permissible services for independent auditors to a Fund. The Committee has determined to grant general pre-approval to other services that it believes are routine and recurring, do not impair auditor independence, and are consistent with SEC rules on auditor independence.
The Committee has pre-approved the non-audit services listed on Appendix D. The Committee must specifically approve all non-audit services not listed on Appendix D.
A list of the SEC’s prohibited non-audit services is attached to this Policy as Appendix E. The SEC’s rules and relevant guidance should be consulted to determine the precise definitions of these impermissible services and the applicability of exceptions to certain of the SEC’s prohibitions.
VI. Pre-approval of Fee levels and Budgeted Amounts
The Committee will annually establish pre-approval fee levels or budgeted amounts for audit, audit-related, tax and non-audit services to be provided to the Funds by the independent auditors. Any proposed services exceeding these levels or amounts require the Committee’s specific pre-approval. The Committee considers fees for audit and non-audit services when deciding whether to pre-approve services. The Committee may determine, for a pre-approval period of 12 months, the appropriate ratio between the total amount of fees for the Fund’s audit, audit-related, and tax services (including fees for services provided to Fund affiliates that are subject to pre-approval), and the total amount of fees for certain permissible non-audit services for the Fund classified as other services (including any such services provided to Fund affiliates that are subject to pre-approval).
VII. Procedures
Requests or applications for services to be provided by the independent auditors will be submitted to management. If management determines that the services do not fall within those services generally pre-approved by the Committee and set out in the appendices to these procedures, management will submit the services to the Committee or its delagee. Any such submission will include a detailed description of the services to be rendered. Notwithstanding this paragraph, the Committee will, on a quarterly basis, receive from the independent auditors a list of services provided for the previous calendar quarter on a cumulative basis by the auditors during the Pre-Approval Period.
5
VIII. Delegation
The Committee may delegate pre-approval authority to one or more of the Committee’s members. Any member or members to whom such pre-approval authority is delegated must report any pre-approval decisions, including any pre-approved services, to the Committee at its next scheduled meeting. The Committee will identify any member to whom pre-approval authority is delegated in writing. The member will retain such authority for a period of 12 months from the date of pre-approval unless the Committee determines that a different period is appropriate. The period of delegated authority may be terminated by the Committee or at the option of the member.
IX. Additional Requirements
The Committee will take any measures the Committee deems necessary or appropriate to oversee the work of the independent auditors and to assure the auditors’ independence from the Funds. This may include reviewing a formal written statement from the independent auditors delineating all relationships between the auditors and the Funds, consistent with Independence Standards Board No. 1, and discussing with the auditors their methods and procedures for ensuring independence.
Last Approved: November 29, 2007
6
Appendix A
Pre-Approved Audit Services for the Pre-Approval Period January 1, 2008 through December 31, 2008
Service | | | | |
| | | | |
| | The Fund(s) | | Fee Range |
| | | | |
Statutory audits or financial audits (including tax services associated with audit services) | | x | | As presented to Audit Committee(1) |
| | | | |
Services associated with SEC registration statements, periodic reports and other documents filed with the SEC or other documents issued in connection with securities offerings (e.g., consents), and assistance in responding to SEC comment letters. | | x | | Not to exceed $9,750 per filing |
| | | | |
Consultations by Fund management with respect to accounting or disclosure treatment of transactions or events and/or the actual or potential effect of final or proposed rules, standards or interpretations by the SEC, Financial Accounting Standards Board, or other regulatory or standard setting bodies. | | x | | Not to exceed $8,000 during the Pre-Approval Period |
| | | | |
Seed capital audit and related review and issuance of consent on the N-2 registration statement | | x | | Not to exceed $12,600 per audit |
(1) For new Funds launched during the Pre-Approval Period, the fee ranges pre-approved will be the same as those for existing Funds, pro-rated in accordance with inception dates as provided in the auditors’ Proposal or any Engagement Letter covering the period at issue. Fees in the Engagement Letter will be controlling.
7
Appendix B
Pre-Approved Audit-Related Services for the Pre-Approval Period January 1, 2008 through December 31, 2008
Service | | | | | | |
| | | | | | |
| | The Fund(s) | | Fund Affiliates | | Fee Range |
| | | | | | |
Services related to Fund mergers (Excludes tax services — See Appendix C for tax services associated with Fund mergers) | | x | | x | | Not to exceed $10,000 per merger |
| | | | | | |
Consultations by Fund management with respect to accounting or disclosure treatment of transactions or events and/or the actual or potential effect of final or proposed rules, standards or interpretations by the SEC, Financial Accounting Standards Board, or other regulatory or standard setting bodies. [Note: Under SEC rules some consultations may be “audit” services and others may be “audit-related” services.] | | x | | | | Not to exceed $5,000 per occurrence during the Pre-Approval Period |
| | | | | | |
Review of the Funds’ semi-annual financial statements | | x | | | | Not to exceed $2,200 per set of financial statements per fund |
| | | | | | |
Reports to regulatory or government agencies related to the annual engagement | | x | | | | Up to $5,000 per occurrence during the Pre-Approval Period |
| | | | | | |
Regulatory compliance assistance | | x | | x | | Not to exceed $5,000 per quarter |
| | | | | | |
Training courses | | | | x | | Not to exceed $2,000 per course |
| | | | | | |
For Prime Rate Trust, agreed upon procedures for quarterly reports to rating agencies | | x | | | | Not to exceed $9,450 per quarter |
| | | | | | |
For Prime Rate Trust and Senior Income Fund, agreed upon procedures for the Revolving Credit and Security Agreement with Citigroup | | x | | | | Not to exceed $21,000 per fund per year |
8
Appendix C
Pre-Approved Tax Services for the Pre-Approval Period January 1, 2008 through December 31, 2008
Service | | | | | | |
| | | | | | |
| | The Fund(s) | | Fund
Affiliates | | Fee Range |
| | | | | | |
Preparation of federal and state income tax returns and federal excise tax returns for the Funds including assistance and review with excise tax distributions | | x | | | | As presented to Audit Committee(2) |
| | | | | | |
Review of IRC Sections 851(b) and 817(h) diversification testing on a real-time basis | | x | | | | As presented to Audit Committee(2) |
| | | | | | |
Assistance and advice regarding year-end reporting for 1099’s | | x | | | | As presented to Audit Committee(2) |
| | | | | | |
Tax assistance and advice regarding statutory, regulatory or administrative developments | | x | | x | | Not to exceed $5,000 for the Funds or for the Funds’ investment adviser during the Pre-Approval Period |
(2) For new Funds launched during the Pre-Approval Period, the fee ranges pre-approved will be the same as those for existing Funds, pro-rated in accordance with inception dates as provided in the auditors’ Proposal or any Engagement Letter covering the period at issue. Fees in the Engagement Letter will be controlling.
9
Appendix C, continued
Service | | | | | | |
| | | | | | |
| | The Fund(s) | | Fund
Affiliates | | Fee Range |
| | | | | | |
Tax training courses | | | | x | | Not to exceed $2,000 per course during the Pre-Approval Period |
| | | | | | |
Tax services associated with Fund mergers | | x | | x | | Not to exceed $4,000 per fund per merger during the Pre-Approval Period |
| | | | | | |
Other tax-related assistance and consultation, including, without limitation, assistance in evaluating derivative financial instruments and international tax issues, qualification and distribution issues, and similar routine tax consultations. | | x | | | | Not to exceed $120,000 during the Pre-Approval Period |
10
Appendix D
Pre-Approved Other Services for the Pre-Approval Period January 1, 2008 through December 31, 2008
Service | | | | | | |
| | | | | | |
| | The Fund(s) | | Fund Affiliates | | Fee Range |
| | | | | | |
Agreed-upon procedures for Class B share 12b-1 programs | | | | x | | Not to exceed $50,000 during the Pre-Approval Period |
| | | | | | |
Security counts performed pursuant to Rule 17f-2 of the 1940 Act (i.e., counts for Funds holding securities with affiliated sub-custodians)
Cost to be borne 50% by the Funds and 50% by ING Investments, LLC. | | x | | x | | Not to exceed $5,000 per Fund during the Pre-Approval Period |
| | | | | | |
Agreed upon procedures for 15 (c) FACT Books | | x | | | | Not to exceed $35,000 during the Pre-Approval Period |
11
Appendix E
Prohibited Non-Audit Services
Dated: January 1, 2008
· Bookkeeping or other services related to the accounting records or financial statements of the Funds
· Financial information systems design and implementation
· Appraisal or valuation services, fairness opinions, or contribution-in-kind reports
· Actuarial services
· Internal audit outsourcing services
· Management functions
· Human resources
· Broker-dealer, investment adviser, or investment banking services
· Legal services
· Expert services unrelated to the audit
· Any other service that the Public Company Accounting Oversight Board determines, by regulation, is impermissible
12
EXHIBIT A
ING EQUITY TRUST
ING FUNDS TRUST
ING ASIA PACIFIC HIGH DIVIDEND EQUITY INCOME FUND
ING GLOBAL ADVANTAGE AND PREMIUM OPPORTUNITY FUND
ING GLOBAL EQUITY DIVIDEND AND PREMIUM OPPORTUNITY FUND
ING INTERNATIONAL HIGH DIVIDEND EQUITY INCOME FUND
ING RISK MANAGED NATURAL RESOURCES FUND
ING INVESTMENT FUNDS, INC.
ING INVESTORS TRUST
ING MAYFLOWER TRUST
ING MUTUAL FUNDS
ING PARTNERS, INC.
ING PRIME RATE TRUST
ING SENIOR INCOME FUND
ING SEPARATE PORTFOLIOS TRUST
ING VARIABLE INSURANCE TRUST
ING VARIABLE PRODUCTS TRUST
13
(e) (2) Percentage of services referred to in 4(b) — (4)(d) that were approved by the audit committee
100% of the services were approved by the audit committee.
(f) Percentage of hours expended attributable to work performed by other than full time employees of KPMG if greater than 50%.
Not applicable.
(g) Non-Audit Fees: The non-audit fees billed by the registrant’s accountant for services rendered to the registrant, and rendered to the registrant’s investment adviser, and any entity controlling, controlled by, or under common control with the adviser that provides ongoing services to the registrant for each of the last two fiscal years of the registrant were $1,826,535 for year ended December 31, 2008 and $391,637 for year ended December 31, 2007.
(h) Principal Accountants Independence: The Registrant’s Audit committee has considered whether the provision of non-audit services that were rendered to the registrant’s investment adviser and any entity controlling, controlled by, or under common control with the investment adviser that provides ongoing services to the registrant that were not pre-approved pursuant to Rule 2-01(c)(7)(ii) of Regulation S-X is compatible with maintaining KPMG’s independence.
14
Item 5. Audit Committee of Listed Registrants.
Not applicable.
Item 6. Schedule of Investments
Schedule is included as part of the report to shareholders filed under Item 1 of this Form.
Item 7. Disclosure of Proxy Voting Policies and Procedures for Closed-End Management Investment Companies.
Not applicable.
Item 8. Portfolio Managers of Closed-End Management Investment Companies.
Not applicable.
Item 9. Purchases of Equity Securities by Closed-End Management Investment Company and Affiliated Purchasers
Not applicable.
Item 10. Submission of Matters to a Vote of Security Holders.
The Board has a Nominating Committee for the purpose of considering and presenting to the Board candidates it proposes for nomination to fill Independent Trustee vacancies on the Board. The Committee currently consists of all Independent Trustees of the Board (6 individuals). The Nominating Committee operates pursuant to a Charter approved by the Board. The primary purpose of the Nominating Committee is to consider and present to the Board the candidates it proposes for nomination to fill vacancies on the Board. In evaluating candidates, the Nominating Committee may consider a variety of factors, but it has not at this time set any specific minimum qualifications that must be met. Specific qualifications of candidates for Board membership will be based on the needs of the Board at the time of nomination.
The Nominating Committee is willing to consider nominations received from shareholders and shall assess shareholder nominees in the same manner as it reviews its own nominees. A shareholder nominee for director should be submitted in writing to the Fund’s Secretary. Any such shareholder nomination should include at a minimum the following information as to each individual proposed for nomination as trustee: such individual’s written consent to be named in the proxy statement as a nominee (if nominated) and to serve as a trustee (if elected), and all information relating to such individual that is required to be disclosed in the solicitation of proxies for election of trustees, or is otherwise required, in each case under applicable federal securities laws, rules and regulations.
The Secretary shall submit all nominations received in a timely manner to the Nominating Committee. To be timely, any such submission must be delivered to the Fund’s Secretary not earlier than the 90th day prior to such meeting and not later than the close of business on the later of the 60th day prior to such meeting or the 10th day following the day on which public announcement of the date of the meeting is first made, by either disclosure in a press release or in a document publicly filed by the Fund with the Securities and Exchange Commission.
Item 11. Controls and Procedures.
(a) Based on our evaluation conducted within 90 days of the filing date, hereof, the design and operation of the registrant’s disclosure controls and procedures are effective to ensure that material information relating to the registrant is made known to the certifying officers by others within the appropriate entities, particularly during the period in which Forms N-CSR are being prepared, and the registrant’s disclosure controls and procedures allow timely preparation and review of the information for the registrant’s Form N-CSR and the officer certifications of such Form N-CSR.
(b) There were no significant changes in the registrant’s internal controls that occurred during the second fiscal quarter of the period covered by this report that has materially affected, or is reasonably likely to materially affect, the registrant’s internal control over financial reporting.
Item 12. Exhibits.
(a)(1) Code of Ethics pursuant to Item 2 of Form N-CSR is filed and attached hereto as EX-99.CODE ETH.
(a)(2) A separate certification for each principal executive officer and principal financial officer of the registrant as required by Rule 30a-2 under the Act (17 CFR 270.30a-2) is attached hereto as EX-99.CERT.
(b) The officer certifications required by Section 906 of the Sarbanes-Oxley Act of 2002 are attached hereto as EX-99.906CERT.
(3) Not applicable.
15
SIGNATURES
Pursuant to the requirements of the Securities Exchange Act of 1934 and the Investment Company Act of 1940, the registrant has duly caused this report to be signed on its behalf by the undersigned, thereunto duly authorized.
(Registrant): ING Partners, Inc.
By | /s/ Shaun P. Mathews |
| Shaun P. Mathews |
| President and Chief Executive Officer |
Date: March 6, 2009
Pursuant to the requirements of the Securities Exchange Act of 1934 and the Investment Company Act of 1940, this report has been signed below by the following persons on behalf of the registrant and in the capacities and on the dates indicated.
By | /s/ Shaun P. Mathews |
| Shaun P. Mathews |
| President and Chief Executive Officer |
Date: March 6, 2009
By | /s/ Todd Modic |
| Todd Modic |
| Senior Vice President and Chief Financial Officer |
Date: March 6, 2009
16