OMB APPROVAL
OMB Number: 3235-0570
Expires: August 31, 2010
Estimated average burden hours per response: 18.9
UNITED STATES
SECURITIES AND EXCHANGE COMMISSION
Washington, D.C. 20549
FORM N-CSR
CERTIFIED SHAREHOLDER REPORT OF
REGISTERED MANAGEMENT INVESTMENT COMPANIES
Investment Company Act file number: 811-8319
ING Partners, Inc.
(Exact name of registrant as specified in charter)
7337 E. Doubletree Ranch Rd., Scottsdale, AZ | | 85258 |
(Address of principal executive offices) | | (Zip code) |
The Corporation Trust Company, 1209 Orange Street, Wilmington, DE 19801
(Name and address of agent for service)
Registrant’s telephone number, including area code: 1-800-992-0180
Date of fiscal year end: | December 31 |
| |
Date of reporting period: | January 1, 2007 to December 31, 2007 |
Item 1. Reports to Stockholders.
The following is a copy of the report transmitted to stockholders pursuant to Rule 30e-1 under the Act (17 CFR 270.30e-1):

Funds
Annual Report
December 31, 2007
Classes I, S and ADV
ING Partners, Inc.
n ING American Century Large Company Value Portfolio
n ING American Century Small-Mid Cap Value Portfolio
n ING Baron Asset Portfolio
n ING Baron Small Cap Growth Portfolio
n ING Columbia Small Cap Value II Portfolio
n ING Davis New York Venture Portfolio
(formerly Davis Venture Value Portfolio)
n ING JPMorgan International Portfolio
n ING JPMorgan Mid Cap Value Portfolio
n ING Legg Mason Partners Aggressive Growth Portfolio
n ING Legg Mason Partners Large Cap Growth Portfolio
n ING Lord Abbett U.S. Government Securities Portfolio
n ING Neuberger Berman Partners Portfolio
n ING Neuberger Berman Regency Portfolio
n ING OpCap Balanced Value Portfolio
n ING Oppenheimer Global Portfolio
n ING Oppenheimer Strategic Income Portfolio
n ING PIMCO Total Return Portfolio
n ING Pioneer High Yield Portfolio
n ING T. Rowe Price Diversified Mid Cap Growth Portfolio
n ING T. Rowe Price Growth Equity Portfolio
n ING Templeton Foreign Equity Portfolio
n ING Thornburg Value Portfolio
n ING UBS U.S. Large Cap Equity Portfolio
n ING UBS U.S. Small Cap Growth Portfolio
n ING Van Kampen Comstock Portfolio
n ING Van Kampen Equity and Income Portfolio
This report is submitted for general information to shareholders of the ING Funds. It is not authorized for distribution to prospective shareholders unless accompanied or preceded by a prospectus which includes details regarding the funds' investment objectives, risks, charges, expenses and other information. This information should be read carefully.

TABLE OF CONTENTS
| President's Letter | | | 1 | | |
|
| Market Perspective | | | 2 | | |
|
| Portfolio Managers' Report | | | 4 | | |
|
| Shareholder Expense Examples | | | 56 | | |
|
| Report of Independent Registered Public Accounting Firm | | | 64 | | |
|
| Statements of Assets and Liabilities | | | 65 | | |
|
| Statements of Operations | | | 79 | | |
|
| Statements of Changes in Net Assets | | | 86 | | |
|
| Financial Highlights | | | 99 | | |
|
| Notes to Financial Statements | | | 143 | | |
|
| Portfolios of Investments | | | 172 | | |
|
| Tax Information | | | 290 | | |
|
| Director and Officer Information | | | 293 | | |
|
| Shareholder Meeting Information | | | 299 | | |
|
| Advisory Contact Approval Discussion | | | 301 | | |
|
PROXY VOTING INFORMATION
A description of the policies and procedures that the Portfolios use to determine how to vote proxies related to portfolio securities is available: (1) without charge, upon request, by calling Shareholder Services toll-free at (800) 992-0180; (2) on the ING Funds' website at www.ingfunds.com; and (3) on the U.S. Securities and Exchange Commission's ("SEC") website at www.sec.gov. Information regarding how the Portfolios voted proxies related to portfolio securities during the most recent 12-month period ended June 30 is available without charge on the ING Funds' website at www.ingfunds.com and on the SEC's website at www.sec.gov.
QUARTERLY PORTFOLIO HOLDINGS
The Portfolios file their complete schedule of portfolio holdings with the SEC for the first and third quarters of each fiscal year on Form N-Q. The Portfolios' Forms N-Q are available on the SEC's website at www.sec.gov. The Portfolios' Forms N-Q may be reviewed and copied at the SEC's Public Reference Room in Washington, DC, and information on the operation of the Public Reference Room may be obtained by calling (800) SEC-0330; and is available upon request from the Portfolios by calling Shareholder Services toll-free at (800) 992-0180.
(THIS PAGE INTENTIONALLY LEFT BLANK)
PRESIDENT'S LETTER

Dear Shareholder,
It is impossible to discuss the current market climate without acknowledging the recent turmoil brought on by problems in the sub-prime mortgage market. Clearly the excesses in this sector of the market and other segments of collateralized debt have created challenges throughout credit markets worldwide.
Amidst the volatility, we at ING Funds remind our shareholders that the creditworthiness and quality of our funds' holdings is our ultimate priority — whether those holdings are part of our money market funds, fixed income funds or equity funds. Market volatility is an often present component of investing and we believe the best way to manage through turbulent environments is to build a well-balanced, fully-diversified portfolio, which aligns with your goals and risk tolerance.
ING Funds remains committed to developing and offering a diverse array of mutual funds designed to meet the goals of most investors. We urge you to work with your investment professional to make sure you are invested appropriately. Together, you can select the funds that will help you achieve your financial goals. We thank you for choosing ING Funds and look forward to continuing to serve you.
Sincerely,

Shaun P. Mathews
President
ING Funds
January 28, 2008
The views expressed in the President's Letter reflect those of the President as of the date of the letter. Any such views are subject to change at any time based upon market or other conditions and ING Funds disclaims any responsibility to update such views. These views may not be relied on as investment advice and because investment decisions for an ING Fund are based on numerous factors, may not be relied on as an indication of investment intent on behalf of any ING Fund. Reference to specific company securities should not be construed as recommendations or investment advice.
International investing poses special risks including currency fluctuation, economic and political risks not found in investments that are solely domestic.
1
MARKET PERSPECTIVE: YEAR ENDED DECEMBER 31, 2007
After recording a solid, if frequently nervous, 8.2% in the first half of the reporting period, global equities in the form of the Morgan Stanley Capital International World IndexSM(1) ("MSCI World IndexSM") measured in local currencies, including net reinvested dividends ("MSCI" for regions discussed below) succumbed to a 3.2% loss in the second half of the reportin g period, as some important debt markets all but seized up, the crisis threatening the solvency of financial institutions and forcing central bankers to throw lifelines to stranded borrowers, while investors fled to the safe haven of short Treasuries. By year-end, confidence was wavering, oil was nudging $100 per barrel and markets seemed to be pricing in a recession. In currencies, the yen strengthened as "carry trades" were unwound in the flight from risk. The euro benefited from the European Central Bank's implacable refusal to match the Federal Reserve Board (the "Fed") and reduce interest rates. But the pound finally gave back some of its recent gains as the UK housing market started to sag. For the second six months, the dollar fell 8.5% and 8.9% against the euro and yen respectively, but rose 0.3% against the pound.
A relentlessly deteriorating housing market had caused alarm in the sub-prime mortgage loan sector, where lax lending standards in a low interest rate environment, had driven foreclosure rates inexorably higher. The problem had been exacerbated over the years by the business of securitizing the loans. They would be sliced, diced and repackaged for handsome fees into other securities, then sold on in their billions worldwide to financial institutions, which purchased them by issuing commercial paper, over the cost of which an effortless profit could apparently be made.
At one level this spreads the loan risk. But when the originator is removed from those taking the risk another is created. Like the banking business in its simplest form, everything depends on confidence. When it became obvious that these securities, many of them rated A or higher, were ultimately backed by sub-prime and not so sub-prime mortgages with questionable repayment prospects, confidence evaporated. The asset-backed commercial paper market contracted sharply. Banks stopped lending to each other. The structured investment vehicles, their investors and sponsoring banks would have to bear huge losses, but which ones and how much?
The Fed's first response to the liquidity and resulting economic threats was to reduce the discount rate, (the rate it will lend to banks), by 50 basis points (0.50%) on August 17, 2007 and another 100 basis points (1.00%) in three steps by year end, with matching cuts in the federal funds rate.
But it was no good. Using the discount window had a stigma attached to it while the liquidity problem was not an overnight one. The one-month London Interbank Offered Rate ("LIBOR") continued to rise even as the Fed eased. A procession of financial institutions announced heavy write- downs of mortgage-backed assets, along with various capital saving and raising initiatives, including the tapping of billions of dollars from sovereign wealth funds based in the Middle-East and Asia, surely a development of historic significance.
The spread between the one-month LIBOR and the federal funds rate only drifted down after the announcement of coordinated central bank action to add liquidity where it was needed including in the U.S., the use of a "term auction facility" where loans would be auctioned and broader forms of collateral would be accepted.
But by year end global economic conditions were still clearly weakening and many felt that the U.S. might already be in or on the cusp of recession.
In U.S. fixed income markets' the Treasury yield curve steepened in the first half and continued to do so in the second. The yield on the ten-year Treasury Note fell 100 basis points (1.00%) to 4.03%, while the yield on the three-month Bill fell 153 basis points (1.53%) to 3.14%. The broader Lehman Brothers® Aggregate Bond Index(2) ("LBAB") of investment grade bonds returned 5.93% for the first half of the reporting period and 6.97% for the year ended December 31, 2007.
U.S. equities, represented by the Standard & Poor's 500® Composite Stock Price Index(3) ("S&P 500® Index") including dividends, lost 1.4% in the second half, with the worst fourth quarter since 2000, after gaining 7% through June. For a while, as the events described above played out, investors seemed to believe that the Fed had the will and the tools to keep any down turn brief. The S&P 500® Ind ex actually made a new high on October 9, 2007. For the year ended December 31, 2007, the S&P 500® Index returned 5.49%. But, the sense that a serious crisis was only just beginning to unfold and a succession of earnings disappointments especially among the financials sector, increasingly weighed on sentiment as the year wound down. Bizarrely, gross domestic product ("GDP") growth was being reported at a brisk 4.9%
2
MARKET PERSPECTIVE: YEAR ENDED DECEMBER 31, 2007
for the third quarter, even as S&P 500 companies were reporting a decline in operating profits, the first fall in more than five years.
Internationally, the MSCI Japan® Index(4) slumped 15.8% in the second half of the reporting period on a resumption of falling consumer prices and fading global growth, while the strengthening yen threatened all-important exports. For the year ended December 31, 2007, the MSCI Japan® Index lost 4.23%. The MSCI Europe ex UK® Index(5) lost 4.8% in the second six months of the reporting period. A first half rally gave way to nervousness in mid-July after another rate increase and turned into a rout as the sub-prime debacle took shape. U.S. rate cuts were not reciprocated by the European Central Bank, which, with headline inflation up to 3.1%, confined its response to making liquidity available to the banking system, a staggering €500 billion on December 18, 2007. In the UK, stocks surged into the summer making the August 2007 slide even more violent than in continental Europe. But similar inflation worries limited the Bank of England to one 0.25% rate reduction despite a clea rly weakening housing market. The MSCI UK® Index(5) fell 1.4% in the second half of the reporting period and returned 8.36% for the year ended December 31, 2007.
(1) The MSCI World IndexSM is an unmanaged index that measures the performance of over 1,400 securities listed on exchanges in the U.S., Europe, Canada Australia, New Zealand and the Far East.
(2) The LBAB Index is a widely recognized, unmanaged index of publicly issued investment grade U.S. Government, mortgage-backed, asset-backed and corporate debt securities.
(3) The S&P 500® Index is an unmanaged index that measures the performance of securities of approximately 500 of the largest companies in the United States.
(4) The MSCI Japan® Index is a free float-adjusted market capitalization index that is designed to measure developed market equity performance in Japan.
(5) The MSCI Europe ex UK® Index is a free float rising adjusted market capitalization index that is designed to measure developed market equity performance in Europe, excluding the UK.
(6) The MSCI UK® Index is a free float-adjusted market capitalization index that is designed to measure developed market equity performance in the UK.
All indices are unmanaged and investors cannot invest directly in an index.
Past performance does not guarantee future results. The performance quoted represents past performance. Investment return and principal value of an investment will fluctuate, and shares, when redeemed, may be worth more or less than their original cost. The Portfolio's performance is subject to change since the period's end and may be lower or higher than the performance data shown. Please call (800) 992-0180 or log on to www.ingfunds.com to obtain performance data current to the most recent month end.
Market Perspective reflects the views of ING's Chief Investment Risk Officer only through the end of the period, and is subject to change based on market and other conditions.
3
ING AMERICAN CENTURY LARGE COMPANY VALUE PORTFOLIO
PORTFOLIO MANAGERS' REPORT
ING American Century Large Company Value Portfolio (the "Portfolio") seeks long-term capital growth. Income is a secondary objective. The Portfolio is managed by a team of portfolio managers comprised of Charles A. Ritter, CFA, Vice President and Senior Portfolio Manager and Brendan Healy, CFA, Vice President and Portfolio Manager, American Century Investment Management, Inc. — the Sub-Adviser.
Performance: For the year ended December 31, 2007, the Portfolio's Class S shares provided a total return of (2.00)% compared to the Russell 1000® Value Index(1) and the Standard & Poor's 500® Composite Stock Price® Index(2) ("S&P 500 Index"), which returned (0.17)% and 5.49%, respectively, for the same period.
Portfolio Specifics: Stocks struggled for most of the one-year reporting period, providing a challenging market environment for the Portfolio. The slowing U.S. economy, the sub-prime meltdown, and subsequent credit crisis weighed on investors, who gravitated toward companies that were already strong performers; this momentum bias did not fit well with the Portfolio's investment approach, which seeks stocks that are undervalued by the market. In addition, growth stocks outperformed value across the capitalization spectrum.
The Portfolio benefited from strong security selection in the information technology sector, with most of the gains coming from large leading software and technology companies. A significant holding was software giant Microsoft Corp., which benefited from strong sales of its new Vista operating system and Office 2007. Hewlett-Packard Co. continued to gain ground in the PC market and moved into high-end enterprise printing equipment.
Our position in consumer staples benefited performance as the U.S. economy slowed and investors sought out companies that provide everyday goods and services. During difficult economic times, consumer staples stocks, we believe, are regarded as sound, defensive investments. Moreover, our preference for large industry leaders proved advantageous as many of these names outperformed the primary benchmark. Pepsi Bottling Group, Inc. and Coca-Cola Co., for example, gained about 30% during the period. Despite higher commodity costs, Pepsi Bottling Group, Inc. announced a healthy increase in profit. Meanwhile, Coca-Cola Co. reported growing revenues and bought back a large number of its shares.
Financial stocks — the Portfolio's largest single position, but a relative underweight nonetheless — represented our largest sources of underperformance versus the primary benchmark. Many financial firms came under pressure amid the fallout in the sub-prime lending category. Three of our top detractors were Freddie Mac, a stockholder-owned corporation chartered by Congress to keep money flowing to mortgage lenders in support of home ownership; Washington Mutual, a major thrift involved in mortgage finance; and Citigroup, Inc., a diversified global financial services company. All three stocks declined on news of wider-than-expected losses resulting from housing weakness and the deterioration of mortgage credit.
Although the Portfolio's position in the energy sector contributed on an absolute basis, it underperformed in relative terms. Energy stocks, specifically oil and gas companies, provided the strongest results for the Russell 1000® Value Index. Because of valuations, we held a smaller-than-the-benchmark allocation, which was a drag on results.
Current Strategy & Outlook: The Portfolio is designed for investors seeking long-term capital growth who can tolerate relatively moderate share price fluctuations compared with volatility from more aggressive, growth-oriented investments. We believe the Portfolio can serve as a solid core holding in a diversified portfolio, with the capability to outperform growth-oriented investments when the value discipline is in favor.
As fundamental, bottom-up managers, we evaluate each company individually on its own merits and build the Portfolio from the ground up, one stock at a time. In our search for companies that are undervalued, we will structure exposure to stocks and market segments as warranted based on the attractiveness of individual companies.
As of December 31, 2007, the Portfolio was broadly diversified, with continued overweight positions in the information technology and health care sectors. Our valuation work contributed to our smaller relative weightings in utilities stocks. We have also continued to find greater value opportunities among mega-cap stocks and have maintained our bias toward these firms.
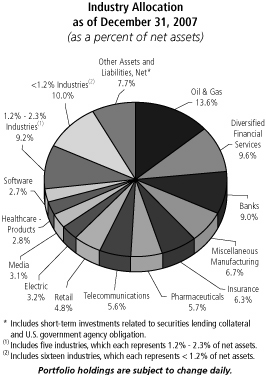
Top Ten Holdings*
as of December 31, 2007
(as a percent of net assets)
| ExxonMobil Corp. | | | 4.9 | % | |
| General Electric Co. | | | 4.2 | % | |
| Chevron Corp. | | | 3.4 | % | |
| AT&T, Inc. | | | 3.2 | % | |
| Citigroup, Inc. | | | 3.1 | % | |
| Bank of America Corp. | | | 3.0 | % | |
| Royal Dutch Shell PLC ADR | | | 2.6 | % | |
| JPMorgan Chase & Co. | | | 2.4 | % | |
| ConocoPhillips | | | 2.3 | % | |
| Johnson & Johnson | | | 2.3 | % | |
* Excludes short-term investments related to securities lending collateral and U.S. government agency obligation.
Portfolio holdings are subject to change daily.
Portfolio holdings and characteristics are subject to change and may not be representative of current holdings and characteristics. The outlook for this Portfolio may differ from that presented for other ING Funds. Performance for the different classes of shares will vary based on differences in fees associated with each class.
4
PORTFOLIO MANAGERS' REPORT
ING AMERICAN CENTURY LARGE COMPANY VALUE PORTFOLIO
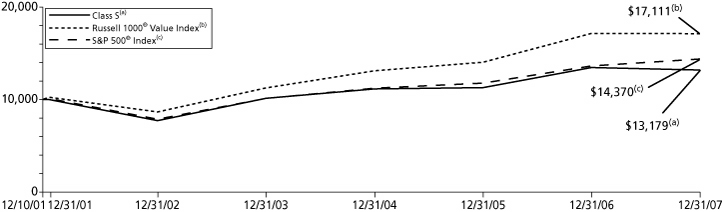
| Average Annual Total Returns for the Periods Ended December 31, 2007 | |
| | | 1 Year | | 5 Year | | Since Inception
of Classes I, S and ADV
December 10, 2001 | |
| Class I | | | (1.72 | )% | | | 11.61 | % | | | 4.94 | % | |
| Class S | | | (2.00 | )% | | | 11.33 | % | | | 4.66 | % | |
| Class ADV | | | (2.17 | )% | | | 11.08 | % | | | 4.40 | % | |
| Russell 1000® Value Index(1) | | | (0.17 | )% | | | 14.63 | % | | | 9.23 | %(3) | |
| S&P 500® Index(2) | | | 5.49 | % | | | 12.83 | % | | | 6.14 | %(3) | |
Based on a $10,000 initial investment, the graph and table above illustrate the total return of ING American Century Large Company Value Portfolio against the indices indicated. An index is unmanaged and has no cash in its portfolio, imposes no sales charges and incurs no operating expenses. An investor cannot invest directly in an index. The Portfolio's performance is shown without the imposition of any expenses or charges which are, or may be, imposed under your annuity contract. Total returns would have been lower if such expenses or charges were included.
The performance graph and table do not reflect the deduction of taxes that a shareholder will pay on portfolio distributions or the redemption of portfolio shares.
The performance shown may include the effect of fee waivers and/or expense reimbursements by the Investment Adviser and/or other service providers, which have the effect of increasing total return. Had all fees and expenses been considered, the total returns would have been lower.
The performance update illustrates performance for a variable investment option available through a variable annuity contract. The performance shown indicates past performance and is not a projection or prediction of future results. Actual investment returns and principal value will fluctuate so that shares and/or units, at redemption, may be worth more or less than their original cost. Please call (800) 262-3862 to get performance through the most recent month end.
This report contains statements that may be "forward-looking" statements. Actual results may differ materially from those projected in the "forward-looking" statements.
The views expressed in this report reflect those of the portfolio manager only through the end of the period as stated on the cover. The portfolio manager's views are subject to change at any time based on marked and other conditions.
Portfolio holdings are subject to change daily.
(1) The Russell 1000® Value Index is an unmanaged index that measures the performance of those Russell 1000® companies with lower price-to-book ratios and lower than forecasted growth values.
(2) The S&P 500® Index is an unmanaged index that measures the performance of the securities of approximately 500 of the largest companies in the U.S.
(3) Since inception performance of the index is shown as of December 1, 2001.
5
ING AMERICAN CENTURY SMALL-MID CAP VALUE PORTFOLIO
PORTFOLIO MANAGERS' REPORT
ING American Century Small-Mid Cap Value Portfolio (the "Portfolio") seeks long-term capital growth, income is a secondary objective. The Portfolio is managed by a team of portfolio managers comprised of Benjamin Z. Giele, Steve Roth, Phillip N. Davidson, Scott A. Moore, and Michael Liss, Portfolio Managers of American Century Investment Management, Inc. — the Sub-Adviser.
Performance: For the year ended December 31, 2007, the Portfolio's Class S shares provided a total return of (2.90)% compared to the Russell 2500TM Value Index(1) and Standard & Poor's ("S&P") Small Cap 600/Citigroup Value Index(2), which returned (7.27)% and (5.54)%, respectively, for the same period.
Portfolio Specifics: Small-Cap Value — Stocks struggled for most of the one-year reporting period, providing a challenging market environment for the Portfolio. The slowing U.S. economy, the sub-prime meltdown, and subsequent credit crisis weighed on investors, which began to gravitate toward companies that were already strong performers. Generally, growth stocks also outperformed value stocks across the capitalization spectrum.
Our emphasis on high-quality stocks and our risk-controlled investment approach helped mitigate the impact of the market volatility on the Portfolio's performance. Moreover, in a difficult year for value investing, our quality bias positioned the Portfolio to benefit from the acquisitions and leveraged buyouts that occurred over the period. More than two dozen of our names were bought by strategic and financial acquirers, a testament to the quality of the companies we typically seek out.
The Portfolio's underweight in the financial sector was one of the top contributors to relative performance, and stock selection boosted results further. Because of our valuation work, we had less exposure than the benchmark to real estate investment trusts ("REITs"). REITS, which comprise nearly 10% of the Russell 2000® Value Index, posted negative results while the Portfolio benefited from its much smaller average stake of around 4.5%.
Many financial firms came under pressure amid the fallout in the sub-prime lending category and suffered further in the credit crisis that followed. We successfully sidestepped broader damage in favor of names that suffered lesser declines. However, one holding was a top detractor. Triad Guaranty, Inc., which provides private mortgage insurance, lost its largest customer — American Home Mortgage Investment Corp. — to bankruptcy in August. This is expected to have a significant impact on the company's earnings in the months ahead.
Our overweight in the industrials sector enhanced performance. Effective stock selection across several industries — specifically, the machinery, aerospace and defense, and commercial services and supplies segments — also boosted our progress versus the benchmark. A key holding was Alliant Techsystems, Inc., a major producer of commercial and military ammunition. Alliant Techsystems, Inc. has enjoyed solid growth and earnings and is expected to benefit from new contracts and strategic acquisitions. Another notable contributor was FTI Consulting, Inc., a global provider of bankruptcy, restructuring, and forensic services. The company's stock nearly doubled as FTI Consulting, Inc. exceeded earnings expectations on greater demand for bankruptcy services in the midst of the sub-prime turmoil.
There were two areas of relative weakness for the Portfolio during the period — materials and consumer staples. Stock prices in both sectors have been momentum-driven and did not meet our valuation criteria. As a result, they have not merited sizeable exposure, which modestly detracted when they outperformed for the benchmark. For example, we held an underweight position in CF Industries Holdings, a major distributor of fertilizer products, whose earnings were propelled by rapidly rising prices for nitrogen and phosphate.
Mid-Cap Value — Stocks struggled for most of the one-year reporting period, providing a challenging market environment for the Portfolio. The slowing U.S. economy, the sub-prime meltdown, and subsequent credit crisis weighed on investors, who favored lower dividend yields over higher dividend yields, and low balance sheet quality versus over high balance sheet quality. Overall, growth stocks outperformed value across the capitalization spectrum. Against that market backdrop, the Portfolio benefited from strong security selection.
Our mix of consumer staples companies contributed to performance. Boosting results was an overweight to several names not represented in the benchmark. Specifically, we owned Kraft — the largest branded food company in the U.S. — which added value as its stock traded on its own fundamentals after the company's spin-off from Altria Group. Kraft Foods, Inc. has also invested in new product development, improved marketing, and is considering the divestiture of non-core businesses. Diamond Foods, Inc., which processes and distributes nuts and other snack foods, beat earnings forecasts as it continued to improve operating performance, expand sales channels, and accelerate earnings growth.
The consumer discretionary sector was another bright spot. Many investors shied away from these stocks in response to the housing downturn and slowing economic growth. Our favorable relative performance was the result of an underweight and strong security selection, including a lack of exposure to homebuilders and media companies. Both industries were down for the benchmark.
Meanwhile, an overweight in health care boosted performance. Our holdings in health care equipment, for example, added materially to results. The industry also provided a top performer — Symmetry Medical Inc., a leading maker of surgical implants, instruments and other devices, that benefited from growing revenues and increased market opportunities. Strong security selection in the information technology sector was another contributor to relative returns, particularly holdings in the electronic equipment and semiconductor segments.
Despite an underweight position, our allocation to the financial sector — and specifically, our overweight in thrifts and our mix of insurance stocks — was a drag on results. Two of our top detractors were MGIC Investment Corporation, the nation's largest private mortgage insurer, and Ambac Financial Group, Inc., a leading municipal bond insurer. Although non-traditional mortgage activity comprised a small percentage of these companies' businesses, both had greater-than-expected exposure to mortgage-related losses. Because of the subsequent capital issues, we sold both holdings.
The Portfolio's underweight in energy — the best performer in the benchmark — hurt relative results. Because of valuations, we did not own certain energy companies, such as Hess Corp. and Noble Energy, Inc., that boosted the benchmark's performance.
Current Strategy & Outlook: Small Cap Value — The Portfolio is designed for investors seeking long-term capital growth who can tolerate relatively high share price fluctuations. The Portfolio may serve a diversifying role in a portfolio. As of December 31, 2007, the Portfolio was broadly diversified, with an overweight position in industrials and an underweight position in financials relative to the benchmark.
Mid Cap Value — The Portfolio is designed for investors seeking long-term capital growth by investing in medium-sized companies. The Portfolio may serve a diversifying role in a portfolio. As of December 31, 2007, we continued to see opportunities in health care and consumer staples stocks, reflected by our overweight positions in these sectors relative to the benchmark. Our fundamental analysis and valuation work contributed to our smaller relative weightings in financials and energy stocks.
As fundamental, bottom-up managers, we evaluate each company individually on its own merits and build the Portfolio from the ground up, one stock at a time. In our search for companies that we believe are undervalued, we will structure exposure to stocks and market segments as warranted based on the attractiveness of individual companies.
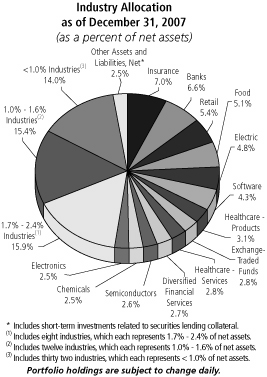
Top Ten Holdings*
as of December 31, 2007
(as a percent of net assets)
| Bemis Co. | | | 1.7 | % | |
| Sybase, Inc. | | | 1.6 | % | |
| Parametric Technology Corp. | | | 1.6 | % | |
| International Speedway Corp. | | | 1.2 | % | |
| Puget Energy, Inc. | | | 1.1 | % | |
| iShares S&P MidCap 400 Index Fund | | | 1.1 | % | |
| Southwest Gas Corp. | | | 1.1 | % | |
| Portland General Electric Co. | | | 1.1 | % | |
| Aspen Insurance Holdings Ltd. | | | 1.0 | % | |
| iShares S&P SmallCap 600 Index Fund | | | 1.0 | % | |
* Excludes short-term investments related to securities lending collateral.
Portfolio holdings are subject to change daily.
Portfolio holdings and characteristics are subject to change and may not be representative of current holdings and characteristics. The outlook for this Portfolio may differ from that presented for other ING Funds. Performance for the different classes of shares will vary based on differences in fees associated with each class.
6
PORTFOLIO MANAGERS' REPORT
ING AMERICAN CENTURY SMALL-MID CAP VALUE PORTFOLIO
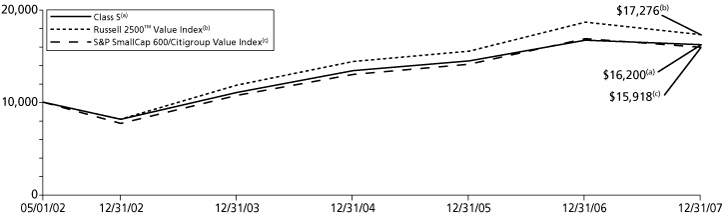
| Average Annual Total Returns for the Periods Ended December 31, 2007 | |
| | | 1 Year | | 5 Year | | Since Inception
of Classes I, S and ADV
May 1, 2002 | |
| Class I | | | (2.70 | )% | | | 14.97 | % | | | 9.15 | % | |
| Class S | | | (2.90 | )% | | | 14.72 | % | | | 8.88 | % | |
| Class ADV | | | (3.17 | )% | | | 14.42 | % | | | 8.60 | % | |
| Russell 2500TM Value Index(1) | | | (7.27 | )% | | | 16.17 | % | | | 10.13 | % | |
| S&P SmallCap 600/Citigroup Value Index(2) | | | (5.54 | )% | | | 15.61 | % | | | 8.55 | % | |
Based on a $10,000 initial investment, the graph and table above illustrate the total return of ING American Century Small-Mid Cap Value Portfolio against the indices indicated. An index is unmanaged and has no cash in its portfolio, imposes no sales charges and incurs no operating expenses. An investor cannot invest directly in an index. The Portfolio's performance is shown without the imposition of any expenses or charges which are, or may be, imposed under your annuity contract. Total returns would have been lower if such expenses or charges were included.
The performance graph and table do not reflect the deduction of taxes that a shareholder will pay on portfolio distributions or the redemption of portfolio shares.
The performance shown may include the effect of fee waivers and/or expense reimbursements by the Investment Adviser and/or other service providers, which have the effect of increasing total return. Had all fees and expenses been considered, the total returns would have been lower.
The performance update illustrates performance for a variable investment option available through a variable annuity contract. The performance shown indicates past performance and is not a projection or prediction of future results. Actual investment returns and principal value will fluctuate so that shares and/or units, at redemption, may be worth more or less than their original cost. Please call (800) 262-3862 to get performance through the most recent month end.
This report contains statements that may be "forward-looking" statements. Actual results may differ materially from those projected in the "forward-looking" statements.
The views expressed in this report reflect those of the portfolio manager only through the end of the period as stated on the cover. The portfolio manager's views are subject to change at any time based on marked and other conditions.
Portfolio holdings are subject to change daily.
(1) The Russell 2500TM Value Index measures the performance of those Russell 2500 companies with lower price-to-book ratios and lower forecasted growth values.
(2) The S&P SmallCap 600/Citigroup Value Index measures the performance of those S&P 600 Index companies with lower price-to-book ratios.
7
ING BARON ASSET PORTFOLIO
PORTFOLIO MANAGERS' REPORT
ING Baron Asset Portfolio (the "Portfolio") seeks capital appreciation. The Portfolio is managed by Ronald Baron*, Founder, Chief Executive Officer, Chairman and Andrew Peck, Vice President, Portfolio Managers of BAMCO, Inc. ("BAMCO") — the Sub-Adviser.
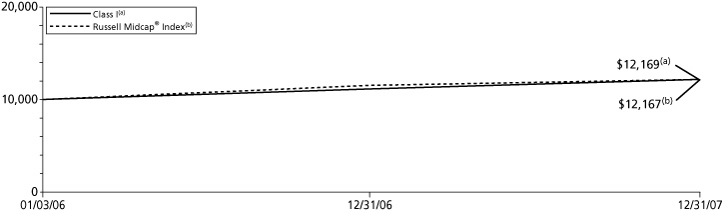
Performance: For the year ended December 31, 2007, the Portfolio's Class I shares provided a total return of 9.25% compared to the Russell Midcap® Index(1), which returned 5.60% for the same period.
Portfolio Specifics: Industries that had the most positive contribution over the one-year reporting period include energy & energy services and financial services-brokerages & exchanges.
Energy & energy services industry had the most positive impact on the Portfolio's performance during 2007, led by Sunpower Corp ("SPWR"), a manufacturer of silicon based photovoltaic solar panels (which convert sunlight to electricity) had an extremely good year in 2007. By our estimates, it increased its output of solar cells by nearly 100% and announced plans to double plant capacity again in 2008. SPWR also structured key arrangements with its raw material suppliers which will enable it to have great visibility for 2008 and 2009 module production. Finally, SPWR completed a key strategic merger early in the year. The merger, with a company called Power Light, enabled SPWR, we believe, to get presence in the larger-scale power plant market and increased its international presence.
The financial services-brokerages & exchanges industry also had a positive impact on performance for 2007, as all five of its holdings were up during the year with Charles Schwab Corp. leading the way. Charles Schwab Corp. continued to report impressive net new asset inflows from its customers, delivering on management's ambitious goal for the year. Account growth and trading metrics were also strong. The prudence of the company's management was highlighted as Charles Schwab Corp. avoided the credit market losses that plagued many other financial institutions.
Real estate and the consulting industry were the worst performing industries in 2007. The real estate industry had the most negative impact on performance due to the decline of all three of the Portfolio's holdings, CB Richard Ellis Group, Inc., St. Joe Co. and Forest City Enterprises, Inc. Shares of CB Richard Ellis Group, Inc., the world's largest full-service commercial real estate services firm, fell sharply during late-2007 over concerns surrounding its vulnerability to a slowdown in the commercial real estate market. The market is particularly concerned about whether the company's unit that advises on the sales of commercial properties will be negatively impacted for a sustained period by turmoil in the credit markets, which has made it very challenging for purchasers to finance real estate acquisitions.
The consulting industry had the second most negative impact on performance, due to both of the Portoflio's holdings, Gartner, Inc. and Corporate Executive Board Co. The Gartner Events division suffered from a decline in exhibitor sales as a result of a change in leadership, which left sales positions vacant. However, Gartner's research metrics continue to be outstanding, which we believe is the true driver of shareholder value over the long term. Corporate Executive Board Co. shares fell as contract value growth failed to accelerate as quickly as we hoped. We believe that contract value growth is poised to increase by the second quarter in 2008, positioning the company to generate better than expected results in 2009 and beyond.
The top five most positively impacting stocks were: Sunpower Corp, Stericycle, Iron Mountain, Charles Schwab and Wynn Resorts. The top five most negatively impacting stocks were; Lamar Advertising, CB Richard Ellis Group, Brookdale Senior Living, Gartner, Inc. and Corporate Executive Board Co.
Current Strategy and Outlook: BAMCO invests for the long-term in what we believe to be forward-looking, well-managed, fast-growing businesses. We believe the companies we own will continue to grow at healthy and sustainable rates and we expect that their share prices will reflect their attractive prospects.

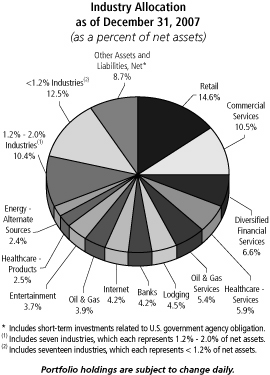
Top Ten Holdings
as of December 31, 2007
(as a percent of net assets)
| Iron Mountain, Inc. | | | 2.5 | % | |
| Charles Schwab Corp. | | | 2.5 | % | |
| CME Group, Inc. | | | 2.4 | % | |
| Eaton Vance Corp. | | | 2.4 | % | |
| Arch Capital Group Ltd. | | | 2.3 | % | |
| Polo Ralph Lauren Corp. | | | 2.2 | % | |
| Lamar Advertising Co. | | | 2.1 | % | |
| Wynn Resorts Ltd. | | | 2.1 | % | |
| CH Robinson Worldwide, Inc. | | | 2.1 | % | |
| Covance, Inc. | | | 1.9 | % | |
Portfolio holdings are subject to change daily.
* Effective January 24, 2008, Ronald Baron no longer manages the Portfolio.
Portfolio holdings and characteristics are subject to change and may not be representative of current holdings and characteristics. The outlook for this Portfolio may differ from that presented for other ING Funds. Performance for the different classes of shares will vary based on differences in fees associated with each class.
8
PORTFOLIO MANAGERS' REPORT
ING BARON ASSET PORTFOLIO
| Average Annual Total Returns for the Periods Ended December 31, 2007 | |
| | | 1 Year | | Since Inception
of Class I
January 3, 2006 | | Since Inception
of Class S
May 3, 2006 | | Since Inception
of Class ADV
January 18, 2006 | |
| Class I | | | 9.25 | % | | | 10.36 | % | | | — | | | | — | | |
| Class S | | | 8.92 | % | | | — | | | | 7.44 | % | | | — | | |
| Class ADV | | | 8.66 | % | | | — | | | | — | | | | 9.81 | % | |
| Russell Midcap® Index(1) | | | 5.60 | % | | | 10.32 | %(2) | | | 7.22 | %(3) | | | 7.94 | %(4) | |
Based on a $10,000 initial investment, the graph and table above illustrate the total return of ING Baron Asset Portfolio against the index indicated. An index is unmanaged and has no cash in its portfolio, imposes no sales charges and incurs no operating expenses. An investor cannot invest directly in an index. The Portfolio's performance is shown without the imposition of any expenses or charges which are, or may be, imposed under your annuity contract. Total returns would have been lower if such expenses or charges were included.
The performance graph and table do not reflect the deduction of taxes that a shareholder will pay on portfolio distributions or the redemption of portfolio shares.
The performance shown may include the effect of fee waivers and/or expense reimbursements by the Investment Adviser and/or other service providers, which have the effect of increasing total return. Had all fees and expenses been considered, the total returns would have been lower.
The performance update illustrates performance for a variable investment option available through a variable annuity contract. The performance shown indicates past performance and is not a projection or prediction of future results. Actual investment returns and principal value will fluctuate so that shares and/or units, at redemption, may be worth more or less than their original cost. Please call (800) 262-3862 to get performance through the most recent month end.
This report contains statements that may be "forward-looking" statements. Actual results may differ materially from those projected in the "forward-looking" statements.
The views expressed in this report reflect those of the portfolio manager only through the end of the period as stated on the cover. The portfolio manager's views are subject to change at any time based on marked and other conditions.
Portfolio holdings are subject to change daily.
(1) The Russell Midcap® Index is an unmanaged index that measures the performance of the 800 smallest companies in the Russell 1000® Index, which represents approximately 26% of the total market capitalization of the Russell 1000® Index.
(2) Since inception performance of the index is shown from January 1, 2006.
(3) Since inception performance of the index is shown from May 1, 2006.
(4) Since inception performance of the index is shown from February 1, 2006.
9
ING BARON SMALL CAP GROWTH PORTFOLIO
PORTFOLIO MANAGERS' REPORT
ING Baron Small Cap Growth Portfolio (the "Portfolio") seeks capital appreciation. The Portfolio is managed by Ronald Baron, Founder, Chief Executive Officer, Chief Investment Officer, Chairman, and Portfolio Manager of BAMCO, Inc. ("BAMCO") — the Sub-Adviser.
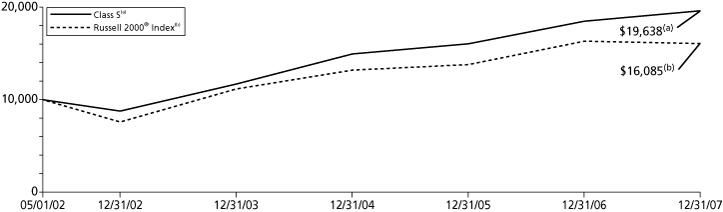
Performance: For the year ended December 31, 2007, the Portfolio's Class S shares provided a total return of 6.11% compared to the Russell 2000® Index(1), which returned (1.57)% for the same period.
Portfolio Specifics: Industries that had the most positive contribution over the one-year reporting period include energy & energy services and education.
Energy & energy services industry made the largest contribution to the Portfolio's gain, led by Sunpower, Corp. Our energy investments in 2007 directly benefited from the increase in oil as the benchmark price rose from $61 per barrel to begin 2007 to just under $96 per barrel to finish the year. The rise was driven by worldwide demand growth of about 1.1%, led by emerging markets in South America and Asia, as supply growth remained in check due to the maturity of existing fields, disruptions caused by political turmoil in key producing regions and the continued cohesion within the Organization of the Petroleum Exporting Countries ("OPEC").
The education industry had the second most positive impact on the Portfolio's performance mainly due to DeVry, Inc., which is generating significant operating leverage from continued improving enrollment trends combined with prior cost-cutting and real estate rationalization activities. Investors were encouraged that these levels could be surpassed as enrollment builds.
Financial services-community banks and chemical were the worst performing industries in 2007. Financial services firms, particularly community banks, in the latter half of 2007 erased all the gains made in the first six months. There were two primary reasons. First, falling housing prices led to increased mortgage and construction loan delinquencies, and ultimately write-offs. Second, community banks found themselves forced to compete with troubled financial firms offering high deposit rates. Yet, loan rates declined. Thus, the rate paid to money going out (deposit interest) remained high, while money coming in (loan payments) fell. These two factors coupled with the overall lack of liquidity in the market (following the sub-prime crisis) made community bank shares under-perform.
The chemical industry had the second most negative impact mainly due to Symyx Technologies. Symyx Technologies experienced a very difficult year. Revenue guidance was lowered because of a host of issues. The expected renewal of the ExxonMobil Corp. contract occurred at only 80% of its prior level. Delays with four major pharmaceutical customers and the loss of three chemical collaborators resulted in lower sales. While the company is taking steps to rectify the problem with the promotion of Isy Goldwasser to CEO and the hiring of additional salesmen, the timing of the turnaround is unclear and we exited the position.
The top five most positively impacting stocks were: Sunpower Corp, Intuitive Surgical, Inc., Devry Inc., Chipotle Mexican Grill and Wynn Resorts. The top five most negatively impacting stocks were; Symyx Technologies, WellCare Group, Isle of Capri Casinos, CB Richard Ellis Group and DSW Inc.
Current Strategy and Outlook: BAMCO invests for the long-term in what we believe to be forward-looking, well-managed, fast-growing businesses. We believe the companies we own will continue to grow at healthy and sustainable rates and we expect that their share prices will reflect their attractive prospects.
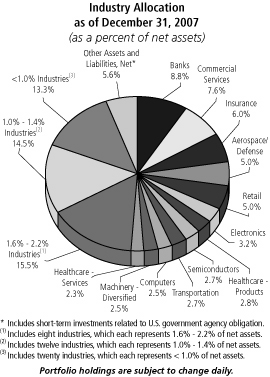
Top Ten Holdings*
as of December 31, 2007
(as a percent of net assets)
| DeVry, Inc. | | | 2.6 | % | |
| Sunpower Corp. | | | 2.4 | % | |
| Equinix, Inc. | | | 1.9 | % | |
| J Crew Group, Inc. | | | 1.9 | % | |
| Dick's Sporting Goods, Inc. | | | 1.7 | % | |
| Ralcorp Holdings, Inc. | | | 1.7 | % | |
| FCStone Group, Inc. | | | 1.6 | % | |
| Core Laboratories NV | | | 1.5 | % | |
| Cohen & Steers, Inc. | | | 1.5 | % | |
| Healthways, Inc. | | | 1.5 | % | |
* Excludes short-term investments related to U.S. government agency obligation.
Portfolio holdings are subject to change daily.
Portfolio holdings and characteristics are subject to change and may not be representative of current holdings and characteristics. The outlook for this Portfolio may differ from that presented for other ING Funds. Performance for the different classes of shares will vary based on differences in fees associated with each class.
10
PORTFOLIO MANAGERS' REPORT
ING BARON SMALL CAP GROWTH PORTFOLIO
| Average Annual Total Returns for the Periods Ended December 31, 2007 | |
| | | 1 Year | | 5 Year | | Since Inception
of Classes I, S and ADV
May 1, 2002 | |
| Class I | | | 6.36 | % | | | 17.82 | % | | | 12.92 | % | |
| Class S | | | 6.11 | % | | | 17.51 | % | | | 12.64 | % | |
| Class ADV | | | 5.80 | % | | | 17.22 | % | | | 12.34 | % | |
| Russell 2000® Index(1) | | | (1.57 | )% | | | 16.25 | % | | | 8.75 | % | |
Based on a $10,000 initial investment, the graph and table above illustrate the total return of ING Baron Small Cap Growth Portfolio against the index indicated. An index is unmanaged and has no cash in its portfolio, imposes no sales charges and incurs no operating expenses. An investor cannot invest directly in an index. The Portfolio's performance is shown without the imposition of any expenses or charges which are, or may be, imposed under your annuity contract. Total returns would have been lower if such expenses or charges were included.
The performance graph and table do not reflect the deduction of taxes that a shareholder will pay on portfolio distributions or the redemption of portfolio shares.
The performance shown may include the effect of fee waivers and/or expense reimbursements by the Investment Adviser and/or other service providers, which have the effect of increasing total return. Had all fees and expenses been considered, the total returns would have been lower.
The performance update illustrates performance for a variable investment option available through a variable annuity contract. The performance shown indicates past performance and is not a projection or prediction of future results. Actual investment returns and principal value will fluctuate so that shares and/or units, at redemption, may be worth more or less than their original cost. Please call (800) 262-3862 to get performance through the most recent month end.
This report contains statements that may be "forward-looking" statements. Actual results may differ materially from those projected in the "forward-looking" statements.
The views expressed in this report reflect those of the portfolio manager only through the end of the period as stated on the cover. The portfolio manager's views are subject to change at any time based on marked and other conditions.
Portfolio holdings are subject to change daily.
(1) The Russell 2000® Index is a broad-based unmanaged capitalization weighted index of small capitalization companies.
11
ING COLUMBIA SMALL CAP VALUE II PORTFOLIO
PORTFOLIO MANAGERS' REPORT
ING Columbia Small Cap Value II Portfolio (the "Portfolio") seeks long-term growth of capital. The Portfolio is managed by Christian Stadlinger, Ph.D. and Jarl Ginsberg, Portfolio Managers, Columbia Management Advisors, LLC — the Sub-Adviser.
Performance: For the year ended December 31, 2007, the Portfolio's Class I shares provided a total return of 3.21% compared to the Russell 2000® Value Index(1), which returned (9.78)% for the same period.
Portfolio Specifics: 2007 marked a challenging period for managers and investors alike largely attributable to the challenging environment caused by continued deterioration in the housing and credit markets, combined with slowing domestic growth.
The Portfolio's performance relative to the benchmark was mostly attributable to strong stock selection in the industrial, financial and consumer discretionary sectors. Industrials on average returned 31.6% compared to 1.4% for industrial companies in the Russell 2000 Value® Index. Investments that continued to perform particularly well included JA Solar Holdings Co., Ltd. ADR, the China based manufacturer of photovoltaic (solar) cells, and several aerospace companies such as BE Aerospace, Inc., Barnes Group, Inc. and Edo Corp. Transportation and general industrial companies also fared well.
Positive stock selection within the volatile financials group allowed the strategy to steer clear of larger losses suffered by the Russell 2000® Value Index within this group. The Portfolio was underweight real estate investment trusts ("REITs") and banks, thereby avoiding the numerous woes of the sector. On a stock specific basis, upscale hotel REIT Equity Inns contributed to performance as it agreed to be acquired.
Consumer discretionary stock selection also contributed to performance with the likes of Bally Technologies in the gaming industry and Tupperware Corp within consumer staples.
Slightly offsetting the positive performance were a handful of consumer and financial names including Brown Shoe Co., Inc. and Carmike, on the consumer side, and Colonial BancGroup, Inc. and Umpqua Holdings Corp., on the banking side.
Throughout the year, companies in the aerospace, machinery and commercial services space have provided strong boosts to performance. With the continued weakness of financial company shares, it is also worth noting that our continued underweight to the group combined with good stock selection was beneficial to performance. Our stock selection process has helped us to avoid many weaker names, while directing our attention to solid investments especially within the insurance industry. Weaker areas in terms of relative performance included materials, health care and utilities.
Current Strategy and Outlook: We employ a disciplined, bottom-up approach that incorporates quantitative screens, fundamental analysis and sophisticated risk management techniques. The investment process is designed to separate value opportunities — companies with solid top-line growth prospects and good cash flow fundamentals — from "value traps," those at a competitive disadvantage due to poor management, a weak product line or a hostile business environment.
Heading into 2008, the process that drives stock selection and portfolio construction remains intact. Looking for attractively valued stocks whose upward inflection points signal possible potential upside in the names has led to an overweight to industrials, consumer discretionary and health care stocks. Where fewer opportunities exist, we have underweight positions. These include financials, utilities and technology names. While we remain cognizant of macro issues and events, these occurrences do not drive our stock selection methodology. We adhere to an approach where a thorough examination of the fundamentals determines to which value opportunities we gain exposure, and the value traps we avoid.
Top Ten Holdings*
as of December 31, 2007
(as a percent of net assets)
| Alexandria Real Estate Equities, Inc. | | | 1.1 | % | |
| Actuant Corp. | | | 1.1 | % | |
| Digital Realty Trust, Inc. | | | 1.1 | % | |
| Magellan Health Services, Inc. | | | 1.1 | % | |
| Esterline Technologies Corp. | | | 1.1 | % | |
| Assured Guaranty Ltd. | | | 1.1 | % | |
| Exterran Holdings, Inc. | | | 1.1 | % | |
| Rockwood Holdings, Inc. | | | 1.1 | % | |
| Aspen Insurance Holdings Ltd. | | | 1.1 | % | |
| Universal Corp. | | | 1.1 | % | |
* Excludes short-term investments related to U.S. government agency obligation.
Portfolio holdings are subject to change daily.
Portfolio holdings and characteristics are subject to change and may not be representative of current holdings and characteristics. The outlook for this Portfolio may differ from that presented for other ING Funds. Performance for the different classes of shares will vary based on differences in fees associated with each class.
12
PORTFOLIO MANAGERS' REPORT
ING COLUMBIA SMALL CAP VALUE II PORTFOLIO
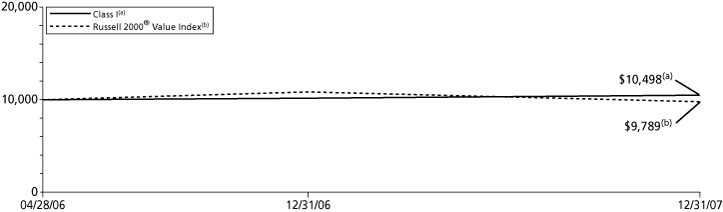
| Average Annual Total Returns for the Periods Ended December 31, 2007 | |
| | | 1 Year | | Since Inception
of Class I
April 28, 2006 | | Since Inception
of Class S
May 1, 2006 | | Since Inception
of Class ADV
December 29, 2006 | |
| Class I | | | 3.21 | % | | | 2.93 | % | | | — | | | | — | | |
| Class S | | | 2.97 | % | | | — | | | | 2.99 | % | | | — | | |
| Class ADV | | | 2.73 | % | | | — | | | | — | | | | 2.71 | % | |
| Russell 2000® Value Index(1) | | | (9.78 | )% | | | (1.27 | )%(2) | | | (1.27 | )% | | | (9.78 | )%(3) | |
Based on a $10,000 initial investment, the graph and table above illustrate the total return of ING Columbia Small Cap Value II Portfolio against the index indicated. An index is unmanaged and has no cash in its portfolio, imposes no sales charges and incurs no operating expenses. An investor cannot invest directly in an index. The Portfolio's performance is shown without the imposition of any expenses or charges which are, or may be, imposed under your annuity contract. Total returns would have been lower if such expenses or charges were included.
The performance graph and table do not reflect the deduction of taxes that a shareholder will pay on portfolio distributions or the redemption of portfolio shares.
The performance shown may include the effect of fee waivers and/or expense reimbursements by the Investment Adviser and/or other service providers, which have the effect of increasing total return. Had all fees and expenses been considered, the total returns would have been lower.
The performance update illustrates performance for a variable investment option available through a variable annuity contract. The performance shown indicates past performance and is not a projection or prediction of future results. Actual investment returns and principal value will fluctuate so that shares and/or units, at redemption, may be worth more or less than their original cost. Please call (800) 262-3862 to get performance through the most recent month end.
This report contains statements that may be "forward-looking" statements. Actual results may differ materially from those projected in the "forward-looking" statements.
The views expressed in this report reflect those of the portfolio manager only through the end of the period as stated on the cover. The portfolio manager's views are subject to change at any time based on marked and other conditions.
Portfolio holdings are subject to change daily.
(1) The Russell 2000® Value Index is an unmanaged index measures the performance of those Russell 2000 securities with lower price-to-book ratios and lower forecasted growth values.
(2) Since inception performance of the index is shown from May 1, 2006.
(3) Since inception performance of the index is shown from January 1, 2007.
13
ING DAVIS NEW YORK VENTURE PORTFOLIO
PORTFOLIO MANAGERS' REPORT
ING Davis New York Venture Portfolio* (the "Portfolio") seeks long-term growth of capital. The Portfolio is managed by Christopher C. Davis and Kenneth C. Feinberg, Portfolio Managers, with Davis Selected Advisers, L.P. — the Sub-Adviser.
Performance: For the year ended December 31, 2007, the Portfolio's Class S shares provided a total return of 4.16% compared to the Standard & Poor's 500® Composite Stock Price Index(1) ("S&P 500® Index"), which returned 5.49% for the same period.
Portfolio Specifics: The energy sector was the top-performing sector of the S&P 500® Index. Energy companies were also the most important contributor to the Portfolio's performance over the year. The Portfolio's energy companies out-performed the corresponding sector within the S&P 500® Index (up 45% versus 34% for the S&P 500® Index) and the Portfolio also benefited from a higher relative average weighting in this sector (13% versus 11% for the S&P 500® Index). ConocoPhillips, Occidental Petroleum Corp., China Coal Energy Co., Devon Energy Corp., EOG Resources, Inc., and Transocean, Inc. were among the top contributors to performance.
The Portfolio made a significant investment in consumer staple companies, and they were the second most important contributor to performance. The Portfolio's consumer staple companies out-performed the corresponding sector within the S&P 500® Index (up 21% versus 14% for the S&P 500® Index) and the Portfolio also benefited from a higher relative weighting in this sector (14% versus 10% for the S&P 500® Index). Altria Group, Inc. and Costco Wholesale Corp. were among the top contributors to performance.
The Portfolio managers have identified a number of investment opportunities in foreign companies. The Portfolio ended the period with approximately 13% of its assets invested in foreign companies. As a group, the foreign companies owned by the Portfolio out-performed the S&P 500® Index over the period.
The most important detractors from performance relative to the S&P 500® Index over the year were that the Portfolio had a higher weighting in financial companies, which was a poorly performing sector, a lower weighting in information technology companies, which was a strongly performing sector, and poor stock selection among material companies.
The financial sector was the worst performing sector of the S&P 500® Index. The Portfolio's financial companies out-performed the corresponding sector within the S&P 500® Index (down 9% versus down 19% for the S&P 500® Index), but were still the largest detractor from performance. A higher relative average weighting in this sector (38% versus 21% for the S&P 500® Index) detracted from both absolute and relative performance. While Berkshire Hathaway, Inc. was among the top contributors to performance, Citigroup, Inc., American International Group, Inc., Wachovia, American Express Co., Moodys, Ambac Financial Group, Inc., and E*Trade Financial Corp. were among the top detractors from performance.
The weak performance of the Portfolio's consumer discretionary companies (down 14% versus down 13% for the S&P 500® Index), along with a higher relative average weighting in this sector (11% versus 10% for the S&P 500® Index) detracted from both absolute and relative performance. While Amazon.com, Inc. was among the top contributors to performance, Comcast Corp. and Harley Davidson, Inc. were among the top detractors from performance.
Current Strategy and Outlook: We have built a portfolio which is quite different in composition from the S&P 500® Index. The Portfolio's investment strategy is to perform extensive research to buy durable companies at a discount to their intrinsic values and hold them for the long term.
Consistent with our low-turnover strategy, only three companies dropped out of the Portfolio's top 10 holdings, Tyco International Ltd., Comcast Corp, and Wells Fargo. The Portfolio continues to own all three companies, but in reduced amounts. Three new additions to the Portfolio's top 10 holdings at year-end were Devon Energy Corp., Microsoft Corp., and Loews Corp, all of which were top 20 holdings at the beginning of the year.
Top Ten Holdings*
as of December 31, 2007
(as a percent of net assets)
| ConocoPhillips | | | 4.5 | % | |
| American Express Co. | | | 4.0 | % | |
| Altria Group, Inc. | | | 3.9 | % | |
| Costco Wholesale Corp. | | | 3.8 | % | |
| American International Group, Inc. | | | 3.5 | % | |
| Berkshire Hathaway, Inc. - Class A | | | 3.3 | % | |
| JPMorgan Chase & Co. | | | 2.9 | % | |
| Devon Energy Corp. | | | 2.6 | % | |
| Microsoft Corp. | | | 2.3 | % | |
| Loews Corp. | | | 2.3 | % | |
* Excludes short-term investments related to commercial paper.
Portfolio holdings are subject to change daily.
* On July 12, 2007, the Board of Trustees of ING Partners, Inc. approved changing the Portfolio's name from "ING Davis Venture Value Portfolio" to "ING Davis New York Venture Portfolio", effective on or about August 20, 2007.
Portfolio holdings and characteristics are subject to change and may not be representative of current holdings and characteristics. The outlook for this Portfolio may differ from that presented for other ING Funds. Performance for the different classes of shares will vary based on differences in fees associated with each class.
14
PORTFOLIO MANAGERS' REPORT
ING DAVIS NEW YORK VENTURE PORTFOLIO

| Average Annual Total Returns for the Periods Ended December 31, 2007 | |
| | | 1 Year | | 5 Year | | Since Inception
of Classes I, S and ADV
December 10, 2001 | |
| Class I | | | 4.43 | % | | | 13.74 | % | | | 6.35 | % | |
| Class S | | | 4.16 | % | | | 13.44 | % | | | 6.08 | % | |
| Class ADV | | | 3.91 | % | | | 13.17 | % | | | 5.83 | % | |
| S&P 500® Index(1) | | | 5.49 | % | | | 12.83 | % | | | 6.14 | %(2) | |
Based on a $10,000 initial investment, the graph and table above illustrate the total return of ING Davis New York Venture Portfolio against the index indicated. An index is unmanaged and has no cash in its portfolio, imposes no sales charges and incurs no operating expenses. An investor cannot invest directly in an index. The Portfolio's performance is shown without the imposition of any expenses or charges which are, or may be, imposed under your annuity contract. Total returns would have been lower if such expenses or charges were included.
The performance graph and table do not reflect the deduction of taxes that a shareholder will pay on portfolio distributions or the redemption of portfolio shares.
The performance shown may include the effect of fee waivers and/or expense reimbursements by the Investment Adviser and/or other service providers, which have the effect of increasing total return. Had all fees and expenses been considered, the total returns would have been lower.
The performance update illustrates performance for a variable investment option available through a variable annuity contract. The performance shown indicates past performance and is not a projection or prediction of future results. Actual investment returns and principal value will fluctuate so that shares and/or units, at redemption, may be worth more or less than their original cost. Please call (800) 262-3862 to get performance through the most recent month end.
This report contains statements that may be "forward-looking" statements. Actual results may differ materially from those projected in the "forward-looking" statements.
The views expressed in this report reflect those of the portfolio manager only through the end of the period as stated on the cover. The portfolio manager's views are subject to change at any time based on marked and other conditions.
Portfolio holdings are subject to change daily.
(1) The S&P 500® Index is an unmanaged index that measures the performance of the securities of approximately 500 of the largest companies in the U.S.
(2) Since inception performance of the index is shown as of December 1, 2001.
15
ING JPMORGAN INTERNATIONAL PORTFOLIO
PORTFOLIO MANAGERS' REPORT
ING JPMorgan International Portfolio (the "Portfolio") seeks long-term growth of capital. The Portfolio is managed by Howard Williams, Managing Director and James Fisher, Portfolio Managers of J.P. Morgan Asset Management (U.K.) Limited — the Sub-Adviser.
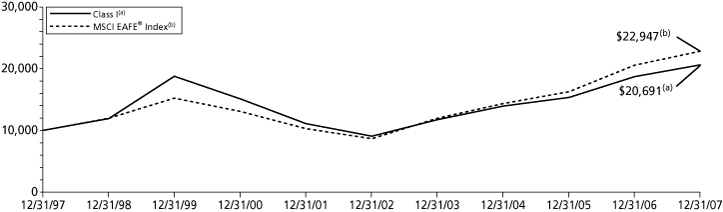
Performance: For the year ended December 31, 2007, the Portfolio's Class I shares provided a total return of 10.12% compared to the Morgan Stanley Capital International Europe, Australasia and Far East® Index(1) ("MSCI EAFE® Index"), which returned 11.17% for the same period.
Portfolio Specifics: The Portfolio seeks to be diversified by region and sector, with stock selection as the primary source of performance. At the regional level, exposure in the emerging markets, Japan and the U.K. contributed to performance, while holdings in Europe ex-U.K. and Asia Pacific ex-Japan weighed on relative performance. Contributors at the sector level came from energy and materials, while financials and telecommunications hurt returns.
At the stock level, contributors included Brazilian oil and gas company Petroleo Brasileiro SA ADR. Shares reflected the strength in crude oil and the company's continued success of its exploration program as well as investors' appetite for emerging markets. The crude oil market remained buoyant throughout the year as geopolitical tensions coupled with strong demand to perpetuate perceptions of market tightness. Shares of CVRD, the Brazilian diversified mineral company, also contributed to returns as the market became increasingly focused on news about an early positive settlement of iron ore price negotiations.
Alternatively, Wolseley PLC, a distributor of plumbing and heating equipment, was a major detractor in the period, as its U.S. division was negatively affected by housing woes. The company derives over half of its revenues from the U.S. There were also concerns that ongoing rate hikes in the U.K. might be detrimental to the company, as its debt levels jumped following last year's purchase of DT Group. More recently, the company reported its first profit decline in six years.
Also detracting from performance was the U.K.-based bank Barclays PLC. Despite impressive performance from its Barclays Capital division in recent years, the bank's stock suffered with the rest of the financial sector due to concerns over the U.S. sub-prime mortgage market.
Current Strategy and Outlook: We believe the optimism for the global economy that pervaded the early months of 2007 has been replaced with a mood of somber caution, as markets continue to focus on the tension between concerns about inflation and the desire for lower interest rates heading into 2008. Financial markets remain fragile despite recent rounds of capital-raising, as risk aversion has become an increasingly common theme. The provision of extra liquidity by central banks and the recent interest rate cuts in the U.S. and the U.K. have assisted in redressing the problems, but the necessity of these actions, especially against the backdrop of ongoing inflationary pressures, underscores the stress in the system.
A slowdown in economic activity in the U.S. has already occurred. While an official recession may be averted, it is unclear as to what factors will drive a recovery in the U.S. economy. A key point of conjecture is the extent to which this slowdown will affect the rest of the global economy. Asian economies continue to power ahead, at least for now, while Europe in aggregate remains solid, despite weakness in a couple of notable geographies, where housing markets have started to soften considerably.
The recent credit market turmoil seems to have tempered investors' risk appetite, and we continue to expect quality to come back into focus. We believe that the Portfolio should be well-positioned to benefit from this shift, given its focus on high-quality names.
Top Ten Holdings*
as of December 31, 2007
(as a percent of net assets)
| Total SA | | | 3.8 | % | |
| HSBC Holdings PLC | | | 3.0 | % | |
| ENI S.p.A. | | | 2.7 | % | |
| Vodafone Group PLC | | | 2.7 | % | |
| Tesco PLC | | | 2.4 | % | |
| E.ON AG | | | 2.2 | % | |
| Nestle SA | | | 2.1 | % | |
| Standard Chartered PLC | | | 2.1 | % | |
| Siemens AG | | | 2.1 | % | |
| Nokia OYJ | | | 2.0 | % | |
* Excludes short-term investments related to securities lending collateral.
Portfolio holdings are subject to change daily.
Portfolio holdings and characteristics are subject to change and may not be representative of current holdings and characteristics. The outlook for this Portfolio may differ from that presented for other ING Funds. Performance for the different classes of shares will vary based on differences in fees associated with each class.
16
PORTFOLIO MANAGERS' REPORT
ING JPMORGAN INTERNATIONAL PORTFOLIO
| Average Annual Total Returns for the Periods Ended December 31, 2007 | |
| | | 1 Year | | 5 Year | | 10 Year | | Since Inception
of Classes S and ADV
December 10, 2001 | |
| Class I | | | 10.12 | % | | | 17.93 | % | | | 7.54 | % | | | — | | |
| Class S | | | 9.76 | % | | | 17.65 | % | | | — | | | | 10.34 | % | |
| Class ADV | | | 9.54 | % | | | 17.36 | % | | | — | | | | 10.07 | % | |
| MSCI EAFE® Index(1) | | | 11.17 | % | | | 21.59 | % | | | 8.66 | % | | | 14.24 | %(2) | |
Based on a $10,000 initial investment, the graph and table above illustrate the total return of ING JPMorgan International Portfolio against the index indicated. An index is unmanaged and has no cash in its portfolio, imposes no sales charges and incurs no operating expenses. An investor cannot invest directly in an index. The Portfolio's performance is shown without the imposition of any expenses or charges which are, or may be, imposed under your annuity contract. Total returns would have been lower if such expenses or charges were included.
The performance graph and table do not reflect the deduction of taxes that a shareholder will pay on portfolio distributions or the redemption of portfolio shares.
The performance shown may include the effect of fee waivers and/or expense reimbursements by the Investment Adviser and/or other service providers, which have the effect of increasing total return. Had all fees and expenses been considered, the total returns would have been lower.
The performance update illustrates performance for a variable investment option available through a variable annuity contract. The performance shown indicates past performance and is not a projection or prediction of future results. Actual investment returns and principal value will fluctuate so that shares and/or units, at redemption, may be worth more or less than their original cost. Please call (800) 262-3862 to get performance through the most recent month end.
This report contains statements that may be "forward-looking" statements. Actual results may differ materially from those projected in the "forward-looking" statements.
The views expressed in this report reflect those of the portfolio manager only through the end of the period as stated on the cover. The portfolio manager's views are subject to change at any time based on marked and other conditions.
Portfolio holdings are subject to change daily.
(1) The MSCI EAFE® Index is an unmanaged index that measures the performance of securities listed on exchanges in markets in Europe, Australia, and the Far East.
(2) Since inception performance for the index is shown as of December 1, 2001.
17
ING JPMORGAN MID CAP VALUE PORTFOLIO
PORTFOLIO MANAGERS' REPORT
ING JPMorgan Mid Cap Value Portfolio (the "Portfolio") seeks growth from capital appreciation. The Portfolio is managed by Jonathan K.L. Simon, Lawrence Playford and Gloria Fu, Portfolio Managers of J.P. Morgan Investment Management Inc. — the Sub-Adviser.
Performance: For the year ended December 31, 2007, the Portfolio's Class S shares provided a total return of 2.34% compared to the Russell Midcap® Value Index(1), which returned (1.42)% for the same period.
Portfolio Specifics: The Portfolio outperformed its benchmark, the Russell Midcap® Value Index, mostly due to stock selection in the financial and consumer discretionary sectors, while stock selection in energy and materials detracted.
At the stock level, shares of Williams Cos., Inc. soared over the period, prompted by the sale of the majority of its power trading business to Bear Stearns and consecutive quarters of impressive earnings helped by increased natural gas production, higher margins and new pipeline rates. The sale of its power business was expected to reduce both earnings volatility and borrowing costs while allowing the company to focus its efforts on its core natural gas business. The divestiture could provide a catalyst for restoration of its investment-grade credit rating and removes a business segment which concerned investors given the volatility of its contribution to earnings.
Another top contributor to performance was Assurant Inc., a U.S. specialty insurer. The company reported solid earnings results throughout the year, driven by increased premium growth in its specialty property unit and higher-than-expected investment income. Analysts revised earnings estimates upward, based on lower-than-expected year-to-date catastrophic losses and increased volumes in its creditor-placed homeowner's business as homeowner's insurance policies have been allowed to lapse and mortgage foreclosures continue to mount.
Detracting from performance was M&T Bank Corp., a Mid-Atlantic regional bank, as concerns over sub-prime mortgages significantly devalued its portfolio of Alt-A mortgage loans, causing an earnings shortfall early in the year. M&T Bank Corp. also posted disappointing third-quarter results due to losses from loans affected by rising delinquencies and depreciation of its investment in a Florida commercial mortgage lender.
Old Republic International Corp., an insurer, also detracted from performance. While the company posted solid results in its property segment, declining revenues in its mortgage guaranty and title insurance segments pressured results.
Sector allocations are a byproduct of our bottom-up stock selection process. The two largest Portfolio sector overweights were in health care and telecommunications for which we have strong conviction in the underlying fundamentals of our holdings. Stock selection in healthcare and telecommunications contributed to results.
The two largest sector underweights in the Portfolio were information technology and materials. Stock selection in information technology contributed to performance while stock selection in materials detracted. We typically underweight the information technology sector as we believe that many technology firms lack the stable business models that meet our investment criteria. We continue to underweight materials as we believe it is difficult to find attractive valuations in this sector.
Current Strategy and Outlook: We employ a bottom-up approach to stock selection, constructing the Portfolio based on company fundamentals, quantitative screening and proprietary fundamental analysis. Our aim is to identify undervalued companies that we believe have the potential to increase their intrinsic values per share and to purchase these companies at a discount.
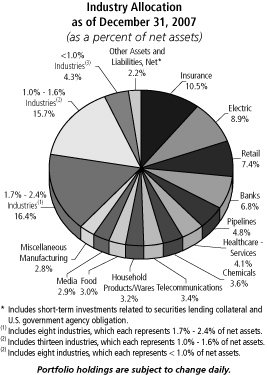
Top Ten Holdings*
as of December 31, 2007
(as a percent of net assets)
| Synovus Financial Corp. | | | 2.5 | % | |
| Williams Cos., Inc. | | | 2.3 | % | |
| Coventry Health Care, Inc. | | | 2.2 | % | |
| Assurant, Inc. | | | 2.1 | % | |
| Devon Energy Corp. | | | 2.1 | % | |
| Cincinnati Financial Corp. | | | 2.0 | % | |
| American Electric Power Co., Inc. | | | 1.8 | % | |
| PG&E Corp. | | | 1.8 | % | |
| M&T Bank Corp. | | | 1.8 | % | |
| Brown-Forman Corp. | | | 1.8 | % | |
* Excludes short-term investments related to securities lending collateral and U.S. government agency obligation.
Portfolio holdings are subject to change daily.
Portfolio holdings and characteristics are subject to change and may not be representative of current holdings and characteristics. The outlook for this Portfolio may differ from that presented for other ING Funds. Performance for the different classes of shares will vary based on differences in fees associated with each class.
18
PORTFOLIO MANAGERS' REPORT
ING JPMORGAN MID CAP VALUE PORTFOLIO
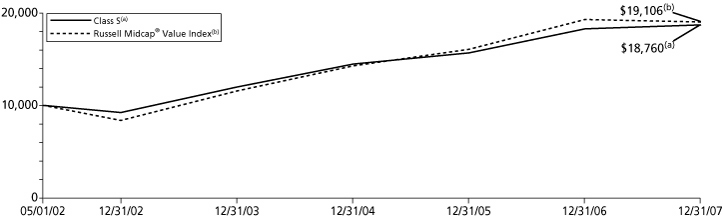
| Average Annual Total Returns for the Periods Ended December 31, 2007 | |
| | | 1 Year | | 5 Year | | Since Inception
of Classes I, S and ADV
May 1, 2002 | |
| Class I | | | 2.61 | % | | | 15.46 | % | | | 12.02 | % | |
| Class S | | | 2.34 | % | | | 15.19 | % | | | 11.73 | % | |
| Class ADV | | | 2.06 | % | | | 14.88 | % | | | 11.44 | % | |
| Russell Midcap® Value Index(1) | | | (1.42 | )% | | | 17.92 | % | | | 12.10 | % | |
Based on a $10,000 initial investment, the graph and table above illustrate the total return of ING JPMorgan Mid Cap Value Portfolio against the index indicated. An index is unmanaged and has no cash in its portfolio, imposes no sales charges and incurs no operating expenses. An investor cannot invest directly in an index. The Portfolio's performance is shown without the imposition of any expenses or charges which are, or may be, imposed under your annuity contract. Total returns would have been lower if such expenses or charges were included.
The performance graph and table do not reflect the deduction of taxes that a shareholder will pay on portfolio distributions or the redemption of portfolio shares.
The performance shown may include the effect of fee waivers and/or expense reimbursements by the Investment Adviser and/or other service providers, which have the effect of increasing total return. Had all fees and expenses been considered, the total returns would have been lower.
The performance update illustrates performance for a variable investment option available through a variable annuity contract. The performance shown indicates past performance and is not a projection or prediction of future results. Actual investment returns and principal value will fluctuate so that shares and/or units, at redemption, may be worth more or less than their original cost. Please call (800) 262-3862 to get performance through the most recent month end.
This report contains statements that may be "forward-looking" statements. Actual results may differ materially from those projected in the "forward-looking" statements.
The views expressed in this report reflect those of the portfolio manager only through the end of the period as stated on the cover. The portfolio manager's views are subject to change at any time based on marked and other conditions.
Portfolio holdings are subject to change daily.
(1) The Russell Midcap® Value Index measures the performance of those Russell Midcap companies with lower price-to-book ratios and lower forecasted growth values.
19
ING LEGG MASON PARTNERS AGGRESSIVE GROWTH PORTFOLIO
PORTFOLIO MANAGERS' REPORT
ING Legg Mason Partners Aggressive Growth Portfolio (the "Portfolio") seeks long-term growth of capital. The Portfolio is managed by Richard Freeman, Managing Director, Portfolio Manager and Evan Bauman, Assistant Portfolio Manager, of ClearBridge Advisors, LLC — the Sub-Adviser.
Performance: For the year ended December 31, 2007, the Portfolio's Class I shares provided a total return of (1.61)% compared to the Russell 3000® Growth Index(1) and the Standard & Poor's 500® Composite Stock Price Index(2) ("S&P 500® Index"), which returned 11.40% and 5.49%, respectively, for the same period.
Portfolio Specifics: Significant contributors to performance for the one-year reporting period included, Anadarko Petroleum Corp. and Weatherford International Ltd. in energy, L-3 Communications Holdings, Inc. in industrials, and Genzyme Corp., Biogen Idec, Inc., and ImClone Systems Inc. in health care. We believe Anadarko Petroleum Corp., and the energy exploration and production sector in general, benefited from growth in production, successful new finds in the Gulf of Mexico and the ability to pay down debt at a faster pace than expected.
The leading detractors from Portfolio performance during the year were Merrill Lynch & Co., Inc. in financials, Comcast Corp. (Class A Special) in consumer discretionary, Forest Laboratories Inc. and Amgen, Inc. in health care, Micron Technology Inc. in information technology, and Time Warner, Inc. in consumer discretionary. We believe Merrill Lynch & Co., Inc was hurt by concerns about troubles in the U.S. housing market.
During the year, an overweight position in the energy sector made a positive contribution to Portfolio performance relative to the benchmark, Russell 3000® Growth Index. The Portfolio's overweight positions in the consumer discretionary, financial and health care sectors detracted from relative performance. Underweight positions in materials, information technology and consumer staples also detracted from performance during the quarter. The Portfolio had no significant holdings in the utilities, materials, telecommunications services and consumer staples sectors.
The Portfolio's sector allocation and subsequent overweight or underweight positions were effectively a byproduct of the manager's bottom-up stock selection process rather than the result of any top-down strategy or questions of benchmark sensitivity.
Current Strategy and Outlook: Our 2008 outlook focuses on psychology, monetary conditions and valuation. We remind investors that the stock market tends, in our opinion, to bottom on fear/pessimism and normally peaks on euphoria/greed. Clearly, we feel we are much closer to the former. The financial stress of 2007 has helped create a much more accommodative Federal Reserve Board, which has cut the federal funds rate by 100 basis points (1.00%) and the discount rate by 150 basis (1.50%) points since the summer and continues to inject reserves into the system to maintain liquidity. On a broad market basis, we believe valuations remain attractive. Given strong cash balances for many corporations, we expect merger and acquisition ("M&A") activity to remain robust.
The success or failure of the Portfolio will be determined by the ability of our holdings to grow earnings/cash flows over a sustained period of time while smartly allocating capital. We feel that conditions are in place for the broad market to advance from the levels at which it closed 2007.
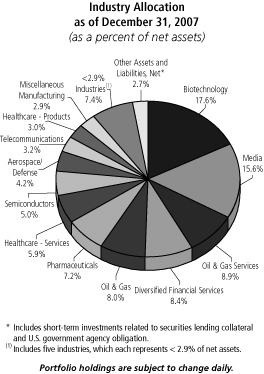
Top Ten Holdings*
as of December 31, 2007
(as a percent of net assets)
| Anadarko Petroleum Corp. | | | 8.0 | % | |
| Weatherford International Ltd. | | | 6.7 | % | |
| Genzyme Corp. | | | 6.2 | % | |
| Biogen Idec, Inc. | | | 6.2 | % | |
| UnitedHealth Group, Inc. | | | 5.9 | % | |
| Lehman Brothers Holdings, Inc. | | | 4.7 | % | |
| Forest Laboratories, Inc. | | | 4.4 | % | |
| L-3 Communications Holdings, Inc | | | 4.2 | % | |
| Comcast Corp. - Special Class A | | | 3.6 | % | |
| Amgen, Inc. | | | 3.6 | % | |
* Excludes short-term investments related to securities lending collateral.
Portfolio holdings are subject to change daily.
Portfolio holdings and characteristics are subject to change and may not be representative of current holdings and characteristics. The outlook for this Portfolio may differ from that presented for other ING Funds. Performance for the different classes of shares will vary based on differences in fees associated with each class.
20
PORTFOLIO MANAGERS' REPORT
ING LEGG MASON PARTNERS AGGRESSIVE GROWTH PORTFOLIO

| Average Annual Total Returns for the Periods Ended December 31, 2007 | |
| | | 1 Year | | 5 Year | | 10 Year | | Since Inception
of Classes S and ADV
December 10, 2001 | |
| Class I | | | (1.61 | )% | | | 12.88 | % | | | 2.14 | % | | | — | | |
| Class S | | | (1.88 | )% | | | 12.60 | % | | | — | | | | 2.45 | % | |
| Class ADV | | | (2.11 | )% | | | 12.32 | % | | | — | | | | 2.20 | % | |
| Russell 3000® Growth Index(1) | | | 11.40 | % | | | 12.42 | % | | | 3.83 | % | | | 4.35 | %(3) | |
| S&P 500® Index(2) | | | 5.49 | % | | | 12.83 | % | | | 5.91 | % | | | 6.14 | %(3) | |
Based on a $10,000 initial investment, the graph and table above illustrate the total return of ING Legg Mason Partners Aggressive Growth Portfolio against the indices indicated. An index is unmanaged and has no cash in its portfolio, imposes no sales charges and incurs no operating expenses. An investor cannot invest directly in an index. The Portfolio's performance is shown without the imposition of any expenses or charges which are, or may be, imposed under your annuity contract. Total returns would have been lower if such expenses or charges were included.
The performance graph and table do not reflect the deduction of taxes that a shareholder will pay on portfolio distributions or the redemption of portfolio shares.
The performance shown may include the effect of fee waivers and/or expense reimbursements by the Investment Adviser and/or other service providers, which have the effect of increasing total return. Had all fees and expenses been considered, the total returns would have been lower.
The performance update illustrates performance for a variable investment option available through a variable annuity contract. The performance shown indicates past performance and is not a projection or prediction of future results. Actual investment returns and principal value will fluctuate so that shares and/or units, at redemption, may be worth more or less than their original cost. Please call (800) 262-3862 to get performance through the most recent month end.
This report contains statements that may be "forward-looking" statements. Actual results may differ materially from those projected in the "forward-looking" statements.
The views expressed in this report reflect those of the portfolio manager only through the end of the period as stated on the cover. The portfolio manager's views are subject to change at any time based on marked and other conditions.
Portfolio holdings are subject to change daily.
(1) The Russell 3000® Growth Index measures the performance of the 3000 largest U.S. companies based on total market capitalization, which represent approximately 98% of the U.S. equity market.
(2) The S&P 500® Index is an unmanaged index that measures the performance of the securities of approximately 500 of the largest companies in the U.S.
(3) Since inception performance for the indices is shown from December 1, 2001.
21
ING LEGG MASON PARTNERS LARGE CAP GROWTH PORTFOLIO
PORTFOLIO MANAGERS' REPORT
ING Legg Mason Partners Large Cap Growth Portfolio (the "Portfolio") seeks long-term capital appreciation. The Portfolio is managed by Alan Blake Managing Director and Portfolio Manager, of ClearBridge Advisors, LLC — the Sub-Adviser.
Performance: For the year ended December 31, 2007, the Portfolio's Class S provided a total return of 4.63% compared to the Russell 1000® Growth Index(1) and the Standard & Poor's 500® Composite Stock Price Index(2) ("S&P 500® Index"), which returned 11.81% and 5.49%, respectively, for the same period.
Portfolio Specifics: The fourth quarter continued the trend that we witnessed in the previous three quarters of calendar 2007. Notably, growth generally outperforming value (as measured by the Russell 1000® Growth Index and the Russell 1000® Value Index, respectively) and large company stocks outperforming small company stocks (as measured by the Russell 1000® Index and the Russell 2000® Index, respectively).
During the year, Portfolio performance was enhanced by overweight positions in the information technology and consumer staples sectors. The Portfolio also benefited from an underweight position in the telecommunications services sector, where it held no significant positions. The Portfolio was hurt by overweight positions in the consumer discretionary and financial sectors and underweight positions in the energy, materials and industrial sectors. The Portfolio had no substantial holdings in the materials and energy sectors, which were the strongest contributors to the performance of the benchmark index. The Portfolio also had no significant holdings in the industrial sector.
The top performing stocks in the Portfolio during the year were Amazon.com, Inc. in the consumer discretionary sector, Nasdaq Stock Market, Inc. and Berkshire Hathaway, Inc. (Class A) in financials, and Juniper Networks, Inc. and Intel Corp. in the information technology sector. Top performing stocks within the strongest sectors were Amazon.com, Harman International Industrial Inc. and Citadel Broadcasting Corp. in consumer discretionary and Coca-Cola Co., PepsiCo Inc., WM Wrigley Jr. Co. and Procter & Gamble Co. in consumer staples.
Stocks that detracted the most from Portfolio performance were Amgen, Inc. and Genentech, Inc., in health care, Merrill Lynch & Co. in financials, Akamai Technologies, Inc. in information technology and IAC/InterActiveCorp. in consumer discretionary. The biggest detractors within the worst performing sectors were Akamai, Motorola Inc., Yahoo Inc., Red Hat Inc. and Cisco Systems Inc. in information technology and Amgen, Genentech, Vertex Pharmaceuticals Inc., Medtronic Inc and Pfizer Inc. in health care.
Current Strategy and Outlook: We feel the market had clearly started discounting a meaningful slowdown in the global economy (and thus corporate profits) well in advance of the mass media musings that are being written. In our opinion, periods like this usually favor self-funding, counter-cyclical industries like consumer staples, health care, and parts of technology.
Pundits suggest that dislocations and market uncertainty usually end with some sort of financial calamity. We can all agree that the most recent mortgage mess at every level of the food chain qualifies. We would argue that the aggressive write-downs and recent capital raises close the chapter on another period of self-perpetuating indiscretion on behalf of the financial services industry. Mercifully, we think the banks have finally bracketed their respective exposure to spread product and have been realistic on asset prices going forward. The Federal Reserve Board will likely continue to 'come to the rescue,' as long as the dislocations persist to ensure proper liquidity and functionality of the financial system.
As the consumer is approximately two thirds of the gross domestic product ("GDP"), things to watch in the new year include: political direction (or lack thereof); unemployment; capital spending plans of corporations; export levels from emerging markets; direction of already elevated levels of input costs; and retail sales trends.
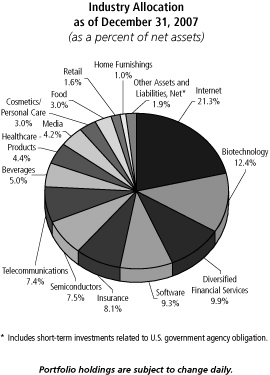
Top Ten Holdings
as of December 31, 2007
(as a percent of net assets)
| Amazon.com, Inc. | | | 9.2 | % | |
| Berkshire Hathaway, Inc. - Class A | | | 5.7 | % | |
| Genentech, Inc. | | | 4.9 | % | |
| Texas Instruments, Inc. | | | 4.1 | % | |
| Amgen, Inc. | | | 3.7 | % | |
| Electronic Arts, Inc. | | | 3.7 | % | |
| Nasdaq Stock Market, Inc. | | | 3.7 | % | |
| Intel Corp. | | | 3.4 | % | |
| Yahoo!, Inc. | | | 3.3 | % | |
| Akamai Technologies, Inc. | | | 3.3 | % | |
Portfolio holdings are subject to change daily.
Portfolio holdings and characteristics are subject to change and may not be representative of current holdings and characteristics. The outlook for this Portfolio may differ from that presented for other ING Funds. Performance for the different classes of shares will vary based on differences in fees associated with each class.
22
PORTFOLIO MANAGERS' REPORT
ING LEGG MASON PARTNERS LARGE CAP GROWTH PORTFOLIO

| Average Annual Total Returns for the Periods Ended December 31, 2007 | |
| | | 1 Year | | Since Inception
of Classes I, S and ADV
May 1, 2003 | |
| Class I | | | 4.92 | % | | | 8.92 | % | |
| Class S | | | 4.63 | % | | | 8.63 | % | |
| Class ADV | | | 4.42 | % | | | 8.38 | % | |
| Russell 1000® Growth Index(1) | | | 11.81 | % | | | 11.57 | % | |
| S&P 500® Index(2) | | | 5.49 | % | | | 12.66 | % | |
Based on a $10,000 initial investment, the graph and table above illustrate the total return of ING Legg Mason Partners Large Cap Growth Portfolio against the indices indicated. An index is unmanaged and has no cash in its portfolio, imposes no sales charges and incurs no operating expenses. An investor cannot invest directly in an index. The Portfolio's performance is shown without the imposition of any expenses or charges which are, or may be, imposed under your annuity contract. Total returns would have been lower if such expenses or charges were included.
The performance graph and table do not reflect the deduction of taxes that a shareholder will pay on portfolio distributions or the redemption of portfolio shares.
The performance shown may include the effect of fee waivers and/or expense reimbursements by the Investment Adviser and/or other service providers, which have the effect of increasing total return. Had all fees and expenses been considered, the total returns would have been lower.
The performance update illustrates performance for a variable investment option available through a variable annuity contract. The performance shown indicates past performance and is not a projection or prediction of future results. Actual investment returns and principal value will fluctuate so that shares and/or units, at redemption, may be worth more or less than their original cost. Please call (800) 262-3862 to get performance through the most recent month end.
This report contains statements that may be "forward-looking" statements. Actual results may differ materially from those projected in the "forward-looking" statements.
The views expressed in this report reflect those of the portfolio manager only through the end of the period as stated on the cover. The portfolio manager's views are subject to change at any time based on marked and other conditions.
Portfolio holdings are subject to change daily.
(1) The Russell 1000® Growth Index is an index of common stocks designed to track performance of large capitalization companies with greater than average growth orientation.
(2) The S&P 500® Index is an unmanaged index that measures the performance of the securities of approximately 500 of the largest companies in the U.S.
23
ING LORD ABBETT U.S. GOVERNMENT SECURITIES PORTFOLIO
PORTFOLIO MANAGERS' REPORT
ING Lord Abbett U.S. Government Securities Portfolio (the "Portfolio") seeks high current income consistent with reasonable risk. The Portfolio is managed by Robert I. Gerber, Partner, Director of Taxable Fixed Income Management and Portfolio Manager of Lord, Abbett & Co. LLC — the Sub-Adviser.
Performance: For the year ended December 31, 2007, the Portfolio's Class I shares provided a total return of 7.31% compared to the Lehman Brothers® Government Bond Index(1), which returned 8.66% for the same period.
Portfolio Specifics: The Portfolio underperformed the benchmark, the Lehman Brothers® Government Bond Index, over the twelve-month period.
As Treasury securities benefited from a flight to quality, the Portfolio's underweight in the Treasury sector relative to the benchmark was a hindrance to performance. In particular, our large exposure to mortgage-backed securities ("MBS") detracted from performance. As concerns grew that accommodative monetary policy increased the risk of inflation, the Portfolio maintained a position in Treasury inflation protected securities ("TIPS"). Our underweight in Agency bonds also detracted from performance relative to the benchmark. As we chose to focus our spread exposure on the MBS market, agency positions were reduced. The agency market outperformed marginally for the period.
Based on weakening valuations, we continue to add to the Portfolio in non-Treasury (spread) sectors. As yields relative to Treasuries for MBS increase resulting in compelling valuations, we continue to add to our existing positions. Due to the slowdown in housing and negative home price appreciation, we swapped out of lower coupon mortgages into higher coupon mortgages during the last few months of 2007.
In the first half of 2007, the Portfolio was positioned with less than usual exposure to spread products (non-U.S. Treasury securities) due to a conviction that at very tight spread levels, the compensation for risk was low. As the sub-prime crisis unfolded, spreads on non-U.S. Treasuries widened. The Portfolio's exposure to spread product, in the form of MBS, was held at a low level. Spread product positioning contributed to the performance of the Portfolio on an absolute basis. The purchase of highly liquid MBS issued by government-sponsored enterprises, such as Fannie Mae and Freddie Mac, added coupon income (yield) to the Portfolio. The higher yield helped offset price decreases arising from increased market volatility. Adding to performance was the increased position in adjustable-rate mortgages (ARMS). On balance, these holdings offered sufficient coupon income to out yield the benchmark. One of the larger exposures in the Portfolio wa s in adjustable rate debt. The April 1 inclusion of this sub-sector in the Lehman Brothers® Aggregate Index improved valuations somewhat.
Current Strategy and Outlook: As we look ahead in 2008, we believe investors' main concern will be the extent of the economic slowdown. Weak employment numbers, disappointing manufacturing data and slumping global stock markets at the start of the year have only added to recession fears. All eyes will be on the Federal Reserve Board (the "Fed") to determine how well they can navigate the post sub-prime economy. The Fed's dual mandate to promote economic growth while limiting inflation will be challenged by a crippled banking system, plagued by illiquidity and housing's drag on the economy. While both monetary and fiscal policy makers take steps to alleviate the sub-prime dilemma, uncertainty about the impact of further home price weakening remains chief among investors' concerns.
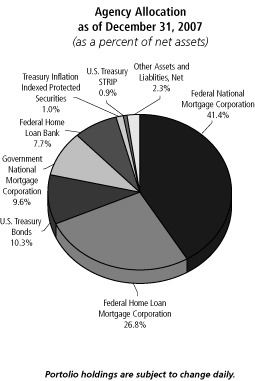
Top Ten Holdings
as of December 31, 2007
(as a percent of net assets)
Federal National Mortgage Corporation,
5.500%, due 02/01/36 | | | 22.8 | % | |
Government National Mortgage Association,
5.500%, due 07/15/36 | | | 9.6 | % | |
| Federal Home Loan Bank, | | | | | |
| 5.125%, due 08/14/13 | | | 6.4 | % | |
Federal Home Loan Mortgage Corporation,
5.500%, due 01/01/22 | | | 4.4 | % | |
| U.S. Treasury Bond, 4.500%, due 02/15/36 | | | 4.3 | % | |
| U.S. Treasury Bond, 4.250%, due 11/15/17 | | | 3.6 | % | |
Federal Home Loan Mortgage Corporation,
5.000%, due 04/01/20 | | | 3.2 | % | |
Federal Home Loan Mortgage Corporation,
5.500%, due 08/01/22 | | | 3.0 | % | |
Federal Home Loan Mortgage Corporation,
5.000%, due 10/01/20 | | | 2.4 | % | |
Federal Home Loan Mortgage Corporation,
5.000%, due 04/01/21 | | | 2.1 | % | |
Portfolio holdings are subject to change daily.
Portfolio holdings and characteristics are subject to change and may not be representative of current holdings and characteristics. The outlook for this Portfolio may differ from that presented for other ING Funds. Performance for the different classes of shares will vary based on differences in fees associated with each class.
24
PORTFOLIO MANAGERS' REPORT
ING LORD ABBETT U.S. GOVERNMENT SECURITIES PORTFOLIO
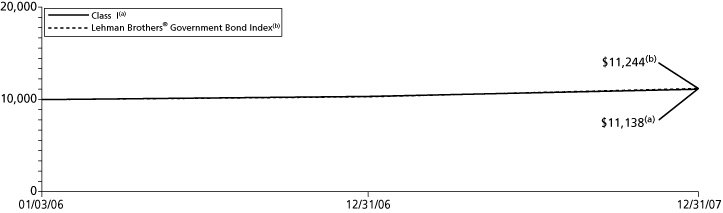
| Average Annual Total Returns for the Periods Ended December 31, 2007 | |
| | | 1 Year | | Since Inception
of Class I
January 3, 2006 | | Since Inception
of Class S
January 18, 2006 | |
| Class I | | | 7.31 | % | | | 5.57 | % | | | — | | |
| Class S | | | 7.02 | % | | | — | | | | 5.12 | % | |
| Lehman Brothers® Government Bond Index(1) | | | 8.66 | % | | | 6.04 | %(2) | | | 6.40 | %(3) | |
Based on a $10,000 initial investment, the graph and table above illustrate the total return of ING Lord Abbett U.S. Government Securities Portfolio against the index indicated. An index is unmanaged and has no cash in its portfolio, imposes no sales charges and incurs no operating expenses. An investor cannot invest directly in an index. The Portfolio's performance is shown without the imposition of any expenses or charges which are, or may be, imposed under your annuity contract. Total returns would have been lower if such expenses or charges were included.
The performance graph and table do not reflect the deduction of taxes that a shareholder will pay on portfolio distributions or the redemption of portfolio shares.
The performance shown may include the effect of fee waivers and/or expense reimbursements by the Investment Adviser and/or other service providers, which have the effect of increasing total return. Had all fees and expenses been considered, the total returns would have been lower.
The performance update illustrates performance for a variable investment option available through a variable annuity contract. The performance shown indicates past performance and is not a projection or prediction of future results. Actual investment returns and principal value will fluctuate so that shares and/or units, at redemption, may be worth more or less than their original cost. Please call (800) 262-3862 to get performance through the most recent month end.
This report contains statements that may be "forward-looking" statements. Actual results may differ materially from those projected in the "forward-looking" statements.
The views expressed in this report reflect those of the portfolio manager only through the end of the period as stated on the cover. The portfolio manager's views are subject to change at any time based on marked and other conditions.
Portfolio holdings are subject to change daily.
(1) The Lehman Brothers® Government Bond Index is an index of U.S. Treasury bonds and notes, and government-agency bonds (excluding mortgage-backed securities).
(2) Since inception performance of the index is shown from January 1, 2006.
(3) Since inception performance of the index is shown from February 1, 2006.
25
ING NEUBERGER BERMAN PARTNERS PORTFOLIO
PORTFOLIO MANAGERS' REPORT
ING Neuberger Berman Partners Portfolio (the "Portfolio") seeks capital growth. The Portfolio is managed by S. Basu Mullick, Vice President and Portfolio Manager of Neuberger Berman Management Inc. — the Sub-Adviser.
Performance: For the year ended December 31, 2007, the Portfolio's Class S shares provided a total return of 8.62% compared to the Standard & Poor's 500® Composite Stock Price Index(1) ("S&P 500® Index"), which returned 5.49% for the same period.
Portfolio Specifics: The year was volatile for the equity markets, but most major indices advanced. In the first half, the strength of earnings and stable interest rate policy lifted stocks, but over the summer concern over the impact of sub-prime mortgage defaults spread to the credit markets, causing a liquidity crunch and dampening enthusiasm for equities. The Federal Reserve Board (the "Fed") stepped in to ease monetary conditions, which helped revive stocks in the fall. However, concern about economic weakness, reflected in slowing retail sales, caused stock declines in the fourth quarter. Within the S&P 500® Index, the energy sector provided the most substantial gains, followed distantly by utilities and materials. Financials and consumer discretionary suffered substantial losses.
For the year, the Portfolio outperformed the S&P 500® Index. Energy had the most favorable impact on total return, followed by industrials and materials. Consumer discretionary was the worst laggard, followed by financials. Relative to the index, the Portfolio's stock selection and overweight in energy provided the most favorable impact. Stock selection in industrials and materials were also considerable positives, with overweights in these sectors contributing modestly to results.
Our assessment of the credit crunch has led us to the view that the recovery in housing was likely to be more protracted than we had anticipated. As such, in the third quarter, we made the decision to exit the bulk of our homebuilding (in consumer discretionary) and mortgage-related stocks (in financials), reinvesting the proceeds in retail, energy and industrials. By the fourth quarter, this change paid significant dividends as we limited our exposure to continued trauma in these areas. However, for the year, consumer discretionary and financials, were significant detractors to relative results.
Current Strategy and Outlook: Over the course of 2007, problems in the housing and sub-prime mortgage markets morphed from seemingly narrow issues to factors affecting the entire economy. Now, it's clear from a variety of metrics that economic growth has decelerated substantially. The Fed has taken a number of steps to ease credit conditions, and we hope that the Fed will continue to be vigilant.
We believe it's likely that the economy will manage to avoid a contraction, helped by strong overseas economies, modest domestic inventory levels and low interest rates. Despite these influences, however, many U.S. stocks have been trading down to levels reflecting a potentially protracted recession. While we regret that we did not sell our homebuilders and financial companies sooner, in reinvesting sale proceeds from these stocks, we have found attractive investments in somewhat cyclical retail, industrial and materials names.
We are excited by the presence of what we believe are many attractively valued, quality companies in our Portfolio. Even if the economy worsened beyond our current expectations, we believe that scenario would only postpone what we think could be a considerable opportunity. We remain focused on our investment discipline, believing that buying high quality, dominant companies with strong balance sheets, purchased at value prices, has the potential to provide superior results over the long term.
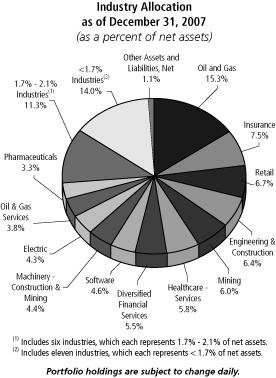
Top Ten Holdings
as of December 31, 2007
(as a percent of net assets)
| Chicago Bridge & Iron Co. NV | | | 3.0 | % | |
| Freeport-McMoRan Copper & Gold, Inc. | | | 2.9 | % | |
| Berkshire Hathaway, Inc. - Class B | | | 2.9 | % | |
| Petroleo Brasileiro SA ADR | | | 2.7 | % | |
| Terex Corp. | | | 2.4 | % | |
| National Oilwell Varco, Inc. | | | 2.4 | % | |
| McDermott International, Inc. | | | 2.3 | % | |
| Assurant, Inc. | | | 2.2 | % | |
| Noble Corp. | | | 2.1 | % | |
| Goldman Sachs Group, Inc. | | | 2.1 | % | |
Portfolio holdings are subject to change daily.
Portfolio holdings and characteristics are subject to change and may not be representative of current holdings and characteristics. The outlook for this Portfolio may differ from that presented for other ING Funds. Performance for the different classes of shares will vary based on differences in fees associated with each class.
26
PORTFOLIO MANAGERS' REPORT
ING NEUBERGER BERMAN PARTNERS PORTFOLIO

| Average Annual Total Returns for the Periods Ended December 31, 2007 | |
| | | 1 Year | | Since Inception
of Class I
January 19, 2006 | | Since Inception
of Class S
January 3, 2006 | | Since Inception
of Class ADV
December 29, 2006 | |
| Class I | | | 8.85 | % | | | 8.22 | % | | | — | | | | — | | |
| Class S | | | 8.62 | % | | | — | | | | 8.85 | % | | | — | | |
| Class ADV | | | 8.40 | % | | | — | | | | — | | | | 8.35 | % | |
| S&P 500® Index(1) | | | 5.49 | % | | | 9.50 | %(2) | | | 10.52 | %(3) | | | 5.49 | %(4) | |
Based on a $10,000 initial investment, the graph and table above illustrate the total return of ING Neuberger Berman Partners Portfolio against the index indicated. An index is unmanaged and has no cash in its portfolio, imposes no sales charges and incurs no operating expenses. An investor cannot invest directly in an index. The Portfolio's performance is shown without the imposition of any expenses or charges which are, or may be, imposed under your annuity contract. Total returns would have been lower if such expenses or charges were included.
The performance graph and table do not reflect the deduction of taxes that a shareholder will pay on portfolio distributions or the redemption of portfolio shares.
The performance shown may include the effect of fee waivers and/or expense reimbursements by the Investment Advisor and/or other service providers, which have the effect of increasing total return. Had all fees and expenses been considered, the total returns would have been lower.
The performance update illustrates performance for a variable investment option available through a variable annuity contract. The performance shown indicates past performance and is not a projection or prediction of future results. Actual investment returns and principal value will fluctuate so that shares and/or units, at redemption, may be worth more or less than their original cost. Please call (800) 262-3862 to get performance through the most recent month end.
This report contains statements that may be "forward-looking" statements. Actual results may differ materially from those projected in the "forward-looking" statements.
The views expressed in this report reflect those of the portfolio manager only through the end of the period as stated on the cover. The portfolio manager's views are subject to change at any time based on marked and other conditions.
Portfolio holdings are subject to change daily.
(1) The S&P 500® Index is an unmanaged index that measures the performance of the securities of approximately 500 of the largest companies in the U.S.
(2) Since inception performance of the index is shown from February 1, 2006.
(3) Since inception performance of the index is shown from January 1, 2006.
(4) Since inception performance of the index is shown from January 1, 2007.
27
ING NEUBERGER BERMAN REGENCY PORTFOLIO
PORTFOLIO MANAGERS' REPORT
ING Neuberger Berman Regency Portfolio (the "Portfolio") seeks capital growth. The Portfolio is managed by S. Basu Mullick, Vice President and Portfolio Manager of Neuberger Berman Management Inc. — the Sub-Adviser.
Performance: For the year ended December 31, 2007, the Portfolio's Class I shares provided a total return of 2.53% compared to the Russell Midcap® Value Index(1), which returned (1.42)% for the same period. The Portfolio's distributions included a return of capital of $0.05 per share.
Portfolio Specifics: The year was volatile for the equity markets, but most major indices advanced. In the first half, the strength of earnings and stable interest rate policy lifted stocks, but over the summer concern over the impact of sub-prime mortgage defaults spread to the credit markets, causing a liquidity crunch and dampening enthusiasm for equities. The Federal Reserve Board (the "Fed") stepped in to ease monetary conditions, which helped revive stocks in the fall. However, concern about economic weakness, reflected in slowing retail sales, caused stock declines in the fourth quarter. Within the Russell Midcap® Value Index, the energy sector provided the most substantial gains followed by materials. Financials and consumer discretionary suffered substantial losses.
For the year, the Portfolio outperformed the Russell Midcap® Value Index. Energy, industrials, and materials had the most favorable impact on total return. Consumer discretionary was the worst laggard, followed by financials. Relative to the index, the Portfolio's overweight in energy provided the most favorable impact. Stock selection in materials and industrials were also considerable positives, with overweights in these sectors also modestly contributing to results.
Our assessment of the credit crunch has led us to the view that the recovery in housing was likely to be more protracted than we had anticipated. As such, in the third quarter, we made the decision to exit the bulk of our homebuilding (in consumer discretionary) and mortgage-related stocks (in financials), reinvesting the proceeds in retail, energy and industrials. By the fourth quarter, this change paid significant dividends as we limited our exposure to continued trauma in these areas. However, for the year, consumer discretionary and financials had the worst impact on relative results.
Current Strategy and Outlook: Over the course of 2007, problems in the housing and sub-prime mortgage markets morphed from seemingly narrow issues to factors affecting the entire economy. Now, it's clear from a variety of metrics that economic growth has decelerated substantially. The Fed has taken a number of steps to ease credit conditions, and we hope that the Fed will continue to be vigilant.
We believe it's likely that the economy will manage to avoid a contraction, helped by strong overseas economies, modest domestic inventory levels and low interest rates. Despite these influences, however, many U.S. stocks have been trading down to levels reflecting a potentially protracted recession. While we regret that we did not sell our homebuilders and financial companies sooner, in reinvesting sale proceeds from these stocks, we have found attractive investments in somewhat cyclical retail, industrial and materials names.
We are excited by the presence of what we believe are many attractively valued, quality companies in our Portfolio. Even if the economy worsened beyond our current expectations, we believe that scenario would only postpone what we think could be a considerable opportunity. We remain focused on our investment discipline, believing that buying high quality, dominant companies with strong balance sheets, purchased at value prices, has the potential to provide superior results over the long term.

Top Ten Holdings
as of December 31, 2007
(as a percent of net assets)
| Freeport-McMoRan Copper & Gold, Inc. | | | 3.5 | % | |
| Chicago Bridge & Iron Co. NV | | | 2.7 | % | |
| Noble Corp. | | | 2.3 | % | |
| Terex Corp. | | | 2.2 | % | |
| Canadian Natural Resources Ltd. | | | 2.2 | % | |
| Constellation Energy Group, Inc. | | | 2.1 | % | |
| United States Steel Corp. | | | 2.0 | % | |
| FirstEnergy Corp. | | | 2.0 | % | |
| Assurant, Inc. | | | 2.0 | % | |
| McDermott International, Inc. | | | 1.9 | % | |
Portfolio holdings are subject to change daily.
Portfolio holdings and characteristics are subject to change and may not be representative of current holdings and characteristics. The outlook for this Portfolio may differ from that presented for other ING Funds. Performance for the different classes of shares will vary based on differences in fees associated with each class.
28
PORTFOLIO MANAGERS' REPORT
ING NEUBERGER BERMAN REGENCY PORTFOLIO

| Average Annual Total Returns for the Periods Ended December 31, 2007 | |
| | | 1 Year | | Since Inception
of Class I
January 3, 2006 | | Since Inception
of Class S
January 12, 2006 | |
| Class I | | | 2.53 | % | | | 4.93 | % | | | — | | |
| Class S | | | 2.32 | % | | | — | | | | 4.02 | % | |
| Russell Midcap® Value Index(1) | | | (1.42 | )% | | | 8.86 | %(2) | | | 8.86 | %(2) | |
Based on a $10,000 initial investment, the graph and table above illustrate the total return of ING Neuberger Berman Regency Portfolio against the index indicated. An index is unmanaged and has no cash in its portfolio, imposes no sales charges and incurs no operating expenses. An investor cannot invest directly in an index. The Portfolio's performance is shown without the imposition of any expenses or charges which are, or may be, imposed under your annuity contract. Total returns would have been lower if such expenses or charges were included.
The performance graph and table do not reflect the deduction of taxes that a shareholder will pay on portfolio distributions or the redemption of portfolio shares.
The performance shown may include the effect of fee waivers and/or expense reimbursements by the Investment Adviser and/or other service providers, which have the effect of increasing total return. Had all fees and expenses been considered, the total returns would have been lower.
The performance update illustrates performance for a variable investment option available through a variable annuity contract. The performance shown indicates past performance and is not a projection or prediction of future results. Actual investment returns and principal value will fluctuate so that shares and/or units, at redemption, may be worth more or less than their original cost. Please call (800) 262-3862 to get performance through the most recent month end.
This report contains statements that may be "forward-looking" statements. Actual results may differ materially from those projected in the "forward-looking" statements.
The views expressed in this report reflect those of the portfolio manager only through the end of the period as stated on the cover. The portfolio manager's views are subject to change at any time based on marked and other conditions.
Portfolio holdings are subject to change daily.
(1) The Russell Midcap® Value Index measures the performance of those Russell Midcap companies with lower price-to-book ratios and lower forecasted growth values.
(2) Since inception performance of the index is shown from January 1, 2006.
29
ING OPCAP BALANCED VALUE PORTFOLIO
PORTFOLIO MANAGERS' REPORT
ING OpCap Balanced Value Portfolio (the "Portfolio") seeks capital growth, and secondarily, investment income. The Portfolio is managed by Colin Glinsman, Managing Director and Chief Investment Officer of Oppenheimer Capital LLC — the Sub-Adviser.
Performance: For the year ended December 31, 2007, the Portfolio's Class S shares provided a total return of (3.97)% compared to the Standard & Poor's 500® Composite Stock Price Index ("S&P 500® Index")(1), the Lehman Brothers® Intermediate Government/Credit Bond Index(2) and the Composite Index (60% S&P 500® Index/40% Lehman Brothers® Intermediate Government/Credit Bond Index)(3), which returned 5.49%, 7.39% and 6.39%, respectively, for the same period.
Portfolio Specifics: U.S. stocks advanced for most of 2007 before declining in the fourth quarter in response to a slowing rate of economic growth, turmoil in the housing and credit markets, and investor concerns about sharply higher oil prices. Our underperformance in 2007 resulted primarily from the poor returns of our financial stocks, the market's weakest sector. In our view, many financial stocks are undervalued and represent some of the better opportunities in the market following their sell-off in 2007. We believe our financial holdings are well chosen and should be good long-term investments. Our consumer discretionary stocks also detracted from performance, while our telecommunication services and technology investments contributed positively to results.
Among individual stocks, ConocoPhillips (oil and gas) was the top contributor as the share price gained in response to record energy prices. MedImmune, Inc. (biotechnology) rose sharply on its acquisition by pharmaceuticals company AstraZeneca. EMC (data storage) advanced during the first 10 months on strong earnings growth. We sold our investment, taking profits, before the shares fell late in the year. Other contributors included Yum! Brands, Inc. (fast food), Lehman Brothers Holdings, Inc. (investment banking) and Eaton Corp. (diversified manufacturer).
Countrywide Financial (mortgage origination and servicing) was the biggest detractor, falling as turmoil in the housing and mortgage markets worsened. The company reported a third-quarter loss. We expect new home starts to bottom by mid-2008 and new home prices to reach their low toward the end of 2008. In addition, we expect Countrywide to return to profitability by the end of 2008. We think the stock is inexpensive at recent prices. Centex (homebuilding) declined in response to the housing slump. Aircraft design and manufacturing company Boeing (industrial) declined throughout the quarter amid speculation that its 787 program was running further behind schedule than previously announced. We believe Boeing continues to trade at a discount to intrinsic value and are encouraged by their backlog of unfilled orders and competitive position. Other detractors included AMBAC Financial Group, Inc. (municipal bond insurance), Moody's (financial rese arch and credit ratings) and Sepracor (healthcare).
In addition to owning stocks, the Portfolio invests in fixed-income securities to generate income and manage risk. Our fixed-income holdings performed well, outperforming the Lehman Brothers® Intermediate Government/Credit Bond Index. These holdings consist of a diverse group of higher-quality securities, including short- and intermediate-term corporate securities, long-term U.S. Treasuries, and intermediate-term U.S. Treasury "strips."
Current Strategy and Outlook: Our goal is to generate long-term performance by investing in stocks trading at a discount to our estimate of their intrinsic value. We are focused at this time on owning undervalued stocks that could perform well even if there is an economic recession in 2008 or could benefit substantially from the monetary easing that might accompany a recession. An example is fast-food company, Yum Brands!, Inc., which we expect to continue its rapid growth in China regardless of economic conditions in the US.
In addition to our investments in financial stocks, we have sizable holdings of health care, consumer discretionary and technology issues. We do not own any materials or utility stocks. We think the chances of a recession in the coming months are approximately 50/50. However, we believe a recession, if one does occur, will be relatively mild. Our research indicates that the stock market is somewhat undervalued to fairly valued as 2008 begins. We believe stocks are likely to perform well in the coming year, albeit with some volatility until a clearer picture of the economic outlook emerges.

Top Ten Holdings*
as of December 31, 2007
(as a percent of net assets)
| ConocoPhillips | | | 7.2 | % | |
| Boeing Co | | | 4.8 | % | |
| WellPoint, Inc. | | | 4.5 | % | |
| U.S. Treasury Note, 3.875%, due 10/31/12 | | | 4.1 | % | |
| Lehman Brothers Holdings, Inc. | | | 3.8 | % | |
| Roche Holding Ltd. ADR | | | 3.5 | % | |
| Biogen Idec, Inc. | | | 3.1 | % | |
| U.S. Treasury Bond, 5.000%, due 05/15/37 | | | 3.0 | % | |
| Freddie Mac | | | 2.9 | % | |
| U.S. Treasury STRIP, 6.762%, due 02/15/15 | | | 2.8 | % | |
* Excludes short-term investments related to securities lending collateral and U.S. government agency obligation.
Portfolio holdings are subject to change daily.
Portfolio holdings and characteristics are subject to change and may not be representative of current holdings and characteristics. The outlook for this Portfolio may differ from that presented for other ING Funds. Performance for the different classes of shares will vary based on differences in fees associated with each class.
30
PORTFOLIO MANAGERS' REPORT
ING OPCAP BALANCED VALUE PORTFOLIO
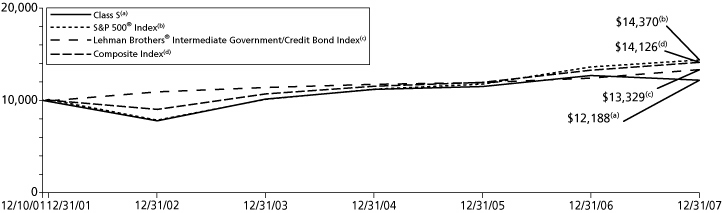
| Average Annual Total Returns for the Periods Ended December 31, 2007 | |
| | | 1 Year | | 5 Year | | Since Inception
of Classes I, S and ADV
December 10, 2001 | |
| Class I | | | (3.79 | )% | | | 9.66 | % | | | 3.57 | % | |
| Class S | | | (3.97 | )% | | | 9.38 | % | | | 3.32 | % | |
| Class ADV | | | (4.27 | )% | | | 9.11 | % | | | 3.06 | % | |
| S&P 500® Index(1) | | | 5.49 | % | | | 12.83 | % | | | 6.14 | %(4) | |
| Lehman Brothers® Intermediate Government/Credit Bond Index(2) | | | 7.39 | % | | | 4.06 | % | | | 4.84 | %(4) | |
| Composite Index(3) | | | 6.39 | % | | | 9.36 | % | | | 5.84 | %(4) | |
Based on a $10,000 initial investment, the graph and table above illustrate the total return of ING OpCap Balanced Value Portfolio against the indices indicated. An index is unmanaged and has no cash in its portfolio, imposes no sales charges and incurs no operating expenses. An investor cannot invest directly in an index. The Portfolio's performance is shown without the imposition of any expenses or charges which are, or may be, imposed under your annuity contract. Total returns would have been lower if such expenses or charges were included.
The performance graph and table do not reflect the deduction of taxes that a shareholder will pay on portfolio distributions or the redemption of portfolio shares.
The performance shown may include the effect of fee waivers and/or expense reimbursements by the Investment Adviser and/or other service providers, which have the effect of increasing total return. Had all fees and expenses been considered, the total returns would have been lower.
The performance update illustrates performance for a variable investment option available through a variable annuity contract. The performance shown indicates past performance and is not a projection or prediction of future results. Actual investment returns and principal value will fluctuate so that shares and/or units, at redemption, may be worth more or less than their original cost. Please call (800) 262-3862 to get performance through the most recent month end.
This report contains statements that may be "forward-looking" statements. Actual results may differ materially from those projected in the "forward-looking" statements.
The views expressed in this report reflect those of the portfolio manager only through the end of the period as stated on the cover. The portfolio manager's views are subject to change at any time based on marked and other conditions.
Portfolio holdings are subject to change daily.
(1) The S&P 500® Index is an unmanaged index that measures the performance of the securities of approximately 500 of the largest companies in the U.S.
(2) The Lehman Brothers® Intermediate Government/Credit Bond Index is an unmanaged index composed of securities including U.S. Government Treasury and agency securities.
(3) The Composite Index consists of 60% of the return of (securities included in) S&P 500® Index and 40% of the return of (securities included in) Lehman Brothers® Intermediate Government/Credit Bond Index.
(4) Since inception performance for the indices is shown from December 1, 2001.
31
ING OPPENHEIMER GLOBAL PORTFOLIO
PORTFOLIO MANAGERS' REPORT
ING Oppenheimer Global Portfolio (the "Portfolio") seeks capital appreciation. The Portfolio is managed by Rajeev Bhaman, Vice President of OppenheimerFunds, Inc. — the Sub-Adviser.
Performance: For the year ended December 31, 2007, the Portfolio's Class S shares provided a total return of 6.35% compared to the Morgan Stanley Capital International ("MSCI") World IndexSM(1) and the MSCI All Country World IndexSM(2), which returned 9.04% and 11.66%, respectively, for the same period.
Portfolio Specifics: In a period of choppy global markets and a credit crunch in the U.S., the Portfolio underperformed its benchmark, the MSCI World IndexSM, for the reporting period.
The most significant contribution to the underperformance of the Portfolio was the Portfolio's lack of holdings of metals and materials stocks and its relative underweight in energy and utilities stocks. Its substantial position in certain technology stocks hurt its relative performance too. Our relative underweight in financials, especially U.S.-based companies, helped returns, as we partially anticipated a more difficult economic environment for financial stocks.
Given the strategic orientation of the Portfolio, which focuses on long-term sustainable competitive advantage and away from commodities, the past year's environment was somewhat unfavorable for our long-term strategy. We had some success in the past year from our investments in our second-largest holding Siemens AG, the German conglomerate, where restructuring continues to deliver value. Also, Nintendo Co. Ltd., which had a blockbuster release of its new Wii gaming platform and continued its dominance of the handheld electronic games business, more than doubled in the past year. Juniper Networks, Inc., one of the world's leading network equipment providers, gained as evidence of the need to increase network capacity in telecom networks mounted. Among our long-term holdings, Vodafone Group plc, our third-largest holding, and Porsche AG, also had good years. Our lack of oil orientation notwithstanding, our investments in the increased complex ity of the oil business also proved to be excellent investments. Transocean, Inc., the world's largest driller and Hyundai Heavy Industries, the world's largest shipbuilder (whose stock we sold and took profits), both had stellar years.
Our largest holding, Telefonaktiebolaget LM Ericsson, the leading wireless network equipment producer in the world had a terrible year, falling considerably, as order shortfalls played havoc with the stock price. We continue to believe that its world leading technology, significant barriers to entry and a compelling valuation presage excellent long term prospects for the company. Japan was the location of many of our poor performers. The lack of growth in the Japanese domestic economy hurt our holdings of Japanese banks. A dramatic reduction in the maximum interest chargeable by finance companies in Japan through a change in regulation hurt our holding in Credit Saison Co. Ltd. Regulatory changes in gaming laws affected the sales of pachinko and pachislot machines which substantially reduced Sega Sammy Holdings, Inc.'s profit and stock price. We are confident that the credit card opportunity in Japan is vast and that Credit Saison Co. Ltd.'s fortunes, while temporarily affected, will be restored and enhanced in the future. One of our most trying holdings has been Advanced Micro Devices, Inc., which declined sharply as a result of missteps and delays. We still believe that the company has much to look forward to if it can execute better.
Current Strategy and Outlook: The Portfolio's investment strategy continues to be focused on identifying long-term structural growth stocks — companies with durable long-term earnings and cash flow growth characteristics, strong economic returns on invested capital, and healthy balance sheets. We continue to like the valuations of large-cap growth companies, particularly technology companies with high barriers to entry and returns on capital.
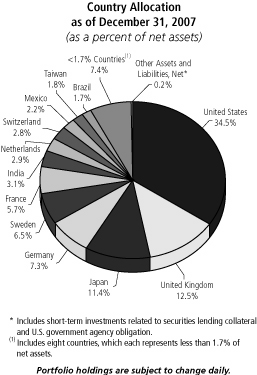
Top Ten Holdings*
as of December 31, 2007
(as a percent of net assets)
| Telefonaktiebolaget LM Ericsson | | | 2.9 | % | |
| Siemens AG | | | 2.6 | % | |
| Vodafone Group PLC | | | 2.4 | % | |
| Microsoft Corp. | | | 1.9 | % | |
| Hennes & Mauritz AB | | | 1.8 | % | |
| Juniper Networks, Inc. | | | 1.8 | % | |
| Sony Corp. | | | 1.7 | % | |
| eBay, Inc. | | | 1.6 | % | |
| LVMH Moet Hennessy Louis Vuitton SA | | | 1.5 | % | |
| Credit Suisse Group | | | 1.5 | % | |
* Excludes short-term investments related to securities lending collateral.
Portfolio holdings are subject to change daily.
Portfolio holdings and characteristics are subject to change and may not be representative of current holdings and characteristics. The outlook for this Portfolio may differ from that presented for other ING Funds. Performance for the different classes of shares will vary based on differences in fees associated with each class.
32
PORTFOLIO MANAGERS' REPORT
ING OPPENHEIMER GLOBAL PORTFOLIO

| Average Annual Total Returns for the Periods Ended December 31, 2007 | |
| | | 1 Year | | 5 Year | | Since Inception
of Classes I, S and ADV
May 1, 2002 | |
| Class I | | | 6.57 | % | | | 17.08 | % | | | 11.45 | % | |
| Class S | | | 6.35 | % | | | 16.51 | % | | | 10.94 | % | |
| Class ADV | | | 6.04 | % | | | 16.24 | % | | | 10.69 | % | |
| MSCI World IndexSM(1) | | | 9.04 | % | | | 16.96 | % | | | 11.03 | % | |
| MSCI All Country World IndexSM(2) | | | 11.66 | % | | | 18.24 | % | | | 12.11 | % | |
Based on a $10,000 initial investment, the graph and table above illustrate the total return of ING Oppenheimer Global Portfolio against the indices indicated. An index is unmanaged and has no cash in its portfolio, imposes no sales charges and incurs no operating expenses. An investor cannot invest directly in an index. The Portfolio's performance is shown without the imposition of any expenses or charges which are, or may be, imposed under your annuity contract. Total returns would have been lower if such expenses or charges were included.
The performance graph and table do not reflect the deduction of taxes that a shareholder will pay on portfolio distributions or the redemption of portfolio shares.
The performance shown may include the effect of fee waivers and/or expense reimbursements by the Investment Adviser and/or other service providers, which have the effect of increasing total return. Had all fees and expenses been considered, the total returns would have been lower.
The performance update illustrates performance for a variable investment option available through a variable annuity contract. The performance shown indicates past performance and is not a projection or prediction of future results. Actual investment returns and principal value will fluctuate so that shares and/or units, at redemption, may be worth more or less than their original cost. Please call (800) 262-3862 to get performance through the most recent month end.
This report contains statements that may be "forward-looking" statements. Actual results may differ materially from those projected in the "forward-looking" statements.
The views expressed in this report reflect those of the portfolio manager only through the end of the period as stated on the cover. The portfolio manager's views are subject to change at any time based on marked and other conditions.
Portfolio holdings are subject to change daily.
(1) The MSCI World IndexSM is an unmanaged index that measures the performance of over 1,400 securities listed on exchanges in the U.S., Europe, Canada, Australia, New Zealand and the Far East.
(2) The MSCI All Country World IndexSM is a broad-based unmanaged index comprised of equity securities in countries around the world, including the United States, other developed countries and emerging markets.
33
ING OPPENHEIMER STRATEGIC INCOME PORTFOLIO
PORTFOLIO MANAGERS' REPORT
ING Oppenheimer Strategic Income Portfolio (the "Portfolio") seeks a high level of current income principally derived from interest on debt securities. The Portfolio is managed by Arthur P. Steinmetz, Senior Vice President and Portfolio Manager of OppenheimerFunds, Inc. — the Sub-Adviser.
Performance: For the year ended December 31, 2007, the Portfolio's Class S shares provided a total return of 8.50% compared to the Lehman Brothers® Aggregate Bond ("LBAB") Index(1) and the S&P/Citigroup World Government Bond Index(2), which returned 6.97% and 10.95%, respectively, for the same period.
Portfolio Specifics: For the reporting period, the Portfolio provided solid returns. We attribute the Portfolio's strong results primarily to the Portfolio's international portfolio, where our emphasis on currencies and securities from emerging markets fared particularly well.
During the summer, a credit crisis in the U.S. sub-prime mortgage sector spread to other parts of the financial markets, causing investors to reassess their attitudes toward risk. A number of highly leveraged hedge funds were forced to liquidate even their more creditworthy holdings to raise cash for redemption requests and margin calls, leading to challenging liquidity conditions in several market sectors. As a result, high yield bonds erased many of their previous gains by year-end. Conversely, prices of U.S. Treasury securities rallied as investor engaged in a "flight to quality." The Federal Reserve Board (the "Fed") intervened in the credit crisis with several reductions in key interest rates, including three cuts in the overnight federal funds rate, which ended the year at 4.25%.
Market conditions in international markets diverged from those in the United States. Robust economic growth in Europe caused the European Central Bank to raise short-term interest rates early in the year, making yields from European bonds more attractive. Bond yields in many Latin American and Asian emerging markets also remained higher than those in the United States. These factors contributed to a steady deterioration in the value of the U.S. dollar, which further enhanced the attractiveness of assets denominated in foreign currencies. Over the summer, in the midst of the U.S. credit crisis, selling pressure increased in the non-government sectors of the international bond markets, leading to sharp declines during July and parts of August. However, international markets generally rebounded as investors recognized that credit problems among U.S. homeowners had little bearing on other parts of the world.
Emerging market bonds represented the primary contributors to the Fund's relative performance. In Latin America, Brazil produced attractive returns over most of the year as its government drew down debt, reduced budget deficits and became more a significant participant in world trade. In Eastern Europe, Turkey prospered through reforms designed to help it qualify for membership in the European Union. Among developed markets, we maintained relatively light exposure to Japan, where bond yields remained very low. Otherwise, we have attempted to diversify holdings across the developed nations of Europe. The Portfolio also benefited from unhedged currency exposure as the U.S. dollar continued to deteriorate relative to most foreign currencies.
We maintained a slightly shorter-than-average duration posture with regard to U.S. Treasury securities over most of the reporting period, as narrow yield differences along the market's maturity range provided little incentive to incur the risks of longer-term bonds. However, because the Portfolio's U.S. government securities portfolio included an allocation to mortgage-backed securities, its performance suffered in the final months of the year due to spillover from the troubled sub-prime mortgage sector. In the high yield bond portfolio, an underweighted position helped the Portfolio weather market volatility, but an emphasis on longer-duration bonds from banks and other financial companies detracted from relative performance.
Current Strategy and Outlook: As of year-end, we expect economic growth to remain stronger in international markets than in the United States. However, we are aware that some emerging markets already have posted impressive rallies, and to reduce risks we recently trimmed the Portfolio's positions in some emerging markets. We believe U.S. government securities should hold up well if the Fed reduces short-term interest rates further. We are more cautious regarding high yield bonds, primarily because we expect default rates to rise in the event of a more severe economic slowdown. In our judgment, the Portfolio is well positioned for these developments. Indeed, enabling investors to participate in fixed-income opportunities wherever they arise is central to our investment philosophy.
Investment Type Allocation
as of December 31, 2007
(as a percent of net assets)
| U.S. Government Agency Obligations | | | 21.2 | % | |
| Other Bonds | | | 20.7 | % | |
| Corporate Bonds/Notes | | | 19.0 | % | |
| U.S. Government Agency Obligations | | | 14.7 | % | |
| Structured Products | | | 13.8 | % | |
| Securities Lending Collateralcc | | | 6.3 | % | |
| Collateralized Mortgage Obligations | | | 3.0 | % | |
| Foreign Government Securities | | | 2.6 | % | |
| Asset-Backed Securities | | | 1.7 | % | |
| Common Stock | | | 1.1 | % | |
| U.S. Treasury Obligations | | | 0.2 | % | |
| Preferred Stock | | | 0.1 | % | |
| Positions In Purchased Options | | | 0.0 | % | |
| Other Assets and Liabilities - Net | | | (4.4 | )% | |
| Net Assets | | | 100.0 | % | |
Portfolio holdings are subject to change daily.
Top Ten Holdings*
as of December 31, 2007
(as a percent of net assets)
Italy Certificati di Credito del Tesoro,
4.200%, due 07/01/09 | | | 1.3 | % | |
Federal National Mortgage Corporation,
5.000%, due 11/01/33 | | | 1.0 | % | |
Turkey Government International Bond,
16.000%, due 03/07/12 | | | 1.0 | % | |
Federal National Mortgage Corporation,
5.500%, due 02/01/33 | | | 0.9 | % | |
Japan Government International Bond,
0.800%, due 01/15/09 | | | 0.8 | % | |
New South Wales Treasury Corp.,
6.000%, due 10/01/09 | | | 0.8 | % | |
| Mexican Bonos, 8.000%, due 12/24/08 | | | 0.8 | % | |
Federal National Mortgage Corporation,
5.500%, due 01/01/33 | | | 0.8 | % | |
Federal National Mortgage Corporation,
5.295%, due 10/01/36 | | | 0.8 | % | |
| United Kingdom Gilt, 5.750%, due 12/07/09 | | | 0.8 | % | |
* Excludes short-term investments related to securities lending collateral, U.S. government agency obligation and foreign Government Securities.
Portfolio holdings are subject to change daily.
Portfolio holdings and characteristics are subject to change and may not be representative of current holdings and characteristics. The outlook for this Portfolio may differ from that presented for other ING Funds. Performance for the different classes of shares will vary based on differences in fees associated with each class.
34
PORTFOLIO MANAGERS' REPORT
ING OPPENHEIMER STRATEGIC INCOME PORTFOLIO

| Average Annual Total Returns for the Periods Ended December 31, 2007 | |
| | | 1 Year | | Since Inception
of Classes I, S and ADV
November 8, 2004 | |
| Class I | | | 8.76 | % | | | 6.21 | % | |
| Class S | | | 8.50 | % | | | 5.98 | % | |
| Class ADV | | | 8.28 | % | | | 5.72 | % | |
| LBAB Index(1) | | | 6.97 | % | | | 4.35 | %(3) | |
| S&P/Citigroup World Government Bond Index(2) | | | 10.95 | % | | | 4.67 | %(3) | |
Based on a $10,000 initial investment, the graph and table above illustrate the total return of ING Oppenheimer Strategic Income Portfolio against the indices indicated. An index is unmanaged and has no cash in its portfolio, imposes no sales charges and incurs no operating expenses. An investor cannot invest directly in an index. The Portfolio's performance is shown without the imposition of any expenses or charges which are, or may be, imposed under your annuity contract. Total returns would have been lower if such expenses or charges were included.
The performance graph and table do not reflect the deduction of taxes that a shareholder will pay on portfolio distributions or the redemption of portfolio shares.
The performance shown may include the effect of fee waivers and/or expense reimbursements by the Investment Adviser and/or other service providers, which have the effect of increasing total return. Had all fees and expenses been considered, the total returns would have been lower.
The performance update illustrates performance for a variable investment option available through a variable annuity contract. The performance shown indicates past performance and is not a projection or prediction of future results. Actual investment returns and principal value will fluctuate so that shares and/or units, at redemption, may be worth more or less than their original cost. Please call (800) 262-3862 to get performance through the most recent month end.
This report contains statements that may be "forward-looking" statements. Actual results may differ materially from those projected in the "forward-looking" statements.
The views expressed in this report reflect those of the portfolio manager only through the end of the period as stated on the cover. The portfolio manager's views are subject to change at any time based on marked and other conditions.
Portfolio holdings are subject to change daily.
(1) The LBAB Index in an unmanaged index composed of securities from the Lehman Brothers® Intermediate Government/Corporate Bond Index, Mortgage-Backed Securities Index, and the Asset Backed Securities Index including securities that are investment-grade quality or better and have at least one year to maturity.
(2) The S&P/Citigroup World Government Bond Index is an unmanaged index of bonds from 14 world government bond markets with maturities of at least one year.
(3) Since inception performance for the indices is shown from November 1, 2004.
35
ING PIMCO TOTAL RETURN PORTFOLIO
PORTFOLIO MANAGERS' REPORT
ING PIMCO Total Return Portfolio (the "Portfolio") seeks maximum total return, consistent with preservation of capital and prudent investment management. The Portfolio is managed by William H. Gross, CFA, Managing Director and Portfolio Manager, of Pacific Investment Management Company LLC — the Sub-Adviser.
Performance: For year ended December 31, 2007, the Portfolio's Class S shares provided a total return of 9.51% compared to the Lehman Brothers® Aggregate Bond ("LBAB") Index(1), which returned 6.97% for the same period.
Portfolio Specifics: The Federal Reserve Board (the "Fed") remained on hold through most of the year after pausing in August 2006 with the federal funds rate at 5.25%. However, turmoil in the sub-prime market and a liquidity crunch in the asset-backed commercial paper market drove the Fed to take action. In August 2007, the Fed cut the discount rate by 50 basis points ("bps"), or one-half of a percentage point, to 5.75% to help alleviate liquidity concerns in the financial markets. Subsequently, at its September 18th meeting, the Fed cut both the federal funds rate and discount rate by 50 bps (0.50%), to 4.75% and 5.25%, respectively. Credit markets seized up again late in the fourth quarter after a partial recovery from the initial subprime-related downturn in August and September. Continued writedowns of subprime assets by many of the world's leading bank s did little to assuage concerns about the soundness of their balance sheets.
To deal with this crisis, the Fed cut the federal funds rate by another 50 bps (0.50%) during the fourth quarter, bringing its total rate reductions in 2007 to 100 basis points. In another move designed to get banks lending again, the Fed joined central banks in Canada, the U.K., the European Union and Switzerland to inject more than $90 billion of liquidity into the global financial system via money market auctions. At the end of 2007, the benchmark 10-year U.S. Treasury Note yielded 4.03%, 68 bps (0.68%) lower than at the start of the year.
For the first part of the year, the Portfolio's main detractors were an above-benchmark duration, curve steepening strategies outside the United States (specifically in the United Kingdom), and an underweight to investment-grade corporate bonds. Strong monthly payroll and gross domestic readings in the U.S., a booming British economy, and strong earnings results meant higher yields in the U.S., expectations for rate increases in the U.K, and further tightening of investment-grade spreads. In the second part of this year, however, sub-prime mortgage headlines increased, the credit crunch took hold, and volatility soared. Investors sought the quality of U.S. Treasury bonds and bid up expectations of interest rate cuts by the Fed. In the U.K., investors cut expectations of rate hikes by the Bank of England. And, in July and August, corporate bonds sold off, driving spreads significantly higher. As a result, curve-steepening strategies in the U. S. and U.K. and an underweight to corporate bonds proved valuable.
Current Strategy and Outlook: We believe he most likely outcome for the global economy in 2008 continues to be a soft landing with some decoupling of growth across regions, and generally stable inflation. However, we believe that the risks to this benign forecast are being skewed increasingly to the downside, as we continue to witness the importance of global financial market linkages to the U.S. and other economies. Self-feeding global risk aversion in the wake of the sub-prime debacle has resulted in less decoupling of growth from the U.S. than would otherwise have been the case. On the positive side, it is now apparent that the Fed and other central banks, as well as fiscal policymakers in the U.S. understand the gravity of these risks and will respond to them. Even so, heightened risk aversion and the sub-prime induced squeeze on credit have increased t he probability of a U.S. recession. We anticipate a long and arduous unwinding of twin bubbles in property markets and assorted non-bank and off-balance sheet vehicles associated with sub-prime lending.
Investment Type Allocation
as of December 31, 2007
(as a percent of net assets)
| U.S. Government Agency Obligations | | | 70.7 | % | |
| Corporate Bonds/Notes | | | 27.5 | % | |
| Collateralized Mortgage Obligations | | | 10.5 | % | |
| Asset-Backed Securities | | | 2.5 | % | |
| Purchased Options | | | 1.5 | % | |
| U.S. Treasury Obligations | | | 0.9 | % | |
| Other Bonds | | | 0.6 | % | |
| Municipal Bonds | | | 0.5 | % | |
| Other Assets and Liabilities - Net* | | | (14.7 | )% | |
| Net Assets | | | 100.0 | % | |
*Includes short-term investments related to commercial paper and securities lending collateral.
Portfolio holdings are subject to change daily.
Top Ten Holdings
as of December 31, 2007
(as a percent of net assets)
Federal Home Loan Mortgage Corporation,
5.500%, due 02/12/37 | | | 8.2 | % | |
Federal National Mortgage Corporation,
5.000%, due 02/13/36 | | | 4.1 | % | |
Federal National Mortgage Corporation,
5.000%, due 03/01/36 | | | 3.2 | % | |
Federal Home Loan Mortgage Corporation,
6.000%, due 01/15/36 | | | 2.9 | % | |
Federal National Mortgage Corporation,
6.000%, due 10/01/37 | | | 2.6 | % | |
Federal National Mortgage Corporation,
6.000%, due 12/01/37 | | | 2.6 | % | |
Federal National Mortgage Corporation,
6.000%, due 01/11/37 | | | 2.3 | % | |
Bear Stearns Adjustable Rate Mortgage Trust,
4.125%, due 03/25/35 | | | 2.3 | % | |
Federal National Mortgage Corporation,
5.500%, due 02/01/35 | | | 2.3 | % | |
Federal National Mortgage Corporation,
5.000%, due 08/01/20 | | | 2.1 | % | |
Portfolio holdings are subject to change daily.
Portfolio holdings and characteristics are subject to change and may not be representative of current holdings and characteristics. The outlook for this Portfolio may differ from that presented for other ING Funds. Performance for the different classes of shares will vary based on differences in fees associated with each class.
36
PORTFOLIO MANAGERS' REPORT
ING PIMCO TOTAL RETURN PORTFOLIO
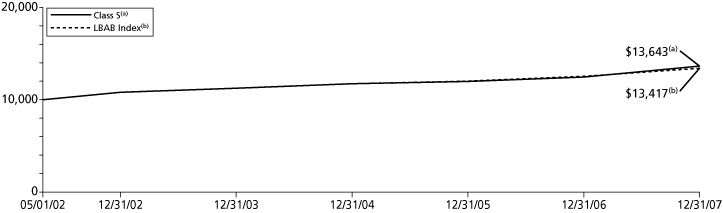
| Average Annual Total Returns for the Periods Ended December 31, 2007 | |
| | | 1 Year | | 5 Year | | Since Inception
of Classes I, S and ADV
May 1, 2002 | |
| Class I | | | 9.79 | % | | | 5.04 | % | | | 5.89 | % | |
| Class S | | | 9.51 | % | | | 4.76 | % | | | 5.63 | % | |
| Class ADV | | | 9.25 | % | | | 4.50 | % | | | 5.36 | % | |
| LBAB Index(1) | | | 6.97 | % | | | 4.42 | % | | | 5.32 | % | |
Based on a $10,000 initial investment, the graph and table above illustrate the total return of ING PIMCO Total Return Portfolio against the index indicated. An index is unmanaged and has no cash in its portfolio, imposes no sales charges and incurs no operating expenses. An investor cannot invest directly in an index. The Portfolio's performance is shown without the imposition of any expenses or charges which are, or may be, imposed under your annuity contract. Total returns would have been lower if such expenses or charges were included.
The performance graph and table do not reflect the deduction of taxes that a shareholder will pay on portfolio distributions or the redemption of portfolio shares.
The performance shown may include the effect of fee waivers and/or expense reimbursements by the Investment Adviser and/or other service providers, which have the effect of increasing total return. Had all fees and expenses been considered, the total returns would have been lower.
The performance update illustrates performance for a variable investment option available through a variable annuity contract. The performance shown indicates past performance and is not a projection or prediction of future results. Actual investment returns and principal value will fluctuate so that shares and/or units, at redemption, may be worth more or less than their original cost. Please call (800) 262-3862 to get performance through the most recent month end.
This report contains statements that may be "forward-looking" statements. Actual results may differ materially from those projected in the "forward-looking" statements.
The views expressed in this report reflect those of the portfolio manager only through the end of the period as stated on the cover. The portfolio manager's views are subject to change at any time based on marked and other conditions.
Portfolio holdings are subject to change daily.
(1) The LBAB Index is an unmanaged index composed of securities from the Lehman Brothers® Intermediate Government/Corporate Bond Index, Mortgage-Backed Securities Index, and the Asset Backed Securities Index including securities that are investment-grade quality or better and have at least one year to maturity.
37
ING PIONEER HIGH YIELD PORTFOLIO
PORTFOLIO MANAGERS' REPORT
ING Pioneer High Yield Portfolio (the "Portfolio") seeks to maximize total return through a combination of income and capital appreciation. The Portfolio is managed by Andrew Feltus and Tracy Wright, Portfolio Managers, Pioneer Investments Management Inc. — the Sub-Adviser.
Performance: For the year ended December 31, 2007, the Portfolio's Class I shares provided a total return of 6.15% compared to the Merrill Lynch High Yield Master II Index(1) and the Merrill Lynch Convertible Bonds (Speculative Quality) Index(2), which returned 2.19% and 1.54%, respectively, for the same period.
Portfolio Specifics: Our outperformance for the year was primarily attributable to asset allocation and security selection. Our equity and convertible exposure contributed to performance, as the Standard and Poor's 500® Composite Stock Price Index returned 5.49%, vs. the Merrill Lynch High Yield Master II Index return of 2.19%. In particular, our equity portfolio, which represented approximately 15% of total fund assets, delivered strong performance, contributing approximately 3.5% or approximately half of the total gross return of the fund. In addition, the higher quality of the bonds in our fixed income portfolio as well as security selection within the portfolio helped performance, as CCC's underperformed, returning 0.43% vs. the BB return of 2.19% and the single B return of 3.07%. Equity or equity-linked securities that outperformed inclu ded: the stock, convertible preferred and bonds of copper and gold mining firm, Freeport-McMoRan Copper & Gold, Inc., due to strong commodity demand; the convertible bonds of BioMarin Pharmaceuticals, Inc., on the FDA approval of its drug Kuvan; the convertible bonds of EDO Corporation, which was acquired; the stock of utility NRG Energy, Inc., up on strong performance; and the stock of General Cable Corp., due to strong operating performance. Bonds that helped performance included Pogo Producing, due to a bond tender upon its acquisition; Petroquest Energy, Inc., which benefited from record high oil prices, and the global utility firm, Intergen NV, due to strong operating performance.
Securities that detracted from performance included the loan of Landsource, a U.S. real estate developer; the bonds of Georgia Gulf, due to the dependence of its chemical business on the U.S. housing sector; certain of our equity and bond real estate investment trust ("REIT") and real estate positions, including General Growth Properties and B.F. Saul REIT. In addition, certain of our convertible bonds including Mannkind (due to concerns about the acceptability of its inhaled insulin product) and Sovereign Capital (reflecting a banking sector decline) hurt performance. Portfolio sector weights were relatively neutral to for the year. Our significant overweights in basic industry, capital goods and underweight to consumer cyclicals contributed positively to performance. This was offset, however, by the negative effects of our overweight in real estate and financials and our underweights in media and telecommunications.
Current Strategy and Outlook: We believe that the U.S. economy could grow below trend this year, at around 1.5%, but will probably not enter a recession. While tight credit conditions and weakness in U.S. housing and financials may adversely affect the economy, decent global growth, particularly from emerging markets, and the weak U.S. dollar should spur demand for exports, counterbalancing these negative effects. We also believe that the Federal Reserve Board, the Bank of England and the European Central Bank will continue to ease or inject liquidity as needed to shore up credit markets and the economic environment.
The Portfolio will focus on export-oriented sectors, and maintain the relatively high quality of the bond portfolio. We are also increasing our investment in more defensive sectors, including equity sectors with fewer issuers in the high yield universe, such as healthcare. We believe the high yield bond market offers compelling value. With spreads at 680 basis points (6.80%), investors are being compensated for an 11% default rate vs. the current 0.8% level and our twelve month estimate of 2% to 3%. This implied default rate is significantly higher than the 10 year average of 6.3% on a par value basis and 4.9% on an issuer basis.
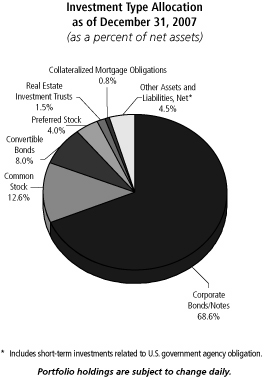
Top Ten Holdings*
as of December 31, 2007
(as a percent of net assets)
DRS Technologies, Inc.,
6.875%, due 11/01/13 | | | 3.4 | % | |
Esterline Technologies Corp.,
7.750%, due 06/15/13 | | | 2.3 | % | |
| Gardner Denver, Inc., 8.000%, due 05/01/13 | | | 2.3 | % | |
Forest City Enterprises, Inc.,
6.500%, due 02/01/17 | | | 2.2 | % | |
Valeant Pharmaceuticals International,
7.000%, due 12/15/11 | | | 2.1 | % | |
| Mueller Industries, Inc., 6.000%, due 11/01/14 | | | 2.0 | % | |
| Novelis, Inc., 7.250%, due 02/15/15 | | | 1.9 | % | |
| Baldor Electric Co., 8.625%, due 02/15/17 | | | 1.7 | % | |
Interpublic Group of Cos., Inc.,
7.250%, due 08/15/11 | | | 1.7 | % | |
| CMS Energy Corp., 6.875%, due 12/15/15 | | | 1.7 | % | |
* Excludes short-term investments related to U.S. government agency obligation.
Portfolio holdings are subject to change daily.
Portfolio holdings and characteristics are subject to change and may not be representative of current holdings and characteristics. The outlook for this Portfolio may differ from that presented for other ING Funds. Performance for the different classes of shares will vary based on differences in fees associated with each class.
38
PORTFOLIO MANAGERS' REPORT
ING PIONEER HIGH YIELD PORTFOLIO
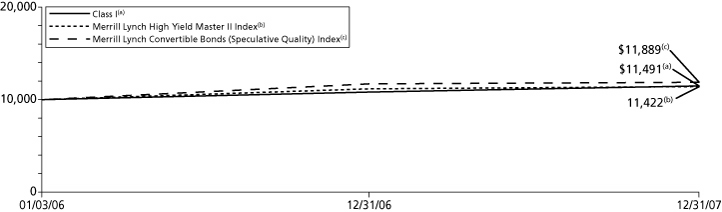
| Average Annual Total Returns for the Periods Ended December 31, 2007 | |
| | | 1 Year | | Since Inception
of Class I
January 3, 2006 | | Since Inception
of Classes S and ADV
January 20, 2006 | |
| Class I | | | 6.15 | % | | | 7.22 | % | | | — | | |
| Class S | | | 5.89 | % | | | — | | | | 7.14 | % | |
| Class ADV | | | 5.43 | % | | | — | | | | 6.89 | % | |
| Merrill Lynch High Yield Master II Index(1) | | | 2.19 | % | | | 6.87 | %(3) | | | 6.31 | %(4) | |
| Merrill Lynch Convertible Bonds (Speculative Quality) Index(2) | | | 1.54 | % | | | 9.05 | %(3) | | | 6.72 | %(4) | |
Based on a $10,000 initial investment, the graph and table above illustrate the total return of ING Pioneer High Yield Portfolio against the indices indicated. An index is unmanaged and has no cash in its portfolio, imposes no sales charges and incurs no operating expenses. An investor cannot invest directly in an index. The Portfolio's performance is shown without the imposition of any expenses or charges which are, or may be, imposed under your annuity contract. Total returns would have been lower if such expenses or charges were included.
The performance graph and table do not reflect the deduction of taxes that a shareholder will pay on portfolio distributions or the redemption of portfolio shares.
The performance shown may include the effect of fee waivers and/or expense reimbursements by the Investment Adviser and/or other service providers, which have the effect of increasing total return. Had all fees and expenses been considered, the total returns would have been lower.
The performance update illustrates performance for a variable investment option available through a variable annuity contract. The performance shown indicates past performance and is not a projection or prediction of future results. Actual investment returns and principal value will fluctuate so that shares and/or units, at redemption, may be worth more or less than their original cost. Please call (800) 262-3862 to get performance through the most recent month end.
This report contains statements that may be "forward-looking" statements. Actual results may differ materially from those projected in the "forward-looking" statements.
The views expressed in this report reflect those of the portfolio manager only through the end of the period as stated on the cover. The portfolio manager's views are subject to change at any time based on marked and other conditions.
Portfolio holdings are subject to change daily.
(1) The Merrill Lynch High Yield Master II Index is a broad-based index consisting of all U.S. dollar-denominated high-yield bonds with a minimum outstanding amount of $100 million and with a maturity of greater than one year period. The quality rating is less than BBB by Standard & Poor's.
(2) The Merrill Lynch Convertible Bonds (Speculative Quality) Index is a market-capitalization weighted index including mandatory and non-mandatory domestic corporate convertible securities. Securities in this index are convertible to U.S. dollar-denominated common stocks, ADRs, or cash equivalent and have an average rating of Ba1/BB+ or lower from Moody's and Standard & Poor's, respectively.
(3) Since inception performance of the indices is shown from January 1, 2006.
(4) Since inception performance of the indices is shown from February 1, 2006.
39
ING T. ROWE PRICE DIVERSIFIED MID CAP GROWTH PORTFOLIO
PORTFOLIO MANAGERS' REPORT
ING T. Rowe Price Diversified Mid Cap Growth Portfolio (the "Portfolio") seeks long-term capital appreciation. The Portfolio is managed by Donald J. Peters, Portfolio Manager of T. Rowe Price Associates, Inc. — the Sub-Adviser.
Performance: For the year ended December 31, 2007, the Portfolio's Class S shares provided a total return of 13.01% compared to the Standard & Poor's ("S&P") 400 Index(1) and the Russell Midcap® Growth Index(2), which returned 7.98% and 11.43%, respectively, for the same period.
Portfolio Specifics: The health care sector was the primary contributor to relative performance, largely on the strength of stock selection, though our overweight position was also productive. Stock selection in the pharmaceuticals industry, combined with a beneficial underweight in the group, added considerable value. Avoiding Forest Laboratories was particularly important in this area. Stock selection in the health care services industry also contributed. Our holdings in Medco Health Solutions, Inc., a non-benchmark stock, as well as Express Scripts, Inc. and Intuitive Surgical all aided relative performance.
Our financials position was also an important contributor, driven by stock selection and a significant underweight. The most significant factor in our outperformance was our lack of exposure to both the real estate investment trusts and the real estate management and development industries. As a result, the Portfolio was largely isolated from the effects of the sub-prime meltdown that dominated financial news in the last six months of 2007. Our overweight stake in the diversified financial services industry also aided returns. Our holdings in energy and commodity exchange operator, IntercontinentalExchange, Inc. and financial exchange operator, CME Group were especially productive.
Stock selection in consumer discretionary, the poorest-performing sector this year, also boosted returns, though the effect was slightly offset by our overweighted position. A major contributor to performance in this sector was our underweight stake in the multiline retail industry, particularly our avoidance of troubled retailer JC Penny. Strong stock selection in the specialty retailer industry also proved productive. In this area, we avoided the plummeting office supply chain Office Depot, Inc. and benefited from our holdings in the jewelry and luxury goods retailer Tiffany's & Co. Other important stocks in this sector are the for-profit educational company DeVry, Inc., the casino company Wynn Resorts Ltd., and China-based advertising company Focus Media Holding Ltd ADR.
Strong stock selection in the energy sector, the highest-performing sector this year, was partially offset by our underweight position. Our holdings in this sector have tended to be in service or exploration companies, as we remain wary of the cyclical nature of gas prices. This year, services company FMC Technology and equipment provider Cameron International both delivered solid returns, aiding relative performance.
Our underweighting in the materials sector represented the primary drag on performance. As in the energy sector, we tend toward companies that are relatively insulated from the cyclical nature of commodity prices. This year, our avoidance of crop nutrient manufacturer, Mosaic Co. and packaging company, Owens-Illinois was particularly detrimental to relative returns.
The utilities sector also detracted from relative performance. We have historically tended to be underweight in this sector, as most stocks do not meet our growth criteria. In an environment where utilities provided one of the few safe havens for investors, however, our underweighting proved detrimental.
Current Strategy and Outlook: Generally, mid-cap growth stocks have had excellent performance over the last few years, driven by merger and leveraged buy-out activity that encouraged short-term speculation over investment strategies, based on long-term prospects. Weak performance in the last two quarters has shown that trend to be unsustainable. We believe that our steady strategy and long-term focus should provide much better capital preservation during tougher market environments than the more aggressive strategies that have set the tone in recent years.
Industry Allocation
as of December 31, 2007
(as a percent of net assets)
| Software | | | 6.7 | % | |
| Semiconductors | | | 6.6 | % | |
| Commercial Services | | | 6.1 | % | |
| Healthcare - Products | | | 5.6 | % | |
| Retail | | | 5.5 | % | |
| Diversified Financial Services | | | 5.0 | % | |
| Oil & Gas Services | | | 4.4 | % | |
| Telecommunications | | | 4.2 | % | |
| Oil & Gas | | | 3.4 | % | |
| Computers | | | 3.3 | % | |
| Pharmaceuticals | | | 3.2 | % | |
| Biotechnology | | | 3.1 | % | |
| Insurance | | | 3.1 | % | |
| Industries between 2.2% - 3.0%(1) | | | 14.9 | % | |
| Industries between 1.0% - 2.0%(2) | | | 14.4 | % | |
| Industries less than 1.0%(3) | | | 10.7 | % | |
| Other Assets and Liabilities - Net* | | | (0.2 | )% | |
| Net Assets | | | 100.0 | % | |
* Includes short-term investments related to Reserve Investment Fund and securities lending collateral.
(1) Includes six industries, which each represents 2.2% - 3.0% of net assets.
(2) Includes ten industries, which each represents 1.0% - 2.0% of net assets.
(3) Includes nineteen industries, which each represents less than 1.0% of net assets.
Portfolio holdings are subject to change daily.
Top Ten Holdings*
as of December 31, 2007
(as a percent of net assets)
| Nymex Holdings, Inc. | | | 0.9 | % | |
| McDermott International, Inc. | | | 0.9 | % | |
| Smith International, Inc. | | | 0.9 | % | |
| Foster Wheeler Ltd. | | | 0.9 | % | |
| Precision Castparts Corp. | | | 0.9 | % | |
| Cameron International Corp. | | | 0.9 | % | |
| Northern Trust Corp. | | | 0.9 | % | |
| Weatherford International Ltd. | | | 0.8 | % | |
| Fluor Corp. | | | 0.8 | % | |
| Allergan, Inc. | | | 0.8 | % | |
* Excludes short-term investments related to securities lending collateral.
Portfolio holdings are subject to change daily.
Portfolio holdings and characteristics are subject to change and may not be representative of current holdings and characteristics. The outlook for this Portfolio may differ from that presented for other ING Funds. Performance for the different classes of shares will vary based on differences in fees associated with each class.
40
PORTFOLIO MANAGERS' REPORT
ING T. ROWE DIVERSIFIED MID CAP GROWTH PORTFOLIO
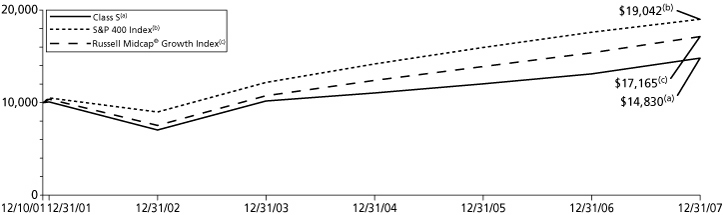
| Average Annual Total Returns for the Periods Ended December 31, 2007 | |
| | | 1 Year | | 5 Year | | Since Inception
of Classes I, S and ADV
December 10, 2001 | |
| Class I | | | 13.39 | % | | | 16.34 | % | | | 7.00 | % | |
| Class S | | | 13.01 | % | | | 16.06 | % | | | 6.72 | % | |
| Class ADV | | | 12.71 | % | | | 15.77 | % | | | 6.46 | % | |
| S&P 400 Index(1) | | | 7.98 | % | | | 16.20 | % | | | 11.17 | %(3) | |
| Russell Midcap® Growth Index(2) | | | 11.43 | % | | | 17.90 | % | | | 9.29 | %(3) | |
Based on a $10,000 initial investment, the graph and table above illustrate the total return of ING T. Rowe Diversified Mid cap Growth Portfolio against the indices indicated. An index is unmanaged and has no cash in its portfolio, imposes no sales charges and incurs no operating expenses. An investor cannot invest directly in an index. The Portfolio's performance is shown without the imposition of any expenses or charges which are, or may be, imposed under your annuity contract. Total returns would have been lower if such expenses or charges were included.
The performance graph and table do not reflect the deduction of taxes that a shareholder will pay on portfolio distributions or the redemption of portfolio shares.
The performance shown may include the effect of fee waivers and/or expense reimbursements by the Investment Adviser and/or other service providers, which have the effect of increasing total return. Had all fees and expenses been considered, the total returns would have been lower.
The performance update illustrates performance for a variable investment option available through a variable annuity contract. The performance shown indicates past performance and is not a projection or prediction of future results. Actual investment returns and principal value will fluctuate so that shares and/or units, at redemption, may be worth more or less than their original cost. Please call (800) 262-3862 to get performance through the most recent month end.
This report contains statements that may be "forward-looking" statements. Actual results may differ materially from those projected in the "forward-looking" statements.
The views expressed in this report reflect those of the portfolio manager only through the end of the period as stated on the cover. The portfolio manager's views are subject to change at any time based on marked and other conditions.
Portfolio holdings are subject to change daily.
(1) The S&P 400 Index is a broad-based unmanaged capitalization weighted index of mid-capitalization companies.
(2) The Russell Midcap® Growth Index measures the performance of the 800 smallest companies the Russell 1000® Index with higher price-to-book ratios and higher forecasted growth values.
(3) Since inception performance for the indices is shown from December 1, 2001.
41
ING T. ROWE PRICE GROWTH EQUITY PORTFOLIO
PORTFOLIO MANAGERS' REPORT
ING T. Rowe Price Growth Equity Portfolio (the "Portfolio") seeks long-term capital growth, and secondarily, increasing dividend income. The Portfolio is managed by Robert Bartolo, Portfolio Manager of T. Rowe Price Associates, Inc. — the Sub-Adviser.
Performance: For the year ended December 31, 2007, the Portfolio's Class I shares, provided a total return of 9.91% compared to the Standard & Poor's 500® Composite Stock Price Index(1) ("S&P 500® Index"), which returned 5.49% for the same period.
Portfolio Specifics: Stock selection and a beneficial underweight in the financial sector were the main reasons for the Portfolio's outperformance against the S&P 500® Index in the period. Stock selection in telecommunication services helped relative performance, as did a significant overweight in information technology stocks. Underweighting the energy sector was the largest detractor, while underweighting utilities and consumer staples also detracted.
During the year, the energy sector was the clear leader in the index, followed by materials. The international demand for oil and commodities drove performance in these sectors. Financials and consumer discretionary were the worst performers in the index, as ripple effects of the sub-prime mortgage lending fallout spread to other areas of the credit markets and dampened consumer spending. Market volatility was extremely high, especially in the second half, and was hobbled by slower corporate profit growth and rising oil prices.
The Portfolio's concentration in the capital markets industry, while underweighting the overall sector, was beneficial. Among the top performers were State Street Corp., Charles Schwab Corp., Northern Trust Corp. and Indian real estate developer, DLF Ltd., all of which avoided the brunt of the sub-prime losses. Telecommunication services rose on holdings in wireless companies, primarily in non-U.S. firms. Holdings in the Internet software and services and the communications equipment industries boosted relative results in information technology. Amazon.com, the online retailer, was top Portfolio contributor followed by Google, Inc., the Internet advertising and search giant. Energy holdings were focused on equipment and services. Energy holdings were focused on equipment and services companies. Exxon Mobil and Schlumberger, the oilfields services company, were top contributors. Citigroup, the financial services behemoth, was a major detracto r, owing to the credit crisis. Mortgage company Countrywide detracted, as did homebuilder Lennar. The significant underweight to utilities is typical of the portfolio, but this period of economic uncertainty made the sector more attractive to investors and detracted. Our position in AES, a large global power company, was troubled by accounting issues. Underweighting combined with stock selection led to negative relative results in consumer staples.
Current Strategy and Outlook: Despite moderating domestic growth, we believe that quality companies with consistent earnings growth will be afforded higher prices by the market. We believe the market has generally underappreciated the strength in U.S. and global economies and the resilience of corporate earnings and free cash flow. We continue to favor the capital markets industry, while underweighting the financial sector, and are markedly overweight information technology based on its attractive growth prospects. Telecommunication services is notably overweight, with a concentration on mobile communications in emerging companies and tower systems in North America. In the energy sector, we continue to believe in the growth prospects of equipment and services companies, which should benefit from expanded exploration and development of oil and gas resources. The Portfolio remains notably underweight utilities.
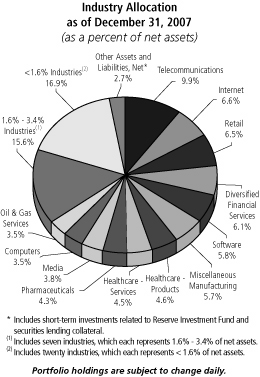
Top Ten Holdings*
as of December 31, 2007
(as a percent of net assets)
| General Electric Co. | | | 3.8 | % | |
| Google, Inc. - Class A | | | 3.1 | % | |
| Microsoft Corp. | | | 2.7 | % | |
| Apple, Inc. | | | 2.5 | % | |
| Schlumberger Ltd. | | | 2.4 | % | |
| CVS Caremark Corp. | | | 2.3 | % | |
| Danaher Corp. | | | 2.0 | % | |
| WellPoint, Inc. | | | 1.8 | % | |
| Nintendo Co., Ltd. | | | 1.6 | % | |
| State Street Corp. | | | 1.6 | % | |
* Excludes short-term investments related to Reserve Investment Fund and securities lending collateral.
Portfolio holdings are subject to change daily.
Portfolio holdings and characteristics are subject to change and may not be representative of current holdings and characteristics. The outlook for this Portfolio may differ from that presented for other ING Funds. Performance for the different classes of shares will vary based on differences in fees associated with each class.
42
PORTFOLIO MANAGERS' REPORT
ING T. ROWE PRICE GROWTH EQUITY PORTFOLIO

| Average Annual Total Returns for the Periods Ended December 31, 2007 | |
| | | 1 Year | | 5 Year | | 10 Year | | Since Inception
of Classes S and ADV
December 10, 2001 | |
| Class I | | | 9.91 | % | | | 13.74 | % | | | 7.42 | % | | | — | | |
| Class S | | | 9.62 | % | | | 13.46 | % | | | — | | | | 6.14 | % | |
| Class ADV | | | 9.36 | % | | | 13.18 | % | | | — | | | | 5.87 | % | |
| S&P 500® Index(1) | | | 5.49 | % | | | 12.83 | % | | | 5.91 | % | | | 6.14 | %(2) | |
Based on a $10,000 initial investment, the graph and table above illustrate the total return of ING T. Rowe Price Growth Equity Portfolio against the index indicated. An index is unmanaged and has no cash in its portfolio, imposes no sales charges and incurs no operating expenses. An investor cannot invest directly in an index. The Portfolio's performance is shown without the imposition of any expenses or charges which are, or may be, imposed under your annuity contract. Total returns would have been lower if such expenses or charges were included.
The performance graph and table do not reflect the deduction of taxes that a shareholder will pay on portfolio distributions or the redemption of portfolio shares.
The performance shown may include the effect of fee waivers and/or expense reimbursements by the Investment Adviser and/or other service providers, which have the effect of increasing total return. Had all fees and expenses been considered, the total returns would have been lower.
The performance update illustrates performance for a variable investment option available through a variable annuity contract. The performance shown indicates past performance and is not a projection or prediction of future results. Actual investment returns and principal value will fluctuate so that shares and/or units, at redemption, may be worth more or less than their original cost. Please call (800) 262-3862 to get performance through the most recent month end.
This report contains statements that may be "forward-looking" statements. Actual results may differ materially from those projected in the "forward-looking" statements.
The views expressed in this report reflect those of the portfolio manager only through the end of the period as stated on the cover. The portfolio manager's views are subject to change at any time based on marked and other conditions.
Portfolio holdings are subject to change daily.
(1) The S&P 500® Index is an unmanaged index that measures the performance of the securities of approximately 500 of the largest companies in the U.S.
(2) Since inception performance for the index is shown from December 1, 2001.
43
ING TEMPLETON FOREIGN EQUITY PORTFOLIO
PORTFOLIO MANAGERS' REPORT
ING Templeton Foreign Equity Portfolio (the "Portfolio") seeks long-term capital growth. The Portfolio is managed by Mr. Gary Motyl, Cindy Sweeting, Antonio Docal, Peter Nori, and Matthew Nagle of Templeton Investment Counsel, LLC — the Sub-Adviser.
Performance: For the year ended December 31, 2007, the Portfolio's Class I shares provided a total return of 15.50% compared to Morgan Stanley Capital International Europe, Australasia and Far East® Index(1) ("MSCI EAFE® Index"), which returned 11.17% for the same period.
Portfolio Specifics: Market volatility has increased dramatically over the past several months and we believe it will likely continue until the magnitude of recent credit problems and their impact on market sentiment and share performance becomes clearer. Central banks around the world are intent upon providing sufficient liquidity to prevent a major financial calamity. However, as has been seen over the past several weeks, many financial institutions will require capital injections to maintain balance sheet integrity. Fortunately, there appear to be sources with the financial resources and the willingness to provide this capital.
Regarding the Portfolio's performance for 2007, overweighted exposure to the strong telecommunication services sector boosted returns, while underweighted allocations and stock selection in the energy and materials sectors detracted.
On an individual stock basis, relative performance benefited from the Portfolio's investments in several strong-performing Chinese and Indian stocks, including China Shenhua Energy Co., Ltd., BYD Company, Ltd., ICICI Bank Ltd. ADR and Housing Development Finance Corporation ("HDFC"). Other contributors included Vestas Wind Systems A/S, a Denmark-based producer of alternative energy equipment, and Telefonica SA, a large Spanish telecommunications company.
The U.S. dollar depreciated versus most foreign currencies, which also contributed to the Portfolio's performance because investments in securities with non-U.S. currency exposure gained value as the dollar weakened.
Lagging stocks in the Portfolio included Aviva PLC, a U.K.-based insurance company, which declined late in the year along with many other financial shares, and Italy's Mediaset S.p.A, one of several underperforming stocks in the out-of-favor media industry. In the materials sector, Finland's forest products producer, UPM-Kymmene OYJ, was another significant detractor. The paper and forest products industry was the weakest performing area of the materials sector due to its lackluster earnings performance. Relative to the index, our holding in Samsung Electronics, which is not an index component, was a major detractor.
Current Strategy and Outlook: We believe our value-oriented, bottom-up process drives our stock selection and, therefore, the Portfolio's returns. Over the past several quarters, we deemed valuations in certain of our materials-related holdings exceeded what we could justify based on underlying company and industry fundamentals. Consequently, we reduced or liquidated several positions, especially given investment alternatives that our analyses indicated had greater potential to unlock shareholder value over the long term. We used part of the proceeds to purchase shares of health care and telecommunication services companies. At period-end, the Portfolio's largest relative overweighted position was in the telecommunication services sector.

Top Ten Holdings*
as of December 31, 2007
(as a percent of net assets)
| Telefonica SA | | | 1.7 | % | |
| Novartis AG | | | 1.4 | % | |
| Telenor ASA | | | 1.3 | % | |
| France Telecom SA | | | 1.3 | % | |
| Housing Development Finance Corp. | | | 1.3 | % | |
| Sanofi-Aventis | | | 1.3 | % | |
| Vodafone Group PLC | | | 1.2 | % | |
| ICICI Bank Ltd. ADR | | | 1.2 | % | |
| Siemens AG | | | 1.2 | % | |
| E.ON AG | | | 1.2 | % | |
* Excludes short-term investments related to U.S. government agency obligation.
Portfolio holdings are subject to change daily.
Portfolio holdings and characteristics are subject to change and may not be representative of current holdings and characteristics. The outlook for this Portfolio may differ from that presented for other ING Funds. Performance for the different classes of shares will vary based on differences in fees associated with each class.
44
PORTFOLIO MANAGERS' REPORT
ING TEMPLETON FOREIGN EQUITY PORTFOLIO

| Average Annual Total Returns for the Periods Ended December 31, 2007 | |
| | | 1 Year | | Since Inception
of Class I
January 3, 2006 | | Since Inception
of Class S
January 12, 2006 | | Since Inception
of Class ADV
December 20, 2006 | |
| Class I | | | 15.50 | % | | | 18.64 | % | | | — | | | | — | | |
| Class S | | | 15.23 | % | | | — | | | | 18.47 | % | | | — | | |
| Class ADV | | | 15.42 | % | | | — | | | | — | | | | 15.68 | % | |
| MSCI EAFE® Index(1) | | | 11.17 | % | | | 18.51 | %(2) | | | 18.51 | %(2) | | | 11.17 | %(3) | |
Based on a $10,000 initial investment, the graph and table above illustrate the total return of ING Templeton Foreign Equity Portfolio against the index indicated. An index is unmanaged and has no cash in its portfolio, imposes no sales charges and incurs no operating expenses. An investor cannot invest directly in an index. The Portfolio's performance is shown without the imposition of any expenses or charges which are, or may be, imposed under your annuity contract. Total returns would have been lower if such expenses or charges were included.
The performance graph and table do not reflect the deduction of taxes that a shareholder will pay on portfolio distributions or the redemption of portfolio shares.
The performance shown may include the effect of fee waivers and/or expense reimbursements by the Investment Adviser and/or other service providers, which have the effect of increasing total return. Had all fees and expenses been considered, the total returns would have been lower.
The performance update illustrates performance for a variable investment option available through a variable annuity contract. The performance shown indicates past performance and is not a projection or prediction of future results. Actual investment returns and principal value will fluctuate so that shares and/or units, at redemption, may be worth more or less than their original cost. Please call (800) 262-3862 to get performance through the most recent month end.
This report contains statements that may be "forward-looking" statements. Actual results may differ materially from those projected in the "forward-looking" statements.
The views expressed in this report reflect those of the portfolio manager only through the end of the period as stated on the cover. The portfolio manager's views are subject to change at any time based on marked and other conditions.
Portfolio holdings are subject to change daily.
(1) The MSCI EAFE® Index is an unmanaged index that measures the performance of securities listed on exchanges in Europe, Australasia and the Far East. It includes the reinvestment of dividends net of withholding taxes, but does not reflect fees, brokerage commissions or other expenses of investing.
(2) Since inception performance of the index is shown from January 1, 2006.
(3) Since inception performance for the index is shown from January 1, 2007.
45
ING THORNBURG VALUE PORTFOLIO
PORTFOLIO MANAGERS' REPORT
ING Thornburg Value Portfolio (the "Portfolio") seeks capital appreciation. The Portfolio is managed by William V. Fries, CFA, Managing Director, Edward Maran, CFA, Managing Director and Connor Browne, CFA Managing Director, all of Thornburg Investment Management — the Sub-Adviser.
Performance: For the year ended December 31, 2007, the Portfolio's Class I shares provided a total return of 7.24% compared to the Standard & Poor's 500® Composite Stock Price Index(1) ("S&P 500® Index"), which returned 5.49% for the same period.
Portfolio Specifics: Areas of positive stock selection included energy, where Apache Corp. performed well due to rising international oil production and rising oil prices; materials, where Freeport-McMoRan Copper & Gold, Inc. and Southern Copper Corp. performed well, as new supplies of copper were easily absorbed and as investors concluded that a U.S. economic slowdown would have limited impact on their businesses; utilities, where Entergy Corp. took advantage of higher forward electricity prices in the Northeast as spare capacity concerns persist; and health care, where Teva Pharmaceutical Industries Ltd. ADR's stock price recovered from an unusual period of negative news flow in late 2006, as some of the worst fears surrounding Wal Mart's generic drug initiative have not materialized. Other contributors were Las Vegas Sands Corp. and Google, Inc., whi ch benefited from investors' enthusiasm for companies that appear to have dependable earnings growth and China Mobile benefited from record subscriber growth (surpassing six million new adds per month) along with a benign competitive environment whereby the government announced further delays to issuing new licenses.
Within our bottom performers, an important underlying trend is the degree of financial leverage. Our biggest detractor, Rite Aid Corp., is in the process of integrating a major acquisition and has borrowed significantly in order to improve its store base and lift operating profitability. Comcast Corp. — Special Class A, in our view, should fare relatively well in a recessionary environment as cable television and high speed internet services have become necessities within the home. JetBlue Airways Corp. suffered from concerns surrounding slower economic growth and higher fuel prices. Level 3 Communications, Inc., despite strong demand for its network services, reported weak results due to poor execution on the integration of several acquired companies. All of the above stocks appear to be pricing in a risk of financial crisis that in our view is unlikely.
We were surprised that at one of our holdings, Citigroup, Inc., management materially increased their sub-prime related exposure and write-off estimates during November. The degree to which the company did not understand its own exposure was disconcerting and we sold the stock. Fundamental deterioration caused us to sell our position in Freddie Mac ("FRE") during the early part of that month, at prices above $40. Subsequent to our sale, FRE raised capital under attractive terms. With the financing in place and the share price significantly lower, we bought back a position in FRE at around $30 per share. Although FRE is significantly exposed to home price declines and rising mortgage foreclosure rates, we believe the company has significant advantages that differentiate it from most thrifts and banks.
Current Strategy and Outlook: The share prices of companies that are exposed to either consumer spending or credit risk have declined in anticipation of rising credit losses and declining consumer spending. In our opinion, some of these companies will emerge from the downturn with their business models intact, their market share greater, and their long-term growth prospects as strong as they have ever been. For long-term investors, we believe, whether or not the economy enters a recession will not be nearly as important as selecting stocks that have solid franchises and choosing entry points where significant, and perhaps excessive, risk is priced into current valuation.
We are mindful of risk as well as return in all of our investments. Seeking promising companies at a discount, being willing to be contrarian, and relying upon fundamental, bottom up analysis has served us well in the past and we are optimistic that it will do so in the future.
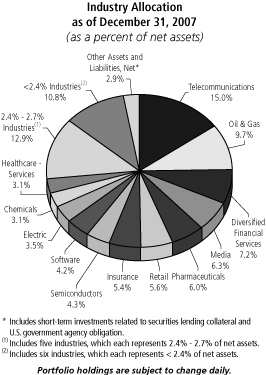
Top Ten Holdings*
as of December 31, 2007
(as a percent of net assets)
| Apache Corp. | | | 4.0 | % | |
| Entergy Corp. | | | 3.5 | % | |
| Comcast Corp. - Special Class A | | | 3.3 | % | |
| Intel Corp. | | | 3.2 | % | |
| ConocoPhillips | | | 3.2 | % | |
| Air Products & Chemicals, Inc. | | | 3.1 | % | |
| WellPoint, Inc. | | | 3.1 | % | |
| DIRECTV Group, Inc. | | | 3.0 | % | |
| Allstate Corp. | | | 2.9 | % | |
| AT&T, Inc. | | | 2.9 | % | |
* Excludes short-term investments related to securities lending collateral and U.S. government agency obligation.
Portfolio holdings are subject to change daily.
Portfolio holdings and characteristics are subject to change and may not be representative of current holdings and characteristics. The outlook for this Portfolio may differ from that presented for other ING Funds. Performance for the different classes of shares will vary based on differences in fees associated with each class.
46
PORTFOLIO MANAGERS' REPORT
ING THORNBURG VALUE PORTFOLIO
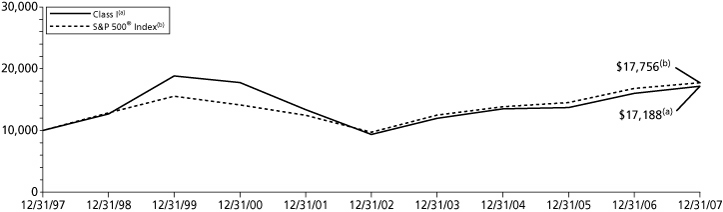
| Average Annual Total Returns for the Periods Ended December 31, 2007 | |
| | | 1 Year | | 5 Year | | 10 Year | | Since Inception
of Classes S and ADV
December 10, 2001 | |
| Class I | | | 7.24 | % | | | 12.96 | % | | | 5.56 | % | | | — | | |
| Class S | | | 7.00 | % | | | 12.68 | % | | | — | | | | 3.91 | % | |
| Class ADV | | | 6.73 | % | | | 12.40 | % | | | — | | | | 3.65 | % | |
| S&P 500® Index(1) | | | 5.49 | % | | | 12.83 | % | | | 5.91 | % | | | 6.14 | %(2) | |
Based on a $10,000 initial investment, the graph and table above illustrate the total return of ING Thornburg Value Portfolio against the index indicated. An index is unmanaged and has no cash in its portfolio, imposes no sales charges and incurs no operating expenses. An investor cannot invest directly in an index. The Portfolio's performance is shown without the imposition of any expenses or charges which are, or may be, imposed under your annuity contract. Total returns would have been lower if such expenses or charges were included.
The performance graph and table do not reflect the deduction of taxes that a shareholder will pay on portfolio distributions or the redemption of portfolio shares.
The performance shown may include the effect of fee waivers and/or expense reimbursements by the Investment Adviser and/or other service providers, which have the effect of increasing total return. Had all fees and expenses been considered, the total returns would have been lower.
The performance update illustrates performance for a variable investment option available through a variable annuity contract. The performance shown indicates past performance and is not a projection or prediction of future results. Actual investment returns and principal value will fluctuate so that shares and/or units, at redemption, may be worth more or less than their original cost. Please call (800) 262-3862 to get performance through the most recent month end.
This report contains statements that may be "forward-looking" statements. Actual results may differ materially from those projected in the "forward-looking" statements.
The views expressed in this report reflect those of the portfolio manager only through the end of the period as stated on the cover. The portfolio manager's views are subject to change at any time based on marked and other conditions.
Portfolio holdings are subject to change daily.
(1) The S&P 500® Index is an unmanaged index that measures the performance of the securities of approximately 500 of the largest companies in the U.S.
(2) Since inception performance for the index is shown from December 1, 2001.
47
ING UBS U.S. LARGE CAP EQUITY PORTFOLIO
PORTFOLIO MANAGERS' REPORT
ING UBS U.S. Large Cap Equity Portfolio (the "Portfolio") seeks long-term growth of capital and future income. The Portfolio is managed by the North American Equities Investment Management Team ("N.A. Equities Team") led by John Leonard, Portfolio Manager, Head of N.A. Equities Team, and Deputy Global Head of Equities and Managing Director of UBS Global Asset Management (Americas) Inc. — the Sub-Adviser.
Performance: For the year ended December 31, 2007, the Portfolio's Class I shares provided a total return of 1.18% compared to the compared to the Standard & Poor's 500® Composite Stock Price Index(1) ("S&P 500® Index") and the Russell 1000® Index(2), which returned 5.49% and 5.77%, respectively, for the same period.
Portfolio Specifics: Volatility returned to the U.S. equity market in 2007, starting in late February and into early March, then continuing into July and August, only to finally culminate in a broader sell-off during the fourth quarter. Generally, the overall U.S. equity market, as defined by the Russell 3000® Index, was up 5.14% in 2007, despite being down 3.34% in the fourth quarter. Large-caps generally outperformed their small-cap counterparts, with the Russell 1000® Index up 5.77% for the year, while the Russell 2000® Index posted a negative return of 1.57% in 2007. This was only the second calendar year since 1998 that large-caps outperformed their small-cap counterparts.
During the one year period ended December 31, 2007, we had positive contributions from diversified utilities company Exelon Corp, Internet retailer Amazon.Com, Inc., pharmaceutical benefit manager Medco Health Solutions, semiconductor firm Intel Corp. and automobile parts company Johnson Controls, Inc. In terms of sectors, the Portfolio's exposures to the health care, utilities and information technology contributed to performance.
On the downside, the primary culprits at the stock level were our exposure to weak-performing Citigroup, Inc., Sprint Nextel Corp., Morgan Stanley, Fifth Third Bancorp, and Freddie Mac. From an industry perspective, aspects of our Portfolio positioning that detracted from results included our exposures to the energy, consumer staples and materials sector.
Current Strategy and Outlook: In our view, the overall U.S. market appears underpriced. That said, there are clearly some sectors that are more attractive to us than others. In fact, according to our models, the valuation spread between underpriced and overpriced stocks in the market has not been as high as it is today since the aftermath of the information technology bubble in the late 1990s. Over time, we expect a contraction in the valuation spread between over- and under-priced stocks. Historically, when this has happened, the Portfolio has generated very attractive levels of excess returns.
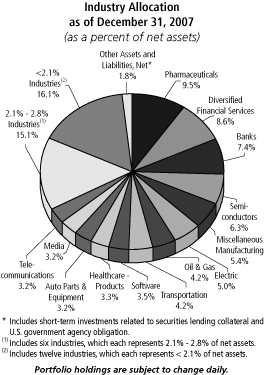
Top Ten Holdings*
as of December 31, 2007
(as a percent of net assets)
| Exelon Corp. | | | 3.4 | % | |
| General Electric Co. | | | 3.3 | % | |
| Intel Corp. | | | 3.1 | % | |
| Wells Fargo & Co. | | | 2.9 | % | |
| Citigroup, Inc. | | | 2.7 | % | |
| Morgan Stanley | | | 2.6 | % | |
| Microsoft Corp. | | | 2.5 | % | |
| Wyeth | | | 2.3 | % | |
| Allergan, Inc. | | | 2.2 | % | |
| Merck & Co., Inc. | | | 2.1 | % | |
* Excludes short-term investments related to securities lending collateral.
Portfolio holdings are subject to change daily.
Portfolio holdings and characteristics are subject to change and may not be representative of current holdings and characteristics. The outlook for this Portfolio may differ from that presented for other ING Funds. Performance for the different classes of shares will vary based on differences in fees associated with each class.
48
PORTFOLIO MANAGERS' REPORT
ING UBS U.S. LARGE CAP EQUITY PORTFOLIO
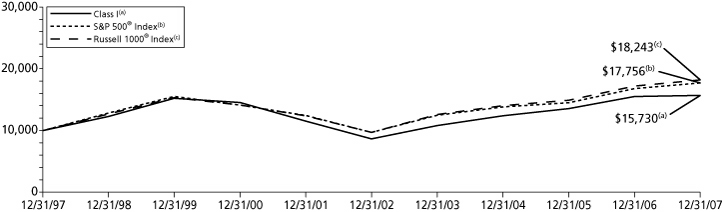
| Average Annual Total Returns for the Periods Ended December 31, 2007 | |
| | | 1 Year | | 5 Year | | 10 Year | | Since Inception
of Classes S and ADV
December 10, 2001 | |
| Class I | | | 1.18 | % | | | 12.68 | % | | | 4.64 | % | | | — | | |
| Class S | | | 0.93 | % | | | 12.40 | % | | | — | | | | 4.95 | % | |
| Class ADV | | | 0.65 | % | | | 12.12 | % | | | — | | | | 4.70 | % | |
| S&P 500® Index(1) | | | 5.49 | % | | | 12.83 | % | | | 5.91 | % | | | 6.14 | %(3) | |
| Russell 1000® Index(2) | | | 5.77 | % | | | 13.43 | % | | | 6.20 | % | | | 9.23 | %(3) | |
Based on a $10,000 initial investment, the graph and table above illustrate the total return of ING UBS U.S. Large Cap Equity Portfolio against the indices indicated. An index is unmanaged and has no cash in its portfolio, imposes no sales charges and incurs no operating expenses. An investor cannot invest directly in an index. The Portfolio's performance is shown without the imposition of any expenses or charges which are, or may be, imposed under your annuity contract. Total returns would have been lower if such expenses or charges were included.
The performance graph and table do not reflect the deduction of taxes that a shareholder will pay on portfolio distributions or the redemption of portfolio shares.
The performance shown may include the effect of fee waivers and/or expense reimbursements by the Investment Adviser and/or other service providers, which have the effect of increasing total return. Had all fees and expenses been considered, the total returns would have been lower.
The performance update illustrates performance for a variable investment option available through a variable annuity contract. The performance shown indicates past performance and is not a projection or prediction of future results. Actual investment returns and principal value will fluctuate so that shares and/or units, at redemption, may be worth more or less than their original cost. Please call (800) 262-3862 to get performance through the most recent month end.
This report contains statements that may be "forward-looking" statements. Actual results may differ materially from those projected in the "forward-looking" statements.
The views expressed in this report reflect those of the portfolio manager only through the end of the period as stated on the cover. The portfolio manager's views are subject to change at any time based on marked and other conditions.
Portfolio holdings are subject to change daily.
(1) The S&P 500® Index is an unmanaged index that measures the performance of the securities of approximately 500 of the largest companies in the U.S.
(2) The Russell 1000® Index is a comprehensive large-cap index measuring the performance of the largest 1,000 U.S. incorporated companies.
(3) Since inception performance for the indices is shown from December 1, 2001.
49
ING UBS U.S. SMALL CAP GROWTH PORTFOLIO
PORTFOLIO MANAGERS' REPORT
ING UBS U.S. Small Cap Growth Portfolio (the "Portfolio") seeks long-term capital appreciation. The Portfolio is managed by an investment management team co-led by Paul Graham and David Wabnik, Portfolio Managers of UBS Global Asset Management (Americas) Inc. — the Sub-Adviser.
Performance: For the year ended December 31, 2007, the Portfolio's Class S shares, provided a total return of 4.81% compared to the Russell 2000® Growth Index(1), which returned 7.05% for the same period.
Portfolio Specifics: Market leadership changed during 2007. Dominated by small-cap and value stocks for six consecutive years, the market finally rewarded the other end of the spectrum, large-cap and growth. What drove the change in appetite? Financials had an exceptionally difficult year in the face of an unprecedented credit crisis and were, on average, among the worst performers across indexes. Specifically, consumer finance and thrifts were hit, as the subprime mortgage market unraveled personal, corporate and intra-bank lending. A crisis in consumer confidence also led to underperformance by consumer discretionary names, with the auto and retailer segments among the hardest hit.
During the one-year reporting period, overall stock selection produced negative results for the Portfolio. In contrast, sector allocations were a slight positive for the Portfolio's relative performance. Stock selection was weakest relative to the benchmark in the consumer discretionary, information technology and industrial sectors. Relative stock selection was the strongest in the health care, financial and materials sectors.
In terms of individual stocks, the largest contributors to performance included First Solar, Inc., Steel Dynamics, Inc., Pediatrix Med Group, Blue Coat Systems, Inc. and Nuance Communications, Inc. Examples of stocks that detracted the most from results included Children's Place Retail Stores, Inc., Tetra Technologies, Inc., Phillips-Van Heusen Corp., Tween Brands, Inc. and Central Garden & Pet Co.
From a sector allocation perspective, the Portfolio's positioning in the financials, consumer discretionary and energy sectors were positive contributors to results. In contrast, positioning in the materials, information technology and utilities sectors were the largest drag on performance.
Current Strategy and Outlook: As economic concerns grow, we believe our tried investment discipline of focusing our investments on liquid securities that have improving fundamentals, industry leading competitive positions, and strong balance sheets, should aid us in weathering the current volatility. From a sector perspective, our biggest deviations from the benchmark remain overweights in the healthcare and information technology sectors. Our biggest sector underweights remain in the financials and consumer discretionary sectors.
We continue to be cautiously optimistic on the outlook for small-cap growth versus small-cap value in the year ahead. Growth, once again, outpaced value in December 2007 (for the ninth straight month). We remain focused on high-quality companies with demonstrable growth catalysts that can add performance while maintaining a lower risk profile than the average security in the Russell 2000 Growth Index.

Top Ten Holdings*
as of December 31, 2007
(as a percent of net assets)
| Pediatrix Medical Group, Inc. | | | 3.5 | % | |
| Steel Dynamics, Inc. | | | 2.7 | % | |
| VCA Antech, Inc. | | | 2.6 | % | |
| iShares Russell 2000 Growth Index Fund | | | 2.3 | % | |
| Nuance Communications, Inc. | | | 2.1 | % | |
| Nice Systems Ltd. ADR | | | 2.0 | % | |
| PetroHawk Energy Corp. | | | 1.9 | % | |
| AAR Corp. | | | 1.8 | % | |
| Middleby Corp. | | | 1.8 | % | |
| LKQ Corp. | | | 1.8 | % | |
* Excludes short-term investments related to securities lending collateral and U.S. government agency obligation.
Portfolio holdings are subject to change daily.
Portfolio holdings and characteristics are subject to change and may not be representative of current holdings and characteristics. The outlook for this Portfolio may differ from that presented for other ING Funds. Performance for the different classes of shares will vary based on differences in fees associated with each class.
50
PORTFOLIO MANAGERS' REPORT
ING UBS U.S. SMALL CAP GROWTH PORTFOLIO
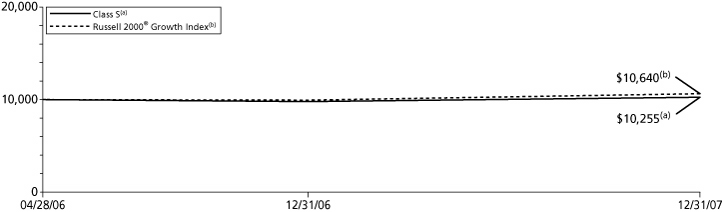
| Average Annual Total Returns for the Periods Ended December 31, 2007 | |
| | | 1 Year | | Since Inception
of Classes I, S and ADV
April 28, 2006 | |
| Class I | | | 5.01 | % | | | 1.74 | % | |
| Class S | | | 4.81 | % | | | 1.50 | % | |
| Class ADV | | | 4.20 | % | | | 0.97 | % | |
| Russell 2000® Growth Index(1) | | | 7.05 | % | | | 3.79 | %(2) | |
Based on a $10,000 initial investment, the graph and table above illustrate the total return of ING UBS U.S. Small Cap Growth Portfolio against the index indicated. An index is unmanaged and has no cash in its portfolio, imposes no sales charges and incurs no operating expenses. An investor cannot invest directly in an index. The Portfolio's performance is shown without the imposition of any expenses or charges which are, or may be, imposed under your annuity contract. Total returns would have been lower if such expenses or charges were included.
The performance graph and table do not reflect the deduction of taxes that a shareholder will pay on portfolio distributions or the redemption of portfolio shares.
The performance shown may include the effect of fee waivers and/or expense reimbursements by the Investment Adviser and/or other service providers, which have the effect of increasing total return. Had all fees and expenses been considered, the total returns would have been lower.
The performance update illustrates performance for a variable investment option available through a variable annuity contract. The performance shown indicates past performance and is not a projection or prediction of future results. Actual investment returns and principal value will fluctuate so that shares and/or units, at redemption, may be worth more or less than their original cost. Please call (800) 262-3862 to get performance through the most recent month end.
This report contains statements that may be "forward-looking" statements. Actual results may differ materially from those projected in the "forward-looking" statements.
The views expressed in this report reflect those of the portfolio manager only through the end of the period as stated on the cover. The portfolio manager's views are subject to change at any time based on marked and other conditions.
Portfolio holdings are subject to change daily.
(1) The Russell 2000® Growth Index is an unmanaged index that measures the performance of securities of smaller U.S. companies with greater than average growth orientation.
(2) Since inception performance for the index is shown from May 1, 2006.
51
ING VAN KAMPEN COMSTOCK PORTFOLIO
PORTFOLIO MANAGERS' REPORT
ING Van Kampen Comstock Portfolio (the "Portfolio") seeks capital growth and income. The Portfolio is managed by a team consisting of B. Robert Baker, Managing Director, Jason Leder Managing Director, and Kevin Holt, Managing Director, Devin E. Armstrong, Vice President and James N. Warwick*, Executive Director each of Morgan Stanley Investment Management, Inc., d/b/a "Van Kampen" — the Sub-Adviser.
Performance: For the year ended December 31, 2007, the Portfolio's Class S shares, provided a total return of (2.28)% compared to the Russell 1000® Value Index(1) and the Standard & Poor's 500® Composite Stock Price Index(2) ("S&P 500® Index"), which returned (0.17)% and 5.49%, respectively, for the same period.
Portfolio Specifics: Despite the strong performance of the broad stock market in the first half of the year, rising uncertainties about economic conditions dampened performance in the second half of the year. Investors worried about how well the U.S. economy would weather ever-higher oil prices, a weakening housing market and slackening consumer spending, as well as the effects of an economic slowdown on corporate profitability. In this period, stocks experienced several periods of significant volatility, such as in July and October-November, wherein investors briefly rotated away from cyclical areas of the market (those with greater economic sensitivity such as materials and energy) that have driven performance for the past several years. During these periods of volatility, however, the Portfolio of undervalued stocks performed relatively well, as we would expect the Portfolio to do in this type of environment. Because of our emphasis on stocks with reasonable valuations relative to our assessment of fair value, the Portfolio had no exposure to the richly valued cyclical stocks, which therefore minimized some of the damage to the Portfolio caused by these sharp downdrafts.
Over the entire reporting period, the primary detractor from relative performance was the Portfolio's lack of exposure to the energy sector. Energy was the best performing sector in the Russell 1000® Value Index for the period. However, we believe energy stock valuations are too expensive for investment, based on our strict risk-reward criteria. Other notable detractors from relative performance were the utilities and industrials sectors. Here, the Portfolio had minimal exposure to utilities and industrials, in accordance with our view that valuations of these securities are too expensive for our investment criteria.
Conversely, among the Portfolio's positive contributors was our stock selection and the resulting underweight allocation in the financials sector. Within the sector, the Portfolio owned holdings in banks, brokerages, insurers, and government-sponsored enterprises. Strong stock selection and an overweight position in the consumer staples sector also bolstered the Portfolio's relative performance.
Current Strategy and Outlook: There were no significant changes to the Portfolio's positioning during the period. We have yet to see a sustainable change in stock market leadership that would prompt us to reconsider our underlying reasons for maintaining the Portfolio's positioning in its relatively unchanged state. Although at two points in the second half of 2007, the market came close to shifting away from the cyclicals-dominated trend that has persisted for the past several years, neither rotation showed any traction. Until the market leadership rotates away from favoring richly valued cyclicals, we believe the Portfolio will likely retain its current stance. As a result of our bottom-up stock-selection process, the Portfolio's largest sector weights at period end, in decreasing order, were financials, consumer staples and health care.

Top Ten Holdings*
as of December 31, 2007
(as a percent of net assets)
| International Paper Co. | | | 3.8 | % | |
| Viacom - Class B | | | 3.3 | % | |
| Bank of America Corp. | | | 3.3 | % | |
| Verizon Communications, Inc. | | | 3.3 | % | |
| Wal-Mart Stores, Inc. | | | 2.9 | % | |
| Coca-Cola Co. | | | 2.9 | % | |
| Citigroup, Inc. | | | 2.7 | % | |
| Wachovia Corp. | | | 2.6 | % | |
| Bristol-Myers Squibb Co. | | | 2.6 | % | |
| Chubb Corp. | | | 2.5 | % | |
* Excludes short-term investments related to securities lending collateral and U.S. government agency obligation.
Portfolio holdings are subject to change daily.
* Effective July 17, 2007, Devin E. Armstrong and James N. Warwick were added as portfolio managers to the Portfolio.
Portfolio holdings and characteristics are subject to change and may not be representative of current holdings and characteristics. The outlook for this Portfolio may differ from that presented for other ING Funds. Performance for the different classes of shares will vary based on differences in fees associated with each class.
52
PORTFOLIO MANAGERS' REPORT
ING VAN KAMPEN COMSTOCK PORTFOLIO
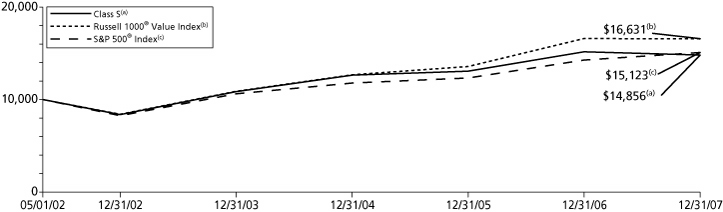
| Average Annual Total Returns for the Periods Ended December 31, 2007 | |
| | | 1 Year | | 5 Year | | Since Inception
of Classes I, S and ADV
May 1, 2002 | |
| Class I | | | (2.04 | )% | | | 12.39 | % | | | 7.49 | % | |
| Class S | | | (2.28 | )% | | | 12.13 | % | | | 7.23 | % | |
| Class ADV | | | (2.51 | )% | | | 11.84 | % | | | 6.95 | % | |
| Russell 1000® Value Index(1) | | | (0.17 | )% | | | 14.63 | % | | | 9.39 | % | |
| S&P 500® Index(2) | | | 5.49 | % | | | 12.83 | % | | | 7.57 | % | |
Based on a $10,000 initial investment, the graph and table above illustrate the total return of ING Van Kampen Comstock Portfolio against the indices indicated. An index is unmanaged and has no cash in its portfolio, imposes no sales charges and incurs no operating expenses. An investor cannot invest directly in an index. The Portfolio's performance is shown without the imposition of any expenses or charges which are, or may be, imposed under your annuity contract. Total returns would have been lower if such expenses or charges were included.
The performance graph and table do not reflect the deduction of taxes that a shareholder will pay on portfolio distributions or the redemption of portfolio shares.
The performance shown may include the effect of fee waivers and/or expense reimbursements by the Investment Adviser and/or other service providers, which have the effect of increasing total return. Had all fees and expenses been considered, the total returns would have been lower.
The performance update illustrates performance for a variable investment option available through a variable annuity contract. The performance shown indicates past performance and is not a projection or prediction of future results. Actual investment returns and principal value will fluctuate so that shares and/or units, at redemption, may be worth more or less than their original cost. Please call (800) 262-3862 to get performance through the most recent month end.
This report contains statements that may be "forward-looking" statements. Actual results may differ materially from those projected in the "forward-looking" statements.
The views expressed in this report reflect those of the portfolio manager only through the end of the period as stated on the cover. The portfolio manager's views are subject to change at any time based on marked and other conditions.
Portfolio holdings are subject to change daily.
(1) The Russell 1000® Value Index is an unmanaged index that measures the performance of those Russell 1000 securities with lower price-to-book ratios and lower forecasted growth values.
(2) The S&P 500® Index is an unmanaged index that measures the performance of the securities of approximately 500 of the largest companies in the U.S.
53
ING VAN KAMPEN EQUITY AND INCOME PORTFOLIO
PORTFOLIO MANAGERS' REPORT
ING Van Kampen Equity and Income Portfolio (the "Portfolio") seeks total return, consisting of long-term capital appreciation and current income. The Portfolio is managed by James A. Gilligan, Managing Director; James O. Roeder, Sergio Marcheli and Mark Laskin, Executive Directors; Thomas B. Bastian, Managing Director of Morgan Stanley Investment Management, Inc., d/b/a "Van Kampen" — the Sub-Adviser.
Performance: For the year ended December 31, 2007, the Portfolio's Class S shares provided a total return of 3.29% compared to the Russell 1000® Value Index(1), Standard & Poor's 500® Composite Stock Price Index(2) ("S&P 500® Index"), Lehman Brothers® U.S. Government/Credit Index(3) and the Composite Index(4) (60% Russell 1000® Value Index/40% Lehman Brothers® U.S. Government/Credit Index), which returned (0.17)%, 5.49%, 7.23% and 2.90%, respectively, for the same period.
Portfolio Specifics: Relative to the Russell 1000® Value Index, the Portfolio's stock portfolio benefited primarily from an underweight to the financial sector (although we note that all sector weights are a result of our bottom-up stock selection process and are not intentional top-down allocations). Through limited exposures to regional banks and diversified financial companies, and no holdings in real estate investment trusts, the Portfolio had minimal exposure to the damage caused by the sub-prime mortgage collapse. The materials sector also bolstered relative performance, but this was primarily due to a single holding which generates a larger share of its business in the health care sector than in the materials sector. An overweight in the consumer staples sector contributed positively to relative returns as well. The main detractor from performance relative to the Russell 1000® Value Index was an underweight in the energy sector. Stock selection in the technology sector was another area of weakness, especially in the hardware and equipment, and the software and services groups.
The Portfolio's fixed-income allocation was additive to overall absolute performance. We kept a defensive credit sector allocation, focusing on selected high-quality issues, which benefited relative performance, particularly later in the year as credit spreads widened. Throughout the year, we also employed a defensive interest rate strategy by keeping the Portfolio's duration (a measure of interest-rate sensitivity) shorter than that of the Lehman Brothers U.S. Government/Credit Index. Although this strategy was beneficial early in the period when interest rates were rising, it detracted from performance for the overall reporting year as Federal Reserve Board easing in the latter months caused rates to decline significantly. In March, the Portfolio's yield curve positioning was adjusted to underweight longer dated issues and overweight intermediate dated issues, which bolstered performance as the spread between intermediate- and long-dated y ields widened and the curve steepened during the summer. We hold an underweight position to agency mortgage-backed securities, with a focus on high-coupon, slow-prepaying agency issues, and an overweight to non-agency mortgages (that is, securities issued by institutions other than Freddie Mac, Fannie Mae or Ginnie Mae) issued to high quality borrowers. With the recent turmoil in the mortgage market and the drying up of liquidity, all mortgage segments struggled during the period. As such, the underweight to agency mortgage-backed securities was beneficial, but the positive influence was more than offset by the poor price performance and relative overweight of the non-agency position.
The Portfolio's convertible securities position detracted from performance, chiefly due to the weak performance of selected holdings.
Current Strategy and Outlook: We continue to seek value stocks, high-quality bonds, and convertible securities, using our bottom-up security selection process. We look for undervalued companies that offer a potential catalyst for change. Such catalysts could be new company management, growth or consolidation within an industry or sector, or new products. We marginally adjusted the Portfolio's asset allocation during the period by slightly increasing the Portfolio's fixed-income weighting, while decreasing the convertible securities weighting. At the end of the period, the Portfolio held stocks, fixed-income, and convertible securities. As a result of our bottom-up stock selection process, the Portfolio continues to overweight health care and consumer staples and underweight financial and energy.
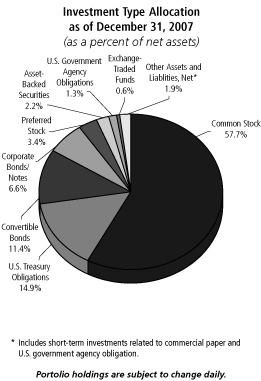
Top Ten Holdings*
as of December 31, 2007
(as a percent of net assets)
| U.S. Treasury Bond, 4.250%, due 08/15/13 | | | 2.9 | % | |
| Bayer AG ADR | | | 2.3 | % | |
| U.S. Treasury Note, 4.875%, due 05/15/09 | | | 2.1 | % | |
| U.S. Treasury Bond, 4.000%, due 02/15/15 | | | 2.1 | % | |
| Wal-Mart Stores, Inc. | | | 1.9 | % | |
| JPMorgan Chase & Co. | | | 1.8 | % | |
| Schering-Plough Corp. | | | 1.7 | % | |
| Verizon Communications, Inc. | | | 1.7 | % | |
| Abbott Laboratories | | | 1.6 | % | |
| Siemens AG ADR | | | 1.5 | % | |
* Excludes short-term investments related to U.S. government agency obligation.
Portfolio holdings are subject to change daily.
Portfolio holdings and characteristics are subject to change and may not be representative of current holdings and characteristics. The outlook for this Portfolio may differ from that presented for other ING Funds. Performance for the different classes of shares will vary based on differences in fees associated with each class.
54
PORTFOLIO MANAGERS' REPORT
ING VAN KAMPEN EQUITY AND INCOME PORTFOLIO
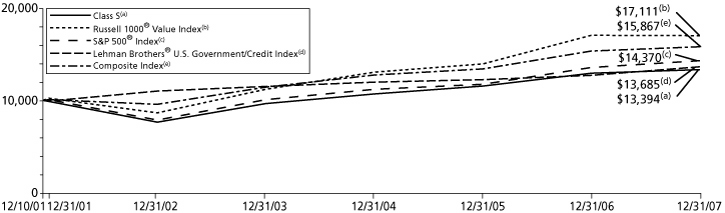
| Average Annual Total Returns for the Periods Ended December 31, 2007 | |
| | | 1 Year | | 5 Year | | Since Inception
of Classes I, S and ADV
December 10, 2001 | |
| Class I | | | 3.56 | % | | | 12.22 | % | | | 5.20 | % | |
| Class S | | | 3.29 | % | | | 11.94 | % | | | 4.94 | % | |
| Class ADV | | | 3.06 | % | | | 11.67 | % | | | 4.68 | % | |
| Russell 1000® Value Index(1) | | | (0.17 | )% | | | 14.63 | % | | | 9.23 | %(5) | |
| S&P 500® Index(2) | | | 5.49 | % | | | 12.83 | % | | | 6.14 | %(5) | |
| Lehman Brothers® U.S. Government/Credit Index(3) | | | 7.23 | % | | | 4.44 | % | | | 5.29 | %(5) | |
| Composite Index(4) | | | 2.90 | % | | | 10.58 | % | | | 7.88 | %(5) | |
Based on a $10,000 initial investment, the graph and table above illustrate the total return of ING Van Kampen Equity and Income Portfolio against the indices indicated. An index is unmanaged and has no cash in its portfolio, imposes no sales charges and incurs no operating expenses. An investor cannot invest directly in an index. The Portfolio's performance is shown without the imposition of any expenses or charges which are, or may be, imposed under your annuity contract. Total returns would have been lower if such expenses or charges were included.
The performance graph and table do not reflect the deduction of taxes that a shareholder will pay on portfolio distributions or the redemption of portfolio shares.
The performance shown may include the effect of fee waivers and/or expense reimbursements by the Investment Adviser and/or other service providers, which have the effect of increasing total return. Had all fees and expenses been considered, the total returns would have been lower.
The performance update illustrates performance for a variable investment option available through a variable annuity contract. The performance shown indicates past performance and is not a projection or prediction of future results. Actual investment returns and principal value will fluctuate so that shares and/or units, at redemption, may be worth more or less than their original cost. Please call (800) 262-3862 to get performance through the most recent month end.
This report contains statements that may be "forward-looking" statements. Actual results may differ materially from those projected in the "forward-looking" statements.
The views expressed in this report reflect those of the portfolio manager only through the end of the period as stated on the cover. The portfolio manager's views are subject to change at any time based on marked and other conditions.
Portfolio holdings are subject to change daily.
(1) The Russell 1000® Value Index is an unmanaged index that measures the performance of those Rusell 1000® companies with lower price-to-book ratios and lower than forecasted growth values.
(2) The S&P 500® Index is an unmanaged index that measures the performances of the securities of approximately 500 of the largest companies in the U.S
(3) The Lehman Brothers® U.S. Government/Credit Index is an index made up of the Lehman Brothers® Government and Credit indices, including securities issued by the U.S. government and its agencies and publicly issued U.S. corporate and foreign debentures and secured notes that meet specified maturity, liquidity and quality requirements.
(4) The Composite Index consists of 60% of the return of (securities included in) Russell 1000® Value Index and 40% of the return of (securities included in) Lehman Brothers® U.S. Government/Credit Index.
(5) Since inception performance for the indices is shown from December 1, 2001.
55
SHAREHOLDER EXPENSE EXAMPLES (UNAUDITED)
As a shareholder of a Portfolio, you incur two types of costs: (1) transaction costs, redemption fees, and exchange fees; and (2) ongoing costs, including management fees, distribution and/or service (12b-1) fees, and other Portfolio expenses. These Examples are intended to help you understand your ongoing costs (in dollars) of investing in a Fund and to compare these costs with the ongoing costs of investing in other mutual funds.
The Examples are based on an investment of $1,000 invested at the beginning of the period and held for the entire period from July 1, 2007 to December 31, 2007. The Portfolios' expenses are shown without the imposition of any charges which are, or may be, imposed under your annuity contract. Expenses would have been higher if such charges were included.
Actual Expenses
The first section of the table shown, "Actual Portfolio Return," provides information about actual account values and actual expenses. You may use the information in this section, together with the amount you invested, to estimate the expenses that you paid over the period. Simply divide your account value by $1,000 (for example, an $8,600 account value divided by $1,000 = 8.6), then multiply the result by the number in the first section under the heading entitled "Expenses Paid During Period'' to estimate the expenses you paid on your account during this period.
Hypothetical Example for Comparison Purposes
The second section of the table shown, "Hypothetical (5% return before expenses)," provides information about hypothetical account values and hypothetical expenses based on the Portfolio's actual expense ratio and an assumed rate of return of 5% per year before expenses, which is not the Portfolio's actual return. The hypothetical account values and expenses may not be used to estimate the actual ending account balance or expenses you paid for the period. You may use this information to compare the ongoing costs of investing in the Portfolio and other mutual funds. To do so, compare this 5% hypothetical example with the 5% hypothetical examples that appear in the shareholder reports of the other mutual funds.
Please note that the expenses shown in the table are meant to highlight your ongoing costs only and do not reflect any transactional costs, redemption fees, or exchange fees. Therefore, the hypothetical lines of the table are useful in comparing ongoing costs only, and will not help you determine the relative total costs of owning different funds. In addition, if these transactional costs were included, your costs would have been higher.
ING American Century
Large Company Value Portfolio | | Beginning
Account
Value
July 1, 2007 | | Ending
Account
Value
December 31, 2007 | | Annualized
Expense
Ratio | | Expenses Paid
During the
Period Ended
December 31, 2007* | |
| Actual Fund Return | |
| Class I | | $ | 1,000.00 | | | $ | 928.90 | | | | 1.00 | % | | $ | 4.86 | | |
| Class S | | | 1,000.00 | | | | 927.40 | | | | 1.25 | | | | 6.07 | | |
| Class ADV | | | 1,000.00 | | | | 926.70 | | | | 1.50 | | | | 7.28 | | |
| Hypothetical (5% return before expenses) | |
| Class I | | $ | 1,000.00 | | | $ | 1,020.16 | | | | 1.00 | % | | $ | 5.09 | | |
| Class S | | | 1,000.00 | | | | 1,018.90 | | | | 1.25 | | | | 6.36 | | |
| Class ADV | | | 1,000.00 | | | | 1,017.64 | | | | 1.50 | | | | 7.63 | | |
* Expenses are equal to each Portfolio's respective annualized expense ratios multiplied by the average account value over the period, multiplied by 184/365 to reflect the most recent fiscal half-year.
56
SHAREHOLDER EXPENSE EXAMPLES (UNAUDITED) (CONTINUED)
ING American Century
Small-Mid Cap Value Portfolio | | Beginning
Account
Value
July 1, 2007 | | Ending
Account
Value
December 31, 2007 | | Annualized
Expense
Ratio | | Expenses Paid
During the
Period Ended
December 31, 2007* | |
| Actual Fund Return | |
| Class I | | $ | 1,000.00 | | | $ | 897.00 | | | | 1.02 | % | | $ | 4.88 | | |
| Class S | | | 1,000.00 | | | | 896.10 | | | | 1.27 | | | | 6.07 | | |
| Class ADV | | | 1,000.00 | | | | 894.60 | | | | 1.52 | | | | 7.26 | | |
| Hypothetical (5% return before expenses) | |
| Class I | | $ | 1,000.00 | | | $ | 1,020.06 | | | | 1.02 | % | | $ | 5.19 | | |
| Class S | | | 1,000.00 | | | | 1,018.80 | | | | 1.27 | | | | 6.46 | | |
| Class ADV | | | 1,000.00 | | | | 1,017.54 | | | | 1.52 | | | | 7.73 | | |
| ING Baron Asset Portfolio | |
| Actual Fund Return | |
| Class I | | $ | 1,000.00 | | | $ | 1,003.30 | | | | 1.05 | % | | $ | 5.30 | | |
| Class S | | | 1,000.00 | | | | 1,001.70 | | | | 1.30 | | | | 6.56 | | |
| Class ADV | | | 1,000.00 | | | | 1,000.80 | | | | 1.55 | | | | 7.82 | | |
| Hypothetical (5% return before expenses) | |
| Class I | | $ | 1,000.00 | | | $ | 1,019.91 | | | | 1.05 | % | | $ | 5.35 | | |
| Class S | | | 1,000.00 | | | | 1,018.65 | | | | 1.30 | | | | 6.61 | | |
| Class ADV | | | 1,000.00 | | | | 1,017.39 | | | | 1.55 | | | | 7.88 | | |
| ING Baron Small Cap Growth Portfolio | |
| Actual Fund Return | |
| Class I | | $ | 1,000.00 | | | $ | 988.50 | | | | 1.08 | % | | $ | 5.41 | | |
| Class S | | | 1,000.00 | | | | 987.30 | | | | 1.32 | | | | 6.61 | | |
| Class ADV | | | 1,000.00 | | | | 985.60 | | | | 1.58 | | | | 7.91 | | |
| Hypothetical (5% return before expenses) | |
| Class I | | $ | 1,000.00 | | | $ | 1,019.76 | | | | 1.08 | % | | $ | 5.50 | | |
| Class S | | | 1,000.00 | | | | 1,018.55 | | | | 1.32 | | | | 6.72 | | |
| Class ADV | | | 1,000.00 | | | | 1,017.24 | | | | 1.58 | | | | 8.03 | | |
| ING Columbia Small Cap Value II Portfolio | |
| Actual Fund Return | |
| Class I | | $ | 1,000.00 | | | $ | 933.90 | | | | 0.85 | % | | $ | 4.14 | | |
| Class S | | | 1,000.00 | | | | 932.40 | | | | 1.10 | | | | 5.36 | | |
| Class ADV | | | 1,000.00 | | | | 931.80 | | | | 1.35 | | | | 6.57 | | |
| Hypothetical (5% return before expenses) | |
| Class I | | $ | 1,000.00 | | | $ | 1,020.92 | | | | 0.85 | % | | $ | 4.33 | | |
| Class S | | | 1,000.00 | | | | 1,019.66 | | | | 1.10 | | | | 5.60 | | |
| Class ADV | | | 1,000.00 | | | | 1,018.40 | | | | 1.35 | | | | 6.87 | | |
* Expenses are equal to each Portfolio's respective annualized expense ratios multiplied by the average account value over the period, multiplied by 184/365 to reflect the most recent fiscal half-year.
57
SHAREHOLDER EXPENSE EXAMPLES (UNAUDITED) (CONTINUED)
ING Davis New York
Venture Portfolio | | Beginning
Account
Value
July 1, 2007 | | Ending
Account
Value
December 31, 2007 | | Annualized
Expense
Ratio | | Expenses Paid
During the
Period Ended
December 31, 2007* | |
| Actual Fund Return | |
| Class I | | $ | 1,000.00 | | | $ | 976.50 | | | | 0.90 | % | | $ | 4.48 | | |
| Class S | | | 1,000.00 | | | | 975.30 | | | | 1.15 | | | | 5.73 | | |
| Class ADV | | | 1,000.00 | | | | 974.30 | | | | 1.40 | | | | 6.97 | | |
| Hypothetical (5% return before expenses) | |
| Class I | | $ | 1,000.00 | | | $ | 1,020.67 | | | | 0.90 | % | | $ | 4.58 | | |
| Class S | | | 1,000.00 | | | | 1,019.41 | | | | 1.15 | | | | 5.85 | | |
| Class ADV | | | 1,000.00 | | | | 1,018.15 | | | | 1.40 | | | | 7.12 | | |
| ING JPMorgan International Portfolio | |
| Actual Fund Return | |
| Class I | | $ | 1,000.00 | | | $ | 1,004.80 | | | | 0.99 | % | | $ | 5.00 | | |
| Class S | | | 1,000.00 | | | | 1,003.10 | | | | 1.24 | | | | 6.26 | | |
| Class ADV | | | 1,000.00 | | | | 1,002.20 | | | | 1.49 | | | | 7.52 | | |
| Hypothetical (5% return before expenses) | |
| Class I | | $ | 1,000.00 | | | $ | 1,020.21 | | | | 0.99 | % | | $ | 5.04 | | |
| Class S | | | 1,000.00 | | | | 1,018.95 | | | | 1.24 | | | | 6.31 | | |
| Class ADV | | | 1,000.00 | | | | 1,017.69 | | | | 1.49 | | | | 7.58 | | |
| ING JPMorgan Mid Cap Value Portfolio | |
| Actual Fund Return | |
| Class I | | $ | 1,000.00 | | | $ | 953.40 | | | | 1.00 | % | | $ | 4.92 | | |
| Class S | | | 1,000.00 | | | | 952.20 | | | | 1.25 | | | | 6.15 | | |
| Class ADV | | | 1,000.00 | | | | 950.70 | | | | 1.50 | | | | 7.38 | | |
| Hypothetical (5% return before expenses) | |
| Class I | | $ | 1,000.00 | | | $ | 1,020.16 | | | | 1.00 | % | | $ | 5.09 | | |
| Class S | | | 1,000.00 | | | | 1,018.90 | | | | 1.25 | | | | 6.36 | | |
| Class ADV | | | 1,000.00 | | | | 1,017.64 | | | | 1.50 | | | | 7.63 | | |
| ING Legg Mason Partners Aggressive Growth Portfolio | |
| Actual Fund Return | |
| Class I | | $ | 1,000.00 | | | $ | 945.00 | | | | 0.80 | % | | $ | 3.92 | | |
| Class S | | | 1,000.00 | | | | 943.70 | | | | 1.05 | | | | 5.14 | | |
| Class ADV | | | 1,000.00 | | | | 942.50 | | | | 1.30 | | | | 6.37 | | |
| Hypothetical (5% return before expenses) | |
| Class I | | $ | 1,000.00 | | | $ | 1,021.17 | | | | 0.80 | % | | $ | 4.08 | | |
| Class S | | | 1,000.00 | | | | 1,019.91 | | | | 1.05 | | | | 5.35 | | |
| Class ADV | | | 1,000.00 | | | | 1,018.65 | | | | 1.30 | | | | 6.61 | | |
* Expenses are equal to each Portfolio's respective annualized expense ratios multiplied by the average account value over the period, multiplied by 184/365 to reflect the most recent fiscal half-year.
58
SHAREHOLDER EXPENSE EXAMPLES (UNAUDITED) (CONTINUED)
ING Legg Mason Partners
Large Cap Growth Portfolio | | Beginning
Account
Value
July 1, 2007 | | Ending
Account
Value
December 31, 2007 | | Annualized
Expense
Ratio | | Expenses Paid
During the
Period Ended
December 31, 2007* | |
| Actual Fund Return | |
| Class I | | $ | 1,000.00 | | | $ | 1,007.80 | | | | 0.84 | % | | $ | 4.25 | | |
| Class S | | | 1,000.00 | | | | 1,006.30 | | | | 1.09 | | | | 5.51 | | |
| Class ADV | | | 1,000.00 | | | | 1,004.70 | | | | 1.34 | | | | 6.77 | | |
| Hypothetical (5% return before expenses) | |
| Class I | | $ | 1,000.00 | | | $ | 1,020.97 | | | | 0.84 | % | | $ | 4.28 | | |
| Class S | | | 1,000.00 | | | | 1,019.71 | | | | 1.09 | | | | 5.55 | | |
| Class ADV | | | 1,000.00 | | | | 1,018.45 | | | | 1.34 | | | | 6.82 | | |
| ING Lord Abbett U.S. Government Securities Portfolio | |
| Actual Fund Return | |
| Class I | | $ | 1,000.00 | | | $ | 1,068.80 | | | | 0.83 | % | | $ | 4.33 | | |
| Class S | | | 1,000.00 | | | | 1,066.90 | | | | 1.08 | | | | 5.63 | | |
| Hypothetical (5% return before expenses) | |
| Class I | | $ | 1,000.00 | | | $ | 1,021.02 | | | | 0.83 | % | | $ | 4.23 | | |
| Class S | | | 1,000.00 | | | | 1,019.76 | | | | 1.08 | | | | 5.50 | | |
| ING Neuberger Berman Partners Portfolio | |
| Actual Fund Return | |
| Class I | | $ | 1,000.00 | | | $ | 998.90 | | | | 0.67 | % | | $ | 3.38 | | |
| Class S | | | 1,000.00 | | | | 998.30 | | | | 0.89 | | | | 4.48 | | |
| Class ADV | | | 1,000.00 | | | | 997.10 | | | | 1.17 | | | | 5.89 | | |
| Hypothetical (5% return before expenses) | |
| Class I | | $ | 1,000.00 | | | $ | 1,021.83 | | | | 0.67 | % | | $ | 3.41 | | |
| Class S | | | 1,000.00 | | | | 1,020.72 | | | | 0.89 | | | | 4.53 | | |
| Class ADV | | | 1,000.00 | | | | 1,019.31 | | | | 1.17 | | | | 5.96 | | |
| ING Neuberger Berman Regency Portfolio | |
| Actual Fund Return | |
| Class I | | $ | 1,000.00 | | | $ | 938.20 | | | | 0.88 | % | | $ | 4.30 | | |
| Class S | | | 1,000.00 | | | | 937.80 | | | | 1.13 | | | | 5.52 | | |
| Hypothetical (5% return before expenses) | |
| Class I | | $ | 1,000.00 | | | $ | 1,020.77 | | | | 0.88 | % | | $ | 4.48 | | |
| Class S | | | 1,000.00 | | | | 1,019.51 | | | | 1.13 | | | | 5.75 | | |
* Expenses are equal to each Portfolio's respective annualized expense ratios multiplied by the average account value over the period, multiplied by 184/365 to reflect the most recent fiscal half-year.
59
SHAREHOLDER EXPENSE EXAMPLES (UNAUDITED) (CONTINUED)
| ING OpCap Balanced Value Portfolio | | Beginning
Account
Value
July 1, 2007 | | Ending
Account
Value
December 31, 2007 | | Annualized
Expense
Ratio | | Expenses Paid
During the
Period Ended
December 31, 2007* | |
| Actual Fund Return | |
| Class I | | $ | 1,000.00 | | | $ | 911.30 | | | | 0.97 | % | | $ | 4.67 | | |
| Class S | | | 1,000.00 | | | | 910.10 | | | | 1.22 | | | | 5.87 | | |
| Class ADV | | | 1,000.00 | | | | 909.10 | | | | 1.47 | | | | 7.07 | | |
| Hypothetical (5% return before expenses) | |
| Class I | | $ | 1,000.00 | | | $ | 1,020.32 | | | | 0.97 | % | | $ | 4.94 | | |
| Class S | | | 1,000.00 | | | | 1,019.06 | | | | 1.22 | | | | 6.21 | | |
| Class ADV | | | 1,000.00 | | | | 1,017.80 | | | | 1.47 | | | | 7.48 | | |
| ING Oppenheimer Global Portfolio | |
| Actual Fund Return | |
| Class I | | $ | 1,000.00 | | | $ | 980.50 | | | | 0.66 | % | | $ | 3.29 | | |
| Class S | | | 1,000.00 | | | | 979.40 | | | | 0.91 | | | | 4.54 | | |
| Class ADV | | | 1,000.00 | | | | 978.40 | | | | 1.15 | | | | 5.73 | | |
| Hypothetical (5% return before expenses) | |
| Class I | | $ | 1,000.00 | | | $ | 1,021.88 | | | | 0.66 | % | | $ | 3.36 | | |
| Class S | | | 1,000.00 | | | | 1,020.62 | | | | 0.91 | | | | 4.63 | | |
| Class ADV | | | 1,000.00 | | | | 1,019.41 | | | | 1.15 | | | | 5.85 | | |
| ING Oppenheimer Strategic Income Portfolio | |
| Actual Fund Return | |
| Class I | | $ | 1,000.00 | | | $ | 1,046.00 | | | | 0.54 | % | | $ | 2.78 | | |
| Class S | | | 1,000.00 | | | | 1,045.40 | | | | 0.75 | | | | 3.87 | | |
| Class ADV | | | 1,000.00 | | | | 1,044.00 | | | | 1.00 | | | | 5.15 | | |
| Hypothetical (5% return before expenses) | |
| Class I | | $ | 1,000.00 | | | $ | 1,022.48 | | | | 0.54 | % | | $ | 2.75 | | |
| Class S | | | 1,000.00 | | | | 1,021.42 | | | | 0.75 | | | | 3.82 | | |
| Class ADV | | | 1,000.00 | | | | 1,020.16 | | | | 1.00 | | | | 5.09 | | |
| ING PIMCO Total Return Portfolio | |
| Actual Fund Return | |
| Class I | | $ | 1,000.00 | | | $ | 1,091.10 | | | | 0.71 | % | | $ | 3.74 | | |
| Class S | | | 1,000.00 | | | | 1,090.20 | | | | 0.96 | | | | 5.06 | | |
| Class ADV | | | 1,000.00 | | | | 1,088.50 | | | | 1.21 | | | | 6.37 | | |
| Hypothetical (5% return before expenses) | |
| Class I | | $ | 1,000.00 | | | $ | 1,021.63 | | | | 0.71 | % | | $ | 3.62 | | |
| Class S | | | 1,000.00 | | | | 1,020.37 | | | | 0.96 | | | | 4.89 | | |
| Class ADV | | | 1,000.00 | | | | 1,019.11 | | | | 1.21 | | | | 6.16 | | |
* Expenses are equal to each Portfolio's respective annualized expense ratios multiplied by the average account value over the period, multiplied by 184/365 to reflect the most recent fiscal half-year.
60
SHAREHOLDER EXPENSE EXAMPLES (UNAUDITED) (CONTINUED)
| ING Pioneer High Yield Portfolio | | Beginning
Account
Value
July 1, 2007 | | Ending
Account
Value
December 31, 2007 | | Annualized
Expense
Ratio | | Expenses Paid
During the
Period Ended
December 31, 2007* | |
| Actual Fund Return | |
| Class I | | $ | 1,000.00 | | | $ | 1,001.10 | | | | 0.77 | % | | $ | 3.88 | | |
| Class S | | | 1,000.00 | | | | 999.90 | | | | 1.02 | | | | 5.14 | | |
| Class ADV | | | 1,000.00 | | | | 999.60 | | | | 1.27 | | | | 6.40 | | |
| Hypothetical (5% return before expenses) | |
| Class I | | $ | 1,000.00 | | | $ | 1,021.32 | | | | 0.77 | % | | $ | 3.92 | | |
| Class S | | | 1,000.00 | | | | 1,020.06 | | | | 1.02 | | | | 5.19 | | |
| Class ADV | | | 1,000.00 | | | | 1,018.80 | | | | 1.27 | | | | 6.46 | | |
| ING T. Rowe Price Diversified Mid Cap Growth Portfolio | |
| Actual Fund Return | |
| Class I | | $ | 1,000.00 | | | $ | 1,018.00 | | | | 0.66 | % | | $ | 3.36 | | |
| Class S | | | 1,000.00 | | | | 1,016.20 | | | | 0.91 | | | | 4.62 | | |
| Class ADV | | | 1,000.00 | | | | 1,015.30 | | | | 1.15 | | | | 5.84 | | |
| Hypothetical (5% return before expenses) | |
| Class I | | $ | 1,000.00 | | | $ | 1,021.88 | | | | 0.66 | % | | $ | 3.36 | | |
| Class S | | | 1,000.00 | | | | 1,020.62 | | | | 0.91 | | | | 4.63 | | |
| Class ADV | | | 1,000.00 | | | | 1,019.41 | | | | 1.15 | | | | 5.85 | | |
| ING T. Rowe Price Growth Equity Portfolio | |
| Actual Fund Return | |
| Class I | | $ | 1,000.00 | | | $ | 1,012.70 | | | | 0.74 | % | | $ | 3.75 | | |
| Class S | | | 1,000.00 | | | | 1,011.50 | | | | 0.99 | | | | 5.02 | | |
| Class ADV | | | 1,000.00 | | | | 1,010.20 | | | | 1.24 | | | | 6.28 | | |
| Hypothetical (5% return before expenses) | |
| Class I | | $ | 1,000.00 | | | $ | 1,021.48 | | | | 0.74 | % | | $ | 3.77 | | |
| Class S | | | 1,000.00 | | | | 1,020.21 | | | | 0.99 | | | | 5.04 | | |
| Class ADV | | | 1,000.00 | | | | 1,018.95 | | | | 1.24 | | | | 6.31 | | |
| ING Templeton Foreign Equity Portfolio | |
| Actual Fund Return | |
| Class I | | $ | 1,000.00 | | | $ | 1,030.80 | | | | 0.98 | % | | $ | 5.02 | | |
| Class S | | | 1,000.00 | | | | 1,029.70 | | | | 1.23 | | | | 6.29 | | |
| Class ADV | | | 1,000.00 | | | | 1,030.10 | | | | 1.48 | | | | 7.57 | | |
| Hypothetical (5% return before expenses) | |
| Class I | | $ | 1,000.00 | | | $ | 1,020.27 | | | | 0.98 | % | | $ | 4.99 | | |
| Class S | | | 1,000.00 | | | | 1,019.00 | | | | 1.23 | | | | 6.26 | | |
| Class ADV | | | 1,000.00 | | | | 1,017.74 | | | | 1.48 | | | | 7.53 | | |
* Expenses are equal to each Portfolio's respective annualized expense ratios multiplied by the average account value over the period, multiplied by 184/365 to reflect the most recent fiscal half-year.
61
SHAREHOLDER EXPENSE EXAMPLES (UNAUDITED) (CONTINUED)
| ING Thornburg Value Portfolio | | Beginning
Account
Value
July 1, 2007 | | Ending
Account
Value
December 31, 2007 | | Annualized
Expense
Ratio | | Expenses Paid
During the
Period Ended
December 31, 2007* | |
| Actual Fund Return | |
| Class I | | $ | 1,000.00 | | | $ | 970.30 | | | | 0.90 | % | | $ | 4.47 | | |
| Class S | | | 1,000.00 | | | | 969.30 | | | | 1.15 | | | | 5.71 | | |
| Class ADV | | | 1,000.00 | | | | 968.00 | | | | 1.40 | | | | 6.94 | | |
| Hypothetical (5% return before expenses) | |
| Class I | | $ | 1,000.00 | | | $ | 1,020.67 | | | | 0.90 | % | | $ | 4.58 | | |
| Class S | | | 1,000.00 | | | | 1,019.41 | | | | 1.15 | | | | 5.85 | | |
| Class ADV | | | 1,000.00 | | | | 1,018.15 | | | | 1.40 | | | | 7.12 | | |
| ING UBS U.S. Large Cap Equity Portfolio | |
| Actual Fund Return | |
| Class I | | $ | 1,000.00 | | | $ | 943.90 | | | | 0.84 | % | | $ | 4.12 | | |
| Class S | | | 1,000.00 | | | | 943.40 | | | | 1.09 | | | | 5.34 | | |
| Class ADV | | | 1,000.00 | | | | 941.30 | | | | 1.34 | | | | 6.56 | | |
| Hypothetical (5% return before expenses) | |
| Class I | | $ | 1,000.00 | | | $ | 1,020.97 | | | | 0.84 | % | | $ | 4.28 | | |
| Class S | | | 1,000.00 | | | | 1,019.71 | | | | 1.09 | | | | 5.55 | | |
| Class ADV | | | 1,000.00 | | | | 1,018.45 | | | | 1.34 | | | | 6.82 | | |
| ING UBS U.S. Small Cap Growth Portfolio | |
| Actual Fund Return | |
| Class I | | $ | 1,000.00 | | | $ | 958.40 | | | | 0.98 | % | | $ | 4.84 | | |
| Class S | | | 1,000.00 | | | | 956.40 | | | | 1.23 | | | | 6.07 | | |
| Class ADV | | | 1,000.00 | | | | 954.20 | | | | 1.48 | | | | 7.29 | | |
| Hypothetical (5% return before expenses) | |
| Class I | | $ | 1,000.00 | | | $ | 1,020.27 | | | | 0.98 | % | | $ | 4.99 | | |
| Class S | | | 1,000.00 | | | | 1,019.00 | | | | 1.23 | | | | 6.26 | | |
| Class ADV | | | 1,000.00 | | | | 1,017.74 | | | | 1.48 | | | | 7.53 | | |
| ING Van Kampen Comstock Portfolio | |
| Actual Fund Return | |
| Class I | | $ | 1,000.00 | | | $ | 921.70 | | | | 0.84 | % | | $ | 4.07 | | |
| Class S | | | 1,000.00 | | | | 920.50 | | | | 1.09 | | | | 5.28 | | |
| Class ADV | | | 1,000.00 | | | | 919.00 | | | | 1.34 | | | | 6.48 | | |
| Hypothetical (5% return before expenses) | |
| Class I | | $ | 1,000.00 | | | $ | 1,020.97 | | | | 0.84 | % | | $ | 4.28 | | |
| Class S | | | 1,000.00 | | | | 1,019.71 | | | | 1.09 | | | | 5.55 | | |
| Class ADV | | | 1,000.00 | | | | 1,018.45 | | | | 1.34 | | | | 6.82 | | |
* Expenses are equal to each Portfolio's respective annualized expense ratios multiplied by the average account value over the period, multiplied by 184/365 to reflect the most recent fiscal half-year.
62
SHAREHOLDER EXPENSE EXAMPLES (UNAUDITED) (CONTINUED)
ING Van Kampen
Equity and Income Portfolio | | Beginning
Account
Value
July 1, 2007 | | Ending
Account
Value
December 31, 2007 | | Annualized
Expense
Ratio | | Expenses Paid
During the
Period Ended
December 31, 2007* | |
| Actual Fund Return | |
| Class I | | $ | 1,000.00 | | | $ | 976.50 | | | | 0.57 | % | | $ | 2.84 | | |
| Class S | | | 1,000.00 | | | | 975.20 | | | | 0.82 | | | | 4.08 | | |
| Class ADV | | | 1,000.00 | | | | 974.40 | | | | 1.07 | | | | 5.32 | | |
| Hypothetical (5% return before expenses) | |
| Class I | | $ | 1,000.00 | | | $ | 1,022.33 | | | | 0.57 | % | | $ | 2.91 | | |
| Class S | | | 1,000.00 | | | | 1,021.07 | | | | 0.82 | | | | 4.18 | | |
| Class ADV | | | 1,000.00 | | | | 1,019.81 | | | | 1.07 | | | | 5.45 | | |
* Expenses are equal to each Portfolio's respective annualized expense ratios multiplied by the average account value over the period, multiplied by 184/365 to reflect the most recent fiscal half-year.
63
REPORT OF INDEPENDENT REGISTERED PUBLIC ACCOUNTING FIRM
The Shareholders and Board of Trustees
ING Partners, Inc.
We have audited the accompanying statements of assets and liabilities, including the portfolios of investments, of ING American Century Large Company Value Portfolio, ING American Century Small-Mid Cap Value Portfolio, ING Baron Asset Portfolio, ING Baron Small Cap Growth Portfolio, ING Columbia Small Cap Value II Portfolio, ING Davis New York Venture Portfolio, ING JPMorgan International Portfolio, ING JPMorgan Mid Cap Value Portfolio, ING Legg Mason Partners Aggressive Growth Portfolio, ING Legg Mason Partners Large Cap Growth Portfolio, ING Lord Abbett U.S. Government Securities Portfolio, ING Neuberger Berman Partners Portfolio, ING Neuberger Berman Regency Portfolio, ING OpCap Balanced Value Portfolio, ING Oppenheimer Global Portfolio, ING Oppenheimer Strategic Income Portfolio, ING PIMCO Total Return Portfolio, ING Pioneer High Yield Portfolio, ING T. Rowe Price Diversified Mid Cap Growth Portfolio, ING T. Rowe Price Growth Equity Port folio, ING Templeton Foreign Equity Portfolio, ING Thornburg Value Portfolio, ING UBS U.S. Large Cap Equity Portfolio, ING UBS U.S. Small Cap Growth Portfolio, ING Van Kampen Comstock Portfolio, ING Van Kampen Equity and Income Portfolio, each a series of ING Partners, Inc., as of December 31, 2007, and the related statements of operations for the year then ended, the statements of changes in net assets for each of the years or periods in the two-year period then ended, and the financial highlights for each of the years or periods in the five-year period then ended. These financial statements and financial highlights are the responsibility of management. Our responsibility is to express an opinion on these financial statements and financial highlights based on our audits.
We conducted our audits in accordance with the standards of the Public Company Accounting Oversight Board (United States). Those standards require that we plan and perform the audits to obtain reasonable assurance about whether the financial statements and financial highlights are free of material misstatement. An audit includes examining, on a test basis, evidence supporting the amounts and disclosures in the financial statements. Our procedures included confirmation of securities owned as of December 31, 2007, by correspondence with the custodian and brokers, or by other appropriate auditing procedures when replies from brokers were not received. An audit also includes assessing the accounting principles used and significant estimates made by management, as well as evaluating the overall financial statement presentation. We believe that our audits provide a reasonable basis for our opinion.
In our opinion, the financial statements and financial highlights referred to above present fairly, in all material respects, the financial position of the aforementioned portfolios of ING Partners, Inc. as of December 31, 2007, and the results of their operations, the changes in their net assets, and the financial highlights for the periods specified in the first paragraph above, in conformity with U.S. generally accepted accounting principles.

Boston, Massachusetts
February 29, 2008
64
STATEMENTS OF ASSETS AND LIABILITIES AS OF DECEMBER 31, 2007
| | | ING
American Century Large
Company Value
Portfolio | | ING
American Century
Small-Mid Cap Value
Portfolio | | ING
Baron
Asset
Portfolio | | ING
Baron Small
Cap Growth
Portfolio | |
| ASSETS: | |
| Investments in securities at value+* | | $ | 120,606,582 | | | $ | 97,162,087 | | | $ | 31,380,466 | | | $ | 589,338,020 | | |
| Short-term investments at amortized cost | | | 18,211,874 | | | | 18,585,906 | | | | — | | | | 52,184,156 | | |
| Cash | | | 1,402,106 | | | | 3,196,078 | | | | 2,610,842 | | | | 5,610,430 | | |
| Receivables: | |
| Investment securities sold | | | 387,094 | | | | 1,419,631 | | | | — | | | | 462,809 | | |
| Fund shares sold | | | 296,507 | | | | 46,913 | | | | 57,655 | | | | 2,304,771 | | |
| Dividends and interest | | | 159,211 | | | | 243,567 | | | | 24,369 | | | | 384,736 | | |
Unrealized appreciation on forward
foreign currency contracts | | | — | | | | 1,144 | | | | — | | | | — | | |
| Reimbursement due from manager | | | — | | | | 13,371 | | | | 474 | | | | — | | |
| Total assets | | | 141,063,374 | | | | 120,668,697 | | | | 34,073,806 | | | | 650,284,922 | | |
| LIABILITIES: | |
| Payable for investment securities purchased | | | 698,566 | | | | 1,521,945 | | | | — | | | | 2,786,980 | | |
| Payable for fund shares redeemed | | | 774,660 | | | | 17,048 | | | | 10,432 | | | | 1,559,269 | | |
| Payable for futures variation margin | | | 38,525 | | | | — | | | | — | | | | — | | |
| Payable upon receipt of securities loaned | | | 8,792,470 | | | | 18,585,906 | | | | — | | | | — | | |
Unrealized depreciation on forward
foreign currency contracts | | | — | | | | 1,653 | | | | — | | | | — | | |
| Payable to affiliates | | | 115,291 | | | | 120,266 | | | | 32,646 | | | | 692,056 | | |
Payable to custodian due to foreign
currency overdraft** | | | — | | | | 724,325 | | | | — | | | | — | | |
| Payable for directors fees | | | — | | | | — | | | | 2,426 | | | | — | | |
| Other accrued expenses and liabilities | | | — | | | | — | | | | 17,395 | | | | — | | |
| Total liabilities | | | 10,419,512 | | | | 20,971,143 | | | | 62,899 | | | | 5,038,305 | | |
| NET ASSETS | | $ | 130,643,862 | | | $ | 99,697,554 | | | $ | 34,010,907 | | | $ | 645,246,617 | | |
| NET ASSETS WERE COMPRISED OF: | |
| Paid-in capital | | $ | 120,154,921 | | | $ | 98,281,342 | | | $ | 31,422,523 | | | $ | 504,694,363 | | |
Undistributed net investment income
(accumulated net investment loss) | | | 1,963,858 | | | | 876,695 | | | | — | | | | 23,826 | | |
Accumulated net realized gain on
investments, foreign currency related
transactions, and futures | | | 8,186,491 | | | | 7,498,032 | | | | 141,214 | | | | 18,994,107 | | |
Net unrealized appreciation or depreciation
on investments, foreign currency related
transactions, and futures | | | 338,592 | | | | (6,958,515 | ) | | | 2,447,170 | | | | 121,534,321 | | |
| NET ASSETS | | $ | 130,643,862 | | | $ | 99,697,554 | | | $ | 34,010,907 | | | $ | 645,246,617 | | |
| + Including securities loaned at value | | $ | 8,542,388 | | | $ | 17,781,178 | | | $ | — | | | $ | — | | |
| * Cost of investments in securities | | $ | 120,181,097 | | | $ | 104,119,950 | | | $ | 28,933,296 | | | $ | 467,803,699 | | |
| ** Cost of foreign currency overdraft | | $ | — | | | $ | 724,170 | | | $ | — | | | $ | — | | |
See Accompanying Notes to Financial Statements
65
STATEMENTS OF ASSETS AND LIABILITIES AS OF DECEMBER 31, 2007 (CONTINUED)
| | | ING
American Century Large
Company Value
Portfolio | | ING
American Century
Small-Mid Cap Value
Portfolio | | ING
Baron
Asset
Portfolio | | ING
Baron Small
Cap Growth
Portfolio | |
| Class I: | |
| Net assets | | $ | 104,021,000 | | | $ | 47,079,192 | | | $ | 25,780,891 | | | $ | 181,258,881 | | |
| Shares authorized | | | 100,000,000 | | | | 100,000,000 | | | | 100,000,000 | | | | 100,000,000 | | |
| Par value | | $ | 0.001 | | | $ | 0.001 | | | $ | 0.001 | | | $ | 0.001 | | |
| Shares outstanding | | | 7,205,820 | | | | 4,107,705 | | | | 2,118,627 | | | | 9,187,629 | | |
Net asset value and redemption
price per share | | $ | 14.44 | | | $ | 11.46 | | | $ | 12.17 | | | $ | 19.73 | | |
| Class S: | |
| Net assets | | $ | 17,125,775 | | | $ | 40,309,109 | | | $ | 4,730,727 | | | $ | 415,539,024 | | |
| Shares authorized | | | 100,000,000 | | | | 100,000,000 | | | | 100,000,000 | | | | 100,000,000 | | |
| Par value | | $ | 0.001 | | | $ | 0.001 | | | $ | 0.001 | | | $ | 0.001 | | |
| Shares outstanding | | | 1,183,493 | | | | 3,536,142 | | | | 391,161 | | | | 21,366,654 | | |
Net asset value and redemption
price per share | | $ | 14.47 | | | $ | 11.40 | | | $ | 12.09 | | | $ | 19.45 | | |
| Class ADV: | |
| Net assets | | $ | 9,497,087 | | | $ | 12,309,253 | | | $ | 3,499,289 | | | $ | 48,448,712 | | |
| Shares authorized | | | 100,000,000 | | | | 100,000,000 | | | | 100,000,000 | | | | 100,000,000 | | |
| Par value | | $ | 0.001 | | | $ | 0.001 | | | $ | 0.001 | | | $ | 0.001 | | |
| Shares outstanding | | | 667,152 | | | | 1,095,161 | | | | 290,435 | | | | 2,528,079 | | |
Net asset value and redemption
price per share | | $ | 14.24 | | | $ | 11.24 | | | $ | 12.05 | | | $ | 19.16 | | |
See Accompanying Notes to Financial Statements
66
STATEMENTS OF ASSETS AND LIABILITIES AS OF DECEMBER 31, 2007
| | | ING
Columbia Small
Cap Value II
Portfolio | | ING
Davis New
York Venture
Portfolio | | ING
JPMorgan
International
Portfolio | | ING
JPMorgan
Mid Cap Value
Portfolio | |
| ASSETS: | |
| Investments in securities at value+* | | $ | 196,921,348 | | | $ | 323,416,763 | | | $ | 642,233,390 | | | $ | 254,614,970 | | |
| Short-term investments at amortized cost | | | 25,574,666 | | | | 18,808,584 | | | | 64,244,011 | | | | 59,930,997 | | |
| Cash | | | 2,922,189 | | | | 579,642 | | | | 770,430 | | | | 661,537 | | |
| Foreign currencies at value** | | | — | | | | — | | | | 781,403 | | | | — | | |
| Receivables: | |
| Investment securities sold | | | 222,808 | | | | 14,897 | | | | — | | | | 247,710 | | |
| Fund shares sold | | | 3,586,956 | | | | 1,668,816 | | | | 361,889 | | | | 211,350 | | |
| Dividends and interest | | | 201,015 | | | | 320,284 | | | | 1,437,210 | | | | 417,079 | | |
| Total assets | | | 229,428,982 | | | | 344,808,986 | | | | 709,828,333 | | | | 316,083,643 | | |
| LIABILITIES: | |
| Payable for investment securities purchased | | | 20,670,550 | | | | 594,970 | | | | 401,647 | | | | 31,968 | | |
| Payable for fund shares redeemed | | | 11,186 | | | | 386,901 | | | | 882,165 | | | | 617,919 | | |
| Payable upon receipt of securities loaned | | | — | | | | — | | | | 58,172,040 | | | | 54,865,855 | | |
| Payable to affiliates | | | 165,211 | | | | 309,661 | | | | 613,764 | | | | 255,720 | | |
Payable to custodian due to foreign
currency overdraft*** | | | — | | | | 29,227 | | | | — | | | | — | | |
| Payable for directors fees | | | 841 | | | | — | | | | — | | | | — | | |
| Other accrued expenses and liabilities | | | 29,023 | | | | — | | | | — | | | | — | | |
| Total liabilities | | | 20,876,811 | | | | 1,320,759 | | | | 60,069,616 | | | | 55,771,462 | | |
| NET ASSETS | | $ | 208,552,171 | | | $ | 343,488,227 | | | $ | 649,758,717 | | | $ | 260,312,181 | | |
| NET ASSETS WERE COMPRISED OF: | |
| Paid-in capital | | $ | 205,022,209 | | | $ | 314,728,070 | | | $ | 326,261,539 | | | $ | 226,549,028 | | |
| Undistributed net investment income | | | 946,098 | | | | 3,537,474 | | | | 10,625,913 | | | | 2,431,848 | | |
Accumulated net realized gain on investments and
foreign currency related transactions | | | 3,778,760 | | | | 4,472,073 | | | | 156,376,392 | | | | 19,768,557 | | |
Net unrealized appreciation or depreciation on
investments and foreign currency related transactions | | | (1,194,896 | ) | | | 20,750,610 | | | | 156,494,873 | | | | 11,562,748 | | |
| NET ASSETS | | $ | 208,552,171 | | | $ | 343,488,227 | | | $ | 649,758,717 | | | $ | 260,312,181 | | |
| + Including securities loaned at value | | $ | — | | | $ | — | | | $ | 55,385,266 | | | $ | 53,576,405 | | |
| * Cost of investments in securities | | $ | 198,116,244 | | | $ | 302,663,362 | | | $ | 485,767,665 | | | $ | 243,052,222 | | |
| ** Cost of foreign currencies | | $ | — | | | $ | — | | | $ | 780,567 | | | $ | — | | |
| *** Cost of foreign currency overdraft | | $ | — | | | $ | 28,725 | | | $ | — | | | $ | — | | |
See Accompanying Notes to Financial Statements
67
STATEMENTS OF ASSETS AND LIABILITIES AS OF DECEMBER 31, 2007 (CONTINUED)
| | | ING
Columbia Small
Cap Value II
Portfolio | | ING
Davis New
York Venture
Portfolio | | ING
JPMorgan
International
Portfolio | | ING
JPMorgan
Mid Cap Value
Portfolio | |
| Class I: | |
| Net assets | | $ | 46,921,569 | | | $ | 101,763,297 | | | $ | 448,456,810 | | | $ | 145,637,755 | | |
| Shares authorized | | | 100,000,000 | | | | 100,000,000 | | | | 100,000,000 | | | | 100,000,000 | | |
| Par value | | $ | 0.001 | | | $ | 0.001 | | | $ | 0.001 | | | $ | 0.001 | | |
| Shares outstanding | | | 4,475,607 | | | | 4,939,288 | | | | 25,601,826 | | | | 9,237,364 | | |
| Net asset value and redemption price per share | | $ | 10.48 | | | $ | 20.60 | | | $ | 17.52 | | | $ | 15.77 | | |
| Class S: | |
| Net assets | | $ | 161,300,901 | | | $ | 231,511,369 | | | $ | 185,539,066 | | | $ | 89,850,521 | | |
| Shares authorized | | | 100,000,000 | | | | 100,000,000 | | | | 100,000,000 | | | | 100,000,000 | | |
| Par value | | $ | 0.001 | | | $ | 0.001 | | | $ | 0.001 | | | $ | 0.001 | | |
| Shares outstanding | | | 15,445,555 | | | | 11,352,113 | | | | 10,593,418 | | | | 5,735,084 | | |
| Net asset value and redemption price per share | | $ | 10.44 | | | $ | 20.39 | | | $ | 17.51 | | | $ | 15.67 | | |
| Class ADV: | |
| Net assets | | $ | 329,701 | | | $ | 10,213,561 | | | $ | 15,762,841 | | | $ | 24,823,905 | | |
| Shares authorized | | | 100,000,000 | | | | 100,000,000 | | | | 100,000,000 | | | | 100,000,000 | | |
| Par value | | $ | 0.001 | | | $ | 0.001 | | | $ | 0.001 | | | $ | 0.001 | | |
| Shares outstanding | | | 31,664 | | | | 508,865 | | | | 916,584 | | | | 1,601,247 | | |
| Net asset value and redemption price per share | | $ | 10.41 | | | $ | 20.07 | | | $ | 17.20 | | | $ | 15.50 | | |
See Accompanying Notes to Financial Statements
68
STATEMENTS OF ASSETS AND LIABILITIES AS OF DECEMBER 31, 2007
| | | ING
Legg Mason
Partners
Aggressive Growth
Portfolio | | ING
Legg Mason
Partners
Large Cap Growth
Portfolio | | ING
Lord Abbett
U.S. Government
Securities
Portfolio | | ING
Neuberger
Berman
Partners
Portfolio | |
| ASSETS: | |
| Investments in securities at value+* | | $ | 1,246,001,971 | | | $ | 36,285,231 | | | $ | 44,372,211 | | | $ | 423,925,136 | | |
| Short-term investments at amortized cost | | | 249,911,495 | | | | 443,925 | | | | — | | | | — | | |
| Cash | | | 4,395,283 | | | | 443,914 | | | | 1,084,971 | | | | 4,581,061 | | |
| Receivables: | |
| Investment securities sold | | | — | | | | — | | | | 4,020,511 | | | | 1,937,489 | | |
| Fund shares sold | | | 3,066,616 | | | | 6,851 | | | | 7,216 | | | | 415,222 | | |
| Dividends and interest | | | 511,795 | | | | 19,440 | | | | 296,173 | | | | 293,432 | | |
| Reimbursement due from manager | | | — | | | | — | | | | 5,271 | | | | 34,598 | | |
| Total assets | | | 1,503,887,160 | | | | 37,199,361 | | | | 49,786,353 | | | | 431,186,938 | | |
| LIABILITIES: | |
| Payable for investment securities purchased | | | — | | | | 104,813 | | | | 4,005,482 | | | | 1,754,133 | | |
| Payable for fund shares redeemed | | | 3,318,941 | | | | 58,961 | | | | 304,618 | | | | 285,849 | | |
| Payable upon receipt of securities loaned | | | 218,788,769 | | | | — | | | | — | | | | — | | |
| Payable to affiliates | | | 936,719 | | | | 35,904 | | | | 24,294 | | | | 287,321 | | |
| Payable for directors fees | | | — | | | | — | | | | 4,919 | | | | 4,944 | | |
| Other accrued expenses and liabilities | | | — | | | | — | | | | 39,722 | | | | 47,128 | | |
| Total liabilities | | | 223,044,429 | | | | 199,678 | | | | 4,379,035 | | | | 2,379,375 | | |
| NET ASSETS | | $ | 1,280,842,731 | | | $ | 36,999,683 | | | $ | 45,407,318 | | | $ | 428,807,563 | | |
| NET ASSETS WERE COMPRISED OF: | |
| Paid-in capital | | $ | 1,173,885,688 | | | $ | 29,416,246 | | | $ | 44,333,736 | | | $ | 372,737,255 | | |
| Undistributed net investment income | | | — | | | | — | | | | 14,614 | | | | 954,887 | | |
Accumulated net realized gain (loss) on
investments | | | (212,715,392 | ) | | | 2,132,565 | | | | 39,862 | | | | (13,431,928 | ) | |
| Net unrealized appreciation on investments | | | 319,672,435 | | | | 5,450,872 | | | | 1,019,106 | | | | 68,547,349 | | |
| NET ASSETS | | $ | 1,280,842,731 | | | $ | 36,999,683 | | | $ | 45,407,318 | | | $ | 428,807,563 | | |
| + Including securities loaned at value | | $ | 211,796,926 | | | $ | — | | | $ | — | | | $ | — | | |
| * Cost of investments in securities | | $ | 926,329,536 | | | $ | 30,834,359 | | | $ | 43,353,105 | | | $ | 355,377,787 | | |
See Accompanying Notes to Financial Statements
69
STATEMENTS OF ASSETS AND LIABILITIES AS OF DECEMBER 31, 2007 (CONTINUED)
| | | ING
Legg Mason
Partners
Aggressive Growth
Portfolio | | ING
Legg Mason
Partners
Large Cap Growth
Portfolio | | ING
Lord Abbett
U.S. Government
Securities
Portfolio | | ING
Neuberger
Berman
Partners
Portfolio | |
| Class I: | |
| Net assets | | $ | 1,103,032,787 | | | $ | 12,659,765 | | | $ | 34,173,375 | | | $ | 271,555,217 | | |
| Shares authorized | | | 100,000,000 | | | | 100,000,000 | | | | 100,000,000 | | | | 100,000,000 | | |
| Par value | | $ | 0.001 | | | $ | 0.001 | | | $ | 0.001 | | | $ | 0.001 | | |
| Shares outstanding | | | 22,833,278 | | | | 1,024,070 | | | | 3,374,221 | | | | 24,020,827 | | |
| Net asset value and redemption price per share | | $ | 48.31 | | | $ | 12.36 | | | $ | 10.13 | | | $ | 11.30 | | |
| Class S: | |
| Net assets | | $ | 169,485,411 | | | $ | 9,417,298 | | | $ | 11,233,943 | | | $ | 157,240,661 | | |
| Shares authorized | | | 100,000,000 | | | | 100,000,000 | | | | 100,000,000 | | | | 100,000,000 | | |
| Par value | | $ | 0.001 | | | $ | 0.001 | | | $ | 0.001 | | | $ | 0.001 | | |
| Shares outstanding | | | 3,561,790 | | | | 772,276 | | | | 1,108,864 | | | | 13,972,697 | | |
| Net asset value and redemption price per share | | $ | 47.58 | | | $ | 12.19 | | | $ | 10.13 | | | $ | 11.25 | | |
| Class ADV: | |
| Net assets | | $ | 8,324,533 | | | $ | 14,922,620 | | | | n/a | | | $ | 11,685 | | |
| Shares authorized | | | 100,000,000 | | | | 100,000,000 | | | | n/a | | | | 100,000,000 | | |
| Par value | | $ | 0.001 | | | $ | 0.001 | | | | n/a | | | $ | 0.001 | | |
| Shares outstanding | | | 177,563 | | | | 1,238,051 | | | | n/a | | | | 1,041 | | |
| Net asset value and redemption price per share | | $ | 46.88 | | | $ | 12.05 | | | | n/a | | | $ | 11.22 | | |
See Accompanying Notes to Financial Statements
70
STATEMENTS OF ASSETS AND LIABILITIES AS OF DECEMBER 31, 2007
| | | ING
Neuberger Berman
Regency
Portfolio | | ING
OpCap
Balanced Value
Portfolio | | ING
Oppenheimer
Global
Portfolio | | ING
Oppenheimer
Strategic Income
Portfolio | |
| ASSETS: | |
| Investments in securities at value+* | | $ | 19,943,957 | | | $ | 61,143,488 | | | $ | 2,616,501,428 | | | $ | 419,726,560 | | |
| Short-term investments** | | | — | | | | — | | | | — | | | | 5,218,605 | | |
| Short-term investments at amortized cost | | | — | | | | 20,374,714 | | | | 362,406,976 | | | | 117,322,794 | | |
| Cash | | | 2,100,390 | | | | 496,594 | | | | 292,189 | | | | 7,308,953 | | |
| Foreign currencies at value*** | | | — | | | | — | | | | 4,885,826 | | | | 2,557,084 | | |
| Receivables: | |
| Investment securities sold | | | 23,314 | | | | 176,450 | | | | — | | | | 5,118,460 | | |
| Fund shares sold | | | 5,971 | | | | 15,680 | | | | 5,361,919 | | | | 681,650 | | |
| Dividends and interest | | | 21,816 | | | | 257,838 | | | | 2,955,662 | | | | 5,132,376 | | |
| Variation margin receivable | | | — | | | | — | | | | — | | | | 427,712 | | |
Unrealized appreciation on forward
foreign currency contracts | | | — | | | | — | | | | — | | | | 6,657,654 | | |
| Upfront payments made on swap agreements | | | — | | | | — | | | | — | | | | 48,063 | | |
| Unrealized appreciation on swap agreements | | | — | | | | — | | | | — | | | | 2,769,523 | | |
| Total assets | | | 22,095,448 | | | | 82,464,764 | | | | 2,992,404,000 | | | | 572,969,434 | | |
| LIABILITIES: | |
| Payable for investment securities purchased | | | 59,310 | | | | — | | | | — | | | | 9,966,535 | | |
| Payable for fund shares redeemed | | | 398,230 | | | | 857,857 | | | | 6,628,708 | | | | 726,217 | | |
| Payable for futures variation margin | | | — | | | | — | | | | — | | | | 47,531 | | |
| Payable upon receipt of securities loaned | | | — | | | | 18,685,000 | | | | 362,276,998 | | | | 32,837,634 | | |
| Sales commitments, at value (Note 2)^ | | | — | | | | — | | | | — | | | | 524,426 | | |
Unrealized depreciation on
forward foreign currency contracts | | | — | | | | — | | | | — | | | | 5,292,352 | | |
| Upfront payments received on swap agreements | | | — | | | | — | | | | — | | | | 402,868 | | |
| Unrealized depreciation on swap agreements | | | — | | | | — | | | | — | | | | 3,406,751 | | |
| Payable to affiliates | | | 23,148 | | | | 68,222 | | | | 1,579,002 | | | | 253,210 | | |
| Payable for directors fees | | | 721 | | | | — | | | | — | | | | — | | |
| Other accrued expenses and liabilities | | | 19,686 | | | | — | | | | 161 | | | | 21,660 | | |
| Options written^^ | | | — | | | | — | | | | — | | | | 18,646 | | |
| Accrued foreign taxes on capital gains | | | — | | | | — | | | | 9,875 | | | | — | | |
| Total liabilities | | | 501,095 | | | | 19,611,079 | | | | 370,494,744 | | | | 53,497,830 | | |
| NET ASSETS | | $ | 21,594,353 | | | $ | 62,853,685 | | | $ | 2,621,909,256 | | | $ | 519,471,604 | | |
| NET ASSETS WERE COMPRISED OF: | |
| Paid-in capital | | $ | 20,890,203 | | | $ | 58,798,351 | | | $ | 1,843,103,711 | | | $ | 473,293,800 | | |
(Distributions in excess of net investment income)/
Undistributed net investment income | | | 957 | | | | 952,371 | | | | 43,956,836 | | | | 33,948,150 | | |
Accumulated net realized gain (loss) on investments,
foreign currency related transactions, futures,
swaps, and written options | | | (347,790 | ) | | | 7,834,576 | | | | 141,963,261 | | | | 1,606,772 | | |
Net unrealized appreciation or depreciation on
investments, foreign currency related
transactions, futures, swaps, and written options | | | 1,050,983 | | | | (4,731,613 | ) | | | 592,885,448 | | | | 10,622,882 | | |
| NET ASSETS | | $ | 21,594,353 | | | $ | 62,853,685 | | | $ | 2,621,909,256 | | | $ | 519,471,604 | | |
| + Including securities loaned at value | | $ | — | | | $ | 18,344,694 | | | $ | 345,357,777 | | | $ | 31,312,678 | | |
| * Cost of investments in securities | | $ | 18,892,974 | | | $ | 65,875,101 | | | $ | 2,023,622,777 | | | $ | 410,297,025 | | |
| ** Cost of short-term investments | | $ | — | | | $ | — | | | $ | — | | | $ | 5,206,372 | | |
| *** Cost of foreign currencies | | $ | — | | | $ | — | | | $ | 4,871,712 | | | $ | 2,297,028 | | |
| ^ Cost of sales commitments | | $ | — | | | $ | — | | | $ | — | | | $ | 524,636 | | |
| ^^ Premiums received from options written | | $ | — | | | $ | — | | | $ | — | | | $ | 61,354 | | |
See Accompanying Notes to Financial Statements
71
STATEMENTS OF ASSETS AND LIABILITIES AS OF DECEMBER 31, 2007 (CONTINUED)
| | | ING
Neuberger Berman
Regency
Portfolio | | ING
OpCap
Balanced Value
Portfolio | | ING
Oppenheimer
Global
Portfolio | | ING
Oppenheimer
Strategic Income
Portfolio | |
| Class I: | |
| Net assets | | $ | 6,222,179 | | | $ | 3,834,655 | | | $ | 2,289,589,478 | | | $ | 415,034,829 | | |
| Shares authorized | | | 100,000,000 | | | | 100,000,000 | | | | 100,000,000 | | | | 100,000,000 | | |
| Par value | | $ | 0.001 | | | $ | 0.001 | | | $ | 0.001 | | | $ | 0.001 | | |
| Shares outstanding | | | 575,346 | | | | 302,448 | | | | 135,752,441 | | | | 37,049,483 | | |
| Net asset value and redemption price per share | | $ | 10.81 | | | $ | 12.68 | | | $ | 16.87 | | | $ | 11.20 | | |
| Class S: | |
| Net assets | | $ | 15,372,174 | | | $ | 58,266,999 | | | $ | 232,650,989 | | | $ | 83,977,174 | | |
| Shares authorized | | | 100,000,000 | | | | 100,000,000 | | | | 100,000,000 | | | | 100,000,000 | | |
| Par value | | $ | 0.001 | | | $ | 0.001 | | | $ | 0.001 | | | $ | 0.001 | | |
| Shares outstanding | | | 1,423,158 | | | | 4,596,238 | | | | 14,134,972 | | | | 7,493,481 | | |
| Net asset value and redemption price per share | | $ | 10.80 | | | $ | 12.68 | | | $ | 16.46 | | | $ | 11.21 | | |
| Class ADV: | |
| Net assets | | | n/a | | | $ | 752,031 | | | $ | 99,668,789 | | | $ | 20,459,601 | | |
| Shares authorized | | | n/a | | | | 100,000,000 | | | | 100,000,000 | | | | 100,000,000 | | |
| Par value | | | n/a | | | $ | 0.001 | | | $ | 0.001 | | | $ | 0.001 | | |
| Shares outstanding | | | n/a | | | | 59,645 | | | | 6,086,066 | | | | 1,840,330 | | |
| Net asset value and redemption price per share | | | n/a | | | $ | 12.61 | | | $ | 16.38 | | | $ | 11.12 | | |
See Accompanying Notes to Financial Statements
72
STATEMENTS OF ASSETS AND LIABILITIES AS OF DECEMBER 31, 2007
| | | ING
PIMCO Total
Return
Portfolio | | ING
Pioneer High
Yield
Portfolio | | ING
T. Rowe Price
Diversified Mid Cap
Growth
Portfolio | | ING
T. Rowe Price
Growth Equity
Portfolio | |
| ASSETS: | |
| Investments in securities at value+* | | $ | 546,429,360 | | | $ | 106,922,211 | | | $ | 1,051,304,042 | | | $ | 1,603,141,940 | | |
| Short-term investments at amortized cost | | | 17,651,322 | | | | 3,161,464 | | | | 301,491,551 | | | | 240,182,511 | | |
| Cash | | | 21,308,102 | | | | 1,284,164 | | | | 346,851 | | | | 8,763,487 | | |
| Cash collateral for futures | | | 2,420,000 | | | | — | | | | — | | | | — | | |
| Foreign currencies at value** | | | 2,651,744 | | | | — | | | | 6,335 | | | | 871,418 | | |
| Receivables: | |
| Investment securities sold | | | 110,014,561 | | | | — | | | | — | | | | 2,058,015 | | |
| Fund shares sold | | | 7,618,872 | | | | 272,694 | | | | 41,443 | | | | 1,694,731 | | |
| Dividends and interest | | | 2,835,318 | | | | 1,426,448 | | | | 548,665 | | | | 1,802,241 | | |
| Variation margin receivable | | | 533,514 | | | | — | | | | — | | | | — | | |
Unrealized appreciation on forward
foreign currency contracts | | | 2,387,959 | | | | — | | | | — | | | | — | | |
| Upfront payments made on swap agreements | | | 827,901 | | | | — | | | | — | | | | — | | |
| Unrealized appreciation on swap agreements | | | 4,994,378 | | | | — | | | | — | | | | — | | |
| Reimbursement due from manager | | | — | | | | 2,902 | | | | — | | | | — | | |
| Total assets | | | 719,673,031 | | | | 113,069,883 | | | | 1,353,738,887 | | | | 1,858,514,343 | | |
| LIABILITIES: | |
| Payable for investment securities purchased | | | 213,305,602 | | | | 865,506 | | | | 864,446 | | | | 951,683 | | |
| Payable for fund shares redeemed | | | 601,325 | | | | 69,243 | | | | 3,027,683 | | | | 2,575,025 | | |
| Payable for floating rate securities | | | 461,592 | | | | — | | | | — | | | | — | | |
| Payable for futures variation margin | | | 55,140 | | | | — | | | | — | | | | — | | |
| Payable upon receipt of securities loaned | | | 9,478,131 | | | | — | | | | 299,744,758 | | | | 205,312,787 | | |
| Sales Commitments, at value (Note 2)^ | | | 11,409,355 | | | | — | | | | — | | | | — | | |
Unrealized depreciation on forward
foreign currency contracts | | | 247,097 | | | | — | | | | — | | | | — | | |
| Upfront payments received on swap agreements | | | 601,610 | | | | — | | | | — | | | | — | | |
| Unrealized depreciation on swap agreements | | | 1,736,061 | | | | — | | | | — | | | | — | | |
| Income distribution payable | | | — | | | | 1,467 | | | | — | | | | — | | |
| Payable to affiliates | | | 301,541 | | | | 67,678 | | | | 617,008 | | | | 1,120,806 | | |
| Payable for directors fees | | | — | | | | 1,783 | | | | — | | | | — | | |
| Other accrued expenses and liabilities | | | 119,575 | | | | 42,428 | | | | — | | | | — | | |
| Options written^^ | | | 4,911,440 | | | | — | | | | — | | | | — | | |
| Accrued foreign taxes on capital gains | | | — | | | | — | | | | — | | | | 1,127,203 | | |
| Total liabilities | | | 243,228,469 | | | | 1,048,105 | | | | 304,253,895 | | | | 211,087,504 | | |
| NET ASSETS | | $ | 476,444,562 | | | $ | 112,021,778 | | | $ | 1,049,484,992 | | | $ | 1,647,426,839 | | |
| NET ASSETS WERE COMPRISED OF: | |
| Paid-in capital | | $ | 440,765,583 | | | $ | 108,273,979 | | | $ | 767,040,986 | | | $ | 1,280,263,485 | | |
| Undistributed net investment income | | | 17,469,733 | | | | 5,483 | | | | 1,740,086 | | | | 10,503,070 | | |
Accumulated net realized gain (loss) on investments,
foreign currency related transactions,
futures, swaps, and written options | | | (137,392 | ) | | | 3,564,509 | | | | 125,931,450 | | | | 87,681,050 | | |
Net unrealized appreciation on investments,
foreign currency related transactions, futures,
swaps, and written options | | | 18,346,638 | | | | 177,807 | | | | 154,772,470 | | | | 268,979,234 | | |
| NET ASSETS | | $ | 476,444,562 | | | $ | 112,021,778 | | | $ | 1,049,484,992 | | | $ | 1,647,426,839 | | |
| + Including securities loaned at value | | $ | 9,243,385 | | | $ | — | | | $ | 291,195,430 | | | $ | 197,807,296 | | |
| * Cost of investments in securities | | $ | 538,683,690 | | | $ | 106,744,404 | | | $ | 896,531,530 | | | $ | 1,334,188,301 | | |
| ** Cost of foreign currencies | | $ | 2,642,247 | | | $ | — | | | $ | 6,377 | | | $ | 868,546 | | |
| ^ Cost of sales commitments | | $ | 11,257,370 | | | $ | — | | | $ | — | | | $ | — | | |
| ^^ Premiums received from options written | | $ | 1,622,245 | | | $ | — | | | $ | — | | | $ | — | | |
See Accompanying Notes to Financial Statements
73
STATEMENTS OF ASSETS AND LIABILITIES AS OF DECEMBER 31, 2007 (CONTINUED)
| | | ING
PIMCO Total
Return
Portfolio | | ING
Pioneer High
Yield
Portfolio | | ING
T. Rowe Price
Diversified Mid Cap
Growth
Portfolio | | ING
T. Rowe Price
Growth Equity
Portfolio | |
| Class I: | |
| Net assets | | $ | 320,725,380 | | | $ | 105,104,665 | | | $ | 995,471,063 | | | $ | 1,442,335,723 | | |
| Shares authorized | | | 100,000,000 | | | | 100,000,000 | | | | 100,000,000 | | | | 100,000,000 | | |
| Par value | | $ | 0.001 | | | $ | 0.001 | | | $ | 0.001 | | | $ | 0.001 | | |
| Shares outstanding | | | 27,151,473 | | | | 10,250,524 | | | | 104,539,331 | | | | 23,304,715 | | |
| Net asset value and redemption price per share | | $ | 11.81 | | | $ | 10.25 | | | $ | 9.52 | | | $ | 61.89 | | |
| Class S: | |
| Net assets | | $ | 122,273,695 | | | $ | 5,898,754 | | | $ | 13,319,109 | | | $ | 101,502,745 | | |
| Shares authorized | | | 100,000,000 | | | | 100,000,000 | | | | 100,000,000 | | | | 100,000,000 | | |
| Par value | | $ | 0.001 | | | $ | 0.001 | | | $ | 0.001 | | | $ | 0.001 | | |
| Shares outstanding | | | 10,402,773 | | | | 575,495 | | | | 1,420,941 | | | | 1,654,383 | | |
| Net asset value and redemption price per share | | $ | 11.75 | | | $ | 10.25 | | | $ | 9.37 | | | $ | 61.35 | | |
| Class ADV: | |
| Net assets | | $ | 33,445,487 | | | $ | 1,018,359 | | | $ | 40,694,820 | | | $ | 103,588,371 | | |
| Shares authorized | | | 100,000,000 | | | | 100,000,000 | | | | 100,000,000 | | | | 100,000,000 | | |
| Par value | | $ | 0.001 | | | $ | 0.001 | | | $ | 0.001 | | | $ | 0.001 | | |
| Shares outstanding | | | 2,867,762 | | | | 99,591 | | | | 4,411,920 | | | | 1,704,414 | | |
| Net asset value and redemption price per share | | $ | 11.66 | | | $ | 10.23 | | | $ | 9.22 | | | $ | 60.78 | | |
See Accompanying Notes to Financial Statements
74
STATEMENTS OF ASSETS AND LIABILITIES AS OF DECEMBER 31, 2007
| | | ING
Templeton
Foreign Equity
Portfolio | | ING
Thornburg
Value
Portfolio | | ING
UBS U.S.
Large Cap Equity
Portfolio | | ING
UBS U.S. Small
Cap Growth
Portfolio | |
| ASSETS: | |
| Investments in securities at value+* | | $ | 130,217,820 | | | $ | 227,529,860 | | | $ | 413,111,929 | | | $ | 34,654,309 | | |
| Short-term investments at amortized cost | | | 50,637,855 | | | | 74,691,990 | | | | 74,558,577 | | | | 12,086,686 | | |
| Cash | | | — | | | | 4,198,957 | | | | 1,284,496 | | | | 504,878 | | |
| Foreign currencies at value** | | | 93,810 | | | | — | | | | — | | | | — | | |
| Receivables: | |
| Investment securities sold | | | 308 | | | | 1,958,441 | | | | 734,951 | | | | 24,941 | | |
| Fund shares sold | | | 139,167 | | | | 553,530 | | | | 598,245 | | | | 73,959 | | |
| Dividends and interest | | | 117,525 | | | | 188,870 | | | | 602,019 | | | | 8,495 | | |
| Reimbursement due from manager | | | 4,108 | | | | — | | | | — | | | | 3,564 | | |
| Total assets | | | 181,210,593 | | | | 309,121,648 | | | | 490,890,217 | | | | 47,356,832 | | |
| LIABILITIES: | |
| Payable for investment securities purchased | | | 1,659,073 | | | | 31,557,322 | | | | 1,266,794 | | | | 156,122 | | |
| Payable for fund shares redeemed | | | 525,211 | | | | 131,235 | | | | 1,129,707 | | | | 890 | | |
| Payable upon receipt of securities loaned | | | — | | | | 42,944,370 | | | | 67,276,811 | | | | 11,240,829 | | |
| Payable to affiliates | | | 144,371 | | | | 163,806 | | | | 336,076 | | | | 29,440 | | |
| Payable to custodian due to bank overdraft | | | 76,468 | | | | — | | | | — | | | | — | | |
Payable to custodian due to
foreign currency overdraft*** | | | — | | | | 2,085 | | | | — | | | | — | | |
| Payable for directors fees | | | 2,427 | | | | — | | | | — | | | | 243 | | |
| Other accrued expenses and liabilities | | | 62,812 | | | | — | | | | — | | | | 20,799 | | |
| Accrued foreign taxes on capital gains | | | 76,793 | | | | — | | | | — | | | | — | | |
| Total liabilities | | | 2,547,155 | | | | 74,798,818 | | | | 70,009,388 | | | | 11,448,323 | | |
| NET ASSETS | | $ | 178,663,438 | | | $ | 234,322,830 | | | $ | 420,880,829 | | | $ | 35,908,509 | | |
| NET ASSETS WERE COMPRISED OF: | |
| Paid-in capital | | $ | 165,532,119 | | | $ | 367,916,327 | | | $ | 428,959,171 | | | $ | 36,011,658 | | |
| Undistributed net investment income | | | 812,669 | | | | 1,829,398 | | | | 4,358,803 | | | | 1,694 | | |
Accumulated net realized loss on investments and
foreign currency related transactions | | | (1,178,436 | ) | | | (145,089,300 | ) | | | (35,314,646 | ) | | | (978,335 | ) | |
Net unrealized appreciation on investments and
foreign currency related transactions | | | 13,497,086 | | | | 9,666,405 | | | | 22,877,501 | | | | 873,492 | | |
| NET ASSETS | | $ | 178,663,438 | | | $ | 234,322,830 | | | $ | 420,880,829 | | | $ | 35,908,509 | | |
| + Including securities loaned at value | | $ | — | | | $ | 41,034,756 | | | $ | 65,034,575 | | | $ | 10,801,244 | | |
| * Cost of investments in securities | | $ | 116,696,709 | | | $ | 217,866,565 | | | $ | 390,234,428 | | | $ | 33,780,817 | | |
| ** Cost of foreign currencies | | $ | 106,232 | | | $ | — | | | $ | — | | | $ | — | | |
| *** Cost of foreign currency overdraft | | $ | — | | | $ | — | | | $ | — | | | $ | — | | |
See Accompanying Notes to Financial Statements
75
STATEMENTS OF ASSETS AND LIABILITIES AS OF DECEMBER 31, 2007 (CONTINUED)
| | | ING
Templeton
Foreign Equity
Portfolio | | ING
Thornburg
Value
Portfolio | | ING
UBS U.S.
Large Cap Equity
Portfolio | | ING
UBS U.S. Small
Cap Growth
Portfolio | |
| Class I: | |
| Net assets | | $ | 46,780,622 | | | $ | 216,407,967 | | | $ | 365,083,537 | | | $ | 32,404,559 | | |
| Shares authorized | | | 100,000,000 | | | | 100,000,000 | | | | 100,000,000 | | | | 100,000,000 | | |
| Par value | | $ | 0.001 | | | $ | 0.001 | | | $ | 0.001 | | | $ | 0.001 | | |
| Shares outstanding | | | 3,425,701 | | | | 6,364,091 | | | | 34,397,149 | | | | 3,373,638 | | |
| Net asset value and redemption price per share | | $ | 13.66 | | | $ | 34.00 | | | $ | 10.61 | | | $ | 9.61 | | |
| Class S: | |
| Net assets | | $ | 131,881,669 | | | $ | 13,718,550 | | | $ | 45,303,004 | | | $ | 3,502,984 | | |
| Shares authorized | | | 100,000,000 | | | | 100,000,000 | | | | 100,000,000 | | | | 100,000,000 | | |
| Par value | | $ | 0.001 | | | $ | 0.001 | | | $ | 0.001 | | | $ | 0.001 | | |
| Shares outstanding | | | 9,676,388 | | | | 406,498 | | | | 4,323,997 | | | | 366,161 | | |
| Net asset value and redemption price per share | | $ | 13.63 | | | $ | 33.75 | | | $ | 10.48 | | | $ | 9.57 | | |
| Class ADV: | |
| Net assets | | $ | 1,147 | | | $ | 4,196,313 | | | $ | 10,494,288 | | | $ | 966 | | |
| Shares authorized | | | 100,000,000 | | | | 100,000,000 | | | | 100,000,000 | | | | 100,000,000 | | |
| Par value | | $ | 0.001 | | | $ | 0.001 | | | $ | 0.001 | | | $ | 0.001 | | |
| Shares outstanding | | | 84 | | | | 125,784 | | | | 1,008,633 | | | | 102 | | |
| Net asset value and redemption price per share | | $ | 13.65 | | | $ | 33.36 | | | $ | 10.40 | | | $ | 9.48 | | |
See Accompanying Notes to Financial Statements
76
STATEMENTS OF ASSETS AND LIABILITIES AS OF DECEMBER 31, 2007
| | | ING
Van Kampen
Comstock
Portfolio | | ING
Van Kampen
Equity and Income
Portfolio | |
| ASSETS: | |
| Investments in securities at value+* | | $ | 936,774,586 | | | $ | 940,670,318 | | |
| Short-term investments** | | | — | | | | 150,716 | | |
| Short-term investments at amortized cost | | | 133,259,502 | | | | 52,587,631 | | |
| Cash | | | 764,248 | | | | 102,473 | �� | |
| Foreign currencies at value*** | | | — | | | | 3,709 | | |
| Receivables: | |
| Fund shares sold | | | 4,299,864 | | | | 862,027 | | |
| Dividends and interest | | | 1,161,384 | | | | 3,233,747 | | |
| Total assets | | | 1,076,259,584 | | | | 997,610,621 | | |
| LIABILITIES: | |
| Payable for investment securities purchased | | | 452,662 | | | | 34,800,933 | | |
| Payable for fund shares redeemed | | | 1,102,754 | | | | 3,241,207 | | |
| Payable upon receipt of securities loaned | | | 82,668,638 | | | | — | | |
| Payable to affiliates | | | 817,754 | | | | 502,898 | | |
| Total liabilities | | | 85,041,808 | | | | 38,545,038 | | |
| NET ASSETS | | $ | 991,217,776 | | | $ | 959,065,583 | | |
| NET ASSETS WERE COMPRISED OF: | |
| Paid-in capital | | $ | 901,078,460 | | | $ | 810,235,836 | | |
| Undistributed net investment income | | | 18,136,074 | | | | 24,074,970 | | |
| Accumulated net realized gain on investments | | | 49,853,905 | | | | 45,048,533 | | |
Net unrealized appreciation on investments
and foreign currency related transactions | | | 22,149,337 | | | | 79,706,244 | | |
| NET ASSETS | | $ | 991,217,776 | | | $ | 959,065,583 | | |
| + Including securities loaned at value | | $ | 79,917,434 | | | $ | — | | |
| * Cost of investments in securities | | $ | 914,625,249 | | | $ | 860,963,531 | | |
| ** Cost of short-term investments | | $ | — | | | $ | 151,784 | | |
| *** Cost of foreign currencies | | $ | — | | | $ | 3,184 | | |
See Accompanying Notes to Financial Statements
77
STATEMENTS OF ASSETS AND LIABILITIES AS OF DECEMBER 31, 2007 (CONTINUED)
| | | ING
Van Kampen
Comstock
Portfolio | | ING
Van Kampen
Equity and Income
Portfolio | |
| Class I: | |
| Net assets | | $ | 608,951,252 | | | $ | 811,810,357 | | |
| Shares authorized | | | 100,000,000 | | | | 100,000,000 | | |
| Par value | | $ | 0.001 | | | $ | 0.001 | | |
| Shares outstanding | | | 48,528,672 | | | | 21,497,097 | | |
| Net asset value and redemption price per share | | $ | 12.55 | | | $ | 37.76 | | |
| Class S: | |
| Net assets | | $ | 342,155,071 | | | $ | 133,012,958 | | |
| Shares authorized | | | 100,000,000 | | | | 100,000,000 | | |
| Par value | | $ | 0.001 | | | $ | 0.001 | | |
| Shares outstanding | | | 27,391,157 | | | | 3,546,751 | | |
| Net asset value and redemption price per share | | $ | 12.49 | | | $ | 37.50 | | |
| Class ADV: | |
| Net assets | | $ | 40,111,453 | | | $ | 14,242,268 | | |
| Shares authorized | | | 100,000,000 | | | | 100,000,000 | | |
| Par value | | $ | 0.001 | | | $ | 0.001 | | |
| Shares outstanding | | | 3,250,852 | | | | 384,043 | | |
| Net asset value and redemption price per share | | $ | 12.34 | | | $ | 37.09 | | |
See Accompanying Notes to Financial Statements
78
STATEMENTS OF OPERATIONS FOR THE YEAR ENDED DECEMBER 31, 2007
| | | ING
American
Century
Large Company
Value
Portfolio | | ING
American
Century
Small-Mid Cap
Value
Portfolio | | ING
Baron
Asset
Portfolio | | ING
Baron
Small Cap
Growth
Portfolio | |
| INVESTMENT INCOME: | |
| Dividends, net of foreign taxes withheld* | | $ | 3,005,542 | | | $ | 2,132,254 | | | $ | 241,898 | | | $ | 3,833,742 | | |
| Interest | | | 263,160 | | | | 66,323 | | | | 36,809 | | | | 1,736,583 | | |
| Securities lending income | | | 15,522 | | | | 61,198 | | | | — | | | | — | | |
| Total investment income | | | 3,284,224 | | | | 2,259,775 | | | | 278,707 | | | | 5,570,325 | | |
| EXPENSES: | |
| Investment management fees | | | 969,402 | | | | 1,076,330 | | | | 236,162 | | | | 4,819,650 | | |
| Distribution and service fees: | |
| Class S | | | 52,265 | | | | 115,993 | | | | 7,965 | | | | 893,864 | | |
| Class ADV | | | 51,365 | | | | 66,532 | | | | 17,046 | | | | 248,306 | | |
| Transfer agent fees | | | — | | | | — | | | | 730 | | | | — | | |
| Administrative service fees | | | 242,353 | | | | 269,132 | | | | 24,859 | | | | 1,304,190 | | |
| Shareholder reporting expense | | | — | | | | — | | | | 2,190 | | | | — | | |
| Professional fees | | | — | | | | — | | | | 11,444 | | | | — | | |
| Custody and accounting expense | | | — | | | | — | | | | 2,920 | | | | — | | |
| Directors fees | | | — | | | | — | | | | 2,285 | | | | — | | |
| Miscellaneous expense | | | — | | | | — | | | | 3,924 | | | | — | | |
| Total expenses | | | 1,315,385 | | | | 1,527,987 | | | | 309,525 | | | | 7,266,010 | | |
| Net waived and reimbursed fees | | | — | | | | (247,925 | ) | | | (23,737 | ) | | | (33,507 | ) | |
| Net expenses | | | 1,315,385 | | | | 1,280,062 | | | | 285,788 | | | | 7,232,503 | | |
| Net investment income (loss) | | | 1,968,839 | | | | 979,713 | | | | (7,081 | ) | | | (1,662,178 | ) | |
REALIZED AND UNREALIZED GAIN (LOSS)
ON INVESTMENTS, FOREIGN CURRENCY
RELATED TRANSACTIONS, AND FUTURES: | |
| Net realized gain (loss) on: | |
| Investments | | | 9,169,714 | | | | 9,734,822 | | | | 362,294 | | | | 20,624,026 | | |
| Foreign currency related transactions | | | — | | | | (33,063 | ) | | | — | | | | — | | |
| Futures | | | (375,104 | ) | | | — | | | | — | | | | — | | |
Net realized gain on investments, foreign
currency related transactions, and futures | | | 8,794,610 | | | | 9,701,759 | | | | 362,294 | | | | 20,624,026 | | |
Net change in unrealized appreciation
or depreciation on: | |
| Investments | | | (13,576,220 | ) | | | (13,409,292 | ) | | | 1,314,017 | | | | 10,257,100 | | |
| Foreign currency related transactions | | | — | | | | 850 | | | | — | | | | — | | |
| Futures | | | (81,477 | ) | | | — | | | | — | | | | — | | |
Net change in unrealized appreciation
or depreciation on investments, foreign
currency related transactions, and futures | | | (13,657,697 | ) | | | (13,408,442 | ) | | | 1,314,017 | | | | 10,257,100 | | |
Net realized and unrealized gain (loss)
on investments, foreign currency
related transactions, and futures | | | (4,863,087 | ) | | | (3,706,683 | ) | | | 1,676,311 | | | | 30,881,126 | | |
Increase (decrease) in net assets resulting from
operations | | $ | (2,894,248 | ) | | $ | (2,726,970 | ) | | $ | 1,669,230 | | | $ | 29,218,948 | | |
| * Foreign taxes withheld | | $ | 26,052 | | | $ | 1,220 | | | $ | 747 | | | $ | 584 | | |
See Accompanying Notes to Financial Statements
79
STATEMENTS OF OPERATIONS FOR THE YEAR ENDED DECEMBER 31, 2007
| | | ING
Columbia
Small Cap
Value II
Portfolio | | ING
Davis
New York
Venture
Portfolio | | ING
JPMorgan
International
Portfolio | | ING
JPMorgan
Mid Cap
Value
Portfolio | |
| INVESTMENT INCOME: | |
| Dividends, net of foreign taxes withheld* | | $ | 2,295,592 | | | $ | 5,899,934 | | | $ | 19,344,950 | | | $ | 5,194,202 | | |
| Interest | | | 193,142 | | | | 676,262 | | | | 592,276 | | | | 444,944 | | |
| Securities lending income | | | — | | | | — | | | | 709,524 | | | | 44,720 | | |
| Total investment income | | | 2,488,734 | | | | 6,576,196 | | | | 20,646,750 | | | | 5,683,866 | | |
| EXPENSES: | |
| Investment management fees | | | 1,064,852 | | | | 2,205,757 | | | | 6,589,701 | | | | 1,985,249 | | |
| Distribution and service fees: | |
| Class S | | | 314,326 | | | | 453,190 | | | | 433,010 | | | | 244,008 | | |
| Class ADV | | | 542 | | | | 57,022 | | | | 65,718 | | | | 130,250 | | |
| Transfer agent fees | | | 465 | | | | — | | | | | | | | | | |
| Administrative service fees | | | 141,979 | | | | 275,771 | | | | 1,647,440 | | | | 661,794 | | |
| Shareholder reporting expense | | | 9,570 | | | | — | | | | — | | | | — | | |
| Professional fees | | | 10,836 | | | | — | | | | — | | | | — | | |
| Custody and accounting expense | | | 21,630 | | | | — | | | | — | | | | — | | |
| Directors fees | | | 1,582 | | | | — | | | | — | | | | — | | |
| Miscellaneous expense | | | 4,005 | | | | — | | | | — | | | | — | | |
| Total expenses | | | 1,569,787 | | | | 2,991,740 | | | | 8,735,869 | | | | 3,021,301 | | |
| Net waived and reimbursed fees | | | — | | | | — | | | | (97,650 | ) | | | — | | |
| Brokerage commission recapture | | | (46,614 | ) | | | — | | | | — | | | | — | | |
| Net expenses | | | 1,523,173 | | | | 2,991,740 | | | | 8,638,219 | | | | 3,021,301 | | |
| Net investment income | | | 965,561 | | | | 3,584,456 | | | | 12,008,531 | | | | 2,662,565 | | |
REALIZED AND UNREALIZED GAIN (LOSS)
ON INVESTMENTS, FOREIGN CURRENCY
RELATED TRANSACTIONS, AND FUTURES: | |
| Net realized gain (loss) on: | |
| Investments | | | 4,807,249 | | | | 4,459,010 | | | | 240,904,660 | | | | 19,782,786 | | |
| Foreign currency related transactions | | | — | | | | (30,041 | ) | | | (1,347,399 | ) | | | — | | |
| Futures | | | (248,628 | ) | | | — | | | | (301,461 | ) | | | — | | |
Net realized gain on investments, foreign
currency related transactions, and futures | | | 4,558,621 | | | | 4,428,969 | | | | 239,255,800 | | | | 19,782,786 | | |
Net change in unrealized appreciation
or depreciation on: | |
| Investments | | | (6,366,221 | ) | | | 1,105,803 | | | | (163,253,369 | ) | | | (17,633,034 | ) | |
| Foreign currency related transactions | | | — | | | | (3,792 | ) | | | (3,799 | ) | | | — | | |
Net change in unrealized appreciation
or depreciation on investments and foreign
currency related transactions | | | (6,366,221 | ) | | | 1,102,011 | | | | (163,257,168 | ) | | | (17,633,034 | ) | |
Net realized and unrealized gain (loss)
on investments, foreign currency
related transactions, and futures | | | (1,807,600 | ) | | | 5,530,980 | | | | 75,998,632 | | | | 2,149,752 | | |
Increase (decrease) in net assets resulting from
operations | | $ | (842,039 | ) | | $ | 9,115,436 | | | $ | 88,007,163 | | | $ | 4,812,317 | | |
| * Foreign taxes withheld | | $ | — | | | $ | 29,764 | | | $ | 1,994,992 | | | $ | 7,323 | | |
See Accompanying Notes to Financial Statements
80
STATEMENTS OF OPERATIONS FOR THE YEAR ENDED DECEMBER 31, 2007
| | | ING
Legg Mason
Partners
Aggressive
Growth
Portfolio | | ING
Legg Mason
Partners
Large Cap
Growth
Portfolio | | ING
Lord Abbett U.S.
Government
Securities
Portfolio | | ING
Neuberger
Berman
Partners
Portfolio | |
| INVESTMENT INCOME: | |
| Dividends, net of foreign taxes withheld* | | $ | 6,565,751 | | | $ | 331,370 | | | $ | — | | | $ | 4,083,362 | | |
| Interest | | | 2,322,940 | | | | 7,330 | | | | 2,633,638 | | | | 167,671 | | |
| Securities lending income | | | 452,150 | | | | — | | | | — | | | | — | | |
| Total investment income | | | 9,340,841 | | | | 338,700 | | | | 2,633,638 | | | | 4,251,033 | | |
| EXPENSES: | |
| Investment management fees | | | 9,021,432 | | | | 259,406 | | | | 211,895 | | | | 2,579,159 | | |
| Distribution and service fees: | |
| Class S | | | 456,942 | | | | 26,436 | | | | 30,316 | | | | 433,774 | | |
| Class ADV | | | 42,834 | | | | 82,926 | | | | — | | | | 32 | | |
| Transfer agent fees | | | — | | | | — | | | | 730 | | | | 730 | | |
| Administrative service fees | | | 1,754,315 | | | | 81,051 | | | | 45,084 | | | | 429,855 | | |
| Shareholder reporting expense | | | — | | | �� | — | | | | 12,013 | | | | 38,008 | | |
| Professional fees | | | — | | | | — | | | | 12,818 | | | | 34,132 | | |
| Custody and accounting expense | | | — | | | | — | | | | 11,680 | | | | 41,616 | | |
| Directors fees | | | — | | | | — | | | | 4,015 | | | | 17,961 | | |
| Miscellaneous expense | | | — | | | | — | | | | 6,944 | | | | 9,863 | | |
| Interest expense on reverse repurchase agreements | | | — | | | | — | | | | 74,352 | | | | — | | |
| Total expenses | | | 11,275,523 | | | | 449,819 | | | | 409,847 | | | | 3,585,130 | | |
| Net waived and reimbursed fees | | | — | | | | — | | | | (5,257 | ) | | | (324,470 | ) | |
| Net expenses | | | 11,275,523 | | | | 449,819 | | | | 404,590 | | | | 3,260,660 | | |
| Net investment income (loss) | | | (1,934,682 | ) | | | (111,119 | ) | | | 2,229,048 | | | | 990,373 | | |
REALIZED AND UNREALIZED GAIN (LOSS)
ON INVESTMENTS AND FOREIGN CURRENCY
RELATED TRANSACTIONS: | |
| Net realized gain (loss) on: | |
| Investments | | | 26,487,762 | | | | 2,699,466 | | | | 307,712 | | | | (13,322,011 | ) | |
| Foreign currency related transactions | | | — | | | | — | | | | — | | | | (19,396 | ) | |
Net realized gain (loss) on investments and foreign
currency related transactions | | | 26,487,762 | | | | 2,699,466 | | | | 307,712 | | | | (13,341,407 | ) | |
Net change in unrealized appreciation
or depreciation on: | |
| Investments | | | (41,450,102 | ) | | | (663,320 | ) | | | 645,705 | | | | 49,539,245 | | |
| Foreign currency related transactions | | | — | | | | — | | | | — | | | | 1,270 | | |
Net change in unrealized appreciation
or depreciation on investments and foreign
currency related transactions | | | (41,450,102 | ) | | | (663,320 | ) | | | 645,705 | | | | 49,540,515 | | |
Net realized and unrealized gain (loss)
on investments and foreign currency
related transactions | | | (14,962,340 | ) | | | 2,036,146 | | | | 953,417 | | | | 36,199,108 | | |
Increase (decrease) in net assets resulting from
operations | | $ | (16,897,022 | ) | | $ | 1,925,027 | | | $ | 3,182,465 | | | $ | 37,189,481 | | |
| * Foreign taxes withheld | | $ | 30,263 | | | $ | — | | | $ | — | | | $ | 52,826 | | |
See Accompanying Notes to Financial Statements
81
STATEMENTS OF OPERATIONS FOR THE YEAR ENDED DECEMBER 31, 2007
| | | ING
Neuberger
Berman
Regency
Portfolio | | ING
OpCap
Balanced
Value
Portfolio | | ING
Oppenheimer
Global
Portfolio | | ING
Oppenheimer
Strategic
Income
Portfolio | |
| INVESTMENT INCOME: | |
| Dividends, net of foreign taxes withheld* | | $ | 323,391 | | | $ | 822,331 | | | $ | 58,451,384 | | | $ | 30,374 | | |
| Interest | | | 22,591 | | | | 1,052,879 | | | | 957,810 | | | | 29,130,726 | | |
| Securities lending income | | | — | | | | 25,082 | | | | 2,741,224 | | | | 134,385 | | |
| Total investment income | | | 345,982 | | | | 1,900,292 | | | | 62,150,418 | | | | 29,295,485 | | |
| EXPENSES: | |
| Investment management fees | | | 139,028 | | | | 622,087 | | | | 16,688,714 | | | | 2,306,960 | | |
| Distribution and service fees: | |
| Class S | | | 30,444 | | | | 178,993 | | | | 486,260 | | | | 157,366 | | |
| Class ADV | | | 8 | | | | 9,188 | | | | 526,220 | | | | 116,108 | | |
| Transfer agent fees | | | 730 | | | | — | | | | — | | | | — | | |
| Administrative service fees | | | 18,537 | | | | 155,523 | | | | 1,668,819 | | | | 185,527 | | |
| Shareholder reporting expense | | | 3,748 | | | | — | | | | — | | | | — | | |
| Professional fees | | | 8,872 | | | | — | | | | — | | | | — | | |
| Custody and accounting expense | | | 6,040 | | | | — | | | | — | | | | — | | |
| Directors fees | | | 62 | | | | — | | | | — | | | | — | | |
| Miscellaneous expense | | | 4,046 | | | | — | | | | — | | | | — | | |
| Total expenses | | | 211,515 | | | | 965,791 | | | | 19,370,013 | | | | 2,765,961 | | |
| Net waived and reimbursed fees | | | (17,526 | ) | | | — | | | | (10,525 | ) | | | (34,468 | ) | |
| Brokerage commission recapture | | | — | | | | (22,999 | ) | | | — | | | | — | | |
| Net expenses | | | 193,989 | | | | 942,792 | | | | 19,359,488 | | | | 2,731,493 | | |
| Net investment income | | | 151,993 | | | | 957,500 | | | | 42,790,930 | | | | 26,563,992 | | |
REALIZED AND UNREALIZED GAIN (LOSS)
ON INVESTMENTS, FOREIGN CURRENCY
RELATED TRANSACTIONS, FUTURES,
SWAPS AND WRITTEN OPTIONS: | |
| Net realized gain (loss) on: | |
| Investments | | | (435,289 | ) | | | 8,082,867 | | | | 161,034,981 | | | | (16,128 | ) | |
| Foreign currency related transactions | | | — | | | | — | | | | (627,743 | ) | | | 5,688,250 | | |
| Futures, swaps, and written options | | | — | | | | — | | | | — | | | | 4,621,747 | | |
Net realized gain (loss) on investments, foreign
currency related transactions, futures,
swaps, and written options | | | (435,289 | ) | | | 8,082,867 | | | | 160,407,238 | | | | 10,293,869 | | |
Net change in unrealized appreciation
or depreciation on: | |
Investments (net of Indian capital
gains tax accrued)** | | | 317,041 | | | | (11,228,723 | ) | | | (25,008,311 | ) | | | 1,756,830 | | |
| Foreign currency related transactions | | | — | | | | — | | | | (48,095 | ) | | | 1,320,150 | | |
| Futures, swaps, and written options | | | — | | | | — | | | | — | | | | (1,542,273 | ) | |
Net change in unrealized appreciation
or depreciation on investments, foreign
currency related transactions, futures,
swaps, and written options | | | 317,041 | | | | (11,228,723 | ) | | | (25,056,406 | ) | | | 1,534,707 | | |
Net realized and unrealized gain (loss)
on investments, foreign currency
related transactions, futures,
swaps, and written options | | | (118,248 | ) | | | (3,145,856 | ) | | | 135,350,832 | | | | 11,828,576 | | |
Increase (decrease) in net assets resulting from
operations | | $ | 33,745 | | | $ | (2,188,356 | ) | | $ | 178,141,762 | | | $ | 38,392,568 | | |
| * Foreign taxes withheld | | $ | 1,697 | | | $ | 19,773 | | | $ | 3,489,927 | | | $ | 29,875 | | |
| ** Foreign tax accrued on Indian investments | | $ | — | | | $ | — | | | $ | 9,875 | | | $ | — | | |
See Accompanying Notes to Financial Statements
82
STATEMENTS OF OPERATIONS FOR THE YEAR ENDED DECEMBER 31, 2007
| | | ING
PIMCO Total
Return
Portfolio | | ING
Pioneer High
Yield
Portfolio | | ING
T. Rowe Price
Diversified
Mid Cap
Growth
Portfolio | | ING
T. Rowe Price
Growth Equity
Portfolio | |
| INVESTMENT INCOME: | |
| Dividends, net of foreign taxes withheld* | | $ | 35,931 | | | $ | 352,888 | | | $ | 8,917,704 | | | $ | 17,289,592 | | |
| Interest | | | 20,252,757 | | | | 7,539,870 | | | | 33,506 | | | | 2,221,621 | | |
| Securities lending income | | | 7,469 | | | | — | | | | 394,272 | | | | 337,423 | | |
| Total investment income | | | 20,296,157 | | | | 7,892,758 | | | | 9,345,482 | | | | 19,848,636 | | |
| EXPENSES: | |
| Investment management fees | | | 1,954,626 | | | | 734,865 | | | | 7,129,681 | | | | 9,256,344 | | |
| Distribution and service fees | |
| Class S | | | 258,635 | | | | 20,504 | | | | 29,908 | | | | 172,526 | | |
| Class ADV | | | 142,422 | | | | 4,756 | | | | 225,932 | | | | 551,878 | | |
| Transfer agent fees | | | — | | | | 836 | | | | — | | | | — | | |
| Administrative service fees | | | 744,288 | | | | 122,476 | | | | 222,835 | | | | 2,311,669 | | |
| Shareholder reporting expense | | | — | | | | 17,250 | | | | — | | | | — | | |
| Professional fees | | | — | | | | 18,266 | | | | — | | | | — | | |
| Custody and accounting expense | | | — | | | | 18,755 | | | | — | | | | — | | |
| Directors fees | | | — | | | | 4,359 | | | | — | | | | — | | |
| Miscellaneous expense | | | — | | | | 34,684 | | | | — | | | | — | | |
| Interest expense | | | 72,295 | | | | — | | | | — | | | | — | | |
| Total expenses | | | 3,172,266 | | | | 976,751 | | | | 7,608,356 | | | | 12,292,417 | | |
| Net waived and reimbursed fees | | | — | | | | (2,872 | ) | | | (4,519 | ) | | | (54,966 | ) | |
| Brokerage commission recapture | | | — | | | �� | — | | | | (931 | ) | | | (54,753 | ) | |
| Net expenses | | | 3,172,266 | | | | 973,879 | | | | 7,602,906 | | | | 12,182,698 | | |
| Net investment income | | | 17,123,891 | | | | 6,918,879 | | | | 1,742,576 | | | | 7,665,938 | | |
REALIZED AND UNREALIZED GAIN (LOSS)
ON INVESTMENTS, FOREIGN CURRENCY
RELATED TRANSACTIONS, FUTURES,
SWAPS AND WRITTEN OPTIONS: | |
| Net realized gain (loss) on: | |
| Investments | | | 3,112,868 | | | | 3,593,207 | | | | 129,203,008 | | | | 96,241,180 | | |
| Foreign currency related transactions | | | 737,837 | | | | — | | | | 339 | | | | (753,727 | ) | |
| Futures, swaps, and written options | | | (822,706 | ) | | | — | | | | — | | | | — | | |
Net realized gain on investments, foreign
currency related transactions, futures,
swaps, and written options | | | 3,027,999 | | | | 3,593,207 | | | | 129,203,347 | | | | 95,487,453 | | |
Net change in unrealized appreciation
or depreciation on: | |
Investments (net of Indian capital
gains tax accrued)** | | | 7,253,871 | | | | (2,411,487 | ) | | | 9,773,664 | | | | 35,456,983 | | |
| Foreign currency related transactions | | | 2,403,419 | | | | — | | | | (42 | ) | | | 31,785 | | |
| Futures, swaps, and written options | | | 9,091,366 | | | | — | | | | — | | | | — | | |
Net change in unrealized appreciation
or depreciation on investments, foreign
currency related transactions, futures,
swaps, and written options | | | 18,748,656 | | | | (2,411,487 | ) | | | 9,773,622 | | | | 35,488,768 | | |
Net realized and unrealized gain
on investments, foreign currency
related transactions, futures,
swaps, and written options | | | 21,776,655 | | | | 1,181,720 | | | | 138,976,969 | | | | 130,976,221 | | |
| Increase in net assets resulting from operations | | $ | 38,900,546 | | | $ | 8,100,599 | | | $ | 140,719,545 | | | $ | 138,642,159 | | |
| * Foreign taxes withheld | | $ | — | | | $ | 459 | | | $ | 30,146 | | | $ | 513,540 | | |
| ** Foreign tax accrued on Indian investments | | $ | — | | | $ | — | | | $ | — | | | $ | 1,127,203 | | |
See Accompanying Notes to Financial Statements
83
STATEMENTS OF OPERATIONS FOR THE YEAR ENDED DECEMBER 31, 2007
| | | ING
Templeton
Foreign
Equity
Portfolio | | ING
Thornburg
Value
Portfolio | | ING
UBS
U.S. Large
Cap Equity
Portfolio | | ING
UBS
U.S. Small
Cap Growth
Portfolio | |
| INVESTMENT INCOME: | |
| Dividends, net of foreign taxes withheld* | | $ | 1,951,631 | | | $ | 3,289,378 | | | $ | 7,905,457 | | | $ | 84,613 | | |
| Interest | | | 595,502 | | | | 217,732 | | | | 322,794 | | | | 34,157 | | |
| Securities lending income | | | — | | | | 277,796 | | | | 69,460 | | | | 5,052 | | |
| Total investment income | | | 2,547,133 | | | | 3,784,906 | | | | 8,297,711 | | | | 123,822 | | |
| EXPENSES: | |
| Investment management fees | | | 747,746 | | | | 1,357,661 | | | | 3,120,349 | | | | 295,581 | | |
| Distribution and service fees: | | | | | | | | | | | | | | | | | |
| Class S | | | 211,899 | | | | 41,448 | | | | 136,768 | | | | 12,683 | | |
| Class ADV | | | — | | | | 11,414 | | | | 47,292 | | | | 8 | | |
| Transfer agent fees | | | 497 | | | | — | | | | — | | | | 399 | | |
| Administrative service fees | | | 93,463 | | | | 522,227 | | | | 668,742 | | | | 33,677 | | |
| Shareholder reporting expense | | | 14,260 | | | | — | | | | — | | | | 4,017 | | |
| Professional fees | | | 9,408 | | | | — | | | | — | | | | 7,027 | | |
| Custody and accounting expense | | | 52,190 | | | | — | | | | — | | | | 19,345 | | |
| Directors fees | | | 2,489 | | | | — | | | | — | | | | 365 | | |
| Miscellaneous expense | | | 3,856 | | | | — | | | | — | | | | 3,932 | | |
| Total expenses | | | 1,135,808 | | | | 1,932,750 | | | | 3,973,151 | | | | 377,034 | | |
| Net waived and reimbursed fees | | | (7,441 | ) | | | — | | | | — | | | | (29,455 | ) | |
| Brokerage commission recapture | | | (1,490 | ) | | | — | | | | (39,330 | ) | | | (6,577 | ) | |
| Net expenses | | | 1,126,877 | | | | 1,932,750 | | | | 3,933,821 | | | | 341,002 | | |
| Net investment income (loss) | | | 1,420,256 | | | | 1,852,156 | | | | 4,363,890 | | | | (217,180 | ) | |
REALIZED AND UNREALIZED GAIN (LOSS)
ON INVESTMENTS AND FOREIGN CURRENCY
RELATED TRANSACTIONS: | |
| Net realized gain (loss) on: | |
| Investments | | | 980,571 | | | | 25,291,043 | | | | 36,381,562 | | | | 1,642,413 | | |
| Foreign currency related transactions | | | (18,769 | ) | | | (17,835 | ) | | | — | | | | — | | |
Net realized gain on investments and foreign
currency related transactions | | | 961,802 | | | | 25,273,208 | | | | 36,381,562 | | | | 1,642,413 | | |
Net change in unrealized appreciation
or depreciation on: | |
Investments (net of Indian capital
gains tax accrued)** | | | 7,836,806 | | | | (13,082,411 | ) | | | (36,024,660 | ) | | | (31,887 | ) | |
| Foreign currency related transactions | | | (10,287 | ) | | | 1,618 | | | | — | | | | — | | |
Net change in unrealized appreciation
or depreciation on investments and foreign
currency related transactions | | | 7,826,519 | | | | (13,080,793 | ) | | | (36,024,660 | ) | | | (31,887 | ) | |
Net realized and unrealized gain
on investments and foreign currency
related transactions | | | 8,788,321 | | | | 12,192,415 | | | | 356,902 | | | | 1,610,526 | | |
| Increase in net assets resulting from operations | | $ | 10,208,577 | | | $ | 14,044,571 | | | $ | 4,720,792 | | | $ | 1,393,346 | | |
| * Foreign taxes withheld | | $ | 167,138 | | | $ | 69,829 | | | $ | — | | | $ | — | | |
| ** Foreign tax accrued on Indian investments | | $ | 76,793 | | | $ | — | | | $ | — | | | $ | — | | |
See Accompanying Notes to Financial Statements
84
STATEMENTS OF OPERATIONS FOR THE YEAR ENDED DECEMBER 31, 2007
| | | ING
Van Kampen
Comstock
Portfolio | | ING
Van Kampen
Equity and Income
Portfolio | |
| INVESTMENT INCOME: | |
| Dividends, net of foreign taxes withheld* | | $ | 24,775,551 | | | $ | 15,995,022 | | |
| Interest | | | 3,470,356 | | | | 14,173,595 | | |
| Securities lending income | | | 153,862 | | | | — | | |
| Total investment income | | | 28,399,769 | | | | 30,168,617 | | |
| EXPENSES: | |
| Investment management fees | | | 6,512,819 | | | | 5,553,159 | | |
| Distribution and service fees: | | | | | | | | | |
| Class S | | | 920,262 | | | | 256,598 | | |
| Class ADV | | | 213,818 | | | | 83,172 | | |
| Administrative service fees | | | 2,710,665 | | | | 202,001 | | |
| Total expenses | | | 10,357,564 | | | | 6,094,930 | | |
| Net waived and reimbursed fees | | | (99,181 | ) | | | — | | |
| Net expenses | | | 10,258,383 | | | | 6,094,930 | | |
| Net investment income | | | 18,141,386 | | | | 24,073,687 | | |
REALIZED AND UNREALIZED GAIN (LOSS) ON
INVESTMENTS AND FOREIGN CURRENCY
RELATED TRANSACTIONS: | |
| Net realized gain on investments | | | 51,676,010 | | | | 50,110,886 | | |
| Net change in unrealized appreciation or depreciation on: | |
| Investments | | | (91,003,406 | ) | | | (37,763,770 | ) | |
| Foreign currency related transactions | | | — | | | | 271 | | |
Net change in unrealized appreciation
or depreciation on investments and foreign currency
related transactions | | | (91,003,406 | ) | | | (37,763,499 | ) | |
Net realized and unrealized gain (loss) on investments
and foreign currency related transactions | | | (39,327,396 | ) | | | 12,347,387 | | |
| Increase (decrease) in net assets resulting from operations | | $ | (21,186,010 | ) | | $ | 36,421,074 | | |
| * Foreign taxes withheld | | $ | 152,623 | | | $ | 298,359 | | |
See Accompanying Notes to Financial Statements
85
STATEMENTS OF CHANGES IN NET ASSETS
| | | ING American Century
Large Company Value Portfolio | | ING American Century
Small-Mid Cap Value Portfolio | |
| | | Year
Ended
December 31,
2007 | | Year
Ended
December 31,
2006 | | Year
Ended
December 31,
2007 | | Year
Ended
December 31,
2006 | |
| FROM OPERATIONS: | |
| Net investment income | | $ | 1,968,839 | | | $ | 1,684,191 | | | $ | 979,713 | | | $ | 590,532 | | |
Net realized gain on investments, foreign currency
related transactions, and futures | | | 8,794,610 | | | | 7,423,430 | | | | 9,701,759 | | | | 11,778,630 | | |
Net change in unrealized appreciation or depreciation on
investments, foreign currency related transactions,
and futures | | | (13,657,697 | ) | | | 8,776,919 | | | | (13,408,442 | ) | | | 2,321,102 | | |
| Increase (decrease) in net assets resulting from operations | | | (2,894,248 | ) | | | 17,884,540 | | | | (2,726,970 | ) | | | 14,690,264 | | |
| FROM DISTRIBUTIONS TO SHAREHOLDERS: | |
| Net investment income: | |
| Class I | | | (1,330,944 | ) | | | (698,723 | ) | | | (302,597 | ) | | | (17,356 | ) | |
| Class S | | | (256,957 | ) | | | (55,160 | ) | | | (181,755 | ) | | | (7,533 | ) | |
| Class ADV | | | (99,016 | ) | | | (81,896 | ) | | | (24,752 | ) | | | (1,313 | ) | |
| Net realized gains: | |
| Class I | | | (5,750,073 | ) | | | (3,884,031 | ) | | | (5,866,192 | ) | | | (181,971 | ) | |
| Class S | | | (1,415,763 | ) | | | (1,011,852 | ) | | | (5,719,356 | ) | | | (124,123 | ) | |
| Class ADV | | | (693,173 | ) | | | (712,066 | ) | | | (1,692,685 | ) | | | (37,866 | ) | |
| Total distributions | | | (9,545,926 | ) | | | (6,443,728 | ) | | | (13,787,337 | ) | | | (370,162 | ) | |
| FROM CAPITAL SHARE TRANSACTIONS: | |
| Net proceeds from sale of shares | | | 74,727,098 | | | | 113,580,487 | | | | 23,051,965 | | | | 41,001,670 | | |
| Dividends reinvested | | | 9,545,926 | | | | 6,443,728 | | | | 13,787,337 | | | | 370,162 | | |
| | | | 84,273,024 | | | | 120,024,215 | | | | 36,839,302 | | | | 41,371,832 | | |
| Cost of shares redeemed | | | (56,986,540 | ) | | | (110,225,198 | ) | | | (29,156,836 | ) | | | (47,475,484 | ) | |
Net increase (decrease) in net assets resulting from capital
share transactions | | | 27,286,484 | | | | 9,799,017 | | | | 7,682,466 | | | | (6,103,652 | ) | |
| Net increase (decrease) in net assets | | | 14,846,310 | | | | 21,239,829 | | | | (8,831,841 | ) | | | 8,216,450 | | |
| NET ASSETS: | |
| Beginning of year | | | 115,797,552 | | | | 94,557,723 | | | | 108,529,395 | | | | 100,312,945 | | |
| End of year | | $ | 130,643,862 | | | $ | 115,797,552 | | | $ | 99,697,554 | | | $ | 108,529,395 | | |
| Undistributed net investment income at end of year | | $ | 1,963,858 | | | $ | 1,681,936 | | | $ | 876,695 | | | $ | 519,895 | | |
See Accompanying Notes to Financial Statements
86
STATEMENTS OF CHANGES IN NET ASSETS
| | |
ING Baron Asset Portfolio | | ING Baron Small Cap
Growth Portfolio | |
| | | Year
Ended
December 31,
2007 | | January 3,
2006(1) to
December 31,
2006 | | Year
Ended
December 31,
2007 | | Year
Ended
December 31,
2006 | |
| FROM OPERATIONS: | |
| Net investment loss | | $ | (7,081 | ) | | $ | (17,416 | ) | | $ | (1,662,178 | ) | | $ | (1,378,652 | ) | |
| Net realized gain (loss) on investments | | | 362,294 | | | | (223,504 | ) | | | 20,624,026 | | | | (1,279,457 | ) | |
Net change in unrealized appreciation or depreciation on
investments | | | 1,314,017 | | | | 1,133,153 | | | | 10,257,100 | | | | 58,074,197 | | |
| Increase in net assets resulting from operations | | | 1,669,230 | | | | 892,233 | | | | 29,218,948 | | | | 55,416,088 | | |
| FROM DISTRIBUTIONS TO SHAREHOLDERS: | |
| Net realized gains: | |
| Class I | | | — | | | | — | | | | — | | | | (1,151,733 | ) | |
| Class S | | | — | | | | — | | | | — | | | | (2,389,008 | ) | |
| Class ADV | | | — | | | | — | | | | — | | | | (368,625 | ) | |
| Total distributions | | | — | | | | — | | | | — | | | | (3,909,366 | ) | |
| FROM CAPITAL SHARE TRANSACTIONS: | |
| Net proceeds from sale of shares | | | 26,601,942 | | | | 8,628,315 | | | | 241,145,808 | | | | 231,956,068 | | |
| Dividends reinvested | | | — | | | | — | | | | — | | | | 3,906,693 | | |
| | | | 26,601,942 | | | | 8,628,315 | | | | 241,145,808 | | | | 235,862,761 | | |
| Cost of shares redeemed | | | (3,367,729 | ) | | | (413,084 | ) | | | (100,775,969 | ) | | | (132,467,474 | ) | |
Net increase in net assets resulting from capital share
transactions | | | 23,234,213 | | | | 8,215,231 | | | | 140,369,839 | | | | 103,395,287 | | |
| Net increase in net assets | | | 24,903,443 | | | | 9,107,464 | | | | 169,588,787 | | | | 154,902,009 | | |
| NET ASSETS: | |
| Beginning of period | | | 9,107,464 | | | | — | | | | 475,657,830 | | | | 320,755,821 | | |
| End of period | | $ | 34,010,907 | | | $ | 9,107,464 | | | $ | 645,246,617 | | | $ | 475,657,830 | | |
| Undistributed net investment income at end of period | | $ | — | | | $ | — | | | $ | 23,826 | | | $ | 38,018 | | |
(1) Commencement of operations
See Accompanying Notes to Financial Statements
87
STATEMENTS OF CHANGES IN NET ASSETS
| | | ING Columbia Small Cap
Value II Portfolio | | ING Davis New York
Venture Portfolio | |
| | | Year
Ended
December 31,
2007 | | April 28,
2006(1) to
December 31,
2006 | | Year
Ended
December 31,
2007 | | Year
Ended
December 31,
2006 | |
| FROM OPERATIONS: | |
| Net investment income | | $ | 965,561 | | | $ | 197,596 | | | $ | 3,584,456 | | | $ | 812,337 | | |
Net realized gain (loss) on investments, foreign currency
related transactions and futures | | | 4,558,621 | | | | (846,617 | ) | | | 4,428,969 | | | | 1,020,443 | | |
Net change in unrealized appreciation or depreciation on
investments, foreign currency related transactions and futures | | | (6,366,221 | ) | | | 5,171,325 | | | | 1,102,011 | | | | 17,059,275 | | |
| Increase (decrease) in net assets resulting from operations | | | (842,039 | ) | | | 4,522,304 | | | | 9,115,436 | | | | 18,892,055 | | |
| FROM DISTRIBUTIONS TO SHAREHOLDERS: | |
| Net investment income: | |
| Class I | | | (20,982 | ) | | | — | | | | (284,154 | ) | | | (3,834 | ) | |
| Class S | | | (149,906 | ) | | | — | | | | (483,957 | ) | | | (4,777 | ) | |
| Class ADV | | | (226 | ) | | | — | | | | — | | | | — | | |
| Net realized gains: | |
| Class I | | | — | | | | — | | | | (303,465 | ) | | | (1,096,008 | ) | |
| Class S | | | — | | | | — | | | | (726,408 | ) | | | (6,206,778 | ) | |
| Class ADV | | | — | | | | — | | | | (34,332 | ) | | | (842,626 | ) | |
| Total distributions | | | (171,114 | ) | | | — | | | | (1,832,316 | ) | | | (8,154,023 | ) | |
| FROM CAPITAL SHARE TRANSACTIONS: | |
| Net proceeds from sale of shares | | | 152,702,805 | | | | 90,490,052 | | | | 185,311,189 | | | | 150,618,280 | | |
| Dividends reinvested | | | 171,114 | | | | — | | | | 1,832,316 | | | | 8,154,023 | | |
| | | | 152,873,919 | | | | 90,490,052 | | | | 187,143,505 | | | | 158,772,303 | | |
| Cost of shares redeemed | | | (31,017,289 | ) | | | (7,303,662 | ) | | | (58,711,455 | ) | | | (17,972,189 | ) | |
Net increase in net assets resulting from capital share
transactions | | | 121,856,630 | | | | 83,186,390 | | | | 128,432,050 | | | | 140,800,114 | | |
| Net increase in net assets | | | 120,843,477 | | | | 87,708,694 | | | | 135,715,170 | | | | 151,538,146 | | |
| NET ASSETS: | |
| Beginning of period | | | 87,708,694 | | | | — | | | | 207,773,057 | | | | 56,234,911 | | |
| End of period | | $ | 208,552,171 | | | $ | 87,708,694 | | | $ | 343,488,227 | | | $ | 207,773,057 | | |
| Undistributed net investment income at end of period | | $ | 946,098 | | | $ | 197,055 | | | $ | 3,537,474 | | | $ | 777,814 | | |
(1) Commencement of operations
See Accompanying Notes to Financial Statements
88
STATEMENTS OF CHANGES IN NET ASSETS
| | | ING JPMorgan
International Portfolio | | ING JPMorgan
Mid Cap Value Portfolio | |
| | | Year
Ended
December 31,
2007 | | Year
Ended
December 31,
2006 | | Year
Ended
December 31,
2007 | | Year
Ended
December 31,
2006 | |
| FROM OPERATIONS: | |
| Net investment income | | $ | 12,008,531 | | | $ | 12,160,460 | | | $ | 2,662,565 | | | $ | 1,872,333 | | |
Net realized gain on investments, foreign currency
related transactions and futures | | | 239,255,800 | | | | 73,432,592 | | | | 19,782,786 | | | | 12,710,480 | | |
Net change in unrealized appreciation or depreciation on
investments, foreign currency related transactions
and futures | | | (163,257,168 | ) | | | 114,826,875 | | | | (17,633,034 | ) | | | 16,832,277 | | |
| Increase in net assets resulting from operations | | | 88,007,163 | | | | 200,419,927 | | | | 4,812,317 | | | | 31,415,090 | | |
| FROM DISTRIBUTIONS TO SHAREHOLDERS: | |
| Net investment income: | |
| Class I | | | (10,733,166 | ) | | | (8,050,923 | ) | | | (1,069,126 | ) | | | (15,763 | ) | |
| Class S | | | (3,129,801 | ) | | | (180,927 | ) | | | (524,023 | ) | | | (4,366 | ) | |
| Class ADV | | | (269,186 | ) | | | (36,480 | ) | | | (117,731 | ) | | | (112 | ) | |
| Net realized gains: | |
| Class I | | | — | | | | — | | | | (6,921,274 | ) | | | (730,561 | ) | |
| Class S | | | — | | | | — | | | | (4,728,001 | ) | | | (581,795 | ) | |
| Class ADV | | | — | | | | — | | | | (1,307,919 | ) | | | (119,694 | ) | |
| Total distributions | | | (14,132,153 | ) | | | (8,268,330 | ) | | | (14,668,074 | ) | | | (1,452,291 | ) | |
| FROM CAPITAL SHARE TRANSACTIONS: | |
| Net proceeds from sale of shares | | | 170,614,890 | | | | 834,826,124 | | | | 76,989,470 | | | | 68,003,190 | | |
| Dividends reinvested | | | 14,132,153 | | | | 8,268,330 | | | | 14,668,074 | | | | 1,452,291 | | |
| | | | 184,747,043 | | | | 843,094,454 | | | | 91,657,544 | | | | 69,455,481 | | |
| Cost of shares redeemed | | | (715,303,301 | ) | | | (847,832,867 | ) | | | (60,552,182 | ) | | | (31,649,117 | ) | |
Net increase (decrease) in net assets resulting from capital
share transactions | | | (530,556,258 | ) | | | (4,738,413 | ) | | | 31,105,362 | | | | 37,806,364 | | |
| Net increase (decrease) in net assets | | | (456,681,248 | ) | | | 187,413,184 | | | | 21,249,605 | | | | 67,769,163 | | |
| NET ASSETS: | |
| Beginning of year | | | 1,106,439,965 | | | | 919,026,781 | | | | 239,062,576 | | | | 171,293,413 | | |
| End of year | | $ | 649,758,717 | | | $ | 1,106,439,965 | | | $ | 260,312,181 | | | $ | 239,062,576 | | |
| Undistributed net investment income at end of year | | $ | 10,625,913 | | | $ | 14,128,261 | | | $ | 2,431,848 | | | $ | 1,776,925 | | |
See Accompanying Notes to Financial Statements
89
STATEMENTS OF CHANGES IN NET ASSETS
| | | ING Legg Mason Partners
Aggressive Growth Portfolio | | ING Legg Mason Partners
Large Cap Growth Portfolio | |
| | | Year
Ended
December 31,
2007 | | Year
Ended
December 31,
2006 | | Year
Ended
December 31,
2007 | | Year
Ended
December 31,
2006 | |
| FROM OPERATIONS: | |
| Net investment loss | | $ | (1,934,682 | ) | | $ | (1,680,845 | ) | | $ | (111,119 | ) | | $ | (83,606 | ) | |
| Net realized gain on investments | | | 26,487,762 | | | | 16,245,044 | | | | 2,699,466 | | | | 454,385 | | |
Net change in unrealized appreciation or depreciation on
investments | | | (41,450,102 | ) | | | 100,027,669 | | | | (663,320 | ) | | | 1,200,255 | | |
| Increase (decrease) in net assets resulting from operations | | | (16,897,022 | ) | | | 114,591,868 | | | | 1,925,027 | | | | 1,571,034 | | |
| FROM DISTRIBUTIONS TO SHAREHOLDERS: | |
| Net realized gains: | |
| Class I | | | — | | | | — | | | | (169,765 | ) | | | (290,112 | ) | |
| Class S | | | — | | | | — | | | | (138,021 | ) | | | (196,333 | ) | |
| Class ADV | | | — | | | | — | | | | (212,710 | ) | | | (311,057 | ) | |
| Total distributions | | | — | | | | — | | | | (520,496 | ) | | | (797,502 | ) | |
| FROM CAPITAL SHARE TRANSACTIONS: | |
| Net proceeds from sale of shares | | | 326,015,465 | | | | 839,171,554 | | | | 7,019,178 | | | | 7,259,163 | | |
| Dividends reinvested | | | — | | | | — | | | | 520,496 | | | | 797,502 | | |
| | | | 326,015,465 | | | | 839,171,554 | | | | 7,539,674 | | | | 8,056,665 | | |
| Cost of shares redeemed | | | (378,341,494 | ) | | | (580,359,060 | ) | | | (15,990,327 | ) | | | (22,910,555 | ) | |
Net increase (decrease) in net assets resulting from
capital share transactions | | | (52,326,029 | ) | | | 258,812,494 | | | | (8,450,653 | ) | | | (14,853,890 | ) | |
| Net increase (decrease) in net assets | | | (69,223,051 | ) | | | 373,404,362 | | | | (7,046,122 | ) | | | (14,080,358 | ) | |
| NET ASSETS: | |
| Beginning of year | | | 1,350,065,782 | | | | 976,661,420 | | | | 44,045,805 | | | | 58,126,163 | | |
| End of year | | $ | 1,280,842,731 | | | $ | 1,350,065,782 | | | $ | 36,999,683 | | | $ | 44,045,805 | | |
| Undistributed net investment income at end of year | | $ | — | | | $ | — | | | $ | — | | | $ | — | | |
See Accompanying Notes to Financial Statements
90
STATEMENTS OF CHANGES IN NET ASSETS
| | | ING Lord Abbett U.S.
Government Securities Portfolio | | ING Neuberger Berman
Partners Portfolio | |
| | | Year
Ended
December 31,
2007 | | January 3,
2006(1) to
December 31,
2006 | | Year
Ended
December 31,
2007 | | January 3,
2006(1) to
December 31,
2006 | |
| FROM OPERATIONS: | |
| Net investment income | | $ | 2,229,048 | | | $ | 2,070,072 | | | $ | 990,373 | | | $ | 1,099,787 | | |
Net realized gain (loss) on investments and foreign currency
related transactions | | | 307,712 | | | | (258,122 | ) | | | (13,341,407 | ) | | | 20,100,578 | | |
Net change in unrealized appreciation or depreciation on
investments and foreign currency related transactions | | | 645,705 | | | | 373,401 | | | | 49,540,515 | | | | (5,615,173 | ) | |
| Increase in net assets resulting from operations | | | 3,182,465 | | | | 2,185,351 | | | | 37,189,481 | | | | 15,585,192 | | |
| FROM DISTRIBUTIONS TO SHAREHOLDERS: | |
| Net investment income: | |
| Class I | | | (1,694,200 | ) | | | (1,544,159 | ) | | | (735,348 | ) | | | — | | |
| Class S | | | (524,972 | ) | | | (574,796 | ) | | | (401,596 | ) | | | — | | |
| Class ADV | | | — | | | | (44 | ) | | | (20 | ) | | | — | | |
| Net realized gains: | |
| Class I | | | — | | | | — | | | | (11,957,793 | ) | | | — | | |
| Class S | | | — | | | | — | | | | (7,987,123 | ) | | | — | | |
| Class ADV | | | — | | | | — | | | | (320 | ) | | | — | | |
| Total distributions | | | (2,219,172 | ) | | | (2,118,999 | ) | | | (21,082,200 | ) | | | — | | |
| FROM CAPITAL SHARE TRANSACTIONS: | |
| Net proceeds from sale of shares | | | 8,690,505 | | | | 75,533,877 | | | | 86,086,803 | | | | 357,380,071 | | |
| Proceeds from shares issued in merger (Note 12) | | | — | | | | — | | | | — | | | | 178,456,953 | | |
| Dividends reinvested | | | 2,219,172 | | | | 2,003,224 | | | | 21,082,146 | | | | — | | |
| | | | 10,909,677 | | | | 77,537,101 | | | | 107,168,949 | | | | 535,837,024 | | |
| Cost of shares redeemed | | | (15,771,976 | ) | | | (28,297,129 | ) | | | (107,998,199 | ) | | | (137,892,684 | ) | |
Net increase (decrease) in net assets resulting from capital
share transactions | | | (4,862,299 | ) | | | 49,239,972 | | | | (829,250 | ) | | | 397,944,340 | | |
| Net increase (decrease) in net assets | | | (3,899,006 | ) | | | 49,306,324 | | | | 15,278,031 | | | | 413,529,532 | | |
| NET ASSETS: | |
| Beginning of period | | | 49,306,324 | | | | — | | | | 413,529,532 | | | | — | | |
| End of period | | $ | 45,407,318 | | | $ | 49,306,324 | | | $ | 428,807,563 | | | $ | 413,529,532 | | |
| Undistributed net investment income at end of period | | $ | 14,614 | | | $ | — | | | $ | 954,887 | | | $ | 1,130,355 | | |
(1) Commencement of operations
See Accompanying Notes to Financial Statements
91
STATEMENTS OF CHANGES IN NET ASSETS
| | | ING Neuberger Berman
Regency Portfolio | | ING OpCap Balanced
Value Portfolio | |
| | | Year
Ended
December 31,
2007 | | January 3,
2006(1) to
December 31,
2006 | | Year
Ended
December 31,
2007 | | Year
Ended
December 31,
2006 | |
| FROM OPERATIONS: | |
| Net investment income | | $ | 151,993 | | | $ | 49,220 | | | $ | 957,500 | | | $ | 1,008,985 | | |
| Net realized gain (loss) on investments | | | (435,289 | ) | | | 64,825 | | | | 8,082,867 | | | | 9,325,152 | | |
Net change in unrealized appreciation or depreciation on
investments | | | 317,041 | | | | 733,942 | | | | (11,228,723 | ) | | | (1,112,478 | ) | |
| Increase (decrease) in net assets resulting from operations | | | 33,745 | | | | 847,987 | | | | (2,188,356 | ) | | | 9,221,659 | | |
| FROM DISTRIBUTIONS TO SHAREHOLDERS: | |
| Net investment income: | |
| Class I | | | (26,377 | ) | | | (26,062 | ) | | | (70,603 | ) | | | (63,166 | ) | |
| Class S | | | (41,001 | ) | | | (18,035 | ) | | | (933,326 | ) | | | (755,243 | ) | |
| Class ADV | | | — | | | | (4 | ) | | | (7,730 | ) | | | (28,385 | ) | |
| Net realized gains: | |
| Class I | | | (10,360 | ) | | | (17,052 | ) | | | (472,086 | ) | | | — | | |
| Class S | | | (22,816 | ) | | | (17,975 | ) | | | (7,746,651 | ) | | | — | | |
| Class ADV | | | — | | | | (3 | ) | | | (167,410 | ) | | | — | | |
| Return of capital: | |
| Class I | | | (32,194 | ) | | | — | | | | — | | | | — | | |
| Class S | | | (61,662 | ) | | | — | | | | — | | | | — | | |
| Class ADV | | | — | | | | — | | | | — | | | | — | | |
| Total distributions | | | (194,410 | ) | | | (79,131 | ) | | | (9,397,806 | ) | | | (846,794 | ) | |
| FROM CAPITAL SHARE TRANSACTIONS: | |
| Net proceeds from sale of shares | | | 21,795,242 | | | | 13,473,019 | | | | 6,539,436 | | | | 7,538,615 | | |
| Dividends reinvested | | | 142,569 | | | | 41,323 | | | | 9,397,806 | | | | 846,794 | | |
| | | | 21,937,811 | | | | 13,514,342 | | | | 15,937,242 | | | | 8,385,409 | | |
| Cost of shares redeemed | | | (12,716,167 | ) | | | (1,749,824 | ) | | | (29,096,784 | ) | | | (57,097,899 | ) | |
Net increase (decrease) in net assets resulting from capital
share transactions | | | 9,221,644 | | | | 11,764,518 | | | | (13,159,542 | ) | | | (48,712,490 | ) | |
| Net increase (decrease) in net assets | | | 9,060,979 | | | | 12,533,374 | | | | (24,745,704 | ) | | | (40,337,625 | ) | |
| NET ASSETS: | |
| Beginning of period | | | 12,533,374 | | | | — | | | | 87,599,389 | | | | 127,937,014 | | |
| End of period | | $ | 21,594,353 | | | $ | 12,533,374 | | | $ | 62,853,685 | | | $ | 87,599,389 | | |
| Undistributed net investment income at end of period | | $ | 957 | | | $ | 3,991 | | | $ | 952,371 | | | $ | 1,006,530 | | |
(1) Commencement of operations
See Accompanying Notes to Financial Statements
92
STATEMENTS OF CHANGES IN NET ASSETS
| | | ING Oppenheimer
Global Portfolio | | ING Oppenheimer
Strategic Income Portfolio | |
| | | Year
Ended
December 31,
2007 | | Year
Ended
December 31,
2006 | | Year
Ended
December 31,
2007 | | Year
Ended
December 31,
2006 | |
| FROM OPERATIONS: | |
| Net investment income | | $ | 42,790,930 | | | $ | 24,110,216 | | | $ | 26,563,992 | | | $ | 24,148,137 | | |
Net realized gain (loss) on investments, foreign currency
related transactions, futures, swaps, and written options | | | 160,407,238 | | | | 107,109,224 | | | | 10,293,869 | | | | (2,389,860 | ) | |
Net change in unrealized appreciation or depreciation on
investments, foreign currency related transactions,
futures, swaps, and written options | | | (25,056,406 | ) | | | 295,576,411 | | | | 1,534,707 | | | | 10,034,887 | | |
| Increase in net assets resulting from operations | | | 178,141,762 | | | | 426,795,851 | | | | 38,392,568 | | | | 31,793,164 | | |
| FROM DISTRIBUTIONS TO SHAREHOLDERS: | |
| Net investment income: | |
| Class I | | | (26,306,990 | ) | | | (1,633,130 | ) | | | (16,544,242 | ) | | | (1,398,755 | ) | |
| Class S | | | (1,992,610 | ) | | | (64,010 | ) | | | (2,774,380 | ) | | | (62,039 | ) | |
| Class ADV | | | (697,050 | ) | | | (65,785 | ) | | | (1,147,519 | ) | | | (14,604 | ) | |
| Net realized gains: | |
| Class I | | | (98,523,340 | ) | | | (3,444,323 | ) | | | — | | | | — | | |
| Class S | | | (8,314,597 | ) | | | (150,378 | ) | | | — | | | | — | | |
| Class ADV | | | (4,651,568 | ) | | | (177,950 | ) | | | — | | | | — | | |
| Total distributions | | | (140,486,155 | ) | | | (5,535,576 | ) | | | (20,466,141 | ) | | | (1,475,398 | ) | |
| FROM CAPITAL SHARE TRANSACTIONS: | |
| Net proceeds from sale of shares | | | 162,375,715 | | | | 219,061,778 | | | | 167,160,488 | | | | 90,602,877 | | |
| Dividends reinvested | | | 140,486,155 | | | | 5,535,576 | | | | 20,466,141 | | | | 1,475,398 | | |
| | | | 302,861,870 | | | | 224,597,354 | | | | 187,626,629 | | | | 92,078,275 | | |
| Cost of shares redeemed | | | (477,615,687 | ) | | | (296,392,861 | ) | | | (111,289,160 | ) | | | (65,688,710 | ) | |
Net increase (decrease) in net assets resulting from capital
share transactions | | | (174,753,817 | ) | | | (71,795,507 | ) | | | 76,337,469 | | | | 26,389,565 | | |
| Net increase (decrease) in net assets | | | (137,098,210 | ) | | | 349,464,768 | | | | 94,263,896 | | | | 56,707,331 | | |
| NET ASSETS: | |
| Beginning of year | | | 2,759,007,466 | | | | 2,409,542,698 | | | | 425,207,708 | | | | 368,500,377 | | |
| End of year | | $ | 2,621,909,256 | | | $ | 2,759,007,466 | | | $ | 519,471,604 | | | $ | 425,207,708 | | |
| Undistributed net investment income at end of year | | $ | 43,956,836 | | | $ | 28,989,763 | | | $ | 33,948,150 | | | $ | 19,686,469 | | |
See Accompanying Notes to Financial Statements
93
STATEMENTS OF CHANGES IN NET ASSETS
| | | ING PIMCO Total Return Portfolio | | ING Pioneer High Yield Portfolio | |
| | | Year
Ended
December 31,
2007 | | Year
Ended
December 31,
2006 | | Year
Ended
December 31,
2007 | | January 3,
2006(1) to
December 31,
2006 | |
| FROM OPERATIONS: | |
| Net investment income | | $ | 17,123,891 | | | $ | 12,142,759 | | | $ | 6,918,879 | | | $ | 4,581,905 | | |
Net realized gain on investments, foreign currency
related transactions, futures, swaps, and written options | | | 3,027,999 | | | | 1,214,775 | | | | 3,593,207 | | | | 318,237 | | |
Net change in unrealized appreciation or depreciation on
investments, foreign currency related transactions,
futures, swaps, and written options | | | 18,748,656 | | | | 334,694 | | | | (2,411,487 | ) | | | 2,589,294 | | |
| Increase in net assets resulting from operations | | | 38,900,546 | | | | 13,692,228 | | | | 8,100,599 | | | | 7,489,436 | | |
| FROM DISTRIBUTIONS TO SHAREHOLDERS: | |
| Net investment income: | |
| Class I | | | (9,593,260 | ) | | | (4,464,221 | ) | | | (6,426,076 | ) | | | (3,999,136 | ) | |
| Class S | | | (3,498,142 | ) | | | (1,499,405 | ) | | | (445,431 | ) | | | (466,680 | ) | |
| Class ADV | | | (947,855 | ) | | | (429,622 | ) | | | (49,613 | ) | | | (175,101 | ) | |
| Net realized gains: | |
| Class I | | | — | | | | — | | | | — | | | | (331,780 | ) | |
| Class S | | | — | | | | — | | | | — | | | | (23,180 | ) | |
| Class ADV | | | — | | | | — | | | | — | | | | (1,397 | ) | |
| Total distributions | | | (14,039,257 | ) | | | (6,393,248 | ) | | | (6,921,120 | ) | | | (4,997,274 | ) | |
| FROM CAPITAL SHARE TRANSACTIONS: | |
| Net proceeds from sale of shares | | | 163,411,362 | | | | 131,923,895 | | | | 48,224,001 | | | | 147,746,231 | | |
| Dividends reinvested | | | 14,039,257 | | | | 6,393,248 | | | | 6,919,827 | | | | 4,830,169 | | |
| | | | 177,450,619 | | | | 138,317,143 | | | | 55,143,828 | | | | 152,576,400 | | |
| Cost of shares redeemed | | | (58,691,524 | ) | | | (96,199,045 | ) | | | (73,049,481 | ) | | | (26,320,610 | ) | |
Net increase (decrease) in net assets resulting from
capital share transactions | | | 118,759,095 | | | | 42,118,098 | | | | (17,905,653 | ) | | | 126,255,790 | | |
| Net increase (decrease) in net assets | | | 143,620,384 | | | | 49,417,078 | | | | (16,726,174 | ) | | | 128,747,952 | | |
| NET ASSETS: | |
| Beginning of period | | | 332,824,178 | | | | 283,407,100 | | | | 128,747,952 | | | | — | | |
| End of period | | $ | 476,444,562 | | | $ | 332,824,178 | | | $ | 112,021,778 | | | $ | 128,747,952 | | |
| Undistributed net investment income at end of period | | $ | 17,469,733 | | | $ | 14,285,429 | | | $ | 5,483 | | | $ | 2,120 | | |
(1) Commencement of operations
See Accompanying Notes to Financial Statements
94
STATEMENTS OF CHANGES IN NET ASSETS
| | | ING T. Rowe Price Diversified
Mid Cap Growth Portfolio | | ING T. Rowe Price
Growth Equity Portfolio | |
| | | Year
Ended
December 31,
2007 | | Year
Ended
December 31,
2006 | | Year
Ended
December 31,
2007 | | Year
Ended
December 31,
2006 | |
| FROM OPERATIONS: | |
| Net investment income | | $ | 1,742,576 | | | $ | 1,957,378 | | | $ | 7,665,938 | | | $ | 7,028,530 | | |
Net realized gain on investments and foreign currency
related transactions | | | 129,203,347 | | | | 98,051,061 | | | | 95,487,453 | | | | 71,505,254 | | |
Net change in unrealized appreciation or depreciation on
investments and foreign currency related transactions | | | 9,773,622 | | | | 2,141,735 | | | | 35,488,768 | | | | 83,050,300 | | |
| Increase in net assets resulting from operations | | | 140,719,545 | | | | 102,150,174 | | | | 138,642,159 | | | | 161,584,084 | | |
| FROM DISTRIBUTIONS TO SHAREHOLDERS: | |
| Net investment income: | |
| Class I | | | (1,960,207 | ) | | | — | | | | (6,544,980 | ) | | | (2,793,872 | ) | |
| Class S | | | — | | | | — | | | | (169,564 | ) | | | — | | |
| Class ADV | | | — | | | | — | | | | (52,430 | ) | | | — | | |
| Net realized gains: | |
| Class I | | | (90,261,425 | ) | | | (23,791,368 | ) | | | (61,978,334 | ) | | | (1,879,138 | ) | |
| Class S | | | (1,209,603 | ) | | | (530,826 | ) | | | (3,766,933 | ) | | | (77,274 | ) | |
| Class ADV | | | (3,939,115 | ) | | | (1,209,471 | ) | | | (5,000,494 | ) | | | (164,722 | ) | |
| Total distributions | | | (97,370,350 | ) | | | (25,531,665 | ) | | | (77,512,735 | ) | | | (4,915,006 | ) | |
| FROM CAPITAL SHARE TRANSACTIONS: | |
| Net proceeds from sale of shares | | | 24,781,765 | | | | 98,056,004 | | | | 386,482,105 | | | | 463,870,698 | | |
| Dividends reinvested | | | 97,370,350 | | | | 25,531,665 | | | | 77,512,735 | | | | 4,915,006 | | |
| | | | 122,152,115 | | | | 123,587,669 | | | | 463,994,840 | | | | 468,785,704 | | |
| Cost of shares redeemed | | | (241,797,598 | ) | | | (297,212,857 | ) | | | (292,305,674 | ) | | | (358,916,531 | ) | |
Net increase (decrease) in net assets resulting from
capital share transactions | | | (119,645,483 | ) | | | (173,625,188 | ) | | | 171,689,166 | | | | 109,869,173 | | |
| Net increase (decrease) in net assets | | | (76,296,288 | ) | | | (97,006,679 | ) | | | 232,818,590 | | | | 266,538,251 | | |
| NET ASSETS: | |
| Beginning of year | | | 1,125,781,280 | | | | 1,222,787,959 | | | | 1,414,608,249 | | | | 1,148,069,998 | | |
| End of year | | $ | 1,049,484,992 | | | $ | 1,125,781,280 | | | $ | 1,647,426,839 | | | $ | 1,414,608,249 | | |
| Undistributed net investment income at end of year | | $ | 1,740,086 | | | $ | 1,957,378 | | | $ | 10,503,070 | | | $ | 6,772,277 | | |
See Accompanying Notes to Financial Statements
95
STATEMENTS OF CHANGES IN NET ASSETS
| | | ING Templeton Foreign
Equity Portfolio | | ING Thornburg Value Portfolio | |
| | | Year
Ended
December 31,
2007 | | January 3,
2006(1) to
December 31,
2006 | | Year
Ended
December 31,
2007 | | Year
Ended
December 31,
2006 | |
| FROM OPERATIONS: | |
| Net investment income | | $ | 1,420,256 | | | $ | 488,803 | | | $ | 1,852,156 | | | $ | 956,724 | | |
Net realized gain on investments and foreign currency
related transactions | | | 961,802 | | | | 34,814 | | | | 25,273,208 | | | | 15,702,977 | | |
Net change in unrealized appreciation or depreciation on
investments and foreign currency related transactions | | | 7,826,519 | | | | 5,670,567 | | | | (13,080,793 | ) | | | 12,080,692 | | |
| Increase in net assets resulting from operations | | | 10,208,577 | | | | 6,194,184 | | | | 14,044,571 | | | | 28,740,393 | | |
| FROM DISTRIBUTIONS TO SHAREHOLDERS: | |
| Net investment income: | |
| Class I | | | (429,134 | ) | | | (120,416 | ) | | | (845,816 | ) | | | (882,011 | ) | |
| Class S | | | (1,000,610 | ) | | | (353,221 | ) | | | (76,409 | ) | | | (742 | ) | |
| Class ADV | | | (11 | ) | | | (11 | ) | | | (9,561 | ) | | | (421 | ) | |
| Net realized gains: | | | | | | | |
| Class I | | | (345,586 | ) | | | (7,035 | ) | | | — | | | | — | | |
| Class S | | | (996,073 | ) | | | (22,646 | ) | | | — | | | | — | | |
| Class ADV | | | (9 | ) | | | (1 | ) | | | — | | | | — | | |
| Total distributions | | | (2,771,423 | ) | | | (503,330 | ) | | | (931,786 | ) | | | (883,174 | ) | |
| FROM CAPITAL SHARE TRANSACTIONS: | |
| Net proceeds from sale of shares | | | 170,278,145 | | | | 46,702,244 | | | | 68,502,537 | | | | 13,297,964 | | |
| Dividends reinvested | | | 2,645,202 | | | | 375,868 | | | | 931,786 | | | | 883,174 | | |
| | | | 172,923,347 | | | | 47,078,112 | | | | 69,434,323 | | | | 14,181,138 | | |
| Cost of shares redeemed | | | (48,889,820 | ) | | | (5,576,209 | ) | | | (41,806,736 | ) | | | (40,932,472 | ) | |
Net increase (decrease) in net assets resulting from
capital share transactions | | | 124,033,527 | | | | 41,501,903 | | | | 27,627,587 | | | | (26,751,334 | ) | |
| Net increase in net assets | | | 131,470,681 | | | | 47,192,757 | | | | 40,740,372 | | | | 1,105,885 | | |
| NET ASSETS: | |
| Beginning of period | | | 47,192,757 | | | | — | | | | 193,582,458 | | | | 192,476,573 | | |
| End of period | | $ | 178,663,438 | | | $ | 47,192,757 | | | $ | 234,322,830 | | | $ | 193,582,458 | | |
| Undistributed net investment income at end of period | | $ | 812,669 | | | $ | 1,653 | | | $ | 1,829,398 | | | $ | 926,863 | | |
(1) Commencement of operations
See Accompanying Notes to Financial Statements
96
STATEMENTS OF CHANGES IN NET ASSETS
| | | ING UBS U.S. Large Cap
Equity Portfolio | | ING UBS U.S. Small Cap
Growth Portfolio | |
| | | Year
Ended
December 31,
2007 | | Year
Ended
December 31,
2006 | | Year
Ended
December 31,
2007 | | April 28,
2006(1) to
December 31,
2006 | |
| FROM OPERATIONS: | |
| Net investment income (loss) | | $ | 4,363,890 | | | $ | 3,086,474 | | | $ | (217,180 | ) | | $ | (44,503 | ) | |
| Net realized gain (loss) on investments | | | 36,381,562 | | | | 21,199,886 | | | | 1,642,413 | | | | (27,700 | ) | |
Net change in unrealized appreciation or depreciation on
investments | | | (36,024,660 | ) | | | 22,179,628 | | | | (31,887 | ) | | | 905,379 | | |
| Increase in net assets resulting from operations | | | 4,720,792 | | | | 46,465,988 | | | | 1,393,346 | | | | 833,176 | | |
| FROM DISTRIBUTIONS TO SHAREHOLDERS: | |
| Net investment income: | | | | | | | | | | | | | | | | | |
| Class I | | | (2,678,126 | ) | | | (2,308,904 | ) | | | — | | | | — | | |
| Class S | | | (342,587 | ) | | | (110,985 | ) | | | — | | | | — | | |
| Class ADV | | | (67,611 | ) | | | (9,291 | ) | | | — | | | | — | | |
| Net realized gains: | | | | | | | | | | | | | | | | | |
| Class I | | | — | | | | — | | | | (1,875,576 | ) | | | (190,476 | ) | |
| Class S | | | — | | | | — | | | | (225,965 | ) | | | (43,189 | ) | |
| Class ADV | | | — | | | | — | | | | (61 | ) | | | (8 | ) | |
| Total distributions | | | (3,088,324 | ) | | | (2,429,180 | ) | | | (2,101,602 | ) | | | (233,673 | ) | |
| FROM CAPITAL SHARE TRANSACTIONS: | |
| Net proceeds from sale of shares | | | 105,677,385 | | | | 123,409,952 | | | | 27,105,175 | | | | 34,639,445 | | |
| Proceeds issued in merger (Note 12) | | | 36,384,223 | | | | — | | | | — | | | | — | | |
| Dividends reinvested | | | 3,088,324 | | | | 2,429,180 | | | | 1,904,929 | | | | 191,856 | | |
| | | | 145,149,932 | | | | 125,839,132 | | | | 29,010,104 | | | | 34,831,301 | | |
| Cost of shares redeemed | | | (113,345,397 | ) | | | (63,216,458 | ) | | | (19,877,147 | ) | | | (7,946,996 | ) | |
Net increase in net assets resulting from
capital share transactions | | | 31,804,535 | | | | 62,622,674 | | | | 9,132,957 | | | | 26,884,305 | | |
| Net increase in net assets | | | 33,437,003 | | | | 106,659,482 | | | | 8,424,701 | | | | 27,483,808 | | |
| NET ASSETS: | |
| Beginning of period | | | 387,443,826 | | | | 280,784,344 | | | | 27,483,808 | | | | — | | |
| End of period | | $ | 420,880,829 | | | $ | 387,443,826 | | | $ | 35,908,509 | | | $ | 27,483,808 | | |
| Undistributed net investment income at end of period | | $ | 4,358,803 | | | $ | 3,083,237 | | | $ | 1,694 | | | $ | 43 | | |
(1) Commencement of operations
See Accompanying Notes to Financial Statements
97
STATEMENTS OF CHANGES IN NET ASSETS
| | | ING Van Kampen Comstock Portfolio | | ING Van Kampen
Equity and Income Portfolio | |
| | | Year
Ended
December 31,
2007 | | Year
Ended
December 31,
2006 | | Year
Ended
December 31,
2007 | | Year
Ended
December 31,
2006 | |
| FROM OPERATIONS: | |
| Net investment income | | $ | 18,141,386 | | | $ | 15,070,077 | | | $ | 24,073,687 | | | $ | 24,109,993 | | |
| Net realized gain on investments | | | 51,676,010 | | | | 27,683,718 | | | | 50,110,886 | | | | 27,988,516 | | |
Net change in unrealized appreciation or depreciation
on investments and foreign currency related
transactions | | | (91,003,406 | ) | | | 89,764,920 | | | | (37,763,499 | ) | | | 65,730,154 | | |
Increase (decrease) in net assets resulting from
operations | | | (21,186,010 | ) | | | 132,518,715 | | | | 36,421,074 | | | | 117,828,663 | | |
| FROM DISTRIBUTIONS TO SHAREHOLDERS: | |
| Net investment income: | |
| Class I | | | (10,143,475 | ) | | | (4,223,582 | ) | | | (21,491,852 | ) | | | (16,983,138 | ) | |
| Class S | | | (4,424,869 | ) | | | (2,802,840 | ) | | | (2,278,945 | ) | | | (1,563,228 | ) | |
| Class ADV | | | (504,981 | ) | | | (241,587 | ) | | | (330,029 | ) | | | (264,974 | ) | |
| Net realized gains: | |
| Class I | | | (17,981,166 | ) | | | (20,901,834 | ) | | | (24,251,403 | ) | | | (30,185,503 | ) | |
| Class S | | | (9,810,845 | ) | | | (19,152,742 | ) | | | (2,802,542 | ) | | | (2,949,494 | ) | |
| Class ADV | | | (1,177,101 | ) | | | (1,609,973 | ) | | | (462,445 | ) | | | (581,467 | ) | |
| Total distributions | | | (44,042,437 | ) | | | (48,932,558 | ) | | | (51,617,216 | ) | | | (52,527,804 | ) | |
| FROM CAPITAL SHARE TRANSACTIONS: | |
| Net proceeds from sale of shares | | | 316,790,683 | | | | 634,525,643 | | | | 77,017,123 | | | | 90,334,622 | | |
| Dividends reinvested | | | 44,042,437 | | | | 48,932,558 | | | | 51,617,216 | | | | 52,527,804 | | |
| | | | 360,833,120 | | | | 683,458,201 | | | | 128,634,339 | | | | 142,862,426 | | |
| Cost of shares redeemed | | | (334,718,811 | ) | | | (433,245,639 | ) | | | (186,472,061 | ) | | | (98,160,881 | ) | |
Net increase (decrease) in net assets resulting from
capital share transactions | | | 26,114,309 | | | | 250,212,562 | | | | (57,837,722 | ) | | | 44,701,545 | | |
| Net increase (decrease) in net assets | | | (39,114,138 | ) | | | 333,798,719 | | | | (73,033,864 | ) | | | 110,002,404 | | |
| NET ASSETS: | |
| Beginning of year | | | 1,030,331,914 | | | | 696,533,195 | | | | 1,032,099,447 | | | | 922,097,043 | | |
| End of year | | $ | 991,217,776 | | | $ | 1,030,331,914 | | | $ | 959,065,583 | | | $ | 1,032,099,447 | | |
| Undistributed net investment income at end of year | | $ | 18,136,074 | | | $ | 15,068,013 | | | $ | 24,074,970 | | | $ | 24,096,125 | | |
See Accompanying Notes to Financial Statements
98
ING AMERICAN CENTURY LARGE COMPANY VALUE PORTFOLIO
FINANCIAL HIGHLIGHTS
Selected data for a share of beneficial interest outstanding throughout each year.
| | | Class I | |
| | | Year Ended December 31, | |
| | | 2007 | | 2006 | | 2005 | | 2004 | | 2003 | |
| Per Share Operating Performance: | |
| Net asset value, beginning of year | | $ | 16.03 | | | | 14.24 | | | | 14.22 | | | | 13.03 | | | | 9.97 | | |
| Income (loss) from investment operations: | | | | | | | | | | | | | | | | | | | | | |
| Net investment income | | $ | 0.27 | * | | | 0.26 | * | | | 0.21 | | | | 0.17 | | | | 0.06 | | |
Net realized and unrealized gain (loss)
on investments | | $ | (0.50 | ) | | | 2.42 | | | | 0.00 | ** | | | 1.15 | | | | 3.09 | | |
| Total from investment operations | | $ | (0.23 | ) | | | 2.68 | | | | 0.21 | | | | 1.32 | | | | 3.15 | | |
| Less distributions: | |
| Net investment income | | $ | 0.26 | | | | 0.14 | | | | 0.19 | | | | 0.13 | | | | 0.09 | | |
| Net realized gains on investments | | $ | 1.10 | | | | 0.75 | | | | — | | | | — | | | | — | | |
| Total distributions | | $ | 1.36 | | | | 0.89 | | | | 0.19 | | | | 0.13 | | | | 0.09 | | |
| Net asset value, end of year | | $ | 14.44 | | | | 16.03 | | | | 14.24 | | | | 14.22 | | | | 13.03 | | |
| Total Return(1) | | % | (1.72 | ) | | | 19.58 | | | | 1.51 | | | | 10.24 | | | | 31.74 | | |
| Ratios and Supplemental Data: | |
| Net assets, end of year (000's) | | $ | 104,021 | | | | 82,254 | | | | 39,624 | | | | 2,956 | | | | 1,077 | | |
| Ratios to average net assets: | |
| Expenses | | % | 1.00 | | | | 1.00 | | | | 1.00 | | | | 1.00 | | | | 1.00 | | |
| Net investment income | | % | 1.72 | | | | 1.73 | | | | 1.50 | | | | 1.39 | | | | 1.20 | | |
| Portfolio turnover rate | | % | 44 | | | | 56 | | | | 105 | | | | 38 | | | | 38 | | |
| | | Class S | |
| | | Year Ended December 31, | |
| | | 2007 | | 2006 | | 2005 | | 2004 | | 2003 | |
| Per Share Operating Performance: | |
| Net asset value, beginning of year | | $ | 16.05 | | | | 14.20 | | | | 14.17 | | | | 12.98 | | | | 9.94 | | |
| Income (loss) from investment operations: | |
| Net investment income | | $ | 0.23 | * | | | 0.21 | * | | | 0.15 | | | | 0.15 | | | | 0.11 | | |
Net realized and change in unrealized
gain (loss) on investments | | $ | (0.51 | ) | | | 2.43 | | | | 0.02 | | | | 1.14 | | | | 3.00 | | |
| Total from investment operations | | $ | (0.28 | ) | | | 2.64 | | | | 0.17 | | | | 1.29 | | | | 3.11 | | |
| Less distributions: | |
| Net investment income | | $ | 0.20 | | | | 0.04 | | | | 0.14 | | | | 0.10 | | | | 0.07 | | |
| Net realized gains on investments | | $ | 1.10 | | | | 0.75 | | | | — | | | | — | | | | — | | |
| Total distributions | | $ | 1.30 | | | | 0.79 | | | | 0.14 | | | | 0.10 | | | | 0.07 | | |
| Net asset value, end of year | | $ | 14.47 | | | | 16.05 | | | | 14.20 | | | | 14.17 | | | | 12.98 | | |
| Total Return(1) | | % | (2.00 | ) | | | 19.30 | | | | 1.26 | | | | 10.05 | | | | 31.34 | | |
| Ratios and Supplemental Data: | |
| Net assets, end of year (000's) | | $ | 17,126 | | | | 23,019 | | | | 43,127 | | | | 66,267 | | | | 63,547 | | |
| Ratios to average net assets: | |
| Expenses | | % | 1.25 | | | | 1.25 | | | | 1.25 | | | | 1.25 | | | | 1.25 | | |
| Net investment income | | % | 1.44 | | | | 1.43 | | | | 1.06 | | | | 1.05 | | | | 1.00 | | |
| Portfolio turnover rate | | % | 44 | | | | 56 | | | | 105 | | | | 38 | | | | 38 | | |
(1) Total return is calculated assuming reinvestment of all dividends and capital gain distributions at net asset value and does not reflect the effect of insurance contract charges.
* Calculated using average number of shares outstanding throughout the period.
** Amount is less than $0.005.
See Accompanying Notes to Financial Statements
99
ING AMERICAN CENTURY LARGE COMPANY VALUE PORTFOLIO (CONTINUED)
FINANCIAL HIGHLIGHTS
Selected data for a share of beneficial interest outstanding throughout each year.
| | | Class ADV | |
| | | Year Ended December 31, | |
| | | 2007 | | 2006 | | 2005 | | 2004 | | 2003 | |
| Per Share Operating Performance: | |
| Net asset value, beginning of year | | $ | 15.80 | | | | 14.08 | | | | 14.05 | | | | 12.89 | | | | 9.90 | | |
| Income (loss) from investment operations: | | | | | | | | | | | | | | | | | | | | | |
| Net investment income | | $ | 0.19 | | | | 0.18 | * | | | 0.12 | * | | | 0.10 | | | | 0.08 | | |
Net realized and unrealized gain (loss)
on investments | | $ | (0.49 | ) | | | 2.38 | | | | 0.03 | | | | 1.14 | | | | 2.99 | | |
| Total from investment operations | | $ | (0.30 | ) | | | 2.56 | | | | 0.15 | | | | 1.24 | | | | 3.07 | | |
| Less distributions: | |
| Net investment income | | $ | 0.16 | | | | 0.09 | | | | 0.12 | | | | 0.08 | | | | 0.08 | | |
| Net realized gains on investments | | $ | 1.10 | | | | 0.75 | | | | — | | | | — | | | | — | | |
| Total distributions | | $ | 1.26 | | | | 0.84 | | | | 0.12 | | | | 0.08 | | | | 0.08 | | |
| Net asset value, end of year | | $ | 14.24 | | | | 15.80 | | | | 14.08 | | | | 14.05 | | | | 12.89 | | |
| Total Return(1) | | % | (2.17 | ) | | | 18.89 | | | | 1.09 | | | | 9.70 | | | | 31.13 | | |
| Ratios and Supplemental Data: | |
| Net assets, end of year (000's) | | $ | 9,497 | | | | 10,524 | | | | 11,806 | | | | 8,684 | | | | 7,313 | | |
| Ratios to average net assets: | |
| Expenses | | % | 1.50 | | | | 1.50 | | | | 1.50 | | | | 1.50 | | | | 1.50 | | |
| Net investment income | | % | 1.20 | | | | 1.21 | | | | 0.87 | | | | 0.81 | | | | 0.75 | | |
| Portfolio turnover rate | | % | 44 | | | | 56 | | | | 105 | | | | 38 | | | | 38 | | |
(1) Total return is calculated assuming reinvestment of all dividends and capital gain distributions at net asset value and does not reflect the effect of insurance contract charges.
* Calculated using average number of shares outstanding throughout the period.
See Accompanying Notes to Financial Statements
100
ING AMERICAN CENTURY SMALL-MID CAP VALUE PORTFOLIO
FINANCIAL HIGHLIGHTS
Selected data for a share of beneficial interest outstanding throughout each year.
| | | Class I | |
| | | Year Ended December 31, | |
| | | 2007 | | 2006 | | 2005 | | 2004 | | 2003 | |
| Per Share Operating Performance: | |
| Net asset value, beginning of year | | $ | 13.58 | | | | 11.77 | | | | 12.24 | | | | 10.77 | | | | 8.16 | | |
| Income (loss) from investment operations: | |
| Net investment income | | $ | 0.14 | * | | | 0.09 | * | | | 0.06 | | | | 0.03 | | | | 0.02 | | |
Net realized and unrealized gain (loss)
on investments | | $ | (0.43 | ) | | | 1.75 | | | | 0.94 | | | | 2.28 | | | | 2.89 | | |
| Total from investment operations | | $ | (0.29 | ) | | | 1.84 | | | | 1.00 | | | | 2.31 | | | | 2.91 | | |
| Less distributions: | |
| Net investment income | | $ | 0.09 | | | | 0.00 | ** | | | 0.05 | | | | 0.02 | | | | 0.03 | | |
| Net realized gains on investments | | $ | 1.74 | | | | 0.03 | | | | 1.42 | | | | 0.82 | | | | 0.27 | | |
| Total distributions | | $ | 1.83 | | | | 0.03 | | | | 1.47 | | | | 0.84 | | | | 0.30 | | |
| Net asset value, end of year | | $ | 11.46 | | | | 13.58 | | | | 11.77 | | | | 12.24 | | | | 10.77 | | |
| Total Return(1) | | % | (2.70 | ) | | | 15.75 | | | | 8.17 | | | | 21.61 | | | | 35.84 | | |
| Ratios and Supplemental Data: | |
| Net assets, end of year (000's) | | $ | 47,079 | | | | 48,088 | | | | 46,237 | | | | 28,433 | | | | 8,007 | | |
| Ratios to average net assets: | | | | | | | | | | | | | | | | | | | | | |
| Gross expenses prior to expense reimbursement | | % | 1.25 | | | | 1.25 | | | | 1.30 | | | | 1.30 | | | | 1.40 | | |
| Net expenses after expense reimbursement(2) | | % | 1.02 | | | | 1.22 | | | | 1.30 | | | | 1.30 | | | | 1.32 | | |
Net investment income after expense
reimbursement(2) | | % | 1.09 | | | | 0.71 | | | | 0.61 | | | | 0.35 | | | | 0.53 | | |
| Portfolio turnover rate | | % | 146 | | | | 156 | | | | 101 | | | | 107 | | | | 137 | | |
| | | Class S | |
| | | Year Ended December 31, | |
| | | 2007 | | 2006 | | 2005 | | 2004 | | 2003 | |
| Per Share Operating Performance: | |
| Net asset value, beginning of year | | $ | 13.51 | | | | 11.74 | | | | 12.22 | | | | 10.76 | | | | 8.15 | | |
| Income (loss) from investment operations: | |
| Net investment income | | $ | 0.11 | * | | | 0.05 | | | | 0.04 | | | | 0.00 | ** | | | 0.02 | | |
Net realized and unrealized gain (loss)
on investments | | $ | (0.42 | ) | | | 1.75 | | | | 0.92 | | | | 2.28 | | | | 2.87 | | |
| Total from investment operations | | $ | (0.31 | ) | | | 1.80 | | | | 0.96 | | | | 2.28 | | | | 2.89 | | |
| Less distributions: | |
| Net investment income | | $ | 0.06 | | | | 0.00 | ** | | | 0.02 | | | | 0.00 | ** | | | 0.01 | | |
| Net realized gains on investments | | $ | 1.74 | | | | 0.03 | | | | 1.42 | | | | 0.82 | | | | 0.27 | | |
| Total distributions | | $ | 1.80 | | | | 0.03 | | | | 1.44 | | | | 0.82 | | | | 0.28 | | |
| Net asset value, end of year | | $ | 11.40 | | | | 13.51 | | | | 11.74 | | | | 12.22 | | | | 10.76 | | |
| Total Return(1) | | % | (2.90 | ) | | | 15.43 | | | | 7.85 | | | | 21.34 | | | | 35.49 | | |
| Ratios and Supplemental Data: | |
| Net assets, end of year (000's) | | $ | 40,309 | | | | 47,839 | | | | 43,053 | | | | 37,816 | | | | 12,363 | | |
| Ratios to average net assets: | | | | | | | | | | | | | | | | | | | | | |
| Gross expenses prior to expense reimbursement | | % | 1.50 | | | | 1.50 | | | | 1.55 | | | | 1.55 | | | | 1.65 | | |
| Net expenses after expense reimbursement(2) | | % | 1.27 | | | | 1.47 | | | | 1.55 | | | | 1.55 | | | | 1.57 | | |
Net investment income after expense
reimbursement(2) | | % | 0.82 | | | | 0.39 | | | | 0.35 | | | | 0.09 | | | | 0.23 | | |
| Portfolio turnover rate | | % | 146 | | | | 156 | | | | 101 | | | | 107 | | | | 137 | | |
(1) Total return is calculated assuming reinvestment of all dividends and capital gain distributions at net asset value and does not reflect the effect of insurance contract charges. Total return for periods less than one year is not annualized.
(2) The Investment Adviser has agreed to limit expenses, (excluding interest, taxes, brokerage and extraordinary expenses) subject to possible recoupment by the Investment Adviser within three years of being incurred.
* Calculated using average number of shares outstanding throughout the period.
** Amount is less than $ 0.005.
See Accompanying Notes to Financial Statements
101
ING AMERICAN CENTURY SMALL-MID CAP VALUE PORTFOLIO (CONTINUED)
FINANCIAL HIGHLIGHTS
Selected data for a share of beneficial interest outstanding throughout each period.
| | | Class ADV | |
| | | Year Ended December 31, | |
| | | 2007 | | 2006 | | 2005 | | 2004 | | 2003 | |
| Per Share Operating Performance: | |
| Net asset value, beginning of year | | $ | 13.35 | | | | 11.63 | | | | 12.13 | | | | 10.71 | | | | 8.13 | | |
| Income (loss) from investment operations: | | | | | | | | | | | | | | | | | | | | | |
| Net investment income (loss) | | $ | 0.08 | ** | | | 0.02 | | | | 0.01 | | | | (0.02 | ) | | | 0.01 | | |
Net realized and unrealized gain (loss)
on investments | | $ | (0.42 | ) | | | 1.73 | | | | 0.92 | | | | 2.26 | | | | 2.84 | | |
| Total from investment operations | | $ | (0.34 | ) | | | 1.75 | | | | 0.93 | | | | 2.24 | | | | 2.85 | | |
| Less distributions: | | | | | | | | | | | | | | | | | | | | | |
| Net investment income | | $ | 0.03 | | | | 0.00 | * | | | 0.01 | | | | — | | | | 0.00 | * | |
| Net realized gains on investments | | $ | 1.74 | | | | 0.03 | | | | 1.42 | | | | 0.82 | | | | 0.27 | | |
| Total distributions | | $ | 1.77 | | | | 0.03 | | | | 1.43 | | | | 0.82 | | | | 0.27 | | |
| Net asset value, end of year | | $ | 11.24 | | | | 13.35 | | | | 11.63 | | | | 12.13 | | | | 10.71 | | |
| Total Return(1) | | % | (3.17 | ) | | | 15.14 | | | | 7.65 | | | | 21.03 | | | | 35.08 | | |
| Ratios and Supplemental Data: | |
| Net assets, end of year (000's) | | $ | 12,309 | | | | 12,602 | | | | 11,023 | | | | 5,266 | | | | 2,843 | | |
| Ratios to average net assets: | | | | | | | | | | | | | | | | | | | | | |
| Gross expenses prior to expense reimbursement | | % | 1.75 | | | | 1.75 | | | | 1.80 | | | | 1.80 | | | | 1.90 | | |
| Net expenses after expense reimbursement(2) | | % | 1.52 | | | | 1.72 | | | | 1.80 | | | | 1.80 | | | | 1.82 | | |
Net investment income (loss) after expense
reimbursement(2) | | % | 0.58 | | | | 0.18 | | | | 0.10 | | | | (0.14 | ) | | | 0.00 | * | |
| Portfolio turnover rate | | % | 146 | | | | 156 | | | | 101 | | | | 107 | | | | 137 | | |
(1) Total return is calculated assuming reinvestment of all dividends and capital gain distributions at net asset value and does not reflect the effect of insurance contract charges.
(2) The Investment Adviser has agreed to limit expenses, (excluding interest, taxes, brokerage and extraordinary expenses) subject to possible recoupment by the Investment Adviser within three years of being incurred.
* Amount is less than $0.005 or 0.005%.
** Calculated using average number of shares outstanding throughout the period.
See Accompanying Notes to Financial Statements
102
ING BARON ASSET PORTFOLIO
FINANCIAL HIGHLIGHTS
Selected data for a share of beneficial interest outstanding throughout each period.
| | | Class I | | Class S | |
| | | Year
Ended
December 31,
2007 | | January 3,
2006(1) to
December 31,
2006 | | Year
Ended
December 31,
2007 | | May 3
2006(1) to
December 31,
2006 | |
| Per Share Operating Performance: | |
| Net asset value, beginning of period | | $ | 11.14 | | | | 10.00 | | | | 11.10 | | | | 10.73 | | |
| Income (loss) from investment operations: | | | | | | | | | | | | | | | | | |
| Net investment income (loss) | | $ | 0.01 | | | | (0.00 | )** | | | (0.01 | ) | | | 0.03 | * | |
| Net realized and unrealized gain on investments | | $ | 1.02 | | | | 1.14 | | | | 1.00 | | | | 0.34 | | |
| Total from investment operations | | $ | 1.03 | | | | 1.14 | | | | 0.99 | | | | 0.37 | | |
| Net asset value, end of period | | $ | 12.17 | | | | 11.14 | | | | 12.09 | | | | 11.10 | | |
| Total Return(2) | | % | 9.25 | | | | 11.40 | | | | 8.92 | | | | 3.45 | | |
| Ratios and Supplemental Data: | |
| Net assets, end of period (000's) | | $ | 25,781 | | | | 5,583 | | | | 4,731 | | | | 313 | | |
| Ratios to average net assets: | | | | | | | | | | | | | | | | | |
| Gross expenses prior to expense reimbursement(3) | | % | 1.14 | | | | 1.58 | | | | 1.39 | | | | 1.83 | | |
| Net expenses after expense reimbursement(3)(4) | | % | 1.05 | | | | 1.05 | | | | 1.30 | | | | 1.30 | | |
| Net investment income (loss) after expense reimbursement(3)(4) | | % | 0.07 | | | | (0.05 | ) | | | (0.14 | ) | | | 0.31 | | |
| Portfolio turnover rate | | % | 18 | | | | 23 | | | | 18 | | | | 23 | | |
| | | Class ADV | |
| | | Year
Ended
December 31,
2007 | | January 18,
2006(1) to
December 31
2006 | |
| Per Share Operating Performance: | |
| Net asset value, beginning of period | | $ | 11.09 | | | | 10.04 | | |
| Income (loss) from investment operations: | |
| Net investment loss | | $ | (0.05 | ) | | | (0.06 | ) | |
| Net realized and unrealized gain on investments | | $ | 1.01 | | | | 1.11 | | |
| Total from investment operations | | $ | 0.96 | | | | 1.05 | | |
| Net asset value, end of period | | $ | 12.05 | | | | 11.09 | | |
| Total Return(2) | | % | 8.66 | | | | 10.46 | | |
| Ratios and Supplemental Data: | |
| Net assets, end of period (000's) | | $ | 3,499 | | | | 3,211 | | |
| Ratios to average net assets: | |
| Gross expenses prior to expense reimbursement(3) | | % | 1.64 | | | | 2.08 | | |
| Net expenses after expense reimbursement(3)(4) | | % | 1.55 | | | | 1.55 | | |
| Net investment loss after expense reimbursement(3)(4) | | % | (0.44 | ) | | | (0.57 | ) | |
| Portfolio turnover rate | | % | 18 | | | | 23 | | |
(1) Commencement of operations.
(2) Total return is calculated assuming reinvestment of all dividends and capital gain distributions at net asset value and does not reflect the effect of insurance contract charges. Total return for periods less than one year is not annualized.
(3) Annualized for periods less than one year.
(4) The Investment Adviser has agreed to limit expenses, (excluding interest, taxes, brokerage and extraordinary expenses) subject to possible recoupment by the Investment Adviser within three years of being incurred.
* Calculated using average number of shares outstanding throughout the period.
** Amount is more than $(0.005).
See Accompanying Notes to Financial Statements
103
ING BARON SMALL CAP GROWTH PORTFOLIO
FINANCIAL HIGHLIGHTS
Selected data for a share of beneficial interest outstanding throughout each year.
| | | Class I | |
| | | Year Ended December 31,, | |
| | | 2007 | | 2006 | | 2005 | | 2004 | | 2003 | |
| Per Share Operating Performance: | |
| Net asset value, beginning of year | | $ | 18.55 | | | | 16.21 | | | | 15.06 | | | | 11.74 | | | | 8.77 | | |
| Income (loss) from investment operations: | | | | | | | | | | | | | | | | | | | | | |
| Net investment loss | | $ | (0.02 | ) | | | (0.02 | ) | | | (0.14 | )* | | | (0.07 | ) | | | (0.05 | ) | |
Net realized and unrealized gain
on investments | | $ | 1.20 | | | | 2.51 | | | | 1.29 | | | | 3.39 | | | | 3.02 | | |
| Total from investment operations | | $ | 1.18 | | | | 2.49 | | | | 1.15 | | | | 3.32 | | | | 2.97 | | |
| Less distributions: | | | | | | | | | | | | | | | | | | | | | |
| Net realized gains on investments | | $ | — | | | | 0.15 | | | | — | | | | — | | | | — | | |
| Total distributions | | $ | — | | | | 0.15 | | | | — | | | | — | | | | — | | |
| Net asset value, end of year | | $ | 19.73 | | | | 18.55 | | | | 16.21 | | | | 15.06 | | | | 11.74 | | |
| Total Return(1) | | % | 6.36 | | | | 15.54 | | | | 7.64 | | | | 28.28 | | | | 33.87 | | |
| Ratios and Supplemental Data: | |
| Net assets, end of year (000's) | | $ | 181,259 | | | | 130,780 | | | | 81,664 | | | | 29,954 | | | | 10,522 | | |
| Ratios to average net assets: | | | | | | | | | | | | | | | | | | | | | |
Gross expenses prior to expense reimbursement
and brokerage commission recapture | | % | 1.08 | | | | 1.08 | | | | 1.25 | | | | 1.20 | | | | 1.25 | | |
Net expenses after expense reimbursement and
prior to brokerage commission recapture | | % | 1.08 | | | | 1.08 | | | | 1.20 | | | | 1.20 | | | | 1.21 | | |
Net expenses after expense reimbursement and
brokerage commission recapture | | % | 1.08 | | | | 1.08 | | | | 1.20 | | | | 1.20 | | | | 1.21 | | |
Net investment loss after expense reimbursement
and brokerage commission recapture | | % | (0.10 | ) | | | (0.13 | ) | | | (0.87 | ) | | | (0.71 | ) | | | (0.90 | ) | |
| Portfolio turnover rate | | % | 23 | | | | 15 | | | | 11 | | | | 19 | | | | 19 | | |
| | | Class S | |
| | | Year Ended December 31, | |
| | | 2007 | | 2006 | | 2005 | | 2004 | | 2003 | |
| Per Share Operating Performance: | |
| Net asset value, beginning of year | | $ | 18.33 | | | | 16.06 | | | | 14.96 | | | | 11.69 | | | | 8.76 | | |
| Income (loss) from investment operations: | | | | | | | | | | | | | | | | | | | | | |
| Net investment loss | | $ | (0.06 | ) | | | (0.06 | ) | | | (0.14 | )* | | | (0.09 | ) | | | (0.07 | ) | |
Net realized and unrealized gain
on investments | | $ | 1.18 | | | | 2.48 | | | | 1.24 | | | | 3.36 | | | | 3.00 | | |
| Total from investment operations | | $ | 1.12 | | | | 2.42 | | | | 1.10 | | | | 3.27 | | | | 2.93 | | |
| Less distributions: | | | | | | | | | | | | | | | | | | | | | |
| Net realized gains on investments | | $ | — | | | | 0.15 | | | | — | | | | — | | | | — | | |
| Total distributions | | $ | — | | | | 0.15 | | | | — | | | | — | | | | — | | |
| Net asset value, end of year | | $ | 19.45 | | | | 18.33 | | | | 16.06 | | | | 14.96 | | | | 11.69 | | |
| Total Return(1) | | % | 6.11 | | | | 15.24 | | | | 7.35 | | | | 27.97 | | | | 33.45 | | |
| Ratios and Supplemental Data: | |
| Net assets, end of year (000's) | | $ | 415,539 | | | | 299,287 | | | | 207,527 | | | | 114,112 | | | | 44,200 | | |
| Ratios to average net assets: | | | | | | | | | | | | | | | | | | | | | |
Gross expenses prior to expense reimbursement
and brokerage commission recapture | | % | 1.33 | | | | 1.33 | | | | 1.50 | | | | 1.45 | | | | 1.50 | | |
Net expenses after expense reimbursement and
prior to brokerage commission recapture | | % | 1.32 | | | | 1.33 | | | | 1.45 | | | | 1.45 | | | | 1.46 | | |
Net expenses after expense reimbursement and
brokerage commission recapture | | % | 1.32 | | | | 1.33 | | | | 1.45 | | | | 1.45 | | | | 1.46 | | |
Net investment loss after expense reimbursement
and brokerage commission recapture | | % | (0.34 | ) | | | (0.38 | ) | | | (0.92 | ) | | | (0.96 | ) | | | (1.15 | ) | |
| Portfolio turnover rate | | % | 23 | | | | 15 | | | | 11 | | | | 19 | | | | 19 | | |
(1) Total return is calculated assuming reinvestment of all dividends and capital gain distributions at net asset value and does not reflect the effect of insurance contract charges.
* Calculated using average number of shares outstanding throughout the period.
See Accompanying Notes to Financial Statements
104
ING BARON SMALL CAP GROWTH PORTFOLIO (CONTINUED)
FINANCIAL HIGHLIGHTS
Selected data for a share of beneficial interest outstanding throughout each year.
| | | Class ADV | |
| | | Year Ended December 31, | |
| | | 2007 | | 2006 | | 2005 | | 2004 | | 2003 | |
| Per Share Operating Performance: | |
| Net asset value, beginning of year | | $ | 18.11 | | | | 15.90 | | | | 14.85 | | | | 11.64 | | | | 8.74 | | |
| Income (loss) from investment operations: | | | | | | | | | | | | | | | | | | | | | |
| Net investment loss | | $ | (0.12 | ) | | | (0.10 | ) | | | (0.19 | )* | | | (0.09 | ) | | | (0.12 | ) | |
Net realized and unrealized gain
on investments | | $ | 1.17 | | | | 2.46 | | | | 1.24 | | | | 3.30 | | | | 3.02 | | |
| Total from investment operations | | $ | 1.05 | | | | 2.36 | | | | 1.05 | | | | 3.21 | | | | 2.90 | | |
| Less distributions: | | | | | | | | | | | | | | | | | | | | | |
| Net realized gains on investments | | $ | — | | | | 0.15 | | | | — | | | | — | | | | — | | |
| Total distributions | | $ | — | | | | 0.15 | | | | — | | | | — | | | | — | | |
| Net asset value, end of year | | $ | 19.16 | | | | 18.11 | | | | 15.90 | | | | 14.85 | | | | 11.64 | | |
| Total Return(1) | | % | 5.80 | | | | 15.02 | | | | 7.07 | | | | 27.58 | | | | 33.18 | | |
| Ratios and Supplemental Data: | |
| Net assets, end of year (000's) | | $ | 48,449 | | | | 45,591 | | | | 31,565 | | | | 17,106 | | | | 3,950 | | |
| Ratios to average net assets: | | | | | | | | | | | | | | | | | | | | | |
Gross expenses prior to expense reimbursements
and brokerage commission recapture | | % | 1.58 | | | | 1.58 | | | | 1.75 | | | | 1.70 | | | | 1.75 | | |
Net expenses after expense reimbursement and
prior to brokerage commission recapture | | % | 1.58 | | | | 1.58 | | | | 1.70 | | | | 1.70 | | | | 1.71 | | |
Net expenses after expense reimbursement and
brokerage commission recapture | | % | 1.58 | | | | 1.58 | | | | 1.70 | | | | 1.70 | | | | 1.71 | | |
Net investment loss after expense reimbursement
and brokerage commission recapture | | % | (0.61 | ) | | | (0.63 | ) | | | (1.23 | ) | | | (1.22 | ) | | | (1.42 | ) | |
| Portfolio turnover rate | | % | 23 | | | | 15 | | | | 11 | | | | 19 | | | | 19 | | |
(1)�� Total return is calculated assuming reinvestment of all dividends and capital gain distributions at net asset value and does not reflect the effect of insurance contract charges.
* Calculated using average number of shares outstanding throughout the period.
See Accompanying Notes to Financial Statements
105
ING COLUMBIA SMALL CAP VALUE II PORTFOLIO
FINANCIAL HIGHLIGHTS
Selected data for a share of beneficial interest outstanding throughout each period.
| | | Class I | | Class S | |
| | | Year
Ended
December 31,
2007 | | April 28,
2006(1) to
December 31,
2006 | | Year
Ended
December 31,
2007 | | May 1,
2006(1) to
December 31,
2006 | |
| Per Share Operating Performance: | |
| Net asset value, beginning of period | | $ | 10.17 | | | | 10.00 | | | | 10.15 | | | | 9.95 | | |
| Income from investment operations: | | | | | | | | | | | | | | | | | |
| Net investment income | | $ | 0.10 | * | | | 0.05 | | | | 0.07 | * | | | 0.04 | * | |
| Net realized and unrealized gain on investments | | $ | 0.23 | | | | 0.12 | | | | 0.23 | | | | 0.16 | | |
| Total from investment operations | | $ | 0.33 | | | | 0.17 | | | | 0.30 | | | | 0.20 | | |
| Less distributions: | |
| Net investment income | | $ | 0.02 | | | | — | | | | 0.01 | | | | — | | |
| Total distributions | | $ | 0.02 | | | | — | | | | 0.01 | | | | — | | |
| Net asset value, end of period | | $ | 10.48 | | | | 10.17 | | | | 10.44 | | | | 10.15 | | |
| Total Return(2) | | % | 3.21 | | | | 1.70 | | | | 2.97 | | | | 2.01 | | |
| Ratios and Supplemental Data: | |
| Net assets, end of period (000's) | | $ | 46,922 | | | | 11,698 | | | | 161,301 | | | | 76,010 | | |
| Ratios to average net assets: | | | | | | | | | | | | | | | | | |
| Gross expenses prior to brokerage commission recapture(3) | | % | 0.88 | | | | 0.99 | | | | 1.13 | | | | 1.24 | | |
| Net expenses after brokerage commission recapture(3)(4) | | % | 0.85 | | | | 0.96 | | | | 1.10 | | | | 1.21 | | |
| Net investment income after brokerage commission recapture(3)(4) | | % | 0.94 | | | | 0.78 | | | | 0.65 | | | | 0.53 | | |
| Portfolio turnover rate | | % | 50 | | | | 48 | | | | 50 | | | | 48 | | |
| | | Class ADV | |
| | | Year
Ended
December 31,
2007 | | December 29,
2006(1) to
December 31,
2006 | |
| Per Share Operating Performance: | |
| Net asset value, beginning of period | | $ | 10.15 | | | | 10.15 | | |
| Income (loss) from investment operations: | |
| Net investment income (loss) | | $ | 0.05 | * | | | (0.00 | )** | |
| Net realized and unrealized gain on investments | | $ | 0.23 | | | | — | | |
| Total from investment operations | | $ | 0.28 | | | | (0.00 | )** | |
| Less distributions: | | | | | | | | | |
| Net investment income | | $ | 0.02 | | | | — | | |
| Total distributions | | $ | 0.02 | | | | — | | |
| Net asset value, end of period | | $ | 10.41 | | | | 10.15 | | |
| Total Return(2) | | % | 2.73 | | | | — | | |
| Ratios and Supplemental Data: | |
| Net assets, end of period (000's) | | $ | 330 | | | | 1 | | |
| Ratios to average net assets: | |
| Gross expenses prior to brokerage commission recapture(3) | | % | 1.38 | | | | 1.49 | | |
| Net expenses after brokerage commission recapture(3)(4) | | % | 1.35 | | | | 1.46 | | |
| Net investment income (loss) after brokerage commission recapture(3)(4) | | % | 0.50 | | | | (1.46 | ) | |
| Portfolio turnover rate | | % | 50 | | | | 48 | | |
(1) Commencement of operations.
(2) Total return is calculated assuming reinvestment of all dividends and capital gain distributions at net asset value and does not reflect the effect of insurance contract charges. Total return for periods less than one year is not annualized.
(3) Annualized for periods less than one year.
(4) The Investment Adviser has agreed to limit expenses, (excluding interest, taxes, brokerage and extraordinary expenses) subject to possible recoupment by the Investment Adviser within three years of being incurred.
* Calculated using average number of shares outstanding throughout the period.
** Amount is more than $(0.005).
See Accompanying Notes to Financial Statements
106
ING DAVIS NEW YORK VENTURE PORTFOLIO
FINANCIAL HIGHLIGHTS
Selected data for a share of beneficial interest outstanding throughout each year.
| | | Class I | |
| | | Year Ended December 31, | |
| | | 2007 | | 2006 | | 2005 | | 2004 | | 2003 | |
| Per Share Operating Performance: | |
| Net asset value, beginning of year | | $ | 19.87 | | | | 18.79 | | | | 18.09 | | | | 16.64 | | | | 12.00 | | |
| Income (loss) from investment operations: | | | | | | | | | | | | | | | | | | | | | |
| Net investment income (loss) | | $ | 0.31 | * | | | 0.18 | * | | | 0.06 | * | | | 0.05 | | | | (0.03 | )* | |
Net realized and unrealized gain
on investments | | $ | 0.57 | | | | 2.34 | | | | 0.66 | | | | 1.40 | | | | 4.92 | | |
| Total from investment operations | | $ | 0.88 | | | | 2.52 | | | | 0.72 | | | | 1.45 | | | | 4.89 | | |
| Less distributions: | | | | | | | | | | | | | | | | | | | | | |
| Net investment income | | $ | 0.07 | | | | 0.01 | | | | 0.02 | | | | — | | | | 0.25 | | |
| Net realized gains on investments | | $ | 0.08 | | | | 1.43 | | | | — | | | | — | | | | — | | |
| Total distributions | | $ | 0.15 | | | | 1.44 | | | | 0.02 | | | | — | | | | 0.25 | | |
| Net asset value, end of year | | $ | 20.60 | | | | 19.87 | | | | 18.79 | | | | 18.09 | | | | 16.64 | | |
| Total Return(1) | | % | 4.43 | | | | 14.19 | | | | 4.10 | | | | 8.71 | | | | 41.06 | | |
| Ratios and Supplemental Data: | |
| Net assets, end of year (000's) | | $ | 101,763 | | | | 59,749 | | | | 3,108 | | | | 3,295 | | | | 2,102 | | |
| Ratios to average net assets: | | | | | | | | | | | | | | | | | | | | | |
| Expenses | | % | 0.90 | | | | 0.90 | | | | 1.07 | | | | 1.10 | | | | 1.10 | | |
| Net investment income (loss) | | % | 1.49 | | | | 0.94 | | | | 0.33 | | | | 0.31 | | | | (0.21 | ) | |
| Portfolio turnover rate | | % | 10 | | | | 6 | | | | 110 | | | | 33 | | | | 105 | | |
| | | Class S | |
| | | Year Ended December 31, | |
| | | 2007 | | 2006 | | 2005 | | 2004 | | 2003 | |
| Per Share Operating Performance: | |
| Net asset value, beginning of year | | $ | 19.70 | | | | 18.69 | | | | 17.99 | | | | 16.59 | | | | 11.97 | | |
| Income (loss) from investment operations: | | | | | | | | | | | | | | | | | | | | | |
| Net investment income (loss) | | $ | 0.25 | * | | | 0.13 | * | | | 0.01 | * | | | 0.00 | ** | | | (0.02 | )* | |
Net realized and unrealized gain
on investments | | $ | 0.57 | | | | 2.31 | | | | 0.69 | | | | 1.40 | | | | 4.86 | | |
| Total from investment operations | | $ | 0.82 | | | | 2.44 | | | | 0.70 | | | | 1.40 | | | | 4.84 | | |
| Less distributions: | | | | | | | | | | | | | | | | | | | | | |
| Net investment income | | $ | 0.05 | | | | — | | | | — | | | | — | | | | 0.22 | | |
| Net realized gains on investments | | $ | 0.08 | | | | 1.43 | | | | — | | | | — | | | | — | | |
| Total distributions | | $ | 0.13 | | | | 1.43 | | | | — | | | | — | | | | 0.22 | | |
| Net asset value, end of year | | $ | 20.39 | | | | 19.70 | | | | 18.69 | | | | 17.99 | | | | 16.59 | | |
| Total Return(1) | | % | 4.16 | | | | 13.85 | | | | 3.89 | | | | 8.44 | | | | 40.68 | | |
| Ratios and Supplemental Data: | |
| Net assets, end of year (000's) | | $ | 231,511 | | | | 134,821 | | | | 41,822 | | | | 56,159 | | | | 56,159 | | |
| Ratios to average net assets: | | | | | | | | | | | | | | | | | | | | | |
| Expenses | | % | 1.15 | | | | 1.15 | | | | 1.32 | | | | 1.35 | | | | 1.35 | | |
| Net investment income (loss) | | % | 1.23 | | | | 0.69 | | | | 0.06 | | | | 0.02 | | | | (0.17 | ) | |
| Portfolio turnover rate | | % | 10 | | | | 6 | | | | 110 | | | | 33 | | | | 105 | | |
(1) Total return is calculated assuming reinvestment of all dividends and capital gain distributions at net asset value and does not reflect the effect of insurance contract charges.
* Calculated using average number of shares outstanding throughout the period.
** Amount is less than $0.005.
See Accompanying Notes to Financial Statements
107
ING DAVIS NEW YORK VENTURE PORTFOLIO (CONTINUED)
FINANCIAL
HIGHLIGHTS
Selected data for a share of beneficial interest outstanding throughout each year.
| | | Class ADV | |
| | | Year Ended December 31, | |
| | | 2007 | | 2006 | | 2005 | | 2004 | | 2003 | |
| Per Share Operating Performance: | |
| Net asset value, beginning of year | | $ | 19.39 | | | | 18.46 | | | | 17.82 | | | | 16.47 | | | | 11.94 | | |
| Income (loss) from investment operations: | | | | | | | | | | | | | | | | | | | | | |
| Net investment income (loss) | | $ | 0.19 | * | | | 0.07 | | | | (0.03 | )* | | | (0.02 | ) | | | (0.07 | )* | |
Net realized and unrealized gain
on investments | | $ | 0.57 | | | | 2.29 | | | | 0.67 | | | | 1.37 | | | | 4.85 | | |
| Total from investment operations | | $ | 0.76 | | | | 2.36 | | | | 0.64 | | | | 1.35 | | | | 4.78 | | |
| Less distributions: | | | | | | | | | | | | | | | | | | | | | |
| Net investment income | | $ | — | | | | — | | | | 0.00 | ** | | | — | | | | 0.25 | | |
| Net realized gains on investments | | $ | 0.08 | | | | 1.43 | | | | — | | | | — | | | | — | | |
| Total distributions | | $ | 0.08 | | | | 1.43 | | | | 0.00 | ** | | | — | | | | 0.25 | | |
| Net asset value, end of year | | $ | 20.07 | | | | 19.39 | | | | 18.46 | | | | 17.82 | | | | 16.47 | | |
| Total Return(1) | | % | 3.91 | | | | 13.58 | | | | 3.62 | | | | 8.20 | | | | 40.31 | | |
| Ratios and Supplemental Data: | |
| Net assets, end of year (000's) | | $ | 10,214 | | | | 13,203 | | | | 11,305 | | | | 10,195 | | | | 3,299 | | |
| Ratios to average net assets: | | | | | | | | | | | | | | | | | | | | | |
| Expenses | | % | 1.40 | | | | 1.40 | | | | 1.57 | | | | 1.60 | | | | 1.60 | | |
| Net investment income (loss) | | % | 0.94 | | | | 0.44 | | | | (0.18 | ) | | | (0.18 | ) | | | (0.51 | ) | |
| Portfolio turnover rate | | % | 10 | | | | 6 | | | | 110 | | | | 33 | | | | 105 | | |
(1) Total return is calculated assuming reinvestment of all dividends and capital gain distributions at net asset value and does not reflect the effect of insurance contract charges.
* Calculated using average number of shares outstanding throughout the period.
** Amount is less than $0.005.
See Accompanying Notes to Financial Statements
108
ING JPMORGAN INTERNATIONAL PORTFOLIO
FINANCIAL HIGHLIGHTS
Selected data for a share of beneficial interest outstanding throughout each year.
| | | Class I | |
| | | Year Ended December 31, | |
| | | 2007 | | 2006 | | 2005 | | 2004 | | 2003 | |
| Per Share Operating Performance: | |
| Net asset value, beginning of year | | $ | 16.26 | | | | 13.43 | | | | 12.31 | | | | 10.47 | | | | 8.16 | | |
| Income from investment operations: | | | | | | | | | | | | | | | | | | | | | |
| Net investment income | | $ | 0.26 | * | | | 0.20 | * | | | 0.17 | * | | | 0.18 | | | | 0.14 | | |
Net realized and unrealized gain
on investments | | $ | 1.37 | | | | 2.77 | | | | 1.04 | | | | 1.79 | | | | 2.26 | | |
| Total from investment operations | | $ | 1.63 | | | | 2.97 | | | | 1.21 | | | | 1.97 | | | | 2.40 | | |
| Less distributions: | | | | | | | | | | | | | | | | | | | | | |
| Net investment income | | $ | 0.37 | | | | 0.14 | | | | 0.09 | | | | 0.13 | | | | 0.09 | | |
| Total distributions | | $ | 0.37 | | | | 0.14 | | | | 0.09 | | | | 0.13 | | | | 0.09 | | |
| Net asset value, end of year | | $ | 17.52 | | | | 16.26 | | | | 13.43 | | | | 12.31 | | | | 10.47 | | |
| Total Return(1) | | % | 10.12 | | | | 22.20 | | | | 9.95 | | | | 18.99 | | | | 29.45 | | |
| Ratios and Supplemental Data: | |
| Net assets, end of year (000's) | | $ | 448,457 | | | | 941,150 | | | | 352,116 | | | | 374,309 | | | | 338,566 | | |
| Ratios to average net assets: | | | | | | | | | | | | | | | | | | | | | |
| Gross expenses prior to expense reimbursement | | % | 1.00 | | | | 1.00 | | | | 1.00 | | | | 1.00 | | | | 1.00 | | |
| Net expenses after expense reimbursement | | % | 0.99 | | | | 1.00 | | | | 1.00 | | | | 1.00 | | | | 1.00 | | |
Net investment income after expense
reimbursement | | % | 1.54 | | | | 1.32 | | | | 1.38 | | | | 1.46 | | | | 1.56 | | |
| Portfolio turnover rate | | % | 15 | | | | 22 | | | | 8 | | | | 12 | | | | 23 | | |
| | | Class S | |
| | | Year Ended December 31, | |
| | | 2007 | | 2006 | | 2005 | | 2004 | | 2003 | |
| Per Share Operating Performance: | |
| Net asset value, beginning of year | | $ | 16.24 | | | | 13.34 | | | | 12.24 | | | | 10.44 | | | | 8.15 | | |
| Income (loss) from investment operations: | | | | | | | | | | | | | | | | | | | | | |
| Net investment income (loss) | | $ | 0.21 | * | | | 0.15 | * | | | 0.13 | * | | | 0.11 | | | | (0.05 | ) | |
Net realized and unrealized gain
on investments | | $ | 1.37 | | | | 2.77 | | | | 1.06 | | | | 1.81 | | | | 2.43 | | |
| Total from investment operations | | $ | 1.58 | | | | 2.92 | | | | 1.19 | | | | 1.92 | | | | 2.38 | | |
| Less distributions: | | | | | | | | | | | | | | | | | | | | | |
| Net investment income | | $ | 0.31 | | | | 0.02 | | | | 0.09 | | | | 0.12 | | | | 0.09 | | |
| Total distributions | | $ | 0.31 | | | | 0.02 | | | | 0.09 | | | | 0.12 | | | | 0.09 | | |
| Net asset value, end of year | | $ | 17.51 | | | | 16.24 | | | | 13.34 | | | | 12.24 | | | | 10.44 | | |
| Total Return(1) | | % | 9.76 | | | | 21.92 | | | | 9.79 | | | | 18.65 | | | | 29.38 | | |
| Ratios and Supplemental Data: | |
| Net assets, end of year (000's) | | $ | 185,539 | | | | 155,075 | | | | 563,406 | | | | 201,653 | | | | 8,034 | | |
| Ratios to average net assets: | | | | | | | | | | | | | | | | | | | | | |
| Gross expenses prior to expense reimbursement | | % | 1.25 | | | | 1.25 | | | | 1.25 | | | | 1.25 | | | | 1.25 | | |
| Net expenses after expense reimbursement | | % | 1.24 | | | | 1.25 | | | | 1.25 | | | | 1.25 | | | | 1.25 | | |
Net investment income (loss) after expense
reimbursement | | % | 1.20 | | | | 1.05 | | | | 1.03 | | | | 0.85 | | | | (0.21 | ) | |
| Portfolio turnover rate | | % | 15 | | | | 22 | | | | 8 | | | | 12 | | | | 23 | | |
(1) Total return is calculated assuming reinvestment of all dividends and capital gain distributions at net asset value and does not reflect the effect of insurance contract charges.
* Calculated using average number of shares outstanding throughout the period.
See Accompanying Notes to Financial Statements
109
ING JPMORGAN INTERNATIONAL PORTFOLIO (CONTINUED)
FINANCIAL HIGHLIGHTS
Selected data for a share of beneficial interest outstanding throughout each year.
| | | Class ADV | |
| | | Year Ended December 31, | |
| | | 2007 | | 2006 | | 2005 | | 2004 | | 2003 | |
| Per Share Operating Performance: | |
| Net asset value, beginning of year | | $ | 16.02 | | | | 13.26 | | | | 12.18 | | | | 10.40 | | | | 8.13 | | |
| Income from investment operations: | | | | | | | | | | | | | | | | | | | | | |
| Net investment income | | $ | 0.15 | * | | | 0.10 | * | | | 0.10 | * | | | 0.08 | | | | 0.05 | | |
Net realized and unrealized gain
on investments | | $ | 1.37 | | | | 2.76 | | | | 1.04 | | | | 1.81 | | | | 2.30 | | |
| Total from investment operations | | $ | 1.52 | | | | 2.86 | | | | 1.14 | | | | 1.89 | | | | 2.35 | | |
| Less distributions: | | | | | | | | | | | | | | | | | | | | | |
| Net investment income | | $ | 0.34 | | | | 0.10 | | | | 0.06 | | | | 0.11 | | | | 0.08 | | |
| Total distributions | | $ | 0.34 | | | | 0.10 | | | | 0.06 | | | | 0.11 | | | | 0.08 | | |
| Net asset value, end of year | | $ | 17.20 | | | | 16.02 | | | | 13.26 | | | | 12.18 | | | | 10.40 | | |
| Total Return(1) | | % | 9.54 | | | | 21.65 | | | | 9.42 | | | | 18.34 | | | | 28.98 | | |
| Ratios and Supplemental Data: | |
| Net assets, end of year (000's) | | $ | 15,763 | | | | 10,215 | | | | 3,505 | | | | 2,224 | | | | 1,184 | | |
| Ratios to average net assets: | | | | | | | | | | | | | | | | | | | | | |
| Gross expenses prior to expense reimbursement | | % | 1.50 | | | | 1.50 | | | | 1.50 | | | | 1.50 | | | | 1.50 | | |
| Net expenses after expense reimbursement | | % | 1.49 | | | | 1.50 | | | | 1.50 | | | | 1.50 | | | | 1.50 | | |
Net investment income (loss) after expense
reimbursement | | % | 0.91 | | | | 0.68 | | | | 0.84 | | | | 0.85 | | | | 0.86 | | |
| Portfolio turnover rate | | % | 15 | | | | 22 | | | | 8 | | | | 12 | | | | 23 | | |
(1) Total return is calculated assuming reinvestment of all dividends and capital gain distributions at net asset value and does not reflect the effect of insurance contract charges.
* Calculated using average number of shares outstanding throughout the period.
See Accompanying Notes to Financial Statements
110
ING JPMORGAN MID CAP VALUE PORTFOLIO
FINANCIAL HIGHLIGHTS
Selected data for a share of beneficial interest outstanding throughout each year.
| | | Class I | |
| | | Year Ended December 31, | |
| | | 2007 | | 2006 | | 2005 | | 2004 | | 2003 | |
| Per Share Operating Performance: | |
| Net asset value, beginning of year | | $ | 16.26 | | | | 14.02 | | | | 13.93 | | | | 11.91 | | | | 9.24 | | |
| Income from investment operations: | | | | | | | | | | | | | | | | | | | | | |
| Net investment income | | $ | 0.19 | ** | | | 0.14 | | | | 0.08 | | | | 0.04 | | | | 0.05 | | |
Net realized and unrealized gain
on investments | | $ | 0.24 | | | | 2.21 | | | | 1.14 | | | | 2.44 | | | | 2.75 | | |
| Total from investment operations | | $ | 0.43 | | | | 2.35 | | | | 1.22 | | | | 2.48 | | | | 2.80 | | |
| Less distributions: | | | | | | | | | | | | | | | | | | | | | |
| Net investment income | | $ | 0.12 | | | | 0.00 | * | | | 0.08 | | | | 0.04 | | | | 0.05 | | |
| Net realized gains on investments | | $ | 0.80 | | | | 0.11 | | | | 1.05 | | | | 0.42 | | | | 0.08 | | |
| Total distributions | | $ | 0.92 | | | | 0.11 | | | | 1.13 | | | | 0.46 | | | | 0.13 | | |
| Net asset value, end of year | | $ | 15.77 | | | | 16.26 | | | | 14.02 | | | | 13.93 | | | | 11.91 | | |
| Total Return(1) | | % | 2.61 | | | | 16.84 | | | | 8.71 | | | | 20.88 | | | | 30.31 | | |
| Ratios and Supplemental Data: | |
| Net assets, end of year (000's) | | $ | 145,638 | | | | 125,602 | | | | 80,426 | | | | 55,163 | | | | 16,662 | | |
| Ratios to average net assets: | | | | | | | | | | | | | | | | | | | | | |
| Expenses | | % | 1.00 | | | | 1.03 | | | | 1.10 | | | | 1.10 | | | | 1.10 | | |
| Net investment income | | % | 1.15 | | | | 1.08 | | | | 0.67 | | | | 0.49 | | | | 1.04 | | |
| Portfolio turnover rate | | % | 52 | | | | 44 | | | | 52 | | | | 45 | | | | 44 | | |
| | | Class S | |
| | | Year Ended December 31, | |
| | | 2007 | | 2006 | | 2005 | | 2004 | | 2003 | |
| Per Share Operating Performance: | |
| Net asset value, beginning of year | | $ | 16.17 | | | | 13.98 | | | | 13.89 | | | | 11.89 | | | | 9.23 | | |
| Income from investment operations: | | | | | | | | | | | | | | | | | | | | | |
| Net investment income | | $ | 0.15 | | | | 0.12 | | | | 0.05 | | | | 0.02 | | | | 0.04 | | |
Net realized and unrealized gain
on investments | | $ | 0.24 | | | | 2.18 | | | | 1.13 | | | | 2.42 | | | | 2.73 | | |
| Total from investment operations | | $ | 0.39 | | | | 2.30 | | | | 1.18 | | | | 2.44 | | | | 2.77 | | |
| Less distributions: | | | | | | | | | | | | | | | | | | | | | |
| Net investment income | | $ | 0.09 | | | | 0.00 | * | | | 0.04 | | | | 0.02 | | | | 0.03 | | |
| Net realized gains on investments | | $ | 0.80 | | | | 0.11 | | | | 1.05 | | | | 0.42 | | | | 0.08 | | |
| Total distributions | | $ | 0.89 | | | | 0.11 | | | | 1.09 | | | | 0.44 | | | | 0.11 | | |
| Net asset value, end of year | | $ | 15.67 | | | | 16.17 | | | | 13.98 | | | | 13.89 | | | | 11.89 | | |
| Total Return(1) | | % | 2.34 | | | | 16.52 | | | | 8.49 | | | | 20.59 | | | | 30.05 | | |
| Ratios and Supplemental Data: | |
| Net assets, end of year (000's) | | $ | 89,851 | | | | 91,338 | | | | 78,459 | | | | 64,420 | | | | 16,372 | | |
| Ratios to average net assets: | | | | | | | | | | | | | | | | | | | | | |
| Expenses | | % | 1.25 | | | | 1.28 | | | | 1.35 | | | | 1.35 | | | | 1.35 | | |
| Net investment income | | % | 0.89 | | | | 0.81 | | | | 0.39 | | | | 0.26 | | | | 0.61 | | |
| Portfolio turnover rate | | % | 52 | | | | 44 | | | | 52 | | | | 45 | | | | 44 | | |
(2) Total return is calculated assuming reinvestment of all dividends and capital gain distributions at net asset value and does not reflect the effect of insurance contract charges.
* Amount is less than $0.005.
** Calculated using average number of shares outstanding throughout the period.
See Accompanying Notes to Financial Statements
111
ING JPMORGAN MID CAP VALUE PORTFOLIO (CONTINUED)
FINANCIAL HIGHLIGHTS
Selected data for a share of beneficial interest outstanding throughout each year.
| | | Class ADV | |
| | | Year Ended December 31, | |
| | | 2007 | | 2006 | | 2005 | | 2004 | | 2003 | |
| Per Share Operating Performance: | |
| Net asset value, beginning of year | | $ | 16.03 | | | | 13.89 | | | | 13.84 | | | | 11.86 | | | | 9.22 | | |
| Income (loss) from investment operations: | | | | | | | | | | | | | | | | | | | | | |
| Net investment income (loss) | | $ | 0.09 | | | | 0.07 | | | | 0.02 | | | | (0.00 | )* | | | 0.03 | | |
Net realized and unrealized gain
on investments | | $ | 0.25 | | | | 2.18 | | | | 1.11 | | | | 2.40 | | | | 2.70 | | |
| Total from investment operations | | $ | 0.34 | | | | 2.25 | | | | 1.13 | | | | 2.40 | | | | 2.73 | | |
| Less distributions: | | | | | | | | | | | | | | | | | | | | | |
| Net investment income | | $ | 0.07 | | | | 0.00 | * | | | 0.03 | | | | — | | | | 0.01 | | |
| Net realized gains on investments | | $ | 0.80 | | | | 0.11 | | | | 1.05 | | | | 0.42 | | | | 0.08 | | |
| Total distributions | | $ | 0.87 | | | | 0.11 | | | | 1.08 | | | | 0.42 | | | | 0.09 | | |
| Net asset value, end of year | | $ | 15.50 | | | | 16.03 | | | | 13.89 | | | | 13.84 | | | | 11.86 | | |
| Total Return(1) | | % | 2.06 | | | | 16.26 | | | | 8.11 | | | | 20.31 | | | | 29.68 | | |
| Ratios and Supplemental Data: | |
| Net assets, end of year (000's) | | $ | 24,824 | | | | 22,123 | | | | 12,408 | | | | 4,980 | | | | 1,354 | | |
| Ratios to average net assets: | | | | | | | | | | | | | | | | | | | | | |
| Expenses | | % | 1.50 | | | | 1.53 | | | | 1.60 | | | | 1.60 | | | | 1.60 | | |
| Net investment income (loss) | | % | 0.64 | | | | 0.61 | | | | 0.20 | | | | (0.02 | ) | | | 0.36 | | |
| Portfolio turnover rate | | % | 52 | | | | 44 | | | | 52 | | | | 45 | | | | 44 | | |
(1) Total return is calculated assuming reinvestment of all dividends and capital gain distributions at net asset value and does not reflect the effect of insurance contract charges.
* Amount is less than $0.005 or more than $(0.005).
See Accompanying Notes to Financial Statements
112
ING LEGG MASON PARTNERS AGGRESSIVE GROWTH PORTFOLIO
FINANCIAL HIGHLIGHTS
Selected data for a share of beneficial interest outstanding throughout each year.
| | | Class I | |
| | | Year Ended December 31, | |
| | | 2007 | | 2006 | | 2005 | | 2004 | | 2003 | |
| Per Share Operating Performance: | |
| Net asset value, beginning of year | | $ | 49.10 | | | | 44.52 | | | | 39.95 | | | | 36.41 | | | | 26.35 | | |
| Income (loss) from investment operations: | | | | | | | | | | | | | | | | | | | | | |
| Net investment income (loss) | | $ | (0.05 | ) | | | (0.02 | )* | | | (0.15 | ) | | | 0.03 | | | | (0.14 | )* | |
Net realized and unrealized gain
on investments | | $ | (0.74 | ) | | | 4.60 | | | | 4.72 | | | | 3.51 | | | | 10.20 | | |
| Total from investment operations | | $ | (0.79 | ) | | | 4.58 | | | | 4.57 | | | | 3.54 | | | | 10.06 | | |
| Net asset value, end of year | | $ | 48.31 | | | | 49.10 | | | | 44.52 | | | | 39.95 | | | | 36.41 | | |
| Total Return(1) | | % | (1.61 | ) | | | 10.29 | | | | 11.44 | † | | | 9.72 | | | | 38.18 | | |
| Ratios and Supplemental Data: | |
| Net assets, end of year (000's) | | $ | 1,103,033 | | | | 1,155,244 | | | | 531,343 | | | | 575,903 | | | | 610,593 | | |
| Ratios to average net assets: | | | | | | | | | | | | | | | | | | | | | |
| Expenses | | % | 0.80 | | | | 0.80 | | | | 0.81 | | | | 0.82 | | | | 0.83 | | |
| Net investment income (loss) | | % | (0.11 | ) | | | (0.05 | ) | | | (0.33 | ) | | | 0.06 | | | | (0.46 | ) | |
| Portfolio turnover rate | | % | 5 | | | | 6 | | | | 10 | | | | 3 | | | | 0 | | |
| | | Class S | |
| | | Year Ended December 31, | |
| | | 2007 | | 2006 | | 2005 | | 2004 | | 2003 | |
| Per Share Operating Performance: | |
| Net asset value, beginning of year | | $ | 48.49 | | | | 44.08 | | | | 39.65 | | | | 36.23 | | | | 26.28 | | |
| Income (loss) from investment operations: | | | | | | | | | | | | | | | | | | | | | |
| Net investment loss | | $ | (0.18 | ) | | | (0.18 | )* | | | (0.23 | ) | | | (0.01 | ) | | | (0.28 | )* | |
Net realized and unrealized gain
on investments | | $ | (0.73 | ) | | | 4.59 | | | | 4.66 | | | | 3.43 | | | | 10.23 | | |
| Total from investment operations | | $ | (0.91 | ) | | | 4.41 | | | | 4.43 | | | | 3.42 | | | | 9.95 | | |
| Net asset value, end of year | | $ | 47.58 | | | | 48.49 | | | | 44.08 | | | | 39.65 | | | | 36.23 | | |
| Total Return(1) | | % | (1.88 | ) | | | 10.00 | | | | 11.17 | † | | | 9.44 | | | | 37.86 | | |
| Ratios and Supplemental Data: | |
| Net assets, end of year (000's) | | $ | 169,485 | | | | 186,363 | | | | 437,476 | | | | 355,857 | | | | 13,970 | | |
| Ratios to average net assets: | | | | | | | | | | | | | | | | | | | | | |
| Expenses | | % | 1.05 | | | | 1.05 | | | | 1.06 | | | | 1.07 | | | | 1.12 | | |
| Net investment loss | | % | (0.36 | ) | | | (0.40 | ) | | | (0.58 | ) | | | (0.04 | ) | | | (0.82 | ) | |
| Portfolio turnover rate | | % | 5 | | | | 6 | | | | 10 | | | | 3 | | | | 0 | | |
(1) Total return is calculated assuming reinvestment of all dividends and capital gain distributions at net asset value and does not reflect the effect of insurance contract charges.
* Calculated using average number of shares outstanding throughout the period.
† In 2005, there was no impact on total return from the gain realized on the disposal of investments made in violation of the Portfolio's investment restrictions.
See Accompanying Notes to Financial Statements
113
ING LEGG MASON PARTNERS AGGRESSIVE GROWTH PORTFOLIO (CONTINUED)
FINANCIAL HIGHLIGHTS
Selected data for a share of beneficial interest outstanding throughout each year.
| | | Class ADV | |
| | | Year Ended December 31, | |
| | | 2007 | | 2006 | | 2005 | | 2004 | | 2003 | |
| Per Share Operating Performance: | |
| Net asset value, beginning of year | | $ | 47.89 | | | | 43.64 | | | | 39.35 | | | | 36.04 | | | | 26.22 | | |
| Income (loss) from investment operations: | | | | | | | | | | | | | | | | | | | | | |
| Net investment loss | | $ | (0.29 | ) | | | (0.27 | )* | | | (0.33 | )* | | | (0.12 | ) | | | (0.28 | )* | |
Net realized and unrealized gain
on investments | | $ | (0.72 | ) | | | 4.52 | | | | 4.62 | | | | 3.43 | | | | 10.10 | | |
| Total from investment operations | | $ | (1.01 | ) | | | 4.25 | | | | 4.29 | | | | 3.31 | | | | 9.82 | | |
| Net asset value, end of year | | $ | 46.88 | | | | 47.89 | | | | 43.64 | | | | 39.35 | | | | 36.04 | | |
| Total Return(1) | | % | (2.11 | ) | | | 9.74 | | | | 10.90 | † | | | 9.18 | | | | 37.45 | | |
| Ratios and Supplemental Data: | |
| Net assets, end of year (000's) | | $ | 8,325 | | | | 8,459 | | | | 7,843 | | | | 3,196 | | | | 1,014 | | |
| Ratios to average net assets: | | | | | | | | | | | | | | | | | | | | | |
| Expenses | | % | 1.30 | | | | 1.30 | | | | 1.31 | | | | 1.32 | | | | 1.33 | | |
| Net investment loss | | % | (0.60 | ) | | | (0.59 | ) | | | (0.82 | ) | | | (0.45 | ) | | | (0.88 | ) | |
| Portfolio turnover rate | | % | 5 | | | | 6 | | | | 10 | | | | 3 | | | | 0 | | |
(1) Total return is calculated assuming reinvestment of all dividends and capital gain distributions at net asset value and does not reflect the effect of insurance contract charges.
* Calculated using average number of shares outstanding throughout the period.
† In 2005, there was no impact on total return from the gain realized on the disposal of investments made in violation of the Portfolio's investment restrictions.
See Accompanying Notes to Financial Statements
114
ING LEGG MASON PARTNERS LARGE CAP GROWTH PORTFOLIO
FINANCIAL HIGHLIGHTS
Selected data for a share of beneficial interest outstanding throughout each period.
| | | Class I | |
| | | Year Ended December 31, | | May 1,
2003(1) to
December 31, | |
| | | 2007 | | 2006 | | 2005 | | 2004 | | 2003 | |
| Per Share Operating Performance: | |
| Net asset value, beginning of period | | $ | 11.94 | | | | 11.66 | | | | 12.28 | | | | 12.13 | | | | 10.00 | | |
| Income (loss) from investment operations: | | | | | | | | | | | | | | | | | | | | | |
| Net investment income (loss) | | $ | (0.00 | )* | | | 0.01 | | | | 0.00 | * | | | 0.00 | * | | | (0.02 | ) | |
| Net realized and unrealized gain on investments | | $ | 0.58 | | | | 0.45 | | | | 0.53 | | | | 0.71 | | | | 2.15 | | |
| Total from investment operations | | $ | 0.58 | | | | 0.46 | | | | 0.53 | | | | 0.71 | | | | 2.13 | | |
| Less distributions: | | | | | | | | | | | | | | | | | | | | | |
| Net realized gains on investments | | $ | 0.16 | | | | 0.18 | | | | 1.15 | | | | 0.56 | | | | — | | |
| Total distributions | | $ | 0.16 | | | | 0.18 | | | | 1.15 | | | | 0.56 | | | | — | | |
| Net asset value, end of period | | $ | 12.36 | | | | 11.94 | | | | 11.66 | | | | 12.28 | | | | 12.13 | | |
| Total Return(2) | | % | 4.92 | | | | 4.19 | | | | 5.24 | | | | 6.69 | | | | 21.30 | | |
| Ratios and Supplemental Data: | |
| Net assets, end of period (000's) | | $ | 12,660 | | | | 14,283 | | | | 18,673 | | | | 18,587 | | | | 1 | | |
| Ratios to average net assets: | |
| Expenses(3) | | % | 0.84 | | | | 0.84 | | | | 0.84 | | | | 0.89 | | | | 0.90 | | |
| Net investment income (loss)(3) | | % | (0.01 | ) | | | 0.10 | | | | 0.01 | | | | 0.04 | | | | (0.26 | ) | |
| Portfolio turnover rate | | % | 16 | | | | 14 | | | | 27 | | | | 291 | | | | 116 | | |
| | | Class S | |
| | | Year Ended December 31, | | May 1,
2003(1) to
December 31, | |
| | | 2007 | | 2006 | | 2005 | | 2004 | | 2003 | |
| Per Share Operating Performance: | |
| Net asset value, beginning of period | | $ | 11.81 | | | | 11.57 | | | | 12.22 | | | | 12.11 | | | | 10.00 | | |
| Income (loss) from investment operations: | | | | | | | | | | | | | | | | | | | | | |
| Net investment loss | | $ | (0.03 | ) | | | (0.02 | ) | | | (0.03 | ) | | | (0.00 | )* | | | (0.04 | ) | |
| Net realized and unrealized gain on investments | | $ | 0.57 | | | | 0.44 | | | | 0.53 | | | | 0.67 | | | | 2.15 | | |
| Total from investment operations | | $ | 0.54 | | | | 0.42 | | | | 0.50 | | | | 0.67 | | | | 2.11 | | |
| Less distributions: | | | | | | | | | | | | | | | | | | | | | |
| Net realized gains on investments | | $ | 0.16 | | | | 0.18 | | | | 1.15 | | | | 0.56 | | | | — | | |
| Total distributions | | $ | 0.16 | | | | 0.18 | | | | 1.15 | | | | 0.56 | | | | — | | |
| Net asset value, end of period | | $ | 12.19 | | | | 11.81 | | | | 11.57 | | | | 12.22 | | | | 12.11 | | |
| Total Return(2) | | % | 4.63 | | | | 3.88 | | | | 5.02 | | | | 6.45 | | | | 21.00 | | |
| Ratios and Supplemental Data: | |
| Net assets, end of period (000's) | | $ | 9,417 | | | | 11,402 | | | | 14,287 | | | | 16,118 | | | | 1 | | |
| Ratios to average net assets: | | | | | | | | | | | | | | | | | | | | | |
| Expenses(3) | | % | 1.09 | | | | 1.09 | | | | 1.09 | | | | 1.14 | | | | 1.15 | | |
| Net investment loss(3) | | % | (0.26 | ) | | | (0.16 | ) | | | (0.23 | ) | | | (0.21 | ) | | | (0.53 | ) | |
| Portfolio turnover rate | | % | 16 | | | | 14 | | | | 27 | | | | 291 | | | | 116 | | |
(1) Commencement of operations.
(2) Total return is calculated assuming reinvestment of all dividends and capital gain distributions at net asset value and does not reflect the effect of insurance contract charges. Total return for periods less than one year is not annualized.
(3) Annualized for periods less than one year.
* Amount is less than $0.005 or more than $(0.005).
See Accompanying Notes to Financial Statements
115
ING LEGG MASON PARTNERS LARGE CAP GROWTH PORTFOLIO (CONTINUED)
FINANCIAL HIGHLIGHTS
Selected data for a share of beneficial interest outstanding throughout each period.
| | | Class ADV | |
| | | Year Ended December 31, | | May 1,
2003(1) to
December 31, | |
| | | 2007 | | 2006 | | 2005 | | 2004 | | 2003 | |
| Per Share Operating Performance: | |
| Net asset value, beginning of period | | $ | 11.70 | | | | 11.49 | | | | 12.18 | | | | 12.09 | | | | 10.00 | | |
| Income (loss) from investment operations: | | | | | | | | | | | | | | | | | | | | | |
| Net investment loss | | $ | (0.07 | ) | | | (0.05 | ) | | | (0.06 | ) | | | (0.08 | ) | | | (0.06 | ) | |
| Net realized and unrealized gain on investments | | $ | 0.58 | | | | 0.44 | | | | 0.52 | | | | 0.73 | | | | 2.15 | | |
| Total from investment operations | | $ | 0.51 | | | | 0.39 | | | | 0.46 | | | | 0.65 | | | | 2.09 | | |
| Less distributions: | | | | | | | | | | | | | | | | | | | | | |
| Net realized gains on investments | | $ | 0.16 | | | | 0.18 | | | | 1.15 | | | | 0.56 | | | | — | | |
| Total distributions | | $ | 0.16 | | | | 0.18 | | | | 1.15 | | | | 0.56 | | | | — | | |
| Net asset value, end of period | | $ | 12.05 | | | | 11.70 | | | | 11.49 | | | | 12.18 | | | | 12.09 | | |
| Total Return(2) | | % | 4.42 | | | | 3.64 | | | | 4.69 | | | | 6.21 | | | | 20.90 | | |
| Ratios and Supplemental Data: | |
| Net assets, end of period (000's) | | $ | 14,923 | | | | 18,361 | | | | 25,166 | | | | 33,408 | | | | 42,935 | | |
| Ratios to average net assets: | | | | | | | | | | | | | | | | | | | | | |
| Expenses(3) | | % | 1.34 | | | | 1.34 | | | | 1.34 | | | | 1.39 | | | | 1.40 | | |
| Net investment loss(3) | | % | (0.50 | ) | | | (0.41 | ) | | | (0.49 | ) | | | (0.57 | ) | | | (0.78 | ) | |
| Portfolio turnover rate | | % | 16 | | | | 14 | | | | 27 | | | | 291 | | | | 116 | | |
(1) Commencement of operations.
(2) Total return is calculated assuming reinvestment of all dividends and capital gain distributions at net asset value and does not reflect the effect of insurance contract charges. Total return for periods less than one year is not annualized.
(3) Annualized for periods less than one year.
See Accompanying Notes to Financial Statements
116
ING LORD ABBETT U.S. GOVERNMENT SECURITIES PORTFOLIO
FINANCIAL HIGHLIGHTS
Selected data for a share of beneficial interest outstanding throughout each period.
| | | Class I | | Class S | |
| | | Year
Ended
December 31,
2007 | | January 3,
2006(1) to
December 31,
2006 | | Year
Ended
December 31,
2007 | | January 18,
2006(1) to
December 31,
2006 | |
| Per Share Operating Performance: | |
| Net asset value, beginning of period | | $ | 9.93 | | | | 10.00 | | | | 9.93 | | | | 10.05 | | |
| Income (loss) from investment operations: | | | | | | | | | | | | | | | | | |
| Net investment income | | $ | 0.51 | * | | | 0.45 | * | | | 0.48 | * | | | 0.42 | * | |
| Net realized and unrealized loss on investments | | $ | 0.21 | | | | (0.07 | ) | | | 0.22 | | | | (0.12 | ) | |
| Total from investment operations | | $ | 0.72 | | | | 0.38 | | | | 0.70 | | | | 0.30 | | |
| Less distributions: | | | | | | | | | | | | | | | | | |
| Net investment income | | $ | 0.52 | | | | 0.45 | | | | 0.50 | | | | 0.42 | | |
| Total distributions | | $ | 0.52 | | | | 0.45 | | | | 0.50 | | | | 0.42 | | |
| Net asset value, end of period | | $ | 10.13 | | | | 9.93 | | | | 10.13 | | | | 9.93 | | |
| Total Return(2) | | % | 7.31 | | | | 3.81 | | | | 7.02 | | | | 3.01 | | |
| Ratios and Supplemental Data: | |
| Net assets, end of period (000's) | | $ | 34,173 | | | | 35,253 | | | | 11,234 | | | | 14,053 | | |
| Ratios to average net assets: | | | | | | | | | | | | | | | | | |
| Gross expenses prior to expense reimbursement(3) | | % | 0.84 | | | | 0.73 | | | | 1.09 | | | | 0.98 | | |
Net expense before interest expense on reverse repurchase
agreements and after expense reimbursements(3)(4) | | % | 0.68 | | | | 0.72 | | | | 0.93 | | | | 0.97 | | |
| Net expenses after expense reimbursement(3)(4) | | % | 0.83 | | | | 0.73 | | | | 1.08 | | | | 0.98 | | |
| Net investment income after expense reimbursement(3)(4) | | % | 5.01 | | | | 4.55 | | | | 4.76 | | | | 4.26 | | |
| Portfolio turnover rate | | % | 250 | | | | 699 | | | | 250 | | | | 699 | | |
(1) Commencement of operations.
(2) Total return is calculated assuming reinvestment of all dividends and capital gain distributions at net asset value and does not reflect the effect of insurance contract charges. Total return for periods less than one year is not annualized.
(3) Annualized for periods less than one year.
(4) The Investment Adviser has agreed to limit expenses, (excluding interest, taxes, brokerage and extraordinary expenses) subject to possible recoupment by the Investment Adviser within three years of being incurred.
* Calculated using average number of shares outstanding throughout the period.
See Accompanying Notes to Financial Statements
117
ING NEUBERGER BERMAN PARTNERS PORTFOLIO
FINANCIAL HIGHLIGHTS
Selected data for a share of beneficial interest outstanding throughout each period.
| | | Class I | | Class S | |
| | | Year
Ended
December 31,
2007 | | January 19,
2006(1) to
December 31,
2006 | | Year
Ended
December 31,
2007 | | January 3,
2006(1) to
December 31
2006 | |
| Per Share Operating Performance: | |
| Net asset value, beginning of period | | $ | 10.93 | | | | 10.20 | | | | 10.90 | | | | 10.00 | | |
| Income from investment operations: | |
| Net investment income | | $ | 0.04 | * | | | 0.06 | * | | | 0.01 | * | | | 0.04 | * | |
| Net realized and unrealized gain on investments | | $ | 0.90 | | | | 0.67 | | | | 0.90 | | | | 0.86 | | |
| Total from investment operations | | $ | 0.94 | | | | 0.73 | | | | 0.91 | | | | 0.90 | | |
| Less distributions: | |
| Net investment income | | $ | 0.03 | | | | — | | | | 0.03 | | | | — | | |
| Net realized gains on investments | | $ | 0.54 | | | | — | | | | 0.53 | | | | — | | |
| Total distributions | | $ | 0.57 | | | | — | | | | 0.56 | | | | — | | |
| Net asset value, end of period | | $ | 11.30 | | | | 10.93 | | | | 11.25 | | | | 10.90 | | |
| Total Return(2) | | % | 8.85 | | | | 7.16 | | | | 8.62 | | | | 9.00 | | |
| Ratios and Supplemental Data: | |
| Net assets, end of period (000's) | | $ | 271,555 | | | | 232,030 | | | | 157,241 | | | | 181,499 | | |
| Ratios to average net assets: | |
| Gross expenses prior to expense reimbursement(3) | | % | 0.73 | | | | 0.75 | | | | 0.98 | | | | 1.00 | | |
| Net expenses after expense reimbursement(3)(4) | | % | 0.67 | | | | 0.67 | | | | 0.89 | | | | 0.92 | | |
| Net investment income after expense reimbursement(3)(4) | | % | 0.32 | | | | 0.65 | | | | 0.10 | | | | 0.37 | | |
| Portfolio turnover rate | | % | 47 | | | | 111 | | | | 47 | | | | 111 | | |
| | | Class ADV | |
| | | Year
Ended
December 31,
2007 | | December 29,
2006(1) to
December 31,
2006 | |
| Per Share Operating Performance: | |
| Net asset value, beginning of period | | $ | 10.90 | | | | 10.90 | | |
| Income (loss) from investment operations: | |
| Net investment loss | | $ | (0.02 | )* | | | (0.00 | )** | |
| Net realized and unrealized gain on investments | | $ | 0.91 | | | | — | | |
| Total from investment operations | | $ | 0.89 | | | | (0.00 | )** | |
| Less distributions: | |
| Net investment income | | $ | 0.03 | | | | — | | |
| Net realized gains on investment | | $ | 0.54 | | | | — | | |
| Total distribution | | $ | 0.57 | | | | — | | |
| Net asset value, end of period | | $ | 11.22 | | | | 10.90 | | |
| Total Return(2) | | % | 8.40 | | | | — | | |
| Ratios and Supplemental Data: | |
| Net assets, end of period (000's) | | $ | 12 | | | | 1 | | |
| Ratios to average net assets: | |
| Gross expenses prior to expense reimbursement(3) | | % | 1.23 | | | | 1.25 | | |
| Net expenses after expense reimbursement(3)(4) | | % | 1.17 | | | | 1.17 | | |
| Net investment loss after expense reimbursement(3)(4) | | % | (0.20 | ) | | | (1.17 | ) | |
| Portfolio turnover rate | | % | 47 | | | | 111 | | |
(1) Commencement of operations.
(2) Total return is calculated assuming reinvestment of all dividends and capital gain distributions at net asset value and does not reflect the effect of insurance contract charges. Total return for periods less than one year is not annualized.
(3) Annualized for periods less than one year.
(4) The Investment Adviser has agreed to limit expenses, (excluding interest, taxes, brokerage and extraordinary expenses) subject to possible recoupment by the Investment Adviser within three years of being incurred.
* Calculated using average number of shares outstanding throughout the period.
** Amount is more than $(0.005).
See Accompanying Notes to Financial Statements
118
ING NEUBERGER BERMAN REGENCY PORTFOLIO
FINANCIAL HIGHLIGHTS
Selected data for a share of beneficial interest outstanding throughout each period.
| | | Class I | | Class S | |
| | | Year
Ended
December 31,
2007 | | January 3,
2006(1) to
December 31,
2006 | | Year
Ended
December 31,
2007 | | January 12,
2006(1) to
December 31,
2006 | |
| Per Share Operating Performance: | |
| Net asset value, beginning of period | | $ | 10.66 | | | | 10.00 | | | | 10.65 | | | | 10.14 | | |
| Income from investment operations: | |
| Net investment income | | $ | 0.10 | | | | 0.06 | * | | | 0.07 | | | | 0.04 | * | |
| Net realized and unrealized gain on investments | | $ | 0.17 | | | | 0.68 | | | | 0.18 | | | | 0.53 | | |
| Total from investment operations | | $ | 0.27 | | | | 0.74 | | | | 0.25 | | | | 0.57 | | |
| Less distributions from: | |
| Net investment income | | $ | 0.05 | | | | 0.05 | | | | 0.03 | | | | 0.03 | | |
| Net realized gains on investments | | $ | 0.02 | | | | 0.03 | | | | 0.02 | | | | 0.03 | | |
| Return of capital | | $ | 0.05 | | | | — | | | | 0.05 | | | | — | | |
| Total distributions | | $ | 0.12 | | | | 0.08 | | | | 0.10 | | | | 0.06 | | |
| Net asset value, end of period | | $ | 10.81 | | | | 10.66 | | | | 10.80 | | | | 10.65 | | |
| Total Return(2) | | % | 2.53 | | | | 7.35 | | | | 2.32 | | | | 5.62 | | |
| Ratios and Supplemental Data: | |
| Net assets, end of period (000's) | | $ | 6,222 | | | | 6,087 | | | | 15,372 | | | | 6,446 | | |
| Ratios to average net assets: | |
| Gross expenses prior to expense reimbursement(3) | | % | 0.98 | | | | 1.38 | | | | 1.23 | | | | 1.63 | | |
| Net expenses after expense reimbursement(3)(4) | | % | 0.88 | | | | 0.88 | | | | 1.13 | | | | 1.13 | | |
| Net investment income after expense reimbursement(3)(4) | | % | 0.92 | | | | 0.62 | | | | 0.77 | | | | 0.45 | | |
| Portfolio turnover rate | | % | 78 | | | | 36 | | | | 78 | | | | 36 | | |
(1) Commencement of operations.
(2) Total return is calculated assuming reinvestment of all dividends and capital gain distributions at net asset value and does not reflect the effect of insurance contract charges. Total return for periods less than one year is not annualized.
(3) Annualized for periods less than one year.
(4) The Investment Adviser has agreed to limit expenses, (excluding interest, taxes, brokerage and extraordinary expenses) subject to possible recoupment by the Investment Adviser within three years of being incurred.
* Calculated using average number of shares outstanding throughout the period.
See Accompanying Notes to Financial Statements
119
ING OPCAP BALANCED VALUE PORTFOLIO
FINANCIAL HIGHLIGHTS
Selected data for a share of beneficial interest outstanding throughout each year.
| | | Class I | |
| | | Year Ended December 31, | |
| | | 2007 | | 2006 | | 2005 | | 2004 | | 2003 | |
| Per Share Operating Performance: | |
| Net asset value, beginning of year | | $ | 15.05 | | | | 13.78 | | | | 13.47 | | | | 12.32 | | | | 9.66 | | |
| Income (loss) from investment operations: | |
| Net investment income | | $ | 0.21 | * | | | 0.17 | | | | 0.11 | | | | 0.14 | | | | 0.10 | | |
Net realized and unrealized gain (loss)
on investments | | $ | (0.63 | ) | | | 1.29 | | | | 0.29 | | | | 1.15 | | | | 2.84 | | |
| Total from investment operations | | $ | (0.42 | ) | | | 1.46 | | | | 0.40 | | | | 1.29 | | | | 2.94 | | |
| Less distributions: | |
| Net investment income | | $ | 0.25 | | | | 0.19 | | | | 0.09 | | | | 0.14 | | | | 0.28 | | |
| Net realized gains on investments | | $ | 1.70 | | | | — | | | | — | | | | — | | | | — | | |
| Total distributions | | $ | 1.95 | | | | 0.19 | | | | 0.09 | | | | 0.14 | | | | 0.28 | | |
| Net asset value, end of year | | $ | 12.68 | | | | 15.05 | | | | 13.78 | | | | 13.47 | | | | 12.32 | | |
| Total Return(1) | | % | (3.79 | ) | | | 10.75 | | | | 2.98 | | | | 10.58 | | | | 30.72 | | |
| Ratios and Supplemental Data: | |
| Net assets, end of year (000's) | | $ | 3,835 | | | | 4,459 | | | | 4,204 | | | | 4,046 | | | | 1,064 | | |
| Ratios to average net assets: | |
Gross expenses prior to brokerage commission
recapture | | % | 1.00 | | | | 1.00 | | | | 1.00 | | | | 1.00 | | | | 1.00 | | |
Net expenses after brokerage commission
recapture | | % | 0.97 | | | | 0.97 | | | | 1.00 | | | | 1.00 | | | | 1.00 | | |
Net investment income after brokerage
commission recapture | | % | 1.44 | | | | 1.30 | | | | 0.82 | | | | 0.59 | | | | 1.12 | | |
| Portfolio turnover rate | | % | 105 | | | | 79 | | | | 80 | | | | 110 | | | | 125 | | |
| | | Class S | |
| | | Year Ended December 31, | |
| | | 2007 | | 2006 | | 2005 | | 2004 | | 2003 | |
| Per Share Operating Performance: | |
| Net asset value, beginning of year | | $ | 15.03 | | | | 13.75 | | | | 13.43 | | | | 12.29 | | | | 9.64 | | |
| Income (loss) from investment operations: | |
| Net investment income | | $ | 0.18 | * | | | 0.14 | * | | | 0.08 | | | | 0.04 | | | | 0.11 | | |
Net realized and unrealized gain (loss)
on investments | | $ | (0.63 | ) | | | 1.27 | | | | 0.29 | | | | 1.22 | | | | 2.79 | | |
| Total from investment operations | | $ | (0.45 | ) | | | 1.41 | | | | 0.37 | | | | 1.26 | | | | 2.90 | | |
| Less distributions: | |
| Net investment income | | $ | 0.20 | | | | 0.13 | | | | 0.05 | | | | 0.12 | | | | 0.25 | | |
| Net realized gains on investments | | $ | 1.70 | | | | — | | | | — | | | | — | | | | — | | |
| Total distributions | | $ | 1.90 | | | | 0.13 | | | | 0.05 | | | | 0.12 | | | | 0.25 | | |
| Net asset value, end of year | | $ | 12.68 | | | | 15.03 | | | | 13.75 | | | | 13.43 | | | | 12.29 | | |
| Total Return(1) | | % | (3.97 | ) | | | 10.36 | | | | 2.70 | | | | 10.32 | | | | 30.32 | | |
| Ratios and Supplemental Data: | |
| Net assets, end of year (000's) | | $ | 58,267 | | | | 79,371 | | | | 120,274 | | | | 160,159 | | | | 140,554 | | |
| Ratios to average net assets: | |
Gross expenses prior to brokerage commission
recapture | | % | 1.25 | | | | 1.25 | | | | 1.25 | | | | 1.25 | | | | 1.25 | | |
Net expenses after brokerage commission
recapture | | % | 1.22 | | | | 1.22 | | | | 1.25 | | | | 1.25 | | | | 1.25 | | |
Net investment income after brokerage
commission recapture | | % | 1.21 | | | | 1.02 | | | | 0.58 | | | | 0.35 | | | | 1.00 | | |
| Portfolio turnover rate | | % | 105 | | | | 79 | | | | 80 | | | | 110 | | | | 125 | | |
(1) Total return is calculated assuming reinvestment of all dividends and capital gain distributions at net asset value and does not reflect the effect of insurance contract charges.
* Calculated using average number of shares outstanding throughout the period.
See Accompanying Notes to Financial Statements
120
ING OPCAP BALANCED VALUE PORTFOLIO (CONTINUED)
FINANCIAL HIGHLIGHTS
Selected data for a share of beneficial interest outstanding throughout each year.
| | | Class ADV | |
| | | Year Ended December 31, | |
| | | 2007 | | 2006 | | 2005 | | 2004 | | 2003 | |
| Per Share Operating Performance: | |
| Net asset value, beginning of year | | $ | 14.88 | | | | 13.62 | | | | 13.32 | | | | 12.21 | | | | 9.61 | | |
| Income (loss) from investment operations: | | | | | | | | | | | | | | | | | | | | | |
| Net investment income | | $ | 0.22 | * | | | 0.11 | | | | 0.04 | | | | 0.04 | | | | 0.09 | | |
Net realized and unrealized gain (loss)
on investments | | $ | (0.72 | ) | | | 1.26 | | | | 0.29 | | | | 1.17 | | | | 2.77 | | |
| Total from investment operations | | $ | (0.50 | ) | | | 1.37 | | | | 0.33 | | | | 1.21 | | | | 2.86 | | |
| Less distributions: | | | | | | | �� | | | | | | | | | | | | | | |
| Net investment income | | $ | 0.08 | | | | 0.11 | | | | 0.03 | | | | 0.10 | | | | 0.26 | | |
| Net realized gains on investments | | $ | 1.69 | | | | — | | | | — | | | | — | | | | — | | |
| Total distributions | | $ | 1.77 | | | | 0.11 | | | | 0.03 | | | | 0.10 | | | | 0.26 | | |
| Net asset value, end of year | | $ | 12.61 | | | | 14.88 | | | | 13.62 | | | | 13.32 | | | | 12.21 | | |
| Total Return(1) | | % | (4.27 | ) | | | 10.19 | | | | 2.46 | | | | 10.00 | | | | 30.08 | | |
| Ratios and Supplemental Data: | |
| Net assets, end of year (000's) | | $ | 752 | | | | 3,769 | | | | 3,458 | | | | 3,767 | | | | 2,665 | | |
| Ratios to average net assets: | | | | | | | | | | | | | | | | | | | | | |
Gross expenses prior to brokerage commission
recapture | | % | 1.50 | | | | 1.50 | | | | 1.50 | | | | 1.50 | | | | 1.50 | | |
Net expenses after brokerage commission
recapture | | % | 1.47 | | | | 1.47 | | | | 1.50 | | | | 1.50 | | | | 1.50 | | |
Net investment income after brokerage
commission recapture | | % | 1.53 | | | | 0.78 | | | | 0.32 | | | | 0.10 | | | | 0.74 | | |
| Portfolio turnover rate | | % | 105 | | | | 79 | | | | 80 | | | | 110 | | | | 125 | | |
(1) Total return is calculated assuming reinvestment of all dividends and capital gain distributions at net asset value and does not reflect the effect of insurance contract charges.
* Calculated using average number of shares outstanding throughout the period.
See Accompanying Notes to Financial Statements
121
ING OPPENHEIMER GLOBAL PORTFOLIO
FINANCIAL HIGHLIGHTS
Selected data for a share of beneficial interest outstanding throughout each year.
| | | Class I | |
| | | Year Ended December 31, | |
| | | 2007 | | 2006 | | 2005 | | 2004 | | 2003 | |
| Per Share Operating Performance: | |
| Net asset value, beginning of year | | $ | 16.68 | | | | 14.17 | | | | 12.80 | | | | 11.23 | | | | 8.40 | | |
| Income from investment operations: | |
| Net investment income | | $ | 0.27 | * | | | 0.15 | * | | | 0.14 | * | | | 0.01 | | | | 0.00 | ** | |
Net realized and unrealized gain
on investments | | $ | 0.82 | | | | 2.39 | | | | 1.60 | | | | 1.69 | | | | 2.83 | | |
| Total from investment operations | | $ | 1.09 | | | | 2.54 | | | | 1.74 | | | | 1.70 | | | | 2.83 | | |
| Less distributions: | |
| Net investment income | | $ | 0.19 | | | | 0.01 | | | | 0.12 | | | | 0.01 | | | | 0.00 | ** | |
| Net realized gains on investments | | $ | 0.71 | | | | 0.02 | | | | 0.25 | | | | 0.12 | | | | — | | |
| Total distributions | | $ | 0.90 | | | | 0.03 | | | | 0.37 | | | | 0.13 | | | | 0.00 | | |
| Net asset value, end of year | | $ | 16.87 | | | | 16.68 | | | | 14.17 | | | | 12.80 | | | | 11.23 | | |
| Total Return(1) | | % | 6.57 | | | | 17.98 | | | | 13.57 | | | | 15.28 | | | | 33.73 | | |
| Ratios and Supplemental Data: | |
| Net assets, end of year (000's) | | $ | 2,289,589 | | | | 2,518,662 | | | | 2,262,201 | | | | 843,253 | | | | 426 | | |
| Ratios to average net assets: | |
| Expenses | | % | 0.66 | | | | 0.66 | | | | 0.66 | | | | 0.77 | | | | 1.20 | | |
| Net investment income | | % | 1.57 | | | | 0.96 | | | | 1.05 | | | | 1.11 | | | | 0.22 | | |
| Portfolio turnover rate | | % | 14 | | | | 23 | | | | 53 | | | | 390 | | | | 157 | | |
| | | Class S | |
| | | Year Ended December 31, | |
| | | 2007 | | 2006 | | 2005 | | 2004 | | 2003 | |
| Per Share Operating Performance: | |
| Net asset value, beginning of year | | $ | 16.31 | | | | 13.90 | | | | 12.58 | | | | 11.06 | | | | 8.39 | | |
| Income from investment operations: | |
| Net investment income | | $ | 0.23 | * | | | 0.10 | * | | | 0.09 | * | | | 0.02 | | | | 0.02 | | |
Net realized and unrealized gain
on investments | | $ | 0.80 | | | | 2.34 | | | | 1.58 | | | | 1.62 | | | | 2.65 | | |
| Total from investment operations | | $ | 1.03 | | | | 2.44 | | | | 1.67 | | | | 1.64 | | | | 2.67 | | |
| Less distributions: | |
| Net investment income | | $ | 0.17 | | | | 0.01 | | | | 0.10 | | | | 0.00 | ** | | | — | | |
| Net realized gains on investments | | $ | 0.71 | | | | 0.02 | | | | 0.25 | | | | 0.12 | | | | — | | |
| Total distributions | | $ | 0.88 | | | | 0.03 | | | | 0.35 | | | | 0.12 | | | | — | | |
| Net asset value, end of year | | $ | 16.46 | | | | 16.31 | | | | 13.90 | | | | 12.58 | | | | 11.06 | | |
| Total Return(1) | | % | 6.35 | | | | 17.60 | | | | 13.27 | | | | 15.01 | | | | 31.82 | | |
| Ratios and Supplemental Data: | |
| Net assets, end of year (000's) | | $ | 232,651 | | | | 145,060 | | | | 40,831 | | | | 19,143 | | | | 14,291 | | |
| Ratios to average net assets: | |
| Expenses | | % | 0.91 | | | | 0.91 | | | | 0.91 | | | | 1.02 | | | | 1.45 | | |
| Net investment income | | % | 1.37 | | | | 0.66 | | | | 0.71 | | | | 0.19 | | | | 0.19 | | |
| Portfolio turnover rate | | % | 14 | | | | 23 | | | | 53 | | | | 390 | | | | 157 | | |
(1) Total return is calculated assuming reinvestment of all dividends and capital gain distributions at net asset value and does not reflect the effect of insurance contract charges.
* Calculated using average number of shares outstanding throughout the period.
** Amount is less than $0.005.
See Accompanying Notes to Financial Statements
122
ING OPPENHEIMER GLOBAL PORTFOLIO (CONTINUED)
FINANCIAL HIGHLIGHTS
Selected data for a share of beneficial interest outstanding throughout each year.
| | | Class ADV | |
| | | Year Ended December 31, | |
| | | 2007 | | 2006 | | 2005 | | 2004 | | 2003 | |
| Per Share Operating Performance: | |
| Net asset value, beginning of year | | $ | 16.22 | | | | 13.85 | | | | 12.50 | | | | 11.02 | | | | 8.38 | | |
| Income from investment operations: | |
| Net investment income | | $ | 0.17 | * | | | 0.07 | * | | | 0.07 | * | | | 0.03 | | | | 0.00 | ** | |
Net realized and unrealized gain
on investments | | $ | 0.81 | | | | 2.33 | | | | 1.56 | | | | 1.57 | | | | 2.64 | | |
| Total from investment operations | | $ | 0.98 | | | | 2.40 | | | | 1.63 | | | | 1.60 | | | | 2.64 | | |
| Less distributions: | |
| Net investment income | | $ | 0.11 | | | | 0.01 | | | | 0.04 | | | | 0.00 | ** | | | — | | |
| Net realized gains on investments | | $ | 0.71 | | | | 0.02 | | | | 0.24 | | | | 0.12 | | | | — | | |
| Total distributions | | $ | 0.82 | | | | 0.03 | | | | 0.28 | | | | 0.12 | | | | — | | |
| Net asset value, end of year | | $ | 16.38 | | | | 16.22 | | | | 13.85 | | | | 12.50 | | | | 11.02 | | |
| Total Return(1) | | % | 6.04 | | | | 17.36 | | | | 13.07 | | | | 14.71 | | | | 31.50 | | |
| Ratios and Supplemental Data: | |
| Net assets, end of year (000's) | | $ | 99,669 | | | | 95,286 | | | | 106,510 | | | | 127,653 | | | | 856 | | |
| Ratios to net assets: | |
Gross expenses prior to expense
reimbursement | | % | 1.16 | | | | 1.16 | | | | 1.16 | | | | 1.28 | | | | 1.70 | | |
| Net expenses after expense reimbursement | | % | 1.15 | | | | 1.15 | | | | 1.15 | | | | 1.27 | | | | 1.70 | | |
Net investment income (loss) after expense
reimbursement | | % | 1.08 | | | | 0.51 | | | | 0.60 | | | | 0.55 | | | | 0.01 | | |
| Portfolio turnover rate | | % | 14 | | | | 23 | | | | 53 | | | | 390 | | | | 157 | | |
(1) Total return is calculated assuming reinvestment of all dividends and capital gain distributions at net asset value and does not reflect the effect of insurance contract charges.
* Calculated using average number of shares outstanding throughout the period.
** Amount is less than $0.005.
See Accompanying Notes to Financial Statements
123
ING OPPENHEIMER STRATEGIC INCOME PORTFOLIO
FINANCIAL HIGHLIGHTS
Selected data for a share of beneficial interest outstanding throughout each period.
| | | Class I | |
| | | Year Ended December 31, | | November 8,
2004(1) to
December 31, | |
| | | 2007 | | 2006 | | 2005 | | 2004 | |
| Per Share Operating Performance: | |
| Net asset value, beginning of period | | $ | 10.80 | | | | 10.00 | | | | 10.12 | | | | 10.00 | | |
| Income (loss) from investment operations: | |
| Net investment income | | $ | 0.64 | * | | | 0.66 | * | | | 0.35 | * | | | 0.02 | | |
| Net realized and unrealized gain (loss) on investments | | $ | 0.28 | | | | 0.18 | | | | (0.24 | ) | | | 0.12 | | |
| Total from investment operations | | $ | 0.92 | | | | 0.84 | | | | 0.11 | | | | 0.14 | | |
| Less distributions: | |
| Net investment income | | $ | 0.52 | | | | 0.04 | | | | 0.23 | | | | 0.02 | | |
| Total distributions | | $ | 0.52 | | | | 0.04 | | | | 0.23 | | | | 0.02 | | |
| Net asset value, end of period | | $ | 11.20 | | | | 10.80 | | | | 10.00 | | | | 10.12 | | |
| Total Return(2) | | % | 8.76 | | | | 8.42 | | | | 1.09 | | | | 1.39 | | |
| Ratios and Supplemental Data: | |
| Net assets, end of period (000's) | | $ | 415,035 | | | | 359,888 | | | | 302,941 | | | | 103,283 | | |
| Ratios to average net assets: | |
| Expenses(3) | | % | 0.54 | | | | 0.54 | | | | 0.54 | | | | 0.52 | | |
| Net investment income(3) | | % | 5.80 | | | | 6.39 | | | | 3.50 | | | | 2.56 | | |
| Portfolio turnover rate | | % | 104 | | | | 140 | | | | 216 | | | | 145 | | |
| | | Class S | |
| | | Year Ended December 31, | | November 8,
2004(1) to
December 31, | |
| | | 2007 | | 2006 | | 2005 | | 2004 | |
| Per Share Operating Performance: | |
| Net asset value, beginning of period | | $ | 10.81 | | | | 9.99 | | | | 10.11 | | | | 10.00 | | |
| Income (loss) from investment operations: | |
| Net investment income | | $ | 0.62 | * | | | 0.64 | * | | | 0.32 | * | | | 0.02 | | |
| Net realized and unrealized gain (loss) on investments | | $ | 0.27 | | | | 0.19 | | | | (0.24 | ) | | | 0.11 | | |
| Total from investment operations | | $ | 0.89 | | | | 0.83 | | | | 0.08 | | | | 0.13 | | |
| Less distributions: | |
| Net investment income | | $ | 0.49 | | | | 0.01 | | | | 0.20 | | | | 0.02 | | |
| Total distributions | | $ | 0.49 | | | | 0.01 | | | | 0.20 | | | | 0.02 | | |
| Net asset value, end of period | | $ | 11.21 | | | | 10.81 | | | | 9.99 | | | | 10.11 | | |
| Total Return(2) | | % | 8.50 | | | | 8.33 | | | | 0.84 | | | | 1.27 | | |
| Ratios and Supplemental Data: | |
| Net assets, end of period (000's) | | $ | 83,977 | | | | 56,054 | | | | 60,478 | | | | 60,836 | | |
| Ratios to average net assets: | |
| Gross expenses prior to expense reimbursement(3) | | % | 0.79 | | | | 0.79 | | | | 0.79 | | | | 0.81 | | |
| Net expenses after expense reimbursement(3) | | % | 0.75 | | | | 0.75 | | | | 0.75 | | | | 0.77 | | |
| Net investment income after expense reimbursement(3) | | % | 5.61 | | | | 6.20 | | | | 3.14 | | | | 2.40 | | |
| Portfolio turnover rate | | % | 104 | | | | 140 | | | | 216 | | | | 145 | | |
(1) Commencement of operations.
(2) Total return is calculated assuming reinvestment of all dividends and capital gain distributions at net asset value and does not reflect the effect of insurance contract charges. Total return for periods less than one year is not annualized.
(3) Annualized for periods less than one year.
* Calculated using average number of shares outstanding throughout the period.
See Accompanying Notes to Financial Statements
124
ING OPPENHEIMER STRATEGIC INCOME PORTFOLIO (CONTINUED)
FINANCIAL HIGHLIGHTS
Selected data for a share of beneficial interest outstanding throughout each period.
| | | Class ADV | |
| | | Year Ended December 31, | | November 8,
2004(1) to
December 31, | |
| | | 2007 | | 2006 | | 2005 | | 2004 | |
| Per Share Operating Performance: | |
| Net asset value, beginning of period | | $ | 10.76 | | | | 9.98 | | | | 10.11 | | | | 10.00 | | |
| Income (loss) from investment operations: | |
| Net investment income | | $ | 0.59 | * | | | 0.62 | * | | | 0.30 | * | | | 0.02 | | |
| Net realized and unrealized gain (loss) on investments | | $ | 0.28 | | | | 0.18 | | | | (0.24 | ) | | | 0.11 | | |
| Total from investment operations | | $ | 0.87 | | | | 0.80 | | | | 0.06 | | | | 0.13 | | |
| Less distributions: | |
| Net investment income | | $ | 0.51 | | | | 0.02 | | | | 0.19 | | | | 0.02 | | |
| Total distributions | | $ | 0.51 | | | | 0.02 | | | | 0.19 | | | | 0.02 | | |
| Net asset value, end of period | | $ | 11.12 | | | | 10.76 | | | | 9.98 | | | | 10.11 | | |
| Total Return(2) | | % | 8.28 | | | | 7.99 | | | | 0.61 | | | | 1.26 | | |
| Ratios and Supplemental Data: | |
| Net assets, end of period (000's) | | $ | 20,460 | | | | 9,266 | | | | 5,082 | | | | 3,655 | | |
| Ratios to net assets: | |
| Gross expenses prior to expense reimbursement(3) | | % | 1.04 | | | | 1.04 | | | | 1.04 | | | | 1.06 | | |
| Net expenses after expense reimbursement(3) | | % | 1.00 | | | | 1.00 | | | | 1.00 | | | | 1.02 | | |
| Net investment income after expense reimbursement(3) | | % | 5.41 | | | | 6.09 | | | | 2.94 | | | | 2.15 | | |
| Portfolio turnover rate | | % | 104 | | | | 140 | | | | 216 | | | | 145 | | |
(1) Commencement of operations.
(2) Total return is calculated assuming reinvestment of all dividends and capital gain distributions at net asset value and does not reflect the effect of insurance contract charges. Total return for periods less than one year is not annualized.
(3) Annualized for periods less than one year.
* Calculated using average number of shares outstanding throughout the period.
See Accompanying Notes to Financial Statements
125
ING PIMCO TOTAL RETURN PORTFOLIO
FINANCIAL HIGHLIGHTS
Selected data for a share of beneficial interest outstanding throughout each year.
| | | Class I | |
| | | Year Ended December 31, | |
| | | 2007 | | 2006 | | 2005 | | 2004 | | 2003 | |
| Per Share Operating Performance: | |
| Net asset value, beginning of year | | $ | 11.16 | | | | 10.92 | | | | 11.00 | | | | 10.62 | | | | 10.55 | | |
| Income (loss) from investment operations: | |
| Net investment income | | $ | 0.51 | * | | | 0.42 | * | | | 0.34 | * | | | 0.16 | * | | | 0.29 | * | |
Net realized and unrealized gain (loss) on
investments | | $ | 0.55 | | | | 0.03 | | | | (0.08 | ) | | | 0.33 | | | | 0.17 | | |
| Total from investment operations | | $ | 1.06 | | | | 0.45 | | | | 0.26 | | | | 0.49 | | | | 0.46 | | |
| Less distributions: | |
| Net investment income | | $ | 0.41 | | | | 0.21 | | | | 0.20 | | | | — | | | | 0.32 | | |
| Net realized gains on investments | | $ | — | | | | — | | | | 0.14 | | | | 0.11 | | | | 0.07 | | |
| Total distributions | | $ | 0.41 | | | | 0.21 | | | | 0.34 | | | | 0.11 | | | | 0.39 | | |
| Net asset value, end of year | | $ | 11.81 | | | | 11.16 | | | | 10.92 | | | | 11.00 | | | | 10.62 | | |
| Total Return(1) | | % | 9.79 | | | | 4.21 | | | | 2.36 | | | | 4.61 | | | | 4.36 | | |
| Ratios and Supplemental Data: | |
| Net assets, end of year (000's) | | $ | 320,725 | | | | 213,734 | | | | 176,607 | | | | 78,521 | | | | 43,987 | | |
| Ratios to average net assets: | |
| Expenses(2) | | % | 0.71 | | | | 0.77 | | | | 0.85 | | | | 0.85 | | | | 0.85 | | |
| Net investment income(2) | | % | 4.49 | | | | 3.86 | | | | 3.07 | | | | 1.51 | | | | 2.67 | | |
| Portfolio turnover rate | | % | 863 | | | | 826 | | | | 926 | | | | 377 | | | | 471 | | |
| | | Class S | |
| | | Year Ended December 31, | |
| | | 2007 | | 2006 | | 2005 | | 2004 | | 2003 | |
| Per Share Operating Performance: | |
| Net asset value, beginning of year | | $ | 11.11 | | | | 10.87 | | | | 10.96 | | | | 10.61 | | | | 10.55 | | |
| Income (loss) from investment operations: | |
| Net investment income | | $ | 0.48 | * | | | 0.39 | * | | | 0.30 | * | | | 0.14 | * | | | 0.22 | * | |
Net realized and unrealized gain (loss) on
investments | | $ | 0.55 | | | | 0.04 | | | | (0.07 | ) | | | 0.32 | | | | 0.21 | | |
| Total from investment operations | | $ | 1.03 | | | | 0.43 | | | | 0.23 | | | | 0.46 | | | | 0.43 | | |
| Less distributions: | |
| Net investment income | | $ | 0.39 | | | | 0.19 | | | | 0.18 | | | | — | | | | 0.30 | | |
| Net realized gains on investments | | $ | — | | | | — | | | | 0.14 | | | | 0.11 | | | | 0.07 | | |
| Total distributions | | $ | 0.39 | | | | 0.19 | | | | 0.32 | | | | 0.11 | | | | 0.37 | | |
| Net asset value, end of year | | $ | 11.75 | | | | 11.11 | | | | 10.87 | | | | 10.96 | | | | 10.61 | | |
| Total Return(1) | | % | 9.51 | | | | 4.00 | | | | 2.08 | | | | 4.33 | | | | 4.06 | | |
| Ratios and Supplemental Data: | |
| Net assets, end of year (000's) | | $ | 122,274 | | | | 93,487 | | | | 83,782 | | | | 88,424 | | | | 50,174 | | |
| Ratios to average net assets: | |
| Expenses(2) | | % | 0.96 | | | | 1.02 | | | | 1.10 | | | | 1.10 | | | | 1.10 | | |
| Net investment income(2) | | % | 4.23 | | | | 3.61 | | | | 2.73 | | | | 1.32 | | | | 2.07 | | |
| Portfolio turnover rate | | % | 863 | | | | 826 | | | | 926 | | | | 377 | | | | 471 | | |
(1) Total return is calculated assuming reinvestment of all dividends and capital gain distributions at net asset value and does not reflect the effect of insurance contract charges.
(2) Includes the impact of interest expense on inverse floaters.
* Calculated using average number of shares outstanding throughout the period.
See Accompanying Notes to Financial Statements
126
ING PIMCO TOTAL RETURN PORTFOLIO (CONTINUED)
FINANCIAL HIGHLIGHTS
Selected data for a share of beneficial interest outstanding throughout each year.
| | | Class ADV | |
| | | Year Ended December 31, | |
| | | 2007 | | 2006 | | 2005 | | 2004 | | 2003 | |
| Per Share Operating Performance: | |
| Net asset value, beginning of period | | $ | 11.03 | | | | 10.81 | | | | 10.91 | | | | 10.59 | | | | 10.53 | | |
| Income (loss) from investment operations: | |
| Net investment income | | $ | 0.44 | * | | | 0.36 | * | | | 0.28 | * | | | 0.09 | * | | | 0.20 | * | |
| Net realized and unrealized gain (loss) on investments | | $ | 0.55 | | | | 0.03 | | | | (0.08 | ) | | | 0.34 | | | | 0.20 | | |
| Total from investment operations | | $ | 0.99 | | | | 0.39 | | | | 0.20 | | | | 0.43 | | | | 0.40 | | |
| Less distributions: | |
| Net investment income | | $ | 0.36 | | | | 0.17 | | | | 0.16 | | | | — | | | | 0.27 | | |
| Net realized gains on investments | | $ | — | | | | — | | | | 0.14 | | | | 0.11 | | | | 0.07 | | |
| Total distributions | | $ | 0.36 | | | | 0.17 | | | | 0.30 | | | | 0.11 | | | | 0.34 | | |
| Net asset value, end of period | | $ | 11.66 | | | | 11.03 | | | | 10.81 | | | | 10.91 | | | | 10.59 | | |
| Total Return(1) | | % | 9.25 | | | | 3.71 | | | | 1.80 | | | | 4.06 | | | | 3.86 | | |
| Ratios and Supplemental Data: | |
| Net assets, end of period (000's) | | $ | 33,445 | | | | 25,603 | | | | 23,018 | | | | 14,827 | | | | 10,388 | | |
| Ratios to average net assets: | |
| Expenses(2) | | % | 1.21 | | | | 1.27 | | | | 1.35 | | | | 1.35 | | | | 1.35 | | |
| Net investment income(2) | | % | 3.98 | | | | 3.36 | | | | 2.54 | | | | 0.81 | | | | 1.84 | | |
| Portfolio turnover rate | | % | 863 | | | | 826 | | | | 926 | | | | 377 | | | | 471 | | |
(1) Total return is calculated assuming reinvestment of all dividends and capital gain distributions at net asset value and does not reflect the effect of insurance contract charges.
(2) Includes impact of interest expense on inverse floaters.
* Calculated using average number of shares outstanding throughout the period.
See Accompanying Notes to Financial Statements
127
ING PIONEER HIGH YIELD PORTFOLIO
FINANCIAL HIGHLIGHTS
Selected data for a share of beneficial interest outstanding throughout each period.
| | | Class I | | Class S | |
| | | Year
Ended
December 31,
2007 | | January 3,
2006(1) to
December 31,
2006 | | Year
Ended
December 31,
2007 | | January 20,
2006(1) to
December 31,
2006 | |
| Per Share Operating Performance: | |
| Net asset value, beginning of period | | $ | 10.22 | | | | 10.00 | | | | 10.22 | | | | 9.99 | | |
| Income from investment operations: | |
| Net investment income | | $ | 0.59 | * | | | 0.57 | * | | | 0.57 | * | | | 0.54 | * | |
| Net realized and unrealized gain on investments | | $ | 0.03 | | | | 0.23 | | | | 0.03 | | | | 0.24 | | |
| Total from investment operations | | $ | 0.62 | | | | 0.80 | | | | 0.60 | | | | 0.78 | | |
| Less distributions: | |
| Net investment income | | $ | 0.59 | | | | 0.55 | | | | 0.57 | | | | 0.52 | | |
| Net realized gains on investments | | $ | — | | | | 0.03 | | | | — | | | | 0.03 | | |
| Total distributions | | $ | 0.59 | | | | 0.58 | | | | 0.57 | | | | 0.55 | | |
| Net asset value, end of period | | $ | 10.25 | | | | 10.22 | | | | 10.25 | | | | 10.22 | | |
| Total Return(2) | | % | 6.15 | | | | 8.24 | | | | 5.89 | | | | 8.01 | | |
| Ratios and Supplemental Data: | |
| Net assets, end of period (000's) | | $ | 105,105 | | | | 119,959 | | | | 5,899 | | | | 8,280 | | |
| Ratios to average net assets: | |
| Gross expenses prior to expense reimbursement(3) | | % | 0.78 | | | | 0.80 | | | | 1.03 | | | | 1.05 | | |
| Net expenses after expense reimbursement(3)(4) | | % | 0.77 | | | | 0.73 | | | | 1.02 | | | | 0.98 | | |
| Net investment income after expense reimbursement(3)(4) | | % | 5.67 | | | | 5.70 | | | | 5.43 | | | | 5.43 | | |
| Portfolio turnover rate | | % | 68 | | | | 20 | | | | 68 | | | | 20 | | |
| | | Class ADV | |
| | | Year
Ended
December 31,
2007 | | January 20,
2006(1) to
December 31,
2006 | |
| Per Share Operating Performance: | |
| Net asset value, beginning of period | | $ | 10.22 | | | | 9.99 | | |
| Income from investment operations: | |
| Net investment income | | $ | 0.54 | * | | | 0.47 | * | |
| Net realized and unrealized gain on investments | | $ | 0.01 | | | | 0.30 | | |
| Total from investment operations | | $ | 0.55 | | | | 0.77 | | |
| Less distributions: | |
| Net investment income | | $ | 0.54 | | | | 0.51 | | |
| Net realized gains on investments | | $ | — | | | | 0.03 | | |
| Total distributions | | $ | 0.54 | | | | 0.54 | | |
| Net asset value, end of period | | $ | 10.23 | | | | 10.22 | | |
| Total Return(2) | | % | 5.43 | | | | 7.98 | | |
| Ratios and Supplemental Data: | |
| Net assets, end of period (000's) | | $ | 1,018 | | | | 510 | | |
| Ratios to average net assets: | |
| Gross expenses prior to expense reimbursement(3) | | % | 1.28 | | | | 1.30 | | |
| Net expenses after expense reimbursement(3)(4) | | % | 1.27 | | | | 1.23 | | |
| Net investment income after expense reimbursement(3)(4) | | % | 5.22 | | | | 4.97 | | |
| Portfolio turnover rate | | % | 68 | | | | 20 | | |
(1) Commencement of operations.
(2) Total return is calculated assuming reinvestment of all dividends and capital gain distributions at net asset value and does not reflect the effect of insurance contract charges. Total return for periods less than one year is not annualized.
(3) Annualized for periods less than one year.
(4) The Investment Adviser has agreed to limit expenses, (excluding interest, taxes, brokerage and extraordinary expenses) subject to possible recoupment by the Investment Adviser within three years of being incurred.
* Calculated using average number of shares outstanding throughout the period.
See Accompanying Notes to Financial Statements
128
ING T. ROWE PRICE DIVERSIFIED MID CAP GROWTH PORTFOLIO
FINANCIAL HIGHLIGHTS
Selected data for a share of beneficial interest outstanding throughout each year.
| | | Class I | |
| | | Year Ended December 31, | |
| | | 2007 | | 2006 | | 2005 | | 2004 | | 2003 | |
| Per Share Operating Performance: | |
| Net asset value, beginning of year | | $ | 9.22 | | | | 8.65 | | | | 8.06 | | | | 7.40 | | | | 5.11 | | |
| Income (loss) from investment operations: | |
| Net investment income (loss) | | $ | 0.02 | | | | 0.02 | | | | (0.00 | )* | | | (0.00 | )* | | | (0.02 | ) | |
| Net realized and unrealized gain on investments | | $ | 1.18 | | | | 0.74 | | | | 0.73 | | | | 0.66 | | | | 2.31 | | |
| Total from investment operations | | $ | 1.20 | | | | 0.76 | | | | 0.73 | | | | 0.66 | | | | 2.29 | | |
| Less distributions: | |
| Net investment income | | $ | 0.02 | | | | — | | | | — | | | | — | | | | — | | |
| Net realized gains on investments | | $ | 0.88 | | | | 0.19 | | | | 0.14 | | | | — | | | | — | | |
| Total distributions | | $ | 0.90 | | | | 0.19 | | | | 0.14 | | | | — | | | | — | | |
| Net asset value, end of year | | $ | 9.52 | | | | 9.22 | | | | 8.65 | | | | 8.06 | | | | 7.40 | | |
| Total Return(1) | | % | 13.39 | | | | 9.10 | | | | 9.26 | | | | 8.92 | | | | 44.81 | | |
| Ratios and Supplemental Data: | |
| Net assets, end of year (000's) | | $ | 995,471 | | | | 1,067,515 | | | | 1,131,231 | | | | 474,397 | | | | 35,010 | | |
| Ratios to average net assets: | |
| Expenses | | % | 0.66 | | | | 0.66 | | | | 0.66 | | | | 0.96 | | | | 1.05 | | |
| Net investment income (loss) | | % | 0.18 | | | | 0.19 | | | | (0.04 | ) | | | (0.06 | ) | | | (0.76 | ) | |
| Portfolio turnover rate | | % | 31 | | | | 37 | | | | 94 | | | | 441 | | | | 187 | | |
| | | Class S | |
| | | Year Ended December 31, | |
| | | 2007 | | 2006 | | 2005 | | 2004 | | 2003 | |
| Per Share Operating Performance: | |
| Net asset value, beginning of year | | $ | 9.10 | | | | 8.55 | | | | 7.99 | | | | 7.36 | | | | 5.09 | | |
| Income (loss) from investment operations: | |
| Net investment loss | | $ | (0.01 | ) | | | (0.01 | ) | | | (0.03 | ) | | | (0.07 | ) | | | (0.04 | ) | |
| Net realized and unrealized gain on investments | | $ | 1.16 | | | | 0.75 | | | | 0.73 | | | | 0.70 | | | | 2.31 | | |
| Total from investment operations | | $ | 1.15 | | | | 0.74 | | | | 0.70 | | | | 0.63 | | | | 2.27 | | |
| Less distributions: | |
| Net realized gains on investments | | $ | 0.88 | | | | 0.19 | | | | 0.14 | | | | — | | | | — | | |
| Total distributions | | $ | 0.88 | | | | 0.19 | | | | 0.14 | | | | — | | | | — | | |
| Net asset value, end of year | | $ | 9.37 | | | | 9.10 | | | | 8.55 | | | | 7.99 | | | | 7.36 | | |
| Total Return(1) % | | | 13.01 | | | | 8.97 | | | | 8.96 | | | | 8.56 | | | | 44.60 | | |
| Ratios and Supplemental Data: | |
| Net assets, end of year (000's) | | $ | 13,319 | | | | 10,100 | | | | 21,871 | | | | 29,155 | | | | 30,354 | | |
| Ratios to average net assets: | |
| Expenses | | % | 0.91 | | | | 0.91 | | | | 0.91 | | | | 1.21 | | | | 1.30 | | |
| Net investment loss | | % | (0.07 | ) | | | (0.07 | ) | | | (0.30 | ) | | | (0.88 | ) | | | (1.00 | ) | |
| Portfolio turnover rate | | % | 31 | | | | 37 | | | | 94 | | | | 441 | | | | 187 | | |
(1) Total return is calculated assuming reinvestment of all dividends and capital gain distributions at net asset value and does not reflect the effect of insurance contract charges.
* Amount is more than $(0.005).
See Accompanying Notes to Financial Statements
129
ING T. ROWE PRICE DIVERSIFIED MID CAP GROWTH PORTFOLIO (CONTINUED)
FINANCIAL HIGHLIGHTS
Selected data for a share of beneficial interest outstanding throughout each year.
| | | Class ADV | |
| | | Year Ended December 31, | |
| | | 2007 | | 2006 | | 2005 | | 2004 | | 2003 | |
| Per Share Operating Performance: | |
| Net asset value, beginning of year | | $ | 8.99 | | | | 8.47 | | | | 7.94 | | | | 7.33 | | | | 5.08 | | |
| Income (loss) from investment operations: | |
| Net investment loss | | $ | (0.03 | ) | | | (0.03 | ) | | | (0.05 | ) | | | (0.10 | ) | | | (0.07 | ) | |
| Net realized and unrealized gain on investments | | $ | 1.14 | | | | 0.74 | | | | 0.72 | | | | 0.71 | | | | 2.32 | | |
| Total from investment operations | | $ | 1.11 | | | | 0.71 | | | | 0.67 | | | | 0.61 | | | | 2.25 | | |
| Less distributions: | |
| Net realized gains on investments | | $ | 0.88 | | | | 0.19 | | | | 0.14 | | | | — | | | | — | | |
| Total distributions | | $ | 0.88 | | | | 0.19 | | | | 0.14 | | | | — | | | | — | | |
| Net asset value, end of year | | $ | 9.22 | | | | 8.99 | | | | 8.47 | | | | 7.94 | | | | 7.33 | | |
| Total Return(1) | | % | 12.71 | | | | 8.70 | | | | 8.64 | | | | 8.32 | | | | 44.29 | | |
| Ratios and Supplemental Data: | |
| Net assets, end of year (000's) | | $ | 40,695 | | | | 48,165 | | | | 69,686 | | | | 80,813 | | | | 107,353 | | |
| Ratios to net assets: | |
| Gross expenses prior to expense reimbursement | | % | 1.16 | | | | 1.16 | | | | 1.16 | | | | 1.47 | | | | 1.55 | | |
| Net expenses after expense reimbursement | | % | 1.15 | | | | 1.15 | | | | 1.15 | | | | 1.46 | | | | 1.55 | | |
| Net investment loss after expense reimbursement | | % | (0.31 | ) | | | (0.23 | ) | | | (0.54 | ) | | | (1.13 | ) | | | (1.24 | ) | |
| Portfolio turnover rate | | % | 31 | | | | 37 | | | | 94 | | | | 441 | | | | 187 | | |
(1) Total return is calculated assuming reinvestment of all dividends and capital gain distributions at net asset value and does not reflect the effect of insurance contract charges.
See Accompanying Notes to Financial Statements
130
ING T. ROWE PRICE GROWTH EQUITY PORTFOLIO
FINANCIAL HIGHLIGHTS
Selected data for a share of beneficial interest outstanding throughout each year.
| | | Class I | |
| | | Year Ended December 31, | |
| | | 2007 | | 2006 | | 2005 | | 2004 | | 2003 | |
| Per Share Operating Performance: | |
| Net asset value, beginning of year | | $ | 59.36 | | | | 52.62 | | | | 49.81 | | | | 45.35 | | | | 34.69 | | |
| Income from investment operations: | |
| Net investment income | | $ | 0.32 | | | | 0.33 | * | | | 0.19 | * | | | 0.29 | | | | 0.09 | | |
| Net realized and unrealized gain on investments | | $ | 5.45 | | | | 6.64 | | | | 2.87 | | | | 4.24 | | | | 10.63 | | |
| Total from investment operations | | $ | 5.77 | | | | 6.97 | | | | 3.06 | | | | 4.53 | | | | 10.72 | | |
| Less distributions: | |
| Net investment income | | $ | 0.31 | | | | 0.14 | | | | 0.25 | | | | 0.07 | | | | 0.06 | | |
| Net realized gains on investments | | $ | 2.93 | | | | 0.09 | | | | — | | | | — | | | | — | | |
| Total distributions | | $ | 3.24 | | | | 0.23 | | | | 0.25 | | | | 0.07 | | | | 0.06 | | |
| Net asset value, end of year | | $ | 61.89 | | | | 59.36 | | | | 52.62 | | | | 49.81 | | | | 45.35 | | |
| Total Return(1) | | % | 9.91 | | | | 13.30 | | | | 6.17 | | | | 10.02 | | | | 30.93 | | |
| Ratios and Supplemental Data: | |
| Net assets, end of year (000's) | | $ | 1,442,336 | | | | 1,271,481 | | | | 898,102 | | | | 830,034 | | | | 669,956 | | |
| Ratios to average net assets: | |
Gross expenses prior to expense reimbursement and
brokerage commission recapture | | % | 0.75 | | | | 0.75 | | | | 0.75 | | | | 0.75 | | | | 0.75 | | |
Net expenses after expense reimbursement and
brokerage commission recapture | | % | 0.74 | | | | 0.75 | | | | 0.75 | | | | 0.75 | | | | 0.75 | | |
Net investment income after expense reimbursement and
brokerage commission recapture | | % | 0.55 | | | | 0.60 | | | | 0.38 | | | | 0.66 | | | | 0.30 | | |
| Portfolio turnover rate | | % | 58 | | | | 43 | | | | 41 | | | | 39 | | | | 34 | | |
| | | Class S | |
| | | Year Ended December 31, | |
| | | 2007 | | 2006 | | 2005 | | 2004 | | 2003 | |
| Per Share Operating Performance: | |
| Net asset value, beginning of year | | $ | 58.85 | | | | 52.16 | | | | 49.48 | | | | 45.12 | | | | 34.59 | | |
| Income from investment operations: | |
| Net investment income | | $ | 0.15 | * | | | 0.28 | * | | | 0.06 | * | | | 0.22 | | | | 0.06 | | |
| Net realized and unrealized gain on investments | | $ | 5.41 | | | | 6.50 | | | | 2.85 | | | | 4.16 | | | | 10.52 | | |
| Total from investment operations | | $ | 5.56 | | | | 6.78 | | | | 2.91 | | | | 4.38 | | | | 10.58 | | |
| Less distributions: | |
| Net investment income | | $ | 0.13 | | | | — | | | | — | | | | — | | | | — | | |
| Net realized gains on investments | | $ | 2.93 | | | | 0.09 | | | | 0.23 | | | | 0.02 | | | | 0.05 | | |
| Total distributions | | $ | 3.06 | | | | 0.09 | | | | 0.23 | | | | 0.02 | | | | 0.05 | | |
| Net asset value, end of year | | $ | 61.35 | | | | 58.85 | | | | 52.16 | | | | 49.48 | | | | 45.12 | | |
| Total Return(1) | | % | 9.62 | | | | 13.03 | | | | 5.92 | | | | 9.74 | | | | 30.58 | | |
| Ratios and Supplemental Data: | |
| Net assets, end of year (000's) | | $ | 101,503 | | | | 37,306 | | | | 163,188 | | | | 18,642 | | | | 8,251 | | |
| Ratios to average net assets: | |
Gross expenses prior to expense reimbursement and
brokerage commission recapture | | % | 1.00 | | | | 1.00 | | | | 1.00 | | | | 1.00 | | | | 1.00 | | |
Net expenses after expense reimbursement and
brokerage commission recapture | | % | 0.99 | | | | 1.00 | | | | 1.00 | | | | 1.00 | | | | 1.00 | | |
Net investment income after expense reimbursement and
brokerage commission recapture | | % | 0.25 | | | | 0.51 | | | | 0.12 | | | | 0.62 | | | | 0.04 | | |
| Portfolio turnover rate | | % | 58 | | | | 43 | | | | 41 | | | | 39 | | | | 34 | | |
(1) Total return is calculated assuming reinvestment of all dividends and capital gain distributions at net asset value and does not reflect the effect of insurance contract charges.
* Calculated using average number of shares outstanding throughout the period.
See Accompanying Notes to Financial Statements
131
ING T. ROWE PRICE GROWTH EQUITY PORTFOLIO (CONTINUED)
FINANCIAL HIGHLIGHTS
Selected data for a share of beneficial interest outstanding throughout each year.
| | | Class ADV | |
| | | Year Ended December 31, | |
| | | 2007 | | 2006 | | 2005 | | 2004 | | 2003 | |
| Per Share Operating Performance: | |
| Net asset value, beginning of year | | $ | 58.37 | | | | 51.87 | | | | 49.14 | | | | 44.89 | | | | 34.50 | | |
| Income (loss) from investment operations: | |
| Net investment income (loss) | | $ | 0.03 | * | | | 0.05 | | | | (0.06 | )* | | | 0.11 | | | | (0.01 | ) | |
| Net realized and unrealized gain on investments | | $ | 5.34 | | | | 6.54 | | | | 2.84 | | | | 4.14 | | | | 10.44 | | |
| Total from investment operations | | $ | 5.37 | | | | 6.59 | | | | 2.78 | | | | 4.25 | | | | 10.43 | | |
| Less distributions: | |
| Net investment income | | $ | 0.03 | | | | — | | | | — | | | | — | | | | — | | |
| Net realized gains on investments | | $ | 2.93 | | | | 0.09 | | | | 0.05 | | | | — | | | | 0.04 | | |
| Total distributions | | $ | 2.96 | | | | 0.09 | | | | 0.05 | | | | — | | | | 0.04 | | |
| Net asset value, end of year | | $ | 60.78 | | | | 58.37 | | | | 51.87 | | | | 49.14 | | | | 44.89 | | |
| Total Return(1) | | % | 9.36 | | | | 12.73 | | | | 5.66 | | | | 9.47 | | | | 30.27 | | |
| Ratios and Supplemental Data: | |
| Net assets, end of year (000's) | | $ | 103,588 | | | | 105,821 | | | | 86,781 | | | | 78,870 | | | | 60,182 | | |
| Ratios to average net assets: | |
Gross expenses prior to expense reimbursement and
brokerage commission recapture | | % | 1.25 | | | | 1.25 | | | | 1.25 | | | | 1.25 | | | | 1.25 | | |
Net expenses after expense reimbursement and
brokerage commission recapture | | % | 1.24 | | | | 1.25 | | | | 1.25 | | | | 1.25 | | | | 1.25 | | |
Net investment income (loss) after expense reimbursement and
brokerage commission recapture | | % | 0.05 | | | | 0.11 | | | | (0.12 | ) | | | 0.19 | | | | (0.24 | ) | |
| Portfolio turnover rate | | % | 58 | | | | 43 | | | | 41 | | | | 39 | | | | 34 | | |
(1) Total return is calculated assuming reinvestment of all dividends and capital gain distributions at net asset value and does not reflect the effect of insurance contract charges.
* Calculated using average number of shares outstanding throughout the period.
See Accompanying Notes to Financial Statements
132
ING TEMPLETON FOREIGN EQUITY PORTFOLIO
FINANCIAL HIGHLIGHTS
Selected data for a share of beneficial interest outstanding throughout each period.
| | | Class I | | Class S | |
| | | Year
Ended
December 31,
2007 | | January 3,
2006(1) to
December 31,
2006 | | Year
Ended
December 31,
2007 | | January 12,
2006(1) to
December 31,
2006 | |
| Per Share Operating Performance: | |
| Net asset value, beginning of period | | $ | 12.03 | | | | 10.00 | | | | 12.01 | | | | 10.02 | | |
| Income from investment operations: | |
| Net investment income | | $ | 0.24 | * | | | 0.27 | | | | 0.20 | * | | | 0.17 | * | |
| Net realized and unrealized gain on investments | | $ | 1.63 | | | | 1.90 | | | | 1.63 | | | | 1.95 | | |
| Total from investment operations | | $ | 1.87 | | | | 2.17 | | | | 1.83 | | | | 2.12 | | |
| Less distributions: | |
| Net investment income | | $ | 0.13 | | | | 0.13 | | | | 0.10 | | | | 0.12 | | |
| Net realized gains on investments | | $ | 0.11 | | | | 0.01 | | | | 0.11 | | | | 0.01 | | |
| Total distributions | | $ | 0.24 | | | | 0.14 | | | | 0.21 | | | | 0.13 | | |
| Net asset value, end of period | | $ | 13.66 | | | | 12.03 | | | | 13.63 | | | | 12.01 | | |
| Total Return(2) | | % | 15.50 | | | | 21.70 | | | | 15.23 | | | | 21.14 | | |
| Ratios and Supplemental Data: | |
| Net assets, end of period (000's) | | $ | 46,781 | | | | 10,991 | | | | 131,882 | | | | 36,200 | | |
| Ratios to average net assets: | |
| Gross expenses prior to expense reimbursement(3) | | % | 0.99 | | | | 1.24 | | | | 1.24 | | | | 1.49 | | |
| Net expenses after expense reimbursement(3)(4) | | % | 0.98 | | | | 0.98 | | | | 1.23 | | | | 1.23 | | |
| Net investment income after expense reimbursement(3)(4) | | % | 1.85 | | | | 2.53 | | | | 1.49 | | | | 1.57 | | |
| Portfolio turnover rate | | % | 20 | | | | 5 | | | | 20 | | | | 5 | | |
| | | Class ADV | |
| | | Year
Ended
December 31,
2007 | | December 20,
2006(1) to
December 31,
2006 | |
| Per Share Operating Performance: | |
| Net asset value, beginning of period | | $ | 12.03 | | | | 12.09 | | |
| Income from investment operations: | |
| Net investment income | | $ | 0.18 | * | | | 0.00 | ** | |
| Net realized and unrealized gain on investments | | $ | 1.68 | | | | 0.08 | | |
| Total from investment operations | | $ | 1.86 | | | | 0.08 | | |
| Less distributions: | |
| Net investment income | | $ | 0.13 | | | | 0.13 | | |
| Net realized gains on investments | | $ | 0.11 | | | | 0.01 | | |
| Total distributions | | $ | 0.24 | | | | 0.14 | | |
| Net asset value, end of period | | $ | 13.65 | | | | 12.03 | | |
| Total Return(2) | | % | 15.42 | | | | 0.66 | | |
| Ratios and Supplemental Data: | |
| Net assets, end of period (000's) | | $ | 1 | | | | 1 | | |
| Ratios to average net assets: | |
| Gross expenses prior to expense reimbursement(3) | | % | 1.49 | | | | 1.74 | | |
| Net expenses after expense reimbursement(3)(4) | | % | 1.48 | | | | 1.48 | | |
| Net investment income after expense reimbursement(3)(4) | | % | 1.40 | | | | 0.00 | ** | |
| Portfolio turnover rate | | % | 20 | | | | 5 | | |
(1) Commencement of operations.
(2) Total return is calculated assuming reinvestment of all dividends and capital gain distributions at net asset value and does not reflect the effect of insurance contract charges. Total return for periods less than one year is not annualized.
(3) Annualized for periods less than one year.
(4) The Investment Adviser has agreed to limit expenses, (excluding interest, taxes, brokerage and extraordinary expenses) subject to possible recoupment by the Investment Adviser within three years of being incurred.
* Calculated using average number of shares outstanding throughout the period.
** Amount is less than $0.005 or 0.005%.
See Accompanying Notes to Financial Statements
133
ING THORNBURG VALUE PORTFOLIO
FINANCIAL HIGHLIGHTS
Selected data for a share of beneficial interest outstanding throughout each year.
| | | Class I | |
| | | Year Ended December 31, | |
| | | 2007 | | 2006 | | 2005 | | 2004 | | 2003 | |
| Per Share Operating Performance: | |
| Net asset value, beginning of year | | $ | 31.85 | | | | 27.40 | | | | 27.20 | | | | 24.21 | | | | 18.94 | | |
| Income from investment operations: | |
| Net investment income | | $ | 0.28 | | | | 0.15 | * | | | 0.11 | * | | | 0.24 | * | | | 0.10 | * | |
| Net realized and unrealized gain on investments | | $ | 2.02 | | | | 4.44 | | | | 0.31 | | | | 2.86 | | | | 5.21 | | |
| Total from investment operations | | $ | 2.30 | | | | 4.59 | | | | 0.42 | | | | 3.10 | | | | 5.31 | | |
| Less distributions: | |
| Net investment income | | $ | 0.15 | | | | 0.14 | | | | 0.22 | | | | 0.11 | | | | 0.04 | | |
| Total distributions | | $ | 0.15 | | | | 0.14 | | | | 0.22 | | | | 0.11 | | | | 0.04 | | |
| Net asset value, end of year | | $ | 34.00 | | | | 31.85 | | | | 27.40 | | | | 27.20 | | | | 24.21 | | |
| Total Return(1) | | % | 7.24 | | | | 16.84 | | | | 1.56 | | | | 12.88 | | | | 28.07 | | |
| Ratios and Supplemental Data: | |
| Net assets, end of year (000's) | | $ | 216,408 | | | | 186,115 | | | | 191,985 | | | | 234,606 | | | | 247,542 | | |
| Ratios to average net assets: | |
| Gross expenses prior to brokerage commission recapture | | % | 0.90 | | | | 0.90 | | | | 0.90 | | | | 0.90 | | | | 0.90 | | |
| Net expenses after brokerage commission recapture | | % | 0.90 | | | | 0.90 | | | | 0.90 | | | | 0.90 | | | | 0.90 | | |
| Net investment income after brokerage commission recapture | | % | 0.92 | | | | 0.51 | | | | 0.43 | | | | 0.85 | | | | 0.47 | | |
| Portfolio turnover rate | | % | 88 | | | | 171 | | | | 95 | | | | 74 | | | | 65 | | |
| | | Class S | |
| | | Year Ended December 31, | |
| | | 2007 | | 2006 | | 2005 | | 2004 | | 2003 | |
| Per Share Operating Performance: | |
| Net asset value, beginning of year | | $ | 31.68 | | | | 27.24 | | | | 27.04 | | | | 24.09 | | | | 18.89 | | |
| Income from investment operations: | |
| Net investment income | | $ | 0.19 | * | | | 0.36 | * | | | 0.05 | * | | | 0.16 | * | | | 0.05 | * | |
| Net realized and unrealized gain on investments | | $ | 2.03 | | | | 4.14 | | | | 0.28 | | | | 2.87 | | | | 5.19 | | |
| Total from investment operations | | $ | 2.22 | | | | 4.50 | | | | 0.33 | | | | 3.03 | | | | 5.24 | | |
| Less distributions: | |
| Net investment income | | $ | 0.15 | | | | 0.06 | | | | 0.13 | | | | 0.08 | | | | 0.04 | | |
| Total distributions | | $ | 0.15 | | | | 0.06 | | | | 0.13 | | | | 0.08 | | | | 0.04 | | |
| Net asset value, end of year | | $ | 33.75 | | | | 31.68 | | | | 27.24 | | | | 27.04 | | | | 24.09 | | |
| Total Return(1) | | % | 7.00 | | | | 16.57 | | | | 1.25 | | | | 12.63 | | | | 27.74 | | |
| Ratios and Supplemental Data: | |
| Net assets, end of year (000's) | | $ | 13,719 | | | | 6,795 | | | | 277 | | | | 445 | | | | 391 | | |
| Ratios to average net assets: | |
| Gross expenses prior prior to brokerage commission recapture | | % | 1.15 | | | | 1.15 | | | | 1.15 | | | | 1.15 | | | | 1.15 | | |
| Net expenses after brokerage commission recapture | | % | 1.15 | | | | 1.15 | | | | 1.15 | | | | 1.15 | | | | 1.15 | | |
| Net investment income after brokerage commission recapture | | % | 0.56 | | | | 1.19 | | | | 0.18 | | | | 0.62 | | | | 0.21 | | |
| Portfolio turnover rate | | % | 88 | | | | 171 | | | | 95 | | | | 74 | | | | 65 | | |
(1) Total return is calculated assuming reinvestment of all dividends and capital gain distributions at net asset value and does not reflect the effect of insurance contract charges.
* Calculated using average number of shares outstanding throughout the period.
See Accompanying Notes to Financial Statements
134
ING THORNBURG VALUE PORTFOLIO (CONTINUED)
FINANCIAL HIGHLIGHTS
Selected data for a share of beneficial interest outstanding throughout each year.
| | | Class ADV | |
| | | Year Ended December 31, | |
| | | 2007 | | 2006 | | 2005 | | 2004 | | 2003 | |
| Per Share Operating Performance: | |
| Net asset value, beginning of year | | $ | 31.38 | | | | 27.03 | | | | 26.86 | | | | 23.98 | | | | 18.84 | | |
| Income (loss) from investment operations: | |
| Net investment income (loss) | | $ | 0.18 | * | | | 0.05 | * | | | (0.02 | )* | | | 0.03 | * | | | (0.01 | )* | |
| Net realized and unrealized gain on investments | | $ | 1.93 | | | | 4.34 | | | | 0.29 | | | | 2.92 | | | | 5.17 | | |
| Total from investment operations | | $ | 2.11 | | | | 4.39 | | | | 0.27 | | | | 2.95 | | | | 5.16 | | |
| Less distributions: | |
| Net investment income | | $ | 0.13 | | | | 0.04 | | | | 0.10 | | | | 0.07 | | | | 0.02 | | |
| Total distributions | | $ | 0.13 | | | | 0.04 | | | | 0.10 | | | | 0.07 | | | | 0.02 | | |
| Net asset value, end of year | | $ | 33.36 | | | | 31.38 | | | | 27.03 | | | | 26.86 | | | | 23.98 | | |
| Total Return(1) | | % | 6.73 | | | | 16.26 | | | | 1.03 | | | | 12.36 | | | | 27.39 | | |
| Ratios and Supplemental Data: | |
| Net assets, end of year (000's) | | $ | 4,196 | | | | 673 | | | | 214 | | | | 267 | | | | 159 | | |
| Ratios to average net assets: | |
| Gross expenses prior to brokerage commission recapture | | % | 1.40 | | | | 1.40 | | | | 1.40 | | | | 1.40 | | | | 1.40 | | |
| Net expenses after brokerage commission recapture | | % | 1.40 | | | | 1.40 | | | | 1.40 | | | | 1.40 | | | | 1.40 | | |
| Net investment income (loss) after brokerage commission recapture | | % | 0.54 | | | | 0.18 | | | | (0.08 | ) | | | 0.27 | | | | (0.04 | ) | |
| Portfolio turnover rate | | % | 88 | | | | 171 | | | | 95 | | | | 74 | | | | 65 | | |
(1) Total return is calculated assuming reinvestment of all dividends and capital gain distributions at net asset value and does not reflect the effect of insurance contract charges.
* Calculated using average number of shares outstanding throughout the period.
See Accompanying Notes to Financial Statements
135
ING UBS U.S. LARGE CAP EQUITY PORTFOLIO
FINANCIAL HIGHLIGHTS
Selected data for a share of beneficial interest outstanding throughout each year.
| | | Class I | |
| | | Year Ended December 31, | |
| | | 2007 | | 2006 | | 2005 | | 2004 | | 2003 | |
| Per Share Operating Performance: | |
| Net asset value, beginning of year | | $ | 10.56 | | | | 9.30 | | | | 8.58 | | | | 7.54 | | | | 6.07 | | |
| Income from investment operations: | |
| Net investment income | | $ | 0.11 | | | | 0.09 | | | | 0.08 | * | | | 0.10 | | | | 0.06 | | |
| Net realized and unrealized gain on investments | | $ | 0.02 | | | | 1.25 | | | | 0.72 | | | | 1.00 | | | | 1.45 | | |
| Total from investment operations | | $ | 0.13 | | | | 1.34 | | | | 0.80 | | | | 1.10 | | | | 1.51 | | |
| Less distributions: | |
| Net investment income | | $ | 0.08 | | | | 0.08 | | | | 0.08 | | | | 0.06 | | | | 0.04 | | |
| Total distributions | | $ | 0.08 | | | | 0.08 | | | | 0.08 | | | | 0.06 | | | | 0.04 | | |
| Net asset value, end of year | | $ | 10.61 | | | | 10.56 | | | | 9.30 | | | | 8.58 | | | | 7.54 | | |
| Total Return(1) | | % | 1.18 | | | | 14.51 | | | | 9.38 | | | | 14.76 | | | | 24.95 | | |
| Ratios and Supplemental Data: | |
| Net assets, end of year (000's) | | $ | 365,084 | | | | 355,204 | | | | 270,692 | | | | 267,249 | | | | 264,755 | | |
| Ratios to average net assets: | |
| Gross expenses prior to brokerage commission recapture | | % | 0.85 | | | | 0.85 | | | | 0.85 | | | | 0.85 | | | | 0.85 | | |
| Net expenses after brokerage commission recapture | | % | 0.84 | | | | 0.84 | | | | 0.85 | | | | 0.85 | | | | 0.85 | | |
| Net investment income after brokerage commission recapture | | % | 1.02 | | | | 0.99 | | | | 0.92 | | | | 1.22 | | | | 0.83 | | |
| Portfolio turnover rate | | % | 48 | | | | 39 | | | | 51 | | | | 140 | | | | 126 | | |
| | | Class S | |
| | | Year Ended December 31, | |
| | | 2007 | | 2006 | | 2005 | | 2004 | | 2003 | |
| Per Share Operating Performance: | |
| Net asset value, beginning of year | | $ | 10.45 | | | | 9.21 | | | | 8.52 | | | | 7.49 | | | | 6.05 | | |
| Income from investment operations: | |
| Net investment income | | $ | 0.08 | * | | | 0.08 | * | | | 0.06 | * | | | 0.09 | | | | 0.01 | | |
| Net realized and unrealized gain on investments | | $ | 0.02 | | | | 1.23 | | | | 0.70 | | | | 1.00 | | | | 1.47 | | |
| Total from investment operations | | $ | 0.10 | | | | 1.31 | | | | 0.76 | | | | 1.09 | | | | 1.48 | | |
| Less distributions: | |
| Net investment income | | $ | 0.07 | | | | 0.07 | | | | 0.07 | | | | 0.06 | | | | 0.04 | | |
| Total distributions | | $ | 0.07 | | | | 0.07 | | | | 0.07 | | | | 0.06 | | | | 0.04 | | |
| Net asset value, end of year | | $ | 10.48 | | | | 10.45 | | | | 9.21 | | | | 8.52 | | | | 7.49 | | |
| Total Return(1) | | % | 0.93 | | | | 14.32 | | | | 8.99 | | | | 14.59 | | | | 24.54 | | |
| Ratios and Supplemental Data: | |
| Net assets, end of year (000's) | | $ | 45,303 | | | | 28,207 | | | | 9,667 | | | | 2,356 | | | | 1,352 | | |
| Ratios to average net assets: | |
| Gross expenses prior to brokerage commission recapture | | % | 1.10 | | | | 1.10 | | | | 1.10 | | | | 1.10 | | | | 1.10 | | |
| Net expenses after brokerage commission recapture | | % | 1.09 | | | | 1.09 | | | | 1.10 | | | | 1.10 | | | | 1.10 | | |
| Net investment income after brokerage commission recapture | | % | 0.75 | | | | 0.79 | | | | 0.64 | | | | 1.06 | | | | 0.37 | | |
| Portfolio turnover rate | | % | 48 | | | | 39 | | | | 51 | | | | 140 | | | | 126 | | |
(1) Total return is calculated assuming reinvestment of all dividends and capital gain distributions at net asset value and does not reflect the effect of insurance contract charges.
* Calculated using average number of shares outstanding throughout the period.
See Accompanying Notes to Financial Statements
136
ING UBS U.S. LARGE CAP EQUITY PORTFOLIO (CONTINUED)
FINANCIAL HIGHLIGHTS
Selected data for a share of beneficial interest outstanding throughout each year.
| | | Class ADV | |
| | | Year Ended December 31, | |
| | | 2007 | | 2006 | | 2005 | | 2004 | | 2003 | |
| Per Share Operating Performance: | |
| Net asset value, beginning of year | | $ | 10.40 | | | | 9.19 | | | | 8.52 | | | | 7.49 | | | | 6.04 | | |
| Income from investment operations: | |
| Net investment income | | $ | 0.06 | * | | | 0.06 | * | | | 0.03 | * | | | 0.05 | | | | 0.02 | | |
| Net realized and unrealized gain on investments | | $ | 0.01 | | | | 1.22 | | | | 0.70 | | | | 1.01 | | | | 1.45 | | |
| Total from investment operations | | $ | 0.07 | | | | 1.28 | | | | 0.73 | | | | 1.06 | | | | 1.47 | | |
| Less distributions: | |
| Net investment income | | $ | 0.07 | | | | 0.07 | | | | 0.06 | | | | 0.03 | | | | 0.02 | | |
| Total distributions | | $ | 0.07 | | | | 0.07 | | | | 0.06 | | | | 0.03 | | | | 0.02 | | |
| Net asset value, end of year | | $ | 10.40 | | | | 10.40 | | | | 9.19 | | | | 8.52 | | | | 7.49 | | |
| Total Return(1) | | % | 0.65 | | | | 14.05 | | | | 8.67 | | | | 14.21 | | | | 24.42 | | |
| Ratios and Supplemental Data: | |
| Net assets, end of year (000's) | | $ | 10,494 | | | | 4,033 | | | | 426 | | | | 48 | | | | 39 | | |
| Ratios to average net assets: | |
| Gross expenses prior to brokerage commission recapture | | % | 1.35 | | | | 1.35 | | | | 1.35 | | | | 1.35 | | | | 1.35 | | |
| Net expenses after brokerage commission recapture | | % | 1.34 | | | | 1.34 | | | | 1.35 | | | | 1.35 | | | | 1.35 | | |
| Net investment income after brokerage commission recapture | | % | 0.52 | | | | 0.58 | | | | 0.37 | | | | 0.73 | | | | 0.33 | | |
| Portfolio turnover rate | | % | 48 | | | | 39 | | | | 51 | | | | 140 | | | | 126 | | |
(1) Total return is calculated assuming reinvestment of all dividends and capital gain distributions at net asset value and does not reflect the effect of insurance contract charges. Total return for periods less than one year is not annualized.
* Calculated using average number of shares outstanding throughout the period.
See Accompanying Notes to Financial Statements
137
ING UBS U.S. SMALL CAP GROWTH PORTFOLIO
FINANCIAL HIGHLIGHTS
Selected data for a share of beneficial interest outstanding throughout each period.
| | | Class I | | Class S | |
| | | Year
Ended
December 31,
2007 | | April 28,
2006(1) to
December 31,
2006 | | Year
Ended
December 31,
2007 | | April 28,
2006(1) to
December 31,
2006 | |
| Per Share Operating Performance: | |
| Net asset value, beginning of period | | $ | 9.72 | | | | 10.00 | | | | 9.70 | | | | 10.00 | | |
| Income (loss) from investment operations: | |
| Net investment loss | | $ | (0.06 | )* | | | (0.02 | ) | | | (0.09 | )* | | | (0.04 | )* | |
| Net realized and unrealized gain (loss) on investments | | $ | 0.55 | | | | (0.18 | ) | | | 0.56 | | | | (0.18 | ) | |
| Total from investment operations | | $ | 0.49 | | | | (0.20 | ) | | | 0.47 | | | | (0.22 | ) | |
| Less distributions: | |
| Net realized gains on investments | | $ | 0.60 | | | | 0.08 | | | | 0.60 | | | | 0.08 | | |
| Total distributions | | $ | 0.60 | | | | 0.08 | | | | 0.60 | | | | 0.08 | | |
| Net asset value, end of period | | $ | 9.61 | | | | 9.72 | | | | 9.57 | | | | 9.70 | | |
| Total Return(2) | | % | 5.01 | | | | (1.97 | ) | | | 4.81 | | | | (2.17 | ) | |
| Ratios and Supplemental Data: | |
| Net assets, end of period (000's) | | $ | 32,405 | | | | 22,417 | | | | 3,503 | | | | 5,065 | | |
| Ratios to average net assets: | |
Gross expenses prior to expense reimbursement and brokerage
commission recapture(3) | | % | 1.08 | | | | 1.27 | | | | 1.33 | | | | 1.52 | | |
Net expenses after expense reimbursement and prior to brokerage
commission recapture(3)(4) | | % | 1.00 | | | | 1.00 | | | | 1.25 | | | | 1.25 | | |
Net expenses after expense reimbursement and brokerage
commission recapture(3)(4) | | % | 0.98 | | | | 0.95 | | | | 1.23 | | | | 1.20 | | |
Net investment loss after expense reimbursement and brokerage
commission recapture(3)(4) | | % | (0.61 | ) | | | (0.43 | ) | | | (0.86 | ) | | | (0.64 | ) | |
| Portfolio turnover rate | | % | 118 | | | | 104 | | | | 118 | | | | 104 | | |
| | | Class ADV | |
| | | Year
Ended
December 31,
2007 | | April 28,
2006(1) to
December 31,
2006 | |
| Per Share Operating Performance: | |
| Net asset value, beginning of period | | $ | 9.67 | | | | 10.00 | | |
| Income (loss) from investment operations: | |
| Net investment loss | | $ | (0.10 | )* | | | (0.08 | ) | |
| Net realized and unrealized gain (loss) on investments | | $ | 0.51 | | | | (0.17 | ) | |
| Total from investment operations | | $ | 0.41 | | | | (0.25 | ) | |
| Less distributions: | |
| Net realized gains on investments | | $ | 0.60 | | | | 0.08 | | |
| Total distributions | | $ | 0.60 | | | | 0.08 | | |
| Net asset value, end of period | | $ | 9.48 | | | | 9.67 | | |
| Total Return(2) | | % | 4.20 | | | | (2.47 | ) | |
| Ratios and Supplemental Data: | |
| Net assets, end of period (000's) | | $ | 1 | | | | 1 | | |
| Ratios to average net assets: | |
| Gross expenses prior to expense reimbursement and brokerage commission recapture(3) | | % | 1.58 | | | | 1.77 | | |
| Net expenses after expense reimbursement and prior to brokerage commission recapture(3)(4) | | % | 1.50 | | | | 1.50 | | |
| Net expenses after expense reimbursement and brokerage commission recapture(3)(4) | | % | 1.48 | | | | 1.45 | | |
| Net investment loss after expense reimbursement and brokerage commission recapture(3)(4) | | % | (1.00 | ) | | | (1.19 | ) | |
| Portfolio turnover rate | | % | 118 | | | | 104 | | |
(1) Commencement of operations.
(2) Total return is calculated assuming reinvestment of all dividends and capital gain distributions at net asset value and does not reflect the effect of insurance contract charges. Total return for periods less than one year is not annualized.
(3) Annualized for periods less than one year.
(4) The Investment Adviser has agreed to limit expenses, (excluding interest, taxes, brokerage and extraordinary expenses) subject to possible recoupment by the Investment Adviser within three years of being incurred.
* Calculated using average number of shares outstanding throughout the period.
See Accompanying Notes to Financial Statements
138
ING VAN KAMPEN COMSTOCK PORTFOLIO
FINANCIAL HIGHLIGHTS
Selected data for a share of beneficial interest outstanding throughout each year.
| | | Class I | |
| | | Year Ended December 31, | |
| | | 2007 | | 2006 | | 2005 | | 2004 | | 2003 | |
| Per Share Operating Performance: | |
| Net asset value, beginning of year | | $ | 13.37 | | | | 12.22 | | | | 12.33 | | | | 10.60 | | | | 8.35 | | |
| Income (loss) from investment operations: | |
| Net investment income | | $ | 0.24 | | | | 0.24 | * | | | 0.19 | * | | | 0.12 | | | | 0.09 | | |
| Net realized and unrealized gain (loss) on investments | | $ | (0.49 | ) | | | 1.66 | | | | 0.24 | | | | 1.66 | | | | 2.41 | | |
| Total from investment operations | | $ | (0.25 | ) | | | 1.90 | | | | 0.43 | | | | 1.78 | | | | 2.50 | | |
| Less distributions: | |
| Net investment income | | $ | 0.21 | | | | 0.13 | | | | 0.08 | | | | — | | | | 0.08 | | |
| Net realized gains on investments | | $ | 0.36 | | | | 0.62 | | | | 0.46 | | | | 0.05 | | | | 0.17 | | |
| Total distributions | | $ | 0.57 | | | | 0.75 | | | | 0.54 | | | | 0.05 | | | | 0.25 | | |
| Net asset value, end of year | | $ | 12.55 | | | | 13.37 | | | | 12.22 | | | | 12.33 | | | | 10.60 | | |
| Total Return(1) | | % | (2.04 | ) | | | 16.19 | | | | 3.74 | | | | 16.90 | | | | 29.92 | | |
| Ratios and Supplemental Data: | |
| Net assets, end of year (000's) | | $ | 608,951 | | | | 634,470 | | | | 133,987 | | | | 70,308 | | | | 33,398 | | |
| Ratios to average net assets: | |
| Gross expenses prior to expense reimbursement | | % | 0.85 | | | | 0.88 | | | | 0.95 | | | | 0.90 | | | | 0.95 | | |
| Net expenses after expense reimbursement | | % | 0.84 | | | | 0.84 | | | | 0.87 | | | | 0.90 | | | | 0.95 | | |
| Net investment income after expense reimbursement | | % | 1.78 | | | | 1.91 | | | | 1.57 | | | | 1.40 | | | | 1.28 | | |
| Portfolio turnover rate | | % | 26 | | | | 27 | | | | 27 | | | | 30 | | | | 32 | | |
| | | Class S | |
| | | Year Ended December 31, | |
| | | 2007 | | 2006 | | 2005 | | 2004 | | 2003 | |
| Per Share Operating Performance: | |
| Net asset value, beginning of period | | $ | 13.30 | | | | 12.16 | | | | 12.29 | | | | 10.58 | | | | 8.34 | | |
| Income (loss) from investment operations: | |
| Net investment income | | $ | 0.21 | | | | 0.21 | * | | | 0.16 | * | | | 0.09 | | | | 0.05 | | |
| Net realized and unrealized gain (loss) on investments | | $ | (0.49 | ) | | | 1.64 | | | | 0.24 | | | | 1.67 | | | | 2.42 | | |
| Total from investment operations | | $ | (0.28 | ) | | | 1.85 | | | | 0.40 | | | | 1.76 | | | | 2.47 | | |
| Less distributions: | |
| Net investment income | | $ | 0.17 | | | | 0.09 | | | | 0.07 | | | | — | | | | 0.06 | | |
| Net realized gains on investments | | $ | 0.36 | | | | 0.62 | | | | 0.46 | | | | 0.05 | | | | 0.17 | | |
| Total distributions | | $ | 0.53 | | | | 0.71 | | | | 0.53 | | | | 0.05 | | | | 0.23 | | |
| Net asset value, end of period | | $ | 12.49 | | | | 13.30 | | | | 12.16 | | | | 12.29 | | | | 10.58 | | |
| Total Return(1) | | % | (2.28 | ) | | | 15.86 | | | | 3.47 | | | | 16.74 | | | | 29.67 | | |
| Ratios and Supplemental Data: | |
| Net assets, end of period (000's) | | $ | 342,155 | | | | 358,431 | | | | 537,092 | | | | 317,797 | | | | 139,236 | | |
| Ratios to average net assets: | |
| Gross expenses prior to expense reimbursement | | % | 1.10 | | | | 1.13 | | | | 1.20 | | | | 1.15 | | | | 1.20 | | |
| Net expenses after expense reimbursement | | % | 1.09 | | | | 1.09 | | | | 1.12 | | | | 1.15 | | | | 1.20 | | |
| Net investment income after expense reimbursement | | % | 1.52 | | | | 1.67 | | | | 1.31 | | | | 1.15 | | | | 1.06 | | |
| Portfolio turnover rate | | % | 26 | | | | 27 | | | | 27 | | | | 30 | | | | 32 | | |
(1) Total return is calculated assuming reinvestment of all dividends and capital gain distributions at net asset value and does not reflect the effect of insurance contract charges.
* Calculated using average number of shares outstanding throughout the period.
See Accompanying Notes to Financial Statements
139
ING VAN KAMPEN COMSTOCK PORTFOLIO (CONTINUED)
FINANCIAL HIGHLIGHTS
Selected data for a share of beneficial interest outstanding throughout each year.
| | | Class ADV | |
| | | Year Ended December 31, | |
| | | 2007 | | 2006 | | 2005 | | 2004 | | 2003 | |
| Per Share Operating Performance: | |
| Net asset value, beginning of year | | $ | 13.17 | | | | 12.08 | | | | 12.22 | | | | 10.55 | | | | 8.32 | | |
| Income (loss) from investment operations: | |
| Net investment income | | $ | 0.17 | * | | | 0.18 | * | | | 0.13 | * | | | 0.08 | | | | 0.07 | | |
| Net realized and unrealized gain (loss) on investments | | $ | (0.48 | ) | | | 1.62 | | | | 0.24 | | | | 1.64 | | | | 2.37 | | |
| Total from investment operations | | $ | (0.31 | ) | | | 1.80 | | | | 0.37 | | | | 1.72 | | | | 2.44 | | |
| Less distributions: | |
| Net investment income | | $ | 0.16 | | | | 0.09 | | | | 0.04 | | | | — | | | | 0.04 | | |
| Net realized gains on investments | | $ | 0.36 | | | | 0.62 | | | | 0.47 | | | | 0.05 | | | | 0.17 | | |
| Total distributions | | $ | 0.52 | | | | 0.71 | | | | 0.51 | | | | 0.05 | | | | 0.21 | | |
| Net asset value, end of year | | $ | 12.34 | | | | 13.17 | | | | 12.08 | | | | 12.22 | | | | 10.55 | | |
| Total Return(1) | | % | (2.51 | ) | | | 15.57 | | | | 3.20 | | | | 16.41 | | | | 29.34 | | |
| Ratios and Supplemental Data: | |
| Net assets, end of year (000's) | | $ | 40,111 | | | | 37,431 | | | | 25,455 | | | | 12,569 | | | | 8,556 | | |
| Ratios to average net assets: | |
| Gross expenses prior to expense reimbursement | | % | 1.35 | | | | 1.38 | | | | 1.45 | | | | 1.40 | | | | 1.45 | | |
| Net expenses after expense reimbursement | | % | 1.34 | | | | 1.34 | | | | 1.37 | | | | 1.40 | | | | 1.45 | | |
| Net investment income after expense reimbursement | | % | 1.27 | | | | 1.42 | | | | 1.06 | | | | 0.86 | | | | 0.77 | | |
| Portfolio turnover rate | | % | 26 | | | | 27 | | | | 27 | | | | 30 | | | | 32 | | |
(1) Total return is calculated assuming reinvestment of all dividends and capital gain distributions at net asset value and does not reflect the effect of insurance contract charges.
* Calculated using average number of shares outstanding throughout the period.
See Accompanying Notes to Financial Statements
140
ING VAN KAMPEN EQUITY AND INCOME PORTFOLIO
FINANCIAL HIGHLIGHTS
Selected data for a share of beneficial interest outstanding throughout each year.
| | | Class I | |
| | | Year Ended December 31, | |
| | | 2007 | | 2006 | | 2005 | | 2004 | | 2003 | |
| Per Share Operating Performance: | |
| Net asset value, beginning of year | | $ | 38.47 | | | | 36.09 | | | | 33.47 | | | | 30.35 | | | | 23.94 | | |
| Income from investment operations: | |
| Net investment income | | $ | 0.95 | * | | | 0.92 | * | | | 0.73 | * | | | 0.14 | | | | 0.14 | | |
| Net realized and unrealized gain on investments | | $ | 0.41 | | | | 3.48 | | | | 1.95 | | | | 3.15 | | | | 6.40 | | |
| Total from investment operations | | $ | 1.36 | | | | 4.40 | | | | 2.68 | | | | 3.29 | | | | 6.54 | | |
| Less distributions: | |
| Net investment income | | $ | 0.97 | | | | 0.73 | | | | 0.03 | | | | 0.17 | | | | 0.13 | | |
| Net realized gains on investments | | $ | 1.10 | | | | 1.29 | | | | 0.03 | | | | — | | | | — | | |
| Total distributions | | $ | 2.07 | | | | 2.02 | | | | 0.06 | | | | 0.17 | | | | 0.13 | | |
| Net asset value, end of year | | $ | 37.76 | | | | 38.47 | | | | 36.09 | | | | 33.47 | | | | 30.35 | | |
| Total Return(1) | | % | 3.56 | | | | 12.67 | | | | 8.02 | | | | 10.86 | | | | 27.37 | | |
| Ratios and Supplemental Data: | |
| Net assets, end of year (000's) | | $ | 811,810 | | | | 925,305 | | | | 847,997 | | | | 551,489 | | | | 2,883 | | |
| Ratios to average net assets: | |
| Expenses | | % | 0.57 | | | | 0.57 | | | | 0.57 | | | | 0.74 | | | | 1.10 | | |
| Net investment income | | % | 2.42 | | | | 2.49 | | | | 2.10 | | | | 1.88 | | | | 0.72 | | |
| Portfolio turnover rate | | % | 89 | | | | 57 | | | | 125 | | | | 797 | | | | 17 | | |
| | | Class S | |
| | | Year Ended December 31, | |
| | | 2007 | | 2006 | | 2005 | | 2004 | | 2003 | |
| Per Share Operating Performance: | |
| Net asset value, beginning of year | | $ | 38.24 | | | | 35.93 | | | | 33.37 | | | | 30.27 | | | | 23.88 | | |
| Income from investment operations: | |
| Net investment income | | $ | 0.83 | * | | | 0.82 | * | | | 0.63 | * | | | 0.17 | | | | 0.12 | | |
| Net realized and unrealized gain on investments | | $ | 0.42 | | | | 3.47 | | | | 1.96 | | | | 3.03 | | | | 6.33 | | |
| Total from investment operations | | $ | 1.25 | | | | 4.29 | | | | 2.59 | | | | 3.20 | | | | 6.45 | | |
| Less distributions: | |
| Net investment income | | $ | 0.89 | | | | 0.69 | | | | — | | | | 0.10 | | | | 0.06 | | |
| Net realized gains on investments | | $ | 1.10 | | | | 1.29 | | | | 0.03 | | | | — | | | | — | | |
| Total distributions | | $ | 1.99 | | | | 1.98 | | | | 0.03 | | | | 0.10 | | | | 0.06 | | |
| Net asset value, end of year | | $ | 37.50 | | | | 38.24 | | | | 35.93 | | | | 33.37 | | | | 30.27 | | |
| Total Return(1) | | % | 3.29 | | | | 12.40 | | | | 7.77 | | | | 10.62 | | | | 27.04 | | |
| Ratios and Supplemental Data: | |
| Net assets, end of year (000's) | | $ | 133,013 | | | | 88,409 | | | | 59,793 | | | | 34,477 | | | | 17,744 | | |
| Ratios to average net assets: | |
| Expenses | | % | 0.82 | | | | 0.82 | | | | 0.82 | | | | 0.99 | | | | 1.35 | | |
| Net investment income | | % | 2.16 | | | | 2.25 | | | | 1.84 | | | | 0.99 | | | | 0.46 | | |
| Portfolio turnover rate | | % | 89 | | | | 57 | | | | 125 | | | | 797 | | | | 17 | | |
(1) Total return is calculated assuming reinvestment of all dividends and capital gain distributions at net asset value and does not reflect the effect of insurance contract charges.
* Calculated using average number of shares outstanding throughout the period.
See Accompanying Notes to Financial Statements
141
ING VAN KAMPEN EQUITY AND INCOME PORTFOLIO (CONTINUED)
FINANCIAL HIGHLIGHTS
Selected data for a share of beneficial interest outstanding throughout each year.
| | | Class ADV | |
| | | Year Ended December 31, | |
| | | 2007 | | 2006 | | 2005 | | 2004 | | 2003 | |
| Per Share Operating Performance: | |
| Net asset value, beginning of year | | $ | 37.82 | | | | 35.55 | | | | 33.11 | | | | 30.07 | | | | 23.81 | | |
| Income from investment operations: | |
| Net investment income | | $ | 0.74 | * | | | 0.72 | * | | | 0.53 | * | | | 0.15 | | | | 0.06 | | |
| Net realized and unrealized gain on investments | | $ | 0.41 | | | | 3.43 | | | | 1.95 | | | | 2.96 | | | | 6.30 | | |
| Total from investment operations | | $ | 1.15 | | | | 4.15 | | | | 2.48 | | | | 3.11 | | | | 6.36 | | |
| Less distributions: | |
| Net investment income | | $ | 0.78 | | | | 0.59 | | | | 0.01 | | | | 0.07 | | | | 0.10 | | |
| Net realized gains on investments | | $ | 1.10 | | | | 1.29 | | | | 0.03 | | | | — | | | | — | | |
| Total distributions | | $ | 1.88 | | | | 1.88 | | | | 0.04 | | | | 0.07 | | | | 0.10 | | |
| Net asset value, end of year | | $ | 37.09 | | | | 37.82 | | | | 35.55 | | | | 33.11 | | | | 30.07 | | |
| Total Return(1) | | % | 3.06 | | | | 12.12 | | | | 7.49 | | | | 10.32 | | | | 26.76 | | |
| Ratios and Supplemental Data: | |
| Net assets, end of year (000's) | | $ | 14,242 | | | | 18,385 | | | | 14,307 | | | | 8,611 | | | | 123 | | |
| Ratios to average net assets: | |
| Expenses | | % | 1.07 | | | | 1.07 | | | | 1.07 | | | | 1.24 | | | | 1.60 | | |
| Net investment income | | % | 1.92 | | | | 1.98 | | | | 1.56 | | | | 1.29 | | | | 0.22 | | |
| Portfolio turnover rate | | % | 89 | | | | 57 | | | | 125 | | | | 797 | | | | 17 | | |
(1) Total return is calculated assuming reinvestment of all dividends and capital gain distributions at net asset value and does not reflect the effect of insurance contract charges.
* Calculated using average number of shares outstanding throughout the period.
See Accompanying Notes to Financial Statements
142
NOTES TO FINANCIAL STATEMENTS AS OF DECEMBER 31, 2007
NOTE 1 — ORGANIZATION
ING Partners, Inc. (the "Fund") is an open-end management investment company registered under the Investment Company Act of 1940, as amended (the "1940 Act"). It was incorporated under the laws of Maryland on May 7, 1997. The Articles of Incorporation permit the Fund to offer separate series (each a "Portfolio" and collectively, the "Portfolios"), each of which has its own investment objective, policies and restrictions. The Fund serves as an investment option in underlying variable insurance products offered by Directed Services, LLC(1) ("DSL" or the "Investment Adviser").
The Fund currently consists of thirty-seven Portfolios of which twenty-four diversified Portfolios and two non-diversified Portfolios are included in this report. The Portfolios are: ING American Century Large Company Value Portfolio ("American Century Large Company Value"); ING American Century Small-Mid Cap Value Portfolio ("American Century Small-Mid Cap"); ING Baron Asset Portfolio ("Baron Asset"); ING Baron Small Cap Growth Portfolio ("Baron Small Cap Growth"); ING Columbia Small Cap Value II Portfolio ("Columbia Small Cap Value II"); ING Davis New York Venture Portfolio ("Davis New York Venture") formerly, ING Davis Venture Value Portfolio; ING JPMorgan International Portfolio ("JPMorgan International"); ING JPMorgan Mid Cap Value Portfolio ("JPMorgan Mid Cap Value"); ING Legg Mason Partners Aggressive Growth Portfolio ("Legg Mason Partners Aggressive Growth"); ING Legg Mason Partners Large Cap Growth Portfolio ("Legg Mason Partners La rge Cap Growth"); ING Lord Abbett U.S. Government Securities Portfolio ("Lord Abbett U.S. Government Securities"); ING Neuberger Berman Partners Portfolio ("Neuberger Berman Partners"); ING Neuberger Berman Regency Portfolio ("Neuberger Berman Regency"); ING OpCap Balanced Value Portfolio ("OpCap Balanced Value"); ING Oppenheimer Global Portfolio ("Oppenheimer Global"); ING Oppenheimer Strategic Income Portfolio ("Oppenheimer Strategic Income"); ING PIMCO Total Return Portfolio ("PIMCO Total Return"); ING Pioneer High Yield Portfolio ("Pioneer High Yield"); ING T. Rowe Price Diversified Mid Cap Growth Portfolio ("T. Rowe Price Diversified Mid Cap Growth"); ING T. Rowe Price Growth Equity Portfolio ("T. Rowe Price Growth Equity"); ING Templeton Foreign Equity Portfolio ("Templeton Foreign Equity"); ING Thornburg Value Portfolio ("Thornburg Value"); ING UBS U.S. Large Cap Equity Portfolio ("UBS U.S. Large Cap Equity"); ING UBS U.S. Small Cap Growth Portfolio ("UBS U.S. Small Cap Growth"); ING Van Kampen Comsto ck Portfolio ("Van Kampen Comstock"); and ING Van Kampen Equity and Income Portfolio ("Van Kampen Equity and Income").
Davis New York Venture is classified as a "non-diversified" portfolio under the 1940 Act.
The following is a brief description of each Portfolio's investment objective:
• American Century Large Company Value seeks long-term capital growth, income is a second objective;
• American Century Small-Mid Cap Value seeks long-term capital growth, income is a secondary objective;
• Baron Asset seeks capital appreciation;
• Baron Small Cap Growth seeks capital appreciation;
• Columbia Small Cap Value II seeks long-term growth of capital;
• Davis New York Venture seeks long-term growth of capital;
• JPMorgan International seeks long-term growth of capital;
• JPMorgan Mid Cap Value seeks growth from capital appreciation;
• Legg Mason Partners Aggressive Growth seeks long-term growth of capital;
• Legg Mason Partners Large Cap Growth seeks long-term capital appreciation;
• Lord Abbett U.S. Government Securities seeks high current income consistent with reasonable risk;
• Neuberger Berman Partners seeks capital growth;
• Neuberger Berman Regency seeks capital growth;
• OpCap Balanced Value seeks capital growth, and secondarily, investment income;
• Oppenheimer Global seeks capital appreciation;
• Oppenheimer Strategic Income seeks a high level of current income principally derived from interest on debt securities;
• PIMCO Total Return seeks maximum total return, consistent with capital preservation and prudent investment management;
• Pioneer High Yield seeks to maximize total return through income and capital appreciation;
• T. Rowe Price Diversified Mid Cap Growth seeks long-term capital appreciation;
• T. Rowe Price Growth Equity seeks long-term capital growth, and secondarily, increasing dividend income;
• Templeton Foreign Equity seeks long-term capital growth;
143
NOTES TO FINANCIAL STATEMENTS AS OF DECEMBER 31, 2007 (CONTINUED)
NOTE 1 — ORGANIZATION (continued)
• Thornburg Value seeks capital appreciation;
• UBS U.S. Large Cap Equity seeks long-term growth of capital and future income;
• UBS U.S. Small Cap Growth seeks long-term capital appreciation;
• Van Kampen Comstock seeks capital growth and income; and
• Van Kampen Equity and Income seeks total return, consisting of long-term capital appreciation and current income.
The Fund offers three classes of shares, referred to as Initial Class (Class "I"), Service Class (Class "S") and Adviser Class (Class "ADV"). The classes differ principally in applicable distribution and shareholder service fees. Shareholders of each class also bear certain expenses that pertain to that particular class. All shareholders bear the common expenses of the Portfolios and earn income and realized gains/losses from the Portfolio pro rata based on the average daily net assets of each class, without discrimination between share classes. Differences in per share dividend rates generally result from differences in separate class expenses, including distribution and shareholder servicing fees. Class I shares are intended for distribution networks including non-qualified annuity and life insurance contracts and qualified retirement plans offered through an annuity contract, as well as qualified retirement plans offered through a custodi al account where the sale is made on a direct basis without the involvement of a financial intermediary or where the qualified retirement plan has assets of $50 million or more. Class S and Class ADV shares of a Portfolio are intended for distribution networks including qualified retirement plans offered through an annuity contract or custodial account. Shareholders of the Class I shares of each Portfolio will generally be entitled to exchange those shares at net asset value ("NAV") for Class I shares of other Portfolios that offer Class I shares. Shareholders of the Class ADV shares of each Portfolio will generally be entitled to exchange those shares at NAV for Class ADV shares of other Portfolios that offer Class ADV shares. Shareholders of the Class ADV shares continue to be subject to the Rule 12b-1 Plan fee applicable to Class ADV shares after the exchange. Shareholders of Class S shares of each Portfolio will generally be entitled to exchange those shares at net asset value for Class S shares of other Portfolios that offer Class S shares. Each Portfolio's shares may be offered to variable annuity and variable life insurance separate accounts, qualified pension and retirement plans outside the separate account context, and to certain investment advisers and their affiliates.
Directed Services, LLC ("DSL" or "Investment Adviser"), a Delaware limited liability company, serves as the investment adviser to the Portfolios. ING Funds Distributor, LLC ("IFD" or the "Distributor") serves as the principal underwriter to the Portfolios. DSL, ING IM and IFD are indirect, wholly-owned subsidiaries of ING Groep N.V. ("ING Groep"). ING Groep is one of the largest financial services organizations in the world, and offers an array of banking, insurance and asset management services to both individuals and institutional investors.
NOTE 2 — SIGNIFICANT ACCOUNTING POLICIES
The following significant accounting policies are consistently followed by the Portfolios in the preparation of their financial statements. Such policies are in conformity with U.S. generally accepted accounting principles for investment companies.
A. Security Valuation. Investments in equity securities traded on a national securities exchange are valued at the last reported sale price. Securities reported by NASDAQ are valued at the NASDAQ official closing prices. Securities traded on an exchange or NASDAQ for which there has been no sale and securities traded in the over-the-counter-market are valued at the mean between the last reported bid and ask prices. All investments quoted in foreign currencies will be valued daily in U.S. dollars on the basis of the foreign currency exchange rates prevailing at that time. Debt securities are valued at prices obtained from independent services or from one or more dealers making markets in the securities and may be adjusted based on the Portfolios' valuation procedures. U.S. government obligations are valued by using market quotations or independent pricing services that use prices provided by market-makers or estimates of market values obtained from yield data relating to instruments or securities with similar characteristics.
Securities and assets for which market quotations are not readily available (which may include certain restricted securities, which are subject to limitations as to their sale) are valued at their fair values as determined in good faith by or under the supervision of the Portfolios' Board of Directors ("Board"), in accordance with methods that are specifically authorized by the Board. Securities traded on exchanges, including foreign exchanges, which close earlier than the time that a Portfolio calculates its NAV may also be valued at their fair values as determined in good faith by or under the supervision of a Portfolio's Board, in accordance with methods that are specifically authorized by the Board. If an event occurs after the time at which the market for foreign securities held by a Portfolio closes but before the time that a Portfolio's NAV is
144
NOTES TO FINANCIAL STATEMENTS AS OF DECEMBER 31, 2007 (CONTINUED)
NOTE 2 — SIGNIFICANT ACCOUNTING POLICIES (continued)
calculated, such event may cause the closing price on the foreign exchange to not represent a readily available reliable market value quotation for such securities at the time a Portfolio determines its NAV. In such a case, a Portfolio will use the fair value of such securities as determined under a Portfolio's valuation procedures. Events after the close of trading on a foreign market that could require a Portfolio to fair value some or all of its foreign securities include, among others, securities trading in the U.S. and other markets, corporate announcements, natural and other disasters, and political and other events. Among other elements of analysis in the determination of a security's fair value, the Board has authorized the use of one or more independent research services to assist with such determinations. An independent research service may use statistical analyses and quantitative models to help determine fair value as of the time a Portfolio calculates its NAV. There can be no assurance that such models accurately reflect the behavior of the applicable markets or the effect of the behavior of such markets on the fair value of securities, or that such markets will continue to behave in a fashion that is consistent with such models. Unlike the closing price of a security on an exchange, fair value determinations employ elements of judgment. Consequently, the fair value assigned to a security may not represent the actual value that a Portfolio could obtain if it were to sell the security at the time of the close of the NYSE. Pursuant to procedures adopted by the Board, a Portfolio is not obligated to use the fair valuations suggested by any research service, and valuation recommendations provided by such research services may be overridden if other events have occurred or if other fair valuations are determined in good faith to be more accurate. Unless an event is such that it causes a Portfolio to determine that the closing prices for one or more securities do not represent readily available reliable market value quotations at the time a Portfolio determines its NAV, events that occur between the time of the close of the foreign market on which they are traded and the close of regular trading on the NYSE will not be reflected in the Portfolio's NAV. Investments in securities maturing in 60 days or less from date of acquisition are valued at amortized cost which approximates market value.
B. Security Transactions and Revenue Recognition. Securities transactions are accounted for on the trade date. Realized gains and losses are reported on the basis of identified cost of securities sold. Interest income is recorded on an accrual basis. Dividend income is recorded on the ex-dividend date, or for certain foreign securities, when the information becomes available to the Portfolios. Premium amortization and discount accretion are determined by the effective yield method.
C. Foreign Currency Translation. The books and records of the Portfolios are maintained in U.S. dollars. Any foreign currency amounts are translated into U.S. dollars on the following basis:
(1) Market value of investment securities, other assets and liabilities — at the exchange rates prevailing at the end of the day.
(2) Purchases and sales of investment securities, income and expenses — at the rates of exchange prevailing on the respective dates of such transactions.
Although the net assets and the market values are presented at the foreign exchange rates at the end of the day, the Portfolios do not isolate the portion of the results of operations resulting from changes in foreign exchange rates on investments from the fluctuations arising from changes in market prices of securities held. Such fluctuations are included with the net realized and unrealized gains or losses from investments. For securities, which are subject to foreign withholding tax upon disposition, liabilities are recorded on the Statements of Assets and Liabilities for the estimated tax withholding based on the securities' current market value. Upon disposition, realized gains or losses on such securities are recorded net of foreign withholding tax. Reported net realized foreign exchange gains or losses arise from sales of foreign currencies, currency gains or losses realized between the trade and settlement dates on securities transac tions, the difference between the amounts of dividends, interest, and foreign withholding taxes recorded on the Portfolios' books, and the U.S. dollar equivalent of the amounts actually received or paid. Net unrealized foreign exchange gains and losses arise from changes in the value of assets and liabilities other than investments in securities at fiscal year end, resulting from changes in the exchange rate. Foreign security and currency transactions may involve certain considerations and risks not typically associated with investing in U.S. companies and U.S. government securities. These risks include, but are not limited to, revaluation of currencies and future adverse political and economic developments, which could cause securities and their markets to be less liquid and prices more volatile than those of comparable U.S. companies and U.S. government securities.
145
NOTES TO FINANCIAL STATEMENTS AS OF DECEMBER 31, 2007 (CONTINUED)
NOTE 2 — SIGNIFICANT ACCOUNTING POLICIES (continued)
D. Foreign Currency Transactions and Futures Contracts. Certain Portfolios may enter into foreign currency exchange transactions to convert to and from different foreign currencies and to and from the U.S. dollar in connection with the planned purchases or sales of securities. When entering into a currency forward contract, a Portfolio agrees to receive or deliver a fixed quantity of foreign currency for an agreed-upon price on an agreed future date. The Portfolios either enter into these transactions on a spot basis at the spot rate prevailing in the foreign currency exchange market or use forward foreign currency contracts to purchase or sell foreign currencies. When the contract is fulfilled or closed, gains or losses are realized. Until then, the gain or loss is included in unre alized appreciation or depreciation. Risks may arise upon entering into forward contracts from the potential inability of counterparties to meet the terms of their forward contracts and from unanticipated movements in the value of foreign currencies relative to the U.S. dollar. Certain Portfolios may enter into futures contracts involving foreign currency, interest rates, securities and securities indices. A futures contract obligates the seller of the contract to deliver and the purchaser of the contract to take delivery of the type of foreign currency, financial instrument or security called for in the contract at a specified future time for a specified price. Upon entering into such a contract, a Portfolio is required to deposit and maintain as collateral such initial margin as required by the exchange on which the contract is traded. Pursuant to the contract, a Portfolio agrees to receive from or pay to the broker an amount equal to the daily fluctuations in the value of the contract. Such receipts or pa yments are known as variation margins and are recorded as unrealized gains or losses by the Portfolio. When the contract is closed, the Portfolio records a realized gain or loss equal to the difference between the value of the contract at the time it was opened and the value at the time it was closed.
E. Distributions to Shareholders. The Portfolios record distributions to their shareholders on the ex-dividend date. Dividends from net investment income and capital gains, if any, are declared and paid annually. The Portfolios may make distributions on a more frequent basis to comply with the distribution requirements of subchapter M of the Internal Revenue Code. The characteristics of income and gains to be distributed are determined in accordance with income tax regulations, which may differ from U.S. generally accepted accounting principles for investment companies.
F. Federal Income Taxes. It is the policy of the Portfolios to comply with subchapter M of the Internal Revenue Code and related excise tax provisions applicable to regulated investment companies and to distribute substantially all of their net investment income and any net realized capital gains to their shareholders. Therefore, no federal income tax provision is required. No capital gain distributions shall be made until any capital loss carryforwards have been fully utilized or expired.
G. Use of Estimates. Management of the Portfolios has made certain estimates and assumptions relating to the reporting of assets, liabilities, income, and expenses to prepare these financial statements in conformity with U.S. generally accepted accounting principles for investment companies. Actual results could differ from these estimates.
H. Repurchase Agreements. Each Portfolio may invest in repurchase agreements only with government securities dealers recognized by the Board of Governors of the Federal Reserve System. Under such agreements, the seller of the security agrees to repurchase it at a mutually agreed upon time and price. The resale price is in excess of the purchase price and reflects an agreed upon interest rate for the period of time the agreement is outstanding. The period of the repurchase agreements is usually short, from overnight to one week, while the underlying securities generally have longer maturities. Each Portfolio will receive as collateral securities acceptable to it whose market value is equal to at least 100% of the carrying amount of the repurchase agreements, plus accrued interest, be ing invested by the Portfolio. The underlying collateral is valued daily on a mark-to-market basis to assure that the value, including accrued interest is at least equal to the repurchase price. There would be a potential loss to the Portfolio in the event the Portfolio is delayed or prevented from exercising its right to dispose of the collateral, and it might incur disposition costs in liquidating the collateral.
I. Securities Lending. Each Portfolio has the option to temporarily loan up to 30% of its total assets to brokers, dealers or other financial institutions in exchange for a negotiated lender's fee. The borrower is required to fully collateralize the loans with cash or U.S. Government securities. Generally, in the event of counterparty default, the Portfolio has the right to use collateral to
146
NOTES TO FINANCIAL STATEMENTS AS OF DECEMBER 31, 2007 (CONTINUED)
NOTE 2 — SIGNIFICANT ACCOUNTING POLICIES (continued)
offset losses incurred. There would be potential loss to the Portfolio in the event the Portfolio is delayed or prevented from exercising its right to dispose of the collateral. The Portfolio bears the risk of loss with respect to the investment of collateral. Engaging in securities lending could have a leveraging effect, which may intensify the credit, market and other risks associated with investing in a Portfolio.
J. Illiquid and Restricted Securities. The Portfolios may not invest more than 15% of their net assets in illiquid securities. Illiquid securities are not readily marketable. Disposing of illiquid investments may involve time consuming negotiation and legal expenses, and it may be difficult or impossible for the Portfolios to sell them promptly at an acceptable price. The Portfolios may also invest in restricted securities, which include those sold under Rule 144A of the Securities Act of 1933 ("1933 Act") or securities offered pursuant to Section 4(2) of the 1933 Act, and/or are subject to legal or contractual restrictions on resale and may not be publicly sold without registration under the 1933 Act. Certain restricted securities may be considered liquid pursuant to guidelines app roved by the Board or may be deemed to be illiquid because they may not be readily marketable. Illiquid and restricted securities are valued using market quotations when readily available. In the absence of market quotations, the securities are valued based upon their fair value determined under procedures approved by the Board.
K. When-Issued and Delayed-Delivery Transactions. Certain Portfolios may purchase or sell securities on a when-issued or forward commitment basis. The price of the underlying securities and date when the securities will be delivered and paid for are fixed at the time the transaction is negotiated. The market value of such is identified in the Portfolios' Portfolio of Investments. Losses may arise due to changes in the market value of the securities or from the inability of counterparties to meet the terms of the contract. In connection with such purchases, the Portfolios are required to hold liquid assets as collateral with the Portfo lios' custodian sufficient to cover the purchase price.
L. Mortgage Dollar Roll Transactions. Certain Portfolios may engage in dollar roll transactions with respect to mortgage-backed securities issued by Government National Mortgage Association, Federal National Mortgage Association and Federal Home Loan Mortgage Corp. In a dollar roll transaction, a Portfolio sells a mortgage-backed security to a financial institution, such as a bank or broker/dealer, and simultaneously agrees to repurchase a substantially similar (i.e., same type, coupon, and maturity) security from the institution on a delayed delivery basis at an agreed upon price. The mortgage-backed securities that are repurchased will bear the same interest rate as those sold, but generally will be collateral ized by different pools of mortgages with different prepayment histories. The Portfolios account for dollar roll transactions as purchases and sales. For fee based dollar roll transactions, the fee is recorded as income.
M. Options Contracts. Certain Portfolios may purchase put and call options and may write (sell) put options and covered call options. The Portfolios may engage in option transactions as a hedge against adverse movements in the value of portfolio holdings or to increase market exposure. Option contracts are valued daily and unrealized gains or losses are recorded based upon the last sales price on the principal exchange on which the options are traded. An amount equal to the proceeds of the premium received by the Portfolios upon the writing of a put or call option is included in the Statements of Assets and Liabilities as an asset and equivalent liability which is subsequently marked-to-market until it is exercised or closed, or it expires. The Portfolios will realize a gain or loss upon the expiration or closing of the option contract. When an option is exercised, the proceeds on sales of the underlying security for a written call option, the purchase cost of the security for a written put option, or the cost of the security for a purchased put or call option is adjusted by the amount of premium received or paid. Realized and unrealized gains or losses on option contracts are reflected in the accompanying financial statements. The risk in writing a covered call option is that the Portfolios give up the opportunity for profit if the market price of the security increases and the option is exercised. The risk in writing a put option is that the Portfolios may incur a loss if the market price of the security decreases and the option is exercised. The risk in buying an option is that the Portfolios pay a premium whether or not the option is exercised. Risks may also arise from an illiquid secondary market or from the inability of counterparties to meet the terms of the contract.
N. Swap Contracts. Certain Portfolios may enter into interest rate swaps, currency swaps and other types of swap agreements, including swaps on securities and indices. A swap is an agreement between two parties pursuant to which each party agrees to make
147
NOTES TO FINANCIAL STATEMENTS AS OF DECEMBER 31, 2007 (CONTINUED)
NOTE 2 — SIGNIFICANT ACCOUNTING POLICIES (continued)
one or more payments to the other on regularly scheduled dates over a stated term, based on different interest rates, currency exchange rates, security prices, the prices or rates of other types of financial instruments or assets or the levels of specified indices. During the term of the swap, changes in the value of the swap are recognized as unrealized appreciation or depreciation.
Derivatives are also subject to credit risks related to the counterparty's ability to perform, and any deterioration in the counterparty's creditworthiness could adversely affect the instrument.
O. Reverse Repurchase Agreements. A reverse repurchase agreement involves the sale of a security, with an agreement to repurchase the same or a substantially similar security at an agreed upon price and date. Reverse repurchase agreements are considered borrowings and the difference between the sale and repurchase prices represents interest expense at an agreed upon rate. Whether such a transaction produces a gain for a Portfolio depends upon whether the income and gains on the securities purchased with the proceeds received from the sale of the security exceeds the interest expense incurred by the Portfolio. Reverse repurchase agreements, as a leveraging technique, may increase a Portfolio's yield; however, such transactions also increase a Portfolio's risk to capital and may resul t in a shareholder's loss of principal.
P. Floating Rate Notes Issued in Conjunction with Securities Held — PIMCO Total Return invested in "inverse floaters" which are fixed income instruments with interest rates that vary with short term interest rate indices in such a way that the yield is inversely related to the market rate of interest. Statement of Financial Accounting Standards No. 140 ("FAS 140"), with respect to certain types of inverse floaters which entail a transaction in which the Portfolio sells a municipal bond to a trust to create the inverse floater, requires that the transaction be characterized as financing instead of a sale for financial statement presentations purposes. At December 31, 2007, PIMCO Total Return investments of these types of inverse floaters were as follows:
| Trust | | Value of
Underlying
Municipal Bond | | Floating
Rate Notes
Outstanding | | Current
Rate | |
Orange County
Sanitation District,
6.510%, due 02/01/33 | | $ | 924,678 | | | $ | 461,592 | | | | 3.67 | % | |
Q. Sale Commitments: Sale commitments involve commitments where the unit price and the estimated principal amount are established upon entering into the contract, with the actual principal amount being within a specified range of the estimate. A Portfolio will enter into sale commitments to hedge its portfolio positions or to sell mortgage-backed securities it owns under delayed delivery arrangements. Proceeds of sale commitments are not received until the contractual settlement date. During the time a sale commitment is outstanding, the Portfolio will maintain, in a segregated account, cash or marketable securities in an amount sufficient to meet the purchase price. Unsettled sale commitments are valued at current market value of the underlying securities. If the sale commitment is closed through the acquisition of an offsetting purchase commitment, the Portfolio realizes a gain or loss on the commitment without regard to any unrealized gain or loss on the underlying security. If the Portfolio delivers securities under the commitment, the Portfolio realizes a gain or loss from the sale of the securities, based upon the unit price established at the date the commitment was entered into.
R. Indemnifications. In the normal course of business, the Fund may enter into contracts that provide certain indemnifications. The Fund's maximum exposure under these arrangements is dependent on future claims that may be made against the Portfolios and, therefore, cannot be estimated; however, based on experience, the risk of loss from such claims is considered remote.
NOTE 3 — INVESTMENT TRANSACTIONS
For the year ended December 31, 2007, the cost of purchases and the proceeds from the sales of securities, excluding U.S. government and short-term securities, were as follows:
| | | Purchases | | Sales | |
American Century Large
Company Value | | $ | 64,853,365 | | | $ | 50,092,714 | | |
American Century Small-Mid
Cap Value | | | 152,383,641 | | | | 156,872,594 | | |
| Baron Asset | | | 25,180,777 | | | | 4,142,445 | | |
| Baron Small Cap Growth | | | 240,885,957 | | | | 121,995,837 | | |
| Columbia Small Cap Value II | | | 181,173,949 | | | | 69,218,786 | | |
| Davis New York Venture | | | 146,581,613 | | | | 27,435,969 | | |
| JPMorgan International | | | 121,574,427 | | | | 628,832,485 | | |
| JPMorgan Mid Cap Value | | | 157,087,927 | | | | 133,015,486 | | |
Legg Mason Partners Aggressive
Growth | | | 80,697,330 | | | | 60,813,115 | | |
Legg Mason Partners Large
Cap Growth | | | 6,269,911 | | | | 15,721,599 | | |
Lord Abbett U.S. Government
Securities | | | 2,447,013 | | | | 1,883,875 | | |
| Neuberger Berman Partners | | | 197,329,354 | | | | 206,700,600 | | |
| Neuberger Berman Regency | | | 22,230,822 | | | | 13,768,982 | | |
| OpCap Balanced Value | | | 70,287,179 | | | | 99,383,310 | | |
148
NOTES TO FINANCIAL STATEMENTS AS OF DECEMBER 31, 2007 (CONTINUED)
NOTE 3 — INVESTMENT TRANSACTIONS (continued)
| | | Purchases | | Sales | |
| Oppenheimer Global | | $ | 373,805,854 | | | $ | 648,136,921 | | |
| Oppenheimer Strategic Income | | | 224,820,117 | | | | 213,487,757 | | |
| PIMCO Total Return | | | 246,776,638 | | | | 112,366,160 | | |
| Pioneer High Yield | | | 81,439,344 | | | | 100,368,438 | | |
| T. Rowe Price Diversified Mid Cap | | | 345,247,103 | | | | 557,012,967 | | |
| T. Rowe Price Growth Equity | | | 944,869,853 | | | | 850,452,362 | | |
| Templeton Foreign Equity | | | 92,408,177 | | | | 16,280,264 | | |
| Thornburg Value | | | 210,042,781 | | | | 179,649,877 | | |
| UBS U.S. Large Cap Equity | | | 207,400,120 | | | | 206,924,479 | | |
| UBS U.S. Small Cap Growth | | | 45,143,671 | | | | 38,987,158 | | |
| Van Kampen Comstock | | | 290,440,987 | | | | 259,810,927 | | |
| Van Kampen Equity And Income | | | 250,319,792 | | | | 340,829,737 | | |
U.S. Government Securities not included above were as follows:
| | | Purchases | | Sales | |
Lord Abbett U.S. Government
Securities | | $ | 107,990,006 | | | $ | 114,739,159 | | |
| OpCap Balanced Value | | | 9,675,095 | | | | 2,123,776 | | |
| Oppenheimer Strategic Income | | | 239,559,265 | | | | 222,664,223 | | |
| PIMCO Total Return | | | 3,877,781,500 | | | | 3,798,658,213 | | |
| Van Kampen Equity And Income | | | 631,735,502 | | | | 604,952,033 | | |
NOTE 4 — INVESTMENT ADVISORY AND ADMINISTRATIVE FEES
For its services, each Portfolio pays the Investment Adviser a monthly fee in arrears equal to the following as a percentage of each Portfolio's average daily net assets during the month:
| Portfolio | | Fee | |
| American Century Large Company Value | | 0.80% | |
| American Century Small-Mid Cap Value | | 1.00% | |
| Baron Asset(1) | | 0.95% on the first $2 billion | |
| | | 0.90% on the next $1 billion | |
| | | 0.85% on the next $1 billion | |
| | | 0.80% on assets over $4 billion | |
| Baron Small Cap Growth(2) | | 0.85% on the first $4 billion | |
| | | 0.80% on assets over $4 billion | |
| Columbia Small Cap Value II | | 0.75% | |
| Davis New York Venture | | 0.80% | |
| JPMorgan International | | 0.80% | |
| JPMorgan Mid Cap Value | | 0.75% | |
| Legg Mason Partners Aggressive Growth | | 0.70% on the first $500 million | |
| | | 0.65% on assets over $500 million | |
| Legg Mason Partners Large Cap Growth | | 0.64% | |
| Lord Abbett U.S. Government Securities | | 0.47% on the first $250 million | |
| | | 0.45% on assets over $250 million | |
| Neuberger Berman Partners | | 0.60% | |
| Neuberger Berman Regency | | 0.75% | |
| OpCap Balanced Value | | 0.80% | |
| Oppenheimer Global(3) | | 0.60% on the first $11 billion | |
| | | 0.58% on the next $4 billion | |
| | | 0.56% on assets over $16 billion | |
| Portfolio | | Fee | |
| Oppenheimer Strategic Income | | 0.50% on the first $6.5 billion | |
| | | 0.475% on the next $5 billion | |
| | | 0.45% on the next $5 billion | |
| | | 0.43% on assets over $16.5 billion | |
| PIMCO Total Return | | 0.50% | |
| Pioneer High Yield | | 0.60% on the first $5 billion | |
| | | 0.50% on the next $2 billion | |
| | | 0.40% on the next $2 billion | |
| | | 0.30% on assets over $9 billion | |
| T. Rowe Price Diversified Mid Cap Growth | | 0.64% | |
| T. Rowe Price Growth Equity | | 0.60% | |
| Templeton Foreign Equity | | 0.80% on the first $500 million | |
| | | 0.75% on assets over $500 million | |
| Thornburg Value | | 0.65% | |
| UBS U.S. Large Cap Equity | | 0.70% on the first $500 million | |
| | | 0.65% on assets over $500 million | |
| UBS U.S. Small Cap Growth(4) | | 0.85% on the first billion | |
| | | 0.82% on assets over $1 billion | |
| Van Kampen Comstock | | 0.60% | |
| Van Kampen Equity and Income | | 0.55% | |
(1) Prior to July 27, 2007, the fee was 0.95%
(2) Prior to July 27, 2007, the fee was 0.85%
(3) Prior to July 27, 2007, the fee was 0.60%
(4) Prior to July 27, 2007, the fee was 0.90%
DSL has contractually agreed to waive a portion of the advisory fee for American Century Small-Mid Cap Value, JPMorgan International, T. Rowe Price Growth Equity and Van Kampen Comstock.
For the year ended December 31, 2007, DSL waived $79,273 $97,650, $54,966 and $99,181 for American Century Small-Mid Cap Value, JPMorgan International, T. Rowe Price Growth Equity and Van Kampen Comstock, respectively.
The waiver represents 50% of negotiated fee reductions in sub-advisory fees being charged to the investment adviser. These waivers will continue through at least May 1, 2008 and there is no guarantee that the waivers will continue after said date. The waiver only renews at the election of DSL.
American Century Investment Management, Inc. serves as sub-adviser to American Century Large Company Value and American Century Small-Mid Cap Value. BAMCO, Inc. serves as sub-adviser to Baron Asset and Baron Small Cap Growth. Columbia Management Advisors, LLC serves as sub-adviser to Columbia Small Cap Value II. Davis Selected Advisers, L.P. serves as sub-adviser to Davis New York Venture. JPMorgan Asset Management (U.K.) Limited serves as
149
NOTES TO FINANCIAL STATEMENTS AS OF DECEMBER 31, 2007 (CONTINUED)
NOTE 4 — INVESTMENT ADVISORY AND ADMINISTRATIVE FEES (continued)
sub-adviser to JPMorgan International. J.P. Morgan Investment Management Inc. serves as sub-adviser to JPMorgan Mid Cap Value. ClearBridge Advisors, LLC serves as sub-adviser to Legg Mason Partners Aggressive Growth and Legg Mason Partners Large Cap Growth. Lord, Abbett & Co., LLC serves as sub-adviser to Lord Abbett U.S. Government Securities. Neuberger Berman Management Inc. serves as sub-adviser to Neuberger Berman Partners and Neuberger Berman Regency. Oppenheimer Capital LLC serves as sub-adviser to OpCap Balanced Value. OppenheimerFunds, Inc. serves as sub-adviser to Oppenheimer Global and Oppenheimer Strategic Income. Pacific Investment Management Company LLC serves as sub-adviser to PIMCO Total Return. Pioneer Investment Management, Inc. serves as sub-adviser to Pioneer High Yield. T. Rowe Price Associates, Inc. serves as sub-adviser to T. Rowe Price Diversified Mid Cap Growth and T. Rowe Price Growth Equity. Templeton Investment Counsel, LLC serves as sub-adviser to Templeton Foreign Equity. Thornburg Investment Management, Inc. serves as sub-adviser to Thornburg Value. UBS Global Asset Management (Americas) Inc. serves as sub-adviser to UBS U.S. Large Cap Equity and UBS U.S. Small Cap Growth. Morgan Stanley Investment Management Inc., d/b/a Van Kampen, serves as sub-adviser to Van Kampen Comstock and Van Kampen Equity and Income.
Under an Administrative Services Agreement, ING Funds Services, LLC (the "Administrator"), an indirect, wholly-owned subsidiary of ING Groep, acts as administrator and provides certain administrative and shareholder services necessary for the following Portfolio's operations and is responsible for the supervision of other service providers. For its services, the Administrator is entitled to receive from each of the following Portfolios a fee at an annual rate of 0.10% of the Portfolios' average daily net assets:
| Portfolio | | Fee | |
| Baron Asset | | 0.10% | |
| Columbia Small Cap Value II | | 0.10% | |
| Lord Abbett U.S. Government Securities | | 0.10% | |
| Neuberger Berman Partners | | 0.10% | |
| Neuberger Berman Regency | | 0.10% | |
| Pioneer High Yield | | 0.10% | |
| Templeton Foreign Equity | | 0.10% | |
| UBS U.S. Small Cap Growth | | 0.10% | |
In addition to providing all administrative services necessary for the Portfolios' operations, the administrator also assumes all ordinary recurring direct costs of the Portfolios below, such as custodian fees, director's fees, transfer agency fees and accounting fees. As compensation for these services, the Administrator receives a monthly fee from each Portfolio below at an annual rate based on the average daily net assets of each Portfolio as follows:
| Portfolio | | Fee | |
| American Century Large Company Value | | 0.20% | |
| American Century Small-Mid Cap Value | | 0.25% | |
| Baron Small Cap Growth | | 0.23% | |
| Davis New York Venture | | 0.10% | |
| JPMorgan International | | 0.20% | |
| JPMorgan Mid Cap Value | | 0.25% | |
| Legg Mason Partners Aggressive Growth | | 0.13% | |
| Legg Mason Partners Large Cap Growth | | 0.20% | |
| OpCap Balanced Value | | 0.20% | |
| Oppenheimer Global | | 0.06% | |
| Oppenheimer Strategic Income | | 0.04% | |
| PIMCO Total Return | | 0.25% on the first $250 million | |
| | | 0.10% on next $100 million | |
| | | 0.05% on next $100 million | |
| | | 0.03% on assets over $450 million | |
| T. Rowe Price Diversified Mid Cap Growth | | 0.02% | |
| T. Rowe Price Growth Equity | | 0.15% | |
| Thornburg Value | | 0.25% | |
| UBS U.S. Large Cap Equity | | 0.15% | |
| Van Kampen Comstock(1) | | 0.25% on the first $1.1 billion | |
| | | 0.20% on assets over $1.1 billion | |
| Van Kampen Equity and Income | | 0.02% | |
(1) Prior to April 30, 2007, the rate was 0.25%
NOTE 5 — DISTRIBUTION AND SERVICE FEES
The Fund has adopted a Plan of Distribution pursuant to Rule 12b-1 ("the Plan") for the ADV Class shares of each Portfolio. The Plan provides for a distribution fee, payable to the Distributor. The Distributor may pay, on behalf of each Portfolio, out of its distribution fee, compensation to certain financial institutions for providing distribution assistance. Under the Plan, a Portfolio makes payments at an annual rate of 0.25% of the Portfolio's average daily net assets attributable to its ADV Class shares. Effective April 28, 2006, the Distributor has contractually agreed to waive all or a portion of the distribution fees for Oppenheimer Global and T. Rowe Price Diversified Mid Cap Growth so that total net operating expenses do not exceed 1.15% for each Portfolio's respective ADV Class shares through May 1, 2007.
S Class and ADV Class of shares are further subject to a shareholder servicing fee payable to Shareholder Organizations pursuant to the Shareholder Servicing Plan adopted for S Class and ADV Class which shall not exceed an annual rate of 0.25% of the average daily net assets of each of the S Class and ADV Class. Effective May 1, 2006, the Distributor has voluntarily agreed to waive all or a portion of the services fees for Oppenheimer Strategic Income, so that total net operating expenses for ADV Class shares do not exceed 1.00% and for S Class shares do not exceed 0.75%, through May 1, 2008. Effective December 16, 2006, the Distributor has contractually agreed to waive all or a portion of service fee for the Neuberger Berman Partners so that total net operation expenses do not
150
NOTES TO FINANCIAL STATEMENTS AS OF DECEMBER 31, 2007 (CONTINUED)
NOTE 5 — DISTRIBUTION AND SERVICE FEES (continued)
exceed 0.89% for the Portfolio's respective S Class shares through April 30, 2009. Effective July 27, 2007, the Distributor has contractually agreed to waive all or a portion of the service fee for Baron Small Cap Growth so that net total expenses do not exceed 1.31% for S Class through July 27, 2009.
Fees paid to the Distributor and Shareholder Organizations by class during the year ended December 31, 2007 are shown in the accompanying Statements of Operations.
NOTE 6 — OTHER TRANSACTIONS WITH AFFILIATES AND RELATED PARTIES
At December 31, 2007, the Portfolios had the following amounts recorded in payable to affiliates on the accompanying Statements of Assets and Liabilities (See Note 4):
| Portfolio | | Accrued
Investment
Management
Fees | | Accrued
Administrative
Fees | | Accrued
Sharholder
Service and
Distribution
Fees | | Accrued
Recoupment | | Total | |
American Century
Large Company
Value | | $ | 85,878 | | | $ | 21,470 | | | $ | 7,943 | | | $ | — | | | $ | 115,291 | | |
American Century
Small-Mid Cap
Value | | | 85,166 | | | | 21,291 | | | | 13,809 | | | | — | | | | 120,266 | | |
| Baron Asset | | | 27,314 | | | | 2,871 | | | | 2,461 | | | | — | | | | 32,646 | | |
Baron Small Cap
Growth | | | 464,871 | | | | 125,789 | | | | 101,396 | | | | — | | | | 692,056 | | |
Columbia Small
Cap Value II | | | 116,190 | | | | 15,492 | | | | 33,529 | | | | — | | | | 165,211 | | |
Davis New York
Venture | | | 228,680 | | | | 28,585 | | | | 52,396 | | | | — | | | | 309,661 | | |
JPMorgan
International | | | 454,561 | | | | 113,641 | | | | 45,562 | | | | — | | | | 613,764 | | |
JPMorgan Mid
Cap Value | | | 168,791 | | | | 56,264 | | | | 30,665 | | | | — | | | | 255,720 | | |
Legg Mason
Partners
Aggressive
Growth | | | 750,806 | | | | 145,913 | | | | 40,000 | | | | — | | | | 936,719 | | |
Legg Mason
Partners Large
Cap Growth | | | 20,806 | | | | 6,502 | | | | 8,596 | | | | — | | | | 35,904 | | |
Lord Abbett U.S.
Government
Securities | | | 18,074 | | | | 3,845 | | | | 2,375 | | | | — | | | | 24,294 | | |
Neuberger Berman
Partners | | | 220,969 | | | | 36,828 | | | | 29,524 | | | | — | | | | 287,321 | | |
Neuberger Berman
Regency | | | 12,876 | | | | 1,717 | | | | 2,966 | | | | 5,589 | | | | 23,148 | | |
OpCap Balanced
Value | | | 44,098 | | | | 11,025 | | | | 13,099 | | | | — | | | | 68,222 | | |
Oppenheimer
Global | | | 1,353,580 | | | | 135,355 | | | | 90,067 | | | | — | | | | 1,579,002 | | |
Oppenheimer
Strategic
Income | | | 212,225 | | | | 16,978 | | | | 24,007 | | | | — | | | | 253,210 | | |
| Portfolio | | Accrued
Investment
Management
Fees | | Accrued
Administrative
Fees | | Accrued
Sharholder
Service and
Distribution
Fees | | Accrued
Recoupment | | Total | |
PIMCO Total
Return | | $ | 196,474 | | | $ | 66,145 | | | $ | 38,922 | | | $ | — | | | $ | 301,541 | | |
Pioneer High
Yield | | | 56,508 | | | | 9,418 | | | | 1,752 | | | | — | | | | 67,678 | | |
T. Rowe Price
Diversified
Mid Cap
Growth | | | 578,679 | | | | 18,082 | | | | 20,247 | | | | — | | | | 617,008 | | |
T. Rowe Price
Growth Equity | | | 842,983 | | | | 210,743 | | | | 67,080 | | | | — | | | | 1,120,806 | | |
Templeton
Foreign Equity | | | 96,988 | | | | 12,123 | | | | 27,645 | | | | 7,615 | | | | 144,371 | | |
| Thornburg Value | | | 114,973 | | | | 44,222 | | | | 4,611 | | | | — | | | | 163,806 | | |
UBS U.S. Large
Cap Equity | | | 264,806 | | | | 56,744 | | | | 14,526 | | | | — | | | | 336,076 | | |
UBS U.S. Small
Cap Growth | | | 25,654 | | | | 3,018 | | | | 768 | | | | — | | | | 29,440 | | |
Van Kampen
Comstock | | | 512,683 | | | | 213,617 | | | | 91,454 | | | | — | | | | 817,754 | | |
Van Kampen
Equity and
Income | | | 452,837 | | | | 16,465 | | | | 33,596 | | | | — | | | | 502,898 | | |
At December 31, 2007, all shares of the Portfolios were owned by 1) separate accounts of DSL and its insurance company affiliates for the benefit of variable contract policyholders 2) ING National Trust, an indirect, wholly-owned subsidiary of ING Groep, as trustee or custodian of qualified pension and retirement plans that invest in the Portfolios directly and 3) DSL in connection with seed capital contributions made to the Portfolios.
The following Portfolio placed a portion of its portfolio transactions with brokerage firms that are affiliates of the Investment Adviser. The commissions paid to these affiliated firms were:
| Portfolio | | Affiliated
Brokers | | Commissions
Paid | |
| JPMorgan International | | ING Baring LLC | | $ | 6,672 | | |
NOTE 7 — OTHER ACCRUED EXPENSES AND LIABILITIES
At December 31, 2007, Baron Asset had the following expense included in Other Accrued Expenses and Liabilities on the Statements of Assets and Liabilities that exceded 5% of total liabilities.
| Portfolio | | Expense | | Amount | |
| Baron Asset | | Audit | | $ | 10,553 | | |
NOTE 8 — EXPENSE LIMITATIONS
The Investment Adviser has entered into a written expense limitation agreement ("Expense Limitation Agreement") with certain of the Portfolios, whereby the Investment Adviser has agreed to limit expenses, excluding interest, taxes, brokerage and extraordinary
151
NOTES TO FINANCIAL STATEMENTS AS OF DECEMBER 31, 2007 (CONTINUED)
NOTE 8 — EXPENSE LIMITATIONS (continued)
expenses to the following annual expenses to average daily net assets:
| | | Class ADV | | Class I | | Class S | |
American Century
Small-Mid Cap Value(1) | | | 1.52 | % | | | 1.02 | % | | | 1.27 | % | |
| Baron Asset | | | 1.55 | % | | | 1.05 | % | | | 1.30 | % | |
Columbia Small Cap
Value II | | | 1.65 | % | | | 1.15 | % | | | 1.40 | % | |
Lord Abbett U.S.
Government Securities | | | N/A | | | | 0.72 | % | | | 0.97 | % | |
| Neuberger Berman Partners | | | 1.17 | % | | | 0.67 | % | | | 0.92 | % | |
| Neuberger Berman Regency | | | N/A | | | | 0.88 | % | | | 1.13 | % | |
| Pioneer High Yield | | | 1.25 | % | | | 0.75 | % | | | 1.00 | % | |
| Templeton Foreign Equity | | | 1.48 | % | | | 0.98 | % | | | 1.23 | % | |
| UBS U.S. Small Cap Growth | | | 1.50 | % | | | 1.00 | % | | | 1.25 | % | |
(1) Effective January 1, 2007, American Century Small-Mid Cap Value implemented an expense limitation.
The Investment Adviser may, at a later date, recoup from a Portfolio for management fees waived and other expenses assumed by the Investment Adviser during the previous 36 months, but only if, after such recoupment, the Portfolio's expense ratio does not exceed the percentage described above. Waived and reimbursed fees by, and any recoupment to the Investment Adviser of such waived and reimbursed fees are reflected on the accompanying Statements of Operations for each Portfolio. Amounts payable by the Investment Adviser are reflected on the accompanying Statements of Assets and Liabilities for each Portfolio.
At December 31, 2007, the amounts of waived and reimbursed fees that are subject to possible recoupment by the Investment Adviser, and the related expiration dates are as follows:
| | | December 31, | | | |
| | | 2008 | | 2009 | | 2010 | | Total | |
American Century
Small-Mid Cap Value | | $ | — | | | $ | — | | | $ | 168,652 | | | $ | 168,652 | | |
| Baron Asset | | | — | | | | 42,786 | | | | 23,737 | | | | 66,523 | | |
Lord Abbett
U.S. Government
Securities | | | — | | | | 1,228 | | | | 5,257 | | | | 6,485 | | |
Neuberger Berman
Partners | | | — | | | | 144,882 | | | | 272,418 | | | | 417,300 | | |
Neuberger Berman
Regency | | | — | | | | 44,767 | | | | 17,526 | | | | 62,293 | | |
| Pioneer High Yield | | | — | | | | 55,492 | | | | 2,872 | | | | 58,364 | | |
| Templeton Foreign Equity | | | — | | | | 64,212 | | | | 7,441 | | | | 71,653 | | |
| UBS U.S. Small Cap Growth | | | — | | | | 26,700 | | | | 29,455 | | | | 56,155 | | |
The Expense Limitation Agreement is contractual and shall renew automatically unless DSL provides written notice of the termination of the Expense Limitation Agreement within 90 days of the end of the then current term.
NOTE 9 — OPTIONS WRITTEN
Transactions in options written for Oppenheimer Strategic Income for the year ended December 31, 2007 were as follows:
| | | EUR
Notional | | GBP
Notional | | JPY
Notional | | TRY
Notional | | Premium | |
| Balance at 12/31/06 | | | 4,180,000 | | | | — | | | | — | | | | 1,780,000 | | | $ | 61,150 | | |
| Options Written | | | 51,700,000 | | | | 9,970,000 | | | | 6,906,000,000 | | | | — | | | | 909,299 | | |
| Options Terminated in Closing Purchase Transactions | | | — | | | | — | | | | (478,000,000 | ) | | | — | | | | (48,441 | ) | |
| Options Expired | | | (29,380,000 | ) | | | (4,675,000 | ) | | | (3,030,000,000 | ) | | | (1,780,000 | ) | | | (461,595 | ) | |
| Options Exercised | | | (25,200,000 | ) | | | (4,675,000 | ) | | | (2,993,000,000 | ) | | | — | | | | (399,059 | ) | |
| Balance at 12/31/07 | | | 1,300,000 | | | | 620,000 | | | | 405,000,000 | | | | — | | | $ | 61,354 | | |
Transactions in options written for PIMCO Total Return for the year ended December 31, 2007 were as follows:
| | | USD
Notional | | EUR
Notional | | GBP
Notional | | Premium | |
| Balance at 12/31/06 | | | 133,300,000 | | | | 15,500,000 | | | | 9,700,000 | | | $ | 1,557,928 | | |
| Options Written | | | 190,100,000 | | | | | | | | | | | | 2,014,228 | | |
| Options Terminated in Closing Purchase Transactions | | | (141,600,000 | ) | | | | | | | | | | | (1,320,815 | ) | |
| Options Expired | | | (46,800,000 | ) | | | (15,500,000 | ) | | | (9,700,000 | ) | | | (660,995 | ) | |
| Options Exercised | | | (7,100,000 | ) | | | | | | | | | | | (54,726 | ) | |
| Balance at 12/31/07 | | | 127,900,000 | | | | — | | | | — | | | $ | 1,535,620 | | |
| | | Number of
Contracts | | Premium | |
| Balance at 12/31/06 | | | 406 | | | $ | 149,395 | | |
| Options Written | | | 1,376 | | | | 506,133 | | |
| Options Terminated in Closing Purchase Transactions | | | (217 | ) | | | (80,109 | ) | |
| Options Expired | | | (896 | ) | | | (293,987 | ) | |
| Options Exercised | | | (541 | ) | | | (194,807 | ) | |
| Balance at 12/31/07 | | | 128 | | | $ | 86,625 | | |
| 12/31/07 Balance of Premiums Received for Options Written: | | | | | | $ | 1,622,245 | | |
152
NOTES TO FINANCIAL STATEMENTS AS OF DECEMBER 31, 2007 (CONTINUED)
NOTE 10 — CAPITAL SHARES
Transactions in capital shares and dollars were as follows:
| | | Class I | | Class S | | Class ADV | |
| | | Year
Ended
December 31,
2007 | | Year
Ended
December 31,
2006 | | Year
Ended
December 31,
2007 | | Year
Ended
December 31,
2006 | | Year
Ended
December 31,
2007 | | Year
Ended
December 31,
2006 | |
American Century Large Company Value
(Number of Shares) | |
| Shares sold | | | 4,303,882 | | | | 6,955,603 | | | | 316,328 | | | | 411,958 | | | | 101,881 | | | | 303,456 | | |
| Dividends reinvested | | | 473,964 | | | | 321,371 | | | | 111,515 | | | | 74,668 | | | | 53,635 | | | | 56,349 | | |
| Shares redeemed | | | (2,704,777 | ) | | | (4,925,884 | ) | | | (678,972 | ) | | | (2,088,243 | ) | | | (154,324 | ) | | | (532,587 | ) | |
| Net increase (decrease) in shares outstanding | | | 2,073,069 | | | | 2,351,090 | | | | (251,129 | ) | | | (1,601,617 | ) | | | 1,192 | | | | (172,782 | ) | |
| American Century Large Company Value ($) | |
| Shares sold | | $ | 67,969,486 | | | $ | 103,021,839 | | | $ | 5,162,715 | | | $ | 6,122,417 | | | $ | 1,594,897 | | | $ | 4,436,231 | | |
| Dividends reinvested | | | 7,081,018 | | | | 4,582,754 | | | | 1,672,720 | | | | 1,067,012 | | | | 792,188 | | | | 793,962 | | |
| Shares redeemed | | | (43,828,890 | ) | | | (71,687,988 | ) | | | (10,736,208 | ) | | | (30,870,813 | ) | | | (2,421,442 | ) | | | (7,666,397 | ) | |
| Net increase (decrease) | | $ | 31,221,614 | | | $ | 35,916,605 | | | $ | (3,900,773 | ) | | $ | (23,681,384 | ) | | $ | (34,357 | ) | | $ | (2,436,204 | ) | |
| | | Class I | | Class S | | Class ADV | |
| | | Year
Ended
December 31,
2007 | | Year
Ended
December 31,
2006 | | Year
Ended
December 31,
2007 | | Year
Ended
December 31,
2006 | | Year
Ended
December 31,
2007 | | Year
Ended
December 31,
2006 | |
American Century Small-Mid Cap Value
(Number of Shares) | |
| Shares sold | | | 982,507 | | | | 2,277,704 | | | | 440,146 | | | | 619,621 | | | | 346,990 | | | | 388,600 | | |
| Dividends reinvested | | | 516,649 | | | | 16,708 | | | | 496,309 | | | | 11,082 | | | | 146,289 | | | | 3,334 | | |
| Shares redeemed | | | (932,848 | ) | | | (2,681,397 | ) | | | (940,661 | ) | | | (758,282 | ) | | | (342,064 | ) | | | (396,055 | ) | |
| Net increase (decrease) in shares outstanding | | | 566,308 | | | | (386,985 | ) | | | (4,206 | ) | | | (127,579 | ) | | | 151,215 | | | | (4,121 | ) | |
| American Century Small-Mid Cap Value ($) | |
| Shares sold | | $ | 12,652,037 | | | $ | 28,364,750 | | | $ | 5,871,061 | | | $ | 7,844,421 | | | $ | 4,528,867 | | | $ | 4,792,499 | | |
| Dividends reinvested | | | 6,168,790 | | | | 199,327 | | | | 5,901,111 | | | | 131,656 | | | | 1,717,436 | | | | 39,179 | | |
| Shares redeemed | | | (12,246,025 | ) | | | (33,077,908 | ) | | | (12,487,848 | ) | | | (9,535,053 | ) | | | (4,422,963 | ) | | | (4,862,523 | ) | |
| Net increase (decrease) | | $ | 6,574,802 | | | $ | (4,513,831 | ) | | $ | (715,676 | ) | | $ | (1,558,976 | ) | | $ | 1,823,340 | | | $ | (30,845 | ) | |
| | | Class I | | Class S | | Class ADV | |
| | | Year
Ended
December 31,
2007 | | January 3,
2006(1) to
December 31,
2006 | | Year
Ended
December 31,
2007 | | May 3,
2006(1) to
December 31,
2006 | | Year
Ended
December 31,
2007 | | January 18,
2006(1) to
December 31,
2006 | |
| Baron Asset (Number of Shares) | |
| Shares sold | | | 1,781,105 | | | | 509,448 | | | | 465,622 | | | | 28,654 | | | | 15,944 | | | | 320,896 | | |
| Shares redeemed | | | (163,523 | ) | | | (8,403 | ) | | | (102,632 | ) | | | (483 | ) | | | (15,089 | ) | | | (31,316 | ) | |
| Net increase in shares outstanding | | | 1,617,582 | | | | 501,045 | | | | 362,990 | | | | 28,171 | | | | 855 | | | | 289,580 | | |
| Baron Asset ($) | |
| Shares sold | | $ | 20,939,377 | | | $ | 5,094,491 | | | $ | 5,472,816 | | | $ | 303,753 | | | $ | 189,749 | | | $ | 3,230,071 | | |
| Shares redeemed | | | (1,962,537 | ) | | | (87,166 | ) | | | (1,227,829 | ) | | | (5,436 | ) | | | (177,363 | ) | | | (320,482 | ) | |
| Net increase | | $ | 18,976,840 | | | $ | 5,007,325 | | | $ | 4,244,987 | | | $ | 298,317 | | | $ | 12,386 | | | $ | 2,909,589 | | |
153
NOTES TO FINANCIAL STATEMENTS AS OF DECEMBER 31, 2007 (CONTINUED)
NOTE 10 — CAPITAL SHARES (continued)
| | | Class I | | Class S | | Class ADV | |
| | | Year
Ended
December 31,
2007 | | Year
Ended
December 31,
2006 | | Year
Ended
December 31,
2007 | | Year
Ended
December 31,
2006 | | Year
Ended
December 31,
2007 | | Year
Ended
December 31,
2006 | |
| Baron Small Cap Growth (Number of Shares) | |
| Shares sold | | | 3,368,711 | | | | 5,011,290 | | | | 8,289,274 | | | | 7,459,932 | | | | 711,825 | | | | 988,254 | | |
| Dividends reinvested | | | — | | | | 71,771 | | | | — | | | | 150,917 | | | | — | | | | 23,539 | | |
| Shares redeemed | | | (1,231,779 | ) | | | (3,071,531 | ) | | | (3,250,673 | ) | | | (4,208,141 | ) | | | (701,331 | ) | | | (478,967 | ) | |
| Net increase in shares outstanding | | | 2,136,932 | | | | 2,011,530 | | | | 5,038,601 | | | | 3,402,708 | | | | 10,494 | | | | 532,826 | | |
| Baron Small Cap Growth ($) | |
| Shares sold | | $ | 66,286,573 | | | $ | 86,211,661 | | | $ | 161,237,158 | | | $ | 128,766,418 | | | $ | 13,622,077 | | | $ | 16,977,989 | | |
| Dividends reinvested | | | — | | | | 1,149,060 | | | | — | | | | 2,389,008 | | | | — | | | | 368,625 | | |
| Shares redeemed | | | (24,071,737 | ) | | | (52,227,320 | ) | | | (63,025,191 | ) | | | (72,246,291 | ) | | | (13,679,041 | ) | | | (7,993,863 | ) | |
| Net increase (decrease) | | $ | 42,214,836 | | | $ | 35,133,401 | | | $ | 98,211,967 | | | $ | 58,909,135 | | | $ | (56,964 | ) | | $ | 9,352,751 | | |
| | | Class I | | Class S | | Class ADV | |
| | | Year
Ended
December 31,
2007 | | April 28,
2006(1) to
December 31,
2006 | | Year
Ended
December 31,
2007 | | May 1,
2006(1) to
December 31,
2006 | | Year
Ended
December 31,
2007 | | December 29,
2006(1) to
December 31,
2006 | |
Columbia Small Cap Value II
(Number of Shares) | |
| Shares sold | | | 4,014,136 | | | | 1,366,939 | | | | 10,171,761 | | | | 8,022,908 | | | | 39,601 | | | | 99 | | |
| Dividends reinvested | | | 1,998 | | | | — | | | | 14,318 | | | | — | | | | 21 | | | | — | | |
| Shares redeemed | | | (690,399 | ) | | | (217,067 | ) | | | (2,227,183 | ) | | | (536,249 | ) | | | (8,057 | ) | | | — | | |
| Net increase in shares outstanding | | | 3,325,735 | | | | 1,149,872 | | | | 7,958,896 | | | | 7,486,659 | | | | 31,565 | | | | 99 | | |
| Columbia Small Cap Value II ($) | |
| Shares sold | | $ | 43,132,497 | | | $ | 13,596,217 | | | $ | 109,142,124 | | | $ | 76,892,835 | | | $ | 428,184 | | | $ | 1,000 | | |
| Dividends reinvested | | | 20,983 | | | | — | | | | 149,906 | | | | — | | | | 225 | | | | — | | |
| Shares redeemed | | | (7,333,930 | ) | | | (2,084,285 | ) | | | (23,593,613 | ) | | | (5,219,377 | ) | | | (89,746 | ) | | | — | | |
| Net increase | | $ | 35,819,550 | | | $ | 11,511,932 | | | $ | 85,698,417 | | | $ | 71,673,458 | | | $ | 338,663 | | | $ | 1,000 | | |
| | | Class I | | Class S | | Class ADV | |
| | | Year
Ended
December 31,
2007 | | Year
Ended
December 31,
2006 | | Year
Ended
December 31,
2007 | | Year
Ended
December 31,
2006 | | Year
Ended
December 31,
2007 | | Year
Ended
December 31,
2006 | |
Davis New York Venture
(Number of Shares) | |
| Shares sold | | | 2,886,372 | | | | 2,891,880 | | | | 5,928,191 | | | | 4,999,094 | | | | 211,403 | | | | 116,404 | | |
| Dividends reinvested | | | 28,904 | | | | 61,204 | | | | 60,068 | | | | 348,181 | | | | 1,730 | | | | 47,958 | | |
| Shares redeemed | | | (982,438 | ) | | | (112,032 | ) | | | (1,478,561 | ) | | | (743,043 | ) | | | (385,091 | ) | | | (96,026 | ) | |
| Net increase (decrease) in shares outstanding | | | 1,932,838 | | | | 2,841,052 | | | | 4,509,698 | | | | 4,604,232 | | | | (171,958 | ) | | | 68,336 | | |
| Davis New York Venture ($) | |
| Shares sold | | $ | 59,326,898 | | | $ | 54,082,000 | | | $ | 121,720,731 | | | $ | 94,372,300 | | | $ | 4,263,560 | | | $ | 2,163,980 | | |
| Dividends reinvested | | | 587,619 | | | | 1,099,844 | | | | 1,210,365 | | | | 6,211,554 | | | | 34,332 | | | | 842,625 | | |
| Shares redeemed | | | (20,596,940 | ) | | | (2,104,773 | ) | | | (30,145,810 | ) | | | (14,069,002 | ) | | | (7,968,705 | ) | | | (1,798,414 | ) | |
| Net increase (decrease) | | $ | 39,317,577 | | | $ | 53,077,071 | | | $ | 92,785,286 | | | $ | 86,514,852 | | | $ | (3,670,813 | ) | | $ | 1,208,191 | | |
154
NOTES TO FINANCIAL STATEMENTS AS OF DECEMBER 31, 2007 (CONTINUED)
NOTE 10 — CAPITAL SHARES (continued)
| | | Class I | | Class S | | Class ADV | |
| | | Year
Ended
December 31,
2007 | | Year
Ended
December 31,
2006 | | Year
Ended
December 31,
2007 | | Year
Ended
December 31,
2006 | | Year
Ended
December 31,
2007 | | Year
Ended
December 31,
2006 | |
| JPMorgan International (Number of Shares) | |
| Shares sold | | | 5,751,139 | | | | 45,558,811 | | | | 3,788,007 | | | | 9,306,142 | | | | 444,379 | | | | 417,670 | | |
| Dividends reinvested | | | 629,511 | | | | 549,926 | | | | 183,458 | | | | 12,367 | | | | 16,052 | | | | 2,525 | | |
| Shares redeemed | | | (38,643,926 | ) | | | (14,457,382 | ) | | | (2,926,294 | ) | | | (42,019,041 | ) | | | (181,393 | ) | | | (46,939 | ) | |
| Net increase (decrease) in shares outstanding | | | (32,263,276 | ) | | | 31,651,355 | | | | 1,045,171 | | | | (32,700,532 | ) | | | 279,038 | | | | 373,256 | | |
| JPMorgan International ($) | |
| Shares sold | | $ | 97,627,235 | | | $ | 693,275,127 | | | $ | 65,457,622 | | | $ | 135,310,861 | | | $ | 7,530,033 | | | $ | 6,240,136 | | |
| Dividends reinvested | | | 10,733,166 | | | | 8,050,923 | | | | 3,129,801 | | | | 180,927 | | | | 269,186 | | | | 36,480 | | |
| Shares redeemed | | | (661,783,179 | ) | | | (217,426,374 | ) | | | (50,420,712 | ) | | | (629,724,417 | ) | | | (3,099,410 | ) | | | (682,076 | ) | |
| Net increase (decrease) | | $ | (553,422,778 | ) | | $ | 483,899,676 | | | $ | 18,166,711 | | | $ | (494,232,629 | ) | | $ | 4,699,809 | | | $ | 5,594,540 | | |
| | | Class I | | Class S | | Class ADVDV | |
| | | Year
Ended
December 31,
2007 | | Year
Ended
December 31,
2006 | | Year
Ended
December 31,
2007 | | Year
Ended
December 31,
2006 | | Year
Ended
December 31,
2007 | | Year
Ended
December 31,
2006 | |
| JPMorgan Mid Cap Value (Number of Shares) | |
| Shares sold | | | 3,088,269 | | | | 2,819,227 | | | | 1,016,458 | | | | 1,058,452 | | | | 497,189 | | | | 626,803 | | |
| Dividends reinvested | | | 500,338 | | | | 50,978 | | | | 330,524 | | | | 40,231 | | | | 90,575 | | | | 8,285 | | |
| Shares redeemed | | | (2,074,434 | ) | | | (882,739 | ) | | | (1,259,703 | ) | | | (1,063,949 | ) | | | (366,173 | ) | | | (148,523 | ) | |
| Net increase in shares outstanding | | | 1,514,173 | | | | 1,987,466 | | | | 87,279 | | | | 34,734 | | | | 221,591 | | | | 486,565 | | |
| JPMorgan Mid Cap Value ($) | |
| Shares sold | | $ | 51,757,122 | | | $ | 42,547,053 | | | $ | 16,968,561 | | | $ | 16,122,783 | | | $ | 8,263,787 | | | $ | 9,333,354 | | |
| Dividends reinvested | | | 7,990,400 | | | | 746,324 | | | | 5,252,024 | | | | 586,161 | | | | 1,425,650 | | | | 119,806 | | |
| Shares redeemed | | | (34,003,961 | ) | | | (13,435,093 | ) | | | (20,654,782 | ) | | | (16,014,541 | ) | | | (5,893,439 | ) | | | (2,199,483 | ) | |
| Net increase | | $ | 25,743,561 | | | $ | 29,858,284 | | | $ | 1,565,803 | | | $ | 694,403 | | | $ | 3,795,998 | | | $ | 7,253,677 | | |
| | | Class I | | Class S | | Class ADV | |
| | | Year
Ended
December 31,
2007 | | Year
Ended
December 31,
2006 | | Year
Ended
December 31,
2007 | | Year
Ended
December 31,
2006 | | Year
Ended
December 31,
2007 | | Year
Ended
December 31,
2006 | |
Legg Mason Partners Aggressive Growth
(Number of Shares) | |
| Shares sold | | | 6,005,976 | | | | 14,639,264 | | | | 505,175 | | | | 3,132,784 | | | | 63,611 | | | | 175,580 | | |
| Shares redeemed | | | (6,698,908 | ) | | | (3,047,781 | ) | | | (786,710 | ) | | | (9,213,654 | ) | | | (62,671 | ) | | | (178,669 | ) | |
| Net increase (decrease) in shares outstanding | | | (692,932 | ) | | | 11,591,483 | | | | (281,535 | ) | | | (6,080,870 | ) | | | 940 | | | | (3,089 | ) | |
| Legg Mason Partners Aggressive Growth ($) | |
| Shares sold | | $ | 297,998,788 | | | $ | 687,226,545 | | | $ | 24,932,471 | | | $ | 144,043,823 | | | $ | 3,084,206 | | | $ | 7,901,186 | | |
| Shares redeemed | | | (336,570,469 | ) | | | (142,216,819 | ) | | | (38,708,227 | ) | | | (429,980,390 | ) | | | (3,062,798 | ) | | | (8,161,851 | ) | |
| Net increase (decrease) | | $ | (38,571,681 | ) | | $ | 545,009,726 | | | $ | (13,775,756 | ) | | $ | (285,936,567 | ) | | $ | 21,408 | | | $ | (260,665 | ) | |
155
NOTES TO FINANCIAL STATEMENTS AS OF DECEMBER 31, 2007 (CONTINUED)
NOTE 10 — CAPITAL SHARES (continued)
| | | Class I | | Class S | | Class ADV | |
| | | Year
Ended
December 31,
2007 | | Year
Ended
December 31,
2006 | | Year
Ended
December 31,
2007 | | Year
Ended
December 31,
2006 | | Year
Ended
December 31,
2007 | | Year
Ended
December 31,
2006 | |
Legg Mason Partners Large Cap Growth
(Number of Shares) | |
| Shares sold | | | 231,436 | | | | 272,902 | | | | 121,171 | | | | 101,246 | | | | 219,040 | | | | 270,377 | | |
| Dividends reinvested | | | 14,147 | | | | 27,949 | | | | 11,647 | | | | 19,117 | | | | 18,149 | | | | 30,526 | | |
| Shares redeemed | | | (417,611 | ) | | | (705,884 | ) | | | (325,980 | ) | | | (390,256 | ) | | | (567,756 | ) | | | (922,106 | ) | |
| Net decrease in shares outstanding | | | (172,028 | ) | | | (405,033 | ) | | | (193,162 | ) | | | (269,893 | ) | | | (330,567 | ) | | | (621,203 | ) | |
| Legg Mason Partners Large Cap Growth ($) | |
| Shares sold | | $ | 2,885,794 | | | $ | 3,110,302 | | | $ | 1,472,773 | | | $ | 1,129,218 | | | $ | 2,660,611 | | | $ | 3,019,643 | | |
| Dividends reinvested | | | 169,765 | | | | 290,112 | | | | 138,021 | | | | 196,333 | | | | 212,710 | | | | 311,057 | | |
| Shares redeemed | | | (5,106,319 | ) | | | (8,171,323 | ) | | | (3,975,369 | ) | | | (4,462,310 | ) | | | (6,908,639 | ) | | | (10,276,922 | ) | |
| Net decrease | | $ | (2,050,760 | ) | | $ | (4,770,909 | ) | | $ | (2,364,575 | ) | | $ | (3,136,759 | ) | | $ | (4,035,318 | ) | | $ | (6,946,222 | ) | |
| | | Class I | | Class S | | Class ADV | |
| | | Year
Ended
December 31,
2007 | | January 3,
2006(1) to
December 31,
2006 | | Year
Ended
December 31,
2007 | | January 18,
2006(1) to
December 31,
2006 | | Year
Ended
December 31,
2007 | | Year
Ended
December 31,
2006 | |
Lord Abbett U.S. Government Securities
(Number of Shares) | |
| Shares sold | | | 667,985 | | | | 5,117,101 | | | | 186,524 | | | | 2,458,020 | | | | 1 | | | | 97 | | |
| Dividends reinvested | | | 167,909 | | | | 143,705 | | | | 51,977 | | | | 57,827 | | | | — | | | | — | | |
| Shares redeemed | | | (1,012,549 | ) | | | (1,709,930 | ) | | | (545,079 | ) | | | (1,100,405 | ) | | | (98 | ) | | | — | | |
| Net increase (decrease) in shares outstanding | | | (176,655 | ) | | | 3,550,876 | | | | (306,578 | ) | | | 1,415,442 | | | | (97 | ) | | | 97 | | |
| Lord Abbett U.S. Government Securities ($) | |
| Shares sold | | $ | 6,802,595 | | | $ | 50,827,619 | | | $ | 1,887,900 | | | $ | 24,705,248 | | | $ | 10 | | | $ | 1,010 | | |
| Dividends reinvested | | | 1,694,200 | | | | 1,428,428 | | | | 524,972 | | | | 574,796 | | | | — | | | | — | | |
| Shares redeemed | | | (10,266,830 | ) | | | (17,296,230 | ) | | | (5,504,119 | ) | | | (11,000,899 | ) | | | (1,027 | ) | | | — | | |
| Net increase (decrease) | | $ | (1,770,035 | ) | | $ | 34,959,817 | | | $ | (3,091,247 | ) | | $ | 14,279,145 | | | $ | (1,017 | ) | | $ | 1,010 | | |
| | | Class I | | Class S | | Class ADV | |
| | | Year
Ended
December 31,
2007 | | January 19,
2006(1) to
December 31,
2006 | | Year
Ended
December 31,
2007 | | January 3,
2006(1) to
December 31,
2006 | | Year
Ended
December 31,
2007 | | December 29,
2006(1) to
December 31,
2006 | |
Neuberger Berman Partners
(Number of Shares) | |
| Shares sold | | | 6,939,602 | | | | 25,101,066 | | | | 721,744 | | | | 9,880,195 | | | | 1,477 | | | | 92 | | |
| Shares issued in merger | | | — | | | | 1 | | | | — | | | | 16,275,105 | | | | — | | | | — | | |
| Dividends reinvested | | | 1,180,757 | | | | — | | | | 782,530 | | | | — | | | | 27 | | | | — | | |
| Shares redeemed | | | (5,336,876 | ) | | | (3,863,723 | ) | | | (4,190,016 | ) | | | (9,496,861 | ) | | | (555 | ) | | | — | | |
| Net increase (decrease) in shares outstanding | | | 2,783,483 | | | | 21,237,344 | | | | (2,685,742 | ) | | | 16,658,439 | | | | 949 | | | | 92 | | |
| Neuberger Berman Partners ($) | |
| Shares sold | | $ | 77,846,499 | | | $ | 258,138,091 | | | $ | 8,223,802 | | | $ | 99,240,980 | | | $ | 16,502 | | | $ | 1,000 | | |
| Proceeds from shares issued in merger | | | — | | | | 18 | | | | — | | | | 178,456,935 | | | | — | | | | — | | |
| Dividends reinvested | | | 12,693,141 | | | | — | | | | 8,388,718 | | | | — | | | | 287 | | | | — | | |
| Shares redeemed | | | (60,909,432 | ) | | | (39,243,444 | ) | | | (47,082,717 | ) | | | (98,649,240 | ) | | | (6,050 | ) | | | — | | |
| Net increase (decrease) | | $ | 29,630,208 | | | $ | 218,894,665 | | | $ | (30,470,197 | ) | | $ | 179,048,675 | | | $ | 10,739 | | | $ | 1,000 | | |
156
NOTES TO FINANCIAL STATEMENTS AS OF DECEMBER 31, 2007 (CONTINUED)
NOTE 10 — CAPITAL SHARES (continued)
| | | Class I | | Class S | | Class ADV | |
| | | Year
Ended
December 31,
2007 | | January 3,
2006(1) to
December 31,
2006 | | Year
Ended
December 31,
2007 | | January 12,
2006(1) to
December 31,
2006 | | Year
Ended
December 31,
2007 | | Year
Ended
December 31,
2006 | |
Neuberger Berman Regency
(Number of Shares) | |
| Shares sold | | | 221,805 | | | | 573,279 | | | | 1,713,579 | | | | 771,224 | | | | 1 | | | | 94 | | |
| Dividends reinvested | | | 1,574 | | | | 495 | | | | 11,575 | | | | 3,356 | | | | — | | | | — | | |
| Shares redeemed | | | (218,895 | ) | | | (2,912 | ) | | | (907,010 | ) | | | (169,566 | ) | | | (95 | ) | | | — | | |
| Net increase in shares outstanding | | | 4,484 | | | | 570,862 | | | | 818,144 | | | | 605,014 | | | | (94 | ) | | | 94 | | |
| Neuberger Berman Regency ($) | |
| Shares sold | | $ | 2,503,111 | | | $ | 5,718,914 | | | $ | 19,292,121 | | | $ | 7,753,095 | | | $ | 10 | | | $ | 1,010 | | |
| Dividends reinvested | | | 17,092 | | | | 5,314 | | | | 125,477 | | | | 36,009 | | | | — | | | | — | | |
| Shares redeemed | | | (2,479,927 | ) | | | (28,762 | ) | | | (10,235,214 | ) | | | (1,721,062 | ) | | | (1,026 | ) | | | — | | |
| Net increase (decrease) | | $ | 40,276 | | | $ | 5,695,466 | | | $ | 9,182,384 | | | $ | 6,068,042 | | | $ | (1,016 | ) | | $ | 1,010 | | |
| | | Class I | | Class S | | Class ADV | |
| | | Year
Ended
December 31,
2007 | | Year
Ended
December 31,
2006 | | Year
Ended
December 31,
2007 | | Year
Ended
December 31,
2006 | | Year
Ended
December 31,
2007 | | Year
Ended
December 31,
2006 | |
| OpCap Balanced Value (Number of Shares) | |
| Shares sold | | | 74,548 | | | | 80,660 | | | | 347,408 | | | | 396,940 | | | | 21,403 | | | | 58,246 | | |
| Dividends reinvested | | | 39,526 | | | | 4,696 | | | | 631,730 | | | | 56,152 | | | | 12,803 | | | | 2,131 | | |
| Shares redeemed | | | (107,998 | ) | | | (94,031 | ) | | | (1,662,471 | ) | | | (3,923,866 | ) | | | (227,865 | ) | | | (60,924 | ) | |
| Net increase (decrease) in shares outstanding | | | 6,076 | | | | (8,675 | ) | | | (683,333 | ) | | | (3,470,774 | ) | | | (193,659 | ) | | | (547 | ) | |
| OpCap Balanced Value ($) | |
| Shares sold | | $ | 1,073,418 | | | $ | 1,134,525 | | | $ | 5,149,766 | | | $ | 5,587,245 | | | $ | 316,252 | | | $ | 816,845 | | |
| Dividends reinvested | | | 542,689 | | | | 63,166 | | | | 8,679,977 | | | | 755,243 | | | | 175,140 | | | | 28,385 | | |
| Shares redeemed | | | (1,533,024 | ) | | | (1,332,794 | ) | | | (24,266,943 | ) | | | (54,913,812 | ) | | | (3,296,817 | ) | | | (851,293 | ) | |
| Net increase (decrease) | | $ | 83,083 | | | $ | (135,103 | ) | | $ | (10,437,200 | ) | | $ | (48,571,324 | ) | | $ | (2,805,425 | ) | | $ | (6,063 | ) | |
| | | Class I | | Class S | | Class ADV | |
| | | Year
Ended
December 31,
2007 | | Year
Ended
December 31,
2006 | | Year
Ended
December 31,
2007 | | Year
Ended
December 31,
2006 | | Year
Ended
December 31,
2007 | | Year
Ended
December 31,
2006 | |
| Oppenheimer Global (Number of Shares) | |
| Shares sold | | | 1,530,215 | | | | 6,424,797 | | | | 6,197,564 | | | | 6,382,382 | | | | 1,854,454 | | | | 1,696,793 | | |
| Dividends reinvested | | | 7,421,542 | | | | 347,770 | | | | 627,341 | | | | 14,921 | | | | 326,733 | | | | 17,165 | | |
| Shares redeemed | | | (24,241,211 | ) | | | (15,372,206 | ) | | | (1,581,234 | ) | | | (443,727 | ) | | | (1,971,448 | ) | | | (3,529,353 | ) | |
| Net increase (decrease) in shares outstanding | | | (15,289,454 | ) | | | (8,599,639 | ) | | | 5,243,671 | | | | 5,953,576 | | | | 209,739 | | | | (1,815,395 | ) | |
| Oppenheimer Global ($) | |
| Shares sold | | $ | 26,007,458 | | | $ | 99,387,512 | | | $ | 104,709,292 | | | $ | 94,829,014 | | | $ | 31,658,965 | | | $ | 24,845,252 | | |
| Dividends reinvested | | | 124,830,332 | | | | 5,077,453 | | | | 10,307,206 | | | | 214,388 | | | | 5,348,617 | | | | 243,735 | | |
| Shares redeemed | | | (418,073,150 | ) | | | (237,338,053 | ) | | | (26,570,489 | ) | | | (6,691,967 | ) | | | (32,972,048 | ) | | | (52,362,841 | ) | |
| Net increase (decrease) | | $ | (267,235,360 | ) | | $ | (132,873,088 | ) | | $ | 88,446,009 | | | $ | 88,351,435 | | | $ | 4,035,534 | | | $ | (27,273,854 | ) | |
157
NOTES TO FINANCIAL STATEMENTS AS OF DECEMBER 31, 2007 (CONTINUED)
NOTE 10 — CAPITAL SHARES (continued)
| | | Class I | | Class S | | Class ADV | |
| | | Year
Ended
December 31,
2007 | | Year
Ended
December 31,
2006 | | Year
Ended
December 31,
2007 | | Year
Ended
December 31,
2006 | | Year
Ended
December 31,
2007 | | Year
Ended
December 31,
2006 | |
Oppenheimer Strategic Income
(Number of Shares) | |
| Shares sold | | | 9,622,685 | | | | 7,029,713 | | | | 3,359,481 | | | | 1,212,240 | | | | 2,141,421 | | | | 526,361 | | |
| Dividends reinvested | | | 1,551,993 | | | | 130,181 | | | | 259,773 | | | | 5,803 | | | | 108,257 | | | | 1,365 | | |
| Shares redeemed | | | (7,443,050 | ) | | | (4,141,588 | ) | | | (1,313,484 | ) | | | (2,082,268 | ) | | | (1,270,661 | ) | | | (175,540 | ) | |
| Net increase (decrease) in shares outstanding | | | 3,731,628 | | | | 3,018,306 | | | | 2,305,770 | | | | (864,225 | ) | | | 979,017 | | | | 352,186 | | |
| Oppenheimer Strategic Income ($) | |
| Shares sold | | $ | 106,503,556 | | | $ | 72,764,925 | | | $ | 37,262,805 | | | $ | 12,449,477 | | | $ | 23,394,127 | | | $ | 5,388,475 | | |
| Dividends reinvested | | | 16,544,242 | | | | 1,398,755 | | | | 2,774,380 | | | | 62,039 | | | | 1,147,519 | | | | 14,604 | | |
| Shares redeemed | | | (82,768,717 | ) | | | (42,555,223 | ) | | | (14,501,828 | ) | | | (21,328,206 | ) | | | (14,018,615 | ) | | | (1,805,281 | ) | |
| Net increase (decrease) | | $ | 40,279,081 | | | $ | 31,608,457 | | | $ | 25,535,357 | | | $ | (8,816,690 | ) | | $ | 10,523,031 | | | $ | 3,597,798 | | |
| | | Class I | | Class S | | Class ADV | |
| | | Year
Ended
December 31,
2007 | | Year
Ended
December 31,
2006 | | Year
Ended
December 31,
2007 | | Year
Ended
December 31,
2006 | | Year
Ended
December 31,
2007 | | Year
Ended
December 31,
2006 | |
| PIMCO Total Return (Number of Shares) | |
| Shares sold | | | 10,130,841 | | | | 9,297,232 | | | | 2,761,334 | | | | 1,694,599 | | | | 1,565,518 | | | | 1,090,059 | | |
| Dividends reinvested | | | 874,500 | | | | 413,354 | | | | 320,343 | | | | 139,350 | | | | 87,360 | | | | 40,189 | | |
| Shares redeemed | | | (3,012,294 | ) | | | (6,727,849 | ) | | | (1,096,037 | ) | | | (1,122,866 | ) | | | (1,107,027 | ) | | | (937,716 | ) | |
| Net increase in shares outstanding | | | 7,993,047 | | | | 2,982,737 | | | | 1,985,640 | | | | 711,083 | | | | 545,851 | | | | 192,532 | | |
| PIMCO Total Return ($) | |
| Shares sold | | $ | 114,568,437 | | | $ | 101,621,577 | | | $ | 31,324,525 | | | $ | 18,505,896 | | | $ | 17,518,400 | | | $ | 11,796,422 | | |
| Dividends reinvested | | | 9,593,260 | | | | 4,464,221 | | | | 3,498,142 | | | | 1,499,405 | | | | 947,855 | | | | 429,622 | | |
| Shares redeemed | | | (34,005,280 | ) | | | (73,757,665 | ) | | | (12,333,433 | ) | | | (12,285,990 | ) | | | (12,352,811 | ) | | | (10,155,390 | ) | |
| Net increase | | $ | 90,156,417 | | | $ | 32,328,133 | | | $ | 22,489,234 | | | $ | 7,719,311 | | | $ | 6,113,444 | | | $ | 2,070,654 | | |
| | | Class I | | Class S | | Class ADV | |
| | | Year
Ended
December 31,
2007 | | January 3,
2006(1) to
December 31,
2006 | | Year
Ended
December 31,
2007 | | January 20,
2006(1) to
December 31,
2006 | | Year
Ended
December 31,
2007 | | January 20,
2006(1) to
December 31,
2006 | |
| Pioneer High Yield (Number of Shares) | |
| Shares sold | | | 4,373,553 | | | | 12,879,573 | | | | 139,291 | | | | 1,074,712 | | | | 106,724 | | | | 804,412 | | |
| Dividends reinvested | | | 615,591 | | | | 412,987 | | | | 42,674 | | | | 48,798 | | | | 4,762 | | | | 17,775 | | |
| Shares redeemed | | | (6,478,867 | ) | | | (1,552,313 | ) | | | (416,873 | ) | | | (313,107 | ) | | | (61,790 | ) | | | (772,292 | ) | |
| Net increase (decrease) in shares outstanding | | | (1,489,723 | ) | | | 11,740,247 | | | | (234,908 | ) | | | 810,403 | | | | 49,696 | | | | 49,895 | | |
| Pioneer High Yield ($) | |
| Shares sold | | $ | 45,648,012 | | | $ | 128,967,126 | | | $ | 1,461,022 | | | $ | 10,739,273 | | | $ | 1,114,967 | | | $ | 8,039,832 | | |
| Dividends reinvested | | | 6,424,994 | | | | 4,162,628 | | | | 445,292 | | | | 490,098 | | | | 49,541 | | | | 177,443 | | |
| Shares redeemed | | | (68,037,070 | ) | | | (15,539,024 | ) | | | (4,370,009 | ) | | | (3,134,130 | ) | | | (642,402 | ) | | | (7,647,456 | ) | |
| Net increase (decrease) | | $ | (15,964,064 | ) | | $ | 117,590,730 | | | $ | (2,463,695 | ) | | $ | 8,095,241 | | | $ | 522,106 | | | $ | 569,819 | | |
158
NOTES TO FINANCIAL STATEMENTS AS OF DECEMBER 31, 2007 (CONTINUED)
NOTE 10 — CAPITAL SHARES (continued)
| | | Class I | | Class S | | Class ADV | |
| | | Year
Ended
December 31,
2007 | | Year
Ended
December 31,
2006 | | Year
Ended
December 31,
2007 | | Year
Ended
December 31,
2006 | | Year
Ended
December 31,
2007 | | Year
Ended
December 31,
2006 | |
T. Rowe Price Diversified Mid Cap Growth
(Number of Shares) | |
| Shares sold | | | 1,022,088 | | | | 6,108,855 | | | | 659,974 | | | | 562,060 | | | | 909,722 | | | | 4,340,652 | | |
| Dividends reinvested | | | 10,024,090 | | | | 2,901,386 | | | | 133,510 | | | | 65,615 | | | | 441,110 | | | | 151,184 | | |
| Shares redeemed | | | (22,226,680 | ) | | | (24,129,518 | ) | | | (482,616 | ) | | | (2,075,230 | ) | | | (2,298,671 | ) | | | (7,359,250 | ) | |
| Net increase (decrease) in shares outstanding | | | (11,180,502 | ) | | | (15,119,277 | ) | | | 310,868 | | | | (1,447,555 | ) | | | (947,839 | ) | | | (2,867,414 | ) | |
| T. Rowe Price Diversified Mid Cap Growth ($) | |
| Shares sold | | $ | 9,701,757 | | | $ | 55,394,856 | | | $ | 6,505,784 | | | $ | 4,998,673 | | | $ | 8,574,224 | | | $ | 37,662,475 | | |
| Dividends reinvested | | | 92,221,632 | | | | 23,791,368 | | | | 1,209,603 | | | | 530,826 | | | | 3,939,115 | | | | 1,209,471 | | |
| Shares redeemed | | | (215,580,871 | ) | | | (214,858,831 | ) | | | (4,459,886 | ) | | | (17,594,314 | ) | | | (21,756,841 | ) | | | (64,759,712 | ) | |
| Net increase (decrease) | | $ | (113,657,482 | ) | | $ | (135,672,607 | ) | | $ | 3,255,501 | | | $ | (12,064,815 | ) | | $ | (9,243,502 | ) | | $ | (25,887,766 | ) | |
| | | Class I | | Class S | | Class ADV | |
| | | Year
Ended
December 31,
2007 | | Year
Ended
December 31,
2006 | | Year
Ended
December 31,
2007 | | Year
Ended
December 31,
2006 | | Year
Ended
December 31,
2007 | | Year
Ended
December 31,
2006 | |
T. Rowe Price Growth Equity
(Number of Shares) | |
| Shares sold | | | 4,286,947 | | | | 7,098,028 | | | | 1,516,329 | | | | 825,959 | | | | 436,142 | | | | 552,839 | | |
| Dividends reinvested | | | 1,145,875 | | | | 89,917 | | | | 66,327 | | | | 1,498 | | | | 85,861 | | | | 3,217 | | |
| Shares redeemed | | | (3,548,185 | ) | | | (2,834,054 | ) | | | (562,225 | ) | | | (3,321,964 | ) | | | (630,547 | ) | | | (416,092 | ) | |
| Net increase (decrease) in shares outstanding | | | 1,884,637 | | | | 4,353,891 | | | | 1,020,431 | | | | (2,494,507 | ) | | | (108,544 | ) | | | 139,964 | | |
| T. Rowe Price Growth Equity ($) | |
| Shares sold | | $ | 265,645,399 | | | $ | 389,488,623 | | | $ | 94,265,100 | | | $ | 44,679,348 | | | $ | 26,571,606 | | | $ | 29,702,727 | | |
| Dividends reinvested | | | 68,523,314 | | | | 4,673,010 | | | | 3,936,497 | | | | 77,274 | | | | 5,052,924 | | | | 164,722 | | |
| Shares redeemed | | | (218,818,550 | ) | | | (154,954,764 | ) | | | (34,757,350 | ) | | | (181,745,667 | ) | | | (38,729,774 | ) | | | (22,216,100 | ) | |
| Net increase (decrease) | | $ | 115,350,163 | | | $ | 239,206,869 | | | $ | 63,444,247 | | | $ | (136,989,045 | ) | | $ | (7,105,244 | ) | | $ | 7,651,349 | | |
| | | Class I | | Class S | | Class ADV | |
| | | Year
Ended
December 31,
2007 | | January 3,
2006(1) to
December 31,
2006 | | Year
Ended
December 31,
2007 | | January 12,
2006(1) to
December 31,
2006 | | Year
Ended
December 31,
2007 | | December 20,
2006(1) to
December 31,
2006 | |
| Templeton Foreign Equity (Number of Shares) | |
| Shares sold | | | 2,842,901 | | | | 1,000,001 | | | | 9,869,197 | | | | 3,418,607 | | | | 1 | | | | 86 | | |
| Dividends reinvested | | | 47,303 | | | | — | | | | 145,910 | | | | 31,296 | | | | — | | | | — | | |
| Shares redeemed | | | (378,132 | ) | | | (86,372 | ) | | | (3,353,116 | ) | | | (435,506 | ) | | | (3 | ) | | | — | | |
| Net increase in shares outstanding | | | 2,512,072 | | | | 913,629 | | | | 6,661,991 | | | | 3,014,397 | | | | (2 | ) | | | 86 | | |
| Templeton Foreign Equity ($) | |
| Shares sold | | $ | 39,542,642 | | | $ | 10,000,010 | | | $ | 130,735,493 | | | $ | 36,701,224 | | | $ | 10 | | | $ | 1,010 | | |
| Dividends reinvested | | | 648,519 | | | | — | | | | 1,996,683 | | | | 375,868 | | | | — | | | | — | | |
| Shares redeemed | | | (4,802,215 | ) | | | (900,000 | ) | | | (44,087,563 | ) | | | (4,676,209 | ) | | | (42 | ) | | | — | | |
| Net increase | | $ | 35,388,946 | | | $ | 9,100,010 | | | $ | 88,644,613 | | | $ | 32,400,883 | | | $ | (32 | ) | | $ | 1,010 | | |
159
NOTES TO FINANCIAL STATEMENTS AS OF DECEMBER 31, 2007 (CONTINUED)
NOTE 10 — CAPITAL SHARES (continued)
| | | Class I | | Class S | | Class ADV | |
| | | Year
Ended
December 31,
2007 | | Year
Ended
December 31,
2006 | | Year
Ended
December 31,
2007 | | Year
Ended
December 31,
2006 | | Year
Ended
December 31,
2007 | | Year
Ended
December 31,
2006 | |
| Thornburg Value (Number of Shares) | |
| Shares sold | | | 1,345,326 | | | | 122,100 | | | | 550,984 | | | | 307,683 | | | | 127,102 | | | | 16,010 | | |
| Dividends reinvested | | | 24,972 | | | | 32,202 | | | | 2,271 | | | | 27 | | | | 287 | | | | 16 | | |
| Shares redeemed | | | (850,590 | ) | | | (1,317,692 | ) | | | (361,252 | ) | | | (103,396 | ) | | | (23,054 | ) | | | (2,510 | ) | |
| Net increase (decrease) in shares outstanding | | | 519,708 | | | | (1,163,390 | ) | | | 192,003 | | | | 204,314 | | | | 104,335 | | | | 13,516 | | |
| Thornburg Value ($) | |
| Shares sold | | $ | 46,207,864 | | | $ | 3,560,314 | | | $ | 17,979,268 | | | $ | 9,260,104 | | | $ | 4,315,405 | | | $ | 477,546 | | |
| Dividends reinvested | | | 845,816 | | | | 882,011 | | | | 76,409 | | | | 742 | | | | 9,561 | | | | 421 | | |
| Shares redeemed | | | (28,670,588 | ) | | | (37,725,387 | ) | | | (12,362,045 | ) | | | (3,138,049 | ) | | | (774,103 | ) | | | (69,036 | ) | |
| Net increase (decrease) | | $ | 18,383,092 | | | $ | (33,283,062 | ) | | $ | 5,693,632 | | | $ | 6,122,797 | | | $ | 3,550,863 | | | $ | 408,931 | | |
| | | Class I | | Class S | | Class ADV | |
| | | Year
Ended
December 31,
2007 | | Year
Ended
December 31,
2006 | | Year
Ended
December 31,
2007 | | Year
Ended
December 31,
2006 | | Year
Ended
December 31,
2007 | | Year
Ended
December 31,
2006 | |
| UBS U.S. Large Cap Equity (Number of Shares) | |
| Shares sold | | | 8,396,965 | | | | 9,595,093 | | | | 809,896 | | | | 2,772,902 | | | | 476,545 | | | | 366,913 | | |
| Shares issued in merger | | | 77 | | | | — | | | | 3,166,308 | | | | — | | | | 294,433 | | | | — | | |
| Dividends reinvested | | | 246,377 | | | | 244,847 | | | | 31,898 | | | | 11,883 | | | | 6,331 | | | | 998 | | |
| Shares redeemed | | | (7,873,477 | ) | | | (5,332,212 | ) | | | (2,384,412 | ) | | | (1,134,560 | ) | | | (156,393 | ) | | | (26,504 | ) | |
| Net increase in shares outstanding | | | 769,942 | | | | 4,507,728 | | | | 1,623,690 | | | | 1,650,225 | | | | 620,916 | | | | 341,407 | | |
| UBS U.S. Large Cap Equity ($) | |
| Shares sold | | $ | 91,879,112 | | | $ | 93,073,309 | | | $ | 8,644,845 | | | $ | 26,738,676 | | | $ | 5,153,428 | | | $ | 3,597,967 | | |
| Proceeds from shares issued in merger | | | 820 | | | | — | | | | 33,300,483 | | | | — | | | | 3,082,920 | | | | — | | |
| Dividends reinvested | | | 2,678,126 | | | | 2,308,904 | | | | 342,587 | | | | 110,985 | | | | 67,611 | | | | 9,291 | | |
| Shares redeemed | | | (85,893,516 | ) | | | (51,922,487 | ) | | | (25,772,531 | ) | | | (11,044,116 | ) | | | (1,679,350 | ) | | | (249,855 | ) | |
| Net increase | | $ | 8,664,542 | | | $ | 43,459,726 | | | $ | 16,515,384 | | | $ | 15,805,545 | | | $ | 6,624,609 | | | $ | 3,357,403 | | |
| | | Class I | | Class S | | Class ADV | |
| | | Year
Ended
December 31,
2007 | | April 28,
2006(1) to
December 31,
2006 | | Year
Ended
December 31,
2007 | | April 28,
2006(1) to
December 31,
2006 | | Year
Ended
December 31,
2007 | | April 28,
2006(1) to
December 31,
2006 | |
UBS U.S. Small Cap Growth
(Number of Shares) | |
| Shares sold | | | 1,793,225 | | | | 2,686,575 | | | | 846,690 | | | | 952,635 | | | | 1 | | | | 101 | | |
| Dividends reinvested | | | 172,618 | | | | 15,156 | | | | 23,215 | | | | 4,411 | | | | — | | | | — | | |
| Shares redeemed | | | (899,226 | ) | | | (394,710 | ) | | | (1,026,023 | ) | | | (434,767 | ) | | | — | | | | — | | |
| Net increase (decrease) in shares outstanding | | | 1,066,617 | | | | 2,307,021 | | | | (156,118 | ) | | | 522,279 | | | | 1 | | | | 101 | | |
| UBS U.S. Small Cap Growth ($) | |
| Shares sold | | $ | 18,451,939 | | | $ | 25,476,263 | | | $ | 8,653,226 | | | $ | 9,162,176 | | | $ | 10 | | | $ | 1,006 | | |
| Dividends reinvested | | | 1,679,025 | | | | 148,676 | | | | 225,904 | | | | 43,180 | | | | — | | | | — | | |
| Shares redeemed | | | (9,429,159 | ) | | | (3,820,768 | ) | | | (10,447,988 | ) | | | (4,126,228 | ) | | | — | | | | — | | |
| Net increase (decrease) | | $ | 10,701,805 | | | $ | 21,804,171 | | | $ | (1,568,858 | ) | | $ | 5,079,128 | | | $ | 10 | | | $ | 1,006 | | |
160
NOTES TO FINANCIAL STATEMENTS AS OF DECEMBER 31, 2007 (CONTINUED)
NOTE 10 — CAPITAL SHARES (continued)
| | | Class I | | Class S | | Class ADV | |
| | | Year
Ended
December 31,
2007 | | Year
Ended
December 31,
2006 | | Year
Ended
December 31,
2007 | | Year
Ended
December 31,
2006 | | Year
Ended
December 31,
2007 | | Year
Ended
December 31,
2006 | |
| Van Kampen Comstock (Number of Shares) | |
| Shares sold | | | 19,609,336 | | | | 40,993,359 | | | | 3,020,733 | | | | 7,978,292 | | | | 888,697 | | | | 1,124,623 | | |
| Dividends reinvested | | | 2,158,453 | | | | 2,092,041 | | | | 1,095,898 | | | | 1,834,218 | | | | 131,003 | | | | 156,118 | | |
| Shares redeemed | | | (20,695,922 | ) | | | (6,592,555 | ) | | | (3,668,044 | ) | | | (27,051,120 | ) | | | (610,607 | ) | | | (546,815 | ) | |
| Net increase (decrease) in shares outstanding | | | 1,071,867 | | | | 36,492,845 | | | | 448,587 | | | | (17,238,610 | ) | | | 409,093 | | | | 733,926 | | |
| Van Kampen Comstock ($) | |
| Shares sold | | $ | 264,513,052 | | | $ | 520,979,421 | | | $ | 40,377,616 | | | $ | 99,575,160 | | | $ | 11,900,015 | | | $ | 13,971,062 | | |
| Dividends reinvested | | | 28,124,641 | | | | 25,125,416 | | | | 14,235,714 | | | | 21,955,582 | | | | 1,682,082 | | | | 1,851,560 | | |
| Shares redeemed | | | (277,927,077 | ) | | | (82,439,322 | ) | | | (48,796,628 | ) | | | (344,077,235 | ) | | | (7,995,106 | ) | | | (6,729,082 | ) | |
| Net increase (decrease) | | $ | 14,710,616 | | | $ | 463,665,515 | | | $ | 5,816,702 | | | $ | (222,546,493 | ) | | $ | 5,586,991 | | | $ | 9,093,540 | | |
| | | Class I | | Class S | | Class ADV | |
| | | Year
Ended
December 31,
2007 | | Year
Ended
December 31,
2006 | | Year
Ended
December 31,
2007 | | Year
Ended
December 31,
2006 | | Year
Ended
December 31,
2007 | | Year
Ended
December 31,
2006 | |
Van Kampen Equity and Income
(Number of Shares) | |
| Shares sold | | | 280,649 | | | | 1,375,407 | | | | 1,583,978 | | | | 952,673 | | | | 121,956 | | | | 127,128 | | |
| Dividends reinvested | | | 1,214,960 | | | | 1,330,944 | | | | 135,760 | | | | 127,984 | | | | 21,389 | | | | 24,246 | | |
| Shares redeemed | | | (4,050,329 | ) | | | (2,148,019 | ) | | | (485,219 | ) | | | (432,456 | ) | | | (245,462 | ) | | | (67,625 | ) | |
| Net increase (decrease) in shares outstanding | | | (2,554,720 | ) | | | 558,332 | | | | 1,234,519 | | | | 648,201 | | | | (102,117 | ) | | | 83,749 | | |
| Van Kampen Equity and Income ($) | |
| Shares sold | | $ | 11,031,962 | | | $ | 50,898,732 | | | $ | 61,243,253 | | | $ | 34,829,393 | | | $ | 4,741,908 | | | $ | 4,606,497 | | |
| Dividends reinvested | | | 45,743,256 | | | | 47,168,642 | | | | 5,081,486 | | | | 4,512,722 | | | | 792,474 | | | | 846,440 | | |
| Shares redeemed | | | (157,940,915 | ) | | | (79,896,329 | ) | | | (18,905,193 | ) | | | (15,811,167 | ) | | | (9,625,953 | ) | | | (2,453,385 | ) | |
| Net increase (decrease) | | $ | (101,165,697 | ) | | $ | 18,171,045 | | | $ | 47,419,546 | | | $ | 23,530,948 | | | $ | (4,091,571 | ) | | $ | 2,999,552 | | |
NOTE 11 — ILLIQUID SECURITIES
Pursuant to guidelines adopted by the Board, the following securities have been deemed to be illiquid. The Portfolio's currently limit investments in illiquid securities to 15% of a Portfolio's net assets, at market value, at time of purchase.
| Portfolio | | Security | | Notional
Principal/Par
Value | | Initial
Acquisition
Date | | Cost/
(Upfront
Payments) | | Value | | Percent
of Net
Assets | |
American Century
| |
Small-Mid
| |
| Cap Value | | Young Innovations, Inc. | | | 20,890 | | | 04/24/07 | | $ | 542,013 | | | $ | 499,480 | | | | 0.5 | % | |
| | | Ulticom, Inc, | | | 66,100 | | | 12/07/05 | | | 622,633 | | | | 528,800 | | | | 0.5 | % | |
| | | Ashford Hospitality Trust, 8.450%, due 07/18/12 | | | 10,468 | | | 07/11/07 | | | 249,319 | | | | 198,892 | | | | 0.2 | % | |
| | | Aspen Insurance Holdings Ltd., 5.625%, due 12/31/49 | | | 18,900 | | | 07/20/06 | | | 967,535 | | | | 999,338 | | | | 1.0 | % | |
| | | National Retail Properties, 7.375%, due 10/12/11 | | | 8,300 | | | 02/10/06 | | | 204,440 | | | | 166,083 | | | | 0.2 | % | |
| | | | | | | | | | | | | | | $ | 2,392,593 | | | | 2.4 | % | |
Davis New York
Venture | | Merrill Lynch & Co., Inc. | | | 95,500 | | | 12/24/07 | | | 4,584,000 | | | $ | 4,460,003 | | | | 1.3 | % | |
| | | | | | | | | | | | | | | $ | 4,460,003 | | | | 1.3 | % | |
Oppenheimer
Strategic
Income | | Arco Capital Corp. Ltd | | | 144,498 | | | 02/27/07 | | | 2,167,470 | | | | 2,167,470 | | | | 0.4 | % | |
| | | ION Media Networks, Inc., due 11/15/49 | | | 17 | | | 09/27/06 | | | 137,324 | | | | 111,350 | | | | 0.0 | % | |
| | | Huntsman International, LLC, 7.375%, due 01/01/15 | | | 470,000 | | | 06/07/07 | | | 483,368 | | | | 495,850 | | | | 0.1 | % | |
| | | Mosaic Co., 7.625%, due 12/01/14 | | | 115,000 | | | 01/12/07 | | | 120,296 | | | | 123,625 | | | | 0.0 | % | |
| | | ACE Cash Express, Inc., 10.250%, due 10/01/14 | | | 35,000 | | | 09/26/06 | | | 35,000 | | | | 33,950 | | | | 0.0 | % | |
| | | DI Finance, 9.500%, due 02/15/13 | | | 100,000 | | | 12/09/05 | | | 100,000 | | | | 104,625 | | | | 0.0 | % | |
| | | iPayment, Inc., 9.750%, due 05/15/14 | | | 75,000 | | | 12/26/06 | | | 73,980 | | | | 70,500 | | | | 0.0 | % | |
| | | SGS International, Inc., 12.000%, due 12/15/13 | | | 55,000 | | | 08/09/06 | | | 55,000 | | | | 54,794 | | | | 0.0 | % | |
| | | Coriolanus Ltd., 12.995%, due 12/31/17 | | | 3,700,000 | | | 09/19/07 | | | 1,422,620 | | | | 1,470,335 | | | | 0.3 | % | |
| | | Eirles Two Ltd., 6.482%, due 04/30/12 | | | 900,000 | | | 09/17/07 | | | 899,370 | | | | 846,900 | | | | 0.2 | % | |
| | | IIRSA Norte Finance Ltd., 8.750%, due 05/30/24 | | | 1,312,468 | | | 08/03/06 | | | 979,185 | | | | 1,492,932 | | | | 0.3 | % | |
| | | EEB International Ltd., 8.750%, due 10/31/14 | | | 470,000 | | | 10/24/07 | | | 470,000 | | | | 481,750 | | | | 0.1 | % | |
| | | Vail Resorts, Inc., 6.750%, due 02/15/14 | | | 350,000 | | | 08/18/05 | | | 360,745 | | | | 346,500 | | | | 0.1 | % | |
161
NOTES TO FINANCIAL STATEMENTS AS OF DECEMBER 31, 2007 (CONTINUED)
| NOTE 11 — ILLIQUID SECURITIES (continued) | |
| Portfolio | | Security | | Notional
Principal/Par
Value | | Initial
Acquisition
Date | | Cost/
(Upfront
Payments) | | Value | | Percent
of Net
Assets | |
Oppenheimer
| |
Strategic
| |
Income
| |
| (continued) | | Helix Energy Solutions Group, Inc., 9.500%, | | | | | | | | | | | | | | | | |
| | |
| | | due 01/15/16 | | | 170,000 | | | 12/18/07 | | $ | 171,185 | | | $ | 173,825 | | | | 0.0 | % | |
| | | Dillard's, Inc., 6.625%, due 11/15/08 | | | 110,000 | | | 11/09/07 | | | 110,120 | | | | 109,863 | | | | 0.0 | % | |
| | | Rural Cellular Corp., 9.875%, due 02/01/10 | | | 400,000 | | | 08/02/05 | | | 416,719 | | | | 417,000 | | | | 0.1 | % | |
| | | Taganka Car Loan Finance PLC, 8.403%, due 11/14/13 | | | 150,000 | | | 10/17/06 | | | 150,000 | | | | 145,500 | | | | 0.0 | % | |
| | | ICE EM CLO, 7.100%, due 08/15/22 | | | 1,110,000 | | | 11/06/07 | | | 964,151 | | | | 962,703 | | | | 0.2 | % | |
| | | ICE EM CLO, 8.400%, due 08/15/22 | | | 930,000 | | | 06/08/07 | | | 930,000 | | | | 790,500 | | | | 0.2 | % | |
| | | ICE EM CLO, 10.400%, due 08/15/22 | | | 930,000 | | | 06/08/07 | | | 930,000 | | | | 790,500 | | | | 0.2 | % | |
| | | Start CLO Ltd., 22.151%, due 06/07/11 | | | 210,000 | | | 11/29/06 | | | 210,000 | | | | 203,700 | | | | 0.0 | % | |
| | | Dominican Republic International Bond, 9.500%,
due 09/27/11 | | | 289,832 | | | 08/16/05 | | | 316,686 | | | | 308,671 | | | | 0.1 | % | |
| | | Johor Corp., 1.000%, due 07/31/12 | | | 1,920,000 | | | 04/06/05 | | | 520,199 | | | | 597,587 | | | | 0.1 | % | |
| | | Republic of Ghana, 8.500%, due 10/04/17 | | | 500,000 | | | 09/27/07 | | | 500,000 | | | | 529,375 | | | | 0.1 | % | |
| | | Citibank N.A. — Renins Nonlife Limited —
Total Return Credit Linked Nts., 12.500%, 05/30/12 | | | 860,000 | | | 05/25/07 | | | 860,000 | | | | 924,500 | | | | 0.2 | % | |
| | | Citigroup Funding Inc. — Argentina (Republic of)
Inflation-Indexed Currency and Credit Linked
Unsecured Nts., Ref ARS Amt x 1.4765604 Ref
Fact x Change in CER Inflation Index x 4%, 05/18/09 | | | 281,000 | | | 01/17/07 | | | 172,808 | | | | 242,615 | | | | 0.0 | % | |
| | | Citigroup Funding Inc. — Dominican Republic Local
Market Credit Linked Unsecured Nts.,
10.086%*, 03/20/08 | | | 4,700,000 | | | 04/19/07 | | | 143,702 | | | | 129,210 | | | | 0.0 | % | |
| | | Citigroup Funding Inc. — Egypt T-Bill Credit Linked
Unsecured Nts., 7.364%*, 01/10/08 | | | 1,730,000 | | | 07/09/07 | | | 303,448 | | | | 313,091 | | | | 0.1 | % | |
| | | Citigroup Funding Inc. — Egypt T-Bill Credit Linked
Unsecured Nts., 8.376%*, 02/28/08 | | | 1,930,000 | | | 02/22/07 | | | 334,799 | | | | 345,963 | | | | 0.1 | % | |
| | | Citigroup Funding Inc. — Russia Corporate Bond
Unsecured Credit Linked Nts.,
Rusfinans Bank, 7.500%, 12/04/08 | | | 11,000,000 | | | 06/01/07 | | | 437,980 | | | | 467,399 | | | | 0.1 | % | |
| | | Citigroup Funding Inc. — Russia Corporate Bond
Unsecured Credit Linked Nts.,
Rusfinans Bank, 7.650%, 12/04/08 | | | 4,480,000 | | | 01/30/07 | | | 170,582 | | | | 195,007 | | | | 0.0 | % | |
| | | Coriolanus Limited — Coriolanus Limited
Pass Through Emerging Markets Portfolio
Credit Linked Nts., 10.620%, 09/10/10 | | | 500,000 | | | 08/02/07 | | | 500,000 | | | | 476,750 | | | | 0.1 | % | |
| | | Credit Suisse International — Indonesia (Republic of)
Total Return Linked Nts., 12.000%, 09/16/11 | | | 3,700,000,000 | | | 05/11/06 | | | 437,085 | | | | 436,984 | | | | 0.1 | % | |
| | | Credit Suisse International — Moitk Fully Funded
Total Return Linked Nts., 8.990%, 03/26/11 | | | 12,330,000 | | | 03/27/07 | | | 482,373 | | | | 482,373 | | | | 0.1 | % | |
| | | Credit Suisse International — Moscoblgaz-Finans
RUR Total Return Linked Nts., 9.250%, 06/24/12 | | | 21,800,000 | | | 06/26/07 | | | 848,415 | | | | 848,415 | | | | 0.2 | % | |
| | | Credit Suisse International — Orenburgskaya
IZHK Fully Funded
Total Return Linked Nts., 9.240%, 02/21/12 | | | 24,380,000 | | | 02/27/07 | | | 937,214 | | | | 943,856 | | | | 0.2 | % | |
| | | Credit Suisse International — Russian Railways
Total Return Linked Bonds, 6.670%, 01/22/09 | | | 10,610,000 | | | 12/19/06 | | | 408,995 | | | | 431,730 | | | | 0.1 | % | |
| | | Credit Suisse International — SPETSSTROY-2
Credit Linked Fully Funded Total Return
Linked Nts., 8.59%, 5/20/10 | | | 19,450,000 | | | 05/24/07 | | | 751,828 | | | | 756,957 | | | | 0.1 | % | |
| | | Credit Suisse International — Vietnam
Shipbuilding Industry Group Total Return
Credit Linked Nts., 10.500%, 01/19/17 | | | 3,048,000,000 | | | 02/06/07 | | | 202,476 | | | | 188,401 | | | | 0.0 | % | |
| | | Deutsche Bank A.G., Singapore — Vietnamese
Bond Linked Fully Funded Total Return
Linked Nts. (Vietnam Shipping Industry
Group (Vinishin)), 9.000%, 04/20/17 | | | 7,600,000,000 | | | 03/23/07 | | | 478,052 | | | | 436,597 | | | | 0.1 | % | |
| | | Deutsche Bank AG, London — Arab Republic of
Egypt Total Return Credit Linked
Nts., 9.381%*, 02/05/08 | | | 1,310,000 | | | 02/01/07 | | | 228,191 | | | | 235,546 | | | | 0.0 | % | |
| | | Deutsche Bank AG, London — Argentina
Total Return Credit Linked Nts., 4.000%, 12/21/11 | | | 1,090,000 | | | 09/29/05 | | | 664,040 | | | | 885,841 | | | | 0.2 | % | |
| | | Deutsche Bank AG, London — Arrendadora
Capita Corporation SA de CV and The Capita
Corporation de Mexico, SA de CV Credit Linked
Nts., 9.090%, 01/05/11 | | | 3,095,197 | | | 05/25/06 | | | 276,147 | | | | 285,009 | | | | 0.1 | % | |
| | | Deutsche Bank AG, London — Arrendadora
Capita Corporation SA de CV and The Capita
Corporation de Mexico, SA de CV Credit Linked
Nts., 9.520%, 01/05/11 | | | 2,022,410 | | | 06/30/06 | | | 178,323 | | | | 186,226 | | | | 0.0 | % | |
| | | Deutsche Bank AG, London — Arrendadora
Capita Corporation SA de CV and The Capita
Corporation de Mexico, SA de CV Credit Linked
Nts., 9.650%, 01/05/11 | | | 2,019,754 | | | 06/01/06 | | | 179,416 | | | | 185,981 | | | | 0.0 | % | |
162
NOTES TO FINANCIAL STATEMENTS AS OF DECEMBER 31, 2007 (CONTINUED)
| NOTE 11 — ILLIQUID SECURITIES (continued) | |
| Portfolio | | Security | | Notional
Principal/Par
Value | | Initial
Acquisition
Date | | Cost/
(Upfront
Payments) | | Value | | Percent
of Net
Assets | |
Oppenheimer
| |
Strategic
| |
Income
| |
| (continued) | | Deutsche Bank AG, London — Multiple Reference | | | | | | | | | | | | | | | | |
| | |
| | | Entities, Credit Linked Nts., 6.000%, 09/07/12 | | | 504,515 | | | 09/01/06 | | $ | 504,515 | | | $ | 507,038 | | | | 0.1 | % | |
| | | Deutsche Bank AG, London — Nigeria Total Return
Credit Linked Nts., 12.500%, 02/27/09 | | | 19,500,000 | | | 03/21/06 | | | 159,308 | | | | 176,807 | | | | 0.0 | % | |
| | | Deutsche Bank AG, London — Nigeria Total Return
Credit Linked Nts., 15.000%, 01/30/09 | | | 26,000,000 | | | 03/21/06 | | | 211,083 | | | | 245,357 | | | | 0.0 | % | |
| | | Eirles Two Ltd. 324 — Floating Rate Credit Linked
Nts., 6-month USD-LIBOR +3.200%, 04/20/12 | | | 900,000 | | | 04/17/07 | | | 902,561 | | | | 757,800 | | | | 0.1 | % | |
| | | Hallertau SPC 2007-01 Republic of Philippines
Credit Linked Nts., 6-month USD-LIBOR
+2.050%, 12/20/17 | | | 3,000,000 | | | 12/13/07 | | | 3,000,001 | | | | 3,000,000 | | | | 0.6 | % | |
| | | JPMorgan Chase Bank N.A, London. — Brazil
Unsecured Credit Linked Nts., 12.184%*, 01/02/15 | | | 12,716,000 | | | 09/15/05 | | | 2,832,298 | | | | 2,987,738 | | | | 0.6 | % | |
| | | JPMorgan Chase Bank N.A. — COP and Colombia
Credit Linked Nts., 10.218%*, 10/31/16 | | | 2,674,000,000 | | | 10/16/06 | | | 476,440 | | | | 502,390 | | | | 0.1 | % | |
| | | JPMorgan Chase Bank N.A. — COP and Colombia
Credit Linked Nts., 10.218%*, 10/31/16 | | | 2,663,000,000 | | | 10/18/06 | | | 476,742 | | | | 500,323 | | | | 0.1 | % | |
| | | JPMorgan Chase Bank N.A. — Multiple Entity
First to Default Credit Linked Fixed Rate Bank
Nts., 14.350%, 02/20/12 | | | 1,210,000 | | | 01/24/07 | | | 568,556 | | | | 650,001 | | | | 0.1 | % | |
| | | JPMorgan Chase Bank N.A., London — Brazil NTN-B
Credit Linked Nts., 6.000%, 05/16/45 | | | 405,000 | | | 02/10/06 | | | 232,528 | | | | 357,037 | | | | 0.1 | % | |
| | | JSC Astana Finance — Guaranteed Senior Notes,
9.160%, 03/14/12 | | | 1,500,000 | | | 02/09/07 | | | 1,500,000 | | | | 1,408,127 | | | | 0.3 | % | |
| | | LatAm Walker Cayman Trust Series 2006-102 — COP
and Colombia Credit Linked
Nts., 10.000%, 11/17/16 | | | 392,000,000 | | | 10/20/06 | | | 167,521 | | | | 178,020 | | | | 0.0 | % | |
| | | Merrill Lynch International — Commercial Bank
Renaissance Capital/Ensorte Enterprises Limited
Fully Funded Total Return Linked
Nts., 10.500%, 10/04/08 | | | 16,000,000 | | | 03/29/07 | | | 615,217 | | | | 629,210 | | | | 0.1 | % | |
| | | MicroAccess Trust 2007 — MicroFinance Institutional
Loans, Variable Rate Nts., 7.550%, 5/24/12 | | | 1,500,000 | | | 06/20/07 | | | 1,520,573 | | | | 1,500,000 | | | | 0.3 | % | |
| | | Morgan Stanley — Peruvian Government
Credit Linked Nts., 6.250%, 03/23/17 | | | 832,000 | | | 07/10/07 | | | 256,482 | | | | 259,653 | | | | 0.0 | % | |
| | | Morgan Stanley — Senior Unsecured 10.090%, 05/03/17 | | | 1,880,000 | | | 04/25/07 | | | 966,601 | | | | 961,124 | | | | 0.2 | % | |
| | | Morgan Stanley Capital Services Inc. — Red Arrow
International Leasing PLC Total Return Linked
Nts., 11.000%, 07/06/12 | | | 5,658,873 | | | 03/24/06 | | | 206,852 | | | | 238,105 | | | | 0.0 | % | |
| | | Morgan Stanley Capital Services Inc. — Red Arrow
International Leasing PLC Total Return Linked
Nts., 8.375%, 07/06/12 | | | 7,720,794 | | | 03/24/06 | | | 279,646 | | | | 313,064 | | | | 0.1 | % | |
| | | Morgan Stanley Capital Services Inc. — WTI Trading
Limited Total Return Linked Nts., 13.500%, 02/06/09 | | | 780,000 | | | 12/28/06 | | | 780,000 | | | | 748,800 | | | | 0.1 | % | |
| | | Morgan Stanley Capital Services Inc. — WTI Trading
Limited Total Return Linked Nts., 13.500%, 02/06/09 | | | 1,040,000 | | | 12/28/06 | | | 1,040,000 | | | | 998,400 | | | | 0.2 | % | |
| | | Redwood Capital X Ltd. — Catstrophe Linked Series 1
Class C Floating Rate Nts.,
3-month USD-LIBOR +4.750%, 01/09/09 | | | 250,000 | | | 12/18/07 | | | 250,000 | | | | 250,000 | | | | 0.0 | % | |
| | | Reforma BLN-Backed I -Asset Backed Variable
Funding Notes, TIIE +2.000%, 10/03/15 | | | 2,070,000 | | | 12/27/07 | | | 190,240 | | | | 189,659 | | | | 0.0 | % | |
| | | UBS AG, Jersey — Ghana (Republic of) Credit Linked
Nts., 14.470%, 12/28/11 | | | 263,055 | | | 12/22/06 | | | 289,363 | | | | 291,054 | | | | 0.1 | % | |
| | | | | | | | | | | | | | | $ | 39,869,394 | | | | 7.5 | % | |
PIMCO Total
| |
| Return | | Foreign Currency Options | | | | | | | | | | | | | | | | | | | |
| | | Call Option OTC — Citibank
USD vs JPY
Strike @ 121-Exp 01/18/08 | | | 1,400,000 | | | 01/18/07 | | | 13,958 | | | | 1,082 | | | | 0.0 | % | |
| | | Call Option OTC — Credit Suisse
USD vs JPY
Strike @ 104-Exp 03/17/10 | | | 3,000,000 | | | 03/20/07 | | | 127,785 | | | | 156,150 | | | | 0.0 | % | |
| | | Put Option OTC — Credit Suisse
USD vs JPY
Strike @ 104-Exp 03/17/10 | | | 3,000,000 | | | 03/20/07 | | | 127,785 | | | | 137,547 | | | | 0.0 | % | |
| | | Interest Rate Swaptions | |
| | | Call Swaption OTC — Barclay's Bank PLC, London
3 Month USD-LIBOR — Fund Pays Floating
Strike @ 4.750%-Exp 02/01/08 | | | 10,500,000 | | | 03/06/07 | | | 30,188 | | | | 80,237 | | | | 0.0 | % | |
| | | Call Swaption OTC — The Royal Bank of Scotland PLC
3 Month USD-LIBOR — Fund Pays Floating
Strike @ 5.000%-Exp 02/01/08 | | | 10,400,000 | | | 01/22/07 | | | 51,571 | | | | 245,757 | | | | 0.1 | % | |
163
NOTES TO FINANCIAL STATEMENTS AS OF DECEMBER 31, 2007 (CONTINUED)
| NOTE 11 — ILLIQUID SECURITIES (continued) | |
| Portfolio | | Security | | Notional
Principal/Par
Value | | Initial
Acquisition
Date | | Cost/
(Upfront
Payments) | | Value | | Percent
of Net
Assets | |
PIMCO Total
| |
Return
| |
| (continued) | | Call Swaption OTC — The Royal Bank of Scotland PLC | | | | | | | | | | | | | | | | |
| | |
| | | 3 Month USD-LIBOR — Fund Pays Floating | | | | | | | | | | | | | | | | |
| | |
| | | Strike @ 4.750%-Exp 03/31/08 | | | 188,500,000 | | | 03/13/07 | | $ | 1,131,875 | | | $ | 3,854,898 | | | | 0.8 | % | |
| | | Call Swaption OTC — Lehman Brothers
Special Financing Inc. 3 Month
USD-LIBOR — Fund Pays Floating
Strike @ 4.750%-Exp 09/26/08 | | | 30,000,000 | | | 05/22/07 | | | 106,350 | | | | 636,027 | | | | 0.1 | % | |
| | | Call Swaption OTC — The Royal Bank of Scotland PLC
3 Month USD-LIBOR — Fund Pays Floating
Strike @ 4.750%-Exp 09/26/08 | | | 26,200,000 | | | 05/23/07 | | | 93,665 | | | | 555,463 | | | | 0.1 | % | |
| | | Call Swaption OTC — The Royal Bank of Scotland PLC
3-month USD-LIBOR — Fund Pays Floating
Strike @ 4.750%-Exp 12/15/08 | | | 9,000,000 | | | 05/25/07 | | | 31,770 | | | | 185,738 | | | | 0.0 | % | |
| | | Call Swaption OTC — The Royal Bank of Scotland PLC
3-Month USD-LIBOR — Fund Pays Floating
Strike @ 5.000%-Exp 12/15/08 | | | 21,000,000 | | | 06/15/07 | | | 59,790 | | | | 513,056 | | | | 0.1 | % | |
| | | Call Swaption OTC — Barclays Bank PLC
3-Month USD-LIBOR — Fund Pays Floating
Strike @ 5.200%-Exp 02/02/09 | | | 12,000,000 | | | 08/08/07 | | | 90,000 | | | | 322,695 | | | | 0.1 | % | |
| | | Credit Default Swaps | |
| | | ABX.HE.A.06-1 Index, pay 0.540% | | | 500,000 | | | 02/01/06 | | | (625 | ) | | | 195,000 | | | | 0.0 | % | |
| | | Bellsouth Corp. 5.200%, 09/15/14, pay 0.325% | | | 3,500,000 | | | 12/06/06 | | | — | | | | 468 | | | | 0.0 | % | |
| | | CDX.EM.3 Index, receive 2.100% | | | 900,000 | | | 04/15/05 | | | (23,400 | ) | | | 22,080 | | | | 0.0 | % | |
| | | CDX.NA.IG.7 Index, pay 0.400% | | | 7,100,000 | | | 11/09/06 | | | (19,062 | ) | | | 115,934 | | | | 0.0 | % | |
| | | Citifinancial 6.625%, 06/01/15, pay 0.145% | | | 400,000 | | | 10/19/06 | | | — | | | | 15,163 | | | | 0.0 | % | |
| | | CVS Corp. 5.750%, 08/15/11, pay 0.235% | | | 2,800,000 | | | 10/19/06 | | | — | | | | 7,269 | | | | 0.0 | % | |
| | | General Electric Capital Corp. 6.000%,
06/15/12, receive 0.620% | | | 1,200,000 | | | 12/19/07 | | | — | | | | 2,263 | | | | 0.0 | % | |
| | | iTraxx Europe HiVol Series 6 Version 1 Index,
pay 0.850% | | | 1,200,000 | | | 12/13/06 | | | (9,050 | ) | | | 6,712 | | | | 0.0 | % | |
| | | iTraxx Europe HiVol Series 6 Version 1 Index,
pay 0.850% | | | 4,500,000 | | | 12/14/06 | | | (50,447 | ) | | | 25,168 | | | | 0.0 | % | |
| | | Ivy Lane CDO Ltd. Series 2006-1A Floating Rate,
02/05/46, pay 1.600% | | | 3,154,539 | | | 10/12/06 | | | — | | | | 2,389,185 | | | | 0.5 | % | |
| | | Nordstrom Inc. 6.950%, 03/15/28, pay 0.370% | | | 1,100,000 | | | 04/12/07 | | | — | | | | 26,987 | | | | 0.0 | % | |
| | | Reynolds American Inc. 7.625%, 06/01/16,
receive 1.280% | | | 600,000 | | | 04/13/07 | | | — | | | | 10,117 | | | | 0.0 | % | |
| | | Weyerhaeuser Co. 6.750%, 03/15/12, pay 1.000% | | | 1,100,000 | | | 04/12/07 | | | — | | | | 13,567 | | | | 0.0 | % | |
| | | Interest Rate Swaps | |
| | | Receive a floating rate based on 6-month
GBP-LIBOR and pay a fixed rate equal to 4.000%
Counterparty: Deutsche Bank AG | | | 2,900,000 | | | 03/08/06 | | | 26,830 | | | | 219,120 | | | | 0.0 | % | |
| | | Receive a floating rate based on 6-month
GBP-LIBOR and pay a fixed rate equal to 4.000%
Counterparty: Barclays Bank PLC, London | | | 1,100,000 | | | 01/11/06 | | | (17,861 | ) | | | 83,115 | | | | 0.0 | % | |
| | | Receive a fixed rate equal to 8.860% and pay a
floating rate based on 28-day MXN-TIIE-BANXICO
Counterparty: Citibank N.A., New York | | | 5,700,000 | | | 09/22/06 | | | — | | | | 10,356 | | | | 0.0 | % | |
| | | Receive a fixed rate equal to 8.720% and pay a
floating rate based on 28-day MXN-TIIE-BANXICO
Counterparty: Merrill Lynch Capital Services, Inc. | | | 9,400,000 | | | 11/15/06 | | | 29,141 | | | | 9,604 | | | | 0.0 | % | |
| | | Receive a floating rate based on 6-month
GBP-LIBOR and pay a fixed rate equal to 4.000%
Counterparty: Goldman Sachs Capital Markets, L.P. | | | 4,900,000 | | | 11/30/06 | | | (10,916 | ) | | | 378,498 | | | | 0.1 | % | |
| | | Receive a floating rate based on 6-month
GBP-LIBOR and pay a fixed rate equal to 4.250%
Counterparty: Goldman Sachs Capital Markets, L.P. | | | 600,000 | | | 06/27/06 | | | 64,306 | | | | 81,701 | | | | 0.0 | % | |
| | | Receive a fixed rate equal to 8.720% and pay a
floating rate based on 28-day MXN-TIIE-BANXICO
Counterparty: Citibank N.A., New York | | | 22,900,000 | | | 11/09/06 | | | 58,651 | | | | 23,397 | | | | 0.0 | % | |
| | | Receive a fixed rate equal to 5.000% and pay a
floating rate based on 3-month USD-LIBOR
Counterparty: Morgan Stanley Capital Services Inc. | | | 3,600,000 | | | 12/14/07 | | | 18,360 | | | | 84,486 | | | | 0.0 | % | |
| | | Receive a fixed rate equal to 4.000% and pay a
floating rate based on 3-month USD-LIBOR
Counterparty: Deutsche Bank AG | | | 12,200,000 | | | 11/29/07 | | | 57,340 | | | | 77,166 | | | | 0.0 | % | |
| | | Receive a fixed rate equal to 4.000% and pay a
floating rate based on 3-month USD-LIBOR
Counterparty: Barclays Bank PLC | | | 7,300,000 | | | 12/13/07 | | | 17,425 | | | | 46,173 | | | | 0.0 | % | |
| | | Receive a floating rate based on 3-month
USD-LIBOR and pay a fixed rate equal to 4.000%
Counterparty: The Royal Bank of Scotland PLC | | | 5,100,000 | | | 12/13/07 | | | 85,425 | | | | 50,909 | | | | 0.0 | % | |
164
NOTES TO FINANCIAL STATEMENTS AS OF DECEMBER 31, 2007 (CONTINUED)
| NOTE 11 — ILLIQUID SECURITIES (continued) | |
| Portfolio | | Security | | Notional
Principal/Par
Value | | Initial
Acquisition
Date | | Cost/
(Upfront
Payments) | | Value | | Percent
of Net
Assets | |
PIMCO Total
| |
Return
| |
| (continued) | | Receive a fixed rate equal to 4.000% and pay a | | | | | | | | | | | | | | | | |
| | |
| | | floating rate based on 3-month USD-LIBOR | | | | | | | | | | | | | | | | |
| | |
| | | Counterparty: The Royal Bank of Scotland PLC | | | 14,400,000 | | | 12/03/07 | | $ | 55,484 | | | $ | 91,081 | | | | 0.0 | % | |
| | | Receive a fixed rate equal to 4.000% and pay a
floating rate based on 3-month USD-LIBOR
Counterparty: Merrill Lynch Captial Services, Inc. | | | 22,200,000 | | | 12/17/07 | | | 107,138 | | | | 140,417 | | | | 0.0 | % | |
| | | Receive a fixed rate equal to 5.000% and pay a
floating rate based on 3-month USD-LIBOR
Counterparty: The Royal Bank of Scotland PLC | | | 8,700,000 | | | 12/13/07 | | | 120,495 | | | | 204,175 | | | | 0.0 | % | |
| | | Receive a floating rate based on 3-month
USD-LIBOR and pay a fixed rate equal to 5.000%
Counterparty: The Royal Bank of Scotland PLC | | | 1,800,000 | | | 12/10/07 | | | 58,995 | | | | 13,858 | | | | 0.0 | % | |
| | | Receive a fixed rate equal to 6.000% and pay a
floating rate based on 6-month GBP-LIBOR
Counterparty: The Royal Bank of Scotland PLC | | | 2,100,000 | | | 06/07/07 | | | (6,067 | ) | | | 38,786 | | | | 0.0 | % | |
| | | Receive a floating rate based on 3-month
USD-LIBOR and pay a fixed rate equal to 4.000%
Counterparty: Merrill Lynch Capital Services, Inc. | | | 1,300,000 | | | 12/20/07 | | | 10,179 | | | | 12,977 | | | | 0.0 | % | |
| | | Receive a floating rate based on 6-month
AUD-BBR-BBSW and pay a fixed rate equal to
6.500% Counterparty: Deutsche
Bank AG, Frankfurt | | | 1,800,000 | | | 09/13/07 | | | (12,536 | ) | | | 10,831 | | | | 0.0 | % | |
| | | Receive a fixed rate equal to 6.000% and pay a
floating rate based on 6-month GBP-LIBOR
Counterparty: Goldman Sachs Capital Markets L.P. | | | 800,000 | | | 07/11/07 | | | (8,334 | ) | | | 21,824 | | | | 0.0 | % | |
| | | Receive a floating rate based on 3-month
USD-LIBOR and pay a fixed rate equal to 5.000%
Counterparty: Citibank N.A., New York | | | 900,000 | | | 12/17/07 | | | 31,455 | | | | 6,929 | | | | 0.0 | % | |
| | | Receive a fixed rate equal to 2.000% and pay a
floating rate based on 6-month JPY-LIBOR
Counterparty: Barclays Bank PLC | | | 50,000,000 | | | 10/10/07 | | | 2,892 | | | | 13,897 | | | | 0.0 | % | |
| | | Receive a fixed rate equal to 5.000% and pay a
floating rate based on 6-month EUR-Euribor
Counterparty: Deutsche Bank AG, Frankfurt | | | 4,200,000 | | | 06/19/07 | | | 18,586 | | | | 47,067 | | | | 0.0 | % | |
| | | Receive a fixed rate equal to 2.000% and pay a
floating rate based on 6-month JPY-LIBOR
Counterparty: Deutsche Bank AG, Frankfurt | | | 110,000,000 | | | 10/10/07 | | | 6,019 | | | | 30,574 | | | | 0.0 | % | |
| | | Receive a fixed rate equal to 6.000% and pay a
floating rate based on 6-month GBP-LIBOR
Counterparty: Goldman Sachs Capital Markets L.P. | | | 7,400,000 | | | 06/06/07 | | | (26,111 | ) | | | 136,184 | | | | 0.0 | % | |
| | | | | | | | | | | | | | | $ | 11,351,148 | | | | 1.9 | % | |
NOTE 12 — REORGANIZATIONS
On January 13, 2007, UBS U.S. Large Cap Equity, as listed below ("Acquiring Portfolio"), acquired the assets and certain liabilities of ING Goldman Sachs Structured Equity Portfolio, also listed below ("Acquired Portfolio"), in a tax-free reorganization in exchange for shares of the Acquiring Portfolio, pursuant to a plan or reorganization approved by the Acquired Portfolio's shareholders. The number and value of shares issued by the Acquiring Portfolio are presented in Note 10 – Capital Share Transactions. Net assets and unrealized appreciation as of the reorganization date were as follows:
Acquiring
Portfolio | | Acquired
Portfolio | | Total
Net Assets of
Acquired
Portfolio (000's) | | Total
Net Assets of
Acquiring
Portfolio (000's) | | Acquired
Capital Loss
Carryforward
(000's) | | Acquired Portfolio
Unrealized
Appreciation (000's) | | Conversion
Ratio | |
| UBS U.S. Large | | ING Goldman Sachs | | | | | | | | | | | | | | | | | | |
| | |
| Cap Equity | | Structured Equity | | | | | | | | | | | | | | | | | | |
| | |
| | | Portfolio | | | | | | | | | | | | | | | | | | |
| | |
| Class I | | Class I | | $ | 1 | | | $ | 359,756 | | | $ | — | | | $ | — | | | | 0.89 | | |
| Class S | | Class S | | | 33,300 | | | | 29,312 | | | | — | | | | 4,276 | | | | 0.91 | | |
| Class ADV | | Class ADV | | | 3,083 | | | | 4,235 | | | | — | | | | (237 | ) | | | 0.89 | | |
| | | | | $ | 36,384 | | | $ | 393,303 | | | $ | — | | | $ | 4,039 | | | | | | |
The net assets of UBS U.S. Large Cap Equity after the acquisition were approximately $429,687,347.
On December 16, 2006, Neuberger Berman Partners, as listed below ("Acquiring Portfolio"), acquired the assets and certain liabilities of ING Eagle Asset Capital Appreciation Portfolio, also listed below ("Acquired Portfolio"), in a tax-free reorganization in exchange for shares of the Acquiring Portfolio, pursuant to a plan or reorganization approved
165
NOTES TO FINANCIAL STATEMENTS AS OF DECEMBER 31, 2007 (CONTINUED)
NOTE 12 — REORGANIZATIONS (continued)
by the Acquired Portfolio's shareholders. The number and value of shares issued by the Acquiring Portfolio are presented in Note 10 — Capital Share Transactions. Net assets and unrealized appreciation as of the reorganization date were as follows:
Acquiring
Portfolio | | Acquired
Portfolio | | Total Net Assets of
Acquired Portfolio (000's) | | Total Net Assets of
Acquiring Portfolio (000's) | | Acquired Portfolio
Unrealized
Appreciation (000's) | | Conversion
Ratio | |
| Neuberger | | ING Eagle Asset | | | | | | | |
| |
| Berman | | Capital Appreciation | | | | | | | |
| |
| | | Portfolio | | $ | 178,457 | | | $ | 237,795 | | | $ | 24,622 | | | | 1.60 | | |
The net assets of Neuberger Berman Partners after the acquisition were approximately $416,252,210.
NOTE 13 — CONCENTRATION OF RISKS
Non-Diversified. Certain Portfolios are each classified as non-diversified investment companies under the 1940 Act, which means that each Portfolio is not limited by the 1940 Act in the proportion of assets that they may invest in the obligations of a single issuer. Declines in the value of that single company can significantly impact the value of a Portfolio. The investment of a large percentage of a Portfolio's assets in the securities of a small number of issuers may cause the Portfolios' share price to fluctuate more than that of a diversified investment company. Conversely, even though classified as non-diversified, a Portfolio may actually maintain a portfolio that is diversified with a large number of issuers. In such an event, a Portfolio would benefit less from appreciation in a single corporate issuer than if it had greater exposure to that issuer.
Foreign Securities. Investments in foreign securities may entail risks not present in domestic investments. Since securities in which a Portfolio may invest are denominated in foreign currencies, changes in the relationship of these foreign currencies to the U.S. dollar can significantly affect the value of the investments and earnings of a Portfolio. Foreign investments may also subject a Portfolio to foreign government exchange restrictions, expropriation, taxation or other political, social or economic developments, as well as changes vis-a-vis the U.S. dollar from movements in currency, and changes in security value and interest rate, all of which could affect the market and/or credit risk of a Portfolio investments.
Emerging Markets Risk. Emerging market countries are generally defined as countries in the initial stage of their industrialization cycles with low per capita income. Investments in emerging market countries present risks in a greater degree than, and in addition to, those presented by investments in foreign issuers in general as these countries may be less politically and economically stable than other countries. A number of emerging market countries restrict, to varying degrees, foreign investment in stocks. Repatriation of investment income, capital and proceeds of sales by foreign investors may require governmental registration and/or approval in some emerging market countries. A number of the currencies of developing countries have experienced significant declines against the U.S. dollar from time to time, and devaluation may occur after investments in those currencies by a Portfolio. Inflation and rapid fluctuations in inflation rates have had, and may continue to have, negative effects on the economies and securities markets of certain emerging market countries.
High-Yield, Lower-Grade Debt Securities Risk. High-yield debt securities (commonly referred to as "junk bonds") generally present greater credit risk that an issuer cannot make timely payment of interest or principal than an issuer of a higher quality debt security, and typically have greater potential price volatility and principal and income risk. Changes in interest rates, the market's perception of the issuers and the credit worthiness of the issuers may significantly affect the value of these bonds. High-yield bonds are not considered investment grade, and are regarded as predominantly speculative with respect to the issuing company's continuing ability to meet principal and interest payments. The secondary market in which high yield securities are traded may be less liquid than the market for higher grade bonds. It may be more difficult to value less liquid high yield securities, and determination of their value may involve elements of judgment.
NOTE 14 — SECURITIES LENDING
Under an agreement with The Bank of New York Mellon Corporation ("BNY"), the Portfolios can lend their securities to approved brokers, dealers and other financial institutions. Loans are collateralized by cash and U.S. Government securities. The collateral must be in an amount equal to at least 105% of the market value of non-U.S. securities loaned and 102% of the market value of U.S. securities loaned. The cash collateral received is
166
NOTES TO FINANCIAL STATEMENTS AS OF DECEMBER 31, 2007 (CONTINUED)
NOTE 14 — SECURITIES LENDING (continued)
invested in approved investments as defined in the Securities Lending Agreement with BNY (the "Agreement"). The securities purchased with cash collateral received are reflected in the Portfolio of Investments. Generally, in the event of counterparty default, the Portfolios have the right to use the collateral to offset losses incurred. The Agreement contains certain guarantees by BNY in the event of counterparty default and/or a borrower's failure to return a loaned security, however there would be a potential loss to the Portfolios in the event the Portfolios are delayed or prevented from exercising their right to dispose of the collateral. The Portfolios bear the risk of loss with respect to the investment of collateral. Engaging in securities lending could have a leveraging effect, which may intensify the credit, market and other risks associated with investing in a Portfolio. At December 31, 2007, the following Portfolios had securities on loan with the following market values:
| Portfolio | | Value of
Securities
Loaned | | Value of
Collateral | |
American Century Large
Company Value | | $ | 8,542,388 | | | $ | 8,792,470 | | |
American Century
Small-Mid Cap Value | | | 17,781,178 | | | | 18,585,906 | | |
| JPMorgan International | | | 55,385,266 | | | | 58,172,040 | | |
| JPMorgan Mid Cap Value | | | 53,576,405 | | | | 54,865,855 | | |
Legg Mason Partners Aggressive
Growth | | | 211,796,926 | | | | 218,788,769 | | |
| OpCap Balanced Value | | | 18,344,694 | | | | 18,685,000 | | |
| Oppenheimer Global | | | 345,357,777 | | | | 362,276,998 | | |
| Oppenheimer Strategic Income | | | 31,312,678 | | | | 32,837,634 | | |
| PIMCO Total Return | | | 9,243,385 | | | | 9,478,131 | | |
T. Rowe Price Diversified
Mid Cap Growth | | | 291,195,430 | | | | 299,744,758 | | |
| T. Rowe Price Growth Equity | | | 197,807,296 | | | | 205,312,787 | | |
| Thornburg Value | | | 41,034,756 | | | | 42,944,370 | | |
| UBS U.S. Large Cap Equity | | | 65,034,575 | | | | 67,276,811 | | |
| UBS U.S. Small Cap Growth | | | 10,801,244 | | | | 11,240,829 | | |
| Van Kampen Comstock | | | 79,917,434 | | | | 82,668,638 | | |
NOTE 15 — REVERSE REPURCHASE AGREEMENT
During the year ended December 31, 2007, Lord Abbett U.S. Government Securities entered into reverse repurchase agreements that had an average daily balance outstanding of $1,776,044 with an average interest rate of 4.775% and paid interest of $74,352. At December 31, 2007, there were no open reverse repurchase agreements.
NOTE 16 — FEDERAL INCOME TAXES
The amount of distributions from net investment income and net realized capital gains are determined in accordance with federal income tax regulations, which may differ from U.S. generally accepted accounting principles for investment companies. These book/tax differences may be either temporary or permanent. Permanent differences are reclassified within the capital accounts based on their federal tax-basis treatment; temporary differences are not reclassified. Key differences include the treatment of short-term capital gains, foreign currency transactions, and wash sale deferrals. Distributions in excess of net investment income and/or net realized capital gains for tax purposes are reported as distributions of paid-in capital.
The following permanent tax differences have been reclassified as of December 31, 2007:
| | | Paid-in
Capital | | Undistributed
Net
Investment
Income | | Accumulated
Net Realized
Gains/
(Losses) | |
American Century
Small-Mid Cap Value | | $ | 19,602 | | | $ | (113,809 | ) | | $ | 94,207 | | |
| Baron Asset | | | (8,107 | ) | | | 7,081 | | | | 1,026 | | |
| Baron Small Cap Growth | | | (1,794,724 | ) | | | 1,647,986 | | | | 146,738 | | |
| Columbia Small Cap Value II | | | (1,261 | ) | | | (45,404 | ) | | | 46,665 | | |
| Davis New York Venture | | | — | | | | (56,685 | ) | | | 56,685 | | |
| JPMorgan International | | | — | | | | (1,378,726 | ) | | | 1,378,726 | | |
| JPMorgan Mid Cap Value | | | — | | | | (296,762 | ) | | | 296,762 | | |
Legg Mason Partners
Aggressive Growth | | | (1,934,682 | ) | | | 1,934,682 | | | | — | | |
Legg Mason Partners
Large Cap Growth | | | (92,930 | ) | | | 111,119 | | | | (18,189 | ) | |
Lord Abbett
U.S. Government
Securities | | | — | | | | 4,738 | | | | (4,738 | ) | |
Neuberger Berman
Partners | | | — | | | | (28,877 | ) | | | 28,877 | | |
Neuberger Berman
Regency | | | — | | | | (87,649 | ) | | | 87,649 | | |
| Oppenheimer Global | | | — | | | | 1,172,793 | | | | (1,172,793 | ) | |
Oppenheimer
Strategic Income | | | — | | | | 8,163,830 | | | | (8,163,830 | ) | |
| PIMCO Total Return | | | — | | | | 99,670 | | | | (99,670 | ) | |
| Pioneer High Yield | | | — | | | | 5,604 | | | | (5,604 | ) | |
T. Rowe Price Diversified
Mid Cap Growth | | | — | | | | 339 | | | | (339 | ) | |
T. Rowe Price Growth
Equity | | | — | | | | 2,831,829 | | | | (2,831,829 | ) | |
| Templeton Foreign Equity | | | — | | | | 820,515 | | | | (820,515 | ) | |
| Thornburg Value | | | — | | | | (17,835 | ) | | | 17,835 | | |
| UBS U.S. Large Cap Equity | | | — | | | | (135 | ) | | | 135 | | |
| UBS U.S. Small Cap Growth | | | (4,951 | ) | | | 218,831 | | | | (213,880 | ) | |
Van Kampen Equity
and Income | | | (40,526 | ) | | | 5,984 | | | | 34,542 | | |
167
NOTES TO FINANCIAL STATEMENTS AS OF DECEMBER 31, 2007 (CONTINUED)
NOTE 16 — FEDERAL INCOME TAXES (continued)
Dividends paid by the Portfolios from net investment income and distributions of net realized short-term capital gains are, for federal income tax purposes, taxable as ordinary income to shareholders.
The tax composition of dividends and distributions to shareholders was as follows:
| | | Year Ended
December 31, 2007 | | Year Ended
December 31, 2006 | |
| | | Ordinary
Income | | Long-Term
Capital
Gains | | Return
of
Capital | | Ordinary
Income | | Long-Term
Capital
Gains | |
| American Century Large Company Value | | $ | 2,664,402 | | | $ | 6,881,524 | | | $ | — | | | $ | 1,442,728 | | | $ | 5,001,000 | | |
| American Century Small-Mid Cap Value | | | 9,409,419 | | | | 4,377,918 | | | | — | | | | 240,929 | | | | 129,233 | | |
| Baron Small Cap Growth | | | — | | | | — | | | | — | | | | — | | | | 3,909,366 | | |
| Columbia Small Cap Value II | | | 171,114 | | | | — | | | | — | | | | — | | | | — | | |
| Davis New York Venture | | | 1,736,952 | | | | 95,364 | | | | — | | | | 8,611 | | | | 8,145,412 | | |
| JPMorgan International | | | 14,132,153 | | | | — | | | | — | | | | 8,268,330 | | | | — | | |
| JPMorgan Mid Cap Value | | | 4,101,685 | | | | 10,566,389 | | | | — | | | | 32,332 | | | | 1,419,959 | | |
| Legg Mason Partners Large Cap Growth | | | — | | | | 520,496 | | | | — | | | | 751,416 | | | | 46,086 | | |
| Lord Abbett U.S. Government Securities | | | 2,219,172 | | | | — | | | | — | | | | 2,118,999 | | | | — | | |
| Neuberger Berman Partners | | | 3,748,694 | | | | 17,333,506 | | | | — | | | | — | | | | — | | |
| Neuberger Berman Regency | | | 99,469 | | | | 1,085 | | | | 93,856 | | | | 74,796 | | | | 4,335 | | |
| OpCap Balanced Value | | | 2,121,932 | | | | 7,275,874 | | | | — | | | | 846,794 | | | | — | | |
| Oppenheimer Global | | | 53,603,497 | | | | 86,882,658 | | | | — | | | | 1,762,925 | | | | 3,772,651 | | |
| Oppenheimer Strategic Income | | | 20,466,141 | | | | — | | | | — | | | | 1,475,398 | | | | — | | |
| PIMCO Total Return | | | 14,039,257 | | | | — | | | | — | | | | 6,393,248 | | | | — | | |
| Pioneer High Yield | | | 6,921,120 | | | | — | | | | — | | | | 4,983,683 | | | | 13,591 | | |
| T. Rowe Price Diversified Mid Cap Growth | | | 19,205,474 | | | | 78,164,876 | | | | — | | | | 23,217,817 | | | | 2,313,848 | | |
| T. Rowe Price Growth Equity | | | 18,410,547 | | | | 59,102,188 | | | | — | | | | 2,793,872 | | | | 2,121,134 | | |
| Templeton Foreign Equity | | | 1,867,499 | | | | 903,924 | | | | — | | | | 503,330 | | | | — | | |
| Thornburg Value | | | 931,786 | | | | — | | | | — | | | | 883,174 | | | | — | | |
| UBS U.S. Large Cap Equity | | | 3,088,324 | | | | — | | | | — | | | | 2,429,180 | | | | — | | |
| UBS U.S. Small Cap Growth | | | 2,101,602 | | | | — | | | | — | | | | 233,673 | | | | — | | |
| Van Kampen Comstock | | | 17,879,359 | | | | 26,163,078 | | | | — | | | | 19,664,407 | | | | 29,268,151 | | |
| Van Kampen Equity and Income | | | 32,047,391 | | | | 19,569,825 | | | | — | | | | 52,527,804 | | | | — | | |
The tax-basis components of distributable earnings and the expiration dates of the capital loss carryforwards which may be used to offset future realized capital gains for federal income tax purposes as of December 31, 2007 were:
| | | Undistributed
Ordinary
Income | | Undistributed
Long-Term
Capital Gains | | Unrealized
Appreciation/
(Depreciation) | | Post-October
Capital
Losses
Deferred | | Post-October
Currency
Losses
Deferred | | Post-October
PFIC
Losses
Deferred | | Capital
Loss
Carryforwards | | Expiration
Dates | |
American Century Large
Company Value | | $ | 2,250,690 | | | $ | 8,428,488 | | | $ | (190,237 | ) | | $ | — | | | $ | — | | | $ | — | | | $ | — | | | | — | | |
American Century Small-Mid
Cap Value | | | 9,040,601 | | | | 3,101,132 | | | | (10,085,593 | ) | | | (639,928 | ) | | | — | | | | — | | | | — | | | | — | | |
| Baron Asset | | | — | | | | 145,053 | | | | 2,443,331 | | | | — | | | | — | | | | — | | | | — | | | | — | | |
| Baron Small Cap Growth | | | — | | | | 19,085,321 | | | | 121,466,933 | | | | — | | | | — | | | | — | | | | — | | | | — | | |
Columbia Small
Cap Value II | | | 2,884,057 | | | | 2,052,699 | | | | (1,406,794 | ) | | | — | | | | — | | | | — | | | | — | | | | — | | |
| Davis New York Venture | | | 4,545,353 | | | | 3,662,022 | | | | 20,552,782 | | | | — | | | | — | | | | — | | | | — | | | | — | | |
JPMorgan
International | | | 10,624,819 | | | | 157,522,700 | | | | 155,349,659 | | | | — | | | | — | | | | — | | | | — | | | | — | | |
| JPMorgan Mid Cap Value | | | 2,645,531 | | | | 19,875,811 | | | | 11,241,811 | | | | — | | | | — | | | | — | | | | — | | | | — | | |
Legg Mason Partners
Aggressive Growth | | | — | | | | — | | | | 318,514,561 | | | | — | | | | — | | | | — | | | | (211,557,518 | ) | | | 2010 | | |
Legg Mason Partners
Large Cap Growth | | | — | | | | 2,672,431 | | | | 4,911,006 | | | | — | | | | — | | | | — | | | | — | | | | — | | |
Lord Abbett U.S.
Government Securities | | | 14,614 | | | | 65,936 | | | | 993,032 | | | | — | | | | — | | | | — | | | | — | | | | — | | |
| Neuberger Berman Partners | | | 958,099 | | | | — | | | | 68,301,798 | | | | — | | | | (3,212 | ) | | | — | | | | (13,186,377 | ) | | | 2015 | | |
| Neuberger Berman Regency | | | — | | | | — | | | | 1,006,879 | | | | (157,421 | ) | | | — | | | | — | | | | (145,308 | ) | | | 2015 | | |
| OpCap Balanced Value | | | 7,038,649 | | | | 1,979,877 | | | | (4,963,192 | ) | | | — | | | | — | | | | — | | | | — | | | | — | | |
| Oppenheimer Global | | | 46,069,267 | | | | 156,625,567 | | | | 576,871,251 | | | | — | | | | (106,064 | ) | | | (654,476 | ) | | | — | | | | — | | |
Oppenheimer
Strategic Income | | | 33,797,261 | | | | 2,275,989 | | | | 10,104,554 | | | | — | | | | — | | | | — | | | | — | | | | — | | |
| PIMCO Total Return | | | 24,524,896 | | | | 4,325,936 | | | | 6,828,147 | | | | — | | | | — | | | | — | | | | — | | | | — | | |
| | | | | | | | | | | | | | | | | | | | | | | | | | | | — | | | | — | | |
| | | | | | | | | | | | | | | | | | | | | | | | | | | | — | | | | | | |
168
NOTES TO FINANCIAL STATEMENTS AS OF DECEMBER 31, 2007 (CONTINUED)
NOTE 16 — FEDERAL INCOME TAXES (continued)
| | | Undistributed
Ordinary
Income | | Undistributed
Long-Term
Capital Gains | | Unrealized
Appreciation/
(Depreciation) | | Post-October
Capital
Losses
Deferred | | Post-October
Currency
Losses
Deferred | | Post-October
PFIC
Losses
Deferred | | Capital
Loss
Carryforwards | | Expiration
Dates | |
| Pioneer High Yield | | $ | 2,905,193 | | | $ | 703,344 | | | $ | 139,262 | | | $ | — | | | $ | — | | | $ | — | | | $ | — | | | | — | | |
T. Rowe Price Diversified
Mid Cap Growth | | | 26,571,278 | | | | 103,251,077 | | | | 152,621,651 | | | | — | | | | — | | | | — | | | | — | | | | — | | |
T. Rowe Price Growth
Equity | | | 19,399,767 | | | | 84,668,501 | | | | 263,095,086 | | | | — | | | | — | | | | — | | | | — | | | | — | | |
| Templeton Foreign Equity | | | 836,435 | | | | — | | | | 12,423,306 | | | | (91,338 | ) | | | (37,084 | ) | | | — | | | | — | | | | — | | |
| Thornburg Value | | | 1,827,169 | | | | — | | | | 7,442,467 | | | | — | | | | — | | | | — | | | | (29,495,368 | ) | | | 2009 | | |
| | | | | | | | | | | | | | | | | | | | | | | | | | | | (113,367,765 | ) | | | 2010 | | |
| | | | | | | | | | | | | | | | | | | | | | | | | | | $ | (142,863,133 | ) | | | | | |
| UBS U.S. Large Cap Equity | | | 4,358,803 | | | | — | | | | 21,731,203 | | | | — | | | | — | | | | — | | | | (34,168,348 | ) | | | 2010 | | |
| UBS U.S. Small Cap Growth | | | — | | | | — | | | | 486,307 | | | | (589,456 | ) | | | — | | | | — | | | | — | | | | — | | |
| Van Kampen Comstock | | | 24,502,230 | | | | 44,732,957 | | | | 20,904,129 | | | | — | | | | — | | | | — | | | | — | | | | — | | |
Van Kampen
Equity and Income | | | 30,599,306 | | | | 42,580,783 | | | | 75,649,658 | | | | — | | | | — | | | | — | | | | — | | | | — | | |
The Portfolios major tax jurisdictions are federal and Arizona. The earliest tax year that remains subject to examination by these jurisdictions is 2003.
Under U.S. federal income tax law, as specified in the Internal Revenue Code (the "Code") and U.S. Treasury regulations, the Portfolios must meet various technical requirements relating to fund administration, portfolio investments, and "eligible investors" in the Portfolios. Complying with these requirements is a condition for beneficial tax treatment of certain insurance products that offer the Portfolios as investment options. The failure of the Portfolios to meet any of these complex requirements could result in an excise tax, administrative penalties imposed by the Internal Revenue Service, potential liability to insurers whose products include the Portfolios as investment options, and unanticipated costs associated with remedying a failure. It was disclosed in the Portfolios' Annual Report for the year ended December 31, 2006, that an affiliate of a Portfolios' investment adviser may have failed to limit the availability of American Ce ntury Large Company Value, American Century Small-Mid Cap Value, Baron Small Cap Growth, Davis New York Venture, JPMorgan Mid Cap Value, Legg Mason Partners Aggressive Growth, Oppenheimer Strategic Income, PIMCO Total Return, T. Rowe Price Growth Equity, UBS U.S. Large Cap Equity, UBS U.S. Small Cap Growth and Van Kampen Comstock for investment to "eligible investors" under the Code. Management has determined that it is more likely than not the Portfolios would sustain their tax positions relative to this matter.
NOTE 17 — SUBSEQUENT EVENTS
On December 5, 2007, the Board approved a proposal to reorganize each Portfolio ("Disappearing Portfolio") into the following respective "Surviving Portfolio" ("Reorganization"):
| Disappearing Portfolio | | Surviving Portfolio | |
| JPMorgan International | | Templeton Foreign Equity | |
Legg Mason Partners
Large Cap Growth | | ING Marsico Growth Portfolio
| |
Lord Abbett U.S. Government
Securities | | ING VP Intermediate Bond
Portfolio | |
Neuberger Berman Regency
| | ING Pioneer Mid Cap Value
Portfolio | |
The proposed Reorganizations are subject to approval by shareholders of the respective Portfolios. If shareholder approval is obtained, it is expected that the Reorganizations shall close on April 26, 2008, or such other date as the parties to the Reorganizations may agree. Shareholders will be notified if the Reorganizations are not approved.
Effective January 1, 2008, the Board has approved implementing expense limits for American Century Large Company Value, OpCap Balanced and Van Kampen Comstock to the following annual expenses to average daily net assets:
| | | Class ADV | | Class I | | Class S | |
American Century
Large Company Value | | | 1.40 | % | | | 0.90 | % | | | 1.15 | % | |
| OpCap Balanced Value | | | 1.35 | % | | | 0.85 | % | | | 1.10 | % | |
| Van Kampen Comstock | | | 1.31 | % | | | 0.81 | % | | | 1.06 | % | |
Dividends. Subsequent to December 31, 2007, the following Portfolio declared dividends from net investment income:
| | | Per Share
Amount | | Payable Date | | Record Date | |
| Pioneer High Yield | |
| Class ADV | | $ | 0.0484 | | | February 1, 2008 | | Daily | |
| Class I | | $ | 0.0528 | | | February 1, 2008 | | Daily | |
| Class S | | $ | 0.0506 | | | February 1, 2008 | | Daily | |
169
NOTES TO FINANCIAL STATEMENTS AS OF DECEMBER 31, 2007 (CONTINUED)
NOTE 18 — OTHER ACCOUNTING PRONOUNCEMENTS
In June 2006, the Financial Accounting Standards Board ("FASB") issued FASB Interpretation No. 48 ("FIN 48"), "Accounting for Uncertainty in Income Taxes." This standard defines the threshold for recognizing the benefits of tax-return positions in the financial statements as "more-likely-than-not" to be sustained upon challenge by the taxing authority and requires measurement of a tax position meeting the more-likely-than-not criterion, based on the largest benefit that is more than 50 percent likely to be realized. FIN 48 was effective for fiscal years beginning after December 15, 2006, with early application permitted if no interim financial statements have been issued. However, acknowledging the unique issues that FIN 48 presents for investment companies that calculate NAVs, the SEC indicated that they would not object if a fund implemented FIN 48 in its NAV calculation as late as its last NAV calculation in the first required financial s tatement reporting period for its fiscal year beginning after December 15, 2006. At adoption, companies must adjust their financial statements to reflect only those tax positions that are more likely-than-not to be sustained as of the adoption date. Management of the Portfolios has analyzed the tax positions of the Portfolios. Upon adoption of FIN 48, we identified no uncertain tax positions that have not met the more likely-than-not standard.
On September 15, 2006, the FASB issued Statement of Financial Accounting Standards No. 157 ("SFAS No. 157"), "Fair Value Measurements." The new accounting statement defines fair value, establishes a framework for measuring fair value in generally accepted accounting principles ("GAAP"), and expands disclosures about fair value measurements. SFAS No. 157 defines fair value as the price that would be received to sell an asset or paid to transfer a liability in an orderly transaction between market participants at the measurement date (an exit price). SFAS No. 157 also stipulates that, as a market-based measurement, fair value should be determined based on the assumptions that market participants would use in pricing the asset or liability, and establishes a fair value hierarchy that distinguishes between (a) market participant assumptions developed based on market data obtained from sources independent of the reporting entity (observable input s) and (b) the reporting entity's own assumptions about market participant assumptions developed based on the best information available in the circumstances (unobservable inputs). SFAS No. 157 is effective for financial statements issued for fiscal years beginning after November 15, 2007. As of December 31, 2007, management of the Portfolios is currently assessing the impact in addition to expanded financial statement disclosures, if any, that will result from adopting SFAS No. 157.
NOTE 19 — INFORMATION REGARDING TRADING OF ING'S U.S. MUTUAL FUNDS
As discussed in earlier supplements that were previously filed with the SEC, DSL, the adviser to the ING Funds, has reported to the Boards of Directors/Trustees (the "Boards") of the ING Funds that, like many U.S. financial services companies, ING Investments and certain of its U.S. affiliates have received informal and formal requests for information since September 2003 from various governmental and self-regulatory agencies in connection with investigations related to mutual funds and variable insurance products. DSL has advised the Boards that it and its affiliates have cooperated fully with each request.
In addition to responding to regulatory and governmental requests, DSL reported that management of U.S. affiliates of ING Groep N.V., including DSL (collectively, "ING"), on their own initiative, have conducted, through independent special counsel and a national accounting firm, an extensive internal review of trading in ING insurance, retirement, and mutual fund products. The goal of this review was to identify any instances of inappropriate trading in those products by third parties or by ING investment professionals and other ING personnel. ING's internal review related to mutual fund trading is now substantially completed. ING has reported that, of the millions of customer relationships that ING maintains, the internal review identified several isolated arrangements allowing third parties to engage in frequent trading of mutual funds within ING's variable insurance and mutual fund products, and identified other circumstances where freque nt trading occurred, despite measures taken by ING intended to combat market timing. ING further reported that each of these arrangements has been terminated and fully disclosed to regulators. The results of the internal review were also reported to the independent members of the Boards.
DSL has advised the Boards that most of the identified arrangements were initiated prior to ING's acquisition of the businesses in question in the U.S. DSL further reported that the companies in question did not receive special benefits in return for any of these arrangements, which have all been terminated.
170
NOTES TO FINANCIAL STATEMENTS AS OF DECEMBER 31, 2007 (CONTINUED)
NOTE 19 — INFORMATION REGARDING TRADING OF ING'S U.S. MUTUAL FUNDS (continued)
Based on the internal review, DSL has advised the Boards that the identified arrangements do not represent a systemic problem in any of the companies that were involved.
Despite the extensive internal review conducted through independent special counsel and a national accounting firm, there can be no assurance that the instances of inappropriate trading reported to the Boards are the only instances of such trading respecting the ING Funds.
DSL reported to the Boards that ING is committed to conducting its business with the highest standards of ethical conduct with zero tolerance for noncompliance. Accordingly, DSL advised the Boards that ING management was disappointed that its voluntary internal review identified these situations. Viewed in the context of the breadth and magnitude of its U.S. business as a whole, ING management does not believe that ING's acquired companies had systemic ethical or compliance issues in these areas. Nonetheless, DSL reported that given ING's refusal to tolerate any lapses, it has taken the steps noted below, and will continue to seek opportunities to further strengthen the internal controls of its affiliates.
• ING has agreed with the ING Funds to indemnify and hold harmless the ING Funds from all damages resulting from wrongful conduct by ING or its employees or from ING's internal investigation, any investigations conducted by any governmental or self-regulatory agencies, litigation or other formal proceedings, including any proceedings by the SEC. DSL reported to the Boards that ING management believes that the total amount of any indemnification obligations will not be material to ING or its U.S. business.
• ING updated its Code of Conduct for employees reinforcing its employees' obligation to conduct personal trading activity consistent with the law, disclosed limits, and other requirements.
Other Regulatory Matters
The New York Attorney General and other federal and state regulators are also conducting broad inquiries and investigations involving the insurance industry. These initiatives currently focus on, among other things, compensation and other sales incentives; potential conflicts of interest; potential anti-competitive activity; reinsurance; marketing practices (including suitability); specific product types (including group annuities and indexed annuities); fund selection for investment products and brokerage sales; and disclosure. It is likely that the scope of these industry investigations will further broaden before they conclude. ING has received formal and informal requests in connection with such investigations, and is cooperating fully with each request. In connection with one such investigation, affiliates of DSL were named in a petition for relief and cease and des ist order filed by the New Hampshire Bureau of Securities Regulation concerning their administration of the New Hampshire state employees deferred compensation plan.
Other federal and state regulators could initiate similar actions in this or other areas of ING's businesses. These regulatory initiatives may result in new legislation and regulation that could significantly affect the financial services industry, including businesses in which ING is engaged. In light of these and other developments, ING continuously reviews whether modifications to its business practices are appropriate. At this time, in light of the current regulatory factors, ING U.S. is actively engaged in reviewing whether any modifications in our practices are appropriate for the future.
There can be no assurance that these matters, or the adverse publicity associated with them, will not result in increased fund redemptions, reduced sale of fund shares, or other adverse consequences to ING Funds.
171
ING AMERICAN CENTURY PORTFOLIO OF INVESTMENTS
LARGE COMPANY VALUE PORTFOLIO AS OF DECEMBER 31, 2007
| Shares | | | | | | Value | |
| COMMON STOCK: 92.3% | | | |
| | | | | Aerospace/Defense: 1.0% | |
| | 16,400 | | | | | Northrop Grumman Corp. | | $ | 1,289,696 | | |
| | | | 1,289,696 | | |
| | | | | Agriculture: 1.2% | |
| | 20,200 | | | | | Altria Group, Inc. | | | 1,526,716 | | |
| | | | 1,526,716 | | |
| | | | | Apparel: 0.5% | |
| | 9,400 | | | | | VF Corp. | | | 645,404 | | |
| | | | 645,404 | | |
| | | | | Banks: 9.0% | |
| | 96,200 | | | S | | Bank of America Corp. | | | 3,969,212 | | |
| | 12,800 | | | | | Bank of New York Mellon Corp. | | | 624,128 | | |
| | 22,900 | | | L | | National City Corp. | | | 376,934 | | |
| | 12,300 | | | | | PNC Financial Services Group, Inc. | | | 807,495 | | |
| | 53,900 | | | | | US Bancorp. | | | 1,710,786 | | |
| | 41,700 | | | L | | Wachovia Corp. | | | 1,585,851 | | |
| | 87,000 | | | L | | Wells Fargo & Co. | | | 2,626,530 | | |
| | | | 11,700,936 | | |
| | | | | Beverages: 1.9% | |
| | 25,400 | | | | | Coca-Cola Co. | | | 1,558,798 | | |
| | 23,200 | | | | | Pepsi Bottling Group, Inc. | | | 915,472 | | |
| | | | 2,474,270 | | |
| | | | | Biotechnology: 0.5% | |
| | 13,400 | | | @ | | Amgen, Inc. | | | 622,296 | | |
| | | | 622,296 | | |
| | | | | Chemicals: 2.1% | |
| | 28,500 | | | | | EI DuPont de Nemours & Co. | | | 1,256,565 | | |
| | 21,200 | | | L | | PPG Industries, Inc. | | | 1,488,876 | | |
| | | | 2,745,441 | | |
| | | | | Commercial Services: 1.1% | |
| | 34,300 | | | L | | H&R Block, Inc. | | | 636,951 | | |
| | 22,200 | | | | | RR Donnelley & Sons Co. | | | 837,828 | | |
| | | | 1,474,779 | | |
| | | | | Computers: 2.3% | |
| | 30,900 | | | | | Hewlett-Packard Co. | | | 1,559,832 | | |
| | 13,700 | | | L | | International Business
Machines Corp. | | | 1,480,970 | | |
| | | | 3,040,802 | | |
| | | | | Diversified Financial Services: 9.6% | |
| | 2,900 | | | | | Bear Stearns Cos., Inc. | | | 255,925 | | |
| | 136,800 | | | | | Citigroup, Inc. | | | 4,027,392 | | |
| | 11,400 | | | L | | Countrywide Financial Corp. | | | 101,916 | | |
| | 15,300 | | | | | Discover Financial Services | | | 230,724 | | |
| | 46,700 | | | | | Freddie Mac | | | 1,591,069 | | |
| | 73,300 | | | | | JPMorgan Chase & Co. | | | 3,199,545 | | |
| | 30,000 | | | | | Merrill Lynch & Co., Inc. | | | 1,610,400 | | |
| | 29,600 | | | | | Morgan Stanley | | | 1,572,056 | | |
| | | | 12,589,027 | | |
| | | | | Electric: 3.2% | |
| | 24,300 | | | L | | Exelon Corp. | | | 1,983,852 | | |
| | 15,200 | | | @,L | | NRG Energy, Inc. | | | 658,768 | | |
| | 30,000 | | | | | PPL Corp. | | | 1,562,700 | | |
| | | | 4,205,320 | | |
| Shares | | | | | | Value | |
| | | | | Environmental Control: 0.5% | |
| | 21,700 | | | | | Waste Management, Inc. | | $ | 708,939 | | |
| | | | 708,939 | | |
| | | | | Food: 1.7% | |
| | 30,000 | | | L | | Kroger Co. | | | 801,300 | | |
| | 38,000 | | | @@ | | Unilever NV ADR | | | 1,385,480 | | |
| | | | 2,186,780 | | |
| | | | | Forest Products & Paper: 1.1% | |
| | 19,900 | | | | | Weyerhaeuser Co. | | | 1,467,426 | | |
| | | | 1,467,426 | | |
| | | | | Healthcare-Products: 2.8% | |
| | 44,700 | | | | | Johnson & Johnson | | | 2,981,490 | | |
| | 12,400 | | | | | Medtronic, Inc. | | | 623,348 | | |
| | | | 3,604,838 | | |
| | | | | Healthcare-Services: 0.3% | |
| | 7,400 | | | | | Quest Diagnostics | | | 391,460 | | |
| | | | 391,460 | | |
| | | | | Household Products/Wares: 0.2% | |
| | 5,500 | | | L | | Avery Dennison Corp. | | | 292,270 | | |
| | | | 292,270 | | |
| | | | | Housewares: 0.6% | |
| | 32,200 | | | L | | Newell Rubbermaid, Inc. | | | 833,336 | | |
| | | | 833,336 | | |
| | | | | Insurance: 6.3% | |
| | 26,700 | | | | | Allstate Corp. | | | 1,394,541 | | |
| | 50,200 | | | | | American International
Group, Inc. | | | 2,926,660 | | |
| | 16,500 | | | | | Hartford Financial Services
Group, Inc. | | | 1,438,635 | | |
| | 19,800 | | | | | Loews Corp. | | | 996,732 | | |
| | 12,100 | | | | | Marsh & McLennan Cos., Inc. | | | 320,287 | | |
| | 18,900 | | | L | | MGIC Investment Corp. | | | 423,927 | | |
| | 12,800 | | | | | Torchmark Corp. | | | 774,784 | | |
| | | | 8,275,566 | | |
| | | | | Iron/Steel: 0.6% | |
| | 12,600 | | | | | Nucor Corp. | | | 746,172 | | |
| | | | 746,172 | | |
| | | | | Machinery-Construction & Mining: 0.7% | |
| | 13,100 | | | | | Caterpillar, Inc. | | | 950,536 | | |
| | | | 950,536 | | |
| | | | | Machinery-Diversified: 0.4% | |
| | 5,700 | | | | | Deere & Co. | | | 530,784 | | |
| | | | 530,784 | | |
| | | | | Media: 3.1% | |
| | 31,600 | | | | | Gannett Co., Inc. | | | 1,232,400 | | |
| | 96,000 | | | | | Time Warner, Inc. | | | 1,584,960 | | |
| | 27,500 | | | @ | | Viacom-Class B | | | 1,207,800 | | |
| | | | 4,025,160 | | |
| | | | | Miscellaneous Manufacturing: 6.7% | |
| | 18,900 | | | | | Dover Corp. | | | 871,101 | | |
| | 146,700 | | | | | General Electric Co. | | | 5,438,169 | | |
| | 22,500 | | | @@ | | Ingersoll-Rand Co. | | | 1,045,575 | | |
| | 11,900 | | | | | Parker Hannifin Corp. | | | 896,189 | | |
| | 14,200 | | | @@ | | Tyco International Ltd. | | | 563,030 | | |
| | | | 8,814,064 | | |
See Accompanying Notes to Financial Statements
172
ING AMERICAN CENTURY PORTFOLIO OF INVESTMENTS
LARGE COMPANY VALUE PORTFOLIO AS OF DECEMBER 31, 2007 (CONTINUED)
| Shares | | | | | | Value | |
| | | | | Office/Business Equip: 0.6% | |
| | 45,800 | | | | | Xerox Corp. | | $ | 741,502 | | |
| | | | 741,502 | | |
| | | | | Oil & Gas: 13.6% | |
| | 47,700 | | | | | Chevron Corp. | | | 4,451,841 | | |
| | 34,500 | | | | | ConocoPhillips | | | 3,046,350 | | |
| | 3,600 | | | | | Devon Energy Corp. | | | 320,076 | | |
| | 68,800 | | | | | ExxonMobil Corp. | | | 6,445,872 | | |
| | 41,100 | | | @@ | | Royal Dutch Shell PLC ADR | | | 3,460,620 | | |
| | | | 17,724,759 | | |
| | | | | Oil & Gas Services: 0.5% | |
| | 8,700 | | | @,L | | National Oilwell Varco, Inc. | | | 639,102 | | |
| | | | 639,102 | | |
| | | | | Pharmaceuticals: 5.7% | |
| | 26,800 | | | | | Abbott Laboratories | | | 1,504,820 | | |
| | 16,200 | | | | | Eli Lilly & Co. | | | 864,918 | | |
| | 18,800 | | | | | Merck & Co., Inc. | | | 1,092,468 | | |
| | 110,900 | | | S | | Pfizer, Inc. | | | 2,520,757 | | |
| | 33,800 | | | | | Wyeth | | | 1,493,622 | | |
| | | | 7,476,585 | | |
| | | | | Retail: 4.8% | |
| | 17,900 | | | | | Best Buy Co., Inc. | | | 942,435 | | |
| | 26,500 | | | | | Gap, Inc. | | | 563,920 | | |
| | 24,500 | | | | | Home Depot, Inc. | | | 660,030 | | |
| | 14,500 | | | @ | | Kohl's Corp. | | | 664,100 | | |
| | 8,400 | | | | | McDonald's Corp. | | | 494,844 | | |
| | 33,700 | | | | | Staples, Inc. | | | 777,459 | | |
| | 17,900 | | | L | | Walgreen Co. | | | 681,632 | | |
| | 31,300 | | | | | Wal-Mart Stores, Inc. | | | 1,487,689 | | |
| | | | 6,272,109 | | |
| | | | | Savings & Loans: 0.6% | |
| | 52,800 | | | L | | Washington Mutual, Inc. | | | 718,608 | | |
| | | | 718,608 | | |
| | | | | Semiconductors: 0.8% | |
| | 23,900 | | | | | Applied Materials, Inc. | | | 424,464 | | |
| | 24,100 | | | | | Intel Corp. | | | 642,506 | | |
| | | | 1,066,970 | | |
| | | | | Software: 2.7% | |
| | 10,400 | | | @,L | | Fiserv, Inc. | | | 577,096 | | |
| | 55,300 | | | S | | Microsoft Corp. | | | 1,968,680 | | |
| | 42,900 | | | @ | | Oracle Corp. | | | 968,682 | | |
| | | | 3,514,458 | | |
| | | | | Telecommunications: 5.6% | |
| | 100,200 | | | | | AT&T, Inc. | | | 4,164,312 | | |
| | 18,000 | | | | | Motorola, Inc. | | | 288,720 | | |
| | 61,900 | | | | | Sprint Nextel Corp. | | | 812,747 | | |
| | 46,800 | | | | | Verizon Communications, Inc. | | | 2,044,692 | | |
| | | | 7,310,471 | | |
| | | Total Common Stock
(Cost $120,181,097) | | | 120,606,582 | | |
Principal
Amount | | | | | | Value | |
| SHORT-TERM INVESTMENTS: 14.0% | |
| | | | | U.S. Government Agency
Obligations: 7.2% | | | |
| $ | 9,421,000 | | | Z | | Federal Home Loan Bank,
3.050%, due 01/02/08 | | $ | 9,419,404 | | |
Total U.S. Government
Agency Obligations
(Cost $9,419,404) | | | 9,419,404 | | |
| | | | | Securities Lending Collateralcc: 6.8% | |
| | 8,792,470 | | | | | Bank of New York Mellon Corp.
Institutional Cash Reserves | | | 8,792,470 | | |
Total Securities Lending Collateral
(Cost $8,792,470) | | | 8,792,470 | | |
Total Short-Term Investments
(Cost $18,211,874) | | | 18,211,874 | | |
Total Investments in
Securities
(Cost $138,392,971)* | | | 106.3 | % | | $ | 138,818,456 | | |
Other Assets and
Liabilities - Net | | | (6.3 | ) | | | (8,174,594 | ) | |
| Net Assets | | | 100.0 | % | | $ | 130,643,862 | | |
@ Non-income producing security
@@ Foreign Issuer
ADR American Depositary Receipt
cc Securities purchased with cash collateral for securities loaned.
L Loaned security, a portion or all of the security is on loan at December 31, 2007.
Z Indicates Zero Coupon Bond; rate shown reflects current effective yield.
S All or a portion of this security is segregated for certain derivatives, when-issued or delayed delivery securities and forward currency exchange contracts.
* Cost for federal income tax purposes is $139,008,693.
Net unrealized appreciation consists of:
| Gross Unrealized Appreciation | | $ | 12,043,316 | | |
| Gross Unrealized Depreciation | | | (12,233,553 | ) | |
| Net Unrealized Appreciation | | $ | (190,237 | ) | |
ING American Century Large Company Value Portfolio Open Futures Contracts on December 31, 2007:
Contract
Description | | Number of
Contracts | | Notional
Market
Value ($) | | Expiration
Date | | Unrealized
Depreciation | |
| Long Contracts | |
| S&P 500 E-Mini | | | 89 | | | | 6,573,540 | | | 03/20/08 | | $ | (86,893 | ) | |
| | | | | | | | | $ | (86,893 | ) | |
See Accompanying Notes to Financial Statements
173
ING AMERICAN CENTURY PORTFOLIO OF INVESTMENTS
SMALL-MID CAP VALUE PORTFOLIO AS OF DECEMBER 31, 2007
| Shares | | | | | | Value | |
| COMMON STOCK: 90.3% | | | |
| | | | | Aerospace/Defense: 1.5% | |
| | 8,200 | | | @,L | | Aerovironment, Inc. | | $ | 198,440 | | |
| | 800 | | | @,L | | Alliant Techsystems, Inc. | | | 91,008 | | |
| | 2,600 | | | | | Curtiss-Wright Corp. | | | 130,520 | | |
| | 4,900 | | | L | | DRS Technologies, Inc. | | | 265,923 | | |
| | 2,700 | | | @ | | Esterline Technologies Corp. | | | 139,725 | | |
| | 3,200 | | | L | | Kaman Corp. | | | 117,792 | | |
| | 5,200 | | | @ | | Moog, Inc. | | | 238,212 | | |
| | 3,600 | | | | | Triumph Group, Inc. | | | 296,460 | | |
| | | | 1,478,080 | | |
| | | | | Agriculture: 0.1% | |
| | 2,800 | | | | | Universal Corp. | | | 143,416 | | |
| | | | 143,416 | | |
| | | | | Airlines: 1.1% | |
| | 8,806 | | | @,L | | Alaska Air Group, Inc. | | | 220,238 | | |
| | 10,200 | | | | | Skywest, Inc. | | | 273,870 | | |
| | 46,019 | | | | | Southwest Airlines Co. | | | 561,432 | | |
| | | | 1,055,540 | | |
| | | | | Apparel: 0.7% | |
| | 4,400 | | | @,L | | Carter's, Inc. | | | 85,140 | | |
| | 4,100 | | | L | | Oxford Industries, Inc. | | | 105,657 | | |
| | 3,600 | | | @,L | | Warnaco Group, Inc. | | | 125,280 | | |
| | 15,900 | | | | | Wolverine World Wide, Inc. | | | 389,868 | | |
| | | | 705,945 | | |
| | | | | Auto Manufacturers: 0.5% | |
| | 18,300 | | | @,L | | ASV, Inc. | | | 253,455 | | |
| | 4,500 | | | @@ | | Bayerische Motoren Werke AG | | | 281,131 | | |
| | | | 534,586 | | |
| | | | | Auto Parts & Equipment: 0.9% | |
| | 16,800 | | | L | | ArvinMeritor, Inc. | | | 197,064 | | |
| | 5,025 | | | @@ | | Autoliv, Inc. | | | 264,868 | | |
| | 18,900 | | | @ | | Commercial Vehicle
Group, Inc. | | | 274,050 | | |
| | 5,200 | | | | | Superior Industries
International | | | 94,484 | | |
| | 3,800 | | | @,L | | Tenneco, Inc. | | | 99,066 | | |
| | | | 929,532 | | |
| | | | | Banks: 6.5% | |
| | 8,400 | | | | | Associated Banc-Corp. | | | 227,556 | | |
| | 17,800 | | | L | | Central Pacific Financial Corp. | | | 328,588 | | |
| | 3,400 | | | | | City National Corp. | | | 202,470 | | |
| | 5,090 | | | | | Commerce Bancshares, Inc. | | | 228,337 | | |
| | 5,200 | | | L | | Cullen/Frost Bankers, Inc. | | | 263,432 | | |
| | 21,500 | | | L | | First Midwest Bancorp., Inc. | | | 657,900 | | |
| | 5,000 | | | L | | FirstMerit Corp. | | | 100,050 | | |
| | 43,610 | | | | | Fulton Financial Corp. | | | 489,304 | | |
| | 31,200 | | | | | Hanmi Financial Corp. | | | 268,944 | | |
| | 21,685 | | | | | Marshall & Ilsley Corp. | | | 574,219 | | |
| | 6,500 | | | L | | Pacific Capital Bancorp. | | | 130,845 | | |
| | 44,025 | | | S | | South Financial Group, Inc. | | | 688,111 | | |
| | 32,700 | | | | | Sterling Bancshares, Inc. | | | 364,932 | | |
| | 12,098 | | | | | SunTrust Bank | | | 756,004 | | |
| | 33,627 | | | L | | TCF Financial Corp. | | | 602,932 | | |
| | 9,300 | | | | | UCBH Holdings, Inc. | | | 131,688 | | |
| | 3,300 | | | | | United Bankshares, Inc. | | | 92,466 | | |
| | 7,500 | | | L | | Wilmington Trust Corp. | | | 264,000 | | |
| | 2,800 | | | | | Zions Bancorp. | | | 130,732 | | |
| | | | 6,502,510 | | |
| Shares | | | | | | Value | |
| | | | | Beverages: 0.5% | |
| | 7,398 | | | | | Anheuser-Busch Cos., Inc. | | $ | 387,211 | | |
| | 2,564 | | | | | Coca-Cola Enterprises, Inc. | | | 66,741 | | |
| | | | 453,952 | | |
| | | | | Biotechnology: 0.1% | |
| | 1,000 | | | @ | | Bio-Rad Laboratories, Inc. | | | 103,620 | | |
| | | | 103,620 | | |
| | | | | Building Materials: 0.7% | |
| | 1,100 | | | @ | | Genlyte Group, Inc. | | | 104,720 | | |
| | 3,000 | | | | | Lennox International, Inc. | | | 124,260 | | |
| | 5,813 | | | L | | LSI Industries, Inc. | | | 105,797 | | |
| | 12,268 | | | | | Masco Corp. | | | 265,111 | | |
| | 3,800 | | | L | | Simpson Manufacturing Co., Inc. | | | 101,042 | | |
| | | | 700,930 | | |
| | | | | Chemicals: 2.5% | |
| | 2,600 | | | L | | Arch Chemicals, Inc. | | | 95,550 | | |
| | 1,400 | | | | | CF Industries Holdings, Inc. | | | 154,084 | | |
| | 3,400 | | | | | Cytec Industries, Inc. | | | 209,372 | | |
| | 4,500 | | | | | Ferro Corp. | | | 93,285 | | |
| | 4,000 | | | L | | HB Fuller Co. | | | 89,800 | | |
| | 12,600 | | | | | Hercules, Inc. | | | 243,810 | | |
| | 18,800 | | | | | Innophos Holdings, Inc. | | | 279,744 | | |
| | 6,405 | | | | | Minerals Technologies, Inc. | | | 428,815 | | |
| | 5,000 | | | | | Olin Corp. | | | 96,650 | | |
| | 5,500 | | | @,L | | OM Group, Inc. | | | 316,470 | | |
| | 1,800 | | | | | Rohm & Haas Co. | | | 95,526 | | |
| | 4,900 | | | | | Sensient Technologies Corp. | | | 138,572 | | |
| | 7,200 | | | L | | Spartech Corp. | | | 101,520 | | |
| | 3,400 | | | | | UAP Holding Corp. | | | 131,240 | | |
| | | | 2,474,438 | | |
| | | | | Coal: 0.1% | |
| | 3,200 | | | @,L | | Alpha Natural Resources, Inc. | | | 103,936 | | |
| | | | 103,936 | | |
| | | | | Commercial Services: 1.0% | |
| | 19,894 | | | L | | Advance America Cash
Advance Centers, Inc. | | | 202,123 | | |
| | 17,800 | | | @,L | | Corinthian Colleges, Inc. | | | 274,120 | | |
| | 4,700 | | | L | | Heidrick & Struggles
International, Inc. | | | 174,417 | | |
| | 9,400 | | | @ | | MPS Group, Inc. | | | 102,836 | | |
| | 9,000 | | | @ | | Rent-A-Center, Inc. | | | 130,680 | | |
| | 3,000 | | | | | Watson Wyatt Worldwide, Inc. | | | 139,230 | | |
| | | | 1,023,406 | | |
| | | | | Computers: 1.6% | |
| | 7,201 | | | | | Diebold, Inc. | | | 208,685 | | |
| | 13,100 | | | @ | | Electronics for Imaging | | | 294,488 | | |
| | 4,400 | | | L | | Imation Corp. | | | 92,400 | | |
| | 4,000 | | | | | Jack Henry & Associates, Inc. | | | 97,360 | | |
| | 34,300 | | | @,L | | Perot Systems Corp. | | | 463,050 | | |
| | 37,000 | | | @ | | Quantum Corp. | | | 99,530 | | |
| | 16,600 | | | @,L | | Rackable Systems, Inc. | | | 166,000 | | |
| | 6,372 | | | @ | | Synopsys, Inc. | | | 165,226 | | |
| | | | 1,586,739 | | |
| | | | | Cosmetics/Personal Care: 0.2% | |
| | 4,500 | | | | | Estee Lauder Cos., Inc. | | | 196,245 | | |
| | | | 196,245 | | |
See Accompanying Notes to Financial Statements
174
ING AMERICAN CENTURY PORTFOLIO OF INVESTMENTS
SMALL-MID CAP VALUE PORTFOLIO AS OF DECEMBER 31, 2007 (CONTINUED)
| Shares | | | | | | Value | |
| | | | | Distribution/Wholesale: 0.5% | |
| | 4,259 | | | | | Genuine Parts Co. | | $ | 197,192 | | |
| | 4,600 | | | L | | Owens & Minor, Inc. | | | 195,178 | | |
| | 2,400 | | | @ | | United Stationers, Inc. | | | 110,904 | | |
| | | | 503,274 | | |
| | | | | Diversified Financial Services: 2.7% | |
| | 2,300 | | | | | Ameriprise Financial, Inc. | | | 126,753 | | |
| | 18,800 | | | @,L | | Asset Acceptance Capital Corp. | | | 195,708 | | |
| | 1,900 | | | | | Bear Stearns Cos., Inc. | | | 167,675 | | |
| | 32,000 | | | @,L | | Cowen Group, Inc. | | | 304,320 | | |
| | 13,243 | | | | | Freddie Mac | | | 451,189 | | |
| | 14,900 | | | @ | | Knight Capital Group, Inc. | | | 214,560 | | |
| | 2,100 | | | @@,L | | Lazard Ltd. | | | 85,428 | | |
| | 1,400 | | | | | Legg Mason, Inc. | | | 102,410 | | |
| | 2,400 | | | | | Merrill Lynch & Co., Inc. | | | 128,832 | | |
| | 5,800 | | | L | | National Financial Partners Corp. | | | 264,538 | | |
| | 8,000 | | | L | | Nelnet, Inc. | | | 101,680 | | |
| | 12,300 | | | @,L | | TradeStation Group, Inc. | | | 174,783 | | |
| | 9,300 | | | | | Waddell & Reed Financial, Inc. | | | 335,637 | | |
| | | | 2,653,513 | | |
| | | | | Electric: 4.8% | |
| | 4,800 | | | L | | Cleco Corp. | | | 133,440 | | |
| | 2,700 | | | | | Consolidated Edison, Inc. | | | 131,895 | | |
| | 18,752 | | | L | | Empire District Electric Co. | | | 427,171 | | |
| | 15,800 | | | | | Great Plains Energy, Inc. | | | 463,256 | | |
| | 1,750 | | | | | Idacorp, Inc. | | | 61,635 | | |
| | 10,400 | | | L | | MGE Energy, Inc. | | | 368,888 | | |
| | 38,444 | | | | | Portland General Electric Co. | | | 1,067,974 | | |
| | 40,704 | | | | | Puget Energy, Inc. | | | 1,116,511 | | |
| | 9,600 | | | | | Sierra Pacific Resources | | | 163,008 | | |
| | 19,300 | | | | | Westar Energy, Inc. | | | 500,642 | | |
| | 4,605 | | | | | Wisconsin Energy Corp. | | | 224,310 | | |
| | 5,800 | | | | | Xcel Energy, Inc. | | | 130,906 | | |
| | | | 4,789,636 | | |
| | | | | | | Electrical Components &
Equipment: 1.3% | | | | | |
| | 8,300 | | | | | Hubbell, Inc. | | | 428,280 | | |
| | 13,276 | | | @ | | Littelfuse, Inc. | | | 437,577 | | |
| | 15,524 | | | | | Molex, Inc. | | | 423,805 | | |
| | | | 1,289,662 | | |
| | | | | Electronics: 2.5% | |
| | 3,600 | | | L | | American Science &
Engineering, Inc. | | | 204,300 | | |
| | 19,200 | | | @,L,S | | Benchmark Electronics, Inc. | | | 340,416 | | |
| | 3,700 | | | | | Brady Corp. | | | 129,833 | | |
| | 8,000 | | | @,L | | Coherent, Inc. | | | 200,560 | | |
| | 6,900 | | | @,L | | Electro Scientific Industries, Inc. | | | 136,965 | | |
| | 1,658 | | | | | Park Electrochemical Corp. | | | 46,822 | | |
| | 3,900 | | | @ | | Plexus Corp. | | | 102,414 | | |
| | 3,600 | | | @,L | | Rogers Corp. | | | 156,132 | | |
| | 4,900 | | | | | Technitrol, Inc. | | | 140,042 | | |
| | 10,502 | | | @@ | | Tyco Electronics Ltd. | | | 389,939 | | |
| | 55,800 | | | @ | | Vishay Intertechnology, Inc. | | | 636,678 | | |
| | | | 2,484,101 | | |
| | | | | Engineering & Construction: 1.1% | |
| | 10,900 | | | @ | | EMCOR Group, Inc. | | | 257,567 | | |
| | 16,600 | | | | | Granite Construction, Inc. | | | 600,588 | | |
| | 4,771 | | | @ | | Sterling Construction Co., Inc. | | | 104,103 | | |
| | 2,600 | | | @ | | URS Corp. | | | 141,258 | | |
| | | | 1,103,516 | | |
| Shares | | | | | | Value | |
| | | | | Entertainment: 2.0% | |
| | 27,947 | | | | | International Speedway Corp. | | $ | 1,150,857 | | |
| | 27,383 | | | L | | Speedway Motorsports, Inc. | | | 851,064 | | |
| | | | 2,001,921 | | |
| | | | | Environmental Control: 1.5% | |
| | 21,000 | | | | | American Ecology Corp. | | | 493,080 | | |
| | 2,000 | | | @,L | | Clean Harbors, Inc. | | | 103,400 | | |
| | 3,000 | | | | | Metal Management, Inc. | | | 136,590 | | |
| | 4,317 | | | | | Republic Services, Inc. | | | 135,338 | | |
| | 4,300 | | | @,L | | Waste Connections, Inc. | | | 132,870 | | |
| | 16,332 | | | | | Waste Management, Inc. | | | 533,566 | | |
| | | | 1,534,844 | | |
| | | | | Food: 5.1% | |
| | 26,800 | | | | | B&G Foods, Inc. | | | 273,628 | | |
| | 8,300 | | | | | Campbell Soup Co. | | | 296,559 | | |
| | 35,378 | | | | | ConAgra Foods, Inc. | | | 841,643 | | |
| | 3,400 | | | | | Corn Products International, Inc. | | | 124,950 | | |
| | 14,800 | | | | | Del Monte Foods Co. | | | 140,008 | | |
| | 9,000 | | | | | Diamond Foods, Inc. | | | 192,870 | | |
| | 4,075 | | | | | General Mills, Inc. | | | 232,275 | | |
| | 6,600 | | | @,L | | Hain Celestial Group, Inc. | | | 211,200 | | |
| | 9,237 | | | | | Hershey Co. | | | 363,938 | | |
| | 9,393 | | | | | HJ Heinz Co. | | | 438,465 | | |
| | 6,700 | | | | | J&J Snack Foods Corp. | | | 209,576 | | |
| | 2,200 | | | | | JM Smucker Co. | | | 113,168 | | |
| | 1,800 | | | | | Kellogg Co. | | | 94,374 | | |
| | 19,407 | | | | | Kraft Foods, Inc. | | | 633,250 | | |
| | 13,900 | | | @@ | | Maple Leaf Foods, Inc. | | | 209,144 | | |
| | 3,800 | | | @ | | Performance Food Group Co. | | | 102,106 | | |
| | 5,200 | | | L | | Pilgrim's Pride Corp. | | | 150,540 | | |
| | 2,200 | | | @ | | Ralcorp Holdings, Inc. | | | 133,738 | | |
| | 9,186 | | | | | Weis Markets, Inc. | | | 366,889 | | |
| | | | 5,128,321 | | |
| | | | | Forest Products & Paper: 0.4% | |
| | 4,988 | | | | | Glatfelter | | | 76,366 | | |
| | 3,036 | | | | | MeadWestvaco Corp. | | | 95,027 | | |
| | 4,500 | | | | | Neenah Paper, Inc. | | | 131,175 | | |
| | 967 | | | | | Weyerhaeuser Co. | | | 71,307 | | |
| | | | 373,875 | | |
| | | | | Gas: 2.2% | |
| | 5,300 | | | | | AGL Resources, Inc. | | | 199,492 | | |
| | 10,100 | | | | | Atmos Energy Corp. | | | 283,204 | | |
| | 1,400 | | | | | Nicor, Inc. | | | 59,290 | | |
| | 945 | | | | | Piedmont Natural Gas Co. | | | 24,721 | | |
| | 36,427 | | | L | | Southwest Gas Corp. | | | 1,084,432 | | |
| | 16,166 | | | | | WGL Holdings, Inc. | | | 529,598 | | |
| | | | 2,180,737 | | |
| | | | | Hand/Machine Tools: 0.5% | |
| | 6,600 | | | | | Kennametal, Inc. | | | 249,876 | | |
| | 3,900 | | | | | Regal-Beloit Corp. | | | 175,305 | | |
| | 2,100 | | | | | Snap-On, Inc. | | | 101,304 | | |
| | | | 526,485 | | |
| | | | | Healthcare-Products: 3.1% | |
| | 7,188 | | | | | Beckman Coulter, Inc. | | | 523,286 | | |
| | 11,000 | | | @ | | Boston Scientific Corp. | | | 127,930 | | |
| | 3,600 | | | @@ | | Covidien Ltd. | | | 159,444 | | |
| | 19,600 | | | @,L | | Cutera, Inc. | | | 307,720 | | |
See Accompanying Notes to Financial Statements
175
ING AMERICAN CENTURY PORTFOLIO OF INVESTMENTS
SMALL-MID CAP VALUE PORTFOLIO AS OF DECEMBER 31, 2007 (CONTINUED)
| Shares | | | | | | Value | |
| | | | | Healthcare-Products (continued) | |
| | 3,000 | | | | | Datascope Corp. | | $ | 109,200 | | |
| | 2,800 | | | @,L | | ICU Medical, Inc. | | | 100,828 | | |
| | 6,400 | | | L | | LCA-Vision, Inc. | | | 127,808 | | |
| | 6,942 | | | | | Steris Corp. | | | 200,207 | | |
| | 20,257 | | | @ | | Symmetry Medical, Inc. | | | 353,080 | | |
| | 9,400 | | | @,L | | Vital Images, Inc. | | | 169,858 | | |
| | 6,600 | | | | | Vital Signs, Inc. | | | 337,392 | | |
| | 20,890 | | | I | | Young Innovations, Inc. | | | 499,480 | | |
| | 1,500 | | | @ | | Zimmer Holdings, Inc. | | | 99,225 | | |
| | | | 3,115,458 | | |
| | | | | Healthcare-Services: 2.8% | |
| | 9,800 | | | @ | | Amsurg Corp. | | | 265,188 | | |
| | 31,400 | | | @,L | | Assisted Living Concepts, Inc. | | | 235,500 | | |
| | 5,300 | | | @,L | | Community Health Systems, Inc. | | | 195,358 | | |
| | 17,900 | | | @ | | LifePoint Hospitals, Inc. | | | 532,346 | | |
| | 3,000 | | | @ | | Magellan Health Services, Inc. | | | 139,890 | | |
| | 9,700 | | | @,L | | Nighthawk Radiology
Holdings, Inc. | | | 204,185 | | |
| | 72,336 | | | @ | | Odyssey HealthCare, Inc. | | | 800,036 | | |
| | 7,528 | | | | | Universal Health Services, Inc. | | | 385,434 | | |
| | | | 2,757,937 | | |
| | | | | Home Builders: 0.4% | |
| | 2,600 | | | | | MDC Holdings, Inc. | | | 96,538 | | |
| | 12,521 | | | | | Winnebago Industries | | | 263,191 | | |
| | | | 359,729 | | |
| | | | | Home Furnishings: 0.7% | |
| | 14,100 | | | L | | Ethan Allen Interiors, Inc. | | | 401,850 | | |
| | 8,700 | | | L | | Furniture Brands
International, Inc. | | | 87,522 | | |
| | 2,800 | | | | | Whirlpool Corp. | | | 228,564 | | |
| | | | 717,936 | | |
| | | | | Household Products/Wares: 2.4% | |
| | 29,400 | | | @,L | | ACCO Brands Corp. | | | 471,576 | | |
| | 5,800 | | | | | American Greetings Corp. | | | 117,740 | | |
| | 8,700 | | | | | Avery Dennison Corp. | | | 462,318 | | |
| | 16,400 | | | @,L | | Central Garden & Pet Co. | | | 94,464 | | |
| | 13,810 | | | | | Kimberly-Clark Corp. | | | 957,585 | | |
| | 5,800 | | | | | Tupperware Corp. | | | 191,574 | | |
| | 2,600 | | | | | WD-40 Co. | | | 98,722 | | |
| | | | 2,393,979 | | |
| | | | | Housewares: 0.3% | |
| | 3,700 | | | @@ | | Hunter Douglas NV | | | 274,158 | | |
| | | | 274,158 | | |
| | | | | Insurance: 6.0% | |
| | 9,186 | | | | | Allstate Corp. | | | 479,785 | | |
| | 27,100 | | | | | American Equity Investment
Life Holding Co. | | | 224,659 | | |
| | 8,011 | | | | | Arthur J Gallagher & Co. | | | 193,786 | | |
| | 19,700 | | | @@ | | Aspen Insurance Holdings Ltd. | | | 568,148 | | |
| | 3,600 | | | | | Chubb Corp. | | | 196,488 | | |
| | 3,600 | | | | | Delphi Financial Group | | | 127,008 | | |
| | 5,500 | | | @@ | | Endurance Specialty
Holdings Ltd. | | | 229,515 | | |
| | 11,843 | | | | | Genworth Financial, Inc. | | | 301,404 | | |
| | 3,700 | | | | | Hanover Insurance Group, Inc. | | | 169,460 | | |
| | 2,653 | | | | | Hartford Financial Services
Group, Inc. | | | 231,315 | | |
| | 31,600 | | | | | HCC Insurance Holdings, Inc. | | | 906,288 | | |
| Shares | | | | | | Value | |
| | 3,200 | | | L | | Hilb Rogal & Hobbs Co. | | $ | 129,824 | | |
| | 12,056 | | | | | Horace Mann Educators Corp. | | | 228,341 | | |
| | 6,700 | | | @@ | | IPC Holdings Ltd. | | | 193,429 | | |
| | 18,955 | | | | | Marsh & McLennan Cos., Inc. | | | 501,739 | | |
| | 6,700 | | | | | MBIA, Inc. | | | 124,821 | | |
| | 10,200 | | | @ | | National Atlantic Holdings Corp. | | | 45,186 | | |
| | 4,500 | | | | | Odyssey Re Holdings Corp. | | | 165,195 | | |
| | 8,200 | | | | | OneBeacon Insurance Group Ltd. | | | 176,300 | | |
| | 8,500 | | | L | | Phoenix Cos., Inc. | | | 100,895 | | |
| | 7,400 | | | @@ | | Platinum Underwriters
Holdings Ltd. | | | 263,144 | | |
| | 6,500 | | | | | PMI Group, Inc. | | | 86,320 | | |
| | 2,400 | | | @,L | | ProAssurance Corp. | | | 131,808 | | |
| | 5,700 | | | | | United Fire & Casualty Co. | | | 165,813 | | |
| | | | 5,940,671 | | |
| | | | | Internet: 0.1% | |
| | 4,400 | | | @ | | Avocent Corp. | | | 102,564 | | |
| | | | 102,564 | | |
| | | | | Investment Companies: 1.7% | |
| | 23,700 | | | | | Apollo Investment Corp. | | | 404,085 | | |
| | 18,200 | | | L | | Ares Capital Corp. | | | 266,266 | | |
| | 21,600 | | | | | Highland Distressed
Opportunities, Inc. | | | 185,112 | | |
| | 20,700 | | | | | MCG Capital Corp. | | | 239,913 | | |
| | 12,500 | | | | | MVC Capital, Inc. | | | 201,750 | | |
| | 22,548 | | | L | | Patriot Capital Funding, Inc. | | | 227,509 | | |
| | 14,560 | | | | | PennantPark Investment Corp. | | | 145,891 | | |
| | | | 1,670,526 | | |
| | | | | Iron/Steel: 0.5% | |
| | 8,900 | | | @,L | | Claymont Steel Holdings, Inc. | | | 207,815 | | |
| | 1,100 | | | L | | Cleveland-Cliffs, Inc. | | | 110,880 | | |
| | 2,600 | | | | | Schnitzer Steel Industries, Inc. | | | 179,738 | | |
| | | | 498,433 | | |
| | | | | Machinery-Diversified: 1.0% | |
| | 4,065 | | | L | | Albany International Corp. | | | 150,812 | | |
| | 40,027 | | | @ | | Altra Holdings, Inc. | | | 665,649 | | |
| | 5,800 | | | L | | Applied Industrial
Technologies, Inc. | | | 168,316 | | |
| | | | 984,777 | | |
| | | | | Media: 0.9% | |
| | 10,300 | | | | | Belo Corp. | | | 179,632 | | |
| | 20,575 | | | @,L | | Entravision Communications Corp. | | | 161,102 | | |
| | 4,600 | | | | | Hearst-Argyle Television, Inc. | | | 101,706 | | |
| | 53,800 | | | L | | Journal Communications, Inc. | | | 480,972 | | |
| | | | 923,412 | | |
| | | | | Metal Fabricate/Hardware: 1.6% | |
| | 3,900 | | | @,L | | Haynes International, Inc. | | | 271,050 | | |
| | 4,600 | | | L | | Kaydon Corp. | | | 250,884 | | |
| | 11,900 | | | | | Mueller Industries, Inc. | | | 344,981 | | |
| | 10,700 | | | L | | Mueller Water Products, Inc. | | | 106,679 | | |
| | 25,100 | | | | | NN, Inc. | | | 236,442 | | |
| | 2,500 | | | L | | Quanex Corp. | | | 129,750 | | |
| | 8,100 | | | L | | Timken Co. | | | 266,085 | | |
| | | | 1,605,871 | | |
| | | | | Mining: 0.2% | |
| | 1,700 | | | @ | | Century Aluminum Co. | | | 91,698 | | |
| | 1,800 | | | @ | | RTI International Metals, Inc. | | | 124,074 | | |
| | | | 215,772 | | |
See Accompanying Notes to Financial Statements
176
ING AMERICAN CENTURY PORTFOLIO OF INVESTMENTS
SMALL-MID CAP VALUE PORTFOLIO AS OF DECEMBER 31, 2007 (CONTINUED)
| Shares | | | | | | Value | |
| | | | | Miscellaneous Manufacturing: 1.9% | |
| | 3,100 | | | | | Acuity Brands, Inc. | | $ | 139,500 | | |
| | 2,900 | | | | | AO Smith Corp. | | | 101,645 | | |
| | 3,200 | | | L | | Aptargroup, Inc. | | | 130,912 | | |
| | 3,300 | | | | | Barnes Group, Inc. | | | 110,187 | | |
| | 2,700 | | | | | Brink's Co. | | | 161,298 | | |
| | 3,000 | | | | | Crane Co. | | | 128,700 | | |
| | 4,500 | | | | | Dover Corp. | | | 207,405 | | |
| | 35,700 | | | @,L | | Griffon Corp. | | | 444,465 | | |
| | 3,802 | | | | | Lancaster Colony Corp. | | | 150,939 | | |
| | 7,200 | | | | | Pentair, Inc. | | | 250,632 | | |
| | 4,000 | | | | | Reddy Ice Holdings, Inc. | | | 101,240 | | |
| | | | 1,926,923 | | |
| | | | | Office Furnishings: 0.7% | |
| | 10,200 | | | | | Herman Miller, Inc. | | | 330,378 | | |
| | 11,388 | | | | | HNI, Corp. | | | 399,263 | | |
| | | | 729,641 | | |
| | | | | Office/Business Equip: 0.5% | |
| | 12,093 | | | | | Pitney Bowes, Inc. | | | 460,018 | | |
| | | | 460,018 | | |
| | | | | Oil & Gas: 2.2% | |
| | 2,468 | | | | | Apache Corp. | | | 265,409 | | |
| | 3,800 | | | @,L | | Continental Resources, Inc. | | | 99,294 | | |
| | 4,600 | | | @ | | Encore Acquisition Co. | | | 153,502 | | |
| | 990 | | | @ | | Forest Oil Corp. | | | 50,332 | | |
| | 2,700 | | | | | Helmerich & Payne, Inc. | | | 108,189 | | |
| | 12,740 | | | L | | St. Mary Land & Exploration Co. | | | 491,891 | | |
| | 4,900 | | | @ | | Swift Energy Co. | | | 215,747 | | |
| | 22,600 | | | | | W&T Offshore, Inc. | | | 677,096 | | |
| | 2,800 | | | @,L | | Whiting Petroleum Corp. | | | 161,448 | | |
| | | | 2,222,908 | | |
| | | | | Oil & Gas Services: 1.8% | |
| | 8,099 | | | @,L | | Cal Dive International, Inc. | | | 107,231 | | |
| | 1,400 | | | @ | | Exterran Holdings, Inc. | | | 114,520 | | |
| | 5,800 | | | @ | | Global Industries Ltd. | | | 124,236 | | |
| | 3,200 | | | @ | | Helix Energy Solutions Group, Inc. | | | 132,800 | | |
| | 2,200 | | | @,L | | Hornbeck Offshore Services, Inc. | | | 98,890 | | |
| | 12,200 | | | @ | | Key Energy Services, Inc. | | | 175,558 | | |
| | 6,400 | | | L | | Lufkin Industries, Inc. | | | 366,656 | | |
| | 25,100 | | | @,@@ | | North American Energy
Partners, Inc. | | | 340,105 | | |
| | 4,500 | | | @ | | Oil States International, Inc. | | | 153,540 | | |
| | 2,500 | | | @ | | W-H Energy Services, Inc. | | | 140,525 | | |
| | | | 1,754,061 | | |
| | | | | Packaging & Containers: 1.7% | |
| | 60,402 | | | L | | Bemis Co. | | | 1,653,807 | | |
| | | | 1,653,807 | | |
| | | | | Pharmaceuticals: 1.2% | |
| | 8,000 | | | @,L | | Alpharma, Inc. | | | 161,200 | | |
| | 7,100 | | | | | Bristol-Myers Squibb Co. | | | 188,292 | | |
| | 8,000 | | | @,L | | Par Pharmaceutical Cos., Inc. | | | 192,000 | | |
| | 2,800 | | | L | | Perrigo Co. | | | 98,028 | | |
| | 12,400 | | | @ | | Sepracor, Inc. | | | 325,500 | | |
| | 9,867 | | | @ | | Watson Pharmaceuticals, Inc. | | | 267,790 | | |
| | | | 1,232,810 | | |
| | | | | Pipelines: 0.3% | |
| | 5,074 | | | | | Equitable Resources, Inc. | | | 270,343 | | |
| | | | 270,343 | | |
| Shares | | | | | | Value | |
| | | | | Real Estate: 0.1% | |
| | 15,900 | | | @ | | HFF, Inc. | | $ | 123,066 | | |
| | | | 123,066 | | |
| | | | | Retail: 5.4% | |
| | 7,700 | | | | | Barnes & Noble, Inc. | | | 265,265 | | |
| | 3,700 | | | @,L | | BJ's Wholesale Club, Inc. | | | 125,171 | | |
| | 5,800 | | | | | Brown Shoe Co., Inc. | | | 87,986 | | |
| | 17,900 | | | @,L | | California Pizza Kitchen, Inc. | | | 278,703 | | |
| | 4,400 | | | | | Casey's General Stores, Inc. | | | 130,284 | | |
| | 8,500 | | | L | | Cato Corp. | | | 133,110 | | |
| | 27,800 | | | @,L | | CEC Entertainment, Inc. | | | 721,688 | | |
| | 18,200 | | | @,L | | Charming Shoppes, Inc. | | | 98,462 | | |
| | 13,600 | | | | | Family Dollar Stores, Inc. | | | 261,528 | | |
| | 14,200 | | | L | | Fred's, Inc. | | | 136,746 | | |
| | 7,300 | | | L | | Group 1 Automotive, Inc. | | | 173,375 | | |
| | 40,200 | | | @,L | | HOT Topic, Inc. | | | 233,964 | | |
| | 5,589 | | | @ | | Insight Enterprises, Inc. | | | 101,943 | | |
| | 30,700 | | | | | Kenneth Cole Productions, Inc. | | | 536,943 | | |
| | 15,653 | | | | | Lowe's Cos., Inc. | | | 354,071 | | |
| | 7,300 | | | @,L | | Panera Bread Co. | | | 261,486 | | |
| | 10,800 | | | L | | Penske Auto Group, Inc. | | | 188,568 | | |
| | 17,000 | | | @,L | | Pier 1 Imports, Inc. | | | 88,910 | | |
| | 8,300 | | | @,L | | Red Robin Gourmet Burgers, Inc. | | | 265,517 | | |
| | 4,600 | | | | | Regis Corp. | | | 128,616 | | |
| | 37,600 | | | L | | Ruby Tuesday, Inc. | | | 366,600 | | |
| | 5,800 | | | L | | Stage Stores, Inc. | | | 85,840 | | |
| | 6,400 | | | | | Talbots, Inc. | | | 75,648 | | |
| | 23,900 | | | L | | Tuesday Morning Corp. | | | 121,173 | | |
| | 7,200 | | | @,L | | Zale Corp. | | | 115,632 | | |
| | | | 5,337,229 | | |
| | | | | Savings & Loans: 0.6% | |
| | 11,000 | | | | | First Niagara Financial
Group, Inc. | | | 132,440 | | |
| | 7,400 | | | | | People's United Financial, Inc. | | | 131,720 | | |
| | 15,600 | | | | | Washington Federal, Inc. | | | 329,316 | | |
| | | | 593,476 | | |
| | | | | Semiconductors: 2.6% | |
| | 5,700 | | | | | Applied Materials, Inc. | | | 101,232 | | |
| | 2,700 | | | @,L | | Cabot Microelectronics Corp. | | | 96,957 | | |
| | 7,600 | | | | | Cohu, Inc. | | | 116,280 | | |
| | 23,900 | | | @ | | Emulex Corp. | | | 390,048 | | |
| | 2,600 | | | | | KLA-Tencor Corp. | | | 125,216 | | |
| | 24,000 | | | @ | | Mattson Technology, Inc. | | | 205,440 | | |
| | 13,600 | | | @ | | MKS Instruments, Inc. | | | 260,304 | | |
| | 18,380 | | | @ | | QLogic Corp. | | | 260,996 | | |
| | 18,700 | | | @,L | | Rudolph Technologies, Inc. | | | 211,684 | | |
| | 22,000 | | | @ | | Teradyne, Inc. | | | 227,480 | | |
| | 21,400 | | | @,L | | Veeco Instruments, Inc. | | | 357,380 | | |
| | 7,400 | | | @,@@ | | Verigy Ltd. | | | 201,058 | | |
| | | | 2,554,075 | | |
| | | | | Software: 4.3% | |
| | 5,800 | | | @,L | | Aspen Technology, Inc. | | | 94,076 | | |
| | 6,200 | | | L | | Fair Isaac Corp. | | | 199,330 | | |
| | 4,100 | | | | | IMS Health, Inc. | | | 94,464 | | |
| | 8,500 | | | L | | MoneyGram International, Inc. | | | 130,645 | | |
| | 15,700 | | | @,L | | Packeteer, Inc. | | | 96,712 | | |
| | 88,701 | | | @ | | Parametric Technology Corp. | | | 1,583,313 | | |
| | 61,700 | | | @ | | Sybase, Inc. | | | 1,609,753 | | |
| | 66,100 | | | @,I | | Ulticom, Inc. | | | 528,800 | | |
| | | | 4,337,093 | | |
See Accompanying Notes to Financial Statements
177
ING AMERICAN CENTURY PORTFOLIO OF INVESTMENTS
SMALL-MID CAP VALUE PORTFOLIO AS OF DECEMBER 31, 2007 (CONTINUED)
| Shares | | | | | | Value | |
| | | | | Telecommunications: 0.7% | |
| | 1,600 | | | @ | | Anixter International, Inc. | | $ | 99,632 | | |
| | 9,500 | | | @,L | | Arris Group, Inc. | | | 94,810 | | |
| | 2,300 | | | @ | | CommScope, Inc. | | | 113,183 | | |
| | 31,100 | | | @ | | EFJ, Inc. | | | 85,214 | | |
| | 20,803 | | | | | Iowa Telecommunications
Services, Inc. | | | 338,257 | | |
| | | | 731,096 | | |
| | | | | Textiles: 0.2% | |
| | 4,400 | | | | | G&K Services, Inc. | | | 165,088 | | |
| | | | 165,088 | | |
| | | | | Toys/Games/Hobbies: 0.6% | |
| | 21,685 | | | @ | | RC2 Corp. | | | 608,698 | | |
| | | | 608,698 | | |
| | | | | Transportation: 1.2% | |
| | 1,800 | | | L | | Alexander & Baldwin, Inc. | | | 92,988 | | |
| | 5,700 | | | L | | Arkansas Best Corp. | | | 125,058 | | |
| | 19,500 | | | @@,L | | Double Hull Tankers, Inc. | | | 238,680 | | |
| | 20,689 | | | L | | Heartland Express, Inc. | | | 295,922 | | |
| | 5,700 | | | L | | OceanFreight, Inc. | | | 109,611 | | |
| | 19,400 | | | | | Werner Enterprises, Inc. | | | 330,382 | | |
| | | | 1,192,641 | | |
Total Common Stock
(Cost $96,446,296) | | | 90,016,956 | | |
| REAL ESTATE INVESTMENT TRUSTS: 2.9% | | | |
| | | | | Apartments: 0.6% | |
| | 50,069 | | | | | Education Realty Trust, Inc. | | | 562,776 | | |
| | | | 562,776 | | |
| | | | | Diversified: 0.4% | |
| | 24,460 | | | | | Lexington Corporate
Properties Trust | | | 355,648 | | |
| | | | 355,648 | | |
| | | | | Forest Products & Paper: 0.1% | |
| | 2,700 | | | | | Rayonier, Inc. | | | 127,548 | | |
| | | | 127,548 | | |
| | | | | Health Care: 0.2% | |
| | 8,400 | | | L | | Healthcare Realty Trust, Inc. | | | 213,276 | | |
| | | | 213,276 | | |
| | | | | Hotels: 0.1% | |
| | 6,700 | | | | | Sunstone Hotel Investors, Inc. | | | 122,543 | | |
| | | | 122,543 | | |
| | | | | Mortgage: 0.4% | |
| | 44,200 | | | | | MFA Mortgage Investments, Inc. | | | 408,850 | | |
| | | | 408,850 | | |
| | | | | Single Tenant: 1.1% | |
| | 33,500 | | | | | Getty Realty Corp. | | | 893,780 | | |
| | 4,500 | | | | | National Retail Properties, Inc. | | | 105,210 | | |
| | 3,700 | | | | | Realty Income Corp. | | | 99,974 | | |
| | | | 1,098,964 | | |
Total Real Estate
Investment Trusts
(Cost $3,223,468) | | | 2,889,605 | | |
| Shares | | | | | | Value | |
| EXCHANGE-TRADED FUNDS: 2.8% | | | |
| | | | | Exchange-Traded Funds: 2.8% | |
| | 9,500 | | | L | | iShares Russell 2000
Value Index Fund | | $ | 669,560 | | |
| | 12,893 | | | | | iShares S&P MidCap 400
Index Fund | | | 1,095,131 | | |
| | 15,100 | | | L | | iShares S&P SmallCap 600
Index Fund | | | 981,802 | | |
| | | | 2,746,493 | | |
Total Exchange-Traded Funds
(Cost $2,893,892) | | | 2,746,493 | | |
| PREFERRED STOCK: 1.5% | | | |
| | | | | Banks: 0.1% | |
| | 5,400 | | | P | | Midwest Banc Holdings, Inc.,
7.750%, due 12/31/49 | | | 144,720 | | |
| | | | 144,720 | | |
| | | | | Hotels: 0.2% | |
| | 10,468 | | | P,I | | Ashford Hospitality Trust,
8.450%, due 07/18/12 | | | 198,892 | | |
| | | | 198,892 | | |
| | | | | Insurance: 1.0% | |
| | 18,900 | | | @@,I | | Aspen Insurance Holdings Ltd.,
5.625%, due 12/31/49 | | | 999,338 | | |
| | | | 999,338 | | |
| | | | | Single Tenant: 0.2% | |
| | 8,300 | | | P,I | | National Retail Properties,
7.375%, due 10/12/11 | | | 166,083 | | |
| | | | 166,083 | | |
Total Preferred Stock
(Cost $1,556,294) | | | 1,509,033 | | |
Total Long-Term Investments
(Cost $104,119,950) | | | 97,162,087 | | |
Principal
Amount | | | | | |
| SHORT-TERM INVESTMENTS: 18.6% | |
| | | Securities Lending Collateralcc: 18.6% | |
| $ | 18,585,905 | | | Bank of New York Mellon Corp.
Institutional Cash Reserves | | | 18,585,906 | | |
Total Short-Term Investments
(Cost $18,585,906) | | | 18,585,906 | | |
Total Investments in
Securities
(Cost $122,705,856)* | | | 116.1 | % | | $ | 115,747,993 | | |
Other Assets and
Liabilities - Net | | | (16.1 | ) | | | (16,050,439 | ) | |
| Net Assets | | | 100.0 | % | | $ | 99,697,554 | | |
See Accompanying Notes to Financial Statements
178
ING AMERICAN CENTURY PORTFOLIO OF INVESTMENTS
SMALL-MID CAP VALUE PORTFOLIO AS OF DECEMBER 31, 2007 (CONTINUED)
@ Non-income producing security
@@ Foreign Issuer
P Preferred Stock may be called prior to convertible date.
cc Securities purchased with cash collateral for securities loaned.
I Illiquid Security
L Loaned security, a portion or all of the security is on loan at December 31, 2007.
S All or a portion of this security is segregated for certain derivatives, when-issued or delayed delivery securities and forward currency exchange contracts.
* Cost for federal income tax purposes is $125,833,551.
Net unrealized depreciation consists of:
| Gross Unrealized Appreciation | | $ | 119,878 | | |
| Gross Unrealized Depreciation | | | (10,205,436 | ) | |
| Net Unrealized Depreciation | | $ | (10,085,558 | ) | |
At December 31, 2007 the following forward foreign currency contracts were outstanding for the American Century Small-Mid Cap Value Portfolio:
| Currency | | Buy/Sell | | Settlement
Date | | In
Exchange
For | | Value | | Unrealized
Appreciation
(Depreciation) | |
| Canada Dollars | | | | | | | | | |
| |
| CAD | 174,420 | | | Sell | | 01/31/08 | | | 177,871 | | | | 176,727 | | | $ | 1,144 | | |
Euro
EUR 375,474 | | Sell | | 01/31/08 | | | 547,310 | | | | 548,963 | | | | (1,653 | ) | |
| | | $ | (509 | ) | |
See Accompanying Notes to Financial Statements
179
PORTFOLIO OF INVESTMENTS
ING BARON ASSET PORTFOLIO AS OF DECEMBER 31, 2007
| Shares | | | | | | Value | |
| COMMON STOCK: 91.0% | | | |
| | | | | Advertising: 2.1% | |
| | 15,000 | | | @ | | Lamar Advertising Co. | | $ | 721,050 | | |
| | | | 721,050 | | |
| | | | | Aerospace/Defense: 0.8% | |
| | 6,000 | | | @@ | | Empresa Brasileira de
Aeronautica SA ADR | | | 273,540 | | |
| | | | 273,540 | | |
| | | | | Banks: 1.1% | |
| | 6,500 | | | | | City National Corp. | | | 387,075 | | |
| | | | 387,075 | | |
| | | | | Commercial Services: 8.9% | |
| | 5,000 | | | | | Corporate Executive Board Co. | | | 300,500 | | |
| | 2,400 | | | @ | | Corrections Corp. of America | | | 70,824 | | |
| | 6,000 | | | | | DeVry, Inc. | | | 311,760 | | |
| | 30,000 | | | @ | | Gartner, Inc. | | | 526,800 | | |
| | 23,000 | | | @ | | Iron Mountain, Inc. | | | 851,460 | | |
| | 4,500 | | | @@ | | Ritchie Bros. Auctioneers, Inc. | | | 372,150 | | |
| | 6,700 | | | | | Robert Half International, Inc. | | | 181,168 | | |
| | 20,000 | | | @ | | SAIC, Inc. | | | 402,400 | | |
| | | | 3,017,062 | | |
| | | | | Computers: 2.9% | |
| | 10,000 | | | | | Factset Research Systems, Inc. | | | 557,000 | | |
| | 7,000 | | | @ | | IHS, Inc. | | | 423,920 | | |
| | | | 980,920 | | |
| | | | | Distribution/Wholesale: 1.3% | |
| | 10,600 | | | | | Fastenal Co. | | | 428,452 | | |
| | | | 428,452 | | |
| | | | | Diversified Financial Services: 12.5% | |
| | 6,500 | | | @ | | AllianceBernstein Holding LP | | | 489,125 | | |
| | 32,800 | | | | | Charles Schwab Corp. | | | 838,040 | | |
| | 1,200 | | | | | CME Group, Inc. | | | 823,200 | | |
| | 18,000 | | | | | Eaton Vance Corp. | | | 817,380 | | |
| | 9,000 | | | @ | | FCStone Group, Inc. | | | 414,270 | | |
| | 1,200 | | | @ | | IntercontinentalExchange, Inc. | | | 231,000 | | |
| | 12,000 | | | | | Jefferies Group, Inc. | | | 276,600 | | |
| | 10,000 | | | @@ | | Onex Corp. | | | 354,527 | | |
| | | | 4,244,142 | | |
| | | | | Electronics: 0.5% | |
| | 1,400 | | | @,@@ | | Mettler Toledo International, Inc. | | | 159,320 | | |
| | | | 159,320 | | |
| | | | | Energy-Alternate Sources: 2.8% | |
| | 15,000 | | | @ | | Covanta Holding Corp. | | | 414,900 | | |
| | 4,000 | | | @ | | Sunpower Corp. | | | 521,560 | | |
| | | | 936,460 | | |
| | | | | Entertainment: 2.2% | |
| | 5,000 | | | @ | | Penn National Gaming, Inc. | | | 297,750 | | |
| | 13,700 | | | @ | | Scientific Games Corp. | | | 455,525 | | |
| | | | 753,275 | | |
| | | | | Environmental Control: 1.7% | |
| | 10,000 | | | @ | | Stericycle, Inc. | | | 594,000 | | |
| | | | 594,000 | | |
| Shares | | | | | | Value | |
| | | | | Food: 1.4% | |
| | 12,000 | | | | | Whole Foods Market, Inc. | | $ | 489,600 | | |
| | | | 489,600 | | |
| | | | | Gas: 1.6% | |
| | 18,500 | | | | | Southern Union Co. | | | 543,160 | | |
| | | | 543,160 | | |
| | | | | Healthcare-Products: 6.1% | |
| | 9,000 | | | | | Densply International, Inc. | | | 405,180 | | |
| | 11,000 | | | @ | | Edwards Lifesciences Corp. | | | 505,890 | | |
| | 7,700 | | | @ | | Henry Schein, Inc. | | | 472,780 | | |
| | 8,400 | | | @ | | Idexx Laboratories, Inc. | | | 492,492 | | |
| | 4,000 | | | @ | | Varian Medical Systems, Inc. | | | 208,640 | | |
| | | | 2,084,982 | | |
| | | | | Healthcare-Services: 5.3% | |
| | 17,000 | | | | | Brookdale Senior Living, Inc. | | | 482,970 | | |
| | 15,300 | | | @ | | Community Health Systems, Inc. | | | 563,958 | | |
| | 7,300 | | | @,W | | Covance, Inc. | | | 632,326 | | |
| | 1,800 | | | @ | | Laboratory Corp. of America Holdings | | | 135,954 | | |
| | | | 1,815,208 | | |
| | | | | Insurance: 5.2% | |
| | 11,000 | | | @,@@ | | Arch Capital Group Ltd. | | | 773,850 | | |
| | 9,000 | | | | | Assurant, Inc. | | | 602,100 | | |
| | 17,000 | | | | | Brown & Brown, Inc. | | | 399,500 | | |
| | | | 1,775,450 | | |
| | | | | Internet: 0.9% | |
| | 3,000 | | | @ | | Equinix, Inc. | | | 303,210 | | |
| | | | 303,210 | | |
| | | | | Lodging: 5.0% | |
| | 11,000 | | | | | Boyd Gaming Corp. | | | 374,770 | | |
| | 8,700 | | | | | Choice Hotels International, Inc. | | | 288,840 | | |
| | 3,000 | | | @ | | Las Vegas Sands Corp. | | | 309,150 | | |
| | 6,400 | | | @ | | Wynn Resorts Ltd. | | | 717,632 | | |
| | | | 1,690,392 | | |
| | | | | Oil & Gas: 4.7% | |
| | 10,000 | | | | | Helmerich & Payne, Inc. | | | 400,700 | | |
| | 6,049 | | | @,@@ | | Petroplus Holdings AG | | | 468,575 | | |
| | 8,300 | | | | | Range Resources Corp. | | | 426,288 | | |
| | 5,625 | | | | | XTO Energy, Inc. | | | 288,900 | | |
| | | | 1,584,463 | | |
| | | | | Oil & Gas Services: 1.0% | |
| | 3,500 | | | @ | | SEACOR Holdings, Inc. | | | 324,590 | | |
| | | | 324,590 | | |
| | | | | Pharmaceuticals: 1.8% | |
| | 14,000 | | | @ | | VCA Antech, Inc. | | | 619,220 | | |
| | | | 619,220 | | |
| | | | | Real Estate: 2.1% | |
| | 22,000 | | | @ | | CB Richard Ellis Group, Inc. | | | 474,100 | | |
| | 5,500 | | | | | Forest City Enterprises, Inc. | | | 244,420 | | |
| | | | 718,520 | | |
| | | | | Retail: 12.3% | |
| | 18,500 | | | @ | | Carmax, Inc. | | | 365,375 | | |
| | 13,900 | | | @ | | Cheesecake Factory | | | 329,569 | | |
| | 14,000 | | | @ | | Copart, Inc. | | | 595,700 | | |
See Accompanying Notes to Financial Statements
180
PORTFOLIO OF INVESTMENTS
ING BARON ASSET PORTFOLIO AS OF DECEMBER 31, 2007 (CONTINUED)
| Shares | | | | | | Value | |
| | | | | Retail (continued) | |
| | 16,000 | | | @ | | Dick's Sporting Goods, Inc. | | $ | 444,160 | | |
| | 10,000 | | | @ | | J Crew Group, Inc. | | | 482,100 | | |
| | 12,000 | | | | | MSC Industrial Direct Co. | | | 485,640 | | |
| | 7,500 | | | @ | | O'Reilly Automotive, Inc. | | | 243,225 | | |
| | 12,000 | | | | | Polo Ralph Lauren Corp. | | | 741,480 | | |
| | 11,000 | | | | | Tiffany & Co. | | | 506,330 | | |
| | | | 4,193,579 | | |
| | | | | Software: 1.7% | |
| | 5,000 | | | @ | | MSCI, Inc.-Class A | | | 192,000 | | |
| | 6,000 | | | @ | | Nuance Communications, Inc. | | | 112,080 | | |
| | 8,200 | | | | | SEI Investments Co. | | | 263,794 | | |
| | | | 567,874 | | |
| | | | | Telecommunications: 1.9% | |
| | 2,000 | | | @ | | NII Holdings, Inc. | | | 96,640 | | |
| | 16,000 | | | @ | | SBA Communications Corp. | | | 541,440 | | |
| | | | 638,080 | | |
| | | | Transportation: 3.2% | |
| | 13,000 | | | | | CH Robinson Worldwide, Inc. | | | 703,560 | | |
| | 8,900 | | | | | Expeditors International
Washington, Inc. | | | 397,652 | | |
| | | | 1,101,212 | | |
Total Common Stock
(Cost $28,446,027) | | | 30,944,836 | | |
| REAL ESTATE INVESTMENT TRUSTS: 1.3% | | | |
| | | | | Office Property: 1.3% | |
| | 11,000 | | | | | Douglas Emmett, Inc. | | | 248,710 | | |
| | 2,000 | | | | | SL Green Realty Corp. | | | 186,920 | | |
Total Real Estate Investment Trusts
(Cost $487,269) | | | 435,630 | | |
Total Investments in
Securities
(Cost $28,933,296)* | | | 92.3 | % | | $ | 31,380,466 | | |
Other Assets and
Liabilities - Net | | | 7.7 | | | | 2,630,441 | | |
| Net Assets | | | 100.0 | % | | $ | 34,010,907 | | |
@ Non-income producing security
@@ Foreign Issuer
ADR American Depositary Receipt
W When-issued or delayed delivery security
* Cost for federal income tax purposes is $28,937,135
Net unrealized appreciation consists of:
| Gross Unrealized Appreciation | | $ | 4,372,066 | | |
| Gross Unrealized Depreciation | | | (1,928,735 | ) | |
| Net Unrealized Appreciation | | $ | 2,443,331 | | |
See Accompanying Notes to Financial Statements
181
ING BARON SMALL CAP PORTFOLIO OF INVESTMENTS
GROWTH PORTFOLIO AS OF DECEMBER 31, 2007
| Shares | | | | | | Value | |
| COMMON STOCK: 88.6% | | | |
| | | | | Airlines: 1.0% | |
| | 200,000 | | | @ | | Allegiant Travel Co. | | $ | 6,428,001 | | |
| | | | 6,428,001 | | |
| | | | | Apparel: 1.1% | |
| | 350,000 | | | @ | | Carter's, Inc. | | | 6,772,500 | | |
| | | | 6,772,500 | | |
| | | | | Banks: 4.2% | |
| | 80,000 | | | | | Cathay General Bancorp. | | | 2,119,200 | | |
| | 160,000 | | | | | Center Financial Corp. | | | 1,971,200 | | |
| | 120,000 | | | | | Central Pacific Financial Corp. | | | 2,215,200 | | |
| | 75,000 | | | | | Frontier Financial Corp. | | | 1,392,750 | | |
| | 165,000 | | | | | Glacier Bancorp., Inc. | | | 3,092,100 | | |
| | 150,000 | | | @ | | SVB Financial Group | | | 7,560,000 | | |
| | 299,990 | | | | | UCBH Holdings, Inc. | | | 4,247,858 | | |
| | 145,000 | | | @ | | Virginia Commerce Bancorp. | | | 1,700,850 | | |
| | 140,500 | | | @ | | Western Alliance Bancorp. | | | 2,637,185 | | |
| | | | 26,936,343 | | |
| | | | | Beverages: 0.9% | |
| | 200,000 | | | @ | | Peet's Coffee & Tea, Inc. | | | 5,814,000 | | |
| | | | 5,814,000 | | |
| | | | | Biotechnology: 0.3% | |
| | 32,000 | | | @ | | Charles River Laboratories
International, Inc. | | | 2,105,600 | | |
| | | | 2,105,600 | | |
| | | | | Building Materials: 0.7% | |
| | 200,000 | | | | | Apogee Enterprises, Inc. | | | 3,422,000 | | |
| | 29,358 | | | | | Eagle Materials, Inc. | | | 1,041,622 | | |
| | | | 4,463,622 | | |
| | | | | Commercial Services: 10.5% | |
| | 77,000 | | | @ | | Bankrate, Inc. | | | 3,702,930 | | |
| | 125,000 | | | | | Chemed Corp. | | | 6,985,000 | | |
| | 47,100 | | | @,W | | ChoicePoint, Inc. | | | 1,715,382 | | |
| | 120,000 | | | @ | | CoStar Group, Inc. | | | 5,670,000 | | |
| | 325,000 | | | | | DeVry, Inc. | | | 16,887,001 | | |
| | 225,000 | | | @ | | Gartner, Inc. | | | 3,951,000 | | |
| | 150,000 | | | | | Macquarie Infrastructure
Co. Trust | | | 6,079,500 | | |
| | 100,000 | | | @ | | Morningstar, Inc. | | | 7,775,000 | | |
| | 24,187 | | | @@ | | Ritchie Bros. Auctioneers, Inc. | | | 2,000,265 | | |
| | 110,000 | | | | | Sotheby's | | | 4,191,000 | | |
| | 100,000 | | | @,@@ | | Steiner Leisure Ltd. | | | 4,416,000 | | |
| | 25,000 | | | | | Strayer Education, Inc. | | | 4,264,500 | | |
| | | | 67,637,578 | | |
| | | | | Distribution/Wholesale: 1.1% | |
| | 326,200 | | | @ | | LKQ Corp. | | | 6,856,724 | | |
| | | | 6,856,724 | | |
| | | | | Diversified Financial Services: 6.6% | |
| | 325,000 | | | | | Cohen & Steers, Inc. | | | 9,740,250 | | |
| | 143,256 | | | | | Evercore Partners, Inc. | | | 3,087,167 | | |
| | 225,000 | | | @ | | FCStone Group, Inc. | | | 10,356,750 | | |
| | 62,457 | | | | | GAMCO Investors, Inc. | | | 4,322,024 | | |
| | 250,000 | | | | | Jefferies Group, Inc. | | | 5,762,500 | | |
| | 145,000 | | | | | National Financial Partners Corp. | | | 6,613,450 | | |
| | 201,300 | | | @ | | Thomas Weisel Partners
Group, Inc. | | | 2,763,849 | | |
| | | | 42,645,990 | | |
| Shares | | | | | | Value | |
| | | | | Electric: 1.4% | |
| | 160,000 | | | | | ITC Holdings Corp. | | $ | 9,027,200 | | |
| | | | 9,027,200 | | |
| | | | | Energy-Alternate Sources: 2.4% | |
| | 120,000 | | | @ | | Sunpower Corp. | | | 15,646,800 | | |
| | | | 15,646,800 | | |
| | | | | Engineering & Construction: 1.5% | |
| | 200,000 | | | @ | | Aecom Technology Corp. | | | 5,714,000 | | |
| | 80,000 | | | @ | | Layne Christensen Co. | | | 3,936,800 | | |
| | | | 9,650,800 | | |
| | | | | Entertainment: 3.7% | |
| | 75,000 | | | @ | | Great Wolf Resorts, Inc. | | | 735,750 | | |
| | 475,000 | | | @ | | Isle of Capri Casinos, Inc. | | | 6,540,750 | | |
| | 50,000 | | | @ | | Penn National Gaming, Inc. | | | 2,977,500 | | |
| | 275,200 | | | @ | | Pinnacle Entertainment, Inc. | | | 6,483,712 | | |
| | 150,000 | | | @ | | Scientific Games Corp. | | | 4,987,500 | | |
| | 45,000 | | | @ | | Vail Resorts, Inc. | | | 2,421,450 | | |
| | | | 24,146,662 | | |
| | | | | Food: 1.7% | |
| | 180,000 | | | @ | | Ralcorp Holdings, Inc. | | | 10,942,200 | | |
| | | | 10,942,200 | | |
| | | | | Gas: 0.4% | |
| | 88,198 | | | | | Southern Union Co. | | | 2,589,493 | | |
| | | | 2,589,493 | | |
| | | | | Healthcare-Products: 2.5% | |
| | 100,000 | | | @ | | Edwards Lifesciences Corp. | | | 4,599,000 | | |
| | 75,000 | | | @ | | Gen-Probe, Inc. | | | 4,719,750 | | |
| | 15,000 | | | @ | | Intuitive Surgical, Inc. | | | 4,867,500 | | |
| | 115,000 | | | @ | | PSS World Medical, Inc. | | | 2,250,550 | | |
| | | | 16,436,800 | | |
| | | | | Healthcare-Services: 5.9% | |
| | 235,000 | | | @ | | AMERIGROUP Corp. | | | 8,565,750 | | |
| | 175,000 | | | @ | | Centene Corp. | | | 4,802,000 | | |
| | 80,000 | | | @ | | Community Health Systems, Inc. | | | 2,948,800 | | |
| | 100,000 | | | @ | | Emeritus Corp. | | | 2,515,000 | | |
| | 165,000 | | | @ | | Healthways, Inc. | | | 9,642,600 | | |
| | 190,900 | | | @ | | Nighthawk Radiology
Holdings, Inc. | | | 4,018,445 | | |
| | 90,000 | | | @ | | Odyssey HealthCare, Inc. | | | 995,400 | | |
| | 159,040 | | | @ | | Skilled Healthcare Group, Inc. | | | 2,326,755 | | |
| | 140,000 | | | @ | | Sun Healthcare Group, Inc. | | | 2,403,800 | | |
| | | | 38,218,550 | | |
| | | | | Home Builders: 0.3% | |
| | 108,500 | | | | | Brookfield Homes Corp. | | | 1,714,300 | | |
| | | | 1,714,300 | | |
| | | | | Household Products/Wares: 1.0% | |
| | 125,000 | | | | | Church & Dwight Co., Inc. | | | 6,758,750 | | |
| | | | 6,758,750 | | |
| | | | | Insurance: 1.1% | |
| | 65,000 | | | @,@@ | | Arch Capital Group Ltd. | | | 4,572,750 | | |
| | 10,000 | | | | | Brown & Brown, Inc. | | | 235,000 | | |
| | 125,000 | | | @,@@ | | CNinsure, Inc. ADR | | | 1,968,750 | | |
| | | | 6,776,500 | | |
See Accompanying Notes to Financial Statements
182
ING BARON SMALL CAP PORTFOLIO OF INVESTMENTS
GROWTH PORTFOLIO AS OF DECEMBER 31, 2007 (CONTINUED)
| Shares | | | | | | Value | |
| | | | | Internet: 4.2% | |
| | 80,000 | | | @ | | Blue Nile, Inc. | | $ | 5,444,800 | | |
| | 676,011 | | | @ | | Emdeon Corp. | | | 9,058,547 | | |
| | 120,000 | | | @ | | Equinix, Inc. | | | 12,128,400 | | |
| | 25,222 | | | @ | | TechTarget, Inc. | | | 372,781 | | |
| | | | 27,004,528 | | |
| | | | | Lodging: 4.5% | |
| | 267,600 | | | | | Ameristar Casinos, Inc. | | | 7,369,704 | | |
| | 250,000 | | | | | Choice Hotels International, Inc. | | | 8,300,000 | | |
| | 180,000 | | | @,W | | Gaylord Entertainment Co. | | | 7,284,600 | | |
| | 55,000 | | | @ | | Wynn Resorts Ltd. | | | 6,167,150 | | |
| | | | 29,121,454 | | |
| | | | | Media: 1.3% | |
| | 75,000 | | | @,@@ | | Central European Media
Enterprises Ltd. | | | 8,698,500 | | |
| | | | 8,698,500 | | |
| | | | | Miscellaneous Manufacturing: 0.6% | |
| | 200,000 | | | | | American Railcar Industries, Inc. | | | 3,850,000 | | |
| | | | 3,850,000 | | |
| | | | | Oil & Gas: 3.9% | |
| | 35,000 | | | @ | | Carrizo Oil & Gas, Inc. | | | 1,916,250 | | |
| | 240,000 | | | @ | | Encore Acquisition Co. | | | 8,008,800 | | |
| | 200,000 | | | @ | | EXCO Resources, Inc. | | | 3,096,000 | | |
| | 175,000 | | | | | Helmerich & Payne, Inc. | | | 7,012,250 | | |
| | 45,000 | | | | | Range Resources Corp. | | | 2,311,200 | | |
| | 45,000 | | | @ | | Whiting Petroleum Corp. | | | 2,594,700 | | |
| | | | 24,939,200 | | |
| | | | | Oil & Gas Services: 5.4% | |
| | 80,000 | | | @ | | Core Laboratories NV | | | 9,977,600 | | |
| | 160,000 | | | @ | | Dresser-Rand Group, Inc. | | | 6,248,000 | | |
| | 160,000 | | | @ | | FMC Technologies, Inc. | | | 9,072,000 | | |
| | 60,000 | | | @ | | SEACOR Holdings, Inc. | | | 5,564,400 | | |
| | 90,000 | | | @ | | Tetra Technologies, Inc. | | | 1,401,300 | | |
| | 60,000 | | | @,@@ | | Willbros Group, Inc | | | 2,297,400 | | |
| | | | 34,560,700 | | |
| | | | | Real Estate: 2.0% | |
| | 240,000 | | | @ | | CB Richard Ellis Group, Inc. | | | 5,172,000 | | |
| | 75,000 | | | @ | | HFF, Inc. | | | 580,500 | | |
| | 200,000 | | | | | St. Joe Co. | | | 7,102,000 | | |
| | | | 12,854,500 | | |
| | | | | Retail: 14.6% | |
| | 390,000 | | | @ | | Cabela's, Inc. | | | 5,877,300 | | |
| | 247,500 | | | @ | | California Pizza Kitchen, Inc. | | | 3,853,575 | | |
| | 200,000 | | | @ | | Carmax, Inc. | | | 3,950,000 | | |
| | 220,000 | | | @ | | Cheesecake Factory | | | 5,216,200 | | |
| | 225,000 | | | @,@@ | | China Nepstar Chain Drugstore
Ltd. ADR | | | 3,955,500 | | |
| | 60,000 | | | @ | | Chipotle Mexican Grill, Inc. | | | 8,824,200 | | |
| | 200,000 | | | @ | | Copart, Inc. | | | 8,510,000 | | |
| | 400,000 | | | @ | | Dick's Sporting Goods, Inc. | | | 11,104,000 | | |
| | 128,500 | | | @ | | DSW, Inc. | | | 2,410,660 | | |
| | 250,000 | | | @ | | J Crew Group, Inc. | | | 12,052,500 | | |
| | 190,000 | | | @ | | Panera Bread Co. | | | 6,805,800 | | |
| | 470,000 | | | | | Penske Auto Group, Inc. | | | 8,206,200 | | |
| | 10,000 | | | | | Polo Ralph Lauren Corp. | | | 617,900 | | |
| Shares | | | | | | Value | |
| | 100,000 | | | @ | | Texas Roadhouse, Inc. | | $ | 1,106,000 | | |
| | 70,000 | | | @ | | Tractor Supply Co. | | | 2,515,800 | | |
| | 38,500 | | | @ | | Ulta Salon Cosmetics &
Fragrance, Inc. | | | 660,275 | | |
| | 200,000 | | | @ | | Under Armour, Inc. | | | 8,734,000 | | |
| | | | 94,399,910 | | |
| | | | | Software: 0.6% | |
| | 200,000 | | | @ | | Allscripts Healthcare
Solutions, Inc. | | | 3,884,000 | | |
| | | | 3,884,000 | | |
| | | | | Telecommunications: 0.5% | |
| | 90,000 | | | @ | | SBA Communications Corp. | | | 3,045,600 | | |
| | | | 3,045,600 | | |
| | | | | Toys/Games/Hobbies: 0.9% | |
| | 225,000 | | | @ | | Marvel Entertainment, Inc. | | | 6,009,750 | | |
| | | | 6,009,750 | | |
| | | | | Transportation: 1.3% | |
| | 250,000 | | | @ | | Genesee & Wyoming, Inc. | | | 6,042,500 | | |
| | 60,000 | | | | | Landstar System, Inc. | | | 2,529,000 | | |
| | | | 8,571,500 | | |
| | | | | Trucking & Leasing: 0.5% | |
| | 123,000 | | | | | Aircastle Ltd. | | | 3,238,590 | | |
| | | | 3,238,590 | | |
Total Common Stock
(Cost $451,695,251) | | | 571,746,645 | | |
| REAL ESTATE INVESTMENT TRUSTS: 2.7% | | | |
| | | | | Diversified: 1.2% | |
| | 200,000 | | | | | Digital Realty Trust, Inc. | | | 7,674,000 | | |
| | | | 7,674,000 | | |
| | | | | Shopping Centers: 0.7% | |
| | 190,000 | | | | | Acadia Realty Trust | | | 4,865,900 | | |
| | | | 4,865,900 | | |
| | | | | Single Tenant: 0.8% | |
| | 14,300 | | | @ | | Alexander's, Inc. | | | 5,051,475 | | |
| | | | 5,051,475 | | |
Total Real Estate
Investment Trusts
(Cost $16,108,448) | | | 17,591,375 | | |
Total Long-Term Investments
(Cost $467,803,699) | | | 589,338,020 | | |
See Accompanying Notes to Financial Statements
183
ING BARON SMALL CAP PORTFOLIO OF INVESTMENTS
GROWTH PORTFOLIO AS OF DECEMBER 31, 2007 (CONTINUED)
Principal
Amount | | | | | | Value | |
| SHORT-TERM INVESTMENTS: 8.1% | |
| | | | | U.S. Government
Agency Obligations: 8.1% | | | |
| $ | 52,193,000 | | | Z | | Federal Home Loan Bank,
3.050%, due 01/02/08 | | $ | 52,184,156 | | |
Total Short-Term Investments
(Cost $52,184,156) | | | 52,184,156 | | |
Total Investments in
Securities
(Cost $519,987,855)* | | | 99.4 | % | | $ | 641,522,176 | | |
Other Assets and
Liabilities - Net | | | 0.6 | | | | 3,724,441 | | |
| Net Assets | | | 100.0 | % | | $ | 645,246,617 | | |
@ Non-income producing security
@@ Foreign Issuer
ADR American Depositary Receipt
W When-issued or delayed delivery security
Z Indicates Zero Coupon Bond; rate shown reflects current effective yield.
* Cost for federal income tax purposes is $520,055,243
Net unrealized appreciation consists of:
| Gross Unrealized Appreciation | | $ | 159,603,945 | | |
| Gross Unrealized Depreciation | | | (38,137,012 | ) | |
| Net Unrealized Appreciation | | $ | 121,466,933 | | |
See Accompanying Notes to Financial Statements
184
ING COLUMBIA PORTFOLIO OF INVESTMENTS
SMALL CAP VALUE II PORTFOLIO AS OF DECEMBER 31, 2007
| Shares | | | | | | Value | |
| COMMON STOCK: 87.8% | | | |
| | | | | Aerospace/Defense: 5.0% | |
| | 54,000 | | | @ | | AAR Corp. | | $ | 2,053,620 | | |
| | 38,000 | | | @ | | BE Aerospace, Inc. | | | 2,010,200 | | |
| | 34,000 | | | | | DRS Technologies, Inc. | | | 1,845,180 | | |
| | 44,000 | | | @ | | Esterline Technologies Corp. | | | 2,277,000 | | |
| | 26,000 | | | | | Triumph Group, Inc. | | | 2,141,100 | | |
| | | | 10,327,100 | | |
| | | | | Agriculture: 1.1% | |
| | 43,000 | | | | | Universal Corp. | | | 2,202,460 | | |
| | | | 2,202,460 | | |
| | | | | Airlines: 0.8% | |
| | 67,800 | | | @ | | Alaska Air Group, Inc. | | | 1,695,678 | | |
| | | | 1,695,678 | | |
| | | | | Apparel: 0.7% | |
| | 44,000 | | | @ | | Warnaco Group, Inc. | | | 1,531,200 | | |
| | | | 1,531,200 | | |
| | | | | Auto Parts & Equipment: 1.3% | |
| | 86,000 | | | | | Cooper Tire & Rubber Co. | | | 1,425,880 | | |
| | 50,000 | | | @ | | Tenneco, Inc. | | | 1,303,500 | | |
| | | | 2,729,380 | | |
| | | | | Banks: 8.8% | |
| | 77,000 | | | | | AmericanWest Bancorp. | | | 1,357,510 | | |
| | 86,000 | | | | | Bancorpsouth, Inc. | | | 2,030,460 | | |
| | 88,000 | | | | | Colonial BancGroup, Inc. | | | 1,191,520 | | |
| | 84,000 | | | | | Community Bank System, Inc. | | | 1,669,080 | | |
| | 47,000 | | | | | First Midwest Bancorp., Inc. | | | 1,438,200 | | |
| | 55,000 | | | | | First State Bancorp. | | | 764,500 | | |
| | 47,600 | | | | | Frontier Financial Corp. | | | 883,932 | | |
| | 60,000 | | | | | Independent Bank Corp. | | | 1,633,200 | | |
| | 50,100 | | | | | Pacific Capital Bancorp. | | | 1,008,513 | | |
| | 68,000 | | | | | Prosperity Bancshares, Inc. | | | 1,998,520 | | |
| | 32,500 | | | @ | | SVB Financial Group | | | 1,638,000 | | |
| | 87,000 | | | | | UCBH Holdings, Inc. | | | 1,231,920 | | |
| | 96,500 | | | | | Umpqua Holdings Corp. | | | 1,480,310 | | |
| | | | 18,325,665 | | |
| | | | | Building Materials: 1.6% | |
| | 111,000 | | | | | Comfort Systems USA, Inc. | | | 1,418,580 | | |
| | 111,000 | | | | | LSI Industries, Inc. | | | 2,020,200 | | |
| | | | 3,438,780 | | |
| | | | | Chemicals: 2.1% | |
| | 107,600 | | | | | Olin Corp. | | | 2,079,908 | | |
| | 67,000 | | | @ | | Rockwood Holdings, Inc. | | | 2,225,740 | | |
| | | | 4,305,648 | | |
| | | | | Coal: 0.9% | |
| | 55,200 | | | | | Massey Energy Co. | | | 1,973,400 | | |
| | | | 1,973,400 | | |
| | | | | Commercial Services: 7.6% | |
| | 106,000 | | | | | ABM Industries, Inc. | | | 2,161,340 | | |
| | 78,000 | | | | | Bowne & Co., Inc. | | | 1,372,800 | | |
| | 125,000 | | | @ | | CBIZ, Inc. | | | 1,226,250 | | |
| | 27,000 | | | @ | | Consolidated Graphics, Inc. | | | 1,291,140 | | |
| | 75,000 | | | @ | | Cornell Cos., Inc. | | | 1,749,000 | | |
| | 65,400 | | | | | Deluxe Corp. | | | 2,151,006 | | |
| | 28,000 | | | @ | | FTI Consulting, Inc. | | | 1,725,920 | | |
| Shares | | | | | | Value | |
| | 30,000 | | | @ | | Integrated Electrical Services, Inc. | | $ | 563,700 | | |
| | 165,600 | | | | | Stewart Enterprises, Inc. | | | 1,473,840 | | |
| | 44,000 | | | | | Watson Wyatt Worldwide, Inc. | | | 2,042,040 | | |
| | | | 15,757,036 | | |
| | | | | Computers: 2.5% | |
| | 190,000 | | | @ | | Brocade Communications
Systems, Inc. | | | 1,394,600 | | |
| | 47,000 | | | @ | | Electronics for Imaging | | | 1,056,560 | | |
| | 124,600 | | | @ | | Mentor Graphics Corp. | | | 1,343,188 | | |
| | 35,500 | | | | | MTS Systems Corp. | | | 1,514,785 | | |
| | | | 5,309,133 | | |
| | | | | Cosmetics/Personal Care: 1.2% | |
| | 20,500 | | | @ | | Chattem, Inc. | | | 1,548,570 | | |
| | 58,000 | | | | | Inter Parfums, Inc. | | | 1,042,260 | | |
| | | | 2,590,830 | | |
| | | | | Distribution/Wholesale: 1.0% | |
| | 47,000 | | | | | Owens & Minor, Inc. | | | 1,994,210 | | |
| | | | 1,994,210 | | |
| | | | | Diversified Financial Services: 2.1% | |
| | 13,800 | | | @ | | Affiliated Managers Group, Inc. | | | 1,620,948 | | |
| | 35,000 | | | @@ | | Lazard Ltd. | | | 1,423,800 | | |
| | 30,000 | | | | | National Financial Partners Corp. | | | 1,368,300 | | |
| | | | 4,413,048 | | |
| | | | | Electric: 1.0% | |
| | 42,000 | | | | | Integrys Energy Group, Inc. | | | 2,170,980 | | |
| | | | 2,170,980 | | |
| | | | | | | Electrical Components &
Equipment: 0.6% | | | | | |
| | 200,000 | | | @ | | C&D Technologies, Inc. | | | 1,322,000 | | |
| | | | 1,322,000 | | |
| | | | | Electronics: 3.2% | |
| | 59,500 | | | @ | | Electro Scientific Industries, Inc. | | | 1,181,075 | | |
| | 44,800 | | | @ | | Rofin-Sinar Technologies, Inc. | | | 2,155,328 | | |
| | 39,500 | | | @ | | Rogers Corp. | | | 1,713,115 | | |
| | 139,000 | | | @ | | X-Rite, Inc. | | | 1,615,180 | | |
| | | | 6,664,698 | | |
| | | | | Energy-Alternate Sources: 0.6% | |
| | 17,100 | | | @,@@ | | JA Solar Holdings Co., Ltd. ADR | | | 1,193,751 | | |
| | | | 1,193,751 | | |
| | | | | Engineering & Construction: 0.5% | |
| | 17,761 | | | @ | | URS Corp. | | | 964,955 | | |
| | | | 964,955 | | |
| | | | | Entertainment: 1.9% | |
| | 36,200 | | | @ | | Bally Technologies, Inc. | | | 1,799,864 | | |
| | 24,157 | | | | | Carmike Cinemas, Inc. | | | 175,380 | | |
| | 113,346 | | | | | Cinemark Holdings, Inc. | | | 1,926,882 | | |
| | | | 3,902,126 | | |
| | | | | Food: 1.4% | |
| | 18,650 | | | @ | | Great Atlantic & Pacific Tea Co. | | | 584,305 | | |
| | 55,100 | | | @ | | Performance Food Group Co. | | | 1,480,537 | | |
| | 51,500 | | | @ | | Winn-Dixie Stores, Inc. | | | 868,805 | | |
| | | | 2,933,647 | | |
See Accompanying Notes to Financial Statements
185
ING COLUMBIA PORTFOLIO OF INVESTMENTS
SMALL CAP VALUE II PORTFOLIO AS OF DECEMBER 31, 2007 (CONTINUED)
| Shares | | | | | | Value | |
| | | | | Forest Products & Paper: 1.4% | |
| | 42,400 | | | | | Rock-Tenn Co. | | $ | 1,077,384 | | |
| | 71,700 | | | | | Schweitzer-Mauduit
International, Inc. | | | 1,857,747 | | |
| | | | 2,935,131 | | |
| | | | | Gas: 2.0% | |
| | 74,000 | | | | | Atmos Energy Corp. | | | 2,074,960 | | |
| | 42,000 | | | | | New Jersey Resources Corp. | | | 2,100,840 | | |
| | | | 4,175,800 | | |
| | | | | Healthcare-Products: 2.8% | |
| | 42,000 | | | | | Datascope Corp. | | | 1,528,800 | | |
| | 12,894 | | | @ | | Haemonetics Corp. | | | 812,580 | | |
| | 70,000 | | | | | Invacare Corp. | | | 1,764,000 | | |
| | 84,000 | | | @ | | Medical Action Industries, Inc. | | | 1,751,400 | | |
| | | | 5,856,780 | | |
| | | | | Healthcare-Services: 2.3% | |
| | 14,609 | | | @ | | Centene Corp. | | | 400,871 | | |
| | 85,000 | | | @ | | Kindred Healthcare, Inc. | | | 2,123,300 | | |
| | 49,000 | | | @ | | Magellan Health Services, Inc. | | | 2,284,870 | | |
| | | | 4,809,041 | | |
| | | | | Household Products/Wares: 1.4% | |
| | 70,000 | | | @ | | Helen of Troy Ltd. | | | 1,199,800 | | |
| | 52,000 | | | | | Tupperware Corp. | | | 1,717,560 | | |
| | | | 2,917,360 | | |
| | | | | Insurance: 6.0% | |
| | 33,000 | | | @,@@ | | Argo Group International
Holdings Ltd. | | | 1,390,290 | | |
| | 76,500 | | | @@ | | Aspen Insurance Holdings Ltd. | | | 2,206,260 | | |
| | 85,000 | | | @@ | | Assured Guaranty Ltd. | | | 2,255,898 | | |
| | 44,000 | | | | | Delphi Financial Group | | | 1,552,320 | | |
| | 45,000 | | | | | NYMAGIC, Inc. | | | 1,040,850 | | |
| | 58,000 | | | @@ | | Platinum Underwriters
Holdings Ltd. | | | 2,062,480 | | |
| | 47,000 | | | | | Zenith National Insurance Corp. | | | 2,102,310 | | |
| | | | 12,610,408 | | |
| | | | | Internet: 0.9% | |
| | 170,000 | | | @ | | Ariba, Inc. | | | 1,895,500 | | |
| | | | 1,895,500 | | |
| | | | | Investment Companies: 0.3% | |
| | 40,313 | | | | | Apollo Investment Corp. | | | 687,337 | | |
| | | | 687,337 | | |
| | | | | Iron/Steel: 1.3% | |
| | 29,000 | | | | | Carpenter Technology Corp. | | | 2,179,930 | | |
| | 14,066 | | | | | Olympic Steel, Inc. | | | 446,033 | | |
| | | | 2,625,963 | | |
| | | | | Leisure Time: 0.8% | |
| | 92,000 | | | | | Callaway Golf Co. | | | 1,603,560 | | |
| | | | 1,603,560 | | |
| | | | | Machinery-Diversified: 2.5% | |
| | 28,900 | | | @ | | AGCO Corp. | | | 1,964,622 | | |
| | 56,000 | | | @ | | Gardner Denver, Inc. | | | 1,848,000 | | |
| | 120,000 | | | @ | | Gerber Scientific, Inc. | | | 1,296,000 | | |
| | | | 5,108,622 | | |
| Shares | | | | | | Value | |
| | | | | Media: 0.8% | |
| | 109,600 | | | | | World Wrestling
Entertainment, Inc. | | $ | 1,617,696 | | |
| | | | 1,617,696 | | |
| | | | | Miscellaneous Manufacturing: 2.2% | |
| | 68,000 | | | | | Actuant Corp. | | | 2,312,680 | | |
| | 65,000 | | | | | Barnes Group, Inc. | | | 2,170,350 | | |
| | | | 4,483,030 | | |
| | | | | Oil & Gas: 0.7% | |
| | 90,000 | | | @ | | EXCO Resources, Inc. | | | 1,393,200 | | |
| | | | 1,393,200 | | |
| | | | | Oil & Gas Services: 1.7% | |
| | 27,500 | | | @ | | Exterran Holdings, Inc. | | | 2,249,500 | | |
| | 40,000 | | | @ | | Oil States International, Inc. | | | 1,364,800 | | |
| | | | 3,614,300 | | |
| | | | | Packaging & Containers: 0.7% | |
| | 56,500 | | | @ | | Crown Holdings, Inc. | | | 1,449,225 | | |
| | | | 1,449,225 | | |
| | | | | Pharmaceuticals: 0.4% | |
| | 65,000 | | | @ | | PharMerica Corp. | | | 902,200 | | |
| | | | 902,200 | | |
| | | | | Retail: 5.0% | |
| | 35,500 | | | @ | | AnnTaylor Stores Corp. | | | 907,380 | | |
| | 250,000 | | | @ | | Blockbuster, Inc. | | | 975,000 | | |
| | 84,000 | | | | | Brown Shoe Co., Inc. | | | 1,274,280 | | |
| | 94,700 | | | @ | | Insight Enterprises, Inc. | | | 1,727,328 | | |
| | 34,746 | | | @ | | Morton's Restaurant Group, Inc. | | | 324,180 | | |
| | 88,900 | | | | | Nu Skin Enterprises, Inc. | | | 1,460,627 | | |
| | 91,000 | | | @ | | Pacific Sunwear of California | | | 1,284,010 | | |
| | 245,400 | | | @ | | Pier 1 Imports, Inc. | | | 1,283,442 | | |
| | 59,000 | | | | | Sonic Automotive, Inc. | | | 1,142,240 | | |
| | | | 10,378,487 | | |
| | | | | Savings & Loans: 0.5% | |
| | 80,000 | | | | | First Niagara Financial Group, Inc. | | | 963,200 | | |
| | | | 963,200 | | |
| | | | | Semiconductors: 2.7% | |
| | 45,700 | | | @ | | Cypress Semiconductor Corp. | | | 1,646,571 | | |
| | 164,600 | | | @ | | IXYS Corp. | | | 1,320,092 | | |
| | 180,000 | | | @ | | Skyworks Solutions, Inc. | | | 1,530,000 | | |
| | 95,000 | | | @ | | Ultra Clean Holdings | | | 1,159,000 | | |
| | | | 5,655,663 | | |
| | | | | Software: 0.8% | |
| | 169,300 | | | @ | | Lawson Software, Inc. | | | 1,733,632 | | |
| | | | 1,733,632 | | |
| | | | | Telecommunications: 1.1% | |
| | 300,000 | | | @ | | Cincinnati Bell, Inc. | | | 1,425,000 | | |
| | 220,000 | | | @ | | Powerwave Technologies, Inc. | | | 886,600 | | |
| | | | 2,311,600 | | |
| | | | | Textiles: 0.4% | |
| | 24,000 | | | | | Unifirst Corp. | | | 912,000 | | |
| | | | 912,000 | | |
See Accompanying Notes to Financial Statements
186
ING COLUMBIA PORTFOLIO OF INVESTMENTS
SMALL CAP VALUE II PORTFOLIO AS OF DECEMBER 31, 2007 (CONTINUED)
| Shares | | | | | | Value | |
| | | | | Transportation: 2.7% | |
| | 74,500 | | | @@ | | Arlington Tankers Ltd. | | $ | 1,648,685 | | |
| | 78,300 | | | | | Eagle Bulk Shipping, Inc. | | | 2,078,865 | | |
| | 57,200 | | | @@ | | Nordic American Tanker Shipping | | | 1,877,304 | | |
| | | | 5,604,854 | | |
| | | | | Trucking & Leasing: 0.5% | |
| | 29,000 | | | | | GATX Corp. | | | 1,063,720 | | |
| | | | 1,063,720 | | |
Total Common Stock
(Cost $183,916,029) | | | 183,054,034 | | |
| REAL ESTATE INVESTMENT TRUSTS: 6.6% | | | |
| | | | | Apartments: 0.8% | |
| | 40,737 | | | | | Mid-America Apartment
Communities, Inc. | | | 1,741,507 | | |
| | | | 1,741,507 | | |
| | | | | Diversified: 1.1% | |
| | 60,000 | | | | | Digital Realty Trust, Inc. | | | 2,302,200 | | |
| | | | 2,302,200 | | |
| | | | | Health Care: 1.9% | |
| | 77,000 | | | | | LTC Properties, Inc. | | | 1,928,850 | | |
| | 130,000 | | | | | Omega Healthcare Investors, Inc. | | | 2,086,500 | | |
| | | | 4,015,350 | | |
| | | | | Mortgage: 0.7% | |
| | 117,500 | | | | | Capstead Mortgage Corp. | | | 1,549,825 | | |
| | | | 1,549,825 | | |
| | | | | Office Property: 1.2% | |
| | 23,525 | | | | | Alexandria Real Estate
Equities, Inc. | | | 2,391,787 | | |
| | | | 2,391,787 | | |
| | | | | Shopping Centers: 0.9% | |
| | 49,500 | | | | | Tanger Factory Outlet
Centers, Inc. | | | 1,866,645 | | |
| | | | 1,866,645 | | |
Total Real Estate
Investment Trusts
(Cost $14,200,215) | | | 13,867,314 | | |
Total Long-Term Investments
(Cost $198,116,244) | | | 196,921,348 | | |
Principal
Amount | | | | | | Value | |
| SHORT-TERM INVESTMENTS: 12.3% | | | |
| | | | | | | U.S. Government
Agency Obligations: 12.3% | | | | | |
| $ | 25,579,000 | | | Z | | Federal Home Loan Bank,
3.050%, due 01/02/08 | | | 25,574,666 | | |
Total Short-Term Investments
(Cost $25,574,666) | | | 25,574,666 | | |
Total Investments in
Securities
(Cost $223,690,910)* | | | 106.7 | % | | $ | 222,496,014 | | |
Other Assets and
Liabilities - Net | | | (6.7 | ) | | | (13,943,843 | ) | |
| Net Assets | | | 100.0 | % | | $ | 208,552,171 | | |
@ Non-income producing security
@@ Foreign Issuer
ADR American Depositary Receipt
Z Indicates Zero Coupon Bond; rate shown reflects current effective yield.
* Cost for federal income tax purposes is $223,902,808
Net unrealized depreciation consists of:
| Gross Unrealized Appreciation | | $ | 14,220,071 | | |
| Gross Unrealized Depreciation | | | (15,626,865 | ) | |
| Net Unrealized Depreciation | | $ | (1,406,794 | ) | |
See Accompanying Notes to Financial Statements
187
PORTFOLIO OF INVESTMENTS
ING DAVIS NEW YORK VENTURE PORTFOLIO AS OF DECEMBER 31, 2007
| Shares | | | | | | Value | |
| COMMON STOCK: 94.1% | | | |
| | | | | Agriculture: 3.9% | |
| | 176,000 | | | | | Altria Group, Inc. | | $ | 13,302,081 | | |
| | | | 13,302,081 | | |
| | | | | Auto Manufacturers: 0.0% | |
| | 400 | | | | | Paccar, Inc. | | | 21,792 | | |
| | | | 21,792 | | |
| | | | | Banks: 7.3% | |
| | 141,500 | | | | | Bank of New York Mellon Corp. | | | 6,899,540 | | |
| | 67,000 | | | | | Commerce Bancorp., Inc. | | | 2,555,380 | | |
| | 161,186 | | | @@ | | HSBC Holdings PLC | | | 2,715,102 | | |
| | 14,200 | | | | | State Street Corp. | | | 1,153,040 | | |
| | 124,290 | | | | | Wachovia Corp. | | | 4,726,749 | | |
| | 226,320 | | | | | Wells Fargo & Co. | | | 6,832,601 | | |
| | | | 24,882,412 | | |
| | | | | Beverages: 2.3% | |
| | 55,000 | | | @@ | | Diageo PLC ADR | | | 4,720,650 | | |
| | 56,200 | | | @@ | | Heineken Holding NV | | | 3,189,553 | | |
| | | | 7,910,203 | | |
| | | | | Building Materials: 0.9% | |
| | 22,300 | | | | | Martin Marietta Materials, Inc. | | | 2,956,980 | | |
| | | | 2,956,980 | | |
| | | | | Coal: 0.8% | |
| | 875,500 | | | @@ | | China Coal Energy Co.-Shares H | | | 2,699,473 | | |
| | | | 2,699,473 | | |
| | | | | Commercial Services: 3.2% | |
| | 291,010 | | | @@ | | COSCO Pacific Ltd. | | | 766,524 | | |
| | 156,600 | | | | | H&R Block, Inc. | | | 2,908,062 | | |
| | 134,800 | | | @ | | Iron Mountain, Inc. | | | 4,990,296 | | |
| | 63,600 | | | | | Moody's Corp. | | | 2,270,520 | | |
| | | | 10,935,402 | | |
| | | | | Computers: 1.7% | |
| | 134,300 | | | @ | | Dell, Inc. | | | 3,291,693 | | |
| | 53,200 | | | | | Hewlett-Packard Co. | | | 2,685,536 | | |
| | | | 5,977,229 | | |
| | | | | Cosmetics/Personal Care: 1.7% | |
| | 37,060 | | | | | Avon Products, Inc. | | | 1,464,982 | | |
| | 61,500 | | | | | Procter & Gamble Co. | | | 4,515,330 | | |
| | | | 5,980,312 | | |
| | | | | Diversified Financial Services: 10.8% | |
| | 263,900 | | | | | American Express Co. | | | 13,728,076 | | |
| | 51,130 | | | | | Ameriprise Financial, Inc. | | | 2,817,774 | | |
| | 140,040 | | | | | Citigroup, Inc. | | | 4,122,778 | | |
| | 20,300 | | | | | Discover Financial Services | | | 306,124 | | |
| | 61,700 | | | @ | | E*Trade Financial Corp. | | | 219,035 | | |
| | 232,000 | | | | | JPMorgan Chase & Co. | | | 10,126,800 | | |
| | 95,500 | | | I,X | | Merrill Lynch & Co., Inc. | | | 4,460,003 | | |
| | 27,400 | | | | | Morgan Stanley | | | 1,455,214 | | |
| | | | 37,235,804 | | |
| | | | | Electronics: 1.6% | |
| | 51,800 | | | @ | | Agilent Technologies, Inc. | | | 1,903,132 | | |
| | 92,475 | | | @@ | | Tyco Electronics Ltd. | | | 3,433,597 | | |
| | | | 5,336,729 | | |
| Shares | | | | | | Value | |
| | | | | Food: 0.2% | |
| | 16,300 | | | | | Hershey Co. | | $ | 642,220 | | |
| | | | 642,220 | | |
| | | | | Food Service: 0.0% | |
| | 5,486 | | | X | | FHC Delaware, Inc. | | | 55 | | |
| | | | 55 | | |
| | | | | Forest Products & Paper: 0.4% | |
| | 56,800 | | | @,@@ | | Sino-Forest Corp. | | | 1,233,894 | | |
| | | | 1,233,894 | | |
| | | | | Healthcare-Products: 1.2% | |
| | 92,475 | | | @@ | | Covidien Ltd. | | | 4,095,718 | | |
| | | | 4,095,718 | | |
| | | | | Healthcare-Services: 1.3% | |
| | 78,000 | | | | | UnitedHealth Group, Inc. | | | 4,539,600 | | |
| | | | 4,539,600 | | |
| | | | | Holding Companies-Diversified: 0.8% | |
| | 440,604 | | | @@ | | China Merchants Holdings
International Co., Ltd. | | | 2,697,707 | | |
| | | | 2,697,707 | | |
| | | | | Housewares: 0.2% | |
| | 8,200 | | | @@ | | Hunter Douglas NV | | | 605,863 | | |
| | | | 605,863 | | |
| | | | | Insurance: 14.8% | |
| | 47,100 | | | | | AMBAC Financial Group, Inc. | | | 1,213,767 | | |
| | 208,100 | | | | | American International
Group, Inc. | | | 12,132,230 | | |
| | 59,500 | | | | | AON Corp. | | | 2,837,555 | | |
| | 79 | | | @ | | Berkshire Hathaway, Inc.-Class A | | | 11,186,400 | | |
| | 92 | | | @ | | Berkshire Hathaway, Inc.-Class B | | | 435,712 | | |
| | 4,300 | | | @@ | | Everest Re Group Ltd. | | | 431,720 | | |
| | 156,300 | | | | | Loews Corp. | | | 7,868,142 | | |
| | 600 | | | @ | | Markel Corp. | | | 294,660 | | |
| | 23,700 | | | | | MBIA, Inc. | | | 441,531 | | |
| | 63,400 | | | @@ | | Millea Holdings, Inc. | | | 2,128,494 | | |
| | 156,100 | | | @@ | | Nipponkoa Insurance Co., Ltd. | | | 1,417,212 | | |
| | 18,400 | | | | | Principal Financial Group, Inc. | | | 1,266,656 | | |
| | 281,900 | | | | | Progressive Corp. | | | 5,401,204 | | |
| | 10,300 | | | @@ | | Sun Life Financial, Inc. | | | 576,182 | | |
| | 44,870 | | | | | Transatlantic Holdings, Inc. | | | 3,260,703 | | |
| | | | 50,892,168 | | |
| | | | | Internet: 1.5% | |
| | 12,000 | | | @ | | Amazon.com, Inc. | | | 1,111,680 | | |
| | 4,720 | | | @ | | Google, Inc.-Class A | | | 3,263,786 | | |
| | 43,000 | | | @ | | Liberty Media
Corp.-Interactive-Class A | | | 820,440 | | |
| | | | 5,195,906 | | |
| | | | | Leisure Time: 0.7% | |
| | 53,600 | | | | | Harley-Davidson, Inc. | | | 2,503,656 | | |
| | | | 2,503,656 | | |
| | | | | Media: 5.0% | |
| | 322,050 | | | @ | | Comcast Corp.-Special Class A | | | 5,835,546 | | |
| | 49,400 | | | @@ | | Grupo Televisa SA ADR | | | 1,174,238 | | |
| | 21,900 | | | @@ | | Lagardere SCA | | | 1,640,099 | | |
See Accompanying Notes to Financial Statements
188
PORTFOLIO OF INVESTMENTS
ING DAVIS NEW YORK VENTURE PORTFOLIO AS OF DECEMBER 31, 2007 (CONTINUED)
| Shares | | | | | | Value | |
| | | | | Media (continued) | |
| | 9,640 | | | @ | | Liberty Media Corp.-Capital
Shares A | | $ | 1,122,964 | | |
| | 242,400 | | | | | News Corp.-Class A | | | 4,966,776 | | |
| | 38,400 | | | @@ | | WPP Group PLC ADR | | | 2,468,736 | | |
| | | | 17,208,359 | | |
| | | | | Mining: 1.4% | |
| | 32,100 | | | @@ | | BHP Billiton PLC | | | 978,837 | | |
| | 13,600 | | | @@ | | Rio Tinto PLC | | | 1,431,297 | | |
| | 31,400 | | | | | Vulcan Materials Co. | | | 2,483,426 | | |
| | | | 4,893,560 | | |
| | | | | Miscellaneous Manufacturing: 1.3% | |
| | 5,300 | | | @@ | | Siemens AG | | | 839,307 | | |
| | 93,675 | | | @@ | | Tyco International Ltd. | | | 3,714,214 | | |
| | | | 4,553,521 | | |
| | | | | Oil & Gas: 13.9% | |
| | 80,710 | | | @@ | | Canadian Natural Resources Ltd. | | | 5,903,129 | | |
| | 175,500 | | | | | ConocoPhillips | | | 15,496,650 | | |
| | 100,000 | | | | | Devon Energy Corp. | | | 8,891,000 | | |
| | 80,500 | | | | | EOG Resources, Inc. | | | 7,184,625 | | |
| | 94,650 | | | | | Occidental Petroleum Corp. | | | 7,287,104 | | |
| | 21,367 | | | @ | | Transocean, Inc. | | | 3,058,686 | | |
| | | | 47,821,194 | | |
| | | | | Packaging & Containers: 1.3% | |
| | 193,500 | | | | | Sealed Air Corp. | | | 4,477,590 | | |
| | | | 4,477,590 | | |
| | | | | Pharmaceuticals: 1.5% | |
| | 35,500 | | | | | Cardinal Health, Inc. | | | 2,050,125 | | |
| | 42,900 | | | @ | | Express Scripts, Inc. | | | 3,131,700 | | |
| | | | 5,181,825 | | |
| | | | | Real Estate: 0.3% | |
| | 199,000 | | | @@ | | Hang Lung Group Ltd. | | | 1,075,292 | | |
| | | | 1,075,292 | | |
| | | | | Retail: 8.3% | |
| | 70,600 | | | @ | | Bed Bath & Beyond, Inc. | | | 2,074,934 | | |
| | 121,700 | | | @ | | Carmax, Inc. | | | 2,403,575 | | |
| | 186,500 | | | | | Costco Wholesale Corp. | | | 13,010,240 | | |
| | 117,027 | | | | | CVS Caremark Corp. | | | 4,651,823 | | |
| | 46,100 | | | | | Lowe's Cos., Inc. | | | 1,042,782 | | |
| | 10,600 | | | @ | | Sears Holding Corp. | | | 1,081,730 | | |
| | 91,930 | | | | | Wal-Mart Stores, Inc. | | | 4,369,433 | | |
| | | | 28,634,517 | | |
| | | | | Semiconductors: 0.9% | |
| | 89,700 | | | | | Texas Instruments, Inc. | | | 2,995,980 | | |
| | | | 2,995,980 | | |
| | | | | Software: 2.3% | |
| | 223,610 | | | | | Microsoft Corp. | | | 7,960,516 | | |
| | | | 7,960,516 | | |
| | | | | Telecommunications: 1.4% | |
| | 56,300 | | | @@ | | SK Telecom Co., Ltd. ADR | | | 1,679,992 | | |
| | 161,600 | | | | | Sprint Nextel Corp. | | | 2,121,808 | | |
| | 53,356 | | | | | Virgin Media, Inc. | | | 914,522 | | |
| | | | 4,716,322 | | |
| Shares | | | | | | Value | |
| | | | | Transportation: 1.2% | |
| | 30,700 | | | @@ | | Asciano Group | | $ | 187,125 | | |
| | 382,000 | | | @@ | | China Shipping Development
Co., Ltd. | | | 991,936 | | |
| | 12,900 | | | @@ | | Kuehne & Nagel
International AG | | | 1,238,671 | | |
| | 42,567 | | | @@ | | Toll Holdings Ltd. | | | 424,994 | | |
| | 19,940 | | | | | United Parcel Service, Inc.-Class B | | | 1,410,157 | | |
| | | | 4,252,883 | | |
Total Common Stock
(Cost $302,663,362) | | | 323,416,763 | | |
Principal
Amount | | | | | | Value | |
| SHORT-TERM INVESTMENTS: 5.5% | | | |
| | | | | Commercial Paper: 5.5% | |
| $ | 8,000,000 | | | | | Sanpaolo IMI U.S. Financial Co.,
4.530%, due 01/02/08 | | | 7,997,987 | | |
| | 10,813,000 | | | | | UBS Americas, Inc.,
4.000%, due 01/02/08 | | | 10,810,597 | | |
| | | | 18,808,584 | | |
Total Short-Term Investments
(Cost $18,808,584) | | | 18,808,584 | | |
Total Investments in
Securities
(Cost $321,471,946)* | | | 99.6 | % | | $ | 342,225,347 | | |
Other Assets and
Liabilities - Net | | | 0.4 | | | | 1,262,880 | | |
| Net Assets | | | 100.0 | % | | $ | 343,488,227 | | |
@ Non-income producing security
@@ Foreign Issuer
ADR American Depositary Receipt
I Illiquid Security
X Fair value determined by ING Funds Valuation Committee appointed by the Funds Board of Directors/Trustees.
* Cost for federal income tax purposes is $321,669,795
Net unrealized appreciation consists of:
| Gross Unrealized Appreciation | | $ | 42,313,065 | | |
| Gross Unrealized Depreciation | | | (21,757,513 | ) | |
| Net Unrealized Appreciation | | $ | 20,555,552 | | |
See Accompanying Notes to Financial Statements
189
PORTFOLIO OF INVESTMENTS
ING JPMORGAN INTERNATIONAL PORTFOLIO AS OF DECEMBER 31, 2007
| Shares | | | | | | Value | |
| COMMON STOCK: 98.4% | | | |
| | | | | Australia: 2.1% | |
| | 327,779 | | | | | BHP Billiton Ltd. | | $ | 11,458,509 | | |
| | 20,632 | | | L | | Rio Tinto Ltd. | | | 2,400,187 | | |
| | | | 13,858,696 | | |
| | | | | Belgium: 1.6% | |
| | 209,700 | | | | | Dexia | | | 5,264,975 | | |
| | 191,925 | | | | | Fortis | | | 5,038,925 | | |
| | | | 10,303,900 | | |
| | | | | Brazil: 2.9% | |
| | 275,444 | | | L | | Cia Vale do Rio Doce ADR | | | 8,998,755 | | |
| | 85,512 | | | L | | Petroleo Brasileiro SA ADR | | | 9,854,403 | | |
| | | | 18,853,158 | | |
| | | | | Egypt: 0.3% | |
| | 9,771 | | | L | | Orascom Construction
Industries GDR | | | 2,027,090 | | |
| | | | 2,027,090 | | |
| | | | | Finland: 2.0% | |
| | 334,768 | | | | | Nokia OYJ | | | 12,860,902 | | |
| | | | 12,860,902 | | |
| | | | | France: 13.8% | |
| | 76,550 | | | L | | Accor SA | | | 6,119,467 | | |
| | 300,378 | | | | | AXA SA | | | 11,975,763 | | |
| | 98,376 | | | | | BNP Paribas | | | 10,673,806 | | |
| | 65,029 | | | | | Cie de Saint-Gobain | | | 6,128,224 | | |
| | 63,898 | | | | | Imerys SA | | | 5,261,012 | | |
| | 54,443 | | | | | Lafarge SA | | | 9,886,180 | | |
| | 37,700 | | | | | Pernod-Ricard SA | | | 8,700,482 | | |
| | 68,198 | | | | | Sanofi-Aventis | | | 6,242,873 | | |
| | 300,916 | | | L | | Total SA | | | 24,915,982 | | |
| | | | 89,903,789 | | |
| | | | | Germany: 7.7% | |
| | 141,840 | | | | | Deutsche Post AG | | | 4,828,892 | | |
| | 66,244 | | | | | E.ON AG | | | 14,084,956 | | |
| | 44,471 | | | | | Linde AG | | | 5,895,120 | | |
| | 150,916 | | | | | SAP AG | | | 7,787,834 | | |
| | 87,393 | | | L | | Siemens AG | | | 13,839,542 | | |
| | 118,937 | | | @ | | Symrise | | | 3,305,498 | | |
| | | | 49,741,842 | | |
| | | | | Greece: 0.6% | |
| | 102,393 | | | | | Piraeus Bank SA | | | 3,982,749 | | |
| | | | 3,982,749 | | |
| | | | | Hong Kong: 1.0% | |
| | 461,700 | | | | | Esprit Holdings Ltd. | | | 6,798,655 | | |
| | | | 6,798,655 | | |
| | | | | Italy: 5.3% | |
| | 485,241 | | | | | ENI S.p.A. | | | 17,709,546 | | |
| | 1,078,600 | | | | | Intesa Sanpaolo S.p.A. | | | 8,488,123 | | |
| | 966,750 | | | | | UniCredito Italiano S.p.A. | | | 7,951,916 | | |
| | | | 34,149,585 | | |
| | | | | Japan: 18.4% | |
| | 154,900 | | | | | Astellas Pharma, Inc. | | | 6,718,108 | | |
| | 146,200 | | | | | Canon, Inc. | | | 6,691,075 | | |
| | 113,300 | | | | | Daikin Industries Ltd. | | | 6,319,430 | | |
| | 588 | | | | | East Japan Railway Co. | | | 4,836,614 | | |
| | 17,800 | | | | | Hirose Electric Co., Ltd. | | | 2,042,730 | | |
| Shares | | | | | | Value | |
| | 199,800 | | | | | Honda Motor Co., Ltd. | | $ | 6,600,362 | | |
| | 627 | | | | | Japan Tobacco, Inc. | | | 3,707,292 | | |
| | 106,800 | | | | | Komatsu Ltd. | | | 2,864,287 | | |
| | 400,600 | | | | | Mitsubishi Corp. | | | 10,842,114 | | |
| | 740,000 | | | | | Mitsubishi UFJ Financial
Group, Inc. | | | 6,978,145 | | |
| | 224,000 | | | | | Mitsui Fudosan Co., Ltd. | | | 4,830,885 | | |
| | 654 | | | | | Mizuho Financial Group, Inc. | | | 3,115,294 | | |
| | 96,100 | | | | | Nidec Corp. | | | 6,943,436 | | |
| | 503,000 | | | | | Nissan Motor Co., Ltd. | | | 5,489,991 | | |
| | 75,300 | | | | | Nitto Denko Corp. | | | 3,957,533 | | |
| | 183,700 | | | | | Nomura Holdings, Inc. | | | 3,077,867 | | |
| | 106,800 | | | | | Seven & I Holdings Co., Ltd. | | | 3,102,800 | | |
| | 91,000 | | | | | Shin-Etsu Chemical Co., Ltd. | | | 5,659,400 | | |
| | 38,400 | | | | | SMC Corp. | | | 4,568,203 | | |
| | 149,100 | | | | | Sony Corp. | | | 8,123,397 | | |
| | 499,400 | | | | | Sumitomo Corp. | | | 6,987,294 | | |
| | 807 | | | | | Sumitomo Mitsui
Financial Group, Inc. | | | 5,972,024 | | |
| | | | 119,428,281 | | |
| | | | | Mexico: 0.6% | |
| | 93,030 | | | | | Fomento Economico
Mexicano SA de CV ADR | | | 3,550,955 | | |
| | | | 3,550,955 | | |
| | | | | Netherlands: 2.8% | |
| | 140,495 | | | | | Koninklijke Philips
Electronics NV | | | 6,020,249 | | |
| | 305,595 | | | L | | Reed Elsevier NV | | | 6,064,647 | | |
| | 194,089 | | | | | Wolters Kluwer NV | | | 6,384,651 | | |
| | | | 18,469,547 | | |
| | | | | South Korea: 0.5% | |
| | 11,313 | | | #,L | | Samsung Electronics GDR | | | 3,359,878 | | |
| | | | 3,359,878 | | |
| | | | | Spain: 1.7% | |
| | 336,130 | | | | | Banco Bilbao Vizcaya
Argentaria SA | | | 8,182,809 | | |
| | 50,000 | | | L | | Inditex SA | | | 3,025,501 | | |
| | | | 11,208,310 | | |
| | | | | Switzerland: 12.4% | |
| | 300,800 | | | | | ABB Ltd. | | | 8,672,604 | | |
| | 101,519 | | | | | Adecco SA | | | 5,457,150 | | |
| | 73,019 | | | | | Holcim Ltd. | | | 7,783,868 | | |
| | 30,269 | | | | | Nestle SA | | | 13,899,231 | | |
| | 193,026 | | | | | Novartis AG | | | 10,556,077 | | |
| | 63,220 | | | | | Roche Holding AG | | | 10,928,574 | | |
| | 244,832 | | | | | UBS AG-Reg | | | 11,288,641 | | |
| | 39,711 | | | | | Zurich Financial Services AG | | | 11,654,644 | | |
| | | | 80,240,789 | | |
| | | | | Taiwan: 0.7% | |
| | 484,434 | | | | | Taiwan Semiconductor
Manufacturing Co., Ltd. ADR | | | 4,824,963 | | |
| | | | 4,824,963 | | |
| | | | | United Kingdom: 24.0% | |
| | 960,884 | | | | | Barclays PLC | | | 9,704,274 | | |
| | 480,429 | | | | | BG Group PLC | | | 11,022,752 | | |
| | 425,387 | | | | | Burberry Group PLC | | | 4,807,913 | | |
| | 366,505 | | | | | Centrica PLC | | | 2,610,659 | | |
| | 478,357 | | | | | GlaxoSmithKline PLC | | | 12,148,631 | | |
See Accompanying Notes to Financial Statements
190
PORTFOLIO OF INVESTMENTS
ING JPMORGAN INTERNATIONAL PORTFOLIO AS OF DECEMBER 31, 2007 (CONTINUED)
| Shares | | | | | | Value | |
| | | | | United Kingdom (continued) | |
| | 1,153,200 | | | | | HSBC Holdings PLC | | $ | 19,390,097 | | |
| | 647,791 | | | | | ICAP PLC | | | 9,335,076 | | |
| | 1,140,545 | | | | | Kingfisher PLC | | | 3,270,582 | | |
| | 483,437 | | | | | Man Group PLC | | | 5,487,860 | | |
| | 23,800 | | | | | Rio Tinto PLC | | | 2,504,770 | | |
| | 144,652 | | | | | Schroders PLC - Non Voting | | | 3,319,771 | | |
| | 510,572 | | | | | Smith & Nephew PLC | | | 5,857,794 | | |
| | 379,800 | | | | | Standard Chartered PLC | | | 13,861,443 | | |
| | 1,619,480 | | | | | Tesco PLC | | | 15,405,373 | | |
| | 4,711,840 | | | | | Vodafone Group PLC | | | 17,687,879 | | |
| | 874,650 | | | | | WM Morrison
Supermarkets PLC | | | 5,588,289 | | |
| | 387,697 | | | | | Wolseley PLC | | | 5,699,960 | | |
| | 634,377 | | | | | WPP Group PLC | | | 8,127,077 | | |
| | | | 155,830,200 | | |
Total Common Stock
(Cost $483,380,423) | | | 639,393,289 | | |
| REAL ESTATE INVESTMENT TRUSTS: 0.4% | | | |
| | | | | United Kingdom: 0.4% | |
| | 151,451 | | | | | British Land Co. PLC | | | 2,840,101 | | |
Total Real Estate
Investment Trusts
(Cost $2,387,242) | | | 2,840,101 | | |
Total Long-Term Investments
(Cost $485,767,665) | | | 642,233,390 | | |
Principal
Amount | | | | | | Value | |
| SHORT-TERM INVESTMENTS: 9.9% | | | |
| | | | | | | U.S. Government Agency
Obligations: 0.9% | | | | | |
| $ | 6,073,000 | | | Z | | Federal Home Loan Bank,
3.050%, due 01/02/08 | | | 6,071,971 | | |
Total U.S. Government
Agency Obligations
(Cost $6,071,971) | | | 6,071,971 | | |
| | | | | Securities Lending Collateralcc: 9.0% | |
| | 58,172,040 | | | | | Bank of New York Mellon Corp.
Institutional Cash Reserves | | | 58,172,040 | | |
Total Securities Lending
Collateral
(Cost $58,172,040) | | | 58,172,040 | | |
Total Short-Term Investments
(Cost $64,244,011) | | | 64,244,011 | | |
Total Investments in
Securities
(Cost $550,011,676)* | | | 108.7 | % | | $ | 706,477,401 | | |
Other Assets and
Liabilities - Net | | | (8.7 | ) | | | (56,718,684 | ) | |
| Net Assets | | | 100.0 | % | | $ | 649,758,717 | | |
@ Non-income producing security
ADR American Depositary Receipt
GDR Global Depositary Receipt
# Securities with purchases pursuant to Rule144A or section 4(2), under the Securities Act of 1933 and may not be resold subject to that rule except to qualified institutional buyers. Unless otherwise noted, these securities have been determined to be liquid under the guidelines established by the Funds' Board of Directors/Trustees.
cc Securities purchased with cash collateral for securities loaned.
L Loaned security, a portion or all of the security is on loan at December 31, 2007.
Z Indicates Zero Coupon Bond; rate shown reflects current effective yield.
* Cost for federal income tax purposes is $551,157,985
Net unrealized appreciation consists of:
| Gross Unrealized Appreciation | | $ | 171,321,581 | | |
| Gross Unrealized Depreciation | | | (16,002,165 | ) | |
| Net Unrealized Appreciation | | $ | 155,319,416 | | |
| Industry | | Percentage of
Net Assets | |
| Agriculture | | | 0.6 | % | |
| Apparel | | | 1.8 | | |
| Auto Manufacturers | | | 1.9 | | |
| Banks | | | 16.7 | | |
| Beverages | | | 1.9 | | |
| Building Materials | | | 5.4 | | |
| Chemicals | | | 2.9 | | |
| Commercial Services | | | 0.8 | | |
| Distribution/Wholesale | | | 3.6 | | |
| Diversified | | | 0.4 | | |
| Diversified Financial Services | | | 5.0 | | |
| Electric | | | 2.2 | | |
| Electronics | | | 2.3 | | |
| Engineering & Construction | | | 1.7 | | |
| Food | | | 5.4 | | |
| Gas | | | 0.4 | | |
| Hand/Machine Tools | | | 0.7 | | |
| Healthcare - Products | | | 0.9 | | |
| Home Furnishings | | | 1.3 | | |
| Insurance | | | 3.6 | | |
| Lodging | | | 0.9 | | |
| Machinery - Construction & Mining | | | 0.4 | | |
| Media | | | 3.2 | | |
| Mining | | | 3.9 | | |
| Miscellaneous Manufacturing | | | 2.1 | | |
| Office/Business Equip | | | 1.0 | | |
| Oil & Gas | | | 9.8 | | |
| Pharmaceuticals | | | 7.2 | | |
| Real Estate | | | 0.7 | | |
| Retail | | | 1.4 | | |
| Semiconductors | | | 1.3 | | |
| Software | | | 1.2 | | |
| Telecommunications | | | 4.7 | | |
| Transportation | | | 1.5 | | |
| Short-Term Investments | | | 9.9 | | |
| Other Assets and Liabilities - Net | | | (8.7 | ) | |
| Net Assets | | | 100.0 | % | |
See Accompanying Notes to Financial Statements
191
PORTFOLIO OF INVESTMENTS
ING JPMORGAN MID CAP VALUE PORTFOLIO AS OF DECEMBER 31, 2007
| Shares | | | | Value | |
| COMMON STOCK: 94.2% | | | |
| | | | | Advertising: 1.7% | |
| | 60,101 | | | @,L | | Clear Channel Outdoor
Holdings, Inc. | | $ | 1,662,394 | | |
| | 26,600 | | | @,L | | Lamar Advertising Co. | | | 1,278,662 | | |
| | 33,500 | | | | | Omnicom Group | | | 1,592,255 | | |
| | | | 4,533,311 | | |
| | | | | Aerospace/Defense: 1.2% | |
| | 26,700 | | | @,L | | Alliant Techsystems, Inc. | | | 3,037,392 | | |
| | | | 3,037,392 | | |
| | | | | Apparel: 1.6% | |
| | 59,800 | | | | | VF Corp. | | | 4,105,868 | | |
| | | | 4,105,868 | | |
| | | | | Auto Manufacturers: 1.1% | |
| | 58,200 | | | | | Oshkosh Truck Corp. | | | 2,750,532 | | |
| | | | 2,750,532 | | |
| | | | | Auto Parts & Equipment: 0.8% | |
| | 41,600 | | | | | WABCO Holdings, Inc. | | | 2,083,744 | | |
| | | | 2,083,744 | | |
| | | | | Banks: 6.8% | |
| | 41,300 | | | L | | Cullen/Frost Bankers, Inc. | | | 2,092,258 | | |
| | 56,340 | | | L | | M&T Bank Corp. | | | 4,595,654 | | |
| | 23,300 | | | | | Northern Trust Corp. | | | 1,784,314 | | |
| | 274,600 | | | | | Synovus Financial Corp. | | | 6,612,366 | | |
| | 51,800 | | | | | Wilmington Trust Corp. | | | 1,823,360 | | |
| | 15,360 | | | L | | Zions Bancorp. | | | 717,158 | | |
| | | | 17,625,110 | | |
| | | | | Beverages: 2.4% | |
| | 61,800 | | | L | | Brown-Forman Corp. | | | 4,579,998 | | |
| | 72,450 | | | @,L | | Constellation Brands, Inc. | | | 1,712,718 | | |
| | | | 6,292,716 | | |
| | | | | Building Materials: 0.4% | |
| | 57,200 | | | @,L | | Owens Corning, Inc. | | | 1,156,584 | | |
| | | | 1,156,584 | | |
| | | | | Chemicals: 3.6% | |
| | 80,308 | | | | | Albemarle Corp. | | | 3,312,705 | | |
| | 49,000 | | | L | | PPG Industries, Inc. | | | 3,441,270 | | |
| | 46,700 | | | | | Sigma-Aldrich Corp. | | | 2,549,820 | | |
| | | | 9,303,795 | | |
| | | | | Commercial Services: 0.7% | |
| | 73,400 | | | | | Western Union Co. | | | 1,782,152 | | |
| | | | 1,782,152 | | |
| | | | | Computers: 1.3% | |
| | 55,300 | | | | | Jack Henry & Associates, Inc. | | | 1,346,002 | | |
| | 81,100 | | | @ | | NCR Corp. | | | 2,035,610 | | |
| | | | 3,381,612 | | |
| | | | | Distribution/Wholesale: 1.7% | |
| | 96,700 | | | | | Genuine Parts Co. | | | 4,477,210 | | |
| | | | 4,477,210 | | |
| | | | | Diversified Financial Services: 1.6% | |
| | 13,800 | | | @,L | | Affiliated Managers Group, Inc. | | | 1,620,948 | | |
| | 5,100 | | | | | Legg Mason, Inc. | | | 373,065 | | |
| | 33,500 | | | | | T. Rowe Price Group, Inc. | | | 2,039,480 | | |
| | | | 4,033,493 | | |
| Shares | | | | | | Value | |
| | | | | Electric: 8.9% | |
| | 101,000 | | | | | American Electric Power
Co., Inc. | | $ | 4,702,560 | | |
| | 196,100 | | | | | CMS Energy Corp. | | | 3,408,218 | | |
| | 57,200 | | | | | FirstEnergy Corp. | | | 4,137,848 | | |
| | 106,900 | | | | | PG&E Corp. | | | 4,606,321 | | |
| | 134,100 | | | L | | Westar Energy, Inc. | | | 3,478,554 | | |
| | 129,200 | | | | | Xcel Energy, Inc. | | | 2,916,044 | | |
| | | | 23,249,545 | | |
| | | | | | | Electrical Components &
Equipment: 1.1% | | | | | |
| | 58,800 | | | W | | Ametek, Inc. | | | 2,754,192 | | |
| | | | 2,754,192 | | |
| | | | | Electronics: 2.3% | |
| | 43,800 | | | | | Amphenol Corp. | | | 2,031,006 | | |
| | 99,800 | | | @ | | Arrow Electronics, Inc. | | | 3,920,144 | | |
| | | | 5,951,150 | | |
| | | | | Environmental Control: 1.1% | |
| | 93,850 | | | | | Republic Services, Inc. | | | 2,942,198 | | |
| | | | 2,942,198 | | |
| | | | | Food: 3.0% | |
| | 35,550 | | | @ | | Dean Foods Co. | | | 919,323 | | |
| | 62,300 | | | | | Safeway, Inc. | | | 2,131,283 | | |
| | 104,500 | | | | | Supervalu, Inc. | | | 3,920,840 | | |
| | 12,300 | | | | | WM Wrigley Jr. Co. | | | 720,165 | | |
| | | | 7,691,611 | | |
| | | | | Gas: 2.3% | |
| | 59,300 | | | | | Energen Corp. | | | 3,808,839 | | |
| | 79,100 | | | | | UGI Corp. | | | 2,155,475 | | |
| | | | 5,964,314 | | |
| | | | | Healthcare-Products: 0.1% | |
| | 4,678 | | | @ | | Henry Schein, Inc. | | | 287,229 | | |
| | | | 287,229 | | |
| | | | | Healthcare-Services: 4.1% | |
| | 69,100 | | | @,L | | Community Health Systems, Inc. | | | 2,547,026 | | |
| | 98,400 | | | @ | | Coventry Health Care, Inc. | | | 5,830,200 | | |
| | 63,800 | | | @,L | | Lincare Holdings, Inc. | | | 2,243,208 | | |
| | | | 10,620,434 | | |
| | | | | Household Products/Wares: 3.2% | |
| | 46,200 | | | L | | Clorox Co. | | | 3,010,854 | | |
| | 56,600 | | | | | Fortune Brands, Inc. | | | 4,095,576 | | |
| | 55,800 | | | @,L | | Jarden Corp. | | | 1,317,438 | | |
| | | | 8,423,868 | | |
| | | | | Insurance: 10.5% | |
| | 10,700 | | | L | | AMBAC Financial Group, Inc. | | | 275,739 | | |
| | 80,750 | | | L | | Assurant, Inc. | | | 5,402,175 | | |
| | 129,861 | | | | | Cincinnati Financial Corp. | | | 5,134,704 | | |
| | 30,200 | | | @@ | | Everest Re Group Ltd. | | | 3,032,080 | | |
| | 286,050 | | | | | Old Republic International Corp. | | | 4,408,031 | | |
| | 118,400 | | | | | OneBeacon Insurance Group Ltd. | | | 2,545,600 | | |
| | 51,900 | | | L | | Principal Financial Group, Inc. | | | 3,572,796 | | |
| | 94,800 | | | | | WR Berkley Corp. | | | 2,825,988 | | |
| | | | 27,197,113 | | |
| | | | | Iron/Steel: 0.3% | |
| | 11,438 | | | | | Carpenter Technology Corp. | | | 859,794 | | |
| | | | 859,794 | | |
See Accompanying Notes to Financial Statements
192
PORTFOLIO OF INVESTMENTS
ING JPMORGAN MID CAP VALUE PORTFOLIO AS OF DECEMBER 31, 2007 (CONTINUED)
| Shares | | | | | | Value | |
| | | | | Lodging: 0.7% | |
| | 53,800 | | | L | | Marriott International, Inc. | | $ | 1,838,884 | | |
| | | | 1,838,884 | | |
| | | | | Media: 2.9% | |
| | 112,100 | | | @ | | Cablevision Systems Corp. | | | 2,746,450 | | |
| | 59,000 | | | | | Clear Channel
Communications, Inc. | | | 2,036,680 | | |
| | 3,490 | | | | | Washington Post | | | 2,762,091 | | |
| | | | 7,545,221 | | |
| | | | | Mining: 0.6% | |
| | 18,100 | | | L | | Vulcan Materials Co. | | | 1,431,529 | | |
| | | | 1,431,529 | | |
| | | | | Miscellaneous Manufacturing: 2.8% | |
| | 72,300 | | | | | Carlisle Cos., Inc. | | | 2,677,269 | | |
| | 98,200 | | | | | Dover Corp. | | | 4,526,038 | | |
| | | | 7,203,307 | | |
| | | | | Oil & Gas: 2.3% | |
| | 29,800 | | | @,L | | CVR Energy, Inc. | | | 743,212 | | |
| | 60,200 | | | | | Devon Energy Corp. | | | 5,352,382 | | |
| | | | 6,095,594 | | |
| | | | | Oil & Gas Services: 1.1% | |
| | 72,000 | | | @,L | | Helix Energy Solutions
Group, Inc. | | | 2,988,000 | | |
| | | | 2,988,000 | | |
| | | | | Packaging & Containers: 1.2% | |
| | 70,200 | | | | | Ball Corp. | | | 3,159,000 | | |
| | | | 3,159,000 | | |
| | | | Pharmaceuticals: 1.1% | |
| | 158,500 | | | @,L | | Warner Chilcott Ltd. | | | 2,810,205 | | |
| | | | 2,810,205 | | |
| | | | | Pipelines: 4.8% | |
| | 31,106 | | | @,L | | Kinder Morgan
Management, LLC | | | 1,646,752 | | |
| | 46,200 | | | | | Oneok, Inc. | | | 2,068,374 | | |
| | 49,800 | | | L | | Questar Corp. | | | 2,694,180 | | |
| | 167,100 | | | | | Williams Cos., Inc. | | | 5,978,838 | | |
| | | | 12,388,144 | | |
| | | | | Real Estate: 1.2% | |
| | 139,950 | | | @@ | | Brookfield Properties Co.
(U.S. Denominated Security) | | | 2,694,038 | | |
| | 10,350 | | | L | | Forest City Enterprises, Inc. | | | 459,954 | | |
| | | | 3,153,992 | | |
| | | | | Retail: 7.4% | |
| | 71,323 | | | @,L | | Autonation, Inc. | | | 1,116,918 | | |
| | 29,450 | | | @,L | | Autozone, Inc. | | | 3,531,350 | | |
| | 71,600 | | | | | Burger King Holdings, Inc. | | | 2,041,316 | | |
| | 47,000 | | | L | | Columbia Sportswear Co. | | | 2,072,230 | | |
| | 100,100 | | | L | | Limited Brands, Inc. | | | 1,894,893 | | |
| | 128,000 | | | | | Staples, Inc. | | | 2,952,960 | | |
| | 45,400 | | | L | | Tiffany & Co. | | | 2,089,762 | | |
| | 127,600 | | | L | | TJX Cos., Inc. | | | 3,665,948 | | |
| | | | 19,365,377 | | |
| | | | | Savings & Loans: 1.1% | |
| | 162,800 | | | L | | People's United Financial, Inc. | | | 2,897,840 | | |
| | | | 2,897,840 | | |
| Shares | | | | | | Value | |
| | | | | Telecommunications: 3.4% | |
| | 49,300 | | | L | | CenturyTel, Inc. | | $ | 2,043,978 | | |
| | 63,700 | | | | | Telephone & Data Systems, Inc. | | | 3,669,120 | | |
| | 246,521 | | | | | Windstream Corp. | | | 3,209,703 | | |
| | | | 8,922,801 | | |
| | | | | Transportation: 1.8% | |
| | 39,800 | | | | | Norfolk Southern Corp. | | | 2,007,512 | | |
| | 52,600 | | | @@,L | | Teekay Shipping Corp. | | | 2,798,846 | | |
| | | | 4,806,358 | | |
Total Common Stock
(Cost $233,632,409) | | | 245,111,219 | | |
| REAL ESTATE INVESTMENT TRUSTS: 3.6% | | | |
| | | | | | | Diversified: 0.7% | | | | | |
| | 22,700 | | | | | Vornado Realty Trust | | | 1,996,465 | | |
| | | | 1,996,465 | | |
| | | | | | | Forest Products & Paper: 1.9% | | | | | |
| | 28,600 | | | L | | Plum Creek Timber Co., Inc. | | | 1,316,744 | | |
| | 76,966 | | | L | | Rayonier, Inc. | | | 3,635,874 | | |
| | | | 4,952,618 | | |
| | | | | | | Storage: 1.0% | | | | | |
| | 34,800 | | | L | | Public Storage, Inc. | | | 2,554,668 | | |
| | | | 2,554,668 | | |
Total Real Estate
Investment Trusts
(Cost $9,419,813) | | | 9,503,751 | | |
Total Long-Term Investments
(Cost $243,052,222) | | | 254,614,970 | | |
Principal
Amount | | | | | | Value | |
| SHORT-TERM INVESTMENTS: 23.0% | | | |
| | | | | | | U.S. Government
Agency Obligations: 1.9% | | | | | |
| $ | 5,066,000 | | | Z | | Federal Home Loan Bank,
3.050%, due 01/02/08 | | | 5,065,142 | | |
Total U.S. Government Agency
Obligations (Cost $5,065,142) | | | 5,065,142 | | |
| | | | | | | Securities Lending Collateralcc: 21.1% | | | | | |
| | 54,865,855 | | | | | Bank of New York Mellon Corp.
Institutional Cash Reserves | | | 54,865,855 | | |
Total Securities Lending
Collateral
(Cost $54,865,855) | | | 54,865,855 | | |
Total Short-Term Investments
(Cost $59,930,997) | | | 59,930,997 | | |
Total Investments in
Securities
(Cost $302,983,219)* | | | 120.8 | % | | $ | 314,545,967 | | |
Other Assets and
Liabilities - Net | | | (20.8 | ) | | | (54,233,786 | ) | |
| Net Assets | | | 100.0 | % | | $ | 260,312,181 | | |
See Accompanying Notes to Financial Statements
193
PORTFOLIO OF INVESTMENTS
ING JPMORGAN MID CAP VALUE PORTFOLIO AS OF DECEMBER 31, 2007 (CONTINUED)
@ Non-income producing security
@@ Foreign Issuer
cc Securities purchased with cash collateral for securities loaned.
W When-issued or delayed delivery security
L Loaned security, a portion or all of the security is on loan at December 31, 2007.
Z Indicates Zero Coupon Bond; rate shown reflects current effective yield.
* Cost for federal income tax purposes is $303,304,156
Net unrealized appreciation consists of:
| Gross Unrealized Appreciation | | $ | 23,972,654 | | |
| Gross Unrealized Depreciation | | | (12,730,843 | ) | |
| Net Unrealized Appreciation | | $ | 11,241,811 | | |
See Accompanying Notes to Financial Statements
194
ING LEGG MASON PARTNERS PORTFOLIO OF INVESTMENTS
AGGRESSIVE GROWTH PORTFOLIO AS OF DECEMBER 31, 2007
| Shares | | | | | | Value | |
| COMMON STOCK: 97.3% | | | |
| | | | | Aerospace/Defense: 4.2% | |
| | 505,500 | | | | | L-3 Communications
Holdings, Inc. | | $ | 53,552,670 | | |
| | | | 53,552,670 | | |
| | | | | Biotechnology: 17.6% | |
| | 999,190 | | | @ | | Amgen, Inc. | | | 46,402,384 | | |
| | 1,386,200 | | | @ | | Biogen Idec, Inc. | | | 78,902,504 | | |
| | 216,900 | | | @,L | | BioMimetic Therapeutics, Inc. | | | 3,767,553 | | |
| | 31,700 | | | @ | | Genentech, Inc. | | | 2,126,119 | | |
| | 1,066,070 | | | @ | | Genzyme Corp. | | | 79,358,251 | | |
| | 34,300 | | | @,L | | Micromet, Inc. | | | 70,658 | | |
| | 694,700 | | | @,L | | Millennium Pharmaceuticals,
Inc. | | | 10,406,606 | | |
| | 192,300 | | | @,L | | Vertex Pharmaceuticals, Inc. | | | 4,467,129 | | |
| | | | 225,501,204 | | |
| | | | | Computers: 2.6% | |
| | 31,500 | | | @,L | | LaserCard Corp. | | | 333,900 | | |
| | 519,600 | | | @,L | | Quantum Corp. | | | 1,397,724 | | |
| | 578,800 | | | @,L | | Sandisk Corp. | | | 19,198,796 | | |
| | 473,766 | | | L | | Seagate Technology, Inc. | | | 12,081,033 | | |
| | 83,100 | | | X | | Seagate Technology,
Inc.-Escrow | | | 1 | | |
| | | | 33,011,454 | | |
| | | | | | | Diversified Financial
Services: 8.4% | | | | | |
| | 74,800 | | | | | CIT Group, Inc. | | | 1,797,444 | | |
| | 121,200 | | | L | | Cohen & Steers, Inc. | | | 3,632,364 | | |
| | 2,696 | | | | | Goldman Sachs Group, Inc. | | | 579,775 | | |
| | 927,208 | | | L | | Lehman Brothers
Holdings, Inc. | | | 60,676,492 | | |
| | 771,160 | | | L | | Merrill Lynch & Co., Inc. | | | 41,395,869 | | |
| | | | 108,081,944 | | |
| | | | | Electronics: 1.5% | |
| | 525,848 | | | @@,L | | Tyco Electronics Ltd. | | | 19,524,736 | | |
| | | | 19,524,736 | | |
| | | | | Healthcare-Products: 3.0% | |
| | 525,848 | | | @@ | | Covidien Ltd. | | | 23,289,808 | | |
| | 224,100 | | | | | Johnson & Johnson | | | 14,947,470 | | |
| | | | 38,237,278 | | |
| | | | | Healthcare-Services: 5.9% | |
| | 1,298,500 | | | | | UnitedHealth Group, Inc. | | | 75,572,699 | | |
| | | | 75,572,699 | | |
| | | | | Internet: 1.1% | |
| | 748,275 | | | @,L | | Liberty Media
Corp.-Interactive-Class A | | | 14,277,087 | | |
| | | | 14,277,087 | | |
| | | | | Media: 15.6% | |
| | 1,173,700 | | | @,L | | Cablevision Systems Corp. | | | 28,755,650 | | |
| | 176,805 | | | | | CBS Corp.-Class B | | | 4,817,936 | | |
| | 166,450 | | | @,L | | Comcast Corp.-Class A | | | 3,039,377 | | |
| | 2,576,285 | | | @,L | | Comcast Corp.-Special Class A | | | 46,682,284 | | |
| | 188,210 | | | @ | | Discovery Holding Co. | | | 4,731,599 | | |
| Shares | | | | | | Value | |
| | 59,346 | | | @,L | | Liberty Global, Inc. | | $ | 2,325,770 | | |
| | 60,213 | | | @,L | | Liberty Global, Inc.-Series C | | | 2,203,194 | | |
| | 154,855 | | | @ | | Liberty Media
Corp.-Capital Shares A | | | 18,039,059 | | |
| | 2,466,720 | | | @,L | | Sirius Satellite Radio, Inc. | | | 7,474,162 | | |
| | 2,716,530 | | | L | | Time Warner, Inc. | | | 44,849,910 | | |
| | 176,805 | | | @,L | | Viacom-Class B | | | 7,765,276 | | |
| | 860,500 | | | L | | Walt Disney Co. | | | 27,776,940 | | |
| | 91,300 | | | | | World Wrestling
Entertainment, Inc. | | | 1,347,588 | | |
| | | | 199,808,745 | | |
| | | | | Miscellaneous Manufacturing: 2.9% | |
| | 397,300 | | | | | Pall Corp. | | | 16,019,136 | | |
| | 525,848 | | | @@,L | | Tyco International Ltd. | | | 20,849,873 | | |
| | | | 36,869,009 | | |
| | | | | Oil & Gas: 8.0% | |
| | 1,556,000 | | | L | | Anadarko Petroleum Corp. | | | 102,213,640 | | |
| | | | 102,213,640 | | |
| | | | | Oil & Gas Services: 8.9% | |
| | 525,700 | | | @,L | | Grant Prideco, Inc. | | | 29,181,607 | | |
| | 1,243,800 | | | @,L | | Weatherford
International Ltd. | | | 85,324,680 | | |
| | | | 114,506,287 | | |
| | | | | Pharmaceuticals: 7.2% | |
| | 132,500 | | | @,L | | Alkermes, Inc. | | | 2,065,675 | | |
| | 1,542,044 | | | @ | | Forest Laboratories, Inc. | | | 56,207,504 | | |
| | 535,000 | | | @,L | | ImClone Systems, Inc. | | | 23,005,000 | | |
| | 92,400 | | | @,L | | Isis Pharmaceuticals, Inc. | | | 1,455,300 | | |
| | 117,700 | | | @,L | | King Pharmaceuticals, Inc. | | | 1,205,248 | | |
| | 72,600 | | | @,L | | Nabi Biopharmaceuticals | | | 262,086 | | |
| | 65,832 | | | @@ | | Teva Pharmaceutical
Industries Ltd. ADR | | | 3,059,871 | | |
| | 410,600 | | | @,L | | Valeant Pharmaceuticals
International | | | 4,914,882 | | |
| | | | 92,175,566 | | |
| | | | | Retail: 0.1% | |
| | 188,300 | | | @,L | | Charming Shoppes, Inc. | | | 1,018,703 | | |
| | | | 1,018,703 | | |
| | | | | Semiconductors: 5.0% | |
| | 624,800 | | | @ | | Broadcom Corp. | | | 16,332,272 | | |
| | 88,400 | | | @,L | | Cabot Microelectronics Corp. | | | 3,174,444 | | |
| | 319,000 | | | @,L | | Cirrus Logic, Inc. | | | 1,684,320 | | |
| | 114,000 | | | @,L | | Cree, Inc. | | | 3,131,580 | | |
| | 84,600 | | | @,L | | DSP Group, Inc. | | | 1,032,120 | | |
| | 664,100 | | | | | Intel Corp. | | | 17,704,906 | | |
| | 2,436,000 | | | @,L | | Micron Technology, Inc. | | | 17,661,000 | | |
| | 288,100 | | | @ | | Teradyne, Inc. | | | 2,978,954 | | |
| | | | 63,699,596 | | |
| | | | | Software: 2.1% | |
| | 95,800 | | | @,L | | Advent Software, Inc. | | | 5,182,780 | | |
| | 320,400 | | | @ | | Autodesk, Inc. | | | 15,943,104 | | |
| | 171,900 | | | | | Microsoft Corp. | | | 6,119,640 | | |
| | | | 27,245,524 | | |
See Accompanying Notes to Financial Statements
195
ING LEGG MASON PARTNERS PORTFOLIO OF INVESTMENTS
AGGRESSIVE GROWTH PORTFOLIO AS OF DECEMBER 31, 2007 (CONTINUED)
| Shares | | | | | | Value | |
| | | | | Telecommunications: 3.2% | |
| | 114,527 | | | @ | | Arris Group, Inc. | | $ | 1,142,979 | | |
| | 1,596,200 | | | | | Motorola, Inc. | | | 25,603,048 | | |
| | 294,900 | | | @@ | | Nokia OYJ ADR | | | 11,321,211 | | |
| | 462,100 | | | @,L | | RF Micro Devices, Inc. | | | 2,638,591 | | |
| | | | 40,705,829 | | |
Total Common Stock
(Cost $926,329,536) | | | 1,246,001,971 | | |
Principal
Amount | | | | | | Value | |
| SHORT-TERM INVESTMENTS: 19.5% | | | |
| | | | | | | U.S. Government
Agency Obligations: 2.4% | | | | | |
| $ | 31,128,000 | | | Z | | Federal Home Loan Bank,
3.050%, due 01/02/08 | | | 31,122,726 | | |
Total U.S. Government
Agency Obligations
(Cost $31,122,726) | | | 31,122,726 | | |
| | | | | | | Securities Lending
Collateralcc: 17.1% | | | | | |
| | 218,788,769 | | | | | Bank of New York
Mellon Corp. Institutional
Cash Reserves | | | 218,788,769 | | |
Total Securities Lending
Collateral
(Cost $218,788,769) | | | 218,788,769 | | |
Total Short-Term Investments
(Cost $249,911,495) | | | 249,911,495 | | |
Total Investments in
Securities (Cost
$1,176,241,031)* | | | 116.8 | % | | $ | 1,495,913,466 | | |
Other Assets and
Liabilities - Net | | | (16.8 | ) | | | (215,070,735 | ) | |
| Net Assets | | | 100.0 | % | | $ | 1,280,842,731 | | |
@ Non-income producing security
@@ Foreign Issuer
ADR American Depositary Receipt
cc Securities purchased with cash collateral for securities loaned.
L Loaned security, a portion or all of the security is on loan at December 31, 2007.
Z Indicates Zero Coupon Bond; rate shown reflects current effective yield.
X Fair Value determined by ING Funds Valuation Committee appointed by the Funds' Board of Directors/Trustees.
* Cost for federal income tax purposes is $1,177,398,906
Net unrealized appreciation consists of:
| Gross Unrealized Appreciation | | $ | 375,099,903 | | |
| Gross Unrealized Depreciation | | | (56,585,343 | ) | |
| Net Unrealized Appreciation | | $ | 318,514,560 | | |
See Accompanying Notes to Financial Statements
196
ING LEGG MASON PARTNERS PORTFOLIO OF INVESTMENTS
LARGE CAP GROWTH PORTFOLIO AS OF DECEMBER 31, 2007
| Shares | | | | | | Value | |
| COMMON STOCK: 98.1% | | | |
| | | | | Beverages: 5.0% | |
| | 15,937 | | | | | Coca-Cola Co. | | $ | 978,054 | | |
| | 11,505 | | | | | PepsiCo, Inc. | | | 873,230 | | |
| | | | 1,851,284 | | |
| | | | | Biotechnology: 12.4% | |
| | 29,739 | | | @ | | Amgen, Inc. | | | 1,381,079 | | |
| | 17,451 | | | @ | | Biogen Idec, Inc. | | | 993,311 | | |
| | 26,997 | | | @ | | Genentech, Inc. | | | 1,810,689 | | |
| | 17,708 | | | @ | | Vertex Pharmaceuticals, Inc. | | | 411,357 | | |
| | | | 4,596,436 | | |
| | | | | Cosmetics/Personal Care: 3.0% | |
| | 15,229 | | | | | Procter & Gamble Co. | | | 1,118,113 | | |
| | | | 1,118,113 | | |
| | | | | Diversified Financial Services: 9.9% | |
| | 11,235 | | | | | Lehman Brothers Holdings, Inc. | | | 735,218 | | |
| | 16,726 | | | | | Merrill Lynch & Co., Inc. | | | 897,852 | | |
| | 12,304 | | | | | Morgan Stanley | | | 653,465 | | |
| | 27,442 | | | @ | | Nasdaq Stock Market, Inc. | | | 1,358,105 | | |
| | | | 3,644,640 | | |
| | | | | Food: 3.0% | |
| | 19,033 | | | | | WM Wrigley Jr. Co. | | | 1,114,382 | | |
| | | | 1,114,382 | | |
| | | | | Healthcare-Products: 4.4% | |
| | 12,832 | | | | | Johnson & Johnson | | | 855,894 | | |
| | 15,047 | | | | | Medtronic, Inc. | | | 756,413 | | |
| | | | 1,612,307 | | |
| | | | | Home Furnishings: 1.0% | |
| | 5,094 | | | | | Harman International Industries,
Inc. | | | 375,479 | | |
| | | | 375,479 | | |
| | | | | Insurance: 8.1% | |
| | 15,229 | | | | | American International
Group, Inc. | | | 887,851 | | |
| | 15 | | | @ | | Berkshire Hathaway,
Inc.-Class A | | | 2,124,000 | | |
| | | | 3,011,851 | | |
| | | | | Internet: 21.3% | |
| | 35,406 | | | @ | | Akamai Technologies, Inc. | | | 1,225,048 | | |
| | 36,847 | | | @ | | Amazon.com, Inc. | | | 3,413,506 | | |
| | 35,406 | | | @ | | eBay, Inc. | | | 1,175,125 | | |
| | 30,093 | | | @ | | IAC/InterActiveCorp. | | | 810,104 | | |
| | 53,114 | | | @ | | Yahoo!, Inc. | | | 1,235,432 | | |
| | | | 7,859,215 | | |
| | | | | Media: 4.2% | |
| | 48,682 | | | | | Time Warner, Inc. | | | 803,740 | | |
| | 23,010 | | | | | Walt Disney Co. | | | 742,763 | | |
| | | | 1,546,503 | | |
| | | | | Retail: 1.6% | |
| | 22,130 | | | | | Home Depot, Inc. | | | 596,182 | | |
| | | | 596,182 | | |
| | | | | Semiconductors: 7.5% | |
| | 46,911 | | | | | Intel Corp. | | | 1,250,647 | | |
| | 45,140 | | | | | Texas Instruments, Inc. | | | 1,507,674 | | |
| | | | 2,758,321 | | |
| Shares | | | | | | Value | |
| | | | | Software: 9.3% | |
| | 23,546 | | | @ | | Electronic Arts, Inc. | | $ | 1,375,322 | | |
| | 29,213 | | | | | Microsoft Corp. | | | 1,039,983 | | |
| | 49,572 | | | @ | | Red Hat, Inc. | | | 1,033,080 | | |
| | | | 3,448,385 | | |
| | | | | Telecommunications: 7.4% | |
| | 35,406 | | | @ | | Cisco Systems, Inc. | | | 958,440 | | |
| | 57,536 | | | | | Motorola, Inc. | | | 922,877 | | |
| | 22,130 | | | | | Qualcomm, Inc. | | | 870,816 | | |
| | | | 2,752,133 | | |
Total Common Stock
(Cost $30,834,359) | | | 36,285,231 | | |
Principal
Amount | | | | | | Value | |
| SHORT-TERM INVESTMENTS: 1.2% | | | |
| | | | | | | U.S. Government Agency
Obligations: 1.2% | | | | | |
| $ | 444,000 | | | Z | | Federal Home Loan Bank,
3.050%, due 01/02/08 | | | 443,925 | | |
Total Short-Term Investments
(Cost $443,925) | | | 443,925 | | |
Total Investments in
Securities
(Cost $31,278,284)* | | | 99.3 | % | | $ | 36,729,156 | | |
Other Assets and
Liabilities - Net | | | 0.7 | | | | 270,527 | | |
| Net Assets | | | 100.0 | % | | $ | 36,999,683 | | |
@ Non-income producing security
Z Indicates Zero Coupon Bond; rate shown reflects current effective yield.
* Cost for federal income tax purposes is $31,818,150
Net unrealized appreciation consists of:
| Gross Unrealized Appreciation | | $ | 6,638,983 | | |
| Gross Unrealized Depreciation | | | (1,727,977 | ) | |
| Net Unrealized Appreciation | | $ | 4,911,006 | | |
See Accompanying Notes to Financial Statements
197
ING LORD ABBETT PORTFOLIO OF INVESTMENTS
U.S. GOVERNMENT SECURITIES PORTFOLIO AS OF DECEMBER 31, 2007
Principal
Amount | | | | | | Value | |
| U.S. GOVERNMENT AGENCY OBLIGATIONS: 85.5% | | | |
| | | | | Federal Home Loan Bank: 7.7% | |
| $ | 2,750,000 | | | | | 5.125%, due 08/14/13 | | $ | 2,902,251 | | |
| | 560,000 | | | | | 5.500%, due 08/13/14 | | | 604,426 | | |
| | | | 3,506,677 | | |
| | | | | | | Federal Home Loan Mortgage
Corporation: 26.8% | | | | | |
| | 282,617 | | | | | 4.198%, due 01/01/34 | | | 285,842 | | |
| | 245,008 | | | | | 4.687%, due 03/01/35 | | | 243,579 | | |
| | 213,759 | | | | | 5.000%, due 01/01/19 | | | 214,319 | | |
| | 1,446,397 | | | S | | 5.000%, due 04/01/20 | | | 1,448,043 | | |
| | 132,145 | | | | | 5.000%, due 05/01/20 | | | 132,295 | | |
| | 1,098,378 | | | | | 5.000%, due 10/01/20 | | | 1,099,628 | | |
| | 575,408 | | | | | 5.000%, due 12/01/20 | | | 576,063 | | |
| | 931,190 | | | | | 5.000%, due 04/01/21 | | | 932,344 | | |
| | 565,587 | | | | | 5.000%, due 11/01/21 | | | 566,288 | | |
| | 119,453 | | | | | 5.500%, due 01/01/21 | | | 120,947 | | |
| | 707,539 | | | | | 5.500%, due 03/01/21 | | | 716,311 | | |
| | 1,974,813 | | | | | 5.500%, due 01/01/22 | | | 1,999,297 | | |
| | 1,358,189 | | | | | 5.500%, due 08/01/22 | | | 1,374,749 | | |
| | 443,592 | | | | | 5.500%, due 06/01/35 | | | 442,917 | | |
| | 686,853 | | | | | 5.500%, due 05/01/37 | | | 685,543 | | |
| | 577,320 | | | | | 5.500%, due 11/01/37 | | | 576,218 | | |
| | 231,498 | | | | | 5.685%, due 11/01/35 | | | 233,491 | | |
| | 305,738 | | | | | 6.142%, due 06/01/36 | | | 309,375 | | |
| | 12,708 | | | C | | 6.500%, due 06/15/08 | | | 12,684 | | |
| | 185,681 | | | | | 7.000%, due 04/01/32 | | | 194,578 | | |
| | | | 12,164,511 | | |
| | | | | | | Federal National Mortgage
Corporation: 41.4% | | | | | |
| | 187,512 | | | | | 3.494%, due 08/01/33 | | | 188,642 | | |
| | 860,000 | | | | | 4.625%, due 10/15/13 | | | 886,393 | | |
| | 305,000 | | | | | 4.856%, due 08/01/35 | | | 304,437 | | |
| | 361,082 | | | | | 4.993%, due 04/01/35 | | | 362,394 | | |
| | 545,205 | | | | | 5.252%, due 10/01/35 | | | 563,337 | | |
| | 416,796 | | | | | 5.389%, due 04/01/36 | | | 430,483 | | |
| | 472,150 | | | | | 5.475%, due 04/01/36 | | | 477,724 | | |
| | 425,541 | | | | | 5.487%, due 11/01/36 | | | 431,400 | | |
| | 296,304 | | | | | 5.500%, due 04/01/33 | | | 296,878 | | |
| | 205,476 | | | | | 5.500%, due 03/01/35 | | | 205,520 | | |
| | 43,342 | | | | | 5.500%, due 05/01/35 | | | 43,323 | | |
| | 10,361,650 | | | S | | 5.500%, due 02/01/36 | | | 10,352,076 | | |
| | 253,800 | | | | | 5.500%, due 06/01/36 | | | 253,565 | | |
| | 496,705 | | | | | 5.500%, due 11/01/36 | | | 496,479 | | |
| | 152,828 | | | | | 5.500%, due 01/01/37 | | | 152,686 | | |
| | 905,146 | | | | | 5.500%, due 05/01/37 | | | 904,267 | | |
| | 286,692 | | | | | 5.500%, due 07/01/37 | | | 286,414 | | |
| | 340,118 | | | | | 5.500%, due 09/01/37 | | | 339,788 | | |
| | 370,559 | | | | | 5.505%, due 04/01/36 | | | 375,211 | | |
| | 249,195 | | | | | 5.512%, due 04/01/36 | | | 252,283 | | |
| | 179,804 | | | ^ | | 5.706%, due 02/01/37 | | | 182,650 | | |
| | 313,754 | | | | | 5.744%, due 10/01/36 | | | 319,316 | | |
| | 185,439 | | | | | 5.936%, due 05/01/36 | | | 189,233 | | |
| | 480,706 | | | | | 5.961%, due 12/01/36 | | | 491,239 | | |
| | | | 18,785,738 | | |
| | | | | | | Government National
Mortgage Association: 9.6% | | | | | |
| | 4,320,000 | | | | | 5.500%, due 07/15/36 | | | 4,352,637 | | |
| | | | 4,352,637 | | |
Total U.S. Government Agency
Obligations (Cost $37,963,346) | | | 38,809,563 | | |
Principal
Amount | | | | | | Value | |
| U.S. TREASURY OBLIGATIONS: 12.2% | | | |
| | | | | U.S. Treasury Bonds: 10.3% | |
| $ | 600,000 | | | S | | 4.000%, due 02/15/14 | | $ | 613,172 | | |
| | 1,595,000 | | | | | 4.250%, due 11/15/17 | | | 1,623,287 | | |
| | 1,930,000 | | | | | 4.500%, due 02/15/36 | | | 1,940,405 | | |
| | 470,000 | | | | | 4.750%, due 02/15/37 | | | 492,032 | | |
| | | | 4,668,896 | | |
| | | | | U.S. Treasury STRIP: 0.9% | |
| | 1,430,000 | | | ^^ | | 4.459%, due 02/15/36 | | | 410,226 | | |
| | | | 410,226 | | |
| | | | | | | Treasury Inflation Indexed
Protected Securities: 1.0% | | | | | |
| | 481,457 | | | | | 1.625%, due 01/15/15 | | | 483,526 | | |
| | | | 483,526 | | |
Total U.S. Treasury Obligations
(Cost $5,389,759) | | | 5,562,648 | | |
Total Investments in
Securities
(Cost $43,353,105)* | | | 97.7 | % | | $ | 44,372,211 | | |
Other Assets and
Liabilities - Net | | | 2.3 | | | | 1,035,107 | | |
| Net Assets | | | 100.0 | % | | $ | 45,407,318 | | |
STRIP Separate Trading of Registered Interest and Principal of Securities
C Bond may be called prior to maturity date.
S All or a portion of this security is segregated for certain derivatives, when-issued or delayed delivery securities and forward currency exchange contracts.
^ Interest Only (IO) Security
^^ Principal Only (PO) Security
* Cost for federal income tax purposes is $43,379,179
Net unrealized appreciation consists of:
| Gross Unrealized Appreciation | | $ | 1,015,078 | | |
| Gross Unrealized Depreciation | | | (22,046 | ) | |
| Net Unrealized Appreciation | | $ | 993,032 | | |
See Accompanying Notes to Financial Statements
198
ING NEUBERGER PORTFOLIO OF INVESTMENTS
BERMAN PARTNERS PORTFOLIO AS OF DECEMBER 31, 2007
| Shares | | | | | | Value | |
| COMMON STOCK: 98.9% | | | |
| | | | | Aerospace/Defense: 1.8% | |
| | 73,400 | | | | | L-3 Communications
Holdings, Inc. | | $ | 7,775,996 | | |
| | | | 7,775,996 | | |
| | | | | Beverages: 1.7% | |
| | 314,842 | | | @ | | Constellation Brands, Inc. | | | 7,442,865 | | |
| | | | 7,442,865 | | |
| | | | | Coal: 0.6% | |
| | 44,700 | | | | | Peabody Energy Corp. | | | 2,755,308 | | |
| | | | 2,755,308 | | |
| | | | | Commercial Services: 1.6% | |
| | 193,200 | | | | | Moody's Corp. | | | 6,897,240 | | |
| | | | 6,897,240 | | |
| | | | | Computers: 1.5% | |
| | 140,900 | | | @ | | Affiliated Computer
Services, Inc. | | | 6,354,590 | | |
| | | | 6,354,590 | | |
| | | | | Diversified Financial Services: 5.5% | |
| | 42,650 | | | | | Goldman Sachs Group, Inc. | | | 9,171,883 | | |
| | 25,200 | | | | | Legg Mason, Inc. | | | 1,843,380 | | |
| | 110,300 | | | | | Merrill Lynch & Co., Inc. | | | 5,920,904 | | |
| | 125,100 | | | | | Morgan Stanley | | | 6,644,061 | | |
| | | | 23,580,228 | | |
| | | | | Electric: 4.3% | |
| | 118,800 | | | | | FirstEnergy Corp. | | | 8,593,992 | | |
| | 76,400 | | | @ | | Mirant Corp. | | | 2,978,072 | | |
| | 157,300 | | | @ | | NRG Energy, Inc. | | | 6,817,382 | | |
| | | | 18,389,446 | | |
| | | | | Engineering & Construction: 6.4% | |
| | 215,200 | | | @@ | | Chicago Bridge & Iron Co. NV | | | 13,006,687 | | |
| | 66,300 | | | @ | | KBR, Inc. | | | 2,572,440 | | |
| | 164,200 | | | @ | | McDermott International, Inc. | | | 9,692,726 | | |
| | 37,500 | | | @ | | Shaw Group, Inc. | | | 2,266,500 | | |
| | | | 27,538,353 | | |
| | | | | Food: 1.6% | |
| | 284,300 | | | | | ConAgra Foods, Inc. | | | 6,763,497 | | |
| | | | 6,763,497 | | |
| | | | | Healthcare-Products: 0.8% | |
| | 51,040 | | | @ | | Zimmer Holdings, Inc. | | | 3,376,296 | | |
| | | | 3,376,296 | | |
| | | | | Healthcare-Services: 5.8% | |
| | 149,900 | | | | | Aetna, Inc. | | | 8,653,727 | | |
| | 157,100 | | | | | UnitedHealth Group, Inc. | | | 9,143,220 | | |
| | 78,100 | | | @ | | WellPoint, Inc. | | | 6,851,713 | | |
| | | | 24,648,660 | | |
| | | | | Home Builders: 1.9% | |
| | 15,200 | | | @ | | NVR, Inc. | | | 7,964,800 | | |
| | | | 7,964,800 | | |
| | | | | Insurance: 7.5% | |
| | 123,620 | | | | | American International
Group, Inc. | | | 7,207,046 | | |
| | 142,100 | | | | | Assurant, Inc. | | | 9,506,490 | | |
| Shares | | | | | | Value | |
| | 2,600 | | | @ | | Berkshire Hathaway,
Inc.-Class B | | $ | 12,313,600 | | |
| | 38,000 | | | | | Hartford Financial Services
Group, Inc. | | | 3,313,220 | | |
| | | | 32,340,356 | | |
| | | | | Internet: 1.8% | |
| | 182,700 | | | @,@@ | | Check Point Software
Technologies | | | 4,012,092 | | |
| | 216,900 | | | @ | | Symantec Corp. | | | 3,500,766 | | |
| | | | 7,512,858 | | |
| | | | | Iron/Steel: 1.5% | |
| | 53,100 | | | | | United States Steel Corp. | | | 6,420,321 | | |
| | | | 6,420,321 | | |
| | | | | Leisure Time: 1.3% | |
| | 118,100 | | | | | Harley-Davidson, Inc. | | | 5,516,451 | | |
| | | | 5,516,451 | | |
| | | | | | | Machinery-Construction &
Mining: 4.4% | | | | | |
| | 58,500 | | | | | Caterpillar, Inc. | | | 4,244,760 | | |
| | 67,100 | | | | | Joy Global, Inc. | | | 4,416,522 | | |
| | 157,800 | | | @ | | Terex Corp. | | | 10,346,946 | | |
| | | | 19,008,228 | | |
| | | | | Media: 1.3% | |
| | 126,400 | | | | | McGraw-Hill Cos., Inc. | | | 5,537,584 | | |
| | | | 5,537,584 | | |
| | | | | Metal Fabricate/Hardware: 0.7% | |
| | 112,600 | | | @,@@ | | Sterlite Industries
India Ltd. ADR | | | 2,935,482 | | |
| | | | 2,935,482 | | |
| | | | | Mining: 6.0% | |
| | 120,600 | | | | | Freeport-McMoRan Copper &
Gold, Inc. | | | 12,354,264 | | |
| | 168,500 | | | @@ | | Teck Cominco Ltd. | | | 6,017,135 | | |
| | 102,800 | | | @@ | | Xstrata PLC | | | 7,213,574 | | |
| | | | 25,584,973 | | |
| | | | | Miscellaneous Manufacturing: 1.6% | |
| | 182,000 | | | | | General Electric Co. | | | 6,746,740 | | |
| | | | 6,746,740 | | |
| | | | | Oil & Gas: 15.3% | |
| | 123,900 | | | @@ | | Canadian Natural Resources Ltd. | | | 9,062,046 | | |
| | 147,400 | | | @ | | Denbury Resources, Inc. | | | 4,385,150 | | |
| | 57,900 | | | | | EOG Resources, Inc. | | | 5,167,575 | | |
| | 48,800 | | | | | ExxonMobil Corp. | | | 4,572,072 | | |
| | 163,000 | | | | | Noble Corp. | | | 9,211,130 | | |
| | 100,900 | | | @@ | | Petroleo Brasileiro SA ADR | | | 11,627,716 | | |
| | 93,500 | | | @ | | Southwestern Energy Co. | | | 5,209,820 | | |
| | 75,800 | | | @@ | | Suncor Energy, Inc. | | | 8,241,734 | | |
| | 212,780 | | | @@ | | Talisman Energy, Inc. | | | 3,940,686 | | |
| | 84,750 | | | | | XTO Energy, Inc. | | | 4,352,760 | | |
| | | | 65,770,689 | | |
| | | | | Oil & Gas Services: 3.8% | |
| | 163,800 | | | | | Halliburton Co. | | | 6,209,658 | | |
| | 137,600 | | | @ | | National Oilwell Varco, Inc. | | | 10,108,096 | | |
| | | | 16,317,754 | | |
See Accompanying Notes to Financial Statements
199
ING NEUBERGER PORTFOLIO OF INVESTMENTS
BERMAN PARTNERS PORTFOLIO AS OF DECEMBER 31, 2007 (CONTINUED)
| Shares | | | | | | Value | |
| | | | | Pharmaceuticals: 3.3% | |
| | 232,800 | | | @ | | NBTY, Inc. | | $ | 6,378,720 | | |
| | 113,200 | | | @@ | | Shire PLC ADR | | | 7,805,140 | | |
| | | | 14,183,860 | | |
| | | | | Retail: 6.7% | |
| | 122,600 | | | | | Best Buy Co., Inc. | | | 6,454,890 | | |
| | 169,200 | | | | | JC Penney Co., Inc. | | | 7,443,108 | | |
| | 31,800 | | | | | Liz Claiborne, Inc. | | | 647,130 | | |
| | 236,700 | | | | | Macy's, Inc. | | | 6,123,429 | | |
| | 150,500 | | | @ | | Saks, Inc. | | | 3,124,380 | | |
| | 176,000 | | | | | TJX Cos., Inc. | | | 5,056,480 | | |
| | | | 28,849,417 | | |
| | | | | Semiconductors: 2.1% | |
| | 88,400 | | | @ | | International Rectifier Corp. | | | 3,002,948 | | |
| | 172,600 | | | | | Texas Instruments, Inc. | | | 5,764,840 | | |
| | | | 8,767,788 | | |
| | | | | Software: 4.6% | |
| | 61,200 | | | @ | | Activision, Inc. | | | 1,817,640 | | |
| | 217,980 | | | | | Microsoft Corp. | | | 7,760,088 | | |
| | 297,910 | | | @ | | Oracle Corp. | | | 6,726,808 | | |
| | 180,800 | | | @ | | Take-Two Interactive
Software, Inc. | | | 3,335,760 | | |
| | | | 19,640,296 | | |
| | | | | Telecommunications: 1.5% | |
| | 75,400 | | | @@ | | China Mobile Ltd. ADR | | | 6,549,998 | | |
| | | | 6,549,998 | | |
| | | | | Transportation: 2.0% | |
| | 58,000 | | | | | DryShips, Inc. | | | 4,489,200 | | |
| | 25,650 | | | @@ | | Frontline Ltd. | | | 1,224,080 | | |
| | 109,772 | | | @@ | | Ship Finance
International Ltd. | | | 3,041,782 | | |
| | | | 8,755,062 | | |
Total Investments in
Securities
(Cost $355,377,787)* | | | 98.9 | % | | $ | 423,925,136 | | |
Other Assets and
Liabilities - Net | | | 1.1 | | | | 4,882,427 | | |
| Net Assets | | | 100.0 | % | | $ | 428,807,563 | | |
@ Non-income producing security
@@ Foreign Issuer
ADR American Depositary Receipt
* Cost for federal income tax purposes is $355,623,338
Net unrealized appreciation consists of:
| Gross Unrealized Appreciation | | $ | 90,603,203 | | |
| Gross Unrealized Depreciation | | | (22,301,405 | ) | |
| Net Unrealized Appreciation | | $ | 68,301,798 | | |
See Accompanying Notes to Financial Statements
200
ING NEUBERGER PORTFOLIO OF INVESTMENTS
BERMAN REGENCY PORTFOLIO AS OF DECEMBER 31, 2007
| Shares | | | | | | Value | |
| COMMON STOCK: 88.7% | | | |
| | | | | Aerospace/Defense: 4.3% | |
| | 5,600 | | | @@ | | Empresa Brasileira de
Aeronautica SA ADR | | $ | 255,304 | | |
| | 2,900 | | | | | L-3 Communications
Holdings, Inc. | | | 307,226 | | |
| | 10,300 | | | @ | | Spirit Aerosystems
Holdings, Inc. | | | 355,350 | | |
| | | | 917,880 | | |
| | | | | Auto Parts & Equipment: 1.0% | |
| | 4,500 | | | | | WABCO Holdings, Inc. | | | 225,405 | | |
| | | | 225,405 | | |
| | | | | Beverages: 1.7% | |
| | 15,200 | | | @ | | Constellation Brands, Inc. | | | 359,328 | | |
| | | | 359,328 | | |
| | | | | Computers: 1.6% | |
| | 7,700 | | | @ | | Affiliated Computer Services, Inc. | | | 347,270 | | |
| | | | 347,270 | | |
| | | | | Diversified Financial Services: 4.9% | |
| | 3,850 | | | | | Bear Stearns Cos., Inc. | | | 339,763 | | |
| | 12,400 | | | | | Jefferies Group, Inc. | | | 285,820 | | |
| | 1,400 | | | | | Legg Mason, Inc. | | | 102,410 | | |
| | 6,300 | | | | | Morgan Stanley | | | 334,593 | | |
| | | | 1,062,586 | | |
| | | | | Electric: 10.0% | |
| | 4,500 | | | | | Constellation Energy Group, Inc. | | | 461,385 | | |
| | 13,700 | | | | | DPL, Inc. | | | 406,205 | | |
| | 6,000 | | | | | FirstEnergy Corp. | | | 434,040 | | |
| | 5,200 | | | @ | | Mirant Corp. | | | 202,696 | | |
| | 7,200 | | | @ | | NRG Energy, Inc. | | | 312,048 | | |
| | 6,600 | | | | | PPL Corp. | | | 343,794 | | |
| | | | 2,160,168 | | |
| | | | | Electronics: 1.4% | |
| | 8,600 | | | @ | | Avnet, Inc. | | | 300,742 | | |
| | | | 300,742 | | |
| | | | | Engineering & Construction: 4.9% | |
| | 9,500 | | | @@ | | Chicago Bridge & Iron Co. NV | | | 574,179 | | |
| | 6,900 | | | @ | | McDermott International, Inc. | | | 407,307 | | |
| | 1,400 | | | @ | | Shaw Group, Inc. | | | 84,616 | | |
| | | | 1,066,102 | | |
| | | | | Food: 2.9% | |
| | 14,700 | | | | | ConAgra Foods, Inc. | | | 349,713 | | |
| | 9,900 | | | @ | | Smithfield Foods, Inc. | | | 286,308 | | |
| | | | 636,021 | | |
| | | | | Healthcare-Products: 1.1% | |
| | 5,200 | | | @@ | | Covidien Ltd. | | | 230,308 | | |
| | | | 230,308 | | |
| | | | | Healthcare-Services: 2.4% | |
| | 5,900 | | | | | Aetna, Inc. | | | 340,607 | | |
| | 3,100 | | | @ | | Coventry Health Care, Inc. | | | 183,675 | | |
| | | | 524,282 | | |
| | | | | Home Builders: 1.5% | |
| | 605 | | | @ | | NVR, Inc. | | | 317,020 | | |
| | | | 317,020 | | |
| | | | | Home Furnishings: 1.1% | |
| | 2,800 | | | | | Whirlpool Corp. | | | 228,564 | | |
| | | | 228,564 | | |
| Shares | | | | | | Value | |
| | | | | Insurance: 5.2% | |
| | 6,400 | | | | | Assurant, Inc. | | $ | 428,160 | | |
| | 5,100 | | | | | Cigna Corp. | | | 274,023 | | |
| | 4,100 | | | @@ | | Endurance Specialty Holdings Ltd. | | | 171,093 | | |
| | 5,000 | | | | | Stancorp Financial Group, Inc. | | | 251,900 | | |
| | | | 1,125,176 | | |
| | | | | Internet: 0.9% | |
| | 8,900 | | | @,@@ | | Check Point Software
Technologies | | | 195,444 | | |
| | | | 195,444 | | |
| | | | | Iron/Steel: 3.2% | |
| | 2,500 | | | | | Cleveland-Cliffs, Inc. | | | 252,000 | | |
| | 3,600 | | | | | United States Steel Corp. | | | 435,276 | | |
| | | | 687,276 | | |
| | | | | Leisure Time: 1.1% | |
| | 5,100 | | | | | Harley-Davidson, Inc. | | | 238,221 | | |
| | | | 238,221 | | |
| | | | | | | Machinery-Construction &
Mining: 3.2% | | | | | |
| | 3,350 | | | | | Joy Global, Inc. | | | 220,497 | | |
| | 7,200 | | | @ | | Terex Corp. | | | 472,104 | | |
| | | | 692,601 | | |
| | | | | Media: 1.2% | |
| | 5,900 | | | | | McGraw-Hill Cos., Inc. | | | 258,479 | | |
| | | | 258,479 | | |
| | | | | Metal Fabricate/Hardware: 1.1% | |
| | 9,200 | | | @,@@ | | Sterlite Industries
India Ltd. ADR | | | 239,844 | | |
| | | | 239,844 | | |
| | | | | Mining: 5.1% | |
| | 7,400 | | | | | Freeport-McMoRan Copper &
Gold, Inc. | | | 758,056 | | |
| | 9,700 | | | @@ | | Teck Cominco Ltd. | | | 346,387 | | |
| | | | 1,104,443 | | |
| | | | | Miscellaneous Manufacturing: 1.5% | |
| | 3,400 | | | | | Eaton Corp. | | | 329,630 | | |
| | | | 329,630 | | |
| | | | | Oil & Gas: 7.9% | |
| | 6,400 | | | @@ | | Canadian Natural Resources Ltd. | | | 468,096 | | |
| | 9,200 | | | @ | | Denbury Resources, Inc. | | | 273,700 | | |
| | 8,600 | | | | | Noble Corp. | | | 485,986 | | |
| | 3,300 | | | @ | | Southwestern Energy Co. | | | 183,876 | | |
| | 7,375 | | | @@ | | Talisman Energy, Inc. | | | 136,585 | | |
| | 3,250 | | | | | XTO Energy, Inc. | | | 166,920 | | |
| | | | 1,715,163 | | |
| | | | | Oil & Gas Services: 2.8% | |
| | 5,200 | | | @ | | National Oilwell Varco, Inc. | | | 381,992 | | |
| | 3,400 | | | @ | | Oceaneering International, Inc. | | | 228,990 | | |
| | | | 610,982 | | |
| | | | | Pharmaceuticals: 4.5% | |
| | 12,100 | | | @ | | Endo Pharmaceuticals
Holdings, Inc. | | | 322,707 | | |
| | 11,500 | | | @ | | NBTY, Inc. | | | 315,100 | | |
| | 4,800 | | | @@ | | Shire PLC ADR | | | 330,960 | | |
| | | | 968,767 | | |
See Accompanying Notes to Financial Statements
201
ING NEUBERGER PORTFOLIO OF INVESTMENTS
BERMAN REGENCY PORTFOLIO AS OF DECEMBER 31, 2007 (CONTINUED)
| Shares | | | | | | Value | |
| | | | | Retail: 5.6% | |
| | 1,800 | | | | | Abercrombie & Fitch Co. | | $ | 143,946 | | |
| | 3,450 | | | @ | | Aeropostale, Inc. | | | 91,425 | | |
| | 6,600 | | | | | JC Penney Co., Inc. | | | 290,334 | | |
| | 5,400 | | | | | Liz Claiborne, Inc. | | | 109,890 | | |
| | 8,700 | | | | | Macy's, Inc. | | | 225,069 | | |
| | 4,800 | | | @ | | Saks, Inc. | | | 99,648 | | |
| | 8,700 | | | | | TJX Cos., Inc. | | | 249,951 | | |
| | | | 1,210,263 | | |
| | | | | Semiconductors: 1.4% | |
| | 8,600 | | | @ | | International Rectifier Corp. | | | 292,142 | | |
| | | | 292,142 | | |
| | | | | Software: 2.3% | |
| | 5,500 | | | @ | | Activision, Inc. | | | 163,350 | | |
| | 17,900 | | | @ | | Take-Two Interactive
Software, Inc. | | | 330,255 | | |
| | | | 493,605 | | |
| | | | | Telecommunications: 1.0% | |
| | 20,900 | | | @ | | Arris Group, Inc. | | | 208,582 | | |
| | | | 208,582 | | |
| | | | | Transportation: 1.9% | |
| | 8,400 | | | | | Eagle Bulk Shipping, Inc. | | | 223,020 | | |
| | 6,867 | | | @@ | | Ship Finance International Ltd. | | | 190,285 | | |
| | | | 413,305 | | |
Total Common Stock
(Cost $17,992,456 ) | | | 19,159,599 | | |
| REAL ESTATE INVESTMENT TRUSTS: 3.7% | | | |
| | | | | Diversified: 0.7% | |
| | 5,900 | | | | | iStar Financial, Inc. | | | 153,695 | | |
| | | | 153,695 | | |
| | | | | Health Care: 0.8% | |
| | 3,600 | | | | | Ventas, Inc. | | | 162,900 | | |
| | | | 162,900 | | |
| | | | | Mortgage: 1.2% | |
| | 13,600 | | | | | Annaly Capital Management, Inc. | | | 247,248 | | |
| | | | 247,248 | | |
| | | | | Shopping Centers: 0.6% | |
| | 3,500 | | | | | Developers Diversified
Realty Corp. | | | 134,015 | | |
| | | | 134,015 | | |
| | | | | Warehouse/Industrial: 0.4% | |
| | 2,500 | | | | | First Industrial Realty Trust, Inc. | | | 86,500 | | |
| | | | 86,500 | | |
Total Real Estate
Investment Trusts
(Cost $900,518) | | | 784,358 | | |
Total Investments in
Securities
(Cost $18,892,974)* | | | 92.4 | % | | $ | 19,943,957 | | |
Other Assets and
Liabilities - Net | | | 7.6 | | | | 1,650,396 | | |
| Net Assets | | | 100.0 | % | | $ | 21,594,353 | | |
@ Non-income producing security
@@ Foreign Issuer
ADR American Depositary Receipt
* Cost for federal income tax purposes is $18,937,078
Net unrealized appreciation consists of:
| Gross Unrealized Appreciation | | $ | 2,289,999 | | |
| Gross Unrealized Depreciation | | | (1,283,120 | ) | |
| Net Unrealized Appreciation | | $ | 1,006,879 | | |
See Accompanying Notes to Financial Statements
202
PORTFOLIO OF INVESTMENTS
ING OPCAP BALANCED VALUE PORTFOLIO AS OF DECEMBER 31, 2007
| Shares | | | | | | Value | |
| COMMON STOCK: 61.2% | | | |
| | | | | Aerospace/Defense: 4.8% | |
| | 34,500 | | | | | Boeing Co. | | $ | 3,017,370 | | |
| | | | 3,017,370 | | |
| | | | | Banks: 2.8% | |
| | 17,000 | | | | | Bank of New York Mellon Corp. | | | 828,920 | | |
| | 10,400 | | | L | | Capital One Financial Corp. | | | 491,504 | | |
| | 27,500 | | | L | | National City Corp. | | | 452,650 | | |
| | | | 1,773,074 | | |
| | | | | Biotechnology: 4.3% | |
| | 34,300 | | | @ | | Biogen Idec, Inc. | | | 1,952,356 | | |
| | 31,700 | | | @,L | | Nektar Therapeutics | | | 212,707 | | |
| | 22,000 | | | @,L | | Regeneron Pharmaceuticals, Inc. | | | 531,300 | | |
| | | | 2,696,363 | | |
| | | | | Commercial Services: 3.8% | |
| | 32,000 | | | @,W,L | | ChoicePoint, Inc. | | | 1,165,440 | | |
| | 34,400 | | | L | | Moody's Corp. | | | 1,228,080 | | |
| | | | 2,393,520 | | |
| | | | | Diversified Financial Services: 10.1% | |
| | 44,800 | | | | | CIT Group, Inc. | | | 1,076,544 | | |
| | 121,800 | | | L | | Countrywide Financial Corp. | | | 1,088,892 | | |
| | 53,300 | | | L | | Freddie Mac | | | 1,815,931 | | |
| | 36,600 | | | L | | Lehman Brothers Holdings, Inc. | | | 2,395,102 | | |
| | | | 6,376,469 | | |
| | | | | Food: 1.6% | |
| | 32,500 | | | | | Sysco Corp. | | | 1,014,325 | | |
| | | | 1,014,325 | | |
| | | | | Healthcare-Services: 4.5% | |
| | 32,000 | | | @ | | WellPoint, Inc. | | | 2,807,360 | | |
| | | | 2,807,360 | | |
| | | | | Home Builders: 3.5% | |
| | 63,900 | | | L | | Lennar Corp. | | | 1,143,171 | | |
| | 97,100 | | | L | | Pulte Homes, Inc. | | | 1,023,434 | | |
| | | | 2,166,605 | | |
| | | | | Insurance: 2.1% | |
| | 30,300 | | | L | | AMBAC Financial Group, Inc. | | | 780,831 | | |
| | 305,000 | | | X | | Conseco, Inc.-Escrow | | | — | | |
| | 19,500 | | | L | | MBIA, Inc. | | | 363,285 | | |
| | 14,100 | | | | | PMI Group, Inc. | | | 187,248 | | |
| | | | 1,331,364 | | |
| | | | | Internet: 1.1% | |
| | 1,000 | | | @ | | Google, Inc.-Class A | | | 691,480 | | |
| | | | 691,480 | | |
| | | | | Oil & Gas: 7.2% | |
| | 51,100 | | | | | ConocoPhillips | | | 4,512,130 | | |
| | | | 4,512,130 | | |
| | | | | Pharmaceuticals: 4.5% | |
| | 5,100 | | | @ | | ImClone Systems, Inc. | | | 219,300 | | |
| | 25,500 | | | @@ | | Roche Holding Ltd. ADR | | | 2,202,800 | | |
| | 22,000 | | | @,L | | Theravance, Inc. | | | 429,000 | | |
| | | | 2,851,100 | | |
| Shares | | | | | | Value | |
| | | | | Retail: 7.0% | |
| | 49,500 | | | L | | Family Dollar Stores, Inc. | | $ | 951,885 | | |
| | 38,000 | | | L | | Petsmart, Inc. | | | 894,140 | | |
| | 30,100 | | | | | Wal-Mart Stores, Inc. | | | 1,430,653 | | |
| | 28,800 | | | | | Yum! Brands, Inc. | | | 1,102,176 | | |
| | | | 4,378,854 | | |
| | | | | Semiconductors: 2.1% | |
| | 22,647 | | | @,@@,L | | ASML Holding NV | | | 708,625 | | |
| | 62,001 | | | @@ | | Taiwan Semiconductor
Manufacturing Co., Ltd. ADR | | | 617,530 | | |
| | | | 1,326,155 | | |
| | | | | Software: 1.1% | |
| | 15,100 | | | @@,L | | Infosys Technologies Ltd. ADR | | | 684,936 | | |
| | | | 684,936 | | |
| | | | | Telecommunications: 0.7% | |
| | 9,500 | | | @,L | | NII Holdings, Inc. | | | 459,040 | | |
| | | | 459,040 | | |
Total Common Stock
(Cost $43,751,904) | | | 38,480,145 | | |
| REAL ESTATE INVESTMENT TRUSTS: 0.8% | | | |
| | | | | Mortgage: 0.8% | |
| | 25,800 | | | | | Annaly Capital Management,
Inc. | | | 469,044 | | |
| | | | 469,044 | | |
Total Real Estate
Investment Trusts
(Cost $402,184) | | | 469,044 | | |
Principal
Amount | | | | | | Value | |
| CORPORATE BONDS/NOTES: 22.0% | | | |
| | | | | Aerospace/Defense: 1.1% | |
| $ | 665,000 | | | C | | General Dynamics Corp.,
4.500%, due 08/15/10 | | | 670,307 | | |
| | | | 670,307 | | |
| | | | | Banks: 2.5% | |
| | 720,000 | | | | | Bank of America Corp.,
4.375%, due 12/01/10 | | | 719,165 | | |
| | 220,000 | | | | | US Bancorp., 4.500%,
due 07/29/10 | | | 222,039 | | |
| | 200,000 | | | | | US Bancorp., 5.300%,
due 04/28/09 | | | 202,068 | | |
| | 460,000 | | | L | | Wachovia Corp., 4.375%,
due 06/01/10 | | | 454,148 | | |
| | | | 1,597,420 | | |
| | | | | Chemicals: 1.0% | |
| | 635,000 | | | C | | EI Du Pont de Nemours & Co.,
4.125%, due 04/30/10 | | | 633,070 | | |
| | | | 633,070 | | |
| | | | | Cosmetics/Personal Care: 1.1% | |
| | 555,000 | | | C,L | | Procter & Gamble Co., 3.500%,
due 12/15/08 | | | 549,343 | | |
| | 130,000 | | | | | Procter & Gamble Co., 6.875%,
due 09/15/09 | | | 136,166 | | |
| | | | 685,509 | | |
See Accompanying Notes to Financial Statements
203
PORTFOLIO OF INVESTMENTS
ING OPCAP BALANCED VALUE PORTFOLIO AS OF DECEMBER 31, 2007
Principal
Amount | | | | | | Value | |
| | | | | Diversified Financial Services: 9.2% | |
| $ | 260,000 | | | | | American Express Credit Corp.,
3.000%, due 05/16/08 | | $ | 258,389 | | |
| | 405,000 | | | | | American Express Credit Corp.,
5.000%, due 12/02/10 | | | 409,687 | | |
| | 520,000 | | | C | | Ameriprise Financial, Inc.,
5.350%, due 11/15/10 | | | 528,893 | | |
| | 575,000 | | | C,L | | Boeing Capital Corp., 6.500%,
due 02/15/12 | | | 617,854 | | |
| | 325,000 | | | | | CIT Group, Inc., 4.750%,
due 12/15/10 | | | 308,479 | | |
| | 260,000 | | | | | Citigroup, Inc., 4.625%,
due 08/03/10 | | | 258,738 | | |
| | 300,000 | | | | | Citigroup, Inc., 6.000%,
due 02/21/12 | | | 310,704 | | |
| | 350,000 | | | | | General Electric Capital Corp.,
4.875%, due 10/21/10 | | | 355,433 | | |
| | 200,000 | | | | | General Electric Capital Corp.,
6.000%, due 06/15/12 | | | 209,872 | | |
| | 340,000 | | | L | | General Motors Acceptance Corp.,
6.125%, due 01/22/08 | | | 338,580 | | |
| | 600,000 | | | | | Goldman Sachs Group, Inc.,
5.700%, due 09/01/12 | | | 617,921 | | |
| | 260,000 | | | | | HSBC Finance Corp., 4.125%,
due 11/16/09 | | | 257,137 | | |
| | 200,000 | | | | | HSBC Finance Corp., 7.000%,
due 05/15/12 | | | 209,749 | | |
| | 325,000 | | | | | John Deere Capital Corp.,
7.000%, due 03/15/12 | | | 354,211 | | |
| | 290,000 | | | | | Merrill Lynch & Co., Inc., 3.700%,
due 04/21/08 | | | 287,926 | | |
| | 500,000 | | | | | SLM Corp., 4.500%,
due 07/26/10 | | | 458,869 | | |
| | | | 5,782,442 | | |
| | | | | Environmental Control: 0.2% | |
| | 125,000 | | | C | | Waste Management, Inc.,
6.500%, due 11/15/08 | | | 126,636 | | |
| | | | 126,636 | | |
| | | | | Food: 1.7% | |
| | 530,000 | | | C | | General Mills, Inc., 6.000%,
due 02/15/12 | | | 544,008 | | |
| | 545,000 | | | C | | Kellogg Co., 2.875%,
due 06/01/08 | | | 539,873 | | |
| | | | 1,083,881 | | |
| | | | | Insurance: 0.8% | |
| | 540,000 | | | C | | Berkshire Hathaway Finance
Corp., 3.375%, due 10/15/08 | | | 535,325 | | |
| | 2,345,000 | | | X | | Conseco Finance Trust II-Escrow,
Discount Note, due 11/15/26 | | | — | | |
| | 2,350,000 | | | X | | Conseco Finance Trust II-Escrow,
Discount Note, due 04/01/27 | | | — | | |
| | | | 535,325 | | |
| | | | | Media: 1.8% | |
| | 125,000 | | | | | News America Holdings,
9.250%, due 02/01/13 | | | 146,263 | | |
| | 280,000 | | | | | Time Warner Entertainment
Co. LP, 7.250%, due 09/01/08 | | | 283,804 | | |
| | 645,000 | | | C | | Walt Disney Co., 5.700%,
due 07/15/11 | | | 672,863 | | |
| | | | 1,102,930 | | |
Principal
Value | | | | | | Value | |
| | | | | Pipelines: 0.7% | |
| $ | 415,000 | | | C | | Spectra Energy Capital, LLC,
7.500%, due 10/01/09 | | $ | 432,789 | | |
| | | | 432,789 | | |
| | | | | Telecommunications: 1.9% | |
| | 585,000 | | | C | | Cisco Systems, Inc., 5.250%,
due 02/22/11 | | | 600,207 | | |
| | 350,000 | | | C | | Verizon Global Funding Corp.,
7.250%, due 12/01/10 | | | 375,422 | | |
| | 200,000 | | | C,L | | Verizon Global Funding Corp.,
7.375%, due 09/01/12 | | | 221,041 | | |
| | | | 1,196,670 | | |
Total Corporate Bonds/Notes
(Cost $13,723,278) | | | 13,846,979 | | |
| U.S. GOVERNMENT AGENCY OBLIGATIONS: 2.4% | | | |
| | | | | | | Federal Home Loan Mortgage
Corporation: 0.1% | | | | | |
| | 75,000 | | | L | | 4.875%, due 02/09/10 | | | 77,000 | | |
| | | | 77,000 | | |
| | | | | | | Federal National Mortgage
Corporation: 0.7% | | | | | |
| | 410,000 | | | L | | 5.000%, due 10/15/11 | | | 427,799 | | |
| | | | 427,799 | | |
| | | | | | | Other U.S. Agency
Obligations: 1.6% | | | | | |
| | 260,000 | | | | | Federal Farm Credit Bank,
4.750%, due 05/07/10 | | | 266,838 | | |
| | 685,000 | | | | | Federal Farm Credit Bank,
4.800%, due 04/25/11 | | | 709,579 | | |
| | | | 976,417 | | |
Total U.S. Government
Agency Obligations
(Cost $1,419,683) | | | 1,481,216 | | |
| U.S. TREASURY OBLIGATIONS: 10.9% | | | |
| | | | | U.S. Treasury Bonds: 3.4% | |
| | 247,000 | | | L | | 4.500%, due 05/15/17 | | | 256,089 | | |
| | 1,725,000 | | | L | | 5.000%, due 05/15/37 | | | 1,880,655 | | |
| | | | 2,136,744 | | |
| | | | | U.S. Treasury Notes: 4.0% | |
| | 2,500,000 | | | L | | 3.875%, due 10/31/12 | | | 2,549,805 | | |
| | | | 2,549,805 | | |
| | | | | U.S. Treasury STRIP: 3.5% | |
| | 2,332,000 | | | ^^ | | 6.762%, due 02/15/15 | | | 1,766,215 | | |
| | 559,000 | | | L,^^ | | 6.763%, due 08/15/15 | | | 413,340 | | |
| | | | 2,179,555 | | |
Total U.S. Treasury Obligations
(Cost $6,578,052) | | | 6,866,104 | | |
Total Long-Term Investments
(Cost $65,875,101) | | | 61,143,488 | | |
See Accompanying Notes to Financial Statements
204
PORTFOLIO OF INVESTMENTS
ING OPCAP BALANCED VALUE PORTFOLIO AS OF DECEMBER 31, 2007
Principal
Amount | | | | | | Value | |
| SHORT-TERM INVESTMENTS: 32.4% | |
| | | | | U.S. Government Agency
Obligations: 2.7% | | | |
| $ | 1,690,000 | | | Z | | Federal Home Loan Bank,
3.050%, due 01/02/08 | | $ | 1,689,714 | | |
Total U.S. Government
Agency Obligations
(Cost $1,689,714) | | | 1,689,714 | | |
| | | | | Securities Lending
Collateralcc: 29.7% | | | |
| | 18,685,000 | | | | | Bank of New York Mellon Corp.
Institutional Cash Reserves | | | 18,685,000 | | |
Total Securities Lending
Collateral
(Cost $18,685,000) | | | 18,685,000 | | |
Total Short-Term Investments
(Cost $20,374,714) | | | 20,374,714 | | |
Total Investments in
Securities
(Cost $86,249,815)* | | | 129.7 | % | | $ | 81,518,202 | | |
Other Assets and
Liabilities - Net | | | (29.7 | ) | | | (18,664,517 | ) | |
| Net Assets | | | 100.0 | % | | $ | 62,853,685 | | |
@ Non-income producing security
@@ Foreign Issuer
ADR American Depositary Receipt
STRIP Separate Trading of Registered Interest and Principal of Securities
C Bond may be called prior to maturity date.
cc Securities purchased with cash collateral for securities loaned.
W When-issued or delayed delivery security
L Loaned security, a portion or all of the security is on loan at December 31, 2007.
^^ Principal Only (PO) Security
Z Zero Coupon Bond; rate shown reflects current effective yield.
X Fair Value determined by ING Funds Valuation Committee appointed by the Funds' Board of Directors/Trustees.
* Cost for federal income tax purposes is $86,481,394
Net unrealized depreciation consists of:
| Gross Unrealized Appreciation | | $ | 3,207,388 | | |
| Gross Unrealized Depreciation | | | (8,170,580 | ) | |
| Net Unrealized Depreciation | | $ | (4,963,192 | ) | |
See Accompanying Notes to Financial Statements
205
PORTFOLIO OF INVESTMENTS
ING OPPENHEIMER GLOBAL PORTFOLIO AS OF DECEMBER 31, 2007
| Shares | | | | | | Value | |
| COMMON STOCK: 98.7% | | | |
| | | | | Australia: 0.0% | |
| | 136,480 | | | L | | Aristocrat Leisure Ltd. | | $ | 1,337,233 | | |
| | | | 1,337,233 | | |
| | | | | Bermuda: 1.1% | |
| | 278,200 | | | | | ACE Ltd. | | | 17,187,196 | | |
| | 227,100 | | | L | | XL Capital Ltd. | | | 11,425,401 | | |
| | | | 28,612,597 | | |
| | | | | Brazil: 1.7% | |
| | 274,400 | | | L | | Cia de Bebidas das Americas
ADR | | | 19,490,632 | | |
| | 576,700 | | | L | | Empresa Brasileira de
Aeronautica SA ADR | | | 26,291,753 | | |
| | | | 45,782,385 | | |
| | | | | Canada: 1.3% | |
| | 773,400 | | | L | | Husky Energy, Inc. | | | 34,941,898 | | |
| | | | 34,941,898 | | |
| | | | | Finland: 1.0% | |
| | 578,600 | | | | | Fortum OYJ | | | 25,991,051 | | |
| | | | 25,991,051 | | |
| | | | | France: 5.7% | |
| | 90,000 | | | | | BNP Paribas | | | 9,765,009 | | |
| | 328,448 | | | | | LVMH Moet Hennessy Louis
Vuitton SA | | | 39,692,723 | | |
| | 146,386 | | | @,L | | NicOx SA | | | 2,342,352 | | |
| | 316,399 | | | L | | Sanofi-Aventis | | | 28,963,296 | | |
| | 157,455 | | | | | Societe Generale | | | 22,772,593 | | |
| | 354,354 | | | | | Technip SA | | | 28,185,803 | | |
| | 198,594 | | | L | | Total SA | | | 16,443,673 | | |
| | | | 148,165,449 | | |
| | | | | Germany: 6.2% | |
| | 163,324 | | | | | Allianz AG | | | 35,217,392 | | |
| | 437,960 | | | | | Bayerische Motoren Werke AG | | | 27,416,921 | | |
| | 630,633 | | | | | SAP AG | | | 32,543,037 | | |
| | 429,564 | | | L | | Siemens AG | | | 68,025,686 | | |
| | | | 163,203,036 | | |
| | | | | India: 3.1% | |
| | 1,685,713 | | | @ | | Dish TV India Ltd. | | | 4,320,293 | | |
| | 2,835,184 | | | | | Hindustan Lever Ltd. | | | 15,269,751 | | |
| | 166,600 | | | L | | ICICI Bank Ltd. ADR | | | 10,245,900 | | |
| | 717,065 | | | | | Infosys Technologies Ltd. | | | 31,983,361 | | |
| | 1,555,538 | | | @ | | Wire and Wireless India Ltd. | | | 3,872,102 | | |
| | 2,006,376 | | | | | Zee Telefilms Ltd. | | | 16,481,178 | | |
| | | | 82,172,585 | | |
| | | | | Italy: 0.9% | |
| | 930,700 | | | | | Bulgari S.p.A. | | | 13,070,577 | | |
| | 167,525 | | | L | | Tod's S.p.A. | | | 11,727,978 | | |
| | | | 24,798,555 | | |
| | | | | Japan: 11.4% | |
| | 460,500 | | | L | | Chugai Pharmaceutical Co., Ltd. | | | 6,585,990 | | |
| | 483,060 | | | | | Credit Saison Co., Ltd. | | | 13,159,018 | | |
| | 75,700 | | | | | Fanuc Ltd. | | | 7,338,973 | | |
| | 590,100 | | | | | Hoya Corp. | | | 18,670,270 | | |
| | 3,774 | | | | | KDDI Corp. | | | 27,924,107 | | |
| | 58,230 | | | | | Keyence Corp. | | | 14,299,517 | | |
| Shares | | | | | | Value | |
| | 144,600 | | | | | Kyocera Corp. | | $ | 12,778,922 | | |
| | 1,017,000 | | | | | Mitsubishi Electric Corp. | | | 10,533,246 | | |
| | 357,500 | | | | | Murata Manufacturing
Co., Ltd. | | | 20,529,300 | | |
| | 100,000 | | | | | Nidec Corp. | | | 7,225,219 | | |
| | 26,900 | | | | | Nintendo Co., Ltd. | | | 15,794,388 | | |
| | 288,000 | | | | | Secom Co., Ltd. | | | 15,723,021 | | |
| | 364,600 | | | L | | Sega Sammy Holdings, Inc. | | | 4,515,229 | | |
| | 301,671 | | | | | Seven & I Holdings Co., Ltd. | | | 8,764,277 | | |
| | 1,195,000 | | | | | Shionogi & Co., Ltd. | | | 21,186,262 | | |
| | 825,500 | | | | | Sony Corp. | | | 44,975,612 | | |
| | 1,081 | | | @ | | Sony Financial Holdings, Inc. | | | 4,131,827 | | |
| | 389,100 | | | L | | Square Enix Co., Ltd. | | | 11,846,111 | | |
| | 2,073 | | | | | Sumitomo Mitsui Financial
Group, Inc. | | | 15,340,776 | | |
| | 315,900 | | | | | Toyota Motor Corp. | | | 16,824,427 | | |
| | | | 298,146,492 | | |
| | | | | Mexico: 2.2% | |
| | 5,159,200 | | | | | Fomento Economico Mexicano
SA de CV ADR | | | 19,739,992 | | |
| | 2,381,600 | | | | | Grupo Modelo SA | | | 11,344,693 | | |
| | 1,073,200 | | | | | Grupo Televisa SA ADR | | | 25,509,964 | | |
| | | | 56,594,649 | | |
| | | | | Netherlands: 2.9% | |
| | 859,393 | | | L | | European Aeronautic Defence
and Space Co. NV | | | 27,427,864 | | |
| | 787,577 | | | | | Koninklijke Philips
Electronics NV | | | 33,747,888 | | |
| | 340,100 | | | | | TNT NV | | | 14,110,692 | | |
| | | | 75,286,444 | | |
| | | | | Norway: 0.6% | |
| | 702,800 | | | | | Tandberg ASA | | | 14,511,113 | | |
| | | | 14,511,113 | | |
| | | | | South Korea: 1.5% | |
| | 23,201 | | | | | Samsung Electronics Co., Ltd. | | | 13,653,738 | | |
| | 851,600 | | | L | | SK Telecom Co., Ltd. ADR | | | 25,411,744 | | |
| | | | 39,065,482 | | |
| | | | | Spain: 1.0% | |
| | 424,700 | | | | | Inditex SA | | | 25,698,609 | | |
| | | | 25,698,609 | | |
| | | | | Sweden: 6.5% | |
| | 1,421,300 | | | | | Assa Abloy AB | | | 28,502,339 | | |
| | 790,600 | | | | | Hennes & Mauritz AB | | | 47,756,671 | | |
| | 902,752 | | | | | Investor AB | | | 20,434,323 | | |
| | 32,055,000 | | | | | Telefonaktiebolaget
LM Ericsson | | | 75,027,247 | | |
| | | | 171,720,580 | | |
| | | | | Switzerland: 2.8% | |
| | 15,077 | | | @ | | Basilea Pharmaceutica - REG | | | 2,933,060 | | |
| | 632,324 | | | | | Credit Suisse Group | | | 38,063,092 | | |
| | 185,869 | | | | | Roche Holding AG | | | 32,130,389 | | |
| | | | 73,126,541 | | |
| | | | | Taiwan: 1.8% | |
| | 1,958,385 | | | | | MediaTek, Inc. | | | 25,102,289 | | |
| | 7,979,193 | | | | | Taiwan Semiconductor
Manufacturing Co., Ltd. | | | 15,128,453 | | |
See Accompanying Notes to Financial Statements
206
PORTFOLIO OF INVESTMENTS
ING OPPENHEIMER GLOBAL PORTFOLIO AS OF DECEMBER 31, 2007 (CONTINUED)
| Shares | | | | | | Value | |
| | | | | Taiwan (continued) | |
| | 658,689 | | | | | Taiwan Semiconductor
Manufacturing Co.,
Ltd. ADR | | $ | 6,560,542 | | |
| | | | 46,791,284 | | |
| | | | | United Kingdom: 12.5% | |
| | 322,090 | | | | | 3I Group PLC | | | 6,377,178 | | |
| | 306,100 | | | L | | BP PLC ADR | | | 22,397,337 | | |
| | 938,768 | | | | | Burberry Group PLC | | | 10,610,373 | | |
| | 2,183,750 | | | | | Cadbury Schweppes PLC | | | 26,700,478 | | |
| | 656,069 | | | | | Diageo PLC | | | 14,082,686 | | |
| | 857,695 | | | | | Experian Group Ltd. | | | 6,774,416 | | |
| | 1,458,752 | | | L | | HSBC Holdings PLC | | | 24,527,699 | | |
| | 764,303 | | | | | Pearson PLC | | | 11,068,549 | | |
| | 1,719,706 | | | | | Prudential PLC | | | 24,214,861 | | |
| | 601,666 | | | | | Reckitt Benckiser PLC | | | 34,962,857 | | |
| | 3,331,531 | | | | | Royal Bank of Scotland
Group PLC | | | 29,415,669 | | |
| | 1,161,754 | | | | | Smith & Nephew PLC | | | 13,328,808 | | |
| | 2,779,220 | | | | | Tesco PLC | | | 26,437,449 | | |
| | 17,081,706 | | | | | Vodafone Group PLC | | | 64,123,383 | | |
| | 971,578 | | | | | WPP Group PLC | | | 12,446,998 | | |
| | | | 327,468,741 | | |
| | | | | United States: 34.5% | |
| | 322,600 | | | | | 3M Co. | | | 27,201,632 | | |
| | 210,900 | | | @,L | | Acadia Pharmaceuticals, Inc. | | | 2,334,663 | | |
| | 760,383 | | | @,L | | Adobe Systems, Inc. | | | 32,491,166 | | |
| | 1,657,500 | | | @,L | | Advanced Micro Devices, Inc. | | | 12,431,250 | | |
| | 330,100 | | | | | Aflac, Inc. | | | 20,674,163 | | |
| | 831,700 | | | | | Altera Corp. | | | 16,068,444 | | |
| | 436,900 | | | | | American International
Group, Inc. | | | 25,471,270 | | |
| | 681,800 | | | | | Automatic Data
Processing, Inc. | | | 30,360,554 | | |
| | 144,700 | | | | | Boeing Co. | | | 12,655,462 | | |
| | 718,500 | | | | | Carnival Corp. | | | 31,966,065 | | |
| | 247,700 | | | | | Chevron Corp. | | | 23,117,841 | | |
| | 441,900 | | | @ | | Cisco Systems, Inc. | | | 11,962,233 | | |
| | 205,000 | | | @ | | Coach, Inc. | | | 6,268,900 | | |
| | 311,400 | | | | | Colgate-Palmolive Co. | | | 24,276,744 | | |
| | 1,278,800 | | | | | Corning, Inc. | | | 30,678,412 | | |
| | 582,700 | | | @,L | | Cree, Inc. | | | 16,006,769 | | |
| | 1,277,400 | | | @,L | | eBay, Inc. | | | 42,396,906 | | |
| | 598,900 | | | | | Emerson Electric Co. | | | 33,933,674 | | |
| | 133,600 | | | @ | | Genentech, Inc. | | | 8,960,552 | | |
| | 575,500 | | | @ | | Gilead Sciences, Inc. | | | 26,478,755 | | |
| | 72,100 | | | @ | | Hospira, Inc. | | | 3,074,344 | | |
| | 191,400 | | | @,L | | InterMune, Inc. | | | 2,551,362 | | |
| | 395,200 | | | L | | International Game
Technology | | | 17,361,136 | | |
| | 953,300 | | | @ | | Intuit, Inc. | | | 30,133,813 | | |
| | 102,100 | | | | | Johnson & Johnson | | | 6,810,070 | | |
| | 1,418,800 | | | @ | | Juniper Networks, Inc. | | | 47,104,160 | | |
| | 343,800 | | | L | | Linear Technology Corp. | | | 10,943,154 | | |
| | 162,600 | | | | | Lockheed Martin Corp. | | | 17,115,276 | | |
| | 768,400 | | | | | Maxim Integrated Products | | | 20,347,232 | | |
| | 386,600 | | | | | McDonald's Corp. | | | 22,774,606 | | |
| | 1,399,800 | | | | | Microsoft Corp. | | | 49,832,880 | | |
| | 170,300 | | | @,L | | Nektar Therapeutics | | | 1,142,713 | | |
| | 403,500 | | | | | Northern Trust Corp. | | | 30,900,030 | | |
| | 180,400 | | | | | Northrop Grumman Corp. | | | 14,186,656 | | |
| | 62,300 | | | @,L | | Pharmion Corp. | | | 3,916,178 | | |
| | 102,700 | | | | | Praxair, Inc. | | | 9,110,517 | | |
| Shares | | | | | | Value | |
| | 298,200 | | | | | Raytheon Co. | | $ | 18,100,740 | | |
| | 123,600 | | | @,L | | Regeneron Pharmaceuticals, Inc. | | | 2,984,940 | | |
| | 291,454 | | | @,L | | Seattle Genetics, Inc. | | | 3,322,576 | | |
| | 205,200 | | | @,L | | Shuffle Master, Inc. | | | 2,460,348 | | |
| | 6,503,539 | | | @,L | | Sirius Satellite Radio, Inc. | | | 19,705,723 | | |
| | 289,400 | | | @,L | | Theravance, Inc. | | | 5,643,300 | | |
| | 540,800 | | | L | | Tiffany & Co. | | | 24,893,024 | | |
| | 243,779 | | | @,L | | Transocean, Inc. | | | 34,896,964 | | |
| | 91,187 | | | | | United Parcel Service, Inc.-
Class B | | | 6,448,745 | | |
| | 519,800 | | | L | | Wal-Mart Stores, Inc. | | | 24,706,094 | | |
| | 833,400 | | | L | | Walt Disney Co. | | | 26,902,152 | | |
| | 555,800 | | | | | Xilinx, Inc. | | | 12,155,346 | | |
| | | | 905,259,534 | | |
Total Common Stock
(Cost $2,009,995,113) | | | 2,588,674,258 | | |
| PREFERRED STOCK: 1.1% | | | |
| | | | | Germany: 1.1% | |
| | 138,116 | | | | | Bayerische Motoren
Werke AG | | | 7,332,251 | | |
| | 10,184 | | | | | Porsche AG | | | 20,494,919 | | |
| | | | 27,827,170 | | |
Total Preferred Stock
(Cost $13,627,664) | | | 27,827,170 | | |
Total Long-Term
Investments
(Cost $2,023,622,777) | | | 2,616,501,428 | | |
Principal
Amount | | | | | | Value | |
| SHORT-TERM INVESTMENTS: 13.8% | | | |
| | | | | | | U.S. Government Agency
Obligations: 0.0% | | | | | |
| $ | 130,000 | | | Z | | Federal Home Loan Bank,
3.050%, due 01/02/08 | | | 129,978 | | |
Total U.S. Government
Agency Obligations
(Cost $129,978) | | | 129,978 | | |
| | | | | | | Securities Lending
Collateralcc: 13.8% | | | | | |
| | 362,276,998 | | | | | Bank of New York
Mellon Corp. Institutional
Cash Reserves | | | 362,276,998 | | |
Total Securities Lending
Collateral
(Cost $362,276,998) | | | 362,276,998 | | |
Total Short-Term Investments
(Cost $362,406,976) | | | 362,406,976 | | |
Total Investments in
Securities
(Cost $2,386,029,753)* | | | 113.6 | % | | $ | 2,978,908,404 | | |
Other Assets and
Liabilities - Net | | | (13.6 | ) | | | (356,999,148 | ) | |
| Net Assets | | | 100.0 | % | | $ | 2,621,909,256 | | |
See Accompanying Notes to Financial Statements
207
PORTFOLIO OF INVESTMENTS
ING OPPENHEIMER GLOBAL PORTFOLIO AS OF DECEMBER 31, 2007 (CONTINUED)
@ Non-income producing security
ADR American Depositary Receipt
cc Securities purchased with cash collateral for securities loaned.
L Loaned security, a portion or all of the security is on loan at December 31, 2007.
Z Indicates Zero Coupon Bond; rate shown reflects current effective yield.
* Cost for federal income tax purposes is $2,402,042,968.
Net unrealized appreciation consists of:
| Gross Unrealized Appreciation | | $ | 677,512,902 | | |
| Gross Unrealized Depreciation | | | (100,647,466 | ) | |
| Net Unrealized Appreciation | | $ | 576,865,436 | | |
| Industry | | Percentage of
Net Assets | |
| Aerospace/Defense | | | 4.4 | % | |
| Apparel | | | 0.8 | | |
| Auto Manufacturers | | | 2.8 | | |
| Banks | | | 5.4 | | |
| Beverages | | | 2.5 | | |
| Biotechnology | | | 0.9 | | |
| Chemicals | | | 0.3 | | |
| Commercial Services | | | 0.9 | | |
| Cosmetics/Personal Care | | | 0.9 | | |
| Diversified Financial Services | | | 2.0 | | |
| Electric | | | 1.0 | | |
| Electrical Components & Equipment | | | 1.7 | | |
| Electronics | | | 4.4 | | |
| Entertainment | | | 0.8 | | |
| Food | | | 2.0 | | |
| Healthcare - Products | | | 0.8 | | |
| Holding Companies - Diversified | | | 1.5 | | |
| Home Furnishings | | | 1.7 | | |
| Household Products/Wares | | | 1.9 | | |
| Insurance | | | 5.3 | | |
| Internet | | | 1.6 | | |
| Investment Companies | | | 0.8 | | |
| Leisure Time | | | 1.4 | | |
| Media | | | 4.4 | | |
| Metal Fabricate/Hardware | | | 1.1 | | |
| Miscellaneous Manufacturing | | | 3.6 | | |
| Oil & Gas | | | 5.0 | | |
| Oil & Gas Services | | | 1.1 | | |
| Pharmaceuticals | | | 5.0 | | |
| Retail | | | 6.6 | | |
| Semiconductors | | | 5.7 | | |
| Software | | | 8.4 | | |
| Telecommunications | | | 11.5 | | |
| Toys/Games/Hobbies | | | 0.6 | | |
| Transportation | | | 0.8 | | |
| Venture Capital | | | 0.2 | | |
| Short-Term Investments | | | 13.8 | | |
| Other Assets and Liabilities - Net | | | (13.6 | ) | |
| Net Assets | | | 100.0 | % | |
See Accompanying Notes to Financial Statements
208
PORTFOLIO OF INVESTMENTS
ING PIMCO TOTAL RETURN PORTFOLIO AS OF DECEMBER 31, 2007
Principal
Amount | | | | | | Value | |
| CORPORATE BONDS/NOTES: 27.5% | | | |
| | | | | Agriculture: 0.1% | |
| $ | 300,000 | | | C | | Reynolds American, Inc.,
7.625%, due 06/01/16 | | $ | 320,399 | | |
| | | | 320,399 | | |
| | | | | Auto Manufacturers: 0.7% | |
| | 1,400,000 | | | C | | DaimlerChrysler NA
Holding Corp., 5.461%,
due 03/13/09 | | | 1,392,590 | | |
| | 1,995,000 | | | | | DaimlerChrysler NA
Holding Corp., 9.000%,
due 08/03/14 | | | 1,923,362 | | |
| | | | 3,315,952 | | |
| | | | | Banks: 9.0% | |
| | 200,000 | | | | | Abbey National Treasury
Services PLC, 4.581%,
due 07/02/08 | | | 200,064 | | |
| | 200,000 | | | | | American Express Bank FSB,
6.000%, due 09/13/17 | | | 201,481 | | |
| | 3,700,000 | | | | | American Express Centurion
Bank, 5.252%,
due 06/12/09 | | | 3,688,112 | | |
| | 200,000 | | | | | American Express Centurion
Bank, 6.000%,
due 09/13/17 | | | 201,481 | | |
| | 900,000 | | | | | Bank of America Corp.,
5.750%, due 12/01/17 | | | 903,753 | | |
| | 5,500,000 | | | | | Bank of America NA,
5.133%, due 06/12/09 | | | 5,489,435 | | |
| | 2,100,000 | | | | | Barclays Bank PLC,
4.989%, due 03/17/08 | | | 2,100,449 | | |
| | 4,100,000 | | | @@ | | Barclays Bank PLC,
5.450%, due 09/12/12 | | | 4,206,756 | | |
| | 700,000 | | | @@,# | | Barclays Bank PLC,
6.050%, due 12/04/17 | | | 706,638 | | |
| | 2,200,000 | | | @@,#,C | | BNP Paribas, 5.186%,
due 06/29/15 | | | 2,005,291 | | |
| | 1,700,000 | | | | | Calyon New York,
5.204%, due 01/16/09 | | | 1,697,935 | | |
| | 1,100,000 | | | @@,#,C | | Commonwealth Bank of
Australia, 6.024%,
due 03/15/16 | | | 1,026,873 | | |
| | 600,000 | | | @@,# | | Credit Agricole SA, 5.053%,
due 05/28/09 | | | 600,481 | | |
| | 700,000 | | | @@,# | | Credit Agricole SA, 5.103%,
due 05/28/10 | | | 700,271 | | |
| | 1,600,000 | | | @@,C,L | | Deutsche Bank AG, 6.000%,
due 09/01/17 | | | 1,662,194 | | |
| | 1,700,000 | | | | | Dexia Credit Local, 4.795%,
due 09/29/08 | | | 1,700,554 | | |
| | 1,700,000 | | | | | Fortis Bank SA, 4.780%,
due 09/30/08 | | | 1,696,612 | | |
| | 1,700,000 | | | | | Fortis Bank SA, 4.790%,
due 06/30/08 | | | 1,698,518 | | |
| DKK | 6,062,445 | | | @@ | | Nykredit Realkredit A/S,
5.000%, due 10/01/38 | | | 1,125,290 | | |
| DKK | 11,644,844 | | | @@ | | Realkredit Danmark A/S,
5.000%, due 10/01/38 | | | 2,152,515 | | |
| $ | 1,200,000 | | | | | Royal Bank of Scotland,
4.810%, due 03/26/08 | | | 1,199,650 | | |
Principal
Amount | | | | | | Value | |
| $ | 1,500,000 | | | @@,# | | Santander US Debt
SA Unipersonal, 4.925%,
due 02/06/09 | | $ | 1,491,869 | | |
| | 1,200,000 | | | | | Societe Generale, 4.815%,
due 03/26/08 | | | 1,200,240 | | |
| | 1,600,000 | | | @@,# | | Unicredit Luxembourg
Finance SA, 5.143%,
due 10/24/08 | | | 1,597,154 | | |
| | 800,000 | | | @@,# | | VTB Capital (VNESHTORGBK),
5.494%, due 08/01/08 | | | 793,000 | | |
| | 2,800,000 | | | | | Wells Fargo & Co., 5.625%,
due 12/11/17 | | | 2,806,997 | | |
| | | | 42,853,613 | | |
| | | | | Biotechnology: 0.3% | |
| | 1,400,000 | | | #,C | | Amgen, Inc., 5.133%,
due 11/28/08 | | | 1,398,677 | | |
| | | | 1,398,677 | | |
| | | | | Building Materials: 0.2% | |
| | 800,000 | | | @@,#,C,L | | C8 Capital SPV Ltd., 6.640%,
due 12/31/49 | | | 760,684 | | |
| | | | 760,684 | | |
| | | | | Chemicals: 0.1% | |
| | 400,000 | | | C | | Rohm & Haas Co., 6.000%,
due 09/15/17 | | | 407,162 | | |
| | | | 407,162 | | |
| | | | | Computers: 1.2% | |
| | 5,700,000 | | | C | | International Business
Machines Corp., 5.700%,
due 09/14/17 | | | 5,903,399 | | |
| | | | 5,903,399 | | |
| | | | | Diversified Financial Services: 11.5% | |
| | 1,300,000 | | | | | American General
Finance Corp., 6.900%,
due 12/15/17 | | | 1,303,618 | | |
| | 900,000 | | | | | Bear Stearns Cos., Inc.,
5.072%, due 08/21/09 | | | 867,003 | | |
| | 3,900,000 | | | | | Bear Stearns Cos., Inc.,
5.494%, due 07/16/09 | | | 3,752,869 | | |
| | 3,000,000 | | | | | Caterpillar Financial
Services Corp., 4.850%,
due 12/07/12 | | | 3,008,439 | | |
| | 400,000 | | | | | CitiFinancial, 6.625%,
due 06/01/15 | | | 420,625 | | |
| | 500,000 | | | | | Citigroup Funding, Inc.,
4.858%, due 06/26/09 | | | 492,528 | | |
| | 700,000 | | | | | Citigroup, Inc., 5.300%,
due 10/17/12 | | | 709,850 | | |
| | 1,900,000 | | | | | Citigroup, Inc., 5.500%,
due 08/27/12 | | | 1,939,676 | | |
| | 100,000 | | | S | | Citigroup, Inc., 5.625%,
due 08/27/12 | | | 101,401 | | |
| | 500,000 | | | | | Citigroup, Inc., 5.850%,
due 07/02/13 | | | 515,351 | | |
| | 1,900,000 | | | L | | Citigroup, Inc., 6.000%,
due 08/15/17 | | | 1,941,977 | | |
| | 1,200,000 | | | C | | Citigroup, Inc., 8.300%,
due 12/21/57 | | | 1,256,585 | | |
| | 2,100,000 | | | | | Ford Motor Credit Co.,
5.800%, due 01/12/09 | | | 1,993,784 | | |
See Accompanying Notes to Financial Statements
245
PORTFOLIO OF INVESTMENTS
ING PIMCO TOTAL RETURN PORTFOLIO AS OF DECEMBER 31, 2007 (CONTINUED)
Principal
Amount | | | | | | Value | |
| | | | | Diversified Financial Services (continued) | |
| $ | 100,000 | | | | | Ford Motor Credit Co.,
7.250%, due 10/25/11 | | $ | 86,685 | | |
| | 1,700,000 | | | | | General Electric Capital Corp.,
4.939%, due 08/15/11 | | | 1,671,697 | | |
| | 1,800,000 | | | | | General Electric Capital Corp.,
5.163%, due 03/12/10 | | | 1,790,266 | | |
| | 4,800,000 | | | | | General Electric Capital Corp.,
5.500%, due 09/05/67 | | | 6,814,236 | | |
| | 400,000 | | | | | General Motors
Acceptance Corp., 6.034%,
due 09/23/08 | | | 386,495 | | |
| | 4,000,000 | | | | | Goldman Sachs Group, Inc.,
5.481%, due 07/23/09 | | | 3,997,708 | | |
| | 2,000,000 | | | | | Goldman Sachs Group, Inc.,
6.250%, due 09/01/17 | | | 2,084,370 | | |
| | 3,200,000 | | | C | | Goldman Sachs Group, Inc.,
6.750%, due 10/01/37 | | | 3,145,197 | | |
| | 1,600,000 | | | | | HSBC Finance Corp., 5.240%,
due 10/21/09 | | | 1,593,115 | | |
| | 1,000,000 | | | | | JPMorgan Chase & Co.,
6.000%, due 01/15/18 | | | 1,018,277 | | |
| | 2,000,000 | | | | | Lehman Brothers
Holdings, Inc., 5.170%,
due 05/25/10 | | | 1,923,840 | | |
| | 2,700,000 | | | | | Lehman Brothers
Holdings, Inc., 6.200%,
due 09/26/14 | | | 2,753,619 | | |
| | 3,700,000 | | | | | Merrill Lynch & Co., Inc.,
4.948%, due 05/08/09 | | | 3,601,562 | | |
| | 300,000 | | | | | Merrill Lynch & Co., Inc.,
6.050%, due 08/15/12 | | | 306,064 | | |
| | 1,800,000 | | | | | Morgan Stanley, 4.925%,
due 05/07/09 | | | 1,778,171 | | |
| | 100,000 | | | C | | Morgan Stanley, 5.300%,
due 03/01/13 | | | 99,860 | | |
| | 1,300,000 | | | C | | Morgan Stanley, 6.250%,
due 08/28/17 | | | 1,323,964 | | |
| | 700,000 | | | @@,#,C,L | | Santander Perpetual
SA Unipersonal, 6.671%,
due 10/24/17 | | | 703,132 | | |
| | 1,100,000 | | | C | | UBS Preferred Funding
Trust V, 6.243%,
due 05/15/49 | | | 1,060,837 | | |
| | 500,000 | | | #,C | | ZFS Finance USA
Trust IV, 5.875%,
due 05/09/32 | | | 467,864 | | |
| | | | 54,910,665 | | |
| | | | | Electric: 0.5% | |
| | 300,000 | | | C,S | | Columbus Southern
Power Co., 6.600%,
due 03/01/33 | | | 302,284 | | |
| | 2,100,000 | | | @@,#,C | | Enel Finance
International SA, 6.250%,
due 09/15/17 | | | 2,128,856 | | |
| | 100,000 | | | C | | Entergy Gulf States, Inc.,
3.600%, due 06/01/08 | | | 99,251 | | |
| | | | 2,530,391 | | |
| | | | | Healthcare-Products: 0.2% | |
| | 1,000,000 | | | | | Fresenius Medical Care
Capital Trust II, 7.875%,
due 02/01/08 | | | 1,001,312 | | |
| | | | 1,001,312 | | |
Principal
Amount | | | | | | Value | |
| | | | | Insurance: 0.9% | |
| $ | 3,000,000 | | | | | American International
Group, Inc., 5.850%,
due 01/16/18 | | $ | 3,025,332 | | |
| | 1,300,000 | | | # | | Metropolitan Life Global
Funding I, 4.945%,
due 05/17/10 | | | 1,291,293 | | |
| | | | 4,316,625 | | |
| | | | | Lodging: 0.2% | |
| | 800,000 | | | C | | Mandalay Resort Group,
6.500%, due 07/31/09 | | | 804,000 | | |
| | | | 804,000 | | |
| | | | | Mining: 0.0% | |
| | 200,000 | | | @@,C | | Vale Overseas Ltd., 6.250%,
due 01/23/17 | | | 201,621 | | |
| | | | 201,621 | | |
| | | | | Office/Business Equip: 0.1% | |
| | 700,000 | | | C | | Xerox Corp., 9.750%,
due 01/15/09 | | | 731,967 | | |
| | | | 731,967 | | |
| | | | | Pharmaceuticals: 0.1% | |
| | 300,000 | | | @@,C | | AstraZeneca PLC, 5.900%,
due 09/15/17 | | | 315,599 | | |
| | 200,000 | | | @@,C | | AstraZeneca PLC, 6.450%,
due 09/15/37 | | | 219,895 | | |
| | | | 535,494 | | |
| | | | | Pipelines: 0.1% | |
| | 300,000 | | | # | | Williams Cos., Inc., 6.375%,
due 10/01/10 | | | 304,875 | | |
| | | | 304,875 | | |
| | | | | Retail: 0.6% | |
| | 2,700,000 | | | C | | CVS Caremark Corp., 5.750%,
due 08/15/11 | | | 2,767,954 | | |
| | | | 2,767,954 | | |
| | | | | Telecommunications: 1.7% | |
| | 24,000 | | | C | | AT&T Corp., 7.300%,
due 11/15/11 | | | 26,026 | | |
| | 400,000 | | | C,S | | AT&T, Inc., 4.125%,
due 09/15/09 | | | 397,618 | | |
| | 4,100,000 | | | C | | AT&T, Inc., 6.300%,
due 01/15/38 | | | 4,179,700 | | |
| | 2,500,000 | | | C,L | | BellSouth Corp., 5.200%,
due 09/15/14 | | | 2,498,543 | | |
| | 30,000 | | | C,S | | New Cingular Wireless
Services, Inc., 7.875%,
due 03/01/11 | | | 32,512 | | |
| | 600,000 | | | C | | Qwest Corp., 5.625%,
due 11/15/08 | | | 600,000 | | |
| | 200,000 | | | C | | Qwest Corp., 8.875%,
due 03/15/12 | | | 215,000 | | |
| | | | 7,949,399 | | |
Total Corporate Bonds/ Notes
(Cost $130,119,996) | | | 131,014,189 | | |
See Accompanying Notes to Financial Statements
246
PORTFOLIO OF INVESTMENTS
ING PIMCO TOTAL RETURN PORTFOLIO AS OF DECEMBER 31, 2007 (CONTINUED)
Principal
Amount | | | | | | Value | |
| U.S. GOVERNMENT AGENCY OBLIGATIONS: 70.7% | | | |
| | | | | | | Federal Home Loan Mortgage
Corporation: 21.8% | | | | | |
| $ | 1,505,689 | | | C | | 3.000%, due 05/15/22 | | $ | 1,496,835 | | |
| | 547,986 | | | C,S | | 3.500%, due 05/15/22 | | | 545,646 | | |
| | 1,455,508 | | | C,S | | 3.500%, due 11/15/22 | | | 1,443,454 | | |
| | 28,811 | | | C | | 3.500%, due 07/15/32 | | | 27,748 | | |
| | 1,544,799 | | | C | | 4.000%, due 06/15/22 | | | 1,537,027 | | |
| | 1,832,043 | | | C | | 4.500%, due 11/15/13 | | | 1,828,393 | | |
| | 1,755,171 | | | C | | 4.500%, due 06/15/17 | | | 1,755,114 | | |
| | 49,740 | | | C | | 5.000%, due 09/15/16 | | | 49,238 | | |
| | 3,788,593 | | | C | | 5.000%, due 12/15/23 | | | 3,797,080 | | |
| | 1,845,397 | | | C | | 5.000%, due 01/15/24 | | | 1,845,887 | | |
| | 1,854,099 | | | C,S | | 5.000%, due 07/15/24 | | | 1,859,008 | | |
| | 3,903,978 | | | C | | 5.000%, due 04/15/26 | | | 3,912,592 | | |
| | 471,579 | | | | | 5.000%, due 08/01/35 | | | 460,492 | | |
| | 789,382 | | | | | 5.000%, due 09/01/35 | | | 770,823 | | |
| | 1,088,826 | | | C | | 5.178%, due 07/15/19 | | | 1,085,087 | | |
| | 4,979,251 | | | C | | 5.178%, due 08/15/19 | | | 4,961,923 | | |
| | 6,636,137 | | | C | | 5.178%, due 10/15/20 | | | 6,612,593 | | |
| | 220,743 | | | C,S | | 5.185%, due 01/25/45 | | | 209,173 | | |
| | 4,465,610 | | | C | | 5.258%, due 02/15/19 | | | 4,443,684 | | |
| | 1,420,473 | | | | | 5.313%, due 09/01/35 | | | 1,427,140 | | |
| | 177,856 | | | C | | 5.500%, due 03/15/17 | | | 180,700 | | |
| | 180,617 | | | | | 5.500%, due 03/01/23 | | | 181,639 | | |
| | 380,160 | | | | | 5.500%, due 05/01/23 | | | 382,312 | | |
| | 4,215 | | | | | 5.500%, due 08/15/30 | | | 4,192 | | |
| | 420,092 | | | | | 5.500%, due 05/01/35 | | | 419,454 | | |
| | 2,072,962 | | | S | | 5.500%, due 05/01/35 | | | 2,069,811 | | |
| | 39,000,000 | | | W | | 5.500%, due 02/12/37 | | | 38,896,416 | | |
| | 3,936,919 | | | | | 5.500%, due 06/01/37 | | | 3,929,407 | | |
| | 1,990,319 | | | | | 5.500%, due 09/01/37 | | | 1,986,522 | | |
| | 683,889 | | | C | | 5.875%, due 03/25/24 | | | 696,354 | | |
| | 5,888 | | | | | 6.000%, due 10/01/17 | | | 6,030 | | |
| | 41,190 | | | | | 6.000%, due 02/01/22 | | | 42,063 | | |
| | 741,001 | | | S | | 6.000%, due 03/01/23 | | | 755,785 | | |
| | 13,500,000 | | | | | 6.000%, due 01/15/36 | | | 13,700,394 | | |
| | 488,321 | | | | | 6.000%, due 05/01/37 | | | 495,690 | | |
| | 419,634 | | | C | | 6.063%, due 10/25/44 | | | 420,663 | | |
| | 27,408 | | | | | 7.321%, due 04/01/32 | | | 27,639 | | |
| | | | 104,264,008 | | |
| | | | | | | Federal National Mortgage
Corporation: 48.9% | | | | | |
| | 2,121,548 | | | | | 4.186%, due 11/01/34 | | | 2,142,091 | | |
| | 1,212,296 | | | | | 4.425%, due 02/01/35 | | | 1,215,572 | | |
| | 1,202,271 | | | | | 4.736%, due 09/01/35 | | | 1,231,063 | | |
| | 612,646 | | | | | 4.848%, due 08/01/35 | | | 612,611 | | |
| | 1,144,646 | | | | | 4.925%, due 07/25/37 | | | 1,101,857 | | |
| | 146,715 | | | | | 4.985%, due 03/25/34 | | | 144,115 | | |
| | 839,872 | | | | | 4.991%, due 09/01/34 | | | 837,115 | | |
| | 103,670 | | | | | 5.000%, due 05/01/18 | | | 103,945 | | |
| | 804,509 | | | | | 5.000%, due 11/01/18 | | | 806,646 | | |
| | 352,332 | | | | | 5.000%, due 02/01/19 | | | 353,037 | | |
| | 37,892 | | | | | 5.000%, due 07/25/19 | | | 37,863 | | |
| | 67,020 | | | | | 5.000%, due 08/01/19 | | | 67,154 | | |
| | 399,160 | | | | | 5.000%, due 10/01/19 | | | 399,959 | | |
| | 1,000,000 | | | W | | 5.000%, due 01/15/20 | | | 1,001,094 | | |
| | 247,933 | | | | | 5.000%, due 06/01/20 | | | 248,215 | | |
| | 255,572 | | | | | 5.000%, due 07/01/20 | | | 255,863 | | |
| | 10,169,669 | | | | | 5.000%, due 08/01/20 | | | 10,181,238 | | |
| | 3,183,479 | | | | | 5.000%, due 09/01/20 | | | 3,187,100 | | |
| | 3,186,234 | | | | | 5.000%, due 01/01/21 | | | 3,189,859 | | |
| | 904,003 | | | | | 5.000%, due 07/01/21 | | | 905,118 | | |
Principal
Amount | | | | | | Value | |
| $ | 3,331,092 | | | | | 5.000%, due 06/25/27 | | $ | 3,337,319 | | |
| | 491,242 | | | | | 5.000%, due 08/01/35 | | | 479,663 | | |
| | 6,000,000 | | | W | | 5.000%, due 01/12/36 | | | 5,854,686 | | |
| | 363,037 | | | | | 5.000%, due 02/01/36 | | | 354,480 | | |
| | 20,000,000 | | | W | | 5.000%, due 02/13/36 | | | 19,503,114 | | |
| | 15,616,401 | | | | | 5.000%, due 03/01/36 | | | 15,248,306 | | |
| | 93,556 | | | | | 5.500%, due 03/01/16 | | | 94,911 | | |
| | 2,999,700 | | | | | 5.500%, due 12/01/22 | | | 3,038,769 | | |
| | 222,804 | | | | | 5.500%, due 06/01/23 | | | 224,272 | | |
| | 589,986 | | | | | 5.500%, due 02/01/24 | | | 593,874 | | |
| | 80,772 | | | | | 5.500%, due 05/01/33 | | | 80,845 | | |
| | 35,076 | | | | | 5.500%, due 07/01/33 | | | 35,107 | | |
| | 647,758 | | | S | | 5.500%, due 11/01/33 | | | 648,339 | | |
| | 245,339 | | | | | 5.500%, due 11/01/33 | | | 245,559 | | |
| | 159,467 | | | | | 5.500%, due 12/01/33 | | | 159,610 | | |
| | 390,314 | | | | | 5.500%, due 04/01/34 | | | 390,665 | | |
| | 75,666 | | | | | 5.500%, due 10/01/34 | | | 75,682 | | |
| | 652,278 | | | S | | 5.500%, due 11/01/34 | | | 652,416 | | |
| | 291,848 | | | | | 5.500%, due 12/01/34 | | | 291,909 | | |
| | 681,451 | | | S | | 5.500%, due 12/01/34 | | | 681,595 | | |
| | 334,861 | | | | | 5.500%, due 01/01/35 | | | 334,932 | | |
| | 730,125 | | | S | | 5.500%, due 01/01/35 | | | 730,279 | | |
| | 6,886,195 | | | S | | 5.500%, due 02/01/35 | | | 6,887,653 | | |
| | 10,786,839 | | | | | 5.500%, due 02/01/35 | | | 10,789,123 | | |
| | 142,544 | | | | | 5.500%, due 04/01/35 | | | 142,479 | | |
| | 663,353 | | | | | 5.500%, due 05/01/35 | | | 663,052 | | |
| | 2,305,076 | | | S | | 5.500%, due 05/01/35 | | | 2,304,031 | | |
| | 1,264,283 | | | | | 5.500%, due 06/01/35 | | | 1,263,709 | | |
| | 736,302 | | | | | 5.500%, due 07/01/35 | | | 735,968 | | |
| | 4,849,803 | | | | | 5.500%, due 08/01/35 | | | 4,847,604 | | |
| | 6,300,629 | | | | | 5.500%, due 09/01/35 | | | 6,297,772 | | |
| | 166,768 | | | | | 5.500%, due 10/01/35 | | | 166,693 | | |
| | 852,935 | | | | | 5.500%, due 12/01/35 | | | 852,548 | | |
| | 7,000,000 | | | W | | 5.500%, due 01/12/36 | | | 6,992,342 | | |
| | 5,262,193 | | | | | 5.500%, due 03/01/36 | | | 5,259,725 | | |
| | 84,279 | | | | | 5.500%, due 04/01/36 | | | 84,201 | | |
| | 843,696 | | | | | 5.500%, due 05/01/36 | | | 843,314 | | |
| | 806,907 | | | | | 5.500%, due 07/01/36 | | | 806,162 | | |
| | 1,000,000 | | | W | | 5.500%, due 02/12/37 | | | 998,281 | | |
| | 6,596,133 | | | | | 5.500%, due 03/01/37 | | | 6,590,039 | | |
| | 201,807 | | | | | 5.627%, due 04/01/32 | | | 206,743 | | |
| | 21,931 | | | | | 6.000%, due 04/01/17 | | | 22,486 | | |
| | 313,597 | | | | | 6.000%, due 06/01/17 | | | 321,524 | | |
| | 58,236 | | | | | 6.000%, due 01/01/18 | | | 59,708 | | |
| | 32,768 | | | | | 6.000%, due 12/01/18 | | | 33,598 | | |
| | 406,400 | | | | | 6.000%, due 04/01/22 | | | 415,220 | | |
| | 896,577 | | | S | | 6.000%, due 06/01/22 | | | 916,035 | | |
| | 168,032 | | | | | 6.000%, due 01/01/23 | | | 171,679 | | |
| | 287,593 | | | | | 6.000%, due 07/01/36 | | | 292,106 | | |
| | 6,046,212 | | | | | 6.000%, due 09/01/36 | | | 6,142,046 | | |
| | 5,438,685 | | | | | 6.000%, due 10/01/36 | | | 5,524,889 | | |
| | 3,706,083 | | | | | 6.000%, due 11/01/36 | | | 3,764,689 | | |
| | 7,671,788 | | | | | 6.000%, due 12/01/36 | | | 7,793,387 | | |
| | 11,000,000 | | | | | 6.000%, due 01/11/37 | | | 11,170,159 | | |
| | 68,561 | | | | | 6.000%, due 05/01/37 | | | 69,638 | | |
| | 3,378,889 | | | | | 6.000%, due 07/01/37 | | | 3,431,988 | | |
| | 3,999,601 | | | | | 6.000%, due 08/01/37 | | | 4,061,830 | | |
| | 2,187,957 | | | | | 6.000%, due 09/01/37 | | | 2,222,341 | | |
| | 12,332,685 | | | | | 6.000%, due 10/01/37 | | | 12,524,967 | | |
| | 1,019,011 | | | | | 6.000%, due 11/01/37 | | | 1,035,024 | | |
| | 12,105,253 | | | | | 6.000%, due 12/01/37 | | | 12,294,065 | | |
| | 5,062,225 | | | | | 6.000%, due 01/01/38 | | | 5,141,613 | | |
| | 434,903 | | | | | 6.063%, due 10/01/44 | | | 436,737 | | |
| | 125,852 | | | | | 6.341%, due 12/01/36 | | | 127,648 | | |
See Accompanying Notes to Financial Statements
247
PORTFOLIO OF INVESTMENTS
ING PIMCO TOTAL RETURN PORTFOLIO AS OF DECEMBER 31, 2007 (CONTINUED)
Principal
Amount | | | | | | Value | |
| | | | | | | Federal National Mortgage
Corporation (continued) | | | | | |
| $ | 163,401 | | | | | 6.375%, due 04/25/24 | | $ | 168,775 | | |
| | 13,861 | | | | | 6.494%, due 02/01/20 | | | 14,363 | | |
| | 115,233 | | | | | 6.500%, due 03/01/17 | | | 119,240 | | |
| | 38,496 | | | | | 6.500%, due 07/01/29 | | | 39,897 | | |
| | 9,300,000 | | | W | | 6.500%, due 01/15/35 | | | 9,560,112 | | |
| | 1,139,504 | | | | | 6.500%, due 09/01/37 | | | 1,171,515 | | |
| | 1,500,000 | | | | | 6.500%, due 06/17/38 | | | 1,564,554 | | |
| | 1,136,800 | | | | | 6.508%, due 02/01/33 | | | 1,144,345 | | |
| | 14,232 | | | | | 7.086%, due 09/01/31 | | | 14,393 | | |
| | 3,260,717 | | | | | 7.500%, due 08/25/35 | | | 3,387,365 | | |
| | | | 232,967,222 | | |
| | | | | | | Government National Mortgage
Association: 0.0% | | | | | |
| | 41,408 | | | C | | 5.428%, due 03/16/32 | | | 41,651 | | |
| | | | 41,651 | | |
Total U.S. Government
Agency Obligations
(Cost $335,164,058) | | | 337,272,881 | | |
| U.S. TREASURY OBLIGATIONS: 0.9% | | | |
| | | | | U.S. Treasury Bonds: 0.2% | |
| | 900,000 | | | | | 4.500%, due 05/15/17 | | | 933,117 | | |
| | | | 933,117 | | |
| | | | | U.S. Treasury Notes: 0.1% | |
| | 500,000 | | | S | | 3.107%, due 02/28/08 | | | 497,710 | | |
| | | | 497,710 | | |
| | | | | | | Treasury Inflation Indexed
Protected Securities: 0.6% | | | | | |
| | 452,304 | | | L | | 2.000%, due 01/15/14 | | | 467,322 | | |
| | 2,175,726 | | | L | | 2.375%, due 01/15/27 | | | 2,301,511 | | |
| | 201,620 | | | L | | 2.625%, due 07/15/17 | | | 217,608 | | |
| | | | 2,986,441 | | |
Total U.S. Treasury
Obligations
(Cost $4,353,145) | | | 4,417,268 | | |
| ASSET-BACKED SECURITIES: 2.5% | | | |
| | | | | | | Automobile Asset-Backed
Securities: 0.0% | | | | | |
| | 169,550 | | | C | | USAA Auto Owner Trust,
5.337%, due 07/11/08 | | | 169,729 | | |
| | | | 169,729 | | |
| | | | | | | Credit Card Asset-Backed
Securities: 0.4% | | | | | |
| | 1,700,000 | | | C | | First USA Credit Card
Master Trust, 5.156%,
due 04/18/11 | | | 1,700,806 | | |
| | | | 1,700,806 | | |
| | | | | | | Home Equity Asset-Backed
Securities: 0.1% | | | | | |
| | 747,457 | | | C | | HFC Home Equity Loan
Asset-Backed Certificates,
5.239%, due 01/20/34 | | | 731,150 | | |
| | | | 731,150 | | |
Principal
Amount | | | | | | Value | |
| | | | | | | Other Asset-Backed
Securities: 2.0% | | | | | |
| $ | 583,408 | | | C | | Countrywide Asset-Backed
Certificates, 4.895%,
due 01/25/46 | | $ | 576,078 | | |
| | 340,255 | | | C | | Countrywide Asset-Backed
Certificates, 4.915%,
due 01/25/37 | | | 335,928 | | |
| | 1,463,509 | | | C | | Countrywide Asset-Backed
Certificates, 4.945%,
due 10/25/37 | | | 1,422,260 | | |
| | 3,568,730 | | | C | | Countrywide Asset-Backed
Certificates, 5.045%,
due 09/25/36 | | | 3,462,558 | | |
| | 545,108 | | | C | | JPMorgan Mortgage
Acquisition Corp., 4.915%,
due 08/25/36 | | | 535,822 | | |
| | 772,420 | | | C | | JPMorgan Mortgage
Acquisition Corp., 4.925%,
due 04/01/37 | | | 747,619 | | |
| | 489,117 | | | C | | Lehman XS Trust, 4.945%,
due 07/25/46 | | | 485,110 | | |
| | 58,753 | | | C | | Long Beach Mortgage
Loan Trust, 5.145%,
due 10/25/34 | | | 56,529 | | |
| | 677,301 | | | C | | Morgan Stanley Capital I,
4.915%, due 11/25/36 | | | 667,523 | | |
| | 451 | | | #,C,S | | Quest Trust, 5.425%,
due 06/25/34 | | | 451 | | |
| | 1,135,132 | | | C | | WAMU Asset-Backed
Certificates, 4.915%,
due 01/25/37 | | | 1,087,582 | | |
| | | | 9,377,460 | | |
Total Asset-Backed Securities
(Cost $12,237,768) | | | 11,979,145 | | |
| COLLATERALIZED MORTGAGE OBLIGATIONS: 10.5% | | | |
| | 502,324 | | | C | | Adjustable Rate
Mortgage Trust, 4.598%,
due 05/25/35 | | | 499,401 | | |
| | 671,857 | | | C | | American Home Mortgage
Investment Trust, 4.390%,
due 02/25/45 | | | 645,019 | | |
| | 926,196 | | | C | | Banc of America
Funding Corp., 4.111%,
due 05/25/35 | | | 914,830 | | |
| | 623,645 | | | C | | Banc of America
Funding Corp., 6.144%,
due 01/20/47 | | | 614,648 | | |
| | 743,188 | | | C | | Banc of America Mortgage
Securities, Inc., 3.994%,
due 07/25/33 | | | 728,839 | | |
| | 380,452 | | | C | | Banc of America Mortgage
Securities, Inc., 5.000%,
due 05/25/34 | | | 363,351 | | |
| | 212,385 | | | C,S | | Banc of America Mortgage
Securities, Inc., 5.315%,
due 01/25/34 | | | 212,101 | | |
| | 11,155,903 | | | C | | Bear Stearns Adjustable Rate
Mortgage Trust, 4.125%,
due 03/25/35 | | | 11,015,227 | | |
See Accompanying Notes to Financial Statements
248
PORTFOLIO OF INVESTMENTS
ING PIMCO TOTAL RETURN PORTFOLIO AS OF DECEMBER 31, 2007 (CONTINUED)
Principal
Amount | | | | | | Value | |
| COLLATERALIZED MORTGAGE OBLIGATIONS (continued) | | | |
| $ | 754,422 | | | C | | Bear Stearns Adjustable Rate
Mortgage Trust, 4.750%,
due 10/25/35 | | $ | 749,551 | | |
| | 1,144,045 | | | C | | Bear Stearns Adjustable Rate
Mortgage Trust, 5.073%,
due 11/25/34 | | | 1,142,765 | | |
| | 490,662 | | | C,S | | Bear Stearns
Alternative-A Trust,
5.368%, due 05/25/35 | | | 485,061 | | |
| | 285,097 | | | C | | Bear Stearns
Alternative-A Trust,
5.527%, due 09/25/35 | | | 280,926 | | |
| | 839,273 | | | C | | Bear Stearns
Alternative-A Trust,
5.811%, due 11/25/36 | | | 827,083 | | |
| | 756,842 | | | | | Bear Stearns Structured
Products, Inc., 5.684%,
due 01/26/36 | | | 748,782 | | |
| | 479,291 | | | | | Bear Stearns Structured
Products, Inc., 5.787%,
due 12/26/46 | | | 472,357 | | |
| | 901,818 | | | C | | Citigroup Mortgage Loan
Trust, Inc., 4.679%,
due 08/25/35 | | | 890,582 | | |
| | 192,464 | | | C | | Countrywide Alternative
Loan Trust, 5.159%,
due 11/20/35 | | | 190,645 | | |
| | 1,322,987 | | | C | | Countrywide
Home Loan Mortgage
Pass-Through Trust,
4.726%, due 02/20/35 | | | 1,316,161 | | |
| | 727,521 | | | C | | Countrywide
Home Loan Mortgage
Pass-Through Trust,
4.801%, due 11/25/34 | | | 722,600 | | |
| | 276,270 | | | C,S | | Countrywide
Home Loan Mortgage
Pass-Through Trust,
5.185%, due 03/25/35 | | | 261,781 | | |
| | 1,316,542 | | | #,C,S | | Countrywide
Home Loan Mortgage
Pass-Through Trust,
5.205%, due 06/25/35 | | | 1,288,524 | | |
| | 259,039 | | | C | | Downey Savings &
Loan Association
Mortgage Loan Trust,
7.053%, due 07/19/44 | | | 262,360 | | |
| | 450,705 | | | C | | First Horizon Asset
Securities, Inc., 5.372%,
due 08/25/35 | | | 448,981 | | |
| | 2,095,013 | | | C | | Freddie Mac, 6.263%,
due 07/25/44 | | | 2,094,977 | | |
| | 356,231 | | | C | | GMAC Mortgage Corp.
Loan Trust, 5.500%,
due 09/25/34 | | | 356,356 | | |
| | 606,329 | | | C | | Greenpoint Mortgage
Pass-Through Certificates,
4.381%, due 10/25/33 | | | 601,265 | | |
| | 820,970 | | | # | | GS Mortgage
Securities Corp. II, 5.342%,
due 03/06/20 | | | 785,169 | | |
| | 940,508 | | | C | | GSR Mortgage Loan Trust,
4.539%, due 09/25/35 | | | 933,511 | | |
Principal
Amount | | | | | | Value | |
| $ | 123,115 | | | C | | GSR Mortgage Loan Trust,
5.298%, due 06/25/34 | | $ | 122,783 | | |
| | 7,886 | | | C | | GSR Mortgage Loan Trust,
6.000%, due 03/25/32 | | | 7,795 | | |
| | 631,460 | | | C | | Harborview Mortgage
Loan Trust, 5.148%,
due 07/19/35 | | | 624,110 | | |
| | 301,752 | | | C | | Harborview Mortgage
Loan Trust, 5.185%,
due 05/19/35 | | | 285,559 | | |
| | 340,353 | | | C | | Indymac Index Mortgage
Loan Trust, 5.047%,
due 12/25/34 | | | 336,843 | | |
| | 1,842,869 | | | C | | JPMorgan Mortgage Trust,
4.766%, due 07/25/35 | | | 1,825,727 | | |
| | 546,131 | | | C | | JPMorgan Mortgage Trust,
5.023%, due 02/25/35 | | | 535,411 | | |
| | 692,357 | | | C | | MASTR Adjustable Rate
Mortgages Trust, 3.786%,
due 11/21/34 | | | 685,866 | | |
| | 906,174 | | | C | | Merrill Lynch Mortgage
Investors, Inc., 3.880%,
due 05/25/33 | | | 898,849 | | |
| | 315,101 | | | C | | Merrill Lynch Mortgage
Investors, Inc., 5.075%,
due 02/25/36 | | | 303,475 | | |
| | 242,728 | | | C | | MLCC Mortgage
Investors, Inc., 5.115%,
due 11/25/35 | | | 234,755 | | |
| | 164,934 | | | C | | MLCC Mortgage
Investors, Inc., 5.865%,
due 10/25/35 | | | 162,072 | | |
| | 887,767 | | | C,S | | RAAC Series, 5.000%,
due 09/25/34 | | | 882,591 | | |
| | 166,418 | | | C,S | | Residential Accredit
Loans, Inc., 5.265%,
due 03/25/33 | | | 163,501 | | |
| | 205,453 | | | C | | Residential Asset
Securitization Trust,
5.265%, due 05/25/33 | | | 199,019 | | |
| | 35,878 | | | C,S | | Residential Funding
Mortgage Security I,
6.500%, due 03/25/32 | | | 35,910 | | |
| | 767,836 | | | C | | Sequoia Mortgage Trust,
4.080%, due 04/20/35 | | | 763,747 | | |
| | 281,934 | | | C,S | | Sequoia Mortgage Trust,
5.299%, due 07/20/33 | | | 275,236 | | |
| | 1,118,386 | | | C | | SLM Student Loan Trust,
5.074%, due 10/27/14 | | | 1,116,426 | | |
| | 298,428 | | | C | | Structured Adjustable Rate
Mortgage Loan Trust,
5.535%, due 08/25/35 | | | 296,343 | | |
| | 673,965 | | | C | | Structured Asset Mortgage
Investments, Inc., 5.215%,
due 07/19/35 | | | 631,007 | | |
| | 555,174 | | | #,C | | Structured Asset
Securities Corp., 5.331%,
due 10/25/35 | | | 550,156 | | |
| | 1,408,450 | | | C | | Thornburg Mortgage
Securities Trust, 4.985%,
due 09/25/46 | | | 1,377,342 | | |
| | 993,156 | | | # | | Wachovia Bank Commercial
Mortgage Trust, 5.108%,
due 06/15/20 | | | 974,579 | | |
See Accompanying Notes to Financial Statements
249
PORTFOLIO OF INVESTMENTS
ING PIMCO TOTAL RETURN PORTFOLIO AS OF DECEMBER 31, 2007 (CONTINUED)
Principal
Amount | | | | | | Value | |
| COLLATERALIZED MORTGAGE OBLIGATIONS (continued) | | | |
| $ | 227,961 | | | C,S | | Washington Mutual
Mortgage Pass-Through
Certificates, 5.175%,
due 01/25/45 | | $ | 215,864 | | |
| | 551,238 | | | C,S | | Washington Mutual
Mortgage Pass-Through
Certificates, 5.405%,
due 12/25/27 | | | 527,409 | | |
| | 66,771 | | | C,S | | Washington Mutual
Mortgage Pass-Through
Certificates, 5.483%,
due 02/27/34 | | | 65,409 | | |
| | 1,126,360 | | | C | | Washington Mutual
Mortgage Pass-Through
Certificates, 5.883%,
due 07/25/46 | | | 1,075,978 | | |
| | 1,273,538 | | | C | | Washington Mutual
Mortgage Pass-Through
Certificates, 5.883%,
due 08/25/46 | | | 1,215,930 | | |
| | 36,623 | | | C | | Washington Mutual
Mortgage Pass-Through
Certificates, 6.188%,
due 08/25/42 | | | 35,248 | | |
| | 1,450,726 | | | C,S | | Wells Fargo
Mortgage-Backed
Securities Trust, 3.989%,
due 12/25/34 | | | 1,436,849 | | |
| | 750,247 | | | C,S | | Wells Fargo
Mortgage-Backed
Securities Trust, 4.394%,
due 05/25/35 | | | 740,794 | | |
| | 923,982 | | | C | | Wells Fargo
Mortgage-Backed
Securities Trust, 4.949%,
due 01/25/35 | | | 914,384 | | |
| | 645,000 | | | C | | Wells Fargo
Mortgage-Backed
Securities Trust, 5.516%,
due 08/25/36 | | | 639,837 | | |
| | | | 50,009,657 | | |
Total Collateralized
Mortgage Obligations
(Cost $50,131,436) | | | 50,009,657 | | |
| MUNICIPAL BONDS: 0.5% | | | |
| | | | | California: 0.2% | |
| | 900,000 | | | C,(I) | | Orange County Sanitation
District, 6.510%,
due 02/01/33 | | | 924,678 | | |
| | | | 924,678 | | |
| | | | | Louisiana: 0.0% | |
| | 100,000 | | | C,S | | Tobacco Settlement
Financing Corp., 5.875%,
due 05/15/39 | | | 96,055 | | |
| | | | 96,055 | | |
| | | | | Rhode Island: 0.1% | |
| | 200,000 | | | C,S | | Tobacco Settlement
Financing Corp., 6.250%,
due 06/01/42 | | | 200,520 | | |
| | | | 200,520 | | |
Principal
Amount | | | | | | Value | |
| | | | | Wisconson: 0.2% | |
| $ | 170,000 | | | C | | Badger TOB Asset
Securitization Corp.,
6.125%, due 06/01/27 | | $ | 175,855 | | |
| | 800,000 | | | C,S | | Badger TOB Asset
Securitization Corp.,
6.375%, due 06/01/32 | | | 810,816 | | |
| | | | 986,671 | | |
Total Municipal Bonds
(Cost $2,156,439) | | | 2,207,924 | | |
| OTHER BONDS: 0.6% | | | |
| | | | | Foreign Government Bonds: 0.6% | |
| | 600,000 | | | # | | Export-Import Bank of China,
4.875%, due 07/21/15 | | | 588,341 | | |
| BRL | 2,000,000 | | | L | | Federative Republic of Brazil,
10.250%, due 01/10/28 | | | 1,084,270 | | |
| $ | 250,000 | | | | | Panama Government
International Bond,
8.875%, due 09/30/27 | | | 326,250 | | |
| | 84,000 | | | | | Panama Government
International Bond,
9.625%, due 02/08/11 | | | 94,710 | | |
| BRL | 900,000 | | | | | Republic of Brazil, 12.500%,
due 01/05/22 | | | 566,292 | | |
| | | | 2,659,863 | | |
Total Other Bonds
(Cost $2,513,256) | | | 2,659,863 | | |
Number of Contracts/
Notional Amount | | | | | | Value | |
| PURCHASED OPTIONS:1.5% | | | |
| Options on Exchange-Traded Futures Contracts | | | |
| | 136 | | | | | Call Option CME 90-Day
Eurodollar Future 03/08
Strike @ $95.25-
Exp 03/17/08 | | | 178,500 | | |
| | 72 | | | | | Put Option CME 90-Day
Eurodollar Future 03/08
Strike @ $91.50-
Exp 03/17/08 | | | — | | |
| | 133 | | | | | Put Option CME 90-Day
Eurodollar Future 03/08
Strike @ $91.75-
Exp 03/17/08 | | | — | | |
| | 90 | | | | | Put Option CME 90-Day
Eurodollar Future 03/08
Strike @ $92.75-
Exp 03/17/08 | | | — | | |
| | 253 | | | | | Put Option CME 90-Day
Eurodollar Future 03/08
Strike @ $93.00-
Exp 03/17/08 | | | — | | |
| | 167 | | | | | Put Option CME 90-Day
Eurodollar Future 3/08
Strike @ $94.625-
Exp 03/17/08 | | | 376 | | |
| | 357 | | | | | Put Option CME 90-Day
Eurodollar Future 06/08
Strike @ $92.50-
Exp 06/16/08 | | | — | | |
See Accompanying Notes to Financial Statements
250
PORTFOLIO OF INVESTMENTS
ING PIMCO TOTAL RETURN PORTFOLIO AS OF DECEMBER 31, 2007 (CONTINUED)
Number of Contracts/
Notional Amount | | | | | | Value | |
| Options on Exchange-Traded Futures Contracts (continued) | | | |
| | 70 | | | | | Put Option CME 90-Day
Eurodollar Future 9/08
Strike @ $92.25-
Exp 09/15/08 | | $ | — | | |
| | 612 | | | | | Put Option CME 90-Day
Eurodollar Future 9/08
Strike @ $92.50-
Exp 09/15/08 | | | — | | |
| | 145 | | | | | Put Option CME 90-Day
Eurodollar Future 12/08
Strike @ $92.75-
Exp 12/15/08 | | | 906 | | |
| | 686 | | | | | Put Option LIFFE 90-Day
Sterling Future 03/08
Strike @ GBP 93.00-
Exp 03/19/08 | | | — | | |
| | 75 | | | | | Put Option LIFFE 90-Day
Sterling Future 12/08
Strike @ GBP 91.50-
Exp 12/17/08 | | | — | | |
| | | | 179,782 | | |
| Foreign Currency Options | | | |
| $ | 1,400,000 | | | I | | Call Option OTC - Citibank
USD vs JPY Strike @ 121-
Exp 01/18/08 | | | 1,082 | | |
| | 3,000,000 | | | I | | Call Option OTC -
Credit Suisse USD vs JPY
Strike @ 104-
Exp 03/17/10 | | | 156,150 | | |
| | 3,000,000 | | | I | | Put Option OTC - Credit Suisse
USD vs JPY Strike @ 104-
Exp 03/17/10 | | | 137,547 | | |
| | | | 294,779 | | |
| Interest Rate Swaptions | | | |
| | 10,500,000 | | | I | | Call Swaption OTC -
Barclay's Bank PLC, London
3 Month USD-LIBOR -
Fund Pays Floating
Strike @ 4.750%-
Exp 02/01/08 | | | 80,237 | | |
| | 10,400,000 | | | I | | Call Swaption OTC -
The Royal Bank of
Scotland PLC
3 Month USD-LIBOR -
Fund Pays Floating
Strike @ 5.000%-
Exp 02/01/08 | | | 245,757 | | |
| | 188,500,000 | | | I | | Call Swaption OTC - The
Royal Bank of Scotland
PLC 3 Month USD-LIBOR -
Fund Pays Floating
Strike @ 4.750%-
Exp 03/31/08 | | | 3,854,898 | | |
| | 30,000,000 | | | I | | Call Swaption OTC -
Lehman Brothers Special
Financing Inc. 3 Month
USD-LIBOR - Fund Pays
Floating Strike @ 4.750%-
Exp 09/26/08 | | | 636,027 | | |
Number of Contracts/
Notional Amount | | | | | | Value | |
| Interest Rate Swaptions (continued) | | | |
| $ | 26,200,000 | | | I | | Call Swaption OTC - The
Royal Bank of Scotland
PLC 3 Month USD-LIBOR -
Fund Pays Floating
Strike @ 4.750%-
Exp 09/26/08 | | $ | 555,463 | | |
| | 9,000,000 | | | I | | Call Swaption OTC - The
Royal Bank of Scotland
PLC 3-month USD-LIBOR -
Fund Pays Floating
Strike @ 4.750%-
Exp 12/15/08 | | | 185,738 | | |
| | 21,000,000 | | | I | | Call Swaption OTC - The
Royal Bank of Scotland
PLC 3-Month USD-LIBOR -
Fund Pays Floating
Strike @ 5.000%-
Exp 12/15/08 | | | 513,056 | | |
| | 12,000,000 | | | I | | Call Swaption OTC -
Barclays Bank PLC
3-Month USD-LIBOR -
Fund Pays Floating
Strike @ 5.200%-
Exp 02/02/09 | | | 322,695 | | |
| | | | 6,393,871 | | |
Total Purchased Options
(Cost $2,007,592) | | | 6,868,432 | | |
Total Long-Term Investments
(Cost $538,683,690) | | | 546,429,360 | | |
Principal
Amount | | | | | | Value | |
| SHORT-TERM INVESTMENTS: 3.7% | | | |
| | | | | Commercial Paper: 1.7% | |
| $ | 400,000 | | | Z | | Fannie Mae,
4.210%, due 01/23/08 | | | 398,927 | | |
| | 200,000 | | | | | Swedbank AB, 4.750%,
due 01/11/08 | | | 199,710 | | |
| | 7,600,000 | | | | | Swedbank AB, 4.950%,
due 01/24/08 | | | 7,574,554 | | |
| | | | 8,173,191 | | |
Total Commercial Paper
(Cost $8,173,191) | | | 8,173,191 | | |
| | | | | Securities Lending Collateralcc: 2.0% | |
| | 9,478,131 | | | | | Bank of New York
Mellon Corp. Institutional
Cash Reserves | | | 9,478,131 | | |
Total Securities Lending
Collateral
(Cost $9,478,131) | | | 9,478,131 | | |
Total Short-Term Investments
(Cost $17,651,322) | | | 17,651,322 | | |
Total Investments in
Securities (Cost
$556,335,012)* | | | 118.4 | % | | $ | 564,080,682 | | |
Other Assets and
Liabilities - Net | | | (18.4 | ) | | | (87,636,120 | ) | |
| Net Assets | | | 100.0 | % | | $ | 476,444,562 | | |
@@ Foreign Issuer
MASTR Mortgage Asset Securitization Transaction, Inc.
See Accompanying Notes to Financial Statements
251
PORTFOLIO OF INVESTMENTS
ING PIMCO TOTAL RETURN PORTFOLIO AS OF DECEMBER 31, 2007 (CONTINUED)
# Securities with purchases pursuant to Rule144A or section 4(2), under the Securities Act of 1933 and may not be resold subject to that rule except to qualified institutional buyers. Unless otherwise noted, these securities have been determined to be liquid under the guidelines established by the Funds' Board of Directors/Trustees.
C Bond may be called prior to maturity date.
cc Securities purchased with cash collateral for securities loaned.
W When-issued or delayed delivery security
S All or a portion of this security is segregated for certain derivatives, when-issued or delayed delivery securities and forward currency exchange contracts.
L Loaned security, a portion or all of the security is on loan at December 31, 2007.
Z Indicates Zero Coupon Bond; rate shown reflects current effective yield.
(I) Security represents the underlying municipal obligation of an inverse floating rate obligation, Orange County Sanitation District, 5.870%, due 02/01/33.
I Illiquid Security
BRL Brazillan Real
DKK Danish Krone
* Cost for federal income tax purposes is $557,311,403.
Net unrealized appreciation consists of:
| Gross Unrealized Appreciation | | $ | 8,934,829 | | |
| Gross Unrealized Depreciation | | | (2,165,550 | ) | |
| Net Unrealized Appreciation | | $ | 6,769,279 | | |
ING PIMCO Total Return Portfolio Open Futures Contracts on December 31, 2007:
Contract
Description | | Number of
Contracts | | Notional
Market
Value ($) | | Expiration
Date | | Unrealized
Appreciation/
(Depreciation) | |
| Long Contracts | |
| 90-Day Eurodollar | | | 881 | | | $ | 212,001,638 | | | 06/16/08 | | $ | 2,277,124 | | |
| 90-Day Eurodollar | | | 173 | | | | 41,740,575 | | | 09/15/08 | | | 652,484 | | |
| 90-Day Eurodollar | | | 457 | | | | 110,399,775 | | | 12/15/08 | | | 1,363,146 | | |
| 90-Day Eurodollar | | | 319 | | | | 77,062,425 | | | 03/16/09 | | | 848,980 | | |
| 90-Day Eurodollar | | | 71 | | | | 17,130,525 | | | 06/15/09 | | | 222,604 | | |
| 90-Day Eurodollar | | | 46 | | | | 11,080,250 | | | 09/14/09 | | | 145,848 | | |
| 90-Day Eurodollar | | | 58 | | | | 13,946,100 | | | 12/14/09 | | | 249,062 | | |
| 90-Day Eurodollar | | | 58 | | | | 13,923,625 | | | 03/15/10 | | | 229,970 | | |
| 90-Day Sterling | | | 93 | | | | 21,849,520 | | | 03/19/08 | | | 78,654 | | |
| 90-Day Sterling | | | 387 | | | | 91,220,713 | | | 06/18/08 | | | 293,393 | | |
| 90-Day Sterling | | | 161 | | | | 38,045,849 | | | 09/17/08 | | | 387,152 | | |
| 90-Day Sterling | | | 263 | | | | 62,260,680 | | | 12/17/08 | | | 664,749 | | |
| 90-Day Sterling | | | 321 | | | | 76,063,057 | | | 03/18/09 | | | 948,252 | | |
| 90-Day Sterling | | | 111 | | | | 26,299,417 | | | 06/17/09 | | | 304,290 | | |
U.S. Treasury
10-Year Note | | | 83 | | | | 9,411,422 | | | 03/19/08 | | | 58,034 | | |
| | | $ | 8,723,742 | | |
| Short Contracts | |
U.S. Treasury
2-Year Note | | | 62 | | | | (13,035,500 | ) | | 03/31/08 | | $ | (45,497 | ) | |
U.S. Treasury
5-Year Note | | | 109 | | | | (12,020,656 | ) | | 03/31/08 | | | (54,449 | ) | |
| | | $ | (99,946 | ) | |
Principal
Amount | | | | Description | | Market
Value | |
| The following sales commitments were held by PIMCO Total Return at December 31, 2007: | | | | | |
| $ | (2,800,000 | ) | | W | | United States Treasury
Note, 3.125%,
due 11/30/09 | | $ | (2,803,940 | ) | |
| | (8,300,000 | ) | | W | | United States Treasury
Note, 4.500%,
due 05/15/17 | | | (8,605,415 | ) | |
| | | | | | | $ | (11,409,355 | ) | |
At December 31, 2007 the following forward foreign currency contracts were outstanding for the ING PIMCO Total Return Portfolio:
| Currency | | Buy/Sell | | Settlement
Date | | In
Exchange
For | | Value | | Unrealized
Appreciation/
(Depreciation) | |
| Brazil Real | | | | | | | USD | | | | | | | |
| | |
| BRL 41,649 | | Buy | | 03/04/08 | | | 19,228 | | | | 23,177 | | | $ | 3,948 | | |
Brazil Real
BRL 3,924,130 | | Buy | | 03/04/08 | | | 1,898,926 | | | | 2,183,694 | | | | 284,768 | | |
Brazil Real
BRL 21,249,036 | | Buy | | 07/02/08 | | | 10,582,189 | | | | 11,625,789 | | | | 1,043,600 | | |
Brazil Real
BRL 406,670 | | Buy | | 07/02/08 | | | 220,000 | | | | 222,498 | | | | 2,498 | | |
Brazil Real
BRL 304,893 | | Buy | | 03/04/08 | | | 171,000 | | | | 169,666 | | | | (1,334 | ) | |
Chile Pesos
CLP 41,000,000 | | Buy | | 03/13/08 | | | 77,821 | | | | 82,206 | | | | 4,385 | | |
Chile Pesos
CLP 4,500,000 | | Buy | | 03/13/08 | | | 8,523 | | | | 9,023 | | | | 500 | | |
China Yuan Renminbi
CNY 3,555,518 | | Buy | | 01/10/08 | | | 481,386 | | | | 487,435 | | | | 6,049 | | |
China Yuan Renminbi
CNY 4,874,644 | | Buy | | 01/10/08 | | | 660,521 | | | | 668,278 | | | | 7,757 | | |
China Yuan Renminbi
CNY 3,630,479 | | Buy | | 01/10/08 | | | 491,535 | | | | 497,712 | | | | 6,177 | | |
China Yuan Renminbi
CNY 3,630,479 | | Buy | | 01/10/08 | | | 491,815 | | | | 497,712 | | | | 5,897 | | |
China Yuan Renminbi
CNY 5,890,002 | | Buy | | 01/10/08 | | | 796,000 | | | | 807,476 | | | | 11,476 | | |
China Yuan Renminbi
CNY 4,542,679 | | Buy | | 01/10/08 | | | 614,000 | | | | 622,768 | | | | 8,768 | | |
China Yuan Renminbi
CNY 4,502,848 | | Buy | | 01/10/08 | | | 608,000 | | | | 617,307 | | | | 9,307 | | |
China Yuan Renminbi
CNY 4,695,214 | | Buy | | 01/10/08 | | | 634,000 | | | | 643,679 | | | | 9,679 | | |
China Yuan Renminbi
CNY 2,431,269 | | Buy | | 01/10/08 | | | 328,395 | | | | 333,309 | | | | 4,914 | | |
Indonesia Rupiahs
IDR 595,687,500 | | Buy | | 05/27/08 | | | 67,500 | | | | 62,689 | | | | (4,811 | ) | |
Indonesia Rupiahs
IDR 1,191,375,000 | | Buy | | 05/27/08 | | | 135,000 | | | | 125,378 | | | | (9,622 | ) | |
Indonesia Rupiahs
IDR 594,337,500 | | Buy | | 05/27/08 | | | 67,500 | | | | 62,547 | | | | (4,953 | ) | |
India Rupees
INR 5,928,400 | | Buy | | 05/12/08 | | | 140,350 | | | | 149,533 | | | | 9,183 | | |
India Rupees
INR 10,686,800 | | Buy | | 05/12/08 | | | 252,047 | | | | 269,555 | | | | 17,508 | | |
India Rupees
INR 4,470,505 | | Buy | | 05/12/08 | | | 106,213 | | | | 112,760 | | | | 6,547 | | |
See Accompanying Notes to Financial Statements
252
PORTFOLIO OF INVESTMENTS
ING PIMCO TOTAL RETURN PORTFOLIO AS OF DECEMBER 31, 2007 (CONTINUED)
| Currency | | Buy/Sell | | Settlement
Date | | In
Exchange
For | | Value | | Unrealized
Appreciation/
(Depreciation) | |
| India Rupees | | | | | | | USD | | | | | | | |
| | |
| INR 5,308,781 | | Buy | | 05/12/08 | | | 126,369 | | | | 133,904 | | | $ | 7,535 | | |
India Rupees
INR 1,626,060 | | Buy | | 08/12/08 | | | 41,000 | | | | 40,923 | | | | (77 | ) | |
India Rupees
INR 1,549,860 | | Buy | | 08/12/08 | | | 39,000 | | | | 39,005 | | | | 5 | | |
India Rupees
INR 750,500 | | Buy | | 08/12/08 | | | 19,000 | | | | 18,888 | | | | (112 | ) | |
India Rupees
INR 832,575 | | Buy | | 08/12/08 | | | 21,046 | | | | 20,953 | | | | (93 | ) | |
Japanese Yen
JPY 35,105,000 | | Buy | | 02/07/08 | | | 316,264 | | | | 315,583 | | | | (681 | ) | |
Korea (South) Won
KRW 874,176,000 | | Buy | | 01/30/08 | | | 960,000 | | | | 936,199 | | | | (23,801 | ) | |
Korea (South) Won
KRW 738,011,300 | | Buy | | 01/30/08 | | | 811,537 | | | | 790,374 | | | | (21,163 | ) | |
Korea (South) Won
KRW 16,198 | | Buy | | 05/30/08 | | | 18 | | | | 17 | | | | — | | |
Korea (South) Won
KRW 28,140,802 | | Buy | | 05/30/08 | | | 30,472 | | | | 30,279 | | | | (193 | ) | |
Korea (South) Won
KRW 150,363,012 | | Buy | | 05/30/08 | | | 161,264 | | | | 161,787 | | | | 523 | | |
Korea (South) Won
KRW 288,912,000 | | Buy | | 08/04/08 | | | 312,000 | | | | 311,143 | | | | (857 | ) | |
Korea (South) Won
KRW 149,787,388 | | Buy | | 05/30/08 | | | 160,527 | | | | 161,168 | | | | 641 | | |
Korea (South) Won
KRW 355,203,994 | | Buy | | 08/04/08 | | | 384,212 | | | | 382,536 | | | | (1,676 | ) | |
Korea (South) Won
KRW 176,421,207 | | Buy | | 08/04/08 | | | 191,533 | | | | 189,996 | | | | (1,537 | ) | |
Korea (South) Won
KRW 838,470,600 | | Buy | | 08/04/08 | | | 913,367 | | | | 902,989 | | | | (10,377 | ) | |
Korea (South) Won
KRW 200,904,000 | | Buy | | 01/30/08 | | | 220,000 | | | | 215,158 | | | | (4,842 | ) | |
Korea (South) Won
KRW 139,693,400 | | Buy | | 01/30/08 | | | 154,000 | | | | 149,605 | | | | (4,395 | ) | |
Korea (South) Won
KRW 58,408,000 | | Buy | | 05/30/08 | | | 64,754 | | | | 62,846 | | | | (1,908 | ) | |
Mexico Pesos
MXN 12,562,585 | | Buy | | 03/13/08 | | | 1,116,228 | | | | 1,145,152 | | | | 28,924 | | |
Mexico Pesos
MXN 1,084,900 | | Buy | | 03/13/08 | | | 98,497 | | | | 98,895 | | | | 397 | | |
Mexico Pesos
MXN 1,144,900 | | Buy | | 03/13/08 | | | 104,233 | | | | 104,364 | | | | 131 | | |
Mexico Pesos
MXN 1,177,200 | | Buy | | 03/13/08 | | | 106,970 | | | | 107,309 | | | | 339 | | |
Mexico Pesos
MXN 1,240,458 | | Buy | | 03/13/08 | | | 113,000 | | | | 113,075 | | | | 75 | | |
Mexico Pesos
MXN 4,334,335 | | Buy | | 03/13/08 | | | 395,000 | | | | 395,100 | | | | 100 | | |
Mexico Pesos
MXN 3,232,530 | | Buy | | 03/13/08 | | | 294,000 | | | | 294,664 | | | | 664 | | |
Mexico Pesos
MXN 2,732,375 | | Buy | | 03/13/08 | | | 250,000 | | | | 249,072 | | | | (928 | ) | |
Mexico Pesos
MXN 8,104,664 | | Buy | | 07/10/08 | | | 721,890 | | | | 731,613 | | | | 9,723 | | |
Mexico Pesos
MXN 2,420,660 | | Buy | | 07/10/08 | | | 220,000 | | | | 218,515 | | | | (1,485 | ) | |
| Currency | | Buy/Sell | | Settlement
Date | | In
Exchange
For | | Value | | Unrealized
Appreciation/
(Depreciation) | |
| Mexico Pesos | | | | | | | USD | | | | | | | |
| | |
| MXN 1,860,610 | | Buy | | 03/13/08 | | | 172,000 | | | | 169,605 | | | $ | (2,395 | ) | |
Mexico Pesos
MXN 715,000 | | Buy | | 07/10/08 | | | 64,715 | | | | 64,544 | | | | (171 | ) | |
Malaysia Ringgits
MYR 414,125 | | Buy | | 05/21/08 | | | 125,000 | | | | 125,704 | | | | 704 | | |
Malaysia Ringgits
MYR 446,040 | | Buy | | 05/21/08 | | | 135,000 | | | | 135,391 | | | | 391 | | |
Malaysia Ringgits
MYR 446,040 | | Buy | | 05/21/08 | | | 135,000 | | | | 135,391 | | | | 391 | | |
Malaysia Ringgits
MYR 385,548 | | Buy | | 05/21/08 | | | 114,000 | | | | 117,029 | | | | 3,029 | | |
Malaysia Ringgits
MYR 1,162,770 | | Buy | | 05/21/08 | | | 343,000 | | | | 352,948 | | | | 9,948 | | |
Malaysia Ringgits
MYR 538,880 | | Buy | | 05/21/08 | | | 160,000 | | | | 163,572 | | | | 3,572 | | |
Malaysia Ringgits
MYR 996,821 | | Buy | | 08/04/08 | | | 293,658 | | | | 302,847 | | | | 9,189 | | |
Norway Krone
NOK 5,192,000 | | Buy | | 03/06/08 | | | 936,626 | | | | 954,467 | | | | 17,840 | | |
Philippines Pesos
PHP 5,758,750 | | Buy | | 05/19/08 | | | 125,000 | | | | 138,813 | | | | 13,813 | | |
Philippines Pesos
PHP 34,609,200 | | Buy | | 05/19/08 | | | 755,000 | | | | 834,246 | | | | 79,246 | | |
Poland Zlotych
PLN 804,261 | | Buy | | 03/13/08 | | | 286,000 | | | | 326,515 | | | | 40,515 | | |
Poland Zlotych
PLN 7,522,003 | | Buy | | 07/10/08 | | | 2,736,667 | | | | 3,040,594 | | | | 303,927 | | |
Poland Zlotych
PLN 599,242 | | Buy | | 07/10/08 | | | 230,000 | | | | 242,230 | | | | 12,230 | | |
Poland Zlotych
PLN 440,125 | | Buy | | 03/13/08 | | | 175,000 | | | | 178,682 | | | | 3,682 | | |
Poland Zlotych
PLN 200,000 | | Buy | | 03/13/08 | | | 79,949 | | | | 81,196 | | | | 1,247 | | |
Russia Rubles
RUB 4,493,550 | | Buy | | 01/11/08 | | | 174,000 | | | | 183,117 | | | | 9,117 | | |
Russia Rubles
RUB 3,974,700 | | Buy | | 01/11/08 | | | 154,237 | | | | 161,973 | | | | 7,736 | | |
Russia Rubles
RUB 11,583,000 | | Buy | | 01/11/08 | | | 450,000 | | | | 472,019 | | | | 22,019 | | |
Russia Rubles
RUB 8,510,010 | | Buy | | 01/11/08 | | | 331,000 | | | | 346,792 | | | | 15,792 | | |
Russia Rubles
RUB 739,863 | | Buy | | 01/11/08 | | | 29,000 | | | | 30,150 | | | | 1,150 | | |
Russia Rubles
RUB 19,722,805 | | Buy | | 07/10/08 | | | 778,988 | | | | 801,408 | | | | 22,420 | | |
Russia Rubles
RUB 2,039,755 | | Buy | | 07/10/08 | | | 80,895 | | | | 82,883 | | | | 1,988 | | |
Russia Rubles
RUB 5,752,300 | | Buy | | 07/10/08 | | | 230,000 | | | | 233,736 | | | | 3,736 | | |
Russia Rubles
RUB 26,377,320 | | Buy | | 07/10/08 | | | 1,050,262 | | | | 1,071,804 | | | | 21,543 | | |
Russia Rubles
RUB 4,458,600 | | Buy | | 01/11/08 | | | 180,000 | | | | 181,693 | | | | 1,693 | | |
Russia Rubles
RUB 20,907,000 | | Buy | | 11/19/08 | | | 842,854 | | | | 849,526 | | | | 6,672 | | |
Russia Rubles
RUR 2,531,100 | | Buy | | 01/11/08 | | | 98,496 | | | | 103,145 | | | | 4,649 | | |
See Accompanying Notes to Financial Statements
253
PORTFOLIO OF INVESTMENTS
ING PIMCO TOTAL RETURN PORTFOLIO AS OF DECEMBER 31, 2007 (CONTINUED)
| Currency | | Buy/Sell | | Settlement
Date | | In
Exchange
For | | Value | | Unrealized
Appreciation/
(Depreciation) | |
| Russia Rubles | | | | | | | USD | | | | | | | |
| | |
| RUR 2,675,200 | | Buy | | 01/11/08 | | | 104,235 | | | | 109,017 | | | $ | 4,782 | | |
Russia Rubles
RUR 2,758,300 | | Buy | | 01/11/08 | | | 106,973 | | | | 112,404 | | | | 5,431 | | |
Russia Rubles
RUR 4,100,610 | | Buy | | 01/11/08 | | | 159,000 | | | | 167,104 | | | | 8,104 | | |
Russia Rubles
RUR 2,909,750 | | Buy | | 01/11/08 | | | 113,000 | | | | 118,575 | | | | 5,575 | | |
Singapore Dollars
SGD 816,365 | | Buy | | 02/20/08 | | | 550,000 | | | | 569,154 | | | | 19,154 | | |
Singapore Dollars
SGD 1,018,142 | | Buy | | 02/20/08 | | | 682,618 | | | | 709,829 | | | | 27,210 | | |
Singapore Dollars
SGD 52,000 | | Buy | | 05/22/08 | | | 34,736 | | | | 36,425 | | | | 1,689 | | |
Singapore Dollars
SGD 650,226 | | Buy | | 05/22/08 | | | 434,556 | | | | 455,476 | | | | 20,920 | | |
Singapore Dollars
SGD 648,577 | | Buy | | 05/22/08 | | | 433,715 | | | | 454,321 | | | | 20,606 | | |
Singapore Dollars
SGD 349,520 | | Buy | | 05/22/08 | | | 235,272 | | | | 244,835 | | | | 9,563 | | |
Singapore Dollars
SGD 840,821 | | Buy | | 05/22/08 | | | 576,339 | | | | 588,986 | | | | 12,647 | | |
Singapore Dollars
SGD 644,568 | | Buy | | 05/22/08 | | | 440,520 | | | | 451,513 | | | | 10,993 | | |
Singapore Dollars
SGD 333,454 | | Buy | | 02/20/08 | | | 230,000 | | | | 232,478 | | | | 2,478 | | |
Singapore Dollars
SGD 221,914 | | Buy | | 02/20/08 | | | 154,000 | | | | 154,714 | | | | 714 | | |
Singapore Dollars
SGD 93,000 | | Buy | | 02/22/08 | | | 65,088 | | | | 64,838 | | | | (250 | ) | |
Taiwan New Dollars
TWD 1,798,991 | | Buy | | 01/28/08 | | | 55,939 | | | | 55,750 | | | | (189 | ) | |
South Africa Rand
ZAR 438,000 | | Buy | | 07/10/08 | | | 64,697 | | | | 61,893 | | | | (2,804 | ) | |
| | | $ | 2,159,469 | | |
China Yuan Renminbi
CNY 5,914,334 | | Sell | | 01/10/08 | | | 795,311 | | | | 810,811 | | | | (15,500 | ) | |
China Yuan Renminbi
CNY 23,654,214 | | Sell | | 01/10/08 | | | 3,181,254 | | | | 3,242,817 | | | | (61,563 | ) | |
China Yuan Renminbi
CNY 8,184,584 | | Sell | | 01/10/08 | | | 1,104,383 | | | | 1,122,046 | | | | (17,663 | ) | |
Denmark Kroner
DKK 17,299,000 | | Sell | | 03/06/08 | | | 3,406,790 | | | | 3,394,200 | | | | 12,591 | | |
EURO
EUR 4,902,000 | | Sell | | 01/17/08 | | | 7,180,499 | | | | 7,169,298 | | | | 11,201 | | |
British Pound Sterling
GBP 1,819,000 | | Sell | | 01/31/08 | | | 3,672,516 | | | | 3,617,580 | | | | 54,936 | | |
British Pound Sterling
GBP 2,137,000 | | Sell | | 01/31/08 | | | 4,296,065 | | | | 4,250,010 | | | | 46,053 | | |
British Pound Sterling
GBP 343,000 | | Sell | | 01/31/08 | | | 680,958 | | | | 682,150 | | | | (1,192 | ) | |
Mexico Pesos
MXN 8,637,892 | | Sell | | 03/13/08 | | | 781,179 | | | | 787,394 | | | | (6,214 | ) | |
New Zealand Dollars
NZD 182,000 | | Sell | | 01/04/08 | | | 141,953 | | | | 139,990 | | | | 1,963 | | |
Poland Zlotych
PLN 751,530 | | Sell | | 07/10/08 | | | 300,000 | | | | 303,788 | | | | (3,788 | ) | |
| Currency | | Buy/Sell | | Settlement
Date | | In
Exchange
For | | Value | | Unrealized
Appreciation/
(Depreciation) | |
| Poland Zlotych | | | | | | | USD | | | | | | | |
| | |
| PLN 124,940 | | Sell | | 03/13/08 | | | 50,000 | | | | 50,723 | | | $ | (723 | ) | |
Poland Zlotych
PLN 110,446 | | Sell | | 03/13/08 | | | 44,545 | | | | 44,839 | | | | (294 | ) | |
Poland Zlotych
PLN 742,233 | | Sell | | 07/10/08 | | | 298,109 | | | | 300,030 | | | | (1,921 | ) | |
Poland Zlotych
PLN 149,000 | | Sell | | 03/13/08 | | | 60,049 | | | | 60,491 | | | | (442 | ) | |
Poland Zlotych
PLN 150,169 | | Sell | | 03/13/08 | | | 60,435 | | | | 60,966 | | | | (531 | ) | |
Poland Zlotych
PLN 276,831 | | Sell | | 03/13/08 | | | 111,616 | | | | 112,388 | | | | (772 | ) | |
Poland Zlotych
PLN 200,000 | | Sell | | 03/13/08 | | | 80,010 | | | | 81,196 | | | | (1,187 | ) | |
Poland Zlotych
PLN 433,000 | | Sell | | 03/13/08 | | | 173,172 | | | | 175,790 | | | | (2,618 | ) | |
Poland Zlotych
PLN 1,089,000 | | Sell | | 07/10/08 | | | 434,349 | | | | 440,203 | | | | (5,854 | ) | |
Poland Zlotych
PLN 1,090,482 | | Sell | | 07/10/08 | | | 434,576 | | | | 440,802 | | | | (6,226 | ) | |
Poland Zlotych
PLN 778,000 | | Sell | | 07/10/08 | | | 310,331 | | | | 314,488 | | | | (4,157 | ) | |
Poland Zlotych
PLN 778,000 | | Sell | | 07/10/08 | | | 310,146 | | | | 314,488 | | | | (4,343 | ) | |
Poland Zlotych
PLN 998,000 | | Sell | | 07/10/08 | | | 400,281 | | | | 403,418 | | | | (3,137 | ) | |
Poland Zlotych
PLN 1,694,000 | | Sell | | 07/10/08 | | | 678,931 | | | | 684,760 | | | | (5,829 | ) | |
Poland Zlotych
PLN 200,000 | | Sell | | 07/10/08 | | | 79,626 | | | | 80,845 | | | | (1,219 | ) | |
Russia Rubles
RUB 3,725,683 | | Sell | | 01/11/08 | | | 151,759 | | | | 151,825 | | | | (66 | ) | |
Russia Rubles
RUB 2,821,000 | | Sell | | 01/11/08 | | | 114,862 | | | | 114,959 | | | | (97 | ) | |
Russia Rubles
RUB 10,644,000 | | Sell | | 01/11/08 | | | 433,564 | | | | 433,754 | | | | (190 | ) | |
Russia Rubles
RUB 10,637,000 | | Sell | | 01/11/08 | | | 433,544 | | | | 433,469 | | | | 75 | | |
Russia Rubles
RUB 6,210,180 | | Sell | | 07/10/08 | | | 251,424 | | | | 252,342 | | | | (917 | ) | |
Russia Rubles
RUB 20,907,000 | | Sell | | 01/11/08 | | | 852,999 | | | | 851,982 | | | | 1,017 | | |
| | | $ | (18,607 | ) | |
See Accompanying Notes to Financial Statements
254
PORTFOLIO OF INVESTMENTS
ING PIMCO TOTAL RETURN PORTFOLIO AS OF DECEMBER 31, 2007 (CONTINUED)
ING PIMCO Total Return Portfolio Credit Default Swap Agreements Outstanding on December 31, 2007:
| Counterparty | | | | Reference
Entity/Obligation | | Buy/Sell
Protection | | (Pay)/receive
Fixed Rate | | Termination
Date | | Notional
Amount | | Unrealized
Appreciation/
(Depreciation) | |
| Deutsche Bank AG | | | | ABX.HE.A.06-1 Index | | Sell | | | 0.540 | % | | 07/25/45 | | USD | 150,000 | | | $ | (48,375 | ) | |
| Goldman Sachs International | | I | | ABX.HE.A.06-1 Index | | Buy | | | (0.540 | )% | | 07/25/45 | | USD | 500,000 | | | | 195,625 | | |
| Merrill Lynch International | | | | ABX.HE.A.06-1 Index | | Sell | | | 0.540 | % | | 07/25/45 | | USD | 200,000 | | | | (64,000 | ) | |
| UBS AG | | | | ABX.HE.A.06-1 Index | | Sell | | | 0.540 | % | | 07/25/45 | | USD | 150,000 | | | | (48,375 | ) | |
Lehman Brothers Special
Financing Inc. | |
| | American International
Group 5.600%, 10/18/16 | | Sell | | | 0.055 | % | | 03/20/08 | | USD | 1,600,000 | | | | (2,088 | ) | |
Lehman Brothers Special
Financing Inc. | | I
| | Bellsouth Corp.
5.200%, 09/15/14 | | Buy | | | (0.325 | )% | | 09/20/14 | | USD | 3,500,000 | | | | 468 | | |
Morgan Stanley Capital
Services Inc. | | I
| | CDX.EM.3 Index | | Sell | | | 2.100 | % | | 06/20/10 | | USD | 900,000 | | | | 45,480 | | |
| Citibank N.A., New York | |
| | CDX.NA.HY.8 Index
(25-35% Tranche) | | Sell | | | 2.144 | % | | 06/20/12 | | USD | 500,000 | | | | (6,543 | ) | |
| Merrill Lynch International | |
| | CDX.NA.HY.8 Index
(25-35% Tranche) | | Sell | | | 1.833 | % | | 06/20/12 | | USD | 1,000,000 | | | | (25,593 | ) | |
Morgan Stanley Capital
Services Inc. | |
| | CDX.NA.HY.8 Index
(25-35% Tranche) | | Sell | | | 2.080 | % | | 06/20/12 | | USD | 1,000,000 | | | | (15,659 | ) | |
| Citibank N.A., New York | |
| | CDX.NA.HY.8 Index
(35-100% Tranche) | | Sell | | | 0.401 | % | | 06/20/12 | | USD | 1,000,000 | | | | (17,197 | ) | |
Morgan Stanley Capital
Services Inc. | |
| | CDX.NA.IG.5 Index
(10-15% Tranche) | | Sell | | | 0.460 | % | | 12/20/15 | | USD | 1,400,000 | | | | (58,047 | ) | |
| Goldman Sachs International | | | | CDX.NA.IG.7 Index | | Sell | | | 0.650 | % | | 12/20/16 | | USD | 12,900,000 | | | | (179,093 | ) | |
| Deutsche Bank AG | | I | | CDX.NA.IG.7 Index | | Buy | | | (0.400 | )% | | 12/20/11 | | USD | 7,100,000 | | | | 134,996 | | |
| Barclays Bank PLC | | I
| | Citifinancial
6.625%, 06/01/15 | | Buy | | | (0.145 | )% | | 06/20/15 | | USD | 400,000 | | | | 15,163 | | |
Morgan Stanley Capital
Services Inc. | | I
| | CVS Corp. 5.750%, 08/15/11
| | Buy | | | (0.235 | )% | | 09/20/11 | | USD | 2,800,000 | | | | 7,269 | | |
| Goldman Sachs International | |
| | Ford Motor Credit Co.
7.000%, 10/01/13 | | Sell | | | 3.850 | % | | 09/20/12 | | USD | 100,000 | | | | (9,273 | ) | |
| Barclays Bank PLC, London | |
| | GAZ Capital (GAZPROM)
LPN 8.625%, 04/28/34 | | Sell | | | 1.600 | % | | 12/20/12 | | USD | 1,300,000 | | | | (5,079 | ) | |
| HSBC Bank USA, N.A. | | | | GAZPROM 9.625%, 03/01/13 | | Sell | | | 0.970 | % | | 11/20/08 | | USD | 600,000 | | | | (937 | ) | |
| Barclays Bank PLC | |
| | General Electric Capital Corp.
6.000%, 06/15/12 | | Sell | | | 0.620 | % | | 03/20/11 | | USD | 1,200,000 | | | | 2,263 | | |
| Barclays Bank PLC | | I
| | General Electric Capital Corp.
6.000%, 06/15/12 | | Sell | | | 0.640 | % | | 12/20/12 | | USD | 1,200,000 | | | | (45 | ) | |
| BNP Paribas | |
| | General Motors Corp.
7.125%, 07/15/13 | | Sell | | | 4.800 | % | | 12/20/12 | | USD | 100,000 | | | | (7,965 | ) | |
| Citibank N.A., New York | |
| | General Motors Corp.
7.125%, 07/15/13 | | Sell | | | 4.600 | % | | 12/20/12 | | USD | 100,000 | | | | (8,648 | ) | |
| Deutsche Bank AG | |
| | General Motors Corp.
7.125%, 07/15/13 | | Sell | | | 4.500 | % | | 12/20/12 | | USD | 100,000 | | | | (8,989 | ) | |
| Deutsche Bank AG | | | | GMAC LLC 6.875%, 08/28/12 | | Sell | | | 3.200 | % | | 09/20/12 | | USD | 200,000 | | | | (25,762 | ) | |
| Deutsche Bank AG | | | | GMAC LLC 6.875%, 08/28/12 | | Sell | | | 4.000 | % | | 09/20/12 | | USD | 1,900,000 | | | | (200,611 | ) | |
Lehman Brothers Special
Financing Inc. | |
| | GMAC LLC 6.875%, 08/28/12 | | Sell | | | 6.800 | % | | 12/20/08 | | USD | 200,000 | | | | (1,568 | ) | |
| Merrill Lynch International | | | | GMAC LLC 6.875%, 08/28/12 | | Sell | | | 1.850 | % | | 09/20/09 | | USD | 1,000,000 | | | | (93,004 | ) | |
| BNP Paribas | | I | | iTraxx Europe HiVol Series 6 Index | | Buy | | | (0.850 | )% | | 12/20/16 | | EUR | 1,200,000 | | | | 15,761 | | |
| Deutsche Bank AG | | I | | iTraxx Europe HiVol Series 6 Index | | Buy | | | (0.850 | )% | | 12/20/16 | | EUR | 4,500,000 | | | | 75,616 | | |
| JPMorgan Chase Bank, N.A. | | I
| | Ivy Lane CDO Ltd. Series 2006-1A
Floating Rate, 02/05/46 | | Buy | | | (1.600 | )% | | 02/05/46 | | USD | 3,100,000 | | | | 3,114,769 | | |
| Barclays Bank PLC | |
| | Lehman Brothers Holdings
6.625%, 01/18/12 | | Sell | | | 0.190 | % | | 09/20/08 | | USD | 1,900,000 | | | | (19,107 | ) | |
| The Royal Bank of Scotland PLC | |
| | Lehman Brothers Holdings
6.625%, 01/18/12 | | Sell | | | 0.300 | % | | 09/20/08 | | USD | 1,300,000 | | | | (12,197 | ) | |
| Citibank N.A., New York | | | | Noble Corp. 5.875%, 06/01/13 | | Buy | | | (0.520 | )% | | 06/20/12 | | USD | 1,000,000 | | | | (2,268 | ) | |
| UBS AG | | I | | Nordstrom Inc. 6.950%, 03/15/28 | | Buy | | | (0.370 | )% | | 06/20/17 | | USD | 1,100,000 | | | | 26,987 | | |
| The Royal Bank of Scotland PLC | |
| | Republic of Indonesia
6.750%, 03/10/14 | | Sell | | | 0.400 | % | | 12/20/08 | | USD | 200,000 | | | | (876 | ) | |
Lehman Brothers Special
Financing Inc. | |
| | Republic of Turkey
11.875%, 01/15/30 | | Buy | | | (2.110 | )% | | 10/20/10 | | USD | 100,000 | | | | (2,702 | ) | |
Morgan Stanley Capital
Services Inc. | |
| | Republic of Turkey
11.875%, 01/15/30 | | Buy | | | (2.200 | )% | | 10/20/10 | | USD | 100,000 | | | | (2,938 | ) | |
| Deutsche Bank AG | | I
| | Reynolds American Inc.
7.625%, 06/01/16 | | Sell | | | 1.280 | % | | 06/20/17 | | USD | 600,000 | | | | 10,117 | | |
| Barclays Bank PLC | | | | Ukraine Government 7.650%, 06/11/13 | | Sell | | | 0.710 | % | | 12/20/08 | | USD | 100,000 | | | | (338 | ) | |
| Deutsche Bank AG | | | | Ukraine Government 7.650%, 06/11/13 | | Sell | | | 0.720 | % | | 12/20/08 | | USD | 100,000 | | | | (329 | ) | |
| Citibank N.A., New York | | I | | Weyerhaeuser Co. 6.750%, 03/15/12 | | Buy | | | (1.000 | )% | | 06/20/17 | | USD | 1,100,000 | | | | 13,567 | | |
| | | $ | 2,790,475 | | |
See Accompanying Notes to Financial Statements
255
PORTFOLIO OF INVESTMENTS
ING PIMCO TOTAL RETURN PORTFOLIO AS OF DECEMBER 31, 2007 (CONTINUED)
ING PIMCO Total Return Portfolio Interest Rate Swap Agreements Outstanding on December 31, 2007:
| | | | | Termination
Date | | Notional
Amount | | Unrealized
Appreciation/
(Depreciation) | |
Receive a fixed rate equal to
7.250% and pay a floating
rate based on 3-month
NZD-BBR-FRA
Counterparty:
Citibank N.A., London | | | | 06/15/09 | | NZD | 5,200,000 | | | $ | (73,306 | ) | |
Receive a fixed rate equal to
7.250% and pay a floating
rate based on 3-month
NZD-BBR-FRA
Counterparty: UBS AG | | | | 06/15/09 | | NZD | 21,000,000 | | | | (214,757 | ) | |
Receive a fixed rate equal to
6.000% and pay a floating
rate based on 6-month
GBP-LIBOR
Counterparty: Goldman
Sachs Capital Markets L.P. | | I | | 06/19/09 | | GBP | 7,400,000 | | | | 162,295 | | |
Receive a fixed rate equal to
6.000% and pay a floating
rate based on 6-month
GBP-LIBOR
Counterparty: The Royal
Bank of Scotland PLC | | I | | 06/19/09 | | GBP | 2,100,000 | | | | 44,853 | | |
Receive a fixed rate equal to
7.000% and pay a floating
rate based on 3-month
AUD-BBR-BBSW
Counterparty: UBS AG | | | | 09/15/09 | | AUD | 12,900,000 | | | | (70,473 | ) | |
Receive a fixed rate equal to
5.000% and pay a floating
rate based on 6-month
EUR-Euribor
Counterparty: Deutsche
Bank AG, Frankfurt | | I | | 12/19/09 | | EUR | 4,200,000 | | | | 28,481 | | |
Receive a fixed rate equal to
6.000% and pay a floating
rate based on 6-month
GBP-LIBOR
Counterparty: Goldman
Sachs Capital Markets L.P. | | I | | 12/19/09 | | GBP | 800,000 | | | | 30,158 | | |
Receive a fixed rate equal to
4.500% and pay a floating
rate based on 6-month
EUR-EURIBOR
Counterparty: Morgan
Stanley Capital Services Inc. | | | | 03/19/10 | | EUR | 2,900,000 | | | | 9,791 | | |
Receive a fixed rate equal to
4.000% and pay a floating
rate based on 3-month
USD-LIBOR
Counterparty:
Barclays Bank PLC | | I | | 06/18/10 | | USD | 7,300,000 | | | | 28,748 | | |
Receive a fixed rate equal to
4.000% and pay a floating
rate based on 3-month
USD-LIBOR
Counterparty: Deutsche
Bank AG | | I | | 06/18/10 | | USD | 12,200,000 | | | | 19,826 | | |
| | | | | Termination
Date | | Notional
Amount | | Unrealized
Appreciation/
(Depreciation) | |
Receive a fixed rate equal to
4.000% and pay a floating
rate based on 3-month
USD-LIBOR
Counterparty: Merrill Lynch
Capital Services, Inc. | | I | | 06/18/10 | | USD | 22,200,000 | | | $ | 33,279 | | |
Receive a fixed rate equal to
4.000% and pay a floating
rate based on 3-month
USD-LIBOR
Counterparty: The Royal
Bank of Scotland PLC | | I | | 06/18/10 | | USD | 14,400,000 | | | | 35,597 | | |
Receive a fixed rate equal to
5.000% and pay a floating
rate based on 6-month
GBP-LIBOR
Counterparty: The Royal
Bank of Scotland PLC | | | | 09/15/10 | | GBP | 900,000 | | | | 21,307 | | |
Receive a fixed rate equal to
11.980% and pay a floating
rate based on the Brazil
Cetip Interbank Deposit
Rate Annualized
Counterparty: Merrill Lynch
Capital Services, Inc. | | | | 01/02/12 | | BRL | 2,100,000 | | | | (25,456 | ) | |
Receive a fixed rate equal to
10.575% and pay a floating
rate based on the Brazil
Cetip Interbank Deposit
Rate Annualized
Counterparty: UBS AG,
London | | | | 01/02/12 | | BRL | 2,900,000 | | | | (43,527 | ) | |
Receive a fixed rate equal to
1.9475% and pay a floating
rate based on France CPI Ex
Tobacco Index (FRCPXTOB)
Counterparty:
Barclays Bank PLC, London | | | | 03/15/12 | | EUR | 1,000,000 | | | | (19,300 | ) | |
Receive a fixed rate equal to
1.995% and pay a floating
rate based on France CPI Ex
Tobacco Index (FRCPXTOB)
Counterparty: Goldman
Sachs Capital Markets L.P. | | | | 03/15/12 | | EUR | 900,000 | | | | (13,543 | ) | |
Receive a fixed rate equal to
1.965% and pay a floating
rate based on France CPI Ex
Tobacco Index (FRCPXTOB)
Counterparty: Lehman
Brothers Special Financing Inc. | | | | 03/15/12 | | EUR | 300,000 | | | | (4,832 | ) | |
Receive a fixed rate equal to
1.955% and pay a floating
rate based on France CPI Ex
Tobacco Index (FRCPXTOB)
Counterparty: The Royal
Bank of Scotland PLC | | | | 03/28/12 | | EUR | 300,000 | | | | (5,429 | ) | |
Receive a fixed rate equal to
1.960% and pay a floating
rate based on France CPI Ex
Tobacco Index (FRCPXTOB)
Counterparty: Goldman
Sachs Capital Markets L.P. | | | | 03/30/12 | | EUR | 300,000 | | | | (5,501 | ) | |
See Accompanying Notes to Financial Statements
256
PORTFOLIO OF INVESTMENTS
ING PIMCO TOTAL RETURN PORTFOLIO AS OF DECEMBER 31, 2007 (CONTINUED)
| | | | | Termination
Date | | Notional
Amount | | Unrealized
Appreciation/
(Depreciation) | |
Receive a fixed rate equal to
1.950% and pay a floating
rate based on France CPI Ex
Tobacco Index (FRCPXTOB)
Counterparty: The Royal
Bank of Scotland PLC | | | | 03/30/12 | | EUR | 300,000 | | | $ | (5,598 | ) | |
Receive a fixed rate equal to
1.960% and pay a floating
rate based on France CPI Ex
Tobacco Index (FRCPXTOB)
Counterparty: Barclays Bank
PLC, London | | | | 04/05/12 | | EUR | 200,000 | | | | (3,743 | ) | |
Receive a fixed rate equal to
1.940% and pay a floating
rate based on France CPI Ex
Tobacco Index (FRCPXTOB)
Counterparty: BNP Paribas | | | | 04/10/12 | | EUR | 500,000 | | | | (11,208 | ) | |
Receive a fixed rate equal to
1.940% and pay a floating
rate based on France CPI Ex
Tobacco Index (FRCPXTOB)
Counterparty: The Royal
Bank of Scotland PLC | | | | 04/10/12 | | EUR | 500,000 | | | | (10,285 | ) | |
Receive a fixed rate equal to
1.980% and pay a floating
rate based on France CPI Ex
Tobacco Index (FRCPXTOB)
Counterparty: Barclays Bank
PLC, London | | | | 04/30/12 | | EUR | 300,000 | | | | (5,738 | ) | |
Receive a fixed rate equal to
7.000% and pay a floating
rate based on 6-month
AUD-BBR-BBSW
Counterparty: Deutsche
Bank AG, Frankfurt | | | | 03/20/13 | | AUD | 1,300,000 | | | | (33,677 | ) | |
Receive a floating rate based
on 3-month USD-LIBOR
and pay a fixed rate
equal to 4.000%
Counterparty: Merrill Lynch
Capital Services, Inc. | | I | | 06/18/13 | | USD | 1,300,000 | | | | 2,798 | | |
Receive a floating rate based
on 3-month USD-LIBOR
and pay fixed rate
equal to 4.000%
Counterparty: The Royal
Bank of Scotland PLC | | I | | 06/18/13 | | USD | 5,100,000 | | | | (34,516 | ) | |
Receive a fixed rate equal to
5.000% and pay a floating
rate based on 6-month
GBP-LIBOR
Counterparty: Goldman
Sachs Capital Markets L.P. | | | | 09/15/15 | | GBP | 900,000 | | | | (6,043 | ) | |
Receive a fixed rate equal to
8.720% and pay a floating
rate based on 28-day
MXN-TIIE-BANXICO
Counterparty: Citibank N.A.,
New York | | I | | 09/05/16 | | MXN | 22,900,000 | | | | (35,254 | ) | |
Receive a fixed rate equal to
8.720% and pay a floating
rate based on 28-day
MXN-TIIE-BANXICO
Counterparty: Merrill Lynch
Capital Services, Inc. | | I | | 09/05/16 | | MXN | 9,400,000 | | | | (19,537 | ) | |
| | | | | Termination
Date | | Notional
Amount | | Unrealized
Appreciation/
(Depreciation) | |
Receive a fixed rate equal to
8.860% and pay a floating
rate based on 28-day
MXN-TIIE-BANXICO
Counterparty: Citibank N.A.,
New York | | I | | 09/12/16 | | MXN | 5,700,000 | | | $ | 10,356 | | |
Receive a fixed rate equal to
8.170% and pay a floating
rate based on 28-day
MXN-TIIE-BANXICO
Counterparty: Goldman
Sachs Capital Markets L.P. | | | | 11/04/16 | | MXN | 20,000,000 | | | | (72,711 | ) | |
Receive a fixed rate equal to
2.000% and pay a floating
rate based on 6-month
JPY-LIBOR
Counterparty: Barclays
Bank PLC | | I | | 12/19/17 | | JPY | 50,000,000 | | | | 11,005 | | |
Receive a fixed rate equal to
2.000% and pay a floating
rate based on 6-month
JPY-LIBOR
Counterparty: Deutsche
Bank AG, Frankfurt | | I | | 12/19/17 | | JPY | 110,000,000 | | | | 24,555 | | |
Receive a floating rate based
on 6-month AUD-BBR-BBSW
and pay a fixed rate equal to
6.500%
Counterparty: Deutsche
Bank AG, Frankfurt | | I | | 03/20/18 | | AUD | 1,800,000 | | | | 23,367 | | |
Receive a fixed rate equal to
5.000% and pay a floating
rate based on 3-month
USD-LIBOR
Counterparty: Morgan
Stanley Capital Services Inc. | | I | | 06/18/18 | | USD | 3,600,000 | | | | 66,126 | | |
Receive a fixed rate equal to
5.000% and pay a floating
rate based on 3-month
USD-LIBOR
Counterparty: The Royal
Bank of Scotland PLC | | I | | 06/18/18 | | USD | 8,700,000 | | | | 83,680 | | |
Receive a floating rate based
on 6-month GBP-LIBOR
and pay a fixed rate
equal to 4.000%
Counterparty: Barclays Bank
PLC, London | | I | | 12/15/35 | | GBP | 1,100,000 | | | | 100,976 | | |
Receive a floating rate based
on 6-month GBP-LIBOR
and pay a fixed rate
equal to 4.000%
Counterparty: Deutsche
Bank AG | | I | | 12/15/35 | | GBP | 2,900,000 | | | | 192,290 | | |
Receive a floating rate based on
6-month GBP-LIBOR
and pay a fixed rate
equal to 4.000%
Counterparty: Goldman
Sachs Capital Markets L.P. | | I | | 12/15/35 | | GBP | 4,900,000 | | | | 389,414 | | |
Receive a floating rate based
on 6-month GBP-LIBOR
and pay a fixed rate
equal to 4.250%
Counterparty: Goldman
Sachs Capital Markets L.P. | | I | | 06/12/36 | | GBP | 600,000 | | | | 17,395 | | |
See Accompanying Notes to Financial Statements
257
PORTFOLIO OF INVESTMENTS
ING PIMCO TOTAL RETURN PORTFOLIO AS OF DECEMBER 31, 2007 (CONTINUED)
| | | | | Termination
Date | | Notional
Amount | | Unrealized
Appreciation/
(Depreciation) | |
Receive a floating rate based
on 6-month GBP-LIBOR
and pay a fixed rate
equal to 5.500%
Counterparty: Goldman
Sachs Capital Markets L.P. | | | | 12/15/36 | | GBP | 500,000 | | | $ | (57,524 | ) | |
Receive a floating rate based
on 6-month GBP-LIBOR
and pay a fixed rate
equal to 5.500%
Counterparty: The Royal
Bank of Scotland PLC | | | | 12/15/36 | | GBP | 100,000 | | | | (12,098 | ) | |
Receive a floating rate based
on 6-month GBP-LIBOR
and pay a fixed rate
equal to 5.000%
Counterparty: Goldman
Sachs Capital Markets L.P. | | | | 12/19/37 | | GBP | 100,000 | | | | (14,736 | ) | |
| | | | | Termination
Date | | Notional
Amount | | Unrealized
Appreciation/
(Depreciation) | |
Receive a floating rate based
on 3-month USD-LIBOR
and pay a fixed rate
equal to 5.000%
Counterparty: Citibank N.A.,
New York | | I | | 06/18/38 | | USD | 900,000 | | | $ | (24,526 | ) | |
Receive a floating rate based
on 3-month USD-LIBOR
and pay a fixed rate
equal to 5.000%
Counterparty: The Royal
Bank of Scotland PLC | | I | | 06/18/38 | | USD | 1,800,000 | | | | (45,137 | ) | |
| | | | | $ | 467,842 | | |
ING PIMCO Total Return Portfolio Written Options Open on December 31, 2007:
Options on Exchange-Traded Futures Contracts
| Description/Name of Issuer | | Exercise
Price | | Expiration
Date | | # of
Contracts | | Premium
Received | | Value | |
| Call Option CBOT US Treasury 10-Year Note Future 03/08 | | USD | 111 | | | 02/22/08 | | | 10 | | | $ | 4,186 | | | $ | (28,438 | ) | |
| Call Option CBOT US Treasury 10-Year Note Future 03/08 | | USD | 112 | | | 02/22/08 | | | 12 | | | | 9,711 | | | | (25,688 | ) | |
| Call Option CBOT US Treasury 10-Year Note Future 03/08 | | USD | 114 | | | 02/22/08 | | | 53 | | | | 43,687 | | | | (59,624 | ) | |
| Put Option CBOT US Treasury 10-Year Note Future 03/08 | | USD | 110 | | | 02/22/08 | | | 53 | | | | 29,041 | | | | (13,250 | ) | |
| | | | | | | $ | 86,625 | | | $ | (127,000 | ) | |
| Interest Rate Swaptions | |
| Description | | Counterparty | | Floating Rate Index/
Underlying Reference Entity | | Pay/Receive
Floating | | Exercise
Rate | | Expiration
Date | | Notional
Amount | | Premium
Received | | Value | |
Call - OTC Interest
Rate Swap | | Barclays Bank
PLC, London | | 3-month USD-LIBOR | | Receive | | | 4.900 | % | | 02/01/08 | | USD | 2,300,000 | | | $ | 28,635 | | | $ | (77,146 | ) | |
Call - OTC Interest
Rate Swap | | Barclays Bank
PLC, London | | 3-Month USD-LIBOR | | Receive | | | 5.450 | % | | 02/02/09 | | USD | 5,000,000 | | | | 85,975 | | | | (257,699 | ) | |
Call - OTC Interest
Rate Swap | | Lehman Brothers
Special
Financing, Inc. | | 3-month USD-LIBOR | | Receive | | | 4.950 | % | | 09/26/08 | | USD | 13,000,000 | | | | 107,263 | | | | (481,585 | ) | |
Call - OTC Interest
Rate Swap | | The Royal Bank
of Scotland PLC | | 3-month USD-LIBOR | | Receive | | | 5.100 | % | | 02/01/08 | | USD | 4,500,000 | | | | 54,000 | | | | (190,190 | ) | |
Call - OTC Interest
Rate Swap | | The Royal Bank
of Scotland PLC | | 3-month USD-LIBOR | | Receive | | | 4.900 | % | | 03/31/08 | | USD | 73,700,000 | | | | 978,367 | | | | (2,602,744 | ) | |
Call - OTC Interest
Rate Swap | | The Royal Bank
of Scotland PLC | | 3-Month USD-LIBOR | | Receive | | | 4.950 | % | | 03/31/08 | | USD | 8,000,000 | | | | 98,400 | | | | (297,903 | ) | |
Call - OTC Interest
Rate Swap | | The Royal Bank
of Scotland PLC | | 3-Month USD-LIBOR | | Receive | | | 4.950 | % | | 09/26/08 | | USD | 11,400,000 | | | | 93,480 | | | | (422,313 | ) | |
Call - OTC Interest
Rate Swap | | The Royal Bank
of Scotland PLC | | 3-Month USD LIBOR | | Receive | | | 5.000 | % | | 12/15/08 | | USD | 3,000,000 | | | | 30,900 | | | | (119,680 | ) | |
Call - OTC Interest
Rate Swap | | The Royal Bank
of Scotland PLC | | 3-Month USD-LIBOR | | Receive | | | 5.200 | % | | 12/15/08 | | USD | 7,000,000 | | | | 58,600 | | | | (335,180 | ) | |
| | | | | | | | | | | | | | | | | | | $ | 1,535,620 | | | $ | (4,784,440 | ) | |
See Accompanying Notes to Financial Statements
258
PORTFOLIO OF INVESTMENTS
ING PIONEER HIGH YIELD PORTFOLIO AS OF DECEMBER 31, 2007
| Shares | | | | | | Value | |
| COMMON STOCK: 12.6% | | | |
| | | | | Agriculture: 0.2% | |
| | 4,100 | | | | | Reynolds American, Inc. | | $ | 270,436 | | |
| | | | 270,436 | | |
| | | | | Auto Parts & Equipment: 0.2% | |
| | 16,900 | | | @ | | Commercial Vehicle Group, Inc. | | | 245,050 | | |
| | | | 245,050 | | |
| | | | | Biotechnology: 0.4% | |
| | 18,600 | | | @ | | Vertex Pharmaceuticals, Inc. | | | 432,078 | | |
| | | | 432,078 | | |
| | | | | Building Materials: 1.0% | |
| | 13,600 | | | | | Lennox International, Inc. | | | 563,312 | | |
| | 8,700 | | | | | Texas Industries, Inc. | | | 609,870 | | |
| | | | 1,173,182 | | |
| | | | | Chemicals: 0.9% | |
| | 4,600 | | | | | Air Products & Chemicals, Inc. | | | 453,698 | | |
| | 24,900 | | | | | RPM International, Inc. | | | 505,470 | | |
| | | | 959,168 | | |
| | | | | Computers: 0.3% | |
| | 11,700 | | | @ | | Network Appliance, Inc. | | | 292,032 | | |
| | | | 292,032 | | |
| | | | | Electric: 2.6% | |
| | 39,900 | | | @ | | NRG Energy, Inc. | | | 1,729,266 | | |
| | 11,900 | | | | | Public Service Enterprise
Group, Inc. | | | 1,169,056 | | |
| | | | 2,898,322 | | |
| | | | | Electrical Components & Equipment: 0.8% | |
| | 12,900 | | | @ | | General Cable Corp. | | | 945,312 | | |
| | | | 945,312 | | |
| | | | | Electronics: 1.7% | |
| | 11,800 | | | @ | | FEI Co. | | | 292,994 | | |
| | 5,500 | | | @ | | Itron, Inc. | | | 527,835 | | |
| | 13,800 | | | @ | | Thermo Electron Corp. | | | 795,984 | | |
| | 7,900 | | | @@ | | Tyco Electronics Ltd. | | | 293,327 | | |
| | | | 1,910,140 | | |
| | | | | Gas: 0.5% | |
| | 17,100 | | | | | Southern Union Co. | | | 502,056 | | |
| | | | 502,056 | | |
| | | | | Healthcare-Products: 0.6% | |
| | 11,400 | | | @ | | Inverness Medical
Innovations, Inc. | | | 640,452 | | |
| | | | 640,452 | | |
| | | | | Mining: 1.1% | |
| | 7,300 | | | @@ | | Barrick Gold Corp. | | | 306,965 | | |
| | 7,100 | | | | | Freeport-McMoRan Copper &
Gold, Inc. | | | 727,324 | | |
| | 60,000 | | | @,@@ | | Polymet Mining Corp. | | | 195,000 | | |
| | | | 1,229,289 | | |
| | | | | Miscellaneous Manufacturing: 1.1% | |
| | 10,000 | | | | | Cooper Industries Ltd. | | | 528,800 | | |
| | 8,200 | | | @ | | ESCO Technologies, Inc. | | | 327,508 | | |
| | 5,700 | | | | | ITT Corp. | | | 376,428 | | |
| | | | 1,232,736 | | |
| Shares | | | | | | Value | |
| | | | | Oil & Gas: 0.8% | |
| | 4,341 | | | @ | | SandRidge Energy, Inc. | | $ | 155,668 | | |
| | 10,900 | | | | | Tesoro Petroleum Corp. | | | 519,930 | | |
| | 3,900 | | | | | Valero Energy Corp. | | | 273,117 | | |
| | | | 948,715 | | |
| | | | | Pipelines: 0.2% | |
| | 3,400 | | | | | Questar Corp. | | | 183,940 | | |
| | | | 183,940 | | |
| | | | | Telecommunications: 0.2% | |
| | 5,600 | | | @ | | CommScope, Inc. | | | 275,576 | | |
| | | | 275,576 | | |
Total Common Stock
(Cost $10,989,153) | | | 14,138,484 | | |
| REAL ESTATE INVESTMENT TRUSTS: 1.5% | | | |
| | | | | Diversified: 0.1% | |
| | 4,000 | | | | | Liberty Property Trust | | | 115,240 | | |
| | | | 115,240 | | |
| | | | | Mortgage: 0.5% | |
| | 31,800 | | | | | Annaly Capital
Management, Inc. | | | 578,124 | | |
| | | | 578,124 | | |
| | | | | Office Property: 0.2% | |
| | 5,100 | | | | | Mack-Cali Realty Corp. | | | 173,400 | | |
| | | | 173,400 | | |
| | | | | Regional Malls: 0.7% | |
| | 18,117 | | | | | General Growth
Properties, Inc. | | | 746,058 | | |
| | | | 746,058 | | |
Total Real Estate
Investment Trusts
(Cost $1,834,251) | | | 1,612,822 | | |
| PREFERRED STOCK: 4.0% | | | |
| | | | | Electric: 0.9% | |
| | 10,700 | | | | | CMS Energy Corp.,
4.500%, due 12/31/49 | | | 971,025 | | |
| | | | 971,025 | | |
| | | | | Electrical Components & Equipment: 0.7% | |
| | 2,200 | | | P | | General Cable Corp.,
5.750%, due 11/24/13 | | | 809,600 | | |
| | | | 809,600 | | |
| | | | | Mining: 1.4% | |
| | 675 | | | | | Freeport-McMoRan Copper &
Gold, Inc.,
5.500%, due 12/31/49 | | | 1,499,766 | | |
| | | | 1,499,766 | | |
| | | | | Oil & Gas: 0.7% | |
| | 13,600 | | | | | Petroquest Energy, Inc.,
6.875%, due 12/31/49 | | | 822,800 | | |
| | | | 822,800 | | |
See Accompanying Notes to Financial Statements
259
PORTFOLIO OF INVESTMENTS
ING PIONEER HIGH YIELD PORTFOLIO AS OF DECEMBER 31, 2007 (CONTINUED)
| Shares | | | | | | Value | |
| | | | | Savings & Loans: 0.3% | |
| | 10,000 | | | | | Sovereign Capital Trust,
4.375%, due 03/01/34 | | $ | 331,250 | | |
| | | | 331,250 | | |
Total Preferred Stock
(Cost $3,709,556) | | | 4,434,441 | | |
Principal
Amount | | | | | | Value | |
| CONVERTIBLE BONDS: 8.0% | | | |
| | | | | Advertising: 0.9% | |
| $ | 1,000,000 | | | #,C | | Interpublic Group of Cos.,
Inc., 4.250%, due 03/15/23 | | | 983,750 | | |
| | | | 983,750 | | |
| | | | | Aerospace/Defense: 0.5% | |
| | 340,000 | | | C | | EDO Corp., 4.000%,
due 11/15/25 | | | 571,324 | | |
| | | | 571,324 | | |
| | | | | Distribution/Wholesale: 0.4% | |
| | 515,000 | | | C | | WESCO International, Inc.,
1.750%, due 11/15/26 | | | 435,819 | | |
| | | | 435,819 | | |
| | | | | Electronics: 1.0% | |
| | 1,000,000 | | | # | | Newport Corp., 2.500%,
due 02/15/12 | | | 876,250 | | |
| | 300,000 | | | C | | Vishay Intertechnology,
Inc., 3.625%, due 08/01/23 | | | 300,000 | | |
| | | | 1,176,250 | | |
| | | | | Energy-Alternate Sources: 0.4% | |
| | 465,000 | | | #,C | | Diversa Corp., 5.500%,
due 04/01/27 | | | 406,875 | | |
| | | | 406,875 | | |
| | | | | Entertainment: 1.0% | |
| | 555,000 | | | | | Macrovision Corp.,
2.625%, due 08/15/11 | | | 525,863 | | |
| | 600,000 | | | C | | Shuffle Master, Inc.,
1.250%, due 04/15/24 | | | 546,000 | | |
| | | | 1,071,863 | | |
| | | | | Healthcare-Products: 0.0% | |
| | 35,000 | | | # | | Inverness Medical
Innovations, Inc.,
3.000%, due 05/15/16 | | | 46,856 | | |
| | | | 46,856 | | |
| | | | | Office Property: 0.5% | |
| | 600,000 | | | #,C | | Alexandria Real Estate
Equities, Inc., 3.700%,
due 01/15/27 | | | 603,000 | | |
| | | | 603,000 | | |
| | | | | Pharmaceuticals: 1.7% | |
| | 525,000 | | | | | BioMarin Pharmaceuticals, Inc.,
1.875%, due 04/23/17 | | | 974,531 | | |
| | 500,000 | | | #,C | | EPIX Pharmaceuticals, Inc.,
3.000%, due 06/15/24 | | | 338,750 | | |
| | 690,000 | | | | | MannKind Corp.,
3.750%, due 12/15/13 | | | 574,425 | | |
| | | | 1,887,706 | | |
Principal
Amount | | | | | | Value | |
| | | | | Regional Malls: 1.1% | |
| $ | 1,500,000 | | | #,C | | General Growth Properties,
Inc., 3.980%, due 04/15/27 | | $ | 1,218,750 | | |
| | | | 1,218,750 | | |
| | | | | Telecommunications: 0.5% | |
| | 500,000 | | | # | | Anixter International, Inc.,
1.000%, due 02/15/13 | | | 573,125 | | |
| | | | 573,125 | | |
Total Convertible Bonds
(Cost $8,983,816) | | | 8,975,318 | | |
| CORPORATE BONDS/NOTES: 68.6% | | | |
| | | | | Advertising: 1.7% | |
| | 1,965,000 | | | C | | Interpublic Group of Cos., Inc.,
7.250%, due 08/15/11 | | | 1,908,506 | | |
| | | | 1,908,506 | | |
| | | | | Aerospace/Defense: 5.7% | |
| | 3,815,000 | | | C | | DRS Technologies, Inc.,
6.875%, due 11/01/13 | | | 3,815,000 | | |
| | 2,500,000 | | | C | | Esterline Technologies Corp.,
7.750%, due 06/15/13 | | | 2,575,000 | | |
| | | | 6,390,000 | | |
| | | | | Auto Parts & Equipment: 0.4% | |
| | 185,000 | | | #,C | | Allison Transmission, Inc.,
11.000%, due 11/01/15 | | | 168,350 | | |
| | 280,000 | | | &,#,C | | Allison Transmission, Inc.,
11.250%, due 11/01/15 | | | 248,500 | | |
| | | | 416,850 | | |
| | | | | Biotechnology: 0.9% | |
| | 1,000,000 | | | C | | Bio-Rad Laboratories, Inc.,
7.500%, due 08/15/13 | | | 1,015,000 | | |
| | | | 1,015,000 | | |
| | | | | Chemicals: 5.1% | |
| | 1,500,000 | | | C | | Georgia Gulf Corp.,
9.500%, due 10/15/14 | | | 1,203,750 | | |
| | 800,000 | | | C | | Georgia Gulf Corp.,
10.750%, due 10/15/16 | | | 540,000 | | |
| | 465,000 | | | @@,#,C | | Ineos Group Holdings PLC,
8.500%, due 02/15/16 | | | 416,175 | | |
| | 1,550,000 | | | | | Millennium America, Inc.,
7.625%, due 11/15/26 | | | 1,263,250 | | |
| | 1,250,000 | | | @@,C | | Nova Chemicals Corp.,
6.500%, due 01/15/12 | | | 1,178,125 | | |
| | 1,200,000 | | | @@,C | | Nova Chemicals Ltd.,
7.875%, due 09/15/25 | | | 1,080,000 | | |
| | | | 5,681,300 | | |
| | | | | Coal: 1.0% | |
| | 1,205,000 | | | C | | Massey Energy Co.,
6.875%, due 12/15/13 | | | 1,141,738 | | |
| | | | 1,141,738 | | |
| | | | | Commercial Services: 1.8% | |
| | 250,000 | | | | | ACE Cash Express, Inc.,
8.216%, due 10/05/13 | | | 231,875 | | |
| | 348,246 | | | | | NCO Group, Inc.,
8.131%, due 05/15/13 | | | 334,606 | | |
See Accompanying Notes to Financial Statements
260
PORTFOLIO OF INVESTMENTS
ING PIONEER HIGH YIELD PORTFOLIO AS OF DECEMBER 31, 2007 (CONTINUED)
Principal
Amount | | | | | | Value | |
| | | | | Commercial Services (continued) | |
| $ | 1,260,000 | | | C | | NCO Group, Inc.,
9.744%, due 11/15/13 | | $ | 1,215,900 | | |
| | 250,000 | | | C | | NCO Group, Inc.,
11.875%, due 11/15/14 | | | 233,750 | | |
| | | | 2,016,131 | | |
| | | | | Computers: 0.4% | |
| | 520,000 | | | C | | Activant Solutions, Inc.,
9.500%, due 05/01/16 | | | 452,400 | | |
| | | | 452,400 | | |
| | | | | Distribution/Wholesale: 2.3% | |
| | 750,000 | | | C | | Intcomex, Inc.,
11.750%, due 01/15/11 | | | 772,500 | | |
| | 1,905,000 | | | C | | Wesco Distribution, Inc.,
7.500%, due 10/15/17 | | | 1,781,175 | | |
| | | | 2,553,675 | | |
| | | | | Diversified Financial Services: 0.9% | |
| | 760,000 | | | C | | Altra Industrial Motion, Inc.,
9.000%, due 12/01/11 | | | 775,200 | | |
| | 250,000 | | | @@,#,C | | Redwood Capital X Ltd.,
8.430%, due 01/09/09 | | | 250,000 | | |
| | | | 1,025,200 | | |
| | | | | Electric: 5.8% | |
| | 520,000 | | | #,C | | Allegheny Energy, Inc.,
8.250%, due 04/15/12 | | | 557,700 | | |
| | 1,855,000 | | | C | | CMS Energy Corp.,
6.875%, due 12/15/15 | | | 1,885,748 | | |
| | 750,000 | | | @@,#,C | | Intergen NV,
9.000%, due 06/30/17 | | | 793,125 | | |
| | 286,203 | | | | | NRG Energy, Inc.,
6.484%, due 02/01/13 | | | 273,574 | | |
| | 687,670 | | | | | NRG Energy, Inc.,
6.734%, due 02/01/13 | | | 657,326 | | |
| | 1,750,000 | | | C | | NRG Energy, Inc.,
7.250%, due 02/01/14 | | | 1,710,625 | | |
| | 675,000 | | | #,C | | Texas Competitive Electric
Holdings Co., LLC,
10.250%, due 11/01/15 | | | 671,625 | | |
| | | | 6,549,723 | | |
| | | | | Electrical Components & Equipment: 2.6% | |
| | 2,000,000 | | | C | | Anixter International, Inc.,
5.950%, due 03/01/15 | | | 1,812,500 | | |
| | 290,000 | | | C | | Belden, Inc.,
7.000%, due 03/15/17 | | | 284,200 | | |
| | 800,000 | | | C | | General Cable Corp.,
7.125%, due 04/01/17 | | | 788,000 | | |
| | | | 2,884,700 | | |
| | | | | Electronics: 1.3% | |
| | 1,430,000 | | | C | | Itron, Inc.,
7.750%, due 05/15/12 | | | 1,415,700 | | |
| | | | 1,415,700 | | |
| | | | | Energy-Alternate Sources: 0.3% | |
| | 400,000 | | | #,C | | VeraSun Energy Corp.,
9.375%, due 06/01/17 | | | 351,000 | | |
| | | | 351,000 | | |
Principal
Amount | | | | | | Value | |
| | | | | Engineering & Construction: 0.7% | |
| $ | 480,000 | | | #,C | | Esco Corp.,
8.625%, due 12/15/13 | | $ | 482,400 | | |
| | 500,000 | | | | | Landsource Communities
Development,
9.820%, due 02/22/14 | | | 287,500 | | |
| | | | 769,900 | | |
| | | | | Entertainment: 0.5% | |
| | 130,000 | | | | | New World Gaming Partners,
8.750%, due 07/16/14 | | | 119,600 | | |
| | 465,000 | | | #,C | | Shingle Springs Tribal
Gaming Authority,
9.375%, due 06/15/15 | | | 453,375 | | |
| | | | 572,975 | | |
| | | | | Hand/Machine Tools: 1.7% | |
| | 1,850,000 | | | C | | Baldor Electric Co.,
8.625%, due 02/15/17 | | | 1,914,750 | | |
| | | | 1,914,750 | | |
| | | | | Healthcare-Products: 0.1% | |
| | 115,000 | | | #,C | | Bausch & Lomb, Inc.,
9.875%, due 11/01/15 | | | 117,013 | | |
| | | | 117,013 | | |
| | | | | Healthcare-Services: 0.7% | |
| | 800,000 | | | &,#,C | | Surgical Care Affiliates, Inc.,
8.875%, due 07/15/15 | | | 732,000 | | |
| | | | 732,000 | | |
| | | | | Holding Companies-Diversified: 0.8% | |
| | 1,000,000 | | | C | | Leucadia National Corp.,
7.125%, due 03/15/17 | | | 930,000 | | |
| | | | 930,000 | | |
| | | | | Household Products/Wares: 0.5% | |
| | 550,000 | | | C | | Yankee Acquisition Corp.,
9.750%, due 02/15/17 | | | 506,000 | | |
| | | | 506,000 | | |
| | | | | Insurance: 2.6% | |
| | 545,000 | | | #,C | | Alliant Holdings I, Inc.,
11.000%, due 05/01/15 | | | 520,475 | | |
| | 150,000 | | | | | Alliant Insurance Services,
7.765%, due 08/21/14 | | | 144,000 | | |
| | 249,375 | | | | | Amwins Group, Inc.,
7.742%, due 06/11/13 | | | 211,969 | | |
| | 700,000 | | | #,C | | HUB International Holdings, Inc.,
10.250%, due 06/15/15 | | | 598,500 | | |
| | 91,503 | | | | | HUB International Ltd.,
7.491%, due 06/13/14 | | | 86,814 | | |
| | 408,497 | | | | | HUB International Ltd.,
7.700%, due 06/13/14 | | | 387,561 | | |
| | 990,000 | | | C | | Presidential Life Corp.,
7.875%, due 02/15/09 | | | 985,050 | | |
| | | | 2,934,369 | | |
| | | | | Investment Companies: 0.7% | |
| | 925,000 | | | @@,#,C | | Algoma Acquisition Corp.,
9.875%, due 06/15/15 | | | 763,125 | | |
| | | | 763,125 | | |
See Accompanying Notes to Financial Statements
261
PORTFOLIO OF INVESTMENTS
ING PIONEER HIGH YIELD PORTFOLIO AS OF DECEMBER 31, 2007 (CONTINUED)
Principal
Amount | | | | | | Value | |
| | | | | Leisure Time: 0.6% | |
| $ | 775,000 | | | #,C | | Pegasus Solutions, Inc.,
10.500%, due 04/15/15 | | $ | 685,875 | | |
| | | | 685,875 | | |
| | | | | Machinery-Diversified: 2.3% | |
| | 2,500,000 | | | C | | Gardner Denver, Inc.,
8.000%, due 05/01/13 | | | 2,537,500 | | |
| | | | 2,537,500 | | |
| | | | | Metal Fabricate/Hardware: 2.7% | |
| | 2,500,000 | | | C | | Mueller Industries, Inc.,
6.000%, due 11/01/14 | | | 2,284,375 | | |
| | 880,000 | | | C | | Mueller Water Products,
7.375%, due 06/01/17 | | | 790,900 | | |
| | | | 3,075,275 | | |
| | | | | Mining: 2.1% | |
| | 240,000 | | | &,#,C | | Noranda Aluminium Acquisition
Corp., 8.738%, due 05/15/15 | | | 202,800 | | |
| | 2,250,000 | | | @@,C | | Novelis, Inc.,
7.250%, due 02/15/15 | | | 2,126,250 | | |
| | | | 2,329,050 | | |
| | | | | Miscellaneous Manufacturing: 0.7% | |
| | 405,000 | | | #,C | | AGY Holding Corp.,
11.000%, due 11/15/14 | | | 394,875 | | |
| | 515,000 | | | +,C | | Roper Industries, Inc.,
1.481% (step rate 0.000%),
due 01/15/34 | | | 406,206 | | |
| | | | 801,081 | | |
| | | | | Oil & Gas: 4.8% | |
| | 920,000 | | | C | | Cimarex Energy Co.,
7.125%, due 05/01/17 | | | 908,500 | | |
| | 400,000 | | | #,C | | Forest Oil Corp.,
7.250%, due 06/15/19 | | | 404,000 | | |
| | 1,000,000 | | | C | | Frontier Oil Corp.,
6.625%, due 10/01/11 | | | 1,000,000 | | |
| | 95,000 | | | #,C | | Hilcorp Energy I LP,
7.750%, due 11/01/15 | | | 93,813 | | |
| | 650,000 | | | #,C | | Hilcorp Energy I LP,
9.000%, due 06/01/16 | | | 676,000 | | |
| | 600,000 | | | | | NCO Group, Inc., 8.625%,
due 03/15/13 | | | 594,000 | | |
| | 850,000 | | | #,C | | Parallel Petroleum Corp.,
10.250%, due 08/01/14 | | | 854,250 | | |
| | 880,000 | | | C | | Tesoro Corp., 6.625%, due
11/01/15 | | | 875,600 | | |
| | | | 5,406,163 | | |
| | | | | Oil & Gas Services: 0.6% | |
| | 200,000 | | | C | | Complete Production Services,
Inc., 8.000%, due 12/15/16 | | | 194,500 | | |
| | 500,000 | | | @@,#,C | | Sevan Marine ASA,
7.744%, due 05/14/13 | | | 496,875 | | |
| | | | 691,375 | | |
| | | | | Packaging & Containers: 1.4% | |
| | 1,760,000 | | | C | | Crown Cork & Seal Co.,
Inc., 7.375%, due 12/15/26 | | | 1,610,400 | | |
| | | | 1,610,400 | | |
Principal
Amount | | | | | | Value | |
| | | | | Pharmaceuticals: 2.5% | |
| $ | 615,000 | | | C | | Omnicare, Inc., 3.250%,
due 12/15/35 | | $ | 451,256 | | |
| | 2,485,000 | | | C | | Valeant Pharmaceuticals
International, 7.000%,
due 12/15/11 | | | 2,401,131 | | |
| | | | 2,852,387 | | |
| | | | | Pipelines: 1.4% | |
| | 1,200,000 | | | C | | Holly Energy Partners LP,
6.250%, due 03/01/15 | | | 1,110,000 | | |
| | 450,000 | | | C | | TEPPCO Partners LP,
7.000%, due 06/01/67 | | | 412,430 | | |
| | | | 1,522,430 | | |
| | | | | Real Estate: 3.9% | |
| | 2,700,000 | | | C | | Forest City Enterprises, Inc.,
6.500%, due 02/01/17 | | | 2,457,000 | | |
| | 1,915,000 | | | C | | Forest City Enterprises, Inc.,
7.625%, due 06/01/15 | | | 1,857,550 | | |
| | | | 4,314,550 | | |
| | | | | Regional Malls: 0.6% | |
| | 750,000 | | | #,C | | Rouse Co. LP/TRC Co.-Issuer, Inc.,
6.750%, due 05/01/13 | | | 700,457 | | |
| | | | 700,457 | | |
| | | | | Retail: 1.2% | |
| | 800,000 | | | C | | Brown Shoe Co., Inc.,
8.750%, due 05/01/12 | | | 820,000 | | |
| | 500,000 | | | C | | Sonic Automotive, Inc.,
8.625%, due 08/15/13 | | | 488,750 | | |
| | | | 1,308,750 | | |
| | | | | Shopping Centers: 1.0% | |
| | 1,200,000 | | | C | | BF Saul Reit,
7.500%, due 03/01/14 | | | 1,116,000 | | |
| | | | 1,116,000 | | |
| | | | | Software: 1.0% | |
| | 1,180,000 | | | #,C | | First Data Corp.,
9.875%, due 09/24/15 | | | 1,098,875 | | |
| | | | 1,098,875 | | |
| | | | | Telecommunications: 2.1% | |
| | 350,079 | | | @@ | | BCE, Inc.,
7.960%, due 10/31/14 | | | 342,338 | | |
| | 700,000 | | | C | | Broadview Networks Holdings,
Inc., 11.375%, due 09/01/12 | | | 733,250 | | |
| | 1,000,000 | | | | | Corning, Inc., 8.875%,
due 08/15/21 | | | 1,275,098 | | |
| | 29,921 | | | @@ | | Telesat Canada, Inc.,
7.894%, due 10/31/14 | | | 29,260 | | |
| | | | 2,379,946 | | |
| | | | | Transportation: 0.5% | |
| | 300,000 | | | #,C | | Bristow Group, Inc.,
7.500%, due 09/15/17 | | | 303,000 | | |
| | 305,000 | | | @@,#,C | | Kansas City Southern de Mexico
SA de CV, 7.375%,
due 06/01/14 | | | 297,375 | | |
| | | | 600,375 | | |
See Accompanying Notes to Financial Statements
262
PORTFOLIO OF INVESTMENTS
ING PIONEER HIGH YIELD PORTFOLIO AS OF DECEMBER 31, 2007 (CONTINUED)
Principal
Amount | | | | | | Value | |
| | | | | Trucking & Leasing: 0.7% | |
| $ | 850,000 | | | C | | Greenbrier Cos., Inc.,
8.375%, due 05/15/15 | | $ | 816,000 | | |
| | | | 816,000 | | |
Total Corporate Bonds/Notes
(Cost $80,218,744) | | | 76,888,544 | | |
| COLLATERALIZED MORTGAGE OBLIGATIONS: 0.8% | | | |
| | 1,000,000 | | | #,C | | Timberstar Trust,
7.530%, due 10/15/36 | | | 872,602 | | |
Total Collateralized
Mortgage Obligations
(Cost $1,008,884) | | | 872,602 | | |
Total Long-Term Investments
(Cost $106,744,404) | | | 106,922,211 | | |
| SHORT-TERM INVESTMENTS: 2.8% | | | |
| | | | | U.S. Government Agency Obligations: 2.8% | |
| | 3,162,000 | | | Z | | Federal Home Loan Bank,
3.050%, due 01/02/08 | | | 3,161,464 | | |
Total Short-Term Investments
(Cost $3,161,464) | | | 3,161,464 | | |
Total Investments in
Securities
(Cost $109,905,868)* | | | 98.3 | % | | $ | 110,083,675 | | |
Other Assets and
Liabilities - Net | | | 1.7 | | | | 1,938,103 | | |
| Net Assets | | | 100.0 | % | | $ | 112,021,778 | | |
@ Non-income producing security
@@ Foreign Issuer
& Payment-in-kind
+ Step-up basis bonds. Interest rates shown reflect current and next coupon rates.
# Securities with purchases pursuant to Rule144A or section 4(2), under the Securities Act of 1933 and may not be resold subject to that rule except to qualified institutional buyers. Unless otherwise noted, these securities have been determined to be liquid under the guidelines established by the Funds' Board of Directors/Trustees.
C Bond may be called prior to maturity date.
P Preferred Stock may be called prior to convertible date.
Z Indicates Zero Coupon Bond; rate shown reflects current effective yield.
* Cost for federal income tax purposes is $109,944,413
Net unrealized appreciation consists of:
| Gross Unrealized Appreciation | | $ | 5,293,625 | | |
| Gross Unrealized Depreciation | | | (5,154,363 | ) | |
| Net Unrealized Appreciation | | $ | 139,262 | | |
See Accompanying Notes to Financial Statements
263
ING T. ROWE PRICE PORTFOLIO OF INVESTMENTS
DIVERSIFIED MID CAP GROWTH PORTFOLIO AS OF DECEMBER 31, 2007
| Shares | | | | | | Value | |
| COMMON STOCK: 100.2% | | | |
| | | | | Advertising: 2.2% | |
| | 203,200 | | | @,L | | Clear Channel Outdoor
Holdings, Inc. | | $ | 5,620,512 | | |
| | 70,900 | | | @,@@,L | | Focus Media Holding Ltd. ADR | | | 4,027,829 | | |
| | 104,700 | | | @,L | | Lamar Advertising Co. | | | 5,032,929 | | |
| | 170,800 | | | | | Omnicom Group | | | 8,118,124 | | |
| | | | 22,799,394 | | |
| | | | | Aerospace/Defense: 1.5% | |
| | 26,400 | | | @,L | | Alliant Techsystems, Inc. | | | 3,003,264 | | |
| | 83,700 | | | @@,L | | Empresa Brasileira de
Aeronautica SA ADR | | | 3,815,883 | | |
| | 117,300 | | | | | Rockwell Collins, Inc. | | | 8,442,081 | | |
| | | | 15,261,228 | | |
| | | | | Airlines: 0.5% | |
| | 91,300 | | | | | Skywest, Inc. | | | 2,451,405 | | |
| | 203,000 | | | | | Southwest Airlines Co. | | | 2,476,600 | | |
| | | | 4,928,005 | | |
| | | | | Auto Parts & Equipment: 0.3% | |
| | 68,500 | | | | | WABCO Holdings, Inc. | | | 3,431,165 | | |
| | | | 3,431,165 | | |
| | | | | Banks: 1.8% | |
| | 29,200 | | | L | | City National Corp. | | | 1,738,860 | | |
| | 60,500 | | | L | | East-West Bancorp., Inc. | | | 1,465,915 | | |
| | 54,200 | | | L | | First Horizon National Corp. | | | 983,730 | | |
| | 118,700 | | | | | Northern Trust Corp. | | | 9,090,046 | | |
| | 44,800 | | | @,L | | SVB Financial Group | | | 2,257,920 | | |
| | 66,600 | | | | | Synovus Financial Corp. | | | 1,603,728 | | |
| | 104,400 | | | | | UCBH Holdings, Inc. | | | 1,478,304 | | |
| | | | 18,618,503 | | |
| | | | | Beverages: 0.4% | |
| | 61,600 | | | | | Brown-Forman Corp. | | | 4,565,176 | | |
| | | | 4,565,176 | | |
| | | | | Biotechnology: 3.1% | |
| | 55,700 | | | @ | | Celgene Corp. | | | 2,573,897 | | |
| | 80,100 | | | @,L | | Charles River Laboratories
International, Inc. | | | 5,270,580 | | |
| | 68,000 | | | @ | | Genzyme Corp. | | | 5,061,920 | | |
| | 61,300 | | | @,L | | Illumina, Inc. | | | 3,632,638 | | |
| | 55,600 | | | @,L | | Integra LifeSciences
Holdings Corp. | | | 2,331,308 | | |
| | 53,100 | | | @,L | | Invitrogen Corp. | | | 4,960,071 | | |
| | 55,100 | | | @,L | | Martek Biosciences Corp. | | | 1,629,858 | | |
| | 41,200 | | | @,L | | Millipore Corp. | | | 3,015,016 | | |
| | 96,900 | | | @,@@,L | | Qiagen NV | | | 2,039,745 | | |
| | 69,800 | | | @,L | | Vertex Pharmaceuticals, Inc. | | | 1,621,454 | | |
| | | | 32,136,487 | | |
| | | | | Chemicals: 0.7% | |
| | 100,300 | | | | | Ecolab, Inc. | | | 5,136,363 | | |
| | 39,400 | | | | | Sigma-Aldrich Corp. | | | 2,151,240 | | |
| | | | 7,287,603 | | |
| | | | | Coal: 1.6% | |
| | 78,500 | | | L | | Arch Coal, Inc. | | | 3,527,005 | | |
| | 101,400 | | | | | Consol Energy, Inc. | | | 7,252,128 | | |
| | 122,600 | | | | | Foundation Coal Holdings, Inc. | | | 6,436,500 | | |
| | | | 17,215,633 | | |
| Shares | | | | | | Value | |
| | | | | Commercial Services: 6.1% | |
| | 72,000 | | | @ | | Apollo Group, Inc.-Class A | | $ | 5,050,800 | | |
| | 55,700 | | | L | | Corporate Executive Board Co. | | | 3,347,570 | | |
| | 68,500 | | | L | | DeVry, Inc. | | | 3,559,260 | | |
| | 76,600 | | | L | | Equifax, Inc. | | | 2,785,176 | | |
| | 89,700 | | | L | | H&R Block, Inc. | | | 1,665,729 | | |
| | 107,100 | | | @,L | | Iron Mountain, Inc. | | | 3,964,842 | | |
| | 36,100 | | | @,L | | ITT Educational Services, Inc. | | | 3,078,247 | | |
| | 50,000 | | | | | Manpower, Inc. | | | 2,845,000 | | |
| | 48,000 | | | | | McKesson Corp. | | | 3,144,480 | | |
| | 120,600 | | | @,L | | Monster Worldwide, Inc. | | | 3,907,440 | | |
| | 168,500 | | | L | | Moody's Corp. | | | 6,015,450 | | |
| | 233,400 | | | @,L | | Quanta Services, Inc. | | | 6,124,416 | | |
| | 95,100 | | | @@ | | Ritchie Bros. Auctioneers, Inc. | | | 7,864,770 | | |
| | 142,600 | | | | | Robert Half International, Inc. | | | 3,855,904 | | |
| | 62,500 | | | @,L | | Vistaprint Ltd. | | | 2,678,125 | | |
| | 166,900 | | | | | Western Union Co. | | | 4,052,332 | | |
| | | | 63,939,541 | | |
| | | | | Computers: 3.3% | |
| | 94,600 | | | @,L | | Cadence Design Systems, Inc. | | | 1,609,146 | | |
| | 183,200 | | | @ | | Cognizant Technology
Solutions Corp. | | | 6,217,808 | | |
| | 26,500 | | | @,L | | DST Systems, Inc. | | | 2,187,575 | | |
| | 81,000 | | | | | Factset Research Systems, Inc. | | | 4,511,700 | | |
| | 86,100 | | | | | Jack Henry & Associates, Inc. | | | 2,095,674 | | |
| | 62,500 | | | @,@@,L | | Logitech International | | | 2,290,000 | | |
| | 288,100 | | | @,L | | Network Appliance, Inc. | | | 7,190,976 | | |
| | 117,600 | | | @,L | | Perot Systems Corp. | | | 1,587,600 | | |
| | 190,900 | | | | | Seagate Technology, Inc. | | | 4,867,950 | | |
| | 70,800 | | | @ | | Synopsys, Inc. | | | 1,835,844 | | |
| | | | 34,394,273 | | |
| | | | | Cosmetics/Personal Care: 0.7% | |
| | 176,600 | | | | | Avon Products, Inc. | | | 6,980,998 | | |
| | | | 6,980,998 | | |
| | | | | Distribution/Wholesale: 0.7% | |
| | 79,800 | | | L | | Fastenal Co. | | | 3,225,516 | | |
| | 49,700 | | | | | WW Grainger, Inc. | | | 4,349,744 | | |
| | | | 7,575,260 | | |
| | | | | Diversified Financial Services: 5.0% | |
| | 34,700 | | | @,L | | Affiliated Managers
Group, Inc. | | | 4,075,862 | | |
| | 28,900 | | | L | | Bear Stearns Cos., Inc. | | | 2,550,425 | | |
| | 20,700 | | | | | Blackrock, Inc. | | | 4,487,760 | | |
| | 100,400 | | | L | | Eaton Vance Corp. | | | 4,559,164 | | |
| | 86,000 | | | | | Federated Investors, Inc. | | | 3,539,760 | | |
| | 77,300 | | | @,L | | Interactive Brokers Group, Inc. | | | 2,498,336 | | |
| | 42,500 | | | @ | | IntercontinentalExchange, Inc. | | | 8,181,250 | | |
| | 100,100 | | | L | | Janus Capital Group, Inc. | | | 3,288,285 | | |
| | 119,100 | | | @@,L | | Lazard Ltd. | | | 4,844,988 | | |
| | 26,600 | | | | | Legg Mason, Inc. | | | 1,945,790 | | |
| | 73,800 | | | L | | Nymex Holdings, Inc. | | | 9,860,418 | | |
| | 70,000 | | | L | | OptionsXpress Holdings, Inc. | | | 2,367,400 | | |
| | | | 52,199,438 | | |
| | | | | Electric: 1.1% | |
| | 235,500 | | | @ | | AES Corp. | | | 5,037,345 | | |
| | 269,600 | | | @ | | Reliant Resources, Inc. | | | 7,074,304 | | |
| | | | 12,111,649 | | |
See Accompanying Notes to Financial Statements
264
ING T. ROWE PRICE PORTFOLIO OF INVESTMENTS
DIVERSIFIED MID CAP GROWTH PORTFOLIO AS OF DECEMBER 31, 2007 (CONTINUED)
| Shares | | | | | | Value | |
| | | | | Electrical Components & Equipment: 0.6% | |
| | 89,450 | | | W | | Ametek, Inc. | | $ | 4,189,838 | | |
| | 32,400 | | | @,L | | General Cable Corp. | | | 2,374,272 | | |
| | | | 6,564,110 | | |
| | | | | Electronics: 2.5% | |
| | 63,500 | | | L | | Applera Corp.-Applied
Biosystems Group | | | 2,153,920 | | |
| | 156,500 | | | @,L | | Cogent, Inc. | | | 1,744,975 | | |
| | 44,700 | | | @,L | | Cymer, Inc. | | | 1,740,171 | | |
| | 55,900 | | | @ | | Dolby Laboratories, Inc. | | | 2,779,348 | | |
| | 78,200 | | | @,L | | Flir Systems, Inc. | | | 2,447,660 | | |
| | 128,000 | | | | | Gentex Corp. | | | 2,274,560 | | |
| | 58,600 | | | @,L | | II-VI, Inc. | | | 1,790,230 | | |
| | 200,400 | | | | | Jabil Circuit, Inc. | | | 3,060,108 | | |
| | 70,600 | | | | | National Instruments Corp. | | | 2,353,098 | | |
| | 69,000 | | | @,L | | Waters Corp. | | | 5,455,830 | | |
| | | | 25,799,900 | | |
| | | | | Engineering & Construction: 2.6% | |
| | 59,800 | | | | | Fluor Corp. | | | 8,714,056 | | |
| | 59,300 | | | @,@@ | | Foster Wheeler Ltd. | | | 9,192,686 | | |
| | 159,600 | | | @ | | McDermott International, Inc. | | | 9,421,187 | | |
| | | | 27,327,929 | | |
| | | | | Entertainment: 0.8% | |
| | 68,200 | | | @ | | DreamWorks Animation
SKG, Inc. | | | 1,741,828 | | |
| | 153,800 | | | | | International Game
Technology | | | 6,756,434 | | |
| | | | 8,498,262 | | |
| | | | | Environmental Control: 1.1% | |
| | 222,300 | | | | | Republic Services, Inc. | | | 6,969,105 | | |
| | 77,300 | | | @,L | | Stericycle, Inc. | | | 4,591,620 | | |
| | | | 11,560,725 | | |
| | | | | Food: 1.2% | |
| | 78,700 | | | L | | Hershey Co. | | | 3,100,780 | | |
| | 116,700 | | | | | McCormick & Co., Inc. | | | 4,424,097 | | |
| | 89,950 | | | | | WM Wrigley Jr. Co. | | | 5,266,573 | | |
| | | | 12,791,450 | | |
| | | | | Healthcare-Products: 5.6% | |
| | 103,900 | | | @,L | | American Medical Systems
Holdings, Inc. | | | 1,502,394 | | |
| | 62,400 | | | @,L | | Arthrocare Corp. | | | 2,998,320 | | |
| | 26,600 | | | | | Becton Dickinson & Co. | | | 2,223,228 | | |
| | 60,900 | | | | | CR Bard, Inc. | | | 5,773,320 | | |
| | 58,100 | | | | | Densply International, Inc. | | | 2,615,662 | | |
| | 38,200 | | | @,L | | Edwards Lifesciences Corp. | | | 1,756,818 | | |
| | 51,700 | | | @ | | Gen-Probe, Inc. | | | 3,253,481 | | |
| | 53,000 | | | @,L | | Henry Schein, Inc. | | | 3,254,200 | | |
| | 42,000 | | | @,L | | Hologic, Inc. | | | 2,882,880 | | |
| | 17,000 | | | @,L | | Intuitive Surgical, Inc. | | | 5,516,500 | | |
| | 56,500 | | | @ | | Masimo Corp. | | | 2,228,925 | | |
| | 53,900 | | | @,L | | Patterson Cos., Inc. | | | 1,829,905 | | |
| | 76,800 | | | @,L | | Resmed, Inc. | | | 4,034,304 | | |
| | 183,700 | | | @ | | St. Jude Medical, Inc. | | | 7,465,568 | | |
| | 62,000 | | | @,L | | Techne Corp. | | | 4,095,100 | | |
| | 52,700 | | | @,L | | Varian Medical Systems, Inc. | | | 2,748,832 | | |
| | 62,300 | | | @ | | Zimmer Holdings, Inc. | | | 4,121,145 | | |
| | | | 58,300,582 | | |
| Shares | | | | | | Value | |
| | | | | Healthcare-Services: 3.0% | |
| | 83,350 | | | @ | | Coventry Health Care, Inc. | | $ | 4,938,488 | | |
| | 34,400 | | | @ | | DaVita, Inc. | | | 1,938,440 | | |
| | 92,200 | | | @ | | Health Net, Inc. | | | 4,453,260 | | |
| | 60,300 | | | @,L | | Healthways, Inc. | | | 3,523,932 | | |
| | 78,700 | | | @ | | Humana, Inc. | | | 5,926,897 | | |
| | 54,900 | | | @,L | | Laboratory Corp. of
America Holdings | | | 4,146,597 | | |
| | 94,700 | | | @,L | | Lincare Holdings, Inc. | | | 3,329,652 | | |
| | 64,000 | | | | | Quest Diagnostics | | | 3,385,600 | | |
| | | | 31,642,866 | | |
| | | | | Home Builders: 0.8% | |
| | 45,900 | | | L | | Centex Corp. | | | 1,159,434 | | |
| | 41,000 | | | L | | KB Home | | | 885,600 | | |
| | 59,000 | | | L | | Lennar Corp. | | | 1,055,510 | | |
| | 68,200 | | | L | | Pulte Homes, Inc. | | | 718,828 | | |
| | 47,400 | | | L | | Thor Industries, Inc. | | | 1,801,674 | | |
| | 65,000 | | | @,L | | Toll Brothers, Inc. | | | 1,303,900 | | |
| | 53,600 | | | L | | Winnebago Industries | | | 1,126,672 | | |
| | | | 8,051,618 | | |
| | | | | Household Products/Wares: 0.5% | |
| | 35,800 | | | L | | Avery Dennison Corp. | | | 1,902,412 | | |
| | 51,000 | | | | | Clorox Co. | | | 3,323,670 | | |
| | | | 5,226,082 | | |
| | | | | Insurance: 3.1% | |
| | 67,900 | | | L | | AMBAC Financial Group, Inc. | | | 1,749,783 | | |
| | 42,100 | | | | | AON Corp. | | | 2,007,749 | | |
| | 47,400 | | | @,@@ | | Arch Capital Group Ltd. | | | 3,334,590 | | |
| | 41,500 | | | | | Assurant, Inc. | | | 2,776,350 | | |
| | 60,400 | | | @@ | | Axis Capital Holdings Ltd. | | | 2,353,788 | | |
| | 79,100 | | | | | Brown & Brown, Inc. | | | 1,858,850 | | |
| | 148,000 | | | | | Cigna Corp. | | | 7,952,040 | | |
| | 4,400 | | | @ | | Markel Corp. | | | 2,160,840 | | |
| | 49,000 | | | L | | MBIA, Inc. | | | 912,870 | | |
| | 78,600 | | | @ | | Philadelphia Consolidated
Holding Co. | | | 3,092,910 | | |
| | 40,500 | | | @@,L | | RenaissanceRe Holdings Ltd. | | | 2,439,720 | | |
| | 43,700 | | | @@ | | Willis Group Holdings Ltd. | | | 1,659,289 | | |
| | | | 32,298,779 | | |
| | | | | Internet: 2.3% | |
| | 6,700 | | | @,@@ | | Baidu.com ADR | | | 2,615,613 | | |
| | 55,600 | | | @ | | Digital River, Inc. | | | 1,838,692 | | |
| | 150,700 | | | @,L | | Expedia, Inc. | | | 4,765,134 | | |
| | 90,200 | | | @,L | | F5 Networks, Inc. | | | 2,572,504 | | |
| | 84,000 | | | @ | | McAfee, Inc. | | | 3,150,000 | | |
| | 54,100 | | | @,@@,L | | Sina Corp. | | | 2,397,171 | | |
| | 138,300 | | | @ | | Symantec Corp. | | | 2,232,162 | | |
| | 121,800 | | | @,L | | VeriSign, Inc. | | | 4,580,898 | | |
| | | | 24,152,174 | | |
| | | | | Iron/Steel: 0.8% | |
| | 105,400 | | | L | | Carpenter Technology Corp. | | | 7,922,918 | | |
| | | | 7,922,918 | | |
| | | | | Leisure Time: 1.0% | |
| | 123,800 | | | L | | Harley-Davidson, Inc. | | | 5,782,698 | | |
| | 41,500 | | | L | | Royal Caribbean Cruises Ltd. | | | 1,761,260 | | |
| | 76,350 | | | @,L | | WMS Industries, Inc. | | | 2,797,464 | | |
| | | | 10,341,422 | | |
See Accompanying Notes to Financial Statements
265
ING T. ROWE PRICE PORTFOLIO OF INVESTMENTS
DIVERSIFIED MID CAP GROWTH PORTFOLIO AS OF DECEMBER 31, 2007 (CONTINUED)
| Shares | | | | | | Value | |
| | | | | Lodging: 2.0% | |
| | 44,500 | | | | | Boyd Gaming Corp. | | $ | 1,516,115 | | |
| | 92,000 | | | | | Choice Hotels International, Inc. | | | 3,054,400 | | |
| | 164,000 | | | | | Marriott International, Inc. | | | 5,605,520 | | |
| | 193,200 | | | @,@@,L | | Melco PBL Entertainment
Macau Ltd. ADR | | | 2,233,392 | | |
| | 92,000 | | | | | Starwood Hotels & Resorts
Worldwide, Inc. | | | 4,050,760 | | |
| | 38,600 | | | @ | | Wynn Resorts Ltd. | | | 4,328,218 | | |
| | | | 20,788,405 | | |
| | | | | Machinery-Construction & Mining: 0.7% | |
| | 79,500 | | | | | Joy Global, Inc. | | | 5,232,690 | | |
| | 33,000 | | | @ | | Terex Corp. | | | 2,163,810 | | |
| | | | 7,396,500 | | |
| | | | | Machinery-Diversified: 0.7% | |
| | 70,600 | | | | | Graco, Inc. | | | 2,630,556 | | |
| | 86,200 | | | | | IDEX Corp. | | | 3,114,406 | | |
| | 55,800 | | | @,L | | Zebra Technologies Corp. | | | 1,936,260 | | |
| | | | 7,681,222 | | |
| | | | | Media: 2.3% | |
| | 76,600 | | | @,L | | Cablevision Systems Corp. | | | 1,876,700 | | |
| | 21,200 | | | @,@@,L | | Central European Media
Enterprises Ltd. | | | 2,458,776 | | |
| | 117,600 | | | @,@@,L | | CTC Media, Inc. | | | 3,551,520 | | |
| | 152,800 | | | | | McGraw-Hill Cos., Inc. | | | 6,694,168 | | |
| | 37,400 | | | | | Meredith Corp. | | | 2,056,252 | | |
| | 122,600 | | | @@ | | Shaw Communications,
Inc.-Class B | | | 2,903,168 | | |
| | 75,400 | | | @@,L | | WPP Group PLC ADR | | | 4,847,466 | | |
| | | | 24,388,050 | | |
| | | | | Metal Fabricate/Hardware: 0.9% | |
| | 66,100 | | | | | Precision Castparts Corp. | | | 9,168,070 | | |
| | | | 9,168,070 | | |
| | | | | Mining: 0.3% | |
| | 50,000 | | | @@,L | | Agnico-Eagle Mines Ltd. | | | 2,731,500 | | |
| | | | 2,731,500 | | |
| | | | | Miscellaneous Manufacturing: 1.3% | |
| | 105,300 | | | L | | Donaldson Co., Inc. | | | 4,883,814 | | |
| | 43,100 | | | | | ITT Corp. | | | 2,846,324 | | |
| | 45,800 | | | | | Pall Corp. | | | 1,846,656 | | |
| | 66,500 | | | | | Roper Industries, Inc. | | | 4,158,910 | | |
| | | | 13,735,704 | | |
| | | | | Office Furnishings: 0.2% | |
| | 48,400 | | | L | | HNI, Corp. | | | 1,696,904 | | |
| | | | 1,696,904 | | |
| | | | | Oil & Gas: 3.4% | |
| | 51,400 | | | @,L | | Bill Barrett Corp. | | | 2,152,118 | | |
| | 54,200 | | | | | Cabot Oil & Gas Corp. | | | 2,188,054 | | |
| | 224,500 | | | @,@@,L | | Compton Petroleum Corp. | | | 2,065,400 | | |
| | 41,600 | | | L | | Diamond Offshore Drilling | | | 5,907,200 | | |
| | 84,500 | | | @,L | | Mariner Energy, Inc. | | | 1,933,360 | | |
| | 93,000 | | | | | Murphy Oil Corp. | | | 7,890,120 | | |
| | 75,000 | | | @,@@,L | | Nabors Industries Ltd. | | | 2,054,250 | | |
| | 75,250 | | | @,L | | SandRidge Energy, Inc. | | | 2,698,465 | | |
| | 95,200 | | | @,L | | Ultra Petroleum Corp. | | | 6,806,800 | | |
| | 40,250 | | | | | XTO Energy, Inc. | | | 2,067,240 | | |
| | | | 35,763,007 | | |
| Shares | | | | | | Value | |
| | | | | Oil & Gas Services: 4.4% | |
| | 84,900 | | | | | BJ Services Co. | | $ | 2,059,674 | | |
| | 189,400 | | | @,L | | Cameron International Corp. | | | 9,115,822 | | |
| | 61,600 | | | @,L | | Core Laboratories NV | | | 7,682,752 | | |
| | 143,700 | | | @ | | FMC Technologies, Inc. | | | 8,147,790 | | |
| | 125,000 | | | | | Smith International, Inc. | | | 9,231,250 | | |
| | 69,200 | | | @,L | | Tetra Technologies, Inc. | | | 1,077,444 | | |
| | 129,100 | | | @ | | Weatherford International Ltd. | | | 8,856,260 | | |
| | | | 46,170,992 | | |
| | | | | Pharmaceuticals: 3.2% | |
| | 94,300 | | | @,L | | Alkermes, Inc. | | | 1,470,137 | | |
| | 133,664 | | | | | Allergan, Inc. | | | 8,586,575 | | |
| | 47,500 | | | @,L | | Amylin Pharmaceuticals, Inc. | | | 1,757,500 | | |
| | 70,600 | | | @,L | | Cephalon, Inc. | | | 5,066,256 | | |
| | 152,400 | | | @,@@,L | | Elan Corp. PLC ADR | | | 3,349,752 | | |
| | 101,800 | | | @ | | Express Scripts, Inc. | | | 7,431,400 | | |
| | 132,300 | | | @,L | | Medarex, Inc. | | | 1,378,566 | | |
| | 47,000 | | | @,L | | Sepracor, Inc. | | | 1,233,750 | | |
| | 58,000 | | | @,L | | Theravance, Inc. | | | 1,131,000 | | |
| | 127,200 | | | @,L | | Warner Chilcott Ltd. | | | 2,255,256 | | |
| | | | 33,660,192 | | |
| | | | | Pipelines: 0.7% | |
| | 218,100 | | | | | Williams Cos., Inc. | | | 7,803,618 | | |
| | | | 7,803,618 | | |
| | | | | Retail: 5.5% | |
| | 43,000 | | | | | Advance Auto Parts, Inc. | | | 1,633,570 | | |
| | 59,100 | | | @,L | | AnnTaylor Stores Corp. | | | 1,510,596 | | |
| | 129,500 | | | @,L | | Bed Bath & Beyond, Inc. | | | 3,806,005 | | |
| | 209,000 | | | @ | | Coach, Inc. | | | 6,391,220 | | |
| | 65,400 | | | @,L | | Dick's Sporting Goods, Inc. | | | 1,815,504 | | |
| | 99,000 | | | L | | Family Dollar Stores, Inc. | | | 1,903,770 | | |
| | 41,600 | | | | | Men's Wearhouse, Inc. | | | 1,122,368 | | |
| | 65,100 | | | @,L | | O'Reilly Automotive, Inc. | | | 2,111,193 | | |
| | 36,600 | | | @,L | | Panera Bread Co. | | | 1,311,012 | | |
| | 83,300 | | | L | | Petsmart, Inc. | | | 1,960,049 | | |
| | 125,000 | | | | | Ross Stores, Inc. | | | 3,196,250 | | |
| | 137,955 | | | | | Staples, Inc. | | | 3,182,622 | | |
| | 110,400 | | | L | | Tiffany & Co. | | | 5,081,712 | | |
| | 86,050 | | | @@ | | Tim Hortons, Inc. | | | 3,177,827 | | |
| | 196,800 | | | | | TJX Cos., Inc. | | | 5,654,064 | | |
| | 36,100 | | | @,L | | Tractor Supply Co. | | | 1,297,434 | | |
| | 72,500 | | | @,L | | Urban Outfitters, Inc. | | | 1,976,350 | | |
| | 103,000 | | | L | | Williams-Sonoma, Inc. | | | 2,667,700 | | |
| | 221,600 | | | | | Yum! Brands, Inc. | | | 8,480,632 | | |
| | | | 58,279,878 | | |
| | | | | Semiconductors: 6.6% | |
| | 274,100 | | | | | Altera Corp. | | | 5,295,612 | | |
| | 166,800 | | | | | Analog Devices, Inc. | | | 5,287,560 | | |
| | 230,850 | | | @ | | Broadcom Corp. | | | 6,034,419 | | |
| | 121,400 | | | @ | | Fairchild Semiconductor
International, Inc. | | | 1,751,802 | | |
| | 133,500 | | | @ | | Integrated Device
Technology, Inc. | | | 1,509,885 | | |
| | 81,300 | | | | | Intersil Corp. | | | 1,990,224 | | |
| | 31,800 | | | | | KLA-Tencor Corp. | | | 1,531,488 | | |
| | 39,000 | | | @ | | Lam Research Corp. | | | 1,685,970 | | |
| | 167,700 | | | L | | Linear Technology Corp. | | | 5,337,891 | | |
| | 233,000 | | | @,@@,L | | Marvell Technology Group Ltd. | | | 3,257,340 | | |
| | 171,100 | | | | | Maxim Integrated Products | | | 4,530,728 | | |
| | 86,600 | | | @ | | MEMC Electronic Materials, Inc. | | | 7,663,234 | | |
See Accompanying Notes to Financial Statements
266
ING T. ROWE PRICE PORTFOLIO OF INVESTMENTS
DIVERSIFIED MID CAP GROWTH PORTFOLIO AS OF DECEMBER 31, 2007 (CONTINUED)
| Shares | | | | | | Value | |
| | | | | Semiconductors (continued) | |
| | 176,500 | | | L | | Microchip Technology, Inc. | | $ | 5,545,630 | | |
| | 200,300 | | | | | National Semiconductor Corp. | | | 4,534,792 | | |
| | 189,400 | | | @,L | | ON Semiconductor Corp. | | | 1,681,872 | | |
| | 180,800 | | | @ | | QLogic Corp. | | | 2,567,360 | | |
| | 74,700 | | | @,L | | Silicon Laboratories, Inc. | | | 2,796,021 | | |
| | 113,400 | | | @ | | Teradyne, Inc. | | | 1,172,556 | | |
| | 239,300 | | | | | Xilinx, Inc. | | | 5,233,491 | | |
| | | | 69,407,875 | | |
| | | | | Software: 6.7% | |
| | 209,980 | | | @ | | Activision, Inc. | | | 6,236,406 | | |
| | 150,900 | | | @,L | | American Reprographics Co. | | | 2,486,832 | | |
| | 151,300 | | | @ | | Autodesk, Inc. | | | 7,528,688 | | |
| | 92,100 | | | @ | | Citrix Systems, Inc. | | | 3,500,721 | | |
| | 28,000 | | | | | Dun & Bradstreet Corp. | | | 2,481,640 | | |
| | 143,900 | | | @ | | Electronic Arts, Inc. | | | 8,405,199 | | |
| | 39,700 | | | | | Fidelity National Information
Services, Inc. | | | 1,651,123 | | |
| | 46,800 | | | @ | | Fiserv, Inc. | | | 2,596,932 | | |
| | 46,700 | | | | | Global Payments, Inc. | | | 2,172,484 | | |
| | 174,000 | | | @,L | | Intuit, Inc. | | | 5,500,140 | | |
| | 193,300 | | | | | Paychex, Inc. | | | 7,001,326 | | |
| | 386,600 | | | @,L | | Red Hat, Inc. | | | 8,056,744 | | |
| | 72,400 | | | @,L | | Salesforce.com, Inc. | | | 4,538,756 | | |
| | 148,400 | | | @@,L | | Satyam Computer
Services Ltd. ADR | | | 3,965,248 | | |
| | 65,300 | | | | | SEI Investments Co. | | | 2,100,701 | | |
| | 77,600 | | | @,L | | THQ, Inc. | | | 2,187,544 | | |
| | | | 70,410,484 | | |
| | | | | Telecommunications: 4.2% | |
| | 184,400 | | | @ | | American Tower Corp. | | | 7,855,440 | | |
| | 180,700 | | | @,L | | Crown Castle
International Corp. | | | 7,517,120 | | |
| | 122,300 | | | @,L | | Foundry Networks, Inc. | | | 2,142,696 | | |
| | 160,300 | | | @,L | | JDS Uniphase Corp. | | | 2,131,990 | | |
| | 184,600 | | | @ | | Juniper Networks, Inc. | | | 6,128,720 | | |
| | 95,100 | | | @,L | | Leap Wireless
International, Inc. | | | 4,435,464 | | |
| | 125,000 | | | @,L | | MetroPCS
Communications, Inc. | | | 2,431,250 | | |
| | 64,100 | | | @,L | | NeuStar, Inc. | | | 1,838,388 | | |
| | 78,000 | | | @ | | NII Holdings, Inc. | | | 3,768,960 | | |
| | 178,950 | | | @,L | | SBA Communications Corp. | | | 6,055,668 | | |
| | | | 44,305,696 | | |
| | | | | Textiles: 0.2% | |
| | 73,600 | | | | | Cintas Corp. | | | 2,474,432 | | |
| | | | 2,474,432 | | |
| | | | | Toys/Games/Hobbies: 0.2% | |
| | 117,100 | | | | | Mattel, Inc. | | | 2,229,584 | | |
| | | | 2,229,584 | | |
| | | | | Transportation: 1.8% | |
| | 117,700 | | | | | CH Robinson Worldwide, Inc. | | | 6,369,924 | | |
| | 131,000 | | | | | Expeditors International
Washington, Inc. | | | 5,853,080 | | |
| | 122,900 | | | | | Landstar System, Inc. | | | 5,180,235 | | |
| | 96,200 | | | @@ | | UTI Worldwide, Inc. | | | 1,885,520 | | |
| | | | 19,288,759 | | |
Total Common Stock
(Cost $896,531,530) | | | 1,051,304,042 | | |
| Shares | | | | | | Value | |
| SHORT-TERM INVESTMENTS: 28.7% | |
| | | | | Mutual Fund: 0.2% | |
| | 1,746,793 | | | | | Reserve Investment Fund | | $ | 1,746,793 | | |
Total Mutual Fund
(Cost $1,746,793) | | | 1,746,793 | | |
Principal
Amount | | | | | | Value | |
| | | | | Securities Lending Collateralcc: 28.5% | |
| $ | 299,744,758 | | | | | Bank of New York Mellon Corp.
Institutional Cash Reserves | | | 299,744,758 | | |
Total Securities Lending Collateral
(Cost $299,744,758) | | | 299,744,758 | | |
Total Short-Term Investments
(Cost $301,491,551) | | | 301,491,551 | | |
Total Investments in
Securities
(Cost $1,198,023,081)* | | | 128.9 | % | | $ | 1,352,795,593 | | |
Other Assets and
Liabilities - Net | | | (28.9 | ) | | | (303,310,601 | ) | |
| Net Assets | | | 100.0 | % | | $ | 1,049,484,992 | | |
@ Non-income producing security
@@ Foreign Issuer
ADR American Depositary Receipt
cc Securities purchased with cash collateral for securities loaned.
W When-issued or delayed delivery security
L Loaned security, a portion or all of the security is on loan at December 31, 2007.
* Cost for federal income tax purposes is $1,200,173,900
Net unrealized appreciation consists of:
| Gross Unrealized Appreciation | | $ | 223,378,188 | | |
| Gross Unrealized Depreciation | | | (70,756,495 | ) | |
| Net Unrealized Appreciation | | $ | 152,621,693 | | |
See Accompanying Notes to Financial Statements
267
ING T. ROWE PRICE PORTFOLIO OF INVESTMENTS
GROWTH EQUITY PORTFOLIO AS OF DECEMBER 31, 2007
| Shares | | | | | | Value | |
| COMMON STOCK: 97.3% | | | |
| | | | | Aerospace/Defense: 0.9% | |
| | 171,200 | | | | | General Dynamics Corp. | | $ | 15,235,088 | | |
| | | | 15,235,088 | | |
| | | | | Airlines: 0.7% | |
| | 971,200 | | | L | | Southwest Airlines Co. | | | 11,848,640 | | |
| | | | 11,848,640 | | |
| | | | | Banks: 2.7% | |
| | 125,900 | | | @@ | | Erste Bank der
Oesterreichischen
Sparkassen AG | | | 8,889,569 | | |
| | 124,200 | | | | | Northern Trust Corp. | | | 9,511,236 | | |
| | 314,900 | | | | | State Street Corp. | | | 25,569,880 | | |
| | | | 43,970,685 | | |
| | | | | Beverages: 1.3% | |
| | 95,300 | | | @@ | | InBev NV | | | 7,922,383 | | |
| | 170,500 | | | | | PepsiCo, Inc. | | | 12,940,950 | | |
| | | | 20,863,333 | | |
| | | | | Biotechnology: 1.2% | |
| | 75,658 | | | @,L | | Celgene Corp. | | | 3,496,156 | | |
| | 251,800 | | | @ | | Genentech, Inc. | | | 16,888,226 | | |
| | | | 20,384,382 | | |
| | | | | Chemicals: 1.3% | |
| | 136,900 | | | | | Monsanto Co. | | | 15,290,361 | | |
| | 70,800 | | | | | Praxair, Inc. | | | 6,280,668 | | |
| | | | 21,571,029 | | |
| | | | | Commercial Services: 2.5% | |
| | 486,700 | | | @@,L | | Accenture Ltd. | | | 17,535,801 | | |
| | 135,500 | | | | | McKesson Corp. | | | 8,876,605 | | |
| | 400,331 | | | L | | Moody's Corp. | | | 14,291,817 | | |
| | | | 40,704,223 | | |
| | | | | Computers: 3.5% | |
| | 203,900 | | | @ | | Apple, Inc. | | | 40,388,512 | | |
| | 361,400 | | | @ | | Dell, Inc. | | | 8,857,914 | | |
| | 477,100 | | | @,L | | EMC Corp. | | | 8,840,663 | | |
| | | | 58,087,089 | | |
| | | | | Cosmetics/Personal Care: 1.3% | |
| | 285,080 | | | | | Procter & Gamble Co. | | | 20,930,574 | | |
| | | | 20,930,574 | | |
| | | | | Distribution/Wholesale: 0.2% | |
| | 92,200 | | | L | | Fastenal Co. | | | 3,726,724 | | |
| | | | 3,726,724 | | |
| | | | | Diversified Financial Services: 6.1% | |
| | 135,400 | | | | | American Express Co. | | | 7,043,508 | | |
| | 37,100 | | | L | | Blackrock, Inc. | | | 8,043,280 | | |
| | 888,900 | | | @,@@ | | Bovespa Holding SA | | | 17,128,803 | | |
| | 532,900 | | | | | Charles Schwab Corp. | | | 13,615,595 | | |
| | 16,900 | | | L | | CME Group, Inc. | | | 11,593,400 | | |
| | 131,700 | | | L | | Franklin Resources, Inc. | | | 15,070,431 | | |
| | 47,100 | | | | | Goldman Sachs Group, Inc. | | | 10,128,855 | | |
| | 128,720 | | | @@ | | Housing Development
Finance Corp. | | | 9,295,502 | | |
| | 87,900 | | | | | Morgan Stanley | | | 4,668,369 | | |
| | 271,700 | | | @@ | | Redecard SA | | | 4,396,045 | | |
| | | | 100,983,788 | | |
| Shares | | | | | | Value | |
| | | | | Electric: 0.7% | |
| | 549,200 | | | @ | | AES Corp. | | $ | 11,747,388 | | |
| | | | 11,747,388 | | |
| | | | | Electrical Components & Equipment: 0.9% | |
| | 108,600 | | | @@ | | Schneider Electric SA | | | 14,709,210 | | |
| | | | 14,709,210 | | |
| | | | | Electronics: 0.6% | |
| | 765,880 | | | @@ | | HON HAI Precision Industry GDR | | | 9,454,975 | | |
| | | | 9,454,975 | | |
| | | | | Engineering & Construction: 1.5% | |
| | 114,500 | | | @,@@,L | | Foster Wheeler Ltd. | | | 17,749,790 | | |
| | 127,800 | | | @ | | McDermott International, Inc. | | | 7,544,034 | | |
| | | | 25,293,824 | | |
| | | | | Entertainment: 0.7% | |
| | 263,000 | | | | | International Game
Technology | | | 11,553,590 | | |
| | | | 11,553,590 | | |
| | | | | Food: 1.7% | |
| | 76,400 | | | @@ | | Groupe Danone | | | 6,847,258 | | |
| | 354,500 | | | | | Sysco Corp. | | | 11,063,945 | | |
| | 256,200 | | | L | | Whole Foods Market, Inc. | | | 10,452,960 | | |
| | | | 28,364,163 | | |
| | | | | Healthcare-Products: 4.6% | |
| | 68,800 | | | @@ | | Alcon, Inc. | | | 9,841,152 | | |
| | 121,000 | | | | | Becton Dickinson & Co. | | | 10,113,180 | | |
| | 248,550 | | | @@ | | Covidien Ltd. | | | 11,008,280 | | |
| | 410,400 | | | | | Medtronic, Inc. | | | 20,630,808 | | |
| | 169,000 | | | @,L | | St. Jude Medical, Inc. | | | 6,868,160 | | |
| | 134,300 | | | | | Stryker Corp. | | | 10,034,896 | | |
| | 115,800 | | | @ | | Zimmer Holdings, Inc. | | | 7,660,170 | | |
| | | | 76,156,646 | | |
| | | | | Healthcare-Services: 4.5% | |
| | 395,300 | | | | | Aetna, Inc. | | | 22,820,669 | | |
| | 113,600 | | | @ | | Humana, Inc. | | | 8,555,216 | | |
| | 178,900 | | | @,L | | Laboratory Corp. of
America Holdings | | | 13,512,317 | | |
| | 339,100 | | | @ | | WellPoint, Inc. | | | 29,749,243 | | |
| | | | 74,637,445 | | |
| | | | | Home Furnishings: 0.3% | |
| | 74,200 | | | | | Harman International
Industries, Inc. | | | 5,469,282 | | |
| | | | 5,469,282 | | |
| | | | | Household Products/Wares: 0.4% | |
| | 105,770 | | | @@ | | Reckitt Benckiser PLC | | | 6,146,303 | | |
| | | | 6,146,303 | | |
| | | | | Insurance: 1.9% | |
| | 126,700 | | | L | | Assurant, Inc. | | | 8,476,230 | | |
| | 183,700 | | | | | Cigna Corp. | | | 9,870,201 | | |
| | 144,600 | | | | | Prudential Financial, Inc. | | | 13,453,584 | | |
| | | | 31,800,015 | | |
See Accompanying Notes to Financial Statements
268
ING T. ROWE PRICE PORTFOLIO OF INVESTMENTS
GROWTH EQUITY PORTFOLIO AS OF DECEMBER 31, 2007 (CONTINUED)
| Shares | | | | | | Value | |
| | | | | Internet: 6.6% | |
| | 185,300 | | | @,L | | Amazon.com, Inc. | | $ | 17,166,192 | | |
| | 100,000 | | | @@ | | B2W Companhia Global
Do Varejo | | | 3,988,764 | | |
| | 331,240 | | | @,L | | Expedia, Inc. | | | 10,473,809 | | |
| | 74,800 | | | @ | | Google, Inc.-Class A | | | 51,722,704 | | |
| | 524,900 | | | @,L | | VeriSign, Inc. | | | 19,741,489 | | |
| | 228,300 | | | @,L | | Yahoo!, Inc. | | | 5,310,258 | | |
| | | | 108,403,216 | | |
| | | | | Lodging: 1.2% | |
| | 88,600 | | | @,L | | Las Vegas Sands Corp. | | | 9,130,230 | | |
| | 216,500 | | | | | Marriott International, Inc. | | | 7,399,970 | | |
| | 33,300 | | | @ | | MGM Mirage | | | 2,797,866 | | |
| | | | 19,328,066 | | |
| | | | | Machinery-Construction & Mining: 0.3% | |
| | 84,000 | | | | | Joy Global, Inc. | | | 5,528,880 | | |
| | | | 5,528,880 | | |
| | | | | Machinery-Diversified: 0.5% | |
| | 84,000 | | | | | Deere & Co. | | | 7,822,080 | | |
| | | | 7,822,080 | | |
| | | | | Media: 3.8% | |
| | 109,500 | | | @,L | | EchoStar Communications Corp. | | | 4,130,340 | | |
| | 486,700 | | | | | McGraw-Hill Cos., Inc. | | | 21,322,327 | | |
| | 434,500 | | | @@ | | Naspers Ltd. | | | 10,299,297 | | |
| | 397,100 | | | @@,L | | Rogers Communications, Inc. | | | 17,968,775 | | |
| | 337,000 | | | @@ | | Shaw Communications,
Inc.-Class B | | | 7,980,160 | | |
| | | | 61,700,899 | | |
| | | | | Mining: 1.8% | |
| | 540,800 | | | @@ | | BHP Billiton Ltd. | | | 18,905,304 | | |
| | 102,700 | | | | | Freeport-McMoRan
Copper & Gold, Inc. | | | 10,520,588 | | |
| | | | 29,425,892 | | |
| | | | | Miscellaneous Manufacturing: 5.7% | |
| | 369,100 | | | | | Danaher Corp. | | | 32,384,834 | | |
| | 1,668,000 | | | | | General Electric Co. | | | 61,832,760 | | |
| | | | 94,217,594 | | |
| | | | | Oil & Gas: 3.4% | |
| | 129,600 | | | | | EOG Resources, Inc. | | | 11,566,800 | | |
| | 141,338 | | | | | ExxonMobil Corp. | | | 13,241,957 | | |
| | 106,900 | | | L | | Murphy Oil Corp. | | | 9,069,396 | | |
| | 272,415 | | | @@,L | | Total SA | | | 22,556,086 | | |
| | | | 56,434,239 | | |
| | | | | Oil & Gas Services: 3.5% | |
| | 232,200 | | | L | | Baker Hughes, Inc. | | | 18,831,420 | | |
| | 400,100 | | | | | Schlumberger Ltd. | | | 39,357,837 | | |
| | | | 58,189,257 | | |
| | | | | Pharmaceuticals: 4.3% | |
| | 229,800 | | | L | | Allergan, Inc. | | | 14,762,352 | | |
| | 434,200 | | | @ | | Gilead Sciences, Inc. | | | 19,977,542 | | |
| | 120,600 | | | @ | | Medco Health Solutions, Inc. | | | 12,228,840 | | |
| | 137,600 | | | | | Merck & Co., Inc. | | | 7,995,936 | | |
| | 39,239 | | | @@ | | Roche Holding AG | | | 6,783,080 | | |
| | 310,900 | | | | | Schering-Plough Corp. | | | 8,282,376 | | |
| | | | 70,030,126 | | |
| Shares | | | | | | Value | |
| | | | | Real Estate: 0.9% | |
| | 522,000 | | | @@ | | DLF Ltd. | | $ | 14,091,273 | | |
| | | | 14,091,273 | | |
| | | | | Retail: 6.5% | |
| | 190,700 | | | @,L | | Bed Bath & Beyond, Inc. | | | 5,604,673 | | |
| | 236,700 | | | L | | Costco Wholesale Corp. | | | 16,512,192 | | |
| | 963,126 | | | | | CVS Caremark Corp. | | | 38,284,259 | | |
| | 202,700 | | | @ | | Kohl's Corp. | | | 9,283,660 | | |
| | 217,200 | | | @@ | | Lojas Renner SA | | | 4,392,809 | | |
| | 123,084 | | | | | Target Corp. | | | 6,154,200 | | |
| | 307,100 | | | L | | Walgreen Co. | | | 11,694,368 | | |
| | 402,300 | | | | | Yum! Brands, Inc. | | | 15,396,021 | | |
| | | | 107,322,182 | | |
| | | | | Semiconductors: 1.5% | |
| | 332,400 | | | | | Intel Corp. | | | 8,861,784 | | |
| | 809,100 | | | @,@@,L | | Marvell Technology
Group Ltd. | | | 11,311,218 | | |
| | 166,400 | | | | | Maxim Integrated Products | | | 4,406,272 | | |
| | | | 24,579,274 | | |
| | | | | Software: 5.8% | |
| | 383,000 | | | | | Automatic Data
Processing, Inc. | | | 17,054,990 | | |
| | 263,000 | | | @,L | | Electronic Arts, Inc. | | | 15,361,830 | | |
| | 190,129 | | | @@ | | Infosys Technologies Ltd. | | | 8,480,353 | | |
| | 1,243,825 | | | | | Microsoft Corp. | | | 44,280,169 | | |
| | 125,961 | | | @,@@ | | TomTom | | | 9,513,426 | | |
| | | | 94,690,768 | | |
| | | | | Telecommunications: 9.9% | |
| | 299,800 | | | @,@@ | | Amdocs Ltd. | | | 10,334,106 | | |
| | 373,700 | | | @@,L | | America Movil SA de CV ADR | | | 22,941,443 | | |
| | 428,200 | | | @ | | American Tower Corp. | | | 18,241,320 | | |
| | 614,900 | | | @,@@ | | Bharti Airtel Ltd. | | | 15,380,225 | | |
| | 728,600 | | | @ | | Cisco Systems, Inc. | | | 19,723,202 | | |
| | 653,300 | | | | | Corning, Inc. | | | 15,672,667 | | |
| | 488,000 | | | @,L | | Crown Castle
International Corp. | | | 20,300,800 | | |
| | 1,921,647 | | | @,@@ | | Idea Cellular Ltd. | | | 6,719,126 | | |
| | 394,900 | | | @,L | | Juniper Networks, Inc. | | | 13,110,680 | | |
| | 74,300 | | | @,L | | Leap Wireless
International, Inc. | | | 3,465,352 | | |
| | 140,300 | | | @,L | | MetroPCS
Communications, Inc. | | | 2,728,835 | | |
| | 350,600 | | | | | Qualcomm, Inc. | | | 13,796,110 | | |
| | | | 162,413,866 | | |
| | | | | Toys/Games/Hobbies: 1.6% | |
| | 44,900 | | | @@ | | Nintendo Co., Ltd. | | | 26,363,124 | | |
| | | | 26,363,124 | | |
| | | | | Transportation: 0.5% | |
| | 200,600 | | | L | | Expeditors International
Washington, Inc. | | | 8,962,808 | | |
| | | | 8,962,808 | | |
Total Common Stock
(Cost $1,334,188,301) | | | 1,603,141,940 | | |
See Accompanying Notes to Financial Statements
269
ING T. ROWE PRICE PORTFOLIO OF INVESTMENTS
GROWTH EQUITY PORTFOLIO AS OF DECEMBER 31, 2007 (CONTINUED)
| Shares | | | | | | Value | |
| SHORT-TERM INVESTMENTS: 14.6% | |
| | | | | Mutual Fund: 2.1% | |
| | 34,869,725 | | | | | Reserve Investment Fund | | $ | 34,869,724 | | |
Total Mutual Fund
(Cost $34,869,724) | | | 34,869,724 | | |
Principal
Amount | | | | | | Value | |
| | | | | Securities Lending Collateralcc: 12.5% | |
| $ | 205,312,787 | | | | | Bank of New York Mellon Corp.
Institutional Cash Reserves | | | 205,312,787 | | |
Total Securities Lending Collateral
(Cost $205,312,787) | | | 205,312,787 | | |
Total Short-Term Investments
(Cost $240,182,511) | | | 240,182,511 | | |
Total Investments in
Securities
(Cost $1,574,370,812)* | | | 111.9 | % | | $ | 1,843,324,451 | | |
Other Assets and
Liabilities - Net | | | (11.9 | ) | | | (195,897,612 | ) | |
| Net Assets | | | 100.0 | % | | $ | 1,647,426,839 | | |
@ Non-income producing security
@@ Foreign Issuer
ADR American Depositary Receipt
GDR Global Depositary Receipt
cc Securities purchased with cash collateral for securities loaned.
L Loaned security, a portion or all of the security is on loan at December 31, 2007.
* Cost for federal income tax purposes is $1,580,254,960.
Net unrealized appreciation consists of:
| Gross Unrealized Appreciation | | $ | 309,586,512 | | |
| Gross Unrealized Depreciation | | | (46,517,021 | ) | |
| Net Unrealized Appreciation | | $ | 263,069,491 | | |
See Accompanying Notes to Financial Statements
270
PORTFOLIO OF INVESTMENTS
ING TEMPLETON FOREIGN EQUITY PORTFOLIO AS OF DECEMBER 31, 2007
| Shares | | | | | | Value | |
| COMMON STOCK: 72.9% | | | |
| | | | | Australia: 0.7% | |
| | 38,582 | | | | | National Australia Bank Ltd. | | $ | 1,270,872 | | |
| | | | 1,270,872 | | |
| | | | | Austria: 0.8% | |
| | 51,730 | | | | | Telekom Austria AG | | | 1,428,575 | | |
| | | | 1,428,575 | | |
| | | | | Bermuda: 0.2% | |
| | 4,710 | | | | | ACE Ltd. | | | 290,984 | | |
| | | | 290,984 | | |
| | | | | Brazil: 0.8% | |
| | 33,040 | | | | | Empresa Brasileira de
Aeronautica SA ADR | | | 1,506,294 | | |
| | | | 1,506,294 | | |
| | | | | Canada: 0.4% | |
| | 14,000 | | | | | George Weston Ltd. | | | 768,124 | | |
| | | | 768,124 | | |
| | | | | China: 2.5% | |
| | 118,500 | | | | | Byd Co., Ltd. | | | 773,445 | | |
| | 213,000 | | | | | China Shenhua
Energy Co., Ltd. | | | 1,254,735 | | |
| | 1,984,000 | | | | | China Telecom Corp., Ltd. | | | 1,554,786 | | |
| | 976,000 | | | | | Shanghai Electric
Group Co., Ltd. | | | 826,122 | | |
| | | | 4,409,088 | | |
| | | | | Denmark: 0.5% | |
| | 8,830 | | | @ | | Vestas Wind Systems A/S | | | 953,471 | | |
| | | | 953,471 | | |
| | | | | Finland: 0.9% | |
| | 12,920 | | | | | Stora Enso OYJ | | | 194,660 | | |
| | 28,720 | | | | | Stora Enso OYJ
(Euro Denominated Security) | | | 428,729 | | |
| | 47,490 | | | | | UPM-Kymmene OYJ | | | 960,941 | | |
| | | | 1,584,330 | | |
| | | | | France: 8.1% | |
| | 6,070 | | | | | Accor SA | | | 485,241 | | |
| | 40,811 | | | | | AXA SA | | | 1,627,093 | | |
| | 14,300 | | | | | Compagnie Generale des
Etablissements Michelin | | | 1,634,898 | | |
| | 13,740 | | | | | Electricite de France | | | 1,636,605 | | |
| | 65,940 | | | | | France Telecom SA | | | 2,365,319 | | |
| | 25,020 | | | | | Sanofi-Aventis | | | 2,290,341 | | |
| | 14,280 | | | | | Suez SA | | | 971,983 | | |
| | 65,820 | | | @ | | Thomson | | | 930,683 | | |
| | 19,660 | | | | | Total SA | | | 1,627,857 | | |
| | 21,660 | | | | | Vivendi | | | 994,477 | | |
| | | | 14,564,497 | | |
| | | | | Germany: 7.6% | |
| | 1,060 | | | | | BASF AG | | | 156,957 | | |
| | 31,290 | | | | | Bayerische Motoren Werke AG | | | 1,958,799 | | |
| | 24,040 | | | | | Celesio AG | | | 1,485,879 | | |
| | 58,010 | | | | | Deutsche Post AG | | | 1,974,930 | | |
| | 9,760 | | | | | E.ON AG | | | 2,075,194 | | |
| | 106,970 | | | @ | | Infineon Technologies AG | | | 1,268,784 | | |
| | 6,473 | | | | | Merck KGaA | | | 845,386 | | |
| Shares | | | | | | Value | |
| | 4,460 | | | | | Muenchener
Rueckversicherungs AG | | $ | 865,585 | | |
| | 13,270 | | | | | Siemens AG | | | 2,101,435 | | |
| | 5,580 | | | | | Siemens AG ADR | | | 878,069 | | |
| | | | 13,611,018 | | |
| | | | | Hong Kong: 1.2% | |
| | 63,400 | | | | | Cheung Kong
Holdings Ltd. ADR | | | 1,172,475 | | |
| | 60,000 | | | | | Hutchison Whampoa Ltd. | | | 675,918 | | |
| | 22,000 | | | | | Swire Pacific Ltd. | | | 301,469 | | |
| | | | 2,149,862 | | |
| | | | | India: 2.5% | |
| | 32,722 | | | | | Housing Development
Finance Corp. | | | 2,363,016 | | |
| | 35,470 | | | | | ICICI Bank Ltd. ADR | | | 2,181,405 | | |
| | | | 4,544,421 | | |
| | | | | Israel: 0.6% | |
| | 45,210 | | | @ | | Check Point
Software Technologies | | | 992,812 | | |
| | | | 992,812 | | |
| | | | | Italy: 3.0% | |
| | 41,863 | | | | | ENI S.p.A. | | | 1,527,849 | | |
| | 153,957 | | | | | Intesa Sanpaolo S.p.A. | | | 1,211,576 | | |
| | 113,129 | | | | | Mediaset S.p.A. | | | 1,139,656 | | |
| | 172,208 | | | | | UniCredito Italiano S.p.A. | | | 1,416,481 | | |
| | | | 5,295,562 | | |
| | | | | Japan: 3.3% | |
| | 23,600 | | | | | Fuji Photo Film Co., Ltd. | | | 987,790 | | |
| | 22,000 | | | | | Hitachi Ltd. | | | 163,446 | | |
| | 22,500 | | | | | Konica Minolta Holdings, Inc. | | | 394,448 | | |
| | 65,100 | | | | | Mitsubishi UFJ
Financial Group, Inc. | | | 613,888 | | |
| | 49,000 | | | | | NGK Spark Plug Co., Ltd. | | | 849,636 | | |
| | 1,700 | | | | | Nintendo Co., Ltd. | | | 998,158 | | |
| | 25,300 | | | | | Sony Corp. | | | 1,378,417 | | |
| | 8,900 | | | | | Takeda
Pharmaceutical Co., Ltd. | | | 519,946 | | |
| | | | 5,905,729 | | |
| | | | | Mexico: 0.4% | |
| | 17,120 | | | | | Telefonos de Mexico
SA de CV ADR | | | 630,701 | | |
| | | | 630,701 | | |
| | | | | Netherlands: 4.7% | |
| | 43,990 | | | | | Koninklijke Philips
Electronics NV | | | 1,884,983 | | |
| | 65,290 | | | | | Reed Elsevier NV | | | 1,295,705 | | |
| | 47,580 | | | | | Royal Dutch Shell PLC-Class B | | | 1,983,407 | | |
| | 16,290 | | | | | SBM Offshore NV | | | 513,591 | | |
| | 50,700 | | | | | Unilever NV | | | 1,862,758 | | |
| | 32,250 | | | | | Vedior NV | | | 820,847 | | |
| | | | 8,361,291 | | |
| | | | | Norway: 1.3% | |
| | 100,690 | | | @ | | Telenor ASA | | | 2,389,263 | | |
| | | | 2,389,263 | | |
See Accompanying Notes to Financial Statements
271
PORTFOLIO OF INVESTMENTS
ING TEMPLETON FOREIGN EQUITY PORTFOLIO AS OF DECEMBER 31, 2007 (CONTINUED)
| Shares | | | | | | Value | |
| | | | | Portugal: 0.9% | |
| | 110,990 | | | | | Portugal Telecom SGPS SA | | $ | 1,455,757 | | |
| | 10,942 | | | | | PT Multimedia Servicos de
Telecomunicacoes e
Multimedia SGPS SA | | | 152,446 | | |
| | | | 1,608,203 | | |
| | | | | Singapore: 2.0% | |
| | 109,000 | | | | | DBS Group Holdings Ltd. | | | 1,547,035 | | |
| | 92,730 | | | @ | | Flextronics International Ltd. | | | 1,118,324 | | |
| | 345,000 | | | | | Singapore
Telecommunications Ltd. | | | 949,188 | | |
| | | | 3,614,547 | | |
| | | | | South Korea: 3.4% | |
| | 19,280 | | | | | Kookmin Bank ADR | | | 1,413,610 | | |
| | 38,270 | | | | | Korea Electric Power Corp. ADR | | | 797,930 | | |
| | 10,963 | | | | | LG Electronics, Inc. | | | 1,158,193 | | |
| | 6,610 | | | # | | Samsung Electronics GDR | | | 1,963,122 | | |
| | 22,090 | | | | | SK Telecom Co., Ltd. ADR | | | 659,166 | | |
| | | | 5,992,021 | | |
| | | | | Spain: 3.3% | |
| | 62,521 | | | | | Banco Santander
Central Hispano SA | | | 1,350,328 | | |
| | 41,097 | | | | | Repsol YPF SA | | | 1,466,062 | | |
| | 93,120 | | | | | Telefonica SA | | | 3,018,609 | | |
| | | | 5,834,999 | | |
| | | | | Sweden: 1.7% | |
| | 100,260 | | | | | Atlas Copco AB | | | 1,490,196 | | |
| | 55,480 | | | | | Nordea Bank AB | | | 926,946 | | |
| | 31,080 | | | | | Securitas AB | | | 432,242 | | |
| | 14,170 | | | @ | | Securitas Direct AB | | | 57,106 | | |
| | 27,830 | | | | | Securitas Systems AB | | | 98,313 | | |
| | | | 3,004,803 | | |
| | | | | Switzerland: 5.0% | |
| | 18,830 | | | | | Adecco SA | | | 1,012,206 | | |
| | 11,550 | | | | | Lonza Group AG | | | 1,396,869 | | |
| | 3,950 | | | | | Nestle SA | | | 1,813,802 | | |
| | 44,740 | | | | | Novartis AG | | | 2,446,711 | | |
| | 18,101 | | | | | Swiss Reinsurance | | | 1,280,544 | | |
| | 20,530 | | | | | UBS AG-Reg | | | 946,591 | | |
| | | | 8,896,723 | | |
| | | | | Taiwan: 0.7% | |
| | 1,177,000 | | | @ | | Chinatrust Financial
Holding Co., Ltd. | | | 830,457 | | |
| | 77,293 | | | # | | Compal Electronics, Inc. GDR | | | 422,994 | | |
| | | | 1,253,451 | | |
| | | | | United Kingdom: 15.9% | |
| | 120,910 | | | | | Aviva PLC | | | 1,611,423 | | |
| | 199,260 | | | | | BAE Systems PLC | | | 1,977,438 | | |
| | 157,100 | | | | | BP PLC | | | 1,919,802 | | |
| | 97,330 | | | | | British Sky Broadcasting PLC | | | 1,197,237 | | |
| | 77,150 | | | | | Burberry Group PLC | | | 871,984 | | |
| | 135,200 | | | | | Cadbury Schweppes PLC | | | 1,653,076 | | |
| | 258,470 | | | | | Compass Group PLC | | | 1,577,175 | | |
| | 78,410 | | | | | GlaxoSmithKline PLC | | | 1,991,346 | | |
| | 253,450 | | | | | Group 4 Securicor PLC | | | 1,238,907 | | |
| | 84,400 | | | | | HSBC Holdings PLC | | | 1,419,116 | | |
| | 195,570 | | | | | Kingfisher PLC | | | 560,809 | | |
| Shares | | | | | | Value | |
| | 70,500 | | | | | Lloyds TSB Group PLC | | $ | 663,878 | | |
| | 35,330 | | | | | National Grid PLC | | | 585,938 | | |
| | 380,120 | | | | | Old Mutual PLC | | | 1,266,463 | | |
| | 71,550 | | | | | Pearson PLC | | | 1,036,179 | | |
| | 55,190 | | | | | Rexam PLC | | | 459,526 | | |
| | 115,390 | | | @ | | Rolls-Royce Group PLC | | | 1,252,446 | | |
| | 3,844,868 | | | @ | | Rolls-Royce Group
PLC-B Shares | | | 8,419 | | |
| | 228,200 | | | | | Royal Bank of Scotland
Group PLC | | | 2,014,886 | | |
| | 33,543 | | | | | Smiths Group PLC | | | 672,963 | | |
| | 40,160 | | | | | Standard Chartered PLC | | | 1,465,707 | | |
| | 589,166 | | | | | Vodafone Group PLC | | | 2,211,683 | | |
| | 105,950 | | | | | Yell Group PLC | | | 844,359 | | |
| | | | 28,500,760 | | |
| | | | | United States: 0.5% | |
| | 27,260 | | | | | Invesco Ltd. | | | 855,419 | | |
| | | | 855,419 | | |
Total Common Stock
(Cost $116,696,709) | | | 130,217,820 | | |
Principal
Amount | | | | | | Value | |
| SHORT-TERM INVESTMENTS: 28.3% | | | |
| | | | | U.S. Government Agency Obligations: 28.3% | |
| $ | 50,647,000 | | | Z | | Federal Home Loan Bank,
3.050%, due 01/02/08 | | | 50,637,855 | | |
Total Short-Term Investments
(Cost $50,637,855) | | | 50,637,855 | | |
Total Investments in
Securities (Cost
$167,334,564)* | | | 101.2 | % | | $ | 180,855,675 | | |
Other Assets and
Liabilities - Net | | | (1.2 | ) | | | (2,192,237 | ) | |
| Net Assets | | | 100.0 | % | | $ | 178,663,438 | | |
@ Non-income producing security
ADR American Depositary Receipt
GDR Global Depositary Receipt
# Securities with purchases pursuant to Rule144A or section 4(2), under the Securities Act of 1933 and may not be resold subject to that rule except to qualified institutional buyers. Unless otherwise noted, these securities have been determined to be liquid under the guidelines established by the Funds' Board of Directors/Trustees.
Z Indicates Zero Coupon Bond; rate shown reflects current effective yield.
* Cost for federal income tax purposes is $168,422,594.
| Net unrealized appreciation consists of: | |
| Gross Unrealized Appreciation | | $ | 16,286,423 | | |
| Gross Unrealized Depreciation | | | (3,853,342 | ) | |
| Net Unrealized Appreciation | | $ | 12,433,081 | | |
See Accompanying Notes to Financial Statements
272
PORTFOLIO OF INVESTMENTS
ING TEMPLETON FOREIGN EQUITY PORTFOLIO AS OF DECEMBER 31, 2007 (CONTINUED)
| Industry | | Percentage of
Net Assets | |
| Aerospace/Defense | | | 2.6 | % | |
| Apparel | | | 0.5 | | |
| Auto Manufacturers | | | 1.1 | | |
| Auto Parts & Equipment | | | 1.4 | | |
| Banks | | | 9.8 | | |
| Chemicals | | | 0.9 | | |
| Coal | | | 0.7 | | |
| Commercial Services | | | 2.0 | | |
| Computers | | | 0.2 | | |
| Diversified Financial Services | | | 2.8 | | |
| Electric | | | 3.4 | | |
| Electrical Components & Equipment | | | 1.7 | | |
| Electronics | | | 1.7 | | |
| Food | | | 3.4 | | |
| Food Service | | | 0.9 | | |
| Forest Products & Paper | | | 0.9 | | |
| Holding Companies - Diversified | | | 0.5 | | |
| Home Furnishings | | | 1.3 | | |
| Insurance | | | 3.9 | | |
| Internet | | | 0.5 | | |
| Lodging | | | 0.3 | | |
| Machinery-Construction & Mining | | | 0.8 | | |
| Machinery - Diversified | | | 0.5 | | |
| Media | | | 3.7 | | |
| Miscellaneous Manufacturing | | | 2.8 | | |
| Oil & Gas | | | 4.8 | | |
| Oil & Gas Services | | | 0.3 | | |
| Packaging & Containers | | | 0.3 | | |
| Pharmaceuticals | | | 5.4 | | |
| Real Estate | | | 0.7 | | |
| Retail | | | 0.3 | | |
| Semiconductors | | | 1.8 | | |
| Telecommunications | | | 9.3 | | |
| Toys/Games/Hobbies | | | 0.6 | | |
| Transportation | | | 1.1 | | |
| Short-Term Investments | | | 28.3 | | |
| Other Assets and Liabilities - Net | | | (1.2 | ) | |
| Net Assets | | | 100.0 | % | |
See Accompanying Notes to Financial Statements
273
PORTFOLIO OF INVESTMENTS
ING THORNBURG VALUE PORTFOLIO AS OF DECEMBER 31, 2007
| Shares | | | | | | Value | |
| COMMON STOCK: 97.1% | | | |
| | | | | Airlines: 0.8% | |
| | 336,600 | | | @,L | | JetBlue Airways Corp. | | $ | 1,985,940 | | |
| | | | 1,985,940 | | |
| | | | | Banks: 1.9% | |
| | 117,430 | | | L | | Wachovia Corp. | | | 4,465,863 | | |
| | | | 4,465,863 | | |
| | | | | Biotechnology: 2.7% | |
| | 95,600 | | | @ | | Genentech, Inc. | | | 6,411,892 | | |
| | | | 6,411,892 | | |
| | | | | Chemicals: 3.1% | |
| | 73,115 | | | | | Air Products &
Chemicals, Inc. | | | 7,211,332 | | |
| | | | 7,211,332 | | |
| | | | | Commercial Services: 2.3% | |
| | 337,950 | | | @,L | | Hertz Global
Holdings, Inc. | | | 5,370,026 | | |
| | | | 5,370,026 | | |
| | | | | Computers: 2.0% | |
| | 192,700 | | | @ | | Dell, Inc. | | | 4,723,077 | | |
| | 64,800 | | | X | | Seagate
Technology, Inc.-Escrow | | | 1 | | |
| | | | 4,723,078 | | |
| | | | | Diversified Financial Services: 7.2% | |
| | 7,395 | | | | | CME Group, Inc. | | | 5,072,970 | | |
| | 148,690 | | | L | | Freddie Mac | | | 5,065,868 | | |
| | 144,200 | | | @@ | | UBS AG-New | | | 6,633,200 | | |
| | | | 16,772,038 | | |
| | | | | Electric: 3.5% | |
| | 68,900 | | | | | Entergy Corp. | | | 8,234,928 | | |
| | | | 8,234,928 | | |
| | | | | Food: 2.4% | |
| | 173,300 | | | | | Kraft Foods, Inc. | | | 5,654,779 | | |
| | | | 5,654,779 | | |
| | | | | Healthcare-Products: 2.5% | |
| | 111,700 | | | @,L | | Varian Medical Systems, Inc. | | | 5,826,272 | | |
| | | | 5,826,272 | | |
| | | | | Healthcare-Services: 3.1% | |
| | 81,857 | | | @ | | WellPoint, Inc. | | | 7,181,315 | | |
| | | | 7,181,315 | | |
| | | | | Insurance: 5.4% | |
| | 132,100 | | | | | Allstate Corp. | | | 6,899,583 | | |
| | 99,500 | | | | | American
International Group, Inc. | | | 5,800,850 | | |
| | | | 12,700,433 | | |
| | | | | Internet: 2.6% | |
| | 8,835 | | | @ | | Google, Inc.-Class A | | | 6,109,226 | | |
| | | | 6,109,226 | | |
| | | | | Lodging: 1.6% | |
| | 37,262 | | | @,L | | Las Vegas Sands Corp. | | | 3,839,849 | | |
| | | | 3,839,849 | | |
| Shares | | | | | | Value | |
| | | | | Media: 6.3% | |
| | 427,000 | | | @,L | | Comcast Corp.-Special Class A | | $ | 7,737,240 | | |
| | 301,800 | | | @ | | DIRECTV Group, Inc. | | | 6,977,616 | | |
| | | | 14,714,856 | | |
| | | | | Mining: 2.2% | |
| | 50,281 | | | | | Freeport-McMoRan
Copper & Gold, Inc. | | | 5,150,786 | | |
| | | | 5,150,786 | | |
| | | | | | | Miscellaneous
Manufacturing: 2.7% | | | | | |
| | 167,900 | | | | | General Electric Co. | | | 6,224,053 | | |
| | | | 6,224,053 | | |
| | | | | Oil & Gas: 9.7% | |
| | 86,300 | | | | | Apache Corp. | | | 9,280,702 | | |
| | 85,200 | | | | | ConocoPhillips | | | 7,523,160 | | |
| | 107,100 | | | @@ | | OAO Gazprom ADR | | | 6,051,886 | | |
| | | | 22,855,748 | | |
| | | | | Pharmaceuticals: 6.0% | |
| | 105,100 | | | @ | | Gilead Sciences, Inc. | | | 4,835,651 | | |
| | 23,300 | | | @@ | | Roche Holding AG | | | 4,027,773 | | |
| | 110,200 | | | @@ | | Teva Pharmaceutical
Industries Ltd. ADR | | | 5,122,096 | | |
| | | | 13,985,520 | | |
| | | | | Retail: 5.6% | |
| | 67,000 | | | L | | Nordstrom, Inc. | | | 2,460,910 | | |
| | 265,975 | | | @ | | Office Depot, Inc. | | | 3,699,712 | | |
| | 1,646,100 | | | @,L | | Rite Aid Corp. | | | 4,592,619 | | |
| | 101,700 | | | | | Staples, Inc. | | | 2,346,219 | | |
| | | | 13,099,460 | | |
| | | | | Semiconductors: 4.3% | |
| | 284,600 | | | | | Intel Corp. | | | 7,587,436 | | |
| | 281,825 | | | @,L | | ON Semiconductor Corp. | | | 2,502,606 | | |
| | | | 10,090,042 | | |
| | | | | Software: 4.2% | |
| | 125,779 | | | @,L | | Eclipsys Corp. | | | 3,183,466 | | |
| | 187,800 | | | | | Microsoft Corp. | | | 6,685,680 | | |
| | | | 9,869,146 | | |
| | | | | Telecommunications: 15.0% | |
| | 164,000 | | | | | AT&T, Inc. | | | 6,815,840 | | |
| | 133,300 | | | @@ | | China Mobile Ltd. | | | 2,321,353 | | |
| | 230,705 | | | @@ | | Chunghwa
Telecom Ltd. ADR | | | 4,870,192 | | |
| | 255,489 | | | | | Corning, Inc. | | | 6,129,181 | | |
| | 132,450 | | | @,L | | Crown Castle
International Corp. | | | 5,509,920 | | |
| | 870,900 | | | @,L | | Level 3 Communications, Inc. | | | 2,647,536 | | |
| | 421,400 | | | | | Motorola, Inc. | | | 6,759,256 | | |
| | | | 35,053,278 | | |
Total Common Stock
(Cost $217,866,565) | | | 227,529,860 | | |
See Accompanying Notes to Financial Statements
274
PORTFOLIO OF INVESTMENTS
ING THORNBURG VALUE PORTFOLIO AS OF DECEMBER 31, 2007 (CONTINUED)
Principal
Amount | | | | | | Value | |
| SHORT-TERM INVESTMENTS: 31.9% | |
| | | | | U.S. Government Agency Obligations: 13.6% | |
| $ | 31,753,000 | | | Z | | Federal Home Loan Bank,
3.050%, due 01/02/08 | | $ | 31,747,620 | | |
Total U.S. Government
Agency Obligations
(Cost $31,747,620) | | | 31,747,620 | | |
| | | | | Securities Lending Collateralcc: 18.3% | |
| | 42,944,370 | | | | | Bank of New York
Mellon Corp. Institutional
Cash Reserves | | | 42,944,370 | | |
Total Securities Lending
Collateral
(Cost $42,944,370) | | | 42,944,370 | | |
Total Short-Term Investments
(Cost $74,691,990) | | | 74,691,990 | | |
Total Investments in
Securities (Cost
$292,558,555)* | | | 129.0 | % | | $ | 302,221,850 | | |
Other Assets and
Liabilities - Net | | | (29.0 | ) | | | (67,899,020 | ) | |
| Net Assets | | | 100.0 | % | | $ | 234,322,830 | | |
@ Non-income producing security
@@ Foreign Issuer
ADR American Depositary Receipt
cc Securities purchased with cash collateral for securities loaned.
L Loaned security, a portion or all of the security is on loan at December 31, 2007.
X Fair Value determined by ING Funds Valuation Committee appointed by the Funds' Board of Directors/Trustees.
Z Indicates Zero Coupon Bond; rate shown reflects current effective yield.
* Cost for federal income tax purposes is $294,784,722.
| Net unrealized appreciation consists of: | |
| Gross Unrealized Appreciation | | $ | 21,884,808 | | |
| Gross Unrealized Depreciation | | | (14,447,680 | ) | |
| Net Unrealized Appreciation | | $ | 7,437,128 | | |
See Accompanying Notes to Financial Statements
275
PORTFOLIO OF INVESTMENTS
ING UBS U.S. LARGE CAP EQUITY PORTFOLIO AS OF DECEMBER 31, 2007
| Shares | | | | | | Value | |
| COMMON STOCK: 97.2% | | | |
| | | | | Advertising: 2.4% | |
| | 321,200 | | | @,L | | Interpublic
Group of Cos., Inc. | | $ | 2,604,932 | | |
| | 99,000 | | | L | | Omnicom Group | | | 4,705,470 | | |
| | 79,486 | | | @,L | | R.H. Donnelley Corp. | | | 2,899,649 | | |
| | | | 10,210,051 | | |
| | | | | Auto Manufacturers: 1.2% | |
| | 91,850 | | | L | | Paccar, Inc. | | | 5,003,988 | | |
| | | | 5,003,988 | | |
| | | | | Auto Parts & Equipment: 3.2% | |
| | 129,600 | | | L | | BorgWarner, Inc. | | | 6,273,936 | | |
| | 199,100 | | | | | Johnson Controls, Inc. | | | 7,175,564 | | |
| | | | 13,449,500 | | |
| | | | | Banks: 7.4% | |
| | 183,192 | | | | | Bank of New York
Mellon Corp. | | | 8,932,442 | | |
| | 27,700 | | | L | | City National Corp. | | | 1,649,535 | | |
| | 218,400 | | | | | Fifth Third Bancorp. | | | 5,488,392 | | |
| | 48,500 | | | | | PNC Financial
Services Group, Inc. | | | 3,184,025 | | |
| | 397,800 | | | | | Wells Fargo & Co. | | | 12,009,582 | | |
| | | | 31,263,976 | | |
| | | | | Beverages: 1.6% | |
| | 61,400 | | | | | Anheuser-Busch Cos., Inc. | | | 3,213,676 | | |
| | 148,700 | | | @,L | | Constellation Brands, Inc. | | | 3,515,268 | | |
| | | | 6,728,944 | | |
| | | | | Biotechnology: 2.6% | |
| | 28,100 | | | @ | | Amgen, Inc. | | | 1,304,964 | | |
| | 112,900 | | | @,L | | Genzyme Corp. | | | 8,404,276 | | |
| | 17,300 | | | @,L | | Millipore Corp. | | | 1,266,014 | | |
| | | | 10,975,254 | | |
| | | | | Building Materials: 1.6% | |
| | 311,300 | | | | | Masco Corp. | | | 6,727,193 | | |
| | | | 6,727,193 | | |
| | | | | Coal: 2.0% | |
| | 6,330 | | | @,L | | Patriot Coal Corp. | | | 264,214 | | |
| | 133,100 | | | L | | Peabody Energy Corp. | | | 8,204,284 | | |
| | | | 8,468,498 | | |
| | | | | Commercial Services: 0.4% | |
| | 43,300 | | | | | Pharmaceutical
Product Development, Inc. | | | 1,748,021 | | |
| | | | 1,748,021 | | |
| | | | | Computers: 1.8% | |
| | 161,100 | | | @ | | Dell, Inc. | | | 3,948,561 | | |
| | 41,500 | | | @,L | | Lexmark International, Inc. | | | 1,446,690 | | |
| | 92,400 | | | @,L | | Network Appliance, Inc. | | | 2,306,304 | | |
| | 71,600 | | | X | | Seagate
Technology, Inc.-Escrow | | | 1 | | |
| | | | 7,701,556 | | |
| | | | | Diversified Financial Services: 8.6% | |
| | 47,461 | | | L | | Blackstone Group LP | | | 1,050,312 | | |
| | 382,366 | | | | | Citigroup, Inc. | | | 11,256,855 | | |
| Shares | | | | | | Value | |
| | 171,400 | | | | | Discover Financial Services | | $ | 2,584,712 | | |
| | 153,900 | | | L | | Freddie Mac | | | 5,243,373 | | |
| | 111,100 | | | | | JPMorgan Chase & Co. | | | 4,849,515 | | |
| | 208,800 | | | | | Morgan Stanley | | | 11,089,368 | | |
| | | | 36,074,135 | | |
| | | | | Electric: 5.0% | |
| | 87,500 | | | | | American Electric Power Co., Inc. | | | 4,074,000 | | |
| | 177,600 | | | | | Exelon Corp. | | | 14,499,264 | | |
| | 10,500 | | | | | Northeast Utilities | | | 328,755 | | |
| | 68,400 | | | L | | Pepco Holdings, Inc. | | | 2,006,172 | | |
| | | | 20,908,191 | | |
| | | | | Food: 1.2% | |
| | 162,800 | | | | | Sysco Corp. | | | 5,080,988 | | |
| | | | 5,080,988 | | |
| | | | | Gas: 1.7% | |
| | 104,400 | | | | | NiSource, Inc. | | | 1,972,116 | | |
| | 83,100 | | | | | Sempra Energy | | | 5,142,228 | | |
| | | | 7,114,344 | | |
| | | | | Healthcare-Products: 3.3% | |
| | 117,914 | | | | | Johnson & Johnson | | | 7,864,864 | | |
| | 120,300 | | | | | Medtronic, Inc. | | | 6,047,481 | | |
| | | | 13,912,345 | | |
| | | | | Healthcare-Services: 1.2% | |
| | 24,300 | | | @ | | DaVita, Inc. | | | 1,369,305 | | |
| | 61,000 | | | | | UnitedHealth Group, Inc. | | | 3,550,200 | | |
| | | | 4,919,505 | | |
| | | | | Household Products/Wares: 0.8% | |
| | 49,300 | | | | | Fortune Brands, Inc. | | | 3,567,348 | | |
| | | | 3,567,348 | | |
| | | | | Insurance: 2.8% | |
| | 103,100 | | | | | Aflac, Inc. | | | 6,457,153 | | |
| | 47,300 | | | | | Hartford Financial
Services Group, Inc. | | | 4,124,087 | | |
| | 14,600 | | | | | Principal Financial Group, Inc. | | | 1,005,064 | | |
| | | | 11,586,304 | | |
| | | | | Internet: 1.6% | |
| | 404,504 | | | @,L | | Symantec Corp. | | | 6,528,695 | | |
| | | | 6,528,695 | | |
| | | | | Leisure Time: 2.6% | |
| | 143,200 | | | | | Carnival Corp. | | | 6,370,968 | | |
| | 42,700 | | | L | | Harley-Davidson, Inc. | | | 1,994,517 | | |
| | 57,600 | | | L | | Royal Caribbean Cruises Ltd. | | | 2,444,544 | | |
| | | | 10,810,029 | | |
| | | | | Media: 3.2% | |
| | 194,000 | | | @,L | | Comcast Corp.-Class A | | | 3,542,440 | | |
| | 43,300 | | | | | McGraw-Hill Cos., Inc. | | | 1,896,973 | | |
| | 200,900 | | | | | News Corp.-Class A | | | 4,116,441 | | |
| | 91,000 | | | @,L | | Viacom-Class B | | | 3,996,720 | | |
| | | | 13,552,574 | | |
| | | | | | | Miscellaneous
Manufacturing: 5.4% | | | | | |
| | 371,900 | | | | | General Electric Co. | | | 13,786,333 | | |
| | 164,000 | | | | | Illinois Tool Works, Inc. | | | 8,780,560 | | |
| | | | 22,566,893 | | |
See Accompanying Notes to Financial Statements
276
PORTFOLIO OF INVESTMENTS
ING UBS U.S. LARGE CAP EQUITY PORTFOLIO AS OF DECEMBER 31, 2007 (CONTINUED)
| Shares | | | | | | Value | |
| | | | | Oil & Gas: 4.2% | |
| | 35,400 | | | | | Chevron Corp. | | $ | 3,303,882 | | |
| | 57,500 | | | L | | ENSCO International, Inc. | | | 3,428,150 | | |
| | 72,800 | | | | | EOG Resources, Inc. | | | 6,497,400 | | |
| | 47,072 | | | | | ExxonMobil Corp. | | | 4,410,176 | | |
| | | | 17,639,608 | | |
| | | | | Oil & Gas Services: 2.1% | |
| | 230,500 | | | L | | Halliburton Co. | | | 8,738,255 | | |
| | | | 8,738,255 | | |
| | | | | Pharmaceuticals: 9.5% | |
| | 147,000 | | | L | | Allergan, Inc. | | | 9,443,280 | | |
| | 102,400 | | | | | Bristol-Myers Squibb Co. | | | 2,715,648 | | |
| | 24,500 | | | @,L | | Cephalon, Inc. | | | 1,758,120 | | |
| | 50,600 | | | @ | | Medco Health Solutions, Inc. | | | 5,130,840 | | |
| | 154,617 | | | | | Merck & Co., Inc. | | | 8,984,794 | | |
| | 86,600 | | | | | Schering-Plough Corp. | | | 2,307,024 | | |
| | 222,300 | | | | | Wyeth | | | 9,823,437 | | |
| | | | 40,163,143 | | |
| | | | | Retail: 2.6% | |
| | 125,400 | | | @,L | | Chico's FAS, Inc. | | | 1,132,362 | | |
| | 71,000 | | | @ | | Coach, Inc. | | | 2,171,180 | | |
| | 59,300 | | | | | Costco Wholesale Corp. | | | 4,136,768 | | |
| | 70,400 | | | | | Target Corp. | | | 3,520,000 | | |
| | | | 10,960,310 | | |
| | | | | Semiconductors: 6.3% | |
| | 211,600 | | | | | Analog Devices, Inc. | | | 6,707,720 | | |
| | 489,900 | | | | | Intel Corp. | | | 13,060,732 | | |
| | 96,400 | | | L | | Linear Technology Corp. | | | 3,068,412 | | |
| | 168,200 | | | L | | Xilinx, Inc. | | | 3,678,534 | | |
| | | | 26,515,398 | | |
| | | | | Software: 3.5% | |
| | 102,900 | | | @,L | | Intuit, Inc. | | | 3,252,669 | | |
| | 289,800 | | | | | Microsoft Corp. | | | 10,316,880 | | |
| | 62,600 | | | @,L | | Red Hat, Inc. | | | 1,304,584 | | |
| | | | 14,874,133 | | |
| | | | | Telecommunications: 3.2% | |
| | 157,867 | | | | | AT&T, Inc. | | | 6,560,953 | | |
| | 514,589 | | | | | Sprint Nextel Corp. | | | 6,756,554 | | |
| | | | 13,317,507 | | |
| | | | | | | Transportation: | | | 4.2 | % | |
| | 103,000 | | | | | Burlington Northern
Santa Fe Corp. | | | 8,572,690 | | |
| | 73,900 | | | L | | FedEx Corp. | | | 6,589,663 | | |
| | 56,300 | | | L | | Ryder System, Inc. | | | 2,646,663 | | |
| | | | 17,809,016 | | |
Total Common Stock
(Cost $385,948,961) | | | 408,915,702 | | |
| EXCHANGE-TRADED FUNDS: 1.0% | | | |
| | | | | Exchange-Traded Funds: 1.0% | |
| | 28,700 | | | L | | SPDR Trust Series 1 | | | 4,196,227 | | |
Total Exchange-Traded Funds
(Cost $4,285,467) | | | 4,196,227 | | |
Total Long-Term Investments
(Cost $390,234,428) | | | 413,111,929 | | |
Principal
Amount | | | | | | Value | |
| SHORT-TERM INVESTMENTS: 17.7% | |
| | | | | U.S. Government Agency Obligations: 1.7% | |
| $ | 7,283,000 | | | Z | | Federal Home Loan Bank,
3.050%, due 01/02/08 | | $ | 7,281,766 | | |
Total U.S. Government
Agency Obligations
(Cost $7,281,766) | | | 7,281,766 | | |
| | | | | Securities Lending Collateralcc: 16.0% | |
| | 67,276,811 | | | | | Bank of New York Mellon Corp.
Institutional Cash Reserves | | | 67,276,811 | | |
Total Securities Lending
Collateral
(Cost $67,276,811) | | | 67,276,811 | | |
Total Short-Term Investments
(Cost $74,558,577) | | | 74,558,577 | | |
Total Investments in
Securities (Cost
$464,793,005)* | | | 115.9 | % | | $ | 487,670,506 | | |
Other Assets and
Liabilities - Net | | | (15.9 | ) | | | (66,789,677 | ) | |
| Net Assets | | | 100.0 | % | | $ | 420,880,829 | | |
@ Non-income producing security
cc Securities purchased with cash collateral for securities loaned.
L Loaned security, a portion or all of the security is on loan at December 31, 2007.
Z Indicates Zero Coupon Bond; rate shown reflects current effective yield.
X Fair Value determined by ING Funds Valuation Committee appointed by the Funds' Board of Directors/Trustees.
* Cost for federal income tax purposes is $465,939,303
| Net unrealized appreciation consists of: | |
| Gross Unrealized Appreciation | | $ | 52,914,540 | | |
| Gross Unrealized Depreciation | | | (31,183,337 | ) | |
| Net Unrealized Appreciation | | $ | 21,731,203 | | |
See Accompanying Notes to Financial Statements
277
PORTFOLIO OF INVESTMENTS
ING UBS U.S. SMALL CAP GROWTH PORTFOLIO AS OF DECEMBER 31, 2007
| Shares | | | | | | Value | |
| COMMON STOCK: 92.2% | | | |
| | | | | Aerospace/Defense: 2.3% | |
| | 17,000 | | | @,L | | AAR Corp. | | $ | 646,510 | | |
| | 3,200 | | | L | | DRS Technologies, Inc. | | | 173,664 | | |
| | | | 820,174 | | |
| | | | | Banks: 1.0% | |
| | 26,000 | | | | | UCBH Holdings, Inc. | | | 368,160 | | |
| | | | 368,160 | | |
| | | | | Biotechnology: 5.7% | |
| | 3,400 | | | @ | | AMAG Pharmaceuticals, Inc. | | | 204,442 | | |
| | 8,100 | | | @,L | | Genomic Health, Inc. | | | 183,384 | | |
| | 9,800 | | | @,L | | Integra LifeSciences
Holdings Corp. | | | 410,914 | | |
| | 13,500 | | | @,L | | Lifecell Corp. | | | 581,985 | | |
| | 3,400 | | | @,L | | Myriad Genetics, Inc. | | | 157,828 | | |
| | 8,200 | | | @ | | Regeneron
Pharmaceuticals, Inc. | | | 198,030 | | |
| | 12,802 | | | @,L | | Sangamo Biosciences, Inc. | | | 167,578 | | |
| | 13,800 | | | @,L | | Seattle Genetics, Inc. | | | 157,320 | | |
| | | | 2,061,481 | | |
| | | | | Building Materials: 1.2% | |
| | 4,700 | | | @ | | Genlyte Group, Inc. | | | 447,440 | | |
| | | | 447,440 | | |
| | | | | Commercial Services: 5.9% | |
| | 8,700 | | | @,L | | CRA International, Inc. | | | 414,207 | | |
| | 15,204 | | | L | | Healthcare Services Group | | | 322,021 | | |
| | 11,800 | | | @ | | Parexel International Corp. | | | 569,940 | | |
| | 23,000 | | | @ | | TeleTech Holdings, Inc. | | | 489,210 | | |
| | 22,100 | | | @ | | TrueBlue, Inc. | | | 320,008 | | |
| | | | 2,115,386 | | |
| | | | | Computers: 2.6% | |
| | 9,700 | | | @,L | | Compellent Technologies, Inc. | | | 116,691 | | |
| | 7,400 | | | | | Factset Research Systems, Inc. | | | 412,180 | | |
| | 15,100 | | | @,L | | Stratasys, Inc. | | | 390,184 | | |
| | | | 919,055 | | |
| | | | | Cosmetics/Personal Care: 1.5% | |
| | 7,100 | | | @,L | | Chattem, Inc. | | | 536,334 | | |
| | | | 536,334 | | |
| | | | | Distribution/Wholesale: 1.9% | |
| | 8,250 | | | @,L | | Beacon Roofing Supply, Inc. | | | 69,465 | | |
| | 30,000 | | | @ | | LKQ Corp. | | | 630,600 | | |
| | | | 700,065 | | |
| | | | | Electrical Components & Equipment: 0.4% | |
| | 4,600 | | | @,L | | Energy Conversion Devices, Inc. | | | 154,790 | | |
| | | | 154,790 | | |
| | | | | Electronics: 3.4% | |
| | 4,200 | | | @ | | Benchmark Electronics, Inc. | | | 74,466 | | |
| | 4,900 | | | @,L | | Faro Technologies, Inc. | | | 133,182 | | |
| | 10,100 | | | @,L | | FEI Co. | | | 250,783 | | |
| | 26,600 | | | @,L | | Taser International, Inc. | | | 382,774 | | |
| | 12,800 | | | | | Technitrol, Inc. | | | 365,824 | | |
| | | | 1,207,029 | | |
| | | | | Engineering & Construction: 1.1% | |
| | 16,800 | | | @ | | EMCOR Group, Inc. | | | 396,984 | | |
| | | | 396,984 | | |
| Shares | | | | | | Value | |
| | | | | Entertainment: 0.3% | |
| | 4,200 | | | | | National CineMedia, Inc. | | $ | 105,882 | | |
| | | | 105,882 | | |
| | | | | Healthcare-Products: 4.0% | |
| | 6,300 | | | @,L | | Accuray, Inc. | | | 95,886 | | |
| | 8,300 | | | @ | | Angiodynamics, Inc. | | | 158,032 | | |
| | 8,900 | | | @,L | | Arthrocare Corp. | | | 427,645 | | |
| | 7,500 | | | @,L | | DexCom, Inc. | | | 66,225 | | |
| | 10,300 | | | @,L | | Hansen Medical, Inc. | | | 308,382 | | |
| | 5,300 | | | @,L | | Resmed, Inc. | | | 278,409 | | |
| | 5,800 | | | @,L | | TomoTherapy, Inc. | | | 113,448 | | |
| | | | 1,448,027 | | |
| | | | | Healthcare-Services: 4.9% | |
| | 18,700 | | | @ | | Pediatrix Medical Group, Inc. | | | 1,274,405 | | |
| | 6,700 | | | @,L | | Psychiatric Solutions, Inc. | | | 217,750 | | |
| | 10,800 | | | @ | | Res-Care, Inc. | | | 271,728 | | |
| | | | 1,763,883 | | |
| | | | | Household Products/Wares: 0.5% | |
| | 9,900 | | | @,L | | Central Garden & Pet Co. | | | 57,024 | | |
| | 19,812 | | | @ | | Central Garden and Pet Co. | | | 106,192 | | |
| | | | 163,216 | | |
| | | | | Internet: 1.5% | |
| | 13,500 | | | @,L | | Blue Coat Systems, Inc. | | | 443,745 | | |
| | 6,000 | | | @ | | Perficient, Inc. | | | 94,440 | | |
| | | | 538,185 | | |
| | | | | Iron/Steel: 2.7% | |
| | 16,200 | | | | | Steel Dynamics, Inc. | | | 965,034 | | |
| | | | 965,034 | | |
| | | | | Lodging: 0.7% | |
| | 4,600 | | | @@,L | | Orient-Express Hotels Ltd. | | | 264,592 | | |
| | | | 264,592 | | |
| | | | | Machinery-Diversified: 1.8% | |
| | 8,300 | | | @,L | | Middleby Corp. | | | 635,946 | | |
| | | | 635,946 | | |
| | | | | | | Miscellaneous
Manufacturing: 1.2% | | | | | |
| | 10,900 | | | @,L | | ESCO Technologies, Inc. | | | 435,346 | | |
| | | | 435,346 | | |
| | | | | Oil & Gas: 3.0% | |
| | 38,615 | | | @,L | | PetroHawk Energy Corp. | | | 668,426 | | |
| | 6,600 | | | @,L | | Quicksilver Resources, Inc. | | | 393,294 | | |
| | | | 1,061,720 | | |
| | | | | Oil & Gas Services: 6.0% | |
| | 22,200 | | | @ | | Complete Production Services, Inc. | | | 398,934 | | |
| | 3,900 | | | @ | | Core Laboratories NV | | | 486,408 | | |
| | 31,800 | | | @,L | | ION Geophysical Corp. | | | 501,804 | | |
| | 7,800 | | | @ | | T-3 Energy Services, Inc. | | | 366,678 | | |
| | 25,100 | | | @ | | Tetra Technologies, Inc. | | | 390,807 | | |
| | | | 2,144,631 | | |
| | | | | Pharmaceuticals: 5.0% | |
| | 17,500 | | | @,L | | Array Biopharma, Inc. | | | 147,350 | | |
| | 6,600 | | | @,L | | Auxilium Pharmaceuticals, Inc. | | | 197,934 | | |
| | 6,800 | | | @,L | | BioMarin Pharmaceuticals, Inc. | | | 240,720 | | |
| | 12,200 | | | @,L | | Isis Pharmaceuticals, Inc. | | | 192,150 | | |
| | 11,800 | | | @,L | | Penwest Pharmaceuticals Co. | | | 69,030 | | |
| | 21,200 | | | @ | | VCA Antech, Inc. | | | 937,676 | | |
| | | | 1,784,860 | | |
See Accompanying Notes to Financial Statements
278
PORTFOLIO OF INVESTMENTS
ING UBS U.S. SMALL CAP GROWTH PORTFOLIO AS OF DECEMBER 31, 2007 (CONTINUED)
| Shares | | | | | | Value | |
| | | | | Retail: 9.2% | |
| | 22,600 | | | @,L | | California Pizza Kitchen, Inc. | | $ | 351,882 | | |
| | 10,300 | | | @ | | Childrens Place Retail Stores, Inc. | | | 267,079 | | |
| | 12,200 | | | | | Christopher & Banks Corp. | | | 139,690 | | |
| | 31,200 | | | L | | CKE Restaurants, Inc. | | | 411,840 | | |
| | 4,400 | | | @,L | | DSW, Inc. | | | 82,544 | | |
| | 9,400 | | | @ | | Gymboree Corp. | | | 286,324 | | |
| | 1,900 | | | @,@@,L | | Lululemon Athletica, Inc. | | | 90,003 | | |
| | 15,300 | | | | | Phillips-Van Heusen | | | 563,958 | | |
| | 11,200 | | | @,L | | Red Robin Gourmet Burgers, Inc. | | | 358,288 | | |
| | 36,500 | | | @,L | | Texas Roadhouse, Inc. | | | 403,690 | | |
| | 11,200 | | | @,L | | Tween Brands, Inc. | | | 296,576 | | |
| | 2,400 | | | @,L | | Ulta Salon Cosmetics &
Fragrance, Inc. | | | 41,160 | | |
| | | | 3,293,034 | | |
| | | | | Semiconductors: 7.3% | |
| | 40,000 | | | @ | | Advanced Analogic
Technologies, Inc. | | | 451,200 | | |
| | 13,250 | | | @,L | | Diodes, Inc. | | | 398,428 | | |
| | 8,500 | | | @ | | Hittite Microwave Corp. | | | 405,960 | | |
| | 25,800 | | | @,L | | Microsemi Corp. | | | 571,212 | | |
| | 10,600 | | | @ | | Power Integrations, Inc. | | | 364,958 | | |
| | 10,800 | | | @ | | Standard Microsystems Corp. | | | 421,956 | | |
| | | | 2,613,714 | | |
| | | | | Software: 9.1% | |
| | 29,200 | | | @,L | | FalconStor Software, Inc. | | | 328,792 | | |
| | 5,928 | | | @ | | Interactive Intelligence, Inc. | | | 156,203 | | |
| | 40,800 | | | @,L | | Nuance Communications, Inc. | | | 762,143 | | |
| | 21,600 | | | @ | | Omnicell, Inc. | | | 581,688 | | |
| | 19,671 | | | @ | | Phase Forward, Inc. | | | 427,844 | | |
| | 13,500 | | | @ | | Progress Software Corp. | | | 454,680 | | |
| | 11,200 | | | @ | | Ultimate Software Group, Inc. | | | 352,464 | | |
| | 10,460 | | | @ | | Verint Systems, Inc. | | | 204,493 | | |
| | | | 3,268,307 | | |
| | | | | Telecommunications: 4.9% | |
| | 20,800 | | | @,@@ | | Ceragon Networks Ltd. | | | 205,712 | | |
| | 9,600 | | | @,L | | Comtech Telecommunications | | | 518,496 | | |
| | 7,200 | | | @,L | | NeuStar, Inc. | | | 206,496 | | |
| | 4,900 | | | @ | | Neutral Tandem, Inc. | | | 93,198 | | |
| | 21,200 | | | @,@@ | | Nice Systems Ltd. ADR | | | 727,584 | | |
| | | | 1,751,486 | | |
| | | | | | | Transportation: | | | 3.1 | % | |
| | 19,700 | | | @ | | HUB Group, Inc. | | | 523,626 | | |
| | 14,400 | | | | | Landstar System, Inc. | | | 606,960 | | |
| | | | 1,130,586 | | |
Total Common Stock
(Cost $32,219,766) | | | 33,095,347 | | |
| REAL ESTATE INVESTMENT TRUSTS: 2.0% | | | |
| | | | | Health Care: 1.5% | |
| | 11,600 | | | | | Ventas, Inc. | | | 524,900 | | |
| | | | 524,900 | | |
| | | | | Office Property: 0.5% | |
| | 8,600 | | | | | BioMed Realty Trust, Inc. | | | 199,262 | | |
| | | | 199,262 | | |
Total Real Estate
Investment Trusts
(Cost $717,266) | | | 724,162 | | |
| Shares | | | | | | Value | |
| EXCHANGE-TRADED FUNDS: 2.3% | | | |
| | | | | Exchange-Traded Funds: 2.3% | |
| | 10,000 | | | L | | iShares Russell 2000
Growth Index Fund | | $ | 834,800 | | |
Total Exchange-Traded Funds
(Cost $843,785) | | | 834,800 | | |
Total Long-Term Investments
(Cost $33,780,817) | | | 34,654,309 | | |
Principal
Amount | | | | �� | | Value | |
| SHORT-TERM INVESTMENTS: 33.7% | | | |
| | | | | U.S. Government Agency Obligations: 2.4% | |
| $ | 846,000 | | | Z | | Federal Home Loan Bank,
3.050%, due 01/02/08 | | | 845,857 | | |
Total U.S. Government Agency
Obligations (Cost $845,857) | | | 845,857 | | |
| | | | | Securities Lending Collateralcc: 31.3% | |
| | 11,240,829 | | | | | Bank of New York Mellon Corp.
Institutional Cash Reserves | | | 11,240,829 | | |
Total Securities Lending
Collateral
(Cost $11,240,829) | | | 11,240,829 | | |
Total Short-Term Investments
(Cost $12,086,686) | | | 12,086,686 | | |
Total Investments in
Securities (Cost
$45,867,503)* | | | 130.2 | % | | $ | 46,740,995 | | |
Other Assets and
Liabilities - Net | | | (30.2 | ) | | | (10,832,486 | ) | |
| Net Assets | | | 100.0 | % | | $ | 35,908,509 | | |
@ Non-income producing security
@@ Foreign Issuer
ADR American Depositary Receipt
cc Securities purchased with cash collateral for securities loaned.
L Loaned security, a portion or all of the security is on loan at December 31, 2007.
Z Indicates Zero Coupon Bond; rate shown reflects current effective yield.
* Cost for federal income tax purposes is $46,254,688
| Net unrealized appreciation consists of: | |
| Gross Unrealized Appreciation | | $ | 3,852,068 | | |
| Gross Unrealized Depreciation | | | (3,365,761 | ) | |
| Net Unrealized Appreciation | | $ | 486,307 | | |
See Accompanying Notes to Financial Statements
279
PORTFOLIO OF INVESTMENTS
ING VAN KAMPEN COMSTOCK PORTFOLIO AS OF DECEMBER 31, 2007
| Shares | | | | | | Value | |
| COMMON STOCK: 94.5% | | | |
| | | | | Agriculture: 1.7% | |
| | 223,600 | | | | | Altria Group, Inc. | | $ | 16,899,687 | | |
| | | | 16,899,687 | | |
| | | | | Airlines: 0.6% | |
| | 511,000 | | | | | Southwest Airlines Co. | | | 6,234,200 | | |
| | | | 6,234,200 | | |
| | | | | Banks: 10.8% | |
| | 789,900 | | | | | Bank of America Corp. | | | 32,591,274 | | |
| | 388,831 | | | | | Bank of New York Mellon Corp. | | | 18,959,400 | | |
| | 36,700 | | | @@,L | | Barclays PLC ADR | | | 1,481,579 | | |
| | 115,500 | | | L | | PNC Financial Services
Group, Inc. | | | 7,582,575 | | |
| | 195,000 | | | | | US Bancorp. | | | 6,189,300 | | |
| | 673,100 | | | L | | Wachovia Corp. | | | 25,597,993 | | |
| | 491,900 | | | | | Wells Fargo & Co. | | | 14,850,461 | | |
| | | | 107,252,582 | | |
| | | | | Beverages: 3.7% | |
| | 162,600 | | | | | Anheuser-Busch Cos., Inc. | | | 8,510,484 | | |
| | 460,500 | | | | | Coca-Cola Co. | | | 28,260,885 | | |
| | | | 36,771,369 | | |
| | | | | Chemicals: 3.3% | |
| | 550,300 | | | L | | EI DuPont de Nemours & Co. | | | 24,262,727 | | |
| | 165,800 | | | | | Rohm & Haas Co. | | | 8,799,006 | | |
| | | | 33,061,733 | | |
| | | | | Commercial Services: 0.5% | |
| | 198,700 | | | | | Western Union Co. | | | 4,824,436 | | |
| | | | 4,824,436 | | |
| | | | | Computers: 3.1% | |
| | 66,100 | | | @,L | | Computer Sciences Corp. | | | 3,269,967 | | |
| | 396,100 | | | @ | | Dell, Inc. | | | 9,708,411 | | |
| | 128,600 | | | | | Hewlett-Packard Co. | | | 6,491,728 | | |
| | 104,000 | | | | | International Business
Machines Corp. | | | 11,242,400 | | |
| | | | 30,712,506 | | |
| | | | | Cosmetics/Personal Care: 1.1% | |
| | 141,800 | | | | | Procter & Gamble Co. | | | 10,410,956 | | |
| | | | 10,410,956 | | |
| | | | | | | Diversified Financial
Services: 6.9% | | | | | |
| | 51,000 | | | | | Bear Stearns Cos., Inc. | | | 4,500,750 | | |
| | 908,000 | | | | | Citigroup, Inc. | | | 26,731,520 | | |
| | 75,300 | | | | | Fannie Mae | | | 3,010,494 | | |
| | 246,800 | | | L | | Freddie Mac | | | 8,408,476 | | |
| | 344,100 | | | | | JPMorgan Chase & Co. | | | 15,019,965 | | |
| | 195,700 | | | | | Merrill Lynch & Co., Inc. | | | 10,505,176 | | |
| | | | 68,176,381 | | |
| | | | | Electronics: 0.1% | |
| | 63,080 | | | @,@@,L | | Flextronics International Ltd. | | | 760,745 | | |
| | 33,950 | | | @,L | | Kemet Corp. | | | 225,089 | | |
| | | | 985,834 | | |
| | | | | Food: 7.1% | |
| | 490,400 | | | @@,L | | Cadbury Schweppes PLC ADR | | | 24,211,048 | | |
| | 611,040 | | | | | Kraft Foods, Inc. | | | 19,938,235 | | |
| | 203,200 | | | | | Sara Lee Corp. | | | 3,263,392 | | |
| | 630,100 | | | @@ | | Unilever NV ADR | | | 22,973,446 | | |
| | | | 70,386,121 | | |
| Shares | | | | | | Value | |
| | | | | Forest Products & Paper: 3.8% | |
| | 1,157,577 | | | | | International Paper Co. | | $ | 37,482,341 | | |
| | | | 37,482,341 | | |
| | | | | Healthcare-Products: 0.6% | |
| | 519,500 | | | @,L | | Boston Scientific Corp. | | | 6,041,785 | | |
| | | | 6,041,785 | | |
| | | | | Healthcare-Services: 0.8% | |
| | 70,300 | | | | | UnitedHealth Group, Inc. | | | 4,091,460 | | |
| | 39,100 | | | @ | | WellPoint, Inc. | | | 3,430,243 | | |
| | | | 7,521,703 | | |
| | | | | Household Products/Wares: 1.4% | |
| | 206,900 | | | | | Kimberly-Clark Corp. | | | 14,346,446 | | |
| | | | 14,346,446 | | |
| | | | | Insurance: 7.7% | |
| | 79,400 | | | L | | Aflac, Inc. | | | 4,972,822 | | |
| | 178,100 | | | L | | American International
Group, Inc. | | | 10,383,230 | | |
| | 1,420 | | | @ | | Berkshire Hathaway,
Inc.-Class B | | | 6,725,120 | | |
| | 453,460 | | | | | Chubb Corp. | | | 24,749,847 | | |
| | 138,400 | | | | | Genworth Financial, Inc. | | | 3,522,280 | | |
| | 49,100 | | | L | | Hartford Financial Services
Group, Inc. | | | 4,281,029 | | |
| | 64,100 | | | L | | MBIA, Inc. | | | 1,194,183 | | |
| | 146,300 | | | L | | Metlife, Inc. | | | 9,015,006 | | |
| | 71,370 | | | | | Torchmark Corp. | | | 4,320,026 | | |
| | 133,005 | | | | | Travelers Cos., Inc. | | | 7,155,669 | | |
| | | | 76,319,212 | | |
| | | | | Internet: 0.9% | |
| | 481,175 | | | @,L | | Liberty Media
Corp.-Interactive-Class A | | | 9,180,819 | | |
| | | | 9,180,819 | | |
| | | | | Machinery-Diversified: 0.0% | |
| | 21,970 | | | L | | Cognex Corp. | | | 442,696 | | |
| | | | 442,696 | | |
| | | | | Media: 10.3% | |
| | 1,335,000 | | | @,L | | Comcast Corp.-Class A | | | 24,377,100 | | |
| | 96,435 | | | @ | | Liberty Media Corp.-Capital
Shares A | | | 11,233,713 | | |
| | 457,200 | | | L | | News Corp.-Class B | | | 9,715,500 | | |
| | 1,465,700 | | | | | Time Warner, Inc. | | | 24,198,707 | | |
| | 743,250 | | | @,L | | Viacom-Class B | | | 32,643,540 | | |
| | | | 102,168,560 | | |
| | | | | Mining: 1.0% | |
| | 213,200 | | | | | Alcoa, Inc. | | | 7,792,460 | | |
| | 33,800 | | | L | | Newmont Mining Corp. | | | 1,650,454 | | |
| | | | 9,442,914 | | |
| | | | | | | Miscellaneous
Manufacturing: 1.3% | | | | | |
| | 350,200 | | | | | General Electric Co. | | | 12,981,914 | | |
| | | | 12,981,914 | | |
| | | | | Pharmaceuticals: 15.0% | |
| | 305,300 | | | | | Abbott Laboratories | | | 17,142,595 | | |
| | 954,500 | | | | | Bristol-Myers Squibb Co. | | | 25,313,340 | | |
| | 252,550 | | | | | Cardinal Health, Inc. | | | 14,584,763 | | |
| | 296,100 | | | | | Eli Lilly & Co. | | | 15,808,779 | | |
See Accompanying Notes to Financial Statements
280
PORTFOLIO OF INVESTMENTS
ING VAN KAMPEN COMSTOCK PORTFOLIO AS OF DECEMBER 31, 2007 (CONTINUED)
| Shares | | | | | | Value | |
| | | | | Pharmaceuticals (continued) | |
| | 189,100 | | | @@ | | GlaxoSmithKline PLC ADR | | $ | 9,528,749 | | |
| | 738,400 | | | | | Pfizer, Inc. | | | 16,783,832 | | |
| | 52,700 | | | @@ | | Roche Holding Ltd. ADR | | | 4,552,453 | | |
| | 805,300 | | | | | Schering-Plough Corp. | | | 21,453,192 | | |
| | 541,900 | | | L | | Wyeth | | | 23,946,561 | | |
| | | | 149,114,264 | | |
| | | | | Retail: 5.6% | |
| | 503,900 | | | L | | CVS Caremark Corp. | | | 20,030,025 | | |
| | 113,100 | | | L | | Home Depot, Inc. | | | 3,046,914 | | |
| | 158,100 | | | | | Lowe's Cos., Inc. | | | 3,576,222 | | |
| | 603,000 | | | | | Wal-Mart Stores, Inc. | | | 28,660,590 | | |
| | | | 55,313,751 | | |
| | | | | Semiconductors: 1.3% | |
| | 229,280 | | | L | | Intel Corp. | | | 6,112,605 | | |
| | 64,200 | | | L | | KLA-Tencor Corp. | | | 3,091,872 | | |
| | 99,100 | | | L | | Texas Instruments, Inc. | | | 3,309,940 | | |
| | | | 12,514,417 | | |
| | | | | Software: 0.8% | |
| | 228,700 | | | L | | Microsoft Corp. | | | 8,141,720 | | |
| | | | 8,141,720 | | |
| | | | | Telecommunications: 5.1% | |
| | 361,800 | | | | | AT&T, Inc. | | | 15,036,408 | | |
| | 104,077 | | | @@ | | Telefonaktiebolaget LM
Ericsson ADR | | | 2,430,198 | | |
| | 745,700 | | | | | Verizon Communications, Inc. | | | 32,579,633 | | |
| | | | 50,046,239 | | |
Total Common Stock
(Cost $914,625,249) | | | 936,774,586 | | |
Principal
Amount | | | | | | Value | |
| SHORT-TERM INVESTMENTS: 13.5% | | | |
| | | | | | | U.S. Government Agency Obligations: 5.1% | | | | | |
| $ | 50,600,000 | | | Z | | Federal Home Loan Bank,
3.050%, due 01/02/08 | | | 50,590,864 | | |
Total U.S. Government
Agency Obligations
(Cost $50,590,864) | | | 50,590,864 | | |
| | | | | | | Securities Lending Collateralcc: 8.4% | | | | | |
| | 82,668,638 | | | | | Bank of New York
Mellon Corp. Institutional
Cash Reserves | | | 82,668,638 | | |
Total Securities Lending
Collateral
(Cost $82,668,638) | | | 82,668,638 | | |
Total Short-Term Investments
(Cost $133,259,502) | | | 133,259,502 | | |
Total Investments in
Securities (Cost
$1,047,884,751)* | | | 108.0 | % | | $ | 1,070,034,088 | | |
Other Assets and
Liabilities - Net | | | (8.0 | ) | | | (78,816,312 | ) | |
| Net Assets | | | 100.0 | % | | $ | 991,217,776 | | |
@ Non-income producing security
@@ Foreign Issuer
ADR American Depositary Receipt
cc Securities purchased with cash collateral for securities loaned.
L Loaned security, a portion or all of the security is on loan at December 31, 2007.
Z Indicates Zero Coupon Bond; rate shown reflects current effective yield.
* Cost for federal income tax purposes is $1,049,129,959
Net unrealized appreciation consists of:
| Gross Unrealized Appreciation | | $ | 95,805,665 | | |
| Gross Unrealized Depreciation | | | (74,901,536 | ) | |
| Net Unrealized Appreciation | | $ | 20,904,129 | | |
See Accompanying Notes to Financial Statements
281
ING VAN KAMPEN EQUITY AND PORTFOLIO OF INVESTMENTS
INCOME PORTFOLIO AS OF DECEMBER 31, 2007
| Shares | | | | | | Value | |
| COMMON STOCK: 57.7% | | | |
| | | | | Aerospace/Defense: 0.9% | |
| | 141,180 | | | | | Raytheon Co. | | $ | 8,569,625 | | |
| | | | 8,569,625 | | |
| | | | | Agriculture: 0.9% | |
| | 112,300 | | | | | Altria Group, Inc. | | | 8,487,634 | | |
| | | | 8,487,634 | | |
| | | | | Auto Manufacturers: 0.3% | |
| | 84,890 | | | @@ | | Honda Motor Co., Ltd. ADR | | | 2,813,255 | | |
| | | | 2,813,255 | | |
| | | | | Banks: 1.0% | |
| | 118,833 | | | | | Bank of America Corp. | | | 4,903,050 | | |
| | 79,717 | | | | | PNC Financial Services
Group, Inc. | | | 5,233,421 | | |
| | | | 10,136,471 | | |
| | | | | Beverages: 1.2% | |
| | 181,260 | | | | | Coca-Cola Co. | | | 11,123,926 | | |
| | | | 11,123,926 | | |
| | | | | Chemicals: 2.7% | |
| | 246,970 | | | @@ | | Bayer AG ADR | | | 22,520,750 | | |
| | 70,770 | | | | | EI DuPont de Nemours & Co. | | | 3,120,249 | | |
| | | | 25,640,999 | | |
| | | | | Computers: 0.8% | |
| | 69,500 | | | @ | | EMC Corp. | | | 1,287,835 | | |
| | 123,326 | | | | | Hewlett-Packard Co. | | | 6,225,496 | | |
| | | | 7,513,331 | | |
| | | | | Cosmetics/Personal Care: 1.1% | |
| | 77,790 | | | | | Estee Lauder Cos., Inc. | | | 3,392,422 | | |
| | 97,520 | | | | | Procter & Gamble Co. | | | 7,159,918 | | |
| | | | 10,552,340 | | |
| | | | | | | Diversified Financial
Services: 5.1% | | | | | |
| | 67,635 | | | | | Bear Stearns Cos., Inc. | | | 5,968,789 | | |
| | 246,715 | | | | | Charles Schwab Corp. | | | 6,303,568 | | |
| | 239,621 | | | | | Citigroup, Inc. | | | 7,054,442 | | |
| | 193,517 | | | | | Freddie Mac | | | 6,593,124 | | |
| | 386,901 | | | | | JPMorgan Chase & Co. | | | 16,888,229 | | |
| | 32,138 | | | | | Lehman Brothers Holdings, Inc. | | | 2,103,111 | | |
| | 70,372 | | | | | Merrill Lynch & Co., Inc. | | | 3,777,569 | | |
| | | | 48,688,832 | | |
| | | | | Electric: 3.5% | |
| | 253,650 | | | | | American Electric
Power Co., Inc. | | | 11,809,944 | | |
| | 11,000 | | | C | | CenterPoint Energy
Resources Corp. | | | 358,380 | | |
| | 115,495 | | | | | Entergy Corp. | | | 13,803,962 | | |
| | 103,920 | | | | | FirstEnergy Corp. | | | 7,517,573 | | |
| | | | 33,489,859 | | |
| | | | | Electronics: 0.3% | |
| | 81,880 | | | | | Applera Corp.-Applied
Biosystems Group | | | 2,777,370 | | |
| | | | 2,777,370 | | |
| Shares | | | | | | Value | |
| | | | | Food: 3.2% | |
| | 170,620 | | | @@ | | Cadbury Schweppes PLC ADR | | $ | 8,423,509 | | |
| | 128,100 | | | | | ConAgra Foods, Inc. | | | 3,047,499 | | |
| | 216,280 | | | | | Kraft Foods, Inc. | | | 7,057,216 | | |
| | 326,320 | | | @@ | | Unilever NV ADR | | | 11,897,627 | | |
| | | | 30,425,851 | | |
| | | | | Healthcare-Products: 0.8% | |
| | 283,680 | | | @ | | Boston Scientific Corp. | | | 3,299,198 | | |
| | 92,540 | | | @@ | | Covidien Ltd. | | | 4,098,597 | | |
| | | | 7,397,795 | | |
| | | | | Home Furnishings: 0.2% | |
| | 28,300 | | | @@ | | Sony Corp. ADR | | | 1,536,690 | | |
| | | | 1,536,690 | | |
| | | | | Household Products/Wares: 0.3% | |
| | 44,460 | | | | | Kimberly-Clark Corp. | | | 3,082,856 | | |
| | | | 3,082,856 | | |
| | | | | Insurance: 4.7% | |
| | 149,820 | | | @@ | | Aegon NV ADR | | | 2,626,345 | | |
| | 170,994 | | | | | Chubb Corp. | | | 9,332,853 | | |
| | 37,900 | | | | | Cigna Corp. | | | 2,036,367 | | |
| | 77,878 | | | @ | | Conseco, Inc. | | | 978,148 | | |
| | 67,220 | | | | | Hartford Financial Services
Group, Inc. | | | 5,860,912 | | |
| | 495,350 | | | | | Marsh & McLennan Cos., Inc. | | | 13,111,915 | | |
| | 211,201 | | | | | Travelers Cos., Inc. | | | 11,362,614 | | |
| | | | 45,309,154 | | |
| | | | | Internet: 1.0% | |
| | 202,273 | | | @ | | Symantec Corp. | | | 3,264,686 | | |
| | 294,724 | | | @ | | Yahoo!, Inc. | | | 6,855,280 | | |
| | | | 10,119,966 | | |
| | | | | Media: 3.2% | |
| | 198,920 | | | @ | | Comcast Corp.-Class A | | | 3,632,279 | | |
| | 826,934 | | | | | Time Warner, Inc. | | | 13,652,680 | | |
| | 303,956 | | | @ | | Viacom-Class B | | | 13,349,748 | | |
| | | | 30,634,707 | | |
| | | | | Mining: 0.9% | |
| | 178,130 | | | | | Newmont Mining Corp. | | | 8,698,088 | | |
| | | | 8,698,088 | | |
| | | | | | | Miscellaneous
Manufacturing: 3.3% | | | | | |
| | 350,260 | | | | | General Electric Co. | | | 12,984,138 | | |
| | 90,440 | | | @@ | | Siemens AG ADR | | | 14,231,638 | | |
| | 116,940 | | | @@ | | Tyco International Ltd. | | | 4,636,671 | | |
| | | | 31,852,447 | | |
| | | | | Oil & Gas: 4.5% | |
| | 114,780 | | | | | ConocoPhillips | | | 10,135,074 | | |
| | 28,000 | | | | | Devon Energy Corp. | | | 2,489,480 | | |
| | 80,000 | | | | | ExxonMobil Corp. | | | 7,495,200 | | |
| | 29,700 | | | | | Marathon Oil Corp. | | | 1,807,542 | | |
| | 125,510 | | | | | Occidental Petroleum Corp. | | | 9,663,015 | | |
| | 142,350 | | | @@ | | Royal Dutch Shell PLC ADR | | | 11,985,870 | | |
| | | | 43,576,181 | | |
| | | | | Oil & Gas Services: 0.9% | |
| | 93,270 | | | | | Schlumberger Ltd. | | | 9,174,970 | | |
| | | | 9,174,970 | | |
See Accompanying Notes to Financial Statements
282
ING VAN KAMPEN EQUITY AND PORTFOLIO OF INVESTMENTS
INCOME PORTFOLIO AS OF DECEMBER 31, 2007 (CONTINUED)
| Shares | | | | | | Value | |
| | | | | Pharmaceuticals: 8.2% | |
| | 273,930 | | | | | Abbott Laboratories | | $ | 15,381,170 | | |
| | 435,140 | | | | | Bristol-Myers Squibb Co. | | | 11,539,913 | | |
| | 183,640 | | | | | Eli Lilly & Co. | | | 9,804,540 | | |
| | 109,100 | | | @@ | | Novartis AG ADR | | | 5,925,221 | | |
| | 101,200 | | | | | Pfizer, Inc. | | | 2,300,276 | | |
| | 81,890 | | | @@ | | Roche Holding Ltd. ADR | | | 7,074,010 | | |
| | 619,850 | | | | | Schering-Plough Corp. | | | 16,512,793 | | |
| | 227,220 | | | | | Wyeth | | | 10,040,852 | | |
| | | | 78,578,775 | | |
| | | | | Pipelines: 0.4% | |
| | 108,780 | | | | | Williams Cos., Inc. | | | 3,892,148 | | |
| | | | 3,892,148 | | |
| | | | | Retail: 3.1% | |
| | 99,580 | | | | | Home Depot, Inc. | | | 2,682,685 | | |
| | 52,020 | | | | | McDonald's Corp. | | | 3,064,498 | | |
| | 185,029 | | | @ | | Office Depot, Inc. | | | 2,573,753 | | |
| | 419,000 | | | @ | | Rite Aid Corp. | | | 1,169,010 | | |
| | 135,100 | | | @ | | Starbucks Corp. | | | 2,765,497 | | |
| | 379,320 | | | | | Wal-Mart Stores, Inc. | | | 18,029,080 | | |
| | | | 30,284,523 | | |
| | | | | Semiconductors: 1.1% | |
| | 298,257 | | | | | Intel Corp. | | | 7,951,532 | | |
| | 316,978 | | | @ | | Micron Technology, Inc. | | | 2,298,091 | | |
| | | | 10,249,623 | | |
| | | | | Software: 0.2% | |
| | 70,400 | | | @ | | Oracle Corp. | | | 1,589,632 | | |
| | | | 1,589,632 | | |
| | | | | Telecommunications: 3.9% | |
| | 837,900 | | | @@ | | Alcatel SA ADR | | | 6,133,428 | | |
| | 123,400 | | | @ | | Cisco Systems, Inc. | | | 3,340,438 | | |
| | 60,386 | | | | | Embarq Corp. | | | 2,990,919 | | |
| | 174,770 | | | @@ | | France Telecom SA ADR | | | 6,227,055 | | |
| | 180,442 | | | | | Sprint Nextel Corp. | | | 2,369,203 | | |
| | 376,026 | | | | | Verizon Communications, Inc. | | | 16,428,576 | | |
| | | | 37,489,619 | | |
Total Common Stock
(Cost $472,664,086) | | | 553,686,667 | | |
| EXCHANGE-TRADED FUNDS: 0.6% | | | |
| | | | | Exchange-Traded Funds: 0.6% | |
| | 398,000 | | | @@ | | iShares MSCI Japan Index Fund | | | 5,289,420 | | |
Total Exchange-Traded Funds
(Cost $5,806,011) | | | 5,289,420 | | |
| PREFERRED STOCK: 3.4% | | | |
| | | | | Advertising: 0.1% | |
| | 900 | | | #,P | | Interpublic Group of Cos., Inc.,
5.250%, due 12/31/49 | | | 741,938 | | |
| | | | 741,938 | | |
| | | | | Auto Manufacturers: 0.3% | |
| | 74,800 | | | P | | Ford Motor Co. Capital Trust II,
6.500%, due 01/15/32 | | | 2,431,000 | | |
| | | | 2,431,000 | | |
| Shares | | | | | | Value | |
| | | | | Healthcare-Services: 0.2% | |
| | 1,600 | | | # | | Healthsouth Corp.,
6.500%, due 12/31/49 | | $ | 1,457,600 | | |
| | | | 1,457,600 | | |
| | | | | Household Products/Wares: 0.1% | |
| | 14,500 | | | | | Avery Dennison Corp.,
7.875%, due 11/15/10 | | | 764,875 | | |
| | | | 764,875 | | |
| | | | | Media: 0.1% | |
| | 27,920 | | | P | | Tribune Co.,
2.000%, due 05/15/29 | | | 1,396,000 | | |
| | | | 1,396,000 | | |
| | | | | Pharmaceuticals: 0.6% | |
| | 35,000 | | | P | | Omnicare, Inc.,
4.000%, due 06/15/33 | | | 1,254,750 | | |
| | 18,488 | | | | | Schering-Plough Corp.,
6.000%, due 08/13/10 | | | 4,489,071 | | |
| | | | 5,743,821 | | |
| | | | | Pipelines: 0.4% | |
| | 105,000 | | | P | | El Paso Energy Capital Trust I,
4.750%, due 03/31/28 | | | 3,780,000 | | |
| | | | 3,780,000 | | |
| | | | | Savings & Loans: 0.7% | |
| | 113,400 | | | | | Sovereign Capital Trust,
4.375%, due 03/01/34 | | | 3,756,375 | | |
| | 70,000 | | | | | Washington Mutual, Inc.,
5.375%, due 05/03/41 | | | 1,977,500 | | |
| | 900 | | | | | Washington Mutual, Inc.,
7.750%, due 12/31/49 | | | 796,500 | | |
| | | | 6,530,375 | | |
| | | | | Sovereign: 0.4% | |
| | 50 | | | P | | Fannie Mae,
5.375%, due 02/19/08 | | | 4,239,950 | | |
| | | | 4,239,950 | | |
| | | | | Telecommunications: 0.5% | |
| | 6,000 | | | P | | Lucent Technologies Capital
Trust I, 7.750%, due 03/15/17 | | | 5,250,750 | | |
| | | | 5,250,750 | | |
Total Preferred Stock
(Cost $39,748,964) | | | 32,336,309 | | |
Principal
Amount | | | | | | Value | |
| CONVERTIBLE BONDS: 11.4% | | | |
| | | | | Advertising: 0.2% | |
| $ | 1,833,000 | | | #,C | | Interpublic Group of Cos., Inc.,
4.750%, due 03/15/23 | | | 1,910,903 | | |
| | | | 1,910,903 | | |
| | | | | Aerospace/Defense: 0.5% | |
| | 4,225,000 | | | C | | L-3 Communications Corp.,
3.000%, due 08/01/35 | | | 5,128,094 | | |
| | | | 5,128,094 | | |
See Accompanying Notes to Financial Statements
283
ING VAN KAMPEN EQUITY AND PORTFOLIO OF INVESTMENTS
INCOME PORTFOLIO AS OF DECEMBER 31, 2007 (CONTINUED)
Principal
Amount | | | | | | Value | |
| | | | | Auto Manufacturers: 0.3% | |
| $ | 2,531,000 | | | C | | Ford Motor Co.,
4.250%, due 12/15/36 | | $ | 2,527,836 | | |
| | | | 2,527,836 | | |
| | | | | Biotechnology: 1.5% | |
| | 1,002,000 | | | C | | Affymetrix, Inc.,
3.500%, due 01/15/38 | | | 1,078,403 | | |
| | 3,800,000 | | | | | Amgen, Inc.,
0.375%, due 02/01/13 | | | 3,358,250 | | |
| | 4,200,000 | | | # | | Amgen, Inc.,
0.375%, due 02/01/13 | | | 3,711,750 | | |
| | 1,018,000 | | | | | Charles River Laboratories
International, Inc.,
2.250%, due 06/15/13 | | | 1,500,278 | | |
| | 3,550,000 | | | C | | Invitrogen Corp.,
1.500%, due 02/15/24 | | | 3,763,000 | | |
| | 725,000 | | | C | | Invitrogen Corp.,
3.250%, due 06/15/25 | | | 846,438 | | |
| | | | 14,258,119 | | |
| | | | | Commercial Services: 0.1% | |
| | 936,000 | | | #,C | | Live Nation, Inc.,
2.875%, due 07/15/27 | | | 801,450 | | |
| | | | 801,450 | | |
| | | | | Computers: 1.3% | |
| | 3,150,000 | | | C | | Electronic Data Systems Corp.,
3.875%, due 07/15/23 | | | 3,146,063 | | |
| | 3,959,000 | | | # | | EMC Corp.,
1.750%, due 12/01/11 | | | 5,369,394 | | |
| | 1,205,000 | | | | | EMC Corp./Massachusetts,
1.750%, due 12/01/11 | | | 1,634,281 | | |
| | 2,548,000 | | | | | SanDisk Corp.,
1.000%, due 05/15/13 | | | 2,060,695 | | |
| | | | 12,210,433 | | |
| | | | | | | Diversified Financial
Services: 1.8% | | | | | |
| | 5,800,000 | | | C | | Goldman Sachs Group, Inc.,
2.000%, due 02/02/12 | | | 5,723,092 | | |
| | 4,500,000 | | | # | | Goldman Sachs Group, Inc.,
2.000%, due 05/09/14 | | | 4,522,950 | | |
| | 7,800,000 | | | C | | Lehman Brothers Holdings, Inc.,
1.500%, due 03/23/12 | | | 7,452,900 | | |
| | | | 17,698,942 | | |
| | | | | Entertainment: 0.2% | |
| | 1,920,000 | | | C | | International Game Technology,
2.600%, due 12/15/36 | | | 1,958,400 | | |
| | | | 1,958,400 | | |
| | | | | Environmental Control: 0.1% | |
| | 1,161,000 | | | C | | Allied Waste North America, Inc.,
4.250%, due 04/15/34 | | | 1,085,535 | | |
| | | | 1,085,535 | | |
| | | | | Healthcare-Products: 1.3% | |
| | 1,300,000 | | | C | | Advanced Medical Optics, Inc.,
2.500%, due 07/15/24 | | | 1,186,250 | | |
| | 3,104,000 | | | #,C | | Beckman Coulter, Inc.,
2.500%, due 12/15/36 | | | 3,620,040 | | |
| | 1,263,000 | | | C | | Edwards Lifesciences Corp.,
3.875%, due 05/15/33 | | | 1,280,366 | | |
Principal
Amount | | | | | | Value | |
| $ | 3,960,000 | | | C | | Medtronic, Inc.,
1.250%, due 09/15/21 | | $ | 3,969,900 | | |
| | 798,000 | | | | | Medtronic, Inc.,
1.500%, due 04/15/11 | | | 855,855 | | |
| | 660,000 | | | # | | St Jude Medical, Inc.,
1.220%, due 12/15/08 | | | 664,950 | | |
| | 889,000 | | | | | Wright Medical Group, Inc.,
2.625%, due 12/01/14 | | | 960,120 | | |
| | | | 12,537,481 | | |
| | | | | Healthcare-Services: 0.4% | |
| | 1,200,000 | | | | | AMERIGROUP Corp.,
2.000%, due 05/15/12 | | | 1,315,500 | | |
| | 2,975,000 | | | C | | Health Management
Associates, Inc.,
4.375%, due 08/01/23 | | | 2,930,375 | | |
| | | | 4,245,875 | | |
| | | | | Media: 0.2% | |
| | 1,615,000 | | | C | | Sinclair Broadcast Group, Inc.,
6.000%, due 09/15/12 | | | 1,485,800 | | |
| | | | 1,485,800 | | |
| | | | | Mining: 0.1% | |
| | 701,000 | | | # | | Newmont Mining Corp.,
1.250%, due 07/15/14 | | | 881,508 | | |
| | | | 881,508 | | |
| | | | | Miscellaneous Manufacturing: 0.6% | |
| | 3,750,000 | | | C | | 3M Co., 2.400%, due 11/21/32 | | | 3,290,625 | | |
| | 2,700,000 | | | C | | Eastman Kodak Co.,
3.375%, due 10/15/33 | | | 2,760,750 | | |
| | | | 6,051,375 | | |
| | | | | Packaging & Containers: 0.3% | |
| | 2,900,000 | | | #,C | | Sealed Air Corp.,
3.000%, due 06/30/33 | | | 2,791,250 | | |
| | | | 2,791,250 | | |
| | | | | Pharmaceuticals: 1.0% | |
| | 3,200,000 | | | C | | ImClone Systems, Inc.,
1.375%, due 05/15/24 | | | 3,028,000 | | |
| | 2,894,000 | | | @@,C | | Teva Pharmaceutical
Finance Co. BV,
1.750%, due 02/01/26 | | | 3,226,810 | | |
| | 3,512,000 | | | C | | Watson Pharmaceuticals, Inc.,
1.750%, due 03/15/23 | | | 3,345,180 | | |
| | | | 9,599,990 | | |
| | | | | Retail: 0.3% | |
| | 2,100,000 | | | C | | Best Buy Co., Inc.,
2.250%, due 01/15/22 | | | 2,535,750 | | |
| | | | 2,535,750 | | |
| | | | | Semiconductors: 0.2% | |
| | 2,208,000 | | | # | | Xilinx, Inc.,
3.125%, due 03/15/37 | | | 1,909,920 | | |
| | | | 1,909,920 | | |
| | | | | Telecommunications: 1.0% | |
| | 2,000,000 | | | #,C | | JDS Uniphase Corp.,
1.000%, due 05/15/26 | | | 1,610,000 | | |
| | 2,600,000 | | | C,Z | | JDS Uniphase Corp.,
1.610%, due 11/15/10 | | | 2,483,000 | | |
See Accompanying Notes to Financial Statements
284
ING VAN KAMPEN EQUITY AND PORTFOLIO OF INVESTMENTS
INCOME PORTFOLIO AS OF DECEMBER 31, 2007 (CONTINUED)
Principal
Amount | | | | | | Value | |
| | | | | Telecommunications (continued) | |
| $ | 2,200,000 | | | | | Level 3 Communications, Inc.,
2.875%, due 07/15/10 | | $ | 1,930,500 | | |
| | 2,400,000 | | | | | Level 3 Communications, Inc.,
6.000%, due 03/15/10 | | | 2,148,000 | | |
| | 1,928,000 | | | C | | Lucent Technologies, Inc.,
2.875%, due 06/15/25 | | | 1,602,650 | | |
| | | | 9,774,150 | | |
Total Convertible Bonds
(Cost $107,082,265) | | | 109,392,811 | | |
| CORPORATE BONDS/NOTES: 6.6% | | | |
| | | | | Airlines: 0.1% | |
| | 443,766 | | | | | America West Airlines, Inc.,
7.100%, due 04/02/21 | | | 461,517 | | |
| | | | 461,517 | | |
| | | | | Auto Manufacturers: 0.0% | |
| | 325,000 | | | @@ | | DaimlerChrysler NA
Holding Corp.,
7.750%, due 01/18/11 | | | 349,463 | | |
| | | | 349,463 | | |
| | | | | Banks: 1.1% | |
| | 615,000 | | | | | Bank of America Corp.,
5.750%, due 12/01/17 | | | 617,565 | | |
| | 425,000 | | | | | Bank of New York,
3.800%, due 02/01/08 | | | 425,037 | | |
| | 175,000 | | | | | Bank One Corp.,
6.000%, due 02/17/09 | | | 176,609 | | |
| | 750,000 | | | | | Marshall & Ilsley Bank,
3.800%, due 02/08/08 | | | 748,597 | | |
| | 320,000 | | | | | Popular North America, Inc.,
5.650%, due 04/15/09 | | | 323,231 | | |
| | 125,000 | | | | | Sovereign Bank,
4.000%, due 02/01/08 | | | 124,873 | | |
| | 905,000 | | | @@,# | | Unicredit Luxembourg
Finance SA,
5.143%, due 10/24/08 | | | 903,390 | | |
| | 5,048,000 | | | #,C | | US Bancorp.,
3.115%, due 02/06/37 | | | 5,040,933 | | |
| | 1,415,000 | | | C | | Wachovia Capital Trust III,
5.800%, due 12/31/49 | | | 1,265,262 | | |
| | 715,000 | | | | | Wells Fargo & Co.,
5.625%, due 12/11/17 | | | 716,787 | | |
| | | | 10,342,284 | | |
| | | | | Beverages: 0.1% | |
| | 485,000 | | | @@,# | | FBG Finance Ltd.,
5.125%, due 06/15/15 | | | 472,290 | | |
| | 445,000 | | | #,C | | Miller Brewing Co.,
4.250%, due 08/15/08 | | | 443,131 | | |
| | | | 915,421 | | |
| | | | | Chemicals: 0.0% | |
| | 315,000 | | | C | | ICI Wilmington, Inc.,
4.375%, due 12/01/08 | | | 314,636 | | |
| | | | 314,636 | | |
Principal
Amount | | | | | | Value | |
| | | | | | | Diversified Financial
Services: 1.7% | | | | | |
| $ | 1,100,000 | | | # | | AIG SunAmerica
Global Financing VI,
6.300%, due 05/10/11 | | $ | 1,143,601 | | |
| | 705,000 | | | | | American General
Finance Corp.,
4.625%, due 05/15/09 | | | 703,335 | | |
| | 50,000 | | | | | American General
Finance Corp.,
4.625%, due 09/01/10 | | | 49,629 | | |
| | 200,000 | | | C | | AXA Financial, Inc.,
6.500%, due 04/01/08 | | | 200,918 | | |
| | 320,000 | | | | | Bear Stearns Cos., Inc.,
6.400%, due 10/02/17 | | | 309,721 | | |
| | 305,000 | | | | | CIT Group, Inc.,
4.750%, due 08/15/08 | | | 302,185 | | |
| | 365,000 | | | | | Citigroup, Inc.,
5.875%, due 05/29/37 | | | 341,786 | | |
| | 380,000 | | | | | Countrywide Home Loans, Inc.,
3.250%, due 05/21/08 | | | 343,423 | | |
| | 600,000 | | | # | | Farmers Exchange Capital,
7.050%, due 07/15/28 | | | 594,777 | | |
| | 250,000 | | | | | General Electric Capital Corp.,
4.250%, due 12/01/10 | | | 249,494 | | |
| | 970,000 | | | | | General Electric Capital Corp.,
5.625%, due 09/15/17 | | | 997,050 | | |
| | 3,500,000 | | | | | Goldman Sachs Group, Inc.,
0.250%, due 08/30/08 | | | 4,698,890 | | |
| | 725,000 | | | C | | Goldman Sachs Group, Inc.,
6.750%, due 10/01/37 | | | 712,584 | | |
| | 125,000 | | | | | HSBC Finance Corp.,
4.125%, due 12/15/08 | | | 123,884 | | |
| | 160,000 | | | | | HSBC Finance Corp.,
4.125%, due 11/16/09 | | | 158,238 | | |
| | 150,000 | | | | | HSBC Finance Corp.,
6.375%, due 10/15/11 | | | 154,678 | | |
| | 775,000 | | | | | HSBC Finance Corp.,
6.750%, due 05/15/11 | | | 804,559 | | |
| | 50,000 | | | | | HSBC Finance Corp.,
8.000%, due 07/15/10 | | | 53,324 | | |
| | 75,000 | | | # | | John Hancock Global Funding II,
7.900%, due 07/02/10 | | | 81,831 | | |
| | 425,000 | | | | | JPMorgan Chase & Co.,
6.750%, due 02/01/11 | | | 446,556 | | |
| | 805,000 | | | C | | Lehman Brothers Holdings, Inc.,
6.875%, due 07/17/37 | | | 789,483 | | |
| | 400,000 | | | @@,#,C | | Mantis Reef Ltd.,
4.692%, due 11/14/08 | | | 401,494 | | |
| | 650,000 | | | | | MBNA Corp.,
5.308%, due 05/05/08 | | | 651,204 | | |
| | 630,000 | | | @@,# | | Nationwide Building Society,
4.250%, due 02/01/10 | | | 629,739 | | |
| | 215,000 | | | | | Textron Financial Corp.,
4.125%, due 03/03/08 | | | 214,800 | | |
| | 480,000 | | | | | Textron Financial Corp.,
5.125%, due 02/03/11 | | | 493,308 | | |
| | 355,000 | | | @@,#,C | | Two-Rock Pass-Through Trust,
5.827%, due 02/11/50 | | | 160,194 | | |
| | 690,000 | | | # | | Xlliac Global Funding,
4.800%, due 08/10/10 | | | 694,539 | | |
| | | | 16,505,224 | | |
See Accompanying Notes to Financial Statements
285
ING VAN KAMPEN EQUITY AND PORTFOLIO OF INVESTMENTS
INCOME PORTFOLIO AS OF DECEMBER 31, 2007 (CONTINUED)
Principal
Amount | | | | | | Value | |
| | | | | Electric: 0.5% | |
| $ | 500,000 | | | C | | Arizona Public Service Co.,
5.800%, due 06/30/14 | | $ | 499,755 | | |
| | 485,000 | | | C | | Carolina Power & Light Co.,
5.125%, due 09/15/13 | | | 486,530 | | |
| | 110,000 | | | C | | Consumers Energy Co.,
4.000%, due 05/15/10 | | | 107,564 | | |
| | 215,000 | | | C | | Consumers Energy Co.,
4.800%, due 02/17/09 | | | 214,549 | | |
| | 280,000 | | | C | | Detroit Edison Co.,
6.125%, due 10/01/10 | | | 290,470 | | |
| | 245,000 | | | C | | Entergy Gulf States, Inc.,
3.600%, due 06/01/08 | | | 243,165 | | |
| | 170,000 | | | C | | Entergy Gulf States, Inc.,
5.524%, due 12/01/09 | | | 168,932 | | |
| | 235,000 | | | C | | Nisource Finance Corp.,
5.585%, due 11/23/09 | | | 232,834 | | |
| | 210,000 | | | C | | Ohio Edison Co.,
6.400%, due 07/15/16 | | | 215,413 | | |
| | 470,000 | | | C | | Ohio Power Co.,
6.000%, due 06/01/16 | | | 475,875 | | |
| | 518,000 | | | | | Pacific Gas & Electric Co.,
9.500%, due 06/30/10 | | | 1,587,670 | | |
| | | | 4,522,757 | | |
| | | | | Electrical Components & Equipment: 0.1% | |
| | 365,000 | | | C | | Cooper Industries, Inc.,
5.250%, due 11/15/12 | | | 376,417 | | |
| | 280,000 | | | @@,# | | LG Electronics, Inc.,
5.000%, due 06/17/10 | | | 280,440 | | |
| | | | 656,857 | | |
| | | | | Environmental Control: 0.0% | |
| | 150,000 | | | C | | Waste Management, Inc.,
7.375%, due 08/01/10 | | | 158,537 | | |
| | | | 158,537 | | |
| | | | | Food: 0.1% | |
| | 205,000 | | | C | | ConAgra Foods, Inc.,
7.000%, due 10/01/28 | | | 218,132 | | |
| | 190,000 | | | C | | ConAgra Foods, Inc.,
8.250%, due 09/15/30 | | | 225,705 | | |
| | 430,000 | | | C | | Fred Meyer, Inc.,
7.450%, due 03/01/08 | | | 431,523 | | |
| | | | 875,360 | | |
| | | | | Healthcare-Services: 0.3% | |
| | 2,544,000 | | | C | | LifePoint Hospitals, Inc.,
3.500%, due 05/15/14 | | | 2,273,700 | | |
| | 235,000 | | | C | | UnitedHealth Group, Inc.,
4.125%, due 08/15/09 | | | 233,696 | | |
| | 335,000 | | | | | UnitedHealth Group, Inc.,
5.204%, due 03/02/09 | | | 334,961 | | |
| | 95,000 | | | C | | WellPoint, Inc.,
4.250%, due 12/15/09 | | | 93,941 | | |
| | | | 2,936,298 | | |
| | | | | Holding Companies-Diversified: 0.1% | |
| | 405,000 | | | #,C | | Capmark Financial Group, Inc.,
5.875%, due 05/10/12 | | | 320,873 | | |
| | 170,000 | | | #,C | | Capmark Financial Group, Inc.,
6.300%, due 05/10/17 | | | 126,934 | | |
| | | | 447,807 | | |
Principal
Amount | | | | | | Value | |
| | | | | Insurance: 0.3% | |
| $ | 540,000 | | | #,C | | Catlin Insurance Co., Ltd.,
7.249%, due 12/31/49 | | $ | 494,513 | | |
| | 2,035,000 | | | +,C | | Conseco, Inc.,
3.500%, (Step rate 0.000%)
due 09/30/35 | | | 1,788,256 | | |
| | 225,000 | | | # | | Farmers Insurance Exchange,
8.625%, due 05/01/24 | | | 251,130 | | |
| | 250,000 | | | | | Nationwide Financial Services,
6.250%, due 11/15/11 | | | 263,217 | | |
| | 205,000 | | | C | | Platinum Underwriters
Finance, Inc.,
7.500%, due 06/01/17 | | | 211,887 | | |
| | 135,000 | | | | | Prudential Financial, Inc.,
6.625%, due 12/01/37 | | | 136,578 | | |
| | | | 3,145,581 | | |
| | | | | Media: 0.2% | |
| | 755,000 | | | C | | Comcast Cable Communications
Holdings, Inc.,
6.750%, due 01/30/11 | | | 789,887 | | |
| | 835,000 | | | | | Time Warner, Inc.,
5.109%, due 11/13/09 | | | 814,816 | | |
| | 495,000 | | | C | | Viacom, Inc.,
6.875%, due 04/30/36 | | | 497,895 | | |
| | | | 2,102,598 | | |
| | | | | | | Miscellaneous
Manufacturing: 0.1% | | | | | |
| | 710,000 | | | | | General Electric Co.,
5.250%, due 12/06/17 | | | 709,842 | | |
| | | | 709,842 | | |
| | | | | Oil & Gas: 0.0% | |
| | 350,000 | | | C | | Valero Energy Corp.,
3.500%, due 04/01/09 | | | 344,138 | | |
| | | | 344,138 | | |
| | | | | Pharmaceuticals: 0.3% | |
| | 3,890,000 | | | C | | Omnicare, Inc.,
3.250%, due 12/15/35 | | | 2,854,288 | | |
| | 207,000 | | | C | | Valeant Pharmaceuticals
International,
4.000%, due 11/15/13 | | | 174,915 | | |
| | | | 3,029,203 | | |
| | | | | Pipelines: 0.1% | |
| | 135,000 | | | C | | CenterPoint Energy
Resources Corp.,
6.250%, due 02/01/37 | | | 129,978 | | |
| | 90,000 | | | C | | Centerpoint Energy, Inc.,
7.875%, due 04/01/13 | | | 98,926 | | |
| | 175,000 | | | C | | Consolidated Natural Gas Co.,
6.250%, due 11/01/11 | | | 182,058 | | |
| | 485,000 | | | C | | Plains All American Pipeline LP,
6.700%, due 05/15/36 | | | 488,953 | | |
| | 215,000 | | | C | | Texas Eastern Transmission LP,
7.000%, due 07/15/32 | | | 241,376 | | |
| | | | 1,141,291 | | |
| | | | | Real Estate: 0.2% | |
| | 110,000 | | | @@,C | | Brookfield Asset
Management, Inc.,
5.800%, due 04/25/17 | | | 110,941 | | |
See Accompanying Notes to Financial Statements
286
ING VAN KAMPEN EQUITY AND PORTFOLIO OF INVESTMENTS
INCOME PORTFOLIO AS OF DECEMBER 31, 2007 (CONTINUED)
Principal
Amount | | | | | | Value | |
| | | | | Real Estate (continued) | |
| $ | 575,000 | | | @@ | | Brookfield Asset
Management, Inc.,
7.125%, due 06/15/12 | | $ | 617,858 | | |
| | 665,000 | | | | | iStar Financial, Inc.,
5.496%, due 03/09/10 | | | 596,627 | | |
| | 590,511 | | | # | | World Financial Properties,
6.910%, due 09/01/13 | | | 617,207 | | |
| | | | 1,942,633 | | |
| | | | | Retail: 0.2% | |
| | 130,000 | | | C | | CVS Caremark Corp.,
5.750%, due 08/15/11 | | | 133,272 | | |
| | 85,000 | | | C | | CVS Caremark Corp.,
5.750%, due 06/01/17 | | | 85,701 | | |
| | 430,245 | | | #,C | | CVS Lease Pass-Through,
6.036%, due 12/10/28 | | | 414,312 | | |
| | 10,000 | | | C | | Federated Department Stores,
6.900%, due 04/01/29 | | | 9,183 | | |
| | 680,000 | | | C | | Home Depot, Inc.,
5.116%, due 12/16/09 | | | 666,503 | | |
| | 380,000 | | | C | | Yum! Brands, Inc.,
8.875%, due 04/15/11 | | | 419,450 | | |
| | | | 1,728,421 | | |
| | | | | Savings & Loans: 0.2% | |
| | 830,000 | | | | | Sovereign Bancorp., Inc.,
5.114%, due 03/23/10 | | | 824,046 | | |
| | 225,000 | | | | | Washington Mutual Bank,
5.500%, due 01/15/13 | | | 199,853 | | |
| | 300,000 | | | #,C | | Washington Mutual
Preferred Funding II,
6.665%, due 12/29/49 | | | 177,258 | | |
| | 260,000 | | | | | Washington Mutual, Inc.,
8.250%, due 04/01/10 | | | 248,412 | | |
| | | | 1,449,569 | | |
| | | | | Semiconductors: 0.2% | |
| | 1,927,000 | | | #,C | | Linear Technology Corp.,
3.000%, due 05/01/27 | | | 1,842,694 | | |
| | | | 1,842,694 | | |
| | | | | Telecommunications: 0.6% | |
| | 2,100,000 | | | @@,C | | Amdocs Ltd.,
0.500%, due 03/15/24 | | | 2,144,625 | | |
| | 200,000 | | | C | | AT&T Corp.,
8.000%, due 11/15/31 | | | 246,341 | | |
| | 270,000 | | | C | | AT&T, Inc.,
6.150%, due 09/15/34 | | | 270,428 | | |
| | 740,000 | | | C | | AT&T, Inc.,
6.300%, due 01/15/38 | | | 754,385 | | |
| | 535,000 | | | @@,C | | France Telecom SA,
8.500%, due 03/01/31 | | | 695,720 | | |
| | 440,000 | | | C | | Sprint Capital Corp.,
8.750%, due 03/15/32 | | | 497,300 | | |
| | 630,000 | | | @@,C | | Telecom Italia Capital SA,
4.000%, due 01/15/10 | | | 617,340 | | |
| | 55,000 | | | @@,C | | Telecom Italia Capital SA,
4.875%, due 10/01/10 | | | 54,748 | | |
| | 515,000 | | | @@,C | | Telefonica Europe BV,
8.250%, due 09/15/30 | | | 637,717 | | |
| | | | 5,918,604 | | |
Principal
Amount | | | | | | Value | |
| | | | | Transportation: 0.1% | |
| $ | 470,000 | | | C | | Burlington Northern
Santa Fe Corp.,
6.125%, due 03/15/09 | | $ | 476,333 | | |
| | 585,000 | | | | | Union Pacific Corp.,
6.625%, due 02/01/08 | | | 585,481 | | |
| | | | 1,061,814 | | |
Total Corporate Bonds/Notes
(Cost $63,653,562) | | | 62,902,549 | | |
| U.S. GOVERNMENT AGENCY OBLIGATIONS: 1.3% | | | |
| | | | | | | Federal Home LoanMortgage
Corporation: 0.7% | | | | | |
| | 2,150,000 | | | | | 6.250%, due 07/15/32 | | | 2,561,686 | | |
| | 3,200,000 | | | | | 6.750%, due 03/15/31 | | | 4,022,704 | | |
| | | | 6,584,390 | | |
| | | | | | | Federal National Mortgage
Corporation: 0.6% | | | | | |
| | 4,850,000 | | | | | 6.625%, due 11/15/30 | | | 6,004,266 | | |
| | | | 6,004,266 | | |
Total U.S. Government
Agency Obligations
(Cost $11,575,561) | | | 12,588,656 | | |
| U.S. TREASURY OBLIGATIONS: 14.9% | | | |
| | | | | U.S. Treasury Bonds: 8.6% | |
| | 5,000,000 | | | | | 3.875%, due 02/15/13 | | | 5,101,565 | | |
| | 6,350,000 | | | | | 4.000%, due 02/15/14 | | | 6,489,408 | | |
| | 19,650,000 | | | | | 4.000%, due 02/15/15 | | | 19,934,021 | | |
| | 27,140,000 | | | | | 4.250%, due 08/15/13 | | | 28,138,671 | | |
| | 4,500,000 | | | | | 4.250%, due 11/15/13 | | | 4,666,995 | | |
| | 9,525,000 | | | | | 4.250%, due 11/15/14 | | | 9,829,362 | | |
| | 2,000,000 | | | | | 4.250%, due 08/15/15 | | | 2,053,438 | | |
| | 700,000 | | | | | 5.375%, due 02/15/31 | | | 788,868 | | |
| | 500,000 | | | | | 6.000%, due 08/15/09 | | | 523,008 | | |
| | 1,325,000 | | | | | 6.250%, due 05/15/30 | | | 1,653,974 | | |
| | 2,200,000 | | | | | 9.000%, due 11/15/18 | | | 3,111,282 | | |
| | | | 82,290,592 | | |
| | | | | U.S. Treasury Notes: 6.2% | |
| | 2,000,000 | | | | | 3.250%, due 01/15/09 | | | 2,004,064 | | |
| | 12,000,000 | | | | | 3.875%, due 05/15/09 | | | 12,129,384 | | |
| | 9,975,000 | | | | | 4.500%, due 02/28/11 | | | 10,393,491 | | |
| | 750,000 | | | | | 4.625%, due 08/31/11 | | | 785,391 | | |
| | 6,000,000 | | | | | 4.625%, due 02/29/12 | | | 6,298,128 | | |
| | 2,875,000 | | | | | 4.875%, due 05/31/08 | | | 2,893,420 | | |
| | 19,500,000 | | | | | 4.875%, due 05/15/09 | | | 19,966,187 | | |
| | 4,000,000 | | | | | 5.125%, due 06/30/08 | | | 4,034,376 | | |
| | 900,000 | | | | | 5.125%, due 06/30/11 | | | 956,462 | | |
| | | | 59,460,903 | | |
| | | | | U.S. Treasury STRIP: 0.1% | |
| | 3,100,000 | | | ^ | | 4.630%, due 05/15/25 | | | 1,378,449 | | |
| | | | 1,378,449 | | |
Total U.S. Treasury Obligations
(Cost $139,151,402) | | | 143,129,944 | | |
See Accompanying Notes to Financial Statements
287
ING VAN KAMPEN EQUITY AND PORTFOLIO OF INVESTMENTS
INCOME PORTFOLIO AS OF DECEMBER 31, 2007 (CONTINUED)
Principal
Amount | | | | | | Value | |
| ASSET-BACKED SECURITIES: 2.2% | | | |
| | | | | | | Automobile Asset-Backed
Securities: 1.4% | | | | | |
| $ | 267,907 | | | C | | Capital Auto Receivables
Asset Trust,
4.050%, due 07/15/09 | | $ | 267,677 | | |
| | 1,350,000 | | | C | | Capital Auto Receivables
Asset Trust,
4.980%, due 05/15/11 | | | 1,355,185 | | |
| | 349,112 | | | C | | Capital Auto Receivables
Asset Trust,
5.030%, due 10/15/09 | | | 349,350 | | |
| | 1,300,000 | | | C | | Capital Auto Receivables
Asset Trust,
5.088%, due 07/15/10 | | | 1,291,115 | | |
| | 1,550,000 | | | #,C | | Capital Auto Receivables
Asset Trust,
5.310%, due 10/20/09 | | | 1,552,462 | | |
| | 700,000 | | | C | | Capital One Auto Finance Trust,
5.070%, due 07/15/11 | | | 702,007 | | |
| | 197,581 | | | C | | Daimler Chrysler Auto Trust,
4.040%, due 09/08/09 | | | 197,400 | | |
| | 454,879 | | | C | | Ford Credit Auto Owner Trust,
5.050%, due 03/15/10 | | | 455,682 | | |
| | 1,225,000 | | | C | | Ford Credit Auto Owner Trust,
5.260%, due 10/15/10 | | | 1,230,765 | | |
| | 969,350 | | | C | | Harley-Davidson
Motorcycle Trust,
3.760%, due 12/17/12 | | | 960,671 | | |
| | 804,832 | | | C | | Harley-Davidson
Motorcycle Trust,
4.070%, due 02/15/12 | | | 801,061 | | |
| | 1,000,000 | | | C | | Harley-Davidson
Motorcycle Trust,
4.410%, due 06/15/12 | | | 997,615 | | |
| | 600,000 | | | #,C | | Hertz Vehicle Financing, LLC,
4.930%, due 02/25/10 | | | 601,489 | | |
| | 24,501 | | | C | | Honda Auto Receivables
Owner Trust,
3.930%, due 01/15/09 | | | 24,495 | | |
| | 518,885 | | | C | | Honda Auto Receivables
Owner Trust,
4.850%, due 10/19/09 | | | 518,980 | | |
| | 294,919 | | | C | | Merrill Auto Trust Securitization,
4.100%, due 08/25/09 | | | 294,530 | | |
| | 373,107 | | | C | | Nissan Auto Receivables
Owner Trust,
3.990%, due 07/15/09 | | | 372,163 | | |
| | 280,905 | | | C | | USAA Auto Owner Trust,
3.580%, due 02/15/11 | | | 280,655 | | |
| | 116,975 | | | C | | USAA Auto Owner Trust,
3.900%, due 07/15/09 | | | 116,885 | | |
| | 164,438 | | | C | | Wachovia Auto Owner Trust,
4.060%, due 09/21/09 | | | 164,051 | | |
| | 494,103 | | | C | | Wachovia Auto Owner Trust,
4.790%, due 04/20/10 | | | 493,943 | | |
| | | | 13,028,181 | | |
| | | | | | | Credit Card Asset-Backed
Securities: 0.4% | | | | | |
| | 650,000 | | | C | | Capital One Multi-Asset
Execution Trust,
5.750%, due 07/15/20 | | | 657,516 | | |
Principal
Amount | | | | | | Value | |
| $ | 800,000 | | | C | | Chase Issuance Trust,
5.120%, due 10/15/14 | | $ | 820,289 | | |
| | 1,175,000 | | | | | Citibank Credit Card
Issuance Trust,
4.874%, due 03/22/12 | | | 1,168,802 | | |
| | 850,000 | | | C | | Citibank Credit Card
Issuance Trust,
5.650%, due 09/20/19 | | | 863,813 | | |
| | 750,000 | | | C | | Discover Card Master Trust,
5.650%, due 03/16/20 | | | 764,766 | | |
| | | | 4,275,186 | | |
| | | | | | | Other Asset-Backed
Securities: 0.4% | | | | | |
| | 1,083,613 | | | C | | Caterpillar Financial Asset Trust,
5.570%, due 05/25/10 | | | 1,090,645 | | |
| | 750,000 | | | C | | CIT Equipment Collateral,
5.070%, due 02/20/10 | | | 750,212 | | |
| | 40,167 | | | C | | CNH Equipment Trust,
4.020%, due 04/15/09 | | | 40,150 | | |
| | 598,723 | | | C | | CNH Equipment Trust,
4.270%, due 01/15/10 | | | 596,539 | | |
| | 590,927 | | | C | | CNH Equipment Trust,
5.200%, due 06/15/10 | | | 592,931 | | |
| | 377,436 | | | #,C | | GE Equipment Small Ticket, LLC,
4.380%, due 07/22/09 | | | 377,181 | | |
| | 591,936 | | | #,C | | GE Equipment Small Ticket, LLC,
4.880%, due 10/22/09 | | | 592,937 | | |
| | | | 4,040,595 | | |
Total Asset-Backed Securities
(Cost $21,281,680) | | | 21,343,962 | | |
Total Long-Term Investments
(Cost $860,963,531) | | | 940,670,318 | | |
| SHORT-TERM INVESTMENTS: 5.5% | | | |
| | | | | Commercial Paper: 0.0% | |
| | 150,000 | | | | | HSBC Finance Corp.,
6.400%, due 06/17/08 | | | 150,716 | | |
Total Commercial Paper
(Cost $151,784) | | | 150,716 | | |
| | | | | | | U.S. Government Agency
Obligations: 5.5% | | | | | |
| | 50,100,000 | | | Z | | Federal Home Loan Bank,
3.050%, due 01/02/08 | | | 50,090,954 | | |
| | 2,500,000 | | | Z | | Federal Home Loan Bank,
4.260%, due 01/11/08 | | | 2,496,677 | | |
Total U.S. Government Agency
Obligations (Cost $52,587,631) | | | 52,587,631 | | |
Total Short-Term Investments
(Cost $52,739,415) | | | 52,738,347 | | |
Total Investments in
Securities (Cost
$913,702,946)* | | | 103.6 | % | | $ | 993,408,665 | | |
Other Assets and
Liabilities - Net | | | (3.6 | ) | | | (34,343,082 | ) | |
| Net Assets | | | 100.0 | % | | $ | 959,065,583 | | |
@ Non-income producing security
@@ Foreign Issuer
ADR American Depositary Receipt
STRIP Separate Trading of Registered Interest and Principal of Securities
See Accompanying Notes to Financial Statements
288
ING VAN KAMPEN EQUITY AND PORTFOLIO OF INVESTMENTS
INCOME PORTFOLIO AS OF DECEMBER 31, 2007 (CONTINUED)
+ Step-up basis bonds. Interest rates shown reflect current and next coupon rates.
# Securities with purchases pursuant to Rule144A or section 4(2), under the Securities Act of 1933 and may
Not be resold subject to that rule except to qualified institutional buyers. Unless otherwise
Noted, these securities have been determined to be liquid under the guidelines established
By the Funds' Board of Directors/Trustees.
C Bond may be called prior to maturity date.
P Preferred Stock may be called prior to convertible date.
^ Interest Only (IO) Security
Z Indicates Zero Coupon Bond; rate shown reflects current effective yield.
* Cost for federal income tax purposes is $917,759,532
| Net unrealized appreciation consists of: | |
| Gross Unrealized Appreciation | | $ | 122,540,258 | | |
| Gross Unrealized Depreciation | | | (46,891,125 | ) | |
| Net Unrealized Appreciation | | $ | 75,649,133 | | |
See Accompanying Notes to Financial Statements
289
TAX INFORMATION (UNAUDITED)
Dividends paid during the year ended December 31, 2007 were as follows:
| Fund Name | | Type | | Per Share Amount | |
ING American Century Large
Company Value Portfolio | |
| Class ADV | | NII | | $ | 0.1578 | | |
| Class I | | NII | | $ | 0.2557 | | |
| Class S | | NII | | $ | 0.2005 | | |
| All Classes | | STCG | | $ | 0.1374 | | |
| All Classes | | LTCG | | $ | 0.9673 | | |
ING American Century Small-Mid Cap
Value Portfolio | |
| Class ADV | | NII | | $ | 0.0254 | | |
| Class I | | NII | | $ | 0.0896 | | |
| Class S | | NII | | $ | 0.0552 | | |
| All Classes | | STCG | | $ | 1.1643 | | |
| All Classes | | LTCG | | $ | 0.5727 | | |
ING Columbia Small Cap
Value II Portfolio | |
| Class ADV | | NII | | $ | 0.0169 | | |
| Class I | | NII | | $ | 0.0165 | | |
| Class S | | NII | | $ | 0.0119 | | |
ING Davis New York Venture
Portfolio | |
| Class ADV | | NII | | $ | — | | |
| Class I | | NII | | $ | 0.0721 | | |
| Class S | | NII | | $ | 0.0513 | | |
| All Classes | | STCG | | $ | 0.0701 | | |
| All Classes | | LTCG | | $ | 0.0069 | | |
ING JPMorgan International
Portfolio | |
| Class ADV | | NII | | $ | 0.3392 | | |
| Class I | | NII | | $ | 0.3746 | | |
| Class S | | NII | | $ | 0.3074 | | |
ING JPMorgan Mid Cap
Value Portfolio | |
| Class ADV | | NII | | $ | 0.0722 | | |
| Class I | | NII | | $ | 0.1239 | | |
| Class S | | NII | | $ | 0.0889 | | |
| All Classes | | STCG | | $ | 0.1480 | | |
| All Classes | | LTCG | | $ | 0.6541 | | |
ING Legg Mason Partners Large Cap
Growth Portfolio | |
| All Classes | | LTCG | | $ | 0.1625 | | |
ING Lord Abbett U.S. Government
Securities Portfolio | |
| Class ADV | | NII | | $ | — | | |
| Class I | | NII | | $ | 0.5240 | | |
| Class S | | NII | | $ | 0.4953 | | |
ING Neuberger Berman
Partners Portfolio | |
| Class ADV | | NII | | $ | 0.0330 | | |
| Class I | | NII | | $ | 0.0329 | | |
| Class S | | NII | | $ | 0.0269 | | |
| All Classes | | STCG | | $ | 0.0701 | | |
| All Classes | | LTCG | | $ | 0.4649 | | |
ING Neuberger Berman
Regency Portfolio | |
| Class ADV | | NII | | $ | — | | |
| Class I | | NII | | $ | 0.0519 | | |
| Class S | | NII | | $ | 0.0288 | | |
| All Classes | | ROC | | $ | 0.0501 | | |
| All Classes | | STCG | | $ | 0.0178 | | |
| All Classes | | LTCG | | $ | 0.0006 | | |
| ING OpCap Balanced Value Portfolio | |
| Class ADV | | NII | | $ | 0.0783 | | |
| Class I | | NII | | $ | 0.2536 | | |
| Class S | | NII | | $ | 0.2043 | | |
| All Classes | | STCG | | $ | 0.2245 | | |
| All Classes | | LTCG | | $ | 1.4712 | | |
| Fund Name | | Type | | Per Share Amount | |
| ING Oppenheimer Global Portfolio | |
| Class ADV | | NII | | $ | 0.1068 | | |
| Class I | | NII | | $ | 0.1903 | | |
| Class S | | NII | | $ | 0.1708 | | |
| All Classes | | STCG | | $ | 0.1573 | | |
| All Classes | | LTCG | | $ | 0.5554 | | |
ING Oppenheimer Strategic
Income Portfolio | |
| Class ADV | | NII | | $ | 0.5059 | | |
| Class I | | NII | | $ | 0.5199 | | |
| Class S | | NII | | $ | 0.4946 | | |
| ING PIMCO Total Return Portfolio | |
| Class ADV | | NII | | $ | 0.3631 | | |
| Class I | | NII | | $ | 0.4114 | | |
| Class S | | NII | | $ | 0.3873 | | |
| ING Pioneer High Yield Portfolio | |
| Class ADV | | NII | | $ | 0.5410 | | |
| Class I | | NII | | $ | 0.5927 | | |
| Class S | | NII | | $ | 0.5669 | | |
ING T. Rowe Price Diversified Mid Cap
Growth Portfolio | |
| Class ADV | | NII | | $ | — | | |
| Class I | | NII | | $ | 0.0192 | | |
| Class S | | NII | | $ | — | | |
| All Classes | | STCG | | $ | 0.1598 | | |
| All Classes | | LTCG | | $ | 0.7243 | | |
ING T. Rowe Price Growth
Equity Portfolio | |
| Class ADV | | NII | | $ | 0.0307 | | |
| Class I | | NII | | $ | 0.3092 | | |
| Class S | | NII | | $ | 0.1318 | | |
| All Classes | | STCG | | $ | 0.4819 | | |
| All Classes | | LTCG | | $ | 2.4461 | | |
ING Templeton Foreign
Equity Portfolio | |
| Class ADV | | NII | | $ | 0.1312 | | |
| Class I | | NII | | $ | 0.1307 | | |
| Class S | | NII | | $ | 0.1048 | | |
| All Classes | | STCG | | $ | 0.0349 | | |
| All Classes | | LTCG | | $ | 0.0700 | | |
| ING Thornburg Value Portfolio | |
| Class ADV | | NII | | $ | 0.1330 | | |
| Class I | | NII | | $ | 0.1542 | | |
| Class S | | NII | | $ | 0.1470 | | |
ING UBS U.S. Large Cap
Equity Portfolio | |
| Class ADV | | NII | | $ | 0.0695 | | |
| Class I | | NII | | $ | 0.0769 | | |
| Class S | | NII | | $ | 0.0684 | | |
ING UBS U.S. Small Cap
Growth Portfolio | |
| All Classes | | STCG | | $ | 0.6006 | | |
| ING Van Kampen Comstock Portfolio | |
| Class ADV | | NII | | $ | 0.1559 | | |
| Class I | | NII | | $ | 0.2050 | | |
| Class S | | NII | | $ | 0.1639 | | |
| All Classes | | STCG | | $ | 0.0352 | | |
| All Classes | | LTCG | | $ | 0.3282 | | |
ING Van Kampen Equity and
Income Portfolio | |
| Class ADV | | NII | | $ | 0.7846 | | |
| Class I | | NII | | $ | 0.9743 | | |
| Class S | | NII | | $ | 0.8940 | | |
| All Classes | | STCG | | $ | 0.3175 | | |
| All Classes | | LTCG | | $ | 0.7819 | | |
NII — Net investment income
ROC — Return of capital
STCG — Short-term capital gain
LTCG — Long-term capital gain
290
TAX INFORMATION (UNAUDITED) (CONTINUED)
Of the ordinary distributions made during the year ended December 31, 2007, the following percentages qualify for the dividends received deduction (DRD) available to corporate shareholders:
| ING American Century Large Company Value Portfolio | | | 91.17 | % | |
| ING American Century Small-Mid Cap Value Portfolio | | | 11.99 | % | |
| ING Columbia Small Cap Value II Portfolio | | | 99.45 | % | |
| ING Davis New York Venture Portfolio | | | 76.69 | % | |
| ING JPMorgan Mid Cap Value Portfolio | | | 95.60 | % | |
| ING Neuberger Berman Partners Portfolio | | | 41.40 | % | |
| ING Neuberger Berman Regency Portfolio | | | 87.85 | % | |
| ING OpCap Balanced Value Portfolio | | | 38.06 | % | |
| ING Oppenheimer Global Portfolio | | | 15.49 | % | |
| ING Oppenheimer Strategic Income Portfolio | | | 0.54 | % | |
| ING Pioneer High Yield Portfolio | | | 2.17 | % | |
| ING T. Rowe Price Diversified Mid Cap Growth Portfolio | | | 37.89 | % | |
| ING T. Rowe Price Growth Equity Portfolio | | | 64.17 | % | |
| ING Templeton Foreign Equity Portfolio | | | 0.14 | % | |
| ING Thornburg Value Portfolio | | | 100.00 | % | |
| ING UBS U.S. Large Cap Equity Portfolio | | | 100.00 | % | |
| ING UBS U.S. Small Cap Growth Portfolio | | | 2.55 | % | |
| ING Van Kampen Comstock Portfolio | | | 98.84 | % | |
| ING Van Kampen Equity and Income Portfolio | | | 38.73 | % | |
Pursuant to Section 853 of the Internal Revenue Code, the Portfolios designate the following amounts as foreign taxes paid for the year ended December 31, 2007. Foreign taxes paid for purposes of Section 853 may be less than actual foreign taxes paid for financial statement purposes.
| | | Foreign Taxes
Paid | | Per Share
Amount | |
| ING JPMorgan International Portfolio | | $ | 1,905,234 | | | $ | 0.0513 | | |
| ING Oppenheimer Global Portfolio | | $ | 3,491,628 | | | $ | 0.0224 | | |
| ING Templeton Foreign Equity Portfolio | | $ | 162,181 | | | $ | 0.0124 | | |
Listed below are the detail by country and per share amounts related to the foreign tax credit.
ING JPMorgan International Portfolio
| Country | | Gross
Income | | Gross
Income
Per Share | | Foreign Taxes
Paid Under
Section 853 | | Foreign Tax
Credit
Per Share | |
| Australia | | $ | 237,764 | | | $ | 0.0064 | | | $ | — | | | $ | — | | |
| Belgium | | | 595,444 | | | | 0.0160 | | | | 89,317 | | | | 0.0024 | | |
| Bermuda | | | 244,778 | | | | 0.0066 | | | | — | | | | — | | |
| Brazil | | | 416,630 | | | | 0.0112 | | | | — | | | | — | | |
| Egypt | | | 18,649 | | | | 0.0005 | | | | — | | | | — | | |
| Finland | | | 265,469 | | | | 0.0071 | | | | 39,820 | | | | 0.0011 | | |
| France | | | 3,584,725 | | | | 0.0965 | | | | 537,259 | | | | 0.0145 | | |
| Germany | | | 949,165 | | | | 0.0256 | | | | 96,773 | | | | 0.0026 | | |
| Greece | | | 54,065 | | | | 0.0015 | | | | — | | | | — | | |
| Ireland | | | 214,510 | | | | 0.0058 | | | | — | | | | — | | |
| Italy | | | 2,059,513 | | | | 0.0555 | | | | 308,927 | | | | 0.0083 | | |
| Japan | | | 2,077,110 | | | | 0.0559 | | | | 145,399 | | | | 0.0039 | | |
| Mexico | | | 41,605 | | | | 0.0011 | | | | — | | | | — | | |
| Netherlands | | | 667,265 | | | | 0.0180 | | | | 100,090 | | | | 0.0027 | | |
| South Korea | | | 63,641 | | | | 0.0017 | | | | 10,475 | | | | 0.0003 | | |
| Spain | | | 475,350 | | | | 0.0128 | | | | 71,260 | | | | 0.0019 | | |
| Sweden | | | 282,809 | | | | 0.0076 | | | | 42,893 | | | | 0.0012 | | |
| Switzerland | | | 2,842,808 | | | | 0.0765 | | | | 425,889 | | | | 0.0114 | | |
| Taiwan | | | 185,665 | | | | 0.0050 | | | | 37,133 | | | | 0.0010 | | |
| United Kingdom | | | 6,039,936 | | | | 0.1626 | | | | — | | | | — | | |
| Total | | $ | 21,316,900 | | | | | | | $ | 1,905,234 | | | $ | 0.0513 | | |
| Other Domestic Income | | | 1,324,842 | | | | | | | | | | | | | | |
| Total | | $ | 22,641,742 | | | | | | | | | | | | | | |
291
TAX INFORMATION (UNAUDITED) (CONTINUED)
ING Oppenheimer Global Portfolio
| Country | | Gross
Income | | Gross
Income
Per Share | | Foreign Taxes
Paid Under
Section 853 | | Foreign Tax
Credit
Per Share | |
| Australia | | $ | 12,471 | | | $ | 0.0001 | | | $ | — | | | $ | — | | |
| Bermuda | | | 75,168 | | | | 0.0005 | | | | — | | | | — | | |
| Brazil | | | 975,163 | | | | 0.0062 | | | | — | | | | — | | |
| Canada | | | 1,235,747 | | | | 0.0079 | | | | 185,362 | | | | 0.0012 | | |
| Cayman Islands | | | 11,939,344 | | | | 0.0765 | | | | — | | | | — | | |
| Denmark | | | 130,183 | | | | 0.0008 | | | | 17,985 | | | | 0.0001 | | |
| Finland | | | 1,061,719 | | | | 0.0068 | | | | 159,258 | | | | 0.0010 | | |
| France | | | 5,080,908 | | | | 0.0326 | | | | 762,115 | | | | 0.0049 | | |
| Germany | | | 2,689,254 | | | | 0.0172 | | | | 402,152 | | | | 0.0026 | | |
| Hong Kong | | | 158,553 | | | | 0.0010 | | | | — | | | | — | | |
| India | | | 1,027,052 | | | | 0.0066 | | | | — | | | | — | | |
| Italy | | | 365,044 | | | | 0.0023 | | | | 54,757 | | | | 0.0004 | | |
| Japan | | | 3,595,766 | | | | 0.0230 | | | | 251,783 | | | | 0.0016 | | |
| Mexico | | | 1,404,348 | | | | 0.0090 | | | | — | | | | — | | |
| Netherlands | | | 827,975 | | | | 0.0053 | | | | 118,254 | | | | 0.0008 | | |
| Norway | | | 105,324 | | | | 0.0007 | | | | 15,799 | | | | 0.0001 | | |
| Panama | | | 989,325 | | | | 0.0063 | | | | — | | | | — | | �� |
| Singapore | | | 101,788 | | | | 0.0007 | | | | — | | | | — | | |
| South Korea | | | 1,245,417 | | | | 0.0080 | | | | 205,494 | | | | 0.0013 | | |
| Spain | | | 540,522 | | | | 0.0035 | | | | 81,078 | | | | 0.0005 | | |
| Sweden | | | 4,071,638 | | | | 0.0261 | | | | 610,337 | | | | 0.0039 | | |
| Switzerland | | | 1,863,109 | | | | 0.0119 | | | | 250,728 | | | | 0.0016 | | |
| Taiwan | | | 1,887,109 | | | | 0.0121 | | | | 376,526 | | | | 0.0024 | | |
| United Kingdom | | | 10,968,875 | | | | 0.0703 | | | | — | | | | — | | |
| Total | | $ | 52,351,803 | | | | | | | $ | 3,491,628 | | | $ | 0.0224 | | |
| Other Domestic Income | | | 13,288,542 | | | | | | | | | | | | | | |
| Total | | $ | 65,640,345 | | | | | | | | | | | | | | |
ING Templeton Foreign Equity Portfolio
| Country | | Gross
Income | | Gross
Income
Per Share | | Foreign Taxes
Paid Under
Section 853 | | Foreign Tax
Credit
Per Share | |
| Australia | | $ | 72,276 | | | $ | 0.0055 | | | $ | — | | | $ | — | | |
| Austria | | | 24,209 | | | | 0.0018 | | | | 3,631 | | | | 0.0003 | | |
| Belgium | | | 10,950 | | | | 0.0008 | | | | 1,598 | | | | 0.0001 | | |
| Brazil | | | 24,649 | | | | 0.0019 | | | | — | | | | — | | |
| Canada | | | 21,787 | | | | 0.0017 | | | | 2,942 | | | | 0.0002 | | |
| Cayman Islands | | | 1,272 | | | | 0.0001 | | | | — | | | | — | | |
| China | | | 51,005 | | | | 0.0039 | | | | — | | | | — | | |
| European Community | | | 214 | | | | 0.0000 | | | | — | | | | — | | |
| Finland | | | 59,835 | | | | 0.0046 | | | | 8,975 | | | | 0.0007 | | |
| France | | | 255,615 | | | | 0.0195 | | | | 35,161 | | | | 0.0027 | | |
| Germany | | | 151,062 | | | | 0.0115 | | | | 16,354 | | | | 0.0013 | | |
| Hong Kong | | | 49,350 | | | | 0.0038 | | | | — | | | | — | | |
| India | | | 17,188 | | | | 0.0013 | | | | — | | | | — | | |
| Italy | | | 157,673 | | | | 0.0120 | | | | 23,651 | | | | 0.0018 | | |
| Japan | | | 28,819 | | | | 0.0022 | | | | 2,017 | | | | 0.0002 | | |
| Mexico | | | 13,793 | | | | 0.0011 | | | | — | | | | — | | |
| Netherlands | | | 93,949 | | | | 0.0072 | | | | 13,765 | | | | 0.0010 | | |
| Norway | | | 20,936 | | | | 0.0016 | | | | 3,141 | | | | 0.0002 | | |
| Portugal | | | 28,129 | | | | 0.0021 | | | | 4,219 | | | | 0.0003 | | |
| Singapore | | | 72,826 | | | | 0.0055 | | | | — | | | | — | | |
| South Africa | | | 5,508 | | | | 0.0004 | | | | — | | | | — | | |
| South Korea | | | 62,675 | | | | 0.0048 | | | | 10,281 | | | | 0.0008 | | |
| Spain | | | 131,763 | | | | 0.0100 | | | | 19,649 | | | | 0.0015 | | |
| Sweden | | | 20,830 | | | | 0.0016 | | | | 3,125 | | | | 0.0002 | | |
| Switzerland | | | 65,807 | | | | 0.0050 | | | | 9,936 | | | | 0.0008 | | |
| Taiwan | | | 18,686 | | | | 0.0014 | | | | 3,737 | | | | 0.0003 | | |
| United Kingdom | | | 680,340 | | | | 0.0518 | | | | — | | | | — | | |
| Total | | $ | 2,141,146 | | | | | | | $ | 162,181 | | | $ | 0.0124 | | |
| Other Domestic Income | | | 573,125 | | | | | | | | | | | | | | |
| Total | | $ | 2,714,271 | | | | | | | | | | | | | | |
Foreign taxes paid or withheld should be included in taxable income with an offsetting deduction from gross income or as a credit for taxes paid to foreign governments. Shareholders are strongly advised to consult their own tax advisors regarding the appropriate treatment of foreign taxes paid.
Above figures may differ from those cited elsewhere in this report due to differences in the calculation of income and gains under U.S. generally accepted accounting principles (book) purposes and Internal Revenue Service (tax) purposes.
Shareholders are strongly advised to consult their own tax advisers with respect to the tax consequences of their investments in the Portfolios. In January, shareholders, excluding corporate shareholders, receive an IRS 1099-DIV regarding the federal tax status of the dividends and distributions they received in the calendar year.
292
DIRECTOR AND OFFICER INFORMATION (UNAUDITED)
The business and affairs of the Fund are managed under the direction of the Fund's Board. A Director who is not an interested person of the Fund, as defined in the 1940 Act, is an independent director ("Independent Director"). The Directors and Officers of the Fund are listed below. The Statement of Additional Information includes additional information about directors of the Fund and is available, without charge, upon request at (800) 992-0180.
Name, Address
and Age | | Position(s)
Held with
Fund | | Term of
Office and
Length of
Time
Served(1) | | Principal
Occupation(s)
During the
Past Five Years | | Number of
Portfolios in
Fund Complex
Overseen
by Director | | Other
Directorships
Held by
Director | |
| Independent Directors: | |
|
Colleen D. Baldwin
7337 E. Doubletree Ranch Rd.
Scottsdale, Arizona 85258
Age: 47 | | Director | | November 2007 -Present | | Consultant (January 2005 - Present). Formerly, Chief Operating Officer, Ivy Asset Management Group (April 2002 - October 2004). Chief Operating Officer, AIG Global Investment Group. (May 1995 - January 2002). | | | 179 | | | None | |
|
John V. Boyer
7337 E. Doubletree Ranch Rd.
Scottsdale, Arizona 85258
Age: 54 | | Director | | November 1997 -Present | | Consultant (July 2007 - Present). Formerly, President and Chief Executive Officer, Franklin and Eleanor Roosevelt Institute (March 2006 - July 2007), and Executive Director, The Mark Twain House & Museum(2) (September 1989 - November 2005). | | | 179 | | | None | |
|
Patricia W. Chadwick
7337 E. Doubletree Ranch Rd.
Scottsdale, Arizona 85258
Age: 59 | | Director | | January 2006 - Present | | Consultant and President of self-owned company, Ravengate Partners LLC (January 2000 - Present). | | | 179 | | | Wisconsin Energy (June 2006 - Present). | |
|
Peter S. Drotch
7337 E. Doubletree Ranch Rd.
Scottsdale, Arizona 85258
Age: 66 | | Director | | November 2007 - Present | | Retired partner. PricewaterhouseCoopers. | | | 179 | | | First Marblehead Corporation,(October 2003 - Present); BlackRock Funds/State Street Research Funds, Trustee (February 2004 - January 2007); Tufts Health Plan, Director (June 2006 - Present); and University of Connecticut, Trustee (November 2004 - Present) | |
|
J. Michael Earley
7337 E. Doubletree Ranch Rd.
Scottsdale, Arizona 85258
Age: 62 | | Director | | January 2005 - Present | | President, Chief Executive Officer and Director, Bankers Trust Company, N.A., Des Moines (June 1992 - Present). | | | 179 | | | Midamerica Financial Corporation (December 2002 - Present). | |
|
Patrick W. Kenny
7337 E. Doubletree Ranch Rd.
Scottsdale, Arizona 85258
Age: 65 | | Director | | March 2002 - Present | | President and Chief Executive Officer, International Insurance Society (June 2001 - Present). | | | 179 | | | Assured Guaranty Ltd. (April 2004 - Present); and Odyssey Reinsurance Holdings (November 2006 - Present). | |
|
293
DIRECTOR AND OFFICER INFORMATION (UNAUDITED) (CONTINUED)
Name, Address
and Age | | Position(s)
Held with
Fund | | Term of
Office and
Length of
Time
Served(1) | | Principal
Occupation(s)
During the
Past Five Years | | Number of
Portfolios in
Fund Complex
Overseen
by Director | | Other
Directorships
Held by
Director | |
Sheryl K. Pressler
7337 E. Doubletree Ranch Rd.
Scottsdale, Arizona 85258
Age: 57 | | Director | | January 2006 - Present | | Consultant (May 2001 - Present). | | | 179 | | | Stillwater Mining Company (May 2002 - Present); California HealthCare Foundation (June 1999 - Present); and Romanian-American Enterprise Fund (February 2004 - Present). | |
|
David W. C. Putnam
7337 E. Doubletree Ranch Rd.
Scottsdale, Arizona 85258
Age: 68 | | Director | | January 2005 - Present | | Chair, Board of Directors and President, F. L. Putnam Securities Company, Inc. (June 1978 - Present). | | | 179 | | | Principled Equity Market Trust (December 1996 - Present); and Asian American Bank and Trust Company (June 1993 - Present). | |
|
Roger B. Vincent
7337 E. Doubletree Ranch Rd.
Scottsdale, Arizona 85258
Age: 62 | | Chairman/
Director | | January 2005 - Present | | President, Springwell Corporation (March 1989 - Present). | | | 179 | | | UGI Corporation (February 2006 - Present); and UGI Utilities, Inc. (February 2006 - Present). | |
|
| Directors who are "Interested Persons": | |
|
Robert W. Crispin(3)
7337 E. Doubletree Ranch Rd.
Scottsdale, Arizona 85258
Age: 61 | | Director | | November 2007 - Present | | Retired Chairman and Chief Investment Officer, ING Investment Management Co. (June 2001 - December 2007) | | | 179 | | | ING Life Insurance and Annuity Company (May 2006 - Present); ING USA Annuity and Life Insurance Company (May 2006 - Present); Midwestern United Life Insurance Company (May 2006 - Present); ReliaStar Life Insurance Company (May 2006 - Present); Security Life of Denver Insurance Company (May 2006 - Present); Belair Insurance Company Inc. (August 2005 - Present); The Nordic Insurance Company of Canada (February 2005 - Present); Trafalgar Insurance Company of Canada (February 2005 - Present); ING Novex Insurance Company of Canada (February 2005 - Present); Allianz Insurance Company of Canada (February 2005 - Present); ING Canada Inc. (December 2004 - Present); ING Bank, fsb (June 2001 - Present); ING Investment Management, Inc (June 2001 - December 2007); ING Insurance Company of Canada (June 2001 - Present ); Sul America S.A. (June 2001 - Present); and ING Foundation (March 2004 - Present) | |
|
294
DIRECTOR AND OFFICER INFORMATION (UNAUDITED) (CONTINUED)
Name, Address
and Age | | Position(s)
Held with
Fund | | Term of
Office and
Length of
Time
Served(1) | | Principal
Occupation(s)
During the
Past Five Years | | Number of
Portfolios in
Fund Complex
Overseen
by Director | | Other
Directorships
Held by
Director | |
Shaun P. Mathews(3)
7337 E. Doubletree Ranch Rd.
Scottsdale, Arizona 85258
Age: 52 | | Director | | November 2007 - Present | | President and Chief Executive Officer, ING Investments, LLC (December 2006 - Present), and Head of ING USFS Mutual Funds and Investment Products (October 2004 - Present). Formerly, CMO, ING USFS (April 2002 - October 2004), and Head of Rollover/Payout (October 2001 - December 2003). | | | 179 | | | Mark Twain House & Museum(2) (September 2002 - Present); Connecticut Forum (May 2002 - Present); Capital Community College Foundation (February 2002 - Present); ING Services Holding Company, Inc. (May 2000 - Present); Southland Life Insurance Company (June 2002 - Present); and ING Capital Corporation, LLC, ING Funds Distributor, LLC,(4) ING Funds Services, LLC,(5) ING Investments, LLC(6) and ING Pilgrim Funding, Inc. (March 2006 - Present). | |
|
(1) Directors serve until their successors are duly elected and qualified, subject to the Board's retirement policy which states that each duly elected or appointed Director who is not an "interested person" of the Fund, as defined in the 1940 Act ("Independent Directors"), shall retire from service as a Director at the conclusion of the first regularly scheduled meeting of the Board that is held after the Director reaches the age of 70. A unanimous vote of the Board may extend the retirement date of a Director for up to one year. An extension may be permitted if the retirement would trigger a requirement to hold a meeting of shareholders of the Fund under applicable law, whether for purposes of appointing a successor to the Director or if otherwise necessary under applicable law, in which case the extension would apply until such time as the shareholder meeting can be held or is no longer needed.
(2) Shaun Mathews, President, ING USFS Mutual Funds and Investment Products, has held a seat on the Board of Directors of The Mark Twain House & Museum since September 19, 2002. ING Groep N.V. makes non-material, charitable contributions to The Mark Twain House & Museum.
(3) Messrs. Mathews and Crispin are deemed to be "interested persons" of the Fund as defined in the 1940 Act because of their relationship with ING Groep, the parent corporation of the Adviser, ING Investments, LLC and the Distributor, ING Funds Distributor, LLC.
(4) ING Funds Distributor, LLC is the sucessor in interest to ING Funds Distributor, Inc., which was previously known as ING Pilgrim Securities, Inc., and before that was known as Pilgrim Securities, Inc., and before that was known as Pilgrim America Securities, Inc.
(5) ING Funds Services, LLC was previously named ING Pilgrim Group, LLC. ING Pilgrim Group, LLC is the sucessor in interest to ING Pilgrim Group, Inc., which was previously known as Pilgrim Group, Inc. and before that was known as Pilgrim America Group, Inc.
(6) ING Investments, LLC was previously named ING Pilgrim Investments, LLC. ING Pilgrim Investments, LLC is the sucessor in interest to ING Pilgrim Investments, Inc., which was previously known as Pilgrim Investments, Inc. and before that was known as Pilgrim America Investments, Inc.
295
DIRECTOR AND OFFICER INFORMATION (UNAUDITED) (CONTINUED)
Name, Address
and Age | | Position(s)
Held with the Fund | | Term of Office and
Length of Time Served(1) | | Principal Occupation(s) during the
Past Five Years | |
| Officers: | |
|
Shaun P. Mathews(5)
7337 East Doubletree Ranch Rd.
Scottsdale, Arizona 85258
Age: 52 | | President and Chief Executive Officer | | November 2006 - Present | | President and Chief Executive Officer, ING Investments, LLC(2) and ING Funds Services, LLC(3) (December 2006 - Present); and Head of ING USFS Mutual Funds and Investment Products (October 2004 - Present). Formerly, CMO, ING USFS (April 2002 - October 2004); and Head of Rollover/Payout (October 2001 - December 2003). | |
|
Michael J. Roland
7337 East Doubletree Ranch Rd.
Scottsdale, Arizona 85258
Age: 49 | | Executive Vice President | | January 2005 - Present | | Head of Mutual Fund Platform (February 2007 - Present); and Executive Vice President, ING Investments, LLC(2) and ING Funds Services, LLC(3) (December 2001 - Present). Formerly, Head of Product Management (January 2005 - January 2007); Chief Compliance Officer, ING Investments, LLC(2) and Directed Services, LLC(6) (October 2004 - December 2005); and Chief Financial Officer and Treasurer, ING Investments, LLC(2) (December 2001 - March 2005). | |
|
Stanley D. Vyner
230 Park Avenue
New York, New York 10169
Age: 57 | | Executive Vice President | | January 2005 - Present | | Executive Vice President, ING Investments, LLC(2) (July 2000 - Present); and Chief Investment Risk Officer, ING Investments, LLC(2) (January 2003 - Present). Formerly, Chief Investment Officer of International Investments (August 2000 - January 2003). | |
|
Joseph M. O'Donnell
7337 East Doubletree Ranch Rd.
Scottsdale, Arizona 85258
Age: 53 | | Chief Compliance Officer
Executive Vice President | | January 2005 - Present
March 2006 - Present | | Chief Compliance Officer of the ING Funds (November 2004 - Present), ING Investments, LLC(2) and Directed Services, LLC(6) (March 2006 - Present); and Executive Vice President of the ING Funds (March 2006 - Present). Formerly, Chief Compliance Officer of ING Life Insurance and Annuity Company (March 2006 - December 2006); Vice President, Chief Legal Counsel, Chief Compliance Officer and Secretary of Atlas Securities, Inc., Atlas Advisers, Inc. and Atlas Funds (October 2001 - October 2004). | |
|
Todd Modic
7337 East Doubletree Ranch Rd.
Scottsdale, Arizona 85258
Age: 40 | | Senior Vice President, Chief/Principal Financial Officer and Assistant Secretary | | March 2005 - Present | | Senior Vice President, ING Funds Services, LLC(3) (April 2005 - Present). Formerly, Vice President, ING Funds Services, LLC(3) (September 2002 - March 2005); and Director of Financial Reporting, ING Investments, LLC(2) (March 2001 - September 2002). | |
|
Kimberly A. Anderson
7337 East Doubletree Ranch Rd.
Scottsdale, Arizona 85258
Age: 43 | | Senior Vice President | | January 2005 - Present | | Senior Vice President, ING Investments, LLC(2) (October 2003 - Present). Formerly, Vice President and Assistant Secretary, ING Investments, LLC(2) (January 2001 - October 2003). | |
|
Ernest J. C'DeBaca
7337 East Doubletree Ranch Rd.
Scottsdale, Arizona 85258
Age: 38 | | Senior Vice President | | May 2006 - Present | | Senior Vice President, ING Investments, LLC(2) (December 2006 - Present); and ING Funds Services, LLC(3) (April 2006 (Present). Formerly, Counsel, ING Americas, U.S. Legal Services (January 2004 (March 2006); and Attorney-Adviser, U.S. Securities and Exchange Commission (May 2001 - December 2003). | |
|
296
DIRECTOR AND OFFICER INFORMATION (UNAUDITED) (CONTINUED)
Name, Address
and Age | | Position(s)
Held with the Fund | | Term of Office and
Length of Time Served(1) | | Principal Occupation(s) during the
Past Five Years | |
Robert Terris
7337 East Doubletree Ranch Rd.
Scottsdale, Arizona 85258
Age: 37 | | Senior Vice President | | May 2006 - Present | | Senior Vice President, Head of Division Operations, ING Funds (May 2006 - Present); and Vice President, Head of Division Operations, ING Funds Services, LLC(3) (March 2006 - Present). Formerly, Vice President of Administration, ING Funds Services, LLC(3) (October 2001 - March 2006). | |
|
Robyn L. Ichilov
7337 East Doubletree Ranch Rd.
Scottsdale, Arizona 85258
Age: 40 | | Vice President and Treasurer | | January 2005 - Present | | Vice President and Treasurer, ING Funds Services, LLC(3) (October 2001 - Present) and ING Investments, LLC(2) (August 1997 - Present). | |
|
Lauren D. Bensinger
7337 East Doubletree Ranch Rd.
Scottsdale, Arizona 85258
Age: 54 | | Vice President | | January 2005 - Present | | Vice President and Chief Compliance Officer, ING Funds Distributor, LLC(4) (July 1995 - Present); and Vice President, ING Investments, LLC(2) (February 1996 - Present); and Director of Compliance, ING Investments, LLC(2) (October 2004 - Present). Formerly, Chief Compliance Officer, ING Investments, LLC(2) (October 2001 - October 2004). | |
|
William Evans
10 State House Square
Hartford, Connecticut 06103
Age: 35 | | Vice President | | September 2007 - Present | | Vice President, Head of Mutual Fund Advisory Group (April 2007 - Present), Vice President, U.S. Mutual Funds and Investment Products (May 2005 - April 2007), Senior Fund Analyst, U.S. Mutual Funds and Investment Products (May 2002 - May 2005) | |
|
Maria M. Anderson
7337 East Doubletree Ranch Rd.
Scottsdale, Arizona 85258
Age: 49 | | Vice President | | January 2005 - Present | | Vice President, ING Funds Services, LLC(3) (September 2004 - Present). Formerly, Assistant Vice President, ING Funds Services, LLC(3) (October 2001 - September 2004); and Manager of Fund Accounting and Fund Compliance, ING Investments, LLC(2) (September 1999 - October 2001). | |
|
Denise Lewis
7337 East Doubletree Ranch Rd.
Scottsdale, Arizona 85258
Age: 44 | | Vice President | | January 2007 - Present | | Vice President, ING Funds Services, LLC(3) (December 2006 - Present). Formerly, Senior Vice President, UMB Investment Services Group, LLC (November 2003 - December 2006); and Vice President, Wells Fargo Funds Management, LLC (December 2000 - August 2003). | |
|
Kimberly K. Palmer
7337 East Doubletree Ranch Rd.
Scottsdale, Arizona 85258
Age: 50 | | Vice President | | March 2006 - Present | | Vice President, ING Funds Services, LLC(3) (March 2006 - Present). Formerly, Assistant Vice President, ING Funds Services, LLC(3) (August 2004 - March 2006); Manager, Registration Statements, ING Funds Services, LLC(3) (May 2003 - August 2004); Associate Partner, AMVESCAP PLC (October 2000 - May 2003); and Director of Federal Filings and Blue Sky Filings, INVESCO Funds Group, Inc. (March 1994 - May 2003). | |
|
Susan P. Kinens
7337 East Doubletree Ranch Rd.
Scottsdale, Arizona 85258
Age: 31 | | Assistant Vice President | | January 2005 - Present | | Assistant Vice President, ING Funds Services, LLC(3) (December 2002 - Present); and has held various other positions with ING Funds Services, LLC(3) for more than the last five years. | |
|
Huey P. Falgout, Jr.
7337 East Doubletree Ranch Rd.
Scottsdale, Arizona 85258
Age: 44 | | Secretary | | August 2003 - Present | | Chief Counsel, ING Americas, U.S. Legal Services (September 2003 - Present). Formerly, Counsel, ING Americas, U.S. Legal Services (November 2002 - September 2003); and Associate General Counsel of AIG American General (January 1999 - November 2002). | |
|
297
DIRECTOR AND OFFICER INFORMATION (UNAUDITED) (CONTINUED)
Name, Address
and Age | | Position(s)
Held with the Fund | | Term of Office and
Length of Time Served(1) | | Principal Occupation(s) during the
Past Five Years | |
Theresa K. Kelety
7337 East Doubletree Ranch Rd.
Scottsdale, Arizona 85258
Age: 44 | | Assistant Secretary | | August 2003 - Present | | Counsel, ING Americas, U.S. Legal Services (April 2003 - Present). Formerly, Senior Associate with Shearman & Sterling (February 2000 - April 2003). | |
|
(1) The officers hold office until the next annual meeting of the Directors and until their successors shall have been elected and qualified.
(2) ING Investments, LLC was previously named ING Pilgrim Investments, LLC. ING Pilgrim Investments, LLC is the sucessor in interest to ING Pilgrim Investments, Inc., which was previously known as Pilgrim Investments, Inc. and before that was known as Pilgrim America Investments, Inc.
(3) ING Funds Services, LLC was previously named ING Pilgrim Group, LLC. ING Pilgrim Group, LLC is the sucessor in interest to ING Pilgrim Group, Inc., which was previously known as Pilgrim Group, Inc. and before that was known as Pilgrim America Group, Inc.
(4) ING Funds Distributor, LLC is the sucessor in interest to ING Funds Distributor, Inc., which was previously known as ING Pilgrim Securities, Inc., and before that was known as Pilgrim Securities, Inc., and before that was known as Pilgrim America Securities, Inc.
(5) Mr. Mathews commenced services as CEO and President of the ING Funds on November 11, 2006.
(6) Directed Services, LLC is the sucessor in interest to Directed Services, Inc.
298
SHAREHOLDER MEETING INFORMATION (UNAUDITED)
A special meeting of shareholders of ING Partners, Inc. was held October 25, 2007, at the offices of ING Funds, 7337 East Doubletree Ranch Road, Scottsdale, AZ 85258.
A brief description of each matter voted upon as well as the results are outlined below:
Matters:
1 To approve the election of eleven nominees to the Boards of Directors/Trustees of the Portfolios.
2 To approve a "Manager-of-Managers" arrangement for certain Portfolios to permit the Portfolios' investment adviser, subject to prior approval by the Board, to enter into and materially amend agreements with unaffiliated sub-advisers without obtaining the approval of the Portfolios' shareholders.
3 To approve the conversion of certain Portfolios' investment objectives from fundamental to non-fundamental.
Results:
| | | Proposal* | | Shares voted for | | Shares voted
against or
withheld | | Shares
abstained | | Broker
non-vote | | Total shares
voted | |
| Colleen D. Baldwin | | | 1 | | | | 483,022,915 | | | | 8,616,966 | | | | — | | | | — | | | | 491,639,881 | | |
| John V. Boyer | | | 1 | | | | 482,570,195 | | | | 9,069,686 | | | | — | | | | — | | | | 491,639,881 | | |
| Patricia W. Chadwick | | | 1 | | | | 482,229,198 | | | | 9,410,683 | | | | — | | | | — | | | | 491,639,881 | | |
| Robert W. Crispin | | | 1 | | | | 482,001,918 | | | | 9,637,963 | | | | — | | | | — | | | | 491,639,881 | | |
| Peter S. Drotch | | | 1 | | | | 482,473,676 | | | | 9,166,205 | | | | — | | | | — | | | | 491,639,881 | | |
| J. Michael Earley | | | 1 | | | | 482,066,524 | | | | 9,573,357 | | | | — | | | | — | | | | 491,639,881 | | |
| Patrick W. Kenny | | | 1 | | | | 482,349,381 | | | | 9,290,500 | | | | — | | | | — | | | | 491,639,881 | | |
| Shaun P. Mathews | | | 1 | | | | 482,345,787 | | | | 9,294,094 | | | | — | | | | — | | | | 491,639,881 | | |
| Sheryl K. Pressler | | | 1 | | | | 481,846,320 | | | | 9,793,561 | | | | — | | | | — | | | | 491,639,881 | | |
| David W.C. Putnam | | | 1 | | | | 481,635,830 | | | | 10,004,051 | | | | — | | | | — | | | | 491,639,881 | | |
| Roger B. Vincent | | | 1 | | | | 482,354,446 | | | | 9,285,435 | | | | — | | | | — | | | | 491,639,881 | | |
ING American Century Large
Company Value Portfolio | | | 2 | | | | 4,150,452 | | | | 358,606 | | | | — | | | | — | | | | 4,509,058 | | |
| ING Baron Asset Portfolio | | | 2 | | | | 2,025,998 | | | | — | | | | — | | | | | | | | 2,025,998 | | |
ING Baron Small Cap
Growth Portfolio | | | 2 | | | | 14,281,034 | | | | 3,159,547 | | | | 262,023 | | | | — | | | | 17,702,604 | | |
ING Columbia Small Cap
Value II Portfolio | | | 2 | | | | 11,535,700 | | | | 639,265 | | | | 205,491 | | | | — | | | | 12,380,456 | | |
| ING Davis Venture Value Portfolio | | | 2 | | | | 9,898,293 | | | | 641,064 | | | | 92,936 | | | | — | | | | 10,632,293 | | |
| ING JPMorgan International Portfolio | | | 3 | | | | 28,254,254 | | | | 2,862,720 | | | | 711,685 | | | | — | | | | 31,828,659 | | |
ING Legg Mason Partners
Aggressive Growth Portfolio | | | 2 | | | | 20,996,397 | | | | 654,524 | | | | 148,221 | | | | — | | | | 21,799,142 | | |
ING Legg Mason Partners
Aggressive Growth Portfolio | | | 3 | | | | 20,998,075 | | | | 655,190 | | | | 145,877 | | | | — | | | | 21,799,142 | | |
ING Lord Abbett U.S. Government
Securities Portfolio | | | 2 | | | | 3,254,135 | | | | — | | | | 5 | | | | — | | | | 3,254,140 | | |
ING Neuberger Berman
Regency Portfolio | | | 2 | | | | 1,412,150 | | | | — | | | | 26,126 | | | | — | | | | 1,438,276 | | |
ING Neuberger Berman
Partners Portfolio | | | 2 | | | | 31,496,605 | | | | 2,978,410 | | | | 519,044 | | | | — | | | | 34,994,059 | | |
| ING Oppenheimer Global Portfolio | | | 2 | | | | 78,164,854 | | | | 3,524,047 | | | | 841,352 | | | | — | | | | 82,530,253 | | |
ING Oppenheimer Strategic
Income Portfolio | | | 2 | | | | 21,753,125 | | | | 1,180,213 | | | | 31,150 | | | | — | | | | 22,964,488 | | |
| ING Pioneer High Yield Portfolio | | | 2 | | | | 10,036,550 | | | | — | | | | — | | | | — | | | | 10,036,550 | | |
ING T. Rowe Price Diversified
Mid Cap Growth Portfolio | | | 2 | | | | 61,392,534 | | | | 7,080,038 | | | | 614,180 | | | | — | | | | 69,086,751 | | |
ING Templeton Foreign
Equity Portfolio | | | 2 | | | | 6,726,167 | | | | 195,089 | | | | 56,902 | | | | — | | | | 6,978,158 | | |
| ING Thornburg Value Portfolio | | | 3 | | | | 3,928,944 | | | | 989,071 | | | | 50,827 | | | | — | | | | 4,968,842 | | |
ING UBS U.S. Small Cap
Growth Portfolio | | | 2 | | | | 3,064,209 | | | | — | | | | — | | | | — | | | | 3,064,209 | | |
| ING Van Kampen Comstock Portfolio | | | 2 | | | | 58,694,881 | | | | 4,119,382 | | | | 863,096 | | | | — | | | | 63,677,359 | | |
ING Van Kampen Equity and
Income Portfolio | | | 2 | | | | 12,551,037 | | | | 579,844 | | | | 49,919 | | | | — | | | | 13,180,800 | | |
ING T. Rowe Price Growth
Equity Portfolio | | | 3 | ** | | | 10,446,448 | | | | 999,458 | | | | 185,998 | | | | — | | | | 11,631,903 | | |
ING UBS U.S. Large Cap
Equity Portfolio | | | 2 | ** | | | 12,124,816 | | | | 724,176 | | | | 161,603 | | | | — | | | | 13,010,595 | | |
ING UBS U.S. Large Cap
Equity Portfolio | | | 3 | ** | | | 12,279,750 | | | | 553,752 | | | | 177,094 | | | | — | | | | 13,010,595 | | |
* All proposals passed at this meeting.
** The Shareholder Meeting for ING T. Rowe Price Growth Equity Portfolio and ING UBS U.S. Large Cap Equity Portfolio was adjourned to November 21, 2007.
299
SHAREHOLDER MEETING INFORMATION (UNAUDITED) (CONTINUED)
A special meeting of shareholders of ING Partners, Inc. was held November 21, 2007, at the offices of ING Funds, 7337 East Doubletree Ranch Road, Scottsdale, AZ 85258.
A brief description of each matter voted upon as well as the results are outlined below:
Matters:
2 To approve a "Manager-of-Managers" arrangement for certain Portfolios to permit the Portfolios' investment adviser, subject to prior approval by the Board, to enter into and materially amend agreements with unaffiliated sub-advisers without obtaining the approval of the Portfolios' shareholders.
3 To approve the conversion of certain Portfolios' investment objectives from fundamental to non-fundamental.
Results:
| | | Proposal* | | Shares voted for | | Shares voted
against or
withheld | | Shares
abstained | | Broker
non-vote | | Total shares
voted | |
ING UBS U.S. Large Cap
Equity Portfolio | | | 2 | | | | 29,609,527 | | | | 1,146,110 | | | | 477,834 | | | | — | | | | 31,233,471 | | |
ING UBS U.S. Large Cap
Equity Portfolio | | | 3 | | | | 29,305,735 | | | | 1,428,039 | | | | 499,697 | | | | — | | | | 31,233,471 | | |
ING T. Rowe Price Growth
Equity Portfolio | | | 3 | | | | 11,294,617 | | | | 941,835 | | | | 430,763 | | | | — | | | | 12,667,215 | | |
* All proposals passed at this meeting.
300
ADVISORY CONTRACT APPROVAL DISCUSSION (UNAUDITED)
Board Consideration and Re-Approval of Investment Advisory and Sub-Advisory Contracts
Section 15(c) of the Investment Company Act of 1940 (the "1940 Act") provides that, after an initial period, the Portfolios' existing investment advisory and sub-advisory contracts will remain in effect only if the Board of Trustees (the "Board") of the Portfolios, including a majority of Board members who have no direct or indirect interest in the advisory and sub-advisory contracts, and who are not "interested persons" of the Portfolios, as such term is defined under the 1940 Act (the "Independent Trustees"), annually review and approve them. Thus, at a meeting held on November 30, 2007, the Board, including a majority of the Independent Trustees, considered whether to renew the investment advisory contracts (the "Advisory Contracts") between Directed Services, LLC (the "Adviser") and the Portfolios and the sub-advisory contracts ("Sub-Advisory Contracts") with one or more sub-advisers to each Portfolio (the "Sub-Advisers").
The Independent Trustees also held separate meetings on October 10 and November 28, 2007 to consider the renewal of the Advisory Contracts and Sub-Advisory Contracts. As a result, subsequent references herein to factors considered and determinations made by the Independent Trustees include, as applicable, factors considered and determinations made on those earlier dates by the Independent Trustees.
At its November 30, 2007 meeting, the Board voted to renew the Advisory and Sub-Advisory Contracts for the Portfolios. In reaching these decisions, the Board took into account information furnished to it throughout the year at regular meetings of the Board and the Board's committees, as well as information prepared specifically in connection with the annual renewal process. Determinations by the Independent Trustees also took into account various factors that they believed, in light of the legal advice furnished to them by Kirkpatrick & Lockhart Preston Gates Ellis LLP ("K&L Gates"), their independent legal counsel, and their own business judgment, to be relevant. Further, while the Advisory Contracts and Sub-Advisory Contracts for all the Portfolios were considered at the same Board meeting, the Trustees considered each Portfolio's advisory and sub-advisory relationships separately.
Provided below is an overview of the Board's contract approval process in general, as well as a discussion of certain specific factors that the Board considered at its renewal meeting. While the Board gave its attention to the information furnished, at its request, that was most relevant to its considerations, discussed below are a number of the primary factors relevant to the Board's consideration as to whether to renew the Advisory and Sub-Advisory Contracts for the one-year period ending November 30, 2008. Each Board member may have accorded different weight to the various factors in reaching his or her conclusions with respect to each Portfolio's advisory and sub-advisory arrangements.
Overview of the Contract Renewal and Approval Process
Several years ago, the Independent Trustees instituted a revised process by which they seek and consider relevant information when they decide whether to approve new or existing advisory and sub-advisory arrangements for the investment companies in the ING Funds complex under their jurisdiction, including the Portfolios' existing Advisory and Sub-Advisory Contracts. Among other actions, the Independent Trustees: retained the services of independent consultants with experience in the mutual fund industry to assist the Independent Trustees in working with the personnel employed by the Adviser or its affiliates who administer the Portfolios ("Management") to identify the types of information presented to the Board to inform its deliberations with respect to advisory and sub-advisory relationships and to help evaluate that information; established a specific format in which certain requested information is provided to the Board; and determined t he process for reviewing such information in connection with Advisory and Sub-Advisory Contract renewals and approvals. The end result was an enhanced process which is currently employed by the Independent Trustees to review and analyze information in connection with their annual renewal of the Portfolios' Advisory and Sub-Advisory Contracts, as well as their review and approval of new advisory relationships.
Since the current renewal and approval process was first implemented, the Board's membership has changed substantially through periodic retirements of some Trustees and the appointment and election of new Trustees. In addition, throughout this period the Independent Trustees have reviewed and refined the renewal and approval process at least annually. The Board also established a Contracts Committee and two Investment Review Committees ("IRCs"). Among other matters, the Contracts Committee provides oversight with respect to the contracts renewal process, and each Portfolio is assigned to one of the two IRCs, which provides oversight regarding, among other matters, investment performance.
301
ADVISORY CONTRACT APPROVAL DISCUSSION (UNAUDITED) (CONTINUED)
The type and format of the information provided to the Board or to legal counsel for the Independent Trustees in connection with the contract approval and renewal process has been codified in the Portfolios' 15(c) Methodology Guide. This Guide was developed under the direction of the Independent Trustees and sets out a blueprint pursuant to which the Independent Trustees request certain information that they deem important to facilitate an informed review in connection with initial and annual approvals of Advisory and Sub-Advisory Contracts.
Management provides certain of the information requested by the 15(c) Methodology Guide in Fund Analysis and Comparison Tables ("FACT sheets") prior to the Independent Trustees' review of Advisory and Sub-Advisory Contracts. The Independent Trustees previously retained an independent firm to verify and test the accuracy of certain FACT sheet data for a representative sample of Funds in the ING Funds complex. In 2007, the Contracts Committee employed the services of an independent consultant to assist in its review and analysis of, among other matters, the 15(c) Methodology Guide, the content and format of the FACT sheets, and proposed selected p eer groups of investment companies ("SPGs") to be used by each Portfolio for certain comparison purposes during the renewal process.
As part of an ongoing process, the Contracts Committee recommends or considers recommendations from Management for refinements to the 15(c) Methodology Guide and other aspects of the review process, and the Board's IRCs review benchmarks used to assess the performance of each Portfolio. The IRCs may apply a heightened level of scrutiny in cases where performance has lagged a Portfolio's relevant benchmark and/or SPG.
The Board employed its process for reviewing contracts when considering the renewals of the Advisory and Sub-Advisory Contracts that would be effective through November 30, 2008. Set forth below is a discussion of many of the Board's primary considerations and conclusions resulting from this process.
Nature, Extent and Quality of Service
In determining whether to approve the Advisory Contracts and Sub-Advisory Contracts for the Portfolios for the year ending November 30, 2008, the Independent Trustees received and evaluated such information as they deemed necessary regarding the nature, extent and quality of services provided to the Portfolios by the Adviser and Sub-Advisers. This included information regarding the Adviser and Sub-Advisers to the Portfolios provided throughout the year at regular meetings of the Board and its committees, as well as information furnished in connection with the contract renewal meetings.
The materials requested by and provided to the Board and/or to K&L Gates prior to the November 30, 2007 Board meeting included, among other information, the following items: (1) FACT sheets for each Portfolio that provided information regarding the performance and expenses of the Portfolio and other similarly managed funds in an SPG, as well as information regarding the Portfolio's investment portfolio, objectives and strategies; (2) the 15(c) Methodology Guide, which describes how the FACT sheets were prepared, including the manner in which benchmarks and SPGs were selected and how profitability was determined; (3) responses from the Adviser and Sub-Advisers to a series of questions posed by K&L Gates on behalf of the Trustees; (4) copies of each form of Advisory Contract and Sub-Advi sory Contract; (5) copies of the Forms ADV for the Adviser and each Sub-Adviser to the Portfolios; (6) financial statements for the Adviser and each Sub-Adviser; (7) drafts of narrative summaries addressing key factors the Board customarily considers in evaluating the renewals of Advisory Contracts and Sub-Advisory Contracts, including a written analysis for each Portfolio of how performance, fees and expenses compare to its SPG and/or designated benchmarks; (8) independent analyses of Portfolio performance by the Company's Chief Investment Risk Officer; (9) information regarding net asset flows into and out of the Funds; and (10) other information relevant to the Board's evaluations.
For each Portfolio, its Initial Class of shares were used for purposes of certain comparisons to the funds in its SPG. Initial Class shares generally were selected so that the class with the longest performance history was compared to the analogous class of shares for each SPG fund. The mutual funds included in a Portfolio's SPG were selected based upon criteria designed to mirror the Portfolio class being compared to the SPG.
In arriving at its conclusions with respect to the Advisory Contracts, the Board was mindful of the "manager-of-managers" platform of the ING Funds that has been developed by Management. The Board also considered the techniques that the Adviser has developed, at the Board's direction, to screen and perform due diligence on Sub-Advisers that are recommended to the Board to manage the Portfolios' investment portfolios. The Board
302
ADVISORY CONTRACT APPROVAL DISCUSSION (UNAUDITED) (CONTINUED)
noted the resources that the Adviser has committed to the Board and to its IRCs to assist the Board and its committees with their assessment of the investment performance of the Portfolios on an ongoing basis throughout the year. This includes the appointment of a Chief Investment Risk Officer and his staff, who report directly to the Board and who have developed attribution analyses and other metrics used by the IRCs to analyze the key factors underlying investment performance for the Portfolios.
The Board also noted the techniques used by the Adviser to monitor the performance of Sub-Advisers and the proactive approach that the Adviser, working in cooperation with the IRCs, has taken to advocate or recommend, when it believed appropriate, changes designed to assist in improving the Portfolios' performance. Such changes could include, for example, changes in personnel who are responsible for managing a Portfolio's portfolio and/or changing the Sub-Adviser to a Portfolio.
In considering the Portfolios' Advisory Contracts, the Board also considered the extent of benefits provided to the Portfolios' shareholders, beyond advisory services, from being part of the ING family of Funds. This includes, in most cases, the right to exchange or transfer investments, without a sales charge, between the same class of shares of such Portfolios and other Funds or among ING Funds available on a product platform, and the wide range of ING Funds available for exchange or transfer.
The Board also took into account the Adviser's efforts in recent years to reduce the expenses of the ING Funds through renegotiated arrangements with the ING Funds' service providers. In addition, the Board considered the efforts of the Adviser and the expenses that it incurred in recent years to help make the ING Funds complex more efficient by combinations of similar funds.
Further, the Board received periodic reports showing that the investment policies and restrictions for each Portfolio were consistently complied with and other periodic reports covering matters such as compliance by Adviser and Sub-Adviser personnel with codes of ethics. The Board considered reports from the Company's Chief Compliance Officer ("CCO") evaluating whether the regulatory compliance systems and procedures of the Adviser and each Sub-Adviser are reasonably designed to assure compliance with the federal securities laws, including those related to, among others, late trading and market timing, best execution, fair value pricing, proxy voting and trade allocation practices. The Board also took into account the CCO's annual and periodic reports and recommendations with respect to service provider compliance programs. In this regard, the Board also considered the policies and procedures developed by the CCO in consultation with the Boa rd's Compliance Committee that guide the CCO's compliance oversight function.
The Board reviewed the level of staffing, quality and experience of each Portfolio's portfolio management team. The Board took into account the respective resources and reputations of the Adviser and the Sub-Advisers, and evaluated the ability of the Adviser and the Sub-Advisers to attract and retain qualified investment advisory personnel. The Board also considered the adequacy of the resources committed to the Portfolios (and other relevant funds in the ING Funds complex) by the Adviser and the Sub-Advisers, and whether those resources are commensurate with the needs of the Portfolios and are sufficient to sustain appropriate levels of performance and compliance needs.
Based on their deliberations and the materials presented to them, the Board concluded that the advisory and related services provided by the Adviser and Sub-Advisers are appropriate in light of the Portfolios' operations, the competitive landscape of the investment company business, and investor needs, and that the nature and quality of the overall services provided by the Adviser and Sub-Advisers were appropriate.
Portfolio Performance
In assessing advisory and sub-advisory relationships, the Board placed emphasis on the net investment returns of each Portfolio. While the Board considered the performance reports and discussions with portfolio managers at Board and committee meetings during the year, particular attention in assessing performance was given to the FACT sheets furnished in connection with the renewal process. The FACT sheet prepared for each Portfolio included its investment performance compared to the Portfolio's Morningstar category median, Lipper category median, SPG and primary benchmark. The Board's findings specific to each Portfolio's performance are discussed under "Portfolio-by-Portfolio Analysis," below.
303
ADVISORY CONTRACT APPROVAL DISCUSSION (UNAUDITED) (CONTINUED)
Economies of Scale
When evaluating the reasonableness of advisory fee rates, the Board also considered whether economies of scale will be realized by the Adviser as a Portfolio grows larger and the extent to which any such economies are reflected in contractual fee rates. In this regard, the Board noted any breakpoints in advisory fee schedules that resulted in a lower advisory fee rate because a Portfolio achieved sufficient asset levels to receive a breakpoint discount. In the case of sub-advisory fees, the Board considered that breakpoints would inure to the benefit of the Adviser, except to the extent that there are corresponding advisory fee breakpoints or waivers. For a Portfolio that did not have advisory fee breakpoints, but did benefit from waivers or reimbursements of advisory or other fees, the Board also considered the extent to which economies of scale could be realized through such waivers, reimbursements or expense reductions.
In evaluating economies of scale, the Independent Trustees also considered prior periodic management reports and industry information on this topic, and the Independent Trustees who were Board members at that time also considered a November 2006 evaluation and analysis presented to them by an independent consultant regarding fee breakpoint arrangements and economies of scale.
Information Regarding Services to Other Clients
The Board requested and, if received, considered information regarding the nature of services and fee rates offered by the Adviser and the Sub-Advisers to other clients, including other registered investment companies and institutional accounts. When fee rates offered to other clients differed materially from those charged to the Portfolios, the Board considered any underlying rationale provided by the Adviser or Sub-Advisers for these differences. For unaffiliated Sub-Advisers, the Board did not view this information as being a key factor in its deliberations because of the arms-length nature of negotiations between the Adviser and unaffiliated Sub-Advisers with respect to sub-advisory fee rates. The Board also noted that the fee rates charged to the Portfolios and similar institutional clients may differ materially due to the different services and additional regulatory overlay associated with registered investment companies, such as the P ortfolios.
Fee Rates and Profitability
The Board reviewed and considered each contractual investment advisory fee rate, combined with the administrative fee rate, payable by each Portfolio to the Adviser. The Board also considered the contractual sub-advisory fee rates payable by the Adviser to each Sub-Adviser for sub-advisory services. In addition, the Board considered any existing and proposed fee waivers and expense limitations applicable to the fees payable by the Portfolios.
The Board considered the fee structures of each Portfolio as they relate to the services provided under the contracts and the potential fall-out benefits to the Adviser and Sub-Advisers and their respective affiliates from their association with the Portfolios. For each Portfolio, the Board determined that the fees payable to the Adviser and Sub-Advisers are reasonable for the services that each performs, which were considered in light of the nature and quality of the services that each has performed and is expected to perform.
For each Portfolio, the Board considered information on revenues, costs and profits realized by the Adviser, which was prepared by Management in accordance with the allocation methodology (including related assumptions) specified in the 15(c) Methodology Guide. In analyzing the profitability of the Adviser in connection with its services to a Portfolio, the Board took into account the sub-advisory fee rate payable by the Adviser to the Sub-Adviser to that Portfolio. The Board also considered information that it requested and was provided by Management with respect to the profitability of service providers affiliated with the Adviser, as well as information provided by certain Sub-Advisers with respect to their profitability. In the case of non-affiliated Sub-Advisers, the Board gave less weigh t to profitability considerations, or did not view this data as imperative to its deliberations, given the arm's-length nature of the relationship between the Adviser and these Sub-Advisers with respect to the negotiation of sub-advisory fee rates.
The Board determined that it had requested and received sufficient information to gain a reasonable understanding regarding the Adviser's and affiliated Sub-Advisers' profitability. The Board also recognized that profitability analysis is not an exact science and there is no uniform methodology for determining profitability for this purpose. In this context, the Board realized that Management's calculations regarding its costs incurred in
304
ADVISORY CONTRACT APPROVAL DISCUSSION (UNAUDITED) (CONTINUED)
establishing the infrastructure necessary for the Portfolios' operations may not be fully reflected in the expenses allocated to each Portfolio in determining profitability, and that the information presented may not portray all of the costs borne by Management or capture Management's entrepreneurial risk associated with offering and managing a mutual fund complex in the current regulatory and market environment.
In their review of advisory fee rates, the Independent Trustees, from time to time, have directed the Adviser, and the Adviser has agreed, to implement remedial actions for certain Funds within the ING Funds complex. These remedial actions have included, among others: reductions in expense caps or management fee rates; the addition of further breakpoints to fee schedules; reductions in Rule 12b-1 fees payable by a Fund; the merger of certain Funds with and into comparable Funds; changes to the Sub-Adviser or portfolio manager managing a Fund; and enhancements to the resources available to a Sub-Adviser when managing a Fund. As applicable, the Independent Trustees have requested these adjustments primarily on the basis of a Fund's performance as compared to its peer group or benchmarks, or its management fee rate or overall expense ratio in relation to its peer group.
Based on the information on revenues, costs, and profitability considered by the Board, and after considering the factors described in this section, as well as any remedial actions requested by the Independent Trustees and agreed to by the Adviser, the Board concluded that the profits, if any, realized by the Adviser and Sub-Advisers were not excessive. In making its determinations, the Board considered that the Adviser had incentives to negotiate the most favorable fees from unaffiliated Sub-Advisers, and it based its conclusions on the reasonableness of the sub-advisory fees of the Sub-Advisers primarily on the factors described for each Portfolio below and, in the case of non-affiliated Sub-Advisers, in reliance on the arm's-length nature of the negotiations between the Adviser and Sub-Advisers with respect to sub-advisory fees.
Portfolio-by-Portfolio Analysis
The following paragraphs outline certain of the specific factors that the Board considered, and the conclusions reached, at its November 30, 2007 meeting in relation to renewing each Portfolio's current Advisory Contract and its Sub-Advisory Contract for the year ending November 30, 2008. These specific factors are in addition to those considerations discussed above. In each case, the Portfolio's performance was compared to its Morningstar category median and its primary benchmark, a broad-based securities market index that appears in the Portfolio's prospectus. With respect to Morningstar quintile rankings, the first quintile represents the highest (best) performance and the fifth quintile represents the lowest performance. Each Portfolio's management fee and expense ratio were compared to the fees and expense ratios of the funds in its SPG.
ING American Century Large Company Value Portfolio
In considering whether to approve the renewal of the Advisory and Sub-Advisory Contracts for ING American Century Large Company Value Portfolio, the Board considered that, based on performance data for the periods ended June 30, 2007: (1) the Portfolio underperformed its Morningstar category median for the three-month, year-to-date, three-year and five-year periods, but outperformed its Morningstar category median for the three-month and one-year periods; (2) the Portfolio underperformed its primary benchmark for all periods presented, with the exception of the most recent calendar quarter, during which it outperformed; (3) the Portfolio underperformed its style specific benchmark for all periods presented, with the exception of the most recent calendar quarter and one-year periods, during which it outperformed; and (4) the Portfolio is ranked in the third quintile of its Morningstar category for the most recent calendar quarter and one-year periods, the fourth quintile for the five-year period, and the fifth (lowest) quintile for the year-to-date and three-year periods.
In analyzing this performance data, the Board took into account: (1) there was a change in sub-adviser to the Portfolio in April 2005 to address the Board's concerns about performance; (2) in December 2006, there was a modification to the Portfolio's portfolio management team; (3) Management would continue to monitor, and the Board or its Investment Review Committee would periodically review, the Portfolio's investment performance; and (4) Management's expectation that the Portfolio's longer-term performance will improve.
In considering the fees payable under the Advisory and Sub-Advisory Contracts for ING American Century Large Company Value Portfolio, the Board took into account the factors described above and also considered: (1) the fairness of the compensation under an Advisory Contract with level fees that does not include breakpoints; (2) the pricing structure (including the expense ratio to be borne by shareholders) of the Portfolio, as compared to its SPG, including that: (a) the management fee for the Portfolio is above the median and the average
305
ADVISORY CONTRACT APPROVAL DISCUSSION (UNAUDITED) (CONTINUED)
management fees of the funds in its SPG; and (b) the expense ratio for the Portfolio is above the median and the average expense ratios of the funds in its SPG.
In analyzing this fee data, the Board considered Management's agreement to put into place, at the direction of the Board following the 2007 contract renewal process, limits on the Portfolio's expenses, to become effective January 1, 2008.
After its deliberation, the Board reached the following conclusions: (1) the Portfolio's management fee rate is reasonable in the context of all factors considered by the Board; (2) the Portfolio's expense ratio is reasonable in the context of all factors considered by the Board; (3) taking into account that Management will continue to monitor, and the Board or its Investment Review Committee will periodically review, its performance, the Portfolio's performance is reasonable in the context of all factors considered by the Board; and (4) the sub-advisory fee rate payable by the Adviser to the Sub-Adviser is reasonable in the context of all factors considered by the Board. Based on these conclusions and other factors, the Board voted to renew the Advisory and Sub-Advisory Contracts for the Portfolio for the year ending November 30, 2008. During this renewal process, different Board members may have given different weight to different individu al factors and related conclusions.
ING American Century Small-Mid Cap Value Portfolio
In considering whether to approve the renewal of the Advisory and Sub-Advisory Contracts for ING American Century Small-Mid Cap Value Portfolio, the Board considered that, based on performance data for the periods ended June 30, 2007: (1) the Portfolio outperformed its Morningstar category median for all periods presented, with the exception of the three-year and five-year periods, during which it underperformed; (2) the Portfolio outperformed its primary benchmark for all periods presented, with the exception of the three-year and five-year periods, during which it underperformed; and (3) the Portfolio is ranked in the first (highest) quintile of its Morningstar category for the one-year period, the second quintile for the most recent calendar quarter, the third quintile for the year-to-date and three-year periods, and the fourth quintile for the five-year period.
In analyzing this performance data, the Board took into account that: (1) in April 2006, a mid-cap sleeve, managed by new portfolio managers, was added to the Portfolio to address capacity constraints; and (2) in November 2006 the Portfolio's portfolio management team was modified.
In considering the fees payable under the Advisory and Sub-Advisory Contracts for ING American Century Small-Mid Cap Value Portfolio, the Board took into account the factors described above and also considered: (1) the fairness of the compensation under an Advisory Contract with level fees that does not include breakpoints; and (2) the pricing structure (including the expense ratio to be borne by shareholders) of the Portfolio, as compared to its SPG, including that: (a) the management fee for the Portfolio is above the median and the average management fees of the funds in its SPG; and (b) the expense ratio for the Portfolio is above the median and the average expense ratios of the funds in its SPG.
In analyzing this fee data, the Board took into consideration: (1) in April 2006 the Portfolio's sub-advisory fee was reduced in conjunction with the addition of the new mid-cap sleeve; and (2) in January 2007, at the direction of the Board following the 2006 contract renewal process, Management implemented limits on the Portfolio's expenses.
After its deliberation, the Board reached the following conclusions: (1) the Portfolio's management fee rate is reasonable in the context of all factors considered by the Board; (2) the Portfolio's expense ratio is reasonable in the context of all factors considered by the Board; (3) in April 2006 the Portfolio's investment strategy was changed in conjunction with the addition of a new mid-cap sleeve managed by new portfolio managers, and its portfolio management team was modified in November 2006, and it is reasonable to permit the Sub-Adviser to continue to manage the Portfolio to assess performance; and (4) the sub-advisory fee rate payable by the Adviser to the Sub-Adviser is reasonable in the context of all factors considered by the Board. Based on these conclusions and other factors, the Board voted to renew the Advisory and Sub-Advisory Contracts for the Portfolio for the year ending November 30, 2008. During this renewal process, dif ferent Board members may have given different weight to different individual factors and related conclusions.
306
ADVISORY CONTRACT APPROVAL DISCUSSION (UNAUDITED) (CONTINUED)
ING Baron Asset Portfolio
In considering whether to approve the renewal of the Advisory and Sub-Advisory Contracts for ING Baron Asset Portfolio, the Board considered that, based on performance data for the periods ended June 30, 2007: (1) the Portfolio underperformed its Morningstar category median for all periods presented; (2) the Portfolio underperformed its primary benchmark for all periods presented, with the exception of the most recent calendar quarter, during which it outperformed; and (3) the Portfolio is ranked in the fourth quintile of its Morningstar category for the one-year period, and the fifth (lowest) quintile for the most recent calendar quarter and year-to-date periods.
In analyzing this performance data, the Board took into account: (1) Management's analysis of the negative effect that sector allocation and stock selection had on the Portfolio's performance; and (2) the Portfolio launched in January 2006, and therefore had a limited operating history for the purpose of analyzing Portfolio performance.
In considering the fees payable under the Advisory and Sub-Advisory Contracts for ING Baron Asset Portfolio, the Board took into account the factors described above and also considered: (1) the fairness of the compensation under an Advisory Contract with level fees that does not include breakpoints; (2) the pricing structure (including the expense ratio to be borne by shareholders) of ING Baron Asset Portfolio, as compared to its SPG, including that: (a) the management fee (inclusive of a 0.10% administration fee) for the Portfolio is above the median and the average management fees of the funds in its SPG; and (b) the expense ratio for the Portfolio is above the median and the average expense ratios of the funds in its SPG.
In analyzing this fee data, the Board took into account: (1) the advisory fee waivers that Management had put into place, which lower the effective management fee rate payable by the Portfolio; and (2) in July 2007 Management had implemented breakpoint discounts on the Portfolio's advisory fee.
After its deliberation, the Board reached the following conclusions: (1) the Portfolio's management fee rate is reasonable in the context of all factors considered by the Board; (2) the Portfolio's expense ratio is reasonable in the context of all factors considered by the Board; (3) the Portfolio was launched in January 2006, and it is reasonable to permit the Portfolio to establish a longer operating history for the purposes of evaluating performance; and (4) the sub-advisory fee rate payable by the Adviser to the Sub-Adviser is reasonable in the context of all factors considered by the Board. Based on these conclusions and other factors, the Board voted to renew the Advisory and Sub-Advisory Contracts for the Portfolio for the year ending November 30, 2008. During this renewal process, different Board members may have given different weight to different individual factors and related conclusions.
ING Baron Small Cap Growth Portfolio
In considering whether to approve the renewal of the Advisory and Sub-Advisory Contracts for ING Baron Small Cap Growth Portfolio, the Board considered that, based on performance data for the periods ended June 30, 2007: (1) the Portfolio underperformed its Morningstar category median for the most recent calendar quarter, year-to-date, and one-year periods, but outperformed for the three-year and five-year periods; (2) the Portfolio outperformed its primary benchmark for all periods presented, with the exception of the one-year period, during which it underperformed; and (3) the Portfolio is ranked in the first (highest) quintile of its Morningstar category for the three-year and five-year periods, the fourth quintile for the one-year period, and the fifth (lowest) quintile for the most recent calendar quarter and year-to-date periods.
In analyzing this performance data, the Board took into account Management's analysis regarding the Sub-Adviser's rationale for underperformance in certain periods, including its analysis regarding the negative effect of stock selection on the Portfolio's more recent performance.
In considering the fees payable under the Advisory and Sub-Advisory Contracts for ING Baron Small Cap Growth Portfolio, the Board took into account the factors described above and also considered: (1) the fairness of the compensation under an Advisory Contract with level fees that does not include breakpoints; (2) the pricing structure (including the expense ratio to be borne by shareholders) of the Portfolio, as compared to its SPG, including that: (a) the management fee for the Portfolio is equal to the median and above the average management fees of the funds in its SPG; and (b) the expense ratio for the Portfolio is above the median and the average expense ratios of the funds in its SPG.
307
ADVISORY CONTRACT APPROVAL DISCUSSION (UNAUDITED) (CONTINUED)
After its deliberation, the Board reached the following conclusions: (1) the Portfolio's management fee rate is reasonable in the context of all factors considered by the Board; (2) the Portfolio's expense ratio is reasonable in the context of all factors considered by the Board; (3) the Portfolio's performance is reasonable in the context of all factors considered by the Board; and (4) the sub-advisory fee rate payable by the Adviser to the Sub-Adviser is reasonable in the context of all factors considered by the Board. Based on these conclusions and other factors, the Board voted to renew the Advisory and Sub-Advisory Contracts for the Portfolio for the year ending November 30, 2008. During this renewal process, different Board members may have given different weight to different individual factors and related conclusions.
ING Columbia Small Cap Value II Portfolio
In considering whether to approve the renewal of the Advisory and Sub-Advisory Contracts for ING Columbia Small Cap Value II Portfolio, the Board considered that, based on performance data for the periods ended June 30, 2007: (1) the Portfolio outperformed its Morningstar category median for all periods presented; (2) the Portfolio outperformed its primary benchmark for all periods presented; and (3) the Portfolio is ranked in the first (highest) quintile for the most recent calendar quarter and year-to-date periods, the second quintile for the one-year period.
In considering the fees payable under the Advisory and Sub-Advisory Contracts for ING Columbia Small Cap Value II Portfolio, the Board took into account the factors described above and also considered: (1) the fairness of the compensation under an Advisory Contract with level fees that does not include breakpoints; (2) the pricing structure (including the expense ratio to be borne by shareholders) of the Portfolio, as compared to its SPG, including that: (a) the management fee (inclusive of 0.10% administration fee) for the Portfolio is equal to the median and below the average management fees of the funds in its SPG; and (b) the expense ratio for the Portfolio is equal to the median and below the average expense ratios of the funds in its SPG.
After its deliberation, the Board reached the following conclusions: (1) the Portfolio's management fee rate is reasonable in the context of all factors considered by the Board; (2) the Portfolio's expense ratio is reasonable in the context of all factors considered by the Board; (3) the Portfolio's performance is reasonable in the context of all factors considered by the Board; and (4) the sub-advisory fee rate payable by the Adviser to the Sub-Adviser is reasonable in the context of all factors considered by the Board. Based on these conclusions and other factors, the Board voted to renew the Advisory and Sub-Advisory Contracts for the Portfolio for the year ending November 30, 2008. During this renewal process, different Board members may have given different weight to different individual factors and related conclusions.
ING Davis New York Venture Portfolio
In considering whether to approve the renewal of the Advisory and Sub-Advisory Contracts for ING Davis New York Venture Value Portfolio (formerly ING Davis Venture Value Portfolio), the Board considered that, based on performance data for the periods ended June 30, 2007: (1) the Portfolio outperformed its Morningstar category median for the most recent calendar quarter and five-year period, but underperformed for the year-to-date, one-year, and three-year periods; (2) the Portfolio outperformed its primary benchmark for the most recent calendar quarter and five-year periods, but underperformed for the year-to-date, one-year, and three-year periods; and (3) the Portfolio is ranked in the second quintile of its Morningstar category for the five-year period, the third quintile for the most recent calendar quarter and year-to-date periods, the fourth quintile for the one-year period, and the fifth (lowest) quintile for the three-year period.
In analyzing this performance data, the Board took into account: (1) in October 2005, a new Sub-Adviser and portfolio management team assumed responsibility for managing the Portfolio's assets; and (2) Management's analysis regarding the rationale for underperformance in certain periods, including its analysis regarding the negative effect of sector allocation on the Portfolio's more recent performance.
In considering the fees payable under the Advisory and Sub-Advisory Contracts for ING Davis New York Venture Value Portfolio, the Board took into account the factors described above and also considered: (1) the fairness of the compensation under an Advisory Contract with level fees that does not include breakpoints; and (2) the pricing structure (including the expense ratio to be borne by shareholders) of the Portfolio as compared to its SPG, including that: (a) the management fee (inclusive of 0.10% administration fee) for the Portfolio is above the
308
ADVISORY CONTRACT APPROVAL DISCUSSION (UNAUDITED) (CONTINUED)
median and the average management fees of the funds in its SPG; and (b) the expense ratio for the Portfolio is above the median and the average expense ratios of the funds in its SPG.
After its deliberation, the Board reached the following conclusions: (1) the Portfolio's management fee rate is reasonable in the context of all factors considered by the Board; (2) the Portfolio's expense ratio is reasonable in the context of all factors considered by the Board; (3) there was a change in the Sub-Adviser and portfolio managers to the Portfolio in October 2005, and it is reasonable to assess whether longer-term performance improves as a result of these changes; and (4) the sub-advisory fee rate payable by the Adviser to the Sub-Adviser is reasonable in the context of all factors considered by the Board. Based on these conclusions and other factors, the Board voted to renew the Advisory and Sub-Advisory Contracts for the Portfolio for the year ending November 30, 2008. During this renewal process, different Board members may have given different weight to different individual factors and related conclusions.
ING JPMorgan International Portfolio
In considering whether to approve the renewal of the Advisory and Sub-Advisory Contracts for ING JPMorgan International Portfolio, the Board considered that, based on performance data for the periods ended June 30, 2007: (1) the Portfolio underperformed its Morningstar category median for all periods presented; (2) the Portfolio underperformed its primary benchmark for all periods presented, with the exception of the most recent calendar quarter, during which it outperformed; and (3) the Portfolio is ranked in the third quintile of its Morningstar category for the most recent calendar quarter, and the fifth (lowest) quintile for the year-to-date, one-year, three-year, and five-year periods.
In analyzing this performance data, the Board took into account: (1) Management's representations that it is exploring alternatives to address the Board's concerns about the Portfolio's underperformance; and (2) Management would continue to monitor, and the Board or its Investment Review Committee would periodically review, the Portfolio's investment performance
In considering the fees payable under the Advisory and Sub-Advisory Contracts for ING JPMorgan International Portfolio, the Board took into account the factors described above and also considered: (1) the fairness of the compensation under an Advisory Contract with level fees that does not include breakpoints; and (2) the pricing structure (including the expense ratio to be borne by shareholders) of the Portfolio as compared to its SPG, including that: (a) the management fee for the Portfolio is equal to the median and the average management fees of the funds in its SPG; and (b) the expense ratio for the Portfolio is above the median and the average expense ratios of the funds in its SPG.
After its deliberation, the Board reached the following conclusions: (1) the Portfolio's management fee rate is reasonable in the context of all factors considered by the Board; (2) the Portfolio's expense ratio is reasonable in the context of all factors considered by the Board; (3) taking into account that Management will continue to monitor, and the Board or its Investment Review Committee will periodically review, its performance, the Portfolio's performance is reasonable in the context of all factors considered by the Board; and (4) the sub-advisory fee rate payable by the Adviser to the Sub-Adviser is reasonable in the context of all factors considered by the Board. Based on these conclusions and other factors, the Board voted to renew the Advisory and Sub-Advisory Contracts for the Portfolio for the year ending November 30, 2008. During this renewal process, different Board members may have given different weight to different individu al factors and related conclusions.
ING JPMorgan Mid Cap Value Portfolio
In considering whether to approve the renewal of the Advisory and Sub-Advisory Contracts for ING JPMorgan Mid Cap Value Portfolio, the Board considered that, based on performance data for the periods ended June 30, 2007: (1) the Portfolio underperformed its Morningstar category median for all periods presented, with the exception of the five-year period, during which it outperformed; (2) the Portfolio underperformed its primary benchmark for all periods presented, except that it outperformed for the most recent calendar quarter; and (3) the Portfolio is ranked in the first (highest) quintile of its Morningstar category for the five-year period, the third quintile for the three-year period, and the fifth (lowest) quintile for the most recent calendar quarter, year-to-date, and one-year periods.
309
ADVISORY CONTRACT APPROVAL DISCUSSION (UNAUDITED) (CONTINUED)
In analyzing this performance data, the Board took into account: (1) Management's analysis of the negative effect that sector allocation and stock selection had on the Portfolio's performance; and (2) that Management would continue to monitor, and the Board or its Investment Review Committee would review, the Portfolio's investment performance.
In considering the fees payable under the Advisory and Sub-Advisory Contracts for ING JPMorgan Mid Cap Value Portfolio, the Board took into account the factors described above and also considered: (1) the fairness of the compensation under an Advisory Contract with level fees that does not include breakpoints; (2) the pricing structure (including the expense ratio to be borne by shareholders) of the Portfolio, as compared to its SPG, including that: (a) the management fee for the Portfolio is equal to the median and below the average management fees of the funds in its SPG; and (b) the expense ratio for the Portfolio is above the median and the average expense ratios of the funds in its SPG.
After its deliberation, the Board reached the following conclusions: (1) the Portfolio's management fee rate is reasonable in the context of all factors considered by the Board; (2) the Portfolio's expense ratio is reasonable in the context of all factors considered by the Board; (3) taking into account that Management will continue to monitor, and the Board or its Investment Review Committee will periodically review, its performance, the Portfolio's performance is reasonable in the context of all factors considered by the Board; and (4) the sub-advisory fee rate payable by the Adviser to the Sub-Adviser is reasonable in the context of all factors considered by the Board. Based on these conclusions and other factors, the Board voted to renew the Advisory and Sub-Advisory Contracts for the Portfolio for the year ending November 30, 2008. During this renewal process, different Board members may have given different weight to different individu al factors and related conclusions.
ING Legg Mason Partners Aggressive Growth Portfolio
In considering whether to approve the renewal of the Advisory and Sub-Advisory Contracts for ING Legg Mason Partners Aggressive Growth Portfolio, the Board considered that, based on performance data for the periods ended June 30, 2007: (1) the Portfolio underperformed its Morningstar category median and its primary benchmark for the most recent calendar quarter, year-to-date, and one-year periods, but outperformed for the three-year and five-year periods; and (2) the Portfolio is ranked in the second quintile of its Morningstar category for the three-year and five-year periods, the fourth quintile for the most recent calendar quarter, and the fifth (lowest) quintile for the year-to-date and one-year periods.
In analyzing this performance data, the Board took into account: (1) Management's analysis of the negative effect that sector allocation and stock selection had on the Portfolio's performance; (2) that Management would continue to monitor, and the Board or its Investment Review Committee would periodically review, the Portfolio's investment performance; and (3) Management's expectation that the Portfolio's longer-term performance will improve.
In considering the fees payable under the Advisory and Sub-Advisory Contracts for ING Legg Mason Partners Aggressive Growth Portfolio, the Board took into account the factors described above and also considered: (1) the economies of scale benefits to the Portfolio and its shareholders from breakpoint discounts applicable to the Portfolio's advisory fees, which result in lower fees at higher asset levels; (2) the pricing structure (including the expense ratio to be borne by shareholders) of the Portfolio, as compared to its SPG, including that: (a) the management fee for the Portfolio is below the median and the average management fees of the funds in its SPG; and (b) the expense ratio for the Portfolio is above the median and the average expense ratios of the funds in its SPG.
After its deliberation, the Board reached the following conclusions: (1) the Portfolio's management fee rate is reasonable in the context of all factors considered by the Board; (2) the Portfolio's expense ratio is reasonable in the context of all factors considered by the Board; (3) taking into account that Management will continue to monitor, and the Board or its Investment Review Committee will periodically review, its performance, the Portfolio's performance is reasonable in the context of all factors considered by the Board; and (4) the sub-advisory fee rate payable by the Adviser to the Sub-Adviser is reasonable in the context of all factors considered by the Board. Based on these conclusions and other factors, the Board voted to renew the Advisory and Sub-Advisory Contracts for the Portfolio for the year ending November 30, 2008. During this renewal process, different Board members may have given different weight to different individu al factors and related conclusions.
310
ADVISORY CONTRACT APPROVAL DISCUSSION (UNAUDITED) (CONTINUED)
ING Legg Mason Partners Large Cap Growth Portfolio
In considering whether to approve the renewal of the Advisory and Sub-Advisory Contracts for ING Legg Mason Partners Large Cap Growth Portfolio, the Board considered that, based on performance data for the periods ended June 30, 2007: (1) the Portfolio underperformed its Morningstar category median for all periods presented, with the exception of the most recent calendar quarter, during which it outperformed; (2) the Portfolio underperformed its primary benchmark for all periods presented, with the exception of the most recent calendar quarter, during which it outperformed; and (3) the Portfolio is ranked in the third quintile of its Morningstar Category for the most recent calendar quarter, the fourth quintile for the one-year period, and the fifth (lowest) quintile for the year-to-date and three-year periods.
In analyzing this performance data, the Board took into account: (1) Management's representations regarding the alternatives that Management was exploring with the Board to address the Board's concerns about the Portfolio's performance; and (2) that Management would continue to monitor, and the Board or its Investment Review Committee would review, the Portfolio's investment performance.
In considering the fees payable under the Advisory and Sub-Advisory Contracts for ING Legg Mason Partners Large Cap Growth Portfolio, the Board took into account the factors described above and also considered: (1) the fairness of the compensation under an Advisory Contract with level fees that does not include breakpoints; (2) the pricing structure (including the expense ratio to be borne by shareholders) of the Portfolio, as compared to its SPG, including that: (a) the management fee for the Portfolio is below the median and the average management fees of the funds in its SPG; and (b) the expense ratio for the Portfolio is equal to the median and below the average expense ratios of the funds in its SPG.
After its deliberation, the Board reached the following conclusions: (1) the Portfolio's management fee rate is reasonable in the context of all factors considered by the Board; (2) the Portfolio's expense ratio is reasonable in the context of all factors considered by the Board; (3) taking into account that Management will continue to monitor, and the Board or its Investment Review Committee will periodically review, its performance, the Portfolio's performance is reasonable in the context of all factors considered by the Board; and (4) the sub-advisory fee rate payable by the Adviser to the Sub-Adviser is reasonable in the context of all factors considered by the Board. Based on these conclusions and other factors, the Board voted to renew the Advisory and Sub-Advisory Contracts for the Portfolio for the year ending November 30, 2008. During this renewal process, different Board members may have given different weight to different individu al factors and related conclusions.
ING Lord Abbett U.S. Government Securities Portfolio
In considering whether to approve the renewal of the Advisory and Sub-Advisory Contracts for ING Lord Abbett U.S. Government Securities Portfolio, the Board considered that, based on performance data for the periods ended June 30, 2007: (1) the Portfolio underperformed its Morningstar category median for all periods presented; (2) the Portfolio underperformed its primary benchmark for all periods presented; and (3) the Portfolio is ranked in the third quintile of its Morningstar category for the one-year period, and the fifth (lowest) quintile for the most recent calendar quarter and year-to-date periods.
In analyzing this performance data, the Board took into account that: (1) the Portfolio was launched in January 2006 and therefore had limited operating history for the purpose of analyzing Portfolio performance; (2) Management's representations that it was exploring opportunities to address the Board's concerns about underperformance, including a possible merger of the Portfolio with and into another ING Fund, which would be completed during 2008 if approved by the Portfolio's shareholders and by the Board; and (3) Management would continue to monitor, and the Board or its Investment Review Committee would periodically review, the Portfolio's investment performance.
In considering the fees payable under the Advisory and Sub-Advisory Contracts for ING Lord Abbett U.S. Government Securities Portfolio, the Board took into account the factors described above and also considered: (1) the fairness of the compensation under an Advisory Contract with a breakpoint fee schedule where the asset level necessary to achieve a breakpoint discount had not been reached by the Portfolio; and (2) the pricing structure (including the expense ratio to be borne by shareholders) of ING Lord Abbett U.S. Government Securities Portfolio, as compared to its SPG, including that: (a) the management fee (inclusive of 0.10% administration fee) for the Portfolio is below the median and below the average management fees of the
311
ADVISORY CONTRACT APPROVAL DISCUSSION (UNAUDITED) (CONTINUED)
funds in its SPG; and (b) the expense ratio for the Portfolio is above the median and above the average expense ratios of the funds in its SPG.
After its deliberation, the Board reached the following conclusions: (1) the Portfolio's management fee rate is reasonable in the context of all factors considered by the Board; (2) the Portfolio's expense ratio is reasonable in the context of all factors considered by the Board; (3) taking into account that Management will continue to monitor, and the Board or its Investment Review Committee will periodically review, its performance, as well as measures proposed to address the Board's performance concerns, the Portfolio's performance is reasonable in the context of all factors considered by the Board; and (4) the sub-advisory fee rate payable by the Adviser to the Sub-Adviser is reasonable in the context of all factors considered by the Board. Based on these conclusions and other factors, the Board voted to renew the Advisory and Sub-Advisory Contracts for the Portfolio for the year ending November 30, 2008. During this renewal process, dif ferent Board members may have given different weight to different individual factors and related conclusions.
ING Neuberger Berman Partners Portfolio
In considering whether to approve the renewal of the Advisory and Sub-Advisory Contracts for ING Neuberger Berman Partners Portfolio, the Board considered that, based on performance data for the periods ended June 30, 2007: (1) the Portfolio outperformed its Morningstar category median for all periods presented; (2) the Portfolio outperformed its primary benchmark for all periods presented; and (3) the Portfolio is ranked in the first (highest) quintile of its Morningstar category median for all periods presented.
In considering the fees payable under the Advisory and Sub-Advisory Contracts for ING Neuberger Berman Partners Portfolio, the Board took into account the factors described above and also considered: (1) the fairness of the compensation under an Advisory Contract with level fees that does not include breakpoints; (2) the pricing structure (including the expense ratio to be borne by shareholders) of the Portfolio, as compared to its SPG, including that: (a) the management fee (inclusive of the advisory fee and a 0.10% administration fee) for the Portfolio is below the median and the average management fees of the funds in its SPG; and (b) the expense ratio for the Portfolio is below the median and the average expense ratios of the funds in its SPG.
After its deliberation, the Board reached the following conclusions: (1) the Portfolio's management fee rate is reasonable in the context of all factors considered by the Board; (2) the Portfolio's expense ratio is reasonable in the context of all factors considered by the Board; (3) the Portfolio's performance is reasonable in the context of all factors considered by the Board; and (4) the sub-advisory fee rate payable by the Adviser to the Sub-Adviser is reasonable in the context of all factors considered by the Board. Based on these conclusions and other factors, the Board voted to renew the Advisory and Sub-Advisory Contracts for the Portfolio for the year ending November 30, 2008. During this renewal process, different Board members may have given different weight to different individual factors and related conclusions.
ING Neuberger Berman Regency Portfolio
In considering whether to approve the renewal of the Advisory and Sub-Advisory Contracts for ING Neuberger Berman Regency Portfolio, the Board considered that, based on performance data for the periods ended June 30, 2007: (1) the Portfolio underperformed its Morningstar category median for all periods presented, with the exception of the most recent calendar quarter, during which it outperformed; (2) the Portfolio outperformed its primary benchmark for all periods presented, with the exception of the one-year period, during which it underperformed; and (3) the Portfolio is ranked in the second quintile of its Morningstar category for the most recent calendar quarter, the fourth quintile for the year-to-date period, and the fifth (lowest) quintile for the one-year period.
In analyzing this performance data, the Board took into account that: (1) the Portfolio launched in December 2005 and therefore had limited operating history for the purpose of analyzing Portfolio performance; (2) Management's analysis regarding the Sub-Adviser's rationale for under performance, including the negative effect of stock selection in the consumer discretionary sector; and (3) Management would continue to monitor, and the Board or its Investment Review Committee would periodically review, the Portfolio's investment performance.
312
ADVISORY CONTRACT APPROVAL DISCUSSION (UNAUDITED) (CONTINUED)
In considering the fees payable under the Advisory and Sub-Advisory Contracts for ING Neuberger Berman Regency Portfolio, the Board took into account the factors described above and also considered: (1) the fairness of the compensation under an Advisory Contract with level fees that does not include breakpoints; (2) the pricing structure (including the expense ratio to be borne by shareholders) of ING Neuberger Berman Regency Portfolio, as compared to its SPG, including that: (a) the management fee (inclusive of 0.10% administration fee) for the Portfolio is above the median and equal to the average management fees of the funds in its SPG; and (b) the expense ratio for the Portfolio is below the median and below the average expense ratios of the funds in its SPG.
After its deliberation, the Board reached the following conclusions: (1) the Portfolio's management fee is reasonable in the context of all factors considered by the Board; (2) the Portfolio's expense ratio is reasonable in the context of all factors considered by the Board; (3) the Portfolio was launched in December 2005, and it is reasonable to permit the Portfolio to establish a longer operating history for purposes of evaluating performance; and (4) the sub-advisory fee rate payable by the Adviser to the Sub-Adviser is reasonable in the context of all factors considered by the Board. Based on these conclusions and other factors, the Board voted to renew the Advisory and Sub-Advisory Contracts for the Portfolio for the year ending November 30, 2008. During this renewal process, different Board members may have given different weight to different individual factors and related conclusions.
ING OpCap Balanced Value Portfolio
In considering whether to approve the renewal of the Advisory and Sub-Advisory Contracts for ING OpCap Balanced Value Portfolio, the Board considered that, based on performance data for the periods ended June 30, 2007: (1) the Portfolio outperformed its Morningstar category median for all periods presented, with the exception of the year-to-date and three-year periods, during which it underperformed; (2) the Portfolio underperformed its primary benchmark for all periods presented, with the exception of the five-year period, during which it outperformed; and (3) the Portfolio is ranked in the first (highest) quintile of its Morningstar category for the most recent calendar quarter and five-year periods, the second quintile for the one-year period, the third quintile for the year-to-date period, and the fourth quintile for the three-year period.
In analyzing this performance data, the Board took into account Management's representations about improvements in the Portfolio's performance during the most recent calendar quarter.
In considering the fees payable under the Advisory and Sub-Advisory Contracts for ING OpCap Balanced Value Portfolio, the Board took into account the factors described above and also considered: (1) the fairness of the compensation under an Advisory Contract with level fees that does not include breakpoints; and (2) the pricing structure (including the expense ratio to be borne by shareholders) of the Portfolio as compared to its SPG, including that: (a) the management fee for the Portfolio is above the median and the average management fees of the funds in its SPG; and (b) the expense ratio for the Portfolio is above the median and the average expense ratios of the funds in its SPG.
In analyzing this fee data, the Board considered Management's agreement to put into place, at the direction of the Board following the 2007 contract renewal process, limits on the Portfolio's expenses, to become effective January 1, 2008.
After its deliberation, the Board reached the following conclusions: (1) the Portfolio's management fee rate is reasonable in the context of all factors considered by the Board; (2) the Portfolio's expense ratio is reasonable in the context of all factors considered by the Board; (3) the Portfolio's performance is reasonable in the context of all factors considered by the Board; and (4) the sub-advisory fee rate payable by the Adviser to the Sub-Adviser is reasonable in the context of all factors considered by the Board. Based on these conclusions and other factors, the Board voted to renew the Advisory and Sub-Advisory Contracts for the Portfolio for the year ending November 30, 2008. During this renewal process, different Board members may have given different weight to different individual factors and related conclusions.
ING Oppenheimer Global Portfolio
In considering whether to approve the renewal of the Advisory and Sub-Advisory Contracts for ING Oppenheimer Global Portfolio, the Board considered that, based on performance data for the periods ended June 30, 2007: (1) the Portfolio outperformed its Morningstar category median for all periods presented, with the exception of
313
ADVISORY CONTRACT APPROVAL DISCUSSION (UNAUDITED) (CONTINUED)
the year-to-date and one-year periods, during which it underperformed; (2) the Portfolio outperformed its primary benchmark for all periods presented, with the exception of the year-to-date and one-year periods, during which it underperformed; and (3) the Portfolio is ranked in the second quintile of its Morningstar category for the most recent calendar quarter and five-year periods, and the third quintile for the year-to-date, one-year, and three-year periods.
In considering the fees payable under the Advisory and Sub-Advisory Contracts for ING Oppenheimer Global Portfolio, the Board took into account the factors described above and also considered: (1) the fairness of the compensation under an Advisory Contract with level fees that does not include breakpoints; and (2) the pricing structure (including the expense ratio to be borne by shareholders) of the Portfolio as compared to its SPG, including that: (a) the management fee for the Portfolio is below the median and the average management fees of the funds in its SPG; and (b) the expense ratio for the Portfolio is below the median and the average expense ratios of the funds in its SPG.
After its deliberation, the Board reached the following conclusions: (1) the Portfolio's management fee rate is reasonable in the context of all factors considered by the Board; (2) the Portfolio's expense ratio is reasonable in the context of all factors considered by the Board; (3) the Portfolio's performance is reasonable in the context of all factors considered by the Board; and (4) the sub-advisory fee rate payable by the Adviser to the Sub-Adviser is reasonable in the context of all factors considered by the Board. Based on these conclusions and other factors, the Board voted to renew the Advisory and Sub-Advisory Contracts for the Portfolio for the year ending November 30, 2008. During this renewal process, different Board members may have given different weight to different individual factors and related conclusions.
ING Oppenheimer Strategic Income Portfolio
In considering whether to approve the renewal of the Advisory and Sub-Advisory Contracts for ING Oppenheimer Strategic Income Portfolio, the Board considered that, based on performance data for the periods ended June 30, 2007: (1) the Portfolio outperformed its Morningstar category median for all periods presented; (2) the Portfolio outperformed its primary benchmark for all periods presented; and (3) the Portfolio is ranked in the first (highest) quintile of its Morningstar category for all periods presented.
In considering the fees payable under the Advisory and Sub-Advisory Contracts for ING Oppenheimer Strategic Income Portfolio, the Board took into account the factors described above and also considered: (1) the fairness of the compensation under an Advisory Contract with a breakpoint fee schedule where the asset level necessary to achieve a breakpoint discount had not been reached by the Portfolio; (2) the pricing structure (including the expense ratio to be borne by shareholders) of the Portfolio, as compared to its SPG, including that: (a) the management fee for the Portfolio is below the median and the average management fees of the funds in its SPG; and (b) the expense ratio for the Portfolio is below the median and below the average expense ratios of the funds in its SPG.
After its deliberation, the Board reached the following conclusions: (1) the Portfolio's management fee rate is reasonable in the context of all factors considered by the Board; (2) the Portfolio's expense ratio is reasonable in the context of all factors considered by the Board; (3) the Portfolio's performance is reasonable in the context of all factors considered by the Board; and (4) the sub-advisory fee rate payable by the Adviser to the Sub-Adviser is reasonable in the context of all factors considered by the Board. Based on these conclusions and other factors, the Board voted to renew the Advisory and Sub-Advisory Contracts for the Portfolio for the year ending November 30, 2008. During this renewal process, different Board members may have given different weight to different individual factors and related conclusions.
ING PIMCO Total Return Portfolio
In considering whether to approve the renewal of the Advisory and Sub-Advisory Contracts for ING PIMCO Total Return Portfolio, the Board considered that, based on performance data for the periods ended June 30, 2007: (1) the Portfolio underperformed its Morningstar category median for the most recent calendar quarter, year-to-date, and one-year periods, but outperformed for the three-year and five-year periods; (2) the Portfolio underperformed its primary benchmark for all periods presented, with the exception of the five-year period, during which it outperformed; and (3) the Portfolio is ranked in the third quintile of its Morningstar category for
314
ADVISORY CONTRACT APPROVAL DISCUSSION (UNAUDITED) (CONTINUED)
the one-year, three-year, and five-year periods, and the fourth quintile for the most recent calendar quarter and year-to-date periods.
In analyzing this performance data, the Board took into account Management's representations regarding the changes to the Portfolio's portfolio management team implemented in April 2007.
In considering the fees payable under the Advisory and Sub-Advisory Contracts for ING PIMCO Total Return Portfolio, the Board took into account the factors described above and also considered: (1) the fairness of the compensation under an Advisory Contract with level fees that does not include breakpoints; (2) the pricing structure (including the expense ratio to be borne by shareholders) of ING PIMCO Total Return Portfolio, as compared to its SPG, including that: (a) the management fee for the Portfolio is equal to the median and above the average management fees of the funds in its SPG; and (b) the expense ratio for the Portfolio is below the median and the average expense ratios of the funds in its SPG.
In analyzing this fee data, the Board took into consideration that, at the direction of the Board following the 2006 contract renewal process, Management implemented breakpoints on the Portfolio's administrative fees.
After its deliberation, the Board reached the following conclusions: (1) the Portfolio's management fee rate is reasonable in the context of all factors considered by the Board; (2) the Portfolio's expense ratio is reasonable in the context of all factors considered by the Board; (3) there was a change in the portfolio managers to the Portfolio in April 2007, and it is reasonable to assess whether longer-term performance improves as a result of this change; and (4) the sub-advisory fee rate payable by the Adviser to the Sub-Adviser is reasonable in the context of all factors considered by the Board. Based on these conclusions and other factors, the Board voted to renew the Advisory and Sub-Advisory Contracts for the Portfolio for the year ending November 30, 2008. During this renewal process, different Board members may have given different weight to different individual factors and related conclusions.
ING Pioneer High Yield Portfolio
In considering whether to approve the renewal of the Advisory and Sub-Advisory Contracts for ING Pioneer High Yield Portfolio, the Board considered that, based on performance data for the periods ended June 30, 2007: (1) the Portfolio outperformed its Morningstar category median for all periods presented; (2) the Portfolio outperformed its primary benchmark for all periods presented; and (3) the Portfolio is ranked in the first (highest) quintile of its Morningstar category for all periods presented.
In considering the fees payable under the Advisory and Sub-Advisory Contracts for ING Pioneer High Yield Portfolio, the Board took into account the factors described above and also considered: (1) the fairness of the compensation under an Advisory Contract with a breakpoint fee schedule where the asset level necessary to achieve a breakpoint discount had not been reached by the Portfolio; (2) the pricing structure (including the expense ratio to be borne by shareholders) of the Portfolio, as compared to its SPG, including that: (a) the management fee (inclusive of 0.10% administration fee) for the Portfolio is equal to the median and above the average management fees of the funds in its SPG; and (b) the expense ratio for the Portfolio is below the median and below the average expense ratios of the funds in its SPG.
After its deliberation, the Board reached the following conclusions: (1) the Portfolio's management fee rate is reasonable in the context of all factors considered by the Board; (2) the Portfolio's expense ratio is reasonable in the context of all factors considered by the Board; (3) the Portfolio's performance is reasonable in the context of all factors considered by the Board; and (4) the sub-advisory fee rate payable by the Adviser to the Sub-Adviser is reasonable in the context of all factors considered by the Board. Based on these conclusions and other factors, the Board voted to renew the Advisory and Sub-Advisory Contracts for the Portfolio for the year ending November 30, 2008. During this renewal process, different Board members may have given different weight to different individual factors and related conclusions.
ING T. Rowe Price Diversified Mid Cap Growth Portfolio
In considering whether to approve the renewal of the Advisory and Sub-Advisory Contracts for ING T. Rowe Price Diversified Mid Cap Growth Portfolio, the Board considered that, based on performance data for the periods ended June 30, 2007: (1) the Portfolio underperformed its Morningstar category median for all periods presented, with the exception of the one-year period, during which it outperformed; (2) the Portfolio underperformed its
315
ADVISORY CONTRACT APPROVAL DISCUSSION (UNAUDITED) (CONTINUED)
primary benchmark for all periods presented, with the exception of the most recent calendar quarter and one-year period during which it outperformed; and (3) the Portfolio is ranked in the third quintile of its Morningstar category for the most recent calendar quarter and one-year periods, and the fourth quintile for the year-to-date, three-year, and five-year periods.
In analyzing this performance data, the Board took into account: (1) Management's analysis regarding the Sub-Adviser's rationale for underperformance during certain periods; and (2) that Management would continue to monitor, and the Board or its Investment Review Committee would periodically review, the Portfolio's investment performance.
In considering the fees payable under the Advisory and Sub-Advisory Contracts for ING T. Rowe Price Diversified Mid Cap Growth Portfolio, the Board took into account the factors described above and also considered: (1) the fairness of the compensation under an Advisory Contract with level fees that does not include breakpoints; and (2) the pricing structure (including the expense ratio to be borne by shareholders) of the Portfolio as compared to its SPG, including that: (a) the management fee for the Portfolio is below the median and the average management fees of the funds in its SPG; and (b) the expense ratio for the Portfolio is below the median and the average expense ratios of the funds in its SPG.
After its deliberation, the Board reached the following conclusions: (1) the Portfolio's management fee rate is reasonable in the context of all factors considered by the Board; (2) the Portfolio's expense ratio is reasonable in the context of all factors considered by the Board; (3) taking into account that Management will continue to monitor, and the Board or its Investment Review Committee will periodically review, its performance, the Portfolio's performance is reasonable in the context of all factors considered by the Board; and (4) the sub-advisory fee rate payable by the Adviser to the Sub-Adviser is reasonable in the context of all factors considered by the Board. Based on these conclusions and other factors, the Board voted to renew the Advisory and Sub-Advisory Contracts for the Portfolio for the year ending November 30, 2008. During this renewal process, different Board members may have given different weight to different individu al factors and related conclusions.
ING T. Rowe Price Growth Equity Portfolio
In considering whether to approve the renewal of the Advisory and Sub-Advisory Contracts for ING T. Rowe Price Growth Equity Portfolio, the Board considered that, based on performance data for the periods ended June 30, 2007: (1) the Portfolio outperformed its Morningstar category median for all periods presented; (2) the Portfolio outperformed its primary benchmark for all periods presented; and (3) the Portfolio is ranked in the first (highest) quintile of its Morningstar category for the one-year, three-year, and five-year periods, the second quintile for the most recent calendar quarter, and the third quintile for the year-to-date period.
In considering the fees payable under the Advisory and Sub-Advisory Contracts for ING T. Rowe Price Growth Equity Portfolio, the Board took into account the factors described above and also considered: (1) the fairness of the compensation under an Advisory Contract with level fees that does not include breakpoints; (2) the pricing structure (including the expense ratio to be borne by shareholders) of the Portfolio, as compared to its SPG, including that: (a) the management fee for the Portfolio is below the median and the average management fees of the funds in its SPG; and (b) the expense ratio for the Portfolio is below the median and equal to the average expense ratios of the funds in its SPG.
After its deliberation, the Board reached the following conclusions: (1) the Portfolio's management fee rate is reasonable in the context of all factors considered by the Board; (2) the Portfolio's expense ratio is reasonable in the context of all factors considered by the Board; (3) the Portfolio's performance is reasonable in the context of all factors considered by the Board; and (4) the sub-advisory fee rate payable by the Adviser to the Sub-Adviser is reasonable in the context of all factors considered by the Board. Based on these conclusions and other factors, the Board voted to renew the Advisory and Sub-Advisory Contracts for the Portfolio for the year ending November 30, 2008. During this renewal process, different Board members may have given different weight to different individual factors and related conclusions.
ING Templeton Foreign Equity Portfolio
In considering whether to approve the renewal of the Advisory and Sub-Advisory Contracts for ING Templeton Foreign Equity Portfolio, the Board considered that, based on performance data for the periods ended June 30, 2007: (1) the Portfolio outperformed its Morningstar category median for all periods presented; (2) the Portfolio
316
ADVISORY CONTRACT APPROVAL DISCUSSION (UNAUDITED) (CONTINUED)
underperformed its primary benchmark for the most recent calendar quarter and year-to-date periods, but outperformed for the one-year period; and (3) the Portfolio is ranked in the first (highest) quintile of its Morningstar category for the year-to-date and one-year periods, and the second quintile for the most recent calendar quarter.
In analyzing this performance data the Board took into account that the Portfolio launched in January 2006, and therefore had a limited operating history for the purpose of analyzing Portfolio performance.
In considering the fees payable under the Advisory and Sub-Advisory Contracts for ING Templeton Foreign Equity Portfolio, the Board took into account the factors described above and also considered: (1) the fairness of the compensation under an Advisory Contract with a breakpoint fee schedule where the asset level necessary to achieve a breakpoint discount had not been reached by the Portfolio; (2) the pricing structure (including the expense ratio to be borne by shareholders) of the Portfolio, as compared to its SPG, including that (a) the management fee (inclusive of a 10% administration fee) for the Portfolio is equal to the median and below the average management fees of the funds in its SPG; and (b) the expense ratio of the Portfolio is above the median and below the average expense ratios of the funds in its SPG.
After its deliberation, the Board reached the following conclusions: (1) the Portfolio's management fee rate is reasonable in the context of all factors considered by the Board; (2) the Portfolio's expense ratio is reasonable in the context of all factors considered by the Board; (3) the Portfolio was launched in January 2006, and it is reasonable to permit the Portfolio to establish a longer operating history for purposes of evaluating performance; and (4) the sub-advisory fee rate payable by the Adviser to the Sub-Adviser is reasonable in the context of all factors considered by the Board. Based on these conclusions and other factors, the Board voted to renew the Advisory and Sub-Advisory Contracts for the Portfolio for the year ending November 30, 2008. During this renewal process, different Board members may have given different weight to different individual factors and related conclusions.
ING Thornburg Value Portfolio
In considering whether to approve the renewal of the Advisory and Sub-Advisory Contracts for ING Thornburg Value Portfolio (formerly ING MFS Capital Opportunities Portfolio), the Board considered that, based on performance data for the periods ended June 30, 2007: (1) the Portfolio outperformed its Morningstar category median for all periods presented; (2) the Portfolio outperformed its primary benchmark for all periods presented, with the exception of the five-year period, during which it underperformed; and (3) the Portfolio is ranked in the first (highest) quintile of its Morningstar category for the most recent calendar quarter, year-to-date, and one-year periods, the second quintile for the three-year period, and the third quintile for the five-year period.
In analyzing this performance data, the Board took into account that in August 2006 a new Sub-Adviser was engaged to manage the Portfolio to address the Board's concerns about performance.
In considering the fees payable under the Advisory and Sub-Advisory Contracts for ING Thornburg Value Portfolio (formerly ING MFS Capital Opportunities Portfolio), the Board took into account the factors described above and also considered: (1) the fairness of the compensation under an Advisory Contract with level fees that does not include breakpoints; (2) the pricing structure (including the expense ratio to be borne by shareholders) of the Portfolio, as compared to its SPG, including that: (a) the management fee for the Portfolio is equal to the median and below the average management fees of the funds in its SPG; and (b) the expense ratio for the Portfolio is above the median and the average expense ratios of the funds in its SPG.
After its deliberation, the Board reached the following conclusions: (1) the Portfolio's management fee rate is reasonable in the context of all factors considered by the Board; (2) the Portfolio's expense ratio is reasonable in the context of all factors considered by the Board; (3) in August 2006 a new Sub-Adviser assumed responsibility for management of the Portfolio, and it is reasonable to permit the Sub-Adviser to continue to manage the Portfolio in order to assess performance; and (4) the sub-advisory fee rate payable by the Adviser to the Sub-Adviser is reasonable in the context of all factors considered by the Board. Based on these conclusions and other factors, the Board voted to renew the Advisory and Sub-Advisory Contracts for the Portfolio for the year ending November 30, 2008. During this renewal process, different Board members may have given different weight to different individual factors and related conclusions.
317
ADVISORY CONTRACT APPROVAL DISCUSSION (UNAUDITED) (CONTINUED)
ING UBS U.S. Large Cap Equity Portfolio
In considering whether to approve the renewal of the Advisory and Sub-Advisory Contracts for ING UBS U.S. Large Cap Equity Portfolio, the Board considered that, based on performance data for the periods ended June 30, 2007: (1) the Portfolio outperformed its Morningstar category median for all periods presented; (2) the Portfolio outperformed its primary benchmark for all periods presented; and (3) the Portfolio is ranked in the first (highest) quintile of its Morningstar category median for the one- and three- year periods, the second quintile for the most recent calendar quarter and five-year periods, and the third quintile for the year-to-date period.
In considering the fees payable under the Advisory and Sub-Advisory Contracts for ING UBS U.S. Large Cap Equity Portfolio, the Board took into account the factors described above and also considered: (1) the fairness of the compensation under an Advisory Contract with a breakpoint fee schedule where the asset level necessary to achieve a breakpoint discount had not been reached by the Portfolio; (2) the pricing structure (including the expense ratio to be borne by shareholders) of the Portfolio, as compared to its SPG, including that: (a) the management fee for the Portfolio is above the median and the average management fees of the funds in its SPG; and (b) the expense ratio for the Portfolio is above the median and the average expense ratios of the funds in its SPG.
After its deliberation, the Board reached the following conclusions: (1) the Portfolio's management fee rate is reasonable in the context of all factors considered by the Board; (2) the Portfolio's expense ratio is reasonable in the context of all factors considered by the Board; (3) the Portfolio's performance is reasonable in the context of all factors considered by the Board; and (4) the sub-advisory fee rate payable by the Adviser to the Sub-Adviser is reasonable in the context of all factors considered by the Board. Based on these conclusions and other factors, the Board voted to renew the Advisory and Sub-Advisory Contracts for the Portfolio for the year ending November 30, 2008. During this renewal process, different Board members may have given different weight to different individual factors and related conclusions.
ING UBS U.S. Small Cap Growth Portfolio
In considering whether to approve the renewal of the Advisory and Sub-Advisory Contracts for ING UBS U.S. Small Cap Growth Portfolio, the Board considered that, based on performance data for the periods ended June 30, 2007: (1) the Portfolio underperformed its Morningstar category median for all periods presented; (2) the Portfolio underperformed its primary benchmark for the most recent calendar quarter and one-year periods, but outperformed for the year-to-date period; and (3) the Portfolio is ranked in the third quintile of its Morningstar category median for the year-to-date period, the fourth quintile for the one-year period, and the fifth (lowest) quintile for the most recent calendar quarter.
In analyzing this performance data, the Board took into account that the Portfolio launched in April 2006, and therefore had a limited operating history for the purpose of analyzing Portfolio performance.
In considering the fees payable under the Advisory and Sub-Advisory Contracts for the Portfolio, the Board took into account the factors described above and also considered: (1) the fairness of the compensation under an Advisory Contract with level fees that does not include breakpoints; and (2) the pricing structure (including the expense ratio to be borne by shareholders) of the Portfolio, as compared to its SPG, including that: (a) the management fee (inclusive of the advisory fee and a 0.10% administration fee) for the Portfolio is above the median and the average management fees of the funds in its SPG; and (b) the expense ratio for the Portfolio is equal to the median and below the average expense ratios of the funds in its SPG.
In analyzing this fee data, the Board took into consideration Management's waiver of a portion of the Portfolio's management fee, which resulted in a lower effective management fee for the Portfolio.
After its deliberation, the Board reached the following conclusions: (1) the Portfolio's management fee rate is reasonable in the context of all factors considered by the Board; (2) the Portfolio's expense ratio is reasonable in the context of all factors considered by the Board; (3) the sub-advisory fee rate payable by the Adviser to the Sub-Adviser is reasonable in the context of all factors considered by the Board; and (4) the Portfolio was launched in April 2006, and it is reasonable to permit the Portfolio to establish a longer operating history for purposes of evaluating performance. Based on these conclusions and other factors, the Board voted to renew the Advisory
318
ADVISORY CONTRACT APPROVAL DISCUSSION (UNAUDITED) (CONTINUED)
and Sub-Advisory Contracts for the Portfolio for the year ending November 30, 2008. During this renewal process, different Board members may have given different weight to different individual factors and related conclusions.
ING Van Kampen Comstock Portfolio
In considering whether to approve the renewal of the Advisory and Sub-Advisory Contracts for ING Van Kampen Comstock Portfolio, the Board considered that, based on performance data for the periods ended June 30, 2007: (1) the Portfolio underperformed its Morningstar category median for all periods presented, with the exception of the five-year period, during which it outperformed; (2) the Portfolio underperformed its primary benchmark for all periods presented, with the exception of the most recent calendar quarter and year-to-date periods, during which it outperformed; and (3) the Portfolio is ranked in the second quintile of its Morningstar category for the five-year period, the fourth quintile for the year-to-date, one-year, and three-year periods, and the fifth (lowest) quintile for the most recent calendar quarter.
In analyzing this performance data, the Board took into account: (1) Management's analysis regarding the reasons for underperformance, including the negative effect of sector allocation and stock selection on performance; (2) Management would continue to monitor, and the Board or its Investment Review Committee would periodically review, the Portfolio's investment performance; and (3) Management's expectation that longer-term performance will improve.
In considering the fees payable under the Advisory and Sub-Advisory Contracts for ING Van Kampen Comstock Portfolio, the Board took into account the factors described above and also considered: (1) the fairness of the compensation under an Advisory Contract with level fees that does not include breakpoints; and (2) the pricing structure (including the expense ratio to be borne by shareholders) of the Portfolio as compared to its SPG, including that: (a) the management fee for the Portfolio is below the median and the average management fees of the funds in its SPG; and (b) the expense ratio for the Portfolio is above the median and the average expense ratios of the funds in its SPG.
In analyzing this fee data, the Board considered Management's agreement to put into place, at the direction of the Board following the 2007 contract renewal process, limits on the Portfolio's expenses, to become effective January 1, 2008.
After its deliberation, the Board reached the following conclusions: (1) the Portfolio's management fee rate is reasonable in the context of all factors considered by the Board; (2) the Portfolio's expense ratio is reasonable in the context of all factors considered by the Board; (3) taking into account that Management will continue to monitor, and the Board or its Investment Review Committee will periodically review, its performance, the Portfolio's performance is reasonable in the context of all factors considered by the Board; and (4) the sub-advisory fee rate payable by the Adviser to the Sub-Adviser is reasonable in the context of all factors considered by the Board. Based on these conclusions and other factors, the Board voted to renew the Advisory and Sub-Advisory Contracts for the Portfolio for the year ending November 30, 2008. During this renewal process, different Board members may have given different weight to different individu al factors and related conclusions.
ING Van Kampen Equity and Income Portfolio
In considering whether to approve the renewal of the Advisory and Sub-Advisory Contracts for ING Van Kampen Equity and Income Portfolio, the Board considered that, based on performance data for the periods ended June 30, 2007: (1) the Portfolio outperformed its Morningstar category median for all periods presented; (2) the Portfolio underperformed its primary benchmark for all periods presented, with the exception of the most recent calendar quarter, during which it outperformed; and (3) the Portfolio is ranked in the first (highest) quintile of its Morningstar category for the most recent calendar quarter, three-year, and five-year periods, and the second quintile for the year-to-date and one-year periods.
In considering the fees payable under the Advisory and Sub-Advisory Contracts for ING Van Kampen Equity and Income Portfolio, the Board took into account the factors described above and also considered: (1) the fairness of the compensation under an Advisory Contract with level fees that does not include breakpoints; (2) the pricing structure (including the expense ratio to be borne by shareholders) of the Portfolio, as compared to its SPG, including that: (a) the management fee for the Portfolio is equal to the median and below the average
319
ADVISORY CONTRACT APPROVAL DISCUSSION (UNAUDITED) (CONTINUED)
management fees of the funds in its SPG; and (b) the expense ratio for the Portfolio is below the median and the average expense ratios of the funds in its SPG.
After its deliberation, the Board reached the following conclusions: (1) the Portfolio's management fee rate is reasonable in the context of all factors considered by the Board; (2) the Portfolio's expense ratio is reasonable in the context of all factors considered by the Board; (3) the Portfolio's performance is reasonable in the context of all factors considered by the Board; and (4) the sub-advisory fee rate payable by the Adviser to the Sub-Adviser is reasonable in the context of all factors considered by the Board. Based on these conclusions and other factors, the Board voted to renew the Advisory and Sub-Advisory Contracts for the Portfolio for the year ending November 30, 2008. During this renewal process, different Board members may have given different weight to different individual factors and related conclusions.
320
(THIS PAGE INTENTIONALLY LEFT BLANK)
(THIS PAGE INTENTIONALLY LEFT BLANK)
Investment Adviser
Directed Services, LLC
1475 Dunwoody Drive
West Chester, Pennsylvania 19380
Administrator
ING Funds Services, LLC
7337 East Doubletree Ranch Road
Scottsdale, Arizona 85258
Distributor
ING Funds Distributor, LLC
7337 East Doubletree Ranch Road
Scottsdale, Arizona 85258
Transfer Agent
DST Systems, Inc.
P.O. Box 419368
Kansas City, Missouri 64141
Independent Registered Public Accounting Firm
KPMG LLP
99 High Street
Boston, Massachusetts 02110
Custodian
The Bank of New York Mellon Corporation
One Wall Street
New York, New York 10286
Legal Counsel
Dechert LLP
1775 I Street, N.W.
Washington, D.C. 20006
Before investing, carefully consider the investment objectives, risks, charges and expenses of the variable universal life insurance policy or variable annuity contract and the underlying variable investment options. This and other information is contained in the prospectus for the variable universal life policy or variable annuity contract and the underlying variable investment options. Obtain these prospectuses from your agent/registered representative and read them carefully before investing.

VPAR-UIPI
(1207-022908)

Funds
Annual Report
December 31, 2007
Service Class ("Class S") and
Adviser Class ("Class ADV")
ING Partners, Inc.
n ING Fidelity® VIP Contrafund® Portfolio*
n ING Fidelity® VIP Equity-Income Portfolio*
n ING Fidelity® VIP Growth Portfolio*
n ING Fidelity® VIP Mid Cap Portfolio*
This report is submitted for general information to shareholders of the ING Funds. It is not authorized for distribution to prospective shareholders unless accompanied or preceded by a prospectus which includes details regarding the funds' investment objectives, risks, charges, expenses and other information. This information should be read carefully.
* Fidelity and Contrafund are registered trademarks of FMR Corp.

TABLE OF CONTENTS
| President's Letter | | | 1 | | |
|
| Market Perspective | | | 2 | | |
|
| Portfolio Managers' Reports | | | 4 | | |
|
| Shareholder Expense Examples | | | 8 | | |
|
| Report of Independent Registered Public Accounting Firm | | | 10 | | |
|
| Statements of Assets and Liabilities | | | 11 | | |
|
| Statements of Operations | | | 12 | | |
|
| Statements of Changes in Net Assets | | | 13 | | |
|
| Financial Highlights | | | 15 | | |
|
| Notes to Financial Statements | | | 23 | | |
|
| Portfolio of Investments | | | 30 | | |
|
| Shareholder Meeting Information | | | 34 | | |
|
| Tax Information | | | 35 | | |
|
| Director and Officer Information | | | 36 | | |
|
| Advisory Contract Approval Discussion | | | 42 | | |
|
PROXY VOTING INFORMATION
A description of the policies and procedures that the Portfolios use to determine how to vote proxies related to portfolio securities is available: (1) without charge, upon request, by calling Shareholder Services toll-free at (800) 992-0180; (2) on the ING Funds' website at www.ingfunds.com; and (3) on the U.S. Securities and Exchange Commission's ("SEC") website at www.sec.gov. Information regarding how the Portfolios voted proxies related to portfolio securities during the most recent 12-month period ended June 30 is available without charge on the ING Funds' website at www.ingfunds.com and on the SEC's website at www.sec.gov.
QUARTERLY PORTFOLIO HOLDINGS
The Portfolios file their complete schedule of portfolio holdings with the SEC for the first and third quarters of each fiscal year on Form N-Q. The Portfolio's Forms N-Q are available on the SEC's website at www.sec.gov. The Portfolio's Forms N-Q may be reviewed and copied at the SEC's Public Reference Room in Washington, DC, and information on the operation of the Public Reference Room may be obtained by calling (800) SEC-0330; and is available upon request from the Portfolio by calling Shareholder Services toll-free at (800) 992-0180.
(THIS PAGE INTENTIONALLY LEFT BLANK)
PRESIDENT'S LETTER

Dear Shareholder,
It is impossible to discuss the current market climate without acknowledging the recent turmoil brought on by problems in the sub-prime mortgage market. Clearly the excesses in this sector of the market and other segments of collateralized debt have created challenges throughout credit markets worldwide.
Amidst the volatility, we at ING Funds remind our shareholders that the creditworthiness and quality of our funds' holdings is our ultimate priority — whether those holdings are part of our money market funds, fixed income funds or equity funds. Market volatility is an often present component of investing and we believe the best way to manage through turbulent environments is to build a well-balanced, fully-diversified portfolio, which aligns with your goals and risk tolerance.
ING Funds remains committed to developing and offering a diverse array of mutual funds designed to meet the goals of most investors. We urge you to work with your investment professional to make sure you are invested appropriately. Together, you can select the funds that will help you achieve your financial goals. We thank you for choosing ING Funds and look forward to continuing to serve you.
Sincerely,

Shaun P. Mathews
President
ING Funds
January 28, 2008
The views expressed in the President's Letter reflect those of the President as of the date of the letter. Any such views are subject to change at any time based upon market or other conditions and ING Funds disclaims any responsibility to update such views. These views may not be relied on as investment advice and because investment decisions for an ING Fund are based on numerous factors, may not be relied on as an indication of investment intent on behalf of any ING Fund. Reference to specific company securities should not be construed as recommendations or investment advice.
International investing poses special risks including currency fluctuation, economic and political risks not found in investments that are solely domestic.
1
MARKET PERSPECTIVE: YEAR ENDED DECEMBER 31, 2007
After recording a solid, if frequently nervous, 8.2% in the first half of the reporting period, global equities in the form of the Morgan Stanley Capital International World IndexSM(1) ("MSCI World IndexSM") measured in local currencies, including net reinvested dividends ("MSCI" for regions discussed below) succumbed to a 3.2% loss in the second half of the reporting period, as some important debt markets all but seized up, the crisis threaten ing the solvency of financial institutions and forcing central bankers to throw lifelines to stranded borrowers, while investors fled to the safe haven of short Treasuries. By year-end, confidence was wavering, oil was nudging $100 per barrel and markets seemed to be pricing in a recession. In currencies, the yen strengthened as "carry trades" were unwound in the flight from risk. The euro benefited from the European Central Bank's implacable refusal to match the Federal Reserve Board (the "Fed") and reduce interest rates. But the pound finally gave back some of its recent gains as the UK housing market started to sag. For the second six months, the dollar fell 8.5% and 8.9% against the euro and yen respectively, but rose 0.3% against the pound.
A relentlessly deteriorating housing market had caused alarm in the sub-prime mortgage loan sector, where lax lending standards in a low interest rate environment, had driven foreclosure rates inexorably higher. The problem had been exacerbated over the years by the business of securitizing the loans. They would be sliced, diced and repackaged for handsome fees into other securities, then sold on in their billions worldwide to financial institutions, which purchased them by issuing commercial paper, over the cost of which an effortless profit could apparently be made.
At one level this spreads the loan risk. But when the originator is removed from those taking the risk another is created. Like the banking business in its simplest form, everything depends on confidence. When it became obvious that these securities, many of them rated A or higher, were ultimately backed by sub-prime and not so sub-prime mortgages with questionable repayment prospects, confidence evaporated. The asset-backed commercial paper market contracted sharply. Banks stopped lending to each other. The structured investment vehicles, their investors and sponsoring banks would have to bear huge losses, but which ones and how much?
The Fed's first response to the liquidity and resulting economic threats was to reduce the discount rate, (the rate it will lend to banks), by 50 basis points (0.50%) on August 17, 2007 and another 100 basis points (1.00%) in three steps by year end, with matching cuts in the federal funds rate.
But it was no good. Using the discount window had a stigma attached to it while the liquidity problem was not an overnight one. The one-month London Interbank Offered Rate ("LIBOR") continued to rise even as the Fed eased. A procession of financial institutions announced heavy write-downs of mortgage-backed assets, along with various capital saving and raising initiatives, including the tapping of billions of dollars from sovereign wealth funds based in the Middle-East and Asia, surely a development of historic significance.
The spread between the one-month LIBOR and the federal funds rate only drifted down after the announcement of coordinated central bank action to add liquidity where it was needed including in the U.S., the use of a "term auction facility" where loans would be auctioned and broader forms of collateral would be accepted.
But by year end global economic conditions were still clearly weakening and many felt that the U.S. might already be in or on the cusp of recession.
In U.S. fixed income markets' the Treasury yield curve steepened in the first half and continued to do so in the second. The yield on the ten-year Treasury Note fell 100 basis points (1.00%) to 4.03%, while the yield on the three-month Bill fell 153 basis points (1.53%) to 3.14%. The broader Lehman Brothers® Aggregate Bond Index(2) ("LBAB") of investment grade bonds returned 5.93% for the first half of the reporting period and 6.97% for the year ended Decemb er 31, 2007.
U.S. equities, represented by the Standard & Poor's 500® Composite Stock Price Index(3) ("S&P 500® Index") including dividends, lost 1.4% in the second half, with the worst fourth quarter since 2000, after gaining 7% through June. For a while, as the events described above played out, investors seemed to believe that the Fed had the will and the tools to keep any down turn brief. The S&P 500® Index actually made a new high on October 9, 2007. For the year ended December 31, 2007, the S&P 500® Index returned 5.49%. But, the sense that a serious crisis was only just beginning to unfold and a succession of earnings disappointments especially among the financials sector, increasingly weighed on sentiment as the year wound down. Bizarrely, gross domestic product ("GDP") growth was being reported at a brisk 4.9% for the third quarter, even as S&P 500 companies were reporting a decline in operating profits, the first fall in more than five years.
2
MARKET PERSPECTIVE: YEAR ENDED DECEMBER 31, 2007
Internationally, the MSCI Japan® Index(4) slumped 15.8% in the second half of the reporting period on a resumption of falling consumer prices and fading global growth, while the strengthening yen threatened all-important exports. For the year ended December 31, 2007, the MSCI Japan® Index lost 4.23%. The MSCI Europe ex UK® Index(5) lost 4.8% in the second six months of the reporting period. A first half rally g ave way to nervousness in mid-July after another rate increase and turned into a rout as the sub-prime debacle took shape. U.S. rate cuts were not reciprocated by the European Central Bank, which, with headline inflation up to 3.1%, confined its response to making liquidity available to the banking system, a staggering €500 billion on December 18, 2007. In the UK, stocks surged into the summer making the August 2007 slide even more violent than in continental Europe. But similar inflation worries limited the Bank of England to one 0.25% rate reduction despite a clearly weakening housing market. The MSCI UK® Inde x(5) fell 1.4% in the second half of the reporting period and returned 8.36% for the year ended December 31, 2007.
(1) The MSCI World IndexSM is an unmanaged index that measures the performance of over 1,400 securities listed on exchanges in the U.S., Europe, Canada Australia, New Zealand and the Far East.
(2) The LBAB Index is a widely recognized, unmanaged index of publicly issued investment grade U.S. Government, mortgage-backed, asset-backed and corporate debt securities.
(3) The S&P 500® Index is an unmanaged index that measures the performance of securities of approximately 500 of the largest companies in the United States.
(4) The MSCI Japan® Index is a free float-adjusted market capitalization index that is designed to measure developed market equity performance in Japan.
(5) The MSCI Europe ex UK® Index is a free float rising adjusted market capitalization index that is designed to measure developed market equity performance in Europe, excluding the UK.
(6) The MSCI UK® Index is a free float-adjusted market capitalization index that is designed to measure developed market equity performance in the UK.
All indices are unmanaged and investors cannot invest directly in an index.
Past performance does not guarantee future results. The performance quoted represents past performance. Investment return and principal value of an investment will fluctuate, and shares, when redeemed, may be worth more or less than their original cost. The Portfolios' performance is subject to change since the period's end and may be lower or higher than the performance data shown. Please call (800) 992-0180 or log on to www.ingfunds.com to obtain performance data current to the most recent month end.
Market Perspective reflects the views of ING's Chief Investment Risk Officer only through the end of the period, and is subject to change based on market and other conditions.
3
ING FIDELITY® VIP CONTRAFUND® PORTFOLIO
PORTFOLIO MANAGERS' REPORT
ING Fidelity® VIP Contrafund® Portfolio (the "Portfolio") seeks long-term capital appreciation by investing all of its assets in the Service Class 2 shares of the VIP Contrafund® Portfolio, a series of Fidelity Variable Insurance Products Fund II, a registered open-end investment company. Please refer to Management's Discussion of Fund Performance on page 4 of the included Fidelity® Variable Insurance Products: Contrafund® Portfolio Annual Report.
For the year ended December 31, 2007, the Portfolio's Class S and Class ADV shares returned 16.92% and 16.69%, respectively, compared to the S&P 500® Index(1), which returned 5.49%.
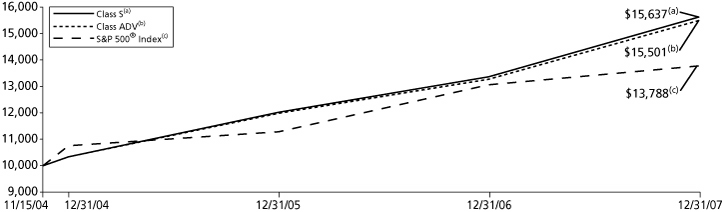
| Average Annual Total Returns for the Periods Ended December 31, 2007 | |
| | | 1 Year | | Since Inception
of Classes S and ADV
November 15, 2004 | |
| Class S | | | 16.92 | % | | | 15.37 | % | |
| Class ADV | | | 16.69 | % | | | 15.05 | % | |
| S&P 500® Index(1) | | | 5.49 | % | | | 10.68 | %(2) | |
Based on a $10,000 initial investment, the graph and table above illustrate the total return of ING Fidelity® VIP Contrafund® Portfolio against the index indicated. An index is unmanaged, has no cash in its portfolio, imposes no sales charges and incurs no operating expenses. An investor cannot invest directly in the index. The Portfolio's performance is shown without the imposition of any expenses or charges which are, or may be, imposed under your annuity contract. Total returns would have been lower if such expenses or charges were included.
The performance graph and table do not reflect the deduction of taxes that a shareholder will pay on Portfolio distributions or the redemption of Portfolio Shares.
The performance shown may include the effect of fee waivers and/or expense reimbursements by the Investment Adviser and/or other service providers, which have the effect of increasing total return. Had all fees and expenses been considered, the total returns would have been lower.
The performance update illustrates performance for a variable investment option available through a variable annuity contract. The performance shown indicates past performance and is not a projection or prediction of future results. Actual investment returns and principal value will fluctuate so that shares and/or units, at redemption, may be worth more or less than their original cost. Please call (800) 992-0180 to get performance through the most recent month end.
(1) The S&P 500® Index is an unmanaged index that measures the performance of the securities of approximately 500 of the largest companies in the U.S.
(2) Since inception performance of the index is shown from November 1, 2004.
This report contains statements that may be "forward-looking" statements. Actual results may differ materially from those projected in the "forward-looking" statements.
The views expressed in this report reflect those of the portfolio managers, only through the end of the period as stated on the cover. The portfolio managers' views are subject to change at any time based on market and other conditions.
4
PORTFOLIO MANAGERS' REPORT
ING FIDELITY® VIP EQUITY-INCOME PORTFOLIO
ING Fidelity® VIP Equity-Income Portfolio (the "Portfolio") seeks reasonable income by investing all of its assets in the Service Class 2 shares of the VIP Equity-Income Portfolio, a series of Fidelity Variable Insurance Products Fund, a registered open-end investment company. Please refer to Management's Discussion of Fund Performance on page 4 of the included Fidelity® Variable Insurance Products: Equity-Income Portfolio Annual Report.
For the year ended December 31, 2007, the Portfolio's Class S and Class ADV shares returned 0.97% and 0.69%, respectively, compared to the Russell 3000® Value Index(1), which returned (1.01)%.
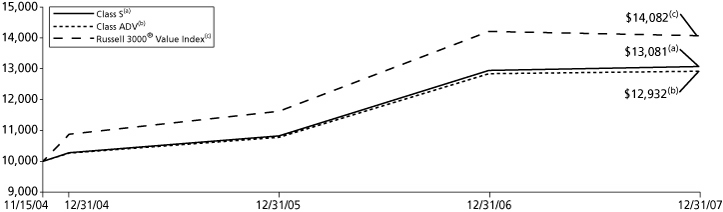
| Average Annual Total Returns for the Periods Ended December 31, 2007 | |
| | | 1 Year | | Since Inception
of Classes S and ADV
November 15, 2004 | |
| Class S | | | 0.97 | % | | | 8.97 | % | |
| Class ADV | | | 0.69 | % | | | 8.57 | % | |
| Russell 3000® Value Index(1) | | | (1.01 | )% | | | 11.41 | %(2) | |
Based on a $10,000 initial investment, the graph and table above illustrate the total return of ING Fidelity® VIP Equity-Income Portfolio against the index indicated. An index is unmanaged, has no cash in its portfolio, imposes no sales charges and incurs no operating expenses. An investor cannot invest directly in the index. The Portfolio's performance is shown without the imposition of any expenses or charges which are, or may be, imposed under your annuity contract. Total returns would have been lower if such expenses or charges were included.
The performance graph and table do not reflect the deduction of taxes that a shareholder will pay on Portfolio distributions or the redemption of Portfolio Shares.
The performance shown may include the effect of fee waivers and/or expense reimbursements by the Investment Adviser and/or other service providers, which have the effect of increasing total return. Had all fees and expenses been considered, the total returns would have been lower.
The performance update illustrates performance for a variable investment option available through a variable annuity contract. The performance shown indicates past performance and is not a projection or prediction of future results. Actual investment returns and principal value will fluctuate so that shares and/or units, at redemption, may be worth more or less than their original cost. Please call (800) 992-0181 to get performance through the most recent month end.
(1) The Russell 3000® Value Index measures the performance of those Russell 3000 securities with lower price-to-book ratios and lower forecasted growth values.
(2) Since inception performance of the index is shown from November 1, 2004.
This report contains statements that may be "forward-looking" statements. Actual results may differ materially from those projected in the "forward-looking" statements.
The views expressed in this report reflect those of the portfolio managers, only through the end of the period as stated on the cover. The portfolio managers' views are subject to change at any time based on market and other conditions.
5
ING FIDELITY® VIP GROWTH PORTFOLIO
PORTFOLIO MANAGERS' REPORT
ING Fidelity® VIP Growth Portfolio (the "Portfolio") seeks capital appreciation by investing all of its assets in the Service Class 2 shares of the VIP Growth Portfolio, a series of Fidelity Variable Insurance Products Fund, a registered open-end investment company. Please refer to Management's Discussion of Fund Performance on page 4 of the included Fidelity® Variable Insurance Products: Growth Portfolio Annual Report.
For the year ended December 31, 2007, the Portfolio's Class S and Class ADV shares returned 26.37% and 26.01%, respectively, compared to the Russell 3000® Growth Index(1), which returned 11.40%.

| Average Annual Total Returns for the Periods Ended December 31, 2007 | |
| | | 1 Year | | Since Inception
of Classes S and ADV
November 15, 2004 | |
| Class S | | | 26.37 | % | | | 12.37 | % | |
| Class ADV† | | | 26.01 | % | | | 11.93 | % | |
| Russell 3000® Growth Index(1) | | | 11.40 | % | | | 10.80 | %(2) | |
Based on a $10,000 initial investment, the graph and table above illustrate the total return of ING Fidelity® VIP Growth Portfolio against the index indicated. An index is unmanaged, has no cash in its portfolio, imposes no sales charges and incurs no operating expenses. An investor cannot invest directly in the index. The Portfolio's performance is shown without the imposition of any expenses or charges which are, or may be, imposed under your annuity contract. Total returns would have been lower if such expenses or charges were included.
The performance graph and table do not reflect the deduction of taxes that a shareholder will pay on Portfolio distributions or the redemption of Portfolio Shares.
The performance shown may include the effect of fee waivers and/or expense reimbursements by the Investment Adviser and/or other service providers, which have the effect of increasing total return. Had all fees and expenses been considered, the total returns would have been lower.
The performance update illustrates performance for a variable investment option available through a variable annuity contract. The performance shown indicates past performance and is not a projection or prediction of future results. Actual investment returns and principal value will fluctuate so that shares and/or units, at redemption, may be worth more or less than their original cost. Please call (800) 992-0181 to get performance through the most recent month end.
† On May 5, 2006, all outstanding shares of Class ADV were fully redeemed. On October 30, 2006, Class ADV re-commenced operations. The returns for Class ADV include the performance of Class S, adjusted to reflect the higher expenses of Class ADV, for the period between May 6, 2006 to October 29, 2006.
(1) The Russell 3000® Growth Index is an index that measures the performance of those Russell 3000® Index companies with higher price-to-book ratios and higher forecasted growth values.
(2) Since inception performance of the index is shown from November 1, 2004.
This report contains statements that may be "forward-looking" statements. Actual results may differ materially from those projected in the "forward-looking" statements.
The views expressed in this report reflect those of the portfolio managers, only through the end of the period as stated on the cover. The portfolio managers' views are subject to change at any time based on market and other conditions.
6
PORTFOLIO MANAGERS' REPORT
ING FIDELITY® VIP MID CAP PORTFOLIO
ING Fidelity® VIP Mid Cap Portfolio (the "Portfolio") seeks long-term growth of capital by investing all of its assets in the Service Class 2 shares of the VIP Mid Cap Portfolio, a series of Fidelity Variable Insurance Products III, a registered open-end investment company. Please refer to Management's Discussion of Fund Performance on page 4 of the included Fidelity® Variable Insurance Products: Mid Cap Portfolio Annual Report.
For the year ended December 31, 2007, the Portfolio's Class S and Class ADV shares returned 15.00% and 14.64%, respectively, compared to the S&P MidCap 400® Index(1), which returned 7.98%.
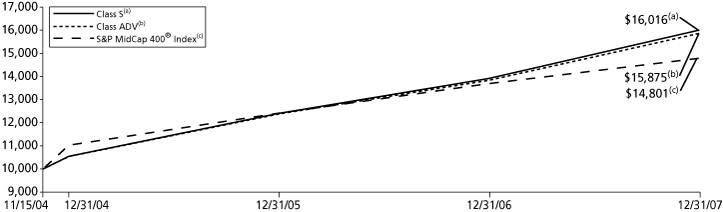
| Average Annual Total Returns for the Periods Ended December 31, 2007 | |
| | | 1 Year | | Since Inception
of Classes S and ADV
November 15, 2004 | |
| Class S | | | 15.00 | % | | | 16.27 | % | |
| Class ADV | | | 14.64 | % | | | 15.93 | % | |
| S&P MidCap 400® Index(1) | | | 7.98 | % | | | 13.18 | %(2) | |
Based on a $10,000 initial investment, the graph and table above illustrate the total return of ING Fidelity® VIP Mid Cap Portfolio against the index indicated. An index is unmanaged, has no cash in its portfolio, imposes no sales charges and incurs no operating expenses. An investor cannot invest directly in the index. The Portfolio's performance is shown without the imposition of any expenses or charges which are, or may be, imposed under your annuity contract. Total returns would have been lower if such expenses or charges were included.
The performance graph and table do not reflect the deduction of taxes that a shareholder will pay on Portfolio distributions or the redemption of Portfolio Shares.
The performance shown may include the effect of fee waivers and/or expense reimbursements by the Investment Adviser and/or other service providers, which have the effect of increasing total return. Had all fees and expenses been considered, the total returns would have been lower.
The performance update illustrates performance for a variable investment option available through a variable annuity contract. The performance shown indicates past performance and is not a projection or prediction of future results. Actual investment returns and principal value will fluctuate so that shares and/or units, at redemption, may be worth more or less than their original cost. Please call (800) 992-0181 to get performance through the most recent month end.
(1) The S&P MidCap 400® Index is an unmanaged index that measures the performance of the mid-size company segment of the U.S. market.
(2) Since inception performance of the index is shown from November 1, 2004.
This report contains statements that may be "forward-looking" statements. Actual results may differ materially from those projected in the "forward-looking" statements.
The views expressed in this report reflect those of the portfolio managers, only through the end of the period as stated on the cover. The portfolio managers' views are subject to change at any time based on market and other conditions.
7
SHAREHOLDER EXPENSE EXAMPLES (UNAUDITED)
As a shareholder of a Portfolio, you incur two types of costs: (1) transaction costs, including redemption fees and exchange fees; and (2) ongoing costs, including management fees, distribution and/or service (12b-1) fees, and other Portfolio expenses. These Examples are intended to help you understand your ongoing costs (in dollars) of investing in a Portfolio and to compare these costs with the ongoing costs of investing in other mutual funds.
The Examples are based on an investment of $1,000 invested at the beginning of the period and held for the entire period from July 1, 2007 to December 31, 2007, unless otherwise indicated. The Portfolios' expenses are shown without the imposition of any charges which are, or may be, imposed under your annuity contract. Expenses would have been higher if such charges were included.
Actual Expenses
The first section of the table shown, "Actual Portfolio Return," provides information about actual account values and actual expenses. You may use the information in this section, together with the amount you invested, to estimate the expenses that you paid over the period. Simply divide your account value by $1,000 (for example, an $8,600 account value divided by $1,000 = 8.6), then multiply the result by the number in the first section under the heading entitled "Expenses Paid During Period" to estimate the expenses you paid on your account during this period.
Hypothetical Example for Comparison Purposes
The second section of the table shown, "Hypothetical (5% return before expenses)," provides information about hypothetical account values and hypothetical expenses based on the Portfolio's actual expense ratio and an assumed rate of return of 5% per year before expenses, which is not the Portfolio's actual return. The hypothetical account values and expenses may not be used to estimate the actual ending account balance or expenses you paid for the period. You may use this information to compare the ongoing costs of investing in the Portfolio and other mutual funds. To do so, compare this 5% hypothetical example with the 5% hypothetical examples that appear in the shareholder reports of the other mutual funds.
Please note that the expenses shown in the table are meant to highlight your ongoing costs only and do not reflect any transactional costs, such as redemption fees or exchange fees. Therefore, the hypothetical lines of the table are useful in comparing ongoing costs only, and will not help you determine the relative total costs of owning different funds. In addition, if these transactional costs were included, your costs would have been higher.
| ING Fidelity VIP Contrafund Portfolio | | Beginning
Account
Value
July 1, 2007 | | Ending
Account
Value
December 31, 2007 | | Annualized
Expense
Ratio | | Expenses Paid
During the
Period Ended
December 31, 2007* | |
| Actual Portfolio Return | |
| Class S | | $ | 1,000.00 | | | $ | 1,075.80 | | | | 1.18 | % | | $ | 6.17 | | |
| Class ADV | | | 1,000.00 | | | | 1,074.60 | | | | 1.43 | | | | 7.48 | | |
| Hypothetical (5% return before expenses) | |
| Class S | | $ | 1,000.00 | | | $ | 1,019.26 | | | | 1.18 | % | | $ | 6.01 | | |
| Class ADV | | | 1,000.00 | | | | 1,018.00 | | | | 1.43 | | | | 7.27 | | |
* Expenses are equal to each Portfolio's respective annualized expense ratios, including the expenses of the affiliated master fund, multiplied by the average account value over the period, multiplied by 184/365 to reflect the most recent fiscal one-half year.
8
SHAREHOLDER EXPENSE EXAMPLES (UNAUDITED) (CONTINUED)
| ING Fidelity VIP Equity-Income Portfolio | | Beginning
Account
Value
July 1, 2007 | | Ending
Account
Value
December 31, 2007 | | Annualized
Expense
Ratio | | Expenses Paid
During the
Period Ended
December 31, 2007* | |
| Actual Portfolio Return | |
| Class S | | $ | 1,000.00 | | | $ | 931.90 | | | | 1.10 | % | | $ | 5.36 | | |
| Class ADV | | | 1,000.00 | | | | 930.70 | | | | 1.35 | | | | 6.57 | | |
| Hypothetical (5% return before expenses) | |
| Class S | | $ | 1,000.00 | | | $ | 1,019.66 | | | | 1.10 | % | | $ | 5.60 | | |
| Class ADV | | | 1,000.00 | | | | 1,018.40 | | | | 1.35 | | | | 6.87 | | |
| ING Fidelity VIP Growth Portfolio | |
| Actual Portfolio Return | |
| Class S | | $ | 1,000.00 | | | $ | 1,125.20 | | | | 1.20 | % | | $ | 6.43 | | |
| Class ADV | | | 1,000.00 | | | | 1,123.90 | | | | 1.45 | | | | 7.76 | | |
| Hypothetical (5% return before expenses) | |
| Class S | | $ | 1,000.00 | | | $ | 1,019.16 | | | | 1.20 | % | | $ | 6.11 | | |
| Class ADV | | | 1,000.00 | | | | 1,017.90 | | | | 1.45 | | | | 7.37 | | |
| ING Fidelity VIP Mid Cap Portfolio | |
| Actual Portfolio Return | |
| Class S | | $ | 1,000.00 | | | $ | 1,026.20 | | | | 1.20 | % | | $ | 6.13 | | |
| Class ADV | | | 1,000.00 | | | | 1,024.30 | | | | 1.45 | | | | 7.40 | | |
| Hypothetical (5% return before expenses) | |
| Class S | | $ | 1,000.00 | | | $ | 1,019.16 | | | | 1.20 | % | | $ | 6.11 | | |
| Class ADV | | | 1,000.00 | | | | 1,017.90 | | | | 1.45 | | | | 7.37 | | |
* Expenses are equal to each Portfolio's respective annualized expense ratios, including the expenses of the affiliated master fund, multiplied by the average account value over the period, multiplied by 184/365 to reflect the most recent fiscal half year.
9
REPORT OF INDEPENDENT REGISTERED PUBLIC ACCOUNTING FIRM
The Shareholders and Board of Directors
ING Partners, Inc.
We have audited the accompanying statements of assets and liabilities, including the portfolios of investments, of ING Fidelity VIP Contrafund Portfolio, ING Fidelity VIP Equity Income Portfolio, ING Fidelity VIP Growth Portfolio, and ING Fidelity VIP Mid Cap Portfolio, each a series of ING Partners, Inc., as of December 31, 2007, and the related statements of operations for the year then ended, the statements of changes in net assets for each of the years in the two-year period then ended, and the financial highlights for each of the years in the three-year period then ended and the period from November 15, 2004 (commencement of operations) to December 31, 2004. These financial statements and financial highlights are the responsibility of management. Our responsibility is to express an opinion on these financial statements and financial highlights based on our audits.
We conducted our audits in accordance with the standards of the Public Company Accounting Oversight Board (United States). Those standards require that we plan and perform the audits to obtain reasonable assurance about whether the financial statements and financial highlights are free of material misstatement. An audit includes examining, on a test basis, evidence supporting the amounts and disclosures in the financial statements. Our procedures included confirmation of securities owned as of December 31, 2007, by correspondence with the transfer agent of the master funds. An audit also includes assessing the accounting principles used and significant estimates made by management, as well as evaluating the overall financial statement presentation. We believe that our audits provide a reasonable basis for our opinion.
In our opinion, the financial statements and financial highlights referred to above present fairly, in all material respects, the financial position of the aforementioned portfolios as of December 31, 2007, and the results of their operations, the changes in their net assets, and the financial highlights for the periods specified in the first paragraph above, in conformity with U.S. generally accepted accounting principles.
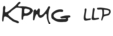
Boston, Massachusetts
February 27, 2008
10
STATEMENTS OF ASSETS AND LIABILITIES AS OF DECEMBER 31, 2007
| | | ING
Fidelity VIP
Contrafund
Portfolio | | ING
Fidelity VIP
Equity-Income
Portfolio | | ING
Fidelity VIP
Growth
Portfolio | | ING
Fidelity VIP
Mid Cap
Portfolio | |
| ASSETS: | |
| Investments in affiliated master fund(1) at value* | | $ | 422,571,126 | | | $ | 54,530,249 | | | $ | 38,276,563 | | | $ | 80,944,465 | | |
| Cash | | | 312 | | | | 704 | | | | 2 | | | | 36 | | |
| Receivables: | |
| Affiliated investment securities sold | | | 830,454 | | | | 62,020 | | | | 181,940 | | | | 391,368 | | |
| Fund shares sold | | | 6,680 | | | | 642 | | | | 15 | | | | 3,355 | | |
| Total assets | | | 423,408,572 | | | | 54,593,615 | | | | 38,458,520 | | | | 81,339,224 | | |
| LIABILITIES: | |
| Payable for affiliated investment securities purchased | | | 6,422 | | | | 88 | | | | — | | | | 3,282 | | |
| Payable for fund shares redeemed | | | 830,712 | | | | 62,574 | | | | 181,955 | | | | 391,441 | | |
| Payable to affiliates | | | 107,135 | | | | 13,991 | | | | 9,520 | | | | 21,166 | | |
| Total liabilities | | | 944,269 | | | | 76,653 | | | | 191,475 | | | | 415,889 | | |
| NET ASSETS | | $ | 422,464,303 | | | $ | 54,516,962 | | | $ | 38,267,045 | | | $ | 80,923,335 | | |
| NET ASSETS WERE COMPRISED OF: | |
| Paid-in capital | | $ | 372,894,000 | | | $ | 53,714,218 | | | $ | 31,336,970 | | | $ | 71,919,142 | | |
| Undistributed net investment income | | | 20,598,762 | | | | 1,075,675 | | | | 22,952 | | | | 163,189 | | |
Accumulated net realized gain on
affiliated master fund | | | 83,515,267 | | | | 4,907,380 | | | | 903,361 | | | | 4,557,508 | | |
Net unrealized appreciation or depreciation
on affiliated master fund | | | (54,543,726 | ) | | | (5,180,311 | ) | | | 6,003,762 | | | | 4,283,496 | | |
| NET ASSETS | | $ | 422,464,303 | | | $ | 54,516,962 | | | $ | 38,267,045 | | | $ | 80,923,335 | | |
| * Cost of investments in affiliated master fund | | $ | 477,114,852 | | | $ | 59,710,560 | | | $ | 32,272,801 | | | $ | 76,660,969 | | |
| Class S: | |
| Net assets | | $ | 414,722,901 | | | $ | 53,572,983 | | | $ | 38,239,128 | | | $ | 77,608,355 | | |
| Shares authorized | | | 100,000,000 | | | | 100,000,000 | | | | 100,000,000 | | | | 100,000,000 | | |
| Par value | | $ | 0.001 | | | $ | 0.001 | | | $ | 0.001 | | | $ | 0.001 | | |
| Shares outstanding | | | 28,172,252 | | | | 4,443,895 | | | | 2,707,180 | | | | 4,938,188 | | |
| Net asset value and redemption price per share | | $ | 14.72 | | | $ | 12.06 | | | $ | 14.13 | | | $ | 15.72 | | |
| Class ADV: | |
| Net assets | | $ | 7,741,402 | | | $ | 943,979 | | | $ | 27,917 | | | $ | 3,314,980 | | |
| Shares authorized | | | 100,000,000 | | | | 100,000,000 | | | | 100,000,000 | | | | 100,000,000 | | |
| Par value | | $ | 0.001 | | | $ | 0.001 | | | $ | 0.001 | | | $ | 0.001 | | |
| Shares outstanding | | | 529,508 | | | | 79,053 | | | | 1,982 | | | | 212,569 | | |
| Net asset value and redemption price per share | | $ | 14.62 | | | $ | 11.94 | | | $ | 14.09 | | | $ | 15.59 | | |
(1) The affiliated master funds for the ING Fidelity® VIP Contrafund®, ING Fidelity® VIP Equity-Income, ING Fidelity® VIP Growth and ING Fidelity® VIP MidCap Portfolios are the Fidelity® VIP Contrafund®, Fidelity® VIP Equity-Income, Fidelity® VIP Growth and Fidelity® VIP MidCap Portfolios, respectively. These financial statements should be read in conjunction with the affiliated master Fidelity funds' financial statements.
See Accompanying Notes to Financial Statements
11
STATEMENTS OF OPERATIONS FOR THE YEAR ENDED DECEMBER 31, 2007
| | | ING
Fidelity VIP
Contrafund
Portfolio | | ING
Fidelity VIP
Equity-Income
Portfolio | | ING
Fidelity VIP
Growth
Portfolio | | ING
Fidelity VIP
Mid Cap
Portfolio | |
| INVESTMENT INCOME: | |
| Dividends from affiliated master fund(1) | | $ | 2,941,138 | | | $ | 904,908 | | | $ | 81,443 | | | $ | 312,620 | | |
| Interest | | | 44 | | | | 3 | | | | — | | | | 5 | | |
| Total investment income | | | 2,941,182 | | | | 904,911 | | | | 81,443 | | | | 312,625 | | |
| EXPENSES: | |
| Distribution and service fees | |
| Class S | | | 776,124 | | | | 116,228 | | | | 66,335 | | | | 149,444 | | |
| Class ADV | | | 35,930 | | | | 5,166 | | | | 122 | | | | 13,944 | | |
| Administrative service fees | | | 158,822 | | | | 23,763 | | | | 13,280 | | | | 31,284 | | |
| Total expenses | | | 970,876 | | | | 145,157 | | | | 79,737 | | | | 194,672 | | |
| Net investment income | | | 1,970,306 | | | | 759,754 | | | | 1,706 | | | | 117,953 | | |
REALIZED AND UNREALIZED GAIN (LOSS)
ON AFFILIATED MASTER FUND: | |
Distributions of realized gains from
affiliated master fund | | | 100,293,694 | | | | 4,569,416 | | | | 23,719 | | | | 4,432,281 | | |
| Net realized gain on sales of affiliated master fund | | | 1,864,343 | | | | 668,690 | | | | 908,162 | | | | 185,737 | | |
| Net realized gain on affiliated master fund | | | 102,158,037 | | | | 5,238,106 | | | | 931,881 | | | | 4,618,018 | | |
Net change in unrealized appreciation
or depreciation on affiliated master fund | | | (55,789,807 | ) | | | (6,157,491 | ) | | | 5,160,396 | | | | 2,935,542 | | |
Net realized and unrealized gain (loss) on affiliated
master fund and net realized gain
distribution from affiliated master fund | | | 46,368,230 | | | | (919,385 | ) | | | 6,092,277 | | | | 7,553,560 | | |
Increase (decrease) in net assets resulting from
operations | | $ | 48,338,536 | | | $ | (159,631 | ) | | $ | 6,093,983 | | | $ | 7,671,513 | | |
(1) The affiliated master funds for the ING Fidelity® VIP Contrafund®, ING Fidelity® VIP Equity-Income, ING Fidelity® VIP Growth and ING Fidelity® VIP MidCap Portfolios are the Fidelity® VIP Contrafund®, Fidelity® VIP Equity-Income, Fidelity® VIP Growth and Fidelity® VIP MidCap Portfolios, respectively. These financial statements should be read in conjunction with the affiliated master Fidelity funds' financial statements.
See Accompanying Notes to Financial Statements
12
STATEMENTS OF CHANGES IN NET ASSETS
| | | ING Fidelity VIP Contrafund Portfolio | | ING Fidelity VIP Equity-Income Portfolio | |
| | | Year Ended
December 31,
2007 | | Year Ended
December 31,
2006 | | Year Ended
December 31,
2007 | | Year Ended
December 31,
2006 | |
| FROM OPERATIONS: | |
| Net investment income | | $ | 1,970,306 | | | $ | 1,194,478 | | | $ | 759,754 | | | $ | 595,138 | | |
| Net realized gain on affiliated master fund | | | 102,158,037 | | | | 17,642,137 | | | | 5,238,106 | | | | 3,091,385 | | |
Net change in unrealized appreciation or
depreciation on affiliated master fund | | | (55,789,807 | ) | | | (2,829,162 | ) | | | (6,157,491 | ) | | | 553,400 | | |
Increase (decrease) in net assets
resulting from operations | | | 48,338,536 | | | | 16,007,453 | | | | (159,631 | ) | | | 4,239,923 | | |
| FROM DISTRIBUTIONS TO SHAREHOLDERS: | |
| Net investment income: | | | | | | | | | | | | | | | | | |
| Class S | | | (1,252,172 | ) | | | — | | | | (836,704 | ) | | | — | | |
| Class ADV | | | (12,185 | ) | | | — | | | | (16,751 | ) | | | — | | |
| Net realized gains: | |
| Class S | | | (17,199,853 | ) | | | (22,772 | ) | | | (2,784,603 | ) | | | (24,482 | ) | |
| Class ADV | | | (386,039 | ) | | | (698 | ) | | | (62,662 | ) | | | (577 | ) | |
| Total distributions | | | (18,850,249 | ) | | | (23,470 | ) | | | (3,700,720 | ) | | | (25,059 | ) | |
| FROM CAPITAL SHARE TRANSACTIONS: | |
| Net proceeds from sale of shares | | | 161,358,701 | | | | 152,796,791 | | | | 27,321,682 | | | | 21,831,009 | | |
| Dividends reinvested | | | 18,850,249 | | | | 23,470 | | | | 3,700,720 | | | | 25,059 | | |
| | | | 180,208,950 | | | | 152,820,261 | | | | 31,022,402 | | | | 21,856,068 | | |
| Cost of shares redeemed | | | (11,476,560 | ) | | | (5,906,700 | ) | | | (6,684,616 | ) | | | (2,368,517 | ) | |
Net increase in net assets resulting from
capital share transactions | | | 168,732,390 | | | | 146,913,561 | | | | 24,337,786 | | | | 19,487,551 | | |
| Net increase in net assets | | | 198,220,677 | | | | 162,897,544 | | | | 20,477,435 | | | | 23,702,415 | | |
| NET ASSETS: | |
| Beginning of year | | | 224,243,626 | | | | 61,346,082 | | | | 34,039,527 | | | | 10,337,112 | | |
| End of year | | $ | 422,464,303 | | | $ | 224,243,626 | | | $ | 54,516,962 | | | $ | 34,039,527 | | |
| Undistributed net investment income at end of year | | $ | 20,598,762 | | | $ | 1,259,972 | | | $ | 1,075,675 | | | $ | 848,423 | | |
See Accompanying Notes to Financial Statements
13
STATEMENTS OF CHANGES IN NET ASSETS
| | | ING Fidelity VIP Growth Portfolio | | ING Fidelity VIP Mid Cap Portfolio | |
| | | Year Ended
December 31,
2007 | | Year Ended
December 31,
2006 | | Year Ended
December 31,
2007 | | Year Ended
December 31,
2006 | |
| FROM OPERATIONS: | |
| Net investment income (loss) | | $ | 1,706 | | | $ | (27,089 | ) | | $ | 117,953 | | | $ | (54,809 | ) | |
| Net realized gain on affiliated master fund | | | 931,881 | | | | 487,638 | | | | 4,618,018 | | | | 1,189,458 | | |
Net change in unrealized appreciation or
depreciation on affiliated master fund | | | 5,160,396 | | | | 418,050 | | | | 2,935,542 | | | | 935,565 | | |
| Increase in net assets resulting from operations | | | 6,093,983 | | | | 878,599 | | | | 7,671,513 | | | | 2,070,214 | | |
| FROM DISTRIBUTIONS TO SHAREHOLDERS: | |
| Net investment income: | | | | | | | | | | | | | | | | | |
| Class S | | | — | | | | — | | | | (45,625 | ) | | | — | | |
| Net realized gains: | | | | | | | | | | | | | | | | | |
| Class S | | | (463,744 | ) | | | (20,310 | ) | | | (1,054,533 | ) | | | (14,205 | ) | |
| Class ADV | | | (429 | ) | | | — | | | | (48,540 | ) | | | (1,042 | ) | |
| Total distributions | | | (464,173 | ) | | | (20,310 | ) | | | (1,148,698 | ) | | | (15,247 | ) | |
| FROM CAPITAL SHARE TRANSACTIONS: | |
| Net proceeds from sale of shares | | | 19,651,816 | | | | 12,365,025 | | | | 35,867,528 | | | | 34,788,020 | | |
| Dividends reinvested | | | 464,173 | | | | 20,310 | | | | 1,148,698 | | | | 15,247 | | |
| | | | 20,115,989 | | | | 12,385,335 | | | | 37,016,226 | | | | 34,803,267 | | |
| Cost of shares redeemed | | | (4,932,973 | ) | | | (6,469,105 | ) | | | (3,368,052 | ) | | | (1,671,925 | ) | |
Net increase in net assets resulting from
capital share transactions | | | 15,183,016 | | | | 5,916,230 | | | | 33,648,174 | | | | 33,131,342 | | |
| Net increase in net assets | | | 20,812,826 | | | | 6,774,519 | | | | 40,170,989 | | | | 35,186,309 | | |
| NET ASSETS: | |
| Beginning of year | | | 17,454,219 | | | | 10,679,700 | | | | 40,752,346 | | | | 5,566,037 | | |
| End of year | | $ | 38,267,045 | | | $ | 17,454,219 | | | $ | 80,923,335 | | | $ | 40,752,346 | | |
| Undistributed net investment income at end of year | | $ | 22,952 | | | $ | — | | | $ | 163,189 | | | $ | 40,472 | | |
See Accompanying Notes to Financial Statements
14
ING FIDELITY® VIP CONTRAFUND PORTFOLIO
FINANCIAL
HIGHLIGHTS
Selected data for a share of beneficial interest outstanding throughout each period.
| | | | | Class S | |
| | | | | Year Ended December 31, | | November 15,
2004(1) to
December 31, | |
| | | | | 2007 | | 2006 | | 2005 | | 2004 | |
| Per Share Operating Performance: | |
| Net asset value, beginning of period | | $ | | | 13.37 | | | | 12.03 | | | | 10.34 | | | | 10.00 | | |
| Income (loss) from investment operations: | |
| Net investment income (loss) | | $ | | | 0.09 | | | | 0.11 | * | | | (0.01 | ) | | | 0.00 | ** | |
| Net realized and unrealized gain on affiliated master fund | | $ | | | 2.11 | | | | 1.23 | | | | 1.70 | | | | 0.34 | | |
| Total from investment operations | | $ | | | 2.20 | | | | 1.34 | | | | 1.69 | | | | 0.34 | | |
| Less distributions from: | |
| Net investment income | | $ | | | 0.06 | | | | — | | | | — | | | | — | | |
| Net realized gains on affiliated master fund | | $ | | | 0.79 | | | | 0.00 | ** | | | — | | | | — | | |
| Total distributions | | $ | | | 0.85 | | | | 0.00 | ** | | | — | | | | — | | |
| Net asset value, end of period | | $ | | | 14.72 | | | | 13.37 | | | | 12.03 | | | | 10.34 | | |
| Total Return(2) | | % | | | 16.92 | | | | 11.16 | | | | 16.34 | | | | 3.40 | | |
| Ratios and Supplemental Data: | |
| Net assets, end of period (000's) | | $ | | | 414,723 | | | | 217,927 | | | | 57,988 | | | | 33 | | |
| Ratios to average net assets: | |
| Expenses excluding expenses of the master fund(3) | | % | | | 0.30 | | | | 0.30 | | | | 0.30 | | | | 0.30 | | |
Net investment income (loss) excluding expenses of the
master fund(3) | | % | | | 0.63 | | | | 0.84 | | | | (0.29 | ) | | | (0.30 | ) | |
| Portfolio turnover rate(4) | | % | | | 35 | | | | 16 | | | | 5 | | | | 0 | | |
(1) Commencement of operations.
(2) Total return is calculated assuming reinvestment of all dividends and capital gain distributions at net asset value. Total returns for periods less than one year are not annualized. The Portfolio's performance is shown without the imposition of any expenses or charges which are, or may be, imposed under your annuity contract. Total returns would have been lower if such expenses or charges were included.
(3) Annualized for periods less than one year.
(4) Portfolio turnover rate is calculated based on the Portfolio's purchases or sales of the master fund.
* Calculated using average number of shares outstanding throughout the period.
** Amount is less than $0.005.
| | | | | Class S | |
| | | | | Year Ended December 31, | | November 15,
2004(1) to
December 31, | |
| | | | | 2007 | | 2006 | | 2005 | | 2004 | |
| Expenses including gross expenses of the master fund(3) | | % | | | 1.20 | | | | 1.21 | | | | 1.21 | | | | 1.23 | † | |
Expenses including expenses net of all reductions of the
master fund(3) | | % | | | 1.19 | | | | 1.20 | | | | 1.19 | | | | 1.21 | † | |
Expenses including expenses net of voluntary waivers,
if any, of the master fund(3) | | % | | | 1.20 | | | | 1.21 | | | | 1.21 | | | | 1.23 | † | |
| Portfolio turnover rate of master fund(3) | | % | | | 134 | | | | 75 | | | | 60 | | | | 64 | † | |
† Expenses of the master fund included in the ratio, as well as the portfolio turnover rate, are for the year ended December 31, 2004.
See Accompanying Notes to Financial Statements
15
ING FIDELITY® VIP CONTRAFUND PORTFOLIO (CONTINUED)
FINANCIAL
HIGHLIGHTS
Selected data for a share of beneficial interest outstanding throughout each period.
| | | | | Class ADV | |
| | | | | Year Ended December 31, | | November 15,
2004(1) to
December 31, | |
| | | | | 2007 | | 2006 | | 2005 | | 2004 | |
| Per Share Operating Performance: | |
| Net asset value, beginning of period | | $ | | | 13.28 | | | | 11.99 | | | | 10.34 | | | | 10.00 | | |
| Income (loss) from investment operations: | |
| Net investment income (loss) | | $ | | | 0.03 | | | | 0.07 | * | | | (0.03 | ) | | | (0.01 | ) | |
| Net realized and unrealized gain on affiliated master fund | | $ | | | 2.12 | | | | 1.22 | | | | 1.68 | | | | 0.35 | | |
| Total from investment operations | | $ | | | 2.15 | | | | 1.29 | | | | 1.65 | | | | 0.34 | | |
| Less distributions from: | |
| Net investment income | | $ | | | 0.02 | | | | — | | | | — | | | | — | | |
| Net realized gains on affiliated master fund | | $ | | | 0.79 | | | | 0.00 | ** | | | — | | | | — | | |
| Total distributions | | $ | | | 0.81 | | | | 0.00 | ** | | | — | | | | — | | |
| Net asset value, end of period | | $ | | | 14.62 | | | | 13.28 | | | | 11.99 | | | | 10.34 | | |
| Total Return(2) | | % | | | 16.69 | | | | 10.78 | | | | 15.96 | | | | 3.40 | | |
| Ratios and Supplemental Data: | |
| Net assets, end of period (000's) | | $ | | | 7,741 | | | | 6,317 | | | | 3,358 | | | | 1 | | |
| Ratios to average net assets: | |
| Expenses excluding expenses of the master fund(3) | | % | | | 0.55 | | | | 0.55 | | | | 0.55 | | | | 0.55 | | |
Net investment income (loss) excluding expenses of the
master fund(3) | | % | | | 0.24 | | | | 0.53 | | | | (0.50 | ) | | | (0.55 | ) | |
| Portfolio turnover rate(4) | | % | | | 35 | | | | 16 | | | | 5 | | | | 0 | | |
(1) Commencement of operations.
(2) Total return is calculated assuming reinvestment of all dividends and capital gain distributions at net asset value. Total returns for periods less than one year are not annualized. The Portfolio's performance is shown without the imposition of any expenses or charges which are, or may be, imposed under your annuity contract. Total returns would have been lower if such expenses or charges were included.
(3) Annualized for periods less than one year.
(4) Portfolio turnover rate is calculated based on the Portfolio's purchases or sales of the master fund.
* Calculated using average number of shares outstanding throughout the period.
** Amount is less than $0.005.
| | | | | Class ADV | |
| | | | | Year Ended December 31, | | November 15,
2004(1) to
December 31, | |
| | | | | 2007 | | 2006 | | 2005 | | 2004 | |
| Expenses including gross expenses of the master fund(3) | | % | | | 1.45 | | | | 1.46 | | | | 1.46 | | | | 1.48 | † | |
Expenses including expenses net of all reductions of the
master fund(3) | | % | | | 1.44 | | | | 1.45 | | | | 1.44 | | | | 1.46 | † | |
Expenses including expenses net of voluntary waivers,
if any, of the master fund(3) | | % | | | 1.45 | | | | 1.46 | | | | 1.46 | | | | 1.48 | † | |
| Portfolio turnover rate of master fund(3) | | % | | | 134 | | | | 75 | | | | 60 | | | | 64 | † | |
† Expenses of the master fund included in the ratio, as well as the portfolio turnover rate, are for the year ended December 31, 2004.
See Accompanying Notes to Financial Statements
16
ING FIDELITY® VIP EQUITY-INCOME PORTFOLIO
FINANCIAL
HIGHLIGHTS
| | | | | Class S | |
| | | | | Year Ended December 31, | | November 15,
2004(1) to
December 31, | |
| | | | | 2007 | | 2006 | | 2005 | | 2004 | |
| Per Share Operating Performance: | |
| Net asset value, beginning of period | | $ | | | 12.94 | | | | 10.83 | | | | 10.28 | | | | 10.00 | | |
| Income (loss) from investment operations: | |
| Net investment income (loss) | | $ | | | 0.21 | | | | 0.33 | * | | | (0.01 | ) | | | 0.00 | ** | |
| Net realized and unrealized gain (loss) on affiliated master fund | | $ | | | (0.05 | ) | | | 1.79 | | | | 0.56 | | | | 0.28 | | |
| Total from investment operations | | $ | | | 0.16 | | | | 2.12 | | | | 0.55 | | | | 0.28 | | |
| Less distributions from: | |
| Net investment income | | $ | | | 0.24 | | | | — | | | | — | | | | — | | |
| Net realized gains on affiliated master fund | | $ | | | 0.80 | | | | 0.01 | | | | — | | | | — | | |
| Total distributions | | $ | | | 1.04 | | | | 0.01 | | | | — | | | | — | | |
| Net asset value, end of period | | $ | | | 12.06 | | | | 12.94 | | | | 10.83 | | | | 10.28 | | |
| Total Return(2) | | % | | | 0.97 | | | | 19.61 | | | | 5.35 | | | | 2.80 | | |
| Ratios and Supplemental Data: | |
| Net assets, end of period (000's) | | $ | | | 53,573 | | | | 33,038 | | | | 10,259 | | | | 1 | | |
| Ratios to average net assets: | |
| Expenses excluding expenses of the master fund(3) | | % | | | 0.30 | | | | 0.30 | | | | 0.30 | | | | 0.30 | | |
Net investment income (loss) excluding expenses of the
master fund(3) | | % | | | 1.61 | | | | 2.77 | | | | (0.30 | ) | | | (0.30 | ) | |
| Portfolio turnover rate(4) | | % | | | 24 | | | | 25 | | | | 22 | | | | 0 | | |
(1) Commencement of operations.
(2) Total return is calculated assuming reinvestment of all dividends and capital gain distributions at net asset value. Total returns for periods less than one year are not annualized. The Portfolio's performance is shown without the imposition of any expenses or charges which are, or may be, imposed under your annuity contract. Total returns would have been lower if such expenses or charges were included.
(3) Annualized for periods less than one year.
(4) Portfolio turnover rate is calculated based on the Portfolio's purchases or sales of the master fund.
* Calculated using average number of shares outstanding throughout the period.
** Amount is less than $0.005.
| | | | | Class S | |
| | | | | Year Ended December 31, | | November 15,
2004(1) to
December 31, | |
| | | | | 2007 | | 2006 | | 2005 | | 2004 | |
| Expenses including gross expenses of the master fund(3) | | % | | | 1.10 | | | | 1.12 | | | | 1.11 | | | | 1.13 | † | |
Expenses including expenses net of all reductions of the
master fund(3) | | % | | | 1.10 | | | | 1.12 | | | | 1.10 | | | | 1.12 | † | |
Expenses including expenses net of voluntary waivers,
if any, of the master fund(3) | | % | | | 1.10 | | | | 1.12 | | | | 1.11 | | | | 1.13 | † | |
| Portfolio turnover rate of master fund(3) | | % | | | 20 | | | | 22 | | | | 19 | | | | 22 | † | |
† Expenses of the master fund included in the ratio, as well as the portfolio turnover rate, are for the year ended December 31, 2004.
See Accompanying Notes to Financial Statements
17
ING FIDELITY® VIP EQUITY-INCOME PORTFOLIO (CONTINUED)
FINANCIAL
HIGHLIGHTS
| | | | | Class ADV | |
| | | | | Year Ended December 31, | | November 15,
2004(1) to
December 31, | |
| | | | | 2007 | | 2006 | | 2005 | | 2004 | |
| Per Share Operating Performance: | |
| Net asset value, beginning of period | | $ | | | 12.83 | | | | 10.78 | | | | 10.27 | | | | 10.00 | | |
| Income (loss) from investment operations: | |
| Net investment income (loss) | | $ | | | 0.13 | * | | | 0.33 | * | | | (0.03 | ) | | | (0.01 | ) | |
| Net realized and unrealized gain (loss) on affiliated master fund | | $ | | | (0.01 | ) | | | 1.73 | | | | 0.54 | | | | 0.28 | | |
| Total from investment operations | | $ | | | 0.12 | | | | 2.06 | | | | 0.51 | | | | 0.27 | | |
| Less distributions from: | |
| Net investment income | | $ | | | 0.21 | | | | — | | | | — | | | | — | | |
| Net realized gains on affiliated master fund | | $ | | | 0.80 | | | | 0.01 | | | | — | | | | — | | |
| Total distributions | | $ | | | 1.01 | | | | 0.01 | | | | — | | | | — | | |
| Net asset value, end of period | | $ | | | 11.94 | | | | 12.83 | | | | 10.78 | | | | 10.27 | | |
| Total Return(2) | | % | | | 0.69 | | | | 19.14 | | | | 4.97 | | | | 2.70 | | |
| Ratios and Supplemental Data: | |
| Net assets, end of period (000's) | | $ | | | 944 | | | | 1,002 | | | | 78 | | | | 1 | | |
| Ratios to average net assets: | |
| Expenses excluding expenses of the master fund(3) | | % | | | 0.55 | | | | 0.55 | | | | 0.55 | | | | 0.55 | | |
Net investment income (loss) excluding expenses of the
master fund(3) | | % | | | 1.01 | | | | 2.80 | | | | (0.44 | ) | | | (0.55 | ) | |
| Portfolio turnover rate(4) | | % | | | 24 | | | | 25 | | | | 22 | | | | 0 | | |
(1) Commencement of operations.
(2) Total return is calculated assuming reinvestment of all dividends and capital gain distributions at net asset value. Total returns for periods less than one year are not annualized. The Portfolio's performance is shown without the imposition of any expenses or charges which are, or may be, imposed under your annuity contract. Total returns would have been lower if such expenses or charges were included.
(3) Annualized for periods less than one year.
(4) Portfolio turnover rate is calculated based on the Portfolio's purchases or sales of the master fund.
* Calculated using average number of shares outstanding throughout the period.
| | | | | Class ADV | |
| | | | | Year Ended December 31, | | November 15,
2004(1) to
December 31, | |
| | | | | 2007 | | 2006 | | 2005 | | 2004 | |
| Expenses including gross expenses of the master fund(3) | | % | | | 1.35 | | | | 1.37 | | | | 1.36 | | | | 1.38 | † | |
Expenses including expenses net of all reductions of the
master fund(3) | | % | | | 1.35 | | | | 1.37 | | | | 1.35 | | | | 1.37 | † | |
Expenses including expenses net of voluntary waivers,
if any, of the master fund(3) | | % | | | 1.35 | | | | 1.37 | | | | 1.36 | | | | 1.38 | † | |
| Portfolio turnover rate of master fund(3) | | % | | | 20 | | | | 22 | | | | 19 | | | | 22 | † | |
† Expenses of the master fund included in the ratio, as well as the portfolio turnover rate, are for the year ended December 31, 2004.
See Accompanying Notes to Financial Statements
18
ING FIDELITY® VIP GROWTH PORTFOLIO
FINANCIAL
HIGHLIGHTS
| | | | | Class S | |
| | | | | Year Ended December 31, | | November 15,
2004(1) to
December 31, | |
| | | | | 2007 | | 2006 | | 2005 | | 2004 | |
| Per Share Operating Performance: | |
| Net asset value, beginning of period | | $ | | | 11.38 | | | | 10.73 | | | | 10.21 | | | | 10.00 | | |
| Income (loss) from investment operations: | |
| Net investment income (loss) | | $ | | | 0.00 | * | | | (0.02 | ) | | | (0.01 | ) | | | (0.00 | )* | |
| Net realized and unrealized gain on affiliated master fund | | $ | | | 2.98 | | | | 0.68 | | | | 0.53 | | | | 0.21 | | |
| Total from investment operations | | $ | | | 2.98 | | | | 0.66 | | | | 0.52 | | | | 0.21 | | |
| Less distributions from: | |
| Net realized gains on affiliated master fund | | $ | | | 0.23 | | | | 0.01 | | | | — | | | | — | | |
| Total distributions | | $ | | | 0.23 | | | | 0.01 | | | | — | | | | — | | |
| Net asset value, end of period | | $ | | | 14.13 | | | | 11.38 | | | | 10.73 | | | | 10.21 | | |
| Total Return(2) | | % | | | 26.37 | | | | 6.19 | | | | 5.09 | | | | 2.10 | | |
| Ratios and Supplemental Data: | |
| Net assets, end of period (000's) | | $ | | | 38,239 | | | | 17,434 | | | | 10,679 | | | | 1 | | |
| Ratios to average net assets: | |
| Expenses excluding expenses of the master fund(3) | | % | | | 0.30 | | | | 0.30 | | | | 0.30 | | | | 0.30 | | |
Net investment income (loss) excluding expenses of the
master fund(3) | | % | | | 0.01 | | | | (0.18 | ) | | | (0.28 | ) | | | (0.30 | ) | |
| Portfolio turnover rate(4) | | % | | | 18 | | | | 43 | | | | 29 | | | | 0 | | |
(1) Commencement of operations.
(2) Total return is calculated assuming reinvestment of all dividends and capital gain distributions at net asset value. Total returns for periods less than one year are not annualized. The Portfolio's performance is shown without the imposition of any expenses or charges which are, or may be, imposed under your annuity contract. Total returns would have been lower if such expenses or charges were included.
(3) Annualized for periods less than one year.
(4) Portfolio turnover rate is calculated based on the Portfolio's purchases and sales of the master fund.
* Amount is more than $(0.005) or less than $0.005.
| | | | | Class S | |
| | | | | Year Ended December 31, | | November 15,
2004(1) to
December 31, | |
| | | | | 2007 | | 2006 | | 2005 | | 2004 | |
| Expenses including gross expenses of the master fund(3) | | % | | | 1.20 | | | | 1.24 | | | | 1.22 | | | | 1.23 | † | |
Expenses including expenses net of all reductions of the
master fund(3) | | % | | | 1.19 | | | | 1.22 | | | | 1.18 | | | | 1.20 | † | |
Expenses including expenses net of voluntary waivers,
if any, of the master fund(3) | | % | | | 1.20 | | | | 1.24 | | | | 1.22 | | | | 1.23 | † | |
| Portfolio turnover rate of master fund(3) | | % | | | 109 | | | | 114 | | | | 79 | | | | 72 | † | |
† Expenses of the master fund included in the ratio, as well as the portfolio turnover rate, are for the year ended December 31, 2004.
See Accompanying Notes to Financial Statements
19
ING FIDELITY® VIP GROWTH PORTFOLIO (CONTINUED)
FINANCIAL
HIGHLIGHTS
| | | | | Class ADV | |
| | | | | Year Ended
December 31,
2007 | | October 30,
2006(5) to
December 31,
2006 | | January 1,
2006 to
May 4,
2006(5) | | Year Ended
December 31,
2005 | | November 15,
2004(1) to
December 31,
2004 | |
| Per Share Operating Performance: | |
| Net asset value, beginning of period | | $ | | | 11.38 | | | | 11.34 | | | | 10.68 | | | | 10.20 | | | | 10.00 | | |
| Income (loss) from investment operations: | |
| Net investment loss | | $ | | | (0.02 | ) | | | (0.01 | ) | | | (0.01 | ) | | | (0.05 | ) | | | (0.01 | ) | |
| Net realized and unrealized gain on affiliated master fund | | $ | | | 2.96 | | | | 0.05 | | | | 0.53 | | | | 0.53 | | | | 0.21 | | |
| Total from investment operations | | $ | | | 2.94 | | | | 0.04 | | | | 0.52 | | | | 0.48 | | | | 0.20 | | |
| Less distributions from: | |
| Net realized gains on affiliated master fund | | $ | | | 0.23 | | | | — | | | | — | | | | — | | | | — | | |
| Total distributions | | $ | | | 0.23 | | | | — | | | | — | | | | — | | | | — | | |
| Net asset value, end of period | | $ | | | 14.09 | | | | 11.38 | | | | 11.20 | | | | 10.68 | | | | 10.20 | | |
| Total Return(2) | | % | | | 26.01 | | | | 0.35 | | | | 4.87 | | | | 4.71 | | | | 2.00 | | |
| Ratios and Supplemental Data: | |
| Net assets, end of period (000's) | | $ | | | 28 | | | | 21 | | | | 1 | | | | 1 | | | | 1 | | |
| Ratios to average net assets: | |
| Expenses excluding expenses of the master fund(3) | | % | | | 0.55 | | | | 0.55 | | | | 0.55 | | | | 0.55 | | | | 0.55 | | |
Net investment loss excluding expenses of the
master fund(3) | | % | | | (0.16 | ) | | | (0.55 | ) | | | (0.20 | ) | | | (0.25 | ) | | | (0.55 | ) | |
| Portfolio turnover rate(4) | | % | | | 18 | | | | 43 | | | | 43 | | | | 29 | | | | 0 | | |
(1) Commencement of operations.
(2) Total return is calculated assuming reinvestment of all dividends and capital gain distributions at net asset value. Total returns for periods less than one year are not annualized. The Portfolio's performance is shown without the imposition of any expenses or charges which are, or may be, imposed under your annuity contract. Total returns would have been lower if such expenses or charges were included.
(3) Annualized for periods less than one year.
(4) Portfolio turnover rate is calculated based on the Portfolio's purchases and sales of the master fund.
(5) Class ADV was fully redeemed on May 5, 2006 and recommenced operations on October 30, 2006.
| | | | | Class ADV | |
| | | | | Year Ended
December 31,
2007 | | October 30,
2006(5) to
December 31,
2006 | | January 1,
2006 to
May 4,
2006(5) | | Year Ended
December 31,
2005 | | November 15,
2004(1) to
December 31,
2004 | |
| Expenses including gross expenses of the master fund(3) | | % | | | 1.45 | | | | 1.49 | | | | 1.49 | | | | 1.47 | | | | 1.48 | † | |
Expenses including expenses net of all reductions of the
master fund(3) | | % | | | 1.44 | | | | 1.47 | | | | 1.47 | | | | 1.43 | | | | 1.45 | † | |
Expenses including expenses net of voluntary waivers,
if any, of the master fund(3) | | % | | | 1.45 | | | | 1.49 | | | | 1.49 | | | | 1.47 | | | | 1.48 | † | |
| Portfolio turnover rate of master fund(3) | | % | | | 109 | | | | 114 | | | | 114 | | | | 79 | | | | 72 | † | |
† Expenses of the master fund included in the ratio, as well as the portfolio turnover rate, are for the year ended December 31, 2004.
See Accompanying Notes to Financial Statements
20
ING FIDELITY® VIP MID CAP PORTFOLIO
FINANCIAL
HIGHLIGHTS
| | | | | Class S | |
| | | | | Year Ended December 31, | | November 15,
2004(1) to
December 31, | |
| | | | | 2007 | | 2006 | | 2005 | | 2004 | |
| Per Share Operating Performance: | |
| Net asset value, beginning of period | | $ | | | 13.92 | | | | 12.42 | | | | 10.56 | | | | 10.00 | | |
| Income (loss) from investment operations: | |
| Net investment income (loss) | | $ | | | 0.03 | * | | | (0.03 | )* | | | (0.01 | ) | | | (0.00 | )** | |
| Net realized and unrealized gain on affiliated master fund | | $ | | | 2.05 | | | | 1.54 | | | | 1.87 | | | | 0.56 | | |
| Total from investment operations | | $ | | | 2.08 | | | | 1.51 | | | | 1.86 | | | | 0.56 | | |
| Less Distributions from: | |
| Net investment income | | $ | | | 0.01 | | | | — | | | | — | | | | — | | |
| Net realized gains on affiliated master fund | | $ | | | 0.27 | | | | 0.01 | | | | — | | | | — | | |
| Total Distributions | | $ | | | 0.28 | | | | 0.01 | | | | — | | | | — | | |
| Net asset value, end of period | | $ | | | 15.72 | | | | 13.92 | | | | 12.42 | | | | 10.56 | | |
| Total Return(2) | | % | | | 15.00 | | | | 12.15 | | | | 17.61 | | | | 5.60 | | |
| Ratios and Supplemental Data: | |
| Net assets, end of period (000's) | | $ | | | 77,608 | | | | 38,562 | | | | 4,065 | | | | 17 | | |
| Ratios to average net assets: | |
| Expenses excluding expenses of the master fund(3) | | % | | | 0.30 | | | | 0.30 | | | | 0.30 | | | | 0.30 | | |
Net investment income (loss) excluding expenses of the
master fund(3) | | % | | | 0.20 | | | | (0.24 | ) | | | (0.32 | ) | | | (0.30 | ) | |
| Portfolio turnover rate(4) | | % | | | 12 | | | | 12 | | | | 14 | | | | 0 | | |
(1) Commencement of operations.
(2) Total return is calculated assuming reinvestment of all dividends and capital gain distributions at net asset value. Total returns for periods less than one year are not annualized. The Portfolio's performance is shown without the imposition of any expenses or charges which are, or may be, imposed under your annuity contract. Total returns would have been lower if such expenses or charges were included.
(3) Annualized for periods less than one year.
(4) Portfolio turnover rate is calculated based on the Portfolio's purchases and sales of the master fund.
* Calculated using average number of shares outstanding throughout the period.
** Amount is more than $(0.005).
| | | | | Class S | |
| | | | | Year Ended
December 31,
2007 | | Year Ended
December 31,
2006 | | Year Ended
December 31,
2005 | | November 15,
2004(1) to
December 31,
2004 | |
| Expenses including gross expenses of the master fund(3) | | % | | | 1.21 | | | | 1.23 | | | | 1.24 | | | | 1.26 | † | |
Expenses including expenses net of all reductions of the
master fund(3) | | % | | | 1.20 | | | | 1.21 | | | | 1.19 | | | | 1.23 | † | |
Expenses including expenses net of voluntary waivers,
if any, of the master fund(3) | | % | | | 1.21 | | | | 1.23 | | | | 1.24 | | | | 1.26 | † | |
| Portfolio turnover rate of master fund(3) | | % | | | 113 | | | | 149 | | | | 107 | | | | 55 | † | |
† Expenses of the master fund included in the ratio, as well as the portfolio turnover rate, are for the year ended December 31, 2004.
See Accompanying Notes to Financial Statements
21
ING FIDELITY® VIP MID CAP PORTFOLIO (CONTINUED)
FINANCIAL
HIGHLIGHTS
| | | | | Class ADV | |
| | | | | Year Ended December 31, | | November 15,
2004(1) to
December 31, | |
| | | | | 2007 | | 2006 | | 2005 | | 2004 | |
| Per Share Operating Performance: | |
| Net asset value, beginning of period | | $ | | | 13.84 | | | | 12.39 | | | | 10.55 | | | | 10.00 | | |
| Income (loss) from investment operations: | |
| Net investment loss | | $ | | | (0.01 | ) | | | (0.05 | )* | | | (0.02 | ) | | | (0.00 | )** | |
| Net realized and unrealized gain on affiliated master fund | | $ | | | 2.03 | | | | 1.51 | | | | 1.86 | | | | 0.55 | | |
| Total from investment operations | | $ | | | 2.02 | | | | 1.46 | | | | 1.84 | | | | 0.55 | | |
| Less Distributions from: | |
| Net realized gains on affiliated master fund | | $ | | | 0.27 | | | | 0.01 | | | | — | | | | — | | |
| Total Distributions | | $ | | | 0.27 | | | | 0.01 | | | | — | | | | — | | |
| Net asset value, end of period | | $ | | | 15.59 | | | | 13.84 | | | | 12.39 | | | | 10.55 | | |
| Total Return(2) | | % | | | 14.64 | | | | 11.77 | | | | 17.44 | | | | 5.50 | | |
| Ratios and Supplemental Data: | |
| Net assets, end of period (000's) | | $ | | | 3,315 | | | | 2,190 | | | | 1,501 | | | | 1 | | |
| Ratios to average net assets: | |
| Expenses excluding expenses of the master fund(3) | | % | | | 0.55 | | | | 0.55 | | | | 0.55 | | | | 0.55 | | |
| Net investment loss excluding expenses of the master fund(3) | | % | | | (0.06 | ) | | | (0.40 | ) | | | (0.48 | ) | | | (0.55 | ) | |
| Portfolio turnover rate(4) | | % | | | 12 | | | | 12 | | | | 14 | | | | 0 | | |
(1) Commencement of operations.
(2) Total return is calculated assuming reinvestment of all dividends and capital gain distributions at net asset value. Total returns for periods less than one year are not annualized. The Portfolio's performance is shown without the imposition of any expenses or charges which are, or may be, imposed under your annuity contract. Total returns would have been lower if such expenses or charges were included.
(3) Annualized for periods less than one year.
(4) Portfolio turnover rate is calculated based on the Portfolio's purchases and sales of the master fund.
* Calculated using average number of shares outstanding throughout the period.
** Amount is more than $(0.005).
| | | | | Class ADV | |
| | | | | Year Ended December 31, | | November 15,
2004(1) to
December 31, | |
| | | | | 2007 | | 2006 | | 2005 | | 2004 | |
| Expenses including gross expenses of the master fund(3) | | % | | | 1.46 | | | | 1.48 | | | | 1.49 | | | | 1.51 | † | |
Expenses including expenses net of all reductions of the
master fund(3) | | % | | | 1.45 | | | | 1.46 | | | | 1.44 | | | | 1.48 | † | |
Expenses including expenses net of voluntary waivers,
if any, of the master fund(3) | | % | | | 1.46 | | | | 1.48 | | | | 1.49 | | | | 1.51 | † | |
| Portfolio turnover rate of master fund(3) | | % | | | 113 | | | | 149 | | | | 107 | | | | 55 | † | |
† Expenses of the master fund included in the ratio, as well as the portfolio turnover rate, are for the year ended December 31, 2004.
See Accompanying Notes to Financial Statements
22
NOTES TO FINANCIAL STATEMENTS AS OF DECEMBER 31, 2007
NOTE 1 — ORGANIZATION
ING Partners, Inc. (the "Fund") is an open-end management investment company registered under the Investment Company Act of 1940, as amended (the "1940 Act"). It was incorporated under the laws of Maryland on May 7, 1997. The Articles of Incorporation permit the Fund to offer separate series ("Portfolios"), each of which has its own investment objective, policies and restrictions. The Portfolios serve as investment options underlying variable insurance products offered by ING Directed Services, LLC ("DSL" or the "Investment Adviser") and its insurance company affiliates. At December 31, 2007 there were thirty-eight separate investment series which comprise the Fund. The four Portfolios included in this report are: ING Fidelity® VIP Contrafund® Portfolio* ("Contrafund"); ING Fidelity® VIP Equity-Income Portfolio ("Equity-Income"), ING Fidelity® VIP Growth Portfolio ("Growth") and ING Fidelity® VIP Mid Cap Portfolio ("Mid Cap") (each, a "Portfolio" and collectively, the "Portfolios").
Contrafund seeks long-term capital appreciation by investing all of its assets in the Service Class 2 Shares of the VIP Contrafund Portfolio, a series of Fidelity Variable Insurance Products Fund II, a registered open-end investment company.
Equity-Income seeks reasonable income and also considers the potential for capital appreciation by investing all of its assets in the Service Class 2 Shares of the VIP Equity-Income Portfolio, a series of Fidelity Variable Insurance Products Fund, a registered open-end investment company.
Growth seeks capital appreciation by investing all of its assets in the Service Class 2 Shares of the VIP Growth Portfolio, a series of Fidelity Variable Insurance Products Fund, a registered open-end investment company.
Mid Cap seeks long-term growth of capital by investing all of its assets in the Service Class 2 Shares of the VIP Mid Cap Portfolio, a series of Fidelity Variable Insurance Products Fund III, a registered open-end investment company.
Each Portfolio in this report operates as a "feeder fund" which means the only investment security is a separate mutual fund, the master funds: VIP Contrafund® Portfolio, VIP Equity-Income Portfolio, VIP Growth Portfolio and VIP Mid Cap Portfolio (each a "Master Fund" and collectively, the "Master Funds"). VIP Contrafund Portfolio is a series of Fidelity Variable Insurance Products Fund II; VIP Equity-Income Portfolio and VIP Growth Portfolio are series of Fidelity Variable Insurance Products Fund; and VIP Mid Cap Growth Portfolio is a series of Fidelity Variable Insurance Products Fund III. Each Portfolio has the same investment objective and limitations as the Master Fund in which it invests. Typically, the Portfolios do not buy investment securities directly. The Master Funds, on the other hand, invest directly in portfolio securities. At December 31, 2 007, Contrafund, Equity-Income, Growth and Mid Cap Portfolios each held 1.7% or less of their respective Master Fund.
The Portfolios offer two classes of shares, referred to as Service Class (Class "S") and Adviser Class (Class "ADV"). Each share class represents interests in the same portfolio of investments of the particular Portfolio, and shall be identical in all respects, except for the impact of expenses, voting, exchange privileges, and any different shareholder services relating to a class of shares. Shareholders of Class ADV of each Portfolio will generally be entitled to exchange those shares at net asset value for Adviser Class shares of other Portfolios that offer Adviser Class shares. Shareholders of the Adviser Class shares continue to be subject to the Rule 12b-1 Plan fee applicable to Adviser Class shares after an exchange. Shareholders of Service Class shares of each Portfolio will generally be entitled to exchange those shares at net asset value for Service Class shares of other Portfolios that offer Service Class shares. Shares of the Por tfolios may be offered to segregated asset accounts ("Separate Accounts") of insurance companies as investment options in connection with variable annuity contracts and variable life insurance policies ("Variable Contracts") and to certain of the Portfolios' investment advisers and their affiliates. In the future, shares may also be offered to qualified pension and retirement plans ("Qualified Plans") outside the Separate Account context. Shares of the
* Fidelity and Contrafund are registered trademarks of FMR Corp.
23
NOTES TO FINANCIAL STATEMENTS AS OF DECEMBER 31, 2007 (CONTINUED)
NOTE 1 — ORGANIZATION (continued)
Portfolios are not currently offered directly to Qualified Plans or custodial accounts.
Each Portfolio is distributed by ING Funds Distributor, LLC ("IFD" or the "Distributor"). DSL serves as the investment adviser to each Portfolio. IFD and DSL are both indirect, wholly-owned subsidiaries of ING Groep N.V. ("ING Groep"). ING Groep is one of the largest financial services institutions in the world, and offers an array of banking, insurance and asset management services to both individuals and institutional investors.
NOTE 2 — SIGNIFICANT ACCOUNTING POLICIES
The following significant accounting policies are consistently followed by the Portfolios in the preparation of their financial statements. Such policies are in conformity with U.S. generally accepted accounting principles for investment companies.
A. Security Valuation. The valuation of each Portfolio's investment in its corresponding Master Fund is based on the net asset value of that Master Fund each business day. Valuation of the investments by the Master Funds is discussed in the Master Funds' notes to their financial statements, which accompany this report.
B. Security Transactions and Revenue Recognition. Securities transactions are accounted for on the trade date. Realized gains and losses are reported on the basis of identified cost of securities sold. Interest income is recorded on an accrual basis. Dividend income is recorded on the ex-dividend date.
C. Distributions to Shareholders. The Portfolios record distributions to their shareholders on the ex-dividend date. Each Portfolio distributes dividends and capital gains, if any, annually. The Portfolios may make distributions on a more frequent basis to comply with the distribution requirements of the Internal Revenue Code. The characteristics of income and gains to be distributed are determined in accordance with income tax regulations, which may differ from U.S. generally accepted accounting principles for investment companies.
D. Federal Income Taxes. It is the policy of the Portfolios to comply with subchapter M of the Internal Revenue Code and related excise tax provisions applicable to regulated investment companies and to distribute substantially all of their net investment income and any net realized capital gains to their shareholders. Therefore, no federal income tax provision is required. The Board of Directors ("Board") intends to offset any net capital gains with any available capital loss carryforward until each carryforward has been fully utilized or expires. In addition, no capital gain distribution shall be made until the capital loss carryforward has been fully utilized or expires.
E. Use of Estimates. The preparation of financial statements in conformity with U.S. generally accepted accounting principles requires management to make estimates and assumptions that affect the reported amounts of assets and liabilities and disclosure of contingent assets and liabilities at the date of the financial statements and the reported amounts of increases and decreases in net assets from operations during the reporting period. Actual results could differ from those estimates.
F. Repurchase Agreements. Each Portfolio may invest in repurchase agreements only with government securities dealers recognized by the Board of Governors of the Federal Reserve System. Under such agreements, the seller of the security agrees to repurchase it at a mutually agreed upon time and price. The resale price is in excess of the purchase price and reflects an agreed upon interest rate for the period of time the agreement is outstanding. The period of the repurchase agreements is usually short, from overnight to one week, while the underlying securities generally have longer maturities. Each Portfolio will always receive as collateral securities acceptable to it whose market value is equal to at least 100% of the carrying amount of the repurchase agreements, plus accrued inter est, being invested by the Portfolio. The underlying collateral is valued daily on a mark-to-market basis to assure that the value, including accrued interest is at least equal to the
24
NOTES TO FINANCIAL STATEMENTS AS OF DECEMBER 31, 2007 (CONTINUED)
NOTE 2 — SIGNIFICANT ACCOUNTING POLICIES (continued)
repurchase price. There would be potential loss to the Portfolio in the event the Portfolio is delayed or prevented from exercising its right to dispose of the collateral, and it might incur disposition costs in liquidating the collateral.
G. Indemnifications. In the normal course of business, the Fund may enter into contracts that provide certain indemnifications. The Fund's maximum exposure under these arrangements is dependent on future claims that may be made against the Portfolios and, therefore, cannot be estimated; however, based on experience, the risk of loss from such claims is considered remote.
NOTE 3 — INVESTMENT MANAGEMENT AND ADMINISTRATIVE FEES
Fidelity Management & Research Company ("FMR") serves as manager to each Master Fund. FMR has day-to-day responsibility for choosing investments for each Master Fund. As shareholders of the Master Funds, the Portfolios indirectly pay a portion of the master-level management fee.
Each Master Fund, VIP Contrafund® Portfolio, VIP Equity-Income Portfolio, VIP Growth Portfolio, and VIP Mid Cap Portfolio, pays FMR a management fee for advisory services at annual rates of 0.56%, 0.46%, 0.56%, and 0.56%, of each respective Master Fund's current average daily net assets. Pursuant to its Investment Management Agreement with the Fund, DSL may charge an annual advisory fee to a respective Portfolio at annual rates equal to 0.58%, 0.48%, 0.58% and 0.58% of average daily net assets if the respective Portfolio does not invest substantially all of its assets in another investment company. If a Portfolio invests substantially all of its assets in another investment company, DSL does not charge an advisory fee. Each Portfolio anticipates investing substantially all of its assets in another investment company.
If a Portfolio invests substantially all of its assets in another investment company, ING Funds Services, LLC will charge an administration fee of 0.05% of average daily net assets for that Portfolio. Pursuant to its administration agreement with the Portfolios, ING Funds Services, LLC may receive an annual administration fee equal to 0.15%, 0.15%, 0.15% and 0.17% of average daily net assets for Contrafund, Equity-Income, Growth and Mid Cap, respectively, if the respective Portfolio does not invest substantially all of its assets in another investment company.
NOTE 4 — INVESTMENT IN UNDERLYING PORTFOLIOS
For the year ended December 31, 2007, the cost of purchases and proceeds from sales of the Master Funds were as follows:
| Portfolio | | Purchases | | Sales | |
| Contrafund | | $ | 263,063,959 | | | $ | 110,892,277 | | |
| Equity Income | | | 32,717,249 | | | | 11,273,263 | | |
| Growth | | | 19,701,416 | | | | 4,980,414 | | |
| Mid Cap | | | 40,333,868 | | | | 7,635,774 | | |
NOTE 5 — DISTRIBUTION AND SERVICE FEES
Each Portfolio has adopted a Shareholder Servicing Plan ("Service Plan") for the Class S and Class ADV shares of each Portfolio. Under the Service Plan, a Portfolio makes payments at an annual rate of 0.25% of the Portfolio's average daily net assets attributable to its Class S and Class ADV shares.
Each Portfolio has adopted a Plan of Distribution pursuant to Rule 12b-1 under the 1940 Act ("Distribution Plan") for the Class ADV shares of each Portfolio. The Distribution Plan provides for a distribution fee, payable to IFD as the Fund's Distributor at an annual rate of 0.25% of the Portfolio's average daily net assets attributable to Class ADV shares.
Fidelity Distributors Corporation ("FDC") distributes Service Class 2 shares of each Master Fund. Service Class 2 of each Master Fund currently pays FDC a 12b-1 (service) fee at an annual rate of 0.25% of its average net assets throughout the month. Shareholders of Class S and Class ADV of each Portfolio pay only their proportionate share of the Master Fund 12b-1 plan expenses.
NOTE 6 — OTHER TRANSACTIONS WITH AFFILIATES AND RELATED PARTIES
At December 31, 2007, the Portfolios had the following amounts recorded as payable to affiliates on the accompanying Statements of Assets and Liabilities:
| | | Accrued
Administrative
Service Fee | | Accrued
Distribution
Fee | | Total | |
| Contrafund | | $ | 17,583 | | | $ | 89,552 | | | $ | 107,135 | | |
| Equity-Income | | | 2,298 | | | | 11,693 | | | | 13,991 | | |
| Growth | | | 1,586 | | | | 7,934 | | | | 9,520 | | |
| Mid Cap | | | 3,411 | | | | 17,755 | | | | 21,166 | | |
25
NOTES TO FINANCIAL STATEMENTS AS OF DECEMBER 31, 2007 (CONTINUED)
NOTE 6 — OTHER TRANSACTIONS WITH AFFILIATES AND RELATED PARTIES (continued)
At December 31, 2007, the following indirect, wholly-owned subsidiaries of ING Groep owned more than 5% of the following Portfolios:
ING Life Insurance and Annuity Company — Contrafund (99.74%); Equity-Income (99.60%); Growth (99.96%); Mid Cap (99.62%).
The Trust has adopted a Retirement Policy ("Policy") covering all independent directors of the Portfolio who will have served as an independent director for at least five years at the time of retirement. Benefits under this Policy are based on an annual rate as defined in the Policy.
Investors in the Portfolios should recognize that an investment in the Portfolios bears not only a proportionate share of the expenses of the Portfolios (including operating costs and management fees, if any), but also indirectly similar expenses of the underlying mutual funds in which each Portfolio invests. Investors also bear their proportionate share of any sales charges incurred by the Portfolios related to the purchase of shares of the mutual fund investments.
NOTE 7 — CAPITAL SHARES
Transactions in capital shares and dollars were as follows:
| | | Class S | | Class ADV | |
| | | Year
Ended
December 31,
2007 | | Year
Ended
December 31,
2006 | | Year
Ended
December 31,
2007 | | Year
Ended
December 31,
2006 | |
| Fidelity VIP Contrafund (Number of Shares) | |
| Shares sold | | | 11,233,736 | | | | 11,899,717 | | | | 118,842 | | | | 239,767 | | |
| Dividends reinvested | | | 1,355,770 | | | | 1,862 | | | | 29,433 | | | | 57 | | |
| Shares redeemed | | | (721,415 | ) | | | (416,699 | ) | | | (94,324 | ) | | | (44,327 | ) | |
| Net increase in shares outstanding | | | 11,868,091 | | | | 11,484,880 | | | | 53,951 | | | | 195,497 | | |
| Fidelity VIP Contrafund ($) | |
| Shares sold | | $ | 159,693,325 | | | $ | 149,782,783 | | | $ | 1,665,376 | | | $ | 3,014,008 | | |
| Dividends reinvested | | | 18,452,025 | | | | 22,772 | | | | 398,224 | | | | 698 | | |
| Shares redeemed | | | (10,138,909 | ) | | | (5,352,587 | ) | | | (1,337,651 | ) | | | (554,113 | ) | |
| Net increase | | $ | 168,006,441 | | | $ | 144,452,968 | | | $ | 725,949 | | | $ | 2,460,593 | | |
| | | Class S | | Class ADV | |
| | | Year
Ended
December 31,
2007 | | Year
Ended
December 31,
2006 | | Year
Ended
December 31,
2007 | | Year
Ended
December 31,
2006 | |
| Fidelity VIP Equity-Income (Number of Shares) | |
| Shares sold | | | 2,086,783 | | | | 1,802,997 | | | | 23,188 | | | | 77,569 | | |
| Dividends reinvested | | | 290,402 | | | | 2,138 | | | | 6,420 | | | | 51 | | |
| Shares redeemed | | | (487,257 | ) | | | (198,437 | ) | | | (28,657 | ) | | | (6,778 | ) | |
| Net increase in shares outstanding | | | 1,889,928 | | | | 1,606,698 | | | | 951 | | | | 70,842 | | |
| Fidelity VIP Equity-Income ($) | |
| Shares sold | | $ | 27,022,729 | | | $ | 20,947,596 | | | $ | 298,953 | | | $ | 883,413 | | |
| Dividends reinvested | | | 3,621,307 | | | | 24,482 | | | | 79,413 | | | | 577 | | |
| Shares redeemed | | | (6,319,144 | ) | | | (2,290,414 | ) | | | (365,472 | ) | | | (78,103 | ) | |
| Net increase | | $ | 24,324,892 | | | $ | 18,681,664 | | | $ | 12,894 | | | $ | 805,887 | | |
26
NOTES TO FINANCIAL STATEMENTS AS OF DECEMBER 31, 2007 (CONTINUED)
NOTE 7 — CAPITAL SHARES (continued)
| | | Class S | | Class ADV | |
| | | Year
Ended
December 31,
2007 | | Year
Ended
December 31,
2006 | | Year
Ended
December 31,
2007 | | Year
Ended
December 31,
2006 | |
| Fidelity VIP Growth (Number of Shares) | |
| Shares sold | | | 1,520,557 | | | | 1,124,091 | | | | 3,893 | | | | 2,495 | | |
| Dividends reinvested | | | 36,573 | | | | 1,960 | | | | 34 | | | | — | | |
| Shares redeemed | | | (381,368 | ) | | | (590,138 | ) | | | (3,752 | ) | | | (788 | ) | |
| Net increase in shares outstanding | | | 1,175,762 | | | | 535,913 | | | | 175 | | | | 1,707 | | |
| Fidelity VIP Growth ($) | |
| Shares sold | | $ | 19,599,609 | | | $ | 12,336,946 | | | $ | 52,207 | | | $ | 28,079 | | |
| Dividends reinvested | | | 463,744 | | | | 20,310 | | | | 429 | | | | — | | |
| Shares redeemed | | | (4,882,310 | ) | | | (6,460,226 | ) | | | (50,663 | ) | | | (8,879 | ) | |
| Net increase | | $ | 15,181,043 | | | $ | 5,897,030 | | | $ | 1,973 | | | $ | 19,200 | | |
| | | Class S | | Class ADV | |
| | | Year
Ended
December 31,
2007 | | Year
Ended
December 31,
2006 | | Year
Ended
December 31,
2007 | | Year
Ended
December 31,
2006 | |
| Fidelity VIP Mid Cap (Number of Shares) | |
| Shares sold | | | 2,285,513 | | | | 2,544,937 | | | | 75,712 | | | | 61,632 | | |
| Dividends reinvested | | | 72,714 | | | | 1,092 | | | | 3,230 | | | | 80 | | |
| Shares redeemed | | | (190,942 | ) | | | (102,288 | ) | | | (24,673 | ) | | | (24,563 | ) | |
| Net increase in shares outstanding | | | 2,167,285 | | | | 2,443,741 | | | | 54,269 | | | | 37,149 | | |
| Fidelity VIP Mid Cap ($) | |
| Shares sold | | $ | 34,715,923 | | | $ | 33,967,125 | | | $ | 1,151,605 | | | $ | 820,895 | | |
| Dividends reinvested | | | 1,100,158 | | | | 14,205 | | | | 48,540 | | | | 1,042 | | |
| Shares redeemed | | | (2,995,720 | ) | | | (1,351,628 | ) | | | (372,332 | ) | | | (320,297 | ) | |
| Net increase | | $ | 32,820,361 | | | $ | 32,629,702 | | | $ | 827,813 | | | $ | 501,640 | | |
NOTE 8 — FEDERAL INCOME TAXES
The amount of distributions from net investment income and net realized capital gains are determined in accordance with federal income tax regulations, which may differ from U.S. generally accepted accounting principles for investment companies. These book/tax differences may be either temporary or permanent. Permanent differences are reclassified within the capital accounts based on their federal tax-basis treatment; temporary differences are not reclassified. Key differences include the treatment of short-term capital gains, foreign currency transactions, and wash sale deferrals. Distributions in excess of net investment income and/or net realized capital gains for tax purposes are reported as distributions of paid-in capital.
The following permanent tax differences have been reclassified as of December 31, 2007:
| | | Undistributed
Net Investment
Income | | Accumulated
Net Realized
Gains/(Losses)
On Investments | |
| Contrafund | | $ | 18,632,841 | | | $ | (18,632,841 | ) | |
| Equity-Income | | | 320,953 | | | | (320,953 | ) | |
| Growth | | | 21,246 | | | | (21,246 | ) | |
| Mid Cap | | | 50,389 | | | | (50,389 | ) | |
Dividends paid by the Portfolios from net investment income and distributions of net realized short-term capital gains are, for federal income tax purposes, taxable as ordinary income to shareholders.
The tax composition of dividends and distributions to shareholders was as follows:
| | | Year Ended
December 31, 2007 | | Year Ended
December 31, 2006 | |
| | | Ordinary
Income | | Long-Term
Capital Gains | | Ordinary
Income | | Long-Term
Capital Gains | |
| Contrafund | | $ | 1,454,608 | | | $ | 17,395,641 | | | $ | 23,470 | | | $ | — | | |
| Equity-Income | | | 959,239 | | | | 2,741,481 | | | | 25,059 | | | | — | | |
| Growth | | | 262,206 | | | | 201,967 | | | | 20,310 | | | | — | | |
| Mid Cap | | | 89,615 | | | | 1,059,083 | | | | 13,176 | | | | 2,071 | | |
27
NOTES TO FINANCIAL STATEMENTS AS OF DECEMBER 31, 2007 (CONTINUED)
NOTE 8 — FEDERAL INCOME TAXES (continued)
The tax-basis components of distributable earnings as of December 31, 2007 were:
| | | Undistributed
Ordinary
Income | | Undistributed
Long-Term
Capital Gains | | Unrealized
Appreciation/
(Depreciation) | |
| Contrafund | | $ | 20,601,929 | | | $ | 83,513,911 | | | $ | (54,545,536 | ) | |
| Equity-Income | | | 1,075,675 | | | | 4,907,384 | | | | (5,180,314 | ) | |
| Growth | | | 22,952 | | | | 905,631 | | | | 6,001,493 | | |
| Mid Cap | | | 163,189 | | | | 4,562,163 | | | | 4,278,842 | | |
The Portfolios' major tax jurisdictions are federal and Arizona. The earliest tax year that remains subject to examination by these jurisdictions is 2003.
NOTE 9 — OTHER ACCOUNTING PRONOUNCEMENTS
In June 2006, the Financial Accounting Standards Board ("FASB") issued FASB Interpretation No. 48 ("FIN 48"), "Accounting for Uncertainty in Income Taxes." This standard defines the threshold for recognizing the benefits of tax-return positions in the financial statements as "more-likely-than-not" to be sustained upon challenge by the taxing authority and requires measurement of a tax position meeting the more-likely-than-not criterion, based on the largest benefit that is more than 50 percent likely to be realized. FIN 48 was effective for fiscal years beginning after December 15, 2006, with early application permitted if no interim financial statements have been issued. However, acknowledging the unique issues that FIN 48 presents for investment companies that calculate NAVs, the SEC indicated that they would not object if a fund implemented FIN 48 in its NAV calculation as late as its last NAV calculation in the first required financial statement reporting period for its fiscal year beginning after December 15, 2006. At adoption, companies must adjust their financial statements to reflect only those tax positions that are more likely-than-not to be sustained as of the adoption date. Management of the Portfolios has analyzed the tax positions of the Portfolios. Upon adoption of FIN 48, we identified no uncertain tax positions that have not met the more likely-than-not standard.
On September 15, 2006, the FASB issued Statement of Financial Accounting Standards No. 157 ("SFAS No. 157"), "Fair Value Measurements." The new accounting statement defines fair value, establishes a framework for measuring fair value in generally accepted accounting principles ("GAAP"), and expands disclosures about fair value measurements. SFAS No. 157 defines fair value as the price that would be received to sell an asset or paid to transfer a liability in an orderly transaction between market participants at the measurement date (an exit price). SFAS No. 157 also stipulates that, as a market-based measurement, fair value should be determined based on the assumptions that market participants would use in pricing the asset or liability, and establishes a fair value hierarchy that distinguishes between (a) market participant assumptions developed based on market data obtained from sources independent of the reporting entity (observable inputs) and (b) the reporting entity's own assumptions about market participant assumptions developed based on the best information available in the circumstances (unobservable inputs). SFAS No. 157 is effective for financial statements issued for fiscal years beginning after November 15, 2007. As of December 31, 2007, management of the Portfolios is currently assessing the impact in addition to expanded financial statement disclosures, if any, that will result from adopting SFAS No. 157.
NOTE 10 — INFORMATION REGARDING TRADING OF ING'S U.S. MUTUAL FUNDS
As discussed in earlier supplements that were previously filed with the SEC, DSL, the adviser to the ING Funds, has reported to the Boards of Directors/Trustees (the "Boards") of the ING Funds that, like many U.S. financial services companies, ING Investments and certain of its U.S. affiliates have received informal and formal requests for information since September 2003 from various governmental and self-regulatory agencies in connection with investigations related to mutual funds and variable insurance products. DSL has advised the Boards that it and its affiliates have cooperated fully with each request.
In addition to responding to regulatory and governmental requests, DSL reported that management of U.S. affiliates of ING Groep N.V., including DSL (collectively, "ING"), on their own initiative, have conducted, through independent special counsel and a national accounting firm, an extensive internal review of trading in ING insurance, retirement, and mutual fund products. The goal of this review was to identify any instances of inappropriate trading in those products by third parties or by ING investment professionals and other ING personnel. ING's internal review related to mutual fund trading is now substantially completed. ING has reported that, of the millions of customer relationships that ING maintains, the internal review identified several isolated arrangements allowing
28
NOTES TO FINANCIAL STATEMENTS AS OF DECEMBER 31, 2007 (CONTINUED)
NOTE 10 — INFORMATION REGARDING TRADING OF ING'S U.S. MUTUAL FUNDS (continued)
third parties to engage in frequent trading of mutual funds within ING's variable insurance and mutual fund products, and identified other circumstances where frequent trading occurred, despite measures taken by ING intended to combat market timing. ING further reported that each of these arrangements has been terminated and fully disclosed to regulators. The results of the internal review were also reported to the independent members of the Boards.
DSL has advised the Boards that most of the identified arrangements were initiated prior to ING's acquisition of the businesses in question in the U.S. DSL further reported that the companies in question did not receive special benefits in return for any of these arrangements, which have all been terminated.
Based on the internal review, DSL has advised the Boards that the identified arrangements do not represent a systemic problem in any of the companies that were involved.
Despite the extensive internal review conducted through independent special counsel and a national accounting firm, there can be no assurance that the instances of inappropriate trading reported to the Boards are the only instances of such trading respecting the ING Funds.
DSL reported to the Boards that ING is committed to conducting its business with the highest standards of ethical conduct with zero tolerance for noncompliance. Accordingly, DSL advised the Boards that ING management was disappointed that its voluntary internal review identified these situations. Viewed in the context of the breadth and magnitude of its U.S. business as a whole, ING management does not believe that ING's acquired companies had systemic ethical or compliance issues in these areas. Nonetheless, DSL reported that given ING's refusal to tolerate any lapses, it has taken the steps noted below, and will continue to seek opportunities to further strengthen the internal controls of its affiliates.
• ING has agreed with the ING Funds to indemnify and hold harmless the ING Funds from all damages resulting from wrongful conduct by ING or its employees or from ING's internal investigation, any investigations conducted by any governmental or self-regulatory agencies, litigation or other formal proceedings, including any proceedings by the SEC. DSL reported to the Boards that ING management believes that the total amount of any indemnification obligations will not be material to ING or its U.S. business.
• ING updated its Code of Conduct for employees reinforcing its employees' obligation to conduct personal trading activity consistent with the law, disclosed limits, and other requirements.
Other Regulatory Matters
The New York Attorney General and other federal and state regulators are also conducting broad inquiries and investigations involving the insurance industry. These initiatives currently focus on, among other things, compensation and other sales incentives; potential conflicts of interest; potential anti- competitive activity; reinsurance; marketing practices (including suitability); specific product types (including group annuities and indexed annuities); fund selection for investment products and brokerage sales; and disclosure. It is likely that the scope of these industry investigations will further broaden before they conclude. ING has received formal and informal requests in connection with such investigations, and is cooperating fully with each request. In connection with one such investigation, affiliates of ING Investments were named in a petition for relief and cease and desist order filed by the New Hampshire Bureau of Securities R egulation concerning their administration of the New Hampshire state employees deferred compensation plan.
Other federal and state regulators could initiate similar actions in this or other areas of ING's businesses. These regulatory initiatives may result in new legislation and regulation that could significantly affect the financial services industry, including businesses in which ING is engaged. In light of these and other developments, ING continuously reviews whether modifications to its business practices are appropriate. At this time, in light of the current regulatory factors, ING U.S. is actively engaged in reviewing whether any modifications in our practices are appropriate for the future.
There can be no assurance that these matters, or the adverse publicity associated with them, will not result in increased fund redemptions, reduced sale of fund shares, or other adverse consequences to ING Funds.
29
PORTFOLIO OF INVESTMENTS
ING FIDELITY® VIP CONTRAFUND® PORTFOLIO AS OF DECEMBER 31, 2007
| Shares | | | | | | Value | |
| AFFILIATED INVESTMENT COMPANIES: 100.0% | |
| | 15,388,606 | | | Fidelity® VIP Contrafund® Portfolio - Service Class 2 Shares | | | | | | $ | 422,571,126 | | |
| | | Total Investments in Securities
(Cost $477,114,852)* | | | 100.0 | % | | $ | 422,571,126 | | |
| | | Other Assets and Liabilities - Net | | | (0.0 | ) | | | (106,823 | ) | |
| | | Net Assets | | | 100.0 | % | | $ | 422,464,303 | | |
* Cost for federal income tax purposes is $477,116,662.
| Net unrealized depreciation consists of: | |
| Gross Unrealized Appreciation | | $ | — | | |
| Gross Unrealized Depreciation | | | (54,545,536 | ) | |
| Net Unrealized Depreciation | | $ | (54,545,536 | ) | |
See Accompanying Notes to Financial Statements
30
PORTFOLIO OF INVESTMENTS
ING FIDELITY® VIP EQUITY-INCOME PORTFOLIO AS OF DECEMBER 31, 2007
| Shares | | | | | | Value | |
| AFFILIATED INVESTMENT COMPANIES: 100.0% | |
| | 2,313,545 | | | Fidelity® VIP Equity-Income Portfolio - Service Class 2 Shares | | | | | | $ | 54,530,249 | | |
| | | Total Investments in Securities
(Cost $59,710,560)* | | | 100.0 | % | | $ | 54,530,249 | | |
| | | Other Assets and Liabilities - Net | | | (0.0 | ) | | | (13,287 | ) | |
| | | Net Assets | | | 100.0 | % | | $ | 54,516,962 | | |
* Cost for federal income tax purposes is $59,710,563.
| Net unrealized depreciation consists of: | |
| Gross Unrealized Appreciation | | $ | — | | |
| Gross Unrealized Depreciation | | | (5,180,314 | ) | |
| Net Unrealized Depreciation | | $ | (5,180,314 | ) | |
See Accompanying Notes to Financial Statements
31
PORTFOLIO OF INVESTMENTS
ING FIDELITY® VIP GROWTH PORTFOLIO AS OF DECEMBER 31, 2007
| Shares | | | | | | Value | |
| AFFILIATED INVESTMENT COMPANIES: 100.0% | |
| | 857,258 | | | Fideility® VIP Growth Portfolio - Service Class 2 shares | | | | | | $ | 38,276,563 | | |
| | | Total Investments in Securities
(Cost $32,272,801)* | | | 100.0 | % | | $ | 38,276,563 | | |
| | | Other Assets and Liabilities - Net | | | 0.0 | | | | (9,518 | ) | |
| | | Net Assets | | | 100.0 | % | | $ | 38,267,045 | | |
* Cost for federal income tax purposes is $32,275,070.
| Net unrealized appreciation consists of: | |
| Gross Unrealized Appreciation | | $ | 6,001,493 | | |
| Gross Unrealized Depreciation | | | — | | |
| Net Unrealized Appreciation | | $ | 6,001,493 | | |
See Accompanying Notes to Financial Statements
32
PORTFOLIO OF INVESTMENTS
ING FIDELITY® VIP MID CAP PORTFOLIO AS OF DECEMBER 31, 2007
| Shares | | | | | | Value | |
| AFFILIATED INVESTMENT COMPANIES: 100.0% | |
| | 2,271,806 | | | Fidelity® VIP MidCap Portfolio - Service Class 2 Shares | | | | | | $ | 80,944,465 | | |
| | | Total Investments in Securities
(Cost $76,660,969)* | | | 100.0 | % | | $ | 80,944,465 | | |
| | | Other Assets and Liabilities - Net | | | (0.0 | ) | | | (21,130 | ) | |
| | | Net Assets | | | 100.0 | % | | $ | 80,923,335 | | |
* Cost for federal income tax purposes is $76,665,623.
| Net unrealized appreciation consists of: | |
| Gross Unrealized Appreciation | | $ | 4,278,842 | | |
| Gross Unrealized Depreciation | | | — | | |
| Net Unrealized Appreciation | | $ | 4,278,842 | | |
See Accompanying Notes to Financial Statements
33
SHAREHOLDER MEETING INFORMATION (UNAUDITED)
A special meeting of shareholders of the ING Partners, Inc. was held October 25, 2007, at the offices of ING Funds, 7337 East Doubletree Ranch Road, Scottsdale, AZ 85258.
A brief description of the matter voted upon as well as the result is outlined below:
Matters:
1. To approve the election of eleven nominees to the Boards of Trustees of the Portfolios.
Results:
| | | Proposal* | | Shares voted for | | Shares voted
against or
withheld | | Shares
abstained | | Broker
non-vote | | Total shares
voted | |
| Colleen D. Baldwin | | | 1 | | | | 483,022,915 | | | | 8,616,966 | | | | — | | | | — | | | | 491,639,881 | | |
| John V. Boyer | | | 1 | | | | 482,570,195 | | | | 9,069,686 | | | | — | | | | — | | | | 491,639,881 | | |
| Patricia W. Chadwick | | | 1 | | | | 482,229,198 | | | | 9,410,683 | | | | — | | | | — | | | | 491,639,881 | | |
| Robert W. Crispin | | | 1 | | | | 482,001,918 | | | | 9,637,963 | | | | — | | | | — | | | | 491,639,881 | | |
| Peter S. Drotch | | | 1 | | | | 482,473,676 | | | | 9,166,205 | | | | — | | | | — | | | | 491,639,881 | | |
| J. Michael Earley | | | 1 | | | | 482,066,524 | | | | 9,573,357 | | | | — | | | | — | | | | 491,639,881 | | |
| Patrick W. Kenny | | | 1 | | | | 482,349,381 | | | | 9,290,500 | | | | — | | | | — | | | | 491,639,881 | | |
| Shaun P. Mathews | | | 1 | | | | 482,345,787 | | | | 9,294,094 | | | | — | | | | — | | | | 491,639,881 | | |
| Sheryl K. Pressler | | | 1 | | | | 481,846,320 | | | | 9,793,561 | | | | — | | | | — | | | | 491,639,881 | | |
| David W.C. Putnam | | | 1 | | | | 481,635,830 | | | | 10,004,051 | | | | — | | | | — | | | | 491,639,881 | | |
| Roger B. Vincent | | | 1 | | | | 482,354,446 | | | | 9,285,435 | | | | — | | | | — | | | | 491,639,881 | | |
* Proposal 1 passed at this meeting.
34
TAX INFORMATION (UNAUDITED)
Dividends paid during the year ended December 31, 2007 were as follows:
| Fund Name | | Type | | Per Share Amount | |
| ING Fidelity® VIP Contrafund® Portfolio | |
| Class ADV | | NII | | $ | 0.0248 | | |
| Class S | | NII | | $ | 0.0572 | | |
| All Classes | | STCG | | $ | 0.0085 | | |
| All Classes | | LTCG | | $ | 0.7772 | | |
| ING Fidelity® VIP Equity-Income Portfolio | |
| Class ADV | | NII | | $ | 0.2137 | | |
| Class S | | NII | | $ | 0.2402 | | |
| All Classes | | STCG | | $ | 0.0297 | | |
| All Classes | | LTCG | | $ | 0.7697 | | |
| Fund Name | | Type | | Per Share Amount | |
| ING Fidelity® VIP Growth Portfolio | |
| All Classes | | STCG | | $ | 0.1271 | | |
| All Classes | | LTCG | | $ | 0.0979 | | |
| ING Fidelity® VIP Mid Cap Portfolio | |
| Class ADV | | NII | | $ | — | | |
| Class S | | NII | | $ | 0.0115 | | |
| All Classes | | STCG | | $ | 0.0106 | | |
| All Classes | | LTCG | | $ | 0.2552 | | |
NII — Net investment income
STCG — Short-term capital gain
LTCG — Long-term capital gain
Of the ordinary distributions made during the year ended December 31, 2007, the following percentages qualify for the dividends received deduction (DRD) available to corporate shareholders:
| ING Fidelity® VIP Contrafund® Portfolio | | | 99.46 | % | |
| ING Fidelity® VIP Equity-Income Portfolio | | | 87.74 | % | |
| ING Fidelity® VIP Growth Portfolio | | | 7.98 | % | |
| ING Fidelity® VIP Mid Cap Portfolio | | | 37.22 | % | |
Above figures may differ from those cited elsewhere in this report due to differences in the calculation of income and gains under U.S. generally accepted accounting principles (book) purposes and Internal Revenue Service (tax) purposes.
Shareholders are strongly advised to consult their own tax advisers with respect to the tax consequences of their investments in the Portfolios. In January, shareholders, excluding corporate shareholders, receive an IRS 1099-DIV regarding the federal tax status of the dividends and distributions they received in the calendar year.
35
DIRECTOR AND OFFICER INFORMATION (UNAUDITED)
The business and affair of the Fund are managed under the direction of the Funds' Board. A Director who is not an interested person of the Fund, as defined in the 1940 Act, is an independent director ("Independent Director"). The Directors and Officers of the Fund are listed below. The Statement of Additional Information includes additional information about directors of the Fund and is available, without charge, upon request at (800) 992-0180.
Name, Address
and Age | | Position(s)
Held with
Fund | | Term of
Office and
Length of
Time
Served(1) | | Principal
Occupation(s)
During the
Past Five Years | | Number of
Portfolios in
Fund Complex
Overseen
by Director | | Other
Directorships
Held by
Director | |
| Independent Directors: | |
|
Colleen D. Baldwin
7337 E. Doubletree Ranch Rd.
Scottsdale, Arizona 85258
Age: 47 | | Director | | November 2007 -Present | | Consultant (January 2005 - Present). Formerly, Chief Operating Officer, Ivy Asset Management Group (April 2002 - October 2004). Chief Operating Officer, AIG Global Investment Group. (May 1995 - January 2002). | | | 179 | | | None | |
|
John V. Boyer
7337 E. Doubletree Ranch Rd.
Scottsdale, Arizona 85258
Age: 54 | | Director | | November 1997 -Present | | Consultant (July 2007 - Present). Formerly, President and Chief Executive Officer, Franklin and Eleanor Roosevelt Institute (March 2006 - July 2007), and Executive Director, The Mark Twain House & Museum(2) (September 1989 - November 2005). | | | 179 | | | None | |
|
Patricia W. Chadwick
7337 E. Doubletree Ranch Rd.
Scottsdale, Arizona 85258
Age: 59 | | Director | | January 2006 - Present | | Consultant and President of self-owned company, Ravengate Partners LLC (January 2000 - Present). | | | 179 | | | Wisconsin Energy (June 2006 - Present). | |
|
Peter S. Drotch
7337 E. Doubletree Ranch Rd.
Scottsdale, Arizona 85258
Age: 66 | | Director | | November 2007 - Present | | Retired partner. PricewaterhouseCoopers. | | | 179 | | | First Marblehead Corporation,(October 2003 - Present); BlackRock Funds/State Street Research Funds, Trustee (February 2004 - January 2007); Tufts Health Plan, Director (June 2006 - Present); and University of Connecticut, Trustee (November 2004 - Present) | |
|
J. Michael Earley
7337 E. Doubletree Ranch Rd.
Scottsdale, Arizona 85258
Age: 62 | | Director | | January 2005 - Present | | President, Chief Executive Officer and Director, Bankers Trust Company, N.A., Des Moines (June 1992 - Present). | | | 179 | | | Midamerica Financial Corporation (December 2002 - Present). | |
|
Patrick W. Kenny
7337 E. Doubletree Ranch Rd.
Scottsdale, Arizona 85258
Age: 65 | | Director | | March 2002 - Present | | President and Chief Executive Officer, International Insurance Society (June 2001 - Present). | | | 179 | | | Assured Guaranty Ltd. (April 2004 - Present); and Odyssey Reinsurance Holdings (November 2006 - Present). | |
|
36
DIRECTOR AND OFFICER INFORMATION (UNAUDITED) (CONTINUED)
Name, Address
and Age | | Position(s)
Held with
Trust | | Term of
Office and
Length of
Time
Served(1) | | Principal
Occupation(s)
During the
Past Five Years | | Number of
Portfolios in
Fund Complex
Overseen
by Trustee | | Other
Directorships
Held by
Trustee | |
Sheryl K. Pressler
7337 E. Doubletree Ranch Rd.
Scottsdale, Arizona 85258
Age: 57 | | Director | | January 2006 - Present | | Consultant (May 2001 - Present). | | | 179 | | | Stillwater Mining Company (May 2002 - Present); California HealthCare Foundation (June 1999 - Present); and Romanian-American Enterprise Fund (February 2004 - Present). | |
|
David W. C. Putnam
7337 E. Doubletree Ranch Rd.
Scottsdale, Arizona 85258
Age: 68 | | Director | | January 2005 - Present | | Chair, Board of Directors and President, F. L. Putnam Securities Company, Inc. (June 1978 - Present). | | | 179 | | | Principled Equity Market Trust (December 1996 - Present); and Asian American Bank and Trust Company (June 1993 - Present). | |
|
Roger B. Vincent
7337 E. Doubletree Ranch Rd.
Scottsdale, Arizona 85258
Age: 62 | | Chairman/
Director | | January 2005 - Present | | President, Springwell Corporation (March 1989 - Present). | | | 179 | | | UGI Corporation (February 2006 - Present); and UGI Utilities, Inc. (February 2006 - Present). | |
|
| Directors who are "Interested Persons": | |
|
Robert W. Crispin(3)
7337 E. Doubletree Ranch Rd.
Scottsdale, Arizona 85258
Age: 61 | | Director | | November 2007 - Present | | Retired Chairman and Chief Investment Officer, ING Investment Management Co. (June 2001 - December 2007) | | | 179 | | | ING Life Insurance and Annuity Company (May 2006 - Present); ING USA Annuity and Life Insurance Company (May 2006 - Present); Midwestern United Life Insurance Company (May 2006 - Present); ReliaStar Life Insurance Company (May 2006 - Present); Security Life of Denver Insurance Company (May 2006 - Present); Belair Insurance Company Inc. (August 2005 - Present); The Nordic Insurance Company of Canada (February 2005 - Present); Trafalgar Insurance Company of Canada (February 2005 - Present); ING Novex Insurance Company of Canada (February 2005 - Present); Allianz Insurance Company of Canada (February 2005 - Present); ING Canada Inc. (December 2004 - Present); ING Bank, fsb (June 2001 - Present); ING Investment Management, Inc (June 2001 - December 2007); ING Insurance Company of Canada (June 2001 - Present ); Sul America S.A. (June 2001 - Present); and ING Foundation (March 2004 - Present) | |
|
37
DIRECTOR AND OFFICER INFORMATION (UNAUDITED) (CONTINUED)
Name, Address
and Age | | Position(s)
Held with
Trust | | Term of
Office and
Length of
Time
Served(1) | | Principal
Occupation(s)
During the
Past Five Years | | Number of
Portfolios in
Fund Complex
Overseen
by Trustee | | Other
Directorships
Held by
Trustee | |
Shaun P. Mathews(3)
7337 E. Doubletree Ranch Rd.
Scottsdale, Arizona 85258
Age: 52 | | Director | | November 2007 - Present | | President and Chief Executive Officer, ING Investments, LLC (December 2006 - Present), and Head of ING USFS Mutual Funds and Investment Products (October 2004 - Present). Formerly, CMO, ING USFS (April 2002 - October 2004), and Head of Rollover/Payout (October 2001 - December 2003). | | | 179 | | | Mark Twain House & Museum(2) (September 2002 - Present); Connecticut Forum (May 2002 - Present); Capital Community College Foundation (February 2002 - Present); ING Services Holding Company, Inc. (May 2000 - Present); Southland Life Insurance Company (June 2002 - Present); and ING Capital Corporation, LLC, ING Funds Distributor, LLC,(4) ING Funds Services, LLC,(5) ING Investments, LLC(6) and ING Pilgrim Funding, Inc. (March 2006 - Present). | |
|
(1) Directors serve until their successors are duly elected and qualified, subject to the Board's retirement policy which states that each duly elected or appointed Director who is not an "interested person" of the Fund, as defined in the 1940 Act ("Independent Directors"), shall retire from service as a Director at the conclusion of the first regularly scheduled meeting of the Board that is held after the Director reaches the age of 70. A unanimous vote of the Board may extend the retirement date of a Director for up to one year. An extension may be permitted if the retirement would trigger a requirement to hold a meeting of shareholders of the Fund under applicable law, whether for purposes of appointing a successor to the Director or if otherwise necessary under applicable law, in which case the extension would apply until such time as the shareholder meeting can be held or is no longer needed.
(2) Shaun Mathews, President, ING USFS Mutual Funds and Investment Products, has held a seat on the Board of Directors of The Mark Twain House & Museum since September 19, 2002. ING Groep N.V. makes non-material, charitable contributions to The Mark Twain House & Museum.
(3) Messrs. Mathews and Crispin are deemed to be "interested persons" of the Fund as defined in the 1940 Act because of their relationship with ING Groep, the parent corporation of the Adviser, ING Investments, LLC and the Distributor, ING Funds Distributor, LLC.
(4) ING Funds Distributor, LLC is the sucessor in interest to ING Funds Distributor, Inc., which was previously known as ING Pilgrim Securities, Inc., and before that was known as Pilgrim Securities, Inc., and before that was known as Pilgrim America Securities, Inc.
(5) ING Funds Services, LLC was previously named ING Pilgrim Group, LLC. ING Pilgrim Group, LLC is the sucessor in interest to ING Pilgrim Group, Inc., which was previously known as Pilgrim Group, Inc. and before that was known as Pilgrim America Group, Inc.
(6) ING Investments, LLC was previously named ING Pilgrim Investments, LLC. ING Pilgrim Investments, LLC is the sucessor in interest to ING Pilgrim Investments, Inc., which was previously known as Pilgrim Investments, Inc. and before that was known as Pilgrim America Investments, Inc.
38
DIRECTOR AND OFFICER INFORMATION (UNAUDITED) (CONTINUED)
Name, Address
and Age | | Position(s)
Held with the Fund | | Term of Office and
Length of Time Served(1) | | Principal Occupation(s) during the
Past Five Years | |
| Officers: | |
|
Shaun P. Mathews(5)
7337 East Doubletree Ranch Rd.
Scottsdale, Arizona 85258
Age: 52 | | President and Chief Executive Officer | | November 2006 - Present | | President and Chief Executive Officer, ING Investments, LLC(2) and ING Funds Services, LLC(3) (December 2006 - Present); and Head of ING USFS Mutual Funds and Investment Products (October 2004 - Present). Formerly, CMO, ING USFS (April 2002 - October 2004); and Head of Rollover/Payout (October 2001 - December 2003). | |
|
Michael J. Roland
7337 East Doubletree Ranch Rd.
Scottsdale, Arizona 85258
Age: 49 | | Executive Vice President | | January 2005 - Present | | Head of Mutual Fund Platform (February 2007 - Present); and Executive Vice President, ING Investments, LLC(2) and ING Funds Services, LLC(3) (December 2001 - Present). Formerly, Head of Product Management (January 2005 - January 2007); Chief Compliance Officer, ING Investments, LLC(2) and Directed Services, LLC(6) (October 2004 - December 2005); and Chief Financial Officer and Treasurer, ING Investments, LLC(2) (December 2001 - March 2005). | |
|
Stanley D. Vyner
230 Park Avenue
New York, New York 10169
Age: 57 | | Executive Vice President | | January 2005 - Present | | Executive Vice President, ING Investments, LLC(2) (July 2000 - Present); and Chief Investment Risk Officer, ING Investments, LLC(2) (January 2003 - Present). Formerly, Chief Investment Officer of International Investments (August 2000 - January 2003). | |
|
Joseph M. O'Donnell
7337 East Doubletree Ranch Rd.
Scottsdale, Arizona 85258
Age: 53 | | Chief Compliance Officer
Executive Vice President | | January 2005 - Present
March 2006 - Present | | Chief Compliance Officer of the ING Funds (November 2004 - Present), ING Investments, LLC(2) and Directed Services, LLC(6) (March 2006 - Present); and Executive Vice President of the ING Funds (March 2006 - Present). Formerly, Chief Compliance Officer of ING Life Insurance and Annuity Company (March 2006 - December 2006); Vice President, Chief Legal Counsel, Chief Compliance Officer and Secretary of Atlas Securities, Inc., Atlas Advisers, Inc. and Atlas Funds (October 2001 - October 2004). | |
|
Todd Modic
7337 East Doubletree Ranch Rd.
Scottsdale, Arizona 85258
Age: 40 | | Senior Vice President, Chief/Principal Financial Officer and Assistant Secretary | | March 2005 - Present | | Senior Vice President, ING Funds Services, LLC(3) (April 2005 - Present). Formerly, Vice President, ING Funds Services, LLC(3) (September 2002 - March 2005); and Director of Financial Reporting, ING Investments, LLC(2) (March 2001 - September 2002). | |
|
Kimberly A. Anderson
7337 East Doubletree Ranch Rd.
Scottsdale, Arizona 85258
Age: 43 | | Senior Vice President | | January 2005 - Present | | Senior Vice President, ING Investments, LLC(2) (October 2003 - Present). Formerly, Vice President and Assistant Secretary, ING Investments, LLC(2) (January 2001 - October 2003). | |
|
Ernest J. C'DeBaca
7337 East Doubletree Ranch Rd.
Scottsdale, Arizona 85258
Age: 38 | | Senior Vice President | | May 2006 - Present | | Senior Vice President, ING Investments, LLC(2) (December 2006 - Present); and ING Funds Services, LLC(3) (April 2006 (Present). Formerly, Counsel, ING Americas, U.S. Legal Services (January 2004 (March 2006); and Attorney-Adviser, U.S. Securities and Exchange Commission (May 2001 - December 2003). | |
|
39
DIRECTOR AND OFFICER INFORMATION (UNAUDITED) (CONTINUED)
Name, Address
and Age | | Position(s)
Held with the Fund | | Term of Office and
Length of Time Served(1) | | Principal Occupation(s) during the
Past Five Years | |
Robert Terris
7337 East Doubletree Ranch Rd.
Scottsdale, Arizona 85258
Age: 37 | | Senior Vice President | | May 2006 - Present | | Senior Vice President, Head of Division Operations, ING Funds (May 2006 - Present); and Vice President, Head of Division Operations, ING Funds Services, LLC(3) (March 2006 - Present). Formerly, Vice President of Administration, ING Funds Services, LLC(3) (October 2001 - March 2006). | |
|
Robyn L. Ichilov
7337 East Doubletree Ranch Rd.
Scottsdale, Arizona 85258
Age: 40 | | Vice President and Treasurer | | January 2005 - Present | | Vice President and Treasurer, ING Funds Services, LLC(3) (October 2001 - Present) and ING Investments, LLC(2) (August 1997 - Present). | |
|
Lauren D. Bensinger
7337 East Doubletree Ranch Rd.
Scottsdale, Arizona 85258
Age: 54 | | Vice President | | January 2005 - Present | | Vice President and Chief Compliance Officer, ING Funds Distributor, LLC(4) (July 1995 - Present); and Vice President, ING Investments, LLC(2) (February 1996 - Present); and Director of Compliance, ING Investments, LLC(2) (October 2004 - Present). Formerly, Chief Compliance Officer, ING Investments, LLC(2) (October 2001 - October 2004). | |
|
William Evans
10 State House Square
Hartford, Connecticut 06103
Age: 35 | | Vice President | | September 2007 - Present | | Vice President, Head of Mutual Fund Advisory Group (April 2007 - Present), Vice President, U.S. Mutual Funds and Investment Products (May 2005 - April 2007), Senior Fund Analyst, U.S. Mutual Funds and Investment Products (May 2002 - May 2005) | |
|
Maria M. Anderson
7337 East Doubletree Ranch Rd.
Scottsdale, Arizona 85258
Age: 49 | | Vice President | | January 2005 - Present | | Vice President, ING Funds Services, LLC(3) (September 2004 - Present). Formerly, Assistant Vice President, ING Funds Services, LLC(3) (October 2001 - September 2004); and Manager of Fund Accounting and Fund Compliance, ING Investments, LLC(2) (September 1999 - October 2001). | |
|
Denise Lewis
7337 East Doubletree Ranch Rd.
Scottsdale, Arizona 85258
Age: 44 | | Vice President | | January 2007 - Present | | Vice President, ING Funds Services, LLC(3) (December 2006 - Present). Formerly, Senior Vice President, UMB Investment Services Group, LLC (November 2003 - December 2006); and Vice President, Wells Fargo Funds Management, LLC (December 2000 - August 2003). | |
|
Kimberly K. Palmer
7337 East Doubletree Ranch Rd.
Scottsdale, Arizona 85258
Age: 50 | | Vice President | | March 2006 - Present | | Vice President, ING Funds Services, LLC(3) (March 2006 - Present). Formerly, Assistant Vice President, ING Funds Services, LLC(3) (August 2004 - March 2006); Manager, Registration Statements, ING Funds Services, LLC(3) (May 2003 - August 2004); Associate Partner, AMVESCAP PLC (October 2000 - May 2003); and Director of Federal Filings and Blue Sky Filings, INVESCO Funds Group, Inc. (March 1994 - May 2003). | |
|
Susan P. Kinens
7337 East Doubletree Ranch Rd.
Scottsdale, Arizona 85258
Age: 31 | | Assistant Vice President | | January 2005 - Present | | Assistant Vice President, ING Funds Services, LLC(3) (December 2002 - Present); and has held various other positions with ING Funds Services, LLC(3) for more than the last five years. | |
|
Huey P. Falgout, Jr.
7337 East Doubletree Ranch Rd.
Scottsdale, Arizona 85258
Age: 44 | | Secretary | | August 2003 - Present | | Chief Counsel, ING Americas, U.S. Legal Services (September 2003 - Present). Formerly, Counsel, ING Americas, U.S. Legal Services (November 2002 - September 2003); and Associate General Counsel of AIG American General (January 1999 - November 2002). | |
|
40
DIRECTOR AND OFFICER INFORMATION (UNAUDITED) (CONTINUED)
Name, Address
and Age | | Position(s)
Held with the Fund | | Term of Office and
Length of Time Served(1) | | Principal Occupation(s) during the
Past Five Years | |
Theresa K. Kelety
7337 East Doubletree Ranch Rd.
Scottsdale, Arizona 85258
Age: 44 | | Assistant Secretary | | August 2003 - Present | | Counsel, ING Americas, U.S. Legal Services (April 2003 - Present). Formerly, Senior Associate with Shearman & Sterling (February 2000 - April 2003). | |
|
(1) The officers hold office until the next annual meeting of the Directors and until their successors shall have been elected and qualified.
(2) ING Investments, LLC was previously named ING Pilgrim Investments, LLC. ING Pilgrim Investments, LLC is the sucessor in interest to ING Pilgrim Investments, Inc., which was previously known as Pilgrim Investments, Inc. and before that was known as Pilgrim America Investments, Inc.
(3) ING Funds Services, LLC was previously named ING Pilgrim Group, LLC. ING Pilgrim Group, LLC is the sucessor in interest to ING Pilgrim Group, Inc., which was previously known as Pilgrim Group, Inc. and before that was known as Pilgrim America Group, Inc.
(4) ING Funds Distributor, LLC is the sucessor in interest to ING Funds Distributor, Inc., which was previously known as ING Pilgrim Securities, Inc., and before that was known as Pilgrim Securities, Inc., and before that was known as Pilgrim America Securities, Inc.
(5) Mr. Mathews commenced services as CEO and President of the ING Funds on November 11, 2006.
(6) Directed Services, LLC is the sucessor in interest to Directed Services, Inc.
41
ADVISORY CONTRACT APPROVAL DISCUSSION (UNAUDITED)
BOARD CONSIDERATION AND RE-APPROVAL OF INVESTMENT ADVISORY CONTRACT
Section 15(c) of the Investment Company Act of 1940 (the "1940 Act") provides that, after an initial period, the Portfolios' existing investment advisory contract will remain in effect only if the Board of Directors (the "Board") of ING Partners, Inc. (the "Company"), including a majority of Board members who have no direct or indirect interest in the advisory contract, and who are not "interested persons" of the Company, as such term is defined under the 1940 Act (the "Independent Directors"), annually review and approve the contract. Thus, at a meeting held on November 30, 2007, the Board, including a majority of the Independent Directors, considered whether to renew the management agreement (the "Advisory Contract") between Directed Services, LLC (the "Adviser") and the Company, on behalf of the Portfolios.
The Independent Directors also held separate meetings on October 10 and November 28, 2007 to consider the renewal of the Advisory Contract. As a result, subsequent references herein to factors considered and determinations made by the Independent Directors include, as applicable, factors considered and determinations made on those earlier dates by the Independent Directors.
At its November 30, 2007 meeting, the Board voted to renew the Advisory Contract for the Portfolios. In reaching this decision, the Board took into account information furnished to it throughout the year at regular meetings of the Board and the Board's committees, as well as information prepared specifically in connection with the annual renewal process. Determinations by the Independent Directors also took into account various factors that they believed, in light of the legal advice furnished to them by Kirkpatrick & Lockhart Preston Gates Ellis LLP ("K&L Gates"), their independent legal counsel, and their own business judgment, to be relevant.
Provided below is an overview of the Board's contract approval process in general, as well as a discussion of certain specific factors that the Board considered at its renewal meeting. While the Board gave its attention to the information furnished, at its request, that was most relevant to its considerations, discussed below are a number of the primary factors relevant to the Board's consideration as to whether to renew the Advisory Contract for the one-year period ending November 30, 2008. Each Board member may have accorded different weight to the various factors in reaching his or her conclusions with respect to each Portfolio's advisory arrangements.
Overview of the Contract Renewal and Approval Process
Several years ago, the Independent Directors instituted a revised process by which they seek and consider relevant information when they decide whether to approve new or existing advisory arrangements for the investment companies in the ING Funds complex under their jurisdiction, including the Portfolios' existing Advisory Contract. Among other actions, the Independent Directors: retained the services of independent consultants with experience in the mutual fund industry to assist the Independent Directors in working with the personnel employed by the Adviser or its affiliates who administer the Portfolios ("Management") to identify the types of information presented to the Board to inform its deliberations with respect to advisory and relationships and to help evaluate that information; established a specific format in which certain requested information is provided to the Board; and determined the process for reviewing such information in connection with advisory contract renewals and approvals. The end result was an enhanced process which is currently employed by the Independent Directors to review and analyze information in connection with their annual renewal of the Advisory Contract, as well as their review and approval of new advisory relationships.
Since the current renewal and approval process was first implemented, the Board's membership has changed substantially through periodic retirements of some Directors and the appointment and election of new Directors. In addition, throughout this period the Independent Directors have reviewed and refined the renewal and approval process at least annually. The Board also established a Contracts Committee and two Investment Review Committees, including the International/Balanced/Fixed Income Funds Investment Review Committee (the "I/B/F IRC"). Among other matters, the Contracts Committee provides oversight with respect to the contracts renewal process, and each Portfolio is assigned to the I/B/F IRC, which provides oversight regarding, among other matters, investment performance.
The type and format of the information provided to the Board or to legal counsel for the Independent Directors in connection with the contract approval and renewal process has been codified in the ING Funds' 15(c) Methodology Guide. This Guide was developed under the direction of the Independent Directors and sets
42
ADVISORY CONTRACT APPROVAL DISCUSSION (UNAUDITED) (CONTINUED)
out a blueprint pursuant to which the Independent Directors request certain information that they deem important to facilitate an informed review in connection with initial and annual approvals of advisory contracts.
Management provides certain of the information requested by the 15(c) Methodology Guide in Fund Analysis and Comparison Tables ("FACT sheets") prior to the Independent Directors' review of advisory contracts. The Independent Directors previously retained an independent firm to verify and test the accuracy of certain FACT sheet data for a representative sample of Funds in the ING Funds complex. In 2007, the Contracts Committee employed the services of an independent consultant to assist in its review and analysis of, among other matters, the 15(c) Methodology Guide, the content and format of the FACT sheets, and proposed selected peer groups of i nvestment companies ("SPGs") to be used by each Portfolio for certain comparison purposes during the renewal process.
As part of an ongoing process, the Contracts Committee recommends or considers recommendations from Management for refinements to the 15(c) Methodology Guide and other aspects of the review process, and the I/B/F IRC reviews benchmarks used to assess the performance of each Portfolio. The I/B/F IRC may apply a heightened level of scrutiny in cases where performance has lagged a Portfolio's relevant benchmark and/or SPG.
The Board employed its process for reviewing contracts when considering the renewal of the Advisory Contract that would be effective through November 30, 2008. Set forth below is a discussion of many of the Board's primary considerations and conclusions resulting from this process.
Nature, Extent and Quality of Service
In determining whether to approve the Advisory Contract for the Portfolios for the year ending November 30, 2008, the Independent Directors received and evaluated such information as they deemed necessary regarding the nature, extent and quality of services provided to the Portfolios by the Adviser. This included information regarding the Adviser provided throughout the year at regular meetings of the Board and its committees, as well as information furnished in connection with the contract renewal meetings.
The materials requested by and provided to the Board and/or to K&L Gates prior to the November 30, 2007 Board meeting included, among other information, the following items: (1) FACT sheets for each Portfolio that provided information regarding the performance and expenses of the Portfolio and other similarly managed funds in an SPG, as well as information regarding the Portfolio's investment portfolio, objectives and strategies; (2) the 15(c) Methodology Guide, which describes how the FACT sheets were prepared, including the manner in which benchmarks and SPGs were selected and how profitability was determined; (3) responses from the Adviser to a series of questions posed by K&L Gates on behalf of the Directors; (4) copy of the form of Advisory Contract; (5) a copy of the Adviser's Fo rm ADV; (6) financial statements for the Adviser; (7) drafts of narrative summaries addressing key factors the Board customarily considers in evaluating the renewal of the Advisory Contract, including a written analysis for each Portfolio of how performance, fees and expenses compare to its SPG and/or designated benchmarks; (8) independent analyses of the Portfolio's performance by the Company's Chief Investment Risk Officer; (9) information regarding net asset flows into and out of the Portfolios; and (10) other information relevant to the Board's evaluations.
Each Portfolio currently has only one class of shares, which was compared to the analogous class of shares for each fund in the SPG. It should be noted that, as a technical matter, the performance of a Portfolio reflects that of the Master Fund in which it invests. Mutual funds chosen for inclusion in a Portfolio's SPG were selected based upon criteria designed to mirror the Portfolio's class being compared to the funds in the SPG.
In arriving at its conclusions with respect to the Advisory Contract, the Board noted the resources that the Adviser has committed to the Board and to the I/B/F IRC to assist the Board and the I/B/F IRC with their assessment of the investment performance of the Portfolios on an ongoing basis throughout the year. This includes the appointment of a Chief Investment Risk Officer and his staff, who report directly to the Board and who have developed attribution analyses and other metrics used by the I/B/F IRC to analyze the key factors underlying investment performance for the Portfolios.
In considering the Portfolios' Advisory Contract, the Board also considered the extent of benefits provided to the Portfolios' shareholders, beyond advisory services, from being part of the ING family of Funds. This includes, in most cases, the right to exchange or transfer investments, without a sales charge, between the same class of
43
ADVISORY CONTRACT APPROVAL DISCUSSION (UNAUDITED) (CONTINUED)
shares of the Portfolio and other ING Funds, or among Funds available on a product platform, and the wide range of Funds available for exchange or transfer.
The Board also took into account the Adviser's efforts in recent years to reduce the expenses of the ING Funds through renegotiated arrangements with the ING Funds' service providers. Further, the Board received periodic reports showing that the investment policies and restrictions for each Portfolio were consistently complied with and other periodic reports covering matters such as compliance by Adviser personnel with the Adviser's code of ethics. The Board considered reports from the Company's Chief Compliance Officer ("CCO") evaluating whether the regulatory compliance systems and procedures of the Adviser are reasonably designed to assure compliance with the federal securities laws, including those related to, among others, late trading and market timing, best execution, fair value pricing, proxy voting and trade allocation practices. The Board also took into account the CCO's annual and periodic reports and recommendations with respect to service provider compliance programs. In this regard, the Board also considered the policies and procedures developed by the CCO in consultation with the Board's Compliance Committee that guide the CCO's compliance oversight function.
The Board reviewed the level of staffing, quality and experience of each Portfolio's portfolio management team. The Board took into account the respective resources and reputations of the Adviser, and evaluated the ability of the Adviser to attract and retain qualified investment advisory personnel. The Board also considered the adequacy of the resources committed to the Portfolios (and other relevant funds in the ING Funds complex) by the Adviser, and whether those resources are commensurate with the needs of the Portfolios and are sufficient to sustain appropriate levels of performance and compliance needs.
Based on their deliberations and the materials presented to them, the Board concluded that the advisory and related services provided by the Adviser are appropriate in light of the Portfolios' operations, the competitive landscape of the investment company business, and investor needs, and that the nature and quality of the overall services provided by the Adviser were appropriate.
Portfolio Performance
In assessing advisory relationships, the Board placed emphasis on the net investment returns of each Portfolio. While the Board considered the performance reports and discussions with portfolio managers at Board and committee meetings during the year, particular attention in assessing performance was given to the FACT sheets furnished in connection with the renewal process. The FACT sheet prepared for each Portfolio included its investment performance compared to the Portfolio's Morningstar category median, Lipper category median, SPG and primary benchmark. The Board's findings specific to each Portfolio's performance are discussed under "Portfolio-by-Portfolio Analysis," below.
Economies of Scale
In considering the reasonableness of advisory fees, the Board also considered whether economies of scale will be realized by the Adviser as a Portfolio grows larger and the extent to which this is reflected in the level of management fee rates charged. In this regard, the Board noted that each Portfolio invests all of its assets in a corresponding "Master Fund" managed by Fidelity Management & Research Company ("FMR"), and that FMR applies a "group rate" discount based upon the assets under FMR's management, lowering the management fees payable by the Master Funds at higher asset levels. The Board considered that these reductions would indirectly benefit the Portfolios. The Board also noted that any waivers to or reimbursements of advisory or other fees payable by the Master Funds would have an indirect benefit to the Portfolios.
In evaluating economies of scale, the Independent Directors also considered prior periodic management reports and industry information on this topic, and the Independent Directors who were Board members at that time also considered a November 2006 evaluation and analysis presented to them by an independent consultant regarding fee breakpoint arrangements and economies of scale.
Information Regarding Services to Other Clients
The Board requested and, if received, considered information regarding the nature of services and fee rates offered by the Adviser and to other clients, including other registered investment companies and institutional accounts. When fee rates offered to other clients differed materially from those charged to the Portfolios, the Board considered any underlying rationale provided by the Adviser for these differences. The Board also noted
44
ADVISORY CONTRACT APPROVAL DISCUSSION (UNAUDITED) (CONTINUED)
that the fee rates charged to the Portfolios and similar institutional clients may differ materially due to the different services and additional regulatory overlay associated with registered investment companies, such as the Portfolios.
Fee Rates and Profitability
The Board reviewed and considered each contractual investment advisory fee rate, combined with any administrative fee rate, payable by each Portfolio to the Adviser. In addition, the Board considered any existing fee waivers applicable to the fees payable by the Portfolios. In analyzing this fee data, the Board took into account that no advisory fees are charged when the Portfolios are invested in the corresponding Master Funds, and that advisory fees charged by the corresponding Master Funds are indirectly borne by Portfolio shareholders.
The Board considered the fee structures of each Portfolio as they relate to the services provided under the Advisory Contract and the potential fall-out benefits to the Adviser and its affiliates from their association with the Portfolios. For each Portfolio, the Board determined that the fee rate payable to the Adviser is reasonable for the services that the Adviser performs, which were considered in light of the nature and quality of the services that it has performed and is expected to perform.
For each Portfolio, the Board considered information on revenues, costs and profits realized by the Adviser, which was prepared by Management in accordance with the allocation methodology (including related assumptions) specified in the 15(c) Methodology Guide. The Board also considered information that it requested and was provided by Management with respect to the profitability of service providers affiliated with the Adviser.
The Board determined that it had requested and received sufficient information to gain a reasonable understanding regarding the Adviser's profitability. The Board also recognized that profitability analysis is not an exact science and there is no uniform methodology for determining profitability for this purpose. In this context, the Board realized that Management's calculations regarding its costs incurred in establishing the infrastructure necessary for the Portfolios' operations may not be fully reflected in the expenses allocated to each Portfolio in determining profitability, and that the information presented may not portray all of the costs borne by Management or capture Management's entrepreneurial risk associated with offering and managing a mutual fund complex in the current regulatory and market environment.
Based on the information on revenues, costs, and profitability considered by the Board, and after considering the factors described in this section, the Board concluded that the profits, if any, realized by the Adviser were not excessive.
Portfolio-by-Portfolio Analysis
The following paragraphs outline certain of the specific factors that the Board considered, and the conclusions reached, at its November 30, 2007 meeting in relation to renewing each Portfolio's current Advisory Contract for the year ending November 30, 2008. These specific factors are in addition to those considerations discussed above. In each case, the Portfolio's performance was compared to its Morningstar category median and its primary benchmark, a broad-based securities market index that appears in the Portfolio's prospectus. With respect to Morningstar quintile rankings, the first quintile represents the highest (best) performance and the fifth quintile represents the lowest performance. Each Portfolio's management fee and expense ratio were compared to the fees and expense ratios of the funds in its SPG.
ING Fidelity® VIP Contrafund® Portfolio
In considering whether to approve the renewal of the Advisory Contract for ING Fidelity® VIP Contrafund® Portfolio, the Board considered that, based on performance data for the periods ended June 30, 2007: (1) the Portfolio outperformed its Morningstar category median for all periods presented, with the exception of the one-year period, during which it underperformed; (2) the Portfolio outperformed its primary benchmark for all periods presented, with the exception of the one-year period, during which it underperformed; and (3) the Portfolio is ranked in the first (highest) quintile of its Morningstar category for the most recent calendar quarter and year-to-date periods, and the fifth (lowest) quintile for the one-year period.
In considering the fees payable under the Advisory Contract for ING Fidelity® VIP Contrafund® Portfolio, the Board took into account the factors described above and also considered: (1) the fairness of the compensation under an
45
ADVISORY CONTRACT APPROVAL DISCUSSION (UNAUDITED) (CONTINUED)
Advisory Contract (a) under which no advisory fees are charged when the Portfolio is fully invested in Fidelity's VIP Contrafund Portfolio (the "Contrafund Master Fund"); and (b) advisory fees are charged by the Contrafund Master Fund and indirectly borne by Portfolio shareholders; (2) the pricing structure (including the expense ratio to be borne by shareholders) of the Portfolio, as compared to its SPG, including that: (a) the management fee for the Portfolio (consisting of a 0.05% administration fee) is below the median and the average management fees of the funds in its SPG; and (b) the expense ratio for the Portfolio is below the median and average expense ratios of the funds in its SPG.
After its deliberation, the Board reached the following conclusions: (1) the Portfolio's management fee rate is reasonable in the context of all factors considered by the Board; (2) the Portfolio's expense ratio is reasonable in the context of all factors considered by the Board; and (3) the Portfolio's performance is reasonable in the context of all factors considered by the Board. Based on these conclusions and other factors, the Board voted to renew the Advisory Contract for the Portfolio for the year ending November 30, 2008. During this renewal process, different Board members may have given different weight to different individual factors and related conclusions.
ING Fidelity® VIP Equity-Income Portfolio
In considering whether to approve the renewal of the Advisory Contract for ING Fidelity® VIP Equity-Income Portfolio, the Board considered that, based on performance data for the periods ended June 30, 2007: (1) the Portfolio outperformed its Morningstar category median for all periods presented; (2) the Portfolio outperformed its primary benchmark for all periods presented; and (3) the Portfolio is ranked in the first (highest) quintile of its Morningstar category for the most recent calendar quarter and one-year periods, and the second quintile for the year-to-date period.
In considering the fees payable under the Advisory Contract for ING Fidelity® VIP Equity-Income Portfolio, the Board took into account the factors described above and also considered: (1) the fairness of the compensation under an Advisory Contract (a) under which no advisory fees are charged when the Portfolio is fully invested in Fidelity's VIP Equity-Income Portfolio (the "Equity-Income Master Fund"); and (b) advisory fees are charged by the Equity-Income Master Fund and indirectly borne by Portfolio shareholders; and (2) the pricing structure (including the expense ratio to be borne by shareholders) of ING Fidelity® VIP Equity-Income Portfolio, as compared to its SPG, including that: (a) the management fee for the Portfolio (consisting of a 0.05% administration fee) is below the median and the average management fees of the funds in its SPG; and (b) the expense ratio for the Portfolio is below the median and the average expense ratios of the funds in its SPG.
After its deliberation, the Board reached the following conclusions: (1) the Portfolio's management fee rate is reasonable in the context of all factors considered by the Board; (2) the Portfolio's expense ratio is reasonable in the context of all factors considered by the Board; and (3) the Portfolio's performance is reasonable in the context of all factors considered by the Board. Based on these conclusions and other factors, the Board voted to renew the Advisory Contract for the Portfolio for the year ending November 30, 2008. During this renewal process, different Board members may have given different weight to different individual factors and related conclusions.
ING Fidelity® VIP Growth Portfolio
In considering whether to approve the renewal of the Advisory Contract for ING Fidelity® VIP Growth Portfolio, the Board considered that, based on performance data for the periods ended June 30, 2007: (1) the Portfolio outperformed its Morningstar category median for all periods presented; (2) the Portfolio outperformed its primary benchmark for all periods presented; and (3) the Portfolio is ranked in the first (highest) quintile of its Morningstar category for the most recent calendar quarter and year-to-date periods, and the second quintile for the one-year period.
In considering the fees payable under the Advisory Contract for ING Fidelity® VIP Growth Portfolio, the Board took into account the factors described above and also considered: (1) the fairness of the compensation under an Advisory Contract (a) under which no advisory fees are charged when the Portfolio is fully invested in Fidelity's VIP Growth Portfolio (the "Growth Master Fund"); and (b) advisory fees are charged by the Growth Master Fund and indirectly borne by Portfolio shareholders; and (2) the pricing structure (including the expense ratio to be borne by shareholders) of the Portfolio, as compared to its SPG, including that: (a) the management fee for the Portfolio (consisting of a 0.05% administration fee) is below the median and the average management fees of the
46
ADVISORY CONTRACT APPROVAL DISCUSSION (UNAUDITED) (CONTINUED)
funds in its SPG; and (b) the expense ratio for the Portfolio is below the median and the average expense ratios of the funds in its SPG.
After its deliberation, the Board reached the following conclusions: (1) the Portfolio's management fee rate is reasonable in the context of all factors considered by the Board; (2) the Portfolio's expense ratio is reasonable in the context of all factors considered by the Board; and (3) the Portfolio's performance is reasonable in the context of all factors considered by the Board. Based on these conclusions and other factors, the Board voted to renew the Advisory Contract for the Portfolio for the year ending November 30, 2008. During this renewal process, different Board members may have given different weight to different individual factors and related conclusions.
ING Fidelity® VIP Mid Cap Portfolio
In considering whether to approve the renewal of the Advisory Contract for ING Fidelity® VIP Mid Cap Portfolio, the Board considered that, based on performance data for the periods ended June 30, 2007: (1) the Portfolio outperformed its Morningstar category median for all periods presented, with the exception of the one-year period, during which it underperformed; (2) the Portfolio outperformed its primary benchmark for all periods presented, with the exception of the one-year period, during which it underperformed; and (3) the Portfolio is ranked in the second quintile of its Morningstar category for the most calendar recent calendar quarter and year-to-date periods, and the fourth quintile for the one-year period.
In considering the fees payable under the Advisory Contract for ING Fidelity® VIP Mid Cap Portfolio, the Board took into account the factors described above and also considered: (1) the fairness of the compensation under an Advisory Contract (a) under which no advisory fees are charged when the Portfolio is fully invested in Fidelity's VIP Mid Cap Portfolio (the "Mid Cap Master Fund"); and (b) advisory fees are charged by the Mid Cap Master Fund and indirectly borne by Portfolio shareholders; (2) the pricing structure (including the expense ratio to be borne by shareholders) of ING Fidelity® VIP Mid Cap Portfolio, as compared to its SPG, including that: (a) the management fee for the Portfolio (consisting of a 0.05% administration fee) is below the median and the average management fees of the funds in its SPG; and (b) the expense ratio for the Portfolio is below the median and the average expense ratios of the funds in its SPG.
After its deliberation, the Board reached the following conclusions: (1) the Portfolio's management fee rate is reasonable in the context of all factors considered by the Board; (2) the Portfolio's expense ratio is reasonable in the context of all factors considered by the Board; and (3) the Portfolio's performance is reasonable in the context of all factors considered by the Board. Based on these conclusions and other factors, the Board voted to renew the Advisory Contract for the Portfolio for the year ending November 30, 2008. During this renewal process, different Board members may have given different weight to different individual factors and related conclusions.
47
(THIS PAGE INTENTIONALLY LEFT BLANK)
(THIS PAGE INTENTIONALLY LEFT BLANK)
(THIS PAGE INTENTIONALLY LEFT BLANK)
Investment Adviser
ING Directed Services, LLC
1475 Dunwoody Drive
West Chester, Pennsylvania 19380
Distributor
ING Funds Distributor, LLC
7337 East Doubletree Ranch Road
Scottsdale, Arizona 85258
Custodian
The Bank of New York Mellon Corporation
One Wall Street
New York, New York 10286
Independent Registered Public Accounting Firm
KPMG LLP
99 High Street
Boston, Massachusetts 02110
Legal Counsel
Dechert LLP
1775 I Street, N.W.
Washington, D.C. 20006
Before investing, carefully consider the investment objectives, risks, charges and expenses of the variable annuity contract and the underlying variable investment options. This and other information is contained in the prospectus for the variable annuity contract and the underlying variable investment options. Obtain these prospectuses from your agent/registered representative and read them carefully before investing.

VPAR-UFID (1207-022708)

Funds
Annual Report
December 31, 2007
Adviser Class (“ADV”), Initial Class (“I”),
Service Class (“S”) and Class T
ING Partners, Inc.
| n | ING Solution Growth and Income Portfolio |
| n | ING Solution Growth Portfolio |
| n | ING Solution Income Portfolio |
| n | ING Solution 2015 Portfolio |
| n | ING Solution 2025 Portfolio |
| n | ING Solution 2035 Portfolio |
| n | ING Solution 2045 Portfolio |
This report is submitted for general information to shareholders of the ING Funds. It is not authorized for distribution to prospective shareholders unless accompanied or preceded by a prospectus which includes details regarding the funds’ investment objectives, risks, charges, expenses and other information. This information should be read carefully.

TABLE OF CONTENTS
PROXY VOTING INFORMATION
A description of the policies and procedures that the Portfolios use to determine how to vote proxies related to portfolio securities is available: (1) without charge, upon request, by calling Shareholder Services toll-free at (800) 992-0180; (2) on the ING Funds’ website at www.ingfunds.com; and (3) on the U.S. Securities and Exchange Commission’s (“SEC”) website at www.sec.gov. Information regarding how the Portfolios voted proxies related to portfolio securities during the most recent 12-month period ended June 30 is available without charge on the ING Funds’ website at www.ingfunds.com and on the SEC’s website at www.sec.gov.
QUARTERLY PORTFOLIO HOLDINGS
The Portfolios file their complete schedule of portfolio holdings with the SEC for the first and third quarters of each fiscal year on Form N-Q. The Portfolios’ Forms N-Q are available on the SEC’s website at www.sec.gov. The Portfolios’ Forms N-Q may be reviewed and copied at the SEC’s Public Reference Room in Washington, DC, and information on the operation of the Public Reference Room may be obtained by calling (800) SEC-0330; and is available upon request from the Portfolios by calling Shareholder Services toll-free at (800) 992-0180.
PRESIDENT’S LETTER

Dear Shareholder,
It is impossible to discuss the current market climate without acknowledging the recent turmoil brought on by problems in the sub-prime mortgage market. Clearly the excesses in this sector of the market and other segments of collateralized debt have created challenges throughout credit markets worldwide.
Amidst the volatility, we at ING Funds remind our shareholders that the creditworthiness and quality of our funds’ holdings is our ultimate priority — whether those holdings are part of our money market funds, fixed income funds or equity funds. Market volatility is an often present component of investing and we believe the best way to manage through turbulent environments is to build a well-balanced, fully-diversified portfolio, which aligns with your goals and risk tolerance.
ING Funds remains committed to developing and offering a diverse array of mutual
funds designed to meet the goals of most investors. We urge you to work with your investment professional to make sure you are invested appropriately. Together, you can select the funds that will help you achieve your financial goals. We thank you for choosing ING Funds and look forward to continuing to serve you.
Sincerely,

Shaun Mathews
President
ING Funds
January 28, 2008
The views expressed in the President’s Letter reflect those of the President as of the date of the letter. Any such views are subject to change at any time based upon market or other conditions and ING Funds disclaims any responsibility to update such views. These views may not be relied on as investment advice and because investment decisions for an ING Fund are based on numerous factors, may not be relied on as an indication of investment intent on behalf of any ING Fund. Reference to specific company securities should not be construed as recommendations or investment advice.
International investing poses special risks including currency fluctuation, economic and political risks not found in investments that are solely domestic.
1
MARKET PERSPECTIVE: YEAR ENDED DECEMBER 31, 2007
After recording a solid, if frequently nervous, 8.2% in the first half of the reporting period, global equities in the form of the Morgan Stanley Capital International World IndexSM(1) (“MSCI World IndexSM”) measured in local currencies, including net reinvested dividends (“MSCI” for regions discussed below) succumbed to a 3.2% loss in the second half of the reporting period, as some important debt markets all but seized up, the crisis threatening the solvency of financial institutions and forcing central bankers to throw lifelines to stranded borrowers, while investors fled to the safe haven of short Treasuries. By year-end, confidence was wavering, oil was nudging $100 per barrel and markets seemed to be pricing in a recession. In currencies, the yen strengthened as “carry trades” were unwound in the flight from risk. The euro benefited from the European Central Bank’s implacable refusal to match the Federal Reserve Board (the “Fed”) and reduce interest rates. But the pound finally gave back some of its recent gains as the UK housing market started to sag. For the second six months, the dollar fell 8.5% and 8.9% against the euro and yen respectively, but rose 0.3% against the pound.
A relentlessly deteriorating housing market had caused alarm in the sub-prime mortgage loan sector, where lax lending standards in a low interest rate environment, had driven foreclosure rates inexorably higher. The problem had been exacerbated over the years by the business of securitizing the loans. They would be sliced, diced and repackaged for handsome fees into other securities, then sold on in their billions worldwide to financial institutions, which purchased them by issuing commercial paper, over the cost of which an effortless profit could apparently be made.
At one level this spreads the loan risk. But when the originator is removed from those taking the risk another is created. Like the banking business in its simplest form, everything depends on confidence. When it became obvious that these securities, many of them rated A or higher, were ultimately backed by sub-prime and not so sub-prime mortgages with questionable repayment prospects, confidence evaporated. The asset-backed commercial paper market contracted sharply. Banks stopped lending to each other. The structured investment vehicles, their investors and sponsoring banks would have to bear huge losses, but which ones and how much?
The Fed’s first response to the liquidity and resulting economic threats was to reduce the discount rate, (the rate it will lend to banks), by 50 basis points (0.50%) on August 17, 2007 and another 100 basis points (1.00%)
in three steps by year end, with matching cuts in the federal funds rate.
But it was no good. Using the discount window had a stigma attached to it while the liquidity problem was not an overnight one. The one-month London Interbank Offered Rate (“LIBOR”) continued to rise even as the Fed eased. A procession of financial institutions announced heavy write-downs of mortgage-backed assets, along with various capital saving and raising initiatives, including the tapping of billions of dollars from sovereign wealth funds based in the Middle-East and Asia, surely a development of historic significance.
The spread between the one-month LIBOR and the federal funds rate only drifted down after the announcement of coordinated central bank action to add liquidity where it was needed including in the U.S., the use of a “term auction facility” where loans would be auctioned and broader forms of collateral would be accepted.
But by year end global economic conditions were still clearly weakening and many felt that the U.S. might already be in or on the cusp of recession.
In U.S. fixed income markets’ the Treasury yield curve steepened in the first half and continued to do so in the second. The yield on the ten-year Treasury Note fell 100 basis points (1.00%) to 4.03%, while the yield on the three-month Bill fell 153 basis points (1.53%) to 3.14%. The broader Lehman Brothers® Aggregate Bond Index(2) (“LBAB”) of investment grade bonds returned 5.93% for the first half of the reporting period and 6.97% for the year ended December 31, 2007.
U.S. equities, represented by the Standard & Poor’s 500® Composite Stock Price Index(3) (“S&P 500® Index”) including dividends, lost 1.4% in the second half, with the worst fourth quarter since 2000, after gaining 7% through June. For a while, as the events described above played out, investors seemed to believe that the Fed had the will and the tools to keep any down turn brief. The S&P 500® Index actually made a new high on October 9, 2007. For the year ended December 31, 2007, the S&P 500® Index returned 5.49%. But, the sense that a serious crisis was only just beginning to unfold and a succession of earnings disappointments especially among the financials sector, increasingly weighed on sentiment as the year wound down. Bizarrely, gross domestic product (“GDP”) growth was being reported at a brisk 4.9% for the third quarter, even as S&P 500 companies were
2
MARKET PERSPECTIVE: YEAR ENDED DECEMBER 31, 2007
reporting a decline in operating profits, the first fall in more than five years.
Internationally, the MSCI Japan® Index(4) slumped 15.8% in the second half of the reporting period on a resumption of falling consumer prices and fading global growth, while the strengthening yen threatened all-important exports. For the year ended December 31, 2007, the MSCI Japan® Index lost 4.23%. The MSCI Europe ex UK® Index(5) lost 4.8% in the second six months of the reporting period. A first half rally gave way to nervousness in mid-July after another rate increase and turned into a rout as the sub-prime debacle took shape. U.S. rate cuts were not reciprocated by the European Central Bank, which, with headline inflation up to 3.1%, confined its response to making liquidity available to the banking system, a staggering €500 billion on December 18, 2007. In the UK, stocks surged into the summer making the August 2007 slide even more violent than in continental Europe. But similar inflation worries limited the Bank of England to one 0.25% rate reduction despite a clearly weakening housing market. The MSCI UK® Index(5) fell 1.4% in the second half of the reporting period and returned 8.36% for the year ended December 31, 2007.
(1) The MSCI World IndexSM is an unmanaged index that measures the performance of over 1,400 securities listed on exchanges in the U.S., Europe, Canada Australia, New Zealand and the Far East.
(2) The LBAB Index is a widely recognized, unmanaged index of publicly issued investment grade U.S. Government, mortgage-backed, asset-backed and corporate debt securities.
(3) The S&P 500® Index is an unmanaged index that measures the performance of securities of approximately 500 of the largest companies in the United States.
(4) The MSCI Japan® Index is a free float-adjusted market capitalization index that is designed to measure developed market equity performance in Japan.
(5) The MSCI Europe ex UK® Index is a free float rising adjusted market capitalization index that is designed to measure developed market equity performance in Europe, excluding the UK.
(6) The MSCI UK® Index is a free float-adjusted market capitalization index that is designed to measure developed market equity performance in the UK.
All indices are unmanaged and investors cannot invest directly in an index.
Past performance does not guarantee future results. The performance quoted represents past performance. Investment return and principal value of an investment will fluctuate, and shares, when redeemed, may be worth more or less than their original cost. The Portfolios’ performance is subject to change since the period’s end and may be lower or higher than the performance data shown. Please call (800) 262-3862 or log on to www.ingfunds.com to obtain performance data current to the most recent month end.
Market Perspective reflects the views of ING’s Chief Investment Risk Officer only through the end of the period, and is subject to change based on market and other conditions.
3
| | |
| ING SOLUTION PORTFOLIOS | | PORTFOLIO MANAGERS’ REPORT |
ING Solution Portfolios consists of ING Solution Growth and Income Portfolio, ING Solution Growth Portfolio, ING Solution Income Portfolio, ING Solution 2015 Portfolio, ING Solution 2025 Portfolio, ING Solution 2035 Portfolio, and ING Solution 2045 Portfolio (each a “Portfolio” or collectively, the “Solution Portfolios”) each seek to achieve their investment objective by investing in other ING Funds (“Underlying Funds”) and use asset allocation strategies to determine how much to invest in the Underlying Funds.
Portfolio Specifics: Directed Services, LLC (“DSL” or “Investment Adviser”) is the investment adviser of each Portfolio. The Adviser is an indirect, wholly-owned subsidiary of ING Groep, N.V. (“ING Groep”), a global financial institution active in the fields of insurance, banking and asset management.
ING Investment Management Co. (“Consultant”) is a consultant to the Investment Adviser. Both the Investment Adviser and the Consultant are indirect, wholly-owned subsidiaries of ING Groep.
The Investment Adviser uses an asset allocation process to determine each Portfolio’s investment mix. This asset allocation process can be found in the Prospectus.
The following table illustrates the Target Sub-Asset Class Mix allocation as of December 31, 2007:
| | | | | | | | | | | | | | | | | | | | | | | | | |
| | | |
| | | Target Sub-Asset Class Mix as of December 31, 2007 (as a percent of net assets) | | | |
| | | | | ING Solution
Growth and
Income
Portfolio | | | ING Solution
Growth
Portfolio | | | ING Solution
Income
Portfolio | | | ING Solution
2015
Portfolio | | | ING Solution
2025
Portfolio | | | ING Solution
2035
Portfolio | | | ING Solution
2045
Portfolio | | | |
| | | Target Sub-Asset Class Mix(1) | | | | | | | | | | | | | | | | | | | | | | | |
| | | U.S. Large Cap Stocks — Blend | | 11.0 | % | | 16.0 | % | | 10.0 | % | | 13.0 | % | | 12.0 | % | | 10.0 | % | | 10.0 | % | | |
| | | U.S. Large Cap Stocks — Growth | | 9.0 | % | | 12.0 | % | | 2.0 | % | | 9.0 | % | | 14.0 | % | | 16.0 | % | | 17.0 | % | | |
| | | U.S. Large Cap Stocks — Value | | 9.0 | % | | 12.0 | % | | 3.0 | % | | 9.0 | % | | 14.0 | % | | 16.0 | % | | 17.0 | % | | |
| | | U.S. Mid Cap Stocks | | 2.0 | % | | 3.0 | % | | — | | | 3.0 | % | | 5.0 | % | | 7.0 | % | | 9.0 | % | | |
| | | U.S. Small Cap Stocks | | 2.0 | % | | 3.0 | % | | — | | | 3.0 | % | | 5.0 | % | | 7.0 | % | | 9.0 | % | | |
| | | Non-U.S./International Stocks | | 9.0 | % | | 11.0 | % | | 6.0 | % | | 7.0 | % | | 12.0 | % | | 15.0 | % | | 19.0 | % | | |
| | | Real Estate Investment Trusts (“REITs”) | | 8.0 | % | | 7.0 | % | | 9.0 | % | | 8.0 | % | | 7.0 | % | | 6.0 | % | | 4.0 | % | | |
| | | Intermediate-Term Bonds | | 33.0 | % | | 22.0 | % | | 42.0 | % | | 28.0 | % | | 15.0 | % | | 15.0 | % | | 5.0 | % | | |
| | | High Yield Bond | | — | | | — | | | 3.0 | % | | 4.0 | % | | 2.0 | % | | — | | | — | | | |
| | | Short-Term Bonds | | 14.0 | % | | 8.0 | % | | 20.0 | % | | 8.0 | % | | 8.0 | % | | — | | | — | | | |
| | | Treasury Inflation Protected Securities | | 3.0 | % | | — | | | 5.0 | % | | 5.0 | % | | — | | | — | | | — | | | |
| | | Emerging Markets Equity | | — | | | 2.0 | % | | — | | | — | | | 3.0 | % | | 5.0 | % | | 7.0 | % | | |
| | | International REITs | | — | | | 4.0 | % | | — | | | 3.0 | % | | 3.0 | % | | 3.0 | % | | 3.0 | % | | |
| | | | | | | | | | | | | | | | | | | | | | | | | | |
| | | | | 100.0 | % | | 100.0 | % | | 100.0 | % | | 100.0 | % | | 100.0 | % | | 100.0 | % | | 100.0 | % | | |
| | | | | | | | | | | | | | | | | | | | | | | | | | |
(1) | | Although the Solution Portfolios expect to be fully invested at all times, they may maintain liquidity reserves to meet redemption requests. |
4
| | |
| PORTFOLIO MANAGERS’ REPORT | | ING SOLUTION GROWTHAND INCOME PORTFOLIO |
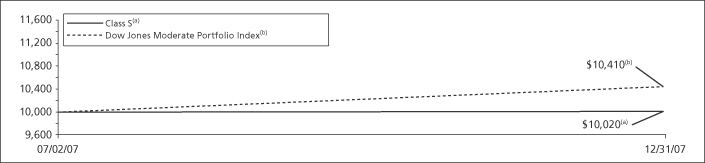
| | | | | | | |
| | | |
| | | Cumulative Total Returns for the Periods Ended December 31, 2007 | | | |
| | | | | Since Inception
of Classes ADV, I and S
July 2, 2007 | | | |
| | | Class ADV | | 0.00 | % | | |
| | | Class I | | 0.40 | % | | |
| | | Class S | | 0.20 | % | | |
| | | Dow Jones Moderate Portfolio Index(1) | | 4.10 | %(2) | | |
Based on a $10,000 initial investment, the graph and table above illustrate the total return of ING Solution Growth and Income Portfolio against the index indicated. An index is unmanaged and has no cash in its portfolio, imposes no sales charges and incurs no operating expenses. An investor cannot invest directly in an index.
The performance graph and table do not reflect the deduction of taxes that a shareholder will pay on Portfolio distributions or the redemption of Portfolio shares.
The performance shown may include the effect of fee waivers and/or expense reimbursements by the Investment Adviser and/or other service providers, which have the effect of increasing total return. Had all fees and expenses been considered, the total returns would have been lower.
Performance data represents past performance and is no assurance of future results. Investment return and principal value of an investment in the Portfolio will fluctuate. Shares, when sold, may be worth more or less than their original cost. The Portfolio’s current
performance may be lower or higher than the performance data shown. Please log on to www.ingfunds.com or call (800) 262-3862 to get performance through the most recent month end.
This report contains statements that may be “forward-looking” statements. Actual results may differ materially from those projected in the “forward-looking” statements.
The views expressed in this report reflect those of the Investment Adviser, only through the end of the period as stated on the cover. The Investment Adviser’s views are subject to change at any time based on market and other conditions.
Portfolio holdings are subject to change daily.
(1) | | The Dow Jones Moderate Portfolio Index is comprised of a set of equity, bond and cash sub-indexes. |
(2) | | Since inception performance for the index is shown as of July 1, 2007. |
5
| | |
| ING SOLUTION GROWTH PORTFOLIO | | PORTFOLIO MANAGERS’ REPORT |
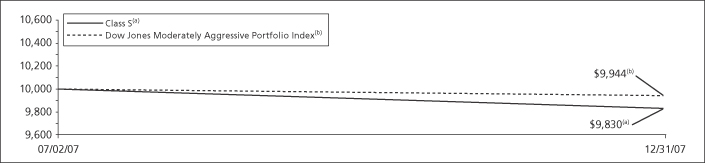
| | | | | | | |
| | | |
| | | Cumulative Total Returns for the Periods Ended December 31, 2007 | | | |
| | | | | Since Inception
of Classes ADV, I and S
July 2, 2007 | | | |
| | | Class ADV | | (1.90 | )% | | |
| | | Class I | | (1.50 | )% | | |
| | | Class S | | (1.70 | )% | | |
| | | Dow Jones Moderately Aggressive Portfolio Index(1) | | (0.56 | )%(2) | | |
Based on a $10,000 initial investment, the graph and table above illustrate the total return of ING Solution Growth Portfolio against the index indicated. An index is unmanaged and has no cash in its portfolio, imposes no sales charges and incurs no operating expenses. An investor cannot invest directly in an index.
The performance graph and table do not reflect the deduction of taxes that a shareholder will pay on Portfolio distributions or the redemption of Portfolio shares.
The performance shown may include the effect of fee waivers and/or expense reimbursements by the Investment Adviser and/or other service providers, which have the effect of increasing total return. Had all fees and expenses been considered, the total returns would have been lower.
Performance data represents past performance and is no assurance of future results. Investment return and principal value of an investment in the Portfolio will fluctuate. Shares, when sold, may be worth more or less than their original cost. The Portfolio’s current
performance may be lower or higher than the performance data shown. Please log on to www.ingfunds.com or call (800) 262-3862 to get performance through the most recent month end.
This report contains statements that may be “forward-looking” statements. Actual results may differ materially from those projected in the “forward-looking” statements.
The views expressed in this report reflect those of the Investment Adviser, only through the end of the period as stated on the cover. The Investment Adviser’s views are subject to change at any time based on market and other conditions.
Portfolio holdings are subject to change daily.
(1) | | The Dow Jones Moderately Aggressive Portfolio Index is comprised of a set of equity, bond and cash sub-indexes. |
(2) | | Since inception performance for the index is shown as of July 1, 2007. |
6
| | |
| PORTFOLIO MANAGERS’ REPORT | | ING SOLUTION INCOME PORTFOLIO |
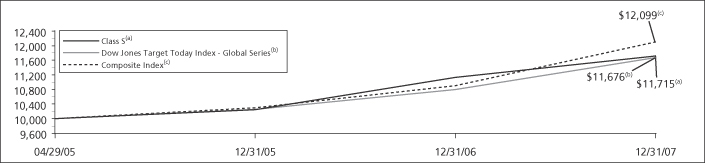
| | | | | | | | | | | | | |
| | | |
| | | Average Annual Total Returns for the Periods Ended December 31, 2007 | | | |
| | | | | 1 Year | | | Since Inception
of Classes ADV, I and S
April 29, 2005 | | | Since Inception
of Class T
August 31, 2005 | | | |
| | | Class ADV | | 4.91 | % | | 5.81 | % | | — | | | |
| | | Class I | | 5.44 | % | | 6.36 | % | | — | | | |
| | | Class S | | 5.23 | % | | 6.10 | % | | — | | | |
| | | Class T | | 4.72 | % | | — | | | 5.23 | % | | |
| | | Dow Jones Target Today Index — Global Series(1) | | 6.48 | % | | 5.98 | %(3) | | 5.94 | %(4) | | |
| | | Composite Index(2) | | 4.75 | % | | 7.40 | %(3) | | 6.77 | %(4) | | |
Based on a $10,000 initial investment, the graph and table above illustrate the total return of ING Solution Income Portfolio against the indices indicated. An index is unmanaged and has no cash in its portfolio, imposes no sales charges and incurs no operating expenses. An investor cannot invest directly in an index.
The performance graph and table do not reflect the deduction of taxes that a shareholder will pay on Portfolio distributions or the redemption of Portfolio shares.
The performance shown may include the effect of fee waivers and/or expense reimbursements by the Investment Adviser and/or other service providers, which have the effect of increasing total return. Had all fees and expenses been considered, the total returns would have been lower.
Performance data represents past performance and is no assurance of future results. Investment return and principal value of an investment in the Portfolio will fluctuate. Shares, when sold, may be worth more or less than their original cost. The Portfolio’s current performance may be lower or higher than the performance data shown. Please log on to www.ingfunds.com or call (800) 262-3862 to get performance through the most recent month end.
This report contains statements that may be “forward-looking” statements. Actual results may differ materially from those projected in the “forward-looking” statements.
The views expressed in this report reflect those of the Investment Adviser, only through the end of the period as stated on the cover. The Investment Adviser’s views are subject to change at any time based on market and other conditions.
Portfolio holdings are subject to change daily.
(1) | | The Dow Jones Target Today Index — Global Series is comprised of a set of equity, bond and cash sub-indexes. |
(2) | | The Composite Index is comprised of 10% S&P 500® Index/2% Russell 1000® Growth Index/3% Russell 1000® Value Index/6% MSCI EAFE® Index/9% DJ Wilshire Real Estate Securities Index/42% LBAB Index/3% LB High Yield Index/20% LB 1-3 Year Government/Credit Index/5% Citigroup U.S. Inflation-Linked Securities Index. |
(3) | | Since inception performance for the indices is shown as of May 1, 2005. |
(4) | | Since inception performance for the indices is shown as of September 1, 2005. |
7
| | |
| ING SOLUTION 2015 PORTFOLIO | | PORTFOLIO MANAGERS’ REPORT |

| | | | | | | | | | | | | |
| | | |
| | | Average Annual Total Returns for the Periods Ended December 31, 2007 | | | |
| | | | | 1 Year | | | Since Inception
of Classes ADV, I and S
April 29, 2005 | | | Since Inception
of Class T
August 31, 2005 | | | |
| | | Class ADV | | 4.30 | % | | 8.16 | % | | — | | | |
| | | Class I | | 4.90 | % | | 8.77 | % | | — | | | |
| | | Class S | | 4.60 | % | | 8.48 | % | | — | | | |
| | | Class T | | 4.15 | % | | — | | | 7.01 | % | | |
| | | Dow Jones Target 2015 Index — Global Series(1) | | 7.78 | % | | 9.45 | %(3) | | 8.33 | %(4) | | |
| | | Composite Index(2) | | 4.34 | % | | 9.68 | %(3) | | 8.56 | %(4) | | |
Based on a $10,000 initial investment, the graph and table above illustrate the total return of ING Solution 2015 Portfolio against the indices indicated. An index is unmanaged and has no cash in its portfolio, imposes no sales charges and incurs no operating expenses. An investor cannot invest directly in an index.
The performance graph and table do not reflect the deduction of taxes that a shareholder will pay on Portfolio distributions or the redemption of Portfolio shares.
The performance shown may include the effect of fee waivers and/or expense reimbursements by the Investment Adviser and/or other service providers, which have the effect of increasing total return. Had all fees and expenses been considered, the total returns would have been lower.
Performance data represents past performance and is no assurance of future results. Investment return and principal value of an investment in the Portfolio will fluctuate. Shares, when sold, may be worth more or less than their original cost. The Portfolio’s current performance may be lower or higher than the performance data shown. Please log on to www.ingfunds.com or call (800) 262-3862 to get performance through the most recent month end.
This report contains statements that may be “forward-looking” statements. Actual results may differ materially from those projected in the “forward-looking” statements.
The views expressed in this report reflect those of the Investment Adviser, only through the end of the period as stated on the cover. The Investment Adviser’s views are subject to change at any time based on market and other conditions.
Portfolio holdings are subject to change daily.
(1) | | The Dow Jones 2015 Index — Global Series is comprised of a set of equity, bond and cash sub-indexes. |
(2) | | The Composite Index is comprised of 13% S&P 500® Index/9% Russell 1000® Growth Index/9% Russell 1000® Value Index/3% Russell MidCap® Index/3% Russell 2000® Index/7% MSCI EAFE® Index/8% DJ Wilshire Real Estate Securities Index/28% LBAB Index/4% LB High Yield Index/8% LB 1-3 Year Government/Credit Index/5% Citigroup U.S. Inflation-Linked Securities Index/3% S&P/Citigroup World Property ex U.S. Index. |
(3) | | Since inception performance for the indices is shown from May 1, 2005. |
(4) | | Since inception performance for the indices is shown from September 1, 2005. |
8
| | |
| PORTFOLIO MANAGERS’ REPORT | | ING SOLUTION 2025 PORTFOLIO |
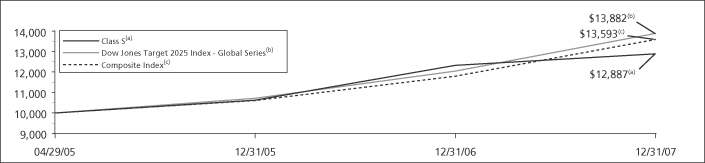
| | | | | | | | | | | | | |
| | | |
| | | Average Annual Total Returns for the Periods Ended December 31, 2007 | | | |
| | | | | 1 Year | | | Since Inception
of Classes ADV, I and S
April 29, 2005 | | | Since Inception
of Class T
August 31, 2005 | | | |
| | | Class ADV | | 4.28 | % | | 9.64 | % | | — | | | |
| | | Class I | | 4.84 | % | | 10.30 | % | | — | | | |
| | | Class S | | 4.64 | % | | 9.97 | % | | — | | | |
| | | Class T | | 4.17 | % | | — | | | 8.10 | % | | |
| | | Dow Jones Target 2025 Index — Global Series(1) | | 8.31 | % | | 13.08 | %(3) | | 11.37 | %(4) | | |
| | | Composite Index(2) | | 4.89 | % | | 12.19 | %(3) | | 10.76 | %(4) | | |
Based on a $10,000 initial investment, the graph and table above illustrate the total return of ING Solution 2025 Portfolio against the indices indicated. An index is unmanaged and has no cash in its portfolio, imposes no sales charges and incurs no operating expenses. An investor cannot invest directly in an index.
The performance graph and table do not reflect the deduction of taxes that a shareholder will pay on Portfolio distributions or the redemption of Portfolio shares.
The performance shown may include the effect of fee waivers and/or expense reimbursements by the Investment Adviser and/or other service providers, which have the effect of increasing total return. Had all fees and expenses been considered, the total returns would have been lower.
Performance data represents past performance and is no assurance of future results. Investment return and principal value of an investment in the Portfolio will fluctuate. Shares, when sold, may be worth more or less than their original cost. The Portfolio’s current performance may be lower or higher than the performance data shown. Please log on to www.ingfunds.com or call (800) 262-3862 to get performance through the most recent month end.
This report contains statements that may be “forward-looking” statements. Actual results may differ materially from those projected in the “forward-looking” statements.
The views expressed in this report reflect those of the Investment Adviser, only through the end of the period as stated on the cover. The Investment Adviser’s views are subject to change at any time based on market and other conditions.
Portfolio holdings are subject to change daily.
(1) | | The Dow Jones Target 2025 Index — Global Series is comprised of a set of equity, bond and cash sub-indexes. |
(2) | | The Composite Index is comprised of 12% S&P 500® Index/14% Russell 1000® Growth Index/14% Russell 1000® Value Index/5% Russell MidCap® Index/5% Russell 2000® Index/12% MSCI EAFE® Index/7% DJ Wilshire Real Estate Securities Index/15% LBAB Index/2% LB High Yield Index/8% LB 1-3 Year Government/Credit Index/3% MSCI Emerging Markets Index/3% S&P/Citigroup World Property ex U.S. Index. |
(3) | | Since inception performance for the indices is shown from May 1, 2005. |
(4) | | Since inception performance for the indices is shown from September 1, 2005. |
9
| | |
| ING SOLUTION 2035 PORTFOLIO | | PORTFOLIO MANAGERS’ REPORT |
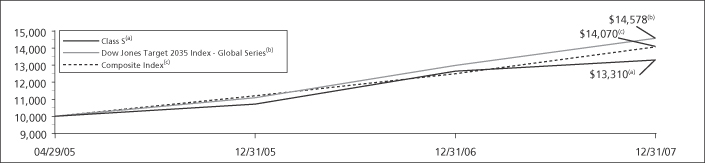
| | | | | | | | | | | | | |
| | | |
| | | Average Annual Total Returns for the Periods Ended December 31, 2007 | | | |
| | | | | 1 Year | | | Since Inception
of Classes ADV, I and S
April 29, 2005 | | | Since Inception
of Class T
August 31, 2005 | | | |
| | | Class ADV | | 5.03 | % | | 11.01 | % | | — | | | |
| | | Class I | | 5.66 | % | | 11.62 | % | | — | | | |
| | | Class S | | 5.30 | % | | 11.31 | % | | — | | | |
| | | Class T | | 4.89 | % | | — | | | 9.31 | % | | |
| | | Dow Jones Target 2035 Index — Global Series(1) | | 8.48 | % | | 15.17 | %(3) | | 13.08 | %(4) | | |
| | | Composite Index(2) | | 5.52 | % | | 13.65 | %(3) | | 12.00 | %(4) | | |
Based on a $10,000 initial investment, the graph and table above illustrate the total return of ING Solution 2035 Portfolio against the indices indicated. An index is unmanaged and has no cash in its portfolio, imposes no sales charges and incurs no operating expenses. An investor cannot invest directly in an index.
The performance graph and table do not reflect the deduction of taxes that a shareholder will pay on Portfolio distributions or the redemption of Portfolio shares.
The performance shown may include the effect of fee waivers and/or expense reimbursements by the Investment Adviser and/or other service providers, which have the effect of increasing total return. Had all fees and expenses been considered, the total returns would have been lower.
Performance data represents past performance and is no assurance of future results. Investment return and principal value of an investment in the Portfolio will fluctuate. Shares, when sold, may be worth more or less than their original cost. The Portfolio’s current performance may be lower or higher than the performance data shown. Please log on to www.ingfunds.com or call (800) 262-3862 to get performance through the most recent month end.
This report contains statements that may be “forward-looking” statements. Actual results may differ materially from those projected in the “forward-looking” statements.
The views expressed in this report reflect those of the Investment Adviser, only through the end of the period as stated on the cover. The Investment Adviser’s views are subject to change at any time based on market and other conditions.
Portfolio holdings are subject to change daily.
(1) | | The Dow Jones Target 2035 Index — Global Series is comprised of a set of equity, bond and cash sub-indexes. |
(2) | | The Composite Index is comprised of 10% S&P 500® Index/16% Russell 1000® Growth Index/16% Russell 1000® Value Index/7% Russell MidCap® Index/7% Russell 2000® Index/15% MSCI EAFE® Index/6% DJ Wilshire Real Estate Securities Index/15% LBAB Index/5% MSCI Emerging Markets Index/3% S&P/Citigroup World Property ex U.S. Index. |
(3) | | Since inception performance for the indices is shown from May 1, 2005. |
(4) | | Since inception performance for the indices is shown from September 1, 2005. |
10
| | |
| PORTFOLIO MANAGERS’ REPORT | | ING SOLUTION 2045 PORTFOLIO |
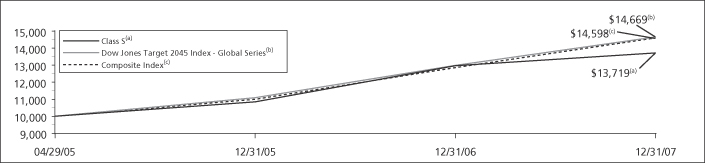
| | | | | | | | | | | | | |
| | | |
| | | Average Annual Total Returns for the Periods Ended December 31, 2007 | | | |
| | | | | 1 Year | | | Since Inception
of Classes ADV, I and S
April 29, 2005 | | | Since Inception
of Class T
August 31, 2005 | | | |
| | | Class ADV | | 5.51 | % | | 12.31 | % | | — | | | |
| | | Class I | | 5.96 | % | | 12.88 | % | | — | | | |
| | | Class S | | 5.79 | % | | 12.58 | % | | — | | | |
| | | Class T | | 5.27 | % | | — | | | 10.17 | % | | |
| | | Dow Jones Target 2045 Index — Global Series(1) | | 8.47 | % | | 15.44 | %(3) | | 13.31 | %(4) | | |
| | | Composite Index(2) | | 6.33 | % | | 15.23 | %(3) | | 13.41 | %(4) | | |
Based on a $10,000 initial investment, the graph and table above illustrate the total return of ING Solution 2045 Portfolio against the indices indicated. An index is unmanaged and has no cash in its portfolio, imposes no sales charges and incurs no operating expenses. An investor cannot invest directly in an index.
The performance graph and table do not reflect the deduction of taxes that a shareholder will pay on Portfolio distributions or the redemption of Portfolio shares.
The performance shown may include the effect of fee waivers and/or expense reimbursements by the Investment Adviser and/or other service providers, which have the effect of increasing total return. Had all fees and expenses been considered, the total returns would have been lower.
Performance data represents past performance and is no assurance of future results. Investment return and principal value of an investment in the Portfolio will fluctuate. Shares, when sold, may be worth more or less than their original cost. The Portfolio’s current performance may be lower or higher than the performance data shown. Please log on to www.ingfunds.com or call (800) 262-3862 to get performance through the most recent month end.
This report contains statements that may be “forward-looking” statements. Actual results may differ materially from those projected in the “forward-looking” statements.
The views expressed in this report reflect those of the Investment Adviser, only through the end of the period as stated on the cover. The Investment Adviser’s views are subject to change at any time based on market and other conditions.
Portfolio holdings are subject to change daily.
(1) | | The Dow Jones Target 2045 Index — Global Series is comprised of a set of equity, bond and cash sub-indexes. |
(2) | | The Composite Index is comprised of 10% S&P 500® Index/17% Russell 1000® Growth Index/17% Russell 1000® Value Index/9% Russell MidCap® Index/9% Russell 2000® Index/19% MSCI EAFE® Index/4% DJ Wilshire Real Estate Securities Index/5% LBAB Index/7% MSCI Emerging Markets Index/3% S&P/Citigroup World Property ex U.S. Index. |
(3) | | Since inception performance for the indices is shown from May 1, 2005. |
(4) | | Since inception performance for the indices is shown from September 1, 2005. |
11
SHAREHOLDER EXPENSE EXAMPLES (UNAUDITED)
As a shareholder of a Portfolio, you incur two types of costs: (1) transaction costs, including exchange fees; and (2) ongoing costs including management fees, distribution and/or service (12b-1) fees, and other Portfolio expenses. These Examples are intended to help you understand your ongoing costs (in dollars) of investing in a Portfolio and to compare these costs with the ongoing costs of investing in other mutual funds.
The Examples are based on an investment of $1,000 invested at the beginning of the period (except as noted) and held for the entire period from July 1, 2007 to December 31, 2007. The Portfolios’ expenses are shown without the imposition of any charges which are, or may be, imposed under your annuity contract. Expenses would have been higher if such charges were included.
Actual Expenses
The first section of the table shown, “Actual Portfolio Return,” provides information about actual account values and actual expenses. You may use the information in this section, together with the amount you invested, to estimate the expenses that you paid over the period. Simply divide your account value by $1,000 (for example, an $8,600 account value divided by $1,000 = 8.6), then multiply the result by the number in the first section under the heading entitled “Expenses Paid During the Period” to estimate the expenses you paid on your account during this period.
Hypothetical Example for Comparison Purposes
The second section of the table shown, “Hypothetical (5% return before expenses),” provides information about hypothetical account values and hypothetical expenses based on the Portfolio’s actual expense ratio and an assumed rate of return of 5% per year before expenses, which is not the Portfolio’s actual return. The hypothetical account values and expenses may not be used to estimate the actual ending account balance or expenses you paid for the period. You may use this information to compare the ongoing costs of investing in the Fund and other mutual funds. To do so, compare this 5% hypothetical example with the 5% hypothetical examples that appear in the shareholder reports of the other mutual funds.
Please note that the expenses shown in the table are meant to highlight your ongoing costs only and do not reflect any transactional costs, such as redemption fees or exchange fees. Therefore, the hypothetical lines of the table are useful in comparing ongoing costs only, and will not help you determine the relative total costs of owning different mutual funds. In addition, if these transactional costs were included, your costs would have been higher.
| | | | | | | | | | | | | | | | |
| | | ING Solution Growth and Income Portfolio | | Beginning
Account
Value
July 1, 2007 | | Ending
Account
Value
December 31, 2007 | | Annualized
Expense
Ratio* | | | Expenses Paid During
the
Period Ended
December 31, 2007** | | |
| | Actual Portfolio Return | | | | | | | | | | | | | | |
| | Class A(1) | | $ | 1,000.00 | | $ | 1,000.00 | | 0.62 | % | | $ | 3.13 | | |
| | Class I(1) | | | 1,000.00 | | | 1,004.00 | | 0.12 | | | | 0.61 | | |
| | Class S(1) | | | 1,000.00 | | | 1,002.00 | | 0.37 | | | | 1.87 | | |
| | Hypothetical (5% return before expenses) | | | | | | | | | | | | | | |
| | Class A | | $ | 1,000.00 | | $ | 1,022.08 | | 0.62 | % | | $ | 3.16 | | |
| | Class I | | | 1,000.00 | | | 1,024.60 | | 0.12 | | | | 0.61 | | |
| | Class S | | | 1,000.00 | | | 1,023.34 | | 0.37 | | | | 1.89 | | |
| | | | | | | | | | | | | | | | |
(1) | | Commencement of operations for the Portfolio was July 2, 2007. Expenses paid reflect the 183-day period ended December 31, 2007. |
| * | | Expense ratios do not include expense of the Underlying Funds. |
| ** | | Expenses are equal to each Portfolio’s respective annualized expense ratios multiplied by the average account value over the period, multiplied by 184/365 to reflect the most recent fiscal half-year. |
12
SHAREHOLDER EXPENSE EXAMPLES (UNAUDITED) (CONTINUED)
| | | | | | | | | | | | | | | | |
| | | ING Solution Growth Portfolio | | Beginning
Account
Value
July 1, 2007 | | Ending
Account
Value
December 31, 2007 | | Annualized
Expense
Ratio* | | | Expenses Paid During
the
Period Ended
December 31, 2007** | | |
| | Actual Portfolio Return | | | | | | | | | | | | | | |
| | Class A(1) | | $ | 1,000.00 | | $ | 981.00 | | 0.62 | % | | $ | 3.10 | | |
| | Class I(1) | | | 1,000.00 | | | 985.00 | | 0.12 | | | | 0.60 | | |
| | Class S(1) | | | 1,000.00 | | | 983.00 | | 0.37 | | | | 1.85 | | |
| | Hypothetical (5% return before expenses) | | | | | | | | | | | | | | |
| | Class A | | $ | 1,000.00 | | $ | 1,022.08 | | 0.62 | % | | $ | 3.16 | | |
| | Class I | | | 1,000.00 | | | 1,024.60 | | 0.12 | | | | 0.61 | | |
| | Class S | | | 1,000.00 | | | 1,023.34 | | 0.37 | | | | 1.89 | | |
| | ING Solution Income Portfolio | | | | | | | | | | | | | | |
| | Actual Portfolio Return | | | | | | | | | | | | | | |
| | Class A | | $ | 1,000.00 | | $ | 1,023.30 | | 0.62 | % | | $ | 3.16 | | |
| | Class I | | | 1,000.00 | | | 1,025.10 | | 0.12 | | | | 0.61 | | |
| | Class S | | | 1,000.00 | | | 1,024.70 | | 0.37 | | | | 1.89 | | |
| | Class T | | | 1,000.00 | | | 1,022.20 | | 0.82 | | | | 4.18 | | |
| | Hypothetical (5% return before expenses) | | | | | | | | | | | | | | |
| | Class A | | $ | 1,000.00 | | $ | 1,022.08 | | 0.62 | % | | $ | 3.16 | | |
| | Class I | | | 1,000.00 | | | 1,024.60 | | 0.12 | | | | 0.61 | | |
| | Class S | | | 1,000.00 | | | 1,023.34 | | 0.37 | | | | 1.89 | | |
| | Class T | | | 1,000.00 | | | 1,021.07 | | 0.82 | | | | 4.18 | | |
| | ING Solution 2015 Portfolio | | | | | | | | | | | | | | |
| | Actual Portfolio Return | | | | | | | | | | | | | | |
| | Class A | | $ | 1,000.00 | | $ | 1,003.20 | | 0.62 | % | | $ | 3.13 | | |
| | Class I | | | 1,000.00 | | | 1,006.80 | | 0.12 | | | | 0.61 | | |
| | Class S | | | 1,000.00 | | | 1,005.50 | | 0.37 | | | | 1.87 | | |
| | Class T | | | 1,000.00 | | | 1,003.30 | | 0.82 | | | | 4.14 | | |
| | Hypothetical (5% return before expenses) | | | | | | | | | | | | | | |
| | Class A | | $ | 1,000.00 | | $ | 1,022.08 | | 0.62 | % | | $ | 3.16 | | |
| | Class I | | | 1,000.00 | | | 1,024.60 | | 0.12 | | | | 0.61 | | |
| | Class S | | | 1,000.00 | | | 1,023.34 | | 0.37 | | | | 1.89 | | |
| | Class T | | | 1,000.00 | | | 1,021.07 | | 0.82 | | | | 4.18 | | |
| | ING Solution 2025 Portfolio | | | | | | | | | | | | | | |
| | Actual Portfolio Return | | | | | | | | | | | | | | |
| | Class A | | $ | 1,000.00 | | $ | 992.60 | | 0.62 | % | | $ | 3.11 | | |
| | Class I | | | 1,000.00 | | | 995.50 | | 0.12 | | | | 0.60 | | |
| | Class S | | | 1,000.00 | | | 994.80 | | 0.37 | | | | 1.86 | | |
| | Class T | | | 1,000.00 | | | 992.30 | | 0.82 | | | | 4.12 | | |
| | Hypothetical (5% return before expenses) | | | | | | | | | | | | | | |
| | Class A | | $ | 1,000.00 | | $ | 1,022.08 | | 0.62 | % | | $ | 3.16 | | |
| | Class I | | | 1,000.00 | | | 1,024.60 | | 0.12 | | | | 0.61 | | |
| | Class S | | | 1,000.00 | | | 1,023.34 | | 0.37 | | | | 1.89 | | |
| | Class T | | | 1,000.00 | | | 1,021.07 | | 0.82 | | | | 4.18 | | |
| | | | | | | | | | | | | | | | |
(1) | | Commencement of operations for the Portfolio was July 2, 2007. Expenses paid reflect the 183-day period ended December 31, 2007. |
| * | | Expense ratios do not include expense of the Underlying Funds. |
| ** | | Expenses are equal to each Portfolio’s respective annualized expense ratios multiplied by the average account value over the period, multiplied by 184/365 to reflect the most recent fiscal half-year. |
13
SHAREHOLDER EXPENSE EXAMPLES (UNAUDITED) (CONTINUED)
| | | | | | | | | | | | | | | | |
| | | ING Solution 2035 Portfolio | | Beginning
Account
Value
July 1, 2007 | | Ending
Account
Value
December 31, 2007 | | Annualized
Expense
Ratio* | | | Expenses Paid During
the
Period Ended
December 31, 2007** | | |
| | Actual Portfolio Return | | | | | | | | | | | | | | |
| | Class A | | $ | 1,000.00 | | $ | 993.70 | | 0.62 | % | | $ | 3.12 | | |
| | Class I | | | 1,000.00 | | | 996.40 | | 0.12 | | | | 0.60 | | |
| | Class S | | | 1,000.00 | | | 994.30 | | 0.37 | | | | 1.86 | | |
| | Class T | | | 1,000.00 | | | 993.00 | | 0.82 | | | | 4.12 | | |
| | Hypothetical (5% return before expenses) | | | | | | | | | | | | | | |
| | Class A | | $ | 1,000.00 | | $ | 1,022.08 | | 0.62 | % | | $ | 3.16 | | |
| | Class I | | | 1,000.00 | | | 1,024.60 | | 0.12 | | | | 0.61 | | |
| | Class S | | | 1,000.00 | | | 1,023.34 | | 0.37 | | | | 1.89 | | |
| | Class T | | | 1,000.00 | | | 1,021.07 | | 0.82 | | | | 4.18 | | |
| | ING Solution 2045 Portfolio | | | | | | | | | | | | | | |
| | Actual Portfolio Return | | | | | | | | | | | | | | |
| | Class A | | $ | 1,000.00 | | $ | 990.40 | | 0.62 | % | | $ | 3.11 | | |
| | Class I | | | 1,000.00 | | | 993.00 | | 0.12 | | | | 0.60 | | |
| | Class S | | | 1,000.00 | | | 991.80 | | 0.37 | | | | 1.86 | | |
| | Class T | | | 1,000.00 | | | 989.40 | | 0.82 | | | | 4.11 | | |
| | Hypothetical (5% return before expenses) | | | | | | | | | | | | | | |
| | Class A | | $ | 1,000.00 | | $ | 1,022.08 | | 0.62 | % | | $ | 3.16 | | |
| | Class I | | | 1,000.00 | | | 1,024.60 | | 0.12 | | | | 0.61 | | |
| | Class S | | | 1,000.00 | | | 1,023.34 | | 0.37 | | | | 1.89 | | |
| | Class T | | | 1,000.00 | | | 1,021.07 | | 0.82 | | | | 4.18 | | |
| | | | | | | | | | | | | | | | |
| * | | Expense ratios do not include expenses of the Underlying Funds. |
| ** | | Expenses are equal to each Portfolio’s respective annualized expense ratios multiplied by the average account value over the period, multiplied by 184/365 to reflect the most recent fiscal half-year. |
14
REPORT OF INDEPENDENT REGISTERED PUBLIC ACCOUNTING FIRM
The Shareholders and Board of Directors
ING Partners, Inc.
We have audited the accompanying statements of assets and liabilities, including the portfolios of investments, of ING Solution Growth and Income Portfolio, ING Solution Growth Portfolio, ING Solution Income Portfolio, ING Solution 2015 Portfolio, ING Solution 2025 Portfolio, ING Solution 2035 Portfolio, and ING Solution 2045 Portfolio, each a series of ING Partners, Inc., as of December 31, 2007, and the related statements of operations for the year or period then ended, the statements of changes in net assets for each of the years or periods in the two-year period then ended, and the financial highlights for each of the years or periods in the three-year period then ended. These financial statements and financial highlights are the responsibility of management. Our responsibility is to express an opinion on these financial statements and financial highlights based on our audits.
We conducted our audits in accordance with the standards of the Public Company Accounting Oversight Board (United States). Those standards require that we plan and perform the audits to obtain reasonable assurance about whether the financial statements and financial highlights are free of material misstatement. An audit includes examining, on a test basis, evidence supporting the amounts and disclosures in the financial statements. Our procedures included confirmation of securities owned as of December 31, 2007, by correspondence with the transfer agent of the underlying funds. An audit also includes assessing the accounting principles used and significant estimates made by management, as well as evaluating the overall financial statement presentation. We believe that our audits provide a reasonable basis for our opinion.
In our opinion, the financial statements and financial highlights referred to above present fairly, in all material respects, the financial position of the aforementioned portfolios as of December 31, 2007, and the results of their operations, the changes in their net assets, and the financial highlights for the periods specified in the first paragraph above, in conformity with U.S. generally accepted accounting principles.
Boston, Massachusetts
February 29, 2008
15
STATEMENTS OF ASSETS AND LIABILITIESASOF DECEMBER 31, 2007
| | | | | | | | | | | |
| | | ING Solution
Growth and
Income
Portfolio | | | ING Solution
Growth
Portfolio | | | ING Solution
Income
Portfolio |
ASSETS: | | | | | | | | | | | |
Investments in affiliated underlying funds at value* | | $ | 3,037 | | | $ | 2,980 | | | $ | 202,296,300 |
Receivables: | | | | | | | | | | | |
Fund shares sold | | | — | | | | — | | | | 7,585,186 |
Dividends from affiliated underlying funds | | | 30 | | | | 24 | | | | 1,882,169 |
| | | | | | | | | | | |
Total assets | | | 3,067 | | | | 3,004 | | | | 211,763,655 |
| | | | | | | | | | | |
LIABILITIES: | | | | | | | | | | | |
Payable for investment purchased in affiliated underlying funds | | | 30 | | | | 24 | | | | 9,287,776 |
Payable for fund shares redeemed | | | — | | | | — | | | | 179,579 |
Payable to affiliates | | | — | | | | — | | | | 72,813 |
| | | | | | | | | | | |
Total liabilities | | | 30 | | | | 24 | | | | 9,540,168 |
| | | | | | | | | | | |
NET ASSETS | | $ | 3,037 | | | $ | 2,980 | | | $ | 202,223,487 |
| | | | | | | | | | | |
NET ASSETS WERE COMPRISED OF: | | | | | | | | | | | |
Paid-in capital | | $ | 3,027 | | | $ | 3,027 | | | $ | 193,883,386 |
Undistributed net investment income | | | 45 | | | | 31 | | | | 3,814,234 |
Accumulated net realized gain on investments | | | 8 | | | | 8 | | | | 3,253,656 |
Net unrealized appreciation or depreciation on investments | | | (43 | ) | | | (86 | ) | | | 1,272,211 |
| | | | | | | | | | | |
NET ASSETS | | $ | 3,037 | | | $ | 2,980 | | | $ | 202,223,487 |
| | | | | | | | | | | |
| | | | | | | | | | | |
* Cost of investments in affiliated underlying funds | | $ | 3,080 | | | $ | 3,066 | | | $ | 201,024,089 |
| | | | | | | | | | | |
Class ADV: | | | | | | | | | | | |
Net assets | | $ | 1,010 | | | $ | 991 | | | $ | 93,759,925 |
Shares authorized | | | 100,000,000 | | | | 100,000,000 | | | | 100,000,000 |
Par value | | $ | 0.001 | | | $ | 0.001 | | | $ | 0.001 |
Shares outstanding | | | 101 | | | | 101 | | | | 8,126,853 |
Net asset value and redemption price per share | | $ | 10.00 | | | $ | 9.81 | | | $ | 11.54 |
Class I: | | | | | | | | | | | |
Net assets | | $ | 1,015 | | | $ | 996 | | | $ | 18,104,468 |
Shares authorized | | | 100,000,000 | | | | 100,000,000 | | | | 100,000,000 |
Par value | | $ | 0.001 | | | $ | 0.001 | | | $ | 0.001 |
Shares outstanding | | | 101 | | | | 101 | | | | 1,546,959 |
Net asset value and redemption price per share | | $ | 10.04 | | | $ | 9.85 | | | $ | 11.70 |
Class S: | | | | | | | | | | | |
Net assets | | $ | 1,012 | | | $ | 993 | | | $ | 88,723,289 |
Shares authorized | | | 100,000,000 | | | | 100,000,000 | | | | 100,000,000 |
Par value | | $ | 0.001 | | | $ | 0.001 | | | $ | 0.001 |
Shares outstanding | | | 101 | | | | 101 | | | | 7,628,603 |
Net asset value and redemption price per share | | $ | 10.02 | | | $ | 9.83 | | | $ | 11.63 |
Class T: | | | | | | | | | | | |
Net assets | | | n/a | | | | n/a | | | $ | 1,635,805 |
Shares authorized | | | n/a | | | | n/a | | | | 100,000,000 |
Par value | | | n/a | | | | n/a | | | $ | 0.001 |
Shares outstanding | | | n/a | | | | n/a | | | | 141,811 |
Net asset value and redemption price per share | | | n/a | | | | n/a | | | $ | 11.54 |
See Accompanying Notes to Financial Statements
16
STATEMENTS OF ASSETS AND LIABILITIESASOF DECEMBER 31, 2007
| | | | | | | | | | | | |
| | | ING
Solution
2015
Portfolio | | ING
Solution
2025
Portfolio | | ING
Solution
2035
Portfolio | | ING
Solution
2045
Portfolio |
ASSETS: | | | | | | | | | | | | |
Investments in affiliated underlying funds at value* | | $ | 584,375,838 | | $ | 859,942,697 | | $ | 679,656,787 | | $ | 380,166,828 |
Receivables: | | | | | | | | | | | | |
Investments in affiliated underlying funds sold | | | 369,131 | | | — | | | — | | | — |
Fund shares sold | | | 454,850 | | | 1,551,387 | | | 1,811,657 | | | 937,456 |
Dividends from affiliated underlying funds | | | 4,728,581 | | | 6,760,343 | | | 4,921,771 | | | 1,279,841 |
| | | | | | | | | | | | |
Total assets | | | 589,928,400 | | | 868,254,427 | | | 686,390,215 | | | 382,384,125 |
| | | | | | | | | | | | |
LIABILITIES: | | | | | | | | | | | | |
Payable for investment purchased in affiliated underlying funds | | | 4,728,581 | | | 7,742,711 | | | 6,528,080 | | | 2,099,355 |
Payable for fund shares redeemed | | | 823,981 | | | 569,020 | | | 205,349 | | | 117,942 |
Payable to affiliates | | | 220,381 | | | 326,412 | | | 261,375 | | | 143,217 |
| | | | | | | | | | | | |
Total liabilities | | | 5,772,943 | | | 8,638,143 | | | 6,994,804 | | | 2,360,514 |
| | | | | | | | | | | | |
NET ASSETS | | $ | 584,155,457 | | $ | 859,616,284 | | $ | 679,395,411 | | $ | 380,023,611 |
| | | | | | | | | | | | |
NET ASSETS WERE COMPRISED OF: | | | | | | | | | | | | |
Paid-in capital | | $ | 556,205,606 | | $ | 815,758,635 | | $ | 639,399,309 | | $ | 357,783,019 |
Undistributed net investment income | | | 10,350,134 | | | 11,353,908 | | | 8,776,610 | | | 4,082,363 |
Accumulated net realized gain on investments | | | 12,980,541 | | | 24,316,319 | | | 21,810,741 | | | 12,198,845 |
Net unrealized appreciation on investments | | | 4,619,176 | | | 8,187,422 | | | 9,408,751 | | | 5,959,384 |
| | | | | | | | | | | | |
NET ASSETS | | $ | 584,155,457 | | $ | 859,616,284 | | $ | 679,395,411 | | $ | 380,023,611 |
| | | | | | | | | | | | |
| | | | | | | | | | | | |
* Cost of investments in affiliated underlying funds | | $ | 579,756,662 | | $ | 851,755,275 | | $ | 670,248,036 | | $ | 374,207,444 |
| | | | | | | | | | | | |
Class ADV: | | | | | | | | | | | | |
Net assets | | $ | 237,368,533 | | $ | 345,763,167 | | $ | 279,170,820 | | $ | 148,649,274 |
Shares authorized | | | 100,000,000 | | | 100,000,000 | | | 100,000,000 | | | 100,000,000 |
Par value | | $ | 0.001 | | $ | 0.001 | | $ | 0.001 | | $ | 0.001 |
Shares outstanding | | | 19,355,279 | | | 27,193,910 | | | 21,164,634 | | | 10,884,914 |
Net asset value and redemption price per share | | $ | 12.26 | | $ | 12.71 | | $ | 13.19 | | $ | 13.66 |
Class I: | | | | | | | | | | | | |
Net assets | | $ | 41,863,369 | | $ | 59,211,546 | | $ | 44,254,174 | | $ | 28,380,698 |
Shares authorized | | | 100,000,000 | | | 100,000,000 | | | 100,000,000 | | | 100,000,000 |
Par value | | $ | 0.001 | | $ | 0.001 | | $ | 0.001 | | $ | 0.001 |
Shares outstanding | | | 3,365,916 | | | 4,586,608 | | | 3,308,429 | | | 2,050,546 |
Net asset value and redemption price per share | | $ | 12.44 | | $ | 12.91 | | $ | 13.38 | | $ | 13.84 |
Class S: | | | | | | | | | | | | |
Net assets | | $ | 300,703,500 | | $ | 446,724,187 | | $ | 347,196,915 | | $ | 199,687,696 |
Shares authorized | | | 100,000,000 | | | 100,000,000 | | | 100,000,000 | | | 100,000,000 |
Par value | | $ | 0.001 | | $ | 0.001 | | $ | 0.001 | | $ | 0.001 |
Shares outstanding | | | 24,328,982 | | | 34,847,615 | | | 26,119,145 | | | 14,528,016 |
Net asset value and redemption price per share | | $ | 12.36 | | $ | 12.82 | | $ | 13.29 | | $ | 13.75 |
Class T: | | | | | | | | | | | | |
Net assets | | $ | 4,220,055 | | $ | 7,917,384 | | $ | 8,773,502 | | $ | 3,305,943 |
Shares authorized | | | 100,000,000 | | | 100,000,000 | | | 100,000,000 | | | 100,000,000 |
Par value | | $ | 0.001 | | $ | 0.001 | | $ | 0.001 | | $ | 0.001 |
Shares outstanding | | | 343,724 | | | 622,599 | | | 665,860 | | | 242,783 |
Net asset value and redemption price per share | | $ | 12.28 | | $ | 12.72 | | $ | 13.18 | | $ | 13.62 |
See Accompanying Notes to Financial Statements
17
STATEMENTS OF OPERATIONS
| | | | | | | | | | | | |
| | | ING
Solution
Growth and Income
Portfolio
| | | ING
Solution
Growth
Portfolio | | | ING
Solution
Income
Portfolio | |
| | | July 2, 2007(1)
to December 31,
2007 | | | July 2, 2007(1)
to December 31,
2007 | | | Year Ended
December 31,
2007 | |
INVESTMENT INCOME: | | | | | | | | | | | | |
Dividends from affiliated underlying funds | | $ | 48 | | | $ | 34 | | | $ | 4,344,061 | |
| | | | | | | | | | | | |
Total investment income | | | 48 | | | | 34 | | | | 4,344,061 | |
| | | | | | | | | | | | |
EXPENSES: | | | | | | | | | | | | |
Investment management fees | | | 2 | | | | 2 | | | | 137,118 | |
Distribution and service fees: | | | | | | | | | | | | |
Class ADV | | | 4 | | | | 4 | | | | 263,376 | |
Class S | | | 2 | | | | 2 | | | | 179,717 | |
Class T | | | — | | | | — | | | | 15,242 | |
Administrative service fees | | | — | | | | — | | | | 27,421 | |
| | | | | | | | | | | | |
Total expenses | | | 8 | | | | 8 | | | | 622,874 | |
Net waived and reimbursed fees | | | — | | | | — | | | | (1,016 | ) |
| | | | | | | | | | | | |
Net expenses | | | 8 | | | | 8 | | | | 621,858 | |
| | | | | | | | | | | | |
Net investment income | | | 40 | | | | 26 | | | | 3,722,203 | |
| | | | | | | | | | | | |
REALIZED AND UNREALIZED GAIN (LOSS) ON AFFILIATED UNDERLYING FUNDS: | | | | | | | | | | | | |
Distributions of realized gains from affiliated underlying funds | | | 13 | | | | 16 | | | | 780,746 | |
Net realized gain (loss) on affiliated underlying funds | | | (3 | ) | | | (6 | ) | | | 2,622,388 | |
Net change in unrealized appreciation or depreciation on affiliated underlying funds | | | (43 | ) | | | (86 | ) | | | (782,798 | ) |
| | | | | | | | | | | | |
Net realized and unrealized gain (loss) on affiliated underlying funds | | | (33 | ) | | | (76 | ) | | | 2,620,336 | |
| | | | | | | | | | | | |
Increase (decrease) in net assets resulting from operations | | $ | 7 | | | $ | (50 | ) | | $ | 6,342,539 | |
| | | | | | | | | | | | |
(1) | | Commencement of operations |
See Accompanying Notes to Financial Statements
18
STATEMENTS OF OPERATIONSFORTHE YEAR ENDED DECEMBER 31, 2007
| | | | | | | | | | | | | | | | |
| | | ING
Solution
2015
Portfolio | | | ING
Solution
2025
Portfolio | | | ING
Solution
2035
Portfolio | | | ING
Solution
2045
Portfolio | |
INVESTMENT INCOME: | | | | | | | | | | | | | | | | |
Dividends from affiliated underlying funds | | $ | 10,606,342 | | | $ | 10,626,768 | | | $ | 7,105,326 | | | $ | 2,584,109 | |
| | | | | | | | | | | | | | | | |
Total investment income | | | 10,606,342 | | | | 10,626,768 | | | | 7,105,326 | | | | 2,584,109 | |
| | | | | | | | | | | | | | | | |
EXPENSES: | | | | | | | | | | | | | | | | |
Investment management fees | | | 433,954 | | | | 645,320 | | | | 513,853 | | | | 278,725 | |
Distribution and service fees: | | | | | | | | | | | | | | | | |
Class ADV | | | 765,846 | | | | 1,131,678 | | | | 891,286 | | | | 462,134 | |
Class S | | | 619,488 | | | | 932,568 | | | | 745,043 | | | | 408,719 | |
Class T | | | 32,819 | | | | 68,748 | | | | 70,145 | | | | 26,707 | |
Administrative service fees | | | 86,784 | | | | 129,055 | | | | 102,763 | | | | 55,741 | |
| | | | | | | | | | | | | | | | |
Total expenses | | | 1,938,891 | | | | 2,907,369 | | | | 2,323,090 | | | | 1,232,026 | |
Net waived and reimbursed fees | | | (2,187 | ) | | | (4,583 | ) | | | (4,676 | ) | | | (1,781 | ) |
| | | | | | | | | | | | | | | | |
Net expenses | | | 1,936,704 | | | | 2,902,786 | | | | 2,318,414 | | | | 1,230,245 | |
| | | | | | | | | | | | | | | | |
Net investment income | | | 8,669,638 | | | | 7,723,982 | | | | 4,786,912 | | | | 1,353,864 | |
| | | | | | | | | | | | | | | | |
REALIZED AND UNREALIZED GAIN (LOSS) ON AFFILIATED UNDERLYING FUNDS: | | | | | | | | | | | | | | | | |
Distributions of realized gains from affiliated underlying funds | | | 6,694,143 | | | | 13,040,781 | | | | 12,516,634 | | | | 8,231,004 | |
Net realized gain on affiliated underlying funds | | | 8,039,797 | | | | 15,085,748 | | | | 13,390,104 | | | | 6,763,395 | |
Net change in unrealized appreciation or depreciation on affiliated underlying funds | | | (7,974,407 | ) | | | (14,894,305 | ) | | | (10,954,687 | ) | | | (5,337,828 | ) |
| | | | | | | | | | | | | | | | |
Net realized and unrealized gain on investments | | | 6,759,533 | | | | 13,232,224 | | | | 14,952,051 | | | | 9,656,571 | |
| | | | | | | | | | | | | | | | |
Increase in net assets resulting from operations | | $ | 15,429,171 | | | $ | 20,956,206 | | | $ | 19,738,963 | | | $ | 11,010,435 | |
| | | | | | | | | | | | | | | | |
See Accompanying Notes to Financial Statements
19
STATEMENTS OF CHANGES IN NET ASSETS
| | | | | | | | |
| | | ING Solution Growth and Income Portfolio | | | ING Solution
Growth Portfolio | |
| | | July 2, 2007(1)
to December 31,
2007 | | | July 2, 2007(1)
to December 31,
2007 | |
FROM OPERATIONS: | | | | | | | | |
Net investment income | | $ | 40 | | | $ | 26 | |
Net realized gain on affiliated underlying funds | | | 10 | | | | 10 | |
Net change in unrealized appreciation or depreciation on affiliated underlying funds | | | (43 | ) | | | (86 | ) |
| | | | | | | | |
Increase (decrease) in net assets resulting from operations | | | 7 | | | | (50 | ) |
| | | | | | | | |
FROM CAPITAL SHARE TRANSACTIONS: | | | | | | | | |
Net proceeds from sale of shares | | | 3,030 | | | | 3,030 | |
| | | | | | | | |
Net increase in net assets resulting from capital share transactions | | | 3,030 | | | | 3,030 | |
| | | | | | | | |
Net increase in net assets | | | 3,037 | | | | 2,980 | |
| | | | | | | | |
NET ASSETS: | | | | | | | | |
Beginning of period | | | — | | | | — | |
| | | | | | | | |
End of period | | $ | 3,037 | | | $ | 2,980 | |
| | | | | | | | |
Undistributed net investment income at end of period | | $ | 45 | | | $ | 31 | |
| | | | | | | | |
(1) | | Commencement of operations |
See Accompanying Notes to Financial Statements
20
STATEMENTS OF CHANGES IN NET ASSETS
| | | | | | | | | | | | | | | | |
| | | ING Solution Income Portfolio | | | ING Solution 2015 Portfolio | |
| | | Year Ended
December 31,
2007 | | | Year Ended
December 31,
2006 | | | Year Ended
December 31,
2007 | | | Year Ended
December 31,
2006 | |
FROM OPERATIONS: | | | | | | | | | | | | | | | | |
Net investment income | | $ | 3,722,203 | | | $ | 806,760 | | | $ | 8,669,638 | | | $ | 2,208,440 | |
Net realized gain on affiliated underlying funds | | | 3,403,134 | | | | 161,325 | | | | 14,733,940 | | | | 925,199 | |
Net change in unrealized appreciation or depreciation on affiliated underlying funds | | | (782,798 | ) | | | 2,057,529 | | | | (7,974,407 | ) | | | 12,537,767 | |
| | | | | | | | | | | | | | | | |
Increase in net assets resulting from operations | | | 6,342,539 | | | | 3,025,614 | | | | 15,429,171 | | | | 15,671,406 | |
| | | | | | | | | | | | | | | | |
FROM DISTRIBUTIONS TO SHAREHOLDERS: | | | | | | | | | | | | | | | | |
Net investment income: | | | | | | | | | | | | | | | | |
Class ADV | | | (374,184 | ) | | | (4,748 | ) | | | (929,591 | ) | | | (16,429 | ) |
Class I | | | (67,894 | ) | | | (713 | ) | | | (173,501 | ) | | | (6,011 | ) |
Class S | | | (451,344 | ) | | | (5,235 | ) | | | (1,359,222 | ) | | | (26,675 | ) |
Class T | | | — | | | | (3,528 | ) | | | — | | | | (9,123 | ) |
Net realized gains: | | | | | | | | | | | | | | | | |
Class ADV | | | (52,417 | ) | | | (968 | ) | | | (272,277 | ) | | | (8,506 | ) |
Class I | | | (9,059 | ) | | | (142 | ) | | | (46,931 | ) | | | (2,991 | ) |
Class S | | | (65,686 | ) | | | (1,137 | ) | | | (407,766 | ) | | | (14,550 | ) |
Class T | | | (1,873 | ) | | | (729 | ) | | | (7,683 | ) | | | (4,772 | ) |
| | | | | | | | | | | | | | | | |
Total distributions | | | (1,022,457 | ) | | | (17,200 | ) | | | (3,196,971 | ) | | | (89,057 | ) |
| | | | | | | | | | | | | | | | |
FROM CAPITAL SHARE TRANSACTIONS: | | | | | | | | | | | | | | | | |
Net proceeds from sale of shares | | | 144,337,737 | | | | 88,382,379 | | | | 335,555,784 | | | | 289,918,561 | |
Dividends reinvested | | | 1,022,457 | | | | 17,200 | | | | 3,196,971 | | | | 89,057 | |
| | | | | | | | | | | | | | | | |
| | | 145,360,194 | | | | 88,399,579 | | | | 338,752,755 | | | | 290,007,618 | |
Cost of shares redeemed | | | (28,865,911 | ) | | | (11,798,218 | ) | | | (48,897,153 | ) | | | (29,363,311 | ) |
| | | | | | | | | | | | | | | | |
Net increase in net assets resulting from capital share transactions | | | 116,494,283 | | | | 76,601,361 | | | | 289,855,602 | | | | 260,644,307 | |
| | | | | | | | | | | | | | | | |
Net increase in net assets | | | 121,814,365 | | | | 79,609,775 | | | | 302,087,802 | | | | 276,226,656 | |
| | | | | | | | | | | | | | | | |
NET ASSETS: | | | | | | | | | | | | | | | | |
Beginning of year | | | 80,409,122 | | | | 799,347 | | | | 282,067,655 | | | | 5,840,999 | |
| | | | | | | | | | | | | | | | |
End of year | | $ | 202,223,487 | | | $ | 80,409,122 | | | $ | 584,155,457 | | | $ | 282,067,655 | |
| | | | | | | | | | | | | | | | |
Undistributed net investment income at end of year | | $ | 3,814,234 | | | $ | 887,929 | | | $ | 10,350,134 | | | $ | 2,458,163 | |
| | | | | | | | | | | | | | | | |
See Accompanying Notes to Financial Statements
21
STATEMENTS OF CHANGES IN NET ASSETS
| | | | | | | | | | | | | | | | |
| | | ING Solution 2025 Portfolio | | | ING Solution 2035 Portfolio | |
| | | Year Ended
December 31,
2007 | | | Year Ended
December 31,
2006 | | | Year Ended
December 31,
2007 | | | Year Ended
December 31,
2006 | |
FROM OPERATIONS: | | | | | | | | | | | | | | | | |
Net investment income | | $ | 7,723,982 | | | $ | 2,154,357 | | | $ | 4,786,912 | | | $ | 1,786,705 | |
Net realized gain on affiliated underlying funds | | | 28,126,529 | | | | 2,574,296 | | | | 25,906,738 | | | | 1,893,585 | |
Net change in unrealized appreciation or depreciation on affiliated underlying funds | | | (14,894,305 | ) | | | 22,592,857 | | | | (10,954,687 | ) | | | 20,212,377 | |
| | | | | | | | | | | | | | | | |
Increase in net assets resulting from operations | | | 20,956,206 | | | | 27,321,510 | | | | 19,738,963 | | | | 23,892,667 | |
| | | | | | | | | | | | | | | | |
FROM DISTRIBUTIONS TO SHAREHOLDERS: | | | | | | | | | | | | | | | | |
Net investment income: | | | | | | | | | | | | | | | | |
Class ADV | | | (1,055,258 | ) | | | (30,595 | ) | | | (859,961 | ) | | | (12,127 | ) |
Class I | | | (166,637 | ) | | | (7,286 | ) | | | (138,756 | ) | | | (5,261 | ) |
Class S | | | (1,523,586 | ) | | | (72,887 | ) | | | (1,303,842 | ) | | | (16,903 | ) |
Class T | | | — | | | | (17,250 | ) | | | — | | | | (7,106 | ) |
Net realized gains: | | | | | | | | | | | | | | | | |
Class ADV | | | (794,407 | ) | | | (20,156 | ) | | | (533,769 | ) | | | (10,106 | ) |
Class I | | | (113,925 | ) | | | (4,654 | ) | | | (78,913 | ) | | | (4,231 | ) |
Class S | | | (1,203,303 | ) | | | (51,886 | ) | | | (838,184 | ) | | | (15,551 | ) |
Class T | | | (31,400 | ) | | | (11,500 | ) | | | (28,825 | ) | | | (5,921 | ) |
| | | | | | | | | | | | | | | | |
Total distributions | | | (4,888,516 | ) | | | (216,214 | ) | | | (3,782,250 | ) | | | (77,206 | ) |
| | | | | | | | | | | | | | | | |
FROM CAPITAL SHARE TRANSACTIONS: | | | | | | | | | | | | | | | | |
Net proceeds from sale of shares | | | 473,518,467 | | | | 393,904,233 | | | | 372,578,074 | | | | 315,209,674 | |
Dividends reinvested | | | 4,888,516 | | | | 216,214 | | | | 3,782,250 | | | | 77,206 | |
| | | | | | | | | | | | | | | | |
| | | 478,406,983 | | | | 394,120,447 | | | | 376,360,324 | | | | 315,286,880 | |
Cost of shares redeemed | | | (44,151,502 | ) | | | (29,385,613 | ) | | | (34,277,635 | ) | | | (23,423,811 | ) |
| | | | | | | | | | | | | | | | |
Net increase in net assets resulting from capital share transactions | | | 434,255,481 | | | | 364,734,834 | | | | 342,082,689 | | | | 291,863,069 | |
| | | | | | | | | | | | | | | | |
Net increase in net assets | | | 450,323,171 | | | | 391,840,130 | | | | 358,039,402 | | | | 315,678,530 | |
| | | | | | | | | | | | | | | | |
NET ASSETS: | | | | | | | | | | | | | | | | |
Beginning of year | | | 409,293,113 | | | | 17,452,983 | | | | 321,356,009 | | | | 5,677,479 | |
| | | | | | | | | | | | | | | | |
End of year | | $ | 859,616,284 | | | $ | 409,293,113 | | | $ | 679,395,411 | | | $ | 321,356,009 | |
| | | | | | | | | | | | | | | | |
Undistributed net investment income at end of year | | $ | 11,353,908 | | | $ | 2,742,172 | | | $ | 8,776,610 | | | $ | 2,298,752 | |
| | | | | | | | | | | | | | | | |
See Accompanying Notes to Financial Statements
22
STATEMENTS OF CHANGES IN NET ASSETS
| | | | | | | | |
| | | ING Solution 2045 Portfolio | |
| | | Year Ended
December 31,
2007 | | | Year Ended
December 31,
2006 | |
FROM OPERATIONS: | | | | | | | | |
Net investment income | | $ | 1,353,864 | | | $ | 425,179 | |
Net realized gain on affiliated underlying funds | | | 14,994,399 | | | | 916,604 | |
Net change in unrealized appreciation or depreciation on affiliated underlying funds | | | (5,337,828 | ) | | | 11,285,992 | |
| | | | | | | | |
Increase in net assets resulting from operations | | | 11,010,435 | | | | 12,627,775 | |
| | | | | | | | |
FROM DISTRIBUTIONS TO SHAREHOLDERS: | | | | | | | | |
Net investment income: | | | | | | | | |
Class ADV | | | (242,428 | ) | | | (1,819 | ) |
Class I | | | (56,679 | ) | | | (1,552 | ) |
Class S | | | (396,764 | ) | | | (2,219 | ) |
Class T | | | — | | | | (796 | ) |
Net realized gains: | | | | | | | | |
Class ADV | | | (240,224 | ) | | | (6,640 | ) |
Class I | | | (48,646 | ) | | | (4,873 | ) |
Class S | | | (410,575 | ) | | | (8,711 | ) |
Class T | | | (9,245 | ) | | | (2,779 | ) |
| | | | | | | | |
Total distributions | | | (1,404,561 | ) | | | (29,389 | ) |
| | | | | | | | |
FROM CAPITAL SHARE TRANSACTIONS: | | | | | | | | |
Net proceeds from sale of shares | | | 222,131,104 | | | | 166,572,144 | |
Dividends reinvested | | | 1,404,561 | | | | 29,389 | |
| | | | | | | | |
| | | 223,535,665 | | | | 166,601,533 | |
Cost of shares redeemed | | | (18,197,614 | ) | | | (15,422,677 | ) |
| | | | | | | | |
Net increase in net assets resulting from capital share transactions | | | 205,338,051 | | | | 151,178,856 | |
| | | | | | | | |
Net increase in net assets | | | 214,943,925 | | | | 163,777,242 | |
| | | | | | | | |
NET ASSETS: | | | | | | | | |
Beginning of year | | | 165,079,686 | | | | 1,302,444 | |
| | | | | | | | |
End of year | | $ | 380,023,611 | | | $ | 165,079,686 | |
| | | | | | | | |
Undistributed net investment income at end of year | | $ | 4,082,363 | | | $ | 690,414 | |
| | | | | | | | |
See Accompanying Notes to Financial Statements
23
| | |
| ING SOLUTION GROWTH AND INCOME PORTFOLIO | | FINANCIAL HIGHLIGHTS |
Selected data for a share of beneficial interest outstanding throughout each period.
| | | | | | | | | | | |
| | | | | Class ADV | | | Class I | | | Class S | |
| | | | | July 2, 2007
to
December 31,
2007(1) | | | July 2, 2007
to
December 31,
2007(1) | | | July 2, 2007
to
December 31,
2007(1) | |
Per Share Operating Performance: | | | | | | | | | | | |
| Net asset value, beginning of period | | $ | | 10.00 | | | 10.00 | | | 10.00 | |
| Income (loss) from investment operations: | | | | | | | | | | | |
| Net investment income | | $ | | 0.13 | | | 0.15 | | | 0.14 | |
| Net realized and unrealized loss on investments | | $ | | (0.13 | ) | | (0.11 | ) | | (0.12 | ) |
| Total from investment operations | | $ | | — | | | 0.04 | | | 0.02 | |
| Net asset value, end of period | | $ | | 10.00 | | | 10.04 | | | 10.02 | |
Total Return(2) | | % | | 0.00 | * | | 0.40 | | | 0.20 | |
Ratios and Supplemental Data: | | | | | | | | | | | |
| Net assets, end of period (000’s) | | $ | | 1 | | | 1 | | | 1 | |
| Ratios to average net assets: | | | | | | | | | | | |
| Expenses(3)(4) | | % | | 0.62 | | | 0.12 | | | 0.37 | |
| Net investment income(3) | | % | | 2.55 | | | 3.04 | | | 2.79 | |
| Portfolio turnover rate | | % | | 7 | | | 7 | | | 7 | |
(1) | | Commencement of operations. |
(2) | | Total return is calculated assuming reinvestment of all dividends and capital gain distributions at net asset value and does not reflect the effect of insurance contract charges. Total returns for periods less than one year are not annualized. |
(3) | | Annualized for periods less than one year. |
(4) | | Expense ratios do not include expenses of Underlying Funds and do not include fees and expenses charged under the variable annuity contract or variable life insurance policy. |
| * | | Amount is less than 0.005%. |
See Accompanying Notes to Financial Statements
24
| | |
| ING SOLUTION GROWTH PORTFOLIO | | FINANCIAL HIGHLIGHTS |
Selected data for a share of beneficial interest outstanding throughout each period.
| | | | | | | | | | | |
| | | | | Class ADV | | | Class I | | | Class S | |
| | | | | July 2, 2007(1)
to
December 31,
2007 | | | July 2, 2007(1)
to
December 31,
2007 | | | July 2, 2007(1)
to
December 31,
2007 | |
Per Share Operating Performance: | | | | | | | | | | | |
| Net asset value, beginning of period | | $ | | 10.00 | | | 10.00 | | | 10.00 | |
| Income (loss) from investment operations: | | | | | | | | | | | |
| Net investment income | | $ | | 0.08 | | | 0.11 | | | 0.09 | |
| Net realized and unrealized loss on investments | | $ | | (0.27 | ) | | (0.26 | ) | | (0.26 | ) |
| Total from investment operations | | $ | | (0.19 | ) | | (0.15 | ) | | (0.17 | ) |
| Net asset value, end of period | | $ | | 9.81 | | | 9.85 | | | 9.83 | |
Total Return(2) | | % | | (1.90 | ) | | (1.50 | ) | | (1.70 | ) |
Ratios and Supplemental Data: | | | | | | | | | | | |
| Net assets, end of period (000’s) | | $ | | 1 | | | 1 | | | 1 | |
| Ratios to average net assets: | | | | | | | | | | | |
| Expenses(3)(4) | | % | | 0.62 | | | 0.12 | | | 0.37 | |
| Net investment income(3) | | % | | 1.58 | | | 2.28 | | | 1.83 | |
| Portfolio turnover rate | | % | | 8 | | | 8 | | | 8 | |
(1) | | Commencement of operations. |
(2) | | Total return is calculated assuming reinvestment of all dividends and capital gain distributions at net asset value and does not reflect the effect of insurance contract charges. Total returns for periods less than one year are not annualized. |
(3) | | Annualized for periods less than one year. |
(4) | | Expense ratios do not include expenses of Underlying Funds and do not include fees and expenses charged under the variable annuity contract or variable life insurance policy. |
See Accompanying Notes to Financial Statements
25
| | |
| ING SOLUTION INCOME PORTFOLIO | | FINANCIAL HIGHLIGHTS |
Selected data for a share of beneficial interest outstanding throughout each period.
| | | | | | | | | | | | | | | | | | | | |
| | | | | Class ADV | | | Class I | |
| | | | | Year Ended
December 31, | | | April 29,
2005(1) to
December 31,
2005 | | | Year Ended
December 31, | | | April 29,
2005(1) to
December 31,
2005 | |
| | | | | 2007 | | | 2006 | | | | 2007 | | | 2006 | | |
Per Share Operating Performance: | | | | | | | | | | | | | | | | | | | | |
| Net asset value, beginning of period | | $ | | 11.08 | | | 10.36 | | | 10.02 | | | 11.18 | | | 10.41 | | | 10.02 | |
| Income (loss) from investment operations: | | | | | | | | | | | | | | | | | | | | |
| Net investment income | | $ | | 0.32 | * | | 0.57 | * | | 0.54 | * | | 0.37 | * | | 0.42 | * | | 0.29 | |
| Net realized and unrealized gain (loss) on investments | | $ | | 0.22 | | | 0.17 | | | (0.20 | ) | | 0.24 | | | 0.37 | | | 0.10 | |
| Total from investment operations | | $ | | 0.54 | | | 0.74 | | | 0.34 | | | 0.61 | | | 0.79 | | | 0.39 | |
| Less distributions from: | | | | | | | | | | | | | | | | | | | | |
| Net investment income | | $ | | 0.07 | | | 0.02 | | | — | | | 0.08 | | | 0.02 | | | — | |
| Net realized gains on investments | | $ | | 0.01 | | | 0.00 | ** | | — | | | 0.01 | | | 0.00 | ** | | — | |
| Total distributions | | $ | | 0.08 | | | 0.02 | | | — | | | 0.09 | | | 0.02 | | | — | |
| Net asset value, end of period | | $ | | 11.54 | | | 11.08 | | | 10.36 | | | 11.70 | | | 11.18 | | | 10.41 | |
Total Return(2) | | % | | 4.91 | | | 7.21 | | | 3.39 | | | 5.44 | | | 7.66 | | | 3.89 | |
Ratios and Supplemental Data: | | | | | | | | | | | | | | | | | | | | |
| Net assets, end of period (000’s) | | $ | | 93,760 | | | 20,477 | | | 188 | | | 18,104 | | | 3,053 | | | 1 | |
| Ratios to average net assets: | | | | | | | | | | | | | | | | | | | | |
| Expenses(3)(4) | | % | | 0.62 | | | 0.62 | | | 0.62 | | | 0.12 | | | 0.12 | | | 0.12 | |
| Net investment income(3) | | % | | 2.80 | | | 5.29 | | | 7.93 | | | 3.20 | | | 3.89 | | | 4.27 | |
| Portfolio turnover rate | | % | | 35 | | | 32 | | | 21 | | | 35 | | | 32 | | | 21 | |
| | | | | | | | | | | | | | | | | | | | |
| | | | | Class S | | | Class T | |
| | | | | Year Ended
December 31, | | | April 29,
2005(1) to
December 31,
2005 | | | Year Ended
December 31, | | | August 31,
2005(1) to
December 31,
2005 | |
| | | | | 2007 | | | 2006 | | | | 2007 | | | 2006 | | |
Per Share Operating Performance: | | | | | | | | | | | | | | | | | | | | |
| Net asset value, beginning of period | | $ | | 11.13 | | | 10.39 | | | 10.02 | | | 11.03 | | | 10.34 | | | 10.28 | |
| Income (loss) from investment operations: | | | | | | | | | | | | | | | | | | | | |
| Net investment income | | $ | | 0.30 | * | | 0.36 | * | | 0.36 | * | | 0.20 | | | 0.10 | * | | 0.12 | |
| Net realized and unrealized gain (loss) on investments | | $ | | 0.28 | | | 0.40 | | | 0.01 | | | 0.32 | | | 0.61 | | | (0.06 | ) |
| Total from investment operations | | $ | | 0.58 | | | 0.76 | | | 0.37 | | | 0.52 | | | 0.71 | | | 0.06 | |
| Less distributions from: | | | | | | | | | | | | | | | | | | | | |
| Net investment income | | $ | | 0.07 | | | 0.02 | | | — | | | — | | | 0.02 | | | — | |
| Net realized gains on investments | | $ | | 0.01 | | | 0.00 | ** | | — | | | 0.01 | | | 0.00 | ** | | — | |
| Total distributions | | $ | | 0.08 | | | 0.02 | | | — | | | 0.01 | | | 0.02 | | | — | |
| Net asset value, end of period | | $ | | 11.63 | | | 11.13 | | | 10.39 | | | 11.54 | | | 11.03 | | | 10.34 | |
Total Return(2) | | % | | 5.23 | | | 7.37 | | | 3.69 | | | 4.72 | | | 6.93 | | | 0.58 | |
Ratios and Supplemental Data: | | | | | | | | | | | | | | | | | | | | |
| Net assets, end of period (000’s) | | $ | | 88,723 | | | 54,634 | | | 507 | | | 1,636 | | | 2,245 | | | 103 | |
| Ratios to average net assets: | | | | | | | | | | | | | | | | | | | | |
| Gross expenses prior to expense waiver(3)(4) | | % | | 0.37 | | | 0.37 | | | 0.37 | | | 0.87 | | | 0.87 | | | 0.87 | |
| Net expenses after expense waiver(3)(4) | | % | | 0.37 | | | 0.37 | | | 0.37 | | | 0.82 | | | 0.82 | | | 0.82 | |
| Net investment income after expense waiver(3) | | % | | 2.61 | | | 3.28 | | | 5.22 | | | 1.75 | | | 0.94 | | | 6.36 | |
| Portfolio turnover rate | | % | | 35 | | | 32 | | | 21 | | | 35 | | | 32 | | | 21 | |
(1) | | Commencement of operations. |
(2) | | Total return is calculated assuming reinvestment of all dividends and capital gain distributions at net asset value and does not reflect the effect of insurance contract charges. Total returns for periods less than one year is not annualized. |
(3) | | Annualized for periods less than one year. |
(4) | | Expense ratios do not include expenses of Underlying Funds and do not include fees and expenses charged under the variable annuity contract or variable life insurance policy. |
| * | | Calculated using average number of shares outstanding throughout the period. |
| ** | | Amount is less than $0.005. |
See Accompanying Notes to Financial Statements
26
| | |
| ING SOLUTION 2015 PORTFOLIO | | FINANCIAL HIGHLIGHTS |
Selected data for a share of beneficial interest outstanding throughout each period.
| | | | | | | | | | | | | | | | | | | |
| | | | | Class ADV | | | Class I |
| | | | | Year Ended
December 31, | | | April 29,
2005(1) to
December 31,
2005 | | | Year Ended
December 31, | | | April 29,
2005(1) to
December 31,
2005 |
| | | | | 2007 | | | 2006 | | | | 2007 | | | 2006 | | |
Per Share Operating Performance: | | | | | | | | | | | | | | | | | | | |
| Net asset value, beginning of period | | $ | | 11.84 | | | 10.74 | | | 10.04 | | | 11.95 | | | 10.80 | | | 10.04 |
| Income from investment operations: | | | | | | | | | | | | | | | | | | | |
| Net investment income | | $ | | 0.24 | * | | 0.40 | * | | 0.44 | * | | 0.30 | * | | 0.33 | * | | 0.11 |
| Net realized and unrealized gain on investments | | $ | | 0.27 | | | 0.73 | | | 0.26 | | | 0.28 | | | 0.85 | | | 0.65 |
| Total from investment operations | | $ | | 0.51 | | | 1.13 | | | 0.70 | | | 0.58 | | | 1.18 | | | 0.76 |
| Less distributions from: | | | | | | | | | | | | | | | | | | | |
| Net investment income | | $ | | 0.07 | | | 0.02 | | | — | | | 0.07 | | | 0.02 | | | — |
| Net realized gains on investments | | $ | | 0.02 | | | 0.01 | | | — | | | 0.02 | | | 0.01 | | | — |
| Total distributions | | $ | | 0.09 | | | 0.03 | | | — | | | 0.09 | | | 0.03 | | | — |
| Net asset value, end of period | | $ | | 12.26 | | | 11.84 | | | 10.74 | | | 12.44 | | | 11.95 | | | 10.80 |
Total Return(2) | | % | | 4.30 | | | 10.54 | | | 6.97 | | | 4.90 | | | 10.96 | | | 7.57 |
Ratios and Supplemental Data: | | | | | | | | | | | | | | | | | | | |
| Net assets, end of period (000’s) | | $ | | 237,369 | | | 71,923 | | | 1,032 | | | 41,863 | | | 14,384 | | | 1 |
| Ratios to average net assets: | | | | | | | | | | | | | | | | | | | |
| Expenses(3)(4) | | % | | 0.62 | | | 0.62 | | | 0.62 | | | 0.12 | | | 0.12 | | | 0.12 |
| Net investment income(3) | | % | | 1.99 | | | 3.49 | | | 6.29 | | | 2.41 | | | 2.85 | | | 1.51 |
| Portfolio turnover rate | | % | | 39 | | | 14 | | | 49 | | | 39 | | | 14 | | | 49 |
| | | | | | | | | | | | | | | | | | | |
| | | | | Class S | | | Class T |
| | | | | Year Ended
December 31, | | | April 29,
2005(1) to
December 31,
2005 | | | Year Ended
December 31, | | | August 31,
2005(1) to
December 31,
2005 |
| | | | | 2007 | | | 2006 | | | | 2007 | | | 2006 | | |
Per Share Operating Performance: | | | | | | | | | | | | | | | | | | | |
| Net asset value, beginning of period | | $ | | 11.90 | | | 10.77 | | | 10.04 | | | 11.81 | | | 10.74 | | | 10.53 |
| Income from investment operations: | | | | | | | | | | | | | | | | | | | |
| Net investment income | | $ | | 0.24 | * | | 0.29 | * | | 0.27 | * | | 0.17 | | | 0.04 | * | | 0.13 |
| Net realized and unrealized gain on investments | | $ | | 0.31 | | | 0.87 | | | 0.46 | | | 0.32 | | | 1.06 | | | 0.08 |
| Total from investment operations | | $ | | 0.55 | | | 1.16 | | | 0.73 | | | 0.49 | | | 1.10 | | | 0.21 |
| Less distributions from: | | | | | | | | | | | | | | | | | | | |
| Net investment income | | $ | | 0.07 | | | 0.02 | | | — | | | — | | | 0.02 | | | — |
| Net realized gains on investments | | $ | | 0.02 | | | 0.01 | | | — | | | 0.02 | | | 0.01 | | | — |
| Total distributions | | $ | | 0.09 | | | 0.03 | | | — | | | 0.02 | | | 0.03 | | | — |
| Net asset value, end of period | | $ | | 12.36 | | | 11.90 | | | 10.77 | | | 12.28 | | | 11.81 | | | 10.74 |
Total Return(2) | | % | | 4.60 | | | 10.78 | | | 7.27 | | | 4.15 | | | 10.26 | | | 1.99 |
Ratios and Supplemental Data: | | | | | | | | | | | | | | | | | | | |
| Net assets, end of period (000’s) | | $ | | 300,704 | | | 191,100 | | | 4,114 | | | 4,220 | | | 4,661 | | | 694 |
| Ratios to average net assets: | | | | | | | | | | | | | | | | | | | |
| Gross expenses prior to expense waiver(3)(4) | | % | | 0.37 | | | 0.37 | | | 0.37 | | | 0.87 | | | 0.87 | | | 0.87 |
| Net expenses after expense waiver(3)(4) | | % | | 0.37 | | | 0.37 | | | 0.37 | | | 0.82 | | | 0.82 | | | 0.82 |
| Net investment income after expense waiver(3) | | % | | 1.96 | | | 2.52 | | | 3.82 | | | 1.38 | | | 0.38 | | | 11.28 |
| Portfolio turnover rate | | % | | 39 | | | 14 | | | 49 | | | 39 | | | 14 | | | 49 |
(1) | | Commencement of operations. |
(2) | | Total return is calculated assuming reinvestment of all dividends and capital gain distributions at net asset value and does not reflect the effect of insurance contract charges. Total returns for periods less than one year are not annualized. |
(3) | | Annualized for periods less than one year. |
(4) | | Expense ratios do not include expenses of Underlying Funds and do not include fees and expenses charged under the variable annuity contract or variable life insurance policy. |
| * | | Calculated using average number of shares outstanding throughout the period. |
See Accompanying Notes to Financial Statements
27
| | |
| ING SOLUTION 2025 PORTFOLIO | | FINANCIAL HIGHLIGHTS |
Selected data for a share of beneficial interest outstanding throughout each period.
| | | | | | | | | | | | | | | | | | | | |
| | | | | Class ADV | | | Class I | |
| | | | | Year Ended
December 31, | | | April 29,
2005(1) to
December 31,
2005 | | | Year Ended
December 31, | | | April 29,
2005(1) to
December 31,
2005 | |
| | | | | 2007 | | | 2006 | | | | 2007 | | | 2006 | | |
Per Share Operating Performance: | | | | | | | | | | | | | | | | | | | | |
| Net asset value, beginning of period | | $ | | 12.28 | | | 10.97 | | | 10.05 | | | 12.41 | | | 11.03 | | | 10.05 | |
| Income from investment operations: | | | | | | | | | | | | | | | | | | | | |
| Net investment income | | $ | | 0.15 | * | | 0.27 | * | | 0.24 | * | | 0.22 | * | | 0.22 | * | | 0.05 | * |
| Net realized and unrealized gain on investments | | $ | | 0.37 | | | 1.09 | | | 0.68 | | | 0.38 | | | 1.21 | | | 0.93 | |
| Total from investment operations | | $ | | 0.52 | | | 1.35 | | | 0.92 | | | 0.60 | | | 1.43 | | | 0.98 | |
| Less distributions from: | | | | | | | | | | | | | | | | | | | | |
| Net investment income | | $ | | 0.05 | | | 0.02 | | | — | | | 0.06 | | | 0.03 | | | — | |
| Net realized gains on investments | | $ | | 0.04 | | | 0.02 | | | — | | | 0.04 | | | 0.02 | | | — | |
| Total distributions | | $ | | 0.09 | | | 0.04 | | | — | | | 0.10 | | | 0.05 | | | — | |
| Net asset value, end of period | | $ | | 12.71 | | | 12.28 | | | 10.97 | | | 12.91 | | | 12.41 | | | 11.03 | |
Total Return(2) | | % | | 4.28 | | | 12.37 | | | 9.15 | | | 4.84 | | | 12.94 | | | 9.75 | |
Ratios and Supplemental Data: | | | | | | | | | | | | | | | | | | | | |
| Net assets, end of period (000’s) | | $ | | 345,763 | | | 100,091 | | | 944 | | | 59,212 | | | 17,540 | | | 36 | |
| Ratios to average net assets: | | | | | | | | | | | | | | | | | | | | |
| Expenses(3)(4) | | % | | 0.62 | | | 0.62 | | | 0.62 | | | 0.12 | | | 0.12 | | | 0.12 | |
| Net investment income(3) | | % | | 1.16 | | | 2.29 | | | 3.37 | | | 1.74 | | | 1.87 | | | 0.79 | |
| Portfolio turnover rate | | % | | 39 | | | 23 | | | 47 | | | 39 | | | 23 | | | 47 | |
| | | | | | | | | | | | | | | | | | | | |
| | | | | Class S | | | Class T | |
| | | | | Year Ended
December 31, | | | April 29,
2005(1) to
December 31,
2005 | | | Year Ended
December 31, | | | August 31,
2005(1) to
December 31,
2005 | |
| | | | | 2007 | | | 2006 | | | | 2007 | | | 2006 | | |
Per Share Operating Performance: | | | | | | | | | | | | | | | | | | | | |
| Net asset value, beginning of period | | $ | | 12.34 | | | 11.00 | | | 10.05 | | | 12.25 | | | 10.97 | | | 10.68 | |
| Income from investment operations: | | | | | | | | | | | | | | | | | | | | |
| Net investment income | | $ | | 0.15 | * | | 0.19 | * | | 0.24 | * | | 0.07 | * | | 0.02 | * | | 0.08 | |
| Net realized and unrealized gain on investments | | $ | | 0.42 | | | 1.19 | | | 0.71 | | | 0.44 | | | 1.31 | | | 0.21 | |
| Total from investment operations | | $ | | 0.57 | | | 1.38 | | | 0.95 | | | 0.51 | | | 1.33 | | | 0.29 | |
| Less distributions from: | | | | | | | | | | | | | | | | | | | | |
| Net investment income | | $ | | 0.05 | | | 0.02 | | | — | | | — | | | 0.03 | | | — | |
| Net realized gains on investments | | $ | | 0.04 | | | 0.02 | | | — | | | 0.04 | | | 0.02 | | | — | |
| Total distributions | | $ | | 0.09 | | | 0.04 | | | — | | | 0.04 | | | 0.05 | | | — | |
| Net asset value, end of period | | $ | | 12.82 | | | 12.34 | | | 11.00 | | | 12.72 | | | 12.25 | | | 10.97 | |
Total Return(2) | | % | | 4.64 | | | 12.59 | | | 9.45 | | | 4.17 | | | 12.09 | | | 2.72 | |
Ratios and Supplemental Data: | | | | | | | | | | | | | | | | | | | | |
| Net assets, end of period (000’s) | | $ | | 446,724 | | | 282,074 | | | 15,503 | | | 7,917 | | | 9,588 | | | 971 | |
| Ratios to average net assets: | | | | | | | | | | | | | | | | | | | | |
| Gross expenses prior to expense waiver(3)(4) | | % | | 0.37 | | | 0.37 | | | 0.37 | | | 0.87 | | | 0.87 | | | 0.87 | |
| Net expenses after expense waiver(3)(4) | | % | | 0.37 | | | 0.37 | | | 0.37 | | | 0.82 | | | 0.82 | | | 0.82 | |
| Net investment income after expense waiver(3) | | % | | 1.18 | | | 1.58 | | | 3.38 | | | 0.53 | | | 0.19 | | | 6.79 | |
| Portfolio turnover rate | | % | | 39 | | | 23 | | | 47 | | | 39 | | | 23 | | | 47 | |
(1) | | Commencement of operations. |
(2) | | Total return is calculated assuming reinvestment of all dividends and capital gain distributions at net asset value and does not reflect the effect of insurance contract charges. Total returns for periods less than one year are not annualized. |
(3) | | Annualized for periods less than one year. |
(4) | | Expense ratios do not include expenses of Underlying Funds and do not include fees and expenses charged under the variable annuity contract or variable life insurance policy. |
| * | | Calculated using average number of shares outstanding throughout the period. |
See Accompanying Notes to Financial Statements
28
| | |
| ING SOLUTION 2035 PORTFOLIO | | FINANCIAL HIGHLIGHTS |
Selected data for a share of beneficial interest outstanding throughout each period.
| | | | | | | | | | | | | | | | | | | | |
| | | | | Class ADV | | | Class I | |
| | | | | Year Ended
December 31, | | | April 29,
2005(1) to
December 31,
2005 | | | Year Ended
December 31, | | | April 29,
2005(1) to
December 31,
2005 | |
| | | | | 2007 | | | 2006 | | | | 2007 | | | 2006 | | |
Per Share Operating Performance: | | | | | | | | | | | | | | | | | | | | |
| Net asset value, beginning of period | | $ | | 12.65 | | | 11.13 | | | 10.07 | | | 12.76 | | | 11.19 | | | 10.07 | |
| Income from investment operations: | | | | | | | | | | | | | | | | | | | | |
| Net investment income | | $ | | 0.12 | * | | 0.31 | * | | 0.34 | * | | 0.19 | * | | 0.22 | * | | 0.98 | * |
| Net realized and unrealized gain on investments | | $ | | 0.51 | | | 1.23 | | | 0.72 | | | 0.53 | | | 1.37 | | | 0.14 | |
| Total from investment operations | | $ | | 0.63 | | | 1.54 | | | 1.06 | | | 0.72 | | | 1.59 | | | 1.12 | |
| Less distributions from: | | | | | | | | | | | | | | | | | | | | |
| Net investment income | | $ | | 0.05 | | | 0.01 | | | — | | | 0.06 | | | 0.01 | | | — | |
| Net realized gain on investments | | $ | | 0.04 | | | 0.01 | | | — | | | 0.04 | | | 0.01 | | | — | |
| Total distributions | | $ | | 0.09 | | | 0.02 | | | — | | | 0.10 | | | 0.02 | | | — | |
| Net asset value, end of period | | $ | | 13.19 | | | 12.65 | | | 11.13 | | | 13.38 | | | 12.76 | | | 11.19 | |
Total Return(2) | | % | | 5.03 | | | 13.91 | | | 10.53 | | | 5.66 | | | 14.29 | | | 11.12 | |
Ratios and Supplemental Data: | | | | | | | | | | | | | | | | | | | | |
| Net assets, end of period (000’s) | | $ | | 279,171 | | | 73,683 | | | 542 | | | 44,254 | | | 16,647 | | | 20 | |
| Ratios to average net assets: | | | | | | | | | | | | | | | | | | | | |
| Expenses(3)(4) | | % | | 0.62 | | | 0.62 | | | 0.62 | | | 0.12 | | | 0.12 | | | 0.12 | |
| Net investment income(3) | | % | | 0.88 | | | 2.60 | | | 4.59 | | | 1.43 | | | 1.84 | | | 13.21 | |
| Portfolio turnover rate | | % | | 32 | | | 15 | | | 33 | | | 32 | | | 15 | | | 33 | |
| | | | | | | | | | | | | | | | | | | | |
| | | | | Class S | | | Class T | |
| | | | | Year Ended
December 31, | | | April 29,
2005(1) to
December 31,
2005 | | | Year Ended
December 31, | | | August 31,
2005(1) to
December 31,
2005 | |
| | | | | 2007 | | | 2006 | | | | 2007 | | | 2006 | | |
Per Share Operating Performance: | | | | | | | | | | | | | | | | | | | | |
| Net asset value, beginning of period | | $ | | 12.71 | | | 11.16 | | | 10.07 | | | 12.60 | | | 11.12 | | | 10.76 | |
| Income from investment operations: | | | | | | | | | | | | | | | | | | | | |
| Net investment income | | $ | | 0.12 | * | | 0.22 | * | | 0.23 | * | | 0.05 | | | 0.02 | * | | 0.12 | |
| Net realized and unrealized gain on investments | | $ | | 0.55 | | | 1.35 | | | 0.86 | | | 0.57 | | | 1.48 | | | 0.24 | |
| Total from investment operations | | $ | | 0.67 | | | 1.57 | | | 1.09 | | | 0.62 | | | 1.50 | | | 0.36 | |
| Less distributions from: | | | | | | | | | | | | | | | | | | | | |
| Net investment income | | $ | | 0.05 | | | 0.01 | | | — | | | — | | | 0.01 | | | — | |
| Net realized gain on investments | | $ | | 0.04 | | | 0.01 | | | — | | | 0.04 | | | 0.01 | | | — | |
| Total distributions | | $ | | 0.09 | | | 0.02 | | | — | | | 0.04 | | | 0.02 | | | — | |
| Net asset value, end of period | | $ | | 13.29 | | | 12.71 | | | 11.16 | | | 13.18 | | | 12.60 | | | 11.12 | |
Total Return(2) | | % | | 5.30 | | | 14.13 | | | 10.82 | | | 4.89 | | | 13.56 | | | 3.35 | |
Ratios and Supplemental Data: | | | | | | | | | | | | | | | | | | | | |
| Net assets, end of period (000’s) | | $ | | 347,197 | | | 222,502 | | | 4,656 | | | 8,774 | | | 8,525 | | | 460 | |
| Ratios to average net assets: | | | | | | | | | | | | | | | | | | | | |
| Gross expenses prior to expense waiver(3)(4) | | % | | 0.37 | | | 0.37 | | | 0.37 | | | 0.87 | | | 0.87 | | | 0.87 | |
| Net expenses after expense waiver(3)(4) | | % | | 0.37 | | | 0.37 | | | 0.37 | | | 0.82 | | | 0.82 | | | 0.82 | |
| Net investment income after expense waiver(3) | | % | | 0.93 | | | 1.85 | | | 3.16 | | | 0.38 | | | 0.18 | | | 15.26 | |
| Portfolio turnover rate | | % | | 32 | | | 15 | | | 33 | | | 32 | | | 15 | | | 33 | |
(1) | | Commencement of operations. |
(2) | | Total return is calculated assuming reinvestment of all dividends and capital gain distributions at net asset value and does not reflect the effect of insurance contract charges. Total returns for periods less than one year are not annualized. |
(3) | | Annualized for periods less than one year. |
(4) | | Expense ratios do not include expenses of Underlying Funds and do not include fees and expenses charged under the variable annuity contract or variable life insurance policy. |
| * | | Calculated using average number of shares outstanding throughout the period. |
See Accompanying Notes to Financial Statements
29
| | |
| ING SOLUTION 2045 PORTFOLIO | | FINANCIAL HIGHLIGHTS |
Selected data for a share of beneficial interest outstanding throughout each period.
| | | | | | | | | | | | | | | | | | |
| | | | | Class ADV | | | Class I | |
| | | | | Year Ended
December 31, | | | April 29,
2005(1) to
December 31,
2005 | | | Year Ended
December 31, | | | April 29,
2005(1) to
December 31,
2005 | |
| | | | | 2007 | | 2006 | | | | 2007 | | 2006 | | |
Per Share Operating Performance: | | | | | | | | | | | | | | | | | | |
| Net asset value, beginning of period | | $ | | 13.01 | | 11.35 | | | 10.08 | | | 13.13 | | 11.40 | | | 10.08 | |
| Income from investment operations: | | | | | | | | | | | | | | | | | | |
| Net investment income | | $ | | 0.05 | | 0.15 | * | | 0.19 | * | | 0.12 | | 0.12 | * | | 0.08 | * |
| Net realized and unrealized gain on investments | | $ | | 0.66 | | 1.53 | | | 1.08 | | | 0.66 | | 1.64 | | | 1.24 | |
| Total from investment operations | | $ | | 0.71 | | 1.68 | | | 1.27 | | | 0.78 | | 1.76 | | | 1.32 | |
| Less distributions from: | | | | | | | | | | | | | | | | | | |
| Net investment income | | $ | | 0.03 | | 0.00 | ** | | — | | | 0.04 | | 0.01 | | | — | |
| Net realized gains on investments | | $ | | 0.03 | | 0.02 | | | — | | | 0.03 | | 0.02 | | | — | |
| Total distributions | | $ | | 0.06 | | 0.02 | | | — | | | 0.07 | | 0.03 | | | — | |
| Net asset value, end of period | | $ | | 13.66 | | 13.01 | | | 11.35 | | | 13.84 | | 13.13 | | | 11.40 | |
Total Return(2) | | % | | 5.51 | | 14.82 | | | 12.60 | | | 5.96 | | 15.38 | | | 13.10 | |
Ratios and Supplemental Data: | | | | | | | | | | | | | | | | | | |
| Net assets, end of period (000’s) | | $ | | 148,649 | | 36,741 | | | 334 | | | 28,381 | | 10,442 | | | 2 | |
| Ratios to average net assets: | | | | | | | | | | | | | | | | | | |
| Expenses(3)(4) | | % | | 0.62 | | 0.62 | | | 0.62 | | | 0.12 | | 0.12 | | | 0.12 | |
| Net investment income(3) | | % | | 0.33 | | 1.22 | | | 2.54 | | | 0.84 | | 0.98 | | | 1.12 | |
| Portfolio turnover rate | | % | | 39 | | 20 | | | 106 | | | 39 | | 20 | | | 106 | |
| | | | | | | | | | | | | | | | | | |
| | | | | Class S | | | Class T | |
| | | | | Year Ended
December 31, | | | April 29,
2005(1) to
December 31,
2005 | | | Year Ended
December 31, | | | August 31,
2005(1) to
December 31,
2005 | |
| | | | | 2007 | | 2006 | | | | 2007 | | 2006 | | |
Per Share Operating Performance: | | | | | | | | | | | | | | | | | | |
| Net asset value, beginning of period | | $ | | 13.06 | | 11.37 | | | 10.08 | | | 12.97 | | 11.34 | | | 10.91 | |
| Income (loss) from investment operations: | | | | | | | | | | | | | | | | | | |
| Net investment income (loss) | | $ | | 0.07 | | 0.11 | * | | 0.08 | * | | 0.01 | | (0.04 | )* | | 0.33 | * |
| Net realized and unrealized gain on investments | | $ | | 0.68 | | 1.60 | | | 1.21 | | | 0.67 | | 1.69 | | | 0.10 | |
| Total from investment operations | | $ | | 0.75 | | 1.71 | | | 1.29 | | | 0.68 | | 1.65 | | | 0.43 | |
| Less distributions from: | | | | | | | | | | | | | | | | | | |
| Net investment income | | $ | | 0.03 | | 0.00 | ** | | — | | | — | | 0.00 | ** | | — | |
| Net realized gains on investments | | $ | | 0.03 | | 0.02 | | | — | | | 0.03 | | 0.02 | | | — | |
| Total distributions | | $ | | 0.06 | | 0.02 | | | — | | | 0.03 | | 0.02 | | | — | |
| Net asset value, end of period | | $ | | 13.75 | | 13.06 | | | 11.37 | | | 13.62 | | 12.97 | | | 11.34 | |
Total Return(2) | | % | | 5.79 | | 15.06 | | | 12.80 | | | 5.27 | | 14.57 | | | 3.94 | |
Ratios and Supplemental Data: | | | | | | | | | | | | | | | | | | |
| Net assets, end of period (000’s) | | $ | | 199,688 | | 114,650 | | | 783 | | | 3,306 | | 3,247 | | | 183 | |
| Ratios to average net assets: | | | | | | | | | | | | | | | | | | |
| Gross expenses prior to expense waiver(3)(4) | | % | | 0.37 | | 0.37 | | | 0.37 | | | 0.87 | | 0.87 | | | 0.87 | |
| Net expenses after expense waiver(3)(4) | | % | | 0.37 | | 0.37 | | | 0.37 | | | 0.82 | | 0.82 | | | 0.82 | |
| Net investment income (loss) after expense waiver(3) | | % | | 0.54 | | 0.90 | | | 1.11 | | | 0.06 | | (0.29 | ) | | 9.02 | |
| Portfolio turnover rate | | % | | 39 | | 20 | | | 106 | | | 39 | | 20 | | | 106 | |
(1) | | Commencement of operations. |
(2) | | Total return is calculated assuming reinvestment of all dividends and capital gain distributions at net asset value and does not reflect the effect of insurance contract charges. Total returns for periods less than one year are not annualized. |
(3) | | Annualized for periods less than one year. |
(4) | | Expense ratios do not include expenses of Underlying Funds and do not include fees and expenses charged under the variable annuity contract or variable life insurance policy. |
| * | | Calculated using average number of shares outstanding throughout the period. |
| ** | | Amount is less than $0.005. |
See Accompanying Notes to Financial Statements
30
NOTES TO FINANCIAL STATEMENTSASOF DECEMBER 31, 2007
NOTE 1 — ORGANIZATION
Organization. ING Partners, Inc. (the “Fund”) is an open-end management investment company registered under the Investment Company Act of 1940, as amended (the “1940 Act”). It was incorporated under the laws of Maryland on May 7, 1997. The Articles of Incorporation permit the Fund to offer separate series, each of which has its own investment objective, policies and restrictions. As of December 31, 2007, the Fund consists of thirty-seven Portfolios. The seven Portfolios included in this report are: ING Solution Growth and Income Portfolio (“Solution Growth and Income”), ING Solution Growth Portfolio (“Solution Growth”), ING Solution Income Portfolio (“Solution Income”), ING Solution 2015 Portfolio (“Solution 2015”), ING Solution 2025 Portfolio (“Solution 2025”), ING Solution 2035 Portfolio (“Solution 2035”) and ING Solution 2045 Portfolio (“Solution 2045”) (each, a “Portfolio” and collectively, the “Portfolios”). With the exception of Solution Growth and Income, Solution Growth and Solution Income, each Portfolio is structured and managed around a specific target retirement or financial goal date (“Target Date”). The investment objectives of the Portfolios are as follows: Solution Growth and Income — seeks to provide a combination of total return and stability of principal through a diversified asset allocation strategy; Solution Growth — seeks to provide capital growth through a diversified asset allocation strategy; Solution Income — seeks to provide a combination of total return and stability of principal consistent with an asset allocation targeted to retirement; and for each of Solution 2015, 2025, 2035 and 2045 Portfolios — until the day prior to the Target Date, the Portfolio will seek to provide total return consistent with an asset allocation targeted at retirement in approximately 2015, 2025, 2035 and 2045, respectively. On the Target Date, the investment objective will be to seek to provide a combination of total return and stability of principal consistent with an asset allocation targeted to retirement. When Solution 2015, 2025, 2035 and 2045 Portfolios reach their respective Target Date, they may be combined with the Solution Income, without a vote of shareholders, if approved by the Board of Directors (the “Board”). The Portfolios serve as an investment option in underlying variable insurance products offered by Direct Services, LLC (“DSL” or “Investment Adviser”).
Shares of the Portfolios are currently being offered only to participating insurance companies for allocation to certain of their separate accounts established for the purpose of funding variable annuity contracts and
variable life insurance policies issued by the participating insurance companies.
The Portfolios offer at least three of the following four classes: Adviser Class (“Class ADV”), Initial Class (“Class I”), Service Class (“Class S”) and Class T. The classes differ principally in applicable distribution and shareholder service fees. Shareholders of each class also bear certain expenses that pertain to that particular class. All shareholders bear the common expenses of the Portfolios and earn income and realized gains/losses from the Portfolio pro rata based on the average daily net assets of each class, without discrimination between share classes. Common expenses of the Portfolios (including custodial asset-based fees, legal and audit fees, printing and mailing expenses, transfer agency out-of-pocket expenses, and fees and expenses of the independent trustees) are allocated to each Portfolio in proportion to its relative daily net assets. Expenses directly attributable to a particular Portfolio (including advisory, administration, custodial transaction-based, registration, other professional, distribution and/or service fees, certain taxes, and offering costs) are charged directly to that Portfolio. Differences in per share dividend rates generally result from differences in separate class expenses, including distribution and shareholder servicing fees.
Each Portfolio seeks to achieve its investment objective by investing in other ING Funds (“Underlying Funds”) and uses asset allocation strategies to determine how much to invest in the Underlying Funds.
NOTE 2 — SIGNIFICANT ACCOUNTING POLICIES
The following significant accounting policies are consistently followed by the Portfolios in the preparation of their financial statements. Such policies are in conformity with U.S. generally accepted accounting principles for investment companies.
| A. | Security Valuation. The valuation of each Portfolio’s investments in its Underlying Funds is based on the net asset values of the Underlying Funds each business day. |
| B. | Security Transactions and Revenue Recognition. Securities transactions are accounted for on the trade date. Realized gains and losses are reported on the basis of identified cost of securities sold. Interest income is recorded on an accrual basis. Dividend income is recorded on the ex-dividend date. |
| C. | Distributions to Shareholders. The Portfolios record distributions to their shareholders on the ex-dividend date. Each Portfolio distributes |
31
NOTES TO FINANCIAL STATEMENTSASOF DECEMBER 31, 2007 (CONTINUED)
NOTE 2 — SIGNIFICANT ACCOUNTING POLICIES (continued)
| | dividends and capital gains, if any, annually. The Portfolios may make distributions on a more frequent basis to comply with the distribution requirements of the Internal Revenue Code. The characteristics of income and gains to be distributed are determined in accordance with income tax regulations, which may differ from U.S. generally accepted accounting principles for investment companies. |
| D. | Federal Income Taxes. It is the policy of the Portfolios to comply with subchapter M of the Internal Revenue Code and related excise tax provisions applicable to regulated investment companies and to distribute substantially all of their net investment income and any net realized capital gains to their shareholders. Therefore, no federal income tax provision is required. |
| E. | Use of Estimates. The preparation of financial statements in conformity with U.S. generally accepted accounting principles requires management to make estimates and assumptions that affect the reported amounts of assets and liabilities and disclosure of contingent assets and liabilities at the date of the financial statements and the reported amounts of increases and decreases in net assets from operations during the reporting period. Actual results could differ from those estimates. |
| F. | Repurchase Agreements. Certain Underlying Funds may invest in repurchase agreements only with government securities dealers recognized by the Board of Governors of the Federal Reserve System. Under such agreements, the seller of the security agrees to repurchase it at a mutually agreed upon time and price. The resale price is in excess of the purchase price and reflects an agreed upon interest rate for the period of time the agreement is outstanding. The period of the repurchase agreements is usually short, from overnight to one week, while the underlying securities generally have longer maturities. An Underlying Fund will receive as collateral securities acceptable to it whose market value is equal to at least 100% of the carrying amount of the repurchase agreements, plus accrued interest, being invested by the Underlying Fund. The underlying collateral is valued daily on a mark to market basis to assure that the value, including accrued interest is at least equal to the repurchase price. There would be |
| | potential loss to the Underlying Fund in the event the Underlying Fund is delayed or prevented from exercising its right to dispose of the collateral, and it might incur disposition costs in liquidating the collateral. |
| G. | Indemnifications. In the normal course of business, the Fund may enter into contracts that provide certain indemnifications. The Fund’s maximum exposure under these arrangements is dependent on future claims that may be made against the Portfolios and, therefore, cannot be estimated; however, based on experience, the risk of loss from such claims is considered remote. |
NOTE 3 — INVESTMENT ADVISER AND ADMINISTRATIVE SERVICE FEES
The Portfolios entered into an investment management agreement with the Investment Adviser. For its services, each Portfolio pays the Investment Adviser a monthly fee in arrears equal to 0.10% of each Portfolio’s average daily net assets during the month.
ING Investment Management Co. (the “Consultant”) is a consultant to the Investment Adviser. DSL pays the Consultant a consulting fee of 0.03% of the first $500 million, 0.025% of the next $500 million, 0.02% of the next $1 billion and 0.01% of amounts over $2 billion based on each Portfolio’s average daily net assets. Both the Investment Adviser and the Consultant are indirect, wholly-owned subsidiaries of ING Groep. ING Groep is one of the largest financial services organizations in the world, and offers an array of banking, insurance and asset management services to both individuals and institutional investors. The Consultant will provide tactical allocation recommendations to the Investment Adviser. The Investment Adviser has set up an Investment Committee made up of a team of professionals to consider, review and implement the recommendations of the Consultant, and will retain discretion over implementation of the Consultant’s recommendations. The Consultant will provide ongoing recommendations to the Investment Committee of the Investment Adviser quarterly or as warranted by market conditions.
Under an Administrative Services Agreement between the Portfolios and ING Fund Services, LLC (“IFS”), an indirect, wholly-owned subsidiary of ING Groep, IFS provides all administrative services necessary for the Portfolios’ operations and is responsible for the supervision of the Portfolios’ other service providers. IFS also assumes all ordinary recurring direct costs of the Portfolios, such as custodian fees, director fees, transfer
32
NOTES TO FINANCIAL STATEMENTSASOF DECEMBER 31, 2007 (CONTINUED)
NOTE 3 — INVESTMENT ADVISER AND ADMINISTRATIVE SERVICE FEES (continued)
agency fees and accounting fees. As compensation for these services, IFS receives a monthly fee from each portfolio at an annual rate of 0.02% based on the average daily net assets of each Portfolio.
NOTE 4 — INVESTMENTS IN AFFILIATED UNDERLYING FUNDS
For the year ended December 31, 2007, the cost of purchases and the proceeds from sales of the Underlying Funds were as follows:
| | | | | | |
| | | Purchases | | Sales |
Solution Growth and Income | | $ | 3,294 | | $ | 224 |
Solution Growth | | | 3,302 | | | 246 |
Solution Income | | | 167,200,432 | | | 48,046,387 |
Solution 2015 | | | 466,357,910 | | | 171,038,804 |
Solution 2025 | | | 691,498,471 | | | 253,195,652 |
Solution 2035 | | | 510,020,070 | | | 165,411,774 |
Solution 2045 | | | 314,220,229 | | | 107,413,636 |
NOTE 5 — DISTRIBUTION AND SERVICE FEES
Class ADV and Class T of the Portfolios have adopted a Plan of Distribution pursuant to Rule 12b-1 under the 1940 Act (the “12b-1 Plans”), whereby ING Funds Distributor, LLC (the “Distributor” or “IFD”), an indirect, wholly-owned subsidiary of ING Groep, is reimbursed or compensated by the Portfolios for expenses incurred in the distribution of each Portfolio’s shares (“Distribution Fees”). The Distributor may pay, on behalf of each Portfolio, out of its distribution fee, compensation to certain financial institutions for providing distribution assistance pursuant to a Distribution Services Agreement. Under the Rule 12b-1 Plan, each Portfolio makes payments to IFD at an annual rate of 0.25% and 0.50% of the Portfolio’s average daily net assets attributable to its Class ADV and Class T shares, respectively. The Distributor has contractually agreed to waive 0.05% for Class T shares so that the actual fee paid is an annual rate of 0.45%. The expense waiver will continue through at least May 1, 2008.
The Fund has also adopted a Shareholder Servicing Plan (“Service Plan”) for the Classes ADV, S and T shares of each Portfolio. The Service Plan allows the Fund’s Distributor to enter into shareholder servicing agreements with insurance companies, broker dealers or other financial intermediaries that provide administrative services related to Classes ADV, S and T shares and their shareholders including Variable Contract owners or Qualified Plan participants with interests in the Portfolios. Under the Service Plan, each Portfolio makes payments to IFD at an annual rate of
0.25% of each Portfolio’s average daily net assets attributable to its Classes ADV, S and T shares.
NOTE 6 — OTHER TRANSACTIONS WITH AFFILIATES AND RELATED PARTIES
At December 31, 2007, the Portfolios had the following amounts recorded in payable to affiliates on the accompanying Statements of Assets and Liabilities (see Note 5):
| | | | | | | | | | | | |
Portfolio | | Accrued
Investment
Management
Fees | | Accrued
Administrative
Fees | | Accrued
Shareholder
Service
Fees | | Total |
Solution Income | | $ | 15,838 | | $ | 3,167 | | $ | 53,808 | | $ | 72,813 |
Solution 2015 | | | 48,170 | | | 9,633 | | | 162,578 | | | 220,381 |
Solution 2025 | | | 71,153 | | | 14,230 | | | 241,029 | | | 326,412 |
Solution 2035 | | | 56,508 | | | 11,301 | | | 193,566 | | | 261,375 |
Solution 2045 | | | 31,612 | | | 6,322 | | | 105,283 | | | 143,217 |
The Fund has adopted a Retirement Policy (“Policy”) covering all Independent Directors of the Portfolio who will have served as an Independent Directors for at least five years at the time of retirement. Benefits under this Policy are based on an annual rate as defined in the Policy.
At December 31, 2007, the following indirect, wholly-owned subsidiaries of ING Groep owned more than 5% of the following Series:
ING Life Insurance and Annuity Company — Solution Growth and Income (99.01%); Solution Growth (99.01%); Solution Income (79.52%); Solution 2015 (84.07%); Solution 2025 (85.16%); Solution 2035 (86.03%); Solution 2045 (86.57%).
ING National Trust — Solution Income (18.06%); Solution 2015 (14.22%); Solution 2025 (13.98%); Solution 2035 (12.75%); Solution 2045 (13.07%).
NOTE 7 — EXPENSE LIMITATIONS
The Investment Adviser has agreed to limit expenses, excluding interest, taxes, brokerage and extraordinary expenses to the levels listed below:
| | | | | | | | | | | | |
Portfolio(1) | | Class ADV | | | Class I | | | Class S | | | Class T | |
Solution Growth and Income | | 0.62 | % | | 0.12 | % | | 0.37 | % | | N/A | |
Solution Growth | | 0.62 | % | | 0.12 | % | | 0.37 | % | | N/A | |
Solution Income | | 0.62 | % | | 0.12 | % | | 0.37 | % | | 0.82 | % |
Solution 2015 | | 0.62 | % | | 0.12 | % | | 0.37 | % | | 0.82 | % |
Solution 2025 | | 0.62 | % | | 0.12 | % | | 0.37 | % | | 0.82 | % |
Solution 2035 | | 0.62 | % | | 0.12 | % | | 0.37 | % | | 0.82 | % |
Solution 2045 | | 0.62 | % | | 0.12 | % | | 0.37 | % | | 0.82 | % |
(1) | The operating expense limits apply only at the Portfolio level and do not limit the fees payable by the underlying investment companies in which the Portfolios invest. |
The Investment Adviser may at a later date recoup from a Portfolio management fees waived and other
33
NOTES TO FINANCIAL STATEMENTSASOF DECEMBER 31, 2007 (CONTINUED)
NOTE 7 — EXPENSE LIMITATIONS (continued)
expenses assumed by the Investment Adviser during the previous 36 months, but only if, after such recoupment, the Portfolio’s expense ratio does not exceed the percentage described above. Waived and reimbursed fees and any recoupment by the Investment Adviser of such waived and reimbursed fees are reflected on the accompanying Statements of Operations for each Portfolio.
As of December 31, 2007, the Portfolios did not have any waived or reimbursed fees subject to recoupment.
Outstanding reimbursement balances due to the Portfolios, if any, under their respective expense limitation agreements are reflected in Reimbursement Due from Manager on the accompanying Statements of Assets and Liabilities.
The expense limitation agreement is contractual and shall renew automatically for one-year terms unless the Investment Adviser provides written notice of the termination of the expense limitation agreement within 90 days of the end of the then current term.
NOTE 8 — CAPITAL SHARES
Transactions in capital shares and dollars were as follows:
| | | | | | | | | |
| | | Class ADV | | Class I | | Class S |
| | | July 2,
2007(1) to
December 31,
2007 | | July 2,
2007(1) to
December 31,
2007 | | July 2,
2007(1) to
December 31,
2007 |
Solution Growth and Income (Number of Shares) | | | | | | | | | |
Shares sold | | | 101 | | | 101 | | | 101 |
| | | | | | | | | |
Net increase in shares outstanding | | | 101 | | | 101 | | | 101 |
| | | | | | | | | |
Solution Growth and Income ($) | | | | | | | | | |
Shares sold | | $ | 1,010 | | $ | 1,010 | | $ | 1,010 |
| | | | | | | | | |
Net increase | | $ | 1,010 | | $ | 1,010 | | $ | 1,010 |
| | | | | | | | | |
| | | | | | | | | |
| | | Class ADV | | Class I | | Class S |
| | | July 2,
2007(1) to
December 31,
2007 | | July 2,
2007(1) to
December 31,
2007 | | July 2,
2007(1) to
December 31,
2007 |
Solution Growth (Number of Shares) | | | | | | | | | |
Shares sold | | | 101 | | | 101 | | | 101 |
| | | | | | | | | |
Net increase in shares outstanding | | | 101 | | | 101 | | | 101 |
| | | | | | | | | |
Solution Growth ($) | | | | | | | | | |
Shares sold | | $ | 1,010 | | $ | 1,010 | | $ | 1,010 |
| | | | | | | | | |
Net increase | | $ | 1,010 | | $ | 1,010 | | $ | 1,010 |
| | | | | | | | | |
| | | | | | | | | | | | | | | | |
| | | Class ADV | | | Class I | |
| | | Year
Ended
December 31,
2007 | | | Year
Ended
December 31,
2006 | | | Year
Ended
December 31,
2007 | | | Year
Ended
December 31,
2006 | |
Solution Income (Number of Shares) | | | | | | | | | | | | | | | | |
Shares sold | | | 7,237,328 | | | | 1,907,885 | | | | 1,652,599 | | | | 556,689 | |
Dividends reinvested | | | 38,021 | | | | 545 | | | | 6,774 | | | | 81 | |
Shares redeemed | | | (997,394 | ) | | | (77,675 | ) | | | (385,358 | ) | | | (283,927 | ) |
| | | | | | | | | | | | | | | | |
Net increase in shares outstanding | | | 6,277,955 | | | | 1,830,755 | | | | 1,274,015 | | | | 272,843 | |
| | | | | | | | | | | | | | | | |
Solution Income ($) | | | | | | | | | | | | | | | | |
Shares sold | | $ | 82,362,845 | | | $ | 20,740,763 | | | $ | 18,979,355 | | | $ | 5,946,250 | |
Dividends reinvested | | | 426,601 | | | | 5,716 | | | | 76,953 | | | | 855 | |
Shares redeemed | | | (11,282,023 | ) | | | (856,402 | ) | | | (4,437,475 | ) | | | (2,997,928 | ) |
| | | | | | | | | | | | | | | | |
Net increase | | $ | 71,507,423 | | | $ | 19,890,077 | | | $ | 14,618,833 | | | $ | 2,949,177 | |
| | | | | | | | | | | | | | | | |
(1) | | Commencement of operations. |
34
NOTES TO FINANCIAL STATEMENTSASOF DECEMBER 31, 2007 (CONTINUED)
NOTE 8 — CAPITAL SHARES (continued)
| | | | | | | | | | | | | | | | |
| | | Class S | | | Class T | |
| | | Year
Ended
December 31,
2007 | | | Year
Ended
December 31,
2006 | | | Year
Ended
December 31,
2007 | | | Year
Ended
December 31,
2006 | |
Solution Income (Number of Shares) | | | | | | | | | | | | | | | | |
Shares sold | | | 3,667,575 | | | | 5,027,469 | | | | 89,716 | | | | 749,746 | |
Dividends reinvested | | | 45,755 | | | | 606 | | | | 167 | | | | 407 | |
Shares redeemed | | | (991,697 | ) | | | (169,911 | ) | | | (151,644 | ) | | | (556,567 | ) |
| | | | | | | | | | | | | | | | |
Net increase (decrease) in shares outstanding | | | 2,721,633 | | | | 4,858,164 | | | | (61,761 | ) | | | 193,586 | |
| | | | | | | | | | | | | | | | |
Solution Income ($) | | | | | | | | | | | | | | | | |
Shares sold | | $ | 41,982,136 | | | $ | 53,762,702 | | | $ | 1,013,401 | | | $ | 7,932,664 | |
Dividends reinvested | | | 517,030 | | | | 6,372 | | | | 1,873 | | | | 4,257 | |
Shares redeemed | | | (11,422,695 | ) | | | (1,813,910 | ) | | | (1,723,718 | ) | | | (6,129,978 | ) |
| | | | | | | | | | | | | | | | |
Net increase (decrease) | | $ | 31,076,471 | | | $ | 51,955,164 | | | $ | (708,444 | ) | | $ | 1,806,943 | |
| | | | | | | | | | | | | | | | |
| | | | | | | | | | | | | | | | |
| | | Class ADV | | | Class I | |
| | | Year
Ended
December 31,
2007 | | | Year
Ended
December 31,
2006 | | | Year
Ended
December 31,
2007 | | | Year
Ended
December 31,
2006 | |
Solution 2015 (Number of Shares) | | | | | | | | | | | | | | | | |
Shares sold | | | 14,429,321 | | | | 6,105,141 | | | | 2,938,413 | | | | 1,541,635 | |
Dividends reinvested | | | 99,989 | | | | 2,279 | | | | 18,113 | | | | 816 | |
Shares redeemed | | | (1,250,862 | ) | | | (126,726 | ) | | | (794,396 | ) | | | (338,766 | ) |
| | | | | | | | | | | | | | | | |
Net increase in shares outstanding | | | 13,278,448 | | | | 5,980,694 | | | | 2,162,130 | | | | 1,203,685 | |
| | | | | | | | | | | | | | | | |
Solution 2015 ($) | | | | | | | | | | | | | | | | |
Shares sold | | $ | 176,412,557 | | | $ | 69,935,176 | | | $ | 36,140,606 | | | $ | 17,405,454 | |
Dividends reinvested | | | 1,201,868 | | | | 24,935 | | | | 220,432 | | | | 9,002 | |
Shares redeemed | | | (15,207,346 | ) | | | (1,480,275 | ) | | | (9,783,725 | ) | | | (3,787,325 | ) |
| | | | | | | | | | | | | | | | |
Net increase | | $ | 162,407,079 | | | $ | 68,479,836 | | | $ | 26,577,313 | | | $ | 13,627,131 | |
| | | | | | | | | | | | | | | | |
| | | | | | | | | | | | | | | | |
| | | Class S | | | Class T | |
| | | Year Ended
December 31,
2007 | | | Year Ended
December 31,
2006 | | | Year Ended
December 31,
2007 | | | Year Ended
December 31,
2006 | |
Solution 2015 (Number of Shares) | | | | | | | | | | | | | | | | |
Shares sold | | | 9,824,043 | | | | 16,004,205 | | | | 191,986 | | | | 2,061,655 | |
Dividends reinvested | | | 146,032 | | | | 3,751 | | | | 638 | | | | 1,271 | |
Shares redeemed | | | (1,704,508 | ) | | | (326,494 | ) | | | (243,672 | ) | | | (1,732,735 | ) |
| | | | | | | | | | | | | | | | |
Net increase (decrease) in shares outstanding | | | 8,265,567 | | | | 15,681,462 | | | | (51,048 | ) | | | 330,191 | |
| | | | | | | | | | | | | | | | |
Solution 2015 ($) | | | | | | | | | | | | | | | | |
Shares sold | | $ | 120,665,807 | | | $ | 179,620,021 | | | $ | 2,336,814 | | | $ | 22,957,910 | |
Dividends reinvested | | | 1,766,988 | | | | 41,225 | | | | 7,683 | | | | 13,895 | |
Shares redeemed | | | (20,959,510 | ) | | | (3,706,649 | ) | | | (2,946,572 | ) | | | (20,389,062 | ) |
| | | | | | | | | | | | | | | | |
Net increase (decrease) | | $ | 101,473,285 | | | $ | 175,954,597 | | | $ | (602,075 | ) | | $ | 2,582,743 | |
| | | | | | | | | | | | | | | | |
35
NOTES TO FINANCIAL STATEMENTSASOF DECEMBER 31, 2007 (CONTINUED)
NOTE 8 — CAPITAL SHARES (continued)
| | | | | | | | | | | | | | | | |
| | | Class ADV | | | Class I | |
| | | Year
Ended
December 31,
2007 | | | Year
Ended
December 31,
2006 | | | Year
Ended
December 31,
2007 | | | Year
Ended
December 31,
2006 | |
Solution 2025 (Number of Shares) | | | | | | | | | | | | | | | | |
Shares sold | | | 19,838,440 | | | | 8,235,636 | | | | 3,738,402 | | | | 1,754,814 | |
Dividends reinvested | | | 147,855 | | | | 4,539 | | | | 22,144 | | | | 1,059 | |
Shares redeemed | | | (946,702 | ) | | | (171,857 | ) | | | (587,751 | ) | | | (345,323 | ) |
| | | | | | | | | | | | | | | | |
Net increase in shares outstanding | | | 19,039,593 | | | | 8,068,318 | | | | 3,172,795 | | | | 1,410,550 | |
| | | | | | | | | | | | | | | | |
Solution 2025 ($) | | | | | | | | | | | | | | | | |
Shares sold | | $ | 252,696,867 | | | $ | 97,202,839 | | | $ | 47,618,442 | | | $ | 20,311,966 | |
Dividends reinvested | | | 1,849,665 | | | | 50,751 | | | | 280,562 | | | | 11,941 | |
Shares redeemed | | | (11,865,610 | ) | | | (2,061,444 | ) | | | (7,598,424 | ) | | | (4,009,731 | ) |
| | | | | | | | | | | | | | | | |
Net increase | | $ | 242,680,922 | | | $ | 95,192,146 | | | $ | 40,300,580 | | | $ | 16,314,176 | |
| | | | | | | | | | | | | | | | |
| | | | | | | | | | | | | | | | |
| | | Class S | | | Class T | |
| | | Year
Ended
December 31,
2007 | | | Year
Ended
December 31,
2006 | | | Year
Ended
December 31,
2007 | | | Year
Ended
December 31,
2006 | |
Solution 2025 (Number of Shares) | | | | | | | | | | | | | | | | |
Shares sold | | | 13,305,242 | | | | 21,609,670 | | | | 242,058 | | | | 2,444,861 | |
Dividends reinvested | | | 216,420 | | | | 11,111 | | | | 2,508 | | | | 2,576 | |
Shares redeemed | | | (1,529,397 | ) | | | (174,510 | ) | | | (404,703 | ) | | | (1,753,211 | ) |
| | | | | | | | | | | | | | | | |
Net increase (decrease) in shares outstanding | | | 11,992,265 | | | | 21,446,271 | | | | (160,137 | ) | | | 694,226 | |
| | | | | | | | | | | | | | | | |
Solution 2025 ($) | | | | | | | | | | | | | | | | |
Shares sold | | $ | 170,138,444 | | | $ | 248,578,051 | | | $ | 3,064,714 | | | $ | 27,811,377 | |
Dividends reinvested | | | 2,726,889 | | | | 124,773 | | | | 31,400 | | | | 28,749 | |
Shares redeemed | | | (19,564,309 | ) | | | (2,033,538 | ) | | | (5,123,159 | ) | | | (21,280,900 | ) |
| | | | | | | | | | | | | | | | |
Net increase (decrease) | | $ | 153,301,024 | | | $ | 246,669,286 | | | $ | (2,027,045 | ) | | $ | 6,559,226 | |
| | | | | | | | | | | | | | | | |
| | | | | | | | | | | | | | | | |
| | | Class ADV | | | Class I | |
| | | Year
Ended
December 31,
2007 | | | Year
Ended
December 31,
2006 | | | Year
Ended
December 31,
2007 | | | Year
Ended
December 31,
2006 | |
Solution 2035 (Number of Shares) | | | | | | | | | | | | | | | | |
Shares sold | | | 15,692,755 | | | | 5,836,546 | | | | 2,408,122 | | | | 1,598,144 | |
Dividends reinvested | | | 107,790 | | | | 1,954 | | | | 16,629 | | | | 828 | |
Shares redeemed | | | (462,668 | ) | | | (60,452 | ) | | | (420,452 | ) | | | (296,587 | ) |
| | | | | | | | | | | | | | | | |
Net increase in shares outstanding | | | 15,337,877 | | | | 5,778,048 | | | | 2,004,299 | | | | 1,302,385 | |
| | | | | | | | | | | | | | | | |
Solution 2035 ($) | | | | | | | | | | | | | | | | |
Shares sold | | $ | 206,813,701 | | | $ | 70,492,067 | | | $ | 31,958,692 | | | $ | 18,948,312 | |
Dividends reinvested | | | 1,393,730 | | | | 22,234 | | | | 217,669 | | | | 9,491 | |
Shares redeemed | | | (6,028,697 | ) | | | (756,495 | ) | | | (5,614,492 | ) | | | (3,509,479 | ) |
| | | | | | | | | | | | | | | | |
Net increase | | $ | 202,178,734 | | | $ | 69,757,806 | | | $ | 26,561,869 | | | $ | 15,448,324 | |
| | | | | | | | | | | | | | | | |
36
NOTES TO FINANCIAL STATEMENTSASOF DECEMBER 31, 2007 (CONTINUED)
NOTE 8 — CAPITAL SHARES (continued)
| | | | | | | | | | | | | | | | |
| | | Class S | | | Class T | |
| | | Year
Ended
December 31,
2007 | | | Year
Ended
December 31,
2006 | | | Year
Ended
December 31,
2007 | | | Year
Ended
December 31,
2006 | |
Solution 2035 (Number of Shares) | | | | | | | | | | | | | | | | |
Shares sold | | | 9,849,051 | | | | 17,302,033 | | | | 286,776 | | | | 1,964,584 | |
Dividends reinvested | | | 164,518 | | | | 2,842 | | | | 2,229 | | | | 1,148 | |
Shares redeemed | | | (1,400,827 | ) | | | (215,632 | ) | | | (299,614 | ) | | | (1,330,655 | ) |
| | | | | | | | | | | | | | | | |
Net increase (decrease) in shares outstanding | | | 8,612,742 | | | | 17,089,243 | | | | (10,609 | ) | | | 635,077 | |
| | | | | | | | | | | | | | | | |
Solution 2035 ($) | | | | | | | | | | | | | | | | |
Shares sold | | $ | 130,046,033 | | | $ | 202,986,613 | | | $ | 3,759,648 | | | $ | 22,782,682 | |
Dividends reinvested | | | 2,142,026 | | | | 32,454 | | | | 28,825 | | | | 13,027 | |
Shares redeemed | | | (18,697,541 | ) | | | (2,529,800 | ) | | | (3,936,905 | ) | | | (16,628,037 | ) |
| | | | | | | | | | | | | | | | |
Net increase (decrease) | | $ | 113,490,518 | | | $ | 200,489,267 | | | $ | (148,432 | ) | | $ | 6,167,672 | |
| | | | | | | | | | | | | | | | |
| | | | | | | | | | | | | | | | |
| | | Class ADV | | | Class I | |
| | | Year
Ended
December 31,
2007 | | | Year
Ended
December 31,
2006 | | | Year
Ended
December 31,
2007 | | | Year
Ended
December 31,
2006 | |
Solution 2045 (Number of Shares) | | | | | | | | | | | | | | | | |
Shares sold | | | 8,364,192 | | | | 2,819,182 | | | | 1,535,768 | | | | 1,075,065 | |
Dividends reinvested | | | 36,073 | | | | 727 | | | | 7,785 | | | | 549 | |
Shares redeemed | | | (338,761 | ) | | | (25,954 | ) | | | (288,482 | ) | | | (280,285 | ) |
| | | | | | | | | | | | | | | | |
Net increase in shares outstanding | | | 8,061,504 | | | | 2,793,955 | | | | 1,255,071 | | | | 795,329 | |
| | | | | | | | | | | | | | | | |
Solution 2045 ($) | | | | | | | | | | | | | | | | |
Shares sold | | $ | 113,782,181 | | | $ | 35,057,716 | | | $ | 21,114,561 | | | $ | 12,980,615 | |
Dividends reinvested | | | 482,652 | | | | 8,459 | | | | 105,325 | | | | 6,425 | |
Shares redeemed | | | (4,627,426 | ) | | | (320,552 | ) | | | (4,002,764 | ) | | | (3,369,963 | ) |
| | | | | | | | | | | | | | | | |
Net increase | | $ | 109,637,407 | | | $ | 34,745,623 | | | $ | 17,217,122 | | | $ | 9,617,077 | |
| | | | | | | | | | | | | | | | |
| | | | | | | | | | | | | | | | |
| | | Class S | | | Class T | |
| | | Year
Ended
December 31,
2007 | | | Year
Ended
December 31,
2006 | | | Year
Ended
December 31,
2007 | | | Year
Ended
December 31,
2006 | |
Solution 2045 (Number of Shares) | | | | | | | | | | | | | | | | |
Shares sold | | | 6,251,430 | | | | 8,983,495 | | | | 131,307 | | | | 878,375 | |
Dividends reinvested | | | 60,025 | | | | 937 | | | | 692 | | | | 308 | |
Shares redeemed | | | (559,627 | ) | | | (277,134 | ) | | | (139,533 | ) | | | (644,531 | ) |
| | | | | | | | | | | | | | | | |
Net increase (decrease) in shares outstanding | | | 5,751,828 | | | | 8,707,298 | | | | (7,534 | ) | | | 234,152 | |
| | | | | | | | | | | | | | | | |
Solution 2045 ($) | | | | | | | | | | | | | | | | |
Shares sold | | $ | 85,467,661 | | | $ | 108,029,718 | | | $ | 1,766,701 | | | $ | 10,504,095 | |
Dividends reinvested | | | 807,339 | | | | 10,930 | | | | 9,245 | | | | 3,575 | |
Shares redeemed | | | (7,686,957 | ) | | | (3,449,562 | ) | | | (1,880,467 | ) | | | (8,282,600 | ) |
| | | | | | | | | | | | | | | | |
Net increase (decrease) | | $ | 78,588,043 | | | $ | 104,591,086 | | | $ | (104,521 | ) | | $ | 2,225,070 | |
| | | | | | | | | | | | | | | | |
37
NOTES TO FINANCIAL STATEMENTSASOF DECEMBER 31, 2007 (CONTINUED)
NOTE 9 — FEDERAL INCOME TAXES
The amount of distributions from net investment income and net realized capital gains are determined in accordance with federal income tax regulations, which may differ from U.S. generally accepted accounting principles for investment companies. These book/tax differences may be either temporary or permanent. Permanent differences are reclassified within the capital accounts based on their federal tax-basis treatment; temporary differences are not reclassified. Key differences include the treatment of short-term capital gains, foreign currency transactions, and wash sale deferrals. Distributions in excess of net investment income and/or net realized capital gains for tax purposes are reported as distributions of paid-in capital.
The following permanent tax differences have been reclassified as of December 31, 2007:
| | | | | | | | | | | |
| | | Paid-in
Capital | | | Undistributed Net
Investment Income | | Accumulated
Net Realized
Gains/(Losses)
On Investments | |
Solution Growth
and Income | | $ | (3 | ) | | $ | 5 | | $ | (2 | ) |
Solution Growth | | | (3 | ) | | | 5 | | | (2 | ) |
Solution Income | | | — | | | | 97,524 | | | (97,524 | ) |
Solution 2015 | | | — | | | | 1,684,647 | | | (1,684,647 | ) |
Solution 2025 | | | — | | | | 3,633,235 | | | (3,633,235 | ) |
Solution 2035 | | | — | | | | 3,993,505 | | | (3,993,505 | ) |
Solution 2045 | | | — | | | | 2,733,956 | | | (2,733,956 | ) |
Dividends paid by the Portfolios from net investment income and distributions of net realized short-term capital gains are, for federal income tax purposes, taxable as ordinary income to shareholders.
The tax composition of dividends and distributions to shareholders was as follows:
| | | | | | | | | | | | |
| | | Year Ended
December 31, 2007 | | Year Ended
December 31, 2006 |
| | | Ordinary
Income | | Long-Term
Capital Gains | | Ordinary
Income | | Long-Term
Capital Gains |
Solution Income | | $ | 984,130 | | $ | 38,327 | | $ | 16,646 | | $ | 554 |
Solution 2015 | | | 2,966,927 | | | 230,044 | | | 82,410 | | | 6,647 |
Solution 2025 | | | 4,115,530 | | | 772,986 | | | 192,065 | | | 24,149 |
Solution 2035 | | | 3,317,791 | | | 464,459 | | | 67,553 | | | 9,653 |
Solution 2045 | | | 1,174,833 | | | 229,728 | | | 26,605 | | | 2,784 |
The tax-basis components of distributable earnings as of December 31, 2007 were:
| | | | | | | | | | | | | | |
| | | Undistributed
Ordinary
Income | | Undistributed
Long-Term
Capital Gains | | Post-October
Capital Loss
Deferred | | | Unrealized
Appreciation/
(Depreciation) | |
Solution Growth
and Income | | $ | 45 | | $ | 8 | | $ | — | | | $ | (44 | ) |
Solution Growth | | | 31 | | | 10 | | | | (1) | | | (87 | ) |
Solution Income | | | 5,960,842 | | | 1,514,256 | | | — | | | | 865,003 | |
Solution 2015 | | | 15,871,004 | | | 7,976,453 | | | — | | | | 4,102,394 | |
Solution 2025 | | | 20,430,739 | | | 16,190,995 | | | — | | | | 7,235,915 | |
Solution 2035 | | | 18,152,248 | | | 12,933,065 | | | — | | | | 8,910,790 | |
Solution 2045 | | | 9,022,184 | | | 7,643,551 | | | — | | | | 5,574,857 | |
The Portfolios’ major tax jurisdictions are federal and Arizona. The earliest tax year that remains subject to examination by these jurisdictions is 2003.
Under U.S. federal income tax law, as specified in the Internal Revenue Code (the “Code”) and U.S. Treasury regulations, the Portfolios must meet various technical requirements relating to fund administration, portfolio investments, and “eligible investors” in the Portfolios. Complying with these requirements is a condition for beneficial tax treatment of certain insurance products that offer the Portfolios as investment options. The failure of the Portfolios to meet any of these complex requirements could result in an excise tax, administrative penalties imposed by the Internal Revenue Service, potential liability to insurers whose products include the Portfolios as investment options, and unanticipated costs associated with remedying a failure. It was disclosed in the Portfolio’s Annual Report for the year ended December 31, 2006, that an affiliate of a Portfolio’s investment adviser may have failed to limit the availability of Solution 2025 and Solution 2035 for investment to “eligible investors” under the Code. Management has determined that it is more likely than not the Portfolios would sustain their tax positions relative to this matter.
NOTE 10 — OTHER ACCOUNTING PRONOUNCEMENTS
In June 2006, the Financial Accounting Standards Board (“FASB”) issued FASB Interpretation No. 48 (“FIN 48”), “Accounting for Uncertainty in Income Taxes.” This standard defines the threshold for recognizing the benefits of tax-return positions in the financial statements as “more-likely-than-not” to be sustained upon challenge by the taxing authority and requires measurement of a tax position meeting the more-likely-than-not criterion, based on the largest benefit that is more than 50 percent likely to be realized. FIN 48 was effective for fiscal years beginning after December 15, 2006, with early application permitted if no interim financial statements have been issued. However, acknowledging the unique issues that FIN 48 presents for investment companies that calculate NAVs, the SEC indicated that they would not object if a fund
38
NOTES TO FINANCIAL STATEMENTSASOF DECEMBER 31, 2007 (CONTINUED)
NOTE 10 — OTHER ACCOUNTING PRONOUNCEMENTS (continued)
implemented FIN 48 in its NAV calculation as late as its last NAV calculation in the first required financial statement reporting period for its fiscal year beginning after December 15, 2006. At adoption, companies must adjust their financial statements to reflect only those tax positions that are more likely-than-not to be sustained as of the adoption date. Management of the Portfolios has analyzed the tax positions of the Portfolios. Upon adoption of FIN 48, we identified no uncertain tax positions that have not met the more likely-than-not standard.
On September 15, 2006, the FASB issued Statement of Financial Accounting Standards No. 157 (“SFAS No. 157”), “Fair Value Measurements.” The new accounting statement defines fair value, establishes a framework for measuring fair value in generally accepted accounting principles (“GAAP”), and expands disclosures about fair value measurements. SFAS No. 157 defines fair value as the price that would be received to sell an asset or paid to transfer a liability in an orderly transaction between market participants at the measurement date (an exit price). SFAS No. 157 also stipulates that, as a market-based measurement, fair value should be determined based on the assumptions that market participants would use in pricing the asset or liability, and establishes a fair value hierarchy that distinguishes between (a) market participant assumptions developed based on market data obtained from sources independent of the reporting entity (observable inputs) and (b) the reporting entity’s own assumptions about market participant assumptions developed based on the best information available in the circumstances (unobservable inputs). SFAS No. 157 is effective for financial statements issued for fiscal years beginning after November 15, 2007. As of December 31, 2007, management of the Portfolios is currently assessing the impact in addition to expanded financial statement disclosures, if any, that will result from adopting SFAS No. 157.
NOTE 11 — CONCENTRATION OF INVESTMENT RISK
Foreign Securities: Investments in foreign securities may entail risks not present in domestic investments. Since securities in which the Underlying Fund may invest are denominated in foreign currencies, changes in the relationship of these foreign currencies to the U.S. dollar can significantly affect the value of the investments and earnings of the Underlying Funds. Foreign investments may also subject the Underlying
Funds to foreign government exchange restrictions, expropriation, taxation or other political, social or economic developments, as well as changes vis-à-vis the U.S. dollar from movements in currency, and changes in security value and interest rate, all of which could affect the market and/or credit risk of the Underlying Funds’ investments.
NOTE 12 — INFORMATION REGARDING TRADING OF ING’S U.S. MUTUAL FUNDS
As discussed in earlier supplements that were previously filed with the SEC, DSL, the adviser to the ING Funds, has reported to the Boards of Directors/Trustees (the “Boards”) of the ING Funds that, like many U.S. financial services companies, DSL and certain of its U.S. affiliates have received informal and formal requests for information since September 2003 from various governmental and self-regulatory agencies in connection with investigations related to mutual funds and variable insurance products. DSL has advised the Boards that it and its affiliates have cooperated fully with each request.
In addition to responding to regulatory and governmental requests, DSL reported that management of U.S. affiliates of ING Groep N.V., including DSL (collectively, “ING”), on their own initiative, have conducted, through independent special counsel and a national accounting firm, an extensive internal review of trading in ING insurance, retirement, and mutual fund products. The goal of this review was to identify any instances of inappropriate trading in those products by third parties or by ING investment professionals and other ING personnel. ING’s internal review related to mutual fund trading is now substantially completed. ING has reported that, of the millions of customer relationships that ING maintains, the internal review identified several isolated arrangements allowing third parties to engage in frequent trading of mutual funds within ING’s variable insurance and mutual fund products, and identified other circumstances where frequent trading occurred, despite measures taken by ING intended to combat market timing. ING further reported that each of these arrangements has been terminated and fully disclosed to regulators. The results of the internal review were also reported to the independent members of the Boards.
DSL has advised the Boards that most of the identified arrangements were initiated prior to ING’s acquisition of the businesses in question in the U.S. DSL further reported that the companies in question did not
39
NOTES TO FINANCIAL STATEMENTSASOF DECEMBER 31, 2007 (CONTINUED)
NOTE 12 — INFORMATION REGARDING TRADING OF ING’S U.S. MUTUAL FUNDS (continued)
receive special benefits in return for any of these arrangements, which have all been terminated.
Based on the internal review, DSL has advised the Boards that the identified arrangements do not represent a systemic problem in any of the companies that were involved.
Despite the extensive internal review conducted through independent special counsel and a national accounting firm, there can be no assurance that the instances of inappropriate trading reported to the Boards are the only instances of such trading respecting the ING Funds.
DSL reported to the Boards that ING is committed to conducting its business with the highest standards of ethical conduct with zero tolerance for noncompliance. Accordingly, DSL advised the Boards that ING management was disappointed that its voluntary internal review identified these situations. Viewed in the context of the breadth and magnitude of its U.S. business as a whole, ING management does not believe that ING’s acquired companies had systemic ethical or compliance issues in these areas. Nonetheless, DSL reported that given ING’s refusal to tolerate any lapses, it has taken the steps noted below, and will continue to seek opportunities to further strengthen the internal controls of its affiliates.
| • | | ING has agreed with the ING Funds to indemnify and hold harmless the ING Funds from all damages resulting from wrongful conduct by ING or its employees or from ING’s internal investigation, any investigations conducted by any governmental or self-regulatory agencies, litigation or other formal proceedings, including any proceedings by the SEC. DSL reported to the Boards that ING management believes that the total amount of any indemnification obligations will not be material to ING or its U.S. business. |
| • | | ING updated its Code of Conduct for employees reinforcing its employees’ obligation to conduct personal trading activity consistent with the law, disclosed limits, and other requirements. |
Other Regulatory Matters
The New York Attorney General and other federal and state regulators are also conducting broad inquiries and investigations involving the insurance industry. These initiatives currently focus on, among other things,
compensation and other sales incentives; potential conflicts of interest; potential anti-competitive activity; reinsurance; marketing practices (including suitability); specific product types (including group annuities and indexed annuities); fund selection for investment products and brokerage sales; and disclosure. It is likely that the scope of these industry investigations will further broaden before they conclude. ING has received formal and informal requests in connection with such investigations, and is cooperating fully with each request. In connection with one such investigation, affiliates of DSL were named in a petition for relief and cease and desist order filed by the New Hampshire Bureau of Securities Regulation concerning their administration of the New Hampshire state employees deferred compensation plan.
Other federal and state regulators could initiate similar actions in this or other areas of ING’s businesses. These regulatory initiatives may result in new legislation and regulation that could significantly affect the financial services industry, including businesses in which ING is engaged. In light of these and other developments, ING continuously reviews whether modifications to its business practices are appropriate. At this time, in light of the current regulatory factors, ING U.S. is actively engaged in reviewing whether any modifications in our practices are appropriate for the future.
There can be no assurance that these matters, or the adverse publicity associated with them, will not result in increased fund redemptions, reduced sale of fund shares, or other adverse consequences to ING Funds.
40
| | |
| ING SOLUTION PORTFOLIOS | | PORTFOLIO ASSET ALLOCATION ASOF DECEMBER 31, 2007 |
The following table illustrates the asset allocation of the underlying portfolios as of December 31, 2007 (as a percent of net assets).
| | | | | | | | | | | | | | | | | | | | | |
Underlying Affiliated Funds | | | | ING Solution
Growth and
Income
Portfolio | | ING Solution
Growth
Portfolio | | ING Solution
Income
Portfolio | | | ING Solution
2015
Portfolio | | | ING Solution
2025
Portfolio | | | ING Solution
2035
Portfolio | | | ING Solution
2045
Portfolio | |
ING American Century Large Company Value Portfolio — Class I | | % | | 2.0 | | 3.0 | | 2.0 | | | 2.0 | | | 4.0 | | | 4.0 | | | 4.5 | |
ING Baron Asset Portfolio — Class I | | % | | — | | — | | — | | | — | | | 1.0 | | | 1.0 | | | 1.5 | |
ING Baron Small Cap Growth Portfolio — Class I | | % | | — | | — | | — | | | — | | | 1.0 | | | 2.0 | | | 2.0 | |
ING BlackRock Inflation Protected Bond Portfolio — Class I | | % | | 3.1 | | — | | 5.0 | | | 5.1 | | | — | | | — | | | — | |
ING BlackRock Large Cap Value Portfolio —
Class I | | % | | 2.0 | | 3.0 | | — | | | 2.0 | | | 3.0 | | | 4.0 | | | 4.0 | |
ING Columbia Small Cap Value II Portfolio —
Class I | | % | | — | | — | | — | | | — | | | — | | | — | | | 1.9 | |
ING Davis New York Venture Portfolio — Class I | | % | | 2.5 | | 3.5 | | 1.5 | | | 2.5 | | | 3.0 | | | 3.0 | | | 3.0 | |
ING Global Real Estate Portfolio — Class I | | % | | — | | 2.0 | | — | | | 2.0 | | | 2.0 | | | 2.0 | | | 2.0 | |
ING JPMorgan Emerging Markets Equity Portfolio — Class I | | % | | — | | 1.0 | | — | | | — | | | 2.0 | | | 4.0 | | | 5.0 | |
ING JPMorgan Mid Cap Value Portfolio —
Class I | | % | | — | | — | | — | | | — | | | 1.0 | | | 1.0 | | | 1.5 | |
ING Julius Baer Foreign Portfolio — Class I | | % | | 5.0 | | 7.1 | | — | | | 4.0 | | | 7.1 | | | 7.1 | | | 10.1 | |
ING Legg Mason Partners Aggressive Growth Portfolio — Class I | | % | | 2.4 | | 2.9 | | — | | | 2.4 | | | 3.9 | | | 4.4 | | | 5.0 | |
ING Legg Mason Value Portfolio — Class I | | % | | 2.4 | | 3.4 | | 1.5 | | | 2.4 | | | 3.0 | | | 3.0 | | | 3.0 | |
ING Limited Maturity Bond Portfolio — Class I | | % | | 12.1 | | 7.1 | | 16.0 | | | 7.1 | | | 7.1 | | | — | | | — | |
ING Marsico Growth Portfolio — Class I | | % | | 2.5 | | 3.0 | | — | | | 2.4 | | | 4.0 | | | 4.4 | | | 5.0 | |
ING Marsico International Opportunities Portfolio — Class I | | % | | — | | — | | — | | | 2.0 | | | 3.0 | | | 4.0 | | | 5.0 | |
ING Oppenheimer Strategic Income Portfolio —
Class I | | % | | — | | — | | 5.0 | | | 7.1 | | | — | | | — | | | — | |
ING PIMCO Total Return Portfolio — Class I | | % | | 10.2 | | 3.0 | | 19.2 | | | 6.1 | | | — | | | — | | | — | |
ING T. Rowe Price Equity Income Portfolio —
Class I | | % | | 3.0 | | 3.0 | | 1.0 | | | 3.0 | | | 3.0 | | | 4.0 | | | 4.0 | |
ING T. Rowe Price Growth Equity Portfolio —
Class I | | % | | 3.9 | | 6.0 | | 2.0 | | | 4.0 | | | 6.0 | | | 7.0 | | | 7.0 | |
ING UBS U.S. Large Cap Equity Portfolio —
Class I | | % | | 3.9 | | 5.9 | | 3.9 | | | 4.9 | | | 3.9 | | | 3.9 | | | 3.0 | |
ING UBS U.S. Small Cap Growth Portfolio —
Class I | | % | | — | | — | | — | | | — | | | 1.0 | | | 2.0 | | | 2.0 | |
ING Van Kampen Comstock Portfolio — Class I | | % | | — | | — | | — | | | 2.0 | | | 3.9 | | | 4.0 | | | 4.5 | |
ING Van Kampen Growth and Income Portfolio | | % | | 2.0 | | 3.0 | | — | | | — | | | — | | | — | | | — | |
ING Van Kampen Real Estate Portfolio — Class I | | % | | 3.9 | | 4.9 | | 3.9 | | | 3.9 | | | 2.9 | | | 1.9 | | | 1.9 | |
ING VP Index Plus International Equity Portfolio — Class I | | % | | 5.0 | | 7.0 | | 7.0 | | | 4.0 | | | 6.0 | | | 8.1 | | | 9.1 | |
ING VP Index Plus Large-Cap Portfolio — Class I | | % | | 3.9 | | 5.9 | | 3.9 | | | 4.9 | | | 3.9 | | | 3.0 | | | 3.0 | |
ING VP Index Plus Mid-Cap Portfolio — Class I | | % | | 1.0 | | 2.0 | | — | | | 2.0 | | | 2.0 | | | 3.0 | | | 3.9 | |
ING VP Intermediate Bond Portfolio — Class I | | % | | 25.3 | | 20.4 | | 25.2 | | | 20.3 | | | 18.4 | | | 15.3 | | | 5.1 | |
ING VP Real Estate Portfolio — Class I | | % | | 2.9 | | 1.0 | | 2.9 | | | 2.0 | | | 2.0 | | | 2.0 | | | 1.0 | |
ING VP Small Company Portfolio — Class I | | % | | 1.0 | | 1.9 | | — | | | 1.9 | | | 1.9 | | | 1.9 | | | 2.0 | |
Other assets and liabilities — Net | | % | | — | | — | | (0.0 | )* | | (0.0 | )* | | (0.0 | )* | | (0.0 | )* | | (0.0 | )* |
| | | | | | | | | | | | | | | | | | | | | |
| | % | | 100.0 | | 100.0 | | 100.0 | | | 100.0 | | | 100.0 | | | 100.0 | | | 100.0 | |
| | | | | | | | | | | | | | | | | | | | | |
| * | Amount is more than (0.05)% |
Portfolio holdings are subject to change daily.
41
| | |
| ING SOLUTION GROWTHAND INCOME PORTFOLIO | | PORTFOLIO OF INVESTMENTS ASOF DECEMBER 31, 2007 |
| | | | | | | | | |
| Shares | | | | Value |
| AFFILIATED INVESTMENT COMPANIES: 100.0% |
| | 4 | | | | ING American Century Large Company Value Portfolio — Class I | | $ | 60 |
| | 9 | | | | ING BlackRock Inflation Protected Bond Portfolio — Class I | | | 93 |
| | 4 | | | | ING BlackRock Large Cap Value Portfolio — Class I | | | 60 |
| | 4 | | | | ING Davis New York Venture Portfolio — Class I | | | 75 |
| | 8 | | | | ING Julius Baer Foreign Portfolio — Class I | | | 152 |
| | 7 | | | | ING Legg Mason Partners Aggressive Growth Portfolio — Class I | | | 74 |
| | 2 | | | | ING Legg Mason Value Portfolio — Class I | | | 74 |
| | 33 | | | | ING Limited Maturity Bond Portfolio — Class I | | | 367 |
| | 4 | | | | ING Marsico Growth Portfolio — Class I | | | 75 |
| | 26 | | | | ING PIMCO Total Return Portfolio — Class I | | | 310 |
| | 6 | | | | ING T. Rowe Price Equity Income Portfolio — Class I | | | 90 |
| | 2 | | | | ING T. Rowe Price Growth Equity Portfolio — Class I | | | 120 |
| | 11 | | | | ING UBS U.S. Large Cap Equity Portfolio — Class I | | | 119 |
| | 2 | | | | ING Van Kampen Growth and Income Portfolio — Class I | | | 60 |
| | 4 | | | | ING Van Kampen Real Estate Portfolio — Class I | | | 118 |
| | 11 | | | | ING VP Index Plus International Equity Portfolio — Class I | | | 152 |
| | 7 | | | | ING VP Index Plus Large-Cap Portfolio — Class I | | | 120 |
| | 2 | | | | ING VP Index Plus Mid-Cap Portfolio — Class I | | | 30 |
| | 58 | | | | ING VP Intermediate Bond Portfolio — Class I | | | 769 |
| | 6 | | | | ING VP Real Estate Portfolio — Class I | | | 89 |
| | 2 | | | | ING VP Small Company Portfolio — Class I | | | 30 |
| | | | | | | | | |
| | | | | | | | | | | | |
| | | | | | Total Investments in Securities
(Cost $3,080)* | | 100.0 | % | | $ | 3,037 |
| | | | | | Other Assets and Liabilities - Net | | — | | | | — |
| | | | | | | | | | | | |
| | | | | | Net Assets | | 100.0 | % | | $ | 3,037 |
| | | | | | | | | | | | |
| * | Cost for federal income tax purposes is $3,081. |
| | | | |
Net unrealized depreciation consists of: | | | | |
Gross Unrealized Appreciation | | $ | 47 | |
Gross Unrealized Depreciation | | | (91 | ) |
| | | | |
Net Unrealized Depreciation | | $ | (44 | ) |
| | | | |
See Accompanying Notes to Financial Statements
42
| | |
| ING SOLUTION GROWTH PORTFOLIO | | PORTFOLIO OF INVESTMENTS ASOF DECEMBER 31, 2007 |
| | | | | | | | | |
| | | Shares | | | | Value |
| | | | | | | | | |
| AFFILIATED INVESTMENT COMPANIES: 100.0% |
| | 6 | | | | ING American Century Large Company Value Portfolio — Class I | | $ | 89 |
| | 6 | | | | ING BlackRock Large Cap Value Portfolio — Class I | | | 89 |
| | 5 | | | | ING Davis New York Venture Portfolio — Class I | | | 104 |
| | 5 | | | | ING Global Real Estate Portfolio — Class I | | | 59 |
| | 1 | | | | ING JPMorgan Emerging Markets Equity Portfolio — Class I | | | 30 |
| | 11 | | | | ING Julius Baer Foreign Portfolio — Class I | | | 211 |
| | 5 | | | | ING Legg Mason Partners Aggressive Growth Portfolio — Class I | | | 88 |
| | 10 | | | | ING Legg Mason Value Portfolio — Class I | | | 103 |
| | 19 | | | | ING Limited Maturity Bond Portfolio — Class I | | | 211 |
| | 2 | | | | ING Marsico Growth Portfolio — Class I | | | 88 |
| | 8 | | | | ING PIMCO Total Return Portfolio — Class I | | | 91 |
| | 6 | | | | ING T. Rowe Price Equity Income Portfolio — Class I | | | 89 |
| | 3 | | | | ING T. Rowe Price Growth Equity Portfolio — Class I | | | 178 |
| | 17 | | | | ING UBS U.S. Large Cap Equity Portfolio — Class I | | | 176 |
| | 3 | | | | ING Van Kampen Growth and Income Portfolio — Class I | | | 89 |
| | 5 | | | | ING Van Kampen Real Estate Portfolio — Class I | | | 145 |
| | 15 | | | | ING VP Index Plus International Equity Portfolio — Class I | | | 210 |
| | 10 | | | | ING VP Index Plus Large-Cap Portfolio — Class I | | | 177 |
| | 3 | | | | ING VP Index Plus Mid-Cap Portfolio — Class I | | | 59 |
| | 46 | | | | ING VP Intermediate Bond Portfolio — Class I | | | 607 |
| | 2 | | | | ING VP Real Estate Portfolio — Class I | | | 29 |
| | 3 | | | | ING VP Small Company Portfolio — Class I | | | 58 |
| | | | | | | | | |
| | | | | | | | | | |
| | | | Total Investments in Securities
(Cost $3,066)* | | 100.0 | % | | $ | 2,980 |
| | | | Other Assets and Liabilities - Net | | — | | | | — |
| | | | | | | | | | |
| | | | Net Assets | | 100.0 | % | | $ | 2,980 |
| | | | | | | | | | |
| * | Cost for federal income tax purposes is $3,067. |
| | | | |
Net unrealized depreciation consists of: | | | | |
Gross Unrealized Appreciation | | $ | 31 | |
Gross Unrealized Depreciation | | | (118 | ) |
| | | | |
| | | | |
Net Unrealized Depreciation | | $ | (87 | ) |
| | | | |
See Accompanying Notes to Financial Statements
43
| | |
| ING SOLUTION INCOME PORTFOLIO | | PORTFOLIO OF INVESTMENTS AS OF DECEMBER 31, 2007 |
| | | | | | | |
| Shares | | | | | | Value |
| AFFILIATED INVESTMENT COMPANIES: 100.0% |
| 275,391 | | | | ING American Century Large Company Value Portfolio — Class I | | $ | 3,976,653 |
| 990,702 | | | | ING BlackRock Inflation Protected Bond Portfolio — Class I | | | 10,204,230 |
| 144,998 | | | | ING Davis New York Venture Portfolio — Class I | | | 2,986,954 |
| 281,337 | | | | ING Legg Mason Value Portfolio — Class I | | | 2,965,287 |
| 2,926,858 | | | | ING Limited Maturity Bond Portfolio — Class I | | | 32,458,861 |
| 907,185 | | | | ING Oppenheimer Strategic Income Portfolio — Class I | | | 10,160,473 |
| 3,295,410 | | | | ING PIMCO Total Return Portfolio — Class I | | | 38,852,883 |
| 130,486 | | | | ING T. Rowe Price Equity Income Portfolio — Class I | | | 1,991,223 |
| 64,389 | | | | ING T. Rowe Price Growth Equity Portfolio — Class I | | | 3,985,039 |
| 745,891 | | | | ING UBS U.S. Large Cap Equity Portfolio — Class I | | | 7,913,908 |
| 274,711 | | | | ING Van Kampen Real Estate Portfolio — Class I | | | 7,842,997 |
| 996,502 | | | | ING VP Index Plus International Equity Portfolio — Class I | | | 14,120,432 |
| 437,476 | | | | ING VP Index Plus Large-Cap Portfolio — Class I | | | 7,931,447 |
| 3,854,924 | | | | ING VP Intermediate Bond Portfolio — Class I | | | 51,000,648 |
| 386,470 | | | | ING VP Real Estate Portfolio — Class I | | | 5,905,265 |
| | | | | | | |
| | | | | | | | | |
| | Total Investments in Securities
(Cost $201,024,089)* | | 100.0 | % | | $ | 202,296,300 | |
| | Other Assets and Liabilities - Net | | (0.0 | ) | | | (72,813 | ) |
| | | | | | | | | |
| | Net Assets | | 100.0 | % | | $ | 202,223,487 | |
| | | | | | | | | |
| * | Cost for federal income tax purposes is $201,431,297. |
| | | | |
Net unrealized appreciation consists of: | | | | |
Gross Unrealized Appreciation | | $ | 3,629,813 | |
Gross Unrealized Depreciation | | | (2,764,810 | ) |
| | | | |
Net Unrealized Appreciation | | $ | 865,003 | |
| | | | |
See Accompanying Notes to Financial Statements
44
| | |
| ING SOLUTION 2015 PORTFOLIO | | PORTFOLIO OF INVESTMENTS ASOF DECEMBER 31, 2007 |
| | | | | | | |
| Shares | | | | | | Value |
| | | | | | | |
| AFFILIATED INVESTMENT COMPANIES: 100.0% | | | |
| 800,251 | | | | ING American Century Large Company Value Portfolio — Class I | | $ | 11,555,631 |
| 2,881,948 | | | | ING BlackRock Inflation Protected Bond Portfolio — Class I | | | 29,684,068 |
| 820,364 | | | | ING BlackRock Large Cap Value Portfolio — Class I | | | 11,550,723 |
| 702,281 | | | | ING Davis New York Venture Portfolio — Class I | | | 14,466,989 |
| 961,118 | | | | ING Global Real Estate Portfolio — Class I | | | 11,610,311 |
| 1,272,689 | | | | ING Julius Baer Foreign Portfolio — Class I | | | 23,519,300 |
| 297,139 | | | | ING Legg Mason Partners Aggressive Growth Portfolio — Class I | | | 14,354,791 |
| 1,362,231 | | | | ING Legg Mason Value Portfolio — Class I | | | 14,357,913 |
| 3,724,120 | | | | ING Limited Maturity Bond Portfolio — Class I | | | 41,300,495 |
| 752,289 | | | | ING Marsico Growth Portfolio — Class I | | | 14,398,803 |
| 683,368 | | | | ING Marsico International Opportunities Portfolio — Class I | | | 11,692,435 |
| 3,693,989 | | | | ING Oppenheimer Strategic Income Portfolio — Class I | | | 41,372,679 |
| 3,027,512 | | | | ING PIMCO Total Return Portfolio — Class I | | | 35,694,370 |
| 1,137,601 | | | | ING T. Rowe Price Equity Income Portfolio — Class I | | | 17,359,791 |
| 374,244 | | | | ING T. Rowe Price Growth Equity Portfolio — Class I | | | 23,161,968 |
| 2,711,061 | | | | ING UBS U.S. Large Cap Equity Portfolio — Class I | | | 28,764,358 |
| 917,795 | | | | ING Van Kampen Comstock Portfolio — Class I | | | 11,518,328 |
| 795,951 | | | | ING Van Kampen Real Estate Portfolio — Class I | | | 22,724,405 |
| 1,655,679 | | | | ING VP Index Plus International Equity Portfolio — Class I | | | 23,460,977 |
| 1,590,231 | | | | ING VP Index Plus Large-Cap Portfolio — Class I | | | 28,830,883 |
| 625,552 | | | | ING VP Index Plus Mid-Cap Portfolio — Class I | | | 11,466,364 |
| 8,971,075 | | | | ING VP Intermediate Bond Portfolio — Class I | | | 118,687,321 |
| 749,344 | | | | ING VP Real Estate Portfolio — Class I | | | 11,449,973 |
| 582,462 | | | | ING VP Small Company Portfolio — Class I | | | 11,392,962 |
| | | | | | | |
| | | | | | | | | | | |
| | | | Total Investments in Securities
(Cost $579,756,662)* | | 100.0 | % | | $ | 584,375,838 | |
| | | | Other Assets and Liabilities - Net | | (0.0 | ) | | | (220,381 | ) |
| | | | | | | | | | | |
| | | | Net Assets | | 100.0 | % | | $ | 584,155,457 | |
| | | | | | | | | | | |
| * | Cost for federal income tax purposes is $580,273,444. |
| | | | |
Net unrealized appreciation consists of: | | | | |
Gross Unrealized Appreciation | | $ | 13,894,097 | |
Gross Unrealized Depreciation | | | (9,791,703 | ) |
| | | | |
Net Unrealized Appreciation | | $ | 4,102,394 | |
| | | | |
See Accompanying Notes to Financial Statements
45
| | |
| ING SOLUTION 2025 PORTFOLIO | | PORTFOLIO OF INVESTMENTS ASOF DECEMBER 31, 2007 |
| | | | | | | |
| Shares | | | | | | Value |
| | | | | | | |
| AFFILIATED INVESTMENT COMPANIES: 100.0% | | | |
| 2,365,931 | | | | ING American Century Large Company Value Portfolio — Class I | | $ | 34,164,042 |
| 699,693 | | | | ING Baron Asset Portfolio — Class I | | | 8,515,258 |
| 428,393 | | | | ING Baron Small Cap Growth Portfolio — Class I | | | 8,452,186 |
| 1,819,045 | | | | ING BlackRock Large Cap Value Portfolio — Class I | | | 25,612,151 |
| 1,245,767 | | | | ING Davis New York Venture Portfolio — Class I | | | 25,662,795 |
| 1,420,661 | | | | ING Global Real Estate Portfolio — Class I | | | 17,161,580 |
| 637,233 | | | | ING JPMorgan Emerging Markets Equity Portfolio — Class I | | | 17,103,345 |
| 540,664 | | | | ING JPMorgan Mid Cap Value Portfolio — Class I | | | 8,526,269 |
| 3,292,225 | | | | ING Julius Baer Foreign Portfolio — Class I | | | 60,840,310 |
| 702,798 | | | | ING Legg Mason Partners Aggressive Growth Portfolio — Class I | | | 33,952,163 |
| 2,416,479 | | | | ING Legg Mason Value Portfolio — Class I | | | 25,469,690 |
| 5,504,908 | | | | ING Limited Maturity Bond Portfolio — Class I | | | 61,049,435 |
| 1,779,314 | | | | ING Marsico Growth Portfolio — Class I | | | 34,056,078 |
| 1,515,236 | | | | ING Marsico International Opportunities Portfolio — Class I | | | 25,925,690 |
| 1,681,644 | | | | ING T. Rowe Price Equity Income Portfolio — Class I | | | 25,661,889 |
| 829,831 | | | | ING T. Rowe Price Growth Equity Portfolio — Class I | | | 51,358,214 |
| 3,206,832 | | | | ING UBS U.S. Large Cap Equity Portfolio — Class I | | | 34,024,483 |
| 877,478 | | | | ING UBS U.S. Small Cap Growth Portfolio — Class I | | | 8,432,565 |
| 2,713,465 | | | | ING Van Kampen Comstock Portfolio — Class I | | | 34,053,982 |
| 881,795 | | | | ING Van Kampen Real Estate Portfolio — Class I | | | 25,175,261 |
| 3,671,122 | | | | ING VP Index Plus International Equity Portfolio — Class I | | | 52,019,799 |
| 1,881,025 | | | | ING VP Index Plus Large-Cap Portfolio — Class I | | | 34,102,980 |
| 924,732 | | | | ING VP Index Plus Mid-Cap Portfolio — Class I | | | 16,950,329 |
| 11,934,614 | | | | ING VP Intermediate Bond Portfolio — Class I | | | 157,894,948 |
| 1,108,323 | | | | ING VP Real Estate Portfolio — Class I | | | 16,935,177 |
| 861,047 | | | | ING VP Small Company Portfolio — Class I | | | 16,842,078 |
| | | | | | | |
| | | | | | | | | | | |
| | | | Total Investments in Securities
(Cost $851,755,275)* | | 100.0 | % | | $ | 859,942,697 | |
| | | | Other Assets and Liabilities - Net | | (0.0 | ) | | | (326,413 | ) |
| | | | | | | | | | | |
| | | | Net Assets | | 100.0 | % | | $ | 859,616,284 | |
| | | | | | | | | | | |
| * | Cost for federal income tax purposes is $852,706,782. |
| | | | |
Net unrealized appreciation consists of: | | | | |
Gross Unrealized Appreciation | | $ | 22,554,482 | |
Gross Unrealized Depreciation | | | (15,318,567 | ) |
| | | | |
Net Unrealized Appreciation | | $ | 7,235,915 | |
| | | | |
See Accompanying Notes to Financial Statements
46
| | |
| ING SOLUTION 2035 PORTFOLIO | | PORTFOLIO OF INVESTMENTS ASOF DECEMBER 31, 2007 |
| | | | | | | | | |
| Shares | | | | | | | | Value |
| | | | | | | | | |
| AFFILIATED INVESTMENT COMPANIES: 100.0% | | | |
| 1,873,616 | | | | | | ING American Century Large Company Value Portfolio — Class I | | $ | 27,055,015 |
| 554,099 | | | | | | ING Baron Asset Portfolio — Class I | | | 6,743,386 |
| 678,510 | | | | | | ING Baron Small Cap Growth Portfolio — Class I | | | 13,387,012 |
| 1,920,706 | | | | | | ING BlackRock Large Cap Value Portfolio — Class I | | | 27,043,547 |
| 986,539 | | | | | | ING Davis New York Venture Portfolio — Class I | | | 20,322,712 |
| 1,125,360 | | | | | | ING Global Real Estate Portfolio — Class I | | | 13,594,344 |
| 1,009,553 | | | | | | ING JPMorgan Emerging Markets Equity Portfolio — Class I | | | 27,096,412 |
| 428,161 | | | | | | ING JPMorgan Mid Cap Value Portfolio — Class I | | | 6,752,094 |
| 2,607,103 | | | | | | ING Julius Baer Foreign Portfolio — Class I | | | 48,179,268 |
| 626,130 | | | | | | ING Legg Mason Partners Aggressive Growth Portfolio — Class I | | | 30,248,362 |
| 1,913,659 | | | | | | ING Legg Mason Value Portfolio — Class I | | | 20,169,967 |
| 1,585,206 | | | | | | ING Marsico Growth Portfolio — Class I | | | 30,340,835 |
| 1,599,894 | | | | | | ING Marsico International Opportunities Portfolio — Class I | | | 27,374,185 |
| 1,775,622 | | | | | | ING T. Rowe Price Equity Income Portfolio — Class I | | | 27,095,988 |
| 766,679 | | | | | | ING T. Rowe Price Growth Equity Portfolio — Class I | | | 47,449,788 |
| 2,538,823 | | | | | | ING UBS U.S. Large Cap Equity Portfolio — Class I | | | 26,936,915 |
| 1,389,802 | | | | | | ING UBS U.S. Small Cap Growth Portfolio — Class I | | | 13,355,998 |
| 2,148,841 | | | | | | ING Van Kampen Comstock Portfolio — Class I | | | 26,967,957 |
| 465,690 | | | | | | ING Van Kampen Real Estate Portfolio — Class I | | | 13,295,437 |
| 3,876,216 | | | | | | ING VP Index Plus International Equity Portfolio — Class I | | | 54,925,980 |
| 1,117,099 | | | | | | ING VP Index Plus Large-Cap Portfolio — Class I | | | 20,252,997 |
| 1,098,474 | | | | | | ING VP Index Plus Mid-Cap Portfolio — Class I | | | 20,135,028 |
| 7,875,728 | | | | | | ING VP Intermediate Bond Portfolio — Class I | | | 104,195,882 |
| 876,959 | | | | | | ING VP Real Estate Portfolio — Class I | | | 13,399,938 |
| 681,889 | | | | | | ING VP Small Company Portfolio — Class I | | | 13,337,740 |
| | | | | | | | | |
| | | | | | | | | | | |
| | | | Total Investments in Securities
(Cost $670,248,036)* | | 100.0 | % | | $ | 679,656,787 | |
| | | | Other Assets and Liabilities - Net | | (0.0 | ) | | | (261,376 | ) |
| | | | | | | | | | | |
| | | | Net Assets | | 100.0 | % | | $ | 679,395,411 | |
| | | | | | | | | | | |
| * | Cost for federal income tax purposes is $670,745,997. |
| | | | |
Net unrealized appreciation consists of: | | | | |
Gross Unrealized Appreciation | | $ | 21,367,965 | |
Gross Unrealized Depreciation | | | (12,457,175 | ) |
| | | | |
Net Unrealized Appreciation | | $ | 8,910,790 | |
| | | | |
See Accompanying Notes to Financial Statements
47
| | |
| ING SOLUTION 2045 PORTFOLIO | | PORTFOLIO OF INVESTMENTS ASOF DECEMBER 31, 2007 |
| | | | | | | |
| Shares | | | | | | Value |
| | | | | | | |
| AFFILIATED INVESTMENT COMPANIES: 100.0% | | | |
| 1,181,604 | | | | ING American Century Large Company Value Portfolio — Class I | | $ | 17,062,366 |
| 465,929 | | | | ING Baron Asset Portfolio — Class I | | | 5,670,357 |
| 380,365 | | | | ING Baron Small Cap Growth Portfolio — Class I | | | 7,504,600 |
| 1,076,711 | | | | ING BlackRock Large Cap Value Portfolio — Class I | | | 15,160,088 |
| 712,601 | | | | ING Columbia Small Cap Value II Portfolio — Class I | | | 7,468,061 |
| 553,037 | | | | ING Davis New York Venture Portfolio — Class I | | | 11,392,559 |
| 630,574 | | | | ING Global Real Estate Portfolio — Class I | | | 7,617,328 |
| 707,229 | | | | ING JPMorgan Emerging Markets Equity Portfolio — Class I | | | 18,982,035 |
| 360,029 | | | | ING JPMorgan Mid Cap Value Portfolio — Class I | | | 5,677,662 |
| 2,087,811 | | | | ING Julius Baer Foreign Portfolio — Class I | | | 38,582,740 |
| 389,997 | | | | ING Legg Mason Partners Aggressive Growth Portfolio — Class I | | | 18,840,751 |
| 1,072,767 | | | | ING Legg Mason Value Portfolio — Class I | | | 11,306,963 |
| 987,376 | | | | ING Marsico Growth Portfolio — Class I | | | 18,898,372 |
| 1,121,073 | | | | ING Marsico International Opportunities Portfolio — Class I | | | 19,181,564 |
| 995,379 | | | | ING T. Rowe Price Equity Income Portfolio — Class I | | | 15,189,491 |
| 429,785 | | | | ING T. Rowe Price Growth Equity Portfolio — Class I | | | 26,599,376 |
| 1,068,268 | | | | ING UBS U.S. Large Cap Equity Portfolio — Class I | | | 11,334,322 |
| 779,106 | | | | ING UBS U.S. Small Cap Growth Portfolio — Class I | | | 7,487,211 |
| 1,355,179 | | | | ING Van Kampen Comstock Portfolio — Class I | | | 17,007,494 |
| 260,585 | | | | ING Van Kampen Real Estate Portfolio — Class I | | | 7,439,699 |
| 2,444,515 | | | | ING VP Index Plus International Equity Portfolio — Class I | | | 34,638,777 |
| 626,607 | | | | ING VP Index Plus Large-Cap Portfolio — Class I | | | 11,360,390 |
| 821,049 | | | | ING VP Index Plus Mid-Cap Portfolio — Class I | | | 15,049,831 |
| 1,471,632 | | | | ING VP Intermediate Bond Portfolio — Class I | | | 19,469,696 |
| 246,603 | | | | ING VP Real Estate Portfolio — Class I | | | 3,768,100 |
| 382,259 | | | | ING VP Small Company Portfolio — Class I | | | 7,476,995 |
| | | | | | | |
| | | | | | | | | | | |
| | | | Total Investments in Securities
(Cost $374,207,444)* | | 100.0 | % | | $ | 380,166,828 | |
| | | | Other Assets and Liabilities - Net | | (0.0 | ) | | | (143,217 | ) |
| | | | | | | | | | | |
| | | | Net Assets | | 100.0 | % | | $ | 380,023,611 | |
| | | | | | | | | | | |
| * | Cost for federal income tax purposes is $374,591,971. |
| | | | |
Net unrealized appreciation consists of: | | | | |
Gross Unrealized Appreciation | | $ | 12,723,554 | |
Gross Unrealized Depreciation | | | (7,148,697 | ) |
| | | | |
Net Unrealized Appreciation | | $ | 5,574,857 | |
| | | | |
See Accompanying Notes to Financial Statements
48
SHAREHOLDER MEETING INFORMATION (UNAUDITED)
A special meeting of shareholders of ING Partners, Inc. was held October 25, 2007, at the offices of ING Funds, 7337 East Doubletree Ranch Road, Scottsdale, AZ 85258.
A brief description of each matter voted upon as well as the results are outlined below:
Matters:
| | 1 | To approve the election of eleven nominees to the Board of Directors of the Portfolios. |
Results:
| | | | | | | | |
| | | Proposal* | | Shares voted for | | Shares voted
against or
withheld | | Total shares
voted |
| | | | |
Colleen D. Baldwin | | 1 | | 483,022,915 | | 8,616,966 | | 491,639,881 |
| | | | |
John V. Boyer | | 1 | | 482,570,195 | | 9,069,686 | | 491,639,881 |
| | | | |
Patricia W. Chadwick | | 1 | | 482,229,198 | | 9,410,683 | | 491,639,881 |
| | | | |
Robert W. Crispin | | 1 | | 482,001,918 | | 9,637,963 | | 491,639,881 |
| | | | |
Peter S. Drotch | | 1 | | 482,473,676 | | 9,166,205 | | 491,639,881 |
| | | | |
J. Michael Earley | | 1 | | 482,066,524 | | 9,573,357 | | 491,639,881 |
| | | | |
Patrick W. Kenny | | 1 | | 482,349,381 | | 9,290,500 | | 491,639,881 |
| | | | |
Shaun P. Mathews | | 1 | | 482,345,787 | | 9,294,094 | | 491,639,881 |
| | | | |
Sheryl K. Pressler | | 1 | | 481,846,320 | | 9,793,561 | | 491,639,881 |
| | | | |
David W.C. Putnam | | 1 | | 481,635,830 | | 10,004,051 | | 491,639,881 |
| | | | |
Roger B. Vincent | | 1 | | 482,354,446 | | 9,285,435 | | 491,639,881 |
| * | | Proposal 1 passed at this meeting. |
49
| | |
TAX INFORMATION (UNAUDITED) |
Dividends paid during the year ended December 31, 2007 were as follows:
| | | | | |
| Portfolio Name | | Type | | Per Share Amount |
ING Solution Income Portfolio | | | | | |
Class ADV | | NII | | $ | 0.0721 |
Class I | | NII | | $ | 0.0757 |
Class S | | NII | | $ | 0.0694 |
Class T | | NII | | $ | — |
All Classes | | STCG | | $ | 0.0071 |
All Classes | | LTCG | | $ | 0.0030 |
ING Solution 2015 Portfolio | | | | | |
Class ADV | | NII | | $ | 0.0676 |
Class I | | NII | | $ | 0.0732 |
Class S | | NII | | $ | 0.0660 |
Class T | | NII | | $ | — |
All Classes | | STCG | | $ | 0.0136 |
All Classes | | LTCG | | $ | 0.0062 |
ING Solution 2025 Portfolio | | | | | |
Class ADV | | NII | | $ | 0.0534 |
Class I | | NII | | $ | 0.0588 |
Class S | | NII | | $ | 0.0509 |
Class T | | NII | | $ | — |
All Classes | | STCG | | $ | 0.0257 |
All Classes | | LTCG | | $ | 0.0145 |
ING Solution 2035 Portfolio | | | | | |
Class ADV | | NII | | $ | 0.0580 |
Class I | | NII | | $ | 0.0633 |
Class S | | NII | | $ | 0.0560 |
Class T | | NII | | $ | — |
All Classes | | STCG | | $ | 0.0247 |
All Classes | | LTCG | | $ | 0.0113 |
ING Solution 2045 Portfolio | | | | | |
Class ADV | | NII | | $ | 0.0330 |
Class I | | NII | | $ | 0.0381 |
Class S | | NII | | $ | 0.0316 |
Class T | | NII | | $ | — |
All Classes | | STCG | | $ | 0.0221 |
All Classes | | LTCG | | $ | 0.0106 |
NII – Net investment income
STCG – Short-term capital gain
LTCG – Long-term capital gain
Of the ordinary distributions made during the year ended December 31, 2007, the following percentages qualify for the dividends received deduction (DRD) available to corporate shareholders:
| | | | | |
ING Solution Income Portfolio | | 0.85 | % | | |
ING Solution 2015 Portfolio | | 2.59 | % | | |
ING Solution 2025 Portfolio | | 4.37 | % | | |
ING Solution 2035 Portfolio | | 4.14 | % | | |
ING Solution 2045 Portfolio | | 5.82 | % | | |
Above figures may differ from those cited elsewhere in this report due to differences in the calculation of income and gains under U.S. generally accepted accounting principles (book) purposes and Internal Revenue Service (tax) purposes.
Shareholders are strongly advised to consult their own tax advisers with respect to the tax consequences of their investments in the Portfolios. In January, shareholders, excluding corporate shareholders, receive an IRS 1099-DIV regarding the federal tax status of the dividends and distributions they received in the calendar year.
See Accompanying Notes to Financial Statements
50
DIRECTOR AND OFFICER INFORMATION (UNAUDITED)
The business and affairs of the Fund are managed under the direction of the Fund’s Board. A Director who is not an interested person of the Fund, as defined in the 1940 Act, is an independent director (“Independent Director”). The Directors and Officers of the Fund are listed below. The Statement of Additional Information includes additional information about directors of the Fund and is available, without charge, upon request at (800) 992-0180.
| | | | | | | | | | |
Name, Address and Age | | Position(s)
held with
Fund | | Term of Office
and Length of
Time Served(1) | | Principal Occupation(s) during the Past Five Years | | Number of
Portfolios
in Fund
Complex
Overseen
by Director | | Other Directorships
held by Director |
Independent Directors: | | | | | | | | | | |
| | | | | |
Colleen D. Baldwin 7337 E. Doubletree Ranch Rd. Scottsdale, Arizona 85258 Age: 47 | | Director | | November 2007 - Present | | Consultant (January 2005 - Present). Formerly, Chief Operating Officer, Ivy Asset Management Group (April 2002 - October 2004). Chief Operating Officer, AIG Global Investment Group. (May 1995 - January 2002). | | 179 | | None |
| | | | | |
John V. Boyer 7337 E. Doubletree Ranch Rd. Scottsdale, Arizona 85258 Age: 54 | | Director | | November 1997 - Present | | Consultant (July 2007 - Present). Formerly, President and Chief Executive Officer, Franklin and Eleanor Roosevelt Institute (March 2006 - July 2007), and Executive Director, The Mark Twain House & Museum(2) (September 1989 - November 2005). | | 179 | | None |
| | | | | |
Patricia W. Chadwick
7337 E. Doubletree Ranch Rd. Scottsdale, Arizona 85258 Age: 59 | | Director | | January 2006 - Present | | Consultant and President of self-owned company, Ravengate Partners LLC (January 2000 - Present). | | 179 | | Wisconsin Energy (June 2006 - Present). |
| | | | | |
Peter S. Drotch 7337 E. Doubletree Ranch Rd. Scottsdale, Arizona 85258 Age: 66 | | Director | | November 2007 - Present | | Retired partner. PricewaterhouseCoopers. | | 179 | | First Marblehead Corporation,(October 2003 - Present); BlackRock Funds/State Street Research Funds, Trustee (February 2004 - January 2007); Tufts Health Plan, Director (June 2006 - Present); and University of Connecticut, Trustee (November 2004 - Present) |
| | | | | |
J. Michael Earley 7337 E. Doubletree Ranch Rd. Scottsdale, Arizona 85258 Age: 62 | | Director | | January 2005 - Present | | President, Chief Executive Officer and Director, Bankers Trust Company, N.A., Des Moines (June 1992 - Present). | | 179 | | Midamerica Financial Corporation (December 2002 - Present). |
| | | | | |
Patrick W. Kenny 7337 E. Doubletree Ranch Rd. Scottsdale, Arizona 85258 Age: 65 | | Director | | March 2002 - Present | | President and Chief Executive Officer, International Insurance Society (June 2001 - Present). | | 179 | | Assured Guaranty Ltd. (April 2004 - Present); and Odyssey Reinsurance Holdings (November 2006 - Present). |
| | | | | |
Sheryl K. Pressler 7337 E. Doubletree Ranch Rd. Scottsdale, Arizona 85258 Age: 57 | | Director | | January 2006 - Present | | Consultant (May 2001 - Present). | | 179 | | Stillwater Mining Company (May 2002 - Present); California HealthCare Foundation (June 1999 - Present); and Romanian-American Enterprise Fund (February 2004 - Present). |
| | | | | |
David W. C. Putnam 7337 E. Doubletree Ranch Rd. Scottsdale, Arizona 85258 Age: 68 | | Director | | January 2005 - Present | | Chair, Board of Directors and President, F. L. Putnam Securities Company, Inc. (June 1978 - Present). | | 179 | | Principled Equity Market Trust (December 1996 - Present); and Asian American Bank and Trust Company (June 1993 - Present). |
| | | | | |
Roger B. Vincent 7337 E. Doubletree Ranch Rd. Scottsdale, Arizona 85258 Age: 62 | | Chairman/ Director | | January 2005 - Present | | President, Springwell Corporation (March 1989 - Present). | | 179 | | UGI Corporation (February 2006 - Present); and UGI Utilities, Inc. (February 2006 - Present). |
51
DIRECTOR AND OFFICER INFORMATION (UNAUDITED) (CONTINUED)
| | | | | | | | | | |
Name, Address and Age | | Position(s)
held with
Fund | | Term of Office
and Length of
Time Served(1) | | Principal Occupation(s) during the Past Five Years | | Number of
Portfolios
in Fund
Complex
Overseen
by Director | | Other Directorships
Held by Director |
Directors who are “Interested Persons:” | | | | | | | | |
| | | | | |
Robert W. Crispin(3) 7337 E. Doubletree Ranch Rd. Scottsdale, Arizona 85258 Age: 61 | | Director | | November 2007 - Present | | Retired Chairman and Chief Investment Officer, ING Investment Management Co. 12/31/2007 | | 179 | | ING Life Insurance and Annuity Company (May 2006- Present); ING USA Annuity and Life Insurance Company (May 2006 - Present); Midwestern United Life Insurance Company (May 2006 - Present); ReliaStar Life Insurance Company (May 2006 - Present); Security Life of Denver Insurance Company (May 2006 - Present); Belair Insurance Company Inc. (August 2005 - Present); The Nordic Insurance Company of Canada (February 2005 - Present); Trafalgar Insurance Company of Canada (February 2005 - Present); ING Novex Insurance Company of Canada (February 2005 - Present); Allianz Insurance Company of Canada (February 2005 - Present); ING Canada Inc. (December 2004 - Present);ING Bank, fsb (June 2001 - Present); ING Investment Management, Inc (June 2001 - December 2007); ING Insurance Company of Canada (June 2001 - Present); Sul America S.A. (June 2001 - Present); and ING Foundation (March 2004 - Present) |
| | | | | |
Shaun P. Mathews(3) 7337 E. Doubletree Ranch Rd. Scottsdale, Arizona 85258 Age: 52 | | Director | | November 2007 - Present | | President and Chief Executive Officer, ING Investments, LLC (December 2006 - Present), and Head of ING USFS Mutual Funds and Investment Products (October 2004 - Present). Formerly, CMO, ING USFS (April 2002 - October 2004), and Head of Rollover/Payout (October 2001 - December 2003). | | 179 | | Mark Twain House & Museum (September 2002 - Present); Connecticut Forum (May 2002 - Present); Capital Community College Foundation (February 2002 - Present); ING Services Holding Company, Inc. (May 2000 - Present); Southland Life Insurance Company (June 2002 - Present); and ING Capital Corporation, LLC, ING Funds Distributor, LLC(4), ING Funds Services, LLC(5), ING Investments, LLC(6) and ING Pilgrim Funding, Inc. (March 2006 - Present). |
(1) | | Directors serve until their successors are duly elected and qualified, subject to the Board’s retirement policy which states that each duly elected or appointed Trustee who is not an “interested person” of the Fund, as defined in the 1940 Act (“Independent Trustees”), shall retire from service as a Director at the conclusion of the first regularly scheduled meeting of the Board that is held after the Director reaches the age of 70. A unanimous vote of the Board may extend the retirement date of a Trustee for up to one year. An extension may be permitted if the retirement would trigger a requirement to hold a meeting of shareholders of the Fund under applicable law, whether for purposes of appointing a successor to the Trustee or if otherwise necessary under applicable law, in which case the extension would apply until such time as the shareholder meeting can be held or is no longer needed. |
(2) | | Shaun Mathews, President, ING USFS Mutual Funds and Investment Products, has held a seat on the Board of Directors of The Mark Twain House & Museum since September 19, 2002. ING Groep N.V. makes non-material, charitable contributions to The Mark Twain House & Museum. |
(3) | | Messrs. Mathews and Crispin are deemed to be “interested persons” of the Fund as defined in the 1940 Act because of their relationship with ING Groep, the parent corporation of the Adviser, ING Investments, LLC and the Distributor, ING Funds Distributor, LLC. |
(4) | | ING Funds Distributor, LLC is the sucessor in interest to ING Funds Distributor, Inc., which was previously known as ING Pilgrim Securities, Inc., and before that was known as Pilgrim Securities, Inc., and before that was known as Pilgrim America Securities, Inc. |
(5) | | ING Investments, LLC was previously named ING Pilgrim Investments, LLC. ING Pilgrim Investments, LLC is the sucessor in interest to ING Pilgrim Investments, Inc., which was previously known as Pilgrim Investments, Inc. and before that was known as Pilgrim America Investments, Inc. |
(6) | | ING Funds Services, LLC was previously named ING Pilgrim Group, LLC. ING Pilgrim Group, LLC is the sucessor in interest to ING Pilgrim Group, Inc., which was previously known as Pilgrim Group, Inc. and before that was known as Pilgrim America Group, Inc. |
52
DIRECTOR AND OFFICER INFORMATION (UNAUDITED) (CONTINUED)
| | | | | | |
Name, Address and Age | | Position(s) Held
with the Fund | | Term of Office
and Length of
Time Served(1) | | Principal Occupation(s) during the Past Five Years |
Officers: | | | | | | |
| | | |
Shaun P. Mathews(5) 7337 East Doubletree Ranch Rd. Scottsdale, Arizona 85258 Age: 52 | | President and Chief Executive Officer | | November 2006 - Present | | President and Chief Executive Officer, ING Investments, LLC(2) and ING Funds Services, LLC(3) (December 2006 - Present); and Head of ING USFS Mutual Funds and Investment Products (October 2004 - Present). Formerly, CMO, ING USFS (April 2002 - October 2004); and Head of Rollover/Payout (October 2001 - December 2003). |
| | | |
Michael J. Roland 7337 East Doubletree Ranch Rd. Scottsdale, Arizona 85258 Age: 49 | | Executive Vice President | | January 2005 - Present | | Head of Mutual Fund Platform (February 2007 - Present); and Executive Vice President, ING Investments, LLC(2) and ING Funds Services, LLC(3) (December 2001 - Present). Formerly, Head of Product Management (January 2005 - January 2007); Chief Compliance Officer, ING Investments, LLC(2) and Directed Services, LLC(6) (October 2004 - December 2005); and Chief Financial Officer and Treasurer, ING Investments, LLC(2) (December 2001 - March 2005). |
| | | |
Stanley D. Vyner 230 Park Avenue New York, New York 10169 Age: 57 | | Executive Vice President | | January 2005 - Present | | Executive Vice President, ING Investments, LLC(2) (July 2000 - Present); and Chief Investment Risk Officer, ING Investments, LLC(2) (January 2003 - Present). Formerly, Chief Investment Officer of International Investments (August 2000 - January 2003). |
| | | |
Joseph M. O’Donnell 7337 East Doubletree Ranch Rd. Scottsdale, Arizona 85258 Age: 53 | | Executive Vice President and Chief Compliance Officer | | March 2006 - Present
January 2005 - Present | | Chief Compliance Officer of the ING Funds (November 2004 - Present), ING Investments, LLC(2) and Directed Services, LLC(6) (March 2006 - Present); and Executive Vice President of the ING Funds (March 2006 - Present). Formerly, Chief Compliance Officer of ING Life Insurance and Annuity Company (March 2006 - December 2006); Vice President, Chief Legal Counsel, Chief Compliance Officer and Secretary of Atlas Securities, Inc., Atlas Advisers, Inc. and Atlas Funds (October 2001 - October 2004). |
| | | |
Todd Modic 7337 East Doubletree Ranch Rd. Scottsdale, Arizona 85258 Age: 40 | | Senior Vice President, Chief/Principal Financial Officer and Assistant Secretary | | March 2005 - Present | | Senior Vice President, ING Funds Services, LLC(3) (April 2005 - Present). Formerly, Vice President, ING Funds Services, LLC(3) (September 2002 - March 2005); and Director of Financial Reporting, ING Investments, LLC(2) (March 2001 - September 2002). |
| | | |
Kimberly A. Anderson 7337 East Doubletree Ranch Rd. Scottsdale, Arizona 85258 Age: 43 | | Senior Vice President | | January 2005 - Present | | Senior Vice President, ING Investments, LLC(2) (October 2003 - Present). Formerly, Vice President and Assistant Secretary, ING Investments, LLC(2) (January 2001 - October 2003). |
| | | |
Ernest J. C’DeBaca 7337 East Doubletree Ranch Rd. Scottsdale, Arizona 85258 Age: 38 | | Senior Vice President | | May 2006 - Present | | Senior Vice President, ING Investments, LLC(2) (December 2006 - Present); and ING Funds Services, LLC(3) (April 2006 - Present). Formerly, Counsel, ING Americas, U.S. Legal Services (January 2004 - March 2006); and Attorney-Adviser, U.S. Securities and Exchange Commission (May 2001 - December 2003). |
| | | |
Robert Terris 7337 East Doubletree Ranch Rd. Scottsdale, Arizona 85258 Age: 37 | | Senior Vice President | | May 2006 - Present | | Senior Vice President, Head of Division Operations, ING Funds (May 2006 - Present); and Vice President, Head of Division Operations, ING Funds Services, LLC(3) (March 2006 - Present). Formerly, Vice President of Administration, ING Funds Services, LLC(3) (October 2001 - March 2006). |
| | | |
Robyn L. Ichilov 7337 East Doubletree Ranch Rd. Scottsdale, Arizona 85258 Age: 40 | | Vice President and Treasurer | | January 2005 - Present | | Vice President and Treasurer, ING Funds Services, LLC(3) (October 2001 - Present) and ING Investments, LLC(2) (August 1997 - Present). |
| | | |
Lauren D. Bensinger 7337 East Doubletree Ranch Rd. Scottsdale, Arizona 85258 Age: 54 | | Vice President | | January 2005 - Present | | Vice President and Chief Compliance Officer, ING Funds Distributor, LLC(4) (July 1995 - Present); and Vice President, ING Investments, LLC(2) (February 1996 - Present); and Director of Compliance, ING Investments, LLC(2) (October 2004 - Present). Formerly, Chief Compliance Officer, ING Investments, LLC(2) (October 2001 - October 2004). |
| | | |
William Evans 10 State House Square Hartford, Connecticut 06103 Age: 35 | | Vice President | | September 2007 - Present | | Vice President, Head of Mutual Fund Advisory Group (April 2007 - Present), Vice President, U.S. Mutual Funds and Investment Products ( May 2005 - April 2007), Senior Fund Analyst, U.S. Mutual Funds and Investment Products (May 2002 - May 2005) |
53
DIRECTOR AND OFFICER INFORMATION (UNAUDITED) (CONTINUED)
| | | | | | |
Name, Address and Age | | Position(s) Held
with the Fund | | Term of Office
and Length of
Time Served(1) | | Principal Occupation(s) during the Past Five Years |
| | | |
Maria M. Anderson 7337 East Doubletree Ranch Rd. Scottsdale, Arizona 85258 Age: 49 | | Vice President | | January 2005 - Present | | Vice President, ING Funds Services, LLC(3) (September 2004 - Present). Formerly, Assistant Vice President, ING Funds Services, LLC(3) (October 2001 - September 2004); and Manager of Fund Accounting and Fund Compliance, ING Investments, LLC(2) (September 1999 - October 2001). |
| | | |
Denise Lewis 7337 East Doubletree Ranch Rd. Scottsdale, Arizona 85258 Age: 44 | | Vice President | | January 2007 - Present | | Vice President, ING Funds Services, LLC(3) (December 2006 - Present). Formerly, Senior Vice President, UMB Investment Services Group, LLC (November 2003 - December 2006); and Vice President, Wells Fargo Funds Management, LLC (December 2000 - August 2003). |
| | | |
Kimberly K. Palmer 7337 East Doubletree Ranch Rd. Scottsdale, Arizona 85258 Age: 50 | | Vice President | | March 2006 - Present | | Vice President, ING Funds Services, LLC(3) (March 2006 - Present). Formerly, Assistant Vice President, ING Funds Services, LLC(3) (August 2004 - March 2006); Manager, Registration Statements, ING Funds Services, LLC(3) (May 2003 - August 2004); Associate Partner, AMVESCAP PLC (October 2000 - May 2003); and Director of Federal Filings and Blue Sky Filings, INVESCO Funds Group, Inc. (March 1994 - May 2003). |
| | | |
Susan P. Kinens 7337 East Doubletree Ranch Rd. Scottsdale, Arizona 85258 Age: 31 | | Assistant Vice President | | January 2005 - Present | | Assistant Vice President, ING Funds Services, LLC(3) (December 2002 - Present); and has held various other positions with ING Funds Services, LLC(3) for more than the last five years. |
| | | |
Huey P. Falgout, Jr. 7337 East Doubletree Ranch Rd. Scottsdale, Arizona 85258 Age: 44 | | Secretary | | August 2003 - Present | | Chief Counsel, ING Americas, U.S. Legal Services (September 2003 - Present). Formerly, Counsel, ING Americas, U.S. Legal Services (November 2002 - September 2003); and Associate General Counsel of AIG American General (January 1999 - November 2002). |
| | | |
Theresa K. Kelety 7337 East Doubletree Ranch Rd. Scottsdale, Arizona 85258 Age: 44 | | Assistant Secretary | | August 2003 - Present | | Counsel, ING Americas, U.S. Legal Services (April 2003 - Present). Formerly, Senior Associate with Shearman & Sterling (February 2000 - April 2003). |
(1) | | The officers hold office until the next annual meeting of the Directors and until their successors shall have been elected and qualified. |
(2) | | ING Investments, LLC was previously named ING Pilgrim Investments, LLC. ING Pilgrim Investments, LLC is the sucessor in interest to ING Pilgrim Investments, Inc., which was previously known as Pilgrim Investments, Inc. and before that was known as Pilgrim America Investments, Inc. |
(3) | | ING Funds Services, LLC was previously named ING Pilgrim Group, LLC. ING Pilgrim Group, LLC is the sucessor in interest to ING Pilgrim Group, Inc., which was previously known as Pilgrim Group, Inc. and before that was known as Pilgrim America Group, Inc. |
(4) | | ING Funds Distributor, LLC is the sucessor in interest to ING Funds Distributor, Inc., which was previously known as ING Pilgrim Securities, Inc., and before that was known as Pilgrim Securities, Inc., and before that was known as Pilgrim America Securities, Inc. |
(5) | | Mr. Mathews commenced services as CEO and President of the ING Funds on November 11, 2006. |
(6) | | Directed Services, LLC is the sucessor in interest to Directed Services, Inc. |
54
ADVISORY CONTRACT APPROVAL DISCUSSION (UNAUDITED)
BOARD CONSIDERATION AND RE-APPROVAL OF INVESTMENT ADVISORY CONTRACTS
Section 15(c) of the Investment Company Act of 1940 (the “1940 Act”) provides that, after an initial period, the Portfolios’ existing advisory contract will remain in effect only if the Board of Directors (the “Board”) of ING Partners, Inc. (the “Company”), including a majority of Board members who have no direct or indirect interest in the advisory contract, and who are not “interested persons” of the Company, as such term is defined under the 1940 Act (the “Independent Directors”), annually review and approve the contract. Thus, at a meeting held on November 30, 2007, the Board, including a majority of the Independent Directors, considered whether to renew the Investment Advisory Agreement (the “Advisory Contract”) between Directed Services, LLC (the “Adviser”) and the Company, on behalf of the Portfolios.
The Independent Directors also held separate meetings on October 10 and November 28, 2007 to consider the renewal of the Advisory Contract. As a result, subsequent references herein to factors considered and determinations made by the Independent Directors include, as applicable, factors considered and determinations made on those earlier dates by the Independent Directors.
At its November 30, 2007 meeting, the Board voted to renew the Portfolios’ Advisory Contract. In reaching this decision, the Board took into account information furnished to it throughout the year at regular meetings of the Board and the Board’s committees, as well as information prepared specifically in connection with the annual renewal process. Determinations by the Independent Directors also took into account various factors that they believed, in light of the legal advice furnished to them by Kirkpatrick & Lockhart Preston Gates Ellis LLP (“K&L Gates”), their independent legal counsel, and their own business judgment, to be relevant.
Provided below is an overview of the Board’s contract approval process in general, as well as a discussion of certain specific factors that the Board considered at its renewal meeting. While the Board gave its attention to the information furnished, at its request, that was most relevant to its considerations, discussed below are a number of the primary factors relevant to the Board’s consideration as to whether to renew the Advisory Contract for the one-year period ending November 30, 2008. Each Board member may have accorded different weight to the various factors in reaching his or her conclusions with respect to each Portfolio’s advisory arrangements.
Overview of the Contract Renewal and Approval Process
Several years ago, the Independent Directors instituted a revised process by which they seek and consider relevant information when they decide whether to approve new or existing advisory arrangements for the investment companies in the ING Funds complex under their jurisdiction, including the Portfolios’ existing Advisory Contract. Among other actions, the Independent Directors: retained the services of independent consultants with experience in the mutual fund industry to assist the Independent Directors in working with the personnel employed by the Adviser or its affiliates who administer the Portfolios (“Management”) to identify the types of information presented to the Board to inform its deliberations with respect to advisory relationships and to help evaluate that information; established a specific format in which certain requested information is provided to the Board; and determined the process for reviewing such information in connection with Advisory Contract renewals and approvals. The end result was an enhanced process which is currently employed by the Independent Directors to review and analyze information in connection with their annual renewal of the Portfolios’ Advisory Contract, as well as their review and approval of new advisory relationships.
Since the current renewal and approval process was first implemented, the Board’s membership has changed substantially through periodic retirements of some Directors and the appointment and election of new Directors. In addition, throughout this period the Independent Directors have reviewed and refined the renewal and approval process at least annually. The Board also established a Contracts Committee and two Investment Review Committees, including the International/Balanced/Fixed Income Funds Investment Review Committee (the “I/B/F IRC”). Among other matters, the Contracts Committee provides oversight with respect to the contracts renewal process, and each Portfolio is assigned to the I/B/F IRC, which provides oversight regarding, among other matters, investment performance.
The type and format of the information provided to the Board or to legal counsel for the Independent Directors in connection with the contract approval and renewal process has been codified in the ING Funds’ 15(c) Methodology
55
ADVISORY CONTRACT APPROVAL DISCUSSION (UNAUDITED) (CONTINUED)
Guide. This Guide was developed under the direction of the Independent Directors and sets out a blueprint pursuant to which the Independent Directors request certain information that they deem important to facilitate an informed review in connection with initial and annual approvals of advisory arrangements for the Funds in the ING Funds complex.
Management provides certain of the information requested by the 15(c) Methodology Guide in Fund Analysis and Comparison Tables (“FACT sheets”) prior to the Independent Directors’ review of advisory contracts. The Independent Directors previously retained an independent firm to verify and test the accuracy of certain FACT sheet data for a representative sample of Funds in the ING Funds complex. In 2007, the Contracts Committee employed the services of an independent consultant to assist in its review and analysis of, among other matters, the 15(c) Methodology Guide, the content and format of the FACT sheets, and proposed selected peer groups of investment companies (“SPGs”) to be used by each Portfolio for certain comparison purposes during the renewal process.
As part of an ongoing process, the Contracts Committee recommends or considers recommendations from Management for refinements to the 15(c) Methodology Guide and other aspects of the review process, and the I/B/F IRC reviews benchmarks used to assess the performance of each Portfolio. The I/B/F IRC may apply a heightened level of scrutiny in cases where performance has lagged a Portfolio’s relevant benchmark and/or SPG.
The Board employed its process for reviewing contracts when considering the renewal of the Advisory Contract that would be effective through November 30, 2008. Set forth below is a discussion of many of the Board’s primary considerations and conclusions resulting from this process.
Nature, Extent and Quality of Service
In determining whether to approve the Advisory Contract for the Portfolios for the year ending November 30, 2008, the Independent Directors received and evaluated such information as they deemed necessary regarding the nature, extent and quality of services provided to the Portfolios by the Adviser. This included information regarding the Adviser provided throughout the year at regular meetings of the Board and its committees, as well as information furnished in connection with the contract renewal meetings.
The materials requested by and provided to the Board and/or to K&L Gates prior to the November 30, 2007 Board meeting included, among other information, the following items: (1) FACT sheets for each Portfolio that provided information regarding the performance and expenses of the Portfolio and other similarly managed funds in an SPG, as well as information regarding the Portfolio’s investment portfolio, objectives and strategies; (2) the 15(c) Methodology Guide, which describes how the FACT sheets were prepared, including the manner in which benchmarks and SPGs were selected and how profitability was determined; (3) responses from the Adviser to a series of questions posed by K&L Gates on behalf of the Directors; (4) a copy of the form of Advisory Contract; (5) a copy of the Adviser’s Form ADV; (6) the Adviser’s financial statements; (7) drafts of narrative summaries addressing key factors the Board customarily considers in evaluating the renewals of the Advisory Contract, including a written analysis for each Portfolio of how performance, fees and expenses compare to its SPG and designated benchmarks; (8) independent analyses of each Portfolio’s performance by the Company’s Chief Investment Risk Officer; (9) information regarding net asset flows into and out of the Portfolios; and (10) other information relevant to the Board’s evaluations.
For each Portfolio, its Initial Class of shares was used for purposes of certain comparisons to the funds in its SPG. Initial Class shares generally were selected so that the Portfolios’ class with the longest performance history was compared to the analogous class of shares for each SPG fund. The mutual funds included in a Portfolio’s SPG were selected based upon criteria designed to mirror the Portfolio’s class being compared to the SPG.
In arriving at its conclusions with respect to the Advisory Contract, the Board was mindful of the “manager-of-managers” platform of the ING Funds that has been developed by Management, under which it oversees the sub-advisers to the underlying Funds in which the Portfolios invest. The Board noted the resources that the Adviser has committed to the Board and to the I/B/F IRC to assist the Board and the I/B/F IRC with their assessment of the investment performance of the Portfolios on an ongoing basis throughout the year. This includes the appointment of a Chief Investment Risk Officer and his staff, who report directly to the Board and who have developed attribution analyses and other metrics used by the I/B/F IRC to analyze the key factors underlying investment performance for the Portfolios.
56
ADVISORY CONTRACT APPROVAL DISCUSSION (UNAUDITED) (CONTINUED)
In considering the Portfolios’ Advisory Contract, the Board also considered the extent of benefits provided to the Portfolios’ shareholders, beyond advisory services, from being part of the ING family of Funds. This includes, in most cases, the right to exchange or transfer investments, without a sales charge, between the same class of shares of the Portfolios and other ING Funds, or among the ING Funds available on a product platform, and the wide range of ING Funds available for exchange or transfer.
The Board also took into account the Adviser’s efforts in recent years to reduce the expenses of the ING Funds through renegotiated arrangements with the ING Funds’ service providers. In addition, the Board considered the efforts of the Adviser and the expenses that it incurred in recent years to help make the ING Funds complex more efficient by combinations of similar funds.
Further, the Board received periodic reports showing that the investment policies and restrictions for each Portfolio were consistently complied with and other periodic reports covering matters such as compliance by Adviser personnel with the Adviser’s code of ethics. The Board considered reports from the Company’s Chief Compliance Officer (“CCO”) evaluating whether the regulatory compliance systems and procedures of the Adviser are reasonably designed to assure compliance with the federal securities laws, including those related to, among others, late trading and market timing, best execution, fair value pricing, proxy voting and trade allocation practices. The Board also took into account the CCO’s annual and periodic reports and recommendations with respect to service provider compliance programs. In this regard, the Board also considered the policies and procedures developed by the CCO in consultation with the Board’s Compliance Committee that guide the CCO’s compliance oversight function.
The Board reviewed the level of staffing, quality and experience of each Portfolio’s portfolio management team. The Board took into account the resources and reputation of the Adviser, and evaluated the ability of the Adviser to attract and retain qualified investment advisory personnel. The Board also considered the adequacy of the resources committed to the Portfolios (and other relevant funds in the ING Funds complex) by the Adviser, and whether those resources are commensurate with the needs of the Portfolios and are sufficient to sustain appropriate levels of performance and compliance needs.
Based on their deliberations and the materials presented to them, the Board concluded that the advisory and related services provided by the Adviser are appropriate in light of the Portfolios’ operations, the competitive landscape of the investment company business, and investor needs, and that the nature and quality of the overall services provided by the Adviser were appropriate.
Portfolio Performance
In assessing advisory relationships, the Board placed emphasis on the net investment returns of each Portfolio. While the Board considered the performance reports and discussions with portfolio managers at Board and committee meetings during the year, particular attention in assessing performance was given to the FACT sheets furnished in connection with the renewal process. The FACT sheet prepared for each Portfolio included its investment performance compared to the Portfolio’s Morningstar category median, Lipper category median, SPG and primary benchmark. The Board’s findings specific to each Portfolio’s performance are discussed under “Portfolio-by-Portfolio Analysis,” below.
Economies of Scale
When evaluating the reasonableness of advisory fee rates, the Board also considered whether economies of scale will be realized by the Adviser as a Portfolio grows larger and the extent to which any such economies are reflected in contractual fee rates. In this regard, while each Portfolio is subject to a level advisory fee rate, the Board noted that any breakpoints in advisory fee schedules of certain underlying Funds in which the Portfolios invest would result in a lower advisory fee rate for the underlying Fund when the Fund achieves sufficient asset levels to receive a breakpoint discount. Further, each Portfolio benefits from expense limits and waivers of certain fees, and the Board also considered the extent to which economies of scale could be realized through such limitations and waivers.
57
ADVISORY CONTRACT APPROVAL DISCUSSION (UNAUDITED) (CONTINUED)
In evaluating economies of scale, the Independent Directors also considered prior periodic management reports and industry information on this topic, and the Independent Directors who were Board members at that time also considered a November 2006 evaluation and analysis presented to them by an independent consultant regarding fee breakpoint arrangements and economies of scale.
Information Regarding Services to Other Clients
The Board requested and, if received, considered information regarding the nature of services and fee rates offered by the Adviser to other clients, including other registered investment companies and institutional accounts. If a fee rate offered to other clients differed materially from those charged to the Portfolios, the Board considered any underlying rationale provided by the Adviser for these differences. The Board also noted that the fee rates charged to the Portfolios and similar institutional clients may differ materially due to the different services and additional regulatory overlay associated with registered investment companies, such as the Portfolios.
Fee Rates and Profitability
The Board reviewed and considered each contractual investment advisory fee rate, combined with the administrative fee rate, payable by each Portfolio to the Adviser. In addition, the Board considered any fee waivers and expense limitations applicable to the fees payable by the Portfolios.
The Board considered the fee structures of each Portfolio as they relate to the services provided under the contracts and the potential fall-out benefits to the Adviser and its affiliates from their association with the Portfolios. For each Portfolio, the Board determined that the fees payable to the Adviser are reasonable for the services that it performs, which were considered in light of the nature and quality of the services that it has performed and is expected to perform.
For each Portfolio, the Board considered information on revenues, costs and profits realized by the Adviser, which was prepared by Management in accordance with the allocation methodology (including related assumptions) specified in the 15(c) Methodology Guide. The Board also considered information that it requested and was provided by Management with respect to the profitability of service providers affiliated with the Adviser.
The Board determined that it had requested and received sufficient information to gain a reasonable understanding regarding the Adviser’s profitability. The Board also recognized that profitability analysis is not an exact science and there is no uniform methodology for determining profitability for this purpose. In this context, the Board realized that Management’s calculations regarding its costs incurred in establishing the infrastructure necessary for the Portfolios’ operations may not be fully reflected in the expenses allocated to each Portfolio in determining profitability, and that the information presented may not portray all of the costs borne by Management or capture Management’s entrepreneurial risk associated with offering and managing a mutual fund complex in the current regulatory and market environment.
Based on the information on revenues, costs, and profitability considered by the Board, and after considering the factors described in this section, the Board concluded that the profits, if any, realized by the Adviser were not excessive.
Portfolio-by-Portfolio Analysis
The following paragraphs outline certain of the specific factors that the Board considered, and the conclusions reached, at its November 30, 2007 meeting in relation to renewing the Advisory Contract for the year ending November 30, 2008. These specific factors are in addition to those considerations discussed above. In each case, the Portfolio’s performance was compared to its Morningstar category median and its primary benchmark, a broad-based securities market index that appears in the Portfolio’s prospectus. With respect to Morningstar quintile rankings, the first quintile represents the highest (best) performance and the fifth quintile represents the lowest performance. Each Portfolio’s management fee and expense ratio were compared to the fees and expense ratios of the funds in its SPG.
58
ADVISORY CONTRACT APPROVAL DISCUSSION (UNAUDITED) (CONTINUED)
ING Solution Income Portfolio
In considering whether to approve the renewal of the Advisory Contract for ING Solution Income Portfolio, the Board considered that, based on performance data for the periods ended June 30, 2007: (1) the Portfolio outperformed its Morningstar category median for all periods presented; (2) the Portfolio underperformed its primary benchmark for the most recent calendar quarter and year-to-date periods, but outperformed for the one-year period; and (3) the Portfolio is ranked in the third quintile of its Morningstar category for the one-year period, and the fourth quintile for the most recent calendar quarter and year-to-date periods.
In analyzing this performance data, the Board took into account that: (1) the Portfolio launched in April 2005, and therefore had a limited operating history for the purpose of analyzing Portfolio performance; and (2) in April 2007 additional asset classes were added to the Portfolio as a result of the Asset Allocation Committee’s annual review.
In considering the fees payable under the Advisory Contract for ING Solution Income Portfolio, the Board took into account the factors described above and also considered: (1) the fairness of the compensation under an Advisory Contract with level fees that does not include breakpoints; (2) the pricing structure (including the expense ratio to be borne by shareholders) of ING Solution Income Portfolio, as compared to its SPG, including that: (a) the management fee (inclusive of the advisory fee and a 0.02% administration fee) for the Portfolio is below the median and the average management fees of the funds in its SPG; and (b) the expense ratio for the Portfolio is below the median and average expense ratios of the funds in its SPG. In analyzing this fee data, the Board took into account that the Portfolio indirectly bears the fees payable by the underlying Funds in which the Portfolio invests.
After its deliberation, the Board reached the following conclusions: (1) the Portfolio’s management fee rate is reasonable in the context of all factors considered by the Board; (2) the Portfolio’s expense ratio is reasonable in the context of all factors considered by the Board; and (3) the Portfolio’s performance is reasonable in the context of all factors considered by the Board. Based on these conclusions and other factors, the Board voted to renew the Advisory Contract for the Portfolio for the year ending November 30, 2008. During this renewal process, different Board members may have given different weight to different individual factors and related conclusions.
ING Solution 2015 Portfolio
In considering whether to approve the renewal of the Advisory Contract for ING Solution 2015 Portfolio, the Board considered that, based on performance data for the periods ended June 30, 2007: (1) the Portfolio underperformed its Morningstar category median for all periods presented; (2) the Portfolio outperformed its primary benchmark for all periods presented, with the exception of the year-to-date period, during which it underperformed; and (3) the Portfolio is ranked in the fifth (lowest) quintile of its Morningstar category for all periods presented.
In analyzing this performance data, the Board took into account that: (1) the Portfolio launched in April 2005, and therefore had a limited operating history for the purpose of analyzing Portfolio performance; and (2) in April 2007 additional asset classes were added to the Portfolio as a result of the Asset Allocation Committee’s annual review.
In considering the fees payable under the Advisory Contract for ING Solution 2015 Portfolio, the Board took into account the factors described above and also considered: (1) the fairness of the compensation under an Advisory Contract with level fees that does not include breakpoints; (2) the pricing structure (including the expense ratio to be borne by shareholders) of the Portfolio, as compared to its SPG, including that: (a) the management fee (inclusive of the advisory fee and a 0.02% administration fee) for the Portfolio is below the median and the average management fees of the funds in its SPG; and (b) the expense ratio for the Portfolio is below the median and the average expense ratios of the funds in its SPG. In analyzing the fee data, the Board took into account that the Portfolio indirectly bears the fees payable by the underlying Funds in which the Portfolio invests.
After its deliberation, the Board reached the following conclusions: (1) the Portfolio’s management fee rate is reasonable in the context of all factors considered by the Board; (2) the Portfolio’s expense ratio is reasonable in the context of all factors considered by the Board; and (3) the Portfolio was launched in April 2005, and it is reasonable to permit the Adviser to continue to manage the Portfolio to evaluate performance. Based on these conclusions and
59
ADVISORY CONTRACT APPROVAL DISCUSSION (UNAUDITED) (CONTINUED)
other factors, the Board voted to renew the Advisory Contract for the Portfolio for the year ending November 30, 2008. During this renewal process, different Board members may have given different weight to different individual factors and related conclusions.
ING Solution 2025 Portfolio
In considering whether to approve the renewal of the Advisory Contract for ING Solution 2025 Portfolio, the Board considered that, based on performance data for the periods ended June 30, 2007: (1) the Portfolio underperformed its Morningstar category median for all periods presented; (2) the Portfolio underperformed its primary benchmark for the most recent calendar quarter and year-to-date periods, but outperformed for the one-year period; and (3) the Portfolio is ranked in the fourth quintile of its Morningstar category for all periods presented.
In analyzing this performance data, the Board took into account that: (1) the Portfolio launched in April 2005, and therefore had a limited operating history for the purpose of analyzing Portfolio performance; and (2) in April 2007 additional asset classes were added to the Portfolio as a result of the Asset Allocation Committee’s annual review.
In considering the fees payable under the Advisory Contract for ING Solution 2025 Portfolio, the Board took into account the factors described above and also considered: (1) the fairness of the compensation under an Advisory Contract with level fees that does not include breakpoints; (2) the pricing structure (including the expense ratio to be borne by shareholders) of ING Solution 2025 Portfolio, as compared to its SPG, including that: (a) the management fee (inclusive of the advisory fee and a 0.02% administration fee) for the Portfolio is below the median and the average management fees of the funds in its SPG; and (b) the expense ratio for the Portfolio is below the median and the average expense ratios of the funds in its SPG. In analyzing the fee data, the Board took into account that the Portfolio indirectly bears the fees payable by the underlying Funds in which the Portfolio invests.
After its deliberation, the Board reached the following conclusions: (1) the Portfolio’s management fee rate is reasonable in the context of all factors considered by the Board; (2) the Portfolio’s expense ratio is reasonable in the context of all factors considered by the Board; and (3) the Portfolio was launched in April 2005, and it is reasonable to permit the Adviser to continue to manage the Portfolio to evaluate performance. Based on these conclusions and other factors, the Board voted to renew the Advisory Contract for the Portfolio for the year ending November 30, 2008. During this renewal process, different Board members may have given different weight to different individual factors and related conclusions.
ING Solution 2035 Portfolio
In considering whether to approve the renewal of the Advisory Contract for ING Solution 2035 Portfolio, the Board considered that, based on performance data for the periods ended June 30, 2007: (1) the Portfolio underperformed its Morningstar category median for all periods presented; (2) the Portfolio underperformed its primary benchmark for all periods presented; and (3) the Portfolio is ranked in the fourth quintile of its Morningstar category for all periods presented.
In analyzing this performance data, the Board took into account that: (1) the Portfolio launched in April 2005, and therefore had a limited operating history for the purpose of analyzing Portfolio performance; and (2) in April 2007 additional asset classes were added to the Portfolio as a result of the Asset Allocation Committee’s annual review.
In considering the fees payable under the Advisory Contract for ING Solution 2035 Portfolio, the Board took into account the factors described above and also considered: (1) the fairness of the compensation under an Advisory Contract with level fees that does not include breakpoints; (2) the pricing structure (including the expense ratio to be borne by shareholders) of the Portfolio, as compared to its SPG, including that: (a) the management fee (inclusive of the advisory fee and a 0.02% administration fee) for the Portfolio is below the median and the average management fees of the funds in its SPG; and (b) the expense ratio for the Portfolio is below the median and the average expense ratios of the funds in its SPG. In analyzing the fee data, the Board took into account that the Portfolio indirectly bears the fees payable by the underlying Funds in which the Portfolio invests.
60
ADVISORY CONTRACT APPROVAL DISCUSSION (UNAUDITED) (CONTINUED)
After its deliberation, the Board reached the following conclusions: (1) the Portfolio’s management fee rate is reasonable in the context of all factors considered by the Board; (2) the Portfolio’s expense ratio is reasonable in the context of all factors considered by the Board; and (3) the Portfolio was launched in April 2005, and it is reasonable to permit the Adviser to continue to manage the Portfolio to evaluate performance. Based on these conclusions and other factors, the Board voted to renew the Advisory Contract for the Portfolio for the year ending November 30, 2008. During this renewal process, different Board members may have given different weight to different individual factors and related conclusions.
ING Solution 2045 Portfolio
In considering whether to approve the renewal of the Advisory Contract for ING Solution 2045 Portfolio, the Board considered that, based on performance data for the periods ended June 30, 2007: (1) the Portfolio outperformed its Morningstar category median for all periods presented; (2) the Portfolio underperformed its primary benchmark for the most recent calendar quarter and year-to-date periods, but outperformed for the one-year period; and (3) the Portfolio is ranked in the second quintile of its Morningstar category for all periods presented.
In analyzing this performance data, the Board took into account that: (1) the Portfolio launched in April 2005, and therefore had a limited operating history for the purpose of analyzing Portfolio performance; and (2) in April 2007 additional asset classes were added to the Portfolio as a result of the Asset Allocation Committee’s annual review.
In considering the fees payable under the Advisory Contract for ING Solution 2045 Portfolio, the Board took into account the factors described above and also considered: (1) the fairness of the compensation under an Advisory Contract with level fees that does not include breakpoints; (2) the pricing structure (including the expense ratio to be borne by shareholders) of ING Solution 2045 Portfolio, as compared to its SPG, including that: (a) the management fee (inclusive of the advisory fee and a 0.02% administration fee) for the Portfolio is below the median and the average management fees of the funds in its SPG; and (b) the expense ratio for the Portfolio is below the median and average expense ratios of the funds in its SPG. In analyzing the fee data, the Board took into account that the Portfolio indirectly bears the fees payable by the underlying Funds in which the Portfolio invests.
After its deliberation, the Board reached the following conclusions: (1) the Portfolio’s management fee rate is reasonable in the context of all factors considered by the Board; (2) the Portfolio’s expense ratio is reasonable in the context of all factors considered by the Board; and (3) the Portfolio was launched in April 2005, and it is reasonable to permit the Adviser to continue to manage the Portfolio to evaluate performance. Based on these conclusions and other factors, the Board voted to renew the Advisory Contract for the Portfolio for the year ending November 30, 2008. During this renewal process, different Board members may have given different weight to different individual factors and related conclusions.
BOARD CONSIDERATION AND APPROVAL OF THE ADVISORY CONTRACT FOR ING SOLUTION GROWTH AND INCOME PORTFOLIO AND ING SOLUTION GROWTH PORTFOLIO
Section 15 of the 1940 Act mandates that, when a series of the Company enters into a new advisory arrangement, the Board, including a majority of the Independent Directors, must approve the new arrangement. Therefore, in order for a new series of the Company to be launched, the Board must approve the Advisory Contract for that series prior to the commencement of its operations. At a meeting held on May 10, 2007, the Board approved the Advisory Contract for ING Solution Growth and Income Portfolio and ING Solution Growth Portfolio, each a new series of the Company, for an initial, two-year term that commenced on June 2, 2007.
In determining whether to approve the Advisory Contract for each of these Portfolios, the Board received and evaluated such information as it deemed necessary for an informed determination of whether the Advisory Contract, and the proposed policies and procedures for the Portfolios, should be approved. The materials provided to the Board in support of the new advisory arrangements included the following: (1) a memorandum presenting Management’s rationale for requesting the launch of the Portfolios that discusses, among other things, the Adviser’s experience and expertise in the management of other Funds within the ING Funds complex, including the five other
61
ADVISORY CONTRACT APPROVAL DISCUSSION (UNAUDITED) (CONTINUED)
ING Solution Portfolios; (2) information about the new Portfolios’ proposed investment objectives and strategies and anticipated portfolio characteristics; (3) FACT sheets for the Portfolios that compare the Portfolios’ proposed fee structures to their comparable SPGs and Morningstar/Lipper category medians; (4) supporting documentation, including a copy of the form of Advisory Contract for the Portfolios; and (5) other information relevant to the Board’s evaluation. In addition, the Board considered the information provided periodically throughout the year in presentations to the Board by the Adviser in the context of the Adviser’s oversight and management of Funds in the ING Funds complex (including the other ING Solution Portfolios).
At the May 2007 Board meeting at which the Advisory Contract was approved with respect to the new Portfolios, the Board considered that the Portfolios would be subject to the Company’s standard policies and procedures previously approved by the Board for other series of the Company and approved in accordance with Rule 38a-1 under the 1940 Act. The Board also noted that, in managing the Portfolios, the Adviser would be subject to procedures adopted pursuant to Rule 206(4)-7 under the Investment Advisers Act of 1940 that had been previously approved by the Board in connection with other Funds in the ING Funds complex.
The Board’s consideration of whether to approve the Advisory Contract with the Adviser on behalf of the new Portfolios took into account several factors including, but not limited to, the following: (1) the nature and quality of the services to be provided by the Adviser to the Portfolios under the proposed Advisory Contract; (2) the Adviser’s experience in managing other Funds within the ING Funds complex, including similar Funds-of-Funds; (3) the Adviser’s strength and reputation within the industry; (4) the fairness of the compensation under the proposed Advisory Contract in light of the services to be provided to the Portfolios; (5) the costs for the services to be provided by the Adviser, including that the proposed advisory fees would not be subject to breakpoint discounts; (6) the pricing structure (including the estimated expense ratio to be borne by shareholders) of the Portfolios, including that: (a) the proposed management fee (inclusive of the advisory fee and a 0.02% administration fee) for each Portfolio is below the median and the average management fees of the funds in the Portfolio’s SPG, and (b) the estimated expense ratio for the Portfolio is below the median and average expense ratios of the funds in the Portfolio’s SPG; (7) the projected profitability of the Adviser; (8) the personnel, operations, financial condition, and investment management capabilities, methodologies and resources of the Adviser, including its management team’s expertise in the management of other Funds, including other Funds-of-Funds and asset allocation products; (9) the Adviser’s compliance capabilities, as demonstrated by, among other things, its policies and procedures designed to prevent violations of the Federal securities laws, which had previously been approved by the Board in connection with their oversight of other Funds in the ING Funds complex; (10) the information that had been provided by the Adviser at regular Board meetings, and in anticipation of the May 2007 meeting, with respect to its capabilities in overseeing similar asset allocation products; and (11) “fall-out benefits” to the Adviser and its affiliates that were anticipated to arise from the Adviser’s management of the Portfolios.
After its deliberation, the Board reached the following conclusions: (1) each Portfolio’s proposed management fee rate is reasonable in the context of all factors considered by the Board; (2) each Portfolio’s estimated expense ratio is reasonable in the context of all factors considered by the Board; and (3) the Adviser maintains an appropriate compliance program, with this conclusion based upon the Board’s previous and ongoing review of the compliance program and the representations of the Company’s CCO in materials provided to the Board in advance of the May 2007 meeting. Based on these conclusions and other factors, the Board voted to approve the Advisory Contract for the Portfolios. During its deliberations, different Board members may have given different weight to different individual factors and related conclusions.
62
Investment Adviser
Directed Services, LLC
1475 Dunwoody Drive
West Chester, Pennsylvania 19380
Administrator
ING Funds Services, LLC
7337 East Doubletree Ranch Road
Scottsdale, Arizona 85258
Distributor
ING Funds Distributor, LLC
7337 East Doubletree Ranch Road
Scottsdale, Arizona 85258
Transfer Agent
DST Systems, Inc.
P.O. Box 419368
Kansas City, Missouri 64141
Independent Registered Public Accounting Firm
KPMG LLP
99 High Street
Boston, Massachusetts 02110
Custodian
The Bank of New York Mellon Corporation
One Wall Street
New York, New York 10286
Legal Counsel
Dechert LLP
1775 I Street, N.W.
Washington, D.C. 20006
Before investing, carefully consider the investment objectives, risks, charges and expenses of the variable universal life insurance policy or variable annuity contract and the underlying variable investment options. This and other information is contained in the prospectus for the variable universal life policy or variable annuity contract and the underlying variable investment options. Obtain these prospectuses from your agent/registered representative and read them carefully before investing.
| | | | |
 | | VPAR-USOL | | (1207-022908) |
Item 2. Code of Ethics.
As of the end of the period covered by this report, Registrant had adopted a code of ethics, as defined in Item 2 of Form N-CSR, that applies to the Registrant’s principal executive officer and principal financial officer. There were no amendments to the Code during the period covered by the report. The Registrant did not grant any waivers, including implicit waivers, from any provisions of the Code during the period covered by this report. The code of ethics is filed herewith pursuant to Item 10(a)(1), Exhibit 99.CODE ETH.
Item 3. Audit Committee Financial Expert.
The Board of Trustees has determined that Patrick W. Kenny is an audit committee financial expert, as defined in Item 3 of Form N-CSR. Mr. Kenny is “independent” for purposes of Item 3 of Form N-CSR.
Item 4. Principal Accountant Fees and Services.
(a) Audit Fees: The aggregate fees billed for each of the last two fiscal years for professional services rendered by KPMG LLP (“KPMG”), the principal accountant for the audit of the registrant’s annual financial statements, for services that are normally provided by the accountant in connection with statutory and regulatory filings or engagements for those fiscal years were $653,000 for year ended December 31, 2007 and $638,250 for year ended December 31, 2006.
(b) Audit-Related Fees: The aggregate fees billed in each of the last two fiscal years for assurance and related services by KPMG that are reasonably related to the performance of the audit of the registrant’s financial statements and are not reported under paragraph (a) of this Item were $74,700 for year ended December 31, 2007 and $77,025 for year ended December 31, 2006.
None
(c) Tax Fees: The aggregate fees billed in each of the last two fiscal years for professional services rendered by KPMG for tax compliance, tax advice, and tax planning were $176,537 in the year ended December 31, 2007 and $184,760 in the year ended December 31, 2006. Such services included review of excise distribution calculations (if applicable), preparation of the Funds’ federal, state and excise tax returns, tax services related to mergers and routine consulting.
(d) All Other Fees: The aggregate fees billed in each of the last two fiscal years for products and services provided by KPMG, other than the services reported in paragraphs (a) through (c) of this Item.
None
(e) (1) Audit Committee Pre-Approval Policies and Procedures
2
AUDIT AND NON-AUDIT SERVICES
PRE-APPROVAL POLICY
I. Statement of Principles
Under the Sarbanes-Oxley Act of 2002 (the “Act”), the Audit Committee of the Board of Directors or Trustees (the “Committee”) of the ING Funds (each a “Fund,” collectively, the “Funds”) set out on Exhibit A to this Audit and Non-Audit Services Pre-Approval Policy (“Policy”) is responsible for the oversight of the work of the Funds’ independent auditors. As part of its responsibilities, the Committee must pre-approve the audit and non-audit services performed by the auditors in order to assure that the provision of these services does not impair the auditors’ independence from the Funds. The Committee has adopted, and the Board has ratified, this Policy, which sets out the procedures and conditions under which the services of the independent auditors may be pre-approved.
Under Securities and Exchange Commission (“SEC”) rules promulgated in accordance with the Act, the Funds may establish two different approaches to pre-approving audit and non-audit services. The Committee may approve services without consideration of specific case-by-case services (“general pre-approval”) or it may pre-approve specific services (“specific pre-approval”). The Committee believes that the combination of these approaches contemplated in this Policy results in an effective and efficient method for pre-approving audit and non-audit services to be performed by the Funds’ independent auditors. Under this Policy, services that are not of a type that may receive general pre-approval require specific pre-approval by the Committee. Any proposed services that exceed pre-approved cost levels or budgeted amounts will also require the Committee’s specific pre-approval.
For both types of approval, the Committee considers whether the subject services are consistent with the SEC’s rules on auditor independence and that such services are compatible with maintaining the auditors independence. The Committee also considers whether a particular audit firm is in the best position to provide effective and efficient services to the Funds. Reasons that the auditors are in the best position include the auditors’ familiarity with the Funds’ business, personnel, culture, accounting systems, risk profile, and other factors, and whether the services will enhance the Funds’ ability to manage and control risk or improve audit quality. Such factors will be considered as a whole, with no one factor being determinative.
The appendices attached to this Policy describe the audit, audit-related, tax-related, and other services that have the Committee’s general pre-approval. For any service that has been approved through general pre-approval, the general pre-approval will remain in place for a period 12 months from the date of pre-approval, unless the Committee determines that a different period is appropriate. The Committee will annually review and pre-approve the services that may be provided by the independent auditors without specific pre-approval. The Committee will revise the list of services subject to general pre-approval as appropriate. This Policy does not serve as a delegation to Fund management of the Committee’s duty to pre-approve services performed by the Funds’ independent auditors.
3
II. Audit Services
The annual audit services engagement terms and fees are subject to the Committee’s specific pre-approval. Audit services are those services that are normally provided by auditors in connection with statutory and regulatory filings or engagements or those that generally only independent auditors can reasonably provide. They include the Funds’ annual financial statement audit and procedures that the independent auditors must perform in order to form an opinion on the Funds’ financial statements (e.g., information systems and procedural reviews and testing). The Committee will monitor the audit services engagement and approve any changes in terms, conditions or fees deemed by the Committee to be necessary or appropriate.
The Committee may grant general pre-approval to other audit services, such as statutory audits and services associated with SEC registration statements, periodic reports and other documents filed with the SEC or issued in connection with securities offerings.
The Committee has pre-approved the audit services listed on Appendix A. The Committee must specifically approve all audit services not listed on Appendix A.
III. Audit-related Services
Audit-related services are assurance and related services that are reasonably related to the performance of the audit or the review of the Funds’ financial statements or are traditionally performed by the independent auditors. The Committee believes that the provision of audit-related services will not impair the independent auditors’ independence, and therefore may grant pre-approval to audit-related services. Audit-related services include accounting consultations related to accounting, financial reporting or disclosure matters not classified as “audit services;” assistance with understanding and implementing new accounting and financial reporting guidance from rulemaking authorities; agreed-upon or expanded audit procedures relating to accounting and/or billing records required to respond to or comply with financial, accounting or regulatory reporting matters; and assistance with internal control reporting requirements under Form N-SAR or Form N-CSR.
The Committee has pre-approved the audit-related services listed on Appendix B. The Committee must specifically approve all audit-related services not listed on Appendix B.
IV. Tax Services
The Committee believes the independent auditors can provide tax services to the Funds, including tax compliance, tax planning, and tax advice, without compromising the auditors’ independence. Therefore, the Committee may grant general pre-approval with respect to tax services historically provided by the Funds’ independent auditors that do not, in the Committee’s view, impair auditor independence and that are consistent with the SEC’s rules on auditor independence.
The Committee will not grant pre-approval if the independent auditors initially recommends a transaction the sole business purpose of which is tax avoidance and the tax treatment of which may not be supported in the Internal Revenue Code and related regulations. The Committee may consult
4
outside counsel to determine that tax planning and reporting positions are consistent with this Policy.
The Committee has pre-approved the tax-related services listed on Appendix C. The Committee must specifically approve all tax-related services not listed on Appendix C.
V. Other Services
The Committee believes it may grant approval of non-audit services that are permissible services for independent auditors to a Fund. The Committee has determined to grant general pre-approval to other services that it believes are routine and recurring, do not impair auditor independence, and are consistent with SEC rules on auditor independence.
The Committee has pre-approved the non-audit services listed on Appendix D. The Committee must specifically approve all non-audit services not listed on Appendix D.
A list of the SEC’s prohibited non-audit services is attached to this Policy as Appendix E. The SEC’s rules and relevant guidance should be consulted to determine the precise definitions of these impermissible services and the applicability of exceptions to certain of the SEC’s prohibitions.
VI. Pre-approval of Fee levels and Budgeted Amounts
The Committee will annually establish pre-approval fee levels or budgeted amounts for audit, audit-related, tax and non-audit services to be provided to the Funds by the independent auditors. Any proposed services exceeding these levels or amounts require the Committee’s specific pre-approval. The Committee considers fees for audit and non-audit services when deciding whether to pre-approve services. The Committee may determine, for a pre-approval period of 12 months, the appropriate ratio between the total amount of fees for the Fund’s audit, audit-related, and tax services (including fees for services provided to Fund affiliates that are subject to pre-approval), and the total amount of fees for certain permissible non-audit services for the Fund classified as other services (including any such services provided to Fund affiliates that are subject to pre-approval).
VII. Procedures
Requests or applications for services to be provided by the independent auditors will be submitted to management. If management determines that the services do not fall within those services generally pre-approved by the Committee and set out in the appendices to these procedures, management will submit the services to the Committee or its delagee. Any such submission will include a detailed description of the services to be rendered. Notwithstanding this paragraph, the Committee will, on a quarterly basis, receive from the independent auditors a list of services provided for the previous calendar quarter on a cumulative basis by the auditors during the Pre-Approval Period.
5
VIII. Delegation
The Committee may delegate pre-approval authority to one or more of the Committee’s members. Any member or members to whom such pre-approval authority is delegated must report any pre-approval decisions, including any pre-approved services, to the Committee at its next scheduled meeting. The Committee will identify any member to whom pre-approval authority is delegated in writing. The member will retain such authority for a period of 12 months from the date of pre-approval unless the Committee determines that a different period is appropriate. The period of delegated authority may be terminated by the Committee or at the option of the member.
IX. Additional Requirements
The Committee will take any measures the Committee deems necessary or appropriate to oversee the work of the independent auditors and to assure the auditors’ independence from the Funds. This may include reviewing a formal written statement from the independent auditors delineating all relationships between the auditors and the Funds, consistent with Independence Standards Board No. 1, and discussing with the auditors their methods and procedures for ensuring independence.
Amended: February 23, 2007
6
Appendix A
Pre-Approved Audit Services for the Pre-Approval Period January 1, 2007 through December 31, 2007
Service | | | | |
| | | | |
| | The Fund(s) | | Fee Range |
Statutory audits or financial audits (including tax services associated with audit services) | | x | | As presented to Audit Committee(1) |
| | | | |
Services associated with SEC registration statements, periodic reports and other documents filed with the SEC or other documents issued in connection with securities offerings (e.g., consents), and assistance in responding to SEC comment letters. | | x | | Not to exceed $9,750 per filing |
| | | | |
Consultations by Fund management with respect to accounting or disclosure treatment of transactions or events and/or the actual or potential effect of final or proposed rules, standards or interpretations by the SEC, Financial Accounting Standards Board, or other regulatory or standard setting bodies. | | x | | Not to exceed $8,000 during the Pre- Approval Period |
| | | | |
Seed capital audit and related review and issuance of consent on the N-2 registration statement | | x | | Not to exceed $12,600 per audit |
(1) For new Funds launched during the Pre-Approval Period, the fee ranges pre-approved will be the same as those for existing Funds, pro-rated in accordance with inception dates as provided in the auditors’ Proposal or any Engagement Letter covering the period at issue. Fees in the Engagement Letter will be controlling.
7
Appendix B
Pre-Approved Audit-Related Services for the Pre-Approval Period January 1, 2007 through December 31, 2007
Service | | | | | | |
| | | | | | |
| | The Fund(s) | | Fund Affiliates | | Fee Range |
Services related to Fund mergers (Excludes tax services - See Appendix C for tax services associated with Fund mergers) | | x | | x | | Not to exceed $10,000 per merger |
| | | | | | |
Consultations by Fund management with respect to accounting or disclosure treatment of transactions or events and/or the actual or potential effect of final or proposed rules, standards or interpretations by the SEC, Financial Accounting Standards Board, or other regulatory or standard setting bodies. [Note: Under SEC rules some consultations may be “audit” services and others may be “audit-related” services.] | | x | | | | Not to exceed $5,000 per occurrence during the Pre-Approval Period |
| | | | | | |
Review of the Funds’ semi-annual financial statements | | x | | | | Not to exceed $2,200 per set of financial statements per fund |
| | | | | | |
Reports to regulatory or government agencies related to the annual engagement | | x | | | | Up to $5,000 per occurrence during the Pre-Approval Period |
| | | | | | |
Regulatory compliance assistance | | x | | x | | Not to exceed $5,000 per quarter |
| | | | | | |
Training courses | | | | x | | Not to exceed $2,000 per course |
| | | | | | |
For Prime Rate Trust, agreed upon procedures for quarterly reports to rating agencies | | x | | | | Not to exceed $9,450 per quarter |
| | | | | | |
For Prime Rate Trust and Senior Income Fund, agreed upon procedures for the Revolving Credit and Security Agreement with Citigroup | | x | | | | Not to exceed $21,000 per fund per year |
8
Appendix C
Pre-Approved Tax Services for the Pre-Approval Period January 1, 2007 through December 31, 2007
Service | | | | | | |
| | | | | | |
| | The Fund(s) | | Fund
Affiliates | | Fee Range |
Preparation of federal and state income tax returns and federal excise tax returns for the Funds including assistance and review with excise tax distributions | | x | | | | As presented to Audit Committee(2) |
| | | | | | |
Review of IRC Sections 851(b) and 817(h) diversification testing on a real-time basis | | x | | | | As presented to Audit Committee(2) |
| | | | | | |
Assistance and advice regarding year-end reporting for 1099’s | | x | | | | As presented to Audit Committee(2) |
| | | | | | |
Tax assistance and advice regarding statutory, regulatory or administrative developments | | x | | x | | Not to exceed $5,000 for the Funds or for the Funds’ investment adviser during the Pre-Approval Period |
(2) For new Funds launched during the Pre-Approval Period, the fee ranges pre-approved will be the same as those for existing Funds, pro-rated in accordance with inception dates as provided in the auditors’ Proposal or any Engagement Letter covering the period at issue. Fees in the Engagement Letter will be controlling.
9
Appendix C, continued
Service | | | | | | |
| | | | | | |
| | The Fund(s) | | Fund
Affiliates | | Fee Range |
Tax training courses | | | | x | | Not to exceed $2,000 per course during the Pre-Approval Period |
| | | | | | |
Tax services associated with Fund mergers | | x | | x | | Not to exceed $4,000 per fund per merger during the Pre-Approval Period |
| | | | | | |
Other tax-related assistance and consultation, including, without limitation, assistance in evaluating derivative financial instruments and international tax issues, qualification and distribution issues, and similar routine tax consultations. | | x | | | | Not to exceed $120,000 during the Pre-Approval Period |
10
Appendix D
Pre-Approved Other Services for the Pre-Approval Period January 1, 2007 through December 31, 2007
Service | | | | | | |
| | | | | | |
| | The Fund(s) | | Fund Affiliates | | Fee Range |
Agreed-upon procedures for Class B share 12b-1 programs | | | | x | | Not to exceed $50,000 during the Pre-Approval Period |
| | | | | | |
Security counts performed pursuant to Rule 17f-2 of the 1940 Act (i.e., counts for Funds holding securities with affiliated sub-custodians) Cost to be borne 50% by the Funds and 50% by ING Investments, LLC. | | x | | x | | Not to exceed $5,000 per Fund during the Pre-Approval Period |
| | | | | | |
Agreed upon procedures for 15 (c) FACT Books | | x | | | | Not to exceed $35,000 during the Pre-Approval Period |
11
Appendix E
Prohibited Non-Audit Services
Dated: January 1, 2007
· Bookkeeping or other services related to the accounting records or financial statements of the Funds
· Financial information systems design and implementation
· Appraisal or valuation services, fairness opinions, or contribution-in-kind reports
· Actuarial services
· Internal audit outsourcing services
· Management functions
· Human resources
· Broker-dealer, investment adviser, or investment banking services
· Legal services
· Expert services unrelated to the audit
· Any other service that the Public Company Accounting Oversight Board determines, by regulation, is impermissible
12
EXHIBIT A
ING EQUITY TRUST
ING FUNDS TRUST
ING ASIA PACIFIC HIGH DIVIDEND EQUITY INCOME FUND
ING GLOBAL ADVANTAGE AND PREMIUM OPPORTUNITY FUND
ING GLOBAL EQUITY DIVIDEND AND PREMIUM OPPORTUNITY FUND
ING RISK MANAGED NATURAL RESOURCES FUND
ING INVESTMENT FUNDS, INC.
ING INVESTORS TRUST
ING MAYFLOWER TRUST
ING MUTUAL FUNDS
ING PARTNERS, INC.
ING PRIME RATE TRUST
ING SENIOR INCOME FUND
ING VARIABLE INSURANCE TRUST
ING VARIABLE PRODUCTS TRUST
ING VP NATURAL RESOURCES TRUST
13
(e) (2) Percentage of services referred to in 4(b) — (4)(d) that were approved by the audit committee
100% of the services were approved by the audit committee.
(f) Percentage of hours expended attributable to work performed by other than full time employees of KPMG if greater than 50%.
Not applicable.
(g) Non-Audit Fees: The non-audit fees billed by the registrant’s accountant for services rendered to the registrant, and rendered to the registrant’s investment adviser, and any entity controlling, controlled by, or under common control with the adviser that provides ongoing services to the registrant for each of the last two fiscal years of the registrant were $391,637 for year ended December 31, 2007 and $986,810 for year ended December 31, 2006.
(h) Principal Accountants Independence: The Registrant’s Audit committee has considered whether the provision of non-audit services that were rendered to the registrant’s investment adviser and any entity controlling, controlled by, or under common control with the investment adviser that provides ongoing services to the registrant that were not pre-approved pursuant to Rule 2-01(c)(7)(ii) of Regulation S-X is compatible with maintaining KPMG’s independence.
14
Item 5. Audit Committee of Listed Registrants.
Not applicable.
Item 6. Schedule of Investments
Schedule is included as part of the report to shareholders filed under Item 1 of this Form.
Item 7. Disclosure of Proxy Voting Policies and Procedures for Closed-End Management Investment Companies.
Not applicable.
Item 8. Portfolio Managers of Closed-End Management Investment Companies.
Not applicable.
Item 9. Purchases of Equity Securities by Closed-End Management Investment Company and Affiliated Purchasers
Not applicable.
Item 10. Submission of Matters to a Vote of Security Holders.
The Board has a Nominating Committee for the purpose of considering and presenting to the Board candidates it proposes for nomination to fill Independent Trustee vacancies on the Board. The Committee currently consists of all Independent Trustees of the Board (6 individuals). The Nominating Committee operates pursuant to a Charter approved by the Board. The primary purpose of the Nominating Committee is to consider and present to the Board the candidates it proposes for nomination to fill vacancies on the Board. In evaluating candidates, the Nominating Committee may consider a variety of factors, but it has not at this time set any specific minimum qualifications that must be met. Specific qualifications of candidates for Board membership will be based on the needs of the Board at the time of nomination.
The Nominating Committee is willing to consider nominations received from shareholders and shall assess shareholder nominees in the same manner as it reviews its own nominees. A shareholder nominee for director should be submitted in writing to the Fund’s Secretary. Any such shareholder nomination should include at a minimum the following information as to each individual proposed for nomination as trustee: such individual’s written consent to be named in the proxy statement as a nominee (if nominated) and to serve as a trustee (if elected), and all information relating to such individual that is required to be disclosed in the solicitation of proxies for election of trustees, or is otherwise required, in each case under applicable federal securities laws, rules and regulations.
The Secretary shall submit all nominations received in a timely manner to the Nominating Committee. To be timely, any such submission must be delivered to the Fund’s Secretary not earlier than the 90th day prior to such meeting and not later than the close of business on the later of the 60th day prior to such meeting or the 10th day following the day on which public announcement of the date of the meeting is first made, by either disclosure in a press release or in a document publicly filed by the Fund with the Securities and Exchange Commission.
Item 11. Controls and Procedures.
(a) Based on our evaluation conducted within 90 days of the filing date, hereof, the design and operation of the registrant’s disclosure controls and procedures are effective to ensure that material information relating to the registrant is made known to the certifying officers by others within the appropriate entities, particularly during the period in which Forms N-CSR are being prepared, and the registrant’s disclosure controls and procedures allow timely preparation and review of the information for the registrant’s Form N-CSR and the officer certifications of such Form N-CSR.
(b) There were no significant changes in the registrant’s internal controls that occurred during the second fiscal quarter of the period covered by this report that has materially affected, or is reasonably likely to materially affect, the registrant’s internal control over financial reporting.
Item 12. Exhibits.
(a)(1) Code of Ethics pursuant to Item 2 of Form N-CSR is filed and attached hereto as EX-99.CODE ETH.
(a)(2) A separate certification for each principal executive officer and principal financial officer of the registrant as required by Rule 30a-2 under the Act (17 CFR 270.30a-2) is attached hereto as EX-99.CERT.
(b) The officer certifications required by Section 906 of the Sarbanes-Oxley Act of 2002 are attached hereto as EX-99.906CERT.
(3) Not applicable.
15
SIGNATURES
Pursuant to the requirements of the Securities Exchange Act of 1934 and the Investment Company Act of 1940, the registrant has duly caused this report to be signed on its behalf by the undersigned, thereunto duly authorized.
(Registrant): ING Partners, Inc.
By | /s/ Shaun P. Mathews |
| Shaun P. Mathews |
| President and Chief Executive Officer |
Date: March 4, 2008
Pursuant to the requirements of the Securities Exchange Act of 1934 and the Investment Company Act of 1940, this report has been signed below by the following persons on behalf of the registrant and in the capacities and on the dates indicated.
By | /s/ Shaun P. Mathews |
| Shaun P. Mathews |
| President and Chief Executive Officer |
Date: March 4, 2008
By | /s/ Todd Modic |
| Todd Modic |
| Senior Vice President and Chief Financial Officer |
Date: March 4, 2008
16