OMB APPROVAL
OMB Number: 3235-0570
Expires: October 31, 2006
Estimated average burden hours per response: 19.3
UNITED STATES
SECURITIES AND EXCHANGE COMMISSION
Washington, D.C. 20549
FORM N-CSR
CERTIFIED SHAREHOLDER REPORT OF
REGISTERED MANAGEMENT INVESTMENT COMPANIES
Investment Company Act file number: 811-8319
ING Partners, Inc.
(Exact name of registrant as specified in charter)
7337 E. Doubletree Ranch Rd., Scottsdale, AZ | | 85258 |
(Address of principal executive offices) | | (Zip code) |
The Corporation Trust Company, 1209 Orange Street, Wilmington, DE 19801
(Name and address of agent for service)
Registrant’s telephone number, including area code: 1-800-992-0180
Date of fiscal year end: | December 31 |
| |
Date of reporting period: | January 1, 2005 to December 31, 2005 |
Item 1. Reports to Stockholders.
The following is a copy of the report transmitted to stockholders pursuant to Rule 30e-1 under the Act (17 CFR 270.30e-1):

| Funds |
Annual Report
December 31, 2005
Classes I, S and ADV
ING Partners, Inc.
§ ING American Century Large Company Value Portfolio (Formerly ING Salomon Brothers Investors Value Portfolio)
§ ING American Century Select Portfolio
§ ING American Century Small Cap Value Portfolio
§ ING Baron Small Cap Growth Portfolio
§ ING Davis Venture Value Portfolio (Formerly, ING Salomon Brothers Fundamental Value Portfolio)
§ ING Fundamental Research Portfolio (Formerly ING Aeltus Enhanced Index)
§ ING Goldman Sachs® Capital Growth Portfolio
§ ING Goldman Sachs® Core Equity Portfolio
§ ING JPMorgan Fleming International Portfolio
§ ING JPMorgan Mid Cap Value Portfolio
§ ING MFS Capital Opportunities Portfolio
§ ING OpCap Balanced Value Portfolio
§ ING Oppenheimer Global Portfolio
§ ING Oppenheimer Strategic Income Portfolio
§ ING PIMCO Total Return Portfolio
§ ING Salomon Brothers Aggressive Growth Portfolio
§ ING Salomon Brothers Large Cap Growth Portfolio
§ ING T. Rowe Price Diversified Mid Cap Growth Portfolio
§ ING T. Rowe Price Growth Equity Portfolio
§ ING UBS U.S. Large Cap Equity Portfolio
§ ING Van Kampen Comstock Portfolio
§ ING Van Kampen Equity and Income Portfolio
This report is submitted for general information to shareholders of the ING Funds. It is not authorized for distribution to prospective shareholders unless accompanied or preceded by a prospectus which includes details regarding the funds’ investment objectives, risks, charges, expenses and other information. This information should be read carefully. | 
|
PROXY VOTING INFORMATION
A description of the policies and procedures that the Portfolios use to determine how to vote proxies related to portfolio securities is available (1) without charge, upon request, by calling Shareholder Services toll-free at 1-800-992-0180; (2) on the ING Fund’s website at www.ingfunds.com and (3) on the Securities and Exchange Commission (“SEC”) website at www.sec.gov. Information regarding how the Portfolios voted proxies related to portfolio securities during the most recent 12-month period ended June 30 is available without charge on the ING Fund’s website at www.ingfunds.com and on the SEC’s website at www.sec.gov.
QUARTERLY PORTFOLIO HOLDINGS
The Registrants file their complete schedule of portfolio holdings with the SEC for the first and third quarters of each fiscal year on Form N-Q. The Registrants’ Forms N-Q are available on the SEC’s website at www.sec.gov. The Registrants’ Forms N-Q may be reviewed and copied at the SEC’s Public Reference Room in Washington, DC, and information on the operation of the Public Reference Room may be obtained by calling 1-800-SEC-0330; and is available upon request from the Registrants by calling Shareholder Services toll-free at 1-800-992-0180.
(THIS PAGE INTENTIONALLY LEFT BLANK)

| Dear Shareholder, |
|
As you may recall, in my last letter I described the enthusiasm that we were experiencing here at ING Funds as we worked to bring more of the world’s investment opportunities to you, the investor. |
|
That enthusiasm, I am happy to report, is continuing to thrive. With the New Year, we have launched a series of new international mutual funds, each created to bring more of the world’s opportunities to you. |
|
Meanwhile, we have also heard you loud and clear. Our research tells us that many investors report that they find investing an intimidating and overly-complex endeavor. That is why ING is committed to helping investors across the country cut through the confusion and clutter. “Your future. Made easier.SM” is more than words; they represent our promise to you. |
JAMES M. HENNESSY | |
Those two objectives — bringing you more of the world’s opportunities and doing it in a way that is easier for you — are behind the development of the new portfolios. |
| |
According to a recent finding, 58 percent of the world market capitalization now lies outside of the U.S.1 In other words, the majority of investment opportunities are now beyond our borders and we think that the ING VP Index Plus International Portfolio — a broad-based international portfolio — is an easy, single-step method to gain exposure to many of those opportunities. |
|
Meanwhile, the ING VP Global Real Estate Portfolio was developed as an easy way to bring global — international and domestic — real estate opportunities to the variable portfolio investor. Real Estate Investment Trusts (REITs) are becoming more and more popular around the world, and this new portfolio seeks to capitalize on that popularity. But again, we’ve made it easy. With just one investment, investors bring the diversification of global real estate to their investment strategy. |
|
One of our goals at ING Funds is to find tomorrow’s opportunities today, and we believe these two portfolios are just the latest examples of that plan in action. |
|
On behalf of everyone at ING Funds, I thank you for your continued support and loyalty. We look forward to serving you in the future. |
Sincerely,

James M. Hennessy President ING Funds |
January 28, 2006 | |
The views expressed in the President’s Letter reflect those of the President as of the date of the letter. Any such views are subject to change at any time based upon market or other conditions and ING Funds disclaims any responsibility to update such views. These views may not be relied on as investment advice and because investment decisions for an ING Fund are based on numerous factors, may not be relied on as an indication of investment intent on behalf of any ING Fund. Reference to specific company securities should not be construed as recommendations or investment advice.
International investing does pose special risks including currency fluctuation, economic and political risks not found in investments that are solely domestic. Investments in issuers that are principally engaged in real estate, including REITs, may subject the Fund to risks similar to those associated with the direct ownership of real estate, including terrorist attacks, war or other acts that destroy real property (in addition to market risks). These companies are sensitive to factors such as changes in real estate values and property taxes, interest rates, cash flow of underlying real estate assets, supply and demand, and the management skill and creditworthiness of the issuer. REITs may also be affected by tax and regulatory requirements.
1 MSCI December, 2005
1
MARKET PERSPECTIVE: YEAR ENDED DECEMBER 31, 2005 |
In our semi-annual report, we referred to mixed markets in which the U.S. investor lost on both domestic and international stocks, with gains in the latter trumped by the rebounding U.S. dollar. In the second half, global equities registered solid gains, although foreign markets ended the 2005 year more convincingly. The Morgan Stanley Capital International (“MSCI”) World® Index(1) calculated in dollars, including net reinvested dividends rose 10.3% for the six months ended December 31, 2005, and 9.5% for the full year. As for currencies, the dollar extended its first half run for the six months ended December 31, 2005, rising 2.1% against the euro (12.6% for the full year), 6.2% against the yen (14.7% for the full year), and 3.8% against the pound (10.2% for the full year). Commentators explained the U.S. dollar’s unexpected strength by pointing to relatively high U.S. interest rates, the re-cycling of oil exporters’ burgeoning wealth into dollar securities, the tax-related “repatriation” into dollars of U.S. corporations’ foreign currency balances, and, regarding the yen’s particular weakness, non-Japanese investors pouring money into the stock market but hedging their currency risk. Each dynamic was losing steam by 2005 year-end.
For more than a year, the main issue for U.S. fixed-income investors had been the unexpected flattening of the yield curve, i.e. the shrinking difference between short-term and long-term interest rates. From June 2004 through June 2005 the Federal Open Market Committee (“FOMC”) had raised the Federal Funds Rate by 25 basis points nine times, pulling other short-term rates up. However, the yield on the ten-year U.S. Treasury Note had actually fallen by 0.71% over the same thirteen months. This was put down to an apparently growing perception in the market that inflation was a problem solved, due to a vigilant Federal Reserve, cheap goods and labor abroad, consistent productivity growth at home and foreign investors’ hunger for U.S. investments. Occasionally in the second half, for example when Hurricane Katrina and Rita affected oil prices, having peaked near $70 per barrel at the end of August 2005, there looked to be filtering through to general prices, and the trend seemed about to break. Nevertheless, in the end the forces of curve flattening prevailed. By December 31, 2005, the FOMC had raised rates four more times, oil prices and the inflation scare had subsided and foreigners were still buying record amounts of U.S. securities. For the six months ended December 31, 2005, the yield on the ten-year Treasury rose by 45 basis points to 4.39% (17 basis points for the full year), and on 13-week U.S. Treasury Bills by 93 basis points (180 basis points for the full year) to 3.98%. The returns on the broad Lehman Brothers Aggregate Bond Index(2) and the Lehman Brothers High Yield Bond Index(3) was - -0.1% and 1.6% for the six months ended December 31, 2005, and 2.4% and 2.7% for the full year, respectively.
The U.S. equities market in the form of the Standard & Poor’s 500 Composite Stock Price (“S&P 500”) Index(4), added 5.8% including dividends in the latter half of 2005 and 4.9% for the full year, thanks to gains of 3.5% in July and November of 2005. Other months were flat to down and by 2005 year-end, the market, trading at a fairly undemanding price-to-earnings level of about 16 times earnings for the current fiscal year, was definitely struggling. Stock investors were initially encouraged by bullish economic reports and even more by second quarter company earnings figures, which were on average up more than 10% year over year. The optimistic mood lasted into early August of 2005, when the S&P 500 reached a four-year high, before drifting back as resurgent oil prices made records almost daily. In September and October of 2005 with Hurricanes Katrina and Rita seldom out of the news, two attempted rallies fizzled. High prices at the gas pump were already here. An expensive winter for heating fuel was certain. Sharply rising factory prices started to be found in local Federal Reserve and purchasing managers’ reports and, with consumer confidence slumping, the word “stagflation” was heard more than once. In spite of this, as November approached, an evidently swift recovery from the Hurricanes Katrina and Rita cheered investors and stock prices powered ahead through mid-December 2005, as oil prices fell back below $60 per barrel, inflation moderated, corporate profits remained buoyant and gross domestic product (“GDP”) growth, at 4.1% per annum, was the envy of the developed world. Yet the market gave back nearly 1.6% between Christmas and New Year, when new reports suggested that the end of the bubbling housing market might be at hand. Rising house prices had encouraged the consumer spending that was largely behind robust GDP growth; spending that is, by people who on average were saving little, if anything.
In international markets Japan was the shining star of the second half, soaring 33.3%, based on the MSCI Japan® Index(5) in dollars plus net dividends for the six months ended December 31, 2005, and 25.5% for
2
MARKET PERSPECTIVE: YEAR ENDED DECEMBER 31, 2005 |
the full year, as the market repeatedly broke five-year records amid new optimism. Investors, albeit mainly foreign ones, came to the belief that Japan is re-emerging as a balanced economy and less dependent on exports. Japanese corporations and banks have repaired their balance sheets at last. Rising wages are supporting domestic demand, in addition to an expected end to deflation, seems at hand. European ex UK markets leaped 11.8%, according to the MSCI Europe ex UK® Index(6) in dollars including net dividends for the six months ended December 31, 2005 (10.5% for the full year) and 14.7% in local currencies (27.7% for the full year) to the best levels in over four years, despite the first interest rate increase, to 2.5%, in over five years. Mounting evidence of a recovery in local demand, resilient profits and an upsurge of merger and acquisition activity boosted markets that are not particularly expensive. UK equities advanced 6.4% in the six months ended December 31, 2005 (7.4% for the full year) based on the MSCI UK® Index(7) in dollars including net dividends, concealing a more impressive 11.1% increase in pounds (20.1% for the full year), to the highest in four years. The period was dominated by the effect of five interest rate increases to restrain over-stretched consumers and soaring real estate prices. Yet, in the face of mostly miserable economic reports, and despite terrorist attacks in London over two days in July of
2005, investors, encouraged by merger and acquisition activity, supported an inexpensive market yielding over 3%.
(1) The MSCI World® Index is an unmanaged index that measures the performance of over 1,400 securities listed on exchanges in the U.S., Europe, Canada, Australia, New Zealand and the Far East.
(2) The Lehman Brothers Aggregate Bond Index is a widely recognized, unmanaged index of publicly issued investment grade U.S. Government, mortgage-backed, asset-backed and corporate debt securities.
(3) The Lehman Brothers High Yield Bond Index is an unmanaged index that measures the performance of fixed-income securities generally representative of corporate bonds rated below investment-grade.
(4) The Standard & Poor’s 500 Composite Stock Price Index is an unmanaged index that measures the performance of securities of approximately 500 large-capitalization companies whose securities are traded on major U.S. stock markets.
(5) The MSCI Japan® Index is a free float-adjusted market capitalization index that is designed to measure developed market equity performance in Japan.
(6) The MSCI Europe ex UK® Index is a free float-adjusted market capitalization index that is designed to measure developed market equity performance in Europe, excluding the UK.
(7) The MSCI UK® Index is a free float-adjusted market capitalization index that is designed to measure developed market equity performance in the UK.
All indices are unmanaged and investors cannot invest directly in an index.
Past performance does not guarantee future results. The performance quoted represents past performance. Investment return and principal value of an investment will fluctuate, and shares, when redeemed, may be worth more or less than their original cost. The Funds’ performance is subject to change since the period’s end and may be lower or higher than the performance data shown. Please call (800) 992-0180 or log on to www.ingfunds.com to obtain performance data current to the most recent month end.
Market Perspective reflects the views of the Chief Investment Risk Officer only through the end of the period, and is subject to change based on market and other conditions.
3
ING AMERICAN CENTURY LARGE COMPANY VALUE PORTFOLIO |
| | |
(FORMERLY, ING SALOMON BROTHERS INVESTORS VALUE PORTFOLIO) | | PORTFOLIO MANAGERS’ REPORT |
Industry Allocation
as of December 31, 2005
(as a percent of net assets)
Oil and Gas | | 12.0% |
| | |
Banks | | 11.8% |
| | |
Diversified Financial Services | | 11.6% |
| | |
Insurance | | 6.6% |
| | |
Pharmaceuticals | | 5.1% |
| | |
Federal Home Loan Bank | | 5.0% |
| | |
Telecommunications | | 4.9% |
| | |
Miscellaneous Manufacturing | | 4.6% |
| | |
Computers | | 3.5% |
| | |
Media | | 3.5% |
| | |
Electric | | 3.4% |
| | |
Industries between 2.0%-3.2%(1) | | 11.6% |
| | |
Industries between 1.0%-2.0%(2) | | 10.3% |
| | |
Industries less than 1.0%(3) | | 7.5% |
| | |
Other Assets and Liabilities, Net* | | (1.4)% |
| | |
Total | | 100.0% |
* Includes securities lending collateral. |
|
(1) Includes 4 industries, which each represents 2.0%-3.2% of net assets. |
|
(2) Includes 6 industries, which each represents 1.0%-2.0% of net assets. |
|
(3) Includes 13 industries, which each represents less than 1.0% of net assets. |
Portfolio holdings are subject to change daily.
The ING American Century Large Company Value Portfolio (formerly, ING Salomon Brothers Investors Value Portfolio, the “Portfolio”) seeks long-term capital growth. Income is a secondary objective. The Portfolio is managed by a team of portfolio managers comprised of Mark Mallon, Chief Investment Officer and Executive Vice President, Charles A. Ritter, Vice President and Senior Portfolio Manager, and Brendan Healy, Vice President and Portfolio Manager, American Century Investment Management, Inc. — the Sub-Adviser.*
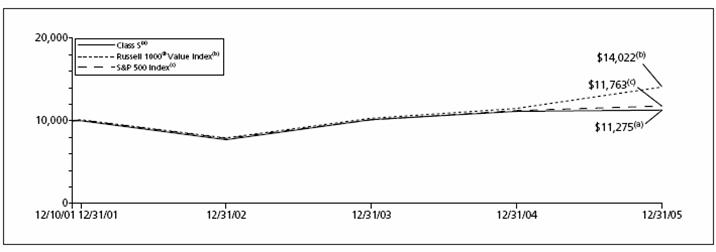
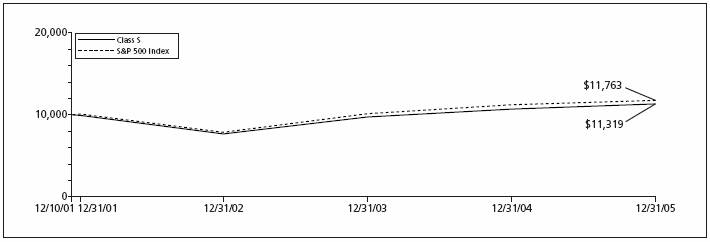
Performance: For the year ended December 31, 2005, the Portfolio’s Class S Shares provided a total return of 1.26% compared to the Russell 1000® Value Index and the Standard & Poor’s 500 Composite Stock Price® Index (“S&P 500”), which returned 7.05% and 4.91%, respectively, for the same period.
Portfolio Specifics: Equity investors faced numerous headwinds during the year, a period marked by concern about the effects of soaring oil prices, destructive hurricanes and climbing interest rates on the economy and corporate profit growth. Ultimately, the equities market demonstrated resilience, and stocks recorded modest gains.
Our interest in the energy sector, a position devoted entirely to oil and gas firms, contributed the most to performance during the fiscal year. Soaring oil prices, which reached new record highs, underpinned gains for companies across the industry, and each of our holdings advanced. Major, integrated energy firms ConocoPhillips, Exxon Mobil Corp., ChevronTexaco Corp., and Royal Dutch Shell PLC all ranked high among the contributors.
Still, many of the strongest performers in the sector did not meet our value criteria. For example, energy equipment and services companies recorded powerful gains, but were too richly valued by our standards to merit inclusion in the Portfolio. Consequently, our smaller exposure to the energy sector as a whole contributed to our overall underperformance versus our benchmark and adverse stock selection was a major source of under performance.
The financials sector, on average our largest single stake, also made significant contribution to absolute performance during the period. Insurance companies paced gains, producing two top contributors in Loews Corp. and Hartford Financial Services (“Hartford”). In April, Hartford, one of the nation’s largest financial services and insurance companies, recorded its most profitable quarter ever driven by strength in its property and casualty insurance segment. The next quarter, the firm reported a 96% increase in quarterly income in the same segment, a gain accomplished despite a difficult pricing environment and driven by higher income from its investment portfolio and lower spring-time catastrophe losses.
Elsewhere, investments in the information technology sector produced the Portfolio’s top stock. During the period, Hewlett-Packard announced four consecutive quarters of increased revenues, and reports that the company had emerged as the global leader in the server business further supported the stock’s climb.
Despite those successes, we encountered difficulty in the consumer discretionary area, the top sector-level detractor. During the year, we owned and sold both GM and Toyota Motor, and each had a different impact on performance. As GM’s structural challenges intensified, this once-compelling opportunity became a detractor as negative sentiment hurt the stock price. We eliminated the position and avoided further losses. Conversely, Toyota stock climbed in line with its earnings. We sold into that strength and captured performance, a factor that helped us offset the downdraft from GM.
Stock selection in the health care sector also detracted from performance.
Current Strategy and Outlook: The Portfolio’s team of portfolio managers will continue to follow its investment discipline of searching for large, fundamentally sound businesses that, because of transitory issues, are selling at prices we believe are below fair market value.
Top Ten Holdings*
as of December 31, 2005
(as a percent of net assets)
Citigroup, Inc. | | 4.8% |
| | |
Exxon Mobil Corp. | | 4.3% |
| | |
Bank of America Corp. | | 3.8% |
| | |
Freddie Mac | | 3.2% |
| | |
Wells Fargo & Co. | | 2.7% |
| | |
Royal Dutch Shell PLC ADR | | 2.7% |
| | |
ChevronTexaco Corp. | | 2.2% |
| | |
ConocoPhillips | | 2.2% |
| | |
Wachovia Corp. | | 1.7% |
| | |
Morgan Stanley | | 1.7% |
* Excludes short-term investments related to U.S. government obligations and securities lending collateral. |
Portfolio holdings are subject to change daily.
* The Portfolio changed sub-adviser to American Century Investment Management, Inc. effective April 29, 2005. Prior to this date, the Portfolio was managed by a different sub-adviser and had different principal investment strategies.
4
PORTFOLIO MANAGERS’ REPORT | ING AMERICAN CENTURY LARGE COMPANY VALUE PORTFOLIO |
| | | | | | |
| Average Annual Total Returns for the Periods Ended December 31, 2005 | |
| | | 1 Year | | Since Inception
of Classes I, S, and ADV
December 10, 2001 | |
| Class I | | 1.51 | % | | 3.27 | % | |
| Class S | | 1.26 | % | | 3.00 | % | |
| Class ADV | | 1.09 | % | | 2.74 | % | |
| Russell 1000® Value Index(1) | | 7.05 | % | | 8.63 | %(3) | |
| S&P 500 Index(2) | | 4.91 | % | | 4.06 | %(3) | |
| | | | | | | | |
Based on a $10,000 initial investment, the graph and table above illustrate the total return of ING American Century Large Company Value Portfolio against the Indices indicated. An index is unmanaged and has no cash in its portfolio, imposes no sales charges and incurs no operating expenses. An investor cannot invest directly in an index. The Portfolio’s performance is shown without the imposition of any expenses or charges which are, or may be, imposed under your annuity contract. Total returns would have been lower if such expenses or charges were included.
The performance graph and table do not reflect the deduction of taxes that a shareholder will pay on portfolio distributions or the redemption of portfolio shares.
The performance shown may include the effect of fee waivers and/or expense reimbursements by the Investment Manager and/or other service providers, which have the effect of increasing total return. Had all fees and expenses been considered, the total returns would have been lower.
The performance update illustrates performance for a variable investment option available through a variable annuity contract. The performance shown indicates past performance and is not a projection or prediction of future results. Actual investment returns and principal value will fluctuate so that shares and/or units, at redemption, may be worth more or less than their original cost. Please call (800) 922-0180 to get performance through the most recent month end.
This report contains statements that may be “forward-looking” statements. Actual results may differ materially from those projected in the “forward-looking” statements.
The views expressed in this report reflect those of the portfolio manager only through the end of the period as stated on the cover. The portfolio manager’s views are subject to change at any time based on marked and other conditions.
Portfolio holdings are subject to change daily.
(1) The Russell 1000® Value Index is an unmanaged index that measures the performance of those Russell 1000® companies with lower price-to-book ratios and lower than forecasted growth values.
(2) The S&P 500 Index is an unmanaged index that measures the performance of securities of approximately 500 of the largest companies in the U.S.
(3) Since inception performance of the index is shown as of December 1, 2001.
5
ING AMERICAN CENTURY SELECT PORTFOLIO | | PORTFOLIO MANAGERS’ REPORT |
Industry Allocation*
as of December 31, 2005
(as a percent of net assets)

(1) | Includes 4 industries, which each represents 2.5% - 4.0% of net assets. |
(2) | Includes 10 industries, which each represents less than 2.5% of net assets. |
Portfolio holdings are subject to change daily.
The ING American Century Select Portfolio (the “Portfolio”) seeks long-term capital appreciation. The Portfolio is managed by John Sykora, CFA, Vice President and Senior Portfolio Manager, and Keith Lee, CFA and Portfolio Manager, American Century Investment Management, Inc. — the Sub-Adviser.
Performance: For the year ended December 31, 2005, the Portfolio’s Class S Shares provided a total return of 0.65% compared to the Russell 1000® Growth Index, which returned 5.26% for the same period.
Portfolio Specifics: As they did in 2004, stocks in energy and utilities sectors again paced broad market returns in 2005. Combined, the two sectors accounted for 57% of the Standard & Poor’s 500 Composite Stock Price Index’s total return, with energy stocks riding a 42% increase in crude oil prices. At the same time, consumer discretionary stocks fell 7% during the year. Combined, these market factors, as well as the Portfolio’s stock selection in the consumers sector, worked against the Portfolio throughout much of the year.
The Portfolio traditionally focuses on growth-oriented investments in companies with solid returns on invested capital. As such, it typically avoids stakes in the utilities and energy sectors. The energy sector, as a whole, has failed to earn its cost of capital 18 times in the past 22 years, and the utilities sector, as a whole, has failed to earn its cost of capital every year in that time frame. However, the Portfolio’s significant underweight in those sectors during 2005 hurt its return substantially.
At the same time, the Portfolio maintained a considerable overweight in consumer discretionary stocks, which further dented its performance. Stocks in that sector suffered as consumers battled soaring gasoline prices and rising short-term interest rates as the year progressed.
Nonetheless, the Portfolio’s return improved as the year progressed, partly because investors finally engaged a noticeable shift to large-cap stocks and stocks with growth characteristics. Small-cap and value stocks have led the way for U.S. markets since 2000, but both trends reversed in the second half of 2005. The Russell 1000® Index’s return in the second half of the year surpassed that of the Russell 2000® Index by a margin of 6.15% to 5.88%. Likewise, the Russell 3000® Growth Index exceeded the Russell 3000® Value Index by 7.19% to 5.07% in the second half of the year.
Meanwhile, the Portfolio’s largest holding, UnitedHealth Group, ranked as its largest individual contributor on a relative basis. Throughout the year, the Portfolio maintained an average overweight position in both the health care sector and, specifically, in health care providers and services. Those positions led all other sectors and industries, respectively, in contributing to the Portfolio’s relative return for the year.
Current Strategy and Outlook: The Portfolio’s investment team will continue seeking companies with attractive valuations and risk/reward characteristics that also appear capable of sustaining long-term growth in earnings and revenue.
Top Ten Holdings*
as of December 31, 2005
(as a percent of net assets)
UnitedHealth Group, Inc. | | 4.2% |
Wal-Mart Stores, Inc. | | 4.0% |
Johnson & Johnson | | 3.7% |
Teva Pharmaceutical Industries Ltd ADR | | 3.4% |
Amgen, Inc. | | 3.3% |
Microsoft Corp. | | 3.2% |
Weight Watchers International, Inc. | | 3.2% |
Procter & Gamble Co. | | 3.1% |
SLM Corp. | | 3.0% |
American International Group, Inc. | | 2.9% |
* Excludes short-term investments related to U.S. government obligations and securities lending collateral. |
Portfolio holdings are subject to change daily.
6
PORTFOLIO MANAGERS’ REPORT | | ING AMERICAN CENTURY SELECT PORTFOLIO |

| | | | | | |
| Average Annual Total Returns for the Periods Ended December 31, 2005 | |
| | | 1 Year | | Since Inception
of Classes I, S, and ADV
December 10, 2001 | |
| Class I | | 0.96 | % | | (1.21) | % | |
| Class S | | 0.65 | % | | (1.50) | % | |
| Class ADV | | 0.43 | % | | (1.73) | % | |
| Russell 1000® Growth Index(1) | | 5.26 | % | | 1.08 | %(2) | |
| | | | | | | | |
| | | | | | | | |
Based on a $10,000 initial investment, the graph and table above illustrate the total return of ING American Century Select Portfolio against the Index indicated. An index is unmanaged and has no cash in its portfolio, imposes no sales charges and incurs no operating expenses. An investor cannot invest directly in an index. The Portfolio’s performance is shown without the imposition of any expenses or charges which are, or may be, imposed under your annuity contract. Total returns would have been lower if such expenses or charges were included.
The performance graph and table do not reflect the deduction of taxes that a shareholder will pay on portfolio distributions or the redemption of portfolio shares.
The performance shown may include the effect of fee waivers and/or expense reimbursements by the Investment Manager and/or other service providers, which have the effect of increasing total return. Had all fees and expenses been considered, the total returns would have been lower.
The performance update illustrates performance for a variable investment option available through a variable annuity contract. The performance shown indicates past performance and is not a projection or prediction of future results. Actual investment returns and principal value will fluctuate so that shares and/or units, at redemption, may be worth more or less than their original cost. Please call (800) 922-0180 to get performance through the most recent month end.
This report contains statements that may be “forward-looking” statements. Actual results may differ materially from those projected in the “forward-looking” statements.
The views expressed in this report reflect those of the portfolio manager only through the end of the period as stated on the cover. The portfolio manager’s views are subject to change at any time based on marked and other conditions.
Portfolio holdings are subject to change daily.
(1) The Russell 1000® Growth Index is an index of common stocks designed to track performance of large capitalization companies with greater than average growth orientation.
(2) Since inception performance of the index is shown from December 1, 2001.
7
ING AMERICAN CENTURY SMALL CAP VALUE PORTFOLIO | | PORTFOLIO MANAGERS’ REPORT |
Industry Allocation
as of December 31, 2005
(as a percent of net assets)
Retail | | 8.0% |
| | |
Insurance | | 7.4% |
| | |
Banks | | 6.2% |
| | |
Equity Fund | | 4.9% |
| | |
Software | | 4.8% |
| | |
Federal Home Loan Bank | | 4.7% |
| | |
Real Estate Investment Trust | | 4.7% |
| | |
Oil & Gas | | 4.2% |
| | |
Industries between 3.0%-4.0%(1) | | 13.6% |
| | |
Industries between 2.0%-3.0%(2) | | 15.6% |
| | |
Industries between 1.0%-2.0%(3) | | 16.6% |
| | |
Industries equal to or less than 1.0%(4) | | 11.8% |
| | |
Other Assets and Liabilities, Net* | | (2.5)% |
| | |
Total | | 100.0% |
* | Includes securities lending collateral. |
| |
(1) | Includes 4 industries, which each represents 3.0%-4.0% of net assets. |
| |
(2) | Includes 7 industries, which each represents 2.0%-3.0% of net assets. |
| |
(3) | Includes 11 industries, which each represents 1.0%-2.0% of net assets. |
| |
(4) | Includes 21 industries, which each represents 1.0% or less of net assets. |
Portfolio holdings are subject to change daily.
ING American Century Small Cap Value Portfolio (the “Portfolio”) seeks long-term capital growth. Income is a secondary objective. The Portfolio is managed by Benjamin Z. Giele, Vice President and Senior Portfolio Manager, and Kevin Laub, Vice President and Portfolio Manager, American Century Investment Management, Inc. — the Sub-Adviser.
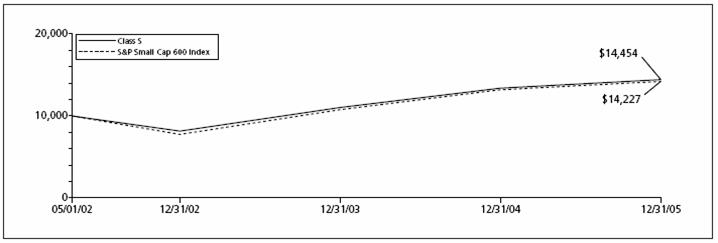
Performance: For the year ended December 31, 2005, the Portfolio’s Class S Shares provided a total return of 7.85% compared to the Standard & Poor’s 600 Index, which returned 7.68% for the same period.
Portfolio Specifics: Equity investors faced numerous headwinds during 2005, a year marked by concern about the effects of soaring oil prices, destructive hurricanes and climbing interest rates on the economy and corporate profit growth. Volatility prevailed, and the three major stock market indices alternately moved higher only to surrender gains and fall back into troughs. Ultimately, the equities market demonstrated resilience, and stocks recorded solid gains for the year.
Strength in global demand combined with ramping oil prices, which reached a series of record highs during the period, helped underpin gains for companies across the energy sector, and our investments in this sector made the greatest contribution to performance during the fiscal year.
Energy equipment and services firms paced gains, and we held many that recorded powerful advances but were not represented in the index. Of those, several ranked among the Portfolio’s top-contributing names. One was Helmerich & Payne, a driller that works primarily in the United States and South America. Cal Dive International Inc., a service provider to offshore rigs, was another standout. Similarly, our stake in the oil and gas industry included numerous strong performers that were exclusive to the Portfolio, such as Western Gas Resources Inc., another top contributor.
The Portfolio’s stake in the industrials sector also augmented results, with aerospace and defense companies turning in the best finish. Effective selection in that group yielded the Portfolio’s top-contributing stock, United Defense Industries Inc., a leading producer of munitions and combat vehicles, including the Bradley Fighting Vehicle. During the period, the company was acquired at a premium by BAE Systems.
Investments in the information technology arena provided lift on an absolute basis and also gave the Portfolio its best finish against the benchmark, an outcome attributable almost entirely to effective security selection.
Though security selection was overwhelmingly positive, and our performance was solid on both absolute and relative bases, we nonetheless encountered some disappointments along the way. One was specialty retailer Pier 1 Imports, from the consumer discretionary area, the only sector-level detractor during the period. Despite aggressive pricing and advertising campaigns, the company reported disappointing sales, eventually recording losses amid tepid consumer response to new merchandising initiatives. It was the Portfolio’s top-detracting stock.
Current Strategy and Outlook: We remained true to our bottom-up approach that mandates evaluation of each stock individually and on its own merits. To meet our investment objective of providing long-term capital growth, with income as a secondary objective, we continue to seek out smaller, fundamentally sound companies that appear to be undervalued by the market.
Top Ten Holdings*
as of December 31, 2005
(as a percent of net assets)
Sybase, Inc. | | 2.1% |
| | |
iShares Russell 2000 Value Index Fund | | 1.5% |
| | |
iShares Russell 2000 Index Fund | | 1.2% |
| | |
Cimarex Energy Co. | | 1.2% |
| | |
Sensient Technologies Corp. | | 1.2% |
| | |
iShares S&P SmallCap 600 Index Fund | | 1.1% |
| | |
HCC Insurance Holdings, Inc. | | 1.1% |
| | |
Bemis Co. | | 1.1% |
| | |
Briggs & Stratton Corp. | | 1.1% |
| | |
Perot Systems Corp. | | 1.1% |
* Excludes short-term investments related to U.S. government securities and securities lending collateral. |
Portfolio holdings are subject to change daily.
8
PORTFOLIO MANAGERS’ REPORT | | ING AMERICAN CENTURY SMALL CAP VALUE PORTFOLIO |
| | | | | | |
| Average Annual Total Returns for the Periods Ended December 31, 2005 | |
| | | 1 Year | | Since Inception
of Classes I, S, and ADV
May 1, 2002 | |
| Class I | | 8.17 | % | | 10.83 | % | |
| Class S | | 7.85 | % | | 10.56 | % | |
| Class ADV | | 7.65 | % | | 10.28 | % | |
| S&P SmallCap 600 Index(1) | | 7.68 | % | | 10.09 | % | |
| | | | | | | | |
Based on a $10,000 initial investment, the graph and table above illustrate the total return of ING American Century Small Cap Value Portfolio against the Index indicated. An index is unmanaged and has no cash in its portfolio, imposes no sales charges and incurs no operating expenses. An investor cannot invest directly in an index. The Portfolio’s performance is shown without the imposition of any expenses or charges which are, or may be, imposed under your annuity contract. Total returns would have been lower if such expenses or charges were included.
The performance graph and table do not reflect the deduction of taxes that a shareholder will pay on portfolio distributions or the redemption of portfolio shares.
The performance shown may include the effect of fee waivers and/or expense reimbursements by the Investment Manager and/or other service providers, which have the effect of increasing total return. Had all fees and expenses been considered, the total returns would have been lower.
The performance update illustrates performance for a variable investment option available through a variable annuity contract. The performance shown indicates past performance and is not a projection or prediction of future results. Actual investment returns and principal value will fluctuate so that shares and/or units, at redemption, may be worth more or less than their original cost. Please call (800) 922-0180 to get performance through the most recent month end.
This report contains statements that may be “forward-looking” statements. Actual results may differ materially from those projected in the “forward-looking” statements.
The views expressed in this report reflect those of the portfolio manager only through the end of the period as stated on the cover. The portfolio manager’s views are subject to change at any time based on marked and other conditions.
Portfolio holdings are subject to change daily.
(1) The S&P SmallCap 600 Index is a market-weighted index of 600 small-sized domestic stocks.
9
ING BARON SMALL CAP GROWTH PORTFOLIO | | PORTFOLIO MANAGERS’ REPORT |
Industry Allocation*
as of December 31, 2005
(as a percent of net assets)

* | Includes securities lending collateral. |
(1) | Includes 3 industries, which each represents 2.0% - 3.0% of net assets. |
(2) | Includes 9 industries, which each represents 1.0% - 2.0 of net assets. |
(3) | Includes 11 industries, which each represents 1.0% of net assets. |
Portfolio holdings are subject to change daily.
The ING Baron Small Cap Growth Portfolio (the “Portfolio”) seeks capital appreciation. The Portfolio is managed by Ronald Baron, Founder, Chief Executive Officer, Chief Investment Officer, Chairman, and Portfolio Manager, BAMCO, Inc. — the Sub-Adviser.
Performance: For the year ended December 31, 2005, the Portfolio’s Class S Shares provided a total return of 7.35% compared to the Russell 2000 Index, which returned 4.55% for the same period.
Portfolio Specifics: Sectors that had the most positive contribution over the one-year period include energy & energy services, apparel and real estate.
The energy & energy services industry made the largest contribution to the Portfolio’s gain. Record high gas and oil prices resulted in a very tight balance between supply and demand, which was exacerbated by an especially hot summer in the U.S. and Hurricanes Katrina and Rita.
The apparel industry also made a significant contribution, led by Carters, Inc. The company performed extremely well in 2005, driven by continued double digit revenue and earnings growth in its core baby clothes business and a strategic acquisition of struggling competitor Osh-Kosh this past summer. Together, the two businesses will represent the most recognized brands of children’s apparel in the U.S. and offer several avenues for continued market share gains. Throughout the year, Carter’s Inc. posted robust growth across all channels, mass, wholesale, and retail, and expanded operating margins to double digit levels.
Health services (insurance) and financial services (miscellaneous) were the worst performing industries in 2005. Amerigroup had the most negative impact on the Portfolio. Despite strong enrollment growth and significant new business wins, the stock declined 48% in 2005 when the company experienced higher than anticipated medical cost trends in several of its markets. Lower earnings, limited visibility into the causes, and questions over Amerigroup’s ability to return to its historically stable and predictable healthcare cost trends contributed to the stock’s sell off. We believe the opportunity for pure play Medicaid HMO’s like Amerigroup remains very large, and that their talented management team is taking proper steps to restore the company to its former growth and profitability. First Marblehead, a provider of outsourcing services for firms participating in the private student lending sector, had the second most negative impact on the Portfolio. First Marblehead came under significant pressure during 2005, as investors grew concerned about the sustainability of the firm’s relationships with several of its key financial sector clients. In addition, the firm’s CEO resigned and was replaced by the firm’s chief operating officer.
Current Strategy and Outlook: The Portfolio invests for the long-term in what we believe to be forward-looking, well-managed, fast-growing businesses. We believe the companies we own will continue to grow at very healthy and sustainable rates and we expect that their share prices will continue to reflect their attractive prospects.
Top Ten Holdings*
as of December 31, 2005
(as a percent of net assets)
Dick’s Sporting Goods, Inc. | | 2.1% |
| | |
DeVry, Inc. | | 2.0% |
| | |
Carter’s, Inc. | | 2.0% |
| | |
California Pizza Kitchen, Inc. | | 1.8% |
| | |
First Marblehead Corp. | | 1.8% |
| | |
Shuffle Master, Inc. | | 1.8% |
| | |
Jefferies Group, Inc. | | 1.8% |
| | |
First Republic Bank | | 1.7% |
| | |
International Securities Exchange, Inc. | | 1.7% |
| | |
Select Comfort Corp. | | 1.7% |
* Excludes short-term investments related to securities lending collateral. |
Portfolio holdings are subject to change daily.
10
PORTFOLIO MANAGERS’ REPORT | | ING BARON SMALL CAP GROWTH PORTFOLIO |

| | | | | | |
| Average Annual Total Returns for the Periods Ended December 31, 2005 | |
| | | 1 Year | | Since Inception
of Classes I, S, and ADV
May 1, 2002 | |
| Class I | | 7.64 | % | | 14.06 | % | |
| Class S | | 7.35 | % | | 13.77 | % | |
| Class ADV | | 7.07 | % | | 13.46 | % | |
| Russell 2000® Index(1) | | 4.55 | % | | 9.19 | % | |
| | | | | | | | |
Based on a $10,000 initial investment, the graph and table above illustrate the total return of ING Baron Small Cap Growth Portfolio against the Index indicated. An index is unmanaged and has no cash in its portfolio, imposes no sales charges and incurs no operating expenses. An investor cannot invest directly in an index. The Portfolio’s performance is shown without the imposition of any expenses or charges which are, or may be, imposed under your annuity contract. Total returns would have been lower if such expenses or charges were included.
The performance graph and table do not reflect the deduction of taxes that a shareholder will pay on portfolio distributions or the redemption of portfolio shares.
The performance shown may include the effect of fee waivers and/or expense reimbursements by the Investment Manager and/or other service providers, which have the effect of increasing total return. Had all fees and expenses been considered, the total returns would have been lower.
The performance update illustrates performance for a variable investment option available through a variable annuity contract. The performance shown indicates past performance and is not a projection or prediction of future results. Actual investment returns and principal value will fluctuate so that shares and/or units, at redemption, may be worth more or less than their original cost. Please call (800) 922-0180 to get performance through the most recent month end.
This report contains statements that may be “forward-looking” statements. Actual results may differ materially from those projected in the “forward-looking” statements.
The views expressed in this report reflect those of the portfolio manager only through the end of the period as stated on the cover. The portfolio manager’s views are subject to change at any time based on marked and other conditions.
Portfolio holdings are subject to change daily.
(1) The Russell 2000® Index is a broad-based unmanaged capitalization weighted index of small capitalization companies.
11
ING DAVIS VENTURE VALUE PORTFOLIO
(FORMERLY, ING SALOMON BROTHERS FUNDAMENTAL VALUE PORTFOLIO) | | PORTFOLIO MANAGERS’ REPORT |
Industry Allocation
as of December 31, 2005
(as a percent of total investments)
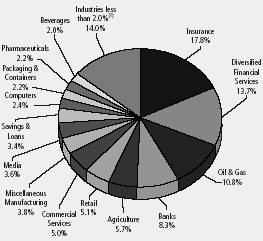
(1) | Includes industries, which each represents 2.0% of total investments. |
Portfolio holdings are subject to change daily.
The ING Davis Venture Value Portfolio (formerly, ING Salomon Brothers Fundamental Value Portfolio, the “Portfolio”) seeks long-term growth of capital. The Portfolio is managed by Christopher C. Davis and Kenneth C. Feinberg, Portfolio Managers, Davis Selected Advisers, L.P. — the Sub-Adviser*.
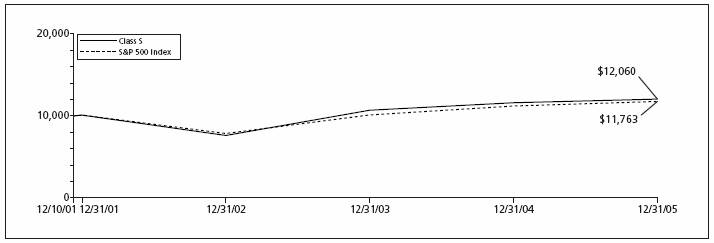
Performance: For the year ended December 31, 2005, the Portfolio’s Class S Shares provided a total return of 3.89% compared to the Standard & Poors 500 Composite Stock Price® (“S&P 500”) Index, which returned 4.91% for the same period.
Portfolio Specifics: During the first ten months of 2005, the under performance against the former primary benchmark, the Russell 3000® Index, was due largely to an over weighting and adverse stock selection in the weak media industry and poor industry group allocation in health care sector, partially offset by an over weighting and favorable stock selection in the stong energy sector.
Thereafter, the Portfolio’s holdings in the financials sector were the largest contributors to performance. The Portfolio’s holdings in the energy, information technology, and financials sectors were the largest contributors to performance. Another factor that deserves comment concerns the performance of large-capitalization companies compared to their smaller capitalization counterparts. There are periods of time, often five years or more, when bigger companies outperform and there are times when the opposite is true. During 2005 after the management change, our stock selection increasingly favored larger companies where we felt there was greater value. This emphasis penalized performance over this reporting period.
During the end of October 2005, the Portfolio’s holdings in the energy sector were reduced to a neutral weight of the benchmark.
During the year ended December 31, 2005, the stock market, as measured by the S&P 500 Index, increased by 4.91%. U.S. economic activity, as measured by the inflation-adjusted gross domestic product (“GDP”), increased between 3.3% and 4.1% over each of the first three calendar quarters of the year. Interest rates, as measured by the 10-year Treasury bond, began 2005 at about 4.2%, ranged as low as 4.0% and ended 2005 at about 4.4%.
The Portfolio has made substantial investments in diversified financial companies, and, as a group, these were the most important contributors to performance. J.P. Morgan Chase, Moody’s, American Express, and Citigroup were all among the top 10 contributors to performance. The Portfolio also made substantial investments in insurance companies, and as a group, these companies were also important contributors to performance. American International Group was among the top 10 contributors to performance. Other companies among the top 10 contributors to performance included Golden West Financial, a thrift & mortgage finance company, and Tyco, a diversified industrial company.
No single market sector stands out as having harmed performance. The most important individual companies that detracted from performance were ConocoPhillips, an energy company, Comcast, a media company, Dell, a technology company, and Fifth Third Bank, a commercial bank.
The Portfolio had approximately 9% of its portfolio invested in foreign companies at December 31, 2005. As a group, the foreign companies owned by the Portfolio out-performed the S&P 500 Index over the period.
Current Strategy and Outlook: While we believe that a two month period is too short to provide meaningful insight into a Portfolio’s future long-term performance, we are building a portfolio which is quite different in composition from the S&P 500 Index. The Portfolio’s investment strategy is to perform extensive research to buy durable companies at a discount to their intrinsic values and hold them for the long-term.
Top Ten Holdings*
as of December 31, 2005
(as a percent of net assets)
Altria Group, Inc. | | 5.9% |
| | |
American Express Co. | | 5.5% |
| | |
American International Group, Inc. | | 5.0% |
| | |
Tyco International Ltd. | | 3.9% |
| | |
JPMorgan Chase & Co. | | 3.9% |
| | |
Costco Wholesale Corp. | | 3.8% |
| | |
Progressive Corp. | | 3.6% |
| | |
Golden West Financial Corp. | | 3.5% |
| | |
Wells Fargo & Co. | | 3.2% |
| | |
Berkshire Hathaway, Inc., Class A | | 3.2% |
* Excludes short-term investments related to U.S. government securities and securities lending collateral. |
Portfolio holdings are subject to change daily.
* The Portfolio changed sub-adviser to Davis Selected Advisers, L.P. effective October 31, 2005. Prior to this date, the Portfolio was managed by a different sub-adviser and had different principal investment strategies.
12
PORTFOLIO MANAGERS’ REPORT | | ING DAVIS VENTURE VALUE PORTFOLIO |
| | | | | | |
| Average Annual Total Returns for the Periods Ended December 31, 2005 | |
| | | 1 Year | | Since Inception
of Classes I, S, and ADV
December 10, 2001 | |
| Class I | | 4.10 | % | | 4.98 | % | |
| Class S | | 3.89 | % | | 4.72 | % | |
| Class ADV | | 3.62 | % | | 4.47 | % | |
| S&P 500 Index(1) | | 4.91 | % | | 4.06 | %(2) | |
| | | | | | | | |
Based on a $10,000 initial investment, the graph and table above illustrate the total return of ING Davis Venture Value Portfolio against the Index indicated. An index is unmanaged and has no cash in its portfolio, imposes no sales charges and incurs no operating expenses. An investor cannot invest directly in an index. The Portfolio’s performance is shown without the imposition of any expenses or charges which are, or may be, imposed under your annuity contract. Total returns would have been lower if such expenses or charges were included.
The performance graph and table do not reflect the deduction of taxes that a shareholder will pay on portfolio distributions or the redemption of portfolio shares.
The performance shown may include the effect of fee waivers and/or expense reimbursements by the Investment Manager and/or other service providers, which have the effect of increasing total return. Had all fees and expenses been considered, the total returns would have been lower.
The performance update illustrates performance for a variable investment option available through a variable annuity contract. The performance shown indicates past performance and is not a projection or prediction of future results. Actual investment returns and principal value will fluctuate so that shares and/or units, at redemption, may be worth more or less than their original cost. Please call (800) 922-0180 to get performance through the most recent month end.
This report contains statements that may be “forward-looking” statements. Actual results may differ materially from those projected in the “forward-looking” statements.
The views expressed in this report reflect those of the portfolio manager only through the end of the period as stated on the cover. The portfolio manager’s views are subject to change at any time based on marked and other conditions.
Portfolio holdings are subject to change daily.
(1) The S&P 500 Index is an unmanaged index that measures the performance of securities of approximately 500 of the largest companies in the U.S.
(2) Since inception performance of the index is shown as of December 1, 2001.
13
ING FUNDAMENTAL RESEARCH PORTFOLIO | | PORTFOLIO MANAGERS’ REPORT |
Industry Allocation
as of December 31, 2005
(as a percent of total investments)

(1) | Includes 6 industries, which each represents 2.2% - 3.0% of total investments. |
(2) | Includes 10 industries, which each represents 2.2% of total investments. |
Portfolio holdings are subject to change daily.
The ING Fundamental Research Portfolio (the “Portfolio”) seeks to maximize total return through investments in a diversified portfolio of common stocks and securities convertible into common stock. The Portfolio is managed by Christopher Corapi, ING Investment Management Co. — the Sub-Adviser.
Performance: For the year ended December 31, 2005, the Portfolio’s Class S shares provided a total return of 5.71% compared to the Standard & Poor’s 500 Composite Stock Price Index (“S&P 500 Index”), which returned 4.91% for the same period.
Portfolio Specifics: The Portfolio outperformed the S&P 500 Index over the course of the 2005 year due to strong stock selection in a few key sectors, namely information technology, energy and health care. The Portfolio’s relative performance was held back somewhat by its holdings in the materials and consumer discretionary sectors. Chris Corapi, a senior portfolio manager on the ING Fundamental Equity team, took over the reigns in May replacing a quantitative, enhanced index process with a fundamental, research-based strategy.
Within information technology, the Portfolio benefited from holding stocks such as Jabil Circuit, Business Objects, Activision and Qualcomm. Jabil is benefiting from the continuing industry trend towards outsourced manufacturing. Product designers, such as chip companies and packaged product makers HP and Cisco, are increasingly outsourcing their end product manufacturing to foundries and contract manufacturers like Jabil Circuit. Activision introduced a series of new video games consistent with the replacement cycle in the video game console arena. The Portfolio also benefited from owning Qualcomm; however, we sold the stock in November of 2005, believing the substantial licensing revenues the company enjoyed would soon be in jeopardy.
The Portfolio’s energy holdings performed well and confirmed our belief that the better business models, the more attractive valuations, and the strongest links to the strength in commodity prices were to be found in the equipment and services companies rather than in the large integrated players, such as Exxon and Chevron. Schlumberger and ENSCO International provide services and equipment to exploration and production companies and are benefiting from the upswing in capital spending in the sector, and they contributed positively to performance. Another important contributor to performance was our overweighting in independent exploration and production concerns, such as EOG Resources, XTO Energy and Plains Exploration & Production. These independent companies are more niche like and more likely to find oil and gas that they can sell at market prices vis a vis their larger competitors.
Within the materials sector, Dow Chemical and Alcoa detracted from performance, as the broader sector traded down. Investors believed the petrochemicals and raw materials profit cycle was reaching its conclusion, and that profit margins would begin to suffer due to higher oil prices that could not easily be passed through to the customer. Alcoa disappointed investors early in the year after their first quarter earnings came in below expectations. Many investors had bid up the shares in anticipation of a strong report.
Current Strategy and Outlook: Our current strategy is focused on companies with superior capital allocation, strong competitive position, and operations in industries with attractive outlooks. Key holdings, such as Jabil Circuit, Dresser Rand Group and Halliburton exhibit strong fundamentals, clear catalysts for market recognition and attractive valuations.
Halliburton continues to offer upside potential in the energy services space, even after performing strongly in 2005. We believe the stock may benefit greatly in 2006 if management spins off their engineering and construction subsidiary Kellogg, Brown & Root. More broadly, we like other energy services stocks based on our forecast for continued robust spending by producers and refiners on creating new production capacity to meet global demand. This bodes well for drillers like ENSCO, who provide contract drilling services to the oil and gas industry. ENSCO enjoys a strong competitive position due to its state of the art fleet of offshore drilling rigs.
Our technology holdings reflect our belief that the industry is in a maturation cycle and companies are looking to outsource low return-on-capital endeavors such as production and manufacturing. Contract manufacturers like Jabil Circuit and Taiwan Semiconductor continue to benefit from the growth in outsourcing and are well positioned to increase their already dominant market shares.
Top Ten Holdings*
as of December 31, 2005
(as a percent of net assets)
Citigroup, Inc. | | 4.0% |
| | |
General Electric Co. | | 4.0% |
| | |
Exxon Mobil Corp. | | 3.7% |
| | |
Bank of America Corp. | | 2.8% |
| | |
Wells Fargo & Co. | | 2.8% |
| | |
Johnson & Johnson | | 2.7% |
| | |
Microsoft Corp. | | 2.5% |
| | |
Altria Group Inc. | | 2.4% |
| | |
Medco Health Solutions, Inc. | | 2.3% |
| | |
Oracle Corp. | | 2.2% |
* Excludes short-term investments related to repurchase agreements. |
Portfolio holdings are subject to change daily.
14
PORTFOLIO MANAGERS’ REPORT | | ING FUNDAMENTAL RESEARCH PORTFOLIO |
| | | | | | |
| Average Annual Total Returns for the Periods Ended December 31, 2005 | |
| | | 1 Year | | Since Inception
of Classes I, S, and ADV
December 10, 2001 | |
| Class I | | 5.90 | % | | 3.32 | % | |
| Class S | | 5.71 | % | | 3.10 | % | |
| Class ADV | | 5.33 | % | | 2.83 | % | |
| S&P 500 Index(1) | | 4.91 | % | | 4.06 | %(2) | |
| | | | | | | | |
Based on a $10,000 initial investment, the graph and table above illustrate the total return of ING Fundamental Research Portfolio against the Index indicated. An index is unmanaged and has no cash in its portfolio, imposes no sales charges and incurs no operating expenses. An investor cannot invest directly in an index. The Portfolio’s performance is shown without the imposition of any expenses or charges which are, or may be, imposed under your annuity contract. Total returns would have been lower if such expenses or charges were included.
The performance graph and table do not reflect the deduction of taxes that a shareholder will pay on portfolio distributions or the redemption of portfolio shares.
The performance shown may include the effect of fee waivers and/or expense reimbursements by the Investment Manager and/or other service providers, which have the effect of increasing total return. Had all fees and expenses been considered, the total returns would have been lower.
The performance update illustrates performance for a variable investment option available through a variable annuity contract. The performance shown indicates past performance and is not a projection or prediction of future results. Actual investment returns and principal value will fluctuate so that shares and/or units, at redemption, may be worth more or less than their original cost. Please call (800) 922-0180 to get performance through the most recent month end.
This report contains statements that may be “forward-looking” statements. Actual results may differ materially from those projected in the “forward-looking” statements.
The views expressed in this report reflect those of the portfolio manager only through the end of the period as stated on the cover. The portfolio manager’s views are subject to change at any time based on marked and other conditions.
Portfolio holdings are subject to change daily.
(1) The S&P 500 Index is an unmanaged index that measures the performance of securities of approximately 500 of the largest companies in the U.S.
(2) Since inception performance for the index is shown as of December 1, 2001.
15
ING GOLDMAN SACHS® CAPITAL GROWTH PORTFOLIO | | PORTFOLIO MANAGERS’ REPORT |
Industry Allocation
as of December 31, 2005
(as a percent of net assets)
Diversified Financial Services | | 12.0% |
| | |
Media | | 10.2% |
| | |
Software | | 9.8% |
| | |
Telecommunications | | 8.2% |
| | |
Retail | | 8.0% |
| | |
Pharmaceuticals | | 6.7% |
| | |
Healthcare-Products | | 6.5% |
| | |
Oil & Gas | | 4.9% |
| | |
Oil & Gas Services | | 4.8% |
| | |
Beverages | | 4.6% |
| | |
Industries between 3.0%-4.0%(1) | | 12.7% |
| | |
Industries between 2.0%-3.0%(2) | | 10.9% |
| | |
Industries less than 1.0%(3) | | 6.7% |
| | |
Other Assets and Liabilities, Net* | | (6.0)% |
| | |
Total | | 100.0% |
* | Includes securities lending collateral. |
| |
(1) | Includes 4 industries, which each represents 3.0%-4.0% of net assets. |
| |
(2) | Includes 6 industries, which each represents 1.0%-3.0% of net assets. |
| |
(3) | Includes industries, which each represents less than 1.0% of net assets. |
Portfolio holdings are subject to change daily.
The ING Goldman Sachs Capital Growth Portfolio (the “Portfolio”) seeks long-term growth of capital. The Portfolio is managed by a team of investment professionals led by Herbert Elhers, Managing Director, Goldman Sachs Asset Management, L.P. — the Sub-Adviser.
Performance: For the year ended December 31, 2005, the Portfolio’s Class S shares provided a total return of 1.90% compared to the Standard & Poor’s Composite Stock Price (“S&P 500”) Index, which returned 4.91% for the same period.
Portfolio Specifics: The main source of the under performance for the year was adverse stock selection in the financials, industrials, and technology sectors.
During the 2005 year, Wal-Mart Stores Inc. reported that its earnings would fall short of analysts’ expectations. The company cited concerns about the impact of high oil prices on low-income consumers. Despite the recent weakness, we believe that Wal-Mart’s long-term growth will be supported by its U.S. grocery effort as it currently has a 12-14% market share. We believe that this figure may potentially be higher as the company increases its presence in this area. We also feel that Wal-Mart’s international business, which currently constitutes between 15-20% of sales, should proliferate and help the company sustain strong long-term growth.
At the beginning of November of 2005, Dell Inc. lowered its earnings guidance for its recently completed fiscal third quarter, driving its stock down. The reduced expectations for growth were attributed to restructuring and faulty computer component charges. Although Dell is in the midst of a turnaround, refocusing on profitability versus volume, we do not believe that its business model is broken. As Dell works through some of its near-term issues, we believe the market will realize that some of the problems facing Dell are transitional, and are not all secular in nature.
Despite being a detractor for the year, Federal Home Loan Mortgage Corporation (“Freddie Mac”) began a rally during the fourth quarter as the company announced a $2 billion stock buyback plan. We believe this indicates that Freddie Mac is focused on strengthening its business. The company currently holds an additional $4.8 billion in excess capital above the imposed capital surcharge. When Freddie Mac finalizes its updated financial report, we believe it should receive approval from its regulator, the Office of Federal Housing Enterprise Oversight (OFHEO), thereby increasing its financial flexibility. It is our belief that when this occurs, Freddie will use some of the excess capital to buy back stock more aggressively.
While the Energy sector demonstrated strength again this year, outperformance of the Portfolio’s energy holdings was driven by stock selection. Many energy companies’ earnings are directly linked to the price of oil. Schlumberger Ltd, however, is not in the business of buying or selling oil - it is in the business of testing to determine the presence of oil. With oil reserves becoming harder to find and the size of new discoveries shrinking, it is likely that more wells will need to be drilled in order to meet global oil demand. For Schlumberger, more wells translate into more testing services. While the exploration companies’ drilling efforts require large capital investments, we believe Schlumberger’s testing services are less capital intensive. Since it does not have much of a manufacturing base, Schlumberger’s return on capital has increased sharply.
The Portfolio’s ratings agencies, McGraw-Hill Companies, which owns Standard & Poor’s (“S&P”), and Moody’s Corp. performed well in during the year. These businesses meet our investment criteria as they operate in an industry environment that can be characterized as quasi-monopolistic or a “partnership-monopoly.” This is because most issuers tend to have at least two ratings, one from each agency. As a result, S&P and Moody’s rate approximately 90% of the debt issuance in the U.S. We believe their growth is sustainable because it is supported by favorable secular trends such as the globalization of capitalism, deregulation, and financial innovation.
Current Strategy and Outlook: We have pared the number of stocks in the Portfolio, reflecting the confidence we have in these companies and the potential for their shares to perform well as they are recognized by investors. In several instances, on both a stock and sector level, the Portfolio is meaningfully different from its benchmark, thus representing potential sources of strong relative returns. For example, we are underweight in Cyclicals, as most of these businesses do not typically meet our investment criteria because their revenues predominantly depend on the increasing price of an underlying commodity. We believe the holdings in the Portfolio are of the highest quality and are financially healthy, as evidenced by the fact that virtually all of these companies generate free cash flow.
Top Ten Holdings*
as of December 31, 2005
(as a percent of net assets)
Freddie Mac | | 5.5% |
| | |
McGraw-Hill Cos, Inc. | | 4.5% |
| | |
Microsoft Corp. | | 4.1% |
| | |
PepsiCo, Inc. | | 3.6% |
| | |
First Data Corp. | | 3.5% |
| | |
Lowe’s Cos., Inc. | | 3.4% |
| | |
Qualcomm, Inc. | | 3.2% |
| | |
Schlumberger Ltd. | | 3.1% |
| | |
Dell, Inc. | | 2.8% |
| | |
Wal-Mart Stores, Inc. | | 2.5% |
* Excludes short-term investments related to securities lending collateral. |
Portfolio holdings are subject to change daily.
16
PORTFOLIO MANAGERS’ REPORT | | ING GOLDMAN SACHS® CAPITAL GROWTH PORTFOLIO |

| | | | | | |
| Average Annual Total Returns for the Periods Ended December 31, 2005 | |
| | | 1 Year | | Since Inception
of Classes��I, S, and ADV
December 10, 2001 | |
| Class I | | 2.17 | % | | 0.77 | % | |
| Class S | | 1.90 | % | | 0.52 | % | |
| Class ADV | | 1.69 | % | | 0.42 | % | |
| Russell 1000® Growth Index(1) | | 5.26 | % | | 1.08 | %(3) | |
| S&P 500 Index(2) | | 4.91 | % | | 4.06 | %(3) | |
| | | | | | | | |
Based on a $10,000 initial investment, the graph and table above illustrate the total return of ING Goldman Sachs® Capital Growth Portfolio against the Index indicated. An index is unmanaged and has no cash in its portfolio, imposes no sales charges and incurs no operating expenses. An investor cannot invest directly in an index. The Portfolio’s performance is shown without the imposition of any expenses or charges which are, or may be, imposed under your annuity contract. Total returns would have been lower if such expenses or charges were included.
The performance graph and table do not reflect the deduction of taxes that a shareholder will pay on portfolio distributions or the redemption of portfolio shares.
The performance shown may include the effect of fee waivers and/or expense reimbursements by the Investment Manager and/or other service providers, which have the effect of increasing total return. Had all fees and expenses been considered, the total returns would have been lower.
The performance update illustrates performance for a variable investment option available through a variable annuity contract. The performance shown indicates past performance and is not a projection or prediction of future results. Actual investment returns and principal value will fluctuate so that shares and/or units, at redemption, may be worth more or less than their original cost. Please call (800) 922-0180 to get performance through the most recent month end.
This report contains statements that may be “forward-looking” statements. Actual results may differ materially from those projected in the “forward-looking” statements.
The views expressed in this report reflect those of the portfolio manager only through the end of the period as stated on the cover. The portfolio manager’s views are subject to change at any time based on marked and other conditions.
Portfolio holdings are subject to change daily.
(1) The Russell 1000® Growth Index is an index of common stocks designed to track performance of large capitalization companies with greater than average growth orientation.
(2) The S&P 500 Index is an unmanaged index that measures the performance of securities of approximately 500 of the largest companies in the U.S.
(3) Since inception performance for the indices is shown as of December 1, 2001.
17
ING GOLDMAN SACHS® CORE EQUITY PORTFOLIO | | PORTFOLIO MANAGERS’ REPORT |
Industry Allocation
as of December 31, 2005
(as a percent of net assets)
Oil & Gas | | 9.6% |
| | |
Diversified Financial Services | | 8.4% |
| | |
Pharmaceuticals | | 7.2% |
| | |
Agriculture | | 6.7% |
| | |
Insurance | | 6.2% |
| | |
Media | | 5.8% |
| | |
Miscellaneous Manufacturing | | 5.2% |
| | |
Telecommunications | | 5.0% |
| | |
Computers | | 4.9% |
| | |
Banks | | 4.6% |
| | |
Semiconductors | | 4.6% |
| | |
Industries between 3.1%-4.0%(1) | | 17.9% |
| | |
Industries between 1.0%-3.0%(2) | | 12.7% |
| | |
Industries less than 1.0%(3) | | 4.3% |
| | |
Other Assets and Liabilities, Net* | | (3.1)% |
| | |
Total | | 100.0% |
* | Includes securities lending collateral. |
| |
(1) | Includes 5 industries, which each represents 3.1%-4.0% of net assets. |
| |
(2) | Includes 7 industries, which each represents 1.0%-3.0% of net assets. |
| |
(3) | Includes 12 industries, which each represents less than 1.0% of net assets. |
Portfolio holdings are subject to change daily.
The ING Goldman Sachs Core Equity Portfolio (the “Portfolio”) seeks long-term growth of capital and dividend income. The Portfolio is managed by a team of investment professionals led by Melissa R. Brown, CFA, Managing Director and Senior Portfolio Manager, and Gary Chropuvka, CFA, Vice President and Head of Portfolio Implementation, Goldman Sachs Asset Management, L.P. — the Sub-Adviser.
Performance: For the year ended December 31, 2005, the Portfolio’s Class S shares provided a total return of 5.54% compared to the Standard & Poor’s 500 Composite Stock Price (“S&P 500”) Index, which returned 4.91% for the same period.
Portfolio Specifics: In managing the CORESM products, we do not take size or sector bets. We hope to add value versus each Portfolio’s respective index by individual stock selection. Our quantitative process seeks out stocks with good momentum that also appear to be good values. We prefer stocks about which fundamental research analysts are becoming more positive, and companies with strong profit margins, sustainable earnings, and that use their capital to enhance shareholder value. Over the long term, these factors have led to excess returns, and they are not highly correlated, which diversifies the Portfolio’s sources of returns.
The Portfolio outperformed the S&P 500 Index for the year ended December 31, 2005. Returns to the CORE investment themes were positive for the period. Momentum and Valuation were the biggest positive contributors to relative returns, as inexpensive companies with strong momentum characteristics outperformed their industry counterparts. Earnings Quality also contributed significantly, followed by Management Impact, Profitability, and Analyst Sentiment.
Stock selection was positive in six of the ten sectors for the year. The Portfolio’s holdings in the energy sector outperformed their peers in the benchmark the most. Holdings in the financials and information technology sectors also contributed positively to relative performance. Conversely, holdings in the consumer discretionary, and healthcare sectors detracted the most relative to the benchmark for the period.
In individual stocks, overweight positions in Burlington Resources Inc., Google Inc., and Sunoco Inc. were among the top contributors to the Portfolio’s relative performance. On the downside, overweights in Biogen Idec Inc. and Harman International Industries Inc. along with an underweight in eBay Inc. detracted the most from relative returns over the 2005 year.
Current Strategy and Outlook: Looking ahead, we continue to believe that cheaper stocks should outpace more expensive ones and good momentum stocks should do better than poor momentum stocks. We also prefer names about which fundamental research analysts are becoming more positive and companies that are profitable, have sustainable earnings and use their capital to enhance shareholder value. As such, we anticipate remaining fully invested and expect that the value we add over time will be due to stock selection, as opposed to sector or size allocations. The Goldman Sachs Core Equity Portfolio invests in a diversified portfolio of equity investments in U.S. issuers. The Portfolio is subject to market risk so that the value of the securities in which it invests may go up or down in response to the prospects of individual companies, particular industry sectors and/or general economic conditions.
Top Ten Holdings*
as of December 31, 2005
(as a percent of net assets)
General Electric Co. | | 4.8% |
| | |
Bank of America Corp. | | 3.3% |
| | |
Johnson & Johnson | | 3.2% |
| | |
Altria Group, Inc. | | 3.1% |
| | |
JPMorgan Chase & Co. | | 3.0% |
| | |
Amgen, Inc. | | 2.5% |
| | |
Hewlett-Packard Co. | | 2.4% |
| | |
Time Warner, Inc. | | 2.4% |
| | |
Intel Corp. | | 2.3% |
| | |
Pfizer, Inc. | | 2.3% |
* Excludes short-term investments related to securities lending collateral. |
Portfolio holdings are subject to change daily.
18
PORTFOLIO MANAGERS’ REPORT | | ING GOLDMAN SACHS® CORE EQUITY PORTFOLIO |

| | | | | | |
| Average Annual Total Returns for the Periods Ended December 31, 2005 | |
| | | 1 Year | | Since Inception
of Classes I, S, and ADV
May 1, 2003 | |
| Class I | | 5.88 | % | | 16.24 | % | |
| Class S | | 5.54 | % | | 15.87 | % | |
| Class ADV | | 5.26 | % | | 15.34 | % | |
| S&P 500 Index(1) | | 4.91 | % | | 14.29 | % | |
| | | | | | | | |
Based on a $10,000 initial investment, the graph and table above illustrate the total return of ING Goldman Sachs® Core Equity Portfolio against the Index indicated. An index is unmanaged and has no cash in its portfolio, imposes no sales charges and incurs no operating expenses. An investor cannot invest directly in an index. The Portfolio’s performance is shown without the imposition of any expenses or charges which are, or may be, imposed under your annuity contract. Total returns would have been lower if such expenses or charges were included.
The performance graph and table do not reflect the deduction of taxes that a shareholder will pay on portfolio distributions or the redemption of portfolio shares.
The performance shown may include the effect of fee waivers and/or expense reimbursements by the Investment Manager and/or other service providers, which have the effect of increasing total return. Had all fees and expenses been considered, the total returns would have been lower.
The performance update illustrates performance for a variable investment option available through a variable annuity contract. The performance shown indicates past performance and is not a projection or prediction of future results. Actual investment returns and principal value will fluctuate so that shares and/or units, at redemption, may be worth more or less than their original cost. Please call (800) 922-0180 to get performance through the most recent month end.
This report contains statements that may be “forward-looking” statements. Actual results may differ materially from those projected in the “forward-looking” statements.
The views expressed in this report reflect those of the portfolio manager only through the end of the period as stated on the cover. The portfolio manager’s views are subject to change at any time based on marked and other conditions.
Portfolio holdings are subject to change daily.
(1) The S&P 500 Index is an unmanaged index that measures the performance of securities of approximately 500 of the largest companies in the U.S.
19
ING JPMORGAN FLEMING INTERNATIONAL PORTFOLIO | | PORTFOLIO MANAGERS’ REPORT |
Country Allocation
as of December 31, 2005
(as a percent of net assets)
Other Countries less than 1.3%(1)
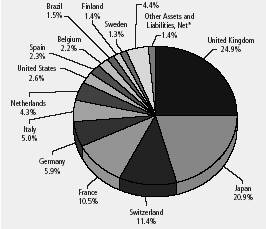
* | Includes securities lending collateral. |
(1) | Includes 5 countries, which each represents less than 1.3% of net assets. |
Portfolio holdings are subject to change daily.
The ING JPMorgan Fleming International Portfolio (the “Portfolio”) seeks long-term growth of capital. The Portfolio is managed by a team of investment professionals led by Howard Williams, James Fisher and Tim Leask, J.P. Morgan Fleming Asset Management Limited (London) — the Sub-Adviser.
Performance: For the year ended December 31, 2005, the Portfolio’s Class I shares provided a total return of 9.95% compared to the Morgan Stanley Capital International Europe, Australasia and Far East (“MSCI EAFE®”) Index, which returned 14.02% for the same period.
Portfolio Specifics: Stock selection was the primary source of performance. At a regional level, our exposure to emerging markets contributed positively to performance, while Europe, especially the United Kingdom and an underweight in Japan detracted the most. From a sector perspective, stock selection in information technology and an under weighting in telecommunications aided returns the most, while consumer discretionary, financials and industrials detracted.
Mitsubishi Corp., the Japanese trading company, had a tremendous year, outperforming the local and international markets. The company benefited from the weakening yen, as have all the major exporters, and experienced strong cyclical trends across its major divisions. We continue to find shares attractively valued at current levels and believe that continued strong performance across the company’s Portfolio of businesses should drive earnings higher.
Companhia Vale do Rio Doce (CVRD), the Brazilian mining company, had another spectacular year as investors looked to participate in the commodity rally, buoyed by significant price rises in the iron ore market. We continue to believe that the company should benefit from ongoing Asian demand for iron ore and realize meaningful prices rises in 2006. Furthermore, CVRD continues to demonstrate a disciplined use of cash, has an attractive dividend yield and its shares remain at a sizeable discount to its global peers.
Holdings that detracted from performance, included Kingfisher, the European home-improvement retailer. The company was a disappointing performer following a profit warning earlier in the year, driven by significant deterioration in consumer spending in its core U.K. market. However, a meeting with management gave us more comfort with their strategy of focusing on improving returns in mature domestic markets and reinvesting cash flows in emerging geographies.
Global telecommunications company Vodafone was a disappointing performer in the period, as was most of the telecommunications sector. Investors focused on concerns about the company’s operations in Japan, which remain under pressure combined with increased competition in Europe. We continue to believe the company is focused on delivering of shareholder value, as demonstrated in recent moves to increase the dividend. We find the stock attractively valued at current levels.
Current Strategy and Outlook: We continue to believe that global gross domestic product (“GDP”) will grow in 2006, although at a slower pace than 2005. The ultimate level of U.S. economic expansion will be determined by the ability of the Federal Reserve to suppress inflation while simultaneously keeping consumer demand buoyant. Conflicting forces are at work with, for example, the benefit of lower gas prices being offset by early signs of a slowing housing market. Elsewhere, notably in the euro zone and Japan, modest GDP expansion is expected, driven for the latter by ongoing bottom-up corporate restructuring. We prefer these two markets over North America in our global mandates.
The outlook for global equity markets remains constructive. However, with risk appetite unusually high, equities may be vulnerable to any bad news that could emerge in the near term. Markets are certainly not expensive at current levels, though increasingly we see limited opportunities for broad-based upward earnings revisions. We remain focused on companies that we believe have meaningful scope for earnings upgrades and multiples expansion, as these businesses can differentiate themselves from the broader stock — market due to their outstanding growth characteristics.
Top Ten Holdings*
as of December 31, 2005
(as a percent of net assets)
Banks | | 19.8% |
| | |
Oil & Gas | | 8.6% |
| | |
Pharmaceuticals | | 8.2% |
| | |
Telecommunications | | 6.0% |
| | |
Building Materials | | 5.3% |
| | |
Food | | 4.9% |
| | |
Distribution/Wholesale | | 4.9% |
| | |
Electronics | | 4.1% |
| | |
Insurance | | 3.7% |
| | |
Diversified Financial Services | | 2.9% |
* | Excludes short-term investments related to securities lending collateral. |
Portfolio holdings are subject to change daily.
20
PORTFOLIO MANAGERS’ REPORT | | ING JPMORGAN FLEMING INTERNATIONAL PORTFOLIO |
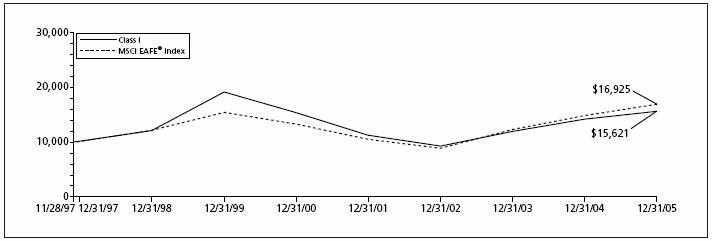
| | |
| Average Annual Total Returns for the Periods Ended December 31, 2005 | |
| | |
| | | 1 Year | | 5 Year | | Since Inception
of Class I
November 28, 1997 | | Since Inception of
Classes S, and ADV
December 10, 2001 | |
| Class I | | 9.95 | % | | 0.27 | % | | 5.66 | % | | — | | |
| Class S | | 9.79 | % | | — | | | — | | | 7.81 | % | |
| Class ADV | | 9.42 | % | | — | | | — | | | 7.52 | % | |
| MSCI EAFE® Index(1) | | 14.02 | % | | 4.79 | % | | 6.73 | %(2) | | 12.62 | %(3) | |
| | |
| | | | | | | | | | | | | | | |
Based on a $10,000 initial investment, the graph and table above illustrate the total return of ING JPMorgan Fleming International Portfolio against the Index indicated. An index is unmanaged and has no cash in its portfolio, imposes no sales charges and incurs no operating expenses. An investor cannot invest directly in an index. The Portfolio’s performance is shown without the imposition of any expenses or charges which are, or may be, imposed under your annuity contract. Total returns would have been lower if such expenses or charges were included.
The performance graph and table do not reflect the deduction of taxes that a shareholder will pay on portfolio distributions or the redemption of portfolio shares.
The performance shown may include the effect of fee waivers and/or expense reimbursements by the Investment Manager and/or other service providers, which have the effect of increasing total return. Had all fees and expenses been considered, the total returns would have been lower.
The performance update illustrates performance for a variable investment option available through a variable annuity contract. The performance shown indicates past performance and is not a projection or prediction of future results. Actual investment returns and principal value will fluctuate so that shares and/or units, at redemption, may be worth more or less than their original cost. Please call (800) 922-0180 to get performance through the most recent month end.
This report contains statements that may be “forward-looking” statements. Actual results may differ materially from those projected in the “forward-looking” statements.
The views expressed in this report reflect those of the portfolio manager only through the end of the period as stated on the cover. The portfolio manager’s views are subject to change at any time based on marked and other conditions.
Portfolio holdings are subject to change daily.
(1) The MSCI EAFE® Index is an unmanaged index that measures the performance of securities listed on exchanges in markets in Europe, Australia, and the Far East.
(2) Since inception performance for the index is shown as of December 1, 1997.
(3) Since inception performance for the index is shown as of December 1, 2001.
21
ING JPMORGAN MID CAP VALUE PORTFOLIO | | PORTFOLIO MANAGERS’ REPORT |
Industry Allocation
as of December 31, 2005
(as a percent of net assets)
Retail | | 9.8% |
| | |
Insurance | | 9.1% |
| | |
Banks | | 8.5% |
| | |
Electric | | 7.0% |
| | |
Chemicals | | 5.5% |
| | |
Oil & Gas | | 5.2% |
| | |
Telecommunications | | 4.2% |
| | |
Media | | 4.0% |
| | |
Miscellaneous Manufacturing | | 3.8% |
| | |
Healthcare-Services | | 3.7% |
| | |
Apparel | | 3.5% |
| | |
Industries between 2.0%-3.0%(1) | | 9.6% |
| | |
Industries between 1.6%-1.9%(2) | | 13.3% |
| | |
Industries less than 1.6%(3) | | 13.6% |
| | |
Other Assets and Liabilities, Net* | | (0.8)% |
| | |
Total | | 100.0% |
* | Includes securities lending collateral. |
| |
(1) | Includes four industries, which each represents 2.0%-3.0% of net assets. |
| |
(2) | Includes eight industries, which each represents 1.6%-1.9% of net assets. |
| |
(3) | Includes 16 industries, which each represents less than 1.6% of net assets. |
Portfolio holdings are subject to change daily.
The ING JPMorgan Mid Cap Value Portfolio (the “Portfolio”) seeks growth from capital appreciation. The Portfolio is managed by Jonathan K.L. Simon and Lawrence Playford, J.P. Morgan Investment Management Inc. — the Sub-Adviser.
Performance: For the year ended December 31, 2005, the Portfolio’s Class S shares provided a total return of 8.49% compared to the Russell MidCap® Value Index, which returned 12.65% for the same period.
Portfolio Specifics: U.S. equity market activity in 2005 was dominated by the outlook for interest rates, as economic data was intensely scrutinized to anticipate a pause in rate hikes by the Federal Open Market Committee (FOMC). Although there were headwinds, particularly a slowdown in growth and a rise in inflation following the hurricanes of late summer, the economy and continued strength in corporate profits generally supported equity gains in 2005.
The Portfolio underperformed the benchmark mostly due to overall stock selection in the consumer discretionary and materials sectors. Consumers were faced with the headwinds of higher interest rates, increasing winter heating costs and a softening U.S. housing market while many materials manufacturers encountered increased costs associated with higher energy prices.
At the individual stock level, IPC Holdings Ltd. and Gannett Co., Inc. were among the larger detractors to performance. IPC Holdings, a provider of property catastrophe reinsurance, announced significant insured losses from Hurricanes Katrina and Rita. Despite relatively stable operating results prior to the hurricanes, the storms negatively impacted the company’s third-quarter financial results. Gannett Co., a U.S.-based news and information company, experienced weaker revenues throughout the year as significantly lower political ad spending in its broadcasting segment and weaker ad demand in Britain pulled down results.
The Portfolio was positively impacted by overall stock selection in the industrials and consumer staples sectors. Burlington Resources, Inc. and Coventry Health Care Inc. were among the top individual contributors to performance. Burlington Resources, Inc. an energy exploration and production company, reported strong results throughout the year from higher energy prices, production growth and accelerated share repurchases. In addition the stock strengthened in December of 2005 as the company agreed to be acquired by ConocoPhillips. Coventry Health Care, a managed healthcare company, experienced accelerated earning growth in 2005 from improving margins and realized synergies from its acquisition of First Health Group Corporation.
Current Strategy and Outlook: We still expect U.S. growth to decelerate in early 2006 as further Federal Reserve tightening and a slowing housing market eventually impact consumer spending, but we are not forecasting a recession. The U.S. Treasury yield curve may invert and companies may become slightly more cautious in their spending, but the U.S. economy has repeatedly shown that it is likely to weather the bumps along the way to a non-inflationary expansion. We expect another positive but choppy year for U.S. equities in 2006, with returns likely in the high single digits. Valuation factors remain strongly in favor of equities and a range of indicators suggests that stocks are generally inexpensive, relative to both their history and to other asset classes.
We employ a bottom-up approach to stock selection, constructing portfolios based on company fundamentals, quantitative screening, and proprietary fundamental analysis. Our aim is to identify and invest in undervalued companies that have the potential to grow their intrinsic values per share. Potential investments are subjected to rigorous financial analysis and a disciplined approach to valuation. The research process is designed to identify companies with predictable and durable business models deemed capable of achieving sustainable growth.
Top Ten Holdings*
as of December 31, 2005
(as a percent of net assets)
VF Corp. | | 2.5% |
| | |
Assurant, Inc. | | 2.3% |
| | |
Burlington Resources, Inc. | | 2.1% |
| | |
M&T Bank Corp. | | 2.0% |
| | |
Coventry Health Care, Inc. | | 2.0% |
| | |
Devon Energy Corp. | | 1.9% |
| | |
CenturyTel, Inc. | | 1.8% |
| | |
Autozone, Inc. | | 1.8% |
| | |
North Fork Bancorporation, Inc. | | 1.7% |
| | |
Kinder Morgan, Inc. | | 1.7% |
* | Excludes short-term investments related to U.S. government obligations and securities lending collateral. |
Portfolio holdings are subject to change daily.
22
PORTFOLIO MANAGERS’ REPORT | | ING JPMORGAN MID CAP VALUE PORTFOLIO |
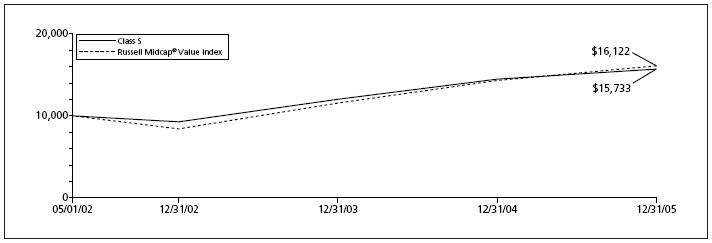
| | | | | | |
| Average Annual Total Returns for the Periods Ended December 31, 2005 | |
| | | 1 Year | | Since Inception
of Classes I, S, and ADV
May 1, 2002 | |
| Class I | | 8.71 | % | | 13.41 | % | |
| Class S | | 8.49 | % | | 13.14 | % | |
| Class ADV | | 8.11 | % | | 12.84 | % | |
| Russell Midcap® Value Index(1) | | 12.65 | % | | 13.91 | % | |
| | | | | | | | |
Based on a $10,000 initial investment, the graph and table above illustrate the total return of ING JPMorgan Mid Cap Value Portfolio against the Index indicated. An index is unmanaged and has no cash in its portfolio, imposes no sales charges and incurs no operating expenses. An investor cannot invest directly in an index. The Portfolio’s performance is shown without the imposition of any expenses or charges which are, or may be, imposed under your annuity contract. Total returns would have been lower if such expenses or charges were included.
The performance graph and table do not reflect the deduction of taxes that a shareholder will pay on portfolio distributions or the redemption of portfolio shares.
The performance shown may include the effect of fee waivers and/or expense reimbursements by the Investment Manager and/or other service providers, which have the effect of increasing total return. Had all fees and expenses been considered, the total returns would have been lower.
The performance update illustrates performance for a variable investment option available through a variable annuity contract. The performance shown indicates past performance and is not a projection or prediction of future results. Actual investment returns and principal value will fluctuate so that shares and/or units, at redemption, may be worth more or less than their original cost. Please call (800) 922-0180 to get performance through the most recent month end.
This report contains statements that may be “forward-looking” statements. Actual results may differ materially from those projected in the “forward-looking” statements.
The views expressed in this report reflect those of the portfolio manager only through the end of the period as stated on the cover. The portfolio manager’s views are subject to change at any time based on marked and other conditions.
Portfolio holdings are subject to change daily.
(1) The Russell Midcap® Value Index measures the performance of those Russell Midcap companies with lower price-to-book ratios and lower forecasted growth values.
23
ING MFS CAPITAL OPPORTUNITIES PORTFOLIO | | PORTFOLIO MANAGERS’ REPORT |
Industry Allocation
as of December 31, 2005
(as a percent of net assets)
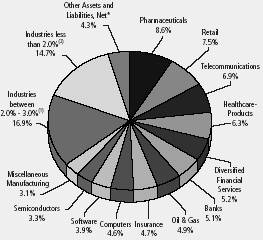
* | Includes securities lending collateral. |
(1) | Includes 7 industries, which each represents 2.0% - 3.0% of net assets. |
(2) | Includes 15 industries, which each represents 1.0% of net assets. |
Portfolio holdings are subject to change daily.
The ING MFS Capital Opportunities Portfolio (the “Portfolio”) seeks capital appreciation. The Portfolio is managed by Jeffrey C. Constantino, Vice President and Gregory W. Locraft, Senior Vice President, Portfolio Managers, Massachusetts Financial Services Company (“MFS”) — the Sub-Adviser.
Performance: For the year ended December 31, 2005, the Portfolio’s Class I shares provided a total return of 1.56%, compared to the Standard & Poor’s 500 Composite Stock Price (“S&P 500”) Index, which returned 4.91% for the same period.
Portfolio Specifics: Health care, retailing, and financial services were the Portfolio’s top contributing sectors over the 2005 reporting period. In health care, a combination of stock selection and an overweighted position in the sector boosted relative results. Our holdings in drug company MedImmune and our avoidance of poor-performing pharmaceutical giant Pfizer were among the Portfolio’s top contributors.
Although positive relative contribution from the retailing and financial services sectors resulted primarily from superior stock selection, no individual stocks within either sector were among the portfolio’s top contributors.
Several energy holdings helped relative performance during the 2005 year. These included our positions in drilling rig operator Global Santa Fe and oil and gas equipment manufacturer Cooper Cameron, neither of which are benchmark constituents. Devon Energy, offshore drilling company Noble Corp, and oilfield services provider BJ Services were also among the top contributors.
Other investments that added to the portfolio’s performance included our overweighted positions in software developer Compuware and cell phone manufacturer Nokia, which is not a benchmark constituent.
Relative to the portfolio’s benchmark, utilities & communications, technology, leisure, and basic materials were the portfolio’s weakest-contributing sectors over the 2005 year. In all four sectors, stock selection detracted from relative returns. In the utilities & communications sector, our overweighted positions in power producer Calpine and telecom services provider Verizon were among the portfolio’s top detractors for the 2005 year.
In technology, our holdings in network security software company Symantec, global telecom equipment maker Nortel Networks, which is not a benchmark constituent, and not holding strong-performing Apple Computer held back relative results.
A combination of stock selection and an overweighted position in the leisure sector dampened investment performance. Our holdings in advertising and marketing services company Interpublic Group and media giant Viacom detracted from relative returns.
In basic materials, our holdings in newsprint maker Bowater, which is not a benchmark constituent, held back returns.
Stocks in other sectors that negatively impacted performance included our overweighted positions in poor-performing health services provider Tenet Healthcare and manufacturing conglomerate Tyco International.
During the reporting period, our currency exposure was also a detractor from the portfolio’s relative performance. All of MFS’ investment decisions are driven by the fundamentals of each individual opportunity and, as such, it is common for our portfolios to have different currency exposure than the benchmark.
Current Strategy and Outlook: Greg Locraft and Jeff Constantino, the new portfolio management team as of December 6, 2005, manage the portfolio as a flexible core investment portfolio utilizing growth, value and core positions in companies with market capitalizations greater than $1 billion. We take a bottom-up focus on winners and losers in industries rather than a macro economic or sector focus, leveraging the in-depth research work of the MFS global sector terms. We take a long term view and evaluate securities over a three year holding period with a preference for position concentration (50-100 names) and low turnover. Investments center on 3 types of opportunities:
Sustainable growth: seek companies with open ended growth opportunities
Contrarian value: focus on companies that are heavily out of favor trading below their intrinsic value
Growth at a reasonable price: own companies with very high barriers to entry trading at reasonable valuations.
Top Ten Holdings*
as of December 31, 2005
(as a percent of net assets)
Wyeth | | 3.8% |
| | |
Johnson & Johnson | | 2.5% |
| | |
Cisco Systems, Inc. | | 2.5% |
| | |
JPMorgan Chase & Co. | | 2.1% |
| | |
Owens-Illinois, Inc. | | 2.1% |
| | |
Tyco International Ltd. | | 2.0% |
| | |
Symantec Corp. | | 2.0% |
| | |
Nortel Networks Corp. | | 2.0% |
| | |
PNC Financial Services Group, Inc. | | 2.0% |
| | |
Oracle Corp. | | 2.0% |
* Excludes short-term investments related to securities lending collateral. |
Portfolio holdings are subject to change daily.
24
PORTFOLIO MANAGERS’ REPORT | ING MFS CAPITAL OPPORTUNITIES PORTFOLIO |

| Average Annual Total Returns for the Periods Ended December 31, 2005 | |
|
| | | 1 Year | | 5 Year | | Since Inception
of Class I
November 28, 1997 | | Since Inception of
Class S, and ADV
December 10, 2001 | |
| Class I | | 1.56% | | (5.05 | )% | | 4.16 | % | | — | | |
| Class S | | 1.25% | | — | | | — | | | 0.28 | % | |
| Class ADV | | 1.03% | | — | | | — | | | 0.03 | % | |
| S&P 500 Index(1) | | 4.91% | | 0.54 | % | | 4.96 | %(2) | | 4.06 | %(3) | |
|
Based on a $10,000 initial investment, the graph and table above illustrate the total return of ING MFS Capital Opportunities Portfolio against the Index indicated. An index is unmanaged and has no cash in its portfolio, imposes no sales charges and incurs no operating expenses. An investor cannot invest directly in an index. The Portfolio’s performance is shown without the imposition of any expenses or charges which are, or may be, imposed under your annuity contract. Total returns would have been lower if such expenses or charges were included.
The performance graph and table do not reflect the deduction of taxes that a shareholder will pay on portfolio distributions or the redemption of portfolio shares.
The performance shown may include the effect of fee waivers and/or expense reimbursements by the Investment Manager and/or other service providers, which have the effect of increasing total return. Had all fees and expenses been considered, the total returns would have been lower.
The performance update illustrates performance for a variable investment option available through a variable annuity contract. The performance shown indicates past performance and is not a projection or prediction of future results. Actual investment returns and principal value will fluctuate so that shares and/or units, at redemption, may be worth more or less than their original cost. Please call (800) 922-0180 to get performance through the most recent month end.
This report contains statements that may be “forward-looking” statements. Actual results may differ materially from those projected in the “forward-looking” statements.
The views expressed in this report reflect those of the portfolio manager only through the end of the period as stated on the cover. The portfolio manager’s views are subject to change at any time based on marked and other conditions.
Portfolio holdings are subject to change daily.
(1) The S&P 500 Index is an unmanaged index that measures the performance of securities of approximately 500 of the largest companies in the U.S.
(2) Since inception performance for the index is shown from December 1, 1997.
(3) Since inception performance for the index is shown from December 1, 2001.
25
ING OPCAP BALANCED VALUE PORTFOLIO | PORTFOLIO MANAGERS’ REPORT |
Industry Allocation
as of December 31, 2005
(as a percent of net assets)
Diversified Financial Services | | 21.8 | % |
| | | |
Insurance | | 9.9 | % |
| | | |
Pharmaceuticals | | 9.4 | % |
| | | |
Telecommunications | | 8.2 | % |
| | | |
Oil & Gas | | 7.2 | % |
| | | |
Retail | | 6.3 | % |
| | | |
Leisure Time | | 4.6 | % |
| | | |
Commercial Services | | 4.4 | % |
| | | |
Miscellaneous Manufacturing | | 3.8 | % |
| | | |
Biotechnology | | 3.5 | % |
| | | |
Internet | | 3.5 | % |
| | | |
Food | | 3.1 | % |
| | | |
Industries between 2.0%-3.0%(1) | | 7.5 | % |
| | | |
Industries less than 2.0%(2) | | 10.1 | % |
| | | |
Other Assets and Liabilities, Net* | | (3.3) | % |
| | | |
Total | | 100.0 | % |
* Includes securities lending collateral. (1) Includes 3 industries, which each represents 2.0%-3.0% of net assets. (2) Includes 12 industries, which each represents 2.0% of net assets. |
Portfolio holdings are subject to change daily.
The ING OpCap Balanced Value Portfolio (the “Portfolio”) seeks capital growth, and secondarily, investment income. The Portfolio is managed by Colin Glinsman, Managing Director and Chief Investment Officer, OpCap Advisors LLC — the Sub-Adviser.
Performance: For the year ended December 31, 2005, the Portfolio’s Class S Shares provided a total return of 2.70% compared to the Composite Index (60% Standard & Poor’s 500 Composite Stock Price® (“S&P”) Index/40% Lehman Brothers Intermediate Government/Credit Bond Index), which returned 4.21% for the same period.
Portfolio Specifics: After struggling to start the year in the face of rising energy prices and mixed economic signals, stocks posted modest gains in each of the last three quarters to end 2005 with returns in the mid-single digits. International equities outperformed domestic equities by a wide margin for the year. Japan, South Korea, and Canada were among the year’s best performing equity markets. Fundamental economic improvement in Europe and Japan, low global interest rates, and strong economic growth in Asia were major performance catalysts for the year.
Large-cap stocks generally outperformed small-caps for the first time in seven years while value stocks held on to their lead over growth with strong relative performance in the first quarter. Energy and utilities stocks were the best performers in 2005 while consumer discretionary and telecom stocks were the poorest performers for the year.
In the equity portion of the Portfolio, an overweighting and strong stock selection in the energy sector contributed to Portfolio performance for the year. In particular, a large position in ConocoPhillips and exposure to XTO Energy were key contributors. The Portfolio also benefited from strong stock selection in the consumer discretionary sector.
Conversely, stock selection in the consumer staples sector detracted from Portfolio performance. A large position in Wal-Mart underperformed as the company suffered earnings weakness as high oil prices cut into the lower-end of consumer demand. The stock has since been sold from the Portfolio.
In addition, our underweighting in utilities was a detractor, but we believe this positioning will bolster the Portfolio going forward as higher interest rates begin to dampen investors’ reach for yield in the dividend-paying utility sector.
The fixed income portion of the Portfolio consisted of corporate bonds with maturities less than ten years. A shorter than index duration was maintained during the year, which accounted for the fixed income portion outperforming its benchmark, the Lehman Brothers Intermediate Government/Credit Bond Index. Bonds struggled during 2005 as the Federal Reserve (“Fed”) remained committed to raising rates in order to stave off future inflation. This impacted the bond market, particularly in the five year part of the yield curve, where the portfolio was underweighted. Looking down the road, we perceive the Fed will be near the end of its tightening cycle sometime in 2006 which could have implications for a shift in the yield curve towards a more normal positive slope.
Current Strategy and Outlook: Our positive expectations for Japan continue to materialize, with recent developments reaffirming the country’s commitment to economic reform and recovery. Job growth, consumer spending and price stability are improving, providing a favorable backdrop for Japan to emerge from its 15 years of economic stagnation.
In Europe, we believe labor reforms will progress regardless of politics, enabling regional economic potential to be better realized. The lower euro should continue to provide a tail-wind for the European export sector and help corporate earnings accelerate further.
Currency movements in 2005 were mostly dictated by interest-rate moves in the U.S. Given the likely rise in European interest rates and end to U.S. tightening, we think the euro will probably strengthen versus the dollar in 2006, as well as versus the pound and yen.
In the U.S., economic fundamentals, corporate profitability and equity valuations remain favorable heading into 2006. The Portfolio remains invested in attractively valued stocks that are poised to benefit from a relatively stable interest rate environment and a continuation of a multi-year expansionary period.
Top Ten Holdings*
as of December 31, 2005
(as a percent of net assets)
Pfizer, Inc. | | 4.9 | % |
| | | |
Citigroup, Inc. | | 4.8 | % |
| | | |
Royal Caribbean Cruises Ltd. | | 4.6 | % |
| | | |
Countrywide Financial Corp. | | 3.8 | % |
| | | |
Hartford Financial Services Group, Inc. | | 3.7 | % |
| | | |
Cisco Systems, Inc. | | 3.6 | % |
| | | |
Biogen Idec, Inc. | | 3.5 | % |
| | | |
Eaton Corp. | | 3.3 | % |
| | | |
Capital One Financial Corp. | | 3.0 | % |
| | | |
ConocoPhillips | | 2.9 | % |
* Excludes short-term investments related to securities lending collateral and U.S. Government Obligations. |
Portfolio holdings are subject to change daily.
26
PORTFOLIO MANAGERS’ REPORT | ING OPCAP BALANCED VALUE PORTFOLIO |
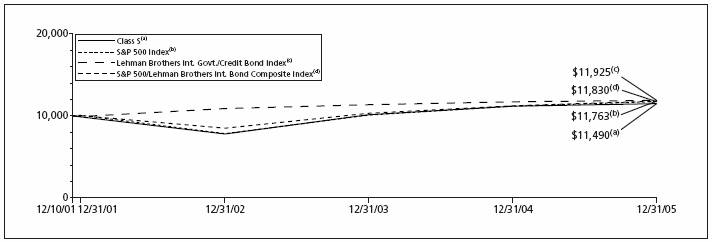
| Average Annual Total Returns for the Periods Ended December 31, 2005 | |
| | |
| | | 1 Year | | Since Inception
of Classes I, S, and ADV
December 10, 2001 | |
| Class I | | 2.98 | % | | 3.75 | % | |
| Class S | | 2.70 | % | | 3.48 | % | |
| Class ADV | | 2.46 | % | | 3.23 | % | |
| S&P 500 Index(1) | | 4.91 | % | | 4.06 | %(4) | |
| Lehman Bros. Int. Govt/Credit Bond Index(2) | | 1.58 | % | | 4.41 | %(4) | |
| 60% S&P 500/40% Lehman Bros. Intermediate Government/Credit Bond Composite(3) | | 3.58 | % | | 4.20 | %(4) | |
| | | | | | | | |
Based on a $10,000 initial investment, the graph and table above illustrate the total return of ING OpCap Balanced Value Portfolio against the Indices indicated. An index is unmanaged and has no cash in its portfolio, imposes no sales charges and incurs no operating expenses. An investor cannot invest directly in an index. The Portfolio’s performance is shown without the imposition of any expenses or charges which are, or may be, imposed under your annuity contract. Total returns would have been lower if such expenses or charges were included.
The performance graph and table do not reflect the deduction of taxes that a shareholder will pay on portfolio distributions or the redemption of portfolio shares.
The performance shown may include the effect of fee waivers and/or expense reimbursements by the Investment Manager and/or other service providers, which have the effect of increasing total return. Had all fees and expenses been considered, the total returns would have been lower.
The performance update illustrates performance for a variable investment option available through a variable annuity contract. The performance shown indicates past performance and is not a projection or prediction of future results. Actual investment returns and principal value will fluctuate so that shares and/or units, at redemption, may be worth more or less than their original cost. Please call (800) 922-0180 to get performance through the most recent month end.
This report contains statements that may be “forward-looking” statements. Actual results may differ materially from those projected in the “forward-looking” statements.
The views expressed in this report reflect those of the portfolio manager only through the end of the period as stated on the cover. The portfolio manager’s views are subject to change at any time based on marked and other conditions.
Portfolio holdings are subject to change daily.
(1) The S&P 500 Index is an unmanaged index that measures the performance of securities of approximately 500 of the largest companies in the U.S.
(2) The Lehman Brothers Intermediate Government/Credit Bond Index is an unmanaged index composed of securities including U.S. Government Treasury and agency securities.
(3) The 60% S&P 500/40% Lehman Brothers Intermediate Government/Credit Bond Composite is a benchmark consisting of a mix of 60% of an unmanaged stock index (the S&P 500) and 40% of an unmanaged bond index (Lehman Bros. Gov’t Credit Bond Index).
(4) Since inception performance for the indices is shown from December 1, 2001.
27
ING OPPENHEIMER GLOBAL PORTFOLIO | PORTFOLIO MANAGERS’ REPORT |
Country Allocation
as of December 31, 2005
(as a percent of net assets)
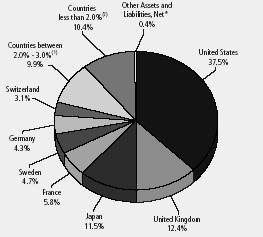
* Includes securities leading collateral. |
(1) Includes 4 countries, which each represents 2.0% - 3.0% of net assets. |
(2) Includes 15 countries, which each represents less than 2.0% of net assets. |
Portfolio holdings are subject to change daily.
The ING Oppenheimer Global Portfolio (the “Portfolio”) seeks capital appreciation. The Portfolio is managed by William L. Wilby, Senior Vice President and Senior Investment Officer, Director of Equities, and Rajeev Bhaman, Vice President, OppenheimerFunds, Inc. — the Sub-Adviser.
Performance: For the year ended December 31, 2005, the Portfolio’s Class S shares provided a total return of 13.27% compared to the Morgan Stanley Capital International (“MSCI”) All Country World® Index, which returned 11.37% for the same period.
Portfolio Specifics: It is important to bear in mind that a discussion of the stocks that added to or detracted from performance is merely meant to illustrate our investment approach rather than suggest any attempt to make a country, sector or thematic bet. With that logic in mind, the Portfolio actually benefited from quite a few of its holdings, mostly for company-specific reasons. Hyundai Heavy Industries, the world’s largest shipbuilder, was one of the Portfolio’s best performing stocks. A long-term holding for us, we bought the stock on the belief that the average tanker age was high and the move toward double-hulled tankers would create a demand for new ship construction. The stock was very reasonably priced due to some concerns over their ownership of non-core businesses, among other things. Those issues have now been resolved and the stock more than doubled during the reporting period.
Against the benchmark, stock selection was particularly favorable in the U.S. This was partially offset by adverse selection in the United Kingdom and Japan. Exposure to emerging markets added materially to performance.
Another winner for the Portfolio was AMD, whose new dual core processor chip achieved significant traction in the server market ahead of Intel’s competitive offering. The market’s skepticism of AMD’s competitive position turned to acceptance over the period helping the stock’s rise.
Otherwise, two of the Portfolio’s energy stocks – Husky Energy, Inc. and Transocean, Inc. – an oil reserves company and driller, respectively, helped fuel performance due to the rising cost of oil and natural gas.
On balance, a few of the Portfolio’s stocks hindered returns during the reporting period, including JDS Uniphase Corp., an optical components company. We had bought this stock in previous years believing that there was a significant opportunity for a turnaround and that the risk was reflected in its stock price. However, the turnaround never materialized and we have since sold the stock. Another negative contributor was Vodafone. As one of our largest holdings Vodafone has yet to deliver performance in line with our expectations. A slow market in Europe coupled with greater than expected expenditure in Japan and a realized tax change all contributed to hurt expected results. A lengthening of the sales cycle in video conferencing technology led to earnings disappointments at Tandberg, one of our poorest performers. We believe the technology has merit, which will allow for adoption in the coming year. Our holdings in International Game Technology, the world’s largest manufacturer of casino gaming machines, also disappointed. The company’s earnings growth did not meet investors’ expectations and consequently, its stock price fell. However, we believe the long-term prospects remain strong, the company is a leader in its industry and its stock is reasonably priced. Therefore, we added modestly to the stock on its weakness.
Current Strategy and Outlook: Our investment themes of Mass Affluence, New Technologies, Restructuring and Aging (“MANTRA”) provide a number of well-stocked pools in which to fish. The luxury goods industry is a business that fits into our mass affluence theme which we see as offering long-term growth opportunities. This is especially true in the Far East where we’re seeing substantial economic growth and where people are very fashion conscious. To that end, we own shares in LVMH Moet Hennessey Louis Vuitton, the spirits and fine leather goods firm. We like this company because it offers leading brands in each of its categories, including one of the world’s most important champagne houses (the company owns Dom Perignon).
We are also finding very good opportunities in Health Care including in Pharmaceuticals. New drugs to treat unmet needs in cancer and diabetes, vaccines to prevent flu and new antibiotics should drive higher than average profits growth in this industry for the foreseeable future.
Top Ten Industries*
as of December 31, 2005
(as a percent of net assets)
Telecommunications | | 10.8 | % |
| | | |
Pharmaceuticals | | 8.2 | % |
| | | |
Banks | | 7.2 | % |
| | | |
Oil & Gas | | 6.7 | % |
| | | |
Software | | 6.1 | % |
| | | |
Semiconductors | | 5.3 | % |
| | | |
Insurance | | 4.4 | % |
| | | |
Aerospace/Defense | | 4.3 | % |
| | | |
Media | | 4.3 | % |
| | | |
Diversified Financial Services | | 3.7 | % |
* Excludes short-term investments related to U.S. government securities and securities lending collateral. |
Portfolio holdings are subject to change daily.
28
PORTFOLIO MANAGERS’ REPORT | ING OPPENHEIMER GLOBAL PORTFOLIO |
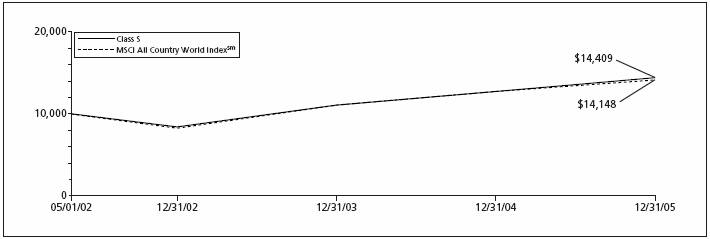
| Average Annual Total Returns for the Periods Ended December 31, 2005 | |
| | |
| | | 1 Year | | Since Inception
of Classes I, S, and ADV
May 1, 2002 | |
| Class I | | 13.57% | | 11.08 | % | |
| Class S | | 13.27% | | 10.46 | % | |
| Class ADV | | 13.07% | | 10.22 | % | |
| MSCI All Country World IndexSM(1) | | 11.37% | | 9.93 | % | |
| | |
Based on a $10,000 initial investment, the graph and table above illustrate the total return of ING Oppenheimer Global Portfolio against the Index indicated. An index is unmanaged and has no cash in its portfolio, imposes no sales charges and incurs no operating expenses. An investor cannot invest directly in an index. The Portfolio’s performance is shown without the imposition of any expenses or charges which are, or may be, imposed under your annuity contract. Total returns would have been lower if such expenses or charges were included.
The performance graph and table do not reflect the deduction of taxes that a shareholder will pay on portfolio distributions or the redemption of portfolio shares.
The performance shown may include the effect of fee waivers and/or expense reimbursements by the Investment Manager and/or other service providers, which have the effect of increasing total return. Had all fees and expenses been considered, the total returns would have been lower.
The performance update illustrates performance for a variable investment option available through a variable annuity contract. The performance shown indicates past performance and is not a projection or prediction of future results. Actual investment returns and principal value will fluctuate so that shares and/or units, at redemption, may be worth more or less than their original cost. Please call (800) 922-0180 to get performance through the most recent month end.
This report contains statements that may be “forward-looking” statements. Actual results may differ materially from those projected in the “forward-looking” statements.
The views expressed in this report reflect those of the portfolio manager only through the end of the period as stated on the cover. The portfolio manager’s views are subject to change at any time based on marked and other conditions.
Portfolio holdings are subject to change daily.
(1) The MSCI All Country World IndexSM is a broad-based unmanaged index comprised of equity securities in countries around the world, including the United States, other developed countries and emerging markets.
29
ING OPPENHEIMER STRATEGIC INCOME PORTFOLIO | PORTFOLIO MANAGERS’ REPORT |
Investment Types
as of December 31, 2005
(as a percent of net assets)
Other Bonds | | 29.6 | % |
| | | |
Corp Bonds Notes | | 28.8 | % |
| | | |
U.S. Government Agency Obligations | | 24.6 | % |
| | | |
Equity-Linked Securities | | 7.9 | % |
| | | |
U.S. Treasury Obligations | | 4.9 | % |
| | | |
Common Stock | | 2.3 | % |
| | | |
Asset-Backed Securities | | 1.9 | % |
| | | |
Collateralized Mortgage Obligations | | 1.6 | % |
| | | |
Preferred Stock | | 0.3 | % |
| | | |
Other Assets and Liabilities* | | (1.9 | )% |
| | | |
Total | | 100.0 | % |
* Includes securities lending collateral and less than 1/2% of convertible bonds. |
Portfolio holdings are subject to change daily.
The ING Oppenheimer Strategic Income Portfolio (the “Portfolio”) seeks a high level of current income principally derived from interest on debt securities. The Portfolio is managed by Arthur P. Steinmetz, Vice President and Senior Portfolio Manager, OppenheimerFunds, Inc. — the Sub-Adviser.
Performance: For the year ended December 31, 2005, the Portfolio’s Class S shares provided a total return of 0.84% compared to the Lehman Brothers Aggregate Bond Index, which returned 2.43% for the same period.
Portfolio Specifics: During the reporting period, the U.S. Federal Reserve Board continued to raise the overnight Federal Funds Rate, driving it from 2.25% to 4.25%. However, contrary to historical norms, longer term bond yields remained remarkably resilient, ending the reporting period close to where they began. In addition, bond prices were supported by investors’ low inflation expectations and robust demand from overseas investors, including central banks in Asia.
Unlike the United States, interest rates in most international markets remained in a relatively narrow range, and the Portfolio’s international holdings were influenced mainly by changes in currency exchange rates. After appreciating against the U.S. dollar through most of 2004, the euro and yen weakened during 2005. The yield advantage offered by U.S. Treasury securities over government bonds in Europe and Japan caused foreign capital to flow into the U.S. financial markets. Consequently, bonds from developed markets lost a modest amount of value in U.S. dollar terms. Conversely, higher yields and improving credit characteristics in the emerging markets helped attract investment capital, supporting local currencies relative to the U.S. dollar. Therefore, emerging-market bonds performed quite well for U.S. investors.
During the spring of 2005, we shifted the Portfolio’s emphasis in its international portfolio from bonds of developed nations to the emerging markets. We focused on unhedged positions in countries where we expected fiscal improvements to attract more investment capital. Despite a mildly underweighted position, the Portfolio also achieved relatively strong results through its investments in U.S. dollar-denominated bonds from the emerging markets.
We maintained relatively light exposure to the high yield corporate bond market due to historically narrow yield differences between high yield securities and U.S. Treasuries. The Portfolio added value through our emphasis on higher quality securities from issuers with strong cash flows, such as cell tower operators and energy companies.
Finally, we maintained a generally neutral posture with regard to U.S. government securities. We set the Portfolio’s average duration in a range we considered to be in line with industry averages, and we placed a modest emphasis on mortgage-backed securities that we believed would be less sensitive to prepayment risks. This strategy enabled the Portfolio to capture higher yields while effectively managing the risks of higher short-term interest rates.
Current Strategy and Outlook: When the Federal Reserve raised interest rates in mid-December 2005, the language in its accompanying statement indicated that it may be approaching the end of the current credit-tightening cycle. While this could prove to be a positive influence on U.S. government securities and high yield corporate bonds, rich valuations and unexpected changes in the rate of economic growth could forestall potential rallies.
In international markets, we have maintained the Portfolio’s emphasis on nations, such as Brazil and Turkey, where falling interest rates and lower inflation may create further opportunities. In contrast, interest rates are already low in Europe and Japan, leaving little room for further cuts.
As always, we intend to monitor economic and market developments, and to adjust our strategies accordingly.
Top Ten Industries*
as of December 31, 2005
(as a percent of net assets)
Foreign Government Bonds | | 28.7 | % |
| | | |
Federal National Mortgage Association | | 11.2 | % |
| | | |
Sovereign | | 7.9 | % |
| | | |
Federal Home Loan Bank | | 7.8 | % |
| | | |
Diversified Financial Services | | 7.2 | % |
| | | |
Federal Home Loan Mortgage Corporation | | 3.7 | % |
| | | |
Treasury Bill | | 3.5 | % |
| | | |
Telecommunications | | 2.8 | % |
| | | |
Media | | 2.4 | % |
| | | |
Oil & Gas | | 2.3 | % |
* Excludes short-term investments related to securities lending collateral. |
Portfolio holdings are subject to change daily.
30
PORTFOLIO MANAGERS’ REPORT | ING OPPENHEIMER STRATEGIC INCOME PORTFOLIO |

| Average Annual Total Returns for the Periods Ended December 31, 2005 | |
| | |
| | | 1 Year | | Since Inception
of Classes I, S, and ADV
November 8, 2004 | |
| Class I | | 1.09 | % | | 2.17 | % | |
| Class S | | 0.84 | % | | 1.84 | % | |
| Class ADV | | 0.61 | % | | 1.63 | % | |
| Lehman Brothers Aggregate Bond Index(1) | | 2.43 | % | | 2.18 | %(3) | |
| S&P/Citigroup World Government Bond Index(2) | | (6.88 | )% | | (1.60 | )%(3) | |
| | | | | | |
Based on a $10,000 initial investment, the graph and table above illustrate the total return of ING Oppenheimer Strategic Income Portfolio against the Indices indicated. An index is unmanaged and has no cash in its portfolio, imposes no sales charges and incurs no operating expenses. An investor cannot invest directly in an index. The Portfolio’s performance is shown without the imposition of any expenses or charges which are, or may be, imposed under your annuity contract. Total returns would have been lower if such expenses or charges were included.
The performance graph and table do not reflect the deduction of taxes that a shareholder will pay on portfolio distributions or the redemption of portfolio shares.
The performance shown may include the effect of fee waivers and/or expense reimbursements by the Investment Manager and/or other service providers, which have the effect of increasing total return. Had all fees and expenses been considered, the total returns would have been lower.
The performance update illustrates performance for a variable investment option available through a variable annuity contract. The performance shown indicates past performance and is not a projection or prediction of future results. Actual investment returns and principal value will fluctuate so that shares and/or units, at redemption, may be worth more or less than their original cost. Please call (800) 922-0180 to get performance through the most recent month end.
This report contains statements that may be “forward-looking” statements. Actual results may differ materially from those projected in the “forward-looking” statements.
The views expressed in this report reflect those of the portfolio manager only through the end of the period as stated on the cover. The portfolio manager’s views are subject to change at any time based on marked and other conditions.
Portfolio holdings are subject to change daily.
(1) The Lehman Brothers Aggregate Bond Index in an unmanaged index composed of securities from the Lehman Brothers Intermediate Government/Corporate Bond Index, Mortgage-Backed Securities Index, and the Asset Backed Securities Index including securities that are investment-grade quality or better and have at least one year to maturity.
(2) The S&P/Citigroup World Government Bond Index is an unmanaged index of bonds from 14 world government bond markets with maturities of at least one year.
(3) Since inception performance for the indices is shown from November 1, 2004.
31
ING PIMCO TOTAL RETURN PORTFOLIO | PORTFOLIO MANAGERS’ REPORT |
Investment Types
as of December 31, 2005
(as a percent of net assets)
U.S. Government Agency Obligations | | 67.6 | % |
| | | |
Commercial Paper | | 18.0 | % |
| | | |
U.S. Treasury Obligations | | 15.7 | % |
| | | |
Other Bonds | | 12.6 | % |
| | | |
Collateralized Mortgage Obligations | | 10.8 | % |
| | | |
Asset-Backed Securities | | 2.5 | % |
| | | |
Municipals | | 2.1 | % |
| | | |
Corporate/Bonds Notes | | 1.6 | % |
| | | |
Options | | 0.1 | % |
| | | |
Preferred Stock | | 0.1 | % |
| | | |
Other Assets and Liabilities* | | (31.0 | )% |
| | | |
Total | | 100.0 | % |
* Includes securities lending collateral. |
Portfolio holdings are subject to change daily.
The ING PIMCO Total Return Portfolio (the “Portfolio”) seeks maximum total return, consistent with capital preservation and prudent investment management. The Portfolio is managed by Pasi Hamalainen, Managing Director and Portfolio Manager, Pacific Investment Management Company LLC — the Sub-Adviser.
Performance: For year ended December 31, 2005, the Portfolio’s Class S Shares provided a total return of 2.08% compared to the Lehman Brothers Aggregate Bond Index, which returned 2.43% for the same period.
Portfolio Specifics: Bonds gained ground in 2005, leaning against the headwinds of 200 basis points of Federal Reserve (“Fed”) tightening and concern that higher energy prices would fuel inflation. The Lehman Brothers Aggregate Bond Index, a widely used index of high-grade U.S. bonds, returned 2.43% for the year. The benchmark ten-year U.S. Treasury yield ended the quarter at 4.40%, 17 basis points higher than at the start of the year. Bond markets were dominated during 2005 by speculation about the pace and duration of the Fed’s tightening cycle. The U.S. central bank raised the federal funds rate in 25 basis point increments at each of its eight meetings during the year, including twice during the final quarter to 4.25%.
Broad diversification helped returns for all of 2005 amid a challenging environment for bonds. Above-index duration detracted from performance as interest rates rose during the year. An overweight to shorter maturities hurt returns, as the yield curve continued to flatten as short rates rose. Mortgage security selection helped returns, which offset the negative impact of a sector overweight, as mortgages lagged like-duration Treasuries. An underweight to corporates was positive, as they trailed U.S. Treasuries as credit premiums widened. Most government bond markets outside the U.S. outperformed Treasuries for all of 2005, as economic growth was generally slower and rate increases milder outside the U.S. Emerging market bonds, the best performing fixed income sector for the year, helped performance, as investors continued to be drawn to their improving credit fundamentals. Treasury inflation protected securities modestly outpaced like-duration nominals for the full year, however, supported by high consumer price index accruals. Municipal securities helped returns, as they usually outperform as interest rates rise.
Current Strategy and Outlook: We believe the U.S. economy should grow more slowly over the next year as the housing market cools and consumer spending grows more in line with incomes. The Fed should stop tightening early in 2006; yields on 1-5 year Treasuries may fall as much as 100 basis points this year as markets anticipate the start of Fed easing. Inflation should be well contained, as commodity prices are moderating after their post-Katrina rally, with little pass-through of higher energy prices into core U.S. inflation. More importantly, the long-run economic trend of an expanding global labor supply (in China, India and Brazil, for example) will put downward pressure on the price of labor, making a wage-induced boost in inflation highly unlikely. The PIMCO Total Return Portfolio will continue to take moderate risks across a variety of strategies that are expected to add value in a slowing U.S. economy. Exposures will focus mainly on the U.S., where we see better value at present.
Top Ten Industries*
as of December 31, 2005
(as a percent of net assets)
Federal National Mortgage Association | | 60.9 | % |
| | | |
Commercial Paper | | 18.0 | % |
| | | |
Foreign Government Bonds | | 12.6 | % |
| | | |
U.S. Treasury Note | | 8.6 | % |
| | | |
Whole Loan Collateral CMO | | 8.2 | % |
| | | |
Federal Home Loan Mortgage Corporation | | 6.8 | % |
| | | |
U.S. Treasury Bond | | 5.6 | % |
| | | |
Municipal | | 2.1 | % |
| | | |
Agency Collateral CMO | | 2.0 | % |
| | | |
Home Equity Asset Backed Securities | | 1.8 | % |
* Excludes short-term investments related to securities lending collateral. |
Portfolio holdings are subject to change daily.
32
PORTFOLIO MANAGERS’ REPORT | ING PIMCO TOTAL RETURN PORTFOLIO |
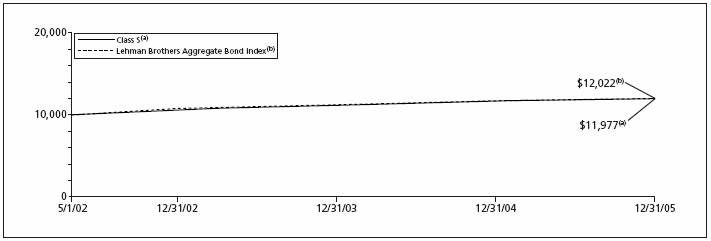
| Average Annual Total Returns for the Periods Ended December 31, 2005 | |
| | | 1 Year | | Since Inception of
Classes I, S, and ADV
May 1, 2002 | |
| Class I | | 2.36 | % | | 5.31 | % | |
| Class S | | 2.08 | % | | 5.04 | % | |
| Class ADV | | 1.80 | % | | 4.78 | % | |
| Lehman Brothers Aggregate Bond Index(1) | | 2.43 | % | | 5.15 | % | |
| | | | | | | | |
Based on a $10,000 initial investment, the graph and table above illustrate the total return of ING PIMCO Total Return Portfolio against the Index indicated. An index is unmanaged and has no cash in its portfolio, imposes no sales charges and incurs no operating expenses. An investor cannot invest directly in an index. The Portfolio’s performance is shown without the imposition of any expenses or charges which are, or may be, imposed under your annuity contract. Total returns would have been lower if such expenses or charges were included.
The performance graph and table do not reflect the deduction of taxes that a shareholder will pay on portfolio distributions or the redemption of portfolio shares.
The performance shown may include the effect of fee waivers and/or expense reimbursements by the Investment Manager and/or other service providers, which have the effect of increasing total return. Had all fees and expenses been considered, the total returns would have been lower.
The performance update illustrates performance for a variable investment option available through a variable annuity contract. The performance shown indicates past performance and is not a projection or prediction of future results. Actual investment returns and principal value will fluctuate so that shares and/or units, at redemption, may be worth more or less than their original cost. Please call (800) 922-0180 to get performance through the most recent month end.
This report contains statements that may be “forward-looking” statements. Actual results may differ materially from those projected in the “forward-looking” statements.
The views expressed in this report reflect those of the portfolio manager only through the end of the period as stated on the cover. The portfolio manager’s views are subject to change at any time based on marked and other conditions.
Portfolio holdings are subject to change daily.
(1) The Lehman Brothers Aggregate Bond Index is an unmanaged index composed of securities from the Lehman Brothers Intermediate Government/Corporate Bond Index, Mortgage-Backed Securities Index, and the Asset Backed Securities Index including securities that are investment-grade quality or better and have at least one year to maturity.
33
ING SALOMON BROTHERS AGGRESSIVE GROWTH PORTFOLIO | PORTFOLIO MANAGERS’ REPORT |
Industry Allocation
as of December 31, 2005
(as a percent of net assets)
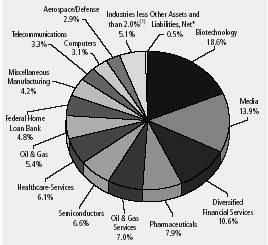
* Includes securities leading collateral. |
(1) Includes 4 industries, which each represents 2.0% of net assets. |
Portfolio holdings are subject to change daily.
The ING Salomon Brothers Aggressive Growth Portfolio (the “Portfolio”) seeks long-term growth of capital. The Portfolio is managed by a team of individuals led by Richie Freeman, Managing Director and Portfolio Manager, Salomon Brothers Asset Management Inc – the Sub-Adviser.
Performance: For the year ended December 31, 2005, the Portfolio’s Class I Shares provided a total return of 11.44% compared to the Russell 3000® Growth Index and the Standard & Poor’s 500 Composite Stock Price (“S&P”) Index, which returned 5.17% and 4.91%, respectively, for the same period.
Portfolio Specifics: After a lackluster start to 2005, we saw the market’s mood switch dramatically in April, as investors reached levels of pessimism we had not seen for sometime. These rarely seen extreme levels of bearish sentiment often foreshadow a market recovery and we viewed the shift as a very positive sign for the markets. Following the April lows, the market experienced a healthy rally in the second quarter, but gave back a portion of those gains as investors grew increasingly negative again. By the end of the third quarter, another wave of troubling headlines including the Gulf Coast hurricanes and continued rising short-term interest rates contributed to investor unease. However, we remained bullish. Again, the market rallied strongly in late October and continued on an upswing as several major equity indices reached or neared multi-year highs before they started to plateau to close out the year.
Both stock selection and sector allocation contributed positively to relative Portfolio performance for the year, with sector allocation accounting for the majority of outperformance. Energy stocks were clearly the biggest winners for the past year, buoyed by crude oil’s temporary spike to over $70 per barrel in the wake of Hurricanes Katrina and Rita. The Portfolio’s overweight position in energy, with a focus on oil production services and equipment stocks, was the leading contributor to relative performance. Despite an underweight position in information technology (“IT”), the sector also made a meaningful contribution to performance. It was those IT companies that were able to meet and exceed expectations while building strong franchises and solid balance sheets that were most heavily rewarded. We continue to think that stock selection within the IT sector is vital and we look for those companies which are entering secular, long-term periods of earnings growth.
The Portfolio’s overweight position in health care, with a concentration in biotechnology and biopharmaceuticals, along with a significant holding in the managed care industry, had a positive absolute return but detracted from relative performance. Biotechnology is not a new area for us but we believe the biotech industry in general will remain an important driver of growth going forward and we continue to look for investments in selected areas, such as targeted oncology. While our financial sector holdings contributed significantly to relative Portfolio performance for the year, holdings in the consumer discretionary sector, especially our cable TV holdings, and industrials sector stocks detracted from relative performance.
Current Strategy and Outlook: At December 31, 2005, the Portfolio remained overweight in healthcare, energy, financials and consumer discretionary, with underweights in industrials, information technology and telecommunications services and no significant holdings in consumer staples, materials or utilities. The Portfolio’s top ten holdings were Weatherford International Ltd., UnitedHealth Group Inc., Amgen Inc., Anadarko Petroleum Corp., Forest Laboratories, Inc., Comcast Corp., Lehman Brothers Holdings Inc., Merrill Lynch & Co., Inc., Chiron Corp. and Genzyme Corp.
Our outlook remains very optimistic. With the economy showing signs of slowing, we believe the Federal Reserve Board will likely end its tightening cycle sooner rather than later. We also see a significant amount of liquidity that is likely to find its way into equities and help drive the next bull market. We’ve already seen a lot of consolidation and stock buyback activity in 2005, both positive signs for the market in our opinion, which we think will accelerate in 2006.
While our focus is always on the stocks we own and those candidates we think might make appropriate holdings, regardless of the market conditions, we think the wind has been at the market’s side for the past few years but could actually be at its back in the new year.
Top Ten Holdings*
as of December 31, 2005
(as a percent of net assets)
Lehman Brothers Holdings, Inc. | | 6.1 | % |
| | | |
UnitedHealth Group, Inc. | | 6.1 | % |
| | | |
Anadarko Petroleum Corp. | | 5.4 | % |
| | | |
Amgen, Inc. | | 5.3 | % |
| | | |
Genzyme Corp. | | 4.9 | % |
| | | |
Weatherford International Ltd. | | 4.7 | % |
| | | |
Forest Laboratories, Inc. | | 4.2 | % |
| | | |
Merrill Lynch & Co., Inc. | | 3.9 | % |
| | | |
Chiron Corp. | | 3.8 | % |
| | | |
Comcast Corp. | | 3.3 | % |
* Excludes short-term investments related to securities lending collateral. |
Portfolio holdings are subject to change daily.
34
PORTFOLIO MANAGERS’ REPORT | ING SALOMON BROTHERS AGGRESSIVE GROWTH PORTFOLIO |

| Average Annual Total Returns for the Periods Ended December 31, 2005 | |
| | |
| | | 1 Year | | 5 Year | | Since Inception
of Class I
November 28, 1997 | | Since Inception of
Classes S, and ADV
December 10, 2001 | |
| Class I | | 11.44 | % | | (3.95 | )% | | 1.48 | % | | — | | |
| Class S | | 11.17 | % | | — | | | — | | | 1.75 | % | |
| Class ADV | | 10.90 | % | | — | | | — | | | 1.49 | % | |
| Russell 3000® Growth Index(1) | | 5.17 | % | | (3.15 | )% | | 2.35 | %(3) | | 1.47 | %(4) | |
| S&P 500 Index(2) | | 4.91 | % | | 0.54 | % | | 4.96 | %(3) | | 4.06 | %(4) | |
| | |
Based on a $10,000 initial investment, the graph and table above illustrate the total return of ING Salomon Brothers Aggressive Growth Portfolio against the Indices indicated. An index is unmanaged and has no cash in its portfolio, imposes no sales charges and incurs no operating expenses. An investor cannot invest directly in an index. The Portfolio’s performance is shown without the imposition of any expenses or charges which are, or may be, imposed under your annuity contract. Total returns would have been lower if such expenses or charges were included.
The performance graph and table do not reflect the deduction of taxes that a shareholder will pay on portfolio distributions or the redemption of portfolio shares.
The performance shown may include the effect of fee waivers and/or expense reimbursements by the Investment Manager and/or other service providers, which have the effect of increasing total return. Had all fees and expenses been considered, the total returns would have been lower.
The performance update illustrates performance for a variable investment option available through a variable annuity contract. The performance shown indicates past performance and is not a projection or prediction of future results. Actual investment returns and principal value will fluctuate so that shares and/or units, at redemption, may be worth more or less than their original cost. Please call (800) 922-0180 to get performance through the most recent month end.
This report contains statements that may be “forward-looking” statements. Actual results may differ materially from those projected in the “forward-looking” statements.
The views expressed in this report reflect those of the portfolio manager only through the end of the period as stated on the cover. The portfolio manager’s views are subject to change at any time based on marked and other conditions.
Portfolio holdings are subject to change daily.
(1) The Russell 3000® Growth Index measures the performance of the 3000 largest U.S. companies based on total market capitalization, which represent approximately 98% of the U.S. equity market.
(2) The S&P 500 Index is an unmanaged index that measures the performance of securities of approximately 500 of the largest companies in the U.S.
(3) Since inception performance for the indices is shown from December 1, 1997.
(4) Since inception performance for the indices is shown from December 1, 2001.
35
ING SALOMON BROTHERS LARGE CAP GROWTH PORTFOLIO | PORTFOLIO MANAGERS’ REPORT |
Industry Allocation
as of December 31, 2005
(as a percent of total investments)
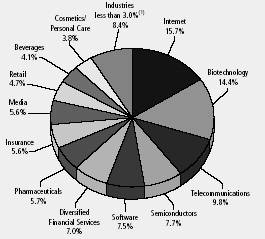
(1) Includes 4 industries, which each represents less than 3.0% of total investments. |
Portfolio holdings are subject to change daily.
The ING Salomon Brothers Large Cap Growth Portfolio (the “Portfolio”) seeks long-term capital appreciation. The Portfolio is managed by a team of individuals led by Alan Blake, Managing Director and Senior Portfolio Manager, Salomon Brothers Asset Management Inc. – the Sub-Adviser.
Performance: For the year ended December 31, 2005, the Portfolio’s Class S Shares provided a total return of 5.02% compared to the Standard & Poor’s 500 Composite Stock Price (“S&P”) Index and the Russell 1000® Growth Index, which returned 4.91% and 5.26%, respectively, for the same period.
Portfolio Specifics: Looking back at 2005, after early weakness through the first quarter, the markets improved during the summer on the back of good economic data, positive corporate profits and lower oil prices, only to sell-off sharply early in the fall as investors were hit with the uncertainty surrounding Hurricanes Katrina and Rita and the pending challenges of rebuilding. Showing considerable resilience, a year-end rally led by strong earnings and weaker oil prices began in late October and produced positive full-year returns for almost all major equity indexes. High quality companies (small, medium and large) have led this rally and we expect this trend to continue into 2006. Also of note, we have begun to see the resurgence of interest in growth stocks in what has been a decidedly value-oriented market over the last 4-5 years. Investors have shown interest in companies that can generate consistent earnings-per-share (EPS) growth and organic revenue growth, as opposed to reliance on broad moves in the economy. Furthermore, many years of cost cutting have allowed leadership companies to operate near peak margins while allowing more revenue to drop to the bottom line.
Over the last 12 months, the markets traded in one of the tightest ranges of the last 15 years, making stock selection paramount to performance in managing a concentrated, low-turnover portfolio. We believe this will continue to be the case in the coming year. The markets are also trading at 9-year lows on a price-to-earnings basis even though interest rates and inflation remain benign. It is our belief that given this scenario, the market can support significantly higher multiples for true growth companies. Those leading companies that have been able to expand market share, return capital to shareholders (in the form of buybacks and dividend increases), while still investing significant free cash flows into growth strategies, we find very attractive.
For the year, the effect of sector allocation on relative performance was negative, but the impact of stock selection was positive. The information technology and consumer staples sectors made the biggest contributions to relative performance followed by the health care and financials sectors. Leading detractors from relative performance were the energy, consumer discretionary and industrials sectors. Top stock contributors to performance included Genentech Inc., Gillette, Red Hat Inc., Texas Instruments Inc. and Amgen Inc, while top detractors included Biogen Idec Inc., Dell Inc., Time Warner Inc., Juniper Networks Inc. and Lucent Technologies Inc.
Current Strategy and Outlook: At December 31, 2005, the Portfolio remained overweight in the consumer discretionary, health care, information technology and financials sectors, and was underweight in the industrials and consumer staples sectors, with no significant holdings in the energy, utilities, telecommunications services or materials sectors. The Portfolio’s top ten holdings at the end of the period were Amazon.com Inc., Genentech Inc., Amgen Inc., Texas Instruments Inc., Merrill Lynch & Co. Inc., Motorola Inc., Procter & Gamble Co. (which acquired existing Portfolio holding Gillette in the fourth quarter), Time Warner Inc., Home Depot Inc., and Biogen Idec Inc.
Looking ahead, our goal remains to build the highest quality portfolio of companies with strong long-term growth prospects in our favored sectors.
Top Ten Holdings
as of December 31, 2005
(as a percent of net assets)
Amazon.com, Inc. | | 6.3 | % |
| | | |
Genentech, Inc. | | 6.2 | % |
| | | |
Amgen, Inc. | | 5.3 | % |
| | | |
Texas Instruments, Inc. | | 4.3 | % |
| | | |
Merrill Lynch & Co., Inc. | | 4.2 | % |
| | | |
Motorola, Inc. | | 3.8 | % |
| | | |
Procter & Gamble Co. | | 3.8 | % |
| | | |
Time Warner, Inc. | | 3.5 | % |
| | | |
Home Depot, Inc. | | 3.4 | % |
| | | |
Biogen Idec, Inc. | | 3.0 | % |
Portfolio holdings are subject to change daily.
36
PORTFOLIO MANAGERS’ REPORT | ING SALOMON BROTHERS LARGE CAP GROWTH PORTFOLIO |

| Average Annual Total Returns for the Periods Ended December 31, 2005 | |
| | | | | | |
| | | 1 Year | | Since Inception
of Classes I, S, and ADV
May 1, 2003 | |
| Class I | | 5.24 | % | | 12.30 | % | |
| Class S | | 5.02 | % | | 12.02 | % | |
| Class ADV | | 4.69 | % | | 11.75 | % | |
| Russell 1000® Growth Index(1) | | 5.26 | % | | 12.42 | % | |
| S&P 500 Index(2) | | 4.91 | % | | 14.29 | % | |
| | | | | | |
Based on a $10,000 initial investment, the graph and table above illustrate the total return of ING Salomon Brothers Large cap Growth Portfolio against the Index indicated. An index is unmanaged and has no cash in its portfolio, imposes no sales charges and incurs no operating expenses. An investor cannot invest directly in an index. The Portfolio’s performance is shown without the imposition of any expenses or charges which are, or may be, imposed under your annuity contract. Total returns would have been lower if such expenses or charges were included.
The performance graph and table do not reflect the deduction of taxes that a shareholder will pay on portfolio distributions or the redemption of portfolio shares.
The performance shown may include the effect of fee waivers and/or expense reimbursements by the Investment Manager and/or other service providers, which have the effect of increasing total return. Had all fees and expenses been considered, the total returns would have been lower.
The performance update illustrates performance for a variable investment option available through a variable annuity contract. The performance shown indicates past performance and is not a projection or prediction of future results. Actual investment returns and principal value will fluctuate so that shares and/or units, at redemption, may be worth more or less than their original cost. Please call (800) 922-0180 to get performance through the most recent month end.
This report contains statements that may be “forward-looking” statements. Actual results may differ materially from those projected in the “forward-looking” statements.
The views expressed in this report reflect those of the portfolio manager only through the end of the period as stated on the cover. The portfolio manager’s views are subject to change at any time based on marked and other conditions.
Portfolio holdings are subject to change daily.
(1) The Russell 1000® Growth Index is an index of common stocks designed to track performance of large capitalization companies with greater than average growth orientation.
(2) The S&P 500 Index is an unmanaged index that measures the performance of securities of approximately 500 of the largest companies in the U.S.
37
ING T. ROWE DIVERSIFIED MID CAP GROWTH PORTFOLIO | PORTFOLIO MANAGERS’ REPORT |
Industry Allocation
as of December 31, 2005
(as a percent of net assets)
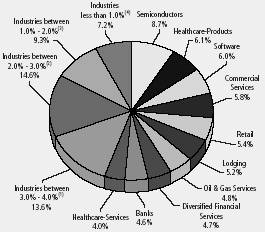
(1) Includes four industries, which each represents 3.0% - 4.0% of net assets. |
(2) Includes six industries, which each represents 2.0% - 3.0% of net assets. |
(3) Includes seven industries, which each represents 1.0% - 2.0% of net assets. |
(4) Includes 17 industries, which each represents less than 1.0% of net assets. |
Portfolio holdings are subject to change daily.
The ING T. Rowe Price Diversified Mid Cap Growth Portfolio (the “Portfolio”) seeks long-term capital appreciation. The Portfolio is managed by a committee of investment professionals chaired by Donald J. Peters, Vice President, T. Rowe Price Associates, Inc. – the Sub-Adviser.
Performance: For the year ended December 31, 2005, the Portfolio’s Class S Shares provided a total return of 8.96% compared to the Standard & Poor’s MidCap 400 Index and the Russell MidCap® Growth Index, which returned 12.56% and 12.10%, respectively, for the same period.
Portfolio Specifics: U.S. equities produced a third consecutive year of positive returns in 2005, despite soaring energy costs. Firm economic and corporate earnings growth and merger activity lent support to stock prices, which finished 2005 near their highest levels of the year amid hopes that the Federal Reserve (“Fed”) would soon stop raising short-term interest rates. Mid-cap stocks decisively outperformed their small- and large-cap counterparts.
Throughout the 12-month period, we consistently adhered to our investment process. Our process combines bottom-up fundamental research with quantitative analysis to build a diversified portfolio of attractively priced companies with the potential for above-average earnings growth.
The Portfolio’s increase in 2005 was broad-based, with nearly all the sectors of investment registering gains except consumer discretionary and consumer staples. Absolute returns were strongest in the telecommunications services and energy sectors, where the average holding rose by more than 60% and 55%, respectively. Compared to the Russell MidCap® Growth Index, the Portfolio trailed. Stock selection in the consumer discretionary sector had the largest negative impact on relative results. Within the consumer discretionary sector, select holdings in the hotels, restaurants, and leisure industry were weak, including Royal Caribbean Cruise Lines and Shuffle Master, a manufacturer of products for the gaming industry. In addition, a number of retailers weighed on relative performance, including Family Dollar Stores and PetSmart. The Portfolio’s energy holdings were another key source of weakness versus the benchmark in 2005. While the Portfolio’s energy investments kept up with the energy stocks in the benchmark, an underweight in the sector was unfavorable. Energy was the best-performing group in the Russell MidCap Index during the year amid soaring oil prices.
On the plus side, stock selection in the health care sector had the largest positive impact on performance versus the Russell MidCap® Growth Index. Vertex Pharmaceutical, Techne Corporation, and Amylin Pharmaceuticals – biotechnology companies with strong product pipelines – all did exceedingly well during the year. Our holdings in health care providers and services companies also outperformed, including Coventry Health Care and Express Scripts. Telecommunications services was another major contributor to relative performance due to stock selection and an overweight in the sector.
Current Strategy and Outlook: We are optimistic on the equity market in 2006. The economy will likely soften from its rapid 2005 pace, but growth should remain solid. Solid economic growth, combined with reasonably low inflation and interest rates (with the Fed nearing the end of rate increases), should translate into continued healthy growth in corporate profits.
In terms of the Portfolio’s positioning, sector and industry weightings are largely driven by company-specific fundamental and quantitative analysis. While our process is very bottom-up in nature, we do maintain a bias toward industries in which we have high confidence and which offer the most attractive risk/reward scenarios. For example, in the energy sector, the Portfolio’s exposure is tilted toward equipment and services companies, which tend to have better business models and are less sensitive to changes in commodity prices than oil and gas producers.
Fundamentals of the companies in your Portfolio remain very strong, supported by a good environment for growth-oriented equities. Our fully invested approach focuses on strong businesses and management teams with a long-term orientation. As the economic recovery matures, we will look for our strategy to benefit from its focus on companies with consistent earnings growth.
Top Ten Holdings*
as of December 31, 2005
(as a percent of net assets)
Microchip Technology, Inc. | | 1.0 | % |
| | | |
National Semiconductor Corp. | | 1.0 | % |
| | | |
Moody’s Corp. | | 0.9 | % |
| | | |
BJ Services Co. | | 0.9 | % |
| | | |
Cooper Cameron Corp. | | 0.9 | % |
| | | |
Xilinx, Inc. | | 0.9 | % |
| | | |
Grant Prideco, Inc. | | 0.9 | % |
| | | |
XTO Energy, Inc. | | 0.9 | % |
| | | |
Linear Technology Corp. | | 0.9 | % |
| | | |
Smith International, Inc. | | 0.9 | % |
* Excludes short-term investments related to securities lending collateral. |
Portfolio holdings are subject to change daily.
38
PORTFOLIO MANAGERS’ REPORT | ING T. ROWE DIVERSIFIED MID CAP GROWTH PORTFOLIO |
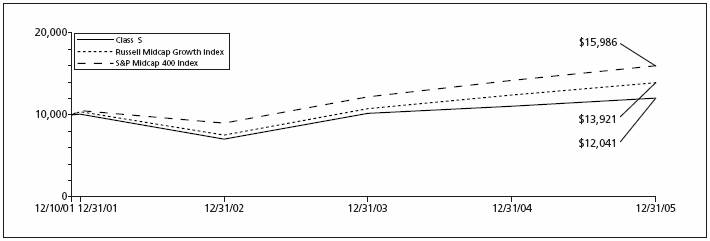
| Average Annual Total Returns for the Periods Ended December 31, 2005 | |
| | |
| | | 1 Year | | Since Inception
of Classes I, S, and ADV
December 10, 2001 | |
| Class I | | 9.26 | % | | 4.98 | % | |
| Class S | | 8.96 | % | | 4.68 | % | |
| Class ADV | | 8.64 | % | | 4.44 | % | |
| S&P Midcap 400 Index(1) | | 12.56 | % | | 12.17 | %(3) | |
| Russell Midcap® Growth Index(2) | | 12.10 | % | | 8.44 | %(3) | |
| | | | | | | | |
Based on a $10,000 initial investment, the graph and table above illustrate the total return of ING T. Rowe Diversified Mid cap Growth Portfolio against the Indices indicated. An index is unmanaged and has no cash in its portfolio, imposes no sales charges and incurs no operating expenses. An investor cannot invest directly in an index. The Portfolio’s performance is shown without the imposition of any expenses or charges which are, or may be, imposed under your annuity contract. Total returns would have been lower if such expenses or charges were included.
The performance graph and table do not reflect the deduction of taxes that a shareholder will pay on portfolio distributions or the redemption of portfolio shares.
The performance shown may include the effect of fee waivers and/or expense reimbursements by the Investment Manager and/or other service providers, which have the effect of increasing total return. Had all fees and expenses been considered, the total returns would have been lower.
The performance update illustrates performance for a variable investment option available through a variable annuity contract. The performance shown indicates past performance and is not a projection or prediction of future results. Actual investment returns and principal value will fluctuate so that shares and/or units, at redemption, may be worth more or less than their original cost. Please call (800) 922-0180 to get performance through the most recent month end.
This report contains statements that may be “forward-looking” statements. Actual results may differ materially from those projected in the “forward-looking” statements.
The views expressed in this report reflect those of the portfolio manager only through the end of the period as stated on the cover. The portfolio manager’s views are subject to change at any time based on marked and other conditions.
Portfolio holdings are subject to change daily.
(1) The S&P MidCap 400 Index is a market capitalization-weighted index of 400 medium-capitalization stocks chosed for market size, liquidity, and industry group representation.
(2) The Russell MidCap® Growth Index measures the performance of the 800 smallest companies the Russell 1000 Index with higher price-to-book ratios and higher forecasted growth values.
(3) Since inception performance for the indices is shown from December 1, 2001.
39
ING T. ROWE PRICE GROWTH EQUITY PORTFOLIO | PORTFOLIO MANAGERS’ REPORT |
Industry Allocation
as of December 31, 2005
(as a percent of net assets)
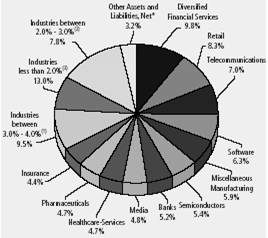
(1) Includes securities lending collateral. |
(2) Includes 3 industries, which each represents 3.0% - 4.0% of net assets. |
(3) Includes 3 industries, which each represents 2.0% - 3.0% of net assets. |
(4) Includes 17 industries, which each represents less than 2.0% of net assets. |
Portfolio holdings are subject to change daily.
The ING T. Rowe Price Growth Equity Portfolio (the “Portfolio”) seeks long-term capital growth, and secondarily, increasing dividend income. The Portfolio is managed by a committee of investment professionals chaired by Robert W. Smith, Vice President, T. Rowe Price Associates, Inc. – the Sub-Adviser.
Performance: For the year ended December 31, 2005, the Portfolio’s Class I Shares provided a total return of 6.17% compared to the Standard & Poor’s 500 Composite Stock Price (“S&P”) Index, which returned 4.91% for the same period.
Portfolio Specifics: With the price of oil rising for most of the year, energy and utilities stocks dominated the market until the fourth quarter, when they gave back some of their tremendous earlier gains. But higher energy prices and rising interest rates were hard on the consumer, and many consumer-oriented stocks struggled. Growth companies in many sectors – healthcare and technology, for example – had solid business performance but had a hard time being noticed.
As a consequence, value stocks were generally again ahead of growth for the year. However, growth outperformed value in the second half. Strong performances by capital markets firms, healthcare services and biotechs, and Internet companies led the way as oil and utilities stocks slowed.
Our positioning in healthcare made the largest contribution to our outperformance. The healthcare-services segment made consistent gains and our stock choices fared especially well. Leading contributors in this area included UnitedHealth and Wellpoint, both of which reported good earnings with continuing improvements in cost and pricing trends. In addition, key holdings in the biotechnology segment, notably Genentech and Gilead Sciences, advanced on positive drug developments.
Even though short-term interest rates rose throughout the year, many segments of the financials sector performed well. On an absolute basis, the financials sector achieved notable results in the Portfolio. Our focus on capital markets companies made a significant contribution on a relative basis as well, with State Street, UBS, Ameritrade, and others posting strong returns. For most of the past year, we have focused on capital markets companies because we believe they have good earnings prospects and will not be unduly harmed by the rising interest-rate environment.
Our stock selection in the telecommunications services sector also added value over the benchmark. Most notably, our positions in Latin America wireless provider America Movil and tower operator Crown Castle were strong performers, benefiting from subscriber growth and industry consolidation. We remain overweighted in this sector with a focus on the larger wireless service providers and tower operators.
The good results in these areas helped overcome some challenges. An underweight in the surging energy sector – a common position for a growth portfolio – held us back compared with the benchmark. We were also well exposed to the weakening consumer sectors, and our overweight on media companies in this sector proved especially unhelpful. But the largest detractor for the period was our position in the industrials and business services sector. Many of our chosen stocks, including Cendant, Tyco, and Deere, did not live up to our expectations and weighed down our relative results.
Current Strategy and Outlook: For 2006, we expect slower but still solid economic growth and slowing inflation. In this environment, we are optimistic that the companies we have invested in will be able to sustain double-digit growth. We are also hopeful that as the market turns its attention to growth stocks, it will begin to reward companies such as GE and Microsoft which have generated good operational performance but remain notably undervalued.
Top Ten Holdings*
as of December 31, 2005
(as a percent of net assets)
General Electric Co. | | 3.7 | % |
| | | |
Microsoft Corp. | | 3.0 | % |
| | | |
UnitedHealth Group, Inc. | | 2.6 | % |
| | | |
Wal-Mart Stores, Inc. | | 2.4 | % |
| | | |
American International Group, Inc. | | 2.4 | % |
| | | |
Citigroup, Inc. | | 2.3 | % |
| | | |
UBS AG | | 2.2 | % |
| | | |
Dell, Inc. | | 1.8 | % |
| | | |
Accenture Ltd. | | 1.7 | % |
| | | |
Danaher Corp. | | 1.7 | % |
* Excludes short-term investments related to securities lending collateral. |
Portfolio holdings are subject to change daily.
40
PORTFOLIO MANAGERS’ REPORT | ING T. ROWE PRICE GROWTH EQUITY PORTFOLIO |
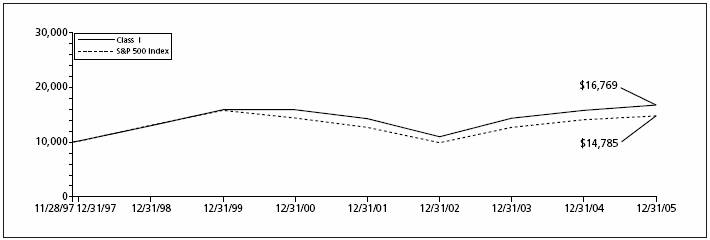
| Average Annual Total Returns for the Periods Ended December 31, 2005 | |
| | | | | | | | | | | | | | |
| | | 1 Year | | 5 Year | | Since Inception
of Class I
November 28, 1997 | | Since Inception of
Classes S, and ADV
December 10, 2001 | |
| Class I | | 6.17 | % | | 1.04 | % | | 6.59 | % | | — | | |
| Class S | | 5.92 | % | | — | | | — | | | 3.68 | % | |
| Class ADV | | 5.66 | % | | — | | | — | | | 3.42 | % | |
| S&P 500 Index(1) | | 4.91 | % | | 0.54 | % | | 4.96 | %(2) | | 4.06 | %(3) | |
| | | | | | | | | | | | | | |
Based on a $10,000 initial investment, the graph and table above illustrate the total return of ING T. Rowe Price Growth Equity Portfolio against the Index indicated. An index is unmanaged and has no cash in its portfolio, imposes no sales charges and incurs no operating expenses. An investor cannot invest directly in an index. The Portfolio’s performance is shown without the imposition of any expenses or charges which are, or may be, imposed under your annuity contract. Total returns would have been lower if such expenses or charges were included.
The performance graph and table do not reflect the deduction of taxes that a shareholder will pay on portfolio distributions or the redemption of portfolio shares.
The performance shown may include the effect of fee waivers and/or expense reimbursements by the Investment Manager and/or other service providers, which have the effect of increasing total return. Had all fees and expenses been considered, the total returns would have been lower.
The performance update illustrates performance for a variable investment option available through a variable annuity contract. The performance shown indicates past performance and is not a projection or prediction of future results. Actual investment returns and principal value will fluctuate so that shares and/or units, at redemption, may be worth more or less than their original cost. Please call (800) 922-0180 to get performance through the most recent month end.
This report contains statements that may be “forward-looking” statements. Actual results may differ materially from those projected in the “forward-looking” statements.
The views expressed in this report reflect those of the portfolio manager only through the end of the period as stated on the cover. The portfolio manager’s views are subject to change at any time based on marked and other conditions.
Portfolio holdings are subject to change daily.
(1) The S&P 500 Index is an unmanaged index that measures the performance of securities of approximately 500 of the largest companies in the U.S.
(2) Since inception performance for the index is shown from December 1, 1997.
(3) Since inception performance for the index is shown from December 1, 2001.
41
ING UBS U.S. LARGE CAP EQUITY PORTFOLIO | PORTFOLIO MANAGERS’ REPORT |
Industry Allocation
as of December 31, 2005
(as a percent of net assets)
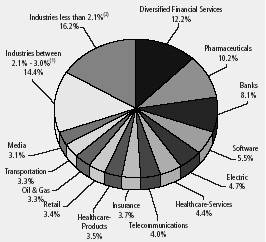
(1) Includes 6 industries, which each represents 2.1% - 3.0% of net assets. |
(2) Includes 12 industries, which each represents less than 2.1% of net assets. |
Portfolio holdings are subject to change daily.
The ING UBS U.S. Large Cap Equity Portfolio (the “Portfolio”) seeks long-term growth of capital and future income. The Portfolio is managed by the North American Equities Investment Management Team (“N.A. Equities Team”) led by John Leonard, Portfolio Manager, Head of N.A. Equities Team, and Deputy Global head of Equities and Managing Director, UBS Global Asset Management (Americas) Inc. – the Sub-Adviser.
Performance: For the year ended December 31, 2005, the Portfolio’s Class I Shares provided a total return of 9.38% compared to the Standard & Poor’s 500 Composite Stock Price (“S&P”) Index and the Russell 1000® Index, which returned 4.91% and 6.27%, respectively, for the same period.
Portfolio Specifics: Equities were generally flat for the first three quarters of 2005, as many investors seemed to express concern over the overall health of the economy, the potential for inflation, and rising interest rates. These fears proved to be overblown, and a number of factors combined to drive a year-end market rally: Ben Bernanke was named as the successor to Alan Greenspan as Chairman of the Federal Reserve (the “Fed”); oil prices dropped back into the $60 range, coming off their record highs of over $70 a barrel earlier in the year; corporate profitability remained robust; and consumer confidence, after soaring in November, climbed again in December. While the economy’s growth is slowing (but still strong), the market seems to believe the Fed has established an implicit cap of 4.5% or 4.75% for short term rates, after raising rates twice in the quarter to bring the federal funds rate to 4.25%. In addition, housing is holding up, staving off concerns, at least for the near term, of the bursting of the much discussed “housing bubble.”
As always, during the year we relied on our bottom-up research process to guide sector allocation and stock selection for the Portfolio. Overall, this process led us to avoid energy stocks, which ultimately detracted from performance. However this was mostly recovered by being overweight in utilities and underweight in technology. Stock selection was generally favorable especially in the health care and consumer discretionary sectors.
With regard to the oil and gas industry, we believe the recent broad-based increase in energy prices (partially due to the hurricanes) poses a threat to short-term growth in the U.S. and elsewhere. While inflation was tame over the year, with consumer and producer price measures registering fairly low levels of growth (particularly the “core” measures that exclude volatile components such as energy) we nonetheless continued to underweight the energy sector as we believed (and continue to believe) the price of crude oil and many other commodities is well in excess of equilibrium.
On the positive side, underweighting computer hardware, and specifically IBM, was beneficial to performance on a relative basis (although not owning Apple Computer, a stellar performer, represented something of a missed opportunity). Construction and real property was another strong sector. Martin Marietta Materials – the nation’s second-largest producer and distributor of construction materials including rocks, sand, and gravel – was the Portfolio’s top performer in this industry.
Current Strategy and Outlook: In our opinion, the U.S. economy is expanding at a moderate rate, inflation is under control and the consumer has spending capacity. Given this scenario, our strategy for the year ahead is largely a continuation of our current approach, emphasizing the bottom-up search for valuation opportunities in sectors and specific stocks. We have limited factor bets at present, since most of the opportunities available in the current market are in fact more bottom-up in nature.
From a sector standpoint, we continue to believe that energy and materials are overvalued on the whole, while the healthcare sector is providing us with the best current opportunities. Within healthcare, we are currently avoiding large-cap pharmaceutical companies with high levels of geriatric exposure. We believe the 2006 Medicare prescription drug benefit program rollout will create significant price pressure for some of these health care companies, but notable opportunities for pharmacy benefit managers.
Top Ten Holdings*
as of December 31, 2005
(as a percent of net assets)
Citigroup, Inc. | | 4.5 | % |
| | | |
Microsoft Corp. | | 3.7 | % |
| | | |
Morgan Stanley | | 3.2 | % |
| | | |
SPDR Trust Series 1 | | 3.0 | % |
| | | |
Wells Fargo & Co. | | 2.9 | % |
| | | |
Wyeth | | 2.9 | % |
| | | |
Sprint Corp.-FON Group | | 2.9 | % |
| | | |
UnitedHealth Group, Inc. | | 2.6 | % |
| | | |
American International Group, Inc. | | 2.6 | % |
| | | |
Exelon Corp. | | 2.6 | % |
* Excludes short-term investments related to securities lending collateral and U.S. government obligations. |
Portfolio holdings are subject to change daily.
42
PORTFOLIO MANAGERS’ REPORT | ING UBS U.S. LARGE CAP EQUITY PORTFOLIO |
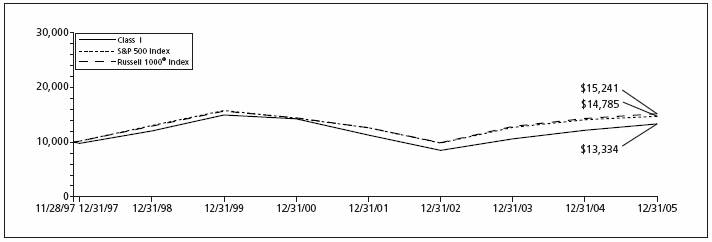
| Average Annual Total Returns for the Periods Ended December 31, 2005 | |
| | |
| | | 1 Year | | 5 Year | | Since Inception
of Class I
November 28, 1997 | | Since Inception of
Classes S, and ADV
December 10, 2001 | |
| Class I | | 9.38 | % | | (1.40 | )% | | 3.62 | % | | — | | |
| Class S | | 8.99 | % | | — | | | — | | | 3.75 | % | |
| Class ADV | | 8.67 | % | | — | | | — | | | 3.52 | % | |
| Russell 1000® Index(1) | | 6.27 | % | | 1.07 | % | | 5.35 | %(3) | | 4.94 | %(4) | |
| S&P 500 Index(2) | | 4.91 | % | | 0.54 | % | | 4.96 | %(3) | | 4.06 | %(4) | |
| | | | | | | | | | | | | | |
Based on a $10,000 initial investment, the graph and table above illustrate the total return of ING UBS U.S. Large Cap Equity Portfolio against the Indices indicated. An index is unmanaged and has no cash in its portfolio, imposes no sales charges and incurs no operating expenses. An investor cannot invest directly in an index. The Portfolio’s performance is shown without the imposition of any expenses or charges which are, or may be, imposed under your annuity contract. Total returns would have been lower if such expenses or charges were included.
The performance graph and table do not reflect the deduction of taxes that a shareholder will pay on portfolio distributions or the redemption of portfolio shares.
The performance shown may include the effect of fee waivers and/or expense reimbursements by the Investment Manager and/or other service providers, which have the effect of increasing total return. Had all fees and expenses been considered, the total returns would have been lower.
The performance update illustrates performance for a variable investment option available through a variable annuity contract. The performance shown indicates past performance and is not a projection or prediction of future results. Actual investment returns and principal value will fluctuate so that shares and/or units, at redemption, may be worth more or less than their original cost. Please call (800) 922-0180 to get performance through the most recent month end.
This report contains statements that may be “forward-looking” statements. Actual results may differ materially from those projected in the “forward-looking” statements.
The views expressed in this report reflect those of the portfolio manager only through the end of the period as stated on the cover. The portfolio manager’s views are subject to change at any time based on marked and other conditions.
Portfolio holdings are subject to change daily.
(1) The Russell 1000® Index is a comprehensive large-cap index measuring the performance of the largest 1,000 U.S. incorporated companies.
(2) The S&P 500 Index is an unmanaged index that measures the performance of securities of approximately 500 of the largest companies in the U.S.
(3) Since inception performance for the indices is shown from December 1, 1997.
(4) Since inception performance for the indices is shown from December 1, 2001.
43
ING VAN KAMPEN COMSTOCK PORTFOLIO | PORTFOLIO MANAGERS’ REPORT |
Industry Allocation
as of December 31, 2005
(as a percent of net assets)
Pharmaceuticals | | 15.6 | % |
| | | |
Telecommunications | | 10.6 | % |
| | | |
Media | | 10.5 | % |
| | | |
Diversified Financial Services | | 9.8 | % |
| | | |
Banks | | 9.4 | % |
| | | |
Federal Home Loan Bank | | 8.6 | % |
| | | |
Insurance | | 5.9 | % |
| | | |
Food | | 3.7 | % |
| | | |
Forest Products & Paper | | 3.6 | % |
| | | |
Chemicals | | 3.5 | % |
| | | |
Industries between 2.0%-3.0%(1) | | 12.7 | % |
| | | |
Industries less than 2.0%(2) | | 7.6 | % |
| | | |
Other Assets and Liabilities, Net* | | (1.5 | )% |
| | | |
Total | | 100.0 | % |
* Includes securities lending collateral. (1) Includes five industries, which each represents 2.0%-3.0% of net assets. (2) Includes thirteen industries, which each represents less than 2.0% of net assets. |
Portfolio holdings are subject to change daily.
The ING Van Kampen Comstock Portfolio (the “Portfolio”) seeks capital growth and income. The Portfolio is managed by the Van Kampen Multi-Cap Value team. Current members of the team include B. Robert Baker, Jason Leder and Kevin Holt, each a Managing Director, Van Kampen – the Sub-Adviser.
Performance: For the year ended December 31, 2005, the Portfolio’s Class S Shares provided a total return of 3.47% compared to the Standard & Poor’s 500 Composite Stock Price (“S&P 500”) Index and the S&P 500/Citigroup Value Index, which returned 4.91% and 6.33%, respectively, for the same period.
Portfolio Specifics: During the 12-month period ended December 31, 2005, the stock market advanced modestly in an environment of mixed influences. Among the market’s most significant challenges were rising interest rates and oil prices. Moreover, signs of trouble at U.S. auto manufacturers added to investor woes. Nonetheless, the market was resilient during the period. Despite expectations of the contrary, consumer spending and confidence held up reasonably well, corporate profits remained intact and balance sheets were healthy. Sizeable cash stockpiles gave corporate managements reason to repurchase shares of stock, increase dividend payouts, or complete merger activities. Some highly anticipated initial public offerings generated additional positive sentiment for stock investing, and the economy continued to maintain a decent growth rate. Within the S&P 500/Citigroup Value Index (the Portfolio’s universe), the energy sector led, driven by lofty commodity prices. Utilities stocks posted a sizeable gain as well. The consumer discretionary and telecommunication services sectors were the S&P Barra Value Index’s most significant laggards.
For the overall Portfolio, stock selection was the primary cause of lagging performance relative to the S&P 500/Citigroup Value Index. More specifically, our selection in materials, primarily paper stocks, hurt relative returns. Paper companies languished in the face of high production costs (due to rising commodity prices), overcapacity in the industry, and weak pricing power. Stock selection in the information technology sector dampened results. Telecommunication services was another area of weakness, due to industry consolidation, management issues and changing business models. Nevertheless, we continued to believe that the valuations and risk-reward profiles of select names have been attractive, and we are monitoring the situation carefully.
On the positive side, exposure to consumer discretionary stocks helped the Portfolio hold its ground relative to the S&P 500/Citigroup Value Index. Although the sector struggled in the broad market, select media and retail stocks in the Portfolio performed better than the sector overall.
Current Strategy and Outlook: We focus on analyzing the financial health of individual companies rather than trying to forecast broad market movements or the direction of the economy. Although market conditions have challenged us to find abundant new investment opportunities lately, we continue to seek stocks with reasonable valuations relative to our assessment of fair value. The Portfolio’s positioning remained largely unchanged throughout the period and going into the new year. As a result of our individual stock selection, the Portfolio’s notable overweights relative to the S&P 500/Citigroup Value Index were in pharmaceuticals and telecommunication services, while energy, financials (the Portfolio’s largest absolute sector weight) and industrials continued to be relative underweights.
Top Ten Holdings*
as of December 31, 2005
(as a percent of net assets)
GlaxoSmithKline PLC ADR | | 4.4 | % |
| | | |
Freddie Mac | | 4.2 | % |
| | | |
AT&T, Inc. | | 3.8 | % |
| | | |
International Paper Co. | | 3.6 | % |
| | | |
Citigroup, Inc. | | 3.3 | % |
| | | |
Bank of America Corp. | | 3.3 | % |
| | | |
Verizon Communications, Inc. | | 3.3 | % |
| | | |
Bristol-Myers Squibb Co. | | 3.2 | % |
| | | |
Sprint Corp.-FON Group | | 2.4 | % |
| | | |
Clear Channel Communications, Inc. | | 2.4 | % |
* Excludes short-term investments related to securities lending collateral. |
Portfolio holdings are subject to change daily.
44
PORTFOLIO MANAGERS’ REPORT | ING VAN KAMPEN COMSTOCK PORTFOLIO |

| Average Annual Total Returns for the Periods Ended December 31, 2005 | |
| | | | | | |
| | | 1 Year | | Since Inception
of Classes I, S, and ADV
May 1, 2002 | |
| Class I | | 3.74 | % | | 7.93 | % | |
| Class S | | 3.47 | % | | 7.68 | % | |
| Class ADV | | 3.20 | % | | 7.40 | % | |
| S&P 500 Index(1) | | 4.91 | % | | 6.00 | % | |
| S&P 500/Citigroup Value Index(2) | | 6.33 | % | | 8.16 | % | |
| | | | | | |
Based on a $10,000 initial investment, the graph and table above illustrate the total return of ING Van Kampen Comstock Portfolio against the Indices indicated. An index is unmanaged and has no cash in its portfolio, imposes no sales charges and incurs no operating expenses. An investor cannot invest directly in an index. The Portfolio’s performance is shown without the imposition of any expenses or charges which are, or may be, imposed under your annuity contract. Total returns would have been lower if such expenses or charges were included.
The performance graph and table do not reflect the deduction of taxes that a shareholder will pay on portfolio distributions or the redemption of portfolio shares.
The performance shown may include the effect of fee waivers and/or expense reimbursements by the Investment Manager and/or other service providers, which have the effect of increasing total return. Had all fees and expenses been considered, the total returns would have been lower.
The performance update illustrates performance for a variable investment option available through a variable annuity contract. The performance shown indicates past performance and is not a projection or prediction of future results. Actual investment returns and principal value will fluctuate so that shares and/or units, at redemption, may be worth more or less than their original cost. Please call (800) 922-0180 to get performance through the most recent month end.
This report contains statements that may be “forward-looking” statements. Actual results may differ materially from those projected in the “forward-looking” statements.
The views expressed in this report reflect those of the portfolio manager only through the end of the period as stated on the cover. The portfolio manager’s views are subject to change at any time based on marked and other conditions.
Portfolio holdings are subject to change daily.
(1) The S&P 500 Index is an unmanaged index that measures the performance of securities of approximately 500 of the largest companies in the U.S.
(2) The S&P Citigroup Value Index is constructed by dividing the stocks in the S&P 500 Index by a single attribute of price-to-book ratio. The Index contains companies with lower price-to-book ratios and is capitalization weighted so that each stock is weighted in the appropriate index in porportion to its market value.
45
ING VAN KAMPEN EQUITY AND INCOME PORTFOLIO | PORTFOLIO MANAGERS’ REPORT |
Asset Allocation
as of December 31, 2005
(as a percent of net assets)
Asset-Backed Securities | | 2.2 | % |
| | | |
Common Stock | | 59.3 | % |
| | | |
Convertible Bonds | | 11.2 | % |
| | | |
Corporate Bonds/Notes | | 6.5 | % |
| | | |
Federal Home Loan Bank | | 6.5 | % |
| | | |
Other Bonds | | 0.1 | % |
| | | |
Preferred Stock | | 4.9 | % |
| | | |
U.S. Treasury Obligations | | 10.6 | % |
| | | |
Other Assets and Liabilities | | (1.4 | )% |
| | | |
Total | | 100.0 | % |
Portfolio holdings are subject to change daily.
The ING Van Kampen Equity and Income Portfolio (the “Portfolio”) seeks total return, consisting of long-term capital appreciation and current income. The Portfolio is managed by the Van Kampen Equity Income team. Current members include James A. Gilligan, James O. Roeder, Sergio Marcheli, Thomas B. Bastian, and Vincent E. Vizachero, Van Kampen – the Sub-Adviser.
Performance: For the year ended December 31, 2005, the Portfolio’s Class S Shares provided a total return of 7.77% compared to the Standard & Poor’s 500 Composite Stock Price (“S&P”) Index and the Russell 1000® Value Index, which returned 4.91% and 7.05%, respectively, for the same period.
Portfolio Specifics: For the 12-month period ended December 31, 2005, the broad stock market produced a modest gain. Throughout the period, rising interest rates and high oil prices fed investor uncertainty about the economy’s growth prospects, the ability of the consumer to continue spending, and the potential for inflation. However, despite some fears of a “soft patch” earlier in the spring and the devastating Gulf Coast hurricanes, economic news remained generally upbeat and inflation was contained. With the exception of the U.S. auto industry, healthy corporate profits and strong earnings across a range of sectors helped support the market. Other corporate actions – such as stock buybacks and merger and acquisition activity – were more prevalent than they have been in some time, spurring additional confidence in the stock market. Value stocks, which comprise the Portfolio, maintained a very slight edge over growth stocks. The best performing sectors in the Russell 1000® Value Index (the Portfolio’s universe), were energy, utilities, and health care. Laggards were consumer discretionary and telecommunication services.
From an absolute performance standpoint, energy was the Portfolio’s best performing group. The Portfolio had a particular emphasis on refining and marketing companies, which generated standout gains. These companies were able to capture significantly wider profit margins as the spread between the rising cost of crude oil and the higher price for refining into oil into gasoline continued to increase. The Portfolio was well positioned in the financials sector. The Portfolio had limited exposure to regional banks, which tend to suffer disproportionately to other types of financial companies in a rising interest-rate and flattening yield curve environment. Diversified financial service companies, in which the Portfolio had more sizeable weighting, did well because of their capital markets exposure. Insurance securities were also a notable contributor in the financials area. Health care holdings, primarily in pharmaceuticals companies, were also a positive influence on performance. Less bad news, positive expectations for new drug launches, and favorable patent protection rulings helped buoy the beleaguered industry.
In contrast, the Portfolio’s telecommunication services holdings did not fare so well. Within the industry, competition has intensified, and the landline companies have begun to lose revenues to cable and wireless carriers. Media securities, part of the consumer discretionary sector, also drove down returns, as these companies continued to slump amid weak advertising revenues.
Current Strategy and Outlook: We seek value stocks, high-quality bonds, and convertible securities, using our bottom-up security selection process. We look for undervalued companies that offer a potential catalyst for change. Such catalysts could be new company management, growth or consolidation within an industry or sector, or new products. During the year, we increased the Portfolio’s convertibles exposure while slightly decreasing its bond weighting. New issuance in the convertibles market and selected buying opportunities among what we consider attractively valued convertible securities prompted us to make the increase. We continued to reduce the Portfolio’s energy exposure; high commodity prices are unsustainable over the long term, in our view. We also selectively added to the Portfolio’s financials position, as the flattening yield curve provided attractive valuation opportunities. The Portfolio’s overall positioning was reasonably defensive at year end, with overweights in large-cap pharmaceuticals and consumer staples, and underweights in financials and industrials.
Top Ten Holdings*
as of December 31, 2005
(as a percent of net assets)
U.S. Treasury Notes 4.250%, due 08/15/13 | | 2.9 | % |
| | | |
U.S. Treasury Notes 2.000%, due 05/15/06 | | 2.9 | % |
| | | |
JPMorgan Chase & Co. | | 2.0 | % |
| | | |
Bayer AG ADR | | 1.9 | % |
| | | |
Citigroup, Inc. | | 1.6 | % |
| | | |
Merrill Lynch & Co., Inc. | | 1.6 | % |
| | | |
Roche Holding AG ADR | | 1.6 | % |
| | | |
General Electric Co. | | 1.5 | % |
| | | |
Bristol-Myers Squibb Co. | | 1.5 | % |
| | | |
Schering-Plough Corp. | | 1.5 | % |
* Excludes short-term investments related to Federal Home Loan Bank. |
Portfolio holdings are subject to change daily.
46
PORTFOLIO MANAGERS’ REPORT | ING VAN KAMPEN EQUITY AND INCOME PORTFOLIO |
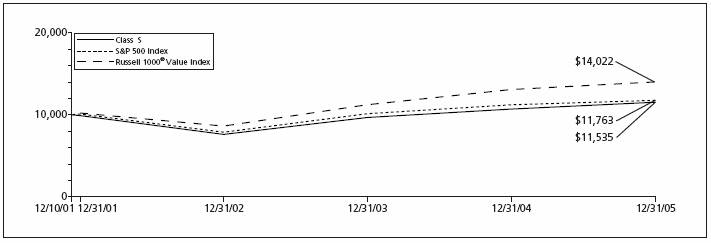
| Average Annual Total Returns for the Periods Ended December 31, 2005 | |
| | | | | | | | |
| | | 1 Year | | Since Inception
of Classes I, S, and ADV
December 10, 2001 | |
| Class I | | 8.02 | % | | 3.84 | % | |
| Class S | | 7.77 | % | | 3.58 | % | |
| Class ADV | | 7.49 | % | | 3.32 | % | |
| Russell 1000® Value Index(1) | | 7.05 | % | | 8.63 | %(3) | |
| S&P 500 Index(2) | | 4.91 | % | | 4.06 | %(3) | |
| | | | | | | | |
| | | | | | | | | |
Based on a $10,000 initial investment, the graph and table above illustrate the total return of ING Van Kampen Equity and Income Portfolio against the Indices indicated. An index is unmanaged and has no cash in its portfolio, imposes no sales charges and incurs no operating expenses. An investor cannot invest directly in an index. The Portfolio’s performance is shown without the imposition of any expenses or charges which are, or may be, imposed under your annuity contract. Total returns would have been lower if such expenses or charges were included.
The performance graph and table do not reflect the deduction of taxes that a shareholder will pay on portfolio distributions or the redemption of portfolio shares.
The performance shown may include the effect of fee waivers and/or expense reimbursements by the Investment Manager and/or other service providers, which have the effect of increasing total return. Had all fees and expenses been considered, the total returns would have been lower.
The performance update illustrates performance for a variable investment option available through a variable annuity contract. The performance shown indicates past performance and is not a projection or prediction of future results. Actual investment returns and principal value will fluctuate so that shares and/or units, at redemption, may be worth more or less than their original cost. Please call (800) 922-0180 to get performance through the most recent month end.
This report contains statements that may be “forward-looking” statements. Actual results may differ materially from those projected in the “forward-looking” statements.
The views expressed in this report reflect those of the portfolio manager only through the end of the period as stated on the cover. The portfolio manager’s views are subject to change at any time based on marked and other conditions.
Portfolio holdings are subject to change daily.
(1) The Russell 1000® Value Index is an unmanaged index that measures the performance of those Rusell 1000® companies with lower price-to-book ratios and lower than forecasted growth values.
(2) The S&P 500 Index is an unmanaged index that measures the performance of securities of approximately 500 of the largest companies in the U.S.
(3) Since inception performance for the indices is shown from December 1, 2001.
47
SHAREHOLDER EXPENSE EXAMPLES
As a shareholder of a Fund, you incur two types of costs: (1) transaction costs, including sales charges (loads) on purchase payments, reinvested dividends, or other distributions; redemption fees; and exchange fees; and (2) ongoing costs, including management fees; distribution [and/or service] (12b-1) fees; and other Fund expenses. These Examples are intended to help you understand your ongoing costs (in dollars) of investing in a Fund and to compare these costs with the ongoing costs of investing in other mutual funds.
The Examples are based on an investment of $1,000 invested at the beginning of the period and held for the entire period from July 1, 2005 to December 31, 2005.
Actual Expenses
The first section of the table shown, “Actual Fund Return,” provides information about actual account values and actual expenses. You may use the information in this section, together with the amount you invested, to estimate the expenses that you paid over the period. Simply divide your account value by $1,000 (for example, an $8,600 account value divided by $1,000 = 8.6), then multiply the result by the number in the first section under the heading entitled “Expenses Paid During Period” to estimate the expenses you paid on your account during this period.
Hypothetical Example for Comparison Purposes
The second section of the table shown, “Hypothetical 5% Return,” provides information about hypothetical account values and hypothetical expenses based on the Fund’s actual expense ratio and an assumed rate of return of 5% per year before expenses, which is not the Fund’s actual return. The hypothetical account values and expenses may not be used to estimate the actual ending account balance or expenses you paid for the period. You may use this information to compare the ongoing costs of investing in the Fund and other funds. To do so, compare this 5% hypothetical example with the 5% hypothetical examples that appear in the shareholder reports of the other funds.
Please note that the expenses shown in the table are meant to highlight your ongoing costs only and do not reflect any transactional costs, such as sales charges (loads), redemption fees, or exchange fees. Therefore, the hypothetical lines of the table are useful in comparing ongoing costs only, and will not help you determine the relative total costs of owning different funds. In addition, if these transactional costs were included, your costs would have been higher.
| ING American Century
Large Company Value Portfolio | | | Beginning
Account
Value
July 1, 2005 | | Ending
Account
Value
December 31, 2005 | | Annualized
Expense
Ratio | | Expenses Paid
During the
Six Months Ended
December 31, 2005* | |
| | | | | | | | | | | |
| Actual Fund Return | | | | | | | | | |
| Class I | | $1,000.00 | | | $1,040.70 | | | 1.00 | % | | $5.14 | | |
| Class S | | 1,000.00 | | | 1,039.00 | | | 1.25 | | | 6.42 | | |
| Class ADV | | 1,000.00 | | | 1,038.20 | | | 1.50 | | | 7.71 | | |
| Hypothetical (5% return before expenses) | | | | | | | | | | | | | |
| Class I | | $1,000.00 | | | $1,020.16 | | | 1.00 | % | | $5.09 | | |
| Class S | | 1,000.00 | | | 1,018.90 | | | 1.25 | | | 6.36 | | |
| Class ADV | | 1,000.00 | | | 1,017.64 | | | 1.50 | | | 7.63 | | |
| | | | | | | | | | | | | | |
* Expenses are equal to each Fund’s respective annualized expense ratios multiplied by the average account value over the period, multiplied by 184/365 to reflect the most recent fiscal half-year.
48
SHAREHOLDER EXPENSE EXAMPLES (CONTINUED)
| ING American Century
Select Portfolio | | | Beginning
Account
Value
July 1, 2005 | | Ending
Account
Value
December 31, 2005 | | Annualized
Expense
Ratio | | Expenses Paid
During the
Six Months Ended
December 31, 2005* | |
| | | | | | | | | | | |
| Actual Fund Return | | | | | | | | | |
| Class I | | $1,000.00 | | | $1,044.20 | | | 0.66 | % | | $3.40 | | |
| Class S | | 1,000.00 | | | 1,042.50 | | | 0.91 | | | 4.68 | | |
| Class ADV | | 1,000.00 | | | 1,041.70 | | | 1.16 | | | 5.97 | | |
| Hypothetical (5% return before expenses) | | | | | | | | | | | | | |
| Class I | | $1,000.00 | | | $1,021.88 | | | 0.66 | % | | $3.36 | | |
| Class S | | 1,000.00 | | | 1,020.62 | | | 0.91 | | | 4.63 | | |
| Class ADV | | 1,000.00 | | | 1,019.36 | | | 1.16 | | | 5.90 | | |
| ING American Century
Small Cap Value Portfolio | | | | | | | | | | | | | |
| Actual Fund Return | | | | | | | | | | | | | |
| Class I | | $1,000.00 | | | $1,055.80 | | | 1.30 | % | | $6.74 | | |
| Class S | | 1,000.00 | | | 1,054.40 | | | 1.55 | | | 8.03 | | |
| Class ADV | | 1,000.00 | | | 1,053.10 | | | 1.80 | | | 9.31 | | |
| Hypothetical (5% return before expenses) | | | | | | | | | | | | | |
| Class I | | $1,000.00 | | | $1,018.65 | | | 1.30 | % | | $6.61 | | |
| Class S | | 1,000.00 | | | 1,017.39 | | | 1.55 | | | 7.88 | | |
| Class ADV | | 1,000.00 | | | 1,016.13 | | | 1.80 | | | 9.15 | | |
| ING Baron Small
Cap Growth Portfolio | | | | | | | | | | | | | |
| Actual Fund Return | | | | | | | | | | | | | |
| Class I | | $1,000.00 | | | $1,035.80 | | | 1.20 | % | | $6.16 | | |
| Class S | | 1,000.00 | | | 1,034.10 | | | 1.45 | | | 7.43 | | |
| Class ADV | | 1,000.00 | | | 1,032.50 | | | 1.70 | | | 8.71 | | |
| Hypothetical (5% return before expenses) | | | | | | | | | | | | | |
| Class I | | $1,000.00 | | | $1,019.16 | | | 1.20 | % | | $6.11 | | |
| Class S | | 1,000.00 | | | 1,017.90 | | | 1.45 | | | 7.37 | | |
| Class ADV | | 1,000.00 | | | 1,016.64 | | | 1.70 | | | 8.64 | | |
| ING Davis Venture Value Portfolio | | | | | | | | | | | | | |
| Actual Fund Return | | | | | | | | | | | | | |
| Class I | | $1,000.00 | | | $1,062.20 | | | 1.07 | % | | $5.56 | | |
| Class S | | 1,000.00 | | | 1,061.30 | | | 1.32 | | | 6.86 | | |
| Class ADV | | 1,000.00 | | | 1,060.10 | | | 1.57 | | | 8.15 | | |
| Hypothetical (5% return before expenses) | | | | | | | | | | | | | |
| Class I | | $1,000.00 | | | $1,019.81 | | | 1.07 | % | | $5.45 | | |
| Class S | | 1,000.00 | | | 1,018.55 | | | 1.32 | | | 6.72 | | |
| Class ADV | | 1,000.00 | | | 1,017.29 | | | 1.57 | | | 7.98 | | |
| | | | | | | | | | | | | | |
* Expenses are equal to each Fund’s respective annualized expense ratios multiplied by the average account value over the period, multiplied by 184/365 to reflect the most recent fiscal half-year.
49
SHAREHOLDER EXPENSE EXAMPLES (CONTINUED)
| ING Fundamental Research Portfolio | | Beginning
Account
Value
July 1, 2005 | | Ending
Account
Value
December 31, 2005 | | Annualized
Expense
Ratio | | Expenses Paid
During the
Six Months Ended
December 31, 2005* | |
| | | | | | | | | | |
| Actual Fund Return | | | | | | | | | |
| Class I | | $1,000.00 | | | $1,077.60 | | | 0.80 | % | | $4.19 | | |
| Class S | | 1,000.00 | | | 1,076.90 | | | 1.05 | | | 5.50 | | |
| Class ADV | | 1,000.00 | | | 1,074.40 | | | 1.30 | | | 6.80 | | |
| Hypothetical (5% return before expenses) | | | | | | | | | | | | | |
| Class I | | $1,000.00 | | | $1,021.17 | | | 0.80 | % | | $4.08 | | |
| Class S | | 1,000.00 | | | 1,019.91 | | | 1.05 | | | 5.35 | | |
| Class ADV | | 1,000.00 | | | 1,018.65 | | | 1.30 | | | 6.61 | | |
| ING Goldman Sachs
Capital Growth Portfolio | | | | | | | | | | | | | |
| Actual Fund Return | | | | | | | | | | | | | |
| Class I | | $1,000.00 | | | $1,055.30 | | | 1.05 | % | | $5.44 | | |
| Class S | | 1,000.00 | | | 1,053.70 | | | 1.30 | | | 6.73 | | |
| Class ADV | | 1,000.00 | | | 1,052.50 | | | 1.55 | | | 8.02 | | |
| Hypothetical (5% return before expenses) | | | | | | | | | | | | | |
| Class I | | $1,000.00 | | | $1,019.91 | | | 1.05 | % | | $5.35 | | |
| Class S | | 1,000.00 | | | 1,018.65 | | | 1.30 | | | 6.61 | | |
| Class ADV | | 1,000.00 | | | 1,017.39 | | | 1.55 | | | 7.88 | | |
| ING Goldman Sachs
Core Equity Portfolio | | | | | | | | | | | | | |
| Actual Fund Return | | | | | | | | | | | | | |
| Class I | | $1,000.00 | | | $1,093.80 | | | 0.90 | % | | $4.75 | | |
| Class S | | 1,000.00 | | | 1,091.30 | | | 1.15 | | | 6.06 | | |
| Class ADV | | 1,000.00 | | | 1,090.30 | | | 1.40 | | | 7.38 | | |
| Hypothetical (5% return before expenses) | | | | | | | | | | | | | |
| Class I | | $1,000.00 | | | $1,020.67 | | | 0.90 | % | | $4.58 | | |
| Class S | | 1,000.00 | | | 1,019.41 | | | 1.15 | | | 5.85 | | |
| Class ADV | | 1,000.00 | | | 1,018.15 | | | 1.40 | | | 7.12 | | |
| ING J.P. Morgan
Fleming International Portfolio | | | | | | | | | | | | | |
| Actual Fund Return | | | | | | | | | | | | | |
| Class I | | $1,000.00 | | | $1,128.90 | | | 1.00 | % | | $5.37 | | |
| Class S | | 1,000.00 | | | 1,128.40 | | | 1.25 | | | 6.71 | | |
| Class ADV | | 1,000.00 | | | 1,126.50 | | | 1.50 | | | 8.04 | | |
| Hypothetical (5% return before expenses) | | | | | | | | | | | | | |
| Class I | | $1,000.00 | | | $1,020.16 | | | 1.00 | % | | $5.09 | | |
| Class S | | 1,000.00 | | | 1,018.90 | | | 1.25 | | | 6.36 | | |
| Class ADV | | 1,000.00 | | | 1,017.64 | | | 1.50 | | | 7.63 | | |
| | | | | | | | | | | | | | |
* Expenses are equal to each Fund’s respective annualized expense ratios multiplied by the average account value over the period, multiplied by 184/365 to reflect the most recent fiscal half-year.
50
SHAREHOLDER EXPENSE EXAMPLES (CONTINUED)
| ING J.P. Morgan
Mid Cap Value Portfolio | | Beginning
Account
Value
July 1, 2005 | | Ending
Account
Value
December 31, 2005 | | Annualized
Expense
Ratio | | Expenses Paid
During the
Six Months Ended
December 31, 2005* | |
| | | | | | | | | | |
| Actual Fund Return | | | | | | | | | |
| Class I | | $1,000.00 | | | $1,037.20 | | | 1.10 | % | | $5.65 | | |
| Class S | | 1,000.00 | | | 1,036.40 | | | 1.35 | | | 6.93 | | |
| Class ADV | | 1,000.00 | | | 1,034.10 | | | 1.60 | | | 8.20 | | |
| Hypothetical (5% return before expenses) | | | | | | | | | | | | | |
| Class I | | $1,000.00 | | | $1,019.66 | | | 1.10 | % | | $5.60 | | |
| Class S | | 1,000.00 | | | 1,018.40 | | | 1.35 | | | 6.87 | | |
| Class ADV | | 1,000.00 | | | 1,017.14 | | | 1.60 | | | 8.13 | | |
| ING MFS Capital Opportunities Portfolio | | | | | | | | | | | | | |
| Actual Fund Return | | | | | | | | | | | | | |
| Class I | | $1,000.00 | | | $1,040.10 | | | 0.90 | % | | $4.63 | | |
| Class S | | 1,000.00 | | | 1,038.30 | | | 1.15 | | | 5.91 | | |
| Class ADV | | 1,000.00 | | | 1,037.40 | | | 1.40 | | | 7.19 | | |
| Hypothetical (5% return before expenses) | | | | | | | | | | | | | |
| Class I | | $1,000.00 | | | $1,020.67 | | | 0.90 | % | | $4.58 | | |
| Class S | | 1,000.00 | | | 1,019.41 | | | 1.15 | | | 5.85 | | |
| Class ADV | | 1,000.00 | | | 1,018.15 | | | 1.40 | | | 7.12 | | |
| ING OpCap Balanced Value Portfolio | | | | | | | | | | | | | |
| Actual Fund Return | | | | | | | | | | | | | |
| Class I | | $1,000.00 | | | $1,027.50 | | | 1.00 | % | | $5.11 | | |
| Class S | | 1,000.00 | | | 1,026.20 | | | 1.25 | | | 6.38 | | |
| Class ADV | | 1,000.00 | | | 1,024.60 | | | 1.50 | | | 7.65 | | |
| Hypothetical (5% return before expenses) | | | | | | | | | | | | | |
| Class I | | $1,000.00 | | | $1,020.16 | | | 1.00 | % | | $5.09 | | |
| Class S | | 1,000.00 | | | 1,018.90 | | | 1.25 | | | 6.36 | | |
| Class ADV | | 1,000.00 | | | 1,017.64 | | | 1.50 | | | 7.63 | | |
| ING Oppenheimer Global Portfolio | | | | | | | | | | | | | |
| Actual Fund Return | | | | | | | | | | | | | |
| Class I | | $1,000.00 | | | $1,146.40 | | | 0.66 | % | | $3.57 | | |
| Class S | | 1,000.00 | | | 1,145.40 | | | 0.91 | | | 4.92 | | |
| Class ADV | | 1,000.00 | | | 1,143.50 | | | 1.15 | | | 6.21 | | |
| Hypothetical (5% return before expenses) | | | | | | | | | | | | | |
| Class I | | $1,000.00 | | | $1,021.88 | | | 0.66 | % | | $3.36 | | |
| Class S | | 1,000.00 | | | 1,020.62 | | | 0.91 | | | 4.63 | | |
| Class ADV | | 1,000.00 | | | 1,019.41 | | | 1.15 | | | 5.85 | | |
| | | | | | | | | | | | | | |
* Expenses are equal to each Fund’s respective annualized expense ratios multiplied by the average account value over the period, multiplied by 184/365 to reflect the most recent fiscal half-year.
51
SHAREHOLDER EXPENSE EXAMPLES (CONTINUED)
| ING Oppenheimer
Strategic Income Portfolio | | Beginning
Account
Value
July 1, 2005 | | Ending
Account
Value
December 31, 2005 | | Annualized
Expense
Ratio | | Expenses Paid
During the
Six Months Ended
December 31, 2005* | |
| | | | | | | | | | |
| Actual Fund Return | | | | | | | | | |
| Class I | | $1,000.00 | | | $1,008.90 | | | 0.54 | % | | $2.73 | | |
| Class S | | 1,000.00 | | | 1,007.40 | | | 0.75 | | | 3.79 | | |
| Class ADV | | 1,000.00 | | | 1,006.10 | | | 1.00 | | | 5.06 | | |
| Hypothetical (5% return before expenses) | | | | | | | | | | | | | |
| Class I | | $1,000.00 | | | $1,022.48 | | | 0.54 | % | | $2.75 | | |
| Class S | | 1,000.00 | | | 1,021.42 | | | 0.75 | | | 3.82 | | |
| Class ADV | | 1,000.00 | | | 1,020.16 | | | 1.00 | | | 5.09 | | |
| ING PIMCO Total Return Portfolio | | | | | | | | | | | | | |
| Actual Fund Return | | | | | | | | | | | | | |
| Class I | | $1,000.00 | | | $ 997.30 | | | 0.85 | % | | $4.28 | | |
| Class S | | 1,000.00 | | | 996.20 | | | 1.10 | | | 5.53 | | |
| Class ADV | | 1,000.00 | | | 995.10 | | | 1.35 | | | 6.79 | | |
| Hypothetical (5% return before expenses) | | | | | | | | | | | | | |
| Class I | | $1,000.00 | | | $1,020.92 | | | 0.85 | % | | $4.33 | | |
| Class S | | 1,000.00 | | | 1,019.66 | | | 1.10 | | | 5.60 | | |
| Class ADV | | 1,000.00 | | | 1,018.40 | | | 1.35 | | | 6.87 | | |
| ING Salomon Brothers
Aggressive Growth Portfolio | | | | | | | | | | | | | |
| Actual Fund Return | | | | | | | | | | | | | |
| Class I | | $1,000.00 | | | $1,142.10 | | | 0.81 | % | | $4.37 | | |
| Class S | | 1,000.00 | | | 1,140.80 | | | 1.06 | | | 5.72 | | |
| Class ADV | | 1,000.00 | | | 1,139.40 | | | 1.31 | | | 7.06 | | |
| Hypothetical (5% return before expenses) | | | | | | | | | | | | | |
| Class I | | $1,000.00 | | | $1,021.12 | | | 0.81 | % | | $4.13 | | |
| Class S | | 1,000.00 | | | 1,019.86 | | | 1.06 | | | 5.40 | | |
| Class ADV | | 1,000.00 | | | 1,018.60 | | | 1.31 | | | 6.67 | | |
| ING Salomon Brothers
Large Cap Growth Portfolio | | | | | | | | | | | | | |
| Actual Fund Return | | | | | | | | | | | | | |
| Class I | | $1,000.00 | | | $1,098.00 | | | 0.84 | % | | $4.44 | | |
| Class S | | 1,000.00 | | | 1,097.80 | | | 1.09 | | | 5.76 | | |
| Class ADV | | 1,000.00 | | | 1,095.40 | | | 1.34 | | | 7.08 | | |
| Hypothetical (5% return before expenses) | | | | | | | | | | | | | |
| Class I | | $1,000.00 | | | $1,020.97 | | | 0.84 | % | | $4.28 | | |
| Class S | | 1,000.00 | | | 1,019.71 | | | 1.09 | | | 5.55 | | |
| Class ADV | | 1,000.00 | | | 1,018.45 | | | 1.34 | | | 6.82 | | |
| | | | | | | | | | | | | | |
* Expenses are equal to each Fund’s respective annualized expense ratios multiplied by the average account value over the period, multiplied by 184/365 to reflect the most recent fiscal half-year.
52
SHAREHOLDER EXPENSE EXAMPLES (CONTINUED)
| ING T. Rowe Price
Diversified Mid Cap Growth Portfolio | | Beginning
Account
Value
July 1, 2005 | | Ending
Account
Value
December 31, 2005 | | Annualized
Expense
Ratio | | Expenses Paid
During the
Six Months Ended
December 31, 2005* | |
| | | | | | | | | | |
| Actual Fund Return | | | | | | | | | |
| Class I | | $1,000.00 | | | $1,103.60 | | | 0.66 | % | | $3.50 | | |
| Class S | | 1,000.00 | | | 1,102.00 | | | 0.91 | | | 4.82 | | |
| Class ADV | | 1,000.00 | | | 1,100.20 | | | 1.15 | | | 6.09 | | |
| Hypothetical (5% return before expenses) | | | | | | | | | | | | | |
| Class I | | $1,000.00 | | | $1,021.88 | | | 0.66 | % | | $3.36 | | |
| Class S | | 1,000.00 | | | 1,020.62 | | | 0.91 | | | 4.63 | | |
| Class ADV | | 1,000.00 | | | 1,019.41 | | | 1.15 | | | 5.85 | | |
| ING T. Rowe Price
Growth Equity Portfolio | | | | | | | | | | | | | |
| Actual Fund Return | | | | | | | | | | | | | |
| Class I | | $1,000.00 | | | $1,076.00 | | | 0.75 | % | | $3.92 | | |
| Class S | | 1,000.00 | | | 1,074.60 | | | 1.00 | | | 5.23 | | |
| Class ADV | | 1,000.00 | | | 1,073.20 | | | 1.25 | | | 6.53 | | |
| Hypothetical (5% return before expenses) | | | | | | | | | | | | | |
| Class I | | $1,000.00 | | | $1,021.42 | | | 0.75 | % | | $3.82 | | |
| Class S | | 1,000.00 | | | 1,020.16 | | | 1.00 | | | 5.09 | | |
| Class ADV | | 1,000.00 | | | 1,018.90 | | | 1.25 | | | 6.36 | | |
| ING UBS U.S.
Large Cap Equity Portfolio | | | | | | | | | | | | | |
| Actual Fund Return | | | | | | | | | | | | | |
| Class I | | $1,000.00 | | | $1,075.00 | | | 0.85 | % | | $4.45 | | |
| Class S | | 1,000.00 | | | 1,073.50 | | | 1.10 | | | 5.75 | | |
| Class ADV | | 1,000.00 | | | 1,071.60 | | | 1.35 | | | 7.05 | | |
| Hypothetical (5% return before expenses) | | | | | | | | | | | | | |
| Class I | | $1,000.00 | | | $1,020.92 | | | 0.85 | % | | $4.33 | | |
| Class S | | 1,000.00 | | | 1,019.66 | | | 1.10 | | | 5.60 | | |
| Class ADV | | 1,000.00 | | | 1,018.40 | | | 1.35 | | | 6.87 | | |
| ING Van Kampen Comstock Portfolio | | | | | | | | | | | | | |
| Actual Fund Return | | | | | | | | | | | | | |
| Class I | | $1,000.00 | | | $1,051.10 | | | 0.87 | % | | $4.50 | | |
| Class S | | 1,000.00 | | | 1,050.10 | | | 1.12 | | | 5.79 | | |
| Class ADV | | 1,000.00 | | | 1,048.30 | | | 1.37 | | | 7.07 | | |
| Hypothetical (5% return before expenses) | | | | | | | | | | | | | |
| Class I | | $1,000.00 | | | $1,020.82 | | | 0.87 | % | | $4.43 | | |
| Class S | | 1,000.00 | | | 1,019.56 | | | 1.12 | | | 5.70 | | |
| Class ADV | | 1,000.00 | | | 1,018.30 | | | 1.37 | | | 6.97 | | |
| | | | | | | | | | | | | | |
* Expenses are equal to each Fund’s respective annualized expense ratios multiplied by the average account value over the period, multiplied by 184/365 to reflect the most recent fiscal half-year.
53
SHAREHOLDER EXPENSE EXAMPLES (CONTINUED)
| ING Van Kampen
Equity and Income Portfolio | | Beginning
Account
Value
July 1, 2005 | | Ending
Account
Value
December 31, 2005 | | Annualized
Expense
Ratio | | Expenses Paid
During the
Six Months Ended
December 31, 2005* | |
| | | | | | | | | | |
| Actual Fund Return | | | | | | | | | |
| Class I | | $1,000.00 | | | $1,060.60 | | | 0.57 | % | | $2.96 | | |
| Class S | | 1,000.00 | | | 1,059.30 | | | 0.82 | | | 4.26 | | |
| Class ADV | | 1,000.00 | | | 1,058.00 | | | 1.07 | | | 5.55 | | |
| Hypothetical (5% return before expenses) | | | | | | | | | | | | | |
| Class I | | $1,000.00 | | | $1,022.33 | | | 0.57 | % | | $2.91 | | |
| Class S | | 1,000.00 | | | 1,021.07 | | | 0.82 | | | 4.18 | | |
| Class ADV | | 1,000.00 | | | 1,019.81 | | | 1.07 | | | 5.45 | | |
| | | | | | | | | | | | | | |
* Expenses are equal to each Fund’s respective annualized expense ratios multiplied by the average account value over the period, multiplied by 184/365 to reflect the most recent fiscal half-year.
54
REPORT OF INDEPENDENT REGISTERED PUBLIC ACCOUNTING FIRM
The Board of Directors and Shareholders
ING Partners Inc.
We have audited the accompanying statements of assets and liabilities, including the portfolios of investments, of ING American Century Large Company Value Portfolio (formerly ING Salomon Brothers Investors Value Portfolio), ING American Century Select Portfolio, ING American Century Small Cap Value Portfolio, ING Baron Small Cap Growth Portfolio, ING Davis Venture Value Portfolio (formerly ING Salomon Brothers Fundamental Value Portfolio), ING Fundamental Research Portfolio (formerly Aeltus Enhanced Index Portfolio), ING Goldman Sachs® Capital Growth Portfolio, ING Goldman Sachs® Core Equity Portfolio, ING JPMorgan Fleming International Portfolio, ING JPMorgan Mid Cap Value Portfolio, ING MFS Capital Opportunities Portfolio, ING OpCap Balanced Value Portfolio, ING Oppenheimer Global Portfolio, ING Oppenheimer Strategic Income Portfolio, ING PIMCO Total Return Portfolio, ING Salomon Brothers Aggressive Growth Portfolio, ING Salomon Brothers Large Cap Growth Portfolio, ING T. Rowe Price Diversified Mid Cap Growth Portfolio, ING T. Rowe Price Growth Equity Portfolio, ING UBS U.S. Large Cap Equity Portfolio, ING Van Kampen Comstock Portfolio, and ING Van Kampen Equity and Income Portfolio, each a series of ING Partners Inc. as of December 31, 2005, and the related statements of operations for the year then ended, the statements of changes in net assets for each of the years or periods in the two-year period then ended, and the financial highlights for each of the years or periods in the five-year period then ended. These financial statements and financial highlights are the responsibility of management. Our responsibility is to express an opinion on these financial statements and financial highlights based on our audits.
We conducted our audits in accordance with the standards of the Public Company Accounting Oversight Board (United States). Those standards require that we plan and perform the audit to obtain reasonable assurance about whether the financial statements and financial highlights are free of material misstatement. An audit includes examining, on a test basis, evidence supporting the amounts and disclosures in the financial statements. Our procedures included confirmation of securities owned as of December 31, 2005 by correspondence with the custodian and brokers, or by other appropriate auditing procedures when replies from brokers were not received. An audit also includes assessing the accounting principles used and significant estimates made by management, as well as evaluating the overall financial statement presentation. We believe that our audits provide a reasonable basis for our opinion.
In our opinion, the financial statements and financial highlights referred to above, present fairly, in all material respects, the financial position of the aforementioned series of ING Partners Inc. as of December 31, 2005, the results of their operations, the changes in their net assets, and the financial highlights for each of the years or periods specified in the first paragraph above, in conformity with U.S. generally accepted accounting principles.

Boston, Massachusetts
February 28, 2006
55
STATEMENTS OF ASSETS AND LIABILITIES AS OF DECEMBER 31, 2005
| | ING American
Century Large
Company
Value Portfolio | | ING American
Century Select
Portfolio | | ING American
Century Small Cap
Value Portfolio | | ING Baron
Small Cap Growth
Portfolio | |
ASSETS: | | | | | | | | | |
Investments in securities at value+* | | $ | 91,146,872 | | $ | 427,813,317 | | $ | 98,080,454 | | $ | 295,290,189 | |
Short-term investments** | | 4,738,736 | | 6,535,257 | | 4,669,754 | | 23,278,791 | |
Short-term investments at amortized cost | | 13,825,000 | | 78,983,000 | | 24,072,000 | | — | |
Cash | | 531,681 | | 729,052 | | 676,400 | | 2,599,448 | |
Foreign currencies at value*** | | — | | 10 | | — | | — | |
Receivables: | | | | | | | | | |
Investment securities sold | | 138,477 | | — | | 2,567,344 | | 162,320 | |
Fund shares sold | | 764,250 | | 9,450 | | 327,109 | | 626,371 | |
Dividends and interest | | 109,341 | | 319,991 | | 100,245 | | 70,539 | |
Unrealized appreciation on forward foreign currency contracts | | — | | 75,139 | | — | | — | |
Total assets | | 111,254,357 | | 514,465,216 | | 130,493,306 | | 322,027,658 | |
LIABILITIES: | | | | | | | | | |
Payable for investment securities purchased | | 1,510,172 | | — | | 2,773,340 | | 466,173 | |
Payable for fund shares redeemed | | 1,268,637 | | 841,407 | | 3,207,828 | | 424,046 | |
Payable upon receipt of securities loaned | | 13,825,000 | | 78,983,000 | | 24,072,000 | | — | |
Payable to affiliates | | 92,825 | | 261,080 | | 127,193 | | 381,618 | |
Other accrued expenses and liabilities | | — | | 212 | | — | | — | |
Total liabilities | | 16,696,634 | | 80,085,699 | | 30,180,361 | | 1,271,837 | |
NET ASSETS | | $ | 94,557,723 | | $ | 434,379,517 | | $ | 100,312,945 | | $ | 320,755,821 | |
NET ASSETS WERE COMPRISED OF: | | | | | | | | | |
Paid-in capital | | $ | 83,069,420 | | $ | 410,546,732 | | $ | 96,682,926 | | $ | 264,104,226 | |
Undistributed net investment income | | 833,524 | | 4,356,244 | | 55,273 | | 38,018 | |
Accumulated net realized gain (loss) on investments and foreign currency related transactions | | 5,435,409 | | (3,961,047 | ) | (554,079 | ) | 3,410,553 | |
Net unrealized appreciation on investments and foreign currency related transactions | | 5,219,370 | | 23,437,588 | | 4,128,825 | | 53,203,024 | |
NET ASSETS | | $ | 94,557,723 | | $ | 434,379,517 | | $ | 100,312,945 | | $ | 320,755,821 | |
+ | Including securities loaned at value | | $ | 13,377,487 | | $ | 76,472,198 | | $ | 23,273,617 | | $ | — | |
* | Cost of investments in securities | | $ | 85,927,081 | | $ | 404,445,254 | | $ | 93,951,214 | | $ | 242,085,096 | |
** | Cost of short-term investments | | $ | 4,739,157 | | $ | 6,535,838 | | $ | 4,670,169 | | $ | 23,280,860 | |
*** | Cost of foreign currencies | | $ | — | | $ | 10 | | $ | — | | $ | — | |
Class ADV: | | | | | | | | | |
Net assets | | $ | 11,806,152 | | $ | 21,389,906 | | $ | 11,022,557 | | $ | 31,564,627 | |
Shares authorized | | 100,000,000 | | 100,000,000 | | 100,000,000 | | 100,000,000 | |
Par value | | $ | 0.001 | | $ | 0.001 | | $ | 0.001 | | $ | 0.001 | |
Shares outstanding | | 838,742 | | 2,313,884 | | 948,067 | | 1,984,759 | |
Net asset value and redemption price per share | | $ | 14.08 | | $ | 9.24 | | $ | 11.63 | | $ | 15.90 | |
Class I: | | | | | | | | | |
Net assets | | $ | 39,624,437 | | $ | 404,821,977 | | $ | 46,237,077 | | $ | 81,664,361 | |
Shares authorized | | 100,000,000 | | 100,000,000 | | 100,000,000 | | 100,000,000 | |
Par value | | $ | 0.001 | | $ | 0.001 | | $ | 0.001 | | $ | 0.001 | |
Shares outstanding | | 2,781,661 | | 42,881,640 | | 3,928,382 | | 5,039,167 | |
Net asset value and redemption price per share | | $ | 14.24 | | $ | 9.44 | | $ | 11.77 | | $ | 16.21 | |
Class S: | | | | | | | | | |
Net assets | | $ | 43,127,134 | | $ | 8,167,634 | | $ | 43,053,311 | | $ | 207,526,833 | |
Shares authorized | | 100,000,000 | | 100,000,000 | | 100,000,000 | | 100,000,000 | |
Par value | | $ | 0.001 | | $ | 0.001 | | $ | 0.001 | | $ | 0.001 | |
Shares outstanding | | 3,036,239 | | 875,176 | | 3,667,927 | | 12,925,345 | |
Net asset value and redemption price per share | | $ | 14.20 | | $ | 9.33 | | $ | 11.74 | | $ | 16.06 | |
See Accompanying Notes to Financial Statements
56
STATEMENTS OF ASSETS AND LIABILITIES AS OF DECEMBER 31, 2005
| | ING
Davis Venture
Value Portfolio | | ING
Fundamental
Research Portfolio | | ING Goldman
Sachs® Capital
Growth Portfolio | | ING Goldman
Sachs®Core
Equity Portfolio | |
ASSETS: | �� | | | | | | | | |
Investments in securities at value+* | | $ | 56,762,791 | | $ | 40,224,414 | | $ | 66,192,368 | | $ | 103,181,342 | |
Short-term investments** | | 1,005,648 | | — | | — | | — | |
Short-term investments at amortized cost | | — | | — | | 11,018,000 | | 15,680,000 | |
Repurchase agreement | | — | | 1,405,000 | | — | | — | |
Cash | | 210,710 | | 1,737 | | 321,028 | | — | |
Cash collateral for futures | | — | | 25,200 | | — | | — | |
Receivables: | | | | | | | | | |
Investment securities sold | | — | | — | | 410,264 | | 1,511,947 | |
Fund shares sold | | 71,365 | | 17,732 | | 9,938 | | 544 | |
Dividends and interest | | 91,268 | | 36,962 | | 39,817 | | 169,631 | |
Prepaid expenses | | — | | 54 | | — | | — | |
Reimbursement due from manager | | — | | 92 | | — | | — | |
Total assets | | 58,141,782 | | 41,711,191 | | 77,991,415 | | 120,543,464 | |
LIABILITIES: | | | | | | | | | |
Payable for investment securities purchased | | 124,984 | | 315,700 | | — | | 586,799 | |
Payable for fund shares redeemed | | 1,563,942 | | 162,255 | | 4,462,063 | | 3,332,717 | |
Payable for futures variation margin | | — | | 2,100 | | — | | — | |
Payable upon receipt of securities loaned | | — | | — | | 11,018,000 | | 15,680,000 | |
Payable to affiliates | | 58,127 | | 36,029 | | 75,518 | | 102,876 | |
Payable to custodian due to bank overdraft | | — | | — | | — | | 167,025 | |
Other accrued expenses and liabilities | | 159,818 | | 33,476 | | — | | — | |
Total liabilities | | 1,906,871 | | 549,560 | | 15,555,581 | | 19,869,417 | |
NET ASSETS | | $ | 56,234,911 | | $ | 41,161,631 | | $ | 62,435,834 | | $ | 100,674,047 | |
NET ASSETS WERE COMPRISED OF: | | | | | | | | | |
Paid-in capital | | $ | 45,495,906 | | $ | 40,072,815 | | $ | 71,986,095 | | $ | 84,234,472 | |
Undistributed net investment income | | 8,141 | | 220,088 | | 3,322 | | 558,080 | |
Accumulated net realized gain (loss) on investments, foreign currency related transactions and futures | | 8,141,540 | | (512,198 | ) | (17,438,450 | ) | 7,342,568 | |
Net unrealized appreciation on investments, foreign currency related transactions and futures | | 2,589,324 | | 1,380,926 | | 7,884,867 | | 8,538,927 | |
NET ASSETS | | $ | 56,234,911 | | $ | 41,161,631 | | $ | 62,435,834 | | $ | 100,674,047 | |
| | | | | | | | | | | | | | | | | | | | | |
+ | Including securities loaned at value | | $ | — | | $ | — | | $ | 10,700,557 | | $ | 15,167,106 | |
* | Cost of investments in securities | | $ | 54,173,820 | | $ | 38,832,528 | | $ | 58,307,501 | | $ | 94,642,415 | |
** | Cost of short-term investments | | $ | 1,005,765 | | $ | — | | $ | — | | $ | — | |
Class ADV: | | | | | | | | | |
Net assets | | $ | 11,304,572 | | $ | 3,812,802 | | $ | 3,845,423 | | $ | 953,263 | |
Shares authorized | | 100,000,000 | | 100,000,000 | | 100,000,000 | | 100,000,000 | |
Par value | | $ | 0.001 | | $ | 0.001 | | $ | 0.001 | | $ | 0.001 | |
Shares outstanding | | 612,487 | | 422,783 | | 336,500 | | 77,422 | |
Net asset value and redemption price per share | | $ | 18.46 | | $ | 9.02 | | $ | 11.43 | | $ | 12.31 | |
Class I: | | | | | | | | | |
Net assets | | $ | 3,108,388 | | $ | 10,591,393 | | $ | 2,805,714 | | $ | 1,500 | |
Shares authorized | | 100,000,000 | | 100,000,000 | | 100,000,000 | | 100,000,000 | |
Par value | | $ | 0.001 | | $ | 0.001 | | $ | 0.001 | | $ | 0.001 | |
Shares outstanding | | 165,398 | | 1,164,261 | | 244,186 | | 120 | |
Net asset value and redemption price per share | | $ | 18.79 | | $ | 9.10 | | $ | 11.49 | | $ | 12.50 | |
Class S: | | | | | | | | | |
Net assets | | $ | 41,821,951 | | $ | 26,757,436 | | $ | 55,784,697 | | $ | 99,719,284 | |
Shares authorized | | 100,000,000 | | 100,000,000 | | 100,000,000 | | 100,000,000 | |
Par value | | $ | 0.001 | | $ | 0.001 | | $ | 0.001 | | $ | 0.001 | |
Shares outstanding | | 2,238,183 | | 2,942,051 | | 4,874,529 | | 8,007,387 | |
Net asset value and redemption price per share | | $ | 18.69 | | $ | 9.10 | | $ | 11.44 | | $ | 12.45 | |
See Accompanying Notes to Financial Statements
57
STATEMENTS OF ASSETS AND LIABILITIES AS OF DECEMBER 31, 2005
| | ING JP Morgan
Fleming
International
Portfolio | | ING JP Morgan
Mid Cap Value
Portfolio | | ING MFS Capital
Opportunities
Portfolio | | ING OpCap
Balanced Value
Portfolio | |
ASSETS: | | | | | | | | | |
Investments in securities at value+* | | $ | 882,485,767 | | $ | 168,788,968 | | $ | 184,209,384 | | $ | 130,901,268 | |
Short-term investments** | | 23,401,758 | | 4,180,885 | | — | | 1,179,685 | |
Short-term investments at amortized cost | | 19,213,000 | | 31,852,000 | | 41,108,000 | | 21,130,000 | |
Cash | | 3,466,365 | | 158,292 | | 7,350,099 | | — | |
Foreign currencies at value*** | | 5,084,908 | | — | | — | | — | |
Receivables: | | | | | | | | | |
Investment securities sold | | 3,302,048 | | 6,525 | | 2,067,584 | | 865,267 | |
Fund shares sold | | 1,169,989 | | 170,533 | | 16 | | 360 | |
Dividends and interest | | 1,657,935 | | 185,509 | | 211,990 | | 462,967 | |
Total assets | | 939,781,770 | | 205,342,712 | | 234,947,073 | | 154,539,547 | |
LIABILITIES: | | | | | | | | | |
Payable for investment securities purchased | | — | | 1,576,572 | | 777,042 | | — | |
Payable for fund shares redeemed | | 655,570 | | 438,720 | �� | 435,659 | | 5,027,673 | |
Payable upon receipt of securities loaned | | 19,213,000 | | 31,852,000 | | 41,108,000 | | 21,130,000 | |
Payable to affiliates | | 886,419 | | 182,007 | | 149,799 | | 142,773 | |
Payable to custodian due to bank overdraft | | — | | — | | — | | 302,087 | |
Total liabilities | | 20,754,989 | | 34,049,299 | | 42,470,500 | | 26,602,533 | |
NET ASSETS | | $ | 919,026,781 | | $ | 171,293,413 | | $ | 192,476,573 | | $ | 127,937,014 | |
NET ASSETS WERE COMPRISED OF: | | | | | | | | | |
Paid-in capital | | $ | 861,556,210 | | $ | 157,637,302 | | $ | 367,040,074 | | $ | 120,670,383 | |
Undistributed net investment income | | 8,267,001 | | 37,022 | | 880,670 | | 844,339 | |
Accumulated net realized gain (loss) on investments, and foreign currency related transactions | | (155,721,596 | ) | 1,255,584 | | (186,110,677 | ) | (1,187,296 | ) |
Net unrealized appreciation on investments and foreign currency related transactions | | 204,925,166 | | 12,363,505 | | 10,666,506 | | 7,609,588 | |
NET ASSETS | | $ | 919,026,781 | | $ | 171,293,413 | | $ | 192,476,573 | | $ | 127,937,014 | |
+ | Including securities loaned at value | | $ | 18,501,370 | | $ | 30,891,230 | | $ | 38,814,257 | | $ | 20,562,825 | |
* | Cost of investments in securities | | $ | 677,459,495 | | $ | 156,425,091 | | $ | 173,542,878 | | $ | 123,291,575 | |
** | Cost of short-term investments | | $ | 23,403,839 | | $ | 4,181,257 | | $ | — | | $ | 1,179,790 | |
*** | Cost of foreign currencies | | $ | 5,142,986 | | $ | — | | $ | — | | $ | — | |
Class ADV: | | | | | | | | | |
Net assets | | $ | 3,505,025 | | $ | 12,408,341 | | $ | 214,397 | | $ | 3,458,317 | |
Shares authorized | | 100,000,000 | | 100,000,000 | | 100,000,000 | | 100,000,000 | |
Par value | | $ | 0.001 | | $ | 0.001 | | $ | 0.001 | | $ | 0.001 | |
Shares outstanding | | 264,290 | | 893,091 | | 7,933 | | 253,851 | |
Net asset value and redemption price per share | | $ | 13.26 | | $ | 13.89 | | $ | 27.03 | | $ | 13.62 | |
Class I: | | | | | | | | | |
Net assets | | $ | 352,115,659 | | $ | 80,425,753 | | $ | 191,984,801 | | $ | 4,204,246 | |
Shares authorized | | 100,000,000 | | 100,000,000 | | 100,000,000 | | 100,000,000 | |
Par value | | $ | 0.001 | | $ | 0.001 | | $ | 0.001 | | $ | 0.001 | |
Shares outstanding | | 26,213,747 | | 5,735,725 | | 7,007,773 | | 305,047 | |
Net asset value and redemption price per share | | $ | 13.43 | | $ | 14.02 | | $ | 27.40 | | $ | 13.78 | |
Class S: | | | | | | | | | |
Net assets | | $ | 563,406,097 | | $ | 78,459,319 | | $ | 277,375 | | $ | 120,274,451 | |
Shares authorized | | 100,000,000 | | 100,000,000 | | 100,000,000 | | 100,000,000 | |
Par value | | $ | 0.001 | | $ | 0.001 | | $ | 0.001 | | $ | 0.001 | |
Shares outstanding | | 42,248,779 | | 5,613,071 | | 10,181 | | 8,750,345 | |
Net asset value and redemption price per share | | $ | 13.34 | | $ | 13.98 | | $ | 27.24 | | $ | 13.75 | |
See Accompanying Notes to Financial Statements
58
STATEMENTS OF ASSETS AND LIABILITIES AS OF DECEMBER 31, 2005
| | ING
Oppenheimer
Global Portfolio | | ING Oppenheimer
Strategic Income
Portfolio | | ING PIMCO
Total Return
Portfolio | | ING Salomon
Bros. Aggressive
Growth Portfolio | |
ASSETS: | | | | | | | | | |
Investments in securities at value+* | | $ | 2,399,739,959 | | $ | 337,196,505 | | $ | 319,746,820 | | $ | 924,868,593 | |
Short-term investments** | | 272,927 | | 40,953,363 | | 51,628,444 | | 46,547,584 | |
Short-term investments at amortized cost | | 321,186,000 | | 62,254,000 | | 16,934,000 | | 208,383,000 | |
Cash | | 409,022 | | 3,224,958 | | 3,008,566 | | 6,354,188 | |
Foreign currencies at value*** | | 6,963,458 | | 119,533 | | 348,424 | | — | |
Receivables: | | | | | | | | | |
Investment securities sold | | 2,319,666 | | 558,539 | | 17,090,924 | | — | |
Fund shares sold | | 349,532 | | 60,014 | | 3,225,431 | | 695,380 | |
Dividends and interest | | 4,693,169 | | 3,790,077 | | 1,794,932 | | 434,330 | |
Variation margin recievable | | — | | 85,110 | | 12,610 | | — | |
Other | | — | | 11,470 | | — | | — | |
Unrealized appreciation on forward foreign currency contracts | | — | | 3,629,624 | | 57,416 | | — | |
Upfront payments made on swap agreements | | — | | — | | 166,006 | | — | |
Unrealized appreciation on swap agreements | | — | | 1,419,431 | | 140,934 | | — | |
Total assets | | 2,735,933,733 | | 453,302,624 | | 414,154,507 | | 1,187,283,075 | |
LIABILITIES: | | | | | | | | | |
Payable for investment securities purchased | | 958,419 | | 17,292,764 | | 104,124,190 | | — | |
Payable for fund shares redeemed | | 2,543,766 | | 770,209 | | 259,868 | | 1,474,531 | |
Payable for futures variation margin | | — | | 51,486 | | 24,500 | | — | |
Payable upon receipt of securities loaned | | 321,186,000 | | 62,254,000 | | 16,934,000 | | 208,383,000 | |
Securities sold short | | — | | — | | 7,752,496 | | — | |
Unrealized depreciation on forward currency contracts | | — | | 2,960,711 | | 179,466 | | — | |
Payable to affiliates | | 1,399,356 | | 182,267 | | 226,963 | | 764,124 | |
Options written^ | | — | | 3,730 | | 163,739 | | — | |
Upfront payment received from swap agreements | | — | | 1,178,869 | | 675,783 | | — | |
Unrealized depreciation on swap agreements | | — | | 108,211 | | 406,402 | | — | |
Other accrued expenses and liabilities | | 303,494 | | — | | — | | — | |
Total liabilities | | 326,391,035 | | 84,802,247 | | 130,747,407 | | 210,621,655 | |
NET ASSETS | | $ | 2,409,542,698 | | $ | 368,500,377 | | $ | 283,407,100 | | $ | 976,661,420 | |
NET ASSETS WERE COMPRISED OF: | | | | | | | | | |
Paid-in capital | | $ | 2,089,653,035 | | $ | 370,566,766 | | $ | 279,888,390 | | $ | 971,014,750 | |
Undistributed net investment income (accumulated net investment loss or distributions in excess) | | 1,566,525 | | (301,523 | ) | 6,533,108 | | — | |
Accumulated net realized loss on investments, foreign currency related transactions, futures, options and swaps | | (4,042,305 | ) | (1,991,188 | ) | (2,277,686 | ) | (255,448,198 | ) |
Net unrealized appreciation or depreciation on investments foreign currency related transactions, futures, options and swaps | | 322,365,443 | | 226,322 | | (736,712 | ) | 261,094,868 | |
NET ASSETS | | $ | 2,409,542,698 | | $ | 368,500,377 | | $ | 283,407,100 | | $ | 976,661,420 | |
| | | | | | | | | | | | | | | | | | | |
+ | Including securities loaned at value | | $ | 310,065,073 | | $ | 60,682,633 | | $ | 16,605,511 | | $ | 201,933,033 | |
* | Cost of investments in securities | | $ | 2,077,238,151 | | $ | 339,173,780 | | $ | 320,269,470 | | $ | 663,769,586 | |
** | Cost of short-term investments | | $ | 272,951 | | $ | 40,953,599 | | $ | 51,624,066 | | $ | 46,551,723 | |
*** | Cost of foreign currencies | | $ | 7,099,775 | | $ | 114,415 | | $ | 354,065 | | $ | — | |
^ | Premiums received from options | | $ | — | | $ | 15,949 | | $ | 258,938 | | $ | — | |
See Accompanying Notes to Financial Statements
59
STATEMENTS OF ASSETS AND LIABILITIES AS OF DECEMBER 31, 2005 (CONTINUED)
| | ING
Oppenheimer
Global Portfolio | | ING Oppenheimer
Strategic Income
Portfolio | | ING PIMCO
Total Return
Portfolio | | ING Salomon
Bros. Aggressive
Growth Portfolio | |
Class ADV: | | | | | | | | | |
Net assets | | $ | 106,510,113 | | $ | 5,081,516 | | $ | 23,017,936 | | $ | 7,842,562 | |
Shares authorized | | 100,000,000 | | 100,000,000 | | 100,000,000 | | 100,000,000 | |
Par value | | $ | 0.001 | | $ | 0.001 | | $ | 0.001 | | $ | 0.001 | |
Shares outstanding | | 7,691,722 | | 509,127 | | 2,129,379 | | 179,712 | |
Net asset value and redemption price per share | | $ | 13.85 | | $ | 9.98 | | $ | 10.81 | | $ | 43.64 | |
Class I: | | | | | | | | | |
Net assets | | $ | 2,262,201,314 | | $ | 302,941,065 | | $ | 176,607,036 | | $ | 531,342,580 | |
Shares authorized | | 250,000,000 | | 100,000,000 | | 100,000,000 | | 100,000,000 | |
Par value | | $ | 0.001 | | $ | 0.001 | | $ | 0.001 | | $ | 0.001 | |
Shares outstanding | | 159,641,534 | | 30,299,549 | | 16,175,689 | | 11,934,727 | |
Net asset value and redemption price per share | | $ | 14.17 | | $ | 10.00 | | $ | 10.92 | | $ | 44.52 | |
Class S: | | | | | | | | | |
Net assets | | $ | 40,831,271 | | $ | 60,477,796 | | $ | 83,782,128 | | $ | 437,476,278 | |
Shares authorized | | 100,000,000 | | 100,000,000 | | 100,000,000 | | 100,000,000 | |
Par value | | $ | 0.001 | | $ | 0.001 | | $ | 0.001 | | $ | 0.001 | |
Shares outstanding | | 2,937,725 | | 6,051,936 | | 7,706,050 | | 9,924,195 | |
Net asset value and redemption price per share | | $ | 13.90 | | $ | 9.99 | | $ | 10.87 | | $ | 44.08 | |
| | | | | | | | | | | | | | | | | | |
See Accompanying Notes to Financial Statements
60
STATEMENTS OF ASSETS AND LIABILITIES AS OF DECEMBER 31, 2005
| | ING Salomon
Bros. Large Cap
Growth Portfolio | | ING T. Rowe
Price Diversified Mid Cap
Growth Portfolio | | ING T. Rowe
Price Growth
Equity Portfolio | |
ASSETS: | | | | | | | |
Investments in securities at value+* | | $ | 58,441,956 | | $ | 1,222,141,348 | | $ | 1,111,805,841 | |
Short-term investments at amortized cost | | — | | 304,867,000 | | 164,956,000 | |
Cash | | 275,272 | | 6,537,064 | | 37,969,082 | |
Foreign currencies at value*** | | — | | 1,175 | | 96,213 | |
Receivables: | | | | | | | |
Investment securities sold | | — | | 3,864,435 | | 458,435 | |
Fund shares sold | | 30,518 | | 126,511 | | 1,487,502 | |
Dividends and interest | | 34,950 | | 650,721 | | 1,385,842 | |
Total assets | | 58,782,696 | | 1,538,188,254 | | 1,318,158,915 | |
LIABILITIES: | | | | | | | |
Payable for investment securities purchased | | — | | 6,188,620 | | 4,297,922 | |
Payable for fund shares redeemed | | 599,389 | | 3,605,944 | | 34,460 | |
Payable upon receipt of securities loaned | | — | | 304,867,000 | | 164,956,000 | |
Payable to affiliates | | 57,144 | | 738,731 | | 800,535 | |
Total liabilities | | 656,533 | | 315,400,295 | | 170,088,917 | |
NET ASSETS | | $ | 58,126,163 | | $ | 1,222,787,959 | | $ | 1,148,069,998 | |
NET ASSETS WERE COMPRISED OF: | | | | | | | |
Paid-in capital | | $ | 52,897,325 | | $ | 1,060,311,657 | | $ | 998,705,146 | |
Undistributed net investment income | | — | | — | | 2,799,826 | |
Accumulated net realized gain (loss) on investments and foreign currency related transactions | | 314,901 | | 19,619,189 | | (3,875,140 | ) |
Net unrealized appreciation on investments and foreign currency related transactions | | 4,913,937 | | 142,857,113 | | 150,440,166 | |
NET ASSETS | | $ | 58,126,163 | | $ | 1,222,787,959 | | $ | 1,148,069,998 | |
| | | | | | | | | | | | | | |
+ | Including securities loaned at value | | $ | — | | $ | 295,787,469 | | $ | 160,550,748 | |
* | Cost of investments in securities | | $ | 53,528,019 | | $ | 1,079,284,200 | | $ | 961,359,637 | |
*** | Cost of foreign currencies | | $ | — | | $ | 1,210 | | $ | 97,173 | |
Class ADV: | | | | | | | |
Net assets | | $ | 25,166,397 | | $ | 69,685,639 | | $ | 86,780,501 | |
Shares authorized | | 100,000,000 | | 100,000,000 | | 100,000,000 | |
Par value | | $ | 0.001 | | $ | 0.001 | | $ | 0.001 | |
Shares outstanding | | 2,189,821 | | 8,227,173 | | 1,672,994 | |
Net asset value and redemption price per share | | $ | 11.49 | | $ | 8.47 | | $ | 51.87 | |
Class I: | | | | | | | |
Net assets | | $ | 18,672,603 | | $ | 1,131,231,203 | | $ | 898,101,510 | |
Shares authorized | | 100,000,000 | | 250,000,000 | | 100,000,000 | |
Par value | | $ | 0.001 | | $ | 0.001 | | $ | 0.001 | |
Shares outstanding | | 1,601,131 | | 130,839,110 | | 17,066,187 | |
Net asset value and redemption price per share | | $ | 11.66 | | $ | 8.65 | | $ | 52.62 | |
Class S: | | | | | | | |
Net assets | | $ | 14,287,163 | | $ | 21,871,117 | | $ | 163,187,987 | |
Shares authorized | | 100,000,000 | | 100,000,000 | | 100,000,000 | |
Par value | | $ | 0.001 | | $ | 0.001 | | $ | 0.001 | |
Shares outstanding | | 1,235,331 | | 2,557,628 | | 3,128,459 | |
Net asset value and redemption price per share | | $ | 11.57 | | $ | 8.55 | | $ | 52.16 | |
See Accompanying Notes to Financial Statements
61
STATEMENTS OF ASSETS AND LIABILITIES AS OF DECEMBER 31, 2005
| | ING UBS
U.S. Large Cap
Equity Portfolio | | ING Van Kampen
Comstock
Portfolio | | ING Van Kampen
Equity and
Income Portfolio | |
ASSETS: | | | | | | | |
Investments in securities at value+* | | $ | 277,899,925 | | $ | 646,825,504 | | $ | 874,983,982 | |
Short-term investments** | | 2,786,257 | | 59,783,057 | | 59,783,057 | |
Short-term investments at amortized cost | | 54,508,000 | | 75,258,000 | | — | |
Cash | | 316,880 | | 378,759 | | — | |
Foreign currencies at value*** | | — | | — | | 1,298 | |
Receivables: | | | | | | | |
Investment securities sold | | 14,071 | | 20,024 | | 344,223 | |
Fund shares sold | | 10,513 | | 863,865 | | 380,829 | |
Dividends and interest | | 252,881 | | 1,022,525 | | 3,027,145 | |
Total assets | | 335,788,527 | | 784,151,734 | | 938,520,534 | |
LIABILITIES: | | | | | | | |
Payable for investment securities purchased | | — | | 11,546,692 | | 14,638,203 | |
Payable for fund shares redeemed | | 288,434 | | 187,962 | | 1,020,591 | |
Payable for interest purchased | | — | | — | | 299,675 | |
Payable upon receipt of securities loaned | | 54,508,000 | | 75,258,000 | | — | |
Payable to affiliates | | 207,749 | | 625,885 | | 465,022 | |
Total liabilities | | 55,004,183 | | 87,618,539 | | 16,423,491 | |
NET ASSETS | | $ | 280,784,344 | | $ | 696,533,195 | | $ | 922,097,043 | |
NET ASSETS WERE COMPRISED OF: | | | | | | | |
Paid-in capital | | $ | 338,266,784 | | $ | 624,751,589 | | $ | 823,412,539 | |
Undistributed net investment income | | 2,425,943 | | 7,265,945 | | 18,809,095 | |
Accumulated net realized gain (loss) on investments and foreign currency related transactions | | (92,592,061 | ) | 41,127,838 | | 28,135,820 | |
Net unrealized appreciation on investments and foreign currency related transactions | | 32,683,678 | | 23,387,823 | | 51,739,589 | |
NET ASSETS | | $ | 280,784,344 | | $ | 696,533,195 | | $ | 922,097,043 | |
| | | | | | | | | | | | | | | | |
+ | Including securities loaned at value | | $ | 52,914,433 | | $ | 73,078,912 | | $ | — | |
* | Cost of investments in securities | | $ | 245,216,000 | | $ | 623,432,033 | | $ | 823,238,853 | |
** | Cost of short-term investments | | $ | 2,786,504 | | $ | 59,788,705 | | $ | 59,788,704 | |
*** | Cost of foreign currencies | | $ | — | | $ | — | | $ | 1,191 | |
Class ADV: | | | | | | | |
Net assets | | $ | 425,630 | | $ | 25,454,791 | | $ | 14,307,281 | |
Shares authorized | | 100,000,000 | | 100,000,000 | | 100,000,000 | |
Par value | | $ | 0.001 | | $ | 0.001 | | $ | 0.001 | |
Shares outstanding | | 46,310 | | 2,107,833 | | 402,411 | |
Net asset value and redemption price per share | | $ | 9.19 | | $ | 12.08 | | $ | 35.55 | |
Class I: | | | | | | | |
Net assets | | $ | 270,691,925 | | $ | 133,986,520 | | $ | 847,996,781 | |
Shares authorized | | 100,000,000 | | 100,000,000 | | 100,000,000 | |
Par value | | $ | 0.001 | | $ | 0.001 | | $ | 0.001 | |
Shares outstanding | | 29,119,479 | | 10,963,960 | | 23,493,485 | |
Net asset value and redemption price per share | | $ | 9.30 | | $ | 12.22 | | $ | 36.09 | |
Class S: | | | | | | | |
Net assets | | $ | 9,666,789 | | $ | 537,091,884 | | $ | 59,792,981 | |
Shares authorized | | 100,000,000 | | 100,000,000 | | 100,000,000 | |
Par value | | $ | 0.001 | | $ | 0.001 | | $ | 0.001 | |
Shares outstanding | | 1,050,082 | | 44,181,180 | | 1,664,031 | |
Net asset value and redemption price per share | | $ | 9.21 | | $ | 12.16 | | $ | 35.93 | |
See Accompanying Notes to Financial Statements
62
STATEMENTS OF OPERATIONS FOR THE YEAR ENDED DECEMBER 31, 2005
| | ING American
Century Large
Company Value
Portfolio | | ING
American
Century Select
Portfolio | | ING
American Century
SmallCap Value
Portfolio | | ING
Baron Small Cap
Growth Portfolio | |
INVESTMENT INCOME: | | | | | | | | | |
Dividends, net of foreign taxes withheld* | | $ | 1,713,520 | | $ | 4,082,978 | | $ | 1,503,976 | | $ | 706,404 | |
Interest | | 56,754 | | 59,800 | | 57,000 | | 304,511 | |
Securities lending income | | 3,675 | | 25,678 | | 22,074 | | 101,533 | |
Total investment income | | 1,773,949 | | 4,168,456 | | 1,583,050 | | 1,112,448 | |
EXPENSES: | | | | | | | | | |
Investment management fees | | 602,793 | | 2,510,773 | | 831,491 | | 1,980,374 | |
Distribution and service fees: | | | | | | | | | |
Class ADV | | 46,242 | | 123,824 | | 36,461 | | 125,878 | |
Class S | | 126,934 | | 23,983 | | 100,460 | | 388,298 | |
Administrative service fees | | 150,700 | | 78,455 | | 332,596 | | 931,939 | |
Total expenses | | 926,669 | | 2,737,035 | | 1,301,008 | | 3,426,489 | |
Net waived and reimbursed fees | | — | | — | | (83,148 | ) | (116,495 | ) |
Net expenses | | 926,669 | | 2,737,035 | | 1,217,860 | | 3,309,994 | |
Net investment income (loss) | | 847,280 | | 1,431,421 | | 365,190 | | (2,197,546 | ) |
REALIZED AND UNREALIZED GAIN ON INVESTMENTS AND FOREIGN CURRENCY RELATED TRANSACTIONS: | | | | | | | | | |
Net realized gain on: | | | | | | | | | |
Investments | | 6,661,783 | | 1,040,466 | | 9,320,042 | | 7,571,949 | |
Foreign currency related transactions | | — | | 2,743,885 | | — | | — | |
Net realized gain on investments and foreign currency related transactions | | 6,661,783 | | 3,784,351 | | 9,320,042 | | 7,571,949 | |
Net change in unrealized appreciation or depreciation on: | | | | | | | | | |
Investments | | (6,488,782 | ) | 16,386,639 | | (2,786,831 | ) | 11,255,372 | |
Foreign currency related transactions | | — | | 251,043 | | — | | — | |
Net change in unrealized appreciation or depreciation on investments and foreign currency related transactions | | (6,488,782 | ) | 16,637,682 | | (2,786,831 | ) | 11,255,372 | |
Net realized and unrealized gain on investments and foreign currency related transactions | | 173,001 | | 20,422,033 | | 6,533,211 | | 18,827,321 | |
Increase in net assets resulting from operations | | $ | 1,020,281 | | $ | 21,853,454 | | $ | 6,898,401 | | $ | 16,629,775 | |
| | | | | | | | | | | | | |
|
* Foreign taxes withheld | | $ | 21,034 | | $ | 75,546 | | $ | — | | $ | 652 | |
| | | | | | | | | | | | | | | | | | | | | |
See Accompanying Notes to Financial Statements
63
STATEMENTS OF OPERATIONS FOR THE YEAR ENDED DECEMBER 31, 2005
| | ING
Davis Venture
Value
Portfolio | | ING
Fundamental
Research
Portfolio | | ING
Goldman Sachs®
Capital Growth
Portfolio | | ING
Goldman Sachs®
Core Equity
Portfolio | |
INVESTMENT INCOME: | | | | | | | | | |
Dividends, net of foreign taxes withheld* | | $ | 813,110 | | $ | 606,688 | | $ | 795,198 | | $ | 1,777,029 | |
Interest | | 52,512 | | 38,563 | | 5,771 | | 5,830 | |
Securities lending income | | 303 | | — | | 2,806 | | 5,082 | |
Other | | — | | 24 | | — | | — | |
Total investment income | | 865,925 | | 645,275 | | 803,775 | | 1,787,941 | |
EXPENSES: | | | | | | | | | |
Investment management fees | | 552,895 | | 241,999 | | 658,891 | | 740,881 | |
Distribution and service fees: | | | | | | | | | |
Class ADV | | 68,675 | | 17,992 | | 20,735 | | 3,056 | |
Class S | | 113,863 | | 81,273 | | 178,319 | | 263,068 | |
Administrative service fees | | 115,509 | | 80,667 | | 154,883 | | 211,682 | |
Miscellaneous expense | | — | | 12 | | — | | — | |
Total expenses | | 850,942 | | 421,943 | | 1,012,828 | | 1,218,687 | |
Net investment income (loss) | | 14,983 | | 223,332 | | (209,053 | ) | 569,254 | |
REALIZED AND UNREALIZED GAIN (LOSS) ON INVESTMENTS, FOREIGN CURRENCY RELATED TRANSACTIONS AND FUTURES: | | | | | | | | | |
Net realized gain (loss) on: | | | | | | | | | |
Investments | | 12,962,941 | | 4,702,435 | | 917,207 | | 7,750,789 | |
Foreign currency related transactions | | (6,221 | ) | — | | — | | — | |
Futures | | — | | 196,143 | | — | | (6,829 | ) |
Net realized gain on investments, foreign currency related transactions, and futures | | 12,956,720 | | 4,898,578 | | 917,207 | | 7,743,960 | |
Net change in unrealized appreciation or depreciation on: | | | | | | | | | |
Investments | | (11,075,742 | ) | (2,659,078 | ) | (164,568 | ) | (2,998,584 | ) |
Foreign currency related transactions | | 470 | | (2,245 | ) | — | | (3,301 | ) |
Futures | | — | | (10,960 | ) | — | | — | |
Net change in unrealized appreciation or depreciation on investments, foreign currency related transactions and futures | | (11,075,272 | ) | (2,672,283 | ) | (164,568 | ) | (3,001,885 | ) |
Net realized and unrealized gain on investments, foreign currency related transactions and futures | | 1,881,448 | | 2,226,295 | | 752,639 | | 4,742,075 | |
Increase in net assets resulting from operations | | $ | 1,896,431 | | $ | 2,449,627 | | $ | 543,586 | | $ | 5,311,329 | |
| | | | | | | | | | | | | |
|
* Foreign taxes withheld | | $ | 15,618 | | $ | 3,256 | | $ | 1,135 | | $ | — | |
| | | | | | | | | | | | | | | | | | | | | |
See Accompanying Notes to Financial Statements
64
STATEMENTS OF OPERATIONS FOR THE YEAR ENDED DECEMBER 31, 2005
| | ING
JP Morgan Fleming
International
Portfolio | | ING
JP Morgan
Mid Cap Value
Portfolio | | ING
MFS Capital
Opportunities
Portfolio | | ING
OpCap
Balanced Value
Portfolio | |
INVESTMENT INCOME: | | | | | | | | | |
Dividends, net of foreign taxes withheld* | | $ | 16,769,514 | | $ | 2,485,555 | | $ | 2,675,682 | | $ | 1,234,842 | |
Interest | | 307,097 | | 82,973 | | 23,952 | | 1,425,378 | |
Securities lending income | | 176,901 | | 8,143 | | 77,756 | | 19,120 | |
Total investment income | | 17,253,512 | | 2,576,671 | | 2,777,390 | | 2,679,340 | |
EXPENSES: | | | | | | | | | |
Investment management fees | | 5,926,372 | | 1,100,932 | | 1,359,536 | | 1,173,806 | |
Distribution and service fees: | | | | | | | | | |
Class ADV | | 13,459 | | 41,928 | | 1,148 | | 18,316 | |
Class S | | 958,828 | | 187,167 | | 921 | | 347,244 | |
Administrative service fees | | 1,481,606 | | 513,768 | | 522,898 | | 293,454 | |
Total expenses | | 8,380,265 | | 1,843,795 | | 1,884,503 | | 1,832,820 | |
Net investment income | | 8,873,247 | | 732,876 | | 892,887 | | 846,520 | |
REALIZED AND UNREALIZED GAIN ON INVESTMENTS AND FOREIGN CURRENCY RELATED TRANSACTIONS: | | | | | | | | | |
Net realized gain (loss) on: | | | | | | | | | |
Investments | | 15,606,563 | | 12,106,839 | | 21,404,330 | | 7,799,945 | |
Foreign currency related transactions | | (682,313 | ) | — | | (10,103 | ) | — | |
Net realized gain on investments and foreign currency related transactions | | 14,924,250 | | 12,106,839 | | 21,394,227 | | 7,799,945 | |
Net change in unrealized appreciation or depreciation on: | | | | | | | | | |
Investments | | 59,919,513 | | (739,943 | ) | (20,168,080 | ) | (5,196,957 | ) |
Foreign currency related transactions | | (95,278 | ) | — | | — | | — | |
Net change in unrealized appreciation or depreciation on investments and foreign currency related transactions | | 59,824,235 | | (739,943 | ) | (20,168,080 | ) | (5,196,957 | ) |
Net realized and unrealized gain on investments and foreign currency related transactions | | 74,748,485 | | 11,366,896 | | 1,226,147 | | 2,602,988 | |
Increase in net assets resulting from operations | | $ | 83,621,732 | | $ | 12,099,772 | | $ | 2,119,034 | | $ | 3,449,508 | |
| | | | | | | | | | | | | |
|
* Foreign taxes withheld | | $ | 1,531,762 | | $ | 3,521 | | $ | 25,317 | | $ | 13,096 | |
| | | | | | | | | | | | | | | | | | | | | |
See Accompanying Notes to Financial Statements
65
STATEMENTS OF OPERATIONS FOR THE YEAR ENDED DECEMBER 31, 2005
| | ING
Oppenheimer
Global
Portfolio | | ING
Oppenheimer
Strategic Income
Portfolio | | ING
PIMCO
Total Return
Portfolio | | ING
Salomon Bros.
Aggressive Growth
Portfolio | |
INVESTMENT INCOME: | | | | | | | | | |
Dividends, net of foreign taxes withheld* | | $ | 30,662,696 | | $ | 182,003 | | $ | 15,708 | | $ | 3,792,798 | |
Interest, net of foreign taxes withheld* | | 637,868 | | 12,018,581 | | 8,832,807 | | 500,097 | |
Securities lending income | | 268,753 | | 137,199 | | 46,190 | | 128,279 | |
Total investment income | | 31,569,317 | | 12,337,783 | | 8,894,705 | | 4,421,174 | |
EXPENSES: | | | | | | | | | |
Investment management fees | | 11,064,267 | | 1,540,037 | | 1,143,901 | | 6,273,151 | |
Distribution and service fees: | | | | | | | | | |
Class ADV | | 632,836 | | 21,542 | | 93,688 | | 26,209 | |
Class S | | 46,843 | | 152,035 | | 197,548 | | 989,005 | |
Administrative service fees | | 1,106,400 | | 123,204 | | 800,729 | | 1,204,616 | |
Total expenses | | 12,850,346 | | 1,836,818 | | 2,235,866 | | 8,492,981 | |
Net waived and reimbursed fees | | (12,658 | ) | (26,063 | ) | — | | — | |
Net expenses | | 12,837,688 | | 1,810,755 | | 2,235,866 | | 8,492,981 | |
Net investment income (loss) | | 18,731,629 | | 10,527,028 | | 6,658,839 | | (4,071,807 | ) |
REALIZED AND UNREALIZED GAIN (LOSS) ON INVESTMENTS, FOREIGN CURRENCY RELATED TRANSACTIONS, FUTURES, OPTIONS AND SWAPS: | | | | | | | | | |
Net realized gain (loss) on: | | | | | | | | | |
Investments | | 39,123,465 | | (526,467 | ) | (2,150,505 | ) | 40,718,226 | |
Foreign currency related transactions | | (1,044,736 | ) | (2,726,712 | ) | 557,689 | | — | |
Futures, options and swaps | | — | | (1,172,949 | ) | 247,979 | | — | |
Net realized gain (loss) on investments, foreign currency related transactions, futures, options and swaps | | 38,078,729 | | (4,426,128 | ) | (1,344,837 | ) | 40,718,226 | |
Net change in unrealized appreciation or depreciation on: | | | | | | | | | |
Investments | | 301,627,318 | | (2,711,857 | ) | (1,233,923 | ) | 52,471,455 | |
Foreign currency related transactions | | (231,188 | ) | 717,257 | | 1,081,063 | | — | |
Futures, options and swaps | | — | | 1,562,484 | | (441,336 | ) | — | |
Net change in unrealized appreciation or depreciation on investments, foreign currency related transactions, futures, options and swaps | | 301,396,130 | | (432,116 | ) | (594,196 | ) | 52,471,455 | |
Net realized and unrealized gain (loss) on investments, foreign currency related transactions, futures, options and swaps | | 339,474,859 | | (4,858,244 | ) | (1,939,033 | ) | 93,189,681 | |
Increase in net assets resulting from operations | | $ | 358,206,488 | | $ | 5,668,784 | | $ | 4,719,806 | | $ | 89,117,874 | |
| | | | | | | | | | | | | |
|
* Foreign taxes withheld | | $ | 2,015,329 | | $ | 122,188 | | $ | (18,994 | ) | $ | 24,761 | |
| | | | | | | | | | | | | | | | | | | | | |
See Accompanying Notes to Financial Statements
66
STATEMENTS OF OPERATIONS FOR THE YEAR ENDED DECEMBER 31, 2005
| | ING
Salomon Bros.
Large Cap Growth
Portfolio | | ING T. Rowe Price
Diversified
Mid Cap Growth
Portfolio | | ING
T. Rowe Price
Growth Equity
Portfolio | |
INVESTMENT INCOME: | | | | | | | |
Dividends, net of foreign taxes withheld* | | $ | 536,358 | | $ | 5,866,872 | | $ | 10,455,957 | |
Interest | | 1,683 | | 15,197 | | 690,811 | |
Securities lending income | | — | | 96,671 | | 70,925 | |
Total investment income | | 538,041 | | 5,978,740 | | 11,217,693 | |
EXPENSES: | | | | | | | |
Investment management fees | | 404,581 | | 6,135,183 | | 5,968,337 | |
Distribution and service fees: | | | | | | | |
Class ADV | | 144,247 | | 349,176 | | 409,422 | |
Class S | | 37,007 | | 57,210 | | 189,650 | |
Administrative service fees | | 126,433 | | 191,709 | | 1,492,074 | |
Total expenses | | 712,268 | | 6,733,278 | | 8,059,483 | |
Net waived and reimbursed fees | | — | | (6,943 | ) | — | |
Net expenses | | 712,268 | | 6,726,335 | | 8,059,483 | |
Net investment income (loss) | | (174,227 | ) | (747,595 | ) | 3,158,210 | |
REALIZED AND UNREALIZED GAIN ON INVESTMENTS AND FOREIGN CURRENCY RELATED TRANSACTIONS: | | | | | | | |
Net realized gain (loss) on: | | | | | | | |
Investments | | 740,873 | | 21,372,546 | | 54,713,320 | |
Foreign currency related transactions | | — | | 18,842 | | (398,223 | ) |
Net realized gain on investments and foreign currency related transactions | | 740,873 | | 21,391,388 | | 54,315,097 | |
Net change in unrealized appreciation or depreciation on: | | | | | | | |
Investments | | 2,548,360 | | 124,275,307 | | 8,250,646 | |
Foreign currency related transactions | | — | | (35 | ) | (9,690 | ) |
Net change in unrealized appreciation or depreciation on investments and foreign currency related transactions | | 2,548,360 | | 124,275,272 | | 8,240,956 | |
Net realized and unrealized gain on investments and foreign currency related transactions | | 3,289,233 | | 145,666,660 | | 62,556,053 | |
Increase in net assets resulting from operations | | $ | 3,115,006 | | $ | 144,919,065 | | $ | 65,714,263 | |
| | | | | | | | | | |
|
* Foreign taxes withheld | | $ | — | | $ | 13,257 | | $ | 218,442 | |
| | | | | | | | | | | | | | | | |
See Accompanying Notes to Financial Statements
67
STATEMENTS OF OPERATIONS FOR THE YEAR ENDED DECEMBER 31, 2005
| | ING
UBS U.S. Large
Cap Equity
Portfolio | | ING
Van Kampen
Comstock
Portfolio | | ING
Van Kampen
Equity & Income
Portfolio | |
INVESTMENT INCOME: | | | | | | | |
Dividends, net of foreign taxes withheld* | | $ | 4,641,367 | | $ | 12,332,086 | | $ | 14,559,015 | |
Interest | | 54,583 | | 736,802 | | 9,489,476 | |
Securities lending income | | 17,153 | | 22,949 | | 49 | |
Total investment income | | 4,713,103 | | 13,091,837 | | 24,048,540 | |
EXPENSES: | | | | | | | |
Investment management fees | | 1,869,865 | | 3,246,569 | | 4,948,718 | |
Distribution and service fees: | | | | | | | |
Class ADV | | 850 | | 83,936 | | 62,176 | |
Class S | | 13,765 | | 1,069,586 | | 96,216 | |
Administrative service fees | | 400,686 | | 1,886,617 | | 179,939 | |
Total expenses | | 2,285,166 | | 6,286,708 | | 5,287,049 | |
Net waived and reimbursed fees | | — | | (462,722 | ) | — | |
Net expenses | | 2,285,166 | | 5,823,986 | | 5,287,049 | |
Net investment income | | 2,427,937 | | 7,267,851 | | 18,761,491 | |
REALIZED AND UNREALIZED GAIN (LOSS) ON INVESTMENTS, FOREIGN CURRENCY RELATED TRANSACTIONS, FUTURES, OPTIONS AND SWAPS: | | | | | | | |
Net realized gain (loss) on: | | | | | | | |
Investments | | 16,383,118 | | 41,320,450 | | 30,303,983 | |
Foreign currency related transactions | | — | | — | | 47,626 | |
Futures, options and swaps | | — | | — | | (1,964,025 | ) |
Net realized gain on investments, foreign currency related transactions, futures, options and swaps | | 16,383,118 | | 41,320,450 | | 28,387,584 | |
Net change in unrealized appreciation or depreciation on: | | | | | | | |
Investments | | 5,356,121 | | (22,798,099 | ) | 39,278,146 | |
Foreign currency related transactions | | — | | — | | 107 | |
Net change in unrealized appreciation or depreciation on investments and foreign currency related transactions | | 5,356,121 | | (22,798,099 | ) | 39,278,253 | |
Net realized and unrealized gain on investments, foreign currency related transactions, futures, options and swaps | | 21,739,239 | | 18,522,351 | | 67,665,837 | |
Increase in net assets resulting from operations | | $ | 24,167,176 | | $ | 25,790,202 | | $ | 86,427,328 | |
| | | | | | | | | | |
|
* Foreign taxes withheld | | $ | — | | $ | 145,034 | | $ | 267,258 | |
| | | | | | | | | | | | | | | | |
See Accompanying Notes to Financial Statements
68
STATEMENTS OF CHANGES IN NET ASSETS
| | ING American Century
Large Company Value Portfolio | | ING American Century
Select Portfolio | |
| | Year
Ended
December 31,
2005 | | Year
Ended
December 31,
2004 | | Year
Ended
December 31,
2005 | | Year
Ended
December 31,
2004 | |
FROM OPERATIONS: | | | | | | | | | |
Net investment income (loss) | | $ | 847,280 | | $ | 774,263 | | $ | 1,431,421 | | $ | (202,910 | ) |
Net realized gain on investments and foreign currency related transactions | | 6,661,783 | | 3,164,747 | | 3,784,351 | | 9,509,329 | |
Net change in unrealized appreciation or depreciation on investments and foreign currency related transactions | | (6,488,782 | ) | 2,972,327 | | 16,637,682 | | (2,714,442 | ) |
Net increase in net assets resulting from operations | | 1,020,281 | | 6,911,337 | | 21,853,454 | | 6,591,977 | |
FROM DISTRIBUTIONS TO SHAREHOLDERS: | | | | | | | | | |
Net investment income: | | | | | | | | | |
Class ADV | | (68,599 | ) | (49,520 | ) | — | | — | |
Class I | | (179,496 | ) | (19,821 | ) | — | | — | |
Class S | | (521,380 | ) | (499,364 | ) | — | | — | |
Total distributions | | (769,475 | ) | (568,705 | ) | — | | — | |
FROM CAPITAL SHARE TRANSACTIONS: | | | | | | | | | |
Net proceeds from sale of shares | | 48,249,646 | | 14,836,273 | | 284,479,850 | | 228,406,674 | |
Dividends reinvested | | 769,474 | | 568,705 | | — | | — | |
| | 49,019,120 | | 15,404,978 | | 284,479,850 | | 228,406,674 | |
Cost of shares redeemed | | (32,619,007 | ) | (15,777,594 | ) | (118,024,396 | ) | (46,520,781 | ) |
Net increase (decrease) in net assets resulting from capital share transactions | | 16,400,113 | | (372,616 | ) | 166,455,454 | | 181,885,893 | |
Net increase in net assets | | 16,650,919 | | 5,970,016 | | 188,308,908 | | 188,477,870 | |
NET ASSETS: | | | | | | | | | |
Beginning of year | | 77,906,804 | | 71,936,788 | | 246,070,609 | | 57,592,739 | |
End of year | | $ | 94,557,723 | | $ | 77,906,804 | | $ | 434,379,517 | | $ | 246,070,609 | |
Undistributed net investment income at end of year | | $ | 833,524 | | $ | 773,682 | | $ | 4,356,244 | | $ | 180,938 | |
| | | | | | | | | | | | | | | | | | | | | | |
See Accompanying Notes to Financial Statements
69
STATEMENTS OF CHANGES IN NET ASSETS
| | ING American Century
Small Cap Value Portfolio | | ING Baron Small Cap
Growth Portfolio | |
| | Year
Ended
December 31,
2005 | | Year
Ended
December 31,
2004 | | Year
Ended
December 31,
2005 | | Year
Ended
December 31,
2004 | |
FROM OPERATIONS: | | | | | | | | | |
Net investment income (loss) | | $ | 365,190 | | $ | 70,477 | | $ | (2,197,546 | ) | $ | (915,140 | ) |
Net realized gain (loss) on investments and foreign currency related transactions | | 9,320,042 | | 5,269,264 | | 7,571,949 | | (3,243,640 | ) |
Net change in unrealized appreciation or depreciation on investments and foreign currency related transactions | | (2,786,831 | ) | 4,289,625 | | 11,255,372 | | 31,610,332 | |
Net increase in net assets resulting from operations | | 6,898,401 | | 9,629,366 | | 16,629,775 | | 27,451,552 | |
FROM DISTRIBUTIONS TO SHAREHOLDERS: | | | | | | | | | |
Net investment income: | | | | | | | | | |
Class ADV | | (9,562 | ) | — | | — | | — | |
Class I | | (193,431 | ) | (53,804 | ) | — | | — | |
Class S | | (74,329 | ) | (9,978 | ) | — | | — | |
Net realized gains: | | | | | | | | | |
Class ADV | | (1,143,069 | ) | (327,424 | ) | — | | — | |
Class I | | (5,000,736 | ) | (1,720,743 | ) | — | | — | |
Class S | | (4,715,809 | ) | (2,337,402 | ) | — | | — | |
Total distributions | | (11,136,936 | ) | (4,449,351 | ) | — | | — | |
FROM CAPITAL SHARE TRANSACTIONS: | | | | | | | | | |
Net proceeds from sale of shares | | 41,255,914 | | 49,551,353 | | 184,661,901 | | 91,041,407 | |
Dividends reinvested | | 11,136,936 | | 4,449,351 | | — | | — | |
| | 52,392,850 | | 54,000,704 | | 184,661,901 | | 91,041,407 | |
Cost of shares redeemed | | (19,356,113 | ) | (10,879,758 | ) | (41,707,603 | ) | (15,993,010 | ) |
Net increase in net assets resulting from capital share transactions | | 33,036,737 | | 43,120,946 | | 142,954,298 | | 75,048,397 | |
Net increase in net assets | | 28,798,202 | | 48,300,961 | | 159,584,073 | | 102,499,949 | |
NET ASSETS: | | | | | | | | | |
Beginning of year | | 71,514,743 | | 23,213,782 | | 161,171,748 | | 58,671,799 | |
End of year | | $ | 100,312,945 | | $ | 71,514,743 | | $ | 320,755,821 | | $ | 161,171,748 | |
Undistributed net investment income at end of year | | $ | 55,273 | | $ | 2,506 | | $ | 38,018 | | $ | — | |
| | | | | | | | | | | | | | | | | |
See Accompanying Notes to Financial Statements
70
STATEMENTS OF CHANGES IN NET ASSETS
| | ING Davis Venture
Value Portfolio | | ING Fundamental
Research Portfolio | |
| | Year
Ended
December 31,
2005 | | Year
Ended
December 31,
2004 | | Year
Ended
December 31,
2005 | | Year
Ended
December 31,
2004 | |
FROM OPERATIONS: | | | | | | | | | |
Net investment income | | $ | 14,983 | | $ | 12,313 | | $ | 223,332 | | $ | 416,677 | |
Net realized gain on investments, foreign currency related transactions, futures, options and swaps | | 12,956,720 | | 3,852,778 | | 4,898,578 | | 1,119,788 | |
Net change in unrealized appreciation or depreciation on investments, foreign currency related transactions, futures, options and swaps | | (11,075,272 | ) | 1,249,516 | | (2,672,283 | ) | 2,699,833 | |
Net increase in net assets resulting from operations | | 1,896,431 | | 5,114,607 | | 2,449,627 | | 4,236,298 | |
FROM DISTRIBUTIONS TO SHAREHOLDERS: | | | | | | | | | |
Net investment income: | | | | | | | | | |
Class ADV | | (5,573 | ) | — | | (27,298 | ) | (14,333 | ) |
Class I | | (7,346 | ) | — | | (49,929 | ) | (30,448 | ) |
Class S | | — | | — | | (339,663 | ) | (221,996 | ) |
Total distributions | | (12,919 | ) | — | | (416,890 | ) | (266,777 | ) |
FROM CAPITAL SHARE TRANSACTIONS: | | | | | | | | | |
Net proceeds from sale of shares | | 19,075,747 | | 20,253,033 | | 6,671,750 | | 12,671,341 | |
Net proceeds from shares issued in merger | | — | | — | | 6,558,722 | | — | |
Dividends reinvested | | 12,919 | | — | | 416,890 | | 266,777 | |
| | 19,088,666 | | 20,253,033 | | 13,647,362 | | 12,938,118 | |
Cost of shares redeemed | | (34,385,548 | ) | (17,278,626 | ) | (21,847,250 | ) | (12,508,582 | ) |
Net increase (decrease) in net assets resulting from capital share transactions | | (15,296,882 | ) | 2,974,407 | | (8,199,888 | ) | 429,536 | |
Net increase (decrease) in net assets | | (13,413,370 | ) | 8,089,014 | | (6,167,151 | ) | 4,399,057 | |
NET ASSETS: | | | | | | | | | |
Beginning of year | | 69,648,281 | | 61,559,267 | | 47,328,782 | | 42,929,725 | |
End of year | | $ | 56,234,911 | | $ | 69,648,281 | | $ | 41,161,631 | | $ | 47,328,782 | |
Undistributed net investment income at end of year | | $ | 8,141 | | $ | 12,298 | | $ | 220,088 | | $ | 414,732 | |
| | | | | | | | | | | | | | | | | |
See Accompanying Notes to Financial Statements
71
STATEMENTS OF CHANGES IN NET ASSETS
| | ING Goldman Sachs® Capital
Growth Portfolio | | ING Goldman Sachs® Core
Equity Portfolio | |
| | Year
Ended
December 31,
2005 | | Year
Ended
December 31,
2004 | | Year
Ended
December 31,
2005 | | Year
Ended
December 31,
2004 | |
FROM OPERATIONS: | | | | | | | | | |
Net investment income (loss) | | $ | (209,053 | ) | $ | 251,129 | | $ | 569,254 | | $ | 907,307 | |
Net realized gain (loss) on investments, foreign currency related transactions, futures, options and swaps | | 917,207 | | (2,116,669 | ) | 7,743,960 | | 11,223,685 | |
Net change in unrealized appreciation or depreciation on investments, foreign currency related transactions, futures, options and swaps | | (164,568 | ) | 9,678,762 | | (3,001,885 | ) | 566,328 | |
Net increase in net assets resulting from operations | | 543,586 | | 7,813,222 | | 5,311,329 | | 12,697,320 | |
FROM DISTRIBUTIONS TO SHAREHOLDERS: | | | | | | | | | |
Net investment income: | | | | | | | | | |
Class ADV | | — | | — | | (7,453 | ) | (68 | ) |
Class I | | (9,755 | ) | (5,353 | ) | (15 | ) | (6 | ) |
Class S | | (226,138 | ) | (38,908 | ) | (891,307 | ) | (317,101 | ) |
Net realized gains: | | | | | | | | | |
Class ADV | | — | | — | | (75,142 | ) | (657 | ) |
Class I | | — | | — | | (150 | ) | (56 | ) |
Class S | | — | | — | | (11,280,104 | ) | (4,264,459 | ) |
Total distributions | | (235,893 | ) | (44,261 | ) | (12,254,171 | ) | (4,582,347 | ) |
FROM CAPITAL SHARE TRANSACTIONS: | | | | | | | | | |
Net proceeds from sale of shares | | 8,276,562 | | 8,567,337 | | 9,121,069 | | 19,953,344 | |
Dividends reinvested | | 235,892 | | 44,261 | | 12,254,177 | | 4,582,347 | |
| | 8,512,454 | | 8,611,598 | | 21,375,246 | | 24,535,691 | |
Cost of shares redeemed | | (41,616,066 | ) | (17,662,517 | ) | (26,870,423 | ) | (16,037,730 | ) |
Net increase (decrease) in net assets resulting from capital share transactions | | (33,103,612 | ) | (9,050,919 | ) | (5,495,177 | ) | 8,497,961 | |
Net increase (decrease) in net assets | | (32,795,919 | ) | (1,281,958 | ) | (12,438,019 | ) | 16,612,934 | |
NET ASSETS: | | | | | | | | | |
Beginning of year | | 95,231,753 | | 96,513,711 | | 113,112,066 | | 96,499,132 | |
End of year | | $ | 62,435,834 | | $ | 95,231,753 | | $ | 100,674,047 | | $ | 113,112,066 | |
Undistributed net investment income at end of year | | $ | 3,322 | | $ | 246,661 | | $ | 558,080 | | $ | 899,904 | |
| | | | | | | | | | | | | | | | | |
See Accompanying Notes to Financial Statements
72
STATEMENTS OF CHANGES IN NET ASSETS
| | ING JPMorgan Fleming
International Portfolio | | ING JPMorgan
Mid Cap Value Portfolio | |
| | Year
Ended
December 31,
2005 | | Year
Ended
December 31,
2004 | | Year
Ended
December 31,
2005 | | Year
Ended
December 31,
2004 | |
FROM OPERATIONS: | | | | | | | | | |
Net investment income | | $ | 8,873,247 | | $ | 5,600,715 | | $ | 732,876 | | $ | 232,441 | |
Net realized gain on investments, foreign currency related transactions, futures, options and swaps | | 14,924,250 | | 9,822,077 | | 12,106,839 | | 4,594,684 | |
Net change in unrealized appreciation or depreciation on investments, foreign currency related transactions, futures, options and swaps | | 59,824,235 | | 68,725,679 | | (739,943 | ) | 9,418,762 | |
Net increase in net assets resulting from operations | | 83,621,732 | | 84,148,471 | | 12,099,772 | | 14,245,887 | |
FROM DISTRIBUTIONS TO SHAREHOLDERS: | | | | | | | | | |
Net investment income: | | | | | | | | | |
Class ADV | | (13,389 | ) | (16,919 | ) | (20,785 | ) | — | |
Class I | | (2,668,525 | ) | (3,834,376 | ) | (401,198 | ) | (146,244 | ) |
Class S | | (2,914,895 | ) | (965,386 | ) | (214,725 | ) | (90,240 | ) |
Net realized gains: | | | | | | | | | |
Class ADV | | — | | — | | (837,030 | ) | (143,820 | ) |
Class I | | — | | — | | (5,487,183 | ) | (1,604,710 | ) |
Class S | | — | | — | | (5,587,089 | ) | (1,866,604 | ) |
Total distributions | | (5,596,809 | ) | (4,816,681 | ) | (12,548,010 | ) | (3,851,618 | ) |
FROM CAPITAL SHARE TRANSACTIONS: | | | | | | | | | |
Net proceeds from sale of shares | | 460,466,142 | | 271,489,659 | | 76,471,872 | | 86,225,669 | |
Dividends reinvested | | 5,596,809 | | 4,816,681 | | 12,548,010 | | 3,851,618 | |
| | 466,062,951 | | 276,306,340 | | 89,019,882 | | 90,077,287 | |
Cost of shares redeemed | | (203,247,154 | ) | (125,236,722 | ) | (41,841,366 | ) | (10,296,101 | ) |
Net increase in net assets resulting from capital share transactions | | 262,815,797 | | 151,069,618 | | 47,178,516 | | 79,781,186 | |
Net increase in net assets | | 340,840,720 | | 230,401,408 | | 46,730,278 | | 90,175,455 | |
NET ASSETS: | | | | | | | | | |
Beginning of year | | 578,186,061 | | 347,784,653 | | 124,563,135 | | 34,387,680 | |
End of year | | $ | 919,026,781 | | $ | 578,186,061 | | $ | 171,293,413 | | $ | 124,563,135 | |
Undistributed net investment income at end of year | | $ | 8,267,001 | | $ | 5,139,495 | | $ | 37,022 | | $ | — | |
| | | | | | | | | | | | | | | | |
See Accompanying Notes to Financial Statements
73
STATEMENTS OF CHANGES IN NET ASSETS
| | ING MFS Capital
Opportunities Portfolio | | ING OpCap Balanced
Value Portfolio | |
| | Year
Ended
December 31,
2005 | | Year
Ended
December 31,
2004 | | Year
Ended
December 31,
2005 | | Year
Ended
December 31,
2004 | |
FROM OPERATIONS: | | | | | | | | | |
Net investment income | | $ | 892,887 | | $ | 2,024,912 | | $ | 846,520 | | $ | 554,508 | |
Net realized gain on investments, foreign currency related transactions, futures, options and swaps | | 21,394,227 | | 30,511,144 | | 7,799,945 | | 17,732,737 | |
Net change in unrealized appreciation or depreciation on investments, foreign currency related transactions, futures, options and swaps | | (20,168,080 | ) | (4,586,292 | ) | (5,196,957 | ) | (2,872,304 | ) |
Net increase in net assets resulting from operations | | 2,119,034 | | 27,949,764 | | 3,449,508 | | 15,414,941 | |
FROM DISTRIBUTIONS TO SHAREHOLDERS: | | | | | | | | | |
Net investment income: | | | | | | | | | |
Class ADV | | (946 | ) | (939 | ) | (7,580 | ) | (28,287 | ) |
Class I | | (1,677,923 | ) | (1,043,438 | ) | (28,329 | ) | (34,098 | ) |
Class S | | (1,735 | ) | (1,317 | ) | (520,776 | ) | (1,427,497 | ) |
Total distributions | | (1,680,604 | ) | (1,045,694 | ) | (556,685 | ) | (1,489,882 | ) |
FROM CAPITAL SHARE TRANSACTIONS: | | | | | | | | | |
Net proceeds from sale of shares | | 5,877,627 | | 5,104,811 | | 13,204,322 | | 31,380,980 | |
Dividends reinvested | | 1,680,603 | | 1,045,694 | | 556,685 | | 1,489,882 | |
| | 7,558,230 | | 6,150,505 | | 13,761,007 | | 32,870,862 | |
Cost of shares redeemed | | (50,839,039 | ) | (45,826,717 | ) | (56,688,446 | ) | (23,107,632 | ) |
Net increase (decrease) in net assets resulting from capital share transactions | | (43,280,809 | ) | (39,676,212 | ) | (42,927,439 | ) | 9,763,230 | |
Net increase (decrease) in net assets | | (42,842,379 | ) | (12,772,142 | ) | (40,034,616 | ) | 23,688,289 | |
NET ASSETS: | | | | | | | | | |
Beginning of year | | 235,318,952 | | 248,091,094 | | 167,971,630 | | 144,283,341 | |
End of year | | $ | 192,476,573 | | $ | 235,318,952 | | $ | 127,937,014 | | $ | 167,971,630 | |
Undistributed net investment income at end of year | | $ | 880,670 | | $ | 1,678,490 | | $ | 844,339 | | $ | 554,504 | |
| | | | | | | | | | | | | | | | | |
See Accompanying Notes to Financial Statements
74
STATEMENTS OF CHANGES IN NET ASSETS
| | ING Oppenheimer
Global Portfolio | | ING Oppenheimer
Strategic Income Portfolio | |
| | Year
Ended
December 31,
2005 | | Year
Ended
December 31,
2004 | | Year
Ended
December 31,
2005 | | Year
Ended
December 31,
2004 | |
FROM OPERATIONS: | | | | | | | | | |
Net investment income | | $ | 18,731,629 | | $ | 750,696 | | $ | 10,527,028 | | $ | 290,483 | |
Net realized gain (loss) on investments, foreign currency related transactions, futures, options and swaps | | 38,078,729 | | 1,515,571 | | (4,426,128 | ) | (244,797 | ) |
Net change in unrealized appreciation or depreciation on investments, foreign currency related transactions, futures, options and swaps | | 301,396,130 | | 19,246,415 | | (432,116 | ) | 658,438 | |
Net increase in net assets resulting from operations | | 358,206,488 | | 21,512,682 | | 5,668,784 | | 704,124 | |
FROM DISTRIBUTIONS TO SHAREHOLDERS: | | | | | | | | | |
Net investment income: | | | | | | | | | |
Class ADV | | (274,831 | ) | (9,068 | ) | (97,781 | ) | (5,702 | ) |
Class I | | (18,570,448 | ) | (366,693 | ) | (6,830,671 | ) | (194,710 | ) |
Class S | | (262,232 | ) | (3,190 | ) | (1,224,476 | ) | (103,399 | ) |
Net realized gains: | | | | | | | | | |
Class ADV | | (1,887,663 | ) | (127,791 | ) | — | | — | |
Class I | | (38,556,836 | ) | (778,632 | ) | — | | — | |
Class S | | (623,934 | ) | (166,005 | ) | — | | — | |
Total distributions | | (60,175,944 | ) | (1,451,379 | ) | (8,152,928 | ) | (303,811 | ) |
FROM CAPITAL SHARE TRANSACTIONS: | | | | | | | | | |
Net proceeds from sale of shares | | 1,313,067,141 | | 971,601,118 | | 257,525,626 | | 182,185,564 | |
Dividends reinvested | | 60,175,944 | | 1,451,379 | | 8,152,928 | | 294,361 | |
| | 1,373,243,085 | | 973,052,497 | | 265,678,554 | | 182,479,925 | |
Cost of shares redeemed | | (251,779,828 | ) | (18,638,346 | ) | (62,468,193 | ) | (15,106,078 | ) |
Net increase in net assets resulting from capital share transactions | | 1,121,463,257 | | 954,414,151 | | 203,210,361 | | 167,373,847 | |
Net increase in net assets | | 1,419,493,801 | | 974,475,454 | | 200,726,217 | | 167,774,160 | |
NET ASSETS: | | | | | | | | | |
Beginning of year | | 990,048,897 | | 15,573,443 | | 167,774,160 | | — | |
End of year | | $ | 2,409,542,698 | | $ | 990,048,897 | | $ | 368,500,377 | | $ | 167,774,160 | |
Undistributed net investment income (accumulated net investment loss or distributions in excess) at end of year | | $ | 1,566,525 | | $ | (99,311 | ) | $ | (301,523 | ) | $ | 52,423 | |
| | | | | | | | | | | | | | | | | |
See Accompanying Notes to Financial Statements
75
STATEMENTS OF CHANGES IN NET ASSETS
| | ING PIMCO
Total Return Portfolio | | ING Salomon Brothers
Aggressive Growth Portfolio | |
| | Year
Ended
December 31,
2005 | | Year
Ended
December 31,
2004 | | Year
Ended
December 31,
2005 | | Year
Ended
December 31,
2004 | |
FROM OPERATIONS: | | | | | | | | | |
Net investment income (loss) | | $ | 6,658,839 | | $ | 1,877,340 | | $ | (4,071,807 | ) | $ | 310,362 | |
Net realized gain (loss) on investments, foreign currency related transactions, futures, options and swaps | | (1,344,837 | ) | 5,075,591 | | 40,718,226 | | 11,495,281 | |
Net change in unrealized appreciation or depreciation on investments, foreign currency related transactions, futures, options and swaps | | (594,196 | ) | (711,203 | ) | 52,471,455 | | 66,881,864 | |
Net increase in net assets resulting from operations | | 4,719,806 | | 6,241,728 | | 89,117,874 | | 78,687,507 | |
FROM DISTRIBUTIONS TO SHAREHOLDERS: | | | | | | | | | |
Net investment income: | | | | | | | | | |
Class ADV | | (278,056 | ) | — | | — | | — | |
Class I | | (2,420,204 | ) | — | | — | | — | |
Class S | | (1,260,749 | ) | — | | — | | — | |
Net realized gains: | | | | | | | | | |
Class ADV | | (236,721 | ) | (138,031 | ) | — | | — | |
Class I | | (1,621,001 | ) | (669,551 | ) | — | | — | |
Class S | | (946,778 | ) | (597,319 | ) | — | | — | |
Total distributions | | (6,763,509 | ) | (1,404,901 | ) | — | | — | |
FROM CAPITAL SHARE TRANSACTIONS: | | | | | | | | | |
Net proceeds from sale of shares | | 156,194,806 | | 118,610,539 | | 321,714,457 | | 353,252,299 | |
Dividends reinvested | | 6,763,510 | | 1,404,901 | | — | | — | |
| | 162,958,316 | | 120,015,440 | | 321,714,457 | | 353,252,299 | |
Cost of shares redeemed | | (59,280,406 | ) | (47,628,925 | ) | (369,126,556 | ) | (122,559,959 | ) |
Net increase (decrease) in net assets resulting from capital share transactions | | 103,677,910 | | 72,386,515 | | (47,412,099 | ) | 230,692,340 | |
Net increase in net assets | | 101,634,207 | | 77,223,342 | | 41,705,775 | | 309,379,847 | |
NET ASSETS: | | | | | | | | | |
Beginning of year | | 181,772,893 | | 104,549,551 | | 934,955,645 | | 625,575,798 | |
End of year | | $ | 283,407,100 | | $ | 181,772,893 | | $ | 976,661,420 | | $ | 934,955,645 | |
Undistributed net investment income at end of year | | $ | 6,533,108 | | $ | 3,791,391 | | $ | — | | $ | — | |
| | | | | | | | | | | | | | | | | |
See Accompanying Notes to Financial Statements
76
STATEMENTS OF CHANGES IN NET ASSETS
| | ING Salomon Brothers
Large Cap Growth Portfolio | | ING T. Rowe Price
Diversified Mid Cap Portfolio | |
| | Year
Ended
December 31,
2005 | | Year
Ended
December 31,
2004 | | Year
Ended
December 31,
2005 | | Year
Ended
December 31,
2004 | |
FROM OPERATIONS: | | | | | | | | | |
Net investment loss | | $ | (174,227 | ) | $ | (226,938 | ) | $ | (747,595 | ) | $ | (1,287,517 | ) |
Net realized gain on investments, foreign currency related transactions, futures, options and swaps | | 740,873 | | 6,250,008 | | 21,391,388 | | 26,980,149 | |
Net change in unrealized appreciation or depreciation on investments, foreign currency related transactions, futures, options and swaps | | 2,548,360 | | (3,299,831 | ) | 124,275,272 | | (4,016,793 | ) |
Net increase in net assets resulting from operations | | 3,115,006 | | 2,723,239 | | 144,919,065 | | 21,675,839 | |
FROM DISTRIBUTIONS TO SHAREHOLDERS: | | | | | | | | | |
Net realized gains: | | | | | | | | | |
Class ADV | | (2,850,971 | ) | (1,902,819 | ) | (1,195,725 | ) | — | |
Class I | | (2,054,680 | ) | (56 | ) | (18,009,139 | ) | — | |
Class S | | (1,369,162 | ) | (56 | ) | (369,650 | ) | — | |
Total distributions | | (6,274,813 | ) | (1,902,931 | ) | (19,574,514 | ) | — | |
FROM CAPITAL SHARE TRANSACTIONS: | | | | | | | | | |
Net proceeds from sale of shares | | 11,904,700 | | 40,323,776 | | 705,259,094 | | 480,424,948 | |
Dividends reinvested | | 6,274,813 | | 1,902,931 | | 19,574,514 | | — | |
| | 18,179,513 | | 42,226,707 | | 724,833,608 | | 480,424,948 | |
Cost of shares redeemed | | (25,006,303 | ) | (17,871,217 | ) | (211,755,331 | ) | (90,452,549 | ) |
Net increase (decrease) in net assets resulting from capital share transactions | | (6,826,790 | ) | 24,355,490 | | 513,078,277 | | 389,972,399 | |
Net increase (decrease) in net assets | | (9,986,597 | ) | 25,175,798 | | 638,422,828 | | 411,648,238 | |
NET ASSETS: | | | | | | | | | |
Beginning of year | | 68,112,760 | | 42,936,962 | | 584,365,131 | | 172,716,893 | |
End of year | | $ | 58,126,163 | | $ | 68,112,760 | | $ | 1,222,787,959 | | $ | 584,365,131 | |
Undistributed net investment income at end of year | | $ | — | | $ | — | | $ | — | | $ | — | |
| | | | | | | | | | | | | | | | | | | |
See Accompanying Notes to Financial Statements
77
STATEMENTS OF CHANGES IN NET ASSETS
| | ING T. Rowe Price
Growth Equity Portfolio | | ING UBS U.S. Large Cap
Equity Portfolio | |
| | Year
Ended
December 31,
2005 | | Year
Ended
December 31,
2004 | | Year
Ended
December 31,
2005 | | Year
Ended
December 31,
2004 | |
FROM OPERATIONS: | | | | | | | | | |
Net investment income | | $ | 3,158,210 | | $ | 5,330,870 | | $ | 2,427,937 | | $ | 3,166,091 | |
Net realized gain on investments, foreign currency related transactions, futures, options and swaps | | 54,315,097 | | 41,153,242 | | 16,383,118 | | 29,862,666 | |
Net change in unrealized appreciation or depreciation on investments, foreign currency related transactions, futures, options and swaps | | 8,240,956 | | 34,583,274 | | 5,356,121 | | 3,164,759 | |
Net increase in net assets resulting from operations | | 65,714,263 | | 81,067,386 | | 24,167,176 | | 36,193,516 | |
FROM DISTRIBUTIONS TO SHAREHOLDERS: | | | | | | | | | |
Net investment income: | | | | | | | | | |
Class ADV | | (86,062 | ) | — | | (913 | ) | (173 | ) |
Class I | | (4,157,878 | ) | (1,272,937 | ) | (2,317,124 | ) | (2,047,360 | ) |
Class S | | (459,082 | ) | (4,880 | ) | (36,503 | ) | (11,802 | ) |
Total distributions | | (4,703,022 | ) | (1,277,817 | ) | (2,354,540 | ) | (2,059,335 | ) |
FROM CAPITAL SHARE TRANSACTIONS: | | | | | | | | | |
Net proceeds from sale of shares | | 261,255,686 | | 198,580,862 | | 36,702,100 | | 10,253,458 | |
Dividends reinvested | | 4,703,022 | | 1,277,817 | | 2,354,540 | | 2,059,335 | |
| | 265,958,708 | | 199,858,679 | | 39,056,640 | | 12,312,793 | |
Cost of shares redeemed | | (106,445,922 | ) | (90,490,737 | ) | (49,737,719 | ) | (42,939,834 | ) |
Net increase (decrease) in net assets resulting from capital share transactions | | 159,512,786 | | 109,367,942 | | (10,681,079 | ) | (30,627,041 | ) |
Net increase in net assets | | 220,524,027 | | 189,157,511 | | 11,131,557 | | 3,507,140 | |
NET ASSETS: | | | | | | | | | |
Beginning of year | | 927,545,971 | | 738,388,460 | | 269,652,787 | | 266,145,647 | |
End of year | | $ | 1,148,069,998 | | $ | 927,545,971 | | $ | 280,784,344 | | $ | 269,652,787 | |
Undistributed net investment income at end of year | | $ | 2,799,826 | | $ | 4,708,299 | | $ | 2,425,943 | | $ | 2,352,546 | |
| | | | | | | | | | | | | | | | | |
See Accompanying Notes to Financial Statements
78
STATEMENTS OF CHANGES IN NET ASSETS
| | ING Van Kampen
Comstock Portfolio | | ING Van Kampen
Equity & Income Portfolio | |
| | Year
Ended
December 31,
2005 | | Year
Ended
December 31,
2004 | | Year
Ended
December 31,
2005 | | Year
Ended
December 31,
2004 | |
FROM OPERATIONS: | | | | | | | | | |
Net investment income | | $ | 7,267,851 | | $ | 3,047,871 | | $ | 18,761,491 | | $ | 972,892 | |
Net realized gain on investments, foreign currency related transactions, futures, options and swaps | | 41,320,450 | | 21,126,731 | | 28,387,584 | | 1,907,315 | |
Net change in unrealized appreciation or depreciation on investments, foreign currency related transactions, futures, options and swaps | | (22,798,099 | ) | 21,244,254 | | 39,278,253 | | 11,488,066 | |
Net increase in net assets resulting from operations | | 25,790,202 | | 45,418,856 | | 86,427,328 | | 14,368,273 | |
FROM DISTRIBUTIONS TO SHAREHOLDERS: | | | | | | | | | |
Net investment income: | | | | | | | | | |
Class ADV | | (58,758 | ) | — | | (2,613 | ) | (258 | ) |
Class I | | (597,068 | ) | — | | (934,945 | ) | (22,124 | ) |
Class S | | (2,370,408 | ) | — | | — | | (61,002 | ) |
Net realized gains: | | | | | | | | | |
Class ADV | | (638,099 | ) | (49,401 | ) | (11,548 | ) | — | |
Class I | | (3,495,178 | ) | (258,350 | ) | (937,820 | ) | — | |
Class S | | (16,744,159 | ) | (969,765 | ) | (29,541 | ) | — | |
Total distributions | | (23,903,670 | ) | (1,277,516 | ) | (1,916,467 | ) | (83,384 | ) |
FROM CAPITAL SHARE TRANSACTIONS: | | | | | | | | | |
Net proceeds from sale of shares | | 315,024,796 | | 192,149,706 | | 572,188,500 | | 579,104,218 | |
Dividends reinvested | | 23,903,670 | | 1,277,516 | | 1,916,468 | | 83,384 | |
| | 338,928,466 | | 193,427,222 | | 574,104,968 | | 579,187,602 | |
Cost of shares redeemed | | (44,956,448 | ) | (18,083,859 | ) | (331,095,654 | ) | (19,644,769 | ) |
Net increase in net assets resulting from capital share transactions | | 293,972,018 | | 175,343,363 | | 243,009,314 | | 559,542,833 | |
Net increase in net assets | | 295,858,550 | | 219,484,703 | | 327,520,175 | | 573,827,722 | |
NET ASSETS: | | | | | | | | | |
Beginning of year | | 400,674,645 | | 181,189,942 | | 594,576,868 | | 20,749,146 | |
End of year | | $ | 696,533,195 | | $ | 400,674,645 | | $ | 922,097,043 | | $ | 594,576,868 | |
Undistributed net investment income at end of year | | $ | 7,265,945 | | $ | 3,024,328 | | $ | 18,809,095 | | $ | 937,536 | |
| | | | | | | | | | | | | | | | | |
See Accompanying Notes to Financial Statements
79
ING AMERICAN CENTURY LARGE COMPANY VALUE PORTFOLIO | FINANCIAL HIGHLIGHTS |
Selected data for a share outstanding for each period.
| | Class I | |
| | Year Ended December 31, | | December 10,
2001(1) to
December 31, | |
| | 2005 | | 2004 | | 2003 | | 2002 | | 2001 | |
Per Share Operating Performance: | | | | | | | | | | | |
Net asset value, beginning of period | $ | 14.22 | | | 13.03 | | | 9.97 | | | 12.90 | | | 12.92 | | |
Income (loss) from investment operations: | | | | | | | | | | | | | | | | |
Net investment income | $ | 0.21 | | | 0.17 | | | 0.06 | | | 0.03 | | | 0.01 | | |
Net realized and unrealized gain (loss) on investments | $ | 0.00 | | | 1.15 | | | 3.09 | | | (2.94 | ) | | (0.03 | ) | |
Total from investment operations | $ | 0.21 | | | 1.32 | | | 3.15 | | | (2.91 | ) | | (0.02 | ) | |
Less distributions: | | | | | | | | | | | | | | | | |
Net investment income | $ | (0.19 | ) | | (0.13 | ) | | (0.09 | ) | | (0.01 | ) | | — | | |
Net realized gain on investments | $ | — | | | — | | | — | | | (0.01 | ) | | — | | |
Total distributions | $ | (0.19 | ) | | (0.13 | ) | | (0.09 | ) | | (0.02 | ) | | — | | |
Net asset value, end of period | $ | 14.24 | | | 14.22 | | | 13.03 | | | 9.97 | | | 12.90 | | |
Total Return(2) | % | 1.51 | | | 10.24 | | | 31.74 | | | (22.59 | ) | | (0.15 | ) | |
| | | | | | | | | | | | | | | | |
Ratios and Supplemental Data: | | | | | | | | | | | | | | | | |
Net assets, end of period (000’s) | | 39,624 | | | 2,956 | | | 1,077 | | | 35 | | | 10 | | |
Ratios to average net assets: | | | | | | | | | | | | | | | | |
Expenses(3) | % | 1.00 | | | 1.00 | | | 1.00 | | | 1.00 | | | 1.00 | | |
Net investment income(3) | % | 1.50 | | | 1.39 | | | 1.20 | | | 0.98 | | | 0.83 | | |
Portfolio turnover rate | % | 105 | | | 38 | | | 38 | | | 47 | | | 1 | | |
| | | | | | | | | | | | | | | | |
| | Class S | |
| | Year Ended December 31, | | December 10,
2001(1) to
December 31, | |
| | 2005 | | 2004 | | 2003 | | 2002 | | 2001 | |
Per Share Operating Performance: | | | | | | | | | | | | |
Net asset value, beginning of period | $ | 14.17 | | | 12.98 | | | 9.94 | | | 12.89 | | | 12.92 | | |
Income (loss) from investment operations: | | | | | | | | | | | | | | | | |
Net investment income | $ | 0.15 | | | 0.15 | | | 0.11 | | | 0.07 | | | 0.00 | * | |
Net realized and change in unrealized gain (loss) on investments | $ | 0.02 | | | 1.14 | | | 3.00 | | | (3.01 | ) | | (0.03 | ) | |
Total from investment operations | $ | 0.17 | | | 1.29 | | | 3.11 | | | (2.94 | ) | | (0.03 | ) | |
Less distributions: | | | | | | | | | | | | | | | | |
Net investment income | $ | (0.14 | ) | | (0.10 | ) | | (0.07 | ) | | (0.00 | )* | | — | | |
Net realized gain on investments | $ | — | | | — | | | — | | | (0.01 | ) | | — | | |
Total distributions | $ | (0.14 | ) | | (0.10 | ) | | (0.07 | ) | | (0.01 | ) | | — | | |
Net asset value, end of period | $ | 14.20 | | | 14.17 | | | 12.98 | | | 9.94 | | | 12.89 | | |
Total Return(2) | % | 1.26 | | | 10.05 | | | 31.34 | | | (22.84 | ) | | (0.23 | ) | |
| | | | | | | | | | | | | | | | |
Ratios and Supplemental Data: | | | | | | | | | | | | | | | | |
Net assets, end of period (000’s) | $ | 43,127 | | | 66,267 | | | 63,547 | | | 46,345 | | | 50,415 | | |
Ratios to average net assets: | | | | | | | | | | | | | | | | |
Expenses(3) | % | 1.25 | | | 1.25 | | | 1.25 | | | 1.25 | | | 1.25 | | |
Net investment income(3) | % | 1.06 | | | 1.05 | | | 1.00 | | | 0.70 | | | 0.58 | | |
Portfolio turnover rate | % | 105 | | | 38 | | | 38 | | | 47 | | | 1 | | |
(1) Commencement of operations.
(2) Total return is calculated assuming reinvestment of all dividends and capital gain distributions at net asset value and does not reflect the effect of insurance contract changes. Total return for periods less than one year is not annualized.
(3) Annualized for periods less than one year.
* Amount is less than $0.005 or $(0.005).
See Notes to Financial Statements.
80
ING AMERICAN CENTURY LARGE COMPANY VALUE PORTFOLIO (CONTINUED) | FINANCIAL HIGHLIGHTS |
Selected data for a share outstanding for each period.
| | Class ADV | |
| | Year Ended December 31, | | December 10,
2001(1) to
December 31, | |
| | 2005 | | 2004 | | 2003 | | 2002 | | 2001 | |
Per Share Operating Performance: | | | | | | | | | | | | | |
Net asset value, beginning of period | $ | 14.05 | | | 12.89 | | | 9.90 | | | 12.89 | | | 12.92 | | |
Income (loss) from investment operations: | | | | | | | | | | | | | | | | |
Net investment income | $ | 0.12 | † | | 0.10 | | | 0.08 | | | 0.03 | | | 0.00 | * | |
Net realized and unrealized gain (loss) on investments | $ | 0.03 | | | 1.14 | | | 2.99 | | | (3.00 | ) | | (0.03 | ) | |
Total from investment operations | $ | 0.15 | | | 1.24 | | | 3.07 | | | (2.97 | ) | | (0.03 | ) | |
Less distributions: | | | | | | | | | | | | | | | | |
Net investment income | $ | (0.12 | ) | | (0.08 | ) | | (0.08 | ) | | (0.01 | ) | | — | | |
Net realized gain on investments | $ | — | | | — | | | — | | | (0.01 | ) | | — | | |
Total distributions | $ | (0.12 | ) | | (0.08 | ) | | (0.08 | ) | | (0.02 | ) | | — | | |
Net asset value, end of period | $ | 14.08 | | | 14.05 | | | 12.89 | | | 9.90 | | | 12.89 | | |
Total Return(2) | % | 1.09 | | | 9.70 | | | 31.13 | | | (23.08 | ) | | (0.23 | ) | |
| | | | | | | | | | | | | | | | |
Ratios and Supplemental Data: | | | | | | | | | | | | | | | | |
Net assets, end of period (000’s) | $ | 11,806 | | | 8,684 | | | 7,313 | | | 5,197 | | | 10 | | |
Ratios to average net assets: | | | | | | | | | | | | | | | | |
Expenses(3) | % | 1.50 | | | 1.50 | | | 1.50 | | | 1.50 | | | 1.50 | | |
Net investment income(3) | % | 0.87 | | | 0.81 | | | 0.75 | | | 0.99 | | | 0.41 | | |
Portfolio turnover rate | % | 105 | | | 38 | | | 38 | | | 47 | | | 1 | | |
(1) Commencement of operations.
(2) Total return is calculated assuming reinvestment of all dividends and capital gain distributions at net asset value and does not reflect the effect of insurance contract changes. Total return for periods less than one year is not annualized.
(3) Annualized for periods less than one year.
* Amount is less than $0.005.
† Per share numbers have been calculated using the average number of shares outstanding throughout the period.
See Notes to Financial Statements.
81
ING AMERICAN CENTURY SELECT PORTFOLIO | FINANCIAL HIGHLIGHTS |
Selected data for a share outstanding for each period.
| | Class I | |
| | Year Ended December 31, | | December 10,
2001(1) to
December 31, | |
| | 2005 | | 2004 | | 2003 | | 2002 | | 2001 | |
Per Share Operating Performance: | | | | | | | | | | | |
Net asset value, beginning of period | $ | 9.35 | | | 8.90 | | | 6.62 | | | 9.85 | | | 9.92 | | |
Income (loss) from investment operations: | | | | | | | | | | | | | | | | |
Net investment income (loss) | $ | 0.03 | | | 0.00 | * | | (0.01 | ) | | (0.00 | )* | | 0.00 | * | |
Net realized and unrealized gain (loss) on investments | $ | 0.06 | | | 0.45 | | | 2.29 | | | (3.23 | ) | | (0.07 | ) | |
Total from investment operations | $ | 0.09 | | | 0.45 | | | 2.28 | | | (3.23 | ) | | (0.07 | ) | |
Net asset value, end of period | $ | 9.44 | | | 9.35 | | | 8.90 | | | 6.62 | | | 9.85 | | |
Total Return(2) | % | 0.96 | † | | 5.06 | | | 34.44 | | | (32.79 | ) | | (0.71 | ) | |
| | | | | | | | | | | | | | | | |
Ratios and Supplemental Data: | | | | | | | | | | | | | | | | |
Net assets, end of period (000’s) | $ | 404,822 | | | 202,265 | | | 721 | | | 82 | | | 10 | | |
Ratios to average net assets: | | | | | | | | | | | | | | | | |
Expenses(3) | % | 0.66 | | | 0.90 | | | 1.00 | | | 1.00 | | | 1.00 | | |
Net investment income(3) | % | 0.41 | | | 0.38 | | | (0.21 | ) | | (0.09 | ) | | 0.50 | | |
Portfolio turnover rate | % | 133 | | | 506 | | | 169 | | | 245 | | | 6 | | |
| | | | | | | | | | | | | | |
| | Class S | |
| | Year Ended December 31, | | December 10,
2001(1) to
December 31, | |
| | 2005 | | 2004 | | 2003 | | 2002 | | 2001 | |
Per Share Operating Performance: | | | | | | | | | | | | |
Net asset value, beginning of period | $ | 9.27 | | | 8.85 | | | 6.60 | | | 9.85 | | | 9.92 | | |
Income (loss) from investment operations: | | | | | | | | | | | | | | | | |
Net investment income (loss) | $ | 0.02 | | | (0.00 | )* | | (0.02 | ) | | (0.01 | ) | | 0.00 | * | |
Net realized and unrealized gain (loss) on investments | $ | 0.04 | | | 0.42 | | | 2.27 | | | (3.24 | ) | | (0.07 | ) | |
Total from investment operations | $ | 0.06 | | | 0.42 | | | 2.25 | | | (3.25 | ) | | (0.07 | ) | |
Net asset value, end of period | $ | 9.33 | | | 9.27 | | | 8.85 | | | 6.60 | | | 9.85 | | |
Total Return(2) | % | 0.65 | † | | 4.75 | | | 34.29 | | | (33.10 | ) | | (0.71 | ) | |
| | | | | | | | | | | | | | | | |
Ratios and Supplemental Data: | | | | | | | | | | | | | | | | |
Net assets, end of period (000’s) | $ | 8,168 | | | 13,482 | | | 2,874 | | | 321 | | | 10 | | |
Ratios to average net assets: | | | | | | | | | | | | | | | | |
Expenses(3) | % | 0.91 | | | 1.15 | | | 1.25 | | | 1.25 | | | 1.25 | | |
Net investment income(3) | % | 0.11 | | | (0.10 | ) | | (0.45 | ) | | (0.31 | ) | | 0.17 | | |
Portfolio turnover rate | % | 133 | | | 506 | | | 169 | | | 245 | | | 6 | | |
(1) Commencement of operations.
(2) Total return is calculated assuming reinvestment of all dividends and capital gain distributions at net asset value and does not reflect the effect of insurance contract changes. Total return for periods less than one year is not annualized.
(3) Annualized for periods less than one year.
* Amount is less than $0.005 or $(0.005).
See Notes to Financial Statements.
82
ING AMERICAN CENTURY SELECT PORTFOLIO (CONTINUED) | | FINANCIAL HIGHLIGHTS |
Selected data for a share outstanding for each period.
| | Class ADV | |
| | Year Ended December 31, | | December 10,
2001(1) to
December 31, | |
| | 2005 | | 2004 | | 2003 | | 2002 | | 2001 | |
Per Share Operating Performance: | | | | | | | | | | | |
Net asset value, beginning of period | $ | 9.20 | | | 8.81 | | | 6.58 | | | 9.85 | | | 9.92 | | |
Income (loss) from investment operations: | | | | | | | | | | | | | | | | |
Net investment loss | $ | (0.01 | ) | | (0.08 | ) | | (0.05 | ) | | (0.05 | ) | | (0.00 | )* | |
Net realized and unrealized gain (loss) on investments | $ | 0.05 | | | 0.47 | | | 2.28 | | | (3.22 | ) | | (0.07 | ) | |
Total from investment operations | $ | 0.04 | | | 0.39 | | | 2.23 | | | (3.27 | ) | | (0.07 | ) | |
Net asset value, end of period | $ | 9.24 | | | 9.20 | | | 8.81 | | | 6.58 | | | 9.85 | | |
Total Return(2) | % | 0.43 | † | | 4.43 | | | 33.89 | | | (33.20 | ) | | (0.71 | ) | |
| | | | | | | | | | | | | | | | |
Ratios and Supplemental Data: | | | | | | | | | | | | | | | | |
Net assets, end of period (000’s) | $ | 21,390 | | | 30,324 | | | 53,998 | | | 45,533 | | | 38,319 | | |
Ratios to average net assets: | | | | | | | | | | | | | | | | |
Expenses(3) | % | 1.16 | | | 1.40 | | | 1.50 | | | 1.50 | | | 1.48 | | |
Net investment income(3) | % | (0.13 | ) | | (0.60 | ) | | (0.70 | ) | | (0.65 | ) | | (0.06 | ) | |
Portfolio turnover rate | % | 133 | | | 506 | | | 169 | | | 245 | | | 6 | | |
(1) Commencement of operations.
(2) Total return is calculated assuming reinvestment of all dividends and capital gain distributions at net asset value and does not reflect the effect of insurance contract changes. Total return for periods less than one year is not annualized.
(3) Annualized for periods less than one year.
* Amount is more than $(0.005).
† In 2005, the Sub-Adviser fully reimbursed the Portfolio for a loss on a transaction not meeting the Portfolio’s investment guidelines, which did not impact total return.
See Notes to Financial Statements.
83
ING AMERICAN CENTURY SMALL CAP VALUE PORTFOLIO | FINANCIAL HIGHLIGHTS |
Selected data for a share outstanding for each period.
| | Class I | |
| | Year Ended December 31, | | May 1,
2002(1) to
December 31, | |
| | 2005 | | 2004 | | 2003 | | 2002 | |
Per Share Operating Performance: | | | | | | | | | | | | |
Net asset value, beginning of period | $ | 12.24 | | | 10.77 | | | 8.16 | | | 10.00 | | |
Income (loss) from investment operations: | | | | | | | | | | | | | |
Net investment income | $ | 0.06 | | | 0.03 | | | 0.02 | | | 0.01 | | |
Net realized and unrealized gain (loss) on investments | $ | 0.94 | | | 2.28 | | | 2.89 | | | (1.84 | ) | |
Total from investment operations | $ | 1.00 | | | 2.31 | | | 2.91 | | | (1.83 | ) | |
Less distributions: | | | | | | | | | | | | | |
Net investment income | $ | (0.05 | ) | | (0.02 | ) | | (0.03 | ) | | (0.01 | ) | |
Net realized gain on investments | $ | (1.42 | ) | | (0.82 | ) | | (0.27 | ) | | — | | |
Total distributions | $ | (1.47 | ) | | (0.84 | ) | | (0.30 | ) | | (0.01 | ) | |
Net asset value, end of period | $ | 11.77 | | | 12.24 | | | 10.77 | | | 8.16 | | |
Total Return(2) | % | 8.17 | | | 21.61 | | | 35.84 | | | (18.36 | ) | |
| | | | | | | | | | | | | |
Ratios and Supplemental Data: | | | | | | | | | | | | | |
Net assets, end of period (000’s) | $ | 46,237 | | | 28,433 | | | 8,007 | | | 669 | | |
Ratios to average net assets: | | | | | | | | | | | | | |
Net expenses after expense reimbursement(3) | % | 1.30 | | | 1.30 | | | 1.32 | | | 1.40 | | |
Gross expenses prior to expense reimbursement(3) | % | 1.30 | | | 1.30 | | | 1.40 | | | 1.40 | | |
Net investment income(3) | % | 0.61 | | | 0.35 | | | 0.53 | | | 0.48 | | |
Portfolio turnover rate | % | 101 | | | 107 | | | 137 | | | 70 | | |
| | | | | | | | | | | | |
| | Class S | |
| | Year Ended December 31, | | May 1,
2002(1) to
December 31, | |
| | 2005 | | 2004 | | 2003 | | 2002 | |
Per Share Operating Performance: | | | | | | | | | | | | |
Net asset value, beginning of period | $ | 12.22 | | | 10.76 | | | 8.15 | | | 10.00 | | |
Income (loss) from investment operations: | | | | | | | | | | | | | |
Net investment income | $ | 0.04 | | | 0.00 | * | | 0.02 | | | 0.00 | * | |
Net realized and unrealized gain (loss) on investments | $ | 0.92 | | | 2.28 | | | 2.87 | | | (1.85 | ) | |
Total from investment operations | $ | 0.96 | | | 2.28 | | | 2.89 | | | (1.85 | ) | |
Less distributions: | | | | | | | | | | | | | |
Net investment income | $ | (0.02 | ) | | (0.00 | )* | | (0.01 | ) | | (0.00 | )* | |
Net realized gain on investments | $ | (1.42 | ) | | (0.82 | ) | | (0.27 | ) | | — | | |
Total distributions | $ | (1.44 | ) | | (0.82 | ) | | (0.28 | ) | | (0.00 | ) | |
Net asset value, end of period | $ | 11.74 | | | 12.22 | | | 10.76 | | | 8.15 | | |
Total Return(2) | % | 7.85 | | | 21.34 | | | 35.49 | | | (18.48 | ) | |
| | | | | | | | | | | | | |
Ratios and Supplemental Data: | | | | | | | | | | | | | |
Net assets, end of period (000’s) | $ | 43,053 | | | 37,816 | | | 12,363 | | | 6,324 | | |
Ratios to average net assets: | | | | | | | | | | | | | |
Net expenses after expense reimbursement(3) | % | 1.55 | | | 1.55 | | | 1.57 | | | 1.65 | | |
Gross expenses prior to expense reimbursement(3) | % | 1.55 | | | 1.55 | | | 1.65 | | | 1.65 | | |
Net investment income(3) | % | 0.35 | | | 0.09 | | | 0.23 | | | 0.09 | | |
Portfolio turnover rate | % | 101 | | | 107 | | | 137 | | | 70 | | |
(1) Commencement of operations.
(2) Total return is calculated assuming reinvestment of all dividends and capital gain distributions at net asset value and does not reflect the effect of insurance contract changes. Total return for periods less than one year is not annualized.
(3) Annualized for periods less than one year.
* Amount is less than $0.005 or $(0.005).
See Notes to Financial Statements.
84
ING AMERICAN CENTURY SMALL CAP VALUE PORTFOLIO (CONTINUED) | FINANCIAL HIGHLIGHTS |
Selected data for a share outstanding for each period.
| | | Class ADV | |
| | | Year Ended December 31, | | May 1,
2002(1) to
December 31, | |
| | | 2005 | | 2004 | | 2003 | | 2002 | |
| | | | | | | | | | |
Per Share Operating Performance: | | | | | | | | | | |
Net asset value, beginning of period | | $ | 12.13 | | | 10.71 | | | 8.13 | | | 10.00 | | |
Income (loss) from investment operations: | | | | | | | | | | | | | | |
Net investment income (loss) | | $ | 0.01 | | | (0.02 | ) | | 0.01 | | | 0.00 | * | |
Net realized and unrealized gain (loss) on investments | | $ | 0.92 | | | 2.26 | | | 2.84 | | | (1.86 | ) | |
Total from investment operations | | $ | 0.93 | | | 2.24 | | | 2.85 | | | (1.86 | ) | |
Less distributions: | | | | | | | | | | | | | | |
Net investment income | | $ | (0.01 | ) | | — | | | (0.00 | )* | | (0.01 | ) | |
Net realized gain on investments | | $ | (1.42 | ) | | (0.82 | ) | | (0.27 | ) | | — | | |
Total distributions | | $ | (1.43 | ) | | (0.82 | ) | | (0.27 | ) | | (0.01 | ) | |
Net asset value, end of period | | $ | 11.63 | | | 12.13 | | | 10.71 | | | 8.13 | | |
Total Return(2) | | % | 7.65 | | | 21.03 | | | 35.08 | | | (18.62 | ) | |
| | | | | | | | | | | | | | |
Ratios and Supplemental Data: | | | | | | | | | | | | | | |
Net assets, end of period (000’s) | | $ | 11,023 | | | 5,266 | | | 2,843 | | | 815 | | |
Ratios to average net assets: | | | | | | | | | | | | | | |
Net expenses after expense reimbursement(3) | | % | 1.80 | | | 1.80 | | | 1.82 | | | 1.90 | | |
Gross expenses prior to expense reimbursement(3) | | % | 1.80 | | | 1.80 | | | 1.90 | | | 1.90 | | |
Net investment income(3) | | % | 0.10 | | | (0.14 | ) | | 0.00 | * | | 0.06 | | |
Portfolio turnover rate | | % | 101 | | | 107 | | | 137 | | | 70 | | |
(1) Commencement of operations.
(2) Total return is calculated assuming reinvestment of all dividends and capital gain distributions at net asset value and does not reflect the effect of insurance contract changes. Total return for periods less than one year is not annualized.
(3) Annualized for periods less than one year.
* Amount is less than $0.005, $(0.005) or 0.005%.
See Notes to Financial Statements.
85
ING BARON SMALL CAP GROWTH PORTFOLIO | FINANCIAL HIGHLIGHTS |
Selected data for a share outstanding for each period.
| | | Class I | |
| | | Year Ended December 31, | | May 1,
2002(1) to
December 31, | |
| | | 2005 | | 2004 | | 2003 | | 2002 | |
| | | | | | | | | | |
Per Share Operating Performance: | | | | | | | | | | |
Net asset value, beginning of period | | $ | 15.06 | | | 11.74 | | | 8.77 | | | 10.00 | | |
Income (loss) from investment operations: | | | | | | | | | | | | | | |
Net investment loss | | $ | (0.14 | )* | | (0.07 | ) | | (0.05 | ) | | (0.03 | ) | |
Net realized and unrealized gain (loss) on investments | | $ | 1.29 | | | 3.39 | | | 3.02 | | | (1.20 | ) | |
Total from investment operations | | $ | 1.15 | | | 3.32 | | | 2.97 | | | (1.23 | ) | |
Net asset value, end of period | | $ | 16.21 | | | 15.06 | | | 11.74 | | | 8.77 | | |
Total Return | | % | 7.64 | | | 28.28 | | | 33.87 | | | (12.30 | ) | |
| | | | | | | | | | | | | | |
Ratios and Supplemental Data: | | | | | | | | | | | | | | |
Net assets, end of period (000’s) | | $ | 81,664 | | | 29,954 | | | 10,522 | | | 706 | | |
Ratios to average net assets: | | | | | | | | | | | | | | |
Net expenses after expense reimbursement(3) | | % | 1.20 | | | 1.20 | | | 1.21 | | | 1.25 | | |
Gross expenses prior to expense reimbursement(3) | | % | 1.25 | | | 1.20 | | | 1.25 | | | 1.25 | | |
Net investment loss(3) | | % | (0.87 | ) | | (0.71 | ) | | (0.90 | ) | | (1.01 | ) | |
Portfolio turnover rate | | % | 11 | | | 19 | | | 19 | | | 12 | | |
| | | Class S | |
| | | Year Ended December 31, | | May 1,
2002(1) to
December 31, | |
| | | 2005 | | 2004 | | 2003 | | 2002 | |
| | | | | | | | | | |
Per Share Operating Performance: | | | | | | | | | | |
Net asset value, beginning of period | | $ | 14.96 | | | 11.69 | | | 8.76 | | | 10.00 | | |
Income (loss) from investment operations: | | | | | | | | | | | | | | |
Net investment loss | | $ | (0.14 | )* | | (0.09 | ) | | (0.07 | ) | | (0.06 | ) | |
Net realized and unrealized gain (loss) on investments | | $ | 1.24 | | | 3.36 | | | 3.00 | | | (1.18 | ) | |
Total from investment operations | | $ | 1.10 | | | 3.27 | | | 2.93 | | | (1.24 | ) | |
Net asset value, end of period | | $ | 16.06 | | | 14.96 | | | 11.69 | | | 8.76 | | |
Total Return | | % | 7.35 | | | 27.97 | | | 33.45 | | | (12.40 | ) | |
| | | | | | | | | | | | | | |
Ratios and Supplemental Data: | | | | | | | | | | | | | | |
Net assets, end of period (000’s) | | $ | 207,527 | | | 114,112 | | | 44,200 | | | 7,793 | | |
Ratios to average net assets: | | | | | | | | | | | | | | |
Net expenses after expense reimbursement(3) | | % | 1.45 | | | 1.45 | | | 1.46 | | | 1.50 | | |
Gross expenses prior to expense reimbursement(3) | | % | 1.50 | | | 1.45 | | | 1.50 | | | 1.50 | | |
Net investment loss(3) | | % | (0.92 | ) | | (0.96 | ) | | (1.15 | ) | | (1.23 | ) | |
Portfolio turnover rate | | % | 11 | | | 19 | | | 19 | | | 12 | | |
(1) Commencement of operations.
(2) Total return is calculated assuming reinvestment of all dividends and capital gain distributions at net asset value and does not reflect the effect of insurance contract changes. Total return for periods less than one year is not annualized.
(3) Annualized for periods less than one year.
* Per share numbers have been calculated using the average number of shares outstanding throughout the period.
See Notes to Financial Statements.
86
ING BARON SMALL CAP GROWTH PORTFOLIO (CONTINUED) | FINANCIAL HIGHLIGHTS |
Selected data for a share outstanding for each period.
| | | Class ADV | |
| | | | | | | | | May 1, | |
| | | | | | | | | 2002(1) to | |
| | | Year Ended December 31, | | December 31, | |
| | | 2005 | | 2004 | | 2003 | | 2002 | |
| | | | | | | | | | |
Per Share Operating Performance: | | | | | | | | | | |
Net asset value, beginning of period | | $ | 14.85 | | | 11.64 | | | 8.74 | | | 10.00 | | |
Income (loss) from investment operations: | | | | | | | | | | | | | | |
Net investment loss | | $ | (0.19 | )* | | (0.09 | ) | | (0.12 | ) | | (0.02 | ) | |
Net realized and unrealized gain (loss) on investments | | $ | 1.24 | | | 3.30 | | | 3.02 | | | (1.24 | ) | |
Total from investment operations | | $ | 1.05 | | | 3.21 | | | 2.90 | | | (1.26 | ) | |
Net asset value, end of period | | $ | 15.90 | | | 14.85 | | | 11.64 | | | 8.74 | | |
Total Return(2) | | % | 7.07 | | | 27.58 | | | 33.18 | | | (12.60 | ) | |
| | | | | | | | | | | | | | |
Ratios and Supplemental Data: | | | | | | | | | | | | | | |
Net assets, end of period (000’s) | | $ | 31,565 | | | 17,106 | | | 3,950 | | | 2,131 | | |
Ratios to average net assets: | | | | | | | | | | | | | | |
Net expenses after expense reimbursement(3) | | % | 1.70 | | | 1.70 | | | 1.71 | | | 1.75 | | |
Gross expenses prior to expense reimbursements(3) | | % | 1.75 | | | 1.70 | | | 1.75 | | | 1.75 | | |
Net investment loss(3) | | % | (1.23 | ) | | (1.22 | ) | | (1.42 | ) | | (1.56 | ) | |
Portfolio turnover rate | | % | 11 | | | 19 | | | 19 | | | 12 | | |
(1) Commencement of operations.
(2) Total return is calculated assuming reinvestment of all dividends and capital gain distributions at net asset value and does not reflect the effect of insurance contract changes. Total return for periods less than one year is not annualized.
(3) Annualized for periods less than one year.
* Per share numbers have been calculated using the average number of shares outstanding throughout the period.
See Notes to Financial Statements.
87
ING DAVIS VENTURE VALUE PORTFOLIO | FINANCIAL HIGHLIGHTS |
Selected data for a share outstanding for each period.
| | | Class I | |
| | | | | | | | | | | December 10, | |
| | | | | | | | | | | 2001(1) to | |
| | | Year Ended December 31, | | December 31, | |
| | | 2005 | | 2004 | | 2003 | | 2002 | | 2001 | |
| | | | | | | | | | | | |
Per Share Operating Performance: | | | | | | | | | | | | |
Net asset value, beginning of period | | $ | 18.09 | | 16.64 | | 12.00 | | 16.01 | | 15.86 | | |
Income (loss) from investment operations: | | | | | | | | | | | | | |
Net investment income (loss) | | $ | 0.06 | † | 0.05 | | (0.03 | )† | 0.10 | | 0.01 | | |
Net realized and unrealized gain (loss)
on investments | | $ | 0.66 | | 1.40 | | 4.92 | | (4.01 | ) | 0.14 | | |
Total from investment operations | | $ | 0.72 | | 1.45 | | 4.89 | | (3.91 | ) | 0.15 | | |
Less distributions: | | | | | | | | | | | | | |
Net investment income | | $ | (0.02 | ) | — | | (0.25 | ) | (0.01 | ) | — | | |
Net realized gain on investments | | $ | — | | — | | — | | (0.09 | ) | — | | |
Total distributions | | $ | (0.02 | ) | — | | (0.25 | ) | (0.10 | ) | — | | |
Net asset value, end of period | | $ | 18.79 | | 18.09 | | 16.64 | | 12.00 | | 16.01 | | |
Total Return(2) | | % | 4.10 | | 8.71 | | 41.06 | | (24.42 | ) | 0.95 | | |
| | | | | | | | | | | | | |
Ratios and Supplemental Data: | | | | | | | | | | | | | |
Net assets, end of period (000’s) | | $ | 3,108 | | 3,295 | | 2,102 | | 62 | | 10 | | |
Ratios to average net assets: | | | | | | | | | | | | | |
Expenses(3) | | % | 1.07 | | 1.10 | | 1.10 | | 1.10 | | 1.10 | | |
Net investment income (loss)(3) | | % | 0.33 | | 0.31 | | (0.21 | ) | 2.13 | | 1.00 | | |
Portfolio turnover rate | | % | 110 | | 33 | | 105 | | 114 | | 4 | | |
| | | Class S | |
| | | | | | | | | | | December 10, | |
| | | | | | | | | | | 2001(1) to | |
| | | Year Ended December 31, | | December 31, | |
| | | 2005 | | 2004 | | 2003 | | 2002 | | 2001 | |
| | | | | | | | | | | | |
Per Share Operating Performance: | | | | | | | | | | | | |
Net asset value, beginning of period | | $ | 17.99 | | 16.59 | | 11.97 | | 16.01 | | 15.86 | | |
Income (loss) from investment operations: | | | | | | | | | | | | | |
Net investment income (loss) | | $ | 0.01 | † | 0.00 | * | (0.02 | )† | 0.21 | | 0.01 | | |
Net realized and unrealized gain (loss)
on investments | | $ | 0.69 | | 1.40 | | 4.86 | | (4.15 | ) | 0.14 | | |
Total from investment operations | | $ | 0.70 | | 1.40 | | 4.84 | | (3.94 | ) | 0.15 | | |
Less distributions: | | | | | | | | | | | | | |
Net investment income | | $ | — | | — | | (0.22 | ) | (0.01 | ) | — | | |
Net realized gain on investments | | $ | — | | — | | — | | (0.09 | ) | — | | |
Total distributions | | $ | — | | — | | (0.22 | ) | (0.10 | ) | — | | |
Net asset value, end of period | | $ | 18.69 | | 17.99 | | 16.59 | | 11.97 | | 16.01 | | |
Total Return(2) | | % | 3.89 | | 8.44 | | 40.68 | | (24.62 | ) | 0.95 | | |
| | | | | | | | | | | | | |
Ratios and Supplemental Data: | | | | | | | | | | | | | |
Net assets, end of period (000’s) | | $ | 41,822 | | 56,159 | | 56,159 | | 34,833 | | 40,370 | | |
Ratios to average net assets: | | | | | | | | | | | | | |
Expenses(3) | | % | 1.32 | | 1.35 | | 1.35 | | 1.35 | | 1.35 | | |
Net investment income (loss)(3) | | % | 0.06 | | 0.02 | | (0.17 | ) | 1.48 | | 0.87 | | |
Portfolio turnover rate | | % | 110 | | 33 | | 105 | | 114 | | 4 | | |
(1) Commencement of operations.
(2) Total return is calculated assuming reinvestment of all dividends and capital gain distributions at net asset value and does not reflect the effect of insurance contract changes. Total return for periods less than one year is not annualized.
(3) Annualized for periods less than one year.
* Amount is less than $0.005.
† Per share numbers have been calculated using the average number of shares outstanding throughout the period.
See Notes to Financial Statements.
88
ING DAVIS VENTURE VALUE PORTFOLIO (CONTINUED) | FINANCIAL HIGHLIGHTS |
Selected data for a share outstanding for each period.
| | | Class ADV | |
| | | | | | | | | | | December 10, | |
| | | | | | | | | | | 2001(1) to | |
| | | Year Ended December 31, | | December 31, | |
| | | 2005 | | 2004 | | 2003 | | 2002 | | 2001 | |
| | | | | | | | | | | | |
Per Share Operating Performance: | | | | | | | | | | | | |
Net asset value, beginning of period | | $ | 17.82 | | 16.47 | | 11.94 | | 16.01 | | 15.86 | | |
Income (loss) from investment operations: | | | | | | | | | | | | | |
Net investment income (loss) | | $ | (0.03 | )† | (0.02 | ) | (0.07 | )† | 0.06 | | 0.00 | * | |
Net realized and unrealized gain (loss)
on investments | | $ | 0.66 | | 1.37 | | 4.85 | | (4.03 | ) | 0.15 | | |
Total from investment operations | | $ | 0.63 | | 1.35 | | 4.78 | | (3.97 | ) | 0.15 | | |
Less distributions: | | | | | | | | | | | | | |
Net investment income | | $ | (0.00 | )* | — | | (0.25 | ) | (0.01 | ) | — | | |
Net realized gain on investments | | $ | — | | — | | — | | (0.09 | ) | — | | |
Total distributions | | $ | (0.00 | )* | — | | (0.25 | ) | (0.10 | ) | — | | |
Net asset value, end of period | | $ | 18.46 | | 17.82 | | 16.47 | | 11.94 | | 16.01 | | |
Total Return(2) | | % | 3.62 | | 8.20 | | 40.31 | | (24.79 | ) | 0.95 | | |
| | | | | | | | | | | | | |
Ratios and Supplemental Data: | | | | | | | | | | | | | |
Net assets, end of period (000’s) | | $ | 11,305 | | 10,195 | | 3,299 | | 535 | | 10 | | |
Ratios to average net assets: | | | | | | | | | | | | | |
Expenses(3) | | % | 1.57 | | 1.60 | | 1.60 | | 1.60 | | 1.60 | | |
Net investment income (loss)(3) | | % | (0.18 | ) | (0.18 | ) | (0.51 | ) | 1.79 | | 0.50 | | |
Portfolio turnover rate | | % | 110 | | 33 | | 105 | | 114 | | 4 | | |
(1) Commencement of operations.
(2) Total return is calculated assuming reinvestment of all dividends and capital gain distributions at net asset value and does not reflect the effect of insurance contract changes. Total return for periods less than one year is not annualized.
(3) Annualized for periods less than one year.
* Amount is less than $0.005 or more than $(0.005).
† Per share numbers have been calculated using the average number of shares outstanding throughout the period.
See Notes to Financial Statements.
89
ING FUNDAMENTAL RESEARCH PORTFOLIO | FINANCIAL HIGHLIGHTS |
Selected data for a share outstanding for each period.
| | | Class I | |
| | | | | | | | | | | December 10, | |
| | | | | | | | | | | 2001(1) to | |
| | | Year Ended December 31, | | December 31, | |
| | | 2005 | | 2004 | | 2003 | | 2002 | | 2001 | |
| | | | | | | | | | | | |
Per Share Operating Performance: | | | | | | | | | | | | |
Net asset value, beginning of period | | $ | 8.71 | | 7.97 | | 6.30 | | 8.16 | | 8.23 | | |
Income (loss) from investment operations: | | | | | | | | | | | | | |
Net investment income | | $ | 0.07 | † | 0.07 | | 0.04 | | 0.03 | | 0.00 | * | |
Net realized and unrealized gain (loss)
on investments | | $ | 0.44 | | 0.73 | | 1.70 | | (1.89 | ) | (0.07 | ) | |
Total from investment operations | | $ | 0.51 | | 0.80 | | 1.74 | | (1.86 | ) | (0.07 | ) | |
Less distributions: | | | | | | | | | | | | | |
Net investment income | | $ | (0.12 | ) | (0.06 | ) | (0.07 | ) | (0.00 | )* | — | | |
Net realized gain on investments | | $ | — | | — | | — | | (0.00 | )* | — | | |
Total distributions | | $ | (0.12 | ) | (0.06 | ) | (0.07 | ) | (0.00 | ) | — | | |
Net asset value, end of period | | $ | 9.10 | | 8.71 | | 7.97 | | 6.30 | | 8.16 | | |
Total Return(2) | | % | 5.90 | | 10.19 | | 27.74 | | (22.76 | ) | (0.85 | ) | |
| | | | | | | | | | | | | |
Ratios and Supplemental Data: | | | | | | | | | | | | | |
Net assets, end of period (000’s) | | $ | 10,591 | | 4,047 | | 650 | | 199 | | 10 | | |
Ratios to average net assets: | | | | | | | | | | | | | |
Expenses(3) | | % | 0.80 | | 0.80 | | 0.80 | | 0.80 | | 0.80 | | |
Net investment income(3) | | % | 0.78 | | 1.33 | | 1.03 | | 1.08 | | 0.66 | | |
Portfolio turnover rate | | % | 220 | | 91 | | 35 | | 60 | | 0 | | |
| | | Class S | |
| | | | | | | | | | | December 10, | |
| | | | | | | | | | | 2001(1) to | |
| | | Year Ended December 31, | | December 31, | |
| | | 2005 | | 2004 | | 2003 | | 2002 | | 2001 | |
| | | | | | | | | | | | |
Per Share Operating Performance: | | | | | | | | | | | | |
Net asset value, beginning of period | | $ | 8.70 | | 7.96 | | 6.29 | | 8.16 | | 8.23 | | |
Income (loss) from investment operations: | | | | | | | | | | | | | |
Net investment income | | $ | 0.05 | † | 0.08 | | 0.06 | | 0.05 | | 0.00 | * | |
Net realized and unrealized gain (loss)
on investments | | $ | 0.44 | | 0.71 | | 1.66 | | (1.92 | ) | (0.07 | ) | |
Total from investment operations | | $ | 0.49 | | 0.79 | | 1.72 | | (1.87 | ) | (0.07 | ) | |
Less distributions: | | | | | | | | | | | | | |
Net investment income | | $ | (0.09 | ) | (0.05 | ) | (0.05 | ) | (0.00 | )* | — | | |
Net realized gain on investments | | $ | — | | — | | — | | (0.00 | )* | — | | |
Total distributions | | $ | (0.09 | ) | (0.05 | ) | (0.05 | ) | (0.00 | ) | — | | |
Net asset value, end of period | | $ | 9.10 | | 8.70 | | 7.96 | | 6.29 | | 8.16 | | |
Total Return(2) | | % | 5.71 | | 9.95 | | 27.38 | | (22.89 | ) | (0.85 | ) | |
| | | | | | | | | | | | | |
Ratios and Supplemental Data: | | | | | | | | | | | | | |
Net assets, end of period (000’s) | | $ | 26,757 | | 39,657 | | 37,612 | | 32,443 | | 43,927 | | |
Ratios to average net assets: | | | | | | | | | | | | | |
Expenses(3) | | % | 1.05 | | 1.05 | | 1.05 | | 1.05 | | 1.05 | | |
Net investment income(3) | | % | 0.55 | | 0.93 | | 0.74 | | 0.57 | | 0.44 | | |
Portfolio turnover rate | | % | 220 | | 91 | | 35 | | 60 | | 0 | | |
(1) Commencement of operations.
(2) Total return is calculated assuming reinvestment of all dividends and capital gain distributions at net asset value and does not reflect the effect of insurance contract changes. Total return for periods less than one year is not annualized.
(3) Annualized for periods less than one year.
* Amount is less than $0.01 or $(0.01).
† Per share numbers have been calculated using the average number of shares outstanding throughout the period.
See Notes to Financial Statements.
90
ING FUNDAMENTAL RESEARCH PORTFOLIO (CONTINUED) | FINANCIAL HIGHLIGHTS |
Selected data for a share outstanding for each period.
| | | Class ADV | |
| | | | | | | | | | | December 10, | |
| | | | | | | | | | | 2001(1) to | |
| | | Year Ended December 31, | | December 31, | |
| | | 2005 | | 2004 | | 2003 | | 2002 | | 2001 | |
| | | | | | | | | | | | |
Per Share Operating Performance: | | | | | | | | | | | | |
Net asset value, beginning of period | | $ | 8.63 | | 7.90 | | 6.28 | | 8.16 | | 8.23 | | |
Income (loss) from investment operations: | | | | | | | | | | | | | |
Net investment income | | $ | 0.03 | † | 0.05 | | 0.05 | | 0.00 | * | 0.00 | * | |
Net realized and unrealized gain (loss)
on investments | | $ | 0.43 | | 0.71 | | 1.64 | | (1.88 | ) | (0.07 | ) | |
Total from investment operations | | $ | 0.46 | | 0.76 | | 1.69 | | (1.88 | ) | (0.07 | ) | |
Less distributions: | | | | | | | | | | | | | |
Net investment income | | $ | (0.07 | ) | (0.03 | ) | (0.07 | ) | (0.00 | )* | — | | |
Net realized gain on investments | | $ | — | | — | | — | | (0.00 | )* | — | | |
Total distributions | | $ | (0.07 | ) | (0.03 | ) | (0.07 | ) | (0.00 | ) | — | | |
Net asset value, end of period | | $ | 9.02 | | 8.63 | | 7.90 | | 6.28 | | 8.16 | | |
Total Return(2) | | % | 5.33 | | 9.73 | | 26.99 | | (23.03 | ) | (0.85 | ) | |
| | | | | | | | | | | | | |
Ratios and Supplemental Data: | | | | | | | | | | | | | |
Net assets, end of period (000’s) | | $ | 3,813 | | 3,625 | | 4,669 | | 1,036 | | 10 | | |
Ratios to average net assets: | | | | | | | | | | | | | |
Expenses(3) | | % | 1.30 | | 1.30 | | 1.30 | | 1.30 | | 1.30 | | |
Net investment income(3) | | % | 0.30 | | 0.61 | | 0.50 | | 0.53 | | 0.17 | | |
Portfolio turnover rate | | % | 220 | | 91 | | 35 | | 60 | | 0 | | |
(1) Commencement of operations.
(2) Total return is calculated assuming reinvestment of all dividends and capital gain distributions at net asset value and does not reflect the effect of insurance contract changes. Total return for periods less than one year is not annualized.
(3) Annualized for periods less than one year.
* Amount is less than $0.01 or $(0.01).
† Per share numbers have been calculated using the average number of shares outstanding throughout the period.
See Notes to Financial Statements.
91
ING GOLDMAN SACHS® CAPITAL GROWTH PORTFOLIO | FINANCIAL HIGHLIGHTS |
Selected data for a share outstanding for each period.
| | | Class I | |
| | | | | | | | | | | December 10, | |
| | | | | | | | | | | 2001(1) to | |
| | | Year Ended December 31, | | December 31, | |
| | | 2005 | | 2004 | | 2003 | | 2002 | | 2001 | |
| | | | | | | | | | | | |
Per Share Operating Performance: | | | | | | | | | | | | |
Net asset value, beginning of period | | $ | 11.31 | | 10.40 | | 8.40 | | 11.15 | | 11.24 | | |
Income (loss) from investment operations: | | | | | | | | | | | | | |
Net investment income (loss) | | $ | (0.00 | )†* | 0.05 | | 0.02 | | 0.01 | | 0.00 | * | |
Net realized and unrealized gain (loss)
on investments | | $ | 0.24 | | 0.89 | | 1.98 | | (2.76 | ) | (0.09 | ) | |
Total from investment operations | | $ | 0.24 | | 0.94 | | 2.00 | | (2.75 | ) | (0.09 | ) | |
Less distributions: | | | | | | | | | | | | | |
Net investment income | | $ | (0.06 | ) | (0.03 | ) | — | | (0.00 | )* | — | | |
Total distributions | | $ | (0.06 | ) | (0.03 | ) | — | | (0.00 | ) | — | | |
Net asset value, end of period | | $ | 11.49 | | 11.31 | | 10.40 | | 8.40 | | 11.15 | | |
Total Return(2) | | % | 2.17 | | 9.08 | | 23.81 | | (24.65 | ) | (0.80 | ) | |
| | | | | | | | | | | | | |
Ratios and Supplemental Data: | | | | | | | | | | | | | |
Net assets, end of period (000’s) | | $ | 2,806 | | 1,761 | | 1,210 | | 173 | | 10 | | |
Ratios to net assets: | | | | | | | | | | | | | |
Expenses(3) | | $ | 1.05 | | 1.05 | | 1.05 | | 1.05 | | 1.05 | | |
Net investment income (loss)(3) | | $ | (0.01 | ) | 0.54 | | 0.30 | | 0.45 | | 0.50 | | |
Portfolio turnover rate | | $ | 34 | | 46 | | 23 | | 32 | | 1 | | |
| | | | | | | | | | | | | | |
| | | Class S | |
| | | | | | | | | | | December 10, | |
| | | | | | | | | | | 2001(1) to | |
| | | Year Ended December 31, | | December 31, | |
| | | 2005 | | 2004 | | 2003 | | 2002 | | 2001 | |
| | | | | | | | | | | | |
Per Share Operating Performance: | | | | | | | | | | | | |
Net asset value, beginning of period | | $ | 11.26 | | 10.36 | | 8.38 | | 11.15 | | 11.24 | | |
Income (loss) from investment operations: | | | | | | | | | | | | | |
Net investment income (loss) | | $ | (0.03 | )† | 0.02 | | 0.01 | | (0.01 | ) | 0.00 | * | |
Net realized and unrealized gain (loss)
on investments | | $ | 0.24 | | 0.88 | | 1.97 | | (2.76 | ) | (0.09 | ) | |
Total from investment operations | | $ | 0.21 | | 0.90 | | 1.98 | | (2.77 | ) | (0.09 | ) | |
Less distributions: | | | | | | | | | | | | | |
Net investment income | | $ | (0.03 | ) | (0.00 | )† | — | | (0.00 | )* | — | | |
Total distributions | | $ | (0.03 | ) | (0.00 | ) | — | | (0.00 | ) | — | | |
Net asset value, end of period | | $ | 11.44 | | 11.26 | | 10.36 | | 8.38 | | 11.15 | | |
Total Return(2) | | % | 1.90 | | 8.74 | | 23.63 | | (24.84 | ) | (0.80 | ) | |
| | | | | | | | | | | | | |
Ratios and Supplemental Data: | | | | | | | | | | | | | |
Net assets, end of period (000’s) | | $ | 55,785 | | 87,353 | | 90,005 | | 78,023 | | 103,118 | | |
Ratios to net assets: | | | | | | | | | | | | | |
Expenses(3) | | % | 1.30 | | 1.30 | | 1.30 | | 1.30 | | 1.30 | | |
Net investment income (loss)(3) | | % | (0.26 | ) | 0.28 | | 0.06 | | (0.08 | ) | 0.07 | | |
Portfolio turnover rate | | % | 34 | | 46 | | 23 | | 32 | | 1 | | |
(1) Commencement of operations.
(2) Total return is calculated assuming reinvestment of all dividends and capital gain distributions at net asset value and does not reflect the effect of insurance contract changes. Total return for periods less than one year is not annualized.
(3) Annualized for periods less than one year.
* Amount is less than $0.05 or more than $(0.05).
† Per share numbers have been calculated using the average number of shares outstanding throughout the period.
See Notes to Financial Statements.
92
ING GOLDMAN SACHS® CAPITAL GROWTH PORTFOLIO (CONTINUED) | FINANCIAL HIGHLIGHTS |
Selected data for a share outstanding for each period.
| | | Class ADV | |
| | | | | | | | | | | December 10, | |
| | | | | | | | | | | 2001(1) to | |
| | | Year Ended December 31, | | December 31, | |
| | | 2005 | | 2004 | | 2003 | | 2002 | | 2001 | |
| | | | | | | | | | | | |
Per Share Operating Performance: | | | | | | | | | | | | |
Net asset value, beginning of period | | $ | 11.24 | | 10.36 | | 8.41 | | 11.15 | | 11.24 | | |
Income (loss) from investment operations: | | | | | | | | | | | | | |
Net investment income (loss) | | $ | (0.06 | )† | 0.01 | | (0.02 | ) | (0.00 | )* | (0.00 | )* | |
Net realized and unrealized gain (loss)
on investments | | $ | 0.25 | | 0.87 | | 1.97 | | (2.74 | ) | (0.09 | ) | |
Total from investment operations | | $ | 0.19 | | 0.88 | | 1.95 | | (2.74 | ) | (0.09 | ) | |
Less distributions: | | | | | | | | | | | | | |
Net investment income | | $ | — | | — | | — | | (0.00 | )* | — | | |
Total distributions | | $ | — | | — | | — | | (0.00 | ) | — | | |
Net asset value, end of period | | $ | 11.43 | | 11.24 | | 10.36 | | 8.41 | | 11.15 | | |
Total Return(2) | | % | 1.69 | | 8.49 | | 23.19 | | (24.56 | ) | (0.80 | ) | |
| | | | | | | | | | | | | |
Ratios and Supplemental Data: | | | | | | | | | | | | | |
Net assets, end of period (000’s) | | $ | 3,845 | | 6,117 | | 5,299 | | 4,124 | | 10 | | |
Ratios to average net assets: | | | | | | | | | | | | | |
Expenses(3) | | % | 1.55 | | 1.55 | | 1.55 | | 1.55 | | 1.55 | | |
Net investment income (loss)(3) | | % | (0.51 | ) | 0.06 | | (0.19 | ) | (0.09 | ) | (0.03 | ) | |
Portfolio turnover rate | | % | 34 | | 46 | | 223 | | 32 | | 1 | | |
(1) Commencement of operations.
(2) Total return is calculated assuming reinvestment of all dividends and capital gain distributions at net asset value and does not reflect the effect of insurance contract changes. Total return for periods less than one year is not annualized.
(3) Annualized for periods less than one year.
* Amount is more than $(0.01).
† Per share numbers have been calculated using the average number of shares outstanding throughout the period.
See Notes to Financial Statements.
93
ING GOLDMAN SACHS® CORE EQUITY PORTFOLIO | FINANCIAL HIGHLIGHTS |
Selected data for a share outstanding for each period.
| | | Class I | |
| | | | | | | May 1, | |
| | | | | | | 2003(1) to | |
| | | Year Ended December 31, | | December 31, | |
| | | 2005 | | 2004 | | 2003 | |
| | | | | | | | |
Per Share Operating Performance: | | | | | | | | |
Net asset value, beginning of period | | $ | 13.42 | | | 12.46 | | | 10.00 | | |
Income from investment operations: | | | | | | | | | | | |
Net investment income | | $ | 0.11 | | | 0.14 | | | 0.06 | | |
Net realized and unrealized gain on investments | | $ | 0.53 | | | 1.44 | | | 2.40 | | |
Total from investment operations | | $ | 0.64 | | | 1.58 | | | 2.46 | | |
Less distributions: | | | | | | | | | | | |
Net investment income | | $ | (0.14 | ) | | (0.06 | ) | | — | | |
Net realized gain on investments | | $ | (1.42 | ) | | (0.56 | ) | | — | | |
Total distributions | | $ | (1.56 | ) | | (0.62 | ) | | — | | |
Net asset value, end of period | | $ | 12.50 | | | 13.42 | | | 12.46 | | |
Total Return(2) | | % | 5.88 | | | 13.32 | | | 24.60 | | |
| | | | | | | | | | | |
Ratios and Supplemental Data: | | | | | | | | | | | |
Net assets, end of period (000’s) | | $ | 1 | | | 1 | | | 1 | | |
Ratios to average net assets: | | | | | | | | | | | |
Expenses(3) | | % | 0.90 | | | 0.90 | | | 0.90 | | |
Net investment income(3) | | % | 0.86 | | | 1.16 | | | 0.80 | | |
Portfolio turnover rate | | % | 108 | | | 120 | | | 66 | | |
| | | Class S | |
| | | | | | | May 1, | |
| | | | | | | 2003(1) to | |
| | | Year Ended December 31, | | December 31, | |
| | | 2005 | | 2004 | | 2003 | |
| | | | | | | | |
Per Share Operating Performance: | | | | | | | | |
Net asset value, beginning of period | | $ | 13.38 | | | 12.44 | | | 10.00 | | |
Income from investment operations: | | | | | | | | | | | |
Net investment income | | $ | 0.07 | | | 0.11 | | | 0.04 | | |
Net realized and unrealized gain on investments | | $ | 0.53 | | | 1.43 | | | 2.40 | | |
Total from investment operations | | $ | 0.60 | | | 1.54 | | | 2.44 | | |
Less distributions: | | | | | | | | | | | |
Net investment income | | $ | (0.11 | ) | | (0.04 | ) | | — | | |
Net realized gain on investments | | $ | (1.42 | ) | | (0.56 | ) | | — | | |
Total distributions | | $ | (1.53 | ) | | (0.60 | ) | | — | | |
Net asset value, end of period | | $ | 12.45 | | | 13.38 | | | 12.44 | | |
Total Return(2) | | % | 5.54 | | | 13.00 | | | 24.40 | | |
| | | | | | | | | | | |
Ratios and Supplemental Data: | | | | | | | | | | | |
Net assets, end of period (000’s) | | $ | 99,719 | | | 113,003 | | | 96,497 | | |
Ratios to average net assets: | | | | | | | | | | | |
Expenses(3) | | % | 1.15 | | | 1.15 | | | 1.15 | | |
Net investment income(3) | | % | 0.54 | | | 0.91 | | | 0.53 | | |
Portfolio turnover rate | | % | 108 | | | 120 | | | 66 | | |
(1) | | Commencement of operations. |
| | |
(2) | | Total return is calculated assuming reinvestment of all dividends and capital gain distributions at net asset value and does not reflect the effect of insurance contract changes. Total return for periods less than one year is not annualized. |
| | |
(3) | | Annualized for periods less than one year. |
See Notes to Financial Statements.
94
ING GOLDMAN SACHS® CORE EQUITY PORTFOLIO (CONTINUED) | FINANCIAL HIGHLIGHTS |
Selected data for a share outstanding for each period.
| | | Class ADV | |
| | | | | | | May 1, | |
| | | | | | | 2003(1) to | |
| | | Year Ended December 31, | | December 31, | |
| | | 2005 | | 2004 | | 2003 | |
| | | | | | | | |
Per Share Operating Performance: | | | | | | | | |
Net asset value, beginning of period | | $ | 13.31 | | | 12.42 | | | 10.00 | | |
Income from investment operations: | | | | | | | | | | | |
Net investment income | | $ | 0.04 | * | | 0.08 | | | 0.02 | | |
Net realized and unrealized gain on investments | | $ | 0.52 | | | 1.43 | | | 2.40 | | |
Total from investment operations | | $ | 0.56 | | | 1.51 | | | 2.42 | | |
Less distributions: | | | | | | | | | | | |
Net investment income | | $ | (0.14 | ) | | (0.06 | ) | | — | | |
Net realized gain on investments | | $ | (1.42 | ) | | (0.56 | ) | | — | | |
Total distributions | | $ | (1.56 | ) | | (0.62 | ) | | — | | |
Net asset value, end of period | | $ | 12.31 | | | 13.31 | | | 12.42 | | |
Total Return(2) | | % | 5.26 | | | 12.76 | | | 24.20 | | |
| | | | | | | | | | | |
Ratios and Supplemental Data: | | | | | | | | | | | |
Net assets, end of period (000’s) | | $ | 953 | | | 108 | | | 1 | | |
Ratios to average net assets: | | | | | | | | | | | |
Expenses(3) | | % | 1.40 | | | 1.40 | | | 1.40 | | |
Net investment income(3) | | % | 0.34 | | | 1.14 | | | 0.27 | | |
Portfolio turnover rate | | % | 108 | | | 120 | | | 66 | | |
(1) Commencement of operations.
(2) Total return is calculated assuming reinvestment of all dividends and capital gain distributions at net asset value and does not reflect the effect of insurance contract changes. Total return for periods less than one year is not annualized.
(3) Annualized for periods less than one year.
* Per share numbers have been calculated using the average number of shares outstanding throughout the period.
See Notes to Financial Statements.
95
ING JPMORGAN FLEMING INTERNATIONAL PORTFOLIO | FINANCIAL HIGHLIGHTS |
Selected data for a share outstanding for each period.
| | | Class I | |
| | | Year Ended December 31, | |
| | | 2005 | | 2004 | | 2003 | | 2002 | | 2001 | |
| | | | | | | | | | | | |
Per Share Operating Performance: | | | | | | | | | | | | |
Net asset value, beginning of year | | $ | 12.31 | | 10.47 | | 8.16 | | 10.03 | | 18.44 | | |
Income (loss) from investment operations: | | | | | | | | | | | | | |
Net investment income | | $ | 0.17 | * | 0.18 | | 0.14 | | 0.06 | * | 0.06 | | |
Net realized and unrealized gain (loss)
on investments | | $ | 1.04 | | 1.79 | | 2.26 | | (1.88 | ) | (4.64 | ) | |
Total from investment operations | | $ | 1.21 | | 1.97 | | 2.40 | | (1.82 | ) | (4.58 | ) | |
Less distributions: | | | | | | | | | | | | | |
Net investment income | | $ | (0.09 | ) | (0.13 | ) | (0.09 | ) | (0.05 | ) | (0.05 | ) | |
Net realized gain on investments | | $ | — | | — | | — | | — | | (3.78 | ) | |
Total distributions | | $ | (0.09 | ) | (0.13 | ) | (0.09 | ) | (0.05 | ) | (3.83 | ) | |
Net asset value, end of year | | $ | 13.43 | | 12.31 | | 10.47 | | 8.16 | | 10.03 | | |
Total Return(1) | | % | 9.95 | | 18.89 | | 29.45 | | (18.08 | ) | (26.93 | ) | |
| | | | | | | | | | | | | |
Ratios and Supplemental Data: | | | | | | | | | | | | | |
Net assets, end of year (000’s) | | $ | 352,116 | | 374,309 | | 338,566 | | 282,054 | | 369,992 | | |
Ratios to average net assets: | | | | | | | | | | | | | |
Expenses(2) | | % | 1.00 | | 1.00 | | 1.00 | | 1.00 | | 1.01 | | |
Net investment income(2) | | % | 1.38 | | 1.46 | | 1.56 | | 0.65 | | 0.44 | | |
Portfolio turnover rate | | % | 8 | | 12 | | 23 | | 174 | | 97 | | |
| | | Class S | |
| | | | | | | | | | | December 10, | |
| | | | | | | | | | | 2001(1) to | |
| | | Year Ended December 31, | | December 31, | |
| | | 2005 | | 2004 | | 2003 | | 2002 | | 2001 | |
| | | | | | | | | | | | |
Per Share Operating Performance: | | | | | | | | | | | | |
Net asset value, beginning of period | | $ | 12.24 | | 10.44 | | 8.15 | | 10.04 | | 10.18 | | |
Income (loss) from investment operations: | | | | | | | | | | | | | |
Net investment income (loss) | | $ | 0.13 | * | 0.11 | | (0.05 | ) | 0.02 | * | (0.00 | )† | |
Net realized and unrealized gain (loss) on investments | | $ | 1.06 | | 1.81 | | 2.43 | | (1.86 | ) | (0.14 | ) | |
Total from investment operations | | $ | 1.19 | | 1.92 | | 2.38 | | (1.84 | ) | (0.14 | ) | |
Less distributions: | | | | | | | | | | | | | |
Net investment income | | $ | (0.09 | ) | (0.12 | ) | (0.09 | ) | (0.05 | ) | — | | |
Total distributions | | $ | (0.09 | ) | (0.12 | ) | (0.09 | ) | (0.05 | ) | — | | |
Net asset value, end of period | | $ | 13.34 | | 12.24 | | 10.44 | | 8.15 | | 10.04 | | |
Total Return(1) | | % | 9.79 | | 18.65 | | 29.38 | | (18.29 | ) | (1.38 | ) | |
| | | | | | | | | | | | | |
Ratios and Supplemental Data: | | | | | | | | | | | | | |
Net assets, end of period (000’s) | | $ | 563,406 | | 201,653 | | 8,034 | | 18 | | 10 | | |
Ratios to average net assets: | | | | | | | | | | | | | |
Expenses(2) | | % | 1.25 | | 1.25 | | 1.25 | | 1.25 | | 1.25 | | |
Net investment income (loss)(2) | | % | 1.03 | | 0.85 | | (0.21 | ) | 0.24 | | (0.34 | ) | |
Portfolio turnover rate | | % | 8 | | 12 | | 23 | | 174 | | 97 | | |
(1) | | Total return is calculated assuming reinvestment of all dividends and capital gain distributions at net asset value and does not reflect the effect of insurance contract changes. Total return for periods less than one year is not annualized. |
| | |
(2) | | Annualized for periods less than one year. |
| | |
(3) | | Commencement of operations. |
| | |
* | | Per share numbers have been calculated using the average number of shares outstanding throughout the period. |
| | |
† | | Amount is more than $(0.01). |
See Notes to Financial Statements.
96
ING JPMORGAN FLEMING INTERNATIONAL PORTFOLIO (CONTINUED) | FINANCIAL HIGHLIGHTS |
Selected data for a share outstanding for each period.
| | | Class ADV | |
| | | | | | | | | | | December 10, | |
| | | | | | | | | | | 2001(1) to | |
| | | Year Ended December 31, | | December 31, | |
| | | 2005 | | 2004 | | 2003 | | 2002 | | 2001 | |
| | | | | | | | | | | | |
Per Share Operating Performance: | | | | | | | | | | | | |
Net asset value, beginning of period | | $ | 12.18 | | 10.40 | | 8.13 | | 10.03 | | 10.18 | | |
Income (loss) from investment operations: | | | | | | | | | | | | | |
Net investment income (loss) | | $ | 0.10 | * | 0.08 | | 0.05 | | (0.04 | )* | (0.00 | )† | |
Net realized and unrealized gain (loss) on investments | | $ | 1.04 | | 1.81 | | 2.30 | | (1.81 | ) | (0.15 | ) | |
Total from investment operations | | $ | 1.14 | | 1.89 | | 2.35 | | (1.85 | ) | (0.15 | ) | |
Less distributions: | | | | | | | | | | | | | |
Net investment income | | $ | (0.06 | ) | (0.11 | ) | (0.08 | ) | (0.05 | ) | — | | |
Total distributions | | $ | (0.06 | ) | (0.11 | ) | (0.08 | ) | (0.05 | ) | — | | |
Net asset value, end of period | | $ | 13.26 | | 12.18 | | 10.40 | | 8.13 | | 10.03 | | |
Total Return(2) | | % | 9.42 | | 18.34 | | 28.98 | | (18.48 | ) | (1.47 | ) | |
| | | | | | | | | | | | | |
Ratios and Supplemental Data: | | | | | | | | | | | | | |
Net assets, end of period (000’s) | | $ | 3,505 | | 2,224 | | 1,184 | | 485 | | 10 | | |
Ratios to average net assets: | | | | | | | | | | | | | |
Expenses(3) | | % | 1.50 | | 1.50 | | 1.50 | | 1.50 | | 1.50 | | |
Net investment income (loss)(3) | | % | 0.84 | | 0.85 | | 0.86 | | (0.45 | ) | (0.67 | ) | |
Portfolio turnover rate | | % | 8 | | 12 | | 23 | | 174 | | 97 | | |
(1) Commencement of operations.
(2) Total return is calculated assuming reinvestment of all dividends and capital gain distributions at net asset value and does not reflect the effect of insurance contract changes. Total return for periods less than one year is not annualized.
(3) Annualized for periods less than one year.
* Per share numbers have been calculated using the average number of shares outstanding throughout the period.
† Amount is more than $(0.01).
See Notes to Financial Statements.
97
ING JPMORGAN MID CAP VALUE PORTFOLIO | FINANCIAL HIGHLIGHTS |
Selected data for a share outstanding for each period.
| | | Class I | |
| | | | | | | | | May 1,
2002(1) to | |
| | | Year Ended December 31, | | December 31, | |
| | | 2005 | | 2004 | | 2003 | | 2002 | |
| | | | | | | | | | |
Per Share Operating Performance: | | | | | | | | | | |
Net asset value, beginning of period | | $ | 13.93 | | | 11.91 | | | 9.24 | | | 10.00 | | |
Income (loss) from investment operations: | | | | | | | | | | | | | | |
Net investment income | | $ | 0.08 | | | 0.04 | | | 0.05 | | | 0.02 | | |
Net realized and unrealized gain (loss) on investments | | $ | 1.14 | | | 2.44 | | | 2.75 | | | (0.75 | ) | |
Total from investment operations | | $ | 1.22 | | | 2.48 | | | 2.80 | | | (0.73 | ) | |
Less distributions: | | | | | | | | | | | | | | |
Net investment income | | $ | (0.08 | ) | | (0.04 | ) | | (0.05 | ) | | (0.03 | ) | |
Net realized gain on investments | | $ | (1.05 | ) | | (0.42 | ) | | (0.08 | ) | | | | |
Total distributions | | $ | (1.13 | ) | | (0.46 | ) | | (0.13 | ) | | (0.03 | ) | |
Net asset value, end of period | | $ | 14.02 | | | 13.93 | | | 11.91 | | | 9.24 | | |
Total Return(2) | | % | 8.71 | | | 20.88 | | | 30.31 | | | (7.30 | ) | |
| | | | | | | | | | | | | | |
Ratios and Supplemental Data: | | | | | | | | | | | | | | |
Net assets, end of period (000’s) | | $ | 80,426 | | | 55,163 | | | 16,662 | | | 957 | | |
Ratios to average net assets: | | | | | | | | | | | | | | |
Expenses(3) | | % | 1.10 | | | 1.10 | | | 1.10 | | | 1.10 | | |
Net investment income(3) | | % | 0.67 | | | 0.49 | | | 1.04 | | | 0.85 | | |
Portfolio turnover rate | | % | 52 | | | 45 | | | 44 | | | 31 | | |
| | | Class S | |
| | | | | | | | | May 1,
2002(1) to | |
| | | Year Ended December 31, | | December 31, | |
| | | 2005 | | 2004 | | 2003 | | 2002 | |
| | | | | | | | | | |
Per Share Operating Performance: | | | | | | | | | | |
Net asset value, beginning of period | | $ | 13.89 | | | 11.89 | | | 9.23 | | | 10.00 | | |
Income (loss) from investment operations: | | | | | | | | | | | | | | |
Net investment income | | $ | 0.05 | | | 0.02 | | | 0.04 | | | 0.02 | | |
Net realized and unrealized gain (loss) on investments | | $ | 1.13 | | | 2.42 | | | 2.73 | | | (0.77 | ) | |
Total from investment operations | | $ | 1.18 | | | 2.44 | | | 2.77 | | | (0.75 | ) | |
Less distributions: | | | | | | | | | | | | | | |
Net investment income | | $ | (0.04 | ) | | (0.02 | ) | | (0.03 | ) | | (0.02 | ) | |
Net realized gain on investments | | $ | (1.05 | ) | | (0.42 | ) | | (0.08 | ) | | — | | |
Total distributions | | $ | (1.09 | ) | | (0.44 | ) | | (0.11 | ) | | (0.02 | ) | |
Net asset value, end of period | | $ | 13.98 | | | 13.89 | | | 11.89 | | | 9.23 | | |
Total Return(2) | | % | 8.49 | | | 20.59 | | | 30.05 | | | (7.53 | ) | |
| | | | | | | | | | | | | | |
Ratios and Supplemental Data: | | | | | | | | | | | | | | |
Net assets, end of period (000’s) | | $ | 78,459 | | | 64,420 | | | 16,372 | | | 6,027 | | |
Ratios to average net assets: | | | | | | | | | | | | | | |
Expenses(3) | | % | 1.35 | | | 1.35 | | | 1.35 | | | 1.35 | | |
Net investment income(3) | | % | 0.39 | | | 0.26 | | | 0.61 | | | 0.35 | | |
Portfolio turnover rate | | % | 52 | | | 45 | | | 44 | | | 31 | | |
(1) Commencement of operations.
(2) Total return is calculated assuming reinvestment of all dividends and capital gain distributions at net asset value and does not reflect the effect of insurance contract changes. Total return for periods less than one year is not annualized.
(3) Annualized for periods less than one year.
See Notes to Financial Statements.
98
ING JPMORGAN MID CAP VALUE PORTFOLIO (CONTINUED) | FINANCIAL HIGHLIGHTS |
Selected data for a share outstanding for each period.
| | | Class ADV | |
| | | | | | | | | May 1,
2002(1) to | |
| | | Year Ended December 31, | | December 31, | |
| | | 2005 | | 2004 | | 2003 | | 2002 | |
| | | | | | | | | | |
Per Share Operating Performance: | | | | | | | | | | |
Net asset value, beginning of period | | $ | 13.84 | | | 11.86 | | | 9.22 | | | 10.00 | | |
Income (loss) from investment operations: | | | | | | | | | | | | | | |
Net investment income (loss) | | $ | 0.02 | | | (0.00 | )* | | 0.03 | | | 0.01 | | |
Net realized and unrealized gain (loss) on investments | | $ | 1.11 | | | 2.40 | | | 2.70 | | | (0.77 | ) | |
Total from investment operations | | $ | 1.13 | | | 2.40 | | | 2.73 | | | (0.76 | ) | |
Less distributions: | | | | | | | | | | | | | | |
Net investment income | | $ | (0.03 | ) | | — | | | (0.01 | ) | | (0.02 | ) | |
Net realized gain on investments | | $ | (1.05 | ) | | (0.42 | ) | | (0.08 | ) | | — | | |
Total distributions | | $ | (1.08 | ) | | (0.42 | ) | | (0.09 | ) | | (0.02 | ) | |
Net asset value, end of period | | $ | 13.89 | | | 13.84 | | | 11.86 | | | 9.22 | | |
Total Return(2) | | % | 8.11 | | | 20.31 | | | 29.68 | | | (7.64 | ) | |
| | | | | | | | | | | | | | |
Ratios and Supplemental Data: | | | | | | | | | | | | | | |
Net assets, end of period (000’s) | | $ | 12,408 | | | 4,980 | | | 1,354 | | | 331 | | |
Ratios to average net assets: | | | | | | | | | | | | | | |
Expenses(3) | | % | 1.60 | | | 1.60 | | | 1.60 | | | 1.60 | | |
Net investment income (loss)(3) | | % | 0.20 | | | (0.02 | ) | | 0.36 | | | 0.26 | | |
Portfolio turnover rate | | % | 52 | | | 45 | | | 44 | | | 31 | | |
(1) Commencement of operations.
(2) Total return is calculated assuming reinvestment of all dividends and capital gain distributions at net asset value and does not reflect the effect of insurance contract changes. Total return for periods less than one year is not annualized.
(3) Annualized for periods less than one year.
* Amount is more than $0.005, or $(0.005).
See Notes to Financial Statements.
99
ING MFS CAPITAL OPPORTUNITIES PORTFOLIO | FINANCIAL HIGHLIGHTS |
Selected data for a share outstanding for each period.
| | | Class I | |
| | | Year Ended December 31, | |
| | | 2005 | | 2004 | | 2003 | | 2002 | | 2001 | |
| | | | | | | | | | | | |
Per Share Operating Performance: | | | | | | | | | | | | |
Net asset value, beginning of year | | $ | 27.20 | | 24.21 | | 18.94 | | 27.12 | | 44.41 | | |
Income (loss) from investment operations: | | | | | | | | | | | | | |
Net investment income (loss) | | $ | 0.11 | * | 0.24 | * | 0.10 | * | 0.04 | * | (0.03 | ) | |
Net realized and unrealized gain (loss)
on investments | | $ | 0.31 | | 2.86 | | 5.21 | | (8.22 | ) | (10.25 | ) | |
Total from investment operations | | $ | 0.42 | | 3.10 | | 5.31 | | (8.18 | ) | (10.28 | ) | |
Less distributions: | | | | | | | | | | | | | |
Net investment income | | $ | (0.22 | ) | (0.11 | ) | (0.04 | ) | — | | — | | |
Net realized gain on investments | | $ | — | | — | | — | | — | | (7.01 | ) | |
Total distributions | | $ | (0.22 | ) | (0.11 | ) | (0.04 | ) | — | | (7.01 | ) | |
Net asset value, end of year | | $ | 27.40 | | 27.20 | | 24.21 | | 18.94 | | 27.12 | | |
Total Return(2) | | % | 1.56 | | 12.88 | | 28.07 | | (30.16 | ) | (24.75 | ) | |
| | | | | | | | | | | | | |
Ratios and Supplemental Data: | | | | | | | | | | | | | |
Net assets, end of year (000’s) | | $ | 191,985 | | 234,606 | | 247,542 | | 212,841 | | 351,204 | | |
Ratios to average net assets: | | | | | | | | | | | | | |
Expenses(3) | | % | 0.90 | | 0.90 | | 0.90 | | 0.90 | | 0.90 | | |
Net investment income (loss)(3) | | % | 0.43 | | 0.85 | | 0.47 | | 0.19 | | (0.09) | | |
Portfolio turnover rate | | % | 95 | | 74 | | 65 | | 151 | | 106 | | |
| | | Class S | |
| | | | | | | | | | | December 10, | |
| | | | | | | | | | | 2001(1) to | |
| | | Year Ended December 31, | | December 31, | |
| | | 2005 | | 2004 | | 2003 | | 2002 | | 2001 | |
| | | | | | | | | | | | |
Per Share Operating Performance: | | | | | | | | | | | | |
Net asset value, beginning of period | | $ | 27.04 | | 24.09 | | 18.89 | | 27.11 | | 27.21 | | |
Income (loss) from investment operations: | | | | | | | | | | | | | |
Net investment income (loss) | | $ | 0.05 | * | 0.16 | * | 0.05 | * | 0.02 | * | (0.00 | )† | |
Net realized and unrealized gain (loss)
on investments | | $ | 0.28 | | 2.87 | | 5.19 | | (8.24 | ) | (0.10 | ) | |
Total from investment operations | | $ | 0.33 | | 3.03 | | 5.24 | | (8.22 | ) | (0.10 | ) | |
Less distributions: | | | | | | | | | | | | | |
Net investment income | | $ | (0.13 | ) | (0.08 | ) | (0.04 | ) | — | | — | | |
Total distributions | | $ | (0.13 | ) | (0.08 | ) | (0.04 | ) | — | | — | | |
Net asset value, end of period | | $ | 27.24 | | 27.04 | | 24.09 | | 18.89 | | 27.11 | | |
Total Return(2) | | % | 1.25 | | 12.63 | | 27.74 | | (30.35 | ) | (0.37 | ) | |
| | | | | | | | | | | | | |
Ratios and Supplemental Data: | | | | | | | | | | | | | |
Net assets, end of period (000’s) | | $ | 277 | | 445 | | 391 | | 80 | | 10 | | |
Ratios to average net assets: | | | | | | | | | | | | | |
Expenses(3) | | % | 1.15 | | 1.15 | | 1.15 | | 1.15 | | 1.15 | | |
Net investment income (loss)(3) | | % | 0.18 | | 0.62 | | 0.21 | | 0.08 | | (0.03 | ) | |
Portfolio turnover rate | | % | 95 | | 74 | | 65 | | 151 | | 106 | | |
(1) | | Commencement of operations. |
| | |
(2) | | Total return is calculated assuming reinvestment of all dividends and capital gain distributions at net asset value and does not reflect the effect of insurance contract changes. Total return for periods less than one year is not annualized. |
| | |
(3) | | Annualized for periods less than one year. |
| | |
* | | Per share numbers have been calculated using the average number of shares outstanding throughout the period. |
| | |
† | | Amount is more than $(0.005). |
See Notes to Financial Statements.
100
ING MFS CAPITAL OPPORTUNITIES PORTFOLIO (CONTINUED) | FINANCIAL HIGHLIGHTS |
Selected data for a share outstanding for each period.
| | | Class ADV | |
| | | | | | | | | | | December 10, | |
| | | | | | | | | | | 2001(1) to | |
| | | Year Ended December 31, | | December 31, | |
| | | 2005 | | 2004 | | 2003 | | 2002 | | 2001 | |
| | | | | | | | | | | | |
Per Share Operating Performance: | | | | | | | | | | | | |
Net asset value, beginning of period | | $ | 26.86 | | 23.98 | | 18.84 | | 27.11 | | 27.21 | | |
Income (loss) from investment operations: | | | | | | | | | | | | | |
Net investment income (loss) | | $ | (0.02 | )* | 0.03 | * | (0.01 | )* | (0.01 | )* | (0.01 | ) | |
Net realized and unrealized gain (loss)
on investments | | $ | 0.29 | | 2.92 | | 5.17 | | (8.26 | ) | (0.09 | ) | |
Total from investment operations | | $ | 0.27 | | 2.95 | | 5.16 | | (8.27 | ) | (0.10 | ) | |
Less distributions: | | | | | | | | | | | | | |
Net investment income | | $ | (0.10 | ) | (0.07 | ) | (0.02 | ) | — | | — | | |
Total distributions | | $ | (0.10 | ) | (0.07 | ) | (0.02 | ) | — | | — | | |
Net asset value, end of period | | $ | 27.03 | | 26.86 | | 23.98 | | 18.84 | | 27.11 | | |
Total Return(2) | | % | 1.03 | | 12.36 | | 27.39 | | (30.51 | ) | (0.37 | ) | |
| | | | | | | | | | | | | |
Ratios and Supplemental Data: | | | | | | | | | | | | | |
Net assets, end of period (000’s) | | $ | 214 | | 267 | | 159 | | 54 | | 10 | | |
Ratios to average net assets: | | | | | | | | | | | | | |
Expenses(3) | | % | 1.40 | | 1.40 | | 1.40 | | 1.40 | | 1.40 | | |
Net investment income (loss)(3) | | % | (0.08 | ) | 0.27 | | (0.04 | ) | (0.06 | ) | (0.33 | ) | |
Portfolio turnover rate | | % | 95 | | 74 | | 65 | | 151 | | 106 | | |
(1) | | Commencement of operations. |
| | |
(2) | | Total return is calculated assuming reinvestment of all dividends and capital gain distributions at net asset value and does not reflect the effect of insurance contract changes. Total return for periods less than one year is not annualized. |
| | |
(3) | | Annualized for periods less than one year. |
| | |
* | | Per share numbers have been calculated using the average number of shares outstanding throughout the period. |
See Notes to Financial Statements.
101
ING OPCAP BALANCED VALUE PORTFOLIO | FINANCIAL HIGHLIGHTS |
Selected data for a share outstanding for each period.
| | | Class I | |
| | | | | | | | | | | December 10, | |
| | | | | | | | | | | 2001(1) to | |
| | | Year Ended December 31, | | December 31, | |
| | | 2005 | | 2004 | | 2003 | | 2002 | | 2001 | |
| | | | | | | | | | | | |
Per Share Operating Performance: | | | | | | | | | | | | |
Net asset value, beginning of period | | $ | 13.47 | | 12.32 | | 9.66 | | 12.40 | | 12.55 | | |
Income (loss) from investment operations: | | | | | | | | | | | | | |
Net investment income | | $ | 0.11 | | 0.14 | | 0.10 | | 0.07 | | 0.00 | * | |
Net realized and unrealized gain (loss)
on investments | | $ | 0.29 | | 1.15 | | 2.84 | | (2.68 | ) | (0.15 | ) | |
Total from investment operations | | $ | 0.40 | | 1.29 | | 2.94 | | (2.61 | ) | (0.15 | ) | |
Less distributions: | | | | | | | | | | | | | |
Net investment income | | $ | (0.09 | ) | (0.14 | ) | (0.28 | ) | (0.01 | ) | — | | |
Net realized gain on investments | | $ | — | | — | | — | | (0.12 | ) | — | | |
Total distributions | | $ | (0.09 | ) | (0.14 | ) | (0.28 | ) | (0.13 | ) | — | | |
Net asset value, end of period | | $ | 13.78 | | 13.47 | | 12.32 | | 9.66 | | 12.40 | | |
Total Return(2) | | % | 2.98 | | 10.58 | | 30.72 | | (21.06 | ) | (1.20 | ) | |
| | | | | | | | | | | | | |
Ratios and Supplemental Data: | | | | | | | | | | | | | |
Net assets, end of period (000’s) | | $ | 4,204 | | 4,046 | | 1,064 | | 196 | | 10 | | |
Ratios to average net assets: | | | | | | | | | | | | | |
Expenses(3) | | % | 1.00 | | 1.00 | | 1.00 | | 1.00 | | 1.00 | | |
Net investment income(3) | | % | 0.82 | | 0.59 | | 1.12 | | 2.11 | | 0.67 | | |
Portfolio turnover rate | | % | 80 | | 110 | | 125 | | 133 | | 8 | | |
| | | Class S | |
| | | | | | | | | | | December 10, | |
| | | | | | | | | | | 2001(1) to | |
| | | Year Ended December 31, | | December 31, | |
| | | 2005 | | 2004 | | 2003 | | 2002 | | 2001 | |
| | | | | | | | | | | | |
Per Share Operating Performance: | | | | | | | | | | | | |
Net asset value, beginning of period | | $ | 13.43 | | 12.29 | | 9.64 | | 12.40 | | 12.55 | | |
Income (loss) from investment operations: | | | | | | | | | | | | | |
Net investment income | | $ | 0.08 | | 0.04 | | 0.11 | | 0.23 | | 0.00 | * | |
Net realized and unrealized gain (loss)
on investments | | $ | 0.29 | | 1.22 | | 2.79 | | (2.86 | ) | (0.15 | ) | |
Total from investment operations | | $ | 0.37 | | 1.26 | | 2.90 | | (2.63 | ) | (0.15 | ) | |
Less distributions: | | | | | | | | | | | | | |
Net investment income | | $ | (0.05 | ) | (0.12 | ) | (0.25 | ) | (0.01 | ) | — | | |
Net realized gain on investments | | $ | — | | — | | — | | (0.12 | ) | — | | |
Total distributions | | $ | (0.05 | ) | (0.12 | ) | (0.25 | ) | (0.13 | ) | — | | |
Net asset value, end of period | | $ | 13.75 | | 13.43 | | 12.29 | | 9.64 | | 12.40 | | |
Total Return(2) | | % | 2.70 | | 10.32 | | 30.32 | | (21.23 | ) | (1.20 | ) | |
| | | | | | | | | | | | | |
Ratios and Supplemental Data: | | | | | | | | | | | | | |
Net assets, end of period (000’s) | | $ | 120,274 | | 160,159 | | 140,554 | | 102,619 | | 143,306 | | |
Ratios to average net assets: | | | | | | | | | | | | | |
Expenses(3) | | % | 1.25 | | 1.25 | | 1.25 | | 1.25 | | 1.27 | | |
Net investment income(3) | | % | 0.58 | | 0.35 | | 1.00 | | 1.85 | | 0.52 | | |
Portfolio turnover rate | | % | 80 | | 110 | | 125 | | 133 | | 8 | | |
(1) | | Commencement of operations. |
| | |
(2) | | Total return is calculated assuming reinvestment of all dividends and capital gain distributions at net asset value and does not reflect the effect of insurance contract changes. Total return for periods less than one year is not annualized. |
| | |
(3) | | Annualized for periods less than one year. |
| | |
* | | Amount is less than $0.01. |
See Notes to Financial Statements.
102
ING OPCAP BALANCED VALUE PORTFOLIO (CONTINUED) | FINANCIAL HIGHLIGHTS |
Selected data for a share outstanding for each period.
| | | Class ADV | |
| | | | | | | | | | | December 10, | |
| | | | | | | | | | | 2001(1) to | |
| | | Year Ended December 31, | | December 31, | |
| | | 2005 | | 2004 | | 2003 | | 2002 | | 2001 | |
| | | | | | | | | | | | |
Per Share Operating Performance: | | | | | | | | | | | | |
Net asset value, beginning of period | | $ | 13.32 | | 12.21 | | 9.61 | | 12.40 | | 12.55 | | |
Income (loss) from investment operations: | | | | | | | | | | | | | |
Net investment income | | $ | 0.04 | | 0.04 | | 0.09 | | 0.05 | | 0.00 | * | |
Net realized and unrealized gain (loss)
on investments | | $ | 0.29 | | 1.17 | | 2.77 | | (2.71 | ) | (0.15 | ) | |
Total from investment operations | | $ | 0.33 | | 1.21 | | 2.86 | | (2.66 | ) | (0.15 | ) | |
Less distributions: | | | | | | | | | | | | | |
Net investment income | | $ | (0.03 | ) | (0.10 | ) | (0.26 | ) | (0.01 | ) | — | | |
Net realized gain on investments | | $ | — | | — | | — | | (0.12 | ) | — | | |
Total distributions | | $ | (0.03 | ) | (0.10 | ) | (0.26 | ) | (0.13 | ) | — | | |
Net asset value, end of period | | $ | 13.62 | | 13.32 | | 12.21 | | 9.61 | | 12.40 | | |
Total Return(2) | | % | 2.46 | | 10.00 | | 30.08 | | (21.46 | ) | (1.20 | ) | |
| | | | | | | | | | | | | |
Ratios and Supplemental Data: | | | | | | | | | | | | | |
Net assets, end of period (000’s) | | $ | 3,458 | | 3,767 | | 2,665 | | 1,756 | | 10 | | |
Ratios to average net assets: | | | | | | | | | | | | | |
Expenses(3) | | % | 1.50 | | 1.50 | | 1.50 | | 1.50 | | 1.50 | | |
Net investment income(3) | | % | 0.32 | | 0.10 | | 0.74 | | 1.40 | | 0.21 | | |
Portfolio turnover rate | | % | 80 | | 110 | | 125 | | 133 | | 8 | | |
(1) | | Commencement of operations. |
| | |
(2) | | Total return is calculated assuming reinvestment of all dividends and capital gain distributions at net asset value and does not reflect the effect of insurance contract changes. Total return for periods less than one year is not annualized. |
| | |
(3) | | Annualized for periods less than one year. |
| | |
* | | Amount is less than $0.01. |
See Notes to Financial Statements.
103
ING OPPENHEIMER GLOBAL PORTFOLIO | FINANCIAL HIGHLIGHTS |
Selected data for a share outstanding for each period.
| | | Class I | |
| | | | | | | | | May 1, | |
| | | | | | | | | 2002(1) to | |
| | | Year Ended December 31, | | December 31, | |
| | | 2005 | | 2004 | | 2003 | | 2002 | |
| | | | | | | | | | |
Per Share Operating Performance: | | | | | | | | | | |
Net asset value, beginning of period | | $ | 12.80 | | | 11.23 | | | 8.40 | | | 10.00 | | |
Income (loss) from investment operations: | | | | | | | | | | | | | | |
Net investment income | | $ | 0.14 | † | | 0.01 | | | 0.00 | * | | 0.02 | | |
Net realized and unrealized gain (loss) on investments | | $ | 1.60 | | | 1.69 | | | 2.83 | | | (1.62 | ) | |
Total from investment operations | | $ | 1.74 | | | 1.70 | | | 2.83 | | | (1.60 | ) | |
Less distributions: | | | | | | | | | | | | | | |
Net investment income | | $ | (0.12 | ) | | (0.01 | ) | | (0.00 | )* | | — | | |
Net realized gain on investments | | $ | (0.25 | ) | | (0.12 | ) | | — | | | — | | |
Total distributions | | $ | (0.37 | ) | | (0.13 | ) | | (0.00 | ) | | — | | |
Net asset value, end of period | | $ | 14.17 | | | 12.80 | | | 11.23 | | | 8.40 | | |
Total Return(2) | | % | 13.57 | | | 15.28 | | | 33.73 | | | (16.00 | ) | |
| | | | | | | | | | | | | | |
Ratios and Supplemental Data: | | | | | | | | | | | | | | |
Net assets, end of period (000’s) | | $ | 2,262,201 | | | 843,253 | | | 426 | | | 89 | | |
Ratios to average net assets: | | | | | | | | | | | | | | |
Expenses(3) | | % | 0.66 | | | 0.77 | | | 1.20 | | | 1.20 | | |
Net investment income(3) | | % | 1.05 | | | 1.11 | | | 0.22 | | | 0.33 | | |
Portfolio turnover rate | | % | 53 | | | 390 | | | 157 | | | 87 | | |
| | | Class S | |
| | | | | | | | | May 1, | |
| | | | | | | | | 2002(1) to | |
| | | Year Ended December 31, | | December 31, | |
| | | 2005 | | 2004 | | 2003 | | 2002 | |
| | | | | | | | | | |
Per Share Operating Performance: | | | | | | | | | | |
Net asset value, beginning of period | | $ | 12.58 | | | 11.06 | | | 8.39 | | | 10.00 | | |
Income (loss) from investment operations: | | | | | | | | | | | | | | |
Net investment income | | $ | 0.09 | † | | 0.02 | | | 0.02 | | | 0.00 | * | |
Net realized and unrealized gain (loss) on investments | | $ | 1.58 | | | 1.62 | | | 2.65 | | | (1.61 | ) | |
Total from investment operations | | $ | 1.67 | | | 1.64 | | | 2.67 | | | (1.61 | ) | |
Less distributions: | | | | | | | | | | | | | | |
Net investment income | | $ | (0.10 | ) | | (0.00 | )* | | — | | | — | | |
Net realized gain on investments | | $ | (0.25 | ) | | (0.12 | ) | | — | | | — | | |
Total distributions | | $ | (0.35 | ) | | (0.12 | ) | | — | | | — | | |
Net asset value, end of period | | $ | 13.90 | | | 12.58 | | | 11.06 | | | 8.39 | | |
Total Return(2) | | % | 13.27 | | | 15.01 | | | 31.82 | | | (16.10 | ) | |
| | | | | | | | | | | | | | |
Ratios and Supplemental Data: | | | | | | | | | | | | | | |
Net assets, end of period (000’s) | | $ | 40,831 | | | 19,143 | | | 14,291 | | | 8,516 | | |
Ratios to average net assets: | | | | | | | | | | | | | | |
Expenses(3) | | % | 0.91 | | | 1.02 | | | 1.45 | | | 1.45 | | |
Net investment income(3) | | % | 0.71 | | | 0.19 | | | 0.19 | | | 0.07 | | |
Portfolio turnover rate | | % | 53 | | | 390 | | | 157 | | | 87 | | |
(1) | | Commencement of operations. |
| | |
(2) | | Total return is calculated assuming reinvestment of all dividends and capital gain distributions at net asset value and does not reflect the effect of insurance contract changes. Total return for periods less than one year is not annualized. |
| | |
(3) | | Annualized for periods less than one year. |
| | |
* | | Amount is less than $0.01 or $(0.01). |
| | |
† | | Per share numbers have been calculated using the average number of shares outstanding throughout the period. |
See Notes to Financial Statements.
104
ING OPPENHEIMER GLOBAL PORTFOLIO (CONTINUED) | FINANCIAL HIGHLIGHTS |
Selected data for a share outstanding for each period.
| | | Class ADV | |
| | | | | | | | | May 1, | |
| | | | | | | | | 2002(1) to | |
| | | Year Ended December 31, | | December 31, | |
| | | 2005 | | 2004 | | 2003 | | 2002 | |
| | | | | | | | | | |
Per Share Operating Performance: | | | | | | | | | | |
Net asset value, beginning of period | | $ | 12.50 | | | 11.02 | | | 8.38 | | | 10.00 | | |
Income (loss) from investment operations: | | | | | | | | | | | | | | |
Net investment income (loss) | | $ | 0.07 | † | | 0.03 | | | 0.00 | * | | (0.01 | ) | |
Net realized and unrealized gain (loss) on investments | | $ | 1.56 | | | 1.57 | | | 2.64 | | | (1.61 | ) | |
Total from investment operations | | $ | 1.63 | | | 1.60 | | | 2.64 | | | (1.62 | ) | |
Less distributions: | | | | | | | | | | | | | | |
Net investment income | | $ | (0.04 | ) | | (0.00 | )* | | — | | | — | | |
Net realized gain on investments | | $ | (0.24 | ) | | (0.12 | ) | | — | | | — | | |
Total distributions | | $ | (0.28 | ) | | (0.12 | ) | | — | | | — | | |
Net asset value, end of period | | $ | 13.85 | | | 12.50 | | | 11.02 | | | 8.38 | | |
Total Return(2) | | % | 13.07 | | | 14.71 | | | 31.50 | | | (16.20 | ) | |
| | | | | | | | | | | | | | |
Ratios and Supplemental Data: | | | | | | | | | | | | | | |
Net assets, end of period (000’s) | | $ | 106,510 | | | 127,653 | | | 856 | | | 665 | | |
Ratios to net assets: | | | | | | | | | | | | | | |
Net expenses after expense reimbursement(3) | | % | 1.15 | | | 1.27 | | | 1.70 | | | 1.70 | | |
Gross expenses prior to expense reimbursement(3) | | % | 1.16 | | | 1.28 | | | — | | | — | | |
Net investment income (loss)(3) | | % | 0.60 | | | 0.55 | | | 0.01 | | | (0.43 | ) | |
Portfolio turnover rate | | % | 53 | | | 390 | | | 157 | | | 87 | | |
(1) | | Commencement of operations. |
| | |
(2) | | Total return is calculated assuming reinvestment of all dividends and capital gain distributions at net asset value and does not reflect the effect of insurance contract changes. Total return for periods less than one year is not annualized. |
| | |
(3) | | Annualized for periods less than one year. |
| | |
* | | Amount is less than $0.01 or $(0.01). |
| | |
† | | Per share numbers have been calculated using the average number of shares outstanding throughout the period. |
See Notes to Financial Statements.
105
ING OPPENHEIMER STRATEGIC INCOME PORTFOLIO | FINANCIAL HIGHLIGHTS |
Selected data for a share outstanding for each period.
| | | Class I | |
| | | | | November 8, | |
| | | Year Ended | | 2004(1) to | |
| | | December 31, | | December 31, | |
| | | 2005 | | 2004 | |
| | | | | | |
Per Share Operating Performance: | | | | | | |
Net asset value, beginning of period | | $ | 10.12 | | | 10.00 | | |
Income (loss) from investment operations: | | | | | | | | |
Net investment income | | $ | 0.35 | * | | 0.02 | | |
Net realized and unrealized gain (loss) on investments | | $ | (0.24 | ) | | 0.12 | | |
Total from investment operations | | $ | 0.11 | | | 0.14 | | |
Less distributions: | | | | | | | | |
Net investment income | | $ | (0.23 | ) | | (0.02 | ) | |
Total distributions | | $ | (0.23 | ) | | (0.02 | ) | |
Net asset value, end of period | | $ | 10.00 | | | 10.12 | | |
Total Return(2) | | % | 1.09 | | | 1.39 | | |
| | | | | | | | |
Ratios and Supplemental Data: | | | | | | | | |
Net assets, end of period (000’s) | | $ | 302,941 | | | 103,283 | | |
Ratios to average net assets: | | | | | | | | |
Net expenses after expense reimbursement(3) | | % | 0.54 | | | 0.52 | | |
Net investment income(3) | | % | 3.50 | | | 2.56 | | |
Portfolio turnover rate | | % | 216 | | | 145 | | |
| | | Class S | |
| | | | | November 8, | |
| | | Year Ended | | 2004(1) to | |
| | | December 31, | | December 31, | |
| | | 2005 | | 2004 | |
| | | | | | |
Per Share Operating Performance: | | | | | | |
Net asset value, beginning of period | | $ | 10.11 | | | 10.00 | | |
Income (loss) from investment operations: | | | | | | | | |
Net investment income | | $ | 0.32 | * | | 0.02 | | |
Net realized and unrealized gain (loss) on investments | | $ | (0.24 | ) | | 0.11 | | |
Total from investment operations | | $ | 0.08 | | | 0.13 | | |
Less distributions: | | | | | | | | |
Net investment income | | $ | (0.20 | ) | | (0.02 | ) | |
Total distributions | | $ | (0.20 | ) | | (0.02 | ) | |
Net asset value, end of period | | $ | 9.99 | | | 10.11 | | |
Total Return(2) | | % | 0.84 | | | 1.27 | | |
| | | | | | | | |
Ratios and Supplemental Data: | | | | | | | | |
Net assets, end of period (000’s) | | $ | 60,478 | | | 60,836 | | |
Ratios to average net assets: | | | | | | | | |
Net expenses after expense reimbursement(3) | | % | 0.75 | | | 0.77 | | |
Gross expenses prior to expense reimbursement(3) | | % | 0.79 | | | 0.81 | | |
Net investment income(3) | | % | 3.14 | | | 2.40 | | |
Portfolio turnover rate | | % | 216 | | | 145 | | |
(1) | | Commencement of operations. |
| | |
(2) | | Total return is calculated assuming reinvestment of all dividends and capital gain distributions at net asset value and does not reflect the effect of insurance contract changes. Total return for periods less than one year is not annualized. |
| | |
(3) | | Annualized for periods less than one year. |
| | |
* | | Per share numbers have been calculated using the average number of shares outstanding throughout the period. |
See Notes to Financial Statements.
106
ING OPPENHEIMER STRATEGIC INCOME PORTFOLIO (CONTINUED) | FINANCIAL HIGHLIGHTS |
Selected data for a share outstanding for each period.
| | | Class ADV | |
| | | | | November 8, | |
| | | Year Ended | | 2004(1) to | |
| | | December 31, | | December 31, | |
| | | 2005 | | 2004 | |
| | | | | | |
Per Share Operating Performance: | | | | | | |
Net asset value, beginning of period | | $ | 10.11 | | | 10.00 | | |
Income (loss) from investment operations: | | | | | | | | |
Net investment income | | $ | 0.30 | * | | 0.02 | | |
Net realized and unrealized gain (loss) on investments | | $ | (0.24 | ) | | 0.11 | | |
Total from investment operations | | $ | 0.06 | | | 0.13 | | |
Less distributions: | | | | | | | | |
Net investment income | | $ | (0.19 | ) | | (0.02 | ) | |
Total distributions | | $ | (0.19 | ) | | (0.02 | ) | |
Net asset value, end of period | | $ | 9.98 | | | 10.11 | | |
Total Return(2) | | % | 0.61 | | | 1.26 | | |
| | | | | | | | |
Ratios and Supplemental Data: | | | | | | | | |
Net assets, end of period (000’s) | | $ | 5,082 | | | 3,655 | | |
Ratios to net assets: | | | | | | | | |
Net expenses after expense reimbursement(3) | | % | 1.00 | | | 1.02 | | |
Gross expenses prior to expense reimbursement(3) | | % | 1.04 | | | 1.06 | | |
Net investment income(3) | | % | 2.94 | | | 2.15 | | |
Portfolio turnover rate | | % | 216 | | | 145 | | |
(1) | | Commencement of operations. |
| | |
(2) | | Total return is calculated assuming reinvestment of all dividends and capital gain distributions at net asset value and does not reflect the effect of insurance contract changes. Total return for periods less than one year is not annualized. |
| | |
(3) | | Annualized for periods less than one year. |
| | |
* | | Per share numbers have been calculated using the average number of shares outstanding throughout the period. |
See Notes to Financial Statements.
107
ING PIMCO TOTAL RETURN PORTFOLIO | FINANCIAL HIGHLIGHTS |
Selected data for a share outstanding for each period.
| | | Class I | |
| | | | | | | | | May 1, | |
| | | | | | | | | 2002(1) to | |
| | | Year Ended December 31, | | December 31, | |
| | | 2005 | | 2004 | | 2003 | | 2002 | |
| | | | | | | | | | |
Per Share Operating Performance: | | | | | | | | | | |
Net asset value, beginning of period | | $ | 11.00 | | | 10.62 | | | 10.55 | | | 10.00 | | |
Income from investment operations: | | | | | | | | | | | | | | |
Net investment income | | $ | 0.34 | * | | 0.16 | * | | 0.29 | * | | 0.09 | | |
Net realized and unrealized gain on investments | | $ | (0.08 | ) | | 0.33 | | | 0.17 | | | 0.73 | | |
Total from investment operations | | $ | 0.26 | | | 0.49 | | | 0.46 | | | 0.82 | | |
Less distributions: | | | | | | | | | | | | | | |
Net investment income | | $ | (0.20 | ) | | — | | | (0.32 | ) | | (0.16 | ) | |
Net realized gain on investments | | $ | (0.14 | ) | | (0.11 | ) | | (0.07 | ) | | (0.11 | ) | |
Total distributions | | $ | (0.34 | ) | | (0.11 | ) | | (0.39 | ) | | (0.27 | ) | |
Net asset value, end of period | | $ | 10.92 | | | 11.00 | | | 10.62 | | | 10.55 | | |
Total Return(2) | | % | 2.36 | | | 4.61 | | | 4.36 | | | 8.21 | | |
| | | | | | | | | | | | | | |
Ratios and Supplemental Data: | | | | | | | | | | | | | | |
Net assets, end of period (000’s) | | $ | 176,607 | | | 78,521 | | | 43,987 | | | 8,026 | | |
Ratios to average net assets: | | | | | | | | | | | | | | |
Expenses(3) | | % | 0.85 | | | 0.85 | | | 0.85 | | | 0.85 | | |
Net investment income(3) | | % | 3.07 | | | 1.51 | | | 2.67 | | | 2.99 | | |
Portfolio turnover rate | | % | 926 | | | 377 | | | 471 | | | 419 | | |
| | | Class S | |
| | | | | | | | | May 1, | |
| | | | | | | | | 2002(1) to | |
| | | Year Ended December 31, | | December 31, | |
| | | 2005 | | 2004 | | 2003 | | 2002 | |
| | | | | | | | | | |
Per Share Operating Performance: | | | | | | | | | | |
Net asset value, beginning of period | | $ | 10.96 | | | 10.61 | | | 10.55 | | | 10.00 | | |
Income from investment operations: | | | | | | | | | | | | | | |
Net investment income | | $ | 0.30 | * | | 0.14 | * | | 0.22 | * | | 0.14 | | |
Net realized and unrealized gain on investments | | $ | (0.07 | ) | | 0.32 | | | 0.21 | | | 0.67 | | |
Total from investment operations | | $ | 0.23 | | | 0.46 | | | 0.43 | | | 0.81 | | |
Less distributions: | | | | | | | | | | | | | | |
Net investment income | | $ | (0.18 | ) | | — | | | (0.30 | ) | | (0.15 | ) | |
Net realized gain on investments | | $ | (0.14 | ) | | (0.11 | ) | | (0.07 | ) | | (0.11 | ) | |
Total distributions | | $ | (0.32 | ) | | (0.11 | ) | | (0.37 | ) | | (0.26 | ) | |
Net asset value, end of period | | $ | 10.87 | | | 10.96 | | | 10.61 | | | 10.55 | | |
Total Return(2) | | % | 2.08 | | | 4.33 | | | 4.06 | | | 8.07 | | |
| | | | | | | | | | | | | | |
Ratios and Supplemental Data: | | | | | | | | | | | | | | |
Net assets, end of period (000’s) | | $ | 83,782 | | | 88,424 | | | 50,174 | | | 25,186 | | |
Ratios to average net assets: | | | | | | | | | | | | | | |
Expenses(3) | | % | 1.10 | | | 1.10 | | | 1.10 | | | 1.10 | | |
Net investment income(3) | | % | 2.73 | | | 1.32 | | | 2.07 | | | 2.60 | | |
Portfolio turnover rate | | % | 926 | | | 377 | | | 471 | | | 419 | | |
(1) | | Commencement of operations. |
| | |
(2) | | Total return is calculated assuming reinvestment of all dividends and capital gain distributions at net asset value and does not reflect the effect of insurance contract changes. Total return for periods less than one year is not annualized. |
| | |
(3) | | Annualized for periods less than one year. |
| | |
* | | Per share numbers have been calculated using the average number of shares outstanding throughout the period. |
See Notes to Financial Statements.
108
ING PIMCO TOTAL RETURN PORTFOLIO (CONTINUED) | FINANCIAL HIGHLIGHTS |
Selected data for a share outstanding for each period.
| | | Class ADV | |
| | | | | | | | | May 1, | |
| | | | | | | | | 2002(1) to | |
| | | Year Ended December 31, | | December 31, | |
| | | 2005 | | 2004 | | 2003 | | 2002 | |
| | | | | | | | | | |
Per Share Operating Performance: | | | | | | | | | | |
Net asset value, beginning of period | | $ | 10.91 | | | 10.59 | | | 10.53 | | | 10.00 | | |
Income from investment operations: | | | | | | | | | | | | | | |
Net investment income | | $ | 0.28 | * | | 0.09 | * | | 0.20 | * | | 0.07 | | |
Net realized and unrealized gain on investments | | $ | (0.08 | ) | | 0.34 | | | 0.20 | | | 0.72 | | |
Total from investment operations | | $ | 0.20 | | | 0.43 | | | 0.40 | | | 0.79 | | |
Less distributions: | | | | | | | | | | | | | | |
Net investment income | | $ | (0.16 | ) | | — | | | (0.27 | ) | | (0.15 | ) | |
Net realized gain on investments | | $ | (0.14 | ) | | (0.11 | ) | | (0.07 | ) | | (0.11 | ) | |
Total distributions | | $ | (0.30 | ) | | (0.11 | ) | | (0.34 | ) | | (0.26 | ) | |
Net asset value, end of period | | $ | 10.81 | | | 10.91 | | | 10.59 | | | 10.53 | | |
Total Return(2) | | % | 1.80 | | | 4.06 | | | 3.86 | | | 7.88 | | |
| | | | | | | | | | | | | | |
Ratios and Supplemental Data: | | | | | | | | | | | | | | |
Net assets, end of period (000’s) | | $ | 23,018 | | | 14,827 | | | 10,388 | | | 4,880 | | |
Ratios to average net assets: | | | | | | | | | | | | | | |
Expenses(3) | | % | 1.35 | | | 1.35 | | | 1.35 | | | 1.35 | | |
Net investment income(3) | | % | 2.54 | | | 0.81 | | | 1.84 | | | 2.40 | | |
Portfolio turnover rate | | % | 926 | | | 377 | | | 471 | | | 419 | | |
(1) | | Commencement of operations. |
| | |
(2) | | Total return is calculated assuming reinvestment of all dividends and capital gain distributions at net asset value and does not reflect the effect of insurance contract changes. Total return for periods less than one year is not annualized. |
| | |
(3) | | Annualized for periods less than one year. |
| | |
* | | Per share numbers have been calculated using the average number of shares outstanding throughout the period. |
See Notes to Financial Statements.
109
ING SALOMON BROTHERS AGGRESSIVE GROWTH PORTFOLIO | FINANCIAL HIGHLIGHTS |
Selected data for a share outstanding for each period.
| | | Class I | |
| | | Year Ended December 31, | |
| | | 2005 | | 2004 | | 2003 | | 2002 | | 2001 | |
| | | | | | | | | | | | |
Per Share Operating Performance: | | | | | | | | | | | | |
Net asset value, beginning of year | | $ | 39.95 | | 36.41 | | 26.35 | | 40.73 | | 58.36 | | |
Income (loss) from investment operations: | | | | | | | | | | | | | |
Net investment income (loss) | | $ | (0.15 | ) | 0.03 | | (0.14 | )* | (0.11 | ) | (0.22 | ) | |
Net realized and unrealized gain (loss) on
investments | | $ | 4.72 | | 3.51 | | 10.20 | | (14.27 | ) | (14.22 | ) | |
Total from investment operations | | $ | 4.57 | | 3.54 | | 10.06 | | (14.38 | ) | (14.44 | ) | |
Less distributions: | | | | | | | | | | | | | |
Net realized gain on investments | | $ | — | | — | | — | | — | | (3.19 | ) | |
Total distributions | | $ | — | | — | | — | | — | | (3.19 | ) | |
Net asset value, end of year | | $ | 44.52 | | 39.95 | | 36.41 | | 26.35 | | 40.73 | | |
Total Return(1) | | % | 11.44 | † | 9.72 | | 38.18 | | (35.31 | ) | (25.21 | ) | |
| | | | | | | | | | | | | |
Ratios and Supplemental Data: | | | | | | | | | | | | | |
Net assets, end of year (000’s) | | $ | 531,343 | | 575,903 | | 610,593 | | 452,465 | | 805,194 | | |
Ratios to average net assets: | | | | | | | | | | | | | |
Expenses(2) | | % | 0.81 | | 0.82 | | 0.83 | | 0.82 | | 0.81 | | |
Net investment income (loss)(2) | | % | (0.33 | ) | 0.06 | | (0.46 | ) | (0.31 | ) | (0.48 | ) | |
Portfolio turnover rate | | % | 10 | | 3 | | 0 | | 174 | | 160 | | |
| | | Class S | |
| | | | | | | | | | | December 10, | |
| | | | | | | | | | | 2001(1) to | |
| | | Year Ended December 31, | | December 31, | |
| | | 2005 | | 2004 | | 2003 | | 2002 | | 2001 | |
| | | | | | | | | | | | |
Per Share Operating Performance: | | | | | | | | | | | | |
Net asset value, beginning of period | | $ | 39.65 | | 36.23 | | 26.28 | | 40.72 | | 41.09 | | |
Income (loss) from investment operations: | | | | | | | | | | | | | |
Net investment loss | | $ | (0.23 | ) | (0.01 | ) | (0.28 | )* | (0.18 | ) | (0.01 | ) | |
Net realized and unrealized gain (loss)
on investments | | $ | 4.66 | | 3.43 | | 10.23 | | (14.26 | ) | (0.36 | ) | |
Total from investment operations | | $ | 4.43 | | 3.42 | | 9.95 | | (14.44 | ) | (0.37 | ) | |
Net asset value, end of period | | $ | 44.08 | | 39.65 | | 36.23 | | 26.28 | | 40.72 | | |
Total Return(1) | | % | 11.17 | † | 9.44 | | 37.86 | | (35.46 | ) | (0.90 | ) | |
| | | | | | | | | | | | | |
Ratios and Supplemental Data: | | | | | | | | | | | | | |
Net assets, end of period (000’s) | | $ | 437,476 | | 355,857 | | 13,970 | | 7 | | 10 | | |
Ratios to average net assets: | | | | | | | | | | | | | |
Expenses(2) | | % | 1.06 | | 1.07 | | 1.12 | | 1.07 | | 1.04 | | |
Net investment loss(2) | | % | (0.58 | ) | (0.04 | ) | (0.82 | ) | (0.57 | ) | (0.50 | ) | |
Portfolio turnover rate | | % | 10 | | 3 | | 0 | | 174 | | 160 | | |
(1) | | Total return is calculated assuming reinvestment of all dividends and capital gain distributions at net asset value and does not reflect the effect of insurance contract changes. Total return for periods less than one year is not annualized. |
| | |
(2) | | Annualized for periods less than one year. |
| | |
(3) | | Commencement of operations. |
| | |
* | | Per share numbers have been calculated using the average number of shares outstanding throughout the period. |
| | |
† | | In 2005, there was no impact on total return from the gain realized on the disposal of investments made in violation of the Portfolio’s investment restrictions. |
See Notes to Financial Statements.
110
ING SALOMON BROTHERS AGGRESSIVE GROWTH PORTFOLIO (CONTINUED) | FINANCIAL HIGHLIGHTS |
Selected data for a share outstanding for each period.
| | | Class ADV | |
| | | | | | | | | | | December 10, | |
| | | | | | | | | | | 2001(1) to | |
| | | Year Ended December 31, | | December 31, | |
| | | 2005 | | 2004 | | 2003 | | 2002 | | 2001 | |
| | | | | | | | | | | | |
Per Share Operating Performance: | | | | | | | | | | | | |
Net asset value, beginning of period | | $ | 39.35 | | 36.04 | | 26.22 | | 40.71 | | 41.09 | | |
Income (loss) from investment operations: | | | | | | | | | | | | | |
Net investment loss | | $ | (0.33 | )* | (0.12 | ) | (0.28 | )* | (0.25 | ) | (0.02 | ) | |
Net realized and unrealized gain (loss)
on investments | | $ | 4.62 | | 3.43 | | 10.10 | | (14.24 | ) | (0.36 | ) | |
Total from investment operations | | $ | 4.29 | | 3.31 | | 9.82 | | (14.49 | ) | (0.38 | ) | |
Net asset value, end of period | | $ | 43.64 | | 39.35 | | 36.04 | | 26.22 | | 40.71 | | |
Total Return(2) | | % | 10.90 | † | 9.18 | | 37.45 | | (35.59 | ) | (0.92 | ) | |
| | | | | | | | | | | | | |
Ratios and Supplemental Data: | | | | | | | | | | | | | |
Net assets, end of period (000’s) | | $ | 7,843 | | 3,196 | | 1,014 | | 489 | | 10 | | |
Ratios to average net assets: | | | | | | | | | | | | | |
Expenses(3) | | % | 1.31 | | 1.32 | | 1.33 | | 1.32 | | 1.29 | | |
Net investment loss(3) | | % | (0.82 | ) | (0.45 | ) | (0.88 | ) | (0.76 | ) | (0.66 | ) | |
Portfolio turnover rate | | % | 10 | | 3 | | 0 | | 174 | | 160 | | |
(1) | | Commencement of operations. |
| | |
(2) | | Total return is calculated assuming reinvestment of all dividends and capital gain distributions at net asset value and does not reflect the effect of insurance contract changes. Total return for periods less than one year is not annualized. |
| | |
(3) | | Annualized for periods less than one year. |
| | |
* | | Per share numbers have been calculated using the average number of shares outstanding throughout the period. |
| | |
† | | In 2005, there was no impact on total return from the gain realized on the disposal of investments made in violation of the Portfolio’s investment restrictions. |
See Notes to Financial Statements.
111
ING SALOMON BROTHERS LARGE CAP GROWTH PORTFOLIO | FINANCIAL HIGHLIGHTS |
Selected data for a share outstanding for each period.
| | | Class I | |
| | | | | | | May 1, | |
| | | | | | | 2003(1) to | |
| | | Year Ended December 31, | | December 31, | |
| | | 2005 | | 2004 | | 2003 | |
| | | | | | | | |
Per Share Operating Performance: | | | | | | | | |
Net asset value, beginning of period | | $ | 12.28 | | | 12.13 | | | 10.00 | | |
Income (loss) from investment operations: | | | | | | | | | | | |
Net investment income (loss) | | $ | 0.00 | * | | 0.00 | * | | (0.02 | ) | |
Net realized and unrealized gain on investments | | $ | 0.53 | | | 0.71 | | | 2.15 | | |
Total from investment operations | | $ | 0.53 | | | 0.71 | | | 2.13 | | |
Less distributions: | | | | | | | | | | | |
Net realized gain on investments | | $ | (1.15 | ) | | (0.56 | ) | | — | | |
Total distributions | | $ | (1.15 | ) | | (0.56 | ) | | — | | |
Net asset value, end of period | | $ | 11.66 | | | 12.28 | | | 12.13 | | |
Total Return(2) | | % | 5.24 | | | 6.69 | | | 21.30 | | |
| | | | | | | | | | | |
Ratios and Supplemental Data: | | | | | | | | | | | |
Net assets, end of period (000’s) | | $ | 18,673 | | | 18,587 | | | 1 | | |
Ratios to average net assets: | | | | | | | | | | | |
Expenses(3) | | % | 0.84 | | | 0.89 | | | 0.90 | | |
Net investment income (loss)(3) | | % | 0.01 | | | 0.04 | | | (0.26 | ) | |
Portfolio turnover rate | | % | 27 | | | 291 | | | 116 | | |
| | | Class S | |
| | | | | | | May 1, | |
| | | | | | | 2003(1) to | |
| | | Year Ended December 31, | | December 31, | |
| | | 2005 | | 2004 | | 2003 | |
| | | | | | | | |
Per Share Operating Performance: | | | | | | | | |
Net asset value, beginning of period | | $ | 12.22 | | | 12.11 | | | 10.00 | | |
Income (loss) from investment operations: | | | | | | | | | | | |
Net investment loss | | $ | (0.03 | ) | | (0.00 | )* | | (0.04 | ) | |
Net realized and unrealized gain on investments | | $ | 0.53 | | | 0.67 | | | 2.15 | | |
Total from investment operations | | $ | 0.50 | | | 0.67 | | | 2.11 | | |
Less distributions: | | | | | | | | | | | |
Net realized gain on investments | | $ | (1.15 | ) | | (0.56 | ) | | — | | |
Total distributions | | $ | (1.15 | ) | | (0.56 | ) | | — | | |
Net asset value, end of period | | $ | 11.57 | | | 12.22 | | | 12.11 | | |
Total Return(2) | | % | 5.02 | | | 6.45 | | | 21.00 | | |
| | | | | | | | | | | |
Ratios and Supplemental Data: | | | | | | | | | | | |
Net assets, end of period (000’s) | | $ | 14,287 | | | 16,118 | | | 1 | | |
Ratios to average net assets: | | | | | | | | | | | |
Expenses(3) | | % | 1.09 | | | 1.14 | | | 1.15 | | |
Net investment loss(3) | | % | (0.23 | ) | | (0.21 | ) | | (0.53 | ) | |
Portfolio turnover rate | | % | 27 | | | 291 | | | 116 | | |
(1) | | Commencement of operations. |
| | |
(2) | | Total return is calculated assuming reinvestment of all dividends and capital gain distributions at net asset value and does not reflect the effect of insurance contract changes. Total return for periods less than one year is not annualized. |
| | |
(3) | | Annualized for periods less than one year. |
| | |
* | | Amount is less than $0.005, or $(0.005)%. |
See Notes to Financial Statements.
112
ING SALOMON BROTHERS LARGE CAP GROWTH PORTFOLIO (CONTINUED) | FINANCIAL HIGHLIGHTS |
Selected data for a share outstanding for each period.
| | | Class ADV | |
| | | | | | | May 1, | |
| | | | | | | 2003(1) to | |
| | | Year Ended December 31, | | December 31, | |
| | | 2005 | | 2004 | | 2003 | |
| | | | | | | | |
Per Share Operating Performance: | | | | | | | | |
Net asset value, beginning of period | | $ | 12.18 | | | 12.09 | | | 10.00 | | |
Income (loss) from investment operations: | | | | | | | | | | | |
Net investment loss | | $ | (0.06 | ) | | (0.08 | ) | | (0.06 | ) | |
Net realized and unrealized gain on investments | | $ | 0.52 | | | 0.73 | | | 2.15 | | |
Total from investment operations | | $ | 0.46 | | | 0.65 | | | 2.09 | | |
Less distributions: | | | | | | | | | | | |
Net realized gain on investments | | $ | (1.15 | ) | | (0.56 | ) | | — | | |
Total distributions | | $ | (1.15 | ) | | (0.56 | ) | | — | | |
Net asset value, end of period | | $ | 11.49 | | | 12.18 | | | 12.09 | | |
Total Return(2) | | % | 4.69 | | | 6.21 | | | 20.90 | | |
| | | | | | | | | | | |
Ratios and Supplemental Data: | | | | | | | | | | | |
Net assets, end of period (000’s) | | $ | 25,166 | | | 33,408 | | | 42,935 | | |
Ratios to average net assets: | | | | | | | | | | | |
Expenses(3) | | % | 1.34 | | | 1.39 | | | 1.40 | | |
Net investment loss(3) | | % | (0.49 | ) | | (0.57 | ) | | (0.78 | ) | |
Portfolio turnover rate | | % | 27 | | | 291 | | | 116 | | |
(1) | | Commencement of operations. |
| | |
(2) | | Total return is calculated assuming reinvestment of all dividends and capital gain distributions at net asset value and does not reflect the effect of insurance contract changes. Total return for periods less than one year is not annualized. |
| | |
(3) | | Annualized for periods less than one year. |
See Notes to Financial Statements.
113
ING T. ROWE PRICE DIVERSIFIED MID CAP GROWTH PORTFOLIO | FINANCIAL HIGHLIGHTS |
Selected data for a share outstanding for each period.
| | | Class I | |
| | | | | | | | | | | December 10, | |
| | | | | | | | | | | 2001(1) to | |
| | | Year Ended December 31, | | December 31, | |
| | | 2005 | | 2004 | | 2003 | | 2002 | | 2001 | |
| | | | | | | | | | | | |
Per Share Operating Performance: | | | | | | | | | | | | |
Net asset value, beginning of period | | $ | 8.06 | | 7.40 | | 5.11 | | 7.29 | | 7.23 | | |
Income (loss) from investment operations: | | | | | | | | | | | | | |
Net investment loss | | $ | (0.00 | )* | (0.00 | )* | (0.02 | ) | (0.01 | ) | (0.00 | )* | |
Net realized and unrealized gain (loss)
on investments | | $ | 0.73 | | 0.66 | | 2.31 | | (2.17 | ) | 0.06 | | |
Total from investment operations | | $ | 0.73 | | 0.66 | | 2.29 | | (2.18 | ) | 0.06 | | |
Less distributions: | | | | | | | | | | | | | |
Net realized gain on investments | | $ | (0.14 | ) | — | | — | | — | | — | | |
Total distributions | | $ | (0.14 | ) | — | | — | | — | | — | | |
Net asset value, end of period | | $ | 8.65 | | 8.06 | | 7.40 | | 5.11 | | 7.29 | | |
Total Return(2) | | % | 9.26 | | 9.05 | | 44.81 | | (29.90 | ) | 0.83 | | |
| | | | | | | | | | | | | |
Ratios and Supplemental Data: | | | | | | | | | | | | | |
Net assets, end of period (000’s) | | $ | 1,131,231 | | 474,397 | | 35,010 | | 2,644 | | 10 | | |
Ratios to average net assets: | | | | | | | | | | | | | |
Expenses(3) | | % | 0.66 | | 0.96 | | 1.05 | | 1.05 | | 1.05 | | |
Net investment loss(3) | | % | (0.04 | ) | (0.06 | ) | (0.76 | ) | (0.68 | ) | (0.82 | ) | |
Portfolio turnover rate | | % | 94 | | 441 | | 187 | | 328 | | 58 | | |
| | | | | | | | | | | | | | |
| | | Class S | |
| | | | | | | | | | | December 10, | |
| | | | | | | | | | | 2001(1) to | |
| | | Year Ended December 31, | | December 31, | |
| | | 2005 | | 2004 | | 2003 | | 2002 | | 2001 | |
| | | | | | | | | | | | |
Per Share Operating Performance: | | | | | | | | | | | | |
Net asset value, beginning of period | | $ | 7.99 | | 7.36 | | 5.09 | | 7.29 | | 7.23 | | |
Income (loss) from investment operations: | | | | | | | | | | | | | |
Net investment loss | | $ | (0.03 | ) | (0.07 | ) | (0.04 | ) | (0.02 | ) | (0.00 | )* | |
Net realized and unrealized gain (loss) on
investments | | $ | 0.73 | | 0.70 | | 2.31 | | (2.18 | ) | 0.06 | | |
Total from investment operations | | $ | 0.70 | | 0.63 | | 2.27 | | (2.20 | ) | 0.06 | | |
Less distributions: | | | | | | | | | | | | | |
Net realized gain on investments | | $ | (0.14 | ) | — | | — | | — | | — | | |
Total distributions | | $ | (0.14 | ) | — | | — | | — | | — | | |
Net asset value, end of period | | $ | 8.55 | | 7.99 | | 7.36 | | 5.09 | | 7.29 | | |
Total Return(2) | | % | 8.96 | | 8.56 | | 44.60 | | (30.18 | ) | 0.83 | | |
| | | | | | | | | | | | | |
Ratios and Supplemental Data: | | | | | | | | | | | | | |
Net assets, end of period (000’s) | | $ | 21,871 | | 29,155 | | 30,354 | | 1,110 | | 10 | | |
Ratios to average net assets: | | | | | | | | | | | | | |
Expenses(3) | | % | 0.91 | | 1.21 | | 1.30 | | 1.30 | | 1.30 | | |
Net investment loss(3) | | % | (0.30 | ) | (0.88 | ) | (1.00 | ) | (0.90 | ) | (0.99 | ) | |
Portfolio turnover rate | | % | 94 | | 441 | | 187 | | 328 | | 58 | | |
| | | | | | | | | | | | | | |
(1) | | Commencement of operations. |
| | |
(2) | | Total return is calculated assuming reinvestment of all dividends and capital gain distributions at net asset value and does not reflect the effect of insurance contract changes. Total return for periods less than one year is not annualized. |
| | |
(3) | | Annualized for periods less than one year. |
| | |
* | | Amount is less than $0.005. |
See Notes to Financial Statements.
114
ING T. ROWE PRICE DIVERSIFIED MID CAP GROWTH PORTFOLIO (CONTINUED) | FINANCIAL HIGHLIGHTS |
Selected data for a share outstanding for each period.
| | Class ADV | |
| | Year Ended December 31, | | December 10,
2001(1) to
December 31, | |
| | 2005 | | 2004 | | 2003 | | 2002 | | 2001 | |
Per Share Operating Performance: | | | | | | | | | | | |
Net asset value, beginning of period | $ | 7.94 | | | 7.33 | | | 5.08 | | | 7.29 | | | 7.23 | | |
Income (loss) from investment operations: | | | | | | | | | | | | | | | | |
Net investment loss | $ | (0.05 | ) | | (0.10 | ) | | (0.07 | ) | | (0.07 | ) | | (0.01 | ) | |
Net realized and unrealized gain (loss) on investments | $ | 0.72 | | | 0.71 | | | 2.32 | | | (2.14 | ) | | 0.07 | | |
Total from investment operations | $ | 0.67 | | | 0.61 | | | 2.25 | | | (2.21 | ) | | 0.06 | | |
Less distributions: | | | | | | | | | | | | | | | | |
Net realized gain on investments | $ | (0.14 | ) | | — | | | — | | | — | | | — | | |
Total distributions | $ | (0.14 | ) | | — | | | — | | | — | | | — | | |
Net asset value, end of period | $ | 8.47 | | | 7.94 | | | 7.33 | | | 5.08 | | | 7.29 | | |
Total Return(2) | % | 8.64 | | | 8.32 | | | 44.29 | | | (30.32 | ) | | 0.83 | | |
| | | | | | | | | | | | | | | | |
Ratios and Supplemental Data: | | | | | | | | | | | | | | | | |
Net assets, end of period (000’s) | $ | 69,686 | | | 80,813 | | | 107,353 | | | 71,775 | | | 80,999 | | |
Ratios to net assets: | | | | | | | | | | | | | | | | |
Net expenses after expense reimbursement(3) | % | 1.15 | | | 1.46 | | | 1.55 | | | 1.55 | | | 1.53 | | |
Gross expenses prior to expense reimbursement(3) | % | 1.16 | | | 1.47 | | | — | | | — | | | — | | |
Net investment loss(3) | % | (0.54 | ) | | (1.13 | ) | | (1.24 | ) | | (1.19 | ) | | (1.28 | ) | |
Portfolio turnover rate | % | 94 | | | 441 | | | 187 | | | 328 | | | 58 | | |
(1) Commencement of operations.
(2) Total return is calculated assuming reinvestment of all dividends and capital gain distributions at net asset value and does not reflect the effect of insurance contract changes. Total return for periods less than one year is not annualized.
(3) Annualized for periods less than one year.
See Notes to Financial Statements.
115
ING T. ROWE PRICE GROWTH EQUITY PORTFOLIO | | FINANCIAL HIGHLIGHTS |
Selected data for a share outstanding for each period.
| | Class I | |
| | Year Ended December 31, | |
| | 2005 | | 2004 | | 2003 | | 2002 | | 2001 | |
Per Share Operating Performance: | | | | | | | | | | | |
Net asset value, beginning of year | $ | 49.81 | | | 45.35 | | | 34.69 | | | 45.32 | | | 60.44 | | |
Income (loss) from investment operations: | | | | | | | | | | | | | | | | |
Net investment income | $ | 0.19 | † | | 0.29 | | | 0.09 | | | 0.08 | † | | 0.09 | | |
Net realized and unrealized gain (loss) on investments | $ | 2.87 | | | 4.24 | | | 10.63 | | | (10.63 | ) | | (6.23 | ) | |
Total from investment operations | $ | 3.06 | | | 4.53 | | | 10.72 | | | (10.55 | ) | | (6.14 | ) | |
Less distributions: | | | | | | | | | | | | | | | | |
Net investment income | $ | (0.25 | ) | | (0.07 | ) | | (0.06 | ) | | (0.08 | ) | | (0.07 | ) | |
Net realized gain on investments | $ | — | | | — | | | — | | | — | | | (8.91 | ) | |
Total distributions | $ | (0.25 | ) | | (0.07 | ) | | (0.06 | ) | | (0.08 | ) | | (8.98 | ) | |
Net asset value, end of year | $ | 52.62 | | | 49.81 | | | 45.35 | | | 34.69 | | | 45.32 | | |
Total Return(1) | % | 6.17 | | | 10.02 | | | 30.93 | | | (23.29 | ) | | (10.21 | ) | |
| | | | | | | | | | | | | | | | |
Ratios and Supplemental Data: | | | | | | | | | | | | | | | | |
Net assets, end of year (000’s) | $ | 898,102 | | | 830,034 | | | 669,956 | | | 429,634 | | | 592,879 | | |
Ratios to average net assets: | | | | | | | | | | | | | | | | |
Expenses(2) | % | 0.75 | | | 0.75 | | | 0.75 | | | 0.75 | | | 0.75 | | |
Net investment income(2) | % | 0.38 | | | 0.66 | | | 0.30 | | | 0.21 | | | 0.20 | | |
Portfolio turnover rate | % | 41 | | | 39 | | | 34 | | | 49 | | | 65 | | |
| | Class S | |
| | Year Ended December 31, | | December 10,
2001(3) to
December 31, | |
| | 2005 | | 2004 | | 2003 | | 2002 | | 2001 | |
Per Share Operating Performance: | | | | | | | | | | | | |
Net asset value, beginning of period | $ | 49.48 | | | 45.12 | | | 34.59 | | | 45.31 | | | 45.44 | | |
Income (loss) from investment operations: | | | | | | | | | | | | | | | | |
Net investment income | $ | 0.06 | † | | 0.22 | | | 0.06 | | | 0.03 | † | | 0.00 | * | |
Net realized and unrealized gain (loss) on investments | $ | 2.85 | | | 4.16 | | | 10.52 | | | (10.67 | ) | | (0.13 | ) | |
Total from investment operations | $ | 2.91 | | | 4.38 | | | 10.58 | | | (10.64 | ) | | (0.13 | ) | |
Less distributions: | | | | | | | | | | | | | | | | |
Net investment income | $ | (0.23 | ) | | (0.02 | ) | | (0.05 | ) | | (0.08 | ) | | — | | |
Total distributions | $ | (0.23 | ) | | (0.02 | ) | | (0.05 | ) | | (0.08 | ) | | — | | |
Net asset value, end of period | $ | 52.16 | | | 49.48 | | | 45.12 | | | 34.59 | | | 45.31 | | |
Total Return(1) | % | 5.92 | | | 9.74 | | | 30.58 | | | (23.50 | ) | | (0.29 | ) | |
| | | | | | | | | | | | | | | | |
Ratios and Supplemental Data: | | | | | | | | | | | | | | | | |
Net assets, end of period (000’s) | $ | 163,188 | | | 18,642 | | | 8,251 | | | 1,530 | | | 10 | | |
Ratios to average net assets: | | | | | | | | | | | | | | | | |
Expenses(2) | % | 1.00 | | | 1.00 | | | 1.00 | | | 1.00 | | | 1.00 | | |
Net investment income(2) | % | 0.12 | | | 0.62 | | | 0.04 | | | 0.09 | | | 0.17 | | |
Portfolio turnover rate | % | 41 | | | 39 | | | 34 | | | 49 | | | 65 | | |
(1) Total return is calculated assuming reinvestment of all dividends and capital gain distributions at net asset value and does not reflect the effect of insurance contract changes. Total return for periods less than one year is not annualized.
(2) Annualized for periods less than one year.
(3) Commencement of operations.
* Amount is less than $0.01.
† Per share numbers have been calculated using the average number of shares outstanding throughout the period.
See Notes to Financial Statements.
116
ING T. ROWE PRICE GROWTH EQUITY PORTFOLIO (CONTINUED) | | FINANCIAL HIGHLIGHTS |
Selected data for a share outstanding for each period.
| | Class ADV | |
| | Year Ended December 31, | | December 10,
2001(1) to
December 31, | |
| | 2005 | | 2004 | | 2003 | | 2002 | | 2001 | |
Per Share Operating Performance: | | | | | | | | | | | | | |
Net asset value, beginning of period | $ | 49.14 | | | 44.89 | | | 34.50 | | | 45.30 | | | 45.44 | | |
Income (loss) from investment operations: | | | | | | | | | | | | | | | | |
Net investment income (loss) | $ | (0.06 | )† | | 0.11 | | | (0.01 | ) | | (0.06 | )† | | (0.00 | )* | |
Net realized and unrealized gain (loss) on investments | $ | 2.84 | | | 4.14 | | | 10.44 | | | (10.66 | ) | | (0.14 | ) | |
Total from investment operations | $ | 2.78 | | | 4.25 | | | 10.43 | | | (10.72 | ) | | (0.14 | ) | |
Less distributions: | | | | | | | | | | | | | | | | |
Net investment income | $ | (0.05 | ) | | — | | | (0.04 | ) | | (0.08 | ) | | — | | |
Total distributions | $ | (0.05 | ) | | — | | | (0.04 | ) | | (0.08 | ) | | — | | |
Net asset value, end of period | $ | 51.87 | | | 49.14 | | | 44.89 | | | 34.50 | | | 45.30 | | |
Total Return(2) | % | 5.66 | | | 9.47 | | | 30.27 | | | (23.70 | ) | | (0.31 | ) | |
| | | | | | | | | | | | | | | | |
Ratios and Supplemental Data: | | | | | | | | | | | | | | | | |
Net assets, end of period (000’s) | $ | 86,781 | | | 78,870 | | | 60,182 | | | 13,601 | | | 10 | | |
Ratios to average net assets: | | | | | | | | | | | | | | | | |
Expenses(3) | % | 1.25 | | | 1.25 | | | 1.25 | | | 1.25 | | | 1.25 | | |
Net investment income (loss)(3) | % | (0.12 | ) | | 0.19 | | | (0.24 | ) | | (0.18 | ) | | (0.00 | )* | |
Portfolio turnover rate | % | 41 | | | 39 | | | 34 | | | 49 | | | 65 | | |
(1) Commencement of operations.
(2) Total return is calculated assuming reinvestment of all dividends and capital gain distributions at net asset value and does not reflect the effect of insurance contract changes. Total return for periods less than one year is not annualized.
(3) Annualized for periods less than one year.
* Amount is more than $(0.01) or (0.01)
† Per share numbers have been calculated using the average number of shares outstanding throughout the period.
See Notes to Financial Statements.
117
ING UBS U.S. LARGE CAP EQUITY PORTFOLIO | | FINANCIAL HIGHLIGHTS |
Selected data for a share outstanding for each period.
| | Class I | |
| | Year Ended December 31, | |
| | 2005 | | 2004 | | 2003 | | 2002 | | 2001 | |
Per Share Operating Performance: | | | | | | | | | | | |
Net asset value, beginning of year | $ | 8.58 | | | 7.54 | | | 6.07 | | | 8.11 | | | 13.08 | | |
Income (loss) from investment operations: | | | | | | | | | | | | | | | | |
Net investment income | $ | 0.08 | † | | 0.10 | | | 0.06 | | | 0.03 | | | 0.01 | | |
Net realized and unrealized gain (loss) on investments | $ | 0.72 | | | 1.00 | | | 1.45 | | | (2.06 | ) | | (2.58 | ) | |
Total from investment operations | $ | 0.80 | | | 1.10 | | | 1.51 | | | (2.03 | ) | | (2.57 | ) | |
Less distributions: | | | | | | | | | | | | | | | | |
Net investment income | $ | (0.08 | ) | | (0.06 | ) | | (0.04 | ) | | (0.01 | ) | | — | | |
Net realized gain on investments | $ | — | | | — | | | — | | | — | | | (2.40 | ) | |
Total distributions | $ | (0.08 | ) | | (0.06 | ) | | (0.04 | ) | | (0.01 | ) | | (2.40 | ) | |
Net asset value, end of year | $ | 9.30 | | | 8.58 | | | 7.54 | | | 6.07 | | | 8.11 | | |
Total Return(1) | % | 9.38 | | | 14.76 | | | 24.95 | | | (24.89 | ) | | (20.78 | ) | |
| | | | | | | | | | | | | | | | |
Ratios and Supplemental Data: | | | | | | | | | | | | | | | | |
Net assets, end of year (000’s) | $ | 270,692 | | | 267,249 | | | 264,755 | | | 245,281 | | | 384,924 | | |
Ratios to average net assets: | | | | | | | | | | | | | | | | |
Expenses(2) | % | 0.85 | | | 0.85 | | | 0.85 | | | 0.85 | | | 0.85 | | |
Net investment income(2) | % | 0.92 | | | 1.22 | | | 0.83 | | | 0.50 | | | 0.15 | | |
Portfolio turnover rate | % | 51 | | | 140 | | | 126 | | | 106 | | | 92 | | |
| | Class S | |
| | Year Ended December 31, | | December 10,
2001(3) to
December 31, | |
| | 2005 | | 2004 | | 2003 | | 2002 | | 2001 | |
Per Share Operating Performance: | | | | | | | | | | | |
Net asset value, beginning of period | $ | 8.52 | | | 7.49 | | | 6.05 | | | 8.10 | | | 8.12 | | |
Income (loss) from investment operations: | | | | | | | | | | | | | | | | |
Net investment income (loss) | $ | 0.06 | † | | 0.09 | | | 0.01 | | | 0.01 | | | (0.00 | )* | |
Net realized and unrealized gain (loss) on investments | $ | 0.70 | | | 1.00 | | | 1.47 | | | (2.05 | ) | | (0.02 | ) | |
Total from investment operations | $ | 0.76 | | | 1.09 | | | 1.48 | | | (2.04 | ) | | (0.02 | ) | |
Less distributions: | | | | | | | | | | | | | | | | |
Net investment income | $ | (0.07 | ) | | (0.06 | ) | | (0.04 | ) | | (0.01 | ) | | — | | |
Total distributions | $ | (0.07 | ) | | (0.06 | ) | | (0.04 | ) | | (0.01 | ) | | — | | |
Net asset value, end of period | $ | 9.21 | | | 8.52 | | | 7.49 | | | 6.05 | | | 8.10 | | |
Total Return(1) | % | 8.99 | | | 14.59 | | | 24.54 | | | (25.15 | ) | | (0.25 | ) | |
| | | | | | | | | | | | | | | | |
Ratios and Supplemental Data: | | | | | | | | | | | | | | | | |
Net assets, end of period (000’s) | $ | 9,667 | | | 2,356 | | | 1,352 | | | 8 | | | 10 | | |
Ratios to average net assets: | | | | | | | | | | | | | | | | |
Expenses(2) | % | 1.10 | | | 1.10 | | | 1.10 | | | 1.09 | | | 1.09 | | |
Net investment income (loss)(2) | % | 0.64 | | | 1.06 | | | 0.37 | | | 0.26 | | | (0.17 | ) | |
Portfolio turnover rate | % | 51 | | | 140 | | | 126 | | | 106 | | | 92 | | |
(1) Total return is calculated assuming reinvestment of all dividends and capital gain distributions at net asset value and does not reflect the effect of insurance contract changes. Total return for periods less than one year is not annualized.
(2) Annualized for periods less than one year.
(3) Commencement of operations.
* Amount is less than $0.005.
† Per share numbers have been calculated using the average number of shares outstanding throughout the period.
See Notes to Financial Statements.
118
ING UBS U.S. LARGE CAP EQUITY PORTFOLIO (CONTINUED) | | FINANCIAL HIGHLIGHTS |
Selected data for a share outstanding for each period.
| | Class ADV | |
| | Year Ended December 31, | | December 10,
2001(1) to
December 31, | |
| | 2005 | | 2004 | | 2003 | | 2002 | | 2001 | |
Per Share Operating Performance: | | | | | | | | | | | |
Net asset value, beginning of period | $ | 8.52 | | | 7.49 | | | 6.04 | | | 8.10 | | | 8.12 | | |
Income (loss) from investment operations: | | | | | | | | | | | | | | | | |
Net investment income (loss) | $ | 0.03 | † | | 0.05 | | | 0.02 | | | 0.02 | | | (0.00 | )* | |
Net realized and unrealized gain (loss) on investments | $ | 0.70 | | | 1.01 | | | 1.45 | | | (2.07 | ) | | (0.02 | ) | |
Total from investment operations | $ | 0.73 | | | 1.06 | | | 1.47 | | | (2.05 | ) | | (0.02 | ) | |
Less distributions: | | | | | | | | | | | | | | | | |
Net investment income | $ | (0.06 | ) | | (0.03 | ) | | (0.02 | ) | | (0.01 | ) | | — | | |
Total distributions | $ | (0.06 | ) | | (0.03 | ) | | (0.02 | ) | | (0.01 | ) | | — | | |
Net asset value, end of period | $ | 9.19 | | | 8.52 | | | 7.49 | | | 6.04 | | | 8.10 | | |
Total Return(2) | % | 8.67 | | | 14.21 | | | 24.42 | | | (25.29 | ) | | (0.25 | ) | |
| | | | | | | | | | | | | | | | |
Ratios and Supplemental Data: | | | | | | | | | | | | | | | | |
Net assets, end of period (000’s) | $ | 426 | | | 48 | | | 39 | | | 39 | | | 10 | | |
Ratios to average net assets: | | | | | | | | | | | | | | | | |
Expenses(3) | % | 1.35 | | | 1.35 | | | 1.35 | | | 1.34 | | | 1.34 | | |
Net investment income (loss)(3) | % | 0.37 | | | 0.73 | | | 0.33 | | | 0.29 | | | (0.33 | ) | |
Portfolio turnover rate | % | 51 | | | 140 | | | 126 | | | 106 | | | 92 | | |
(1) Commencement of operations.
(2) Total return is calculated assuming reinvestment of all dividends and capital gain distributions at net asset value and does not reflect the effect of insurance contract changes. Total return for periods less than one year is not annualized.
(3) Annualized for periods less than one year.
* Amount is more than $(0.01).
† Per share numbers have been calculated using the average number of shares outstanding throughout the period.
See Notes to Financial Statements.
119
ING VAN KAMPEN COMSTOCK PORTFOLIO | | FINANCIAL HIGHLIGHTS |
Selected data for a share outstanding for each period.
| | Class I | |
| | Year Ended December 31, | | May 1,
2002(1) to
December 31, | |
| | 2005 | | 2004 | | 2003 | | 2002 | |
Per Share Operating Performance: | | | | | | | | | |
Net asset value, beginning of period | $ | 12.33 | | | 10.60 | | | 8.35 | | | 10.00 | | |
Income (loss) from investment operations: | | | | | | | | | | | | | |
Net investment income | $ | 0.19 | * | | 0.12 | | | 0.09 | | | 0.04 | | |
Net realized and unrealized gain (loss) on investments | $ | 0.24 | | | 1.66 | | | 2.41 | | | (1.64 | ) | |
Total from investment operations | $ | 0.43 | | | 1.78 | | | 2.50 | | | (1.60 | ) | |
Less distributions: | | | | | | | | | | | | | |
Net investment income | $ | (0.08 | ) | | — | | | (0.08 | ) | | (0.05 | ) | |
Net realized gain on investments | $ | (0.46 | ) | | (0.05 | ) | | (0.17 | ) | | — | | |
Total distributions | $ | (0.54 | ) | | (0.05 | ) | | (0.25 | ) | | (0.05 | ) | |
Net asset value, end of period | $ | 12.22 | | | 12.33 | | | 10.60 | | | 8.35 | | |
Total Return(2) | % | 3.74 | | | 16.90 | | | 29.92 | | | (16.01 | ) | |
| | | | | | | | | | | | | |
Ratios and Supplemental Data: | | | | | | | | | | | | | |
Net assets, end of period (000’s) | $ | 133,987 | | | 70,308 | | | 33,398 | | | 3,874 | | |
Ratios to average net assets: | | | | | | | | | | | | | |
Net expenses after expense reimbursement(3) | % | 0.87 | | | 0.90 | | | 0.95 | | | 0.95 | | |
Gross expenses prior to expense reimbursement(3) | % | 0.95 | | | 0.90 | | | 0.95 | | | 0.95 | | |
Net investment income(3) | % | 1.57 | | | 1.40 | | | 1.28 | | | 1.70 | | |
Portfolio turnover rate | % | 27 | | | 30 | | | 32 | | | 47 | | |
| | | | | | | | | |
| | Class S | |
| | Year Ended December 31, | | May 1,
2002(1) to
December 31, | |
| | 2005 | | 2004 | | 2003 | | 2002 | |
Per Share Operating Performance: | | | | | | | | | |
Net asset value, beginning of period | $ | 12.29 | | | 10.58 | | | 8.34 | | | 10.00 | | |
Income (loss) from investment operations: | | | | | | | | | | | | | |
Net investment income | $ | 0.16 | * | | 0.09 | | | 0.05 | | | 0.05 | | |
Net realized and unrealized gain (loss) on investments | $ | 0.24 | | | 1.67 | | | 2.42 | | | (1.67 | ) | |
Total from investment operations | $ | 0.40 | | | 1.76 | | | 2.47 | | | (1.62 | ) | |
Less distributions: | | | | | | | | | | | | | |
Net investment income | $ | (0.07 | ) | | — | | | (0.06 | ) | | (0.04 | ) | |
Net realized gain on investments | $ | (0.46 | ) | | (0.05 | ) | | (0.17 | ) | | — | | |
Total distributions | $ | (0.53 | ) | | (0.05 | ) | | (0.23 | ) | | (0.04 | ) | |
Net asset value, end of period | $ | 12.16 | | | 12.29 | | | 10.58 | | | 8.34 | | |
Total Return(2) | % | 3.47 | | | 16.74 | | | 29.67 | | | (16.22 | ) | |
| | | | | | | | | | | | | |
Ratios and Supplemental Data: | | | | | | | | | | | | | |
Net assets, end of period (000’s) | $ | 537,092 | | | 317,797 | | | 139,236 | | | 12,723 | | |
Ratios to average net assets: | | | | | | | | | | | | | |
Net expenses after expense reimbursement(3) | % | 1.12 | | | 1.15 | | | 1.20 | | | 1.20 | | |
Gross expenses prior to expense reimbursement(3) | % | 1.20 | | | 1.15 | | | 1.20 | | | 1.20 | | |
Net investment income(3) | % | 1.31 | | | 1.15 | | | 1.06 | | | 1.23 | | |
Portfolio turnover rate | % | 27 | | | 30 | | | 32 | | | 47 | | |
(1) Commencement of operations.
(2) Total return is calculated assuming reinvestment of all dividends and capital gain distributions at net asset value and does not reflect the effect of insurance contract changes. Total return for periods less than one year is not annualized.
(3) Annualized for periods less than one year.
* Per share numbers have been calculated using the average number of shares outstanding throughout the period.
See Notes to Financial Statements.
120
ING VAN KAMPEN COMSTOCK PORTFOLIO (CONTINUED) | | FINANCIAL HIGHLIGHTS |
Selected data for a share outstanding for each period.
| | Class ADV | |
| | Year Ended December 31, | | May 1,
2002(1) to
December 31, | |
| | 2005 | | 2004 | | 2003 | | 2002 | |
Per Share Operating Performance: | | | | | | | | | |
Net asset value, beginning of period | $ | 12.22 | | 10.55 | | 8.32 | | 10.00 | |
Income (loss) from investment operations: | | | | | | | | | |
Net investment income | $ | 0.13 | * | 0.08 | | 0.07 | | 0.01 | |
Net realized and unrealized gain (loss) on investments | $ | 0.24 | | 1.64 | | 2.37 | | (1.65 | ) |
Total from investment operations | $ | 0.37 | | 1.72 | | 2.44 | | (1.64 | ) |
Less distributions: | | | | | | | | | |
Net investment income | $ | (0.04 | ) | — | | (0.04 | ) | (0.04 | ) |
Net realized gain on investments | $ | (0.47 | ) | (0.05 | ) | (0.17 | ) | — | |
Total distributions | $ | (0.51 | ) | (0.05 | ) | (0.21 | ) | (0.04 | ) |
Net asset value, end of period | $ | 12.08 | | 12.22 | | 10.55 | | 8.32 | |
Total Return(2) | % | 3.20 | | 16.41 | | 29.34 | | (16.36 | ) |
| | | | | | | | | |
Ratios and Supplemental Data: | | | | | | | | | |
Net assets, end of period (000’s) | $ | 25,455 | | 12,569 | | 8,556 | | 3,699 | |
Ratios to average net assets: | | | | | | | | | |
Net expenses after expense reimbursement(3) | % | 1.37 | | 1.40 | | 1.45 | | 1.45 | |
Gross expenses prior to expense reimbursement(3) | % | 1.45 | | 1.40 | | 1.45 | | 1.45 | |
Net investment income(3) | % | 1.06 | | 0.86 | | 0.77 | | 1.75 | |
Portfolio turnover rate | % | 27 | | 30 | | 32 | | 47 | |
(1) Commencement of operations.
(2) Total return is calculated assuming reinvestment of all dividends and capital gain distributions at net asset value and does not reflect the effect of insurance contract changes. Total return for periods less than one year is not annualized.
(3) Annualized for periods less than one year.
* Per share numbers have been calculated using the average number of shares outstanding throughout the period.
See Notes to Financial Statements.
121
ING VAN KAMPEN EQUITY AND INCOME PORTFOLIO (CONTINUED) | | FINANCIAL HIGHLIGHTS |
Selected data for a share outstanding for each period.
| | Class I | |
| | Year Ended December 31, | | December 10,
2001(1) to
December 31, | |
| | 2005 | | 2004 | | 2003 | | 2002 | | 2001 | |
Per Share Operating Performance: | | | | | | | | | | | |
Net asset value, beginning of period | $ | 33.47 | | | 30.35 | | | 23.94 | | | 31.14 | | | 31.41 | | |
Income (loss) from investment operations: | | | | | | | | | | | | | | | | |
Net investment income | $ | 0.73 | † | | 0.14 | | | 0.14 | | | 0.07 | | | 0.00 | * | |
Net realized and unrealized gain (loss) on investments | $ | 1.96 | | | 3.15 | | | 6.40 | | | (7.22 | ) | | (0.27 | ) | |
Total from investment operations | $ | 2.68 | | | 3.29 | | | 6.54 | | | (7.15 | ) | | (0.27 | ) | |
Less distributions: | | | | | | | | | | | | | | | | |
Net investment income | $ | (0.03 | ) | | (0.17 | ) | | (0.13 | ) | | (0.00 | )†* | | — | | |
Net realized gain on investments | $ | (0.03 | ) | | — | | | — | | | (0.05 | ) | | — | | |
Total distributions | $ | (0.06 | ) | | (0.17 | ) | | (0.13 | ) | | (0.05 | ) | | — | | |
Net asset value, end of period | $ | 36.09 | | | 33.47 | | | 30.35 | | | 23.94 | | | 31.14 | | |
Total Return(2) | % | 8.02 | | | 10.86 | | | 27.37 | | | (22.92 | ) | | (0.86 | ) | |
| | | | | | | | | | | | | | | | |
Ratios and Supplemental Data: | | | | | | | | | | | | | | | | |
Net assets, end of period (000’s) | $ | 847,997 | | | 551,489 | | | 2,883 | | | 1,378 | | | 10 | | |
Ratios to average net assets: | | | | | | | | | | | | | | | | |
Expenses(3) | % | 0.57 | | | 0.74 | | | 1.10 | | | 1.10 | | | 1.10 | | |
Net investment income(3) | % | 2.10 | | | 1.88 | | | 0.72 | | | 0.73 | | | 0.17 | | |
Portfolio turnover rate | % | 125 | | | 797 | | | 17 | | | 15 | | | 5 | | |
| | | | | | | | | | | | | | | | |
| | Class S | |
| | Year Ended December 31, | | December 10,
2001(1) to
December 31, | |
| | 2005 | | 2004 | | 2003 | | 2002 | | 2001 | |
Per Share Operating Performance: | | | | | | | | | | | | | | | | |
Net asset value, beginning of period | $ | 33.37 | | | 30.27 | | | 23.88 | | | 31.14 | | | 31.41 | | |
Income (loss) from investment operations: | | | | | | | | | | | | | | | | |
Net investment income | $ | 0.63 | † | | 0.17 | | | 0.12 | | | 0.07 | | | 0.00 | * | |
Net realized and unrealized gain (loss) on investments | $ | 1.96 | | | 3.03 | | | 6.33 | | | (7.28 | ) | | (0.27 | ) | |
Total from investment operations | $ | 2.59 | | | 3.20 | | | 6.45 | | | (7.21 | ) | | (0.27 | ) | |
Less distributions: | | | | | | | | | | | | | | | | |
Net investment income | $ | — | | | (0.10 | ) | | (0.06 | ) | | (0.00 | )†* | | — | | |
Net realized gain on investments | $ | (0.03 | ) | | — | | | — | | | (0.05 | ) | | — | | |
Total distributions | $ | (0.03 | ) | | (0.10 | ) | | (0.06 | ) | | (0.05 | ) | | — | | |
Net asset value, end of period | $ | 35.93 | | | 33.37 | | | 30.27 | | | 23.88 | | | 31.14 | | |
Total Return(2) | % | 7.77 | | | 10.62 | | | 27.04 | | | (23.13 | ) | | (0.86 | ) | |
| | | | | | | | | | | | | | | | |
Ratios and Supplemental Data: | | | | | | | | | | | | | | | | |
Net assets, end of period (000’s) | $ | 59,793 | | | 34,477 | | | 17,744 | | | 13,685 | | | 13,660 | | |
Ratios to average net assets: | | | | | | | | | | | | | | | | |
Expenses(3) | % | 0.82 | | | 0.99 | | | 1.35 | | | 1.35 | | | 1.34 | | |
Net investment income(3) | % | 1.84 | | | 0.99 | | | 0.46 | | | 0.27 | | | 0.04 | | |
Portfolio turnover rate | % | 125 | | | 797 | | | 17 | | | 15 | | | 5 | | |
| | | | | | | | | | | | | | | | | | | |
(1) Commencement of operations.
(2) Total return is calculated assuming reinvestment of all dividends and capital gain distributions at net asset value and does not reflect the effect of insurance contract changes. Total return for periods less than one year is not annualized.
(3) Annualized for periods less than one year.
* Amount is less than $0.005.
† Per share numbers have been calculated using the average number of shares outstanding throughout the period.
See Notes to Financial Statements.
122
ING VAN KAMPEN EQUITY AND INCOME PORTFOLIO (CONTINUED) | | FINANCIAL HIGHLIGHTS |
Selected data for a share outstanding for each period.
| | Class ADV | |
| | Year Ended December 31, | | December 10,
2001(1) to
December 31, | |
| | 2005 | | 2004 | | 2003 | | 2002 | | 2001 | |
Per Share Operating Performance: | | | | | | | | | | | |
Net asset value, beginning of period | $ | 33.11 | | 30.07 | | 23.81 | | 31.13 | | 31.41 | |
Income (loss) from investment operations: | | | | | | | | | | | |
Net investment income (loss) | $ | 0.53 | † | 0.15 | | 0.06 | | 0.02 | | (0.00 | )* |
Net realized and unrealized gain (loss) on investments | $ | 1.95 | | 2.96 | | 6.30 | | (7.29 | ) | (0.28 | ) |
Total income (loss) from investment operations | $ | 2.48 | | 3.11 | | 6.36 | | (7.27 | ) | (0.28 | ) |
Less distributions: | | | | | | | | | | | |
Net investment income | $ | (0.01 | ) | (0.07 | ) | (0.10 | ) | — | | — | |
Net realized gain on investments | $ | (0.03 | ) | — | | — | | (0.05 | ) | — | |
Total distributions | $ | (0.04 | ) | (0.07 | ) | (0.10 | ) | (0.05 | ) | — | |
Net asset value, end of period | $ | 35.55 | | 33.11 | | 30.07 | | 23.81 | | 31.13 | |
Total Return(2) | % | 7.49 | | 10.32 | | 26.76 | | (23.35 | ) | (0.89 | ) |
| | | | | | | | | | | |
Ratios and Supplemental Data: | | | | | | | | | | | |
Net assets, end of period (000’s) | $ | 14,307 | | 8,611 | | 123 | | 22 | | 10 | |
Ratios to average net assets: | | | | | | | | | | | |
Expenses(3) | % | 1.07 | | 1.24 | | 1.60 | | 1.60 | | 1.60 | |
Net investment income (loss)(3) | % | 1.56 | | 1.29 | | 0.22 | | 0.09 | | (0.17 | ) |
Portfolio turnover rate | % | 125 | | 797 | | 17 | | 15 | | 5 | |
(1) Commencement of operations.
(2) Total return is calculated assuming reinvestment of all dividends and capital gain distributions at net asset value and does not reflect the effect of insurance contract changes. Total return for periods less than one year is not annualized.
(3) Annualized for periods less than one year.
* Amount is less than $0.005.
† Per share numbers have been calculated using the average number of shares outstanding throughout the period.
See Notes to Financial Statements.
123
NOTES TO FINANCIAL STATEMENTS AS OF DECEMBER 31, 2005
NOTE 1 — ORGANIZATION
ING Life Insurance and Annuity Company (“ILIAC” or the “Investment Advisor”) created ING Partners, Inc. (the “Fund”) to serve as an investment option underlying variable insurance products offered by ILIAC and its insurance company affiliates. The Fund is an open-end management investment company registered under the Investment Company Act of 1940 (the “1940 Act”). It was incorporated under the laws of Maryland on May 7, 1997. The Articles of Incorporation permit the Fund to offer separate series (“Portfolios”), each of which has its own investment objective, policies and restrictions.
The Fund currently consists of thirty five diversified Portfolios and two non-diversified Portfolios. The twenty-two included in this report are: ING American Century Large Company Value Portfolio (“American Century Large Company Value”); ING American Century Select Portfolio (“American Century Select”); ING American Century Small Cap Value Portfolio (“American Century Small Cap Value”); ING Baron Small Cap Growth Portfolio (“Baron Small Cap Growth”); ING Davis Venture Value Portfolio (formerly, ING Salomon Brothers Fundamental Value Portfolio, “Davis Venture Value”); ING Fundamental Research Portfolio (“Fundamental Research”); ING Goldman Sachs® Capital Growth Portfolio (“Goldman Sachs® Capital Growth”); ING Goldman Sachs® Core Equity Portfolio (“Goldman Sachs® Core Equity”); ING JPMorgan Fleming International Portfolio (“JPMorgan Fleming International”); ING JPMorgan Mid Cap Value Portfolio (“JPMorgan Mid Cap Value”); ING MFS Capital Opportunities Portfolio (“MFS Capital Opportunities”); ING OpCap Balanced Value Portfolio (“OpCap Balanced Value”); ING Oppenheimer Global Portfolio (“Oppenheimer Global”); ING Oppenheimer Strategic Income Portfolio (“Oppenheimer Strategic Income”); ING PIMCO Total Return Portfolio (“PIMCO Total Return”); ING Salomon Brothers Aggressive Growth Portfolio (“Salomon Brothers Aggressive Growth”); ING Salomon Brothers Large Cap Growth Portfolio (“Salomon Brothers Large Cap Growth”); ING T. Rowe Price Diversified Mid Cap Growth Portfolio (“T. Rowe Price Diversified Mid Cap Growth”); ING T. Rowe Price Growth Equity Portfolio (“T. Rowe Price Growth Equity”); ING UBS U.S. Large Cap Equity Portfolio (“UBS U.S. Large Cap Equity”); ING Van Kampen Comstock Portfolio (“Van Kampen Comstock”) and ING Van Kampen Equity and Income Portfolio (“Van Kampen Equity and Income”).
ING JPMorgan Mid Cap Value and ING Davis Venture Value are classified as “non-diversified” portfolios under the 1940 Act.
The following is a brief description of each Portfolio’s investment objective:
• American Century Large Company Value seeks long-term capital growth;
• American Century Select seeks long-term capital appreciation;
• American Century Small Cap Value seeks long-term growth of capital, income is a secondary objective;
• Baron Small Cap Growth seeks capital appreciation;
• Davis Venture Value seeks to provide long-term growth of capital;
• Fundamental Research seeks to maximize total return through investments in a diversified portfolio of common stocks and securities convertible into common stocks;
• Goldman Sachs® Capital Growth seeks long-term growth of capital;
• Goldman Sachs® Core Equity seeks long-term growth of capital and dividend income;
• JPMorgan Fleming International seeks long-term growth of capital;
• JPMorgan Mid Cap Value seeks growth from capital appreciation;
• MFS Capital Opportunities seeks capital appreciation;
• OpCap Balanced Value seeks capital growth and, secondarily, investment income;
• Oppenheimer Global seeks capital appreciation;
• Oppenheimer Strategic Income seeks a high level of current income principally derived from interest on debt securities;
• PIMCO Total Return seeks maximum total return, consistent with capital preservation and prudent investment management;
• Salomon Brothers Aggressive Growth seeks to provide long-term growth of capital;
• Salomon Brothers Large Cap Growth seeks long-term capital appreciation;
• T. Rowe Price Diversified Mid Cap Growth seeks long-term capital appreciation;
• T. Rowe Price Growth Equity seeks long-term capital growth and, secondarily, increased dividend income;
• UBS U.S. Large Cap Equity seeks long-term growth of capital and future income;
124
NOTES TO FINANCIAL STATEMENTS AS OF DECEMBER 31, 2005 (CONTINUED)
NOTE 1 — ORGANIZATION (continued)
• Van Kampen Comstock seeks capital growth and income; and
• Van Kampen Equity and Income seeks total return that consists of long-term capital appreciation and current income.
The Fund offers three classes of shares, referred to as Initial Class (Class “I”), Service Class (Class “S”) and Adviser Class (Class “ADV”). The classes differ principally in applicable distribution and shareholder service fees. Shareholders of each class also bear certain expenses that pertain to that particular class. All shareholders bear the common expenses of the Portfolios and earn income and realized gains/losses from the Portfolio pro rata based on the average daily net assets of each class, without discrimination between share classes. Differences in per share dividend rates generally result from differences in separate class expenses, including distribution and shareholder servicing fees. Class I shares are intended for distribution networks including non-qualified annuity and life insurance contracts and qualified retirement plans offered through an annuity contract, as well as qualified retirement plans offered through a custodial account where the sale is made on a direct basis without the involvement of a financial intermediary or where the qualified retirement plan has assets of $50 million or more. Class S and Class ADV shares of a Portfolio are intended for distribution networks including qualified retirement plans offered through an annuity contract or custodial account. Shareholders of the Class I shares of each Portfolio will generally be entitled to exchange those shares at net asset value for Class I shares of other Portfolios that offer Class I shares. Shareholders of the Class ADV shares of each Portfolio will generally be entitled to exchange those shares at net asset value for Class ADV shares of other Portfolios that offer Class ADV shares. Shareholders of the Class ADV shares continue to be subject to the Rule 12b-1 Plan fee applicable to Class ADV shares after the exchange. Shareholders of Class S shares of each Portfolio will generally be entitled to exchange those shares at net asset value for Class S shares of other Portfolios that offer Class S shares. Each Portfolio’s shares may be offered to variable annuity and variable life insurance separate accounts, qualified pension and retirement plans outside the separate account context, and to certain investment advisers and their affiliates.
ILIAC serves as the Investment Adviser to the Portfolios. ILIAC has engaged ING Investment Management Co. (“ING IM’’), a Connecticut corporation, to serve as the Sub-Adviser to the Fundamental Research. ING Financial Advisers, LLC (“IFA” or the “Distributor”) serves as the principal underwriter to the Portfolios. ILIAC, ING IM and IFA are indirect, wholly-owned subsidiaries of ING Groep N.V. (“ING Groep”). ING Groep is one of the largest financial services organizations in the world, and offers an array of banking, insurance and asset management services to both individuals and institutional investors.
NOTE 2 — SIGNIFICANT ACCOUNTING POLICIES
The following significant accounting policies are consistently followed by the Portfolios in the preparation of their financial statements. Such policies are in conformity with U.S. generally accepted accounting principles for investment companies.
A. Security Valuation. Investments in equity securities traded on a national securities exchange are valued at the last reported sale price. Securities reported by NASDAQ are valued at the NASDAQ official closing prices. Securities traded on an exchange or NASDAQ for which there has been no sale and securities traded in the over-the-counter-market are valued at the mean between the last reported bid and ask prices. All investments quoted in foreign currencies will be valued daily in U.S. dollars on the basis of the foreign currency exchange rates prevailing at that time. Debt securities are valued at prices obtained from independent services or from one or more dealers making markets in the securities and may be adjusted based on the Portfolios’ valuation procedures. U.S. Government obligations are valued by using market quotations or independent pricing services that use prices provided by market-makers or estimates of market values obtained from yield data relating to instruments or securities with similar characteristics.
Securities and assets for which market quotations are not readily available (which may include certain restricted securities, which are subject to limitations as to their sale) are valued at their fair values as determined in good faith by or under the supervision of the Portfolios’ Board of Directors (“Board”), in accordance with methods that are specifically authorized by the Board. Securities traded on exchanges, including foreign exchanges, which close earlier than the time that a Portfolio calculates its net asset value (“NAV”) may also be valued at their fair values as determined in good faith by or under the supervision of a Portfolio’s Board, in accordance with methods that are specifically authorized by the Board. If an event occurs after the time at which the market for foreign securities held by the Portfolio closes but before the time that the
125
NOTES TO FINANCIAL STATEMENTS AS OF DECEMBER 31, 2005 (CONTINUED)
NOTE 2 — SIGNIFICANT ACCOUNTING POLICIES (continued)
Portfolio’s NAV is calculated, such event may cause the closing price on the foreign exchange to not represent a readily available reliable market value quotation for such securities at the time the Portfolio determines its NAV. In such a case, the Portfolio will use the fair value of such securities as determined under the Portfolio’s valuation procedures. Events after the close of trading on a foreign market that could require the Portfolio to fair value some or all of its foreign securities include, among others, securities trading in the U.S. and other markets, corporate announcements, natural and other disasters, and political and other events. Among other elements of analysis in the determination of a security’s fair value, the Board has authorized the use of one or more independent research services to assist with such determinations. An independent research service may use statistical analyses and quantitative models to help determine fair value as of the time a Portfolio calculates its NAV. There can be no assurance that such models accurately reflect the behavior of the applicable markets or the effect of the behavior of such markets on the fair value of securities, or that such markets will continue to behave in a fashion that is consistent with such models. Unlike the closing price of a security on an exchange, fair value determinations employ elements of judgment. Consequently, the fair value assigned to a security may not represent the actual value that the Portfolio could obtain if it were to sell the security at the time of the close of the NYSE. Pursuant to procedures adopted by the Board, the Portfolio is not obligated to use the fair valuations suggested by any research service, and valuation recommendations provided by such research services may be overridden if other events have occurred or if other fair valuations are determined in good faith to be more accurate. Unless an event is such that it causes the Portfolio to determine that the closing prices for one or more securities do not represent readily available reliable market value quotations at the time the Portfolio determines its NAV, events that occur between the time of the close of the foreign market on which they are traded and the close of regular trading on the NYSE will not be reflected in the Portfolio’s NAV. Investments in securities maturing in 60 days or less at the date of valuation are valued at amortized cost, which, when combined with accrued interest, approximates market value.
B. Security Transactions and Revenue Recognition. Securities transactions are accounted for on the trade date. Realized gains and losses are reported on the basis of identified cost of securities sold. Interest income is recorded on an accrual basis. Dividend income is recorded on the ex-dividend date, or for certain foreign securities, when the information becomes available to the Portfolios. Premium amortization and discount accretion are determined by the effective yield method.
C. Foreign Currency Translation. The books and records of the portfolios are maintained in U.S. dollars. Any foreign currency amounts are translated into U.S. dollars on the following basis:
(1) Market value of investment securities, other assets and liabilities — at the exchange rates prevailing at the end of the day.
(2) Purchases and sales of investment securities, income and expenses — at the rates of exchange prevailing on the respective dates of such transactions.
Although the net assets and the market values are presented at the foreign exchange rates at the end of the day, the Portfolios do not isolate the portion of the results of operations resulting from changes in foreign exchange rates on investments from the fluctuations arising from changes in market prices of securities held. Such fluctuations are included with the net realized and unrealized gains or losses from investments. For securities, which are subject to foreign withholding tax upon disposition, liabilities are recorded on the Statements of Assets and Liabilities for the estimated tax withholding based on the securities’ current market value. Upon disposition, realized gains or losses on such securities are recorded net of foreign withholding tax. Reported net realized foreign exchange gains or losses arise from sales of foreign currencies, currency gains or losses realized between the trade and settlement dates on securities transactions, the difference between the amounts of dividends, interest, and foreign withholding taxes recorded on the Portfolio’s books, and the U.S. dollar equivalent of the amounts actually received or paid. Net unrealized foreign exchange gains and losses arise from changes in the value of assets and liabilities other than investments in securities at fiscal year end, resulting from changes in the exchange rate. Foreign security and currency transactions may involve certain considerations and risks not typically associated with investing in U.S.
126
NOTES TO FINANCIAL STATEMENTS AS OF DECEMBER 31, 2005 (CONTINUED)
NOTE 2 — SIGNIFICANT ACCOUNTING POLICIES (continued)
companies and U.S. Government securities. These risks include, but are not limited to, revaluation of currencies and future adverse political and economic developments, which could cause securities and their markets to be less liquid and prices more volatile than those of comparable U.S. companies and U.S. Government securities.
D. Foreign Currency Transactions and Futures Contracts. Certain Portfolios may enter into foreign currency exchange transactions to convert to and from different foreign currencies and to and from the U.S. dollar in connection with the planned purchases or sales of securities. When entering into a currency forward contract, a Portfolio agrees to receive or deliver a fixed quantity of foreign currency for an agreed-upon price on an agreed future date. The Portfolios either enter into these transactions on a spot basis at the spot rate prevailing in the foreign currency exchange market or use forward foreign currency contracts to purchase or sell foreign currencies. When the contract is fulfilled or closed, gains or losses are realized. Until then, the gain or loss is included in unrealized appreciation or depreciation. Risks may arise upon entering into forward contracts from the potential inability of counterparties to meet the terms of their forward contracts and from unanticipated movements in the value of foreign currencies relative to the U.S. dollar. Certain Portfolios may enter into futures contracts involving foreign currency, interest rates, securities and securities indices. A futures contract obligates the seller of the contract to deliver and the purchaser of the contract to take delivery of the type of foreign currency, financial instrument or security called for in the contract at a specified future time for a specified price. Upon entering into such a contract, a Portfolio is required to deposit and maintain as collateral such initial margin as required by the exchange on which the contract is traded. Pursuant to the contract, a Portfolio agrees to receive from or pay to the broker an amount equal to the daily fluctuations in the value of the contract. Such receipts or payments are known as variation margins and are recorded as unrealized gains or losses by the Portfolio. When the contract is closed, the Portfolio records a realized gain or loss equal to the difference between the value of the contract at the time it was opened and the value at the time it was closed.
E. Distributions to Shareholders. The Portfolios record distributions to their shareholders on the ex-dividend date. Dividends from net investment income and capital gains, if any, are declared and paid annually. The Portfolios may make distributions on a more frequent basis to comply with the distribution requirements of Sub-Chapter M of the Internal Revenue Code. The characteristics of income and gains to be distributed are determined in accordance with income tax regulations, which may differ from U.S. generally accepted accounting principles for investment companies.
F. Federal Income Taxes. It is the policy of the Portfolios to comply with subchapter M of the Internal Revenue Code and related excise tax provisions applicable to regulated investment companies and to distribute substantially all of their net investment income and any net realized capital gains to their shareholders. Therefore, no federal income tax provision is required. No capital gain distributions shall be made until any capital loss carryforwards have been fully utilized or expired.
G. Use of Estimates. Management of the Portfolios has made certain estimates and assumptions relating to the reporting of assets, liabilities, income, and expenses to prepare these financial statements in conformity with U.S. generally accepted accounting principles for investment companies. Actual results could differ from these estimates.
H. Repurchase Agreements. Each Portfolio may invest in repurchase agreements only with government securities dealers recognized by the Board of Governors of the Federal Reserve System. Under such agreements, the seller of the security agrees to repurchase it at a mutually agreed upon time and price. The resale price is in excess of the purchase price and reflects an agreed upon interest rate for the period of time the agreement is outstanding. The period of the repurchase agreements is usually short, from overnight to one week, while the underlying securities generally have longer maturities. Each Portfolio will receive as collateral securities acceptable to it whose market value is equal to at least 100% of the carrying amount of the repurchase agreements, plus accrued interest, being invested by the Portfolio. The underlying collateral is valued daily on a mark-to-market basis to assure that the value, including accrued interest is at least equal to the repurchase price. There would be a potential loss to the Portfolio in the event the Portfolio is delayed or prevented from exercising its right to
127
NOTES TO FINANCIAL STATEMENTS AS OF DECEMBER 31, 2005 (CONTINUED)
NOTE 2 — SIGNIFICANT ACCOUNTING POLICIES (continued)
dispose of the collateral, and it might incur disposition costs in liquidating the collateral.
I. Securities Lending. Each Portfolio has the option to temporarily loan up to 30% of its total assets to brokers, dealers or other financial institutions in exchange for a negotiated lender’s fee. The borrower is required to fully collateralize the loans with cash or U.S. Government securities. Generally, in the event of counterparty default, the Portfolio has the right to use collateral to offset losses incurred. There would be potential loss to the Portfolio in the event the Portfolio is delayed or prevented from exercising its right to dispose of the collateral. The Portfolio bears the risk of loss with respect to the investment of collateral. Engaging in securities lending could have a leveraging effect, which may intensify the credit, market and other risks associated with investing in a Portfolio.
J. Illiquid and Restricted Securities. The Portfolios may not invest more than 15% of their net assets in illiquid securities. Illiquid securities are not readily marketable. Disposing of illiquid investments may involve time consuming negotiation and legal expenses, and it may be difficult or impossible for the Portfolios to sell them promptly at an acceptable price. The Portfolios may also invest in restricted securities, which include those sold under Rule 144A of the Securities Act of 1933 (“1933 Act”) or securities offered pursuant to Section 4(2) of the 1933 Act, and/or are subject to legal or contractual restrictions on resale and may not be publicly sold without registration under the 1933 Act. Certain restricted securities may be considered liquid pursuant to guidelines approved by the Board or may be deemed to be illiquid because they may not be readily marketable. Illiquid and restricted securities are valued using market quotations when readily available. In the absence of market quotations, the securities are valued based upon their fair value determined under procedures approved by the Board.
K. Delayed Delivery Transactions. Each Portfolio may purchase or sell securities on a when-issued or forward commitment basis. The price of the underlying securities and date when the securities will be delivered and paid for are fixed at the time the transaction is negotiated. The market value of such is identified in the Portfolios’ Portfolio of Investments. Losses may arise due to changes in the market value of the securities or from the inability of counterparties to meet the terms of the contract. In connection with such purchases, the Portfolios are required to hold liquid assets as collateral with the Portfolios’ custodian sufficient to cover the purchase price.
L. Mortgage Dollar Roll Transactions. Fundamental Research, Goldman Sachs® Core Equity, MFS Capital Opportunities, Oppenheimer Global, Oppenheimer Strategic Income, PIMCO Total Return, Salomon Brothers Aggressive Growth and Van Kampen Equity and Income may engage in dollar roll transactions with respect to mortgage-backed securities issued by Government National Mortgage Association, Federal National Mortgage Association and Federal Home Loan Mortgage Corp. In a dollar roll transaction, a Portfolio sells a mortgage-backed security to a financial institution, such as a bank or broker/dealer, and simultaneously agrees to repurchase a substantially similar (i.e., same type, coupon, and maturity) security from the institution on a delayed delivery basis at an agreed upon price. The mortgage-backed securities that are repurchased will bear the same interest rate as those sold, but generally will be collateralized by different pools of mortgages with different prepayment histories. The Portfolios account for dollar roll transactions as purchases and sales. For fee based dollar roll transactions, the fee is recorded as income.
M. Options Contracts. Each Portfolio, with the exception of Baron Small Cap Growth, may purchase put and call options and may write (sell) put options and covered call options. MFS Capital Opportunities may only write or sell calls on securities if the calls are covered. The Portfolios may engage in option transactions as a hedge against adverse movements in the value of portfolio holdings or to increase market exposure. Option contracts are valued daily and unrealized gains or losses are recorded based upon the last sales price on the principal exchange on which the options are traded. The Portfolios will realize a gain or loss upon the expiration or closing of the option contract. When an option is exercised, the proceeds on sales of the underlying security for a written call option, the purchase cost of the security for a written put option, or the cost of the security for a purchased put or call option is adjusted by the amount of premium received or paid. Realized and unrealized gains or losses on option contracts are reflected in the accompanying financial statements. The risk in
128
NOTES TO FINANCIAL STATEMENTS AS OF DECEMBER 31, 2005 (CONTINUED)
NOTE 2 — SIGNIFICANT ACCOUNTING POLICIES (continued)
writing a call option is that the Portfolios give up the opportunity for profit if the market price of the security increases and the option is exercised. The risk in writing a put option is that the Portfolios may incur a loss if the market price of the security decreases and the option is exercised. The risk in buying an option is that the Portfolios pay a premium whether or not the option is exercised. Risks may also arise from an illiquid secondary market or from the inability of counterparties to meet the terms of the contract.
N. Futures Contracts. Each Portfolio, with the exception of Baron Small Cap Growth, may enter into futures contracts involving foreign currency, interest rates, securities and securities indices. Goldman Sachs® Core Equity may enter into futures transactions only with respect to the S&P 500 Index. A futures contract obligates the seller of the contract to deliver and the purchaser of the contract to take delivery of the type of foreign currency, financial instrument or security called for in the contract at a specified future time for a specified price. Upon entering into such a contract, a Portfolio is required to deposit and maintain as collateral such initial margin as required by the exchange on which the contract is traded. Pursuant to the contract, a Portfolio agrees to receive from or pay to the broker an amount equal to the daily fluctuations in the value of the contract. Such receipts or payments are known as variation margins and are recorded as unrealized gains or losses by the Portfolio. When the contract is closed, the Portfolio records a realized gain or loss equal to the difference between the value of the contract at the time it was opened and the value at the time it was closed.
O. Swap Contracts. Certain Portfolios may enter into interest rate swaps, currency swaps and other types of swap agreements, including swaps on securities and indices. A swap is an agreement between two parties pursuant to which each party agrees to make one or more payments to the other on regularly scheduled dates over a stated term, based on different interest rates, currency exchange rates, security prices, the prices or rates of other types of financial instruments or assets or the levels of specified indices. During the term of the swap, changes in the value of the swap are recognized as unrealized appreciation or depreciation.
NOTE 3 — INVESTMENT TRANSACTIONS
For the year ended December 31, 2005, the cost of purchases and the proceeds from the sales of securities, excluding U.S. Government and short-term securities, were as follows:
| | Purchases | | Sales | |
American Century Large Company Value | | $ | 90,991,215 | | $ | 74,244,923 | |
American Century Select | | 665,801,847 | | 506,142,155 | |
American Century Small Cap Value | | 102,491,290 | | 81,309,430 | |
Baron Small Cap Growth | | 152,524,595 | | 24,926,301 | |
Davis Venture Value | | 63,742,510 | | 73,685,183 | |
Fundamental Research | | 83,893,729 | | 92,661,308 | |
Goldman Sachs Capital Growth | | 26,009,962 | | 55,319,711 | |
Goldman Sachs Core Equity | | 114,368,893 | | 127,674,859 | |
JPMorgan Fleming International | | 292,197,663 | | 54,107,452 | |
JPMorgan Mid Cap Value | | 110,401,348 | | 73,946,914 | |
MFS Capital Opportunities | | 195,335,019 | | 243,009,583 | |
OpCap Balanced Value | | 115,651,195 | | 148,277,232 | |
Oppenheimer Global | | 2,041,493,522 | | 939,674,764 | |
Oppenheimer Strategic Income | | 437,378,372 | | 230,195,976 | |
PIMCO Total Return | | 61,344,793 | | 48,539,761 | |
Salomon Brothers Aggressive Growth | | 90,701,266 | | 132,821,008 | |
Salomon Brothers Large Cap Growth | | 16,818,618 | | 28,809,980 | |
T. Rowe Price Diversified Mid Cap Growth | | 1,382,861,182 | | 895,506,416 | |
T. Rowe Price Growth Equity | | 535,806,515 | | 392,393,476 | |
UBS U.S. Large Cap Equity | | 134,963,365 | | 142,006,033 | |
Van Kampen Comstock | | 396,891,176 | | 132,084,328 | |
Van Kampen Equity and Income | | 992,002,829 | | 784,851,628 | |
| | | | | | | |
U.S. Government securities not included above were as follows:
| | Purchases | | Sales | |
OpCap Balanced Value | | $ | — | | $ | 1,168,436 | |
Oppenheimer Strategic Income | | 296,688,291 | | 260,499,326 | |
PIMCO Total Return | | 1,397,853,472 | | 1,265,994,037 | |
Van Kampen Equity and Income | | 198,511,020 | | 217,324,029 | |
| | | | | | | |
NOTE 4 — INVESTMENT ADVISORY AND ADMINISTRATIVE FEES
For its services, each Portfolio pays the Investment Adviser a monthly fee in arrears equal to the following as a percentage of the Portfolio’s average daily net assets during the month:
Portfolio | | Fee | | |
American Century Large Company Value | | 0.80 | % | | |
American Century Select | | 0.64 | % | | |
American Century Small Cap Value | | 1.00 | % | | |
Baron Small Cap Growth | | 0.85 | % | | |
Davis Venture Value* | | 0.80 | % | | |
Fundamental Research | | 0.60 | % | | |
Goldman Sachs® Capital Growth | | 0.85 | % | | |
Goldman Sachs® Core Equity | | 0.70 | % | | |
JPMorgan Fleming International | | 0.80 | % | | |
JPMorgan Mid Cap Value | | 0.75 | % | | |
MFS Capital Opportunities | | 0.65 | % | | |
OpCap Balanced Value | | 0.80 | % | | |
Oppenheimer Global | | 0.60 | % | | |
Oppenheimer Strategic Income | | 0.50 | % | | |
PIMCO Total Return | | 0.50 | % | | |
Salomon Brothers Aggressive Growth | | 0.70 | % | on the first $500 million | |
| | 0.65 | % | on assets over $500 million | |
Salomon Brothers Large Cap Growth | | 0.64 | % | | |
T. Rowe Price Diversified Mid Cap Growth | | 0.64 | % | | |
T. Rowe Price Growth Equity | | 0.60 | % | | |
UBS U.S. Large Cap Equity | | 0.70 | % | on the first $500 million | |
| | 0.65 | % | on assets over $500 million | |
Van Kampen Comstock | | 0.60 | % | | |
Van Kampen Equity and Income | | 0.55 | % | | |
* Prior to October 31, 2005, rate was 0.90%.
129
NOTES TO FINANCIAL STATEMENTS AS OF DECEMBER 31, 2005 (CONTINUED)
NOTE 4 — INVESTMENT ADVISORY AND ADMINISTRATIVE FEES (continued)
American Century Investment Management, Inc. serves as Sub-Adviser to American Century Large Company Value, American Century Select and American Century Small Cap Value. BAMCO, Inc. serves as Sub-Adviser to Baron Small Cap Growth. Davis Selected Advisors, L.P. serves as Sub-Adviser to Davis Venture Value. Goldman Sachs® Asset Management, L.P. serves as Sub-Adviser to Goldman Sachs® Capital Growth and Goldman Sachs® Core Equity. J.P. Morgan Fleming Asset Management (London) Ltd. serves as Sub-Adviser to JPMorgan Fleming International. J.P. Morgan Investment Management Inc. serves as Sub-Adviser to JPMorgan Mid Cap Value. Massachusetts Financial Services Company serves as Sub-Adviser to MFS Capital Opportunities. OpCap Advisors LLC serves as Sub-Adviser to OpCap Balanced Value. OppenheimerFunds, Inc. serves as Sub-Adviser to Oppenheimer Global and Oppenheimer Strategic Income. Pacific Investment Management Company LLC serves as Sub-Adviser to PIMCO Total Return. Salomon Brothers Asset Management Inc. serves as Sub-Adviser to Salomon Brothers Aggressive Growth and Salomon Brothers Large Cap Growth. T. Rowe Price Associates, Inc. serves as Sub-Adviser to T. Rowe Price Diversified Mid Cap Growth and T. Rowe Price Growth Equity. UBS Global Asset Management (Americas) Inc. serves as Sub-Adviser to UBS U.S. Large Cap Equity. Morgan Stanley Investment Management Inc. doing business as Van Kampen serves as Sub-Adviser to Van Kampen Comstock and Van Kampen Equity and Income.
Prior to April 29, 2005, Salomon Brothers Asset Management Inc. served as Sub-Adviser to American Century Large Company Value.
Prior to October 31, 2005, Salomon Brothers Asset Management Inc. served as Sub-Adviser to Davis Venture Value.
Under an Administrative Services Agreement between the Fund and ING Funds Services, LLC (“IFS”), an indirect, wholly-owned subsidiary of ING Groep, IFS provides all administrative services necessary for the Fund’s operations and is responsible for the supervision of the Fund’s other service providers. IFS also assumes all ordinary recurring direct costs of the Fund, such as custodian fees, director’s fees, transfer agency fees and accounting fees. As compensation for these services, IFS receives a monthly fee from each
Portfolio at an annual rate based on the average daily net assets of each Portfolio as follows:
Portfolio | | Rate | |
American Century Large Company Value | | 0.20 | % |
American Century Select | | 0.02 | % |
American Century Small Cap Value* | | 0.40 | % |
Baron Small Cap Growth* | | 0.40 | % |
Davis Venture Value(1) | | 0.10 | % |
Fundamental Research | | 0.20 | % |
Goldman Sachs® Capital Growth | | 0.20 | % |
Goldman Sachs® Core Equity | | 0.20 | % |
JPMorgan Fleming International | | 0.20 | % |
JPMorgan Mid Cap Value | | 0.35 | % |
MFS Capital Opportunities | | 0.25 | % |
OpCap Balanced Value | | 0.20 | % |
Oppenheimer Global | | 0.06 | % |
Oppenheimer Strategic Income | | 0.04 | % |
PIMCO Total Return | | 0.35 | % |
Salomon Brothers Aggressive Growth | | 0.13 | % |
Salomon Brothers Large Cap Growth | | 0.20 | % |
T. Rowe Price Diversified Mid Cap Growth | | 0.02 | % |
T. Rowe Price Growth Equity | | 0.15 | % |
UBS U.S. Large Cap Equity | | 0.15 | % |
Van Kampen Comstock* | | 0.35 | % |
Van Kampen Equity and Income | | 0.02 | % |
* A portion of the administrative fees may be waived to limit total net expenses.
(1) Prior to October 31, 2005, rate was 0.20%.
The Fund has adopted a Plan of Distribution pursuant to Rule 12b-1 (“the Plan”) for the Adviser Class shares of each Portfolio. The Plan provides for a distribution fee, payable to the Distributor. The Distributor may pay, on behalf of each Portfolio, out of its distribution fee, compensation to certain financial institutions for providing distribution assistance pursuant to a Distribution Services Agreement as described under the Plan. Under the Plan, a Portfolio makes payments at an annual rate of 0.25% of the Portfolio’s average daily net assets attributable to its Adviser Class shares. Effective December 1, 2004, the Distributor has voluntarily agreed to waive distribution fees for the Oppenheimer Global and the T. Rowe Price Diversified Mid Cap Growth Portfolios at an annual rate of 0.01% of average daily net assets attributable to their respective Adviser Class Shares.
Service and Adviser Classes of shares are further subject to a shareholder servicing fee payable to Shareholder Organizations pursuant to the Shareholder Servicing Plan adopted for Service and Adviser Classes which shall not initially exceed an annual rate of 0.25% of the average daily net assets of each of the Service and Adviser Classes.
Fees paid to the Distributor and Shareholder Organizations by class during the year ended December 31, 2005 are shown in the accompanying Statements of Operations.
130
NOTES TO FINANCIAL STATEMENTS AS OF DECEMBER 31, 2005 (CONTINUED)
NOTE 4 — INVESTMENT ADVISORY AND ADMINISTRATIVE FEES (continued)
The Investment Adviser (Directed Services, Inc or “DSI”) has contractually agreed to waive a portion of the advisory fee for the Van Kampen Comstock.
The waiver represents 50% of negotiated fee reductions in subadvisory fees being charged to the advisor.
NOTE 5 — OTHER TRANSACTIONS WITH AFFILIATES AND RELATED PARTIES
The waiver only renews at the election of DSI.
At December 31, 2005, the Portfolios had the following amounts recorded in payable to affiliates on the accompanying Statements of Assets and Liabilities (See Note 4):
Fund | | Accrued
Investment
Management
Fees | | Accrued
Administrative
Fees | | Accrued
Shareholder
Service and
Distribution
Fees | | Accrued
Waivers | | Total | |
American Century Large Company Value | | $ | 62,663 | | $ | 15,666 | | $ | 14,496 | | $ | — | | $ | 92,825 | |
American Century Select | | 242,454 | | 7,576 | | 11,050 | | — | | 261,080 | |
American Century Small Cap Value | | 87,161 | | 97,855 | | 13,883 | | (71,706 | ) | 127,193 | |
Baron Small Cap Growth | | 229,635 | | 197,212 | | 57,428 | | (102,657 | ) | 381,618 | |
Davis Venture Value | | 38,991 | | 4,874 | | 14,262 | | — | | 58,127 | |
Fundamental Research | | 21,526 | | 7,055 | | 7,448 | | — | | 36,029 | |
Goldman Sachs Capital Growth | | 49,230 | | 11,579 | | 14,709 | | — | | 75,518 | |
Goldman Sachs Core Equity | | 62,505 | | 17,859 | | 22,512 | | — | | 102,876 | |
JPMorgan Fleming International | | 614,896 | | 153,725 | | 117,798 | | — | | 886,419 | |
JPMorgan Mid Cap Value | | 109,095 | | 50,911 | | 22,001 | | — | | 182,007 | |
MFS Capital Opportunities | | 108,078 | | 41,568 | | 153 | | — | | 149,799 | |
OpCap Balanced Value | | 91,462 | | 22,866 | | 28,445 | | — | | 142,773 | |
Oppenheimer Global | | 1,224,687 | | 122,466 | | 62,869 | | (10,666 | ) | 1,399,356 | |
| | | | | | | | | | | | | | | | |
Fund | | Accrued
Investment
Management
Fees | | Accrued
Administrative
Fees | | Shareholder
Service and
Distribution
Fees | | Accrued
Waivers | | Total | |
Oppenheimer Strategic Income | | $ | 156,812 | | $ | 12,545 | | $ | 34,815 | | $ | (21,905 | ) | $ | 182,267 | |
PIMCO Total Return | | 117,402 | | 82,181 | | 27,380 | | — | | 226,963 | |
Salomon Brothers Aggressive Growth | | 560,970 | | 107,946 | | 95,208 | | — | | 764,124 | |
Salomon Brothers Large Cap Growth | | 32,677 | | 10,212 | | 14,255 | | — | | 57,144 | |
T. Rowe Price Diversified Mid Cap Growth | | 683,188 | | 21,103 | | 40,194 | | (5,754 | ) | 738,731 | |
T. Rowe Price Growth Equity | | 582,145 | | 147,051 | | 71,339 | | — | | 800,535 | |
UBS U.S. Large Cap Equity | | 169,108 | | 36,237 | | 2,404 | | — | | 207,749 | |
Van Kampen Comstock | | 352,101 | | 495,239 | | 123,560 | | (345,015 | ) | 625,885 | |
Van Kampen Equity and Income | | 431,046 | | 15,673 | | 18,303 | | — | | 465,022 | |
| | | | | | | | | | | | | | | | |
At December 31, 2005 all shares of the Portfolios were owned by 1) separate accounts of ILIAC and its insurance company affiliates for the benefit of variable contract policyholders 2) ING National Trust, an indirect, wholly-owned subsidiary of ING Groep, as trustee or custodian of qualified pension and retirement plans that invest in the Portfolios directly and 3) ILIAC in connection with seed capital contributions made to the Portfolios.
During the year ended December 31, 2005, the Salomon Brothers Aggressive Growth realized a gain of $19,448 on the disposal of investments made in violation of the Portfolio’s investment restrictions.
NOTE 6 — CALL OPTIONS WRITTEN
As of December 31, 2005, portfolio securities valued at $400,143 for Oppenheimer Strategic Income and $2,230,350 for PIMCO Total Return were held in escrow by the custodian as cover for call options written.
131
NOTES TO FINANCIAL STATEMENTS AS OF DECEMBER 31, (CONTINUED)
NOTE 6 — CALL OPTIONS WRITTEN
Written option activity for the Oppenheimer Strategic Income and PIMCO Total Return Portfolios for the year ended December 31, 2005 was as follows:
| | Number of
Contracts | | Premiums
Received | |
ING Oppenheimer Strategic Income Portfolio | | | | | |
Options outstanding at December 31, 2004 | | 37 | | | | $ | 27,277 | |
Options written | | 160 | | | | | 139,353 | |
Options terminated in closing purchase transactions | | (115 | ) | | | | (123,221 | ) |
Options expired | | | (43 | ) | | | | (27,460 | ) |
Options outstanding at December 31, 2005 | | | 39 | | | | $ | 15,949 | |
| | | | | | | | |
ING PIMCO Total Return Portfolio | | | | | | | | |
Options outstanding at December 31, 2004 | | 410 | | | | $ | 450,080 | |
Options written | | 1,203 | | | | | 539,356 | |
Options terminated in closing purchase transactions | | (162 | ) | | | | (101,822 | ) |
Options expired | | (1,032 | ) | | | | (615,634 | ) |
Options exercised | | | — | | | | | (13,042 | ) |
Options outstanding at December 31, 2005 | | | 419 | | | | $ | 258,938 | |
| | | | | | | | | | |
132
NOTES TO FINANCIAL STATEMENTS AS OF DECEMBER 31, 2005 (CONTINUED)
NOTE 7 — CAPITAL SHARES
Transactions in capital shares and dollars were as follows:
| | Class I Shares | | Class S Shares | | Class ADV Shares | |
| | Year
Ended
December 31,
2005 | | Year
Ended
December31,
2004 | | Year
Ended
December 31,
2005 | | Year
Ended
December 31,
2004 | | Year
Ended
December 31,
2005 | | Year
Ended
December 31,
2004 | |
American Century Large Company Value (Number of Shares) | | | | | | | | | | | | | |
Shares sold | | 2,661,918 | | 148,751 | | 306,759 | | 839,017 | | 478,928 | | 117,723 | |
Dividends reinvested | | 13,064 | | 1,552 | | 38,001 | | 39,197 | | 5,040 | | 3,915 | |
Shares redeemed | | (101,274 | ) | (25,062 | ) | (1,986,733 | ) | (1,094,339 | ) | (263,373 | ) | (70,895 | ) |
Net increase (decrease) in shares outstanding | | 2,573,708 | | 125,241 | | (1,641,973 | ) | (216,125 | ) | 220,595 | | 50,743 | |
| | | | | | | | | | | | | |
American Century Large Company Value ($) | | | | | | | | | | | | | |
Shares sold | | $ | 37,349,021 | | $ | 1,966,782 | | $ | 4,287,796 | | $ | 11,272,945 | | $ | 6,612,829 | | $ | 1,566,546 | |
Dividends reinvested | | 179,496 | | 19,821 | | 521,379 | | 499,364 | | 68,599 | | 49,520 | |
Shares redeemed | | (1,407,870 | ) | (337,852 | ) | (27,663,175 | ) | (14,513,641 | ) | (3,547,962 | ) | (926,101 | ) |
Net increase (decrease) | | $ | 36,120,647 | | $ | 1,648,751 | | $ | (22,854,000 | ) | $ | (2,741,332 | ) | $ | 3,133,466 | | $ | 689,965 | |
| | Class I Shares | | Class S Shares | | Class ADV Shares | |
| | Year
Ended
December 31,
2005 | | Year
Ended
December 31,
2004 | | Year
Ended
December 31,
2005 | | Year
Ended
December 31,
2004 | | Year
Ended
December 31,
2005 | | Year
Ended
December 31,
2004 | |
American Century Select (Number of Shares) | | | | | | | | | | | | | |
Shares sold | | 31,914,281 | | 22,620,173 | | 436,803 | | 1,451,458 | | 246,400 | | 991,938 | |
Shares redeemed | | (10,661,975 | ) | (1,071,859 | ) | (1,016,486 | ) | (321,500 | ) | (1,227,514 | ) | (3,826,255 | ) |
Net increase (decrease) in shares outstanding | | 21,252,306 | | 21,548,314 | | (579,683 | ) | 1,129,958 | | (981,114 | ) | (2,834,317 | ) |
| | | | | | | | | | | | | |
American Century Select ($) | | | | | | | | | | | | | |
Shares sold | | $ | 278,369,130 | * | $ | 206,472,495 | | $ | 3,904,181 | | $ | 13,091,503 | | $ | 2,206,539 | | $ | 8,842,676 | |
Shares redeemed | | (97,997,787 | ) | (9,923,972 | ) | (9,000,068 | ) | (2,836,199 | ) | (11,026,541 | ) | (33,760,610 | ) |
Net increase (decrease) | | $ | 180,371,343 | | $ | 196,548,523 | | $ | (5,095,887 | ) | $ | 10,255,304 | | $ | (8,820,002 | ) | $ | (24,917,934 | ) |
| | Class I Shares | | Class S Shares | | Class ADV Shares | |
| | Year
Ended
December 31, 2005 | | Year
Ended
December 31, 2004 | | Year
Ended
December 31, 2005 | | Year
Ended
December 31, 2004 | | Year
Ended
December 31, 2005 | | Year
Ended
December 31, 2004 | |
American Century Small Cap Value (Number of Shares) | | | | | | | | | | | | | |
Shares sold | | 1,827,763 | | 1,602,807 | | 912,770 | | 2,323,856 | | 587,711 | | 346,623 | |
Dividends reinvested | | 436,034 | | 146,081 | | 402,482 | | 194,144 | | 97,983 | | 27,280 | |
Shares redeemed | | (657,550 | ) | (170,244 | ) | (742,863 | ) | (571,631 | ) | (171,647 | ) | (205,307 | ) |
Net increase in shares outstanding | | 1,606,247 | | 1,578,644 | | 572,389 | | 1,946,369 | | 514,047 | | 168,596 | |
| | | | | | | | | | | | | |
American Century Small Cap Value ($) | | | | | | | | | | | | | |
Shares sold | | $ | 22,769,281 | | $ | 18,900,807 | | $ | 11,224,653 | | $ | 26,715,877 | | $ | 7,261,980 | | $ | 3,934,669 | |
Dividends reinvested | | 5,194,173 | | 1,774,547 | | 4,790,132 | | 2,347,380 | | 1,152,631 | | 327,424 | |
Shares redeemed | | (7,948,088 | ) | (1,969,616 | ) | (9,329,831 | ) | (6,602,869 | ) | (2,078,194 | ) | (2,307,273 | ) |
Net increase | | $ | 20,015,366 | | $ | 18,705,738 | | $ | 6,684,954 | | $ | 22,460,388 | | $ | 6,336,417 | | $ | 1,954,820 | |
* Includes in-kind subscriptions from a substitution.
133
NOTES TO FINANCIAL STATEMENTS AS OF DECEMBER 31, (CONTINUED)
| | Class I Shares | | Class S Shares | | Class ADV Shares | |
| | Year
Ended
December 31,
2005 | | Year
Ended
December 31,
2004 | | Year
Ended
December 31,
2005 | | Year
Ended
December 31,
2004 | | Year
Ended
December 31,
2005 | | Year
Ended
December 31,
2004 | |
Baron Small Cap Growth (Number of Shares) | | | | | | | | | | | | | |
Shares sold | | 3,405,463 | | 1,337,197 | | 7,294,601 | | 4,649,190 | | 1,175,024 | | 1,011,904 | |
Shares redeemed | | (355,053 | ) | (244,633 | ) | (1,997,997 | ) | (801,347 | ) | (341,891 | ) | (199,682 | ) |
Net increase in shares outstanding | | 3,050,410 | | 1,092,564 | | 5,296,604 | | 3,847,843 | | 833,133 | | 812,222 | |
| | | | | | | | | | | | | |
Baron Small Cap
Growth ($) | | | | | | | | | | | | | |
Shares sold | | $ | 53,251,215 | | $ | 17,318,049 | | $ | 113,602,924 | | $ | 60,740,062 | | $ | 17,807,762 | | $ | 12,983,296 | |
Shares redeemed | | (5,541,929 | ) | (3,304,000 | ) | (30,969,966 | ) | (10,169,278 | ) | (5,195,708 | ) | (2,519,732 | ) |
Net increase | | $ | 47,709,286 | | $ | 14,014,049 | | $ | 82,632,958 | | $ | 50,570,784 | | $ | 12,612,054 | | $ | 10,463,564 | |
| | Class I Shares | | Class S Shares | | Class ADV Shares | |
| | Year
Ended
December 31,
2005 | | Year
Ended
December 31,
2004 | | Year
Ended
December 31,
2005 | | Year
Ended
December 31,
2004 | | Year
Ended
December 31,
2005 | | Year
Ended
December 31,
2004 | |
Davis Venture Value (Number of Shares) | | | | | | | | | | | | | |
Shares sold | | 45,465 | | 90,373 | | 486,605 | | 641,823 | | 539,144 | | 444,017 | |
Dividends reinvested | | 408 | | — | | — | | — | | 315 | | — | |
Shares redeemed | | (62,574 | ) | (34,621 | ) | (1,369,582 | ) | (906,728 | ) | (499,011 | ) | (72,248 | ) |
Net increase (decrease) in shares outstanding | | (16,701 | ) | 55,752 | | (882,977 | ) | (264,905 | ) | 40,448 | | 371,769 | |
| | | | | | | | | | | | | |
Davis Venture Value ($) | | | | | | | | | | | | | |
Shares sold | | $ | 817,668 | | $ | 1,546,968 | | $ | 8,749,608 | | $ | 10,993,620 | | $ | 9,508,471 | | $ | 7,712,445 | |
Dividends reinvested | | 7,346 | | — | | — | | — | | 5,573 | | — | |
Shares redeemed | | (1,130,716 | ) | (586,779 | ) | (24,365,401 | ) | (15,468,573 | ) | (8,889,431 | ) | (1,223,274 | ) |
Net increase (decrease) | | $ | (305,702 | ) | $ | 960,189 | | $ | (15,615,793 | ) | $ | (4,474,953 | ) | $ | 624,613 | | $ | 6,489,171 | |
| | Class I Shares | | Class S Shares | | Class ADV Shares | |
| | Year
Ended
December 31,
2005 | | Year
Ended
December 31,
2004 | | Year
Ended
December 31,
2005 | | Year
Ended
December 31,
2004 | | Year
Ended
December 31,
2005 | | Year
Ended
December 31,
2004 | |
Fundamental Research (Number of Shares) | | | | | | | | | | | | | |
Shares sold | | 62,654 | | 451,577 | | 652,623 | | 1,001,814 | | 53,097 | | 113,866 | |
Shares issued in merger | | 795,084 | | — | | — | | — | | — | | — | |
Dividends reinvested | | 5,902 | | 3,914 | | 40,102 | | 28,534 | | 3,246 | | 1,857 | |
Shares redeemed | | (163,939 | ) | (72,429 | ) | (2,307,923 | ) | (1,198,761 | ) | (53,779 | ) | (286,485 | ) |
Net increase (decrease) in shares outstanding | | 699,701 | | 383,062 | | (1,615,198 | ) | (168,413 | ) | 2,564 | | (170,762 | ) |
| | | | | | | | | | | | | |
Fundamental Research ($) | | | | | | | | | | | | | |
Shares sold | | $ | 545,101 | | $ | 3,664,370 | | $ | 5,666,170 | | $ | 8,091,737 | | $ | 460,479 | | $ | 915,234 | |
Shares issued in merger | | 7,324,877 | | — | | — | | — | | — | | — | |
Dividends reinvested | | 49,929 | | 30,448 | | 339,663 | | 221,996 | | 27,298 | | 14,333 | |
Shares redeemed | | (1,422,007 | ) | (583,080 | ) | (19,964,556 | ) | (9,651,053 | ) | (460,687 | ) | (2,274,449 | ) |
Net increase (decrease) | | $ | 6,497,900 | | $ | 3,111,738 | | $ | (13,958,723 | ) | $ | (1,337,320 | ) | $ | 27,090 | | $ | (1,344,882 | ) |
134
NOTES TO FINANCIAL STATEMENTS AS OF DECEMBER 31, (CONTINUED)
| | Class I Shares | | Class S Shares | | Class ADV Shares | |
| | Year
Ended
December 31,
2005 | | Year
Ended
December 31,
2004 | | Year
Ended
December 31,
2005 | | Year
Ended
December 31,
2004 | | Year
Ended
December 31,
2005 | | Year
Ended
December 31,
2004 | |
Goldman Sachs Capital Growth (Number of Shares) | | | | | | | | | | | | | |
Shares sold | | 118,944 | | 76,985 | | 565,786 | | 650,799 | | 69,593 | | 84,873 | |
Dividends reinvested | | 895 | | 526 | | 20,823 | | 3,841 | | — | | — | |
Shares redeemed | | (31,348 | ) | (38,108 | ) | (3,466,737 | ) | (1,589,477 | ) | (277,094 | ) | (52,372 | ) |
Net increase (decrease) in shares outstanding | | 88,491 | | 39,403 | | (2,880,128 | ) | (934,837 | ) | (207,501 | ) | 32,501 | |
| | | | | | | | | | | | | |
Goldman Sachs Capital Growth ($) | | | | | | | | | | | | | |
Shares sold | | $ | 1,337,332 | | $ | 818,914 | | $ | 6,177,415 | | $ | 6,851,055 | | $ | 761,815 | | $ | 897,368 | |
Dividends reinvested | | 9,754 | | 5,353 | | 226,138 | | 38,908 | | — | | — | |
Shares redeemed | | (345,991 | ) | (400,434 | ) | (38,259,051 | ) | (16,711,121 | ) | (3,011,024 | ) | (550,962 | ) |
Net increase (decrease) | | $ | 1,001,095 | | $ | 423,833 | | $ | (31,855,498 | ) | $ | (9,821,158 | ) | $ | (2,249,209 | ) | $ | 346,406 | |
| | Class I Shares | | Class S Shares | | Class ADV Shares | |
| | Year
Ended
December 31,
2005 | | Year
Ended
December 31,
2004 | | Year
Ended
December 31,
2005 | | Year
Ended
December 31,
2004 | | Year
Ended
December 31,
2005 | | Year
Ended
December 31,
2004 | |
Goldman Sachs Core Equity (Number of Shares) | | | | | | | | | | | | | |
Shares sold | | — | | — | | 634,380 | | 1,570,839 | | 92,324 | | 8,416 | |
Dividends reinvested | | 15 | | 5 | | 1,064,865 | | 387,939 | | 7,296 | | 62 | |
Shares redeemed | | — | | — | | (2,136,095 | ) | (1,269,272 | ) | (30,304 | ) | (472 | ) |
Net increase (decrease) in shares outstanding | | 15 | | 5 | | (436,850 | ) | 689,506 | | 69,316 | | 8,006 | |
| | | | | | | | | | | | | |
Goldman Sachs Core Equity ($) | | | | | | | | | | | | | |
Shares sold | | $ | — | | $ | — | | $ | 7,962,329 | | $ | 19,848,494 | | $ | 1,158,740 | | $ | 104,850 | |
Dividends reinvested | | 170 | | 62 | | 12,171,411 | | 4,581,560 | | 82,596 | | 725 | |
Shares redeemed | | — | | — | | (26,495,371 | ) | (16,031,736 | ) | (375,052 | ) | 5,994 | |
Net increase (decrease) | | $ | 170 | | $ | 62 | | $ | (6,361,631 | ) | $ | 8,398,318 | | $ | 866,284 | | $ | 111,569 | |
| | Class I Shares | | Class S Shares | | Class ADV Shares | |
| | Year
Ended
December 31,
2005 | | Year
Ended
December 31,
2004 | | Year
Ended
December 31,
2005 | | Year
Ended
December 31,
2004 | | Year
Ended
December 31,
2005 | | Year
Ended
December 31,
2004 | |
JPMorgan Fleming International (Number of Shares) | | | | | | | | | | | | | |
Shares sold | | 2,992,581 | | 4,828,032 | | 34,481,815 | | 19,751,827 | | 164,851 | | 191,469 | |
Dividends reinvested | | 224,057 | | 367,982 | | 246,190 | | 93,004 | | 1,136 | | 1,638 | |
Shares redeemed | | (7,421,491 | ) | (7,107,002 | ) | (8,952,601 | ) | (4,140,652 | ) | (84,381 | ) | (124,331 | ) |
Net increase (decrease) in shares outstanding | | (4,204,853 | ) | (1,910,988 | ) | 25,775,404 | | 15,704,179 | | 81,606 | | 68,776 | |
| | | | | | | | | | | | | |
JPMorgan Fleming International ($) | | | | | | | | | | | | | |
Shares sold | | $ | 37,093,357 | | $ | 52,846,466 | | $ | 421,334,049 | | $ | 216,596,515 | | $ | 2,038,736 | | $ | 2,046,678 | |
Dividends reinvested | | 2,668,525 | | 3,834,376 | | 2,914,895 | | 965,386 | | 13,389 | | 16,919 | |
Shares redeemed | | (91,750,930 | ) | (77,960,663 | ) | (110,440,369 | ) | (45,930,044 | ) | (1,055,855 | ) | (1,346,015 | ) |
Net increase (decrease) | | $ | (51,989,048 | ) | $ | (21,279,821 | ) | $ | 313,808,575 | | $ | 171,631,857 | | $ | 996,270 | | $ | 717,582 | |
135
NOTES TO FINANCIAL STATEMENTS AS OF DECEMBER 31, (CONTINUED)
| | Class I Shares | | Class S Shares | | Class ADV Shares | |
| | Year
Ended
December 31,
2005 | | Year
Ended
December 31,
2004 | | Year
Ended
December 31,
2005 | | Year
Ended
December 31,
2004 | | Year
Ended
December 31,
2005 | | Year
Ended
December 31,
2004 | |
JPMorgan Mid Cap Value (Number of Shares) | | | | | | | | | | | | | |
Shares sold | | 2,647,024 | | 2,824,865 | | 2,011,533 | | 3,464,084 | | 666,879 | | 283,469 | |
Dividends reinvested | | 414,890 | | 126,196 | | 410,041 | | 141,376 | | 61,014 | | 10,444 | |
Shares redeemed | | (1,286,352 | ) | (389,997 | ) | (1,445,928 | ) | (344,727 | ) | (194,750 | ) | (48,150 | ) |
Net increase in shares outstanding | | 1,775,562 | | 2,561,064 | | 975,646 | | 3,260,733 | | 533,143 | | 245,763 | |
| | | | | | | | | | | | | |
JPMorgan Mid Cap
Value ($) | | | | | | | | | | | | | |
Shares sold | | $ | 38,175,596 | | $ | 37,085,709 | | $ | 28,693,277 | | $ | 45,498,414 | | $ | 9,602,999 | | $ | 3,641,546 | |
Dividends reinvested | | 5,888,381 | | 1,750,954 | | 5,801,817 | | 1,956,844 | | 857,812 | | 143,820 | |
Shares redeemed | | (18,071,001 | ) | (5,061,165 | ) | (20,973,214 | ) | (4,622,553 | ) | (2,797,151 | ) | (612,383 | ) |
Net increase | | $ | 25,992,976 | | $ | 33,775,498 | | $ | 13,521,880 | | $ | 42,832,705 | | $ | 7,663,660 | | $ | 3,172,983 | |
| | Class I Shares | | Class S Shares | | Class ADV Shares | |
| | Year
Ended
December 31,
2005 | | Year
Ended
December 31,
2004 | | Year
Ended
December 31,
2005 | | Year
Ended
December 31,
2004 | | Year
Ended
December 31,
2005 | | Year
Ended
December 31,
2004 | |
MFS Capital Opportunities (Number of Shares) | | | | | | | | | | | | | |
Shares sold | | 218,098 | | 189,115 | | 766 | | 2,607 | | 1,354 | | 10,994 | |
Dividends reinvested | | 63,630 | | 44,008 | | 66 | | 56 | | 36 | | 40 | |
Shares redeemed | | (1,898,027 | ) | (1,834,165 | ) | (7,115 | ) | (2,413 | ) | (3,414 | ) | (7,702 | ) |
Net increase (decrease) in shares outstanding | | (1,616,299 | ) | (1,601,042 | ) | (6,283 | ) | 250 | | (2,024 | ) | 3,332 | |
| | | | | | | | | | | | | |
MFS Capital
Opportunities ($) | | | | | | | | | | | | | |
Shares sold | | $ | 5,821,235 | | $ | 4,761,822 | | $ | 20,613 | | $ | 64,766 | | $ | 35,779 | | $ | 278,223 | |
Dividends reinvested | | 1,677,923 | | 1,043,438 | | 1,734 | | 1,317 | | 946 | | 939 | |
Shares redeemed | | (50,560,022 | ) | (45,580,002 | ) | (188,367 | ) | (57,772 | ) | (90,650 | ) | (188,943 | ) |
Net increase (decrease) | | $ | (43,060,864 | ) | $ | (39,774,742 | ) | $ | (166,020 | ) | $ | 8,311 | | $ | (53,925 | ) | $ | 90,219 | |
| | Class I Shares | | Class S Shares | | Class ADV Shares | |
| | Year
Ended
December 31,
2005 | | Year
Ended
December 31,
2004 | | Year
Ended
December 31,
2005 | | Year
Ended
December 31,
2004 | | Year
Ended
December 31,
2005 | | Year
Ended
December 31,
2004 | |
OpCap Balanced Value (Number of Shares) | | | | | | | | | | | | | |
Shares sold | | 80,997 | | 243,128 | | 862,329 | | 2,113,164 | | 44,169 | | 107,448 | |
Dividends reinvested | | 2,106 | | 2,739 | | 38,777 | | 114,935 | | 569 | | 2,294 | |
Shares redeemed | | (78,341 | ) | (31,902 | ) | (4,073,657 | ) | (1,738,538 | ) | (73,629 | ) | (45,271 | ) |
Net increase (decrease) in shares outstanding | | 4,762 | | 213,965 | | (3,172,551 | ) | 489,561 | | (28,891 | ) | 64,471 | |
| | | | | | | | | | | | | |
OpCap Balanced Value ($) | | | | | | | | | | | | | |
Shares sold | | $ | 1,080,048 | | $ | 3,117,586 | | $ | 11,538,629 | | $ | 26,896,461 | | $ | 585,645 | | $ | 1,366,933 | |
Dividends reinvested | | 28,329 | | 34,098 | | 520,776 | | 1,427,497 | | 7,580 | | 28,287 | |
Shares redeemed | | (1,056,901 | ) | (407,429 | ) | (54,650,002 | ) | (22,131,191 | ) | (981,543 | ) | (569,012 | ) |
Net increase (decrease) | | $ | 51,476 | | $ | 2,744,255 | | $ | (42,590,597 | ) | $ | 6,192,767 | | $ | (388,318 | ) | $ | 826,208 | |
136
NOTES TO FINANCIAL STATEMENTS AS OF DECEMBER 31, (CONTINUED)
| | Class I Shares | | Class S Shares | | Class ADV Shares | |
| | Year
Ended
December 31,
2005 | | Year
Ended
December 31,
2004 | | Year
Ended
December 31,
2005 | | Year
Ended
December 31,
2004 | | Year
Ended
December 31,
2005 | | Year
Ended
December 31,
2004 | |
Oppenheimer Global (Number of Shares) | | | | | | | | | | | | | |
Shares sold | | 103,016,953 | | 66,743,847 | | 3,428,892 | | 541,553 | | 1,210,802 | | 10,333,622 | |
Dividends reinvested | | 4,041,348 | | 89,713 | | 63,798 | | 15,688 | | 156,780 | | 11,097 | |
Shares redeemed | | (13,320,574 | ) | (967,702 | ) | (2,076,401 | ) | (327,715 | ) | (3,887,592 | ) | (210,710 | ) |
Net increase (decrease) in shares outstanding | | 93,737,727 | | 65,865,858 | | 1,416,289 | | 229,526 | | (2,520,010 | ) | 10,134,009 | |
| | | | | | | | | | | | | |
Oppenheimer Global ($) | | | | | | | | | | | | | |
Shares sold | | $ | 1,252,579,506 | * | $ | 838,298,498 | | $ | 45,138,934 | | $ | 6,266,786 | | $ | 15,348,701 | | $ | 127,035,834 | |
Dividends reinvested | | 57,127,283 | | 1,145,325 | | 886,167 | | 169,195 | | 2,162,494 | | 136,859 | |
Shares redeemed | | (174,735,557 | ) | (12,286,322 | ) | (25,073,244 | ) | (3,777,493 | ) | (51,971,027 | ) | (2,574,531 | ) |
Net increase (decrease) | | $ | 1,134,971,232 | | $ | 827,157,501 | | $ | 20,951,857 | | $ | 2,658,488 | | $ | (34,459,832 | ) | $ | 124,598,162 | |
| | Class I Shares | | Class S Shares | | Class ADV Shares | |
| | Year | | November 5, | | Year | | November 5, | | Year | | November 5, | |
| | Ended | | 2004(1) to | | Ended | | 2004(1) to | | Ended | | 2004(1) to | |
| | December 31,
2005 | | December 31,
2004 | | December 31,
2005 | | December 31,
2004 | | December 31,
2005 | | December 31,
2004 | |
Oppenheimer Strategic Income (Number of Shares) | | | | | | | | | | | | | |
Shares sold | | 23,300,205 | | 10,708,088 | | 2,073,206 | | 6,939,750 | | 277,984 | | 402,039 | |
Dividends reinvested | | 685,117 | | 18,306 | | 122,816 | | 10,227 | | 9,827 | | 564 | |
Shares redeemed | | (3,891,420 | ) | (520,747 | ) | (2,161,397 | ) | (932,666 | ) | (140,231 | ) | (41,056 | ) |
Net increase in shares outstanding | | 20,093,902 | | 10,205,647 | | 34,625 | | 6,017,311 | | 147,580 | | 361,547 | |
| | | | | | | | | | | | | |
Oppenheimer Strategic Income ($) | | | | | | | | | | | | | |
Shares sold | | $ | 233,758,163 | * | $ | 108,109,338 | | $ | 20,965,239 | * | $ | 70,019,685 | | $ | 2,802,224 | | $ | 4,056,541 | |
Dividends reinvested | | 6,830,671 | | 185,260 | | 1,224,476 | | 103,399 | | 97,781 | | 5,702 | |
Shares redeemed | | (39,258,179 | ) | (5,263,620 | ) | (21,799,624 | ) | (9,427,990 | ) | (1,410,390 | ) | (414,468 | ) |
Net increase | | $ | 201,330,655 | | $ | 103,030,978 | | $ | 390,091 | | $ | 60,695,094 | | $ | 1,489,615 | | $ | 3,647,775 | |
| | Class I Shares | | Class S Shares | | Class ADV Shares | |
| | Year
Ended
December 31,
2005 | | Year
Ended
December 31,
2004 | | Year
Ended
December 31,
2005 | | Year
Ended
December 31,
2004 | | Year
Ended
December 31,
2005 | | Year
Ended
December 31,
2004 | |
PIMCO Total Return (Number of Shares) | | | | | | | | | | | | | |
Shares sold | | 9,717,091 | | 3,947,212 | | 3,353,861 | | 4,646,455 | | 1,177,965 | | 2,392,874 | |
Dividends reinvested | | 370,074 | | 61,996 | | 202,898 | | 55,461 | | 47,533 | | 12,864 | |
Shares redeemed | | (1,047,575 | ) | (1,015,254 | ) | (3,915,857 | ) | (1,367,170 | ) | (455,201 | ) | (2,028,008 | ) |
Net increase (decrease) in shares outstanding | | 9,039,590 | | 2,993,954 | | (359,098 | ) | 3,334,746 | | 770,297 | | 377,730 | |
| | | | | | | | | | | | | |
PIMCO Total Return ($) | | | | | | | | | | | | | |
Shares sold | | $ | 106,751,522 | | $ | 42,657,879 | | $ | 36,646,753 | | $ | 50,221,723 | | $ | 12,796,531 | | $ | 25,730,937 | |
Dividends reinvested | | 4,041,205 | | 669,551 | | 2,207,527 | | 597,319 | | 514,778 | | 138,031 | |
Shares redeemed | | (11,475,514 | ) | (11,026,626 | ) | (42,874,969 | ) | (14,681,347 | ) | (4,929,923 | ) | (21,920,952 | ) |
Net increase (decrease) | | $ | 99,317,213 | | $ | 32,300,804 | | $ | (4,020,689 | ) | $ | 36,137,695 | | $ | 8,381,386 | | $ | 3,948,016 | |
(1) Commencement of operations.
* Includes in-kind subscriptions from a substitution.
137
NOTES TO FINANCIAL STATEMENTS AS OF DECEMBER 31, (CONTINUED)
| | Class I Shares | | Class S Shares | | Class ADV Shares | |
| | Year
Ended
December 31,
2005 | | Year
Ended
December 31,
2004 | | Year
Ended
December 31,
2005 | | Year
Ended
December 31,
2004 | | Year
Ended
December 31,
2005 | | Year
Ended
December 31,
2004 | |
Salomon Brothers Aggressive Growth (Number of Shares) | | | | | | | | | | | | | |
Shares sold | | 501,090 | | 427,898 | | 7,470,449 | | 9,075,422 | | 117,048 | | 64,521 | |
Shares redeemed | | (2,982,665 | ) | (2,782,866 | ) | (6,520,178 | ) | (487,121 | ) | (18,541 | ) | (11,436 | ) |
Net increase (decrease) in shares outstanding | | (2,481,575 | ) | (2,354,968 | ) | 950,271 | | 8,588,301 | | 98,507 | | 53,085 | |
| | | | | | | | | | | | | |
Salomon Brothers Aggressive Growth ($) | | | | | | | | | | | | | |
Shares sold | | $ | 21,086,158 | | $ | 16,246,871 | | $ | 295,891,931 | | $ | 334,650,664 | | $ | 4,736,368 | | $ | 2,354,764 | |
Shares redeemed | | (119,361,484 | ) | (103,994,271 | ) | (249,022,493 | ) | (18,143,172 | ) | (742,579 | ) | (422,516 | ) |
Net increase (decrease) | | $ | (98,275,326 | ) | $ | (87,747,400 | ) | $ | 46,869,438 | | $ | 316,507,492 | | $ | 3,993,789 | | $ | 1,932,248 | |
| | Class I Shares | | Class S Shares | | Class ADV Shares | |
| | Year
Ended
December 31,
2005 | | Year
Ended
December 31,
2004 | | Year
Ended
December 31,
2005 | | Year
Ended
December 31,
2004 | | Year
Ended
December 31,
2005 | | Year
Ended
December 31,
2004 | |
Salomon Brothers Large Cap Growth (Number of Shares) | | | | | | | | | | | | | |
Shares sold | | 562,690 | | 1,538,270 | | 156,502 | | 1,360,858 | | 324,990 | | 469,837 | |
Dividends reinvested | | 193,291 | | 5 | | 129,778 | | 5 | | 271,521 | | 182,963 | |
Shares redeemed | | (668,226 | ) | (24,999 | ) | (370,087 | ) | (41,825 | ) | (1,150,132 | ) | (1,460,940 | ) |
Net increase (decrease) in shares outstanding | | 87,755 | | 1,513,276 | | (83,807 | ) | 1,319,038 | | (553,621 | ) | (808,140 | ) |
| | | | | | | | | | | | | |
Salomon Brothers Large Cap Growth ($) | | | | | | | | | | | | | |
Shares sold | | $ | 6,393,969 | | $ | 18,423,562 | | $ | 1,799,706 | | $ | 16,218,615 | | $ | 3,711,025 | | $ | 5,681,599 | |
Dividends reinvested | | 2,054,680 | | 56 | | 1,369,162 | | 56 | | 2,850,971 | | 1,902,819 | |
Shares redeemed | | (7,577,392 | ) | (301,960 | ) | (4,297,264 | ) | (502,726 | ) | (13,131,647 | ) | (17,066,531 | ) |
Net increase (decrease) | | $ | 871,257 | | $ | 18,121,658 | | $ | (1,128,396 | ) | $ | 15,715,945 | | $ | (6,569,651 | ) | $ | (9,482,113 | ) |
| | Class I Shares | | Class S Shares | | Class ADV Shares | |
| | Year
Ended
December 31,
2005 | | Year
Ended
December 31,
2004 | | Year
Ended
December 31,
2005 | | Year
Ended
December 31,
2004 | | Year
Ended
December 31,
2005 | | Year
Ended
December 31,
2004 | |
T. Rowe Price Diversified Mid Cap Growth (Number of Shares) | | | | | | | | | | | | | |
Shares sold | | 90,855,628 | | 56,923,070 | | 830,513 | | 1,310,554 | | 1,278,984 | | 2,826,239 | |
Dividends reinvested | | 2,294,158 | | — | | 47,513 | | — | | 155,088 | | — | |
Shares redeemed | | (21,132,843 | ) | (2,830,650 | ) | (1,967,457 | ) | (1,790,374 | ) | (3,384,627 | ) | (7,303,573 | ) |
Net increase (decrease) in shares outstanding | | 72,016,943 | | 54,092,420 | | (1,089,431 | ) | (479,820 | ) | (1,950,555 | ) | (4,477,334 | ) |
| | | | | | | | | | | | | |
T. Rowe Price Diversified Mid Cap Growth ($) | | | | | | | | | | | | | |
Shares sold | | $ | 688,591,097 | * | $ | 448,863,731 | | $ | 6,593,530 | | $ | 10,074,983 | | $ | 10,074,467 | | $ | 21,486,234 | |
Dividends reinvested | | 18,009,139 | | — | | 369,650 | | — | | 1,195,725 | | — | |
Shares redeemed | | (170,184,281 | ) | (22,047,983 | ) | (14,967,425 | ) | (13,296,866 | ) | (26,603,625 | ) | (55,107,700 | ) |
Net increase (decrease) | | $ | 536,415,955 | | $ | 426,815,748 | | $ | (8,004,245 | ) | $ | (3,221,883 | ) | $ | (15,333,433 | ) | $ | (33,621,466 | ) |
* Includes in-kind subscriptions from a substitution.
138
NOTES TO FINANCIAL STATEMENTS AS OF DECEMBER 31, (CONTINUED)
| | Class I Shares | | Class S Shares | | Class ADV Shares | |
| | Year
Ended
December 31,
2005 | | Year
Ended
December 31,
2004 | | Year
Ended
December 31,
2005 | | Year
Ended
December 31,
2004 | | Year
Ended
December 31,
2005 | | Year
Ended
December 31,
2004 | |
T. Rowe Price Growth Equity (Number of Shares) | | | | | | | | | | | | | |
Shares sold | | 1,609,059 | | 3,614,473 | | 3,099,968 | | 233,199 | | 570,153 | | 468,928 | |
Dividends reinvested | | 84,803 | | 29,142 | | 9,434 | | 112 | | 1,776 | | — | |
Shares redeemed | | (1,291,892 | ) | (1,752,164 | ) | (357,686 | ) | (39,458 | ) | (503,779 | ) | (204,594 | ) |
Net increase in shares outstanding | | 401,970 | | 1,891,451 | | 2,751,716 | | 193,853 | | 68,150 | | 264,334 | |
| | | | | | | | | | | | | |
T. Rowe Price Growth Equity ($) | | | | | | | | | | | | | |
Shares sold | | $ | 79,961,165 | | $ | 166,701,460 | | $ | 153,365,981 | | $ | 10,578,860 | | $ | 27,928,540 | | $ | 21,300,542 | |
Dividends reinvested | | 4,157,878 | | 1,272,937 | | 459,082 | | 4,880 | | 86,062 | | — | |
Shares redeemed | | (63,812,431 | ) | (79,405,553 | ) | (18,001,009 | ) | (1,795,611 | ) | (24,632,482 | ) | (9,289,573 | ) |
Net increase | | $ | 20,306,612 | | $ | 88,568,844 | | $ | 135,824,054 | | $ | 8,788,129 | | $ | 3,382,120 | | $ | 12,010,969 | |
| | Class I Shares | | Class S Shares | | Class ADV Shares | |
| | Year
Ended
December 31,
2005 | | Year
Ended
December 31,
2004 | | Year
Ended
December 31,
2005 | | Year
Ended
December 31,
2004 | | Year
Ended
December 31,
2005 | | Year
Ended
December 31,
2004 | |
UBS U.S. Large Cap Equity (Number of Shares) | | | | | | | | | | | | | |
Shares sold | | 2,809,555 | | 1,132,421 | | 1,353,016 | | 143,657 | | 47,362 | | 29,545 | |
Dividends reinvested | | 267,258 | | 272,255 | | 4,244 | | 1,580 | | 106 | | 23 | |
Shares redeemed | | (5,088,577 | ) | (5,385,859 | ) | (583,822 | ) | (49,058 | ) | (6,802 | ) | (29,090 | ) |
Net increase (decrease) in shares outstanding | | (2,011,764 | ) | (3,981,183 | ) | 773,438 | | 96,179 | | $ | 40,666 | | $ | 478 | |
| | | | | | | | | | | | | |
UBS U.S. Large Cap Equity ($) | | | | | | | | | | | | | |
Shares sold | | $ | 24,386,763 | | $ | 8,885,946 | | $ | 11,895,077 | | $ | 1,123,691 | | $ | 420,260 | | $ | 243,821 | |
Dividends reinvested | | 2,317,124 | | 2,047,360 | | 36,503 | | 11,802 | | 913 | | 173 | |
Shares redeemed | | (44,378,759 | ) | (42,323,371 | ) | (5,299,117 | ) | (376,132 | ) | (59,843 | ) | (240,331 | ) |
Net increase (decrease) | | $ | (17,674,872 | ) | $ | (31,390,065 | ) | $ | 6,632,463 | | $ | 759,361 | | $ | 361,330 | | $ | 3,663 | |
| | Class I Shares | | Class S Shares | | Class ADV Shares | |
| | Year
Ended
December 31,
2005 | | Year
Ended
December 31,
2004 | | Year
Ended
December 31,
2005 | | Year
Ended
December 31,
2004 | | Year
Ended
December 31,
2005 | | Year
Ended
December 31,
2004 | |
Van Kampen Comstock (Number of Shares) | | | | | | | | | | | | | |
Shares sold | | 5,486,121 | | 3,006,385 | | 19,691,222 | | 13,321,253 | | 1,196,208 | | 653,919 | |
Dividends reinvested | | 351,568 | | 23,877 | | 1,647,807 | | 89,876 | | 60,386 | | 4,600 | |
Shares redeemed | | (574,665 | ) | (481,233 | ) | (3,022,164 | ) | (702,510 | ) | (177,672 | ) | (440,571 | ) |
Net increase in shares outstanding | | 5,263,024 | | 2,549,029 | | 18,316,865 | | 12,708,619 | | 1,078,922 | | 217,948 | |
| | | | | | | | | | | | | |
Van Kampen Comstock ($) | | | | | | | | | | | | | |
Shares sold | | $ | 65,570,222 | | $ | 33,558,478 | | $ | 235,202,173 | | $ | 151,378,954 | | $ | 14,252,401 | | $ | 7,212,274 | |
Dividends reinvested | | 4,092,246 | | 258,350 | | 19,114,567 | | 969,765 | | 696,857 | | 49,401 | |
Shares redeemed | | (6,932,026 | ) | (5,431,315 | ) | (35,920,390 | ) | (7,789,976 | ) | (2,104,032 | ) | (4,862,568 | ) |
Net increase | | $ | 62,730,442 | | $ | 28,385,513 | | $ | 218,396,350 | | $ | 144,558,743 | | $ | 12,845,226 | | $ | 2,399,107 | |
139
NOTES TO FINANCIAL STATEMENTS AS OF DECEMBER 31, (CONTINUED)
| | Class I Shares | | Class S Shares | | Class ADV Shares | |
| | Year
Ended
December 31,
2005 | | Year
Ended
December 31,
2004 | | Year
Ended
December 31,
2005 | | Year
Ended
December 31,
2004 | | Year
Ended
December 31,
2005 | | Year
Ended
December 31,
2004 | |
Van Kampen Equity and Income (Number of Shares) | | | | | | | | | | | | | |
Shares sold | | 15,795,367 | | 16,685,648 | | 1,212,672 | | 734,569 | | 216,494 | | 273,893 | |
Dividends reinvested | | 54,984 | | 731 | | 870 | | 2,019 | | 421 | | 9 | |
Shares redeemed | | (8,835,762 | ) | (302,461 | ) | (582,681 | ) | (289,561 | ) | (74,607 | ) | (17,888 | ) |
Net increase in shares outstanding | | 7,014,589 | | 16,383,918 | | 630,861 | | 447,027 | | 142,308 | | 256,014 | |
| | | | | | | | | | | | | |
Van Kampen Equity and Income ($) | | | | | | | | | | | | | |
Shares sold | | $ | 522,792,481 | * | $ | 546,480,561 | | $ | 42,084,427 | | $ | 23,807,535 | | $ | 7,311,592 | | $ | 8,816,122 | |
Dividends reinvested | | 1,872,766 | | 22,124 | | 29,541 | | 61,002 | | 14,161 | | 258 | |
Shares redeemed | | (309,018,920 | ) | (9,920,902 | ) | (19,559,547 | ) | (9,144,492 | ) | (2,517,187 | ) | (579,375 | ) |
Net increase | | $ | 215,646,327 | | $ | 536,581,783 | | $ | 22,554,421 | | $ | 14,724,045 | | $ | 4,808,566 | | $ | 8,237,005 | |
* Includes in-kind subscriptions from a substitution.
140
NOTES TO FINANCIAL STATEMENTS AS OF DECEMBER 31, (CONTINUED)
NOTE 8 — ILLIQUID SECURITIES
Pursuant to guidelines adopted by the Portfolio’s Board, the following securities have been deemed to be illiquid. The Portfolios may invest up to 15% of its net assets, in illiquid securities. ING value for certain of securities was determined by ING Funds Valuation Committee appointed by the Fund’s Board.
Portfolio | | Security | | Notional
Principal/
Par Value | | Initial
Acquisition
Date | | Cost | | Value | | Percent
of Net
Assets | |
Oppenheimer Strategic Income | | Argentina Government International Bond, (0.580)%, due 12/31/33 | | ARS 496,991 | | 06/17/05 | | | 156,683 | | | $ | 193,377 | | 0.1 | % |
| | Argentina Government International Bond, 2.000%, due 02/04/18 | | ARS 1,056,000 | | 05/18/05 | | | 464,588 | | | 512,952 | | 0.1 | % |
| | Argentina Government International Bond, 0.000%, due 12/15/35 | | ARS 1,409,496 | | 05/18/05 | | | 16,702 | | | 20,959 | | 0.0 | % |
| | JPY Put Swaption, Strike Price 122.50, expires 03/02/06 | | JPY 757,000,000 | | 12/01/05 | | | 37,541 | | | 9,735 | | 0.0 | % |
| | | | | | | | | | | | $ | 737,023 | | 0.2 | % |
PIMCO Total Return | | Federal Home Loan Mortgage Corporation, 0.010%, due 04/25/24 | | USD 18,775 | | 06/04/03 | | | 18,426 | | | $ | 18,736 | | 0.0 | % |
| | EURO Call Swaption, Strike Price 4.50, expires 04/04/06 | | EUR 2,300,000 | | 10/04/05 | | | 7,130 | | | 1,277 | | 0.0 | % |
| | EURO Call Swaption, Strike Price 4.50, expires 04/04/06 | | EUR 3,000,000 | | 10/05/05 | | | 9,600 | | | 1,665 | | 0.0 | % |
| | EURO Call Swaption, Strike Price 4.50, expires 06/02/06 | | EUR 1,000,000 | | 06/02/05 | | | 31,950 | | | 4,455 | | 0.0 | % |
| | EURO Call Swaption, Strike Price 4.50, expires 10/04/06 | | EUR 2,300,000 | | 10/04/05 | | | 11,730 | | | 5,624 | | 0.0 | % |
| | EURO Call Swaption, Strike Price 4.50, expires 10/04/06 | | EUR 4,200,000 | | 10/05/05 | | | 21,420 | | | 10,975 | | 0.0 | % |
| | EURO Call Swaption, Strike Price 4.25, expires 10/24/06 | | EUR 5,100,000 | | 10/24/05 | | | 15,874 | | | 7,823 | | 0.0 | % |
| | EURO Put Swaption, Strike Price 6.25, expires 04/27/09 | | EUR 500,000 | | 04/28/04 | | | 35,750 | | | 14,964 | | 0.0 | % |
| | EURO Call Swaption, Strike Price 4.25, expires 10/12/06 | | EUR 12,100,000 | | 10/12/05 | | | 37,208 | | | 17,303 | | 0.0 | % |
| | EURO Call Swaption, Strike Price 4.50, expires 10/18/06 | | EUR 9,500,000 | | 10/18/05 | | | 41,325 | | | 26,334 | | 0.0 | % |
| | EURO Call Swaption, Strike Price 4.75, expires 08/08/06 | | EUR 12,800,000 | | 11/08/05 | | | 52,224 | | | 47,629 | | 0.0 | % |
| | EURO Call Swaption, Strike Price 5.75, expires 04/27/09 | | EUR 500,000 | | 04/28/04 | | | 25,850 | | | 64,883 | | 0.0 | % |
| | Interest Rate Swap USD 3-Month LIBOR-5.000%, termination date 06/21/2011 | | USD 15,300,000 | | 12/14/05 | | | 62,118 | | | 66,082 | | 0.1 | % |
| | Interest Rate Swap USD 3-Month LIBOR-5.000%, termination date 06/21/2011 | | USD 6,900,000 | | 12/07/05 | | | (2,829 | ) | | 29,802 | | 0.0 | % |
| | Interest Rate Swap USD 3-Month LIBOR-5.000%, termination date 06/21/2011 | | USD 8,000,000 | | 12/07/05 | | | (4,560 | ) | | 34,553 | | 0.0 | % |
| | Credit Default Swap, Russian Federation, 0.610%, termination date 03/20/07 | | USD 400,000 | | 03/11/05 | | | — | | | 1,158 | | 0.0 | % |
| | Credit Default Swap, Russian Federation, 0.700%, termination date 03/20/07 | | USD 500,000 | | 03/15/05 | | | — | | | 1,985 | | 0.0 | % |
| | Credit Default Swap, Russian Federation, 0.580%, termination date 06/20/06 | | USD 100,000 | | 05/26/05 | | | — | | | 136 | | 0.0 | % |
| | Credit Default Swap, Dow Jones CDX EM3, 2.100%, termination date 06/20/10 | | USD 900,000 | | 04/15/05 | | | (23,400 | ) | | 34,964 | | 0.0 | % |
| | | | | | | | | | | | $ | 390,348 | | 0.1 | % |
NOTE 9 — REORGANIZATIONS
On December 3, 2005, Fundamental Research as listed below (“Acquiring Portfolio”), acquired the assets and certain liabilities of the ING VP Disciplined LargeCap Portfolio, also listed below (“Acquired Portfolio”), in a tax-free reorganization in exchange for shares of the Acquiring Portfolio, pursuant to a plan or reorganization approved by the Acquired Portfolio’s shareholders. The number and value of shares issued by the Acquiring Portfolio are presented in Note 7 — Capital Share Transactions. Net assets and unrealized appreciation as of the reorganization dates were as follows:
Acquiring Portfolio | | Acquired | | Total Net Assets of | | Total Net Assets of | | Acquired Portfolio
Unrealized | | Conversion | |
Portfolio | | Portfolio | | Acquired Portfolio (000’s) | | Acquiring Portfolio (000��s) | | Appreciation (000) | | Ratio | |
Fundamental Research | | ING VP Disciplined LargeCap Portfolio | | $7,325 | | $34,839 | | $766 | | 0.4634 | |
The net assets of Fundamental Research after the acquisition were approximately $42,163,829.
141
NOTES TO FINANCIAL STATEMENTS AS OF DECEMBER 31, 2005 (CONTINUED)
NOTE 10 — CONCENTRATION OF RISKS
Non-Diversified (JPMorgan Mid Cap Value and Davis Venture Value). There is additional risk associated with being non-diversified, since the Portfolios are not limited in the proportion of their assets in a single issuer. The investment of a large percentage of a Portfolio’s assets in the securities of a small number of issuers may cause that Portfolio’s share price to fluctuate more than that of a diversified portfolio.
NOTE 11 — SECURITIES LENDING
Under an agreement with The Bank of New York (“BNY”), the Portfolios can lend their securities to approved brokers, dealers and other financial institutions. Loans are collateralized by cash and U.S. Government securities. The collateral must be in an amount equal to at least 105% of the market value of non-U.S. securities loaned and 102% of the market value of U.S. securities loaned. The cash collateral received is invested in approved investments as defined in the Securities Lending Agreement with BNY (the “Agreement”). The securities purchased with cash collateral received are reflected in the Portfolio of Investments. Generally, in the event of counterparty default, the Portfolios have the right to use the collateral to offset losses incurred. The Agreement contains certain guarantees by BNY in the event of counterparty default and/or a borrower’s failure to return a loaned security, however there would be a potential loss to the Portfolios in the event the Portfolios are delayed or prevented from exercising their right to dispose of the collateral. The Portfolios bear the risk of loss with respect to the investment of collateral. Engaging in securities lending could have a leveraging effect, which may intensify the credit, market and other risks associated with investing in a Portfolio. At December 31, 2005, the following Portfolios had securities on loan with the following market values:
Portfolio | | Value of
Securities
Loaned | | Value of
Collateral | |
American Century Large Company Value | | $ | 13,377,487 | | $ | 13,825,000 | |
American Century Select | | 76,472,198 | | 78,983,000 | |
American Century Small Cap Value | | 23,273,617 | | 24,072,000 | |
Goldman Sachs Capital Growth | | 10,700,557 | | 11,018,000 | |
Goldman Sachs Core Equity | | 15,167,106 | | 15,680,000 | |
JPMorgan Fleming International | | 18,501,370 | | 19,213,000 | |
JPMorgan Mid Cap Value | | 30,891,230 | | 31,852,000 | |
MFS Capital Opportunities | | 38,814,257 | | 41,108,000 | |
OpCap Balanced Value | | 20,562,825 | | 21,130,000 | |
Oppenheimer Global | | 310,065,073 | | 321,186,000 | |
Oppenheimer Strategic Income | | 60,682,633 | | 62,254,000 | |
PIMCO Total Return | | 16,605,511 | | 16,934,000 | |
Salomon Brothers Aggressive Growth | | 201,933,033 | | 208,383,000 | |
T. Rowe Price Diversified Mid Cap Growth | | 295,787,469 | | 304,867,000 | |
T. Rowe Price Growth Equity | | 160,550,748 | | 164,956,000 | |
UBS U.S. Large Cap Equity | | 52,914,433 | | 54,508,000 | |
Van Kampen Comstock | | 73,078,912 | | 75,258,000 | |
| | | | | | | |
NOTE 12 — FEDERAL INCOME TAXES
The amount of distributions from net investment income and net realized capital gains are determined in accordance with federal income tax regulations, which may differ from U.S. generally accepted accounting principles for investment companies. These book/tax differences may be either temporary or permanent. Permanent differences are reclassified within the capital accounts based on their federal tax-basis treatment; temporary differences are not reclassified. Key differences include the treatment of short-term capital gains, foreign currency transactions, and wash sale deferrals. Distributions in excess of net investment income and/or net realized capital gains for tax purposes are reported as distributions of paid-in capital.
The following permanent tax differences have been reclassified as of December 31, 2005:
| | Paid-in
Capital | | Undistributed
Net Investment
Income On
Investments | | Accumulated
Net Realized
Gains/
(Losses) | |
American Century Large Company Value | | $ | — | | $ | (17,963 | ) | $ | 17,963 | |
American Century Select | | — | | 2,743,885 | | (2,743,885 | ) |
American Century Small Cap Value | | 2,386 | | (35,101 | ) | 32,715 | |
Baron Small Cap Growth | | (2,235,564 | ) | 2,235,564 | | — | |
Davis Venture Value | | — | | (6,221 | ) | 6,221 | |
Fundamental Research | | 1,742,107 | | (1,086 | ) | (1,741,021 | ) |
Goldman Sachs® Capital Growth | | (211,655 | ) | 201,607 | | 10,048 | |
Goldman Sachs® Core Equity | | — | | (12,303 | ) | 12,303 | |
JPMorgan Fleming International | | — | | (148,932 | ) | 148,932 | |
JPMorgan Mid Cap Value | | — | | (59,146 | ) | 59,146 | |
MFS Capital Opportunities | | — | | (10,103 | ) | 10,103 | |
Oppenheimer Global | | — | | 2,041,718 | | (2,041,718 | ) |
Oppenheimer Strategic Income | | (14,129 | ) | (2,728,046 | ) | 2,742,175 | |
PIMCO Total Return | | — | | 41,887 | | (41,887 | ) |
Salomon Brothers Aggressive Growth | | (4,071,807 | ) | 4,071,807 | | — | |
Salomon Brothers Large Cap Growth | | — | | 174,227 | | (174,227 | ) |
T. Rowe Price Diversified Mid Cap Growth | | — | | 747,595 | | (747,595 | ) |
T. Rowe Price Growth Equity | | — | | (363,661 | ) | 363,661 | |
Van Kampen Equity and Income | | — | | 47,626 | | (47,626 | ) |
| | | | | | | | | | |
142
NOTES TO FINANCIAL STATEMENTS AS OF DECEMBER 31, (CONTINUED)
Dividends paid by the Portfolios from net investment income and distributions of net realized short-term capital gains are, for federal income tax purposes, taxable as ordinary income to shareholders.
The tax composition of dividends and distributions to shareholders was as follows:
| | Year Ended
December 31, 2005 | | Year Ended
December 31, 2004 | |
| | Ordinary
Income | | Long-Term
Capital Gains | | Ordinary
Income | | Long-Term
Capital Gains | |
American Century Large Company Value | | $ | 769,475 | | $ | — | | $ | 568,705 | | $ | — | |
American Century Small Cap Value | | 8,405,035 | | 2,731,901 | | 3,536,224 | | 913,127 | |
Davis Venture Value | | 12,919 | | — | | — | | — | |
Fundamental Research | | 416,890 | | — | | 266,777 | | — | |
Goldman Sachs® Capital Growth | | 235,893 | | — | | 44,261 | | — | |
Goldman Sachs® Core Equity | | 4,563,634 | | 7,690,537 | | 4,582,347 | | — | |
JPMorgan Fleming International | | 5,596,809 | | — | | 4,816,681 | | — | |
JPMorgan Mid Cap Value | | 5,769,366 | | 6,778,644 | | 2,034,792 | | 1,816,826 | |
MFS Capital Opportunities | | 1,680,604 | | — | | 1,045,694 | | — | |
OpCap Balanced Value | | 556,685 | | — | | 1,489,882 | | — | |
Oppenheimer Global | | 56,677,221 | | 3,498,723 | | 703,921 | | 747,458 | |
Oppenheimer Strategic Income | | 8,152,928 | | — | | 303,811 | | — | |
PIMCO Total Return | | 5,368,461 | | 1,395,048 | | 1,203,212 | | 201,689 | |
Salomon Brothers Large Cap Growth | | 3,143,124 | | 3,131,689 | | 1,902,931 | | — | |
T. Rowe Price Diversified Mid Cap Growth | | 11,971,399 | | 7,603,115 | | — | | — | |
T. Rowe Price Growth Equity | | 4,703,022 | | — | | 1,277,817 | | — | |
UBS U.S. Large Cap Equity | | 2,354,540 | | — | | 2,059,335 | | — | |
Van Kampen Comstock | | 8,250,085 | | 15,653,585 | | 1,203,940 | | 73,576 | |
Van Kampen Equity and Income | | 1,595,480 | | 320,987 | | 83,384 | | — | |
| | | | | | | | | | | | | |
The tax-basis components of distributable earnings and the expiration dates of the capital loss carryforwards which may be used to offset future realized capital gains for federal income tax purposes as of December 31, 2005 were:
| | Undistributed
Ordinary
Income | | Undistributed
Long Term
Capital Gains | | Unrealized
Appreciation/
Depreciation | | Post-October
Capital
Losses
Deferred | | Post-October
Currency
Losses
Deferred | | Capital
Loss
Carryforwards | | Expiration
Dates | |
American Century Large Company Value | | $ | 1,439,489 | | $ | 4,999,754 | | $ | 5,049,060 | | $ | — | | $ | — | | | $ | — | | — | | |
American Century Select | | 4,431,383 | | — | | 21,150,090 | | — | | — | | | | (1,748,688 | ) | 2010 | | |
American Century Small Cap Value | | 240,365 | | 128,533 | | 3,261,121 | | — | | — | | | | — | | — | | |
Baron Small Cap Growth | | — | | 3,907,753 | | 52,743,842 | | — | | — | | | | — | | — | | |
Davis Venture Value | | 8,141 | | 8,144,363 | | 2,586,501 | | — | | — | | | | — | | — | | |
Fundamental Research | | — | | — | | — | | — | | — | | | $ | (966,939 | ) | 2008 | | |
| | 969,249 | | 834,436 | | 896,696 | | — | | — | | | | (322,313 | ) | 2009 | | |
| | | | | | | | | | | | | | (322,313 | ) | 2010 | | |
| | | | | | | | | | | | | $ | (1,611,565 | ) | | | |
Goldman Sachs® Capital Growth | | — | | — | | 6,832,526 | | — | | — | | | $ | (10,123,388 | ) | 2010 | | |
| | | | | | | | | | | | | | (4,114,134 | ) | 2011 | | |
| | | | | | | | | | | | | | (2,145,265 | ) | 2012 | | |
| | | | | | | | | | | | | $ | (16,382,787 | ) | | | |
Goldman Sachs® Core Equity | | 2,646,146 | | 5,747,720 | | 8,045,709 | | — | | — | | | | — | | — | | |
JPMorgan Fleming International | | 8,267,001 | | — | | 201,186,027 | | — | | — | | | $ | (81,211,114 | ) | 2009 | | |
| | | | | | | | | | | | | | (70,771,343 | ) | 2010 | | |
| | | | | | | | | | | | | $ | (151,982,457 | ) | | | |
JPMorgan Mid Cap Value | | 30,492 | | 1,419,529 | | 12,206,090 | | — | | — | | — | | | | — | | |
MFS Capital Opportunities | | 880,670 | | — | | 8,562,951 | | — | | — | | | $ | (70,639,357 | ) | 2009 | | |
| | | | | | | | | | | | | | (113,367,765 | ) | 2010 | | |
| | | | | | | | | | | | | $ | (184,007,122 | ) | | | |
OpCap Balanced Value | | 844,339 | | — | | 7,527,330 | | — | | — | | | | (1,105,038 | ) | 2010 | | |
Oppenheimer Global | | 1,752,025 | | 3,300,634 | | 315,022,504 | | — | | (185,500 | ) | | | — | | — | | |
Oppenheimer Strategic Income | | 83,002 | | — | | (639,441 | ) | — | | — | | | | (1,718,846 | ) | 2013 | | |
PIMCO Total Return | | 6,390,302 | | — | | (1,062,513 | ) | — | | — | | | | (1,828,225 | ) | 2013 | | |
Salomon Brothers Aggressive Growth | | — | | — | | 259,751,153 | | — | | — | | | | (254,104,483 | ) | 2010 | | |
Salomon Brothers Large Cap Growth | | 750,931 | | 45,255 | | 4,432,652 | | — | | — | | | | — | | — | | |
T. Rowe Price Diversified Mid Cap Growth | | 23,212,590 | | 2,312,806 | | 136,950,906 | | — | | — | | | | — | | — | | |
T. Rowe Price Growth Equity | | 2,792,044 | | 2,118,210 | | 144,454,598 | | — | | — | | | | — | | — | | |
UBS U.S. Large Cap Equity | | 2,425,943 | | — | | 31,327,236 | | — | | — | | | $ | (19,480,163 | ) | 2009 | | |
| | | | | | | | | | | | | | (71,755,456 | ) | 2010 | | |
| | | | | | | | | | | | | $ | (91,235,619 | ) | | | |
Van Kampen Comstock | | 19,656,162 | | 29,262,771 | | 22,862,673 | | — | | — | | | | — | | — | | |
Van Kampen Equity and Income | | 52,523,285 | | — | | 46,161,219 | | — | | — | | | | — | | — | | |
| | | | | | | | | | | | | | | | | | | | | | | |
143
NOTES TO FINANCIAL STATEMENTS AS OF DECEMBER 31, 2005 (CONTINUED)
NOTE 13 — INFORMATION REGARDING TRADING OF ING’S U.S. MUTUAL FUNDS
In 2004, ING Investments reported to the Boards of Directors/Trustees (the “Boards”) of the ING Funds that, like many U.S. financial services companies, ING Investments and certain of its U.S. affiliates have received informal and formal requests for information since September 2003 from various governmental and self-regulatory agencies in connection with investigations related to mutual funds and variable insurance products. ING Investments has advised the Boards that it and its affiliates have cooperated fully with each request.
In addition to responding to regulatory and governmental requests, ING Investments reported that management of U.S. affiliates of ING Groep N.V., including ING Investments (collectively, “ING”), on their own initiative, have conducted, through independent special counsel and a national accounting firm, an extensive internal review of trading in ING insurance, retirement, and mutual fund products. The goal of this review was to identify any instances of inappropriate trading in those products by third parties or by ING investment professionals and other ING personnel. ING’s internal review related to mutual fund trading is now substantially completed. ING has reported that, of the millions of customer relationships that ING maintains, the internal review identified several isolated arrangements allowing third parties to engage in frequent trading of mutual funds within ING’s variable insurance and mutual fund products, and identified other circumstances where frequent trading occurred, despite measures taken by ING intended to combat market timing. ING further reported that each of these arrangements has been terminated and fully disclosed to regulators. The results of the internal review were also reported to the independent members of the Board.
ING Investments has advised the Board that most of the identified arrangements were initiated prior to ING’s acquisition of the businesses in question in the U.S. ING Investments further reported that the companies in question did not receive special benefits in return for any of these arrangements, which have all been terminated.
Based on the internal review, ING Investments has advised the Board that the identified arrangements do not represent a systemic problem in any of the companies that were involved.
In September 2005, ING Funds Distributor, LLC (“IFD”), the distributor of certain ING Funds, settled an administrative proceeding with the NASD regarding three arrangements, dating from 1995, 1996 and 1998, under which the administrator to the then-Pilgrim Funds, which subsequently became part of the ING Funds, entered into formal and informal arrangements that permitted frequent trading. Under the terms of the Letter of Acceptance, Waiver and Consent (“AWC”) with the NASD, under which IFD neither admitted nor denied the allegations or findings, IFD consented to the following sanctions: (i) a censure; (ii) a fine of $1.5 million; (iii) restitution of approximately $1.44 million to certain ING Funds for losses attributable to excessive trading described in the AWC; and (iv) agreement to make certification to NASD regarding the review and establishment of certain procedures.
In addition to the arrangements discussed above, in 2004, ING Investments reported to the Board that, at that time, these instances include the following, in addition to the arrangements subject to the AWC discussed above:
• Aeltus Investment Management, Inc. (a predecessor entity to ING Investment Management Co.) has identified two investment professionals who engaged in extensive frequent trading in certain ING Funds. One was subsequently terminated for cause and incurred substantial financial penalties in connection with this conduct and the second has been disciplined.
• ReliaStar Life Insurance Company (“ReliaStar”) entered into agreements seven years ago permitting the owner of policies issued by the insurer to engage in frequent trading and to submit orders until 4pm Central Time. In 2001 ReliaStar also entered into a selling agreement with a broker-dealer that engaged in frequent trading. Employees of ING affiliates were terminated and/or disciplined in connection with these matters.
• In 1998, Golden American Life Insurance Company entered into arrangements permitting a broker-dealer to frequently trade up to certain specific limits in a fund available in an ING variable annuity product. No employee responsible for this arrangement remains at the company.
For additional information regarding these matters and the AWC, you may consult the Form 8-K and Form 8-K/A for each of four life insurance companies, ING USA Annuity and Life Insurance Company, ING Life Insurance and Annuity Company, ING Insurance
144
NOTES TO FINANCIAL STATEMENTS AS OF DECEMBER 31, 2005 (CONTINUED)
NOTE 13 — INFORMATION REGARDING TRADING OF ING’S U.S. MUTUAL FUNDS (continued)
Company of America, and ReliaStar Life Insurance Company of New York, each filed with the Securities and Exchange Commission (the “SEC”) on October 29, 2004 and September 8, 2004. These Forms 8-K and Forms 8-K/A can be accessed through the SEC’s Web site at http://www.sec.gov. Despite the extensive internal review conducted through independent special counsel and a national accounting firm, there can be no assurance that the instances of inappropriate trading reported to the Board are the only instances of such trading respecting the ING Funds.
ING Investments reported to the Board that ING is committed to conducting its business with the highest standards of ethical conduct with zero tolerance for noncompliance. Accordingly, ING Investments advised the Board that ING management was disappointed that its voluntary internal review identified these situations. Viewed in the context of the breadth and magnitude of its U.S. business as a whole, ING management does not believe that ING’s acquired companies had systemic ethical or compliance issues in these areas. Nonetheless, ING Investments reported that given ING’s refusal to tolerate any lapses, it has taken the steps noted below, and will continue to seek opportunities to further strengthen the internal controls of its affiliates.
• ING has agreed with the ING Funds to indemnify and hold harmless the ING Funds from all damages resulting from wrongful conduct by ING or its employees or from ING’s internal investigation, any investigations conducted by any governmental or self-regulatory agencies, litigation or other formal proceedings, including any proceedings by the Securities and Exchange Commission. ING Investments reported to the Board that ING management believes that the total amount of any indemnification obligations will not be material to ING or its U.S. business.
• ING updated its Code of Conduct for employees reinforcing its employees’ obligation to conduct personal trading activity consistent with the law, disclosed limits, and other requirements.
• The ING Funds, upon a recommendation from ING, updated their respective Codes of Ethics applicable to investment professionals with ING entities and certain other fund personnel, requiring such personnel to pre-clear any purchases or sales of ING Funds that are not systematic in nature (i.e., dividend reinvestment), and imposing minimum holding periods for shares of ING Funds.
• ING instituted excessive trading policies for all customers in its variable insurance and retirement products and for shareholders of the ING Funds sold to the public through financial intermediaries. ING does not make exceptions to these policies.
• ING reorganized and expanded its U.S. Compliance Department, and created an Enterprise Compliance team to enhance controls and consistency in regulatory compliance.
As has been widely reported in the media, the New York Attorney General’s office (“NYAG”) is conducting broad investigations regarding insurance quoting and brokerage practices. ING U.S. has been subpoenaed in this regard, and is cooperating fully with these NYAG requests for information.
ING U.S. believes that its practices are consistent with our business principles and our commitment to our customers.
At this time, in light of the current regulatory factors, ING U.S. is actively engaged in reviewing whether any modifications in our practices are appropriate for the future.
There can be no assurance that these matters, or the adverse publicity associated with them, will not result in increased fund redemptions, reduced sale of fund shares, or other adverse consequences to ING Funds.
145
ING AMERICAN CENTURY | PORTFOLIO OF INVESTMENTS |
LARGE COMPANY VALUE PORTFOLIO | AS OF DECEMBER 31, 2005 |
Shares | | | | | | Value | |
COMMON STOCK: 96.4% | | | |
| | | | | | | |
| | | | Aerospace/Defense: 0.7% | | | |
11,600 | | L | | Northrop Grumman Corp. | | $ | 697,276 | |
| | | | | | 697,276 | |
| | | | Agriculture: 1.5% | | | |
18,400 | | | | Altria Group, Inc. | | 1,374,848 | |
| | | | | | 1,374,848 | |
| | | | Apparel: 1.3% | | | |
17,500 | | L | | Liz Claiborne, Inc. | | 626,850 | |
11,300 | | | | VF Corp. | | 625,342 | |
| | | | | | 1,252,192 | |
| | | | Auto Parts & Equipment: 0.4% | | | |
11,800 | | | | Lear Corp. | | 335,828 | |
| | | | | | 335,828 | |
| | | | Banks: 11.8% | | | |
77,400 | | | | Bank of America Corp. | | 3,572,010 | |
27,400 | | | | Bank of New York | | 872,690 | |
12,600 | | L | | National City Corp. | | 422,982 | |
11,700 | | | | PNC Financial Services Group, Inc. | | 723,411 | |
45,000 | | | | US BanCorp. | | 1,345,050 | |
31,300 | | | | Wachovia Corp. | | 1,654,518 | |
41,300 | | L | | Wells Fargo & Co. | | 2,594,879 | |
| | | | | | 11,185,540 | |
| | | | Beverages: 2.2% | | | |
20,500 | | | | Coca-Cola Co. | | 826,355 | |
7,400 | | L | | Molson Coors Brewing Co. | | 495,726 | |
26,700 | | | | Pepsi Bottling Group, Inc. | | 763,887 | |
| | | | | | 2,085,968 | |
| | | | Chemicals: 1.9% | | | |
18,700 | | | | EI Du Pont de Nemours & Co. | | 794,750 | |
17,400 | | | | PPG Industries, Inc. | | 1,007,460 | |
| | | | | | 1,802,210 | |
| | | | Commercial Services: 0.6% | | | |
17,100 | | | | RR Donnelley & Sons Co. | | 584,991 | |
| | | | | | 584,991 | |
| | | | Computers: 3.5% | | | |
9,500 | | @,L | | Computer Sciences Corp. | | 481,080 | |
55,900 | | | | Hewlett-Packard Co. | | 1,600,417 | |
15,100 | | | | International Business Machines Corp. | | 1,241,220 | |
| | | | | | 3,322,717 | |
| | | | Cosmetics/Personal Care: 0.3% | | | |
8,600 | | | | Avon Products, Inc. | | 245,530 | |
| | | | | | 245,530 | |
| | | | Diversified Financial Services: 11.6% | | | |
94,100 | | | | Citigroup, Inc. | | 4,566,673 | |
47,000 | | | | Freddie Mac | | 3,071,450 | |
24,300 | | | | Merrill Lynch & Co., Inc. | | 1,645,839 | |
29,100 | | | | Morgan Stanley | | 1,651,134 | |
| | | | | | 10,935,096 | |
| | | | Electric: 3.4% | | | |
27,800 | | | | Exelon Corp. | | 1,477,292 | |
28,700 | | L | | NiSource, Inc. | | 598,682 | |
39,800 | | | | PPL Corp. | | $ | 1,170,120 | |
| | | | | | 3,246,094 | |
| | | | Environmental Control: 0.7% | | | |
22,400 | | | | Waste Management, Inc. | | 679,840 | |
| | | | | | 679,840 | |
| | | | Equity Fund: 1.4% | | | |
10,500 | | L | | SPDR Trust Series 1 | | 1,307,355 | |
| | | | | | 1,307,355 | |
| | | | Food: 3.2% | | | |
21,000 | | | | HJ Heinz Co. | | 708,120 | |
46,200 | | @ | | Kroger Co. | | 872,256 | |
30,000 | | L | | Sara Lee Corp. | | 567,000 | |
12,400 | | @@ | | Unilever NV | | 851,260 | |
| | | | | | 2,998,636 | |
| | | | Forest Products & Paper: 1.3% | | | |
19,100 | | L | | Weyerhaeuser Co. | | 1,267,094 | |
| | | | | | 1,267,094 | |
| | | | Healthcare-Products: 1.3% | | | |
20,400 | | | | Johnson & Johnson | | 1,226,040 | |
| | | | | | 1,226,040 | |
| | | | Healthcare Services: 0.5% | | | |
9,600 | | L | | HCA, Inc. | | 484,800 | |
| | | | | | 484,800 | |
| | | | Housewares: 0.6% | | | |
25,100 | | L | | Newell Rubbermaid, Inc. | | 596,878 | |
| | | | | | 596,878 | |
| | | | Insurance: 6.6% | | | |
22,300 | | | | Allstate Corp. | | 1,205,761 | |
20,000 | | | | American International Group, Inc. | | 1,364,600 | |
13,400 | | | | Hartford Financial Services Group, Inc. | | 1,150,926 | |
7,900 | | | | Loews Corp. | | 749,315 | |
16,000 | | | | Marsh & McLennan Cos., Inc. | | 508,160 | |
7,600 | | L | | MGIC Investment Corp. | | 500,232 | |
13,100 | | | | Torchmark Corp. | | 728,360 | |
| | | | | | 6,207,354 | |
| | | | Iron/Steel: 0.4% | | | |
6,000 | | | | Nucor Corp. | | 400,320 | |
| | | | | | 400,320 | |
| | | | Machinery-Diversified: 0.7% | | | |
10,300 | | | | Deere & Co. | | 701,533 | |
| | | | | | 701,533 | |
| | | | Media: 3.5% | | | |
17,100 | | | | Gannett Co., Inc. | | 1,035,747 | |
92,900 | | | | Time Warner, Inc. | | 1,620,176 | |
19,900 | | | | Viacom, Inc. | | 648,740 | |
| | | | | | 3,304,663 | |
| | | | Mining: 0.9% | | | |
29,300 | | | | Alcoa, Inc. | | 866,401 | |
| | | | | | 866,401 | |
See Accompanying Notes to Financial Statements
146
ING AMERICAN CENTURY | PORTFOLIO OF INVESTMENTS |
LARGE COMPANY VALUE PORTFOLIO | AS OF DECEMBER 31, 2005 (CONTINUED) |
Shares | | | | | | Value | |
| | | | Miscellaneous Manufacturing: 4.6% | | | |
16,100 | | | | Dover Corp. | | $ | 651,889 | |
33,100 | | | | General Electric Co. | | 1,160,155 | |
21,100 | | @@ | | Ingersoll-Rand Co. | | 851,807 | |
10,100 | | | | Parker Hannifin Corp. | | 666,196 | |
36,600 | | @@,L | | Tyco International Ltd. | | 1,056,276 | |
| | | | | | 4,386,323 | |
| | | | Office/Business Equipment: 0.7% | | | |
47,000 | | @,L | | Xerox Corp. | | 688,550 | |
| | | | | | 688,550 | |
| | | | Oil & Gas: 12.0% | | | |
2,600 | | | | Anadarko Petroleum Corp. | | 246,350 | |
37,400 | | | | ChevronTexaco Corp. | | 2,123,198 | |
35,200 | | | | ConocoPhillips | | 2,047,936 | |
3,900 | | | | Devon Energy Corp. | | 243,906 | |
73,000 | | | | Exxon Mobil Corp. | | 4,100,410 | |
41,400 | | @@ | | Royal Dutch Shell PLC ADR | | 2,545,686 | |
| | | | | | 11,307,486 | |
| | | | Pharmaceuticals: 5.1% | | | |
31,500 | | | | Abbott Laboratories | | 1,242,045 | |
10,300 | | | | Bristol-Myers Squibb Co. | | 236,694 | |
17,800 | | | | Merck & Co., Inc. | | 566,218 | |
66,200 | | | | Pfizer, Inc. | | 1,543,784 | |
26,100 | | | | Wyeth | | 1,202,427 | |
| | | | | | 4,791,168 | |
| | | | Retail: 3.2% | | | |
31,600 | | | | Dollar General Corp. | | 602,612 | |
29,900 | | | | Gap, Inc./The | | 527,436 | |
33,400 | | | | McDonald’s Corp. | | 1,126,248 | |
16,200 | | | | Wal-Mart Stores, Inc. | | 758,160 | |
| | | | | | 3,014,456 | |
| | | | Savings & Loans: 1.6% | | | |
34,300 | | L | | Washington Mutual, Inc. | | 1,492,050 | |
| | | | | | 1,492,050 | |
| | | | Semiconductors: 0.8% | | | |
30,700 | | | | Intel Corp. | | 766,272 | |
| | | | | | 766,272 | |
| | | | Software: 3.0% | | | |
15,200 | | @ | | Fiserv, Inc. | | 657,704 | |
61,100 | | | | Microsoft Corp. | | 1,597,765 | |
46,500 | | @ | | Oracle Corp. | | 567,765 | |
| | | | | | 2,823,234 | |
| | | | Telecommunications: 4.9% | | | |
61,800 | | | | AT&T, Inc. | | 1,513,482 | |
22,100 | | @,L | | Avaya, Inc. | | 235,807 | |
38,300 | | | | BellSouth Corp. | | 1,037,930 | |
32,900 | | L | | Sprint Corp. - FON Group | | 768,544 | |
34,000 | | | | Verizon Communications, Inc. | | 1,024,080 | |
| | | | | | 4,579,843 | |
| | | | Transportation: 0.2% | | | |
4,200 | | | | Norfolk Southern Corp. | | 188,286 | |
| | | | | | 188,286 | |
| | | | Total Common Stock
(Cost $85,927,081) | | 91,146,872 | |
| | | | | | | | |
Principal
Amount | | | | | | Value | |
SHORT-TERM INVESTMENTS: 19.6% | | | |
| | Federal Home Loan Bank 5.0% | | | |
$ | 4,740,000 | | Discount Note, 3.200%, due 01/03/06 | | $ | 4,738,736 | |
| | Total Federal Home Loan Bank
(Cost $4,739,157) | | 4,738,736 | |
| | Securities Lending Collateralcc 14.6% | | | |
13,825,000 | | The Bank of New York Institutional Cash Reserves Fund | | 13,825,000 | |
| | Total Securities Lending Collateral
(Cost $13,825,000) | | 13,825,000 | |
| | Total Short-Term Investments
(Cost $18,564,157) | | 18,563,736 | |
| | Total Investments in Securities
(Cost $104,491,238)* | 116.0 | % | | $ | 109,710,608 | |
| | Other Assets and Liabilities-Net | (16.0 | ) | | (15,152,885 | ) |
| | Net Assets | 100.0 | % | | $ | 94,557,723 | |
| | | | | | | | | | | |
@ | Non-income producing security |
@@ | Foreign Issuer |
ADR | American Depositary Receipt |
cc | Securities purchased with cash collateral for securities loaned. |
L | Loaned security, a portion or all of the security is on loan at December 31, 2005. |
* | Cost for federal income tax purposes is $104,661,548. |
| Net unrealized appreciation consists of: |
| | | | Gross Unrealized Appreciation | | $ | 6,563,341 | |
| | | | Gross Unrealized Depreciation | | (1,514,281 | ) |
| | | | Net Unrealized Appreciation | | $ | 5,049,060 | |
See Accompanying Notes to Financial Statements
147
ING AMERICAN CENTURY | PORTFOLIO OF INVESTMENTS |
SELECT PORTFOLIO | AS OF DECEMBER 31, 2005 |
Shares | | | | | | Value | |
COMMON STOCK: 98.5% | | | |
| | | | Beverages: 3.5% | | | | |
87,850 | | L | | Anheuser-Busch Cos., Inc. | | $ | 3,774,036 | |
81,390 | | | | Coca-Cola Co. | | 3,280,831 | |
100,151 | | @@ | | Diageo PLC | | 1,444,179 | |
115,320 | | | | PepsiCo, Inc. | | 6,813,106 | |
| | | | | | 15,312,152 | |
| | | | Biotechnology: 3.3% | | | |
181,750 | | @,S | | Amgen, Inc. | | 14,332,805 | |
| | | | | | 14,332,805 | |
| | | | Commercial Services: 11.6% | | | |
174,510 | | @,L | | Apollo Group, Inc. | | 10,550,875 | |
394,829 | | L | | Aramark Corp. | | 10,968,350 | |
56,250 | | @,L | | CoStar Group, Inc. | | 2,428,313 | |
2,806,500 | | @@ | | Hopewell Highway Infrastructure Ltd. | | 1,864,111 | |
18,550 | | @,L | | Iron Mountain, Inc. | | 783,181 | |
203,930 | | L | | Paychex, Inc. | | 7,773,812 | |
285,190 | | @,L | | Weight Watchers International, Inc. | | 14,096,942 | |
2,892,000 | | @@ | | Zhejiang Expressway Co. Ltd. | | 1,786,196 | |
| | | | | | 50,251,780 | |
| | | | Computers: 2.3% | | | |
327,368 | | @ | | Dell, Inc. | | 9,817,766 | |
| | | | | | 9,817,766 | |
| | | | Cosmetics/Personal Care: 5.1% | | | |
198,172 | | L | | Avon Products, Inc. | | 5,657,811 | |
22,320 | | | | Colgate-Palmolive Co. | | 1,224,252 | |
45,720 | | L | | Estee Lauder Cos., Inc. | | 1,530,706 | |
235,550 | | L | | Procter & Gamble Co. | | 13,633,634 | |
| | | | | | 22,046,403 | |
| | | | Diversified Financial Services: 5.0% | | | |
175,250 | | | | Citigroup, Inc. | | 8,504,883 | |
240,130 | | L | | SLM Corp. | | 13,228,762 | |
| | | | | | 21,733,645 | |
| | | | Electronics: 2.1% | | | |
240,336 | | @@ | | Koninklijke Philips Electronics NV | | 7,436,901 | |
56,110 | | @@ | | Koninklijke Philips Electronics NV-NY Reg Shares | | 1,745,021 | |
| | | | | | 9,181,922 | |
| | | | Entertainment: 2.0% | | | |
277,150 | | | | International Game Technology | | 8,530,677 | |
| | | | | | 8,530,677 | |
| | | | Food: 2.9% | | | |
18,520 | | @@ | | Nestle SA | | 5,514,422 | |
229,800 | | | | Sysco Corp. | | 7,135,290 | |
| | | | | | 12,649,712 | |
| | | | Healthcare-Products: 10.5% | | | |
199,190 | | @ | | Boston Scientific Corp. | | 4,878,163 | |
267,130 | | | | Johnson & Johnson | | 16,054,513 | |
215,050 | | | | Medtronic, Inc. | | 12,380,429 | |
126,440 | | | | Stryker Corp. | | 5,617,729 | |
96,480 | | @,L | | Zimmer Holdings, Inc. | | 6,506,611 | |
| | | | | | 45,437,445 | |
| | | | Healthcare-Services: 4.2% | | | |
293,270 | | | | UnitedHealth Group, Inc. | | $ | 18,223,798 | |
| | | | | | 18,223,798 | |
| | | | Holding Companies-Diversified: 0.2% | | | |
489,777 | | @@ | | China Merchants Holdings International Co. Ltd | | 1,062,982 | |
| | | | | | 1,062,982 | |
| | | | Insurance: 7.3% | | | |
28,760 | | | | AMBAC Financial Group, Inc. | | 2,216,246 | |
181,680 | | | | American International Group, Inc. | | 12,396,026 | |
97 | | @,L | | Berkshire Hathaway, Inc.-Class A | | 8,596,140 | |
2,920 | | @,L | | Berkshire Hathaway, Inc.-Class B | | 8,571,660 | |
| | | | | | 31,780,072 | |
| | | | Internet: 5.0% | | | |
49,740 | | @,L | | Amazon.com, Inc. | | 2,345,241 | |
280,460 | | @,L | | eBay, Inc. | | 12,129,895 | |
188,745 | | @,L | | IAC/InterActiveCorp | | 5,343,371 | |
116,250 | | @,L | | Symantec Corp. | | 2,034,375 | |
| | | | | | 21,852,882 | |
| | | | Leisure Time: 2.9% | | | |
157,560 | | L | | Carnival Corp. | | 8,424,733 | |
81,370 | | L | | Harley-Davidson, Inc. | | 4,189,741 | |
| | | | | | 12,614,474 | |
| | | | Media: 0.2% | | | |
37,820 | | @,L | | Xm Satellite Radio, Inc. | | 1,031,730 | |
| | | | | | 1,031,730 | |
| | | | Miscellaneous Manufacturing: 6.5% | | | |
110,110 | | | | 3M Co. | | 8,533,525 | |
314,930 | | | | General Electric Co. | | 11,038,297 | |
297,420 | | @@,L | | Tyco International Ltd. | | 8,583,541 | |
| | | | | | 28,155,363 | |
| | | | Pharmaceuticals: 6.2% | | | |
69,830 | | L | | Eli Lilly & Co. | | 3,951,680 | |
23,950 | | @ | | Medco Health Solutions, Inc. | | 1,336,410 | |
46,427 | | @@ | | Novartis AG | | 2,427,891 | |
116,130 | | | | Pfizer, Inc. | | 2,708,152 | |
10,770 | | @@ | | Roche Holding AG | | 1,610,077 | |
343,300 | | @@,S | | Teva Pharmaceutical Industries Ltd ADR | | 14,765,333 | |
| | | | | | 26,799,543 | |
| | | | Retail: 5.8% | | | |
127,050 | | @,L | | Cabela’s, Inc. | | 2,109,030 | |
13,330 | | @ | | Cheesecake Factory | | 498,409 | |
89,760 | | | | Home Depot, Inc. | | 3,633,485 | |
7,200 | | | | Lowe’s Cos., Inc. | | 479,952 | |
18,670 | | @,L | | PF Chang’s China Bistro, Inc. | | 926,592 | |
373,040 | | | | Wal-Mart Stores, Inc. | | 17,458,272 | |
| | | | | | 25,105,740 | |
| | | | Semiconductors: 2.3% | | | |
102,330 | | | | Applied Materials, Inc. | | 1,835,800 | |
229,980 | | | | Linear Technology Corp. | | 8,295,379 | |
| | | | | | 10,131,179 | |
See Accompanying Notes to Financial Statements
148
ING AMERICAN CENTURY | PORTFOLIO OF INVESTMENTS |
SELECT PORTFOLIO | AS OF DECEMBER 31, 2005 (CONTINUED) |
Shares | | | | | | Value | |
| | | | Software: 6.6% | | | |
36,231 | | @,L | | Electronic Arts, Inc. | | $ | 1,895,244 | |
259,180 | | | | First Data Corp. | | 11,147,332 | |
10,770 | | @,L | | Intuit, Inc. | | 574,041 | |
539,520 | | | | Microsoft Corp. | | 14,108,448 | |
83,780 | | @ | | Oracle Corp. | | 1,022,954 | |
| | | | | | 28,748,019 | |
| | | | Telecommunications: 1.4% | | | |
269,930 | | @ | | Cisco Systems, Inc. | | 4,621,202 | |
18,550 | | | | Qualcomm, Inc. | | 799,134 | |
25,882 | | | | Sprint Corp.-FON Group | | 604,604 | |
| | | | | | 6,024,940 | |
| | | | Textiles: 1.0% | | | |
109,990 | | | | Cintas Corp. | | 4,529,388 | |
| | | | | | 4,529,388 | |
| | | | Transportation: 0.6% | | | |
32,720 | | | | United Parcel Service, Inc. | | 2,458,900 | |
| | | | | | 2,458,900 | |
| | | | Total Common Stock
(Cost $404,445,254) | | 427,813,317 | |
| | | | | | | | |
Principal
Amount | | | | | | Value | |
SHORT-TERM INVESTMENTS: 19.7% | | | |
| | Federal Home Loan Bank 1.5% | | | |
$ | 6,537,000 | | Discount Note, 3.200%, due 01/03/06 | | 6,535,257 | |
| | Total Federal Home Loan Bank
(Cost $6,535,838) | | 6,535,257 | |
| | Securities Lending Collateralcc 18.2% | | | |
$ | 78,983,000 | | The Bank of New York Institutional Cash Reserves Fund | | 78,983,000 | |
| | Total Securities Lending Collateral
(Cost $78,983,000) | | 78,983,000 | |
| | Total Short-Term Investments:
(Cost $85,518,838) | | 85,518,257 | |
| | Total Investments in Securities
(Cost $489,964,092)* | 118.2 | % | | $ | 513,331,574 | |
| | Other Assets and Liabilities-Net | (18.2 | ) | | (78,952,057 | ) |
| | Net Assets | 100.0 | % | | $ | 434,379,517 | |
| | | | | | | | | | | |
Certain foreign securities have been fair valued in accordance with procedures approved by the Board of Trustees (Note 2A).
@ Non-income producing security
@@ Foreign Issuer
ADR American Depositary Receipt
cc Securities purchased with cash collateral for securities loaned.
S Segregated securities for certain derivatives, when-issued or delayed delivery securities and forward currency exchange contracts.
L Loaned security, a portion or all of the security is on loan at December 31, 2005.
* Cost for federal income tax purposes is $492,176,451.
Net unrealized appreciation consists of:
| | | | Gross Unrealized Appreciation | | $ | 33,199,288 | |
| | | | Gross Unrealized Depreciation | | (12,044,165 | ) |
| | | | Net Unrealized Appreciation | | $ | 21,155,123 | |
At December 31, 2005 the following forward foreign currency contracts were outstanding for the ING American Century Select Portfolio:
Currency | | Buy/Sell | | Settlement
Date | | In
Exchange
For | | Value | | Unrealized
Appreciation
(Depreciation) | |
Swiss Francs | | | | | | USD | | | | | |
CHF 6,240,857 | | Sell | | 01/31/06 | | 4,783,824 | | 4,750,670 | | 33,154 | |
Euro | | | | | | USD | | | | | |
EUR 3,195,267 | | Sell | | 01/31/06 | | 3,812,015 | | 3,775,575 | | 36,440 | |
British Pound Sterling | | | | | | USD | | | | | |
GBP 420,133 | | Sell | | 01/31/06 | | 726,712 | | 721,167 | | | 5,545 | |
| | | | | | | | | | | $75,139 | |
See Accompanying Notes to Financial Statements
149
ING AMERICAN CENTURY | PORTFOLIO OF INVESTMENTS |
SMALL CAP VALUE PORTFOLIO | AS OF DECEMBER 31, 2005 (CONTINUED) |
Shares | | | | | | Value | |
COMMON STOCK: 97.5% | | | |
| | | | Advertising: 0.2% | | | |
7,700 | | | | Advo, Inc. | | $ | 216,986 | |
| | | | | | 216,986 | |
| | | | Aerospace/Defense: 1.0% | | | |
6,600 | | @,L | | Alliant Techsystems, Inc. | | 502,722 | |
8,800 | | L | | Curtiss-Wright Corp. | | 480,480 | |
| | | | | | 983,202 | |
| | | | Airlines: 0.2% | | | |
5,800 | | | | Skywest, Inc. | | 155,788 | |
| | | | | | 155,788 | |
| | | | Apparel: 0.7% | | | |
6,800 | | @,L | | Columbia Sportswear Co. | | 324,564 | |
6,400 | | L | | Kellwood Co. | | 152,832 | |
8,061 | | | | Wolverine World Wide, Inc. | | 181,050 | |
| | | | | | 658,446 | |
| | | | Auto Parts & Equipment: 1.2% | | | |
21,600 | | L | | ArvinMeritor, Inc. | | 310,824 | |
31,100 | | | | Cooper Tire & Rubber Co. | | 476,452 | |
7,200 | | | | Lear Corp. | | 204,912 | |
9,300 | | | | Superior Industries International | | 207,018 | |
| | | | | | 1,199,206 | |
| | | | Banks: 6.2% | | | |
14,886 | | L | | Bancorpsouth, Inc. | | 328,534 | |
15,698 | | | | Chemical Financial Corp. | | 498,568 | |
18,400 | | | | Chittenden Corp. | | 511,704 | |
7,700 | | | | Cullen/Frost Bankers, Inc. | | 413,336 | |
12,500 | | | | Fulton Financial Corp. | | 220,000 | |
7,300 | | L | | Pacific Capital Bancorp | | 259,734 | |
7,700 | | | | Provident Bankshares Corp. | | 260,029 | |
18,700 | | L | | Sky Financial Group, Inc. | | 520,234 | |
30,100 | | | | South Financial Group, Inc. | | 828,954 | |
18,000 | | | | Sterling Bancshares, Inc. | | 277,920 | |
30,400 | | L | | Susquehanna Bancshares, Inc. | | 719,872 | |
25,000 | | L | | TCF Financial Corp. | | 678,500 | |
17,500 | | | | Wilmington Trust Corp. | | 680,925 | |
| | | | | | 6,198,310 | |
| | | | Building Materials: 0.7% | | | |
6,300 | | | | Texas Industries, Inc. | | 313,992 | |
12,900 | | @,L | | Trex Co., Inc. | | 361,845 | |
| | | | | | 675,837 | |
| | | | Chemicals: 3.9% | | | |
10,100 | | | | Engelhard Corp. | | 304,515 | |
28,200 | | | | Ferro Corp. | | 529,032 | |
4,800 | | @ | | FMC Corp. | | 255,216 | |
4,800 | | | | HB Fuller Co. | | 153,936 | |
12,473 | | | | Minerals Technologies, Inc. | | 697,116 | |
26,200 | | | | Olin Corp. | | 515,616 | |
65,400 | | S | | Sensient Technologies Corp. | | 1,170,660 | |
13,900 | | L | | UAP Holding Corp. | | 283,838 | |
| | | | | | 3,909,929 | |
| | | | Coal: 0.5% | | | |
28,600 | | @,L | | Alpha Natural Resources, Inc. | | 549,406 | |
| | | | | | 549,406 | |
| | | | Commercial Services: 2.9% | | | |
12,500 | | | | ABM Industries, Inc. | | $ | 244,375 | |
4,100 | | | | Banta Corp. | | 204,180 | |
19,900 | | L | | Kelly Services, Inc. | | 521,778 | |
14,500 | | | | MAXIMUS, Inc. | | 532,005 | |
39,100 | | @ | | Parexel International Corp. | | 792,166 | |
11,700 | | @,L | | Valassis Communications, Inc. | | 340,119 | |
11,700 | | | | Watson Wyatt & Co. Holdings | | 326,430 | |
| | | | | | 2,961,053 | |
| | | | Computers: 2.5% | | | |
7,900 | | @,L | | Electronics for Imaging | | 210,219 | |
19,800 | | @ | | IHS, Inc. | | 406,296 | |
9,400 | | | | Imation Corp. | | 433,058 | |
71,509 | | @,L | | Perot Systems Corp. | | 1,011,066 | |
5,800 | | | | Reynolds & Reynolds Co. | | 162,806 | |
15,400 | | @ | | Synopsys, Inc. | | 308,924 | |
| | | | | | 2,532,369 | |
| | | | Distribution/Wholesale: 1.1% | | | |
13,033 | | | | Hughes Supply, Inc. | | 467,233 | |
11,800 | | | | Owens & Minor, Inc. | | 324,854 | |
6,200 | | | | United Stationers, Inc. | | 300,700 | |
| | | | | | 1,092,787 | |
| | | | Diversified Financial Services: 1.7% | | | |
10,700 | | @,L | | Asset Acceptance Capital Corp. | | 240,322 | |
14,500 | | @@,L | | Lazard Ltd | | 462,550 | |
13,300 | | @,L | | Piper Jaffray Cos | | 537,320 | |
23,100 | | | | Waddell & Reed Financial, Inc. | | 484,407 | |
| | | | | | 1,724,599 | |
| | | | Electric: 2.0% | | | |
31,000 | | L | | Empire District Electric Co. | | 630,230 | |
28,500 | | L | | Idacorp, Inc. | | 835,050 | |
24,000 | | | | Westar Energy, Inc. | | 516,000 | |
| | | | | | 1,981,280 | |
| | | | Electrical Components & Equipment: 0.8% | | | |
10,900 | | | | Belden Cdt, Inc. | | 266,287 | |
19,200 | | @,L | | Littelfuse, Inc. | | 523,200 | |
| | | | | | 789,487 | |
| | | | Electronics: 2.1% | | | |
17,600 | | @,L | | Benchmark Electronics, Inc. | | 591,888 | |
7,700 | | @ | | Coherent, Inc. | | 228,536 | |
24,500 | | | | Methode Electronics, Inc. | | 244,265 | |
32,500 | | @,L | | Paxar Corp. | | 637,975 | |
30,100 | | @,L | | Vishay Intertechnology, Inc. | | 414,176 | |
| | | | | | 2,116,840 | |
| | | | Engineering & Construction: 0.8% | | | |
2,695 | | @,L | | EMCOR Group, Inc. | | 181,993 | |
16,548 | | | | Granite Construction, Inc. | | 594,239 | |
| | | | | | 776,232 | |
| | | | Environmental Control: 0.3% | | | |
18,300 | | @,L | | Tetra Tech, Inc. | | 286,761 | |
| | | | | | 286,761 | |
| | | | Equity Fund: 4.9% | | | |
18,800 | | L | | iShares Russell 2000 Index Fund | | 1,253,772 | |
See Accompanying Notes to Financial Statements
150
ING AMERICAN CENTURY | PORTFOLIO OF INVESTMENTS |
SMALL CAP VALUE PORTFOLIO | AS OF DECEMBER 31, 2005 (CONTINUED) |
Shares | | | | | | Value | |
22,800 | | L | | iShares Russell 2000 Value Index Fund | | $ | 1,503,204 | |
19,700 | | L | | iShares S&P SmallCap 600 Index Fund | | 1,138,660 | |
15,400 | | L | | iShares S&P SmallCap 600/BARRA Value Index Fund | | 983,752 | |
| | | | | | 4,879,388 | |
| | | | Food: 0.9% | | | |
17,300 | | | | Corn Products International, Inc. | | 413,297 | |
9,200 | | @,L | | Performance Food Group Co. | | 261,004 | |
5,100 | | @ | | Ralcorp Holdings, Inc. | | 203,541 | |
| | | | | | 877,842 | |
| | | | Gas: 2.0% | | | |
5,900 | | | | AGL Resources, Inc. | | 205,379 | |
12,000 | | | | Atmos Energy Corp. | | 313,920 | |
9,500 | | L | | Northwest Natural Gas Co. | | 324,710 | |
8,300 | | | | Southwest Gas Corp. | | 219,120 | |
30,600 | | | | WGL Holdings, Inc. | | 919,836 | |
| | | | | | 1,982,965 | |
| | | | Hand/Machine Tools: 1.3% | | | |
14,400 | | | | Kennametal, Inc. | | 734,976 | |
8,300 | | | | Regal-Beloit Corp. | | 293,820 | |
6,800 | | | | Snap-On, Inc. | | 255,408 | |
| | | | | | 1,284,204 | |
| | | | Healthcare Products: 1.9% | | | |
6,900 | | | | Arrow International, Inc. | | 200,031 | |
5,500 | | @,L | | Biosite, Inc. | | 309,595 | |
16,500 | | | | Dade Behring Holdings, Inc. | | 674,685 | |
10,700 | | @,@@ | | Orthofix International NV | | 426,823 | |
12,100 | | | | Steris Corp. | | 302,742 | |
| | | | | | 1,913,876 | |
| | | | Healthcare-Services: 2.0% | | | |
37,609 | | @,L | | Alliance Imaging, Inc. | | 223,774 | |
17,309 | | @,L | | Amsurg Corp. | | 395,684 | |
8,900 | | @ | | Apria Healthcare Group, Inc. | | 214,579 | |
11,100 | | @ | | Community Health Systems, Inc. | | 425,574 | |
2,500 | | @ | | Pediatrix Medical Group, Inc. | | 221,425 | |
11,200 | | | | Universal Health Services, Inc. | | 523,488 | |
| | | | | | 2,004,524 | |
| | | | Home Builders: 0.7% | | | |
2,200 | | L | | Beazer Homes USA, Inc. | | 160,248 | |
5,900 | | L | | Standard-Pacific Corp. | | 217,120 | |
12,100 | | @,L | | WCI Communities, Inc. | | 324,885 | |
| | | | | | 702,253 | |
| | | | Home Furnishings: 0.7% | | | |
19,700 | | | | Ethan Allen Interiors, Inc. | | 719,641 | |
| | | | | | 719,641 | |
| | | | Household Products/Wares: 0.9% | | | |
4,800 | | @ | | Central Garden & Pet Co. | | 220,512 | |
27,252 | | L | | Ennis, Inc. | | 495,169 | |
7,700 | | | | WD-40 Co. | | 202,202 | |
| | | | | | 917,883 | |
| | | | Housewares: 0.1% | | | |
10,400 | | | | Libbey, Inc. | | $ | 106,288 | |
| | | | | | 106,288 | |
| | | | Insurance: 7.2% | | | |
12,900 | | | | American Equity Investment Life Holding Co. | | 168,345 | |
8,400 | | L | | AmerUs Group Co. | | 476,028 | |
31,600 | | @@ | | Aspen Insurance Holdings Ltd. | | 747,972 | |
8,300 | | | | Delphi Financial Group | | 381,883 | |
9,700 | | | | Direct General Corp. | | 163,930 | |
37,800 | | | | HCC Insurance Holdings, Inc. | | 1,121,904 | |
13,500 | | | | Hilb Rogal & Hamilton Co. | | 519,885 | |
8,500 | | | | Horace Mann Educators Corp. | | 161,160 | |
32,700 | | @ | | National Atlantic Holdings Corp. | | 358,065 | |
28,378 | | @@ | | Platinum Underwriters Holdings Ltd. | | 881,704 | |
7,300 | | | | PMI Group, Inc. | | 299,811 | |
4,300 | | @,L | | ProAssurance Corp. | | 209,152 | |
6,900 | | | | Protective Life Corp. | | 302,013 | |
20,200 | | @@,L | | Scottish Re Group Ltd. | | 495,910 | |
13,755 | | @ | | Triad Guaranty, Inc. | | 605,082 | |
7,900 | | | | United Fire & Casualty Co. | | 319,397 | |
| | | | | | 7,212,241 | |
| | | | Internet: 0.6% | | | |
5,800 | | @,L | | ProQuest Co. | | 161,878 | |
56,400 | | @ | | TIBCO Software, Inc. | | 421,308 | |
| | | | | | 583,186 | |
| | | | Investment Companies: 0.4% | | | |
9,200 | | | | Medallion Financial Corp. | | 103,592 | |
27,200 | | | | Patriot Capital Funding, Inc. | | 331,840 | |
| | | | | | 435,432 | |
| | | | Iron/Steel: 0.5% | | | |
13,900 | | | | Gibraltar Industries, Inc. | | 318,866 | |
3,200 | | | | Reliance Steel & Aluminum Co. | | 195,584 | |
| | | | | | 514,450 | |
| | | | Lodging: 0.2% | | | |
13,900 | | @,L | | La Quinta Corp. | | 154,846 | |
| | | | | | 154,846 | |
| | | | Machinery-Diversified: 1.8% | | | |
6,493 | | | | Albany International Corp. | | 234,787 | |
28,400 | | L | | Briggs & Stratton Corp. | | 1,101,636 | |
11,400 | | @ | | Kadant, Inc. | | 210,900 | |
6,900 | | | | Nordson Corp. | | 279,519 | |
| | | | | | 1,826,842 | |
| | | | Media: 1.3% | | | |
22,300 | | | | Hearst-Argyle Television, Inc. | | 531,855 | |
45,800 | | | | Journal Communications, Inc. | | 638,910 | |
3,200 | | | | Liberty Corp. | | 149,792 | |
| | | | | | 1,320,557 | |
Metal Fabricate/Hardware: 2.0% | | | |
28,100 | | L | | Kaydon Corp. | | 903,134 | |
7,900 | | L | | Mueller Industries, Inc. | | 216,618 | |
3,000 | | | | Quanex Corp. | | 149,910 | |
10,100 | | | | Timken Co. | | 323,402 | |
21,900 | | | | Worthington Industries | | 420,699 | |
| | | | | | 2,013,763 | |
See Accompanying Notes to Financial Statements
151
ING AMERICAN CENTURY | PORTFOLIO OF INVESTMENTS |
SMALL CAP VALUE PORTFOLIO | AS OF DECEMBER 31, 2005 (CONTINUED) |
Shares | | | | | | Value | |
| | | | Mining: 0.3% | | | |
12,000 | | L | | Compass Minerals Intl., Inc. | | $ | 294,480 | |
| | | | | | 294,480 | |
| | | | Miscellaneous Manufacturing: 3.1% | | | |
6,700 | | L | | Acuity Brands, Inc. | | 213,060 | |
11,400 | | | | AO Smith Corp. | | 400,140 | |
10,100 | | @ | | Applied Films Corp. | | 209,777 | |
4,143 | | | | Aptargroup, Inc. | | 216,265 | |
14,600 | | L | | Crane Co. | | 514,942 | |
22,800 | | @,L | | Griffon Corp. | | 542,868 | |
16,600 | | | | Lancaster Colony Corp. | | 615,030 | |
5,600 | | | | Pentair, Inc. | | 193,312 | |
10,300 | | | | Reddy Ice Holdings, Inc. | | 224,643 | |
| | | | | | 3,130,037 | |
| | | | Oil & Gas: 4.2% | | | |
28,800 | | L | | Cimarex Energy Co. | | 1,238,688 | |
6,400 | | @ | | Encore Acquisition Co. | | 205,056 | |
6,600 | | @ | | Forest Oil Corp. | | 300,762 | |
15,500 | | | | Helmerich & Payne, Inc. | | 959,605 | |
5,000 | | @ | | Plains Exploration & Production Co. | | 198,650 | |
5,600 | | @,L | | Remington Oil & Gas Corp. | | 204,400 | |
11,500 | | L | | St. Mary Land & Exploration Co. | | 423,315 | |
6,000 | | @ | | Unit Corp. | | 330,180 | |
11,000 | | | | W&T Offshore, Inc. | | 323,400 | |
| | | | | | 4,184,056 | |
| | | | Oil & Gas Services: 3.3% | | | |
7,976 | | @,L | | Basic Energy Services, Inc. | | 159,121 | |
15,400 | | @ | | Cal Dive International, Inc. | | 552,706 | |
46,500 | | @ | | Global Industries Ltd. | | 527,775 | |
6,800 | | @ | | Hornbeck Offshore Services, Inc. | | 222,360 | |
69,300 | | @ | | Key Energy Services, Inc. | | 933,471 | |
12,200 | | @ | | Lone Star Technologies | | 630,252 | |
8,500 | | @ | | W-H Energy Services, Inc. | | 281,180 | |
| | | | | | 3,306,865 | |
| | | | Packaging & Containers: 1.7% | | | |
40,100 | | L | | Bemis Co. | | 1,117,587 | |
21,000 | | | | Sonoco Products Co. | | 617,400 | |
| | | | | | 1,734,987 | |
| | | | Pharmaceuticals: 0.5% | | | |
6,200 | | @,L | | Par Pharmaceutical Cos, Inc. | | 194,308 | |
24,000 | | L | | Perrigo Co. | | 357,840 | |
| | | | | | 552,148 | |
| | | | Real Estate Investment Trust: 4.7% | | | |
34,600 | | | | American Financial Realty Trust | | 415,200 | |
6,700 | | L | | BRE Properties | | 304,716 | |
27,900 | | L | | Commercial Net Lease Realty | | 568,323 | |
34,100 | | | | Getty Realty Corp. | | 896,489 | |
17,100 | | L | | Healthcare Realty Trust, Inc. | | 568,917 | |
37,625 | | | | Highland Hospitality Corp. | | 415,756 | |
15,400 | | L | | Lexington Corporate Properties Trust | | 328,020 | |
12,100 | | | | Liberty Property Trust | | 518,485 | |
6,700 | | | | Mack-Cali Realty Corp. | | 289,440 | |
19,600 | | | | Realty Income Corp. | | 423,752 | |
| | | | | | 4,729,098 | |
| | | | Retail: 8.0% | | | |
7,200 | | @ | | BJ’s Wholesale Club, Inc. | | $ | 212,832 | |
7,100 | | L | | Bob Evans Farms, Inc. | | 163,726 | |
29,400 | | | | Borders Group, Inc. | | 637,098 | |
6,600 | | L | | Casey’s General Stores, Inc. | | 163,680 | |
6,200 | | | | CBRL Group, Inc. | | 217,930 | |
24,700 | | @ | | CEC Entertainment, Inc. | | 840,788 | |
26,700 | | L | | Christopher & Banks Corp. | | 501,426 | |
26,300 | | L | | Fred’s, Inc. | | 427,901 | |
29,500 | | @,L | | HOT Topic, Inc. | | 420,375 | |
10,500 | | @ | | J Jill Group, Inc. | | 199,815 | |
32,700 | | L | | Kenneth Cole Productions, Inc. | | 833,850 | |
23,600 | | @,L | | Linens ’N Things, Inc. | | 627,760 | |
15,400 | | | | Outback Steakhouse, Inc. | | 640,794 | |
11,000 | | @,L | | Petco Animal Supplies, Inc. | | 241,450 | |
37,400 | | L | | Pier 1 Imports, Inc. | | 326,502 | |
8,400 | | L | | Ruby Tuesday, Inc. | | 217,476 | |
23,000 | | | | Talbots, Inc. | | 639,860 | |
28,900 | | @,L | | Zale Corp. | | 726,835 | |
| | | | | | 8,040,098 | |
| | | | Savings & Loans: 1.7% | | | |
22,400 | | L | | Flagstar Bancorp, Inc. | | 322,560 | |
7,400 | | | | MAF Bancorp, Inc. | | 306,212 | |
45,300 | | | | Washington Federal, Inc. | | 1,041,447 | |
| | | | | | 1,670,219 | |
| | | | Semiconductors: 1.4% | | | |
33,000 | | @,L | | Mattson Technology, Inc. | | 331,980 | |
6,600 | | @,L | | QLogic Corp. | | 214,566 | |
27,656 | | @ | | Rudolph Technologies, Inc. | | 356,209 | |
18,400 | | | | Skyworks Solutions, Inc. | | 93,656 | |
10,000 | | @,L | | Varian Semiconductor Equipment Associates, Inc. | | 439,300 | |
| | | | | | 1,435,711 | |
| | | | Software: 4.8% | | | |
17,800 | | @ | | Compuware Corp. | | 159,666 | |
46,700 | | @,L | | Dendrite International, Inc. | | 672,947 | |
25,550 | | | | MoneyGram International, Inc. | | 666,344 | |
136,800 | | @ | | Parametric Technology Corp. | | 834,480 | |
95,530 | | @ | | Sybase, Inc. | | 2,088,286 | |
44,600 | | @,L | | Ulticom, Inc. | | 437,526 | |
| | | | | | 4,859,249 | |
| | | | Telecommunications: 1.5% | | | |
25,300 | | @,L | | Adaptec, Inc. | | 147,246 | |
21,700 | | @,L | | Aeroflex, Inc. | | 233,275 | |
30,000 | | @,L | | Andrew Corp. | | 321,900 | |
9,500 | | L | | Commonwealth Telephone Enterprises, Inc. | | 320,815 | |
26,900 | | @ | | EFJ, Inc. | | 273,035 | |
15,600 | | @,L | | Tekelec | | 216,840 | |
| | | | | | 1,513,111 | |
| | | | Textiles: 0.8% | | | |
20,936 | | | | G&K Services, Inc. | | 821,738 | |
| | | | | | 821,738 | |
See Accompanying Notes to Financial Statements
152
ING AMERICAN CENTURY | PORTFOLIO OF INVESTMENTS |
SMALL CAP VALUE PORTFOLIO | AS OF DECEMBER 31, 2005 (CONTINUED) |
Shares | | | | | | Value | |
| | | | Transportation: 3.3% | | | | |
7,800 | | | | Alexander & Baldwin, Inc. | | $ | 423,072 | |
7,400 | | L | | Arkansas Best Corp. | | 323,232 | |
26,200 | | @@,L | | Arlington Tankers Ltd. | | 569,850 | |
43,061 | | @,@@,L | | Double Hull Tankers, Inc. | | 567,113 | |
22,300 | | | | Heartland Express, Inc. | | 452,467 | |
7,700 | | | | Ryder System, Inc. | | 315,854 | |
33,300 | | | | Werner Enterprises, Inc. | | 656,012 | |
| | | | | | 3,307,600 | |
| | | | Total Common Stock
(Cost $93,741,101) | | 97,838,096 | |
PREFERRED STOCK: 0.2% | | | |
| | | | Insurance: 0.2% | | | |
6,200 | | | | Phoenix Cos., Inc. | | 242,358 | |
| | | | | | 242,358 | |
| | | | Total Preferred Stock
(Cost $210,113) | | 242,358 | |
| | | | Total Long-Term Investments:
(Cost $93,951,214) | | 98,080,454 | |
Principal
Amount | | | | | | Value | |
| | | | | | | |
SHORT-TERM INVESTMENTS: 28.7% | | | |
| | Federal Home Loan Bank: 4.7% | | | |
$ | 4,671,000 | | Discount Note, 3.200%, due 01/03/06 | | 4,669,754 | |
| | Total Federal Home Loan Bank
(Cost $4,670,169) | | 4,669,754 | |
| | Securities Lending Collateralcc: 24.0% | | | |
24,072,000 | | The Bank of New York Institutional Cash Reserves Fund | | 24,072,000 | |
| | Total Securities Lending Collateral
(Cost $24,072,000) | | 24,072,000 | |
| | Total Short-Term Investments:
(Cost $28,742,169) | | 28,741,754 | |
| | Total Investments in Securities
(Cost $122,693,383)* | 126.4 | % | | $ | 126,822,208 | |
| | Other Assets and Liabilities-Net | (26.4 | ) | | (26,509,263 | ) |
| | Net Assets | 100.0 | % | | $ | 100,312,945 | |
| | | | | | | | | | | |
S Segregated securities for certain derivatives, when-issued or delayed delivery securities and forwards currency exchange contracts.
@ Non-income producing security
@@ Foreign Issuer
cc Securities purchased with cash collateral for securities loaned.
L Loaned security, a portion or all of the security is on loan at December 31, 2005.
* Cost for federal income tax purposes is $123,561,087.
Net unrealized appreciation consists of:
| | | | Gross Unrealized Appreciation | | $ | 5,954,625 | |
| | | | Gross Unrealized Depreciation | | (2,693,504 | ) |
| | | | Net Unrealized Appreciation | | $ | 3,261,121 | |
See Accompanying Notes to Financial Statements
153
ING BARON SMALL CAP | PORTFOLIO OF INVESTMENTS |
GROWTH PORTFOLIO | AS OF DECEMBER 31, 2005 |
Shares | | | | | | Value | |
COMMON STOCK: 91.3% | | | |
| | | | Advertising: 1.3% | | | |
12,000 | | @ | | Getty Images, Inc. | | $ | 1,071,240 | |
100,000 | | | | Harte-Hanks, Inc. | | 2,639,000 | |
10,000 | | @ | | RH Donnelley Corp. | | 616,200 | |
| | | | | | 4,326,440 | |
| | | | Airlines: 0.5% | | | |
105,000 | | @ | | JetBlue Airways Corp. | | 1,614,900 | |
| | | | | | 1,614,900 | |
| | | | Apparel: 2.2% | | | |
110,000 | | @ | | Carter’s, Inc. | | 6,473,500 | |
10,000 | | | | Polo Ralph Lauren Corp. | | 561,400 | |
| | | | | | 7,034,900 | |
| | | | Banks: 5.2% | | | |
60,000 | | | | Cathay General Bancorp | | 2,156,400 | |
100,000 | | | | Center Financial Corp. | | 2,516,000 | |
109,200 | | | | Central Pacific Financial Corp. | | 3,922,464 | |
150,000 | | | | First Republic Bank | | 5,551,500 | |
150,000 | | | | UCBH Holdings, Inc. | | 2,682,000 | |
| | | | | | 16,828,364 | |
| | | | Beverages: 0.8% | | | |
80,000 | | @ | | Peet’s Coffee & Tea, Inc. | | 2,428,000 | |
| | | | | | 2,428,000 | |
| | | | Biotechnology: 0.4% | | | |
32,000 | | @ | | Charles River Laboratories International, Inc. | | 1,355,840 | |
| | | | | | 1,355,840 | |
| | | | Building Materials: 1.5% | | | |
15,000 | | | | Eagle Materials, Inc. | | 1,835,400 | |
25,000 | | | | Eagle Materials, Inc. | | 2,944,250 | |
| | | | | | 4,779,650 | |
| | | | Chemicals: 1.3% | | | |
150,000 | | @ | | Symyx Technologies | | 4,093,500 | |
| | | | | | 4,093,500 | |
| | | | Coal: 0.2% | | | |
70,000 | | @ | | International Coal Group, Inc. | | 665,000 | |
| | | | | | 665,000 | |
| | | | Commercial Services: 12.1% | | | |
70,000 | | | | Chemed Corp. | | 3,477,600 | |
50,500 | | @ | | ChoicePoint, Inc. | | 2,247,755 | |
100,000 | | @ | | CoStar Group, Inc. | | 4,317,000 | |
325,000 | | @ | | DeVry, Inc. | | 6,500,000 | |
150,000 | | @ | | Education Management Corp. | | 5,026,500 | |
120,000 | | | | Gevity HR, Inc. | | 3,086,400 | |
50,000 | | @ | | Hewitt Associates, Inc. | | 1,400,500 | |
50,000 | | @ | | LECG Corp. | | 869,000 | |
100,000 | | @ | | Morningstar, Inc. | | 3,464,000 | |
100,000 | | @ | | PRA International | | 2,815,000 | |
100,000 | | @ | | Senomyx, Inc. | | 1,212,000 | |
25,000 | | | | Strayer Education, Inc. | | 2,342,500 | |
64,000 | | @ | | Universal Technical Institute, Inc. | | 1,980,160 | |
| | | | | | 38,738,415 | |
| | | | Computers: 1.9% | | | |
60,000 | | @ | | Anteon International Corp. | | 3,261,000 | |
65,000 | | @ | | Kronos, Inc. | | $ | 2,720,900 | |
| | | | | | 5,981,900 | |
| | | | Diversified Financial Services: 6.3% | | | |
145,900 | | | | Cohen & Steers, Inc. | | 2,718,117 | |
175,000 | | | | First Marblehead Corp. | | 5,750,500 | |
16,000 | | | | GAMCO Investors, Inc. | | 696,480 | |
200,000 | | @ | | International Securities Exchange, Inc. | | 5,504,000 | |
125,000 | | | | Jefferies Group, Inc. | | 5,622,500 | |
| | | | | | 20,291,597 | |
| | | | Electric: 1.1% | | | |
120,000 | | | | ITC Holdings Corp. | | 3,370,800 | |
| | | | | | 3,370,800 | |
| | | | Entertainment: 5.2% | | | |
125,000 | | @ | | Great Wolf Resorts, Inc. | | 1,288,750 | |
100,000 | | @ | | Isle of Capri Casinos, Inc. | | 2,436,000 | |
50,000 | | @ | | Penn National Gaming, Inc. | | 1,647,500 | |
150,000 | | @ | | Scientific Games Corp. | | 4,092,000 | |
225,000 | | @ | | Shuffle Master, Inc. | | 5,656,500 | |
45,000 | | @ | | Vail Resorts, Inc. | | 1,486,350 | |
| | | | | | 16,607,100 | |
| | | | Food: 0.9% | | | |
70,000 | | @ | | Ralcorp Holdings, Inc. | | 2,793,700 | |
| | | | | | 2,793,700 | |
| | | | Gas: 0.7% | | | |
88,198 | | | | Southern Union Co. | | 2,084,119 | |
| | | | | | 2,084,119 | |
| | | | Healthcare-Products: 4.3% | | | |
80,000 | | @ | | Edwards Lifesciences Corp. | | 3,328,800 | |
75,000 | | @ | | Gen-Probe, Inc. | | 3,659,250 | |
14,000 | | @ | | Inamed Corp. | | 1,227,520 | |
35,000 | | @ | | Intuitive Surgical, Inc. | | 4,104,450 | |
70,000 | | @ | | Kensey Nash Corp. | | 1,542,100 | |
| | | | | | 13,862,120 | |
| | | | Healthcare-Services: 4.8% | | | |
150,000 | | @ | | Ameri Group Corp. | | 2,919,000 | |
160,000 | | @ | | Centene Corp. | | 4,206,400 | |
100,000 | | @ | | Community Health Systems, Inc. | | 3,834,000 | |
35,000 | | | | Manor Care, Inc. | | 1,391,950 | |
90,000 | | @ | | Odyssey HealthCare, Inc. | | 1,677,600 | |
45,000 | | @ | | United Surgical Partners International, Inc. | | 1,446,750 | |
| | | | | | 15,475,700 | |
| | | | Home Builders: 0.5% | | | |
5,000 | | | | Brookfield Homes Corp. | | 248,650 | |
30,000 | | @ | | Hovnanian Enterprises, Inc. | | 1,489,200 | |
| | | | | | 1,737,850 | |
| | | | Insurance: 1.6% | | | |
65,000 | | @,@@ | | Arch Capital Group Ltd. | | 3,558,750 | |
10,000 | | | | Brown & Brown, Inc. | | 305,400 | |
74,200 | | @ | | Universal American Financial Corp. | | 1,118,936 | |
| | | | | | 4,983,086 | |
See Accompanying Notes to Financial Statements
154
ING BARON SMALL CAP | PORTFOLIO OF INVESTMENTS |
GROWTH PORTFOLIO | AS OF DECEMBER 31, 2005 (CONTINUED) |
Shares | | | | | | Value | |
| | | | Internet: 4.3% | | | |
80,000 | | @ | | Blue Nile, Inc. | | $ | 3,224,800 | |
50,000 | | @ | | Checkfree Corp. | | 2,295,000 | |
120,000 | | @ | | Equinix, Inc. | | 4,891,200 | |
120,000 | | @ | | ProQuest Co. | | 3,349,200 | |
| | | | | | 13,760,200 | |
| | | | Leisure Time: 0.8% | | | |
70,000 | | @ | | Life Time Fitness, Inc. | | 2,666,300 | |
| | | | | | 2,666,300 | |
| | | | Lodging: 7.0% | | | |
145,595 | | | | Ameristar Casinos, Inc. | | 3,305,007 | |
80,000 | | | | Choice Hotels International, Inc. | | 3,340,800 | |
80,000 | | @@ | | Four Seasons Hotels, Inc. | | 3,980,000 | |
40,000 | | @ | | Gaylord Entertainment Co. | | 1,743,600 | |
61,000 | | @,@@ | | Kerzner International Ltd. | | 4,193,750 | |
45,000 | | | | Station Casinos, Inc. | | 3,051,000 | |
50,000 | | @ | | Wynn Resorts Ltd. | | 2,742,500 | |
| | | | | | 22,356,657 | |
| | | | Media: 0.3% | | | |
18,500 | | | | Gray Television, Inc. | | 181,670 | |
30,000 | | @ | | Lin TV Corp. | | 334,200 | |
27,500 | | @ | | Radio One, Inc. | | 284,625 | |
18,100 | | @ | | Saga Communications, Inc. | | 196,746 | |
| | | | | | 997,241 | |
| | | | Oil & Gas: 2.5% | | | |
160,000 | | @ | | Encore Acquisition Co. | | 5,126,400 | |
45,000 | | | | Range Resources Corp. | | 1,185,300 | |
45,000 | | @ | | Whiting Petroleum Corp. | | 1,800,000 | |
| | | | | | 8,111,700 | |
| | | | Oil & Gas Services: 2.4% | | | |
60,000 | | | | CARBO Ceramics, Inc. | | 3,391,200 | |
80,000 | | @ | | FMC Technologies, Inc. | | 3,433,600 | |
15,000 | | @ | | Seacor Smit, Inc. | | 1,021,500 | |
| | | | | | 7,846,300 | |
| | | | Pharmaceuticals: 0.5% | | | |
250,000 | | @ | | Depomed, Inc. | | 1,500,000 | |
| | | | | | 1,500,000 | |
| | | | Real Estate: 1.5% | | | |
80,000 | | @ | | CB Richard Ellis Group, Inc. | | 4,708,000 | |
| | | | | | 4,708,000 | |
| | | | Real Estate Investment Trust: 1.1% | | | |
7,500 | | @ | | Alexander’s, Inc. | | 1,841,250 | |
160,000 | | | | Spirit Finance Corp. | | 1,816,000 | |
| | | | | | 3,657,250 | |
| | | | Retail: 15.9% | | | |
85,000 | | @ | | Cabela’s, Inc. | | 1,411,000 | |
180,000 | | @ | | California Pizza Kitchen, Inc. | | 5,754,600 | |
100,000 | | @ | | Carmax, Inc. | | 2,768,000 | |
60,000 | | @ | | Cheesecake Factory | | 2,243,400 | |
150,000 | | @ | | Copart, Inc. | | 3,459,000 | |
200,000 | | @ | | Dick’s Sporting Goods, Inc. | | 6,648,000 | |
80,000 | | @ | | DSW, Inc. | | 2,097,600 | |
50,000 | | @ | | Guitar Center, Inc. | | 2,500,500 | |
20,000 | | @ | | Panera Bread Co. | | 1,313,600 | |
60,000 | | @ | | Petco Animal Supplies, Inc. | | 1,317,000 | |
80,000 | | @ | | PF Chang’s China Bistro, Inc. | | $ | 3,970,400 | |
90,000 | | @ | | Red Robin Gourmet Burgers, Inc. | | 4,586,400 | |
200,000 | | @ | | Select Comfort Corp. | | 5,470,000 | |
100,000 | | @ | | Texas Roadhouse, Inc. | �� | 1,555,000 | |
60,000 | | @ | | Tractor Supply Co. | | 3,176,400 | |
74,300 | | | | United Auto Group, Inc. | | 2,838,260 | |
| | | | | | 51,109,160 | |
| | | | Telecommunications: 0.5% | | | |
90,000 | | @ | | SBA Communications Corp. | | 1,611,000 | |
| | | | | | 1,611,000 | |
| | | | Transportation: 1.7% | | | |
80,000 | | @ | | Genesee & Wyoming, Inc. | | 3,004,000 | |
60,000 | | | | Landstar System, Inc. | | 2,504,400 | |
| | | | | | 5,508,400 | |
| | | | Total Common Stock
(Cost $241,103,222) | | 292,885,189 | |
Principal
Amount | | | | | | Value | |
| | | | | | | |
CORPORATE BONDS/NOTES: 0.7% | | | |
| | | | Lodging: 0.7% | | | |
$ | 1,000,000 | | # | | Wynn Resorts Ltd., 6.000%, due 07/15/15 | | 2,405,000 | |
| | | | Total Corporate Bonds/Notes
(Cost $981,874) | | 2,405,000 | |
| | | | Total Long-Term Investments:
(Cost $242,085,096) | | 295,290,189 | |
SHORT-TERM INVESTMENTS: 7.3% | | | |
| | | | Federal Home Loan Bank: 7.3% | | | |
23,285,000 | | | | Discount Note, 3.200%, due 01/03/06 | | 23,278,791 | |
| | | | Total Federal Home Loan Bank
(Cost $23,280,860) | | 23,278,791 | |
| | | | Total Short-Term Investments:
(Cost $23,280,860) | | 23,278,791 | |
| | | | Total Investments in Securities
(Cost $265,365,956)* | 99.3 | % | | $ | 318,568,980 | |
| | | | Other Assets and Liabilities-Net | 0.7 | | | 2,186,841 | |
| | | | Net Assets | 100.0 | % | | $ | 320,755,821 | |
| | | | | | | | | | | |
@ Non-income producing security
@@ Foreign Issuer
# Securities with purchases pursuant to Rule 144A, under the Securities Act of 1933 and may not be resold subject to that rule except to qualified institutional buyers. These securities have been determined to be liquid under the guidelines established by the Funds’ Board of Directors/Trustees.
* Cost for federal income tax purposes is $265,825,138.
Net unrealized appreciation consists of:
| | | | Gross Unrealized Appreciation | | $ | 60,003,543 | |
| | | | Gross Unrealized Depreciation | | (7,259,701 | ) |
| | | | Net Unrealized Appreciation | | $ | 52,743,842 | |
See Accompanying Notes to Financial Statements
155
| PORTFOLIO OF INVESTMENTS |
ING DAVIS VENTURE VALUE PORTFOLIO | AS OF DECEMBER 31, 2005 |
Shares | | | | | | Value | |
COMMON STOCK: 100.9% | | | |
| | | | Advertising: 0.3% | | | |
3,200 | | @@ | | WPP Group PLC ADR | | $ | 172,800 | |
| | | | | | 172,800 | |
| | | | Agriculture: 5.9% | | | |
44,200 | | | | Altria Group, Inc. | | 3,302,624 | |
| | | | | | 3,302,624 | |
| | | | Banks: 8.5% | | | |
6,300 | | | | Commerce BanCorp, Inc. | | 216,783 | |
10,400 | | | | Fifth Third BanCorp | | 392,288 | |
108,100 | | @@ | | HSBC Holdings PLC | | 1,729,423 | |
13,400 | | @@ | | Lloyds TSB Group PLC ADR | | 452,920 | |
3,500 | | | | State Street Corp. | | 194,040 | |
28,400 | | | | Wells Fargo & Co. | | 1,784,372 | |
| | | | | | 4,769,826 | |
| | | | Beverages: 2.1% | | | |
12,800 | | @@ | | Diageo PLC ADR | | 746,240 | |
14,500 | | @@ | | Heineken Holding NV | | 424,409 | |
| | | | | | 1,170,649 | |
| | | | Building Materials: 1.9% | | | |
7,100 | | | | Martin Marietta Materials, Inc. | | 544,712 | |
7,900 | | | | Vulcan Materials Co. | | 535,225 | |
| | | | | | 1,079,937 | |
| | | | Commercial Services: 5.1% | | | |
84,000 | | @@ | | COSCO Pacific Ltd. | | 153,504 | |
31,600 | | | | H&R Block, Inc. | | 775,780 | |
23,100 | | @ | | Iron Mountain, Inc. | | 975,282 | |
16,000 | | | | Moody’s Corp. | | 982,720 | |
| | | | | | 2,887,286 | |
| | | | Computers: 2.4% | | | |
18,400 | | @ | | Dell, Inc. | | 551,816 | |
11,700 | | | | Hewlett-Packard Co. | | 334,971 | |
10,700 | | @ | | Lexmark International, Inc. | | 479,681 | |
| | | | | | 1,366,468 | |
| | | | Cosmetics/Personal Care: 0.9% | | | |
17,600 | | | | Avon Products, Inc. | | 502,480 | |
| | | | | | 502,480 | |
| | | | Diversified Financial Services: 14.1% | | | |
60,400 | | | | American Express Co. | | 3,108,184 | |
14,300 | | | | Ameriprise Financial, Inc. | | 586,300 | |
34,100 | | | | Citigroup, Inc. | | 1,654,873 | |
55,300 | | | | JPMorgan Chase & Co. | | 2,194,857 | |
6,800 | | | | Morgan Stanley | | 385,832 | |
| | | | | | 7,930,046 | |
| | | | Food: 0.9% | | | |
9,700 | | | | Hershey Foods Corp. | | 535,925 | |
| | | | | | 535,925 | |
| | | | Food Service: 0.0% | | | |
5,486 | | @,X | | FHC Delaware, Inc. | | 35,165 | |
| | | | | | 35,165 | |
| | | | Healthcare-Services: 1.2% | | | |
14,000 | | | | HCA, Inc. | | $ | 707,000 | |
| | | | | | 707,000 | |
| | | | Holding Companies- Diversified: 0.4% | | | |
96,000 | | @@ | | China Merchants Holdings International Co. Ltd | | 208,352 | |
| | | | | | 208,352 | |
| | | | Housewares: 0.2% | | | |
1,900 | | @@ | | Hunter Douglas NV | | 102,735 | |
| | | | | | 102,735 | |
| | | | Insurance: 18.3% | | | |
41,400 | | | | American International Group, Inc. | | 2,824,722 | |
15,500 | | | | AON Corp. | | 557,225 | |
20 | | @ | | Berkshire Hathaway, Inc. | | 1,772,400 | |
24 | | @ | | Berkshire Hathaway, Inc. | | 70,452 | |
2,900 | | | | Chubb Corp. | | 283,185 | |
1,100 | | @@ | | Everest Re Group Ltd. | | 110,385 | |
13,300 | | | | Loews Corp. | | 1,261,505 | |
100 | | @ | | Markel Corp. | | 31,705 | |
14,900 | | | | Marsh & McLennan Cos., Inc. | | 473,224 | |
4,700 | | | | Principal Financial Group | | 222,921 | |
17,500 | | | | Progressive Corp. | | 2,043,650 | |
2,700 | | @@ | | Sun Life Financial, Inc. | | 108,351 | |
7,900 | | | | Transatlantic Holdings, Inc. | | 530,880 | |
| | | | | | 10,290,605 | |
| | | | Internet: 0.4% | | | |
4,300 | | @ | | Expedia, Inc. | | 103,028 | |
4,100 | | @ | | IAC/InterActiveCorp | | 116,071 | |
| | | | | | 219,099 | |
| | | | Leisure Time: 1.0% | | | |
10,700 | | | | Harley-Davidson, Inc. | | 550,943 | |
| | | | | | 550,943 | |
| | | | Media: 3.7% | | | |
48,300 | | @ | | Comcast Corp. | | 1,240,827 | |
2,900 | | | | Gannett Co., Inc. | | 175,653 | |
8,600 | | @@ | | Lagardere SCA | | 658,728 | |
| | | | | | 2,075,208 | |
| | | | Miscellaneous Manufacturing: 3.9% | | | |
76,200 | | @@ | | Tyco International Ltd. | | 2,199,132 | |
| | | | | | 2,199,132 | |
| | | | Oil & Gas: 11.1% | | | |
28,300 | | | | ConocoPhillips | | 1,646,494 | |
25,500 | | | | Devon Energy Corp. | | 1,594,770 | |
20,300 | | | | EOG Resources, Inc. | | 1,489,411 | |
12,000 | | | | Occidental Petroleum Corp. | | 958,560 | |
7,700 | | @ | | Transocean, Inc. | | 536,613 | |
| | | | | | 6,225,848 | |
| | | | Packaging & Containers: 2.3% | | | |
22,700 | | @ | | Sealed Air Corp. | | 1,275,059 | |
| | | | | | 1,275,059 | |
See Accompanying Notes to Financial Statements
156
| PORTFOLIO OF INVESTMENTS |
ING DAVIS VENTURE VALUE PORTFOLIO | AS OF DECEMBER 31, 2005 (CONTINUED) |
Shares | | | | | | Value | |
| | | | Pharmaceuticals: 2.3% | | | |
8,800 | | | | Cardinal Health, Inc. | | $ | 605,000 | |
13,400 | | @ | | Caremark Rx, Inc. | | 693,986 | |
| | | | | | 1,298,986 | |
| | | | Real Estate Investment Trust: 1.7% | | | |
1,400 | | | | Centerpoint Properties Trust | | 69,272 | |
19,100 | | | | General Growth Properties, Inc. | | 897,509 | |
| | | | | | 966,781 | |
| | | | Retail: 5.3% | | | |
43,300 | | | | Costco Wholesale Corp. | | 2,142,051 | |
17,700 | | | | Wal-Mart Stores, Inc. | | 828,360 | |
| | | | | | 2,970,411 | |
| | | | Savings & Loans: 3.5% | | | |
29,600 | | | | Golden West Financial Corp. | | 1,953,600 | |
| | | | | | 1,953,600 | |
| | | | Software: 1.2% | | | |
26,000 | | | | Microsoft Corp. | | 679,900 | |
| | | | | | 679,900 | |
| | | | Telecommunications: 1.3% | | | |
8,600 | | @@ | | Nokia OYJ ADR | | 157,380 | |
2,000 | | @ | | NTL, Inc. | | 136,160 | |
10,100 | | @@ | | SK Telecom Co., Ltd. ADR | | 204,929 | |
10,200 | | @,@@ | | Telewest Global, Inc. | | 242,964 | |
| | | | | | 741,433 | |
| | | | Transportation: 1.0% | | | |
600 | | @@ | | Kuehne & Nagel International AG | | 168,743 | |
5,000 | | | | United Parcel Service, Inc. | | 375,750 | |
| | | | | | 544,493 | |
| | | | Total Common Stock
(Cost $54,173,820) | | 56,762,791 | |
| | | | | | | | |
Principal
Amount | | | | | | Value | |
| | | | | | | |
SHORT-TERM INVESTMENT: 1.8% | | | |
| | Commercial Paper: 1.8% | | | |
$ | 1,006,000 | | CLIPPER DSCP, 4.200%, due 01/03/06 | | 1,005,648 | |
| | Total Short-Term Investments:
(Cost $1,005,765) | | 1,005,648 | |
| | Total Investments in Securities
(Cost $55,179,585)* | 102.7 | % | | $ | 57,768,439 | |
| | Other Assets and Liabilities-Net | (2.7 | ) | | (1,533,528 | ) |
| | Net Assets | 100.0 | % | | $ | 56,234,911 | |
| | | | | | | | | | | |
Certain foreign securities have been fair valued in accordance with procedures approved by the Board of Trustees (Note 2A).
@ Non-income producing security
@@ Foreign Issuer
ADR American Depositary Receipt
X Fair value determined by ING Funds Valuation Committee appointed by the Funds’ Board of Directors/Trustees.
* Cost for federal income tax purposes is $55,182,408.
Net unrealized appreciation consists of:
| | | | Gross Unrealized Appreciation | | $ | 2,995,643 | |
| | | | Gross Unrealized Depreciation | | (409,612 | ) |
| | | | Net Unrealized Appreciation | | $ | 2,586,031 | |
See Accompanying Notes to Financial Statements
157
| PORTFOLIO OF INVESTMENTS |
ING FUNDAMENTAL RESEARCH PORTFOLIO | AS OF DECEMBER 31, 2005 |
Shares | | | | | | Value | |
COMMON STOCK: 97.7% | | | |
| | | | | | | |
| | | | Aerospace/Defense: 2.1% | | | |
15,397 | | | | United Technologies Corp. | | $ | 860,846 | |
| | | | | | 860,846 | |
| | | | Agriculture: 2.4% | | | |
12,993 | | | | Altria Group, Inc. | | 970,837 | |
| | | | | | 970,837 | |
| | | | Banks: 5.5% | | | |
24,595 | | | | Bank of America Corp. | | 1,135,059 | |
18,081 | | | | Wells Fargo & Co. | | 1,136,029 | |
| | | | | | 2,271,088 | |
| | | | Beverages: 0.8% | | | |
5,265 | | | | PepsiCo, Inc. | | 311,056 | |
| | | | | | 311,056 | |
| | | | Biotechnology: 1.8% | | | |
9,652 | | @ | | Amgen, Inc. | | 761,157 | |
| | | | | | 761,157 | |
| | | | Chemicals: 0.8% | | | |
7,495 | | | | E.I. du Pont de Nemours & Co. | | 318,538 | |
| | | | | | 318,538 | |
| | | | Computers: 2.9% | | | |
44,400 | | @ | | EMC Corp. | | 604,728 | |
7,090 | | | | International Business Machines Corp. | | 582,798 | |
2,600 | | @,X | | Seagate Technology | | — | |
| | | | | | 1,187,526 | |
| | | | Cosmetics/Personal Care: 2.0% | | | |
7,600 | | | | Colgate-Palmolive Co. | | 416,860 | |
7,227 | | | | Procter & Gamble Co. | | 418,299 | |
| | | | | | 835,159 | |
| | | | Distribution/Wholesale: 1.5% | | | |
14,400 | | @ | | Wesco Intl., Inc | | 615,312 | |
| | | | | | 615,312 | |
| | | | Diversified Financial Services: 12.1% | | | |
6,500 | | @ | | Affiliated Managers Group, Inc. | | 521,625 | |
7,499 | | | | Capital One Financial Corp. | | 647,914 | |
34,146 | | | | Citigroup, Inc. | | 1,657,104 | |
20,900 | | | | Countrywide Financial Corp. | | 714,571 | |
6,500 | | | | Franklin Resources, Inc. | | 611,065 | |
12,265 | | | | Merrill Lynch & Co., Inc. | | 830,708 | |
| | | | | | 4,982,987 | |
| | | | Electric: 2.2% | | | |
14,000 | | @ | | Mirant Corp. | | 315,000 | |
9,100 | | @ | | Public Service Enterprise Group, Inc. | | 591,227 | |
| | | | | | 906,227 | |
| | | | Electronics: 4.6% | | | |
24,400 | | @ | | Jabil Circuit, Inc. | | 904,996 | |
25,800 | | | | Symbol Technologies, Inc. | | 330,756 | |
15,200 | | @ | | Thomas & Betts Corp. | | 637,792 | |
| | | | | | 1,873,544 | |
| | | | Food: 1.2% | | | |
9,100 | | | | Hershey Foods Corp. | | $ | 502,775 | |
| | | | | | 502,775 | |
| | | | Healthcare-Products: 4.9% | | | |
8,300 | | | | Baxter Intl., Inc. | | 312,495 | |
18,635 | | | | Johnson & Johnson | | 1,119,964 | |
10,500 | | | | Medtronic, Inc. | | 604,485 | |
| | | | | | 2,036,944 | |
| | | | Healthcare-Services: 2.5% | | | |
10,131 | | @ | | Health Net, Inc. | | 522,253 | |
13,200 | | @ | | Triad Hospitals, Inc. | | 517,836 | |
| | | | | | 1,040,089 | |
| | | | Insurance: 2.8% | | | |
7,700 | | @@ | | ACE Ltd. | | 411,488 | |
6,475 | | | | American Intl. Group, Inc. | | 441,790 | |
6,999 | | | | St. Paul Travelers Cos., Inc. | | 312,645 | |
| | | | | | 1,165,923 | |
| | | | Internet: 1.4% | | | |
14,928 | | @ | | Yahoo!, Inc. | | 584,879 | |
| | | | | | 584,879 | |
| | | | Lodging: 2.2% | | | |
12,504 | | | | Harrah’s Entertainment, Inc. | | 891,410 | |
| | | | | | 891,410 | |
| | | | Media: 3.4% | | | |
28,858 | | | | Time Warner, Inc. | | 503,284 | |
28,087 | | @ | | Viacom, Inc. | | 915,636 | |
| | | | | | 1,418,920 | |
| | | | Mining: 0.8% | | | |
10,700 | | | | Alcoa, Inc. | | 316,399 | |
| | | | | | 316,399 | |
| | | | Miscellaneous Manufacturing: 6.8% | | | |
7,100 | | | | Cooper Industries Ltd. | | 518,300 | |
46,915 | | | | General Electric Co. | | 1,644,371 | |
16,206 | | | | Roper Industries, Inc. | | 640,299 | |
| | | | | | 2,802,970 | |
| | | | Oil and Gas: 7.5% | | | |
6,949 | | | | ENSCO Intl., Inc. | | 308,188 | |
27,205 | | | | Exxon Mobil Corp. | | 1,528,104 | |
8,500 | | @ | | Newfield Exploration Co. | | 425,595 | |
5,100 | | @ | | Plains Exploration & Production Co. | | 202,623 | |
11,500 | | @ | | Southwestern Energy Co. | | 413,310 | |
4,569 | | | | XTO Energy, Inc. | | 200,762 | |
| | | | | | 3,078,582 | |
| | | | Oil and Gas Services: 2.8% | | | |
18,000 | | @ | | Dresser-Rand Group, Inc. | | 435,240 | |
6,600 | | | | Halliburton Co. | | 408,936 | |
3,251 | | | | Schlumberger Ltd. | | 315,835 | |
| | | | | | 1,160,011 | |
| | | | Pharmaceuticals: 5.5% | | | |
17,021 | | @ | | Medco Health Solutions, Inc. | | 949,772 | |
27,953 | | | | Pfizer, Inc. | | 651,864 | |
7,300 | | @@ | | Teva Pharmaceutical Industries Ltd. ADR | | 313,973 | |
7,369 | | | | Wyeth | | 339,490 | |
| | | | | | 2,255,099 | |
See Accompanying Notes to Financial Statements
158
| PORTFOLIO OF INVESTMENTS |
ING FUNDAMENTAL RESEARCH PORTFOLIO | AS OF DECEMBER 31, 2005 (CONTINUED) |
Shares | | | | | | Value | |
| | | | Retail: 5.1% | | | |
17,000 | | | | CVS Corp. | | $ | 449,140 | |
14,927 | | | | Home Depot, Inc. | | 604,245 | |
15,800 | | @ | | Urban Outfitters, Inc. | | 399,898 | |
13,372 | | | | Wal-Mart Stores, Inc. | | 625,810 | |
| | | | | | 2,079,093 | |
| | | | Semiconductors: 4.2% | | | |
12,300 | | @ | | Broadcom Corp. | | 579,945 | |
16,856 | | | | Maxim Integrated Products, Inc. | | 610,861 | |
53,404 | | @@ | | Taiwan Semiconductor Manufacturing Co. Ltd. ADR | | 529,234 | |
| | | | | | 1,720,040 | |
| | | | Software: 4.7% | | | |
39,094 | | | | Microsoft Corp. | | 1,022,308 | |
75,705 | | @ | | Oracle Corp. | | 924,358 | |
| | | | | | 1,946,666 | |
| | | | Telecommunications: 3.2% | | | |
26,326 | | | | Bellsouth Corp. | | 713,435 | |
36,034 | | @ | | Cisco Systems, Inc. | | 616,902 | |
| | | | | | 1,330,337 | |
| | | | Total Common Stock
(Cost $38,832,528) | | 40,224,414 | |
| | | | | | | | |
Principal
Amount | | | | | | Value | |
| | | | | | | |
SHORT-TERM INVESTMENTS: 3.4% | | | |
| | | | Repurchase Agreement: 3.4% | | | |
$1,405,000 | | S | | Goldman Sachs Repurchase Agreement dated 12/30/05, 4.250%, due 01/03/06, $1,405,663 to be received upon repurchase (Collateralized by $1,458,000 Federal Home Loan Mortgage Corporation, 3.625%, Market Value plus accrued interest $1,433,772, due 09/15/08. | | 1,405,000 | |
| | | | Total Short-Term Investments
(Cost $1,405,000) | | 1,405,000 | |
| | | | Total Investments In Securities
(Cost $40,237,528)* | 101.1 | % | | $41,629,414 | |
| | | | Other Assets and Liabilities-Net | (1.1 | ) | | (467,783 | ) |
| | | | Net Assets | 100.0 | % | | $41,161,631 | |
| | | | | | | | | | | |
@ Non-income producing security
@@ Foreign issuer
ADR American Depositary Receipt
S Segregated securities for certain derivatives, when-issued or delayed delivery securities and forward currency exchange contracts.
X Fair value determined by ING Funds Valuation Committee appointed by the Funds’ Board of Directors/Trustees.
* Cost for federal income tax purposes is $40,732,718. Net unrealized appreciation consists of:
| | | | Gross Unrealized Appreciation | | $ | 1,419,663 | |
| | | | Gross Unrealized Depreciation | | (522,967 | ) |
| | | | Net Unrealized Appreciation | | $ | 896,696 | |
Information concerning open futures contracts for the ING Fundamental Research Portfolio at December 31, 2005 is shown below:
Long Contracts | | No. of
Contracts | | Notional
Market Value | | Expiration
Date | | Unrealized
Loss | |
S&P 500 | | 8 | | $501,900 | | 03/17/06 | | $(10,960 | ) | |
| | | | | | | | | | |
See Accompanying Notes to Financial Statements
159
ING GOLDMAN SACHS® | PORTFOLIO OF INVESTMENTS |
CAPITAL GROWTH PORTFOLIO | AS OF DECEMBER 31, 2005 |
Shares | | | | | | Value | |
COMMON STOCK: 106.0% | | | |
| | | | Advertising: 1.4% | | | |
18,400 | | @,L | | Lamar Advertising Co. | | $ | 848,976 | |
| | | | | | 848,976 | |
| | | | Aerospace/Defense: 0.6% | | | |
6,290 | | | | United Technologies Corp. | | 351,674 | |
| | | | | | 351,674 | |
| | | | Apparel: 0.6% | | | |
4,020 | | | | Nike, Inc. | | 348,896 | |
| | | | | | 348,896 | |
| | | | Beverages: 4.6% | | | |
15,900 | | | | Coca-Cola Co. | | 640,929 | |
38,060 | | | | PepsiCo, Inc. | | 2,248,585 | |
| | | | | | 2,889,514 | |
| | | | Biotechnology: 2.3% | | | |
18,560 | | @ | | Amgen, Inc. | | 1,463,642 | |
| | | | | | 1,463,642 | |
| | | | Commercial Services: 3.2% | | | |
12,310 | | | | Aramark Corp. | | 341,972 | |
22,420 | | | | Moody’s Corp. | | 1,377,036 | |
8,780 | | @,L | | Valassis Communications, Inc. | | 255,235 | |
| | | | | | 1,974,243 | |
| | | | Computers: 3.3% | | | |
6,900 | | @ | | Cognizant Technology Solutions Corp. | | 347,415 | |
57,720 | | @ | | Dell, Inc. | | 1,731,023 | |
| | | | | | 2,078,438 | |
| | | | Cosmetics/Personal Care: 0.8% | | | |
9,250 | | | | Procter & Gamble Co. | | 535,390 | |
| | | | | | 535,390 | |
| | | | Distribution/Wholesale: 0.6% | | | |
5,430 | | | | WW Grainger, Inc. | | 386,073 | |
| | | | | | 386,073 | |
| | | | Diversified Financial Services: 12.0% | | | |
6,700 | | | | American Express Co. | | 344,782 | |
72,240 | | L | | Charles Schwab Corp. | | 1,059,761 | |
15,460 | | | | Fannie Mae | | 754,603 | |
52,770 | | | | Freddie Mac | | 3,448,519 | |
18,574 | | | | JPMorgan Chase & Co. | | 737,202 | |
8,860 | | | | Merrill Lynch & Co., Inc. | | 600,088 | |
9,750 | | | | Morgan Stanley | | 553,215 | |
| | | | | | 7,498,170 | |
| | | | Electronics: 0.5% | | | |
5,200 | | L | | Fisher Scientific International, Inc. | | 321,672 | |
| | | | | | 321,672 | |
| | | | Entertainment: 0.9% | | | |
17,800 | | @ | | GTECH Holdings Corp. | | 564,972 | |
| | | | | | 564,972 | |
| | | | Food: 1.7% | | | |
15,860 | | | | WM Wrigley Jr. Co. | | $ | 1,054,531 | |
| | | | | | 1,054,531 | |
| | | | Healthcare-Products: 6.5% | | | |
4,170 | | | | CR Bard, Inc. | | 274,886 | |
23,380 | | | | Medtronic, Inc. | | 1,345,987 | |
7,120 | | | | St. Jude Medical, Inc. | | 357,424 | |
24,850 | | | | Stryker Corp. | | 1,104,086 | |
14,680 | | @ | | Zimmer Holdings, Inc. | | 990,019 | |
| | | | | | 4,072,402 | |
| | | | Home Furnishings: 0.6% | | | |
3,900 | | L | | Harman International Industries, Inc. | | 381,615 | |
| | | | | | 381,615 | |
| | | | Household Products/Wares: 1.0% | | | |
7,960 | | | | Fortune Brands, Inc. | | 621,039 | |
| | | | | | 621,039 | |
| | | | Insurance: 0.6% | | | |
9,600 | | @@ | | Willis Group Holdings Ltd. | | 354,624 | |
| | | | | | 354,624 | |
| | | | Internet: 3.2% | | | |
3,630 | | @ | | Google, Inc. | | 1,505,942 | |
13,130 | | @,L | | Yahoo!, Inc. | | 514,433 | |
| | | | | | 2,020,375 | |
| | | | Leisure Time: 1.7% | | | |
19,800 | | L | | Carnival Corp. | | 1,058,706 | |
| | | | | | 1,058,706 | |
| | | | Lodging: 2.8% | | | |
13,220 | | | | Harrah’s Entertainment, Inc. | | 942,454 | |
12,140 | | | | Marriott International, Inc. | | 813,016 | |
| | | | | | 1,755,470 | |
| | | | Media: 10.2% | | | |
54,080 | | | | McGraw-Hill Cos, Inc. | | 2,792,150 | |
77,010 | | | | Time Warner, Inc. | | 1,343,054 | |
27,850 | | @,L | | Univision Communications, Inc. | | 818,512 | |
34,342 | | | | Viacom, Inc. | | 1,119,549 | |
11,470 | | @,L | | Xm Satellite Radio, Inc. | | 312,902 | |
| | | | | | 6,386,167 | |
| | | | Miscellaneous Manufacturing: 0.8% | | | |
17,020 | | @@,L | | Tyco International Ltd. | | 491,197 | |
| | | | | | 491,197 | |
| | | | Oil & Gas: 4.9% | | | |
27,280 | | @@ | | Canadian Natural Resources Ltd. | | 1,353,634 | |
4,638 | | | | Exxon Mobil Corp. | | 260,516 | |
23,050 | | @@ | | Suncor Energy, Inc. | | 1,455,146 | |
| | | | | | 3,069,296 | |
| | | | Oil & Gas Services: 4.8% | | | |
17,580 | | | | Baker Hughes, Inc. | | 1,068,512 | |
19,850 | | L | | Schlumberger Ltd. | | 1,928,427 | |
| | | | | | 2,996,939 | |
See Accompanying Notes to Financial Statements
160
ING GOLDMAN SACHS® | PORTFOLIO OF INVESTMENTS |
CAPITAL GROWTH PORTFOLIO | AS OF DECEMBER 31, 2005 (CONTINUED) |
Shares | | | | | | Value | |
| | | | Pharmaceuticals: 6.7% | | | |
25,980 | | @ | | Caremark Rx, Inc. | | $ | 1,345,504 | |
10,390 | | | | Eli Lilly & Co. | | 587,970 | |
15,430 | | @ | | Medco Health Solutions, Inc. | | 860,994 | |
19,370 | | | | Pfizer, Inc. | | 451,708 | |
19,790 | | | | Wyeth | | 911,725 | |
| | | | | | 4,157,901 | |
| | | | Retail: 8.0% | | | |
31,380 | | | | Lowe’s Cos., Inc. | | 2,091,791 | |
33,660 | | @ | | Petco Animal Supplies, Inc. | | 738,837 | |
11,140 | | L | | Target Corp. | | 612,366 | |
33,300 | | | | Wal-Mart Stores, Inc. | | 1,558,440 | |
| | | | | | 5,001,434 | |
| | | | Savings & Loans: 0.7% | | | |
6,350 | | L | | Golden West Financial Corp. | | 419,100 | |
| | | | | | 419,100 | |
| | | | Semiconductors: 3.0% | | | |
19,970 | | | | Intel Corp. | | 498,451 | |
38,350 | | L | | Linear Technology Corp. | | 1,383,285 | |
| | | | | | 1,881,736 | |
| | | | Software: 9.8% | | | |
20,570 | | @,L | | Electronic Arts, Inc. | | 1,076,017 | |
50,370 | | | | First Data Corp. | | 2,166,414 | |
96,890 | | | | Microsoft Corp. | | 2,533,674 | |
26,200 | | @ | | Oracle Corp. | | 319,902 | |
| | | | | | 6,096,007 | |
| | | | Telecommunications: 8.2% | | | |
43,370 | | @,L | | American Tower Corp. | | 1,175,327 | |
77,400 | | @ | | Cisco Systems, Inc. | | 1,325,088 | |
23,190 | | @ | | Crown Castle International Corp. | | 624,043 | |
46,140 | | | | Qualcomm, Inc. | | 1,987,711 | |
| | | | | | 5,112,169 | |
| | | | Total Common Stock
(Cost $58,307,501) | | 66,192,368 | |
| | | | | | | | |
Principal
Amount | | | | Value | |
| | | | | |
SHORT-TERM INVESTMENTS: 17.7% | | | |
| | Securities Lending Collateralcc: 17.7% | | | |
$ | 11,018,000 | | The Bank of New York Institutional Cash Reserves Fund | | 11,018,000 | |
| | Total Securities Lending Collateral
(Cost $11,018,000) | | 11,018,000 | |
| | Total Short-Term Investments
(Cost $11,018,000) | | 11,018,000 | |
| | Total Investments in Securities
(Cost $69,325,501)* | 123.7 | % | | $ | 77,210,368 | |
| | Other Assets and Liabilities-Net | (23.7 | ) | | (14,774,534 | ) |
| | Net Assets | 100.0 | % | | $ | 62,435,834 | |
| | | | | | | | | |
@ Non-income producing security
@@ Foreign Issuer
cc Securities purchased with cash collateral for securities loaned.
L Loaned security, a portion or all of the security is on loan at December 31, 2005.
* Cost for federal income tax purposes is $70,377,842. Net unrealized appreciation consists of:
| | | | Gross Unrealized Appreciation | | $ | 9,055,833 | |
| | | | Gross Unrealized Depreciation | | (2,223,307 | ) |
| | | | Net Unrealized Appreciation | | $ | 6,832,526 | |
See Accompanying Notes to Financial Statements
161
ING GOLDMAN SACHS® | PORTFOLIO OF INVESTMENTS |
CORE EQUITY PORTFOLIO | AS OF DECEMBER 31, 2005 |
Shares | | | | | | Value | |
COMMON STOCK: 102.5% | | | |
| | | | Aerospace/Defense: 3.9% | | | |
22,500 | | | | Boeing Co. | | $ | 1,580,111 | |
30,900 | | L | | Northrop Grumman Corp. | | 1,857,437 | |
13,300 | | | | Raytheon Co. | | 533,995 | |
| | | | | | 3,971,543 | |
| | | | Agriculture: 6.7% | | | |
41,100 | | | | Altria Group, Inc. | | 3,070,992 | |
71,799 | | | | Archer-Daniels-Midland Co. | | 1,770,546 | |
24,000 | | | | Monsanto Co. | | 1,861,056 | |
| | | | | | 6,702,594 | |
| | | | Airlines: 0.1% | | | |
6,400 | | | | Southwest Airlines Co. | | 105,151 | |
| | | | | | 105,151 | |
| | | | Apparel: 1.5% | | | |
44,100 | | @ | | Coach, Inc. | | 1,470,294 | |
| | | | | | 1,470,294 | |
| | | | Banks: 4.6% | | | |
72,700 | | L | | Bank of America Corp. | | 3,355,156 | |
18,100 | | | | UnionBanCal Corp. | | 1,243,832 | |
| | | | | | 4,598,988 | |
| | | | Biotechnology: 3.2% | | | |
32,200 | | @ | | Amgen, Inc. | | 2,539,292 | |
7,600 | | @,L | | Genentech, Inc. | | 703,000 | |
| | | | | | 3,242,292 | |
| | | | Commercial Services: 2.4% | | | |
662 | | @,L | | CCE Spinco, Inc. | | 8,672 | |
2,900 | | | | ChoicePoint, Inc. | | 128,757 | |
9,600 | | | | McKesson Corp. | | 495,264 | |
29,000 | | | | Moody’s Corp. | | 1,781,180 | |
| | | | | | 2,413,873 | |
| | | | Computers: 4.9% | | | |
13,000 | | @ | | Cadence Design Systems, Inc. | | 219,960 | |
30,600 | | @ | | Computer Sciences Corp. | | 1,549,584 | |
83,900 | | | | Hewlett-Packard Co. | | 2,402,085 | |
2,200 | | @ | | Seagate Technology, Inc. | | — | |
23,500 | | @ | | Synopsys, Inc. | | 471,410 | |
13,600 | | @,L | | Western Digital Corp. | | 253,096 | |
| | | | | | 4,896,135 | |
| | | | Cosmetics/Personal Care: 3.0% | | | |
18,800 | | | | Colgate-Palmolive Co. | | 1,031,180 | |
33,982 | | L | | Procter & Gamble Co. | | 1,966,878 | |
| | | | | | 2,998,058 | |
| | | | Diversified Financial Services: 8.3% | | | |
14,500 | | @,L | | AmeriCredit Corp. | | 371,635 | |
24,100 | | | | Ameriprise Financial, Inc. | | 988,100 | |
13,966 | | | | Citigroup, Inc. | | 677,770 | |
73,600 | | | | JPMorgan Chase & Co. | | 2,921,392 | |
32,800 | | | | Merrill Lynch & Co., Inc. | | 2,221,630 | |
21,100 | | L | | SLM Corp. | | 1,162,399 | |
| | | | | | 8,342,926 | |
| | | | Electric: 3.4% | | | |
6,200 | | L | | American Electric Power Co., Inc. | | $ | 229,958 | |
5,900 | | | | Edison International | | 257,299 | |
45,200 | | | | Pacific Gas & Electric Co. | | 1,677,824 | |
25,000 | | L | | TXU Corp. | | 1,254,750 | |
| | | | | | 3,419,831 | |
| | | | Electrical Components & Equipment: 0.3% | | | |
5,900 | | @ | | Energizer Holdings, Inc. | | 293,322 | |
| | | | | | 293,322 | |
| | | | Electronics: 0.4% | | | |
15,400 | | @ | | Avnet, Inc. | | 368,676 | |
| | | | | | 368,676 | |
| | | | Food: 1.2% | | | |
2,700 | | @ | | Dean Foods Co. | | 101,682 | |
17,100 | | @ | | Kroger Co. | | 322,848 | |
11,500 | | | | Safeway, Inc. | | 272,098 | |
7,400 | | | | Supervalu, Inc. | | 240,352 | |
14,700 | | L | | Tyson Foods, Inc. | | 251,370 | |
| | | | | | 1,188,350 | |
| | | | Healthcare-Products: 4.0% | | | |
4,400 | | | | Baxter International, Inc. | | 165,660 | |
2,900 | | | | Guidant Corp. | | 187,775 | |
54,200 | | | | Johnson & Johnson | | 3,257,420 | |
3,900 | | | | Medtronic, Inc. | | 225,759 | |
4,000 | | | | St. Jude Medical, Inc. | | 200,800 | |
| | | | | | 4,037,414 | |
| | | | Healthcare-Services: 0.2% | | | |
2,900 | | @ | | Humana, Inc. | | 157,557 | |
| | | | | | 157,557 | |
| | | | Household Products/Wares: 0.2% | | | |
8,500 | | | | American Greetings | | 186,745 | |
| | | | | | 186,745 | |
| | | | Insurance: 6.2% | | | |
5,900 | | | | Chubb Corp. | | 576,135 | |
33,200 | | | | Genworth Financial, Inc. | | 1,148,056 | |
18,700 | | | | Loews Corp. | | 1,773,695 | |
28,500 | | L | | MBIA, Inc. | | 1,714,789 | |
5,400 | | | | Metlife, Inc. | | 264,600 | |
1,900 | | | | Torchmark Corp. | | 105,270 | |
14,850 | | | | WR Berkley Corp. | | 707,157 | |
| | | | | | 6,289,702 | |
| | | | Internet: 1.8% | | | |
3,950 | | @ | | Google, Inc. | | 1,638,688 | |
9,300 | | @,L | | Symantec Corp. | | 162,750 | |
| | | | | | 1,801,438 | |
| | | | Lodging: 0.5% | | | |
13,400 | | | | Choice Hotels International, Inc. | | 559,584 | |
| | | | | | 559,584 | |
| | | | Media: 5.8% | | | |
5,300 | | | | Clear Channel Communications, Inc. | | 166,685 | |
19,900 | | @,L | | Comcast Corp. | | 516,598 | |
106,300 | | @ | | Liberty Media Corp. | | 836,581 | |
See Accompanying Notes to Financial Statements
162
ING GOLDMAN SACHS® | PORTFOLIO OF INVESTMENTS |
CORE EQUITY PORTFOLIO | AS OF DECEMBER 31, 2005 (CONTINUED) |
Shares | | | | | | Value | |
137,450 | | | | Time Warner, Inc. | | $ | 2,397,139 | |
58,811 | | | | Viacom, Inc. | | 1,917,257 | |
| | | | | | 5,834,260 | |
| | | | Mining: 0.3% | | | |
3,000 | | L | | Freeport-McMoRan Copper & Gold, Inc. | | 161,289 | |
2,200 | | L | | Newmont Mining Corp. | | 117,514 | |
| | | | | | 278,803 | |
| | | | Miscellaneous Manufacturing: 5.2% | | | |
137,700 | | | | General Electric Co. | | 4,826,385 | |
6,700 | | | | Teleflex, Inc. | | 435,366 | |
| | | | | | 5,261,751 | |
| | | | Oil & Gas: 9.6% | | | |
19,300 | | | | Anadarko Petroleum Corp. | | 1,828,675 | |
22,700 | | | | Burlington Resources, Inc. | | 1,956,905 | |
2,300 | | | | ConocoPhillips | | 133,814 | |
29,600 | | | | Devon Energy Corp. | | 1,851,184 | |
4,900 | | | | EOG Resources, Inc. | | 359,513 | |
29,472 | | | | Exxon Mobil Corp. | | 1,655,442 | |
2,200 | | | | Helmerich & Payne, Inc. | | 136,202 | |
21,900 | | | | Sunoco, Inc. | | 1,716,522 | |
| | | | | | 9,638,257 | |
| | | | Pharmaceuticals: 7.1% | | | |
43,400 | | L | | AmerisourceBergen Corp. | | 1,796,760 | |
13,900 | | @,L | | Express Scripts, Inc. | | 1,164,820 | |
58,400 | | | | Merck & Co., Inc. | | 1,856,693 | |
99,595 | | | | Pfizer, Inc. | | 2,322,556 | |
| | | | | | 7,140,829 | |
| | | | Pipelines: 0.3% | | | |
8,100 | | | | Equitable Resources, Inc. | | 297,189 | |
| | | | | | 297,189 | |
| | | | Real Estate Investment Trust: 0.7% | | | |
11,000 | | | | Kimco Realty Corp. | | 352,907 | |
6,700 | | | | Prologis | | 313,024 | |
| | | | | | 665,931 | |
| | | | Retail: 3.5% | | | |
60,000 | | @,L | | Autonation, Inc. | | 1,303,800 | |
80,137 | | | | Circuit City Stores, Inc. | | 1,810,295 | |
9,600 | | | | Yum! Brands, Inc. | | 450,048 | |
| | | | | | 3,564,143 | |
| | | | Savings & Loans: 1.2% | | | |
28,500 | | | | Washington Mutual, Inc. | | 1,239,750 | |
| | | | | | 1,239,750 | |
| | | | Semiconductors: 4.4% | | | |
4,100 | | @,L | | Freescale Semiconductor, Inc. | | 105,820 | |
94,600 | | | | Intel Corp. | | 2,361,216 | |
61,200 | | | | Texas Instruments, Inc. | | 1,963,007 | |
| | | | | | 4,430,043 | |
| | | | Software: 1.8% | | | |
7,600 | | L | | Autodesk, Inc. | | 326,420 | |
2,200 | | | | Automatic Data Processing, Inc. | | 101,472 | |
12,000 | | | | Global Payments, Inc. | | 559,320 | |
25,800 | | | | Microsoft Corp. | | 674,670 | |
8,200 | | @ | | Sybase, Inc. | | 179,252 | |
| | | | | | 1,841,134 | |
| | | | Telecommunications: 4.8% | | | |
20,200 | | | | CenturyTel, Inc. | | $ | 669,832 | |
54,100 | | @ | | Cisco Systems, Inc. | | 926,192 | |
36,000 | | @ | | Corning, Inc. | | 708,679 | |
25,200 | | | | Qualcomm, Inc. | | 1,085,616 | |
26,600 | | | | Sprint Corp. - FON Group | | 621,376 | |
28,100 | | | | Verizon Communications, Inc. | | 846,372 | |
| | | | | | 4,858,067 | |
| | | | Transportation: 0.1% | | | |
2,500 | | | | CSX Corp. | | 126,984 | |
| | | | | | 126,984 | |
| | | | Trucking & Leasing: 0.9% | | | |
26,600 | | | | GATX Corp. | | 959,728 | |
| | | | | | 959,728 | |
| | | | Total Common Stock | | | |
| | | | (Cost $94,642,415) | | 103,181,342 | |
Principal
Amount | | | | | | Value | |
| | | |
SHORT-TERM INVESTMENTS: 15.6% | | | |
| | Securities Lending Collateralcc 15.6% | | | |
$ 15,680,000 | | The Bank of New York Institutional
Cash Reserves Fund | | 15,680,000 | |
| | Total Short-Term Investments
(Cost $15,680,000) | | 15,680,000 | |
| | Total Investments in Securities
(Cost $110,322,415)* | 118.1 | % | | $ | 118,861,342 | |
| | Other Assets and
Liabilities-Net | (18.1 | ) | | (18,187,295 | ) |
| | Net Assets | 100.0 | % | | $ | 100,674,047 | |
| | | | | | | | | | |
@ | Non-income producing security |
cc | Securities purchased with cash collateral for securities loaned. |
S | Segregated securities for certain derivatives, when-issued or delayed delivery securities and forwards currency exchange contracts. |
L | Loaned security, a portion or all of the security is on loan at December 31, 2005. |
X | Fair value determined by ING Funds Valuation Committee appointed by the Funds’ Board of Directors/Trustees. |
* | Cost for federal income tax purposes is $110,815,633. Net unrealized appreciation consists of: |
| |
| Gross Unrealized Appreciation | | $ | 10,259,731 | |
| Gross Unrealized Depreciation | | (2,214,022 | ) |
| Net Unrealized Appreciation | | $ | 8,045,709 | |
| | | | | | |
Information concerning open futures contracts at December 31, 2005 is shown below:
Long Contracts | | No. of
Contracts | | Notional
Market Value | | Expiration
Date | | Unrealized
Loss | |
S&P 500 E-Mini | | 12 | | $ | 752,880 | | March 2006 | | — | |
| | | | | | | | | | |
See Accompanying Notes to Financial Statements
163
ING JPMORGAN FLEMING | PORTFOLIO OF INVESTMENTS |
INTERNATIONAL PORTFOLIO | AS OF DECEMBER 31, 2005 |
Shares | | | | | | Value | |
COMMON STOCK: 96.0% | | | |
| | | | Australia: 1.1% | | | |
592,689 | | | | BHP Billiton Ltd. | | $ | 9,877,112 | |
| | | | | | 9,877,112 | |
| | | | Belgium: 2.2% | | | |
420,300 | | | | Dexia | | 9,653,993 | |
60,000 | | | | Fortis | | 1,906,163 | |
270,215 | | | | Fortis | | 8,567,310 | |
| | | | | | 20,127,466 | |
| | | | Brazil: 1.5% | | | |
344,782 | | | | Cia Vale do Rio Doce ADR | | 14,184,331 | |
| | | | | | 14,184,331 | |
| | | | Finland: 1.4% | | | |
722,212 | | | | Nokia OYJ | | 13,196,118 | |
| | | | | | 13,196,118 | |
| | | | France: 10.5% | | | |
507,596 | | | | AXA | | 16,332,455 | |
183,051 | | | | BNP Paribas | | 14,733,022 | |
214,399 | | | | Cie de Saint-Gobain | | 12,696,281 | |
93,548 | | | | Imerys SA | | 6,736,934 | |
116,953 | | L | | Lafarge SA | | 10,478,266 | |
141,599 | | | | Total SA | | 35,576,537 | |
| | | | | | 96,553,495 | |
| | | | Germany: 5.9% | | | |
90,706 | | | | BASF AG | | 6,906,495 | |
251,170 | | | | Bayerische Motoren Werke AG | | 10,923,052 | |
379,790 | | | | Deutsche Post AG | | 9,172,690 | |
53,254 | | | | SAP AG | | 9,561,624 | |
102,214 | | | | Schering AG | | 6,813,063 | |
126,493 | | | | Siemens AG | | 10,783,064 | |
| | | | | | 54,159,988 | |
| | | | Hong Kong: 0.7% | | | |
928,500 | | | | Esprit Holdings Ltd. | | 6,586,164 | |
| | | | | | 6,586,164 | |
| | | | Ireland: 0.7% | | | |
433,591 | | | | Bank of Ireland | | 6,793,605 | |
| | | | | | 6,793,605 | |
| | | | Italy: 5.0% | | | |
1,064,961 | | | | ENI-Ente Nazionale Idrocarburi S.p.A. | | 29,648,322 | |
519,256 | | | | Mediaset S.p.A. | | 5,488,954 | |
1,595,400 | | | | UniCredito Italiano S.p.A. | | 10,958,066 | |
| | | | | | 46,095,342 | |
| | | | Japan: 20.9% | | | |
231,000 | | | | Canon, Inc. | | 13,548,816 | |
187,400 | | | | Credit Saison Co., Ltd. | | 9,332,696 | |
259,500 | | | | Daikin Industries Ltd | | 7,565,522 | |
74,500 | | L | | Fanuc Ltd | | 6,322,980 | |
33,800 | | | | Hirose Electric Co., Ltd. | | 4,492,367 | |
203,900 | | | | Honda Motor Co., Ltd. | | 11,758,313 | |
290,000 | | | | Hoya Corp. | | 10,415,302 | |
221,000 | | | | Kao Corp. | | 5,913,859 | |
303,000 | | | | Matsushita Electric Industrial Co., Ltd. | | 5,835,177 | |
500,900 | | | | Mitsubishi Corp. | | $ | 11,050,340 | |
1,497 | | | | Mitsubishi Tokyo Financial Group, Inc. | | 20,369,363 | |
74,100 | | | | Nidec Corp. | | 6,298,933 | |
535,500 | | | | Nikko Cordial Corp. | | 8,513,143 | |
24,800 | | | | Nintendo Co., Ltd. | | 3,000,529 | |
620 | | | | Nippon Telegraph & Telephone Corp. | | 2,811,492 | |
137,300 | | | | Nitto Denko Corp. | | 10,688,769 | |
124,000 | | | | Secom Co., Ltd. | | 6,489,141 | |
212,000 | | | | Sharp Corp. | | 3,223,066 | |
162,800 | | | | Shin-Etsu Chemical Co., Ltd. | | 8,658,986 | |
50,500 | | | | SMC Corp. | | 7,210,989 | |
989,000 | | | | Sumitomo Corp. | | 12,788,992 | |
64,280 | | | | Takefuji Corp. | | 4,361,042 | |
293,000 | | | | Yamanouchi Pharmaceutical Co., Ltd. | | 11,441,602 | |
| | | | | | 192,091,419 | |
| | | | Mexico: 0.7% | | | |
84,200 | | | | Fomento Economico Mexicano | | | |
| | | | SA de CV ADR | | 6,105,342 | |
| | | | | | 6,105,342 | |
| | | | Netherlands: 4.3% | | | |
444,174 | | | | ABN Amro Holding NV | | 11,553,521 | |
314,695 | | | | Koninklijke Philips Electronics NV | | 9,737,848 | |
713,265 | | | | Reed Elsevier NV | | 9,905,107 | |
425,769 | | | | Wolters Kluwer NV | | 8,583,651 | |
| | | | | | 39,780,127 | |
| | | | South Korea: 1.2% | | | |
25,163 | | #,L | | Samsung Electronics Co., Ltd. GDR | | 8,202,215 | |
116,500 | | L | | SK Telecom Co., Ltd. ADR | | 2,363,785 | |
| | | | | | 10,566,000 | |
| | | | Spain: 2.3% | | | |
202,327 | | | | Altadis SA | | 9,136,566 | |
955,110 | | | | Banco Popular Espanol SA | | 11,607,027 | |
| | | | | | 20,743,593 | |
| | | | Sweden: 1.3% | | | |
3,462,600 | | | | Telefonaktiebolaget LM Ericsson | | 11,909,190 | |
| | | | | | 11,909,190 | |
| | | | Switzerland: 11.4% | | | |
201,629 | | | | Adecco SA | | 9,263,188 | |
160,699 | | | | Holcim Ltd | | 10,906,859 | |
57,879 | | | | Nestle SA | | 17,233,759 | |
335,596 | | | | Novartis AG | | 17,549,930 | |
113,710 | | | | Roche Holding AG | | 16,999,245 | |
210,111 | | | | UBS AG | | 19,912,115 | |
62,271 | | @ | | Zurich Financial Services AG | | 13,212,919 | |
| | | | | | 105,078,015 | |
| | | | United Kingdom: 24.9% | | | |
377,570 | | | | Aviva Plc | | 4,567,443 | |
1,453,444 | | | | Barclays PLC | | 15,214,449 | |
1,421,779 | | | | BG Group PLC | | 14,040,119 | |
461,171 | | | | British Land Co. PLC | | 8,445,034 | |
1,961,092 | | | | Centrica Plc | | 8,573,549 | |
See Accompanying Notes to Financial Statements
164
ING JPMORGAN FLEMING | PORTFOLIO OF INVESTMENTS |
INTERNATIONAL PORTFOLIO | AS OF DECEMBER 31, 2005 (CONTINUED) |
Shares | | | | | | Value | |
| | | | United Kingdom: (continued) | | | |
908,487 | | | | GlaxoSmithKline PLC | | $ | 22,884,391 | |
1,558,400 | | | | HSBC Holdings PLC | | 25,019,488 | |
1,639,661 | | | | Kingfisher PLC | | 6,672,019 | |
2,879,670 | | | | Morrison WM Supermarkets | | 9,557,470 | |
724,939 | | | | National Grid PLC | | 7,072,216 | |
481,177 | | | | Royal Bank of Scotland Group PLC | | 14,489,007 | |
282,130 | | | | Schroders PLC | | 4,334,903 | |
957,892 | | | | Smith & Nephew PLC | | 8,792,443 | |
498,600 | | | | Standard Chartered PLC | | 11,070,554 | |
3,175,260 | | | | Tesco PLC | | 18,059,515 | |
11,647,978 | | | | Vodafone Group PLC | | 25,011,211 | |
681,527 | | | | Wolseley PLC | | 14,338,793 | |
972,277 | | | | WPP Group PLC | | 10,495,856 | |
| | | | | | 228,638,460 | |
| | | | Total Common Stock | | | |
| | | | (Cost $677,459,495) | | 882,485,767 | |
| | | | | | | | |
Principal
Amount | | | | | | Value | |
| | | | | | | |
SHORT-TERM INVESTMENTS: 4.7% | | | |
| | Federal Home Loan Bank: 2.6% | | | |
$23,408,000 | | Discount Note, 3.200%, due 01/03/06 | | 23,401,758 | |
| | Total Federal Home Loan Bank
(Cost $23,403,839) | | 23,401,758 | |
| | Securities Lending Collateralcc: 2.1% | | | |
19,213,000 | | The Bank of New York Institutional Cash Reserves Fund | | 19,213,000 | |
| | Total Securities Lending Collateral
(Cost $19,213,000) | | 19,213,000 | |
| | Total Short-Term Investments:
(Cost $42,616,839) | | 42,614,758 | |
| | Total Investments in Securities
(Cost $720,076,334)* | 100.7 | % | | $ | 925,100,525 | |
| | Other Assets and
Liabilities-Net | (0.7 | ) | | (6,073,744 | ) |
| | Net Assets | 100.0 | % | | $ | 919,026,781 | |
| | | | | | | | | | |
Certain foreign securities have been fair valued in accordance with procedures approved by the Board of Trustees (Note 2A).
@ | Non-income producing security |
ADR | American Depositary Receipt |
GDR | Global Depositary Receipt |
# | Securities with purchases pursuant to Rule 144A, under the Securities Act of 1933 and may not be resold subject to that rule except to qualified institutional buyers. These securities have been determined to be liquid under the guidelines established by the Funds’ Board of Directors/Trustees. |
cc | Securities purchased with cash collateral for securities loaned. |
L | Loaned security, a portion or all of the security is on loan at December 31, 2005. |
* | Cost for federal income tax purposes is $723,815,473. Net unrealized appreciation consists of: |
| Gross Unrealized Appreciation | | $ | 207,230,640 | | |
| Gross Unrealized Depreciation | | (5,945,588 | ) | |
| Net Unrealized Appreciation | | $ | 201,285,052 | | |
| | | | | | | |
Banks | | 19.8 | % |
Oil & Gas | | 8.6 | |
Pharmaceuticals | | 8.2 | |
Telecommunications | | 6.0 | |
Building Materials | | 5.3 | |
Food | | 4.9 | |
Distribution/Wholesale | | 4.9 | |
Electronics | | 4.1 | |
Insurance | | 3.7 | |
Diversified Financial Services | | 2.9 | |
Chemicals | | 2.9 | |
Mining | | 2.6 | |
Media | | 2.6 | |
Federal Home Loan Bank | | 2.5 | |
Auto Manufacturers | | 2.5 | |
Office/Business Equipment | | 1.5 | |
Hand/Machine Tools | | 1.5 | |
Miscellaneous Manufacturing | | 1.2 | |
Advertising | | 1.1 | |
Software | | 1.0 | |
Commercial Services | | 1.0 | |
Transportation | | 1.0 | |
Agriculture | | 1.0 | |
Healthcare - Products | | 1.0 | |
Gas | | 0.9 | |
Real Estate | | 0.9 | |
Semiconductors | | 0.9 | |
Electric | | 0.8 | |
Retail | | 0.7 | |
Beverages | | 0.7 | |
Cosmetics/Personal Care | | 0.6 | |
Home Furnishings | | 0.6 | |
Electrical Components & Equipment | | 0.4 | |
Toys/Games/Hobbies | | 0.3 | |
Securities Lending Collateral | | 2.1 | |
Other Assets and Liabilities, Net | | (0.7 | ) |
Net Assets | | 100.0 | % |
See Accompanying Notes to Financial Statements
165
ING JPMORGAN | PORTFOLIO OF INVESTMENTS |
MID CAP VALUE PORTFOLIO | AS OF DECEMBER 31, 2005 |
Shares | | | | | | Value | |
COMMON STOCK: 98.6% | | | |
| | | | | | | |
| | | | Advertising: 0.6% | | | |
53,500 | | @ | | Clear Channel Outdoor
Holdings, Inc. | | $ | 1,072,675 | |
| | | | | | 1,072,675 | |
| | | | Apparel: 3.6% | | | |
39,300 | | @,L | | Columbia Sportswear Co. | | 1,875,789 | |
76,200 | | | | VF Corp. | | 4,216,908 | |
| | | | | | 6,092,697 | |
| | | | Auto Parts & Equipment: 0.2% | | | |
5,200 | | | | BorgWarner, Inc. | | 315,276 | |
| | | | | | 315,276 | |
| | | | Banks: 8.6% | | | |
28,000 | | | | Cullen/Frost Bankers, Inc. | | 1,503,040 | |
31,400 | | L | | M&T Bank Corp. | | 3,424,170 | |
105,750 | | L | | North Fork Bancorporation, Inc. | | 2,893,320 | |
24,300 | | L | | Northern Trust Corp. | | 1,259,226 | |
58,800 | | L | | TCF Financial Corp. | | 1,595,832 | |
29,700 | | | | Webster Financial Corp. | | 1,392,930 | |
41,700 | | | | Wilmington Trust Corp. | | 1,622,547 | |
13,200 | | | | Zions Bancorporation | | 997,652 | |
| | | | | | 14,688,717 | |
| | | | Beverages: 1.1% | | | |
16,400 | | L | | Brown-Forman Corp. | | 1,136,848 | |
31,200 | | @ | | Constellation Brands, Inc. | | 818,042 | |
| | | | | | 1,954,890 | |
| | | | Building Materials: 2.2% | | | |
42,300 | | | | American Standard Cos, Inc. | | 1,689,885 | |
30,900 | | | | Vulcan Materials Co. | | 2,093,475 | |
| | | | | | 3,783,360 | |
| | | | Chemicals: 5.5% | | | |
57,400 | | L | | Albemarle Corp. | | 2,201,290 | |
32,800 | | L | | Ashland, Inc. | | 1,899,120 | |
33,800 | | | | PPG Industries, Inc. | | 1,957,020 | |
37,000 | | | | Sherwin-Williams Co. | | 1,680,540 | |
25,600 | | | | Sigma-Aldrich Corp. | | 1,620,224 | |
| | | | | | 9,358,194 | |
| | | | Commercial Services: 0.5% | | | |
40,900 | | @ | | Interactive Data Corp. | | 928,839 | |
| | | | | | 928,839 | |
| | | | Computers: 1.7% | | | |
26,400 | | @,L | | Affiliated Computer Services, Inc. | | 1,562,352 | |
39,800 | | @,L | | NCR Corp. | | 1,350,812 | |
| | | | | | 2,913,164 | |
| | | | Cosmetics/Personal Care: 0.9% | | | |
44,700 | | L | | Estee Lauder Cos., Inc. | | 1,496,556 | |
| | | | | | 1,496,556 | |
| | | | Distribution/Wholesale: 1.6% | | | |
33,100 | | | | Genuine Parts Co. | | 1,453,752 | |
34,100 | | | | Hughes Supply, Inc. | | 1,222,485 | |
| | | | | | 2,676,237 | |
| | | | Diversified Financial Services: 1.5% | | | |
64,900 | | @ | | E*Trade Financial Corp. | | $ | 1,353,814 | |
17,600 | | | | T. Rowe Price Group, Inc. | | 1,267,728 | |
| | | | | | 2,621,542 | |
| | | | Electric: 7.1% | | | |
45,200 | | L | | American Electric Power Co., Inc. | | 1,676,468 | |
61,400 | | L | | DPL, Inc. | | 1,597,014 | |
55,100 | | L | | Energy East Corp. | | 1,256,280 | |
18,800 | | | | FirstEnergy Corp. | | 920,896 | |
37,000 | | | | Pacific Gas & Electric Co. | | 1,373,440 | |
69,200 | | | | PPL Corp. | | 2,034,480 | |
42,500 | | L | | SCANA Corp. | | 1,673,650 | |
75,800 | | | | Westar Energy, Inc. | | 1,629,700 | |
| | | | | | 12,161,928 | |
| | | | Electrical Components &
Equipment: 1.0% | | | |
40,300 | | | | Ametek, Inc. | | 1,714,362 | |
| | | | | | 1,714,362 | |
| | | | Electronics: 0.7% | | | |
25,700 | | | | Amphenol Corp. | | 1,137,482 | |
| | | | | | 1,137,482 | |
| | | | Environmental Control: 0.9% | | | |
39,900 | | | | Republic Services, Inc. | | 1,498,245 | |
| | | | | | 1,498,245 | |
| | | | Food: 1.9% | | | |
39,550 | | @ | | Dean Foods Co. | | 1,489,453 | |
106,400 | | | | Del Monte Foods Co. | | 1,109,752 | |
20,600 | | | | Hormel Foods Corp. | | 673,208 | |
| | | | | | 3,272,413 | |
| | | | Forest Products & Paper: 1.6% | | | |
54,400 | | | | MeadWestvaco Corp. | | 1,524,832 | |
32,009 | | L | | Rayonier, Inc. | | 1,275,559 | |
| | | | | | 2,800,391 | |
| | | | Gas: 2.6% | | | |
49,500 | | | | AGL Resources, Inc. | | 1,723,095 | |
41,700 | | | | Energen Corp. | | 1,514,544 | |
60,800 | | | | UGI Corp. | | 1,252,480 | |
| | | | | | 4,490,119 | |
| | | | Healthcare-Products: 0.2% | | | |
9,400 | | @ | | Henry Schein, Inc. | | 410,285 | |
| | | | | | 410,285 | |
| | | | Healthcare-Services: 3.7% | | | |
59,600 | | @ | | Coventry Health Care, Inc. | | 3,394,816 | |
38,100 | | L | | Manor Care, Inc. | | 1,515,237 | |
26,900 | | | | Quest Diagnostics | | 1,384,812 | |
| | | | | | 6,294,865 | |
| | | | Household Products/Wares: 2.3% | | | |
39,700 | | | | Clorox Co. | | 2,258,533 | |
20,800 | | | | Fortune Brands, Inc. | | 1,622,816 | |
| | | | | | 3,881,349 | |
See Accompanying Notes to Financial Statements
166
ING JPMORGAN | PORTFOLIO OF INVESTMENTS |
MID CAP VALUE PORTFOLIO | AS OF DECEMBER 31, 2005 (CONTINUED) |
Shares | | | | | | Value | |
| | | | Insurance: 9.1% | | | |
90,900 | | | | Assurant, Inc. | | $ | 3,953,241 | |
37,161 | | | | Cincinnati Financial Corp. | | 1,660,353 | |
43,000 | | | | Genworth Financial, Inc. | | 1,486,940 | |
44,100 | | @@ | | IPC Holdings Ltd. | | 1,207,458 | |
31,000 | | L | | MGIC Investment Corp. | | 2,040,420 | |
99,800 | | | | Old Republic International Corp. | | 2,620,748 | |
16,400 | | L | | Principal Financial Group | | 777,852 | |
32,700 | | | | Safeco Corp. | | 1,847,550 | |
| | | | | | 15,594,562 | |
| | | | Lodging: 1.4% | | | |
100,000 | | | | Hilton Hotels Corp. | | 2,411,000 | |
| | | | | | 2,411,000 | |
| | | | Media: 4.0% | | | |
47,300 | | @ | | Cablevision Systems Corp. | | 1,110,131 | |
56,200 | | | | Dex Media, Inc. | | 1,522,458 | |
6,491 | | | | EW Scripps Co. | | 311,698 | |
26,000 | | | | Gannett Co., Inc. | | 1,574,820 | |
19,200 | | L | | Knight-Ridder, Inc. | | 1,215,360 | |
1,490 | | | | Washington Post | | 1,139,850 | |
| | | | | | 6,874,317 | |
| | | | Miscellaneous Manufacturing: 3.8% | | | |
28,500 | | | | Carlisle Cos., Inc. | | 1,970,775 | |
26,500 | | @ | | Cooper Industries Ltd. | | 1,934,500 | |
40,100 | | L | | Crane Co. | | 1,414,327 | |
16,900 | | | | Harsco Corp. | | 1,140,919 | |
| | | | | | 6,460,521 | |
| | | | Office/Business Equipment: 1.0% | | | |
39,600 | | | | Pitney Bowes, Inc. | | 1,673,100 | |
| | | | | | 1,673,100 | |
| | | | Oil & Gas: 5.2% | | | |
41,000 | | | | Burlington Resources, Inc. | | 3,534,200 | |
51,600 | | | | Devon Energy Corp. | | 3,227,064 | |
19,937 | | | | Marathon Oil Corp. | | 1,215,559 | |
19,700 | | | | Pioneer Natural Resources Co. | | 1,010,019 | |
| | | | | | 8,986,842 | |
| | | | Packaging & Containers: 1.1% | | | |
46,100 | | | | Ball Corp. | | 1,831,092 | |
| | | | | | 1,831,092 | |
| | | | Pharmaceuticals: 0.8% | | | |
23,500 | | L | | Omnicare, Inc. | | 1,344,670 | |
| | | | | | 1,344,670 | |
| | | | Pipelines: 1.7% | | | |
31,300 | | L | | Kinder Morgan, Inc. | | 2,878,035 | |
| | | | | | 2,878,035 | |
| | | | Real Estate: 1.6% | | | |
56,200 | | @@ | | Brookfield Properties Co. | | 1,653,404 | |
28,500 | | | | Forest City Enterprises, Inc. | | 1,081,005 | |
| | | | | | 2,734,409 | |
| | | | Real Estate Investment Trust: 1.6% | | | |
23,000 | | | | iStar Financial, Inc. | | 819,950 | |
22,800 | | | | Vornado Realty Trust | | 1,903,116 | |
| | | | | | 2,723,066 | |
| | | | Retail: 9.8% | | | |
73,900 | | | | Applebees International, Inc. | | $ | 1,669,401 | |
66,700 | | @,L | | Autonation, Inc. | | 1,449,391 | |
33,900 | | @ | | Autozone, Inc. | | 3,110,325 | |
59,700 | | | | Family Dollar Stores, Inc. | | 1,479,963 | |
23,376 | | | | Federated Department Stores | | 1,550,530 | |
82,800 | | L | | Limited Brands | | 1,850,580 | |
51,300 | | L | | Outback Steakhouse, Inc. | | 2,134,593 | |
27,700 | | | | Tiffany & Co. | | 1,060,633 | |
72,400 | | | | TJX Cos., Inc. | | 1,681,852 | |
40,200 | | L | | Tuesday Morning Corp. | | 840,984 | |
| | | | | | 16,828,252 | |
| | | | Savings & Loans: 1.6% | | | |
41,900 | | L | | Golden West Financial Corp. | | 2,765,400 | |
| | | | | | 2,765,400 | |
| | | | Software: 1.1% | | | |
67,800 | | | | Computer Associates
International, Inc. | | 1,911,282 | |
| | | | | | 1,911,282 | |
| | | | Telecommunications: 4.2% | | | |
42,000 | | | | Alltel Corp. | | 2,650,200 | |
94,500 | | | | CenturyTel, Inc. | | 3,133,620 | |
41,700 | | | | Telephone & Data Systems, Inc. | | 1,443,237 | |
| | | | | | 7,227,057 | |
| | | | Transportation: 0.6% | | | |
21,900 | | | | Norfolk Southern Corp. | | 981,777 | |
| | | | | | 981,777 | |
| | | | Total Common Stock
(Cost $156,425,091) | | 168,788,968 | |
Principal
Amount | | | | Value | |
| | | | | |
SHORT-TERM INVESTMENTS: 21.0% | | | |
| | Federal Home Loan Bank: 2.4% | | | |
$ | 4,182,000 | | Discount Note, 3.200%,
due 01/03/06 | | 4,180,885 | |
| | Total Federal Home Loan Bank
(Cost $4,181,257) | | 4,180,885 | |
| | Securities Lending Collateralcc 18.6% | | | |
31,852,000 | | The Bank of New York Institutional
Cash Reserves Fund | | 31,852,000 | |
| | Total Securities Lending Collateral
(Cost $31,852,000) | | 31,852,000 | |
| | Total Short-Term Investments:
(Cost $36,033,257) | | 36,032,885 | |
| | Total Investments in Securities
(Cost $192,458,348)* | | 119.6 | % | | $ | 204,821,853 | |
| | Other Assets and
Liabilities-Net | | (19.6 | ) | | (33,528,440 | ) |
| | Net Assets | | 100.0 | % | | $ | 171,293,413 | |
| | | | | | | | | | | |
See Accompanying Notes to Financial Statements
167
ING JPMORGAN | PORTFOLIO OF INVESTMENTS |
MID CAP VALUE PORTFOLIO | AS OF DECEMBER 31, 2005 (CONTINUED) |
@ | | Non-income producing security |
@@ | | Foreign Issuer |
cc | | Securities purchased with cash collateral for securities loaned. |
L | | Loaned security, a portion or all of the security is on loan at December 31, 2005. |
* | | Cost for federal income tax purposes is $192,615,763. Net
unrealized appreciation consists of: |
| Gross Unrealized Appreciation | | $ | 15,847,818 | |
| Gross Unrealized Depreciation | | (3,641,728 | ) |
| Net Unrealized Appreciation | | $ | 12,206,090 | |
| | | | | | | |
See Accompanying Notes to Financial Statements
168
ING MFS | PORTFOLIO OF INVESTMENTS |
CAPITAL OPPORTUNITIES PORTFOLIO | AS OF DECEMBER 31, 2005 |
Shares | | | | | | Value | |
COMMON STOCK: 95.7% | | | |
| | | | Aerospace/Defense: 2.7% | | | |
32,240 | | | | Lockheed Martin Corp. | | $ | 2,051,431 | |
17,280 | | L | | Northrop Grumman Corp. | | 1,038,701 | |
36,800 | | | | United Technologies Corp. | | 2,057,488 | |
| | | | | | 5,147,620 | |
| | | | Apparel: 1.5% | | | |
33,050 | | | | Nike, Inc. | | 2,868,409 | |
| | | | | | 2,868,409 | |
| | | | Banks: 5.1% | | | |
65,224 | | | | Bank of America Corp. | | 3,010,088 | |
87,480 | | | | Mellon Financial Corp. | | 2,996,190 | |
62,120 | | L | | PNC Financial Services Group, Inc. | | 3,840,880 | |
| | | | | | 9,847,158 | |
| | | | Beverages: 0.8% | | | |
26,080 | | | | PepsiCo, Inc. | | 1,540,806 | |
| | | | | | 1,540,806 | |
| | | | Biotechnology: 2.3% | | | |
20,590 | | @ | | Amgen, Inc. | | 1,623,727 | |
17,310 | | @ | | Genzyme Corp. | | 1,225,202 | |
23,000 | | @ | | Millipore Corp. | | 1,518,920 | |
| | | | | | 4,367,849 | |
| | | | Building Materials: 1.0% | | | |
65,850 | | | | Masco Corp. | | 1,988,011 | |
| | | | | | 1,988,011 | |
| | | | Chemicals: 1.0% | | | |
37,470 | | | | Praxair, Inc. | | 1,984,411 | |
| | | | | | 1,984,411 | |
| | | | Coal: 0.5% | | | |
12,580 | | L | | Arch Coal, Inc. | | 1,000,110 | |
| | | | | | 1,000,110 | |
| | | | Commercial Services: 2.2% | | | |
31,910 | | @,L | | Apollo Group, Inc. | | 1,929,279 | |
24,610 | | | | ITT Educational Services, Inc. | | 1,454,697 | |
9,990 | | L | | Strayer Education, Inc. | | 936,063 | |
| | | | | | 4,320,039 | |
| | | | Computers: 4.6% | | | |
75,190 | | @ | | Dell, Inc. | | 2,254,948 | |
141,800 | | | | EMC Corp. | | 1,931,316 | |
31,230 | | @ | | M-Systems Flash disk Pioneers Ltd. | | 1,034,338 | |
20,290 | | @ | | Sandisk Corp. | | 1,274,618 | |
64,800 | | @,X | | Seagate Technology, Inc. | | 1 | |
550,810 | | @,L | | Sun Microsystems, Inc. | | 2,307,894 | |
| | | | | | 8,803,115 | |
| | | | Cosmetics/Personal Care: 1.0% | | | |
57,850 | | L | | Estee Lauder Cos., Inc. | | 1,936,818 | |
| | | | | | 1,936,818 | |
| | | | Distribution/Wholesale: 1.5% | | | |
49,730 | | L | | CDW Corp. | | 2,862,956 | |
| | | | | | 2,862,956 | |
| | | | Diversified Financial Services: 5.2% | | | |
12,070 | | @,L | | Affiliated Managers Group | | $ | 968,618 | |
38,320 | | | | American Express Co. | | 1,971,947 | |
10,170 | | | | Franklin Resources, Inc. | | 956,082 | |
103,430 | | | | JPMorgan Chase & Co. | | 4,105,137 | |
37,670 | | L | | SLM Corp. | | 2,075,240 | |
| | | | | | 10,077,024 | |
| | | | Electric: 2.2% | | | |
35,040 | | @ | | Allegheny Energy, Inc. | | 1,109,016 | |
13,070 | | | | Dominion Resources, Inc. | | 1,009,004 | |
18,970 | | | | Exelon Corp. | | 1,008,066 | |
22,630 | | @,L | | NRG Energy, Inc. | | 1,066,326 | |
| | | | | | 4,192,412 | |
| | | | Food: 0.5% | | | |
3,325 | | @@ | | Nestle SA | | 990,035 | |
| | | | | | 990,035 | |
| | | | Healthcare-Products: 6.3% | | | |
45,520 | | @ | | Advanced Medical Optics, Inc. | | 1,902,736 | |
20,280 | | @ | | Gen-Probe, Inc. | | 989,461 | |
81,380 | | | | Johnson & Johnson | | 4,890,938 | |
35,500 | | | | Medtronic, Inc. | | 2,043,735 | |
23,920 | | | | St. Jude Medical, Inc. | | 1,200,784 | |
15,530 | | @ | | Zimmer Holdings, Inc. | | 1,047,343 | |
| | | | | | 12,074,997 | |
| | | | Healthcare-Services: 1.0% | | | |
255,110 | | @,L | | Tenet Healthcare Corp. | | 1,954,143 | |
| | | | | | 1,954,143 | |
| | | | Home Furnishings: 0.6% | | | |
11,610 | | | | Harman International Industries, Inc. | | 1,136,038 | |
| | | | | | 1,136,038 | |
| | | | Insurance: 4.7% | | | |
17,980 | | @@ | | ACE Ltd | | 960,851 | |
29,410 | | | | American International Group, Inc. | | 2,006,644 | |
650 | | @ | | Berkshire Hathaway, Inc. | | 1,908,075 | |
94,480 | | @,L | | Conseco, Inc. | | 2,189,102 | |
42,840 | | | | St. Paul Cos. | | 1,913,663 | |
| | | | | | 8,978,335 | |
| | | | Internet: 2.5% | | | |
223,966 | | @,L | | Symantec Corp. | | 3,919,405 | |
25,170 | | @,L | | Yahoo!, Inc. | | 986,161 | |
| | | | | | 4,905,566 | |
| | | | Leisure Time: 0.6% | | | |
21,980 | | L | | Carnival Corp. | | 1,175,271 | |
| | | | | | 1,175,271 | |
| | | | Machinery-Construction &
Mining: 1.0% | | | |
33,820 | | | | Caterpillar, Inc. | | 1,953,781 | |
| | | | | | 1,953,781 | |
See Accompanying Notes to Financial Statements
169
ING MFS | PORTFOLIO OF INVESTMENTS |
CAPITAL OPPORTUNITIES PORTFOLIO | AS OF DECEMBER 31, 2005(CONTINUED) |
Shares | | | | | | Value | |
| | | | Media: 2.9% | | | |
10,170 | | @@ | | Grupo Televisa SA ADR | | $ | 818,685 | |
59,101 | | | | Viacom, Inc. | | 1,926,693 | |
119,900 | | | | Walt Disney Co. | | 2,874,003 | |
| | | | | | 5,619,381 | |
| | | | Mining: 1.5% | | | |
61,030 | | @@ | | BHP Billiton Ltd. ADR | | 2,039,623 | |
22,190 | | @@ | | Cia Vale do Rio Doce ADR | | 912,897 | |
| | | | | | 2,952,520 | |
| | | | Miscellaneous Manufacturing: 3.1% | | | |
25,160 | | | | 3M Co. | | 1,949,900 | |
136,144 | | @@,L | | Tyco International Ltd. | | 3,929,116 | |
| | | | | | 5,879,016 | |
| | | | Oil & Gas: 4.9% | | | |
11,850 | | | | Amerada Hess Corp. | | 1,502,817 | |
39,930 | | | | Devon Energy Corp. | | 2,497,222 | |
50,627 | | @,L | | Global Santa Fe Corp. | | 2,437,690 | |
41,120 | | @,L | | Noble Corp. | | 2,900,605 | |
| | | | | | 9,338,334 | |
| | | | Oil & Gas Services: 1.1% | | | |
28,760 | | | | BJ Services Co. | | 1,054,629 | |
15,990 | | @,L | | National-Oilwell, Inc. | | 1,002,573 | |
| | | | | | 2,057,202 | |
| | | | Packaging & Containers: 2.1% | | | |
191,210 | | @ | | Owens-Illinois, Inc. | | 4,023,058 | |
| | | | | | 4,023,058 | |
| | | | Pharmaceuticals: 8.6% | | | |
53,010 | | | | Abbott Laboratories | | 2,090,184 | |
58,070 | | L | | Eli Lilly & Co. | | 3,286,181 | |
37,650 | | @ | | Gilead Sciences, Inc. | | 1,981,519 | |
13,120 | | @@ | | Roche Holding AG | | 1,961,394 | |
158,380 | | | | Wyeth | | 7,296,567 | |
| | | | | | 16,615,845 | |
| | | | Retail: 7.5% | | | |
39,880 | | @,L | | Aeropostale, Inc. | | 1,048,844 | |
73,040 | | @,L | | Carmax, Inc. | | 2,021,747 | |
33,160 | | | | CVS Corp. | | 876,087 | |
80,650 | | | | Family Dollar Stores, Inc. | | 1,999,313 | |
42,870 | | @ | | Kohl’s Corp. | | 2,083,482 | |
82,430 | | L | | Petsmart, Inc. | | 2,115,154 | |
40,780 | | | | Staples, Inc. | | 926,114 | |
72,730 | | | | Wal-Mart Stores, Inc. | | 3,403,764 | |
| | | | | | 14,474,505 | |
| | | | Semiconductors: 3.3% | | | |
110,490 | | | | Intel Corp. | | 2,757,830 | |
7,420 | | @@,# | | Samsung Electronics Co., Ltd. GDR | | 2,418,648 | |
44,680 | | | | Xilinx, Inc. | | 1,126,383 | |
| | | | | | 6,302,861 | |
| | | | Software: 3.9% | | | |
34,730 | | @,L | | Electronic Arts, Inc. | | 1,816,726 | |
73,450 | | | | Microsoft Corp. | | 1,920,717 | |
310,350 | | @ | | Oracle Corp. | | 3,789,373 | |
| | | | | | 7,526,816 | |
| | | | Telecommunications: 6.9% | | | |
75,250 | | @,@@ | | Amdocs Ltd. | | $ | 2,069,375 | |
11,860 | | @@ | | America Movil SA de CV ADR | | 347,024 | |
281,930 | | @ | | Cisco Systems, Inc. | | 4,826,642 | |
113,330 | | @@,L | | Nokia OYJ ADR | | 2,073,939 | |
1,275,920 | | @,@@ | | Nortel Networks Corp. | | 3,904,315 | |
| | | | | | 13,221,295 | |
| | | | Transportation: 1.1% | | | |
20,250 | | | | FedEx Corp. | | 2,093,647 | |
| | | | | | 2,093,647 | |
| | | | Total Common Stock
(Cost $173,542,878) | | 184,209,384 | |
| | | | | | | | | |
Principal
Amount | | | | Value | |
| | | | | |
SHORT-TERM INVESTMENTS: 21.4% | | | |
| | Securities Lending Collateralcc 21.4% | | | |
$ | 41,108,000 | | The Bank of New York | | | | | |
| | Institutional Cash | | | | | |
| | Reserves Fund | | | | 41,108,000 | |
| | Total Securities Lending Collateral
(Cost $41,108,000) | | | | 41,108,000 | |
| | Total Short-Term Investments
(Cost $41,108,000) | | | | 41,108,000 | |
| | Total Investments in Securities
(Cost $214,650,878)* | | 117.1 | % | $ | 225,317,384 | |
| | Other Assets and
Liabilities-Net | | (17.1 | ) | (32,840,811 | ) |
| | Net Assets | | 100.0 | % | $ | 192,476,573 | |
| | | | | | | | | | | |
| Certain foreign securities have been fair valued in accordance with procedures approved by the Board of Trustees (Note 2A). |
@ | Non-income producing security |
@@ | Foreign Issuer |
ADR | American Depositary Receipt |
GDR | Global Depositary Receipt |
# | Securities with purchases pursuant to Rule 144A, under the Securities Act of 1933 and may not be resold subject to that rule except to qualified institutional buyers. These securities have been determined to be liquid under the guidelines established by the Funds’ Board of Directors/Trustees. |
cc | Securities purchased with cash collateral for securities loaned. |
L | Loaned security, a portion or all of the security is on loan at December 31, 2005. |
X | Fair value determined by ING Funds Valuation Committee appointed by the Funds’ Board of Directors/Trustees. |
* | Cost for federal income tax purposes is $216,754,433. Net unrealized appreciation consists of: |
| Gross Unrealized Appreciation | | $ | 12,780,437 | |
| Gross Unrealized Depreciation | | (4,217,486 | ) |
| Net Unrealized Appreciation | | $ | 8,562,951 | |
| | | | | | |
See Accompanying Notes to Financial Statements
170
| PORTFOLIO OF INVESTMENTS |
Ing OPCAP BALANCED VALUE PORTFOLIO | AS OF DECEMBER 31, 2005 |
Shares | | | | | | Value | |
COMMON STOCK: 75.2% | | | |
| | | | Biotechnology: 3.5% | | | |
99,000 | | @,L | | Biogen Idec, Inc. | | $ | 4,487,670 | |
| | | | | | 4,487,670 | |
| | | | Commercial Services: 4.1% | | | |
53,800 | | @,L | | Apollo Group, Inc. | | 3,252,748 | |
44,100 | | @ | | ChoicePoint, Inc. | | 1,962,891 | |
| | | | | | 5,215,639 | |
| | | | Computers: 1.4% | | | |
108,200 | | @,L | | Cadence Design Systems, Inc. | | 1,830,744 | |
| | | | | | 1,830,744 | |
| | | | Diversified Financial Services: 13.1% | | | |
45,000 | | L | | Capital One Financial Corp. | | 3,888,000 | |
126,600 | | | | Citigroup, Inc. | | 6,143,898 | |
143,900 | | | | Countrywide Financial Corp. | | 4,919,941 | |
45,700 | | | | JPMorgan Chase & Co. | | 1,813,833 | |
| | | | | | 16,765,672 | |
| | | | Healthcare-Products: 0.8% | | | |
40,600 | | @ | | Boston Scientific Corp. | | 994,294 | |
| | | | | | 994,294 | |
| | | | Insurance: 9.3% | | | |
45,700 | | | | AMBAC Financial Group, Inc. | | 3,521,642 | |
54,100 | | | | American International Group, Inc. | | 3,691,243 | |
54,400 | | | | Hartford Financial Services Group, Inc. | | 4,672,416 | |
| | | | | | 11,885,301 | |
| | | | Internet: 3.5% | | | |
45,000 | | @,L | | Amazon.com, Inc. | | 2,121,750 | |
85,800 | | @,L | | McAfee, Inc. | | 2,327,754 | |
| | | | | | 4,449,504 | |
| | | | Leisure Time: 4.6% | | | |
131,500 | | @,L | | Royal Caribbean Cruises Ltd. | | 5,925,390 | |
| | | | | | 5,925,390 | |
| | | | Mining: 1.9% | | | |
54,700 | | @@,L | | Inco Ltd. | | 2,383,279 | |
| | | | | | 2,383,279 | |
| | | | Miscellaneous Manufacturing: 3.3% | | | |
63,100 | | | | Eaton Corp. | | 4,233,379 | |
| | | | | | 4,233,379 | |
| | | | Oil & Gas: 5.4% | | | |
64,600 | | | | ConocoPhillips | | 3,758,428 | |
72,500 | | | | XTO Energy, Inc. | | 3,185,650 | |
| | | | | | 6,944,078 | |
| | | | Pharmaceuticals: 9.4% | | | |
63,000 | | @ | | Forest Laboratories, Inc. | | 2,562,840 | |
269,500 | | | | Pfizer, Inc. | | 6,284,740 | |
72,500 | | @@ | | Sanofi-Synthelabo SA ADR | | 3,182,750 | |
| | | | | | 12,030,330 | |
| | | | Retail: 5.7% | | | |
54,200 | | | | Best Buy Co., Inc. | | $ | 2,356,616 | |
72,400 | | | | Family Dollar Stores, Inc. | | 1,794,796 | |
62,900 | | @ | | Kohl’s Corp. | | 3,056,940 | |
| | | | | | 7,208,352 | |
| | | | Semiconductors: 2.9% | | | |
377,200 | | @@ | | Taiwan Semiconductor Manufacturing Co., Ltd. ADR | | 3,738,052 | |
| | | | | | 3,738,052 | |
| | | | Telecommunications: 6.3% | | | |
269,700 | | @ | | Cisco Systems, Inc. | | 4,617,264 | |
153,100 | | | | Motorola, Inc. | | 3,458,529 | |
| | | | | | 8,075,793 | |
| | | | Total Common Stock
(Cost $88,161,633) | | 96,167,477 | |
Principal
Amount | | | | | | Value | |
| | | | | | | |
CORPORATE BONDS/NOTES: 27.2% | | | |
| | | | Aerospace/Defense: 2.0% | | | |
$ | 830,000 | | C | | General Dynamics Corp.,
2.125%, due 05/15/06 | | 822,684 | |
890,000 | | | | Northrop Grumman Corp.,
4.079%, due 11/16/06 | | 883,311 | |
885,000 | | C | | Raytheon Co., 6.750%,
due 08/15/07 | | 907,000 | |
| | | | | | 2,612,995 | |
| | | | Auto Manufacturers: 0.5% | | | |
670,000 | | | | DaimlerChrysler NA Holding
Corp., 6.400%, due 05/15/06 | | 673,383 | |
| | | | | | 673,383 | |
| | | | Banks: 1.8% | | | |
810,000 | | | | Keycorp, 2.750%, due 02/27/07 | | 787,176 | |
760,000 | | | | US Bank National Association,
2.850%, due 11/15/06 | | 747,615 | |
725,000 | | | | Wachovia Corp., 4.950%,
due 11/01/06 | | 725,201 | |
| | | | | | 2,259,992 | |
| | | | Commercial Services: 0.3% | | | |
360,000 | | L | | Cendant Corp., 6.875%,
due 08/15/06 | | 363,749 | |
| | | | | | 363,749 | |
| | | | Cosmetics/Personal Care: 0.6% | | | |
805,000 | | C,L | | Procter & Gamble Co., 3.500%,
due 12/15/08 | | 777,877 | |
| | | | | | 777,877 | |
| | | | Diversified Financial
Services: 8.7% | | | |
835,000 | | | | American Express Co., 5.500%,
due 09/12/06 | | 839,078 | |
360,000 | | | | American Express Credit Corp.,
3.000%, due 05/16/08 | | 345,203 | |
720,000 | | | | Bear Stearns Cos., Inc., 7.800%, due 08/15/07 | | 752,342 | |
| | | | | | | | |
See Accompanying Notes to Financial Statements
171
| PORTFOLIO OF INVESTMENTS |
Ing OPCAP BALANCED VALUE PORTFOLIO | AS OF DECEMBER 31, 2005 (CONTINUED) |
Principal
Amount | | | | | | Value | |
| | | | Diversified Financial Services (continued) | | | |
$ | 200,000 | | C,L | | Boeing Capital Corp., 6.500%,
due 02/15/12 | | $ | 216,158 | |
200,000 | | L | | CIT Group, Inc., 7.750%,
due 04/02/12 | | 227,111 | |
530,000 | | L | | Citigroup, Inc., 5.000%,
due 03/06/07 | | 530,928 | |
300,000 | | | | Citigroup, Inc., 6.000%,
due 02/21/12 | | 315,266 | |
960,000 | | C,L | | Credit Suisse First Boston USA,
Inc., 5.750%, due 04/15/07 | | 970,303 | |
460,000 | | | | Ford Motor Credit Co., 6.125%,
due 01/09/06 | | 459,922 | |
450,000 | | | | General Electric Capital Corp.,
4.875%, due 10/21/10 | | 449,478 | |
400,000 | | | | General Electric Capital Corp.,
6.000%, due 06/15/12 | | 421,839 | |
665,000 | | L | | General Motors Acceptance
Corp., 6.750%, due 01/15/06 | | 664,718 | |
500,000 | | | | Goldman Sachs Group, Inc.,
5.700%, due 09/01/12 | | 515,048 | |
400,000 | | | | Household Finance Corp.,
7.000%, due 05/15/12 | | 438,114 | |
860,000 | | | | International Lease Finance
Corp., 5.625%, due 06/01/07 | | 867,522 | |
720,000 | | L | | John Deere Capital Corp.,
3.875%, due 03/07/07 | | 712,603 | |
930,000 | | | | JPMorgan Chase & Co., 5.250%,
due 05/30/07 | | 934,527 | |
840,000 | | | | Merrill Lynch & Co., Inc., 3.700%,
due 04/21/08 | | 818,840 | |
600,000 | | L | | SLM Corp., 4.500%, due 07/26/10 | | 588,010 | |
| | | | | | 11,067,010 | |
| | | | Electric: 0.6% | | | |
775,000 | | + | | Dominion Resources, Inc.,
3.660%, due 11/15/06 | | 766,063 | |
| | | | | | 766,063 | |
| | | | Environmental Control: 0.1% | | | |
125,000 | | C | | Waste Management, Inc.,
6.500%, due 11/15/08 | | 129,705 | |
| | | | | | 129,705 | |
| | | | Food: 3.1% | | | |
860,000 | | | | General Mills, Inc., 2.625%,
due 10/24/06 | | 842,306 | |
820,000 | | C | | Kellogg Co., 2.875%,
due 06/01/08 | | 781,715 | |
840,000 | | | | Kraft Foods, Inc., 4.625%,
due 11/01/06 | | 837,528 | |
720,000 | | C | | Safeway, Inc., 4.800%,
due 07/16/07 | | 717,133 | |
810,000 | | C | | Tyson Foods, Inc., 7.250%,
due 10/01/06 | | 823,118 | |
| | | | | | 4,001,800 | |
| | | | Insurance: 0.6% | | | |
790,000 | | C | | Berkshire Hathaway, Inc.,
3.375%, due 10/15/08 | | 761,686 | |
| | | | | | 761,686 | |
| | | | Media: 1.6% | | | |
$ | 500,000 | | | | Historic TW, Inc., 8.110%,
due 08/15/06 | | $ | 508,703 | |
100,000 | | | | News America Holdings, 9.250%,
due 02/01/13 | | 121,616 | |
690,000 | | | | Viacom, Inc., 6.400%,
due 01/30/06 | | 690,855 | |
755,000 | | | | Walt Disney Co., 5.375%,
due 06/01/07 | | 760,021 | |
| | | | | | 2,081,195 | |
| | | | Mining: 0.7% | | | |
880,000 | | C | | Alcoa, Inc., 4.250%, due 08/15/07 | | 871,636 | |
| | | | | | 871,636 | |
| | | | Miscellaneous
Manufacturing: 0.5% | | | |
660,000 | | @@ | | Tyco International Group SA,
5.800%, due 08/01/06 | | 662,855 | |
| | | | | | 662,855 | |
| | | | Oil & Gas: 1.8% | | | |
920,000 | | @@,C,L | | ChevronTexaco Capital Co.,
3.500%, due 09/17/07 | | 901,624 | |
820,000 | | C | | Marathon Oil Corp., 5.375%,
due 06/01/07 | | 824,649 | |
530,000 | | C | | Valero Energy Corp., 6.125%,
due 04/15/07 | | 536,700 | |
| | | | | | 2,262,973 | |
| | | | Pipelines: 0.6% | | | |
800,000 | | | | Duke Capital LLC, 4.302%,
due 05/18/06 | | 798,169 | |
| | | | | | 798,169 | |
| | | | Retail: 0.6% | | | |
780,000 | | C,L | | CVS Corp., 3.875%, due 11/01/07 | | 765,454 | |
| | | | | | 765,454 | |
| | | | Savings & Loans: 0.5% | | | |
650,000 | | | | World Savings Bank FSB, 4.125%,
due 03/10/08 | | 639,203 | |
| | | | | | 639,203 | |
| | | | Telecommunications: 1.9% | | | |
520,000 | | C | | AT&T Wireless Services, Inc.,
7.350%, due 03/01/06 | | 522,174 | |
880,000 | | | | Motorola, Inc., 4.608%,
due 11/16/07 | | 874,889 | |
740,000 | | C | | SBC Communications, Inc.,
5.750%, due 05/02/06 | | 741,931 | |
200,000 | | C,L | | Verizon Global Funding Corp.,
7.375%, due 09/01/12 | | 223,345 | |
| | | | | | 2,362,339 | |
| | | | Transportation: 0.7% | | | |
900,000 | | | | FedEx Corp., 2.650%,
due 04/01/07 | | 875,707 | |
| | | | | | 875,707 | |
| | | | Total Corporate Bonds/Notes
(Cost $35,129,942) | | 34,733,791 | |
| | | | Total Long-Term Investments:
(Cost $123,291,575) | | 130,901,268 | |
See Accompanying Notes to Financial Statements
172
| PORTFOLIO OF INVESTMENTS |
ING OPCAP BALANCED VALUE PORTFOLIO | AS OF DECEMBER 31, 2005 (CONTINUED) |
Principal
Amount | | | | Value | |
SHORT-TERM INVESTMENTS: 17.4% | | | |
| | Federal Home Loan Bank: 0.9% | | | |
$ | 1,180,000 | | Discount Note, 3.200%,
due 01/03/06 | | $ | 1,179,685 | |
| | Total Federal Home Loan Bank
(Cost $1,179,790) | | 1,179,685 | |
| | Securities Lending Collateralcc 16.5% | | | |
21,130,000 | | The Bank of New York
Institutional Cash
Reserves Fund | | 21,130,000 | |
| | Total Securities Lending Collateral
(Cost $21,130,000) | | 21,130,000 | |
| | Total Short-Term Investments:
(Cost $22,309,790) | | 22,309,685 | |
| | Total Investments in Securities
(Cost $145,601,365)* | 119.8 | % | | $ | 153,210,953 | |
| | Other Assets and
Liabilities-Net | (19.8 | ) | | (25,273,939 | ) |
| | Net Assets | 100.0 | % | | $ | 127,937,014 | |
| | | | | | | | | |
@ Non-income producing security
@@ Foreign Issuer
ADR American Depositary Receipt
+ Step-up basis bonds. Interest rates shown reflect current coupon rates.
# Securities with purchases pursuant to Rule 144A, under the Securities Act of 1933 and may not be resold subject to that rule except to qualified institutional buyers. These securities have been determined to be liquid under the guidelines established by the Funds’ Board of Directors/Trustees.
C Bond may be called prior to maturity date.
cc Securities purchased with cash collateral for securities loaned.
L Loaned security, a portion or all of the security is on loan at December 31, 2005.
* Cost for federal income tax purposes is $145,683,623. Net unrealized appreciation consists of:
| | Gross Unrealized Appreciation | | $ | 10,054,554 | |
| | Gross Unrealized Depreciation | | (2,527,224 | ) |
| | Net Unrealized Appreciation | | $ | 7,527,330 | |
See Accompanying Notes to Financial Statements
173
| PORTFOLIO OF INVESTMENTS |
ING OPPENHEIMER GLOBAL PORTFOLIO | AS OF DECEMBER 31, 2005 |
Shares | | | | | | Value | |
COMMON STOCK: 98.6% | | | |
| | | | Australia: 0.5% | | | |
320,121 | | | | Australia & New Zealand Banking Group Ltd. | | $ | 5,605,693 | |
3,057,711 | | | | Macquarie Airports | | 7,079,793 | |
| | | | | | 12,685,486 | |
| | | | Barbados: 0.3% | | | |
83,400 | | L | | Everest Re Group Ltd. | | 8,369,190 | |
| | | | | | 8,369,190 | |
| | | | Bermuda: 1.1% | | | |
304,200 | | | | ACE Ltd | | 16,256,448 | |
142,900 | | L | | XL Capital Ltd | | 9,628,602 | |
| | | | | | 25,885,050 | |
| | | | Brazil: 1.6% | | | |
371,900 | | L | | Cia de Bebidas das Americas ADR | | 14,150,795 | |
629,300 | | L | | Empresa Brasileira de Aeronautica SA ADR | | 24,605,630 | |
| | | | | | 38,756,425 | |
| | | | Canada: 1.8% | | | |
608,900 | | L | | Husky Energy, Inc. | | 30,753,842 | |
219,700 | | | | Manulife Financial Corp. | | 12,839,891 | |
| | | | | | 43,593,733 | |
| | | | Denmark: 0.3% | | | |
108,900 | | | | Novo-Nordisk A/S | | 6,105,677 | |
| | | | | | 6,105,677 | |
| | | | Finland: 0.5% | | | |
589,000 | | | | Fortum OYJ | | 11,003,529 | |
35,975 | | @ | | Neste Oil Oyj | | 1,013,394 | |
| | | | | | 12,016,923 | |
| | | | France: 5.8% | | | |
42,724 | | # | | Cie Generale D’Optique Essilor International SA | | 3,434,307 | |
324,437 | | @ | | JC Decaux SA | | 7,533,625 | |
317,138 | | | | LVMH Moet Hennessy Louis Vuitton SA | | 28,050,587 | |
454,419 | | | | Sanofi-Synthelabo SA | | 39,637,185 | |
186,844 | | | | Societe Generale | | 22,877,513 | |
459,004 | | | | Technip SA | | 27,643,555 | |
43,511 | | | | Total SA | | 10,932,074 | |
| | | | | | 140,108,846 | |
| | | | Germany: 3.8% | | | |
179,558 | | | | Allianz AG | | 27,062,965 | |
317,954 | | | | Bayerische Motoren Werke AG | | 13,827,400 | |
136,518 | | | | SAP AG | | 24,511,470 | |
307,160 | | L | | Siemens AG | | 26,184,262 | |
| | | | | | 91,586,097 | |
| | | | Hong Kong: 1.3% | | | |
5,265,000 | | | | Hong Kong & China Gas | | 11,230,140 | |
939,000 | | | | Hutchison Whampoa International Ltd. | | 8,919,909 | |
1,954,000 | | | | Television Broadcasts Ltd. | | 10,376,255 | |
| | | | | | 30,526,304 | |
| | | | India: 2.9% | | | |
3,762,784 | | | | Hindustan Lever Ltd. | | $ | 16,450,846 | |
336,700 | | L | | ICICI Bank Ltd. ADR | | 9,696,960 | |
466,307 | | | | Infosys Technologies Ltd. | | 31,037,693 | |
3,638,776 | | | | Zee Telefilms | | 12,698,952 | |
| | | | | | 69,884,451 | |
| | | | Ireland: 0.4% | | | |
676,917 | | | | Anglo Irish Bank Corp. PLC | | 10,207,861 | |
| | | | | | 10,207,861 | |
| | | | Japan: 11.5% | | | |
136,900 | | L | | Canon, Inc. | | 8,029,580 | |
493,800 | | L | | Chugai Pharmaceutical Co., Ltd. | | 10,616,160 | |
314,400 | | | | Credit Saison Co., Ltd. | | 15,657,416 | |
82,400 | | | | Fanuc Ltd | | 6,993,470 | |
441,600 | | | | Hoya Corp. | | 15,859,990 | |
330,000 | | | | JGC Corp. | | 6,280,385 | |
337,000 | | | | Kao Corp. | | 9,017,966 | |
4,953 | | | | KDDI Corp. | | 28,650,615 | |
44,500 | | | | Keyence Corp. | | 12,644,929 | |
327,800 | | | | Murata Manufacturing Co. Ltd | | 21,031,785 | |
108,800 | | | | Nidec Corp. | | 9,248,636 | |
71,000 | | | | Nintendo Co., Ltd. | | 8,590,226 | |
4,025 | | @ | | Resona Holdings, Inc. | | 16,194,636 | |
1,243,000 | | | | Shionogi & Co., Ltd. | | 17,461,131 | |
651,000 | | | | Shiseido Co., Ltd. | | 12,102,197 | |
743,400 | | L | | Sony Corp. | | 30,315,543 | |
338,300 | | L | | Square Enix Co., Ltd. | | 9,501,279 | |
168,300 | | | | Takeda Chemical Industries Ltd. | | 9,111,813 | |
438,600 | | | | Toyota Motor Corp. | | 22,895,821 | |
4,314 | | L | | Yahoo! Japan Corp. | | 6,538,656 | |
| | | | | | 276,742,234 | |
| | | | Mexico: 1.9% | | | |
1,874,000 | | | | Fomento Economico Mexicano SA de CV | | 13,564,838 | |
2,571,300 | | | | Grupo Modelo SA | | 9,306,101 | |
284,900 | | | | Grupo Televisa SA ADR | | 22,934,450 | |
| | | | | | 45,805,389 | |
| | | | Netherlands: 2.3% | | | |
688,973 | | | | European Aeronautic Defense and Space Co. | | 25,886,945 | |
980,177 | | | | Koninklijke Philips Electronics NV | | 30,330,367 | |
| | | | | | 56,217,312 | |
| | | | Norway: 0.2% | | | |
919,900 | | L | | Tandberg ASA | | 5,601,877 | |
| | | | | | 5,601,877 | |
| | | | Portugal: 0.3% | | | |
2,324,954 | | | | Electricidade de Portugal SA | | 7,131,527 | |
| | | | | | 7,131,527 | |
| | | | Singapore: 0.4% | | | |
3,864,800 | | | | Singapore Press Holdings Ltd. | | 9,976,834 | |
| | | | | | 9,976,834 | |
See Accompanying Notes to Financial Statements
174
ING OPPENHEIMER GLOBAL PORTFOLIO | PORTFOLIO OF INVESTMENTS
AS OF december 31, 2005 (CONTINUED) |
Shares | | | | | | Value | |
| | | | South Korea: 2.6% | | | |
180,680 | | @ | | Hyundai Heavy Industries | | $ | 13,610,283 | |
41,600 | | | | Samsung Electronics Co., Ltd. | | 26,763,731 | |
1,038,100 | | L | | SK Telecom Co., Ltd. ADR | | 21,063,049 | |
| | | | | | 61,437,063 | |
| | | | Spain: 0.7% | | | |
506,200 | | | | Inditex SA | | 16,476,665 | |
| | | | | | 16,476,665 | |
| | | | Sweden: 4.7% | | | |
1,125,400 | | | | Hennes & Mauritz AB | | 38,164,887 | |
517,796 | | | | Investor AB | | 9,044,040 | |
18,967,400 | | | | Telefonaktiebolaget LM Ericsson | | 65,236,059 | |
| | | | | | 112,444,986 | |
| | | | Switzerland: 3.1% | | | |
519,632 | | | | Credit Suisse Group | | 26,391,169 | |
265,671 | | | | Novartis AG | | 13,893,215 | |
204,218 | | | | Roche Holding AG | | 30,529,873 | |
36,726 | | @ | | Syngenta AG, 0.000%, due 11/30/00 | | 4,557,818 | |
| | | | | | 75,372,075 | |
| | | | Taiwan: 0.7% | | | |
8,531,823 | | | | Taiwan Semiconductor Manufacturing Co., Ltd. | | 16,247,993 | |
| | | | | | 16,247,993 | |
| | | | United Kingdom: 12.4% | | | |
745,734 | | | | 3i Group PLC | | 10,835,720 | |
335,500 | | L | | BP PLC ADR | | 21,545,810 | |
1,019,128 | | | | Burberry Group PLC | | 7,504,404 | |
2,665,000 | | | | Cadbury Schweppes PLC | | 25,125,770 | |
81,850 | | | | Diageo PLC | | 1,180,278 | |
451,904 | | | | GUS PLC | | 8,008,856 | |
1,445,232 | | | | HSBC Holdings PLC | | 23,202,621 | |
1,111,523 | | | | Pearson PLC | | 13,116,109 | |
1,971,979 | | | | Prudential PLC | | 18,637,764 | |
1,329,956 | | | | Reckitt Benckiser PLC | | 43,763,887 | |
1,201,822 | | | | Royal Bank of Scotland Group PLC | | 36,188,778 | |
1,739,474 | | | | Smith & Nephew PLC | | 15,966,546 | |
1,318,760 | | | | Tesco PLC | | 7,500,540 | |
27,637,443 | | | | Vodafone Group PLC | | 59,344,711 | |
725,558 | | | | WPP Group PLC | | 7,832,492 | |
| | | | | | 299,754,286 | |
| | | | United States: 37.5% | | | |
246,600 | | | | 3M Co. | | 19,111,500 | |
412,200 | | L | | Adobe Systems, Inc. | | 15,234,912 | |
1,539,700 | | @,L | | Advanced Micro Devices, Inc. | | 47,114,820 | |
253,500 | | @,L | | Affymetrix, Inc. | | 12,104,625 | |
578,700 | | @,L | | Altera Corp. | | 10,723,311 | |
85,800 | | L | | Altria Group, Inc. | | 6,410,976 | |
183,300 | | @,L | | Amazon.com, Inc. | | 8,642,595 | |
385,300 | | | | American Express Co. | | 19,827,538 | |
299,100 | | @ | | Amgen, Inc. | | 23,587,026 | |
103,700 | | @,L | | Amylin Pharmaceuticals, Inc. | | 4,139,704 | |
215,900 | | L | | Avon Products, Inc. | | 6,163,945 | |
4,780 | | @ | | Berkshire Hathaway, Inc. | | 14,031,690 | |
244,000 | | L | | Biomet, Inc. | | 8,923,080 | |
219,600 | | | | Boeing Co. | | 15,424,704 | |
498,200 | | @ | | Boston Scientific Corp. | | 12,200,918 | |
285,400 | | | | Burlington Resources, Inc. | | 24,601,480 | |
450,900 | | @,L | | Cadence Design Systems, Inc. | | $ | 7,629,228 | |
409,700 | | L | | Carnival Corp. | | 21,906,659 | |
271,500 | | | | ChevronTexaco Corp. | | 15,413,055 | |
735,100 | | @ | | Cisco Systems, Inc. | | 12,584,912 | |
133,500 | | | | Citigroup, Inc. | | 6,478,755 | |
387,000 | | @ | | Coach, Inc. | | 12,902,580 | |
1,478,400 | | @ | | Corning, Inc. | | 29,065,344 | |
450,500 | | @,L | | Cree, Inc. | | 11,370,620 | |
752,600 | | @ | | eBay, Inc. | | 32,549,950 | |
208,100 | | | | Emerson Electric Co. | | 15,545,070 | |
184,900 | | @,L | | Express Scripts, Inc. | | 15,494,620 | |
345,200 | | | | Gap, Inc. | | 6,089,328 | |
147,100 | | @,L | | Genentech, Inc. | | 13,606,750 | |
354,200 | | @ | | Gilead Sciences, Inc. | | 18,641,546 | |
490,900 | | @,L | | Global Santa Fe Corp. | | 23,636,835 | |
152,300 | | @,L | | ImClone Systems, Inc. | | 5,214,752 | |
222,300 | | | | International Business Machines Corp. | | 18,273,060 | |
497,600 | | | | International Game Technology | | 15,316,128 | |
334,300 | | @ | | International Rectifier Corp. | | 10,664,170 | |
360,600 | | @,L | | Intuit, Inc. | | 19,219,980 | |
503,700 | | | | JPMorgan Chase & Co. | | 19,991,853 | |
279,700 | | @,L | | Juniper Networks, Inc. | | 6,237,310 | |
178,500 | | L | | Lockheed Martin Corp. | | 11,357,955 | |
95,000 | | | | Medtronic, Inc. | | 5,469,150 | |
1,252,800 | | | | Microsoft Corp. | | 32,760,720 | |
459,600 | | | | Morgan Stanley | | 26,077,704 | |
170,700 | | @,L | | Nektar Therapeutics | | 2,809,722 | |
455,400 | | | | Northern Trust Corp. | | 23,598,828 | |
198,800 | | L | | Northrop Grumman Corp. | | 11,949,868 | |
1,774,700 | | @,L | | Novell, Inc. | | 15,670,601 | |
436,300 | | | | Pfizer, Inc. | | 10,174,516 | |
168,330 | | | | Procter & Gamble Co. | | 9,742,940 | |
454,400 | | | | Qualcomm, Inc. | | 19,575,552 | |
360,200 | | | | Quest Diagnostics | | 18,543,096 | |
379,900 | | | | Raytheon Co. | | 15,252,985 | |
106,000 | | @,L | | Silicon Laboratories, Inc. | | 3,885,960 | |
3,098,139 | | @,L | | Sirius Satellite Radio, Inc. | | 20,757,531 | |
382,200 | | @ | | Starbucks Corp. | | 11,469,822 | |
2,019,500 | | @,L | | Sun Microsystems, Inc. | | 8,461,705 | |
212,500 | | @ | | Theravance, Inc. | | 4,785,500 | |
161,100 | | | | Tiffany & Co. | | 6,168,519 | |
483,400 | | @,L | | Transocean, Inc. | | 33,688,146 | |
584,600 | | | | Walt Disney Co. | | 14,012,862 | |
240,900 | | | | Wyeth | | 11,098,260 | |
| | | | | | 903,387,271 | |
| | | | Total Common Stock
(Cost $2,057,066,983) | | 2,376,321,555 | |
PREFERRED STOCK: 1.0% | | | |
| | | | Brazil: 0.5% | | | |
711,200 | | | | Tele Norte Leste Participacoes SA | | 12,637,465 | |
| | | | | | 12,637,465 | |
| | | | Germany: 0.5% | | | |
15,097 | | | | Porsche AG | | 10,780,939 | |
| | | | | | 10,780,939 | |
| | | | | | | |
| | | | Total Preferred Stock
(Cost $20,171,168) | | 23,418,404 | |
| | | | Total Long-Term Investments:
(Cost $2,077,238,151) | | 2,399,739,959 | |
See Accompanying Notes to Financial Statements
175
ING OPPENHEIMER GLOBAL PORTFOLIO | PORTFOLIO OF INVESTMENTS
AS OF december 31, 2005 (CONTINUED) |
Principal
Amount | | | | | | Value | |
| | | | | | | |
SHORT-TERM INVESTMENTS: 13.3% | | | |
| | | | Federal Home Loan Bank: 0.0% | | | |
$ | 273,000 | | | | Discount Note, 3.200%, due 01/03/06 | | $ | 272,927 | |
| | | | Total Federal Home Loan Bank (Cost $272,951) | | 272,927 | |
| | | | Securities Lending Collateralcc 13.3% | | | |
321,186,000 | | | | The Bank of New York Institutional Cash Reserves Fund | | 321,186,000 | |
| | | | Total Securities Lending Collateral (Cost $321,186,000) | | 321,186,000 | |
| | | | Total Short-Term Investments: (Cost $321,458,951) | | 321,458,927 | |
| | | | Total Investments in Securities (Cost $2,398,697,102)* | 112.9 | % | $ | 2,721,198,886 | |
| | | | Other Assets and Liabilities-Net | (12.9 | ) | (311,656,188) | |
| | | | Net Assets | 100.0 | % | $ | 2,409,542,698 | |
| | | | | | | | | | |
| | Certain foreign securities have been fair valued in accordance with procedures approved by the Board of Trustees (Note 2A). |
@ | | Non-income producing security |
ADR | | American Depositary Receipt |
# | | Securities with purchases pursuant to Rule 144A, under the Securities Act of 1933 and may not be resold subject to that rule except to qualified institutional buyers. These securities have been determined to be liquid under the guidelines established by the Funds’ Board of Directors/Trustees. |
cc | | Securities purchased with cash collateral for securities loaned. |
L | | Loaned security, a portion or all of the security is on loan at December 31, 2005. |
* | | Cost for federal income tax purposes is $2,406,040,041. Net unrealized appreciation consists of: |
Gross Unrealized Appreciation | | $ | 356,968,903 | |
Gross Unrealized Depreciation | | (41,810,058 | ) |
Net Unrealized Appreciation | | $ | 315,158,845 | |
Telecommunications | | 10.8 | % |
Pharmaceuticals | | 8.2 | |
Banks | | 7.2 | |
Oil & Gas | | 6.7 | |
Software | | 6.1 | |
Semiconductors | | 5.3 | |
Insurance | | 4.4 | |
Aerospace/Defense | | 4.3 | |
Media | | 4.3 | |
Diversified Financial Services | | 3.7 | |
Electronics | | 3.6 | |
Retail | | 3.6 | |
Household Products/Wares | | 2.5 | |
Biotechnology | | 2.2 | |
Internet | | 2.0 | |
Auto Manufacturers | | 2.0 | |
Healthcare - Products | | 1.9 | |
Miscellaneous Manufacturing | | 1.9 | |
Beverages | | 1.6 | |
Cosmetics/Personal Care | | 1.5 | |
Holding Companies - Diversified | | 1.5 | |
Computers | | 1.4 | |
Food | | 1.4 | |
Home Furnishings | | 1.3 | |
Oil & Gas Services | | 1.1 | |
Leisure Time | | 0.9 | |
Apparel | | 0.8 | |
Healthcare - Services | | 0.8 | |
Electric | | 0.7 | |
Investment Companies | | 0.7 | |
Electrical Components & Equipment | | 0.6 | |
Advertising | | 0.6 | |
Entertainment | | 0.6 | |
Shipbuilding | | 0.6 | |
Gas | | 0.5 | |
Venture Capital | | 0.4 | |
Hand/Machine Tools | | 0.4 | |
Toys/Games/Hobbies | | 0.4 | |
Office/Business Equipment | | 0.3 | |
Agriculture | | 0.3 | |
Engineering & Construction | | 0.3 | |
Chemicals | | 0.2 | |
Federal Home Loan Bank | | 0.0 | |
Securities Lending Collateral | | 13.3 | |
Other Assets and Liabilities, Net | | (12.9 | ) |
Net Assets | | 100.0 | % |
See Accompanying Notes to Financial Statements
176
ING OPPENHEIMER
STRATEGIC INCOME PORTFOLIO | PORTFOLIO OF INVESTMENTS
AS OF december 31, 2005 |
Shares | | | | | | Value | |
COMMON STOCK: 2.3% | |
| | | | Advertising: 0.0% | | | |
3,040 | | @@ | | PagesJaunes SA | | $ | 78,833 | |
| | | | | | 78,833 | |
| | | | Aerospace/Defense: 0.0% | | | |
378,422 | | @@ | | Rolls-Royce Group PLC | | 666 | |
| | | | | | 666 | |
| | | | Agriculture: 0.0% | | | |
3,400 | | @@ | | British American Tobacco PLC | | 75,812 | |
| | | | | | 75,812 | |
| | | | Apparel: 0.0% | | | |
1,300 | | | | Reebok International Ltd. | | 75,699 | |
| | | | | | 75,699 | |
| | | | Auto Parts & Equipment: 0.0% | | | |
4,290 | | @,L | | Goodyear Tire & Rubber Co. | | 74,560 | |
| | | | | | 74,560 | |
| | | | Banks: 0.1% | | | |
940 | | @@ | | BNP Paribas | | 75,657 | |
9,100 | | @@ | | Lloyds TSB Group PLC | | 76,031 | |
620 | | @@ | | Societe Generale | | 75,914 | |
| | | | | | 227,602 | |
| | | | Building Materials: 0.1% | | | |
5,550 | | @@ | | BPB PLC | | 73,417 | |
7,220 | | @@ | | Hanson PLC | | 79,202 | |
28,810 | | @@ | | Pilkington PLC | | 73,582 | |
| | | | | | 226,201 | |
| | | | Chemicals: 0.1% | | | |
1,270 | | | | Ashland, Inc. | | 73,533 | |
1,370 | | L | | Eastman Chemical Co. | | 70,678 | |
17,000 | | @@ | | Tosoh Corp. | | 74,498 | |
| | | | | | 218,709 | |
| | | | Commercial Services: 0.0% | | | |
16,750 | | @@ | | Aggreko PLC | | 78,089 | |
| | | | | | 78,089 | |
| | | | Computers: 0.0% | | | |
1,000 | | @ | | Apple Computer, Inc. | | 71,890 | |
| | | | | | 71,890 | |
| | | | Diversified Financial Services: 0.1% | | | |
750 | | @@ | | Deutsche Boerse AG | | 76,304 | |
3,710 | | @,L | | E*Trade Financial Corp. | | 77,391 | |
600 | | | | Lehman Brothers Holdings, Inc. | | 76,902 | |
| | | | | | 230,597 | |
| | | | Electric: 0.1% | | | |
1,620 | | | | Edison International | | 70,648 | |
780 | | @@ | | EON AG | | 80,363 | |
2,600 | | @@ | | Suez SA | | 80,621 | |
| | | | | | 231,632 | |
| | | | Engineering & Construction: 0.0% | | | |
1,820 | | @@ | | Hochtief AG | | $ | 81,299 | |
| | | | | | 81,299 | |
| | | | Equity Fund: 0.3% | | | |
6,010 | | L | | Energy Select Sector SPDR Fund | | 302,363 | |
9,570 | | | | Financial Select Sector SPDR Fund | | 303,082 | |
9,740 | | | | Utilities Select Sector SPDR Fund | | 305,739 | |
| | | | | | 911,184 | |
| | | | Food: 0.0% | | | |
3,350 | | @@ | | Suedzucker AG | | 78,139 | |
| | | | | | 78,139 | |
| | | | Food Service: 0.0% | | | |
1,860 | | @@ | | Sodexho Alliance SA | | 76,319 | |
| | | | | | 76,319 | |
| | | | Forest Products & Paper: 0.0% | | | |
2,700 | | | | Louisiana-Pacific Corp. | | 74,169 | |
| | | | | | 74,169 | |
| | | | Healthcare - Services: 0.0% | | | |
1,300 | | @ | | Coventry Health Care, Inc. | | 74,048 | |
| | | | | | 74,048 | |
| | | | Home Builders: 0.2% | | | |
4,750 | | @@ | | Barratt Developments PLC | | 80,439 | |
970 | | L | | Centex Corp. | | 69,345 | |
2,000 | | | | DR Horton, Inc. | | 71,460 | |
1,000 | | L | | KB Home | | 72,660 | |
1,280 | | L | | Lennar Corp. | | 78,106 | |
3,890 | | @@ | | Persimmon PLC | | 83,873 | |
1,720 | | | | Pulte Homes, Inc. | | 67,699 | |
12,640 | | @@ | | Taylor Woodrow PLC | | 82,760 | |
| | | | | | 606,342 | |
| | | | Insurance: 0.2% | | | |
2,060 | | L | | AON Corp. | | 74,057 | |
6,260 | | @@ | | Aviva PLC | | 75,727 | |
2,470 | | @@ | | AXA | | 79,475 | |
6,700 | | @@ | | Britannic Group PLC | | 74,851 | |
780 | | | | Chubb Corp. | | 76,167 | |
660 | | | | Cigna Corp. | | 73,722 | |
22,530 | | @@ | | Friends Provident PLC | | 73,249 | |
810 | | L | | Hartford Financial Services Group, Inc. | | 69,571 | |
780 | | | | Loews Corp. | | 73,983 | |
980 | | | | Prudential Financial, Inc. | | 71,726 | |
3,300 | | L | | UnumProvident Corp. | | 75,075 | |
| | | | | | 817,603 | |
| | | | Internet: 0.0% | | | |
7,470 | | @@,L | | Matsui Securities Co., Ltd. | | 103,548 | |
| | | | | | 103,548 | |
| | | | Iron/Steel: 0.2% | | | |
2,160 | | L | | Allegheny Technologies, Inc. | | 77,933 | |
3,100 | | @@ | | Arcelor | | 76,489 | |
10,247 | | @@ | | Daido Steel Co., Ltd. | | 97,625 | |
See Accompanying Notes to Financial Statements
177
ING OPPENHEIMER
STRATEGIC INCOME PORTFOLIO | PORTFOLIO OF INVESTMENTS
AS OF december 31, 2005 (CONTINUED) |
Shares | | | | | | Value | |
| | | | Iron/Steel (continued) | | | |
21,848 | | @@ | | Nippon Steel Corp. | | $ | 77,434 | |
1,090 | | | | Nucor Corp. | | 72,725 | |
21,310 | | @@ | | Sumitomo Metal Industries Ltd. | | 81,569 | |
3,680 | | @@ | | ThyssenKrupp AG | | 76,404 | |
5,710 | | @@ | | Tokyo Steel Manufacturing Co., Ltd. | | 82,610 | |
1,520 | | L | | United States Steel Corp. | | 73,066 | |
| | | | | | 715,855 | |
| | | | Leisure Time: 0.0% | | | |
3,830 | | @@ | | TUI AG | | 77,728 | |
| | | | | | 77,728 | |
| | | | Machinery - Diversified: 0.1% | | | |
8,950 | | @@ | | Amada Co., Ltd. | | 78,771 | |
850 | | L | | Cummins, Inc. | | 76,271 | |
9,640 | | @@ | | Kubota Corp. | | 81,451 | |
1,490 | | @@ | | MAN AG | | 79,165 | |
| | | | | | 315,658 | |
| | | | Mining: 0.0% | | | |
490 | | | | Phelps Dodge Corp. | | 70,496 | |
| | | | | | 70,496 | |
| | | | Miscellaneous Manufacturing: 0.0% | | | |
5,000 | | @@ | | Nikon Corp. | | 78,854 | |
| | | | | | 78,854 | |
| | | | Oil & Gas: 0.3% | | | |
600 | | L | | Amerada Hess Corp. | | 76,092 | |
1,100 | | | | Apache Corp. | | 75,372 | |
990 | | L | | Burlington Resources, Inc. | | 85,338 | |
1,190 | | | | ConocoPhillips | | 69,234 | |
1,200 | | | | Devon Energy Corp. | | 75,048 | |
1,030 | | | | EOG Resources, Inc. | | 75,571 | |
1,172 | | L | | Marathon Oil Corp. | | 71,457 | |
11,280 | | @@ | | Nippon Mining Holdings, Inc. | | 80,110 | |
920 | | | | Occidental Petroleum Corp. | | 73,490 | |
2,000 | | | | Rowan Cos., Inc. | | 71,280 | |
860 | | | | Sunoco, Inc. | | 67,407 | |
7,000 | | @@,L | | TonenGeneral Sekiyu KK | | 75,061 | |
1,540 | | L | | Valero Energy Corp. | | 79,464 | |
| | | | | | 974,924 | |
| | | | Oil & Gas Services: 0.0% | | | |
1,100 | | | | Halliburton Co. | | 68,156 | |
1,310 | | @@ | | Technip SA | | 78,895 | |
| | | | | | 147,051 | |
| | | | Pharmaceuticals: 0.1% | | | |
850 | | @,L | | Express Scripts, Inc. | | 71,230 | |
6,000 | | @@ | | Shionogi & Co., Ltd. | | 84,285 | |
| | | | | | 155,515 | |
| | | | Real Estate: 0.0% | | | |
3,820 | | @@ | | IVG Immobilien AG | | 79,966 | |
| | | | | | 79,966 | |
| | | | Real Estate Investment Trust: 0.1% | | | |
9,400 | | @,L | | Criimi MAE, Inc. | | $ | 186,120 | |
660 | | @@ | | Gecina SA | | 75,515 | |
600 | | @@,L | | Unibail | | 79,516 | |
| | | | | | 341,151 | |
| | | | Retail: 0.0% | | | |
2,000 | | | | Nordstrom, Inc. | | 74,800 | |
2,500 | | @ | | Office Depot, Inc. | | 78,500 | |
| | | | | | 153,300 | |
| | | | Semiconductors: 0.1% | | | |
2,600 | | L | | National Semiconductor Corp. | | 67,548 | |
2,040 | | @,L | | Nvidia Corp. | | 74,582 | |
1,220 | | @@ | | Tokyo Electron Ltd. | | 76,570 | |
| | | | | | 218,700 | |
| | | | Software: 0.0% | | | |
8,100 | | @ | | Compuware Corp. | | 72,657 | |
8,790 | | @ | | Novell, Inc. | | 77,616 | |
| | | | | | 150,273 | |
| | | | Telecommunications: 0.1% | | | |
6,600 | | @ | | Avaya, Inc. | | 70,422 | |
4,450 | | @@ | | Deutsche Telekom AG | | 73,710 | |
3,120 | | | | Motorola, Inc. | | 70,481 | |
22,290 | | @@ | | Oki Electric Industry Ltd. | | 81,516 | |
| | | | | | 296,129 | |
| | | | Transportation: 0.1% | | | |
1,120 | | | | Burlington Northern Santa Fe Corp. | | 79,318 | |
20 | | @@ | | Deutsche Post AG | | 483 | |
11,105 | | @@ | | Keisei Electric Railway Co., Ltd. | | 75,892 | |
1,700 | | | | Norfolk Southern Corp. | | 76,211 | |
9,710 | | @@ | | Peninsular and Oriental Steam Navigation Co. | | 77,641 | |
| | | | | | 309,545 | |
| | | | Water: 0.0% | | | |
6,650 | | @@ | | United Utilities PLC | | 76,470 | |
| | | | | | 76,470 | |
| | | | Total Common Stock
(Cost $7,689,403) | | 8,574,556 | |
PREFERRED STOCK: 0.3% | | | |
| | | | Diversified Financial Services: 0.1% | | | |
5,400 | | C | | Chevy Chase Preferred Capital Corp. | | 302,400 | |
| | | | | | 302,400 | |
| | | | Electric: 0.0% | | | |
1,220 | | @@ | | RWE AG | | 78,021 | |
| | | | | | 78,021 | |
| | | | Media: 0.1% | | | |
16 | | C | | Paxson Communications Corp. | | 139,240 | |
| | | | | | 139,240 | |
See Accompanying Notes to Financial Statements
178
ING OPPENHEIMER
STRATEGIC INCOME PORTFOLIO | PORTFOLIO OF INVESTMENTS
AS OF december 31, 2005 (CONTINUED) |
Shares | | | | | | Value | |
| | | | Savings & Loans: 0.1% | | | |
18,450 | | C,L | | Chevy Chase Bank FSB | | $ | 477,855 | |
| | | | | | 477,855 | |
| | | | Total Preferred Stock
(Cost $1,043,541) | | 997,516 | |
| | | | | | | | |
Principal
Amount | | | | | | Value | |
CREDIT-LINKED SECURITIES: 7.9% | | | |
| | | | | Sovereign: 7.9% | | | |
BRL | 679,800 | | @@ | | Brazil Government Bond, 0.250%, due 01/02/15 | | 87,718 | |
UAH | 1,800,000 | | @@ | | Ukraine Treasury Bill, 5.592%, due 05/16/07 | | 355,720 | |
RUR | 200,000,000 | | @@ | | Barclays RUB Treasury Bill, 0.000%, due 08/18/08 | | 5,976,048 | |
BRL | 1,960,000 | | @@ | | Citibank BRL Treasury Bill, 0.000%, due 07/03/07 | | 671,007 | |
COP | 410,000,000 | | @@ | | Citibank COL Treasury Bill, 11.000%, due 07/24/20 | | 211,139 | |
DOP | 4,119,070 | | @@ | | Citibank DOP Treasury Bill, 0.000%, due 03/10/06 | | 118,314 | |
DOP | 3,190,000 | | @@ | | Citibank DOP Treasury Bill, 0.000%, due 03/31/06 | | 90,685 | |
DOP | 2,260,000 | | @@ | | Citibank DOP Treasury Bill, 0.000%, due 04/27/06 | | 63,682 | |
DOP | 6,660,000 | | @@ | | Citibank DOP Treasury Bill, 0.000%, due 05/02/06 | | 187,109 | |
DOP | 7,210,000 | | @@ | | Citibank DOP Treasury Bill, 0.000%, due 05/12/06 | | 201,363 | |
DOP | 9,500,000 | | @@ | | Citibank DOP Treasury Bill, 0.000%, due 07/07/06 | | 259,014 | |
DOP | 8,200,000 | | @@ | | Citibank DOP Treasury Bill, 17.000%, due 03/12/07 | | 248,675 | |
UAH | 400,000 | | @@ | | Credit Suisse First Boston UKR Treasury Bill - E, 11.940%, due 12/30/09 | | 92,138 | |
UAH | 4,600,000 | | @@ | | Credit Suisse First Boston UKR Treasury Bill - F, 11.940%, due 12/30/09 | | 1,059,590 | |
ARS | 1,090,000 | | @@ | | Deutsche ARG Treasury Bill, 0.000%, due 12/21/11 | | 866,957 | |
EGP | 2,650,000 | | @@ | | Deutsche EGP Treasury Bill, 0.000%, due 12/12/06 | | 427,232 | |
EGP | 960,000 | | @@ | | Deutsche EGP Treasury Bill, 0.000%, due 03/09/06 | | 164,557 | |
EGP | 1,730,000 | | @@ | | Deutsche EGP Treasury Bill, 0.000%, due 01/17/06 | | 300,300 | |
$ | 10,000,000 | | @@ | | Deutsche Volga Treasury Bill, 0.000%, due 04/02/08 | | 10,000,000 | |
UAH | 1,440,000 | | @@ | | FIB UKR Treasury Bill, 11.940%, due 12/30/09 | | 331,698 | |
EUR | 1,750,000 | | @@ | | Italy Treasury Bill, 0.000%, due 07/30/10 | | 2,058,020 | |
ARS | 1,565,000 | | @@ | | J.P. Morgan ARG Treasury Bill, 0.000%, due 11/30/12 | | 369,053 | |
BRL | 2,430,000 | | @@ | | J.P. Morgan BRL Treasury Bill, 0.000%, due 06/01/13 | | 378,884 | |
COP | 6,500,000,000 | | @@ | | J.P. Morgan COL Treasury Bill, 0.000%, due 01/05/15 | | 1,033,621 | |
PEN | 1,360,000 | | @@ | | J.P. Morgan PEN Treasury Bill, 0.000%, due 09/02/15 | | 157,507 | |
$ | 505,000 | | @@ | | J.P. Morgan SWAZ Treasury Bill, 0.000%, due 06/20/10 | | 485,558 | |
BRL | 1,500,000 | | @@ | | Morgan Stanley BRL Treasury Bill, 15.450%, due 01/02/14 | | $ | 601,349 | |
$ | 290,000 | | @@ | | Morgan Stanley PHP Treasury Bill, 0.000%, due 09/20/15 | | 298,071 | |
UAH | 300,000 | | @@ | | Salomon Brothers UKR Treasury Bill, 11.940%, due 01/02/10 | | 68,793 | |
$ | 1,305,000 | | @@ | | UBS BRL Treasury Bill, 0.000%, due 04/20/10 | | 1,386,562 | |
$ | 157,867 | | @@ | | Deutsche Bank IDR Treasury Bill, 0.000%, due 06/22/13 | | 165,034 | |
RUR | 387,000 | | @@ | | Deutsche Bank Moscow Treasury Bill, 0.000%, due 03/30/10 | | 14,983 | |
BRL | 1,480,000 | | @@ | | J.P. Morgan BRL Treasury Bill, 0.000%, due 01/02/15 | | 190,971 | |
TRL | 260,000 | | @@ | | Turkey Treasury Bill - A, 0.000%, due 07/05/06 | | 179,613 | |
$ | 685,000 | | @@ | | Morgan Stanley, Venezuela (Republic of), 6.89%**, due 5/20/10 | | 683,966 | |
$ | 125,000 | | @@ | | Morgan Stanley, Venezuela (Republic of), 8.17%**, due 11/20/15 | | 128,109 | |
$ | 550,000 | | @@ | | Morgan Stanley, Venezuela (Republic of), 8.69%**, due 5/20/10 | | 591,399 | |
$ | 900,000 | | @@ | | Morgan Stanley, Mexican Government, 5.82%**, due 11/20/15 | | 908,874 | |
| | | | | | | 31,413,313 | |
| | | | | Total Credit-Linked Securities
(Cost $31,977,665) | | 31,413,313 | |
CONVERTIBLE BOND: 0.0% | | | |
| | | | | Telecommunications: 0.0% | | | |
| 125,000 | | C | | Qwest Communications International, Inc.,
3.500%, due 11/15/25 | | 145,469 | |
| | | | | | | 145,469 | |
| | | | | Total Convertible Bond
(Cost $125,000) | | 145,469 | |
OPTIONS: 0.0% | | | |
| | | |
Notional Principal | | | | | | Value | |
MXN | 2,280,000 | | | | MXN Call Swaption, Strike Price 11.40, expires 10/12/06 | | $ | 2,721 | |
MXN | 2,280,000 | | | | MXN Put Swaption, Strike Price 11.40, expires 10/12/06 | | 11,199 | |
JPY | 757,000,000 | | | | JPY Put Swaption, Strike Price 122.50, expires 03/02/06 | | 9,735 | |
AUD | 5,190,000 | | | | AUD Call Swaption, Strike Price 5.665, expires 02/09/06 | | 6,835 | |
MXN | 22,090,000 | | | | MXN Call Swaption, Strike Price 9.13, expires 03/15/06 | | 33,804 | |
| | | | | Total Purchased Options
(Cost $98,314) | | 64,294 | |
See Accompanying Notes to Financial Statements
179
ING OPPENHEIMER
STRATEGIC INCOME PORTFOLIO | PORTFOLIO OF INVESTMENTS
AS OF december 31, 2005 (CONTINUED) |
Principal
Amount | | | | | | Value | |
CORPORATE BONDS/NOTES: 28.8% | | | |
| | | | | Advertising: 0.3% | | | |
$ | 378,000 | | C,L | | Lamar Media Corp., 6.625%, due 08/15/15 | | $ | 381,308 | |
| 300,000 | | C | | RH Donnelley Corp., 6.875%, due 01/15/13 | | 277,875 | |
| 100,000 | | C,L | | Vertis, Inc., 10.875%, due 06/15/09 | | 99,000 | |
| 300,000 | | C | | Vertis, Inc., 9.750%, due 04/01/09 | | 312,375 | |
| | | | | | | 1,070,558 | |
| | | | | Aerospace/Defense: 0.3% | | | |
| 50,000 | | C | | L-3 Communications Corp., 5.875%, due 01/15/15 | | 48,750 | |
| 100,000 | | C | | L-3 Communications Corp., 6.125%, due 01/15/14 | | 99,500 | |
| 525,000 | | #,C,L | | L-3 Communications Corp., 6.375%, due 10/15/15 | | 526,313 | |
| 400,000 | | C | | TransDigm, Inc., 8.375%, due 07/15/11 | | 423,000 | |
| | | | | | | 1,097,563 | |
| | | | | Airlines: 0.0% | | | |
| 50,000 | | | | AMR Corp., 9.000%, due 08/01/12 | | 43,625 | |
| | | | | | | 43,625 | |
| | | | | Apparel: 0.3% | | | |
| 85,000 | | C | | Levi Strauss & Co., 8.804%, due 04/01/12 | | 86,063 | |
| 872,000 | | C,L | | Levi Strauss & Co., 9.750%, due 01/15/15 | | 911,240 | |
| 225,000 | | C | | Quiksilver, Inc., 6.875%, due 04/15/15 | | 217,688 | |
| | | | | | | 1,214,991 | |
| | | | | Auto Manufacturers: 0.1% | | | |
| 100,000 | | | | Ford Motor Co., 7.450%, due 07/16/31 | | 68,500 | |
| 100,000 | | C | | General Motors Corp., 8.375%, due 07/15/33 | | 66,500 | |
| 40,000 | | C | | Navistar International Corp., 6.250%, due 03/01/12 | | 36,000 | |
| | | | | | | 171,000 | |
| | | | | Auto Parts & Equipment: 0.5% | | | |
| 424,000 | | C,L | | Dura Operating Corp., 8.625%, due 04/15/12 | | 351,920 | |
| 500,000 | | C,L | | Goodyear Tire & Rubber Co., 7.857%, due 08/15/11 | | 490,000 | |
| 270,000 | | #,C,L | | Goodyear Tire & Rubber Co., 9.000%, due 07/01/15 | | 267,300 | |
| 550,000 | | C,L | | Tenneco, Inc., 8.625%, due 11/15/14 | | 522,500 | |
EUR | 149,000 | | C | | TRW Automotive, Inc., 10.125%, due 02/15/13 | | 199,040 | |
| 50,000 | | C,L | | Visteon Corp., 7.000%, due 03/10/14 | | 38,875 | |
| 100,000 | | C,L | | Visteon Corp., 8.250%, due 08/01/10 | | 85,500 | |
| | | | | | | 1,955,135 | |
| | | | | Banks: 1.3% | | | |
$ | 735,000 | | @@,# | | Banco BMG SA, 9.150%, due 01/15/16 | | $ | 720,631 | |
| 330,000 | | @@ | | Dresdner Bank AG for Ukreximbank, 8.750%, due 02/10/10 | | 339,900 | |
| 290,000 | | @@ | | HSBC Bank PLC, 9.240%, due 07/08/09 | | 218,092 | |
| 920,000 | | @@ | | HSBC Bank PLC, 10.910%, due 01/12/10 | | 605,976 | |
| 290,000 | | @@ | | HSBC Bank PLC, 13.450%, due 03/09/09 | | 202,089 | |
| 730,000 | | @@,# | | Kuznetski Capital for Bank of Moscow, 7.375%, due 11/26/10 | | 750,075 | |
| 830,000 | | @@,C | | UBS Luxembourg SA for Sberbank, 6.230%, due 02/11/15 | | 839,130 | |
| 1,020,000 | | @@,# | | VTB Capital SA, 6.250%, due 06/30/35 | | 1,040,400 | |
| | | | | | | 4,716,293 | |
| | | | | Beverages: 0.0% | | | |
| 90,000 | | @@,# | | Argentine Beverages Financial Trust, 7.375%, due 03/22/12 | | 90,900 | |
| | | | | | | 90,900 | |
| | | | | Building Materials: 0.1% | | | |
| 200,000 | | #,C,L | | Goodman Global Holding Co., Inc., 7.875%, due 12/15/12 | | 187,000 | |
| 50,000 | | C | | Nortek Inc-Old, 8.500%, due 09/01/14 | | 48,500 | |
| 135,000 | | C,L | | NTK Holdings, Inc., 5.740%, due 03/01/14 | | 85,050 | |
| | | | | | | 320,550 | |
| | | | | Chemicals: 0.6% | | | |
| 50,000 | | C | | Equistar Chemicals LP, 8.750%, due 02/15/09 | | 52,875 | |
| 1,190,000 | | #,C,L | | Huntsman International LLC, 7.375%, due 01/01/15 | | 1,154,300 | |
| 50,000 | | #,C | | Innophos, Inc., 8.875%, due 08/15/14 | | 50,625 | |
| 75,000 | | C,L | | Lyondell Chemical Co., 10.500%, due 06/01/13 | | 85,594 | |
| 700,000 | | C,L | | Lyondell Chemical Co., 9.625%, due 05/01/07 | | 734,125 | |
| 185,000 | | #,C | | Tronox Worldwide LLC/ Tronox Finance Corp., 9.500%, due 12/01/12 | | 189,625 | |
| | | | | | | 2,267,144 | |
| | | | | Coal: 0.3% | | | |
| 400,000 | | C,L | | Foundation PA Coal Co., 7.250%, due 08/01/14 | | 415,500 | |
| 90,000 | | #,C | | Massey Energy Co., 6.875%, due 12/15/13 | | 91,238 | |
| 400,000 | | C | | Peabody Energy Corp., 6.875%, due 03/15/13 | | 418,000 | |
| | | | | | | 924,738 | |
See Accompanying Notes to Financial Statements
180
ING OPPENHEIMER
STRATEGIC INCOME PORTFOLIO | PORTFOLIO OF INVESTMENTS
AS OF december 31, 2005 (CONTINUED) |
Principal
Amount | | | | | | Value | |
| | | | | Commercial Services: 0.5% | | | |
$ | 400,000 | | C | | Alderwoods Group, Inc., 7.750%, due 09/15/12 | | $ | 416,000 | |
| 85,000 | | C | | Corrections Corp. of America, 6.250%, due 03/15/13 | | 84,575 | |
| 110,000 | | C | | DI Finance/DynCorp International, 9.500%, due 02/15/13 | | 114,950 | |
| 140,000 | | #,C,L | | Hertz Corp., 10.500%, due 01/01/16 | | 144,900 | |
| 370,000 | | #,C | | Hertz Corp., 8.875%, due 01/01/14 | | 378,788 | |
| 200,000 | | C | | Iron Mountain, Inc., 7.750%, due 01/15/15 | | 202,500 | |
| 600,000 | | C,L | | United Rentals North America, Inc., 7.000%, due 02/15/14 | | 564,000 | |
| | | | | | | 1,905,713 | |
| | | | | Computers: 0.2% | | | |
| 555,000 | | #,C,L | | Solar Capital Corp., 10.250%, due 08/15/15 | | 557,775 | |
| 135,000 | | #,C,L | | Solar Capital Corp., 9.125%, due 08/15/13 | | 140,400 | |
| | | | | | | 698,175 | |
| | | | | Distribution/Wholesale: 0.1% | | | |
| 185,000 | | #,C | | SGS International, Inc., 12.000%, due 12/15/13 | | 186,229 | |
| | | | | | | 186,229 | |
| | | | | Diversified Financial Services: 6.9% | | | |
EUR | 250,000 | | @@ | | Aiolos Ltd., 7.188%, due 04/08/09 | | 294,003 | |
| 200,000 | | C | | Alamosa Delaware, Inc., 8.500%, due 01/31/12 | | 217,250 | |
EUR | 250,000 | | @@,# | | Aries Vermoegensverwaltungs GmbH, 7.750%, due 10/25/09 | | 337,823 | |
| 400,000 | | #,C | | Atlantic & Western Re Ltd., 14.300%, due 11/15/10 | | 400,000 | |
| 700,000 | | C,L | | BCP Crystal US Holdings Corp., 9.625%, due 06/15/14 | | 782,250 | |
| 250,000 | | # | | Cascadia Ltd., 7.582%, due 06/13/08 | | 249,250 | |
| 270,000 | | #,C,L | | CCM Merger, Inc., 8.000%, due 08/01/13 | | 260,550 | |
| 300,000 | | @@,# | | Champlain Ltd., 0.000%, due 01/07/09 | | 300,000 | |
| 400,000 | | @@,C | | Cloverie PLC, 8.741%, due 12/20/10 | | 400,000 | |
| 60,000 | | +,C,L | | Crystal US Holdings 3 LLC/ Crystal US Sub 3 Corp., 3.590%, due 10/01/14 | | 43,950 | |
| 10,142,020 | | #,L | | Dow Jones CDX NA HY, 8.250%, due 06/29/10 | | 10,268,795 | |
| 4,055,000 | | #,L | | Dow Jones CDX NA HY, 8.750%, due 12/29/10 | | 4,080,344 | |
| 54,000 | | #,C | | E*Trade Financial Corp., 7.375%, due 09/15/13 | | 54,945 | |
| 150,000 | | #,C | | E*Trade Financial Corp., 8.000%, due 06/15/11 | | 156,750 | |
| 500,000 | | | | Ford Motor Credit Co., 5.625%, due 10/01/08 | | 438,993 | |
$ | 280,000 | | | | Ford Motor Credit Co., 7.375%, due 10/28/09 | | $ | 248,526 | |
| 425,000 | | L | | General Motors Acceptance Corp., 5.850%, due 01/14/09 | | 380,470 | |
| 150,000 | | | | General Motors Acceptance Corp., 6.875%, due 09/15/11 | | 136,948 | |
| 300,000 | | | | General Motors Acceptance Corp., 7.250%, due 03/02/11 | | 276,029 | |
| 200,000 | | | | General Motors Acceptance Corp., 8.000%, due 11/01/31 | | 192,084 | |
| 250,000 | | @@,# | | Helix 04 Ltd., 9.420%, due 06/30/09 | | 248,165 | |
| 50,000 | | | | Milacron Escrow Corp., 11.500%, due 05/15/11 | | 43,000 | |
| 1,600,000 | | @@,#,C | | Petroleum Export Ltd/Cayman SPV, 5.265%, due 06/15/11 | | 1,586,650 | |
| 250,000 | | @@,# | | Pioneer 2002 Ltd., 10.491%, due 06/15/06 | | 250,500 | |
| 250,000 | | @@,# | | Pioneer 2002 Ltd., 8.620%, due 06/15/06 | | 250,725 | |
| 400,000 | | #,C | | Rainbow National Services LLC, 8.750%, due 09/01/12 | | 428,000 | |
| 500,000 | | @@,# | | Redwood Capital V Ltd., 8.265%, due 01/09/07 | | 488,420 | |
| 400,000 | | C | | Sensus Metering Systems, Inc., 8.625%, due 12/15/13 | | 356,000 | |
| 1,756,098 | | #,L | | TRAINS, 7.651%, due 06/15/15 | | 1,807,355 | |
| 190,000 | | C | | Universal City Development Partners, 11.750%, due 04/01/10 | | 213,988 | |
| 100,000 | | +,C | | Vanguard Health Holding Co. I LLC, 3.180%, due 10/01/15 | | 73,500 | |
| | | | | | | 25,265,263 | |
| | | | | Electric: 0.9% | | | |
| 75,000 | | C,L | | AES Corp., 7.750%, due 03/01/14 | | 79,031 | |
| 239,488 | | #,C | | Calpine Corp., 9.900%, due 07/15/07 | | 195,781 | |
| 200,000 | | C,L | | CMS Energy Corp., 7.500%, due 01/15/09 | | 207,000 | |
BRL | 475,000 | | @@ | | Eletropaulo Metropolitana de Sao Paulo SA, 19.125%, due 06/28/10 | | 216,602 | |
| 48,872 | | #,C | | FPL Energy National Wind, 5.608%, due 03/10/24 | | 48,828 | |
| 29,217 | | #,C | | FPL Energy National Wind, 6.125%, due 03/25/19 | | 28,652 | |
| 740,000 | | C | | Midwest Generation LLC, 8.750%, due 05/01/34 | | 818,625 | |
| 75,000 | | #,C,L | | Mirant North America LLC, 7.375%, due 12/31/13 | | 76,219 | |
| 586,000 | | C | | NRG Energy, Inc., 8.000%, due 12/15/13 | | 656,320 | |
See Accompanying Notes to Financial Statements
181
ING OPPENHEIMER
STRATEGIC INCOME PORTFOLIO | PORTFOLIO OF INVESTMENTS
AS OF december 31, 2005 (CONTINUED) |
Principal
Amount | | | | | | Value | |
| | | | | Electric (continued) | | | |
$ | 505,000 | | C,L | | Reliant Resources, Inc., 9.500%, due 07/15/13 | | $ | 508,788 | |
| 507,000 | | #,C | | Sierra Pacific Resources, 6.750%, due 08/15/17 | | 507,000 | |
| 127,000 | | #,C | | Texas Genco LLC, 6.875%, due 12/15/14 | | 138,113 | |
| | | | | | | 3,480,959 | |
| | | | | Electronics: 0.2% | | | |
| 579,000 | | @@,C,L | | Flextronics International Ltd, 6.250%, due 11/15/14 | | 573,934 | |
| 60,000 | | C,L | | Sanmina-SCI Corp., 6.750%, due 03/01/13 | | 57,375 | |
| | | | | | | 631,309 | |
| | | | | Entertainment: 1.6% | | | |
| 200,000 | | C,L | | AMC Entertainment, Inc., 9.500%, due 02/01/11 | | 197,750 | |
| 390,000 | | C,L | | AMC Entertainment, Inc., 9.875%, due 02/01/12 | | 384,150 | |
| 400,000 | | C | | American Casino and Entertainment, 7.850%, due 02/01/12 | | 412,000 | |
| 800,000 | | C,L | | Cinemark USA, Inc., 9.000%, due 02/01/13 | | 850,000 | |
| 280,000 | | #,C | | Greektown Holdings, 10.750%, due 12/01/13 | | 279,300 | |
| 600,000 | | C,L | | Isle of Capri Casinos, Inc., 7.000%, due 03/01/14 | | 588,000 | |
| 40,000 | | C,L | | Mohegan Tribal Gaming Authority, 6.125%, due 02/15/13 | | 39,500 | |
| 360,000 | | C,L | | Mohegan Tribal Gaming Authority, 6.875%, due 02/15/15 | | 364,500 | |
| 200,000 | | C | | Mohegan Tribal Gaming Authority, 8.000%, due 04/01/12 | | 211,500 | |
| 40,000 | | C | | Penn National Gaming, Inc., 6.750%, due 03/01/15 | | 39,500 | |
| 150,000 | | C,L | | Penn National Gaming, Inc., 6.875%, due 12/01/11 | | 152,250 | |
| 800,000 | | C,L | | Pinnacle Entertainment, Inc., 8.250%, due 03/15/12 | | 831,000 | |
| 160,000 | | C | | Six Flags Theme Parks, Inc., 8.875%, due 02/01/10 | | 156,800 | |
| 50,000 | | C | | Six Flags Theme Parks, Inc., 9.625%, due 06/01/14 | | 48,875 | |
| 550,000 | | C | | Six Flags Theme Parks, Inc., 9.750%, due 04/15/13 | | 542,438 | |
| 350,000 | | C | | Vail Resorts, Inc., 6.750%, due 02/15/14 | | 351,750 | |
| 800,000 | | +,C | | WMG Holdings Corp., 3.940%, due 12/15/14 | | 564,000 | |
| | | | | | | 6,013,313 | |
| | | | | Environmental Control: 0.3% | | | |
| 150,000 | | C,L | | Allied Waste North America, 7.250%, due 03/15/15 | | 152,250 | |
| 600,000 | | C,L | | Allied Waste North America, Inc., 7.375%, due 04/15/14 | | 586,500 | |
$ | 450,000 | | C | | Allied Waste North America, Inc., 8.875%, due 04/01/08 | | $ | 477,000 | |
| | | | | | | 1,215,750 | |
| | | | | Food: 0.2% | | | |
| 35,000 | | C,L | | Del Monte Corp., 6.750%, due 02/15/15 | | 34,300 | |
| 160,000 | | C,S | | Del Monte Corp., 8.625%, due 12/15/12 | | 170,800 | |
| 195,000 | | #,C | | Doane Pet Care Co., 10.625%, due 11/15/15 | | 204,263 | |
| 350,000 | | C | | Doane Pet Care Co., 10.750%, due 03/01/10 | | 382,375 | |
| | | | | | | 791,738 | |
| | | | | Forest Products & Paper: 0.2% | | | |
| 105,000 | | C | | Boise Cascade LLC, 7.125%, due 10/15/14 | | 98,438 | |
| 536,000 | | C | | Georgia-Pacific Corp., 8.125%, due 05/15/11 | | 539,350 | |
| 250,000 | | C | | Inland Fiber Group LLC, 9.625%, due 11/15/07 | | 131,250 | |
| 60,000 | | C | | Mercer International, Inc.-Sbi, 9.250%, due 02/15/13 | | 50,850 | |
| 24,000 | | @@,C,L | | Tembec Industries, Inc., 8.500%, due 02/01/11 | | 13,440 | |
| | | | | | | 833,328 | |
| | | | | Healthcare - Products: 0.1% | | | |
| 105,000 | | | | Fresenius Medical Care Capital Trust, 7.875%, due 06/15/11 | | 112,350 | |
| 400,000 | | C | | MedQuest, Inc., 11.875%, due 08/15/12 | | 388,000 | |
| | | | | | | 500,350 | |
| | | | | Healthcare - Services: 1.2% | | | |
| 85,000 | | C,L | | DaVita, Inc., 6.625%, due 03/15/13 | | 86,913 | |
| 770,000 | | C,L | | DaVita, Inc., 7.250%, due 03/15/15 | | 783,475 | |
| 100,000 | | C,L | | Genesis HealthCare Corp., 8.000%, due 10/15/13 | | 105,750 | |
| 181,000 | | C | | HCA, Inc., 6.300%, due 10/01/12 | | 182,809 | |
| 579,000 | | C,L | | HCA, Inc., 6.375%, due 01/15/15 | | 588,168 | |
| 400,000 | | C | | HCA, Inc., 8.750%, due 09/01/10 | | 444,399 | |
| 533,000 | | C,L | | Healthsouth Corp., 7.625%, due 06/01/12 | | 543,660 | |
| 50,000 | | C | | Healthsouth Corp., 8.375%, due 10/01/11 | | 51,125 | |
| 90,000 | | C | | Psychiatric Solutions, Inc., 7.750%, due 07/15/15 | | 93,375 | |
| 385,000 | | C | | Select Medical Corp., 7.625%, due 02/01/15 | | 372,488 | |
| 200,000 | | C,L | | Tenet Healthcare Corp., 6.375%, due 12/01/11 | | 183,500 | |
| 618,000 | | C,L | | Tenet Healthcare Corp., 9.875%, due 07/01/14 | | 628,815 | |
| 275,000 | | C,L | | Triad Hospitals, Inc., 7.000%, due 11/15/13 | | 277,063 | |
See Accompanying Notes to Financial Statements
182
ING OPPENHEIMER
STRATEGIC INCOME PORTFOLIO | PORTFOLIO OF INVESTMENTS
AS OF december 31, 2005 (CONTINUED) |
Principal
Amount | | | | | | Value | |
| | | | | Healthcare - Services (continued) | | | |
$ | 55,000 | | C | | US Oncology, Inc., 9.000%, due 08/15/12 | | $ | 59,125 | |
| | | | | | | 4,400,665 | |
| | | | | Holding Companies - Diversified: 0.4% | | | |
| 65,000 | | @@,C,L | | JSG Funding PLC, 7.750%, due 04/01/15 | | 54,275 | |
| 1,055,000 | | @@,#,C,L | | Nell AF Sarl, 8.375%, due 08/15/15 | | 1,049,725 | |
| 400,000 | | @@, C | | Stena AB, 7.500%, due 11/01/13 | | 386,000 | |
| | | | | | | 1,490,000 | |
| | | | | Home Builders: 0.1% | | | |
| 300,000 | | C | | Beazer Homes USA, Inc., 8.375%, due 04/15/12 | | 313,500 | |
| 50,000 | | C,L | | K Hovnanian Enterprises, Inc., 7.750%, due 05/15/13 | | 49,606 | |
| 60,000 | | C | | Meritage Homes Corp., 6.250%, due 03/15/15 | | 54,900 | |
| 50,000 | | C | | Standard-Pacific Corp., 7.750%, due 03/15/13 | | 49,188 | |
| | | | | | | 467,194 | |
| | | | | Home Furnishings: 0.0% | | | |
| 68,000 | | C,L | | Sealy Mattress Co., 8.250%, due 06/15/14 | | 70,380 | |
| | | | | | | 70,380 | |
| | | | | Household Products/Wares: 0.2% | | | |
| 50,000 | | C,L | | Church & Dwight Co., Inc., 6.000%, due 12/15/12 | | 49,500 | |
| 500,000 | | C,L | | Playtex Products, Inc., 9.375%, due 06/01/11 | | 526,250 | |
| | | | | | | 575,750 | |
| | | | | Insurance: 0.1% | | | |
| 250,000 | | @@,# | | Foundation Re Ltd., 7.897%, due 11/24/08 | | 251,250 | |
| 300,000 | | @@,# | | Residential Reinsurance Ltd., 12.320%, due 06/06/08 | | 280,500 | |
| | | | | | | 531,750 | |
| | | | | Iron/Steel: 0.2% | | | |
| 650,000 | | C,L | | AK Steel Corp., 7.750%, due 06/15/12 | | 589,875 | |
| 110,000 | | #,C | | Gibraltar Industries, Inc., 8.000%, due 12/01/15 | | 111,375 | |
| | | | | | | 701,250 | |
| | | | | Leisure Time: 0.1% | | | |
| 40,000 | | C | | Leslie’s Poolmart, 7.750%, due 02/01/13 | | 40,300 | |
| 155,000 | | @@ | | Royal Caribbean Cruises Ltd., 6.875%, due 12/01/13 | | 164,942 | |
| | | | | | | 205,242 | |
| | | | | Lodging: 1.1% | | | |
| 400,000 | | C,L | | Boyd Gaming Corp., 8.750%, due 04/15/12 | | 431,000 | |
| 400,000 | | C,L | | Caesars Entertainment, Inc., 7.875%, due 03/15/10 | | 432,000 | |
$ | 300,000 | | C | | Gaylord Entertainment Co., 8.000%, due 11/15/13 | | $ | 315,750 | |
| 180,000 | | @@,#,C,L | | Kerzner International Ltd., 6.750%, due 10/01/15 | | 175,950 | |
| 300,000 | | C | | MGM Mirage, 6.625%, due 07/15/15 | | 300,750 | |
| 500,000 | | C,L | | MGM Mirage, 8.375%, due 02/01/11 | | 537,500 | |
| 65,000 | | C | | Starwood Hotels & Resorts Worldwide, Inc., 7.875%, due 05/01/12 | | 71,988 | |
| 572,000 | | C,L | | Station Casinos, Inc., 6.500%, due 02/01/14 | | 580,580 | |
| 90,000 | | C | | Station Casinos, Inc., 6.875%, due 03/01/16 | | 92,475 | |
| 350,000 | | C,L | | Trump Entertainment Resorts, Inc., 8.500%, due 06/01/15 | | 343,000 | |
| 726,000 | | C,L | | Wynn Las Vegas LLC/Wynn Las Vegas Capital Corp., 6.625%, due 12/01/14 | | 709,665 | |
| | | | | | | 3,990,658 | |
| | | | | Media: 2.3% | | | |
| 200,000 | | L | | Adelphia Communications Corp., 9.420%, due 06/15/11 | | 121,000 | |
| 400,000 | | C,L | | Allbritton Communications Co., 7.750%, due 12/15/12 | | 404,000 | |
| 300,000 | | C,L | | American Media Operations, Inc., 10.250%, due 05/01/09 | | 275,250 | |
| 130,000 | | #,C | | Block Communications, Inc., 8.250%, due 12/15/15 | | 129,350 | |
| 200,000 | | C,L | | Cablevision Systems Corp., 8.000%, due 04/15/12 | | 188,000 | |
| 150,000 | | +,#,C | | CCH I Holdings LLC,
7.050%, due 05/15/14 | | 84,000 | |
| 1,297,000 | | #,C | | Charter Communications, Inc.,
8.375%, due 04/30/14 | | 1,297,000 | |
| 100,000 | | @@,C | | Corus Entertainment, Inc.,
8.750%, due 03/01/12 | | 108,750 | |
| 94,000 | | L | | CSC Holdings, Inc.,
7.625%, due 04/01/11 | | 94,000 | |
| 220,000 | | C,S | | Dex Media East LLC,
12.125%, due 11/15/12 | | 258,500 | |
| 225,000 | | C,S | | Dex Media Finance/West,
9.875%, due 08/15/13 | | 250,875 | |
| 1,080,000 | | C | | Dex Media, Inc.,
8.000%, due 11/15/13 | | 1,107,000 | |
| 398,000 | | C | | Echostar DBS Corp.,
6.625%, due 10/01/14 | | 383,573 | |
| 139,000 | | C,L | | Echostar DBS Corp.,
9.125%, due 01/15/09 | | 145,776 | |
| 700,000 | | C,L | | Granite Broadcasting Corp.,
9.750%, due 12/01/10 | | 647,500 | |
| 55,000 | | C | | LIN Television Corp.,
6.500%, due 05/15/13 | | 53,006 | |
| 110,000 | | #,C,L | | Mediacom Broadband LLC,
8.500%, due 10/15/15 | | 102,438 | |
| 400,000 | | C | | Mediacom LLC,
9.500%, due 01/15/13 | | 392,500 | |
See Accompanying Notes to Financial Statements
183
ING OPPENHEIMER
STRATEGIC INCOME PORTFOLIO | PORTFOLIO OF INVESTMENTS
AS OF december 31, 2005 (CONTINUED) |
Principal
Amount | | | | | | Value | |
| | | | | Media (continued) | | | |
$ | 850,000 | | C | | Medianews Group, Inc., 6.875%, due 10/01/13 | | $ | 817,063 | |
| 275,000 | | #,C | | Paxson Communications Corp., 10.777%, due 01/15/13 | | 265,719 | |
| 400,000 | | C | | Primedia, Inc., 8.875%, due 05/15/11 | | 371,000 | |
| 675,000 | | C,L | | Sinclair Broadcast Group, Inc., 8.000%, due 03/15/12 | | 698,625 | |
| | | | | | | 8,194,925 | |
| | | | | Metal Fabricate/Hardware: 0.1% | | | |
| 350,000 | | C | | Trimas Corp., 9.875%, due 06/15/12 | | 290,500 | |
| | | | | | | 290,500 | |
| | | | | Mining: 0.2% | | | |
| 450,000 | | @@,# | | ALROSA Finance SA, 8.875%, due 11/17/14 | | 516,870 | |
| 330,000 | | @@,#,C,L | | Novelis, Inc., 7.500%, due 02/15/15 | | 309,375 | |
| | | | | | | 826,245 | |
| | | | | Oil & Gas: 2.0% | | | |
| 850,000 | | C | | Chesapeake Energy Corp., 6.875%, due 01/15/16 | | 875,500 | |
| 70,000 | | C | | Clayton Williams Energy, Inc., 7.750%, due 08/01/13 | | 67,550 | |
| 130,000 | | @@,#,C | | Compton Petroleum Corp., 7.625%, due 12/01/13 | | 133,575 | |
| 25,000 | | C | | Delta Petroleum Corp., 7.000%, due 04/01/15 | | 23,188 | |
| 610,000 | | | | El Paso CGP Co., 7.625%, due 09/01/08 | | 622,200 | |
| 681,000 | | C | | El Paso Production Holding Co., 7.750%, due 06/01/13 | | 709,943 | |
| 120,000 | | C | | Forest Oil Corp., 8.000%, due 12/15/11 | | 131,700 | |
| 940,000 | | @@,L | | Gazprom International SA, 7.201%, due 02/01/20 | | 1,003,450 | |
| 700,000 | | @@ | | Naftogaz Ukrainy, 8.125%, due 09/30/09 | | 728,350 | |
| 600,000 | | C | | Newfield Exploration Co., 6.625%, due 09/01/14 | | 613,500 | |
| 65,000 | | C | | Premcor Refining Group, Inc., 9.500%, due 02/01/13 | | 72,486 | |
| 40,000 | | L | | Range Resources Corp., 6.375%, due 03/15/15 | | 39,400 | |
| 650,000 | | C | | Stone Energy Corp., 6.750%, due 12/15/14 | | 619,125 | |
| 572,000 | | @@,# | | Tengizchevroil, 6.124%, due 11/15/14 | | 584,584 | |
| 140,000 | | #,C | | Tesoro Corp., 6.250%, due 11/01/12 | | 141,400 | |
| 140,000 | | #,C,L | | Tesoro Corp., 6.625%, due 11/01/15 | | 142,100 | |
| 700,000 | | C | | Whiting Petroleum Corp., 7.250%, due 05/01/12 | | 712,250 | |
| | | | | | | 7,220,301 | |
| | | | | Oil & Gas Services: 0.0% | | | |
$ | 153,000 | | @@,#,C | | Titan Petrochemicals Group Ltd., 8.500%, due 03/18/12 | | $ | 147,645 | |
| | | | | | | 147,645 | |
| | | | | Packaging & Containers: 0.8% | | | |
| 100,000 | | C | | Berry Plastics Corp., 10.750%, due 07/15/12 | | 108,000 | |
| 150,000 | | #,C,L | | Crown Americas, Inc., 7.750%, due 11/15/15 | | 156,000 | |
| 500,000 | | C,L | | Graphic Packaging International Corp., 8.500%, due 08/15/11 | | 503,750 | |
| 155,000 | | C,L | | Owens Brockway Glass Container, Inc., 7.750%, due 05/15/11 | | 162,556 | |
| 72,000 | | C | | Owens Brockway Glass Container, Inc., 8.750%, due 11/15/12 | | 77,760 | |
| 475,000 | | C | | Owens Brockway Glass Container, Inc., 8.875%, due 02/15/09 | | 498,156 | |
| 100,000 | | C,L | | Pliant Corp., 11.125%, due 09/01/09 | | 89,500 | |
| 24,000 | | C | | Smurfit-Stone Container Corp., 8.250%, due 10/01/12 | | 23,160 | |
| 150,000 | | C,L | | Solo Cup Co., 8.500%, due 02/15/14 | | 132,000 | |
| 1,100,000 | | C,L | | Stone Container Corp., 8.375%, due 07/01/12 | | 1,069,750 | |
| 55,000 | | #,C | | Tekni-Plex, Inc., 10.875%, due 08/15/12 | | 60,225 | |
| | | | | | | 2,880,857 | |
| | | | | Pharmaceuticals: 0.1% | | | |
| 75,000 | | C | | Omnicare, Inc., 6.750%, due 12/15/13 | | 76,219 | |
| 90,000 | | C,L | | Omnicare, Inc., 6.875%, due 12/15/15 | | 91,800 | |
| | | | | | | 168,019 | |
| | | | | Pipelines: 0.9% | | | |
| 90,000 | | #,C | | Atlas Pipeline Partners LP, 8.125%, due 12/15/15 | | 91,238 | |
| 560,000 | | #,C,L | | Dynergy Holdings, Inc., 10.125%, due 07/15/13 | | 635,600 | |
| 37,000 | | C,L | | Dynergy Holdings, Inc., 8.750%, due 02/15/12 | | 40,145 | |
| 335,000 | | C,L | | El Paso Corp., 7.875%, due 06/15/12 | | 346,725 | |
| 148 | | #,C | | Kern River Funding Corp., 4.893%, due 04/30/18 | | 146 | |
| 35,000 | | #,C,L | | Pacific Energy Partners LP / Pacific Energy Finance Corp., 6.250%, due 09/15/15 | | 34,650 | |
| 155,000 | | C,L | | Plains All America Pipeline, 5.625%, due 12/15/13 | | 157,186 | |
| 185,000 | | #,C,L | | Targa Resources, Inc., 8.500%, due 11/01/13 | | 190,550 | |
| 733,000 | | | | Tennessee Gas Pipeline Co., 7.500%, due 04/01/17 | | 788,569 | |
| 400,000 | | C | | Williams Cos., Inc., 7.125%, due 09/01/11 | | 417,500 | |
See Accompanying Notes to Financial Statements
184
ING OPPENHEIMER
STRATEGIC INCOME PORTFOLIO | PORTFOLIO OF INVESTMENTS
AS OF december 31, 2005 (CONTINUED) |
Principal
Amount | | | | | | Value | |
| | | | | Pipelines (continued) | | | |
| 72,000 | | C,L | | Williams Cos., Inc., 7.625%, due 07/15/19 | | $ | 77,580 | |
| 581,000 | | C,L | | Williams Cos., Inc., 8.750%, due 03/15/32 | | 676,865 | |
| | | | | | | 3,456,754 | |
| | | | | Real Estate Investment Trust: 0.1% | | | |
| 100,000 | | C,L | | Host Marriott LP, 6.375%, due 03/15/15 | | 100,250 | |
| 73,000 | | L | | MeriStar Hospitality Corp., 9.125%, due 01/15/11 | | 79,935 | |
| 140,000 | | C | | Trustreet Properties, Inc., 7.500%, due 04/01/15 | | 140,700 | |
| | | | | | | 320,885 | |
| | | | | Regional (state/province): 0.1% | | | |
MYR | 1,920,000 | | @@ | | Johor Corp., 1.000%, due 07/31/12 | | 525,498 | |
| | | | | | | 525,498 | |
| | | | | Retail: 0.3% | | | |
| 100,000 | | @@,C,L | | Jean Coutu Group, Inc., 8.500%, due 08/01/14 | | 92,000 | |
| 280,000 | | #,C,L | | Neiman-Marcus Group, Inc., 10.375%, due 10/15/15 | | 285,950 | |
| 555,000 | | #,C | | Neiman-Marcus Group, Inc., 9.000%, due 10/15/15 | | 570,263 | |
| 300,000 | | C | | Rite Aid Corp., 8.125%, due 05/01/10 | | 306,750 | |
| | | | | | | 1,254,963 | |
| | | | | Savings & Loans: 0.0% | | | |
| 65,000 | | C | | Chevy Chase Bank FSB, 6.875%, due 12/01/13 | | 67,275 | |
| | | | | | | 67,275 | |
| | | | | Semiconductors: 0.4% | | | |
| 850,000 | | C | | Advanced Micro Devices, Inc., 7.750%, due 11/01/12 | | 862,750 | |
| 300,000 | | C,L | | Amkor Technology, Inc., 9.250%, due 02/15/08 | | 292,500 | |
| 210,000 | | C,L | | Freescale Semiconductor, Inc., 6.875%, due 07/15/11 | | 221,550 | |
| | | | | | | 1,376,800 | |
| | | | | Telecommunications: 2.7% | | | |
| 250,000 | | C | | American Cellular Corp., 10.000%, due 08/01/11 | | 272,500 | |
| 1,000,000 | | C | | American Tower Corp., 7.125%, due 10/15/12 | | 1,035,000 | |
| 48,000 | | C | | AT&T Corp., 9.050%, due 11/15/11 | | 53,190 | |
| 400,000 | | C | | AT&T Corp., 9.750%, due 11/15/31 | | 503,940 | |
| 236,000 | | C | | Centennial Cellular Communications Corp., 10.125%, due 06/15/13 | | 257,830 | |
| 50,000 | | C,L | | Dobson Cellular Systems, 8.375%, due 11/01/11 | | 53,313 | |
| 55,000 | | #,C,L | | Dobson Communications Corp., 8.400%, due 10/15/12 | | 55,000 | |
$ | 100,000 | | C,L | | Dobson Communications Corp., 8.875%, due 10/01/13 | | $ | 100,250 | |
| 515,000 | | @@,#,C | | Intelsat Bermuda Ltd., 8.625%, due 01/15/15 | | 522,725 | |
| 640,000 | | L | | Lucent Technologies, Inc., 6.450%, due 03/15/29 | | 552,000 | |
| 600,000 | | C | | MCI, Inc., 7.688%, due 05/01/09 | | 621,000 | |
| 285,000 | | C | | Nextel Communications, Inc., 6.875%, due 10/31/13 | | 297,564 | |
| 932,000 | | C | | Nextel Communications, Inc., 7.375%, due 08/01/15 | | 984,324 | |
| 50,000 | | C | | Nextel Partners, Inc., 8.125%, due 07/01/11 | | 53,688 | |
| 800,000 | | C | | PanAmSat Corp., 9.000%, due 08/15/14 | | 842,000 | |
| 50,000 | | +,C | | PanAmSat Holding Corp., 4.000%, due 11/01/14 | | 35,250 | |
| 200,000 | | C,L | | Qwest Capital Funding, Inc., 7.900%, due 08/15/10 | | 208,000 | |
| 750,000 | | C | | Qwest Corp., 8.875%, due 03/15/12 | | 849,375 | |
| 568,000 | | @@,C,L | | Rogers Wireless, Inc., 7.500%, due 03/15/15 | | 616,280 | |
| 200,000 | | C,L | | Rural Cellular Corp., 9.750%, due 01/15/10 | | 203,000 | |
| 500,000 | | C,L | | Rural Cellular Corp., 9.875%, due 02/01/10 | | 530,000 | |
| 359,000 | | C,L | | SBA Communications Corp., 8.500%, due 12/01/12 | | 400,285 | |
| 61,000 | | +,C | | SBA Telecommunications, Inc., 1.180%, due 12/15/11 | | 56,883 | |
PEN | 1,194,600 | | @@,# | | Telefonica del Peru SAA, 8.000%, due 04/11/16 | | 342,706 | |
| 380,000 | | C,L | | Time Warner Telecom Holdings, Inc., 9.250%, due 02/15/14 | | 402,800 | |
| 25,000 | | C,L | | Time Warner Telecom, Inc., 10.125%, due 02/01/11 | | 26,313 | |
| 40,000 | | C,L | | Valor Telecommunications Enterprises LLC/Finance Corp., 7.750%, due 02/15/15 | | 42,000 | |
| | | | | | | 9,917,216 | |
| | | | | Textiles: 0.3% | | | |
| 200,000 | | C | | Collins & Aikman Floor Cover, 9.750%, due 02/15/10 | | 177,000 | |
| 703,000 | | #,C,L | | Invista, 9.250%, due 05/01/12 | | 753,968 | |
| | | | | | | 930,968 | |
| | | | | Trucking & Leasing: 0.1% | | | |
| 170,000 | | C | | Greenbrier Cos., Inc., 8.375%, due 05/15/15 | | 174,250 | |
| | | | | | | 174,250 | |
| | | | | Venture Capital: 0.1% | | | |
| 400,000 | | C,L | | Arch Western Finance LLC, 6.750%, due 07/01/13 | | 409,484 | |
| | | | | | | 409,484 | |
| | | | | Total Corporate Bonds/Notes
(Cost $106,872,785) | | 105,990,098 | |
See Accompanying Notes to Financial Statements
185
ING OPPENHEIMER
STRATEGIC INCOME PORTFOLIO | PORTFOLIO OF INVESTMENTS
AS OF december 31, 2005 (CONTINUED) |
Principal
Amount | | | | | | Value | |
U.S. GOVERNMENT AGENCY OBLIGATIONS: 17.0% | | | |
| | | | | Federal Home Loan Bank: 0.2% | | | |
$ | 550,000 | | S | | 3.125%, due 11/15/06 | | $ | 542,477 | |
| 65,000 | | S | | 3.500%, due 11/15/07 | | 63,560 | |
| | | | | | | 606,037 | |
| | | | | Federal Home Loan Mortgage Corporation: 3.7% | | | |
| 1,084,837 | | C,^,S | | Freddie Mac Interest STRIP, 2.720%, due 03/15/29 | | 80,314 | |
| 1,450,000 | | S | | 2.750%, due 08/15/06 | | 1,433,661 | |
| 816,049 | | C,^,S | | Freddie Mac Interest STRIP, 2.820%, due 07/15/25 | | 29,823 | |
| 500,000 | | S | | 3.625%, due 02/15/07 | | 493,934 | |
| 1,173,749 | | C,^,S | | Freddie Mac Interest STRIP, 3.730%, due 03/15/29 | | 89,343 | |
| 1,205,000 | | S | | 4.125%, due 07/12/10 | | 1,176,255 | |
| 235,000 | | | | 4.375%, due 11/16/07 | | 233,542 | |
| 643,194 | | S | | 4.500%, due 02/01/18 | | 627,767 | |
| 1,136,154 | | | | 4.500%, due 05/01/19 | | 1,107,631 | |
| 274,844 | | S | | 4.500%, due 02/01/20 | | 267,539 | |
| 268,597 | | C | | 4.669%, due 08/15/25 | | 267,776 | |
| 62,452 | | | | 5.000%, due 01/01/20 | | 61,855 | |
| 438,187 | | | | 5.000%, due 02/01/20 | | 433,998 | |
| 1,210,000 | | W | | 5.000%, due 01/15/35 | | 1,171,431 | |
| 1,200,000 | | L | | 5.500%, due 09/15/11 | | 1,243,583 | |
| 351,002 | | S | | 5.500%, due 01/01/18 | | 353,426 | |
| 85,200 | | C,S | | 5.500%, due 03/15/22 | | 85,362 | |
| 555,178 | | S | | 5.500%, due 12/01/32 | | 551,736 | |
| 326,867 | | S | | 5.500%, due 12/01/34 | | 324,289 | |
| 269,394 | | S | | 5.500%, due 12/01/34 | | 267,269 | |
| 857,395 | | S | | 6.000%, due 04/01/17 | | 875,461 | |
| 384,149 | | S | | 6.000%, due 09/01/24 | | 390,551 | |
| 34,169 | | C,S | | 6.000%, due 03/15/30 | | 34,239 | |
| 355,066 | | S | | 6.000%, due 02/01/34 | | 358,756 | |
| 174,790 | | S | | 6.000%, due 10/01/34 | | 176,606 | |
| 106,909 | | S | | 6.000%, due 11/01/34 | | 108,020 | |
| 137,503 | | S | | 6.000%, due 12/01/34 | | 138,932 | |
| 272,971 | | S | | 6.000%, due 01/01/35 | | 275,814 | |
| 102,605 | | S | | 6.500%, due 04/01/18 | | 105,480 | |
| 131,444 | | C,S | | 6.500%, due 06/15/31 | | 135,429 | |
| 52,579 | | S | | 6.500%, due 08/01/32 | | 54,008 | |
| 64,469 | | S | | 6.500%, due 07/01/34 | | 66,094 | |
| 118,326 | | S | | 6.500%, due 07/01/34 | | 121,308 | |
| 500,000 | | S | | 6.625%, due 09/15/09 | | 531,657 | |
| 130,916 | | C,^,S | | Freddie Mac Interest STRIP, 7.000%, due 03/15/28 | | 24,244 | |
| 770,504 | | C,^,S | | Freddie Mac Interest STRIP, 7.000%, due 04/15/28 | | 134,318 | |
| | | | | | | 13,831,451 | |
| | | | | Federal National Mortgage Association: 11.2% | | | |
| 181,000 | | C,S | | 3.010%, due 06/02/06 | | 179,840 | |
| 570,000 | | S | | 3.250%, due 07/31/06 | | 565,494 | |
| 527,450 | | ^,S | | Fannie Mae Interest STRIP, 3.430%, due 08/25/25 | | 31,519 | |
| 697,892 | | ^,S | | Fannie Mae Interest STRIP, 3.850%, due 05/25/35 | | 37,185 | |
| 224,715 | | ^,S | | Fannie Mae Interest STRIP, 3.900%, due 05/25/35 | | 12,795 | |
| 145,000 | | S | | 4.000%, due 02/28/07 | | 143,784 | |
| 1,748,504 | | ^,S | | Fannie Mae Interest STRIP, 4.109%, due 07/25/31 | | 133,196 | |
$ | 637,802 | | ^,S | | Fannie Mae Interest STRIP, 4.270%, due 12/25/33 | | $ | 69,674 | |
| 133,430 | | S | | 4.500%, due 03/01/19 | | 130,179 | |
| 442,163 | | S | | 4.500%, due 02/01/20 | | 431,056 | |
| 400,000 | | S | | 4.500%, due 08/25/25 | | 375,700 | |
| 2,050,000 | | L | | 4.625%, due 01/15/08 | | 2,046,524 | |
| 492,143 | | | | 4.729%, due 08/25/35 | | 493,394 | |
| 518,000 | | S | | 4.730%, due 01/31/07 | | 492,668 | |
| 1,005,000 | | L,S | | 4.750%, due 12/15/10 | | 1,006,110 | |
| 191,783 | | S | | 5.000%, due 06/01/18 | | 190,067 | |
| 475,489 | | S | | 5.000%, due 11/01/18 | | 471,234 | |
| 722,484 | | S | | 5.000%, due 08/01/19 | | 715,359 | |
| 260,017 | | S | | 5.000%, due 04/01/34 | | 252,928 | |
| 3,904,000 | | W | | 5.000%, due 01/12/36 | | 3,783,218 | |
| 780,000 | | | | 5.500%, due 03/15/11 | | 807,152 | |
| 202,992 | | S | | 5.500%, due 09/01/19 | | 204,385 | |
| 265,127 | | S | | 5.500%, due 09/01/19 | | 266,947 | |
| 1,075,000 | | W | | 5.500%, due 01/15/20 | | 1,081,719 | |
| 698,000 | | S | | 5.500%, due 03/25/23 | | 703,299 | |
| 992,000 | | S | | 5.500%, due 04/25/23 | | 999,229 | |
| 549,719 | | S | | 5.500%, due 09/01/24 | | 549,161 | |
| 160,000 | | | | 5.500%, due 11/25/25 | | 157,807 | |
| 762,001 | | S | | 5.500%, due 02/01/33 | | 756,874 | |
| 1,218,241 | | ^,S | | Fannie Mae Interest STRIP, 5.500%, due 03/01/33 | | 272,986 | |
| 225,158 | | S | | 5.500%, due 03/01/33 | | 223,577 | |
| 925,209 | | S | | 5.500%, due 05/01/33 | | 918,713 | |
| 3,967,060 | | ^,S | | Fannie Mae Interest STRIP, 5.500%, due 06/01/33 | | 886,532 | |
| 254,307 | | S | | 5.500%, due 07/01/33 | | 252,521 | |
| 625,421 | | S | | 5.500%, due 11/01/33 | | 621,030 | |
| 331,767 | | S | | 5.500%, due 11/01/33 | | 329,437 | |
| 184,434 | | S | | 5.500%, due 12/01/33 | | 183,139 | |
| 379,995 | | S | | 5.500%, due 02/01/34 | | 376,756 | |
| 132,014 | | | | 5.500%, due 11/01/34 | | 130,889 | |
| 770,354 | | S | | 5.500%, due 12/01/34 | | 763,789 | |
| 425,282 | | S | | 5.500%, due 03/01/35 | | 421,339 | |
| 6,598,000 | | W | | 5.500%, due 01/12/36 | | 6,534,078 | |
| 2,598,000 | | S | | 6.000%, due 05/15/11 | | 2,750,889 | |
| 278,862 | | S | | 6.000%, due 06/01/17 | | 285,143 | |
| 295,514 | | S | | 6.000%, due 11/01/17 | | 302,173 | |
| 448,164 | | S | | 6.000%, due 09/01/19 | | 458,262 | |
| 605,366 | | S | | 6.000%, due 07/01/20 | | 619,001 | |
| 735,298 | | ^,S | | Fannie Mae Interest STRIP, 6.000%, due 08/01/32 | | 158,605 | |
| 528,858 | | S | | 6.000%, due 09/01/32 | | 534,952 | |
| 272,687 | | S | | 6.000%, due 11/01/32 | | 275,987 | |
| 698,701 | | S | | 6.000%, due 07/01/34 | | 705,526 | |
| 439,476 | | S | | 6.000%, due 08/01/34 | | 443,768 | |
| 201,508 | | S | | 6.500%, due 12/01/28 | | 207,640 | |
| 333,032 | | S | | 6.500%, due 10/25/31 | | 343,006 | |
| 562,789 | | S | | 6.500%, due 01/01/34 | | 577,621 | |
| 227,874 | | S | | 6.500%, due 08/01/34 | | 234,309 | |
| 145,141 | | S | | 6.500%, due 11/01/34 | | 148,947 | |
| 146,741 | | S | | 6.500%, due 01/01/35 | | 150,589 | |
| 1,925,000 | | W | | 6.500%, due 01/15/35 | | 1,974,930 | |
| 1,185,000 | | S | | 6.625%, due 09/15/09 | | 1,261,091 | |
| 280,000 | | S | | 6.625%, due 11/15/30 | | 346,406 | |
| 209,881 | | ^,S | | Fannie Mae Interest STRIP, 6.870%, due 02/25/33 | | 22,282 | |
| 59,268 | | S | | 7.000%, due 09/01/14 | | 61,622 | |
See Accompanying Notes to Financial Statements
186
ING OPPENHEIMER
STRATEGIC INCOME PORTFOLIO | PORTFOLIO OF INVESTMENTS
AS OF december 31, 2005 (CONTINUED) |
Principal
Amount | | | | | | Value | |
| | | | | Federal National Mortgage Association (continued) | | | |
$ | 205,037 | | S | | 7.000%, due 11/01/17 | | $ | 213,189 | |
| 312,561 | | ^,S | | Fannie Mae Interest STRIP, 7.000%, due 02/01/28 | | 65,545 | |
| | | | | | | 41,144,766 | |
| | | | | Government National Mortgage Association: 0.6% | | | |
| 624,520 | | | | 5.000%, due 04/15/34 | | 617,255 | |
| 478,035 | | | | 5.500%, due 04/15/33 | | 481,941 | |
| 99,501 | | | | 5.500%, due 07/15/33 | | 100,314 | |
| 211,140 | | | | 5.500%, due 04/15/34 | | 212,656 | |
| 507,703 | | | | 6.000%, due 10/20/34 | | 518,984 | |
| 218,176 | | | | 6.500%, due 02/20/35 | | 226,250 | |
| | | | | | | 2,157,400 | |
| | | | | Tennessee Valley Authority: 1.0% | | | |
| 50,000 | | | | 5.880%, due 04/01/36 | | 57,017 | |
| 3,251,000 | | | | 6.790%, due 05/23/12 | | 3,602,491 | |
| | | | | | | 3,659,508 | |
| | | | | Other Government Agencies: 0.3% | | | |
| 2,233,000 | | | | Resolution Funding Corp. STRIP, 6.810%, due 01/15/21 | | 1,094,594 | |
| | | | | | | 1,094,594 | |
| | | | | Total U.S. Government Agency Obligations
(Cost $62,928,830) | | 62,493,756 | |
U.S. TREASURY OBLIGATIONS: 1.5% | | | |
| | | | | U.S. Treasury Bond: 0.7% | | | |
| 310,000 | | L | | 5.375%, due 02/15/31 | | 348,314 | |
| 730,000 | | L | | 6.250%, due 05/15/30 | | 906,854 | |
| 916,000 | | | | 7.250%, due 05/15/16 | | 1,125,035 | |
| | | | | | | 2,380,203 | |
| | | | | U.S. Treasury Note: 0.8% | | | |
| 3,000,000 | | L | | 4.250%, due 11/30/07 | | 2,992,149 | |
| | | | | | | 2,992,149 | |
| | | | | Total U.S. Treasury Obligations
(Cost $5,361,234) | | 5,372,352 | |
ASSET-BACKED SECURITIES: 1.9% | | | |
| | | | | Automobile Asset Backed Securities: 1.0% | | | |
| 40,000 | | #,C | | AESOP Funding II LLC, 4.430%, due 04/20/09 | | 40,029 | |
| 114,692 | | C | | BMW Vehicle Owner Trust, 3.660%, due 12/26/07 | | 114,340 | |
| 121,712 | | C | | Capital Auto Receivables Asset Trust, 3.730%, due 07/16/07 | | 121,555 | |
| 370,000 | | C | | Capital One Prime Auto Receivables Trust, 4.240%, due 11/15/07 | | 369,171 | |
| 280,000 | | C | | Chase Manhattan Auto Owner Trust, 3.720%, due 12/15/07 | | 278,798 | |
| 25,197 | | C | | Daimler Chrysler Auto Trust, 2.620%, due 06/08/07 | | 25,135 | |
$ | 84,237 | | C,S | | Daimler Chrysler Auto Trust, 3.170%, due 09/08/07 | | $ | 83,989 | |
| 232,121 | | C,S | | Daimler Chrysler Auto Trust, 3.750%, due 12/08/07 | | 231,579 | |
| 90,000 | | C | | Ford Credit Auto Owner Trust, 3.480%, due 11/15/08 | | 88,919 | |
| 83,018 | | C | | Ford Credit Auto Owner Trust, 3.780%, due 09/15/07 | | 82,845 | |
| 370,000 | | C | | Ford Credit Auto Owner Trust, 4.240%, due 03/15/08 | | 368,712 | |
| 710,000 | | C | | GS Auto Loan Trust, 4.320%, due 05/15/08 | | 708,135 | |
| 36,738 | | C | | Honda Auto Receivables Owner Trust, 3.210%, due 05/21/07 | | 36,638 | |
| 260,000 | | C | | Honda Auto Receivables Owner Trust, 3.730%, due 10/18/07 | | 258,758 | |
| 430,000 | | C | | Nissan Auto Receivables Owner Trust, 4.140%, due 01/15/08 | | 428,268 | |
| 210,000 | | C | | Onyx Acceptance Grantor Trust, 4.030%, due 04/15/08 | | 209,355 | |
| 101,396 | | C | | Volkswagen Auto Lease Trust, 3.520%, due 04/20/07 | | 101,085 | |
| 51,852 | | +,C | | WFS Financial Owner Trust, 4.500%, due 02/20/10 | | 51,877 | |
| | | | | | | 3,599,188 | |
| | | | | Home Equity Asset Backed Securities: 0.2% | | | |
| 140,000 | | C | | ACE Securities Corp., 4.559%, due 11/25/35 | | 140,086 | |
| 24,994 | | +,C | | Centex Home Equity, 4.050%, due 03/25/35 | | 24,865 | |
| 159,650 | | +,C | | Centex Home Equity, 4.196%, due 06/25/35 | | 158,808 | |
| 297,655 | | +,C | | Centex Home Equity, 5.040%, due 10/25/35 | | 296,871 | |
| 199,853 | | C | | HFC Home Equity Loan Asset Backed Certificates, 4.630%, due 01/20/35 | | 199,996 | |
| | | | | | | 820,626 | |
| | | | | Other Asset Backed Securities: 0.7% | | | |
| 196,763 | | C | | Countrywide Asset-Backed Certificates, 4.317%, due 11/25/35 | | 195,737 | |
| 464,428 | | C | | Countrywide Asset-Backed Certificates, 4.539%, due 02/25/36 | | 464,733 | |
| 200,000 | | C | | Countrywide Asset-Backed Certificates, 4.580%, due 05/25/36 | | 199,992 | |
| 60,000 | | C | | Countrywide Asset-Backed Certificates, 5.363%, due 05/25/36 | | 60,015 | |
See Accompanying Notes to Financial Statements
187
ING OPPENHEIMER
STRATEGIC INCOME PORTFOLIO | PORTFOLIO OF INVESTMENTS
AS OF december 31, 2005 (CONTINUED) |
Principal
Amount | | | | | | Value | |
| | | | | Other Asset Backed Securities (continued) | | | |
$ | 100,000 | | C | | Countrywide Asset-Backed Certificates, 5.382%, due 05/25/36 | | $ | 100,000 | |
| 240,000 | | C | | Equity One ABS, Inc., 3.800%, due 07/25/34 | | 239,048 | |
| 410,000 | | C,S | | First Franklin Mtg Loan Asset Backed Certificates, 4.589%, due 11/25/35 | | 410,253 | |
| 317,849 | | +,C | | Lehman XS Trust, 3.630%, due 08/25/35 | | 318,298 | |
| 30,000 | | C | | Popular ABS Mortgage Pass-Through Trust, 3.914%, due 05/25/35 | | 29,587 | |
| 40,000 | | C | | Popular ABS Mortgage Pass-Through Trust, 4.415%, due 04/25/35 | | 39,608 | |
| 100,000 | | C | | Popular ABS Mortgage Pass-Through Trust, 5.680%, due 01/25/36 | | 100,000 | |
| 200,000 | | C | | Residential Asset Mortgage Products, Inc., 4.450%, due 07/25/28 | | 198,995 | |
| 75,550 | | +,C | | Structured Asset Securities Corp., 4.510%, due 08/25/33 | | 75,316 | |
| 268,620 | | +,C | | Structured Asset Securities Corp., 5.180%, due 03/25/35 | | 268,721 | |
| | | | | | | 2,700,303 | |
| | | | | Total Asset-Backed Securities
(Cost $7,139,088) | | 7,120,117 | |
| | | | | | | | |
COLLATERALIZED MORTGAGE OBLIGATION: 1.6% | | | |
| | | | | Commercial Mortgage Backed Securities: 0.9% | | | |
| 290,000 | | C | | Banc of America Commercial Mortgage, Inc., 4.501%, due 07/10/43 | | 283,150 | |
| 100,000 | | C | | Banc of America Commercial Mortgage, Inc., 4.512%, due 12/10/42 | | 96,888 | |
| 350,000 | | C | | Banc of America Commercial Mortgage, Inc., 4.783%, due 07/10/43 | | 343,635 | |
| 730,000 | | C | | Banc of America Commercial Mortgage, Inc., 5.182%, due 09/10/47 | | 733,845 | |
| 50,000 | | C | | Bear Stearns Commercial Mortgage Securities, 4.945%, due 02/11/41 | | 49,450 | |
| 330,000 | | C,L | | Citigroup/Deutsche Bank Commercial Mortgage Trust, 5.225%, due 07/15/44 | | 333,646 | |
| 40,000 | | C | | GE Capital Commercial Mortgage Corp., 4.578%, due 06/10/48 | | 38,934 | |
| 170,000 | | C | | GE Capital Commercial Mortgage Corp., 4.853%, due 07/10/45 | | 168,873 | |
$ | 233,000 | | C | | GMAC Commercial Mortgage Securities, Inc., 7.189%, due 05/15/30 | | $ | 239,974 | |
| 80,000 | | C | | Greenwich Capital Commercial Funding Corp., 4.305%, due 08/10/42 | | 77,950 | |
| 190,000 | | C | | Greenwich Capital Commercial Funding Corp., 5.117%, due 04/10/37 | | 190,580 | |
| 70,000 | | C | | JP Morgan Chase Commercial Mortgage Securities Corp., 4.575%, due 07/15/42 | | 68,615 | |
| 240,000 | | C | | JP Morgan Chase Commercial Mortgage Securities Corp., 4.790%, due 10/15/42 | | 236,945 | |
| 200,000 | | C | | LB-UBS Commercial Mortgage Trust, 4.885%, due 09/15/30 | | 198,690 | |
| 150,000 | | C | | Wachovia Bank Commercial Mortgage Trust, 4.782%, due 03/15/42 | | 148,345 | |
| 200,000 | | C | | Wachovia Bank Commercial Mortgage Trust, 5.087%, due 07/15/42 | | 198,689 | |
| | | | | | | 3,408,209 | |
| | | | | Diversified Financial Services: 0.1% | | | |
| 250,000 | | @@,# | | Arbor Series IV, 18.491%, due 03/15/06 | | 248,950 | |
| | | | | | | 248,950 | |
| | | | | Whole Loan Collateral CMO: 0.6% | | | |
| 61,950 | | C | | Banc of America Mortgage Securities, 4.986%, due 06/25/35 | | 61,669 | |
| 521,539 | | C | | Countrywide Alternative Loan Trust, 6.500%, due 08/25/32 | | 530,830 | |
| 260,000 | | +,C | | MASTR Alternative Loans Trust, 4.700%, due 08/25/34 | | 258,814 | |
| 55,846 | | C | | MASTR Alternative Loans Trust, 6.000%, due 07/25/34 | | 56,152 | |
| 500,527 | | C | | MASTR Seasoned Securities Trust, 6.500%, due 08/25/32 | | 505,375 | |
| 179,127 | | C | | Residential Accredit Loans, Inc., 5.750%, due 01/25/33 | | 179,472 | |
| 322,662 | | C | | Washington Mutual, Inc., 4.287%, due 07/25/45 | | 322,561 | |
| 164,697 | | C | | Washington Mutual, Inc., 4.847%, due 05/25/35 | | 164,579 | |
| 63,271 | | C | | Wells Fargo Mortgage Backed Securities Trust, 4.524%, due 01/25/35 | | 63,078 | |
| | | | | | | 2,142,530 | |
| | | | | Total Collateralized Mortgage Obligations
(Cost $5,850,960) | | 5,799,689 | |
See Accompanying Notes to Financial Statements
188
ING OPPENHEIMER
STRATEGIC INCOME PORTFOLIO | PORTFOLIO OF INVESTMENTS
AS OF december 31, 2005 (CONTINUED) |
Principal
Amount | | | | | | Value | |
OTHER BONDS: 29.6% | | | |
| | | | | Foreign Government Bonds: 28.7% | | | |
ARS | 7,983,000 | | @@ | | Argentina Bonos, 2.000%, due 09/30/14 | | $ | 2,659,845 | |
ARS | 496,991 | | @@, I | | Argentina Government International Bond, (0.580)%, due 12/31/33 | | 193,377 | |
ARS | 1,409,496 | �� | @@ | | Argentina Government International Bond, 0.000%, due 12/15/35 | | 20,959 | |
ARS | 580,000 | | @@,+ | | Argentina Government International Bond, 1.200%, due 12/31/38 | | 224,466 | |
ARS | 450,000 | | @@,+ | | Argentina Government International Bond, 1.330%, due 12/31/38 | | 149,625 | |
ARS | 1,056,000 | | @@,I | | Argentina Government International Bond, 2.000%, due 02/04/18 | | 512,952 | |
ARS | 2,236,500 | | @@ | | Argentina Government International Bond, 4.006%, due 08/03/12 | | 1,763,480 | |
EUR | 570,000 | | @@,# | | Austria Government Bond, 3.800%, due 10/20/13 | | 699,088 | |
$ | 130,000 | | @@ | | Brazilian Government Bond, 7.875%, due 03/07/15 | | 138,775 | |
$ | 2,393,000 | | @@,L | | Brazilian Government Bond, 8.000%, due 01/15/18 | | 2,585,637 | |
$ | 890,000 | | @@ | | Brazil Government Bond, 8.250%, due 01/20/34 | | 946,960 | |
$ | 425,000 | | @@ | | Brazil Government Bond, 8.750%, due 02/04/25 | | 470,688 | |
BRL | 3,060,000 | | @@,L | | Brazilian Government Bond, 12.500%, due 01/05/16 | | 1,313,487 | |
BRL | 15,272,000 | | @@ | | Brazil Treasury Bill, 0.000%, due 01/02/15 | | 1,970,614 | |
| 1,030,000 | | @@,L | | Colombia Government Bond, 8.125%, due 05/21/24 | | 1,117,550 | |
| 662,000 | | @@ | | Colombia Government Bond, 8.250%, due 12/22/14 | | 738,130 | |
| 80,000 | | @@ | | Colombia Government Bond, 10.750%, due 01/15/13 | | 99,600 | |
COP | 435,000,000 | | @@ | | Colombia Government Bond, 11.750%, due 03/01/10 | | 213,847 | |
COP | 6,053,000,000 | | @@ | | Colombia Government Bond, 12.000%, due 10/22/15 | | 3,129,498 | |
COP | 4,650,000,000 | | @@ | | Colombia Treasury Bill, 0.000%, due 08/03/20 | | 523,452 | |
EUR | 140,000 | | @@ | | Deutsche Bundesrepublik, 4.000%, due 07/04/09 | | 170,612 | |
EUR | 2,570,000 | | @@ | | Deutsche Bundesrepublik, 5.000%, due 07/04/11 | | 3,319,391 | |
EUR | 1,569,000 | | @@ | | Deutsche Bundesrepublik, 5.250%, due 01/04/11 | | 2,034,608 | |
DOP | 24,180,000 | | @@ | | Dominican Republic Treasury Bill, 0.000%, due 05/08/06 | | 679,324 | |
DOP | 12,800,000 | | @@ | | Dominican Republic Treasury Bill, 0.000%, due 11/06/06 | | 330,435 | |
$ | 733,250 | | @@,#,L | | Dominican Republic International Bond, 9.500%, due 09/27/11 | | 777,245 | |
EGP | 5,700,000 | | @@ | | Egypt Treasury Bill, 0.000%, due 09/19/06 | | $ | 933,077 | |
EGP | 1,970,000 | | @@ | | Egypt Treasury Bill, 0.000%, due 02/02/06 | | 340,251 | |
$ | 150,000 | | @@ | | Export-Import Bank of Ukraine, 6.800%, due 10/04/12 | | 147,960 | |
EUR | 105,000 | | @@ | | Finland Government Bond, 5.375%, due 07/04/13 | | 141,633 | |
$ | 30,000 | | @@,# | | Indonesia Government International Bond, 6.750%, due 03/10/14 | | 30,000 | |
$ | 50,000 | | @@,# | | Indonesia Government International Bond, 7.250%, due 04/20/15 | | 51,563 | |
$ | 1,020,000 | | @@,# | | Indonesia Government International Bond, 8.500%, due 10/12/35 | | 1,114,350 | |
ILS | 6,690,000 | | @@ | | Israel Government Bond, (1.580)%, due 03/31/14 | | 1,657,478 | |
EUR | 2,115,000 | | @@ | | Italy Buoni Poliennali Del Tesoro, 4.250%, due 02/01/19 | | 2,652,284 | |
EUR | 2,100,000 | | @@ | | Italy Treasury Bill, 0.000%, due 07/30/10 | | 2,492,413 | |
JPY | 365,000,000 | | @@ | | Japan Government Bond, 1.400%, due 06/20/12 | | 3,153,383 | |
JPY | 134,000,000 | | @@ | | Japan Government Twenty Year Bond, 2.000%, due 09/20/25 | | 1,138,633 | |
JPY | 229,000,000 | | @@ | | Japan Government Twenty Year Bond, 2.000%, due 09/20/25 | | 1,947,072 | |
JPY | 1,234,000,000 | | @@ | | Japan Government Two Year Bond, 0.200%, due 10/15/07 | | 10,448,905 | |
MYR | 1,525,000 | | @@ | | Malaysia Government Bond, 4.720%, due 09/30/15 | | 418,959 | |
MXN | 272,000 | | @@ | | Mexico Cetes, 0.000%, due 04/12/06 | | 248,499 | |
MXN | 770,000 | | @@,L | | Mexico Government Bond, 6.625%, due 03/03/15 | | 845,075 | |
JPY | 20,000,000 | | @@ | | Mexico Government Bond, 6.750%, due 06/06/06 | | 174,108 | |
$ | 168,000 | | @@,L | | Mexico Government Bond, 7.500%, due 01/14/12 | | 187,740 | |
MXN | 2,984,000 | | @@ | | Mexico Government Bond, 8.000%, due 12/07/23 | | 264,496 | |
MXN | 2,395,000 | | @@ | | Mexico Government Bond, 8.000%, due 12/19/13 | | 222,307 | |
$ | 50,000 | | @@ | | Mexico Government Bond, 8.300%, due 08/15/31 | | 64,375 | |
MXN | 8,322,000 | | @@ | | Mexico Government Bond, 9.500%, due 12/18/14 | | 843,180 | |
MXN | 11,000,000 | | @@ | | Mexico Government Bond, 10.000%, due 12/05/24 | | 1,171,490 | |
MXN | 11,230,000 | | @@ | | Mexico Government Bond, 10.500%, due 07/14/11 | | 1,209,022 | |
EUR | 110,000 | | @@ | | Netherlands Government Bond, 5.500%, due 01/15/28 | | 167,387 | |
NZD | 4,615,000 | | @@ | | New Zealand Government Bond, 6.000%, due 07/15/08 | | 3,146,956 | |
See Accompanying Notes to Financial Statements
189
ING OPPENHEIMER
STRATEGIC INCOME PORTFOLIO | PORTFOLIO OF INVESTMENTS
AS OF december 31, 2005 (CONTINUED) |
Principal
Amount | | | | | | Value | |
| | | | | Foreign Government Bonds (continued) | | | |
$ | 1,665,000 | | @@,L | | Panama Government Bond, 8.125%, due 04/28/34 | | $ | 1,864,800 | |
| 450,000 | | @@ | | Panama Government Bond, 9.375%, due 04/01/29 | | 568,125 | |
$ | 212,380 | | @@ | | Peru Government Bond, 5.000%, due 03/07/17 | | 204,416 | |
PEN | 1,000,000 | | @@ | | Peru Government Bond, 7.340%, due 08/12/16 | | 274,829 | |
$ | 470,000 | | @@ | | Peru Government Bond, 7.350%, due 07/21/25 | | 465,300 | |
PEN | 6,410,000 | | @@ | | Peru Government Bond, 7.840%, due 08/12/20 | | 1,793,791 | |
PEN | 1,380,000 | | @@ | | Peru Government Bond, 8.600%, due 08/12/17 | | 412,491 | |
$ | 310,000 | | @@ | | Peru Government Bond, 8.750%, due 11/21/33 | | 350,300 | |
PEN | 240,000 | | @@ | | Peru Government Bond, 9.000%, due 01/31/12 | | 75,963 | |
$ | 635,000 | | @@,L | | Peru Government Bond, 9.875%, due 02/06/15 | | 765,175 | |
PEN | 3,110,000 | | @@ | | Peru Government Bond, 9.910%, due 05/05/15 | | 1,018,082 | |
PEN | 270,000 | | @@ | | Peru Government Bond, 12.250%, due 08/10/11 | | 97,052 | |
$ | 170,000 | | @@,L | | Philippine Government Bond, 8.000%, due 01/15/16 | | 178,500 | |
$ | 100,000 | | @@ | | Philippine Government Bond, 8.250%, due 01/15/14 | | 106,875 | |
$ | 700,000 | | @@,L | | Philippine Government Bond, 8.875%, due 03/17/15 | | 777,875 | |
$ | 178,000 | | @@,L | | Philippine Government Bond, 9.500%, due 02/02/30 | | 209,595 | |
$ | 3,460,000 | | @@ | | Phillippine Treasury Bill, 0.000%, due 09/20/15 | | 3,715,832 | |
PLN | 2,050,000 | | @@ | | Poland Government Bond, 4.550%, due 08/12/07 | | 585,760 | |
PLN | 2,650,000 | | @@ | | Poland Government Bond, 5.000%, due 10/24/13 | | 809,847 | |
PLN | 635,000 | | @@ | | Poland Government Bond, 5.750%, due 09/23/22 | | 207,288 | |
RON | 470,000 | | @@ | | Romania Treasury Bill, 6.750%, due 03/10/08 | | 147,476 | |
RON | 41,000 | | @@ | | Romania Treasury Bill, 7.250%, due 04/18/10 | | 13,119 | |
RON | 68,000 | | @@ | | Romania Treasury Bill, 7.500%, due 03/05/07 | | 21,642 | |
RON | 167,000 | | @@ | | Romania Treasury Bill, 7.750%, due 04/18/08 | | 53,430 | |
RUB | 903,000 | | @@ | | Russia Government Bond, 3.000%, due 05/14/08 | | 858,663 | |
RUB | 490,000 | | @@ | | Russian Ministry of Finance, 3.000%, due 05/14/11 | | 437,031 | |
ZAR | 11,462,000 | | @@ | | South Africa Government Bond, 10.500%, due 12/21/26 | | 2,469,738 | |
ZAR | 4,600,000 | | @@,^ | | South Africa Government Bond, 13.000%, due 08/31/10 | | 885,622 | |
ZAR | 945,000 | | @@ | | South Africa Government Bond, 13.500%, due 09/15/15 | | $ | 210,373 | |
EUR | 2,314,000 | | @@ | | Spain Government Bond, 5.350%, due 10/31/11 | | 3,044,670 | |
EUR | 327,000 | | @@ | | Spain Government Bond, 5.750%, due 07/30/32 | | 528,167 | |
TRL | 530,000 | | @@ | | Turkey Government Bond, 0.000%, due 02/11/10 | | 452,980 | |
$ | 719,000 | | @@ | | Turkey Government Bond, 7.250%, due 03/15/15 | | 760,343 | |
$ | 1,085,000 | | @@ | | Turkey Government Bond, 8.000%, due 02/14/34 | | 1,200,281 | |
TRL | 4,800,000 | | @@ | | Turkey Treasury Bill, 0.000%, due 01/24/07 | | 3,032,009 | |
$ | 420,000 | | @@ | | Ukraine Government Bond, 0.000%, due 02/21/12 | | 422,100 | |
$ | 420,000 | | @@ | | Ukraine Government Bond, 0.000%, due 02/22/11 | | 422,100 | |
$ | 420,000 | | @@ | | Ukraine Government Bond, 0.000%, due 08/19/10 | | 422,100 | |
$ | 420,000 | | @@ | | Ukraine Government Bond, 0.000%, due 08/19/11 | | 422,100 | |
$ | 420,000 | | @@ | | Ukraine Government Bond, 0.000%, due 08/20/12 | | 422,100 | |
$ | 500,000 | | @@,# | | Ukraine Government Bond, 7.650%, due 06/11/13 | | 542,500 | |
GBP | 4,905,000 | | @@ | | United Kingdom Gilt, 4.000%, due 03/07/09 | | 8,371,533 | |
$ | 67,000 | | @@ | | United Mexican States, 7.500%, due 04/08/33 | | 79,496 | |
$ | 515,000 | | @@ | | Uruguay Government Bond, 8.000%, due 11/18/22 | | 529,163 | |
EUR | 373,000 | | @@ | | Venezuela Government Bond, 7.000%, due 03/16/15 | | 465,578 | |
EUR | 730,000 | | @@ | | Venezuela Government Bond, 9.250%, due 09/15/27 | | 866,875 | |
EUR | 1,500,000 | | @@ | | Venezuela Government Bond, 13.625%, due 08/15/18 | | 2,186,250 | |
| | | | | | | 105,745,576 | |
| | | | | Regional (state/province): 0.9% | | | |
AUD | 4,645,000 | | @@ | | Queensland Treasury Corp., 6.000%, due 07/14/09 | | 3,479,769 | |
| | | | | | | 3,479,769 | |
| | | | | Total Other Bond
(Cost $110,061,812) | | 109,225,345 | |
| | | | | Total Long-Term Investments:
(Cost $339,173,780) | | 337,196,505 | |
| | | | | SHORT-TERM INVESTMENTS: 28.0% | | | |
| | | | | Federal Home Loan Bank: 7.6% | | | |
$ | 28,201,000 | | | | Discount Note, 3.200%, due 01/03/06 | | 28,193,480 | |
| | | | | | | 28,193,480 | |
| | | | | Treasury Bill: 3.5% | | | |
$ | 12,850,000 | | L | | United States Treasury Bill, 3.740%, due 03/09/06 | | 12,759,883 | |
| | | | | | | 12,759,883 | |
See Accompanying Notes to Financial Statements
190
ING OPPENHEIMER
STRATEGIC INCOME PORTFOLIO | PORTFOLIO OF INVESTMENTS
AS OF december 31, 2005 (CONTINUED) |
Principal
Amount | | | | | | Value | |
| | | | | Securities Lending Collateralcc 16.9% | | | |
$ | 62,254,000 | | | | The Bank of New York Institutional Cash Reserves Fund | | $ | 62,254,000 | |
| | | | | | | 62,254,000 | |
| | | | | Total Short-Term Investments:
(Cost $103,207,599) | | 103,207,363 | |
| | | | | Total Investments in Securities
(Cost $442,381,379)* | 118.9 | % | $ | 440,403,868 | |
| | | | | Other Assets and Liabilities-Net | (18.9 | ) | (71,903,491 | ) |
| | | | | Net Assets | 100.0 | % | $ | 368,500,377 | |
| Certain foreign securities have been fair valued in accordance with procedures approved by the Board of Trustees (Note 2A). |
@ | Non-income producing security |
@@ | Foreign Issuer |
STRIP | Separate Trading of Registered Interest and Principal of Securities |
+ | Step-up basis bonds. Interest rates shown reflect current coupon rates. |
# | Securities with purchases pursuant to Rule 144A, under the Securities Act of 1933 and may not be resold subject to that rule except to qualified institutional buyers. These securities have been determined to be liquid under the guidelines established by the Funds’ Board of Directors/Trustees. |
C | Bond may be called prior to maturity date. |
cc | Securities purchased with cash collateral for securities loaned. |
W | When-issued or delayed delivery security. |
S | Segregated securities for certain derivatives, when-issued or delayed delivery securities and forward currency exchange contracts. |
I | Illiquid security |
L | Loaned security, a portion or all of the security is on loan at December 31, 2005. |
^ | Interest Only (IO) Security |
** | Floating Rate |
* | Cost for federal income tax purposes is $442,417,975. |
Net unrealized depreciation consists of: | | | |
Gross Unrealized Appreciation | | $ | 4,865,006 | |
Gross Unrealized Depreciation | | (6,879,113 | ) |
Net Unrealized Depreciation | | $ | (2,014,107 | ) |
Notional
Principal | | Expiration
Date | | Strike
Price/Rate | | Value | |
| | | | | | | |
WRITTEN OPTIONS
Call Options Written | | | | | | | |
USD 3,890,000
USD Call Swaption Counterparty: UBS AG | | 2/9/06 | | 4.74 | | ($3,730 | ) |
Total Liability for Call Options Written (Premiums received $15,949) | | | | | | ($3,730 | ) |
Total Written Options (Premiums received $15,949) | | | | | | ($3,730 | ) |
Information concerning open futures contracts for the ING Oppenheimer Strategic Income Portfolio at December 31, 2005 is shown below:
Long Contracts | | No. of
Contracts | | Notional
Market Value | | Expiration
Date | | Unrealized
Gain (Loss) | |
S&P Index Future | | 3 | | $ | 633,772 | | 03/17/06 | | $ | 13,382 | |
Amsterdam Index Future | | 6 | | 618,627 | | 01/20/06 | | 5,776 | |
SPI 200 Future | | 7 | | 606,811 | | 03/16/06 | | 16,857 | |
U.S. 2 Year Treasury Note Future | | 22 | | 4,514,125 | | 03/31/06 | | 2,543 | |
Euro-Bond Future | | 24 | | 3,449,193 | | 03/08/06 | | 24,155 | |
U.S. Long Bond Future | | 128 | | 14,616,000 | | 03/31/06 | | 163,703 | |
| | | | | | | | $ | 226,416 | |
| | | | | | | | | | |
Short Contracts | | | | | | | | | |
OMXS 30 Index Future | | 58 | | $ | 701,078 | | 01/27/06 | | $ | (14,832 | ) |
NASDAQ 100 E-mini Future | | 37 | | 1,227,660 | | 03/17/06 | | 675 | |
S&P 500 Index Future | | 25 | | 7,842,500 | | 03/16/06 | | 69,906 | |
U.S. 5 Year Treasury Note Future | | 14 | | 1,488,813 | | 03/22/06 | | (2,674 | ) |
CAC 40 Index Future | | 12 | | 667,885 | | 01/20/06 | | (3,561 | ) |
NIKKEI 225 Index Future | | 12 | | 1,631,789 | | 03/09/06 | | (53,173 | ) |
FTSE 100 Index Future | | 12 | | 1,156,952 | | 03/17/06 | | (18,283 | ) |
10 Year Mini JGB Future | | 6 | | 698,212 | | 03/08/06 | | (2,549 | ) |
U.S. 10 Year Treasury Note Future | | 6 | | 656,438 | | 03/22/06 | | 1,681 | |
U.K. Long GILT Future | | 1 | | 196,482 | | 03/29/06 | | (2,421 | ) |
| | | | | | | | $ | (25,231) | |
At December 31, 2005 the following forward foreign currency contracts were outstanding for the ING Oppenheimer Strategic Income Portfolio:
Currency | | Buy/Sell | | Settlement
Date | | In
Exchange
For | | Value | | Unrealized
Appreciation
(Depreciation) | |
Argentine Peso | | | | | | USD | | | | | |
ARS 2,250,000 | | Buy | | 01/05/06 | | 752,508 | | 742,226 | | (10,282 | ) |
Argentine Peso | | | | | | USD | | | | | |
ARS 1,125,000 | | Buy | | 01/17/06 | | 371,594 | | 369,591 | | (2,003 | ) |
Argentine Peso | | | | | | USD | | | | | |
ARS 1,125,000 | | Buy | | 01/19/06 | | 372,825 | | 369,337 | | (3,488 | ) |
Brazilian Real | | | | | | USD | | | | | |
BRL 612,000 | | Buy | | 03/07/06 | | 199,739 | | 256,264 | | 56,525 | |
Brazilian Real | | | | | | USD | | | | | |
BRL 790,000 | | Buy | | 04/28/06 | | 272,414 | | 325,827 | | 53,413 | |
Brazilian Real | | | | | | USD | | | | | |
BRL 12,000,000 | | Buy | | 03/07/06 | | 4,662,910 | | 5,024,782 | | 361,872 | |
Brazilian Real | | | | | | USD | | | | | |
BRL 13,995,000 | | Buy | | 09/22/06 | | 5,403,475 | | 5,678,637 | | 275,162 | |
See Accompanying Notes to Financial Statements
191
ING OPPENHEIMER
STRATEGIC INCOME PORTFOLIO | PORTFOLIO OF INVESTMENTS
AS OF december 31, 2005 (CONTINUED) |
Currency | | Buy/Sell | | Settlement
Date | | In
Exchange
For | | Value | | Unrealized
Appreciation
(Depreciation) | |
Brazilian Real | | | | | | USD | | | | | |
BRL 5,830,000 | | Buy | | 09/25/06 | | 2,255,319 | | 2,365,591 | | 110,272 | |
Brazilian Real | | | | | | USD | | | | | |
BRL 1,210,000 | | Buy | | 10/31/06 | | 472,656 | | 490,972 | | 18,316 | |
Brazilian Real | | | | | | USD | | | | | |
BRL 2,410,000 | | Buy | | 10/31/06 | | 954,040 | | 977,886 | | 23,846 | |
Brazilian Real | | | | | | USD | | | | | |
BRL 1,390,000 | | Buy | | 01/17/06 | | 611,877 | | 592,014 | | (19,863 | ) |
Brazilian Real | | | | | | USD | | | | | |
BRL 1,810,000 | | Buy | | 01/17/06 | | 789,888 | | 770,896 | | (18,992 | ) |
Canadian Dollar | | | | | | USD | | | | | |
CAD 1,900,000 | | Buy | | 01/23/06 | | 1,625,321 | | 1,627,647 | | 2,326 | |
Swiss Francs | | | | | | USD | | | | | |
CHF 11,710,000 | | Buy | | 01/19/06 | | 9,099,280 | | 8,902,786 | | (196,494 | ) |
Swiss Francs | | | | | | USD | | | | | |
CHF 1,030,000 | | Buy | | 01/19/06 | | 791,413 | | 783,080 | | (8,333 | ) |
Swiss Francs | | | | | | USD | | | | | |
CHF 2,070,000 | | Buy | | 02/02/06 | | 1,584,580 | | 1,576,016 | | (8,564 | ) |
Chilean Peso | | | | | | USD | | | | | |
CLP 200,000,000 | | Buy | | 01/06/06 | | 378,609 | | 390,564 | | 11,955 | |
Colombian Peso | | | | | | USD | | | | | |
COP 2,405,780,000 | | Buy | | 01/06/06 | | 1,058,011 | | 1,052,079 | | (5,932 | ) |
Euro | | | | | | USD | | | | | |
EUR 100,000 | | Buy | | 03/08/06 | | 121,174 | | 118,394 | | (2,780 | ) |
Euro | | | | | | USD | | | | | |
EUR 5,060,000 | | Buy | | 01/18/06 | | 6,076,858 | | 5,974,599 | | (102,259 | ) |
Euro | | | | | | USD | | | | | |
EUR 2,525,000 | | Buy | | 01/19/06 | | 3,034,469 | | 2,981,564 | | (52,905 | ) |
Euro | | | | | | USD | | | | | |
EUR 2,460,000 | | Buy | | 01/17/06 | | 2,955,419 | | 2,904,483 | | (50,936 | ) |
Euro | | | | | | USD | | | | | |
EUR 4,075,000 | | Buy | | 01/19/06 | | 4,811,027 | | 4,811,831 | | 804 | |
Euro | | | | | | USD | | | | | |
EUR 4,130,000 | | Buy | | 01/19/06 | | 4,847,588 | | 4,876,776 | | 29,188 | |
Euro | | | | | | USD | | | | | |
EUR 4,105,000 | | Buy | | 01/19/06 | | 4,853,752 | | 4,847,256 | | (6,496 | ) |
Euro | | | | | | USD | | | | | |
EUR 1,080,000 | | Buy | | 01/20/06 | | 1,286,150 | | 1,275,355 | | (10,795 | ) |
Euro | | | | | | USD | | | | | |
EUR 1,080,000 | | Buy | | 01/20/06 | | 1,276,042 | | 1,275,355 | | (687 | ) |
Euro | | | | | | USD | | | | | |
EUR 2,150,000 | | Buy | | 01/19/06 | | 2,543,213 | | 2,538,757 | | (4,456 | ) |
Euro | | | | | | USD | | | | | |
EUR 1,245,000 | | Buy | | 01/20/06 | | 1,468,627 | | 1,470,201 | | 1,574 | |
Euro | | | | | | USD | | | | | |
EUR 5,115,000 | | Buy | | 02/14/06 | | 6,069,203 | | 6,048,520 | | (20,683 | ) |
Euro | | | | | | USD | | | | | |
EUR 3,575,000 | | Buy | | 01/17/06 | | 4,281,009 | | 4,220,945 | | (60,064 | ) |
Euro | | | | | | USD | | | | | |
EUR 1,530,000 | | Buy | | 02/13/06 | | 1,837,137 | | 1,809,137 | | (28,000 | ) |
Euro | | | | | | USD | | | | | |
EUR 1,785,000 | | Buy | | 01/19/06 | | 2,145,570 | | 2,107,759 | | (37,811 | ) |
Euro | | | | | | USD | | | | | |
EUR 2,765,000 | | Buy | | 01/23/06 | | 3,286,064 | | 3,265,698 | | (20,366 | ) |
British Pound | | | | | | USD | | | | | |
GBP 300,000 | | Buy | | 03/09/06 | | 529,260 | | 514,983 | | (14,277 | ) |
British Pound | | | | | | USD | | | | | |
GBP 300,000 | | Buy | | 03/09/06 | | 529,928 | | 514,983 | | (14,945 | ) |
British Pound | | | | | | USD | | | | | |
GBP 150,000 | | Buy | | 03/09/06 | | 267,364 | | 257,491 | | (9,873 | ) |
British Pound | | | | | | USD | | | | | |
GBP 150,000 | | Buy | | 03/09/06 | | 267,560 | | 257,491 | | (10,069 | ) |
British Pound | | | | | | USD | | | | | |
GBP 300,000 | | Buy | | 03/09/06 | | 531,366 | | 514,983 | | (16,383 | ) |
British Pound | | | | | | USD | | | | | |
GBP 400,000 | | Buy | | 03/09/06 | | 709,148 | | 686,643 | | (22,505 | ) |
British Pound | | | | | | USD | | | | | |
GBP 400,000 | | Buy | | 03/09/06 | | 697,730 | | 686,643 | | (11,087 | ) |
British Pound | | | | | | USD | | | | | |
GBP 2,340,000 | | Buy | | 01/17/06 | | 4,028,310 | | 4,016,890 | | (11,420 | ) |
British Pound | | | | | | USD | | | | | |
GBP 400,000 | | Buy | | 03/09/06 | | 695,292 | | 686,643 | | (8,649 | ) |
Indonesian Rupiahs | | | | | | USD | | | | | |
IDR 3,550,000,000 | | Buy | | 01/04/06 | | 335,856 | | 360,772 | | 24,916 | |
Indonesian Rupiahs | | | | | | USD | | | | | |
IDR 7,150,000,000 | | Buy | | 01/04/06 | | 674,528 | | 726,626 | | 52,098 | |
Indonesian Rupiahs | | | | | | USD | | | | | |
IDR 3,510,000,000 | | Buy | | 01/05/06 | | 334,924 | | 356,707 | | 21,783 | |
Indonesian Rupiahs | | | | | | USD | | | | | |
IDR 3,520,000,000 | | Buy | | 01/05/06 | | 334,283 | | 357,724 | | 23,441 | |
Indonesian Rupiahs | | | | | | USD | | | | | |
IDR 10,580,000,000 | | Buy | | 04/03/06 | | 1,067,070 | | 1,075,203 | | 8,133 | |
Indian Rupee | | | | | | USD | | | | | |
INR 14,330,000 | | Buy | | 01/05/06 | | 310,106 | | 318,250 | | 8,144 | |
Indian Rupee | | | | | | USD | | | | | |
INR 53,670,000 | | Buy | | 01/05/06 | | 1,160,357 | | 1,191,939 | | 31,582 | |
Japanese Yen | | | | | | USD | | | | | |
JPY 10,000,000 | | Buy | | 03/08/06 | | 92,618 | | 85,427 | | (7,191 | ) |
Japanese Yen | | | | | | USD | | | | | |
JPY 410,000,000 | | Buy | | 03/09/06 | | 3,754,338 | | 3,502,951 | | (251,387 | ) |
Japanese Yen | | | | | | USD | | | | | |
JPY 410,000,000 | | Buy | | 03/09/06 | | 3,726,426 | | 3,502,951 | | (223,475 | ) |
Japanese Yen | | | | | | USD | | | | | |
JPY 5,000,000 | | Buy | | 03/09/06 | | 44,588 | | 42,719 | | (1,869 | ) |
Japanese Yen | | | | | | USD | | | | | |
JPY 565,000,000 | | Buy | | 01/04/06 | | 4,995,579 | | 4,789,386 | | (206,193 | ) |
Japanese Yen | | | | | | USD | | | | | |
JPY 341,000,000 | | Buy | | 01/04/06 | | 3,021,068 | | 2,890,585 | | (130,483 | ) |
Japanese Yen | | | | | | USD | | | | | |
JPY 163,000,000 | | Buy | | 01/04/06 | | 1,438,658 | | 1,381,717 | | (56,941 | ) |
See Accompanying Notes to Financial Statements
192
ING OPPENHEIMER
STRATEGIC INCOME PORTFOLIO | PORTFOLIO OF INVESTMENTS
AS OF december 31, 2005 (CONTINUED) |
Currency | | Buy/Sell | | Settlement
Date | | In
Exchange
For | | Value | | Unrealized
Appreciation
(Depreciation) | |
Japanese Yen | | | | | | USD | | | | | |
JPY 338,000,000 | | Buy | | 01/05/06 | | 2,992,713 | | 2,865,524 | | (127,189 | ) |
Japanese Yen | | | | | | USD | | | | | |
JPY 338,000,000 | | Buy | | 01/06/06 | | 2,970,274 | | 2,865,893 | | (104,381 | ) |
Japanese Yen | | | | | | USD | | | | | |
JPY 338,000,000 | | Buy | | 01/06/06 | | 2,944,482 | | 2,865,893 | | (78,589 | ) |
Japanese Yen | | | | | | USD | | | | | |
JPY 207,000,000 | | Buy | | 01/04/06 | | 1,811,990 | | 1,754,695 | | (57,295 | ) |
Japanese Yen | | | | | | USD | | | | | |
JPY 207,000,000 | | Buy | | 01/05/06 | | 1,809,614 | | 1,754,921 | | (54,693 | ) |
Japanese Yen | | | | | | USD | | | | | |
JPY 207,000,000 | | Buy | | 01/06/06 | | 1,813,960 | | 1,755,147 | | (58,813 | ) |
Japanese Yen | | | | | | USD | | | | | |
JPY 605,000,000 | | Buy | | 01/06/06 | | 5,053,255 | | 5,132,420 | | 79,165 | |
Japanese Yen | | | | | | USD | | | | | |
JPY 249,000,000 | | Buy | | 01/19/06 | | 2,150,631 | | 2,114,798 | | (35,833 | ) |
Japanese Yen | | | | | | USD | | | | | |
JPY 59,000,000 | | Buy | | 04/05/06 | | 506,446 | | 505,824 | | (622 | ) |
Japanese Yen | | | | | | USD | | | | | |
JPY 209,000,000 | | Buy | | 01/05/06 | | 1,772,989 | | 1,771,877 | | (1,112 | ) |
Mexican Peso | | | | | | USD | | | | | |
MXN 11,710,000 | | Buy | | 04/25/06 | | 1,051,545 | | 1,087,770 | | 36,225 | |
Mexican Peso | | | | | | USD | | | | | |
MXN 15,700,000 | | Buy | | 01/17/06 | | 1,468,319 | | 1,472,667 | | 4,348 | |
Norwegian Krone | | | | | | USD | | | | | |
NOK 9,010,000 | | Buy | | 01/20/06 | | 1,393,012 | | 1,332,124 | | (60,888 | ) |
New Zealand Dollar | | | | | | USD | | | | | |
NZD 540,000 | | Buy | | 02/02/06 | | 383,168 | | 366,637 | | (16,531 | ) |
New Zealand Dollar | | | | | | USD | | | | | |
NZD 540,000 | | Buy | | 02/02/06 | | 385,630 | | 366,637 | | (18,993 | ) |
New Zealand Dollar | | | | | | USD | | | | | |
NZD 3,560,000 | | Buy | | 02/02/06 | | 2,507,628 | | 2,417,088 | | (90,540 | ) |
Swedish Kronor | | | | | | USD | | | | | |
SEK 12,260,000 | | Buy | | 02/13/06 | | 1,542,352 | | 1,545,530 | | 3,178 | |
Swedish Kronor | | | | | | USD | | | | | |
SEK 12,160,000 | | Buy | | 02/13/06 | | 1,534,579 | | 1,532,924 | | (1,655 | ) |
Thailand Bhat | | | | | | USD | | | | | |
THB 56,000,000 | | Buy | | 01/17/06 | | 1,365,188 | | 1,365,335 | | 147 | |
Turkish Lira | | | | | | USD | | | | | |
TRY 600,000 | | Buy | | 02/07/06 | | 433,840 | | 439,474 | | 5,634 | |
Turkish Lira | | | | | | USD | | | | | |
TRY 2,010,000 | | Buy | | 01/17/06 | | 1,482,301 | | 1,480,291 | | (2,010 | ) |
| | | | | | | | | | $ | (1,134,033 | ) |
Euro | | | | | | USD | | | | | |
EUR 1,200,000 | | Sell | | 03/08/06 | | 1,488,552 | | 1,420,733 | | 67,819 | |
British Pound | | | | | | USD | | | | | |
GBP 600,000 | | Sell | | 03/08/06 | | 1,083,558 | | 1,029,961 | | 53,597 | |
Japanese Yen | | | | | | USD | | | | | |
JPY 120,000,000 | | Sell | | 03/08/06 | | 1,154,734 | | 1,025,124 | | 129,610 | |
Japanese Yen | | | | | | USD | | | | | |
JPY 10,000,000 | | Sell | | 03/08/06 | | 91,853 | | 85,427 | | 6,426 | |
Euro | | | | | | USD | | | | | |
EUR 2,000,000 | | Sell | | 03/09/06 | | 2,507,000 | | 2,368,026 | | 138,974 | |
British Pound | | | | | | USD | | | | | |
GBP 150,000 | | Sell | | 03/09/06 | | 275,190 | | 257,491 | | 17,699 | |
Japanese Yen | | | | | | USD | | | | | |
JPY 205,000,000 | | Sell | | 03/09/06 | | 1,898,623 | | 1,751,475 | | 147,148 | |
Brazilian Real | | | | | | USD | | | | | |
BRL 12,612,000 | | Sell | | 03/07/06 | | 5,187,993 | | 5,281,046 | | (93,053 | ) |
Japanese Yen | | | | | | USD | | | | | |
JPY 410,000,000 | | Sell | | 03/09/06 | | 3,742,378 | | 3,502,951 | | 239,427 | |
Japanese Yen | | | | | | USD | | | | | |
JPY 623,000,000 | | Sell | | 01/04/06 | | 5,562,500 | | 5,281,040 | | 281,460 | |
Indonesian Rupiah | | | | | | USD | | | | | |
IDR 7,150,000,000 | | Sell | | 01/04/06 | | 671,362 | | 726,626 | | (55,264 | ) |
Euro | | | | | | USD | | | | | |
EUR 50,000 | | Sell | | 03/09/06 | | 60,048 | | 59,201 | | 847 | |
Euro | | | | | | USD | | | | | |
EUR 100,000 | | Sell | | 03/08/06 | | 120,086 | | 118,394 | | 1,692 | |
Japanese Yen | | | | | | USD | | | | | |
JPY 10,000,000 | | Sell | | 03/08/06 | | 89,119 | | 85,427 | | 3,692 | |
South African Rand | | | | | | USD | | | | | |
ZAR 4,820,000 | | Sell | | 01/11/06 | | 725,794 | | 759,282 | | (33,488 | ) |
Euro | | | | | | USD | | | | | |
EUR 2,460,000 | | Sell | | 01/17/06 | | 2,964,226 | | 2,904,483 | | 59,743 | |
British Pound | | | | | | USD | | | | | |
GBP 1,110,000 | | Sell | | 01/17/06 | | 1,944,720 | | 1,905,448 | | 39,272 | |
Euro | | | | | | USD | | | | | |
EUR 2,440,000 | | Sell | | 01/18/06 | | 2,949,008 | | 2,881,032 | | 67,976 | |
Euro | | | | | | USD | | | | | |
EUR 2,550,000 | | Sell | | 01/19/06 | | 3,036,767 | | 2,981,564 | | 55,203 | |
British Pound | | | | | | USD | | | | | |
GBP 300,000 | | Sell | | 03/09/06 | | 529,913 | | 514,983 | | 14,930 | |
Euro | | | | | | USD | | | | | |
EUR 1,150,000 | | Sell | | 01/20/06 | | 1,384,934 | | 1,358,017 | | 26,917 | |
British Pound | | | | | | USD | | | | | |
GBP 300,000 | | Sell | | 03/09/06 | | 531,926 | | 514,983 | | 16,943 | |
Norwegian Krone | | | | | | USD | | | | | |
NOK 9,010,000 | | Sell | | 01/20/06 | | 1,406,208 | | 1,332,124 | | 74,084 | |
British Pound | | | | | | USD | | | | | |
GBP 300,000 | | Sell | | 03/09/06 | | 532,578 | | 514,983 | | 17,595 | |
British Pound | | | | | | USD | | | | | |
GBP 1,010,000 | | Sell | | 01/17/06 | | 1,803,678 | | 1,733,786 | | 69,892 | |
Japanese Yen | | | | | | USD | | | | | |
JPY 5,000,000 | | Sell | | 03/09/06 | | 43,514 | | 42,719 | | 795 | |
British Pound | | | | | | USD | | | | | |
GBP 350,000 | | Sell | | 03/09/06 | | 617,108 | | 600,813 | | 16,295 | |
British Pound | | | | | | USD | | | | | |
GBP 400,000 | | Sell | | 03/09/06 | | 708,720 | | 686,643 | | 22,077 | |
| | | | | | | | | | | | |
See Accompanying Notes to Financial Statements
193
ING OPPENHEIMER
STRATEGIC INCOME PORTFOLIO | PORTFOLIO OF INVESTMENTS
AS OF december 31, 2005 (CONTINUED) |
Currency | | Buy/Sell | | Settlement
Date | | In
Exchange
For | | Value | | Unrealized
Appreciation
(Depreciation) | |
Euro | | | | | | USD | | | | | |
EUR 1,190,000 | | Sell | | 01/19/06 | | 1,413,839 | | 1,405,173 | | 8,666 | |
Euro | | | | | | USD | | | | | |
EUR 2,620,000 | | Sell | | 01/18/06 | | 3,108,420 | | 3,093,567 | | 14,853 | |
Euro | | | | | | USD | | | | | |
EUR 2,255,000 | | Sell | | 01/20/06 | | 2,667,947 | | 2,662,894 | | 5,053 | |
Euro | | | | | | USD | | | | | |
EUR 2,140,000 | | Sell | | 01/19/06 | | 2,536,777 | | 2,526,949 | | 9,828 | |
British Pound | | | | | | USD | | | | | |
GBP 220,000 | | Sell | | 01/17/06 | | 382,470 | | 377,656 | | 4,814 | |
Japanese Yen | | | | | | USD | | | | | |
JPY 795,000,000 | | Sell | | 01/06/06 | | 6,798,765 | | 6,740,783 | | 57,982 | |
Canadian Dollar | | | | | | USD | | | | | |
CAD 40,000 | | Sell | | 01/23/06 | | 33,755 | | 34,266 | | (511 | ) |
South African Rand | | | | | | USD | | | | | |
ZAR 3,230,000 | | Sell | | 01/12/06 | | 476,408 | | 508,773 | | (32,365 | ) |
Japanese Yen | | | | | | USD | | | | | |
JPY 370,000,000 | | Sell | | 01/05/06 | | 3,150,357 | | 3,136,816 | | 13,541 | |
Euro | | | | | | USD | | | | | |
EUR 250,000 | | Sell | | 05/18/06 | | 295,250 | | 297,189 | | (1,939 | ) |
Swiss Francs | | | | | | USD | | | | | |
CHF 6,380,000 | | Sell | | 01/19/06 | | 4,861,693 | | 4,850,536 | | 11,157 | |
Japanese Yen | | | | | | USD | | | | | |
JPY 368,000,000 | | Sell | | 01/10/06 | | 3,112,798 | | 3,121,869 | | (9,071 | ) |
Japanese Yen | | | | | | USD | | | | | |
JPY 205,000,000 | | Sell | | 03/09/06 | | 1,743,865 | | 1,751,475 | | (7,610 | ) |
Swiss Francs | | | | | | USD | | | | | |
CHF 6,360,000 | | Sell | | 01/19/06 | | 4,862,571 | | 4,835,330 | | 27,241 | |
Brazilian Real | | | | | | USD | | | | | |
BRL 13,995,000 | | Sell | | 09/22/06 | | 5,774,706 | | 5,678,637 | | 96,069 | |
Japanese Yen | | | | | | USD | | | | | |
JPY 1,075,000,000 | | Sell | | 01/13/06 | | 9,019,970 | | 9,123,110 | | (103,140 | ) |
Euro | | | | | | USD | | | | | |
EUR 3,415,000 | | Sell | | 01/19/06 | | 4,040,184 | | 4,032,492 | | 7,692 | |
Japanese Yen | | | | | | USD | | | | | |
JPY 205,000,000 | | Sell | | 03/09/06 | | 1,734,613 | | 1,751,475 | | (16,862 | ) |
New Zealand Dollar | | | | | | USD | | | | | |
NZD 4,640,000 | | Sell | | 02/02/06 | | 3,244,265 | | 3,150,362 | | 93,903 | |
Euro | | | | | | USD | | | | | |
EUR 1,330,000 | | Sell | | 02/02/06 | | 1,573,190 | | 1,571,717 | | 1,473 | |
Euro | | | | | | USD | | | | | |
EUR 100,000 | | Sell | | 03/08/06 | | 117,636 | | 118,394 | | (758 | ) |
Japanese Yen | | | | | | USD | | | | | |
JPY 5,000,000 | | Sell | | 03/09/06 | | 42,080 | | 42,719 | | (639 | ) |
Euro | | | | | | USD | | | | | |
EUR 4,300,000 | | Sell | | 01/19/06 | | 5,048,071 | | 5,077,515 | | (29,444 | ) |
Australian Dollar | | | | | | USD | | | | | |
AUD 2,990,000 | | Sell | | 03/06/06 | | 2,212,600 | | 2,188,984 | | 23,616 | |
Argentine Peso | | | | | | USD | | | | | |
ARS 100,000 | | Sell | | 01/05/06 | | 33,445 | | 32,988 | | 457 | |
British Pound | | | | | | USD | | | | | |
GBP 400,000 | | Sell | | 03/09/06 | | 692,344 | | 686,643 | | 5,701 | |
Japanese Yen | | | | | | USD | | | | | |
JPY 303,000,000 | | Sell | | 01/10/06 | | 2,516,494 | | 2,570,452 | | (53,958 | ) |
Euro | | | | | | USD | | | | | |
EUR 1,245,000 | | Sell | | 01/19/06 | | 1,469,187 | | 1,470,118 | | (931 | ) |
Euro | | | | | | USD | | | | | |
EUR 1,270,000 | | Sell | | 01/19/06 | | 1,500,810 | | 1,499,638 | | 1,172 | |
Euro | | | | | | USD | | | | | |
EUR 1,300,000 | | Sell | | 02/13/06 | | 1,541,865 | | 1,537,175 | | 4,690 | |
Japanese Yen | | | | | | USD | | | | | |
JPY 594,000,000 | | Sell | | 01/04/06 | | 4,958,264 | | 5,035,213 | | (76,949 | ) |
British Pound | | | | | | USD | | | | | |
GBP 2,405,000 | | Sell | | 01/17/06 | | 4,269,260 | | 4,128,470 | | 140,790 | |
Swiss Francs | | | | | | USD | | | | | |
CHF 1,950,000 | | Sell | | 01/17/06 | | 1,510,399 | | 1,482,219 | | 28,180 | |
Chinese Yuan | | | | | | USD | | | | | |
CNY 12,000,000 | | Sell | | 01/17/06 | | 1,490,757 | | 1,490,886 | | (129 | ) |
Japanese Yen | | | | | | USD | | | | | |
JPY 177,000,000 | | Sell | | 01/17/06 | | 1,515,411 | | 1,502,904 | | 12,507 | |
Taiwanese Dollar | | | | | | USD | | | | | |
TWD 49,600,000 | | Sell | | 01/17/06 | | 1,483,919 | | 1,513,354 | | (29,435 | ) |
Swedish Kronor | | | | | | USD | | | | | |
SEK 12,000,000 | | Sell | | 01/17/06 | | 1,532,391 | | 1,509,779 | | 22,612 | |
New Zealand Dollar | | | | | | USD | | | | | |
NZD 2,160,000 | | Sell | | 02/21/06 | | 1,491,394 | | 1,464,455 | | 26,939 | |
New Zealand Dollar | | | | | | USD | | | | | |
NZD 2,640,000 | | Sell | | 02/21/06 | | 1,819,013 | | 1,789,889 | | 29,124 | |
Euro | | | | | | USD | | | | | |
EUR 1,785,000 | | Sell | | 01/19/06 | | 2,133,271 | | 2,107,759 | | 25,512 | |
Japanese Yen | | | | | | USD | | | | | |
JPY 249,000,000 | | Sell | | 01/19/06 | | 2,153,234 | | 2,114,798 | | 38,436 | |
Japanese Yen | | | | | | USD | | | | | |
JPY 384,000,000 | | Sell | | 01/23/06 | | 3,290,122 | | 3,263,052 | | 27,070 | |
Japanese Yen | | | | | | USD | | | | | |
JPY 384,000,000 | | Sell | | 01/05/06 | | 3,282,177 | | 3,255,506 | | 26,671 | |
Brazilian Real | | | | | | USD | | | | | |
BRL 4,380,000 | | Sell | | 01/04/06 | | 1,855,146 | | 1,873,068 | | (17,922 | ) |
Brazilian Real | | | | | | USD | | | | | |
BRL 4,370,000 | | Sell | | 01/04/06 | | 1,854,524 | | 1,868,792 | | (14,268 | ) |
Euro | | | | | | USD | | | | | |
EUR 7,675,000 | | Sell | | 01/24/06 | | 9,090,577 | | 9,065,334 | | 25,243 | |
Brazilian Real | | | | | | USD | | | | | |
BRL 8,710,000 | | Sell | | 02/02/06 | | 3,709,145 | | 3,690,562 | | 18,583 | |
Japanese Yen | | | | | | USD | | | | | |
JPY 209,000,000 | | Sell | | 04/05/06 | | 1,792,806 | | 1,791,826 | | 994 | |
| | | | | | | | | | $ | 1,802,946 | |
| | | | | | | | | | | | |
See Accompanying Notes to Financial Statements
194
ING OPPENHEIMER
STRATEGIC INCOME PORTFOLIO | PORTFOLIO OF INVESTMENTS
AS OF december 31, 2005 (CONTINUED) |
Information conerning the Interest Rate Swap Agreements outstanding for the ING Oppenheimer Strategic Income Portfolio at December 31,2005, is shown below:
Type | | Termination
Date | | Notional
Principal | | | Unrealized
Appreciation
(Depreciation) | |
Receive a fixed rate equal
to 4.480% and pay a
floating rate based
on the 6-month WIBOR | | 07/01/10 | | 265,000 | PLN | | $ | (1,646 | ) | |
Counterparty: Credit
Suisse First Boston | | | | | | | | | |
Receive a fixed rate equal
to 4.530% and pay a
floating rate based
on the 6-month WIBOR | | 07/05/10 | | 1,950,000 | PLN | | (9,565 | ) | |
Counterparty: Lehman
Brothers | | | | | | | | | |
Receive a fixed rate equal
to 10.290% and pay a
floating rate based
on the MXN-TIIE Index | | 06/04/15 | | 2,340,000 | MXN | | 18,993 | | |
Counterparty: Goldman Sachs | | | | | | | | | |
Receive a fixed rate equal
to 9.410% and pay a
floating rate based
on the MXN-TIIE Index | | 08/31/20 | | 2,240,000 | MXN | | 3,936 | | |
Counterparty: Goldman Sachs | | | | | | | | | |
Receive a fixed rate equal
to 10.700% and pay a
floating rate based
on the MXN-TIIE Index | | 05/08/15 | | 4,060,000 | MXN | | 43,056 | | |
Counterparty: Goldman Sachs | | | | | | | | | |
Receive a fixed rate equal
to 5.520% and pay a
floating rate based
on the 6-month WIBOR | | 03/24/10 | | 20,000 | PLN | | 340 | | |
Counterparty: Citigroup
Global Markets | | | | | | | | | |
Receive a fixed rate equal
to 5.550% and pay a
floating rate based
on the 6-month WIBOR | | 03/24/10 | | 32,000 | PLN | | 556 | | |
Counterparty: Citigroup
Global Markets | | | | | | | | | |
Receive a fixed rate equal
to 10.850% and pay a
floating rate based
on the MXN-TIIE Index | | 03/05/15 | | 800,000 | MXN | | 9,217 | | |
Counterparty: Goldman Sachs | | | | | | | | | |
Receive a fixed rate equal
to 18.000% and pay a
floating rate based
on the 6-Month
BRR-CDI Index | | 01/02/07 | | 599,000 | BRL | | 1,482 | | |
Counterparty: Goldman Sachs | | | | | | | | | |
Receive a fixed rate equal
to 0.670% and pay a
floating rate based
on 6-Month LIBOR | | 10/05/08 | | 222,000,000 | JPY | | 70 | | |
Counterparty:
Morgan Stanley | | | | | | | | | |
Receive a floating rate
based on the 6-Month
LIBOR and pay a fixed
rate equal to 1.522% | | 10/05/13 | | 65,000,000 | JPY | | (360 | ) | |
Counterparty: Morgan Stanley | | | | | | | | | |
Receive a fixed rate equal
to 9.510% and pay a
floating rate based
on the MXIB-TIIE Index | | 08/26/25 | | 6,700,000 | MXN | | $ | 11,908 | | |
Counterparty: Goldman Sachs | | | | | | | | | |
Receive a fixed rate equal
to 9.500% and pay a
floating rate based
on the MXIB-TIIE Index | | 08/28/25 | | 4,450,000 | MXN | | 7,489 | | |
Counterparty: Goldman Sachs | | | | | | | | | |
Receive a fixed rate equal
to 17.180% and pay a
floating rate based
on the 3-month
BRR-CDI Index | | 01/02/08 | | 4,648,000 | USD | | 1,009,203 | | |
Counterparty: Goldman Sachs | | | | | | | | | |
Receive a fixed rate equal
to 5.460% and pay a
floating rate based
on the 6-Month U.S.
Treasury Index | | 05/13/15 | | 730,000 | USD | | (37,353 | ) | |
Counterparty: Deutsche Bank | | | | | | | | | |
Receive a fixed rate equal
to 9.990% and pay a
floating rate based
on the MXIB-TIIE Index | | 07/09/15 | | 3,790,000 | MXN | | 22,712 | | |
Counterparty:
Lehman Brothers | | | | | | | | | |
Receive a fixed rate equal
to 10.000% and pay a
floating rate based
on the MXIB-TIIE Index | | 07/09/15 | | 3,830,000 | MXN | | 23,664 | | |
Counterparty: Credit Suisse
First Boston | | | | | | | | | |
Receive a fixed rate equal
to 18.160% and pay a
floating rate based
on the BZDIOVRA Index | | 01/02/08 | | 497,000 | USD | | 139,638 | | |
Counterparty: Goldman Sachs | | | | | | | | | |
Receive a fixed rate equal
to 8.140% and pay a
floating rate based
on the JIBAR 3-Month Index | | 05/18/10 | | 2,210,000 | BRL | | 9,817 | | |
Counterparty: Morgan Stanley | | | | | | | | | |
Receive a fixed rate equal
to 9.760% and pay a
floating rate based
on the MXN-TIIE Index | | 08/17/15 | | 3,700,000 | MXN | | 17,576 | | |
Counterparty: J.P. Morgan | | | | | | | | | |
Receive a fixed rate equal
to 10.430% and pay a
floating rate based
on the MXIB-TIIE Index | | 05/29/15 | | 3,400,000 | MXN | | 30,606
| | |
Counterparty: Goldman Sachs | | | | | | | | | |
Receive a fixed rate equal
to 10.300% and pay a
floating rate based
on the MXIB-TIIE Index | | 06/01/15 | | 3,400,000 | MXN | | 27,844 | | |
Counterparty:
Goldman Sachs | | | | | | | | | |
| | | | | | | | | | | |
See Accompanying Notes to Financial Statements
195
ING OPPENHEIMER
STRATEGIC INCOME PORTFOLIO | PORTFOLIO OF INVESTMENTS
AS OF december 31, 2005 (CONTINUED) |
Type | | Termination
Date | | Notional
Principal | | | Unrealized
Appreciation
(Depreciation) | |
Receive a fixed rate equal
to 5.250% and pay a
floating rate based
on the 6-Month U.S.
Treasury Index | | 06/23/15 | | 390,000 | USD | | $ | (10,530 | ) | |
Counterparty: Deutsche Bank | | | | | | | | | |
Receive a fixed rate equal
to 10.000% and pay a
floating rate based
on the MXIB-TIIE Index | | 05/29/15 | | 1,920,000 | MXN | | 12,221 | | |
Counterparty: Goldman Sachs | | | | | | | | | |
Receive a fixed rate equal
to 17.590% and pay a
floating rate based
on the 6-Month
BRR-CDI Index | | 01/02/07 | | 1,445,000 | BRL | | 2,501 | | |
Counterparty: Morgan Stanley | | | | | | | | | |
Total Interest Rate Swap Agreements | | | | | | | $ | 1,333,375 | | |
Information concerning the Credit Default Swap Agreements outstanding for the ING Oppenheimer Strategic Income Portfolio at December 31,2005, is shown below:
Ukraine
Receive $2,173,000 in the
event of default and pay
6-Month LIBOR + 1.650%
Counterparty:
Morgan Stanley | | 10/20/10 | | $2,173,000 | | | $ | (12,223 | ) | |
Phillippines
Receive $1,500,000 in the
event of default and pay
3.690% Counterparty:
Deutsche Bank | | 09/20/15 | | 1,500,000 | | | 26,250 | | |
Republic of Colombia
Receive $360,000 in the
event of default and pay
3.700% Counterparty:
Morgan Stanley | | 08/20/15 | | 360,000 | | | (36,534) | | |
Hungary
Receive $745,000 in the
event of default and pay
0.400% Counterparty:
Citigroup Global Markets | | 12/20/15 | | 745,000 | | | 352 | | |
Total Credit Default Swap Agreements | | | | | | | $ | (22,155 | ) | |
Total Swap Agreements | | | | | | | $ | 1,311,220 | | |
See Accompanying Notes to Financial Statements
196
| PORTFOLIO OF INVESTMENTS |
ING PIMCO TOTAL RETURN PORTFOLIO | AS OF DECEMBER 31, 2005 |
Principal
Amount | | | | | | Value | |
CORPORATE BONDS/NOTES: 1.6% | | | |
| | | | | | | |
| | | | Auto Manufacturers: 0.2% | | | |
$ | 500,000 | | | | DaimlerChrysler NA Holding Corp., 4.700%, due 03/07/07 | | $ | 499,660 | |
| | | | | | 499,660 | |
| | | | | | | |
| | | | Diversified Financial Services: 0.5% | | | |
150,000 | | L | | CIT Group, Inc., 7.750%, due 04/02/12 | | 170,333 | |
100,000 | | S | | Citigroup, Inc., 5.625%, due 08/27/12 | | 103,214 | |
600,000 | | | | Ford Motor Credit Co., 5.800%, due 01/12/09 | | 523,751 | |
400,000 | | | | Ford Motor Credit Co., 7.000%, due 10/01/13 | | 342,268 | |
100,000 | | | | Ford Motor Credit Co., 7.375%, due 02/01/11 | | 87,741 | |
100,000 | | C,L | | Morgan Stanley, 5.300%, due 03/01/13 | | 100,348 | |
| | | | | | 1,327,655 | ` |
| | | | | | | |
| | | | Electric: 0.2% | | | |
300,000 | | C,S | | Columbus Southern Power Co., 6.600%, due 03/01/33 | | 330,352 | |
100,000 | | C | | Entergy Gulf States, Inc., 3.600%, due 06/01/08 | | 96,216 | |
150,000 | | C | | TXU Energy Co. LLC, 4.300%, due 01/17/06 | | 150,001 | |
| | | | | | 576,569 | |
| | | | | | | |
| | | | Healthcare-Services: 0.1% | | | |
340,000 | | C,L | | HCA, Inc., 5.250%, due 11/06/08 | | 337,220 | |
| | | | | | 337,220 | |
| | | | | | | |
| | | | Oil & Gas: 0.2% | | | |
100,000 | | | | Pemex Project Funding Master Trust, 7.375%, due 12/15/14 | | 111,350 | |
200,000 | | | | Pemex Project Funding Master Trust, 8.625%, due 02/01/22 | | 247,000 | |
100,000 | | # | | Pemex Project Funding Master Trust, 9.750%, due 03/30/18 | | 127,600 | |
| | | | | | 485,950 | |
| | | | | | | |
| | | | Pipelines: 0.2% | | | |
200,000 | | C,L | | El Paso Corp., 7.750%, due 01/15/32 | | 201,500 | |
300,000 | | # | | Williams Cos, Inc., 6.375%, due 10/01/10 | | 301,125 | |
| | | | | | 502,625 | |
| | | | | | | |
| | | | Telecommunications: 0.2% | | | |
24,000 | | C | | AT&T Corp., 9.050%, due 11/15/11 | | 26,595 | |
30,000 | | C,S | | AT&T Wireless Services, Inc., 7.875%, due 03/01/11 | | 33,698 | |
200,000 | | C,L | | Qwest Corp., 8.875%, due 03/15/12 | | 226,500 | |
400,000 | | C,S | | SBC Communications, Inc., 4.125%, due 09/15/09 | | 386,575 | |
| | | | | | 673,368 | |
| | | | Total Corporate Bonds/Notes
(Cost $4,349,559) | | 4,403,047 | |
| | | | | | | |
U.S. GOVERNMENT AGENCY OBLIGATIONS: 67.6% | | | |
| | | | | | | |
| | | | Federal Home Loan Mortgage Corporation: 6.8% | | | |
$ | 18,775 | | C | | 0.010%, due 04/25/24 | | $ | 18,736 | |
918,666 | | C,S | | 2.750%, due 02/15/12 | | 911,928 | |
805,746 | | C,S | | 3.500%, due 03/15/10 | | 802,928 | |
51,202 | | C | | 3.500%, due 07/15/32 | | 49,101 | |
1,086,086 | | C | | 4.363%, due 10/25/44 | | 1,092,826 | |
721,530 | | C,S | | 4.510%, due 01/25/45 | | 720,452 | |
61,399 | | C | | 4.770%, due 05/15/29 | | 61,557 | |
124,658 | | C | | 5.000%, due 09/15/16 | | 124,610 | |
4,546,182 | | C | | 5.000%, due 01/15/24 | | 4,546,207 | |
2,600,000 | | C | | 5.000%, due 07/15/24 | | 2,596,139 | |
498,242 | | | | 5.000%, due 08/01/35 | | 482,516 | |
989,664 | | | | 5.000%, due 09/01/35 | | 958,428 | |
37,452 | | | | 5.500%, due 08/01/07 | | 37,695 | |
236,179 | | | | 5.500%, due 03/01/23 | | 236,442 | |
513,908 | | | | 5.500%, due 05/01/23 | | 514,481 | |
66,924 | | | | 5.500%, due 08/15/30 | | 66,872 | |
488,094 | | | | 5.500%, due 05/01/35 | | 483,874 | |
3,644,243 | | | | 5.500%, due 05/01/35 | | 3,612,736 | |
683,889 | | C | | 5.630%, due 03/25/24 | | 713,766 | |
123,265 | | | | 5.694%, due 04/01/32 | | 127,145 | |
10,386 | | | | 6.000%, due 10/01/17 | | 10,605 | |
57,011 | | | | 6.000%, due 02/01/22 | | 58,059 | |
1,063,124 | | S | | 6.000%, due 03/01/23 | | 1,082,057 | |
| | | | | | 19,309,160 | |
| | | | | | | |
| | | | Federal National Mortgage Association: 60.8% | | | |
834,168 | | S | | 3.822%, due 11/28/35 | | 834,470 | |
924,436 | | | | 4.000%, due 08/25/09 | | 920,305 | |
6,200,000 | | | | 4.120%, due 03/22/06 | | 6,143,109 | |
3,443,812 | | | | 4.197%, due 11/01/34 | | 3,406,290 | |
526,435 | | | | 4.310%, due 03/25/34 | | 527,153 | |
525,475 | | | | 4.363%, due 10/01/44 | | 530,146 | |
800,544 | | | | 4.363%, due 10/01/44 | | 807,661 | |
3,900,000 | | S | | 4.376%, due 09/22/06 | | 3,899,906 | |
2,454,306 | | | | 4.447%, due 02/01/35 | | 2,430,269 | |
68,310 | | C | | 4.541%, due 05/25/34 | | 68,122 | |
32,265 | | | | 4.772%, due 02/01/20 | | 32,978 | |
35,145 | | | | 4.963%, due 09/01/31 | | 36,076 | |
1,139,602 | | | | 4.994%, due 09/01/34 | | 1,129,961 | |
150,410 | | | | 5.000%, due 05/01/18 | | 149,064 | |
956,090 | | | | 5.000%, due 11/01/18 | | 947,534 | |
522,435 | | | | 5.000%, due 02/01/19 | | 517,282 | |
96,126 | | | | 5.000%, due 08/01/19 | | 95,177 | |
483,195 | | | | 5.000%, due 10/01/19 | | 478,429 | |
5,882,669 | | | | 5.000%, due 06/25/27 | | 5,867,655 | |
772,443 | | | | 5.000%, due 08/01/35 | | 748,707 | |
24,946 | | | | 5.000%, due 09/01/35 | | 24,180 | |
654,075 | | | | 5.000%, due 11/01/35 | | 633,976 | |
344,258 | | | | 5.000%, due 11/01/35 | | 333,679 | |
499,168 | | | | 5.000%, due 11/01/35 | | 483,829 | |
4,980,748 | | | | 5.000%, due 11/01/35 | | 4,827,694 | |
392,196 | | | | 5.000%, due 11/01/35 | | 380,144 | |
386,754 | | | | 5.000%, due 11/01/35 | | 374,870 | |
713,754 | | | | 5.000%, due 11/01/35 | | 693,202 | |
1,492,527 | | | | 5.000%, due 12/01/35 | | 1,446,663 | |
8,000,000 | | W | | 5.000%, due 02/13/36 | | 7,747,504 | |
186,079 | | | | 5.275%, due 12/01/36 | | 186,765 | |
3,645,436 | | | | 5.337%, due 02/01/33 | | 3,681,137 | |
13,405 | | | | 5.500%, due 01/25/16 | | 13,377 | |
160,077 | | | | 5.500%, due 03/01/16 | | 161,377 | |
See Accompanying Notes to Financial Statements
197
| PORTFOLIO OF INVESTMENTS |
Ing Pimco TOTAL RETURN PORTFOLIO | AS OF DECEMBER 31, 2005 (CONTINUED) |
Principal
Amount | | | | | | Value | |
| | | | Federal National Mortgage Association (continued) | | | |
$ | 306,941 | | | | 5.500%, due 06/01/23 | | $ | 307,098 | |
821,181 | | | | 5.500%, due 02/01/24 | | 821,600 | |
107,771 | | | | 5.500%, due 05/01/33 | | 107,015 | |
44,032 | | | | 5.500%, due 07/01/33 | | 43,723 | |
854,084 | | S | | 5.500%, due 11/01/33 | | 848,087 | |
320,437 | | | | 5.500%, due 11/01/33 | | 318,187 | |
223,528 | | | | 5.500%, due 12/01/33 | | 221,959 | |
512,638 | | | | 5.500%, due 04/01/34 | | 509,039 | |
99,538 | | | | 5.500%, due 10/01/34 | | 98,690 | |
861,697 | | S | | 5.500%, due 11/01/34 | | 854,354 | |
330,064 | | | | 5.500%, due 12/01/34 | | 327,251 | |
893,000 | | S | | 5.500%, due 12/01/34 | | 885,390 | |
44,268 | | | | 5.500%, due 12/01/34 | | 43,891 | |
519,110 | | | | 5.500%, due 01/01/35 | | 514,686 | |
962,249 | | S | | 5.500%, due 01/01/35 | | 954,048 | |
14,183,210 | | | | 5.500%, due 02/01/35 | | 14,062,340 | |
9,101,984 | | S | | 5.500%, due 02/01/35 | | 9,024,417 | |
37,655 | | | | 5.500%, due 04/01/35 | | 37,306 | |
115,359 | | | | 5.500%, due 04/01/35 | | 114,290 | |
38,767 | | | | 5.500%, due 04/01/35 | | 38,407 | |
877,621 | | | | 5.500%, due 05/01/35 | | 869,485 | |
52,388 | | | | 5.500%, due 05/01/35 | | 51,902 | |
3,089,442 | | S | | 5.500%, due 05/01/35 | | 3,060,801 | |
801,788 | | | | 5.500%, due 06/01/35 | | 794,355 | |
882,479 | | | | 5.500%, due 06/01/35 | | 874,298 | |
863,706 | | | | 5.500%, due 07/01/35 | | 855,699 | |
744,270 | | | | 5.500%, due 07/01/35 | | 737,370 | |
50,245 | | | | 5.500%, due 08/01/35 | | 49,779 | |
2,440,465 | | | | 5.500%, due 08/01/35 | | 2,417,840 | |
2,932,612 | | | | 5.500%, due 08/01/35 | | 2,905,424 | |
489,277 | | | | 5.500%, due 08/01/35 | | 484,741 | |
488,879 | | | | 5.500%, due 09/01/35 | | 484,346 | |
7,419,802 | | | | 5.500%, due 09/01/35 | | 7,351,014 | |
59,000,000 | | | | 5.500%, due 01/12/36 | | 58,428,408 | |
3,000,000 | | | | 5.500%, due 02/13/36 | | 2,968,125 | |
244,518 | | | | 5.720%, due 04/25/24 | | 253,090 | |
294,636 | | | | 5.735%, due 04/01/32 | | 294,078 | |
155,431 | | | | 6.000%, due 04/01/17 | | 158,931 | |
430,660 | | | | 6.000%, due 06/01/17 | | 440,360 | |
76,604 | | | | 6.000%, due 01/01/18 | | 78,330 | |
51,913 | | | | 6.000%, due 12/01/18 | | 52,925 | |
582,475 | | | | 6.000%, due 04/01/22 | | 592,891 | |
1,246,824 | | S | | 6.000%, due 06/01/22 | | 1,269,121 | |
240,929 | | | | 6.000%, due 01/01/23 | | 245,238 | |
188,076 | | | | 6.500%, due 03/01/17 | | 193,294 | |
45,688 | | | | 6.500%, due 07/01/29 | | 47,065 | |
5,370,536 | | | | 7.500%, due 08/25/35 | | 5,598,657 | |
| | | | | | 172,248,036 | |
| | | | | | | |
| | | | Government National Mortgage Association: 0.0% | | | |
65,089 | | C | | 4.770%, due 03/16/32 | | 65,568 | |
| | | | | | 65,568 | |
| | | | Total U.S. Government Agency Obligations
(Cost $192,243,902) | | 191,622,764 | |
| | | | | | | |
U.S. TREASURY OBLIGATIONS: 15.4% | | | |
| | | | | | | |
| | | | U.S. Treasury Bond: 5.6% | | | |
1,700,000 | | S | | 6.250%, due 08/15/23 | | 2,030,572 | |
300,000 | | L | | 7.250%, due 08/15/22 | | 390,774 | |
2,000,000 | | L | | 8.125%, due 08/15/19 | | 2,713,908 | |
$ | 6,100,000 | | L | | 8.750%, due 05/15/17 | | $ | 8,378,448 | |
1,700,000 | | S | | 8.875%, due 08/15/17 | | 2,362,867 | |
| | | | | | 15,876,569 | |
| | | | | | | |
| | | | U.S. Treasury Inflation-Indexed Bond: 1.2% | | | |
1,400,000 | | L | | 1.875%, due 07/15/13 | | 1,498,141 | |
700,000 | | L | | 1.875%, due 07/15/15 | | 705,229 | |
1,200,000 | | S,L | | 2.000%, due 07/15/14 | | 1,261,449 | |
| | | | | | 3,464,819 | |
| | | | | | | |
| | | | U.S. Treasury Note: 8.6% | | | |
2,900,000 | | | | 4.250%, due 08/15/13 | | 2,874,967 | |
6,400,000 | | | | 4.250%, due 11/15/13 | | 6,341,005 | |
6,600,000 | | | | 4.250%, due 08/15/14 | | 6,529,882 | |
8,800,000 | | | | 4.250%, due 11/15/14 | | 8,700,313 | |
| | | | | | 24,446,167 | |
| | | | Total U.S. Treasury Obligations
(Cost $43,810,739) | | 43,787,555 | |
| | | | | | | |
ASSET-BACKED SECURITIES: 2.5% | | | |
| | | | | | | |
| | | | Credit Card Asset Backed Securities: 0.2% | | | |
700,000 | | C,S | | Bank One Issuance Trust, 4.420%, due 10/15/08 | | 700,490 | |
| | | | | | 700,490 | |
| | | | | | | |
| | | | Home Equity Asset Backed Securities: 1.8% | | | |
1,296,026 | | #,C,S | | AAA Trust, 3.560%, due 11/26/35 | | 1,297,648 | |
1,187,014 | | C | | ACE Securities Corp., 4.489%, due 10/25/35 | | 1,187,844 | |
1,295,902 | | C | | Argent Securities, Inc., 4.479%, due 11/25/35 | | 1,296,813 | |
101,029 | | C | | HFC Home Equity Loan Asset Backed Certificates, 4.720%, due 10/20/32 | | 101,128 | |
784,806 | | C | | New Century Home Equity Loan Trust, 4.280%, due 07/25/35 | | 785,165 | |
489,465 | | C | | New Century Home Equity Loan Trust, 4.300%, due 09/25/35 | | 489,832 | |
| | | | | | 5,158,430 | |
| | | | | | | |
| | | | Other Asset Backed Securities: 0.5% | | | |
792,434 | | C | | Countrywide Asset-Backed Certificates, 4.270%, due 12/25/35 | | 792,970 | |
196,720 | | #,C,S | | Quest Trust, 4.750%, due 06/25/34 | | 197,233 | |
86,424 | | C,S | | Residential Asset Mortgage Products, Inc., 4.330%, due 05/25/26 | | 86,485 | |
229,280 | | C,S | | Residential Asset Mortgage Products, Inc., 4.530%, due 11/25/33 | | 229,422 | |
44,249 | | C,S | | Structured Asset Securities Corp., 4.690%, due 05/25/32 | | 44,476 | |
| | | | | | 1,350,586 | |
| | | | Total Asset-Backed Securities
(Cost $7,203,984) | | 7,209,506 | |
See Accompanying Notes to Financial Statements
198
| PORTFOLIO OF INVESTMENTS |
Ing pimco TOTAL RETURN PORTFOLIO | AS OF DECEMBER 31, 2005 (CONTINUED) |
Principal
Amount | | | | | | Value | |
COLLATERALIZED MORTGAGE OBLIGATIONS: 10.8% | | | |
| | | | | | | |
| | | | Agency Collateral CMO: 2.0% | | | |
$ | 5,596,241 | | C | | FHLMC Structured Pass Through Securities, 4.419%, due 07/25/44 | | $ | 5,682,976 | |
| | | | | | 5,682,976 | |
| | | | | | | |
| | | | Agency Collateral PAC CMO: 0.3% | | | |
310,111 | | | | Fannie Mae, 3.500%, due 04/25/17 | | 307,082 | |
648,016 | | | | Fannie Mae, 5.000%, due 04/25/14 | | 646,692 | |
| | | | | | 953,774 | |
| | | | | | | |
| | | | Commercial Mortgage Backed Securities: 0.1% | | | |
190,825 | | #,S | | Banc of America Large Loan, 4.570%, due 11/15/15 | | 191,032 | |
| | | | | | 191,032 | |
| | | | | | | |
| | | | Whole Loan Collateral CMO: 8.2% | | | |
845,181 | | C | | Adjustable Rate Mortgage Trust, 4.625%, due 05/25/35 | | 834,167 | |
1,219,784 | | C | | American Home Mortgage Investment Trust, 4.390%, due 02/25/45 | | 1,191,020 | |
1,181,697 | | C | | Banc of America Funding Corp., 4.116%, due 05/25/35 | | 1,170,801 | |
944,622 | | C | | Banc of America Mortgage Securities, 3.990%, due 07/25/33 | | 909,297 | |
316,884 | | C,S | | Banc of America Mortgage Securities, 4.830%, due 01/25/34 | | 319,030 | |
512,143 | | C | | Banc of America Mortgage Securities, 5.000%, due 05/25/34 | | 504,883 | |
1,247,962 | | C | | Bear Stearns Adjustable Rate Mortgage Trust, 4.750%, due 10/25/35 | | 1,240,196 | |
35,082 | | C,S | | Bear Stearns Adjustable Rate Mortgage Trust, 5.942%, due 06/25/32 | | 35,007 | |
826,822 | | C,S | | Bear Stearns Alt-A Trust, 5.426%, due 05/25/35 | | 829,620 | |
1,129,463 | | C | | Citigroup Mortgage Loan Trust, Inc., 4.722%, due 08/25/35 | | 1,112,270 | |
1,276,115 | | C | | Countrywide Alternative Loan Trust, 4.580%, due 11/20/35 | | 1,275,568 | |
1,190,809 | | C | | Countrywide Alternative Loan Trust, 4.580%, due 11/20/35 | | 1,190,133 | |
193,081 | | C,S | | Countrywide Home Loan Mortgage Pass Through Trust, 4.470%, due 08/25/34 | | 193,199 | |
701,025 | | C,S | | Countrywide Home Loan Mortgage Pass Through Trust, 4.699%, due 03/25/35 | | 700,240 | |
2,045,375 | | #,C,S | | Countrywide Home Loan Mortgage Pass Through Trust, 4.719%, due 06/25/35 | | 2,049,711 | |
213,814 | | C,S | | CS First Boston Mortgage Securities Corp., 5.750%, due 09/22/17 | | 211,548 | |
$ | 932,836 | | C | | Downey Savings & Loan Association Mortgage Loan Trust, 5.244%, due 07/19/44 | | $ | 942,439 | |
488,530 | | C | | GMAC Mortgage Corp. Loan Trust, 5.500%, due 09/25/34 | | 485,828 | |
437,867 | | C | | GSR Mortgage Loan Trust, 3.412%, due 06/25/34 | | 429,664 | |
1,226,976 | | C | | GSR Mortgage Loan Trust, 4.541%, due 09/25/35 | | 1,207,671 | |
17,548 | | C | | GSR Mortgage Loan Trust, 6.000%, due 03/25/32 | | 17,522 | |
883,170 | | C | | Harborview Mortgage Loan Trust, 4.590%, due 05/19/35 | | 879,278 | |
60,852 | | C,S | | Residential Funding Mtg Sec I, 6.500%, due 03/25/32 | | 61,744 | |
649,654 | | C,S | | Sequoia Mortgage Trust, 4.720%, due 07/20/33 | | 651,663 | |
93,488 | | C,S | | Washington Mutual, Inc., 4.324%, due 02/27/34 | | 93,124 | |
148,764 | | C | | Washington Mutual, Inc., 4.419%, due 08/25/42 | | 148,060 | |
839,509 | | C,S | | Washington Mutual, Inc., 4.649%, due 12/25/27 | | 839,415 | |
704,290 | | C,S | | Washington Mutual, Inc., 4.689%, due 01/25/45 | | 704,998 | |
1,881,344 | | C,S | | Wells Fargo Mortgage Backed Securities Trust, 3.989%, due 01/25/35 | | 1,844,428 | |
1,076,061 | | C | | Wells Fargo Mortgage Backed Securities Trust, 4.362%, due 05/25/35 | | 1,062,696 | |
| | | | | | 23,135,220 | |
| | | | | | | |
| | | | Whole Loan Collateral PAC: 0.2% | | | |
272,231 | | C,S | | Residential Accredit Loans, Inc., 4.779%, due 03/25/33 | | 272,613 | |
328,383 | | C | | Residential Asset Securitization Trust, 4.779%, due 05/25/33 | | 329,126 | |
| | | | | | 601,739 | |
| | | | Total Collateralized Mortgage Obligations
(Cost $30,664,676) | | 30,564,741 | |
| | | | | | | |
MUNICIPAL BONDS: 2.1% | | | |
| | | | | | | |
| | | | Municipal: 2.1% | | | |
250,000 | | C,S | | Akron, OH, 5.000%, due 12/01/33 | | 260,083 | |
200,000 | | C | | Badger TOB Asset Securitization Corp., 6.125%, due 06/01/27 | | 211,094 | |
800,000 | | C,S | | Badger TOB Asset Securitization Corp., 6.375%, due 06/01/32 | | 852,504 | |
10,000 | | S | | City of San Antonio TX, 5.000%, due 02/01/10 | | 10,588 | |
390,000 | | S | | City of San Antonio TX, 5.000%, due 02/01/10 | | 412,164 | |
50,000 | | C | | Clark County School District, 6.970%, due 06/15/13 | | 60,646 | |
100,000 | | S | | Energy Northwest, 5.500%, due 07/01/12 | | 109,996 | |
50,000 | | | | Energy Northwest, 8.310%, due 07/01/15 | | 62,167 | |
200,000 | | C | | Florida State Board of Education, 5.000%, due 06/01/32 | | 208,634 | |
See Accompanying Notes to Financial Statements
199
| PORTFOLIO OF INVESTMENTS |
Ing Pimco TOTAL RETURN PORTFOLIO | AS OF DECEMBER 31, 2005 (CONTINUED) |
Principal
Amount | | | | | | Value | |
| | | | Municipal (continued) | | | |
$ | 100,000 | | C | | Golden State Tobacco Securitization Corp., 6.250%, due 06/01/33 | | $ | 108,877 | |
300,000 | | C | | Golden State Tobacco Securitization Corp., 6.750%, due 06/01/39 | | 335,883 | |
100,000 | | C | | Kettering City School District, 5.000%, due 12/01/30 | | 104,441 | |
645,000 | | C | | New York City Municipal Water Finance Authority, 6.220%, due 06/15/34 | | 688,679 | |
300,000 | | C | | New York City Municipal Water Finance Authority, 5.667%, due 06/15/38 | | 322,392 | |
450,000 | | C | | Orange County Sanitation District, 6.240%, due 02/01/33 | | 487,962 | |
150,000 | | | | State of California, 6.240%, due 07/01/11 | | 173,226 | |
300,000 | | C | | State of Texas, 5.185%, due 04/01/35 | | 303,978 | |
890,000 | | C | | Texas State University, 5.000%, due 03/15/30 | | 928,181 | |
100,000 | | C,S | | Tobacco Settlement Financing Corp./LA, 5.875%, due 05/15/39 | | 104,332 | |
200,000 | | C,S | | Tobacco Settlement Financing Corp./RI, 6.250%, due 06/01/42 | | 208,870 | |
| | | | | | 5,954,697 | |
| | | | Total Municipal Bonds
(Cost $5,739,290) | | 5,954,697 | |
| | | | | | | |
OTHER BONDS: 12.6% | | | |
| | | | | | | |
| | | | Foreign Government Bonds: 12.6% | | | |
24,000 | | @@,C,L | | Brazil Government Bond, 5.188%, due 04/15/06 | | 24,016 | |
143,300 | | @@,C | | Brazil Government Bond, 5.250%, due 04/15/09 | | 142,743 | |
592,658 | | @@,C | | Brazil Government Bond, 5.250%, due 04/15/12 | | 586,731 | |
738,000 | | @@,L | | Brazilian Government International Bond, 8.000%, due 01/15/18 | | 797,409 | |
380,000 | | @@,L | | Brazil Government Bond, 10.271%, due 06/29/09 | | 439,375 | |
160,000 | | @@,L | | Brazil Government Bond, 11.500%, due 03/12/08 | | 179,360 | |
1,100,000 | | @@ | | Deutsche Bundesrepublik, 4.250%, due 01/04/14 | | 1,388,790 | |
600,000 | | @@ | | Deutsche Bundesrepublik, 4.250%, due 07/04/14 | | 758,857 | |
6,200,000 | | @@ | | Dutch Treasury Certificate, 2.080%, due 01/31/06 | | 7,300,116 | |
4,800,000 | | @@ | | Dutch Treasury Certificate, 2.110%, due 02/28/06 | | 5,642,366 | |
600,000 | | @@,# | | Export-Import Bank of China, 4.875%, due 07/21/15 | | 584,315 | |
3,320,000 | | @@ | | French Discount T-Bill, 2.370%, due 02/09/06 | | 3,905,808 | |
3,990,000 | | @@ | | French Discount T-Bill, 2.430%, due 03/23/06 | | 4,680,472 | |
$ | 1,310,000 | | @@ | | French Discount T-Bill, 2.500%, due 05/24/06 | | $ | 1,529,897 | |
4,040,000 | | @@ | | French Government Bond OAT, 5.000%, due 01/12/06 | | 4,769,077 | |
400,000 | | @@,# | | Hong Kong Government Bond, 5.125%, due 08/01/14 | | 401,333 | |
100,000 | | @@,S | | Mexico Government Bond, 6.375%, due 01/16/13 | | 106,500 | |
150,000 | | @@ | | Mexico Government Bond, 8.125%, due 12/30/19 | | 184,500 | |
300,000 | | @@,S | | Mexico Government Bond, 8.300%, due 08/15/31 | | 386,250 | |
250,000 | | @@,L | | Panama Government Bond, 8.875%, due 09/30/27 | | 298,750 | |
25,000 | | @@ | | Panama Government Bond, 9.375%, due 01/16/23 | | 31,438 | |
84,000 | | @@ | | Panama Government Bond, 9.625%, due 02/08/11 | | 98,490 | |
100,000 | | @@,L | | Peru Government Bond, 9.125%, due 01/15/08 | | 108,000 | |
340,000 | | @@ | | Peru Government Bond, 9.125%, due 02/21/12 | | 390,150 | |
740,000 | | @@ | | Russia Government Bond, 5.000%, due 03/31/30 | | 837,221 | |
60,000 | | @@ | | Russia Government Bond, 8.250%, due 03/31/10 | | 64,014 | |
75,000 | | @@ | | South Africa Government Bond, 9.125%, due 05/19/09 | | 84,281 | |
117,608 | | @@ | | Ukraine Government Bond, 11.000%, due 03/15/07 | | 122,546 | |
| | | | | | 35,842,805 | |
| | | | Total Other Bonds
(Cost $35,821,092) | | 35,842,805 | |
| | | | | | | | | | |
Shares | | | | | | Value | |
| | | | | | | |
PREFERRED STOCK: 0.1% | | | |
| | | | | | | |
| | | | Federal National Mortgage Association: 0.1% | | | |
2,900 | | C | | Fannie Mae | | $ | 158,775 | |
| | | | | | 158,775 | |
| | | | Total Preferred Stock
(Cost $145,000) | | 158,775 | |
| | | | | | | | |
No. of
Contracts/Notional Principal | | Value | |
| | | | | | | |
OPTIONS: 0.1% | | | | | | | |
| 123 | | | | EuroDollar Put Option, expires 12/18/2006 | | $ | — | |
EUR | 5,300,000 | | I | | EURO Call Swaption, Strike Price 4.50, expires 04/04/06 | | 2,942 | |
EUR | 1,000,000 | | I | | EURO Call Swaption, Strike Price 4.50, expires 06/02/06 | | 4,455 | |
EUR | 6,500,000 | | I | | EURO Call Swaption, Strike Price 4.50, expires 10/04/06 | | 16,598 | |
EUR | 5,100,000 | | I | | EURO Call Swaption, Strike Price 4.25, expires 10/24/06 | | 7,823 | |
EUR | 500,000 | | I | | EURO Put Swaption, Strike Price 6.25, expires 04/27/09 | | 14,964 | |
EUR | 12,100,000 | | I | | EURO Call Swaption, Strike Price 4.25, expires 10/12/06 | | 17,303 | |
| | | | | | | | | |
See Accompanying Notes to Financial Statements
200
| PORTFOLIO OF INVESTMENTS |
Ing Pimco TOTAL RETURN PORTFOLIO | AS OF DECEMBER 31, 2005 (CONTINUED) |
No. of
Contracts | | | | | | Value | |
OPTIONS (continued) | | | | | |
9,500,000 | | | | EURO Call Swaption, Strike Price 4.50, expires 10/18/06 | | $ | 26,334 | |
12,800,000 | | | | EURO Call Swaption, Strike Price 4.75, expires 08/08/06 | | 47,629 | |
500,000 | | | | EURO Call Swaption, Strike Price 5.75, expires 04/27/09 | | 64,882 | |
| | | | | | 202,930 | |
| | | | Total Purchased Options
(Cost $291,228) | | 202,930 | |
| | | | Total Long-Term Investments:
(Cost $320,269,470) | | 319,746,820 | |
| | | | | | | | | |
No. of
Contracts | | | | | | Value | |
| | | | | | | |
SHORT-TERM INVESTMENTS: 24.2% | | | |
| | | | Commercial Paper: 18.0% | | | |
$ | 3,700,000 | | | | Barclays PLC, 4.300%, due 02/28/05 | | 3,376,562 | |
3,400,000 | | | | Barclays PLC, 4.310%, due 02/27/06 | | 3,674,090 | |
7,600,000 | | | | BNP Paribas, 4.380%, due 04/20/06 | | 7,499,604 | |
800,000 | | # | | COX Communications, Inc., 4.270%, due 01/17/06 | | 800,000 | |
2,600,000 | | | | Den Norske Bank ASA, 4.100%, due 02/22/06 | | 2,584,390 | |
3,100,000 | | | | Den Norske Bank ASA, 4.440%, due 04/28/06 | | 3,055,515 | |
2,000,000 | | | | Dexia Delaware LLC, 4.220%, due 03/14/06 | | 1,983,020 | |
1,500,000 | | | | HBOS Treasury Services PLC, 4.130%, due 02/15/06 | | 1,492,127 | |
2,900,000 | | | | HBOS Treasury Services PLC, 4.150%, due 04/28/06 | | 2,882,055 | |
3,600,000 | | | | NAT AUS FDG, 4.300%, due 01/04/06 | | 3,598,280 | |
2,100,000 | | | | Skandinavia Enskilda Banken, 4.300%, due 02/17/06 | | 2,088,020 | |
800,000 | | | | Societe Generale, 4.180%, due 03/06/06 | | 794,008 | |
7,500,000 | | | | Societe Generale, 4.250%, due 03/20/06 | | 7,430,625 | |
1,800,000 | | | | UBS Finance LLC, 4.070%, due 02/22/06 | | 1,789,272 | |
400,000 | | | | UBS Finance LLC, 4.300%, due 02/28/06 | | 397,199 | |
1,100,000 | | | | UBS Finance LLC, 4.150%, due 03/02/06 | | 1,092,311 | |
5,000,000 | | | | UBS Finance LLC, 4.370%, due 04/17/06 | | 4,935,850 | |
1,500,000 | | | | Westpac Trust, 4.300%, due 02/21/06 | | 1,490,743 | |
| | | | | | 50,963,671 | |
| | | | Treasury Bill: 0.2% | | | |
670,000 | | L | | United States Treasury Bill, 3.770%, due 03/16/06 | | 664,773 | |
| | | | | | 664,773 | |
| | | | | | | |
$ | 208,383,000 | | | | The Bank of New York Institutional Cash Reserves Fund | | $ | 16,934,000 | |
| | | | | | 16,934,000 | |
| | | | Total Short-Term Investments:
(Cost $68,558,066) | | 68,562,444 | |
| | | | Total Investments in Securities
(Cost $388,827,536)* | | 137.0 | % | | | $ | 388,309,264 | |
| | | | Other Assets and Liabilities-Net | | (37.0 | ) | | | (104,902,164 | ) |
| | | | Net Assets | | 100.0 | | | | $ | 283,407,100 | |
| | | | | | | | | | | | | | | |
@@ | | Foreign Issuer |
# | | Securities with purchases pursuant to Rule 144A, under the Securities Act of 1933 and may not be resold subject to that rule except to qualified institutional buyers. These securities have been determined to be liquid under the guidelines established by the Funds’ Board of Directors/Trustees. |
C | | Bond may be called prior to maturity date. |
cc | | Securities purchased with cash collateral for securities loaned. |
W | | When-issued or delayed delivery security. |
S | | Segregated securities for certain derivatives, when-issued or delayed-delivery securities and forward foreign currency exchange contracts. |
I | | Illiquid security |
L | | Loaned security, a portion or all of the security is on loan at December 31, 2005. |
* | | Cost for federal income tax purposes is $389,296,250. |
| Net unrealized depreciation consists of: | | | |
| Gross Unrealized Appreciation | | $ | 4,050,412 | |
| Gross Unrealized Depreciation | | (5,037,398 | ) |
| Net Unrealized Depreciation | | $ | (986,986 | ) |
| | | | | | | |
No. of Contracts/
Notional Principal | | Expiration Date | | Strike Price/Rate | | Value | |
| | | | | | | |
WRITTEN OPTIONS
Call Options Written | | | | | | | |
64 | | U.S. Treasury
Note Future | | 2/24/06 | | 111 | | $ | (16,000 | ) |
EUR
5,500,000 | | OTC 3 Months LIBOR/
5 Years Interest Rate
Swaption Counterparty:
Merrill Lynch Capital Services | | 8/8/06 | | 4.78 | | (52,305 | ) |
EUR 4,100,000 | | OTC 3 Months LIBOR/
5 Years Interest Rate
Swaption Counterparty: J.P. Morgan
Chase Bank | | 10/18/06 | | 4.56 | | (30,676 | ) |
EUR 5,200,000 | | OTC 3 Months LIBOR/
5 Years Interest Rate
Swaption Counterparty: J.P. Morgan
Chase Bank | | 10/12/06 | | 4.30 | | (20,847 | ) |
EUR 1,800,000 | | OTC 3 Months LIBOR/
5 Years Interest Rate Swaption
Counterparty: Citibank NA | | 10/4/06 | | 4.54 | | (12,343 | ) |
| | | | | | | | | | |
See Accompanying Notes to Financial Statements
201
| PORTFOLIO OF INVESTMENTS |
Ing Pimco TOTAL RETURN PORTFOLIO | AS OF DECEMBER 31, 2005 (CONTINUED) |
No. of Contracts/
Notional Principal | | Expiration Date | | Strike Price/Rate | | Value | |
| | | | | | | | | |
EUR | | OTC 3 Months LIBOR/ | | | | | | | |
1,000,000 | | 5 Years Interest Rate
Swaption Counterparty:
Merrill Lynch Capital Services | | 10/4/06 | | 4.54 | | $ | (6,857 | ) |
EUR | | OTC 3 Months LIBOR/ | | | | | | | |
2,200,000 | | 5 Years Interest Rate
Swaption Counterparty:
Wachovia NA | | 10/24/06 | | 4.31 | | (9,539 | ) |
EUR | | OTC 3 Months LIBOR/ | | | | | | | |
1,300,000 | | 7 Years Interest Rate
Swaption Counterparty:
Lehman Brothers
Special Financing, Inc. | | 4/4/06 | | 4.54 | | (2,531 | ) |
EUR | | OTC 3 Months LIBOR/ | | | | | | | |
1,000,000 | | 5 Years Interest Rate
Swaption Counterparty:
Citibank NA | | 4/4/06 | | 4.54 | | (1,643 | ) |
EUR | | OTC 3 Months LIBOR/ | | | | | | | |
2,300,000 | | 7 Years Interest Rate
Swaption Counterparty:
J.P. Morgan
Chase Bank | | 6/2/06 | | 4.00 | | (998 | ) |
| | Total Liability for Call Options Written
(Premiums received $243,816) | | | | | | $ | (153,739 | ) |
| | | | | | | | | |
Put Options Written | | | | | | | |
64 | | U.S. Treasury Note Future 2/24/06 | | | | 107 | | $ | (10,000 | ) |
| | Total Liability for Put Options Written
(Premiums received $15,122) | | | | | | $ | (10,000 | ) |
| | Total Written Options
(Premiums received $258,938) | | | | | | $ | (163,739 | ) |
The following short positions were held by the ING PIMCO Total Return Portfolio at December 31, 2005:
Principal
Amount | | Descriptions | | | | | | Market
Value | |
(8,000,000 | ) | Federal National Mortgage
Association, 5.000%, due 01/12/36 | | | | | | $ | (7,752,496 | ) |
| | | | | | | | | | |
| | Total Short Positions
(Proceeds $7,714,062) | | | | | | $ | (7,752,496 | ) |
Information concerning open futures contracts for the ING PIMCO Total Return Portfolio at December 31, 2005 is shown below:
Long Contracts | | No. of Contracts | | Notional Market Value | | Expiration
Date | | Unrealized
Gain (Loss) | |
EuroDollar Future | | 85 | | $ | 20,235,313 | | 03/13/06 | | $ | (44,520 | ) |
EuroDollar Future | | 90 | | 21,431,250 | | 03/19/07 | | 32 | |
90 Day Euro Future | | 390 | | 92,776,125 | | 06/19/06 | | (29,940 | ) |
Euro-Bond Future | | 66 | | 9,485,280 | | 03/08/06 | | 97,480 | |
U.S. Long Bond | | 37 | | 4,224,938 | | 03/31/06 | | 52,431 | |
| | | | | | | | $ | 75,483 | |
| | | | | | | | | | | |
At December 31, 2005 the following forward foreign currency contracts were outstanding for the ING PIMCO Total Return Portfolio:
Currency | | Buy/Sell | | Settlement
Date | | In
Exchange
For | | Value | | Unrealized
Appreciation
(Depreciation) | |
Chilean Peso
CLP 4,431,000 | | Buy | | 02/02/06 | | USD
7,870 | | 8,650 | | 780 | |
Chilean Peso
CLP 22,343,000 | | Buy | | 02/16/06 | | USD
41,113 | | 43,606 | | 2,493 | |
Chilean Peso
CLP 18,181,000 | | Buy | | 02/16/06 | | USD
33,835 | | 35,483 | | 1,648 | |
Euro
EUR 5,337,000 | | Buy | | 01/18/06 | | USD
6,326,218 | | 6,301,667 | | (24,551 | ) |
Indian Rupee
INR 2,316,000 | | Buy | | 03/20/06 | | USD
52,469 | | 51,230 | | (1,239 | ) |
Japanese Yen
JPY 307,728,000 | | Buy | | 01/10/06 | | USD
2,612,720 | | 2,610,561 | | (2,159 | ) |
South Korean Won KRW
139,100,000 | | Buy | | 01/26/06 | | USD
136,306 | | 137,642 | | 1,336 | |
South Korean Won KRW
28,000,000 | | Buy | | 02/24/06 | | USD
27,446 | | 27,717 | | 271 | |
South Korean Won KRW
35,400,000 | | Buy | | 03/21/06 | | USD
34,570 | | 35,052 | | 482 | |
Mexican Peso
MXN 716,000 | | Buy | | 02/28/06 | | USD
64,204 | | 66,864 | | 2,660 | |
Mexican Peso
MXN 337,000 | | Buy | | 03/23/06 | | USD
30,369 | | 31,403 | | 1,034 | |
Peruvian Neuvos Soles PEN
192,000 | | Buy | | 02/22/06 | | USD
59,122 | | 55,994 | | (3,128 | ) |
Peruvian Neuvos Soles PEN
119,000 | | Buy | | 03/13/06 | | USD
36,214 | | 34,709 | | (1,505 | ) |
Polish Zloty
PLN 96,000 | | Buy | | 03/27/06 | | USD
29,703 | | 29,473 | | (230 | ) |
Russian Ruble
RUR 1,833,000 | | Buy | | 01/31/06 | | USD
63,602 | | 63,696 | | 94 | |
Russian Ruble
RUR 685,000 | | Buy | | 02/13/06 | | USD
23,989 | | 23,795 | | (194 | ) |
Russian Ruble
RUR 918,000 | | Buy | | 03/22/06 | | USD
32,404 | | 31,858 | | (546 | ) |
Singapore Dollar
SGD 109,000 | | Buy | | 01/26/06 | | USD
66,411 | | 65,607 | | (804 | ) |
Singapore Dollar
SGD 41,000 | | Buy | | 02/24/06 | | USD
24,796 | | 24,702 | | (94 | ) |
Singapore Dollar
SGD 52,000 | | Buy | | 03/20/06 | | USD
31,222 | | 31,359 | | 499 | |
Slovakian Koruna
SKK 1,817,000 | | Buy | | 03/02/06 | | USD
57,518 | | 56,787 | | (733 | ) |
Slovakian Koruna
SKK 1,140,000 | | Buy | | 03/27/06 | | USD
36,116 | | 35,670 | | (446 | ) |
Taiwanese Dollar
TWD 800,000 | | Buy | | 02/24/06 | | USD
25,149 | | 24,498 | | (651 | ) |
Taiwanese Dollar
TWD 1,000,000 | | Buy | | 03/21/06 | | USD
30,581 | | 30,722 | | 141 | |
| | | | | | | | | | $ | (24,842) | |
| | | | | | | | | | | | |
See Accompanying Notes to Financial Statements
202
| PORTFOLIO OF INVESTMENTS |
Ing Pimco TOTAL RETURN PORTFOLIO | AS OF DECEMBER 31, 2005 (CONTINUED) |
Currency | | Buy/Sell | | Settlement
Date | | In
Exchange
For | | Value | | Unrealized
Appreciation
(Depreciation) | |
Euro
EUR 18,756,000 | | Sell | | 01/18/06 | | USD
22,013,392 | | 22,146,160 | | $ | (132,768 | ) |
Euro
EUR 1,393,000 | | Sell | | 01/18/06 | | USD
1,634,368 | | 1,644,786 | | (10,418 | ) |
Euro
EUR 3,700,000 | | Sell | | 01/18/06 | | USD
4,394,601 | | 4,368,778 | | 25,823 | |
Euro
EUR 3,969,000 | | Sell | | 01/18/06 | | USD
4,703,706 | | 4,686,400 | | 17,306 | |
Euro
EUR 1,298,000 | | Sell | | 01/18/06 | | USD
1,535,463 | | 1,532,614 | | 2,849 | |
| | | | | | | | | | $ | (97,208) | |
Information concerning the Interest Rate Swap Agreements outstanding for the ING PIMCO Total Return Portfolio at December 31, 2005 is shown below:
Type | | Termination
Date | | Notional
Principal | | Unrealized
Appreciation
(Depreciation) | |
Receive a floating rate based on the 6-month EURIBOR and pay a fixed rate equal to 4.000% Counterparty: J.P. Morgan Chase Bank | | 12/15/14 | | 3,200,000 | | EUR | | $ | (58,698 | ) |
Receive a floating rate based on the 6-month EURIBOR and pay a fixed rate equal to 4.000% Counterparty: Merrill Lynch Capital Services | | 12/15/14 | | 9,200,000 | | EUR | | 2,521 | |
Receive a floating rate based on the 6-month LIBOR and pay a fixed rate equal to 2.000% Counterparty: Morgan Stanley Capital Services, Inc. | | 06/15/12 | | 130,000,000 | | JPY | | (55,426 | ) |
Receive a fixed rate equal to 4.000% and pay a floating rate based on the 3-month LIBOR (I) Counterparty: Goldman Sachs Capital Markets, L.P. | | 12/15/07 | | 900,000 | | USD | | (14,034 | ) |
Receive a fixed rate equal to 5.000% and pay a floating rate based on the 3-month LIBOR (I) Counterparty: UBS AG | | 06/21/11 | | 15,300,000 | | USD | | 3,964 | |
Receive a floating rate based on the 3-month LIBOR and pay a fixed rate equal to 5.000% Counterparty: Barclays Bank PLC | | 06/21/16 | | 3,000,000 | | USD | | (40,043 | ) |
Receive a fixed rate equal to 5.000% and pay a floating rate based on the 3-month LIBOR (I) Counterparty: Goldman Sachs Capital Markets, L.P. | | 06/21/11 | | 6,900,000 | | USD | | 32,631 | |
Receive a floating rate based on the 6-month EURIBOR and pay a fixed rate equal to 4.00% Counterparty: Barclays Bank PLC | | 12/15/14 | | 3,400,000 | | EUR | | 0 | |
Receive a floating rate based on the 3-month LIBOR and pay a fixed rate equal to 5.000% Counterparty: GoldmanSachs Capital Markets, L.P. | | 06/21/16 | | 6,600,000 | | USD | | $ | (87,700 | ) |
Receive a floating rate based on the 3-month
LIBOR and pay a fixed rate equal to 5.000% Counterparty: Lehman Brothers Special
Financing, Inc. | | 06/21/16 | | 400,000 | | USD | | (5,323 | ) |
Receive a fixed rate equal to 5.000% and pay a floating rate based on the 3-month LIBOR (I) Counterparty: Barclays Bank PLC | | 06/21/11 | | 8,000,000 | | USD | | 39,113 | |
Total Interest Rate Swap Agreements | | | | | | $ | (182,995 | ) |
Information concerning the Credit Default Swap Agreements outstanding for the ING PIMCO Total Return Portfolio at December 31, 2005 is shown below:
Russian Federation Receive 0.610% and pay $400,000 in the event of default. (I) Counterparty: Merrill Lynch International | | 03/20/07 | | $ | 400,000 | | | | | $ | 1,158 | |
Russian Federation Receive 0.700% and pay $500,000 in the event of default. (I) Counterparty: Goldman Sachs International | | 03/20/07 | | 500,000 | | | | | 1,985 | |
Dow Jones CDX EM3 Receive 2.100% and pay $900,000 in the event of default. (I) Counterparty: Morgan Stanley Capital Services, Inc. | | 06/20/10 | | 900,000 | | | | | 58,364 | |
General Motors Corp. Receive 4.480% and pay $500,000 in the event of default. Counterparty: HSBC Bank USA, N.A. | | 06/20/07 | | 500,000 | | | | | (75,294 | ) |
Type | | Termination
Date | | Notional
Principal | | Unrealized
Appreciation
(Depreciation) | |
General Motors Acceptance Corp. Receive 3.550% and pay $500,000 in the event of default. Counterparty: Lehman Brothers Special Financing, Inc. | | 06/20/07 | | 500,000 | | $ | (12,395 | ) |
Ford Motor Co. Receive 2.680% and pay $500,000 in the event of default. Counterparty: HSBC Bank USA, N.A. | | 06/20/07 | | 500,000 | | (17,285 | ) |
| | | | | | | | |
See Accompanying Notes to Financial Statements
203
| PORTFOLIO OF INVESTMENTS |
Ing pimco TOTAL RETURN PORTFOLIO | AS OF DECEMBER 31, 2005 (CONTINUED) |
Type | | Termination
Date | | Notional
Principal | | Unrealized
Appreciation
(Depreciation) | |
Ford Motor Co. Receive 3.300% and pay $500,000 in the event of default. Counterparty: Morgan Stanley Capital Services, Inc. | | 06/20/06 | | 500,000 | | $ | (4,101 | ) |
Russian Federation Receive 0.770% and pay $200,000 in the event of default. Counterparty: J.P. Morgan Chase Bank | | 05/20/07 | | 200,000 | | 1,061 | |
Russian Federation Receive 0.580% and pay $100,000 in the event of default. Counterparty: Morgan Stanley Capital Services, Inc. | | 06/20/06 | | 100,000 | | 136 | |
General Motors Acceptance Corp. Receive 1.700% and pay $500,000 in the event of default. Counterparty: Morgan Stanley Capital Services, Inc. | | 09/20/06 | | 500,000 | | (13,172 | ) |
Dow Jones CDX XO5 Receive 2.000% and pay $400,000 in the event of default. Counterparty: Lehman Brothers Special Financing, Inc. | | 12/20/10 | | 400,000 | | (781 | ) |
Republic of Turkey Receive $300,000 in the event of default and pay 2.110% Counterparty: Lehman Brothers Special Financing, Inc. | | 09/20/10 | | 300,000 | | (10,446 | ) |
Republic of Turkey Receive $100,000 in the event of default and pay 2.260% Counterparty: Morgan Stanley Capital Services, Inc. | | 10/20/10 | | 100,000 | | (3,191 | ) |
Dow Jones CDX XO5 Receive 2.200% and pay $2,600,000 in the event of default. Counterparty: Citibank NA | | 12/20/10 | | 2,600,000 | | (5,752 | ) |
Republic of Turkey Receive $100,000 in the event of default and pay 2.110% Counterparty: Lehman Brothers Special Financing, Inc. | | 10/20/10 | | 100,000 | | (2,761 | ) |
Total Credit Default Swap Agreements | | | | | | $ | (82,474 | ) |
Total Swap Agreements | | | | | | $ | (265,468 | ) |
See Accompanying Notes to Financial Statements
204
ING SALOMON BROTHERS | | PORTFOLIO OF INVESTMENTS |
AGGRESSIVE GROWTH PORTFOLIO | | AS OF DECEMBER 31, 2005 |
Shares | | | | Value | |
COMMON STOCK: 94.7% | | | |
| | Aerospace/Defense: 2.9% | | | | |
375,500 | | L-3 Communications Holdings, Inc. | | $ | 27,918,425 | |
| | | | 27,918,425 | |
| | Biotechnology: 18.6% | | | |
654,190 | @ | Amgen, Inc. | | 51,589,423 | |
669,200 | @,L | Biogen Idec, Inc. | | 30,334,836 | |
102,900 | @,L | CancerVax Corp. | | 142,002 | |
839,800 | @,L | Chiron Corp. | | 37,337,508 | |
31,700 | @,L | Genentech, Inc. | | 2,932,250 | |
681,070 | @ | Genzyme Corp. | | 48,206,135 | |
540,100 | @,L | Millennium Pharmaceuticals, Inc. | | 5,238,970 | |
198,300 | @,L | Vertex Pharmaceuticals, Inc. | | 5,486,961 | |
| | | | 181,268,085 | |
| | Computers: 3.1% | | | |
31,500 | @,L | LaserCard Corp. | | 472,185 | |
731,800 | @,L | Maxtor Corp. | | 5,078,692 | |
534,600 | @ | Quantum Corp. | | 1,630,530 | |
370,800 | @,L | Sandisk Corp. | | 23,293,656 | |
83,100 | @,X | Seagate Technology, Inc. | | 1 | |
| | | | 30,475,064 | |
| | Diversified Financial Services: 10.6% | | | |
76,800 | | CIT Group, Inc. | | 3,976,704 | |
91,700 | L | Cohen & Steers, Inc. | | 1,708,371 | |
2,696 | | Goldman Sachs Group, Inc. | | 344,306 | |
466,604 | | Lehman Brothers Holdings, Inc. | | 59,804,635 | |
562,160 | | Merrill Lynch & Co., Inc. | | 38,075,097 | |
| | | | 103,909,113 | |
| | Equity Fund: 1.3% | | | |
312,200 | L | Nasdaq-100 Index Tracking Stock | | 12,619,124 | |
| | | | 12,619,124 | |
| | Healthcare-Products: 1.8% | | | |
79,800 | @,L | Biosite, Inc. | | 4,491,942 | |
20,900 | @ | BioVeris Corp. | | 95,513 | |
220,100 | | Johnson & Johnson | | 13,228,010 | |
| | | | 17,815,465 | |
| | Healthcare-Services: 6.1% | | | |
954,500 | | UnitedHealth Group, Inc. | | 59,312,630 | |
| | | | 59,312,630 | |
| | Media: 13.9% | | | |
805,700 | @,L | Cablevision Systems Corp. | | 18,909,779 | |
1,243,190 | @,L | Comcast Corp. | | 31,937,551 | |
112,300 | @,L | Comcast Corp. | | 2,915,308 | |
193,210 | @,L | Discovery Holding Co. | | 2,927,132 | |
67,550 | @,L | Liberty Global, Inc. | | 1,519,875 | |
67,550 | @ | Liberty Global, Inc.- Series C Shares | | 1,432,060 | |
1,932,100 | @,L | Liberty Media Corp. | | 15,205,627 | |
1,812,530 | | Time Warner, Inc. | | 31,610,523 | |
363,611 | | Viacom, Inc. | | 11,853,719 | |
689,500 | | Walt Disney Co. | | $ | 16,527,315 | |
93,300 | | World Wrestling Entertainment, Inc. | | 1,369,644 | |
| | | | 136,208,533 | |
| | Miscellaneous Manufacturing: 4.2% | | | |
353,300 | | Pall Corp. | | 9,489,638 | |
1,101,395 | @@,L | Tyco International Ltd. | | 31,786,260 | |
| | | | 41,275,898 | |
| | Oil & Gas: 5.4% | | | |
559,500 | | Anadarko Petroleum Corp. | | 53,012,625 | |
5,645 | @ | Bill Barrett Corp. | | 217,953 | |
| | | | 53,230,578 | |
| | Oil & Gas Services: 7.0% | | | |
495,700 | @ | Grant Prideco, Inc. | | 21,870,284 | |
1,277,800 | @,L | Weatherford International Ltd. | | 46,256,360 | |
| | | | 68,126,644 | |
| | Pharmaceuticals: 7.9% | | | |
136,500 | @,L | Alkermes, Inc. | | 2,609,880 | |
997,044 | @,L | Forest Laboratories, Inc. | | 40,559,750 | |
499,600 | @,L | ImClone Systems, Inc. | | 17,106,304 | |
94,400 | @,L | Isis Pharmaceuticals, Inc. | | 494,656 | |
326,700 | @,L | King Pharmaceuticals, Inc. | | 5,527,764 | |
74,600 | @,L | Nabi Biopharmaceuticals | | 252,148 | |
80,050 | | Pfizer, Inc. | | 1,866,766 | |
67,832 | @@,L | Teva Pharmaceutical Industries Ltd ADR | | 2,917,454 | |
306,600 | | Valeant Pharmaceuticals International | | 5,543,328 | |
27,445 | @,L | ViaCell, Inc. | | 154,241 | |
| | | | 77,032,291 | |
| | Retail: 0.3% | | | |
193,300 | @,L | Charming Shoppes | | 2,551,560 | |
| | | | 2,551,560 | |
| | Semiconductors: 6.6% | | | |
228,700 | @ | Broadcom Corp. | | 10,783,205 | |
90,400 | @,L | Cabot Microelectronics Corp. | | 2,651,432 | |
328,000 | @,L | Cirrus Logic, Inc. | | 2,191,040 | |
117,000 | @,L | Cree, Inc. | | 2,953,080 | |
86,600 | @ | DSP Group, Inc. | | 2,170,196 | |
92,029 | @ | Freescale Semiconductor, Inc. | | 2,316,370 | |
543,100 | L | Intel Corp. | | 13,555,776 | |
1,749,000 | L | Micron Technology, Inc. | | 23,279,190 | |
286,100 | @,L | Teradyne, Inc. | | 4,168,477 | |
| | | | 64,068,766 | |
| | Software: 1.7% | | | |
97,800 | @,L | Advent Software, Inc. | | 2,827,398 | |
214,400 | L | Autodesk, Inc. | | 9,208,480 | |
176,900 | | Microsoft Corp. | | 4,625,935 | |
| | | | 16,661,813 | |
| | Telecommunications: 3.3% | | | |
254,100 | @,L | C-COR.net Corp. | | 1,234,926 | |
1,020,200 | | Motorola, Inc. | | 23,046,317 | |
302,900 | @@,L | Nokia OYJ ADR | | 5,543,070 | |
See Accompanying Notes to Financial Statements
205
ING SALOMON BROTHERS | | PORTFOLIO OF INVESTMENTS |
AGGRESSIVE GROWTH PORTFOLIO | | AS OF DECEMBER 31, 2005(CONTINUED) |
Shares | | | | Value | |
| | Telecommunications (continued) | | | |
475,100 | @,L | RF Micro Devices, Inc. | | $ | 2,570,291 | |
| | | | 32,394,604 | |
| | Total Common Stock
(Cost $663,769,586) | | 924,868,593 | |
| | | | | | |
Principal
Amount | | | | Value | |
| | | |
SHORT-TERM INVESTMENTS: 26.1% | | | |
| | Federal Home Loan Bank: 4.8% | | | |
$ | 46,560,000 | | Discount Note, 3.200%, due 01/03/06 | | 46,547,584 | |
| | Total Federal Home Loan Bank
(Cost $46,551,723) | | 46,547,584 | |
| | Securities Lending Collateralcc: 21.3% | | | |
208,383,000 | | The Bank of New York Institutional Cash Reserves Fund | | 208,383,000 | |
| | Total Securities Lending Collateral
(Cost $208,383,000) | | 208,383,000 | |
| | Total Short-Term Investments:
(Cost $254,934,723) | | 254,930,584 | |
| | Total Investments in
Securities (Cost
$918,704,309)* | 120.8 | % | | $ | 1,179,799,177 | |
| | Other Assets and
Liabilities-Net | (20.8 | ) | | (203,137,757 | ) |
| | Net Assets | 100.0 | % | | $ | 976,661,420 | |
| | | | | | | | | |
@ Non-income producing security
@@ Foreign Issuer
ADR American Depositary Receipt
cc Securities purchased with cash collateral for securities loaned.
L Loaned security, a portion or all of the security is on loan at December 31, 2005.
X Fair value determined by ING Funds Valuation Committee appointed by the Funds’ Board of Directors/Trustees.
* Cost for federal income tax purposes is $920,048,024. Net unrealized appreciation consists of:
| Gross Unrealized Appreciation | | $ | 276,679,809 | |
| Gross Unrealized Depreciation | | (16,928,656 | ) |
| Net Unrealized Appreciation | | $ | 259,751,153 | |
See Accompanying Notes to Financial Statements
206
ING SALOMON BROTHERS | | PORTFOLIO OF INVESTMENTS |
LARGE CAP GROWTH PORTFOLIO | | AS OF DECEMBER 31, 2005 |
Shares | | | | Value | |
COMMON STOCK: 100.5% | | | |
| | Beverages: 4.2% | | | |
31,900 | | Coca-Cola Co. | | $ | 1,285,889 | |
19,100 | | PepsiCo, Inc. | | 1,128,428 | |
| | | | 2,414,317 | |
| | Biotechnology: 14.5% | | | |
38,700 | @ | Amgen, Inc. | | 3,051,882 | |
39,100 | @ | Biogen Idec, Inc. | | 1,772,403 | |
38,700 | @ | Genentech, Inc. | | 3,579,750 | |
| | | | 8,404,035 | |
| | Computers: 1.7% | | | |
33,900 | @ | Dell, Inc. | | 1,016,661 | |
| | | | 1,016,661 | |
| | Cosmetics/Personal Care: 3.8% | | | |
37,890 | | Procter & Gamble Co. | | 2,193,073 | |
| | | | 2,193,073 | |
| | Diversified Financial Services: 7.0% | | | |
35,800 | | Merrill Lynch & Co., Inc. | | 2,424,734 | |
29,100 | | Morgan Stanley | | 1,651,134 | |
| | | | 4,075,868 | |
| | Food: 2.2% | | | |
19,300 | | WM Wrigley Jr. Co. | | 1,283,257 | |
| | | | 1,283,257 | |
| | Healthcare - Products: 2.2% | | | |
21,300 | | Johnson & Johnson | | 1,280,130 | |
| | | | 1,280,130 | |
| | Insurance: 5.6% | | | |
23,400 | | American International Group, Inc. | | 1,596,582 | |
19 | @ | Berkshire Hathaway, Inc. | | 1,683,780 | |
| | | | 3,280,362 | |
| | Internet: 15.8% | | | |
44,000 | @ | Akamai Technologies, Inc. | | 876,920 | |
77,400 | @ | Amazon.com, Inc. | | 3,649,410 | |
39,100 | @ | eBay, Inc. | | 1,691,075 | |
21,300 | @ | Expedia, Inc. | | 510,348 | |
39,800 | @ | IAC/InterActiveCorp | | 1,126,738 | |
34,200 | @ | Yahoo!, Inc. | | 1,339,956 | |
| | | | 9,194,447 | |
| | Media: 5.7% | | | |
116,500 | | Time Warner, Inc. | | 2,031,760 | |
52,700 | | Walt Disney Co. | | 1,263,219 | |
| | | | 3,294,979 | |
| | Miscellaneous Manufacturing: 2.3% | | | |
38,800 | | General Electric Co. | | 1,359,940 | |
| | | | 1,359,940 | |
| | Pharmaceuticals: 5.7% | | | |
28,400 | | Eli Lilly & Co. | | 1,607,156 | |
73,100 | | Pfizer, Inc. | | 1,704,692 | |
| | | | 3,311,848 | |
| | Retail: 4.7% | | | |
21,800 | @ | Bed Bath & Beyond, Inc. | | $ | 788,070 | |
48,400 | | Home Depot, Inc. | | 1,959,232 | |
| | | | 2,747,302 | |
| | Semiconductors: 7.7% | | | |
58,600 | | Intel Corp. | | 1,462,656 | |
78,200 | | Texas Instruments, Inc. | | 2,507,874 | |
21,100 | | Xilinx, Inc. | | 531,931 | |
| | | | 4,502,461 | |
| | Software: 7.6% | | | |
29,100 | @ | Electronic Arts, Inc. | | 1,522,221 | |
58,700 | | Microsoft Corp. | | 1,535,005 | |
48,900 | @ | Red Hat, Inc. | | 1,332,036 | |
| | | | 4,389,262 | |
| | Telecommunications: 9.8% | | | |
67,800 | @ | Cisco Systems, Inc. | | 1,160,736 | |
53,600 | @ | Juniper Networks, Inc. | | 1,195,280 | |
97,800 | | Motorola, Inc. | | 2,209,302 | |
26,200 | | Qualcomm, Inc. | | 1,128,696 | |
| | | | 5,694,014 | |
| | Total Common Stock
(Cost $53,528,019) | | 58,441,956 | |
| | | | | | | |
| Total Investments in
Securities (Cost
$53,528,019)* | 100.5 | % | | $ | 58,441,956 | |
| Other Assets and
Liabilities-Net | (0.5 | ) | | (315,793 | ) |
| Net Assets | 100.0 | % | | $ | 58,126,163 | |
@ Non-income producing security
* Cost for federal income tax purposes is $54,009,304.
Net unrealized appreciation consists of:
| Gross Unrealized Appreciation | | $ | 6,390,593 | |
| Gross Unrealized Depreciation | | (1,957,941 | ) |
| Net Unrealized Appreciation | | $ | 4,432,652 | |
See Accompanying Notes to Financial Statements
207
ING T. ROWE PRICE | | PORTFOLIO OF INVESTMENTS |
DIVERSIFIED MID CAP PORTFOLIO | | AS OF DECEMBER 31, 2005 |
Shares | | | | Value | |
COMMON STOCK: 100.0% | | | |
| | Advertising: 2.7% | | | |
145,400 | @ | Clear Channel Outdoor Holdings, Inc. | | $ | 2,915,270 | |
104,300 | @,L | Getty Images, Inc. | | 9,310,861 | |
86,400 | | Harte-Hanks, Inc. | | 2,280,096 | |
122,600 | @,L | Lamar Advertising Co. | | 5,656,764 | |
86,500 | | Omnicom Group | | 7,363,745 | |
96,300 | @@ | WPP Group PLC ADR | | 5,200,200 | |
| | | | 32,726,936 | |
| | Aerospace/Defense: 1.1% | | | |
159,600 | @@,L | Empresa Brasileira de Aeronautica SA ADR | | 6,240,360 | |
146,800 | L | Rockwell Collins, Inc. | | 6,821,796 | |
| | | | 13,062,156 | |
| | Agriculture: 0.7% | | | |
84,200 | | Delta & Pine Land Co. | | 1,937,442 | |
89,700 | | Monsanto Co. | | 6,954,441 | |
| | | | 8,891,883 | |
| | Airlines: 0.7% | | | |
152,500 | | Skywest, Inc. | | 4,096,150 | |
263,400 | | Southwest Airlines Co. | | 4,327,662 | |
| | | | 8,423,812 | |
| | Apparel: 0.4% | | | |
137,900 | @ | Coach, Inc. | | 4,597,586 | |
| | | | 4,597,586 | |
| | Banks: 4.6% | | | |
78,700 | | Boston Private Financial Holdings, Inc. | | 2,394,054 | |
31,800 | | City National Corp. | | 2,303,592 | |
87,300 | | East-West Bancorp, Inc. | | 3,185,577 | |
53,100 | L | First Horizon National Corp. | | 2,041,164 | |
114,300 | L | Investors Financial Services Corp. | | 4,209,669 | |
161,600 | | Mellon Financial Corp. | | 5,534,800 | |
114,750 | L | North Fork Bancorporation, Inc. | | 3,139,560 | |
192,600 | | Northern Trust Corp. | | 9,980,532 | |
169,900 | | State Street Corp. | | 9,419,256 | |
61,300 | @,L | SVB Financial Group | | 2,871,292 | |
310,100 | | Synovus Financial Corp. | | 8,375,801 | |
162,700 | | UCBH Holdings, Inc. | | 2,909,076 | |
| | | | 56,364,373 | |
| | Biotechnology: 3.6% | | | |
90,200 | @,L | Celgene Corp. | | 5,844,960 | |
56,500 | @ | Charles River Laboratories International, Inc. | | 2,393,905 | |
301,300 | @, @@,L | deCODE genetics, Inc. | | 2,488,738 | |
40,300 | @ | Genzyme Corp. | | 2,852,434 | |
194,100 | @,L | Human Genome Sciences, Inc. | | 1,661,496 | |
62,600 | @,L | Integra LifeSciences Holdings Corp. | | 2,219,796 | |
46,800 | @,L | Invitrogen Corp. | | 3,118,752 | |
55,100 | @,L | Martek Biosciences Corp. | | 1,356,011 | |
113,300 | @ | Medimmune, Inc. | | 3,967,766 | |
216,400 | @ | Millennium Pharmaceuticals, Inc. | | 2,099,080 | |
53,100 | @,L | Millipore Corp. | | $ | 3,506,724 | |
139,500 | @,L | Nektar Therapeutics | | 2,296,170 | |
84,400 | @,L | Protein Design Labs, Inc. | | 2,398,648 | |
232,600 | @,@@,L | Qiagen NV | | 2,733,050 | |
176,100 | @,L | Vertex Pharmaceuticals, Inc. | | 4,872,687 | |
| | | | 43,810,217 | |
| | Chemicals: 1.4% | | | |
100,000 | | Ecolab, Inc. | | 3,627,000 | |
74,900 | | Engelhard Corp. | | 2,258,235 | |
60,700 | | Praxair, Inc. | | 3,214,672 | |
37,200 | L | Sigma-Aldrich Corp. | | 2,354,388 | |
84,600 | @ | Symyx Technologies | | 2,308,734 | |
149,000 | | Valspar Corp. | | 3,675,830 | |
| | | | 17,438,859 | |
| | Commercial Services: 5.8% | | | |
59,600 | @,L | Apollo Group, Inc. | | 3,603,416 | |
85,100 | L | Aramark Corp. | | 2,364,078 | |
76,600 | @,L | Career Education Corp. | | 2,582,952 | |
85,300 | @ | ChoicePoint, Inc. | | 3,796,703 | |
46,100 | | Corporate Executive Board Co. | | 4,135,170 | |
74,500 | @,L | DeVry, Inc. | | 1,490,000 | |
139,700 | @ | Education Management Corp. | | 4,681,347 | |
93,000 | | Equifax, Inc. | | 3,535,860 | |
89,700 | | H&R Block, Inc. | | 2,202,135 | |
134,100 | @,L | Iron Mountain, Inc. | | 5,661,702 | |
71,100 | | ITT Educational Services, Inc. | | 4,202,721 | |
115,000 | @ | LECG Corp. | | 1,998,700 | |
60,300 | | Manpower, Inc. | | 2,803,950 | |
183,800 | | Moody’s Corp. | | 11,288,996 | |
223,000 | | Paychex, Inc. | | 8,500,760 | |
159,300 | | Robert Half International, Inc. | | 6,035,877 | |
86,900 | @,L | Universal Technical Institute, Inc. | | 2,688,686 | |
| | | | 71,573,053 | |
| | Computers: 2.3% | | | |
60,300 | @,L | Affiliated Computer Services, Inc. | | 3,568,554 | |
156,000 | @ | Cadence Design Systems, Inc. | | 2,639,520 | |
144,100 | @ | Cognizant Technology Solutions Corp. | | 7,255,435 | |
50,400 | @,L | DST Systems, Inc. | | 3,019,464 | |
102,000 | | Factset Research Systems, Inc. | | 4,198,320 | |
163,000 | | Jack Henry & Associates, Inc. | | 3,110,040 | |
47,700 | @,L | Lexmark International, Inc. | | 2,138,391 | |
124,800 | @ | Synopsys, Inc. | | 2,503,488 | |
| | | | 28,433,212 | |
| | Cosmetics/Personal Care: 0.1% | | | |
50,100 | L | Avon Products, Inc. | | 1,430,355 | |
| | | | 1,430,355 | |
| | Distribution/Wholesale: 0.4% | | | |
84,200 | L | CDW Corp. | | 4,847,394 | |
| | | | 4,847,394 | |
See Accompanying Notes to Financial Statements
208
ING T. ROWE PRICE | | PORTFOLIO OF INVESTMENTS |
DIVERSIFIED MID CAP PORTFOLIO | | AS OF DECEMBER 31, 2005 (CONTINUED) |
Shares | | | | Value | |
| | Diversified Financial Services: 4.7% | | | |
270,600 | @ | Ameritrade Holding Corp. | | $ | 6,494,400 | |
71,300 | L | Blackrock, Inc./New York | | 7,734,624 | |
422,200 | | Charles Schwab Corp./The | | 6,193,674 | |
356,900 | @,L | E*Trade Financial Corp. | | 7,444,934 | |
238,600 | L | Eaton Vance Corp. | | 6,528,096 | |
76,000 | L | Federated Investors, Inc. | | 2,815,040 | |
100,000 | | Janus Capital Group, Inc. | | 1,863,000 | |
146,000 | @@,L | Lazard Ltd | | 4,657,400 | |
65,200 | | Legg Mason, Inc. | | 7,803,788 | |
134,400 | | Nuveen Investments, Inc. | | 5,728,128 | |
| | | | 57,263,084 | |
| | Electrical Components & Equipment: 0.4% | | | |
119,400 | | Ametek, Inc. | | 5,079,276 | |
| | | | 5,079,276 | |
| | Electronics: 2.6% | | | |
162,600 | @,L | Cogent, Inc. | | 3,687,768 | |
78,000 | @,L | Cymer, Inc. | | 2,769,780 | |
73,700 | @ | Dolby Laboratories, Inc. | | 1,256,585 | |
88,000 | @,L | Flir Systems, Inc. | | 1,965,040 | |
134,800 | | Gentex Corp. | | 2,628,600 | |
103,200 | @,L | II-VI, Inc. | | 1,844,184 | |
184,400 | @ | Jabil Circuit, Inc. | | 6,839,396 | |
86,300 | | National Instruments Corp. | | 2,765,915 | |
271,184 | | Symbol Technologies, Inc. | | 3,476,579 | |
112,900 | @ | Waters Corp. | | 4,267,620 | |
| | | | 31,501,467 | |
| | Entertainment: 1.1% | | | |
68,200 | @,L | DreamWorks Animation SKG, Inc. | | 1,674,992 | |
207,000 | | International Game Technology | | 6,371,460 | |
210,250 | @,L | Shuffle Master, Inc. | | 5,285,685 | |
| | | | 13,332,137 | |
| | Environmental Control: 0.3% | | | |
63,100 | @,L | Stericycle, Inc. | | 3,715,328 | |
| | | | 3,715,328 | |
| | Food: 0.8% | | | |
58,300 | | Hershey Foods Corp. | | 3,221,075 | |
73,300 | | McCormick & Co., Inc. | | 2,266,436 | |
87,742 | L | Tootsie Roll Industries, Inc. | | 2,538,376 | |
32,600 | | WM Wrigley Jr. Co. | | 2,167,574 | |
| | | | 10,193,461 | |
| | Healthcare-Products: 6.1% | | | |
121,800 | @ | American Medical Systems Holdings, Inc. | | 2,171,694 | |
73,400 | @,L | Arthrocare Corp. | | 3,093,076 | |
38,000 | L | Bausch & Lomb, Inc. | | 2,580,200 | |
55,900 | | Becton Dickinson & Co. | | 3,358,472 | |
163,100 | L | Biomet, Inc. | | 5,964,567 | |
35,900 | | Cooper Cos., Inc. | | 1,841,670 | |
95,400 | | CR Bard, Inc. | | 6,288,768 | |
55,500 | | Dentsply International, Inc. | | 2,979,795 | |
78,300 | @ | Edwards Lifesciences Corp. | | 3,258,063 | |
58,700 | @ | Gen-Probe, Inc. | | 2,863,973 | |
96,400 | @,L | Henry Schein, Inc. | | 4,206,896 | |
41,500 | @ | Inamed Corp. | | 3,638,720 | |
62,300 | @,L | Kyphon, Inc. | | $ | 2,543,709 | |
68,200 | @,L | Patterson Cos, Inc. | | 2,277,880 | |
96,800 | @,L | Resmed, Inc. | | 3,708,408 | |
91,900 | @ | Respironics, Inc. | | 3,406,733 | |
63,300 | @@,L | Smith & Nephew PLC ADR | | 2,933,955 | |
75,800 | | St. Jude Medical, Inc. | | 3,805,160 | |
63,000 | @ | Sybron Dental Specialties, Inc. | | 2,508,030 | |
71,700 | @,L | Techne Corp. | | 4,025,955 | |
102,500 | L | Varian Medical Systems, Inc. | | 5,159,850 | |
27,700 | @,L | Zimmer Holdings, Inc. | | 1,868,088 | |
| | | | 74,483,662 | |
| | Healthcare-Services: 4.0% | | | |
160,850 | @ | Coventry Health Care, Inc. | | 9,162,016 | |
93,500 | @ | DaVita, Inc. | | 4,734,840 | |
92,400 | L | Health Management Associates, Inc. | | 2,029,104 | |
134,100 | @,L | Humana, Inc. | | 7,285,653 | |
124,500 | @ | Laboratory Corp. of America Holdings | | 6,704,325 | |
94,700 | @,L | Lincare Holdings, Inc. | | 3,968,877 | |
95,500 | | Manor Care, Inc. | | 3,798,035 | |
162,700 | | Quest Diagnostics | | 8,375,796 | |
38,517 | @ | WellPoint, Inc. | | 3,073,289 | |
| | | | 49,131,935 | |
| | Home Builders: 1.6% | | | |
35,900 | | Centex Corp. | | 2,566,491 | |
36,000 | L | KB Home | | 2,615,760 | |
38,500 | L | Lennar Corp. | | 2,349,270 | |
58,200 | | Pulte Homes, Inc. | | 2,290,752 | |
107,400 | | Thor Industries, Inc. | | 4,303,518 | |
54,600 | @,L | Toll Brothers, Inc. | | 1,891,344 | |
95,800 | L | Winnebago Industries | | 3,188,224 | |
| | | | 19,205,359 | |
| | Home Furnishings: 0.4% | | | |
52,800 | | Harman International Industries, Inc. | | 5,166,480 | |
| | | | 5,166,480 | |
| | Household Products/Wares: 0.2% | | | |
46,200 | | Avery Dennison Corp. | | 2,553,474 | |
| | | | 2,553,474 | |
| | Insurance: 2.1% | | | |
39,800 | | AMBAC Financial Group, Inc. | | 3,066,988 | |
47,400 | @,@@ | Arch Capital Group Ltd. | | 2,595,150 | |
78,200 | | Arthur J Gallagher & Co. | | 2,414,816 | |
73,900 | @@ | Axis Capital Holdings Ltd. | | 2,311,592 | |
88,400 | L | Brown & Brown, Inc. | | 2,699,736 | |
6,800 | @ | Markel Corp. | | 2,155,940 | |
94,700 | | Marsh & McLennan Cos., Inc. | | 3,007,672 | |
39,200 | L | MBIA, Inc. | | 2,358,272 | |
46,800 | @@,L | RenaissanceRe Holdings Ltd. | | 2,064,348 | |
82,100 | @@,L | Willis Group Holdings Ltd. | | 3,032,774 | |
| | | | 25,707,288 | |
| | Internet: 3.3% | | | |
120,200 | @,L | Amazon.com, Inc. | | 5,667,430 | |
151,400 | @,@@ | Check Point Software Technologies | | 3,043,140 | |
85,200 | @,L | Digital River, Inc. | | 2,533,848 | |
See Accompanying Notes to Financial Statements
209
ING T. ROWE PRICE | | PORTFOLIO OF INVESTMENTS |
DIVERSIFIED MID CAP PORTFOLIO | | AS OF DECEMBER 31, 2005 (CONTINUED) |
Shares | | | | Value | |
| | Internet (continued) | | | |
48,900 | @ | F5 Networks, Inc. | | $ | 2,796,591 | |
87 | @ | Homestore, Inc. | | 444 | |
104,700 | @,L | Internet Security Systems | | 2,193,465 | |
199,800 | @,L | McAfee, Inc. | | 5,420,574 | |
214,400 | @,L | Monster Worldwide, Inc. | | 8,751,808 | |
78,800 | @,@@ | Sina Corp. | | 1,903,808 | |
226,800 | @,L | VeriSign, Inc. | | 4,971,456 | |
44,800 | @,L | Websense, Inc. | | 2,940,672 | |
| | | | 40,223,236 | |
| | Leisure Time: 1.2% | | | |
48,700 | L | Brunswick Corp. | | 1,980,142 | |
65,700 | L | Harley-Davidson, Inc. | | 3,382,893 | |
162,700 | @,L | Royal Caribbean Cruises Ltd. | | 7,331,262 | |
82,900 | L | WMS Industries, Inc. | | 2,079,961 | |
| | | | 14,774,258 | |
| | Lodging: 5.2% | | | |
191,600 | L | Boyd Gaming Corp. | | 9,131,656 | |
245,000 | | Choice Hotels International, Inc. | | 10,231,200 | |
228,900 | @@,L | Fairmont Hotels & Resorts, Inc. | | 9,707,649 | |
94,000 | | Harrah’s Entertainment, Inc. | | 6,701,260 | |
156,200 | L | Hilton Hotels Corp. | | 3,765,982 | |
50,000 | @ | Las Vegas Sands Corp. | | 1,973,500 | |
111,400 | | Marriott International, Inc. | | 7,460,458 | |
126,400 | L | Station Casinos, Inc. | | 8,569,920 | |
109,700 | @,L | Wynn Resorts Ltd. | | 6,017,045 | |
| | | | 63,558,670 | |
| | Machinery- Diversified: 0.5% | | | |
55,300 | | IDEX Corp. | | 2,273,383 | |
77,000 | @,L | Zebra Technologies Corp. | | 3,299,450 | |
| | | | 5,572,833 | |
| | Media: 3.3% | | | |
155,300 | | Citadel Broadcasting Corp. | | 2,087,232 | |
127,200 | @,L | Cox Radio, Inc. | | 1,790,976 | |
153,100 | @,L | Cumulus Media, Inc. | | 1,899,971 | |
67,900 | @ | Entercom Communications Corp. | | 2,014,593 | |
46,800 | L | EW Scripps Co. | | 2,247,336 | |
76,400 | | McGraw-Hill Cos, Inc. | | 3,944,532 | |
50,800 | L | Meredith Corp. | | 2,658,872 | |
63,900 | L | New York Times Co. | | 1,690,155 | |
214,500 | @,L | Radio One, Inc. | | 2,220,075 | |
387,600 | @ | Regent Communications, Inc. | | 1,798,464 | |
130,900 | @@ | Rogers Communications, Inc. | | 5,531,834 | |
170,500 | @ | Salem Communications Corp. | | 2,982,045 | |
237,200 | @,L | Spanish Broadcasting Systems, Inc. | | 1,212,092 | |
150,700 | @,L | Univision Communications, Inc. | | 4,429,073 | |
2,300 | | Washington Post | | 1,759,500 | |
105,300 | | Westwood One, Inc. | | 1,716,390 | |
| | | | 39,983,140 | |
| | Metal Fabricate/ Hardware: 0.4% | | | |
106,800 | | Precision Castparts Corp. | | $ | 5,533,308 | |
| | | | 5,533,308 | |
| | Miscellaneous Manufacturing: 1.0% | | | |
54,000 | | Danaher Corp. | | 3,012,120 | |
26,000 | | ITT Industries, Inc. | | 2,673,320 | |
106,100 | | Pall Corp. | | 2,849,846 | |
104,900 | | Roper Industries, Inc. | | 4,144,599 | |
| | | | 12,679,885 | |
| | Office Furnishings: 0.3% | | | |
73,400 | | HNI, Corp. | | 4,031,862 | |
| | | | 4,031,862 | |
| | Oil & Gas: 2.2% | | | |
150,000 | @ | Bill Barrett Corp. | | 5,791,500 | |
191,700 | L | Murphy Oil Corp. | | 10,349,883 | |
240,800 | | XTO Energy, Inc. | | 10,580,752 | |
| | | | 26,722,135 | |
| | Oil & Gas Services: 4.8% | | | |
95,000 | L | Baker Hughes, Inc. | | 5,774,100 | |
306,000 | | BJ Services Co. | | 11,221,020 | |
262,800 | @ | Cooper Cameron Corp. | | 10,879,920 | |
245,200 | @ | Grant Prideco, Inc. | | 10,818,224 | |
280,800 | L | Smith International, Inc. | | 10,420,488 | |
255,400 | @,L | Weatherford International Ltd. | | 9,245,480 | |
| | | | 58,359,232 | |
| | Packaging & Containers: 0.2% | | | |
42,600 | @,L | Sealed Air Corp. | | 2,392,842 | |
| | | | 2,392,842 | |
| | Pharmaceuticals: 3.4% | | | |
40,300 | L | Allergan, Inc. | | 4,350,788 | |
97,000 | @,L | Amylin Pharmaceuticals, Inc. | | 3,872,240 | |
141,300 | @,L | Atherogenics, Inc. | | 2,827,413 | |
58,100 | @,L | Cephalon, Inc. | | 3,761,394 | |
85,100 | @,L | Express Scripts, Inc. | | 7,131,380 | |
114,100 | @ | Medco Health Solutions, Inc. | | 6,366,780 | |
48,400 | @,L | Neurocrine Biosciences, Inc. | | 3,036,132 | |
56,000 | L | Omnicare, Inc. | | 3,204,320 | |
59,900 | @,L | OSI Pharmaceuticals, Inc. | | 1,679,596 | |
101,900 | @,L | Sepracor, Inc. | | 5,258,040 | |
| | | | 41,488,083 | |
| | Pipelines: 0.8% | | | |
437,700 | | Williams Cos., Inc. | | 10,141,509 | |
| | | | 10,141,509 | |
| | Retail: 5.4% | | | |
147,600 | @ | Bed Bath & Beyond, Inc. | | 5,335,740 | |
70,200 | @ | Cheesecake Factory | | 2,624,778 | |
369,600 | | Dollar General Corp. | | 7,048,272 | |
155,700 | | Family Dollar Stores, Inc. | | 3,859,803 | |
138,000 | L | Fred’s, Inc. | | 2,245,260 | |
84,600 | @,L | Men’s Wearhouse, Inc. | | 2,490,624 | |
69,900 | | Michaels Stores, Inc. | | 2,472,363 | |
See Accompanying Notes to Financial Statements
210
ING T. ROWE PRICE | | PORTFOLIO OF INVESTMENTS |
DIVERSIFIED MID CAP PORTFOLIO | | AS OF DECEMBER 31, 2005 (CONTINUED) |
Shares | | | | Value | |
| | Retail (continued) | | | |
183,400 | @ | O’Reilly Automotive, Inc. | | $ | 5,870,634 | |
53,500 | L | Outback Steakhouse, Inc. | | 2,226,135 | |
140,600 | | Petsmart, Inc. | | 3,607,796 | |
166,600 | L | Ross Stores, Inc. | | 4,814,740 | |
225,955 | | Staples, Inc. | | 5,131,438 | |
155,300 | L | Tiffany & Co. | | 5,946,437 | |
288,800 | | TJX Cos., Inc. | | 6,708,824 | |
117,900 | @,L | Williams-Sonoma, Inc. | | 5,087,385 | |
| | | | 65,470,229 | |
| | Semiconductors: 8.7% | | | |
542,600 | @,L | Altera Corp. | | 10,054,378 | |
277,300 | | Analog Devices, Inc. | | 9,946,751 | |
111,900 | @,L | Broadcom Corp. | | 5,276,085 | |
130,100 | | Intersil Corp. | | 3,236,888 | |
55,700 | | Kla-Tencor Corp. | | 2,747,681 | |
80,200 | @,L | Lam Research Corp. | | 2,861,536 | |
293,300 | | Linear Technology Corp. | | 10,579,331 | |
127,400 | @,@@ | Marvell Technology Group Ltd. | | 7,145,866 | |
266,200 | | Maxim Integrated Products | | 9,647,088 | |
384,300 | L | Microchip Technology, Inc. | | 12,355,245 | |
449,500 | | National Semiconductor Corp. | | 11,678,010 | |
86,500 | @ | QLogic Corp. | | 2,812,115 | |
108,800 | @,L | Semtech Corp. | | 1,986,688 | |
134,200 | @,L | Silicon Laboratories, Inc. | | 4,919,772 | |
431,200 | L | Xilinx, Inc. | | 10,870,552 | |
| | | | 106,117,986 | |
| | Software: 6.0% | | | |
255,780 | @ | Activision, Inc. | | 3,514,417 | |
25,900 | @ | Avid Technology, Inc. | | 1,418,284 | |
86,600 | | Certegy, Inc. | | 3,512,496 | |
144,300 | @,L | Citrix Systems, Inc. | | 4,152,954 | |
95,700 | @,@@,L | Cognos, Inc. | | 3,321,747 | |
59,500 | @ | D&B Corp. | | 3,984,120 | |
48,000 | @,L | Electronic Arts, Inc. | | 2,510,880 | |
82,800 | L | Fair Isaac Corp. | | 3,657,276 | |
86,700 | @ | Filenet Corp. | | 2,241,195 | |
70,500 | @ | Fiserv, Inc. | | 3,050,535 | |
98,800 | | Global Payments, Inc. | | 4,605,068 | |
73,350 | @ | Hyperion Solutions Corp. | | 2,627,397 | |
124,800 | @,L | Intuit, Inc. | | 6,651,840 | |
72,200 | @,L | Mercury Interactive Corp. | | 2,006,438 | |
264,900 | | MoneyGram International, Inc. | | 6,908,592 | |
179,200 | @,L | Navteq Corp. | | 7,861,504 | |
168,500 | @,L | Red Hat, Inc. | | 4,589,940 | |
64,600 | @,L | Salesforce.com, Inc. | | 2,070,430 | |
62,700 | | SEI Investments Co. | | 2,319,900 | |
98,400 | @,L | THQ, Inc. | | 2,346,840 | |
| | | | 73,351,853 | |
| | Telecommunications: 2.7% | | | |
340,500 | @,L | American Tower Corp. | | 9,227,550 | |
357,600 | @,L | Crown Castle International Corp. | | 9,623,016 | |
276,600 | @,L | Juniper Networks, Inc. | | 6,168,180 | |
64,100 | @,L | NeuStar, Inc. | | 1,954,409 | |
140,000 | @,L | NII Holdings, Inc. | | 6,115,200 | |
| | | | 33,088,355 | |
| | Textiles: 0.4% | | | |
116,000 | L | Cintas Corp. | | $ | 4,776,880 | |
| | | | 4,776,880 | |
| | Toys/Games/Hobbies: 0.2% | | | |
119,700 | | Mattel, Inc. | | 1,893,654 | |
| | | | 1,893,654 | |
| | Transportation: 1.9% | | | |
170,600 | | CH Robinson Worldwide, Inc. | | 6,317,318 | |
107,700 | L | Expeditors International Washington, Inc. | | 7,270,827 | |
108,100 | | Landstar System, Inc. | | 4,512,094 | |
53,300 | @@ | UTI Worldwide, Inc. | | 4,948,372 | |
| | | | 23,048,611 | |
| | Total Common Stock
(Cost $1,079,284,200) | | 1,222,141,348 | |
| | | | | |
Principal Amount | | | | Value | |
| | | | | |
SHORT-TERM INVESTMENTS: 24.9% | | | |
| | Securities Lending Collateralcc: 24.9% | | | |
$ | 304,867,000 | | The Bank of New York Institutional
Cash Reserves Fund | | 304,867,000 | |
| | Total Securities Lending Collateral
(Cost $304,867,000) | | 304,867,000 | |
| | Total Short-Term Investments:
(Cost $304,867,000) | | 304,867,000 | |
| | Total Investments in
Securities (Cost
$1,384,151,200)* | 124.9 | % | | $ | 1,527,008,348 | |
| | Other Assets and
Liabilities-Net | (24.9 | ) | | (304,220,389 | ) |
| | Net Assets | 100.0 | % | | $ | 1,222,787,959 | |
| | | | | | | | | | | | |
@ Non-income producing security
@@ Foreign Issuer
ADR American Depositary Receipt
GDR Global Depositary Receipt
cc Securities purchased with cash collateral for securities loaned.
L Loaned security, a portion or all of the security is on loan at December 31, 2005.
* Cost for federal income tax purposes is $1,390,057,407. Net unrealized appreciation consists of:
| | Gross Unrealized Appreciation | | | | $ | 169,723,885 | |
| | Gross Unrealized Depreciation | | | | (32,772,944 | ) |
| | Net Unrealized Appreciation | | | | $ | 136,950,941 | |
See Accompanying Notes to Financial Statements
211
ING T. ROWE PRICE | | PORTFOLIO OF INVESTMENTS |
GROWTH EQUITY PORTFOLIO | | AS OF DECEMBER 31, 2005 |
Shares | | | | Value | |
COMMON STOCK: 96.8% | | | | |
| | Aerospace/Defense: 0.5% | | | |
49,300 | | General Dynamics Corp. | | $ | 5,622,665 | |
| | | | 5,622,665 | |
| | Agriculture: 1.2% | | | |
180,400 | | Monsanto Co. | | 13,986,412 | |
| | | | 13,986,412 | |
| | Airlines: 0.4% | | | |
290,900 | | Southwest Airlines Co. | | 4,779,487 | |
| | | | 4,779,487 | |
| | Apparel: 0.9% | | | |
116,400 | | Nike, Inc. | | 10,102,356 | |
| | | | 10,102,356 | |
| | Banks 5.2% | | | |
653,100 | @@ | Anglo Irish Bank Corp. PLC | | 9,832,729 | |
222,100 | | Northern Trust Corp. | | 11,509,222 | |
236,900 | | State Street Corp. | | 13,133,736 | |
262,600 | @@ | UBS AG | | 24,886,471 | |
| | | | 59,362,158 | |
| | Beverages: 0.4% | | | |
85,400 | | PepsiCo, Inc. | | 5,045,432 | |
| | | | 5,045,432 | |
| | Biotechnology: 2.4% | | | |
242,300 | @,L | Amgen, Inc. | | 19,107,778 | |
91,600 | @,L | Genentech, Inc. | | 8,473,000 | |
| | | | 27,580,778 | |
| | Commercial Services: 3.4% | | | |
691,700 | @@ | Accenture Ltd. | | 19,969,379 | |
159,650 | @,L | Apollo Group, Inc. | | 9,652,439 | |
525,200 | | Cendant Corp. | | 9,059,700 | |
| | | | 38,681,518 | |
| | Computers: 3.0% | | | |
88,400 | @,L | Affiliated Computer Services, Inc. | | 5,231,512 | |
698,600 | @ | Dell, Inc. | | 20,951,014 | |
648,500 | | EMC Corp. | | 8,832,570 | |
| | | | 35,015,096 | |
| | Cosmetics/Personal Care: 1.0% | | | |
195,780 | | Procter & Gamble Co. | | 11,331,746 | |
| | | | 11,331,746 | |
| | Diversified Financial Services: 9.8% | | | |
375,800 | | American Express Co. | | 19,338,668 | |
241,900 | @,L | Ameritrade Holding Corp. | | 5,805,600 | |
582,900 | L | Charles Schwab Corp. | | 8,551,143 | |
541,610 | | Citigroup, Inc. | | 26,284,333 | |
168,000 | | Countrywide Financial Corp. | | 5,743,920 | |
172,000 | @ | E*Trade Financial Corp. | | 3,587,920 | |
59,900 | | Franklin Resources, Inc. | | 5,631,199 | |
42,400 | | Goldman Sachs Group, Inc. | | 5,414,904 | |
53,100 | | Legg Mason, Inc. | | 6,355,539 | |
167,800 | | Merrill Lynch & Co., Inc. | | 11,365,094 | |
253,000 | L | SLM Corp. | | 13,937,770 | |
| | | | 112,016,090 | |
| | Electronics: 0.4% | | | |
73,000 | @@,L | Garmin Ltd. | | $ | 4,843,550 | |
| | | | 4,843,550 | |
| | Entertainment: 0.7% | | | |
266,200 | | International Game Technology | | 8,193,636 | |
| | | | 8,193,636 | |
| | Food: 0.6% | | | |
209,400 | | Sysco Corp. | | 6,501,870 | |
| | | | 6,501,870 | |
| | Healthcare-Products: 3.1% | | | |
130,200 | | Johnson & Johnson | | 7,825,020 | |
203,500 | | Medtronic, Inc. | | 11,715,495 | |
73,800 | | St. Jude Medical, Inc. | | 3,704,760 | |
127,200 | | Stryker Corp. | | 5,651,496 | |
92,100 | @,L | Zimmer Holdings, Inc. | | 6,211,224 | |
| | | | 35,107,995 | |
| | Healthcare-Services: 4.7% | | | |
34,300 | @ | Humana, Inc. | | 1,863,519 | |
197,300 | | Quest Diagnostics | | 10,157,004 | |
480,000 | | UnitedHealth Group, Inc. | | 29,827,200 | |
157,500 | @ | WellPoint, Inc. | | 12,566,925 | |
| | | | 54,414,648 | |
| | Home Builders: 0.3% | | | |
55,300 | | Lennar Corp. | | 3,374,406 | |
| | | | 3,374,406 | |
| | Home Furnishings: 0.6% | | | |
69,600 | L | Harman International Industries, Inc. | | 6,810,360 | |
| | | | 6,810,360 | |
| | Household Products/Wares: 0.4% | | | |
156,662 | @@ | Reckitt Benckiser PLC | | 5,155,162 | |
| | | | 5,155,162 | |
| | Insurance: 4.4% | | | |
398,900 | | American International Group, Inc. | | 27,216,947 | |
144,800 | | Genworth Financial, Inc. | | 5,007,184 | |
133,400 | L | Hartford Financial Services Group, Inc. | | 11,457,726 | |
227,100 | | Marsh & McLennan Cos., Inc. | | 7,212,696 | |
| | | | 50,894,553 | |
| | Internet: 1.8% | | | |
22,800 | @,L | Google, Inc. | | 9,458,808 | |
271,600 | @,L | Yahoo!, Inc. | | 10,641,288 | |
| | | | 20,100,096 | |
| | Leisure Time: 1.1% | | | |
243,200 | L | Carnival Corp. | | 13,003,904 | |
| | | | 13,003,904 | |
| | Lodging: 1.1% | | | |
60,400 | @,L | MGM Mirage | | 2,214,868 | |
192,000 | @,L | Wynn Resorts Ltd. | | 10,531,200 | |
| | | | 12,746,068 | |
See Accompanying Notes to Financial Statements
212
ING T. ROWE PRICE | | PORTFOLIO OF INVESTMENTS |
GROWTH EQUITY PORTFOLIO | | AS OF DECEMBER 31, 2005 (CONTINUED) |
Shares | | | | Value | |
| | Machinery-Diversified: 0.7% | | | |
117,900 | | Deere & Co. | | $ | 8,030,169 | |
| | | | 8,030,169 | |
| | Media: 4.8% | | | |
243,100 | @ | Comcast Corp. | | 6,245,239 | |
192,426 | @,L | Discovery Holding Co. | | 2,915,254 | |
1,559,764 | @ | Liberty Media Corp. | | 12,275,343 | |
515,700 | | News Corp., Inc. | | 8,019,135 | |
195,500 | @@,L | Rogers Communications, Inc. | | 8,261,830 | |
386,400 | | Time Warner, Inc. | | 6,738,816 | |
345,000 | @,L | Univision Communications, Inc. | | 10,139,550 | |
| | | | 54,595,167 | |
| | Mining: 0.9% | | | |
438,300 | @@ | BHP Billiton Ltd. | | 7,304,233 | |
90,000 | @@ | BHP Billiton Ltd. ADR | | 3,007,800 | |
| | | | 10,312,033 | |
| | Miscellaneous Manufacturing: 5.9% | | | |
355,500 | | Danaher Corp. | | 19,829,790 | |
1,219,400 | | General Electric Co. | | 42,739,970 | |
185,000 | @@,L | Tyco International Ltd. | | 5,339,100 | |
| | | | 67,908,860 | |
| | Oil & Gas: 2.9% | | | |
188,838 | | Exxon Mobil Corp. | | 10,607,030 | |
148,700 | L | Murphy Oil Corp. | | 8,028,313 | |
58,400 | @@ | Total SA | | 14,672,913 | |
| | | | 33,308,256 | |
| | Oil & Gas Services: 2.5% | | | |
188,000 | L | Baker Hughes, Inc. | | 11,426,640 | |
182,400 | L | Schlumberger Ltd. | | 17,720,160 | |
| | | | 29,146,800 | |
| | Pharmaceuticals: 4.7% | | | |
223,600 | @ | Caremark Rx, Inc. | | 11,580,244 | |
166,400 | @ | Gilead Sciences, Inc. | | 8,757,632 | |
242,300 | @@ | Novartis AG | | 12,671,033 | |
366,368 | | Pfizer, Inc. | | 8,543,702 | |
48,800 | @@ | Roche Holding AG | | 7,295,428 | |
88,600 | @,L | Sepracor, Inc. | | 4,571,760 | |
| | | | 53,419,799 | |
| | Retail: 8.3% | | | |
127,775 | | Best Buy Co., Inc. | | 5,555,657 | |
328,500 | | Home Depot, Inc. | | 13,297,680 | |
118,800 | @@ | Inditex SA | | 3,866,906 | |
315,700 | @,L | Kohl’s Corp. | | 15,343,020 | |
316,300 | | Petsmart, Inc. | | 8,116,258 | |
144,300 | | Target Corp. | | 7,932,171 | |
333,300 | @@ | Wal-Mart de Mexico SA de CV | | 1,848,594 | |
75,600 | @@ | Wal-Mart de Mexico SA de CV ADR | | 4,193,033 | |
587,000 | | Wal-Mart Stores, Inc. | | 27,471,600 | |
172,900 | L | Walgreen Co. | | 7,652,554 | |
| | | | 95,277,473 | |
| | Semiconductors: 5.4% | | | |
375,900 | L | Analog Devices, Inc. | | 13,483,533 | |
615,500 | | Intel Corp. | | 15,362,880 | |
129,600 | @,@@ | Marvell Technology Group Ltd. | | 7,269,264 | |
284,600 | | Maxim Integrated Products | | $ | 10,313,904 | |
10,400 | @@ | Samsung Electronics Co., Ltd. | | 6,690,933 | |
351,800 | L | Xilinx, Inc. | | 8,868,878 | |
| | | | 61,989,392 | |
| | Software: 6.3% | | | |
270,700 | | Automatic Data Processing, Inc. | | 12,422,423 | |
72,300 | @,L | Electronic Arts, Inc. | | 3,782,013 | |
271,400 | | First Data Corp. | | 11,672,914 | |
1,327,100 | | Microsoft Corp. | | 34,703,665 | |
822,200 | @ | Oracle Corp. | | 10,039,062 | |
| | | | 72,620,077 | |
| | Telecommunications: 7.0% | | | |
229,200 | @,@@,L | Amdocs Ltd. | | 6,303,000 | |
348,000 | @@,L | America Movil SA de CV ADR | | 10,182,480 | |
200,400 | @ | Cisco Systems, Inc. | | 3,430,848 | |
741,600 | @ | Corning, Inc. | | 14,579,856 | |
294,700 | @,L | Crown Castle International Corp. | | 7,930,377 | |
314,000 | @,L | Juniper Networks, Inc. | | 7,002,200 | |
427,200 | @@ | Nokia OYJ | | 7,805,716 | |
181,300 | | Qualcomm, Inc. | | 7,810,404 | |
247,005 | | Sprint Corp.-FON Group | | 5,770,037 | |
64,800 | @@ | TELUS Corp. | | 2,654,856 | |
108,600 | @@,L | TELUS Corp.-Non-Voting Shares | | 4,372,236 | |
1,250,814 | @@ | Vodafone Group PLC | | 2,685,819 | |
| | | | 80,527,829 | |
| | Total Common Stock
(Cost $961,359,637) | | 1,111,805,841 | |
| | | | | |
Principal
Amount | | | | Value | |
SHORT-TERM INVESTMENTS: 14.4% | | | |
| | | | | |
| | Securities Lending Collateralcc 14.4% | | | | | |
$ | 304,867,000 | | The Bank of New York Institutional
Cash Reserves Fund | | | | 164,956,000 | |
| | Total Securities Lending Collateral
(Cost $164,956,000) | | | | 164,956,000 | |
| | Total Short-Term Investments:
(Cost $164,956,000) | | | | 164,956,000 | |
| | Total Investments in
Securities (Cost $1,126,315,637)* | 111.2 | % | | $ | 1,276,761,841 | |
| | Other Assets and
Liabilities-Net | (11.2 | ) | | (128,691,843 | ) |
| | Net Assets | 100.0 | % | | $ | 1,148,069,998 | |
| | | | | | | | | | | | | | | |
Certain foreign securities have been fair valued in accordance with procedures approved by the Board of Trustees (Note 2A).
@ Non-income producing security
@@ Foreign Issuer
ADR American Depositary Receipt
cc Securities purchased with cash collateral for securities loaned.
L Loaned security, a portion or all of the security is on loan at December 31, 2005.
* Cost for federal income tax purposes is $1,132,301,205.
Net unrealized appreciation consists of:
| | Gross Unrealized Appreciation | | $ | 163,234,754 | |
| | Gross Unrealized Depreciation | | (18,774,118) | |
| | Net Unrealized Appreciation | | $ | 144,460,636 | |
See Accompanying Notes to Financial Statements
213
ING UBS U.S. LARGE CAP | | PORTFOLIO OF INVESTMENTS |
EQUITY PORTFOLIO | | AS OF DECEMBER 31, 2005 |
Shares | | | | Value | |
COMMON STOCK: 99.0% | | | | |
| | Advertising: 2.1% | | | |
70,300 | | Omnicom Group | | $ | 5,984,639 | |
| | | | 5,984,639 | |
| | Aerospace/Defense: 2.6% | | | |
61,200 | | Lockheed Martin Corp. | | 3,894,156 | |
55,300 | L | Northrop Grumman Corp. | | 3,324,083 | |
| | | | 7,218,239 | |
| | Auto Parts & Equipment: 2.3% | | | |
29,400 | | BorgWarner, Inc. | | 1,782,522 | |
64,200 | | Johnson Controls, Inc. | | 4,680,822 | |
| | | | 6,463,344 | |
| | Banks: 8.1% | | | |
133,200 | | Fifth Third BanCorp | | 5,024,304 | |
167,300 | | Mellon Financial Corp. | | 5,730,025 | |
58,000 | | PNC Financial Services Group, Inc. | | 3,586,140 | |
131,700 | L | Wells Fargo & Co. | | 8,274,711 | |
| | | | 22,615,180 | |
| | Beverages: 0.7% | | | |
46,600 | | Anheuser-Busch Cos., Inc. | | 2,001,936 | |
| | | | 2,001,936 | |
| | Biotechnology: 1.6% | | | |
62,400 | @ | Genzyme Corp. | | 4,416,672 | |
| | | | 4,416,672 | |
| | Building Materials: 1.9% | | | |
179,100 | | Masco Corp. | | 5,407,029 | |
| | | | 5,407,029 | |
| | Commercial Services: 2.1% | | | |
91,800 | @@ | Accenture Ltd. | | 2,650,266 | |
33,300 | @@ | Accenture Ltd. | | 961,371 | |
10,625 | @ | CCE Spinco, Inc. | | 139,188 | |
117,100 | | Cendant Corp. | | 2,019,975 | |
| | | | 5,770,800 | |
| | Computers: 1.2% | | | |
113,900 | @ | Dell, Inc. | | 3,415,861 | |
69,400 | @,X | Seagate Technology, Inc. | | 1 | |
| | | | 3,415,862 | |
| | Diversified Financial Services: 12.2% | | | |
262,800 | | Citigroup, Inc. | | 12,753,684 | |
90,000 | | Freddie Mac | | 5,881,500 | |
167,800 | | JPMorgan Chase & Co. | | 6,659,982 | |
157,800 | | Morgan Stanley | | 8,953,572 | |
| | | | 34,248,738 | |
| | Electric: 4.7% | | | |
66,500 | L | American Electric Power Co., Inc. | | 2,466,485 | |
135,400 | L | Exelon Corp. | | 7,195,156 | |
79,200 | L | NiSource, Inc. | | 1,652,112 | |
37,600 | L | Northeast Utilities | | 740,344 | |
51,700 | | Pepco Holdings, Inc. | | 1,156,529 | |
| | | | 13,210,626 | |
| | Electronics: 1.7% | | | |
44,900 | @,@@ | Mettler Toledo International, Inc. | | 2,478,480 | |
59,300 | @ | Waters Corp. | | 2,241,540 | |
| | | | 4,720,020 | |
| | Equity Fund: 3.0% | | | |
67,000 | L | SPDR Trust Series 1 | | $ | 8,342,170 | |
| | | | 8,342,170 | |
| | Food: 1.3% | | | |
189,200 | @ | Kroger Co. | | 3,572,096 | |
| | | | 3,572,096 | |
| | Gas: 1.0% | | | |
63,200 | | Sempra Energy | | 2,833,888 | |
| | | | 2,833,888 | |
| | Healthcare-Products: 3.5% | | | |
103,600 | | Johnson & Johnson | | 6,226,360 | |
34,100 | | Medtronic, Inc. | | 1,963,137 | |
26,400 | @,L | Zimmer Holdings, Inc. | | 1,780,416 | |
| | | | 9,969,913 | |
| | Healthcare-Services: 4.4% | | | |
186,000 | @ | Healthsouth Corp. | | 911,400 | |
117,000 | | UnitedHealth Group, Inc. | | 7,270,380 | |
53,400 | @ | WellPoint, Inc. | | 4,260,786 | |
| | | | 12,442,566 | |
| | Insurance: 3.7% | | | |
105,600 | | American International Group, Inc. | | 7,205,088 | |
36,000 | | Hartford Financial Services Group, Inc. | | 3,092,040 | |
| | | | 10,297,128 | |
| | Internet: 1.8% | | | |
123,400 | @,L | Expedia, Inc. | | 2,956,664 | |
128,404 | @,L | Symantec Corp. | | 2,247,070 | |
| | | | 5,203,734 | |
| | Leisure Time: 2.3% | | | |
72,100 | L | Carnival Corp. | | 3,855,187 | |
48,100 | L | Harley-Davidson, Inc. | | 2,476,669 | |
| | | | 6,331,856 | |
| | Media: 3.1% | | | |
85,000 | | Clear Channel Communications, Inc. | | 2,673,250 | |
60,700 | | Dex Media, Inc. | | 1,644,363 | |
116,800 | @,L | DIRECTV Group, Inc. | | 1,649,216 | |
94,900 | @,L | Univision Communications, Inc. | | 2,789,111 | |
| | | | 8,755,940 | |
| | Miscellaneous Manufacturing: 2.0% | | | |
62,500 | | Illinois Tool Works, Inc. | | 5,499,375 | |
| | | | 5,499,375 | |
| | Oil & Gas: 3.3% | | | |
43,800 | | Exxon Mobil Corp. | | 2,460,246 | |
57,300 | @ | Global Santa Fe Corp. | | 2,758,995 | |
68,700 | | Marathon Oil Corp. | | 4,188,639 | |
| | | | 9,407,880 | |
| | Oil & Gas Services: 0.6% | | | |
25,700 | L | Baker Hughes, Inc. | | 1,562,046 | |
| | | | 1,562,046 | |
See Accompanying Notes to Financial Statements
214
ING UBS U.S. LARGE CAP | | PORTFOLIO OF INVESTMENTS |
EQUITY PORTFOLIO | | AS OF DECEMBER 31, 2005 (CONTINUED) |
Shares | | | | Value | |
| | Pharmaceuticals: 10.2% | | | |
57,300 | L | Allergan, Inc. | | $ | 6,186,108 | |
83,500 | | Bristol-Myers Squibb Co. | | 1,918,830 | |
51,100 | @ | Caremark Rx, Inc. | | 2,646,469 | |
46,500 | @,L | Cephalon, Inc. | | 3,010,410 | |
64,200 | @ | Medco Health Solutions, Inc. | | 3,582,360 | |
150,800 | | Mylan Laboratories | | 3,009,968 | |
179,100 | | Wyeth | | 8,251,137 | |
| | | | 28,605,282 | |
| | Retail: 3.4% | | | |
123,200 | | Costco Wholesale Corp. | | 6,094,704 | |
69,500 | @,L | Kohl’s Corp. | | 3,377,700 | |
| | | | 9,472,404 | |
| | Semiconductors: 1.4% | | | |
136,500 | | Applied Materials, Inc. | | 2,448,810 | |
62,800 | | Xilinx, Inc. | | 1,583,188 | |
| | | | 4,031,998 | |
| | Software: 5.5% | | | |
62,000 | @,L | Mercury Interactive Corp. | | 1,722,980 | |
399,400 | | Microsoft Corp. | | 10,444,310 | |
277,200 | @ | Oracle Corp. | | 3,384,612 | |
| | | | 15,551,902 | |
| | Telecommunications: 4.0% | | | |
132,500 | | AT&T, Inc. | | 3,244,925 | |
342,689 | | Sprint Corp.-FON Group | | 8,005,215 | |
| | | | 11,250,140 | |
| | Transportation: 3.3% | | | |
70,100 | | Burlington Northern Santa Fe Corp. | | 4,964,482 | |
41,900 | L | FedEx Corp. | | 4,332,040 | |
| | | | 9,296,522 | |
| | Total Common Stock
(Cost $245,216,000) | | 277,899,925 | |
| | | | | |
Principal
Amount | | | | Value | |
| | | | | |
SHORT-TERM INVESTMENTS: 20.4% | | | |
| | Federal Home Loan Bank: 1.0% | | | | | |
$ | 2,787,000 | | Discount Note, 3.200%,
due 01/03/06 | | | | 2,786,257 | |
| | Total Federal Home Loan Bank
(Cost $2,786,504) | | | | 2,786,257 | |
| | Securities Lending Collateralcc 19.4% | | | | | |
54,508,000 | | The Bank of New York Institutional
Cash Reserves Fund | | | | 54,508,000 | |
| | Total Securities Lending Collateral
(Cost $54,508,000) | | | | 54,508,000 | |
| | Total Short-Term Investments:
(Cost $57,294,504) | | | | 57,294,257 | |
| | Total Investments in
Securities (Cost
$302,510,504)* | 119.4 | % | | $ | 335,194,182 | |
| | Other Assets and
Liabilities-Net | (19.4 | ) | | (54,409,838 | ) |
| | Net Assets | 100.0 | % | | $ | 280,784,344 | |
| | | | | | | | | | | | | |
@ Non-income producing security
@@ Foreign Issuer
cc Securities purchased with cash collateral for securities loaned.
L Loaned security, a portion or all of the security is on loan at December 31, 2005.
X Fair value determined by ING Funds Valuation Committee appointed by the Funds’ Board of Directors/Trustees.
* Cost for federal income tax purposes is $303,866,946.
Net unrealized appreciation consists of:
| | Gross Unrealized Appreciation | | | | $ | 35,020,997 | |
| | Gross Unrealized Depreciation | | | | (3,693,761) | |
| | Net Unrealized Appreciation | | | | $ | 31,327,236 | |
See Accompanying Notes to Financial Statements
215
| | PORTFOLIO OF INVESTMENTS |
ING VAN KAMPEN COMSTOCK PORTFOLIO | | AS OF DECEMBER 31, 2005 |
Shares | | | | Value | |
COMMON STOCK: 92.9% | | | |
| | Agriculture: 1.8% | | | |
172,000 | | Altria Group, Inc. | | $ | 12,851,840 | |
| | | | 12,851,840 | |
| | Airlines: 0.5% | | | |
219,800 | | Southwest Airlines Co. | | 3,611,314 | |
| | | | 3,611,314 | |
| | Apparel: 0.5% | | | |
119,300 | | Jones Apparel Group, Inc. | | 3,664,896 | |
| | | | 3,664,896 | |
| | Banks: 9.4% | | | |
498,700 | L | Bank of America Corp. | | 23,015,005 | |
216,700 | | Bank of New York | | 6,901,895 | |
109,700 | | PNC Financial Services Group, Inc. | | 6,782,751 | |
6,920 | L | SunTrust Banks, Inc. | | 503,499 | |
225,700 | | Wachovia Corp. | | 11,930,502 | |
264,200 | | Wells Fargo & Co. | | 16,599,686 | |
| | | | 65,733,338 | |
| | Beverages: 2.0% | | | |
75,600 | L | Anheuser-Busch Cos., Inc. | | 3,247,776 | |
270,700 | | Coca-Cola Co. | | 10,911,917 | |
| | | | 14,159,693 | |
| | Chemicals: 3.5% | | | |
125,300 | | Dow Chemical Co. | | 5,490,646 | |
323,200 | L | EI Du Pont de Nemours & Co. | | 13,736,000 | |
102,800 | | Rohm & Haas Co. | | 4,977,576 | |
| | | | 24,204,222 | |
| | Computers: 2.7% | | | |
118,000 | @,L | Affiliated Computer Services, Inc. | | 6,983,240 | |
174,200 | @ | Dell, Inc. | | 5,224,258 | |
94,200 | | Hewlett-Packard Co. | | 2,696,946 | |
37,200 | | International Business Machines Corp. | | 3,057,840 | |
23,202 | @ | Lexmark International, Inc. | | 1,040,146 | |
| | | | 19,002,430 | |
| | Cosmetics/Personal Care: 0.1% | | | |
15,800 | L | Avon Products, Inc. | | 451,090 | |
| | | | 451,090 | |
| | Diversified Financial Services: 9.8% | | | |
478,300 | | Citigroup, Inc. | | 23,211,899 | |
53,500 | | Fannie Mae | | 2,611,335 | |
447,800 | | Freddie Mac | | 29,263,730 | |
169,000 | | JPMorgan Chase & Co. | | 6,707,610 | |
91,900 | | Merrill Lynch & Co., Inc. | | 6,224,387 | |
| | | | 68,018,961 | |
| | Electric: 2.8% | | | |
125,350 | L | American Electric Power Co., Inc. | | 4,649,232 | |
45,330 | | Constellation Energy Group, Inc. | | 2,611,008 | |
54,800 | L | Dominion Resources, Inc. | | 4,230,560 | |
98,700 | L | FirstEnergy Corp. | | 4,835,313 | |
45,530 | L | Public Service Enterprise Group, Inc. | | 2,958,084 | |
| | | | 19,284,197 | |
| | Electronics: 0.1% | | | |
63,080 | @,@@ | Flextronics International Ltd | | $ | 658,555 | |
33,950 | @,L | Kemet Corp. | | 240,027 | |
| | | | 898,582 | |
| | Food: 3.7% | | | |
352,800 | L | Kraft Foods, Inc. | | 9,927,792 | |
230,800 | @@ | Unilever NV | | 15,844,420 | |
| | | | 25,772,212 | |
| | Forest Products & Paper: 3.6% | | | |
738,777 | L | International Paper Co. | | 24,830,295 | |
| | | | 24,830,295 | |
| | Healthcare-Products: 0.5% | | | |
149,800 | @ | Boston Scientific Corp. | | 3,668,602 | |
| | | | 3,668,602 | |
| | Household Products/Wares: 1.7% | | | |
199,000 | | Kimberly-Clark Corp. | | 11,870,350 | |
| | | | 11,870,350 | |
| | Insurance: 5.9% | | | |
29,500 | | Aflac, Inc. | | 1,369,390 | |
38,600 | L | AMBAC Financial Group, Inc. | | 2,974,516 | |
84,100 | | American International Group, Inc. | | 5,738,143 | |
13,900 | | Assurant, Inc. | | 604,511 | |
1,520 | @,L | Berkshire Hathaway, Inc. | | 4,461,960 | |
121,230 | | Chubb Corp. | | 11,838,110 | |
56,000 | | Genworth Financial, Inc. | | 1,936,480 | |
11,500 | | Hartford Financial Services Group, Inc. | | 987,735 | |
64,800 | L | Metlife, Inc. | | 3,175,200 | |
4,500 | @@,L | RenaissanceRe Holdings Ltd. | | 198,495 | |
79,205 | | St. Paul Cos. | | 3,538,087 | |
72,170 | | Torchmark Corp. | | 4,012,652 | |
| | | | 40,835,279 | |
| | Machinery-Diversified: 0.1% | | | |
21,970 | | Cognex Corp. | | 661,077 | |
| | | | 661,077 | |
| | Media: 10.5% | | | |
530,700 | | Clear Channel Communications, Inc. | | 16,690,515 | |
269,500 | @,L | Comcast Corp. | | 6,996,220 | |
36,600 | L | Gannett Co., Inc. | | 2,216,862 | |
1,014,900 | @ | Liberty Media Corp. | | 7,987,263 | |
243,800 | L | News Corp., Inc. | | 4,049,518 | |
653,700 | | Time Warner, Inc. | | 11,400,528 | |
64,000 | L | Tribune Co. | | 1,936,640 | |
306,500 | | Viacom, Inc. | | 9,991,900 | |
481,840 | | Walt Disney Co. | | 11,549,705 | |
| | | | 72,819,151 | |
| | Mining: 2.3% | | | |
530,000 | L | Alcoa, Inc. | | 15,672,100 | |
| | | | 15,672,100 | |
| | Oil & Gas: 0.9% | | | |
47,400 | @@,L | Total SA ADR | | 5,991,360 | |
| | | | 5,991,360 | |
See Accompanying Notes to Financial Statements
216
| | PORTFOLIO OF INVESTMENTS |
ING VAN KAMPEN COMSTOCK PORTFOLIO | | AS OF DECEMBER 31, 2005 (CONTINUED) |
Shares | | | | Value | |
| | Oil & Gas Services: 0.2% | | | |
25,146 | L | Halliburton Co. | | $ | 1,558,046 | |
| | | | 1,558,046 | |
| | Pharmaceuticals: 15.6% | | | |
34,400 | L | AmerisourceBergen Corp. | | 1,424,160 | |
968,000 | | Bristol-Myers Squibb Co. | | 22,244,640 | |
63,000 | | Cardinal Health, Inc. | | 4,331,250 | |
602,100 | @@,L | GlaxoSmithKline PLC ADR | | 30,394,008 | |
417,800 | | Pfizer, Inc. | | 9,743,096 | |
164,400 | @@ | Roche Holding AG ADR | | 12,305,521 | |
160,300 | @@ | Sanofi-Synthelabo SA ADR | | 7,037,170 | |
525,500 | | Schering-Plough Corp. | | 10,956,675 | |
216,900 | | Wyeth | | 9,992,583 | |
| | | | 108,429,103 | |
| | Retail: 2.9% | | | |
69,500 | | Best Buy Co., Inc. | | 3,021,860 | |
54,100 | | Federated Department Stores | | 3,588,453 | |
297,400 | | Wal-Mart Stores, Inc. | | 13,918,320 | |
| | | | 20,528,633 | |
| | Semiconductors: 0.1% | | | |
64,210 | @,L | Credence Systems Corp. | | 446,902 | |
6,280 | | Intel Corp. | | 156,749 | |
6,120 | @ | Novellus Systems, Inc. | | 147,614 | |
| | | | 751,265 | |
| | Software: 0.8% | | | |
77,200 | | First Data Corp. | | 3,320,372 | |
93,300 | | Microsoft Corp. | | 2,439,795 | |
| | | | 5,760,167 | |
| | Telecommunications: 10.6% | | | |
1,093,200 | AT&T, Inc. | | | 26,772,468 | |
343,400 | @ | Cisco Systems, Inc. | | 5,879,008 | |
38,430 | @@ | Nokia OYJ ADR | | 703,269 | |
714,800 | L | Sprint Corp.-FON Group | | 16,697,728 | |
18,377 | @,@@,L | Telefonaktiebolaget LM Ericsson ADR | | 632,169 | |
757,700 | | Verizon Communications, Inc. | | 22,821,924 | |
| | | | 73,506,566 | |
| | Toys/Games/Hobbies: 0.3% | | | |
144,800 | | Mattel, Inc. | | 2,290,735 | |
| | | | 2,290,735 | |
| | Total Common Stock
(Cost $623,432,033) | | 646,825,504 | |
| | | | | |
Principal
Amount | | | | Value | |
SHORT-TERM INVESTMENTS: 19.4% | | | | |
| | Federal Home Loan Bank: 8.6% | | | | | |
$ | 59,800,000 | | Discount Note, 3.200%,
due 01/03/06 | | | | $ | 59,783,057 | |
| | Total Federal Home Loan Bank
(Cost $59,788,705) | | | | 59,783,057 | |
| | Securities Lending Collateralcc 10.8% | | | | | |
75,258,000 | | The Bank of New York Institutional
Cash Reserves Fund | | | | 75,258,000 | |
| | Total Securities Lending Collateral
(Cost $75,258,000) | | | | 75,258,000 | |
| | Total Short-Term Investments:
(Cost $135,046,705) | | | | 135,041,057 | |
| | Total Investments in Securities
(Cost $758,478,738)* | 112.3 | % | | $ | 781,866,561 | |
| | Other Assets and
Liabilities-Net | (12.3 | ) | | (85,333,366 | ) |
| | Net Assets | 100.0 | % | | $ | 696,533,195 | |
| | | | | | | | | | |
@ Non-income producing security
@@ Foreign Issuer
ADR American Depositary Receipt
cc Securities purchased with cash collateral for securities loaned.
L Loaned security, a portion or all of the security is on loan at December 31, 2005.
* Cost for federal income tax purposes is $759,003,888.
Net unrealized appreciation consists of:
| | Gross Unrealized Appreciation | | | | $ | 40,258,766 | |
| | Gross Unrealized Depreciation | | | | (17,396,093 | ) |
| | Net Unrealized Appreciation | | | | $ | 22,862,673 | |
See Accompanying Notes to Financial Statements
217
ING VAN KAMPEN | | PORTFOLIO OF INVESTMENTS |
EQUITY AND INCOME PORTFOLIO | | AS OF DECEMBER 31, 2005 |
Shares | | | | Value | |
COMMON STOCK: 59.3% | | | |
| | Aerospace/Defense: 1.3% | | | |
99,580 | | Northrop Grumman Corp. | | $ | 5,985,754 | |
146,580 | | Raytheon Co. | | 5,885,187 | |
| | | | 11,870,941 | |
| | Agriculture: 0.8% | | | |
103,480 | | Altria Group, Inc. | | 7,732,026 | |
| | | | 7,732,026 | |
| | Auto Manufacturers: 0.6% | | | |
176,750 | @@ | Honda Motor Co., Ltd. ADR | | 5,120,448 | |
| | | | 5,120,448 | |
| | Banks: 2.2% | | | |
182,040 | | Bank of America Corp. | | 8,401,146 | |
96,440 | | PNC Financial Services Group, Inc. | | 5,962,885 | |
108,450 | | State Street Corp. | | 6,012,468 | |
| | | | 20,376,499 | |
| | Beverages: 1.4% | | | |
210,560 | | Coca-Cola Co. | | 8,487,674 | |
74,200 | @@ | Diageo PLC ADR | | 4,325,860 | |
| | | | 12,813,534 | |
| | Biotechnology: 0.7% | | | |
147,160 | @ | Chiron Corp. | | 6,542,734 | |
| | | | 6,542,734 | |
| | Chemicals: 2.6% | | | |
425,180 | @@ | Bayer AG ADR | | 17,755,517 | |
123,110 | | Dow Chemical Co. | | 5,394,680 | |
33,369 | @,@@ | Lanxess | | 1,055,646 | |
| | | | 24,205,843 | |
| | Commercial Services: 0.1% | | | |
46,181 | @ | CCE Spinco, Inc. | | 604,974 | |
4,159 | | McKesson Corp. | | 214,563 | |
| | | | 819,537 | |
| | Computers: 0.6% | | | |
191,370 | | Hewlett-Packard Co. | | 5,478,923 | |
| | | | 5,478,923 | |
| | Cosmetics/Personal Care: 0.6% | | | |
45,850 | | Avon Products, Inc. | | 1,309,018 | |
76,010 | | Procter & Gamble Co. | | 4,399,459 | |
| | | | 5,708,477 | |
| | Diversified Financial Services: 8.0% | | | |
557,000 | | Charles Schwab Corp./The | | 8,171,190 | |
311,680 | | Citigroup, Inc. | | 15,125,830 | |
165,570 | | Freddie Mac | | 10,820,000 | |
29,440 | | Goldman Sachs Group, Inc. | | 3,759,782 | |
474,252 | | JPMorgan Chase & Co. | | 18,823,062 | |
68,310 | | MBNA Corp. | | 1,854,617 | |
219,050 | | Merrill Lynch & Co., Inc. | | 14,836,257 | |
| | | | 73,390,738 | |
| | Electric: 2.1% | | | |
158,270 | | American Electric Power Co., Inc. | | $ | 5,870,234 | |
11,000 | @ | CenterPoint Energy Resources Corp. | | 370,018 | |
95,440 | | Entergy Corp. | | 6,551,956 | |
129,420 | | FirstEnergy Corp. | | 6,340,286 | |
| | | | 19,132,494 | |
| | Electronics: 0.3% | | | |
112,230 | | Applera Corp. - Applied Biosystems Group | | 2,980,829 | |
10 | | Symbol Technologies, Inc. | | 128 | |
| | | | 2,980,957 | |
| | Food: 2.0% | | | |
142,600 | @@ | Cadbury Schweppes PLC ADR | | 5,460,154 | |
195,300 | @@ | Unilever NV | | 13,407,345 | |
| | | | 18,867,499 | |
| | Healthcare-Products: 0.8% | | | |
80,960 | | Bausch & Lomb, Inc. | | 5,497,184 | |
80,200 | @ | Boston Scientific Corp. | | 1,964,098 | |
| | | | 7,461,282 | |
| | Insurance: 5.2% | | | |
29,600 | @@ | ACE Ltd | | 1,581,824 | |
147,860 | @@ | Aegon NV | | 2,413,075 | |
96,247 | | Chubb Corp. | | 9,398,520 | |
84,650 | | Cigna Corp. | | 9,455,405 | |
64,180 | | Hartford Financial Services Group, Inc. | | 5,512,420 | |
205,500 | | Marsh & McLennan Cos., Inc. | | 6,526,680 | |
225,961 | | St. Paul Cos. | | 10,093,678 | |
44,500 | @@ | XL Capital Ltd | | 2,998,410 | |
| | | | 47,980,012 | |
| | Internet: 1.2% | | | |
632,640 | @ | Symantec Corp. | | 11,071,200 | |
| | | | 11,071,200 | |
| | Media: 4.4% | | | |
369,450 | | Clear Channel Communications, Inc. | | 11,619,203 | |
770,580 | | Time Warner, Inc. | | 13,438,915 | |
205,650 | | Viacom, Inc. | | 6,704,190 | |
349,060 | | Walt Disney Co. | | 8,366,968 | |
| | | | 40,129,276 | |
| | Mining: 1.0% | | | |
178,950 | | Newmont Mining Corp. | | 9,555,930 | |
| | | | 9,555,930 | |
| | Miscellaneous Manufacturing: 3.0% | | | |
393,240 | | General Electric Co. | | 13,783,062 | |
119,030 | @@ | Ingersoll-Rand Co. | | 4,805,241 | |
108,930 | @@ | Siemens AG ADR | | 9,323,319 | |
| | | | 27,911,622 | |
| | Oil & Gas: 3.5% | | | |
129,080 | @@ | BP PLC ADR | | 8,289,518 | |
142,710 | | ConocoPhillips | | 8,302,868 | |
61,760 | | Exxon Mobil Corp. | | 3,469,059 | |
147,240 | @@ | Royal Dutch Shell PLC ADR | | 9,053,788 | |
60,780 | | Valero Energy Corp. | | 3,136,248 | |
| | | | 32,251,481 | |
See Accompanying Notes to Financial Statements
218
ING VAN KAMPEN | | PORTFOLIO OF INVESTMENTS |
EQUITY AND INCOME PORTFOLIO | | AS OF DECEMBER 31, 2005 (CONTINUED) |
Shares | | | | | | Value | |
| | | | Oil & Gas Services: 1.2% | | | |
118,140 | | | | Schlumberger Ltd. | | $ | 11,477,301 | |
| | | | | | 11,477,301 | |
| | | | Pharmaceuticals: 7.8% | | | |
598,690 | | | | Bristol-Myers Squibb Co. | | 13,757,896 | |
164,910 | | | | Eli Lilly & Co. | | 9,332,257 | |
103,450 | | @@ | | GlaxoSmithKline PLC ADR | | 5,222,156 | |
194,860 | | @@ | | Roche Holding AG ADR | | 14,585,485 | |
153,660 | | @@ | | Sanofi-Synthelabo SA ADR | | 6,745,674 | |
656,510 | | | | Schering-Plough Corp. | | 13,688,234 | |
193,260 | | | | Wyeth | | 8,903,488 | |
| | | | | | 72,235,190 | |
| | | | Pipelines: 0.6% | | | |
218,700 | | | | Williams Cos., Inc. | | 5,067,279 | |
| | | | | | 5,067,279 | |
| | | | Retail: 2.0% | | | |
100,710 | | @ | | Kohl’s Corp. | | 4,894,506 | |
86,410 | | | | McDonald’s Corp. | | 2,913,745 | |
69,150 | | @ | | Office Depot, Inc. | | 2,171,310 | |
184,460 | | | | Wal-Mart Stores, Inc. | | 8,632,728 | |
| | | | | | 18,612,289 | |
| | | | Semiconductors: 1.5% | | | |
295,070 | | | | Intel Corp. | | 7,364,947 | |
475,640 | | | | Micron Technology, Inc. | | 6,330,768 | |
| | | | | | 13,695,715 | |
| | | | Telecommunications: 3.8% | | | |
258,200 | | @@ | | France Telecom SA ADR | | 6,413,688 | |
209,760 | | | | Motorola, Inc. | | 4,738,478 | |
565,767 | | | | Sprint Corp. - FON Group | | 13,216,317 | |
340,370 | | | | Verizon Communications, Inc. | | 10,251,942 | |
| | | | | | 34,620,425 | |
| | | | Total Common Stock
(Cost $498,864,842) | | 547,109,652 | |
PREFERRED STOCK: 5.0% | | | |
| | | | Advertising: 0.1% | | | |
900 | | #,C | | Interpublic Group of Cos, Inc. | | 830,475 | |
| | | | | | 830,475 | |
| | | | Airlines: 0.1% | | | |
22,310 | | C | | Continental Airlines Finance Trust II | | 641,413 | |
| | | | | | 641,413 | |
| | | | Commercial Services: 0.2% | | | |
38,400 | | C | | United Rentals Trust I | | 1,641,600 | |
| | | | | | 1,641,600 | |
| | | | Diversified Financial Services: 0.1% | | | |
24,600 | | @@ | | Lazard Ltd | | 729,390 | |
| | | | | | 729,390 | |
| | | | Federal National Mortgage Association: 0.5% | | | |
50 | | C | | Fannie Mae | | 4,607,038 | |
| | | | | | 4,607,038 | |
| | | | Healthcare-Products: 0.7% | | | |
113,250 | | | | Baxter International, Inc. | | $ | 6,087,188 | |
| | | | | | 6,087,188 | |
| | | | Housewares: 0.3% | | | |
73,100 | | C | | Newell Financial Trust I | | 3,051,925 | |
| | | | | | 3,051,925 | |
| | | | Insurance: 0.8% | | | |
56,850 | | | | Conseco, Inc. | | 1,608,287 | |
83,650 | | C | | Travelers Property Casualty Corp. | | 2,071,174 | |
59,950 | | | | UnumProvident Corp. | | 2,622,813 | |
36,300 | | @@ | | XL Capital Ltd. | | 927,465 | |
| | | | | | 7,229,739 | |
| | | | Media: 0.2% | | | |
27,920 | | C | | Tribune Co. | | 2,090,370 | |
| | | | | | 2,090,370 | |
| | | | Oil & Gas: 0.2% | | | |
17,300 | | | | Amerada Hess Corp. | | 1,869,784 | |
| | | | | | 1,869,784 | |
| | | | Pharmaceuticals: 0.5% | | | |
89,650 | | | | Schering-Plough Corp. | | 4,822,274 | |
| | | | | | 4,822,274 | |
| | | | Pipelines: 0.6% | | | |
1,900 | | # | | El Paso Corp. | | 2,084,535 | |
105,000 | | C | | El Paso Energy Capital Trust I | | 3,469,200 | |
| | | | | | 5,553,735 | |
| | | | Savings & Loans: 0.1% | | | |
13,600 | | | | Sovereign Capital Trust | | 598,400 | |
| | | | | | 598,400 | |
| | | | Telecommunications: 0.6% | | | |
6,000 | | C | | Lucent Technologies Capital Trust I | | 5,745,000 | |
| | | | | | 5,745,000 | |
| | | | Total Preferred Stock
(Cost $44,942,158) | | 45,498,331 | |
Principal Amount | | | | | | Value | |
CONVERTIBLE BOND: 11.2% | | | |
| | | | Aerospace/Defense: 0.5% | | | |
$ | 4,225,000 | | #,C | | L-3 Communications Corp., 3.000%, due 08/01/35 | | 4,198,594 | |
| | | | | | 4,198,594 | |
| | | | Airlines: 0.3% | | | |
1,184,000 | | C | | American Airlines, Inc., 4.250%, due 09/23/23 | | 1,670,920 | |
956,000 | | C | | Continental Airlines, Inc., 4.500%, due 02/01/07 | | 896,250 | |
| | | | | | 2,567,170 | |
| | | | | | | | |
See Accompanying Notes to Financial Statements
219
ING VAN KAMPEN | PORTFOLIO OF INVESTMENTS |
EQUITY AND INCOME PORTFOLIO | AS OF DECEMBER 31, 2005 (CONTINUED) |
Principal Amount | | | | | | Value | |
| | | | Biotechnology: 0.8% | | | |
$ | 6,196,000 | | C | | Amgen, Inc., 1.030%, due 03/01/32 | | $ | 4,863,860 | |
2,000,000 | | C | | Chiron Corp., 2.750%, due 06/30/34 | | 1,987,500 | |
210,000 | | C | | Enzon Pharmaceuticals, Inc., 4.500%, due 07/01/08 | | 189,525 | |
| | | | | | 7,040,885 | |
| | | | Diversified Financial Services: 1.4% | | | |
5,800,000 | | C | | Goldman Sachs Group, Inc., 2.000%, due 02/02/12 | | 5,983,802 | |
7,800,000 | | | | Lehman Brothers Holdings, Inc., 1.500%, due 03/23/12 | | 6,984,900 | |
| | | | | | 12,968,702 | |
| | | | Entertainment: 0.2% | | | |
2,335,000 | | C | | International Game Technology, 1.480%, due 01/29/33 | | 1,567,369 | |
| | | | | | 1,567,369 | |
| | | | Environmental Control: 0.1% | | | |
1,161,000 | | C | | Allied Waste North America, Inc., 4.250%, due 04/15/34 | | 1,010,070 | |
| | | | | | 1,010,070 | |
| | | | Food: 1.1% | | | |
10,800,000 | | C | | General Mills, Inc., 1.990%, due 10/28/22 | | 7,749,000 | |
7,100,000 | | C | | Supervalu, Inc., 4.250%, due 11/02/31 | | 2,422,875 | |
| | | | | | 10,171,875 | |
| | | | Forest Products & Paper: 0.3% | | | |
5,350,000 | | C | | International Paper Co., 3.770%, due 06/20/21 | | 3,016,063 | |
| | | | | | 3,016,063 | |
| | | | Healthcare-Products: 0.9% | | | |
1,263,000 | | C | | Edwards Lifesciences Corp., 3.875%, due 05/15/33 | | 1,248,791 | |
3,960,000 | | C | | Medtronic, Inc., 1.250%, due 09/15/21 | | 4,029,300 | |
2,573,000 | | C | | St Jude Medical, Inc., 2.800%, due 12/15/35 | | 2,576,216 | |
| | | | | | 7,854,307 | |
| | | | Healthcare-Services: 0.3% | | | |
3,013,000 | | +, #,C | | Manor Care, Inc., 2.125%, due 08/01/35 | | 3,118,455 | |
| | | | | | 3,118,455 | |
| | | | Insurance: 0.2% | | | |
2,035,000 | | +, #,C | | Conseco, Inc., 3.500%, due 09/30/35 | | 2,169,819 | |
| | | | | | 2,169,819 | |
| | | | Internet: 0.1% | | | |
1,440,000 | | C | | Amazon.com, Inc., 4.750%, due 02/01/09 | | 1,391,400 | |
| | | | | | 1,391,400 | |
| | | | | | | |
| | | | Media: 0.4% | | | |
$ | 2,428,000 | | C | | EchoStar Communications Corp., 5.750%, due 05/15/08 | | $ | 2,379,440 | |
1,615,000 | | C | | Sinclair Broadcast Group, Inc., 6.000%, due 09/15/12 | | 1,415,144 | |
| | | | | | 3,794,584 | |
| | | | Miscellaneous Manufacturing: 0.4% | | | |
3,750,000 | | C | | 3M Co., 2.400%, due 11/21/32 | | 3,351,563 | |
| | | | | | 3,351,563 | |
| | | | Packaging & Containers: 0.3% | | | |
2,900,000 | | #,C | | Sealed Air Corp., 3.000%, due 06/30/33 | | 2,907,250 | |
| | | | | | 2,907,250 | |
| | | | Pharmaceuticals: 1.0% | | | |
847,000 | | C | | Alpharma, Inc., 3.000%, due 06/01/06 | | 1,113,805 | |
533,000 | | C | | ImClone Systems, Inc., 1.375%, due 05/15/24 | | 448,386 | |
3,438,000 | | C | | Teva Pharmaceutical Finance LLC, 0.500%, due 02/01/24 | | 4,099,815 | |
3,512,000 | | C | | Watson Pharmaceuticals, Inc., 1.750%, due 03/15/23 | | 3,362,740 | |
| | | | | | 9,024,746 | |
| | | | Pipelines: 0.5% | | | |
8,807,000 | | C | | El Paso Corp., 4.020%, due 02/28/21 | | 4,843,850 | |
| | | | | | 4,843,850 | |
| | | | Semiconductors: 1.3% | | | |
3,800,000 | | C | | Advanced Micro Devices, Inc., 4.750%, due 02/01/22 | | 5,020,750 | |
1,947,000 | | # | | Intel Corp., 2.950%, due 12/15/35 | | 1,910,494 | |
4,000,000 | | C | | Micron Technology, Inc., 2.500%, due 02/01/10 | | 4,650,000 | |
| | | | | | 11,581,244 | |
| | | | Software: 0.1% | | | |
916,000 | | C | | Red Hat, Inc., 0.500%, due 01/15/24 | | 1,075,155 | |
| | | | | | 1,075,155 | |
| | | | Telecommunications: 1.0% | | | |
5,006,000 | | @@,C | | Nortel Networks Corp., 4.250%, due 09/01/08 | | 4,718,155 | |
4,053,000 | | C | | Qwest Communications International, Inc., 3.500%, due 11/15/25 | | 4,716,677 | |
| | | | | | 9,434,832 | |
| | | | Total Convertible Bonds
(Cost $99,721,862) | | 103,087,933 | |
See Accompanying Notes to Financial Statements
220
ING VAN KAMPEN | PORTFOLIO OF INVESTMENTS |
EQUITY AND INCOME PORTFOLIO | AS OF DECEMBER 31, 2005 (CONTINUED) |
Principal Amount | | | | | | Value | |
CORPORATE BONDS/NOTES: 6.5% | | | |
| | | | Aerospace/Defense: 0.1% | | | |
$ | 255,000 | | C | | Raytheon Co., 6.150%, due 11/01/08 | | $ | 264,816 | |
12,000 | | C | | Raytheon Co., 8.300%, due 03/01/10 | | 13,453 | |
400,000 | | C | | United Technologies Corp., 4.375%, due 05/01/10 | | 393,947 | |
| | | | | | 672,216 | |
| | | | Airlines: 0.1% | | | |
472,302 | | | | America West Airlines, 7.100%, due 04/02/21 | | 502,631 | |
125,000 | | | | Southwest Airlines Co., 5.496%, due 11/01/06 | | 125,595 | |
| | | | | | 628,226 | |
| | | | Auto Manufacturers: 0.0% | | | |
325,000 | | | | DaimlerChrysler NA Holding Corp., 7.750%, due 01/18/11 | | 355,964 | |
| | | | | | 355,964 | |
| | | | Banks: 0.2% | | | |
425,000 | | | | Bank of New York, 3.800%, due 02/01/08 | | 416,349 | |
75,000 | | | | Bank of New York, 5.200%, due 07/01/07 | | 75,399 | |
175,000 | | | | Bank One Corp., 6.000%, due 02/17/09 | | 179,371 | |
750,000 | | | | Marshall & Ilsley Bank, 3.800%, due 02/08/08 | | 736,208 | |
125,000 | | | | Sovereign Bank, 4.000%, due 02/01/08 | | 122,606 | |
| | | | | | 1,529,933 | |
| | | | Beverages: 0.1% | | | |
400,000 | | @@,# | | FBG Finance Ltd., 5.125%, due 06/15/15 | | 389,884 | |
400,000 | | #,C | | Miller Brewing Co., 4.250%, due 08/15/08 | | 392,796 | |
| | | | | | 782,680 | |
| | | | Biotechnology: 0.7% | | | |
1,020,000 | | C | | Chiron Corp., 1.625%, due 08/01/33 | | 1,007,250 | |
1,573,000 | | #,C | | Chiron Corp., 2.750%, due 06/30/34 | | 1,563,169 | |
3,537,000 | | C | | Medimmune, Inc., 1.000%, due 07/15/23 | | 3,466,260 | |
| | | | | | 6,036,679 | |
| | | | Diversified Financial Services: 2.3% | | | |
15,000 | | | | AIG Credit Card, 4.625%, due 09/01/10 | | 14,694 | |
970,000 | | # | | AIG SunAmerica Global Financing, 6.300%, due 05/10/11 | | 1,031,656 | |
4,100,000 | | +, C | | American Express Co., 1.850%, due 12/01/33 | | 4,371,625 | |
705,000 | | | | American General Finance Corp., 4.625%, due 05/15/09 | | 698,461 | |
690,000 | | | | Caterpillar Financial Services Corp., 3.625%, due 11/15/07 | | 675,129 | |
$ | 125,000 | | | | CIT Group, Inc., 2.875%, due 09/29/06 | | $ | 123,286 | |
100,000 | | | | CIT Group, Inc., 3.650%, due 11/23/07 | | 97,799 | |
305,000 | | | | CIT Group, Inc., 4.750%, due 08/15/08 | | 304,023 | |
100,000 | | | | CIT Group, Inc., 7.375%, due 04/02/07 | | 102,943 | |
545,000 | | | | Citigroup, Inc., 5.625%, due 08/27/12 | | 562,514 | |
250,000 | | | | Citigroup, Inc., 6.000%, due 02/21/12 | | 262,722 | |
425,000 | | | | Citigroup, Inc., 6.500%, due 01/18/11 | | 453,325 | |
645,000 | | | | Countrywide Home Loans, Inc., 3.250%, due 05/21/08 | | 619,724 | |
80,000 | | C | | Equitable Co., 6.500%, due 04/01/08 | | 82,940 | |
600,000 | | # | | Farmers Exchange Capital, 7.050%, due 07/15/28 | | 636,455 | |
250,000 | | | | General Electric Capital Corp., 4.250%, due 12/01/10 | | 244,294 | |
175,000 | | | | General Electric Capital Corp., 4.750%, due 09/15/14 | | 172,417 | |
200,000 | | | | General Electric Capital Corp., 5.875%, due 02/15/12 | | 208,877 | |
270,000 | | C | | General Electric Capital Corp., 6.750%, due 03/15/32 | | 317,993 | |
3,500,000 | | | | Goldman Sachs Group, Inc., 0.250%, due 08/30/08 | | 3,417,645 | |
310,000 | | | | Goldman Sachs Group, Inc., 5.250%, due 10/15/13 | | 310,415 | |
150,000 | | C | | Goldman Sachs Group, Inc., 6.600%, due 01/15/12 | | 161,329 | |
160,000 | | | | Household Finance Corp., 4.125%, due 11/16/09 | | 154,614 | |
125,000 | | | | Household Finance Corp., 4.125%, due 12/15/08 | | 122,140 | |
150,000 | | | | Household Finance Corp., 6.400%, due 06/17/08 | | 154,833 | |
50,000 | | | | Household Finance Corp., 8.000%, due 07/15/10 | | 55,832 | |
775,000 | | | | HSBC Finance Corp., 6.750%, due 05/15/11 | | 832,645 | |
75,000 | | # | | John Hancock Global Funding, 7.900%, due 07/02/10 | | 84,420 | |
425,000 | | | | JPMorgan Chase & Co., 6.750%, due 02/01/11 | | 455,697 | |
400,000 | | @@,#,C | | Mantis Reef Ltd., 4.692%, due 11/14/08 | | 393,270 | |
510,000 | | | | MBNA Corp., 4.721%, due 05/05/08 | | 514,040 | |
370,000 | | | | MBNA Corp., 6.125%, due 03/01/13 | | 392,924 | |
530,000 | | @@,# | | Nationwide Building Society, 4.250%, due 02/01/10 | | 516,927 | |
455,000 | | C | | Residential Capital Corp., 6.375%, due 06/30/10 | | 462,779 | |
320,000 | | | | SLM Corp., 4.000%, due 01/15/10 | | 308,022 | |
435,000 | | | | SLM Corp., 5.000%, due 10/01/13 | | 430,624 | |
215,000 | | | | Textron Financial Corp., 4.125%, due 03/03/08 | | 211,801 | |
355,000 | | @@,#,C | | Two-Rock Pass Through, 5.270%, due 02/11/50 | | 353,101 | |
690,000 | | # | | Xlliac Global Funding, 4.800%, due 08/10/10 | | 681,995 | |
| | | | | | 20,995,930 | |
See Accompanying Notes to Financial Statements
221
ING VAN KAMPEN | PORTFOLIO OF INVESTMENTS |
EQUITY AND INCOME PORTFOLIO | AS OF DECEMBER 31, 2005 (CONTINUED) |
Principal Amount | | | | | | Value | |
| | | | Electric: 0.6% | | | |
$ | 385,000 | | | | Ameren Corp., 4.263%, due 05/15/07 | | $ | 379,609 | |
445,000 | | C | | Arizona Public Service Co., 5.800%, due 06/30/14 | | 459,400 | |
80,000 | | C | | Arizona Public Service Co., 6.750%, due 11/15/06 | | 81,068 | |
485,000 | | C | | Carolina Power & Light, 5.125%, due 09/15/13 | | 484,474 | |
385,000 | | | | CC Funding Trust I, 6.900%, due 02/16/07 | | 392,511 | |
260,000 | | C | | Cincinnati Gas & Electric Co., 5.700%, due 09/15/12 | | 267,233 | |
110,000 | | C | | Consumers Energy Co., 4.000%, due 05/15/10 | | 104,565 | |
175,000 | | C | | Consumers Energy Co., 4.800%, due 02/17/09 | | 172,842 | |
5,000 | | C | | Detroit Edison Co., 6.125%, due 10/01/10 | | 5,221 | |
370,000 | | C | | Duquesne Light Co., 5.700%, due 05/15/14 | | 380,847 | |
175,000 | | C | | Entergy Gulf States, Inc., 3.600%, due 06/01/08 | | 168,379 | |
170,000 | | C | | Entergy Gulf States, Inc., 4.810%, due 12/01/09 | | 166,017 | |
185,000 | | C | | Exelon Corp., 6.750%, due 05/01/11 | | 197,175 | |
320,000 | | | | FPL Group Capital, Inc., 3.250%, due 04/11/06 | | 318,761 | |
235,000 | | C | | Nisource Finance Corp., 4.950%, due 11/23/09 | | 235,985 | |
235,000 | | C | | Pacific Gas & Electric Co., 6.050%, due 03/01/34 | | 244,050 | |
518,000 | | | | Pacific Gas & Electric Co., 9.500%, due 06/30/10 | | 1,445,220 | |
5,000 | | C | | Wisconsin Electric Power, 3.500%, due 12/01/07 | | 4,871 | |
| | | | | | 5,508,228 | |
| | | | Electrical Components & Equipment: 0.0% | | | |
215,000 | | C | | Cooper Industries, Inc., 5.250%, due 11/15/12 | | 216,550 | |
250,000 | | @@,# | | LG Electronics, Inc., 5.000%, due 06/17/10 | | 245,050 | |
| | | | | | 461,600 | |
| | | | Environmental Control: 0.0% | | | |
150,000 | | C | | Waste Management, Inc., 7.375%, due 08/01/10 | | 163,403 | |
| | | | | | 163,403 | |
| | | | Food: 0.1% | | | |
110,000 | | C | | ConAgra Foods, Inc., 7.000%, due 10/01/28 | | 119,858 | |
55,000 | | C | | ConAgra Foods, Inc., 8.250%, due 09/15/30 | | 68,134 | |
215,000 | | # | | HJ Heinz Co., 6.428%, due 12/01/08 | | 221,007 | |
485,000 | | C | | Kroger Co., 7.500%, due 04/01/31 | | 543,064 | |
145,000 | | C | | Safeway, Inc., 7.250%, due 02/01/31 | | 156,935 | |
| | | | | | 1,108,998 | |
| | | | Gas: 0.0% | | | |
$ | 300,000 | | | | Sempra Energy, 4.621%, due 05/17/07 | | $ | 297,972 | |
| | | | | | 297,972 | |
| | | | Healthcare-Products: 0.0% | | | |
410,000 | | @@,#,C | | Baxter FinCo BV, 4.750%, due 10/15/10 | | 404,772 | |
| | | | | | 404,772 | |
| | | | Healthcare-Services: 0.1% | | | |
675,000 | | C | | Aetna, Inc., 7.375%, due 03/01/06 | | 677,657 | |
430,000 | | | | WellPoint, Inc., 3.750%, due 12/14/07 | | 420,644 | |
95,000 | | C | | WellPoint, Inc., 4.250%, due 12/15/09 | | 92,616 | |
| | | | | | 1,190,917 | |
| | | | Insurance: 0.2% | | | |
225,000 | | # | | Farmers Insurance Exchange, 8.625%, due 05/01/24 | | 273,784 | |
650,000 | | C | | Marsh & McLennan Cos., Inc., 5.375%, due 07/15/14 | | 640,826 | |
250,000 | | | | Nationwide Financial Services, 6.250%, due 11/15/11 | | 263,450 | |
275,000 | | C | | Platinum Underwriters Finance, Inc., 7.500%, due 06/01/17 | | 280,781 | |
370,000 | | @@ | | Platinum Underwriters Holdings Ltd., 6.371%, due 11/16/07 | | 371,369 | |
490,000 | | | | St. Paul Travelers Cos, Inc., 5.010%, due 08/16/07 | | 489,957 | |
| | | | | | 2,320,167 | |
| | | | Lodging: 0.1% | | | |
520,000 | | C | | Harrah’s Operating Co., Inc., 5.625%, due 06/01/15 | | 511,780 | |
340,000 | | #,C | | Hyatt Equities LLC, 6.875%, due 06/15/07 | | 347,011 | |
| | | | | | 858,791 | |
| | | | Media: 0.2% | | | |
175,000 | | | | Comcast Cable Communications, 6.375%, due 01/30/06 | | 175,241 | |
755,000 | | C | | Comcast Cable Communications, 6.750%, due 01/30/11 | | 800,255 | |
350,000 | | C | | Cox Communications, Inc., 7.750%, due 11/01/10 | | 379,457 | |
295,000 | | C | | Knight Ridder, Inc., 5.750%, due 09/01/17 | | 250,714 | |
220,000 | | | | News America, Inc., 7.280%, due 06/30/28 | | 241,236 | |
| | | | | | 1,846,903 | |
| | | | Oil & Gas: 0.1% | | | |
465,000 | | | | Pemex Project Funding Master Trust, 7.375%, due 12/15/14 | | 517,778 | |
125,000 | | | | Pemex Project Funding Master Trust, 9.125%, due 10/13/10 | | 144,188 | |
150,000 | | #,C | | Ras Laffan Liq Natural Gas, 8.294%, due 03/15/14 | | 173,721 | |
| | | | | | 835,687 | |
See Accompanying Notes to Financial Statements
222
ING VAN KAMPEN | PORTFOLIO OF INVESTMENTS |
EQUITY AND INCOME PORTFOLIO | AS OF DECEMBER 31, 2005 (CONTINUED) |
Principal Amount | | | | | | Value | |
| | | | Packaging & Containers: 0.1% | | | |
$ | 525,000 | | #,C | | Sealed Air Corp., 5.625%, due 07/15/13 | | $ | 521,935 | |
| | | | | | 521,935 | |
| | | | Pharmaceuticals: 0.4% | | | |
3,890,000 | | C | | Omnicare, Inc., 3.250%, due 12/15/35 | | 3,880,275 | |
207,000 | | C | | Valeant Pharmaceuticals International, 4.000%, due 11/15/13 | | 177,503 | |
| | | | | | 4,057,778 | |
| | | | Pipelines: 0.1% | | | |
350,000 | | C | | Consolidated Natural Gas Co., 5.000%, due 12/01/14 | | 340,163 | |
285,000 | | C | | Consolidated Natural Gas Co., 6.250%, due 11/01/11 | | 298,807 | |
140,000 | | C | | Panhandle Eastern Pipe Line, 2.750%, due 03/15/07 | | 136,173 | |
175,000 | | C | | Texas Eastern Transmission LP, 7.000%, due 07/15/32 | | 204,716 | |
| | | | | | 979,859 | |
| | | | Real Estate: 0.2% | | | |
385,000 | | @@ | | Brascan Corp., 7.125%, due 06/15/12 | | 420,267 | |
225,000 | | C | | EOP Operating LP, 7.875%, due 07/15/31 | | 266,304 | |
746,830 | | # | | World Financial Properties, 6.910%, due 09/01/13 | | 784,897 | |
| | | | | | 1,471,468 | |
| | | | Retail: 0.0% | | | |
10,000 | | C | | Federated Department Stores, 6.900%, due 04/01/29 | | 10,913 | |
290,000 | | C | | Ltd Brands, 6.950%, due 03/01/33 | | 294,417 | |
| | | | | | 305,330 | |
| | | | Savings & Loans: 0.1% | | | |
225,000 | | | | Washington Mutual Bank, 5.500%, due 01/15/13 | | 228,843 | |
360,000 | | | | Washington Mutual, Inc., 8.250%, due 04/01/10 | | 401,208 | |
| | | | | | 630,051 | |
| | | | Semiconductors: 0.1% | | | |
825,000 | | C | | Teradyne, Inc., 3.750%, due 10/15/06 | | 817,781 | |
| | | | | | 817,781 | |
| | | | Telecommunications: 0.4% | | | |
455,000 | | @@ | | Deutsche Telekom International Finance BV, 8.250%, due 06/15/30 | | 580,428 | |
410,000 | | @@,C | | France Telecom SA, 8.500%, due 03/01/31 | | 548,710 | |
270,000 | | C | | SBC Communications, Inc., 6.150%, due 09/15/34 | | 272,118 | |
185,000 | | C | | Sprint Capital Corp., 8.750%, due 03/15/32 | | 246,253 | |
1,430,000 | | @@,C | | Telecom Italia Capital SA, 4.000%, due 01/15/10 | | 1,363,245 | |
410,000 | | @@ | | Vodafone Group PLC, 4.611%, due 12/28/07 | | 410,134 | |
| | | | | | 3,420,888 | |
| | | | Textiles: 0.0% | | | |
$ | 192,000 | | C | | Mohawk Industries, Inc., 7.200%, due 04/15/12 | | $ | 211,882 | |
| | | | | | 211,882 | |
| | | | Transportation: 0.2% | | | |
470,000 | | C | | Burlington Northern Santa Fe Corp., 6.125%, due 03/15/09 | | 486,459 | |
250,000 | | | | FedEx Corp., 2.650%, due 04/01/07 | | 243,252 | |
140,000 | | | | Norfolk Southern Corp., 7.350%, due 05/15/07 | | 144,520 | |
585,000 | | | | Union Pacific Corp., 6.625%, due 02/01/08 | | 604,474 | |
| | | | | | 1,478,705 | |
| | | | Total Corporate Bonds/Notes
(Cost $60,413,231) | | 59,894,743 | |
| | | | | | | |
U.S. TREASURY OBLIGATIONS: 10.6% | | | |
| | | | U.S. Treasury Note: 7.7% | | | |
7,270,000 | | | | 1.625%, due 02/28/06 | | 7,245,010 | |
26,875,000 | | | | 2.000%, due 05/15/06 | | 26,656,667 | |
27,140,000 | | | | 4.250%, due 08/15/13 | | 26,905,727 | |
1,400,000 | | | | 4.250%, due 11/15/13 | | 1,387,095 | |
2,130,000 | | | | 4.625%, due 05/15/06 | | 2,132,831 | |
6,500,000 | | | | 4.750%, due 11/15/08 | | 6,564,493 | |
| | | | | | 70,891,823 | |
| | | | U.S. Treasury Bond: 2.3% | | | |
475,000 | | | | 5.500%, due 08/15/28 | | 534,245 | |
3,860,000 | | | | 6.125%, due 08/15/29 | | 4,703,020 | |
1,325,000 | | | | 6.250%, due 05/15/30 | | 1,646,003 | |
710,000 | | | | 6.375%, due 08/15/27 | | 879,762 | |
2,100,000 | | | | 7.625%, due 02/15/25 | | 2,894,228 | |
3,325,000 | | | | 8.125%, due 08/15/21 | | 4,614,608 | |
1,925,000 | | | | 8.750%, due 08/15/20 | | 2,769,896 | |
2,200,000 | | | | 9.000%, due 11/15/18 | | 3,146,000 | |
| | | | | | 21,187,762 | |
| | | | U.S. Treasury STRIP: 0.6% | | | |
3,375,000 | | | | 4.650%, due 02/15/27 | | 1,278,366 | |
2,700,000 | | | | 7.300%, due 02/15/25 | | 1,116,990 | |
8,125,000 | | | | 7.400%, due 05/15/25 | | 3,310,190 | |
| | | | | | 5,705,546 | |
| | | | Total U.S. Treasury Obligations
(Cost $97,515,538) | | 97,785,131 | |
| | | | | | | |
ASSET-BACKED SECURITY: 2.2% | | | |
| | | | Automobile Asset Backed Securities: 1.5% | | | |
1,175,000 | | C | | Capital Auto Receivables Asset Trust, 4.050%, due 07/15/09 | | 1,162,805 | |
900,000 | | C | | Daimler Chrysler Auto Trust, 4.040%, due 09/08/09 | | 890,514 | |
425,000 | | C | | Ford Credit Auto Owner Trust, 4.170%, due 01/15/09 | | 421,911 | |
1,175,000 | | C | | Harley-Davidson Motorcycle Trust, 3.760%, due 12/17/12 | | 1,152,642 | |
825,000 | | C | | Harley-Davidson Motorcycle Trust, 4.070%, due 02/15/12 | | 812,912 | |
1,000,000 | | C | | Harley-Davidson Motorcycle Trust, 4.410%, due 06/15/12 | | 992,075 | |
See Accompanying Notes to Financial Statements
223
ING VAN KAMPEN | PORTFOLIO OF INVESTMENTS |
EQUITY AND INCOME PORTFOLIO | AS OF DECEMBER 31, 2005 (CONTINUED) |
Principal Amount | | | | | | Value | |
| | | | Automobile Asset Backed Securities (continued) | | | |
$ | 600,000 | | #,C | | Hertz Vehicle Financing LLC, 4.930%, due 02/25/10 | | $ | 600,562 | |
325,000 | | C | | Honda Auto Receivables Owner Trust, 3.930%, due 01/15/09 | | 321,410 | |
800,000 | | C | | Honda Auto Receivables Owner Trust, 4.850%, due 10/19/09 | | 801,332 | |
1,275,000 | | C | | Merrill Auto Trust Securitization, 4.100%, due 08/25/09 | | 1,261,163 | |
1,300,000 | | C | | Nissan Auto Receivables Owner Trust, 3.990%, due 07/15/09 | | 1,285,683 | |
500,000 | | C | | USAA Auto Owner Trust, 3.160%, due 02/17/09 | | 493,208 | |
680,000 | | C | | USAA Auto Owner Trust, 3.580%, due 02/15/11 | | 666,951 | |
1,000,000 | | C | | USAA Auto Owner Trust, 3.900%, due 07/15/09 | | 989,166 | |
425,000 | | C | | Volkswagen Auto Lease Trust, 3.820%, due 05/20/08 | | 420,994 | |
625,000 | | C | | Wachovia Auto Owner Trust, 4.060%, due 09/21/09 | | 618,498 | |
825,000 | | C | | Wachovia Auto Owner Trust, 4.790%, due 04/20/10 | | 825,000 | |
400,000 | | C | | World Omni Auto Receivables Trust, 3.290%, due 11/12/08 | | 395,771 | |
| | | | | | 14,112,597 | |
| | | | Credit Card Asset Backed Securities: 0.1% | | | |
1,200,000 | | C | | MBNA Credit Card Master Note Trust, 2.700%, due 09/15/09 | | 1,169,172 | |
| | | | | | 1,169,172 | |
| | | | Other Asset Backed Securities: 0.6% | | | |
850,000 | | C | | Caterpillar Financial Asset Trust, 3.900%, due 02/25/09 | | 840,207 | |
400,000 | | C | | CIT Equipment Collateral, 3.500%, due 09/20/08 | | 394,224 | |
400,000 | | C | | CNH Equipment Trust, 4.020%, due 04/15/09 | | 395,876 | |
1,525,000 | | C | | CNH Equipment Trust, 4.270%, due 01/15/10 | | 1,509,880 | |
1,050,000 | | #,C | | GE Equipment Small Ticket LLC, 4.380%, due 07/22/09 | | 1,042,336 | |
1,000,000 | | #,C | | GE Equipment Small Ticket LLC, 4.880%, due 10/22/09 | | 1,001,400 | |
| | | | | | 5,183,923 | |
| | | | Total Asset-Backed Securities
(Cost $20,637,377) | | 20,465,692 | |
| | | | | | | |
OTHER BONDS: 0.1% | | | |
| | | | Foreign Government Bonds: 0.1% | | | |
1,000,000 | | @@ | | United Mexican States, 8.375%, due 01/14/11 | | 1,142,500 | |
| | | | | | 1,142,500 | |
| | | | Total Other Bonds
(Cost $1,143,845) | | 1,142,500 | |
| | | | Total Long-Term Investments:
(Cost $823,238,853) | | 874,983,982 | |
| | | | | | | |
SHORT-TERM INVESTMENTS: 6.5% | | | |
| | | | Federal Home Loan Bank: 6.5% | | | |
$ | 59,800,000 | | | | Discount Note, 3.400%, due 01/03/06 | | $ | 59,783,057 | |
| | | | Total Federal Home Loan Bank
(Cost $59,788,704) | | 59,783,057 | |
| | | | Total Short-Term Investments:
(Cost $59,788,704) | | 59,783,057 | |
| | | | Total Investments in Securities
(Cost $883,027,557)* | 101.4 | % | | $ | 934,767,039 | |
| | | | Other Assets and Liabilities-Net | (1.4 | ) | | (12,669,996) | |
| | | | Net Assets | 100.0 | % | | $ | 922,097,043 | |
| | Certain foreign securities have been fair valued in accordance with procedures approved by the Board of Trustees (Note 2A). |
@ | | Non-income producing security |
@@ | | Foreign Issuer |
ADR | | American Depositary Receipt |
STRIP | | Separate Trading of Registered Interest and Principal of Securities |
+ | | Step-up basis bonds. Interest rates shown reflect current coupon rates. |
# | | Securities with purchases pursuant to Rule 144A, under the Securities Act of 1933 and may not be resold subject to that rule except to qualified institutional buyers. These securities have been determined to be liquid under the guidelines established by the Funds’ Board of Directors/Trustees. |
C | | Bond may be called prior to maturity date. |
* | | Cost for federal income tax purposes is $888,605,927. Net unrealized appreciation consists of: |
| | Gross Unrealized Appreciation | | $ | 58,166,599 | |
| | Gross Unrealized Depreciation | | (12,005,487 | ) |
| | Net Unrealized Appreciation | | $ | 46,161,112 | |
| | | | | | | | |
See Accompanying Notes to Financial Statements
224
TAX INFORMATION (UNAUDITED)
Dividends paid during the year ended December 31, 2005 were as follows:
Fund Name | | Type | | Per Share Amount | |
ING American Century Large Company Value Portfolio | | | | | |
Class A | | NII | | $0.1191 | |
Class I | | NII | | $0.1877 | |
Class S | | NII | | $0.1430 | |
ING American Century Small Cap Value Portfolio | | | | | |
Class A | | NII | | $0.0111 | |
Class I | | NII | | $0.0524 | |
Class S | | NII | | $0.0223 | |
All Classes | | STCG | | $1.0621 | |
All Classes | | LTCG | | $0.3524 | |
ING Davis Venture Value Portfolio | | | | | |
Class A | | NII | | $0.0053 | |
Class I | | NII | | $0.0275 | |
ING Fundamental Research Portfolio | | | | | |
Class A | | NII | | $0.0651 | |
Class I | | NII | | $0.1152 | |
Class S | | NII | | $0.0900 | |
ING Goldman Sachs® Capital Growth Portfolio | | | | | |
Class I | | NII | | $0.0626 | |
Class S | | NII | | $0.0327 | |
ING Goldman Sachs® Core Equity Portfolio | | | | | |
Class A | | NII | | $0.1411 | |
Class I | | NII | | $0.1440 | |
Class S | | NII | | $0.1124 | |
All Classes | | STCG | | $0.4591 | |
All Classes | | LTCG | | $0.9634 | |
ING JPMorgan Fleming International Portfolio | | | | | |
Class A | | NII | | $0.0594 | |
Class I | | NII | | $0.0931 | |
Class S | | NII | | $0.0877 | |
ING JPMorgan Mid Cap Value Portfolio | | | | | |
Class A | | NII | | $0.0255 | |
Class I | | NII | | $0.0759 | |
Class S | | NII | | $0.0406 | |
All Classes | | STCG | | $0.4556 | |
All Classes | | LTCG | | $0.5989 | |
ING MFS Capital Opportunities Portfolio | | | | | |
Class A | | NII | | $0.1040 | |
Class I | | NII | | $0.2158 | |
Class S | | NII | | $0.1339 | |
ING OpCap Balanced Value Portfolio | | | | | |
Class A | | NII | | $0.0276 | |
Class I | | NII | | $0.0888 | |
Class S | | NII | | $0.0514 | |
ING Oppenheimer Global Portfolio | | | | | |
Class A | | NII | | $0.0363 | |
Class I | | NII | | $0.1189 | |
Class S | | NII | | $0.1015 | |
All Classes | | STCG | | $0.2258 | |
All Classes | | LTCG | | $0.0241 | |
ING Oppenheimer Strategic Income Portfolio | | | | | |
Class A | | NII | | $0.1911 | |
Class I | | NII | | $0.2295 | |
Class S | | NII | | $0.2042 | |
ING PIMCO Total Return Portfolio | | | | | |
Class A | | NII | | $0.1601 | |
Class I | | NII | | $0.2035 | |
Class S | | NII | | $0.1815 | |
All Classes | | STCG | | $0.0682 | |
All Classes | | LTCG | | $0.0678 | |
ING Salomon Brothers Large Cap Growth | | | | | |
All Classes | | STCG | | $0.5772 | |
All Classes | | LTCG | | $0.5751 | |
ING T. Rowe Price Diversified Mid Cap Growth Portfolio | | | | | |
All Classes | | STCG | | $0.0868 | |
All Classes | | LTCG | | $0.0551 | |
ING T. Rowe Price Growth Equity Portfolio | | | | | |
Class A | | NII | | $0.0492 | |
Class I | | NII | | $0.2475 | |
Class S | | NII | | $0.2332 | |
ING UBS U.S. Large Cap Equity Portfolio | | | | | |
Class A | | NII | | $0.0639 | |
Class I | | NII | | $0.0787 | |
Class S | | NII | | $0.0707 | |
ING Van Kampen Comstock Portfolio | | | | | |
Class A | | NII | | $0.0428 | |
Class I | | NII | | $0.0794 | |
Class S | | NII | | $0.0658 | |
All Classes | | STCG | | $0.1163 | |
All Classes | | LTCG | | $0.3485 | |
ING Van Kampen Equity and Income Portfolio | | | | | |
Class A | | NII | | $0.0069 | |
Class I | | NII | | $0.0304 | |
All Classes | | STCG | | $0.0205 | |
All Classes | | LTCG | | $0.0099 | |
NII — Net investment income
STCG — Short-term capital gain
LTCG — Long-term capital gain
225
TAX INFORMATION (UNAUDITED) (CONTINUED)
Of the ordinary distributions made during the year ended December 31, 2005, the following percentages qualify for the dividends received deduction (DRD) available to corporate shareholders:
ING American Century Large Company Value Portfolio | | 100.00 | % |
ING American Century Small Cap Value Portfolio | | 16.97 | % |
ING Davis Venture Value Portfolio | | 4.81 | % |
ING Fundamental Research Portfolio | | 100.00 | % |
ING Goldman Sachs® Capital Growth Portfolio | | 100.00 | % |
ING Goldman Sachs® Core Equity Portfolio | | 20.86 | % |
ING JPMorgan Mid Cap Value Portfolio | | 41.30 | % |
ING MFS Capital Opportunities Portfolio | | 100.00 | % |
ING OpCap Balanced Value Portfolio | | 73.71 | % |
ING Oppenheimer Global Portfolio | | 8.98 | % |
ING Oppenheimer Strategic Income Portfolio | | 1.40 | % |
ING Salomon Brothers Large Cap Growth Portfolio | | 7.87 | % |
ING T. Rowe Price Growth Equity Portfolio | | 100.00 | % |
ING UBS U.S. Large Cap Equity Portfolio | | 100.00 | % |
ING Van Kampen Comstock Portfolio | | 37.95 | % |
ING Van Kampen Equity and Income Portfolio | | 99.88 | % |
Pursuant to Section 853 of the Internal Revenue Code, the Portfolios designate the following amounts as foreign taxes paid for the year ended December 31, 2005:
| | Foreign Taxes
Paid | | Per Share Amount | |
| | | | | |
ING JPMorgan Fleming International Portfolio | | $1,446,044 | | $0.0211 | |
ING Oppenheimer Global Portfolio | | $1,810,826 | | $0.0106 | |
Above figures may differ from those cited elsewhere in this report due to differences in the calculation of income and gains under U.S. generally accepted accounting principles (book) purposes and Internal Revenue Service (tax) purposes.
Shareholders are strongly advised to consult their own tax advisers with respect to the tax consequences of their investments in the Funds. In January, shareholders, excluding corporate shareholders, receive an IRS 1099-DIV regarding the federal tax status of the dividends and distributions they received in the calendar year.
226
DIRECTOR AND OFFICER INFORMATION (UNAUDITED)
The business and affairs of the Funds are managed under the direction of the Funds’ Board of Directors. A Director who is not an interested person of the Company, as defined in the 1940 Act, is an independent director (“Independent Director”). The Directors and Officers of the Funds are listed below. The Statement of Additional Information includes additional information about directors of the Registrant and is available, without charge, upon request at 1-800-992-0180.
| | | | Term of | | | | Number of | | |
| | | | Office and | | Principal | | Portfolios in | | Other |
| | Position(s) | | Length of | | Occupation(s) | | Fund Complex | | Directorships |
Name, Address | | Held with | | Time | | During the | | Overseen | | Held by |
and Age | | Company | | Served(1) | | Past Five Years | | by Director | | Director |
Independent Directors: | | | | | | | | | |
| | | | | | | | | | |
John V. Boyer(3)
7337 E. Doubletree Ranch Rd.
Scottsdale, Arizona 85258
Age: 52 | | Director | | November
1997 - Present | | Executive Director, The Mark Twain House & Museum(2) (September 1989 - Present). | | 172 | | None |
| | | | | | | | | | |
J. Michael Earley(4)
7337 E. Doubletree Ranch Rd.
Scottsdale, Arizona 85258
Age : 60 | | Director | | January 2005 - Present | | President and Chief Executive Officer, Bankers Trust Company, N.A. (June 1992 - Present). | | 172 | | None |
| | | | | | | | | | |
R. Barbara Gitenstein(3)
7337 E. Doubletree Ranch Rd.
Scottsdale, Arizona 85258
Age : 57 | | Director | | January 2005 - Present | | President, College of New Jersey (January 1999 - Present). | | 172 | | None |
| | | | | | | | | | |
Patrick W. Kenny(4)
7337 E. Doubletree Ranch Rd.
Scottsdale, Arizona 85258
Age : 62 | | Director | | March 2002 - Present | | President and Chief Executive Officer International Insurance Society (June 2001 - Present). Formerly, Executive Vice President, Frontier Insurance Group, Inc. (September 1998 - March 2001). | | 172 | | Assured Guaranty Ltd. (November 2003 - Present). |
| | | | | | | | | | |
Walter H. May(3)
7337 E. Doubletree Ranch Rd.
Scottsdale, Arizona 85258
Age : 68 | | Director | | January 2005 - Present | | Retired. | | 172 | | BestPrep (September 1991 - Present). |
| | | | | | | | | | |
Jock Patton(3)
7337 E. Doubletree Ranch Rd. Scottsdale, Arizona 85258
Age : 59 | | Chairman and Director | | January 2005 - Present | | Private Investor (June 1997 - Present). Formerly, Director and Chief Executive Officer, Rainbow Multimedia Group, Inc. (January 1999 - December 2001). | | 172 | | JDA Software Group, Inc. (January 1999 - Present); Swift Transportation Co. (March 2004 - Present). |
| | | | | | | | | | |
David W.C. Putnam(4)
7337 E. Doubletree Ranch Rd. Scottsdale, Arizona 85258
Age : 66 | | Director | | January 2005 - Present | | President and Director, F.L. Putnam Securities Company, Inc. (June 1978 - Present). | | 172 | | Progressive Capital Accumulation Trust (August 1998 - Present); Principled Equity Market Trust (November 1996 - Present); Mercy Endowment Foundation (September 1995 - Present); Asian American Bank and Trust Company (June 1992 - Present); and Notre Dame Health Care Center (July 1991 - Present). |
| | | | | | | | | | |
Roger B. Vincent(4)
7337 E. Doubletree Ranch Rd. Scottsdale, Arizona 85258
Age : 60 | | Director | | January 2005 - Present | | President, Springwell Corporation (March 1989 - Present). | | 172 | | AmeriGas Propane, Inc. (January 1998 - Present). |
227
DIRECTOR AND OFFICER INFORMATION (UNAUDITED)
| | | | Term of | | | | Number of | | |
| | | | Office and | | Principal | | Portfolios in | | Other |
| | Position(s) | | Length of | | Occupation(s) | | Fund Complex | | Directorships |
Name, Address | | Held with | | Time | | During the | | Overseen | | Held by |
and Age | | Company | | Served(1) | | Past Five Years | | by Director | | Director |
Richard A. Wedemeyer(3)
7337 E. Doubletree Ranch Rd. Scottsdale, Arizona 85258
Age : 69 | | Director | | January 2005 -
Present | | Retired. Formerly, Vice President - Finance and Administration, The Channel Corporation (June 1996 - April 2002). Formerly, Trustee, First Choice Funds (February 1997 - April 2001). | | 172 | | Touchstone Consulting Group (June 1997 - Present) and Jim Henson Legacy (April 1994 - Present). |
| | | | | | | | | | |
Directors who are “Interested Persons”: | | | | | | | | |
| | | | | | | | | | |
Thomas J. McInerney(5)
7337 E. Doubletree Ranch Rd. Scottsdale, Arizona 85258
Age : 49 | | Director | | January 2005 -
Present | | Chief Executive Officer, ING U.S. Financial Services (January 2005 - Present); General Manager and Chief Executive Officer, U.S. Financial Services (December 2003 - December 2004); Chief Executive Officer, ING U.S. Financial Services (September 2001 - December 2003); and General Manager and Chief Executive Officer, U.S. Worksite Financial Services (December 2000 - September 2001). | | 212 | | Equitable Life Insurance Co., Golden American Life Insurance Co., Life Insurance Company of Georgia, Midwestern United Life Insurance Co., ReliaStar Life Insurance Co., Security Life of Denver, Security Connecticut Life Insurance Co., Southland Life Insurance Co., USG Annuity and Life Company, and United Life and Annuity Insurance Co. Inc.; Ameribest Life Insurance Co.; First Columbine Life Insurance Co.; and Metro Atlanta Chamber of Commerce (January 2003 - Present). |
| | | | | | | | | | |
John G. Turner(6)
7337 E. Doubletree Ranch Rd. Scottsdale, Arizona 85258
Age : 66 | | Director | | January 2005 -
Present | | Retired. Formerly, Vice Chairman of ING Americas (September 2000 - January 2002); Director of ReliaStar Life Insurance Company of New York (April 1975 - December 2001); and Chairman and Trustee of the Northstar affiliated investment companies (May 1993 - December 2001). | | 177 | | Hormel Foods Corporation (March 2000 - Present); ShopKo Stores, Inc. (August 1999 - Present); and Conseco, Inc. (September 2003 - Present). |
(1) Directors serve until their successors are duly elected and qualified, subject to the Board’s retirement policy.
(2) Shaun Mathews, Senior Vice President of ING Life Insurance and Annuity Company, has held a seat on the board of directors of The Mark Twain House & Museum since September 19, 2002. ING Groep N.V. makes non-material, charitable contributions to The Mark Twain House & Museum.
(3) Valuation, Proxy and Brokerage Committee member.
(4) Audit Committee member.
(5) Mr. McInerney is an “interested person,” as defined under the 1940 Act, because of his affiliation with ING Groep N.V., the parent corporation of the Investment Manager, ING Investments, LLC and the Distributor, ING Funds Distributor, LLC.
(6) Mr. Turner is an “interested person,” as defined under the 1940 Act, because of his affiliation with ING Groep N.V., the parent corporation of the Investment Manager, ING Investments, LLC and the Distributor, ING Funds Distributor, LLC.
228
Name, Address | | Position(s) | | Term of Office and | | Principal Occupation(s) during the |
And Age | | Held with the Company | | Length of Time Served(1) | | Past Five Years |
| | | | | | |
Officers: | | | | | | |
James M. Hennessy
7337 E. Doubletree Ranch Rd. Scottsdale, Arizona 85258
Age : 56 | | President and Chief Executive Officer
Chief Operating Officer | | February 2001 - Present
July 2000 - Present | | President, Chief Executive Officer and Chief Operating Officer, ING Investments, LLC (December 2000 - Present). Formerly, Senior Executive Vice President and Chief Operating Officer, ING Investments, LLC (April 1995 - December 2000). |
| | | | | | |
Michael J. Roland
7337 E. Doubletree Ranch Rd. Scottsdale, Arizona 85258
Age : 47 | | Executive Vice President | | February 2002 - Present | | Executive Vice President (December 2001 - Present) and Chief Compliance Officer (October 2004 - Present), ING Investments, LLC. Formerly, Chief Financial Officer and Treasurer, ING Investments, LLC (December 2001 - March 2005); Senior Vice President, ING Investments, LLC (June 1998 - December 2001). |
| | | | | | |
Stanley D. Vyner
7337 E. Doubletree Ranch Rd. Scottsdale, Arizona 85258
Age : 55 | | Executive Vice President | | May 1999 - Present | | Executive Vice President, ING Investments, LLC (July 2000 - Present) and Chief Investment Risk Officer (January 2003 - Present). Formerly, Chief Investment Officer of the International Portfolios, ING Investments, LLC (August 2000 - January 2003). |
| | | | | | |
Joseph M. O’Donnell
7337 E. Doubletree Ranch Rd.
Scottsdale, Arizona 85258
Age : 50 | | Chief Compliance Officer | | November 2004 - Present | | Chief Compliance Officer of the ING Funds (November 2004 - Present). Formerly, Vice President, Chief Legal Counsel, Chief Compliance Officer and Secretary of Atlas Securities, Inc., Atlas Advisers, Inc. and Atlas Funds (October 2001 - October 2004); and Chief Operating Officer and General Counsel of Matthews International Capital Management LLC and Vice President and Secretary of Matthews International Funds (August 1999 - May 2001). |
| | | | | | |
Todd Modic
7337 E. Doubletree Ranch Rd. Scottsdale, Arizona 85258
Age : 37 | | Senior Vice President, Chief Financial Officer and Assistant Secretary | | March 2005 - Present | | Senior Vice President, ING Funds Services, LLC (April 2005 - Present). Formerly, Vice President, ING Funds Services, LLC (September 2002 - March 2005); Director, Financial Reporting, ING Investments, LLC (March 2001 - September 2002); Director of Financial Reporting, Axient Communications, Inc. (May 2000 - January 2001). |
| | | | | | |
Robert S. Naka
7337 E. Doubletree Ranch Rd. Scottsdale, Arizona 85258
Age : 42 | | Senior Vice President Assistant Secretary | | November 1999 - PresentMay 1999 - Present | | Senior Vice President (August 1999 - Present) and Assistant Secretary (October 2001 - Present), ING Funds Services, LLC. |
| | | | | | |
Kimberly A. Anderson
7337 E. Doubletree Ranch Rd. Scottsdale, Arizona 85258
Age : 41 | | Senior Vice President | | November 2003 - Present | | Senior Vice President, ING Investments, LLC (October 2003 - Present). Formerly, Vice President and Assistant Secretary, ING Investments, LLC (January 2001 - October 2003); and Assistant Vice President, ING Funds Services, LLC (November 1999 - January 2001). |
| | | | | | |
Robyn L. Ichilov
7337 E. Doubletree Ranch Rd. Scottsdale, Arizona 85258
Age : 38 | | Vice President and Treasurer | | May 1999 - Present | | Vice President and Treasurer, ING Funds Services, LLC (October 2001 - Present) and ING Investments, LLC (August 1997 - Present). |
| | | | | | |
Lauren D. Bensinger
7337 E. Doubletree Ranch Rd. Scottsdale, Arizona 85258
Age : 51 | | Vice President | | February 2003 - Present | | Vice President and Chief Compliance Officer, ING Funds Distributor, LLC (July 1995 - Present); and Vice President, ING Investments, LLC (February 2003 - Present). Formerly, Chief Compliance Officer, ING Investments, LLC (October 2001 - October 2004). |
229
Name, Address | | Position(s) | | Term of Office and | | Principal Occupation(s) during the |
And Age | | Held with the Company | | Length of Time Served(1) | | Past Five Years |
| | | | | | |
Maria M. Anderson
7337 E. Doubletree Ranch Rd. Scottsdale, Arizona 85258
Age : 47 | | Vice President | | September 2004 - Present | | Vice President, ING Funds Services, LLC (September 2004 - Present). Formerly, Assistant Vice President, ING Funds Services, LLC (October 2001 - September 2004); and Manager Fund Accounting and Fund Compliance, ING Investments, LLC (September 1999 - October 2001). |
| | | | | | |
Mary A. Gaston
7337 E. Doubletree Ranch Rd
Scottsdale, Arizona 85258
Age : 39 | | Vice President | | March 2005 - Present | | Vice President, ING Fund Services, LLC (April 2005 - Present). Formerly, Assistant Vice President, Financial Reporting, ING Investments, LLC (April 2004 - April 2005); Manager, Financial Reporting, ING Investments, LLC (August 2002 - April 2004); and Controller Z Seven Fund, Inc. and Ziskin Asset Management, Inc. (January 2000 - March 2002). |
| | | | | | |
Susan P. Kinens
7337 E. Doubletree Ranch Rd. Scottsdale, Arizona 85258
Age : 28 | | Assistant Vice President | | February 2003 - Present | | Assistant Vice President, ING Funds Services, LLC (December 2002 - Present); and has held various other positions with ING Funds Services, LLC for more than the last five years. |
| | | | | | |
Kimberly K. Palmer
7337 E. Doubletree Rand Rd.
Scottsdale, Arizona 85258
Age : 48 | | Assistant Vice President | | September 2004 - Present | | Assistant Vice President, ING Funds Services, LLC (August 2004 - Present). Formerly, Manager, Registration Statements, ING Funds Services, LLC (May 2003 - August 2004); Associate Partner, AMVESCAP PLC (October 2000 - May 2003); Director of Federal Filings and Blue Sky Filings, INVESCO Funds Group, Inc. (March 1994 - May 2003). |
| | | | | | |
Huey P. Falgout, Jr.
7337 E. Doubletree Ranch Rd.
Scottsdale, Arizona 85258
Age : 41 | | Secretary | | August 2003 - Present | | Chief Counsel, ING Americas, U.S. Legal Services (September 2003 - Present). Formerly, Counsel, ING Americas, U.S. Legal Services (November 2002 - September 2003); and Associate General Counsel of AIG American General (January 1999 - November 2002). |
| | | | | | |
Theresa K. Kelety
7337 E. Doubletree Ranch Rd.
Scottsdale, Arizona 85258
Age : 42 | | Assistant Secretary | | August 2003 - Present | | Counsel, ING Americas, U.S. Legal Services (April 2003 - Present). Formerly, Senior Associate with Shearman & Sterling (February 2000 - April 2003). |
| | | | | | |
Robin R. Nesbitt
7337 E. Doubletree Rand Rd.
Scottsdale, Arizona 85258
Age : 32 | | Assistant Secretary | | September 2004 - Present | | Supervisor, Board Operations, ING Funds Services, LLC (August 2003 - Present). Formerly, Senior Legal Analyst, ING Funds Services, LLC (August 2002 - August 2003); Associate, PricewaterhouseCoopers (January 2001 - August 2001); and Paralegal, McManis, Faulkner & Morgan (May 2000 - December 2000). |
(1) The officers hold office until the next annual meeting of the Directors and until their successors have been elected and qualified.
230
ADVISORY CONTRACT APPROVAL DISCUSSION (UNAUDITED)
Section 15(c) of the Investment Company Act of 1940 (the “1940 Act”) provides that, after an initial period, the Portfolios’ existing investment advisory and sub-advisory contracts remain in effect only if the Board of Directors (the “Board”) of ING Partners, Inc., including a majority of the Directors who have no direct or indirect interest in the advisory and sub-advisory contracts, and who are not “interested persons” of the Portfolios, as such term is defined under the 1940 Act (the “Independent Directors”), annually review and renew them. In this regard, at a meeting held on November 10, 2005 the Board, including a majority of the Independent Directors, considered whether to renew the Investment Management Agreements and Advisory Contracts (the “Advisory Contracts”) between ING Life Insurance and Annuity Company (the “Adviser” or “ILIAC”) and the Portfolios and the Portfolio Management Agreements and Sub-Advisory Contracts (“Sub-Advisory Contracts”) with the sub-advisers to the Portfolios (the “Sub-Advisers”).
The Independent Directors also held separate meetings on October 11 and November 8, 2005 to consider renewals of the Advisory Contracts and Sub-Advisory Contracts. Thus, references herein to factors considered and determinations made by the Independent Directors include, as applicable, factors considered and determinations made on those earlier dates.
At the November 10, 2005 meeting, the Board voted to renew the Advisory and Sub-Advisory Contracts for the Portfolios. In reaching these decisions, the Board took into account information furnished throughout the year at regular Board meetings, as well as information prepared specifically in connection with the annual review process. The Board’s determination took into account a number of factors that its members believed, in light of the legal advice furnished to them by Kirkpatrick & Lockhart Nicholson Graham LLP (“K&LNG”), their independent legal counsel, and their own business judgment, to be relevant. Further, while the Advisory Contracts and Sub-Advisory Contracts for all the Portfolios were considered at the same Board meeting, the Directors considered each Portfolio’s advisory and sub-advisory relationships separately.
Provided below is an overview of the Board’s contract approval process in general, as well as a discussion of certain of the specific factors the Board considered at the November 10, 2005 meeting. While the Board gave its attention to the information furnished, at its request, that was most relevant to its consideration, discussed below are a number of the primary factors relevant to the Board’s consideration as to whether to renew the Advisory and Sub-Advisory Contracts for the year ending November 30, 2006. Each Director may have accorded different weight to the various factors in reaching his or her conclusions with respect to the Portfolios’ advisory and sub-advisory arrangements.
Overview of the Contract Approval Process
In 2003, the Board that currently oversees the Portfolios determined to undertake steps to further enhance the process under which the Board determines whether to renew existing Advisory and Sub-Advisory Contracts and to approve new advisory arrangements. Among the measures the Board implemented was to retain the services of an independent consultant with experience in the mutual fund industry to assist the Independent Directors of the Board in working with the personnel employed by the Portfolios’ Adviser or its affiliates who administer the Portfolios (“Management”) to identify the types of information presented to the Directors to inform their deliberations with respect to advisory and sub-advisory relationships; establish the format in which the information requested by the Board is provided to the Board; and determine the process for reviewing such information in connection with the Advisory and Sub-Advisory Contract renewal process. The end result was the implementation of the current process relied upon by the Board to review and analyze information in connection with the annual renewal of the Portfolios’ Advisory and Sub-Advisory Contracts, as well as its review and approval of new advisory relationships.
Since this process was implemented, the Board has continuously reviewed and refined the process. In addition, the Board established a Contracts Committee and two Investment Review Committees. The type and format of the information provided to the Board or its counsel to inform its annual review and renewal process has been codified in the Portfolios’ 15(c) Methodology Guide (the “Methodology Guide”). The Methodology Guide was developed under the direction of the Board, and sets out a written blueprint under which the Board requests certain information necessary to facilitate a thorough and informed review in connection with the annual Advisory and Sub-Advisory Contract renewal process. Management provides Portfolio-specific information to the Board based on the Methodology Guide through “Fund Analysis and Comparison Tables” or “FACT” sheets prior
231
ADVISORY CONTRACT APPROVAL DISCUSSION (UNAUDITED) (CONTINUED)
to the Board’s review of Advisory and Sub-Advisory Contracts. Certain of this information for a representative sample of Funds in the ING Funds complex was verified, at the Board’s request, by an independent firm to test its accuracy.
On its own and as part of a regular on-going process, the Board’s Contracts Committee recommends or considers recommendations from Management for refinements and other changes to the Methodology Guide and other aspects of the review process, and the Board’s Investment Review Committees review benchmarks used to assess the performance of each Portfolio. The Investment Review Committees also meet regularly with the Adviser and periodically with the Portfolios’ Sub-Advisers. The Investment Review Committees may apply a heightened level of scrutiny in cases where performance has lagged a benchmark and/or peer group.
The Board employed its process for reviewing contracts when considering the renewals of the Advisory and Sub-Advisory Contracts that would be effective through November 30, 2006. A number of the Board’s primary considerations and conclusions resulting from this process are discussed below.
Nature, Extent and Quality of Service
In determining whether to approve the Advisory Contracts and Sub-Advisory Contracts for the Portfolios for the year ending November 30, 2006, the Board received and evaluated such information as it deemed necessary regarding the nature, extent and quality of services provided to the Portfolios by the Adviser and Sub-Advisers. This included information about the Adviser and Sub-Advisers to the Portfolios provided throughout the year at regular Board meetings, as well as information furnished for the November 10, 2005 Board meeting, which was held to specifically consider renewal for the period ending November 30, 2006. In addition, the Board’s Independent Directors also held meetings on October 11th and November 8th, prior to the November 10, 2005 meeting of the full Board, to consider the annual renewal of the Advisory and Sub-Advisory Contracts.
The materials requested by and provided to the Board prior to the November 2005 Board meeting included the following items: (1) FACT sheets for each Portfolio that provide information about the performance and expenses of the Portfolio and other, similarly managed funds in a selected peer group (“Selected Peer Group”), as well as information about the Portfolio’s investment portfolio, objectives and strategies; (2) the Methodology Guide, which describes how the FACT sheets were prepared, including the manner in which benchmarks and Selected Peer Groups were selected and how profitability was determined; (3) responses to a detailed series of questions from K&LNG, legal counsel to the Independent Directors; (4) copies of each form of Advisory Contract and Sub-Advisory Contract; (5) copies of the Form ADV for the Adviser and each Sub-Adviser to the Portfolios; (6) financial statements for the Adviser and each Sub-Adviser; (7) drafts of narrative summaries addressing key factors the Board customarily considers in evaluating the renewals of Advisory Contracts and Sub-Advisory Contracts, including a written analysis for each Portfolio of how performance and fees compare to its Selected Peer Group and/or designated benchmarks; and (8) other information relevant to the Board’s evaluations.
For each Portfolio except ING Stock Index Portfolio, the Portfolio’s Class I shares were used for purposes of certain comparisons to the funds in the Selected Peer Group. Class I shares were selected, as general matter, so that the Portfolio class with the longest performance history was compared to the analogous class of shares for each fund in the Selected Peer Group. The mutual funds chosen for inclusion in a Portfolio’s Selected Peer group were selected based upon criteria designed to mirror the Portfolio class being compared to the Selected Peer Group.
In arriving at its conclusions with respect to the advisory arrangements with the Adviser, the Board was mindful of the “manager-of-managers” platform of the ING Funds. The Board considered the techniques that the Adviser developed, in response to the direction of the Board, to screen and perform due diligence on Sub-Advisers that are recommended to the Board to manage the Portfolios. The Board also noted the resources that the Adviser has committed to the Board and its Investment Review Committees to assist the Board and Committee members with their assessment of the investment performance of the Portfolios. This includes the appointment of a Chief Investment Risk Officer and his staff, who report directly to the Board, and who have developed attribution analyses and other metrics used by the Investment Review Committees to analyze the key factors underlying investment performance for the Portfolios.
The Board also noted the techniques used by the Adviser to monitor the performance of the Sub-Advisers, and took note of the pro-active approach that the Adviser, working in cooperation with the Board’s Investment
232
ADVISORY CONTRACT APPROVAL DISCUSSION (UNAUDITED) (CONTINUED)
Review Committees, has taken to advocate or recommend, when it believed appropriate, changes intended to assist performance of the Portfolios. These changes have historically included modifications in personnel responsible for managing a Portfolio and/or changes in the Sub-Adviser to a Portfolio.
In considering the Portfolios’ Advisory Contracts, the Board also considered the extent of benefits provided to the Portfolios’ shareholders, beyond advisory services, from being part of the ING family of Funds. This includes, in most cases, the right to exchange or transfer investments between the same class of shares of such Funds, without a sales charge, or among Funds available in a product platform, and the wide variety in the types of Funds available for exchange or transfer.
The Board also took into account the Adviser’s extensive efforts in recent years to reduce the expenses of the Portfolios through re-negotiated arrangements with the Portfolios’ service providers. In addition, the Board considered the extensive efforts of the Adviser and expense it incurred in recent years to help make the Fund complex more efficient by reducing the number of Portfolios through reorganizations of similar Portfolios.
Further, the Board received periodic reports showing that the investment policies and restrictions for each Portfolio were consistently complied with and other periodic reports covering matters such as compliance by Adviser and Sub-Adviser personnel with codes of ethics. The Board evaluated the Adviser’s and Sub-Advisers’ regulatory compliance systems and procedures reasonably designed to assure compliance with the federal securities laws, including those related to late trading and market timing, best execution, fair value pricing, proxy voting procedures, and trade allocation, among others. The Board considered the implementation by the Adviser and certain Sub-Advisers of enhanced compliance policies and procedures in response to SEC rule changes and other regulatory initiatives. The Board also took into account the reports of the Chief Compliance Officer and his recommendations. In this regard, the Board also considered the policies and procedures developed by the Chief Compliance Officer in consultation with the Board’s Compliance Committee that guide the Chief Compliance Officer’s compliance oversight function.
The Board reviewed the level of staffing, quality and experience of each Portfolio’s portfolio management team. The Board took into account the respective resources and reputations of the Adviser and the Sub-Advisers, and evaluated the ability of the Adviser and the Sub-Advisers to attract and retain qualified investment advisory personnel. For larger Portfolios, the Board also considered the adequacy of the resources committed to the Portfolios by the Adviser and the Sub-Advisers, and whether those resources are commensurate with the needs of larger Portfolios and are appropriate to attempt to sustain expected levels of performance, compliance, and other needs.
Based on their deliberations and the materials presented to them, the Board concluded that the advisory and related services provided by the Adviser and Sub-Advisers are appropriate in light of the Portfolios’ operations, the competitive landscape of the investment company business, and investor needs, and that the nature and quality of the overall services provided by the Adviser and Sub-Advisers were appropriate.
Portfolio Performance
In assessing advisory and sub-advisory relationships, the Board placed emphasis on the investment performance of each Portfolio, taking into account the importance of such performance to the Portfolio’s shareholders. While the Board considered the performance reports and discussions with portfolio managers at Board and Committee meetings during the year, particular attention in assessing performance was given to the Portfolio FACT sheets furnished in advance of the November meeting of the Independent Directors. The FACT sheet prepared for each Portfolio included its investment performance compared to the Morningstar category median, Lipper category median, Selected Peer Group and Portfolio’s primary benchmark. The Board’s findings specific to each Portfolio’s performance are discussed under “Portfolio-by-Portfolio Analysis,” below.
Economies of Scale
In considering the reasonableness of advisory fees, the Board also considered whether economies of scale will be realized by the Adviser as a Portfolio grows larger and the extent to which this is reflected in the level of management fee rates charged. In this regard, the Board noted any breakpoints in advisory fee schedules that resulted in a lower advisory fee because a Portfolio achieved sufficient asset levels to receive a breakpoint discount. In the case of sub-advisory fees, the Board considered that breakpoints would inure to the benefit of the Adviser, except to the extent that these savings are passed through in the form of breakpoints on advisory
233
ADVISORY CONTRACT APPROVAL DISCUSSION (UNAUDITED) (CONTINUED)
fees that resulted in savings to the Portfolios. For Portfolios that did not have breakpoint discounts on advisory fees, but did benefit from waivers to or reimbursements of advisory or other fees, the Board also considered the extent to which economies of scale could effectively be realized through such waivers, reimbursements, or expense reductions.
Information about Services to Other Clients
The Board requested, and in many instances received and, if so, considered, information about the nature of services and fee rates offered by the Adviser and the Sub-Advisers to other clients, including other registered investment companies and institutional accounts. When rates offered to other clients differed materially from those charged to the Portfolios, the Board considered the underlying rationale provided by the Adviser and Sub-Advisers for these differences. For the unaffiliated Sub-Advisers, the Board did not view this information as imperative to its deliberations because of the arms-length nature of the negotiations between the Adviser and unaffiliated Sub-Advisers with respect to sub-advisory fees.
Fee Rates and Profitability
The Board reviewed and considered each contractual investment advisory fee rate, combined with the administrative fee rate, payable by each Portfolio to the Adviser. The Board also considered the contractual sub-advisory fee rates payable by the Adviser to each Sub-Adviser for sub-advisory services. In addition, the Board reviewed and took into account existing and proposed fee waivers and expense limitations applicable to the fees payable by the Portfolios.
The Board considered the fee structures of the Portfolios as they relate to the services provided under the Contracts, and the potential fall-out benefits to the Adviser and Sub-Advisers, and their respective affiliates, from their association with the Portfolios. For each Portfolio, the Board determined that the fees payable to the Adviser and Sub-Advisers are reasonable for the services that each performs, which were considered in light of the nature and quality of the services that each has performed and is expected to perform through the year ending November 30, 2006.
For each Portfolio, the Board considered information on revenues, costs and profits realized by the Adviser, which was prepared by Management in accordance with the allocation methodology (including assumptions) specified in the Methodology Guide. In analyzing the profitability of the Adviser in connection with its services to a Portfolio, the Board took into account the sub-advisory fee rate payable by the Adviser to the Sub-Adviser to that Portfolio. The Board also considered information that it requested and was provided by Management with respect to the profitability of service providers affiliated with the Adviser, as well as information provided by certain Sub-Advisers with respect to their profitability. In the case of non-affiliated Sub-Advisers, the Board gave less weight to profitability considerations, or did not view this data as imperative to its deliberations, given the arms-length nature of the relationship between the Adviser and these Sub-Advisers with respect to the negotiation of sub-advisory fees.
The Board determined that it had requested and received sufficient information to gain a reasonable understanding regarding the Adviser’s and affiliated Sub-Advisers’ profitability. The Board also recognized that profitability analysis is not an exact science and there is no uniform methodology for determining profitability for this purpose. In this context, the Board realized that Management’s calculations regarding its costs incurred in establishing the infrastructure necessary for the Portfolios’ operations may not be fully reflected in the expenses allocated to each Portfolio in determining profitability, and that the information presented may not portray all of the costs borne by Management nor capture Management’s entrepreneurial risk associated with offering and managing a mutual fund complex in today’s regulatory environment.
In their examination of advisory fees, the Independent Directors have, from time to time, requested the Adviser, and the Adviser has agreed, to implement remedial actions for certain Portfolios. These remedial actions have included, among others: reductions in expense caps or management fee rates; the addition of further breakpoints to fee schedules; reductions in 12b-1 fees payable by a Portfolio; the merger of certain Portfolios with and into comparable Portfolios; changes to the Sub-Adviser or portfolio manager managing a Portfolio; and enhancements to the resources available to a Sub-Adviser when managing a Portfolio. The Independent Directors requested these adjustments largely on the basis of: (a) a Portfolio’s performance, as compared to its Selected Peer Group;
234
ADVISORY CONTRACT APPROVAL DISCUSSION (UNAUDITED) (CONTINUED)
(b) the performance of a Portfolio, as compared to its benchmarks; or (c) a Portfolio’s expenses in relation to its Selected Peer Group.
Based on the information on revenues, costs, and profitability considered by the Board, after considering the factors described in this section, as well as any remedial actions requested by the Independent Directors and agreed to by the Adviser, the Board concluded that the profits, if any, realized by the Adviser and Sub-Advisers were not excessive. In making its determinations, the Board considered that the Adviser had incentive to negotiate the most favorable fees from unaffiliated Sub-Advisers, and it based its conclusions on the reasonableness of the sub-advisory fees of the Sub-Advisers primarily on the factors described for each Portfolio below and, in the case of non-affiliated Sub-Advisers, in reliance on the arms-length nature of the negotiations between the Adviser and Sub-Advisers with respect to sub-advisory fees.
Portfolio-by-Portfolio Analysis
The following paragraphs outline certain of the specific factors that the Board considered, and the conclusions reached, at its November 2005 meeting in relation to renewing each Portfolio’s current Advisory Contract and its Sub-Advisory Contract for the year ending November 30, 2006. These specific factors are in addition to those considerations discussed above. In each case, the Portfolio’s performance was compared to its Morningstar category median and its primary benchmark, a broad-based securities market index that appears in the Portfolio’s prospectus. Each Portfolio’s management fee and expense ratio were compared to the fees and expense ratios of the funds in its Selected Peer Group.
ING American Century Large Company Value Portfolio
In considering whether to approve the renewal of the Advisory and Sub-Advisory Contracts for ING American Century Large Company Value Portfolio, the Board considered that, based on performance data for the periods ended June 30, 2005: (1) the Portfolio underperformed its Morningstar category median and its benchmark for all periods presented and one- and three-year periods; and (2) the Portfolio is ranked in the fifth (lowest) quintile for the year-to-date and one-year periods and in the third quintile for the three-year period.
In analyzing this performance data, the Board took into account that in April 2005 American Century Investment Management, Inc. (“American Century”) assumed responsibility for the day-to-day management of the Portfolio. In addition, in connection with the sub-adviser change, the Portfolio’s investment strategy was changed.
In considering the fees payable under the Advisory and Sub-Advisory Contracts for ING American Century Large Company Value Portfolio, the Board took into account the factors described above and also considered: (1) the fairness of the compensation under an Advisory Contract with level fees that does not include breakpoints; (2) the pricing structure (including the expense ratio to be borne by shareholders) of the Portfolio, as compared to its Selected Peer Group, including that: (a) the management fee for the Portfolio is above the median and the average management fees of the funds in its Selected Peer Group; and (b) the expense ratio for the Portfolio is above the median and the average expense ratios of the funds in its Selected Peer Group.
After its deliberation, the Board reached the following conclusions: (1) the Portfolio’s management fee rate is reasonable in the context of all factors considered by the Board; (2) the Portfolio’s expense ratio is reasonable in the context of all factors considered by the Board; (3) the sub-advisory fee rate payable to the Sub-Adviser is reasonable in the context of all factors considered by the Board; and (4) in April 2005, American Century assumed responsibility for management of the Portfolio, and it is reasonable to allow the new portfolio management team to continue to manage the Portfolio to assess Portfolio performance. Based on these conclusions and other factors, the Board voted to renew the Advisory and Sub-Advisory Contracts for the Portfolio for the year ending November 30, 2006. During this renewal process, different Board members may have given different weight to different individual factors and related conclusions.
ING American Century Select Portfolio
In considering whether to approve the renewal of the Advisory and Sub-Advisory Contracts for ING American Century Select Portfolio, the Board considered that, based on performance data for the periods ended June 30, 2005: (1) the Portfolio underperformed its Morningstar category median and its primary benchmark for all periods
235
ADVISORY CONTRACT APPROVAL DISCUSSION (UNAUDITED) (CONTINUED)
presented; and (2) the Portfolio is ranked in the fifth (lowest) quintile for the one- and three-year periods, and in the fourth quintile for the most recent calendar quarter and year-to-date periods.
In analyzing this performance data, the Board took into account that, to address concerns about long-term performance, in November 2004, American Century Investment Management, Inc. (“American Century”) assumed responsibility for the day-to-day management of the Portfolio.
In considering the fees payable under the Advisory and Sub-Advisory Contracts for ING American Century Select Portfolio, the Board took into account the factors described above and also considered: (1) the fairness of the compensation under an Advisory Contract with level fees that does not include breakpoints; (2) the pricing structure (including the expense ratio to be borne by shareholders) of the Portfolio, as compared to its Selected Peer Group, including that: (a) the management fee for the Portfolio is below the median and the average management fees of the funds in its Selected Peer Group; and (b) the expense ratio for the Portfolio is below the median and the average expense ratios of the funds in its Selected Peer Group.
After its deliberation, the Board reached the following conclusions: (1) the Portfolio’s management fee rate is reasonable in the context of all factors considered by the Board; (2) the Portfolio’s expense ratio is reasonable in the context of all factors considered by the Board; (3) American Century assumed day-to-day management of the Portfolio in November 2004, and it is reasonable to permit the Sub-Adviser to continue to manage the Portfolio to assess longer-term performance; and (4) the sub-advisory fee rate payable by the Adviser to the Sub-Adviser is reasonable in the context of all factors considered by the Board. Based on these conclusions and other factors, the Board voted to renew the Advisory and Sub-Advisory Contracts for the Portfolio for the year ending November 30, 2006. During this renewal process, different Board members may have given different weight to different individual factors and related conclusions.
ING American Century Small Cap Value Portfolio
In considering whether to approve the renewal of the Advisory and Sub-Advisory Contracts for ING American Century Small Cap Value Portfolio, the Board considered that, based on performance data for the periods ended June 30, 2005: (1) the Portfolio outperformed its Morningstar category median for the most recent calendar quarter and year-to-date, and underperformed for the one- and three-year periods; (2) the Portfolio outperformed its primary benchmark for the year-to-date and one-year periods and underperformed for the three-year period; and (3) the Portfolio is ranked in the fourth quintile for the three-year period, in the third quintile for the one-year period, and in the second quintile year-to-date.
In considering the fees payable under the Advisory and Sub-Advisory Contracts for ING American Century Small Cap Value Portfolio, the Board took into account the factors described above and also considered: (1) the fairness of the compensation under an Advisory Contract with level fees that does not include breakpoints; and (2) the pricing structure (including the expense ratio to be borne by shareholders) of ING American Century Small Cap Value Portfolio, as compared to its Selected Peer Group, including that: (a) the management fee for the Portfolio is above the median and the average management fees of the funds in its Selected Peer Group; and (b) the expense ratio for the Portfolio is above the median and the average expense ratios of the funds in its Selected Peer Group. In analyzing this fee data, the Board took into account that Management determined to: (1) convert the Administrator’s current agreement to waive 0.10% of the Portfolio’s administrative fees, which was to expire on May 1, 2008, to a permanent fee waiver, and (2) increase the waiver by an additional 0.05%.
After its deliberation, the Board reached the following conclusions: (1) the Portfolio’s management fee rate is reasonable in the context of all factors considered by the Board; (2) Management agreed to lower the expense ratio of the Portfolio through additional, permanent fee waivers, and the post-waiver expense ratio is reasonable in the context of all factors considered by the Board; (3) the Portfolio’s more recent performance has improved, and it is reasonable to permit the Sub-Adviser to continue to manage the Portfolio to appropriately assess longer-term performance; and (4) the sub-advisory fee rate payable by the Adviser to the Sub-Adviser is reasonable in the context of all factors considered by the Board. Based on these conclusions and other factors, the Board voted to renew the Advisory and Sub-Advisory Contracts for the Portfolio for the year ending November 30, 2006. During this renewal process, different Board members may have given different weight to different individual factors and related conclusions.
236
ADVISORY CONTRACT APPROVAL DISCUSSION (UNAUDITED) (CONTINUED)
ING Baron Small Cap Growth Portfolio
In considering whether to approve the renewal of the Advisory and Sub-Advisory Contracts for ING Baron Small Cap Growth Portfolio, the Board considered that, based on performance data for the periods ended June 30, 2005: (1) the Portfolio outperformed its Morningstar category median for the year-to-date, one- and three-year periods, but underperformed for the most recent calendar quarter; (2) the Portfolio outperformed its primary benchmark for the year-to-date, one- and three-year periods, but underperformed for the most recent calendar quarter; and (3) the Portfolio is ranked in the first (highest) quintile for the one- and three-year periods.
In considering the fees payable under the Advisory and Sub-Advisory Contracts for ING Baron Small Cap Growth Portfolio, the Board took into account the factors described above and also considered: (1) the fairness of the compensation under an Advisory Contract with level fees that does not include breakpoints; and (2) the pricing structure (including the expense ratio to be borne by shareholders) of ING Baron Small Cap Growth Portfolio, as compared to its Selected Peer Group, including that: (a) the management fee for the Portfolio is below the median and above the average management fees of the funds in its Selected Peer Group; and (b) the expense ratio for the Portfolio is above the median and the average expense ratios of the funds in its Selected Peer Group. In analyzing this fee data, the Board took into account Management’s representations that it would: (1) convert the Administrator’s current agreement to waive the Portfolio’s administrative fees in an amount equal to 0.05%, which was to expire on May 1, 2006, to a permanent fee waiver, and (2) increase the waiver to achieve an additional reduction equal to 0.12%.
After its deliberation, the Board reached the following conclusions: (1) the Portfolio’s management fee rate is reasonable in the context of all factors considered by the Board; (2) Management agreed to lower the expense ratio of the Portfolio through additional, permanent fee waivers, and that post-waiver expense ratio is reasonable in the context of all factors considered by the Board; (3) the Portfolio’s performance is reasonable in the context of all factors considered by the Board; and (4) the sub-advisory fee rate payable by the Adviser to the Sub-Adviser is reasonable in the context of all factors considered by the Board. Based on these conclusions and other factors, the Board voted to renew the Advisory and Sub-Advisory Contracts for the Portfolio for the year ending November 30, 2006. During this renewal process, different Board members may have given different weight to different individual factors and related conclusions.
ING Davis Venture Value Portfolio (formerly, ING Salomon Brothers Fundamental Value Portfolio)
Approval of New Sub-Advisory Contract
At its July 21, 2005 meeting, the Board approved a new Sub-Advisory Contract with Davis Selected Advisers, L.P. (“Davis”) under which Davis would serve as Sub-Adviser to ING Davis Venture Value Portfolio (formerly, ING Salomon Brothers Fundamental Value Portfolio). The new Sub-Advisory Contract with Templeton became effective on December 1, 2005.
The information provided to the Board to inform its consideration of whether to approve the Sub-Advisory Contract with Davis included the following: (1) a memorandum discussing management’s rationale for the change in Sub-Adviser to the Portfolio, the reasons management is recommending Davis and the performance of Davis in managing Davis NY Venture Fund (the “Davis Fund”), a proprietary fund managed in a manner similar to that in which Davis would manage the Portfolio, with such performance being compared against an appropriate benchmark, Morningstar Category Average, and Selected Peer Group; (2) FACT sheets for the Portfolio that provide information about the performance of the Davis Fund and the performance of the Portfolio’s Selected Peer Group; (3) Davis’ responses to inquiries from counsel to the Independent Directors; (4) supporting documentation, including copies of the form of Sub-Advisory Contract with Davis for ING Davis Venture Value Portfolio (formerly, ING Salomon Brothers Fundamental Value Portfolio); (5) an analysis regarding the effect that the proposed Sub-Adviser change would have on ILIAC’s profitability and (6) other information relevant to the Board’s evaluation.
In reaching a decision to engage Davis as the Portfolio’s Sub-Adviser, the Board, including a majority of the Independent Directors, considered the performance of the Davis Fund for the year-to-date, and one-year, three-year and five-year periods. In addition, the Board evaluated and discussed other factors, including, but not limited to, the following: (1) the process employed by Davis in managing a large-capitalization (“large-cap”) fund and the
237
ADVISORY CONTRACT APPROVAL DISCUSSION (UNAUDITED) (CONTINUED)
consistency of Davis’ process over time; (2) ILIAC’s view of the reputation of Davis as a manager to similar funds; (3) Davis’ experience and skill in managing large-cap funds; (4) the nature and quality of the services to be provided by Davis under the proposed Sub-Advisory Contract; (5) the personnel, operations, financial condition, and investment management capabilities, methodologies and resources of Davis, including its management team’s expertise in the management of the Davis Fund, and its fit among the stable of managers in the ING Funds line-up; (6) the fairness of the compensation under the proposed Sub-Advisory Contract in light of the services to be provided; (7) the costs for the services to be provided by Davis, including that Davis would charge a fee with breakpoints that is the same as that charged by Salomon Brothers Asset Management Inc (“SaBAM”), the Portfolio’s former sub-adviser, but that because the Portfolio’s assets will no longer be aggregated with those of other Funds sub-advised by SaBAM, the sub-advisory fees payable by ILIAC would increase, with no effect on the management fee payable by the Portfolio; (8) Davis’ operations and compliance program, and its policies and procedures intended to assure compliance with the Federal securities laws, which had been reviewed and evaluated by the Chief Compliance Officer to the Funds; (9) Davis’ financial condition; (10) the appropriateness of the selection of Davis and the employment of the new investment strategy in light of the Portfolio’s investment objective and its current and prospective investor base; and (11) Davis’ Code of Ethics and related procedures for complying with the Code. The Board also considered the management fee to be retained by ILIAC for its oversight and monitoring services that will be provided to the Portfolio.
During the course of its deliberations as to whether to approve Davis as the sub-adviser to ING Davis Venture Value Portfolio (formerly, ING Salomon Brothers Fundamental Value Portfolio) based on the factors and considerations discussed above (provided that individual Board members may have given different weight to different factors), the Board reached the following conclusions regarding Davis and the proposed Sub-Advisory Contract, among others: (1) Davis is qualified to manage Salomon Brothers Fundamental Value Portfolio’s assets in accordance with its investment objective and investment strategy; (2) the new investment strategy is appropriate for pursuing long-term growth of capital and is consistent with the interests of current and prospective investors in the Portfolio; (3) based on the Board’s knowledge of Davis, Davis has sufficient financial resources available to it to fulfill its commitments to the Portfolio under the proposed Sub-Advisory Contract; (4) based upon the complexity and quality of the investment management services to be provided the Portfolio, and in view of industry averages for similar funds, the compensation to be paid by ILIAC under the proposed Sub-Advisory Contract is reasonable in relation to the services to be provided by Davis; (5) Davis maintains an appropriate compliance program and compliance procedures reasonably designed to assure compliance with the Federal securities laws, with this conclusion based upon representations from the Portfolio’s Chief Compliance Officer; and (8) while no economies of scale benefits would benefit Portfolio shareholders from the breakpoints in Davis’ sub-advisory fee, those fees would be higher than the break-pointed fee schedule in place for SaBAM, the Portfolio’s former sub-adviser, and this increase would be borne solely by ILIAC. The Board also considered the amount that would be retained by ILIAC under the proposed Sub-Advisory Contract and concluded that this amount is reasonable in light of the services provided by ILIAC.
Renewal of Advisory Contract
The Board considered whether to approve renewing the Advisory Contract with the Adviser for ING Davis Venture Value Portfolio (formerly, ING Salomon Brothers Fundamental Value Portfolio), at its November meeting. In considering whether to approve the renewal of the Advisory Contract for the Portfolio, the Board considered that, based on performance data for the periods ended June 30, 2005: (1) the Portfolio outperformed its Morningstar category median and its primary benchmark for the three-year period; (2) the Portfolio underperformed its Morningstar category median and primary benchmark for the one-year period; and (3) the Portfolio was ranked in the fifth (lowest) quintile for the one-year period and the first (highest) quintile for the three-year period.
In analyzing this performance data, the Board took into account that, in order to enhance performance, in October 2005 Davis assumed responsibility for the day-to-day management of the Portfolio, replacing SaBAM.
In considering the fees payable under the Advisory and Sub-Advisory Contracts for ING Davis Venture Value Portfolio (formerly, ING Salomon Brothers Fundamental Value Portfolio), the Board took into account the factors described above and also considered: (1) the fairness of the compensation under an Advisory Contract with level fees that does not include breakpoints; and (2) the pricing structure (including the expense ratio to be borne by shareholders) of the Portfolio, as compared to its Selected Peer Group, including that: (a) the management fee
238
ADVISORY CONTRACT APPROVAL DISCUSSION (UNAUDITED) (CONTINUED)
for the Portfolio is above the median and the average management fees of the funds in its Selected Peer Group; and (b) the expense ratio for the Portfolio is above the median and the average expense ratios of the funds in its Selected Peer Group. In analyzing this fee data the Board took into account Management’s representations that it lowered the Portfolio’s management fee to 0.80% in connection with the Sub-Adviser change to Davis.
After its deliberation, the Board reached the following conclusions: (1) the Portfolio’s management fee rate is reasonable in the context of all factors considered by the Board; (2) the Portfolio’s expense ratio of the Adviser is reasonable in the context of all factors considered by the Board; and (3) appropriate actions are being taken to enhance the Portfolio’s performance, and additional time is needed to evaluate the effectiveness of these actions. Based on these conclusions and other factors, the Board voted to renew the Advisory Contract for the Portfolio for the year ending November 30, 2006. During this renewal process, different Board members may have given different weight to different individual factors and related conclusions.
ING Fundamental Research Portfolio
In considering whether to approve the renewal of the Advisory and Sub-Advisory Contracts for ING Fundamental Research Portfolio, the Board considered that, based on performance data for the periods ended June 30, 2005: (1) the Portfolio underperformed its Morningstar category median and its primary benchmark for all periods presented; and (2) the Portfolio is ranked in the third quintile for the one- and three-year periods.
In analyzing this performance data, the Board considered that, in April 2005, a new portfolio manager, Christopher Corapi, assumed responsibility for the Portfolio. The Board also took into account that the Portfolio’s investment strategy was subsequently changed from an enhanced index portfolio to a fundamental research style.
In considering the fees payable under the Advisory and Sub-Advisory Contracts for ING Fundamental Research Portfolio, the Board took into account the factors described above and also considered: (1) the fairness of the compensation under an Advisory Contract with level fees that does not include breakpoints; (2) the pricing structure (including the expense ratio to be borne by shareholders) of the Portfolio, as compared to its Selected Peer Group, including that: (a) the management fee for the Portfolio is below the median and the average management fees of the funds in its Selected Peer Group; and (b) the expense ratio for the Portfolio is below the median and the average expense ratios of the funds in its Selected Peer Group.
After its deliberation, the Board reached the following conclusions: (1) the Portfolio’s management fee rate is reasonable in the context of all factors considered by the Board; (2) the Portfolio’s expense ratio is reasonable in the context of all factors considered by the Board; (3) in April 2005 there was a change in portfolio manager to the Portfolio and its investment strategy, and it is reasonable to permit the Sub-Adviser to continue to manage the Portfolio in order to assess longer-term performance; and (4) the sub-advisory fee payable by the Adviser to the Sub-Adviser is reasonable in the context of all factors considered by the Board. Based on these conclusions and other factors, the Board voted to renew the Advisory and Sub-Advisory Contracts for the Portfolio for the year ending November 30, 2006. During this renewal process, different Board members may have given different weight to different individual factors and related conclusions.
ING Goldman Sachs® Core Equity Portfolio
In considering whether to approve the renewal of the Advisory and Sub-Advisory Contracts for ING Goldman Sachs® Core Equity Portfolio, the Board considered that, based on performance data for the periods ended June 30, 2005: (1) the Portfolio underperformed its Morningstar category median and its primary benchmark for all periods presented; and (2) the Portfolio is ranked in the fifth (lowest) quintile for the year-to-date and in the fourth quintile for the most recent calendar quarter and one-year periods. In analyzing this performance data, the Board took into account that the Portfolio was launched in May 2003 and has only one full calendar year of performance and, in 2004, it achieved superior performance.
In considering the fees payable under the Advisory and Sub-Advisory Contracts for ING Goldman Sachs® Core Equity Portfolio, the Board took into account the factors described above and also considered: (1) the fairness of the compensation under an Advisory Contract with level fees that does not include breakpoints; (2) the pricing structure (including the expense ratio to be borne by shareholders) of the Portfolio, as compared to its Selected Peer Group, including that: (a) the management fee for the Portfolio is equal to the median and above the
239
ADVISORY CONTRACT APPROVAL DISCUSSION (UNAUDITED) (CONTINUED)
average management fees of the funds in its Selected Peer Group; and (b) the expense ratio for the Portfolio is above the median and the average expense ratios of the funds in its Selected Peer Group.
After its deliberation, the Board reached the following conclusions: (1) the management fee rate is reasonable in the context of all factors considered by the Board; (2) the expense ratio for the Portfolio is reasonable in the context of all factors considered by the Board; (3) the Portfolio was launched in May 2003, and it is reasonable to permit the Sub-Adviser to continue to manage the Portfolio to assess longer-term performance; and (4) the sub-advisory fee rate payable by the Adviser to the Sub-Adviser is reasonable in the context of all factors considered by the Board. Based on these conclusions and other factors, the Board voted to renew the Advisory and Sub-Advisory Contracts for the Portfolio for the year ending November 30, 2006. During this renewal process, different Board members may have given different weight to different individual factors and related conclusions.
ING Goldman Sachs® Capital Growth Portfolio
In considering whether to approve the renewal of the Advisory and Sub-Advisory Contracts for ING Goldman Sachs® Capital Growth Portfolio, the Board considered that, based on performance data for the periods ended June 30, 2005: (1) the Portfolio underperformed its primary benchmark and its Morningstar category median for the one-year period, but outperformed its secondary benchmark during this period; (2) the Portfolio underperformed its benchmark indices and its Morningstar category median year-to-date and for the three-year period, ranking in the fourth and third quintiles, respectively; and (3) the Portfolio outperformed its secondary benchmark and Morningstar Category median in 2002 and 2004, ranking in the second quintile.
In analyzing this performance data, the Board took into account: (1) Management’s analysis regarding the Sub-Adviser’s underperformance in certain periods; (2) Management’s representations that weakness in the Portfolio’s performance in early 2005 stemmed from stock selection in the media sector; and (3) Management would continue to monitor, and the Board or its Investment Review Committee would periodically review, the Portfolio’s investment performance.
In considering the fees payable under the Advisory and Sub-Advisory Contracts for ING Goldman Sachs® Capital Growth Portfolio, the Board took into account the factors described above and also considered: (1) the fairness of the compensation under an Advisory Contract with level fees that does not include breakpoints; (2) the pricing structure (including the expense ratio to be borne by shareholders) of ING Goldman Sachs® Capital Growth Portfolio, as compared to its Selected Peer Group, including that: (a) the management fee for the Portfolio is above the median and the average management fees of the funds in its Selected Peer Group; and (b) the expense ratio for the Portfolio is above the median and the average expense ratios of the funds in its Selected Peer Group. In analyzing this fee data, the Board took into account that, at the direction of the Board following the November 2005 contracts renewal process, the Portfolio’s administrative and advisory fees would be waived in amounts equal to 10 and 5 basis points, respectively effective January 1, 2006.
After its deliberation, the Board reached the following conclusions: (1) the Portfolio’s management fee rate is reasonable in the context of all factors considered by the Board; (2) the Portfolio’s expense ratio is reasonable in the context of all factors considered by the Board; (3) the Portfolio’s overall performance is reasonable in the context of all factors considered by the Board; and (4) the sub-advisory fee rate payable by the Adviser to the Sub-Adviser is reasonable in the context of all factors considered by the Board. Based on these conclusions and other factors, the Board voted to renew the Advisory and Sub-Advisory Contracts for the Portfolio for the year ending November 30, 2006. During this renewal process, different Board members may have given different weight to different individual factors and related conclusions.
ING JPMorgan Fleming International Portfolio
In considering whether to approve the renewal of the Advisory and Sub-Advisory Contracts for ING JPMorgan Fleming International Portfolio, the Board considered that, based on performance data for the periods ended June 30, 2005: (1) the Portfolio underperformed its Morningstar category average for all periods presented; (2) the Portfolio underperformed its primary benchmark for the one-,
three-, and five-year periods; and (3) the Portfolio is ranked in the third quintile for the one-year period and in the fourth quintile for the three- and five-year periods. In analyzing this performance data, the Board considered that, effective December 16, 2002, a new Sub-Adviser assumed responsibility for the management of the Portfolio.
240
ADVISORY CONTRACT APPROVAL DISCUSSION (UNAUDITED) (CONTINUED)
In considering the fees payable under the Advisory and Sub-Advisory Contracts for ING JPMorgan Fleming International Portfolio, the Board took into account the factors described above and also considered: (1) the fairness of the compensation under an Advisory Contract with level fees that does not include breakpoints; (2) the pricing structure (including the expense ratio to be borne by shareholders) of the Portfolio, as compared to its Selected Peer Group, including that: (a) the management fee for the Portfolio is below the median and the average management fees of the funds in its Selected Peer Group; and (b) the expense ratio for the Portfolio is below the median and the average expense ratios of the funds in its Selected Peer Group.
After its deliberation, the Board reached the following conclusions: (1) the management fee rate is reasonable in the context of all factors considered by the Board; (2) the expense ratio for the Portfolio is reasonable in the context of all factors considered by the Board; (3) a new Sub-Adviser assumed the day-to-day management of the Portfolio in December 2002, and it is reasonable to permit the Sub-Adviser to continue to manage the Portfolio to assess longer-term performance; and (4) the sub-advisory fee rate payable by the Adviser to the Sub-Adviser is reasonable in the context of all factors considered by the Board. Based on these conclusions and other factors, the Board voted to renew the Advisory and Sub-Advisory Contracts for the Fund for the year ending November 30, 2006. During this renewal process, different Board members may have given different weight to different individual factors and related conclusions.
ING JPMorgan Mid Cap Value Portfolio
In considering whether to approve the renewal of the Advisory and Sub-Advisory Contracts for ING JPMorgan Mid Cap Value Portfolio, the Board considered that, based on performance data for the periods ended June 30, 2005: (1) the Portfolio outperformed its Morningstar category median for all periods presented; (2) the Portfolio underperformed its primary benchmark for the one-year period, but outperformed for the three-year period; and (3) the Portfolio is ranked in the first (highest) quintile for the year-to-date, one- and three-year periods.
In considering the fees payable under the Advisory and Sub-Advisory Contracts for ING JPMorgan Mid Cap Value Portfolio, the Board took into account the factors described above and also considered: (1) the fairness of the compensation under an Advisory Contract with level fees that does not include breakpoints; (2) the pricing structure (including the expense ratio to be borne by shareholders) of ING JPMorgan Mid Cap Value Portfolio, as compared to its Selected Peer Group, including that: (a) the management fee for the Portfolio is equal to the median and below the average management fees of the funds in its Selected Peer Group; and (b) the expense ratio for the Portfolio is above the median and the average expense ratios of the funds in its Selected Peer Group.
After its deliberation, the Board reached the following conclusions: (1) the Portfolio’s management fee rate is reasonable in the context of all factors considered by the Board; (2) the Portfolio’s expense ratio is reasonable in the context of all factors considered by the Board; (3) the Portfolio’s performance is reasonable in the context of all factors considered by the Board; and (4) the sub-advisory fee rate payable by the Adviser to the Sub-Adviser is reasonable in the context of all factors considered by the Board. Based on these conclusions and other factors, the Board voted to renew the Advisory and Sub-Advisory Contracts for the Portfolio for the year ending November 30, 2006. During this renewal process, different Board members may have given different weight to different individual factors and related conclusions.
ING MFS Capital Opportunities Portfolio
In considering whether to approve the renewal of the Advisory and Sub-Advisory Contracts for ING MFS Capital Opportunities Portfolio, the Board considered that, based on performance data for the periods ended June 30, 2005: (1) the Portfolio underperformed its Morningstar category median and its primary benchmark for the one-, three-, and five-year periods; (2) the Portfolio’s performance matched that of its Morningstar Category median and outperformed its primary benchmark for the most recent calendar quarter; and (3) the Portfolio is ranked in the fifth (lowest) quintile for the five-year period, in the fourth quintile for the three-year period and in the third quintile for the most recent calendar quarter and one-year periods ended June 30, 2005. In analyzing this performance data, the Board took into account that there had been a change in portfolio managers in October 2002, and since that time the Portfolio’s performance had demonstrated improvement.
In considering the fees payable under the Advisory and Sub-Advisory Contracts for ING MFS Capital Opportunities Portfolio, the Board took into account the factors described above and also considered: (1) the fairness of the
241
ADVISORY CONTRACT APPROVAL DISCUSSION (UNAUDITED) (CONTINUED)
compensation under an Advisory Contract with level fees that does not include breakpoints; (2) the pricing structure (including the expense ratio to be borne by shareholders) of ING MFS Capital Opportunities Portfolio, as compared to its Selected Peer Group, including that: (a) the management fee for the Portfolio is below the median and equal to the average management fees of the funds in its Selected Peer Group; and (b) the expense ratio for the Portfolio is above the median and the average expense ratios of the funds in its Selected Peer Group.
After its deliberation, the Board reached the following conclusions: (1) the Portfolio’s management fee rate is reasonable in the context of all factors considered by the Board; (2) the Portfolio’s expense ratio is reasonable in the context of all factors considered by the Board; (3) although the Portfolio has underperformed in the one-, three- and five-year periods ending June 30, 2005, the Portfolio’s performance has shown improvement, and it is reasonable to permit the Sub-Adviser to continue to manage the Portfolio to assess performance; and (4) the sub-advisory fee rate payable by the Adviser to the Sub-Adviser is reasonable in the context of all factors considered by the Board. Based on these conclusions and other factors, the Board voted to renew the Advisory and Sub-Advisory Contracts for the Portfolio for the year ending November 30, 2006. During this renewal process, different Board members may have given different weight to different individual factors and related conclusions.
ING OpCap Balanced Value Portfolio
In considering whether to approve the renewal of the Advisory and Sub-Advisory Contracts for ING OpCap Balanced Value Portfolio, the Board considered that, based on performance data for the periods ended June 30, 2005: (1) the Portfolio underperformed its Morningstar category median for the most recent calendar quarter and one-year period, but outperformed for the three-year period; (2) the Portfolio underperformed its primary benchmark for the one-year period but outperformed for the three-year period; and (3) the Portfolio is ranked in the fourth quintile for the year-to-date and one-year periods and the first (highest) quintile for the three-year period.
In considering the fees payable under the Advisory and Sub-Advisory Contracts for ING OpCap Balanced Value Portfolio, the Board took into account the factors described above and also considered: (1) the fairness of the compensation under an Advisory Contract with level fees that does not include breakpoints; (2) the pricing structure (including the expense ratio to be borne by shareholders) of ING OpCap Balanced Value Portfolio, as compared to its Selected Peer Group, including that: (a) the management fee for the Portfolio is above the median and the average management fees of the funds in its Selected Peer Group; and (b) the expense ratio for the Portfolio is above the median and the average expense ratios of the funds in its Selected Peer Group.
After its deliberation, the Board reached the following conclusions: (1) the Portfolio’s management fee rate is reasonable in the context of all factors considered by the Board; (2) the Portfolio’s expense ratio is reasonable in the context of all factors considered by the Board; (3) the Portfolio’s performance is reasonable in the context of all factors considered by the Board; and (4) the sub-advisory fee rate payable by the Adviser to the Sub-Adviser is reasonable in the context of all factors considered by the Board. Based on these conclusions and other factors, the Board voted to renew the Advisory and Sub-Advisory Contracts for the Portfolio for the year ending November 30, 2006. During this renewal process, different Board members may have given different weight to different individual factors and related conclusions.
ING Oppenheimer Global Portfolio
In considering whether to approve the renewal of the Advisory and Sub-Advisory Contracts for ING Oppenheimer Global Portfolio, the Board considered that, based on performance data for the periods ended June 30, 2005: (1) the Portfolio outperformed its Morningstar category median and its benchmark for all periods presented, except it underperformed for the year-to-date period; (2) the Portfolio is ranked in the third quintile for year-to-date and one-year periods, in the second quintile for the three-year period, and in the first (highest) quintile for the most recent calendar quarter. In analyzing this performance data, the Board considered that, in November 2004, a new Sub-Adviser assumed responsibility for the Portfolio, replacing the previous manager. The Board also took into account that the Portfolio’s investment strategy was changed in connection with the Sub-Adviser change.
In considering the fees payable under the Advisory and Sub-Advisory Contracts for ING Oppenheimer Global Portfolio, the Board took into account the factors described above and also considered: (1) the fairness of the compensation under an Advisory Contract with level fees that does not include breakpoints; (2) the pricing structure (including the expense ratio to be borne by shareholders) of the Portfolio, as compared to its Selected
242
ADVISORY CONTRACT APPROVAL DISCUSSION (UNAUDITED) (CONTINUED)
Peer Group, including that: (a) the management fee for the Portfolio is below the median and the average management fees of the funds in its Selected Peer Group; and (b) the expense ratio for the Portfolio is below the median and the average expense ratios of the funds in its Selected Peer Group.
After its deliberation, the Board reached the following conclusions: (1) the Portfolio’s management fee rate is reasonable in the context of all factors considered by the Board; (2) the Portfolio’s expense ratio is reasonable in the context of all factors considered by the Board; (3) the sub-advisory fee rate payable by the Adviser to the Sub-Adviser is reasonable in the context of all factors considered by the Board; and (4) in November 2004 an new Sub-Adviser assumed management of the Portfolio and its strategies were changed, and it is reasonable to permit the Sub-Adviser to continue to manage the Portfolio to assess performance. Based on these conclusions and other factors, the Board voted to renew the Advisory and Sub-Advisory Contracts for the Portfolio for the year ending November 30, 2006. During this renewal process, different Board members may have given different weight to different individual factors and related conclusions.
ING Oppenheimer Strategic Income Portfolio
In considering whether to approve the renewal of the Advisory and Sub-Advisory Contracts for ING Oppenheimer Strategic Income Portfolio, the Board considered that, based on performance data for the periods ended June 30, 2005: (1) the Portfolio underperformed its Morningstar category median and its benchmark for the year-to-date and most recent calendar quarter; and (2) the Portfolio is ranked in the fifth (lowest) quintile for the most recent calendar quarter and in the fourth quintile for the year-to-date period. In considering this performance data, the Board took into account that the Portfolio launched in November 2004, and therefore had a limited operating history for purposes of analyzing Portfolio performance.
In considering the fees payable under the Advisory and Sub-Advisory Contracts for ING Oppenheimer Strategic Income Portfolio, the Board took into account the factors described above and also considered (1) the fairness of the compensation under an Advisory Contract with level fees that does not include breakpoints; and (2) the pricing structure (including the expense ratio to be borne by shareholders) of the Portfolio, as compared to its Selected Peer Group, including that: (a) the management fee for the Portfolio is below the median and the average management fees of the funds in its Selected Peer Group; and (b) the expense ratio for the Portfolio is below the median and average expense ratios of the funds in its Selected Peer Group.
After its deliberation, the Board reached the following conclusions: (1) the Portfolio’s management fee rate is reasonable in the context of all factors considered by the Board; (2) the Portfolio’s expense ratio is reasonable in the context of all factors considered by the Board; (3) the sub-advisory fee rate payable by the Adviser to the Sub-Adviser is reasonable in the context of all factors considered by the Board; and (4) the Portfolio was launched in November 2004, and it is reasonable to permit the Portfolio to establish a longer operating history for purposes of evaluating performance. Based on these conclusions and other factors, the Board voted to renew the Advisory and Sub-Advisory Contracts for the Portfolio for the year ending November 30, 2006. During this renewal process, different Board members may have given different weight to different individual factors and related conclusions.
ING PIMCO Total Return Portfolio
In considering whether to approve the renewal of the Advisory and Sub-Advisory Contracts for ING PIMCO Total Return Portfolio, the Board considered that, based on performance data for the periods ended June 30, 2005: (1) the Portfolio outperformed its Morningstar category median for all periods presented; (2) the Portfolio outperformed its primary benchmark for all periods presented; and (3) the Portfolio is ranked in the second quintile for the one- and three-year periods, and in the first (highest) quintile for the most recent calendar quarter and year-to-date periods.
In considering the fees payable under the Advisory and Sub-Advisory Contracts for ING PIMCO Total Return Portfolio, the Board took into account the factors described above and also considered: (1) the fairness of the compensation under an Advisory Contract with level fees that does not include breakpoints; (2) the pricing structure (including the expense ratio to be borne by shareholders) of ING PIMCO Total Return Portfolio, as compared to its Selected Peer Group, including that: (a) the management fee for the Portfolio is below the median and the average management fees of the funds in its Selected Peer Group; and (b) the expense ratio for the Portfolio is above the median and the average expense ratios of the funds in its Selected Peer Group. In
243
ADVISORY CONTRACT APPROVAL DISCUSSION (UNAUDITED) (CONTINUED)
analyzing this fee data, the Board took into account that, at the direction of the Board following the 2005 contract renewal process, Management would reduce the administration fee payable by the Portfolio by 0.10% effective January 1, 2006, thereby lowering the Portfolio’s expense ratio to 0.75%.
After its deliberation, the Board reached the following conclusions: (1) the Portfolio’s management fee rate is reasonable in the context of all factors considered by the Board; (2) Management agreed to lower the expense ratio of the Portfolio through a reduction of the administration fee, and expense ratio is reasonable in the context of all factors considered by the Board; (3) the Portfolio’s performance is reasonable in the context of all factors considered by the Board; and (4) the sub-advisory fee rate payable by the Adviser to the Sub-Adviser is reasonable in the context of all factors considered by the Board. Based on these conclusions and other factors, the Board voted to renew the Advisory and Sub-Advisory Contracts for the Portfolio for the year ending November 30, 2006. During this renewal process, different Board members may have given different weight to different individual factors and related conclusions.
ING Salomon Brothers Aggressive Growth Portfolio
Renewal of Advisory and Sub-Advisory Contracts
In considering whether to approve the renewal of the Advisory and Sub-Advisory Contracts for ING Salomon Brothers Aggressive Growth Portfolio, the Board considered that, based on performance data for the periods ended June 30, 2005: (1) the Portfolio underperformed its Morningstar category median for the most recent calendar quarter, year-to-date, one- and five-year periods, but outperformed for the three-year period; (2) the Portfolio underperformed its primary benchmark for the most recent calendar quarter, year-to-date, and five-year periods, but outperformed for the one- and three-year periods; and (3) the Portfolio is ranked in the third quintile for the most recent calendar quarter and one-year periods, in the second quintile for the three-year period, in the fourth quintile for the year-to-date period, and in the fifth (lowest) quintile for the five-year period.
In considering the fees payable under the Advisory and Sub-Advisory Contracts for ING Salomon Brothers Aggressive Growth Portfolio, the Board took into account the factors described above and also considered: (1) the economies of scale benefits to the Portfolio and its shareholders from breakpoint discounts applicable to the Portfolio’s advisory fee, which result in lower fees at higher asset levels; (2) the pricing structure (including the expense ratio to be borne by shareholders) of ING Salomon Brothers Aggressive Growth Portfolio, as compared to its Selected Peer Group, including that: (a) the management fee for the Portfolio is below the median and the average management fees of the funds in its Selected Peer Group; and (b) the expense ratio for the Portfolio is above the median and the average expense ratios of the funds in its Selected Peer Group.
After its deliberation, the Board reached the following conclusions: (1) the Portfolio’s management fee rate is reasonable in the context of all factors considered by the Board; (2) the Portfolio’s expense ratio is reasonable in the context of all factors considered by the Board; (3) the Portfolio’s performance is reasonable in the context of all factors considered by the Board; and (4) the sub-advisory fee rate payable by the Adviser to the Sub-Adviser is reasonable in the context of all factors considered by the Board. Based on these conclusions and other factors, the Board voted to renew the Advisory and Sub-Advisory Contracts for the Portfolio for the year ending November 30, 2006. During this renewal process, different Board members may have given different weight to different individual factors and related conclusions.
Approval of New Sub-Advisory Contract
SaBAM has managed ING Salomon Brothers Aggressive Growth Portfolio since December 16, 2002 (the “Former Agreement”). As discussed above, the Former Agreement was last approved for renewal by the Board on November 10, 2005. On December 1, 2005, Citigroup Inc. (“Citigroup) the parent of SaBAM completed the sale of substantially all of its asset management business, Citigroup Asset Management, to Legg Mason Inc. (“Legg Mason”). As a result, SaBAM, previously an indirect wholly-owned subsidiary of Citigroup, has become a wholly-owned subsidiary of Legg Mason. The 1940 Act requires that an agreement under which a registered investment adviser serves as the sub-adviser to an investment company must provide for the automatic termination of the agreement in the event of its “assignment” (as defined in the 1940 Act). A sale of a controlling block of an investment adviser’s voting securities generally is deemed to result in an assignment of the investment adviser’s
244
ADVISORY CONTRACT APPROVAL DISCUSSION (UNAUDITED) (CONTINUED)
advisory agreements. The consummation of the transaction constituted a sale of a controlling block of voting securities of SaBAM, resulting in the assignment and automatic termination of the Portfolio’s Sub-Advisory Contract with SaBAM, effective November 30, 2005.
In order for management of the Portfolio to continue uninterrupted after the sale, ILIAC entered into a new Sub-Advisory Contract with SaBAM dated December 1, 2005 under which SaBAM has continued to provide day-to-day management services to the Portfolio (the “New Agreement”). The Transaction did not result in a change to the personnel managing the Portfolio or its investment strategy. The Portfolio has continued to be managed by Richard Freeman.
Under a licensing agreement between Citigroup and Legg Mason, the name “Salomon Brothers Asset Management Inc,” as well as all logos, trademarks, and service marks related to Citigroup or any of its affiliates (“Citi Marks”) are licensed for use by Legg Mason. All Citi Marks are owned by Citigroup and are used under license. Legg Mason and its affiliates, as well as SaBAM, are not affiliated with Citigroup.
At a meeting of the Board held on September 15, 2005, the Board, including a majority of the Independent Directors, determined to appoint SaBAM as sub-adviser to the Portfolio under the New Agreement. In determining whether to approve the New Agreement for the Portfolio, the Board received and evaluated such information as it deemed necessary for an informed determination of whether the Agreement should be approved for the Portfolio. The materials provided to the Board in support of the sub-advisory arrangement with SaBAM included the following: (1) a memorandum discussing the change of control of SaBAM and the resulting assignment and automatic termination of the Former Agreement; (2) responses from SaBAM to questions posed by Kirkpatrick & Lockhart Nicholson Graham LLP, independent legal counsel, on behalf of the Independent Directors; (3) supporting documentation, including a copy of the form of New Agreement with SaBAM on behalf of the Portfolio; and (4) other information relevant to the Board’s evaluation. In addition, the Board considered the information provided periodically throughout the year in presentations to the Board by management and by SaBAM in connection with its management of Funds in the ING Funds complex, including the Portfolio and ING Salomon Brothers Large Cap Growth Portfolio, each a series of IPI; and ING Salomon Brothers Investors Portfolio and ING Salomon Brothers All Cap Portfolio, each a series of ING Investors Trust, a registered investment company managed by an affiliate of ILIAC. Such information included, among other things: (1) detailed analysis of the Portfolio’s performance, including attribution analysis, provided at regular Board meetings; and (2) a presentation to IPI’s Domestic Equity Investment Review Committee, at the Committee’s July 20, 2005 meeting, from SaBAM representatives regarding the change of control of SaBAM.
The Board’s consideration of whether to approve the New Agreement took into account several factors including, but not limited to, the following: (1) ILIAC’s view with respect to SaBAM’s management of the Portfolio; (2) the nature and quality of the services to be provided by SaBAM under the New Agreement; (3) the personnel, operations, and investment management capabilities of SaBAM after the consummation of the Transaction, including SaBAM’s representations that the portfolio management personnel providing day-to-day management services to the Portfolio would remain in place through the closing of the Transaction and continue to manage assets after the close; (4) the fairness of the compensation under the New Agreement in light of the services to be provided by SaBAM and the fact that there would be no change in the advisory or sub-advisory fees payable with respect to the Portfolio, or the projected profitability of the SaBAM or ILIAC, in connection with the Transaction; (5) that breakpoints in the sub-advisory fees payable by ILIAC would remain unchanged, and any economies-of-scale benefits from such breakpoints would continue to inure to the benefit of ILIAC and would not affect the advisory fee payable by the Portfolio to ILIAC; (6) SaBAM’s representations that the Transaction would not adversely affect the nature and quality of services provided to the Portfolio and that the Transaction was not expected to have a material adverse effect on the ability of SaBAM to provide those services; (7) SaBAM’s operations and compliance program, including its policies and procedures intended to assure compliance with the Federal securities laws, which had previously been approved by the Board as part of its oversight of the Portfolio and other Funds in the ING Funds complex; and (8) SaBAM’s Code of Ethics, which has previously been approved for the Portfolio and other ING Funds, and related procedures for complying with that Code.
After its deliberation, the Board reached the following conclusions: (1) SaBAM should be appointed as the Portfolio’s sub-adviser under the New Agreement and continue to provide advisory services to the Portfolio; and (2) the sub-advisory fee rate payable by ILIAC to SaBAM is reasonable in the context of all factors considered by
245
ADVISORY CONTRACT APPROVAL DISCUSSION (UNAUDITED) (CONTINUED)
the Board. The Board also noted that there would be further opportunity for review of the Portfolio’s more recent performance and other relevant factors in the course of deliberations for the next annual renewal of the Investment Advisory Agreement in November 2005.
Based on these conclusions and other factors, the Board voted to approve the New Agreement. During this approval process, different Board members may have given different weight to different individual factors and related conclusions.
ING Salomon Brothers Large Cap Growth Portfolio
Renewal of Advisory and Sub-Advisory Contracts
In considering whether to approve the renewal of the Advisory and Sub-Advisory Contracts for ING Salomon Brothers Large Cap Growth Portfolio, the Board considered that, based on performance data for the periods ended June 30, 2005: (1) the Portfolio underperformed its Morningstar category median and its benchmark for the one-year and year-to-date periods, but outperformed for the most recent calendar quarter; and (2) the Portfolio is ranked in the fifth (lowest) quintile for the one-year and year-to-date periods and in the second quintile for the most recent calendar quarter.
In analyzing this performance data, the Board took into account that in November 2004, Salomon Brothers Asset Management Inc (“SaBAM”) assumed responsibility for the Portfolio and that since the change in Sub-Advisers, the Portfolio’s performance has shown improvement. The Board also considered that the Portfolio’s investment strategy was changed in connection with the Sub-Adviser change.
In considering the fees payable under the Advisory and Sub-Advisory Contracts for ING Salomon Brothers Large Cap Growth Portfolio, the Board took into account the factors described above and also considered: (1) the fairness of the compensation under an Advisory Contract with level fees that does not include breakpoints; (2) the pricing structure (including the expense ratio to be borne by shareholders) of the Portfolio, as compared to its Selected Peer Group, including that: (a) the management fee for the Portfolio is below the median and the average management fees of the funds in its Selected Peer Group; and (b) the expense ratio for the Portfolio is below the median and equal to the average expense ratios of the funds in its Selected Peer Group.
After its deliberation, the Board reached the following conclusions: (1) the Portfolio’s management fee rate is reasonable in the context of all factors considered by the Board; (2) the Portfolio’s expense ratio is reasonable in the context of all factors considered by the Board; (3) the sub-advisory fee rate payable to the Sub-Adviser is reasonable in the context of all factors considered by the Board; and (4) in November 2004, SaBAM assumed responsibility for management of the Portfolio, and it is reasonable to allow the new Sub-Adviser to continue to manage the Portfolio to assess Portfolio performance. Based on these conclusions and other factors, the Board voted to renew the Advisory and Sub-Advisory Contracts for the Portfolio for the year ending November 30, 2006. During this renewal process, different Board members may have given different weight to different individual factors and related conclusions.
Approval of New Sub-Advisory Contract
SaBAM has managed ING Salomon Brothers Large Cap Growth Portfolio since November 2004 under a Sub-Advisory Contract with ILIAC (the “Former Agreement”). The Former Agreement was last approved for renewal by the Board on November 10, 2005.
As discussed above for ING Salomon Brothers Aggressive Growth Portfolio, on December 1, 2005, Citigroup, the parent of SaBAM, completed the sale of substantially all of its asset management business, Citigroup Asset Management, to Legg Mason. As a result, SaBAM, previously an indirect wholly-owned subsidiary of Citigroup, has become a wholly-owned subsidiary of Legg Mason. The 1940 Act requires that an agreement under which a registered investment adviser serves as the sub-adviser to an investment company must provide for the automatic termination of the agreement in the event of its “assignment” (as defined in the 1940 Act). A sale of a controlling block of an investment adviser’s voting securities generally is deemed to result in an assignment of the investment adviser’s advisory agreements. The consummation of the transaction constituted a sale of a controlling block of voting securities of SaBAM, resulting in the assignment and automatic termination of the Former Agreement with SaBAM, effective November 30, 2005.
246
ADVISORY CONTRACT APPROVAL DISCUSSION (UNAUDITED) (CONTINUED)
In order for management of the Portfolio to continue uninterrupted after the sale, ILIAC entered into an interim Sub-Advisory Contract with SaBAM dated December 1, 2005 (the “Interim Agreement”) under which SaBAM has continued to provide day-to-day management services to the Portfolio. A proxy has been sent to shareholders to request that they approve a new Sub-Advisory Contract with SaBAM for ING Salomon Brothers Large Cap Growth Portfolio (the “Proposed Sub-Advisory Contract”). The meeting of shareholders at with the New Sub-Advisory Contract will be considered is scheduled for March 2, 2006.
(It should be noted that, under a licensing agreement between Citigroup and Legg Mason, the name “Salomon Brothers Asset Management Inc,” as well as all logos, trademarks, and service marks related to Citigroup or any of its affiliates (as defined above, “Citi Marks”) are licensed for use by Legg Mason. All Citi Marks are owned by Citigroup and are used under license. Legg Mason and its affiliates, as well as SaBAM, are not affiliated with Citigroup.)
At a meeting of the Board held on September 15, 2005, the Board, including a majority of the Independent Directors, determined to appoint SaBAM as sub-adviser to the Portfolio under the Interim Agreement and the Proposed Sub-Advisory Contract. In determining whether to approve the Proposed Sub-Advisory Contract for the Portfolio, the Board received and evaluated such information as it deemed necessary for an informed determination of whether the Agreement should be approved for the Portfolio. The materials provided to the Board in support of the sub-advisory arrangement with SaBAM included the following: (1) a memorandum discussing the change of control of SaBAM and the resulting assignment and automatic termination of the Former Agreement; (2) responses from SaBAM to questions posed by Kirkpatrick & Lockhart Nicholson Graham LLP, independent legal counsel, on behalf of the Independent Directors; (3) supporting documentation, including a copy of the form of Proposed Sub-Advisory Contract with SaBAM on behalf of the Portfolio; and (4) other information relevant to the Board’s evaluation. In addition, the Board considered the information provided periodically throughout the year in presentations to the Board by SaBAM in connection with its management of Funds in the ING Funds complex, including the Portfolio and ING Salomon Brothers Aggressive Growth Portfolio, each a series of IPI; and ING Salomon Brothers Investors Portfolio and ING Salomon Brothers All Cap Portfolio, each a series of ING Investors Trust, a registered investment company managed by an affiliate of ILIAC. Such information included, among other things: (1) detailed analysis of Portfolio performance, including attribution analysis, provided at regular Board meetings; and (2) a presentation to IPI’s Domestic Equity Investment Review Committee, at the Committee’s July 20, 2005 meeting, from SaBAM representatives regarding the change of control of SaBAM.
The Board’s consideration of whether to approve the Proposed Sub-Advisory Contract took into account several factors including, but not limited to, the following: (1) ILIAC’s view with respect to SaBAM’s management of the Portfolio; (2) the nature and quality of the services to be provided by SaBAM under the Proposed Sub-Advisory Contract; (3) the personnel, operations, and investment management capabilities of SaBAM after the consummation of the Transaction, including SaBAM’s representations that the portfolio management personnel providing day-to-day management services to the Portfolio would remain in place through the closing of the Transaction and continue to manage assets after the close; (4) the fairness of the compensation under the Proposed Sub-Advisory Contract in light of the services to be provided by SaBAM and the fact that there would be no change in the advisory or sub-advisory fees payable with respect to the Portfolio, or the projected profitability of the SaBAM or ILIAC, in connection with the Transaction; (5) that breakpoints in the sub-advisory fees payable by ILIAC would remain unchanged, and any economies-of-scale benefits from such breakpoints would continue to inure to the benefit of ILIAC and would not affect the advisory fee payable by the Portfolio to ILIAC; (6) SaBAM’s representations that the Transaction would not adversely affect the nature and quality of services provided to the Portfolio and that the Transaction was not expected to have a material adverse effect on the ability of SaBAM to provide those services; (7) SaBAM’s operations and compliance program, including its policies and procedures intended to assure compliance with the Federal securities laws, which had previously been approved by the Board as part of its oversight of the Portfolio and other Funds in the ING Funds complex; and (8) SaBAM’s Code of Ethics, which has previously been approved for the Portfolio and other ING Funds, and related procedures for complying with that Code.
After its deliberation, the Board reached the following conclusions: (1) SaBAM should be appointed as the Portfolio’s sub-adviser under the Interim Agreement and the Proposed Sub-Advisory Contract and continue to provide advisory services to the Portfolio; (2) the Proposed Sub-Advisory Contract should be submitted to
247
ADVISORY CONTRACT APPROVAL DISCUSSION (UNAUDITED) (CONTINUED)
shareholders for approval; and (3) the sub-advisory fee rate payable by ILIAC to SaBAM is reasonable in the context of all factors considered by the Board. The Board also noted that there would be further opportunity for review of the Portfolio’s more recent performance and other relevant factors in the course of deliberations for the next annual renewal of the Investment Advisory Agreement in November 2005.
Based on these conclusions and other factors, the Board voted to approve the Interim Agreement and the Proposed Sub-Advisory Contract. During this approval process, different Board members may have given different weight to different individual factors and related conclusions.
ING T. Rowe Price Diversified Mid Cap Portfolio
In considering whether to approve the renewal of the Advisory and Sub-Advisory Contracts for ING T. Rowe Price Diversified Mid Cap Portfolio, the Board considered that, based on performance data for the periods ended June 30, 2005: (1) the Portfolio underperformed its Morningstar category median and its primary benchmark for all periods presented; and (2) and the Portfolio is ranked in the fifth (lowest) quintile for the one-year period, in the third quintile for the three-year period, and in the fourth quintile for the most recent calendar quarter and year-to-date periods.
In analyzing this performance data, the Board took into account that in November 2004, T. Rowe Price Associates, Inc. assumed responsibility for the day-to-day management of the Portfolio. The Board also considered that the Portfolio’s investment strategy was changed in connection with the change in Sub-Advisers.
In considering the fees payable under the Advisory and Sub-Advisory Contracts for ING T. Rowe Price Diversified Mid Cap Portfolio, the Board took into account the factors described above and also considered: (1) the fairness of the compensation under an Advisory Contract with level fees that does not include breakpoints; and (2) the pricing structure (including the expense ratio to be borne by shareholders) of ING T. Rowe Price Diversified Mid Cap Portfolio, as compared to its Selected Peer Group, including that: (a) the management fee for the Portfolio is below the median and the average management fees of the funds in its Selected Peer Group; and (b) the expense ratio for the Portfolio is below the median and average expense ratios of the funds in its Selected Peer Group.
After its deliberation, the Board reached the following conclusions: (1) the Portfolio’s management fee rate is reasonable in the context of all factors considered by the Board; (2) the Portfolio’s expense ratio is reasonable in the context of all factors considered by the Board; (3) in November 2004, the new Sub-Adviser assumed responsibility for management of the Portfolio and it is reasonable to permit the Portfolio to continue to manage the Portfolio in order to assess Portfolio performance; and (4) the sub-advisory fee rate payable by the Adviser to the Sub-Adviser is reasonable in the context of all factors considered by the Board. Based on these conclusions and other factors, the Board voted to renew the Advisory and Sub-Advisory Contracts for the Portfolio for the year ending November 30, 2006. During this renewal process, different Board members may have given different weight to different individual factors and related conclusions.
ING T. Rowe Price Growth Equity Portfolio
In considering whether to approve the renewal of the Advisory and Sub-Advisory Contracts for ING T. Rowe Price Growth Equity Portfolio, the Board considered that, based on performance data for the periods ended June 30, 2005: (1) the Portfolio outperformed its Morningstar category median for all periods presented; (2) the Portfolio underperformed its benchmark for the year-to-date and one-year periods and outperformed for the most recent calendar quarter, three- and five-year periods; (3) the Portfolio is ranked in the second quintile for the most recent calendar quarter and one-year periods, in the third quintile for the year-to-date period, and in the first (highest) quintile for the three- and five-year periods.
In considering the fees payable under the Advisory and Sub-Advisory Contracts for ING T. Rowe Price Growth Equity Portfolio, the Board took into account the factors described above and also considered: (1) the fairness of the compensation under an Advisory Contract with level fees that does not include breakpoints; (2) the pricing structure (including the expense ratio to be borne by shareholders) of the Portfolio, as compared to its Selected Peer Group, including that: (a) the management fee for the Portfolio is below the median and the average management fees of the funds in its Selected Peer Group; and (b) the expense ratio for the Portfolio is below the median and the average expense ratios of the funds in its Selected Peer Group.
248
ADVISORY CONTRACT APPROVAL DISCUSSION (UNAUDITED) (CONTINUED)
After its deliberation, the Board reached the following conclusions: (1) the Portfolio’s management fee rate is reasonable in the context of all factors considered by the Board; (2) the Portfolio’s expense ratio is reasonable in the context of all factors considered by the Board; (3) the Portfolio’s performance is reasonable in the context of all factors considered by the Board; and (4) the sub-advisory fee rate payable to the Sub-Adviser is reasonable in the context of all factors considered by the Board. Based on these conclusions and other factors, the Board voted to renew the Advisory and Sub-Advisory Contracts for the Portfolio for the year ending November 30, 2006. During this renewal process, different Board members may have given different weight to different individual factors and related conclusions.
ING UBS U.S. Large Cap Equity Portfolio
In considering whether to approve the renewal of the Advisory and Sub-Advisory Contracts for ING UBS U.S. Large Cap Equity Portfolio, the Board considered that, based on performance data for the periods ended June 30, 2005: (1) the Portfolio outperformed its Morningstar category median for the most recent calendar quarter, year-to-date, one- and three-year periods, but underperformed for the five-year period; (2) the Portfolio outperformed its primary benchmark for the most recent calendar quarter, year-to-date, one- and three-year periods, but underperformed for the five-year period; and (3) the Portfolio is ranked in the fifth (lowest) quintile for the five-year period, the second quintile for the three-year period, and in the first (highest) quintile for the remaining periods.
In analyzing this performance data, the Board also considered that, in May 2004, UBS Global Asset Management Inc. assumed responsibility for the Portfolio to enhance the Portfolio’s performance, and performance has improved since this Sub-Adviser change.
In considering the fees payable under the Advisory and Sub-Advisory Contracts for ING UBS U.S. Large Cap Equity Portfolio, the Board took into account the factors described above and also considered: (1) the fairness of the compensation under an Advisory Contract with a breakpoint fee schedule where the asset level necessary to achieve a breakpoint discount had not been reached by the Portfolio; (2) the pricing structure (including the expense ratio to be borne by shareholders) of ING UBS U.S. Large Cap Equity Portfolio, as compared to its Selected Peer Group, including that: (a) the management fee for the Portfolio is equal to the median and above the average management fees of the funds in its Selected Peer Group; and (b) the expense ratio for the Portfolio is above the median and the average expense ratios of the funds in its Selected Peer Group.
After its deliberation, the Board reached the following conclusions: (1) the Portfolio’s management fee rate is reasonable in the context of all factors considered by the Board; (2) the Portfolio’s expense ratio is reasonable in the context of all factors considered by the Board; (3) the Portfolio’s performance is reasonable in the context of all factors considered by the Board; and (4) the sub-advisory fee rate payable by the Adviser to the Sub-Adviser is reasonable in the context of all factors considered by the Board. Based on these conclusions and other factors, the Board voted to renew the Advisory and Sub-Advisory Contracts for the Portfolio for the year ending November 30, 2006. During this renewal process, different Board members may have given different weight to different individual factors and related conclusions.
ING Van Kampen Comstock Portfolio
In considering whether to approve the renewal of the Advisory and Sub-Advisory Contracts for ING Van Kampen Comstock Portfolio, the Board considered that, based on performance data for the periods ended June 30, 2005: (1) the Portfolio underperformed its Morningstar category median for the most recent calendar quarter, but outperformed for the one- and three-year periods; (2) the Portfolio underperformed its primary benchmark for the one- and three-year periods; and (3) the Portfolio is ranked in the third quintile for the one-year period and the first (highest) quintile for the three-year period.
In considering the fees payable under the Advisory and Sub-Advisory Contracts for ING Van Kampen Comstock Portfolio, the Board took into account the factors described above and also considered: (1) the fairness of the compensation under an Advisory Contract with level fees that does not include breakpoints; (2) the pricing structure (including the expense ratio to be borne by shareholders) of ING Van Kampen Comstock Portfolio, as compared to its Selected Peer Group, including that: (a) the management fee for the Portfolio is below the median and the average management fees of the funds in its Selected Peer Group; and (b) the expense ratio for the Portfolio is above the median and the average expense ratios of the funds in its Selected Peer Group. In
249
ADVISORY CONTRACT APPROVAL DISCUSSION (UNAUDITED) (CONTINUED)
analyzing this fee data, the Board took into account that, in June 2005, the Portfolio’s management fee was reduced in order to pass through to Portfolio shareholders certain savings from reductions in sub-advisory fees payable by the Adviser to the Sub-Adviser.
After its deliberation, the Board reached the following conclusions: (1) the Portfolio’s management fee is reasonable in the context of all factors considered by the Board; (2) the Portfolio’s expense ratio is reasonable in the context of all factors considered by the Board; (3) the Portfolio’s performance is reasonable in the context of all factors considered by the Board; and (4) the sub-advisory fee rate payable by the Adviser to the Sub-Adviser is reasonable in the context of all factors considered by the Board. Based on these conclusions and other factors, the Board voted to renew the Advisory and Sub-Advisory Contracts for the Portfolio for the year ending November 30, 2006. During this renewal process, different Board members may have given different weight to different individual factors and related conclusions.
ING Van Kampen Equity and Income Portfolio
In considering whether to approve the renewal of the Advisory and Sub-Advisory Contracts for ING Van Kampen Equity and Income Portfolio, the Board considered that, based on performance data for the periods ended June 30, 2005: (1) the Portfolio outperformed its Morningstar category median for all periods presented; (2) the Portfolio underperformed its benchmark for the one- and three-year periods, but outperformed for the most recent calendar quarter and year-to-date periods; and (3) the Portfolio is ranked in the second quintile for the most recent calendar quarter and three-year periods and in the first (highest) quintile for the year-to-date and one-year periods.
In considering this performance data, the Board took into account that, in November 2004, a new Sub-Adviser assumed management of the Portfolio, replacing the previous Sub-Adviser. The Board also considered that the Portfolio’s investment strategy was changed in connection with the change in Sub-Advisers.
In considering the fees payable under the Advisory and Sub-Advisory Contracts for ING Van Kampen Equity and Income Portfolio, the Board took into account the factors described above and also considered: (1) the fairness of the compensation under an Advisory Contract with level fees that does not include breakpoints; (2) the pricing structure (including the expense ratio to be borne by shareholders) of the Portfolio, as compared to its Selected Peer Group, including that: (a) the management fee for the Portfolio is below the median and the average management fees of the funds in its Selected Peer Group; and (b) the expense ratio for the Portfolio is below the median and the average expense ratios of the funds in its Selected Peer Group.
After its deliberation, the Board reached the following conclusions: (1) the Portfolio’s management fee rate is reasonable in the context of all factors considered by the Board; (2) the Portfolio’s expense ratio is reasonable in the context of all factors considered by the Board; (3) the sub-advisory fee rate payable to the Sub-Adviser is reasonable in the context of all factors considered by the Board; and (4) in November 2004, the new Sub-Adviser assumed responsibility for management of the Portfolio and its investment strategy was modified in connection with this change, and it is reasonable to permit the Sub-Adviser to continue to manage the Portfolio to assess Portfolio performance. Based on these conclusions and other factors, the Board voted to renew the Advisory and Sub-Advisory Contracts for the Portfolio for the year ending November 30, 2006. During this renewal process, different Board members may have given different weight to different individual factors and related conclusions.
250
Investment Adviser and Administrator | Custodian |
ING Life Insurance and Annuity Company | The Bank of New York |
151 Farmington Avenue | 100 Colonial Center Parkway, Suite 300 |
Hartford, Connecticut 06156 | Lake Mary, Florida 32746 |
| |
Distributor | Legal Counsel |
ING Financial Advisers, LLC | Dechert LLP |
151 Farmington Avenue | 1775 I Street, N.W. |
Hartford, Connecticut 06156 | Washington, D.C. 20006 |
1-800-262-3862 | |
| Independent Registered Public |
Transfer Agent | Accounting Firm |
DST Systems, Inc. | KPMG LLP |
P.O. Box 419368 | 99 High Street |
Kansas City, Missouri 64141 | Boston, Massachusetts 02110 |
Before investing, carefully consider the investment objectives, risks, charges and expenses of the variable universal life insurance policy or variable annuity contract and the underlying variable investment options. This and other information is contained in the prospectus for the variable universal life policy or variable annuity contract and the underlying variable investment options. Obtain these prospectuses from your agent/registered representative and read them carefully before investing.

| | | |
FUNDS | VPAR-UIPI | | (1205-022506) |

|
|
| Annual Report |
| |
| December 31, 2005 |
| |
| Adviser (“ADV”), Initial (“I”), Service (“S”) |
| Classes and Class T |
| |
| ING Partners, Inc. |
| |
| • ING Solution Income Portfolio |
| • ING Solution 2015 Portfolio |
| • ING Solution 2025 Portfolio |
| • ING Solution 2035 Portfolio |
| • ING Solution 2045 Portfolio |
|
This report is submitted for general information to shareholders of the ING Funds. It is not authorized for distribution to prospective shareholders unless accompanied or preceded by a prospectus which includes details regarding the funds’ investment objectives, risks, charges, expenses and other information. This information should be read carefully. | 
|
| | |
PROXY VOTING INFORMATION
A description of the policies and procedures that the Portfolios uses to determine how to vote proxies related to portfolio securities is available (1) without charge, upon request, by calling Shareholder Services toll-free at 1-800-992-0180; (2) on the ING Funds website at www.ingfunds.com and (3) on the Securities and Exchange Commissions (“SEC”) website at www.sec.gov. Information regarding how the Portfolios voted proxies related to portfolio securities during the most recent 12-month period ended December 31 is available without charge on the ING Funds website at www.ingfunds.com and on the SEC’s website at www.sec.gov.
QUARTERLY PORTFOLIO HOLDINGS
The Registrant files its complete schedule of portfolio holdings with the SEC for the first and third quarters of each fiscal year on Form N-Q. The Registrant’s Forms N-Q are available on the SEC’s website at www.sec.gov. The Registrant’s Forms N-Q may be reviewed and copied at the SEC’s Public Reference Room in Washington, DC, and information on the operation of the Public Reference Room may be obtained by calling 1-800-SEC-0330; and is available upon request from the Registrant by calling Shareholder Services toll-free at 1-800-992-0180.
(THIS PAGE INTENTIONALLY LEFT BLANK)

| Dear Shareholder, |
|
As you may recall, in my last letter I described the enthusiasm that we were experiencing here at ING Funds as we worked to bring more of the world’s investment opportunities to you, the investor. |
|
That enthusiasm, I am happy to report, is continuing to thrive. With the New Year, we have launched a series of new international mutual funds, each created to bring more of the world’s opportunities to you. |
|
Meanwhile, we have also heard you loud and clear. Our research tells us that many investors report that they find investing an intimidating and overly-complex endeavor. That is why ING is committed to helping investors across the country cut through the confusion and clutter. “Your future. Made easier.SM” is more than words; they represent our promise to you. |
JAMES M. HENNESSY | |
| |
Those two objectives — bringing you more of the world’s opportunities and doing it in a way that is easier for you — are behind the development of the new portfolios. |
| |
According to a recent finding, 58 percent of the world market capitalization now lies outside of the U.S.1 In other words, the majority of investment opportunities are now beyond our borders and we think that the ING VP Index Plus International Portfolio — a broad-based international portfolio — is an easy, single-step method to gain exposure to many of those opportunities. |
|
Meanwhile, the ING VP Global Real Estate Portfolio was developed as an easy way to bring global — international and domestic — real estate opportunities to the variable portfolio investor. Real Estate Investment Trusts (REITs) are becoming more and more popular around the world, and this new portfolio seeks to capitalize on that popularity. But again, we’ve made it easy. With just one investment, investors bring the diversification of global real estate to their investment strategy. |
|
One of our goals at ING Funds is to find tomorrow’s opportunities today, and we believe these two portfolios are just the latest examples of that plan in action. |
|
On behalf of everyone at ING Funds, I thank you for your continued support and loyalty. We look forward to serving you in the future. |
Sincerely,

James M. Hennessy
President
ING Funds |
January 28, 2006 | |
The views expressed in the President’s Letter reflect those of the President as of the date of the letter. Any such views are subject to change at any time based upon market or other conditions and ING Funds disclaims any responsibility to update such views. These views may not be relied on as investment advice and because investment decisions for an ING Fund are based on numerous factors, may not be relied on as an indication of investment intent on behalf of any ING Fund. Reference to specific company securities should not be construed as recommendations or investment advice.
International investing does pose special risks including currency fluctuation, economic and political risks not found in investments that are solely domestic. Investments in issuers that are principally engaged in real estate, including REITs, may subject the Fund to risks similar to those associated with the direct ownership of real estate, including terrorist attacks, war or other acts that destroy real property (in addition to market risks). These companies are sensitive to factors such as changes in real estate values and property taxes, interest rates, cash flow of underlying real estate assets, supply and demand, and the management skill and creditworthiness of the issuer. REITs may also be affected by tax and regulatory requirements.
1 MSCI December, 2005
1
MARKET PERSPECTIVE: | YEAR ENDED DECEMBER 31, 2005 |
In our semi-annual report, we referred to mixed markets in which the U.S. investor lost on both domestic and international stocks, with gains in the latter trumped by the rebounding U.S. dollar. In the second half, global equities registered solid gains, although foreign markets ended the 2005 year more convincingly. The Morgan Stanley Capital International (“MSCI”) World® Index(1) calculated in dollars, including net reinvested dividends rose 10.3% for the six months ended December 31, 2005, and 9.5% for the full year. As for currencies, the dollar extended its first half run for the six months ended December 31, 2005, rising 2.1% against the euro (12.6% for the full year), 6.2% against the yen (14.7% for the full year), and 3.8% against the pound (10.2% for the full year). Commentators explained the U.S. dollar’s unexpected strength by pointing to relatively high U.S. interest rates, the re-cycling of oil exporters’ burgeoning wealth into dollar securities, the tax-related “repatriation” into dollars of U.S. corporations’ foreign currency balances, and, regarding the yen’s particular weakness, non-Japanese investors pouring money into the stock market but hedging their currency risk. Each dynamic was losing steam by 2005 year-end.
For more than a year, the main issue for US fixed income investors had been the unexpected flattening of the yield curve, i.e. the shrinking difference between short-term and long-term interest rates. From June 2004 through June 2005 the Federal Open Market Committee (“FOMC”) had raised the Federal Funds Rate by 25 basis points nine times, pulling other short-term rates up. However, the yield on the ten-year U.S. Treasury Note had actually fallen by 0.71% over the same thirteen months. This was put down to an apparently growing perception in the market that inflation was a problem solved, due to a vigilant Federal Reserve, cheap goods and labor abroad, consistent productivity growth at home and foreign investors’ hunger for U.S. investments. Occasionally in the second half, for example when Hurricane Katrina and Rita affected oil prices, having peaked near $70 per barrel at the end of August 2005, there looked to be filtering through to general prices, and the trend seemed about to break. Nevertheless, in the end the forces of curve flattening prevailed. By December 31, 2005, the FOMC had raised rates four more times, oil prices and the inflation scare had subsided and foreigners were still buying record amounts of U.S. securities. For the six months ended December 31, 2005, the yield on the ten-year Treasury rose by 45 basis points to 4.39% (17 basis points for the full year), and on 13-week U.S. Treasury Bills by 93 basis points (180 basis points for the full year) to 3.98%. The returns on the broad Lehman Brothers Aggregate Bond Index(2) and the Lehman Brothers High Yield Bond Index(3) was -0.1% and 1.6% for the six months ended December 31, 2005, and 2.4% and 2.7% for the full year, respectively.
The U.S. equities market in the form of the Standard & Poor’s 500 Composite Stock Price (“S&P 500”) Index(4), added 5.8% including dividends in the latter half of 2005 and 4.9% for the full year, thanks to gains of 3.5% in July and November of 2005. Other months were flat to down and by 2005 year-end, the market, trading at a fairly undemanding price-to-earnings level of about 16 times earnings for the current fiscal year, was definitely struggling. Stock investors were initially encouraged by bullish economic reports and even more by second quarter company earnings figures, which were on average up more than 10% year over year. The optimistic mood lasted into early August of 2005, when the S&P 500 reached a four-year high, before drifting back as resurgent oil prices made records almost daily. In September and October of 2005 with Hurricanes Katrina and Rita seldom out of the news, two attempted rallies fizzled. High prices at the gas pump were already here. An expensive winter for heating fuel was certain. Sharply rising factory prices started to be found in local Federal Reserve and purchasing managers’ reports and, with consumer confidence slumping, the word “stagflation” was heard more than once. In spite of this, as November approached, an evidently swift recovery from the Hurricanes Katrina and Rita cheered investors and stock prices powered ahead through mid-December 2005, as oil prices fell back below $60 per barrel, inflation moderated, corporate profits remained buoyant and gross domestic product (“GDP”) growth, at 4.1% per annum, was the envy of the developed world. Yet the market gave back nearly 1.6% between Christmas and New Year, when new reports suggested that the end of the bubbling housing market might be at hand. Rising house prices had encouraged the consumer spending that was largely behind robust GDP growth; spending that is, by people who on average were saving little, if anything.
In international markets Japan was the shining star of the second half, soaring 33.3%, based on the MSCI Japan® Index(5) in dollars plus net dividends for the six months ended December 31, 2005, and 25.5% for the
2
MARKET PERSPECTIVE: YEAR ENDED DECEMBER 31, 2005 |
full year, as the market repeatedly broke five-year records amid new optimism. Investors, albeit mainly foreign ones, came to the belief that Japan is re-emerging as a balanced economy and less dependent on exports. Japanese corporations and banks have repaired their balance sheets at last. Rising wages are supporting domestic demand, in addition to an expected end to deflation, seems at hand. European ex UK markets leaped 11.8%, according to the MSCI Europe ex UK® Index(6) in dollars including net dividends for the six months ended December 31, 2005 (10.5% for the full year) and 14.7% in local currencies (27.7% for the full year) to the best levels in over four years, despite the first interest rate increase, to 2.5%, in over five years. Mounting evidence of a recovery in local demand, resilient profits and an upsurge of merger and acquisition activity boosted markets that are not particularly expensive. UK equities advanced 6.4% in the six months ended December 31, 2005 (7.4% for the full year) based on the MSCI UK® Index(7) in dollars including net dividends, concealing a more impressive 11.1% increase in pounds (20.1% for the full year), to the highest in four years. The period was dominated by the effect of five interest rate increases to restrain over-stretched consumers and soaring real estate prices. Yet, in the face of mostly miserable economic reports, and despite terrorist attacks in London over two days in July of 2005, investors, encouraged by merger and acquisition activity, supported an inexpensive market yielding over 3%.
(1) The MSCI World® Index is an unmanaged index that measures the performance of over 1,400 securities listed on exchanges in the U.S., Europe, Canada, Australia, New Zealand and the Far East.
(2) The Lehman Brothers Aggregate Bond Index is a widely recognized, unmanaged index of publicly issued investment grade U.S. Government, mortgage-backed, asset-backed and corporate debt securities.
(3) The Lehman Brothers High Yield Bond Index is an unmanaged index that measures the performance of fixed-income securities generally representative of corporate bonds rated below investment-grade.
(4) The Standard & Poor’s 500 Composite Stock Price Index is an unmanaged index that measures the performance of securities of approximately 500 large-capitalization companies whose securities are traded on major U.S. stock markets.
(5) The MSCI Japan® Index is a free float-adjusted market capitalization index that is designed to measure developed market equity performance in Japan.
(6) The MSCI Europe ex UK® Index is a free float-adjusted market capitalization index that is designed to measure developed market equity performance in Europe, excluding the UK.
(7) The MSCI UK® Index is a free float-adjusted market capitalization index that is designed to measure developed market equity performance in the UK.
All indices are unmanaged and investors cannot invest directly in an index.
Past performance does not guarantee future results. The performance quoted represents past performance. Investment return and principal value of an investment will fluctuate, and shares, when redeemed, may be worth more or less than their original cost. The Funds’ performance is subject to change since the period’s end and may be lower or higher than the performance data shown. Please call (800) 992-0180 or log on to www.ingfunds.com to obtain performance data current to the most recent month end.
Market Perspective reflects the views of the Chief Investment Risk Officer only through the end of the period, and is subject to change based on market and other conditions.
3
ING SOLUTION PORTFOLIOS | PORTFOLIO MANAGERS’ REPORT |
The ING Solution Portfolios (the “Portfolios”) each seek to achieve its investment objective by investing in other ING Funds (“Underlying Funds”) and uses asset allocation strategies to determine how much to invest in the Underlying Funds.
Portfolio Specifics: ING Life Insurance and Annuity Company (“ILIAC” or “Adviser”) is the investment adviser of each Portfolio. The Adviser is an indirect, wholly-owned subsidiary of ING Groep, N.V., a global financial institution active in the fields of insurance, banking and asset management.
ING Investment Management Co. (“Consultant”) is a consultant to the Adviser. Both the Adviser and the Consultant are wholly-owned indirect subsidiaries of ING Groep, N.V. The Adviser and the Consultant, working together, have designed Target Date (as defined below) asset allocation funds, called Solution Portfolios that will be constructed and managed in accordance with the following processes:
The Adviser uses an asset allocation process to determine each Portfolio’s investment mix. This asset allocation process can be found in the Prospectus.
The following tables illustrate the Target Sub-Asset Mix allocation as of May 6, 2005 for ING Solution 2015 and ING Solution 2025 and as of April 29, 2005 for ING Solution Income, ING Solution 2035 and ING Solution 2045 Portfolios.
Asset Allocation
as of December 31, 2004
(as a percent of net assets)
Target Sub-Asset Mix(1) | | ING Solution
Income
Portfolio | | ING Solution
2015
Portfolio | | ING Solution
2025
Portfolio | | ING Solution
2035
Portfolio | | ING Solution
2045
Portfolio | |
U.S. Large Cap Blend | | 17 | % | | 12 | % | | 10 | % | | 10 | % | | 10 | % | |
U.S. Large Cap Growth | | 0 | % | | 12 | % | | 17 | % | | 24 | % | | 27 | % | |
U.S. Large Cap Value | | 0 | % | | 7 | % | | 12 | % | | 16 | % | | 18 | % | |
U.S. Mid Cap | | 0 | % | | 0 | % | | 3 | % | | 4 | % | | 5 | % | |
U.S. Small Cap | | 0 | % | | 0 | % | | 6 | % | | 8 | % | | 10 | % | |
Non-U.S./International | | 3 | % | | 9 | % | | 12 | % | | 13 | % | | 15 | % | |
Real Estate | | 0 | % | | 5 | % | | 5 | % | | 5 | % | | 5 | % | |
Intermediate-Term Bond | | 45 | % | | 30 | % | | 22 | % | | 20 | % | | 10 | % | |
High Yield Bond | | 10 | % | | 10 | % | | 3 | % | | 0 | % | | 0 | % | |
Short-Term Bond | | 0 | % | | 0 | %* | | 0 | %* | | 0 | % | | 0 | % | |
Insurance Company Fixed Contracts | | 25 | % | | 15 | %* | | 10 | %* | | 0 | % | | 0 | % | |
| | 100 | % | | 100 | % | | 100 | % | | 100 | % | | 100 | % | |
Portfolio holdings are subject to change daily.
* No amounts will be allocated to insurance company fixed contracts until the SEC grants exemptive relief permitting investment by the Portfolio in insurance company fixed contracts. There can be no assurance that such relief will be granted. In the absence of that relief the approximate target allocation to short-term bonds would be 15%. The allocated amound includes a portion of the Portfolio’s assets held as a liquidity facility in order to satisfy certain conditions required under the terms of the insurance company fixed contracts (see Description and Risk of Insurance Company Fixed Contracts).
(1) Although the Solution Portfolios expect to be fully invested at all times, they may maintain liquidity reserves to meet redemption requests.
4
PORTFOLIO MANAGERS’ REPORT | | ING SOLUTION INCOME PORTFOLIO |

| | | | | | |
| Cumulative Total Returns for the Periods Ended December 31, 2005 | |
| | |
| | | Since Inception
of Classes I, S and ADV
April 29, 2005 | | Since Inception
of Class T
August 31, 2005 | |
| Class ADV | | 3.39 | % | | — | | |
| Class I | | 3.89 | % | | — | | |
| Class S | | 3.69 | % | | — | | |
| Class T | | — | | | 0.58 | % | |
| Lehman Brothers Aggregate Bond Index(1) | | 1.55 | %(2) | | (0.44 | )%(3) | |
| | | | | | | | |
| | | | | | | | | | | |
Based on a $10,000 initial investment, the graph and table above illustrate the total return of ING Solution Income Portfolio against the Lehman Brothers Aggregate Bond Index. The Index is unmanaged and has no cash in its portfolio, imposes no sales charges and incurs no operating expenses. An investor cannot invest directly in an index.
The performance graph and table do not reflect the deduction of taxes that a shareholder will pay on Portfolio distributions or the redemption of Portfolio shares.
The performance shown may include the effect of fee waivers and/or expense reimbursements by the Adviser and/or other service providers, which have the effect of increasing total return. Had all fees and expenses been considered, the total returns would have been lower.
Performance data represents past performance and is no assurance of future results. Investment return and principal value of an investment in the Portfolio will fluctuate. Shares, when sold, may be worth more or less than their original cost. The Portfolio’s current performance may be lower or higher than the performance data shown. Please log on to www.ingfunds.com or call (800) 992-0180 to get performance through the most recent month end.
This report contains statements that may be “forward-looking” statements. Actual results may differ materially from those projected in the “forward-looking” statements.
The views expressed in this report reflect those of the Adviser, only through the end of the period as stated on the cover. The Advisers’ views are subject to change at any time based on market and other conditions.
Portfolio holdings are subject to change daily.
(1) The Lehman Brothers Aggregate Bond Index is an unmanaged index composed of securities from the Lehman Brothers Intermediate Government and Corporate Bond Indices, including U.S. Government Treasury and agency securities as well as corporate and yankee bonds.
(2) Since inception performance for the Index is shown as of May 1, 2005.
(3) Since inception performance for the Index is shown as of September 1, 2005.
5
ING SOLUTION 2015 PORTFOLIO | PORTFOLIO MANAGERS’ REPORT |

| | | | | | |
| Cumulative Total Returns for the Periods Ended December 31, 2005 | |
| | |
| | | Since Inception
of Classes I, S and ADV
April 29, 2005 | | Since Inception
of Class T
August 31, 2005 | |
| Class ADV | | 6.97 | % | | — | | |
| Class I | | 7.57 | % | | — | | |
| Class S | | 7.27 | % | | — | | |
| Class T | | — | | | 1.99 | % | |
| Lehman Brothers Aggregate Bond Index(1) | | 1.55 | %(4) | | (0.44 | )%(5) | |
| S&P 500 Composite Stock Price Index(2) | | 9.29 | %(4) | | 2.91 | %(5) | |
| 60% S&P 500 Composite Stock Price Index / 40% LB Aggregate Bond Index(3) | | 6.18 | %(4) | | 1.58 | %(5) | |
| | | | | | | | |
| | | | | | | | | | | |
Based on a $10,000 initial investment, the graph and table above illustrate the total return of ING Solution 2015 Portfolio against the indices indicated. Each Index is unmanaged and has no cash in its portfolio, imposes no sales charges and incurs no operating expenses. An investor cannot invest directly in an index.
The performance graph and table do not reflect the deduction of taxes that a shareholder will pay on Portfolio distributions or the redemption of Portfolio shares.
The performance shown may include the effect of fee waivers and/or expense reimbursements by the Adviser and/or other service providers, which have the effect of increasing total return. Had all fees and expenses been considered, the total returns would have been lower.
Performance data represents past performance and is no assurance of future results. Investment return and principal value of an investment in the Portfolio will fluctuate. Shares, when sold, may be worth more or less than their original cost. The Portfolio’s current performance may be lower or higher than the performance data shown. Please log on to www.ingfunds.com or call (800) 992-0180 to get performance through the most recent month end.
This report contains statements that may be “forward-looking” statements. Actual results may differ materially from those projected in the “forward-looking” statements.
The views expressed in this report reflect those of the Adviser, only through the end of the period as stated on the cover. The Advisers’ views are subject to change at any time based on market and other conditions.
Portfolio holdings are subject to change daily.
(1) The Lehman Brothers Aggregate Bond Index is an unmanaged index composed of securities from the Lehman Brothers Intermediate Government and Corporate Bond Indices, including U.S. Government Treasury and agency securities as well as corporate and yankee bonds.
(2) The S&P 500 Composite Stock Price Index is a value-weighted, unmanaged index of 500 of the largest companies in the U.S.
(3) The 60% S&P 500 Composite Stock Price Index/40% Lehman Brothers Aggregate Bond Index is a benchmark consisting of a mix of 60% of an unmanaged stock index (the S&P 500 Composite Stock Price Index) and 40% of an unmanaged bond index (Lehman Bros. Aggregate Bond Index).
(4) Since inception performance for the indices is shown from May 1, 2005.
(5) Since inception performance for the indices is shown from September 1, 2005.
6
PORTFOLIO MANAGERS’ REPORT | ING SOLUTION 2025 PORTFOLIO |
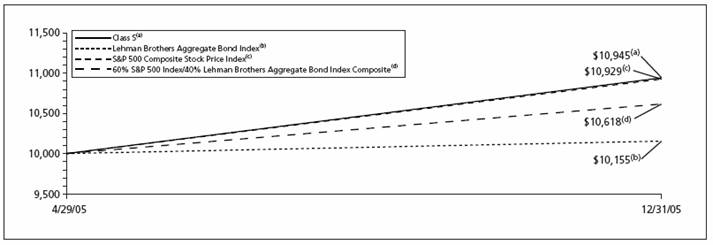
| | | | | | |
| Cumulative Total Returns for the Periods Ended December 31, 2005 | |
| | |
| | | Since Inception
of Classes I, S and ADV
April 29, 2005 | | Since Inception
of Class T
August 31, 2005 | |
| Class ADV | | 9.15 | % | | — | | |
| Class I | | 9.75 | % | | — | | |
| Class S | | 9.45 | % | | — | | |
| Class T | | — | | | 2.72 | % | |
| Lehman Brothers Aggregate Bond Index(1) | | 1.55 | %(4) | | (0.44 | )%(5) | |
| S&P 500 Composite Stock Price Index(2) | | 9.29 | %(4) | | 2.91 | %(5) | |
| 60% S&P 500 Composite Stock Price Index / 40% LB Aggregate Bond Index(3) | | 6.18 | %(4) | | 1.58 | %(5) | |
| | | | | | | | |
| | | | | | | | | | | |
Based on a $10,000 initial investment, the graph and table above illustrate the total return of ING Solution 2025 Portfolio against the indices indicated. Each Index is unmanaged and has no cash in its portfolio, imposes no sales charges and incurs no operating expenses. An investor cannot invest directly in an index.
The performance graph and table do not reflect the deduction of taxes that a shareholder will pay on Portfolio distributions or the redemption of Portfolio shares.
The performance shown may include the effect of fee waivers and/or expense reimbursements by the Adviser and/or other service providers, which have the effect of increasing total return. Had all fees and expenses been considered, the total returns would have been lower.
Performance data represents past performance and is no assurance of future results. Investment return and principal value of an investment in the Portfolio will fluctuate. Shares, when sold, may be worth more or less than their original cost. The Portfolio’s current performance may be lower or higher than the performance data shown. Please log on to www.ingfunds.com or call (800) 992-0180 to get performance through the most recent month end.
This report contains statements that may be “forward-looking” statements. Actual results may differ materially from those projected in the “forward-looking” statements.
The views expressed in this report reflect those of the Adviser, only through the end of the period as stated on the cover. The Advisers’ views are subject to change at any time based on market and other conditions.
Portfolio holdings are subject to change daily.
(1) The Lehman Brothers Aggregate Bond Index is an unmanaged index composed of securities from the Lehman Brothers Intermediate Government and Corporate Bond Indices, including U.S. Government Treasury and agency securities as well as corporate and yankee bonds.
(2) The S&P 500 Composite Stock Price index is a value-weighted, unmanaged index of 500 of the largest companies in the U.S.
(3) The 60% S&P 500 Composite Stock Price Index/40% Lehman Brothers Aggregate Bond Index is a benchmark consisting of a mix of 60% of an unmanaged stock index (the S&P 500 Composite Stock Price Index) and 40% of an unmanaged bond index (Lehman Bros. Aggregate Bond Index).
(4) Since inception performance for the indices is shown from May 1, 2005.
(5) Since inception performance for the indices is shown from September 1, 2005.
7
ING SOLUTION 2035 PORTFOLIO | PORTFOLIO MANAGERS’ REPORT |

| | | | | | |
| Cumulative Total Returns for the Periods Ended December 31, 2005 | |
| | |
| | | Since Inception
of Classes I, S and ADV
April 29, 2005 | | Since Inception
of Class T
August 31, 2005 | |
| Class ADV | | 10.53 | % | | — | | |
| Class I | | 11.12 | % | | — | | |
| Class S | | 10.82 | % | | — | | |
| Class T | | — | | | 3.35 | % | |
| Russell 3000® Index(1) | | 10.92 | %(2) | | 2.93 | %(3) | |
| | | | | | | | |
| | | | | | | | | | | |
Based on a $10,000 initial investment, the graph and table above illustrate the total return of ING Solution 2035 Portfolio against the Russell 3000® Index. The Index is unmanaged and has no cash in its portfolio, imposes no sales charges and incurs no operating expenses. An investor cannot invest directly in an index.
The performance graph and table do not reflect the deduction of taxes that a shareholder will pay on Portfolio distributions or the redemption of Portfolio shares.
The performance shown may include the effect of fee waivers and/or expense reimbursements by the Adviser and/or other service providers, which have the effect of increasing total return. Had all fees and expenses been considered, the total returns would have been lower.
Performance data represents past performance and is no assurance of future results. Investment return and principal value of an investment in the Portfolio will fluctuate. Shares, when sold, may be worth more or less than their original cost. The Portfolio’s current performance may be lower or higher than the performance data shown. Please log on to www.ingfunds.com or call (800) 992-0180 to get performance through the most recent month end.
This report contains statements that may be “forward-looking” statements. Actual results may differ materially from those projected in the “forward-looking” statements.
The views expressed in this report reflect those of the Adviser, only through the end of the period as stated on the cover. The Advisers’ views are subject to change at any time based on market and other conditions.
Portfolio holdings are subject to change daily.
(1) The Russell 3000® Index measures the performance of the 3000 largest U.S. companies based on total market capitalization, which represent approximately 98% of the U.S. equity market.
(2) Since inception performance for the Index is shown from May 1, 2005.
(3) Since inception performance for the Index is shown from September 1, 2005.
8
PORTFOLIO MANAGERS’ REPORT | ING SOLUTION 2045 PORTFOLIO |
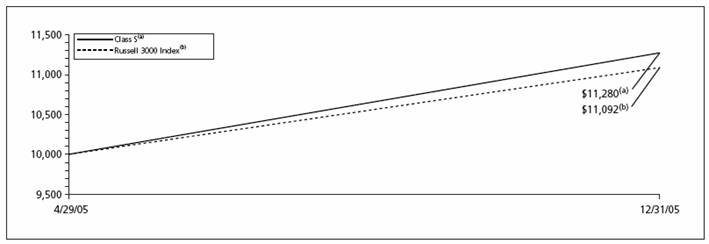
| | | | | | |
| Cumulative Total Returns for the Periods Ended December 31, 2005 | |
| | |
| | | Since Inception
of Classes I, S and ADV
April 29, 2005 | | Since Inception
of Class T
August 31, 2005 | |
| Class ADV | | 12.60 | % | | — | | |
| Class I | | 13.10 | % | | — | | |
| Class S | | 12.80 | % | | — | | |
| Class T | | — | | | 3.94 | % | |
| Russell 3000 Index(1) | | 10.92 | %(2) | | 2.93 | %(3) | |
| | | | | | | | |
| | | | | | | | | | | |
Based on a $10,000 initial investment, the graph and table above illustrate the total return of ING Solution 2045 Portfolio against the Russell 3000® Index. The Index is unmanaged and has no cash in its portfolio, imposes no sales charges and incurs no operating expenses. An investor cannot invest directly in an index.
The performance graph and table do not reflect the deduction of taxes that a shareholder will pay on Portfolio distributions or the redemption of Portfolio shares.
The performance shown may include the effect of fee waivers and/or expense reimbursements by the Adviser and/or other service providers, which have the effect of increasing total return. Had all fees and expenses been considered, the total returns would have been lower.
Performance data represents past performance and is no assurance of future results. Investment return and principal value of an investment in the Portfolio will fluctuate. Shares, when sold, may be worth more or less than their original cost. The Portfolio’s current performance may be lower or higher than the performance data shown. Please log on to www.ingfunds.com or call (800) 992-0180 to get performance through the most recent month end.
This report contains statements that may be “forward-looking” statements. Actual results may differ materially from those projected in the “forward-looking” statements.
The views expressed in this report reflect those of the Adviser, only through the end of the period as stated on the cover. The Advisers’ views are subject to change at any time based on market and other conditions.
Portfolio holdings are subject to change daily.
(1) The Russell 3000® Index measures the performance of the 3000 largest U.S. companies based on total market capitalization, which represent approximately 98% of the U.S. equity market.
(2) Since inception performance for the Index is shown from May 1, 2005.
(3) Since inception performance for the Index is shown from September 1, 2005.
9
SHAREHOLDER EXPENSE EXAMPLES (UNAUDITED) |
As a shareholder of a Fund, you incur two types of costs: (1) transaction costs, including sales charges (loads) on purchase payments; redemption fees; and exchange fees; and (2) ongoing costs, including management fees; distribution [and/or service] (12b-1) fees; and other Fund expenses. These Examples are intended to help you understand your ongoing costs (in dollars) of investing in a Fund and to compare these costs with the ongoing costs of investing in other mutual funds.
The Examples are based on an investment of $1,000 invested at the beginning of the period (except as noted) and held for the entire period from July 1, 2005, inception of the Portfolios, to December 31, 2005.
Actual Expenses
The first section of the table shown, “Actual Fund Return,” provides information about actual account values and actual expenses. You may use the information in this section, together with the amount you invested, to estimate the expenses that you paid over the period. Simply divide your account value by $1,000 (for example, an $8,600 account value divided by $1,000 = 8.6), then multiply the result by the number in the first section under the heading entitled “Expenses Paid During Period” to estimate the expenses you paid on your account during this period.
Hypothetical Example for Comparison Purposes
The second section of the table shown, “Hypothetical 5% Return,” provides information about hypothetical account values and hypothetical expenses based on the Fund’s actual expense ratio and an assumed rate of return of 5% per year before expenses, which is not the Fund’s actual return. The hypothetical account values and expenses may not be used to estimate the actual ending account balance or expenses you paid for the period. You may use this information to compare the ongoing costs of investing in the Fund and other funds. To do so, compare this 5% hypothetical example with the 5% hypothetical examples that appear in the shareholder reports of the other funds.
Please note that the expenses shown in the table are meant to highlight your ongoing costs only and do not reflect any transactional costs, such as sales charges (loads), redemption fees, or exchange fees. Therefore, the hypothetical lines of the table are useful in comparing ongoing costs only, and will not help you determine the relative total costs of owning different funds. In addition, if these transactional costs were included, your costs would have been higher.
| | | | | | | | | | |
| ING Solution Income Portfolio | | Beginning
Account
Value
July 1, 2005 | | Ending
Account
Value
December 31, 2005 | | Expenses Paid
Annualized
Expense
Ratio | | During the
Six Months Ended
December 31, 2005 | |
| Actual Fund Return | | | | | | | | | |
| Class ADV | | $1,000.00 | | $1,016.70 | | 0.62% | | $3.15 | |
| Class I | | $1,000.00 | | $1,019.60 | | 0.12% | | $0.61 | |
| Class S | | $1,000.00 | | $1,018.60 | | 0.37% | | $1.88 | |
| Class T(a) | | $1,000.00 | | $1,005.80 | | 0.82% | | $4.15 | |
| Hypothetical (5% return before expenses) | | | | | | | | | |
| Class ADV | | $1,000.00 | | $1,022.08 | | 0.62% | | $3.16 | |
| Class I | | $1,000.00 | | $1,024.60 | | 0.12% | | $0.61 | |
| Class S | | $1,000.00 | | $1,023.34 | | 0.37% | | $1.89 | |
| Class T(a) | | $1,000.00 | | $1,021.07 | | 0.82% | | $4.18 | |
| | | | | | | | | | |
* Expenses are equal to each Portfolio’s respective annualized expense ratios multiplied by the average account value over the period, multiplied by 184/365 to reflect the most recent fiscal half-year (except “Actual Fund Return” information for each Solution Portfolio, which reflects the 123-day period ended December 31, 2005 due to their Class T inception date of August 31, 2005).
(a) Commencement of operations for Class T in all Solution Portfolios August 31, 2005.
10
SHAREHOLDER EXPENSE EXAMPLES (UNAUDITED) (CONTINUED) |
| ING Solution 2015 Portfolio | | Beginning
Account
Value
July 1, 2005 | | Ending
Account
Value
December 31, 2005 | | Expenses Paid
Annualized
Expense
Ratio | | During the
Six Months Ended
December 31, 2005 | |
| Actual Fund Return | | | | | | | | | |
| Class ADV | | $1,000.00 | | $1,038.70 | | 0.62% | | $3.19 | |
| Class I | | $1,000.00 | | $1,042.50 | | 0.12% | | $0.62 | |
| Class S | | $1,000.00 | | $1,040.60 | | 0.37% | | $1.90 | |
| Class T(a) | | $1,000.00 | | $1,019.90 | | 0.82% | | $4.17 | |
| Hypothetical (5% return before expenses) | | | | | | | | | |
| Class ADV | | $1,000.00 | | $1,022.08 | | 0.62% | | $3.16 | |
| Class I | | $1,000.00 | | $1,024.60 | | 0.12% | | $0.61 | |
| Class S | | $1,000.00 | | $1,023.34 | | 0.37% | | $1.89 | |
| Class T(a) | | $1,000.00 | | $1,021.07 | | 0.82% | | $4.18 | |
| | | | | | | | | | |
| ING Solution 2025 Portfolio | | | | | | | | | |
| Actual Fund Return | | | | | | | | | |
| Class ADV | | $1,000.00 | | $1,052.80 | | 0.62% | | $3.21 | |
| Class I | | $1,000.00 | | $1,056.50 | | 0.12% | | $0.62 | |
| Class S | | $1,000.00 | | $1,054.70 | | 0.37% | | $1.92 | |
| Class T(a) | | $1,000.00 | | $1,027.20 | | 0.82% | | $4.19 | |
| Hypothetical (5% return before expenses) | | | | | | | | | |
| Class ADV | | $1,000.00 | | $1,022.08 | | 0.62% | | $3.16 | |
| Class I | | $1,000.00 | | $1,024.60 | | 0.12% | | $0.61 | |
| Class S | | $1,000.00 | | $1,023.34 | | 0.37% | | $1.89 | |
| Class T(a) | | $1,000.00 | | $1,021.07 | | 0.82% | | $4.18 | |
| | | | | | | | | | |
* Expenses are equal to each Portfolio’s respective annualized expense ratios multiplied by the average account value over the period, multiplied by 184/365 to reflect the most recent fiscal half-year (except “Actual Fund Return” information for each Solution Portfolio, which reflects the 123-day period ended December 31, 2005 due to their Class T inception date of August 31, 2005).
(a) Commencement of operations for Class T in all Solution Portfolios August 31, 2005
11
SHAREHOLDER EXPENSE EXAMPLES (UNAUDITED) (CONTINUED) |
| ING Solution 2035 Portfolio | | Beginning
Account
Value
July 1, 2005 | | Ending
Account
Value
December 31, 2005 | | Expenses Paid
Annualized
Expense
Ratio | | During the
Six Months Ended
December 31, 2005 | |
| Actual Fund Return | | | | | | | | | |
| Class ADV | | $1,000.00 | | $1,064.10 | | 0.62% | | $3.23 | |
| Class I | | $1,000.00 | | $1,068.80 | | 0.12% | | $0.63 | |
| Class S | | $1,000.00 | | $1,065.90 | | 0.37% | | $1.93 | |
| Class T(a) | | $1,000.00 | | $1,033.50 | | 0.82% | | $4.20 | |
| Hypothetical (5% return before expenses) | | | | | | | | | |
| Class ADV | | $1,000.00 | | $1,022.08 | | 0.62% | | $3.16 | |
| Class I | | $1,000.00 | | $1,024.60 | | 0.12% | | $0.61 | |
| Class S | | $1,000.00 | | $1,023.34 | | 0.37% | | $1.89 | |
| Class T(a) | | $1,000.00 | | $1,021.07 | | 0.82% | | $4.18 | |
| | | | | | | | | | |
| ING Solution 2045 Portfolio | | | | | | | | | |
| Actual Fund Return | | | | | | | | | |
| Class ADV | | $1,000.00 | | $1,074.80 | | 0.62% | | $3.24 | |
| Class I | | $1,000.00 | | $1,077.50 | | 0.12% | | $0.63 | |
| Class S | | $1,000.00 | | $1,075.73 | | 0.37% | | $1.94 | |
| Class T(a) | | $1,000.00 | | $1,039.40 | | 0.82% | | $4.22 | |
| Hypothetical (5% return before expenses) | | | | | | | | | |
| Class ADV | | $1,000.00 | | $1,022.08 | | 0.62% | | $3.16 | |
| Class I | | $1,000.00 | | $1,024.60 | | 0.12% | | $0.61 | |
| Class S | | $1,000.00 | | $1,023.34 | | 0.37% | | $1.89 | |
| Class T(a) | | $1,000.00 | | $1,021.07 | | 0.82% | | $4.18 | |
| | | | | | | | | | |
* Expenses are equal to each Portfolio’s respective annualized expense ratios multiplied by the average account value over the period, multiplied by 184/365 to reflect the most recent fiscal half-year (except “Actual Fund Return” information for each Solution Portfolio, which reflects the 123-day period ended December 31, 2005 due to their Class T inception date of August 31, 2005).
(a) Commencement of operations for Class T in all Solution Portfolios August 31, 2005
12
REPORT OF INDEPENDENT REGISTERED PUBLIC ACCOUNTING FIRM |
The Board of Trustees and Shareholders
ING Partners, Inc.
We have audited the accompanying statements of assets and liabilities, including the portfolios of investments, of ING Solution Income Portfolio, ING Solution 2015 Portfolio, ING Solution 2025 Portfolio, ING Solution 2035 Portfolio, and ING Solution 2045 Portfolio, each a series of ING Partners, Inc. as of December 31, 2005, and the related statements of operations, the statements of changes in net assets, and the financial highlights for the period from April 29, 2005 (commencement of operations) to December 31, 2005. These financial statements and financial highlights are the responsibility of management. Our responsibility is to express an opinion on these financial statements and financial highlights based on our audits.
We conducted our audits in accordance with the standards of the Public Company Accounting Oversight Board (United States). Those standards require that we plan and perform the audits to obtain reasonable assurance about whether the financial statements and financial highlights are free of material misstatement. An audit includes examining, on a test basis, evidence supporting the amounts and disclosures in the financial statements. Our procedures included confirmation of securities owned as of December 31, 2005 by correspondence with the transfer agent of the underlying funds. An audit also includes assessing the accounting principles used and significant estimates made by management, as well as evaluating the overall financial statement presentation. We believe that our audits provide a reasonable basis for our opinion.
In our opinion, the financial statements and financial highlights referred to above present fairly, in all material respects, the financial position of the aforementioned portfolios as of December 31, 2005, the results of their operations, the changes in their net assets, and the financial highlights for the period specified in the first paragraph above, in conformity with U.S. generally accepted accounting principles.

Boston, Massachusetts
February 27, 2006
13
STATEMENTS OF ASSETS AND LIABILITIES AS OF DECEMBER 31, 2005
| | ING
Solution Income
Portfolio | | ING
Solution 2015
Portfolio | | ING
Solution 2025
Portfolio | | ING
Solution 2035
Portfolio | | ING
Solution 2045
Portfolio | |
ASSETS: | | | | | | | | | | | |
Investments in affiliated underlying funds* | | $ | 799,656 | | $ | 5,843,096 | | $ | 17,458,744 | | $ | 5,679,377 | | $ | 1,302,950 | |
Cash | | 20 | | 20 | | 20 | | 20 | | 20 | |
Receivables: | | | | | | | | | | | |
Fund shares sold | | 351 | | 3,515 | | 124,516 | | 5,522 | | 33,974 | |
Dividends and interest | | 241 | | 1,701 | | 3,130 | | — | | — | |
Total assets | | 800,268 | | 5,848,332 | | 17,586,410 | | 5,684,919 | | 1,336,944 | |
LIABILITIES: | | | | | | | | | | | |
Payable for investment securities purchased | | 611 | | 5,211 | | 127,665 | | 5,543 | | 33,994 | |
Payable for fund shares redeemed | | — | | 19 | | — | | — | | — | |
Payable to affiliates | | 310 | | 2,103 | | 5,762 | | 1,897 | | 506 | |
Total liabilities | | 921 | | 7,333 | | 133,427 | | 7,440 | | 34,500 | |
NET ASSETS | | $ | 799,347 | | $ | 5,840,999 | | $ | 17,452,983 | | $ | 5,677,479 | | $ | 1,302,444 | |
NET ASSETS WERE COMPRISED OF: | | | | | | | | | | | |
Paid-in capital | | $ | 787,742 | | $ | 5,705,697 | | $ | 16,768,320 | | $ | 5,453,551 | | $ | 1,266,112 | |
Undistributed net investment income | | 12,720 | | 56,750 | | 126,479 | | 39,876 | | 4,925 | |
Accumulated net realized gain on investments | | 1,405 | | 22,736 | | 69,314 | | 32,991 | | 20,187 | |
Net unrealized appreciation or depreciation on investments | | (2,520 | ) | 55,816 | | 488,870 | | 151,061 | | 11,220 | |
NET ASSETS | | $ | 799,347 | | $ | 5,840,999 | | $ | 17,452,983 | | $ | 5,677,479 | | $ | 1,302,444 | |
* Cost of investments in underlying funds | | $ | 802,176 | | $ | 5,787,280 | | $ | 16,969,874 | | $ | 5,528,316 | | $ | 1,291,730 | |
| | | | | | | | | | | |
Class ADV: | | | | | | | | | | | |
Net assets | | $ | 187,903 | | $ | 1,032,439 | | $ | 943,516 | | $ | 542,166 | | $ | 334,302 | |
Shares authorized | | 100,000,000 | | 100,000,000 | | 100,000,000 | | 100,000,000 | | 100,000,000 | |
Par value | | $ | 0.001 | | $ | 0.001 | | $ | 0.001 | | $ | 0.001 | | $ | 0.001 | |
Shares outstanding | | 18,143 | | 96,137 | | 85,999 | | 48,709 | | 29,455 | |
Net asset value and redemption price per share | | $ | 10.36 | | $ | 10.74 | | $ | 10.97 | | $ | 11.13 | | $ | 11.35 | |
Class I: | | | | | | | | | | | |
Net assets | | $ | 1,051 | | $ | 1,091 | | $ | 35,994 | | $ | 19,523 | | $ | 1,664 | |
Shares authorized | | 100,000,000 | | 100,000,000 | | 100,000,000 | | 100,000,000 | | 100,000,000 | |
Par value | | $ | 0.001 | | $ | 0.001 | | $ | 0.001 | | $ | 0.001 | | $ | 0.001 | |
Shares outstanding | | 101 | | 101 | | 3,263 | | 1,745 | | 146 | |
Net asset value and redemption price per share | | $ | 10.41 | | $ | 10.80 | | $ | 11.03 | | $ | 11.19 | | $ | 11.40 | |
Class S: | | | | | | | | | | | |
Net assets | | $ | 507,090 | | $ | 4,113,839 | | $ | 15,502,795 | | $ | 4,655,603 | | $ | 783,145 | |
Shares authorized | | 100,000,000 | | 100,000,000 | | 100,000,000 | | 100,000,000 | | 100,000,000 | |
Par value | | $ | 0.001 | | $ | 0.001 | | $ | 0.001 | | $ | 0.001 | | $ | 0.001 | |
Shares outstanding | | 48,806 | | 381,953 | | 1,409,079 | | 417,160 | | 68,890 | |
Net asset value and redemption price per share | | $ | 10.39 | | $ | 10.77 | | $ | 11.00 | | $ | 11.16 | | $ | 11.37 | |
Class T: | | | | | | | | | | | |
Net assets | | $ | 103,303 | | $ | 693,630 | | $ | 970,678 | | $ | 460,187 | | $ | 183,333 | |
Shares authorized | | 100,000,000 | | 100,000,000 | | 100,000,000 | | 100,000,000 | | 100,000,000 | |
Par value | | $ | 0.001 | | $ | 0.001 | | $ | 0.001 | | $ | 0.001 | | $ | 0.001 | |
Shares outstanding | | 9,986 | | 64,581 | | 88,510 | | 41,392 | | 16,165 | |
Net asset value and redemption price per share | | $ | 10.34 | | $ | 10.74 | | $ | 10.97 | | $ | 11.12 | | $ | 11.34 | |
See Accompanying Notes to Financial Statements
14
| | ING Solution | | ING Solution | | ING Solution | | ING Solution | | ING Solution | |
| | Income | | 2015 | | 2025 | | 2035 | | 2045 | |
| | Portfolio | | Portfolio | | Portfolio | | Portfolio | | Portfolio | |
| | April 29,
2005(1) to
December 31,
2005 | | April 29,
2005(1) to
December 31,
2005 | | April 29,
2005(1) to
December 31,
2005 | | April 29,
2005(1) to
December 31,
2005 | | April 29,
2005(1) to
December 31,
2005 | |
INVESTMENT INCOME: | | | | | | | | | | | |
Dividends, from affiliated underlying funds | | $ | 13,637 | | $ | 61,916 | | $ | 140,738 | | $ | 44,247 | | $ | 6,136 | |
Total investment income | | 13,637 | | 61,916 | | 140,738 | | 44,247 | | 6,136 | |
EXPENSES: | | | | | | | | | | | |
Investment management fees | | 226 | | 1,250 | | 3,622 | | 1,089 | | 283 | |
Distribution and service fees: | | | | | | | | | | | |
Class ADV | | 116 | | 707 | | 894 | | 442 | | 278 | |
Class S | | 460 | | 2,589 | | 8,331 | | 2,413 | | 536 | |
Class T | | 140 | | 544 | | 827 | | 240 | | 92 | |
Administrative service fees | | 46 | | 250 | | 724 | | 218 | | 56 | |
Total expenses | | 988 | | 5,340 | | 14,398 | | 4,402 | | 1,245 | |
Net waived fees | | (9 | ) | (36 | ) | (72 | ) | (25 | ) | (8 | ) |
Net expenses | | 979 | | 5,304 | | 14,326 | | 4,377 | | 1,237 | |
Net investment income | | 12,658 | | 56,612 | | 126,412 | | 39,870 | | 4,899 | |
REALIZED AND UNREALIZED GAIN (LOSS) ON INVESTMENTS: | | | | | | | | | | | |
Distributions of realized gains from affiliated underlying funds | | 1,060 | | 23,304 | | 85,698 | | 33,908 | | 9,029 | |
Net realized gain (loss) on affiliated investments | | 345 | | (568 | ) | (16,384 | ) | (917 | ) | 11,158 | |
Net change in unrealized appreciation or depreciation on affiliated investments | | (2,520 | ) | 55,816 | | 488,870 | | 151,061 | | 11,220 | |
Net realized and unrealized gain (loss) on affiliated investments | | (1,115 | ) | 78,552 | | 558,184 | | 184,052 | | 31,407 | |
Increase in net assets resulting from operations | | $ | 11,543 | | $ | 135,164 | | $ | 684,596 | | $ | 223,922 | | $ | 36,306 | |
(1) Commencement of Operations
See Accompanying Notes to Financial Statements
15
STATEMENTS OF CHANGES IN NET ASSETS
| | ING Solution
Income
Portfolio | | ING Solution
2015
Portfolio | | ING Solution
2025
Portfolio | | ING Solution
2035
Portfolio | | ING Solution
2045
Portfolio | |
| | April29,
2005(1) to
December 31,
2005 | | April 29,
2005(1) to
December 31,
2005 | | April 29,
2005(1) to
December 31,
2005 | | April 29,
2005(1) to
December 31,
2005 | | April 29,
2005(1) to
December 31,
2005 | |
FROM OPERATIONS: | | | | | | | | | | | |
Net investment income | | $ | 12,658 | | $ | 56,612 | | $ | 126,412 | | $ | 39,870 | | $ | 4,899 | |
Net realized gain on affiliated investments | | 1,405 | | 22,736 | | 69,314 | | 32,991 | | 20,187 | |
Net change in unrealized appreciation or depreciation on affiliated investments | | (2,520 | ) | 55,816 | | 488,870 | | 151,061 | | 11,220 | |
Net increase in net assets resulting from operations | | 11,543 | | 135,164 | | 684,596 | | 223,922 | | 36,306 | |
FROM CAPITAL SHARE TRANSACTIONS: | | | | | | | | | | | |
Net proceeds from sale of shares | | 818,111 | | 6,044,016 | | 17,145,903 | | 5,591,300 | | 1,647,245 | |
Cost of shares redeemed | | (30,307 | ) | (338,181 | ) | (377,516 | ) | (137,743 | ) | (381,107 | ) |
Net increase in net assets resulting from capital share transactions | | 787,804 | | 5,705,835 | | 16,768,387 | | 5,453,557 | | 1,266,138 | |
Net increase in net assets | | 799,347 | | 5,840,999 | | 17,452,983 | | 5,677,479 | | 1,302,444 | |
NET ASSETS: | | | | | | | | | | | |
Beginning of period | | — | | — | | — | | — | | — | |
End of period | | $ | 799,347 | | $ | 5,840,999 | | $ | 17,452,983 | | $ | 5,677,479 | | $ | 1,302,444 | |
Undistributed net investment income at end of period | | $ | 12,720 | | $ | 56,750 | | $ | 126,479 | | $ | 39,876 | | $ | 4,925 | |
(1) Commencement of Operations
See Accompanying Notes to Financial Statements
16
ING SOLUTION INCOME PORTFOLIO | FINANCIAL HIGHLIGHTS |
Selected data for a share of beneficial interest outstanding throughout each period.
| | Class ADV | | Class I | | Class S | | Class T | |
| | April 29,
2005(1) to
December 31,
2005 | | April 29,
2005(1) to
December 31,
2005 | | April 29,
2005(1) to
December 31,
2005 | | August 31,
2005(1) to
December 31,
2005 | |
Per Share Operating Performance: | | | | | | | | | | | | |
Net asset value, beginning of period | $ | 10.02 | | | 10.02 | | | 10.02 | | | 10.28 | | |
Income (loss) from investment operations: | | | | | | | | | | | | | |
Net investment income | $ | 0.54 | † | | 0.29 | | | 0.36 | † | | 0.12 | | |
Net realized and unrealized gain (loss) on investments | $ | (0.20 | ) | | 0.10 | | | 0.01 | | | (0.06 | ) | |
Total from investment operations | $ | 0.34 | | | 0.39 | | | 0.37 | | | 0.06 | | |
Net asset value, end of period | $ | 10.36 | | | 10.41 | | | 10.39 | | | 10.34 | | |
Total Return(2) | % | 3.39 | | | 3.89 | | | 3.69 | | | 0.58 | | |
Ratios and Supplemental Data: | | | | | | | | | | | | | |
Net assets, end of period (000’s) | $ | 188 | | | 1 | | | 507 | | | 103 | | |
Ratios to average net assets: | | | | | | | | | | | | | |
Net Expenses after expense waiver(3)(4) | % | 0.62 | | | 0.12 | | | 0.37 | | | 0.82 | | |
Gross Expenses prior to expense waiver(3)(4) | % | 0.62 | | | 0.12 | | | 0.37 | | | 0.87 | | |
Net investment income(3) | % | 7.93 | | | 4.27 | | | 5.22 | | | 6.36 | | |
Portfolio turnover rate | % | 21 | | | 21 | | | 21 | | | 21 | | |
(1) Commencement of operations.
(2) Total return is calculated assuming reinvestment of all dividends and capital gain distributions at net asset value and does not reflect the effect of insurance contract charges. Total returns for periods less than one year are not annualized.
(3) Annualized for periods less than one year.
(4) Expense ratios do not include expenses of Underlying Funds.
† Per share numbers have been calculated using the average number of shares outstanding throughout the period.
See Accompanying Notes to Financial Statements.
17
ING SOLUTION 2015 PORTFOLIO | FINANCIAL HIGHLIGHTS |
Selected data for a share of beneficial interest outstanding throughout each period.
| | Class ADV | | Class I | | Class S | | Class T | |
| | April 29,
2005(1) to
December 31,
2005 | | April 29,
2005(1) to
December 31,
2005 | | April 29,
2005(1) to
December 31,
2005 | | August 31,
2005(1) to
December 31,
2005 | |
Per Share Operating Performance: | | | | | | | | | |
Net asset value, beginning of period | $ | 10.04 | | | 10.04 | | | 10.04 | | | 10.53 | | |
Income from investment operations: | | | | | | | | | | | | | |
Net investment income | $ | 0.44 | † | | 0.11 | | | 0.27 | † | | 0.13 | | |
Net realized and unrealized gain on investments | $ | 0.26 | | | 0.65 | | | 0.46 | | | 0.08 | | |
Total from investment operations | $ | 0.70 | | | 0.76 | | | 0.73 | | | 0.21 | | |
Net asset value, end of period | $ | 10.74 | | | 10.80 | | | 10.77 | | | 10.74 | | |
Total Return(2) | % | 6.97 | | | 7.57 | | | 7.27 | | | 1.99 | | |
Ratios and Supplemental Data: | | | | | | | | | | | | | |
Net assets, end of period (000’s) | $ | 1,032 | | | 1 | | | 4,114 | | | 694 | | |
Ratios to average net assets: | | | | | | | | | | | | | |
Net expenses after expense waiver(3)(4) | % | 0.62 | | | 0.12 | | | 0.37 | | | 0.82 | | |
Gross expenses prior to expense waiver(3)(4) | % | 0.62 | | | 0.12 | | | 0.37 | | | 0.87 | | |
Net investment income(3) | % | 6.29 | | | 1.51 | | | 3.82 | | | 11.28 | | |
Portfolio turnover rate | % | 49 | | | 49 | | | 49 | | | 49 | | |
(1) Commencement of operations.
(2) Total return is calculated assuming reinvestment of all dividends and capital gain distributions at net asset value and does not reflect the effect of insurance contract charges. Total returns for periods less than one year are not annualized.
(3) Annualized for periods less than one year.
(4) Expense ratios do not include expenses of Underlying Funds.
† Per share numbers have been calculated using the average number of shares outstanding throughout the period.
See Accompanying Notes to Financial Statements.
18
ING SOLUTION 2025 PORTFOLIO | FINANCIAL HIGHLIGHTS |
Selected data for a share of beneficial interest outstanding throughout each period.
| | Class ADV | | Class I | | Class S | | Class T | |
| | April 29,
2005(1) to
December 31,
2005 | | April 29,
2005(1) to
December 31,
2005 | | April 29,
2005(1) to
December 31,
2005 | | August 31,
2005(1) to
December 31,
2005 | |
Per Share Operating Performance: | | | | | | | | | | | |
Net asset value, beginning of period | $ | 10.05 | | | 10.05 | | | 10.05 | | | 10.68 | | |
Income from investment operations: | | | | | | | | | | | | | |
Net investment income | $ | 0.24 | † | | 0.05 | † | | 0.24 | † | | 0.08 | | |
Net realized and unrealized gain on investments | $ | 0.68 | | | 0.93 | | | 0.71 | | | 0.21 | | |
Total from investment operations | $ | 0.92 | | | 0.98 | | | 0.95 | | | 0.29 | | |
Net asset value, end of period | $ | 10.97 | | | 11.03 | | | 11.00 | | | 10.97 | | |
Total Return(2) | % | 9.15 | | | 9.75 | | | 9.45 | | | 2.72 | | |
Ratios and Supplemental Data: | | | | | | | | | | | | | |
Net assets, end of period (000’s) | $ | 944 | | | 36 | | | 15,503 | | | 971 | | |
Ratios to average net assets: | | | | | | | | | | | | | |
Net expenses after expense waiver(3)(4) | % | 0.62 | | | 0.12 | | | 0.37 | | | 0.82 | | |
Gross expenses prior to expense waiver(3)(4) | % | 0.62 | | | 0.12 | | | 0.37 | | | 0.87 | | |
Net investment income(3) | % | 3.37 | | | 0.79 | | | 3.38 | | | 6.79 | | |
Portfolio turnover rate | % | 47 | | | 47 | | | 47 | | | 47 | | |
(1) Commencement of operations.
(2) Total return is calculated assuming reinvestment of all dividends and capital gain distributions at net asset value and does not reflect the effect of insurance contract charges. Total returns for periods less than one year are not annualized.
(3) Annualized for periods less than one year.
(4) Expense ratios do not include expenses of Underlying Funds.
† Per share numbers have been calculated using the average number of shares outstanding throughout the period.
See Accompanying Notes to Financial Statements.
19
ING SOLUTION 2035 PORTFOLIO | FINANCIAL HIGHLIGHTS |
Selected data for a share of beneficial interest outstanding throughout each period.
| | Class ADV | | Class I | | Class S | | Class T | |
| | April 29,
2005(1) to
December 31,
2005 | | April 29,
2005(1) to
December 31,
2005 | | April 29,
2005(1) to
December 31,
2005 | | August 31,
2005(1) to
December 31,
2005 | |
Per Share Operating Performance: | | | | | | | | | |
Net asset value, beginning of period | $ | 10.07 | | | 10.07 | | | 10.07 | | | 10.76 | | |
Income from investment operations: | | | | | | | | | | | | | |
Net investment income | $ | 0.34 | † | | 0.98 | † | | 0.23 | † | | 0.12 | | |
Net realized and unrealized gain on investments | $ | 0.72 | | | 0.14 | | | 0.86 | | | 0.24 | | |
Total from investment operations | $ | 1.06 | | | 1.12 | | | 1.09 | | | 0.36 | | |
Net asset value, end of period | $ | 11.13 | | | 11.19 | | | 11.16 | | | 11.12 | | |
Total Return(2) | % | 10.53 | | | 11.12 | | | 10.82 | | | 3.35 | | |
Ratios and Supplemental Data: | | | | | | | | | | | | | |
Net assets, end of period (000’s) | $ | 542 | | | 20 | | | 4,656 | | | 460 | | |
Ratios to average net assets: | | | | | | | | | | | | | |
Net expenses after expense waiver(3)(4) | % | 0.62 | | | 0.12 | | | 0.37 | | | 0.82 | | |
Gross expenses prior to expense waiver(3)(4) | % | 0.62 | | | 0.12 | | | 0.37 | | | 0.87 | | |
Net investment income(3) | % | 4.59 | | | 13.21 | | | 3.16 | | | 15.26 | | |
Portfolio turnover rate | % | 33 | | | 33 | | | 33 | | | 33 | | |
(1) Commencement of operations.
(2) Total return is calculated assuming reinvestment of all dividends and capital gain distributions at net asset value and does not reflect the effect of insurance contract charges. Total returns for periods less than one year are not annualized.
(3) Annualized for periods less than one year.
(4) Expense ratios do not include expenses of Underlying Funds.
† Per share numbers have been calculated using the average number of shares outstanding throughout the period.
See Accompanying Notes to Financial Statements.
20
ING SOLUTION 2045 PORTFOLIO | FINANCIAL HIGHLIGHTS |
Selected data for a share of beneficial interest outstanding throughout each period.
| | Class ADV | | Class I | | Class S | | Class T | |
| | April 29,
2005(1) to
December 31,
2005 | | April 29,
2005(1) to
December 31,
2005 | | April 29,
2005(1) to
December 31,
2005 | | August 31,
2005(1) to
December 31,
2005 | |
Per Share Operating Performance: | | | | | | | | | |
Net asset value, beginning of period | $ | 10.08 | | | 10.08 | | | 10.08 | | | 10.91 | | |
Income from investment operations: | | | | | | | | | | | | | |
Net investment income | $ | 0.19 | † | | 0.08 | † | | 0.08 | † | | 0.33 | † | |
Net realized and unrealized gain on investments | $ | 1.08 | | | 1.24 | | | 1.21 | | | 0.10 | | |
Total from investment operations | $ | 1.27 | | | 1.32 | | | 1.29 | | | 0.43 | | |
Net asset value, end of period | $ | 11.35 | | | 11.40 | | | 11.37 | | | 11.34 | | |
Total Return(2) | % | 12.60 | | | 13.10 | | | 12.80 | | | 3.94 | | |
Ratios and Supplemental Data: | | | | | | | | | | | | | |
Net assets, end of period (000’s) | $ | 334 | | | 2 | | | 783 | | | 183 | | |
Ratios to average net assets: | | | | | | | | | | | | | |
Net expenses after expense waiver(3)(4) | % | 0.62 | | | 0.12 | | | 0.37 | | | 0.82 | | |
Gross expenses prior to expense waiver(3)(4) | % | 0.62 | | | 0.12 | | | 0.37 | | | 0.87 | | |
Net investment income(3) | % | 2.54 | | | 1.12 | | | 1.11 | | | 9.02 | | |
Portfolio turnover rate | % | 106 | | | 106 | | | 106 | | | 106 | | |
(1) Commencement of operations.
(2) Total return is calculated assuming reinvestment of all dividends and capital gain distributions at net asset value and does not reflect the effect of insurance contract charges. Total returns for periods less than one year are not annualized.
(3) Annualized for periods less than one year.
(4) Expense ratios do not include expenses of Underlying Funds.
† Per share numbers have been calculated using the average number of shares outstanding throughout the period.
See Accompanying Notes to Financial Statements.
21
NOTES TO FINANCIAL STATEMENTS AS OF DECEMBER 31, 2005
NOTE 1 — ORGANIZATION
Organization. ING Life Insurance and Annuity Company (“ILIAC” or the “Investment Adviser”) created ING Partners, Inc. (the “Fund”) to serve as an investment option underlying variable insurance products offered by ILIAC and its insurance company affiliates. The Fund is an open-end management investment company registered under the Investment Company Act of 1940 (the “1940 Act”). It was incorporated under the laws of Maryland on May 7, 1997. The Articles of Incorporation permit the Fund to offer separate series (“Portfolios”), each of which has its own investment objective, policies and restrictions. The Fund currently consists of thirty-nine Portfolios. The five included in this report are: ING Solution Income Portfolio (“Solution Income”), ING Solution 2015 Portfolio (“Solution 2015”), ING Solution 2025 Portfolio (“Solution 2025”), ING Solution 2035 Portfolio (“Solution 2035”) and ING Solution 2045 Portfolio (“Solution 2045”) (each a “Portfolio” and collectively, the “Portfolios”). The investment objectives of the Portfolios are as follows: Income Solution — a combination of total return and stability of principal consistent with an asset allocation targeted to retirement; and Solution 2015, 2025, 2035 and 2045 Portfolios — until the day prior to the Target Dates, the Portfolios will seek to provide total return consistent with an asset allocation targeted at retirement in approximately 2015, 2025, 2035 and 2045, respectively. On the Target Date, the investment objective will be to seek to provide a combination of total return and stability of principal consistent with an asset allocation targeted to retirement. When Solution 2015, 2025, 2035 and 2045 Portfolios reach their respective Target Date, they may be combined with the Income Portfolio, without a vote of shareholders, if approved by the Board of Directors.
Shares of the Fund are currently being offered only to participating insurance companies for allocation to certain of their separate accounts established for the purpose of funding variable annuity contracts and variable life insurance policies issued by the participating insurance companies.
The Portfolios offer the following three classes: Adviser Class (“Class ADV”), Initial Class (“Class I”), Service Class (“Class S”) and Class T. The classes differ principally in applicable distribution and shareholder service fees. Shareholders of each class also bear certain expenses that pertain to that particular class. All shareholders bear the common expenses of the Portfolios and earn income and realized gains/losses from the Portfolio pro rata based on the average daily net assets of each class, without discrimination between share classes. Differences in per share dividend rates generally result from differences in separate class expenses, including distribution and shareholder servicing fees.
Each Portfolio seeks to achieve its investment objective by investing in other ING Funds (“Underlying Funds”) and uses asset allocation strategies to determine how much to invest in the Underlying Funds.
NOTE 2 — SIGNIFICANT ACCOUNTING POLICIES
The following significant accounting policies are consistently followed by the Portfolios in the preparation of their financial statements. Such policies are in conformity with accounting principles generally accepted in the United States of America for investment companies.
A. Security Valuation. The valuation of each Portfolio’s investments in its underlying funds is based on the net asset values of the underlying funds each business day.
B. Security Transactions and Revenue Recognition. Securities transactions are accounted for on the trade date. Realized gains and losses are reported on the basis of identified cost of securities sold. Interest income is recorded on an accrual basis. Dividend income is recorded on the ex-dividend date.
C. Distributions to Shareholders. The Portfolios record distributions to their shareholders on ex-dividend date. Each Portfolio distributes dividends and capital gains, if any, annually. The Portfolios may make distributions on a more frequent basis to comply with the distribution requirements of the Internal Revenue Code. The characteristics of income and gains to be distributed are determined in accordance with income tax regulations, which may differ from accounting principles generally accepted in the United States of America for investment companies.
D. Federal Income Taxes. It is the policy of the Portfolios to comply with subchapter M of the Internal Revenue Code and related excise tax provisions applicable to regulated investment companies and to distribute substantially all of their net investment income and any net realized capital gains to their shareholders. Therefore, no federal income tax provision is required.
The Board of Trustees intends to offset any net capital gains with any available capital loss carryforward until each carryforward has been fully utilized or expires. In addition, no capital
22
NOTES TO FINANCIAL STATEMENTS AS OF DECEMBER 31, 2005 (CONTINUED)
NOTE 2 — SIGNIFICANT ACCOUNTING POLICIES (continued)
gain distribution shall be made until the capital loss carryforward has been fully utilized or expires.
E. Use of Estimates. Management of the Portfolios has made certain estimates and assumptions relating to the reporting of assets, liabilities, income, and expenses to prepare these financial statements in conformity with accounting principles generally accepted in the United States of America for investment companies. Actual results could differ from these estimates.
F. Repurchase Agreements. Certain of the Underlying Funds may invest in repurchase agreements only with government securities dealers recognized by the Board of Governors of the Federal Reserve System. Under such agreements, the seller of the security agrees to repurchase it at a mutually agreed upon time and price. The resale price is in excess of the purchase price and reflects an agreed upon interest rate for the period of time the agreement is outstanding. The period of the repurchase agreements is usually short, from overnight to one week, while the underlying securities generally have longer maturities. An Underlying Fund will receive as collateral securities acceptable to it whose market value is equal to at least 100% of the carrying amount of the repurchase agreements, plus accrued interest, being invested by the Portfolio. The underlying collateral is valued daily on a mark to market basis to assure that the value, including accrued interest is at least equal to the repurchase price. There would be potential loss to the Fund in the event the Fund is delayed or prevented from exercising its right to dispose of the collateral, and it might incur disposition costs in liquidating the collateral.
NOTE 3 — INVESTMENT ADVISOR AND ADMINISTRATIVE SERVICE FEES
The Portfolios entered into an Investment Management Agreement with the Investment Adviser. For its services, each Portfolio pays the Investment Adviser a monthly fee in arrears equal to 0.10% of the Portfolio’s average daily net assets during the month.
ING Investment Management Co. (the “Consultant”) is a consultant to the Investment Adviser. Both the Investment Adviser and the Consultant are indirect, wholly-owned subsidiaries of ING Groep, N.V. (“ING Groep”). ING Groep is one of the largest financial services organizations in the world, and offers an array of banking, insurance and asset management services to both individuals and institutional investors. The Consultant will provide tactical allocation recommendations to the Investment Adviser. The Investment Adviser has set up an Investment Committee made up of a team of professionals to consider, review and implement the recommendations of the Consultant, and will retain discretion over implementation of the Consultant’s recommendations. The Consultant will provide ongoing recommendations to the Investment Committee of the Investment Adviser quarterly or as warranted by market conditions.
Under an Administrative Services Agreement between ING Fund Services, LLC (“IFS”), an indirect, wholly-owned subsidiary of ING Groep, IFS provides all administrative services necessary for the Portfolios’ operations and is responsible for the supervision of the Portfolios’ other service providers. IFS also assumes all ordinary recurring direct costs of the Portfolios, such as custodian fees, director’s fees, transfer agency fees and accounting fees. As compensation for these services, IFS receives a monthly fee from each portfolio at an annual rate of 0.02% based on the average daily net assets of each Portfolio.
NOTE 4 — INVESTMENTS IN UNDERLYING FUNDS
For the year ended December 31, 2005, the cost of purchases and the proceeds from the sales of the Underlying Funds were as follows:
| | Purchases | | Sales | |
Solution Income | | $ | 878,494 | | $ | 76,663 | |
Solution 2015 | | 6,772,918 | | 985,070 | |
Solution 2025 | | 19,717,300 | | 2,731,041 | |
Solution 2035 | | 6,120,229 | | 590,996 | |
Solution 2045 | | 1,764,508 | | 483,934 | |
| | | | | | | |
NOTE 5 — DISTRIBUTION AND SERVICE FEES
Class ADV and Class T of the Portfolios have adopted a Plan pursuant to Rule 12b-1 under the 1940 Act (the “12b-1 Plans”), whereby ING Financial Advisers, LLC (the “Distributor”), an indirect, wholly-owned subsidiary of ING Groep, is reimbursed or compensated by the Portfolios for expenses incurred in the distribution of each Portfolio’s shares (“Distribution Fees”). The Distributor may pay, on behalf of each Portfolio, out of its distribution fee, compensation to certain financial institutions for providing distribution assistance pursuant to a Distribution Services Agreement. Under the Rule 12b-1 Plan, each Portfolio makes payments at an annual rate of 0.25% and 0.50% of the Portfolio’s average daily net assets attributable to its Class ADV and Class T shares, respectively. The Distributor has contractually agreed to waive 0.05% for Class T shares so that the actual fee paid is an annual rate of 0.45%.
23
NOTES TO FINANCIAL STATEMENTS AS OF DECEMBER 31, 2005 (CONTINUED)
NOTE 5 — DISTRIBUTION AND SERVICE FEES (continued)
The expense waiver will continue through at least May 1, 2007. The Fund has also adopted a Shareholder Services Plan (“Service Plan”) for the Class ADV, S and T shares of each Portfolio. The Service Plan allows the Fund’s distributor to enter into shareholder servicing agreements with insurance companies, broker dealers or other financial intermediaries that provide administrative services related to Class ADV, S and T shares and their shareholders including Variable Contract owners or Qualified Plan participants with interests in the Portfolios. Under the Service Plan, each Portfolio makes payments at an annual rate of 0.25% of the Portfolio’s average daily net assets attributable to its Class ADV, S and T shares.
NOTE 6 — OTHER TRANSACTIONS WITH AFFILIATES AND RELATED PARTIES
Each Portfolio has adopted a Retirement Policy covering all Independent Directors of the Portfolio who will have served as an Independent Directors for at least five years at the time of retirement. Benefits under this policy are based on an annual rate as defined in the policy agreement.
At December 31, 2005, the following indirect, wholly owned subsidiaries of ING Groep owned the following Series:
ING Life Insurance and Annuity Company — Solution Income (68.4%); Solution 2015 (67.3%); Solution 2025 (89.1%); Solution 2035 (89.1%); and Solution 2045 (88.8%).
ING USA Annuity and Life Insurance Company — Solution 2015 (6.21%).
ING National Trust — Solution Income (31.2%); Solution 2015 (26.5%); Solution 2025 (9.0%); Solution 2035 (10.2%); and Solution 2045 (10.6%).
NOTE 7 — OTHER ACCRUED EXPENSES
At December 31, 2005, the Portfolios had the following amounts recorded in payable to affiliates on the accompanying Statements of Assets and Liabilities (see Notes 5 and 6):
| | Accrued
Investment
Management
Fees | | Accrued
Administrative
Service Fees | | Accrued
Shareholder
Service and
Distribution | | Total | |
Solution Income | | $ | 64 | | $ | 13 | | $ | 233 | | $ | 310 | |
Solution 2015 | | 457 | | 91 | | 1,555 | | 2,103 | |
Solution 2025 | | 1,436 | | 287 | | 4,039 | | 5,762 | |
Solution 2035 | | 458 | | 92 | | 1,347 | | 1,897 | |
Solution 2045 | | 108 | | 22 | | 376 | | 506 | |
| | | | | | | | | | | | | | | | | | | | | |
NOTE 8 — EXPENSE LIMITATIONS
For the following Portfolios, the Investment Adviser has agreed to limit expenses, excluding interest, taxes, brokerage and extraordinary expenses to the levels listed below:
Portfolio | | | Class ADV(1) | | Class I(1) | | Class S(1) | | Class T(1) | |
Solution Income | | 0.62 | % | 0.12 | % | 0.37 | % | 0.82 | % |
Solution 2015 | | 0.62 | % | 0.12 | % | 0.37 | % | 0.82 | % |
Solution 2025 | | 0.62 | % | 0.12 | % | 0.37 | % | 0.82 | % |
Solution 2035 | | 0.62 | % | 0.12 | % | 0.37 | % | 0.82 | % |
Solution 2045 | | 0.62 | % | 0.12 | % | 0.37 | % | 0.82 | % |
| | | | | | | | | | | | | | | | | | |
(1) The operating expense limits apply only at the Portfolio level and do not limit the fees payable by the underlying investment companies in which the Portfolios invest.
The Investment Adviser may at a later date recoup from a Portfolio for management fees waived and other expenses assumed by the Investment Adviser during the previous 36 months, but only if, after such reimbursement, the Portfolio’s expense ratio does not exceed the percentage described above. Waived and reimbursed fees and any recoupment by the Investment Adviser of such waived and reimbursed fees are reflected on the accompanying Statements of Operations for each Portfolio.
Outstanding reimbursement balances due to the Portfolios, if any, under their respective expense limitation agreements are reflected in Reimbursement Due from Manager on the accompanying Statements of Assets and Liabilities.
The Expense Limitation Agreement is contractual and shall renew automatically for one-year terms unless the Investment Adviser provides written notice of the termination of the Expense Limitation Agreement within 90 days of the end of the then current term.
NOTE 9 — CAPITAL SHARES
Transactions in capital shares and dollars were as follows:
| | Class ADV
Shares | | Class I
Shares | | Class S
Shares | | Class T
Shares | |
| | April 29,
2005(1) to
December 31,
2005 | | April 29,
2005(1) to
December 31,
2005 | | April 29,
2005(1) to
December 31,
2005 | | August 31,
2005(1) to
December 31,
2005 | |
Solution Income (Number of Shares) | | | | | | | | | |
Shares sold | | 18,429 | | 101 | | 50,923 | | 10,522 | |
Shares redeemed | | (286 | ) | — | | (2,117 | ) | (536 | ) |
Net increase in shares outstanding | | 18,143 | | 101 | | 48,806 | | 9,986 | |
Solution Income ($) | | | | | | | | | |
Shares sold | | $188,909 | | $1,015 | | $520,544 | | $107,643 | |
Shares redeemed | | (2,956 | ) | — | | (21,887 | ) | (5,464 | ) |
Net increase | | $185,953 | | $1,015 | | $498,657 | | $102,179 | |
24
NOTES TO FINANCIAL STATEMENTS AS OF DECEMBER 31, 2005 (CONTINUED)
NOTE 9 — CAPITAL SHARES (continued)
| | Class ADV
Shares | | Class I
Shares | | Class S
Shares | | Class T
Shares | |
| | April 29,
2005(1) to
December 31,
2005 | | April 29,
2005(1) to
December 31,
2005 | | April 29,
2005(1) to
December 31,
2005 | | August 31,
2005(1) to
December 31,
2005 | |
Solution 2015 (Number of Shares) | | | | | | | | | |
Shares sold | | 105,917 | | 101 | | 403,952 | | 64,995 | |
Shares redeemed | | (9,780 | ) | — | | (21,999 | ) | (414 | ) |
Net increase in shares outstanding | | 96,137 | | 101 | | 381,953 | | 64,581 | |
Solution 2015 ($) | | | | | | | | | |
Shares sold | | $ | 1,121,677 | | $ | 1,010 | | $ | 4,231,966 | | $ | 689,363 | |
Shares redeemed | | (101,097 | ) | — | | (232,751 | ) | (4,333 | ) |
Net increase | | $ | 1,020,580 | | $ | 1,010 | | $ | 3,999,215 | | $ | 685,030 | |
| | Class ADV
Shares | | Class I
Shares | | Class S
Shares | | Class T
Shares | |
| | April 29,
2005(1) to
December 31,
2005 | | April 29,
2005(1) to
December 31,
2005 | | April 29,
2005(1) to
December 31,
2005 | | August 31,
2005(1) to
December 31,
2005 | |
Solution 2025 (Number of Shares) | | | | | | | | | |
Shares sold | | 88,717 | | 3,263 | | 1,440,645 | | 89,258 | |
Shares redeemed | | (2,718 | ) | — | | (31,566 | ) | (748 | ) |
Net increase in shares outstanding | | 85,999 | | 3,263 | | 1,409,079 | | 88,510 | |
Solution 2025 ($) | | | | | | | | | |
Shares sold | | $ | 946,537 | | $ | 36,015 | | $ | 15,196,157 | | $ | 967,194 | |
Shares redeemed | | (28,625 | ) | — | | (341,002 | ) | (7,889 | ) |
Net increase | | $ | 917,912 | | $ | 36,015 | | $ | 14,855,155 | | $ | 959,305 | |
| | Class ADV
Shares | | Class I
Shares | | Class S
Shares | | Class T
Shares | |
| | April 29,
2005(1) to
December 31,
2005 | | April 29,
2005(1) to
December 31,
2005 | | April 29,
2005(1) to
December 31,
2005 | | August 31,
2005(1) to
December 31,
2005 | |
Solution 2035 (Number of Shares) | | | | | | | | | |
Shares sold | | 48,885 | | 4,862 | | 426,175 | | 41,567 | |
Shares redeemed | | (176 | ) | (3,117 | ) | (9,015 | ) | (175 | ) |
Net increase in shares outstanding | | 48,709 | | 1,745 | | 417,160 | | 41,392 | |
Solution 2035 ($) | | | | | | | | | |
Shares sold | | $ | 532,594 | | $ | 54,325 | | $ | 4,542,888 | | $ | 461,493 | |
Shares redeemed | | (1,945 | ) | (35,000 | ) | (98,830 | ) | (1,968 | ) |
Net increase | | $ | 530,649 | | $ | 19,325 | | $ | 4,444,058 | | $ | 459,525 | |
| | Class ADV
Shares | | Class I
Shares | | Class S
Shares | | Class T
Shares | |
| | April 29,
2005(1) to
December 31,
2005 | | April 29,
2005(1) to
December 31,
2005 | | April 29,
2005(1) to
December 31,
2005 | | August 31,
2005(1) to
December 31,
2005 | |
Solution 2045 (Number of Shares) | | | | | | | | | |
Shares sold | | 29,467 | | 146 | | 101,444 | | 17,484 | |
Shares redeemed | | (12 | ) | — | | (32,554 | ) | (1,319 | ) |
Net increase in shares outstanding | | 29,455 | | 146 | | 68,890 | | 16,165 | |
Solution 2045 ($) | | | | | | | | | |
Shares sold | | $ | 330,615 | | $ | 1,529 | | $ | 1,117,355 | | $ | 197,744 | |
Shares redeemed | | (126 | ) | — | | (365,948 | ) | (15,031 | ) |
Net increase | | $ | 330,489 | | $ | 1,529 | | $ | 751,407 | | $ | 182,713 | |
(1) Commencement of operations.
NOTE 10 — FEDERAL INCOME TAXES
The amount of distributions from net investment income and net realized capital gains are determined in accordance with federal income tax regulations, which may differ from accounting principles generally accepted in the United States of America for investment companies. These book/tax differences may be either temporary or permanent. Permanent differences are reclassified within the capital accounts based on their federal tax-basis treatment; temporary differences are not reclassified. Key differences include the treatment of short-term capital gains, foreign currency transactions, and wash sale deferrals. Distributions in excess of net investment income and/or net realized capital gains for tax purposes are reported as distributions of paid-in capital.
The following permanent tax differences have been reclassified as of December 31, 2005:
| | Paid-in | | Undistributed
Net Investment | |
| | Capital | | | Income | | |
Solution Income Portfolio | | $ | (62) | | | $ | 62 | | |
Solution 2015 Portfolio | | (138) | | | 138 | | |
Solution 2025 Portfolio | | (67) | | | 67 | | |
Solution 2035 Portfolio | | (6) | | | 6 | | |
Solution 2045 Portfolio | | (26) | | | 26 | | |
| | | | | | | | | |
Dividends paid by the Portfolios from net investment income and distributions of net realized short-term capital gains are, for federal income tax purposes, taxable as ordinary income to shareholders.
There were no dividends or distributions to shareholders of the Portfolios during the period from April 29, 2005 to December 31, 2005.
The tax-basis components of distributable earnings and the expiration dates of the capital loss carryforwards which may be used to offset future realized capital gains for federal income tax purposes as of December 31, 2005 were:
| | Undistributed
Ordinary | | Undistributed
Long Term | | Unrealized
Appreciation/ | | Post-
October
Capital
Losses | |
| | | Income | | | Capital Gains | | (Depreciation) | | Deferred | |
Solution Income | | $ | 14,636 | | $ | 330 | | $ | (3,323 | ) | $ | (38 | ) |
Solution 2015 | | 80,398 | | 6,089 | | 48,815 | | — | |
Solution 2025 | | 190,244 | | 23,415 | | 471,004 | | — | |
Solution 2035 | | 65,653 | | 9,142 | | 149,133 | | — | |
Solution 2045 | | 24,638 | | 2,259 | | 9,435 | | — | |
| | | | | | | | | | | | | | | | | | | | | | | |
NOTE 11 — INFORMATION REGARDING TRADING OF ING’S U.S. MUTUAL FUNDS
In 2004 ING Investments reported to the Boards of Directors/Trustees (the “Boards”) of the ING Funds that, like many U.S. financial services companies, ING Investments and certain of its U.S. affiliates have
25
NOTES TO FINANCIAL STATEMENTS AS OF DECEMBER 31, 2005 (CONTINUED)
NOTE 11 — INFORMATION REGARDING TRADING OF ING’S U.S. MUTUAL FUNDS (continued)
received informal and formal requests for information since September 2003 from various governmental and self-regulatory agencies in connection with investigations related to mutual funds and variable insurance products. ING Investments has advised the Boards that it and its affiliates have cooperated fully with each request.
In addition to responding to regulatory and governmental requests, ING Investments reported that management of U.S. affiliates of ING Groep N.V., including ING Investments (collectively, “ING”), on their own initiative, have conducted, through independent special counsel and a national accounting firm, an extensive internal review of trading in ING insurance, retirement, and mutual fund products. The goal of this review was to identify any instances of inappropriate trading in those products by third parties or by ING investment professionals and other ING personnel. ING’s internal review related to mutual fund trading is now substantially completed. ING has reported that, of the millions of customer relationships that ING maintains, the internal review identified several isolated arrangements allowing third parties to engage in frequent trading of mutual funds within ING’s variable insurance and mutual fund products, and identified other circumstances where frequent trading occurred, despite measures taken by ING intended to combat market timing. ING further reported that each of these arrangements has been terminated and fully disclosed to regulators. The results of the internal review were also reported to the independent members of the Board.
ING Investments has advised the Board that most of the identified arrangements were initiated prior to ING’s acquisition of the businesses in question in the U.S. ING Investments further reported that the companies in question did not receive special benefits in return for any of these arrangements, which have all been terminated.
Based on the internal review, ING Investments has advised the Board that the identified arrangements do not represent a systemic problem in any of the companies that were involved.
In September 2005, ING Funds Distributor, LLC (“IFD”), the distributor of certain ING Funds, settled an administrative proceeding with the NASD regarding three arrangements, dating from 1995, 1996 and 1998, under which the administrator to the then-Pilgrim Funds, which subsequently became part of the ING Funds, entered into formal and informal arrangements that permitted frequent trading. Under the terms of the Letter of Acceptance, Waiver and Consent (“AWC”) with the NASD, under which IFD neither admitted nor denied the allegations or findings, IFD consented to the following sanctions: (i) a censure; (ii) a fine of $1.5 million; (iii) restitution of approximately $1.44 million to certain ING Funds for losses attributable to excessive trading described in the AWC; and (iv) agreement to make certification to NASD regarding the review and establishment of certain procedures.
In addition to the arrangements discussed above, in 2004, ING Investments reported to the Board that, at that time, these instances include the following, in addition to the arrangements subject to the AWC discussed above:
• Aeltus Investment Management, Inc. (a predecessor entity to ING Investment Management Co.) has identified two investment professionals who engaged in extensive frequent trading in certain ING Funds. One was subsequently terminated for cause and incurred substantial financial penalties in connection with this conduct and the second has been disciplined.
• ReliaStar Life Insurance Company (“ReliaStar”) entered into agreements seven years ago permitting the owner of policies issued by the insurer to engage in frequent trading and to submit orders until 4pm Central Time. In 2001 ReliaStar also entered into a selling agreement with a broker-dealer that engaged in frequent trading. Employees of ING affiliates were terminated and/or disciplined in connection with these matters.
• In 1998, Golden American Life Insurance Company entered into arrangements permitting a broker-dealer to frequently trade up to certain specific limits in a fund available in an ING variable annuity product. No employee responsible for this arrangement remains at the company.
For additional information regarding these matters, you may consult the Form 8-K and Form 8-K/A for each of four life insurance companies, ING USA Annuity and Life Insurance Company, ING Life Insurance and Annuity Company, ING Insurance Company of America, and ReliaStar Life Insurance Company of New York, each filed with the Securities and Exchange Commission (the “SEC”) on October 29, 2004 and September 8, 2004. These Forms 8-K and Forms 8-K/A can be accessed through the SEC’s Web site at http://www.sec.gov. Despite the extensive internal
26
NOTES TO FINANCIAL STATEMENTS AS OF DECEMBER 31, 2005 (CONTINUED)
NOTE 11 — INFORMATION REGARDING TRADING OF ING’S U.S. MUTUAL FUNDS (continued)
review conducted through independent special counsel and a national accounting firm, there can be no assurance that the instances of inappropriate trading reported to the Board are the only instances of such trading respecting the ING Funds.
ING Investments reported to the Board that ING is committed to conducting its business with the highest standards of ethical conduct with zero tolerance for noncompliance. Accordingly, ING Investments advised the Board that ING management was disappointed that its voluntary internal review identified these situations. Viewed in the context of the breadth and magnitude of its U.S. business as a whole, ING management does not believe that ING’s acquired companies had systemic ethical or compliance issues in these areas. Nonetheless, ING Investments reported that given ING’s refusal to tolerate any lapses, it has taken the steps noted below, and will continue to seek opportunities to further strengthen the internal controls of its affiliates.
• ING has agreed with the ING Funds to indemnify and hold harmless the ING Funds from all damages resulting from wrongful conduct by ING or its employees or from ING’s internal investigation, any investigations conducted by any governmental or self-regulatory agencies, litigation or other formal proceedings, including any proceedings by the Securities and Exchange Commission. ING Investments reported to the Board that ING management believes that the total amount of any indemnification obligations will not be material to ING or its U.S. business.
• ING updated its Code of Conduct for employees reinforcing its employees’ obligation to conduct personal trading activity consistent with the law, disclosed limits, and other requirements.
• The ING Funds, upon a recommendation from ING, updated their respective Codes of Ethics applicable to investment professionals with ING entities and certain other fund personnel, requiring such personnel to pre-clear any purchases or sales of ING Funds that are not systematic in nature (i.e., dividend reinvestment), and imposing minimum holding periods for shares of ING Funds.
• ING instituted excessive trading policies for all customers in its variable insurance and retirement products and for shareholders of the ING Funds sold to the public through financial intermediaries. ING does not make exceptions to these policies.
• ING reorganized and expanded its U.S. Compliance Department, and created an Enterprise Compliance team to enhance controls and consistency in regulatory compliance.
As has been widely reported in the media, the New York Attorney General’s office (“NYAG”) is conducting broad investigations regarding insurance quoting and brokerage practices. ING U.S. has been subpoenaed in this regard, and is cooperating fully with these NYAG requests for information.
ING U.S. believes that its practices are consistent with our business principles and our commitment to our customers.
At this time, in light of the current regulatory factors, ING U.S. is actively engaged in reviewing whether any modifications in our practices are appropriate for the future.
There can be no assurance that these matters, or the adverse publicity associated with them, will not result in increased fund redemptions, reduced sale of fund shares, or other adverse consequences to ING Funds.
27
PORTFOLIO ASSET ALLOCATION | |
AS OF DECEMBER 31, 2005 | ING SOLUTION PORTFOLIOS |
The following table illustrates the asset allocation of the Underlying Portfolios as of December 31, 2005 (as a percent of net assets).
Underlying Affiliated Portfolios | | Solution
Income | | Solution
2015 | | Solution
2025 | | Solution
2035 | | Solution
2045 | |
ING American Century Large Company Value Portfolio, Class I | | — | | 3.0 | % | 6.0 | % | 7.9 | % | 8.9 | % |
ING Baron Small Cap Growth Portfolio, Class I | | — | | — | | 6.1 | % | 5.0 | % | 5.0 | % |
ING Julius Baer Foreign Portfolio, Class I | | — | | 4.2 | % | 5.2 | % | 6.2 | % | 7.2 | % |
ING Limited Bond Portfolio, Class I | | 24.7 | % | 14.7 | % | 9.7 | % | — | | — | |
ING Marisco Growth Portfolio, Class I | | — | | 3.1 | % | 5.1 | % | 6.1 | % | 7.0 | % |
ING Marisco International Portfolio, Class I | | — | | 3.3 | % | 3.3 | % | 4.3 | % | 5.3 | % |
ING Oppenheimer Strategic Income Portfolio, Class I | | 9.9 | % | 9.8 | % | 4.9 | % | — | | — | |
ING PIMCO High Yield Bond Portfolio, Class I | | 5.0 | % | 4.9 | % | 2.9 | % | — | | — | |
ING PIMCO Total Return Portfolio, Class I | | 14.9 | % | 4.9 | % | — | | — | | — | |
ING Salomon Brothers Aggressive Growth Portfolio, Class I | | — | | 3.0 | % | 5.0 | % | 6.0 | % | 7.0 | % |
ING T. Rowe Price Growth Equity Portfolio, Class I | | — | | 6.1 | % | 9.1 | % | 12.0 | % | 12.9 | % |
ING UBS U.S. Large Cap Equity Portfolio, Class I | | 7.2 | % | 7.1 | % | 5.0 | % | 5.0 | % | 5.0 | % |
ING Van Kampen Comstock Portfolio, Class I | | — | | 2.0 | % | 6.1 | % | 8.0 | % | 9.0 | % |
ING VP Index Plus International Equity Portfolio, Class I | | 5.2 | % | 4.1 | % | 5.1 | % | 6.1 | % | 6.1 | % |
ING VP Index Plus Large Cap Portfolio, Class I | | 8.2 | % | 8.0 | % | 5.0 | % | 5.0 | % | 4.9 | % |
ING VP Index Plus Mid Cap Portfolio, Class I | | — | | — | | 3.0 | % | 4.0 | % | 5.0 | % |
ING VP Index Plus Small Cap Portfolio, Class I | | — | | — | | — | | 3.0 | % | 4.9 | % |
ING VP Intermediate Bond Portfolio, Class I | | 24.9 | % | 19.7 | % | 16.5 | % | 19.4 | % | 9.8 | % |
ING VP Real Estate Portfolio, Class I | | — | | 2.1 | % | 2.0 | % | 2.0 | % | 2.0 | % |
Other Assets and Liabilities | | 0.0 | % | 0.0 | % | 0.0 | % | 0.0 | % | 0.0 | % |
| | 100.0 | % | 100.0 | % | 100.0 | % | 100.0 | % | 100.0 | % |
| | | | | | | | | | | | | | | | |
Portfolio holdings are subject to change daily.
28
| PORTFOLIO OF INVESTMENTS |
ING SOLUTION INCOME PORTFOLIO | AS OF DECEMBER 31, 2005 |
Shares | | | | | | Value | |
AFFILIATED INVESTMENT COMPANIES: 100.0% | | | | | |
18,459 | | ING Limited Bond Portfolio-Class I | | | | $ | 197,510 | |
7,946 | | ING Oppenheimer Strategic Income Portfolio-Class I | | | | 79,456 | |
3,923 | | ING PIMCO High Yield Bond Portfolio-Class I | | | | 40,010 | |
10,915 | | ING PIMCO Total Return Portfolio-Class I | | | | 119,187 | |
6,189 | | ING UBS U.S. Large Cap Equity Portfolio-Class I | | | | 57,557 | |
3,877 | | ING VP Index Plus International Equity Portfolio-Class I | | | | 41,945 | |
4,230 | | ING VP Index Plus LargeCap Portfolio-Class I | | | | 65,225 | |
15,325 | | ING VP Intermediate Bond Portfolio-Class I | | | | 198,766 | |
| | Total Investments in Securities (Cost $802,176) | | 100.0 | % | $ | 799,656 | |
| | Other Assets and Liabilities-Net | | 0.0 | | (309 | ) |
| | Net Assets | | 100.0 | % | $ | 799,347 | |
| | | | | | | |
* Cost for federal income tax purposes is $802,979. Net unrealized depreciation consists of: | |
| | Gross Unrealized Appreciation | | | | $ | 5,205 | |
| | Gross Unrealized Depreciation | | | | (8,528 | ) |
| | Net Unrealized Depreciation | | | | $ | (3,323 | ) |
See Accompanying Notes to Financial Statements
29
| PORTFOLIO OF INVESTMENTS |
ING SOLUTION 2015 PORTFOLIO | AS OF DECEMBER 31, 2005 |
Shares | | | | | | Value | |
AFFILIATED INVESTMENT COMPANIES: 100.0% | | | | | |
12,276 | | ING American Century Large Company Value Portfolio-Class I | | | | $ | 174,808 | |
18,598 | | ING Julius Baer Foreign Portfolio-Class I | | | | 243,078 | |
80,203 | | ING Limited Bond Portfolio-Class I | | | | 858,175 | |
11,232 | | ING Marsico Growth Portfolio-Class I | | | | 178,595 | |
15,319 | | ING Marsico International Portfolio-Class I | | | | 189,648 | |
57,524 | | ING Oppenheimer Strategic Income Portfolio-Class I | | | | 575,242 | |
28,383 | | ING PIMCO High Yield Bond Portfolio-Class I | | | | 289,509 | |
26,341 | | ING PIMCO Total Return Portfolio-Class I | | | | 287,648 | |
3,984 | | ING Salomon Brothers Aggressive Growth Portfolio-Class I | | | | 177,387 | |
6,748 | | ING T. Rowe Price Growth Equity Portfolio-Class I | | | | 355,073 | |
44,521 | | ING UBS U.S. Large Cap Equity Portfolio-Class I | | | | 414,048 | |
9,690 | | ING Van Kampen Comstock Portfolio-Class I | | | | 118,408 | |
22,316 | | ING VP Index Plus International Equity Portfolio-Class I | | | | 241,457 | |
30,421 | | ING VP Index Plus Large Cap Portfolio-Class I | | | | 469,087 | |
88,755 | | ING VP Intermediate Bond Portfolio-Class I | | | | 1,151,145 | |
8,007 | | ING VP Real Estate Portfolio-Class I | | | | 119,788 | |
| | Total Investments in Securities (Cost $5,787,280) | | 100.0 | % | $ | 5,843,096 | |
| | Other Assets and Liabilities-Net | | 0.0 | | (2,098 | ) |
| | Net Assets | | 100.0 | % | $ | 5,840,998 | |
| | | | | | | |
* Cost for federal income tax purposes is $5,794,281. Net unrealized appreciation consists of: | | | |
| | Gross Unrealized Appreciation | | | | $ | 92,549 | |
| | Gross Unrealized Depreciation | | | | (43,734 | ) |
| | Net Unrealized Appreciation | | | | $ | 48,815 | |
See Accompanying Notes to Financial Statements
30
| PORTFOLIO OF INVESTMENTS |
ING SOLUTION 2025 PORTFOLIO | AS OF DECEMBER 31, 2005 |
Shares | | | | | | Value | |
AFFILIATED INVESTMENT COMPANIES: 100.0% | | | | | |
73,001 | | ING American Century Large Company Value Portfolio-Class I | | | | $ | 1,039,536 | |
65,322 | | ING Baron Small Cap Growth Portfolio-Class I | | | | 1,058,870 | |
69,169 | | ING Julius Baer Foreign Portfolio-Class I | | | | 904,038 | |
157,616 | | ING Limited Bond Portfolio-Class I | | | | 1,686,490 | |
55,888 | | ING Marsico Growth Portfolio-Class I | | | | 888,620 | |
45,844 | | ING Marsico International Portfolio-Class I | | | | 567,550 | |
84,830 | | ING Oppenheimer Strategic Income Portfolio-Class I | | | | 848,305 | |
50,108 | | ING PIMCO High Yield Bond Portfolio-Class I | | | | 511,104 | |
19,756 | | ING Salomon Brothers Aggressive Growth Portfolio-Class I | | | | 879,518 | |
30,197 | | ING T. Rowe Price Growth Equity Portfolio-Class I | | | | 1,588,961 | |
94,667 | | ING UBS U.S. Large Cap Equity Portfolio-Class I | | | | 880,402 | |
86,583 | | ING Van Kampen Comstock Portfolio-Class I | | | | 1,058,044 | |
56,601 | | ING VP Index Plus LargeCap Portfolio-Class I | | | | 872,794 | |
28,497 | | ING VP Index Plus MidCap Portfolio-Class I | | | | 532,615 | |
82,967 | | ING VP Index Plus International Equity Portfolio-Class I | | | | 897,708 | |
222,573 | | ING VP Intermediate Bond Portfolio-Class I | | | | 2,886,770 | |
23,892 | | ING VP Real Estate Portfolio-Class I | | | | 357,419 | |
| | Total Investments in Securities (Cost $16,969,874) | | 100.0 | % | $ | 17,458,744 | |
| | Other Assets and Liabilities-Net | | 0.0 | | (5,761 | ) |
| | Net Assets | | 100.0 | % | $ | 17,452,983 | |
| | | | | | | |
* Cost for federal income tax purposes is $16,987,740. Net unrealized appreciation consists of: | | | |
| | Gross Unrealized Appreciation | | | | $ | 559,566 | |
| | Gross Unrealized Depreciation | | | | (88,562 | ) |
| | Net Unrealized Appreciation | | | | $ | 471,004 | |
See Accompanying Notes to Financial Statements
31
| PORTFOLIO OF INVESTMENTS |
ING SOLUTION 2035 PORTFOLIO | AS OF DECEMBER 31, 2005 |
Shares | | | | | | Value | |
AFFILIATED INVESTMENT COMPANIES: 100.0% | | | | | |
31,453 | | ING American Century Large Company Value Portfolio-Class I | | | | $ | 447,897 | |
17,552 | | ING Baron Small Cap Growth Portfolio-Class I | | | | 284,515 | |
26,817 | | ING Julius Baer Foreign Portfolio-Class I | | | | 350,500 | |
21,608 | | ING Marsico Growth Portfolio-Class I | | | | 343,568 | |
19,673 | | ING Marsico International Portfolio-Class I | | | | 243,556 | |
7,654 | | ING Salomon Brothers Aggressive Growth Portfolio-Class I | | | | 340,757 | |
12,979 | | ING T. Rowe Price Growth Equity Portfolio-Class I | | | | 682,979 | |
30,566 | | ING UBS U.S. Large Cap Equity Portfolio-Class I | | | | 284,266 | |
37,278 | | ING Van Kampen Comstock Portfolio-Class I | | | | 455,532 | |
18,272 | | ING VP Index Plus LargeCap Portfolio-Class I | | | | 281,753 | |
12,257 | | ING VP Index Plus MidCap Portfolio-Class I | | | | 229,089 | |
10,112 | | ING VP Index Plus SmallCap Portfolio-Class I | | | | 168,668 | |
32,158 | | ING VP Index Plus International Equity Portfolio-Class I | | | | 347,948 | |
85,047 | | ING VP Intermediate Bond Portfolio-Class I | | | | 1,103,060 | |
7,706 | | ING VP Real Estate Portfolio-Class I | | | | 115,289 | |
| | Total Investments in Securities (Cost $5,528,316) | | 100.0 | % | $ | 5,679,377 | |
| | Other Assets and Liabilities-Net | | 0.0 | | (1,898 | ) |
| | Net Assets | | 100.0 | % | $ | 5,677,479 | |
| | | | | | | |
* Cost for federal income tax purposes is $5,530,244. Net unrealized appreciation consists of: | | | |
| | Gross Unrealized Appreciation | | | | $ | 184,908 | |
| | Gross Unrealized Depreciation | | | | (35,775 | ) |
| | Net Unrealized Appreciation | | | | $ | 149,133 | |
See Accompanying Notes to Financial Statements
32
| PORTFOLIO OF INVESTMENTS |
ING SOLUTION 2045 PORTFOLIO | AS OF DECEMBER 31, 2005 |
Shares | | | | | | Value | |
AFFILIATED INVESTMENT COMPANIES: 100.0% | | | | | |
8,095 | | ING American Century Large Company Value Portfolio-Class I | | | | $ | 115,267 | |
3,987 | | ING Baron Small Cap Growth Portfolio-Class I | | | | 64,636 | |
7,184 | | ING Julius Baer Foreign Portfolio-Class I | | | | 93,900 | |
5,729 | | ING Marsico Growth Portfolio-Class I | | | | 91,099 | |
5,599 | | ING Marsico International Portfolio-Class I | | | | 69,319 | |
2,040 | | ING Salomon Brothers Aggressive Growth Portfolio-Class I | | | | 90,842 | |
3,198 | | ING T. Rowe Price Growth Equity Portfolio-Class I | | | | 168,257 | |
6,990 | | ING UBS U.S. Large Cap Equity Portfolio-Class I | | | | 65,010 | |
9,586 | | ING Van Kampen Comstock Portfolio-Class I | | | | 117,142 | |
7,381 | | ING VP Index Plus International Equity Portfolio-Class I | | | | 79,862 | |
4,171 | | ING VP Index Plus Large Cap Portfolio-Class I | | | | 64,324 | |
3,489 | | ING VP Index Plus Mid Cap Portfolio-Class I | | | | 65,215 | |
3,836 | | ING VP Index Plus Small Cap Portfolio-Class I | | | | 63,989 | |
9,855 | | ING VP Intermediate Bond Portfolio-Class I | | | | 127,814 | |
1,756 | | ING VP Real Estate Portfolio-Class I | | | | 26,274 | |
| | Total Investments in Securities (Cost $1,291,730) | | 100.0 | % | $ | 1,302,950 | |
| | Other Assets and Liabilities-Net | | 0.0 | | (506 | ) |
| | Net Assets | | 100.0 | % | $ | 1,302,444 | |
| | | | | | | |
* Cost for federal income tax purposes is $1,293,515. Net unrealized appreciation consists of: | | | |
| | Gross Unrealized Appreciation | | | | $ | 14,950 | |
| | Gross Unrealized Depreciation | | | | (5,515 | ) |
| | Net Unrealized Appreciation | | | | $ | 9,435 | |
See Accompanying Notes to Financial Statements
33
DIRECTOR AND OFFICER INFORMATION (UNAUDITED)
The business and affairs of the Funds are managed under the direction of the Funds’ Board of Directors. A Director who is not an interested person of the Company, as defined in the 1940 Act, is an independent director (“Independent Director”). The Directors and Officers of the Funds are listed below. The Statement of Additional Information includes additional information about directors of the Registrant and is available, without charge, upon request at 1-800-992-0180.
Name, Address | | Position(s)
Held with | | Term of
Office and
Length of
Time | | Principal
Occupation(s)
During the | | Number of
Portfolios in
Fund Complex
Overseen | | Other
Directorships
Held by |
| and Age | | | | Company | | | | Served(1) | | | | Past Five Years | | | | by Director | | | | Director | |
Independent Directors: | | | | | | | | | | |
| | | | | | | | | | |
John V. Boyer(3)
7337 E. Doubletree Ranch Rd.
Scottsdale, Arizona 85258
Age: 52 | | Director | | November 1997 - Present | | Executive Director, The Mark Twain House &
Museum(2) (September 1989 - Present). | | 172 | | None |
| | | | | | | | | | |
J. Michael Earley(4)
7337 E. Doubletree Ranch Rd.
Scottsdale, Arizona 85258
Age : 60 | | Director | | January 2005 - Present | | President and Chief Executive Officer, Bankers Trust Company, N.A. (June 1992 - Present). | | 172 | | None |
| | | | | | | | | | |
R. Barbara Gitenstein(3)
7337 E. Doubletree Ranch Rd.
Scottsdale, Arizona 85258
Age : 57 | | Director | | January 2005 - Present | | President, College of New Jersey (January 1999 - Present). | | 172 | | None |
| | | | | | | | | | |
Patrick W. Kenny(4)
7337 E. Doubletree Ranch Rd.
Scottsdale, Arizona 85258
Age : 62 | | Director | | March 2002 - Present | | President and Chief Executive Officer International Insurance Society (June 2001 - Present). Formerly, Executive Vice President, Frontier Insurance Group, Inc. (September 1998 - March 2001). | | 172 | | Assured Guaranty Ltd. (November 2003 - Present). |
| | | | | | | | | | |
Walter H. May(3)
7337 E. Doubletree Ranch Rd.
Scottsdale, Arizona 85258
Age : 68 | | Director | | January 2005 - Present | | Retired. | | 172 | | BestPrep (September 1991 - Present). |
| | | | | | | | | | |
Jock Patton(3)
7337 E. Doubletree Ranch Rd.
Scottsdale, Arizona 85258
Age : 59 | | Chairman and Director | | January 2005 - Present | | Private Investor (June 1997 - Present). Formerly, Director and Chief Executive Officer, Rainbow Multimedia Group, Inc. (January 1999 - December 2001). | | 172 | | JDA Software Group, Inc. (January 1999 - Present); Swift Transportation Co. (March 2004 - Present). |
| | | | | | | | | | |
David W.C. Putnam(4)
7337 E. Doubletree Ranch Rd.
Scottsdale, Arizona 85258
Age : 66 | | Director | | January 2005 - Present | | President and Director, F.L. Putnam Securities Company, Inc. (June 1978 - Present). | | 172 | | Progressive Capital Accumulation Trust (August 1998 - Present); Principled Equity Market Trust (November 1996 - Present); Mercy Endowment Foundation (September 1995 - Present); Asian American Bank and Trust Company (June 1992 - Present); and Notre Dame Health Care Center (July 1991 - Present). |
| | | | | | | | | | |
Roger B. Vincent(4)
7337 E. Doubletree Ranch Rd.
Scottsdale, Arizona 85258
Age : 60 | | Director | | January 2005 - Present | | President, Springwell Corporation (March 1989 - Present). | | 172 | | AmeriGas Propane, Inc. (January 1998 - Present). |
| | | | | | | | | | | | | | | | | | | | | | |
34
DIRECTOR AND OFFICER INFORMATION (UNAUDITED)
Name, Address | | Position(s)
Held with | | Term of
Office and
Length of
Time | | Principal
Occupation(s)
During the | | Number of
Portfolios in
Fund Complex
Overseen | | Other
Directorships
Held by |
| and Age | | | | Company | | | | Served(1) | | | | Past Five Years | | | | by Director | | | | Director | |
Richard A. Wedemeyer(3)
7337 E. Doubletree Ranch Rd.
Scottsdale, Arizona 85258
Age : 69 | | Director | | January 2005 - Present | | Retired. Formerly, Vice President - Finance and Administration, The Channel Corporation (June 1996 - April 2002). Formerly, Trustee, First Choice Funds (February
1997 - April 2001). | | 172 | | Touchstone Consulting Group (June 1997 - Present) and Jim Henson Legacy (April 1994 - Present). |
| | | | | | | | | | |
Directors who are “Interested Persons”: | | | | | | | | |
| | | | | | | | | | |
Thomas J. McInerney(5)
7337 E. Doubletree Ranch Rd.
Scottsdale, Arizona 85258
Age : 49 | | Director | | January 2005 - Present | | Chief Executive Officer, ING U.S. Financial Services (January 2005 - Present); General Manager and Chief Executive Officer, U.S. Financial Services (December 2003 - December 2004); Chief Executive Officer, ING U.S. Financial Services (September 2001 - December 2003); and General Manager and Chief Executive Officer, U.S. Worksite Financial Services (December 2000 - September 2001). | | 212 | | Equitable Life Insurance Co., Golden American Life Insurance Co., Life Insurance Company of Georgia, Midwestern United Life Insurance Co., ReliaStar Life Insurance Co., Security Life of Denver, Security Connecticut Life Insurance Co., Southland Life Insurance Co., USG Annuity and Life Company, and United Life and Annuity Insurance Co. Inc.; Ameribest Life Insurance Co.; First Columbine Life Insurance Co.; and Metro Atlanta Chamber of Commerce (January 2003 - Present). |
| | | | | | | | | | |
John G. Turner(6)
7337 E. Doubletree Ranch Rd.
Scottsdale, Arizona 85258
Age : 66 | | Director | | January 2005 - Present | | Retired. Formerly, Vice Chairman of ING Americas (September 2000 - January 2002); Director of ReliaStar Life Insurance Company of New York (April 1975 - December 2001); and Chairman and Trustee of the Northstar affiliated investment companies (May 1993 - December 2001). | | 177 | | Hormel Foods Corporation (March 2000 - Present); ShopKo Stores, Inc. (August 1999 - Present); and Conseco, Inc. (September 2003 - Present). |
| | | | | | | | | | | | | | | | | | | | | | |
(1) Directors serve until their successors are duly elected and qualified, subject to the Board’s retirement policy.
(2) Shaun Mathews, Senior Vice President of ING Life Insurance and Annuity Company, has held a seat on the board of directors of The Mark Twain House & Museum since September 19, 2002. ING Groep N.V. makes non-material, charitable contributions to The Mark Twain House & Museum.
(3) Valuation, Proxy and Brokerage Committee member.
(4) Audit Committee member.
(5) Mr. McInerney is an “interested person,” as defined under the 1940 Act, because of his affiliation with ING Groep N.V., the parent corporation of the Investment Manager, ING Investments, LLC and the Distributor, ING Funds Distributor, LLC.
(6) Mr. Turner is an “interested person,” as defined under the 1940 Act, because of his affiliation with ING Groep N.V., the parent corporation of the Investment Manager, ING Investments, LLC and the Distributor, ING Funds Distributor, LLC.
35
DIRECTOR AND OFFICER INFORMATION (UNAUDITED) (CONTINUED)
Name, Address | | Position(s) | | Term of Office and | | Principal Occupation(s) during the |
| and Age | | | | Held with the Company | | | | Length of Time Served(1) | | | | Past Five Years | |
Officers: | | | | | | |
| | | | | | |
James M. Hennessy
7337 E. Doubletree Ranch Rd.
Scottsdale, Arizona 85258
Age : 56 | | President and Chief Executive Officer
Chief Operating Officer | | February 2001 - Present
July 2000 - Present | | President, Chief Executive Officer and Chief Operating Officer, ING Investments, LLC (December 2000 - Present). Formerly, Senior Executive Vice President and Chief Operating Officer, ING Investments, LLC (April 1995 - December 2000). |
| | | | | | |
Michael J. Roland
7337 E. Doubletree Ranch Rd.
Scottsdale, Arizona 85258
Age : 47 | | Executive Vice President | | February 2002 - Present | | Executive Vice President (December 2001 - Present) and Chief Compliance Officer (October 2004 - Present), ING Investments, LLC. Formerly, Chief Financial Officer and Treasurer, ING Investments, LLC (December 2001 - March 2005); Senior Vice President, ING Investments, LLC (June 1998 - December 2001). |
| | | | | | |
Stanley D. Vyner
7337 E. Doubletree Ranch Rd.
Scottsdale, Arizona 85258
Age : 55 | | Executive Vice President | | May 1999 - Present | | Executive Vice President, ING Investments, LLC (July 2000 - Present) and Chief Investment Risk Officer (January 2003 - Present). Formerly, Chief Investment Officer of the International Portfolios, ING Investments, LLC (August 2000 - January 2003). |
| | | | | | |
Joseph M. O’Donnell
7337 E. Doubletree Ranch Rd.
Scottsdale, Arizona 85258
Age : 50 | | Chief Compliance Officer | | November 2004 - Present | | Chief Compliance Officer of the ING Funds (November 2004 - Present). Formerly, Vice President, Chief Legal Counsel, Chief Compliance Officer and Secretary of Atlas Securities, Inc., Atlas Advisers, Inc. and Atlas Funds (October 2001 - October 2004); and Chief Operating Officer and General Counsel of Matthews International Capital Management LLC and Vice President and Secretary of Matthews International Funds (August 1999 - May 2001). |
| | | | | | |
Todd Modic
7337 E. Doubletree Ranch Rd.
Scottsdale, Arizona 85258
Age : 37 | | Senior Vice President, Chief Financial Officer and Assistant Secretary | | March 2005 - Present | | Senior Vice President, ING Funds Services, LLC (April 2005 - Present). Formerly, Vice President, ING Funds Services, LLC (September 2002 - March 2005); Director, Financial Reporting, ING Investments, LLC (March 2001 - September 2002); Director of Financial Reporting, Axient Communications, Inc. (May 2000 - January 2001). |
| | | | | | |
Robert S. Naka
7337 E. Doubletree Ranch Rd.
Scottsdale, Arizona 85258
Age : 42 | | Senior Vice President Assistant Secretary | | November 1999 - Present
May 1999 - Present | | Senior Vice President (August 1999 - Present) and Assistant Secretary (October 2001 - Present), ING Funds Services, LLC. |
| | | | | | |
Kimberly A. Anderson
7337 E. Doubletree Ranch Rd.
Scottsdale, Arizona 85258
Age : 41 | | Senior Vice President | | November 2003 - Present | | Senior Vice President, ING Investments, LLC (October 2003 - Present). Formerly, Vice President and Assistant Secretary, ING Investments, LLC (January 2001 - October 2003); and Assistant Vice President, ING Funds Services, LLC (November 1999 - January 2001). |
| | | | | | |
Robyn L. Ichilov
7337 E. Doubletree Ranch Rd.
Scottsdale, Arizona 85258
Age : 38 | | Vice President and Treasurer | | May 1999 - Present | | Vice President and Treasurer, ING Funds Services, LLC (October 2001 - Present) and ING Investments, LLC (August 1997 - Present). |
| | | | | | |
Lauren D. Bensinger
7337 E. Doubletree Ranch Rd.
Scottsdale, Arizona 85258
Age : 51 | | Vice President | | February 2003 - Present | | Vice President and Chief Compliance Officer, ING Funds Distributor, LLC (July 1995 - Present); and Vice President, ING Investments, LLC (February 2003 - Present). Formerly, Chief Compliance Officer, ING Investments, LLC (October 2001 - October 2004). |
| | | | | | | | | | | | | | |
36
DIRECTOR AND OFFICER INFORMATION (UNAUDITED) (CONTINUED)
Name, Address | | Position(s) | | Term of Office and | | Principal Occupation(s) during the |
| and Age | | | | Held with the Company | | | | Length of Time Served(1) | | | | Past Five Years | |
Maria M. Anderson
7337 E. Doubletree Ranch Rd.
Scottsdale, Arizona 85258
Age : 47 | | Vice President | | September 2004 - Present | | Vice President, ING Funds Services, LLC (September 2004 - Present). Formerly, Assistant Vice President, ING Funds Services, LLC (October 2001 - September 2004); and Manager Fund Accounting and Fund Compliance, ING Investments, LLC (September 1999 - October 2001). |
| | | | | | |
Mary A. Gaston
7337 E. Doubletree Ranch Rd
Scottsdale, Arizona 85258
Age : 39 | | Vice President | | March 2005 - Present | | Vice President, ING Fund Services, LLC (April 2005 - Present). Formerly, Assistant Vice President, Financial Reporting, ING Investments, LLC (April 2004 - April 2005); Manager, Financial Reporting, ING Investments, LLC (August 2002 - April 2004); and Controller Z Seven Fund, Inc. and Ziskin Asset Management, Inc. (January 2000 - March 2002). |
| | | | | | |
Susan P. Kinens
7337 E. Doubletree Ranch Rd.
Scottsdale, Arizona 85258
Age : 28 | | Assistant Vice President | | February 2003 - Present | | Assistant Vice President, ING Funds Services, LLC (December 2002 - Present); and has held various other positions with ING Funds Services, LLC for more than the last five years. |
| | | | | | |
Kimberly K. Palmer
7337 E. Doubletree Rand Rd.
Scottsdale, Arizona 85258
Age : 48 | | Assistant Vice President | | September 2004 - Present | | Assistant Vice President, ING Funds Services, LLC (August 2004 - Present). Formerly, Manager, Registration Statements, ING Funds Services, LLC (May 2003 - August 2004); Associate Partner, AMVESCAP PLC (October 2000 - May 2003); Director of Federal Filings and Blue Sky Filings, INVESCO Funds Group, Inc. (March 1994 - May 2003). |
| | | | | | |
Huey P. Falgout, Jr.
7337 E. Doubletree Ranch Rd.
Scottsdale, Arizona 85258
Age : 41 | | Secretary | | August 2003 - Present | | Chief Counsel, ING Americas, U.S. Legal Services (September 2003 - Present). Formerly, Counsel, ING Americas, U.S. Legal Services (November 2002 - September 2003); and Associate General Counsel of AIG American General (January 1999 - November 2002). |
| | | | | | |
Theresa K. Kelety
7337 E. Doubletree Ranch Rd.
Scottsdale, Arizona 85258
Age : 42 | | Assistant Secretary | | August 2003 - Present | | Counsel, ING Americas, U.S. Legal Services (April 2003 - Present). Formerly, Senior Associate with Shearman & Sterling (February 2000 - April 2003). |
| | | | | | |
Robin R. Nesbitt
7337 E. Doubletree Rand Rd.
Scottsdale, Arizona 85258
Age : 32 | | Assistant Secretary | | September 2004 - Present | | Supervisor, Board Operations, ING Funds Services, LLC (August 2003 - Present). Formerly, Senior Legal Analyst, ING Funds Services, LLC (August 2002 - August 2003); Associate, PricewaterhouseCoopers (January 2001 - August 2001); and Paralegal, McManis, Faulkner & Morgan (May 2000 - December 2000). |
| | | | | | | | | | | | | | |
(1) The officers hold office until the next annual meeting of the Directors and until their successors have been elected and qualified.
37
ADVISORY CONTRACT APPROVAL DISCUSSION (UNAUDITED)
Section 15(c) of the Investment Company Act of 1940 (the “1940 Act”) requires that the Board of Directors (the “Board”) of ING Partners, Inc., including a majority of the Directors who have no direct or indirect interest in the advisory and sub-advisory contracts, and who are not “interested persons” of the Portfolios, as such term is defined under the 1940 Act (the “Independent Directors”), approve the Investment Advisory Agreement (the “Advisory Contract”) under ING Life Insurance and Annuity Company (the “Adviser” or “ILIAC”) provides investment advisory services to the Portfolios.
At a meeting held on November 17, 2004, the Board, including the Independent Directors, approved the Advisory Contract with respect to the Portfolios. The effective date of the Advisory Contract for the Portfolios commences on December 1, 2004, and will remain in effect for an initial term of two years. After this initial term, the Board will, on an annual basis, review the Advisory Contract with respect to the Portfolios and determine whether to renew the Contract for the Portfolios.
In connection with its approval of the initial term of the Portfolios’ Advisory Contract, the Board considered, with the assistance of independent counsel, its legal responsibilities and reviewed the nature and quality of the Adviser’s services provided to the Portfolios and ILIAC’s experience and qualifications. Among other items, the Board also reviewed and considered: (1) the experience and qualifications of the personnel providing services; (2) ILIAC’s compliance policies and procedures; (3) an evaluation of the fee structure and ILIAC’s profitability with respect to each Portfolio; (4) ILIAC’s current Form ADV and recent financial statements; (5) formal or informal regulatory inquiries, material litigation or administrative proceedings, if any; (6) supplemental materials, including the investment advisory agreement and investment advisory response for ILIAC; and (7) a memorandum from independent counsel setting forth the Board’s fiduciary duties and its responsibilities under the 1940 Act and Maryland law, the duty of care, the duty of loyalty and the business judgment rule, and the factors which the Board should consider in the review. After discussion, the Board concluded that ILIAC had the capabilities, resources, and personnel necessary to manage the Portfolios, and that based on the services that ILIAC provides to the Portfolios under the Advisory Contract and the expenses incurred by ILIAC in the performance of such services, the compensation payable to ILIAC was fair and equitable. Based on such information as it considered necessary to the exercise of its reasonable business judgment, the Board, upon recommendation of the Committee, concluded unanimously that it was in the best interest of the Portfolios to approve the Advisory Contract.
38
Investment Adviser and Administrator | Custodian |
ING Life Insurance and Annuity Company | The Bank of New York |
151 Farmington Avenue | 100 Colonial Center Parkway, Suite 300 |
Hartford, Connecticut 06156 | Lake Mary, Florida 32746 |
| |
Distributor | Legal Counsel |
ING Financial Advisers, LLC | Dechert LLP |
151 Farmington Avenue | 1775 I Street, N.W. |
Hartford, Connecticut 06156 | Washington, D.C. 20006 |
1-800-262-3862 | |
| Independent Registered Public Accounting Firm |
Transfer Agent | KPMG LLP |
DST Systems, Inc. | 99 High Street |
P.O. Box 419368 | Boston, Massachusetts 02110 |
Kansas City, Missouri 64141 | |
Before investing, carefully consider the investment objectives, risks, charges and expenses of the variable universal life insurance policy or variable annuity contract and the underlying variable investment options. This and other information is contained in the prospectus for the variable universal life policy or variable annuity contract and the underlying variable investment options. Obtain these prospectuses from your agent/registered representative and read them carefully before investing.

FUNDS
| VPAR-USOL | (1205-022506) |

Funds
Annual Report |
|
December 31, 2005 |
|
Service Class (“Class S”) and
Adviser Class (“Class ADV”) |
|
ING Partners, Inc. |
|
• ING Fidelity® VIP Contrafund® Portfolio* |
• ING Fidelity® VIP Equity-Income Portfolio* |
• ING Fidelity® VIP Growth Portfolio* |
• ING Fidelity® VIP Mid Cap Portfolio* |
| This report is submitted for general information to shareholders of the ING Funds. It is not authorized for distribution to prospective shareholders unless accompanied or preceded by a prospectus which includes details regarding the funds’ investment objectives, risks, charges, expenses and other information. This information should be read carefully. | |
* Fidelity and Contrafund are registered trademarks of FMR Corp.

PROXY VOTING INFORMATION
A description of the policies and procedures that the Portfolios uses to determine how to vote proxies related to portfolio securities is available (1) without charge, upon request, by calling Shareholder Services toll-free at 1-800-992-0180; (2) on the ING Funds website at www.ingfunds.com and (3) on the Securities and Exchange Commission’s (“SEC”) website at www.sec.gov. Information regarding how the Portfolios voted proxies related to portfolio securities during the most recent 12-month period ended December 31 is available without charge on the ING Funds website at www.ingfunds.com and on the SEC’s website at www.sec.gov.
QUARTERLY PORTFOLIO HOLDINGS
The Registrant files its complete schedule of portfolio holdings with the SEC for the first and third quarters of each fiscal year on Form N-Q. The Registrant’s Forms N-Q are available on the SEC’s website at www.sec.gov. The Registrant’s Forms N-Q may be reviewed and copied at the SEC’s Public Reference Room in Washington, DC, and information on the operation of the Public Reference Room may be obtained by calling 1-800-SEC-0330; and is available upon request from the Registrant by calling Shareholder Services toll-free at 1-800-992-0180.
(THIS PAGE INTENTIONALLY LEFT BLANK)

JAMES M. HENNESSY
Dear Shareholder,
As you may recall, in my last letter I described the enthusiasm that we were experiencing here at ING Funds as we worked to bring more of the world’s investment opportunities to you, the investor.
That enthusiasm, I am happy to report, is continuing to thrive. With the New Year, we have launched a series of new international mutual funds, each created to bring more of the world’s opportunities to you.
Meanwhile, we have also heard you loud and clear. Our research tells us that many investors report that they find investing an intimidating and overly-complex endeavor. That is why ING is committed to helping investors across the country cut through the confusion and clutter. “Your future. Made easier.SM” is more than words; they represent our promise to you.
Those two objectives — bringing you more of the world’s opportunities and doing it in a way that is easier for you — are behind the development of the new portfolios.
According to a recent finding, 58 percent of the world market capitalization now lies outside of the U.S.1 In other words, the majority of investment opportunities are now beyond our borders and we think that the ING VP Index Plus International Portfolio — a broad-based international portfolio — is an easy, single-step method to gain exposure to many of those opportunities.
Meanwhile, the ING VP Global Real Estate Portfolio was developed as an easy way to bring global — international and domestic — real estate opportunities to the variable portfolio investor. Real Estate Investment Trusts (REITs) are becoming more and more popular around the world, and this new portfolio seeks to capitalize on that popularity. But again, we’ve made it easy. With just one investment, investors bring the diversification of global real estate to their investment strategy.
One of our goals at ING Funds is to find tomorrow’s opportunities today, and we believe these two portfolios are just the latest examples of that plan in action.
On behalf of everyone at ING Funds, I thank you for your continued support and loyalty. We look forward to serving you in the future.
Sincerely,

James M. Hennessy
President
ING Funds
January 28, 2006
The views expressed in the President’s Letter reflect those of the President as of the date of the letter. Any such views are subject to change at any time based upon market or other conditions and ING Funds disclaims any responsibility to update such views. These views may not be relied on as investment advice and because investment decisions for an ING Fund are based on numerous factors, may not be relied on as an indication of investment intent on behalf of any ING Fund. Reference to specific company securities should not be construed as recommendations or investment advice.
International investing does pose special risks including currency fluctuation, economic and political risks not found in investments that are solely domestic. Investments in issuers that are principally engaged in real estate, including REITs, may subject the Fund to risks similar to those associated with the direct ownership of real estate, including terrorist attacks, war or other acts that destroy real property (in addition to market risks). These companies are sensitive to factors such as changes in real estate values and property taxes, interest rates, cash flow of underlying real estate assets, supply and demand, and the management skill and creditworthiness of the issuer. REITs may also be affected by tax and regulatory requirements.
1 MSCI December, 2005
1
MARKET PERSPECTIVE: YEAR ENDED DECEMBER 31, 2005
In our semi-annual report, we referred to mixed markets in which the U.S. investor lost on both domestic and international stocks, with gains in the latter trumped by the rebounding U.S. dollar. In the second half, global equities registered solid gains, although foreign markets ended the 2005 year more convincingly. The Morgan Stanley Capital International (“MSCI”) World® Index(1) calculated in dollars, including net reinvested dividends rose 10.3% for the six months ended December 31, 2005, and 9.5% for the full year. As for currencies, the dollar extended its first half run for the six months ended December 31, 2005, rising 2.1% against the euro (12.6% for the full year), 6.2% against the yen (14.7% for the full year), and 3.8% against the pound (10.2% for the full year). Commentators explained the U.S. dollar’s unexpected strength by pointing to relatively high U.S. interest rates, the re-cycling of oil exporters’ burgeoning wealth into dollar securities, the tax-related “repatriation” into dollars of U.S. corporations’ foreign currency balances, and, regarding the yen’s particular weakness, non-Japanese investors pouring money into the stock market but hedging their currency risk. Each dynamic was losing steam by 2005 year-end.
For more than a year, the main issue for US fixed income investors had been the unexpected flattening of the yield curve, i.e. the shrinking difference between short-term and long-term interest rates. From June 2004 through June 2005 the Federal Open Market Committee (“FOMC”) had raised the Federal Funds Rate by 25 basis points nine times, pulling other short-term rates up. However, the yield on the ten-year U.S. Treasury Note had actually fallen by 0.71% over the thirteen months. This was put down to an apparently growing perception in the market that inflation was a problem solved, due to a vigilant Federal Reserve, cheap goods and labor abroad, consistent productivity growth at home and foreign investors’ hunger for U.S. investments. Occasionally in the second half, for example when Hurricane Katrina and Rita affected oil prices, having peaked near $70 per barrel at the end of August 2005 there, looked to be filtering through to general prices, and the trend seemed about to break. Nevertheless, in the end the forces of curve flattening prevailed. By December 31, 2005, the FOMC had raised rates four more times, oil prices and the inflation scare had subsided and foreigners were still buying record amounts of U.S. securities. For the six months ended December 31, 2005, the yield on the ten-year Treasury rose by 45 basis points to 4.39% (17 basis points for the full year), and on 13-week U.S. Treasury Bills by 93 basis points (180 basis points for the full year) to 3.98%. The returns on the broad Lehman Brothers Aggregate Bond Index(2) and the Lehman Brothers High Yield Bond Index(3) was -0.1% and 1.6% for the six months ended December 31, 2005, and 2.4% and 2.7% for the full year, respectively.
The U.S. equities market in the form of the Standard & Poor’s 500 Composite Stock Price (“S&P 500”) Index(4), added 5.8% including dividends in the latter half of 2005 and 4.9% for the full year, thanks to gains of 3.5% in July and November of 2005. Other months were flat to down and by 2005 year-end, the market, trading at a fairly undemanding price-to-earnings level of about 16 times earnings for the current fiscal year, was definitely struggling. Stock investors were initially encouraged by bullish economic reports and even more by second quarter company earnings figures, on average up more than 10% year over year. The optimistic mood lasted into early August of 2005, when the S&P 500 reached a four-year high, before drifting back as resurgent oil prices made records almost daily. In September and October of 2005 with Hurricanes Katrina and Rita seldom out of the news, two attempted rallies fizzled. High prices at the gas pump were already here. An expensive winter for heating fuel was certain. Sharply rising factory prices started to be found in local Federal Reserve and purchasing managers’ reports and, with consumer confidence slumping, the word “stagflation” was heard more than once. In spite of this, as November approached, an evidently swift recovery from the Hurricanes Katrina and Rita cheered investors and stock prices powered ahead through mid-December 2005, as oil prices fell back below $60 per barrel, inflation moderated, corporate profits remained buoyant and gross domestic product (“GDP”) growth, at 4.1% per annum, was the envy of the developed world. Yet the market gave back nearly 1.6% between Christmas and New Year, when new reports suggested that the end of the bubbling housing market might be at hand. Rising house prices had encouraged the consumer spending that was largely behind robust GDP growth; spending that is, by people who on average were saving little, if anything.
In international markets Japan was the shining star of the second half, soaring 33.3%, based on the MSCI Japan® Index(5) in dollars plus net dividends for the six months ended December 31, 2005, and 25.5% for the
2
MARKET PERSPECTIVE: YEAR ENDED DECEMBER 31, 2005
full year, as the market repeatedly broke five-year records amid new optimism. Investors, albeit mainly foreign ones, came to the belief that Japan is re-emerging as a balanced economy and less dependent on exports. Corporations and the banks have repaired their balance sheets at last. Rising wages are supporting domestic demand, in addition to an expected end to deflation, seems at hand. European ex UK markets leaped 11.8%, according to the MSCI Europe ex UK® Index(6) in dollars including net dividends for the six months ended December 31, 2005 (10.5% for the full year) and 14.7% in local currencies (27.7% for the full year) to the best levels in over four years, despite the first interest rate increase, to 2.5%, in over five years. Mounting evidence of a recovery in local demand, resilient profits and an upsurge of merger and acquisition activity boosted markets that are not particularly expensive. UK equities advanced 6.4% in the six months ended December 31, 2005 (7.4% for the full year) based on the MSCI UK® Index(7) in dollars including net dividends, concealing a more impressive 11.1% increase in pounds (20.1% for the full year), to the highest in four years. The period was dominated by the effect of five interest rate increases to restrain over-stretched consumers and soaring real estate prices. Yet, in the face of mostly miserable economic reports, and despite terrorist attacks in London over two days in July of 2005, investors, encouraged by merger and acquisition activity, supported an inexpensive market yielding over 3%.
(1) The MSCI World® Index is an unmanaged index that measures the performance of over 1,400 securities listed on exchanges in the U.S., Europe, Canada, Australia, New Zealand and the Far East.
(2) The Lehman Brothers Aggregate Bond Index is a widely recognized, unmanaged index of publicly issued investment grade U.S. Government, mortgage-backed, asset-backed and corporate debt securities.
(3) The Lehman Brothers High Yield Bond Index is an unmanaged index that measures the performance of fixed-income securities generally representative of corporate bonds rated below investment-grade.
(4) The Standard & Poor’s 500 Composite Stock Price Index is an unmanaged index that measures the performance of securities of approximately 500 large-capitalization companies whose securities are traded on major U.S. stock markets.
(5) The MSCI Japan® Index is a free float-adjusted market capitalization index that is designed to measure developed market equity performance in Japan.
(6) The MSCI Europe ex UK® Index is a free float-adjusted market capitalization index that is designed to measure developed market equity performance in Europe, excluding the UK.
(7) The MSCI UK® Index is a free float-adjusted market capitalization index that is designed to measure developed market equity performance in the UK.
All indices are unmanaged and investors cannot invest directly in an index.
Past performance does not guarantee future results. The performance quoted represents past performance. Investment return and principal value of an investment will fluctuate, and shares, when redeemed, may be worth more or less than their original cost. The Funds’ performance is subject to change since the period’s end and may be lower or higher than the performance data shown. Please call (800) 992-0180 or log on to www.ingfunds.com to obtain performance data current to the most recent month end.
Market Perspective reflects the views of the Chief Investment Risk Officer only through the end of the period, and is subject to change based on market and other conditions.
3
ING FIDELITY® VIP CONTRAFUND® PORTFOLIO
PORTFOLIO MANAGERS’ REPORT
The ING Fidelity® VIP Contrafund® Portfolio (the “Portfolio”) seeks long-term capital appreciation by investing all of its assets in the Service Class 2 Shares of the VIP Contrafund® Portfolio, a series of Fidelity Variable Insurance Products Fund II, a registered open-end investment company. Please refer to Management’s Discussion of Fund Performance on page 4 of the included Fidelity® Variable Insurance Products: Contrafund® Portfolio Annual Report.
For the period ended December 31, 2005, the Portfolio’s Class S and Class ADV shares returned 16.34% and 15.96%, respectively, compared to the S&P 500 Composite Stock Price (“S&P 500”) Index(1), which returned 4.91%.

Average Annual Total Returns for the Periods Ended December 31, 2005
| | | | Since Inception | |
| | 1 Year | | November 15, 2004 | |
| | | | | |
Class S | | 16.34% | | 17.85% | | |
Class ADV | | 15.96% | | 17.51% | | |
S&P 500 Index(1) | | 4.91% | | 10.94% | (2) | |
Based on a $10,000 initial investment, the graph and table above illustrate the total return of ING Fidelity® VIP Contrafund® Portfolio against the S&P 500 Index. The index is unmanaged and has no cash in its portfolio, imposes no sales charges and incurs no operating expenses. An investor cannot invest directly in the index. The Portfolio’s performance is shown without the imposition of any expenses or charges which are, or may be, imposed under your annuity contract. Total returns would have been lower if such expenses or charges were included.
The performance graph and table do not reflect the deduction of taxes that a shareholder will pay on Portfolio distributions or the redemption of Portfolio Shares.
The performance shown may include the effect of fee waivers and/or expense reimbursements by the Investment Manager and/or other service providers, which have the effect of increasing total return. Had all fees and expenses been considered, the total returns would have been lower.
The performance update illustrates performance for a variable investment option available through a variable annuity contract. The performance shown indicates past performance and is not a projection or prediction of future results. Actual investment returns and principal value will fluctuate so that shares and/or units, at redemption, may be worth more or less than their original cost. Please call (800) 922-0180 to get performance through the most recent month end.
(1)The Standard & Poor’s 500 Composite Stock Price® (“S&P 500”) Index is an unmanaged index that measures the performance of securities of approximately 500 large-capitalization companies whose securities are traded on major U.S. stock markets.
(2)Since inception performance of the index is shown from November 1, 2004.
This report contains statements that may be “forward-looking” statements. Actual results may differ materially from those projected in the “forward-looking” statements.
The views expressed in this report reflect those of the portfolio managers, only through the end of the period as stated on the cover. The portfolio managers’ views are subject to change at any time based on market and other conditions.
4
ING FIDELITY® VIP EQUITY-INCOME PORTFOLIO
PORTFOLIO MANAGERS’ REPORT
The ING Fidelity® VIP Equity-Income Portfolio (the “Portfolio”) seeks reasonable income by investing all of its assets in the Service Class 2 Shares of the VIP Equity-Income Portfolio, a series of Fidelity Variable Insurance Products Fund, a registered open-end investment company. Please refer to Management’s Discussion of Fund Performance on page 4 of the included Fidelity® Variable Insurance Products: Equity-Income Portfolio Annual Report.
For the period ended December 31, 2005, the Portfolio’s Class S and Class ADV shares returned 5.35% and 4.97%, respectively, compared to the Russell 3000 Value Index(1), which returned 6.85%.

Average Annual Total Returns for the Periods Ended December 31, 2005
| | | | Since Inception | |
| | 1 Year | | November 15, 2004 | |
| | | | | | |
Class S | | 5.35% | | 7.34% | | |
Class ADV | | 4.97% | | 6.91% | | |
Russell 3000® Value Index(1) | | 6.85% | | 13.80% | (2) | |
Based on a $10,000 initial investment, the graph and table above illustrate the total return of ING Fidelity® VIP Equity-Income Portfolio against the Russell 3000® Value Index. The index is unmanaged and has no cash in its portfolio, imposes no sales charges and incurs no operating expenses. An investor cannot invest directly in the index. The Portfolio’s performance is shown without the imposition of any expenses or charges which are, or may be, imposed under your annuity contract. Total returns would have been lower if such expenses or charges were included.
The performance graph and table do not reflect the deduction of taxes that a shareholder will pay on Portfolio distributions or the redemption of Portfolio Shares.
The performance shown may include the effect of fee waivers and/or expense reimbursements by the Investment Manager and/or other service providers, which have the effect of increasing total return. Had all fees and expenses been considered, the total returns would have been lower.
The performance update illustrates performance for a variable investment option available through a variable annuity contract. The performance shown indicates past performance and is not a projection or prediction of future results. Actual investment returns and principal value will fluctuate so that shares and/or units, at redemption, may be worth more or less than their original cost. Please call (800) 922-0181 to get performance through the most recent month end.
(1)The Russell 3000® Value Index measures the performance of those Russell 3000 securities with lower price-to-book ratios and lower forecasted growth values.
(2)Since inception performance of the index is shown from November 1, 2004.
This report contains statements that may be “forward-looking” statements. Actual results may differ materially from those projected in the “forward-looking” statements.
The views expressed in this report reflect those of the portfolio managers, only through the end of the period as stated on the cover. The portfolio managers’ views are subject to change at any time based on market and other conditions.
5
ING FIDELITY® VIP GROWTH PORTFOLIO
PORTFOLIO MANAGERS’ REPORT
The ING Fidelity® VIP Growth Portfolio (the “Portfolio”) seeks capital appreciation by investing all of its assets in the Service Class 2 Shares of the VIP Growth Portfolio, a series of Fidelity Variable Insurance Products Fund, a registered open-end investment company. Please refer to Management’s Discussion of Fund Performance on page 4 of the included Fidelity® Variable Insurance Products: Growth Portfolio Annual Report.
For the period ended December 31, 2005, the Portfolio’s Class S and Class ADV shares returned 5.09% and 4.71%, respectively, compared to the Russell 3000® Growth Index(1), which returned 5.17%.
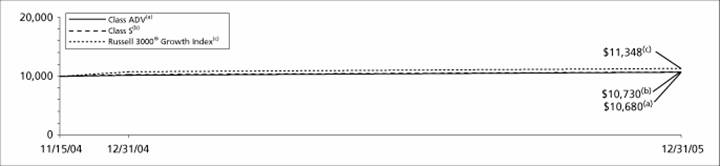
Average Annual Total Returns for the Periods Ended December 31, 2005
| | | | Since Inception | |
| | 1 Year | | November 15, 2004 | |
| | | | | | |
Class S | | 5.09% | | 6.46% | | |
Class ADV | | 4.71% | | 6.03% | | |
Russell 3000® Growth Index(1) | | 5.17% | | 11.45% | (2) | |
Based on a $10,000 initial investment, the graph and table above illustrate the total return of ING Fidelity® VIP Growth Portfolio against the Russell 3000® Growth Index. The index is unmanaged and has no cash in its portfolio, imposes no sales charges and incurs no operating expenses. An investor cannot invest directly in the index. The Portfolio’s performance is shown without the imposition of any expenses or charges which are, or may be, imposed under your annuity contract. Total returns would have been lower if such expenses or charges were included.
The performance graph and table do not reflect the deduction of taxes that a shareholder will pay on Portfolio distributions or the redemption of Portfolio Shares.
The performance shown may include the effect of fee waivers and/or expense reimbursements by the Investment Manager and/or other service providers, which have the effect of increasing total return. Had all fees and expenses been considered, the total returns would have been lower.
The performance update illustrates performance for a variable investment option available through a variable annuity contract. The performance shown indicates past performance and is not a projection or prediction of future results. Actual investment returns and principal value will fluctuate so that shares and/or units, at redemption, may be worth more or less than their original cost. Please call (800) 922-0181 to get performance through the most recent month end.
(1)The Russell 3000® Growth Index is an index that measures the performance of those Russell 3000® Index companies with higher price-to-book ratios and higher forecasted growth values.
(2)Since inception performance of the index is shown from November 1, 2004.
This report contains statements that may be “forward-looking” statements. Actual results may differ materially from those projected in the “forward-looking” statements.
The views expressed in this report reflect those of the portfolio managers, only through the end of the period as stated on the cover. The portfolio managers’ views are subject to change at any time based on market and other conditions.
6
ING FIDELITY® VIP MID CAP PORTFOLIO
PORTFOLIO MANAGERS’ REPORT
The ING Fidelity® VIP Mid Cap Portfolio (the “Portfolio”) seeks long-term growth of capital by investing all of its assets in the Service Class 2 Shares of the VIP Mid Cap Portfolio, a series of Fidelity Variable Insurance Products III, a registered open-end investment company. Please refer to Management’s Discussion of Fund Performance on page 4 of the included Fidelity® Variable Insurance Products: Mid Cap Portfolio Annual Report.
For the period ended December 31, 2005, the Portfolio’s Class S and Class ADV shares returned 17.61% and 17.44%, respectively, compared to the S&P MidCap 400 Index(1), which returned 12.56%.
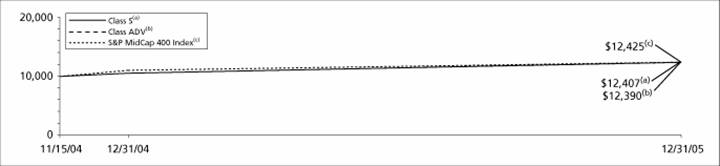
Average Annual Total Returns for the Periods Ended December 31, 2005
| | | | Since Inception | |
| | 1 Year | | November 15, 2004 | |
| | | | | | |
Class S | | 17.61% | | 21.06% | | |
Class ADV | | 17.44% | | 20.91% | | |
S&P MidCap 400 Index(1) | | 12.56% | | 20.46% | (2) | |
Based on a $10,000 initial investment, the graph and table above illustrate the total return of ING Fidelity® VIP Mid Cap Portfolio against the S&P MidCap 400 Index. The index is unmanaged and has no cash in its portfolio, imposes no sales charges and incurs no operating expenses. An investor cannot invest directly in the index. The Portfolio’s performance is shown without the imposition of any expenses or charges which are, or may be, imposed under your annuity contract. Total returns would have been lower if such expenses or charges were included.
The performance graph and table do not reflect the deduction of taxes that a shareholder will pay on Portfolio distributions or the redemption of Portfolio Shares.
The performance shown may include the effect of fee waivers and/or expense reimbursements by the Investment Manager and/or other service providers, which have the effect of increasing total return. Had all fees and expenses been considered, the total returns would have been lower.
The performance update illustrates performance for a variable investment option available through a variable annuity contract. The performance shown indicates past performance and is not a projection or prediction of future results. Actual investment returns and principal value will fluctuate so that shares and/or units, at redemption, may be worth more or less than their original cost. Please call (800) 922-0181 to get performance through the most recent month end.
(1)The S&P MidCap 400 Index is an unmanaged index that measures the performance of the mid-size company segment of the U.S. market.
(2)Since inception performance of the index is shown from November 1, 2004.
This report contains statements that may be “forward-looking” statements. Actual results may differ materially from those projected in the “forward-looking” statements.
The views expressed in this report reflect those of the portfolio managers, only through the end of the period as stated on the cover. The portfolio managers’ views are subject to change at any time based on market and other conditions.
7
SHAREHOLDER EXPENSE EXAMPLES
As a shareholder of a Fund, you incur two types of costs: (1) transaction costs, including sales charges (loads) on purchase payments; redemption fees; and exchange fees; and (2) ongoing costs, including management fees; distribution [and/or service] (12b–1) fees; and other Fund expenses. These Examples are intended to help you understand your ongoing costs (in dollars) of investing in a Fund and to compare these costs with the ongoing costs of investing in other mutual funds.
The Examples are based on an investment of $1,000 invested at the beginning of the period and held for the entire period from July 1, 2005 to December 31, 2005, unless otherwise indicated.
Actual Expenses
The first section of the table shown, “Actual Fund Return,” provides information about actual account values and actual expenses. You may use the information in this section, together with the amount you invested, to estimate the expenses that you paid over the period. Simply divide your account value by $1,000 (for example, an $8,600 account value divided by $1,000 = 8.6), then multiply the result by the number in the first section under the heading entitled “Expenses Paid During Period” to estimate the expenses you paid on your account during this period.
Hypothetical Example for Comparison Purposes
The second section of the table shown, “Hypothetical 5% Return,” provides information about hypothetical account values and hypothetical expenses based on the Fund’s actual expense ratio and an assumed rate of return of 5% per year before expenses, which is not the Fund’s actual return. The hypothetical account values and expenses may not be used to estimate the actual ending account balance or expenses you paid for the period. You may use this information to compare the ongoing costs of investing in the Fund and other funds. To do so, compare this 5% hypothetical example with the 5% hypothetical examples that appear in the shareholder reports of the other funds.
Please note that the expenses shown in the table are meant to highlight your ongoing costs only and do not reflect any transactional costs, such as sales charges (loads), redemption fees, or exchange fees. Therefore, the hypothetical lines of the table are useful in comparing ongoing costs only, and will not help you determine the relative total costs of owning different funds. In addition, if these transactional costs were included, your costs would have been higher.
ING Fidelity® VIP Contrafund® Portfolio | | Beginning
Account
Value
July 1, 2005 | | Ending
Account
Value
December 31, 2005 | | Annualized
Expense
Ratio | | Expenses Paid
During the
Six Months Ended
December 31, 2005* | |
| | | | | | | | | |
Actual Fund Return | | | | | | | | | |
Class S | | $1,000.00 | | | $1,125.40 | | | 1.21 | % | | $6.48 | | |
Class ADV | | 1,000.00 | | | 1,124.80 | | | 1.46 | | | 7.82 | | |
Hypothetical (5% return before expenses) | | | | | | | | | | | | | |
Class S | | $1,000.00 | | | $1,019.11 | | | 1.21 | % | | $6.16 | | |
Class ADV | | 1,000.00 | | | 1,017.85 | | | 1.46 | | | 7.43 | | |
* Expenses are equal to each Portfolio’s respective annualized expense ratios, including the expenses of the underlying Portfolio multiplied by the average account value over the period, multiplied by 184/365 to reflect the most recent fiscal half-year.
8
SHAREHOLDER EXPENSE EXAMPLES (CONTINUED)
ING Fidelity® VIP Equity Income Portfolio | | Beginning
Account
Value
July 1, 2005 | | Ending
Account
Value
December 31, 2005 | | Annualized
Expense
Ratio | | Expenses Paid
During the
Six Months Ended
December 31, 2005* | |
| | | | | | | | | |
Actual Fund Return | | | | | | | | | |
Class S | | $1,000.00 | | | $1,069.10 | | | 1.11 | % | | $5.79 | | |
Class ADV | | 1,000.00 | | | 1,067.30 | | | 1.36 | | | 7.09 | | |
Hypothetical (5% return before expenses) | | | | | | | | | | | | | |
Class S | | $1,000.00 | | | $1,019.61 | | | 1.11 | % | | $5.65 | | |
Class ADV | | 1,000.00 | | | 1,018.35 | | | 1.36 | | | 6.92 | | |
ING Fidelity® VIP GrowthPortfolio | | Beginning
Account
Value
July 1, 2005 | | Ending
Account
Value
December 31, 2005 | | Annualized
Expense
Ratio | | Expenses Paid
During the
Six Months Ended
December 31, 2005* | |
| | | | | | | | | |
Actual Fund Return | | | | | | | | | |
Class S | | $1,000.00 | | | $1,077.30 | | | 1.21 | % | | $6.34 | | |
Class ADV | | 1,000.00 | | | 1,074.40 | | | 1.46 | | | 7.63 | | |
Hypothetical (5% return before expenses) | | | | | | | | | | | | | |
Class S | | $1,000.00 | | | $1,019.11 | | | 1.21 | % | | $6.16 | | |
Class ADV | | 1,000.00 | | | 1,017.85 | | | 1.46 | | | 7.43 | | |
ING Fidelity® VIP Mid Cap Portfolio | | Beginning
Account
Value
July 1, 2005 | | Ending
Account
Value
December 31, 2005 | | Annualized
Expense
Ratio | | Expenses Paid
During the
Six Months Ended
December 31, 2005* | |
| | | | | | | | | |
Actual Fund Return | | | | | | | | | |
Class S | | $1,000.00 | | | $1,144.70 | | | 1.24 | % | | $6.70 | | |
Class ADV | | 1,000.00 | | | 1,144.00 | | | 1.49 | | | 8.05 | | |
Hypothetical (5% return before expenses) | | | | | | | | | | | | | |
Class S | | $1,000.00 | | | $1,018.95 | | | 1.24 | % | | $6.31 | | |
Class ADV | | 1,000.00 | | | 1,017.69 | | | 1.49 | | | 7.58 | | |
* Expenses are equal to each Portfolio’s respective annualized expense ratios, including the expenses of the underlying Portfolio multiplied by the average account value over the period, multiplied by 184/365 to reflect the most recent fiscal half-year.
9
REPORT OF INDEPENDENT REGISTERED PUBLIC ACCOUNTING FIRM
The Board of Trustees and Shareholders
ING Partners, Inc.
We have audited the accompanying statements of assets and liabilities of ING Fidelity® VIP Contrafund® Portfolio, ING Fidelity® VIP Equity Income Portfolio, ING Fidelity® VIP Growth Portfolio, and ING Fidelity® VIP Mid Cap Portfolio, each a series of ING Partners, Inc, as of December 31, 2005, and the related statements of operations for the year then ended, the statements of changes in net assets, and the financial highlights for the year then ended and for the period from November 29, 2004 (commencement of operations) to December 31, 2004. These financial statements and financial highlights are the responsibility of management. Our responsibility is to express an opinion on these financial statements and financial highlights based on our audits.
We conducted our audits in accordance with the standards of the Public Company Accounting Oversight Board (United States). Those standards require that we plan and perform the audits to obtain reasonable assurance about whether the financial statements and financial highlights are free of material misstatement. An audit includes examining, on a test basis, evidence supporting the amounts and disclosures in the financial statements. Our procedures included confirmation of securities owned as of December 31, 2005 by correspondence with the transfer agent of the underlying funds. An audit also includes assessing the accounting principles used and significant estimates made by management, as well as evaluating the overall financial statement presentation. We believe that our audits provide a reasonable basis for our opinion.
In our opinion, the financial statements and financial highlights referred to above present fairly, in all material respects, the financial position of the aforementioned series of ING Partners, Inc. as of December 31, 2005, the results of their operations, the changes in their net assets, and the financial highlights for the periods specified in the first paragraph above, in conformity with U.S. generally accepted accounting principles.

Boston, Massachusetts
February 27, 2006
10
STATEMENTS OF ASSETS AND LIABILITIES AS OF DECEMBER 31, 2005
| | ING Fidelity® | | ING Fidelity® | | ING Fidelity® | | ING Fidelity® | |
| | VIP Contrafund® | | VIP Equity-Income | | VIP Growth | | VIP Mid Cap | |
| | Portfolio | | Portfolio | | Portfolio | | Portfolio | |
| | | | | | | | | |
ASSETS: | | | | | | | | | |
Investments in underlying fund(1) at value* | | $ | 61,360,296 | | $ | 10,338,667 | | $ | 10,682,122 | | $ | 5,567,572 | |
Cash | | 3 | | 1,001 | | 1 | | 18 | |
| | | | | | | | | |
Receivables: | | | | | | | | | |
Fund shares sold | | 927,568 | | 12,017 | | 10,103 | | 13,563 | |
Total assets | | 62,287,867 | | 10,351,685 | | 10,692,226 | | 5,581,153 | |
| | | | | | | | | |
LIABILITIES: | | | | | | | | | |
Payable for investment securities purchased | | 927,568 | | 12,017 | | 10,103 | | 13,563 | |
Payable to affiliates | | 14,217 | | 2,556 | | 2,423 | | 1,553 | |
Total liabilities | | 941,785 | | 14,573 | | 12,526 | | 15,116 | |
NET ASSETS | | $ | 61,346,082 | | $ | 10,337,112 | | $ | 10,679,700 | | $ | 5,566,037 | |
| | | | | | | | | |
NET ASSETS WERE COMPRISED OF: | | | | | | | | | |
Paid-in capital | | $ | 57,248,049 | | $ | 9,888,881 | | $ | 10,237,724 | | $ | 5,139,626 | |
Accumulated net realized gain on investments | | 22,790 | | 24,451 | | 16,660 | | 14,022 | |
Net unrealized appreciation on investments | | 4,075,243 | | 423,780 | | 425,316 | | 412,389 | |
NET ASSETS | | $ | 61,346,082 | | $ | 10,337,112 | | $ | 10,679,700 | | $ | 5,566,037 | |
* Cost of investments in securities | | $ | 57,285,053 | | $ | 9,914,887 | | $ | 10,256,806 | | $ | 5,155,183 | |
| | | | | | | | | |
Class S: | | | | | | | | | |
Net Assets | | $ | 57,988,394 | | $ | 10,258,840 | | $ | 10,678,632 | | $ | 4,064,886 | |
Shares authorized | | 100,000,000 | | 100,000,000 | | 100,000,000 | | 100,000,000 | |
Par value | | $ | 0.001 | | $ | 0.001 | | $ | 0.001 | | $ | 0.001 | |
Shares outstanding | | 4,819,281 | | 947,269 | | 995,505 | | 327,162 | |
Net asset value and redemption price per share | | $ | 12.03 | | $ | 10.83 | | $ | 10.73 | | $ | 12.42 | |
| | | | | | | | | |
Class ADV: | | | | | | | | | |
Net Assets | | $ | 3,357,688 | | $ | 78,272 | | $ | 1,068 | | $ | 1,501,151 | |
Shares authorized | | 100,000,000 | | 100,000,000 | | 100,000,000 | | 100,000,000 | |
Par value | | $ | 0.001 | | $ | 0.001 | | $ | 0.001 | | $ | 0.001 | |
Shares outstanding | | 280,060 | | 7,260 | | 100 | | 121,151 | |
Net asset value and redemption price per share | | $ | 11.99 | | $ | 10.78 | | $ | 10.68 | | $ | 12.39 | |
(1) The underlying funds for the ING Fidelity® VIP Contrafund®, ING Fidelity® VIP Equity-Income, ING Fidelity® VIP Growth and ING Fidelity® VIP MidCap Portfolios are the Fidelity® VIP Contrafund®, Fidelity® VIP Equity-Income, Fidelity® VIP Growth and Fidelity® VIP MidCap Portfolios, respectively.
See Accompanying Notes to Financial Statements
11
STATEMENTS OF OPERATIONS FOR THE YEAR ENDED DECEMBER 31, 2005
| | ING Fidelity® | | ING Fidelity® | | ING Fidelity® | | ING Fidelity® | |
| | VIP Contrafund® | | VIP Equity-Income | | VIP Growth | | VIP Mid Cap | |
| | Portfolio | | Portfolio | | Portfolio | | Portfolio | |
| | | | | | | | | |
INVESTMENT INCOME: | | | | | | | | | |
Dividends from underlying fund(1) | | | $ | 2,019 | | | | $ | 215 | | | | $ | 479 | | | | $ | — | | |
| | | | | | | | | | | | | | | | | |
Total investment income | | | 2,019 | | | | 215 | | | | 479 | | | | — | | |
| | | | | | | | | | | | | | | | | |
EXPENSES: | | | | | | | | | | | | | | | | | |
Administrative service fees | | | 10,124 | | | | 1,929 | | | | 1,775 | | | | 956 | | |
| | | | | | | | | | | | | | | | | |
Distribution and service fees: | | | | | | | | | | | | | | | | | |
Class S | | | 46,602 | | | | 9,540 | | | | 8,874 | | | | 3,694 | | |
Class ADV | | | 8,037 | | | | 210 | | | | 8 | | | | 2,169 | | |
| | | | | | | | | | | | | | | | | |
Total expenses | | | 64,763 | | | | 11,679 | | | | 10,657 | | | | 6,819 | | |
| | | | | | | | | | | | | | | | | |
Net investment loss | | | (62,744 | ) | | | (11,464 | ) | | | (10,178 | ) | | | (6,819 | ) | |
| | | | | | | | | | | | | | | | | |
REALIZED AND UNREALIZED GAIN (LOSS) ON INVESTMENTS: | | | | | | | | | | | | | | | | | |
Net realized gain distributions from underlying fund | | | 289 | | | | 532 | | | | — | | | | 2,146 | | |
Net realized gain on investments | | | 84,958 | | | | 35,382 | | | | 26,800 | | | | 18,673 | | |
Net change in unrealized appreciation or depreciation on investments | | | 4,075,175 | | | | 423,723 | | | | 425,274 | | | | 412,270 | | |
| | | | | | | | | | | | | | | | | |
Net realized and unrealized gain on investments and net realized gain distributions from underlying fund | | | 4,160,422 | | | | 459,637 | | | | 452,074 | | | | 433,089 | | |
| | | | | | | | | | | | | | | | | |
Increase in net assets resulting from operations | | | $ | 4,097,678 | | | | $ | 448,173 | | | | $ | 441,896 | | | | $ | 426,270 | | |
(1) The underlying funds for the ING Fidelity® VIP Contrafund®, ING Fidelity® VIP Equity-Income, ING Fidelity® VIP Growth and ING Fidelity® VIP MidCap Portfolios are the Fidelity® VIP Contrafund®, Fidelity® VIP Equity-Income, Fidelity® VIP Growth and Fidelity® VIP MidCap Portfolios, respectively.
See Accompanying Notes to Financial Statements
12
STATEMENTS OF CHANGES IN NET ASSETS
| | ING Fidelity® VIP Contrafund® | | ING Fidelity® VIP Equity- | |
| | Portfolio | | Income Portfolio | |
| | | | November 15, | | | | November 15, | |
| | Year Ended | | 2004(1) to | | Year Ended | | 2004(1) to | |
| | December 31, | | December 31, | | December 31, | | December 31, | |
| | 2005 | | 2004 | | 2005 | | 2004 | |
| | | | | | | | | |
FROM OPERATIONS: | | | | | | | | | |
Net investment loss | | | $ | (62,744 | ) | | | $ | (1 | ) | | | $ | (11,464 | ) | | $ | (1 | ) | |
Net realized gain on investments | | | 85,247 | | | | — | | | | 35,914 | | | — | | |
Net change in unrealized appreciation or depreciation on investments | | | 4,075,175 | | | | 68 | | | | 423,723 | | | 57 | | |
| | | | | | | | | | | | | | | | |
Net increase in net assets resulting from operations | | | 4,097,678 | | | | 67 | | | | 448,173 | | | 56 | | |
| | | | | | | | | | | | | | | | |
FROM CAPITAL SHARES TRANSACTIONS: | | | | | | | | | | | | | | | | |
Net proceeds from sale of shares | | | 58,299,540 | | | | 34,133 | | | | 10,730,499 | | | 1,999 | | |
Cost of shares redeemed | | | (1,085,336 | ) | | | — | | | | (843,615 | ) | | — | | |
Net increase in net asset resulting from capital share transactions | | | 57,214,204 | | | | 34,133 | | | | 9,886,884 | | | 1,999 | | |
| | | | | | | | | | | | | | | | |
Net increase in net assets | | | 61,311,882 | | | | 34,200 | | | | 10,335,057 | | | 2,055 | | |
| | | | | | | | | | | | | | | | |
NET ASSETS: | | | | | | | | | | | | | | | | |
Beginning of period | | | 34,200 | | | | — | | | | 2,055 | | | — | | |
| | | | | | | | | | | | | | | | |
End of period | | | $ | 61,346,082 | | | | $ | 34,200 | | | | $ | 10,337,112 | | | $ | 2,055 | | |
| | | | | | | | | | | | | | | | |
Accumulated net investment loss at end of period | | | $ | 0 | | | | $ | (1 | ) | | | $ | 0 | | | $ | (1 | ) | |
| | | | | | | | | | | | | | | | | | | | | |
(1) Commencement of operations.
See Accompanying Notes to Financial Statements
13
STATEMENTS OF CHANGES IN NET ASSETS
| | ING Fidelity® VIP Growth | | ING Fidelity® VIP Mid Cap | |
| | Portfolio | | Portfolio | |
| | | | November 15, | | | | November 15, | |
| | Year Ended | | 2004(1) to | | Year Ended | | 2004(1) to | |
| | December 31, | | December 31, | | December 31, | | December 31, | |
| | 2005 | | 2004 | | 2005 | | 2004 | |
| | | | | | | | | |
FROM OPERATIONS: | | | | | | | | | |
Net investment loss | | | $ | (10,178 | ) | | | $ | (1 | ) | | | $ | (6,819 | ) | | | $ | (1 | ) | |
Net realized gain on investments | | | 26,800 | | | | — | | | | 20,819 | | | | — | | |
Net change in unrealized appreciation or depreciation on investments | | | 425,274 | | | | 42 | | | | 412,270 | | | | 119 | | |
| | | | | | | | | | | | | | | | | |
Net increase in net assets resulting from operations | | | 441,896 | | | | 41 | | | | 426,270 | | | | 118 | | |
| | | | | | | | | | | | | | | | | |
| | | | | | | | | | | | | | | | | |
FROM CAPITAL SHARES TRANSACTIONS: | | | | | | | | | | | | | | | | | |
Net proceeds from sale of shares | | | 11,332,632 | | | | 2,000 | | | | 5,390,919 | | | | 18,175 | | |
Cost of shares redeemed | | | (1,096,869 | ) | | | — | | | | (269,445 | ) | | | — | | |
| | | | | | | | | | | | | | | | | |
Net increase in net asset resulting from capital share transactions | | | 10,235,763 | | | | 2,000 | | | | 5,121,474 | | | | 18,175 | | |
| | | | | | | | | | | | | | | | | |
Net increase in net assets | | | 10,677,659 | | | | 2,041 | | | | 5,547,744 | | | | 18,293 | | |
| | | | | | | | | | | | | | | | | |
NET ASSETS: | | | | | | | | | | | | | | | | | |
Beginning of period | | | 2,041 | | | | — | | | | 18,293 | | | | — | | |
| | | | | | | | | | | | | | | | | |
End of period | | | $ | 10,679,700 | | | | $ | 2,041 | | | | $ | 5,566,037 | | | | $ | 18,293 | | |
| | | | | | | | | | | | | | | | | |
Accumulated net investment loss at end of period | | | $ | — | | | | $ | (1 | ) | | | $ | 0 | | | | $ | (1 | ) | |
(1) Commencement of operations.
See Accompanying Notes to Financial Statements
14
ING FIDELITY® VIP CONTRAFUND PORTFOLIO
Selected data for a share of beneficial interest outstanding throughout each period.
| | Class S | | Class ADV | |
| | | | November 15, | | | | November 15, | |
| | Year Ended | | 2004(1) to | | Year Ended | | 2004(1) to | |
| | December 31, | | December 31, | | December 31, | | December 31, | |
| | 2005 | | 2004 | | 2005 | | 2004 | |
Per Share Operating Performance: | | | | | | | | | |
| | | | | | | | | |
Net asset value, beginning of period | $ | 10.34 | | | 10.00 | | | 10.34 | | | 10.00 | | |
| | | | | | | | | | | | | |
Income (loss) from investment operations: | | | | | | | | | | | | | |
| | | | | | | | | | | | | |
Net investment income (loss) | $ | (0.01 | ) | | 0.00 | ** | | (0.03 | ) | | (0.01 | ) | |
| | | | | | | | | | | | | |
Net realized and unrealized gain on investments | $ | 1.70 | | | 0.34 | | | 1.68 | | | 0.35 | | |
| | | | | | | | | | | | | |
Total from investment operations | $ | 1.69 | | | 0.34 | | | 1.65 | | | 0.34 | | |
| | | | | | | | | | | | | |
Net asset value, end of period | $ | 12.03 | | | 10.34 | | | 11.99 | | | 10.34 | | |
| | | | | | | | | | | | | |
Total Return(2) | % | 16.34 | | | 3.40 | | | 15.96 | | | 3.40 | | |
| | | | | | | | | | | | | |
Ratios and Supplemental Data: | | | | | | | | | | | | | |
| | | | | | | | | | | | | |
Net assets, end of period (000’s) | $ | 57,988 | | | 33 | | | 3,358 | | | 1 | | |
| | | | | | | | | | | | | |
Ratios to average net assets: | | | | | | | | | | | | | |
| | | | | | | | | | | | | |
Expenses excluding expenses of the master fund | % | 0.30 | | | 0.30 | | | 0.55 | | | 0.55 | | |
| | | | | | | | | | | | | |
Net investment loss excluding expenses of the master fund | % | (0.29 | ) | | (0.30 | ) | | (0.50 | ) | | (0.55 | ) | |
| | | | | | | | | | | | | |
Portfolio turnover rate(3) | % | 5 | | | 0 | | | 5 | | | 0 | | |
(1) Commencement of operations.
(2) Total return is calculated assuming reinvestment of all dividends and capital gain distributions at net asset value and excluding the deduction of sales charges. Total returns for periods less than one year are not annualized. The Portfolio’s performance is shown without the imposition of any expenses or charges which are, or may be, imposed under your annuity contract. Total returns would have been lower if such expenses or charges were included.
(3) Portfolio turnover rate is calculated based on the Portfolio’s purchases or sales of the master fund.
**Amount is less than $0.005 per share or 0.005%.
| | Class S | | Class ADV | |
| | | | November 15, | | | | November 15, | |
| | Year Ended | | 2004(1) to | | Year Ended | | 2004(1) to | |
| | December 31, | | December 31, | | December 31, | | December 31, | |
| | 2005 | | 2004 | | 2005 | | 2004 | |
Expenses including expenses net of all reductions of the master fund | % | 1.19 | | | 1.21 | † | | 1.44 | | | 1.46 | † | |
Expenses including expenses net of voluntary waivers, if any, of the master fund | % | 1.21 | | | 1.23 | † | | 1.46 | | | 1.48 | † | |
Expenses including gross expenses of the master fund | % | 1.21 | | | 1.23 | † | | 1.46 | | | 1.48 | † | |
Portfolio turnover rate of master fund | % | 60 | | | 64 | † | | 60 | | | 64 | † | |
† Expenses of the master fund included in the ratio, as well as the portfolio turnover rate, are for the year ended December 31, 2004.
See Accompanying Notes to Financial Statements
15
ING FIDELITY® VIP EQUITY-INCOME PORTFOLIO
| | Class S | | Class ADV | |
| | | | November 15, | | | | November 15, | |
| | Year Ended | | 2004(1) to | | Year Ended | | 2004(1) to | |
| | December 31, | | December 31, | | December 31, | | December 31, | |
| | 2005 | | 2004 | | 2005 | | 2004 | |
Per Share Operating Performance: | | | | | | | | | |
| | | | | | | | | |
Net asset value, beginning of period | $ | 10.28 | | | 10.00 | | | 10.27 | | | 10.00 | | |
| | | | | | | | | | | | | |
Income (loss) from investment operations: | | | | | | | | | | | | | |
| | | | | | | | | | | | | |
Net investment income (loss) | $ | (0.01 | ) | | 0.00 | ** | | (0.03 | ) | | (0.01 | ) | |
| | | | | | | | | | | | | |
Net realized and unrealized gain (loss) on investments | $ | 0.56 | | | 0.28 | | | 0.54 | | | 0.28 | | |
| | | | | | | | | | | | | |
Total from investment operations | $ | 0.55 | | | 0.28 | | | 0.51 | | | 0.27 | | |
| | | | | | | | | | | | | |
Net asset value, end of period | $ | 10.83 | | | 10.28 | | | 10.78 | | | 10.27 | | |
| | | | | | | | | | | | | |
Total Return(2) | % | 5.35 | | | 2.80 | | | 4.97 | | | 2.70 | | |
| | | | | | | | | | | | | |
Ratios and Supplemental Data: | | | | | | | | | | | | | |
| | | | | | | | | | | | | |
Net assets, end of period (000’s) | $ | 10,259 | | | 1 | | | 78 | | | 1 | | |
| | | | | | | | | | | | | |
Ratios to average net assets: | | | | | | | | | | | | | |
| | | | | | | | | | | | | |
Expenses excluding expenses of the master fund | % | 0.30 | | | 0.30 | | | 0.55 | | | 0.55 | | |
| | | | | | | | | | | | | |
Net investment income (loss) excluding expenses of the master fund | % | (0.30 | ) | | (0.30 | ) | | (0.44 | ) | | (0.55 | ) | |
| | | | | | | | | | | | | |
Portfolio turnover rate(3) | % | 22 | | | 0 | | | 22 | | | 0 | | |
(1) Commencement of operations.
(2) Total return is calculated assuming reinvestment of all dividends and capital gain distributions at net asset value and excluding the deduction of sales charges. Total returns for periods less than one year are not annualized. The Portfolio’s performance is shown without the imposition of any expenses or charges which are, or may be, imposed under your annuity contract. Total returns would have been lower if such expenses or charges were included.
(3) Portfolio turnover rate is calculated based on the Portfolio’s purchases or sales of the master fund.
** Amount is less than $0.005 per share or 0.005%.
| | Class S | | Class ADV | |
| | | | November 15, | | | | November 15, | |
| | Year Ended | | 2004(1) to | | Year Ended | | 2004(1) to | |
| | December 31, | | December 31, | | December 31, | | December 31, | |
| | 2005 | | 2004 | | 2005 | | 2004 | |
Expenses including expenses net of all reductions of the master fund | % | 1.10 | | | 1.12 | † | | 1.35 | | | 1.37 | † | |
Expenses including expenses net of voluntary waivers, if any, of the master fund | % | 1.11 | | | 1.13 | † | | 1.36 | | | 1.38 | † | |
Expenses including gross expenses of the master fund | % | 1.11 | | | 1.13 | † | | 1.36 | | | 1.38 | † | |
Portfolio turnover rate of master fund | % | 19 | | | 22 | † | | 19 | | | 22 | † | |
† Expenses of the master fund included in the ratio, as well as the portfolio turnover rate, are for the year ended December 31, 2004.
See Accompanying Notes to Financial Statements
16
ING FIDELITY® VIP GROWTH PORTFOLIO
| | Class S | | Class ADV | |
| | | | November 15, | | | | November 15, | |
| | Year Ended | | 2004(1) to | | Year Ended | | 2004(1) to | |
| | December 31, | | December 31, | | December 31, | | December 31, | |
| | 2005 | | 2004 | | 2005 | | 2004 | |
Per Share Operating Performance: | | | | | | | | | |
| | | | | | | | | |
Net asset value, beginning of period | $ | 10.21 | | | 10.00 | | | 10.20 | | | 10.00 | | |
| | | | | | | | | | | | | |
Income (loss) from investment operations: | | | | | | | | | | | | | |
| | | | | | | | | | | | | |
Net investment loss | $ | (0.01 | ) | | (0.00 | )** | | (0.05 | ) | | (0.01 | ) | |
| | | | | | | | | | | | | |
Net realized and unrealized gain (loss) on investments | $ | 0.53 | | | 0.21 | | | 0.53 | | | 0.21 | | |
| | | | | | | | | | | | | |
Total from investment operations | $ | 0.52 | | | 0.21 | | | 0.48 | | | 0.20 | | |
| | | | | | | | | | | | | |
Net asset value, end of period | $ | 10.73 | | | 10.21 | | | 10.68 | | | 10.20 | | |
| | | | | | | | | | | | | |
Total Return(2) | % | 5.09 | | | 2.10 | | | 4.71 | | | 2.00 | | |
| | | | | | | | | | | | | |
Ratios and Supplemental Data: | | | | | | | | | | | | | |
| | | | | | | | | | | | | |
Net assets, end of period (000’s) | $ | 10,679 | | | 1 | | | 1 | | | 1 | | |
| | | | | | | | | | | | | |
Ratios to average net assets: | | | | | | | | | | | | | |
| | | | | | | | | | | | | |
Expenses excluding expenses of the master fund | % | 0.30 | | | 0.30 | | | 0.55 | | | 0.55 | | |
| | | | | | | | | | | | | |
Net investment loss excluding expenses of the master fund | % | (0.28 | ) | | (0.30 | ) | | (0.25 | ) | | (0.55 | ) | |
| | | | | | | | | | | | | |
Portfolio turnover rate(3) | % | 29 | | | 0 | | | 29 | | | 0 | | |
(1) Commencement of operations.
(2) Total return is calculated assuming reinvestment of all dividends and capital gain distributions at net asset value and excluding the deduction of sales charges. Total returns for periods less than one year are not annualized. The Portfolio’s performance is shown without the imposition of any expenses or charges which are, or may be, imposed under your annuity contract. Total returns would have been lower if such expenses or charges were included.
(3) Portfolio turnover rate is calculated based on the Portfolio’s purchases and sales of the master fund.
** Amount is less than $0.005 per share or 0.005%.
| | Class S | | Class ADV | |
| | | | November 15, | | | | November 15, | |
| | Year Ended | | 2004(1) to | | Year Ended | | 2004(1) to | |
| | December 31, | | December 31, | | December 31, | | December 31, | |
| | 2005 | | 2004 | | 2005 | | 2004 | |
Expenses including expenses net of all reductions of the master fund | % | 1.18 | | | 1.20 | † | | 1.43 | | | 1.45 | † | |
Expenses including expenses net of voluntary waivers, if any, of the master fund | % | 1.22 | | | 1.23 | † | | 1.47 | | | 1.48 | † | |
Expenses including gross expenses of the master fund | % | 1.22 | | | 1.23 | † | | 1.47 | | | 1.48 | † | |
Portfolio turnover rate of master fund | % | 79 | | | 72 | † | | 79 | | | 72 | † | |
† Expenses of the master fund included in the ratio, as well as the portfolio turnover rate, are for the year ended December 31, 2004.
See Accompanying Notes to Financial Statements
17
ING FIDELITY® VIP MID CAP PORTFOLIO
| | Class S | | Class ADV | |
| | | | November 15, | | | | November 15, | |
| | Year Ended | | 2004(1) to | | Year Ended | | 2004(1) to | |
| | December 31, | | December 31, | | December 31, | | December 31, | |
| | 2005 | | 2004 | | 2005 | | 2004 | |
Per Share Operating Performance: | | | | | | | | | | | | | |
| | | | | | | | | | | | | |
Net asset value, beginning of period | $ | 10.56 | | | 10.00 | | | 10.55 | | | 10.00 | | |
| | | | | | | | | | | | | |
Income (loss) from investment operations: | | | | | | | | | | | | | |
| | | | | | | | | | | | | |
Net investment income (loss) | $ | (0.01 | ) | | (0.00 | )* | | (0.02 | ) | | (0.00 | )* | |
| | | | | | | | | | | | | |
Net realized and unrealized gain on investments | $ | 1.87 | | | 0.55 | | | 1.90 | | | 0.55 | | |
| | | | | | | | | | | | | |
Total from investment operations | $ | 1.86 | | | 0.55 | | | 1.84 | | | 0.55 | | |
| | | | | | | | | | | | | |
Net asset value, end of period | $ | 12.42 | | | 10.55 | | | 12.39 | | | 10.55 | | |
| | | | | | | | | | | | | |
Total Return(2) | % | 17.61 | | | 5.50 | | | 17.44 | | | 5.50 | | |
| | | | | | | | | | | | | |
Ratios and Supplemental Data: | | | | | | | | | | | | | |
| | | | | | | | | | | | | |
Net assets, end of period (000’s) | $ | 4,065 | | | 17 | | | 1,501 | | | 1 | | |
| | | | | | | | | | | | | |
Ratios to average net assets: | | | | | | | | | | | | | |
| | | | | | | | | | | | | |
Expenses excluding expenses of the master fund | % | 0.30 | | | 0.30 | | | 0.55 | | | 0.55 | | |
| | | | | | | | | | | | | |
Net investment loss excluding expenses of the master fund | % | (0.32 | ) | | (0.30 | ) | | (0.48 | ) | | (0.55 | ) | |
| | | | | | | | | | | | | |
Portfolio turnover rate(3) | % | 14 | | | 0 | | | 14 | | | 0 | | |
(1) Commencement of operations.
(2) Total return is calculated assuming reinvestment of all dividends and capital gain distributions at net asset value and excluding the deduction of sales charges. Total returns for periods less than one year are not annualized. The Portfolio’s performance is shown without the imposition of any expenses or charges which are, or may be, imposed under your annuity contract. Total returns would have been lower if such expenses or charges were included.
(3) Portfolio turnover rate is calculated based on the Portfolio’s purchases and sales of the master fund.
* Amount is less than $0.005 per share or 0.005%.
| | Class S | | Class ADV | |
| | | | November 15, | | | | November 15, | |
| | Year Ended | | 2004(1) to | | Year Ended | | 2004(1) to | |
| | December 31, | | December 31, | | December 31, | | December 31, | |
| | 2005 | | 2004 | | 2005 | | 2004 | |
Expenses including expenses net of all reductions of the master fund | % | 1.19 | | | 1.23 | † | | 1.44 | | | 1.48 | † | |
Expenses including expenses net of voluntary waivers, if any, of the master fund | % | 1.24 | | | 1.26 | † | | 1.49 | | | 1.51 | † | |
Expenses including gross expenses of the master fund | % | 1.24 | | | 1.26 | † | | 1.49 | | | 1.51 | † | |
Portfolio turnover rate of master fund | % | 107 | | | 55 | † | | 107 | | | 55 | † | |
† Expenses of the master fund included in the ratio, as well as the portfolio turnover rate, are for the year ended December 31, 2004.
See Accompanying Notes to Financial Statements
18
NOTES TO FINANCIAL STATEMENTS AS OF DECEMBER 31, 2005
NOTE 1 — ORGANIZATION
The ING Partners, Inc. (the “Fund”) is an open-end management investment company registered under the Investment Company Act of 1940 (the “1940 Act”). It was incorporated under the laws of Maryland on May 7, 1997. The Articles of Incorporation permit the Fund to offer separate series (“Portfolios”), each of which has its own investment objective, policies and restrictions. The Portfolios serve as investment options underlying variable insurance products offered by ING Life Insurance and Annuity Company (“ILIAC”) and its insurance company affiliates. At December 31, 2005 there are thirty-one separate investment series which comprise the Fund. The four Portfolios included in this report are: ING Fidelity® VIP Contrafund® Portfolio* (“Contrafund”); ING Fidelity® VIP Equity-Income Portfolio (“Equity-Income”), ING Fidelity® VIP Growth Portfolio (“Growth”) and ING Fidelity® VIP Mid Cap Portfolio (“Mid Cap”).
Each Portfolio in this report operates as a “feeder fund” which means the only investment security is a separate mutual fund, the “master fund.” The Master Funds (VIP Contrafund® Portfolio, VIP Equity-Income Portfolio, VIP Growth Portfolio and VIP Mid Cap Portfolio) (each a “Master Fund” and collectively, the “Master Funds”) are a series of the Fidelity Variable Insurance Products Fund II (VIP Contrafund® Portfolio), Fidelity Variable Insurance Products Fund (VIP Equity-Income Portfolio and VIP Growth Portfolio), or Fidelity Variable Insurance Products Fund III (VIP Mid Cap Portfolio), each an open end investment company. Each Portfolio has the same investment objective and limitations as the Master Fund in which it invests. Typically, the Portfolios do not buy investment securities directly. The Master Funds, on the other hand, invest directly in portfolio securities. At December 31, 2005, Contrafund, Equity Income, Growth and Mid Cap Portfolios each held 0.4% or less of their respective Master Fund.
The Portfolios offer two classes of shares, referred to as Service Class (Class “S”) and Adviser Class (Class “ADV”). Each share class represents interests in the same portfolio of investments of the particular Portfolio, and shall be identical in all respects, except for the impact of expenses, voting, exchange privileges, and any different shareholder services relating to a class of shares. Shareholders of the Adviser Class of each Portfolio will generally be entitled to exchange those shares at net asset value for Adviser Class shares of other Portfolios that offer Adviser Class shares. Shareholders of the Adviser Class shares continue to be subject to the Rule 12b-1 Plan fee applicable to Adviser Class shares after an exchange. Shareholders of Service Class shares of each Portfolio will generally be entitled to exchange those shares at net asset value for Service Class shares of other Portfolios that offer Service Class shares. Shares of the Portfolios may be offered to segregated asset accounts (“Separate Accounts”) of insurance companies as investment options in connection with variable annuity contracts and variable life insurance policies (“Variable Contracts”) and to certain of the Portfolios’ investment advisers and their affiliates. In the future, shares may also be offered to qualified pension and retirement plans (“Qualified Plans”) outside the Separate Account context. Shares of the Portfolios are not currently offered directly to Qualified Plans or custodial accounts.
Each Portfolio is distributed by ING Financial Advisers, LLC (“IFA”). ILIAC serves as the Investment Manager to each Portfolio. IFA and the Investment Manager are both indirect wholly-owned subsidiaries of ING Groep N.V. (“ING Groep”). ING Groep is one of the largest financial services institutions in the world, and offers an array of banking, insurance and asset management services to both individuals and institutional investors.
NOTE 2 — SIGNIFICANT ACCOUNTING POLICIES
The following significant accounting policies are consistently followed by the Portfolios in the preparation of their financial statements. Such policies are in conformity with U.S. generally accepted accounting principles for investment companies.
A. | Security Valuation. The valuation of each Portfolio’s investment in its corresponding Master Fund is based on the net asset value of that Master Fund each business day. Valuation of the investments by the Master Funds is discussed in the Master Funds’ notes to their Financial statements, which accompany this report. |
| |
B. | Security Transactions and Revenue Recognition. Securities transactions are accounted for on the trade date. Realized gains and losses are reported on the basis of identified cost of securities sold. Interest income is recorded on an |
* Fidelity and Contrafund are registered trademarks of FMR Corp.
19
NOTES TO FINANCIAL STATEMENTS AS OF DECEMBER 31, 2005 (CONTINUED)
NOTE 2 — SIGNIFICANT ACCOUNTING POLICIES (continued)
| accrual basis. Dividend income is recorded on the ex-dividend date. |
| |
C. | Distributions to Shareholders. The Portfolios record distributions to their shareholders on ex-dividend date. Each Portfolio distributes dividends and capital gains, if any, annually. The Portfolios may make distributions on a more frequent basis to comply with the distribution requirements of the Internal Revenue Code. The characteristics of income and gains to be distributed are determined in accordance with income tax regulations, which may differ from U.S. generally accepted accounting principles. |
| |
D. | Federal Income Taxes. It is the policy of the Portfolios to comply with subchapter M of the Internal Revenue Code and related excise tax provisions applicable to regulated investment companies and to distribute substantially all of their net investment income and any net realized capital gains to their shareholders. Therefore, no federal income tax provision is required. The Board of Directors intends to offset any net capital gains with any available capital loss carryforward until each carryforward has been fully utilized or expires. In addition, no capital gain distribution shall be made until the capital loss carryforward has been fully utilized or expires. |
| |
E. | Use of Estimates. Management of the Portfolios has made certain estimates and assumptions relating to the reporting of assets, liabilities, income, and expenses to prepare these financial statements in conformity with accounting principles generally accepted in the United States of America for investment companies. Actual results could differ from these estimates. |
| |
F. | Repurchase Agreements. Each Portfolio may invest in repurchase agreements only with government securities dealers recognized by Board of Governors of the Federal Reserve System. Under such agreements, the seller of the security agrees to repurchase it at a mutually agreed upon time and price. The resale price is in excess of the purchase price and reflects an agreed upon interest rate for the period of time the agreement is outstanding. The period of the repurchase agreements is usually short, from overnight to one week, while the underlying securities generally have longer maturities. Each Portfolio will always receive as collateral securities acceptable to it whose market value is equal at least 100% of the carrying amount of the repurchase agreements, plus accrued interest, being invested by the Portfolio. The underlying collateral is valued daily on a mark-to-market basis to assure that the value, including accrued interest is at least equal to the repurchase price. There would be potential loss to the Fund in the event the Fund is delayed or prevented from exercising its right to dispose of the collateral, and it might incur disposition costs in liquidating the collateral. |
NOTE 3 — INVESTMENT MANAGEMENT AND ADMINISTRATIVE FEES
Fidelity Management & Research Company (“FMR”) serves as manager to each Master Fund. FMR has day-to-day responsibility for choosing investments for each Master Fund. As shareholders of the Master Funds, the Portfolios indirectly pay a portion of the master-level management fee.
Each Master Fund, VIP Contrafund® Portfolio, VIP Equity-Income Portfolio, VIP Growth Portfolio, and VIP Mid Cap Portfolio, pays FMR a management fee for advisory services at annual rates of 0.57%, 0.47%, 0.57%, and 0.57%, of each respective Master Fund’s current average daily net assets. Pursuant to its investment management agreement with the Fund, ILIAC may charge an annual advisory fee to a respective Portfolio at annual rates up to the respective annual rates paid by that respective Portfolio’s Master Fund. If the respective Portfolio does not invest substantially all of its assets in another investment company. If a Portfolio invests substantially all of its assets in another investment company, ILIAC does not charge an advisory fee. Each Portfolio anticipates investing substantially all of its assets in another investment company.
If a Portfolio invests substantially all of its assets in another investment company, ING Funds Services, LLC will charge an administration fee of 0.05% of average daily net assets for that Portfolio. Pursuant to its administration agreement with the Portfolios, ING Funds Services, LLC may receive an annual administration fee equal to 0.15%, 0.15%, 0.15% and
20
NOTES TO FINANCIAL STATEMENTS AS OF DECEMBER 31, 2005 (CONTINUED)
NOTE 3 — INVESTMENT AND ADMINISTRATIVE MANAGEMENT FEES (continued)
0.17% of average daily net assets for Contrafund, Equity-Income, Growth and Mid Cap, respectively, if the respective Portfolio does not invest substantially all of its assets in another investment company.
NOTE 4 — INVESTMENT IN UNDERLYING PORTFOLIOS
For the year ended December 31, 2005, the cost of purchases and proceeds from sales of the Master Funds were as follows:
Portfolio | | Purchases | | Sales | |
Contrafund | | $58,303,182 | | | $1,137,218 | | |
Equity-Income | | 10,733,978 | | | 856,470 | | |
Growth | | 11,334,645 | | | 1,106,654 | | |
Mid Cap | | 5,396,940 | | | 278,597 | | |
NOTE 5 — DISTRIBUTION AND SERVICE FEES
Each Portfolio has adopted a Shareholder Servicing Plan (“Service Plan”) for the Class S and Class ADV shares of each Portfolio. Under the Service Plan, a Portfolio makes payments at an annual rate of 0.25% of the Portfolio’s average daily net assets attributable to its Class S and Class ADV shares.
Each Portfolio has adopted a Plan of Distribution pursuant to Rule 12b-1 under the Investment Company Act of 1940 (“Distribution Plan”) for the Class ADV shares of each Portfolio. The Distribution Plan provides for a distribution fee, payable to IFA as the Fund’s Distributor at an annual rate of 0.25% of the Portfolio’s average daily net assets attributable to Class ADV shares.
Fidelity Distributors Corporation (“FDC”) distributes Service Class 2 shares of each Master Fund. Service Class 2 of each Master Fund currently pays FDC a 12b-1 (service) fee at an annual rate of 0.25% of its average net assets throughout the month. Shareholders of Class S and Class ADV of each Portfolio pay only their proportionate share of the Master Fund 12b-1 plan expenses.
NOTE 6 — OTHER TRANSACTIONS WITH AFFILIATES AND RELATED PARTIES
Each Portfolio has adopted a Retirement Policy covering all independent directors of the Portfolio who will have served as an independent directors for at least five years at the time of retirement. Benefits under this policy are based on an annual rate as defined in the policy.
Investors in the Portfolios should recognize that an investment in the Portfolios bears not only a proportionate share of the expenses of the Portfolios (including operating costs and management fees, if any) but also indirectly similar expenses of the underlying mutual funds in which each Portfolio invests. Investors also bear their proportionate share of any sales charges incurred by the Portfolios related to the purchase of shares of the mutual fund investments.
NOTE 7 — CAPITAL SHARES
Transactions in capital shares and dollars were as follows:
| | Class S Shares | | Class ADV Shares | |
| | | | November 15, | | | | November 15, | |
| | Year Ended | | 2004(1) to | | Year Ended | | 2004(1) to | |
| | December 31, | | December 31, | | December 31, | | December 31, | |
| | 2005 | | 2004 | | 2005 | | 2004 | |
Contrafund (Number of Shares) | | | | | | | | | | | |
Shares sold | | | 4,898,470 | | | | 3,208 | | | | 297,528 | | | | 100 | | |
Shares redeemed | | | (82,397 | ) | | | — | | | | (17,568 | ) | | | — | | |
| | | | | | | | | | | | | | | | | |
Net increase in shares outstanding | | | 4,816,073 | | | | 3,208 | | | | 279,960 | | | | 100 | | |
Contrafund ($) | | | | | | | | | | | | | | | | | |
Shares sold | | | $55,076,541 | | | | $33,135 | | | | $3,222,999 | | | | $998 | | |
Shares redeemed | | | (892,763 | ) | | | — | | | | (192,573 | ) | | | — | | |
| | | | | | | | | | | | | | | | | |
Net increase | | | $54,183,778 | | | | $33,135 | | | | $3,030,426 | | | | $998 | | |
(1) Commencement of operations.
21
NOTES TO FINANCIAL STATEMENTS AS OF DECEMBER 31, 2005 (CONTINUED)
NOTE 7 — CAPITAL SHARES (continued)
| | Class S Shares | | Class ADV Shares | |
| | | | November 15, | | | | November 15, | |
| | Year Ended | | 2004(1) to | | Year Ended | | 2004(1) to | |
| | December 31, | | December 31, | | December 31, | | December 31, | |
| | 2005 | | 2004 | | 2005 | | 2004 | |
Equity-Income (Number of Shares) | | | | | | | | | | | |
Shares sold | | | 1,026,875 | | | | 100 | | | | 8,314 | | | | 100 | | |
Shares redeemed | | | (79,706 | ) | | | — | | | | (1,154 | ) | | | — | | |
| | | | | | | | | | | | | | | | | |
Net increase in shares outstanding | | | 947,169 | | | | 100 | | | | 7,160 | | | | 100 | | |
| | | | | | | | | | | | | | | | | |
Equity-Income ($) | | | | | | | | | | | | | | | | | |
Shares sold | | | $ | 10,646,329 | | | | $ | 1,001 | | | | $ | 84,170 | | | | $ | 998 | | |
Shares redeemed | | | (831,747 | ) | | | — | | | | (11,868 | ) | | | — | | |
| | | | | | | | | | | | | | | | | |
Net increase | | | $ | 9,814,582 | | | | $ | 1,001 | | | | $ | 72,302 | | | | $ | 998 | | |
| | Class S Shares | | Class ADV Shares | |
| | | | November 15, | | | | November 15, | |
| | Year Ended | | 2004(1) to | | Year Ended | | 2004(1) to | |
| | December 31, | | December 31, | | December 31, | | December 31, | |
| | 2005 | | 2004 | | 2005 | | 2004 | |
Growth (Number of Shares) | | | | | | | | | | | |
Shares sold | | | 1,102,036 | | | | 100 | | | | — | | | | 100 | | |
Shares redeemed | | | (106,631 | ) | | | — | | | | — | | | | — | | |
| | | | | | | | | | | | | | | | | |
Net increase in shares outstanding | | | 995,405 | | | | 100 | | | | — | | | | 100 | | |
| | | | | | | | | | | | | | | | | |
Growth ($) | | | | | | | | | | | | | | | | | |
Shares sold | | | $11,332,632 | | | | $1,002 | | | | $ — | | | | $998 | | |
Shares redeemed | | | (1,096,869 | ) | | | — | | | | — | | | | — | | |
| | | | | | | | | | | | | | | | | |
Net increase | | | $10,235,763 | | | | $1,002 | | | | $ — | | | | $998 | | |
| | Class S Shares | | Class ADV Shares | |
| | | | November 15, | | | | November 15, | |
| | Year Ended | | 2004(1) to | | Year Ended | | 2004(1) to | |
| | December 31, | | December 31, | | December 31, | | December 31, | |
| | 2005 | | 2004 | | 2005 | | 2004 | |
Mid Cap (Number of Shares) | | | | | | | | | | | |
Shares sold | | | 342,770 | | | | 1,633 | | | | 127,283 | | | | 100 | | |
Shares redeemed | | | (17,241 | ) | | | — | | | | (6,232 | ) | | | — | | |
| | | | | | | | | | | | | | | | | |
Net increase in shares outstanding | | | 325,529 | | | | 1,633 | | | | 121,051 | | | | 100 | | |
| | | | | | | | | | | | | | | | | |
Mid Cap ($) | | | | | | | | | | | | | | | | | |
Shares sold | | | $3,913,415 | | | | $17,177 | | | | $1,477,504 | | | | $998 | | |
Shares redeemed | | | (199,008 | ) | | | — | | | | (70,437 | ) | | | — | | |
| | | | | | | | | | | | | | | | | |
Net increase | | | $3,714,407 | | | | $17,177 | | | | $1,407,067 | | | | $998 | | |
(1) Commencement of operations.
NOTE 8 — FEDERAL INCOME TAXES
The amount of distributions from net investment income and net realized capital gains are determined in accordance with federal income tax regulations, which may differ from accounting principles generally accepted in the United States of America for investment companies. These book/tax differences may be either temporary or permanent. Permanent differences are reclassified within the capital accounts based on their federal tax-basis treatment; temporary differences are not reclassified. Key differences include the treatment of short-term capital gains, foreign currency transactions, and wash sale deferrals. Distributions in excess of net investment income and/or net realized capital gains for tax purposes are reported as distributions of paid-in capital.
The following permanent tax differences have been reclassified as of December 31, 2005:
| | | | Undistributed Net | | Accumulated | |
| | Paid-in | | Investment Income on | | Net Realized | |
| | Capital | | Investments | | Gains/(Losses) | |
Contrafund | | $(288 | ) | | $62,745 | | | $(62,457 | ) | |
Equity-Income | | (2 | ) | | 11,465 | | | (11,463 | ) | |
Growth | | (39 | ) | | 10,179 | | | (10,140 | ) | |
Mid Cap | | (23 | ) | | 6,820 | | | (6,797 | ) | |
22
NOTES TO FINANCIAL STATEMENTS AS OF DECEMBER 31, 2005 (CONTINUED)
NOTE 8 — FEDERAL INCOME TAXES (continued)
Dividends paid by the Portfolios from net investment income and distributions of net realized short-term capital gains are, for federal income tax purposes, taxable as ordinary income to shareholders.
The Portfolios paid no dividends or distributions to shareholders for the years ended December 31, 2004 and December 31, 2005.
The tax-basis components of distributable earnings and the expiration dates of the capital loss carryforwards which may be used to offset future realized capital gains for federal income tax purposes as of December 31, 2005 were:
| | Undistributed | | Undistributed | | Unrealized | |
| | Ordinary | | Long Term | | Appreciation/ | |
| | Income | | Capital Gains | | Depreciation | |
| | | | | | | |
Contrafund | | $22,816 | | | $ | — | | | $4,075,218 | | |
Equity-Income | | 24,514 | | | | — | | | 423,718 | | |
Growth | | 19,887 | | | | — | | | 422,090 | | |
Mid Cap | | 12,765 | | | | 1,870 | | | 411,777 | | |
NOTE 9 — INFORMATION REGARDING TRADING OF ING’S U.S. MUTUAL FUNDS
In 2004 ING Investments reported to the Boards of Directors/ Trustees (the “Boards”) of the ING Funds that, like many U.S. financial services companies, ING Investments and certain of its U.S. affiliates have received informal and formal requests for information since September 2003 from various governmental and self-regulatory agencies in connection with investigations related to mutual funds and variable insurance products. ING Investments has advised the Boards that it and its affiliates have cooperated fully with each request.
In addition to responding to regulatory and governmental requests, ING Investments reported that management of U.S. affiliates of ING Groep N.V., including ING Investments (collectively, “ING”), on their own initiative, have conducted, through independent special counsel and a national accounting firm, an extensive internal review of trading in ING insurance, retirement, and mutual fund products. The goal of this review was to identify any instances of inappropriate trading in those products by third parties or by ING investment professionals and other ING personnel. ING’s internal review related to mutual fund trading is now substantially completed. ING has reported that, of the millions of customer relationships that ING maintains, the internal review identified several isolated arrangements allowing third parties to engage in frequent trading of mutual funds within ING’s variable insurance and mutual fund products, and identified other circumstances where frequent trading occurred, despite measures taken by ING intended to combat market timing. ING further reported that each of these arrangements has been terminated and fully disclosed to regulators. The results of the internal review were also reported to the independent members of the Board.
ING Investments has advised the Board that most of the identified arrangements were initiated prior to ING’s acquisition of the businesses in question in the U.S. ING Investments further reported that the companies in question did not receive special benefits in return for any of these arrangements, which have all been terminated.
Based on the internal review, ING Investments has advised the Board that the identified arrangements do not represent a systemic problem in any of the companies that were involved.
In September 2005, ING Funds Distributor, LLC (“IFD”), the distributor of certain ING Funds, settled an administrative proceeding with the NASD regarding three arrangements, dating from 1995, 1996 and 1998, under which the administrator to the then-Pilgrim Funds, which subsequently became part of the ING Funds, entered into formal and informal arrangements that permitted frequent trading. Under the terms of the Letter of Acceptance, Waiver and Consent (“AWC”) with the NASD, under which IFD neither admitted nor denied the allegations or findings, IFD consented to the following sanctions: (i) a censure; (ii) a fine of $1.5 million; (iii) restitution of approximately $1.44 million to certain ING Funds for losses attributable to excessive trading described in the AWC; and (iv) agreement to make certification to NASD regarding the review and establishment of certain procedures.
In addition to the arrangements discussed above, in 2004 ING Investments reported to the Board that, at that time, these instances include the following, in addition to the arrangements subject to the AWC discussed above:
• Aeltus Investment Management, Inc. (a predecessor entity to ING Investment Management Co.) has identified two investment professionals who engaged in extensive frequent trading in certain ING Funds. One was subsequently terminated for cause and incurred substantial financial penalties in connection with this conduct and the second has been disciplined.
23
NOTES TO FINANCIAL STATEMENTS AS OF DECEMBER 31, 2005 (CONTINUED)
NOTE 9 — INFORMATION REGARDING TRADING OF ING’S U.S. MUTUAL FUNDS (continued)
• ReliaStar Life Insurance Company (“ReliaStar”) entered into agreements seven years ago permitting the owner of policies issued by the insurer to engage in frequent trading and to submit orders until 4pm Central Time. In 2001 ReliaStar also entered into a selling agreement with a broker-dealer that engaged in frequent trading. Employees of ING affiliates were terminated and/or disciplined in connection with these matters.
• In 1998, Golden American Life Insurance Company entered into arrangements permitting a broker-dealer to frequently trade up to certain specific limits in a fund available in an ING variable annuity product. No employee responsible for this arrangement remains at the company.
For additional information regarding these matters, you may consult the Form 8-K and Form 8-K/A for each of four life insurance companies, ING USA Annuity and Life Insurance Company, ING Life Insurance and Annuity Company, ING Insurance Company of America, and ReliaStar Life Insurance Company of New York, each filed with the Securities and Exchange Commission (the “SEC”) on October 29, 2004 and September 8, 2004. These Forms 8-K and Forms 8-K/A can be accessed through the SEC’s Web site at http://www.sec.gov. Despite the extensive internal review conducted through independent special counsel and a national accounting firm, there can be no assurance that the instances of inappropriate trading reported to the Board are the only instances of such trading respecting the ING Funds.
ING Investments reported to the Board that ING is committed to conducting its business with the highest standards of ethical conduct with zero tolerance for noncompliance. Accordingly, ING Investments advised the Board that ING management was disappointed that its voluntary internal review identified these situations. Viewed in the context of the breadth and magnitude of its U.S. business as a whole, ING management does not believe that ING’s acquired companies had systemic ethical or compliance issues in these areas. Nonetheless, ING Investments reported that given ING’s refusal to tolerate any lapses, it has taken the steps noted below, and will continue to seek opportunities to further strengthen the internal controls of its affiliates.
• ING has agreed with the ING Funds to indemnify and hold harmless the ING Funds from all damages resulting from wrongful conduct by ING or its employees or from ING’s internal investigation, any investigations conducted by any governmental or self-regulatory agencies, litigation or other formal proceedings, including any proceedings by the Securities and Exchange Commission. ING Investments reported to the Board that ING management believes that the total amount of any indemnification obligations will not be material to ING or its U.S. business.
• ING updated its Code of Conduct for employees reinforcing its employees’ obligation to conduct personal trading activity consistent with the law, disclosed limits, and other requirements.
• The ING Funds, upon a recommendation from ING, updated their respective Codes of Ethics applicable to investment professionals with ING entities and certain other fund personnel, requiring such personnel to pre-clear any purchases or sales of ING Funds that are not systematic in nature (i.e., dividend reinvestment), and imposing minimum holding periods for shares of ING Funds.
• ING instituted excessive trading policies for all customers in its variable insurance and retirement products and for shareholders of the ING Funds sold to the public through financial intermediaries. ING does not make exceptions to these policies.
• ING reorganized and expanded its U.S. Compliance Department, and created an Enterprise Compliance team to enhance controls and consistency in regulatory compliance.
As has been widely reported in the media, the New York Attorney General’s office (“NYAG”) is conducting broad investigations regarding insurance quoting and brokerage practices. ING U.S. has been subpoenaed in this regard, and is cooperating fully with these NYAG requests for information.
ING U.S. believes that its practices are consistent with our business principles and our commitment to our customers.
At this time, in light of the current regulatory factors, ING U.S. is actively engaged in reviewing whether any modifications in our practices are appropriate for the future.
There can be no assurance that these matters, or the adverse publicity associated with them, will not result in increased fund redemptions, reduced sale of fund shares, or other adverse consequences to ING Funds.
24
DIRECTOR AND OFFICER INFORMATION (UNAUDITED)
The business and affairs of the Funds are managed under the direction of the Funds’ Board of Directors. A Director who is not an interested person of the Company, as defined in the 1940 Act, is an independent trustee (“Independent Director”). The Directors and Officers of the Funds are listed below. The Statement of Additional Information includes additional information about directors of the Registrant and is available, without charge, upon request at 1-800-992-0180.
Name, Address and Age | | Position(s)
held with
Company | | Term of Office
and Length of
Time Served(1) | | Principal Occupation(s)
during the Past Five
Years |
| | | | | | |
Independent Directors: | | | | | | |
| | | | | | |
John V. Boyer(3)
7337 E. Doubletree Ranch Rd.
Scottsdale, Arizona 85258
Age: 52 | | Director | | January 2005 —
Present | | Unemployed. Formerly, Executive Director,
The Mark Twain House & Museum(2)
(September 1989 — November 2005). |
| | | | | | |
J. Michael Earley(4)
7337 E. Doubletree Ranch Rd.
Scottsdale, Arizona 85258
Age: 60 | | Director | | February 2001 —
Present | | President and Chief Executive Officer,
Bankers Trust Company, N.A. (June 1992 —
Present). |
| | | | | | |
R. Barbara Gitenstein(3)
7337 E. Doubletree Ranch Rd.
Scottsdale, Arizona 85258
Age: 57 | | Director | | February 2002 —
Present | | President, College of New Jersey (January
1999 — Present). |
| | | | | | |
Patrick W. Kenny(4)
7337 E. Doubletree Ranch Rd.
Scottsdale, Arizona 85258
Age: 62 | | Director | | January 2005 —
Present | | President and Chief Executive Officer
International Insurance Society (June 2001 — Present). Formerly, Executive Vice President, Frontier Insurance Group, Inc. (September 1998 — March 2001). |
| | | | | | |
Walter H. May(3)
7337 E. Doubletree Ranch Rd.
Scottsdale, Arizona 85258
Age: 69 | | Director | | October 1999 —
Present | | Retired. |
| | | | | | |
Jock Patton(3)
7337 E. Doubletree Ranch Rd.
Scottsdale, Arizona 85258
Age: 60 | | Chairman and Director | | May 1999 —
Present | | Private Investor (June 1997 — Present).
Formerly, Director and Chief Executive
Officer, Rainbow Multimedia Group, Inc.
(January 1999 — December 2001). |
| | | | | | |
David W.C. Putnam(4)
7337 E. Doubletree Ranch Rd.
Scottsdale, Arizona 85258
Age: 66 | | Director | | October 1999 —
Present | | President and Director, F.L. Putnam Securities Company, Inc. (June 1978 — Present). |
| | | | | | |
Roger B. Vincent(4)
7337 E. Doubletree Ranch Rd.
Scottsdale, Arizona 85258
Age: 60 | | Director | | February 2002 —
Present | | President, Springwell Corporation (March
1989 — Present). |
[Additional columns below]
[Continued from above table, first column(s) repeated]
| | Number of | | |
| | Portfolios | | |
| | in Fund | | |
| | Complex | | |
| | Overseen | | Other Directorships |
Name, Address and Age | | by Director | | held by Director |
| | | | |
Independent Directors: | | | | |
John V. Boyer(3)
7337 E. Doubletree Ranch Rd.
Scottsdale, Arizona 85258
Age: 52 | | 172 | | None |
J. Michael Earley(4)
7337 E. Doubletree Ranch Rd.
Scottsdale, Arizona 85258
Age: 60 | | 172 | | None |
R. Barbara Gitenstein(3)
7337 E. Doubletree Ranch Rd.
Scottsdale, Arizona 85258
Age: 57 | | 172 | | None |
Patrick W. Kenny(4)
7337 E. Doubletree Ranch Rd.
Scottsdale, Arizona 85258
Age: 62 | | 172 | | Assured Guaranty Ltd. (November 2003 — Present). |
Walter H. May(3)
7337 E. Doubletree Ranch Rd.
Scottsdale, Arizona 85258
Age: 69 | | 172 | | BestPrep (September 1991 — Present). |
Jock Patton(3)
7337 E. Doubletree Ranch Rd.
Scottsdale, Arizona 85258
Age: 60 | | 172 | | JDA Software Group, Inc. (January 1999 — Present); and
Swift Transportation Co. (March 2004 — Present). |
David W.C. Putnam(4)
7337 E. Doubletree Ranch Rd.
Scottsdale, Arizona 85258
Age: 66 | | 172 | | Progressive Capital Accumulation Trust (August 1998 —
Present); Principled Equity Market Trust (November
1996 — Present); Mercy Endowment Foundation
(September 1995 — Present); Asian American Bank and
Trust Company (June 1992 — Present); and Notre Dame
Health Care Center (July 1991 — Present). |
Roger B. Vincent(4)
7337 E. Doubletree Ranch Rd.
Scottsdale, Arizona 85258
Age: 60 | | 172 | | AmeriGas Propane, Inc. (January 1998 — Present). |
25
DIRECTOR AND OFFICER INFORMATION (UNAUDITED) (CONTINUED)
| | | | | | |
| | Position(s) | | Term of Office | | Principal Occupation(s) |
| | held with | | and Length of | | during the Past Five |
Name, Address and Age | | Company | | Time Served(1) | | Years |
| | | | | | |
Richard A. Wedemeyer(3)
7337 E. Doubletree Ranch Rd.
Scottsdale, Arizona 85258
Age: 69 | | Director | | February 2001 —
Present | | Retired. Formerly, Vice President — Finance
and Administration, The Channel Corporation
(June 1996 — April 2002). Formerly, Trustee,
First Choice Funds (February 1997 — April
2001). |
| | | | | | |
Trustees who are “Interested
Persons”: | | | | | | |
| | | | | | |
Thomas J. McInerney(5)
7337 E. Doubletree Ranch Rd.
Scottsdale, Arizona 85258
Age: 49 | | Director | | February 2001 —
Present | | Chief Executive Officer, ING U.S. Financial
Services (January 2005 — Present); General
Manager and Chief Executive Officer,
U.S. Financial Services (December 2003 —
December 2004); Chief Executive Officer,
ING U.S. Financial Services (September
2001 — December 2003); and General
Manager and Chief Executive Officer,
U.S. Worksite Financial Services (December
2000 — September 2001). |
| | | | | | |
John G. Turner(6)
7337 E. Doubletree Ranch Rd.
Scottsdale, Arizona 85258
Age: 66 | | Director | | October 1999 —
Present | | Retired. Formerly, Vice Chairman of ING
Americas (September 2000 — January 2002);
Chairman and Chief Executive Officer of
ReliaStar Financial Corp. and ReliaStar Life
Insurance Company (July 1993 — September
2000); Director of ReliaStar Life Insurance
Company of New York (April 1975 —
December 2001); and Chairman and Trustee of
the Northstar affiliated investment companies
(May 1993 — December 2001). |
[Additional columns below]
[Continued from above table, first column(s) repeated]
| | Number of | | |
| | Portfolios | | |
| | in Fund | | |
| | Complex | | |
| | Overseen | | Other Directorships |
Name, Address and Age | | by Director | | held by Director |
Richard A. Wedemeyer(3)
7337 E. Doubletree Ranch Rd.
Scottsdale, Arizona 85258
Age: 69 | | 172 | | Touchstone Consulting Group (June 1997 — Present) and Jim Henson
Legacy (April 1994 — Present). |
| | | | |
Trustees who are “Interested
Persons”: | | | | |
Thomas J. McInerney(5)
7337 E. Doubletree Ranch Rd.
Scottsdale, Arizona 85258
Age: 49 | | 212 | | Equitable Life Insurance Co., Golden American Life Insurance Co., Life
Insurance Company of Georgia, Midwestern United Life Insurance Co.,
ReliaStar Life Insurance Co., Security Life of Denver, Security Connecticut
Life Insurance Co., Southland Life Insurance Co., USG Annuity and Life
Company, and United Life and Annuity Insurance Co. Inc.; Ameribest Life
Insurance Co.; First Columbine Life Insurance Co.; and Metro Atlanta
Chamber of Commerce (January 2003 — Present). |
John G. Turner(6)
7337 E. Doubletree Ranch Rd.
Scottsdale, Arizona 85258
Age: 66 | | 172 | | Hormel Foods Corporation (March 2000 — Present); ShopKo Stores, Inc.
(August 1999 — Present); and Conseco, Inc. (September 2003 — Present). |
(1) Directors serve until their successors are duly elected and qualified, subject to the Board’s retirement policy.
(2) Shaun Mathews, Senior Vice President of ING Life Insurance and Annuity Company, has held a seat on the board of directors of The Mark Twain House & Museum since September 19, 2002. ING Groep N.V. makes non-material, charitable contributions to The Mark Twain House & Museum.
(3) Valuation, Proxy and Brokerage Committee member.
(4) Audit Committee member.
(5) Mr. McInerney is an “interested person,” as defined under the 1940 Act, because of his affiliation with ING Groep N.V., the parent corporation of the Investment Manager, ING Investments, LLC and the Distributor, ING Funds Distributor, LLC.
(6) Mr. Turner is an “interested person,” as defined under the 1940 Act, because of his affiliation with ING Groep N.V., the parent corporation of the Investment Manager, ING Investments, LLC and the Distributor, ING Funds Distributor, LLC.
26
DIRECTOR AND OFFICER INFORMATION (UNAUDITED) (CONTINUED)
| | | | Term of Office | | |
| | Position(s) | | and Length of | | Principal Occupation(s) |
Name, Address and Age | | held with the Trust | | Time Served(1) | | during the Past Five Years |
| | | | | | |
Officers: | | | | | | |
| | | | | | |
James M. Hennessy
7337 E. Doubletree Ranch Rd.
Scottsdale, Arizona 85258
Age: 56 | | President and Chief
Executive Officer
Chief Operating
Officer | | May 2003 — Present | | President, Chief Executive Officer and
Chief Operating Officer, ING
Investments, LLC (December 2000 —
Present). Formerly, Senior Executive
Vice President and Chief Operating
Officer, ING Investments, LLC (April
1995 — December 2000). |
| | | | | | |
Michael J. Roland
7337 E. Doubletree Ranch Rd.
Scottsdale, Arizona 85258
Age: 47 | | Executive Vice
President | | January 2005 — Present | | Executive Vice President, ING
Investments, LLC (December 2001 —
Present). Formerly, Chief Compliance
Officer, ING Investments, LLC
(October 2004 — December 2005);
Chief Financial Officer and Treasurer,
ING Investments, LLC (December
2001 — March 2005); and Senior Vice
President, ING Investments, LLC (June
1998 — December 2001). |
| | | | | | |
Stanley D. Vyner
7337 E. Doubletree Ranch Rd.
Scottsdale, Arizona 85258
Age: 55 | | Executive Vice
President | | January 2005 — Present | | Executive Vice President, ING
Investments, LLC (July 2000 —
Present) and Chief Investment Risk
Officer (January 2003 — Present).
Formerly, Chief Investment Officer of
the International Portfolios, ING
Investments, LLC (August 2000 —
January 2003). |
| | | | | | |
Joseph M. O’Donnell
7337 E. Doubletree Ranch Rd.
Scottsdale, Arizona 85258
Age: 51 | | Chief Compliance
Officer | | January 2005 — Present | | Chief Compliance Officer of the ING
Funds (November 2004 — Present) and
Directed Services, Inc. (January 2006 —
Present). Formerly, Vice President,
Chief Legal Counsel, Chief Compliance
Officer and Secretary of Atlas
Securities, Inc., Atlas Advisers, Inc. and
Atlas Funds (October 2001 — October
2004); and Chief Operating Officer and
General Counsel of Matthews
International Capital Management LLC
and Vice President and Secretary of
Matthews International Funds (August
1999 — May 2001). |
| | | | | | |
Todd Modic
7337 E. Doubletree Ranch Rd.
Scottsdale, Arizona 85258
Age: 38 | | Senior Vice
President, Chief
Financial Officer
and Assistant
Secretary | | March 2005 — Present | | Senior Vice President, ING Funds
Services, LLC (April 2005 — Present).
Formerly, Vice President, ING Funds
Services, LLC (September 2002 —
March 2005); Director, Financial
Reporting, ING Investments, LLC
(March 2001 — September 2002);
Director of Financial Reporting, Axient
Communications, Inc. (May 2000 —
January 2001). |
| | | | | | |
Robert S. Naka
7337 E. Doubletree Ranch Rd.
Scottsdale, Arizona 85258
Age: 42 | | Senior Vice
President | | January 2005 — Present | | Senior Vice President (August 1999 —
Present) and Assistant Secretary
(October 2001 — Present), ING Funds
Services, LLC. |
| | | | | | |
Kimberly A. Anderson
7337 E. Doubletree Ranch Rd.
Scottsdale, Arizona 85258
Age: 41 | | Senior Vice
President | | January 2005 — Present | | Senior Vice President and Assistant
Secretary, ING Investments, LLC
(October 2003 — Present). Formerly,
Vice President and Assistant Secretary,
ING Investments, LLC (January
2001 — October 2003); and Assistant
Vice President, ING Funds Services,
LLC (November 1999 — January
2001). |
| | | | | | |
Robyn L. Ichilov
7337 E. Doubletree Ranch Rd.
Scottsdale, Arizona 85258
Age: 38 | | Vice President and
Treasurer | | January 2005 — Present | | Vice President and Treasurer, ING
Funds Services, LLC (October 2001 —
Present) and ING Investments, LLC
(August 1997 — Present). |
| | | | | | |
Lauren D. Bensinger
7337 E. Doubletree Ranch Rd.
Scottsdale, Arizona 85258
Age: 51 | | Vice President | | January 2005 — Present | | Vice President and Chief Compliance
Officer, ING Funds Distributor, LLC
(July 1995 — Present); and Vice
President, ING Investments, LLC
(February 2003 — Present). Formerly,
Chief Compliance Officer, ING
Investments, LLC (October 2001 —
October 2004). |
| | | | | | |
Maria M. Anderson
7337 E. Doubletree Ranch Rd.
Scottsdale, Arizona 85258
Age: 47 | | Vice President | | January 2005 — Present | | Vice President, ING Funds Services,
LLC (September 2004 — Present).
Formerly, Assistant Vice President, ING
Funds Services, LLC (October 2001 —
September 2004); and Manager Fund
Accounting and Fund Compliance, ING
Investments, LLC (September 1999 —
October 2001). |
27
DIRECTOR AND OFFICER INFORMATION (UNAUDITED) (CONTINUED)
| | | | Term of Office | | |
| | Position(s) | | and Length of | | Principal Occupation(s) |
Name, Address and Age | | held with the Trust | | Time Served(1) | | during the Past Five Years |
| | | | | | |
Mary A. Gaston
7337 E. Doubletree Ranch Rd.
Scottsdale, Arizona 85258
Age: 39 | | Vice President | | March 2005 — Present | | Vice President, ING Fund Services,
LLC (April 2005 — Present). Formerly,
Assistant Vice President, Financial
Reporting, ING Investments, LLC
(April 2004 — April 2005); Manager,
Financial Reporting, ING Investments,
LLC (August 2002 — April 2004); and
Controller Z Seven Fund, Inc. and
Ziskin Asset Management, Inc. (January
2000 — March 2002). |
| | | | | | |
Laurie M. Tillinghast
7337 E. Doubletree Ranch Rd.
Scottsdale, Arizona 85258
Age: 53 | | Vice President | | May 2003 — Present | | Vice President, ING Life Insurance and
Annuity Company (December 2000 —
Present). Formerly, Vice President,
Aetna Retirement Services, Fund
Strategy and Management (December
1995 — December 2000); and Director
and President, ING Partners, Inc.
(November 1997 — May 2003). |
| | | | | | |
Susan P. Kinens
7337 E. Doubletree Ranch Rd.
Scottsdale, Arizona 85258
Age: 29 | | Assistant Vice President | | January 2005 — Present | | Assistant Vice President, ING Funds
Services, LLC (December 2002 —
Present); and has held various other
positions with ING Funds Services,
LLC for more than the last five years. |
| | | | | | |
Kimberly K. Palmer
7337 E. Doubletree Rand Rd.
Scottsdale, Arizona 85258
Age: 48 | | Assistant Vice President | | January 2005 — Present | | Assistant Vice President, ING Funds
Services, LLC (August 2004 —
Present). Formerly, Manager,
Registration Statements, ING Funds
Services, LLC (May 2003 — August
2004); Associate Partner, AMVESCAP
PLC (October 2000 — May 2003);
Director of Federal Filings and Blue Sky
Filings, INVESCO Funds Group, Inc.
(March 1994 — May 2003). |
| | | | | | |
Huey P. Falgout, Jr.
7337 E. Doubletree Ranch Rd.
Scottsdale, Arizona 85258
Age: 42 | | Secretary | | August 2003 — Present | | Chief Counsel, ING Americas,
U.S. Legal Services (September 2003 —
Present). Formerly, Counsel, ING
Americas, U.S. Legal Services
(November 2002 — September 2003);
and Associate General Counsel of AIG
American General (January 1999 —
November 2002). |
| | | | | | |
Theresa K. Kelety
7337 E. Doubletree Ranch Rd.
Scottsdale, Arizona 85258
Age: 42 | | Assistant Secretary | | August 2003 — Present | | Counsel, ING Americas, U.S. Legal
Services (April 2003 — Present).
Formerly, Senior Associate with
Shearman & Sterling (February 2000 —
April 2003). |
| | | | | | |
Robin R. Nesbitt
7337 E. Doubletree Rand Rd.
Scottsdale, Arizona 85258
Age: 32 | | Assistant Secretary | | August 2004 — Present | | Supervisor, Board Operations, ING
Funds Services, LLC (August 2003 —
Present). Formerly, Senior Legal
Analyst, ING Funds Services, LLC
(August 2002 — August 2003);
Associate, PricewaterhouseCoopers
(January 2001 — August 2001); and
Paralegal, McManis, Faulkner &
Morgan (May 2000 — December 2000). |
(1) The officers hold office until the next annual meeting of the Trustees and until their successors have been elected and qualified.
28
ADVISORY CONTRACT APPROVAL DISCUSSION (UNAUDITED)
Section 15(c) of the Investment Company Act of 1940 (the “1940 Act”) provides that, after an initial period, the Portfolios’ existing advisory agreement between ING Life Insurance and Annuity Company (the “Adviser”) and IPI, on behalf of the Portfolios (the “Advisory Contract”), remains in effect only if the Board of Directors (the “Board”) of ING Partners, Inc. (“IPI”), including a majority of the Directors who have no direct or indirect interest in the Advisory Contract, and who are not “interested persons” of the Portfolios, as such term is defined under the 1940 Act (the “Independent Directors”), annually review and renew the Contract. In this regard, at a meeting held on November 10, 2005 the Board, including a majority of the Independent Directors, considered whether to renew the Advisory Contract.
The Independent Directors also held separate meetings on October 11 and November 8, 2005 to consider renewals of the Advisory Contract. Thus, references herein to factors considered and determinations made by the Independent Directors include, as applicable, factors considered and determinations made on those earlier dates.
At the November 10, 2005 meeting, the Board voted to renew the Advisory Contract for the Portfolios. In reaching this decision, the Board took into account information furnished throughout the year at regular Board meetings, as well as information prepared specifically in connection with the annual review process. The Board’s determination took into account a number of factors that its members believed, in light of the legal advice furnished to them by Kirkpatrick & Lockhart Nicholson Graham LLP (“K&LNG”), their independent legal counsel, and their own business judgment, to be relevant.
Provided below is an overview of the Board’s contract approval process in general, as well as a discussion of certain of the specific factors the Board considered at the November 10, 2005 meeting. While the Board gave its attention to the information furnished, at its request, that was most relevant to its consideration, discussed below are a number of the primary factors relevant to the Board’s consideration as to whether to renew the Advisory Contract for the year ending November 30, 2006. Each Director may have accorded different weight to the various factors in reaching his or her conclusions with respect to the Portfolios’ advisory arrangements.
Overview of the Contract Approval Process
In 2003, the Board that currently oversees the Portfolios determined to undertake steps to further enhance the process under which the Board determines whether to renew existing advisory arrangements and to approve new advisory arrangements. Among the measures the Board implemented was to: retain the services of an independent consultant with experience in the mutual fund industry to assist the Independent Directors of the Board in working with the personnel employed by the Portfolios’ Adviser or its affiliates who administer the Portfolios (“Management”) to identify the types of information presented to the Directors to inform their deliberations with respect to advisory relationships; establish the format in which the information requested by the Board is provided to the Board; and determine the process for reviewing such information in connection with the Advisory Contract renewal process. The end result was the implementation of the current process relied upon by the Board to review and analyze information in connection with the annual renewal of the Portfolios’ Advisory Contract, as well as its review and approval of new advisory relationships.
Since this process was implemented, the Board has continuously reviewed and refined the process. In addition, the Board established a Contracts Committee and two Investment Review Committees, including a Domestic Equity Investment Review Committee. The type and format of the information provided to the Board or its counsel to inform its annual review and renewal process has been codified in the Portfolios’ 15(c) Methodology Guide (the “Methodology Guide”). The Methodology Guide was developed under the direction of the Board, and sets out a written blueprint under which the Board requests certain information necessary to facilitate a thorough and informed review in connection with the annual Advisory Contract renewal process. Management provides Portfolio-specific information to the Board based on the Methodology Guide through “Fund Analysis and Comparison Tables” or “FACT” sheets prior to the Board’s review of the Advisory Contract. Certain of this information for a representative sample of Funds in the ING Funds complex (other than the Portfolios) was verified, at the Board’s request, by an independent firm to test its accuracy.
On its own and as part of a regular on-going process, the Board’s Contracts Committee recommends or
29
ADVISORY CONTRACT APPROVAL DISCUSSION (UNAUDITED) (CONTINUED)
considers recommendations from Management for refinements and other changes to the Methodology Guide and other aspects of the review process, and the Board’s Domestic Equity Investment Review Committee reviews benchmarks used to assess the performance of each Portfolio. The Investment Review Committee also meets regularly with the Adviser. The Domestic Equity Investment Review Committee may apply a heightened level of scrutiny in cases where performance has lagged a benchmark and/or peer group.
The Board employed its process for reviewing contracts when considering the renewal of the Advisory Contract that would be effective through November 30, 2006. A number of the Board’s primary considerations and conclusions resulting from this process are discussed below.
Nature, Extent and Quality of Service
In determining whether to approve the Advisory Contract for the year ending November 30, 2006, the Board received and evaluated such information as it deemed necessary regarding the nature, extent and quality of services provided to the Portfolios by the Adviser. This included information about the Adviser provided throughout the year at regular Board meetings, as well as information furnished for the November 10, 2005 Board meeting, which was held to specifically consider renewal for the period ending November 30, 2006. In addition, the Board’s Independent Directors also held meetings on October 11th and November 8th, prior to the November 10, 2005 meeting of the full Board, to consider the annual renewal of the Advisory Contract.
The materials requested by and provided to the Board prior to the November 2005 Board meeting included the following items: (1) FACT sheets for each Portfolio that provide information about the performance and expenses of the Portfolio and other, similarly managed funds in a selected peer group (“Selected Peer Group”), as well as information about the Portfolio’s investment portfolio, objectives and strategies; (2) the Methodology Guide, which describes how the FACT sheets were prepared, including the manner in which benchmarks and Selected Peer Groups were selected and how profitability was determined; (3) responses to a detailed series of questions from K&LNG, legal counsel to the Independent Directors; (4) a copy of the form of Advisory Contract; (5) a copy of the Form ADV for the Adviser; (6) financial statements for the Adviser; (7) drafts of narrative summaries addressing key factors the Board customarily considers in evaluating the renewal of the Advisory Contract, including a written analysis for each Portfolio of how performance and fees compare to its Selected Peer Group and/or designated benchmarks; and (8) other information relevant to the Board’s evaluations.
Each Portfolio’s Class S shares were used for purposes of certain comparisons to the funds in the Selected Peer Group. Class S shares were selected, as general matter, so that the Portfolio class with the longest performance history was compared to the analogous class of shares for each fund in the Selected Peer Group. The mutual funds chosen for inclusion in a Portfolio’s Selected Peer group were selected based upon criteria designed to mirror the Portfolio class being compared to the Selected Peer Group.
In arriving at its conclusions with respect to the advisory arrangements with the Adviser, the Board noted the resources that the Adviser has committed to the Board and its Investment Review Committees to assist the Board and Committee members with their assessment of the investment performance of the Portfolios and other Funds in the ING Funds complex. This includes the appointment of a Chief Investment Risk Officer and his staff, who report directly to the Board, and who have developed attribution analyses and other metrics used by the Domestic Equity Investment Review Committees to analyze the key factors underlying investment performance for the Portfolios and other ING Funds.
In considering the Advisory Contract, the Board also considered the extent of benefits provided to the Portfolios’ shareholders, beyond advisory services, from being part of the ING family of Funds. This includes, in most cases, the right to exchange or transfer investments between the same class of shares of such Funds, without a sales charge, or among Funds available in a product platform, and the wide variety in the types of Funds available for exchange or transfer.
The Board received periodic reports showing that the investment policies and restrictions for each Portfolio were consistently complied with and other periodic reports covering matters such as compliance by Adviser personnel with codes of ethics. The Board evaluated the Adviser’s regulatory compliance systems and procedures reasonably designed to assure
30
ADVISORY CONTRACT APPROVAL DISCUSSION (UNAUDITED) (CONTINUED)
compliance with the federal securities laws, including those related to late trading and market timing, best execution, fair value pricing, proxy voting procedures, and trade allocation, among others. The Board considered the implementation by the Adviser of enhanced compliance policies and procedures in response to SEC rule changes and other regulatory initiatives. The Board also took into account the reports of the Chief Compliance Officer and his recommendations. In this regard, the Board also considered the policies and procedures developed by the Chief Compliance Officer in consultation with the Board’s Compliance Committee that guide the Chief Compliance Officer’s compliance oversight function.
The Board reviewed the level of staffing, quality and experience of each Portfolio’s portfolio management team. The Board took into account the resources and reputation of the Adviser, and evaluated the ability of the Adviser to attract and retain qualified investment advisory personnel. For larger Portfolios, the Board also considered the adequacy of the resources committed to the Portfolios by the Adviser, and whether those resources are commensurate with the needs of larger Portfolios and are appropriate to attempt to sustain expected levels of performance, compliance, and other needs.
Based on their deliberations and the materials presented to them, the Board concluded that the advisory and related services provided by the Adviser are appropriate in light of the Portfolios’ operations, the competitive landscape of the investment company business, and investor needs, and that the nature and quality of the overall services provided by the Adviser were appropriate.
Portfolio Performance
In assessing advisory relationships, the Board placed emphasis on the investment performance of each Portfolio, taking into account the importance of such performance to the Portfolio’s shareholders. While the Board considered the performance reports and discussions with portfolio managers at Board and Committee meetings during the year, particular attention in assessing performance was given to the Portfolio FACT sheets furnished in advance of the November meeting of the Independent Directors. The FACT sheet prepared for each Portfolio included its investment performance compared to the Morningstar category median, Lipper category median, Selected Peer Group and Portfolio’s primary benchmark. The Board’s findings specific to each Portfolio’s performance are discussed under “Portfolio-by-Portfolio Analysis,” below.
Economies of Scale
In considering the reasonableness of advisory fees, the Board also considered whether economies of scale will be realized by the Adviser as a Portfolio grows larger and the extent to which this is reflected in the level of management fee rates charged. In this regard, the Board noted that each Portfolio invests all of its assets in a corresponding “Master Fund” managed by Fidelity Management & Research Company (“FMR”), and that FMR applies a “group rate” discount based upon the assets under FMR’s management, lowering the management fees payable by the Master Funds at higher asset levels. The Board considered that these reductions would indirectly benefit the Portfolios. The Board also noted that any waivers to or reimbursements of advisory or other fees payable by the Master Funds would have an indirect benefit to the Portfolios, and the extent to which economies of scale could effectively be realized through such waivers or reimbursements.
Information about Services to Other Clients
The Board requested and received information about the nature of services and fee rates offered by the Adviser to other registered investment companies.
Fee Rates and Profitability
The Board reviewed and considered the contractual investment advisory fee rate, combined with the administrative fee rate, payable by each Portfolio to the Adviser. In analyzing this information, the Board took into account that no advisory fees are charged when the Portfolio is fully invested in the corresponding Master Fund, and that advisory fees charged by the Master Funds are indirectly borne by Portfolio shareholders.
The Board considered the fee structures of the Portfolios as they relate to the services provided under the Advisory Contract and the potential fall-out benefits to the Adviser and its affiliates from their association with the Portfolios. For each Portfolio, the Board determined that the fees payable to the Adviser and/or its affiliates, which consist of an administrative fee while the Portfolio invests in the corresponding Master Fund and “other” expenses, are reasonable for the services that the Adviser and its
31
ADVISORY CONTRACT APPROVAL DISCUSSION (UNAUDITED) (CONTINUED)
affiliates perform, which were considered in light of the nature and quality of the services that each has performed and is expected to perform through the year ending November 30, 2006.
For each Portfolio, the Board considered information on revenues, costs and profits realized by the Adviser, which was prepared by Management in accordance with the allocation methodology (including assumptions) specified in the Methodology Guide. The Board also considered information that it requested and was provided by Management with respect to the profitability of service providers affiliated with the Adviser.
The Board determined that it had requested and received sufficient information to gain a reasonable understanding regarding the Adviser’s profitability. The Board also recognized that profitability analysis is not an exact science and there is no uniform methodology for determining profitability for this purpose. In this context, the Board realized that Management’s calculations regarding its costs incurred in establishing the infrastructure necessary for the Portfolios’ operations may not be fully reflected in the expenses allocated to each Portfolio in determining profitability, and that the information presented may not portray all of the costs borne by Management nor capture Management’s entrepreneurial risk associated with offering and managing a mutual fund complex in today’s regulatory environment.
Based on the information on revenues, costs, and profitability considered by the Board, after considering the factors described in this section that the profits, if any, realized by the Adviser were not excessive.
Portfolio-by-Portfolio Analysis
The following paragraphs outline certain of the specific factors that the Board considered, and the conclusions reached, at its November 2005 meeting in relation to renewing each Portfolio’s current Advisory Contract for the year ending November 30, 2006. These specific factors are in addition to those considerations discussed above. In each case, the Portfolio’s performance was compared to its Morningstar category median and its primary benchmark, a broad-based securities market index that appears in the Portfolio’s prospectus. Each Portfolio’s management fee and expense ratio were compared to the fees and expense ratios of the funds in its Selected Peer Group.
ING Fidelity® VIP Contrafund® Portfolio
In considering whether to approve the renewal of the Advisory Contract for ING Fidelity® VIP Contrafund Portfolio, the Board considered that, based on performance data for the periods ended June 30, 2005: (1) the Portfolio outperformed its Morningstar category median and its primary benchmark for all periods presented; (2) the Portfolio ranked in the first (highest) quintile for the one-month and year-to-date periods and the most recent calendar quarter. In analyzing this performance data, the Board took into account that the Portfolio launched in November 2004, and therefore had less than one year of operating history.
In considering the fees payable under the Advisory Contract for ING Fidelity® VIP Contrafund Portfolio, the Board took into account the factors described above and also considered: (1) the fairness of the compensation under an Advisory Contract (a) under which no advisory fees are charged when the Portfolio is fully invested in Fidelity’s VIP Contrafund Portfolio (the “Contrafund Master Fund”); and (b) advisory fees are charged by the Contrafund Master Fund and indirectly borne by Portfolio shareholders; (2) the pricing structure (including the expense ratio to be borne by shareholders) of ING Fidelity® VIP Contrafund Portfolio, as compared to its Selected Peer Group, including management’s analysis that: (a) the management fee for the Portfolio (consisting of a 0.05% administration fee) is below the median and the average management fees of the funds in its Selected Peer Group; and (b) the expense ratio for the Portfolio is equal to the median and above the average expense ratios of the funds in its Selected Peer Group.
After its deliberation, the Board reached the following conclusions: (1) the Portfolio’s management fee rate is reasonable in the context of all factors considered by the Board; (2) the Portfolio’s expense ratio is reasonable in the context of all factors considered by the Board; and (3) the Portfolio’s performance is reasonable in the context of all factors considered by the Board. Based on these conclusions and other factors, the Board voted to renew the Advisory Contract for the Portfolio for the year ending November 30, 2006. During this renewal process, different Board members may have given
32
ADVISORY CONTRACT APPROVAL DISCUSSION (UNAUDITED) (CONTINUED)
different weight to different individual factors and related conclusions.
ING Fidelity® Equity-Income Portfolio
In considering whether to approve the renewal of the Advisory Contract for ING Fidelity® VIP Equity-Income Portfolio, the Board considered that, based on performance data for the periods ended June 30, 2005: (1) the Portfolio underperformed its Morningstar category median and its primary benchmark for all periods presented; and (2) the Portfolio is ranked in the fourth quintile for the
year-to-date period and most recent calendar quarter. In analyzing this performance data, the Board took into account that the Portfolio launched in November 2004, and therefore had less than one year of operating history.
In considering the fees payable under the Advisory Contract for ING Fidelity® VIP Equity-Income Portfolio, the Board took into account the factors described above and also considered: (1) the fairness of the compensation under an Advisory Contract (a) under which no advisory fees are charged when the Portfolio is fully invested in Fidelity’s VIP Equity-Income Portfolio (the “Equity-Income Master Fund”); and (b) advisory fees are charged by the Equity-Income Master Fund and indirectly borne by Portfolio shareholders; (2) the pricing structure (including the expense ratio to be borne by shareholders) of ING Fidelity® VIP Equity-Income Portfolio, as compared to its Selected Peer Group, including management’s analysis that: (a) the management fee for the Portfolio (consisting of a 0.05% administration fee) is below the median and the average management fees of the funds in its Selected Peer Group; and (b) the expense ratio for the Portfolio is equal to the median and above the average expense ratios of the funds in its Selected Peer Group.
After its deliberation, the Board reached the following conclusions: (1) the Portfolio’s management fee rate is reasonable in the context of all factors considered by the Board; (2) the Portfolio’s expense ratio is reasonable in the context of all factors considered by the Board; and (3) the Portfolio was launched in November 2004, and it is reasonable to permit the Adviser to continue to manage the Portfolio as a master-feeder fund investing in the Equity-Income Master Fund to assess Portfolio performance. Based on these conclusions and other factors, the Board voted to renew the Advisory Contract for the Portfolio for the year ending November 30, 2006. During this renewal process, different Board members may have given different weight to different individual factors and related conclusions.
ING Fidelity® VIP Growth Portfolio
In considering whether to approve the renewal of the Advisory Contract for ING Fidelity® VIP Growth Portfolio, the Board considered that, based on performance data for the periods ended June 30, 2005: (1) the Portfolio underperformed its Morningstar category median and its primary benchmark for all periods presented; and (2) the Portfolio is ranked in the fifth (lowest) quintile for the year-to-date period and in the fourth quintile for the most recent calendar quarter. In analyzing this performance data, the Board took into account that the Portfolio launched in November 2004, and therefore had less than one year of operating history.
In considering the fees payable under the Advisory Contract for ING Fidelity® VIP Growth Portfolio, the Board took into account the factors described above and also considered: (1) the fairness of the compensation under an Advisory Contract (a) under which no advisory fees are charged when the Portfolio is fully invested in Fidelity’s VIP Growth Portfolio (the “Growth Master Fund”); and (b) advisory fees are charged by the Growth Master Fund and indirectly borne by Portfolio shareholders; (2) the pricing structure (including the expense ratio to be borne by shareholders) of ING Fidelity® VIP Growth Portfolio, as compared to its Selected Peer Group, including management’s analysis that: (a) the management fee for the Portfolio (consisting of a 0.05% administration fee) is below the median and the average management fees of the funds in its Selected Peer Group; and (b) the expense ratio for the Portfolio is equal to the median and above the average expense ratios of the funds in its Selected Peer Group.
After its deliberation, the Board reached the following conclusions: (1) the Portfolio’s management fee rate is reasonable in the context of all factors considered by the Board; (2) the Portfolio’s expense ratio is reasonable in the context of all factors considered by the Board; and (3) the Portfolio was launched in November 2004, and it is reasonable to permit the Adviser to continue to manage the Portfolio as a master-feeder fund investing in the
33
ADVISORY CONTRACT APPROVAL DISCUSSION (UNAUDITED) (CONTINUED)
Growth Master Fund to assess Portfolio performance. Based on these conclusions and other factors, the Board voted to renew the Advisory Contract for the Portfolio for the year ending November 30, 2006. During this renewal process, different Board members may have given different weight to different individual factors and related conclusions.
ING Fidelity® VIP Mid Cap Portfolio
In considering whether to approve the renewal of the Advisory Contract for ING Fidelity® VIP Mid Cap Portfolio, the Board considered that, based on performance data for the periods ended June 30, 2005: (1) the Portfolio outperformed its Morningstar category median for the most recent one-month and year-to-date periods, but underperformed for the most recent calendar quarter; (2) the Portfolio outperformed its primary benchmark for the most recent one-month period, but underperformed for the most recent calendar quarter and year-to-date periods; and (3) the Portfolio is ranked in the second quintile for the year-to-date period and in the fourth quintile for the most recent calendar quarter. In analyzing this performance data, the Board took into account that the Portfolio launched in November 2004, and therefore had less than one year of operating history.
In considering the fees payable under the Advisory Contract for ING Fidelity® VIP Mid Cap Portfolio, the Board took into account the factors described above and also considered: (1) the fairness of the compensation under an Advisory Contract (a) under which no advisory fees are charged when the Portfolio is fully invested in Fidelity’s VIP Mid Cap Portfolio (the “Mid Cap Master Fund”); and (b) advisory fees are charged by the Mid Cap Master Fund and indirectly borne by Portfolio shareholders; (2) the pricing structure (including the expense ratio to be borne by shareholders) of ING Fidelity® VIP Mid Cap Portfolio, as compared to its Selected Peer Group, including management’s analysis that: (a) the management fee for the Portfolio (consisting of a 0.05% administration fee) is below the median and the average management fees of the funds in its Selected Peer Group; and (b) the expense ratio for the Portfolio is equal to the median and above the average expense ratios of the funds in its Selected Peer Group.
After its deliberation, the Board reached the following conclusions: (1) the Portfolio’s management fee rate is reasonable in the context of all factors considered by the Board; (2) the Portfolio’s expense ratio is reasonable in the context of all factors considered by the Board; and (3) the Portfolio was launched in November 2004, and it is reasonable to permit the Adviser to continue to manage the Portfolio as a master-feeder fund investing in the Mid Cap Master Fund to assess Portfolio performance. Based on these conclusions and other factors, the Board voted to renew the Advisory Contract for the Portfolio for the year ending November 30, 2006. During this renewal process, different Board members may have given different weight to different individual factors and related conclusions.
34
Investment Manager and Distributor
ING Life Insurance and Annuity Company
151 Farmington Avenue
Hartford, Connecticut 06156
Custodian
The Bank of New York
100 Colonial Center Parkway, Suite 300
Lake Mary, Florida 32746
Legal Counsel
Dechert LLP
1775 I Street, N.W.
Washington, D.C. 20006
Independent Registered Public Accounting Firm
KPMG LLP
99 High Street
Boston, Massachusetts 02110
Before investing, carefully consider the investment objectives, risks, charges and expenses of the variable annuity contract and the underlying variable investment options. This and other information is contained in the prospectus for the variable annuity contract and the underlying variable investment options. Obtain these prospectuses from your agent/registered representative and read them carefully before investing.
 
| VPSAR-UFID (1205-022406) |
Item 2. Code of Ethics.
As of the end of the period covered by this report, Registrant had adopted a code of ethics, as defined in Item 2 of Form N-CSR, that applies to the Registrant’s principal executive officer and principal financial officer. There were no amendments to the Code during the period covered by the report. The Registrant did not grant any waivers, including implicit waivers, from any provisions of the Code during the period covered by this report. The code of ethics is filed herewith pursuant to Item 10(a)(1), Exhibit 99.CODE ETH.
Item 3. Audit Committee Financial Expert.
The Board of Trustees has determined that Patrick W. Kenny is an audit committee financial expert, as defined in Item 3 of Form N-CSR. Mr. Kenny is “independent” for purposes of Item 3 of Form N-CSR.
Item 4. Principal Accountant Fees and Services.
(a) Audit Fees: The aggregate fees billed for each of the last two fiscal years for professional services rendered by KPMG LLP (“KPMG”), the principal accountant for the audit of the registrant’s annual financial statements, for services that are normally provided by the accountant in connection with statutory and regulatory filings or engagements for those fiscal years were $445,750 for year ended December 31, 2005 and $273,600 for year ended December 31, 2004.
(b) Audit-Related Fees: The aggregate fees billed in each of the last two fiscal years for assurance and related services by KPMG that are reasonably related to the performance of the audit of the registrant’s financial statements and are not reported under paragraph (a) of this Item.
None
(c) Tax Fees: The aggregate fees billed in each of the last two fiscal years for professional services rendered by KPMG for tax compliance, tax advice, and tax planning were $24,250 in the year ended December 31, 2005 and $48,900 in the year ended December 31, 2004. Such services included review of excise distribution calculations (if applicable), preparation of the Funds’ federal, state and excise tax returns, tax services related to mergers and routine consulting.
(d) All Other Fees: The aggregate fees billed in each of the last two fiscal years for products and services provided by KPMG, other than the services reported in paragraphs (a) through (c) of this Item.
None
(e) (1) Audit Committee Pre-Approval Policies and Procedures
2
FORM OF
AUDIT AND NON-AUDIT SERVICES
PRE-APPROVAL POLICY
I. Statement of Principles
Under the Sarbanes-Oxley Act of 2002 (the “Act”), the Audit Committee of the Board of Directors or Trustees (the “Committee”) of the ING Funds (each a “Fund,” collectively, the “Funds”) set out on Exhibit A to this Audit and Non-Audit Services Pre-Approval Policy (“Policy”) is responsible for the oversight of the work of the Funds’ independent auditors. As part of its responsibilities, the Committee must pre-approve the audit and non-audit services performed by the auditors in order to assure that the provision of these services does not impair the auditors’ independence from the Funds. The Committee has adopted, and the Board has ratified, this Policy, which sets out the procedures and conditions under which the services of the independent auditors may be pre-approved.
Under Securities and Exchange Commission (“SEC”) rules promulgated in accordance with the Act, the Funds may establish two different approaches to pre-approving audit and non-audit services. The Committee may approve services without consideration of specific case-by-case services (“general pre-approval”) or it may pre-approve specific services (“specific pre-approval”). The Committee believes that the combination of these approaches contemplated in this Policy results in an effective and efficient method for pre-approving audit and non-audit services to be performed by the Funds’ independent auditors. Under this Policy, services that are not of a type that may receive general pre-approval require specific pre-approval by the Committee. Any proposed services that exceed pre-approved cost levels or budgeted amounts will also require the Committee’s specific pre-approval.
For both types of approval, the Committee considers whether the subject services are consistent with the SEC’s rules on auditor independence and that such services are compatible with maintaining the auditors independence. The Committee also considers whether a particular audit firm is in the best position to provide effective and efficient services to the Funds. Reasons that the auditors are in the best position include the auditors’ familiarity with the Funds’ business, personnel, culture, accounting systems, risk profile, and other factors, and whether the services will enhance the Funds’ ability to manage and control risk or improve audit quality. Such factors will be considered as a whole, with no one factor being determinative.
The appendices attached to this Policy describe the audit, audit-related, tax-related, and other services that have the Committee’s general pre-approval. For any service that has been approved through general pre-approval, the general pre-approval will remain in place for a period 12 months from the date of pre-approval, unless the Committee determines that a different period is appropriate. The Committee will annually review and pre-approve the services that may be provided by the independent auditors without specific pre-approval. The Committee will revise the list of services subject to general pre-approval as appropriate. This Policy does not serve as a delegation to Fund management of the Committee’s duty to pre-approve services performed by the Funds’ independent auditors.
3
II. Audit Services
The annual audit services engagement terms and fees are subject to the Committee’s specific pre-approval. Audit services are those services that are normally provided by auditors in connection with statutory and regulatory filings or engagements or those that generally only independent auditors can reasonably provide. They include the Funds’ annual financial statement audit and procedures that the independent auditors must perform in order to form an opinion on the Funds’ financial statements (e.g., information systems and procedural reviews and testing). The Committee will monitor the audit services engagement and approve any changes in terms, conditions or fees deemed by the Committee to be necessary or appropriate.
The Committee may grant general pre-approval to other audit services, such as statutory audits and services associated with SEC registration statements, periodic reports and other documents filed with the SEC or issued in connection with securities offerings.
The Committee has pre-approved the audit services listed on Appendix A. The Committee must specifically approve all audit services not listed on Appendix A.
III. Audit-related Services
Audit-related services are assurance and related services that are reasonably related to the performance of the audit or the review of the Funds’ financial statements or are traditionally performed by the independent auditors. The Committee believes that the provision of audit-related services will not impair the independent auditors’ independence, and therefore may grant pre-approval to audit-related services. Audit-related services include accounting consultations related to accounting, financial reporting or disclosure matters not classified as “audit services;” assistance with understanding and implementing new accounting and financial reporting guidance from rulemaking authorities; agreed-upon or expanded audit procedures relating to accounting and/or billing records required to respond to or comply with financial, accounting or regulatory reporting matters; and assistance with internal control reporting requirements under Form N-SAR or Form N-CSR.
The Committee has pre-approved the audit-related services listed on Appendix B. The Committee must specifically approve all audit-related services not listed on Appendix B.
IV. Tax Services
The Committee believes the independent auditors can provide tax services to the Funds, including tax compliance, tax planning, and tax advice, without compromising the auditors’ independence. Therefore, the Committee may grant general pre-approval with respect to tax services historically provided by the Funds’ independent auditors that do not, in the Committee’s view, impair auditor independence and that are consistent with the SEC’s rules on auditor independence.
The Committee will not grant pre-approval if the independent auditors initially recommends a transaction the sole business purpose of which is tax avoidance and the tax treatment of which may not be supported in the Internal Revenue Code and related regulations. The Committee may consult
4
outside counsel to determine that tax planning and reporting positions are consistent with this Policy.
The Committee has pre-approved the tax-related services listed on Appendix C. The Committee must specifically approve all tax-related services not listed on Appendix C.
V. Other Services
The Committee believes it may grant approval of non-audit services that are permissible services for independent auditors to a Fund. The Committee has determined to grant general pre-approval to other services that it believes are routine and recurring, do not impair auditor independence, and are consistent with SEC rules on auditor independence.
The Committee has pre-approved the non-audit services listed on Appendix D. The Committee must specifically approve all non-audit services not listed on Appendix D.
A list of the SEC’s prohibited non-audit services is attached to this Policy as Appendix E. The SEC’s rules and relevant guidance should be consulted to determine the precise definitions of these impermissible services and the applicability of exceptions to certain of the SEC’s prohibitions.
VI. Pre-approval of Fee levels and Budgeted Amounts
The Committee will annually establish pre-approval fee levels or budgeted amounts for audit, audit-related, tax and non-audit services to be provided to the Funds by the independent auditors. Any proposed services exceeding these levels or amounts require the Committee’s specific pre-approval. The Committee considers fees for audit and non-audit services when deciding whether to pre-approve services. The Committee may determine, for a pre-approval period of 12 months, the appropriate ratio between the total amount of fees for the Fund’s audit, audit-related, and tax services (including fees for services provided to Fund affiliates that are subject to pre-approval), and the total amount of fees for certain permissible non-audit services for the Fund classified as other services (including any such services provided to Fund affiliates that are subject to pre-approval).
VII. Procedures
Requests or applications for services to be provided by the independent auditors will be submitted to management. If management determines that the services do not fall within those services generally pre-approved by the Committee and set out in the appendices to these procedures, management will submit the services to the Committee or its delagee. Any such submission will include a detailed description of the services to be rendered. Notwithstanding this paragraph, the Committee will, on a quarterly basis, receive from the independent auditors a list of services provided for the previous calendar quarter on a cumulative basis by the auditors during the Pre-Approval Period.
5
VIII. Delegation
The Committee may delegate pre-approval authority to one or more of the Committee’s members. Any member or members to whom such pre-approval authority is delegated must report any pre-approval decisions, including any pre-approved services, to the Committee at its next scheduled meeting. The Committee will identify any member to whom pre-approval authority is delegated in writing. The member will retain such authority for a period of 12 months from the date of pre-approval unless the Committee determines that a different period is appropriate. The period of delegated authority may be terminated by the Committee or at the option of the member.
IX. Additional Requirements
The Committee will take any measures the Committee deems necessary or appropriate to oversee the work of the independent auditors and to assure the auditors’ independence from the Funds. This may include reviewing a formal written statement from the independent auditors delineating all relationships between the auditors and the Funds, consistent with Independence Standards Board No. 1, and discussing with the auditors their methods and procedures for ensuring independence.
Amended: November 9, 2005
6
Appendix A
Pre-Approved Audit Services for the Pre-Approval Period January 1, 2006 through December 31, 2006
Service
| | The Fund(s) | | Fee Range |
| | | | |
Statutory audits or financial audits (including tax services associated with audit services) | | ý | | As presented to Audit Committee(1) |
| | | | |
Services associated with SEC registration statements, periodic reports and other documents filed with the SEC or other documents issued in connection with securities offerings (e.g., consents), and assistance in responding to SEC comment letters. | | ý | | Not to exceed $9,300 per filing |
| | | | |
Consultations by Fund management with respect to accounting or disclosure treatment of transactions or events and/or the actual or potential effect of final or proposed rules, standards or interpretations by the SEC, Financial Accounting Standards Board, or other regulatory or standard setting bodies. | | ý | | Not to exceed $8,000 during the Pre-Approval Period |
| | | | |
Seed capital audit and related review and issuance of consent on the N-2 registration statement | | ý | | Not to exceed $12,000 per audit |
(1) For new Funds launched during the Pre-Approval Period, the fee ranges pre-approved will be the same as those for existing Funds, pro-rated in accordance with inception dates as provided in the auditors’ Proposal or any Engagement Letter covering the period at issue. Fees in the Engagement Letter will be controlling.
7
Appendix B
Pre-Approved Audit-Related Services for the Pre-Approval Period January 1, 2006 through December 31, 2006
Service
| | The Fund(s) | | Fund Affiliates | | Fee Range |
| | | | | | |
Services related to Fund mergers (Excludes tax services - See Appendix C for tax services associated with Fund mergers) | | ý | | ý | | Not to exceed $10,000 per merger |
| | | | | | |
Consultations by Fund management with respect to accounting or disclosure treatment of transactions or events and/or the actual or potential effect of final or proposed rules, standards or interpretations by the SEC, Financial Accounting Standards Board, or other regulatory or standard setting bodies. [Note: Under SEC rules some consultations may be “audit” services and others may be “audit-related” services.] | | ý | | | | Not to exceed $5,000 per occurrence during the Pre-Approval Period |
| | | | | | |
Review of the Funds’ semi-annual financial statements | | ý | | | | Not to exceed $2,100 per set of financial statements per fund |
| | | | | | |
Reports to regulatory or government agencies related to the annual engagement | | ý | | | | Up to $5,000 per occurrence during the Pre-Approval Period |
| | | | | | |
Regulatory compliance assistance | | ý | | ý | | Not to exceed $5,000 per quarter |
| | | | | | |
Training courses | | ý | | ý | | Not to exceed $2,000 per course |
| | | | | | |
For Prime Rate Trust, agreed upon procedures for quarterly reports to rating agencies | | ý | | | | Not to exceed $9,000 per quarter |
| | | | | | |
For Prime Rate Trust and Senior Income Fund, agreed upon procedures for the Revolving Credit and Security Agreement with Citigroup | | ý | | | | Not to exceed $20,000 per fund per year |
8
Appendix C
Pre-Approved Tax Services for the Pre-Approval Period January 1, 2006 through December 31, 2006
Service
| | The Fund(s) | | Fund
Affiliates | | Fee Range |
| | | | | | |
Preparation of federal and state income tax returns and federal excise tax returns for the Funds including assistance and review with excise tax distributions | | ý | | | | As presented to Audit Committee(2) |
| | | | | | |
Review of IRC Sections 851(b) and
817(h) diversification testing on a real-time basis | | ý | | | | As presented to Audit Committee(2) |
| | | | | | |
Assistance and advice regarding year-end reporting for 1099’s | | ý | | | | As presented to Audit Committee(2) |
| | | | | | |
Tax assistance and advice regarding statutory, regulatory or administrative developments | | ý | | ý | | Not to exceed $5,000 for the Funds or for the Funds’ investment adviser during the Pre-Approval Period |
(2) For new Funds launched during the Pre-Approval Period, the fee ranges pre-approved will be the same as those for existing Funds, pro-rated in accordance with inception dates as provided in the auditors’ Proposal or any Engagement Letter covering the period at issue. Fees in the Engagement Letter will be controlling.
9
Appendix C
Pre-Approved Tax Services for the Pre-Approval Period January 1, 2006 through December 31, 2006 (continued)
Service
| | The Fund(s) | | Fund
Affiliates | | Fee Range |
| | | | | | |
Tax training courses | | ý | | ý | | Not to exceed $2,000 per course during the Pre-Approval Period |
| | | | | | |
Tax services associated with Fund mergers | | ý | | ý | | Not to exceed $4,000 per fund per merger during the Pre-Approval Period |
| | | | | | |
Loan Staff Services | | ý | | | | Not to exceed $15,000 during the Pre-Approval Period |
| | | | | | |
Other tax-related assistance and consultation, including, without limitation, assistance in evaluating derivative financial instruments and international tax issues, qualification and distribution issues, and similar routine tax consultations. | | ý | | | | Not to exceed $120,000 during the Pre-Approval Period |
10
Appendix D
Pre-Approved Other Services for the Pre-Approval Period January 1, 2006 through December 31, 2006
Service
| | The Fund(s) | | Fund Affiliates | | Fee Range |
| | | | | | |
Agreed-upon procedures for Class B share 12b-1 programs | | | | ý | | Not to exceed $50,000 during the Pre-Approval Period |
| | | | | | |
Security counts performed pursuant to Rule 17f-2 of the 1940 Act (i.e., counts for Funds holding securities with affiliated sub-custodians) | | ý | | | | Not to exceed $5,000 per Fund during the Pre-Approval Period |
| | | | | | |
Agreed upon procedures for 15 (c) FACT Books | | ý | | | | Not to exceed $35,000 during the Pre-Approval Period |
11
Appendix E
Prohibited Non-Audit Services
Dated: January 1, 2006
• Bookkeeping or other services related to the accounting records or financial statements of the Funds
• Financial information systems design and implementation
• Appraisal or valuation services, fairness opinions, or contribution-in-kind reports
• Actuarial services
• Internal audit outsourcing services
• Management functions
• Human resources
• Broker-dealer, investment adviser, or investment banking services
• Legal services
• Expert services unrelated to the audit
• Any other service that the Public Company Accounting Oversight Board determines, by regulation, is impermissible
12
EXHIBIT A
ING EQUITY TRUST
ING FUNDS TRUST
ING GLOBAL ADVANTAGE AND PREMIUM OPPORTUNITY FUND
ING GLOBAL EQUITY DIVIDEND AND PREMIUM OPPORTUNITY FUND
ING INVESTMENT FUNDS, INC.
ING INVESTORS TRUST
ING MAYFLOWER TRUST
ING MUTUAL FUNDS
ING PARTNERS, INC.
ING PRIME RATE TRUST
ING SENIOR INCOME FUND
ING VARIABLE INSURANCE TRUST
ING VARIABLE PRODUCTS TRUST
ING VP EMERGING MARKETS FUND, INC.
ING VP NATURAL RESOURCES TRUST
USLICO SERIES FUND
13
(e) (2) Percentage of services referred to in 4(b) — (4)(d) that were approved by the audit committee
100% of the services were approved by the audit committee.
(f) Percentage of hours expended attributable to work performed by other than full time employees of KPMG if greater than 50%.
Not applicable.
(g) Non-Audit Fees: The non-audit fees billed by the registrant’s accountant for services rendered to the registrant, and rendered to the registrant’s investment adviser, and any entity controlling, controlled by, or under common control with the adviser that provides ongoing services to the registrant for each of the last two fiscal years of the registrant were $300,889 for year ended December 31, 2005 and $476,230 for year ended December 31, 2004.
(h) Principal Accountants Independence: The Registrant’s Audit committee has considered whether the provision of non-audit services that were rendered to the registrant’s investment adviser and any entity controlling, controlled by, or under common control with the investment adviser that provides ongoing services to the registrant that were not pre-approved pursuant to Rule 2-01(c)(7)(ii) of Regulation S-X is compatible with maintaining KPMG’s independence.
14
Item 5. Audit Committee of Listed Registrants.
Not applicable.
Item 6. Schedule of Investments
Schedule is included as part of the report to shareholders filed under Item 1 of this Form.
Item 7. Disclosure of Proxy Voting Policies and Procedures for Closed-End Management Investment Companies.
Not applicable.
Item 8. Portfolio Managers of Closed-End Management Investment Companies.
Not applicable.
Item 9. Purchases of Equity Securities by Closed-End Management Investment Company and Affiliated Purchasers
Not applicable.
Item 10. Submission of Matters to a Vote of Security Holders.
The Board has a Nominating Committee for the purpose of considering and presenting to the Board candidates it proposes for nomination to fill Independent Trustee vacancies on the Board. The Committee currently consists of all Independent Trustees of the Board (6 individuals). The Nominating Committee operates pursuant to a Charter approved by the Board. The primary purpose of the Nominating Committee is to consider and present to the Board the candidates it proposes for nomination to fill vacancies on the Board. In evaluating candidates, the Nominating Committee may consider a variety of factors, but it has not at this time set any specific minimum qualifications that must be met. Specific qualifications of candidates for Board membership will be based on the needs of the Board at the time of nomination.
The Nominating Committee is willing to consider nominations received from shareholders and shall assess shareholder nominees in the same manner as it reviews its own nominees. A shareholder nominee for director should be submitted in writing to the Fund’s Secretary. Any such shareholder nomination should include at a minimum the following information as to each individual proposed for nomination as trustee: such individual’s written consent to be named in the proxy statement as a nominee (if nominated) and to serve as a trustee (if elected), and all information relating to such individual that is required to be disclosed in the solicitation of proxies for election of trustees, or is otherwise required, in each case under applicable federal securities laws, rules and regulations.
The Secretary shall submit all nominations received in a timely manner to the Nominating Committee. To be timely, any such submission must be delivered to the Fund’s Secretary not earlier than the 90th day prior to such meeting and not later than the close of business on the later of the 60th day prior to such meeting or the 10th day following the day on which public announcement of the date of the meeting is first made, by either disclosure in a press release or in a document publicly filed by the Fund with the Securities and Exchange Commission.
Item 11. Controls and Procedures.
(a) Based on our evaluation conducted within 90 days of the filing date, hereof, the design and operation of the registrant’s disclosure controls and procedures are effective to ensure that material information relating to the registrant is made known to the certifying officers by others within the appropriate entities, particularly during the period in which Forms N-CSR are being prepared, and the registrant’s disclosure controls and procedures allow timely preparation and review of the information for the registrant’s Form N-CSR and the officer certifications of such Form N-CSR.
(b) There were no significant changes in the registrant’s internal controls that occurred during the second fiscal quarter of the period covered by this report that has materially affected, or is reasonably likely to materially affect, the registrant’s internal control over financial reporting.
Item 12. Exhibits.
(a)(1) Code of Ethics pursuant to Item 2 of Form N-CSR is filed and attached hereto as
EX-99.CODE ETH.
(a)(2) A separate certification for each principal executive officer and principal financial officer of the registrant as required by Rule 30a-2 under the Act (17 CFR 270.30a-2) is attached hereto as EX-99.CERT.
(b) The officer certifications required by Section 906 of the Sarbanes-Oxley Act of 2002 are attached hereto as EX-99.906CERT.
(3) Not applicable.
15
SIGNATURES
Pursuant to the requirements of the Securities Exchange Act of 1934 and the Investment Company Act of 1940, the registrant has duly caused this report to be signed on its behalf by the undersigned, thereunto duly authorized.
(Registrant): ING Partners, Inc.
By | /s/ James M. Hennessy |
| James M. Hennessy |
| President and Chief Executive Officer |
Date: March 10, 2006
Pursuant to the requirements of the Securities Exchange Act of 1934 and the Investment Company Act of 1940, this report has been signed below by the following persons on behalf of the registrant and in the capacities and on the dates indicated.
By | /s/ James M. Hennessy |
| James M. Hennessy |
| President and Chief Executive Officer |
Date: March 10, 2006
By | /s/ Todd Modic |
| Todd Modic |
| Senior Vice President and Chief Financial Officer |
Date: March 10, 2006
16